IDCF 2015 Intensified Diarrhoea Control Fortnight - Cg Health

6960 Biochemistry 1988, 27, 6960-6967
Comparison of the B- and Z-Form Hairpin Loop Structures Formed by d ( C G ) 5 T 4 ( C G ) S t
Steven K. Wolk,* Charles C. Hardin,* Markus W. Germann,O Johan H. van de Sande,5 and Ignacio Tinoco, Jr.*,*
Department of Medicinal Biochemistry, Faculty of Medicine, The University of Calgary, Calgary, Alberta T2N 4N1, Canada Received January 15, 1988; Revised Manuscript Received May 10, 1988
Department of Chemistry and Laboratory of Chemical Biodynamics, University of California, Berkeley, California 94720, and
ABSTRACT: The partially self-complementary synthetic DNA oligonucleotide d(CG),T,(CG), has been studied by using ’H and 31P N M R and circular dichroism. Results show that, under low-salt conditions (120 mM NaCl buffer), an intramolecular hairpin loop exists in which the double-helical stem region is B-form and the thymidine loop residues have predominantly southern (C2’-endo) sugar conformations. The thymidine glycosidic torsion angles are intermediate between syn and anti or exist as an equilibrium mixture of residues in the two extremes. NOESY data indicate that the structure of the loop region is very similar to that found for d(CG)*T,(CG)* [Hare, D. R., & Reid, B. R. (1986) Biochemistry 25, 534143501. Under high-salt conditions (6 M NaC10, buffer), the dominant form ( ~ 8 5 % ) is an intramolecular hairpin structure in which the stem region forms a Z-form double helix. As in the B-form, the loop thymidine residues are intermediate between the syn and anti conformations or exist as an equilibrium mixture of the two, but the thymidine sugar conformations differ in that they are biased toward northern (C3’-endo) conformations.
I n recent years it has become increasingly clear that DNA has conformational variability far beyond the original B-form double helix proposed by Watson and Crick (1953). Right- handed A-form (Fuller et al., 1965), C-form (Marvin et al., 1961), D-form (Arnott et al., 1974), and left-handed Z-form (Pohl & Jovin, 1972; Wang et al., 1979) have all been re- ported. Short sequences that are not fully complementary have been shown to form double helices containing mismatched bases (Patel et al., 1982a), bulged bases (Patel et al., 1982b; Morden et al., 1983), and hairpin loops (Haasnoot et al., 1986). Very recently, it has been shown that the Tetrahymena telomere DNA sequence forms an intramolecular structure containing only non-Watson-Crick base pairs in 20 mM phosphate buffer (Henderson et al., 1987).
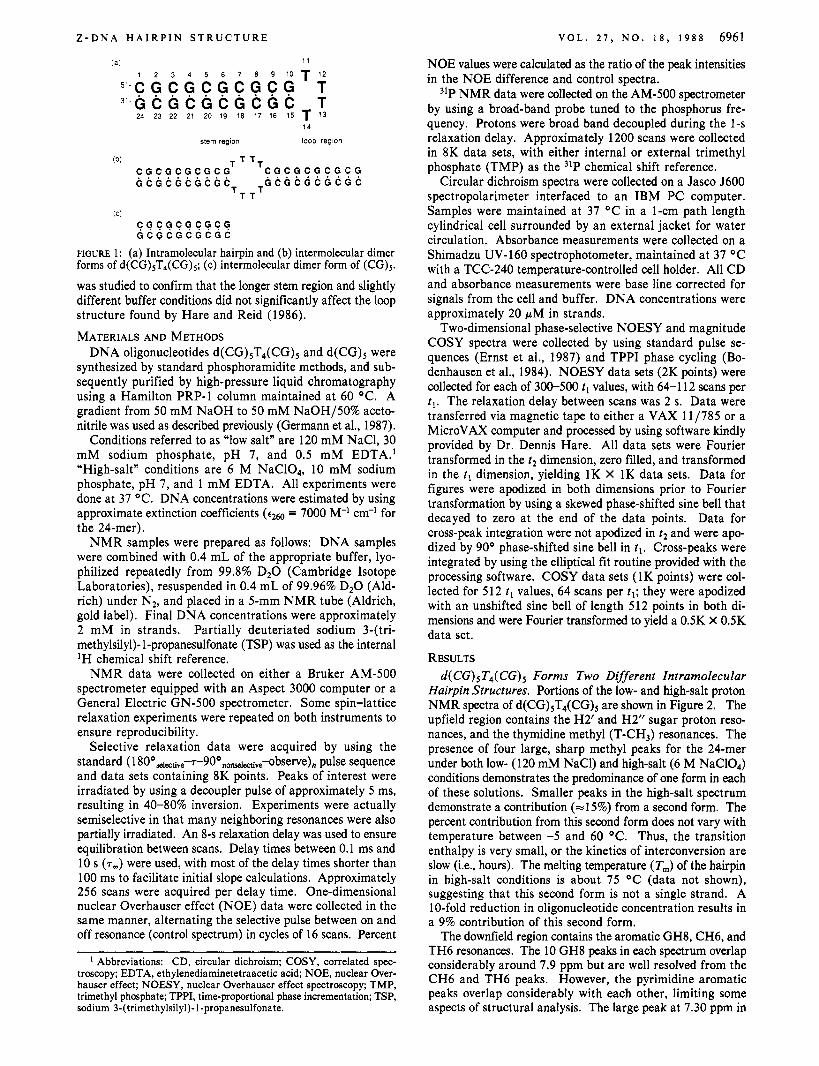
With the large range of accessible conformations, it is likely that more and more of these structures will be found to have biological importance. Detailed studies of these structures should provide clues that facilitate the discovery of these bi- ological roles. We therefore undertook the study of the DNA oligonucleotide d(5’-CGCGCGCGCGTTTTCGCGCGC- GCG-3’) [henceforth referred to as d(CG),T,(CG), or “24- mer”], which was reported to have the unusual property of forming an intramolecular hairpin loop structure (Figure 1 a) with a Z-form double-helical stem region (Germann et al., 1985). Hairpin loops are clearly important in maintaining the structure of transfer RNAs. They may also occur in chro- mosomal regions containing nearly palindromic sequences, where they could play a role in transcription or other in vivo processes (Lilley, 1981; Courey & Wang, 1983; Lilley et al., 1987). The significance of Z-form structures has yet to be clearly established, though immunofluorescence experiments
‘This work was supported by National Institutes of Health Grant Grant GM 10840 (I.T.) and the U S . Department of Energy Office of Energy Research, under contract DE-FG03-86ER60406 (I.T.). C.C.H. was supported by NIH-NRSA Postdoctoral Fellowship GMll638. M.W.G. was supported by the Alberta Heritage Foundation for Medical Research. J.H.v.d.S. was supported by the Medical Research Council of Canada.
*University of California. 8 The University of Calgary.
suggest that Z-form tracts may exist in vivo in both DNA (Rich et al., 1984; Zarling et al., 1984) and RNA (Zarling et al., 1987). Possible biological roles of Z-DNA, e.g., in Recl-catalyzed recombination (Kmiec & Holloman, 1986), and inhibition of methylation in plasmids by EcoRI methylase (Jaworski et al., 1987) are currently being investigated.
Oligonucleotides with hairpin loops of four thymidine res- idues and right-handed helical stems have been well charac- terized. Ikuta et al. (1986) found by NMR methods that d(CG),T,(CG), forms a unimolecular hairpin structure over a large range of experimental conditions and that the thy- midine in the seventh position [T(7)] stacks upon the neigh- boring guanine [G(6)] at the loop/stem junction. Hare and Reid (1986) published the detailed structure of d(CG)2T4- (CG),, using a combination of NMR and distance geometry methods. They showed that three of four thymidines stacked in a continuation of the stem helix [T(5) stacked upon G(4), and T(7) and T(8) upon C(9)], while the last [T(6)] was rotated away from the center of the loop. All sugar confor- mations were B-like, but there was considerable variation in the pseudorotation phase angle (P = 137-238’). Glycosidic torsion angles were also B-like and varied (x = -52’ to -1 16O), but the thymidines were biased slightly toward syn confor- mations.
To our knowledge, only circular dichroism data have been presented as evidence for a Z-form hairpin structure in solu- tion, and only for the sequences d(CG),T,(CG), (Xodo et al., 1986) and d(CG),T,(CG), (Germann et al., 1985). A Z- hairpin crystal structure of d(CG),T,(CG), has recently been reported (Chattopadhyaya et al., 1988) in which all four loop thymidines are rotated away from the center of the loop, with T(9) and T(10) stacking on one another. The authors noted, however, that intermolecular interactions were present in the crystal that may not be important in solution. We have thus used NMR methods to study the Z-form hairpin structure of d(CG),T,(CG), to (1) verify with interproton distances and phosphorous chemical shifts that the stem region is indeed Z-form, as CD evidence suggests, and (2) elucidate the structure of the loop region in order to compare the B- and Z-forms. The B-form hairpin structure of d(CG)5T4(CG)S
0006-2960/88/0427-6960$01 S O / O 0 1988 American Chemical Society
Z - D N A H A I R P I N S T R U C T U R E V O L . 2 7 , N O . 1 8 , 1 9 8 8 6961
NOE values were calculated as the ratio of the peak intensities in the NOE difference and control spectra.
31P NMR data were collected on the AM-500 spectrometer by using a broad-band probe tuned to the phosphorus fre- quency. Protons were broad band decoupled during the 1-s relaxation delay. Approximately 1200 scans were collected in 8K data sets, with either internal or external trimethyl phosphate (TMP) as the
Circular dichroism spectra were collected on a Jasco 5600 spectropolarimeter interfaced to an IBM PC computer. Samples were maintained at 37 OC in a 1-cm path length cylindrical cell surrounded by an external jacket for water circulation. Absorbance measurements were collected on a Shimadzu UV-160 spectrophotometer, maintained at 37 OC with a TCC-240 temperature-controlled cell holder. All CD and absorbance measurements were base line corrected for signals from the cell and buffer. DNA concentrations were approximately 20 HM in strands.
Two-dimensional phase-selective NOESY and magnitude COSY spectra were collected by using standard pulse se- quences (Ernst et al., 1987) and TPPI phase cycling (Bo- denhausen et al., 1984). NOESY data sets (2K points) were collected for each of 300-500 tl values, with 64-1 12 scans per t l . The relaxation delay between scans was 2 s. Data were transferred via magnetic tape to either a VAX 11/785 or a MicroVAX computer and processed by using software kindly provided by Dr. Dennis Hare. All data sets were Fourier transformed in the t2 dimension, zero filled, and transformed in the t l dimension, yielding 1K X 1K data sets. Data for figures were apodized in both dimensions prior to Fourier transformation by using a skewed phase-shifted sine bell that decayed to zero at the end of the data points. Data for cross-peak integration were not apodized in t2 and were apo- dized by 90° phase-shifted sine bell in t l . Cross-peaks were integrated by using the elliptical fit routine provided with the processing software. COSY data sets (1K points) were col- lected for 512 t l values, 64 scans per t l ; they were apodized with an unshifted sine bell of length 512 points in both di- mensions and were Fourier transformed to yield a 0.5K X 0.5K data set.
RESULTS d( CG), T4( CG), Forms Two Different Intramolecular
Hairpin Structures. Portions of the low- and high-salt proton NMR spectra of d(CG),T4(CG), are shown in Figure 2. The upfield region contains the H2’ and H2” sugar proton reso- nances, and the thymidine methyl (T-CH3) resonances. The presence of four large, sharp methyl peaks for the 24-mer under both low- (120 mM NaCI) and high-salt (6 M NaC104) conditions demonstrates the predominance of one form in each of these solutions. Smaller peaks in the high-salt spectrum demonstrate a contribution ( ~ 1 5 % ) from a second form. The percent contribution from this second form does not vary with temperature between -5 and 60 OC. Thus, the transition enthalpy is very small, or the kinetics of interconversion are slow (i.e., hours). The melting temperature (T,) of the hairpin in high-salt conditions is about 75 OC (data not shown), suggesting that this second form is not a single strand. A 10-fold reduction in oligonucleotide concentration results in a 9% contribution of this second form.
The downfield region contains the aromatic GH8, CH6, and TH6 resonances. The 10 GH8 peaks in each spectrum overlap considerably around 7.9 ppm but are well resolved from the CH6 and TH6 peaks. However, the pyrimidine aromatic peaks overlap considerably with each other, limiting some aspects of structural analysis. The large peak at 7.30 ppm in
chemical shift reference.
1 4
stem region loop region
(b) T ~ ~ T
T T T
C O C C I C O C G C S . G C G C G C G C G C
(C)
c c c c c c c c c c G C Q C G C G C G C
FIGURE 1 : (a) Intramolecular hairpin and (b) intermolecular dimer forms of d(CG),T,(CG),; (c) intermolecular dimer form of (CG),.
was studied to confirm that the longer stem region and slightly different buffer conditions did not significantly affect the loop structure found by Hare and Reid (1986).
MATERIALS AND METHODS DNA oligonucleotides d(CG),T,(CG), and d(CG)5 were
synthesized by standard phosphoramidite methods, and sub- sequently purified by high-pressure liquid chromatography using a Hamilton PRP-1 column maintained at 60 OC. A gradient from 50 mM NaOH to 50 mM NaOH/SO% aceto- nitrile was used as described previously (Germann et al., 1987).
Conditions referred to as “low salt” are 120 mM NaCl, 30 mM sodium phosphate, pH 7, and 0.5 mM EDTA.’ “High-salt” conditions are 6 M NaC104, 10 mM sodium phosphate, pH 7, and 1 mM EDTA. All experiments were done at 37 OC. DNA concentrations were estimated by using approximate extinction coefficients (ezao = 7000 M-’ cm-’ for the 24-mer).
NMR samples were prepared as follows: DNA samples were combined with 0.4 mL of the appropriate buffer, lyo- philized repeatedly from 99.8% D 2 0 (Cambridge Isotope Laboratories), resuspended in 0.4 mL of 99.96% D 2 0 (Ald- rich) under N2, and placed in a 5-mm NMR tube (Aldrich, gold label). Final DNA concentrations were approximately 2 mM in strands. Partially deuteriated sodium 3-(tri- methylsily1)- 1 -propanesulfonate (TSP) was used as the internal ‘H chemical shift reference.
NMR data were collected on either a Bruker AM-500 spectrometer equipped with an Aspect 3000 computer or a General Electric GN-500 spectrometer. Some spin-lattice relaxation experiments were repeated on both instruments to ensure reproducibility.
Selective relaxation data were acquired by using the standard ( 1 8 0 ° s c l c c t i v e - r 9 0 0 n o ~ ~ ~ ” e ~ b s e ~ e ) , pulse sequence and data sets containing 8K points. Peaks of interest were irradiated by using a decoupler pulse of approximately 5 ms, resulting in 40-80% inversion. Experiments were actually semiselective in that many neighboring resonances were also partially irradiated. An 8-s relaxation delay was used to ensure equilibration between scans. Delay times between 0.1 ms and 10 s (7,) were used, with most of the delay times shorter than 100 ms to facilitate initial slope calculations. Approximately 256 scans were acquired per delay time. One-dimensional nuclear Overhauser effect (NOE) data were collected in the same manner, alternating the selective pulse between on and off resonance (control spectrum) in cycles of 16 scans. Percent
Abbreviations: CD, circular dichroism; COSY, correlated spec- troscopy; EDTA, ethylenediarninetetraacetic acid; NOE, nuclear Over- hauser effect; NOESY, nuclear Overhauser effect spectroscopy; TMP, trimethyl phosphate; TPPI, time-proportional phase incrementation; TSP, sodium 3-(trimethylsilyl)-l-propanesulfonate.

6962 B I O C H E M I S T R Y W O L K E T A L .
GH8 X a .
GHB b. I
CH6 + TH6 T-CH - A
8 . 0 1.6 1 . 2 2 . 8 2 . 4 2 . 0 1 .6 PPM PPM
FIGURE 2: Aromatic and HZ’,”’’,methyl regions of the 500-MHz proton NMR spectrum of d(CG),T,(CG), in (a) 6 M NaC10, buffer and (b) 120 mM NaCl buffer at 37 OC. Samples were 2 mM in oligonucleotides. Impurity peaks are marked with an “X”. Regions are not equally scaled.
the high-salt spectrum is due to six CH6 resonances; these peaks probably correspond to central residues in the stem structure, since they are expected to have similar magnetic environments.
It must first be determined whether the dominant form under low- and high-salt conditions is the intramolecular hairpin (Figure la). Gel electrophoresis results show this to be the case in 90 mM Tris-borate (pH 8.3) buffer (Germann et al., 1985). It is unclear, however, whether the same will be true in 6 M NaC104 buffer and/or at the oligonucleotide concentrations used in NMR experiments. Thus, NMR re- laxation measurements were used to determine the size of the structure formed by the 24-mer. Because cross-relaxation with other protons is the dominant relaxation pathway (Abragam, 1961; Kearns, 1984), the selective spin-lattice relaxation rates (Rls ) are approximately proportional to the correlation time (TJ of the molecule, which is proportional to the length of short helices. Thus, if the 24-mer forms a hairpin, its correlation time should be roughly equivalent to that of d(CG)5 (the 10-mer), though slightly larger. If a duplex with an internal loop (Figure lb) is the dominant structure, then the correlation time should be about a factor of 2 larger. Wemmer and co-workers used this reasoning to explain observed R,, values for the hairpin-to-duplex transition in an oligonucleotide containing twelve bases (2.0 s-l vs 4.2 s-l; Wemmer et al.,
Selective R1, values for both oligonucleotides were deter- mined by using the 1 80°selective-~-900nons~,~i~~-observe pulse sequence, and the intensities of the irradiated peaks measured as a function of the delay time T. The CH6 resonances were irradiated, since they should be in very similar spin systems in both the IO-mer and the 24-mer, and all CH6 resonances were irradiated simultaneously. Some overlapping TH6 res- onances were also irradiated, but this should not affect the results since the relatively large internuclear distance (>5 A) prohibits significant cross-relaxation. Figure 3b shows a plot of In ( I , - I,) vs T for an irradiated CH6 peak in the spectrum of the 24-mer in high salt; the initial slope is equal to -R1,. Table I lists the R1, values for the CH6 resonances that were resolved from TH6 resonances in the spectrum of the 24-mer in low and high salt and CH6 resonances in the control duplex
1985).
Table I: Spin-Lattice Relaxation Rates of Cytosine H6 Protons in d(CG)ST4(CG)S and d(CG)S at 37 O C
high salt low salt high salt low salt Ri, (s-’) RI, (s-l) R,, (s-’) R1, (s-9
d(CG)S -4.8 -2.5 d(CG)sT,(CG)s -4.9 -2.3 -3.4 -1.8 -4.7 -2.5
(10-mer) spectrum. As expected, both molecules give similar R1, values in low salt, where the 24-mer is presumed to be a hairpin. In high salt, the rates for both molecules are larger, presumably due to the effect of viscosity on the molecular correlation times. As in the low-salt experiments, the rates of both molecules are the same within experimental error. Thus, the hairpin is also the dominant form in high-salt buffer. Several R1, values seem uncharacteristically small, but these rates probably correspond to cytidine residues located near the end of the helix.. These residues probably have additional motional freedom due to fraying (Pate1 et al., 1982b), which may account for the slower relaxation rates of these nuclei.
Since the 24-mer is a hairpin structure in high-salt solution, circular dichroism, 31P NMR, and ‘H NMR experiments were performed to verify that the double-stranded stem adopts a left-handed Z conformation and to elucidate details of the T4 loop conformation.
Circular Dichroism and UV Absorption Spectroscopies. Circular dichroism measurements of nucleic acids are sensitive to the stacking geometry of the bases, which is dependent on the helical conformation. A-form, B-form, and Z-form spectra each have unique characteristics. The CD spectra of the 24-mer in low and high salt are shown in Figure 4. These characteristics closely match those first observed by Pohl and Jovin (1972) for poly(dG-dC) in 0.2 M NaCl and 2.5 M NaCl solutions and those observed by Germann et al. (1985) for the 24-mer in 5 M NaCl. Due to the strong absorbance of chloride ion below 200 nm, data for the 24-mer in the 187-200-nm range in low-salt solution could not be obtained. Thus, the CD spectrum of the 24-mer was obtained in distilled deionized water (with residual Na+ concentration) and was compared to the low-salt spectrum. Since the low salt and H 2 0 spectra of the 24-mer in the 210-320-nm range match within ex-

Z - D N A H A I R P I N S T R U C T U R E VOL. 2 1 , NO. 1 8 , 1 9 8 8 6963
I
... ( 0 ) e l l , l , , , ...... I 6 A .....' ... a 1 4 h
, , , w , , , ( , ( , , , , ,
7 . 5 7 . 0 6: 5 6 : O 5 . 5
DDm
b
\ '1 I 0
0 . . . . , . . . . , . . . . , . . . . : . 0.0 0.5 1 .o 1.5 2.0
TIME (sec) FIGURE 3: (a) Selective inversion-recovery data for d(CG),T,(CG), in 6 M NaC10, buffer. CH6 and TH6 resonances are inverted and plotted as a function of the recovery time (7 ) . (b) Plot of In ( I , - I,) vs T for the group of CH6 resonances denoted by an arrow in panel a. The initial slope is equal to -R1,. (See text.)
perimental error (Figure 4a), it is reasonable to assume that the structure of the 24-mer is very similar under each of these conditions. Thus, for comparison of the 187-210-nm region of the CD spectra, the H20 spectrum is contrasted with the high-salt spectrum. These results are very similar to the B- and Z-form spectra of poly(dG-dC) observed in 10 mM phosphate and 2 M NaC10, (Riazance et al., 1985). Thus, CD evidence suggests that the low-salt form of the 24-mer has a B-form stem region, while the high-salt form has a Z-form stem region. Figure 4a also includes the CD spectrum of the 24-mer in 90% trifluoroethanol, 1 mM NaC1, and 0.1 mM EDTA, pH 7, which has characteristics of a molecule with an A-form stem region. Further experiments to confirm this possibility are in progress.
Figure 4c shows the ratio of absorbance values at 295 and 260 nm in the spectrum of the 24-mer obtained as a function of NaClO, concentration. This ratio has been used as an indicator of the B to Z conformational transition in DNA (Pohl & Jovin, 1972). The A295/A260 ratio indicates that at 37 OC the transition midpoint occurs at 2.1 M NaClO,, and the transition is virtually complete by 4 M.
210 2% 2 5 0 2 7 0 2 9 0 310 Wovelength (nm)
- m m I 9 0 210 2 3 0 2 5 0 2 7 0 2 9 0 310
Wovelength (nm)
0 1 2 3 4 5 6 7
[NaC104], (Molar)
FIGURE 4: Circular dichroism spectra of d(CG),T,(CG),. (a) In 6 M NaC10, buffer [Z-form (-)I, 120 mM NaCl buffer [B-form (- - - ) I , H20 [B-form (-..)I, and 90% trifluoroethanol, 1 mM NaCl, and 0.1 mM EDTA, pH 7 [A-form ( 0 *)I, in the 220-320-nm region. (b) In 6 M NaCIO, buffer [Z-form (-)I and H20 [B-form ( . -e ) ] ,
in the 187-320-nm region. (c) Transition profile of the B- to Z-form transition in d(CG),T,(CG), as a function of NaC10, concentration in 10 mM sodium phosphate (pH 7) and 1 mM EDTA at 37 O C .
Transition is monitored by the A295/A2,54 ratio.
-2 , ' 5 - 3 . 0 - 3 . 5 - 4 : o -4:5 PPM
FIGURE 5: Proton-decoupled 202-MHz 31P NMR spectra of d- (CG)5T4(CG)S in (a) 6 M NaC10, buffer and (b) 120 mM NaCl buffer at 37 O C . Samples were 2 mM in oligonucleotides.
Phosphodiester Backbone Conformations. Figure 5 shows the phosphorus NMR spectrum of the 24-mer under low- and high-salt conditions. The low-salt spectrum (Figure Sa) shows that all of the backbone phosphodiester resonances are near -4 ppm, which is characteristic of right-handed oligo- and polynucleotides (Chen & Cohen, 1984). The resonances (-3.7, -4.0, and -4.4 ppm) resolved from the main group (-4.2 ppm) are likely to be from the phosphates in the loop region, since 31P chemical shifts are known to be sensitive to the backbone torsion angles (Gorenstein, 198 l), and the phosphodiester conformations in the loop are likely to be distorted relative to those in the stem region. The 31P spectrum of the 24-mer

6964 B I O C H E M I S T R Y
in high salt is shown in Figure 5b. Two main groups of peaks are observed at -2.4 and -3.9 ppm. This splitting pattern and these chemical shift values are characteristic of Z-form nucleic acids (Pate1 et al., 1982d; Sklenar et al., 1987). As in the low-salt spectrum, other peaks (-2.95, -3.3, -4.3, and -4.4 ppm) are dispersed from the main groups and are likely to be from the loop region. However, this spread is more pronounced in the Z-form spectrum. This may reflect greater variation in the average phosphodiester conformations that could be required to form a hairpin loop of four nucleotides spanning the strands terminating a Z-form stem.
Studies in Sodium Chloride and Sodium Bromide. Cir- cular dichroism and 31P NMR results suggest that the 24-mer also forms structures with a Z-form stem region in 5 M NaCl or 6 M NaBr buffers. However, the methyl region of the 500-MHz ’H NMR spectra indicates the presence of two or more conformations in equilibrium under these conditions.
Structural Details of Z-Form d(CG),T,(CG),. The most detailed structural information was obtained from a 2D NOESY experiment (Ernst et al., 1987). Interproton distances were calculated by using the approximation
ay/ak( = rkt/ri j6 (1) where ay and ak( are cross-relaxation rates between nuclei i and j and between nuclei k and I, respectively; rij and rkl are the respective internuclear distances (Wagner & Wuthrich, 1979). Using two measured cross-relaxation rates, one cor- responding to a known fixed distance within the molecule of interest, the remaining distance can be calculated. For ex- periments on DNA oligonucleotides, the cytosine H5/H6 distance (2.4 A) is typically used as the reference; the sugar H2’/H2’’ or thymidine H6/CH3 distances can also be used (Hare & Reid, 1986). Cross-relaxation rates are estimated from the initial slopes of NOE buildup curves, Le., plots of % NOE vs the time that the interaction was allowed to occur (the mixing time). The NOE intensity is measured as a cross-peak volume in the NOESY spectrum.
In order to determine mixing times appropriate for calcu- lating u values, one-dimensional NOE buildup curves were generated by irradiating the cytidine H6 protons of the six peaks corresponding to the most central cytidine residues in the stem region. Magnitudes of the NOES to the cytidine H5 and H1’ protons were measured. As mentioned previously, these protons all have the same chemical shift. From these data (not shown), it is evident that the linear region of the CH6/CH5 buildup curve occurs below 100 ms. However, for shorter times, the intensity of the CH6ICHl’ NOE is close to the limit of reasonable signal to noise. For slightly larger distances, Le., 4 A, the signal to noise ratio becomes so small that accurate integration is unlikely. Thus, distance calcu- lations for the Z-form hairpin were made from one NOESY experiment with a mixing time of 100 ms, with the average cytosine H5/H6 NOE intensity as the reference. To estimate the errors introduced in the latter case, a comparison was made between the u value obtained from the 100-ms time point for the H5/H6 buildup and from the slope through all time points less than 50 ms. It was found that the latter calculation yielded a u value 30% larger. When used in eq 1, this yields distance errors of about 5%, which are well within the inherent error in these measurements estimated by other authors (Fesik et al., 1986; Hare & Reid, 1986).
Assignments of the Z-form resonances were made from the appropriate regions of the NOESY spectrum. Each thymidine CH3 resonance shows a cross-peak to the H6 resonance on the same residue, which in turn shows NOES to the intraresidue HI’, H2’, H2”, and (in this case) H3’ protons. Cross-peaks
W U L K 0 1
6 . 4 6 . 2 6 . 0 5 . 8 5 . 6 5 . 4 5 . 2 PPM
6 . 2 6 . 0 5 . 8 5 . 6 5 . 4 PPM
AL.
N
r
U
r
I a loa
I’.
m r-
FIGURE 6: (a) Aromatic/Hl’,HS cross-peak region of the 500-MHz NOESY spectrum of d(CG)sT4(CG)5 in 6 M NaC10, buffer at 37 OC. The mixing time is 100 ms. Peaks A-D are intranucleotide TH6/THI’ cross-peaks. Peaks E, F, G, and H are 1, 1, 2, and 6 CH6/CH5 cross-peaks, respectively. Peak J is 10 nearly overlapping GH8IGHl’ cross-peaks. Peak K is six overlapping CH6/GHl’ cross-peaks. (b) Aromatic/Hl’,HS cross-peak region of the 500-MHz NOESY spectrum of d(CG),T,(CG), in 120 mM NaCl buffer at 37 OC. Solid lines show the [Hl‘(n) + H6(n) + Hl’(n - l)] B-form connectivity path (Hare et al., 1983) which is broken between T(12) and T( 13). Peak L is the C( 15)H5/T( 14)/H6 cross-peak. Peak M is the C(l5)H6/T(14)Hl’ cross-peak.
between these deoxyribose resonances are also observed, al- lowing assignment of the H6, CH3, Hl’, H2’, H2”, and H3’ resonances for each thymidine residue. These results are listed in Table 11. The thymidine protons of one of these groups (1.8 1 ppm) were found to be in NOE contact with an H1’ and an H2” proton belonging to a guanosine residue (data not shown); thus, at least one thymidine residue is proximal to the G(10) sugar moiety. No NOES were found that could un- ambiguously assign the thymidine residues.
Cytidine H6 and H5 resonances were assigned from the aromaticlH5,Hl’ region of the COSY spectrum (data not shown). From the intensities of these same cross-peaks in the NOESY spectrum (Figure 6a), it is clear that these peaks (E, F, G, and H) represent 1, 1, 6, and 2 H6/H5 cross-peaks, respectively. This supports our earlier assumption that the six most internal cytidine residues have virtually identical magnetic environments. Peak J (Figure 6a) contains the overlapping guanosine H8/H1’ cross-peaks; its large magni- tude is indicative of the syn conformation expected for gua- nosine residues in a Z-form stem region (see below).
Cross-peak intensities were determined and distances were calculated by using eq 1 and the above assignments. For equivalent cross-peaks from superimposed residues (i.e., the six superimposed H6 protons giving NOES to the corre- sponding six superimposed H5 protons), cross-peak volumes were divided by the number of contributing resonances and

Z - D N A H A I R P I N S T R U C T U R E V O L . 2 7 , N O . 1 8 , 1 9 8 8 6965
Table 11: Chemical Shift Values of d(CG)5T4(CG)5 Peaks in Low- and High-Salt Conditions
Low Salt (B-Form)
H6/H8 7.40 7.58 7.50 7.53 7.86 7.63 H1‘ 6.00 6.09 5.95 6.16 6.02 H 2” 2.43 2.39 2.28 2.55 H 2’ 2.09 2.12 2.05 2.32 H3’ 4.91 4.65 4.73 4.72 CH3/H5 1.75 1.82 1.64 1.85 5.84
High Salt (Z-Form) T(D) T(A) T(B) T(C) G(10) 6C(i)‘
H6/H8 7.48 7.39 7.40 7.46 7.30 H1‘ 6.18 6.06 6.13 6.08 6.27 5.75 H2” 2.48 2.27 2.24 2.30 2.61 2.57 H2‘ 2.28 2.17 2.13 2.12 1.66 H3‘ 4.78 4.73 4.54 4.68 CH,/H5 1.81 1.70 1.73 1.80 5.21
T(l1) T(12) T(13) T(14) G(10) C(15)
a Chemical shift values for the overlapping cytidine resonances C(3) through C(21) (see text).
compared to single cross-peak intensities. Therefore, the calculated distances represent an average for these residues. When this NOESY experiment was done, the GH8 protons had already exchanged approximately 40% with DzO. Thus, cross-peak intensities involving the GH8 peaks were scaled by a factor of 1/0.6 to correct for this. Table I11 shows a sum- mary of the distances calculated from the 100-ms NOESY and those same distances from X-ray crystallographic studies of Z-form oligonucleotides [Wang et al., 1981; Orbons et al. (1986) and references cited therein]. With a few exceptions, these distances are in excellent agreement with the crystal- lographic results, providing strong evidence that the stem region of the 24-mer is in the Z conformation under high-salt conditions. In the cases that showed poor agreement, the distances calculated from NMR data were usually shorter. This may reflect a contribution from spin diffusion or dynamic motion of the molecule in solution, since the inverse sixth power distance dependence of the NOE biases a time-averaged distance toward the shorter extreme.
Although the lack of internucleotide NOEs in the loop region precludes assignments, intranucleotide NOEs do allow estimation of the glycosidic torsion angle (x) and pseudoro- tation phase angle (P) [Wiithrich (1986), Chapter 111 in these nucleotides. Computed distances are listed in Table 111. The H6/H1’ distance is a very sensitive measure of x and is nearly independent of P. For a nucleotide in the anti range [x z -140°, according to the convention of Saenger (1984)], this distance is about 3.7 A. For the syn conformation (x +60°), this distance decreases to 2.3 A. Table I11 shows that the H6/H1’ distances in all of the Z-form loop thymidine residues are in the 2.7-2.9-h; range, clearly intermediate between the distances listed above. These nucleotides therefore have nonstandard glycosidic conformations (x = Oo) or are present as an equilibrium mixture of syn and anti conformations in fast exchange.
Intranucleotide distances can also be indicative of the pseudorotation phase angle, P. One informative distance for distinguishing northern conformations [P = 0 f 90°, including C3’-endo (P = IS0)] from southern conformations [P = 180 f 90°, including C2’-endo (P = 162O)I is the H6/H3’ dis- tance, though it is also sensitive to x. For the x values con- sistent with measured H6/H 1’ distances, the H6/H3’ distance changes from 3.0 h; (north) to 4.5 A (south). From the H6/H3’ distances listed in Table 111, all four Z-form thymidine loop sugars appear to be in predominantly northern (C3’-endo) conformations. The H2”/H4 distance is also a good indicator
Table 111: Calculated Distances in d(CG)5T4(CG)5 in High-Salt Solution (Z-Form) Compared to Those Obtained from Crystallographic Studiesn
Stem Region Distances (A) NMRb d(CG)3C ~ ( I ~ ~ C - G ) , ~
CH6/GH 1’ 4.lC 5.6 4.9 CH6ICHl’ 3.4c 3.5 3.7 CH6/CH2’ 2.ge 3.3 3.1 CH6/GH2’ 2.7c 3.0 2.6 CH6/GH2” 3.1e 4.2 4.0 CH5/GH2” 3.lC 4.2 4.1g CH5/GH2’ 2.7e 3.1 2.98 GH8IGHl’ 2.Y 2.3 2.3 CH5/GH8 4.4e 4.9 4.38
Intraresidue Loop Thymidine Distances, Z-Form (A)
TH6/TH 1’ 2.8 2.9 2.9 2.7
TH6/TH2’ 2.3h 2.3h 2.3 TH6/TH3’ 3.3 2.8 3.1 3.0
T(D) = T(11) T(A) T(B) T(C)
TH6/TH2” 3.3 2.7h 2 . v
‘ Internucleotide distances are n/(n - 1). bErrors are approximately f0 .2 A for distances less than 3 8, and f0 .5 8, for distances greater than 3 A. cFrom Wang et al. (1981). dFrom Orbons et al. (1986) and references cited therein. Average of six internal cytosine residues with identical chemical shifts (see text). ’Average of ten guanosine resi- dues, scaled for exchange with D 2 0 (see text). #Distances are to methyl protons of m5C instead of CH5. hAverage values of residues T(A) and T(B).
of sugar pucker, varying from 2.3 to 4.0 A in the C3’-endo and C2’-endo conformers, respectively. However, these cross-peaks were not sufficiently resolved to be interpreted.
Structural Details of B-Form d(CG),T,(CG),. Figure 6b shows the aromatic/H 1’,H5 region of the NOESY spectrum collected in low-salt solution. Standard assignment methods were used (Hare et al., 1983), and chemical shifts are listed in Table 11. Poor spectral resolution resulted in significant cross-peak overlap and restricted the number of distances that could be calculated from the data. However, the qualitative similarity of chemical shifts and cross-peaks between this spectrum and that of d(CG),T,(CG), in 20 mM sodium phosphate, pH 7, at 25 “C (Hare & Reid, 1986) indicates that the structure of the T4 loop region is essentially the same in these molecules.
DISCUSSION One- and two-dimensional NMR experiments indicate that
d(CG),T,(CG), exists in two slowly exchanging forms at millimolar DNA concentrations in high-salt solution (6M NaClO,, 10 mm sodium phosphate, pH 7, and 1 mM EDTA) and in one form in low-salt solution (1 20 mM NaCl, 30 mM sodium phosphate, pH 7, and 0.5 mM EDTA) at 37 OC. Selective spin-lattice relaxation measurements indicate that the dominant form ( ~ 8 5 % ) in high salt is the hairpin monomer shown in Figure la. Because the T,,, of the hairpin is ap- proximately 75 OC under these conditions, the second form is not likely to be a single-stranded state. Simple two-state theory for a monomer/dimer equilibrium (Figure la,b) pre- dicts that a 10-fold decrease in concentration should result in a 2% contribution of the dimer form; empirically, a 9% con- tribution is observed. Thus, the concentration dependence implies that the minor conformer is a nonmonomeric species such as the dimer; however, the system cannot be described by a simple two-state equilibrium.
Circular dichroism, 31P NMR, and ‘H NMR results all indicate that in low-salt conditions the stem region forms a B-family double helix. In the high-salt conditions, the results of these experiments are consistent with a Z-form stem. CD spectra were previously published for this molecule in 5 M

6966 B I O C H E M I S T R Y
NaCl (Germann et al., 1985); the results in 6 M NaClO, were comparable.
One of the most interesting questions, which to our knowledge has not been studied previously, addresses how the structural transition in the stem region affects the loop con- formation in solution. NOESY data indicate that the T4 loop structure of (CG),T,(CG), in 120 mM NaCl buffer is similar to the T4 loop structure of (CG),T,(CG), in 10 mM sodium phosphate buffer found by Hare and Reid (1 986), demon- strating that the changes in stem length and solvent conditions had little effect. Hare’s distance geometry structures show that T(8) and T(7) stack on C(9) in an apparent continuation of the 5’ side of the helix, while T(5) stacks on G(4) to start the 3’side of the stem helix. T(6) is rotated away from the center of the helix: it is still in NOE contact with T(5), but not with T(7). In contrast, the lack of NOE contacts in the Z-hairpin loop suggests that it is considerably less compact or more flexible than the B-form loop. It is likely that all but one of the thymine residues are rotated away from the center of the loop region, thus decreasing thymidine-thymidine in- teractions and increasing their exposure to the solvent. This is consistent with the absence of thymidine imino proton resonances for the Z-hairpin loop, even at pH 5.5.
Intranucleotide NOE intensities allow comparison of the glycosidic torsion angles and pseudorotation phase angles of the thymidine residues in the two forms of the DNA hairpin. Distances calculated from NOE data, especially from one mixing time, should be interpreted cautiously. For example, spin diffusion effects can cause intranucleotide H6/H 1’ and H6/H3’ distances to appear shorter than they actually are due to transfer of magnetization through the H2’ proton. In ad- dition, dynamic effects such as pseudorotation of the sugar residue give a time-averaged inverse sixth power distance value, which is biased toward the shorter distances. Errors in these distances have been suggested to be *0.2 A for strong NOEs (less than about 3 A) and f0.5 8, for weak NOEs (Hare & Reid, 1986). Thus we have limited our structural conclusions on the basis of these distances to a qualitative level that in- cludes consideration of these uncertainties.
The H6/H1’ distance is most sensitive to changes in the glycosidic torsion angles. For a nucleotide in the anti con- formation, this distance should be approximately 3.7 A; in the syn conformation, it shortens to 2.3 A. In the Z-form loop, all thymidine H6/H1’ distances were in the 2.7-2.9-A range, consistent with x values of -0’. Hare and Reid (1986) report x values that ranged from -53’ to -90’ for B-form loop residues. Thus, in both the B- and Z-form hairpin loops the thymidine glycosidic torsion angles appear to be intermediate between the syn and anti conformations or exist as an equi- librium between the two. In the Z-form hairpin, the T residues are more biased toward the syn conformation.
The pseudorotation phase angle of the deoxyribose moieties can be estimated from aromatic-to-sugar and sugar-to-sugar interproton distances. The most sensitive distances among the assigned protons are the H6/H3’ and the H2”/H4’ (Wuthrich, 1986). The H2”/H4’ cross-peaks were not sufficiently resolved to allow interpretation. Consideration of the magnitudes of the H6/H3’ cross-peaks for the Z-form loop (distances of about 3 A) is consistent with a larger contribution from northern (C3’-endo) conformations. This is in contrast with the B-form results, which indicate predominantly southern (C2’-endo) conformations.
ADDED IN PROOF We have recently become aware of work by Wang et al.
(Biochemistry, submitted for publication), who have used
W O L K E T A L .
NMR and circular dichroism to study the Z-hairpin formed by (CG),T,(CG),.
Registry No. 24-mer, 91950-19-3; d(CG)5, 114142-14-4.
REFERENCES Abragam, A. (1961) Principles of Nuclear Magnetism, pp
289-305, Oxford University Press, Oxford. Arnott, S., Chandrasekaran, R., Hukins, D. W. L., Smith, P.
J. C., & Watts, L. (1974) J . Mol. Biol. 88, 523-533. Aue, W. P., Bartholdi, E., & Ernst, R. R. (1976) J . Chem.
Bodenhausen, G., Kogler, H., & Ernst, R. R. (1984) J. Magn. Reson. 58, 370-388.
Chattopadhyaya, R., Ikuta, S., Grzeskowiak, K., & Dickerson, R. E. (1988) Nature (London) 334, 175-179.
Chen, C.-W., & Cohen, J. S . (1984) in Phosphorous-31 NMR, Principles and Applications (Gorenstein, D., Ed.) pp 233-263. Academic. Orlando.
Phys. 64, 2229-2246.
Courey, A. J., & Wangl J. C. (1983) Cell (Cambridge, Mass.) 33, 8 17-829.
Ernst, R. R., Bodenhausen, G., & Wokaun, A. (1987) Prin- ciples of Nuclear Magnetic Resonance in One and Two Dimensions, Chapters 8 and 9, Clarendon, Oxford.
Fesik, S. W., O’Donnell, T. J., Gampe, R. T., Jr., & Olejniczak, E. T. (1986) J . A m . Chem. SOC. 108,
Fujii, S . , Wang, A. H.-J., van der Marel, G. A., van Boom, & Rich, A. (1982) Nucleic Acids Res. 10,
Fuller, W., Wilkins, M. H. F., Wilson, H. R., & Hamilton,
Germann, M. W., Schoenwalder, K.-H., & van de Sande, J.
Germann, M. W., Pon, R. P., & van de Sande, J. H. (1987)
Gorenstein, D. G. (1981) Annu. Rev. Biophys. Bioeng. 10,
Gronenborn, A. M., Clore, G. M., & Kimber, B. J. (1984) Biochem. J . 221, 723-736.
Haasnoot, C. A. G., Hilbers, C. W., van der Marel, G. A., van Boom, J. H., Singh, U. C., Pattabiraman, N., & Kollman, P. A. (1986) J . Biomol. Struct. Dyn. 3, 843-857.
Hare, D. R., & Reid, B. R. (1986) Biochemistry 25,
Hare, D. R., Wemmer, D. E., Chou, S.-H., Drobny, G., & Reid, B. R. (1983) J . Mol. Biol. 171, 3 19-336.
Henderson, E., Hardin, C. C., Wolk, S., Tinoco, I., Jr., & Blackburn, E. H. (1987) Cell (Cambridge, Mass.) 51,
Ikuta, S., Chattopadhyana, R., Ito, H., Dickerson, R. E., & Kearns, D. R. (1986) Biochemistry 25, 4840-4849.
Jaworski, A., Hsieh, W.-T., Blaho, J. A., Larson, J. E., & Wells, R. D. (1987) Science (Washington, D.C.) 238,
Kearns, D. R. (1984) CRC Crit. Rev. Biochem. 15,237-290. Kmiec, E. B., & Holloman, W. K. (1986) Cell (Cambridge,
Lilley, D. M. J. (1981) Nucleic Acids Res. 9, 1271-1289. Lilley, D. M. J., Sullivan, K. M., & Murche, A. I. H. (1987)
in Nucleic Acids and Molecular Biology (Eckstein, F., & Lilley, D. M. J., Eds.) pp 126-137, Springer-Verlag, New York.
Marvin, D. A., Spencer, M., Wilkins, M. H. F., & Hamilton, L. D. (1961) J . Mol. Biol. 3 , 547-565.
Morden, K. M., Chu, Y . G., Martin, F. H., & Tinoco, I., Jr. (1983) Biochemistry 22, 5557-5563.
3165-3170.
J. H., 7879-7892.
L. D. (1965) J . Mol. Biol. 12, 60-80.
H. (1985) Biochemistry 24, 5698-5702.
Anal. Biochem. 165, 399-405.
355-386.
5341-5350.
899-908.
773-777.
Mass.) 44, 545-554.
Biochemistry 1988, 27, 6967-697 1 6967
Orbons, L. P. M., van der Marel, G. A., van Boom, J. H., & Altona, C. (1986) Eur. J . Biochem. 160, 131-139.
Patel, D. J., Kozlowski, S . A., Marky, L. A., Rice, J. A., Broka, C., Dallas, J., Itakura, K., & Breslauer, K. (1982a) Bio- chemistry 21, 437-444.
Patel, D. J., Kozlowski, S. A., Marky, L. A., Rice, J. A., Broka, C., Itakura, K., & Breslauer, K. (1982b) Biochemistry 21,
Patel, D. J., Kozlowski, S . A,, Marky, L. A., Rice, J. A,, Broka, C., Itakura, K., & Breslauer, K. (1982~) Biochemistry 21,
Patel, D. J., Kozlowski, S . A., Nordheim, A., & Rich, A. (1982d) Proc. Natl. Acad. Sci. U.S.A. 79, 1413-1417.
Pohl, F. M., & Jovin, T. M. (1972) J. Mol. Biol. 67, 375-396. Riazance, J. H., Baase, W. A., Johnson, W. C., Jr., Hall, K.
H., Cruz, P., & Tinoco, I., Jr. (1985) Nucleic Acids Res.
Rich, A., Nordeim, A., & Wang, A. H.-J. (1984) Annu. Rev.
Saenger, W. (1984) Principles of Nucleic Acid Structure, p
Sklenar, V., & Bax, A. (1987) J . Am. Chem. SOC. 109,
428-436.
445-45 1.
13,4983-4989.
Biochem. 53, 791-846.
22, Springer-Verlag, New York.
222 1-2222.
Wagner, G., & Wuthrich, K. (1979) J . Magn. Reson. 33,
Wang, A. H.-J., Quigley, G. J., Kolpak, F. J., Crawford, J. L., van Boom, J. H., van der Marel, G., & Rich, A. (1979) Nature (London) 282, 743-745.
Wang, A. H.-J., Quigley, G. J., Kolpak, F. J., van der Marel, G., van Boom, J. H., & Rich, A. (1981) Science (Wash- ington, D.C.) 211, 171-176.
Watson, J. D., & Crick, F. H. C. (1953) Nature (London)
Wemmer, D. E., Chou, S. H., Hare, D. R., & Reid, B. R. (1985) Nucleic Acids Res. 13, 3755-3772.
Wuthrich, K. (1986) N M R of Proteins and Nucleic Acids, pp 203-223, Wiley, New York.
Xodo, L. E., Manzini, G., Quadrifoglio, F., van der Marel, G. A., & van Boom, J. A. (1986) Nucleic Acids Res. 14,
Zarling, D. A., Arndt-Jovin, D. J., Robert-Nicond, M., McIntosh, L. P., Thomae, R., & Jovin, T. M. (1984) J. Mol. Biol. 176, 369-415.
Zarling, D. A., Calhoun, C. J., Hardin, C. C., & Zarling, A. H. (1987) Proc. Natl. Acad. Sci. U.S.A. 84, 6117-6121.
675-680.
171, 737-738.
5389-5397.
Phased Psoralen Cross-Links Do Not Bend the DNA Double Helixt Tali E. Haran and Donald M. Crothers*
Department of Chemistry, Yale University. New Haven, Connecticut 0651 1 Received December 22, 1987; Revised Manuscript Received April 21, 1988
ABSTRACT: Although the chemical reaction of psoralens with nucleic acids is well understood, the structure of psoralen-DNA cross-linked products is still not clear. Model building studies based on the crystal structure of the psoralen-thymine monoadduct suggest that each cross-link bends the DNA double helix by 46.5’ [Pearlman, D. A., Holbrook, S. R., Pirkle, D. H., & Kim, S.-H. (1985) Science (Washington, D.C.) 227, 1304-13081. On the other hand, Sinden and Hagerman [Sinden, R. R., & Hagerman, P. J. (1984) Biochemistry 23, 6299-63031 find that, in solution, psoralen cross-linked DNA is not bent. Here we use gel electrophoresis to test the validity of the current models. We have synthesized a series of DNA fragments (21-24 base pairs in length), each containing one unique T-A site for 4’-(hydroxymethyl)-4,5’,8-tri- methylpsoralen (HMT) cross-linking. Because of an estimated 28’ unwinding of the helix by H M T [Wiesehahn, G., & Hearst, J. E. (1978) Proc. Nat l . Acad. Sci. U .S .A . 75,2703-27071, one expects that the 22-bp cross-linked fragment will be repeated nearly in phase with the average helical screw when multimerized. In that sequence ligation will maximally amplify any deformation to the double helix. We find that the ligated multimers of cross-linked DNA migrate close to the multimers of non-cross-linked DNA on polyacrylamide gels. Our observations place an upper limit of 10’ on DNA bending induced by psoralen cross-linking and indicate unwinding by about 1 bp, as well as stiffening of the double helix. These properties are not unexpected for classical intercalators.
T e use of psoralens in medicine started with the ancient Hindus, Turks, and Egyptians more than 3000 years ago and has been practiced ever since. In particular, the psoralens (furocoumarins) have been used in the treatment of vitiligo, a disease in which the skin pigment melanin is lost from certain skin areas, and psoriasis, a disorder showing an increased turnover rate of the epidermal tissue [reviewed by Scott et al. (1976) and Ben Hur and Song (1984)l. The successful use of psoralens in medicine has been linked to their ability to
+This work was supported by National Institutes of Health Grant CA15583 (to D.M.C.) and by a Rothschild postdoctoral fellowship (to T.E.H.).
0006-2960/88/0427-6967$01.50/0
cross-link adjacent pyrimidine bases on two strands of the DNA double helix [reviewed by Scott et al. (1976) and Song and Tapley (1979)l. As cross-linking agents psoralens are popular probes of the structure of DNA, RNA, and chromatin [reviewed by Cimino et al. (1985)l. At present we understand the chemical reactions of psoralens with nucleic acids [reviewed by Hearst (1981) and Cimino et al. (1985)], but the spatial arrangment of psoralen cross-linked DNA is not clear.
Understanding the struture of psoralen-DNA complexes is important for the design and synthesis of new and better psoralen derivatives, with greater therapeutic potential and less severe side effects. They can be used in the design of more sensitive probes of nucleic acid conformation and for eluci-
0 1988 American Chemical Society
Copyright © 2022 FDOKUMEN


![CHHATTISGARH HOUSING BOARD RAIPUR [CG.]](https://static.fdokumen.com/doc/165x107/63259b6f6d480576770c5eea/chhattisgarh-housing-board-raipur-cg.jpg)