Equidistribution and counting under equilibrium states in ...
Upload
independentCategory
view
1download
0
Fax +41 61 306 12 34E-Mail [email protected]
Original Paper
Nephron Exp Nephrol 2006;103:e139–e148 DOI: 10.1159/000092905
Comparison of Methods for Counting Cells in the Mouse Glomerulus
John M. Basgen a Susanne B. Nicholas b Michael Mauer a Silvia Rozen a Jens R. Nyengaard c
a Department of Pediatrics, University of Minnesota, Minneapolis, Minn. , b
Department of Medicine, David Geffen School of Medicine at UCLA, Los Angeles, Calif. , USA; c
Stereology and Electron Microscopy Laboratory and MIND Center, University of Aarhus, Aarhus , Denmark
glomerulus was statistically different from the Exhaus-tive Count method (p = 0.003). Conclusion: The Weibel-Gomez produced a 10% overestimation, whereas the di-sector/fractionator method was unbiased and thus a good substitute for the Exhaustive Count method.
Copyright © 2006 S. Karger AG, Basel
Introduction
Knowing the number of cells within the glomerulus has long been a goal of anatomists, pathologists and oth-ers interested in the structure and function of the kidney. As we better understand renal pathology in diseases such as diabetes, where cells, such as glomerular epithelial cells or podocytes, are lost into the urine which may defi ne [1] or predict [2] the disease progression, the number of cells in the glomerulus in normal physiology becomes increas-ingly important. In order to ‘see’ inside the glomerulus and count the total number of mesangial, endothelial and glomerular epithelial or podocyte cells, specimens are em-bedded in a medium such as paraffi n or plastic, and sec-tions cut and observed under a microscope. The true number of cells in the glomerulus can be identifi ed by completely cutting through the glomerulus, observing each section sequentially, and counting cells as they ap-pear [3–5] . This is time-consuming and not practical for large studies.
Key Words Glomerular cell number, mouse � Stereology � Unbiased sampling � Disector/fractionator method
Abstract Background: Researchers have long been interested in counting the number of cells within the glomerulus. In-vestigators using different techniques have yielded con-fl icting results. The most direct method is to count the cells in serial sections from the entire glomerulus. This Exhaustive Count method is not usually practical. The disector/fractionator method counts the number of cells in a fraction of sections. The total is estimated from the product of the cell count and the reciprocal of the fraction. The Weibel-Gomez method determines the density of cells per glomerulus, then multiplies this density by glo-merular volume to obtain cell number. In this study, we compared the disector/fractionator and Weibel-Gomez methods to identify a practical alternative for the time-consuming Exhaustive Count method. Methods: Glo-meruli from a normal mouse kidney were completely sec-tioned and images obtained. Appropriate images were used to count glomerular cell number using each meth-od. Results: The Exhaustive Count method yielded 213 8 22 (mean 8 SD) cells/glomerulus vs. the disector/frac-tionator average of 211 8 29 cells/glomerulus (p = 0.82). The Weibel-Gomez method average of 235 8 26 cells/
Received: June 26, 2005 Accepted: December 1, 2005 Published online: April 21, 2006
Susanne B. Nicholas, MD, PhD Warren Hall, 900 Veteran Avenue Suite 24-130 Los Angeles, CA 90095 (USA) Tel. +1 310 794 7555, Fax +1 310 794 7654, E-Mail [email protected]
© 2006 S. Karger AG, Basel
Accessible online at: www.karger.com/nee
Basgen /Nicholas /Mauer /Rozen /Nyengaard
Nephron Exp Nephrol 2006;103:e139–e148 e140
Quicker methods were developed using one section through a glomerulus and determining the ratio of one cell type to another [6, 7] or determining the ratio of cell number to glomerular area [7–10] . These methods have been extensively used but yield confl icting results. As ear-ly as the 1920s, Wicksell [11] showed that the number of profi les, or two-dimensional cross-sections, of particles (i.e. any three-dimensional object) seen in tissue sections cut from a three-dimensional object is a function of both the number of particles within the object and the size of the particles. Large particles have a greater chance of in-tersecting the section plane than small particles. To over-come this problem Weibel and Gomez [12, 13] proposed a method where the numerical density of particles per volume of the object was a function of the profi les of par-ticles per area of object and volume fraction of particles per object. This method also assumed that the shape of the particles was known. Pagtalunan et al. [2] used this method to count podocytes in diabetic Pima Indians. Since that publication, several other groups have used the Weibel-Gomez method to count the number of glomeru-lar cells in patients with diabetes and other kidney dis-eases [14–17] . The disector/fractionator is a method of counting particles within a three-dimensional space inde-pendent of particle shape, size, or orientation [18–20] . White et al. [21] and White and Bilous [22] used this method to specifi cally count podocyte cells in the human glomerulus and found differences from results obtained using the Weibel-Gomez method. Bertram et al. [23] and Rasch et al. [24] also used this method to count podocytes in rats.
Here, we count the total number of glomerular cells in the mouse kidney. To determine the method that yields results similar to the gold standard, the Exhaustive Count method, we cut sections through glomeruli and count the exact number of cells. We then compare these fi ndings with both the Weibel-Gomez and disector/fractionator methods, which estimate the number of glomerular cells. We also compare the density of cells per glomerulus, us-ing all three methods.
Materials and Methods
Renal Perfusion A normal mouse was anesthetized and the left kidney fi xed by
retrograde perfusion with 1% glutaraldehyde in Millonig buffer at a rate equivalent to its mean arterial pressure. Perfusion was con-sidered adequate when the entire kidney blanched within seconds of starting perfusion indicating that tubules and capillary lumens were patent. Following perfusion, the kidney was excised, cut into
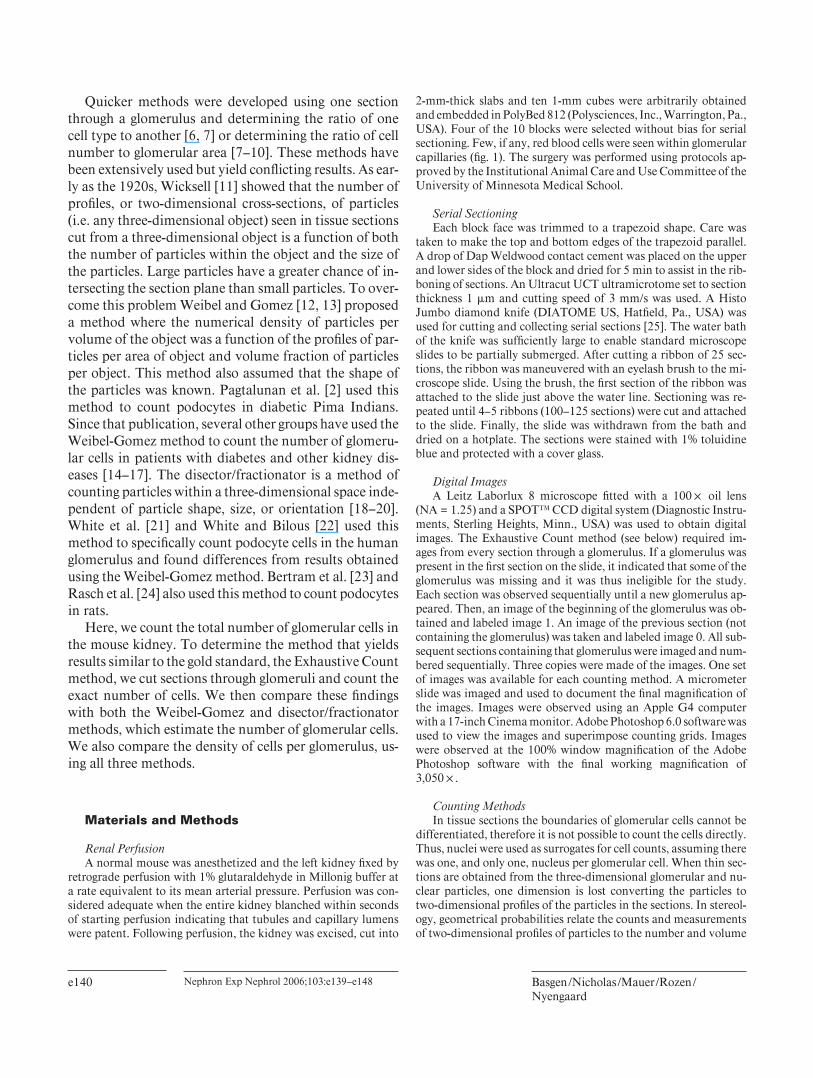
2-mm-thick slabs and ten 1-mm cubes were arbitrarily obtained and embedded in PolyBed 812 (Polysciences, Inc., Warrington, Pa., USA). Four of the 10 blocks were selected without bias for serial sectioning. Few, if any, red blood cells were seen within glomerular capillaries ( fi g. 1 ). The surgery was performed using protocols ap-proved by the Institutional Animal Care and Use Committee of the University of Minnesota Medical School.
Serial Sectioning Each block face was trimmed to a trapezoid shape. Care was
taken to make the top and bottom edges of the trapezoid parallel. A drop of Dap Weldwood contact cement was placed on the upper and lower sides of the block and dried for 5 min to assist in the rib-boning of sections. An Ultracut UCT ultramicrotome set to section thickness 1 � m and cutting speed of 3 mm/s was used. A Histo Jumbo diamond knife (DIATOME US, Hatfi eld, Pa., USA) was used for cutting and collecting serial sections [25] . The water bath of the knife was suffi ciently large to enable standard microscope slides to be partially submerged. After cutting a ribbon of 25 sec-tions, the ribbon was maneuvered with an eyelash brush to the mi-croscope slide. Using the brush, the fi rst section of the ribbon was attached to the slide just above the water line. Sectioning was re-peated until 4–5 ribbons (100–125 sections) were cut and attached to the slide. Finally, the slide was withdrawn from the bath and dried on a hotplate. The sections were stained with 1% toluidine blue and protected with a cover glass.
Digital Images A Leitz Laborlux 8 microscope fi tted with a 100 ! oil lens
(NA = 1.25) and a SPOT™ CCD digital system (Diagnostic Instru-ments, Sterling Heights, Minn., USA) was used to obtain digital images. The Exhaustive Count method (see below) required im-ages from every section through a glomerulus. If a glomerulus was present in the fi rst section on the slide, it indicated that some of the glomerulus was missing and it was thus ineligible for the study. Each section was observed sequentially until a new glomerulus ap-peared. Then, an image of the beginning of the glomerulus was ob-tained and labeled image 1. An image of the previous section (not containing the glomerulus) was taken and labeled image 0. All sub-sequent sections containing that glomerulus were imaged and num-bered sequentially. Three copies were made of the images. One set of images was available for each counting method. A micrometer slide was imaged and used to document the fi nal magnifi cation of the images. Images were observed using an Apple G4 computer with a 17-inch Cinema monitor. Adobe Photoshop 6.0 software was used to view the images and superimpose counting grids. Images were observed at the 100% window magnifi cation of the Adobe Photoshop software with the fi nal working magnifi cation of 3,050 ! .
Counting Methods In tissue sections the boundaries of glomerular cells cannot be
differentiated, therefore it is not possible to count the cells directly. Thus, nuclei were used as surrogates for cell counts, assuming there was one, and only one, nucleus per glomerular cell. When thin sec-tions are obtained from the three-dimensional glomerular and nu-clear particles, one dimension is lost converting the particles to two-dimensional profi les of the particles in the sections. In stereol-ogy, geometrical probabilities relate the counts and measurements of two-dimensional profi les of particles to the number and volume
Counting Glomerular Cell Number Nephron Exp Nephrol 2006;103:e139–e148 e141
of particles in three-dimensional space. In this study, stereological principles were used to relate the number and area of nuclear and glomerular profi les in sections to the number of nuclei (i.e. cells) within the three-dimensional glomerulus.
Exhaustive Count Method The Exhaustive Count method uses all consecutive images from
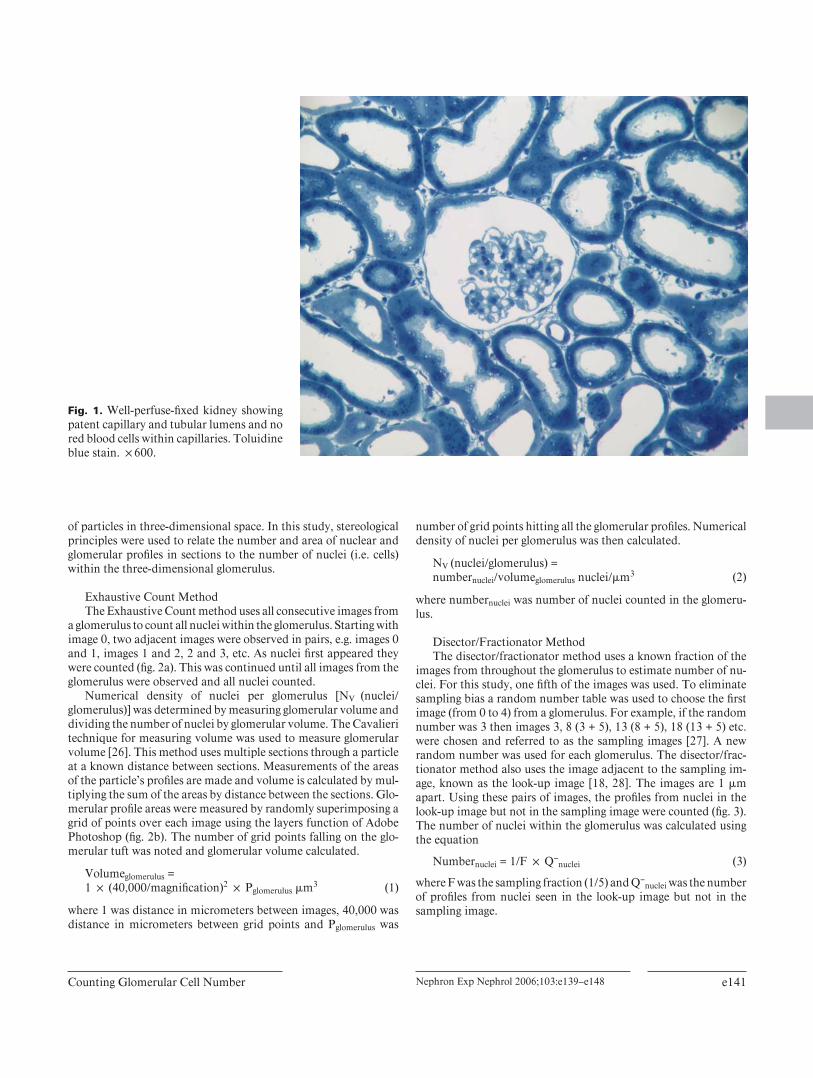
a glomerulus to count all nuclei within the glomerulus. Starting with image 0, two adjacent images were observed in pairs, e.g. images 0 and 1, images 1 and 2, 2 and 3, etc. As nuclei fi rst appeared they were counted ( fi g. 2 a). This was continued until all images from the glomerulus were observed and all nuclei counted.
Numerical density of nuclei per glomerulus [N V (nuclei/ glomerulus)] was determined by measuring glomerular volume and dividing the number of nuclei by glomerular volume. The Cavalieri technique for measuring volume was used to measure glomerular volume [26] . This method uses multiple sections through a particle at a known distance between sections. Measurements of the areas of the particle’s profi les are made and volume is calculated by mul-tiplying the sum of the areas by distance between the sections. Glo-merular profi le areas were measured by randomly superimposing a grid of points over each image using the layers function of Adobe Photoshop ( fi g. 2 b). The number of grid points falling on the glo-merular tuft was noted and glomerular volume calculated.
Volume glomerulus = 1 ! (40,000/magnifi cation) 2 ! P glomerulus � m 3 (1)
where 1 was distance in micrometers between images, 40,000 was distance in micrometers between grid points and P glomerulus was
number of grid points hitting all the glomerular profi les. Numerical density of nuclei per glomerulus was then calculated.
N V (nuclei/glomerulus) = number nuclei /volume glomerulus nuclei/ � m 3 (2)
where number nuclei was number of nuclei counted in the glomeru-lus.
Disector/Fractionator Method The disector/fractionator method uses a known fraction of the
images from throughout the glomerulus to estimate number of nu-clei. For this study, one fi fth of the images was used. To eliminate sampling bias a random number table was used to choose the fi rst image (from 0 to 4) from a glomerulus. For example, if the random number was 3 then images 3, 8 (3 + 5), 13 (8 + 5), 18 (13 + 5) etc. were chosen and referred to as the sampling images [27] . A new random number was used for each glomerulus. The disector/frac-tionator method also uses the image adjacent to the sampling im-age, known as the look-up image [18, 28] . The images are 1 � m apart. Using these pairs of images, the profi les from nuclei in the look-up image but not in the sampling image were counted ( fi g. 3 ). The number of nuclei within the glomerulus was calculated using the equation
Number nuclei = 1/F ! Q – nuclei (3)
where F was the sampling fraction (1/5) and Q – nuclei was the number
of profi les from nuclei seen in the look-up image but not in the sampling image.
Fig. 1. Well-perfuse-fi xed kidney showing patent capillary and tubular lumens and no red blood cells within capillaries. Toluidine blue stain. ! 600.
Basgen /Nicholas /Mauer /Rozen /Nyengaard
Nephron Exp Nephrol 2006;103:e139–e148 e142
2
Counting Glomerular Cell Number Nephron Exp Nephrol 2006;103:e139–e148 e143
3
4
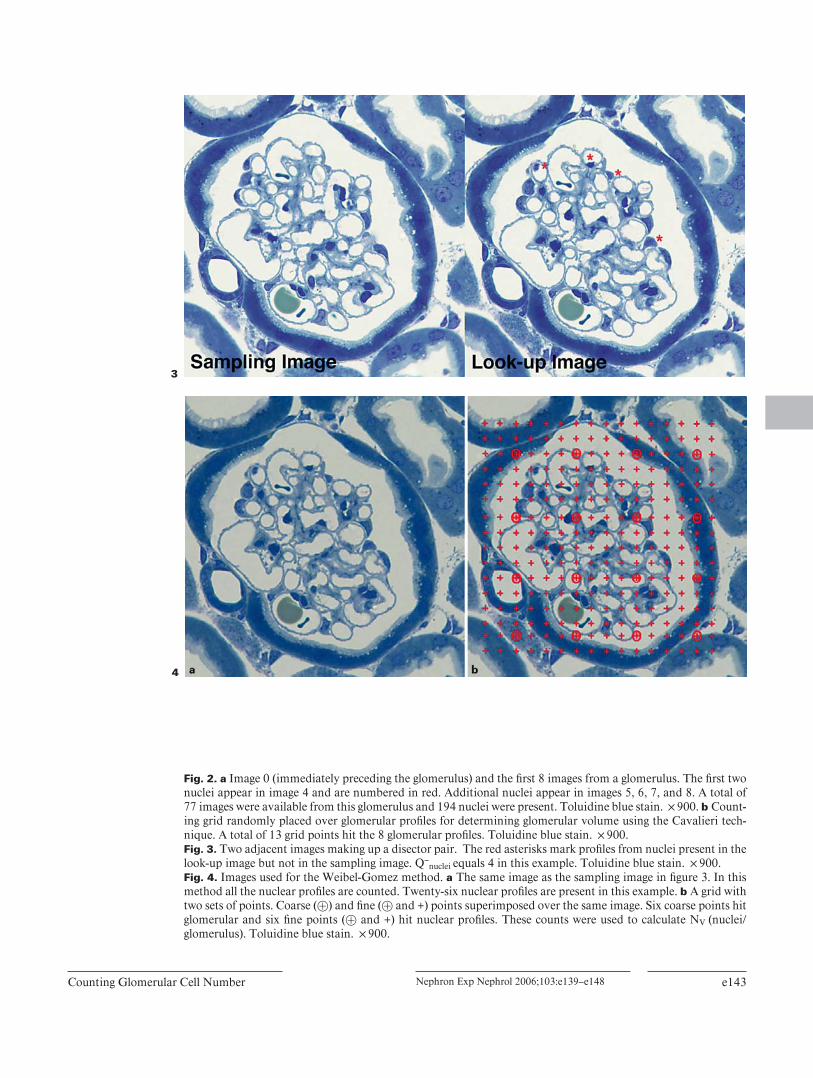
Fig. 2. a Image 0 (immediately preceding the glomerulus) and the fi rst 8 images from a glomerulus. The fi rst two nuclei appear in image 4 and are numbered in red. Additional nuclei appear in images 5, 6, 7, and 8. A total of 77 images were available from this glomerulus and 194 nuclei were present. Toluidine blue stain. ! 900. b Count-ing grid randomly placed over glomerular profi les for determining glomerular volume using the Cavalieri tech-nique. A total of 13 grid points hit the 8 glomerular profi les. Toluidine blue stain. ! 900. Fig. 3. Two adjacent images making up a disector pair. The red asterisks mark profi les from nuclei present in the look-up image but not in the sampling image. Q –
nuclei equals 4 in this example. Toluidine blue stain. ! 900. Fig. 4. Images used for the Weibel-Gomez method. a The same image as the sampling image in fi gure 3. In this method all the nuclear profi les are counted. Twenty-six nuclear profi les are present in this example. b A grid with two sets of points. Coarse ( � ) and fi ne ( � and +) points superimposed over the same image. Six coarse points hit glomerular and six fi ne points ( � and +) hit nuclear profi les. These counts were used to calculate N V (nuclei/glo merulus). Toluidine blue stain. ! 900.
Basgen /Nicholas /Mauer /Rozen /Nyengaard
Nephron Exp Nephrol 2006;103:e139–e148 e144
Glomerular volume was estimated using the Cavalieri method. The same grid used for volume determination in the Exhaustive Count method was randomly superimposed over the sampling im-ages and the points hitting glomerular tuft were counted. Glomeru-lar volume was calculated using equation 1 except the distance between images was 5 � m. N V (nuclei/glomerulus) was calculated using equation 2.
Weibel-Gomez Method Unlike the previous two methods which determined nuclear
number directly, the Weibel-Gomez method fi rst determinesN V (nuclei/glomerulus), then number of nuclei was calculated by multiplying this density by glomerular volume.
Number nuclei = N V (nuclei/glomerulus) ! volume glomerulus (4)
To measure N V (nuclei/glomerulus), the numerical density of nuclear profi les per glomerular area must be determined. First, the number of nuclear profi les was counted ( fi g. 4 a). Next a grid of two sets of points (coarse and fi ne points) was superimposed over the image. The number of coarse points falling on glomerular tuft was counted ( fi g. 4 b). The numeric density of nuclei per glomerular area was calculated.
N A (nuclei/glomerulus) = N profi les / [(40,000/magnifi cation) 2 ! CP glomerulus ] profi les/ � m 2 (5)
where N profi les was the number of nuclear profi les counted in the glomerular profi le, 40,000 was the distance between coarse grid points, and CP glomerulus was the number of coarse points falling on the glomerular profi le. Next, the volume fraction of glomer - ular nuclei per glomerulus [V V (nuclei/glomerulus)] was calcu - lated by counting the number of fi ne points falling on nuclei( fi g. 4 b).
V V (nuclei/glomerulus) = FP nuclei /(CP glomerulus ! 16) � m 3 / � m 3 (6)
where FP nuclei was the number of fi ne points falling on nuclei,CP glomerulus was the number of coarse points falling on glomerulus, which was counted previously, and 16 was the number of fi ne points for each coarse point on the grid. Finally numeric density of nuclei per glomerulus was calculated.
N V (nuclei/glomerulus) = [N A (nuclei/glomerulus)/ V V (nuclei/glomerulus)] 3/2 ! 1/ � nuclei/ � m 3 (7)
where � is a shape factor for the nuclei. For this study 1.55 was used for � as previously described [13, 16] . Similar to the disector/frac-tionator method, images were obtained 5 � m apart from through-out each glomerulus, resulting in 13–19 sections per glomerulus. In fact, copies of sampling images from the disector/fractionator method were used for the Weibel-Gomez method. This helped eliminate variability between methods because of variability in cell density at different levels within the glomerulus.
Statistical Analyses Paired t tests were used to determine statistical differences be-
tween methods. Bland-Altman analysis was used to determine aver-age differences between methods and to look for patterns in the scat-ter of mean differences between the Exhaustive Count method and the other two methods [29] . Results are given as means 8 SD.
Results
Comparison of Cell-Counting Methods An average of 79 images per glomerulus was obtained
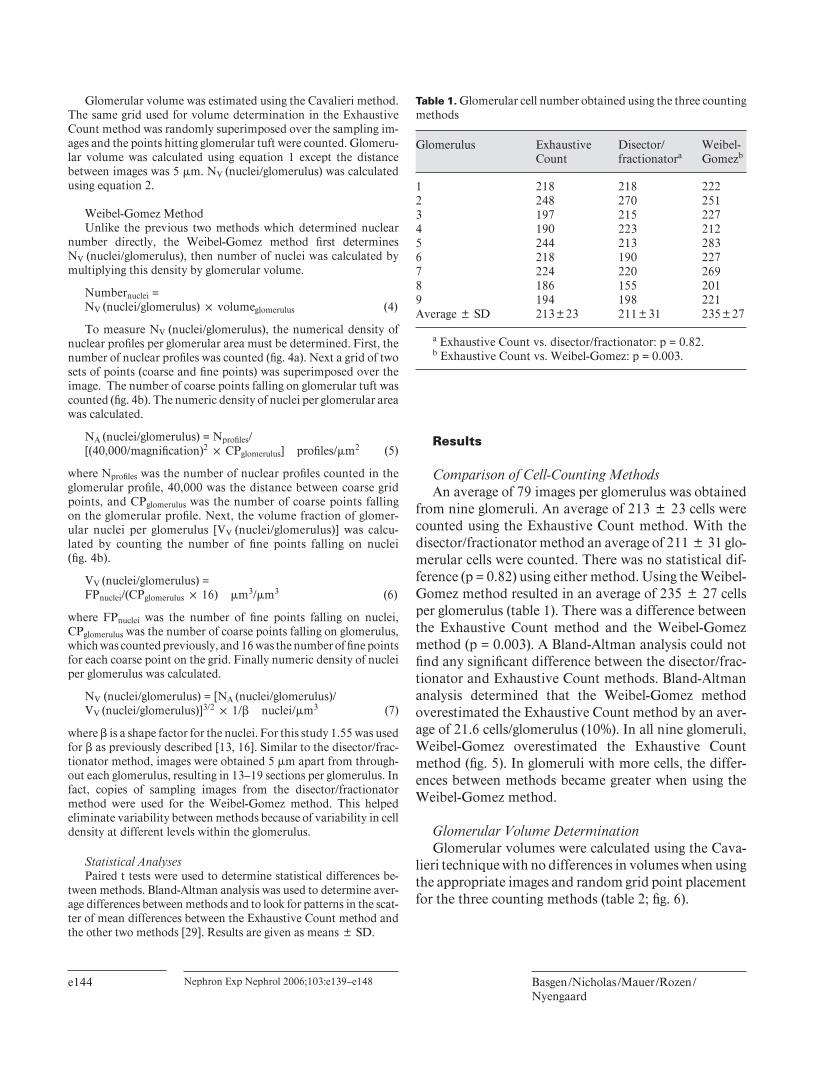
from nine glomeruli. An average of 213 8 23 cells were counted using the Exhaustive Count method. With the disector/fractionator method an average of 211 8 31 glo-merular cells were counted. There was no statistical dif-ference (p = 0.82) using either method. Using the Weibel-Gomez method resulted in an average of 235 8 27 cells per glomerulus ( table 1 ). There was a difference between the Exhaustive Count method and the Weibel-Gomez method (p = 0.003). A Bland-Altman analysis could not fi nd any signifi cant difference between the disector/frac-tionator and Exhaustive Count methods. Bland-Altman analysis determined that the Weibel-Gomez method overestimated the Exhaustive Count method by an aver-age of 21.6 cells/glomerulus (10%). In all nine glomeruli, Weibel-Gomez overestimated the Exhaustive Count method ( fi g. 5 ). In glomeruli with more cells, the differ-ences between methods became greater when using the Weibel-Gomez method.
Glomerular Volume Determination Glomerular volumes were calculated using the Cava-
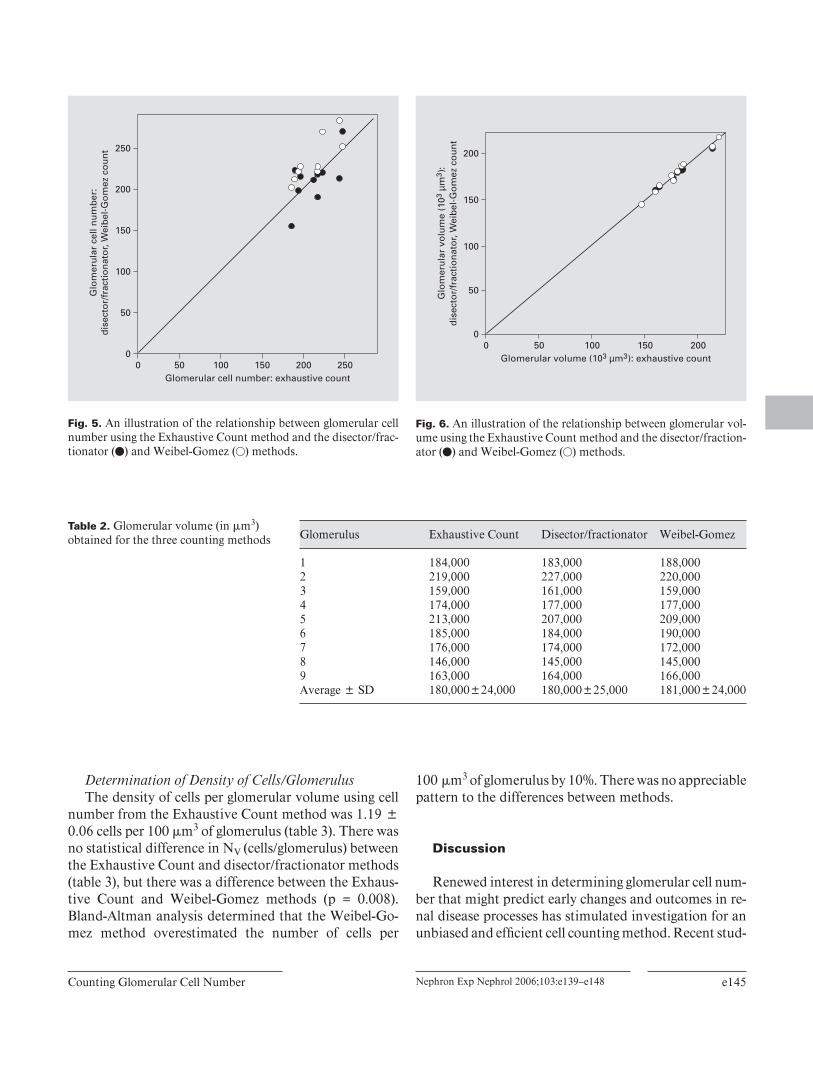
lieri technique with no differences in volumes when using the appropriate images and random grid point placement for the three counting methods ( table 2 ; fi g. 6 ).
Table 1. Glomerular cell number obtained using the three counting methods
Glomerulus ExhaustiveCount
Disector/fractionatora
Weibel-Gomezb
1 218 218 2222 248 270 2513 197 215 2274 190 223 2125 244 213 2836 218 190 2277 224 220 2698 186 155 2019 194 198 221Average 8 SD 213823 211831 235827
a Exhaustive Count vs. disector/fractionator: p = 0.82.b Exhaustive Count vs. Weibel-Gomez: p = 0.003.
Counting Glomerular Cell Number Nephron Exp Nephrol 2006;103:e139–e148 e145
Determination of Density of Cells/Glomerulus The density of cells per glomerular volume using cell
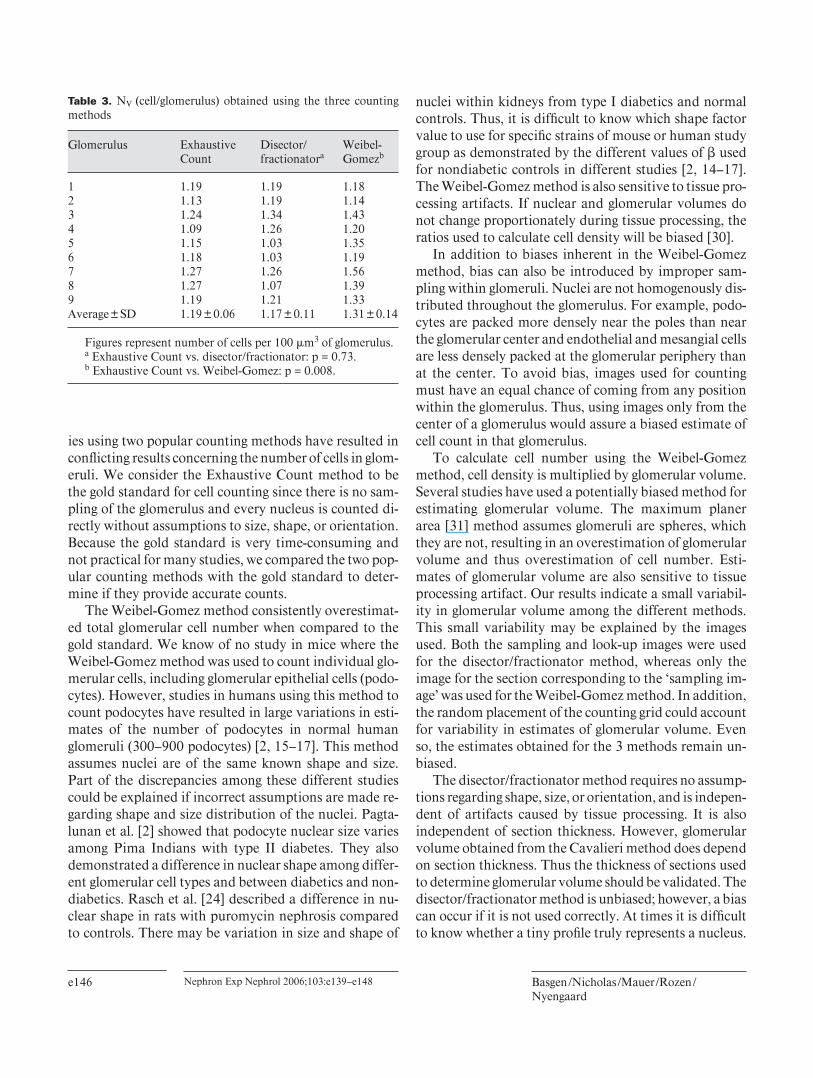
number from the Exhaustive Count method was 1.19 8 0.06 cells per 100 � m 3 of glomerulus ( table 3 ). There was no statistical difference in N V (cells/glomerulus) between the Exhaustive Count and disector/fractionator methods ( table 3 ), but there was a difference between the Exhaus-tive Count and Weibel-Gomez methods (p = 0.008). Bland-Altman analysis determined that the Weibel-Go-mez method overestimated the number of cells per
100 � m 3 of glomerulus by 10%. There was no appreciable pattern to the differences between methods.
Discussion
Renewed interest in determining glomerular cell num-ber that might predict early changes and outcomes in re-nal disease processes has stimulated investigation for an unbiased and effi cient cell counting method. Recent stud-
Glomerulus Exhaustive Count Disector/fractionator Weibel-Gomez
1 184,000 183,000 188,0002 219,000 227,000 220,0003 159,000 161,000 159,0004 174,000 177,000 177,0005 213,000 207,000 209,0006 185,000 184,000 190,0007 176,000 174,000 172,0008 146,000 145,000 145,0009 163,000 164,000 166,000Average 8 SD 180,000824,000 180,000825,000 181,000824,000
Table 2. Glomerular volume (in � m 3 ) obtained for the three counting methods
Fig. 5. An illustration of the relationship between glomerular cell number using the Exhaustive Count method and the disector/frac-tionator ( U ) and Weibel-Gomez ( S ) methods.
0
50
100
150
200
0 50 100 150 200Glomerular volume (10 m ): exhaustive count3 3µ
Glo
mer
ula
r vo
lum
e:
dis
ecto
r/fr
acti
on
ato
r, W
eib
el-G
om
ez c
ou
nt
(10
m)
33
µ
Fig. 6. An illustration of the relationship between glomerular vol-ume using the Exhaustive Count method and the disector/fraction-ator ( U ) and Weibel-Gomez ( S ) methods.
Basgen /Nicholas /Mauer /Rozen /Nyengaard
Nephron Exp Nephrol 2006;103:e139–e148 e146
ies using two popular counting methods have resulted in confl icting results concerning the number of cells in glom-eruli. We consider the Exhaustive Count method to be the gold standard for cell counting since there is no sam-pling of the glomerulus and every nucleus is counted di-rectly without assumptions to size, shape, or orientation. Because the gold standard is very time-consuming and not practical for many studies, we compared the two pop-ular counting methods with the gold standard to deter-mine if they provide accurate counts.
The Weibel-Gomez method consistently overestimat-ed total glomerular cell number when compared to the gold standard. We know of no study in mice where the Weibel-Gomez method was used to count individual glo-merular cells, including glomerular epithelial cells (podo-cytes). However, studies in humans using this method to count podocytes have resulted in large variations in esti-mates of the number of podocytes in normal human glomeruli (300–900 podocytes) [2, 15–17] . This method assumes nuclei are of the same known shape and size. Part of the discrepancies among these different studies could be explained if incorrect assumptions are made re-garding shape and size distribution of the nuclei. Pagta-lunan et al. [2] showed that podocyte nuclear size varies among Pima Indians with type II diabetes. They also demonstrated a difference in nuclear shape among differ-ent glomerular cell types and between diabetics and non-diabetics. Rasch et al. [24] described a difference in nu-clear shape in rats with puromycin nephrosis compared to controls. There may be variation in size and shape of
nuclei within kidneys from type I diabetics and normal controls. Thus, it is diffi cult to know which shape factor value to use for specifi c strains of mouse or human study group as demonstrated by the different values of � used for nondiabetic controls in different studies [2, 14–17] . The Weibel-Gomez method is also sensitive to tissue pro-cessing artifacts. If nuclear and glomerular volumes do not change proportionately during tissue processing, the ratios used to calculate cell density will be biased [30] .
In addition to biases inherent in the Weibel-Gomez method, bias can also be introduced by improper sam-pling within glomeruli. Nuclei are not homogenously dis-tributed throughout the glomerulus. For example, podo-cytes are packed more densely near the poles than near the glomerular center and endothelial and mesangial cells are less densely packed at the glomerular periphery than at the center. To avoid bias, images used for counting must have an equal chance of coming from any position within the glomerulus. Thus, using images only from the center of a glomerulus would assure a biased estimate of cell count in that glomerulus.
To calculate cell number using the Weibel-Gomez method, cell density is multiplied by glomerular volume. Several studies have used a potentially biased method for estimating glomerular volume. The maximum planer area [31] method assumes glomeruli are spheres, which they are not, resulting in an overestimation of glomerular volume and thus overestimation of cell number. Esti-mates of glomerular volume are also sensitive to tissue processing artifact. Our results indicate a small variabil-ity in glomerular volume among the different methods. This small variability may be explained by the images used. Both the sampling and look-up images were used for the disector/fractionator method, whereas only the image for the section corresponding to the ‘sampling im-age’ was used for the Weibel-Gomez method. In addition, the random placement of the counting grid could account for variability in estimates of glomerular volume. Even so, the estimates obtained for the 3 methods remain un-biased.
The disector/fractionator method requires no assump-tions regarding shape, size, or orientation, and is indepen-dent of artifacts caused by tissue processing. It is also independent of section thickness. However, glomerular volume obtained from the Cavalieri method does depend on section thickness. Thus the thickness of sections used to determine glomerular volume should be validated. The disector/fractionator method is unbiased; however, a bias can occur if it is not used correctly. At times it is diffi cult to know whether a tiny profi le truly represents a nucleus.
Table 3. N V (cell/glomerulus) obtained using the three counting methods
Glomerulus ExhaustiveCount
Disector/fractionatora
Weibel-Gomezb
1 1.19 1.19 1.182 1.13 1.19 1.143 1.24 1.34 1.434 1.09 1.26 1.205 1.15 1.03 1.356 1.18 1.03 1.197 1.27 1.26 1.568 1.27 1.07 1.399 1.19 1.21 1.33Average8SD 1.1980.06 1.1780.11 1.3180.14
Figures represent number of cells per 100 �m3 of glomerulus.a Exhaustive Count vs. disector/fractionator: p = 0.73.b Exhaustive Count vs. Weibel-Gomez: p = 0.008.
Counting Glomerular Cell Number Nephron Exp Nephrol 2006;103:e139–e148 e147
When using the Exhaustive Count method adjacent im-ages can be used to help identify small profi les. For the Weibel-Gomez method there are no adjacent images available to assist with identifi cation of small profi les. In contrast, the disector/fractionator method does utilize adjacent sections but prohibits use of adjacent sections in identifi cation of tiny profi les. If a tiny profi le is seen in the look-up section, and the adjacent sampling section is used to assist in identifi cation, tiny profi les will be count-ed less often than if the sampling section is not used [20 , see fi gure 9 in this reference]. We tested this pitfall by us-ing the sampling image to help identify tiny profi les seen in the look-up image. This resulted in an average count of 172 cells per glomerulus, an underestimation of the true cell number by 18% (data not shown). To avoid this problem we observed the sampling images fi rst and marked profi les as nuclei or not. We then viewed the look-up images and marked the profi les as nuclei or not. Fi-nally, we viewed the sampling and look-up pairs together and counted Q – .
Sanden et al. [32] have used a unique method to count podocytes in rat kidneys. In single sections they counted nuclear profi les that were immunostained for Wilm’s tu-mor-1 protein. They related these counts to glomerular volume estimates assuming the glomeruli were spheres. To lessen the overestimation bias inherent in the method, they used correction factors to reduce the estimate. Their fi nal estimate of 120 podocytes per glomerulus in a nor-mal rat exceeds the estimate of 90 podocytes per glo-merulus obtained by Helmchen et al. [4] using the Ex-haustive Count method.
In addition to determining the accuracy of a counting method before it is used in research study, the precision of estimates should also be evaluated. The precision of morphometric estimates is related to number of counts or measurements made that are subsequently used to cal-culate a specifi c morphometric parameter. Precision of an estimate of cell number using the disector/fractionator method increases as the count of Q – increases. In this study, we estimated the number of cells within individu-al glomeruli. Therefore, to obtain a precise estimate of the number of cells within each glomerulus, the number of Q – counted within individual glomeruli needed to be high. To obtain a high count within glomeruli we chose an interval of 5 � m between sampling images. This inter-val resulted in sampling 13–19 levels (disector pairs) from individual glomeruli and a suffi cient average of 84 Q – counted per glomerulus. Whether planning a mouse, rat, or human study, the optimal number of Q – , and thus lev-els, depends on the type of study, the variation in Q –
among levels, and the variation of cell number among glomeruli, within sampling groups [20] . Thus, for studies comparing differences in cell number among mice in dif-ferent experimental groups, sampling levels 20–50 � m apart (1–3 levels per mouse glomerulus) should suffi ce. For studies using human or rat kidneys, a pilot study should be performed to determine the relative variability among levels within glomeruli, among the glomeruli with-in an experimental group and the amount of difference in group means expected in the future study. Such a pilot study could consist of three animals (or human biopsies) per experimental group. From each animal (biopsy), se-lect three glomeruli without bias. From each glomerulus select disector pairs equally spaced from fi ve levels throughout the glomerulus. Count the number of Q – from all the disector pairs. Determine the variability among glomeruli and within glomeruli by partitioning the vari-ance [33] .
The precision of the Weibel-Gomez estimate increases as the number of profi les and number of grid points counted increases. In this study, to increase the counts and thus the precision of the method, multiple levels within glomeruli (5 � m apart) were used. An average of 272 nuclear profi les were counted per glomerulus which is probably more than suffi cient for studies comparing differences between experimental groups. For such stud-ies, one or two levels selected without bias per glomerulus may suffi ce.
To reduce the diffi culty in identifying cells we used well-perfused, well-fi xed tissue that allowed resident nu-clei to be easily identifi ed. In studies of glomerular disease where the glomerular architecture is distorted it becomes more diffi cult to identify specifi c cell types. Care must be taken to avoid interpreting misidentifi ed cells as loss of a specifi c cell type. It may be necessary to use specifi c cell markers to help identify specifi c cell types provided the cell marker is not decreased with advancing disease. In advanced glomerulopathy identifi cation by light micros-copy may become impossible and electron microscopy may be needed for positive identifi cation.
The Exhaustive Count method has been used to deter-mine the number of glomeruli in rats [2] the number of cells in glomeruli [3] and the number of glial cells in rat brains [4] . It is the most direct method for counting cell number but is very time-consuming and not practical for most studies. In this study, the disector/fractionator method took less than half the time as the Exhaustive Count method. In addition, the results of this study dem-onstrate that counting profi les on single sections (Weibel-Gomez) in a normal mouse results in a biased estimate
Basgen /Nicholas /Mauer /Rozen /Nyengaard
Nephron Exp Nephrol 2006;103:e139–e148 e148
References
1 Nakamure T, Ushiyama C, Suzuki S, Hara M, Shimada N, Ebihara I, Koide H: Urinary ex-cretion of podocytes in patients with diabetic nephropathy. Nephrol Dial Transplant 2000; 15: 1379–1383.
2 Pagtalunan ME, Miller P, Jumping-Eagle S, Nelson RG, Myers BD, Rennke HG, Coplon NS, Sun L, Meyer TW: Podocyte loss and pro-gressive glomerular injury in type II diabetes. J Clin Invest 1997; 99: 342–348.
3 Kittelson JA: The postnatal growth of the kid-ney of the albino rat, with observations on an adult human kidney. Anat Rec 1917; 13: 385–408.
4 Helmchen U, Kneissler U, Uelmchen U, Boh-le A: Three-dimensional electron microscopy of the structure of the normal mesangium of the rat glomerulus. Kidney Int 1977; 11: 215A.
5 Pover CM, Coggeshall RE: Verifi cation of the disector method for counting neurons, with comments on the empirical method. Anat Rec 1991; 231: 573–578.
6 Bell ET: The early stages of glomerulonephri-tis. Am J Pathol 1936; 12: 801–824.
7 Østerby, R: Early phases in the development of diabetic glomerulopathy. Acta Med Scand 1974; 574: 3–82.
8 Brun C, Steen Olsen T, Raaschou F, Sørensen AWS: Renal biopsy in rheumatoid arthritis. Nephron 1965; 2: 65–81.
9 Iidaka K, McCoy J, Kimmelstiel P: The glo-merular mesangium a quantitative analysis. Lab Invest 1968; 19: 573–579.
10 Fukuhara N: Histometrical studies on the kid-neys in diabetes mellitus. Tohoku J Exp Med 1968; 95: 15–27.
11 Wicksell SD: The corpuscle problem. A math-ematical study of a biometric problem. Bio-metrica 1925; 17: 84–99.
12 Weibel ER, Gomez DM: A principle for count-ing tissue structures on random sections. J Appl Physiol 1962; 17: 343–348.
13 Weibel ER: Stereological Methods. Practical Methods for Biological Morphometry. Lon-don, Academic Press, 1979, vol 1, pp 43–45.
14 Hishiki T, Shirato I, Takahashi Y, Funabiki K, Horikoshi S, Tomino Y: Podocyte injury pre-dicts prognosis in patients with IgA nephropa-thy using a small amount of renal biopsy tissue. Kidney Blood Press Res 2001; 24: 99–104.
15 Lemley KV, Lafayette RA, Safai M, Derby G, Blouch K, Squarer A, Myers BD: Podocytope-nia and disease severity in IgA nephropathy. Kidney Int 2002; 61: 1475–1485.
16 Steffes MW, Schmidt D, McCrery R, Basgen JM, IDN Study Group: Glomerular cell num-ber in normal subjects and in type 1 diabetic patients. Kidney Int 2001; 59: 2104–2113.
17 Dalla Vestra M, Masiero A, Roiter AM, Saller A, Grepaldi C, Fioretto P: Is podocyte injury relevant in diabetic nephropathy? Diabetes 2003; 52: 1031–1035.
18 Sterio DC: The unbiased estimation of number and sizes of arbitrary particles using the disec-tor. J Microsc 1984; 134: 127–136.
19 Pakkenberg B, Gundersen HJ: Total number of neurons and glial cells in human brain nuclei estimated by the disector and the fractionator. J Microsc 1988; 150: 1–20.
20 Nyengaard JR: Stereologic methods and their application in kidney research. JASN 1999; 10: 1100–1123.
21 White KE, Bilous RW, Marshall SM, Nahas ME, Remuzz G, Piras G, De Cosmo S, Viberti GC, and ESPRIT: Podocyte number in normo-tensive type 1 diabetic patients with albumin-uria. Diabetes 2002; 51: 3083–3089.
22 White KE, Bilous RW: Structural alterations to the podocytes are related to proteinuria in type 2 diabetic patients. Nephrol Dial Trans-plant 2004; 19: 1437–1440.
23 Bertram JF, Soosaipillai MC, Ricardo SD, Ryan GB: Total numbers of glomeruli and in-dividual glomerular cell types in the normal rat kidney. Cell Tissue Res 1992; 270: 37–45.
24 Rasch R, Nyengaard JR, Marcussen N, Meyer TW: Renal structural abnormalities following recovery from acute puromycin nephrosis. Kidney Int 2002; 62: 496–506.
25 Blumer JF, Gahleitner P, Narzt T, Handl C, Ruthensteiner B: Ribbons of semithin sec-tions: an advanced method with a new type of diamond knife. J Neurosci Methods 2002; 120: 11–16.
26 Gundersen HJG, Jensen EB: The effi ciency of systematic sampling in stereology and its pre-dictions. J Microsc 1987; 147: 229–263.
27 Gundersen HJG: Stereology of arbitrary par-ticles. J Microsc 1986; 143: 3–45.
28 Gundersen HJG, Bagger P, Bendtsen TF, Ev-ans SM, Korbo L, Marcussen N, Møller A, Nielsen K, Nyengaard JR, Pakkenberg B, Sø-rensen FB, Vesterby A, West MJ: The new ste-reological tools: disector, fractionator, nuclea-tor and point sampled intercepts and their use in pathological research and diagnosis. APMIS 1988; 96: 857–881.
29 Bland JM, Altman DG: Statistical methods for assessing agreement between two methods of clinical measurement. Lancet 1986;i:307–310.
30 Dorph-Petersen KA, Nyengaard JR, Gunder-sen HJ: Tissue shrinkage and unbiased stereo-logical estimation of particle number and size. J Microsc 2001; 204: 232–246.
31 Lane PH, Steffes MW, Mauer SM: Estimation of glomerular volume. A comparison of four methods. Kidney Int 1992; 41: 1085–1089.
32 Sanden SK, Wiggins JE, Goyal M, Riggs LK, Wiggins RC: Evaluation of a thick and thin section method for estimation of podocytes number, glomerular volume, and glomerular volume per podocytes in rat kidney with Wilms’ tumor-1 protein used as a podocytes nuclear marker. JASN 2003; 14: 2484–2493.
33 Howard CV, Reed MG: Unbiased Stereology, ed 2. Oxford, BIOS Scientifi c Publishers, 2005, pp 152–154.
of cell number. The disector/fractionator method, when properly used, is unbiased and a good surrogate for the Exhaustive Count method. For future studies that count cells, such as podocytes, in health and disease, we advo-cate for the fractionator/disector method. We also recom-mend that other counting methods be validated using the Exhaustive Count method before they are globally used.
Acknowledgements
This work was supported by a grant from the National Institutes of Health (DK059343) to S.B.N. The MIND Center at the Univer-sity of Aarhus is funded by the Lundbeck Foundation. An oral ab-stract of this work was presented at the Microscopy Society of America Annual Meeting in Honolulu, August 2005.
Copyright © 2022 FDOKUMEN