Comparison of early growth and survivability in indigenous ...
17
REGULAR ARTICLES Comparison of early growth and survivability in indigenous guinea fowls from Northern Ghana Kurukulasuriya Mariesta Jayaroshini Ahiagbe 1 & Esinam Nancy Amuzu-Aweh 2 & Patrick Bonney 1 & John Kormla Nyameasem 1 & Franklin Kodzo Avornyo 1 & Christopher Adenyo 3 & Kwame Owusu Amoah 1 & Augustine Naazie 2 & Boniface Baboreka Kayang 2 Received: 24 July 2020 /Accepted: 3 December 2020 /Published online: 7 January 2021 # The Author(s), under exclusive licence to Springer Nature B.V. part of Springer Nature 2021 Abstract Three guinea fowl populations from Northern Ghana were compared in terms of their body weight, growth rates, and surviv- ability during the first 11 weeks of life. Keets (n = 865) were hatched from eggs collected from 32 sampling areas divided into eleven subpopulations within three populations in Northern Ghana. Together with an experimental flock maintained at Animal Research Institute (ARI flock), these birds were raised and appraised for weekly body weights, weekly growth rates, and survivability. Weekly body weights did not differ significantly (p > 0.05) among the three populations, although ARI flock were significantly heavier (p ˂ 0.05) compared to the main populations until the fourth week. In contrast, among the subpopulations, significant differences emerged in body weights from the second week and were more pronounced from the sixth week. Growth rates measured as weekly weight gains also differed significantly among subpopulations beyond the second week, although differences in growth rates were not significantly different among whole populations. The mean values for total feed intake, daily feed intake, and feed conversion ratio (FCR) did not vary significantly (p > 0.05) between the populations. Therefore, although the variations in body weight and growth rates were limited among the populations, there existed significant variations among subpopulations, creating opportunities to establish genetically divergent populations for growth rate and to improve early growth rates and body weights in local guinea fowls by selection. High survivability observed in the ARI flock compared to keets from the three populations of Northern Ghana was likely due to good breeder stock management practices despite their common ancestry. Keywords Body weight . Growth rate . Guinea fowls . Survivability . Northern Ghana Introduction The helmeted guinea fowl (Numida meleagris) is one of the important animal genetic resources of the African continent. It is thought to have originated from the Coast of Guinea (Newbold 1926), an area that spans the coastal zone of present-day West Africa. Since its introduction to Europe during colonization, guinea fowl production has been im- proved to large-scale commercial operations in some European countries and the USA (Nahashon et al. 2006) with integrated improvements in nutrition and husbandry coupled with genetic improvement by selective breeding. They are raised mainly under semi-intensive or extensive system with minimal farm inputs in many African countries including Botswana (Moreki and Seabo 2012), Benin (Dahouda et al. 2007), Nigeria (Ogah 2013), Zimbabwe (Kusina et al. 2012), Ghana (Avornyo et al. 2016), and others (Moreki and Radikara 2013). In Ghana, guinea fowl is the most common poultry species in the northern part of the coun- try (Agbolosu et al. 2012a), where almost every rural house- hold keeps a few birds in their backyard (Dei and Karbo 2004). While meat and eggs from guinea fowls provide pro- tein in the rural diet, income from guinea fowl production helps the inhabitants to meet their daily needs, often providing * Boniface Baboreka Kayang [email protected] 1 Animal Research Institute, Council for Scientific and Industrial Research, P.O. Box AH 20, Achimota, Accra, Ghana 2 Department of Animal Science, University of Ghana, Legon, Ghana 3 Livestock and Poultry Research Centre, University of Ghana, Legon, Ghana Tropical Animal Health and Production (2021) 53: 89 https://doi.org/10.1007/s11250-020-02510-4
-
Upload
khangminh22 -
Category
Documents
-
view
1 -
download
0
Transcript of Comparison of early growth and survivability in indigenous ...

REGULAR ARTICLES
Comparison of early growth and survivability in indigenous guineafowls from Northern Ghana
Kurukulasuriya Mariesta Jayaroshini Ahiagbe1& Esinam Nancy Amuzu-Aweh2
& Patrick Bonney1 &
John Kormla Nyameasem1& Franklin Kodzo Avornyo1
& Christopher Adenyo3& Kwame Owusu Amoah1
&
Augustine Naazie2 & Boniface Baboreka Kayang2
Received: 24 July 2020 /Accepted: 3 December 2020 /Published online: 7 January 2021# The Author(s), under exclusive licence to Springer Nature B.V. part of Springer Nature 2021
AbstractThree guinea fowl populations from Northern Ghana were compared in terms of their body weight, growth rates, and surviv-ability during the first 11 weeks of life. Keets (n = 865) were hatched from eggs collected from 32 sampling areas divided intoeleven subpopulations within three populations in Northern Ghana. Together with an experimental flock maintained at AnimalResearch Institute (ARI flock), these birds were raised and appraised for weekly body weights, weekly growth rates, andsurvivability. Weekly body weights did not differ significantly (p > 0.05) among the three populations, although ARI flock weresignificantly heavier (p ˂ 0.05) compared to the main populations until the fourth week. In contrast, among the subpopulations,significant differences emerged in body weights from the second week and were more pronounced from the sixth week. Growthrates measured as weekly weight gains also differed significantly among subpopulations beyond the second week, althoughdifferences in growth rates were not significantly different among whole populations. The mean values for total feed intake, dailyfeed intake, and feed conversion ratio (FCR) did not vary significantly (p > 0.05) between the populations. Therefore, althoughthe variations in body weight and growth rates were limited among the populations, there existed significant variations amongsubpopulations, creating opportunities to establish genetically divergent populations for growth rate and to improve early growthrates and body weights in local guinea fowls by selection. High survivability observed in the ARI flock compared to keets fromthe three populations of Northern Ghana was likely due to good breeder stock management practices despite their commonancestry.
Keywords Bodyweight . Growth rate . Guinea fowls . Survivability . Northern Ghana
Introduction
The helmeted guinea fowl (Numida meleagris) is one of theimportant animal genetic resources of the African continent. Itis thought to have originated from the Coast of Guinea(Newbold 1926), an area that spans the coastal zone ofpresent-day West Africa. Since its introduction to Europe
during colonization, guinea fowl production has been im-proved to large-scale commercial operations in someEuropean countries and the USA (Nahashon et al. 2006) withintegrated improvements in nutrition and husbandry coupledwith genetic improvement by selective breeding.
They are raised mainly under semi-intensive or extensivesystem with minimal farm inputs in many African countriesincluding Botswana (Moreki and Seabo 2012), Benin(Dahouda et al. 2007), Nigeria (Ogah 2013), Zimbabwe(Kusina et al. 2012), Ghana (Avornyo et al. 2016), and others(Moreki and Radikara 2013). In Ghana, guinea fowl is themost common poultry species in the northern part of the coun-try (Agbolosu et al. 2012a), where almost every rural house-hold keeps a few birds in their backyard (Dei and Karbo2004). While meat and eggs from guinea fowls provide pro-tein in the rural diet, income from guinea fowl productionhelps the inhabitants to meet their daily needs, often providing
* Boniface Baboreka [email protected]
1 Animal Research Institute, Council for Scientific and IndustrialResearch, P.O. Box AH 20, Achimota, Accra, Ghana
2 Department of Animal Science, University of Ghana, Legon, Ghana3 Livestock and Poultry Research Centre, University of Ghana,
Legon, Ghana
Tropical Animal Health and Production (2021) 53: 89https://doi.org/10.1007/s11250-020-02510-4

direct investments for crop farming (Avornyo et al. 2016;Issaka and Yeboah 2016).
The majority of the guinea fowl farmers (98%) in NorthernGhana (NG) depend solely on local varieties of guinea fowlsand rearing specialized exotic breeds improved for meat isnegligible (FAO 2014; Avornyo et al. 2016). However, theserich genetic resources are not well characterized. Publishedliterature on important production characteristics includingbody weight, growth rate, and disease resistance of localGhanaian guinea fowl varieties is scanty. There have beenno reports on breeding programs for genetic improvement ofthese varieties or phenotypic recording schemes to facilitateinitiation of long-term breeding programs for local guineafowls. However, available evidence suggests the existenceof diversity among the local varieties kept by local farmersin NG (Kayang et al. 2010) providing opportunities for futurebreeding programs. Agbolosu et al. (2012b) observed signif-icant differences in body weights of local guinea fowls origi-nating from the Upper West Region, Upper East Region, andNorthern Region (former) of Ghana during the eighth to eigh-teenth weeks growth period.
Most long-term breeding programs aiming at selecting di-vergent lines for faster growth in chicken have used bodyweights and growth rates during the juvenile stage with bodyweight at the eighth week being the most commonly usedselection criterion (Flisar et al. 2014). Despite the importanceof body weight and growth rate data during juvenile growthphase in poultry for selective breeding for faster growth, thereis still a paucity of published literature on body weight traits,growth rate traits, and their variations among the local guineafowl populations of NG during the brooding period that in-clude the first 8 weeks of the production cycle.
Although growth remains a priority trait in poultrybreeding in all economic species, other characteristicspertaining to fertility and survivability should not beoverlooked during breed improvement (ALBC 2007).While high survivability is an important production traitto be improved or maintained when aiming for geneticgains in growth rate, it is even more important forbreeds meant for dissemination to resource poor poultryfarmers with limited access to veterinary care as thosein the northern part of Ghana.
Therefore, this study sought to characterize and comparethree main guinea fowl populations from the Upper EastRegion (UER), Former Northern Region (FNR, which nowincludes Northern, North East, and Savannah Regions), andUpper West Region (UWR) in terms of their body weight,growth rate, and survivability during the early growth period.The study also compared the subpopulations of local guineafowls raised within these three populations for the same quan-titative traits. Such information would be of immense impor-tance for researchers who plan to design and implement sus-tainable breeding programs to facilitate sustainable utilization
of this less well studied but important animal genetic resourcein Africa and the world at large.
Materials and methods
Source of experimental animals
Eggs from laying helmeted guinea fowls (Numida meleagris)were collected from 32 selected guinea fowl growing areasfrom three main populations of Northern Ghana (TPNG).The three main populations of Northern Ghana included guin-ea fowl populations from the Upper East Region (UER;Fig. 1), Former Northern Region (FNR; Fig. 2), and UpperWest Region (UWR; Fig. 3). After the completion of thisstudy, FNR was split into three administrative regions namelyNorth East Region, Northern Region, and Savannah Region.Therefore, it is important to note that FNR currently includesthree regions. Additionally, eggs from a breeder flock main-tained at the Animal Research Institute of the Council forScientific and Industrial Research (CSIR-ARI) were also col-lected. The breeder flock at CSIR-ARI was from keetshatched from eggs collected a year earlier from the same sam-ple locations of UER, FNR, and UWR.
Each of the TPNG was divided into three or foursubpopulations based on their origin to compare guineafowl populations within the main populations for thepurpose of this study. The UER subpopulations wereE1, E2, E3, and E4, the FNR subpopulations wereN1, N2, N3, and N4, and the UWR subpopulationswe r e W1, W2 , and W3 (F ig s . 1 , 2 , and 3 ,respectively). After collection and assembly, eggs wereairlifted from a central location in the capital (Tamale)of the FNR to CSIR-ARI, Accra. Eggs were handledaccording to standard procedures of handling breedingeggs from the collection of eggs at sampling locationsuntil incubation.
Animals
In total, 865-day-old keets from the four main study popula-tions including UER (n = 250), FNR (n = 242), UWR (n =322), and the experimental breeder stock maintained atCSIR-ARI (n = 51) were used for the study. Day-old keetsfrom each population were randomly assigned in replicatesof 40–50 birds with nearly an equal number of keets from asubpopulation represented in all replicates for a given mainpopulation. Therefore, both UER and FNR had six replicateseach, while UWR had eight replicates. The population fromCSIR-ARI (ARI flock; ARI population) was included in onereplicate of the total 21 replicates. All keets were individuallytagged within the first 24 h after hatching with caution tominimize stress and trauma during handling.
89 Page 2 of 17 Trop Anim Health Prod (2021) 53: 89

Fig. 1 Sampling areas in the Upper East Region
Fig. 2 Sampling areas in the Former Northern Region
Trop Anim Health Prod (2021) 53: 89 Page 3 of 17 89

Management of experimental animals
Keets belonging to all replicates were raised at thebrooder house of the Guinea fowl Resource Centre,Animal Research Institute, Accra, Ghana. Replicateswere housed within compartments each measuring1 m × 1.5 m × 2.5 m for length, breadth, and height,respectively. The brooder pens were preheated 24 h be-fore receiving the keets. Keets were then brooded withprovision of artificial light and heat tightly regulatingthe temperatures at 35 °C, 33 °C, 31 °C, and 29 °Cfrom the first to the fourth week, respectively, with thehelp of gas brooders. Beyond the fourth week, internaltemperature of the brooder house was maintained at29 °C up to the eighth week. Best practices for prepar-ing the brooder house and biosafety during dailyoperations were adhered to according to procedures ofAhiagbe et al. (2016) during the entire brooding periodof 8 weeks. A vaccination schedule was followed ac-cording to recommendations by Ahiagbe et al. (2016).From day one up to 8 weeks, keets were fed with aformulated diet containing 24% crude protein (CP) and12.5 MJ metabolizable energy (ME)/kg (Table 1). Feedand water were available ad libitum.
At 8 weeks, surviving birds (n = 222) were trans-ferred to a deep litter house, where they were randomlyreassigned to replicates consisting of 15–18 birds. In all,UER (n = 34), NR (n = 64), UWR (n = 73), and ARI
(n = 51) populations had 2, 4, 4, and 3 replicates, re-spectively. Each replicate was housed in a compartmentat a stocking density of twenty growers per square me-ter. From 8 to 12 weeks, the birds were fed with aformulated grower diet with 16.37% CP and 11.23 MJME/kg (Table 1). Feed and water were available adlibitum. A prophylactic health management plan forraising growers was followed ensuring biosafety duringdaily operations. In the 12th week, guinea fowl growerswere distributed to guinea fowl farmers as per the re-quirements of the associated research and developmentproject.
Data collection
Body weight of each bird was recorded using an elec-tronic balance at week 1 (BW1), week 2 (BW2), week3 (BW3), week 4 (BW4), week 6 (BW6), week 7(BW7), week 9 (BW9), and week 11 (BW11). Weightgain per week was used as an indicator of growth ratefor selected time intervals. Recorded body weights wereused to determine growth rates (Formula 1) betweenweeks 1 and 2 (GR1), weeks 2 and 3 (GR2), weeks 3and 4 (GR3), weeks 4 and 6 (GR4), weeks 6 and 7(GR5), weeks 7 and 9 (GR6), weeks 9 and 11 (GR7),and the overall growth rate between weeks 1 and 11(GRO). The body weights in between the specifiedweeks could not be measured due to unavailability of
Fig. 3 Sampling areas in the Upper West Region
89 Page 4 of 17 Trop Anim Health Prod (2021) 53: 89

electricity at the experimental pens on those days. Feedintake per replicate was recorded daily and was used tocalculate mean feed intake for the entire study periodper population. Feed conversion ratio (FCR) was calcu-lated using Formula 2. Mortalities were recorded dailyand used to calculate percentage mortalities per weekaccording to Yassin et al. (2009) using Formula 3.
Growth rate measured as weekly weight gain
¼ Final weight–Initial weight
Time interval weeksð Þ ð1Þ
Feed conversion ratio FCRð Þ
¼ Total feed consumed per bird
Total weight gain per birdð2Þ
Percentage mortality at week N
¼ No:of mortalities during week N
No:of keets at day 1
� �100 ð3Þ
Data analysis
Data collected were entered intoMicrosoft Excel spreadsheetsand validated. Analysis of variance (ANOVA) was performedfor weekly body weights and growth rates at specified timeintervals using the generalized linear model below.
Y ijk ¼ μþ Pi þ S j þ eijk
where, Yijk is the given dependable variable, μ is the overallmean, Pi is the effect of ith sample population, Sj is the effectof jth subpopulation, and eijk is the random error. The traitsused as dependable variables included the body weights mea-sured at first, second, third, fourth, sixth, seventh, ninth, andeleventh weeks, growth rates measured at specific weeklyintervals of 1–2, 2–3, 3–4, 4–6, 6–7, and 9–11, and the overallgrowth rate. Least square means (LSM) and standard error(SE) were calculated. Multiple pairwise comparisons weredone using Tukey’s method. All statistical analysis was per-formed using R Version 0.99.489 (R Core Team 2016).
Table 1 Composition of diets fedto guinea fowls at different stagesof growth
Ingredients (%) 0–8 weeks 9–12 weeks Guinea fowl breeders
Maize 62.30 55.00 60.00
Soybean meal 21.00 15.00 17.70
Wheat bran – 14.00 5.00
Di-calcium phosphate 0.70 0.90 0.90
Limestone 0.90 2.00 8.40
Salt (NaCl) 0.15 0.20 0.25
Lysine 0.15 0.20 0.20
Methionine 0.15 0.10 0.10
Fishmeal 13.20 1.00 3.00
Vitamin and mineral premix* 0.25 0.25 0.25
Palm oil 1.20 1.35 2.20
Palm Kernel Cake (PKC) – 10.00 2.00
Total 100 100 100
Calculated composition
Metabolizable energy (MJ/kg) 12.50 11.23 11.60
Crude protein (%) 24.00 16.37 16.92
Lysine (%) 1.39 0.80 0.92
Methionine (%) 0.57 0.30 0.35
Crude fiber (%) 2.42 4.54 2.82
Crude fat (%) 3.70 5.02 5.29
Calcium (%) 1.31 1.06 3.40
Available phosphorus (%) 0.47 0.37 0.36
**P:E 19.20 14.58 14.59
*Vitamin and mineral premix per 100-kg diet: vitamins, vitamin A (8 × 10⁵ IU); vitamin D3 (1.5 × 10⁴ IU);vitamin E (250 mg); vitamin K (100 mg); vitamin B2 (2 × 10² mg); vitamin B12 (0.5 mg); folic acid (50 mg);nicotinic acid (8 × 10² mg); calcium pantothenate (200 mg); choline (5 × 10³ mg); trace elements, Mg (5 × 10³
mg); Zn (4 × 10³ mg); Cu (4.5 × 10² mg); Co (10 mg); I (100 mg); Se (10 mg); antioxidants, butylated hydroxy-toluene (1 × 10³ mg). Carrier: calcium carbonate qsp (0.25 kg)
**P:E, protein:energy (g protein/MJ ME)
Trop Anim Health Prod (2021) 53: 89 Page 5 of 17 89
Results
Body weight traits
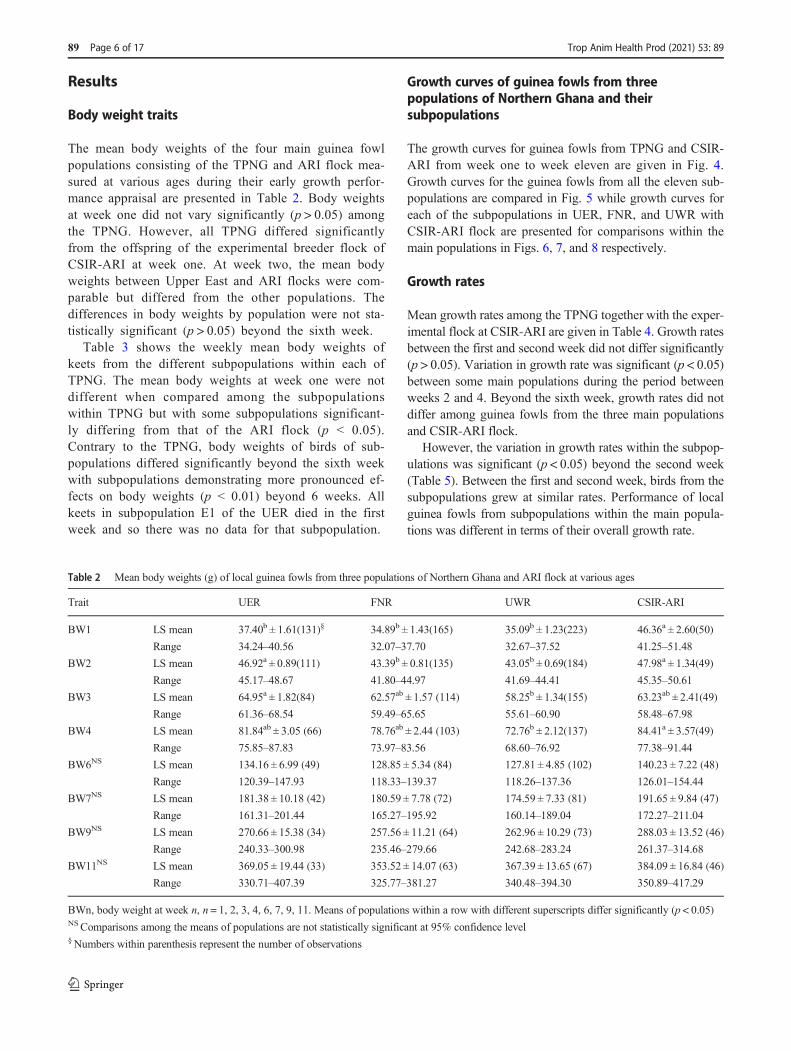
The mean body weights of the four main guinea fowlpopulations consisting of the TPNG and ARI flock mea-sured at various ages during their early growth perfor-mance appraisal are presented in Table 2. Body weightsat week one did not vary significantly (p > 0.05) amongthe TPNG. However, all TPNG differed significantlyfrom the offspring of the experimental breeder flock ofCSIR-ARI at week one. At week two, the mean bodyweights between Upper East and ARI flocks were com-parable but differed from the other populations. Thedifferences in body weights by population were not sta-tistically significant (p > 0.05) beyond the sixth week.
Table 3 shows the weekly mean body weights ofkeets from the different subpopulations within each ofTPNG. The mean body weights at week one were notdifferent when compared among the subpopulationswithin TPNG but with some subpopulations significant-ly differing from that of the ARI flock (p ˂ 0.05).Contrary to the TPNG, body weights of birds of sub-populations differed significantly beyond the sixth weekwith subpopulations demonstrating more pronounced ef-fects on body weights (p ˂ 0.01) beyond 6 weeks. Allkeets in subpopulation E1 of the UER died in the firstweek and so there was no data for that subpopulation.
Growth curves of guinea fowls from threepopulations of Northern Ghana and theirsubpopulations
The growth curves for guinea fowls from TPNG and CSIR-ARI from week one to week eleven are given in Fig. 4.Growth curves for the guinea fowls from all the eleven sub-populations are compared in Fig. 5 while growth curves foreach of the subpopulations in UER, FNR, and UWR withCSIR-ARI flock are presented for comparisons within themain populations in Figs. 6, 7, and 8 respectively.
Growth rates
Mean growth rates among the TPNG together with the exper-imental flock at CSIR-ARI are given in Table 4. Growth ratesbetween the first and second week did not differ significantly(p > 0.05). Variation in growth rate was significant (p < 0.05)between some main populations during the period betweenweeks 2 and 4. Beyond the sixth week, growth rates did notdiffer among guinea fowls from the three main populationsand CSIR-ARI flock.
However, the variation in growth rates within the subpop-ulations was significant (p < 0.05) beyond the second week(Table 5). Between the first and second week, birds from thesubpopulations grew at similar rates. Performance of localguinea fowls from subpopulations within the main popula-tions was different in terms of their overall growth rate.
Table 2 Mean body weights (g) of local guinea fowls from three populations of Northern Ghana and ARI flock at various ages
Trait UER FNR UWR CSIR-ARI
BW1 LS mean 37.40b ± 1.61(131)§ 34.89b ± 1.43(165) 35.09b ± 1.23(223) 46.36a ± 2.60(50)
Range 34.24–40.56 32.07–37.70 32.67–37.52 41.25–51.48
BW2 LS mean 46.92a ± 0.89(111) 43.39b ± 0.81(135) 43.05b ± 0.69(184) 47.98a ± 1.34(49)
Range 45.17–48.67 41.80–44.97 41.69–44.41 45.35–50.61
BW3 LS mean 64.95a ± 1.82(84) 62.57ab ± 1.57 (114) 58.25b ± 1.34(155) 63.23ab ± 2.41(49)
Range 61.36–68.54 59.49–65.65 55.61–60.90 58.48–67.98
BW4 LS mean 81.84ab ± 3.05 (66) 78.76ab ± 2.44 (103) 72.76b ± 2.12(137) 84.41a ± 3.57(49)
Range 75.85–87.83 73.97–83.56 68.60–76.92 77.38–91.44
BW6NS LS mean 134.16 ± 6.99 (49) 128.85 ± 5.34 (84) 127.81 ± 4.85 (102) 140.23 ± 7.22 (48)
Range 120.39–147.93 118.33–139.37 118.26–137.36 126.01–154.44
BW7NS LS mean 181.38 ± 10.18 (42) 180.59 ± 7.78 (72) 174.59 ± 7.33 (81) 191.65 ± 9.84 (47)
Range 161.31–201.44 165.27–195.92 160.14–189.04 172.27–211.04
BW9NS LS mean 270.66 ± 15.38 (34) 257.56 ± 11.21 (64) 262.96 ± 10.29 (73) 288.03 ± 13.52 (46)
Range 240.33–300.98 235.46–279.66 242.68–283.24 261.37–314.68
BW11NS LS mean 369.05 ± 19.44 (33) 353.52 ± 14.07 (63) 367.39 ± 13.65 (67) 384.09 ± 16.84 (46)
Range 330.71–407.39 325.77–381.27 340.48–394.30 350.89–417.29
BWn, body weight at week n, n = 1, 2, 3, 4, 6, 7, 9, 11. Means of populations within a row with different superscripts differ significantly (p < 0.05)NSComparisons among the means of populations are not statistically significant at 95% confidence level§ Numbers within parenthesis represent the number of observations
89 Page 6 of 17 Trop Anim Health Prod (2021) 53: 89

Table3
Com
parisonof
meanbody
weights(g)of
localg
uineafowlsatdifferentagesby
subpopulations
intheTPN
GandARIflock
Subpopulation/
populatio
nBW1
BW2
BW3
BW4
BW6
BW7
BW9
BW11
E2
38.00a
b±1.94
(91)
§47.56a
±1.06
(77)
67.42a±2.26
(53)
85.53a
b±3.86
(38)
136.29
c±9.41
(23)
185.15
b±14.73
(17)
266.71
c±24.31
(12)
341.53
b±31.63b
(11)
E3
36.52a
b±8.28
(5)
52.47a
b±5.37
(3)
80.33a
b±9.49
(3)
110.20
ab±23.82
(1)
180.80
abc±45.15
(1)
294.90
ab±60.74
(1)
386.40
abc±84.22
(1)
459.60
ab±104.91
(1)
E4
35.96a
b±3.13
(35)
44.79a
b±1.67
(31)
58.63a
b±3.11
(28)
75.59b
±4.58
(27)
130.34
c±9.03
(25)
173.98
b±12.40
(24)
267.40
abc±18.38
(21)
379.15
b±22.89
(21)
N1
34.28b
±2.57
(52)
40.80b
±1.55
(36)
57.88a
b±3.11
(28)
67.03b
±4.58
(27)
106.19
c±9.85
(21)
157.13
b±16.23
(14)
230.04
ac±22.51
(14)
323.15
b±28.04
(14)
N2
34.79b
±2.35
(62)
44.56a
b±1.25
(55)
61.56a
b±2.32
(50)
76.53b
±3.59
(44)
114.52
c±7.52
(36)
156.20
b±10.27
(35)
240.02
ac±14.89
(32)
333.34
b±18.84
(31)
N3
35.63a
b±3.50
(28)
41.74a
b±1.86
(25)
62.32a
b±3.59
(21)
80.55b
±5.46
(19)
133.24
bc±11.66
(15)
189.34
b±17.53
(12)
253.99
ac±25.39
(11)
329.97
b±31.63
(11)
N4
35.61a
b±3.86
(23)
47.08a
b±2.13
(19)
74.83a±4.24
(15)
108.11
a±6.61
(13)
206.03
a±13.03
(12)
278.50
a±18.31
(11)
398.41
a±31.83
(7)
540.63
a±39.65
(7)
W1
36.12a
b±1.95
(90)
44.11a
b±1.08
(74)
58.29b
±2.10
(61)
72.84b
±3.18
(56)
129.16
c±6.81
(44)
173.87
b±9.60
(40)
266.52
ac±14.66
(33)
368.56
b±20.19
(27)
W2
36.38a
b±4.14
(20)
44.92a
b±2.26
(17)
64.06a
b±3.99
(17)
83.48a
b±5.96
(16)
160.79
b±12.07
(14)
217.46
ab±16.85
(13)
329.29
bc±24.31
(12)
434.95
ab±30.29
(12)
W3
34.05b
±1.74
(113)
41.87b
±0.96
(93)
56.95b
±1.87
(77)
70.06b
±2.95
(65)
115.97
c±6.81
(44)
155.71
b±11.48
(28)
233.49
a±15.13
(28)
337.31
b±19.82
(28)
ARI
46.34a±2.62
(50)
47.98a
±1.33
(49)
63.23a
b±2.37
(48)
84.41a
b±3.44
(48)
140.23
c±6.66
(47)
191.65
b±9.05
(45)
288.03
abc±12.70
(44)
384.09
b±15.82
(44)
BWn,body
weightatw
eekn,n=1,2,3,4,6,7,9,11.E
2,E3,E4,subpopulations
intheUpperEastR
egion;N1,N2,N3,N4,subpopulations
oftheform
erNorthernRegion;W1,W2,W3,subpopulations
oftheUpper
WestR
egion.Means
ofsubpopulations
with
inacolumnwith
differentsuperscriptsdiffer
significantly
(p<0.05)
§Num
berswith
inparenthesisrepresentthe
numberof
observations.
Trop Anim Health Prod (2021) 53: 89 Page 7 of 17 89

Feed intake
The mean values for total feed intake, daily feed intake, andFCR did not vary significantly (p > 0.05) between the mainpopulations (Table 6). Due to the experimental design adoptedby raising birds of different subpopulations together in a rep-licate, to avoid experimental bias originating from lower num-bers of birds in some subpopulations, feed intake was notmeasured per subpopulation.
Survivability
The highest mortalities were reported during the first weekpost-hatch accounting for more than 50% of total mortalitiesobserved during the study period for each of the main
populations and subpopulations excluding the ARI flock. Asummary of percentage mortalities at weekly intervals is pre-sented in Table 7. The cumulative mortalities for TPNGby the eighth week are also given in Table 7 due torelatively high rate of mortalities recorded by localguinea fowl farmers in NG during the first 8 weeks ofrearing. The survivability plots for TPNG, CSIR-ARIflock, and subpopulations, CSIR-ARI flock are present-ed in Figs. 9 and 10 respectively.
Discussion
Due to the importance of carcass weight at the end of theproduction cycle, body weights are important quantitative
Fig. 4 Growth curves for guineafowls from the Upper East,former Northern, and Upper Westregions and the breeder flock atCSIR-ARI during the earlygrowth stage (0–11 weeks)
Fig. 5 Growth curves for guineafowls from designatedsubpopulations within the UpperEast, former Northern, and UpperWest regions and ARI flockduring the early growth stage (0–11 weeks)
89 Page 8 of 17 Trop Anim Health Prod (2021) 53: 89

traits for poultry farmers. Although guinea fowls have beenimproved for faster growth and higher carcass weight inFrance, Belgium, and the USA and growth characteristicsare available for some of such breeds in literature (Nahashonet al. 2006), there is limited literature on factors influencingbody weight and early growth in guinea fowls. Most of ourcurrent understanding on factors affecting body weight duringearly growth stage in poultry comes from the experimentsinvolving broiler chicken breeds.
Body weight traits in broilers have been reported to beinfluenced by factors that have permanent or long-term influ-ence on growth such as genetic makeup of juveniles and man-agement practices throughout the growth period (Ayorinde2007). However, there is also another subset of factors thatinfluence body weight traits especially during the post-hatchgrowth which include maternal nutrition, breeder age, pre-in-cubation, and incubation conditions of eggs, the effects ofwhich subside with advancement in age in broiler chicks(Decuypere and Bruggeman 2007).
The growth rate during the first week is usually slow due tothe time taken by the chicks to increase digestive enzymeactivity, feed utilization, and acclimatization to life outsidethe egg. Therefore, body weight of chicks within the firstweek is largely a function of hatch weight. Several factors
including maternal diet, length of pre-incubation egg storage,and age of breeders have been reported to influence hatchweight and by extension body weights within the first weekof age (Decuypere and Bruggeman 2007). Nahashon et al.(2007) compared laying performance of guinea fowl breedersfed with diets containing varying levels of metabolizable en-ergy and crude protein and recorded the best hatch weight inoffspring from guinea hens fed with a diet including 24% and21% crude protein between 0 and 8weeks and 9 and 16weeks,respectively, during the growth of breeders. This providesstrong evidence for major influence of maternal diet on hatchweight, hence early post-hatch weight in guinea fowls. Longerpre-incubation storage of eggs has also been associated withlower hatch weights (Reis et al. 1997; Tona et al. 2003; Tonaet al. 2004) and body weight at day seven in broiler chicks(Tona et al. 2004).
During the current study, week one bodyweights (BW1) oflocal guinea fowls did not vary significantly (p > 0.05), thoughthe Upper East Region recorded the highest BW1 among theTPNG. Keets from the experimental breeder flock at ARI hadsignificantly heavier BW1 than keets from the TPNG.Although all the four populations were raised under identicalmanagement conditions after hatch, fed with a similar diet, theinfluence of the maternal diet on body weight within the first
Fig. 6 Growth curves for guineafowls from subpopulations withinthe Upper East Region and CSIR-ARI flock
Fig. 7 Growth curves for guineafowls from subpopulations withinthe former Northern Region andCSIR-ARI flock
Trop Anim Health Prod (2021) 53: 89 Page 9 of 17 89

week cannot be overlooked. According to Avornyo et al.(2014), the practice of maintaining a separate breeder stockis non-existent in production systems prevailing in NorthernGhana. Therefore, breeder hens are left to scavenge with lim-ited supplementary feed that included maize or millet(Avornyo et al. 2016). The experimental flock at CSIR-ARIrepresents the offspring from a base population originallyfrom the same sample locations of NG a year earlier.However, the parents were raised under best managementpractices recommended for raising breeders and providedwitha formulated breeder diet according to Ahiagbe et al. (2016).Therefore, difference in maternal diet might be a major
contributing factor for significantly higher BW1 in theCSIR-ARI population.
Although eggs laid within the last 24 h were requested fromfarmers during egg collection in the current study, the exact ageof eggs could be longer due to poor record keeping. Older butfertile layers are reported to lay heavier eggs reflected in higherhatch weights of their offspring compared to younger layers ofthe broiler lines (Tona et al. 2003; Tona et al. 2004). Ages of thelayers in the TPNGwere not available due to poor record keep-ing by the farmers. Therefore, better maternal nutrition andshorter pre-incubation storage might be among the main con-tributing factors for observed higher BW1 in ARI flock.
Fig. 8 Growth curves for guineafowls from subpopulations withinthe Upper West Region andCSIR-ARI flock
Table 4 Comparison of growthrates (g/week) of guinea fowlsfrom three populations ofNorthern Ghana and theexperimental flock at CSIR-ARI
Trait UER FNR UWR CSIR-ARI
GR1NS LS mean 8.40 ± 1.86 7.41 ± 1.68 6.73 ± 1.44 1.19 ± 2.80
Range 4.75–12.05 4.10–10.72 3.90–9.56 −4.30 - 6.68
GR2*** LS mean 16.53ab ± 1.16 17.67a ± 0.99 13.62b ± 0.86 15.09ab ± 1.54
Range 14.24–18.82 15.70–19.63 11.93–15.30 12.06–18.12
GR3** LS mean 16.15ab ± 1.55 14.71b ± 1.23 13.60 b ± 1.08 21.18a ± 1.82
Range 13.10–19.19 12.27–17.14 11.48–15.72 17.61–24.75
GR4NS LS mean 25.07 ± 2.08 23.84 ± 1.59 25.22 ± 1.44 27.45 ± 2.15
Range 20.97–29.17 20.70–26.97 22.38–28.06 23.22–31.68
GR5NS LS mean 46.63 ± 3.84 49.55 ± 2.93 40.73 ± 2.76 49.73 ± 3.71
Range 39.07–54.19 43.77–55.32 35.29–46.18 42.43–57.03
GR6NS LS mean 42.65 ± 3.31 43.22 ± 2.39 44.68 ± 2.22 47.47 ± 2.86
Range 36.13–49.17 38.51–47.94 40.29–49.06 41.83–53.12
GR7NS LS mean 49.47 ± 3.32 47.19 ± 2.41 49.27 ± 2.33 48.03 ± 2.88
Range 42.91–56.02 42.45–51.94 44.67–53.87 42.36–53.71
GRO*** LS mean 17.89b ± 1.43 20.92b ± 1.29 18.08b ± 1.11 31.81a ± 2.15
Range 15.08–20.69 18.38–23.46 15.91–20.26 27.60–36.03
GR, growth rate; GR1, GR between weeks 1 and 2; GR2, GR between weeks 2 and 3; GR3, GR between weeks 3and 4; GR4, GR between weeks 4 and 6; GR5, GR between weeks 6 and 7; GR6, GR between weeks 7 and 9;GR7,GR betweenweeks 9 and 11; GRO, overall GR between weeks 1 and 11.Means of populations within a rowwith different superscripts differ significantly at **p ˂ 0.05, ***p ˂ 0.001NSDifference of means between the populations are not statistically significant at 95% confidence level
89 Page 10 of 17 Trop Anim Health Prod (2021) 53: 89

There were significant differences between the BW2,BW3, and BW4 between some populations with no signifi-cant differences between the Upper East and CSIR-ARI thatrecorded comparable mean body weights. There have been noprevious reports on body weights during post-hatch growthcompared among the same three populations from NorthernGhana for comparisons with observations of the current study.Dei et al. (2009) recorded slightly higher body weights atweek four for local guinea fowls intensively raised withincages in a study conducted to compare different broodingoptions.
The variations in body weights observed during the currentstudy beyond the sixth week were not statistically differentamong the TPNG. This was contrary to observations byAgbolosu et al. (2012a) who reported significant differences
in the overall body weights beyond 8 weeks of age for theTPNG. However, Agbolosu et al. (2012a) did not comparebody weights from hatch to the eighth week. The UpperEast Region was the best performing in terms of weekly bodyweights for most weeks during the current study comparedwith the former Northern and Upper West Regions.Agbolosu et al. (2012a) also reported the Upper East Regionas the best performing in terms of overall body weight forgrowth period between 8 and 16 weeks. Avornyo et al.(2016) observed that the proportion of farmers providing sup-plementary feeding is higher in the Upper East Region andincluded millet as a major supplementary feed in that region.Pearl millet, the variety ofmillet popularly grown in the UpperEast Region, contains a higher protein and iron percentagecompared to maize (FAO 1995). This difference in the quality
Table 5 Growth rates (g/week) of local guinea fowls across the designated subpopulations within three populations of Northern Ghana
Subpopulation/population
GR1NS GR2** GR3** GR4** GR5** GR6** GR7** GRO **
E2 8.25 ± 2.24 17.49 ab ± 1.44 16.00bc ± 1.97 22.56c ± 2.75 45.88abc ± 5.77 42.30b ± 5.52 38.40b ± 5.55 14.15bc ± 1.63
E3 15.60 ± 11.36 27.87 ab ± 6.06 14.20abc ± 12.15 35.30abc ± 13.20 114.10ab ± 23.79 45.75ab ± 18.30 36.60ab ± 18.41 27.08abc ± 8.25
E4 8.06 ± 3.53 13.49b ± 1.98 16.43bc ± 2.34 26.97bc ± 2.64 44.35bc ± 4.86 42.69b ± 3.99 55.88ab ± 4.02 26.27ae ± 2.57
N1 4.88 ± 3.28 15.39 ab ± 1.98 8.26c ± 2.34 18.58c ± 2.88 49.82abc ± 6.36 41.04b ± 5.08 46.56ab ± 4.92 15.71bce ± 2.38
N2 8.71 ± 2.65 16.19 ab ± 1.48 13.34bc ± 1.83 18.53c ± 2.20 40.06bc ± 4.02 40.86b ± 3.23 45.35b ± 3.31 20.75bcde ± 1.93
N3 5.66 ± 3.93 19.17 ab ± 2.29 16.92abc ± 2.79 24.79bc ± 3.41 55.60abc ± 6.87 35.11b ± 5.52 37.99b ± 5.55 20.06bcde ± 2.86
N4 10.76 ± 4.51 24.77a ± 2.71 29.51a ± 3.37 47.75a ± 3.81 72.79a ± 7.17 70.83a ± 6.92 71.11a ± 6.96 32.41ad ± 3.28
W1 6.79 ± 2.29 12.79 b ± 1.34 13.83bc ± 1.64 25.99bc ± 1.99 42.47bc ± 3.76 44.17b ± 3.18 48.04ab ± 3.54 19.02bce ± 1.66
W2 7.32 ± 4.77 19.15ab ± 2.54 18.60abc ± 3.04 37.45ab ± 3.53 48.87abc ± 6.60 54.35ab ± 5.28 52.83ab ± 5.31 32.34ad ± 3.47
W3 6.57 ± 2.04 13.06b ± 1.20 12.18c ± 1.51 20.56c ± 1.99 34.47c ± 4.50 41.13b ± 3.46 48.92ab ± 3.48 14.73c ± 1.48
CSIR-ARI 1.19 ± 2.81 15.09ab ± 1.51 21.18ab ± 1.75 27.45bc ± 1.95 49.73abc ± 3.55 47.47ab ± 2.76 48.03ab ± 2.77 31.81a ± 2.04
GR, growth rate measured as weekly weight gain; GR1, GR between weeks 1 and 2; GR2, GR betweenweeks 2 and 3; GR3,GR between weeks 3 and 4;GR4, GR between weeks 4 and 6; GR5, GR between weeks 6 and 7; GR6, GR between weeks 7 and 9; GR7, GR between weeks 9 and 11; GRO, overallGR between weeks 1 and 11; E2, E3, E4, subpopulations in the Upper East Region with surviving birds; N1, N2, N3, N4, subpopulations of the formerNorthern Region; W1, W2, W3, subpopulations of the Upper West Region. Means of subpopulations within a column with different superscripts differsignificantly (p ˂ 0.05)NSDifference between the means per subpopulation is not significant (p > 0.05)
Table 6 Comparison of feedconsumption and feed conversionratio of local guinea fowls fromthree populations of NorthernGhana and ARI flock
Parameter Population
UER FNR UWR CSIR-ARI
Final weightNS (g/bird) 369.05 353.52 367.39 384.09
Initial weight* (g/bird) 37.40a 34.89a 35.09a 46.36b
Total weight gainNS (g/bird) 331.65 318.63 332.30 337.73
Average daily weight gainNS (ADWG, g/bird/day) 4.74 4.55 4.75 4.82
Total feed intakeNS (g) 1266.90 1315.94 1322.55 1357.67
Daily feed consumptionNS (g/bird/day) 18.10 18.80 18.89 19.40
FCRNS 3.82 4.13 3.98 4.02
NSVariations between means within a row are not statistically significant at 95% confidence level
*Variations between means within a row are statistically significant at 95% confidence level, where means thatdiffer bear different superscripts
Trop Anim Health Prod (2021) 53: 89 Page 11 of 17 89

and quantity of supplementary feed probably contributed tohigher body weights from weeks one to four in birds from theUpper East Region combined with genetic factors.
Juvenile body weights observed during the current study ata given age varied from previously reported values for similar
age groups in different varieties of helmeted guinea fowls inother countries. Fajemilehin (2010) reported slightly greatervalues for body weight at 4 and 8 weeks in cross-bred helmet-ed guinea fowls in Nigeria. Mohammed and Dei (2017) ob-served higher values for guinea keets at 8 weeks raised within
Table 7 Percentage mortalities of guinea fowls at weekly intervals across the four populations and subpopulations
Pop.Subpop.
InitialNo.
Mortalities (%)
Week1
Week2
Week3
Week4
Week5
Week6
Week7
Week8
Cumulative atweek 8
Week9
Week10
Week11
Week12
E1 16 100.00 0.00 0.00 0.00 0.00 0.00 0.00 0.00 100.00 0.00 0.00 0.00 0.00
E2 152 40.13 9.21 15.79 9.87 0.09 0.66 3.95 3.29 82.99 0.00 0.66 0.00 0.00
E3 21 76.19 9.52 0.00 9.52 0.00 0.00 0.00 0.00 95.24 0.00 0.00 0.00 0.00
E4 61 42.62 6.56 4.92 1.64 0.02 1.64 1.64 4.92 63.95 0.00 0.00 0.00 0.00
UER 250 48.00 8.00 10.80 7.20 6.00 0.80 2.80 3.20 86.80 0.00 0.40 0.00 0.00
N1 83 37.35 19.28 9.64 1.20 0.05 2.41 8.43 0.00 78.36 0.00 0.00 0.00 0.00
N2 88 29.55 7.95 5.68 6.82 9.09 0.00 1.14 3.41 63.64 0.00 1.14 0.00 0.00
N3 45 37.78 6.67 8.89 4.44 0.09 0.00 6.67 2.22 66.76 0.00 0.00 0.00 0.00
N4 27 14.81 14.81 14.81 7.41 3.70 0.00 3.70 14.81 74.07 0.00 0.00 0.00 0.00
FNR 243 32.10 12.35 8.64 4.53 0.07 0.82 4.94 3.29 66.74 0.00 0.41 0.00 0.00
W1 123 26.83 13.01 10.57 4.07 8.13 1.63 3.25 5.69 73.98 0.00 4.88 0.00 0.00
W2 36 44.44 8.33 0.00 2.78 0.03 2.78 2.78 2.78 63.92 0.00 0.00 0.00 0.00
W3 163 30.67 12.27 9.82 7.36 11.04 1.84 9.82 0.00 82.82 0.00 0.00 0.00 0.00
UWR 322 31.06 12.11 9.01 5.59 0.09 1.86 6.52 2.48 68.72 0.00 1.86 0.00 0.00
CSIR-ARI 51 1.96 1.96 0.00 0.00 1.96 0.00 1.96 0.00 7.84 1.96 0.00 0.00 0.00
Pop., population; Subpop., subpopulation; E2, E3, E4, subpopulations in the Upper East Region (UER) with surviving birds; N1, N2, N3, N4,subpopulations of the former Northern Region (FNR); W1, W2, W3, subpopulations of the Upper West Region (UWR)
Fig. 9 Survival plots for the fourpopulations from the Upper East,former Northern, and Upper WestRegions and CSIR-ARI flock
89 Page 12 of 17 Trop Anim Health Prod (2021) 53: 89

cages under intensive system in the Northern Region (former)of Ghana. Dahouda et al. (2007) reported higher values for 10-week-old local varieties in the Republic of Benin. BW1 toBW4 observed during the current study were comparable tobody weights at similar ages reported by Khairunnesa et al.(2016) for helmeted guinea fowl varieties in Bangladesh.Body weights of pearl gray guinea fowls that have been ge-netically improved for higher body weight and faster growthreported by Nahashon et al. (2006) in the USA drasticallyvaried from the values observed during the current study.However, it should be noted that performance of populationsin different experiments cannot be compared due to differ-ences in experimental conditions and breed differences.
Remarkably high values for juvenile body weights ofimproved varieties is undoubtedly due to the genetic gainachieved over years of selection. Greater maternal nutri-tion ensured in standard breeder flocks coupled with goodbreeder stock management may be the second dominantreason for this observed difference. Avornyo et al. (2016)indicated that 98% of farmers in NG depend on the localvarieties that have not been improved by selection. Thesame study indicated that farmers do not maintain a sep-arate breeder stock even within their flocks. Irrespectiveof age, they are raised under extensive or semi-intensiveproduction systems (Avornyo et al. 2016) where nutritiondemands of breeding hens are hardly met. These observa-tions highlight the importance of long-term selection pro-grams and management of breeder stock with improvednutrition in confinement in order to increase juvenile body
weights in local guinea fowls and possibly to achievebetter carcass yield.
Although the variation of weekly body weights amongTPNG was statistically insignificant beyond the sixth week,differences in body weights between the subpopulations weresignificant beyond the sixth week even at 99% confidence lev-el. This suggests that although overall the main populations didnot exhibit significant variations in body weights, there was ahigh degree of variations between the subpopulations. Thesevariations are also vivid when growth curves are comparedamong the subpopulations within a region. As indicated fromcalculated contrasts between the subpopulations designatedduring this study, the variations between subpopulations ofthe Former Northern Region were prominent. Formerly, theNorthern Region was the largest region among the administra-tive regions of Northern Ghana covering a larger geographicalarea that probably resulted in populations with greater variation.
Faster growth has been the primary breeding objective inmost past breeding programs in poultry (Flisar et al. 2014).Due to the importance of post-hatch growth to the poultryfarmer, factors affecting post-hatch growth have been exten-sively studied for broilers. Genetic factors, post-hatch diet,and early access to feed have been known to influence theweekly weight gains to the end of the growth period in chick-en (Noy and Sklan 1997) while pre-incubation storage time ofeggs and age of hens have been reported to influence theweight gain during early post-hatch growth (Tona et al. 2004).
In the current experiment, the differences among popula-tions in the mean weekly weight gains were significant from
Fig. 10 Survival plots for thesubpopulations within the threepopulations of guinea fowls ofNG and CSIR-ARI flock
Trop Anim Health Prod (2021) 53: 89 Page 13 of 17 89

the second week up to the fourth week, but with no furthersignificant variations beyond the sixth week. Keets weretransported to the brooder facility within an hour post-hatchto minimize delays and stress due to treatments such asweighing and tagging at hatch, to give them access to feedwithin 24 h post-hatch and to nullify the effects of varyingfasting times on post-hatch growth. After hatch, they were fedwith the same diet ensuring equal access to feeders.Representation of keets was approximately equal in all repli-cates per population. Therefore, observed variations in earlypost-hatch growth between some of the main populations thatsubsided beyond the fourth week are likely due to pre-experimental factors that have transient effects such as ageof breeders and preincubation storage of eggs possiblyinteracting with genetic factors.
Significant contrasts in weekly weight gains between thesubpopulations that persisted beyond the sixth week mighthave been influenced by some pre-experimental conditionsinteracting with genetic influences. As these contrastspersisted and became dominant until the end of study period,the influence of these genetic factors is likely to play a signif-icant role on growth rate and remain to be characterized.
Indeed, genetic variations within adapted guinea fowl pop-ulations in Europe and the USA have been utilized to establishgenetically stable faster growing guinea fowl breeds bycommercial breeding companies. Nahashon et al. (2006) re-ported remarkably high growth rates for pearl gray guineafowls compared to growth rates observed during current studyand rates reported in similar studies across Africa due to ob-vious genetic gain achieved by years of selection in fastergrowing breeds. When compared with other studies involvingunimproved local varieties elsewhere, local birds from thecurrent study areas performed better than local varieties ofBangladesh for the first 3 weeks with a reverse trend for theremaining weeks according to reports by Khairunnesa et al.(2016). However, growth rates observed during the currentstudy and those reported by other studies cannot be comparedin absolute terms due to differences in experimental, pre-experimental conditions, and genetic factors that influencepost-hatch growth. A pre-requisite for funding of the currentstudy was the distribution of grower guinea fowls to benefi-ciary farmers at 12weeks. Therefore, no data beyond 12weekscould be recorded.
The current study provides strong evidence for the exis-tence of phenotypic variations in body weight and growthtraits within the local guinea fowl populations of NorthernGhana. These variations provide opportunities to select phe-notypically divergent lines for growth rates from local guineafowls. However, care should be taken to retain traits related todisease resistance, fertility, and vigor that are of interest tosmallholder guinea fowl farmers.
Reported growth rates of improved varieties raised inFrance, Belgium, and the USA are remarkably higher but
exotic varieties are generally less adapted to climatic condi-tions prevalent in the guinea savannah ecozone. Past poultrybreeding programs that overlooked the adaptive features oflocal breeds to tropical climate and production systems optingfor breed replacement or crossbreeding with exotic breedshave recorded little successes (FAO 2007). Considering thenon-sustainability of breeding programs to disseminate im-proved breeder stock to smallholder farmers and observationsfrom the current study, it is recommended that future researchshould further explore observed variations that exist within thelocal populations of guinea fowls and design breeding pro-grams to develop fast growing strains from local populationsinstead of opting for breed replacement or cross breeding.
The feed intake and FCR did not vary significantlybetween the TPNG. To avoid experimental bias from raisingbirds of subpopulations in separate pens due to differentnumber of birds per subpopulation that survived, the birdsfrom different subpopulations were randomly allocated toreplicates of main populations. Hence, the feed intake wasonly measured at population levels and variation in FCR andits influence on observed variations within subpopulationscannot be discussed. Agbolosu et al. (2012a) also observedno significant differences in feed efficiency (1/FCR) betweenthe birds from the TPNG.
Survivability is an important economic trait in commercialpoultry production. During the current study, the highest mor-talities were reported during the first week in all the popula-tions and the subpopulations. During the first week, chicksundergo a major shift in their physiology as they change froma yolk sac dependent mode of nutrition to feeding solid feedindependently (Decuypere et al. 2001). The additional stresscreated during this transformation must be a major factor pre-disposing keets to high mortalities during the first week.While high mortalities later in life are largely functions ofgenotype and management of growers, high mortality inchicken during the first week is largely affected by the qualityof the day-old chicks (Decuypere et al. 2001; Kidd 2003).Therefore, high level of mortalities that subside with age asobserved during this study is likely due to low quality of day-old keets hatched from the eggs collected from the TPNG. Bycontrast, the CSIR-ARI flock exhibited the lowest mortalitiesduring the first week indicating improvements in quality ofkeets in that group.
High rate of keet mortality during the first 8 weeks post-hatch has been a persistent challenge among guinea fowlfarmers from NG according to previous reports by Teye andAdam (2000) and more recent reports by Avornyo et al.(2016). The trend is similar across tropical Africa (Bessinet al. 1998; Boko et al. 2011; Moreki and Radikara 2013). Asimilar trend was observed for the groups representing theTPNG and subpopulations of Northern Ghana during the cur-rent study with survivability increasing beyond eighth week inall groups.
89 Page 14 of 17 Trop Anim Health Prod (2021) 53: 89

In tropical Africa, majority of mortalities before the eighthweek have been attributed to bad weather and diseases(Dahouda et al. 2007; Boko et al. 2011). Informed by theseobservations, improving the microclimate of keets during thefirst 8 weeks with provision of heat, light, water, and a well-balanced diet have been proposed and have been proved tosignificantly reducemortalities (Dei et al. 2009; Avornyo et al.2015; Ahiagbe et al. 2016; Mohammed and Dei 2017).Although best practices during brooding have been widelydisseminated in NG with some farmers adopting them, guineafowl farmers still record high keet mortalities (Avornyo et al.2016). On the other hand, survivability of chicks duringbrooding appears to be more complex and is influenced byseveral factors related to breeders such as breeder strain,breeder age (Peebles et al. 1999), breeder nutrition (Heieret al. 2002), factors related to egg such as egg size(Decuypere et al. 2001), pre-incubation storage conditions ofthe eggs (Tona et al. 2004), and incubation conditions(Lourens et al. 2005) beside post-hatch brooding.
In the current study, all birds were fed with a formulateddiet, with provision of heat, light, and adhering to strict bio-safety guidelines, according to the best brooding practices asper the current understanding. However, survivability was stilllow in keets hatched from the eggs collected from the TPNG.Although all the groups were hatched at the same time andraised under the same conditions, ARI flock exhibited remark-ably low levels of mortalities compared to other groups. Thisflock was established from parents hatched from eggs collect-ed a year earlier from the same locations as the birds used forthe comparative growth appraisal and has not been subjectedto selection. Considering the common practices of obtainingeggs from their own farm or from neighbors for incubation inNorthern Ghana (Avornyo et al. 2016), they can be assumedto be not significantly different in descent from the birds usedfor present comparative growth performance trial. However,the parents of CSIR-ARI keets were being raised under bestpractices for breeder stock management fed with a breederdiet, a health management plan and under strict biosafety mea-sures. Unlike the breeder flock of CSIR-ARI, laying guineahens raised by the majority of farmers are not raised intensive-ly and are not provided adequate feed but are left to scavengewith the rest of the flock. The resulting inadequate maternaldiet and poor maternal health may be major contributing fac-tors to high mortalities during keet stage beside other pre-incubation factors affecting the egg and the chick quality.Improved maternal diet with supplementation of vitamins Eand D and other micronutrients has been demonstrated to di-rectly improve immunity in chicks. Supplementation of breed-er diet with vitamin and mineral premixes has resulted inincreased antibody production in chicks. Similarly, zinc sup-plementation in the breeder diet has been demonstrated toimprove both cellular immunity, humoral immunity, andEscherichia coli resistance in chicks (Kidd 2003).
Therefore, this study provides evidence for mortalities thatcannot be maintained even by the best practices of post-hatchbrooding as also reported by some farmers and highlights thecomplex factors that predispose local keets to high rates ofmortality. However, the remarkable improvement observedin the CSIR-ARI flock in terms of survivability suggests thatsuch mortalities can be overcome by integrating best practicesof breeder stock management, pre-incubation treatment ofbreeding eggs, and post-hatch brooding. Observed symptomsbefore mortality included paralysis and nervous-like symp-toms and may suggest possible vertical transfer of pathogensfrom parents that could not be controlled during egg collectionand needs further investigation.
Conclusion
Variation among the three main populations of local guineafowls studied from Northern Ghana is minimal in terms ofjuvenile body weights and early growth rates. However, thereexist variations within these populations and among the sub-populations of local varieties for traits of juvenile bodyweights and growth rates that should be further explored andif possible utilized for selection to ensure sustainable manage-ment of the genetic resource of indigenous guinea fowls as analternative to breed replacement or cross breeding with exoticbreeds. The high rate of keet mortality in the first 8 weekspost-hatch which is common throughout NG is likely to bebest managed by integrating best practices of breeder stockmanagement, best practices for pre-incubation treatment ofbreeding eggs with best practices for post-hatch brooding.
Funding information The study was funded by the World Bank throughthe Phase II of West Africa Agricultural Productivity Programme(WAAPP II).
Compliance with ethical standards
Conflict of interest The authors declare that they have no conflict ofinterest.
Ethical approval The manuscript does not contain data related to anyclinical study or patient data.
References
Agbolosu, A. A., Teye, G. A., Adjetey, A. N. A., Addah, W. andNaandam, J., 2012a. Performance characteristics of growing indig-enous guinea fowls from Upper East, Upper West and NorthernRegion of Ghana. Agriculture and Biology Journal of NorthAmerica, 3(8), 336–339. https://doi.org/10.5251/abjna.2012.3.8.336.339.
Agbolosu, A. A., Teye, G. A., Jebuni, S. N., Ansah, T. and Naandam, J.,2012b. Comparative study of growth and laying performance ofindigenous layer guinea fowls (Numida meleagris) from Upper
Trop Anim Health Prod (2021) 53: 89 Page 15 of 17 89

East, Upper West and Northern regions of Ghana. Agriculture andBiology Journal of North America, 3(9), 354-359.
Ahiagbe, K. M. J., Karbo, N., Avornyo, F., Nyame-asem, J. K., Adu-Aboagye, G., Amoah, K. O., Affedzie-Obresi, S., Beckley, C. S. K.and Duncan, J. L., 2016. Improving Guinea Fowl Keet Survivabilityin Ghana: A manual for management of keet mortalities using anintegrated approach (CSIR-Animal Research Institute, Accra,Ghana), ISBN: 978-9988-2-41248-5.
ALBC, 2007. Selecting for Meat Qualities and Rate of growth. In:Chicken assessment for improving productivity. AmericanLivestock Breed Conservancy, Pittsboro, North Carolina, USA, 1–8.
Avornyo, F. K., Salifu, S., Panyan, E. K., Al-Hassan, B. I., Ahiagbe, M.and Yeboah, F., 2014. Social and Economic Profitability of GuineaFowl Production – A baseline study in project districts, CSIR-Animal Research Institute.
Avornyo, F. K., Munkaila, L., Allegye-Cudjoe, E., Karbo, N. andAtosona, B. S., 2015. A comparison of six treatments for controllingmortality of keets in the wet season of the Northern Region ofGhana. Ghana Journal of Science, 55(1), 15-25.
Avornyo, F. K., Salifu, S., Panyan, E. K., Al-Hassan, B. I., Ahiagbe, M.and Yeboah, F. K., 2016. Characteristics of guinea fowl productionsystems in northern Ghana. Livestock Research for RuralDevelopment, 28(8), Article 134.
Ayorinde, K. L., 2007. Body weight increase of indigenous pearl guineafowl in Nigeria through crossbreeding. British Poultry Science,32(2), 295-301. https://doi.org/10.1080/00071669108417353.
Bessin, R., Belem, A.M.G., Boussini, H., Compaore, Z., Kaboret, Y. andDembele, M. A., 1998. Causes of young guinea fowl mortality inBurkina Faso. Revue d’élevage et de médecine vétérinaire des paystropicaux. The Journal of Animal Husbandry and VeterinaryMedicine in Tropical Countries, 51(1), 87-93.
Boko, C. K., Kpodekon, M. T., Farougou, S., Dahouda, M., Youssao, A.K. I., Aplogan, G. L., Zanou, J. and Mainil J. G., 2011. Farmerperceptions and pathological constraints in helmeted guinea fowlfarming in the Borgou department in North-East Benin. AfricanJournal of Agricultural Research, 6(10), 2348-2357.
R Core Team, 2016. R: A language and environment for statistical com-puting. R Foundation for Statistical Computing, Vienna, Austria.URL: https://www.R-project.org/.
Dahouda, M., Toleba, S. S., Youssao, A. K. I., Kogui, S. B., Aboubakari,S. Y. and Hornick, J. L., 2007. Guinea fowl rearing constraints andflock composition under traditional management in BorguDepartment, Benin. Family Poultry, 17(1&2), 3-14.
Decuypere, E. and Bruggeman, V., 2007. The endocrine interface ofenvironmental and egg factors affecting chick quality. PoultryScience, 86(5), 1037–1042. https://doi.org/10.1093/ps/86.5.1037.
Decuypere, E., Tona, K., Bruggeman, V. and Bamelis, F., 2001. The day-old chick: A crucial hinge between breeders and broilers. World’sPoultry Science Journal, 57, 127–138.
Dei, H. K. and Karbo, N., 2004. Improving Small holder Guinea fowlProduction in Ghana: A training manual. University forDevelopment Studies, Tamale and Animal Research Institute(CSIR), Nyankpala Station, Tamale, Ghana.
Dei, H. K., Alidu, I., Otchere, E. O., Donkoh, A., Boa-Amponsem,K. andAdam, I., 2009. Improving the brooding management of local guin-ea Fowl (Numida meleagris). Family Poultry, 18(1), 3–5.
Fajemilehin, S. O. K., 2010. Morphostructural characteristics of threevarieties of grey-breasted helmeted Guinea fowl in Nigeria.International Journal of Morphology, 28(2), 557-562.
FAO, 1995. Sorghum and millets in human nutrition, FAO Food andNutrition Series, No. 27, Food and Agriculture Organization of theUnited Nations, Rome, Italy. ISBN 92-5-103381-1
FAO, 2007. The state of the Worlds Animal Genetic Resources for Foodand Agriculture. Commission on Genetic Resources for Food and
Agriculture, Barbara Rischkwosky and Dafydd Piling (Eds.), Foodand Agriculture Organization of the United Nations, Rome, Italy.
FAO, 2014. Poultry Sector Ghana. FAO Animal Production and HealthLivestock Country Reviews. No. 6. Food and AgricultureOrganization of the United Nations, Rome, Italy.
Flisar, T., Malovrh, Š., Terčič, D., Holcman, A. and Kovač, M., 2014.Thirty-four generations of divergent selection for 8-week bodyweight in chickens. Poultry Science, 93(1), 16–23. https://doi.org/10.3382/ps.2013-03464
Heier, B. T., Hogasen, H. R. and Jarp, J., 2002. Factors associated withmortality in Norwegian broiler flocks. Preventive VeterinaryMedicine, 53, 147–157.
Issaka, B. Y. and Yeboah, N. Y., 2016. Socio-economic attributes ofguinea fowl production in two districts in Northern Ghana. AfricanJournal of Agricultural Research, 11(14), 1209–1217.
Kayang, B. B., Youssao, I., Inoue, E., Naazie A., Abe, H., Ito, S. andInoue-Murayama, M., 2010. Genetic Diversity of Helmeted Guineafowl (Numida meleagris) Based on Microsatellite Analysis. TheJournal of Poultry Science, 47, 120-124. https://doi.org/10.2141/jpsa.009103.
Khairunnesa, M., Das, S. and Khatun, A., 2016. Hatching and growthperformances of guinea fowl under intensive management system.Progressive Agriculture, 27(1), 70-77. https://doi.org/10.3329/pa.v27i1.27544.
Kidd, M. T., 2003. A treatise on chicken dam nutrition that impacts onprogeny. World’s Poultry Science Journal, 59, 475–494.
Kusina, N. T., Saina, H., Kusina, J. F. and Lebel, S., 2012. An insight intoguinea fowl rearing practices and productivity by guinea fowlkeepers in Zimbabwe. African Journal of Agricultural Research,7(25), 3621-3625.
Lourens, A., van den Brand, H., Meijerhof, R. and Kemp, B., 2005.Effect of eggshell temperature during incubation on embryo devel-opment, hatchability, and posthatch development. Poultry Science,84, 914–920.
Mohammed, A. and Dei, H. K., 2017. Comparative performance of guin-ea keets managed under two brooding systems in the Tolon districtof Northern Region of Ghana. UDS International Journal ofDevelopment, 4(1), 42-45.
Moreki, J . C. and Radikara, M. V., 2013. Chal lenges toCommercialization of Guinea Fowl in Africa. International Journalof Science and Research, 2(11), 436–440.
Moreki, J. C. and Seabo, D., 2012. Guinea fowl production in Botswana.Journal of World’s Poultry Research, 2(1), 1-4.
Nahashon, S. N., Aggrey, S. E., Adefope, N. A., Amenyenu, A. andWright, D., 2006. Growth Characteristics of Pearl Gray GuineaFowl as Predicted by the Richards, Gompertz, and LogisticModels. Poultry Science, 85, 359–363.
Nahashon, S. N., Adefope, N. A., Amenyenu, A. and Wright, D., 2007.Effect of Varying Concentrations of Dietary Crude Protein andMetabolizable Energy on Laying Performance of Pearl GreyGuinea Fowl Hens. Poultry Science, 86, 1793–1799. https://doi.org/10.1093/ps/86.8.1793
Newbold, S., 1926. A historical note on the guinea-fowl. Sudan Notesand Records, 9(1), 125-129.
Noy, Y. and Sklan, D., 1997. Posthatch development in poultry. Journalof Applied Poultry Research, 6(3), 344–354. https://doi.org/10.1093/japr/6.3.344
Ogah, D.M., 2013. Variability in Body Shape characters in an indigenousguinea fowl (Numida meleagris L.). Slovak Journal of AnimalScience, 46(3), 110-114.
Peebles, E. D., Doyle, S. M., Pansky, T., Gerard, P. D., Latour, M. A.,Boyle, C. R. and Smith, T.W., 1999. Effects of breeder age anddietary fat on subsequent broiler performance, Growth, mortality,and feed conversion. Poultry Science, 78, 505–511.
89 Page 16 of 17 Trop Anim Health Prod (2021) 53: 89

Reis, L. H., Gama, L. T. and Soares, M. C., 1997. Effects of short storageconditions and broiler breeder age on hatchability, hatching time andchick weight. Poultry Science, 76, 1459–1466.
Teye, G. A. and Adam, M., 2000. Constraints to Guinea fowl productionin northern Ghana: A case study of the Damongo area. GhanaianJournal of Agricultural Science, 33, 153-157.
Tona, K., Bamelis, F., De Ketelaere, B., Bruggeman, V., Moraes, V. M.B., Buyse, J., Onagbesan, O. and Decuypere, E., 2003. Effects ofegg storage time on spread of hatch, chick quality, and chick juve-nile growth. Poultry Science, 82, 736–741.
Tona, K., Onagbesan, O., De Ketelaere, B., Decuypere, E. andBruggeman, V., 2004. Effects of age of broiler breeders and egg
storage on egg quality, hatchability, chick quality, chick weight,and chick posthatch growth to forty-two days. Journal of AppliedPoultry Research, 13(1), 10–18. https://doi.org/10.1093/japr/13.1.10.
Yassin, H., Velthuis, A. G. J., Boerjan, M. and van Riel, J., 2009. Fieldstudy on broilers’ first-week mortality. Poultry Science, 88, 798–804. https://doi.org/10.3382/ps.2008-00292.
Publisher’s note Springer Nature remains neutral with regard to jurisdic-tional claims in published maps and institutional affiliations.
Trop Anim Health Prod (2021) 53: 89 Page 17 of 17 89