Comparing the Szondi Test results of Hungarian and Portuguese community samples
11
1 Comparing the Szondi Test results of Hungarian and Portuguese community samples Bruno Gonçalves*, Enikő Gyöngyösiné Kiss**, Mátyás Káplár** *Faculdade de Psicologia e de Ciências da Educaçâo, Universidade de Lisboa, Alameda da Universidade, 1649-013 Lisboa, Portugal **University of Pécs, Institute of Psychology, Department of Personality -, Developmental and Clinical Psychology, H-7624 Pécs, 6. Ifjúság útja, Hungary Introduction Szondi applied his test to a large sample of 1000 adults from the Hungarian general population. The most frequent responses in this sample defined a very similar profile to what Szondi had previously described as the profile of the “man in the street” (Alltagsmensch). One important feature of this profile is the disciplined ego (Sch --). In the fist edition of his Experimentelle Triebdiagnostik (1947) Szondi stressed that this type of ego was found most frequently in manual workers from lower social classes and that it was rare among “intellectuals”. Reference to social classes was omitted in the 2 nd and 3 rd editions of this book. Soto-Yarritu (1955) studied a sample of 750 adults from the Spanish (Navarre) general population. Overall, as can be seen in Table 4, his results were consistent with those obtained by Szondi. However, there were also some clear differences, namely in the C vector results. In the Navarrese the tendencies to cling to the object in a more or less rigid way (C-+) seem to be much more frequent than in Hungarians. Szondi (1947) attributed this difference to cultural characteristics, namely to the strong attachment of the Navarrese to the Catholic Church. These kind of studies with large samples of the general population have not been repeated since. However, other studies with smaller samples, namely A. Pochet study (data published by Satassart, 1999) with a sample of 200 Italians, yielded results in the C vector similar to those obtained by Soto-Yarritu. In the other vectors, results of these modern studies tend to confirm Szondi and Soto-Yarritu’s results but they also show some differences, namely in the p factor, where the p+ tends to be much more frequent than p-, exactly the opposite of what was found by Szondi and Soto-Yarritu. This implies that the “disciplined” ego becomes relatively rare (7%). Gonçalves (1999) suggested that this difference could be related to the
Transcript of Comparing the Szondi Test results of Hungarian and Portuguese community samples

1
Comparing the Szondi Test results of Hungarian and Portuguese
community samples
Bruno Gonçalves*, Enikő Gyöngyösiné Kiss**, Mátyás Káplár**
*Faculdade de Psicologia e de Ciências da Educaçâo, Universidade de Lisboa, Alameda da Universidade, 1649-013 Lisboa, Portugal
**University of Pécs, Institute of Psychology, Department of Personality -, Developmental
and Clinical Psychology, H-7624 Pécs, 6. Ifjúság útja, Hungary Introduction Szondi applied his test to a large sample of 1000 adults from the Hungarian general
population. The most frequent responses in this sample defined a very similar profile to what
Szondi had previously described as the profile of the “man in the street” (Alltagsmensch). One
important feature of this profile is the disciplined ego (Sch --). In the fist edition of his
Experimentelle Triebdiagnostik (1947) Szondi stressed that this type of ego was found most
frequently in manual workers from lower social classes and that it was rare among
“intellectuals”. Reference to social classes was omitted in the 2nd and 3rd editions of this
book.
Soto-Yarritu (1955) studied a sample of 750 adults from the Spanish (Navarre) general
population. Overall, as can be seen in Table 4, his results were consistent with those obtained
by Szondi. However, there were also some clear differences, namely in the C vector results. In
the Navarrese the tendencies to cling to the object in a more or less rigid way (C-+) seem to
be much more frequent than in Hungarians. Szondi (1947) attributed this difference to cultural
characteristics, namely to the strong attachment of the Navarrese to the Catholic Church.
These kind of studies with large samples of the general population have not been repeated
since. However, other studies with smaller samples, namely A. Pochet study (data published
by Satassart, 1999) with a sample of 200 Italians, yielded results in the C vector similar to
those obtained by Soto-Yarritu. In the other vectors, results of these modern studies tend to
confirm Szondi and Soto-Yarritu’s results but they also show some differences, namely in the
p factor, where the p+ tends to be much more frequent than p-, exactly the opposite of what
was found by Szondi and Soto-Yarritu. This implies that the “disciplined” ego becomes
relatively rare (7%). Gonçalves (1999) suggested that this difference could be related to the
2
subjects’ social level. Unfortunately, data on the subjects’ educational or social level are
generally not given on all these studies with the Szondi test. On the other hand, as we have no
modern studies with the Hungarian population, we do not know if Szondi results come from
stable cultural characteristics or whether they were influenced by historic circumstances or by
the specific social characteristics of the initial sample studied by Szondi.
The aim of this study is to compare the results of a Hungarian and Portuguese community
sample taking into account the possible effect of differences in age, educational level, work
status and sex between the two samples.
Initial data of this comparison were presented by Gonçalves and Gyöngyösiné Kiss (2008),
and Káplár, Gyöngyösiné Kiss, and Gonçalves (2008).
Method
1. Participants
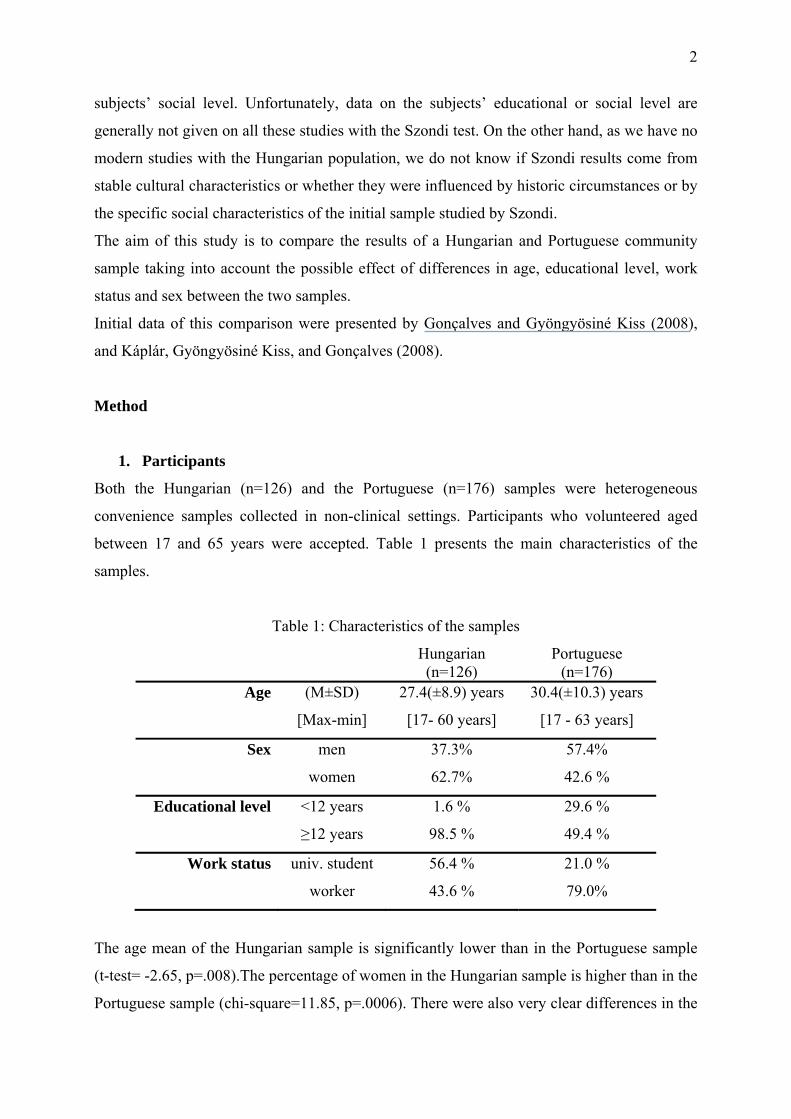
Both the Hungarian (n=126) and the Portuguese (n=176) samples were heterogeneous
convenience samples collected in non-clinical settings. Participants who volunteered aged
between 17 and 65 years were accepted. Table 1 presents the main characteristics of the
samples.
Table 1: Characteristics of the samples
Hungarian (n=126)
Portuguese (n=176)
Age (M±SD) 27.4(±8.9) years 30.4(±10.3) years
[Max-min] [17- 60 years] [17 - 63 years]
Sex men 37.3% 57.4%
women 62.7% 42.6 %
Educational level <12 years 1.6 % 29.6 %
≥12 years 98.5 % 49.4 %
Work status univ. student 56.4 % 21.0 %
worker 43.6 % 79.0%
The age mean of the Hungarian sample is significantly lower than in the Portuguese sample
(t-test= -2.65, p=.008).The percentage of women in the Hungarian sample is higher than in the
Portuguese sample (chi-square=11.85, p=.0006). There were also very clear differences in the
3
educational level: almost all the subjects in the Hungarian sample had at least 12 years of
schooling. In the Portuguese sample almost 30% of the subjects had less than 12 years of
schooling. Finally, the percentage of university students was higher in the Hungarian sample.
2. Measures
In a clinical setting, the Szondi test normally includes 10 different profiles, obtained on 10
different days. However, for research purposes, a shorter, 5-profile form has often been used.
All the subjects in the Hungarian sample had a 10-profile Szondi test. Most of the subjects in
the Portuguese sample had only a 5-profile test (in which case results were extrapolated to 10
profiles). The total number of profiles collected was 1156 in the Hungarian sample and 1017
in the Portuguese sample. Data on the subjects’ sex, age, profession and education level were
also obtained.
Results
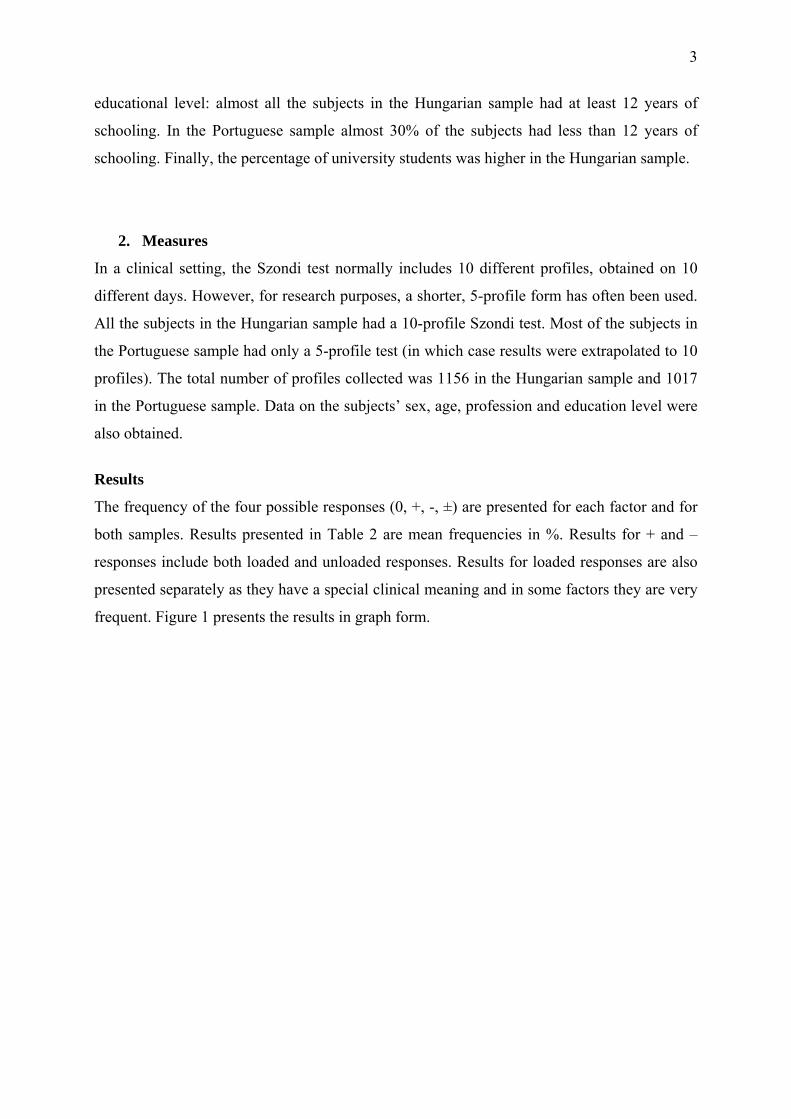
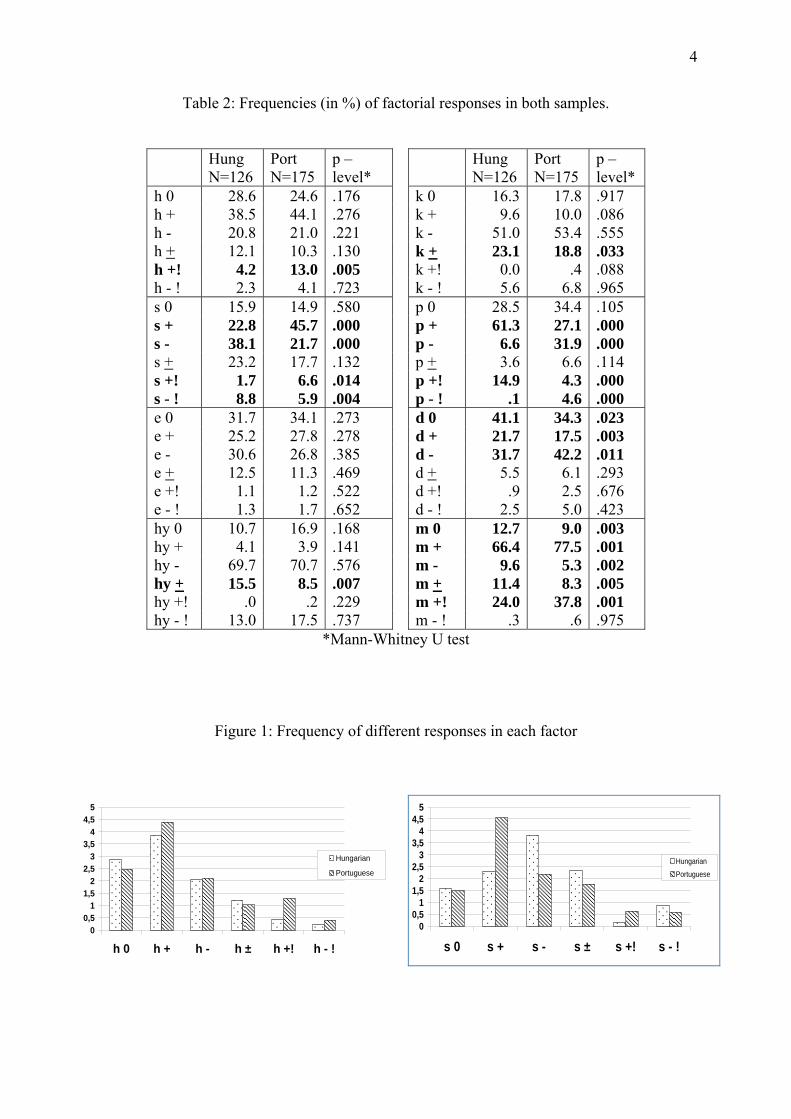
The frequency of the four possible responses (0, +, -, ±) are presented for each factor and for
both samples. Results presented in Table 2 are mean frequencies in %. Results for + and –
responses include both loaded and unloaded responses. Results for loaded responses are also
presented separately as they have a special clinical meaning and in some factors they are very
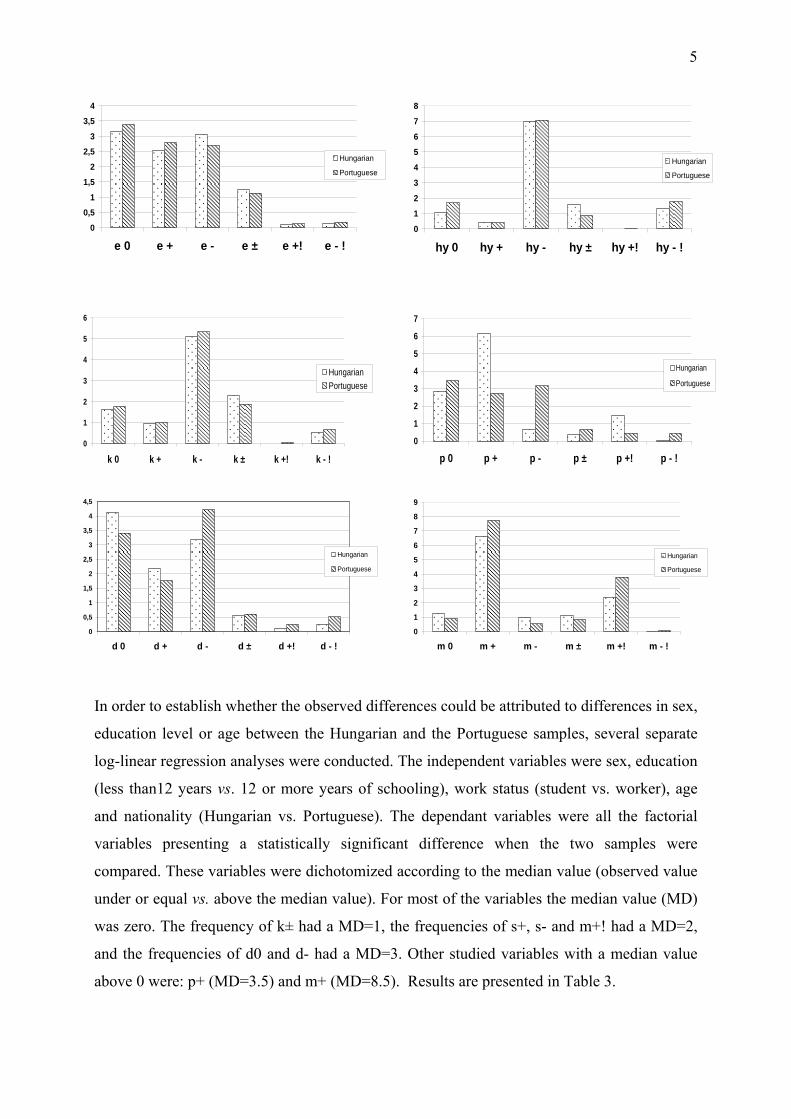
frequent. Figure 1 presents the results in graph form.
4
Table 2: Frequencies (in %) of factorial responses in both samples.
Hung N=126
Port N=175
p – level*
Hung N=126
Port N=175
p – level*
h 0 28.6 24.6 .176 k 0 16.3 17.8 .917 h + 38.5 44.1 .276 k + 9.6 10.0 .086 h - 20.8 21.0 .221 k - 51.0 53.4 .555 h + 12.1 10.3 .130 k + 23.1 18.8 .033 h +! 4.2 13.0 .005 k +! 0.0 .4 .088 h - ! 2.3 4.1 .723 k - ! 5.6 6.8 .965 s 0 15.9 14.9 .580 p 0 28.5 34.4 .105 s + 22.8 45.7 .000 p + 61.3 27.1 .000 s - 38.1 21.7 .000 p - 6.6 31.9 .000 s + 23.2 17.7 .132 p + 3.6 6.6 .114 s +! 1.7 6.6 .014 p +! 14.9 4.3 .000 s - ! 8.8 5.9 .004 p - ! .1 4.6 .000 e 0 31.7 34.1 .273 d 0 41.1 34.3 .023 e + 25.2 27.8 .278 d + 21.7 17.5 .003 e - 30.6 26.8 .385 d - 31.7 42.2 .011 e + 12.5 11.3 .469 d + 5.5 6.1 .293 e +! 1.1 1.2 .522 d +! .9 2.5 .676 e - ! 1.3 1.7 .652 d - ! 2.5 5.0 .423 hy 0 10.7 16.9 .168 m 0 12.7 9.0 .003 hy + 4.1 3.9 .141 m + 66.4 77.5 .001 hy - 69.7 70.7 .576 m - 9.6 5.3 .002 hy + 15.5 8.5 .007 m + 11.4 8.3 .005 hy +! .0 .2 .229 m +! 24.0 37.8 .001 hy - ! 13.0 17.5 .737 m - ! .3 .6 .975
*Mann-Whitney U test
Figure 1: Frequency of different responses in each factor
05152535455
h 0 h + h - h ± h +! h - !
0,
1,
2,
3,
4,
Hungarian
Portuguese
00,5
11,5
22,5
33,5
44,5
5
s 0 s + s - s ± s +! s - !
HungarianPortuguese
5
0
5
1
5
2
5
3
5
4
e 0 e + e - e ± e +! e - !
0,
1,
2,
3,
Hungarian
Portuguese
0
1
2
3
4
5
6
7
8
hy 0 hy + hy - hy ± hy +! hy - !
Hungarian
Portuguese
0
1
2
3
4
5
6
k 0 k + k - k ± k +! k - !
HungarianPortuguese
0
1
2
3
4
5
6
7
p 0 p + p - p ± p +! p - !
Hungarian
Portuguese
0
0,5
1
1,5
2
2,5
3
3,5
4
4,5
d 0 d + d - d ± d +! d - !
Hungarian
Portuguese
0
1
2
3
4
5
6
7
8
9
m 0 m + m - m ± m +! m - !
Hungarian
Portuguese
In order to establish whether the observed differences could be attributed to differences in sex,
education level or age between the Hungarian and the Portuguese samples, several separate
log-linear regression analyses were conducted. The independent variables were sex, education
(less than12 years vs. 12 or more years of schooling), work status (student vs. worker), age
and nationality (Hungarian vs. Portuguese). The dependant variables were all the factorial
variables presenting a statistically significant difference when the two samples were
compared. These variables were dichotomized according to the median value (observed value
under or equal vs. above the median value). For most of the variables the median value (MD)
was zero. The frequency of k± had a MD=1, the frequencies of s+, s- and m+! had a MD=2,
and the frequencies of d0 and d- had a MD=3. Other studied variables with a median value
above 0 were: p+ (MD=3.5) and m+ (MD=8.5). Results are presented in Table 3.
6
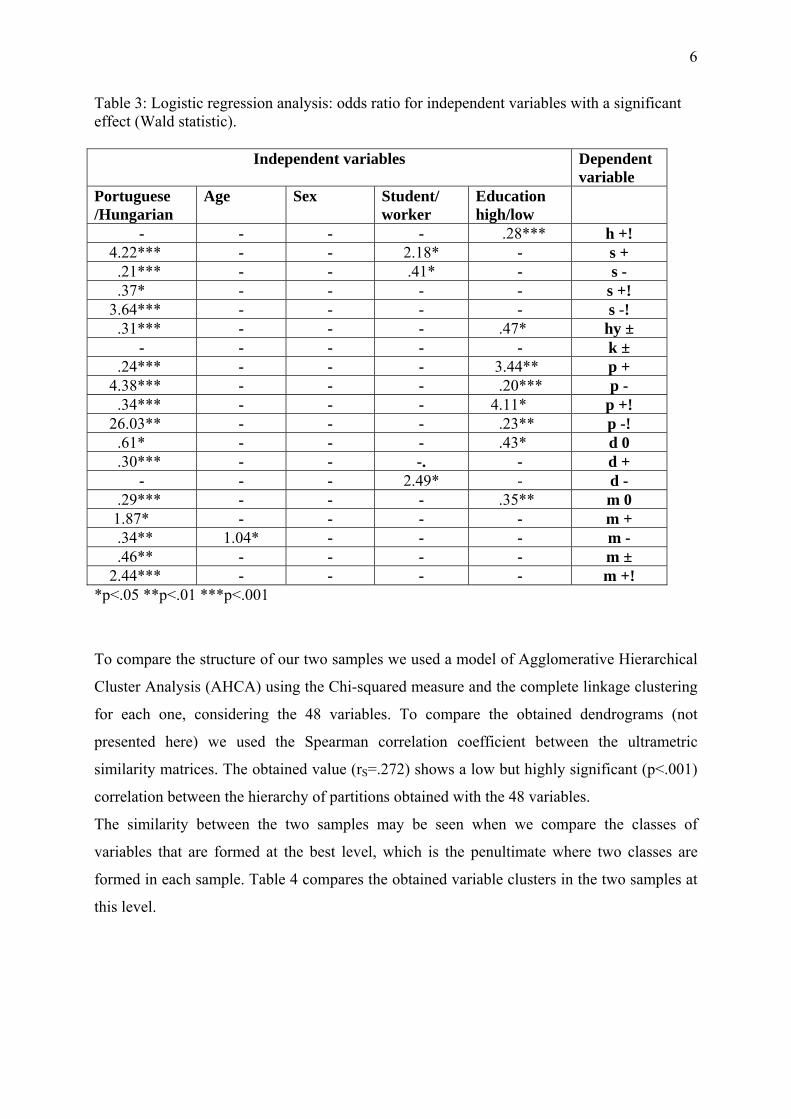
Table 3: Logistic regression analysis: odds ratio for independent variables with a significant effect (Wald statistic).
Independent variables Dependent variable
Portuguese /Hungarian
Age Sex Student/ worker
Education high/low
- - - - .28*** h +! 4.22*** - - 2.18* - s + .21*** - - .41* - s - .37* - - - - s +! 3.64*** - - - - s -! .31*** - - - .47* hy ±
- - - - - k ± .24*** - - - 3.44** p + 4.38*** - - - .20*** p - .34*** - - - 4.11* p +! 26.03** - - - .23** p -! .61* - - - .43* d 0 .30*** - - -. - d +
- - - 2.49* - d - .29*** - - - .35** m 0 1.87* - - - - m + .34** 1.04* - - - m - .46** - - - - m ± 2.44*** - - - - m +!
*p<.05 **p<.01 ***p<.001
To compare the structure of our two samples we used a model of Agglomerative Hierarchical
Cluster Analysis (AHCA) using the Chi-squared measure and the complete linkage clustering
for each one, considering the 48 variables. To compare the obtained dendrograms (not
presented here) we used the Spearman correlation coefficient between the ultrametric
similarity matrices. The obtained value (rS=.272) shows a low but highly significant (p<.001)
correlation between the hierarchy of partitions obtained with the 48 variables.
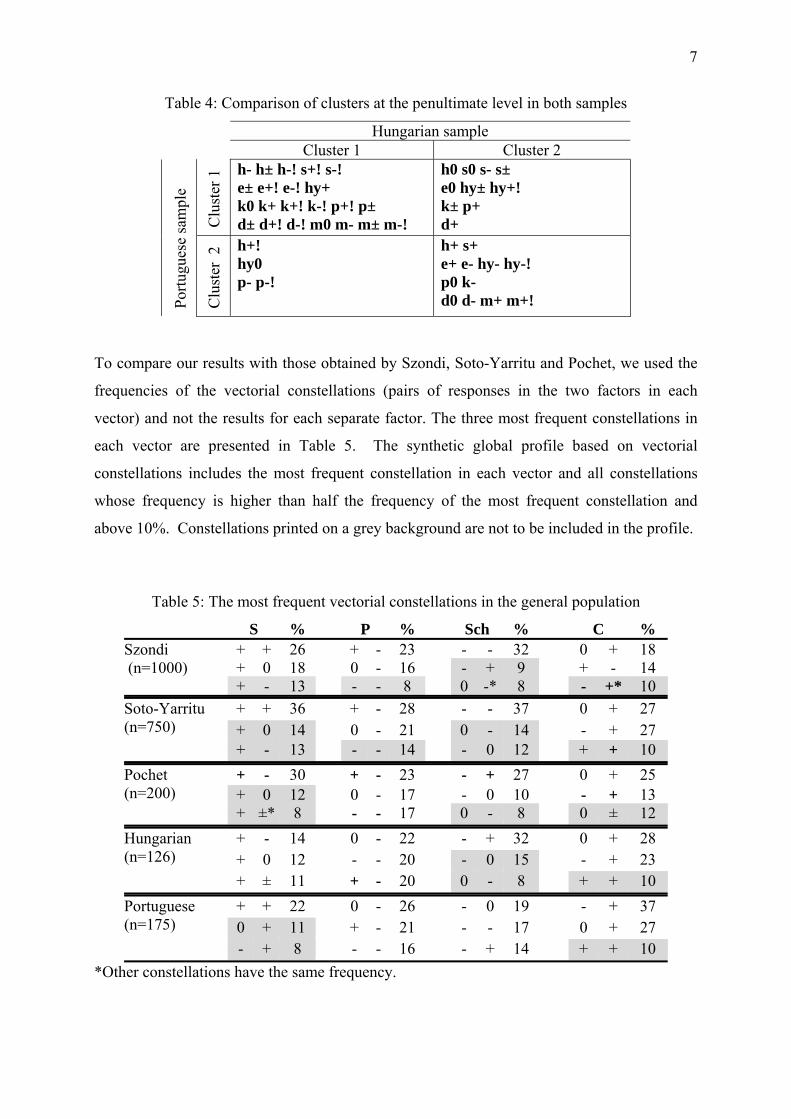
The similarity between the two samples may be seen when we compare the classes of
variables that are formed at the best level, which is the penultimate where two classes are
formed in each sample. Table 4 compares the obtained variable clusters in the two samples at
this level.
7
Table 4: Comparison of clusters at the penultimate level in both samples
Hungarian sample Cluster 1 Cluster 2
Portu
gues
e sa
mpl
e
Clu
ster
1 h- h± h-! s+! s-!
e± e+! e-! hy+ k0 k+ k+! k-! p+! p± d± d+! d-! m0 m- m± m-!
h0 s0 s- s± e0 hy± hy+! k± p+ d+
Clu
ster
2 h+!
hy0 p- p-!
h+ s+ e+ e- hy- hy-! p0 k- d0 d- m+ m+!
To compare our results with those obtained by Szondi, Soto-Yarritu and Pochet, we used the
frequencies of the vectorial constellations (pairs of responses in the two factors in each
vector) and not the results for each separate factor. The three most frequent constellations in
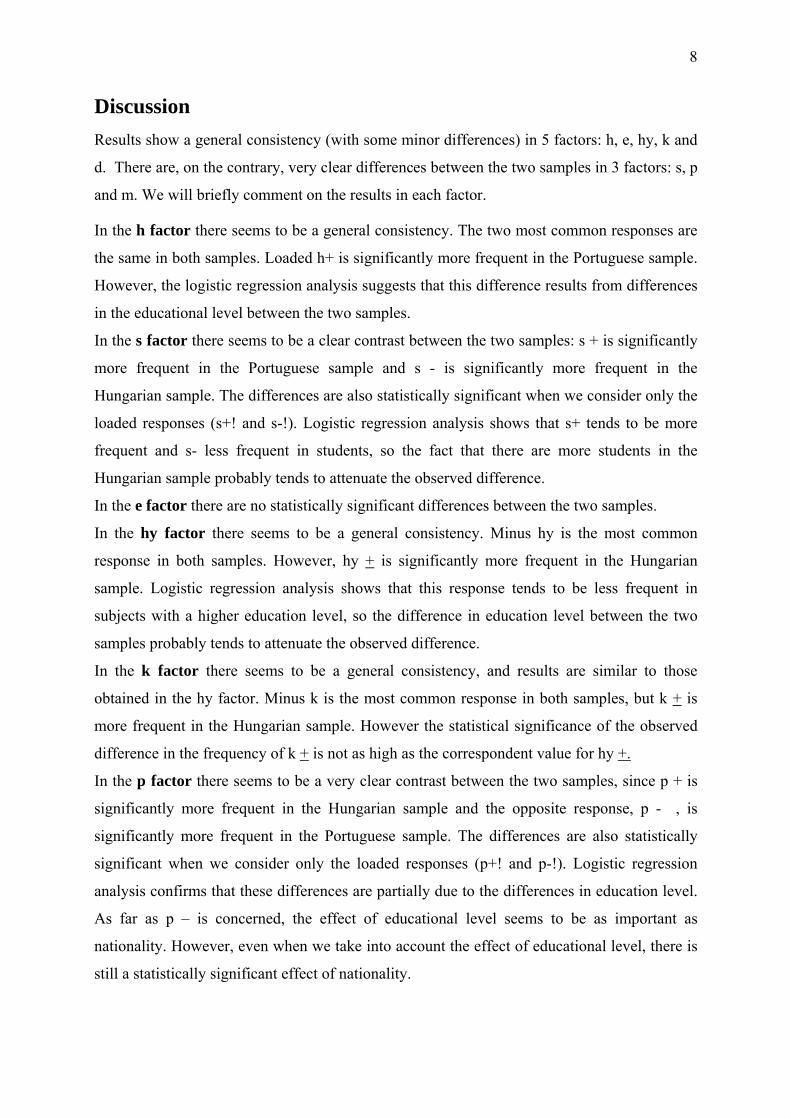
each vector are presented in Table 5. The synthetic global profile based on vectorial
constellations includes the most frequent constellation in each vector and all constellations
whose frequency is higher than half the frequency of the most frequent constellation and
above 10%. Constellations printed on a grey background are not to be included in the profile.
Table 5: The most frequent vectorial constellations in the general population
S % P % Sch % C % Szondi (n=1000)
+ + 26 + - 23 - - 32 0 + 18 + 0 18 0 - 16 - + 9 + - 14 + - 13 - - 8 0 -* 8 - +* 10
Soto-Yarritu (n=750)
+ + 36 + - 28 - - 37 0 + 27 + 0 14 0 - 21 0 - 14 - + 27 + - 13 - - 14 - 0 12 + + 10
Pochet (n=200)
+ - 30 + - 23 - + 27 0 + 25 + 0 12 0 - 17 - 0 10 - + 13 + ±* 8 - - 17 0 - 8 0 ± 12
Hungarian (n=126)
+ - 14 0 - 22 - + 32 0 + 28 + 0 12 - - 20 - 0 15 - + 23 + ± 11 + - 20 0 - 8 + + 10
Portuguese (n=175)
+ + 22 0 - 26 - 0 19 - + 37 0 + 11 + - 21 - - 17 0 + 27 - + 8 - - 16 - + 14 + + 10
*Other constellations have the same frequency.
8
Discussion Results show a general consistency (with some minor differences) in 5 factors: h, e, hy, k and
d. There are, on the contrary, very clear differences between the two samples in 3 factors: s, p
and m. We will briefly comment on the results in each factor.
In the h factor there seems to be a general consistency. The two most common responses are
the same in both samples. Loaded h+ is significantly more frequent in the Portuguese sample.
However, the logistic regression analysis suggests that this difference results from differences
in the educational level between the two samples.
In the s factor there seems to be a clear contrast between the two samples: s + is significantly
more frequent in the Portuguese sample and s - is significantly more frequent in the
Hungarian sample. The differences are also statistically significant when we consider only the
loaded responses (s+! and s-!). Logistic regression analysis shows that s+ tends to be more
frequent and s- less frequent in students, so the fact that there are more students in the
Hungarian sample probably tends to attenuate the observed difference.
In the e factor there are no statistically significant differences between the two samples.
In the hy factor there seems to be a general consistency. Minus hy is the most common
response in both samples. However, hy + is significantly more frequent in the Hungarian
sample. Logistic regression analysis shows that this response tends to be less frequent in
subjects with a higher education level, so the difference in education level between the two
samples probably tends to attenuate the observed difference.
In the k factor there seems to be a general consistency, and results are similar to those
obtained in the hy factor. Minus k is the most common response in both samples, but k + is
more frequent in the Hungarian sample. However the statistical significance of the observed
difference in the frequency of k + is not as high as the correspondent value for hy +.
In the p factor there seems to be a very clear contrast between the two samples, since p + is
significantly more frequent in the Hungarian sample and the opposite response, p - , is
significantly more frequent in the Portuguese sample. The differences are also statistically
significant when we consider only the loaded responses (p+! and p-!). Logistic regression
analysis confirms that these differences are partially due to the differences in education level.
As far as p – is concerned, the effect of educational level seems to be as important as
nationality. However, even when we take into account the effect of educational level, there is
still a statistically significant effect of nationality.
9
In the d factor, there seems to be a general consistency. The two most common responses (d-
and d0) are the same in both samples (although not in the same order). On the other hand d0
and d+ are significantly more frequent in the Hungarian sample and d- is significantly more
frequent in the Portuguese sample. Logistic regression analysis shows that d0 tends to be less
frequent in subjects with a higher education level and d- tends to be more frequent in students,
so the difference in education level between the two samples and the fact that there are more
students in the Hungarian sample, both probably tend to attenuate the observed difference.
In the m factor, there seems to be a general consistency. The two most common responses (m
+ and m 0) are the same in both samples. However, there are also several significant
differences: m + and m + ! are significantly more frequent in the Portuguese sample, while m
0, m - and m ± are significantly more frequent in the Hungarian sample.
The comparative analysis of the global profiles from both samples suggests that Hungarians
are more passive (s-, s-!) and idealistic (p+). The Portuguese seem to be more active or
aggressive (s+, s+!), yearning for a participative link (p-) and in fear of losing their
attachment objects (m+!).
The cluster analysis performed on both samples shows some interesting similarities. We will
focus on the variables that are classed in the same cluster in both samples (Table 4). In Cluster
1 we find signs of problematic or immature contact (m-, m-!, m±, m0) related to loaded
reactions in almost all the other factors, suggesting the danger of imbalanced drive dynamics.
Some of these reactions (m0, m-, m±, s-!) are significantly more frequent in the Hungarian
sample but we cannot say that they characterize the global profile of this same sample. In
Cluster 2 we find almost all the reactions that can be included in what we could call a
relatively stable neurotic profile with some attachment anxiety which is, in fact, the global
profile of the Portuguese sample (see Table 5).
The fact that these variables are grouped in the same way in both samples suggests that they
can also be interpreted in the same way in both samples. Interpretation can be more complex
when the reactions are grouped in a different way. Such is the case, namely, with the p+ and
p- reactions. In the Portuguese sample the p+ reaction is included in Cluster 1, suggesting a
psychically imbalanced context, while in the Hungarian sample it is included in Cluster 2. The
opposite can be observed as far as reaction p- is concerned. In these cases a more detailed
analysis of the global profiles including these reactions would be necessary.
10
The vectorial profiles (Table 5) confirm the above mentioned differences at the factorial level
and allow for a quick comparison with results from previous studies using community
samples.
In the S and Sch vectors, there are clear differences between the Hungarian and the
Portuguese samples, resulting from the above mentioned factorial differences in the s and p
factors. The results of the Portuguese sample are closer to those obtained by Szondi or Soto-
Yarritu. The results of the Hungarian sample are very similar to those obtained by Pochet with
an Italian sample from the region of Padova.
In the C vector, both the Portuguese and the Hungarian sample results are similar to those
obtained by Soto-Yarritu and different from Szondi’s initial results.
In the P vector there are no major differences between all the compared community samples.
There is no clear explanation for these results. Similarities between the Portuguese sample
and the Spanish sample may result from shared cultural features. Northern Italy and Hungary
are not very far away and both regions may also share some cultural features. However, there
is no explanation for the fact that the results from the Portuguese sample in the S and Sch
vectors seem to be closer to those obtained by Szondi. As far as the Sch vector is concerned,
this similarity could result from the fact that the Portuguese sample has more subjects with a
low educational level than the Hungarian sample.
One interesting issue for further research would be to find out if we can find differences
related to educational and social level among the Hungarian population as have been found
among the Portuguese population.
References Gonçalves, B. (1999). Tendances projectives et inflatives dans la population générale.
Szondiana, 19, 2, 91-103. Gonçalves, B., Gyöngyösiné Kiss, E. (2008). Comparing test results from Hungarian and
Portuguese community samples. 18. Szondi International Society Congress, Lisbon, Portugal, 2008. 07. 10 - 07. 12.
Gyöngyösiné Kiss Enikő: Personality and the familial unconscious in Szondi’s fate-analysis. Empirical Text and Cultural Research (in press).
Káplár, M., Gyöngyösiné Kiss, E., Gonçalves, B. (2008): Az átlagprofil vizsgálata hazai és kulturközi elemzésben. (Examination of the average profiles in national and cross cultural analysis) XVII. Országos Pszichológiai Nagygyűlés, (17th National Psychological Conference of the Hungarian Psychological Association) Nyíregyháza, Hungary, 2008. május 22-24. Abstract book, 232.
Stassart, M. (1999). L’épilepsie essentielle aux tests de Szondi et de Rorschach. 15th Colloque de la SIS [Abstract book]. Louvain-la Neuve, Belgium.

11
Szondi, L. (1947). Experimentelle Triebdiagnostik, Tiefenpsychologische Diagnostik im Dienste der Pychopathologie-, Kriminal- und Berufspsychologie, Charakterologie und Pädagogik. Bern: Verlag Hans Huber.
Yarritu, S. (1955). Validierung des Szondi-testes durch eine Gruppenuntersuchung von 2352 Fällen. Szondiana. Zeitschrift für Tiefenpsychologie und Beiträge zur
Schicksalsanalyse 2, 65-75.