Comparing the mechanisms of metal action in bacteria - PRISM
312
University of Calgary PRISM: University of Calgary's Digital Repository Graduate Studies The Vault: Electronic Theses and Dissertations 2019-07-25 Comparing the mechanisms of metal action in bacteria: insight into novel genes involved in silver, gallium and copper resistance and toxicity in Escherichia coli Gugala, Natalie Gugala, N. (2019). Comparing the mechanisms of metal action in bacteria: insight into novel genes involved in silver, gallium and copper resistance and toxicity in Escherichia coli (Unpublished doctoral thesis). University of Calgary, Calgary, AB. http://hdl.handle.net/1880/110682 doctoral thesis University of Calgary graduate students retain copyright ownership and moral rights for their thesis. You may use this material in any way that is permitted by the Copyright Act or through licensing that has been assigned to the document. For uses that are not allowable under copyright legislation or licensing, you are required to seek permission. Downloaded from PRISM: https://prism.ucalgary.ca
-
Upload
khangminh22 -
Category
Documents
-
view
0 -
download
0
Transcript of Comparing the mechanisms of metal action in bacteria - PRISM

University of Calgary
PRISM: University of Calgary's Digital Repository
Graduate Studies The Vault: Electronic Theses and Dissertations
2019-07-25
Comparing the mechanisms of metal action in
bacteria: insight into novel genes involved in silver,
gallium and copper resistance and toxicity in
Escherichia coli
Gugala, Natalie
Gugala, N. (2019). Comparing the mechanisms of metal action in bacteria: insight into novel
genes involved in silver, gallium and copper resistance and toxicity in Escherichia coli
(Unpublished doctoral thesis). University of Calgary, Calgary, AB.
http://hdl.handle.net/1880/110682
doctoral thesis
University of Calgary graduate students retain copyright ownership and moral rights for their
thesis. You may use this material in any way that is permitted by the Copyright Act or through
licensing that has been assigned to the document. For uses that are not allowable under
copyright legislation or licensing, you are required to seek permission.
Downloaded from PRISM: https://prism.ucalgary.ca

UNIVERSITY OF CALGARY
Comparing the mechanisms of metal action in bacteria:
insight into novel genes involved in silver, gallium and copper resistance and toxicity in
Escherichia coli
by
Natalie Gugala
A THESIS
SUBMITTED TO THE FACULTY OF GRADUATE STUDIES
IN PARTIAL FULFILMENT OF THE REQUIREMENTS FOR THE
DEGREE OF DOCTOR OF PHILOSOPHY
GRADUATE PROGRAM IN BIOLOGICAL SCIENCES
CALGARY, ALBERTA
JULY, 2019
© Natalie Gugala 2019

ii
Abstract
It is fundamental to understand the mechanisms by which a toxicant is capable of poisoning
the bacterial cell or resistance is developed. The mechanisms of actions of many antimicrobials
such as metal-based compounds are not fully understood, yet, the development of these agents
continues.
Despite the essentiality of metals in the biochemistry of life, both non-essential and
essential metals have been used as antimicrobials for agricultural and medical purposes for
thousands of years. Applications include wound dressings, nanoparticles, antiseptic formulations,
combination treatments, polymers and nanocomposites, among many more. Many of these have
proven to be effective at controlling and eradicating microbial populations at low concentrations.
Currently, studies in this field largely focus attention on developing new formulations and utilities
for metal-based antimicrobials. The identity of the cellular targets that are involved in metal
resistance and toxicity are known to a lesser degree. This current knowledge gap potentiates the
progression of antimicrobial resistance since there is an incomplete understanding of metal action
in microorganisms. Previous studies that have directed efforts toward these fundamental questions
have failed to provide a comprehensive depiction of the global cellular effects of metal exposure;
the literature is often replete with contradicting reports. Based on the aforementioned, we sought
to answer the fundamental question – how do the mechanisms of metal toxicity and resistance
compare in bacteria?
We observed that the efficacies of metal ions varied between bacterial species and isolates
of the same species. By means of the Keio collection, this comparison was validated by
demonstrating that silver, copper and gallium act differently in Escherichia coli. Here, we
presented a list of novel resistant and sensitive gene hits that may be involved in metal action.

iii
These experiments were performed under sublethal prolonged metal exposure, rather than acute
shock. Resistance mechanisms range from efflux, iron-sulfur cluster maintenance, DNA repair,
nucleotide biosynthesis to tRNA modification, and sensitive pathways include biomolecule
import, NAD+ synthesis, amino acid biosynthesis, sulfur assimilation, electron transport, carbon
metabolism and outer membrane maintenance, amongst others.
To mitigate the improper use of metal-based antimicrobials, it is imperative that we
understand precisely how these agents are able to eradicate bacterial cells and what are the
accompanying mechanisms of resistance, particularly as development and use expands.

iv
Preface
The interaction of metal ions with microbial organisms is complex and multifaceted; a
relationship that cannot be met using organic compounds alone. The occurrence of metals in the
environment, whether in the gut microbiota of a host or near a hydrothermal vent, is dynamic,
permitting many combinations with proteins, enzymes, lipids, nucleic acids and other
biomolecules. Despite the biotic essentiality of metals, humans have been employing their toxic
capabilities for thousands of years in agriculture and medicine. As the onset of antimicrobial
resistance continues, alternative antimicrobials are becoming more popular and amongst these are
metal-based antimicrobials.
Currently, metal-based antimicrobials can be found as nanomaterials and coatings, and in
combination treatments, textiles or polymers. Nonetheless, with the advancement of these
antimicrobials comes great responsibility. The interactions of these compounds with organisms
must be understood if we are to continue their development and use. In turn, this will ensure the
appropriate metal is used against the correct organism and at the precise concentration.
In this thesis, I compared the mechanisms of metal action in a number of bacterial species
and extended on these observations as a means of uncovering novel genes involved in metal action
in Escherichia coli. The use of this important model organism is -fold given our knowledge of
gene function, preceding studies performed using this organism for the purpose of studying metal
action, access to the complete Keio collection and relevance of this organism in healthcare settings.
Metal ions are capable of undergoing several ionization events that alters the charge and
chemical properties. If precise metal speciation is unknown, then it is difficult to predict chemical
reactions and metal activities in vivo. Speciation is reliant on intra- and extracellular targets, the
redox potential, inherent metal characteristics and the growth medium selected. Studying metal

v
resistance in bacteria is challenging and studies often report contradicting results. One typical
example includes the formation of reactive oxygen species and genotoxicity upon metal exposure
– mechanisms that have been reputed and disapproved several times. These factors along with
others must be integrated into future studies, such as this one, to ensure the correct application of
these agents and their full potential for use.
In this thesis, “Comparing the mechanisms of metal action in bacteria: an insight into novel
genes involved in silver, gallium and copper resistance and toxicity in Escherichia coli,” a number
of investigations are provided that aim to answer the fundamental questions - how do bacterial
strains respond to metal stress and do different metals act on the same organism similarly or
distinctively? Chapter 1 provides an introduction into the background information required for
this thesis, with some of the material published previously as book chapters (The Potential of
Metals in Combating Bacterial Pathogens in Biomedical Applications of Metals, 2018 and Metal-
based Antimicrobials in Antimicrobial Materials for Biomedical Applications, accepted and in
press). Chapter 2 reports on the antimicrobial and antibiofilm activity of seven metals; silver,
copper, titanium, gallium, nickel, aluminum and zinc against three bacterial strains, Pseudomonas
aeruginosa, Staphylococcus aureus, and Escherichia coli (The Journal of Antibiotics, January
2017). Chapter 3 extends these observations to isolates of the same species (Antibiotics, May
2019). Chapter 4 is the first of three chapters in which the Keio collection is used to recover novel
silver resistant and sensitive gene hits in E. coli BW25113 (Genes, July 2018). Chapters 5 and 6
are extensions of Chapter 4 in which the same methodology is used to uncover genes involved in
gallium (Genes, January 2019) and copper action, respectively. Chapter 7 further employs this
comparative approach as a means of investigating genes that are common between the three
datasets. It is here that we begin examining metal sensitive hits in more detail. Chapters 2-5 contain

vi
peer-reviewed manuscripts in their original form, only the format and location of the figures have
been altered. Appendix A presents a study on the action of different formulations of silver, among
other metals, against dual-species biofilms. Appendix B provides information on the gene lists of
the resistant and sensitive hits obtained in Chapters 4-7. Appendix C contains brief methodology
regarding uncompleted work that was not included in any chapter of this thesis. Lastly, Appendix
D contains copyright agreement information.

vii
References to research articles included in this thesis and precise author
contributions:
Gugala, N.; Lemire, J. A.; Turner, R. J. The efficacy of different anti-microbial metals at
preventing the formation of, and eradicating bacterial biofilms of pathogenic indicator strains. J.
Antibiot. (Tokyo). 2017, 70, 775–780, 10.1038/ja.2017.10
This manuscript was conceptualized by Natalie Gugala, Dr. Joe Lemire (PDF at this time) and
Dr. Raymond Turner. The methodology and writing of the manuscript was completed by Natalie
Gugala. Editing comepleted by all three authors.
Gugala, N.; Vu, D.; Parkins, M. D.; Turner, Raymond, J. Specificity in the susceptibilities of
Escherichia coli, Pseudomonas aeruginosa and Staphylococcus aureus clinical isolates to six
metal antimicrobials. Antibiotics 2019, 8, 51, 10.3390/antibiotics8020051
Conceptualization completed by Natalie Gugala and Dr. Raymond Turner. The methods were
completed with the help of Dennis Vu (undergraduate student at this time), and Natalie Gugala.
The formal analyses and writing of this manuscript was completed by Natalie Gugala. Editing
preformed by Natalie Gugala, Dr. Michael Parkins and Dr. Raymond Turner.
Gugala, N.; Lemire, J.; Chatfield-Reed, K.; Yan, Y.; Chua, G.; Turner, R. Using a chemical
genetic screen to enhance our understanding of the antibacterial properties of silver. Genes
(Basel). 2018, 9, 344, 10.3390/genes9070344
Natalie Gugala, Dr. Joe Lemire (PDF at this time) and Dr. Katie Chatfield-Reed (PDF as this
time) contributed equally to this paper. Conceptualization and methodology completed by Dr.
Joe Lemire, Dr. Katie Chatfield-Reed and Natalie Gugala. Formal analysis completed by Dr.
Kate Chatfield-Reed, Dr. Ying Yan and Natalie Gugala. The manuscript was written by Natalie
Gugala and edited by all the authors of this paper.
Gugala, N.; Chatfield-Reed, K.; Turner, R. J.; Chua, G. Using a chemical genetic screen to
enhance our understanding of the antimicrobial properties of gallium against Escherichia coli.
Genes (Basel). 2019, 10, 34 10.3390/genes10010034
Methodology completed by Natalie Gugala. The analysis of this paper was completed by Natalie
Gugala and Dr. Katie Chatfield-Reed (PDF at this time). This work was written by Natalie
Gugala and edited by all the authors of this paper.
Lemire, J. A.; Kalan, L.; Gugala, N.; Bradu, A.; Turner, R. J. Silver oxynitrate–an efficacious
compound for the prevention and eradication of dual-species biofilms. Biofouling 2017, 33, 460–
469, 10.1080/08927014.2017.1322586

viii
Dr. Joe Lemire (PDF at this time), Dr. Lindsay Kalan (PDF at this time) and Dr. Raymond
Turner contributed to the conceptualization of this paper. The methodology was completed by
Dr. Joe Lemire, Natalie Gugala and Alex Bradu (undergraduate student at this time). This
manuscript was written by Dr. Joe Lemire and Dr. Lindsay Kalan. Editing performed by Dr. Joe
Lemire, Dr. Lindsay Kalan, Natalie Gugala and Dr. Raymond Turner.

ix
Acknowledgments
“Writing a thesis is like completing a group project, except the group member is yourself, four
years ago.” – Unknown.
By no means, has this journey been easy. The motivation to complete that extra experiment,
write that additional paragraph or edit one’s work for the seventh time, has not been present at all
times. Self-doubt is a common experience that many students face in graduate school, and I believe
that learning to appreciate one’s work and believe in your results is one of the hardest tasks any
graduate student must face.
Without a number of key people in my life, I am not sure that this thesis would have been
completed. Firstly, I would like to thank my family. Particularly my mother, who still has no idea
what I do, but listens to me regardless. She allows me to vent, let my frustration out and cry on her
shoulders when experiments don’t go as planned. She is my number one supporter, my biggest fan
and my favourite person.
My friends remain in awe at what I do, but it is I who is in awe at them, for they have
stayed by my side, even after all the times I have cancelled on them because of a long workday or
simply bore them to death with ‘interesting’ science facts. Marleea, my best friend, has been one
of my greatest motivators and cheerleaders since grade 12, and I thank her for this.
Dr. Joe Lemire set many foundations for me, both intellectual and technical. I learned how
to write (if I can that is) from his constant edits and harsh comments. Without his supervision this
thesis would have taken a different turn, one that I may not have been fulfilled with. Thank you.

x
Dr. Gordon Chua not only facilitated a number of the papers in this thesis, but also pushed
my limits and helped me ‘dive’ into the data. The use of his equipment provides as the foundation
for this thesis, and potentially many more to come. I would also like to thank my entire committee,
particularly Dr. Harrison and Dr. Lewis who have continuously pushed me and challenged me to
reach new heights. I aspire to be as successful as the two of you. To my external reviewers, Dr.
Shimizu and Dr. Mulvey, thank you for taking the time to read this thesis and attend my defense,
I look forward to meeting you both.
The Turner lab, both past and present, have always lent a helping hand. I have never felt
unwelcome or unappreciated. As a lab we have had countless laughs and cries together, and I hope
to have many more.
Lastly, I want to thank my supervisor, Dr. Turner, whom I now call one of my closest
friends. I arrived in Dr. Raymond Turner’s lab in 2014, as an undergraduate student. A fellow
classmate of mine mentioned him to me, as they knew I was looking for an undergraduate
supervisor and explained that he is known for his caring personality. I entered his lab on this piece
of information alone… and was it ever correct. Still, over the last several years I have come to
appreciate that Dr. Turner is more than just respectful. In fact, many other traits out way this
quality, such as his selflessness, humor, appreciation, empathy and leadership. The latter has been
the most significant to me. I never appreciated that I needed someone to lead me through these last
four years, and I am referring not only to my experiments. His strength and confidence lifted me
and made me a better person each day, allowing me to reach a potential I never thought was
possible. I thank Dr. Turner the most, because not only did he help me complete this work, but he
helped me become a strong independent researcher, who is ready to take on the next chapter of
their life.

xi

xii
Table of Contents
ABSTRACT .................................................................................................................................. II
PREFACE .................................................................................................................................... IV
REFERENCES TO RESEARCH ARTICLES INCLUDED IN THIS THESIS AND
PRECISE AUTHOR CONTRIBUTIONS: ............................................................................ VII
ACKNOWLEDGMENTS .......................................................................................................... IX
TABLE OF CONTENTS ......................................................................................................... XII
LIST OF TABLES ................................................................................................................. XVII
LIST OF FIGURES ................................................................................................................. XIX
LIST OF ABBREVIATIONS ........................................................................................... XXVIII
EPIGRAPH ........................................................................................................................... XXIX
1 INTRODUCTION................................................................................................................. 1
1.1 ESSENTIALITY OF METAL IONS TO THE BIOCHEMISTRY OF LIFE ........................................ 1
1.2 THE REEMERGENCE OF METAL COMPOUNDS AS ANTIMICROBIAL AGENTS ........................ 3
1.2.1 Historical uses of metals ............................................................................................. 4
1.2.2 Current metal-based antimicrobial development and use .......................................... 6
1.3 METAL CHEMISTRY IN BIOLOGICAL SYSTEMS ............................................................... 10
1.3.1 Donor atom preference: Speciation, the Irving-Williams series and the HSAB theory
10
1.3.2 Ligand properties: charge, denticity and metal coordination .................................. 13
1.4 METAL TOXICITY IN BACTERIA ..................................................................................... 15
1.4.1 General mechanisms of metal toxicity ...................................................................... 15
1.4.2 The production of reactive nitrogen/sulfur/oxygen species (RS) .............................. 16
1.4.3 Thiol mediated reduction and antioxidant depletion ................................................ 18
1.4.4 Metal interactions at the cell membrane .................................................................. 20
1.4.5 Protein dysfunction and deactivation ....................................................................... 21
1.5 SPECIFIC MECHANISMS OF METAL TOXICITY .................................................................. 22
1.5.1 Copper toxicity in bacteria ....................................................................................... 22
1.5.2 Silver toxicity in bacteria .......................................................................................... 25
1.5.3 Gallium toxicity in bacteria ...................................................................................... 26
1.6 MECHANISMS OF METAL RESISTANCE IN BACTERIA ....................................................... 27
1.6.1 General mechanisms of metal resistance .................................................................. 27
1.6.2 Copper resistance (and homeostasis) in bacteria ..................................................... 30
1.6.3 Silver resistance in bacteria...................................................................................... 33
1.6.4 Gallium resistance in bacteria .................................................................................. 34
1.7 THE CHALLENGES OF STUDYING METAL ANTIMICROBIALS AND GAPS IN OUR KNOWLEDGE
34
1.8 RESEARCH GOALS AND SPECIFIC AIMS ........................................................................... 38
2 THE EFFICACY OF DIFFERENT ANTIMICROBIAL METALS AT PREVENTING
THE FORMATION OF, AND ERADICATING BACTERIAL BIOFILMS OF
PATHOGENIC INDICATOR STRAINS................................................................................. 40

xiii
2.1 ABSTRACT ..................................................................................................................... 40
2.2 INTRODUCTION .............................................................................................................. 41
2.3 METHODS AND MATERIALS ........................................................................................... 43
2.3.1 Bacterial strains and culture media .......................................................................... 43
2.3.2 Biofilm cultivation ..................................................................................................... 43
2.3.3 Stock and working metal solutions ........................................................................... 44
2.3.4 Prevention of planktonic growth and biofilm formation........................................... 44
2.3.5 Eradication of established biofilms .......................................................................... 45
2.3.6 Assessment of metal efficacy ..................................................................................... 45
2.4 RESULTS ........................................................................................................................ 46
2.4.1 Various metal salts can prevent planktonic growth and biofilm formation.............. 46
2.4.2 Certain metal ions are capable of eradicating established biofilms ........................ 49
2.5 DISCUSSION ................................................................................................................... 50
2.6 CONCLUSION.................................................................................................................. 54
2.7 CHAPTER 2 SUPPLEMENTARY ........................................................................................ 55
3 SPECIFICITY IN THE SUSCEPTIBILITIES OF ESCHERICHIA COLI,
PSEUDOMONAS AERUGINOSA AND STAPHYLOCOCCUS AUREUS CLINICAL
ISOLATES TO SIX METAL ANTIMICROBIALS ............................................................... 58
3.1 ABSTRACT ..................................................................................................................... 58
3.2 INTRODUCTION .............................................................................................................. 59
3.3 MATERIALS AND METHODS ........................................................................................... 61
3.3.1 Bacterial strains and storage .................................................................................... 61
3.3.2 Determination of the effective metal concentrations and metal storage .................. 61
3.3.3 Bacterial growth and the agar disk diffusion method ............................................... 62
3.3.4 Normalization and statistical analyses ..................................................................... 63
3.4 RESULTS ........................................................................................................................ 64
3.5 DISCUSSION ................................................................................................................... 71
3.6 CHAPTER 3 SUPPLEMENTARY ........................................................................................ 74
4 USING A CHEMICAL GENETIC SCREEN TO ENHANCE OUR
UNDERSTANDING OF THE ANTIBACTERIAL PROPERTIES OF SILVER ............... 82
4.1 ABSTRACT ..................................................................................................................... 82
4.2 INTRODUCTION .............................................................................................................. 83
4.3 MATERIALS AND METHODS ........................................................................................... 85
4.3.1 Stock Ag solution....................................................................................................... 85
4.3.2 Determination of the minimal inhibitory concentration and controls ...................... 85
4.3.3 Screening................................................................................................................... 85
4.3.4 Normalization ........................................................................................................... 86
4.3.5 Data mining and analyses ......................................................................................... 87
4.4 RESULTS AND DISCUSSION............................................................................................. 87
4.4.1 Genome-wide screen of Ag resistant and Ag sensitive hits ....................................... 87
4.4.2 Ag resistant gene hits ................................................................................................ 95
4.4.2.1 Regulators of gene expression .......................................................................... 95
4.4.2.2 Cell membrane proteins .................................................................................... 96
4.4.2.3 Biosynthetic enzymes ....................................................................................... 97
4.4.2.4 Catabolic enzymes ............................................................................................ 99

xiv
4.4.2.5 Sulfur metabolism proteins ............................................................................. 100
4.4.2.6 Biofilm formation ........................................................................................... 101
4.4.2.7 DNA damage and repair ................................................................................. 102
4.4.3 Ag sensitive hits....................................................................................................... 103
4.4.3.1 Central dogma and cell exterior proteins ........................................................ 103
4.4.3.2 Lipopolysaccharide biosynthetic genes .......................................................... 104
4.4.3.3 Three Ag sensitive hits comprise the ATP synthase Fo complex ................... 104
4.4.3.4 Oxidative stress response genes ...................................................................... 105
4.5 CONCLUSION................................................................................................................ 106
4.6 CHAPTER 4 SUPPLEMENTARY ...................................................................................... 107
5 USING A CHEMICAL GENETIC SCREEN TO ENHANCE OUR
UNDERSTANDING OF THE ANTIMICROBIAL PROPERTIES OF GALLIUM
AGAINST ESCHERICHIA COLI ........................................................................................... 114
5.1 ABSTRACT ................................................................................................................... 114
5.2 INTRODUCTION ............................................................................................................ 115
5.3 MATERIALS AND METHODS ......................................................................................... 117
5.3.1 Escherichia coli strains........................................................................................... 117
5.3.2 Determination of the minimal inhibitory concentration and controls .................... 118
5.3.3 Screening................................................................................................................. 119
5.3.4 Normalization ......................................................................................................... 120
5.3.5 Data mining and analyses ....................................................................................... 120
5.4 RESULTS AND DISCUSSION........................................................................................... 121
5.4.1 Genome-wide screen of Ga resistant and sensitive hits.......................................... 121
5.4.2 Ga sensitive systems ................................................................................................ 130
5.4.2.1 Iron homeostasis and transport, and Fe-sulfur cluster proteins ...................... 130
5.4.2.2 Deoxynucleotide and cofactor biosynthesis, and DNA replication and repair 134
5.4.3 Systems involved in Ga resistance .......................................................................... 137
5.4.3.1 Fe transport systems ........................................................................................ 137
5.4.3.2 Amino acid biosynthesis ................................................................................. 139
5.4.3.3 Lipopolysaccharides and peptidoglycan ......................................................... 141
5.5 CONCLUSION................................................................................................................ 142
6 USING A CHEMICAL GENETIC SCREEN TO ENHANCE OUR
UNDERSTANDING OF THE ANTIMICROBIAL PROPERTIES OF COPPER
AGAINST ESCHERICHIA COLI ........................................................................................... 145
6.1 ABSTRACT ................................................................................................................... 145
6.2 INTRODUCTION ............................................................................................................ 146
6.3 MATERIALS AND METHODS ......................................................................................... 147
6.3.1 Stock Cu solution .................................................................................................... 147
6.3.2 Determination of the sublethal inhibitory concentration and controls .................. 147
6.3.3 Screening................................................................................................................. 148
6.3.4 Normalization, data mining and analyses .............................................................. 149
6.4 RESULTS AND DISCUSSION........................................................................................... 149
6.4.1 Phenotypic screen of Cu resistant and sensitive hits .............................................. 149
6.4.2 Cu sensitive systems ................................................................................................ 158

xv
6.4.2.1 Cu sensitivity is generated in the absence of CueO and genes involved in the
transport and folding of this protein................................................................................ 158
6.4.2.2 tRNA processing and modification may serve as a resistance mechanism
against Cu........................................................................................................................ 161
6.4.3 Cu resistant systems ................................................................................................ 162
6.4.3.1 Genes involved in importing key biomolecules are potential Cu targets ....... 162
6.4.3.2 Amino acid biosynthesis ................................................................................. 164
6.4.3.3 Cu may alter central carbon metabolism in E. coli ......................................... 166
6.4.3.4 Deleting hisG results in elevated Cu resistance .............................................. 167
6.4.3.5 Two genes involved in NAD biosynthesis were recovered as resistant hits... 167
6.4.4 Gene hits not recovered in this study ...................................................................... 168
6.5 CONCLUSION................................................................................................................ 170
7 COMPARING OXYGEN CONSUMPTION, EXTRACELLULAR PH AND
REACTIVE OXYGEN SPECIES FORMATION IN THE PRESENCE OF SILVER,
GALLIUM AND COPPER ...................................................................................................... 172
7.1 ABSTRACT ................................................................................................................... 172
7.2 INTRODUCTION ............................................................................................................ 172
7.3 METHODS AND MATERIALS ......................................................................................... 174
7.3.1 Strains ..................................................................................................................... 174
7.3.2 Metal solutions ........................................................................................................ 174
7.3.3 Growth tolerance in the presence of silver, gallium and copper ............................ 174
7.3.4 MitoXpress Xtra Oxygen Consumption assay......................................................... 175
7.3.4.1 Signal optimization ......................................................................................... 175
7.3.4.2 Glycolysis assay .............................................................................................. 176
7.3.5 pH-Xtra Glycolysis assay ........................................................................................ 177
7.3.5.1 Signal optimization ......................................................................................... 177
7.3.6 Reactive oxygen species assays .............................................................................. 178
7.4 RESULTS ...................................................................................................................... 180
7.4.1 Growth tolerance in the presence of silver, gallium and copper ............................ 180
7.4.2 MitoXpress Xtra Oxygen Consumption assay......................................................... 183
7.4.3 pH-Xtra Glycolysis assay ........................................................................................ 187
7.5 DISCUSSION AND CONCLUSIONS .................................................................................. 190
PREFACE: WHY SHOULD WE STUDY THE MECHANISMS OF METAL TOXICITY
AND RESISTANCE IN BACTERIA? .................................................................................... 195
8 GLOBAL COMPARISONS AND CONCLUSIONS .................................................... 198
8.1 DIFFERENCES IN THE SUSCEPTIBILITY PROFILES OF BACTERIA TO METALS ................... 198
8.2 COMPARING GENES INVOLVED IN MEDIATING SENSITIVITY OR RESISTANCE UNDER
SILVER, GALLIUM AND COPPER EXPOSURE USING A CHEMICAL GENETIC SCREEN ..................... 199
8.2.1 Silver, gallium and copper sensitive gene hits ........................................................ 202
8.2.2 Silver, gallium and copper resistant gene hits ........................................................ 208
8.3 FINAL CONCLUSIONS, UNKNOWNS AND FUTURE DIRECTIONS ....................................... 212
REFERENCES .......................................................................................................................... 214

xvi
APPENDIX A: SILVER OXYNITRATE – AN EFFICACIOUS COMPOUND FOR THE
PREVENTION AND ERADICATION OF DUAL-SPECIES BIOFILMS ........................ 248
APPENDIX B: COMPLETE GENE LISTS PERTAINING TO THE CHEMICAL
GENETIC SCREENS ............................................................................................................... 270
APPENDIX C: ADDITIONAL METHODOLOGY.............................................................. 271
APPENDIX D: COPYRIGHT INFORMATION .................................................................. 277

xvii
List of Tables
Table 1.1 Examples of the metal-based antimicrobials investigated.
Table S2.1 Metal concentrations required to prevent planktonic growth (MPBC), prevent biofilm
growth (MBBC) and eradicate established biofilms (MBEC) in P. aeruginosa (ATCC 27853).
Table S2.2 Metal concentrations required to prevent planktonic growth (MPBC), prevent biofilm
growth (MBBC) and eradicate established biofilms (MBEC) in E. coli (ATCC 25922).
Table S2.3 Metal concentrations required to prevent planktonic growth (MPBC), prevent biofilm
growth (MBBC) and eradicate established biofilms (MBEC) in S. aureus (ATCC 25923).
Table S3.1 Minimal inhibitory concentrations previously determined by Gugala et al. in
chemically simulated wound fluid [1].
Table S3.2 Escherichia coli zones of growth inhibition (mm) and the corresponding breakpoint
value1 in the presence of the given metal, which were determined using the MIC of the indicator
strain2 E. coli ATCC 25922 as previously observed by Gugala et al [1].
Table S3.3 Pseudomonas aeruginosa zones of growth inhibition (mm) and the corresponding
breakpoint value1 in the presence of the given metal, which were determined using the MIC of
the indicator strain2 P. aeruginosa ATCC 27853 as previously determined by Gugala et al [1].
Table S3.4 Staphylococcus aureus zones of growth inhibition (mm) and the corresponding
breakpoint value1 in the presence of the given metal, which were determined using the MIC of
the indicator strain2 S. aureus ATCC 25923 as previously observed by Gugala et al [1].
Table 4.1 Ag resistant hits organized according to system and subsystem mined using the Omics
Dashboard (Pathway Tools), which surveys against the EcoCyc Database; genes represent
resistant hits, each with a score >0.15 and a false discovery rate of 0.11, 2.
Table 4.2 Ag sensitive hits organized according to system and subsystem mined using the Omics
Dashboard (Pathway Tools), which surveys against the EcoCyc Database; genes represent
resistant hits, each with a score <-0.15 and a false discovery rate of 0.11,2.
Table S4.1 Systems and comprising subsystems cited in this study. The resistant and sensitive
hits were surveyed against the EcoCyc database permitting the clustering of the hits into systems,
subsystems and component subsystems1,2.
Table 5.1 Ga sensitive hits organized according to system and subsystem mined using the Omics
Dashboard (Pathway Tools), which surveys against the EcoCyc Database; genes represent
sensitive hits with scores < -0.154.

xviii
Table 5.2 Ga resistant hits organized according to system and subsystem mined using the Omics
Dashboard (Pathway Tools), which surveys against the EcoCyc Database; genes represent
resistant hits with scores > 0.162.
Table 5.3 Hydroxyurea sensitive and gene hits involved in the synthesis of DNA, normalized to
include only the effects of Ga exposure; those with a score two deviations from the mean are
included.
Table 5.4 Sulfometuron methyl resistant gene hits, involved in the synthesis of amino acids,
normalized to include only the effects of Ga exposure; only those with a score two deviations
from the mean are included.
Table 6.1 Cu sensitive hits organized according to system and subsystem mined using the Omics
Dashboard (Pathway Tools), which surveys against the EcoCyc Database; genes represent
sensitive hits with scores < -0.262 1,2.
Table 6.2 Cu resistant hits organized according to system and subsystem mined using the Omics
Dashboard (Pathway Tools), which surveys against the EcoCyc Database; genes represent
resistant hits with scores > 0.1621,2.
Table 8.1 Comparable hits between the silver, gallium and copper sensitive hits identified in E.
coli BW25113.
Table 8.2 Comparable hits between the silver, gallium and copper resistant hits identified in E.
coli BW25113.
Table A.1 The median, minimal concentration (in μM) of metal compounds (CuSO4, AgNO3 and Ag7NO11) required to (1) inhibit planktonic cell proliferation [minimal inhibitory
concentration (MIC)] and (2) inhibit biofilm formation [minimal biofilm inhibitory concentration
(MBIC)]. Table A.2 The median, minimal concentration (in μM) of metal compounds (CuSO4, AgNO3,
and Ag7NO11 required to (1) eradicate an established planktonic population [minimal bactericidal
concentration (MBC)], and (2) eradicate an established biofilm [minimal biofilm eradication
concentration (MBEC)].

xix
List of Figures
Figure 1.1 Several examples of metal toxicity in bacteria. Shown is a Gram-negative bacterium;
these mechanisms can be extended to a number of different organisms.
Equation 1.1 Generation of reactive oxygen species through the Fenton reaction. This produces
the overall net reaction called the Haber-Weiss reaction. The intermediates of these reactions are
capable of propagating lipid peroxidation, the oxidation of proteins and DNA damage.
Figure 1.2 Several general mechanisms of metal resistance in bacteria. Shown is a Gram-
negative bacterium however these mechanisms can be extended to a number of organisms.
Equation 1.2 Copper readily catalyzes the formation of hydroxyl radicals through the Fenton
and Haber-Weiss reactions. The intermediates of these reactions are capable of propagating lipid
peroxidation, the oxidation of proteins and DNA damage.
Equation 1.3 Copper readily catalyzes the formation of hydrogen peroxide via reactions with
sulfur groups found in cysteine and glutathione, among others.
Figure 2.1 The prevention of bacterial biofilms is attained upon 4hr exposure to various metal
salts. The Calgary Biofilm Device was inoculated with P. aeruginosa (ATCC 27853), S. aureus
(ATCC 25923) or E. coli (ATCC 25922) in the presence of AgNO3, CuSO4, TiCl3,
Ga(NO3)3•H2O, NiSO4•6H2O, Al2(SO4)3•H2O or ZnSO4•7H2O. The bacteria were grown over a
concentration range defined by 2-fold serial dilutions of each metal. After this incubation, the
viable cells were counted to determine the A) MBPC and B) MBBC. Values are represented as
the mean ± the SD n=3. #Note: all metal stock solutions were prepared at equal molar
equivalents of metal molecule. Hence the concentrations found in this figure are reflective of the
concentrations of metal and not the compounds themselves.
Figure 2.2 The eradication of biofilms is achieved upon exposure to various metal salts. The
Calgary biofilm device was inoculated with P. aeruginosa (ATCC 27853), S. aureus (ATCC
25923) or E. coli (ATCC 25922) in order to establish biofilm growth following 24hr incubation.
The established biofilms were then treated with serial dilutions (2-fold) of AgNO3, CuSO4,
TiCl3, Ga(NO3)3•H2O, NiSO4•6H2O, Al2(SO4)3•H2O or ZnSO4•7H2O. Viable cell count was
used to determine the MBEC for each metal. Values are represented as the mean ± the SD, n=3.
#Note: all metal stock solutions were prepared at equal molar equivalents of metal molecule.
Hence the concentrations found in this figure are reflective of the concentrations of metal and not
the compounds themselves.
Figure 2.3 Growth tolerance of P. aeruginosa (ATCC 27853), S. aureus (ATCC 25923) and E.
coli (ATCC 25922) to several metal salts. The Calgary Biofilm Device was inoculated with
bacteria in the presence of AgNO3, CuSO4, TiCl3, Ga(NO3)3•H2O, NiSO4•6H2O, Al2(SO4)3•H2O
or ZnSO4•7H2O. The cells were exposed to serial dilutions (2-fold) of each metal for 4hr
followed by determination of the A) MBPC and B) MBBC by viable cell count. Values are
represented as the mean ± the SD n=3. #Note: all metal stock solutions were prepared at equal

xx
molar equivalents of metal molecule. Hence the concentrations found in this figure are reflective
of the concentrations of metal and not the compounds themselves.
Figure 2.4 Biofilm eradication tolerance to several metal salts for P. aeruginosa ATCC 27853.
The Calgary biofilm device was inoculated following 24hr incubation. The established biofilm
was then treated with serial dilutions (2-fold) of AgNO3, CuSO4, TiCl3, Ga(NO3)3 •H2O, NiSO4
•6H2O, Al2(SO4)3 •H2O or ZnSO4 •7H2O. The MBEC was determined by viable cell count for
the various metal compounds. Values are represented as the mean ± the SD, n=3. #Note: all
metal stock solutions were prepared at equal molar equivalents of metal molecule. Hence the
concentrations found in this figure are reflective of the concentrations of metal and not the
compounds themselves.
Figure S2.1 Heatmaps for the MPBC, MBBC and MBEC of the three bacterial strains tested.
Analysis generated from the (a) MPBC (planktonic), MBBC (biofilm) and (a) MBECs (biofilm),
in the presence of AgNO3, CuSO4, TiCl3, Ga(NO3)3 •H2O, NiSO4 •6H2O, Al2(SO4)3 •H2O or
ZnSO4 •7H2O. The metals that could not prevent and/or eradicate growth in the concentrations
tested were included in the heatmaps and recorded as the maximum dilution tested. For precise
concentrations refer to Tables 2.1 – 2.3.
Figure 3.1 Bar plots signifying the normalized score for each isolate against the corresponding
indicator strain, for which the value is 1.0 (grey line). This score represents the MIC of the
indicator strain under the given metal stress. Orange denotes a resistant isolate. For these
isolates, the zone of growth inhibition was less than the corresponding indicator strain (<1.0).
Purple represents the isolates that fall above the normalized score since the zones of growth
inhibition were larger, these are noted as sensitive isolates (>1.0). Each score represents the
mean of three biological trials, each with two technical replicates. The MICs are as follows in the
order: E. coli ATCC 25922, P. aeruginosa ATCC 27853 and S. aureus ATCC 25923: (a)
aluminum: 250 mM, 1.95 mM and >250 mM, (b) copper: 12.5 mM, 6.25 mM and 12.5 mM, (c)
gallium: 31.25 mM, 15.63 mM, 15.62 mM, (d) nickel: >625 mM, >650 mM and >625 mM, (e)
silver: >0.5 mM, >0.5 mM and >0.5 mM, (f) zinc: >650 mM, >375 mM and 23.44 mM.
Figure 3.2 Dot plots illustrating the dispersity between the normalized scores of the E. coli (red),
P. aeruginosa (green) and S. aureus (blue) isolates. The zones of growth inhibition for the
isolates were normalized against the zones of the indicator strains. A value of 1.0 signifies the
minimal inhibitory concentration corresponding to the indicator strain. Scores >1.0 are
considered sensitive and scores <1.0 are noted as resistant. Each score represents the mean of
three biological trials each with two technical replicates.
Figure 3.3 Clustering of the 93 isolates belonging to the species E. coli (red), P. aeruginosa
(green) or S. aureus (blue) using principle component analysis. Collections were highlighted to
show positioning of each isolate in respect to the remaining collection. Here, each isolate was
normalized against the corresponding indicator strain in the presence of the six metals,
aluminum, copper, gallium, nickel, silver and zinc. Data collected from the mean of three
biological trials, each with two replicates.

xxi
Figure 3.4 Heatmap signifying the normalized zones of growth inhibition. Score of 1.0 was
given to the zone of growth inhibition for the indicator strain This value also represents the MIC
of that organism under metal challenge. The isolates were normalized over the corresponding
strain to yield comparable values. The color red denotes a sensitive hit (>1.0) and the color
purple was given to the isolates that displayed enhanced resistant (<1.0). Data collected from the
mean of three biological trials, each with two replicates; note that the working stock solutions
were not equivalent. The MICs (score = 1.0) for the given data are as follows in the order: E. coli
ATCC 25922, P. aeruginosa ATCC 27853 and S. aureus ATCC 25923: aluminum: 250 mM,
1.95 mM and >250 mM, copper: 12.5 mM, 6.25 mM and 12.5 mM, gallium: 31.25 mM, 15.63
mM, 15.62 mM, nickel: >625 mM, >650 mM and >625 mM, silver: >0.5 mM, >0.5 mM and
>0.5 mM, zinc: >650 mM, >375 mM and 23.44 mM.
Figure 3.5 Heatmap representing the zones of growth inhibition normalized against the
concentration of metal. Each metal was provided an equivalent score of 1.0. Red specifies isolate
sensitivity; therefore, it was interpreted that a concentration of 1.0 M would ensure eradication.
Purple indicates resistance, hence a concentration greater than 1.0 M is required to eradicate the
organism in the growth medium used in this study. Data collected from the mean of three
biological trials, each with two replicates.
Figure 4.1 Synthetic Array Tools (version 1.0) was used to normalize and score the Ag resistant
and sensitive gene hits as a means of representing the growth differences in Escherichia coli K12
BW25113 in the presence of 100 μM AgNO3. Only those with a score greater or less than ±0.15,
respectively, were selected for further analysis. Hits between ±0.15 were regarded as having
neutral or non-specific interactions with Ag. The p-value was a two-tailed t-test and significance
was determined using the Benjamini-Hochberg procedure; false discovery rate was selected to be
0.1. Each individual score represents the mean of 12 trials.
Figure 4.2 Ag resistant and sensitive gene hits mapped to component cellular processes. The
cutoff fitness score implemented was -0.15 and 0.15 (two standard deviations from the mean)
and gene hits with a score less or greater than, respectively, were chosen for further analyses.
The hits were mined using the Omics Dashboard (Pathway Tools), which surveys against the
EcoCyc Database. Several gene hits are mapped to more than one subsystem. The p-value was
calculated as a two-tailed t-test and significance was determined using the Benjamini-Hochberg
procedure; false discovery rate was selected to be 0.1. Each individual score represents the mean
of 12 trials.
Figure 4.3 Functional enrichment among the Ag resistant and sensitive gene hits. The DAVID
gene functional classification (version 6.8) database, a false discovery rate of 0.1 and a score
cutoff of -0.15 and 0.15 (two standard deviations from the mean) were used to measure the
magnitude of enrichment against the genome of Escherichia coli. Processes with a p-value
<0.05, fold enrichment value ≥3 and gene hits >3 are included only. Each individual score
represents the mean of 12 trials.
Figure 4.4 Connectivity map displaying the predicted functional associations between the silver-
resistant gene hits; disconnected gene hits not shown. The thicknesses of the lines indicate the
degree of confidence prediction for the given interaction, based on fusion, co-occurrence,

xxii
experimental and co-expression data. Figure produced using STRING (version 10.5) and a
medium confidence score of 0.4.
Figure 4.5 Connectivity map displaying the predicted functional associations between the silver-
sensitive gene hits; disconnected gene hits not shown. The thicknesses of the lines indicate the
degree of confidence prediction for the given interaction, based on fusion, co-occurrence,
experimental and co-expression data. Figure produced using STRING (version 10.5) and a
medium confidence score (approximate probability) of 0.4.
Figure S4.1 Ag resistant gene hits plotted against respective cellular processes. Y-axis
representative of the normalized score, smaller circles represent the individual hits and the larger
circles represent the mean of each subsystem. The p-value was calculated as a two-tailed t-test
and significance was determined using the Benjamini-Hochberg procedure; false discovery rate
was selected to be 0.1. Each individual score represents the mean of 12 trials. (a) Central Dogma;
(b) Cell exterior; (c) Biosynthesis; (d) Degradation; (e) Other pathways; (f) Energy; (g) Cellular
processes; and (i) Response to stimulus. Plots constructed using Pathway Tools, Omics
Dashboard.
Figure S4.2 Ag sensitive gene hits plotted against respective cellular processes. Y-axis
representative of the normalized score, smaller circles represent the individual hits and the larger
circles represent the mean of each subsystem. The p-value was a two-tailed t-test and
significance was determined using the Benjamini-Hochberg procedure; false discovery rate was
selected to be 0.1. Each individual score represents the mean of 12 trials. (a) Central Dogma; (b)
Cell exterior; (c) Biosynthesis; (d) Degradation; (e) Other pathways; (f) Energy; (g) Cellular
processes; and (i) Response to stimulus. Plots constructed using Pathway Tools, Omics
Dashboard.
Figure S4.3 Resistant (a) and sensitive (b) gene scores plotted against subsystems involved in
cell regulation. The small circles represent the individual hits and the large circles represent the
mean of each subsystem. Each individual score signifies the mean of 12 trials – three biological
and four technical. The p-value was calculated as a two-tailed t-test and significance was
determined using the Benjamini-Hochberg procedure; false discovery rate was selected to be 0.1.
Plots constructed using Pathway Tools, Omics Dashboard.
Figure 5.1 Synthetic Array Tools (version 1.0) was used to normalize and score the Ga resistant
and sensitive hits as a means of representing the growth differences in Escherichia coli K12
BW25113 in the presence of 100 μM Ga(NO3)3. Each individual score represents the mean of 9-
12 trials.
Figure 5.2 Ga resistant and sensitive gene hits mapped to component cellular processes. Several
gene hits are mapped to more than one subsystem. The cutoff fitness score selected was two
standard deviations from the mean and recovered gene hits with a score outside this range were
chosen for further analyses. The hits were mined using the Omics Dashboard (Pathway Tools),
which surveys against the EcoCyc database. Each individual score represents the mean of 9-12
trials.

xxiii
Figure 5.3 Functional enrichment among the Ga resistant and sensitive gene hits. The DAVID
gene functional classification (version 6.8) database, a false discovery rate of 10% and a cutoff
score two standard deviations from the mean was used to measure the magnitude of enrichment
of the selected gene hits against the genome of Escherichia coli K-12. Only processes with gene
hits 3 were included.
Figure 5.4 Connectivity diagram displaying the predicted functional associations between the Ga
sensitive gene hits; disconnected gene hits not shown. The thickness of the line indicates the
degree of confidence prediction for the given interaction, based on fusion, curated databases,
experimental and co-expression evidence. Figure generated using STRING (version 10.5) and a
medium confidence score of 0.4.
Figure 5.5 Connectivity diagram displaying the predicted functional associations between the Ga
resistant gene hits; disconnected gene hits not shown. The thickness of the line indicates the
degree of confidence prediction for the given interaction, based on fusion, curated database,
experimental and co-expression evidence. Figure generated using STRING (version 10.5) and a
medium confidence score of 0.4.
Figure 6.1 Synthetic Array Tools (version 1.0) was used to normalize and score the Cu resistant
and sensitive hits as a means of exposing the growth differences in Escherichia coli K12
BW25113 in the presence of 5 mM Cu(NO3)3. The p-value was a two-tailed t-test and
significance was determined using the Benjamini-Hochberg procedure; false discovery rate was
selected to be 0.1. Each individual score represents the mean of 9-12 trials.
Figure 6.2 Cu resistant and sensitive gene hits mapped to component cellular processes. Gene
hits can be mapped to more than one process. Only hits two standard deviations or greater from
the mean are included. The gene hits were mined using the Omics Dashboard (Pathway Tools),
which surveys against the EcoCyc database.
Figure 6.3 Functional enrichment among the Cu resistant and sensitive gene hits. The DAVID
gene functional classification (version 6.8) database, a false discovery rate of 0.1 and a cutoff
score two standard deviations from the mean was used to measure the magnitude of enrichment
of the selected gene hits against the genome of Escherichia coli K-12. Only clusters with 3
gene hits and a p-value <0.05 were included.
Figure 6.4 Connectivity map presenting the predicted functional associations between the Cu
sensitive gene hits; disconnected gene hits not included. The thickness of the line indicates the
degree of confidence prediction for the given interaction, based on fusion, experimental and co-
expression evidence only; several hits may be excluded based on these requirements. Figure
generated using STRING (version 10.5) and a medium confidence score of 0.4.
Figure 6.5 Connectivity diagram presenting the predicted functional associations between the Cu
resistant gene hits; disconnected gene hits not shown. The thickness of the line indicates the
degree of confidence prediction for the given interaction, based on gene fusion, curated
databases, experimental and co-expression evidence only; several hits may be excluded based on

xxiv
these requirements. Figure generated using STRING (version 11) and a medium confidence
score of 0.4.
Figure 7.1 Planktonic growth tolerance of E. coli BW25113 (blue), tolC (red) and ygfZ
(green) in the presence of silver. Cells were grown in M9 minimal media for 24 hours and spot
plated onto M9 minimal media agar plates (1.0% agar) in order to determine the colony forming
units (CFU/mL). Values are represented as the mean of three biological trials, each with three
technical replicates; included are standard deviations.
Figure 7.2 Planktonic growth tolerance of E. coli BW25113 (blue), tolC (red) and ygfZ
(green) in the presence of gallium. Cells were grown in M9 minimal media for 24 hours and spot
plated onto M9 minimal media agar plates (1.0% agar) in order to determine the colony forming
units (CFU/mL). Values are represented as the mean of three biological trials, each with three
technical replicates; included are standard deviations.
Figure 7.3 Planktonic growth tolerance of E. coli BW25113 (blue), tolC (red) and ygfZ
(green) in the presence of copper. Cells were grown in M9 minimal media for 24 hours and spot
plated onto M9 minimal media agar plates (1.0% agar) in order to determine the colony forming
units (CFU/mL). Values are represented as the mean of three biological trials, each with three
technical replicates; included are standard deviations.
Figure 7.4 Cellular respiration of growing WT E. coli BW25113 cells determined using the
MitoXpress Xtra Assay (HS Method) from Aligent under copper, gallium and silver exposure.
The provided reagent, MitoXpress Xtra, is quenched by O2, through molecular collisions, as a
result, the amount of fluorescence is inversely proportional to the amount of oxygen present.
Two biological trials, each with three technical replicates are shown and the mean of the two
biological trials is provided by the solid line. Included is copper 0.2 mM (blue), copper 0.002
mM (red), silver 0.2 mM (green), silver 0.002 mM (purple), gallium 1.0 mM (orange), gallium
0.01 mM (black), no metal (brown), glucose oxidase at 1 mg/mL (dark blue), which serves as a
positive control, and no cells with the reagent (plum), which serves as a negative control.
Figure 7.5 Cellular respiration of growing tolC E. coli BW25113 cells determined using the
MitoXpress Xtra Assay (HS Method) from Aligent under copper, gallium and silver exposure.
The provided reagent, MitoXpress Xtra, is quenched by O2, through molecular collisions, as a
result, the amount of fluorescence is inversely proportional to the amount of oxygen present.
Two biological trials, each with three technical replicates are shown and the mean of the two
biological trials is provided by the solid line. Included is copper 0.2 mM (blue), copper 0.002
mM (red), silver 0.2 mM (green), silver 0.002 mM (purple), gallium 1.0 mM (orange), gallium
0.01 mM (black), no metal (brown), glucose oxidase at 1 mg/mL (dark blue), which serves as a
positive control, and no cells with the reagent (plum), which serves as a negative control.
Figure 7.6 Cellular respiration of growing ygfZ E. coli BW25113 cells determined using the
MitoXpress Xtra Assay (HS Method) from Aligent under copper, gallium and silver exposure.
The provided reagent, MitoXpress Xtra, is quenched by O2, through molecular collision, as a
result, the amount of fluorescence signal (in arbitrary units) is inversely proportional to the
amount of oxygen present. Two biological trials, each with three technical replicates are shown

xxv
and the mean of the two biological trials is provided by the solid line. Included is copper 0.2 mM
(blue), copper 0.002 mM (red), silver 0.2 mM (green), silver 0.002mM (purple), gallium 1.0
mM (orange), gallium 0.01 mM (black), no metal (brown), glucose oxidase at 1 mg/mL (dark
blue), which serves as a positive control, and no cells with the reagent (plum), which serves as a
negative control.
Figure 7.7 The pH-Xtra Glycolysis Assay from Aligent was used to determine the change in
fluorescence signal (in arbitrary units) after 30 minutes of incubation at 37C. The solid blue line
presents the signal of the WT cells grown in the absence of any metal, the red line provides the
signal of the tolC mutant grown in the absence of any metal, and the green line presents the
signal of the ygfZ mutant grown in the absence of any metals. The orange line represents the
fluorescence signal of the negative control in which no cells were added (only the pH-Xtra
probe) and the pH of this test sample was 7.4. A signal higher than this signifies increased
acidity and vice versa. The grey line represents the complete acidification of the sample in the
absence of cells using glucose oxidase (1.0 mg/mL). Values are represented as the mean of two
biological trials, each with three replicates. Two-way ANOVA was used to compute the
statistical significance between the WT and the mutants. * Indicates a significant difference
between the means, where * = p0.05, ** = p0.01, *** = p0.001 and **** = p0.001. All
three strains grown in the presence of copper at 0.02mM (***), copper at 2.2 mM (****) and
gallium at (****) were significant when compared to the no metal control, as well as tolC in the
presence of silver at 0.2 mM (**) and yfgZ in the presence of 0.002 mM silver (*).
Figure 7.8 2,7-Dichlorodihydrofluorescein was used to qualitatively measure the amount of
hydrogen peroxide, peroxide radical and hydroxyl radical produced at 522 nm. The WT strain
was grown for 24 hours on M9 minimal media agar plates in the presence and absence of silver,
gallium or copper then extracted and exposed to hydrogen peroxide to determine the potential for
ROS production. Cells grown in the presence of copper (blue), copper then exposed to hydrogen
peroxide (red), silver (green), silver then exposed to hydrogen peroxide (purple), gallium
(orange), gallium then exposed to hydrogen peroxide (black), no metal (brown) and no metal
then hydrogen peroxide exposure (dark blue) are shown. Mean of three biological trials, each
with two technical replicates, shown; standard deviations included.
Figure 8.1 Percent enrichment for the silver, gallium and copper sensitive hits. Each dataset was
normalized against the number of hits obtained. Enrichment was performed using Omics
Dashboard from EcoCyc which calls attention to pathways and processes whose changes are
statistically different; the significance value was p < 0.05.
Figure 8.2 Percent enrichment for the silver, gallium and copper resistant hits. Each dataset was
normalized against the number of hits obtained. Enrichment was performed using Omics
Dashboard from EcoCyc which calls attention to pathways and processes whose changes are
statistically different; the significance value was p < 0.05.
Figure 8.3 Silver, gallium and copper sensitive hits identified in E. coli BW25113. Synthetic
Array Tools (version 1.0) was used to normalize and score the sensitive hits. Only those with
scores that were two standard deviations from the normalized mean for each dataset are included.

xxvi
Figure 8.4 Silver, gallium and copper resistant hits identified in E. coli BW25113. Synthetic
Array Tools (version 1.0) was used to normalize and score the sensitive hits. Only those with
scores that were two standard deviations from the normalized mean for each dataset are included.
Figure A.1 The 4 h MIC of CuSO4, AgNO3, and Ag7NO11 against dual-species planktonic
cultures. Viable planktonic cells were enumerated as Cfu mL-1 for E. coli (JM109), S. aureus
(ATCC 25923), and P. aeruginosa (PA01) grown as dual-species planktonic populations in
simulated wound fluid (SWF) containing various concentrations of CuSO4 (• broken line),
AgNO3 (■ solid line), and Ag7NO11 (▴dotted line) for 4 h. (i) S. aureus + P. aeruginosa (A and
B, respectively). (ii) S. aureus + E. coli (A and B, respectively). (iii) P. aeruginosa + E. coli (A
and B, respectively). note that all metal stock solutions were prepared at equal molar
concentrations of Ag or Cu molecules. Hence, concentrations found in this figure are reflective
of the concentration of Ag or Cu and not the metal compound itself. n = 4–6 ± SD of the
concentration of Ag or Cu and not the metal compound itself. n = 4–6 ± SD.
Figure A.2 The 4 h MBIC of CuSO4, AgNO3, and Ag7NO11 for preventing biofilm formation.
Viable biofilm cells were enumerated as Cfu peg-1) for E. coli (JM109), S. aureus (ATCC
25923), and P. aeruginosa (PA01) grown as dual-species biofilm populations in simulated
wound fluid (SWF) containing various concentrations of CuSO4 (• broken line), AgNO3 (■ solid
line), and Ag7NO11 (▴dotted line) for 4 h. (i) S. aureus + P. aeruginosa (A and B, respectively).
(ii) S. aureus + E. coli (A and B, respectively). (iii) P. aeruginosa + E. coli (A and B,
respectively). note that all metal stock solutions were prepared at equal molar concentrations of
Ag or Cu molecules. Hence, concentrations found in this figure are reflective of the
concentration of Ag or Cu and not the metal compound itself. n = 4–6 ± SD.
Figure A.3 The 24 h MBC of CuSO4, AgNO3, and Ag7NO11 against established dual-species
planktonic cultures. Dual-species planktonic populations of E. coli (JM109), S. aureus (ATCC
25923), and P. aeruginosa (PA01) were grown for 24 h in simulated wound fluid (SWF). Then,
the cultures were exposed to various concentrations of CuSO4 (• broken line), AgNO3 (■ solid
line), and Ag7NO11 (▴dotted line) for 24 h. Viable planktonic cells were enumerated as Cfu mL-1
following the 24 h metal exposure. (i) S. aureus + P. aeruginosa (A and B, respectively). (ii) S.
aureus + E. coli (A and B, respectively). (iii) P. aeruginosa + E. coli (A and B, respectively).
note that all metal stock solutions were prepared at equal molar concentrations of Ag or Cu
molecules. Hence, concentrations found in this figure are reflective of the concentration of Ag or
Cu and not the metal compound itself. n = 4–6 ± SD. **Although P. aeruginosa and E. coli
could grow together planktonically for 24 h in 96-well plates (Supplemental figure 2), a further
24 h during the metal challenge led to a lack of viable E. coli cells.
Figure A.4 The 24 h MBEC of CuSO4, AgNO3, and Ag7NO11 against established dual-species
biofilms. Dual-species biofilms of E. coli (JM109), S. aureus (ATCC 25923), and P. aeruginosa
(PA01) were established for 24 h in simulated wound fluid (SWF). Then, the cultures were
exposed to various concentrations of CuSO4 (• broken line), AgNO3 (■ solid line), and Ag7NO11 (▴ dotted line) for 24 h. Viable biofilm cells were enumerated as Cfu peg-1 following the 24 h
metal exposure. (i) S. aureus + P. aeruginosa (A and B, respectively). (ii) S. aureus + E. coli (A
and B, respectively). (iii) P. aeruginosa + E. coli (A and B, respectively). note that all metal
stock solutions were prepared at equal molar concentrations of Ag or Cu molecules. Hence,

xxvii
concentrations found in this figure are reflective of the concentration of Ag or Cu and not the
metal compound itself. n = 4 to 6 ± SD. **Although P. aeruginosa and E. coli could grow
together as a biofilm for 24 h in the MBECTM device (Supplemental figure 3), a further 24 h
during the metal challenge led to a lack of viable E. coli cells.
Figure C.1 Copies/reaction of the (a) rodZ, (b) gshA, (c) trxA and (d) grxD for cells grown in the
in the presence of silver nitrate at 20 M and 50 M for 24 hours at 37°C in M9 minimal media.
Results normalized against the 16S levels and the gBlock corresponding to the gene of interest.

xxviii
List of Abbreviations
ABC ATP-Binding Cassette
ATCC American Type Culture Collection
CBD Calgary Biofilm Device
CSWF Chemically simulated wound fluid
CSWM Chemically simulated wound media
DFCH 2,7-Dichlorodihydrofluorescein
DFCH-DA 2,7-Dichlorodihydrofluorescein diacetate
DNA Deoxyribonucleic acid
GSH Glutathione (reduced)
GSSG Glutathione (oxidized)
HBSS Hank’s Balanced Salt Solution
HU Hydroxyurea
LB Lysogeny Broth/Luria-Bertani
MBBC Minimal biofilm bactericidal concentration
MBC Minimal bactericidal concentration
MBEC Minimal biofilm eradication concentrations
MIC Minimal inhibitory concentration
MPBC Minimal planktonic bactericidal concentration
MRSA Methicillin resistant Staphylococcus aureus
MSSA Methicillin sensitive Staphylococcus aureus
NADH Nicotinamide adenine dinucleotide
OD Optical Density

xxix
RNA Ribonucleic acid
RNR Ribonucleotide reductase
RNS Reactive nitrogen species
ROS Reactive oxygen species
rpm Revolutions per minuet
RS Reactive species
RSS Reactive sulfur species
SD Standard deviation
SMM Sulfometuron methyl
TCA Trichloroacetic acid
tRNA Transfer ribonucleic acid
TSA Tryptic soy agar
UN Universal neutralizer
WT Wild-type
Epigra

xxx
Epigraph
“I would rather have questions
that can’t be answered than answers that
can’t be questioned”
- Robert Feyman

1
1 Introduction
Essentiality of metal ions to the biochemistry of life
With the common occurrence of metals in the environment, it is no surprise that organisms
have adapted to accommodate these elements for imperative cellular functions [2]. Inorganic metal
ions are fundamental to the biochemistry of all living organisms. In fact, it has been estimated that
one-third of all proteins require metal ions [3],[4], along with elegantly coordinated binding sites.
Essential metals satisfy biological functions that cannot be met by organic molecules alone.
Several essential metals include iron, copper, zinc, nickel, magnesium, cobalt, molybdenum,
calcium, manganese and selenium.
Biotic use is heavily influenced by the environmental availability of a metal. The reliance of
early life forms on iron, cobalt, nickel and manganese over copper and zinc, due to the insolubility
of the latter two in the absence of oxygen [5], is an example of this. Once atmospheric oxygen
levels increased, owing to the proliferation of oxygenic photosynthesis, iron was readily oxidized
into insoluble ferric compounds while soluble forms of zinc and copper rose [6], thereby changing
the essentiality of these metals.
The presence and requirement of metals is diverse. Elements found at high concentrations
include magnesium, an element that is key for ribosome stability [7], calcium and sodium, both of
which are vital for the generation of chemical gradients in all domains of life. Magnesium and
sodium can found in concentrations as high as 10-3 – 10-2 M and calcium can be found at
approximately 10-6 M in the cytosols of eukaryotic and prokaryotic organisms [8]. Trace essential
metals such as zinc and copper rarely exceed concentrations greater than 10-10 and 10-18 M [9]–
[11], respectively. Zinc, which has only one oxidation state [zinc(II)] at biologically relevant

2
reduction potentials, is commonly used to organize protein structure such as with DNA and RNA
polymerases [12], and drive catalysis by functioning as a Lewis acid [2]. Copper, while not
extensively utilized by prokaryotes, is largely localized to the periplasm of microbes, in the case
of Gram-negative bacteria, and is a prosthetic group for many enzymes such as cytochrome c
oxidase and NADH dehydrogenase-2. Iron can be found in electron transferring proteins that are
involved in respiratory metabolism such as cytochrome c oxidase [13]. Here, we see the use of
iron-sulfur clusters or haem groups [5]. This metal is also involved in the trichloroacetic acid
(TCA) cycle, oxygen transport, gene regulation and the synthesis of DNA [7]. Manganese is found
within the active sites of several proteins including superoxide dismutases and catalases [14],
which are intended to regulate the oxidative state of the cell. This metal is also associated with
proteins involved in amino acid metabolism and glycolysis. Nickel, which can be found in urease
and several superoxide dismutases, is involved in nitrogen fixation, regulating toxin stress,
anaerobic growth and fatty-acid metabolism [15]. This metal is maintained intracellularly at 10-9
M [16].
Despite the obligatory roles of essential metals, the redox properties, rich coordination
chemistries and competitive binding capabilities are such that they can cause cellular toxicity and
carcinogenic effects at elevated concentrations. This consequence is not limited to essential metals.
Non-essential metals, such as silver, gallium, mercury and tellurium are toxic to microbes at
concentrations as low as 9 – 150 M in the case of gallium [17],[18] and 3 – 40 M for silver
[19],[20]. Indeed, the efficacy of essential and non-essential metals have led to their utilization as
antimicrobials for thousands of years. These agents continue to be developed and used for various
antimicrobial purposes, particularly as the progression of antimicrobial resistance continues (as
reviewed in section 1.2.1 and 1.2.2).

3
The reemergence of metal compounds as antimicrobial agents
The colonization of non-native microorganisms in eukaryotes can lead to disease states.
Consequently, the control and eradication of pathogenic organisms is desirable. The introduction
of antibiotics in the 1940’s was a key achievement in modern medical history [21]. A New York
Times report in 1940 called penicillin “the most powerful germ killer ever discovered” [22]. Still,
not long after this discovery, researchers would come to recognize that bacteria were disposed to
developing resistance. Since then, a positive correlation between the use of antimicrobials and the
generation of resistance has lead researchers to believe that the overuse of antibiotics in agriculture
and inappropriate stewardship in medicine is to blame [23]. This provides an example of
Darwinian selection, in which the use of antibiotics has led to adaptive pressures, thereby,
permitting the colonization of resistant bacteria [24].
Resistance can be an innate characteristic brought on by mutations in the microbial
chromosome, singular or sequential [25]. These resistance elements were procured through
environmental pressures, such as the existence of natural antibiotics excreted by microbes residing
in the immediate area [26]. Exchanging genetic information via plasmids, transposons or
bacteriophages are common modes of transference [24]. Surviving sensitive organisms may
acquire resistance mechanisms novel to their genome [24] and this results in the replacement of
susceptible or sensitive microorganisms with the inherently resistant. Furthermore, this threat is
amplified if the inherently sensitive bacteria are pathogenic or opportunistic microbes. Hence, with
the application of antibiotic pressures, bacteria once sensitive to antibiotics can easily acquire
elements that permit resistance, a process that can occur a number of times, resulting in the
emergence of multidrug resistant bacteria.

4
Unfortunately, the progression of antibiotic resistance is not our only threat. Biofilms,
structured assemblies of bacteria found in singular or as a multi-species consortium that are
surrounded by a self-produced extracellular polymeric substance [27] contribute to the latter.
While the formation of a biofilm is a natural process, the presence of these communities affects
industrial productivity, and the health of humans, livestock and plants [28]. Microbial biofilms
contaminate industrial and clinical surfaces and are responsible for numerous chronic infections
[28]. They are capable of mobilizing toxic elements, depleting oxygen reserves, causing biofouling
and biocorrosion, and contaminating surfaces [29].
Biofilm growth provides enhanced resistance to traditional antibiotics intended for use
against planktonic cells or a single species. Consequently, cells that dwell in acute wounds as a
biofilm are more difficult to treat with traditional antibiotics [30]. Biofilms permit the transfer of
genetic elements, which in turn propagates antimicrobial resistance (refer to [27] for more
information on biofilms and the genetic and structural adaptations they are capable of undergoing).
As a result of the aforementioned threats, in the last several decades, researchers have begun
investigating and developing the use of alternative metal-based antimicrobials, such as copper,
silver, gallium, nickel, tellurium, and zinc [31]. Overall, metals that are being increasingly
considered for antimicrobial agents are typically found in the d-block, which are known for their
transitivity in their properties showing large charge/radius ratio, variable oxidation states and
stable complex formation, and several other metals and metalloids from groups 13-16 of the
periodic table.
1.2.1 Historical uses of metals
For thousands of years metals have been used for their antimicrobial properties in
agriculture and medicine. The Egyptians first reported the use of copper as an astringent in 1500

5
B.C. [32]. The use of this metal as an antiseptic for the treatment of wounds and infections and in
contraceptive intrauterine devices dates back more than 4000 years. Skin diseases like syphilis,
tuberculosis and anaemia were commonly treated with copper in the 18th and 19th centuries [33].
This metal has also been widely used for agricultural purposes as a wood preservative and an
animal feed additive. For example, in the 18th century copper sulfide and copper sulfate solutions
were used to protect grain and grape crops, respectively, against bacterial and fungal infections
[34].
Silver is not acclaimed for use in agriculture. The best-known uses of silver were, and
continue to be for the treatment of burns. Still, it was not until 1965 that the use of this metal was
revived and fully appreciated. Moyer and co-workers conducted extensive in vitro and in vivo tests
to demonstrate the potent antibacterial properties of silver nitrate and different silver formulations
against Staphylococcus aureus, haemolytic streptococci, Pseudomonas aeruginosa and
Escherichia coli [35]. In a short period of time, three silver based medications appeared on the
market, one of which, sulfadiazine, still remains the mostly widely used silver compound in
medicine (for more information refer to the review [35]). Before this, in the 17th century, silver
was administered internally as an counterirritant [36], used for the management of gonorrheal eye
infections in newborns and children [37], used to treat ulcers and as a cauterizing agent [38]. Prior
to WWII, travelers would often use water vessels made of silver or drop silver coins into containers
for disinfection and preservation purposes [32],[36]. Serious harm caused by silver has never been
reported, as a result, this metal is regarded as benign compared to other metal antimicrobials only
causing staining, the destruction of skin cells and argyria when consumed in excess. For these
reasons this metal has remained popular, particularly in consumer products (see 1.2.2 for more
information).

6
Arsenic has been utilized for antimicrobial purposes for more than 2000 years in medicine
and agriculture. Like copper, this metal was used to preserve wood and as a herbicide and fungicide
[38]. This metal was combined with copper and lead to produce potent rodenticides and
insecticides. In the 18th century arsenic oxide, arsenic sulfide and arsenic trisulfide retained a
number of purposes in medicine such as sedatives, antiseptics for skin infections, and as treatment
options for malaria, ulcers and syphilis [39]. In the early twentieth century Ehrlich and coworkers
produced the drug Salvarsan, predominantly for the treatment of syphilis, and this was the drug of
choice for many infections until the introduction of penicillin [40]. In the last four decades many
arsenic products have been removed from market since they have been associated with abnormal
growths, tumors and demonstrated to cause cancer in higher mammals [41].
Despite the elevated toxicity of mercury, which has been known since antiquity, inorganic
salts of mercury were commonly used to prevent plant diseases, as wood preservatives, in animal
feed additives and as rodenticides from the late 19th century and onwards [42]. Mercury has also
been combined with laxatives and diuretics, used to treat sexually transmitted diseases and used
as an antiseptic, antifungal and biocidal agent since the 15th century [43]. The use of this metal in
medicine and agriculture is on the decline since it has been demonstrated to result in neurological
impairments, reproductive failures, acrodynia and death [38],[44].
1.2.2 Current metal-based antimicrobial development and use
Presently, advances in the biomedical applications of metals primarily take the form of
diagnostic procedures and the prevention of infections following the discovery that metals can
disrupt antibiotic resistant biofilms [1],[18],[31],[45] and kill multidrug resistant bacteria at low
concentrations [46]–[49]. In the past several decades, numerous studies documenting the efficacy
and performance of metal ions on a number of medical devices and products have been reported.

7
For example, wound dressings containing silver have proven to be quite effective, demonstrating
a 99% reduction in cell viability within four hours [50]. Urinary catheters coated in silver display
a significant benefit to patients with urinary tract infections when compared to traditional alloy-
coated catheters [51],[52]. Combination coatings produced through the deposition of silver and
titanium demonstrate decreased cell viability against S. aureus and Klebsiella pneumoniae, while
displaying no cytotoxicity to epithelial and osteoblast cells [53]. Titanium dioxide is also an
excellent antimicrobial [54]. Glasses have also been doped with gallium and tested against Gram-
negative and Gram-positive organisms, including a number of multi-drug resistant bacteria, and
shown to prevent bacterial growth at low concentrations [55].
Studies have confirmed that hospital surfaces can be contaminated with isolates such as
methicillin-resistant Staphylococcus aureus (MRSA), vancomycin-resistant Enterococci (VRE),
and spores of Clostridium difficile, among others, that may be transmitted to other innate objects
or patients [56]. As a result of this, various copper surfaces have been examined for their ability to
decrease the viability of pathogenic microorganisms. Reports have demonstrated a reduction in
Listeria monocytogenes [57], E. coli isolates, including a verocytotoxigenic E. coli [58],
Mycobacterium tuberculosis [59], Salmonella enterica, Camplylobacter jejuni [60], VRE [61],
MRSA [62], Bacillus cereus, and Deinococcus radiodurans [63] viability on time scales of only
minutes to a few hours upon copper surface exposure. These results, in strong favor of the copper
surface, were compared to other surfaces such as stainless steel, polyvinyl chloride, aluminum
bronze and silicon bronze. Protective respiratory face masks impregnated with copper oxide
exhibit enhanced anti-influenza biocidal activity [64] and copper impregnated socks have been
shown to improve the healing of minor wounds and cuts in diabetic patients [65]. Copper
impregnated fibers, latex, and polyester have been shown to cause a 2-log reduction in Escherichia

8
coli, MRSA, and VRE numbers after less than two hours of exposure [66]. Furthermore,
encapsulated bismuth-based compounds, in combination with other antibiotics, have been
developed in order to eradicate Helicobacter pylori [67]. The antibacterial properties of copper
have been utilized in breast implants as well. Here, researchers demonstrated that implants coated
with copper (I) and (II) were superior to traditional implants since no cytotoxicity against local
fibroblasts were observed yet the growth of S. epidermidis was decreased [68]. Table 1.1 below
provides a survey of examples of only a small portion of the metal-based antimicrobials under
investigation and development.
Table 1.1 Examples of the metal-based antimicrobials investigated.
Application Description Examples
Additives or
standalone
antimicrobials
Metals are currently being
dosed into products to prevent
bacterial growth and deliver
antimicrobial properties. Here,
the entirety of the formulation
commonly contains evenly
distributed metal ions that upon
contact may be released.
Additives and formulations
used in healthcare settings are
designed to be stable and
Silver-doped hydroxyapatite [72]
Bismuth-doped calcium phosphate for
root canal filling [73]
Gallium-doped phosphate glass [55] and
other phosphocalcic compounds [74]
Wound dressings [75]–[79] and wool
[80] combined with silver to produce
products like Hydrofiber® [81]
Copper [82]–[84], silver [85], and silver-
cellulose fiber [86] biocomposites for
wound healing
Silver [87], silver-lactoferrin/xylitol [88],
silver-amino acid [89], copper-chitosan
polyethylene glycol [90] hydrogels
Silver [91] and copper [92] polymers
Textiles such as socks [65],[93],[94] and
respiratory face masks [64] impregnated
with Copper

9
compatible with the host [69].
Since metals, such as silver and
Copper, are regarded as safe
for consumption (in reasonably
low doses) they are now more
common than ever being
combined with existing
antimicrobials and antibiotics
to produce additive and even
synergistic affects, enhancing
existing antimicrobial
properties.
Metal-based nanostructures
(loosely defined as having one
at least one dimension between
0.1nm and 100nm) can be
produced as simple or
composite assemblies for
antimicrobial use [70]. Recent
advancements in
nanotechnology have permitted
the production of novel
combinations with purposeful
properties that allow for
particular application [71].
Sulfadiazine and silver-chlorhexidine
formulations [95]–[98]
Bismuth-norfloxacin [99] and –
tobramycin formulations [100]
Bismuth Subsalicylate/salts [99]
Copper combined with quaternary
ammonium cations [101]
Gallium-maltolate [102] and -
desferrioxamine [103] combinations
Chitosan-zinc complexes [104],[105]
Nanoparticles of zinc-oxide [106], nickel
[107], silver [71],[106],[108]–[114],
copper [115],[116], and gold [106]
Antimicrobial nanofiber mats produced
from silver-nanoparticles [117]
Ag-nanoparticles on textile fabrics [118]
Antimicrobial polymers with various
metal nanoparticles [119]
Creams [120] and contact lens [121]
loaded with silver-nanoparticles
Antibiotics conjugated to metal
nanoparticles such as gold [107] and
silver-nanoparticles [122]
Coatings and
surfaces
Metals are commonly found as
coatings on the surfaces of a
variety of products. Metal ions
are commonly not evenly
distributed throughout the
entirety of a product.
Titanium surfaces for medical [123] and
dental implants [124], as well as
endotracheal tubes coated with titanium-
dioxide [125]
Silver-nanomaterial coatings on human
dentine [126] and plastic catheters [127]
Copper alloys against multi-drug
resistant nosocomial pathogens [128], E.

10
coli O157 [129], and for the prevention
of osteomyelitis [130]
Copper surfaces for the prevention of
hospital contamination [60],[131],[132]
Copper-oxide coatings on non-porous
solid surfaces [133]
Silver-treated catheters [134]–[137] and
endotracheal tubes [125],[138]
Metal-based antimicrobials are not limited to healthcare or agricultural use. Consumers can
purchase many products in-stores and online. Examples include; clothing
(http://info.lululemon.com/design/fabrics-technology/silverescent), deodorant
(http://www.niveamen.in/products/SILVER-PROTECT) and antibacterial glass (http://www.agc-
glass.eu). Additionally, coating services for a range of products, from flooring to kitchen utensils
and food storage containers are offered (http://www.biocote.com; http://www.silverclear.ca).
Medical devices can also be coated in silver (http://coatings2go.com) and similarly for copper
(http://www.antimicrobialcopper.org/uk).
Metal Chemistry in Biological Systems
In order to understand the targets of metal-antimicrobials it is important to appreciate how
metal ions interact with biological molecules. Thus, a concise overview of background on metal-
organic compound interactions follows.
1.3.1 Donor atom preference: Speciation, the Irving-Williams series, the HSAB theory, and
metal lability
Metal ions bind to donor atoms, such as oxygen, nitrogen and sulfur in proteins, lipids,
DNA and other biomolecules with preference and precision. The interaction between a metal and

11
binding site is reliant on a number of factors including the preferred geometry or coordination of
the metal, as well as the speciation of the metal-donor complex [139]. What mainly governs the
former and the aforementioned is the electronic configuration of a metal ion on the basis of its
number of valance d electrons, this is called ligand field theory. For example, copper(II) prefers
either square planar or square pyramidal geometrics in the d9 electron configuration. Yet copper(I),
in the d10 electron configuration, has no partiality for geometry, thereby permitting for a wide range
of interactions including two, three or four-coordinate binding sites [140]. The electron
configuration also influences the redox of the metal, for example, ligands may provide a coordinate
a binding site that favors a particular geometry, such as square planar in the case of copper, in
which copper(I) is destabilized and the shift to the oxidized form is favored. This can be used to
purposely select for a particular oxidation state or metal, as the case for zinc(II) and copper(II) in
some sites. Given zinc(II) has no geometric preference but copper(II) does [139], proteins can
ensure the correct metal is inserted into the correct site. This is important when considering metals
that yield very stable interactions, such as copper (see below).
The speciation of a metal ion is influenced by several factors including the pH, reduction
potential, type of solvent or accompanying ions, concentration and ionic strength. The diversity of
speciation states is reflected in part by the Pourbaix diagram for each metal. In biological systems
metals are typically coordinated by metabolites, proteins, peptides, lipids, amino acids, DNA and
RNA, thus, the ‘free’ ion concentration of a metal is held low, especially in the case of copper due
to its competitive nature. ‘Free’ refers to the concentration of hydrated metal. This concentration
is governed by a pH-dependent equilibrium constant that is specific for each ligand-metal complex
and oxidation state [141]. The valance state of a metal increases the net charge which thereby

12
increases the strength of interaction with noncharged and anionic entities. In other words, dications
generally present stronger interactions over monocations [142].
Binding preferences and the ability to take on different geometric arrangements gives rise
to the Irving-Williams series – manganese(II) < iron(II) < cobalt(II) < nickel(II) < copper(II) >
zinc(II) [143]. The fourth period is organized by donor-ligand binding affinity in which copper(II)
provides the highest affinity. In general, stability, and therefore binding strength, increases as the
ionic radius deceases. This is due to decreased charge density, a trait that is enhanced for copper(II)
as a result of the Jahn-Teller distortion of its d9 configuration. Following the introduction of the
Irving-Williams series, the hard-soft acid base (HSAB) theory was developed by Pearson in 1965
[144]. This model is based on the polarizability of an atom. Hard acids and bases tend to have high
oxidation states, small ionic radii and low polarizability. Acidic examples include, sodium(I),
potassium(I), magnesium(II), calcium(II), aluminum(III), gallium(III), cobalt(III) and iron(III).
Basic examples include carbonate, carboxylates, sulfate, nitrate, phosphate and amines. In contrast,
soft acids and bases have low oxidation states, large ionic radii and high polarizability. Soft acids
include copper(I), gold(I), mercury(I), and silver(I), whereas soft bases include phenyl groups,
thiols, thioethers and ethylene, among others. A number of metals fall between these two and are
considered borderline acids, including copper(II), zinc(II), nickel(II), cobalt(II), lead(II),
bismuth(III) and iron(II). These acids interact well will borderline bases such as imidazole, nitrite,
pyridine and aniline groups. The interaction of soft acids and bases is largely covalent in nature,
whereas the interaction between hard bases and acids is mostly ionic. Together with the Irving-
Williams series, the HSAB theory can be used to predict the interactions of metal ions in bacterial
cells. For example, soft metal such as silver(I), and copper(I) and intermediate acids, like nickel(II)
and zinc(II) tend to interact with protein sulfur groups (a soft base) found in proteins, and the

13
antimicrobial toxicity of these metals correlate with their affinity for this functional group
[145],[146].
In transition metal biology, lability refers to the ease for which metal-ligand bonds are
broken. If this is reaction occurs at a high rate, then the metal is considered labile. If this process
is slow, generally indicating a kinetically stable complex, then the metal is inert [8]. The above
factors, including coordination, size and the electron configuration of a metal ion, influence metal
lability. In general, metal ions with an oxidation state of +1 display greater lability then those with
an oxidation state of +3 since those with higher oxidation states are better Lewis acids. Ions with
smaller atomic radii form stronger bonds and are therefore more inert. Furthermore, electrons in
higher antibonding levels, as the case for copper(II), weaken the ligand-metal bond, so the complex
can be broken easily. In general, the lability, or ability to coordinate with numerous different
ligands, of metal may account for differences in the mechanisms of metal toxicity reported (see
section 1.7) as well the antimicrobial abilities of metal ions.
1.3.2 Ligand properties: charge, denticity and metal coordination
There are a number of ligand properties that when combined with the electron
configuration of a metal ion govern the free energy of interaction. Firstly, the overall charge of the
ligand is vital. For example, aspartic acid, glutamic acid and deprotonated cysteine present stronger
metal interactions than their noncharged counterparts and other amino acids [147]. Secondly,
atoms with high polarizability, such as thiolate and carboxylate, donate more charge to the metal
ion. Competition with serine or histidine side chains for example, is largely in favor of thiolate and
carboxylate. By increasing the number of possible metal interactions, or denticity, the affinity of
the metal to the ligand binding site increases, this gives rise to the chelate effect [139]. Given the
high concentration of small inorganic molecules, such as chloride, nitrate, sulfate and phosphate

14
ions, in the cell, ranging in concentrations from 0.1 mM to 20 mM, it is probable that metals may
also bind these anions over amino acids or protein complexes [142]. Still, under physiological
conditions, metals have a tendency to bind charged amino acid residues within proteins owing to
the chelate effect or the polydentate binding abilities of the ligand. Furthermore, the metal-binding
pocket is commonly negatively charged, hence, anions are largely kept away, evident form the
free-energy of replacement for anions and amino acids [148]
There is a complex relationship between the chelation and steric strain of the metal-ligand
complex. Typically, metal centers forming five or six membered structures as opposed to four or
eight membered structures, are more stable due to increased enthalpy and a reduction in
unfavorable steric strains, respectively (see paragraph below). Further, the dipole moment of the
ligand constitutes a large part of the metal-ligand interaction. Charged and polar ligands generally
yield small d-orbitals, as a result, high-spin metal complexes [149], such as those exhibiting Jahn-
Teller distortions of the d9 configuration in the case of copper(II), favor these interactions and
display enhanced affinity. Here, we see an interplay between the HSAB theory (see 1.3.1), the
electron configuration of a metal ion and its influence on metal preference for a specific ligand [8].
A feature that is unique to each metal-ligand pair and captures the properties of each
complex is the coordination number, which is defined as the number of ligand atoms that are bound
to the metal being investigated. The coordination number and the geometric arrangement of the
ligand around the metal is key in determining the strength of interaction [141]. According to the
valance bond theory, which states that a bond forms between two atoms by the overlap of half-
filled valance atomic orbitals, increasing the number of bond atoms weakens each metal-ligand
bond [140],[150],[151]. The coordination number of the complex is largely dependent on the
metal’s size more than the charge accepting ability. A larger metal ion generates longer bonds with

15
an uncharged ligand and although this reduces repulsion, it yields a weaker bond. Whereas for a
ligand, it is the charge/charge donating ability that plays a larger role than the size or the number
of bonds it can form [140].
Metal Toxicity in Bacteria
1.4.1 General mechanisms of metal toxicity
The mechanisms of antimicrobials generally follow a broad mode of action, as either
bacteriostatic, in which growth is inhibited, and bactericidal resulting in cell death [152]. There
are a number of general mechanisms of antimicrobials including: the inhibition of DNA
replication, and the inhibition of RNA, cell wall, protein, and membrane synthesis and the
inhibition or destruction of specific enzymes. These general mechanisms can be extended to metal
ions, with variations and differences in the precise modes of action (Figure 1.1).
In this section, proposed mechanisms of metal toxicity are presented, such as the
production of reactive oxygen species (ROS), thiol depletion, membrane disruption, and protein
dysfunction and deactivation.

16
Figure 1.1 Several examples of metal toxicity in bacteria. Shown is a Gram-negative bacterium;
these mechanisms can be extended to a number of different organisms.
1.4.2 The production of reactive nitrogen/sulfur/oxygen species (RS)
Oxygen is a fundamental molecule for aerobic organisms that permits respiration and the
oxidation of nutrients in order to obtain energy. This molecule has a central role in the evolution
of multicellular species.
Single oxygen atoms are unstable, as a result, the formation of molecular oxygen (O2) is
favourable. Molecular oxygen is a free biradical since one pair of electrons is shared, whereas two
electrons remain unpaired [153]. Reaction with a single electron, originating from electron
transport chain quinones or NADH/NADPH for example, generates superoxide (•O2-) [154].
Dismutation may result in hydrogen peroxide formation, followed with hydroxyl radical (•OH)
Interference with nutrient uptake
Genotoxicity
Membrane
damage
Exchange of a catalytic or
structural metal
Amino acid oxidation
Iron-sulfur cluster destruction
Thiol depletion

17
production. In E. coli, it has been estimated that the respiratory chain is responsible for 87% of the
total hydrogen peroxide formed [155].
In biology, the term radical is a collective term that comprises nitrogen, sulfur and oxygen
radicals and non-radicals that are strong oxidizing agents for which electron radical formation can
originate. Some oxygen non-radicals include HOCl, HOBr, O3, and H2O2 [156]. The primary RS
is considered to be the superoxide anion since it can act as a reducing or oxidizing agent and it is
able to react with a wide-range of secondary metabolites, in turn circulating RS [157]. In addition,
the catalysis of the Fenton reaction [158], in which iron(III) is reduced to iron(II), yields the
hydroxyl radical through the Haber-Weiss net reaction (Equation 1.1) [159]. The participation of
iron is key to the production of this radical, which can initiate the oxidation of almost any molecule
present in biological systems either directly or through propagation.
Fe(III) + O2•- Fe(II) + O2
Fe(II) + H2O2 → Fe(III) + •OH + OH-
O2•- + H2O2 O2 + •OH + OH-
Equation 1.1 Generation of reactive oxygen species through the Fenton reaction. This produces
the overall net reaction called the Haber-Weiss reaction. The intermediates of these reactions are
capable of propagating lipid peroxidation, the oxidation of proteins and DNA damage.
Reactive nitrogen species are an additional class of reactive species. Some examples
include peroxynitrate, nitrogen dioxide radical and nitrate. Peroxynitrate, the major nitrogen
centered radical is produced through the reaction of nitric oxide and superoxide radical. [160].
Reactive sulfur species include thiols, hydrogen sulfide, thiosulfinate and thiyl-radical, among
others. These species are redox-active sulfur compounds that are formed under conditions of
oxidative stress while also existing independently in the cell [161].
Free radicals, whether oxygen-, nitrogen- or sulfur-centered, are capable of short-lived
individual existence and are highly reactive species that propagate undesired reactions within

18
biomolecules [153]. Many studies over the last several decades report on the production of reactive
oxygen radicals (ROS), either directly or indirectly, by metals such as copper, iron, mercury,
nickel, silver and vanadium (see the excellent review [157] for examples). The over-production of
ROS cause negative effects including DNA damage, protein and enzyme inactivation, and the
oxidation of lipid membranes and other biomolecules [154]. Reactive oxygen species can react
with the entirety of DNA – from nucleotide bases to the deoxyribose sugar. Here, ROS can cause
double or single stranded breaks, modifications to purine and pyrimidines, and DNA crosslinking
[162]. This genetic instability may inhibit DNA replication or transcription, cause replication
errors, or the induction or suppression of signaling pathways [163]. Metals have been shown to
cause lipid peroxidation, in which a primary effect of toxicity is a decrease in fluidity and the
disruption of protein-lipid interactions [164]. Non-enzymatic hydroxyl radicals are able to drive
the peroxidation of unsaturated fatty acids. This danger is thought to be a major proprietor of
oxidative stress given the proximity of biomolecules, such as proteins, within the membrane, and
due to the formation of aldehydes, long-lived reactants that are able to diffuse through the
membrane. The reactions of ROS with proteins are far-less studied than the aforementioned. Still,
several cases of damage have been documented including the oxidation of sulfhydryl groups
[153],[165] and amino acids [165]–[167], the reduction of disulfides [168],[169], reaction with
aldehydes [163],[170], co-factor modification and protein cross-linking [171],[172].
1.4.3 Thiol mediated reduction and antioxidant depletion
The occurrence of cysteine residues is fairly uncommon compared to other amino acids,
comprising only approximately 2.3% of the human proteome [173], whereas within the proteins
of E. coli, the frequency of this amino acid is approximately 2% [174]. Although one of the least
abundant amino acids, the unique chemical characteristics, redox properties, oxidation states and

19
metal binding abilities of cysteine render this protein key to the biochemistry of life. Cysteine can
bind meal ions such as iron, copper, cadmium and zinc [175] since it can accommodate a large
number of bonds via changes in the oxidation state of the sulfur atom [176]. The thiol group of
cysteine is ionizable, with a pKa of ~8.5, and upon deprotonation, this amino acid is moderately
reactive making it susceptible to attack by ROS [177]. These reactions occur endogenously to
regulate protein function and control radical levels. However, non-specific oxidization can lead to
uncoordinated functional changes that are both reversible and non-reversible. In addition to its
occurrence in proteins, cysteine is found within the redox regulatory peptide glutathione (GSH) at
a concentration of 10 mM in most Gram-negative bacteria [178]. This low molecular weight
molecule participates in disulfide bond formation and regulatory functions. In fact, the oxidation
state of the cell is typically estimated by measuring total GSH/GSSG concentrations [176].
Furthermore, coenzyme A, a substrate found in all bacterial genomes sequenced to date [179],
contains an important thiol group. Soft and borderline metals, such as silver(I), copper(I),
copper(II), mercury, nickel, zinc and iron, among others, react well with thiols thereby leading to
the depletion of antioxidant reserves, such as GSH [180]. This in turn leaves the cell susceptible
to further toxicity by preventing the repair of protein thiols and the propagation of ROS.
Reponses to environmental stress are commonly associated with the expression of several
stress response genes. In particular, these genes are under the control of oxido-responsive signal
transduction systems, in which the transmission of a signal in the form of a series of biochemical
events occurs after the binding of superoxide or other radicals [181]. In addition to enzymatic
defenses, such as superoxide dismutase, hydroperoxidases, glutathione reductase, thioredoxin, and
catalases, non-enzymatic defenses include GSH, NADPH and NADH pools, β-carotene, ascorbic
acid, and α-tocopherol [162]. The depletion of these defense mechanisms, which typically use

20
thiols and thiol derivatives for action, may lead to cell death. As a result, upon the formation of
RS, thiol and antioxidant depletion has been proposed to be a mechanism of metal toxicity.
1.4.4 Metal interactions at the cell membrane
Given the initial site of contact for any incoming threat is the bacterial membrane, it has
been hypothesized that metals may act by impairing membrane function and interfering with the
uptake or export of important biomolecules. The outer membrane of bacteria contains polymers
and carbohydrates that provide ideal binding sites for incoming threats despite their primary
function, which serves as a protective barrier for the bacterial cell from the harsh extracellular
space. The outer membrane of a Gram-negative bacterium is composed of lipopolysaccharides
(LPS) and a number of proteins responsible for import/export. Specifically, the LPS is comprised
of a glucosamine disaccharide with six or seven acyl chains, and a polysaccharide core and
extended chain [182]. The external layer of a Gram-positive bacterium is comprised of
peptidoglycan, proteins and teichoic acids that constitute a polyanionic network [183]. In general,
the surfaces of bacterial cells are commonly anionic and electronegative thus providing coordinate
binding sites for various cations such as metals [184],[185]. In E. coli and S. aureus, metal exposure
has been demonstrated to reduce membrane integrity [186]–[189] through disruption or
detachment of the cell wall from the membrane.
It has also been suggested that metals may affect the activity of the electron transport chain
by inhibiting key components [17],[190],[191]. Decoupling of the proton motive force through
proton leakage may be anticipated if this were in fact a mechanism of toxicity [192]. Furthermore,
metal toxicity has been attributed to starvation-induced growth in which the metal ion interferes
with the uptake of important nutrients such as sulfates, nitrates, amino acids and even other metals
[180].

21
1.4.5 Protein dysfunction and deactivation
Numerous antibiotics are designed to target protein synthesis and folding via the 30S or
50S subunit of the bacterial ribosome by preventing the binding of tRNA into the A site or
disrupting protein targeting, among other mechanisms [193]. In contrast, metals have been
proposed to attack proteins through the oxidation of amino acids of which histidine, arginine,
lysine and proline are major targets. Once oxidized, this results in loss of protein activity which
may then mark the protein for degradation. Soft metals target soft bases, such as thiols, while
borderline metals target borderline bases, such as imidazoles. These functional groups are found
in cysteine and histidine, two essential amino acids typically involved in metal coordination.
Cysteine and histidine coordinate a variety of metals including, zinc, manganese, cobalt and iron.
Regardless, it has been demonstrated both in vivo and in vitro that these metalloproteins are
particularly sensitive to oxidation, forming sulfonic or sulfinic compounds in the case of cysteine
[194],[195].
Several studies have shown that metals may target iron-sulfur clusters, particularly those
found in dehydratases [17],[196],[197]. Given the attraction of thiols for soft metals, it is no
surprise that this has been proposed to be a mechanism of metal toxicity. Upon interaction with an
iron-sulfur cluster, as the incoming threat outcompetes one or more iron ions, iron is released into
the cell offering potentiation for Fenton chemistry. This mechanism is two-fold, firstly the
inactivation of the protein may take place, secondly the production of ROS may occur after the
incoming threat has bound.
An additional mechanism of metal toxicity is metal mimicry, in which the incoming threat
may replace a specific structural or catalytic metal [198]–[200]. This in turn may cause strong

22
protein inhibition. Toxicity may arise if this protein is involved in maintaining the homeostasis of
the cell, such as mediating ROS, even if the targeted protein is not essential.
Specific mechanisms of metal toxicity
The proposed mechanisms of copper, silver and gallium toxicity are introduced and
explained in this section. Use if these metals to study the mechanisms of metal resistance and
toxicity in this work were selected on the basis of several factors including their relevance in
medicine and agriculture as antimicrobials (see section 1.2.2), and their differing chemical
properties – gallium(III) is a hard acid, copper(II) is a borderline acid, and copper(I) and silver(I)
are both soft acids.
1.5.1 Copper toxicity in bacteria
Copper has the ability to cycle between copper(II) and copper(I) and in higher organisms,
this element is a cofactor for over 30 known enzymes [201]. Two examples include cytochrome c
oxidase and NADH dehydrogenase, enzymes that are ubiquitous to aerobic organisms. Regardless
of its importance, accumulated levels of copper can lead to cell toxicity. Harm inflicted by this
metal is commonly attributed to increased ROS production generated through Fenton chemistry in
both Gram-positive [202] and Gram-negative [203] bacteria (Equation 1.2). DNA damage is a
probable consequence. This occurs through breakage, both single and double stranded [204], the
oxidation of DNA bases and the formation of crosslinks [205]. Several studies have reported on
the up-regulation of genes involved in the elimination of ROS after copper addition [206],[207].
In spite of these findings, recent studies suggest that there are alternative mechanisms responsible
for the primary effects of copper mediated death. Many Gram-positive organisms are resistant to
hydrogen peroxide, such as Lactococcus lactis [208] and copper supplementation has been found
to decrease the rate of H2O2 induced DNA damage in E. coli [203]. The production of ROS may

23
not be the sole mechanism of copper toxicity. To further this hypothesis, Macomber and co-
workers demonstrated that copper toxicity is the greatest under anaerobic conditions, contrary to
what may be expected if oxygen radicals were responsible for cell death [209].
Cu(II) + O2•- Cu(I) + O2
Cu(I) + H2O2 → Cu(II) + •OH + OH-
O2•- + H2O2 O2 + •OH + OH-
Equation 1.2 Copper readily catalyzes the formation of hydroxyl radicals through the Fenton
and Haber-Weiss reactions. The intermediates of these reactions are capable of propagating lipid
peroxidation, the oxidation of proteins and DNA damage.
There is a universal order of preference for donor ligands, in which the forth row of the
periodic table gives rise to the Irving-Williams series [2]. In this series, copper is the most
competitive metal and is expected to bind tightly to ligands, particularly to sulfur and nitrogen.
Copper(I), the more highly toxic form of copper, is a strong soft metal with elevated affinity for
thiolates in aqueous solutions. Under in vitro and in vivo conditions copper is capable of disrupting
the activity of isopropyl malate dehydratase by replacing iron as it coordinates with the thiolate or
inorganic sulfur ligands of this enzyme [197]. Copper has also been demonstrated to cause the
depletion of thiols, such as glutathione as it cycles between copper(I) and (II). (Equation 1.3).
Hydrogen peroxide is a product of this reaction and it can participate in a number of reactions
leading to the formation of other reactive species (Equation 1.2). Still, this mechanism has not
been demonstrated in vivo and cells have adapted a number of mechanisms aimed at controlling
hydrogen peroxide stress, therefore, the validity of this mechanism is in question [164].
Cu(II) + 2RSH 2Cu(I) + RSSR + 2H+
2Cu(I) + 2H+ + O2 → 2Cu(II) + H2O2
Equation 1.3 Copper readily catalyzes the formation of hydrogen peroxide via reactions with
sulfur groups found in cysteine and glutathione, among others.

24
More recently, researchers have shown that c-type cytochrome assembly is a target of
copper toxicity in Rubrivivax gelatinosus [210]. Supplementary to this, in B. subtilis, copper stress
has been shown to induce the transcription of a number of proteins containing iron-sulfur clusters,
including molybdopterin, pyrimidine and biotin [211]. Similarly, in E. coli, dihydroxy-acid
dehydratase, isopropyl malate dehydratase, fumarase A and 6-phophogluconate dehydrogenase
were found to be activated by copper ions, constituting as potential copper targets [197]. It has
also been shown that excess copper leads to increased iron acquisition in both Gram-negative and
Gram-positive bacteria [197],[211]. Together, these findings may suggest that copper targets iron-
sulfur clusters and/or copper may replace iron in these sites. Relative to ROS, the liberation of iron
may also result in Fenton chemistry, under the condition that iron is not rapidly chelated or
coordinated by biomolecules in the cell [180].
Given that the initial site of copper contact occurs at the bacterial membrane, researchers
have proposed that damage may occur at the lipopolysaccharides of the outer membrane, which
has been shown to collapse under copper stress [212]. Furthermore, lipid peroxidation and loss of
membrane integrity has been attributed to be the primary cause of cell death in several studies
[213],[214]. One study observed cytoplasmic depolarization of the membrane, loss of outer
membrane integrity, inhibition of respiration and the production of ROS in E. coli O157 [215].
More recently, it has been shown that copper alters glycolysis in Staphylococcus aureus thus
leading to adjustments in central carbon utilization [216].
Whether these are the primary or secondary pathways of copper cell toxicity in other Gram-
negative and Gram-positive organisms, and how these mechanisms translate into cell-wide effects
has yet to be explored.

25
1.5.2 Silver toxicity in bacteria
Compared to copper, the mechanisms of silver toxicity have been documented to a lesser
extent. It has been thought that silver interacts with sulfhydryl groups at the surface of the cell,
replacing hydrogen atoms and forming sulfur-silver bonds. This contact can inhibit respiration and
the electron transport chain, thereby, reducing mechanisms of resistance and rescue [217]. This
observation was reported in E. coli and Vibro cholerae in which low concentrations of silver led
to substantial proton leakage [192],[218]. Silver has been typically considered to target NADH-
ubiquinone oxidoreductase [190],[219],[220], the first respiratory chain complex in many bacteria.
One study demonstrated that toxicity is independent of this enzyme and these mechanisms may be
concentrated to the outer membrane [192]. In another study, morphological changes to the cell
membranes of E. coli and S. aureus were revealed when the cells were exposed to high
concentrations of silver [186], perhaps due to the detachment of the plasma membrane form the
cell wall.
Once silver ions enter the cell, this metal is thought to interact with nucleosides like guanine
[189] initiating pyrimidine dimerization and the interreference of DNA replication [221]–[223].
Still, one of the most widely accepted mechanisms of toxicity is the interaction of silver with thiol
groups and the inactivation of enzymes for which cysteine is commonly necessary for activity
[224]–[226]. Liau and colleagues demonstrated that silver toxicity decreased in the presence of
cysteine and other thiol compounds but not non-sulfur containing amino acids, methyl cysteine
and methionine, among others [224]. Recently, the structure of the nickel-dependent enzyme
urease was crystalized with two silver ions coordinated at the edge of the active site cavity [227],
a first of its kind. This report provides details on how silver interacts with proteins, such as urease,
boarding our current knowledge to the atomic level.

26
Studies have shown that silver produces ROS [228] upon iron liberation from iron-sulfur centers.
This metal is Fenton inactive at biologically relevant reduction potentials therefore a secondary
metal, such as iron, must be involved in this reaction [196]. Anaerobic growing bacteria have been
demonstrated to be less susceptible to silver, still, this mechanism has been challenged several
times. For instance, one group did not find significant differences in toxicity between aerobic and
anaerobic growing E. coli cells [229] and another group found similar results with silver nitrate
only and not with other formulations such as silver zeolite [223].
There is still much to be understood regarding the mechanisms of silver toxicity. Reports
are often contradicting and selectively compared, yet studies are performed under different
conditions, ionic species and with varying organisms. This is problematic, particularly as the
development of silver-based antimicrobials, such as nanoparticles [140],[230],[231], continues to
increase as quickly as it has.
1.5.3 Gallium toxicity in bacteria
Gallium has not been observed to be significant for cellular maintenance. This metal has a
long history as a chemotherapeutic agent for the treatment of cancer. Given the parallels between
gallium(III) and iron(III), such as electron affinity and nuclear radius, this metal participates in
metal mimicry. Unlike iron, gallium cannot be reduced or oxidized in biological systems [232]. If
gallium were to substitute iron within the prosthetic group of enzymes release and replacement by
the former would deactivate the protein. This may also increase the risk of ROS production via
Fenton chemistry, providing evidence for why ROS has been observed under gallium stress [18].
This theory is somewhat supported by the observation that exogenous iron rescues bacterial
viability [233]. Additionally, in P. aeruginosa, gallium has been observed to inhibit the uptake of
iron(III) in a concentration dependent manner by repressing the transcriptional regulator PvdS

27
[18]. This iron-induced regulator is responsible for the expression of genes involved in the uptake
of iron(III). By inhibiting this system, iron is unacquired and cells will die due to the lack of iron
or the direct toxicity of gallium, or both.
Since iron is key to many metabolic processes it is probable that gallium toxicity relies on
cell entry if iron mimicry is indeed a mechanism of toxicity [234]. Iron transport proteins, such as
transferrin and lactoferrin are able to form complexes with gallium in mammalian cells
[235],[236]. Compounds or complexes of gallium have been found to be promising therapeutic
agents since they have broad-spectrum activity against Gram-negative and Gram-positive bacteria
[103],[237]. The exact route of gallium entry into bacterial cells has not been made known, still,
several studies have explored the potential for metal-chelator complexes as enhanced gallium
antimicrobials [233]. These studies have been mainly completed in the P. aeruginosa since its iron
uptake abilities are eminent. Examples of gallium complexes include gallium-deferoxamine B
[103] and gallium-citrate [17], both of which demonstrate enhanced antimicrobial activities when
compared to gallium nitrate alone. This mechanism has not been replicated in other organisms,
such as E. coli, which encodes a functioning iron-citrate transport system. This provides indication
that gallium-‘chelator’ uptake may not be sufficient for antimicrobial activity; much is still
unknown regarding the activity of this metal in bacteria and humans [17].
Mechanisms of metal resistance in bacteria
1.6.1 General mechanisms of metal resistance
Resistance originates as an inherent characteristic [25] upon mutation in the microbial
chromosome, singular or sequential [238]. If the mutation is favourable, the next response is the
replacement of the inherently susceptible, or sensitive microorganisms, with the inherently
resistant [24]. Surviving susceptible organisms develop resistance mechanisms novel to their

28
genome, and threat is enhanced when the sensitive organisms are pathogenic or opportunistic
microbes that can cause infection and other diseases, or the mutation encodes for a threating
response. For example, E. coli O157:H7 expresses Shiga and Shiga-like toxins [236] that cause
severe damage to the lining of the intestines and kidneys and other complications such as hemolytic
uremic syndrome [239]. Exchanging genetic information via plasmids, transposons, or
bacteriophages [24] are common modes of lateral gene transference for bacteria. As a result,
bacteria once sensitive to antibiotics can easily acquire determinants that permit resistance. This
consequence can occur a number of times, resulting in the emergence of multidrug resistant
bacteria, a process accelerated by the overuse of antibiotics and other antimicrobials.
Metal toxicity can be largely prevented by controlling the concentrations of ions inside the
cell or ensuing that they are compartmentalized. For example, if all metals were held at equal
concentrations in the cell, then all metalloproteins would become copper binding proteins based
on the Irving-Williams series [164]. Therefore, what happens when metals are in excess in the
environment? How do cells sense, regulate and abolish these threats?
Whereas no single mechanism delivers widespread metal resistance, several simplified
strategies can be generalized from the appreciable amount of literature dedicated to interpreting
physiological adaptations of metal stress [37],[228]–[230] (Figure 1.2). Some of these are
specified here. Firstly, and most commonly, microorganisms will restrict the influx of metal ions
by regulating the expression and activity of proteins involved in metal uptake. The cytoplasmic
potential of many bacterial cells is reducing. In order to maintain this state, glutathione is present
in millimolar concentrations. This compound is one of the first forms of defense through
sequestration or the reduction of dangerous reactive oxygen species, such as hydrogen peroxide,
after metal entry. Once this occurs, metal ions present in excess can be removed from the cell

29
through the activation of efflux systems. Tight regulators are in control of this resistance
mechanism. Bacterial cells are also capable of repairing damaged biomolecules following direct
or indirect reactions with metals. Several bacteria have adapted mechanisms that permit chemical
modification of the metal, such as changing the redox state to a less harmful species thereby
altering the reactivity and toxicity. Furthermore, organic biomolecules intentionally secreted into
the extracellular and intracellular space can coordinate and sequester metal ions. Extracellular
examples polymers, siderophores and polysaccharides, among others. Intracellular examples
include proteins, amino acids and metal-sulfide complexes. Finally, once a metabolic protein is
inactivated, a proposed mechanism of metal toxicity, bacterial cells are capable of using alternative
pathways to bypass such damage. For more detailed information refer to the excellent review by
Hobman J. L. [38].
Figure 1.2 Several general mechanisms of metal resistance in bacteria. Shown is a Gram-
negative bacterium however these mechanisms can be extended to a number of organisms.
EffluxAlternative pathway
Metalmodification Decreased
influx
Sequestration
Biomolecule reparation

30
Metal resistance mechanisms are also found on transferable plasmids and transposons
[243]–[245]. Wastewater treatments plants are ecosystems with a high rate of gene transfer, and
are reservoirs for both antibiotic and metal resistance gene transfers, a process that may occur
independently or simultaneously in the case of co-resistance [246]. Co-resistance occurs when
resistance determinants are located on the same genetic element and this correlation results in co-
selection for additional resistance genes [247]. For over five decades we have been aware that
several metal and antibiotic resistant genes are linked on plasmids [248]–[250]. Studies have
concluded that a number of metal ion resistance determinants were carried on bacteria from the
pre-antibiotic era [251], and now share co-selection with antibiotic resistance genes, furthering the
propagation of antimicrobial resistance [252]. Furthermore, a number of metal resistance elements
can be found in new emerging and re-emerging pathogenic organisms that are antibiotic resistant
[38].
The development of metal resistance is not exempt from occurring, particularly as metal
antimicrobial use increases. By cause of the processes aforementioned a number of
microorganisms are capable of growing in the presence of metals, whereas others have developed
resistance mechanisms to offset this threat.
1.6.2 Copper resistance (and homeostasis) in bacteria
Given the essentiality of copper and its toxic capabilities, cells necessitate the tight
regulation of copper in the cell. Under typical conditions, bacterial organisms, such as E. coli, are
not faced with copper concentrations that exceed 10-6 M. However, given the excellent binding
capabilities of this metal, even 10-6 M can trigger complications in the cell. A key component in
mediating copper homeostasis in E. coli is the P-type ATPase CopA [253]. This protein removes
copper(I) from the cytoplasm of the cell where it causes the greatest threat, under aerobic and

31
anaerobic conditions. Few copper responsive systems in Gram-negative bacteria facilitate the
export of copper from the cytoplasm, demonstrating the ability of cells to compartmentalize this
element. Disruption of CopA results in copper sensitivity and complementation restores resistance
[254]. The expression of copA is regulated by CueR, which belongs to the Mer-like transcriptional
activators [255],[256]. This family comprises a similar N-terminal helix-turn-helix DNA binding
region, a C-terminal effector binding region, and similarity in the first 100 amino acids [257]. It is
believed that for transcription of a Mer-like operon to take place, DNA conformational changes
must occur. This suggests that an effector molecule, such as copper, must bind the regulator to
trigger structural changes, distorting the DNA strand to allow for RNA polymerase accessibility.
In general, Mer-like regulators respond to environmental stimuli, like metal toxicity and oxidative
stress [257]. The sensitivity of CueR has been determined to be in the zeptomolar range, which
amounts to less than one copper(I) per cell [258],[259]. CueO is an oxidase involved in detoxifying
the cell from the more toxic form of copper, copper(I), by converting it to copper(II) [260]. This
process is oxygen dependent and occurs in the periplasm. Furthermore, the respiratory chain in E.
coli has been demonstrated to possess cupric-reductase activity, NADH dehydrogenase-2 deficient
strains were reported to be more sensitive to growth in copper excess or limiting conditions
suggesting that this enzyme contributes to copper detoxification and homeostasis [261].
An additional copper responsive system in E. coli is the CusCBA proton-cation antiporter
complex. These proteins comprise a pump that is believed to mediate the transport of copper and
other drugs from the periplasm to the extracellular space [262]. The CusCBA system is under the
control of the CusRS two-component regulatory system. In the presence of copper under both
aerobic and anaerobic conditions [263], the cusRS regulatory system activates transcription of
cusCBA [264]. CusR is a phosphate receiver response regulator and the CusS is homologous to

32
sensor histidine kinases. These genes constitute a signal transduction system. CusA is an inner
membrane protein that belongs to the resistance nodulation cell division family of proteins [262].
This protein serves as a transporter energized by protein-substrate antiport. CusB serves as a
connecter between CusA and CusC, which is an outer membrane protein that extends into the
periplasmic space [253]. These proteins belong to a family of homologous transport proteins that
are collectively involved in exporting metals and drugs. CusF, also regulated by CusRS, is a
periplasmic protein that interacts with CusB and CusC, likely functioning as a chaperone for
copper to this system [262].
Plasmid-borne copper resistance in bacteria also exists, including the copABCDRS operon
from Pseudomonas syringae found on plasmid pPT23D [265]. This system, isolated from the gut
flora of a pig fed with a copper rich diet is homologous to the Pco system found on plasmid
pRJ1004 from E. coli [266]. Often, homologs of the Pco system are encoded on genomes [164].
Briefly, PcoC shuttles copper to PcoD, which is of unknown function, in the periplasmic space,
acting as a chaperone [267]. PcoA is similar to CueO, demonstrating oxidase activity, detoxifying
copper(I) and potentially oxidizing catechol siderophores that sequester copper [267]. The function
of PcoB is uncertain but it has been suggested to be a copper sequestering protein that buffers the
periplasmic environment [164]. Finally, PcoE is a small protein that is analogous to SilE, which is
a silver binding protein belonging to the silver resistance system (see section 1.5.3). Again, the
function of this protein is unknown although it is believed to function as a metal chaperone [253].
Additional copper responsive systems exist in other bacterial species, however they
generally follow similar themes to those aforementioned, see the exceptional review [164] for
further detail.

33
1.6.3 Silver resistance in bacteria
The first silver resistant bacterium was isolated in the 1960s from a silver nitrate exposed
burn wound [268]. One of the best characterized silver resistant systems is encoded on a plasmid
pMG101. This plasmid was extracted from Salmonella enterica and confers resistance to silver,
mercury, tellurite and several antibiotics. Specifically, the genes silCFBAPRSE comprise this
system. SilP is a P-type ATPase efflux pump that may function to transport silver from the
cytoplasm to the periplasm [269]–[271]. This protein is similar to copper(I) and zinc(II) efflux
ATPases that are found in E. coli. From here, how silver is transported to the pump or how it is
removed from the periplasm is unknown. One mechanism may rest with the protein SilE as it binds
periplasmic silver. This protein may act as the first line of defense against silver given its ability
to bind up to 38 silver ions under certain experimental conditions [272]. SilE is different from
other metalloproteins in that it has no cysteine residues, binding five silver ions using ten histidine
residues [241]. SilE is also under the control of its own promoter.
The SilCBA cation/proton antiporter complex, belonging to the heavy metal efflux
resistance nodulation cell division family, spans the entire plasma membrane. Based on sequence
homology to AcrB, SilA is thought to form a trimer in the inner membrane as a means of funneling
silver to SilC, the outer membrane component [269]. SilB is a membrane fusion protein, therefore,
this protein may connect the inner and outer membrane components of this system. How
periplasmic silver is removed or funneled to the Sil complex is unknown, although it has been
hypothesized that the last protein of this complex, SilF may transport silver to this system. The Sil
system is under the control of the two-component regulatory complex SilRS. SilS is a histidine-
containing membrane ATP kinase that senses the presence of silver in the periplasmic space and
SilR is the responder that binds DNA in order to activate the transcription of the Sil system [164].

34
Chromosomal silver resistant determinants have been found in E. coli. In particular, the
cusCFBARS gene cluster has been demonstrated to confer resistance against this threat (refer to
section 1.5.2 for more information). Other strategies of silver resistance include limiting the
expression of outer membrane porins such as OmpF or OmpC to lower permeability. Further,
silver crystals have been found in the bacterial envelop as elemental silver, silver sulfide or as
crystals that contain carbon, oxygen, phosphate or chloride [273],[274] suggesting that bacteria
may possess mechanisms that allow for chemical modification.
1.6.4 Gallium resistance in bacteria
Compared to silver and copper, the mechanisms of gallium resistance have been far less
researched, and therefore, less understood. The foremost hypothesis involves iron. Gallium has
been demonstrated to replace iron in vivo (refer to section 1.4.4), however if iron acquisition were
to increase, then the threat might be lessened due to concentration dependent competition. Still,
increased levels of iron acquisition using siderophores or other iron-chelators correlates to
increased levels of toxicity since gallium influx rises simultaneously [18],[275],[276]. Decreasing
the expression of proteins containing iron-sulfur clusters and increasing the expression of proteins
involved in repair may also provide mechanisms of resistance.
Given the increasing use of this metal as an antibacterial [277], we are sure to see more evidence
of gallium resistance in the near future.
The challenges of studying metal antimicrobials and gaps in our knowledge
The activity of metal antimicrobials, such as silver, were initially studied as coatings on
catheters and other medical devices [52],[136]. The effectiveness of metals have been extensively
reported in a number of cases and use reduces the growth of pathogenic bacteria [278]. Still, several
in vivo studies have failed to display increased cell death. These results were found in silver-coated

35
fixation pins [279] and silver coated catheters [280], among others. An explanation for this
inconsistency may rest in the speciation, metal availability and any resistance mechanisms that the
microorganism may retain.
One of the most apparent challenges of metal antibacterial development lies in the
difficulty of understanding the mechanisms of toxicity and resistance in bacteria. Transition metals
are capable of forming a number of different complexes in a given solution based on the electronic
configuration of the atom. This permits a number of different arrangements with ligands and many
of these are difficult to predict in vivo. For example, as mentioned in 1.4.3, one study reported
insignificant differences in silver toxicity between aerobic and anaerobic growing cells [229].
Although another group found similar results with silver nitrate, this was not observed with other
formulations of silver such as silver zeolite [223].
Reactive oxygen species are short-lived entities that react rapidly with biomolecules,
oxygen, water, thiols, and inorganic compounds. Tracking the origin and subsequent downstream
consequences of ROS is a difficult task [281]. There are many analytical techniques for measuring
ROS and reduced thiols, each with its own drawback. Several fluorescent probes do not react with
ROS or reduced thiols directly, whereas others are sensitive for only a single species. Furthermore,
since detection may involve several intermediates, unrelated chemical events, such as reactions
with proteins, inorganics, and lipids, may occur [282]. Older methods of detection, such as spin
trapping react, with radicals at a slow rate [283]. Nearly all probes, whether for the detection of
ROS or thiol depletion detect only a snapshot in time with limited abilities to monitor in real-time.
Furthermore, exact quantification of reduced or radical species is difficult to obtain. This misses
additional information regarding turnover and the redox state of a particular biomolecule. While
reactive oxygen species and reactions with thiols are proposed mechanisms of metal toxicity in

36
microorganisms, detection is limited, and caution must be used when analyzing data and drawing
conclusions.
Numerous studies have concentrated effort towards examining the production of ROS
under metal stress. This hypothesis has been reputed a number of times. For example, in an elegant
study conducted by Macomber and co-workers, copper toxicity was found to be the greatest under
anaerobic conditions, contrary to what might be expected if oxygen radicals were involved in cell
death [209]. While, this study presents an interesting discovery, under aerobic and anaerobic
growth conditions, bacteria express and utilize different metabolic enzymes and pathways. For
example, pyruvate dehydrogenase, isocitrate synthase, aconitase and others involved in central
carbon metabolism, are expressed during aerobic conditions. Under anaerobic conditions these
enzymes are not expressed, rather, enzymes like lactate dehydrogenase and pyruvate formate lyase
are utilized [284]. Electron donating sources shift from fatty acids and succinate to formate and
hydrogen. Cells also respond by altering the expression of membrane bound transport proteins and
processes involved in haem and quinone synthesis. These metabolic adaptations are controlled by
the anaerobic regulator FNR and the two-component regulatory system ArcAB. These regulons
control the expression of over 1700 genes either directly or indirectly. Consequently, it is
problematic to conclude that the copper toxicity is ROS independent, since the expression profile
of the cell deviates dramatically under anaerobic condtions.
The mechanisms of copper resistance are far better understood than any other metal. Given
the ability of this metal to form stable interactions with ligands, organisms have perfected
numerous pathways aimed at controlling the homeostasis of this organsim. Still, what has yet to
be determined is how copper effects the cell after prolonged exposure and what mechanisms are
in place to ensure the organism stays alive. From a review of the literature in previous secitons a

37
number of questions arrise. What other tools do organisms rely on in the absence of some of these
key copper homeostatic genes? Likewise, using what is know about copper, what are the
mechanisms in place for the silver and gallium? How do the susceptibility profiles of organisms
vary, under the same conditons but different metal?
Only a handful of studies offering a systematic approach have been presented in this field
of work. Most studies concentrate their efforts toward examining only a few
genes/proteins/enzymes. Furthermore, given that there is no agreed upon mechanism of metal
toxicity and there are numerous gaps in the pathways of metal resistance, studies are often directed
toward one mechanism as opposed to studying the cell-wide effects and indirect targets of metals.
Only four studies have been published in the last two decades in which systems-biology approach
were used to gain better insight into overlooked mechansims of copper toxicity or resistance
[206],[207],[285],[286]. Systems biology refers to the interdisciplanary field for which a holistic
approach to biologial research is utilized [287]. Some might consider that all fields of science
encompass systems biology, but to varying degrees [288]. Regardles, this type of research aims to
gather information on the entire system at a given time(s). Using this, researchers have identified
novel copper responsive genes including aldehyde dehydrogenase [286], ferric enterobactin
proteins [207], a number of flagellar biosynthesis genes and genes involved in cell envelope stress
[285], amongst many more. Given this information, it is very plausible that numerous mechanisms
of metal toxicity and resistance exist and been overlooked for other metals as well as copper.
What is clear is that determining the direct and indirect effects of metal exposure to bacteria
is not a trivial task. Understanding the mechanisms of metal toxicity and resistance requires
recognition of the complicated interplay between the electronic configuration of the metal and
ligand properties; metabolic responses and cell physiology; and direct and indirect mechanisms.

38
While the precise mechanisms of metal toxicity in microorganisms are not entirely understood, it
has not arrested the accumulation of reports that demonstrate the efficacy and wide-use of metal
antimicrobials [38].
Research goals and specific aims
The literature in the past two decades has become permeated with studies aimed at
developing novel metal-based antimicrobials as the antibiotic era faces the threat of antibiotic
resistant bacteria, biofilm related chronic infections and multidrug resistant microorganisms.
However, studies intended at uncovering mechanisms of metal toxicity are fewer in number.
Continued development and use will propagate resistance, regardless of whether the mechanisms
are made known. Yet, it is important that we gain better insight as a means of developing improved
agents and withholding resistance for as long possible.
The major questions I aimed to address in this research included how bacterial strains
respond to metal stress differently and if metals act on the same organism similarly or otherwise.
Therefore, I chose a comparative approach that allowed me to address my hypothesis that; metal-
based antimicrobials are different in their efficacies against different species, and isolates of the
same species and that there is a universal set of genes involved in metal resistance and toxicity.
With this in mind, I was able to compare various antimicrobial metals to indicator strains under
identical conditions, explore species variability, and use the model organism E. coli (BW25113)
to uncover a number of novel genes that are involved in copper, silver and gallium toxicity and
resistance.
The main objectives of this thesis were as follows:
I. Determine how E. coli, P. aeruginosa and S. aureus respond to metal stress.

39
II. Demonstrate how isolates of the same species respond to metal stress.
III. Draw comparisons between copper, silver and gallium toxicity and resistance in E. coli
BW23115.
IV. Compare the physiological response of E. coli under metal stress.
Aims 3-4 concentrate on the mechanisms of metal toxicity on E. coli for a number of reasons
including; a) much is known about E. coli, and the experimental and curated data on this organism
is in wealth, b) many studies examining the effects of metals in bacteria have been completed using
E. coli, c) access to the Keio collection, a collection of mutants each with a different inactivated
non-essential gene and d) fast doubling time; given the time required to complete each assay robust
growth in minimal media is desirable.

40
2 The efficacy of different antimicrobial metals at preventing the
formation of, and eradicating bacterial biofilms of pathogenic
indicator strains
Authored by:
Natalie Gugala, Joe A. Lemire and Raymond J. Turner
Published in:
The Journal of Antibiotics, January 2017, 9, 1-6 doi: 10.1038/ja.2017.10
Copyright permissions for the reproduction of this manuscript can be found in Appendix D.
Abstract
The emergence of multidrug resistant pathogens and the prevalence of biofilm-related
infections have generated a demand for alternative antimicrobial therapies. Metals have not been
explored in adequate detail for their capacity to combat infectious disease. These compounds can
now be found in textiles, medical devices, and disinfectants – yet, we know little about their
efficacy against specific pathogens. To help fill this knowledge gap, we report on the antimicrobial
and antibiofilm activity of seven metals; silver, copper, titanium, gallium, nickel, aluminum and
zinc against three bacterial strains, Pseudomonas aeruginosa, Staphylococcus aureus, and
Escherichia coli. In order to evaluate the capacity of metal ions to prevent the growth of, and
eradicate biofilms and planktonic cells, bacterial cultures were inoculated in the Calgary Biofilm
Device (MBEC™) in the presence the metal salts. Copper, gallium, and titanium were capable of
preventing planktonic and biofilm growth, and eradicating established biofilms of all tested strains.
Further, we observed that the efficacies of the other tested metal salts displayed variable efficacy
against the tested strains. Contrary to the enhanced resistance anticipated from bacterial biofilms,
particular metal salts were observed to be more effective against biofilm communities versus
planktonic cells. In this study, we have demonstrated that the identity of the bacterial strain must

41
be considered prior to treatment with a particular metal ion. As the use of metal ions as
antimicrobial agents to fight multidrug resistant and biofilm related infections increases, we must
aim for more selective deployment in a given infectious setting.
Introduction
The progression of bacterial resistance to antibiotics has led us to an era that urgently
requires alternative antimicrobial therapies. Furthermore, recent knowledge regarding antibiotic
efficacy has led to the realization that targeted antimicrobial strategies are required for use against
chronic infections – such as those caused by biofilms – which are remarkably different from acute
infections. Typically, more than half of infections are caused by organisms that are involved in
surface-attached communities immersed in a self-produced hydrated extracellular polymer matrix,
known as a biofilm [29]. This matrix has been observed to complicate wound healing by
facilitating the transition between acute and chronic infections [289], and contaminate clinical
surfaces and implanted medical devices such as catheters and endotracheal tubes [290]. The
physiological changes characteristic of biofilms results in enhanced resistant to elimination by the
host immune system and some antibiotics [291]. The use of modern antibiotics to treat infections
caused by bacteria is now a multifactorial challenge given the threat of both multi-drug resistant
bacteria and biofilm-related infections. As a consequence, the administration of metals to combat
either threat has recently regained attention. Metal compounds can now be found in wound
dressings [77], liquid formulations for hand-washing [292] impregnated into textiles such as socks
[65] and on medical devices like catheters [53].
The antimicrobial properties of metals have been documented in many bodies of work [180]
and continue to be the subject of investigation in an attempt to understand the mechanisms of metal
toxicity and resistance [197],[293]–[296]. Despite the wealth of literature committed to examining

42
the antimicrobial activity of metals, less attention has been paid to determining the susceptibility
of bacteria to metals within a defined set of conditions. While the minimal inhibitory
concentrations, minimal bactericidal concentration, and minimal biofilm eradication
concentrations for many metals have been determined, the lack of consistency between techniques,
conditions and media has resulted in difficulties when comparing the susceptibilities of bacterial
strains to metal compounds. Additionally, present data on the antimicrobial properties of metals
are inadequate, which is alarming, particularly since applications have expanded into industry,
agriculture and healthcare [180].
Here we describe our observations from testing the antimicrobial and antibiofilm activity of
seven different metals with demonstrated antimicrobial activity and utility (silver, copper,
titanium, gallium, nickel, aluminum, and zinc) against three indicator strains, Pseudomonas
aeruginosa (ATCC 27853), Staphylococcus aureus (ATCC 25923) and Escherichia coli (ATCC
25922). Chemically simulated wound media (CSWM) was used to provide a rich environment for
bacterial growth, warranting that variation in susceptibility between the three strains was not a
result of nutrient limitations in the growth media. In addition, this growth media provided an
environment comparable to a wound infection – a clinical challenge where metals have a realized
potential for utility. Experiments were designed to reproduce an acute wound infection by
assessing both the prevention and eradication of biofilms as well as the susceptibility of planktonic
cultures. Using the Calgary Biofilm Device (CBD)/MBECTM, the minimal biofilm bactericidal
concentrations (MBBC), the minimal planktonic bactericidal concentrations (MPBC), and the
minimal biofilm eradication concentrations (MBEC) were determined under the various metal
challenges.

43
Methods and Materials
2.3.1 Bacterial strains and culture media
Bacterial strains were stored at -70°C in MicrobankTM vials as described by the
manufacturer (proLab Diagnostics, Richmond Hill, ON, Canada). The three bacterial strains
Pseudomonas aeruginosa ATCC 27853, Staphylococcus aureus ATCC 25923, and Escherichia
coli ATCC 25922 were gifts from Dr. Joe J. Harrison (University of Calgary).
Throughout our studies, we have observed that the growth media chosen to culture bacterial cells
is a significant factor that dictates the efficacy of the metal challenge. Hence, we selected a media
that provides a rich environment to ensure robust bacterial growth in each strain. Chemically
simulated wound media (CSWM), modified from [297] [50% bovine serum (66g/L): 50% peptone
water (0.85% NaCL, 0.1g/L peptone)] was used for metal susceptibility testing throughout this
work. For the dilution of metal working solutions, a 2X peptone water (0.85% NaCl, 0.2g/L
peptone) solution was used.
2.3.2 Biofilm cultivation
In this work, all biofilms were cultivated using the Calgary Biofilm Device
(CBD)/MBECTM as described in [298],[299] and by the manufacture’s guidelines (Innovotech,
Edmonton, AB, Canada). Following overnight growth of the pre-culture, colonies were suspended
in CSWM and matched to a 1.0 McFarland standard. Next, the suspended cells were diluted 30
times in CSWM. In order to cultivate the biofilm, 150 L of the diluted inoculum was placed into
a 96-well microtitre plate (Nunclon, VWR, International) followed by placement of the CBD lid,
which contained 96 equivalent pegs. The CBD was placed on a gyrorotary shaker operating at
150rpm in a humidified incubator at 37oC for either 4hr or 24hr.

44
2.3.3 Stock and working metal solutions
Silver nitrate (AgNO3), copper (II) sulfate (CuSO4), titanium (III) chloride (TiCl3), gallium
(III) nitrate (Ga(NO3)3 H2O), and nickel sulfate (NiSO4 •6H2O) were all obtained from Sigma-
Aldrich (St. Louis, MO, USA). Aluminum sulfate (Al2(SO4)3 • H2O) was obtained from Matheson
Coleman and Bell (Norwood, OH, USA), and zinc sulfate (ZnSO4 •7H2O) was received from
Fisher Scientific (Fair Lawn, NJ, USA). Stock solutions of CuSO4, TiCl3, and Al2(SO4)3 •H2O
were made up to 1M, ZnSO4 •7H2O was made up to 1.5M, NiSO4 • 6H2O to 2.5M, and AgNO3
to 500mM in distilled and deionized (dd)H2O. All stock metal solutions were stored in glass vials
at 21°C for no longer than two weeks. No more than 30 minutes prior to experimental use, working
solutions were made from stock metal solutions in equal amounts of CSWM and 2X peptone water
(dilution factor of 2). In a 96-well plate (the challenge plate) serial dilutions of each metal, with a
dilution factor of 2, were prepared; reservation of the first row served as a growth control (0.0 mM
metal salt).
2.3.4 Prevention of planktonic growth and biofilm formation
In order to assess the capability of the metal salts to prevent the growth of biofilms and
planktonic cells, bacterial cultures were inoculated in the CBD in the absence – to control for
growth – and presence of the metal salt. The CBD was then placed in a 37°C humidified incubator
on a gyrorotary shaker at 150rpm for 4hr. This treatment provided the minimal planktonic
bactericidal concentrations (MPBC) and the minimal biofilm bactericidal concentrations (MBBC).
Overall evaluating if bacteria could establish a culture planktonically or as a biofilm in the presence
of the metal salts.

45
2.3.5 Eradication of established biofilms
To evaluate the ability of the metal salts to eradicate established biofilms, a biofilm was
first cultivated on the pegged lid of the CBD for 24hr. The lid was then rinsed twice with 0.9%
NaCl and placed into a 96-well microtitre plate containing 2-fold serial dilutions of the metal salts;
a column was reserved for bacterial growth in the absence of the metal salts. The plate was then
incubated for 24hr in a humidified incubator at 37°C on a gyrorotary shaker at 150rpm. This
treatment was used to determine the minimal biofilm eradication concentration (MBEC) of each
metal salt.
2.3.6 Assessment of metal efficacy
To assess the susceptibility of planktonic and biofilm populations to the metal salts, the peg
lids from both treatments were first rinsed twice in 0.9% NaCl. Subsequently, the biofilms were
disrupted from the pegs by sonication using a 250HT ultrasonic cleaner (VWR, International) for
10 minutes into 200 L of Lysogeny Broth (LB) media [25 g/L] containing 0.1% Tween®20 and
universal neutralizer (UN) [146] [0.5 g/L histidine (Sigma, USA), 0.5 g/L-cysteine (Sigma, USA),
and 0.l g/L reduced glutathione (Sigma, USA) in (dd)H2O]. To establish the MBBC and MBEC
of the disrupted biofilm populations, 6 dilutions, with a dilution factor of 10, in 0.9% NaCl were
performed. The samples were spot plated on tryptic soy agar plates in order to determine the viable
cell numbers from the biofilm, and subsequently incubated overnight at 37°C. To determine the
MPBC of the planktonic populations 8 serial dilutions, with a dilution factor of 10, were carried
out into 96-well plates with 0.9% saline and UN. Similarly, spot plating the diluted samples onto
TSA plates and incubating overnight at 37°C generated viable cell counts. The concentrations at
which each metal salt gave rise to no viable microbial colonies were determined to be the MPBC,
MBBC and MBEC.

46
Results
2.4.1 Various metal salts can prevent planktonic growth and biofilm formation
To determine the capacity of metal salts in preventing the formation of biofilms of the
selected indicator strains, P. aeruginosa ATCC 27853, S. aureus ATCC 25923, and E. coli ATCC
25922, were grown for 4hr in the presence of the metal salts. This approach gave rise to the
minimal planktonic bactericidal concentration (MPBC) (Figure 2.1 a) and in parallel, the minimal
biofilm bactericidal concentration (MBBC) (Figure 2.1 b). In order for the biofilms to form in the
presence of the metal ions, the planktonic cells would need to survive the metal concentrations
long enough to permit attachment and expression of biofilm related genes. Therefore, this
experiment measures both cell attachment and biofilm proliferation in the presence of metal salts.
Cu Ti Ga Al
0.031250.06250.1250.250.5
1248
163264
128256512
1024
Challenge
Co
nc
en
tra
tio
n (
mM
)
P. aeruginosa A)
Cu Ti Ga Zn
0.031250.06250.1250.250.5
1248
163264
128256512
1024
Challenge
Co
nc
en
trati
on
(m
M)
S. aureus
Cu Ti Ga Al0.031250.06250.1250.250.5
1248
163264
128256512
1024
Challenge
Co
nc
en
tra
tio
n (
mM
)E. coli
Cu Ag Ti Ga Al
0.031250.06250.1250.250.5
1248
163264
128256512
1024
Challenge
Co
nc
en
tra
tio
n (
mM
)
P. aeruginosa B)
Cu Ti Ga Ni Zn
0.031250.06250.125
0.250.5
1248
163264
128256512
1024
Challenge
Co
ncen
trati
on
(m
M)
S. aureus
Cu Ag Ti Ga Al Zn
0.031250.06250.1250.250.5
1248
163264
128256512
1024
Challenge
Co
nc
en
tra
tio
n (
mM
)
E. coli
Zn

47
Figure 2.1 The prevention of bacterial biofilms is attained upon 4hr exposure to various metal
salts. The Calgary Biofilm Device was inoculated with P. aeruginosa (ATCC 27853), S. aureus
(ATCC 25923) or E. coli (ATCC 25922) in the presence of AgNO3, CuSO4, TiCl3,
Ga(NO3)3•H2O, NiSO4•6H2O, Al2(SO4)3•H2O or ZnSO4•7H2O. The bacteria were grown over a
concentration range defined by 2-fold serial dilutions of each metal. After this incubation, the
viable cells were counted to determine the (a) MBPC and (b) MBBC. Values are represented as
the mean ± the SD n=3. #Note: all metal stock solutions were prepared at equal molar
equivalents of metal molecule. Hence the concentrations found in this figure are reflective of the
concentrations of metal and not the compounds themselves.
For all three strains the MPBC (Figure 2.1 a) and MBBC (Figure 2.1 b) of Cu, Ga and Ti
were reached within the tested concentrations. A lower concentration of Cu, as opposed to Ga, was
needed to prevent P. aeruginosa attachment and growth (Table S2.1). This was not observed for
E. coli, in which a greater concentration of Ga, in comparison to Cu, was needed to attain the
MBBC and MPBC (Table S2.2). S. aureus biofilms were 4-fold more resistant to Ti than their
planktonic counterparts indicated by the MBBC and MPBC (Table S2.3). A 4-fold higher
concentration of Cu was needed to prevent planktonic growth than the formation of biofilms in P.
aeruginosa (Table S2.1).
The metals Ag and Al were successful in preventing P. aeruginosa and E. coli biofilm
formation (Figure 2.1 b). However, only Al was capable of eliminating planktonic populations in
these two strains following the concurrent 4hr metal exposure and incubation period (Figure 2.1
a). Notably, the MBBC for Al was found to be 250-fold lower for P. aeruginosa compared to E.
coli. In addition, a greater concentration of Al was needed to reach the MPBC as opposed to the
MBBC for P. aeruginosa. In the concentrations of Ag tested, little change in viable planktonic
cells was observed for P. aeruginosa and E. coli (Figure 2.2). The MPBC and MBBC for S. aureus
were not reached within the concentrations of Al examined, although a 1-log decrease in biofilm
formation and ~2 log decrease in planktonic cells was observed based on the reduction in viable
cell numbers (Figure 2.2). Higher concentrations of Al were not explored due to the solubility of

48
this metal in (dd)H2O. Finally, the MPBC and MBBC of Ag for S. aureus were not reached within
the concentrations tested. The addition of Ag at a concentration >500mM to the CSWM led to
extensive precipitation; thus, concentrations greater than 500mM could not be explored.
Figure 2.2 The eradication of biofilms is achieved upon exposure to various metal salts. The
Calgary biofilm device was inoculated with P. aeruginosa (ATCC 27853), S. aureus (ATCC
25923) or E. coli (ATCC 25922) in order to establish biofilm growth following 24hr incubation.
The established biofilms were then treated with serial dilutions (2-fold) of AgNO3, CuSO4,
TiCl3, Ga(NO3)3•H2O, NiSO4•6H2O, Al2(SO4)3•H2O or ZnSO4•7H2O. Viable cell count was
used to determine the MBEC for each metal. Values are represented as the mean ± SD, n=3.
#Note: all metal stock solutions were prepared at equal molar equivalents of metal molecule.
Hence the concentrations found in this figure are reflective of the concentrations of metal and not
the compounds themselves.
For S. aureus, only the MBBC was reached upon challenge with Ni (Figure 2.1 b), while
a 2-fold reduction in planktonic growth was observed (Figure 2.2). Ni did not inhibit planktonic
growth or biofilm formation in P. aeruginosa or E. coli (Figure 2.1). Zn could not prevent the
formation of biofilms and planktonic cell growth of P. aeruginosa (challenge with Zn or Ni
resulted in a 1-log and 2-log reduction in planktonic (Figure 2.2) and biofilm viable cell numbers
(Figure 2.2), respectively. For S. aureus, the attachment of biofilms and planktonic growth was
prevented upon incubation with Zn, yet only biofilm attachment was prevented for E. coli. Lastly,
there was no observed reduction in planktonic or biofilm viable cell numbers after exposure of E.
coli to Ni for 4hr (Figure 2.2).
Cu Ag Ti Ga Al
0.031250.06250.1250.250.5
1248
163264
128256512
1024
Challenge
Co
nc
en
tra
tio
n (
mM
)
P. aeruginosa
Cu Ag Ti Ga Al Ni Zn
0.031250.06250.1250.250.5
1248
163264
128256512
1024
Challenge
Co
nc
en
tra
tio
n (
mM
)
S. aureus
Cu Ag Ti Ga Al Ni Zn
0.031250.06250.1250.250.5
1248
163264
128256512
1024
Challenge
Co
nc
en
tra
tio
n (
mM
)
E. coli

49
2.4.2 Certain metal ions are capable of eradicating established biofilms
The eradication of biofilms by various metal salts was assessed in a similar manner as the
prevention of biofilms. However, to determine the concentration needed to eradicate an established
biofilm, biofilms were established by incubating the inoculum in a CBD for 24hr. This was
followed by exposure to 2-fold serial dilutions of the metal salts for an additional 24hr. After metal
exposure, it was observed that the metals Cu, Ag, Ga, Ti and Al were able to eradicate biofilms of
all three of the tested strains (Figure 2.3). Although Ni and Zn were found to be effective at
eradicating S. aureus and E. coli biofilms after 24hr metal exposure, P. aeruginosa biofilms were
not eliminated, rather a 50% decrease in viable cell numbers was observed (Figure 2.4). A higher
concentration of Ag, more so than any other metal, was needed to eradicate S. aureus, whereas the
opposite was observed for E. coli (Figure 2.3)
Figure 2.3 Growth tolerance of P. aeruginosa (ATCC 27853), S. aureus (ATCC 25923) and E.
coli (ATCC 25922) to several metal salts. The Calgary Biofilm Device was inoculated with
bacteria in the presence of AgNO3, CuSO4, TiCl3, Ga(NO3)3•H2O, NiSO4•6H2O, Al2(SO4)3•H2O
or ZnSO4•7H2O. The cells were exposed to serial dilutions (2-fold) of each metal for 4hr
followed by determination of the A) MBPC and B) MBBC by viable cell count. Values are
represented as the mean ± SD n=3. #Note: all metal stock solutions were prepared at equal molar
equivalents of metal molecule. Hence the concentrations found in this figure are reflective of the
concentrations of metal and not the compounds themselves.
1 10 100 10000
2
4
6
8
Concentration (mM)
LO
G(C
FU
/mL
)
P. aeruginosa A)
!
!
Zn
!
!
Ag
Ni
Al
1 10 100 10000
2
4
6
8
Concentration (mM)
LO
G(C
FU
/mL
)
E. coli
!
!
Zn
!
!
Ag
Ni
Al
1 10 100 10000
2
4
6
8
Concentration (mM)
LO
G(C
FU
/mL
)
S. aureus
1 10 100 10000
2
4
6
8
Concentration (mM)
LO
G(C
FU
/mL
)
E. coli
1 10 100 10000
2
4
6
8
Concentration (mM)
LO
G(C
FU
/mL
)
S. aureus
1 10 100 10000
2
4
6
8
Concentration (mM)
LO
G(C
FU
/mL
)
Zn
P. aeruginosa B)

50
Figure 2.4 Biofilm eradication tolerance to several metal salts for P. aeruginosa ATCC 27853.
The Calgary Biofilm Device was inoculated following 24hr incubation. The established biofilm
was then treated with serial dilutions (2-fold) of AgNO3, CuSO4, TiCl3, Ga(NO3)3•H2O,
NiSO4•6H2O, Al2(SO4)3•H2O or ZnSO4•7H2O. The MBEC was determined by viable cell count
for the various metal compounds. Values are represented as the mean ± SD, n=3. #Note: all
metal stock solutions were prepared at equal molar equivalents of metal molecule. Hence the
concentrations found in this figure are reflective of the concentrations of metal and not the
compounds themselves.
Discussion
Numerous accounts of resistance, from bacterial biofilms to conventional antimicrobials,
have been reported since the 1990’s [29]. We are entering an era where our options to treat acute
and chronic infections are limited. Consequently, alternative strategies to combat biofilm bacterial
resistance and tolerance are being investigated [300]–[303]. Among these alternate strategies is
the use of metal compounds as antimicrobial agents that are capable of disrupting growth and/or
eradicating biofilms [180]. Despite their reemerging use, little effort has been directed toward
comparing the susceptibility of planktonic cells and biofilm communities to metals under a defined
set of conditions. Here, we demonstrate how a reproducible screening method was used to compare
the susceptibility of bacterial strains to several metal salts. Chemically simulated wound media
was used to provide a rich environment containing proteins, lipids, and a large variety of ions for
promoting bacterial growth. The aim of this study was to provide a robust comparison between the
efficacy of various metals against three defined indicator strains, namely P. aeruginosa, S. aureus,
and E. coli.
1 10 100 10000
2
4
6
8
Concentration (mM)
LO
G(C
FU
/mL
)
P. aeruginosa

51
Ag has been studied for its efficacy at disrupting and/or eliminating biofilms [304]. Contrary
to such studies, the MPBC and MBBC for S. aureus were not reached in the concentrations tested
in this work (Figure 2.1). Decreased antimicrobial susceptibility may be regarded as the most
consequential phenotype of bacterial biofilms, and for many antimicrobial agents this concept
holds true [305]. Despite this, data has suggested that under particular growth conditions, residence
within a biofilm does not always provide enhanced resistance against antimicrobials
[31],[306],[307], and several of our observations support this. In fact, Ag was successful at
preventing the formation of P. aeruginosa and E. coli biofilms (Figure 2.1 b), however, this metal
was incapable of inhibiting planktonic growth within these two strains (Figure 2.1 a).
Cu is known to increase intracellular levels of reactive oxidative species (ROS)
[61],[214],[215], catalyze hydroxyl radical formation [203], and target enzymes in the iron-sulfur
dehydratase family [197]. Both Cu(II) and Ag(I) are thiophilic metals and share similar selectivity
for biological donor ligands in the bacterial cell [180]. Yet, one key difference between the two
metals is their biological function. Cu(II) is an essential metal for a number of cellular redox
enzymes, while Ag(I) is a non-essential metal in which the precise manner of toxicity within all
cell types still remains unclear. In this work, we found Cu to be effective for preventing biofilm
attachment (Figure 2.1 b) and eradicating established biofilms (Figure 2.3). In addition, this metal
was capable of preventing the growth of planktonic cells (Figure 2.1 a), different from what was
observed with Ag. In general, we determined that the tendency of Ag to precipitate in CSWM
proved its efficacy as an antimicrobial agent against cells in either cellular state to be secondary to
Cu. Nonetheless, the efficacy of Ag as an antimicrobial agent continues to be observed [19], and
a substantial amount of effort has gone into developing silver-based materials [308].

52
Certain transition metals have a documented capacity to disrupt cellular donor ligands that
coordinate the essential ion Fe(III) [180]. Destruction of [Fe-S] clusters may release additional
Fenton-active Fe into the cytoplasm increasing intracellular ROS formation [196],[294],[296].
Ga(III) has been found to target solvent-exposed [Fe-S] clusters since many biological systems are
unable to distinguish between Ga(III) and Fe(III) [232]. In fact, we observed that this metal was
effective at inhibiting biofilm and planktonic cell growth in all three strains (Figure 2.1 and Figure
2.3). The use of Ga as an antimicrobial agent is not novel, and in parallel with our data, the
antimicrobial properties of this metal have been demonstrated both in vitro and in vivo against a
number of microorganisms [233]. It should be noted however, that upon comparison to other
bodies of work we observed that a higher concentration of Ga were needed to eliminate all three
strains [18],[293]. This observation provides insight into the influence of experimental conditions
on biofilm and planktonic antimicrobial susceptibility. In fact, we have repeatedly observed that
different media formulations give rise to exceedingly different tolerance levels (unpublished data).
Al(III), like Ag(I), is also a non-essential metal in which the precise mechanism of cellular
uptake has yet to be determined. This metal was found to be effective at preventing the formation
of biofilms and planktonic cells in P. aeruginosa and E. coli (Figure 2.1). Contrary to this, Al was
not effective at preventing biofilm formation and planktonic cell growth in S. aureus in the
concentrations tested, however, a single-fold reduction in viable cell numbers was observed during
a 4hr metal exposure (Figure 2.2). Since the MBEC was reached for S. aureus in the presence of
Al during the 24hr incubation, we speculate that the mechanism of Al toxicity is subject to longer
metal exposure. E. coli cells were found to comply similarly based on the concentrations needed
to reach the MBBC and MBEC, again, a reflection into the requirement of prolonged metal
exposure for the efficacy of some metals [31].

53
Contrary to what was observed for Ag and Al, the biofilms of each indicator strain were found to
be less susceptible to Ti when compared to the planktonic cells (Figure 2.1). This was particularly
evident for S. aureus, in which there was a 4-fold increase in the concentration of Ti needed to
prevent the formation of a biofilm when compared to the concentration needed to eliminate the
planktonic cells.
The MBBC was reached upon the addition of Zn in E. coli and S. aureus in the
concentrations tested (Figure 2.1). For both strains the MBBC were found to be comparable to
work completed in other studies, in which biofilm growth was found to decrease by at least 50%
upon exposure to ZnSO4 [309]. P. aeruginosa was found to be tolerant to this metal salt within the
concentrations tested since no change in the growth of planktonic cells and biofilms were observed
after 4hr and 24hr treatments (Figure 2.1 and Figure 2.3). Upon longer metal exposure, E. coli
and S. aureus biofilms were eradicated, again, giving insight into the time-dependence of metal
toxicity (Figure 2.3).
Ni, similar to Zn, was also observed to be less effective against all three strains. In P. aeruginosa
and E. coli no change in viable cell numbers were found upon Ni exposure. This metal was only
capable of preventing the assembly of a biofilm in S. aureus (Figure 2.1 b). The results suggest
that a concentration well above 650 mM may be needed to reach the MPBC for all three strains,
the MBBC for P. aeruginosa and E. coli, and the MBEC for P. aeruginosa in the conditions tested.
Still this would be problematic as at these concentrations the metal salts precipitate. Nonetheless,
this does not preclude the use of Ni and Zn as surface contact antimicrobials for certain infectious
settings [180].
The literature suggests a variety of mechanisms responsible for metal toxicity, and it is likely
that each metal has different cellular targets and resultant toxicological effects [180]. Here, we

54
observed that a comparison between the seven metals gave rise to remarkably different efficacies
when comparing between three bacterial species. In fact, comparing the susceptibilities of the three
strains to even a single metal revealed pronounced differences. Upon further analysis, we revealed
that the planktonic and biofilm cells of P. aeruginosa appeared to behave similarly with a 4hr
metal exposure (Figure 2.3 a). This trend was not observed for E. coli and S. aureus, in which the
concentrations capable of inhibiting growth were different between planktonic cells or those
residing within a biofilm. The planktonic cells of the Gram-negative strains demonstrated similar
MPBCs for Ti, Ag and Ni, however, the biofilms did not share these similarities (Figure S2.1 a).
Furthermore, differences were found in biofilm susceptibility of S. aureus and E. coli, revealing
the greatest degree of dissimilarity between the MBBCs within the experimental conditions used
in this study. Finally, upon biofilm establishment followed by 24hr metal exposure, the biofilms
of S. aureus and E. coli had similar MBECs following Al, Cu, Zn and Ni addition (Figure S2.1
b).
Conclusion
Based on the MPBC, MBBC and MBEC data generated in this study, Cu, Ti and Al were
the most effective metals for preventing the formation of, and eradication P. aeruginosa biofilms.
Meanwhile, against S. aureus and E. coli biofilms, Cu, Ti and Ga were the most effective metals
tested. From our observations in this study, Cu, Ti and Ga were found to have extended activity
against planktonic cell growth, the attachment of biofilms and biofilm proliferation. This leads us
to conclude that Cu and Ti are the only metals that have reasonable broad-spectrum efficacy
against the strains used in this study. However, an overarching theme of this study is that no metal
should be considered a ‘silver bullet’. The study of metal resistance genes during the 1990’s has
revealed that specific resistance mechanisms exist for almost all metals studied to date [241].

55
Nonetheless, reports have demonstrated that certain metals can enhance antimicrobial activity
[101] and broaden the antibacterial spectrum of antibiotics [310]. Therefore, as a follow up to this
study, future directions include examining the ability of metals to increase bacterial susceptibility
to antibiotics and antibiotic activity against bacterial biofilms.
With the ever-increasing use of metal ion formulations and nanoparticles as antimicrobials, we
must heed to the evolution of antibiotic resistance and aim for more responsible use of
antimicrobial metals – a situational approach of the appropriate metal, at the appropriate
concentration for a given infectious setting.
Chapter 2 Supplementary
Table S2.1 Metal concentrations required to prevent planktonic growth (MPBC), prevent biofilm
growth (MBBC) and eradicate established biofilms (MBEC) in P. aeruginosa (ATCC 27853).*
Metal salt MPBC (mmol L-1)† MBBC (mmol L-1)† MBEC (mmol L-1)‡
AgNO3 >0.50 6.25 × 10⁻² 1.56
CuSO4 6.25 1.56 7.81
TiCl3 1.95 1.95 0.98
Ga(NO3)3 •H2O 15.63 15.63 7.81
Al2(SO4)3 •H2O 1.95 9.77 × 10⁻¹ 7.81
ZnSO4 •7H2O > 375 >375 > 250
NiSO4 > 625 > 625 > 625 * Values represented as the means of n=3.
† Growth in the presence of metal salt for 4hr incubation. ‡ Establishment of biofilms for 24hr followed by growth in the presence of metal salt for 24hr.
Table S2.2 Metal concentrations required to prevent planktonic growth (MPBC), prevent biofilm
growth (MBBC) and eradicate established biofilms (MBEC) in E. coli (ATCC 25922).*
Metal salt MPBC (mmol L-1)† MBBC (mmol L-1)† MBEC (mmol L-1) ‡
AgNO3 > 10 1.56 × 10⁻¹ 3.90 × 10⁻²
CuSO4 12.50 3.13 3.125
TiCl3 1.95 9.77 × 10⁻¹ 1.22
Ga(NO3)3 •H2O 31.25 31.25 7.81
Al2(SO4)3 •H2O 250 125 4.88 × 10⁻¹
ZnSO4 •7H2O > 650 23.44 2.93
NiSO4 > 625 > 625 9.77 × 10⁻¹

56
* Values represented as the mean of n=3. † Growth in the presence of metal salt for 4hr incubation.
‡ Establishment of biofilms for 24hr followed by growth in the presence of metal salt for 24hr.
Table S2.3 Metal concentrations required to prevent planktonic growth (MPBC), prevent biofilm
growth (MBBC) and eradicate established biofilms (MBEC) in S. aureus (ATCC 25923).* Metal salt MPBC (mmol L-1)† MBBC (mmol L-1)† MBEC (mmol L-1)‡
AgNO3 > 125 > 125 10.00
CuSO4 12.50 12.50 3.13
TiCl3 1.95 7.81 1.46
Ga(NO3)3 •H2O 15.63 7.81 15.63
Al2(SO4)3 •H2O > 250 > 250 9.77 × 10⁻¹
ZnSO4 •7H2O 23.44 1.46 2.20
NiSO4 > 625 1.22 1.22 * Values represented as the means of n=3.
† Growth in the presence of metal salt for 4hr incubation. ‡ Establishment of biofilms for 24hr followed by growth in the presence of metal salt for 24hr.
(a)

57
(b)
Figure S2.1 Heatmaps for the MPBC, MBBC and MBEC of the three bacterial strains tested.
Analysis generated from the (a) MPBC (planktonic), MBBC (biofilm) and (a) MBECs (biofilm),
in the presence of AgNO3, CuSO4, TiCl3, Ga(NO3)3 •H2O, NiSO4 •6H2O, Al2(SO4)3 •H2O or
ZnSO4 •7H2O. The metals that could not prevent and/or eradicate growth in the concentrations
tested were included in the heatmaps and recorded as the maximum dilution tested. For precise
concentrations refer to Table 2.1 – 2.3.

58
3 Specificity in the susceptibilities of Escherichia coli,
Pseudomonas aeruginosa and Staphylococcus aureus clinical
isolates to six metal antimicrobials
Authored by:
Natalie Gugala, Dennis Vu, Michael D. Parkins and Raymond J. Turner
Published in:
Antibiotics, May 2019, 8 doi:10.3390/antibiotics8020051
Copyright permissions for the reproduction of this manuscript can be found in Appendix D.
Abstract
In response to the occurrence of antibiotic resistance, the development of metal-based
antimicrobials is on the rise. It is largely assumed that metals provide broad-spectrum microbial
efficacy, however, studies have shown that this is not always the case. Therefore, in this study, we
compared the susceptibilities of 93 clinical isolates belonging to the species Escherichia coli,
Pseudomonas aeruginosa and Staphylococcus aureus against six metals: aluminum, copper,
gallium, nickel, silver and zinc. To provide qualitative comparative information, the resulting
zones of growth inhibition were compared to the minimal inhibitory concentrations of three
indicator strains E. coli ATCC 25922, P. aeruginosa ATCC 27853 and S. aureus ATCC 25923.
Here, we demonstrate that the metal efficacies were species and isolate specific. Only several
isolates were either resistant or sensitive to all of the six metals, displaying great variability,
however, the greatest degree of similarity was found with the E. coli isolates. On the contrary, the
susceptibilities of the remaining two collections, S. aureus and P. aeruginosa, were more highly
dispersed. Using this information, we have shown that metals are not equal in their efficacies,
hence, their use should be tailored against a particular microorganism and care should be taken to
ensure the correct concentration is used.

59
Introduction
At this time, the incidence of antibiotic resistance is a familiar concern that continues to
provide challenges in infection control and disease prevention [311],[312]. In response, in the last
several decades, we have seen an increase in the development of alterative antimicrobials including
peptides [313] and polymers [314], and modifications to traditional therapeutic regimes, such as
combination treatments [315]. Metals and metal-based antimicrobials are among these alternative
agents presently being investigated (see review [278] for more information).
Essential metals, such as zinc, copper and iron, are just that – essential to the biochemistry
of life. In fact, it has been estimated that at least one-third of all proteins require metals
[2],[3],[316]. Despite this, elevated concentrations cause microbial toxicity. Non-essential metals,
including silver, gallium and tellurium, offer similar fate but at considerably lower concentrations
[31],[317]. Presently, advancements in the biomedical applications of metals primarily take the
form of diagnostic procedures and the prevention of diseases following the discovery that metals
can disrupt antibiotic resistant biofilms [1],[18],[31],[45] and kill multidrug resistant bacteria [46]–
[49] at low concentrations. For example, metals are now being impregnated into textiles including
socks and wound bandages [318],[319], coated onto surfaces such as medical devices
[64],[65],[320], and incorporated into liquid formulations [321]. Likewise, metal-based
antimicrobials such as nanoparticles, generally highlighted for their elevated toxicity, are seeing
an increase in development and use [46],[106],[111],[322]. A number of metal infused hydrogels
and polymers, which provide slow and concentrated release, have been developed and tested
against microorganisms [119],[323]. Moreover, metals are being combined with existing
antimicrobials, such as antibiotics as a means of improving their efficacy and repurposing agents
that are no longer useful against multidrug resistant bacteria [122],[324].

60
Metals and metal-based antimicrobials target shared biomolecules and are thereby generally
regarded as board-spectrum [180]. Still, a number of studies have shown that metal ions [1],[325],
like metal nanoparticles [326],[327] are not equivalent in their toxicity towards different strains.
This is problematic particularly since metal-based antimicrobials are being used in consumer
products such as activewear, deodorant and washing machines [328]. There is now strong evidence
that metal resistance exists [38],[145],[242],[249],[329]–[331] and this increase is likely to drive
antibiotic resistance further [247],[332]–[335] since the mechanisms of antibiotics resistance, such
as reduced toxin import, drug inactivation and mutation of toxin targets, among others, are
common mechanisms of metal resistance as well (Refer to review [247] for more detailed
information). As a result, it is imperative that the precise toxicity of metals against microorganisms
is identified to ensure that the correct concentrations of metal ions are utilized against the
appropriate organism.
In this study, the antimicrobial efficacies of six metals, aluminum, copper, gallium, nickel,
silver and zinc, were tested against 34 Staphylococcus aureus, 27 Pseudomonas aeruginosa and
32 Escherichia coli clinical isolates using the disk diffusion assay. The results were compared to
the minimal inhibitory concentrations of the corresponding indicator strains S. aureus ATCC
25923, P. aeruginosa ATCC 27853 and E. coli ATCC 25922 in order to normalize and provide
context to the zones of growth inhibition measured. Here, we found the efficacies of the metals to
be strain and isolate specific. The E. coli collection revealed the greatest degree of similarity, still,
disparities were observed between a number of isolates. There were sharp differences in the
susceptibilities of the S. aureus and P. aeruginosa isolates to aluminum, copper, gallium and silver,
and these observations were variable. Silver displayed the greatest efficacy followed by aluminum
and gallium. Whereas the least efficacious metal was nickel. In this work, we demonstrated that

61
metals are not equivalent in their antimicrobial abilities and isolates of the same species have
varying susceptibilities. As a result, the use of metal-based antimicrobials should be tailored to a
specific organism at a precise concentration.
Materials and Methods
3.3.1 Bacterial strains and storage
All organisms, including those identified as strains, such as P. aeruginosa PAO1, are
referred to as isolates in this work for ease of mention. The strains, S. aureus ATCC 25923, P.
aeruginosa ATCC 27853 and E. coli ATCC 25922 are distinguished as indicator strains, noted by
the American Type Culture Collection.
The Pseudomonas aeruginosa isolates and uropathogenic Escherichia coli CFTO73 were
generous gifts from Dr. J. Harrison (University of Calgary). All bacterial stains and isolates were
stored in Microbank vials at -80C as described by the manufacturer (ProLab Diagnostics,
Richmond Hill, ON, Canada). Prior to the disk diffusion assay, the strains and isolates were
streaked out on Luria-Bertani (LB) media agar (1.5%) plates and grown overnight at 37C. Our
choice of growth medium is reflected in other works that have also used this medium to monitor
the susceptibility of microorganisms to metals.
3.3.2 Determination of the effective metal concentrations and metal storage
The minimal planktonic bactericidal concentrations (MIC) of the indicator strains, S.
aureus ATCC 25923, P. aeruginosa ATCC 27853 and E. coli ATCC 25922, were determined in
a previous report by Gugala et al. (Chapter 2) [1]. These concentrations, which were determined
under identical conditions as in this study, were used as a means of normalizing and drawing
context to the zones of growth inhibition produced upon performing the disk diffusion assay.

62
Silver nitrate (AgNO3), copper sulfate (CuSO4), gallium nitrate [Ga(NO3)3] and nickel sulfate
(NiSO4•6H2O) were obtained from Sigma-Aldrich (St. Louis, MO, USA). Aluminum sulfate
[Al(SO4)3•H2O] was obtained from Matheson Colman and Bell (Norwood, OH, USA) and zinc
sulfate (ZnSO4•7H2O) was obtained from Fisher Scientific (Fair Lawn, NJ, USA). The working
stock solutions of each metal are as follows; Silver nitrate – 0.5 M, copper sulfate – 2.0 M, gallium
nitrate – 1.0 M, nickel sulfate – 2.5 M, aluminum sulfate – 1 .0 M, zinc sulfate – 1.5 M. All stock
solutions were stored in distilled and deionized water (dd)H2O at 21C. Finally, to ensure growth
was not impeded by the accompanying counter ion, stock solutions of sodium nitrate (NaNO3) and
sodium sulfate (NaSO4), at 1.5 M and 2.5 M, respectively, were made, tested and stored for no
longer than two weeks in (dd)H2O at 21C. Neither the blank disks nor the counterion loaded disks
were found to influence the measured zones of growth inhibition.
3.3.3 Bacterial growth and the agar disk diffusion method
All chemicals were obtained from VWR international, Mississauga, Canada. Bacterial
growth and susceptibility testing using the disk diffusion assay followed the Clinical and
Laboratory Standards Institute’s guidelines for bacterial testing [336]. Firstly, the bacterial isolates
were grown for 16 hours in filter-sterilized chemically simulated wound fluid (CSWF) modified
from Werthén et al. [297] [50% peptone water (0.85% NaCl, 0.1 g/L peptone): 50% bovine serum
albumin (66 g/L)]. Mueller Hinton media is the selected medium used for disk diffusion assays.
Despite this, we predicted that the supplemented acid hydrolysate of casein may lead to increased
metal chelation owing to the high level of amino acids found in this ingredient. In other works,
amino acids are used as a means of sequestering metal ions when performing susceptibility testing
[1],[19],[337]. Therefore, the rich medium, CSWF, which closely mimics a wound environment,
was selected. The following day, sterile 6 mm filter disks were soaked in each metal for 30 minutes.

63
Any remaining metal solution was removed to ensure the disks were not oversaturated. Moreover,
to prevent crystallization, the disks were not permitted to dry. Next, 250 L of inoculum,
standardized to an optical density of 1.00 (A600), was added onto fresh LB agar (1.5%) plates,
spread uniformly and allowed to dry. The metal loaded and control disks were placed on solid agar
plates and incubated overnight at 37C. The following day the zones of growth inhibition were
measured to the nearest millimeter.
Each biological trial included two technical replicates and the indicator strain
corresponding to the isolates tested. In total, three biological trials were completed, for a total of
six replicates.
3.3.4 Normalization and statistical analyses
As aforementioned, the indicator strains, E. coli ATCC 25922, P. aeruginosa ATCC 27853 and S.
aureus ATCC 25923, were included as a means of normalizing and providing context to the zones
of growth inhibition, largely due to the variability between trials and the lack of clinical breakpoint
information for the given strains under metal ion challenge.
Firstly, technical replicates within the same biological trial were averaged and these means
were used for subsequent analyses. Next, working within a biological trial, the means of the
isolates were normalized against the mean of reference indicator strain and finally the scores of
each isolate under a given metal challenge were averaged. A score of 1.0 signified no difference
in susceptibility when compared to the indicator strain. Isolates with scores <1.0 were noted as
resistant since the zones of grow inhibition for these isolates were less than the corresponding
indicator strain. Those with scores >1.0 were regarded as sensitive since the zones of growth
inhibition were larger than the indicator strain. Furthermore, since the MICs of the indicator strains
were known and since these strains were used to normalize the dataset, a qualitative concentration

64
– to which we refer to as the breakpoint value – can be attributed to each isolate. As a result, a
score of 1.0 is equal to the MIC of the reference indicator strain under the given metal stress. A
score <1.0 indicates that the breakpoint value is >MIC and a score >1.0 indicates that the
breakpoint value <MIC.
Lastly, to account for the different metal concentrations used, the scores were normalized
against the working stock solutions, which in turn disclosed the most efficacious metal. Here, the
efficacies are only compared between each metal and the breakpoint value is no longer applicable.
This normalization is based on the assumption that the metals diffuse through the agar
equivalently.
Results
In this study the efficacies of six metals, aluminum, copper, gallium, nickel, silver and zinc
were tested against 93 bacterial isolates using the disk diffusion assay, which allows for high-
throughput susceptibility testing. In order to account for independent variables and provide
reference, the zones of grow inhibition were normalized against the three pathogenic indicator
strains, S. aureus ATCC 25923, P. aeruginosa ATCC 27853 and E. coli ATCC 25922 for which
the MICs in chemically simulated wound fluid (CSWF) are known (Table A1). Since the MICs of
the indicator strains were identified, a qualitative concentration – to which we refer to as the
breakpoint value – can be given to each isolate. A score of 1.0 is equal to the MIC of the reference
indicator strain under the given metal stress. Whereas a score <1.0 means the breakpoint value is
>MIC and a score >1.0 means the breakpoint value <MIC.
Less variability between the E. coli isolates was observed when compared to the P.
aeruginosa and S. aureus collections (Figure 3.1 a-f). The three E. coli isolates, CFTO73,
O127:H6 and O157:H7 (the latter noted as multidrug resistant [MDR] [338]) displayed resistance

65
to all the metals except silver. When examining the E. coli collection in more detail, there were a
number of isolates, including E009, E011, E012 and E056, that presented scores distant from the
normalized score when grown in the presence of gallium, nickel, silver and zinc, respectively
(Figure 3.1 c and d-f). The scores of these isolates were below 1.0, therefore, the breakpoint values
were >31.25 mM, >625 mM, >0.50 mM and >650 mM, respectively (Table S3.1). Note that Tables
S.1-S.3 report the average diameters and the standard deviations in order to show the variability in
the data sets and therefore our reasoning for normalizing the values; Figure 3.1 is not entirely
comparable to Tables S.1-S.3.
MRSA362
MRSA94
MRSA147
MRSA148
MRSA166
MSSA124
MSSA103
MSSA387
MRSA145
MRSA206
MES26
MES242
MES84
MES172
MES116
MRSA222
MRSA104
MRSA164
MER142
MSSA323
MES92
MSSA102T
MES104K
MES103
MES101T
MER117
MER118
MER204
MER212
MER108
MER237
MER22
MRSA204
MER155
MM 080P03
DK 122B07
KS F6999
LS 13901
KR 080603
AR 091006
SS 1708
CDS
TB16199
PA01
NP 104491
P62
P6077
PCF5
PMSH3
PCF39S
PX13273
PE2
IM 11008
LL 14837
TF F7783
PT56593
PT53616
PCF127
PS54868
PJJ692
PU2504
E061
E056
E057
E014
E060
E006
E047
E015
E007
E022
E045
E004
E029
E033
E012
E009
E005
E011
E112
E086
E109
E001
E105
E092
E097
E055
E096
E107
O157:H7
O125sc:H6
CFT073
F2348
0.0 0.5 1.0 1.5 2.0
Str
ain
Sensitive Resistant
Zinc
MRSA362
MRSA94
MRSA147
MRSA148
MRSA166
MSSA124
MSSA103
MSSA387
MRSA145
MRSA206
MES26
MES242
MES84
MES172
MES116
MRSA222
MRSA104
MRSA164
MER142
MSSA323
MES92
MSSA102T
MES104K
MES103
MES101T
MER117
MER118
MER204
MER212
MER108
MER237
MER22
MRSA204
MER155
MM 080P03
DK 122B07
KS F6999
LS 13901
KR 080603
AR 091006
SS 1708
CDS
TB16199
PA01
NP 104491
P62
P6077
PCF5
PMSH3
PCF39S
PX13273
PE2
IM 11008
LL 14837
TF F7783
PT56593
PT53616
PCF127
PS54868
PJJ692
PU2504
E061
E056
E057
E014
E060
E006
E047
E015
E007
E022
E045
E004
E029
E033
E012
E009
E005
E011
E112
E086
E109
E001
E105
E092
E097
E055
E096
E107
O157:H7
O125sc:H6
CFT073
F2348
0.0 0.5 1.0 1.5
a) Aluminum
MRSA362
MRSA94
MRSA147
MRSA148
MRSA166
MSSA124
MSSA103
MSSA387
MRSA145
MRSA206
MES26
MES242
MES84
MES172
MES116
MRSA222
MRSA104
MRSA164
MER142
MSSA323
MES92
MSSA102T
MES104K
MES103
MES101T
MER117
MER118
MER204
MER212
MER108
MER237
MER22
MRSA204
MER155
MM 080P03
DK 122B07
KS F6999
LS 13901
KR 080603
AR 091006
SS 1708
CDS
TB16199
PA01
NP 104491
P62
P6077
PCF5
PMSH3
PCF39S
PX13273
PE2
IM 11008
LL 14837
TF F7783
PT56593
PT53616
PCF127
PS54868
PJJ692
PU2504
E061
E056
E057
E014
E060
E006
E047
E015
E007
E022
E045
E004
E029
E033
E012
E009
E005
E011
E112
E086
E109
E001
E105
E092
E097
E055
E096
E107
O157:H7
O125sc:H6
CFT073
F2348
0.0 0.5 1.0 1.5
b) Copper
Esch
erich
ia c
oli
Pse
ud
om
on
as a
eru
gin
osa
S
taph
ylo
co
ccu
s a
ure
us

66
Figure 3.1 Bar plots signifying the normalized score for each isolate against the corresponding
indicator strain, for which the value is 1.0 (grey line). This score represents the MIC of the
indicator strain under the given metal stress. Orange denotes a resistant isolate. For these
isolates, the zone of growth inhibition was less than the corresponding indicator strain (<1.0).
Purple represents the isolates that fall above the normalized score since the zones of growth
inhibition were larger, these are noted as sensitive isolates (>1.0). Each score represents the
mean of three biological trials, each with two technical replicates. The MICs are as follows in the
MRSA362
MRSA94
MRSA147
MRSA148
MRSA166
MSSA124
MSSA103
MSSA387
MRSA145
MRSA206
MES26
MES242
MES84
MES172
MES116
MRSA222
MRSA104
MRSA164
MER142
MSSA323
MES92
MSSA102T
MES104K
MES103
MES101T
MER117
MER118
MER204
MER212
MER108
MER237
MER22
MRSA204
MER155
MM 080P03
DK 122B07
KS F6999
LS 13901
KR 080603
AR 091006
SS 1708
CDS
TB16199
PA01
NP 104491
P62
P6077
PCF5
PMSH3
PCF39S
PX13273
PE2
IM 11008
LL 14837
TF F7783
PT56593
PT53616
PCF127
PS54868
PJJ692
PU2504
E061
E056
E057
E014
E060
E006
E047
E015
E007
E022
E045
E004
E029
E033
E012
E009
E005
E011
E112
E086
E109
E001
E105
E092
E097
E055
E096
E107
O157:H7
O125sc:H6
CFT073
F2348
0.0 0.5 1.0 1.5 2.0
c) Gallium
MRSA362
MRSA94
MRSA147
MRSA148
MRSA166
MSSA124
MSSA103
MSSA387
MRSA145
MRSA206
MES26
MES242
MES84
MES172
MES116
MRSA222
MRSA104
MRSA164
MER142
MSSA323
MES92
MSSA102T
MES104K
MES103
MES101T
MER117
MER118
MER204
MER212
MER108
MER237
MER22
MRSA204
MER155
MM 080P03
DK 122B07
KS F6999
LS 13901
KR 080603
AR 091006
SS 1708
CDS
TB16199
PA01
NP 104491
P62
P6077
PCF5
PMSH3
PCF39S
PX13273
PE2
IM 11008
LL 14837
TF F7783
PT56593
PT53616
PCF127
PS54868
PJJ692
PU2504
E061
E056
E057
E014
E060
E006
E047
E015
E007
E022
E045
E004
E029
E033
E012
E009
E005
E011
E112
E086
E109
E001
E105
E092
E097
E055
E096
E107
O157:H7
O125sc:H6
CFT073
F2348
0.0 0.5 1.0 1.5
d) Nickel
MRSA362
MRSA94
MRSA147
MRSA148
MRSA166
MSSA124
MSSA103
MSSA387
MRSA145
MRSA206
MES26
MES242
MES84
MES172
MES116
MRSA222
MRSA104
MRSA164
MER142
MSSA323
MES92
MSSA102T
MES104K
MES103
MES101T
MER117
MER118
MER204
MER212
MER108
MER237
MER22
MRSA204
MER155
MM 080P03
DK 122B07
KS F6999
LS 13901
KR 080603
AR 091006
SS 1708
CDS
TB16199
PA01
NP 104491
P62
P6077
PCF5
PMSH3
PCF39S
PX13273
PE2
IM 11008
LL 14837
TF F7783
PT56593
PT53616
PCF127
PS54868
PJJ692
PU2504
E061
E056
E057
E014
E060
E006
E047
E015
E007
E022
E045
E004
E029
E033
E012
E009
E005
E011
E112
E086
E109
E001
E105
E092
E097
E055
E096
E107
O157:H7
O125sc:H6
CFT073
F2348
0.0 0.5 1.0 1.5
e) Silver
MRSA362
MRSA94
MRSA147
MRSA148
MRSA166
MSSA124
MSSA103
MSSA387
MRSA145
MRSA206
MES26
MES242
MES84
MES172
MES116
MRSA222
MRSA104
MRSA164
MER142
MSSA323
MES92
MSSA102T
MES104K
MES103
MES101T
MER117
MER118
MER204
MER212
MER108
MER237
MER22
MRSA204
MER155
MM 080P03
DK 122B07
KS F6999
LS 13901
KR 080603
AR 091006
SS 1708
CDS
TB16199
PA01
NP 104491
P62
P6077
PCF5
PMSH3
PCF39S
PX13273
PE2
IM 11008
LL 14837
TF F7783
PT56593
PT53616
PCF127
PS54868
PJJ692
PU2504
E061
E056
E057
E014
E060
E006
E047
E015
E007
E022
E045
E004
E029
E033
E012
E009
E005
E011
E112
E086
E109
E001
E105
E092
E097
E055
E096
E107
O157:H7
O125sc:H6
CFT073
F2348
0.0 0.5 1.0 1.5 2.0
f) Zinc
Esch
erich
ia c
oli
Pse
ud
om
on
as a
eru
gin
osa
S
taph
ylo
co
ccu
s a
ure
us
Esch
erich
ia c
oli
Pse
ud
om
on
as a
eru
gin
osa
S
taph
ylo
co
ccu
s a
ure
us

67
order: E. coli ATCC 25922, P. aeruginosa ATCC 27853 and S. aureus ATCC 25923: (a)
aluminum: 250 mM, 1.95 mM and >250 mM, (b) copper: 12.5 mM, 6.25 mM and 12.5 mM, (c)
gallium: 31.25 mM, 15.63 mM, 15.62 mM, (d) nickel: >625 mM, >650 mM and >625 mM, (e)
silver: >0.5 mM, >0.5 mM and >0.5 mM, (f) zinc: >650 mM, >375 mM and 23.44 mM.
In general, the P. aeruginosa isolates were sensitive to all six metals. Several isolates were
found to have scores that were 2-fold higher than the normalized score of the indicator strain. For
example, PCF5 under gallium exposure, TB161 and DK122B07 under nickel exposure, PT56593
under silver exposure, and KR080603 under zinc exposure. The sensitivities of these isolates were
pronounced in the presence of these metals but not with the remaining metal antimicrobials.
Gallium was found to be efficacious against the P. aeruginosa isolates, yet this metal demonstrated
variable efficacy against the S. aureus and E. coli isolates (Figure 3.1 c). Within the concentrations
tested, the efficacy of silver was the greatest against the Pseudomonas collection (Figure 3.1 e);
all but three isolates had breakpoints values <0.50 mM (Table S3.2).
In the presence of aluminum and copper, a number of the S. aureus isolates, such as
MER155, ME101T and MES92, presented scores that were nearly 1.5-fold greater than S. aureus
ATCC 25923 (Figure 3.1 a and b). Here, the breakpoint values were >250 mM and >12.50 mM,
respectively (Table S3.3). This trend was not met by the other metals. In fact, many of the
aforementioned isolates were resistant to the concentration of silver tested in this study. Nearly all
the MRSA (methicillin resistant) and MSSA (methicillin sensitive) isolates were resistant to
aluminum, nickel and silver, thus, the breakpoint values were >250 mM, >625 mM and >125 mM,
respectively (Table S3.3).
The clustering of Escherichia and the dispersity of the Pseudomonas and Staphylococcus
collections are fostered in Figure 3.2 and Figure 3.3. These plots demonstrate that the
susceptibilities of the P. aeruginosa isolates were more dispersed than the S. aureus isolates in the
presence of aluminum, a trend that was inverted for the metal gallium (Figure 3.2 a and c). Still,

68
the overall spread of the two species is the same in the presence of copper. Upon comparison
between the overall scatterings of the three species, the scores of the Pseudomonas collection
dispersed to a greater degree (Figure 3.3). Further, when considering all six metals together, the
E. coli isolates clustered closely, yet the P. aeruginosa and S. aureus isolates did not (Figure 3.3).
Figure 3.2 Dot plots illustrating the dispersity between the normalized scores of the E. coli (red),
P. aeruginosa (green) and S. aureus (blue) isolates. The zones of growth inhibition for the
isolates were normalized against the zones of the indicator strains. A value of 1.0 signifies the
minimal inhibitory concentration corresponding to the indicator strain. Scores >1.0 are
considered sensitive and scores <1.0 are noted as resistant. Each score represents the mean of
three biological trials each with two technical replicates.
0.5
1.0
1.5
2.0
No
rmaliz
ed S
core
a) Aluminum
0.5
1.0
1.5
2.0
b) Copper
0.5
1.0
1.5
2.0
c) Gallium
0.5
1.0
1.5
2.0
Norm
aliz
ed
Sco
re
d) Nickel
0.5
1.0
1.5
2.0
e) Silver
0.5
1.0
1.5
2.0
f) Zinc
Se
nsitiv
e
Resis
tant
Sensitiv
e
Resis
tant

69
Figure 3.3 Clustering of the 93 isolates belonging to the species E. coli (red), P. aeruginosa
(green) or S. aureus (blue) using principle component analysis. Collections were highlighted to
show positioning of each isolate in respect to the remaining collection. Here, each isolate was
normalized against the corresponding indicator strain in the presence of the six metals,
aluminum, copper, gallium, nickel, silver and zinc. Data collected from the mean of three
biological trials, each with two replicates.
Overall, all the isolates varied in sensitivity to the six metals (Figure 3.4), however, the
working metal solutions in this study were not equal. To account for these differences the scores
were normalized against the respective concentrations (Figure 3.5). Here, the metals can only be
compared to each other, regardless, the overall trends between the isolates of a given metal remain
−0.2
−0.1
0.0
0.1
0.2
0.3
−0.3 −0.2 −0.1 0.0 0.1
PC1 (57.14%)
PC
2 (
16
.42%
)
Escherichia coli Pseudomonas aeruginosa Staphylococcus aureus

70
the same. In general, the scores were found to be the highest for the metal silver, followed by
aluminum and gallium. Opposing this was the metal nickel (Figure 3.5).
Figure 3.4 Heatmap signifying the normalized zones of growth inhibition. Score of 1.0 was
given to the zone of growth inhibition for the indicator strain This value also represents the MIC
of that organism under metal challenge. The isolates were normalized over the corresponding
strain to yield comparable values. The color red denotes a sensitive hit (>1.0) and the color
purple was given to the isolates that displayed enhanced resistant (<1.0). Data collected from the
mean of three biological trials, each with two replicates; note that the working stock solutions
were not equivalent. The MICs (score = 1.0) for the given data are as follows in the order: E. coli
ATCC 25922, P. aeruginosa ATCC 27853 and S. aureus ATCC 25923: aluminum: 250 mM,
1.95 mM and >250 mM, copper: 12.5 mM, 6.25 mM and 12.5 mM, gallium: 31.25 mM, 15.63
mM, 15.62 mM, nickel: >625 mM, >650 mM and >625 mM, silver: >0.5 mM, >0.5 mM and
>0.5 mM, zinc: >650 mM, >375 mM and 23.44 mM.
MRSA362
MRSA94
MRSA147
MRSA148
MRSA166
MSSA124
MSSA103
MSSA387
MRSA145
MRSA206
MES26
MES242
MES84
MES172
MES116
MRSA222
MRSA104
MRSA164
MER142
MSSA323
MES92
MSSA102T
MES104K
MES103
MES101T
MER117
MER118
MER204
MER212
MER108
MER237
MER22
MRSA204
MER155
MM 080P03
DK 122B07
KS F6999
LS 13901
KR 080603
AR 091006
SS 1708
CDS
TB16199
PA01
NP 104491
P62
P6077
PCF5
PMSH3
PCF39S
PX13273
PE2
IM 11008
LL 14837
TF F7783
PT56593
PT53616
PCF127
PS54868
PJJ692
PU2504
E061
E056
E057
E014
E060
E006
E047
E015
E007
E022
E045
E004
E029
E033
E012
E009
E005
E011
E112
E086
E109
E001
E105
E092
E097
E055
E096
E107
O157:H7
O125sc:H6
CFT073
F2348
Aluminum Copper Gallium Nickel Silver Zinc
Metal
Isola
te
0.5
1.0
1.5
2.0
Normalized zone of growth inhibition
Esch
eri
ch
ia
coli
Pse
ud
om
on
as
ae
rug
inosa
Sta
ph
ylo
coccu
s
au
reu
s

71
Figure 3.5 Heatmap representing the zones of growth inhibition normalized against the
concentration of metal. Each metal was provided an equivalent score of 1.0. Red specifies isolate
sensitivity, therefore, it was interpreted that a concentration of 1.0 M would ensure eradication.
Purple indicates resistance, hence a concentration greater than 1.0 M is required to eradicate the
organism in the growth medium used in this study. Data collected from the mean of three
biological trials, each with two replicates.
Discussion
In this study, the efficacies of six metals, aluminum, copper, gallium, nickel, silver and zinc,
against 93 bacterial isolates were compared using the disk diffusion assay. To our knowledge, no
breakpoint values have been reported for the three indicator strains, E. coli ATCC 25922, P.
aeruginosa ATCC 27853 and S. aureus ATCC 25923 under metal challenge. Using a preceding
MRSA362
MRSA94
MRSA147
MRSA148
MRSA166
MSSA124
MSSA103
MSSA387
MRSA145
MRSA206
MES26
MES242
MES84
MES172
MES116
MRSA222
MRSA104
MRSA164
MER142
MSSA323
MES92
MSSA102T
MES104K
MES103
MES101T
MER117
MER118
MER204
MER212
MER108
MER237
MER22
MRSA204
MER155
MM 080P03
DK 122B07
KS F6999
LS 13901
KR 080603
AR 091006
SS 1708
CDS
TB16199
PA01
NP 104491
P62
P6077
PCF5
PMSH3
PCF39S
PX13273
PE2
IM 11008
LL 14837
TF F7783
PT56593
PT53616
PCF127
PS54868
PJJ692
PU2504
E061
E056
E057
E014
E060
E006
E047
E015
E007
E022
E045
E004
E029
E033
E012
E009
E005
E011
E112
E086
E109
E001
E105
E092
E097
E055
E096
E107
O157:H7
O125sc:H6
CFT073
F2348
Aluminum Copper Gallium Nickel Silver Zinc
Metal
Isola
te
0
1
2
3
Normalized zone of growth inhibition
Esch
eri
ch
ia
coli
Pse
ud
om
on
as
ae
rug
inosa
Sta
ph
ylo
coccu
s
au
reu
s

72
study completed by our group, the same MICs were used to provide breakpoint values. Further, a
rich growth medium, chemically simulated wound fluid (CSWF), containing bovine serum
albumin among other components was used to simulate a wound environment. The zones of
growth inhibition were measured, normalized and compared to the indicator strains.
Metal antimicrobials are generally regarded as board-spectrum [278], nonetheless, studies have
demonstrated that this is not always the case. In agreement with this, we have shown that metal
antimicrobials vary in efficacy against different species and different isolates of the same species
and these differences are not uniform. For example, the isolate with the highest gallium sensitivity
was P. aeruginosa KR080603, yet, this microorganism presented substantially less copper
sensitivity than the remaining P. aeruginosa isolates. In fact, the most sensitive copper isolate was
MES192, a S. aureus isolate. If metals behaved similarly in the presence of different
microorganisms and their mechanisms of action were similar or the same, a gallium sensitive
isolate would display comparable copper sensitivity. We have demonstrated that was not the case
since variable sensitivities were observed.
Intraspecies variability may be a result of a number of factors, including the presence of
inherent or acquired metal resistant elements [339]. Some of these mechanisms include toxin
export, reduced uptake [242] and changes to the extracellular biofilm [180]. The source of an
isolate, such as an antibiotic exposed wound versus the lungs of a cystic fibrosis patient, likely
plays a large role in mediating the aforementioned factors. For example, isolates obtained from a
burn wound undergoing treatment are likely conditioned and therefore present elevated resistance
when compared to those obtained elsewhere, such as a urine sample. Studies have demonstrated
that agents other than antibiotics, such as metals, can select for antibiotic resistance
[247],[340],[341], and the opposite may also hold true. As a result, an isolate obtained from a

73
wound sample may demonstrate greater metal resistance, regardless of the species, since it has
undergone selective pressures that permit the expression of antimicrobial resistant factors [337].
Further, if an isolate was extracted from a multispecies consortium, horizontal gene transfers and
changes to the metabolic profile of an organism may have large effects on the susceptibility of an
organism to an external challenge [342]. For instance, our group has shown that in the presence of
metals a dual-species biofilm composed of P. aeruginosa and S. aureus demonstrates elevated
resistance when compared to a single species biofilm and other microbe combinations [337].
Differences amid interspecies susceptibility may be a result of the same factors that
influence intraspecies variability, including genetic differences thereby causing alterations in the
proteomic and metabolic profile of the organism. Still, additional influences are likely to exist,
such as differences in the LPS – or lack thereof in the case of Gram-positive organisms, substantial
changes to the surrounding biofilm, its constituents and in the biomolecules exerted by the
organism [242], and varying ratios of lipids. For example, whereas both E. coli and P. aeruginosa
are Gram-negative bacteria, inner membrane lipid ratios differ. Within the membrane of P.
aeruginosa, and not E. coli, three additional lipids are found as foremost components, including
phosphatidylcholine, ornithine lipid and alanyl-phosphatidylglycerol [343].
Finally, to account for differences in the metal concentrations the isolate scores were
normalized against the working stock solutions (Figure 3.5). Our data conveys that if the working
concentration of silver increased from 0.5 M to 1.0 M, 100% of the isolates would have sensitive
profiles, as observed in Figure S3.3. This concentration would guarantee the prevention of
bacterial growth against the organism tested under the conditions used. To no surprise, we
pronounced silver as the most efficacious metal. The utilization of this metal for both commercial
and medical use is far greater than the remaining metals [36],[308],[344], and for valid reason.

74
Copper is also finding its way into healthcare settings and being used for commercial purposes
[345]. Nonetheless, under the concentration of copper used in this study, only approximately 50%
of the microorganisms tested were marked as sensitive. Therefore, we conclude that whilst still a
useful metal antimicrobial, in comparison to silver, greater care must be taken when using this
metal. Nickel was found to be the least effective metal, and not surprisingly since the use of nickel
as an antimicrobial is not acclaimed [1],[346], likely due to the efficient and tightly regulated
uptake, trafficking and storage of this metal [16]. Copper, which is also tightly regulated in the cell
displays higher binding affinity to biomolecules, based on the Irving-Williams series [143], when
compared to nickel and zinc. In fact, intracellular metal concentrations are generally inversely
correlated with Irving-Williams series in that the greater the binding affinity of a cation the lower
the intracellular concentration, and therefore greater the toxicity when present.
In this work, we asked whether the efficacies of metal antimicrobials were comparable
between species and amongst isolates of the same species. Using the standard method of testing –
the disk diffusion assay, we were able to validate that species respond dissimilarly to metal stress
and isolates of the same species display different metal susceptibilities. Despite the perception that
metals are board-spectrum antimicrobials, certain metals perform better against particular isolates
and species. In summary, great care must be taken when using metal-based antimicrobials both in
healthcare, industrial and consumer settings, due to their variable efficacies.
Chapter 3 Supplementary Table S3.1 Minimal inhibitory concentrations previously determined by Gugala et al. in
chemically simulated wound fluid [1].
Metal Escherichia coli
ATCC 25922
Pseudomonas
aeruginosa ATCC
27853
Staphylococcus aureus
ATCC 25923
Aluminum
[Al2(SO2)3 • H2O] 250 mM 1.95 mM > 250mM
Copper (CuSO4) 12.5 mM 6.25 mM 12.5 mM

75
Gallium
[Ga(NO3)3 •
H2O]
31.25 mM 15.63 mM 15.63 mM
Nickel (NiSO4) >625 mM >625 mM >625 mM
Silver (AgNO3) >0.50 mM1 >0.50 mM1 >0.50 mM1
Zinc (ZnSO4 •
7H2O) >650 mM > 375mM1 23.44 mM
1Maximum concentration of silver reached before significant precipitation occurred, see Gugala
et al. [1] for more information

76
Table S3.2 Escherichia coli zones of growth inhibition (mm) and the corresponding breakpoint value1 in the presence of the given
metal, which were determined using the MIC of the indicator strain2 E. coli ATCC 25922 as previously observed by Gugala et al [1].
Isolate Aluminum
Break-
Point
Value
(mM)
Copper
Break-
point
value
(mM)
Gallium
Break-
point
value
(mM)
Nickel
Break-
point
value
(mM)
Silver
Break-
point
value
(mM)
Zinc
Break
Point
value
(mM)
Atcc 25922 17.2 2.3 250 19.7 1.2 125 13.7 2.8 31.25 25.0 2.1 >625 12.6 2.2 >0.50 25.0 1.4 >650
E061 18.1 0.2 <250 19.4 0.5 >125 15.4 0.2 <31.25 22.9 1.2 11.9 1.2 21.0 3.2
E056 16.8 1.8 >250 19.5 0.4 >125 14.7 0.4 <31.25 23.3 2.3 10.0 1.1 23.5 0.9
E057 18.1 1.3 <250 19.8 1.9 <125 15.0 1.5 <31.25 25.0 1.1 >625 11.8 0.6 24.1 1.6
E014 18.3 1.4 <250 20.5 0.7 <125 15.6 0.2 <31.25 24.1 1.2 12.1 0.7 23.3 1.1
E060 16.9 2.7 >250 20.0 0.4 <125 15.5 2.8 <31.25 24.4 0.5 12.4 1.6 24.0 0.7
E006 17.0 2.8 >250 18.8 1.8 >125 13.5 2.1 >31.25 22.5 0.7 12.4 0.2 22.5 0.0
E047 17.8 1.8 <250 19.1 1.2 >125 15.5 0.7 <31.25 24.3 0.4 12.9 1.2 >0.50 24.3 0.4
E015 19.1 0.2 <250 22.4 0.5 <125 14.4 1.6 <31.25 25.5 1.4 >625 12.8 1.8 >0.50 24.1 0.9
E007 20.0 0.7 <250 20.0 0.7 <125 15.4 0.9 <31.25 24.1 1.2 11.4 0.5 23.9 0.2
E022 18.9 0.5 <250 20.4 1.2 <125 13.1 3.7 >31.25 24.0 0.0 11.1 2.3 26.0 1.4 >650
E045 18.5 0.7 <250 21.0 0.7 <125 12.5 3.5 >31.25 23.9 0.5 11.9 0.2 23.6 0.9
E004 20.0 0.7 <250 24.3 0.4 <125 15.3 0.4 <31.25 27.5 0.7 >625 14.0 0.7 >0.50 27.1 0.2 >650
E029 19.0 2.8 <250 20.1 1.9 <125 19.0 3.0 <31.25 24.8 2.1 12.5 0.7 24.5 2.5
E033 17.1 0.5 >250 19.1 0.5 >125 17.4 1.6 <31.25 22.1 0.2 11.4 1.6 23.3 0.4
E012 18.0 2.5 <250 19.3 1.4 >125 15.4 1.6 <31.25 23.3 2.1 10.1 0.9 24.0 1.4
E009 19.8 1.8 <250 20.8 1.1 <125 15.0 0.4 <31.25 23.4 0.2 11.6 0.2 23.4 0.9
E005 15.6 2.3 >250 18.6 0.2 >125 13.3 0.4 >31.25 19.3 2.5 11.4 0.2 21.8 1.4
E011 18.6 2.7 <250 18.8 0.4 >125 13.0 1.4 >31.25 23.3 3.2 11.5 2.1 23.6 1.9
E112 18.1 2.7 <250 18.9 3.3 >125 13.9 2.7 <31.25 24.4 1.6 13.8 0.0 >0.50 24.3 0.7
E086 18.6 0.2 <250 19.5 0.7 >125 13.9 0.9 <31.25 23.4 1.6 11.8 2.9 23.9 1.9
E109 17.3 1.1 <250 21.1 3.0 <125 12.9 3.3 >31.25 24.4 0.5 12.9 2.3 >0.50 22.6 0.5
E001 18.1 3.9 <250 16.5 2.1 >125 14.3 1.1 <31.25 22.5 1.1 11.8 1.9 23.5 0.7
E105 17.1 2.3 >250 20.3 0.4 <125 13.6 2.7 >31.25 25.4 0.2 >625 13.9 1.9 >0.50 24.9 0.5

77
E092 16.3 2.1 >250 19.9 0.5 <125 11.9 0.5 >31.25 23.8 1.8 13.3 2.8 >0.50 22.9 0.5
E097 17.3 2.5 <250 21.9 0.5 <125 14.4 1.6 <31.25 24.5 0.7 13.6 2.3 >0.50 24.6 0.2
E100 16.8 2.5 >250 19.3 1.1 >125 13.0 2.1 >31.25 25.1 0.9 >625 13.8 0.7 >0.50 25.1 0.2 >650
E055 17.9 2.9 <250 21.8 3.2 <125 14.4 3.7 <31.25 26.5 2.8 >625 13.3 2.5 >0.50 25.5 1.8 >650
E096 19.3 2.5 <250 22.5 2.5 <125 14.1 2.7 <31.25 26.5 0.4 >625 14.4 0.9 >0.50 26.5 0.7 >650
E107 17.9 2.5 <250 19.8 2.5 <125 11.9 2.7 >31.25 25.9 0.4 13.6 0.9 >0.50 24.9 0.7
O157:h7 15.1 2.7 >250 18.0 0.0 >125 12.8 0.9 >31.25 22.4 1.9 8.8 1.6 23.0 0.2
O125sc:h6 15.0 0.0 >250 18.8 1.4 >125 13.3 0.4 <31.25 22.3 1.1 10.4 0.9 22.5 0.0
Cft073 13.8 1.1 >250 18.5 1.4 >125 12.0 1.4 >31.25 22.4 1.2 9.9 0.2 22.0 0.7
F2348 15.0 0.0 >250 17.6 0.9 >125 12.9 0.5 >31.25 22.3 1.8 10.8 1.4 23.3 0.4
1Blank indicates that the breakpoint value cannot be provided, since the precise MIC was not determined in chemically simulated wound fluid due to metal
precipitation 2 These values are included in the first row of the table

78
Table S3.3 Pseudomonas aeruginosa zones of growth inhibition (mm) and the corresponding breakpoint value1 in the presence of the
given metal, which were determined using the MIC of the indicator strain2 P. aeruginosa ATCC 27853 as previously determined by
Gugala et al [1].
Isolate Aluminum
Break-
Point
Value
(mM)
Copper
Break-
point
value
(mM)
Gallium
Break-
point
value
(mM)
Nickel
Break-
point
value
(mM)
Silver
Break-
point
value
(mM)
Zinc
Break
Point
value
(mM)
Atcc
27853 15.0 0.8 1.95 16.5 1.3 6.25 12.7 1.7 >15.63 21.9 1.6 >625 13.2 3.2 >0.50 15.9 1.5 >375
Mm 080p03 15.6 0.9 <1.95 15.5 1.4 >6.25 18.1 0.9 <15.63 26.6 1.6 17.3 2.5 22.8 3.2
Dk 122b07 20.1 0.2 <1.95 19.9 0.5 <6.25 15.1 1.6 <15.63 33.1 2.7 18.0 1.4 19.8 3.2
Ks f6999 16.3 1.1 <1.95 10.6 1.9 >6.25 20.1 2.3 <15.63 28.3 1.8 14.8 0.4 14.9 0.5 >375
Ls 13901 16.8 0.4 <1.95 18.1 0.5 <6.25 12.5 1.4 >15.63 28.4 0.2 19.5 0.7 19.9 1.9
Kr 080603 18.9 0.5 <1.95 22.1 1.2 <6.25 26.3 1.8 <15.63 27.6 2.3 16.8 0.4 28.5 2.1
Ar 091006 17.5 1.4 1.95 19.1 0.9 <6.25 17.3 1.1 <15.63 28.4 0.5 20.0 2.1 18.0 0.0
Ss 1708 15.8 1.1 <1.95 12.8 1.8 >6.25 16.6 0.5 <15.63 23.3 1.1 14.0 1.4 19.0 1.4
Cds 17.5 0.7 <1.95 19.5 0.7 <6.25 16.0 0.7 <15.63 29.0 0.0 15.0 2.8 21.0 2.1
Tb 16199 18.3 0.4 <1.95 19.8 0.4 <6.25 21.0 3.5 <15.63 31.9 0.2 19.5 0.7 22.0 3.5
Pa01 15.8 0 <1.95 15.3 0.4 >6.25 15.3 1.8 <15.63 28.8 3.2 17.5 0.7 16.9 0.9
Np 104491 15.8 1.1 <1.95 18.5 0.4 <6.25 17.5 0.0 <15.63 29.0 0.7 17.9 0.5 17.3 0.4
P62 18.0 0.7 <1.95 17.3 0.9 <6.25 16.4 0.9 <15.63 27.3 1.1 12.5 0.7 >0.50 20.0 2.3
P6077 17.0 1.3 <1.95 18.3 2.0 <6.25 13.1 3.0 <15.63 23.0 2.5 14.4 1.3 17.3 0.4
Pcf5 16.8 3.1 <1.95 20.3 1.1 <6.25 24.2 2.7 <15.63 29.8 3.8 13.1 2.1 >0.50 27.9 0.8
Pmsh3 16.2 0.3 <1.95 15.2 0.8 >6.25 12.2 2.7 >15.63 24.5 1.0 14.1 0.4 16.4 0.8
Pcf39s 17.7 0.8 <1.95 19.9 0.9 <12.5 15.9 2.3 <15.63 27.2 1.4 14.3 1.1 19.7 2.4
Px13273 17.3 2.0 <1.95 16.7 1.9 <12.5 13.9 1.3 <15.63 23.3 1.2 13.6 0.8 17.7 1.5
Pe2 16.7 0.3 <1.95 17.8 0.3 <12.5 14.6 0.9 <15.63 25.5 1.0 12.0 1.0 >0.50 17.4 0.4
Im 11008 17.0 0.0 <1.95 14.8 0.4 >6.25 15.9 3.0 <15.63 24.5 0.0 15.3 1.8 18.3 0.4
Ll 14837 18.8 0.4 <1.95 18.5 0.7 <12.5 14.6 1.6 <15.63 26.3 3.2 14.0 1.1 18.0 1.4
Tf-f7783 15.3 0.4 <1.95 16.0 1.4 <12.5 13.1 2.3 <15.63 23.8 2.5 14.3 0.4 20.0 2.8
Pt56593 15.3 0.3 <1.95 15.7 0.3 >6.25 13.2 1.0 <15.63 23.4 0.4 12.5 0.0 >0.50 17.8 1.5

79
Pt53616 15.8 1.2 <1.95 16.3 0.7 <12.5 13.8 1.9 <15.63 20.8 0.7 11.8 2.0 >0.50 17.2 1.8
Pcf127 18.8 1.6 <1.95 19.0 2.5 <12.5 15.5 1.7 <15.63 27.1 1.7 13.7 0.8 18.6 1.4
Ps54868 16.3 1.4 <1.95 15.7 1.0 >6.25 14.6 2.3 <15.63 22.6 3.9 12.6 0.4 >0.50 16.1 1.8
Pjj629 16.8 0.4 <1.95 17.8 1.8 <12.5 14.3 0.4 <15.63 27.9 1.9 13.3 1.1 20.5 0.7
Pu2504 16.0 0.7 <1.95 19.1 1.6 <12.5 13.8 0.4 <15.63 23.6 2.3 13.0 2.1 >0.50 17.8 1.1
1Blank indicates that the breakpoint value cannot be provided, since the precise MIC was not determined in chemically simulated wound fluid due to metal
precipitation 2 These values are included in the first row of the table

80
Table S3.4 Staphylococcus aureus zones of growth inhibition (mm) and the corresponding breakpoint value1 in the presence of the
given metal, which were determined using the MIC of the indicator strain2 S. aureus ATCC 25923 as previously observed by Gugala
et al [1].
Isolate Aluminum
Break-
Point
Value
(mM)
Copper
Break-
point
value
(mM)
Gallium
Break-
point
value
(mM)
Nickel
Break-
point
value
(mM)
Silver
Break-
point
value
(mM)
Zinc
Break
Point
value
(mM)
ATCC 25923 10.9 1.5 >250 14.7 0.7 12.5 9.8 0.6 15.63 20.6 0.9 >625 11.0 0.9 >0.50 18.7 0.8 23.44
MRSA362 12.9 2.7 14.9 1.2 <12.5 9.8 0.4 15.63 19.4 2.3 10.3 0.3 >0.50 21.5 0.4 <23.44
MRSA94 12.9 0.2 18.5 0.4 <12.5 10.3 0.4 <15.63 20.0 2.1 11.0 0.7 >0.50 20.8 1.1 <23.44
MRSA147 11.6 0.2 14.4 0.9 >12.5 9.8 0.4 15.63 21.3 1.1 >625 10.8 1.1 >0.50 20.6 0.2 <23.44
MRSA148 10.3 1.1 >250 14.4 0.2 >12.5 9.8 0.4 15.63 20.1 2.7 9.6 0.9 >0.50 20.3 0.4 <23.44
MRSA166 11.8 2.5 15.1 1.6 <12.5 9.3 0.0 >15.63 19.5 1.4 10.1 0.9 >0.50 17.9 0.5 >23.44
MSSA124 13.1 2.7 16.3 1.1 <12.5 10.1 1.2 <15.63 20.8 1.1 >625 11.3 0.7 21.0 0.0 <23.44
MSSA103 12.5 1.4 18.3 1.1 <12.5 11.0 0.7 <15.63 20.9 0.9 >625 10.8 0.8 >0.50 19.0 0.0 <23.44
MSSA387 10.3 1.1 >250 17.9 1.9 <12.5 10.6 0.5 <15.63 19.4 1.2 10.3 1.8 >0.50 20.4 0.2 <23.44
MSRA145 12.0 2.8 16.5 2.8 <12.5 14.0 2.8 <15.63 16.8 2.8 12.0 1.4 18.3 0.4 >23.44
MRSA206 10.3 0.4 >250 15.9 0.5 <12.5 9.9 0.2 <15.63 20.5 0.7 10.5 0.7 >0.50 20.0 0.0 <23.44
MES26 14.9 1.6 21.3 0.4 <12.5 13.3 0.4 <15.63 20.9 0.9 >625 10.0 0.0 >0.50 29.5 2.8 <23.44
MES242 14.5 0.0 16.3 1.1 <12.5 11.0 2.1 <15.63 22.4 0.5 >625 9.8 1.1 >0.50 23.3 1.1 <23.44
MES84 14.8 0.4 21.0 2.1 <12.5 12.5 1.8 <15.63 23.4 0.9 >625 11.0 1.4 >0.50 23.9 0.9 <23.44
MES172 14.6 0.5 18.8 0.4 <12.5 12.1 0.2 <15.63 24.3 1.1 >625 9.5 0.7 >0.50 24.3 0.4 <23.44
MES116 14.4 0.5 16.8 0.4 <12.5 8.9 0.2 >15.63 23.0 0.7 >625 10.9 0.9 >0.50 23.0 0.7 <23.44
MRSA222 10.0 0.7 >250 16.3 1.8 <12.5 8.9 0.2 >15.63 20.4 0.2 9.0 0.0 >0.50 22.8 0.4 <23.44
MRSA104 10.5 0.7 >250 16.5 0.7 <12.5 9.50.0 >15.63 21.1 1.2 >625 9.8 0.7 >0.50 21.8 0.4 <23.44
MRSA164 15.0 0.7 16.1 0.2 <12.5 9.0 0.0 >15.63 22.1 1.6 >625 10.1 1.2 >0.50 23.8 1.1 <23.44
MER142 13.8 0.7 18.5 0.2 <12.5 10.0 0.0 <15.63 23.0 1.6 >625 10.1 1.2 >0.50 22.8 1.1 <23.44
MSSA323 10.3 0.4 >250 16.6 0.5 <12.5 10.3 1.1 <15.63 19.0 0.4 10.1 0.9 >0.50 20.8 1.1 <23.44
MES92 14.5 0.0 24.4 1.6 <12.5 11.3 1.1 <15.63 22.3 0.4 >625 12.8 0.4 25.5 0.7 <23.44

81
MSSA102T 10.0 0.0 >250 17.4 1.2 <12.5 10.4 0.2 <15.63 20.0 0.0 9.5 0.7 >0.50 21.1 0.5 <23.44
MES104K 13.3 1.8 18.0 0.7 <12.5 9.0 0.0 >15.63 21.3 0.4 >625 9.8 1.1 >0.50 25.0 0.0 <23.44
MES103 14.3 2.5 16.0 0.0 <12.5 9.0 0.0 >15.63 19.5 0.7 10.3 0.4 24.8 0.4 <23.44
MES101T 16.3 0.4 18.0 0.7 <12.5 9.0 0.0 >15.63 23.1 0.5 >625 10.6 0.2 23.0 0.0 <23.44
MER257 11.8 3.2 20.0 7.1 <12.5 11.3 2.5 <15.63 20.8 3.2 9.5 0.0 24.0 2.1 <23.44
MER117 14.0 0.7 23.8 3.2 <12.5 10.9 0.2 <15.63 23.5 1.4 >625 11.0 2.1 >0.50 24.0 0.7 <23.44
MER118 14.6 0.2 17.3 1.8 <12.5 10.8 1.8 <15.63 20.00.0 10.4 0.5 19.0 0.7 <23.44
MER204 10.3 0.4 >250 15.0 0.7 <12.5 9.3 0.4 >15.63 20.0 0.7 9.5 0.0 20.3 1.8 <23.44
MER212 14.3 0.4 17.3 0.4 <12.5 9.3 0.4 >15.63 23.0 0.0 >625 10.0 0.0 25.0 0.7 <23.44
MER108 14.5 0.0 16.8 0.4 <12.5 8.5 0.0 >15.63 21.6 0.2 >625 9.6 0.2 20.0 0.0 <23.44
MER237 15.6 0.2 21.5 2.1 <12.5 13.5 0.7 <15.63 23.0 0.7 >625 10.3 0.4 24.0 0.0 <23.44
MER22 15.8 0.4 24.3 0.4 <12.5 14.8 1.8 <15.63 23.3 0.4 >625 10.8 0.4 26.8 0.4 <23.44
MRSA204 10.8 0.0 >250 15.8 2.1 <12.5 10.0 0.0 <15.63 21.8 0.4 >625 10.6 0.4 19.3 1.1 <23.44
MER155 16.5 0.0 24.0 2.1 15.0 2.1 <15.63 23.8 0.4 11.3 0.4 >0.50 24.8 1.8 <23.44
1Blank indicates that the breakpoint value cannot be provided, since the precise MIC was not determined in chemically simulated wound fluid due to metal
precipitation 2 These values are included in the first row of the table
82
4 Using a chemical genetic screen to enhance our understanding of
the antibacterial properties of silver
Authored by:
Natalie Gugala, Joe Lemire, Kate Chatfield-Reed, Ying Yan, Gordon Chua, and Raymond J.
Turner
Published in:
Genes, July 2018, 9 doi:10.3390/genes9070344
Copyright permissions for the reproduction of this manuscript can be found in Appendix D.
Abstract
It is essential to understand the mechanisms by which a toxicant is capable of poisoning the
bacterial cell. The mechanism of action of many biocides and toxins, including numerous
ubiquitous compounds, is not fully understood. For example, despite the widespread clinical and
commercial use of silver (Ag), the mechanisms describing how this metal poisons bacterial cells
remains incomplete. To advance our understanding surrounding the antimicrobial action of Ag,
we performed a chemical genetic screen of a mutant library of Escherichia coli – the Keio
collection, in order to identify Ag sensitive or resistant deletion strains. Indeed, our findings
corroborate many previously established mechanisms that describe the antibacterial effects of Ag,
such as the disruption of iron-sulfur cluster containing proteins and certain cellular redox enzymes.
However, the data presented here demonstrates that the activity of Ag within the bacterial cell is
more extensive, encompassing genes involved in cell wall maintenance, quinone metabolism and
sulfur assimilation. Altogether, this study provides further insight into the antimicrobial
mechanism of Ag and the physiological adaption of E. coli to this metal.

83
Introduction
For centuries, metal compounds have been deployed as effective antimicrobial agents [278].
The use of silver (Ag) for antimicrobial purposes is a practice that dates back thousands of years
[347] and is still implemented for medical purposes in an effort to curtail the rise of antimicrobial
resistant pathogens [1],[19],[308],[344], a threat that has once again surfaced as a clinical
challenge [23],[24],[238],[348].
Applications of Ag-based antimicrobials include: wound dressings [75] and other textiles
[349], antiseptic formulations [97], nanoparticles [70], coatings [134], nanocomposites [91],
polymers [191], and part of antibiotic combination therapies [310]. Many of these approaches have
proven to be effective in controlling and eradicating pathogenic microorganisms.
Presently, research in this field focuses on finding new formulations and utilities for Ag-based
antimicrobials. Despite this, the identity of the cellular targets that are involved in Ag antimicrobial
activities are known to a far lesser degree [180]. This current knowledge gap hinders the potential
utility of Ag-based antimicrobials, and in turn the expansion of this metal as a therapeutic agent.
Previous studies examining the mechanisms of Ag resistance and toxicity have not
provided a complete understanding of the global cellular effects of Ag exposure on the bacterial
cell. Further, several studies fail to build upon preceding work and the literature is replete with
contradicting reports, in part due to non-standardized conditions of study. Furthermore, it has been
demonstrated that the speciation/oxidation state of Ag has substantial influence on toxicity, a factor
that is dependent on the source of Ag ions [19], growth conditions, and further complicated by the
organism (species and strain) of interest [1].
Proposed mechanisms of metal toxicity include the production and propagation of reactive
oxygen species through Fenton chemistry and antioxidant depletion, the disruption of iron-sulfur

84
clusters, thiol coordination and the exchange of a catalytic/structural metal that leads to protein
dysfunction, interference with nutrient uptake, and genotoxicity [180]. Microorganisms are able
to withstand metal toxicity through several mechanisms such as reduced uptake, efflux,
extracellular and intracellular sequestration, repair, metabolic by-pass, and chemical modification
[242]. Whether these mechanisms are solely responsible for cell death or resistance has yet to be
determined. Still, what is understood is that metals demonstrate broad-spectrum activity and
decreased target specificity [180] when compared to conventional antimicrobials.
In this work, we hypothesized that Ag exerts its effects on multiple targets both directly
and indirectly, and thus various cellular systems may be altered by Ag exposure. To test this, we
performed a genotypic screening workflow of a mutant library composed of 3985 strains, each
containing a different inactivated non-essential gene in Escherichia coli. Using a comparable
genome-wide workflow [350] and by use of transcriptomic profiling [22], [23], similar approaches
have been implemented in order to study the mechanisms of action caused by Ag. Despite this,
genes conferring resistance to Ag when absent have been studied and compared to a far lesser
degree than those that result in sensitivity when absent. Further, many previous approaches aimed
at studying Ag toxicity and resistance have primarily examined the effects of Ag shock or rapid
pulses of exposure, followed by the evaluation of gene expression. Hence, as a means of
complementing existing work, we have identified a number of genes that are implicated in
prolonged Ag resistance and/or toxicity, and mapped their metabolic function to their respective
cellular system.

85
Materials and Methods
4.3.1 Stock Ag solution
Silver nitrate (AgNO3) was obtained from Sigma-Aldrich (St. Louis, MO, USA). Stock
solutions of Ag were made at equivalent molarities of Ag in distilled and deionized (dd)H2O and
stored in glass vials for no longer than two weeks.
4.3.2 Determination of the minimal inhibitory concentration and controls
The minimal inhibitory concentration was determined using a known Ag sensitive strain
(cusB) and negative control strains (lacA and lacY). CusB is a part of the CusCFBA copper/silver
efflux system [353], therefore it was anticipated that the absence of this gene would confer toxicity,
denoted as a Ag sensitive hit. Further, LacA and LacY, are not expected to be involved in Ag
resistance or toxicity. The aforementioned strains, along with the parent strain [wild type (WT)]
were grown at 37°C on M9 minimal media and Noble agar (1%) in the presence or absence of Ag
at varying concentrations. The Ag concentration found to visibly decrease colony size in the cusB
mutant and demonstrate no changes in colony size in the lacA and lacY mutants was selected.
Furthermore, the latter mutants and the WT were grown in the presence of 100 μM ionic nitrate to
ensure growth was not impeded by the accompanying counter ion. The full chemical genetic screen
was challenged at time zero of inoculation in the presence of 100 μM AgNO3.
4.3.3 Screening
M9 minimal media Noble agar (1%) plates were prepared two days prior to use. Colony
arrays in 96-format were produced and processed using a BM3 robot (S&P Robotics Inc., Toronto,
ON, Canada). The strains were spotted using a 96-pin replicator, allowing for uniform application.
Cells were transferred from the arrayed microtiter plates using the replicator onto LB agar plates.
These plates were then grown overnight at 37°C. Once grown, the colonies were spotted using the

86
replicator onto two sets – with and without 100 μM AgNO3 – of M9 minimal media Noble agar
plates, and subsequently grown overnight at 37°C. Images of both sets of plates were acquired
using the spImager (S&P Robotics Inc., Toronto, ON, Canada) and colony size, which is a measure
of fitness, was determined using integrated image processing software. For each 96-colony array,
four technical trials per strain were combined onto a single plate in 384-colony array format and
three biological trials were performed. Therefore, each strain was tested a total of 12 times.
4.3.4 Normalization
Experimental factors such as incubation time and temperature, local nutrient availability,
colony location, gradients in the growth medium and neighboring mutant fitness were all
considered as independent variables that could contribute to systematic variation, and subsequently
affect colony size. As a result, the colonies were normalized and scored using Synthetic Genetic
Array Tools 1.0 (SGATools) [354]. Firstly, all of the plates were normalized to establish identical
median colony size working on the assumption that most colonies exhibited WT fitness. Next, to
ensure the colonies were directly comparable, colonies were rescaled, a factor that is primarily
important for colonies close to the edge of the plate. Further, spatial smoothing accounted for
partialities in each plate owing to inconsistencies, such as the thickness of the agar. Very large
colonies, likely an indication of contamination among other factors, and those that were different
from the corresponding technical replicates were removed. Lastly, colonies that were larger than
anticipated and located next to colonies that were found to be smaller than anticipated were marked
as potential false-positive hits.
Following this normalization, the colonies were scored. Here, paired evaluation was
completed by comparing the colony size (in the presence of Ag) to a matched control (in the
absence of Ag). Fitness values were established, and the subsequent scores represented deviation

87
from the fitness of the WT strain. Once normalized and scored, colonies displaying a reduction in
size were indicative of a Ag sensitive hit and those displaying an increase in colony size qualified
as a Ag resistant hit. Finally, the p-value was calculated as a two-tailed t-test and significance was
determined using the Benjamini-Hochberg procedure, as a means of lowering the false discovery
rate, which was selected to be 0.1.
4.3.5 Data mining and analyses
Subsequent analyses were conducted using Pathway Tools Omics Dashboard, which
surveys against the EcoCyc database [355]. This allowed for clustering of the hits into systems,
subsystems, component subsystems, and lastly, into individual objects. It is important to note that
genes can be found in multiple systems since many are involved in a number of cellular processes.
Further, in order to identify biological processes most prominent under Ag challenge,
enrichment analyses were conducted for the Ag resistant and Ag sensitive hits. To analyze the
gene list, the DAVID bioinformatics resource was utilized [356],[357]. Lastly, as a means of
exposing the direct (physical) and indirect (functional) protein-protein connectivity between the
gene hits, the STRING database [358] was used. Interactive node maps, based on experimental,
co-expression and gene fusion studies were generated based on genes defined in our chemical
genetics screen.
Results and Discussion
4.4.1 Genome-wide screen of Ag resistant and Ag sensitive hits
The chemical genetic screen completed in this work provided a method for genome-wide
probing of non-essential genes involved in Ag sensitivity or resistance in E. coli. A total of 3810
non-essential genes were screened for growth in the presence of 100 μM AgNO3 (Appendix B).

88
3073 mutants displayed little change in colony size in the presence of Ag with a normalized fitness
score between ±0.1 (Figure 4.1). The statistical colony size cut-off that indicated a significant
difference in fitness was selected to be ±0.15, or two standard deviations from the mean. This
resulted in 225 gene hits, which represents approximately 5% of the open reading frames in the E.
coli genome. The remaining gene hits were not regarded as significant hits in this work based
solely on the cut-offs selected. In general, the normalization was performed on the assumption that
Ag does not specifically interact with the deleted gene but rather impedes growth due to
environmental stress. In short, those displaying hits between the cut off values were assumed to
have non-specific or neutral interactions with Ag.
Figure 4.1 Synthetic Array Tools (version 1.0) was used to normalize and score the Ag resistant
and sensitive gene hits as a means of representing the growth differences in Escherichia coli K12
BW25113 in the presence of 100 μM AgNO3. Only those with a score greater or less than ±0.15,
respectively, were selected for further analysis. Hits between ±0.15 were regarded as having
neutral or non-specific interactions with Ag. The p-value was a two-tailed t-test and significance
was determined using the Benjamini-Hochberg procedure; false discovery rate was selected to be
0.1. Each individual score represents the mean of 12 trials.
2 1 2 11 34 66
245
14871586
302
53 16 50
200
400
600
800
1000
1200
1400
1600
1800
< -0.7 -0.6 to
-0.7
-0.5 to
-0.6
-0.4 to
-0.5
-0.3 to
-0.4
-0.2 to
-0.3
-0.1 to
-0.2
-0.1 to
0.0
0.0 to
0.1
0.1 to
0.2
0.2 to
0.3
0.3 to
0.4
0.4 to
0.5
Num
ber
of
Str
ains
Normalized Score

89
It is important to note that when reflecting on the data generated from our chemical genetic
screen, it is the absence of the gene that imparts the Ag resistant or sensitive phenotype. Upon Ag
exposure, an increase in colony size (>0.15) is suggestive of a Ag resistant hit and therefore the
presence of this gene is proposed to confer toxicity. On the contrary, a decrease in colony size (<-
0.15) was designated to be a Ag sensitive hit, therefore the presence of this gene is proposed to
confer resistance. In total, the deletion of 106 and 119 genes resulted in Ag resistance and
sensitivity, respectively (Table 4.1 and Table 4.2). These gene hits were mapped to their
corresponding cellular systems using EcoCyc (Figure 4.2 and Figure S4.1 – Figure S4.3). In
short, genes were found in multiple cellular systems, validating our hypothesis that Ag cytotoxicity
and the corresponding physiological responses of E. coli involve a number of cellular mechanisms.
Table 4.1 Ag resistant hits organized according to system and subsystem mined using the Omics
Dashboard (Pathway Tools), which surveys against the EcoCyc Database; genes represent
resistant hits, each with a score >0.15 and a false discovery rate of 0.11, 2.
System Subsystem Gene3
Central Dogma Transcription alaS crp dicC gadE
gcvR lysR ogrK putA
yciT yhjB yiif yjiR
Translation alaS ettA
DNA Metabolism cffC dam recT
RNA Metabolism rluF alaS gluQ trmL
crp dicC gadE gcvR
lysR ogrK putA yciT
yhjB yiif yjiR yjtD
Protein Metabolism argE envZ lipB sdhE
ldcA pepB prc
rhsB rzpD
Cell Exterior Transport malE nhaB exbB btuB
dppF glcA ompG lptB
mngA yejF
Cell wall biogenesis/organization idcA
Lipopolysaccharide Metabolism wcaI
Pilus yraK
Flagellum fliL fliR
Outer membrane
bbtuB csgF nlpE ompA
ompG rhsB

90
Plasma membrane agaD cyoC cysQ damX
dppF envZ ettA exbB
fliL fliR glcA IptB
malE mngA nhaB ppx
prc putA yaiP yccF
yejF ygdD yifK
yojI yqfA
Periplasm malE nlpE prc
Biosynthesis Amino acid biosynthesis argE cysk serC proC
serA serC metL
trpB trpD
Nucleotide biosynthesis dcd pyrF
Amine biosynthesis gss
Carbohydrate biosynthesis mdh
Secondary metabolite biosynthesis fldB
Cofactor biosynthesis bioC bioF nudB lipB
nadA nadB nadC gss
thiS serC
Other aroC metL argE alaS
Degradation Amino acid degradation astA cysK gadA putA
Carbohydrate degradation galM yigL glcE
Secondary metabolite degradation idcA
Polymer degradation idcA
Other pathways Inorganic nutrient metabolism cysC cysD cysH cysI
Detoxification gadA sodA
Activation/inactivation/interconversion cysC cysD
Other ahpF bglB cysQ dam
gluQ pepB ppx prc
purU rluF trmL
yfaU yjhG
Energy TCA cycle mdh
Fermentation mdh
Aerobic respiration cyoC putA
Other bioC bioF mdh
Cellular process Cell cycle/Division dam damX dicC
Cell death ldcA
Genetic transfer ompA ygcO
Biofilm formation csgF
Adhesion yraK
Locomotion fliL malE rzpD
Viral response ompA rzpD
Bacterial response rzpD
Host interaction ompA rzpD
Response to stimulus Heat sodA

91
DNA damage dam malE ompA recT
yaiP yciT
pH sodA
Oxidant detoxification sodA
Other ahpF btuB crp cysC
cysD cysH cysI dcd
dppF envZ exbB fliL
nhaB prc putA recT
rzpD ybaM yejF
yigL yojI 1 Each individual score represents the mean of 12 trials – three biological and four technical. 2 Two-tailed t-test and significance was determined using the Benjamini-Hochberg procedure 3 Gene hits can be mapped to more than one system and subsystem.
Table 4.2 Ag sensitive hits organized according to system and subsystem mined using the Omics
Dashboard (Pathway Tools), which surveys against the EcoCyc Database; genes represent
resistant hits, each with a score <-0.15 and a false discovery rate of 0.11,2.
System Subsystem Gene3
Central Dogma Transcription arcB exuR fis galR
glnL higB hupB rapA
rfaH sspA rhoL
ybeY yfjR
Translation higB prfC rhaH rplI
tufB ybeY
DNA Metabolism fis hsdS hofM
ruvA mutL
RNA Metabolism arcB exuR fis galR
glnL higB hupB rapA
rfah rhoL rsmE rraB
sspA ybeY yfjR ygfZ
Protein Metabolism arcB glnL higB hybD
iadA mobA pflA prfC
pqqL rfaH rplI tufB
ybeY ygeY yicR
Cell Exterior Transport chbB clcA cusB cysA
cysP dtpB fepA feoB
tdcC tolC trkH
tyrP yiaN
Cell wall biogenesis/organization amiB rfe
Lipopolysaccharide metabolism kdsD rfaD rfe waaG
Pilus yfcQ
Flagellum flgH
Outer membrane fepA flgH lpp tolC
yraP
Plasma membrane arcB atpB atpE atpF

92
bcsF clcA clcB cstA
cysA dtpB feoB glnL
glvB hokD hycB ppdB
rfe sanA tdcC tolC
trkH tufB tyrP ydcV
ydjZ ygeY ygiZ yhaH
yhjD yiaB yiaN yibN
yjiG yqiJ
Periplasm
amiB cusB cysP hmp
lpp sanA tolC yfdX
yjfY yraP ytfJ
Cell wall components rfe
Biosynthesis Amino acid biosynthesis hisA ilvG lysC
Nucleotide biosynthesis add
Fatty acid and lipid biosynthesis fabF wag clsB
Carbohydrate biosynthesis yggF rfaD kdsD
Cofactor biosynthesis mobA ubiE gshB
Other aroL lysC
Degradation Amino acid degradation ilvG pflB
Nucleotide degradation add
Amine degradation caiC
Carbohydrate degradation yidA ulaG
Secondary metabolite degradation lsrF
Aromatic degradation hcaD mhpC
Other pathways Other amiB higB hmp hsdS
iadA mutL nfsB nudF
pflA qorB rsmE ruvA
Energy Glycolysis yggF
Pentose phosphate pathway rpiA
Fermentation hycB pflB
ATP synthesis atpB atpE atpF
Cellular processes Cell cycle and division amiB minC
Cell death hokD
Genetic transfer ydcV
Biofilm formation yfjR
Adhesion yfcQ
Locomotion flgH
Viral Response fis
Response to
Stimulus
Starvation cstA sanA sspA
Heat nudf ybeY yobF
DNA damage add feoB hisA mutL
pflA ruvA ybiX
yiaB yqiJ
Osmotic stress flgH
pH clcA

93
Detoxification cusB
Other arcB cstA dtpB fis
glnL hcaD hmp hsdS
mhpC sanA sspA tolC
tufB yfdS yggX 1 Each individual score represents the mean of 12 trials – three biological and four technical. 2 Two-tailed t-test and significance was determined using the Benjamini-Hochberg procedure 3 Gene hits can be mapped to more than one system and subsystem.
Figure 4.2 Ag resistant and sensitive gene hits mapped to component cellular processes. The cut-
off fitness score implemented was -0.15 and 0.15 (two standard deviations from the mean) and
gene hits with a score less or greater than, respectively, were chosen for further analyses. The
hits were mined using the Omics Dashboard (Pathway Tools), which surveys against the EcoCyc
Database. Several gene hits are mapped to more than one subsystem. The p-value was calculated
as a two-tailed t-test and significance was determined using the Benjamini-Hochberg procedure;
false discovery rate was selected to be 0.1. Each individual score represents the mean of 12 trials.
Comparable numbers of Ag resistant and sensitive hits were mapped in the systems
‘Response to stimulus’ – starvation, heat, cold, DNA damage, pH, detoxification, osmotic stress,
and other, ‘Cellular processes’ – cell cycle and division, cell death, genetic transfer, biofilm
formation, quorum sensing, adhesion, locomotion, viral response, response to bacterium, host
interactions with host, other pathogenesis proteins, and ‘Degradation’ – amino acids, nucleotide,
amine, carbohydrate/carboxylate, secondary metabolite, alcohol, polymer and aromatic, the cell
0 50 100
150
Central dogma
Cell exterior
Biosynthesis
Degradation
Other pathways
Energy
Cellular processes
Response to stimulus
Regulation
Number of strains
Resistant
Sensitive

94
exterior, and regulation. A greater number of Ag resistant than sensitive hits were mapped to the
processes ‘Biosynthesis’ – amino acids, nucleotides, fatty acid/lipid amines,
carbohydrate/carboxylates, cofactors, secondary metabolites, and other pathways and ‘Other
pathways’ – detoxification, inorganic nutrient metabolism, macromolecule modification,
activation/inactivation/interconversion and other enzymes (See Chapter 4 Supplementary, Table
S4.1 for complete list of each comprising subsystem).
In total, 49 and 73 resistant and sensitive hits, respectively, were found to be a part of the
‘Cell exterior’ – transport, cell wall biogenesis and organization, lipopolysaccharide metabolism,
pilus, flagellar, outer and inner membrane, periplasm, and cell wall components. Compared to the
latter cellular processes, non-essential genes comprising ‘Energy’ processes – including
glycolysis, the pentose phosphate pathway, the TCA cycle, fermentation, and aerobic and
anaerobic respiration were found to be involved in Ag toxicity or resistance the least, by more than
seven-fold when compared to genes mapped to the ‘Cell exterior’.
Based on the fold enrichment, metal binding proteins were affected to the same degree in
both Ag resistant and sensitive groups, displaying an enrichment score <5 (Figure 4.3). However,
when examining proteins involved with specific metals in more detail, such as zinc and
magnesium, fold enrichment values were >5, but only for the Ag sensitive hits (Figure 4.3).
Cellular and anaerobic respiration were represented by the Ag sensitive hits only, while processes
involved in amino acid biosynthesis were heavily enriched for by the Ag resistant hits. A number
of hits were found to be involved with the cell membrane using EcoCyc’s system of classification,
but this was not detected in the fold enrichment analysis. Here, cell membrane proteins were
affected three-fold less than the most highly represented clusters, which were amino acid
biosynthesis and phosphoproteins for the Ag resistant and sensitive hits, respectively (Figure 4.3).

95
Figure 4.3 Functional enrichment among the Ag resistant and sensitive gene hits. The DAVID
gene functional classification (version 6.8) database, a false discovery rate of 0.1 and a score cut-
off of -0.15 and 0.15 (two standard deviations from the mean) were used to measure the
magnitude of enrichment against the genome of Escherichia coli. Processes with a p-value
<0.05, fold enrichment value ≥3 and gene hits >3 are included only. Each individual score
represents the mean of 12 trials.
4.4.2 Ag resistant gene hits
4.4.2.1 Regulators of gene expression
When examining processes of the ‘Central dogma’ – systems involved in replication, and
transcription to translation – in more detail, each subsystem had a mean score between 0.211 and
0.294 (Figure S4.1 a). Despite this consistency, transcription and RNA metabolism contained the

96
greatest number of Ag resistant hits, 12 and 16, respectively. The protein EttA – energy-dependent
translational throttle protein [359], can be found within the subsystems translation and protein
metabolism. EttA is sensitive to the energy state of the cell. This protein represses translational
elongation in response to high ADP/ATP, stimulating dipeptide bond synthesis in the presence of
ATP (cell high energy state) and vice versa. As a result, EttA may inhibit translation in Ag treated
cells due to the occurrence of high ADP/ATP ratios. The absence of EttA might allow for increased
translation of proteins, such as RecA [360] or CusB [353], which may result in Ag resistance.
Furthermore, six proteins involved in proteolysis were found to confer resistance when absent,
such as Prc. This enzyme is a periplasmic protease, which processes and degrades specific proteins,
that has been found to provide resistance against a number of small hydrophilic antibiotics and
cause the leakage of periplasmic proteins when absent [361]. Antibiotic resistant mechanisms have
been compared to those of metal ions, drawing on similarities such as substrate modification or
sequestration. The leakage of the periplasmic proteins in prc mutants may result in Ag
sequestration, thereby causing metal resistance.
4.4.2.2 Cell membrane proteins
It has been demonstrated that Ag may exert toxicity and potentially impede growth by
acting on the cell membrane [71],[186]. In this study, 49 coding genes that resulted in Ag resistance
when absent were determined to be a part of the ‘Cell exterior’, which includes proteins of the cell
membrane, periplasm and extracellular structures (Figure 4.2 and Figure S4.1 b). Of these, 25
genes coded for plasma membrane proteins and while Ag has been observed to enter bacterial cells
[352], the exact mechanism of import has yet to be determined. Loss of the porin genes ompC and
ompF has been observed to confer resistance to Ag [111]. While these two genes were not detected
within our cut-offs, we did recover two additional porin genes (ompA and ompG) as conferring Ag

97
resistance when deleted. Relative to this, it has been demonstrated that a mechanism of entry for
zinc into the cell is co-transport with low molecular weight metabolites via transport proteins found
within the membrane [362]. Further, ExbB, a Ag resistant hit with a score of 0.241, is part of the
energy transducing Ton system that transports iron-siderophore complexes and vitamin B12 across
the outer membrane [363]. Collectively, these findings provide insight into possible mechanisms
of Ag import, such as entry through porins, co-transport with metabolites or the replacement of
Ag with other ions predetermined for import. The enrichment analysis offered further evidence for
this hypothesis, as a number of ion transport proteins and proteins pertaining to the cell membrane
were involved in Ag resistance when absent (Figure 4.3). Furthermore, MngA, a permease that
simultaneously phosphorylates 2-O-α-mannosyl-D-glycerate in a process called group
translocation, contains two putative phosphorylation sites His87 and Cys192 [364]. Thiols are
regarded as soft bases, and according to the hard-soft acid base theory, which is key to the
reactivity and coordination of metals [365], cysteine, and to a lesser degree methionine and
imidazole, chemically interact with Ag(I) with high affinity. Therefore, proteins with key structural
or catalytic thiols/imidazoles are possible Ag interacting sites.
4.4.2.3 Biosynthetic enzymes
Eight hits were found to be involved in the biosynthesis of amino acids and ten hits were
found to be involved in cofactor/prosthetic group/electron carries catabolism (Figure S4.1 c).
When examining the functional enrichment analysis, serine, glycine, threonine, arginine and
proline biosynthetic processes were highly enriched, on average 3-fold more than the remaining
cellular processes (Figure 4.3). The third step in the synthesis of NAD+ from L-aspartate occurs
via the enzyme NadC – quinolinate phosphoribosyltransferase[366] and based on our data the
absence of this protein confers resistance in E. coli. In fact, the genes coding for the first and

98
second steps of de novo NAD+ synthesis, NadB – L-aspartate oxidase and NadA – quinolinate
synthase, respectively, were also found to be Ag resistant hits. NadA contains a [4Fe-4S] cluster
that is required for activity [367]. Soft metals have the capacity to inactivate dehydratases in vitro
via iron-sulfur cluster degradation, possibly leading to the bridging of the sulfur atoms [196]. As
a result, proteins with iron-sulfur centers are of possible interest when examining the interactions
of Ag with cellular biomolecules. Furthermore, it has been demonstrated that H2O2 formation is
diminished via the addition of precursors involved in the synthesis of NAD+ [368]. The absence
of one gene involved in NAD+ biosynthesis may result in metabolite accumulation, since there is
no evidence of negative precursor feedback inhibition. Therefore, there is a possibility that the
deletion of nadA, nadB or nadC may confer resistance if H2O2 is generated in the presence of Ag.
Using the STRING database, several points of interaction were revealed. Amongst the Ag
resistant hits, the latter genes involved in de novo NAD+ production were connected to proteins a
part of amino acid biosynthesis, including trpB, aroC, and metL (Figure 4.4)

99
Figure 4.4 Connectivity map displaying the predicted functional associations between the silver-
resistant gene hits; disconnected gene hits not shown. The thicknesses of the lines indicate the
degree of confidence prediction for the given interaction, based on fusion, co-occurrence,
experimental and co-expression data. Figure produced using STRING (version 10.5) and a
medium confidence score of 0.4.
4.4.2.4 Catabolic enzymes
Genes encoding enzymes functioning in the catabolism of metabolites, such as amino
acids, fatty acids, carbohydrates and polymers, were underrepresented compared to anabolism

100
(Figure 4.2 and Figure S4.1 d). In fact, in the functional enrichment analysis, degradation
processes were not represented within the cut-offs selected (Figure 4.3). The gene idcA – L, D-
carboxypeptidase, a component of secondary metabolite and polymer degradation, had an elevated
score of 0.311. IdcA is essential for murein turnover [369]. Murein processing is an important
energy-conserving activity that transports cell wall components from the exterior of the cell to the
cytoplasm [370]. Evidence has demonstrated that during logarithmic growth, the idcA mutant
strain displays a decrease in the overall cross-linkage of murein, causing a reduction in turnover
and the abundance of murein transported into the cell. In turn, this may result in the transport of
fewer Ag ions which may have bound to the cell wall into the cell, thereby, prompting increased
resistance in the idcA mutant strain. Metal nanoparticles have been proposed to target the outer
membrane regions of bacteria due to strong electrostatic interactions and coordination of the metal
with the LPS or similar cell wall structures [371]. The particles are proposed to release ionic Ag,
likely triggering toxicity through membrane damage and facilitating the entry of excess Ag ions.
4.4.2.5 Sulfur metabolism proteins
Within the subsystem inorganic nutrient metabolism, a part of ‘Other pathways’, which
also includes processes such as macromolecule modification and
activation/inactivation/interconversion, one pathway was found to be affected by Ag exposure –
sulfur metabolism. CysH – phosphor-adenylsulfate reductase is involved in assimilatory sulfate
reduction by catalyzing the reduction of 3’-phospho-adenylylsulfate to sulfite and adenosine 3’,5-
biphospahte (PAP). This protein contains highly conserved cysteine residues that become oxidized
to form a disulfide bond [372] – possible targets based on the affinity of Ag for sulfur. Moreover,
the cysC, cysD and cysI genes, also involved in the pathway sulfate reduction I (assimilatory) via
phosphorylation, adenylation and reduction, respectively, were also Ag resistant hits. These sulfate

101
assimilatory proteins are linked to the Ag resistant hit CysQ, which is involved in the recycling of
PAP and has been experimentally determined to be the main target of lithium toxicity [373]
(Figure 4.4). The protein CysI, contains a siroheme and one [4Fe-4S] cluster per polypeptide chain
[374]. Comparably, it has been demonstrated that the exposure of Ag nanoparticles upregulates
the expression of several genes involved in iron and sulfate homeostasis [351], including those
aforementioned. A decrease in the activity of this pathway reduces the amount of hydrogen sulfide
required for processes such as L-cysteine biosynthesis, and since Ag interacts with sulfur
compounds well, such as hydrogen sulfide – the final product of sulfate reduction I – fewer Ag
targets may be available when genes of this pathway are deleted. CysH had the highest score of
0.360 out of all four sulfur assimilatory genes, and since this protein interacts with thioredoxin,
the absence of CysH may free reduced thioredoxin, thus providing elevated resistance in presence
of reactive oxygen species that may arise under Ag stress.
4.4.2.6 Biofilm formation
In total 19 genes in the ‘Cellular processes’ system, which includes subsystems such as –
genetic transfer, quorum sensing, adhesion and locomotion, were found to confer resistance when
absent (Figure 4.2). Three hits were involved in cell cycle and division, and two were found to be
involved in biofilm formation, such as CsgF – an outer membrane protein that initiates curli subunit
polymerization, and therefore involved in the colonization of surfaces and biofilm formation [373].
In the absence of CsgF, less biofilm is formed, and according to our results, Ag resistance is
generated. Biofilms commonly provide resistance in the face of fluctuating or threatening
environments [375], however studies have shown that bacterial residence within a biofilm does
not always provide enhanced resistance against metals [1],[45],[307], an observation supported by
this work. An explanation for this may reside in the ability of biofilms to sequester Ag ions by

102
attracting them to varying components of the extracellular polymeric matrix. While this may
provide resistance, it may also concentrate ions within a localized area, thereby causing greater
sensitivity. Similarly, Ag nanoparticles have shown to inhibit E. coli biofilm formation by
potentially targeting curli fibers [376], therefore the absence of curli fibers may promote Ag
resistance. Lastly, previous studies that have found that biofilm formation is a source of Ag
resistance [32] were completed under differing culture conditions, therefore direct comparisons
are challenging.
4.4.2.7 DNA damage and repair
The effect of Ag exposure on DNA damage and repair in E. coli has been inconsistent from
several studies involving gene deletion strains. Radzig et al. (2013) showed that several deletion
strains lacking in the ability to excise DNA bases were sensitive to Ag exposure, but not the ΔrecA
strain, which is involved in SOS repair [111]. In contrast, the ΔrecA deletion strain showed Ag
sensitivity in a previous study [377]. From our list of Ag resistant hits, six mutants were identified
within the DNA damage subsystem (Figure S4.1 h) including the Δdam strain. Dam is
methyltransferase that functions in mismatch DNA repair in E. coli and may also play a role in
controlling oxidative damage. Based on this protein’s function, we expect that the deletion strain
of the gene would exhibit Ag sensitivity potentially due to a deficiency in DNA repair of oxidative
damage. However, the dam1Δ strain exhibits an upregulation of RecA and constitutive SOS
activity which may be the nature of the Ag resistance exhibited in this mutant [111]. Moreover,
we also identified several other Ag resistant strains from our screens (purF, damX, dcd, ruvC and
ompA) that are also known to possess RecA-mediated constitutive SOS activity [377].

103
4.4.3 Ag sensitive hits
4.4.3.1 Central dogma and cell exterior proteins
Within the ‘Central dogma’ 56 mutants resulted in Ag sensitivity (Figure S4.2 a). For
example, ruvA, a gene found to be involved in DNA repair, had a normalized score of -0.430 [378].
Direct DNA damage has not been attributed to Ag exposure, however in the presence of reactive
oxygen species potentially triggered by Ag exposure, the propagation of Fenton active iron may
cause DNA damage [180],[379].
In total 73 genes were mapped to the system ‘Cell exterior’. The gene ygiZ, which codes
for a putative inner membrane protein, had a score of -0.751, the lowest value of any protein in
this screen. A common resistance mechanism employed by microbes is the export of the challenge
from the periplasm or interior of the cell to the extracellular space [242]. The fold enrichment
analysis supported this finding – cell membrane proteins and those involved in the ion transport
were highly enriched (Figure 4.3). In total 13 transport proteins conferred Ag sensitivity when
absent, such as cusB, which encodes for a component of the copper/silver export system CusCFBA
in E. coli, and contains several methionine residues important for function [380]. In the absence of
this protein sensitivity is anticipated since the cell is unable to expel Ag ions. Another Ag sensitive
hit was Lpp, considered to be the most abundant protein in E. coli [379]. Cells lacking Lpp have
been found to be hypersensitive to toxic compounds [379], potentially because there is less protein
available to sequester the incoming threat. In addition, the protein TolC was a Ag resistant hit.
This protein is required for the function of a number of efflux systems including the AcrAB
multidrug efflux system, which is involved in the export of a number of toxic exogenous
compounds [381]. In contrast to efflux proteins, we identified the cysA and cysP genes – thiosulfate
and sulfate permeases – to be sensitive hits when absent. CysA and CysP function in the first step

104
of cysteine biosynthesis, which may be important in Ag resistance since this metal may target
cysteine residues via thiol side chains [377].
4.4.3.2 Lipopolysaccharide biosynthetic genes
In total 18 Ag sensitive hits were mapped to ‘Biosynthesis processes’ (Figure S4.2 c).
Processes associated with lipopolysaccharide biosynthesis were highly represented in the
enrichment analysis (Figure 4.3). FabF, a key protein involved in fatty acid biosynthesis, and clsB
– cardiolipin synthase B were found to be Ag sensitive hits. If Ag targets the cellular membrane,
lipid biosynthesis/regeneration could serve as a mechanism of Ag resistance and consequently, Ag
toxicity would be increased if either of these processes were compromised via the deletion of these
candidate genes.
Processes of biomolecule degradation were affected to a lesser degree than biosynthesis
(Figure 4.2). Only nine hits were mapped to this system (Figure S4.2 d). In this screen, the mutant
hcaD had the second lowest score of -0.707. This protein is a predicted ferredoxin reductase
subunit that is involved in the degradation of aromatic acids as carbon sources.
4.4.3.3 Three Ag sensitive hits comprise the ATP synthase Fo complex
Seven hits were mapped to ‘Energy processes’ (Figure S4.2 f). Of these, three are
components of the ATP synthase Fo complex – AtpB, AtpE and AtpF. Ag has been suggested to
damage the respiratory chain of E. coli [382], thereby preventing the efficient pumping of protons
across the membrane. Small disruptions to the Fo complex may amplify this consequence and
render this biological process hypersensitive. If this mechanism is correct and the cytoplasmic
membrane becomes more permeable to protons, than the cell will attempt to compensate for this
increase in acidity via several mechanisms, one being the reversal of ATP synthase in order to
pump protons outward (if ATP is not limiting) and decrease cytoplasmic proton concentrations

105
[383]. If the ATP synthase complex exhibits decreased activity due to disruptions in any of the
subunits, this resistant mechanism may be unable to function properly, resulting in greater Ag
sensitivity. Several nodes of interaction based on the STRING connectivity maps were made
evident within this cluster of proteins such as the association of atpF and atpB to gshB and several
putative membrane proteins, tufB – elongation factor Tu and ppgL – a putative zinc peptidase
(Figure 4.5).
Figure 4.5 Connectivity map displaying the predicted functional associations between the silver-
sensitive gene hits; disconnected gene hits not shown. The thicknesses of the lines indicate the
degree of confidence prediction for the given interaction, based on fusion, co-occurrence,
experimental and co-expression data. Figure produced using STRING (version 10.5) and a
medium confidence score of 0.4.
4.4.3.4 Oxidative stress response genes
Out of the 31 proteins mapped to ‘Response to Stimulus’, 24 were involved in mediating
DNA damage and other processes (Figure S4.2 h). The gene coding for glutathione synthetase –

106
gshB was found to be a Ag sensitive hit. Strains overexpressing either GshA or GshB are more
resistant to oxidative damage, and this system has been shown to mediate metal resistance [384].
As a result, the deletion of either gene is anticipated to cause Ag sensitivity. Furthermore, the
putative Fe+2 trafficking protein, YggX was found to have a score of -0.450. This protein is
proposed to play a role in preventing the oxidation of iron-sulfur clusters [385], a proposed
mechanism of Ag toxicity. The absence of this protective protein may result in sensitivity since it
can be found at elevated concentrations in vivo and it is involved in mediating oxidative damage
[386]. Further, the protein Hmp, a flavohemoglobin with nitric oxide dioxygenase activity [387]
had a score of -0.254. This protein has been shown to protect respiratory cytochromes in E. coli
[362], which is a possible mechanism of Ag toxicity [60], [66].
Conclusion
In this work, a chemical genetic screen of a mutant library was performed as a means of
drawing insight into the mechanisms of Ag toxicity and resistance in bacteria. In total, 3810 mutant
strains containing single deletions of non-essential genes in E. coli were screened, and subsequent
hits were bioinformatically evaluated in order to highlight processes and pathways that are affected
by Ag exposure. This systematic mutant screen involved a low but prolonged concentration of Ag
exposure on solid minimal media to avoid indirect secondary and acute responses, while also
attempting to directly target direct relevant genes. Here, resistant hits represented genes involved
in enhancing the cytotoxicity of Ag, while in contrast, sensitive hits represented genes functioning
in tolerance to Ag including physiological responses that mitigate toxicity.
In short, processes involved with the cell exterior and the central dogma were found to be
affected by Ag exposure to a greater extent than other processes analyzed. However, when further
examining the fold enrichment, the cell membrane and transport were involved in Ag exposure to

107
a lesser degree. In fact, proteins involved in amino acid biosynthesis (Ag sensitivity),
phosphoproteins and metalloproteins (Ag resistance) were most densely represented as hits in this
work – trends that were supported by the protein-protein interaction networks.
Our work supports many previously proposed mechanisms of Ag toxicity – disruption of iron-
sulfur cluster containing proteins and certain cellular redox enzymes, and DNA damage; Ag
resistance – toxin export and sequestration. However, the data presented here also demonstrates
that the activity of Ag within the bacterial cell is more extensive than previously suggested,
involving genes a part of the cell wall structure, quinone metabolism, ATP synthesis and sulfur
reduction.
The use of Ag as an antimicrobial is a practice garnering considerable popularity, as the
introduction of Ag-based compounds, such as combination treatments, nanomaterials, and
formulations make way. In order to continue the development of this metal as a therapeutic agent,
it is imperative that we gather more understanding into the accompanying mechanisms of Ag
toxicity and resistance. This study provides a vast number of biomolecular mechanistic hypotheses
to the community investigating the mechanisms of action of Ag and other metals.
Chapter 4 Supplementary
Table S4.1 Systems and comprising subsystems cited in this study. The resistant and sensitive
hits were surveyed against the EcoCyc database permitting the clustering of the hits into systems,
subsystems and component subsystems1,2.
Systems Subsystems
Regulation Signalling, sigma factor regulon,
transcription factor, and transcription
factor regulons
Response to Stimulus Starvation, heat, cold, DNA damage,
pH, detoxification, osmotic stress, and
other
Cellular processes Cell cycle and division, cell death,
genetic transfer, biofilm formation,

108
quorum sensing, adhesion,
locomotion, viral response, response to
bacterium, host interactions with host,
other pathogenesis proteins
Energy Glycolysis, the pentose phosphate
pathway, the TCA cycle, fermentation,
and aerobic and anaerobic respiration
Other pathways Detoxification, inorganic nutrient
metabolism, macromolecule
modification,
activation/inactivation/interconversion,
and other enzymes
Degradation Amino acids, nucleotide, amine,
carbohydrate/carboxylate, secondary
metabolite, alcohol, polymer and
aromatic, the cell exterior, and
regulation
Biosynthesis Amino acids, nucleotides, fatty
acid/lipid amines,
carbohydrate/carboxylates, cofactors,
secondary metabolites, and other
pathways
Cell exterior Transport, cell wall biogenesis and
organization, lipopolysaccharide
metabolism, pilus, flagellar, outer and
inner membrane, periplasm, and cell
wall components
Central Dogma Transcription, translation, DNA
metabolism, RNA metabolism, protein
metabolism and protein folding and
secretion

109
(d)
(a)
(b)
(c)

110
Figure S4.1 Ag resistant gene hits plotted against respective cellular processes. Y-axis
representative of the normalized score, smaller circles represent the individual hits and the larger
circles represent the mean of each subsystem. The p-value was calculated as a two-tailed t-test
and significance was determined using the Benjamini-Hochberg procedure; false discovery rate
was selected to be 0.1. Each individual score represents the mean of 12 trials. (a) Central
Dogma; (b) Cell exterior; (c) Biosynthesis; (d) Degradation; (e) Other pathways; (f) Energy; (g)
Cellular processes; and (i) Response to stimulus. Plots constructed using Pathway Tools, Omics
Dashboard.
(e)
(f)
(g)
(h)

111
(a)
(c)
(d)
(b)

112
Figure S4.2 Ag sensitive gene hits plotted against respective cellular processes. Y-axis
representative of the normalized score, smaller circles represent the individual hits and the larger
circles represent the mean of each subsystem. The p-value was a two-tailed t-test and
significance was determined using the Benjamini-Hochberg procedure; false discovery rate was
selected to be 0.1. Each individual score represents the mean of 12 trials. (a) Central Dogma; (b)
Cell exterior; (c) Biosynthesis; (d) Degradation; (e) Other pathways; (f) Energy; (g) Cellular
processes; and (i) Response to stimulus. Plots constructed using Pathway Tools, Omics
Dashboard.
(e) (f)
(g)
(h)

113
Figure S4.3 Resistant (a) and sensitive (b) gene scores plotted against subsystems involved in
cell regulation. The small circles represent the individual hits and the large circles represent the
mean of each subsystem. Each individual score signifies the mean of 12 trials – three biological
and four technical. The p-value was calculated as a two-tailed t-test and significance was
determined using the Benjamini-Hochberg procedure; false discovery rate was selected to be 0.1.
Plots constructed using Pathway Tools, Omics Dashboard.
(a)
(b)

114
5 Using a Chemical Genetic Screen to Enhance Our Understanding
of the Antimicrobial Properties of Gallium against Escherichia
coli
Authored by:
Natalie Gugala, Kate Chatfield-Reed, Raymond J. Turner, and Gordon Chua.
Published in:
Genes, January 2019, 10 doi: 10.3390/genes10010034
Copyright permissions for the reproduction of this manuscript can be found in Appendix D.
Abstract
The diagnostic and therapeutic agent gallium offers multiple clinical and commercial uses
including the treatment of cancer and the localization of tumors, among others. Further, this metal
has been proven to be an effective antimicrobial agent against a number of microbes. Despite the
latter, the fundamental mechanisms of gallium action have yet to be fully identified and
understood.
To further the development of this antimicrobial, it is imperative that we understand the
mechanisms by which gallium interacts with cells. Therefore, we screened the Escherichia coli
Keio mutant collection as a means of identifying genes that are implicated in prolonged gallium
toxicity or resistance and mapped their biological processes to their respective cellular system. We
discovered that the deletion of genes functioning in response to oxidative stress, repair of DNA or
iron-sulfur clusters, and nucleotide biosynthesis were sensitive to gallium, while Ga resistance was
comprised of genes involved in iron/siderophore import, amino acid biosynthesis and cell envelope
maintenance. Altogether, our explanations of these findings offer further insight into the
mechanisms of gallium toxicity and resistance in E. coli.

115
Introduction
The therapeutic capabilities of gallium(III) (Ga) have been and continue to be exploited for
a number of clinical applications, which include: the treatment of cancer, autoimmune and
infectious diseases, for the localization of tumors, inflammation and infection sites, and the
reduction of accelerated bone resorption [388],[389]. At the nuclear level, certain characteristics
of this abiogenic metal permit essential metal mimicry, owing its similarities to iron (Fe). In
particular, the pharmacological characteristics of Ga are likely a result of its Fe(III)-like
coordination chemistry and its ability to form stable six-coordinated complexes through ionic
bonding [390]. This metal is trivalent and a hard acid in solution, according to the hard-soft acid-
base theory [391], binding well with strong Lewis bases. As a result, Ga tends to form bonds with
oxygen predominantly forming Ga(OH)4- and other hydroxide species at pH 7.4 [392].
Despite Ga’s similarities to the essential metal Fe, these metals share two main differences; i) Ga
cannot be reduced under biologically relevant reduction potentials, whereas Fe can be readily
changed to and from a reduced state, and ii) the concentration of unbound Fe(III) in solution is
extremely low, localized primarily as a neutral complex with organic compounds, whereas
Ga(OH)4-, which is anionic, can exist at significant concentrations [393].
As an Fe(III) mimetic, Ga(III) can incorporate itself into proteins and enzymes replacing
Fe and effectively halting several essential metabolic processes
[18],[103],[232],[234],[237],[276],[394],[395]. Since the bioavailability of Fe is scarce,
organisms, such as bacteria, have produced a variety of biomolecular chelating scavenging systems
including siderophores and Fe-chelating proteins. Cells rapidly multiplying are more susceptible
to Ga toxicity due to their high Fe demands [388]. As a result, this metal is both US FDA (Ganite,
Genta, NJ, USA) approved for the treatment of cancer-associated hypercalcemia and has been

116
tested as an antimicrobial agent against a variety of organisms including Mycobacterium
tuberculosis [396],[397], Pseudomonas aeruginosa [18],[102],[103], Staphylococcus aureus
[398], Rhodococcus equi [399], Acinetobacter baumannii [400] and Escherichia coli [1].
In general, proposed mechanisms of toxicity for metal-based antimicrobials include the
production and propagation of reactive oxygen species, the disruption of Fe-sulfur centers, thiol
coordination, the exchange of a catalytic or structural metal, which in turn may lead to protein
dysfunction, obstructed nutrient uptake, and genotoxicity [180]. The route by which Ga enters the
cells is unknown, although, it is predominantly assumed that this metal crosses the cytoplasmic
membrane by exploiting Fe-uptake routes, such as siderophores [233]. Several studies have
explored the use of Fe-chelators as ‘Trojan horses’ as a means of improving the delivery and
toxicity of this metal in bacterial cells [276]. Still, there is insufficient research demonstrating that
complexes of Ga and Fe-chelators/siderophores, such as Ga-citrate, increase the antibacterial
abilities of this metal mainly since the import of this metal is not suggested to be the limiting step
[233]. Furthermore, Ga exposure has been demonstrated to trigger the production of reactive
oxygen species (ROS) in vitro [394],[395]. Upon the cytoplasmic replacement of Fe with Ga, the
available Fe pool is thought to increase, in turn fostering Fenton chemistry [180].
Bacteria have developed mechanisms of resistance as a means of withstanding metal
toxicity. Some mechanisms include extracellular and intracellular sequestration, efflux, reduced
uptake, repair, metabolic by-pass and chemical modification [242]. Microbial resistant
mechanisms associated with Ga have been studied to a far lesser degree, nonetheless, studies have
shown that Ga is not as effective as postulated. For example, Ga resistance in P. aeruginosa and
Burkholderia cepacia has been identified, suggested to be the result of decreased Ga import and
the formation of bacterial biofilms [330],[401].

117
Currently, research in this field is directed toward discovering novel utilities for this metal,
still, the expansion of Ga as a therapeutic antimicrobial has been delayed compared to other metal-
based antimicrobials, such as silver and copper. In short, it is essential that the mechanisms of Ga
action in microbes are explored to greater degree in order to further the development of this
antimicrobial agent.
In this work, we hypothesized that Ga exerts toxicity on multiple targets. Furthermore, we
believe that there are several mechanisms of resistance that are fundamental to an organism’s
adaptive response under sub-lethal concentrations of Ga. To evaluate this, we performed a
genotypic screening workflow of an E. coli mutant library composed of 3985 strains. Each strain
contains a different inactivated non-essential gene. Genome-wide toxin/stressor-challenge
workflows have been used to study silver [350],[352],[402],[403], copper [285],[286], cadmium
[404], cobalt [404] and zinc [405], however no such study has been implemented to examine the
effects of Ga. Therefore, as a means of complementing existing work, we have identified a number
of genes that may be involved in Ga toxicity or resistance and mapped their biological processes
to their respective cellular system in E. coli.
Materials and Methods
Methods and materials are as described in Chapter 4 (section 4.3). Unless otherwise stated
all materials were obtained from VWR International, Mississauga, Canada.
5.3.1 Escherichia coli strains
The Keio collection [406] consisting of 3985 single gene Escherichia coli BW25113
mutants (lacIq rrnBT14 ΔlacZWJ19 hsdR514 ΔaraBADAH33 ΔrhaBADLD78), was obtained from the
National BioResource Project E. coli (National Institute of Genetics, Shizuoka, Japan).

118
5.3.2 Determination of the minimal inhibitory concentration and controls
The sublethal inhibitory concentration, a concentration below the minimal inhibitory
concentration that is found to visibly challenge selected mutants under prolonged metal exposure,
was determined using recA, lacA and lacY strains from the Keio collection. RecA is involved
in a number of processes, including homologues recombination and the induction of the SOS
response in reaction to DNA damage [407]. Evidence may suggest that Ga causes the formation
of reactive oxygen species (ROS) although the precise mechanism of production is unknown. As
a result, the absence of this gene was anticipated to confer the Ga sensitive phenotype, implied by
a decrease in colony formation, since it is thought to be involved in mitigating ROS stress. Further,
the protein products of lacA and lacY were not anticipated to be involved in Ga resistance or
toxicity, therefore mutant strains of these genes were used as negative controls. Strains recA,
lacA and lacY, and the WT were grown overnight at 37°C on M9 minimal media plates (6.8
g/L Na2HPO4, 3.0 g/L KH2PO4, 1.0 g/L NH4Cl, 0.5 g/L NaCl, 4.0 mg/L glucose, 0.5 mg/L MgSO4
and 0.1 mg/L CaCl2) containing Noble agar (1.0%) in the presence and absence of Ga at varying
concentrations. The concentration of Ga that visibly decreased colony formation in the recA
mutant and produced no growth changes in the negative control strains was selected as the
sublethal inhibitory concentration. Furthermore, recA, lacA and lacY and the WT strain were
grown overnight in the presence of ionic nitrate at the equivalent molarity as the sublethal
inhibitory concentration to ensure growth was not influenced by the accompanying counter ion
(data not included). In order to identify Ga sensitive and resistant genes in this study, the Keio
collection was exposed to 100 M Ga(NO3)3 (Ga). Gallium nitrate was obtained from Sigma
Aldrich, St. Louis, MO, USA. Stock solutions of Ga were prepared with deionized H2O and stored
in glass vials for no longer than two weeks.

119
Similarly, recA, lacA and lacY and the WT strain were grown on M9 minimal media
plates in the presence of varying concentrations of hydroxyurea (HU), obtained from USBiological
Salmen, MA, USA, or sulfometuron methyl (SMM) obtained from Chem Service, West Chester,
PA, USA, dissolved in ddH2O and dimethyl sulfoxide, respectively. Select mutants from the Keio
collection were exposed to a final concentration of 5.0 mg/mL HU and 5.0 g/mL SMM in the
presence and absence of 100 M Ga.
5.3.3 Screening
M9 minimal media and Noble agar (1.0%) plates, with and without the addition of Ga,
were prepared two days prior to use. Here, Ga was added directly to the liquid agar and swirled
before solidification. Colony arrays in 96-format were produced and processed using a BM3 robot
and spImager (S&P Robotics Inc., Toronto, ON, Canada), respectively. Cells were transferred
from the arrayed microtiter plates using a 96-pin replicator onto LB media agar plates and grown
overnight at 37°C. Colonies were then transferred using the replicator onto two sets of M9 minimal
media Noble agar plates, with and without 100 μM Ga(NO3)3. Plates were then grown overnight
at 37°C. All images were acquired using the spImager and colony size, a measure of Ga sensitivity
or resistance, was determined using integrated image processing software. Three biological trials
were conducted and each of these trials included four technical replicates originating from the 96-
colony array, which were combined and expanded onto a single plate in 384-colony array format;
n (trials) 9. Strains presenting less than nine replicates were excluded (refer to section 4.3.4 for
more information).
Select mutants were exposed to HU or SMM at sublethal inhibitory concentrations.
Identical conditions were maintained to enable direct comparisons between mutants grown in the

120
presence of Ga only, and those grown in the presence of Ga and either HU or SMM. Here HU or
SMM were added to the M9 minimal media plates directly before solidification.
5.3.4 Normalization
In this study, incubation time and temperature, nutrient availability, colony location, agar
plate imperfections, batch effects, and neighboring mutant fitness were considered independent
variables that could influence colony size and subsequently cause systematic variation. As a result,
the colonies were normalized and scored using Synthetic Genetic Array Tools 1.0 (SGATools)
[354],[408], a tool that associates mutant colony size with fitness, thereby enabling quantitative
comparisons. All the plates were normalized to establish average colony size, working on the
assumption that the majority of the colonies would exhibit WT fitness since the concentration of
Ga used in this study was below the minimal inhibitory concentration.
Mutant colony sizes in the presence (challenge) and absence (control) of Ga were
quantified, scored and compared as deviation from the expected fitness of the WT strain. This
assumes a multiplicative model and not an additive effect originating from the challenge. Once
scored, mutants displaying a reduction in colony size were indicative of a Ga sensitive hit and
those displaying an increase in colony size were recovered as Ga resistant hits. Finally, the p-value
was calculated as a two-tailed t-test and significance was determined using the Benjamini-
Hochberg procedure, as a method of lowering the false discovery rate, which was selected to be
10%.
5.3.5 Data mining and analyses
Data mining was performed using Pathway Tools Omics Dashboard, which surveys against
the EcoCyc database [355] and Uniport [409]. This allowed for the clustering of the Ga resistant

121
and sensitive data sets into systems, subsystems and individual objects. Here, genes can be found
in multiple systems since many are involved in a number of cellular processes.
Enrichment analyses were performed using the DAVID Bioinformatics Resource 6.8 [356],[357].
Moreover, as a means of revealing the direct (physical) and indirect (functional) protein
interactions amongst the gene hits, the STRING database [358] was utilized. Node maps based on
experimental, co-expression and gene fusion studies were generated using the Ga resistant and
sensitive hits found in our screen.
Results and Discussion
5.4.1 Genome-wide screen of Ga resistant and sensitive hits
In this work, the chemical genetic screen provided a method for the identification of the
non-essential genes that may be involved in Ga resistance or sensitivity. A total of 3985 non-
essential genes were screened for growth in the presence of 100 μM Ga(NO3)3 and from here, 3641
hits, in which n 9, were used for subsequent statistical analyses (Figure 5.1 and Appendix D).
The statistical cut-off that suggested a significant difference in fitness when compared to the WT,
indicated by a change in colony size, was selected to be two standard deviations from the mean or
a normalized score of +0.162 and -0.154. This resulted in 107 gene hits, which represents
approximately 2.5% of the open reading frames in the E. coli K-12 genome. In general, the
normalization was performed with the assumption that hits presenting scores within two standard
deviations from the mean had non-specific or neutral interactions with Ga. Therefore, the
remaining hits were not regarded as significant based exclusively on the cut-offs selected.

122
Figure 5.1 Synthetic Array Tools (version 1.0) was used to normalize and score the Ga resistant
and sensitive hits as a means of representing the growth differences in Escherichia coli K12
BW25113 in the presence of 100 μM Ga(NO3)3. Each individual score represents the mean of 9-
12 trials.
In this work, the absence of the gene was inferred to give rise to the Ga resistant or sensitive
phenotype. A decrease in colony size (normalized score < -0.154) signified a Ga sensitive hit,
which implied that the presence of this gene increased Ga resistance. Here, 58 genes were found
to cause Ga sensitivity when absent (Table 5.1). Likewise, an increase in colony size (normalized
score > 0.162) signified a Ga resistant hit, therefore the presence of this gene may suggest an
increase in toxicity. Comparably, 49 genes were found to impart resistance when absent (Table
5.2), within the cut-offs applied.
Table 5.1 Ga sensitive hits organized according to system and subsystem mined using the Omics
Dashboard (Pathway Tools), which surveys against the EcoCyc Database; genes represent
sensitive hits with scores < -0.154.
System Subsystem Gene 1 Score 2,3
Central dogma Transcription evgA
hns
lgoR
nagC
rseA
-0.166
-0.175
-0.401
-0.191
-0.260
0 2 2 13 34
146
15641629
202
30 10 4 3 00
200
400
600
800
1000
1200
1400
1600
1800
< -0.6 -0.5 to
-0.6
-0.4 to
-0.5
-0.3 to
-0.4
-0.2 to
-0.3
-0.1 to
-0.2
-0.1 to
0
0 to
0.1
0.1 to
0.2
0.2 to
0.3
0.3 to
0.4
0.4 to
0.5
0.5 to
0.6
> 0.6
Num
ber
of
stra
ins
Normalized Score

123
ulaR -0.556
Translation bipA -0.204
DNA metabolism holC
holD
ruvC
intR
recA
recD
-0.327
-0.217
-0.184
-0.270
-0.309
-0.199
RNA metabolism rbfA
rim
mnmA
rnt
ygfZ
evgA
hns
lgoR
nagC
rseA
sspA
ulaR
-0.350
-0.298
-0.212
-0.322
-0.373
-0.166
-0.175
-0.401
-0.191
-0.269
-0.214
-0.556
Protein metabolism lipA
pphA
slyD
-0.318
-0.198
-0.273
Protein folding and secretion slyD -0.273
Cell exterior Transport zunC
tolC
ugpC
-0.361
-0.539
-0.290
Pilus ybgO -0.163
Flagellum fliG -0.235
Outer membrane tolC -0.539
Plasma membrane clsA
cysQ
fdnI
fliG
gspA
hokA
nuoK
rseA
ubiG
ugpC
znuC
-0.171
-0.203
-0.251
-0.235
-0.199
-0.181
-0.247
-0.269
-0.265
-0.290
-0.361
Periplasm tolC
yebF
-0.539
-0.268
Biosynthesis Amino acid dmI
metL
mtn
-0.418
-0.189
-0.329

124
Nucleoside and nucleotide purT -0.216
Fatty acid/lipid clsA -0.171
Carbohydrate mdh -0.287
Secondary metabolites mtn
fdx
-0.329
-0.168
Cofactor fdx
gshA
lipA
pabA
pabC
ubiG
-0.168
-0.165
-0.318
-0.224
-0.258
-0.265
Other metL -0.189
Degradation Amino acid astD -0.301
Nucleoside and nucleotide mtn -0.329
Amine purT -0.216
Carbohydrate garK
dmlA
-0.173
-0.418
Energy
Glycolysis gpmA -0.175
TCA cycle mdh -0.287
Fermentation mdh -0.287
Aerobic respiration nuoK -0.247
Anaerobic respiration fdnI
nuoK
-0.251
-0.247
Other mdh
nuoK
-0.287
-0.247
Cellular processes Biofilm hns -0.175
Adhesion ybgO -0.163
Locomotion fliG
recA
-0.235
-0.309
Viral response intR -0.270
Host interaction intR
slyD
-0.270
-0.273
Symbiosis slyD -0.273
Response to stimulus Starvation sspA
ugpC
-0.290
-0.214
Heat bipA
gloB
slyD
-0.204
-0.297
-0.273
Cold bipA
rbfA
-0.204
-0.350
DNA damage rbfA
recA
recD
ruvC
-0.350
-0.390
-0.199
-0.184
Osmotic stress gshA -0.165

125
ubiG -0.265
Other evgA
fliG
grxD
holC
holD
pphA
rseA
sspA
tolC
ugpC
-0.166
-0.235
-0.266
-0.327
-0.217
-0.198
-0.269
-0.214
-0.539
-0.290
Other pathways Inorganic nutrient metabolism fdnI
nuoK
-0.251
-0.247
Detoxification gloB
grxD
-0.297
-0.266
Macromolecule modification mnmA
rnt
-0.212
-0.322
Other enzymes bfr
cysQ
pphA
recD
ruvC
slyD
-0.170
-0.203
-0.198
-0.199
-0.184
-0.273 1 Gene hits can be mapped to more than one system and subsystem.
2 Each individual score represents the mean of 9-12 trials. 3 Two-tailed t-test and significance was determined using the Benjamini-Hochberg procedure;
false discovery rate 10%.
Table 5.2 Ga resistant hits organized according to system and subsystem mined using the Omics
Dashboard (Pathway Tools), which surveys against the EcoCyc Database; genes represent
resistant hits with scores > 0.162.
System Subsystem Gene 1 Score 2,3
Central dogma Transcription ilvY
metR
odhR
0.215
0.372
0.353
DNA metabolism hofM
xerD
cas2
0.620
0.168
0.177
RNA metabolism symE
ilvY
metR
pdhR
0.177
0.215
0.372
0.353
Protein metabolism mrcB 0.249
Protein folding and secretion yraI 0.180
Cell exterior Transport cysU 0.362

126
fepG
tonB
caiT
yiaO
par
0.312
0.341
0.403
0.600
0.266
Cell wall biogenesis alr
evnC
mrcB
yraI
0.353
0.203
0.249
0.180
LPS metabolism cspG
rfaC
0.204
0.201
Outer membrane
par
pqiC
0.266
0.345
Plasma membrane atpE
atpH
caiT
cycU
envU
fepG
mrcB
pqiC
tonB
torC
rfaC
yaaU
yafU
yifK
0.172
0.176
0.403
0.362
0.203
0.312
0.249
0.345
0.341
0.259
0.201
0.237
0.214
0.180
Periplasm ansB
asr
envC
mrcB
pqiC
tolB
tonB
torC
yiaO
yral
0.204
0.247
0.203
0.249
0.345
0.200
0.341
0.259
0.600
0.180
Cell wall component mrcB
torC
0.249
0.259
Biosynthesis Amino acid alr
avtA
leuA
leuC
metA
proB
trpB
0.353
0.384
0.302
0.205
0.241
0.258
0.611

127
trpD 0.273
Fatty acid/lipid rfaC 0.201
Carbohydrate cpsG
rfaC
0.204
0.201
Cofactor, prosthetic groups,
electron carrier
bioF
bioH
coaA
thiE
0.183
0.194
0.193
0.226
Cell structure mrcB 0.249
Other aroF 0.236
Degradation Amino acid alr
ansB
0.353
0.204
Fatty acid/lipid atoA 0.246
Energy Glycolysis pykF 0.169
Fermentation pykF 0.169
Anaerobic respiration torC 0.259
ATP biosynthesis atpE
atpH
0.172
0.176
Other hydN 0.249
Cellular processes Cell cycle/division envC
tolB
xerD
0.203
0.200
0.168
Cell death envC 0.203
Adhesion tonB 0.341
Viral response cas2
tonB
0.177
0.341
Symbiosis tonB 0.341
Response to stimulus Heat pykF 0.169
DNA damage par
symE
yiaO
0.266
0.177
0.600
pH oxc 0.519
Other asr
caiT
cas2
envC
mrcB
tolB
tonB
torC
xerD
yaaU
0.247
0.403
0.177
0.203
0.249
0.200
0.341
0.259
0.168
0.237
Other pathways Other enzymes oxc
sepG
0.519
0.201 1 Gene hits can be mapped to more than one system and subsystem.
2 Each individual score represents the mean of 9-12 trials.

128
3 Two-tailed t-test and significance was determined using the Benjamini-Hochberg procedure;
false discovery rate 10%.
Using Pathway Tools, which surveys against the EcoCyc database, a number of gene hits
were mapped to more than one system and subsystem (Table 5.1 and Table 5.2). In general,
comparable numbers of hits were mapped to the system ‘Response to stimulus’, ‘Cellular
processes’, ‘Energy’ and ‘Biosynthesis’ (Figure 5.2). Still, ‘Regulation’, ‘Degradation’ and
proteins of the ‘Cell exterior’ contained more resistant hits. Whereas ‘Other pathways’ and
proteins involved in processes of the ‘Central dogma’ were represented by the Ga sensitive hits at
least 2-fold more than the Ga resistant hits (Figure 5.2). Proteins residing or involved in
maintaining cell envelope homeostasis were not enriched in the resistant hits, however, 2-fold
more hits were mapped to the system ‘Cell exterior’ using EcoCyc’s system of classification when
compared to the sensitive hits (Figure 5.2). (See Chapter 4 Supplementary, Table S4.1 for
complete list of each comprising subsystem)
Figure 5.2 Ga resistant and sensitive gene hits mapped to component cellular processes. Several
gene hits are mapped to more than one subsystem. The cut-off fitness score was selected to be
0 20 40 60 80 100
Central dogma
Cell exterior
Biosynthesis
Degradation
Other pathways
Energy
Cellular processes
Response to stimulus
Regulation
Number of strains
Resistant
Sensitive

129
two standard deviations from the mean and recovered gene hits with a score outside this range
were chosen for further analyses. The hits were mined using the Omics Dashboard (Pathway
Tools), which surveys against the EcoCyc database. Each individual score represents the mean of
9-12 trials.
Despite similar numbers of resistant and sensitive hits scored in this screen, a greater
number of categories were enriched for by the resistant hits, such as the biosynthesis of the vital
coenzyme – biotin, when surveyed using the DAVID gene functional classification (Figure 5.3).
Figure 5.3 Functional enrichment among the Ga resistant and sensitive gene hits. The DAVID
gene functional classification (version 6.8) database, a false discovery rate of 10% and a cutoff
score two standard deviations from the mean was used to measure the magnitude of enrichment
of the selected gene hits against the genome of Escherichia coli K-12. Only processes with gene
hits 3 were included.
In addition, a number of amino acid biosynthetic processes and cytosolic proteins were
enriched in the resistant hits, whereas proteins involved in the processing of 20S pre-rRNA and
malate metabolic processes were enriched in the sensitive hits (Figure 5.3). In general, the
enrichment profile of the resistant and sensitive hits provides insight into the dissimilarities
0 10 20 30 40 50
Branched amino acid biosynthesis
Aromatic amino acid biosynthesis
Valine, leucine and isoleucine biosynthesis
Biotin biosynthesis
Secondary metabolite biosynthesis
Magnesium ion binding
Coenzyme pyridoxal phosphate
Transferase
Homologous recombination
Maturation of small subunit rRNA
Malate metabolic process
ATP binding
Cytosolic proteins
Resistant
Sensitive
Fold Enrichment

130
between the mechanisms of Ga toxicity and resistance since there was no overlap in enrichment
(Figure 5.3). Based on previous reports [410],[411] several mutants belonging to the Keio
collection, such as those involved in the synthesis of amino acids, did not grow in M9 minimal
media, contrary to what we observed in this study. We attribute this observation to the presence of
residual resources, such as amino acids, that were carried over from the LB media agar plates onto
the M9 minimal media agar plates. Once these resources are exhausted, dying cells may provide a
source of nutrients for surviving cells. Furthermore, previous studies have provided cut-off values
as markers of growth, such as one-third the average OD600 [411]. Mutants displaying growth below
the cut-off are regarded as non-growers despite possible survival. As a follow up, we grew a
number of mutants overnight, including leuC, metA, proA, ilvB, trpD, lacA and the WT strain in
liquid M9 minimal media from existing culture stocks and transferred 20 μL onto M9 minimal
agar plates in the absence and presence of Ga. These strains were then grown overnight. Growth
was only observed for the WT strain and the lacA mutant. When the same procedure was
completed with liquid LB medium and agar plates, colony formation was evident for each mutant
tested (data not included). As a result, in this study we were able to test mutants that have otherwise
been reported to not grow on minimal media due to the lack of essential nutrients, such as amino
acids.
5.4.2 Ga sensitive systems
5.4.2.1 Iron homeostasis and transport, and Fe-sulfur cluster proteins
Ga has been shown to disrupt the function of several enzymes containing Fe-sulfur clusters,
likely by competing for Fe-binding sites [394]. E. coli contains over ten Fe-acquisition systems,
encoded by over 35 genes [412], providing an abundance of Ga potential targets, such as the
sensitive hit fdx (ferredoxin). The protein product of fdx serves as an electron transfer protein in a

131
wide variety of metabolic reactions, including the assembly of Fe-sulfur clusters [413],
consequently, Ga resistance is probable if this metal is damaging Fe-sulfur centers. Ferredoxin
may also serve as a binding site since the exchange of Fe may cause Ga sequestration. Furthermore,
the sensitive hit lipA (lipoyl synthase) codes for an enzyme that uses ferredoxin as a reducing
source, and catalytic Fe-sulfur clusters to produce lipoate [414]. LipA’s requirement for ferredoxin
may provide an explanation for the 2-fold score decrease observed in the lipA mutant when
compared to the fdx mutant. Furthermore, our screen recovered the hit ygfZ, which codes for a
folate-binding protein that is implicated in protein assembly and the repair of Fe-sulfur clusters
[415]. The loss of ygfZ results in sensitivity to oxidative stress, likely due to the generation of ROS,
which subsequently may lead to the inhibition of Fe-sulfur cluster assembly or repair [416]. In
addition, disruption of Fe-sulfur clusters has been found to downregulate the uridine thiolation of
particular tRNAs as a means of decreasing sulfur consumption [417]. This process appears
important in coupling translation with levels of sulfur-containing amino acids. We recovered trmU,
which encodes a tRNA thiouridylase as a Ga sensitive hit in this study.
The redox pair Fe(II)/Fe(III) is well suited for a number of redox reactions and electron
transfers. Accordingly, bacteria have developed a number of Fe-acquisition systems, such as
siderophores and Fe-chelating proteins [418]. Siderophores, such as enterobactin are synthesized
internally and exported extracellularly to scavenge Fe(III) from the environment [419]. The ferric-
siderophore complex is imported into the cell and then degraded to release Fe(III) [419] and since
Ga is an Fe mimetic [420], this metal has been demonstrated to bind certain siderophores [233].
TolC is an outer membrane carrier required for the export of the high-affinity siderophore
enterobactin from the periplasm to the external environment [421]. The Ga sensitivity of the ΔtolC
strain may be due to the periplasmic accumulation of Ga-enterobactin complexes. If TolC is

132
inactivated then less enterobactin is exported outside the cell, in turn providing more Ga targets
and as a result, Ga-enterobactin complexes may accumulate inside the cell. Further, EvgA is part
of the EvgAS two-component system involved in the transcriptional regulation of tolC [422].
Therefore, loss of evgA is expected to display a similar defect in enterobactin export as a tolC
mutant, thus resulting in Ga sensitivity. Finally, bacterioferritin (bfr) was recovered as a sensitive
hit in this work. This protein, which binds one haem group per dimer and two Fe atoms per subunit,
functions in Fe storage and oxidation [423]. The sensitivity phenotype of the Δbfr strain may be
associated with a failure to mitigate Fe-mediated ROS production due to the disruption of Fe
homeostasis in the presence of Ga (see section 5.3.2.2).
5.4.2.2 Oxidative stress
The production of ROS has been shown to be a mechanism of metal toxicity. Exposure to
hydrogen peroxide or other agents that catalyze the production of ROS, such as superoxide causes
DNA and protein damage to macromolecules including proteins, lipids, nucleic acids and
carbohydrates [424]. This in turn causes the upregulation of genes encoding ROS-scavenging
enzymes [424]. An increase in cytoplasmic Fe intensifies ROS toxicity by catalyzing the exchange
of electrons from donor to hydrogen peroxide [180]. Consequently, this may require the assistance
of cellular antioxidants such as glutathione, and enzymes such as catalase, superoxide dismutase
and peroxidase [425]. Ga is Fenton inactive and therefore the induction of ROS in the presence of
Ga is likely to result in the release of Fe in the cytoplasm. One study observed higher levels of
oxidized lipids and proteins in Pseudomonas fluorescens exposed to Ga [394]. In turn, the
oxidative environment stimulated the synthesis of NADPH via the overexpression of NADPH-
producing enzymes, invoking a reductive environment.

133
In this screen, several sensitive Ga hits effective in ROS protection were recovered,
including -glutamate-cysteine ligase, or gshA. Strains lacking this gene have been shown to be
hypersensitive to thiol-specific damage generated through mercury and arsenite exposure [426].
Similarly, strains lacking glyoxalase II (gloB), also a sensitive hit in this study, accumulate S-
lactoylglutathione and demonstrate depleted glutathione pools [427]. If this antioxidant is depleted,
then the potential for ROS-mediated protection is lowered. Furthermore, the gene grxD, which
codes for a scaffold protein that transfers intact Fe-sulfur clusters to ferredoxin, was also recovered
as a Ga sensitive hit. The presence of this abundant protein is further upregulated during stationary
phase [428] and one study demonstrated, using the Keio collection, that a grxD mutant is sensitive
to Fe depletion [429]. Based on this observation, Ga exposure may prompt toxicity via Fe
exhaustion, or the introduction of this toxin may result in ROS production thereby leading to Fe-
sulfur damage. Finally, bacterioferritin (bfr) was also identified as a sensitive hit in this work. This
protein acts to prevent the formation of hydrogen peroxide from the oxidation of Fe(II) atoms
[423]. The sensitivity phenotypes of the ΔgshA, ΔgloB, ΔgrxD and Δbfr strains may be associated
with Fe-mediated ROS production upon the disruption of Fe homeostasis in Ga exposed cells.
The sensitive hit ubiG, involved in the production of ubiquinol-8, a key electron carrier
used in the presence of oxygen or nitrogen, was recovered in this screen. The production of
ubiquinol from 4-hydroxybenzoate and trans-octaprenyl diphosphate necessitates the use of six
enzymes and UbiG twice [430]. Mutant strains deficient in ubiquinol demonstrate higher levels of
ROS in the cytoplasmic membranes, a threat lessened via the addition of exogenous ubiquinol
[431]. Furthermore, the ΔubiG strain exhibited reduced fitness when exposed to oxidative stress
[431]. Altogether, the presence of this hit can be explained by the exacerbation in the production

134
of ROS due to Ga exposure alongside the compromised oxidative stress response of the ΔubiG
strain.
5.4.2.2 Deoxynucleotide and cofactor biosynthesis, and DNA replication and repair
Compounds targeting ribonucleotide reductase (RNR), a key enzyme involved in the
synthesis of deoxynucleotides from ribonucleotides, have long been regarded as cancer
therapeutics [432]. In mammalian cells, Ga targets RNR through at least two mechanisms. These
mechanisms include the inhibition of cellular Fe uptake resulting in decreased Fe availability at
the M2 subunit of the enzyme [433] and direct inhibition of RNR activity [434], leading to a
reduction in the concentration of nucleotides in the cell. This mechanism is not limited to
mammalian cells. Ga has been shown to inhibit RNR and aconitase activity in Mycobacterium
tuberculosis [397]. If RNR inhibition is in fact a mechanism of Ga toxicity, then we predict that
gene deletions resulting in decreased deoxynucleotide levels may cause hypersensitivity.
Consequently, the deletion of the gene purT, which is involved in purine nucleotide biosynthesis
[435], resulted in Ga sensitivity in this study.
Chromosomal replication is delayed in E. coli cells when the deoxynucleotide pool is
depleted when RNR function is inhibited [436]. If this is the case, then a defect in DNA replication
may result in hypersensitivity to Ga. Our observation that the loss of the DNA polymerase III
subunits HolC and HolD causes Ga sensitivity appears to support this hypothesis. Another
potential consequence of RNR inhibition is an increase in stalled replication forks, which are prone
to DNA strand breakage [436]. Resumption of stalled replication forks and double strand breaks
due to defective RNR function require the activity of recombination repair enzymes such as the
RuvABC, RecBCD and RecA [437],[438]. Our results support these observations since the
deletion of recA, recD or ruvC triggered the Ga sensitive phenotype. It is important to note that

135
genes involved in base and nucleotide excision repair were not retrieved as Ga sensitive hits
suggesting that DNA damage associated with Ga exposure may be predominantly in the form
double stranded breaks.
A number of sensitive hits were mapped to the subsystem ‘Biosynthesis of cofactors,
prosthetic groups and electron carriers’. Processes affected include folate, lipoate, quinol, quinone,
ubiquinol and thiamine biosynthesis. The gene products of pabA and pabC, which encode an
aminodeoxychorismate synthase and an aminodeoxychorismate lyase, respectively, are involved
in the biosynthesis of p-aminobenzoic acid [439], a precursor of folate. In both prokaryotes and
eukaryotes, folate cofactors are necessary for a range of biosynthetic processes including purine
and methionine biosynthesis (Figure 5.4) [440]. Folate biosynthesis has long served as an
antibiotic target in prokaryotes since this cofactor is synthesized only in bacteria yet actively
imported by eukaryotes using membrane associated processes [441]. Similar to purT, the Ga
sensitivity of ΔpabA and ΔpabC strains may be a result of the reduction in deoxynucleotide levels
caused by the inactivation of RNR.

136
Figure 5.4 Connectivity diagram displaying the predicted functional associations between the Ga
sensitive gene hits; disconnected gene hits not shown. The thickness of the line indicates the
degree of confidence prediction for the given interaction, based on fusion, curated databases,
experimental and co-expression evidence. Figure generated using STRING (version 10.5) and a
medium confidence score of 0.4.
To test the potential connection between Ga and RNR activity, we exposed the holC, holD,
recA, recD, ruvC, and purT mutants to hydroxyurea (HU), which is a known inhibitor of RNR
activity [442]. Further, we included a number of mutants involved in DNA synthesis, such as ruvA
and recR, that were not uncovered in our initial screen. In E. coli, HU has been shown to increase
ribonucleotide pools and decrease total deoxyribonucleotide concentrations, thus negatively
affecting the synthesis of DNA [443]. We exposed these mutants to sublethal concentrations of
HU and normalized the cellular effect of this agent. Using this reagent, the sensitivity of the holC,
ruvC, and recD mutants in the presence of HU and Ga was found to increase (Table 5.3).
Furthermore, ruvA, which assists in recombinational repair together with ruvB [378], was also
found to be a sensitive hit in the presence of this inhibitor. The genes purT and holD were not

137
uncovered as either sensitive or resistant hits based on the cut-offs applied and no changes in the
sensitivity or resistance of either lacA or lacY, negative controls in this work, were found.
Table 5.3 Hydroxyurea sensitive and gene hits involved in the synthesis of DNA, normalized to
include only the effects of Ga exposure; those with a score two deviations from the mean are
included.
Gene Score
without
HU
Score
with HU 1,2
ruvA
recA
ruvC
holC
recD
N/A
-0.309
-0.184
-0.327
-0.199
-0.257
-0.299
-0.299
-0.351
-0.561 1 Each individual score represents the mean of 9-12 trials.
2 Two-tailed t-test and significance was determined using the
Benjamini-Hochberg procedure; false discovery rate 10%.
5.4.3 Systems involved in Ga resistance
5.4.3.1 Fe transport systems
In E. coli, the mechanisms by which Ga is transported into the cell have yet to be identified.
In this screen, we identified a number of transport proteins that confer resistance against Ga when
absent. Metal resistance mechanisms may involve decreased import or enhanced export of the
toxin. Therefore, the loss of a gene in which the product mediates import of the toxin into the cell
would prevent its accumulation and result in resistance. FepG and TonB are two proteins that
demonstrate close interaction (Figure 5.5) and fit the latter criterion, both involved in the import
of Fe-siderophores. FepG is an inner membrane subunit of the ferric enterobactin ABC transporter
complex. When fepG is inactivated, E. coli cells lose ferric enterobactin uptake abilities
[444],[445]. TonB is a component of the Ton system which functions to couple energy from the
proton motive force with the active transport of Fe-siderophore complexes and vitamin B12 across
the outer membrane [369]. Since Ga entry into the bacterial cell can occur through siderophore

138
binding and it is an Fe mimetic [233],[420], we hypothesize that in the absence of fepG and tonB,
Ga import and intracellular accumulation is reduced.
Figure 5.5 Connectivity diagram displaying the predicted functional associations between the Ga
resistant gene hits; disconnected gene hits not shown. The thickness of the line indicates the
degree of confidence prediction for the given interaction, based on fusion, curated database,
experimental and co-expression evidence. Figure generated using STRING (version 10.5) and a
medium confidence score of 0.4.
OmpC is a promiscuous porin that permits the transport of 30+ molecules, and is postulated
to be a transporter of copper(I) and copper(II) [446] and potentially other metal species [164]. It
has been hypothesized that Ga can cross the membrane of E. coli via porins [233]. While this
hypothesis has not been demonstrated in E. coli directly, other works have confirmed findings in
P. aeruginosa [18], Mycobacterium smegmatis [447] and Francisella strains [237]. Further
evidence for the importance of OmpC in Ga resistance can be visualized using the STRING map
(Figure 5.5). Here, OmpC is connected to two proteins that comprise the ATPase complex through
the periplasmic protein TolB. TolB has been shown to physically interact with porins such as

139
OmpC and is required for their assembly into the outer membrane of E. coli cells [448]. The
resistance recovered in the ΔtolB strain may be due to a disruption in OmpC function, thereby
hindering Ga import. In addition, CysU, which is involved in the uptake of sulfate and thiosulfate
was also recovered as a resistant hit [449]. According to the hard-soft acid-base theory, Ga
coordinates well with sulfate or thiosulfate [391]. A reduction in the uptake of these metabolites
may prove useful against Ga stress due to decreased toxin import.
Genes involved in Fe import in other organisms have been shown to confer Ga resistance
when deleted, or Ga sensitivity when overexpressed. A 3-fold increase in Ga resistance was
displayed upon the deletion of the gene hitA, which codes for a Fe-binding protein in P. aeruginosa
[401]. The Haemophilus influenzae proteins FbpABC, which are involved in the delivery of Fe
from the periplasm to the cytoplasm, were expressed in E. coli as a means of investigating their
impact on Ga import, which increased in the presence of these genes [450]. Furthermore, earlier
studies have examined the use of metal-chelators as antimicrobial enhancements. Although the
majority of studies regarding Ga import have been performed in P. aeruginosa, some findings can
be compared. For example, it has been demonstrated that the siderophore complex Ga-
deferoxamine (DFO) was slightly more effective at killing cells than Ga alone [103] and more
promising results have been made with the complex Ga-protoporphyrin IX [451]. Altogether, these
studies and our work suggest that Ga enters the cell via siderophore transport systems or Fe-
binding transporters.
5.4.3.2 Amino acid biosynthesis
Ga resistant hits were functionally enriched for the synthesis of amino acids (Figure 5.3),
classified in the subsystem, ‘Amino acid biosynthesis’ (Table 5.2) and highly connected in the
functional map (Figure 5.5). The genes recovered were found to be mainly involved in the

140
biosynthesis of branched (ilvB, ilvY, leuA, leuC) and aromatic (aroF, trpB, and trpD) amino acids,
methionine (metA and metR) and proline (proA and proB). The demand for NADPH in biosynthetic
pathways of branched and aromatic amino acids, as well as methionine and proline are among the
highest [452]. It is plausible that a defect in the synthesis of these amino acids may increase levels
of NADPH, which has been shown to neutralize the oxidative stress elicited from Ga exposure
[394].
To further test this hypothesis, we exposed a number of the resistant hits mapped to
branched amino acid biosynthesis to sublethal concentrations of sulfometuron methyl (SMM), an
inhibitor of acetolactate synthase [453], a key enzyme involved in the synthesis of branched amino
acids. The resistance score of ilvY and leuA increased in the presence of SMM (Table 5.4). SMM
inhibits acetolactate synthase, which in turn may increase the liable NADPH pool. In fact, ilvY is
a positive regulator of ilvC [454], which encodes a reductoisomerase, and is the only enzyme in
this pathway that directly uses NADPH. Here, ilvB and other genes involved in branched amino
acid biosynthesis did not make the statistical cutoffs owing to large standard deviations. Finally,
no changes in the sensitivity or resistance of lacA or lacY, negative controls in this work, were
found.
Table 5.4 Sulfometuron methyl resistant gene hits, involved in the synthesis of amino acids,
normalized to include only the effects of Ga exposure; only those with a score two deviations
from the mean are included.
Gene Score
without
SMM
Score
With SMM 1,2
leuA
ilvY
0.302
0.215
0.341
0.300 1 Each individual score represents the mean of 9-12 trials.
2 Two-tailed t-test and significance was determined using the Benjamini-Hochberg
procedure; false discovery rate 10%.

141
It has been postulated that the oxidation of amino acids is a common and damaging effect
of metal-induced oxidative stress [455]. Certain side chains, such as Arg, Cys, His, Lys and Pro
residues are major targets, leading to protein damage and intra/inter-crosslinking [455],[456]. If
Ga targets amino acids, both free and within proteins, a possible explanation for the recovery of
amino acid gene resistant hits in this study may rest in the cell’s requirement to repair or replace
damaged amino acids. If these genes are absent fewer Ga targets remain and the cell expends less
energy rebuilding these targeted biomolecules, while directing more energy elsewhere, such as
scavenging and importing required metabolites. Furthermore, the oxidation of these amino acid
side chains may lead to the propagation of ROS, and therefore a deficiency in amino acids may
minimize damage by slowing the advancement of amino acid metal-induced oxidative stress.
5.4.3.3 Lipopolysaccharides and peptidoglycan
The E. coli envelope is composed of lipopolysaccharides (LPS), which surround and
protect the cytoplasm, and the cross-linked polymer peptidoglycan (PG), which is the primary
stress-bearing biomolecule in the cell [457].In this study, a number of genes involved in LPS or
PG biosynthesis/maintenance was observed to cause Ga resistance when absent. These genes
include cpsG and rfaC (LPS), and alr, envC and mrcB (PG). Many of these genes are RpoS-
regulated and participate in maintaining membrane integrity in response to pressure [458]. Loss of
mrcB, which encodes for an inner membrane enzyme functioning in transglycosylation and
transpeptidation of PG, has been shown to result in reduced surface PG density when absent [459].
The protein RfaC is essential in LPS production [460] and cells lacking this gene contain defects
in the core heptose region [461]. The protein EnvC, which is a divisome-associated factor has been
shown to have PG hydrolytic activity and result in decreased cell envelope integrity when deleted.
Furthermore, tolB plays a role in maintaining the structure of the cell envelope and was also a Ga

142
resistant hit. Cells deficient in tolB have been shown to release periplasmic proteins into the
extracellular space [462]. An explanation for the appearance of mrcB, envC and tolB in this study
may reside in the ability of PG to bind metals. Metal ions are known to bind the LPS or PG layer
of Gram-negative and Gram-positive bacteria [184], and the presence of anionic groups such as
carboxylic acids [185] and other hard acids within the cell envelope, provide suitable binding
sights for free metal ions like Ga. Although the major ionic form of Ga is Ga(OH)4-, free Ga ions
produced through equilibrium may be quickly bound by hard acids such as alcohols, carboxylates
and hydroxyls, which comprise the bulk of the PG. Despite their presence at low concentrations
these species may further impede cell health and cause toxicity. However, if the LPS or PG layer
is reduced, as would be the case in the absence of mrcB, rfaC, envC and tolB, then a reduction in
Ga-cell envelope binding may occur. In the case of the ΔtolB strain, the potential release of
periplasmic proteins with Ga-binding sites into the extracellular space may also provide protection
via sequestration, which is a common bacterial resistance mechanism [242]. Another possible
explanation for Ga resistance associated with LPS and PG genes may include the structural
alteration of the cell envelope, which may disrupt Fe import systems. Inhibition of lipid
biosynthesis prevents proper assembly and insertion of porins into the outer membrane since LPS-
porin interaction sites have been shown to be important in their biogenesis [463],[464]. Therefore,
compromised function of siderophore receptors or porins in these mutants could decrease Ga
import and mitigate toxicity.
Conclusion
In this study, the Keio collection was used as a means of drawing insight into the mechanisms
of Ga toxicity and resistance in Escherichia coli BW25113. In total, 3895 non-essential genes were
screened and 3641 of these were normalized and scored. Genes demonstrating resistance or
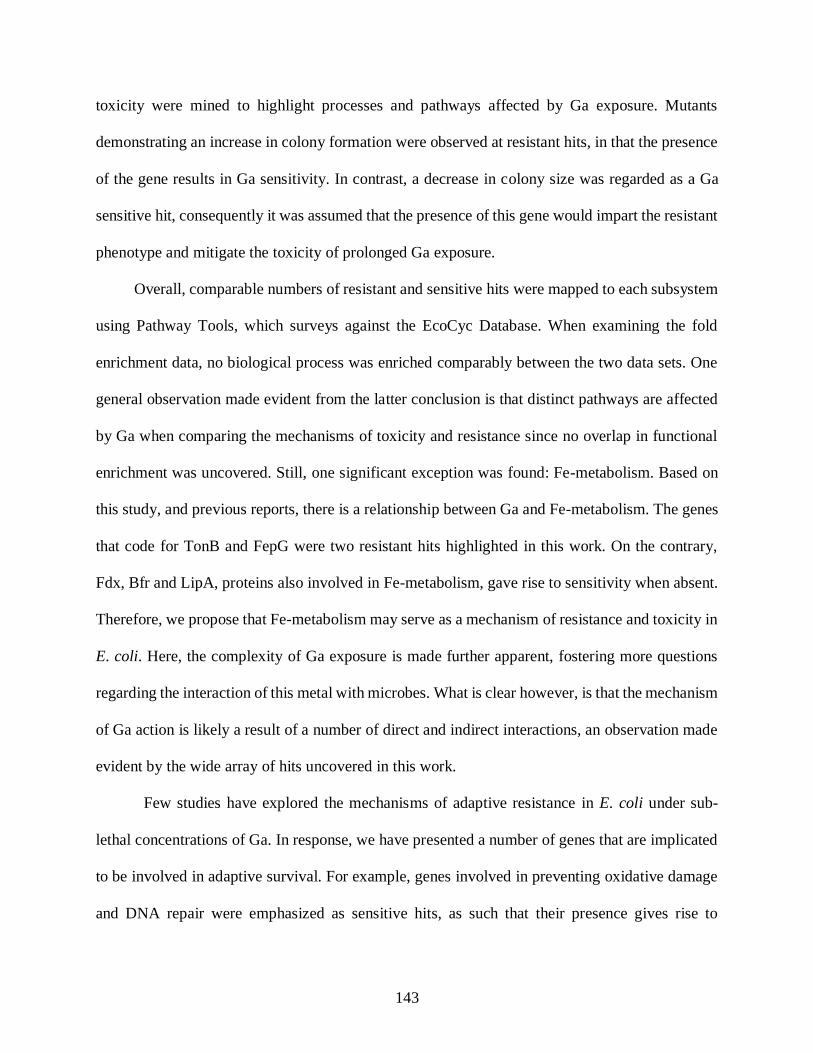
143
toxicity were mined to highlight processes and pathways affected by Ga exposure. Mutants
demonstrating an increase in colony formation were observed at resistant hits, in that the presence
of the gene results in Ga sensitivity. In contrast, a decrease in colony size was regarded as a Ga
sensitive hit, consequently it was assumed that the presence of this gene would impart the resistant
phenotype and mitigate the toxicity of prolonged Ga exposure.
Overall, comparable numbers of resistant and sensitive hits were mapped to each subsystem
using Pathway Tools, which surveys against the EcoCyc Database. When examining the fold
enrichment data, no biological process was enriched comparably between the two data sets. One
general observation made evident from the latter conclusion is that distinct pathways are affected
by Ga when comparing the mechanisms of toxicity and resistance since no overlap in functional
enrichment was uncovered. Still, one significant exception was found: Fe-metabolism. Based on
this study, and previous reports, there is a relationship between Ga and Fe-metabolism. The genes
that code for TonB and FepG were two resistant hits highlighted in this work. On the contrary,
Fdx, Bfr and LipA, proteins also involved in Fe-metabolism, gave rise to sensitivity when absent.
Therefore, we propose that Fe-metabolism may serve as a mechanism of resistance and toxicity in
E. coli. Here, the complexity of Ga exposure is made further apparent, fostering more questions
regarding the interaction of this metal with microbes. What is clear however, is that the mechanism
of Ga action is likely a result of a number of direct and indirect interactions, an observation made
evident by the wide array of hits uncovered in this work.
Few studies have explored the mechanisms of adaptive resistance in E. coli under sub-
lethal concentrations of Ga. In response, we have presented a number of genes that are implicated
to be involved in adaptive survival. For example, genes involved in preventing oxidative damage
and DNA repair were emphasized as sensitive hits, as such that their presence gives rise to

144
resistance. In short, preventing and repairing DNA damage, a mechanism that has yet to be
demonstrated in vivo, and redox maintenance may provide tools by which microbial organisms
mitigate metal stress.
The use of Ga for the treatment of diseases and infections is gaining considerable attention.
Still, to further the development of this metal as an antimicrobial agent, it is imperative that we
determine the associated mechanisms of toxicity and resistance. Further work must be completed
to specifically test the various hypotheses we have presented here, such as determining the mode
of Ga entry, the levels of ROS produced in the cell and the specific influence of Ga on Fe-
metabolism. Nonetheless, this study provides a significant number of biomolecular mechanistic
hypotheses to the community investigating the mechanisms of Ga action in E. coli and other
microbes.

145
6 Using a chemical genetic screen to enhance our understanding of
the antimicrobial properties of copper against Escherichia coli
Abstract
Copper (Cu) is an essential metal that displays elevated binding affinity, more so than any
other transition metal of the fourth period, and the ability to cycle between a reduced and oxidized
state. The competitive nature of copper necessitates numerous systems designed to sequester and
export this metal from the intracellular space. If copper levels are not controlled, then toxicity may
take place. Projected mechanisms include the production of reactive oxygen species, depletion of
thiols, DNA damage and iron-sulfur cluster disruption, among others. Accompanying these are
mechanisms of homeostasis, some of which comprise chelation, oxidation and export. Still, the
mechanisms of metal resistance and toxicity are not fully understood. Furthermore, may studies
fail to demonstrate that copper toxicity is likely a result of numerous mechanisms acting on the
cell, just like homeostasis, in which we see proteins and enzymes working as a collective to
maintain copper concentrations. Therefore, in this study we used the Keio collection, an array of
3985 Escherichia coli mutants each with a different deleted non-essential gene, to gain a better
understanding of prolonged copper exposure towards microbes. Using this phenotypic screen, we
recovered only one copper homeostatic gene and three genes involved in transporting and
assembling this protein to be important in mediating copper stress. Further, the process of tRNA
processing was enriched for by the sensitive hits. The deletion of several proteins involved in
biomolecule import generated copper resistance. Along with this, when deleted, key genes
belonging to central carbon metabolism and NAD biosynthesis were uncovered as resistant hits.
In general, we show that copper adaptation and resistance are a result of numerous mechanisms
acting in combination within the cell.

146
Introduction
Copper’s (Cu) ability to cycle between Cu(I) and Cu(II) provides functionality in a wide
variety of biological processes. The biological utilization of this metal likely extends back to the
great oxidation event, as suggested by the presence of homologous copper tolerance proteins [143],
in which the solubilization of this metal followed [465]. This metal is associated with several
metalloproteins that are involved in electron transport, reduction reactions and denitrification,
among others, and in some cases, it is also a structural element [466]. The Irving-Williams series
predicts that Cu can displace essential metals, such as zinc and iron [143] from their ligands within
metalloproteins, thus, permitting Cu to hold a number of unintended interactions. The reduced
form of Cu displays elevated affinity towards soft bases including thioethers and thiols, whereas
the oxidized form demonstrates affinity for borderline bases such as oxygen donors, like those
found in glutamate, aspartate and imidazole nitrogen groups [180]. Furthermore, as Cu(I) oxidizes
to Cu(II) the potential for radical formation increases. The competitive nature of this element
forces microorganisms to limit the import of this metal [164]. Consequently, bacterial genomes
have evolved to encode numerous copper exporters and chaperones intended to protect against Cu
[467]. Although Cu is essential to many microorganisms, such as Escherichia coli, excess Cu is
highly toxic. Consequently, this element is widely used as an antimicrobial agent in healthcare,
industrial and agricultural settings [32].
It has been demonstrated that Cu can cause the formation of reactive oxygen species (ROS)
through Fenton reactions and metal-catalyzed oxidation, thereby, damaging nucleic acids through
crosslinking and breakage, lipids, proteins and other biomolecules. Copper has been projected to
target proteins by oxidizing key residues, damaging iron-sulfur clusters or replacing either catalytic

147
or structural metals. Further, is has been hypothesized that Cu can impair membrane function
causing membrane damage [180].
Based on existing literature we hypothesize that the mechanisms of prolonged Cu
sensitivity and resistance are likely a result of a combination of mechanisms. To gain further
insight, we completed a genotypic workflow, in which 3985 Escherichia coli mutants, belonging
to the Keio collection [406], were screened for Cu sensitivity or resistance. Preceding genome-
wide toxin/stressor-challenge workflows have been used to study Cu in E. coli [285],[286],
however no studies have been completed under prolonged Cu challenge and to such completion as
in this study. Here, we demonstrate that Cu homeostasis, thus resistance, may be a result of a
number of mechanisms, and not just those programmed to mediate Cu stress directly. Furthermore,
we also show that under prolonged Cu stress, mechanisms of molecule import are likely targeted
by Cu, along with central carbon metabolism, and histidine and NAD biosynthesis.
Materials and Methods
Methods and materials are as described in Chapter 4 (section 4.3). Unless otherwise stated
all materials were obtained from VWR International, Mississauga, Canada.
6.3.1 Stock Cu solution
Copper sulfate (CuSO4) was obtained from Sigma-Aldrich (St. Louis, MO, USA). Stock
solutions were made at equivalent molarities of Cu in distilled and deionized H2O and stored at
21°C.
6.3.2 Determination of the sublethal inhibitory concentration and controls
A sublethal inhibitory concentration, a concentration well below the minimal inhibitory
concentration that was found to visibly challenge selected mutants under prolonged metal

148
exposure, was used throughout this study. This concentration was determined using a known Cu
sensitive strain, cusB and two negative control strains, lacA and lacY. CusB is a membrane
protein that is a part of the CusCFBA copper/silver efflux system. The cusCFBA operon encodes
proteins that are essential to the efflux of Cu(I) across the inner and outer membrane via the proton
motive force [468], in turn maintaining Cu homeostasis inside the cell [353]. As a result, the
absence of cusB was anticipated to confer increased Cu toxicity, signified by a decrease in colony
size. Furthermore, the protein products of lacA and lacY were not expected to be involved in Cu
resistance or toxicity, since these proteins have not been reported to interact with Cu or any other
metal. Strains cusB, lacA and lacY along with the parent strain [wild type (WT)] were grown
for 24 hours at 37°C on M9 minimal media and Noble agar (1.0%) in the presence and absence of
Cu at variable concentrations. The metal concentration found to visibly decrease colony size in the
cusB mutant and demonstrate no changes in colony size in the lacA and lacY mutants was selected
as the sublethal inhibitory concentration. Furthermore, the control mutants and the WT strain were
grown in the presence of 10 mM ionic nitrate to ensure growth was not impeded by the
accompanying counter ion. The chemical genetic screen was performed in the presence of 5 mM
copper sulfate (CuSO4).
6.3.3 Screening
All agar plates were prepared exactly two days prior to use. Challenge plates were prepared
directly by adding Cu to the liquid agar, followed by swirling to ensure uniform distribution before
solidification. Colony arrays in 96-format were made and processed using a BM3 robot and
spImager (S&P Robotics Inc., Toronto, ON, Canada), respectively. Briefly, cells were transferred
from the arrayed microtiter plates using a 96-pin replicator onto LB media agar plates (1.0%) and
grown overnight at 37°C. Colonies were then transferred using the replicator onto two sets of M9

149
minimal media Noble agar plates (1.0%) in the presence and absence of 5 mM Cu. The plates were
grown overnight at 37°C. Images were acquired and colony size, a measure of Cu sensitivity or
resistance, was determined using the image processing software included with the spImager. Three
biological trials were conducted, and each trial included four technical replicates that originated
from the 96-colony array. Strains with less than nine replicates were excluded.
6.3.4 Normalization, data mining and analyses
For a detailed description of the normalization, data mining and analyses conducted in this
chapter refer to 5.3.4. Colony sizes in the presence (challenge) and absence (control) of Cu were
compared, quantified and scored as deviation from the expected fitness of the WT strain. Mutants
presenting a reduction in colony size were recovered as Cu sensitive hits and those displaying an
increase in colony size were recovered as Ga resistant hits.
Results and Discussion
6.4.1 Phenotypic screen of Cu resistant and sensitive hits
In this work, a genome-wide phenotypic screen was used to identify non-essential genes
involved in Cu resistance or toxicity. A total of 3985 genes were screened and from here, 3599
gene hits were used for subsequent statistical analyses (Figure 6.1 and Appendix B). The
statistical cutoff that suggested a significant difference in fitness, indicated by a change in colony
formation when compared to the WT, was selected to be two standard deviations from the mean
or a normalized score of 0.292 and -0.262. This resulted in 127 gene hits, or approximately 2.8%
of the open reading frames in the E. coli K-12 genome. Based on this, gene hits with scores within
two standard deviations were assumed to have non-specific or neutral interactions with Cu and not
regarded as significant.

150
Figure 6.1 Synthetic Array Tools (version 1.0) was used to normalize and score the Cu resistant
and sensitive hits as a means of exposing the growth differences in Escherichia coli K12
BW25113 in the presence of 5 mM Cu(NO3)3. The p-value was a two-tailed t-test and
significance was determined using the Benjamini-Hochberg procedure; false discovery rate was
selected to be 0.1. Each individual score represents the mean of 9-12 trials.
Gene hits displaying increased colony growth were noted as resistant hits. This suggested
that the presence of the gene would cause Cu sensitivity. On the contrary, sensitive hits were noted
as those that displayed decreased colony formation when the gene was deleted. Here, it was
implied that the presence of this gene would cause adaptive Cu resistance or protection. In total 73
and 55 genes were recovered as resistant hits and sensitive hits, respectively, and each were
mapped to their respective cellular system and subsystem (Table 6.1 and Table 6.2).
Table 6.1 Cu sensitive hits organized according to system and subsystem mined using the Omics
Dashboard (Pathway Tools), which surveys against the EcoCyc Database; genes represent
sensitive hits with scores < -0.262 1,2.
System Subsystem Gene3 Score
Central Dogma
DNA metabolism dnaK
fimE
ruvC
xerD
-0.514
-0.349
-0.364
-0.284
1 0 5 18 48122
382
1005
1229
525
164
6125 10 1 1
0
200
400
600
800
1000
1200
1400
< -0.7 -0.6 to
-0.7
-0.5 to
-0.6
-0.4 to
-0.5
-0.3 to
-0.4
-0.2 to
-0.3
-0.1 to
-0.2
-0.1 to
0
0 to
0.1
0.1 to
0.2
0.2 to
0.3
0.3 to
0.4
0.4 to
0.5
0.5 to
0.6
0.6 to
0.7
< 0.8
Num
ber
of
Str
ains
Normalized Score
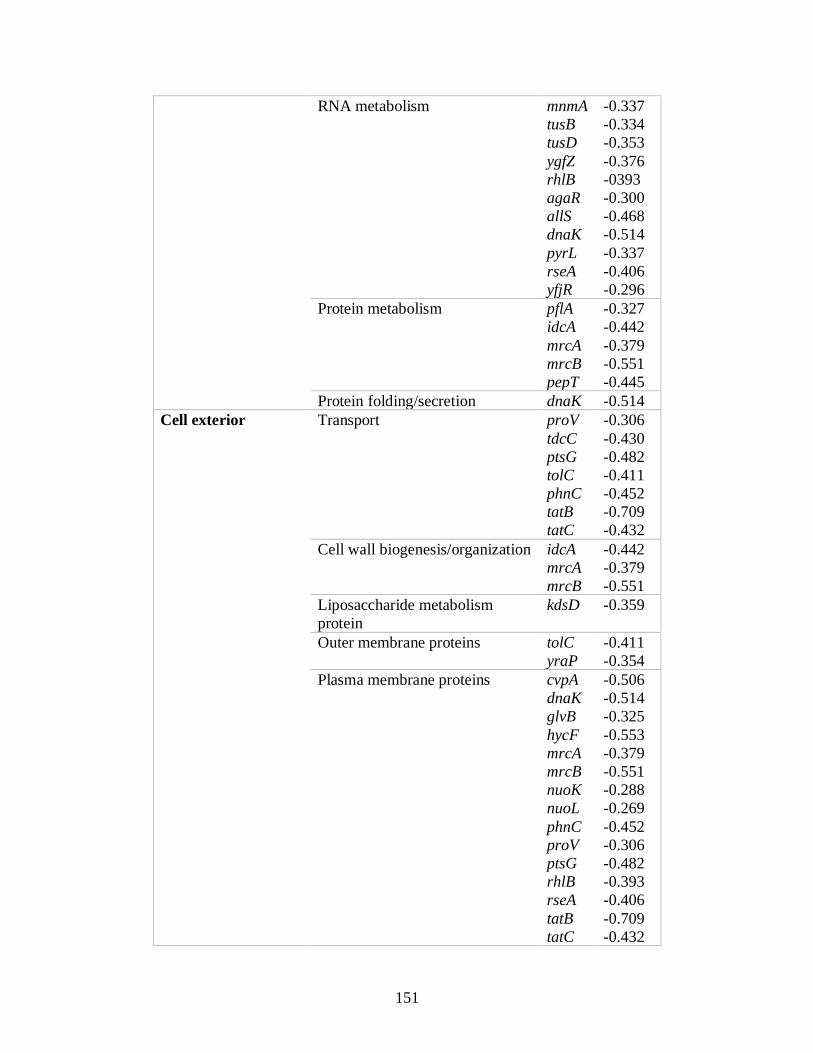
151
RNA metabolism mnmA
tusB
tusD
ygfZ
rhlB
agaR
allS
dnaK
pyrL
rseA
yfjR
-0.337
-0.334
-0.353
-0.376
-0393
-0.300
-0.468
-0.514
-0.337
-0.406
-0.296
Protein metabolism pflA
idcA
mrcA
mrcB
pepT
-0.327
-0.442
-0.379
-0.551
-0.445
Protein folding/secretion dnaK -0.514
Cell exterior Transport proV
tdcC
ptsG
tolC
phnC
tatB
tatC
-0.306
-0.430
-0.482
-0.411
-0.452
-0.709
-0.432
Cell wall biogenesis/organization idcA
mrcA
mrcB
-0.442
-0.379
-0.551
Liposaccharide metabolism
protein
kdsD -0.359
Outer membrane proteins tolC
yraP
-0.411
-0.354
Plasma membrane proteins cvpA
dnaK
glvB
hycF
mrcA
mrcB
nuoK
nuoL
phnC
proV
ptsG
rhlB
rseA
tatB
tatC
-0.506
-0.514
-0.325
-0.553
-0.379
-0.551
-0.288
-0.269
-0.452
-0.306
-0.482
-0.393
-0.406
-0.709
-0.432

152
tdcC
ycaD
yciB
ygiZ
yibN
yohC
-0.430
-0.458
-0.492
-0.290
-0.371
-0.268
Periplasm cueO
drcB
mrcB
tolB
tolC
yraP
-0.326
-0.317
-0.551
-0.384
-0.411
-0.354
Cell wall components mrcB -0.551
Biosynthesis Nucleotide biosynthesis add
purD
cmk
pyrI
-0.391
-0.313
-0.301
-0.333
Carbohydrate biosynthesis kdsD -0.359
Cofactor biosynthesis menB -0.279
Cell-structure biosynthesis mrcA
mrcB
-0.379
-0.511
Degradation Nucleotide degradation add
idcA
-0.391
-0.442
Polymer degradation idcA -0.442
Secondary metabolism
degradation
idcA -0.442
Other pathways Inorganic nutrient metabolism nuoK
nuoL
-0.288
-0.269
Macromolecule modification mnmA
tusB
tusD
-0.337
-0.334
-0.353
Other enzymes cueO
mutL
pepT
pflA
rhlB
ruvC
-0.326
-0.329
-0.445
-0.327
-0.393
-0.364
Energy Fermentation hycF -0.553
Aerobic respiration nuoK
nuoL
-0.288
-0.269
Anaerobic respiration nuoK
nuoL
-0.288
-0.269
Cellular processes Cell/cycle and division protein tolB
xerD
yciB
-0.384
-0.284
-0.492
Biofilm formation yfjR -0.269

153
yihR -0.295
Response to stimulus Heat dnaK -0.514
DNA damage add
mutL
pflA
purD
ruvC
ybiX
yohC
-0.391
-0.329
-0.327
-0.313
-0.364
-0.378
-0.268
Osmotic stress proV -0.306
Detoxification cueO -0.326
Other cmk
mrcA
mrcB
rseA
tatC
tolB
tolC
xerD
-0.301
-0.379
-0.551
-0.406
-0.432
-0.384
-0.411
-0.284 1 Each individual score represents the mean of 12 trials – three biological and four technical.
2 Two-tailed t-test and significance was determined using the Benjamini-Hochberg procedure 3 Gene hits can be mapped to more than one system and subsystem.
Table 6.2 Cu resistant hits organized according to system and subsystem mined using the Omics
Dashboard (Pathway Tools), which surveys against the EcoCyc Database; genes represent
resistant hits with scores > 0.1621,2.
System Subsystem Gene3 Score
Central Dogma Transcription gcvR
yhjB
0.545
0.464
Translation gluQ 0.293
DNA metabolism hofM
holC
0.340
0.311
RNA metabolism rbfA
gluQ
asnC
gcvR
yhjB
0.322
0.293
0.382
0.545
0.464
Protein modofication elaD
lipA
sixA
0.444
0.321
0.400
Protein folding and secretion secG 0.453
Cell exterior Transport gltI
kefB
nikE
cysP
cysW
0.626
0.328
0.489
0.473
0.567

154
Cell wall
biogenesis/organization
alr
dacC
envC
mltA
0.465
0.559
0.396
0.445
LPS metabolism wcaB 0.295
Outer membrane fhuE
mltA
0.352
0.445
Plasma membrane citT
cysW
dacC
emrK
envC
fxsA
ghrA
gltI
kefB
mltA
mscK
nikE
mscK
nikE
oppB
secG
torC
ugpB
ybbW
ydhU
0.480
0.567
0.559
0.337
0.396
0.384
0.346
0.626
0.328
0.445
0.598
0.489
0.344
0.453
0.578
0.453
0.578
0.293
0.297
0.494
Periplasmic Proteins cysP
dacC
envC
gltI
iaaA
mltA
torC
ugpB
yiaO
0.473
0.559
0.396
0.626
0.362
0.445
0.578
0.293
0.366
Cell wall component torC 0.578
Biosynthesis Amino acid biosynthesis alaA
alr
avtA
carB
glyA
hisG
leuA
tyrB
serC
0.308
0.465
0.470
0.426
0.525
0.371
0.310
0.308
0.515

155
metC
tyrB
proA
serC
trpD
tyrB
ilvB
0.812
0.308
0.384
0.515
0.321
0.308
0.782
Nucleoside and nucleotide
biosynthesis
purK
carB
0.326
0.426
Fatty acid and lipid synthesis atoB
Cofactor synthesis glyA
lipA
nadA
nadB
serC
0.525
0.321
0.474
0.304
0.515
Cell-structure synthesis dacC 0.559
Other aroC 0.441
Degradation Amino acid degradation alr
astB
iaaA
metA
carB
ilvB
0.465
0.554
0.362
0.812
0.426
0.782
Fatty acid and lipid degradation atoB 0.387
Amine and polyamine
degradation
carB
caiD
0.426
0.384
Carbohydrate degradation malP 0.426
Other pathways Other elaD
ghrA
gluQ
mltA
purU
ravA
sixA
solA
speG
yfdE
0.444
0.346
0.293
0.445
0.417
0.322
0.400
0.320
0.415
0.497
Energy Anaerobic Respiration torC 0.578
Fermentation pykF 0.397
Glycolysis pykF 0.397
Glyoxylate aceA 0.298
Pentose Phosphate Pathway zwf 0.348
TCA cycle aceA 0.298
Cellular processes Biofilm formation tabA 0.305
Cell cycle and division envC 0.396
Proteins involved in cell death envC 0.396

156
Proteins involved in quorum
sensing
zwf 0.348
Response to stimulus Stress ugpB 0.293
Heat pykF 0.397
Cold rbfA 0.322
DNA damage alaA
emrK
nikE
rbfA
solA
yiaO
0.308
0.337
0.489
0.322
0.320
0.366
Other asnC
dacC
envC
ghrA
gltI
gylA
holC
ptsN
ugpB
0.382
0.559
0.396
0.346
0.626
0.525
0.311
0.328
0.293 1 Each individual score represents the mean of 12 trials – three biological and four technical.
2 Two-tailed t-test and significance was determined using the Benjamini-Hochberg procedure 3 Gene hits can be mapped to more than one system and subsystem.
When comparing the sensitive and resistant data sets, similar numbers of hits were mapped
to each cellular process, excluding Degradation and Biosynthesis, in which more hits, by 2-fold,
were obtained for the resistant data set (Figure 6.2). More resistant hits involved in Regulation
were also recovered, again by more than 2-fold. This was not the case for Response to stimulus,
Cellular processes, Other pathways and the Central dogma for which the numbers of sensitive hits
were comparable or greater (Figure 6.2).

157
Figure 6.2 Cu resistant and sensitive gene hits mapped to component cellular processes. Gene
hits can be mapped to more than one process. Only hits two standard deviations or greater from
the mean are included. The gene hits were mined using the Omics Dashboard (Pathway Tools),
which surveys against the EcoCyc database.
Amongst the sensitive hits, 18 genes that code for protein-binding proteins were recovered,
resulting in an enrichment score of 1.9 (Figure 6.3). In general, more systems were enriched by
the resistant hits, including amino acid biosynthesis, particularly D-alanine, pyridoxal binding and
transferase activity. Finally, out of the 73 resistant hits, 32 were cytosolic and 29 were found to be
involved in metabolic pathways, generating a fold enrichment score of 2.
0 20 40 60 80 100
Central dogma
Cell exterior
Biosynthesis
Degradation
Other pathways
Energy
Cellular processes
Response to stimulus
Regulation
Number of strains
Sensitive Resistant

158
Figure 6.3 Functional enrichment among the Cu resistant and sensitive gene hits. The DAVID
gene functional classification (version 6.8) database, a false discovery rate of 0.1 and a cutoff
score two standard deviations from the mean was used to measure the magnitude of enrichment
of the selected gene hits against the genome of Escherichia coli K-12. Only clusters with 3
gene hits and a p-value <0.05 were included.
6.4.2 Cu sensitive systems
6.4.2.1 Cu sensitivity is generated in the absence of CueO and genes involved in the transport
and folding of this protein
Maintaining Cu homeostasis and resistance necessitates a number of specialized proteins
that primarily address the distribution and control of this metal inside the cell. Proteins proficient
in chelation are needed to bind molecules of Cu and transcriptional regulators are required to sense
and relay the presence of this metal, even when present at picomolar concentrations [466]. E. coli
contains a number of systems that support the proper homeostasis of Cu(I) and Cu(II), including
regulators, namely CueR, CusRS and PcoRS [260], transporters such as CopA and CusABC,
0 10 20 30 40
Transferase
Biosynthesis of secondary metabolites
Pyridoxal phosphate-dependent transferase
Pyridoxal phosphate binding
Metabolic pathways
Glyoxylate and dicarboxylate metabolism
Cytosolic proteins
Aminotransferase
Amino acid binding
Valine, leucine and isoleucine biosynthesis
D-alanine biosynthesis
Aromatic amino acid biosynthesis
Amino acid biosynthesis
tRNA processing
Sulfur relay system
Signal-anchor protein
Protein binding
Fold Enrichment
Sensitive
Resistant

159
chaperones like CusF, and proteins, specifically CueO, involved in the oxidation of Cu(I) to the
less harmful form Cu(II) [256],[260]. We recovered only one hit belonging to these collections of
genes that are directly involved in maintaining Cu homeostasis – the highly copper sensitive
protein CueO. Through oxidase activity and the presence of six Cu ions [469], CueO has been
demonstrated to protect against Cu and Fe damage [260].
One study demonstrated that upon cusCFBA deletion, substantial Cu sensitivity was not
found. Rather, only after the deletion of several genes – cueO and cusCFBA – was elevated
sensitivity observed [470]. Since the tendency for Cu to bind unintended ligands is high, it is
imperative that an organism holds several mechanisms aimed at maintaining intracellular
concentrations. These mechanisms are also held at specific cell locations. If the source of toxicity
occurs in the cytoplasm then the deletion of cusCFBA would likely have no impact on sensitivity
since this system is predicted to export Cu ions from the periplasm to the extracellular space [262].
This may provide an explanation for why only one hit was recovered in this work.
CueO contains a twin-arginine leader sequence, therefore, it is transported across the inner
membrane in a folded state by the Tat system [253],[471]. Both tatB and tatC comprise the
functional unit that are assumed to act as the substrate receptor for the Tat complex [472]. The
deletion of tatC has been found to inhibit the export of precursor proteins that contain the twin-
arginine sequence [473]. In our phenotypic screen, the deletion of either one of these genes resulted
in Cu sensitivity. As a result, we predict that the products of these genes aid against Cu toxicity
through the translocation of CueO across the inner membrane. This interaction can be visualized
further when exposing the connectivity between tatC, tatB and cueO (Figure 6.4). Further, the
protein product of dnaK, also recovered as a sensitive hit in this work, has been proven to be
essential in targeting CueO [474]. Researchers predict that DnaK may aid in the incorporation of

160
Cu ions into CueO or serve as a mediator for interaction with the Tat system [474]. This protein
was not included in the connectivity map since it’s interaction with CueO has not been proved
experimentally (Figure 6.4). Collectively, this data implies that either CueO is key in protecting
against Cu toxicity, more so than any other non-essential gene involved in controlling Cu
concentrations, or the primary source of prolonged Cu toxicity occurs in the periplasm where CueO
is active. The latter hypothesis is arguable however, since the products of cusCFBA and cusF act
in the periplasm. Still, a key feature of CueO may be its ability to oxidize toxic Cu(I), enabling the
removal of this threat from the periplasm, as well as its elevated Cu sensitivity when compared to
the remaining homeostatic proteins [474].
Figure 6.4 Connectivity map presenting the predicted functional associations between the Cu
sensitive gene hits; disconnected gene hits not included. The thickness of the line indicates the
degree of confidence prediction for the given interaction, based on fusion, experimental and co-
expression evidence only; several hits may be excluded based on these requirements. Figure
generated using STRING (version 10.5) and a medium confidence score of 0.4.

161
6.4.2.2 tRNA processing and modification may serve as a resistance mechanism against Cu
Examining the fold enrichment data reveals tRNA processing as a Cu targeted system in
E. coli BW25113 (Figure 6.3). Four genes were recovered as sensitive hits, tusA, tusB, mnmA and
ygfZ. The protein product of the latter is thought to be involved in iron-sulfur cluster repair, which
is a process thought to be targeted by Cu [475]. The products of tusA, tusB and mnmA are involved
in tRNA wobble position uridine thiolation, mainly through the relay of sulfur [476]. The reactants
of these enzymes contain an exposed thiol group. Consequently, we predict that the accumulation
of these molecules, due to gene deletions and thus the halting of this process, is unfavorable in the
presence of Cu(I) owing to its attraction for soft bases. Moreover, if Cu is targeting RNA
translation, these proteins would be beneficial to ensure correct tRNA wobble position uridine
thiolation, which plays a critical role in the biogenesis and metabolism of RNA molecules [477].
In E. coli the OxyR and SoxRS systems are required to prevent damage caused by reactive
oxygen species (ROS) [478], however the translation, transcription and folding of the proteins
controlled by these regulons has been found to take more than 20 minutes [479]. As a result, cells
require mechanisms that respond to stress immediately and this is believed to be at the translational
level [472]. The cleavage of tRNAs leads to the production of small RNA fragments that can
quickly down-regulate translation initiation as well as stimulate processes such as proliferation
[480]. In fact, Zhong et al. observed that cells initially decrease tRNA levels under oxidative stress
to prevent elongation, likely as a means of preventing protein misfolding [481]. However, once
the cells adapted, tRNA levels were restored and even elevated when compared to normal cells
thereby enabling the translation of important proteins that aid in the fight against ROS. A global
resistance mechanism against oxidative induced stress in E. coli is thus crafted. This information
provides the basis of a model relating the presence of tRNAs to protection against Cu induced

162
stress since four out of the seven proteins involved in the modification of the 2-thiol in tRNAs
were recovered as sensitive hits in this study. It is important to note that in our screen traditional
ROS mediating proteins, such as superoxide dismutase or glutathione reductase were not recovered
as statistically significant. Therefore, whether Cu directly generates ROS thereby initiating the
hypothesized cycle has yet to be determined.
6.4.3 Cu resistant systems
6.4.3.1 Genes involved in importing key biomolecules are potential Cu targets
A critical metal resistance mechanism lies in controlling the influx of essential metals and
maintaining appropriate concentrations, while also restricting the import of toxic metals. Still, it
has been projected that the majority of metal ions diffuse through the outer membrane using porins
[482]. Further, if the complex is too large to diffuse through a porin then energy-coupled outer
membrane proteins are utilized [483]. Lastly, specific metal transport proteins belonging to the
ATP-binding cassette, the Ni and Co transporter and Zrt/Irt-like families, among others, that efflux
ions such as Mn, Fe, Cu, Zn, Ni, Co across the membrane, aided by metabolite substrates,
chaperones or key protein residues, are fundamental in controlling the influx of metals [484].
Internal metal ion concentrations must match cell requirements with precision, yet the strength of
Cu binding is the greatest when compared to the remaining metals. To counter this, and any other
metal ion stress, bacterial cells express far more metal exporters than importers [2]. When metal
concentrations are elevated, genes that code for importers, especially those that are specific for the
incoming metal, are repressed as a means of decreasing intracellular levels. Still, based on
numerous studies aimed at detecting the mechanisms of metal toxicity in bacteria, it is evident that
metal ions are making their way into cells and exerting toxicity intracellularly [180]. In our study,
we detected eight hits – oppB, fhuF, yiaO, cysP, cysW, citT, nikE and gltI – that are involved in

163
the import of biomolecules, may potentially bind Cu ions, or enable Cu replacement or metabolite
uptake interference in E. coli. Of these, several require particular attention. One study, which
monitored changes to transcriptional levels in Staphylococcus aureus, found levels of oppA, an
oligopeptide transporter protein like the resistant hit oppB, to be down-regulated in the presence
of Cu [206]. In S. aureus, OppA has 35% homology to NikA [485], which is part of the Ni(II)
ABC-dependent transporter complex in E. coli [486]. This information and the results obtained in
this work may provide evidence that the OppABCDF import system is significant in mediating
metal and oligopeptide import in either organism.
The incidents for the remaining hits involved in biomolecule transport are somewhat
similar. The product of fhuE serves as a receptor for ferric-coprogen uptake in E. coli. Coupled to
TonB and alongside FhuCBD, this protein permits the transport of ferric-coprogen across the outer
membrane. If Cu is able to replace Fe within this chelator, given Cu’s excellent binding affinity,
then the deletion of this gene may offer resistance, as demonstrated in our screen. The genes cysP
and cysW code for a portion of the ABC-dependent thiosulfate/sulfate uptake system in E. coli
[487]. This system demonstrates selenite, selenate [488] and molybdate [489] uptake abilities.
Thiosulfate can be readily reduced by Cu(II) producing Cu(I) inside the cell, which may be
detrimental. Finally, citT is projected to be responsible for the uptake of citrate [490]. Citrate is an
excellent Cu chelator [491]. Copper chelation by citrate would permit the co-import of this metal
into the cell. The deletion of this gene would permit Cu-citrate co-import.
The product of nikE, which is part of the Ni(II) ABC-dependent transporter complex, was
also recovered as a resistant hit in this study. While Cu(II) has been demonstrated to bind NikR –
one of the two Ni regulators in E. coli, this sensor explicitly responds to Ni(I) owing to this metal’s
ability to increase NikR-DNA affinity [492]. Consequently, NikR-Cu recognition would have no

164
impact on the repression of the proteins NikA-E. However, inhibiting the energy-coupling domain
NikE may successfully halt toxin transport if Cu is imported by this complex. This hypothesis is
slightly problematic since the Ni(II) ABC-dependent transporter has not been demonstrated to
import Cu. Another explanation may rest in Cu(II)’s ability to bind NikR. If NikR is successfully
inhibited by Cu, Ni is unable to bind the regulator in order to maintain Ni homeostasis and prevent
the build of this metal. In other words, Ni homeostasis may be interrupted in the presence of Cu.
Therefore, if NikE is deleted then Ni import is limited, thereby, discontinuing the uncontrolled
influx of Ni into the cell.
6.4.3.2 Amino acid biosynthesis
Genes involved in amino acid synthesis, including aromatic, valine, leucine, isoleucine and
D-alanine biosynthesis were enriched for amongst the resistant hits (Figure 6.3). Nearly all of the
amino acid biosynthesis hits recovered in this work were connected to additional resistant hits,
including three genes belonging to central carbon metabolism (See section 7.4.3.3). Furthermore,
aroC and trpD, involved in aromatic and tryptophan biosynthesis, respectively, were connected to
cysP and cysW via the resistant hit hisG, which is involved in the synthesis of histidine (Figure
6.5). The primary precursor of the latter pathway is consumed during tryptophan production. These
connections, supported by the enrichment information (Figure 6.3), suggest nodes of Cu
sensitivity.
In comparison to previous works by our group, amino acid biosynthesis enrichment was
found to be comparable between the resistant hits [403],[493]. Free amino acids are known to
propagate the production of reactive oxygen species [494],[495]. For example, the hydrogen atom
of the -carbon in amino acids, free and within polypeptide chains, is the site of •OH attack [496].
From here, the carbon centered radical results in the production of the peroxyl radical and the

165
reaction continues yielding additional radicals. By decreasing the number of amino acids produced
by deleting genes involved in synthesis, less ROS is propagated throughout the bacterial cell.
Furthermore, the production of amino acids necessitates high levels of NADPH, which plays a
large role in maintaining the reductive state of the cell [452]. It has been projected that the source
of •OH originates from the cleavage of hydrogen peroxide by Fe(II) or Cu(I) [496] through Fenton
reactions. Therefore, by conserving the NADPH pool, cells can allocate more energy towards
fighting incoming threats.
Figure 6.5 Connectivity diagram presenting the predicted functional associations between the Cu
resistant gene hits; disconnected gene hits not shown. The thickness of the line indicates the
degree of confidence prediction for the given interaction, based on gene fusion, curated
databases, experimental and co-expression evidence only; several hits may be excluded based on
these requirements. Figure generated using STRING (version 11) and a medium confidence
score of 0.4.

166
6.4.3.3 Cu may alter central carbon metabolism in E. coli
In this work we recovered three resistant hits involved in central carbon metabolism,
namely, isocitrate lyase, pyruvate kinase I and glucose-6-phospahte 1-dehydrogenase I. In S.
aureus central carbon metabolism is altered under Cu stress [216]. In particular, fructose-
bisphosphate aldolase and a glyceraldehyde-3-phosphate dehydrogenase glycolytic isoenzyme,
GapA, were induced in the presence 1 and 2.5 mM CuSO4.
The deletion of pykF has been demonstrated to increase metabolic flux through the pentose
phosphate pathway thereby increasing the amount of NADPH produced by 2-fold [497]. Studies
have shown that this pathway, namely the production of NADPH since this molecule is universal
to the maintenance of the redox potential in the cell, increases oxidative stress survivability
[498],[499]. Similarly, one study showed that the deletion of aceA (isocitrate lyase), which is
responsible for catalyzing the conversion of isocitrate to succinate and glyoxylate, results in the
production of one extra NAPDH molecule beginning at pyruvate kinase [500]. This study
continues on to explain that the glyoxylate cycle may play a role in mediating NADPH
concentrations when abundant, since too much NADPH is unfavorable as well. Therefore, we
predict that the deletion of aceA halts this control therefore producing extra NADPH when
compared to the WT. Even if the glyoxylate pathway is poorly utilized, owing to growth in glucose
rich media, deleting this gene ensures the glyoxylate cycle does not continue and the redox
buffering of the cell increases.
The last enzyme, glucose-6-phosphate dehydrogenase I, offers a problem to the latter
hypotheses. This enzyme provides a large fraction of the NADPH needed for cell growth and
maintenance. Therefore, why does the deletion of this enzyme increase Cu resistance? Deleting
zwf has been shown to result in increased flux through the transhydrogenase pathway, in which

167
NADH is converted to NADPH [501] as a means of continuously supplying the cell with this
universal molecule [502]. Further, a zwf mutant displays elevated flux through glycolysis and the
TCA cycle [502], thereby providing ATP for growth and biomass accumulation; the threat of Cu
may be lessened.
6.4.3.4 Deleting hisG results in elevated Cu resistance
When investigating the presence of metals in solution, they are rarely ‘free’ in solution
[503]. Metal ions are often hydrated or coordinated by amino acids, anions or other biomolecules.
Histidine, which makes as a common amino acid in catalyzed reactions serving as a base when
unprotonated and an acid when protonated, is one of the strongest metal binding amino acids. This
amino acid displays three potential binding sites, the imidazole, carboxylate oxygen and the amino
nitrogen, however, the imidazole provides the primary means of coordination [504]. Copper(II)-
L-Histidine has been found to be co-transported into cellular systems, enhancing the uptake of this
metal [505]. In this study, we recovered hisG has a resistant hit. This enzyme, which catalyzes the
first step in histidine biosynthesis has been predicted to have an essential role in histidine
biosynthesis since the rate of this pathway is controlled by the regulation of this enzyme. HisG
mutants do not grow in minimal media, however in previous works we have shown that strains
absent in amino acid genes can grow on minimal media following our methodology [493]. In short,
when autotrophic for histidine, Cu resistance is acquired, possibly due to the strong interaction of
this amino acid with Cu and the potential for Cu-His uptake into the cell, which would be largely
prevented in the case of the knockout mutant.
6.4.3.5 Two genes involved in NAD biosynthesis were recovered as resistant hits
Two genes involved de novo NAD+ biosynthesis were recovered in this work, including
nadA and nadB. NadA, a quinolinate synthase that contains a [4Fe-4S] cluster required for activity

168
[367]. It has been shown that soft metals, such as Cu(I), haven been demonstrated to bind iron-
sulfur centers, thereby causing the bridging of sulfur atoms and deactivation of the protein [196].
NadB, an oxidase that catalyzes the first step of NAD biosynthesis is projected to be the
predominant source of hydrogen peroxide formation in the cell [368]. Under anaerobic conditions
this protein uses fumarate as terminal election acceptor, however under aerobic conditions oxygen
is favored due to lower fumarate levels with hydrogen peroxide as a product. The turnover of NadB
is tightly controlled in the cell consequently, the production of hydrogen peroxide is kept to
minimum [506]. Still, the deletion of this gene results in ~30% less hydrogen peroxide formation,
thereby decreasing the propagation of •OH via reaction with Cu(I). Furthermore, it has been
demonstrated that NAD precursor accumulation, which occurs upon gene deletions, lessens
hydrogen peroxide damage since there is no evidence of negative feedback inhibition [368]. As a
result, it is probable that the deletion of either nadA or nadB may confer resistance if hydrogen
peroxide is produced or similar threats are propagated by Cu.
6.4.4 Gene hits not recovered in this study
The mechanisms of Cu homeostasis are far better understood than the mechanisms of Cu
toxicity in bacteria. In this work we recovered few genes that are directly involved in keeping
internal Cu concentrations under control. As projected in section 6.4.2.1, only one hit involved in
this pathway was recovered, likely because the sensitivity of CueO to Cu is greatest [474]. Still,
the concentration of Cu used in this study was not minimal. However, since this work was designed
to study prolonged exposure, the abundance of ‘free’ Cu ions inside the cell were likely lower than
the bulk concentration of 5 mM, particularly for those cells at the top of the colonies. Further, as
cells die, through apoptosis or other mechanisms, released biomolecules increase the potential for
metal chelation. Lastly, since the threat of Cu toxicity is high, due to its chemical properties, cells

169
have adapted to ensure proper mechanisms of resistance are in place, more so than for any other
metal [465]. Therefore, we predict that the deletion of one Cu-homeostatic protein will have little
difference on the adaptive capabilities of the cell, however the deletion of several would, as
demonstrated in other works [507].
One postulated mechanism of Cu induced cell death includes the production of ROS [508],
still, studies have shown that this is not always the case [197],[203],[210],[475],[509]. In this
screen we did not recover any proteins directly involved in mediating this threat. Given the nature
of this screen, it is possible that overtime, cells, whether the WT strain or a mutant, adapt to the
stress caused by the incoming threat by increasing tRNA levels (see section 7.4.2.2), decreasing
metabolite import (see section 7.4.3.1) or altering central carbon metabolism (see section 7.4.3.3),
for example. In addition, the absence of one gene, such as grxD (which was not recovered in this
screen), would have little impact on the reductive means of the cell since E. coli holds a number
of enzymes, such superoxide dismutases and catalase, responsible for maintaining ROS levels to
a minimum. In fact, E. coli possesses two major regulons, SoxRS and OxyR, that provide
superoxide response via the activation of over 90 genes [510],[511]. We only mapped two resistant
hits to the regulon SoxRS – pstG and tolC, and one sensitive hit – zwf, and none to OxyR, within
our statistical parameters.
The recovery of the resistant hit, glucose-6-phosphate dehydrogenase I (zwf), provides
further evidence for the aforementioned hypothesis that Cu does not result in ROS toxicity in the
presence of prolonged exposure (see section 7.4.3.3). This enzyme yields the major source of
NADPH in the cell. Studies have shown that in the absence of this gene, reductive capabilities are
reduced [512],[513] and the zwf mutant displayed Cu resistance, the opposite outcome expected if
ROS was a major source of cell death after prolonged Cu exposure.

170
Conclusion
In this study, the Keio collection was used in order to gain further insight into the
mechanisms of Cu toxicity and resistance in E. coli BW25113. In total 3895 strains, each missing
a different non-essential gene were screened, and from here 73 resistant and 55 sensitive hits were
recovered.
Only one protein that is directly involved in mediating Cu homeostasis in the cell was
recovered – CueO, an oxidase that is responsible for the oxidation of Cu(I) to Cu(II).
Complimenting this find was the retrieval of three hits that are involved in the translocation and
proper assembly of CueO, tatB, tatC and dnaK. From this information it appears that CueO is a
key protein involved in mediating prolonged Cu resistance.
In this study the process of tRNA processing was enriched amongst the sensitive hits. In the
presence of prolonged challenge, tRNA levels have been demonstrated to increase, thus allowing
the translation of key proteins required to limit superoxide stress. Four genes belonging to this
process were retrieved, three of which are involved in tRNA-uridine 2-thiolation. Given this
information, the production of tRNA is likely a key process involved in controlling Cu stress in E.
coli.
Amongst the resistant hits, a number of proteins involved in biomolecule import were
recovered. The genes fhuE and citT, which transport ferric-coprogen and citrate, respectively, into
the cell were amid these hits. We hypothesize that Cu may co-transport with these molecules,
particularly because Cu has been found to outcompete Fe for binding sights, as per the Irving-
Williams series [143] and citrate chelates metal ions, such as Cu [491]. Furthermore, the recovery
of three genes involved in central carbon metabolism may provide indication that Cu may be
capable of altering this process, as evident in other works. Lastly the observation that the deletion

171
of HisG resulted in Cu resistance may support the hypothesis that Cu binds histidine thus providing
a means of co-transport. By deleting this gene, histidine is no longer synthesized by the cells, they
must live off residual amino acids and those scavenged from dying cells. In turn, this decrease in
histidine concentration provides fewer binding sites for Cu and given the importance of this protein
in catalysis and structural integrity, fewer targets.
Based on existing research we believe that there are a number of systems and proteins that
may be targeted by Cu under prolonged stress. Although further research must be completed to
validate some of our justifications, such as the presence of genes involved in central carbon
metabolism and the co-transport of Cu with key biomolecules, we have demonstrated that in the
presence of Cu E. coli employs numerous defense mechanisms, and not just those classically
defined as Cu-homeostatic proteins, to protect against the treat of this metal.

172
7 Comparing oxygen consumption, extracellular pH and reactive
oxygen species formation in the presence of silver, gallium and
copper
Abstract
In this chapter, the physiological response of two sensitive hits common between the three
datasets was compared. In particular, the planktonic growth tolerance, oxygen consumption and
pH of the cells were monitored in the presence and absence of silver, copper and gallium. The
growth tolerance curves showed differences in the susceptibility of the tolC mutant to copper, this
was not found for any other metal or strain. Still, when comparing the minimal inhibitory
concentrations, the ygfZ and tolC mutant behaved differently when compared to the WT strain.
The oxygen consumption of the strains varied between metal and metal concentration, a trend
similarly observed in the pH assays. Lastly, in order to compare the production of reactive oxygen
species between the metals, the WT strain was grown in the presence and absence of the metals
and exposed to hydrogen peroxide. Using the fluorescent probe 2,7-Dichlorodihydrofluorescein,
we found that copper in the presence and absence of hydrogen peroxide induces the formation of
reactive oxygen species, an observation that was not found for the remaining metals.
The sensitive and resistant hits obtained from chapters 4-6 provide prospective targets for
future studies, such as those shown in this study. By further validating these hits, novel
mechanisms of metal action can be explored.
Introduction
The results obtained from the chemical genetic screens performed in Chapters 4-7 provide
valuable information and potential targets for future studies. In this work several novel genes

173
involved in mediating resistance or sensitivity were recovered, a number of which that were
unforeseen based on existing literature. Several of these include, nadA and nadB, both involved in
NAD+ biosynthesis, fdx and bfr, iron binding proteins, recA, ruvA and ruvC, which are involved
in DNA repair, and atpB, atpE and atpF, which comprise the ATPase synthase complex. As an
introduction to the forthcoming potential of this thesis, in this chapter, two sensitive hits are further
investigated.
Between the three genetic screens the sensitive hits tolC and yfgZ were uncovered. TolC is
a well-studied protein that is required for the function of a number of efflux pathways including
the AcrAB multidrug efflux system, involved in the export of numerous toxic exogenous
compounds and antibiotics [381]. This protein is also a potential target for inhibiting drug efflux
in Gram-negative bacteria [514]. The function of YgfZ is unknown, although it is thought to be
involved in iron-sulfur repair, oxidative stress [415] and tRNA modification [515].
In this chapter, the physiological response of the mutants tolC and ygfZ were monitored
and compared to the WT strain in the presence and absence of the metals; silver, gallium and
copper. Oxygen consumption and the pH of the cells were used as measures of oxidative cellular
respiration. The results of the oxygen consumption assay lead us to believe that the bacterial cells
were undergoing anaerobic respiration in the presence of elevated levels of gallium and copper,
however, acidification measured with the pH-Xtra probe from Aligent did not correlate well with
this hypothesis. Furthermore, the production of ROS was compared between cells that were grown
in the presence of metals following the methodology used in Chapters 4-6 to enable close
comparisons for future studies. In the presence of copper, the addition of hydrogen peroxide
initiated ROS production likely as a result of Fenton chemistry, yet still, in the absence of hydrogen

174
peroxide, cells exposed to copper demonstrated ROS production. These trends were not found for
silver and gallium which have been postulated to instigate the formation of ROS indirectly.
Methods and Materials
Unless otherwise stated all materials were obtained from VWR International, Mississauga,
Canada.
7.3.1 Strains
The parent strain Escherichia coli BW25113, tolC and ygfZ (lacIq rrnBT14 ΔlacZWJ19
hsdR514 ΔaraBADAH33 ΔrhaBADLD78) belonging to the Keio collection [406], were collected
from the National BioResource Project E. coli (National Institute of Genetics, Shizuoka, Japan).
All bacterial stains were stored in Microbank vials at -80C as described by the manufacturer
(ProLab Diagnostics, Richmond Hill, ON, Canada)
7.3.2 Metal solutions
Silver nitrate (AgNO3), gallium nitrate [Ga(NO3)3] and copper sulfate (CuSO4) were
obtained from Sigma-Aldrich (St. Louis, MO, USA). Stock solutions were made in deionized H2O
and stored at room temperature for no longer than three weeks.
7.3.3 Growth tolerance in the presence of silver, gallium and copper
To compare the planktonic growth of each strain under metal stress, growth tolerance
curves (also referred to as kill curves or susceptibility tests), were performed for the parent strain,
tolC and ygfZ.
Firstly, cells were inoculated on Luria-Bertani (LB) medium plates (1% agar) for 16 hours.
The following day, the cultures were normalized in saline (0.9% NaCl) to reach an optical density

175
of 1.00 (A600). Using 96-well plates, 180 L of M9 minimal media was added to each well. The
metal challenges were added (20 L) and serially diluted by a dilution factor of two; reservation
of the first row served as a growth control (0.0 mM metal). The normalized bacterial cultures were
seeded to obtain a cell count of 105 cells/well in the absence – to control for growth – and presence
of the metal salt. The plate was then placed in a 37°C humidified incubator on a gyrorotary shaker
set to 150rpm and grown for 24 hours.
The following day, to determine the colony forming units of the bacterial populations, eight
serial dilutions, with a dilution factor of ten, were carried out in 96-well plates with 0.9% saline
and universal neutralizer [146] [0.5 g/L histidine (Sigma, USA), 0.5 g/L-cysteine (Sigma, USA),
and 0.l g/L reduced glutathione (Sigma, USA) in deionized H2O]. Next, each well was spot plated
onto M9 minimal media plates (1.0% agar) and incubated for 28 hours at 37°C. The concentrations
at which each metal gave rise to no viable microbial colonies was determined to be the minimal
bactericidal concentration (MBC).
7.3.4 MitoXpress Xtra Oxygen Consumption assay
7.3.4.1 Signal optimization
In order to measure the cellular respiration of growing bacteria cells, the MitoXpress Xtra
Assay (HS Method) from Aligent was used. The provided reagent, MitoXpress Xtra, is quenched
by O2 through molecular collision, therefore, the fluorescence signal is inversely proportional to
the amount of oxygen present. This reaction is reversible, so care was taken to avoid the exchange
of oxygen between the air and the liquid culture.
Briefly, the contents of the MitoXpress reagent were dissolved in 1.0 mL of sterile
deionized water and stored at 4C for no longer than two days. Prior to conducting the MitoXpress
assay, signal optimization was performed using the provided reagent, the bacterial growth medium

176
and the three metals. Here, 90 L of prewarmed M9 minimal media (6.8 g/L Na2HPO4, 3.0 g/L
KH2PO4, 1.0 g/L NH4Cl, 0.5 g/L NaCl, 4.0 mg/L glucose, 0.5 mg/L MgSO4 and 0.1 mg/L CaCl2)
was added into ten wells of a sterile microtiter plate. To these wells, 10 L of the MitoXpress Xtra
reagent was added to eight wells and to the remaining two wells, 20 L of pre-warmed distilled
H2O was added. The latter served as blank controls. Next, to ensure the metals had no influence
on the fluorescence signal, 10 L of metal challenge was added into two wells each – for a total
of six wells containing challenge – leaving two wells without. The latter serves as a negative
control. Since this assay is volume sensitive, owing to the concentration of oxygen in the solution,
10 L of distilled H2O was added to the remaining two wells that contain the MitoXpress Xtra
reagent. Finally, 90 L of mineral oil was added to each well immediately, taking care to ensure
the same volume of oil was added and no air bubbles were present. The microtiter plate and its
contents were read immediately in a Perkin Elmar EnVision fluorescence plate reader (excitation
340 60 nm, emission 650 8 nm) with an integration time of 40/100 s. Optimization was
complete in ensure that the negative control to blank ratio was greater than two and the negative
control to metal challenge ratio was close to one.
7.3.4.2 Glycolysis assay
Prior to plate preparation, the E. coli strains were grown for 24 hours on LB medium plates
(1.0% agar). The following day, the strains were standardized to an optical density of 1.00 (A600)
in saline (0.9% NaCl) pre-warmed to 37C. The standardized cultures were diluted into M9
minimal medium to obtain a seeding cell density of 105 cells/well. Plate preparation was performed
at 37C on a plate block heater and all media components were warmed to 37C prior to the
beginning of the assay. Into a black-walled/clear bottom sterile microtiter plate, 90 L of
standardized and diluted cell culture was added. To these wells 10 L of MitoXpress was added,

177
followed by 10 L of the given metal challenge. Final assay metal concentrations are as follows;
silver nitrate 0.2 mM and 0.002 mM, copper sulfate 2.2 mM and 0.022 mM and gallium nitrate
1.0 mM and 0.01 mM. A number of controls were included, such as a blank control (free of cells
and the MitoXpress reagent), negative control (cell-free + 10 L MitoXpress reagent) and a
positive control (cell-free + 10 L of Glucose Oxidase at 1.0 mg/mL dissolved in distilled H2O +
10 L MitoXpress reagent). Finally, 90 L of high-grade mineral oil was added to each well. Two
empty wells were loaded with 90 L and 180 L of mineral oil as well. Plate fluorescence was
then measured for 12 hours in a temperature-controlled plate reader (excitation 340 60 nm,
emission 650 8 nm) with an integration time of 40/100 s.
7.3.5 pH-Xtra Glycolysis assay
7.3.5.1 Signal optimization
This assay allows for the analysis of the extracellular acidification of the cell as it
undergoes glycolytic flux. This probe is cell impermeable and provides a signal across the
biological range of pH 6-7.5. In a similar manner to above, the signal was optimized to ensure the
negative control to blank ratio was greater than one. Firstly, the respiration buffer supplied by
Aligent was dissolved in 50 mL distilled H2O and warmed to 37C. The pH of this solution was
then adjusted to pH 7.4 and filtered through a 0.2 m filter. Into a black-walled/clear bottom sterile
microtiter plate, ten wells were filled with the respiration buffer. The pH-Xtra reagent and the
metal challenges were added as above. The fluorescence signal was taken kinetically for 30
minutes (excitation 340 60 nm, emission 615 8.5 nm) with an integration time of 40/100 s
and compared to ensure a signal to blank ratio of three.
7.3.5.2 pH glycolysis assay

178
Plate preparation was performed at 37C on a plate block heater and all media components
were warmed to 37C prior to the beginning of the assay.
The E. coli strains were grown for 24 hours on LB medium plates (1.0% agar). The cells were then
dissolved in saline in order to standardize to an optical density of 1.00 (A600). Next, 1.0 mL of
normalized cell culture was centrifuged at 14 000 rpm for ten minutes. The supernatant was
removed, the cell pellet was dissolved in 1.0 mL Respiration Buffer provided by the manufacturer
and centrifuged once again. The cells were washed once more with the Respiration Buffer. After
the second wash, 1.0 mL of pre-warmed Respiration Buffer was added to the pellet. Once
dissolved, the cell sample was added to 9.0 mL fresh respiration buffer. To this, 1.0 mL of the pH-
Xtra probe, provided by Agilent was added. Into a black-walled/clear bottom sterile microtiter
plate, 90 L of the Respiration Buffer, cell culture and probe mix was added. The metal challenges
were added at 10 L, for a total of 100 L. Final assay metal concentrations are as follows; silver
nitrate 0.2 mM and 0.002 mM, copper sulfate 2.2 mM and 0.022 mM and gallium nitrate 1.0 mM
and 0.01 mM. A number of controls were included, such as a blank control (free of cells and the
pH-Xtra probe), negative control (cell-free + 10 L pH-Xtra probe) and a positive control (cell-
free + 10 L of Glucose Oxidase at 1.0 mg/mL dissolved in distilled H2O + 10 L pH-Xtra probe).
The fluorescence was taken immediately for 30 minutes in a Perkin Elmar EnVision fluorescence
plate reader (excitation 340 60 nm, emission 615 8.5 nm) with an integration time of 40/100
s.
7.3.6 Reactive oxygen species assays
To qualitatively compare the amount of hydrogen peroxide, peroxide radical and hydroxyl
radical produced under metal stress, the fluorescent probe 2,7-dichlorodihydrofluorescein (DFCH)

179
was utilized. As the diacetate form (DFCH-DA), this probe is able to diffuse through cellular
membranes where it is enzymatically hydrolyzed by intracellular esterases to DFCH. Next DFCH
reacts with ROS to produce DCF, which is a fluorescent compound (excitation 498 nm and
emission 522nm) [281].
Firstly, the E. coli strains were streaked out on LB medium plates and grown for 24 hours at 37C.
Next, the cells were transferred to M9 minimal medium plates each containing copper, silver
gallium and a no metal control. These plates were made by adding the appropriate concentration
of metal to the agar before solidification to obtain a final concentration of 100 M silver, 100 M
gallium and 5 mM copper. The plates were incubated to allow for growth at 37C for 24 hours.
The following day, the cells were dissolved in saline (0.9% NaCl) and standardized to an
optical density of 1.00 (A600). Next, 1.0 mL of standardized cell culture was centrifuged at 14 000
rpm for 10 minutes and the supernatant was removed. The pellet was dissolved in Hank’s Balanced
Salt Solution (HBSS) [400 mg/L KCl, 60 mg/L KH2PO4, 8000 mg/L NaCl, 350 mg/L NaHCO3,
48 mg/L Na2HPO4 and 1000 mg/L D-glucose] and centrifuged once again to remove residual
saline. The process was repeated once more with HBSS. Once the cells were washed, 990 L of
HBSS was added along with 10 L DFCH-DA, to obtain a final concentration of 10 M. To ensure
the probe was given sufficient time to cross the cellular membrane, the samples were incubated at
37C for 30 minutes. After this, the cells were washed twice as above to ensure all the residual
extracellular DFCH-DA was removed, and the final pellet was dissolved in 990 L HBSS followed
by rest for 30 minutes at 37C. Next, 10 L hydrogen peroxide (30%) or 10 L deionized waster
was added to each sample; all were incubated at 37C for 5 minutes. Following this, the
fluorescence signal was measured and compared (excitation 498 nm, emission 522 nm). For each
strain, several comparisons were made including the production of ROS in the absence of hydrogen

180
peroxide and no metal, the production of ROS in the presence of hydrogen peroxide and no metal,
the production of ROS in the absence of hydrogen peroxide with metal addition and the production
of ROS in the presence of hydrogen peroxide with metal addition.
Results
7.4.1 Growth tolerance in the presence of silver, gallium and copper
Two gene hits were recovered between the sensitive datasets (Chapters 4-6), including tolC
and ygfZ. These mutants, along with the WT strain were grown in the presence of silver, gallium
and copper in order to determine the growth tolerance of these strains.
Under silver exposure and 24-hour growth, the cells tolerated the metal similarly (Figure
7.1). A log reduction in growth was observed in the absence of silver, when compared to the lowest
concentration of metal tested. The MBC, or the minimal concentration required to kill a bacterium,
was found to be 0.05 mM for all, and the minimal inhibitory concentration (MIC) was ~0.008 mM
for WT and ygfZ and ~0.0008 mM for tolC.

181
Figure 7.1 Planktonic growth tolerance of E. coli BW25113 (blue), tolC (red) and ygfZ
(green) in the presence of silver. Cells were grown in M9 minimal media for 24 hours and spot
plated onto M9 minimal media agar plates (1.0% agar) in order to determine the colony forming
units (CFU/mL). Values are represented as the mean of three biological trials, each with three
technical replicates; included are standard deviations.
Under gallium stress the MBC of parent strain and the two mutants was equivalent, at 100
mM (Figure 7.2). The ygfZ mutant behaved differently between the concentrations 0.1 mM and
10 mM, in which growth was decreased by 2-log when compared to the WT strain.
0
0.00
0000
5
0.00
0005
0.00
005
0.00
05
0.00
50.
05 0.5 5 50 10
00
1
2
3
4
5
6
7
Concentration (mM)
LO
G(C
FU
/mL
) WT
tolC mutant
ygfZ mutant

182
Figure 7.2 Planktonic growth tolerance of E. coli BW25113 (blue), tolC (red) and ygfZ
(green) in the presence of gallium. Cells were grown in M9 minimal media for 24 hours and spot
plated onto M9 minimal media agar plates (1.0% agar) in order to determine the colony forming
units (CFU/mL). Values are represented as the mean of three biological trials, each with three
technical replicates; included are standard deviations.
In the presence of copper, the WT strain grew the greatest between the concentrations 0.01
and the lowest metal concentration tested (Figure 7.3). The MBC of the tolC mutant was on the
order of 1000 magnitudes lower than that of the ygfZ mutant and the WT strain. Furthermore, a
decline in yfgZ growth compared to the WT was observed during the growth tolerance assay with
an estimated MIC of 0.0001 mM. When compared to silver and gallium, the WT strain presented
enhanced growth in the presence of lower concentrations of copper, with LOG(CFU/mL) reaching
past six. At 0.0 mM copper, the CFUs were observed to be the same for each strain.
0
0.00
0001
0.00
001
0.00
01
0.00
10.
01 0.1 1 10 10
020
00
1
2
3
4
5
6
7
Concentration (mM)
LO
G(C
FU
/mL
)
WTtolC mutant
ygfZ mutant

183
Figure 7.3 Planktonic growth tolerance of E. coli BW25113 (blue), tolC (red) and ygfZ
(green) in the presence of copper. Cells were grown in M9 minimal media for 24 hours and spot
plated onto M9 minimal media agar plates (1.0% agar) in order to determine the colony forming
units (CFU/mL). Values are represented as the mean of three biological trials, each with three
technical replicates; included are standard deviations.
7.4.2 MitoXpress Xtra Oxygen Consumption assay
Using the MitoXpress Xtra Assay (HS Method) from Aligent, the oxygen consumption
of growing cells in the presence and absence of metal ions was measured over a 12-hour time
course. The provided reagent, MitoXpress Xtra, is quenched by O2 via molecular collisions. As a
result, the amount of fluorescence is inversely proportional to the amount of oxygen present. In
general, the variability between the two biological trials is large, still, a number of observations
can be extracted. It is important to note that the reaction of oxygen with the probe is reversible.
Wild-type cells grown in the presence of copper at 0.02 mM, silver at 0.2 mM and 0.002 mM and
in the absence of any metal displayed a decline in fluorescence after approximately one hour
(Figure 7.4). This was followed by a steep rise over a two-hour time period and then a gradual
increase until the completion of the assay. Copper at 2.2 mM and gallium at 1.0 mM bore similar
0
0.00
0001
0.00
001
0.00
01
0.00
10.
01 0.1 1 10 10
020
00
1
2
3
4
5
6
7
Concentration (mM)
LO
G(C
FU
/mL
)
WTtolC mutantygfZ mutant

184
trends, displaying no change in fluorescence, thus, oxygen consumption over the allocated time.
One biological trial showed an elevated fluorescence signal for cells grown in absence of metal,
more so than the positive control of this trial, glucose oxidase in a cell-free solution. This control
presented constant fluorescence values throughout the duration of the experiment, signifying that
the probe performed correctly under the conditions tested. Gallium at 0.01 mM did not show any
notable changes in fluorescence, however, at time zero this challenge displayed the greatest
fluorescence signal next to the positive control.
Figure 7.4 Cellular respiration of growing WT E. coli BW25113 cells determined using the
MitoXpress Xtra Assay (HS Method) from Aligent under copper, gallium and silver exposure.
The provided reagent, MitoXpress Xtra, is quenched by O2, through molecular collisions, as a
result, the amount of fluorescence is inversely proportional to the amount of oxygen present.
Two biological trials, each with three technical replicates are shown and the mean of the two
biological trials is provided by the solid line. Included is copper 0.2 mM (blue), copper 0.002
mM (red), silver 0.2 mM (green), silver 0.002 mM (purple), gallium 1.0 mM (orange), gallium
0.01 mM (black), no metal (brown), glucose oxidase at 1 mg/mL (dark blue), which serves as a
positive control, and no cells with the reagent (plum), which serves as a negative control.
0 2 4 6 8 10 121000
1100
1200
1300
1400
1500
1600
1700
Time (hr)
Flu
ore
sence
(a
rbitra
ry u
nits)
Copper 2.2 mM
Copper 0.02 mM
Silver 0.2 mM
Gallium 1.0 mM
Gallium 0.01mM
No metal
Silver 0.002 mM
Glucose Oxidase
No cells

185
Between time zero and one hour, there was a large spike in oxygen consumption in the
mutant tolC when grown in the presence of silver at 0.2 mM and 0.002 mM, copper at 0.02 mM
and cells grown in the absence of any metals (Figure 7.5), which is comparable to the WT strain
(Figure 7.4). This trend was not observed for the cells grown in the presence of gallium at 0.01
mM and 1.0 mM as well as copper at 2.2 mM. A decline in fluorescence in the first 30 minutes
was found for cells grown in the presence of copper at 0.02 mM and gallium at 0.01mM. The
fluorescence of the latter at time zero is higher than any of the other conditions, excluding the
positive control, similar to the WT cells grown in the presence of this metal (Figure 7.4). In the
presence of copper at 2.2 mM the fluorescence was observed to decrease overtime, this treand was
not observed in the WT cells.
Figure 7.5 Cellular respiration of growing tolC E. coli BW25113 cells determined using the
MitoXpress Xtra Assay (HS Method) from Aligent under copper, gallium and silver exposure.
The provided reagent, MitoXpress Xtra, is quenched by O2, through molecular collisions, as a
0 2 4 6 8 10 121000
1100
1200
1300
1400
1500
1600
1700
Flu
ore
sence
(ar
bitra
ry u
nits)
Copper 2.2 mM
Copper 0.02 mM
Silver 0.2 mM
Silver 0.002 mM
Gallium 1.0 mM
Gallium 0.01mM
No metal
Time (hr)
Glucose Oxidase
No cells

186
result, the amount of fluorescence is inversely proportional to the amount of oxygen present.
Two biological trials, each with three technical replicates are shown and the mean of the two
biological trials is provided by the solid line. Included is copper 0.2 mM (blue), copper 0.002
mM (red), silver 0.2 mM (green), silver 0.002 mM (purple), gallium 1.0 mM (orange), gallium
0.01 mM (black), no metal (brown), glucose oxidase at 1 mg/mL (dark blue), which serves as a
positive control, and no cells with the reagent (plum), which serves as a negative control.
Trends for the null mutant ygfZ were more comparable to the WT than the mutant tolC
(Figures 7.4 - 7.6). However, copper at 0.02 mM and gallium at 0.01 mM offered notable
differences. Cells grown in the presence of 0.02 mM copper or the absence of any metal did not
display a decrease in fluorescence after 30 minutes, rather, a gradual increase was observed over
the 12-hour time period. The tolC mutant revealed this trend in the presence of copper at 0.02 mM
(Figure 7.5). Gallium at 0.01 mM did not cause an increase in signal at time zero as observed in
the remaining strains. Finally, cells grown in the presence of 0.2 mM silver displayed robust
oxygen consumption when compared to the remaining conditions, a trend not observed for the WT
strain and the mutant tolC. In general, the mutant yfgZ displayed less oxygen consumption, marked
by lower fluorescence signals, than the WT strain and the null mutant tolC.

187
Figure 7.6 Cellular respiration of growing ygfZ E. coli BW25113 cells determined using the
MitoXpress Xtra Assay (HS Method) from Aligent under copper, gallium and silver exposure.
The provided reagent, MitoXpress Xtra, is quenched by O2, through molecular collision, as a
result, the amount of fluorescence signal (in arbitrary units) is inversely proportional to the
amount of oxygen present. Two biological trials, each with three technical replicates are shown
and the mean of the two biological trials is provided by the solid line. Included is copper 0.2 mM
(blue), copper 0.002 mM (red), silver 0.2 mM (green), silver 0.002 mM (purple), gallium 1.0
mM (orange), gallium 0.01 mM (black), no metal (brown), glucose oxidase at 1 mg/mL (dark
blue), which serves as a positive control, and no cells with the reagent (plum), which serves as a
negative control.
7.4.3 pH-Xtra Glycolysis assay
Following the pH-Xtra Glycolsis assay, comparisons were made to the fluorescence signals
of the cells grown in the absence of metals (Figure 7.7, red, blue and green lines). In the presence
of copper at 2.2 mM and gallium and 1.0 mM, the acidity of the solution decreased based on the
decline in fluorescence signal (Figure 7.7). The signal of the glucose oxidase solution confirms
this, since this enzyme causes acidification upon activity. In the presence of copper at 0.02 mM a
0 2 4 6 8 10 121000
1100
1200
1300
1400
1500
1600
1700
Time (hr)
Flu
ore
sence
(ar
bitra
ry u
nits)
Copper 2.2 mM
Copper 0.02 mM
Silver 0.2 mM
Silver 0.002 mM
Gallium 1.0 mM
Gallium 0.01mM
No metal
Glucose Oxidase
No cells

188
decrease in signal was observed, this was found for only one other condition – yfgZ in the presence
of 0.002 mM silver. An increased signal was observed for the tolC mutant in the presence of silver
at 0.2 mM. Furthermore, the ygfZ mutant was statistically different from the WT strain and the
tolC mutant (p0.01) in the presence of silver at 0.2 mM and gallium at 0.01 mM. The ygfZ mutant
was also statistically different from the tolC mutant in the presence of silver at 0.002 mM (p0.05).
Figure 7.7 The pH-Xtra Glycolysis Assay from Aligent was used to determine the change in
fluorescence signal (in arbitrary units) after 30 minutes of incubation at 37C. The solid blue line
presents the signal of the WT cells grown in the absence of any metal, the red line provides the
signal of the tolC mutant grown in the absence of any metal, and the green line presents the
signal of the ygfZ mutant grown in the absence of any metals. The orange line represents the
fluorescence signal of the negative control in which no cells were added (only the pH-Xtra
probe) and the pH of this test sample was 7.4. A signal higher than this signifies increased
acidity and vice versa. The grey line represents the complete acidification of the sample in the
* ** ** *
Cop
per 2
.2 m
M
Cop
per 0
.02
mM
Silver
0.2
mM
Silver
0.0
02 m
M
Gal
lium
1.0
mM
Gal
lium
0.0
1mM
0
100
200
300
400
500
600
700
800
900
1000
1100
1200
1300
1400
1500
1600
1700
1800
Flu
ore
sence
(ar
bitra
ry u
nits)
WTtolC mutantyfgz mutant
* *
*

189
absence of cells using glucose oxidase (1.0 mg/mL). Values are represented as the mean of two
biological trials, each with three replicates. Two-way ANOVA was used to compute the
statistical significance between the WT and the mutants. * Indicates a significant difference
between the means, where * = p0.05, ** = p0.01, *** = p0.001 and **** = p0.001. All
three strains grown in the presence of copper at 0.02mM (***), copper at 2.2 mM (****) and
gallium at (****) were significant when compared to the no metal control, as well as tolC in the
presence of silver at 0.2 mM (**) and yfgZ in the presence of 0.002 mM silver (*).
7.4.4 Reactive oxygen species assay
In order to determine the potential for ROS production in cells grown in the presence of
silver, gallium or copper, the WT strain was exposed to hydrogen peroxide and the fluorescence
signal was measured using the ROS probe DFCH. In general, cells grown on copper displayed the
greatest fluorescence signal, by 3-fold in the case of copper + hydrogen peroxide exposure, when
compared to the remaining conditions (Figure 7.8). Cells exposed to hydrogen peroxide after
growth on silver or gallium showed an increase in fluorescence signal, by 10%, when compared
to the hydrogen peroxide unexposed cells. An identical trend was observed for the conditions for
which no hydrogen peroxide was added. Copper alone presented the second highest signal, more
than 100 fold higher than, the remaining metals in absence of hydrogen peroxide (Figure 7.8).

190
Figure 7.8 2,7-Dichlorodihydrofluorescein was used to qualitatively measure the amount of
hydrogen peroxide, peroxide radical and hydroxyl radical produced at 522 nm. The WT strain
was grown for 24 hours on M9 minimal media agar plates in the presence and absence of silver,
gallium or copper then extracted and exposed to hydrogen peroxide to determine the potential for
ROS production. Cells grown in the presence of copper (blue), copper then exposed to hydrogen
peroxide (red), silver (green), silver then exposed to hydrogen peroxide (purple), gallium
(orange), gallium then exposed to hydrogen peroxide (black), no metal (brown) and no metal
then hydrogen peroxide exposure (dark blue) are shown. Mean of three biological trials, each
with two technical replicates, shown; standard deviations included.
Discussion and Conclusions
In this chapter, the physiological response of the mutants tolC and yfgZ to silver, gallium
and copper stress was compared. The growth tolerance between the mutants and the WT strain
were similar, excluding silver at a concentration of 0.1 mM and 100 mM and copper, for which
the tolC mutant was 1000-fold more susceptible than the WT strain and the yfgZ mutant. Based on
the chemical genetic screens, lower MBCs might be expected. Yet, this was only found for the
mutant tolC. The screens were conducted under 5.0 mM copper sulfate, 100 M silver nitrate and
100 M gallium nitrate (refer to Chapters 4-6, Materials and Methods for more details). According
0
1000
2000
3000
4000
5000
Copper
Copper + hydrogen peroxide
Silver
Silver + hydrogen peroxide
Gallium
Gallium + hydrogen peroxide
No metal
No metal + hydrogen peroxide
Fluorescence (arbitrary units)

191
to the growth tolerance profiles, these concentrations should only be tolerable in the case of gallium
for which the MBC was 100 mM, greater than 1000-fold when compared to the genetic screen.
Silver was considerably more toxic and the tolC mutant was more susceptible to copper under the
conditions of the growth tolerance assays. The precise MICs between the three strains in the
presence of gallium were also found to be different. Differences corresponding to those highlighted
may account for the presence of these genes in the chemical genetic screens.
What is key in these observations is in the conditions in which they were performed. The
diffusion of antibiotics is inversely proportional to the thickness of agar [516] and this can be
extended to liquid solutions. The chemical genetic screens were performed using 1.5% agar plates
saturated with metal ions. Here, bacterial cells are exposed to varying concentrations of metals
based on the diffusion and chelation of the ion in the solid agar. The growth tolerance curves were
performed in liquid M9 minimal media for which there was continuous mixing of metal ions. As
a result, differences in the susceptibility profiles under different growth conditions are expected.
The coordination of these metals in liquid solution verses agar is different as well, and this is likely
not uniform between the metals. For example, metals, particularly silver, may bind to the agarose
or agaropectin, which comprise agar, the latter containing acidic side groups or other ionic groups.
Lastly, cells in grown in a colony behave differently than free swimming in bulk solution.
An increase in fluorescence signal in Figures 7.4-7.6, signifies the consumption of oxygen.
Cells grown in the presence of silver at 0.2 and 0.002 mM, copper at 0.02 mM and no metal,
showed an increase in oxygen consumption over time, which can be correlated to microbial growth
since the oxygen concentrations decreased. Stationary phase was reached after 3 hours of growth.
This was not observed for the remaining conditions despite the growth tolerance curves of the WT
strain and the mutants, which provided the information for the concentrations selected (Figures

192
7.1-7.3). In general, the results were variable between the two biological trials largely due to the
addition of mineral oil. When the fluorescence signal was taken for mineral oil alone, increased
volume resulted in an increase in signal (data not shown). Even small fluctuations altered the
signal, and this led to difficulty when drawing conclusions. From these curves it appears that
bacterial cells under gallium and copper exposure at 1.0 mM and 2.2 mM, respectively, enter
anaerobic respiration. Whereas cells in the presence of gallium at 0.01 mM quickly respire much
of the oxygen in solution. Furthermore, we predict that following 30 minutes of growth, cells adapt
to growth under metal stress, evident from the decline in signal followed by an increase into log-
phase after 4 hours. In E. coli, the OxyR and SoxRS systems are required to prevent damage caused
by ROS and other stressors and the translation, transcription and folding of associated proteins has
been found to take over 20 minutes [478]. Delayed microbial growth towards the first hour in the
presence of metal stress is anticipated. This observation was not observed for cells grown in the
absence of any metal.
With respect to the pH-Xtra glycolysis dataset, the potential for anaerobic growth in the
presence of 2.2 mM copper and 1.0 mM gallium is disproved. Anaerobic growth results in the
production of lactate, the main contributor of cellular acidification [517], therefore, we would
expect the fluorescence signal to increase past the conditions for which no metal was added.
Acidification was only observed for the tolC mutant under silver and gallium stress at 0.002 mM
and 0.01 mM, respectively (Figure 7.7). Still, when comparing the results to the negative control
(the addition of no cells), the pH increased after the addition of 2.2 mM copper and 1.0 mM gallium
based on the decrease in signal. The methodology of this assay necessitates that all residual growth
medium and saline, are washed away to ensure that the pH is not altered upon the addition of the
cells. Therefore, it is unclear what is leading to this decrease in pH. Furthermore, based on the

193
growth tolerance curves, the concentrations selected in this assay, identical for those in the
MitroXpress Xtra assay, should not have prevented microbial growth; sub-lethal concentrations
were chosen.
Between the strains significant differences in pH were found, namely between the mutant
ygfZ and tolC. Again, these were not identified in the growth tolerance curves, likely due to the
conditions of the assay. At higher concentrations of silver, acidification occurred in the tolC
mutant. A trend not obeyed by the remaining metals or strains. This validates our hypothesis that
metals act differently and the deletion of just one gene can alter this further, as observed when
comparing the two mutants.
In this work, we determined that the addition of hydrogen peroxide to cells that have been
grown in the presence of copper increases ROS production (Figure 7.8). This is no surprise since
copper is Fenton active (for more information refer to section 1.4.2.1). Using DFCH to indirectly
measure ROS is challenging for this reason alone, but still, hydroxyl radical formation initiated by
copper necessitates an oxygen radical. Cells grown in the presence of copper and unexposed to
hydrogen peroxide also illustrate ROS production likely due to the formation of a radical either
originating from oxidative damage or electron transport proteins, among others. This was not
found for silver [228] or gallium [18], for which mechanisms of ROS production have been
postulated (Figure 7.8). Still, this finding is in agreement with other works [518]. Therefore, we
hypothesize that the potential for ROS production exists in cells exposed to copper only, since this
metal is Fenton active. In the case of gallium and silver, little to none ROS is formed, either
because the cell has employed the use of resistance mechanisms or these metals are not associated
with this threat after prolonged exposure. In the case of gallium, the former is probable. In Chapter

194
5, three oxidative hits were recovered as sensitive hits, including gshA, gloB and grxD. These hits
are likely involved in lessening the threat of ROS based on their biological functions.
The work in the chapter requires further investigation. Precisely what these datasets are
presenting are not entirely clear, yet still, the data is consistent with what we expect – cells react
differently to metals, an underlying hypothesis in this thesis. Additional trials need to be completed
for the oxygen consumption and pH assays. Different metal concentrations should also be
explored, particularly in the case of the pH assay, for which the concentrations appear to be too
high. Further, increasing the seeding concentration may also resolve the inconsistencies observed.
In conclusion, here, we have presented the beginnings of what sort of continuing work can be
extracted from this thesis and provided possible future directions as a means of gathering more
insight in the actions of metals in bacteria.

195
Preface: Why should we study the mechanisms of metal toxicity and
resistance in bacteria?
In total, the work presented here pocketed no longer than three years for me to complete.
The fourth year, which lies somewhere during my second year, provided as a means of exploration,
although one might call it – confusion. It was at this time that I spent considerable effort flirting
with techniques and collecting data, and while this may appear harmless, as it would likely provide
reasonable additions to my thesis, it only confused my goals and aims for this work further. I recall
completing my candidacy and beginning the new year with energy and aspirations, however, I lost
my footing quickly and robotized my movements; preforming tasks that did lead to answers or
even questions. This sense of doubt came from my lack of direction; I humbly did not know how
I was going to answer my question, let alone what I was answering.
I entered my PhD lacking clear focus, something I demanded from my supervisor. In the nature
that is he, no argument was offered in return (no remorse toward him here). Rather, my urge for
exploration was matched with equal curiosity. This request deepens the potential for failure, but
mainly, it can foster a sense of misplacement. Around this time, Dr. Turner and I published a
number of articles in which we justified lessening and controlling the use of antimicrobials,
particularly metals. These reports brought me certainty and reasoning, but still, I found it
challenging to describe the exact purpose of this thesis.
Towards the end of this ‘exploratory period’ I was working closely with Dr. Joe Lemire, a
brilliant PDF from whom I learned a tremendous amount. I recall a time when we were head-deep
in an experiment, on a project that we both knew would likely never see the light of day. Under
the hum of the biosafety cabinet, he turned to me and very abruptly commented that one could
purchase a Samsung washing machine that released silver ions. At first, I thought not much of it,
many silver products can be purchased for antimicrobial purposes, so why Joe are you telling me

196
this? But of course! I could add this example to my next PowerPoint presentation, right next to the
silver impregnated Lululemon tank tops (https://info.lululemon.com/design/fabrics-
technology/silverescent) and the “Bioactive Silver Hydrosol for Kids”
(https://sovereignsilver.com/product/sovereign-silver-for-kids/). Indeed, this was not a wasteful
conversation.
One week later, I found myself face to face with one of these machines. Large, monstrous
(almost as tall as I), loud and flashy; everything one would expect from a silver releasing washing
machine. My location at this time? Believe it or not – my mother’s laundry room. How could I
have let this happen?! How can I preach that metal-based antimicrobials should be not abused and
yet support the use of such products?
In truth, I did not know that my mother had purchased this washing machine. Apparently,
I failed to acknowledge the flashy Ag+ symbol on the console for over a year. I proceeded to speak
with my mother. Did she know? Why did she buy one? Does she even know what it does? Who
sold it to her and what did they say? But of course she didn’t know, she didn’t even know what
the elemental symbol for silver was at this time. I spent the majority of that evening explaining to
her why she should completely abandon this machine. My temper was soaring and so were my
words. Return it or destroy it, it makes no difference, just remove it from your home! She
compromised by turning off the silver releasing capabilities. Good enough.
We have known for quite some time that metals make for suitable antimicrobials based on their
efficacy at low concentrations. The development of these agents is relentless, ranging from
combination treatments, to nanomaterials and coatings. Still, the precise mechanisms of toxicity
and adaptation are not known. These products are now everywhere whether we are aware of them
or not, and the story I noted above is an example of this. Until these products are better regulated

197
more effort must be expended to determine how they work and when they will not work, as this
thesis provides. It was this instant that gave me direction and offered my work purpose.

198
8 Global comparisons and conclusions
Differences in the susceptibility profiles of bacteria to metals
The principal goal of this thesis was to draw insight into the mechanisms of metal toxicity
and resistance in bacteria. Firstly, the efficacies of variable metal salts against bacterial organisms
needed to be compared in order to determine whether they acted similarly or differently. The seven
metals selected in Chapter 2, all relevant metals that are currently under investigation as
antimicrobial agents, namely copper, silver, aluminum, titanium, zinc, nickel and gallium,
presented varying levels of efficacy against Pseudomonas aeruginosa (ATCC 27853),
Staphylococcus aureus (ATCC 25923) and Escherichia coli (ATCC 25922). These differences
were furthered pronounced when comparing the susceptibilities of the corresponding biofilms. In
fact, some of the metals selected were unable to prevent bacterial growth in the concentrations and
conditions tested. In the succeeding chapter, we sought to broaden this outcome by examining the
differences in metal efficacy against isolates of the same species, as well as different species. These
studies were completed under identical conditions, a fundamental premise that we sought to
continue throughout this work The latter is unfortunately very rare in this field, since it is still
contaminated with unsubstantiated general statements. In general, our work shows that it is
difficult to predict metal efficacy and whether the right concentration is being used. For example,
in Chapter 3, we found the greatest variability in the susceptibilities of the S. aureus and P.
aeruginosa to copper, gallium and zinc a trend matched only partially by the other metals and even
less by the E. coli isolates (Figure 3.2). Together, these findings present a comprehensive
observation. Metal-based antimicrobials are not equal in their efficacy, even against biofilms and

199
isolates of the same species. Although this may seem trivial, to our knowledge, to date, no studies
like those presented in Chapter 2 and 3 have been previously completed.
A brief literature search of ‘antimicrobial copper’ in PubMed beginning from 2018 brings
forth 565 research articles. Two examples amongst the many include, the use of hydrogels
assembled from copper metal organic polyhedrons [519] and the disinfectant properties of residual
metals in drinking water [520]. While sound studies, these reports fail to acknowledge that
throughout the time course of use, metal release may decrease due to dilution or long-term
instability of the complex, in the case of the metal organic polyhedrons, and that there are varying
species of organisms that reside in drinking water. If the concentration of a metal were to decrease,
efficacy against one organism may follow, like for a MRSA isolate, but not for another, such as
an E. coli isolate, given their differences in susceptibility (Figure 3.1 and Figure 3.2). Even when
tested against the same strain, one concentration of metal may not be effective against different
isolates of the same species, as might be the case for drinking water or an infected wound.
As revealed in Chapters 2 and 3, one metal is not universal against all organisms under a
particular concentration, thus, it is fundamental that these thoughts are considered when new
products are developed and then released for healthcare, agricultural and consumer purposes.
Based on these chapters we conclude that metals act differently against bacteria and isolates of the
same species. This information is key when determining the appropriate concentration of metal to
use as well as the correct metal for a given antimicrobial application.
Comparing genes involved in mediating sensitivity or resistance under silver, gallium
and copper exposure using a chemical genetic screen
The efficacies of different metals vary against bacterial species and isolates of the same
species. The aims of the succeeding chapters in this thesis were to uncover novel genes that are

200
involved in silver, gallium and copper resistance and toxicity in E. coli BW25113. The model
organism E. coli was selected for a number of reasons, including; a) much is known about this
organism and the experimental and curated data on this organism is rich, b) access to the Keio
collection, a collection of mutants each with a different inactivated non-essential gene [406], c)
fast doubling time, given the time required to complete each assay robust growth in minimal media
is desirable, and d) relevance as a threatening microbe in healthcare [521], presence in consumer
food settings and agriculture. In Chapters 4 – 6, genes involved in prolonged silver, gallium and
copper exposure were identified and discussed. When comparing the enrichment scores of the
biological processes recovered in each sensitive dataset, several differences and similarities arise
(Figure 8.1). For instance, processes belonging to Central dogma and Biosynthesis were similarly
enriched. Gallium displayed the least enrichment for all processes expect Energy. Further, the
enrichment for silver was the highest for Cellular processes, whereas copper presented the greatest
enrichment for Energy, by 5-fold when compared to the remaining hits. It is important to note that
Figure 8.1 and Figure 8.2 are normalized against the number of sensitive hits recovered in each
screen, therefore, this accounts for differences in the final numbers obtained, which is 2-fold
greater in the case of silver. Copper display elevated enrichment for many processes (Figure 8.1)
and since numerous hits obtained in the copper screens are involved in multiple biological
processes, such as those found in Energy, a greater enrichment is anticipated.

201
Figure 8.1 Percent enrichment for the silver, gallium and copper sensitive hits. Each dataset was
normalized against the number of hits obtained. Enrichment was performed using Omics
Dashboard from EcoCyc which calls attention to pathways and processes whose changes are
statistically different; the significance value was p < 0.05.
The enrichment profile for the resistant hits differed for a number of processes such as Cell
exterior, Biosynthesis, and Energy (Figure 8.2). Again, the enrichment of copper for these
processes is at least 2-fold greater. The system, Cellular processes, was enriched by silver the
greatest, whereas gallium did not demonstrate larger enrichment percentages in any system. In
general, silver and gallium followed similar percent enrichment values whereas, copper did not,
showing elevated numbers in each system, except Response to stimulus.
Centra
l dogma
Cell ex
terior
Biosynthes
is
Degrad
ation
Other path
ways
Energy
Cellular
proce
sses
Response
to st
imulus
0
5
10
15%
Fold
Enri
chm
ent
Ag
Cu
Ga

202
Figure 8.2 Percent enrichment for the silver, gallium and copper resistant hits. Each dataset was
normalized against the number of hits obtained. Enrichment was performed using Omics
Dashboard from EcoCyc which calls attention to pathways and processes whose changes are
statistically different; the significance value was p < 0.05.
Together, what Figures 8.1 and 8.2 tell us is that there are several processes, such as Central
dogma and Response to stimulus that are enriched by the sensitive and resistant hits, respectively,
similarly between the three metals. Still, large differences arise, like for copper, in which were see
2-fold greater enrichment for a number of processes. Again, the actions of the metals in vivo appear
to be different. More than 100 gene hits with scores greater than two standard deviations from the
mean were obtained for each metal, only 15 and 20 sensitive and resistant hits, respectively,
overlapped.
8.2.1 Silver, gallium and copper sensitive gene hits
Between the sensitive hits obtained under silver or gallium exposure, only one hit was
common between the two datasets – sspA (Figure 8.3 and Table 8.1). The protein product of this
Centra
l dogma
Cell ex
terior
Biosynthes
is
Degrad
ation
Other path
ways
Energy
Cellular
proce
sses
Response
to st
imulus
0
5
10
15%
Fold
Enri
chm
ent
Ag
Cu
Ga

203
gene plays an important role in acid tolerance and oxidative stress during stationary phase [522],
and expression is induced under glucose, nitrogen, phosphate or amino acid starvation [523].
Given the importance of this gene in mediating stress under nutrient deficient conditions, silver
and gallium sensitivity may be expected in a sspA mutant. This gene hit was not included in the
copper analysis since less than 9 technical replicates were acquired thus not meeting the cut-offs
selected.
Figure 8.3 Silver, gallium and copper sensitive hits identified in E. coli BW25113. Synthetic
Array Tools (version 1.0) was used to normalize and score the sensitive hits. Only those with
scores that were two standard deviations from the normalized mean for each dataset are included.
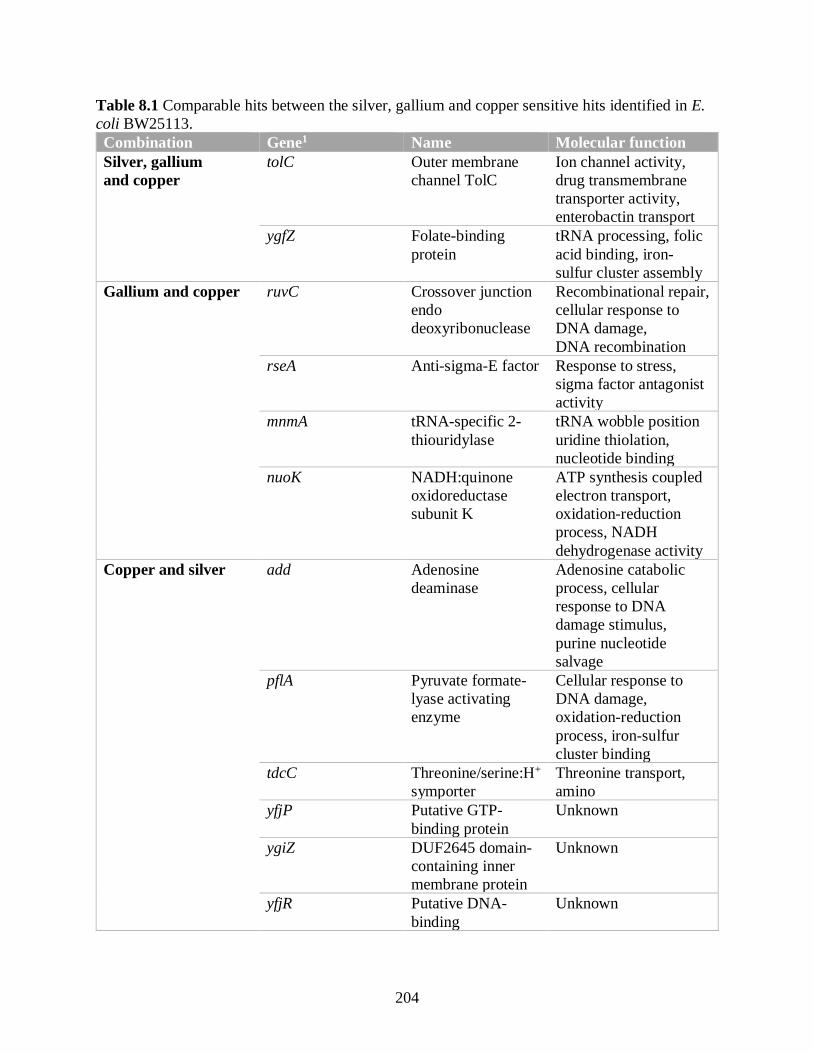
204
Table 8.1 Comparable hits between the silver, gallium and copper sensitive hits identified in E.
coli BW25113.
Combination Gene1 Name Molecular function
Silver, gallium
and copper
tolC Outer membrane
channel TolC
Ion channel activity,
drug transmembrane
transporter activity,
enterobactin transport
ygfZ Folate-binding
protein
tRNA processing, folic
acid binding, iron-
sulfur cluster assembly
Gallium and copper ruvC Crossover junction
endo
deoxyribonuclease
Recombinational repair,
cellular response to
DNA damage,
DNA recombination
rseA Anti-sigma-E factor Response to stress,
sigma factor antagonist
activity
mnmA tRNA-specific 2-
thiouridylase
tRNA wobble position
uridine thiolation,
nucleotide binding
nuoK NADH:quinone
oxidoreductase
subunit K
ATP synthesis coupled
electron transport,
oxidation-reduction
process, NADH
dehydrogenase activity
Copper and silver add Adenosine
deaminase
Adenosine catabolic
process, cellular
response to DNA
damage stimulus,
purine nucleotide
salvage
pflA Pyruvate formate-
lyase activating
enzyme
Cellular response to
DNA damage,
oxidation-reduction
process, iron-sulfur
cluster binding
tdcC Threonine/serine:H+
symporter
Threonine transport,
amino
yfjP Putative GTP-
binding protein
Unknown
ygiZ DUF2645 domain-
containing inner
membrane protein
Unknown
yfjR Putative DNA-
binding
Unknown

205
transcriptional
regulator
yibN Putative sulfur
transferase
Unknown
ybiX PKHD-type
hydroxylase
Cellular iron ion
homeostasis, cellular
response to DNA
damage stimulus
Silver and gallium sspA Stringent starvation
protein A
Response to stress,
positive regulation of
transcription 1 Sensitive gene hits displaying scores two standard deviations from the
normalized mean
Amid the sensitive copper and silver hits, eight genes overlapped, four of which are
putative proteins that have no reported information concerning function. The protein product of
pflA contains an iron-sulfur cluster essential for activity and the protein product of ybiX may bind
iron and serve in iron homeostasis. Copper(I) and silver(I) are soft acids that bind thiols with
preference. The absence of these proteins causes sensitivity. Therefore, we hypothesize that the
presence of these genes offers resistance. For the latter, this result is plausible since controlling
iron homeostasis at the transcriptional level is key if either copper or silver were altering iron
concentrations in the cell. The former gene hit suggests that while a possible target, due to the
presence of an iron-sulfur cluster, the biological role of this protein – a pyruvate formate-lyase
activating enzyme – is more important to the cell when challenged with silver or copper.
Between the copper and gallium sensitive datasets four hits were recovered. The protein
product of one of these, mnmA, which was described in detail in Chapter 7, belongs to a family of
proteins involved in sulfur relay and tRNAGln, tRNALys and tRNAGlu modification at the 2-
thiouridine [524]. Mutants lacking 2-thio modification capabilities have been demonstrated to be
sensitive to oxidative stress and are prone to protein misfolding and aggregation [476]. In fact, any
protein involved in 2-thio modification has been shown to be significant for cell growth [525]. Our

206
results show that that under gallium and copper stress, mmnA is potentially important in mediating
resistance against copper and gallium.
When comparing all three datasets together, two sensitive hits were revealed – tolC and
ygfZ. The product of tolC is a well-studied outer membrane channel involved in the export of a
wide variety of toxic compounds including antibiotics, dyes, bile compounds and organic salts
[526]. Cells lacking tolC exhibit reduced glutathione (GSH) and NAD+ levels in stationary phase,
as well as membrane stress via the over production of PspA [527], which in turn reduces the
electrochemical potential of the cell [528]. Together with our results, these studies may provide an
example of indirect metal resistance. Given GSH is considered to be the first line of intracellular
defence [164], depleted levels would impede cellular growth, particularly if the toxin such as
copper, silver or gallium, were causing oxidative stress inside the cell. When comparing the
susceptibility of the null mutant tolC to the WT strain, we see similar profiles for silver and
gallium. In the case of copper, the mutant displays decreased resistance by 1000-fold (Figure 7.3).
As a result, we conclude that GSH and/or NAD+ may play an important role against copper toxicity
indirectly, or, this metal is removed directly from the cell via TolC. Evidence for the latter is as
follows; tolC mutants display decreased intracellular concentrations of GSH. Cells lacking this
protein excrete the metabolite to the exterior rather than produce fewer molecules of GSH as one
study found that total – both intra- and extra-cellular – concentrations were found to be similar
when compared to the WT strain [528]. This means that GSH is still produced and able to sequester
or react with toxins externally, before oxidization in the extracellular environment. Therefore, we
believe that the large difference in susceptibility between the mutant and WT likely indicates a
mechanism of direct toxicity; copper is directly exported by TolC. Furthermore, tolC mutants
demonstrate high concentrations of NADH and low concentrations of NAD+ [527], suggesting that

207
NADH dehydrogenases are inhibited, particularly NDH-1 as cells transition from log to stationary
phase [525]. Increased concentrations of NADH have been demonstrated to result in DNA damage
in vivo since this metabolite acts as an iron reductant through Fenton chemistry [529]. Among the
copper sensitive hits two genes that comprise NDH-1 were uncovered, nuoK (also a gallium hit)
and nuoL. Together with these studies, our findings suggest that TolC inactivation results in NDH-
1 inhibition [527], which causes copper sensitivity, evident from the two NDH-1 hits uncovered,
and intra-cellular copper accumulation. Toxicity is then 2-fold, thereby causing apparent
differences in susceptibility when compared to the WT strain and the remaining two metals.
The second sensitive hit that is similar between the three datasets is ygfZ. The function of
this protein is still not fully understood, however, it is predicted to be a folate-binding protein
thought to play a role in iron-sulfur cluster assembly [415]. In minimal media, a ygfZ null mutant
is more sensitive to oxidative stress and demonstrates lower levels of modified tRNAs [515].
Again, the involvement of iron-sulfur cluster assembly and tRNA modification arises as possible
mechanisms of metal resistance.
The lack of oxidative enzymes in any of the sensitive datasets can be partially explained
by the results obtained in Chapter 8 (Figure 7.7). At first it may appear that cells grown in the
presence of silver, gallium and copper demonstrate increased ROS production when compared to
those grown in the absence. Still, upon hydrogen peroxide exposure, a drastic spike in ROS
production in the copper exposed cells was found and this was not matched by the other metals.
Two explanations can be attributed here. Cells grown in the presence of silver or gallium are
primed for ROS exposure more so than those grown in the presence of copper. Or copper is
reacting with hydrogen peroxide via biomolecules in the cell leading to an increased fluorescence
assay signal. We conclude that the latter is the most probable explanation since copper is Fenton

208
active. In the absence of hydrogen peroxide an increased signal was still obtained for cells grown
in the presence of copper. This indicates, that even after 24 hour metal exposure, ROS formation
is still taking place and the cells have adapted to grow under this stress as observed in the growth
tolerance (except in the case of tolC), oxygen consumption and glycolysis assays (Figures 7.1 –
7.6). Further, the ROS levels reveal that after 24-hour growth, the formation of ROS is low in the
presence of silver and gallium.
8.2.2 Silver, gallium and copper resistant gene hits
When comparing the gallium and copper resistant hits 20 genes were found to overlap
between the two datasets (Figure 8.3 and Table 8.2).
Figure 8.4 Silver, gallium and copper resistant hits identified in E. coli BW25113. Synthetic
Array Tools (version 1.0) was used to normalize and score the sensitive hits. Only those with
scores that were two standard deviations from the normalized mean for each dataset are included.

209
Table 8.2 Comparable hits between the silver, gallium and copper resistant hits identified in E.
coli BW25113.
Combination Gene1 Name Molecular function
Silver, gallium
and copper
trpD Anthranilate synthase
subunit D
Tryptophan
biosynthetic process,
glutamine metabolic
process
Silver and gallium trpB Tryptophan synthase
subunit B
Tryptophan
biosynthetic process,
pyridoxal phosphate
binding
Silver and copper gcvR Putative transcriptional
regulator
Transcription
yhjB Periplasmic acid stress
protein
Response to acidic
pH
serC Phosphoserine
aminotransferase
L-serine biosynthesis,
pyridoxal phosphate
synthesis
nadB L-aspartate oxidase NAD biosynthesis,
pyridine nucleotide
synthesis
purU Formyltetrahydrofolate
deformylase
Purine nucleotide
synthesis, IMP
biosynthesis
glyA Serine
hydroxymethyltransferase
Glycine catabolic
process, L-serine
catabolic process
aroC Chorismate synthase Chorismate synthesis,
amino acid synthesis
nadA Quinolinate synthase NAD biosynthesis,
pyridine nucleotide
biosynthesis
Gallium and copper yiaO 2,3-diketo-L-
gulonate:Na+ symporter
Response to DNA
damage,
carbohydrate
transport
alr Alanine racemase 1 D-alanine synthesis,
alanine synthesis,
regulation of cell
shape
avtA Valine-pyruvate
aminotransferase
Valine synthesis, D-
and L-alanine
biosynthesis
aroM Unknown Unknown
yrfD DNA utilization protein DNA catabolic
process

210
leuA 2-isopropylmalate
synthase
Leucine synthesis
torC Cytochrome c
menaquinol
dehydrogenase
Negative regulation
of signal
transduction,
anaerobic electron
transport chain
envC Murein hydrolase
activator
Septum digestion
after cytokinesis,
peptidoglycan-based
cell wall biogenesis
pykF Pyruvate kinase I Glycolytic process,
response to heat
speG Spermidine N-
acetyltransferase
Polyamine catabolic
process 1 Resistant gene hits displaying scores two standard deviations from the
normalized mean
The protein product of torC contains a pentaheme that is attached to the inner membrane.
During anaerobic growth this product is key in shuttling electrons from a membrane quinol to the
reductase protein TorA, which resides in the periplasm. Mechanisms of gallium and copper
toxicity likely involve iron to some degree and Chapters 5 and 6, respectively, validate this.
Gallium, acting as an iron mimetic (refer to section 1.4.4 for more information) is capable of
replacing this metal within biomolecules. For example, in mammalian cells, iron transport
proteins, such as transferrin and lactoferrin, are able to form complexes with gallium. It has been
demonstrated that Cu(I) binds iron-sulfur centers, initiating the bridging of sulfur atoms and
deactivation of the protein [196]. We uncovered a number of copper resistant hits that contain iron-
sulfur centres, as the case for torC and nadB. The latter was also recovered as a silver resistant hit.
If copper and gallium are capable of binding TorC then a null mutant would be expected to display
resistance by preventing activity or causing downstream effects, such as the production of ROS.
Between the silver and copper datasets eight hits were found to be similar (Table 8.2).
NadA and NadB are involved in NAD+ biosynthesis. NadB, an oxidase that catalyzes the first step

211
in this pathway is projected to be the predominant source of hydrogen peroxide formation in the
cell. Deleting this gene decreases the amount of hydrogen peroxide production by 30% [368]
thereby lowering the propagation of •OH via reaction with Cu(I). In Chapter 8, we found that ROS
production was amplified when the WT strain was grown in the presence of copper and exposed
to hydrogen peroxide after 24 hours. Deleting genes that lower the potential for hydrogen peroxide
production would result in resistance if copper exposure led to ROS formation.
Amino acid biosynthetic gene hits were recovered in each of the datasets, including trpD
– shared between all three metals, trpB, serC, aroC and lueC. Studies regarding the protective or
hindering abilities of amino acids in the presence of metals offer opposing explanations. It has
been demonstrated that amino acids, particularly the side chains of aromatic, Arg, Cys, His, Lys
and Pro residues, propagate ROS [172],[455],[530],[531]. Still, under metal stress amino acid
synthesis pathways are activated, such as the case for Cys biosynthesis under copper and zinc
exposure [164]. This is a common mechanism in other organisms as well such as Bacillus subtilis.
Under the conditions of each chemical genetic screen, null mutants for amino acid biosynthesis
should not be capable of growing on minimal media. Using our methodology, these mutants were
able to grow. This is likely due to the transfer and presence of residual nutrients from the colony
picking process and dying cells, respectively. Colony formation is always normalized against the
corresponding mutant grown in the absence of metals and then compared to the WT strain,
therefore growth defects in the null mutants are accounted for. Under the statistics preformed, we
conclude that amino acid biosynthesis causes more harm than resistance, particularly in M9
minimal media. By inhibiting amino acid production, the cell is forced to import the absent amino
acids from the extracellular, as observed in Chapters 4-6 since transport proteins are more than
often present as resistant hits when deleted. If metals bind to amino acids extracellularly, the

212
potential for co-import increases. This does not signify that amino acid biosynthesis is only
hindering cellular growth in the presence of metals, but rather that the negatives out way the
positives.
Final conclusions, unknowns and future directions
The information in this thesis provides a wealth of data that permits expansion and further
investigation. We are one of the few groups that have studied prolonged – 24-hour – metal
exposure in bacteria at sublethal concentrations, which provides relevance for environmental and
medical conditions. Daughter cells produced during growth exposure must sustain active
metabolism and cell integrity in order to divide for next generation. In this work, we examine the
adaptive capabilities of E. coli to silver, copper and gallium.
In section 1.6 the challenges of studying metals in bacteria were briefly described. In general,
this is not a trivial task, and as this thesis demonstrates, there are numerous mechanisms of metal
toxicity and adaptation in E. coli. Resistance mechanisms range from efflux, iron-sulfur cluster
maintenance, DNA repair, nucleotide biosynthesis to tRNA modification. Sensitive pathways
include biomolecule import, NAD+ synthesis, amino acid biosynthesis, sulfur assimilation,
electron transport, carbon metabolism and outer membrane maintenance. Given the natural
occurrence of metals in the environment, it is no surprise that numerous mechanisms of resistance
occur. Further, complex metal chemistries make it difficult to predict the interaction of metals with
biomolecules in vivo, yet, in the literature this issue is often diminished or dismissed. This is
amplified when examining the metal silver in which the development of silver nanoparticles is
directing the field, however, very little is understood on what metal species is truly interacting with
the cell [187].

213
By taking a holistic approach to studying bacterial-metal relationships the potential for
missing key components to the narrative decreases, yet, more questions arise. Follow-up studies
to this thesis must be conducted in order to solidify our findings. The role of tolC and ygfZ, and
other mutants, in silver, gallium and copper resistance must be further investigated. As well,
determining how amino acid biosynthesis and the presence of iron-sulfur clusters effects the
toxicity of these metals against E. coli is a future direction that should also be explored, particularly
since the literature presents controversy in the case of amino acid biosynthesis. Furthermore,
Chapters 4-6 were completed under one metal concentration and particular growth time. How
might the resistant and sensitive profiles be modified when these variables are changed? How can
this work be extended to other organisms or isolates of the same species, despite variations in the
susceptibilities?
In Chapter 8, the oxygen consumption and the pH of bacterial cells were measured and
compared. These results demonstrate that even though the concentrations selected were sub-lethal,
growth under oxidative conditions was lowered. These reports need to be further investigated. Are
the cells turning toward anaerobic growth under higher concentrations of gallium and silver and
how is this reflective in the chemical genetic screen given the number of anaerobic hits recovered?
The use of metals as antimicrobial agents is a practice acquiring considerable popularity
through the introduction of combination treatments, nanomaterials, and formulations, among
others. In order to continue the development of these antimicrobials as therapeutic agents and
agricultural tools, it is imperative that we gather more understanding into the accompanying
mechanisms of toxicity and resistance. This thesis provides a vast number of biomolecular
mechanistic hypotheses to the community investigating the mechanisms and actions of metal-
based antimicrobials.

214
References
1. Gugala, N.; Lemire, J. A.; Turner, R. J. The Efficacy of Different Anti-Microbial Metals
at Preventing the Formation of, and Eradicating Bacterial Biofilms of Pathogenic Indicator
Strains. J. Antibiot. (Tokyo). 2017, 70, 775–780, 10.1038/ja.2017.10.
2. Waldron, K. J.; Robinson, N. J. How Do Bacterial Cells Ensure That Metalloproteins Get
the Correct Metal? Nat. Rev. Microbiol. 2009, 7, 25–35, 10.1038/nrmicro2057.
3. Dupont, C. L.; Yang, S.; Palenik, B.; Bourne, P. E. Modern Proteomes Contain Putative
Imprints of Ancient Shifts in Trace Metal Geochemistry. Proc. Natl. Acad. Sci. 2006, 103,
17822–17827, 10.1073/pnas.0605798103.
4. Andreini, C.; Bertini, I.; Rosato, A. A Hint to Search for Metalloproteins in Gene Banks.
Bioinformatics 2004, 20, 1373–1380, 10.1093/bioinformatics/bth095.
5. Frausto da Silva, J. J. R.; Williams, R. J. P. The Biological Chemistry of the Elements: The
Inorganic Chemistry of Life, 2nd ed.; UK: Oxford Universi, 2001.
6. Catling, D. C. Biogenic Methane, Hydrogen Escape, and the Irreversible Oxidation of
Early Earth. Science (80-. ). 2001, 293, 839–843, 10.1126/science.1061976.
7. Andrews, S. C.; Robinson, A. K.; Rodríguez-Quiñones, F. Bacterial Iron Homeostasis.
FEMS Microbiol. Rev. 2003, 27, 215–237, 10.1016/S0168-6445(03)00055-X.
8. Dudev, T.; Lim, C. Competition among Metal Ions for Protein Binding Sites:
Determinants of Metal Ion Selectivity in Proteins. Chem. Rev. 2014, 114, 538–556,
10.1021/cr4004665.
9. Outten, C. E. Femtomolar Sensitivity of Metalloregulatory Proteins Controlling Zinc
Homeostasis. Science (80-. ). 2002, 292, 2488–2492, 10.1126/science.1060331.
10. Biology, C.; Johns, T. Undetactable Intracellular Free Copper: The Requirement of a Cu
Chaperone for SOD. 1999, 284, 805–808.
11. Guerra, A. J.; Giedroc, D. P. Metal Site Occupancy and Allosteric Switching in Bacterial
Metal Sensor Proteins. Arch. Biochem. Biophys. 2012, 519, 210–222,
10.1016/j.abb.2011.11.021.
12. Wu, F. Y. H.; Wu, C.-W. Zinc in DNA Replication and Transcription. 1987.
13. Tsukihara, T.; Aoyama, H.; Yamashita, E.; Tomizaki, T.; Yamaguchi, H.; Shinzawa-Itoh,
K.; Nakashima, R.; Yaono, R.; Yoshikawa, S. Structures of Metal Sites of Oxidized
Bovine Heart Cytochrome c Oxidase at 2.8 A. Science (80-. ). 1995, 269, 1069–1074,
10.1126/science.7652554.
14. Keele, B. B.; McCord, J. M. and Fridovich, I. Superoxidase Dismutase from Escherichia
coli B. J. Biol. Chem. 1970, 245, 6175–6181.
15. Ragsdale, S. W. Nickel-Based Enzyme Systems. J. Biol. Chem. 2009, 284, 18571–18575,
10.1074/jbc.R900020200.
16. Li, Y.; Zamble, D. B. Nickel Homeostasis and Nickel Regulation: An Overview. Chem.
Rev. 2009, 109, 4617–4643, 10.1021/cr900010n.
17. Rzhepishevska, O.; Ekstrand-Hammarström, B.; Popp, M.; Björn, E.; Bucht, A.; Sjöstedt,
A.; Antti, H.; Ramstedt, M. The Antibacterial Activity of Ga 3+ Is Influenced by Ligand
Complexation as Well as the Bacterial Carbon Source. Antimicrob. Agents Chemother.
2011, 55, 5568–5580, 10.1128/aac.00386-11.
18. Kaneko, Y.; Thoendel, M.; Olakanmi, O.; Britigan, B. E.; Singh, P. K. The Transition
Metal Gallium Disrupts Pseudomonas aeruginosa Iron Metabolism and Has

215
Antimicrobial and Antibiofilm Activity. J. Clin. Invest. 2007, 117, 877–888,
10.1172/JCI30783.
19. Lemire, J. A.; Kalan, L.; Bradu, A.; Turner, R. J. Silver Oxynitrate, an Unexplored Silver
Compound with Antimicrobial and Antibiofilm Activity. Antimicrob. Agents Chemother.
2015, 59, 4031–4039, 10.1128/AAC.05177-14.
20. Berger, T. J.; Spadaro, J. A.; Chapin, S. E.; Becker, R. O. Electrically Generated Silver
Ions: Quantitative Effects on Bacterial and Mammalian Cells. Antimicrob. Agents
Chemother. 1976, 9, 357–358, 10.1128/AAC.9.2.357.
21. Radecka, I.; Martin, C.; Hill, D. The Problem of Microbial Drug Resistance. In Novel
Antimicrobial Agents and Strategies; Phoenix, A. D., Fredrick, H., Dennison, R. S., Eds.;
Wiley-VCH, 2014; pp 1–16.
22. Bakalar, N. Penicillin, 1940. The New York Times. 2009, pp 6–7.
23. Aminov, R. I. A Brief History of the Antibiotic Era: Lessons Learned and Challenges for
the Future. Front. Microbiol. 2010, 1, 1–7, 10.3389/fmicb.2010.00134.
24. French, G. L. The Continuing Crisis in Antibiotic Resistance. Int. J. Antimicrob. Agents
2010, 36, S3–S7, 10.1016/S0924-8579(10)70003-0.
25. Fleming, A. On the Antibacterial Action of Cultures of a Penicillium, with Special
Reference to Their Use in the Isolation of B. Influenzae. 1929. Bull. World Health Organ.
2001, 79, 780–790, 10.1093/clinids/2.1.129.
26. Bush, K.; Courvalin, P.; Dantas, G.; Davies, J.; Eisenstein, B.; Huovinen, P.; Jacoby, G.
A.; Kishony, R.; Kreiswirth, B. N.; Kutter, E.; et al. Tackling Antibiotic Resistance. Nat.
Rev. Microbiol. 2011, 9, 894–896, 10.1038/nrmicro2693.
27. Stoodley, P.; Sauer, K.; Davies, D. G.; Costerton, J. W. Biofilms as Complex
Differentiated Communities. Annu. Rev. Microbiol. 2002, 56, 187–209,
10.1146/annurev.micro.56.012302.160705.
28. Hall-Stoodley, L.; Costerton, J. W.; Stoodley, P. Bacterial Biofilms: From the Natural
Environment to Infectious Diseases. Nat. Rev. Microbiol. 2004, 2, 95–108,
10.1038/nrmicro821.
29. Costerton, J. W.; Stewart, P. S.; Greenberg, E. P. Bacterial Biofilms: A Common Cause of
Persistent Infections. Science (80-. ). 1999, 284, 1318–1322,
10.1126/science.284.5418.1318.
30. Bjarnsholt, T. The Role of Bacterial Biofilms in Chronic Infections. Apmis 2013, 121, 1–
58, 10.1111/apm.12099.
31. Harrison, J. J.; Ceri, H.; Stremick, C. A.; Turner, R. J. Biofilm Susceptibility to Metal
Toxicity. Environ. Microbiol. 2004, 6, 1220–1227, 10.1111/j.1462-2920.2004.00656.x.
32. Borkow, G.; Gabbay, J. Copper, An Ancient Remedy Returning to Fight Microbial,
Fungal and Viral Infections. Curr. Chem. Biol. 2009, 3, 272–278,
10.2174/187231309789054887.
33. Grass, G.; Rensing, C.; Solioz, M. Metallic Copper as an Antimicrobial Surface. Appl.
Environ. Microbiol. 2011, 77, 1541–1547, 10.1128/AEM.02766-10.
34. Russell, P. E. A Century of Fungicide Evolution. J. Agric. Sci. 2005, 143, 11–25,
10.1017/S0021859605004971.
35. HJ., K. Historical Review of the Use of Silver in the Treatment of Burns.I. Early Uses.
Burns 2000, 26, 117–130.
36. Alexander, J. W. History of the Medical Use of Silver. Surg. Infect. (Larchmt). 2009, 10,
289–292, 10.1089/sur.2008.9941.

216
37. Klasen, H. J. A Historical Review of the Use of Silver in the Treatment of Burns. II.
Renewed Interest for Silver. Burns 2000, 26, 131–138, 10.1016/S0305-4179(99)00116-3.
38. Hobman, J. L.; Crossman, L. C. Bacterial Antimicrobial Metal Ion Resistance. J. Med.
Microbiol. 2015, 64, 471–497, 10.1099/jmm.0.023036-0.
39. Liu, J.; Lu, Y.; Wu, Q.; Goyer, R. a; Waalkes, M. P. Mineral Arsenicals in Traditional
Medicines: Perspect. Pharmacol. 2008, 326, 363–368, 10.1124/jpet.108.139543.Use.
40. Bosch, F.; Rosich, L. The Contributions of Paul Ehrlich to Pharmacology: A Tribute on
the Occasion of the Centenary of His Nobel Prize. Pharmacology 2008, 82, 171–179,
10.1159/000149583.
41. Hughes, M. F. Arsenic Toxicity and Potential Mechanisms of Action. Toxicol. Lett. 2002,
133, 1–16, 10.1016/S0378-4274(02)00084-X.
42. Huisingh, D. Heavy Metals: Implications for Agriculture. Annu. Rev. Phytopathol. 1974,
12, 375–388, 10.1146/annurev.py.12.090174.002111.
43. Hobman, J. L.; Brown, N. L. Bacterial Mercury-Resistance Genes. Met. Ions Biol. Syst.
1997, 34, 527–568.
44. Frcp, J. B. The Puzzle of Pink Disease. J. R. Soc. Med. 1999, 92, 478–481.
45. Harrison, J. J.; Turner, R. J.; Ceri, H. High-Throughput Metal Susceptibility Testing of
Microbial Biofilms. BMC Microbiol. 2005, 5, 1–11, 10.1186/1471-2180-5-53.
46. Khan, S. T.; Musarrat, J.; Al-Khedhairy, A. A. Countering Drug Resistance, Infectious
Diseases, and Sepsis Using Metal and Metal Oxides Nanoparticles: Current Status.
Colloids Surfaces B Biointerfaces 2016, 146, 70–83, 10.1016/j.colsurfb.2016.05.046.
47. Wright, J. B.; Lam, K.; Burrell, R. E. Wound Management in an Era of Increasing
Bacterial Antibiotic Resistance: A Role for Topical Silver Treatment. Am. J. Infect.
Control 1998, 26, 572–577, 10.1053/ic.1998.v26.a93527.
48. Mikolay, A.; Huggett, S.; Tikana, L.; Grass, G.; Braun, J.; Nies, D. H. Survival of Bacteria
on Metallic Copper Surfaces in a Hospital Trial. Appl. Microbiol. Biotechnol. 2010, 87,
1875–1879, 10.1007/s00253-010-2640-1.
49. Palza, H.; Nuñez, M.; Bastías, R.; Delgado, K. In Situ Antimicrobial Behavior of
Materials with Copper-Based Additives in a Hospital Environment. Int. J. Antimicrob.
Agents 2018, 51, 912–917, 10.1016/j.ijantimicag.2018.02.007.
50. Boonkaew, B.; Kempf, M.; Kimble, R.; Supaphol, P.; Cuttle, L. Antimicrobial Efficacy of
a Novel Silver Hydrogel Dressing Compared to Two Common Silver Burn Wound
Dressings: ActicoatTM and PolyMem Silver®. Burns 2014, 40, 89–96,
10.1016/j.burns.2013.05.011.
51. Saint, S.; Elmore, J. G.; Sullivan, S. D.; Emerson, S. S.; Koepsell, T. D. The Efficacy of
Silver Alloy-Coated Urinary Catheters in Preventing Urinary Tract Infection: A Meta-
Analysis. Am. J. Med. 1998, 105, 236–241, 10.1016/S0002-9343(98)00240-X.
52. Rupp, M. E.; Fitzgerald, T.; Marion, N.; Helget, V.; Puumala, S.; Anderson, J. R.; Fey, P.
D. Effect of Silver-Coated Urinary Catheters: Efficacy, Cost-Effectiveness, and
Antimicrobial Resistance. Am. J. Infect. Control 2004, 32, 445–450,
10.1016/j.ajic.2004.05.002.
53. Ewald, A.; Glückermann, S. K.; Thull, R.; Gbureck, U. Antimicrobial Titanium/Silver
PVD Coatings on Titanium. Biomed. Eng. Online 2006, 5, 22, 10.1186/1475-925X-5-22.
54. Chung, C. J.; Lin, H. I.; Tsou, H. K.; Shi, Z. Y.; He, J. L. An Antimicrobial TiO2 Coating
for Reducing Hospital-Acquired Infection. J. Biomed. Mater. Res. - Part B Appl.
Biomater. 2008, 85, 220–224, 10.1002/jbm.b.30939.

217
55. Valappil, S. P.; Ready, D.; Abou Neel, E. A.; Pickup, D. M.; Chrzanowski, W.; O’Dell, L.
A.; Newport, R. J.; Smith, M. E.; Wilson, M.; Knowles, J. C. Antimicrobial Gallium-
Doped Phosphate-Based Glasses. Adv. Funct. Mater. 2008, 18, 732–741,
10.1002/adfm.200700931.
56. Curtis, L. T. Prevention of Hospital-Acquired Infections: Review of Non-Pharmacological
Interventions. J. Hosp. Infect. 2008, 69, 204–219, 10.1016/j.jhin.2008.03.018.
57. Wilks, S. A.; Michels, H. T.; Keevil, C. W. Survival of Listeria monocytogenes Scott A on
Metal Surfaces: Implications for Cross-Contamination. Int. J. Food Microbiol. 2006, 111,
93–98, 10.1016/j.ijfoodmicro.2006.04.037.
58. Wilks, S. A.; Michels, H.; Keevil, C. W. The Survival of Escherichia coli O157 on a
Range of Metal Surfaces. Int. J. Food Microbiol. 2005, 105, 445–454,
10.1016/j.ijfoodmicro.2005.04.021.
59. Mehtar, S.; Wiid, I.; Todorov, S. D. The Antimicrobial Activity of Copper and Copper
Alloys against Nosocomial Pathogens and Mycobacterium Tuberculosis Isolated from
Healthcare Facilities in the Western Cape: An in vitro Study. J. Hosp. Infect. 2008, 68,
45–51, 10.1016/j.jhin.2007.10.009.
60. Faúndez, G.; Troncoso, M.; Navarrete, P.; Figueroa, G. Antimicrobial Activity of Copper
Surfaces against Suspensions of Salmonella Enterica and Campylobacter Jejuni. BMC
Microbiol. 2004, 4, 1–7, 10.1186/1471-2180-4-19.
61. Warnes, S. L.; Keevil, C. W. Mechanism of Copper Surface Toxicity in Vancomycin-
Resistant Enterococci Following Wet or Dry Surface Contact. Appl. Environ. Microbiol.
2011, 77, 6049–6059, 10.1128/AEM.00597-11.
62. Noyce, J. O.; Michels, H.; Keevil, C. W. Potential Use of Copper Surfaces to Reduce
Survival of Epidemic Meticillin-Resistant Staphylococcus aureus in the Healthcare
Environment. J. Hosp. Infect. 2006, 63, 289–297, 10.1016/j.jhin.2005.12.008.
63. Santo, C. E.; Lam, E. W.; Elowsky, C. G.; Quaranta, D.; Domaille, D. W.; Chang, C. J.;
Grass, G. Bacterial Killing by Dry Metallic Copper Surfaces. Appl. Environ. Microbiol.
2011, 77, 794–802, 10.1128/AEM.01599-10.
64. Borkow, G.; Zhou, S. S.; Page, T.; Gabbay, J. A Novel Anti-Influenza Copper Oxide
Containing Respiratory Face Mask. PLoS One 2010, 5, 1–8,
10.1371/journal.pone.0011295.
65. Borkow, G.; Zatcoff, R. C.; Gabbay, J. Reducing the Risk of Skin Pathologies in Diabetics
by Using Copper Impregnated Socks. Med. Hypotheses 2009, 73, 883–886,
10.1016/j.mehy.2009.02.050.
66. Borkow, G. Putting Copper into Action: Copper-Impregnated Products with Potent
Biocidal Activities. FASEB J. 2004, 18, 1–20, 10.1096/fj.04-2029fje.
67. Laine, L.; Hunt, R.; EI-Zimaity, H.; Nguyen, B.; Osato, M.; Spénard, J. Bismuth-Based
Quadruple Therapy Using a Single Capsule of Bismuth Biskalcitrate, Metronidazole, and
Tetracycline given with Omeprazole versus Omeprazole, Amoxicillin, and Clarithromycin
for Eradication of Helicobacter Pylori in Duodenal Ulcer Patients: A . Am. J.
Gastroenterol. 2003, 98, 562–567, 10.1111/j.1572-0241.2003.t01-1-07288.x.
68. Gosau, M.; Bürgers, R.; Vollkommer, T.; Holzmann, T.; Prantl, L. Effectiveness of
Antibacterial Copper Additives in Silicone Implants. J. Biomater. Appl. 2013, 28, 187–
198, 10.1177/0885328212441957.
69. Gibson, M. Pharmaceutical Preformulation and Formulation: A Practical Guide from
Candidate Drug Selection to Commercial Dosage Form; 2005; Vol. 9.

218
70. Guzman, M.; Dille, J.; Godet, S. Synthesis and Antibacterial Activity of Silver
Nanoparticles against Gram-positive and Gram-negative Bacteria. Nanomedicine
Nanotechnology, Biol. Med. 2012, 8, 37–45, 10.1016/j.nano.2011.05.007.
71. Sondi, I.; Salopek-Sondi, B. Silver Nanoparticles as Antimicrobial Agent: A Case Study
on E. coli as a Model for Gram-negative Bacteria. J. Colloid Interface Sci. 2004, 275,
177–182, 10.1016/j.jcis.2004.02.012.
72. Shi, C.; Gao, J.; Wang, M.; Fu, J.; Wang, D.; Zhu, Y. Ultra-Trace Silver-Doped
Hydroxyapatite with Non-Cytotoxicity and Effective Antibacterial Activity. Mater. Sci.
Eng. C 2015, 55, 497–505, 10.1016/j.msec.2015.05.078.
73. Chen, F.; Liu, C.; Mao, Y. Bismuth-Doped Injectable Calcium Phosphate Cement with
Improved Radiopacity and Potent Antimicrobial Activity for Root Canal Filling. Acta
Biomater. 2010, 6, 3199–3207, 10.1016/j.actbio.2010.02.049.
74. Lundberg, D. Flow Conditioners. US 8 920 555, 2006.
75. Rigo, C.; Roman, M.; Munivrana, I.; Vindigni, V.; Azzena, B.; Barbante, C.; Cairns, W.
R. L. Characterization and Evaluation of Silver Release from Four Different Dressings
Used in Burns Care. Burns 2012, 38, 1131–1142, 10.1016/j.burns.2012.06.013.
76. Ip, M.; Lui, S. L.; Poon, V. K. M.; Lung, I.; Burd, A. Antimicrobial Activities of Silver
Dressings: An in Vitro Comparison. J. Med. Microbiol. 2006, 55, 59–63,
10.1099/jmm.0.46124-0.
77. Kostenko, V.; Lyczak, J.; Turner, K.; Martinuzzi, R. J. Impact of Silver-Containing
Wound Dressings on Bacterial Biofilm Viability and Susceptibility to Antibiotics during
Prolonged Treatment. Antimicrob. Agents Chemother. 2010, 54, 5120–5131,
10.1128/AAC.00825-10.
78. Bergin, S.; Wraight, P. Silver Based Wound Dressings and Topical Agents for Treating
Diabetic Foot Ulcers. Cochrane Database Syst. Rev. 2006, No. 2,
10.1002/14651858.CD005082.pub2.
79. Silver, S.; Phung, L. T.; Silver, G. Silver as Biocides in Burn and Wound Dressings and
Bacterial Resistance to Silver Compounds. J. Ind. Microbiol. Biotechnol. 2006, 33, 627–
634, 10.1007/s10295-006-0139-7.
80. Freddi, G.; Arai, T.; Colonna, G. M.; Boschi, A.; Tsukada, M. Binding of Metal Cations to
Chemically Modified Wool and Antimicrobial Properties of the Wool-Metal Complexes.
J. Appl. Polym. Sci. 2001, 82, 3513–3519, 10.1002/app.2213.
81. Bowler, P. G.; Jones, S. A.; Walker, M.; Parsons, D. Microbicidal Properties of a Silver-
Containing Hydrofiber: Dressing Against a Variety of Burn Wound Pathogens. J. Burn
Care Rehabil. 2004, 25, 192–196, 10.1097/01.BCR.0000112331.72232.1B.
82. Zhao, S.; Li, L.; Wang, H.; Zhang, Y.; Cheng, X.; Zhou, N.; Rahaman, M. N.; Liu, Z.;
Huang, W.; Zhang, C. Wound Dressings Composed of Copper-Doped Borate Bioactive
Glass Microfibers Stimulate Angiogenesis and Heal Full-Thickness Skin Defects in a
Rodent Model. Biomaterials 2015, 53, 379–391, 10.1016/j.biomaterials.2015.02.112.
83. Li, J.; Zhai, D.; Lv, F.; Yu, Q.; Ma, H.; Yin, J.; Yi, Z.; Liu, M.; Chang, J.; Wu, C.
Preparation of Copper-Containing Bioactive Glass/Eggshell Membrane Nanocomposites
for Improving Angiogenesis, Antibacterial Activity and Wound Healing. Acta Biomater.
2016, 36, 254–266, 10.1016/j.actbio.2016.03.011.
84. Wang, X.; Cheng, F.; Liu, J.; Smått, J. H.; Gepperth, D.; Lastusaari, M.; Xu, C.; Hupa, L.
Biocomposites of Copper-Containing Mesoporous Bioactive Glass and Nanofibrillated
Cellulose: Biocompatibility and Angiogenic Promotion in Chronic Wound Healing

219
Application. Acta Biomater. 2016, 46, 286–298, 10.1016/j.actbio.2016.09.021.
85. Bober, P.; Liu, J.; Mikkonen, K. S.; Ihalainen, P.; Pesonen, M.; Plumed-Ferrer, C.; Von
Wright, A.; Lindfors, T.; Xu, C.; Latonen, R. M. Biocomposites of Nanofibrillated
Cellulose, Polypyrrole, and Silver Nanoparticles with Electroconductive and
Antimicrobial Properties. Biomacromolecules 2014, 15, 3655–3663, 10.1021/bm500939x.
86. Guibal, E.; Cambe, S.; Bayle, S.; Taulemesse, J. M.; Vincent, T. Silver/Chitosan/Cellulose
Fibers Foam Composites: From Synthesis to Antibacterial Properties. J. Colloid Interface
Sci. 2013, 393, 411–420, 10.1016/j.jcis.2012.10.057.
87. Guo, C.; Zhou, L.; Lv, J. Effects of Expandable Graphite and Modified Ammonium
Polyphosphate on the Flame-Retardant and Mechanical Properties of Wood Flour-
Polypropylene Composites. Polym. Polym. Compos. 2013, 21, 449–456, 10.1002/app.
88. Ammons, M. C. B.; Ward, L. S.; James, G. A. Anti-Biofilm Efficacy of a
Lactoferrin/Xylitol Wound Hydrogel Used in Combination with Silver Wound Dressings.
Int. Wound J. 2011, 8, 268–273, 10.1111/j.1742-481X.2011.00781.x.
89. Zhang, Z.; He, T.; Yuan, M.; Shen, R.; Deng, L.; Yi, L.; Sun, Z.; Zhang, Y. The in Situ
Synthesis of Ag/Amino Acid Biopolymer Hydrogels as Mouldable Wound Dressings.
Chem. Commun. 2015, 51, 15862–15865, 10.1039/C5CC05195A.
90. Mishra, S. K.; Mary, D. S.; Kannan, S. Copper Incorporated Microporous Chitosan-
Polyethylene Glycol Hydrogels Loaded with Naproxen for Effective Drug Release and
Anti-Infection Wound Dressing. Int. J. Biol. Macromol. 2017, 95, 928–937,
10.1016/j.ijbiomac.2016.10.080.
91. Kumar, R.; Münstedt, H. Silver Ion Release from Antimicrobial Polyamide/Silver
Composites. Biomaterials 2005, 26, 2081–2088, 10.1016/j.biomaterials.2004.05.030.
92. Kumar, R. S.; Arunachalam, S. DNA Binding and Antimicrobial Studies of Polymer-
Copper(II) Complexes Containing 1,10-Phenanthroline and l-Phenylalanine Ligands. Eur.
J. Med. Chem. 2009, 44, 1878–1883, 10.1016/j.ejmech.2008.11.001.
93. Dykes, P. Increase in Skin Surface Elasticity in Normal Volunteer Subjects Following the
Use of Copper Oxide Impregnated Socks. Ski. Res. Technol. 2015, 21, 272–277,
10.1111/srt.12187.
94. Zatcoff, R. C.; Smith, M. S.; Borkow, G. Treatment of Tinea Pedis with Socks Containing
Copper-Oxide Impregnated Fibers. Foot 2008, 18, 136–141, 10.1016/j.foot.2008.03.005.
95. Shao, W.; Liu, H.; Liu, X.; Wang, S.; Wu, J.; Zhang, R.; Min, H.; Huang, M.
Development of Silver Sulfadiazine Loaded Bacterial Cellulose/Sodium Alginate
Composite Films with Enhanced Antibacterial Property. Carbohydr. Polym. 2015, 132,
351–358, 10.1016/j.carbpol.2015.06.057.
96. Lorente, L.; Lecuona, M.; Jiménez, A.; Santacreu, R.; Raja, L.; Gonzalez, O.; Mora, M. L.
Chlorhexidine-Silver Sulfadiazine-Impregnated Venous Catheters Save Costs. Am. J.
Infect. Control 2014, 42, 321–324, 10.1016/j.ajic.2013.09.022.
97. George, N.; Faoagali, J.; Muller, M. Silvazine® (Silver Sulfadiazine and Chlorhexidine)
Activity against 200 Clinical Isolates. Burns 1997, 23, 493–495, 10.1016/S0305-
4179(97)00047-8.
98. Fox, C. L. Silver Sulfadiazine—A New Topical Therapy for Pseudomonas in Burns. Arch.
Surg. 1968, 96, 184, 10.1001/archsurg.1968.01330200022004.
99. Shaikh, A. R.; Giridhar, R.; Yadav, M. R. Bismuth-Norfloxacin Complex: Synthesis,
Physicochemical and Antimicrobial Evaluation. Int. J. Pharm. 2007, 332, 24–30,
10.1016/j.ijpharm.2006.11.037.

220
100. Halwani, M.; Blomme, S.; Suntres, Z. E.; Alipour, M.; Azghani, A. O.; Kumar, A.; Omri,
A. Liposomal Bismuth-Ethanedithiol Formulation Enhances Antimicrobial Activity of
Tobramycin. Int. J. Pharm. 2008, 358, 278–284, 10.1016/j.ijpharm.2008.03.008.
101. Harrison, J. J.; Turner, R. J.; Joo, D. A.; Stan, M. A.; Chan, C. S.; Allan, N. D.; Vrionis,
H. A.; Olson, M. E.; Ceri, H. Copper and Quaternary Ammonium Cations Exert
Synergistic Bactericidal and Antibiofilm Activity against Pseudomonas aeruginosa.
Antimicrob. Agents Chemother. 2008, 52, 2870–2881, 10.1128/AAC.00203-08.
102. DeLeon, K.; Balldin, F.; Watters, C.; Hamood, A.; Griswold, J.; Sreedharan, S.;
Rumbaugh, K. P. Gallium Maltolate Treatment Eradicates Pseudomonas aeruginosa
Infection in Thermally Injured Mice. Antimicrob. Agents Chemother. 2009, 53, 1331–
1337, 10.1128/AAC.01330-08.
103. Banin, E.; Lozinski, A.; Brady, K. M.; Berenshtein, E.; Butterfield, P. W.; Moshe, M.;
Chevion, M.; Greenberg, E. P.; Banin, E. The Potential of Desferrioxamine-Gallium as an
Anti-Pseudomonas Therapeutic Agent. Proc. Natl. Acad. Sci. 2008, 105, 16761–16766,
10.1073/pnas.0808608105.
104. Patale, R. L.; Patravale, V. B. O,N-Carboxymethyl Chitosan-Zinc Complex: A Novel
Chitosan Complex with Enhanced Antimicrobial Activity. Carbohydr. Polym. 2011, 85,
105–110, 10.1016/j.carbpol.2011.02.001.
105. Wang, X.; Du, Y.; Liu, H. Preparation, Characterization and Antimicrobial Activity of
Chitosan-Zn Complex. Carbohydr. Polym. 2004, 56, 21–26,
10.1016/j.carbpol.2003.11.007.
106. Hernández-Sierra, J. F.; Ruiz, F.; Cruz Pena, D. C.; Martínez-Gutiérrez, F.; Martínez, A.
E.; de Jesús Pozos Guillén, A.; Tapia-Pérez, H.; Martínez Castañón, G. The Antimicrobial
Sensitivity of Streptococcus mutans to Nanoparticles of Silver, Zinc Oxide, and Gold.
Nanomedicine Nanotechnology, Biol. Med. 2008, 4, 237–240,
10.1016/j.nano.2008.04.005.
107. Burygin, G. L.; Khlebtsov, B. N.; Shantrokha, A. N.; Dykman, L. A.; Bogatyrev, V. A.;
Khlebtsov, N. G. On the Enhanced Antibacterial Activity of Antibiotics Mixed with Gold
Nanoparticles. Nanoscale Res. Lett. 2009, 4, 794–801, 10.1007/s11671-009-9316-8.
108. Rai, M. K.; Deshmukh, S. D.; Ingle, A. P.; Gade, A. K. Silver Nanoparticles: The
Powerful Nanoweapon against Multidrug-Resistant Bacteria. J. Appl. Microbiol. 2012,
112, 841–852, 10.1111/j.1365-2672.2012.05253.x.
109. Monteiro, D. R.; Gorup, L. F.; Silva, S.; Negri, M.; de Camargo, E. R.; Oliveira, R.;
Barbosa, D. B.; Henriques, M. Silver Colloidal Nanoparticles: Antifungal Effect against
Adhered Cells and Biofilms of Candida albicans and Candida glabrata. Biofouling 2011,
27, 711–719, 10.1080/08927014.2011.599101.
110. Durán, N.; Durán, M.; de Jesus, M. B.; Seabra, A. B.; Fávaro, W. J.; Nakazato, G. Silver
Nanoparticles: A New View on Mechanistic Aspects on Antimicrobial Activity.
Nanomedicine Nanotechnology, Biol. Med. 2016, 12, 789–799,
10.1016/j.nano.2015.11.016.
111. Radzig, M. A.; Nadtochenko, V. A.; Koksharova, O. A.; Kiwi, J.; Lipasova, V. A.;
Khmel, I. A. Antibacterial Effects of Silver Nanoparticles on Gram-negative Bacteria:
Influence on the Growth and Biofilms Formation, Mechanisms of Action. Colloids
Surfaces B Biointerfaces 2013, 102, 300–306, 10.1016/j.colsurfb.2012.07.039.
112. Rai, M.; Yadav, A.; Gade, A. Silver Nanoparticles as a New Generation of
Antimicrobials. Biotechnol. Adv. 2009, 27, 76–83, 10.1016/j.biotechadv.2008.09.002.

221
113. Kim, J. S.; Kuk, E.; Yu, K. N.; Kim, J. H.; Park, S. J.; Lee, H. J.; Kim, S. H.; Park, Y. K.;
Park, Y. H.; Hwang, C. Y.; et al. Antimicrobial Effects of Silver Nanoparticles.
Nanomedicine Nanotechnology, Biol. Med. 2007, 3, 95–101, 10.1016/j.nano.2006.12.001.
114. Sotiriou, G. A.; Pratsinis, S. E. Antibacterial Activity of Nanosilver Ions and Particles.
Environ. Sci. Technol. 2010, 44, 5649–5654, 10.1021/es101072s.
115. Gunawan, C.; Teoh, W. Y.; Marquis, C. P.; Amal, R. Cytotoxic Origin of Copper (II)
Oxide Nanoparticles : Comparative Studies and Metal Salts. 2011, No. 9.
116. Applerot, G.; Lellouche, J.; Lipovsky, A.; Nitzan, Y.; Lubart, R.; Gedanken, A.; Banin, E.
Understanding the Antibacterial Mechanism of CuO Nanoparticles: Revealing the Route
of Induced Oxidative Stress. Small 2012, 8, 3326–3337, 10.1002/smll.201200772.
117. Abdelgawad, A. M.; Hudson, S. M.; Rojas, O. J. Antimicrobial Wound Dressing
Nanofiber Mats from Multicomponent (Chitosan/Silver-NPs/Polyvinyl Alcohol) Systems.
Carbohydr. Polym. 2014, 100, 166–178, 10.1016/j.carbpol.2012.12.043.
118. Perelshtein, I.; Applerot, G.; Perkas, N.; Guibert, G.; Mikhailov, S.; Gedanken, A.
Sonochemical Coating of Silver Nanoparticles on Textile Fabrics (Nylon, Polyester and
Cotton) and Their Antibacterial Activity. Nanotechnology 2008, 19, 245705,
10.1088/0957-4484/19/24/245705.
119. Palza, H. Antimicrobial Polymers with Metal Nanoparticles. Int. J. Mol. Sci. 2015, 16,
2099–2116, 10.3390/ijms16012099.
120. Marslin, G.; Selvakesavan, R. K.; Franklin, G.; Sarmento, B.; Dias, A. C. P. Antimicrobial
Activity of Cream Incorporated with Silver Nanoparticles Biosynthesized from Withania
Somnifera. Int. J. Nanomedicine 2015, 10, 5955–5963, 10.2147/IJN.S81271.
121. Shayani Rad, M.; Khameneh, B.; Sabeti, Z.; Mohajeri, S. A.; Fazly Bazzaz, B. S.
Antibacterial Activity of Silver Nanoparticle-Loaded Soft Contact Lens Materials: The
Effect of Monomer Composition. Curr. Eye Res. 2016, 41, 1286–1293,
10.3109/02713683.2015.1123726.
122. Li, P.; Li, J.; Wu, C.; Wu, Q.; Li, J. Synergistic Antibacterial Effects of Beta-Lactam
Antibiotic Combined with Silver Nanoparticles. Nanotechnology 2005, 16, 1912–1917,
10.1088/0957-4484/16/9/082.
123. Ferraris, S.; Spriano, S. Antibacterial Titanium Surfaces for Medical Implants. Mater. Sci.
Eng. C 2016, 61, 965–978, 10.1016/j.msec.2015.12.062.
124. Kaluđerović, M. R.; Schreckenbach, J. P.; Graf, H. L. Titanium Dental Implant Surfaces
Obtained by Anodic Spark Deposition – From the Past to the Future. Mater. Sci. Eng. C
2016, 69, 1429–1441, 10.1016/j.msec.2016.07.068.
125. Tarquinio, K. M.; Kothurkar, N. K.; Goswami, D. Y.; Sanders, R. C.; Zaritsky, A. L.;
LeVine, A. M. Bactericidal Effects of Silver plus Titanium Dioxide-Coated Endotracheal
Tubes on Pseudomonas aeruginosa and Staphylococcus aureus. Int. J. Nanomedicine
2010, 5, 177–183, 10.2147/IJN.S8746.
126. Besinis, A.; De Peralta, T.; Handy, R. D. Inhibition of Biofilm Formation and
Antibacterial Properties of a Silver Nano-Coating on Human Dentine. Nanotoxicology
2014, 8, 745–754, 10.3109/17435390.2013.825343.
127. Roe, D.; Karandikar, B.; Bonn-Savage, N.; Gibbins, B.; Roullet, J. baptiste. Antimicrobial
Surface Functionalization of Plastic Catheters by Silver Nanoparticles. J. Antimicrob.
Chemother. 2008, 61, 869–876, 10.1093/jac/dkn034.
128. Koseoglu Eser, O.; Ergin, A.; Hascelik, G. Antimicrobial Activity of Copper Alloys
Against Invasive Multidrug-Resistant Nosocomial Pathogens. Curr. Microbiol. 2015, 71,

222
291–295, 10.1007/s00284-015-0840-8.
129. Noyce, J. O.; Michels, H.; Keevil, C. W. Use of Copper Cast Alloys to Control
Escherichia coli O157 Cross-Contamination during Food Processing. Appl. Environ.
Microbiol. 2006, 72, 4239–4244, 10.1128/AEM.02532-05.
130. Li, Y.; Liu, L.; Wan, P.; Zhai, Z.; Mao, Z.; Ouyang, Z.; Yu, D.; Sun, Q.; Tan, L.; Ren, L.;
et al. Biodegradable Mg-Cu Alloy Implants with Antibacterial Activity for the Treatment
of Osteomyelitis: In Vitro and in Vivo Evaluations. Biomaterials 2016, 106, 250–263,
10.1016/j.biomaterials.2016.08.031.
131. Casey, A. L.; Adams, D.; Karpanen, T. J.; Lambert, P. A.; Cookson, B. D.; Nightingale,
P.; Miruszenko, L.; Shillam, R.; Christian, P.; Elliott, T. S. J. Role of Copper in Reducing
Hospital Environment Contamination. J. Hosp. Infect. 2010, 74, 72–77,
10.1016/j.jhin.2009.08.018.
132. Schmidt, M. G.; Von Dessauer, B.; Benavente, C.; Benadof, D.; Cifuentes, P.; Elgueta, A.;
Duran, C.; Navarrete, M. S. Copper Surfaces Are Associated with Significantly Lower
Concentrations of Bacteria on Selected Surfaces within a Pediatric Intensive Care Unit.
Am. J. Infect. Control 2016, 44, 203–209, 10.1016/j.ajic.2015.09.008.
133. Monk, A. B.; Kanmukhla, V.; Trinder, K.; Borkow, G. Potent Bactericidal Efficacy of
Copper Oxide Impregnated Non-Porous Solid Surfaces. BMC Microbiol. 2014, 14, 1–14,
10.1186/1471-2180-14-57.
134. Paladini, F.; Pollini, M.; Talà, A.; Alifano, P.; Sannino, A. Efficacy of Silver Treated
Catheters for Haemodialysis in Preventing Bacterial Adhesion. J. Mater. Sci. Mater. Med.
2012, 23, 1983–1990, 10.1007/s10856-012-4674-7.
135. Cochis, A.; Azzimonti, B.; Della Valle, C.; Chiesa, R.; Arciola, C. R.; Rimondini, L.
Biofilm Formation on Titanium Implants Counteracted by Grafting Gallium and Silver
Ions. J. Biomed. Mater. Res. - Part A 2015, 103, 1176–1187, 10.1002/jbm.a.35270.
136. Davenport, K.; Keeley, F. X. Evidence for the Use of Silver-Alloy-Coated Urethral
Catheters. J. Hosp. Infect. 2005, 60, 298–303, 10.1016/j.jhin.2005.01.026.
137. Ewald, A.; Glückermann, S. K.; Thull, R.; Gbureck, U. Antimicrobial Titanium/Silver
PVD Coatings on Titanium. Biomed. Eng. Online 2006, 5, 1–10, 10.1186/1475-925X-5-
22.
138. Kollef, M. H.; Afessa, B.; Anzueto, A.; Veremakis, C.; Kerr, K. M.; Margolis, B. D.;
Craven, D. E.; Roberts, P. R.; Arroliga, A. C.; Hubmayr, R. D.; et al. Silver-Coated
Endotracheal Tubes and Incidence of Ventilator-Associated Pneumonia: The NASCENT
Randomized Trial. JAMA - J. Am. Med. Assoc. 2008, 300, 805–813,
10.1001/jama.300.7.805.
139. Haas, K. L.; Franz, K. J. Application of Metal Coordination Chemistry To Explore and
Manipulate Cell Biology. Chem. Rev. 2009, 109, 4921–4960, 10.1021/cr900134a.
140. Dudev, T.; Lim, C. Competition among Metal Ions for Protein Binding Sites:
Determinants of Metal Ion Selectivity in Proteins. Chem. Rev. 2014, 114, 538–556,
10.1021/cr4004665.
141. Dean, K. M.; Qin, Y.; Palmer, A. E. Visualizing Metal Ions in Cells: An Overview of
Analytical Techniques, Approaches, and Probes. Biochim. Biophys. Acta - Mol. Cell Res.
2012, 1823, 1406–1415, 10.1016/j.bbamcr.2012.04.001.
142. Dudev, T.; Lim, C. Metal Binding Affinity and Selectivity in Metalloproteins: Insights
from Computational Studies. Annu. Rev. Biophys. 2008, 37, 97–116,
10.1146/annurev.biophys.37.032807.125811.

223
143. Irving, B. H.; Williams, R. J. P. The Stability of Transition-Metal Complexes. J. Chem.
Soc. 1953, 0, 3192–3210, 10.1039/JR9530003192.
144. Pearson, R. G. Hard and Soft Acids and Bases. J. Am. Chem. Soc. 1963, 85, 3533–3539,
10.1021/ja00905a001.
145. Nies, D. H. Efflux-Mediated Heavy Metal Resistance in Prokaryotes. FEMS Microbiol.
Rev. 2003, 27, 313–339, 10.1016/S0168-6445(03)00048-2.
146. Workentine, M. L.; Harrison, J. J.; Stenroos, P. U.; Ceri, H.; Turner, R. J. Pseudomonas
fluorescens’ View of the Periodic Table. Environ. Microbiol. 2008, 10, 238–250,
10.1111/j.1462-2920.2007.01448.x.
147. Robinson, N. J.; Ford, D.; Rutherford, J. C.; Waldron, K. J. Metalloproteins and Metal
Sensing. Nature 2009, 460, 823–830.
148. Dudev, T.; Lim, C. Competition between Protein Ligands and Cytoplasmic Inorganic
Anions for the Metal Cation: A DFT/CDM Study. J. Am. Chem. Soc. 2006, 128, 10541–
10548, 10.1021/ja063111s.
149. Gliemann, G.; Schlafer, H. L. Ligand Field Theory. Nature 1970, 226, 1067–1068.
150. Blades, A. T.; Jayaweera, P.; Ikonomou, M. G.; Kebarle, P. Studies of Alkaline Earth and
Transition Metal M+ Gas Phase Ion Chemistry. J. Chem. Phys. 1990, 92, 5900–5906,
10.1063/1.458360.
151. Peschke, M.; Blades, A. T.; Kebarle, P. Hydration Energies and Entropies for Mg2+ , Ca2+
, Sr2+ , and Ba2+ from Gas-Phase Ion−Water Molecule Equilibria Determinations. J. Phys.
Chem. A 2002, 102, 9978–9985, 10.1021/jp9821127.
152. Kohanski, M. A.; Dwyer, D. J.; Collins, J. J. How Antibiotics Kill Bacteria: From Targets
to Networks. Nat. Rev. Microbiol. 2010, 8, 423–435, 10.1038/nrmicro2333.
153. Buonocore, G.; Perrone, S.; Tataranno, M. L. Oxygen Toxicity: Chemistry and Biology of
Reactive Oxygen Species. Semin. Fetal Neonatal Med. 2010, 15, 186–190,
10.1016/j.siny.2010.04.003.
154. Thannickal, V. J. Oxygen in the Evolution of Complex Life and the Price We Pay. Am. J.
Respir. Cell Mol. Biol. 2009, 40, 507–510, 10.1165/rcmb.2008-0360PS.
155. Demple, B.; Gonzàlez-Flecha, B. Metabolic Sources of Hydrogen Peroxide in Areobically
Growing Escherichia coli. J. Biol. Chem. 2005, 270, 13681–13687.
156. Miller, D. M.; Buettner, G. R.; Aust, S. D. Transition Metals as Catalysts of
“Autoxidation” Reactions. Free Radic. Biol. Med. 1990, 8, 95–108, 10.1016/0891-
5849(90)90148-C.
157. Valko, M.; Morris, H.; Cronin, M. Metals, Toxicity and Oxidative Stress. Curr. Med.
Chem. 2005, 12, 1161–1208, 10.2174/0929867053764635.
158. Imlay, J. A. The Molecular Mechanisms and Physiological Consequences of Oxidative
Stress: Lessons from a Model Bacterium. Nat. Rev. Microbiol. 2013, 11, 443–454,
10.1038/nrmicro3032.
159. Kehrer, J. P. The Haber-Weiss Reaction and Mechanisms of Toxicity. Toxicology 2000,
149, 43–50, 10.1016/S0300-483X(00)00231-6.
160. Chen, X.; Tian, X.; Shin, I.; Yoon, J. Fluorescent and Luminescent Probes for Detection
of Reactive Oxygen and Nitrogen Species. Chem. Soc. Rev. 2011, 40, 4783–4804,
10.1039/c1cs15037e.
161. Gruhlke, M. C. H.; Slusarenko, A. J. The Biology of Reactive Sulfur Species (RSS). Plant
Physiol. Biochem. 2012, 59, 98–107, 10.1016/j.plaphy.2012.03.016.
162. Cabiscol, E.; Tamarit, J.; Ros, J. Oxidative Stress in Bacteria and Protein Damage by

224
Reactive Oxygen Species. Int. Microbiol. 2000, 3, 3–8, 10.2436/im.v3i1.9235.
163. Marnett, L. J. Oxyradicals and DNA Damage. Carcinogenesis 2000, 21, 361–370,
10.1093/carcin/21.3.361.
164. Nies, D. H. Bacterial Tranistion Metal Homeostasis. In Molecular Microbiology of Heavy
Metals; 2007; pp 118–142.
165. Humphries, K. M.; Szweda, L. I. Selective Inactivation of α-Ketoglutarate Dehydrogenase
and Pyruvate Dehydrogenase: Reaction of Lipoic Acid with 4-Hydroxy-2-Nonenal.
Biochemistry 1998, 37, 15835–15841, 10.1021/bi981512h.
166. Tarmarit, J.; Cabiscol, E.; Ros, J. Identification of the Major Oxidatively Damaged
Proteins in Escherichia coli Cells Exposed to Oxidative Stress. J. Biol. Chem. 1998, 273,
3027–3032.
167. Fucci L.; Oliver C. N.; Coon M. J.; Stadtman, E. R. Inactivation of Key Metabolic
Enzymes by Mixed-Function Oxidation Reactions: Possible Implications in Protein
Turnover and Aging. Proc Natl Acad Sci USA 1983, 80, 1521–1525.
168. Shacter, E.; Williams, J. A.; Lim, M.; Levine, R. L. Differential Susceptibility of Plasma
Proteins to Oxidative Modification: Examination by Western Blot Immunoassay. Free
Radic. Biol. Med. 1994, 17, 429–437.
169. Torz, G. I. S. Regulation of the OxyR Transcription Factor by Hydrogen Peroxide and the
Celluar Thiol-Disulfide Status. Proc. Natl. Acad. Sci. USA 1999, 96, 6161–6165.
170. Marnett, L. J. Lipid Peroxidation - DNA Damage by Malondialdehyde. Mutat. Res.
199AD, 424, 83–95.
171. Stadtman, E. R. Protein Oxidation and Aging. Free Radical Research. Science (80-. ).
1992, 40257, 1220–1224, 10.1080/10715760600918142.
172. Stadtman, E. R. Oxidation of Free Amino Acids and Amino Acid Metal-Catalyzed
Reactions. Annu. Rev. Biochem. 1993, 62, 797–821.
173. Rudyk, O.; Eaton, P. Biochemical Methods for Monitoring Protein Thiol Redox States in
Biological Systems. Redox Biol. 2014, 2, 803–813, 10.1016/j.redox.2014.06.005.
174. Miseta, A.; Csutora, P. Relationship between the Occurrence of Cysteine in Proteins and
the Complexity of Organisms. Mol. Biol. Evol. 2000, 17, 1232–1239,
10.1093/oxfordjournals.molbev.a026406.
175. Bonnet, D.; Stevens, J. M.; Alves de Sousa, R.; Sari, M. A.; Mansuy, D.; Artaud, I. New
Inhibitors of Iron-Containing Nitrile Hydratases. J. Biochem. 2001, 130, 227–233,
10.1093/oxfordjournals.jbchem.a002976.
176. Poole, L. B. The Basics of Thiols and Cysteines in Redox Biology and Chemistry. Free
Radic. Biol. Med. 2015, 80, 148–157, 10.1016/j.freeradbiomed.2014.11.013.
177. Ritz, D.; Beckwith, J. Roles of Thiol-Redox Pathways in Bacteria. Annu. Rev. Microbiol.
2001, 55, 21–48, 10.1146/annurev.micro.55.1.21.
178. Smirnova, G.; Muzyka, N.; Oktyabrsky, O. Transmembrane Glutathione Cycling in
Growing Escherichia coli Cells. Microbiol. Res. 2012, 167, 166–172,
10.1016/j.micres.2011.05.005.
179. Marino, S. M.; Gladyshev, V. N. Cysteine Function Governs Its Conservation and
Degeneration and Restricts Its Utilization on Protein Surfaces. J. Mol. Biol. 2010, 404,
902–916, 10.1016/j.jmb.2010.09.027.
180. Lemire, J. A.; Harrison, J. J.; Turner, R. J. Antimicrobial Activity of Metals: Mechanisms,
Molecular Targets and Applications. Nat. Rev. Microbiol. 2013, 11, 371–384,
10.1038/nrmicro3028.

225
181. Pomposiello, P. J.; Bennik, M. H. J.; Demple, B. Genome-Wide Transcriptional Profiling
of the Escherichia coli Responses to Superoxide Stress and Sodium Salicylate. J.
Bacteriol. 2001, 183, 3890–3902, 10.1128/JB.183.13.3890.
182. Nikaido, H. Outer Membrane. Neidhardt F C, Curtiss III R, Ingraham J L, Lin E C C, Low
K B Jr, Magasanik B, Reznikoff W S, Riley M, Schaechter M, Umbarger H E, Editors.
Escherichia Coli and Salmonella: Cellular and Molecular Biology. 2nd Ed. Washington,
D.C: Amer. Microbiol. Mol. Biol. Rev. 1996, 67, 29–47, 10.1128/MMBR.67.4.593.
183. Neuhaus, F. C.; Baddiley, J. A Continuum of Anionic Charge: Structures and Functions of
D-Alanyl-Teichoic Acids in Gram-positive Bacteria. Microbiology 2003, 67, 686–723,
10.1128/MMBR.67.4.686.
184. Beveridge, T. J.; Koval, S. F. Binding of Metals to Cell Envelopes of Escherichia coli
Binding of Metals to Cell Envelopes of Escherichia Coli K-12. 1981, 42, 325–335.
185. Hoyle, B. D.; Beveridge, T. J. Metal Binding by the Peptidoglycan Sacculus of
Escherichia coli K-12. Can. J. Microbiol. 1984, 30, 204–211, 10.1139/m84-031.
186. Jung, W. K.; Koo, H. C.; Kim, K. W.; Shin, S.; Kim, S. H.; Park, Y. H. Antibacterial
Activity and Mechanism of Action of the Silver Ion in Staphylococcus aureus and
Escherichia coli. Appl. Environ. Microbiol. 2008, 74, 2171–2178, 10.1128/AEM.02001-
07.
187. Li, W. R.; Xie, X. B.; Shi, Q. S.; Zeng, H. Y.; Ou-Yang, Y. S.; Chen, Y. Ben.
Antibacterial Activity and Mechanism of Silver Nanoparticles on Escherichia coli. Appl.
Microbiol. Biotechnol. 2010, 85, 1115–1122, 10.1007/s00253-009-2159-5.
188. Yamanaka, M.; Hara, K.; Kudo, J. Bactericidal Actions of a Silver Ion Solution On. Appl.
Environ. Microbiol. 2005, 71, 7589–7593, 10.1128/AEM.71.11.7589.
189. Feng, Q. L.; Wu, J.; Chen, G. Q.; Cui, F. Z.; Kim, T. N.; Kim, J. O. A Mechanistic Study
of the Antibacterial Effect of Silver Ions on Escherichia coli and Staphylococcus aureus. J
Biomed Mater Res 2000, 52, 662–668, 10.1002/1097-4636(20001215)52:43.0.CO;2-3.
190. Bragg, P. D.; Rainnie, D. J. The Effect of Silver Ions on the Respiratory Chain of
Escherichia coli. Can. J. Microbiol. 1974, 20, 883–889, 10.1139/m74-135.
191. Gordon, O.; Slenters, T. V.; Brunetto, P. S.; Villaruz, A. E.; Sturdevant, D. E.; Otto, M.;
Landmann, R.; Fromm, K. M. Silver Coordination Polymers for Prevention of Implant
Infection: Thiol Interaction, Impact on Respiratory Chain Enzymes, and Hydroxyl Radical
Induction. Antimicrob. Agents Chemother. 2010, 54, 4208–4218, 10.1128/AAC.01830-09.
192. Dibrov, P.; Dzioba, J.; Gosink, K. K.; Häse, C. C.; Ha, C. C. Chemiosmotic Mechanism of
Antimicrobial Activity of Ag+ in Vibrio Cholerae. Antimicrob. Agents Chemother. 2002,
46, 2668–2670, 10.1128/AAC.46.8.2668.
193. YONEYAMA, H.; KATSUMATA, R. Antibiotic Resistance in Bacteria and Its Future for
Novel Antibiotic Development. Biosci. Biotechnol. Biochem. 2006, 70, 1060–1075,
10.1271/bbb.70.1060.
194. Anjem, A.; Varghese, S.; Imlay, J. A. Manganese Import Is a Key Element of the OxyR
Reponse to Hydrogen Peroxide in Escherichia coli. Mol. Microbiol. 2009, 72, 844–858,
10.2217/FON.09.6.Dendritic.
195. Anjem, A.; Imlay, J. A. Mononuclear Iron Enzymes Are Primary Targets of Hydrogen
Peroxide Stress. J. Biol. Chem. 2012, 287, 15544–15556, 10.1074/jbc.M111.330365.
196. Xu, F. F.; Imlay, J. A. Silver(I), Mercury(II), Cadmium(II), and Zinc(II) Target Exposed
Enzymic Iron-Sulfur Clusters When They Toxify Escherichia coli. Appl. Environ.
Microbiol. 2012, 78, 3614–3621, 10.1128/AEM.07368-11.

226
197. Macomber, L.; Imlay, J. A. The Iron-Sulfur Clusters of Dehydratases Are Primary
Intracellular Targets of Copper Toxicity. Proc. Natl. Acad. Sci. 2009, 106, 8344–8349,
10.1073/pnas.0812808106.
198. Ogunseitan, O. A.; Yang, S.; Ericson, J. Microbial δ-Aminolevulinate Dehydratase as a
Biosensor of Lead Bioavailability in Contaminated Environments. Soil Biol. Biochem.
2000, 32, 1899–1906, 10.1016/S0038-0717(00)00164-4.
199. Erskine, P. T.; Senior, N.; Awan, S.; Lambert, R.; Lewis, G.; Tickle, I. J.; Sarwar, M.;
Spencer, P.; Thomas, P.; Warren, M. J.; et al. X-Ray Structure of 5-Aminolaevulinate
Dehydratase, a Hybrid Aldolase. Nat. Struct. Biol. 1997, 4, 1025–1031, 10.1038/nsb1297-
1025.
200. Ciriolo, M. R.; Civitareale, P.; Carrì, M. T.; De Martino, A.; Galiazzo, F.; Rotilio, G.
Purification and Characterization of Ag, Zn-Superoxide Dismutase from Saccharomyces
cerevisiae Exposed to Silver. J. Biol. Chem. 1994, 269, 25783–25787.
201. Karlin, K. D. Metalloenzymes, Structural Motifs, and Inorganic Models. Science (80-. ).
1993, 261, 701–708, 10.1126/science.7688141.
202. Solioz, M.; Abicht, H. K.; Mermod, M.; Mancini, S. Response of Gram-positive Bacteria
to Copper Stress. J. Biol. Inorg. Chem. 2010, 15, 3–14, 10.1007/s00775-009-0588-3.
203. Macomber, L.; Rensing, C.; Imlay, J. A. Intracellular Copper Does Not Catalyze the
Formation of Oxidative DNA Damage in Escherichia coli. J. Bacteriol. 2007, 189, 1616–
1626, 10.1128/JB.01357-06.
204. Buchtík, R.; Trávníček, Z.; Vančo, J.; Herchel, R.; Dvořák, Z. Synthesis, Characterization,
DNA Interaction and Cleavage, and in Vitro Cytotoxicity of Copper(II) Mixed-Ligand
Complexes with 2-Phenyl-3-Hydroxy-4(1H)- Quinolinone. Dalt. Trans. 2011, 40, 9404–
9412, 10.1039/c1dt10674k.
205. Cao, H.; Wang, Y. Quantification of Oxidative Single-Base and Intrastrand Cross-Link
Lesions in Unmethylated and CpG-Methylated DNA Induced by Fenton-Type Reagents.
Nucleic Acids Res. 2007, 35, 4833–4844, 10.1093/nar/gkm497.
206. Baker, J.; Sitthisak, S.; Sengupta, M.; Johnson, M.; Jayaswal, R. K.; Morrissey, J. A.
Copper Stress Induces a Global Stress Response in Staphylococcus aureus and Represses
Sae and Agr Expression and Biofilm Formations. Appl. Environ. Microbiol. 2010, 76,
150–160, 10.1128/AEM.02268-09.
207. Teitzel, G. M.; Geddie, A.; De Long, S. K.; Kirisits, M. J.; Whiteley, M.; Parsek, M. R.
Survival and Growth in the Presence of Elevated Copper: Transcriptional Profiling of
Copper-Stressed Pseudomonas aeruginosa. J. Bacteriol. 2006, 188, 7242–7256,
10.1128/JB.00837-06.
208. Rochat, T.; Gratadoux, J. J.; Gruss, A.; Corthier, G.; Maguin, E.; Langella, P.; Van De
Guchte, M. Production of a Heterologous Nonheme Catalase by Lactobacillus Casei: An
Efficient Tool for Removal of H2O2 and Protection of Lactobacillus bulgaricus from
Oxidative Stress in Milk. Appl. Environ. Microbiol. 2006, 72, 5143–5149,
10.1128/AEM.00482-06.
209. Macomber, L.; Rensing, C.; Imlay, J. A. Intracellular Copper Does Not Catalyze the
Formation of Oxidative DNA Damage in Escherichia coli. J. Bacteriol. 2007, 189, 1616–
1626, 10.1128/JB.01357-06.
210. Durand, A.; Azzouzi, A.; Bourbon, M. L.; Steunou, A. S.; Liotenberg, S.; Maeshima, A.;
Astier, C.; Argentini, M.; Saito, S.; Ouchane, S. C-Type Cytochrome Assembly Is a Key
Target of Copper Toxicity within the Bacterial Periplasm. MBio 2015, 6, 1–10,

227
10.1128/mBio.01007-15.
211. Chillappagari, S.; Seubert, A.; Trip, H.; Kuipers, O. P.; Marahiel, M. A.; Miethke, M.
Copper Stress Affects Iron Homeostasis by Destabilizing Iron-Sulfur Cluster Formation in
Bacillus subtilis. J. Bacteriol. 2010, 192, 2512–2524, 10.1128/JB.00058-10.
212. Nan, L.; Liu, Y.; Lü, M.; Yang, K. Study on Antibacterial Mechanism of Copper-Bearing
Austenitic Antibacterial Stainless Steel by Atomic Force Microscopy. J. Mater. Sci.
Mater. Med. 2008, 19, 3057–3062, 10.1007/s10856-008-3444-z.
213. Avery, S. V.; Howlett, N. G.; Radice, S. Copper Toxicity towards Saccharomyces
cerevisiae: Dependence on Plasma Membrane Fatty Acid Composition. Appl. Environ.
Microbiol. 1996, 62, 3960–3966.
214. Hong, R.; Kang, T. Y.; Michels, C. A.; Gadura, N. Membrane Lipid Peroxidation in
Copper Alloy-Mediated Contact Killing of Escherichia coli. Appl. Environ. Microbiol.
2012, 78, 1776–1784, 10.1128/AEM.07068-11.
215. Warnes, S. L.; Caves, V.; Keevil, C. W. Mechanism of Copper Surface Toxicity in
Escherichia coli O157:H7 and Salmonella Involves Immediate Membrane Depolarization
Followed by Slower Rate of DNA Destruction Which Differs from That Observed for
Gram-Positive Bacteria. Environ. Microbiol. 2012, 14, 1730–1743, 10.1111/j.1462-
2920.2011.02677.x.
216. Tarrant, E.; Riboldi, G. P.; Mcilvin, M. R.; Stevenson, J.; Barwinska-sendra, A.; Stewart,
L. J.; Saito, A.; Waldron, K. J. Copper Stress in Staphylococcus Aureus Leads to Adaptive
Changes in Central Carbon Metabolism †. 2018, 10.1039/c8mt00239h.
217. Gordon, O.; Slenters, T. V.; Brunetto, P. S.; Villaruz, A. E.; Sturdevant, D. E.; Otto, M.;
Landmann, R.; Fromm, K. M. Silver Coordination Polymers for Prevention of Implant
Infection: Thiol Interaction, Impact on Respiratory Chain Enzymes, and Hydroxyl Radical
Induction. Antimicrob. Agents Chemother. 2010, 54, 4208–4218, 10.1128/AAC.01830-09.
218. Ener-, A. Effect of Silver Ions on Transport and Retention of Phosphate by Escherchia
Coli. 1982, 152, 7–13.
219. Semeykina, A. L.; Skulachev, V. P. Submicromolar Ag+ increases Passive Na+
permeability and Inhibits the Respiration-Supported Formation of Na+ gradient in Bacillus
FTU Vesicles. FEBS Lett. 1990, 269, 69–72, 10.1016/0014-5793(90)81120-D.
220. Hayashi, M.; Miyoshi, T.; Sato, M.; Unemoto, T. Properties of Respiratory Chain-Linked
Na+-Independent NADH-Quinone Reductase in a Marine Vibrio Alginolyticus. BBA -
Bioenerg. 1992, 1099, 145–151, 10.1016/0005-2728(92)90211-J.
221. Modak, S. M.; Fox, C. L. Binding of Silver Sulfadiazine to the Cellular Components of
Pseudomonas aeruginosa. Biochem. Pharmacol. 1973, 22, 2391–2404, 10.1016/0006-
2952(73)90341-9.
222. Fox, C. L.; Modak, S. M. Mechanism of Silver Sulfadiazine Action on Burn Wound
Infections. Antimicrob. Agents Chemother. 1974, 5, 582–588, 10.1128/AAC.5.6.582.
223. Matsumura, Y.; Yoshikata, K.; Matsumura, Y.; Yoshikata, K.; Kunisaki, S.; Tsuchido, T.
Mode of Bactericidal Action of Silver Zeolite and Its Comparison with That of Silver
Nitrate. 2003, 69, 4278–4281, 10.1128/AEM.69.7.4278.
224. Liau, S. Y.; Read, D. C.; Pugh, W. J.; Furr, J. R.; Russell, A. D. Interaction of Silver
Nitrate with Readily Identifiable Groups: Relationship to the Antibacterial Action of
Silver Ions. Lett. Appl. Microbiol. 1997, 25, 279–283.
225. Flemming, C. A.; Ferris, F. G.; Beveridge, T. J.; Bailey, G. W. Remobilization of Toxic
Heavy Metals Adsorbed to Bacterial Wall-Clay Composites. Appl. Environ. Microbiol.

228
1990, 56, 3191–3203.
226. Mijnendonckx, K.; Leys, N.; Mahillon, J.; Silver, S.; Van Houdt, R. Antimicrobial Silver:
Uses, Toxicity and Potential for Resistance. BioMetals 2013, 26, 609–621,
10.1007/s10534-013-9645-z.
227. Mazzei, L.; Cianci, M.; Gonzalez Vara, A.; Ciurli, S. The Structure of Urease Inactivated
by Ag(i): A New Paradigm for Enzyme Inhibition by Heavy Metals. Dalt. Trans. 2018,
47, 8240–8247, 10.1039/c8dt01190g.
228. Park, H. J.; Kim, J. Y.; Kim, J.; Lee, J. H.; Hahn, J. S.; Gu, M. B.; Yoon, J. Silver-Ion-
Mediated Reactive Oxygen Species Generation Affecting Bactericidal Activity. Water
Res. 2009, 43, 1027–1032, 10.1016/j.watres.2008.12.002.
229. Xiu, Z. M.; Ma, J.; Alvarez, P. J. J. Differential Effect of Common Ligands and Molecular
Oxygen on Antimicrobial Activity of Silver Nanoparticles versus Silver Ions. Environ.
Sci. Technol. 2011, 45, 9003–9008, 10.1021/es201918f.
230. Deshmukh, S. P.; Patil, S. M.; Mullani, S. B.; Delekar, S. D. Silver Nanoparticles as an
Effective Disinfectant: A Review. Mater. Sci. Eng. C 2019, 97, 954–965,
10.1016/j.msec.2018.12.102.
231. Rice, K. M.; Ginjupali, G. K.; Manna, N. D. P. K.; Jones, C. B.; Blough, E. R. A Review
of the Antimicrobial Potential of Precious Metal Derived Nanoparticle Constructs.
Nanotechnology 2019.
232. Chitambar, C. R.; Narasimhan, J. Targeting Iron-Dependant DNA Synthesis with Gallium
and Transferrin-Gallium. Pathobiology 1991, 59, 3–10, 10.1159/000163609.
233. Minandri, F.; Bonchi, C.; Frangipani, E.; Imperi, F.; Visca, P. Promises and Failures of
Gallium as an Antibacterial Agent. Future Microbiol. 2014, 9, 379–397,
10.2217/fmb.14.3.
234. Nikolova, V.; Angelova, S.; Markova, N.; Dudev, T. Gallium as a Therapeutic Agent: A
Thermodynamic Evaluation of the Competition between Ga3+ and Fe3+ Ions in
Metalloproteins. J. Phys. Chem. B 2016, 120, 2241–2248, 10.1021/acs.jpcb.6b01135.
235. Khayam-bashi, H. The Association and of Ga-67 Lactoferrin. 1977.
236. Vallabhajosula, S.; Harwig, J.; Siemsen, J. Radiogallium Localization in Tumors: Blood
Binding and Transport and the Role of Transferrin. J. Nucl. Med. 1980, 21, 650–656.
237. Olakanmi, O.; Gunn, J. S.; Su, S.; Soni, S.; Hassett, D. J.; Britigan, B. E. Gallium Disrupts
Iron Uptake by Intracellular and Extracellular Francisella Strains and Exhibits Therapeutic
Efficacy in a Murine Pulmonary Infection Model. Antimicrob. Agents Chemother. 2010,
54, 244–253, 10.1128/AAC.00655-09.
238. Neu, H. C. The Crisis in Antibiotic Resistance. Science (80-. ). 1992, 257, 1064–1073,
10.1126/science.257.5073.1064.
239. Mayhew, G. F.; Welch, R. A.; Klink, S.; Glasner, J. D.; Lim, A.; Davis, N. W.; Dimalanta,
E. T.; Lin, J.; Hackett, J.; Mau, B.; et al. Genome Sequence of Enterohaemorrhagic
Escherichia coli O157:H7. Nature 2003, 409, 529–533, 10.1038/35054089.
240. Cloete, T. E. Resistance Mechanisms of Bacteria to Antimicrobial Compounds. Int.
Biodeterior. Biodegrad. 2003, 51, 277–282, 10.1016/S0964-8305(03)00042-8.
241. Silver, S. Bacterial Silver Resistance: Molecular Biology and Uses and Misuses of Silver
Compounds. FEMS Microbiol. Rev. 2003, 27, 341–353, 10.1016/S0168-6445(03)00047-0.
242. Harrison, J. J.; Ceri, H.; Turner, R. J. Multimetal Resistance and Tolerance in Microbial
Biofilms. Nat. Rev. Microbiol. 2007, 5, 928–938, 10.1038/nrmicro1774.
243. Kuenne, C.; Voget, S.; Pischimarov, J.; Oehm, S.; Goesmann, A.; Daniel, R.; Hain, T.;

229
Chakraborty, T. Comparative Analysis of Plasmids in the Genus Listeria. PLoS One 2010,
5, 1–7, 10.1371/journal.pone.0012511.
244. Brown, N. L.; Barrett, S. R.; Camakaris, J.; Lee, B. T. O.; Rouch, D. A. Molecular
Genetics and Transport Analysis of the Copper‐resistance Determinant (Pco) from
Escherichia coli Plasmid PRJ1004. Mol. Microbiol. 1995, 17, 1153–1166,
10.1111/j.1365-2958.1995.mmi_17061153.x.
245. Gupta, A.; Maynes, M.; Silver, S. Effects of Halides on Plasmid-Mediated Silver
Resistance in Escherichia coli. Appl. Environ. Microbiol. 1998, 64, 5042–5045.
246. Szczepanowski, R.; Bekel, T.; Goesmann, A.; Krause, L.; Krömeke, H.; Kaiser, O.;
Eichler, W.; Pühler, A.; Schlüter, A. Insight into the Plasmid Metagenome of Wastewater
Treatment Plant Bacteria Showing Reduced Susceptibility to Antimicrobial Drugs
Analysed by the 454-Pyrosequencing Technology. J. Biotechnol. 2008, 136, 54–64,
10.1016/j.jbiotec.2008.03.020.
247. Baker-Austin, C.; Wright, M. S.; Stepanauskas, R.; McArthur, J. V. Co-Selection of
Antibiotic and Metal Resistance. Trends Microbiol. 2006, 14, 176–182,
10.1016/j.tim.2006.02.006.
248. Novick, R. P.; Roth, C. Plasmid-Linked Resistance to Inorganic Salts in Staphylococcus
aureus. J. Bacteriol. 1968, 95, 1335–1342.
249. Foster, T. J. Plasmid-Determined Resistance to Antimicrobial Drugs and Toxic Metal Ions
in Bacteria. Microbiol. Rev. 1983, 47, 361–409.
250. Summers, A. O.; Wireman, J.; Vimy, M. J.; Lorscheider, F. L.; Marshall, B.; Levy, S. B.;
Bennett, S.; Billard, L. Mercury Released from Dental “silver” Fillings Provokes an
Increase in Mercury- and Antibiotic-Resistant Bacteria in Oral and Intestinal Floras of
Primates. Antimicrob. Agents Chemother. 1993, 37, 825–834, 10.1128/AAC.37.4.825.
251. Hughes, V. M.; Datta, N. Conjugative Plasmids in Bacteria of the “pre-Antibiotic” Era
[24]. Nature. 1983, pp 725–726.
252. Davies, J.; Davies, D. Origins and Evolution of Antibiotic Resistance. Microbiol. Mol.
Biol. Rev. 2010, 74, 417–433, 10.1128/MMBR.00016-10.
253. Rensing, C.; Grass, G. Escherichia coli Mechanisms of Copper Homeostasis in a
Changing Environment. FEMS Microbiol. Rev. 2003, 27, 197–213, 10.1016/S0168-
6445(03)00049-4.
254. Rensing, C.; Fan, B.; Sharma, R.; Mitra, B.; Rosen, B. P. CopA: An Escherichia coli
Cu(I)-Translocating P-Type ATPase. Proc. Natl. Acad. Sci. 2002, 97, 652–656,
10.1073/pnas.97.2.652.
255. Petersen, C.; Møller, L. B. Control of Copper Homeostasis in Escherichia coli by a P-
Type ATPase, CopA, and a MerR-like Transcriptional Activator, CopR. Gene 2000, 261,
289–298, 10.1016/S0378-1119(00)00509-6.
256. Outten, F. W.; Outten, C. E.; Hale, J.; O’Halloran, T. V. Transcriptional Activation of an
Escherichia coli Copper Efflux Regulon by the Chromosomal MerR Homologue, CueR. J.
Biol. Chem. 2000, 275, 31024–31029, 10.1074/jbc.M006508200.
257. Brown, N. L.; Stoyanov, J. V; Kidd, S. P.; Hobman, J. L. The MerR Family of
Transcriptional Regulators. FEMS Microbiol. Rev. 2003, 27, 145–163, 10.1016/S0168-
6445(03)00051-2.
258. Stoyanov, J. V.; Hobman, J. L.; Brown, N. L. CueR (Ybbl) of Escherichia coli Is a MerR
Family Regulator Controlling Expression of the Copper Exporter CopA. Mol. Microbiol.
2001, 39, 502–511, 10.1046/j.1365-2958.2001.02264.x.

230
259. Stoyanov, J. V.; Browns, N. L. The Escherichia Coli Copper-Responsive CopA Promoter
Is Activated by Gold. J. Biol. Chem. 2003, 278, 1407–1410, 10.1074/jbc.C200580200.
260. Grass, G.; Rensing, C. CueO Is a Multi-Copper Oxidase That Confers Copper Tolerance
in Escherichia coli. Biochem. Biophys. Res. Commun. 2001, 286, 902–908,
10.1006/bbrc.2001.5474.
261. Rodriguez-Montelongo, L.; de la Cruz-Rodriguez, L. C.; Farías, R. N.; Massa, E. M.
Membrane-Associated Redox Cycling of Copper Mediates Hydroperoxide Toxicity in
Escherichia coli. BBA - Bioenerg. 1993, 1144, 77–84, 10.1016/0005-2728(93)90033-C.
262. Franke, S.; Grass, G.; Rensing, C.; Nies, D. H. Molecular Analysis of the Copper-
Transporting Efflux System CusCFBA of Escherichia Coli. J. Bacteriol. 2003, 185, 3804–
3812, 10.1128/JB.185.13.3804-3812.2003.
263. Outten, F. W.; Huffman, D. L.; Hale, J. A.; O’Halloran, T. V. The Independent Cue and
Cus Systems Confer Copper Tolerance during Aerobic and Anaerobic Growth in
Escherichia coli. J. Biol. Chem. 2001, 276, 30670–30677, 10.1074/jbc.M104122200.
264. Munson, G. P.; Lam, D. L.; Outten, F. W.; O’Halloran, T. V. Identification of a Copper-
Responsive Two-Component System on the Chromosome of Escherichia coli K-12. J.
Bacteriol. 2000, 182, 5864–5871, 10.1128/JB.182.20.5864-5871.2000.
265. Nakajima, M.; Goto, M.; Akutsu, K.; Tadaaki, H. Nucleotide Sequence and Organization
of Copper Resistance Genes from Pseudomonas syringae Pv. Tomato. Eur. J. Plant
Pathol. 2004, 110, 223–226.
266. Tetaz, T. J.; Luke, R. K. J. Plasmid-Controlled Resistance to Copper in Escherichia coli.
J. Bacteriol. 1983, 154, 1263–1268.
267. Mills, S. D.; Lim, C. K.; Cooksey, D. A. Purification and Characterization of CopR, a
Transcriptional Activator Protein That Binds to a Conserved Domain (Cop Box) in
Copper- Inducible Promoters of Pseudomonas syringae. MGG Mol. Gen. Genet. 1994,
244, 341–351, 10.1007/BF00286685.
268. Jelenko, C. Silver Nitrate Resistant E. coli: Report of Case The Modern Revival of the
Use of Silver in Its Nitrate Form or a Colloidal Preparation Began with the Work of
Moyer. 1964.
269. Sharma, R.; Rensing, C.; Rosen, P.; Mitra, B.; Rosen, B. P. The ATP Hydrolytic Activity
of Purified ZntA , a Pb(II)/Cd(II)/Zn(II)-Translocating ATPase from Escherichia coli. J.
Biol. Chem. 2000, 275, 3873–3878.
270. Solioz, M.; Vulpe, C. CPx-Type ATPases: A Class of P-Type ATPases That Pump Heavy
Metals. Trends Biochem. Sci. 1996, 21, 237–241, 10.1016/S0968-0004(96)20016-7.
271. Solioz, M.; Odermatt, A. Copper and Silver Transport by CopB-ATPase in Membrane
Vesicles of Enterococcus hirae. J. Biol. Chem. 1995, 270, 9217–9221.
272. Silver, S.; Gupta, A.; Matsui, K.; Lo, J. F. Resistance to Ag(I) Cations in Bacteria:
Environments, Genes and Proteins. Met. Based. Drugs 1999, 6, 315–320,
10.1155/MBD.1999.315.
273. Ledrich, M. L.; Stemmler, S.; Laval-Gilly, P.; Foucaud, L.; Falla, J. Precipitation of
Silver-Thiosulfate Complex and Immobilization of Silver by Cupriavidus Metallidurans.
BioMetals 2005, 18, 643–650, 10.1007/s10534-005-3858-8.
274. Pooley, F. D. Bacteria Accumulate Silver during Leaching of Sulphide Ore Minerals
Mineralization of Organic Matter in the Sea Bed-the Role of Sulphate Reduction. Nature
1982, 296, 94–95.
275. Kontoghiorghes, G. J.; Kolnagou, A.; Skiada, A.; Petrikkos, G. The Role of Iron and

231
Chelators on Infections in Iron Overload and Non Iron Loaded Conditions: Prospects for
the Design of New Antimicrobial Therapies. Hemoglobin 2010, 34, 227–239,
10.3109/03630269.2010.483662.
276. Kelson, A. B.; Carnevali, M.; Truong-Le, V. Gallium-Based Anti-Infectives: Targeting
Microbial Iron-Uptake Mechanisms. Curr. Opin. Pharmacol. 2013, 13, 707–716,
10.1016/j.coph.2013.07.001.
277. Goss, C. H.; Kaneko, Y.; Khuu, L.; Anderson, G. D.; Ravishankar, S.; Aitken, M. L.;
Lechtzin, N.; Zhou, G.; Czyz, D. M.; McLean, K.; et al. Gallium Disrupts Bacterial Iron
Metabolism and Has Therapeutic Effects in Mice and Humans with Lung Infections. Sci.
Transl. Med. 2018, 10, eaat7520, 10.1126/scitranslmed.aat7520.
278. Turner, R. J. Metal-Based Antimicrobial Strategies. Microb. Biotechnol. 2017, 10, 1062–
1065, 10.1111/1751-7915.12785.
279. Massè, A.; Bruno, A.; Bosetti, M.; Biasibetti, A.; Cannas, M.; Gallinaro, P. Prevention of
Pin Track Infection in External Fixation with Silver Coated Pins: Clinical and
Microbiological Results. J. Biomed. Mater. Res. 2000, 53, 600–604, 10.1002/1097-
4636(200009)53:5<600::AID-JBM21>3.0.CO;2-D.
280. Bologna, R. A.; Tu, L. M.; Polansky, M.; Fraimow, H. D.; Gordon, D. A.; Whitmore, K.
E. Hydrogel/Silver Ion-Coated Urinary Catheter Reduces Nosocomial Urinary Tract
Infection Rates in Intensive Care Unit Patients: A Multicenter Study. Urology 1999, 54,
982–987, 10.1016/S0090-4295(99)00318-0.
281. Gomes, A.; Fernandes, E.; Lima, J. L. F. C. Fluorescence Probes Used for Detection of
Reactive Oxygen Species. J. Biochem. Biophys. Methods 2005, 65, 45–80,
10.1016/j.jbbm.2005.10.003.
282. Imlay, J. A. Diagnosing Oxidative Stress in Bacteria: Not as Easy as You Might Think.
Curr. Opin. Microbiol. 2015, 24, 124–131, 10.1016/j.mib.2015.01.004.
283. Zhao, H.; Joseph, J.; Fales, H. M.; Sokoloski, E. A.; Levine, R. L.; Vasquez-Vivar, J.;
Kalyanaraman, B. Detection and Characterization of the Product of Hydroethidine and
Intracellular Superoxide by HPLC and Limitations of Fluorescence. Proc. Natl. Acad. Sci.
U. S. A. 2005, 102, 5727–5732, 10.1073/pnas.0501719102.
284. Gunsalus, R. P.; Park, S. J. Aerobic-Anaerobic Gene Regulation in Escherichia coli:
Control by the ArcAB and Fnr Regulons. Res. Microbiol. 1994, 145, 437–450,
10.1016/0923-2508(94)90092-2.
285. Kershaw, C. J.; Brown, N. L.; Constantinidou, C.; Patel, M. D.; Hobman, J. L. The
Expression Profile of Escherichia coli K-12 in Response to Minimal, Optimal and Excess
Copper Concentrations. Microbiology 2005, 151, 1187–1198, 10.1099/mic.0.27650-0.
286. Yamamoto, K.; Ishihama, A. Transcriptional Response of Escherichia coli to External
Copper. Mol. Microbiol. 2005, 56, 215–227, 10.1111/j.1365-2958.2005.04532.x.
287. Kitano, H. Systems Biology: A Brief Overview. Science (80-. ). 2002, 295, 1662–1664.
288. Breitling, R. What Is Systems Biology? Front. Physiol. 2010, 1, 1–5,
10.3389/fphys.2010.00009.
289. Percival, S. L.; Hill, K. E.; Williams, D. W.; Hooper, S. J.; Thomas, D. W.; Costerton, J.
W. A Review of the Scientific Evidence for Biofilms in Wounds. Wound Repair Regen.
2012, 20, 647–657, 10.1111/j.1524-475X.2012.00836.x.
290. Bauer, T. T.; Torres, A.; Ferrer, R.; Heyer, C. M.; Schultze-Werninghaus, G.; Rasche, K.
Biofilm Formation in Endotracheal Tubes. Association between Pneumonia and the
Persistence of Pathogens. Monaldi Arch. Chest Dis. - Pulm. Ser. 2002, 57, 84–87.

232
291. Stewart, P. S. Mechanisms of Antibiotic Resistance in Bacterial Biofilms. Int. J. Med.
Microbiol. 2002, 292, 107–113, 10.1078/1438-4221-00196.
292. Gant, V. A.; Wren, M. W. D.; Rollins, M. S. M.; Jeanes, A.; Hickok, S. S.; Hall, T. J.
Three Novel Highly Charged Copper-Based Biocides: Safety and Efficacy against
Healthcare-Associated Organisms. J. Antimicrob. Chemother. 2007, 60, 294–299,
10.1093/jac/dkm201.
293. Rzhepishevska, O.; Ekstrand-Hammarström, B.; Popp, M.; Björn, E.; Bucht, A.; Sjöstedt,
A.; Antti, H.; Ramstedt, M. The Antibacterial Activity of Ga3+ is Influenced by Ligand
Complexation as Well as the Bacterial Carbon Source. Antimicrob. Agents Chemother.
2011, 55, 5568–5580, 10.1128/AAC.00386-11.
294. Middaugh, J.; Hamel, R.; Jean-Baptiste, G.; Beriault, R.; Chenier, D.; Appanna, V. D.
Aluminum Triggers Decreased Aconitase Activity via Fe-S Cluster Disruption and the
Overexpression of Isocitrate Dehydrogenase and Isocitrate Lyase: A Metabolic Network
Mediating Cellular Survival. J. Biol. Chem. 2005, 280, 3159–3165,
10.1074/jbc.M411979200.
295. Holt, K. B.; Bard, A. J. Interaction of Silver(I) with the Respiratory Chain of Escherichia
coli: An Electrochemical and Scanning Electrochemical Microscopy Study of the
Antimicrobial Mechanism of Micromoar Ag+. Biochemistry 2005, 44, 13214–13223,
10.1021/bi0508542.
296. Calderón, I. L.; Elías, A. O.; Fuentes, E. L.; Pradenas, G. A.; Castro, M. E.; Arenas, F. A.;
Pérez, J. M.; Vásquez, C. C. Tellurite-Mediated Disabling of [4Fe-4S] Clusters of
Escherichia coli Dehydratases. Microbiology 2009, 155, 1840–1846,
10.1099/mic.0.026260-0.
297. Werthén, M.; Henriksson, L.; Jensen, P. Ø.; Sternberg, C.; Givskov, M.; Bjarnsholt, T. An
in Vitro Model of Bacterial Infections in Wounds and Other Soft Tissues. APMIS 2010,
118, 156–164, 10.1111/j.1600-0463.2009.02580.x.
298. Ceri, H.; Olson, M. E.; Stremick, C.; Read, R. R.; Morck, D.; Buret, A. The Calgary
Biofilm Device: New Technology for Rapid Determination of Antibiotic Susceptibilities
of Bacterial Biofilms. J. Clin. Microbiol. 1999, 37, 1771–1776.
299. Harrison, J. J.; Stremick, C. A.; Turner, R. J.; Allan, N. D.; Olson, M. E.; Ceri, H.
Microtiter Susceptibility Testing of Microbes Growing on Peg Lids: A Miniaturized
Biofilm Model for High-Throughput Screening. Nat. Protoc. 2010, 5, 1236–1254,
10.1038/nprot.2010.71.
300. Baker, P.; Whitfield, G. B.; Hill, P. J.; Little, D. J.; Pestrak, M. J.; Robinson, H.; Wozniak,
D. J.; Howell, P. L. Characterization of the Pseudomonas aeruginosa Glycoside
Hydrolase PslG Reveals That Its Levels Are Critical for Psl Polysaccharide Biosynthesis
and Biofilm Formation. J. Biol. Chem. 2015, 290, 28374–28387,
10.1074/jbc.M115.674929.
301. Mann, E. E.; Manna, D.; Mettetal, M. R.; May, R. M.; Dannemiller, E. M.; Chung, K. K.;
Brennan, A. B.; Reddy, S. T. Surface Micropattern Limits Bacterial Contamination.
Antimicrob. Resist. Infect. Control 2014, 3, 1–8, 10.1186/2047-2994-3-28.
302. Reffuveille, F.; De La Fuente-Núnez, C.; Mansour, S.; Hancock, R. E. W. A Broad-
Spectrum Antibiofilm Peptide Enhances Antibiotic Action against Bacterial Biofilms.
Antimicrob. Agents Chemother. 2014, 58, 5363–5371, 10.1128/AAC.03163-14.
303. Lopes, S. P.; Azevedo, N. F.; Pereira, M. O. Emergent Bacteria in Cystic Fibrosis: In
Vitro Biofilm Formation and Resilience under Variable Oxygen Conditions. Biomed Res.

233
Int. 2014, 2014, 1–7, 10.1155/2014/678301.
304. Bjarnsholt, T.; Kirketerp-Møller, K.; Kristiansen, S.; Phipps, R.; Nielsen, A. K.; Jensen, P.
Ø.; Høiby, N.; Givskov, M. Silver against Pseudomonas aeruginosa Biofilms. Apmis
2007, 115, 921–928, 10.1111/j.1600-0463.2007.apm_646.x.
305. Høiby, N.; Bjarnsholt, T.; Givskov, M.; Molin, S.; Ciofu, O. Antibiotic Resistance of
Bacterial Biofilms. Int. J. Antimicrob. Agents 2010, 35, 322–332,
10.1016/j.ijantimicag.2009.12.011.
306. Spoering, A. L.; Lewis, K. Biofilms and Planktonic Cells of Pseudomonas aeruginosa
Have Similar Resistance to Killing by Antimicrobials. J. Bacteriol. 2001, 183, 6746–
6751, 10.1128/JB.183.23.6746-6751.2001.
307. Harrison, J. J.; Turner, R. J.; Ceri, H. Persister Cells, the Biofilm Matrix and Tolerance to
Metal Cations in Biofilm and Planktonic Pseudomonas aeruginosa. Environ. Microbiol.
2005, 7, 981–994, 10.1111/j.1462-2920.2005.00777.x.
308. Melaiye, A.; Youngs, W. J. Silver and Its Application as an Antimicrobial Agent. Expert
Opin. Ther. Pat. 2005, 15, 125–130, 10.1517/13543776.15.2.125.
309. Wu, C.; Labrie, J.; Tremblay, Y. D. N.; Haine, D.; Mourez, M.; Jacques, M. Zinc as an
Agent for the Prevention of Biofilm Formation by Pathogenic Bacteria. J. Appl.
Microbiol. 2013, 115, 30–40, 10.1111/jam.12197.
310. J. Ruben Morones-Ramirez Jonathan A. Winkler, Catherine S. Spina, J. J.; Collins. Silver
Enhances Antibiotec Activity Against Gram-negative Bacteria. Sci. Transl. Med. 2013, 5,
1–11, 10.1126/scitranslmed.3006276.Silver.
311. Davies, J.; Davies, D. Origins and Evolution of Antibiotic Resistance. Microbiol. Mol.
Biol. Rev. 2010, 74, 417–433, 10.1128/MMBR.00016-10.
312. Neu, H. C. The Crisis in Antibiotic Resistance. Science (80-. ). 1993, 257, 1064–1073.
313. Park, A. J.; Okhovat, J. P.; Kim, J. Antimicrobial Peptides. Clin. Basic
Immunodermatology Second Ed. 2017, 10.1007/978-3-319-29785-9_6.
314. Kenawy, E. R.; Worley, S. D.; Broughton, R. The Chemistry and Applications of
Antimicrobial Polymers: A State-of-the-Art Review. Biomacromolecules 2007, 8, 1359–
1384, 10.1021/bm061150q.
315. Tyers, M.; Brown, E. D.; Wildenhain, J.; Farha, M. A.; Wright, G. D.; Coombes, B. K.;
Ejim, L.; Falconer, S. B. Combinations of Antibiotics and Nonantibiotic Drugs Enhance
Antimicrobial Efficacy. Nat. Chem. Biol. 2011, 7, 348–350, 10.1038/nchembio.559.
316. Andreini, C.; Bertini, I.; Rosato, A. A Hint to Search for Metalloproteins in Gene Banks.
Bioinformatics 2004, 20, 1373–1380, 10.1093/bioinformatics/bth095.
317. Nies, D. H. Microbial Heavy-Metal Resistance. Appl. Microbiol. Biotechnol. 1999, 51,
730–750, 10.1007/s002530051457.
318. Shastri, J. P.; Rupani, M. G.; Jain, R. L. Antimicrobial Activity of Nanosilver-Coated
Socks Fabrics against Foot Pathogens. J. Text. Inst. 2012, 103, 1234–1243,
10.1080/00405000.2012.675680.
319. Atiyeh, B. S.; Costagliola, M.; Hayek, S. N.; Dibo, S. A. Effect of Silver on Burn Wound
Infection Control and Healing: Review of the Literature. Burns 2007, 33, 139–148,
10.1016/j.burns.2006.06.010.
320. Li, Y.; Leung, P.; Yao, L.; Song, Q. W.; Newton, E. Antimicrobial Effect of Surgical
Masks Coated with Nanoparticles. J. Hosp. Infect. 2006, 62, 58–63,
10.1016/j.jhin.2005.04.015.
321. Ghazvini, K.; Barati, S.; Ahrari, F.; Eslami, N.; Rajabi, O. The Antimicrobial Sensitivity

234
of Streptococcus mutans and Streptococcus sangius to Colloidal Solutions of Different
Nanoparticles Applied as Mouthwashes. Dent. Res. J. (Isfahan). 2015, 12, 44–49,
10.4103/1735-3327.150330.
322. Liu, Y.; He, L.; Mustapha, A.; Li, H.; Hu, Z. Q.; Lin, M. Antibacterial Activities of Zinc
Oxide Nanoparticles against Escherichia coli O157:H7. J. Appl. Microbiol. 2009, 107,
1193–1201, 10.1111/j.1365-2672.2009.04303.x.
323. Wahid, F.; Zhong, C.; Wang, H.; Hu, X.; Chu, L. Recent Advances in Antimicrobial
Hydrogels Containing Metal Ions and Metals/Metal Oxide Nanoparticles. Polymers
(Basel). 2017, 9, 1–27, 10.3390/polym9120636.
324. Fayaz, A. M.; Balaji, K.; Girilal, M.; Yadav, R.; Kalaichelvan, P. T.; Venketesan, R.
Biogenic Synthesis of Silver Nanoparticles and Their Synergistic Effect with Antibiotics:
A Study against Gram-positive and Gram-negative Bacteria. Nanomedicine
Nanotechnology, Biol. Med. 2010, 6, 103–109, 10.1016/j.nano.2009.04.006.
325. Balouiri, M.; Sadiki, M.; Ibnsouda, S. K. Methods for in Vitro Evaluating Antimicrobial
Activity: A Review. J. Pharm. Anal. 2016, 6, 71–79, 10.1016/j.jpha.2015.11.005.
326. Azam, A. Antimicrobial Activity of Metal Oxide Nanoparticles against Gram-positive and
Gram-negative Bacteria: A Comparative Study. Int. J. Nanomedicine 2012, 7, 6003–6009.
327. Ruparelia, J. P.; Kumar, A.; Duttagupta, S. P. Strain Specificity in Antimicrobial Activity
of Silver and Copper Nanoparticles. Acta Biomater. 2008, 4, 707–716.
328. Vance, M. E.; Kuiken, T.; Vejerano, E. P.; McGinnis, S. P.; Hochella, M. F.; Hull, D. R.
Nanotechnology in the Real World: Redeveloping the Nanomaterial Consumer Products
Inventory. Beilstein J. Nanotechnol. 2015, 6, 1769–1780, 10.3762/bjnano.6.181.
329. Teitzel, G. M.; Parsek, M. R. Heavy Metal Resistance of Biofilm and Planktonic
Pseudomonas aeruginosa. Appl. Environ. Microbiol. 2003, 69, 2313–2320,
10.1128/AEM.69.4.2313.
330. Peeters, E.; Nelis, H. J.; Coenye, T. Resistance of Planktonic and Biofilm-Grown
Burkholderia cepacia Complex Isolates to the Transition Metal Gallium. J. Antimicrob.
Chemother. 2008, 61, 1062–1065, 10.1093/jac/dkn072.
331. Harrison, J. J.; Rabiei, M.; Turner, R. J.; Badry, E. A.; Sproule, K. M.; Ceri, H. Metal
Resistance in Candida Biofilms. FEMS Microbiol. Ecol. 2006, 55, 479–491,
10.1111/j.1574-6941.2005.00045.x.
332. Han, D.; Hur, H. Metagenomic Analysis Reveals the Prevalence and Persistence of
Antibiotic- and Heavy Metal-Resistance Genes in Wastewater Treatment. 2018, 56, 408–
415, 10.1007/s12275-018-8195-z.
333. Li, A.-D.; Li, L.-G.; Zhang, T. Exploring Antibiotic Resistance Genes and Metal
Resistance Genes in Plasmid Metagenomes from Wastewater Treatment Plants. Front.
Microbiol. 2015, 6, 1–11, 10.3389/fmicb.2015.01025.
334. Wright, M. S.; Peltier, G. L.; Stepanauskas, R.; McArthur, J. V. Bacterial Tolerances to
Metals and Antibiotics in Metal-Contaminated and Reference Streams. FEMS Microbiol.
Ecol. 2006, 58, 293–302, 10.1111/j.1574-6941.2006.00154.x.
335. Pal, C.; Asiani, K.; Arya, S.; Rensing, C.; Stekel, D. J.; Larsson, D. G. J.; Hobman, J. L.
Metal Resistance and Its Association with Antibiotic Resistance. In Advances in Microbial
Physiology; Elsevier Ltd., 2017; Vol. 70, pp 261–313.
336. Patel, J. B.; Cockerill, F. R.; Bradford, P. A.; Eliopoulos, G. M.; Hindler, J. A.; Jenkins, S.
G.; Lewis, J. S.; Limbago, B. M02-A12: Performance Standards for Antimicrobial Disk
Susceptibility Tests; Approved Standard—Twelfth Edition; 2015.

235
337. Lemire, J. A.; Kalan, L.; Gugala, N.; Bradu, A.; Turner, R. J. Silver Oxynitrate–an
Efficacious Compound for the Prevention and Eradication of Dual-Species Biofilms.
Biofouling 2017, 33, 460–469, 10.1080/08927014.2017.1322586.
338. Um, M. M.; Brugère, H.; Kérourédan, M.; Oswald, E.; Bibbal, D. Antimicrobial
Resistance Profiles of Enterohemorrhagic and Enteropathogenic Escherichia coli of
Serotypes O157:H7, O26:H11, O103:H2, O111:H8, O145:H28 Compared to Escherichia
coli Isolated from the Same Adult Cattle . Microb. Drug Resist. 2018, 24, 852–859,
10.1089/mdr.2017.0106.
339. Blair, J. M. A.; Webber, M. A.; Baylay, A. J.; Ogbolu, D. O.; Piddock, L. J. V. Molecular
Mechanisms of Antibiotic Resistance. Nat. Rev. Microbiol. 2015, 13, 42–51,
10.1038/nrmicro3380.
340. Seiler, C.; Berendonk, T. U. Heavy Metal Driven Co-Selection of Antibiotic Resistance in
Soil and Water Bodies Impacted by Agriculture and Aquaculture. Front. Microbiol. 2012,
3, 1–10, 10.3389/fmicb.2012.00399.
341. Chen, J.; Cen, T.; He, M.; Gu, A. Z.; Zhang, Y.; Li, D.; Li, X. Sub-Inhibitory
Concentrations of Heavy Metals Facilitate the Horizontal Transfer of Plasmid-Mediated
Antibiotic Resistance Genes in Water Environment. Environ. Pollut. 2018, 237, 74–82,
10.1016/j.envpol.2018.01.032.
342. Burmølle, M.; Webb, J. S.; Rao, D.; Hansen, L. H.; Sørensen, S. J.; Kjelleberg, S.
Enhanced Biofilm Formation and Increased Resistance to Antimicrobial Agents and
Bacterial Invasion Are Caused by Synergistic Interactions in Multispecies Biofilms. Appl.
Environ. Microbiol. 2006, 72, 3916–3923, 10.1128/AEM.03022-05.
343. Sohlenkamp, C.; Geiger, O. Bacterial Membrane Lipids: Diversity in Structures and
Pathways. FEMS Microbiol. Rev. 2015, 40, 133–159, 10.1093/femsre/fuv008.
344. Politano, A. D.; Campbell, K. T.; Rosenberger, L. H.; Sawyer, R. G. Use of Silver in the
Prevention and Treatment of Infections: Silver Review. Surg. Infect. (Larchmt). 2013, 14,
8–20, 10.1089/sur.2011.097.
345. O'Gorman, J.; Humphreys, H. Application of Copper to Prevent and Control
Infection. Where Are We Now? J. Hosp. Infect. 2012, 81, 217–223,
10.1016/j.jhin.2012.05.009.
346. Yasuyuki, M.; Kunihiro, K.; Kurissery, S.; Kanavillil, N.; Sato, Y.; Kikuchi, Y.
Antibacterial Properties of Nine Pure Metals: A Laboratory Study Using Staphylococcus
aureus and Escherichia coli. Biofouling 2010, 26, 851–858,
10.1080/08927014.2010.527000.
347. Alexander, J. W. History of the Medical Use of Silver. Surg. Infect. (Larchmt). 2009, 10,
289–292, 10.1089/sur.2008.9941.
348. Spellberg, B.; Guidos, R.; Gilbert, D.; Bradley, J.; Boucher, H. W.; Scheld, W. M.;
Bartlett, J. G.; Edwards, J. The Epidemic of Antibiotic-Resistant Infections: A Call to
Action for the Medical Community from the Infectious Diseases Society of America. Clin.
Infect. Dis. 2008, 46, 155–164, 10.1086/524891.
349. Sataev, M. S.; Koshkarbaeva, S. T.; Tleuova, A. B.; Perni, S.; Aidarova, S. B.;
Prokopovich, P. Novel Process for Coating Textile Materials with Silver to Prepare
Antimicrobial Fabrics. Colloids Surfaces A Physicochem. Eng. Asp. 2014, 442, 146–151,
10.1016/j.colsurfa.2013.02.018.
350. Ivask, A.; Elbadawy, A.; Kaweeteerawat, C.; Boren, D.; Fischer, H.; Ji, Z.; Chang, C. H.;
Liu, R.; Tolaymat, T.; Telesca, D.; et al. Toxicity Mechanisms in Escherichia Coli Vary

236
for Silver Nanoparticles and Differ from Ionic Silver. ACS Nano 2014, 8, 374–386,
10.1021/nn4044047.
351. McQuillan, J. S.; Shaw, A. M. Differential Gene Regulation in the Ag Nanoparticle and
Ag+-Induced Silver Stress Response in Escherichia Coli: A Full Transcriptomic Profile.
Nanotoxicology 2014, 8, 177–184, 10.3109/17435390.2013.870243.
352. Saulou-Bérion, C.; Gonzalez, I.; Enjalbert, B.; Audinot, J. N.; Fourquaux, I.; Jamme, F.;
Cocaign-Bousquet, M.; Mercier-Bonin, M.; Girbal, L. Escherichia coli under Ionic Silver
Stress: An Integrative Approach to Explore Transcriptional, Physiological and
Biochemical Responses. PLoS One 2015, 10, 1–25, 10.1371/journal.pone.0145748.
353. Franke S; Grass, G.; Nies, D. H. The Product of the YbdE Gene of the Escherichia coli
Chromosome Is Involved in Detoxification of Silver Ions. Microbiology 2001, 147, 965–
972, 10.1099/00221287-147-4-965.
354. Wagih, O.; Usaj, M.; Baryshnikova, A.; VanderSluis, B.; Kuzmin, E.; Costanzo, M.;
Myers, C. L.; Andrews, B. J.; Boone, C. M.; Parts, L. SGAtools: One-Stop Analysis and
Visualization of Array-Based Genetic Interaction Screens. Nucleic Acids Res. 2013, 41,
591–596, 10.1093/nar/gkt400.
355. Keseler, I. M.; Mackie, A.; Santos-Zavaleta, A.; Billington, R.; Bonavides-Martínez, C.;
Caspi, R.; Fulcher, C.; Gama-Castro, S.; Kothari, A.; Krummenacker, M.; et al. The
EcoCyc Database: Reflecting New Knowledge about Escherichia coli K-12. Nucleic
Acids Res. 2017, 45, D543–D550, 10.1093/nar/gkw1003.
356. Huang, D. W.; Sherman, B. T.; Lempicki, R. A. Systematic and Integrative Analysis of
Large Gene Lists Using DAVID Bioinformatics Resources. Nat. Protoc. 2009, 4, 44–57,
10.1038/nprot.2008.211.
357. Huang, D. W.; Sherman, B. T.; Lempicki, R. A. Bioinformatics Enrichment Tools: Paths
toward the Comprehensive Functional Analysis of Large Gene Lists. Nucleic Acids Res.
2009, 37, 1–13, 10.1093/nar/gkn923.
358. Szklarczyk, D.; Morris, J. H.; Cook, H.; Kuhn, M.; Wyder, S.; Simonovic, M.; Santos, A.;
Doncheva, N. T.; Roth, A.; Bork, P.; et al. The STRING Database in 2017: Quality-
Controlled Protein-Protein Association Networks, Made Broadly Accessible. Nucleic
Acids Res. 2017, 45, D362–D368, 10.1093/nar/gkw937.
359. Boël, G.; Smith, P. C.; Ning, W.; Englander, M. T.; Chen, B.; Hashem, Y.; Testa, A. J.;
Fischer, J. J.; Wieden, H. J.; Frank, J.; et al. The ABC-F Protein EttA Gates Ribosome
Entry into the Translation Elongation Cycle. Nat. Struct. Mol. Biol. 2014, 21, 143–151,
10.1038/nsmb.2740.
360. Xiu, Z.; Liu, Y.; Mathieu, J.; Wang, J.; Zhu, D.; Alvarez, P. J. J. Elucidating the Genetic
Basis for Escherichia coli Defense against Silver Toxicity Using Mutant Arrays. Environ.
Toxicol. Chem. 2014, 33, 993–997, 10.1002/etc.2514.
361. Chung, C. H.; Goldberg, A. L. Purification and Characterization of Protease So , a
Cytoplasmic Serine Protease in Escherichia coli. 1983, 170, 921–926.
362. Beard, S. J.; Hashim, R.; Wu, G.; Binet, M. R. B.; Hughes, M. N.; Poole, R. K. Evidence
for the Transport of Zinc(II) Ions via the Pit Inorganic Phosphate Transport System in
Escherichia coli. FEMS Microbiol. Lett. 2000, 184, 231–235, 10.1016/S0378-
1097(00)00055-0.
363. Skare, J. T. Evidence for a TonB-Dependent Energy Transduction Compiex in
Escherichia coli. 1991, 5, 2883–2890.
364. Utsumi, R.; Horie, T.; Katoh, A.; Kaino, Y.; Tanabe, H.; Noda, M. Isolation and

237
Characterization of the Heat-Responsive Genes in Escherichia coli. Biosci. Biotechnol.
Biochem. 1996, 60, 309–315, 10.1271/bbb.60.309.
365. Parr, R. G.; Pearson, R. G. Absolute Hardness: Companion Parameter to Absolute
Electronegativity. J. Am. Chem. Soc. 1983, 105, 7512–7516, 10.1021/ja00364a005.
366. Bhatia, R.; Calvo, K. C. The Sequencing, Expression, Purification, and Steady-State
Kinetic Analysis of Quinolinate Phosphoribosyl Transferase from Escherichia coli. Arch.
Biochem. Biophys. 1996, 325, 270–278, 10.1006/abbi.1996.0034.
367. Cicchillo, R. M.; Tu, L.; Stromberg, J. A.; Hoffart, L. M.; Krebs, C.; Booker, S. J.
Escherichia coli Quinolinate Synthetase Does Indeed Harbor a [4Fe-4S] Cluster. J. Am.
Chem. Soc. 2005, 127, 7310–7311, 10.1021/ja051369x.
368. Korshunov, S.; Imlay, J. a. Two Sources of Endogenous H2O2 in Escherichia coli. Mol
Microbiol. 2011, 75, 1389–1401, 10.1111/j.1365-2958.2010.07059.x.Two.
369. Templin, M. F.; Ursinus, A.; Höltje, J. V. A Defect in Cell Wall Recycling Triggers
Autolysis during the Stationary Growth Phase of Escherichia coli. EMBO J. 1999, 18,
4108–4117, 10.1093/emboj/18.15.4108.
370. Goodell, E. W.; Schwarz, U. Release of Cell Wall Peptides into Culture Medium by
Exponentially Growing Escherichia coli. J. Bacteriol. 1985, 162, 391–397.
371. Raghunath, A.; Perumal, E. Metal Oxide Nanoparticles as Antimicrobial Agents: A
Promise for the Future. Int. J. Antimicrob. Agents 2017, 49, 137–152,
10.1016/j.ijantimicag.2016.11.011.
372. Berendt, U.; Haverkamp, T.; Prior, A.; Schwenn, J. D. Reaction Mechanism of
Thioredoxin: 3′‐Phospho‐adenylylsulfate Reductase Investigated by Site‐Directed
Mutagenesis. Eur. J. Biochem. 1995, 233, 347–356, 10.1111/j.1432-1033.1995.347_1.x.
373. White, D. C.; Frerman, F. E. Extraction, Characterization, and Cellular Localization of the
Lipids of Staphylococcus aureus. J. Bacteriol. 1967, 94, 1854–1867.
374. Siegel, L. M.; Rueger, D. C.; Barber, M. J.; Krueger, R. J.; Orme-Johnson, N. R.; Orme-
Johnson, W. H. Escherichia Coli Sulfite Reductase Hemoprotein Subunit. J. Biol. Chem.
1982, 257, 6348–6350.
375. Stewart, P. S.; William Costerton, J. Antibiotic Resistance of Bacteria in Biofilms. Lancet
2001, 358, 135–138, 10.1016/S0140-6736(01)05321-1.
376. Shafreen, R. B.; Seema, S.; Ahamed, A. P.; Thajuddin, N.; Ali Alharbi, S. Inhibitory
Effect of Biosynthesized Silver Nanoparticles from Extract of Nitzschia Palea Against
Curli-Mediated Biofilm of Escherichia coli. Appl. Biochem. Biotechnol. 2017, 183, 1351–
1361, 10.1007/s12010-017-2503-7.
377. Iu, Z. O. X.; Iu, Y. U. L.; Athieu, J. A. M.; Ang, J. I. N. G. W.; Hu, D. O. Z.; Lvarez, P. E.
J. J. A. Elucidating The Genetic Basis For Escherichia coli Defense Against Silver
Toxicity Using Mutant Arrays. 2014, 33, 993–997, 10.1002/etc.2514.
378. Rice, D. W.; Rafferty, J. B.; Artymiuk, P. J.; Lloyd, R. G. Insights into the Mechanisms of
Homologous Recombination from the Structure of RuvA. Curr. Opin. Struct. Biol. 1997,
7, 798–803, 10.1016/S0959-440X(97)80149-2.
379. Linley, E.; Denyer, S. P.; McDonnell, G.; Simons, C.; Maillard, J. Y. Use of Hydrogen
Peroxide as a Biocide: New Consideration of Its Mechanisms of Biocidal Action. J.
Antimicrob. Chemother. 2012, 67, 1589–1596, 10.1093/jac/dks129.
380. Su, C.; Yang, F.; Long, F.; Reyon, D.; Routh, M. D.; W, D.; Mokhtari, A. K.; Ornam, J.
D. Van; Rabe, K. L.; Hoy, J. A.; et al. Crystal Structure of the Membrane Fusion Protein
CusB from Escherichia coli. October 2010, 393, 342–355,

238
10.1016/j.jmb.2009.08.029.Crystal.
381. Fralick, J. O. E. a. Evidence That TolC Is Required for Functioning of the Mar/AcrAB
Efflux Pump of Escherichia. Am. Soc. Microbiol. 1996, 178, 5803–5805,
10.1128/JB.178.19.5803-5805.1996.
382. Holt, K. B.; Bard, A. J. Interaction of Silver(I) Ions with the Respiratory Chain of
Escherichia coli: An Electrochemical and Scanning Electrochemical Microscopy Study of
the Antimicrobial Mechanism of Micromolar Ag. Biochemistry 2005, 44, 13214–13223,
10.1021/bi0508542.
383. Membrane, T. H. E. O.; Gram-negative, P. O. F. Joseph M. DiRienzo, Kenzo Nakamura,
and Masayori Inouye. Proteins 1978, 10.1146/annurev.bi.47.070178.002405.
384. Helbig, K.; Bleuel, C.; Krauss, G. J.; Nies, D. H. Glutathione and Transition-Metal
Homeostasis in Escherichia coli. J. Bacteriol. 2008, 190, 5431–5438, 10.1128/JB.00271-
08.
385. Pomposiello, P. J.; Koutsolioutsou, A.; Carrasco, D.; Demple, B. SoxRS-Regulated
Expression and Genetic Analysis of the YggX Gene of Escherichia coli. Society 2003,
185, 6624–6632, 10.1128/JB.185.22.6624.
386. Link, A. J.; Robison, K.; Church, G. M. Comparing the Predicted and Observed Properties
of Proteins Encoded in the Genome OfEscherichia Coli K-12. Electrophoresis 1997, 18,
1259–1313, 10.1002/elps.1150180807.
387. Ioannidis, N.; Cooper, C. E.; Poole, R. K. Spectroscopic Studies on an Oxygen-Binding
Haemoglobin-like Flavohaemoprotein from Escherichia coli. Biochem. J. 1992, 288, 649–
655, 10.1042/bj2880649.
388. Chitambar, C. R. The Therapeutic Potential of Iron-Targeting Gallium Compounds in
Human Disease: From Basic Research to Clinical Application. Pharmacol. Res. 2017,
115, 56–64, 10.1016/j.phrs.2016.11.009.
389. Bonchi, C.; Imperi, F.; Minandri, F.; Visca, P.; Frangipani, E. Repurposing of Gallium-
Based Drugs for Antibacterial Therapy. BioFactors 2014, 40, 303–312,
10.1002/biof.1159.
390. Bernstein, L. R. Mechanisms of Therapeutic Activity for Gallium. Pharmacol. Rev. 1998,
50, 665–682.
391. Pearson, R. G. Hard and Soft Acids and Bases. J. Am. Chem. Soc. 1963, 85, 3533–3539,
10.1021/ja00905a001.
392. Harris, W. R.; Pecoraro, V. L. Thermodynamic Binding Constants for Gallium
Transferrin. Biochemistry 1983, 22, 292–299, 10.1021/bi00271a010.
393. Weiner, R. E.; Neumann, R. D.; Mulshine, J. Transferrin Dependence of Ga (NO3)3
Inhibition of Growth in Human-Derived Small Cell Lung Cancer Cells. J. Cell. Biochem.
1996, 24, 276–287, 10.1016/S0169-5002(97)82799-7.
394. Beriault, R.; Hamel, R.; Chenier, D.; Mailloux, R. J.; Joly, H.; Appanna, V. D. The
Overexpression of NADPH-Producing Enzymes Counters the Oxidative Stress Evoked by
Gallium, an Iron Mimetic. BioMetals 2007, 20, 165–176, 10.1007/s10534-006-9024-0.
395. Al-Aoukaty, A.; Appanna, V. D.; Falter, H. Gallium Toxicity and Adaptation in
Pseudomonas fluorescens. FEMS Microbiol. Lett. 1992, 92, 265–272, 10.1111/j.1574-
6968.1992.tb05272.
396. Olakanmi, O.; Britigan, B. E.; Larry, S. Gallium Disrupts Iron Metabolism of
Mycobacteria Residing within Human Macrophages. Infect. Immun. 2000, 68, 5619–5627,
10.1128/IAI.68.10.5619-5627.2000.Updated.

239
397. Olakanmi, O.; Kesavalu, B.; Pasula, R.; Abdalla, M. Y.; Schlesinger, L. S.; Britigan, B. E.
Gallium Nitrate Is Efficacious in Murine Models of Tuberculosis and Inhibits Key
Bacterial Fe-Dependent Enzymes. Antimicrob. Agents Chemother. 2013, 57, 6074–6080,
10.1128/AAC.01543-13.
398. Arnold, C. E.; Bordin, A.; Lawhon, S. D.; Libal, M. C.; Bernstein, L. R.; Cohen, N. D.
Antimicrobial Activity of Gallium Maltolate against Staphylococcus aureus and
Methicillin-Resistant S. aureus and Staphylococcus pseudintermedius: An in Vitro Study.
Vet. Microbiol. 2012, 155, 389–394, 10.1016/j.vetmic.2011.09.009.
399. Martens, R. J.; Miller, N. A.; Cohen, N. D.; Harrington, J. R.; Bernstein, L. R.
Chemoprophylactic Antimicrobial Activity of Gallium Maltolate against Intracellular
Rhodococcus Equi. J. Equine Vet. Sci. 2007, 27, 341–345, 10.1016/j.jevs.2007.06.007.
400. Antunes, L. C. S.; Imperi, F.; Minandri, F.; Visca, P. In vitro and In vivo Antimicrobial
Activities of Gallium Nitrate against Multidrug-Resistant Acinetobacter Baumannii.
Antimicrob. Agents Chemother. 2012, 56, 5961–5970, 10.1128/AAC.01519-12.
401. García-Contreras, R.; Lira-Silva, E.; Jasso-Chávez, R.; Hernández-González, I. L.; Maeda,
T.; Hashimoto, T.; Boogerd, F. C.; Sheng, L.; Wood, T. K.; Moreno-Sánchez, R. Isolation
and Characterization of Gallium Resistant Pseudomonas aeruginosa Mutants. Int. J. Med.
Microbiol. 2013, 303, 574–582, 10.1016/j.ijmm.2013.07.009.
402. Mcquillan, J. S.; Shaw, A. M.; Mcquillan, J. S.; Shaw, A. M.; Mcquillan, J. S.; Shaw, A.
M. Differential Gene Regulation in the Ag Nanoparticle and Ag-Induced Silver Stress
Response in Escherichia coli : A Full Transcriptomic Profile. 2014, 5390,
10.3109/17435390.2013.870243.
403. Gugala, N.; Lemire, J.; Chatfield-Reed, K.; Yan, Y.; Chua, G.; Turner, R. Using a
Chemical Genetic Screen to Enhance Our Understanding of the Antibacterial Properties of
Silver. Genes (Basel). 2018, 9, 344, 10.3390/genes9070344.
404. Brocklehurst, K. R.; Morby, A. P. Metal-Ion Tolerance in Escherichia coli: Analysis of
Transcriptional Profiles by Gene-Array Technology. Microbiology 2000, 146, 2277–2282,
10.1099/00221287-146-9-2277.
405. Yamamoto, K. Transcriptional Response of Escherichia coli to External Zinc. J.
Bacteriol. 2005, 187, 6333–6340, 10.1128/JB.187.18.6333.
406. Baba, T.; Ara, T.; Hasegawa, M.; Takai, Y.; Okumura, Y.; Baba, M.; Datsenko, K. A.;
Tomita, M.; Wanner, B. L.; Mori, H. Construction of Escherichia coli K-12 in-Frame,
Single-Gene Knockout Mutants: The Keio Collection. Mol. Syst. Biol. 2006, 2,
10.1038/msb4100050.
407. Kuzminov, A. Recombinational Repair of DNA Damage in Escherichia coli and
Bacteriophage Lambda. Microbiol. Mol. Biol. Rev. 1999, 63, 751–813.
408. Hin, A.; Tong, Y.; Evangelista, M.; Parsons, A. B.; Xu, H.; Bader, G. D.; Page, N.;
Robinson, M.; Raghibizadeh, S.; Hogue, C. W. V; et al. Systematic Genetic Analysis with
Ordered Arrays of Yeast Deletion Mutants. Science (80-. ). 2001, 294, 2364–2369,
10.1126/science.1065810.
409. Bateman, A.; Martin, M. J.; O’Donovan, C.; Magrane, M.; Alpi, E.; Antunes, R.; Bely, B.;
Bingley, M.; Bonilla, C.; Britto, R.; et al. UniProt: The Universal Protein Knowledgebase.
Nucleic Acids Res. 2017, 45, D158–D169, 10.1093/nar/gkw1099.
410. Patrick, M. W.; Quandt, M. E.; Swartzlander, B. D.; Matsumura, I. Multicopy Suppression
Underpins Metabolic Evolvability. Mol Microbiol. Evol. 2007, 24, 2716–2722,
10.1093/molbev/msm204.

240
411. Joyce, A. R.; Reed, J. L.; White, A.; Edwards, R.; Osterman, A.; Baba, T.; Mori, H.;
Lesely, S. A.; Palsson, B.; Agarwalla, S. Experimental and Computational Assessment of
Conditionally Essential Genes in Escherichia coli. J. Bacteriol. 2006, 188, 8259–8271,
10.1128/JB.00740-06.
412. Mchugh, J. P.; Rodríguez-Quiñones, F.; Abdul-Tehrani, H.; Svistunenko, D. A.; Poole, R.
K.; Cooper, C. E.; Andrews, S. C. Global Iron-Dependent Gene Regulation in Escherichia
coli: J. Biol. Chem. 2003, 278, 29478–29486, 10.1074/jbc.M303381200.
413. Kakuta, Y.; Horio, T.; Takahashi, Y.; Fukuyama, K. Crystal Structure of Escherichia coli
Fdx, an Adrenodoxin-Type Ferredoxin Involved in the Assembly of Iron-Sulfur Clusters.
Biochemistry 2001, 40, 11007–11012, 10.1021/bi010544t.
414. Cicchillo, R. M.; Lee, K. H.; Baleanu-Gogonea, C.; Nesbitt, N. M.; Krebs, C.; Booker, S.
J. Escherichia coli Lipoyl Synthase Binds Two Distinct [4Fe-4S] Clusters per
Polypeptide. Biochemistry 2004, 43, 11770–11781, 10.1021/bi0488505.
415. Waller, J. C.; Alvarez, S.; Naponelli, V.; Lara-Nunez, A.; Blaby, I. K.; Da Silva, V.;
Ziemak, M. J.; Vickers, T. J.; Beverley, S. M.; Edison, A. S.; et al. A Role for
Tetrahydrofolates in the Metabolism of Iron-Sulfur Clusters in All Domains of Life. Proc.
Natl. Acad. Sci. 2010, 107, 10412–10417, 10.1073/pnas.0911586107.
416. Jang, S.; Imlay, J. A. Hydrogen Peroxide Inactivates the Escherichia coli Isc Iron-Sulfur
Assembly System, and OxyR Induces the Suf System to Compensate. Mol. Microbiol.
2010, 78, 1448–1467, 10.1111/j.1365-2958.2010.07418.x.
417. Laxman, S.; Sutter, B. M.; Wu, X.; Kumar, S.; Guo, X.; David, C.; Mirzaei, H.; Tu, B. P.
Sulfur Amino Acids Regulate Translational Capacity and Metabolic Homeostasis Through
Modulation of TRNA Thiolation. Cell 2014, 154, 416–429,
10.1016/j.cell.2013.06.043.Sulfur.
418. Miethke, M.; Marahiel, M. A. Siderophore-Based Iron Acquisition and Pathogen Control.
Microbiol. Mol. Biol. Rev. 2007, 71, 413–451, 10.1128/MMBR.00012-07.
419. Raymond, K. N.; Dertz, E. A.; Kim, S. S. Enterobactin: An Archetype for Microbial Iron
Transport. Proc. Natl. Acad. Sci. 2003, 100, 3584–3588,
doi.org/10.1073/pnas.0630018100.
420. Chitambar, C. R. Gallium and Its Competing Roles with Iron in Biological Systems.
Biochim. Biophys. Acta 2016, 1863, 2044–2053, 10.1016/j.bbamcr.2016.04.027.
421. Koronakis, V. TolC - The Bacterial Exit Duct for Proteins and Drugs. FEBS Lett. 2003,
555, 66–71, 10.1016/S0014-5793(03)01125-6.
422. Komendarczyk, R.; Pullen, J. Transcriptional Regulation of Drug Efflux Genes by EvgAS,
a Two-Component System in Escherichia coli. Microbiology 2003, 149, 2819–2828,
10.1099/mic.0.26460-0.
423. Bou-Abdallah, F.; Lewin, A. C.; Le Brun, N. E.; Moore, G. R.; Dennis Chasteen, N. Iron
Detoxification Properties of Escherichia coli Bacterioferritin. Attenuation of Oxyradical
Chemistry. J. Biol. Chem. 2002, 277, 37064–37069, 10.1074/jbc.M205712200.
424. Imlay, J. A. Pathways of Oxidative Damage. Annu. Rev. Microbiol. 2003, 57, 395–418,
10.1146/annurev.micro.57.030502.090938.
425. Imlay, J. A. Cellular Defenses Against Superoxide and Hydrogen Peroxide. Annu. Rev.
Biochem. 2008, 77, 755–776, 10.1146/annurev.biochem.77.061606.161055.Cellular.
426. Latinwo, L. M.; Donald, C.; Ikediobi, C.; Silver, S. Effects of Intracellular Glutathione on
Sensitivity of Escherichia coli to Mercury and Arsenite. Biochem. Biophys. Res. Commun.
1998, 242, 67–70, 10.1006/bbrc.1997.7911.

241
427. Ozyamak, E.; Black, S. S.; Walker, C. A.; MacLean, M. J.; Bartlett, W.; Miller, S.; Booth,
I. R. The Critical Role of S-Lactoylglutathione Formation during Methylglyoxal
Detoxification in Escherichia coli. Mol. Microbiol. 2010, 78, 1577–1590, 10.1111/j.1365-
2958.2010.07426.x.
428. Fernandes, A. P.; Fladvad, M.; Berndt, C.; Andrésen, C.; Lillig, C. H.; Neubauer, P.;
Sunnerhagen, M.; Holmgren, A.; Vlamis-Gardikas, A. A Novel Monothiol Glutaredoxin
(Grx4) from Escherichia coli Can Serve as a Substrate for Thioredoxin Reductase. J. Biol.
Chem. 2005, 280, 24544–24552, 10.1074/jbc.M500678200.
429. Yeung, N.; Gold, B.; Liu, N. L.; Prathapam, R.; Sterling, H. J.; Willams, E. R.; Butland,
G. The E. Coli Monothiol Glutaredoxin GrxD Forms Homodimeric and Heterodimeric
FeS Cluster Containing Complexes. Biochemistry 2011, 50, 8957–8969,
10.1021/bi2008883.The.
430. Meganathan, R. Ubiquinone Biosynthesis in Microorganisms. FEMS Microbiol. Lett.
2001, 203, 131–139, 10.1016/S0378-1097(01)00330-5.
431. Søballe, B.; Poole, R. K. Ubiquinone Limits Oxidative Stress in Escherichia coli.
Microbiology 2000, 146, 787–796, 10.1099/00221287-146-4-787.
432. Nocentini, G. Ribonucleotide Reductase Inhibitors: New Strategies for Cancer
Chemotherapy. Crit. Rev. Oncol. Hematol. 1996, 22, 89–126, 1040-8428(95)00187-5.
433. Chitambar, C. R.; Seligman, P. A. Effects of Different Transferrin Forms on Transferrin
Receptor Expression, Iron Uptake, and Cellular Proliferation of Human Leukemic HL60
Cells. Mechanisms Responsible for the Specific Cytotoxicity of Transferrin-Gallium. J.
Clin. Invest. 1986, 78, 1538–1546, 10.1172/JCI112746.
434. Chitambar, C. R.; Narasimhan, J.; Guy, J.; Sem, D. S.; Brien, W. J. O. Inhibition of
Ribonucleotide Reductase by Gallium in Murine. Cancer Res. 1991, 51, 6199–6202.
435. Smith, J. M.; Daum, H. A. Identification and Nucleotide Sequence of a Gene Encoding 5’-
Phosphoribosylglycinamide Transformylase in Escherichia coli K12. J. Biol. Chem. 1987,
262, 10565–10569.
436. Zhu, M.; Dai, X.; Guo, Z.; Yang, M.; Wang, H.; Wang, Y.-P. Manipulating the Bacterial
Cell Cycle and Cell Size by Titrating the Expression of Ribonucleotide Reductase. MBio
2017, 8, 6–11, 10.1128/mBio.01741-17.
437. Salguero, I.; Guarino, E.; Guzmàn, E. C. RecA-Dependent Replication in the
NrdA101(Ts) Mutant of Escherichia coli under Restrictive Conditions. J. Bacteriol. 2011,
193, 2851–2860, 10.1128/JB.00109-11.
438. Guarino, E.; Jiménez-Sánchez, A.; Guzmán, E. C. Defective Ribonucleoside Diphosphate
Reductase Impairs Replication Fork Progression in Escherichia coli. J. Bacteriol. 2007,
189, 3496–3501, 10.1128/JB.01632-06.
439. Roux, B.; Walsh, C. T. P-Aminobenzoate Synthesis in Escherichia coli: Kinetic and
Mechanistic Characterization of the Amidotransferase PabA. Biochemistry 1992, 31,
6904–6910, 10.1021/bi00145a006.
440. Bermingham, A.; Derrick, J. P. The Folic Acid Biosynthesis Pathway in Bacteria:
Evaluation of Potential for Antibacterial Drug Discovery. BioEssays 2002, 24, 637–648,
10.1002/bies.10114.
441. Henderson, G. B.; Huennekens, F. M. Membrane-Associated Folate Transport Proteins. In
Methods in Enzymology; 1986; Vol. 122, pp 260–269.
442. Krakoff, I. H.; Brown, N. C.; Reichard, P. Inhibition Reductase of Ribonucleoside by
Hydroxyurea Diphosphate. Cancer Res. 1968, 28, 1559–1565.

242
443. Sinha, N. K.; Snustad, D. P. Mechanism of Inhibition of Deoxyribonucleic Acid Synthesis
in Escherichia coli by Hydroxyurea. J. Bacteriol. 1972, 112, 1321–1324.
444. Chenault, S. S.; Earhart, C. F. Organization of Genes Encoding Membrane Proteins of the
Escherichia Coli Ferrienterobactin Permease. Mol. Microbiol. 1991, 5, 1405–1413,
10.1111/j.1365-2958.1991.tb00787.x.
445. Cartron, M. L.; Maddocks, S.; Gillingham, P.; Craven, C. J.; Andrews, S. C. Feo -
Transport of Ferrous Iron into Bacteria. BioMetals 2006, 19, 143–157, 10.1007/s10534-
006-0003-2.
446. Egler, M.; Grosse, C.; Grass, G.; Nies, D. H. Role of the Extracytoplasmic Function
Protein Family Sigma Factor RpoE in Metal Resistance of Eschenchia coli. J. Bacteriol.
2005, 187, 2297–2307, 10.1128/JB.187.7.2297-2307.2005.
447. Jones, C. M.; Niederweis, M. Role of Porins in Iron Uptake by Mycobacterium
Smegmatis. J. Bacteriol. 2010, 192, 6411–6417, 10.1128/JB.00986-10.
448. Rigal, A.; Bouveret, E.; Lloubes, R.; Lazdunski, C.; Benedetti, H. The TolB Protein
Interacts with the Porins of Escherichia coli. J. Bacteriol. 1997, 179, 7274–7279,
10.1128/jb.179.23.7274-7279.1997.
449. Sirko, A.; Hryniewicz, M.; Hulanicka, D.; Böck, A. Sulfate and Thiosulfate Transport in
Escherichia coli K-12: Nucleotide Sequence and Expression of the CysTWAM Gene
Cluster. J. Bacteriol. 1990, 172, 3351–3357, 10.1128/jb.172.6.3351-3357.1990.
450. Anderson, D. S.; Adhikari, P.; Nowalk, A. J.; Chen, C. Y.; Mietzner, T. A. The HFbpABC
Transporter from Haemophilus Influenzae Functions as a Binding-Protein-Dependent
ABC Transporter with High Specificity and Affinity for Ferric Iron. J. Bacteriol. 2004,
186, 6220–6229, 10.1128/JB.186.18.6220.
451. Stojiljkovic, I.; Kumar, V.; Srinivasan, N. Non-Iron Metalloporphyrins: Potent
Antibacterial Compounds That Exploit Haem/Hb Uptake Systems of Pathogenic Bacteria.
Mol. Microbiol. 1999, 31, 429–442, 10.1046/j.1365-2958.1999.01175.x.
452. Xu, J. Z.; Yang, H. K.; Zhang, W. G. NADPH Metabolism: A Survey of Its Theoretical
Characteristics and Manipulation Strategies in Amino Acid Biosynthesis. Crit. Rev.
Biotechnol. 2018, 38, 1061–1076, 10.1080/07388551.2018.1437387.
453. LaRossa, R. A.; Schloss, J. V. The Sulfonylurea Herbicide Sulfometuron Methyl Is an
Extremely Potent and Selective Inhibitor of Acetolactate Synthase in Salmonella
typhimurium. J. Biol. Chem. 1984, 259, 8753–8757, 10.1016/j.bmc.2007.08.036.
454. Watson, M. D.; Wild, J.; Umbarger, H. E. Positive Control of IlvC Expression in
Escherichia Coli K-12; Identification and Mapping of Regulatory Gene IlvY. J. Bacteriol.
1979, 139, 1014–1020.
455. Stohs, S. J.; Bagchi, D. Oxidative Mechanisms in the Toxicity of Metal Ions. Free Radic.
Biol. Med. 1995, 18, 321–336, 10.1016/0891-5849(94)00159-H.
456. Ercal, N.; Gurer-Orhan, H.; Aykin-Burns, N. Toxic Metals and Oxidative Stress Part I:
Mechanisms Involved in Metal Induced Oxidative Damage. Curr. Top. Med. Chem. 2001,
1, 529–539, 10.2174/1568026013394831.
457. Cabeen, M. T.; Jacobs-Wagner, C. Bacterial Cell Shape. Nat. Rev. Microbiol. 2005, 3,
601–610, 10.1038/nrmicro1205.
458. De La Fuente-Núñez, C.; Korolik, V.; Bains, M.; Nguyen, U.; Breidenstein, E. B. M.;
Horsman, S.; Lewenza, S.; Burrows, L.; Hancock, R. E. W. Inhibition of Bacterial Biofilm
Formation and Swarming Motility by a Small Synthetic Cationic Peptide. Antimicrob.
Agents Chemother. 2012, 56, 2696–2704, 10.1128/AAC.00064-12.

243
459. Caparrós, M.; Quintela, J. C.; de Pedro, M. A. Variability of Peptidoglycan Surface
Density in Escherichia coli. FEMS Microbiol. Lett. 1994, 121, 71–76, 10.1111/j.1574-
6968.1994.tb07077.x.
460. Gronow, S.; Brabetz, W.; Brade, H. Comparative Functional Characterization in Vitro of
Heptosyltransferase I (WaaC) and II (WaaF) from Escherichia coli. Eur. J. Biochem.
2000, 267, 6602–6611, 10.1046/j.1432-1327.2000.01754.x.
461. Beher, M.; Schnaitman, C. Regulation of the OmpA Outer Membrane Protein of
Escherichia Coli. J. Bacteriol. 1981, 147, 972–985.
462. Lazzaroni, J. C.; Portalier, R. C. Genetic and Biochemical Characterization of Periplasmic
Leaky Mutants of Escherichia coli K-12. J. Bacteriol. 1981, 145, 1351–1358,
10.1111/j.1574-6968.1979.tb03370.x.
463. Arunmanee, W.; Pathania, M.; Solovyova, A. S.; Le Brun, A. P.; Ridley, H.; Baslé, A.;
van den Berg, B.; Lakey, J. H. Gram-negative Trimeric Porins Have Specific LPS Binding
Sites That Are Essential for Porin Biogenesis. Proc. Natl. Acad. Sci. 2016, 113, 5034–
5043, 10.1073/pnas.1602382113.
464. Bolla, J. M.; Lazdunski, C.; Pagès, J. M. The Assembly of the Major Outer Membrane
Protein OmpF of Escherichia coli Depends on Lipid Synthesis. EMBO J. 1988, 7, 3595–
3599, 10.1002/j.1460-2075.1988.tb03237.x.
465. Ladomersky, E.; Petris, M. J. Copper Tolerance and Virulence in Bacteria. Metallomics
2015, 7, 957–964, 10.1039/c4mt00327f.
466. Argüello, J. M.; Raimunda, D.; Padilla-Benavides, T. Mechanisms of Copper Homeostasis
in Bacteria. Front. Cell. Infect. Microbiol. 2013, 3, 1–14, 10.3389/fcimb.2013.00073.
467. Festa, R. A.; Thiele, D. J. Copper: An Essential Metal in Biology. Curr. Biol. 2013, 21,
877–883, 10.1016/j.cub.2011.09.040.Copper.
468. Meir, A.; Abdelhai, A.; Moskovitz, Y.; Ruthstein, S. EPR Spectroscopy Targets Structural
Changes in the E. coli Membrane Fusion CusB upon Cu(I) Binding. Biophys. J. 2017,
112, 2494–2502, 10.1016/j.bpj.2017.05.013.
469. Roberts, S. A.; Wildner, G. F.; Grass, G.; Weichsel, A.; Ambrus, A.; Rensing, C.;
Montfort, W. R. A Labile Regulatory Copper Ion Lies near the T1 Copper Site in the
Multicopper Oxidase CueO. J. Biol. Chem. 2003, 278, 31958–31963,
10.1074/jbc.M302963200.
470. Grass, G.; Rensing, C. Genes Involved in Copper Homeostasis In. Society 2001, 183,
2145–2147, 10.1128/JB.183.6.2145.
471. Berks, B. C.; Sargent, F.; Palmer, T. The Tat Protein Export Pathway. Mol. Microbiol.
2000, 35, 260–274, 10.1007/BF00461864.
472. Bolhuis, A.; Mathers, J. E.; Thomas, J. D.; Claire, M.; Barrett, L.; Robinson, C. TatB and
TatC Form a Functional and Structural Unit of the Twin-Arginine Translocase from
Escherichia coli. J. Biol. Chem. 2001, 276, 20213–20219, 10.1074/jbc.M100682200.
473. Berks, B. C.; Palmer, T.; Robinson, C.; Stanley, N. R.; Bogsch, E. G.; Sargent, F. An
Essential Component of a Novel Bacterial Protein Export System with Homologues in
Plastids and Mitochondria. J. Biol. Chem. 2002, 273, 18003–18006,
10.1074/jbc.273.29.18003.
474. Graubner, W.; Schierhorn, A.; Brüser, T. DnaK Plays a Pivotal Role in Tat Targeting of
CueO and Functions beside SlyD as a General Tat Signal Binding Chaperone. J. Biol.
Chem. 2007, 282, 7116–7124, 10.1074/jbc.M608235200.
475. Tan, G.; Cheng, Z.; Pang, Y.; Landry, A. P.; Li, J.; Lu, J.; Ding, H. Copper Binding in

244
IscA Inhibits Iron-Sulphur Cluster Assembly in Escherichia coli. 2014, 93, 629–644,
10.1111/mmi.12676.
476. Leimkühler, S.; Bühning, M.; Beilschmidt, L. Shared Sulfur Mobilization Routes for
TRNA Thiolation and Molybdenum Cofactor Biosynthesis in Prokaryotes and Eukaryotes.
Biomolecules 2017, 7, 7–9, 10.3390/biom7010005.
477. Ikeuchi, Y.; Shigi, N.; Kato, J. I.; Nishimura, A.; Suzuki, T. Mechanistic Insights into
Sulfur Relay by Multiple Sulfur Mediators Involved in Thiouridine Biosynthesis at tRNA
Wobble Positions. Mol. Cell 2006, 21, 97–108, 10.1016/j.molcel.2005.11.001.
478. Imlay, J. A. Oxidative Stress : Lessons From a Model Bacterium; 2014; Vol. 11.
479. Selbig, J.; Catchpole, G.; Steinhauser, D.; Cuadros-Inostroza, A.; Willmitzer, L.;
Szymanski, J.; Jozefczuk, S.; Klie, S. Metabolomic and Transcriptomic Stress Response
of Escherichia Coli. Mol. Syst. Biol. 2010, 6, 1–16, 10.1038/msb.2010.18.
480. Lee, Y. S.; Shibata, Y.; Malhotra, A.; Dutta, A. A Novel Class of Small RNAs: tRNA-
Derived RNA Fragments (TRFs). Genes Dev. 2009, 23, 2639–2649,
10.1101/gad.1837609.
481. Zhong, J.; Xiao, C.; Gu, W.; Du, G.; Sun, X.; He, Q. Y.; Zhang, G. Transfer RNAs
Mediate the Rapid Adaptation of Escherichia coli to Oxidative Stress. PLoS Genet. 2015,
11, 1–24, 10.1371/journal.pgen.1005302.
482. Nikaido, H.; Vaara, M. Molecular Basis of Bacterial Outer Membrane Permeability.
Microbiol. Rev. 1985, 49, 1–32, 10.1128/mmbr.67.4.593-656.2003.
483. Braun, V.; Endriß, F. Energy-Coupled Outer Membrane Transport Proteins and
Regulatory Proteins. BioMetals 2007, 20, 219–231, 10.1007/s10534-006-9072-5.
484. Ferguson, A. D.; Deisenhofer, J. Metal Import through Microbial Membranes. Cell 2004,
116, 15–24, 10.1016/S0092-8674(03)01030-4.
485. Hiron, A.; Borezée-Durant, E.; Piard, J. C.; Juillard, V. Only One of Four Oligopeptide
Transport Systems Mediates Nitrogen Nutrition in Staphylococcus Aureus. J. Bacteriol.
2007, 189, 5119–5129, 10.1128/JB.00274-07.
486. Navarro, C.; Wu, L. ‐F; Mandrand‐Berthelot, M. A. The Nik Operon of Escherichia coli
Encodes a Periplasmic Binding‐protein‐dependent Transport System for Nickel. Mol.
Microbiol. 1993, 9, 1181–1191, 10.1111/j.1365-2958.1993.tb01247.x.
487. Hryniewicz, M.; Sirko, A.; Böck, A.; Hulanicka, D. Sulfate and Thiosulfate Transport in
Escherichia coli K-12: Nucleotide Sequence and Expression of the CysTWAM Gene
Cluster. J. Bacteriol. 1990, 172, 3351–3357.
488. Lindblow-Kull, C.; Kull, F. J.; Shrift, A. Single Transporter for Sulfate, Selenate, and
Selenite in Escherichia coli K-12. J. Bacteriol. 1985, 163, 1267–1269.
489. Rosentel, J. K.; Healy, F.; Maupin-Furlow, J. A.; Lee, J. H.; Shanmugam, K. T.
Molybdate and Regulation of Mod (Molybdate Transport), FdhF, and Hyc (Formate
Hydrogenlyase) Operons in Escherichia coli. J. Bacteriol. 1995, 177, 4857–4864.
490. Pos, K.; Dimroth, P.; Bott, M. The Escherichia Coli Citrate Carrier CitT: A Member of a
Novel Eubacterial Transporter. J. Bacteriol. 1998, 180, 4160–4165.
491. Sahbaz, F. The Effect of Citrate Anions on the Kinetics of Cupric Ion-Catalysed
Oxidation of Ascorbic Acid. Food Chem. 2003, 47, 345–349, 10.1016/0308-
8146(93)90175-f.
492. Phillips, C. M.; Schreiter, E. R.; Guo, Y.; Wang, S. W. C.; Zamble, D. B.; Drennan, C. L.
Structural Basis of Metal Specificity for Nickel Regulatory Protein NikR. Biochemistry
2008, 47, 1838–1946, 10.1177/0333102415576222.Is.

245
493. Gugala, N.; Chatfield-reed, K.; Turner, R. J. Using a Chemical Genetic Screen to Enhance
Our Understanding of the Antimicrobial Properties of Gallium against Escherichia coli.
2019, No. i, 10.3390/genes10010034.
494. Garrison, W. M.; Jayko, M. E.; Bennett, W. Radiation-Induced Oxidation of Protein in
Aqueous Solution. Radiat. Res. 1962, 16, 483–502.
495. Garrison, W. M. Reaction Mechanisms in the Radiolysis of Peptides, Polypeptides, and
Proteins. Chem. Rev. 1987, 87, 381–398, 10.1021/cr00078a006.
496. Stadtman, E. R.; Levine, R. L. Free Radical-Mediated Oxidation of Free Amino Acids and
Amino Acid Residues in Proteins. Amino Acids 2003, 25, 207–218, 10.1007/s00726-003-
0011-2.
497. Al Zaid Siddiquee, K.; Arauzo-Bravo, M. J.; Shimizu, K. Metabolic Flux Analysis of
PykF Gene Knockout Escherichia coli Based on 13C-Labeling Experiments Together
with Measurements of Enzyme Activities and Intracellular Metabolite Concentrations.
Appl. Microbiol. Biotechnol. 2004, 63, 407–417, 10.1007/s00253-003-1357-9.
498. Slekar, K. H.; Kosman, D. J.; Culotta, V. C. The Yeast Copper/Zinc Superoxide
Dismutase and the Pentose Phosphate Pathway Play Overlapping Roles in Oxidative
Stress Protection. J. Biol. Chem. 1996, 271, 28831–28836, 10.1074/jbc.271.46.28831.
499. Singh, R.; Mailloux, R. J.; Puiseux-Dao, S.; Appanna, V. D. Oxidative Stress Evokes a
Metabolic Adaptation That Favors Increased NADPH Synthesis and Decreased NADH
Production in Pseudomonas Fluorescens. J. Bacteriol. 2007, 189, 6665–6675,
10.1128/JB.00555-07.
500. Fischer, E.; Sauer, U. A Novel Metabolic Cycle Catalyzes Glucose Oxidation and
Anaplerosis in Hungry Escherichia coli. J. Biol. Chem. 2003, 278, 46446–46451,
10.1074/jbc.M307968200.
501. Singh, R.; Lemire, J.; Mailloux, R. J.; Appanna, V. D. A Novel Strategy Involved Anti-
Oxidative Defense: The Conversion of NADH into NADPH by a Metabolic Network.
PLoS One 2008, 3, 10.1371/journal.pone.0002682.
502. Hua, Q.; Yang, C.; Baba, T.; Mori, H.; Shimizu, K. Responses of the Central Metabolism
in Escherichia coli to Phosphoglucose Isomerase and Glucose-6-Phosphate
Dehydrogenase Knockouts. J. Bacteriol. 2003, 185, 7053–7067, 10.1128/JB.185.24.7053-
7067.2003.
503. Barwinska-Sendra, A.; Waldron, K. J. The Role of Intermetal Competition and Mis-
Metalation in Metal Toxicity, 1st ed.; Elsevier Ltd., 2017; Vol. 70.
504. A, J. C. S. O. C. (A), 1967. 1967, No. 724.
505. Deschamps, P.; Kulkarni, P. P.; Gautam-Basak, M.; Sarkar, B. The Saga of Copper(II)-L-
Histidine. Coord. Chem. Rev. 2005, 249, 895–909, 10.1016/j.ccr.2004.09.013.
506. Nasus, S.; Wicks, F. D.; Gholson, R. K. L-Aspartate Oxidase, a Newly Discovered
Enzyme of Escherichia coli, Is the B Protein of Quinolinate Synthetase. J. Biol. Chem.
1982, 257, 626–632.
507. Grass, G.; Rensing, C. Genes Involved in Copper Homeostasis in Escherichia coli. J.
Bacteriol. 2001, 183, 2145–2147, 10.1128/JB.183.6.2145-2147.2001.
508. Gunther, M. R.; Hanna, P. M.; Mason, R. P.; Cohen, M. S. Hydroxyl Radical Formation
from Cuprous Ion and Hydrogen Peroxide: A Spin-Trapping Study. Archives of
Biochemistry and Biophysics. 1995, pp 515–522.
509. Djoko, K. Y.; McEwan, A. G. Antimicrobial Action of Copper Is Amplified via Inhibition
of Heme Biosynthesis. ACS Chem. Biol. 2013, 8, 2217–2223, 10.1021/cb4002443.

246
510. Altuvia, S.; Weinstein-Fischer, D.; Zhang, A.; Postow, L.; Storz, G. A Small, Stable RNA
Induced by Oxidative Stress: Role as a Pleiotropic Regulator and Antimutator. Cell 1997,
90, 43–53, 10.1016/S0092-8674(00)80312-8.
511. Barbosa, T. M.; Levy, S. B. Differential Expression of over 60 Chromosomal Genes in
Escherichia coli by Constitutive Expression of MarA. J. Bacteriol. 2000, 182, 3467–3474,
10.1128/JB.182.12.3467-3474.2000.
512. Juhnke, H.; Krems, B.; Kötter, P.; Entian, K. D. Mutants That Show Increased Sensitivity
to Hydrogen Peroxide Reveal an Important Role for the Pentose Phosphate Pathway in
Protection of Yeast against Oxidative Stress. Mol. Gen. Genet. 1996, 252, 456–464,
10.1007/BF02173011.
513. Choi, I. Y.; Sup, K. I.; Kim, H. J.; Park, J.-W. Thermosensitive Phenotype of Escherichia
coli Mutant Lacking NADP+ -Dependent Isocitrate Dehydrogenase . Redox Rep. 2003, 8,
51–56, 10.1179/135100003125001251.
514. Gilardi, A.; Bhamidimarri, S. P.; Brönstrup, M.; Bilitewski, U.; Marreddy, R. K. R.; Pos,
K. M.; Benier, L.; Gribbon, P.; Winterhalter, M.; Windshügel, B. Biophysical
Characterization of E. coli TolC Interaction with the Known Blocker Hexaamminecobalt.
Biochim. Biophys. Acta - Gen. Subj. 2017, 1861, 2702–2709,
10.1016/j.bbagen.2017.07.014.
515. Hashimoto, M.; Ikeuchi, Y.; Suzuki, T.; Kato, J.; Su’etsugu, M.; Katayama, T.; Ote, T.
Involvement of the Escherichia coli Folate-Binding Protein YgfZ in RNA Modification
and Regulation of Chromosomal Replication Initiation. Mol. Microbiol. 2005, 59, 265–
275, 10.1111/j.1365-2958.2005.04932.x.
516. Flanagan, J. N.; Steck, T. R. The Relationship Between Agar Thickness and Antimicrobial
Susceptibility Testing. Indian J. Microbiol. 2017, 57, 503–506, 10.1007/s12088-017-
0683-z.
517. Clark, D. P. The Fermentation Pathways of Escherichia coli. FEMS Microbiol. Rev. 1989,
63, 223–234.
518. Harrison, J. J.; Tremaroli, V.; Stan, M. A.; Chan, C. S.; Vacchi-Suzzi, C.; Heyne, B. J.;
Parsek, M. R.; Ceri, H.; Turner, R. J. Chromosomal Antioxidant Genes Have Metal Ion-
Specific Roles as Determinants of Bacterial Metal Tolerance. Environ. Microbiol. 2009,
11, 2491–2509, 10.1111/j.1462-2920.2009.01973.x.
519. Qin, Y.; Chen, L. L.; Pu, W.; Liu, P.; Liu, S. X.; Li, Y.; Liu, X. L.; Lu, Z. X.; Zheng, L.
Y.; Cao, Q. E. A Hydrogel Directly Assembled from a Copper Metal-Organic Polyhedron
for Antimicrobial Application. Chem. Commun. 2019, 55, 2206–2209,
10.1039/c8cc09000a.
520. Sicairos-Ruelas, E. E.; Gerba, C. P.; Bright, K. R. Efficacy of Copper and Silver as
Residual Disinfectants in Drinking Water. J. Environ. Sci. Heal. - Part A Toxic/Hazardous
Subst. Environ. Eng. 2019, 54, 146–155, 10.1080/10934529.2018.1535160.
521. Hoban, D. J.; Zhanel, G. G. Evolution of Antimicrobial Resistance in Canadian Hospitals
from 2007 to 2011: Results of the CANWARD Stduy. J. Antimicrob. Chemother. 2013,
68, i3–i5.
522. Hansen, A. M.; Qiu, Y.; Yeh, N.; Blattner, F. R.; Durfee, T.; Jin, D. J. SspA Is Required
for Acid Resistance in Stationary Phase by Downregulation of H-NS in Escherichia coli.
Mol. Microbiol. 2005, 56, 719–734, 10.1111/j.1365-2958.2005.04567.x.
523. Williams, M. D.; Ouyang, T. X.; Flickinger, M. C. Starvation‐induced Expression of SspA
and SspB: The Effects of a Null Mutation in SspA on Escherichia coli Protein Synthesis

247
and Survival during Growth and Prolonged Starvation. Mol. Microbiol. 1994, 11, 1029–
1043, 10.1111/j.1365-2958.1994.tb00381.x.
524. Kambampati, R.; Lauhon, C. T. Mnma and IscS Are Required for in Vitro 2-Thiouridine
Biosynthesis in Escherichia coli. Biochemistry 2003, 42, 1109–1117, 10.1021/bi026536+.
525. Suzuki, T. Biosynthesis and Function of TRNA Wobble Modifications. 2016, 12, 23–69,
10.1007/b106361.
526. Koronakis, V. TolC - The Bacterial Exit Duct for Proteins and Drugs. FEBS Lett. 2003,
555, 66–71, 10.1016/S0014-5793(03)01125-6.
527. Dhamdhere, G.; Zgurskaya, H. I. Metabolic Shutdown in Escherichia coli Cells Lacking
the Outer Membrane Channel TolC. Mol. Microbiol. 2010, 77, 743–754, 10.1111/j.1365-
2958.2010.07245.x.
528. Kleerebezem, M.; Crieland, W.; Tommassen, J. Involvement of Stress Protein PspA
(Phage Shock Protein A) of Escherichia coli in Maintenance of the Proton Motive Force
under Stress Conditions. EMBO J. 1996, 15, 162–171.
529. Brumaghim, J. L.; Li, Y.; Henle, E.; Linn, S. Effects of Hydrogen Peroxide upon
Nicotinamide Nucleotide Metabolism in Escherichia coli: Changes in Enzyme Levels and
Nicotinamide Nucleotide Pools and Studies of the Oxidation of NAD(P)H by Fe(III). J.
Biol. Chem. 2003, 278, 42495–42504, 10.1074/jbc.M306251200.
530. Dna, O.; Damage, P.; Toxicity, I. N. M. Serial Review : Oxidative DNA Damage and
Repair Oxidative DNA And Protein Damage In Metal-Induced Toxicity. Free Radic. Biol.
Med. 2002, 32, 958–967.
531. Shi, H.; Hudson, L. G.; Liu, K. J. Oxidative Stress and Apoptosis in Metal Ion-Induced
Carcinogenesis. Free Radic. Biol. Med. 2004, 37, 582–593,
10.1016/j.freeradbiomed.2004.03.012.
532. Goeres, D. M.; Hamilton, M. A.; Beck, N. A.; Buckingham-Meyer, K.; Hilyard, J. D.;
Loetterle, L. R.; Lorenz, L. A.; Walker, D. K.; Stewart, P. S. A Method for Growing a
Biofilm under Low Shear at the Air-Liquid Interface Using the Drip Flow Biofilm
Reactor. Nat. Protoc. 2009, 4, 783–788, 10.1038/nprot.2009.59.

248
Appendix A: Silver oxynitrate – an efficacious compound for the prevention
and eradication of dual-species biofilms
Included in this appendix is a study completed by our group that examines the potential for
silver oxynitrate as a biofilm inhibitor. Furthermore, in this work dual-species biofilms were grown
and exposed to varying formulations of silver. In brief, our group determined that silver oxynitrate
provides enhanced efficacy against dual-species biofilm and that organisms grown together deliver
enhanced resistance, some combinations more than others. This research article has been
reformatted; however, the references have not been altered and can be found at the end of
Appendix A.
Authored by: Joe A. Lemire, Lindsay Kalan, Natalie Gugala, Alexandru Bradu and Raymond J.
Turner
Published in: Biofouling, 2017, 33 doi: 10.1080/08927014.2017.1322586
Copyright permissions for the reproduction of this manuscript can be found in Appendix D.
A.1 Abstract
Preventing and eradicating biofilms remains a challenge in clinical and industrial settings.
Recently, the present authors demonstrated that silver oxynitrate (Ag7NO11) prevented and
eradicated single-species planktonic and biofilm populations of numerous microbes at lower
concentrations than other silver (Ag) compounds. Here, the antimicrobial and anti-biofilm efficacy
of Ag7NO11 is elaborated by testing its in vitro activity against combinations of dual-species,
planktonic and biofilm populations of Escherichia coli, Staphylococcus aureus and Pseudomonas
aeruginosa. As further evidence emerges that multispecies bacterial communities are more
common in the environment than their single-species counterparts, this study reinforces the diverse
applicability of the minimal biofilm eradication concentration (MBECTM) assay for testing

249
antimicrobial compounds against biofilms. Furthermore, this study demonstrated that Ag7NO11
had enhanced antimicrobial and anti-biofilm activity compared to copper sulfate (CuSO4) and
silver nitrate (AgNO3) against the tested bacterial species.
A.2 Introduction
Silver (Ag) is widely used in the clinic to combat and con- trol infectious disease (Lemire et
al. 2013; Mijnendonckx et al. 2013), and Ag-impregnated medical devices have a demonstrated
antimicrobial activity (Silver et al. 2006; Afessa et al. 2010; Malin et al. 2013). Additionally, Ag
is an effective antifouling (AF) agent (Huang et al. 2016; Mansouri et al. 2016). Copper (Cu) and
Cu-containing compounds are also used in the clinic to reduce the microbial load on surfaces
(Warnes & Keevil 2013; Michels et al. 2015) and in wound dressings (Sen et al. 2002; Canapp et
al. 2003; Borkow et al. 2010). In addition, Cu has anti- biofilm activity (Lehtola et al. 2004; van
der Kooij et al. 2005; Meier et al. 2013; Lemire et al. 2015; Gugala et al. 2017). Recently, Lemire
et al. (2015) added to the body of literature demonstrating that various Ag compounds are
efficacious for the inhibition and eradication of E. coli, P. aeruginosa, and S. aureus biofilms.
Moreover, this study reaffirmed the utility of Ag for eradicating antibiotic-resist- ant bacteria
(Lemire et al. 2015). A novel observation from this study focused on a previously unexplored Ag
compound, silver oxynitrate [Ag(Ag3O3)4 NO4 or Ag7NO11], which displayed antimicrobial and
an anti-biofilm capacity at lower equimolar concentrations of Ag than other leading compounds,
including AgNO3 (the most soluble Ag salt) and silver sulfadiazine, a compound routinely used in
the clinic (Lemire et al. 2015). This finding is important because eliminating biofilms can be
challenging owing to their ability to contaminate medical devices as well as industrial surfaces,
impede wound healing, promote chronic infections, and resist conventional antimicrobials

250
(Costerton et al. 1999; Stewart & Costerton 2001; Wolcott et al. 2010; Metcalf & Bowler 2014;
Roy et al. 2014).
Since most natural biofilms are found as groupings of multiple species of microbes rather
than as single species, the complexity associated with eliminating them may not be fully realized
(Yang et al. 2012; Bjarnsholt et al. 2013; Røder et al. 2016). Consequently, most Ag-based anti-
biofilm and antimicrobial compounds found in ointments, medical devices, and AF agents, with a
few notable exceptions (Hill et al. 2010; Mei et al. 2013; Wu et al. 2016), have not been tested
against biofilms composed of multiple species (Kostenko et al. 2010; Herron et al. 2014; Walker
& Parsons 2014). These issues are further confounded by (1) standardized antimicrobial testing
methods which focus on planktonic bacteria, not biofilms (Baker et al. 2014); (2) the fact that
biofilms often tolerate elevated metal concentrations (Harrison et al. 2007); and (3) the fact that
the detailed mechanism of Ag toxicity to bacteria remains incomplete (Lemire et al. 2013). Briefly,
the leading hypotheses are that Ag(I) poisons the bacterial cell by binding to reduced thiol groups
(Lemire et al. 2013), disrupting iron–sulfur clusters (Xu & Imlay 2012). The present authors
previously reported that the higher oxidation states of Ag – Ag(II) and Ag(III) – generated by
Ag7NO11, have enhanced antimicrobial and anti-biofilm activity over compounds that release
Ag(I) at equimolar concentrations (Lemire et al. 2015).
To advance the antimicrobial and anti-biofilm potential of Ag7NO11, its efficacy against
dual-species planktonic and biofilm populations consisting of E. coli, S. aureus and P. aeruginosa,
in all combinations, was compared to AgNO3 and CuSO4 using a modified minimal biofilm
eradication concentration (MBECTM) assay. The data presented here reinforce the concept that
biofilms composed of more than one species are more difficult to eradicate. Also, this study
demonstrates that Ag7NO11 has superior antimicrobial and anti-biofilm activity against dual-

251
species planktonic and biofilm communities, composed of the tested strains, compared to AgNO3
and CuSO4. As such, Ag7NO11 may offer an alternative option for the prevention and eradication
of bacterial biofilm communities.
A.3 Materials and methods
A.3.1 Bacterial strains and media
Strains were stored in MicrobankTM vials at –70 °C (ProLab Diagnostics, Richmond Hill,
ON, Canada). Prior to experimentation Pseudomonas aeruginosa (PA01), Staphylococcus aureus
(ATCC 25923), and Escherichia coli (JM109) were pre-cultured on tryptic soy agar (TSA) (VWR
International, Edmonton, Canada) overnight at 37 °C. A medium composed of a rich nutrient
source, simulated wound fluid (SWF) [50% peptone water (0.85% NaCl, 0.1 g l−1 peptone):50%
fetal calf serum (Invitrogen, Life Technologies, Burlington, ON, Canada)] was used as the growth
medium and for susceptibility testing (Lemire et al. 2015).
A.3.2Dual-species biofilm and planktonic culture generation
Dual-species biofilms were cultured using the Calgary Biofilm Device (CBD)/MBECTM
following a modified protocol (Ceri et al. 1999; Lemire et al. 2015). Briefly, following the
overnight growth of the pre-culture on TSA, bacterial colonies were suspended in SWF at the
density of a 1.0 McFarland standard. The optical standard was then diluted 30 times in 150 μl of
SWF, which served as the inoculum for the CBD. A biofilm was formed by placing the lid of the
CBD, 96 equivalent pegs, into a 96-well microtitre plate containing the inoculum. The CBD was
then placed on a gyrorotary shaker at 150 rpm in a humidified incubator at 37 °C for up to 48 h.
As singular species, E. coli, P. aeruginosa and S. aureus reached their stationary phase of
planktonic growth and established a biofilm by 24 h (Supplemental Figure 1). Modifications were

252
necessary to grow dual-species biofilm and plank- tonic populations. To form dual-species
biofilms where the cell numbers of both planktonic and biofilm cell populations would be
approximately equivalent, the following inoculation procedures were performed. (1) For S. aureus
and P. aeruginosa dual-species planktonic and biofilm populations the S. aureus inoculum was
introduced 4 h prior to the addition of the P. aeruginosa inoculum. (2) For E. coli and S. aureus
dual-species planktonic and bio- film populations the E. coli and S. aureus inoculum were
introduced simultaneously. (3) For E. coli and P. aeruginosa dual-species planktonic and biofilm
populations the E. coli and P. aeruginosa inoculum were introduced simultaneously [Supplemental
Figures 2 and 3]. Dual-species planktonic cultures that had been established for 24 h were
cultivated following the aforementioned procedure by adding an equivalent inoculum of each
species into 96-well microtitre plates (Nunclon, VWR International) without CBD lids.
A.3.3 Stock metal solutions
AgNO3 and CuSO4 were obtained from Sigma-Aldrich (Oakville, ON, Canada). Silver
oxynitrate [Ag(Ag3O4)2NO3 or Ag7NO11] was obtained from Exciton Technologies, Inc
(Edmonton, AB, Canada). AgNO3 was chosen as the comparator Ag compound as it is the most
soluble of the Ag salts ([Ksp] = 51.6 M) (Lemire et al. 2015). Meanwhile, CuSO4 was chosen
because Cu, like Ag, is a thiophilic metal and has comparable targets in the bacterial cell (Grass et
al. 2011; Lemire et al. 2013). All stock Ag solutions were made at equivalent molarities of Ag, up
to 5 mM, in distilled and deionized (dd)H2O (Lemire et al. 2015). It is imperative to prepare the
solutions at equimolar concentrations of Ag, as the antimicrobial activity of Ag is dependent on
the formation of Ag+ (Lansdown 2006; Walker & Parsons 2014). Hence, the concentration of
Ag7NO11 is sevenfold less than the reported molar concentrations and the concentration of AgNO3

253
is equal to the reported molar concentrations. The CuSO4 stock was made up to 2 M in ddH2O. All
metal solutions were diluted in SWF, from a stock metal solution, no more than 30 min prior to
experimental use. From these, serial- dilutions (dilution factor of 2) were made in 96-well plates
(the challenge plate). The first row was reserved as a sterility control and the second row as a
growth control (0.0 μM metal). The range of concentrations tested for both Ag compounds was 0
to 2500 μM, while CuSO4 was tested from 0–500,000 μM.
A.3.4 Dual-species biofilm and planktonic culture susceptibility testing
Two scenarios were tested: (1) the capacity of the metal compounds to inhibit the growth
of planktonic cells and biofilm formation, as well as (2) the ability of the metal compounds to
eradicate established planktonic and bio- film populations. For (1) bacterial cultures were
inoculated following the protocol described above into a challenge plate in the presence of the
metal compounds, and then subsequently placed on a gyrorotary shaker at 150 rpm, in a humidified
incubator at 37°C for 4 h (Lemire et al. 2015). Scenario (2) allowed for the establishment of a
biofilm population on the pegged lid of the CBD or the establishment of a planktonic population
in a 96-well plate for 24 h. The peg lid containing the established biofilm was rinsed twice with
0.9% NaCl and placed into a challenge plate. On the other hand, to test established planktonic
populations, 1 × 10⁶ cells mL-1, standardized by measuring the optical density at 600 nm (OD600),
of the established planktonic population were added to a challenge plate. The plates were then
incubated for 24 h on a gyrorotary shaker at 150 rpm, in a humidified incubator at 37 °C.
To test the metal susceptibility of the planktonic and biofilm populations, the plates from
1 and 2 were pre- pared by removing the peg lid and rinsing it twice with 0.9% NaCl. The biofilms
were disrupted from the pegs by sonication using a 250HT ultrasonic cleaner (VWR International),

254
set at 60 Hz for 10 min, into 200 μL of tryptic soy broth (VWR International) containing universal
neutralizer (UN) [0.05 g 1-1 histidine (Sigma-Aldrich, Oakville, ON, Canada), 0.05 g-1L cysteine
(Sigma Aldrich), 0.l g-1 of reduced glutathione (Sigma Aldrich) in ddH2O] and 0.1% Tween® 20.
The minimal biofilm inhibitory concentration (MBIC) and minimal biofilm eradication
concentration (MBEC) of the biofilm populations were determined by performing eight 10-fold
dilutions of the disrupted biofilms in 0.9% NaCl. Spot plating the diluted sample onto selective
media allowed for the enumeration of the viable cell numbers from the biofilm population: for S.
aureus, P. aeruginosa and E. coli, mannitol salts agar, Vogel-Bonner minimal medium agar and
MacConkey agar containing 1 mg L-1 crystal violet (DifcoTM, VWR International) were used,
respectively. The spotted plates were subsequently incubated overnight at 37°C (Lemire et al.
2015). Similarly, the minimal inhibitory concentration (MIC) and minimal bactericidal
concentration (MBC) of the planktonic populations was carried out by serially diluting, 8 times,
10-fold dilutions, the neutralized (UN; as described above) spent media from the 96-well plate into
0.9% saline. Viable cell numbers were recorded following spot plating of the dilutions onto the
selective media. The plates were then incubated overnight at 37°C (Lemire et al. 2015). The MIC,
MBC, MBIC and MBEC were determined by monitoring the concentration of metal compound at
which there were no viable bacterial colonies.
A.4.5 Statistical analysis
Statistical significance for testing the difference in growth of dual-species planktonic and
biofilm populations inoculated concurrently or at different time intervals was performed using a
non-parametric, two-way analysis of variance, with Sidak’s multiple comparison posthoc analysis
for pairs. Statistical significance of the MIC, MBIC, MBC, and MBEC results were performed

255
using the Sidak–Bonferroni multiple t-test with an α = 0.01 and 0.05. All experiments were
performed, at minimum, unless stated otherwise in the figure captions, with two biological
replicates and in duplicate.
A.6 Results and discussion
A.6.1 Evaluating the in vitro capacity of CuSO4, AgNO3, and Ag7NO11 to inhibit the growth of
dual-species planktonic and biofilm populations
To explore the ability of the chosen metal compounds to inhibit the growth of dual-species
planktonic and biofilm populations of the tested bacterial strains (E. coli, S. aureus and P.
aeruginosa), MIC and MBIC assays were performed for 4 h in the presence of serial dilutions of
CuSO4, AgNO3, and Ag7NO11 (Figures A.1 and A.2). With a few exceptions, the MIC of Ag7NO11
was significantly lower than that of AgNO3and CuSO4 for the tested bacterial dichotomies.
However, the MIC of Ag7NO11 was not significantly lower (p < 0.05) than the MIC of AgNO3 for
P. aeruginosa when it was incubated in the presence of S. aureus, in addition to both P. aeruginosa
and E. coli when they were cultured together (Figure A.1 and Table A.1). Meanwhile, the MIC
of Ag7NO11 was significantly lower than that of CuSO4 under all conditions tested. A parallel
observation was made regarding the capacity of Ag7NO11 to prevent the establishment of dual-
species biofilms, with two exceptions: (1) the MBIC of AgNO3 was significantly lower than both
Ag7NO11 and CuSO4 against E. coli in a P. aeruginosa/E. coli dual-species biofilm and (2) while
the MIC of Ag7NO11 was significantly lower than AgNO3 and CuSO4 against S. aureus in a dual-
species planktonic culture with P. aeruginosa, the MBIC of Ag7NO11 was not statistically lower
than AgNO3 with these same species (Figure A.2 and Table A.1).
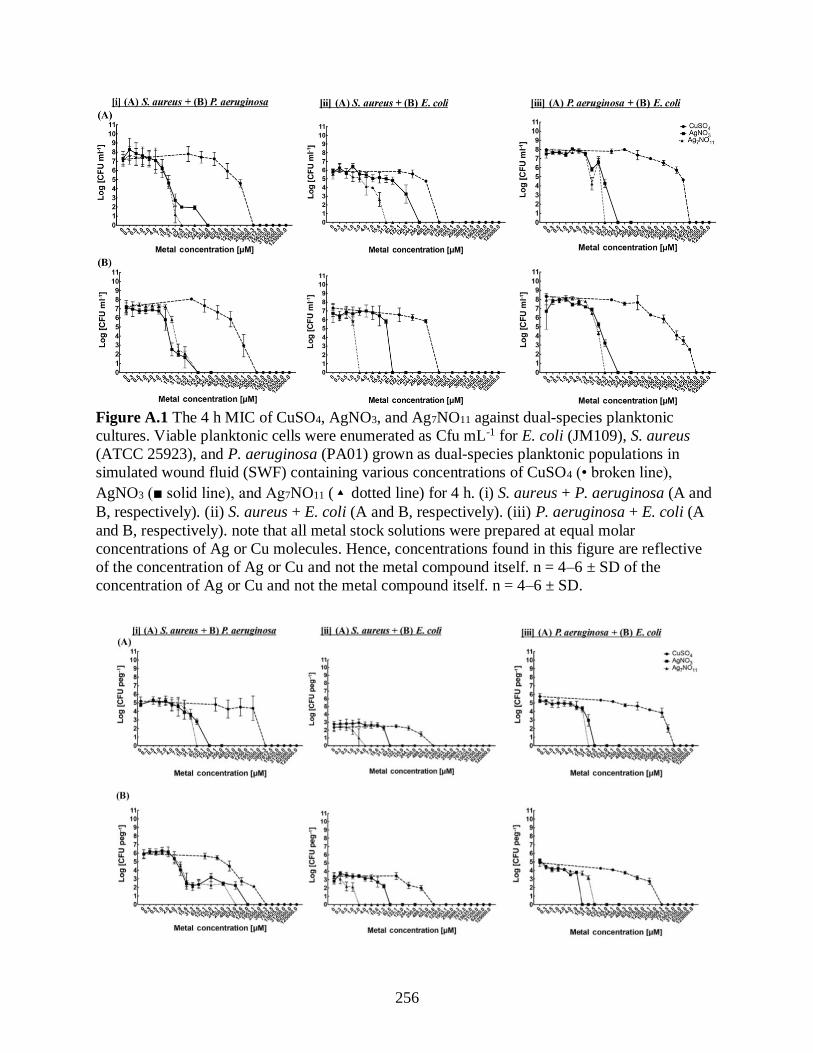
256
Figure A.1 The 4 h MIC of CuSO4, AgNO3, and Ag7NO11 against dual-species planktonic
cultures. Viable planktonic cells were enumerated as Cfu mL-1 for E. coli (JM109), S. aureus
(ATCC 25923), and P. aeruginosa (PA01) grown as dual-species planktonic populations in
simulated wound fluid (SWF) containing various concentrations of CuSO4 (• broken line),
AgNO3 (■ solid line), and Ag7NO11 (▴ dotted line) for 4 h. (i) S. aureus + P. aeruginosa (A and
B, respectively). (ii) S. aureus + E. coli (A and B, respectively). (iii) P. aeruginosa + E. coli (A
and B, respectively). note that all metal stock solutions were prepared at equal molar
concentrations of Ag or Cu molecules. Hence, concentrations found in this figure are reflective
of the concentration of Ag or Cu and not the metal compound itself. n = 4–6 ± SD of the
concentration of Ag or Cu and not the metal compound itself. n = 4–6 ± SD.

257
Figure A.2 The 4 h MBIC of CuSO4, AgNO3, and Ag7NO11 for preventing biofilm formation.
Viable biofilm cells were enumerated as Cfu peg-1) for E. coli (JM109), S. aureus (ATCC
25923), and P. aeruginosa (PA01) grown as dual-species biofilm populations in simulated
wound fluid (SWF) containing various concentrations of CuSO4 (• broken line), AgNO3 (■ solid
line), and Ag7NO11 (▴dotted line) for 4 h. (i) S. aureus + P. aeruginosa (A and B, respectively).
(ii) S. aureus + E. coli (A and B, respectively). (iii) P. aeruginosa + E. coli (A and B,
respectively). note that all metal stock solutions were prepared at equal molar concentrations of
Ag or Cu molecules. Hence, concentrations found in this figure are reflective of the
concentration of Ag or Cu and not the metal compound itself. n = 4–6 ± SD.
Table A.1 The median, minimal concentration (in μM) of metal compounds (CuSO4, AgNO3 and Ag7NO11) required to (1) inhibit planktonic cell proliferation [minimal inhibitory
concentration (MIC)] and (2) inhibit biofilm formation [minimal biofilm inhibitory concentration
(MBIC)].
Overall, with the exception of E. coli incubated in the presence of P. aeruginosa, the MIC
and MBIC were similar for CuSO4 (Figure A.2 and Table A.1) suggesting that, at this
concentration of Cu, the biofilm either offered no protection from CuSO4 or the planktonic cells
could not form a biofilm. Of note was the magnitude of CuSO4 that planktonic E. coli cells could
withstand in the presence of P. aeruginosa: more than 30,000 μM as a dual-species culture (this
study) compared to 2,000 μM as a single species (Lemire et al. 2015). Additionally, P.
aeruginosa/E. coli dual-species cultures were capable of tolerating much higher concentrations of
CuSO4 than the other bacterial dual-species combinations, suggesting the potential to use this

258
bacterial dichotomy for Cu bioremediation. Meanwhile, variable trends were observed with
regards to the MIC and MBIC values for the Ag compounds (Table A.1). While formation of a
biofilm resulted in a higher MBIC compared to the MIC in P. aeruginosa incubated with S. aureus,
this was not the case for P. aeruginosa incubated with E. coli. In other instances, the MBIC was
less than or equivalent to the MIC in some dual-species communities, for example E. coli cultured
with S. aureus, suggesting species level response mechanisms to Ag poisoning (Table A.1).
Additionally, there were three experimental situations where the MIC and MBIC of Ag7NO11 were
equivalent: (1) for S. aureus grown with P. aeruginosa; and E. coli cultured with (2) S. aureus or
(3) P. aeruginosa. However, the MIC was greater than the MBIC of AgNO3 and Ag7NO11 for S.
aureus when S. aureus and E. coli were incubated together. This trend was also observed for P.
aeruginosa co-cultured with E. coli (Figures A.1, A.2 and Table A.1). Though this observation
was comparable for AgNO3 tested against S. aureus grown with P. aeruginosa, and E. coli cultured
with P. aeruginosa, this was not the case for Ag7NO11, where the MBIC was greater than or
equivalent to the MIC, respectively. Finally, the MBIC was greater than the MIC for P. aeruginosa
co-cultured with S. aureus for both Ag compounds tested (Figures A.1, A.2 and Table A.1).
Regardless, Ag7NO11 inhibited the growth of dual-species planktonic cultures and establishment
of dual-species bio- films at lower equimolar concentrations than both AgNO3 and CuSO4.
A.6.2 Evaluating the in vitro capacity of CuSO4, AgNO3, and Ag7NO11 to eradicate dual-species
planktonic and biofilm populations
This study also explored the concentrations of CuSO4, AgNO3, and Ag7NO11 required to
eradicate established dual-species planktonic and biofilm populations. MBC and MBEC assays
were employed to expose dual-species planktonic and biofilm populations, that had established

259
themselves for 24 h prior to metal exposure, to serial dilutions of CuSO4, AgNO3, and Ag7NO11
(Figures A.3 and A.4). First, higher concentrations of all metals were required to eradicate
established dual-species planktonic and bio- film populations than inhibit their growth (MBC >
MIC; MBEC > MBIC) (Figures A.3, A.4 and Table A.2). This observation supports other studies
which demonstrate that eradicating an established biofilm population is more complex than their
planktonic counterparts (Harrison et al. 2007; Chien et al. 2013; Lemire et al. 2015). However,
there were exceptions observed in this study for S. aureus incubated with E. coli for 24 h and
subsequently exposed to AgNO3 or Ag7NO11 and P. aeruginosa incubated with E. coli for 24 h
and subsequently exposed Ag7NO11 (Table A.2). In many cases, the potential MBEC of the
established dual-species biofilms exceeded the solubility limitations of the metals under these
experimental conditions (2,500 μM for Ag and 500,000 μM for Cu). A longer metal exposure time
was attempted in this study, as previous work from Lemire et al. (2015) had demonstrated success
using this strategy.
Figure A.3 The 24 h MBC of CuSO4, AgNO3, and Ag7NO11 against established dual-species
planktonic cultures. Dual-species planktonic populations of E. coli (JM109), S. aureus (ATCC

260
25923), and P. aeruginosa (PA01) were grown for 24 h in simulated wound fluid (SWF). Then,
the cultures were exposed to various concentrations of CuSO4 (• broken line), AgNO3 (■ solid
line), and Ag7NO11 (▴ dotted line) for 24 h. Viable planktonic cells were enumerated as Cfu mL-
1 following the 24 h metal exposure. (i) S. aureus + P. aeruginosa (A and B, respectively). (ii) S.
aureus + E. coli (A and B, respectively). (iii) P. aeruginosa + E. coli (A and B, respectively).
note that all metal stock solutions were prepared at equal molar concentrations of Ag or Cu
molecules. Hence, concentrations found in this figure are reflective of the concentration of Ag or
Cu and not the metal compound itself. n = 4–6 ± SD. **Although P. aeruginosa and E. coli
could grow together planktonically for 24 h in 96-well plates (Supplemental figure 2), a further
24 h during the metal challenge led to a lack of viable E. coli cells.
Nonetheless, in this study one or both species lost viability, potentially due to interspecies
com- petition, in the non-metal exposed control (unpublished observations and Table A.2).
Additionally, no viable E. coli cells were observed after 48 h as a dual-species planktonic or
biofilm population with P. aeruginosa, despite having successfully done so, with no significant
growth inhibition, during the initial 24 h incubation. In contrast, Culotti and Packman (2014) were
able to successfully grow a few derivative species of E. coli K12 with P. aeruginosa PAO1 as
dual-species biofilms using R2A medium. This suggests that strain, culturing methods and/or
medium type selection can drive successful establishment of a biofilm with more than one species.
However, no MBC and MBEC observations were recorded for E. coli cells incubated with P.
aeruginosa in this study.
The MBC of Ag7NO11 was significantly lower (from twofold to 10-fold) than that of
AgNO3 and CuSO4 except against S. aureus cultured with P. aeruginosa. Additionally, the MBC
of AgNO3 was observed to be universally significantly lower than that of CuSO4 (Figure A.3 and
Table A.2). Observing the MBEC was not always experimentally possible, specifically for (1) all
metal compounds tested against S. aureus cultured as a dual-species biofilm with P. aeruginosa;
(2) both Ag compounds tested against P. aeruginosa grown as a dual-species biofilm with S.
aureus; (3) CuSO4 tested against S. aureus cultured as a biofilm with E. coli; and (4) AgNO3 tested
against E. coli cultured as a biofilm with S. aureus (Figure A.4 and Table A.2). When observing

261
the MBEC was possible, the MBEC of Ag7NO11 was significantly lower than that of both AgNO3
and CuSO4. There was one caveat to this observation, viz. when P. aeruginosa was cultured as a
dual-species biofilm with S. aureus, the MBEC of CuSO4 (500,000 μM) is a con- centration well
beyond the solubility limits of Ag under the assaying conditions used. The MBEC values observed
in this study for dual-species biofilms were higher than the MBEC values previously observed for
single-species biofilms of the same species, <40, 40, and 120μM of AgNO3 and 20, 40, and 40 μM
of Ag7NO11, that were necessary to eradicate E. coli, P. aeruginosa and S. aureus single-species
biofilms, respectively (Lemire et al. 2015).
Figure A.4 The 24 h MBEC of CuSO4, AgNO3, and Ag7NO11 against established dual-species
biofilms. Dual-species biofilms of E. coli (JM109), S. aureus (ATCC 25923), and P. aeruginosa
(PA01) were established for 24 h in simulated wound fluid (SWF). Then, the cultures were
exposed to various concentrations of CuSO4 (• broken line), AgNO3 (■ solid line), and Ag7NO11 (▴ dotted line) for 24 h. Viable biofilm cells were enumerated as Cfu peg-1 following the 24 h
metal exposure. (i) S. aureus + P. aeruginosa (A and B, respectively). (ii) S. aureus + E. coli (A
and B, respectively). (iii) P. aeruginosa + E. coli (A and B, respectively). note that all metal
stock solutions were prepared at equal molar concentrations of Ag or Cu molecules. Hence,
concentrations found in this figure are reflective of the concentration of Ag or Cu and not the
metal compound itself. n = 4 to 6 ± SD. **Although P. aeruginosa and E. coli could grow

262
together as a biofilm for 24 h in the MBECTM device (Supplemental figure 3), a further 24 h
during the metal challenge led to a lack of viable E. coli cells.
Table A.2 The median, minimal concentration (in μM) of metal compounds (CuSO4, AgNO3,
and Ag7NO11 required to (1) eradicate an established planktonic population [minimal bactericidal
concentration (MBC)], and (2) eradicate an established biofilm [minimal biofilm eradication
concentration (MBEC)].
Indeed, dual-species biofilms are difficult to eradicate with antimicrobials, a phenomenon
that has previously been described in the literature, albeit without complete mechanistic detail
(Burmolle et al. 2006). Observations made regarding the equivalent MIC and MBIC of CuSO4
(Figures A.1, A.2 and Table A.1), were not in agreement with observations made regarding the
MBEC and MBC of CuSO4. For eradicating dual-species populations, greater concentrations of
CuSO4 were needed to eradicate biofilms than to eradicate planktonic cells (Figures A.3, A.4 and
Table A.2). With regards to Ag, the chemistry of Ag in the presence of saline (0.9% NaCl) restricts
its solubility, so MBEC values could not be obtained for the majority of the tested dual-species
except for S. aureus and P. aeruginosa as a biofilm with E. coli (Figure A.4 and Table A.2).
However, the MBC and MBEC values of AgNO3 were significantly lower than those of CuSO4.
As with the MIC/ MBIC values mentioned above, the MBC/MBEC values of Ag7NO11 were

263
significantly lower than those of both AgNO3 and CuSO4 for all testable dual-species biofilms
(Figure A.4 and Table A.2). Overall, the observations suggest that established dual-species
planktonic and bio- film cultures were much more difficult to eradicate than they were to inhibit
(MBC > MIC and MBEC > MBIC, respectively) with the exception of P. aeruginosa in a dual-
species biofilm with E. coli where the values were similar (Tables A.1 and A.2). This trend was
observed, for the most part, in a previous study using single-species bacterial strains (Lemire et al.
2015). A highlight of these experiments is the difficulty involved in interpreting the physiology
that governs the differential MIC, MBIC, MBC and MBEC values for dual-species biofilms.
Therefore, it is likely that interpreting observations made with biofilms that have greater than two
species may be even more difficult.
A.6.3 The applicability of in vitro observations
Demonstrating the capacity of novel antimicrobial agents to inhibit the growth of and
eradicate bacterial biofilms is increasingly important as their impact to clinical and industrial
environments is understood. Since biofilms are responsible for contaminating in-dwelling devices
(Hoiby et al. 2011), promoting chronic infection (Costerton et al. 1999; Percival et al. 2012;
Metcalf & Bowler 2014), contaminating industrial surfaces (Mattila-Sandholm & Wirtanen 1992;
Kumar & Anand 1998; Meireles et al. 2016) and exhibiting an enhanced antimicrobial resistance
(Stewart & Costerton 2001; Ceri et al. 2010), preventing the formation of and eradicating biofilms
remains a core concern for researchers. Ag(I) has proven antimicrobial efficacy alone and as a co-
treatment against bacterial pathogens including antibiotic resistant bacteria (Lemire et al. 2013,
2015; Morones-Ramirez et al. 2013). A challenge of using Ag-impregnated devices is that the
concentration of Ag(I) ions present may be too low to be effective (Bjarnsholt et al. 2007). In

264
general, lower concentrations of Ag7NO11 and thus Ag(II, III) were needed to prevent and eradicate
both planktonic and biofilm populations of the tested strains in both this study (Tables 1 and 2)
and the study by Lemire et al. (2015). Indeed, the total concentration of Ag7NO11 needed would
be sevenfold less than the molar concentrations reported in this study as every mole of Ag7NO11
releases seven atoms of Ag. This suggests that Ag7NO11 may be a suitable candidate as an
antimicrobial coating for medical devices including bandages, catheters and endotracheal tubes.
However, the toxicology of Ag7NO11, and for that matter Ag in general, to mammalian cells is not
completely understood. Another potential application for Ag7NO11 is its use as surface coatings,
disinfectants and antiseptics in industrial settings to prevent biofilm-induced fouling.
In this study, the MBEC assay was chosen as it is robust and highly reproducible. For
growing biofilms, there are numerous published methods that all have advantages and drawbacks
that need to be considered prior to experimentation. For example, this study uses the CBD to grow
biofilms for antimicrobial susceptibility testing. If the goal of the experiments was to collect
biomass, it may not be the most ideal method to grow a biofilm. To quantify viable cell numbers,
this study employed spot plating and counting the CFUs. However, Tavernier and Coenye (2015)
published details of the quantification of viable P. aeruginosa in a multispecies biofilm using a
qPCR-based technique. Due to its elegance, this approach was considered for this study, but due
to its reduced reliability below 1,000 cells, it was excluded (Taylor et al. 2014). There remains no
superior method for growing and testing resistance/tolerance phenomena in biofilms.
A.7 Conclusions
This study established that Ag7NO11 has enhanced anti- microbial and anti-biofilm capacities
over AgNO3and CuSO4. Additionally, it was demonstrated that Ag7NO11 is effective for the

265
inhibition and eradication of different dual-species planktonic and biofilm bacterial populations.
Finally, this study demonstrated that eradicating biofilms composed of more than one species
requires higher concentrations of metals with an established anti-biofilm activity. This study thus
reinforces findings regarding the difficulty of eradicating multispecies bacterial communities.
Biofilms contribute to and complicate infectious dis- eases as well as contaminate industrial
surfaces. Yet there is a dearth of adequate solutions to eradicate them. The present in vitro assays
demonstrate that Ag7NO11 could have utility as an anti-biofilm agent at much lower concentrations
than other antimicrobial metals. Thus, Ag7NO11 could add to the armamentarium for combatting
and con- trolling bacterial biofilms, which is greatly needed due to increases in antimicrobial-
resistant bacteria.
A.8 References
Afessa B, Shorr AF, Anzueto AR, Craven DE, Schinner R, Kollef MH. 2010. Association
between a silver-coated endotracheal tube and reduced mortality in patients with ventilator-
associated pneumonia. Chest. 137:1015–1021. doi: 10.1378/chest.09-0391.
Baker B, McKernan P, Marsik F. 2014. Clinical and regulatory development of antibiofilm
drugs: the need, the potential, and the challenges. In: Antibiofilm agents. Springer Berlin
Heidelberg; p. 469–477. doi: 10.1007/978- 3-642-53833-9.
Bjarnsholt T, Kirketerp-Moller K, Kristiansen S, Phipps R, Nielsen AK, Jensen PO, Hoiby N,
Givskov M. 2007. Silver against Pseudomonas aeruginosa biofilms. APMIS. 115:921– 928.
doi:10.1111/apm.2007.115.issue-8.
Bjarnsholt T, Alhede M, Alhede M, Eickhardt-Sorensen SR, Moser C, Kuhl M, Jensen PO,
Hoiby N. 2013. The in vivo biofilm. Trends Microbiol. 21:466–474. doi:10.1016/j.
tim.2013.06.002.
Borkow G, Okon-Levy N, Gabbay J. 2010. Copper oxide impregnated wound dressing: biocidal
and safety studies. Wounds. 22:301–310.
Burmolle M, Webb JS, Rao D, Hansen LH, Sorensen SJ, Kjelleberg S. 2006. Enhanced biofilm
formation and increased resistance to antimicrobial agents and bacterial invasion are caused by

266
synergistic interactions in multispecies biofilms. Appl Environ Microbiol. 72:3916– 3923.
doi:10.1128/AEM.03022-05.
Canapp SO Jr, Farese JP, Schultz GS, Gowda S, Ishak AM, Swaim SF, Vangilder J, Lee-
Ambrose L, Martin FG. 2003. The effect of topical tripeptide–copper complex on healing of
ischemic open wounds. Vet Surg. 32:515–523. doi:10.1111/ vsu.2003.32.issue-6.
Ceri H, Olson ME, Stremick C, Read RR, Morck D, Buret A. 1999. The calgary biofilm device:
new technology for rapid determination of antibiotic susceptibilities of bacterial biofilms. J Clin
Microbiol. 37:1771–1776.
Ceri H, Olson ME, Turner RJ. 2010. Needed, new paradigms in antibiotic development. Expert
Opin Pharmacother. 11:1233–1237. doi:10.1517/14656561003724747.
Chien C-C, Lin B-C, Wu C-H. 2013. Biofilm formation and heavy metal resistance by an
environmental Pseudomonas sp. Biochem Eng J. 78:132–137. doi:10.1016/j.bej.2013.01.014.
Costerton JW, Stewart PS, Greenberg EP. 1999. Bacterial biofilms: a common cause of
persistent infections. Science. 284:1318–1322. doi:10.1126/science.284.5418.1318.
Culotti A, Packman AI. 2014. Pseudomonas aeruginosa promotes Escherichia coli biofilm
formation in nutrient- limited medium. PLoS ONE. 9:e107186. doi:10.1371/
journal.pone.0107186.
Grass G, Rensing C, Solioz M. 2011. Metallic copper as an antimicrobial surface. Appl Environ
Microbiol. 77:1541– 1547. doi:10.1128/AEM.02766-10.
Gugala N, Lemire JA, Turner RJ. 2017. The efficacy of different anti-microbial metals at
preventing the formation of, and eradicating bacterial biofilms of pathogenic indicator strains. J
Antibiot (Tokyo): 1–6. doi:10.1038/ja.2017.10.
Harrison JJ, Ceri H, Turner RJ. 2007. Multimetal resistance and tolerance in microbial biofilms.
Nat Rev Microbiol. 5:928– 938. doi:10.1038/nrmicro1774.
Herron M, Agarwal A, Kierski PR, Calderon DF, Teixeira LB, Schurr MJ, Murphy CJ,
Czuprynski CJ, McAnulty JF, Abbott NL. 2014. Reduction in wound bioburden using a silver-
loaded dissolvable microfilm construct. Adv Healthc Mater. 3:916–928.
doi:10.1002/adhm.201300537.
Hill KE, Malic S, McKee R, Rennison T, Harding KG, Williams DW, Thomas DW. 2010. An in
vitro model of chronic wound biofilms to test wound dressings and assess antimicrobial
susceptibilities. J Antimicrob Chemother. 65:1195–1206. doi:10.1093/jac/dkq105.
Hoiby N, Ciofu O, Johansen HK, Song ZJ, Moser C, Jensen PO, Molin S, Givskov M, Tolker-
Nielsen T, Bjarnsholt T. 2011. The clinical impact of bacterial biofilms. Int J Oral Sci. 3:55– 65.
doi:10.4248/IJOS11026.

267
Huang L, Zhao S, Wang Z, Wu J, Wang J, Wang S. 2016. In situ immobilization of silver
nanoparticles for improving permeability, antifouling and anti-bacterial properties of
ultrafiltration membrane. J Membr Sci. 499:269–281. doi:10.1016/j.memsci.2015.10.055.
van der Kooij D, Veenendaal HR, Scheffer WJ. 2005. Biofilm formation and multiplication of
Legionella in a model warm water system with pipes of copper, stainless steel and cross-linked
polyethylene. Water Res. 39:2789–2798. doi:10.1016/j.watres.2005.04.075.
Kostenko V, Lyczak J, Turner K, Martinuzzi RJ. 2010. Impact of silver-containing wound
dressings on bacterial biofilm viability and susceptibility to antibiotics during prolonged
treatment. Antimicrob Agents Chemother. 54:5120–5131. doi:10.1128/AAC.00825-10.
Kumar CG, Anand SK. 1998. Significance of microbial biofilms in food industry: a review. Int J
Food Microbiol. 42:9–27. doi:10.1016/S0168-1605(98)00060-9.
Lansdown AB. 2006. Silver in health care: antimicrobial effects and safety in use. Curr Probl
Dermatol. 33:17–34. doi:10.1159/000093928.
Lehtola MJ, Miettinen IT, Keinanen MM, Kekki TK, Laine O, Hirvonen A, Vartiainen T,
Martikainen PJ. 2004. Microbiology, chemistry and biofilm development in a pilot drinking
water distribution system with copper and plastic pipes. Water Res. 38:3769–3779.
doi:10.1016/j. watres.2004.06.024.
Lemire JA, Harrison JJ, Turner RJ. 2013. Antimicrobial activity of metals: mechanisms,
molecular targets and applications. Nat Rev Microbiol. 11:371–384. doi:10.1038/nrmicro3028.
Lemire JA, Kalan L, Bradu A, Turner RJ. 2015. Silver oxynitrate, an unexplored silver
compound with antimicrobial and antibiofilm activity. Antimicrob Agents Chemother. 59:4031–
4039. doi:10.1128/AAC.05177-14.
Malin EW, Galin CM, Lairet KF, Huzar TF, Williams JF, Renz EM, Wolf SE, Cancio LC. 2013.
Silver-coated nylon dressing plus active DC microcurrent for healing of autogenous skin donor
sites. Ann Plast Surg. 71:481–484. doi:10.1097/ SAP.0b013e31829d2311.
Mansouri J, Charlton T, Chen V, Weiss T. 2016. Biofouling performance of silver-based PES
ultrafiltration membranes. Desalination Water Treat. 57:28100–28114. doi:10.1080/194
43994.2016.1183231.
Mattila-Sandholm T, Wirtanen G. 1992. Biofilm formation in the industry: a review. Food Rev
Int. 8:573–603. doi:10.1080/87559129209540953.
Mei ML, Li QL, Chu CH, Lo EC, Samaranayake LP. 2013. Antibacterial effects of silver
diamine fluoride on multi- species cariogenic biofilm on caries. Ann Clin Microbiol Antimicrob.
12:4. doi:10.1186/1476-0711-12-4.

268
Meier A, Tsaloglou NM, Mowlem MC, Keevil CW, Connelly DP. 2013. Hyperbaric biofilms on
engineering surfaces formed in the deep sea. Biofouling. 29:1029–1042. doi:10.10
80/08927014.2013.824967.
Meireles A, Borges A, Giaouris E, Simoes M. 2016. The current knowledge on the application of
anti-biofilm enzymes in the food industry. Food Res Int. 86:140–146. doi:10.1016/j.
foodres.2016.06.006.
Metcalf DG, Bowler PG. 2014. Clinician perceptions of wound biofilm. Int Wound J. 13:717–
725. doi:10.1111/ iwj.12358.
Michels HT, Keevil CW, Salgado CD, Schmidt MG. 2015. From laboratory research to a clinical
trial: copper alloy surfaces kill bacteria and reduce hospital-acquired infections. HERD. 9:64–79.
doi:10.1177/1937586715592650.
Mijnendonckx K, Leys N, Mahillon J, Silver S, Van Houdt R. 2013. Antimicrobial silver: uses,
toxicity and potential for resistance. Biometals. 26:609–621. doi:10.1007/s10534-013- 9645-z.
Morones-Ramirez JR, Winkler JA, Spina CS, Collins JJ. 2013. Silver enhances antibiotic activity
against gram- negative bacteria. Sci Transl Med. 5:190ra181. doi:10.1126/
scitranslmed.3006276.
Percival SL, Hill KE, Williams DW, Hooper SJ, Thomas DW, Costerton JW. 2012. A review of
the scientific evidence for biofilms in wounds. Wound Repair Regen. 20:647–657.
doi:10.1111/wrr.2012.20.issue-5.
Røder HL, Sørensen SJ, Burmølle M. 2016. Studying bacterial multispecies biofilms: where to
start? Trends Microbiol. 24:503–513. doi:10.1016/j.tim.2016.02.019.
Roy S, Elgharably H, Sinha M, Ganesh K, Chaney S, Mann E, Miller C, Khanna S, Bergdall VK,
Powell HM, et al. 2014. Mixed-species biofilm compromises wound healing by disrupting
epidermal barrier function. J Pathol. 233:331– 343. doi:10.1002/path.2014.233.issue-4.
Sen CK, Khanna S, Venojarvi M, Trikha P, Ellison EC, Hunt TK, Roy S. 2002. Copper-induced
vascular endothelial growth factor expression and wound healing. Am J Physiol Heart Circ
Physiol. 282:H1821–H1827. doi:10.1152/ajpheart.01015.2001.
Silver S, le Phung T, Silver G. 2006. Silver as biocides in burn and wound dressings and
bacterial resistance to silver compounds. J Ind Microbiol Biotechnol. 33:627–634.
doi:10.1007/s10295-006-0139-7.
Stewart PS, Costerton JW. 2001. Antibiotic resistance of bacteria in biofilms. Lancet. 358:135–
138. doi:10.1016/ S0140-6736(01)05321-1.
Tavernier S, Coenye T. 2015. Quantification of Pseudomonas aeruginosa in multispecies
biofilms using PMA-qPCR. PeerJ. 3:e787. doi:10.7717/peerj.787.
Taylor MJ, Bentham RH, Ross KE. 2014. Limitations of using propidium monoazide with qPCR
to discriminate between live and dead Legionella in biofilm samples. Microbiol Insights. 7:15–
24. doi:10.4137/MBI.

269
Walker M, Parsons D. 2014. The biological fate of silver ions following the use of silver-
containing wound care products – a review. Int Wound J. 11:496–504. doi:10.1111/iwj.2014.11.
issue-5.
Warnes SL, Keevil CW. 2013. Inactivation of norovirus on dry copper alloy surfaces. PLoS
ONE. 8:e75017. doi:10.1371/ journal.pone.0075017.
Wolcott RD, Rhoads DD, Bennett ME, Wolcott BM, Gogokhia L, Costerton JW, Dowd SE.
2010. Chronic wounds and the medical biofilm paradigm. J Wound Care. 19:45-53, 48-50, 52-
43. doi:10.12968/jowc.2010.19.2.46966.
Wu Y, Quan X, Si X, Wang X. 2016. A small molecule norspermidine in combination with
silver ion enhances dispersal and disinfection of multi-species wastewater biofilms. Appl
Microbiol Biotechnol. 100:5619–5629. doi:10.1007/s00253-016-7394-y.
Xu FF, Imlay JA. 2012. Silver(I), mercury(II), cadmium(II), and zinc(II) target exposed enzymic
iron–sulfur clusters when they toxify Escherichia coli. Appl Environ Microbiol. 78:3614–3621.
doi:10.1128/AEM.07368-11.
Yang L, Liu Y, Wu H, Song Z, Hoiby N, Molin S, Givskov M. 2012. Combating biofilms.
FEMS Immunol Med Microbiol. 65:146–157. doi:10.1111/j.1574-695X.2011.00858.x.

270
Appendix B: Complete gene lists pertaining to the chemical genetic screens
Complete list of genes recovered in Chapter 4 and Chapter 5 can be found at
https://www.mdpi.com/2073-4425/9/7/344#supplementary and https://www.mdpi.com/2073-
4425/10/1/34#supplementary, respectively.
The complete list for Chapter 6 is supplementary to this thesis..

271
Appendix C: Additional methodology
In this section additional methodology explored is briefly explained and explored.
References can be found in the general reference section following Chapter 8.
C.1 Drip Flow Reactor for biofilm growth under low-shear/laminar flow
C.1.1 Introduction
This chapter provides methodology and standardization for the use of the Drip Flow
Reactor (DFR) for biofilm growth and cultivation. The DFR is widely applicable for a number of
reasons including [532] a) the biofilm is close to air-liquid interface, thereby useful as a model
environment for catheters, lungs with cystic fibrosis and the oral cavity among others, b) low field
velocity over the biofilm, c) can be used for the growth of anaerobic microorganisms, d) the biofilm
can be easily extracted and monitored, e) the reactor can mimic various surfaces for biofilm
growth, and f) robust biofilm growth due the continuous flow of nutrients and the immediate exit
of waste.
Optimization of the DFR was completed in order to produce adequate amounts of biofilm
for prospect studies including metabolomics or proteomics. This technique was optimized, and
biofilms were grown, however, due to modifications in the goal of this thesis, this technique was
not advanced further. The following describes a method for growing an E. coli biofilm on glass
coupons in M9 minima media.

272
C.1.2 Methods
A frozen stock culture of Escherichia coli BW25113 was streaked onto LB media agar
plates and grown overnight at 37°C. The following day, a colony was isolated and used to prepare
a liquid culture stock in LB, this was grown for 16 hours, shaking at 150 rpm and 37°C. Once
grown, the inoculum was standardized to an optical density of 1.00 (A600); a small volume of this
sample was diluted and used to determine the colony forming units of the starting culture. This
culture was used to inoculate the DFR prior to running the experiment.
The drip flow reactor was set to the manufacturer’s specifications (BioSurface Technologies, Drip
Flow Operations Manual) with notable modifications. Two days prior to the experiment the
apparatus was sealed with tinfoil and autoclaved, detached from the influent and effluent silicone
tubing, which was also autoclaved. A 10 L carboy was filled with M9 minimal media and
autoclaved along with the effluent carboy two days prior.
To inoculate the coupons of the DFR, 1 mL of the standardized culture was placed in the
chamber of the sterile DFR and to this, 14 mL of LB media was added. The chamber covers were
screwed back on tightly and the apparatus was gently swirled. This was completed in a biosafety
cabinet to ensure sterility. The DFR reactor was left at room temperature for 16 hours. Following
this, a 1 inch, 21-gauge needle, attached to the influent tubing originating from the growth medium
carboy, was injected into the septum and sealed with parafilm. All proper tubing was connected,
and a glass flow break was included to ensure no back-contamination into the media carboy.
Further, to the influent and effluent waste carboys, a 0.2 um filter was attached to confirm air flow.
The legs of the DFR were added to the desired length, the bacterial air vents were attached to the
DFR, the peristaltic pump flow rate was set, and the pump was turned on. The entire apparatus
was placed into an incubator and run for 16-36 hours, depending on desired biofilm thickness.

273
The following day, the apparatus was removed and sterilely detached from the tubing. The
channel cover was removed. Using sterile forceps, the coupons were removed and placed in a
beaker filled with 45 mL phosphate buffered saline (PBS). The biofilm was then scraped off using
a sterile spatula. The coupon and the spatula were then rinsed with 5 mL PBS. This 50 mL sample
was then added to a falcon tube and the sample was homogenized to ensure the biofilm clumps
were disaggregated. The sample was then diluted in PBS and plated on LB media agar plates to
determine the colony forming units.
C.2 qPCR for the determination of gene transcript levels
C.2.1 Introduction
Here, methods for quantitative polymerase chain reaction are briefly provided. This
technique was optimized and performed in order to quantitatively determine the amount of
transcript level for a particular gene. This work was completed for the genes rodZ, gshA, grxD and
trxA in the absence and presence of silver. We recognize that the use of this technique is valuable
for future studies that stem from this thesis.
C.2.2 Methods
C.2.2.1 RNA isolation, purification and cDNA preparation
RNA purification was completed using RiboPure from Ambion, for detailed protocol
information refer to the instruction manual found online. Following isolation, the sample was
treated with DNase and the purity of the sample was determined using a NanoDrop for which the
260/280 ratio was compared.

274
Using SuperScript II Reverse Transcriptase from Thermofisher, the RNA sample
underwent first-strand cDNA synthesis using random primers. Again, for detailed information
refer to the instruction manual online.
C.2.2.2 PCR reaction
Into a 1.7 mL microfuge tube sterile H2O, DMSO, 10x HE buffer, MgCl2 (25 mM), dNTPs
(10 mM), and the forward and reverse primer (100 nM) were added and gently mixed. The mix
was distributed into PCR tubes and 0.2 L of Taq Polymerase and the synthesized cDNA were
added to each tube. The samples were run in a thermocycler set at, 94°C for 3 min, then repeated
at 94°C for 30 sec, temperature gradient for 30 seconds and 72°C for one minute, followed by
72°C for 10 minute and held at 12°C.
Controls included 16S quantification and gBlock Gene Fragments, linear nucleic acid
fragments that contain a portion of the gene of interest and for which the primers matched, from
IDT.
C.2.3 Preliminary results
The protocol mentioned in C.2.2 was applied to the genes rodZ, gshA, grxD and trxA in
the absence and presence of two concentrations of silver 20 M and 50 M and plotted. The values
presented were normalized against 16S copies/reaction and the gBlock pertaining to the gene of
interest.

275
Figure C.1 Copies/reaction of the (a) rodZ, (b) gshA, (c) trxA and (d) grxD for cells grown in the
in the presence of silver nitrate at 20 M and 50 M for 24 hours at 37°C in M9 minimal media.
Results normalized against the 16S levels and the gBlock corresponding to the gene of interest.
C.3 Bandage project
C.3.1 Introduction
In this project, headed by the Harrison lab, we collected burn bandages from the W21C at the
Foothills hospital. For Turner lab purposes, collection of the bandages and subsequent bacterial
isolation would allow us to acquire silver resistant isolates that could be used for additional testing,
0uM
20uM
50uM
0
100000
200000
300000
(a) rodZ
[AgNO3]
Co
pie
s/r
ea
ctio
n
0uM
20uM
50uM
0
50000
100000
150000
200000
[AgNO3]
Co
pie
s/r
ea
ctio
n
(b) gshA
0uM
20uM
50uM
0
50000
100000
150000
200000
(c) trxA
[AgNO3]
Co
pie
s/r
ea
ctio
n
0uM
20uM
50uM
0
5000
10000
15000
20000
(d) grxA
[AgNO3]
Co
pie
s/r
ea
ctio
n

276
such as for the disk diffusion assays completed in Chapter 3. My role in this project included
assisting Dr. Joe Harrison and Dr. Tie Wang with processing of the bandages.
C.3.2 Methods
The bandage, collected form the W21C, was stored on ice for transport and until processed. Next,
the bandage was aseptically opened and separated from the gauze and cut into four pieces. Each
of the four quadrants (bandage and gauze) were treated differently as follows; a) suspended in 25
mL of bacterial cell storage buffer [50mM Tris-HCl, 5mM MgCl2, and 1mM phenyl methyl
sulphonyl fluoride (PMSF), pH = 7.4] and placed at -21°C in a 50 mL conical tube, b) folded and
placed at -21°C in a 50 mL conical tube, c) placed at 4°C, and d) used to streak onto seven different
types of solid media and grown for 24 hours at 37°C.
i. Brain Heart Infusion (BHI) agar
ii. Pseudomonas isolation (PI) agar
iii. Lysogeny Broth (LB) agar
iv. Staphylococcus isolation (SI) agar
v. Corn meal agar
vi. MacConkey (Mac) agar
vii. Cooked meat agar
Once grown, the cells were removed and resuspended in 30% glycerol:LB and stored at -81°C for
further processing.

277
Appendix D: Copyright information
Chapter 1:
The potential of Metals in Combating Bacterial Pathogens, published in Springer Nature
Terms and Conditions for RightsLink Permissions
Springer Nature Customer Service Centre GmbH (the Licensor) hereby grants you a non-
exclusive, world-wide licence to reproduce the material and for the purpose and
requirements specified in the attached copy of your order form, and for no other use, subject
to the conditions below:
5. Where 'reuse in a dissertation/thesis' has been selected the following terms apply: Print rights of
the final author's accepted manuscript (for clarity, NOT the published version) for up to 100 copies,
electronic rights for use only on a personal website or institutional repository as defined by the
Sherpa guideline (www.sherpa.ac.uk/romeo/).
Metal-based Antimicrobials published in The Royal Society of Chemistry.
When the author accepts the exclusive licence to publish for a journal article, he/she retains certain
rights that may be exercised without reference to the Royal Society of Chemistry.
Reproduce/republish portions of the article (including the abstract).
Photocopy the article and distribute such photocopies and distribute copies of the PDF of the article
for personal or professional use only (the Royal Society of Chemistry makes this PDF available to
the corresponding author of the article upon publication. Any such copies should not be offered
for sale. Persons who receive or access the PDF mentioned above must be notified that this may
not be made available further or distributed.).

278
Adapt the article and reproduce adaptations of the article for any purpose other than the
commercial exploitation of a work similar to the original.
Reproduce, perform, transmit and otherwise communicate the article to the public in spoken
presentations (including those that are accompanied by visual material such as slides, overheads
and computer projections).
Chapter 2:
The efficacy of different anti-microbial metals at preventing the formation of, and eradicating
bacterial biofilms of pathogenic indicator strain, published in the Journal of Antibiotics.
Ownership of copyright in original research articles remains with the Author, and provided that,
when reproducing the contribution or extracts from it or from the Supplementary Information, the
Author acknowledges first and reference publication in the Journal, the Author retains the
following non-exclusive rights: To reproduce the contribution in whole or in part in any printed
volume (book or thesis) of which they are the author(s). The author and any academic institution,
where they work, at the time may reproduce the contribution for the purpose of course teaching.
To reuse figures or tables created by the Author and contained in the Contribution in oral
presentations and other works created by them. To post a copy of the contribution as accepted for
publication after peer review (in locked Word processing file, of a PDF version thereof) on the
Author's own web site, or the Author's institutional repository, or the Author's funding body's
archive, six months after publication of the printed or online edition of the Journal, provided that
they also link to the contribution on the publisher’s website. Authors wishing to use the published
version of their article for promotional use or on a web site must request in the normal way.

279
Chapters 3-5:
Specificity in the susceptibilities of Escherichia coli, Pseudomonas aeruginosa and
Staphylococcus aureus clinical isolates to six metal antimicrobials (Chapter 3), Using a chemical
genetic screen to enhance our understanding of the antibacterial properties of silver (Chapter 4),
Using a chemical genetic screen to enhance our understanding of the antimicrobial properties of
gallium against Escherichia coli (Chapter 5)
For all articles published in MDPI journals, copyright is retained by the authors. Articles are
licensed under an open access Creative Commons CC BY 4.0 license, meaning that anyone may
download and read the paper for free. In addition, the article may be reused and quoted provided
that the original published version is cited.
Appendix A:
Silver oxynitrate – an efficacious compound for the prevention and eradication of dual-species
biofilms published in Biofouling
After assigning copyright, you will still retain the right to:
Be credited as the author of the article.
Make printed copies of your article to use for a lecture or class that you are leading on a non-
commercial basis.

280
Share your article using your free eprints with friends, colleagues and influential people you would
like to read your work.
Include your article Author’s Original Manuscript (AOM) or Accepted Manuscript (AM),
depending on the embargo period in your thesis or dissertation. The Version of Record cannot
be used. For more information about manuscript versions and how you can use them, please see
our guide to sharing your work.
Present your article at a meeting or conference and distribute printed copies of the article on a non-
commercial basis.
Post the AOM/AM on a departmental, personal website or institutional repositories depending on
embargo period. To find the embargo period for any Taylor & Francis journal, please use the Open
Access Options Finder.

281