Citric acid–γ-cyclodextrin crosslinked oligomers as carriers for doxorubicin delivery
Upload
independentCategory
view
5download
0
EurJConcer, Vol. Z8A, No. 415, pp. 778.7&X1992. 0964~1947~92$5.W + 0.00 Pnnred m Grear Bnmn 0 1992 Pqama Press Lrd
Comparative Studies on the Effects of Doxorubicin and Differentiation Inducing Agents on B16
Melanoma Cells Rosanna Supino, Mariangela Mariani, Ambrogio Colombo, Ennio Prosperi,
Anna C. Croce and Giovanni Bottiroli
The differentiation-inducing activity of doxorubicin on B16 melanoma cells grown in vitro was compared with that of other known differentiation inducers, such as theophylline, retinoic acid, and melanocyte-stimulating hormone (MSH). At drug concentrations resulting in cytostatic effects, doxorubicin and theophylline induced morphological changes (dendritic-like structures with a terminal melanin granule) with an enhancement of total melanin content and tyrosinase activity. Retinoic acid did not alter melanin content and cell morphology, although it affected cell growth. MSH enhanced total melanin content and tyrosinase activity, with no significant morphological changes. Flow cytometric analysis showed that MSH led to an accumulation of cells in Gl phase whereas doxorubicin induced an accumulation of cells in G2 + M. Studies on DNA content in doxorubicin- treated cells, selected on the basis of a morphologically differentiated pattern, showed a clustering of these cells in G2 + M, probably due to a cytokinesis block. Thus doxorubicin can induce cell differentiation comparable with other differentiation inducers. EurJ Cancer, Vol. 28A, No. 415, pp. 778-783,1992.
INTRODUCTION MALIGNANT MELANOMA cell lines are useful for studies of neo- plastic cell differentiation [ 1, 21. Indeed, such cells offer at least two different markers of differentiation: a morphological one, i.e. dendrite-like structures from the cell body content [3, 41, and a biochemical, easily quantifiable one, i.e. melanin content f 1, 3, 5). Differentiation of the cells can be revealed also by the production of a bicatalytic enzyme, tyrosinase, which may be present even in non-pigmented cells [6-91 and is a marker of differentiated function in relation to cell potential in producing melanin. Moreover, following differentiation, tumour cells show decreased proliferation, delayed tumour appearance and altered metastatic potential in mice. In melanoma cells such features do not appear simultaneously, thus suggesting a lack of close association between such phenomena [lo].
In in vitro melanoma cells, differentiation can be induced by extracellular stimuli including o-melanocyte-stimulating hor- mone (MSH) [3, 11, 121, forbol ester tumour promoters [l], dimethylsulphoxide [lo], butyric acid [lo], and agents like theophylline [12] and prostaglandins [9] which increase the intracellular level of cyclic adenosine monophosphate able to induce differentiation by itself [ 131; moreover contrasting results have been reported on differentiating activity of retinoic acid [14-161.
A differentiation inducing activity of anthracyclines on myeloid and erythroid leukaemias [17-191, rhabdomyoblastoma [20] and neuroblastoma [21] cells has been already described,
Correspondence to R. Supino. R. Supino is at the Istituto Nazionale Tumori, Via Venezian 1, 20133 Milan, Italy; M. Mariani and A. Colombo are at the Division of Experimental Oncology B, Istituto Nazionale per lo Studio e la Cura dei Tumori, Milano; E. Prosperi, A.C. Croce and G. Bottiroh are at the Centro di Studi per I’Istochimica del CNR, Department of Animal Biology, University of Pavia, Italy. Revised 31 Oct. 1991; accepted 4 Nov. 1991.
but the results cannot be generalised in all the cell systems [22]. Raz [4] reported that daunorubicin induces morphological alterations in B16 melanoma cells toward a differentiation pro- cess.
We have previously reported that B16 melanoma cells, with an induced resistance to doxorubicin, are less proliferative [23] and acquire a significantly higher latency and reduced metastatic potential when grown in viva [24], which indicates a reduced tumorigenic behaviour.
Microscopic observations of doxorubicin-treated cells have indicated a differentiated morphology [25]. In an attempt to clarify whether such a phenomenon was due to a differentiating process or to a selection of already differentiated cells, a number of cell differentiation parameters like intracellular and extra-
cellular melanin levels, tyrosinase activity and cell cycle alter- ations have been quantified in B16 melanoma cells following drug treatment. The results were compared with those obtained with theophylline, retinoic acid and MSH, which have already been reported to be differentiation inducers.
Chemicals MATERIALS AND METHODS
Doxorubicin was supplied by Farmitalia Carlo Erba (Milan). Retinoic acid, MSH, L-Dopa and melanin were purchased from Sigma. Theophylline was used as a clinical preparation (Tefamin, Recordati, Milan). All drugs were dissolved immedi- ately before use in saline, except for retinoic acid, which was dissolved in dimethylsulphoxide and then diluted in saline; the maximal final concentration of dimethylsulphoxide was 0.3%.
Cell line and experiments The B16V melanoma cells were grown in RPM1 1640 medium
(Flow) containing 10% fetal calf serum (Flow), antibiotics and 0.03 mmoV1 Fe(CNJK3 [23]. For the experiments, tumour cells (5 x 10Yml) were seeded in complete culture medium in 10 cm
778
Doxorubicin and Differentiation 779
diameter petri dishes (Corning) and treated 24 h later in replicate samples. Drugs and concentrations used were: doxorubicin, 2 x 10e6 mol/l, 4 x lo-’ mol/l, 2 x 10e8 mol/l; theophylline, 2 x 1O-3 mohl, 6 x lop4 mol/l, 2 x 10m4 molil; retinoic acid and MSH, lo-5 and 10d6 mol/l. Unless otherwise indicated, treatments were performed for 96 h. At the end of the exper- iments, light micrographs were taken on cell cultures with an inverted microscope equipped with a MPS 51s camera (Wild) on AGFA 100 ASA film, and cells were then collected in saline for all the determinations.
Evaluation of cell growth inhibition At 96 h after treatment, cells were counted in a Coulter
Counter; cell viability was determined by trypan blue dye exclusion. The drug effect was expressed as percentage of surviving cells versus control.
Evaluation of melanotic cells percentage Aliquots of cells from each sample were smeared on albu-
minated slides, air dried and fixed in 4% buffered formaldehyde at room temperature for 5 min. The slides were then mounted in UV inert mounting aqueous medium (GURR, Chadwell Heath, Essex) and the percentage of the pigmented cells was estimated by microscopic observation at 1000 X. About 700-1000 cells were counted in each sample.
Intracellular melanin evaluation Biochemical method. Intracellular melanin content was
evaluated according to Whittaker [26]. Briefly, aliquots of cells from each sample were washed twice in saline, then three times with trichloroacetic acid 5%, twice with ethanol: ethyl-ether (3: 1) and once with ether. After removal of ether, the samples were air-dried and dissolved in 1 ml of hot 0.85 moVl KOH. Samples were cooled and the optical density at 400 mn was determined. Melanin levels were evaluated by a standard curve prepared with commercial melanin.
Cytochemical method. The same smears used for cytologic evaluation of melanotic cells were used to measure the amount of melanin in single cells at 450 nm by means of a Vickers M 86 scanning and integrating microdensitometer: 100 x objective oil immersion, 314 pm2 mask, and 1.25 km2 spot. The mean integrated optical density values, corrected for the blank (amelanotic melanoma cells), were then converted to absolute units by calibrating the instrument with neutral filters of known optical density.
Extracellular melanin evaluation Extracellular melanin content was determined in 1 ml of
tissue culture medium from treated cells to which 10 ~1 of 2 N HCl had been added to bleach the phenol red. The optical density was read by means of a Beckman DU 8 spectrophotometer at 560 rm~ (wavelength at which the absorption of the medium was negligible). The amount of melanin, corrected for the blank, was calculated by means of a standard curve.
Cytochemical tyrosinase activity evaluation To evaluate tyrosinase activity, slides obtained from the same
cell preparation were incubated with L-Dopa at 37°C for 4 h [27], carefully rinsed with phosphate buffer and mounted. The optical density of the pigment obtained after this cytochemical reaction was measured by microdensitometry as reported above for cytochemical evaluation of melanotic cells.
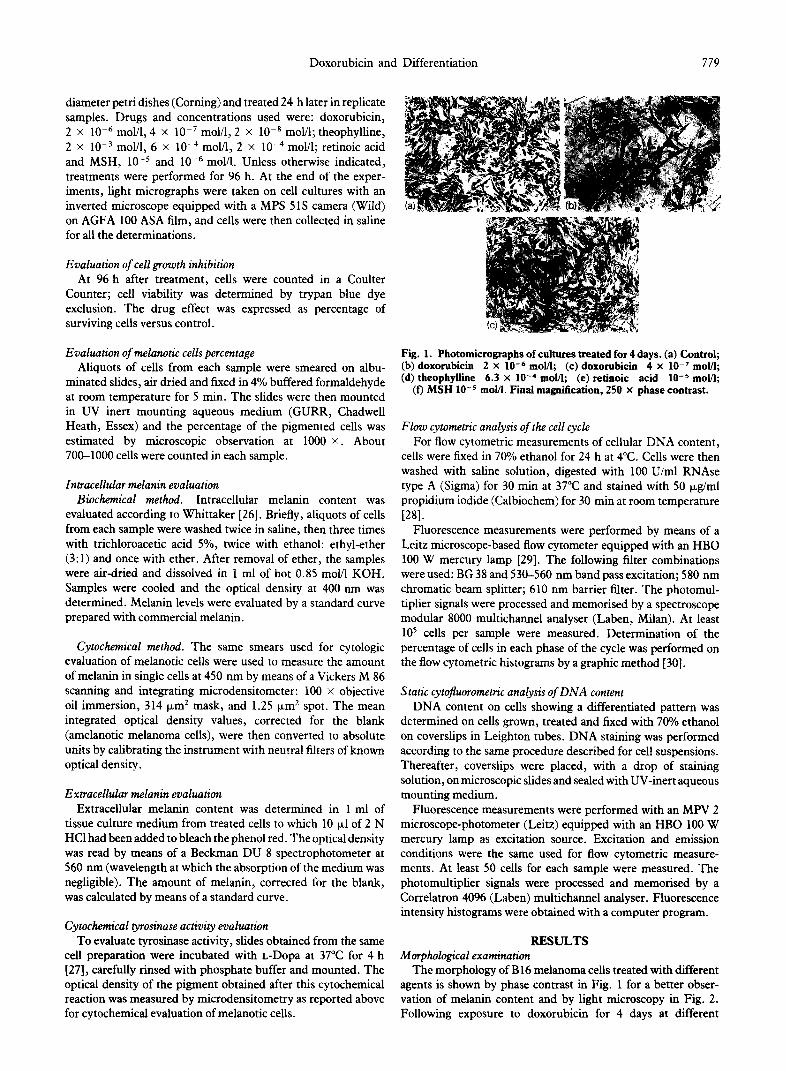
Fig. 1. Photomicrographs of cultures treated for 4 days. (a) Control; (b) doxorubicin 2 X low6 mol/I; (c) doxorubicin 4 X lo-’ mol/l; (d) theophylline 6.3 x 1O-4 molil; (e) retinoic acid lo+ molA;
(f) MSH IO+ mol/l. Final magnification, 250 x phase contrast.
Flow cytometric analysis of the cell cycle For flow cytometric measurements of cellular DNA content,
cells were fixed in 70% ethanol for 24 h at 4°C. Cells were then washed with saline solution, digested with 100 U/ml RNAse type A (Sigma) for 30 min at 37°C and stained with 50 pgiml propidium iodide (Calbiochem) for 30 min at room temperature
WI. Fluorescence measurements were performed by means of a
Leitz microscope-based flow cytometer equipped with an HBO 100 W mercury lamp [29]. The following filter combinations were used: BG 38 and 53k-560 mn band pass excitation; 580 nm chromatic beam splitter; 610 nm barrier filter. The photomul- tiplier signals were processed and memorised by a spectroscope modular 8000 multichannel analyser (Laben, Milan). At least lo5 cells per sample were measured. Determination of the percentage of cells in each phase of the cycle was performed on the flow cytometric histograms by a graphic method [30].
Static cytojhwrometric analysis of DNA content DNA content on cells showing a differentiated pattern was
determined on cells grown, treated and fixed with 70% ethanol on coverslips in Leighton tubes. DNA staining was performed according to the same procedure described for cell suspensions. Thereafter, coverslips were placed, with a drop of staining solution, on microscopic slides and sealed with UV-inert aqueous mounting medium.
Fluorescence measurements were performed with an MPV 2 microscope-photometer (Leitz) equipped with an HBO 100 W mercury lamp as excitation source. Excitation and emission conditions were the same used for flow cytometric measure- ments. At least 50 cells for each sample were measured. The photomultiplier signals were processed and memorised by a Correlatron 4096 (Laben) multichannel analyser. Fluorescence intensity histograms were obtained with a computer program.
RESULTS Morphological examination
The morphology of B 16 melanoma cells treated with different agents is shown by phase contrast in Fig. 1 for a better obser- vation of melanin content and by light microscopy in Fig. 2. Following exposure to doxorubicin for 4 days at different
780 R. Supino et al.
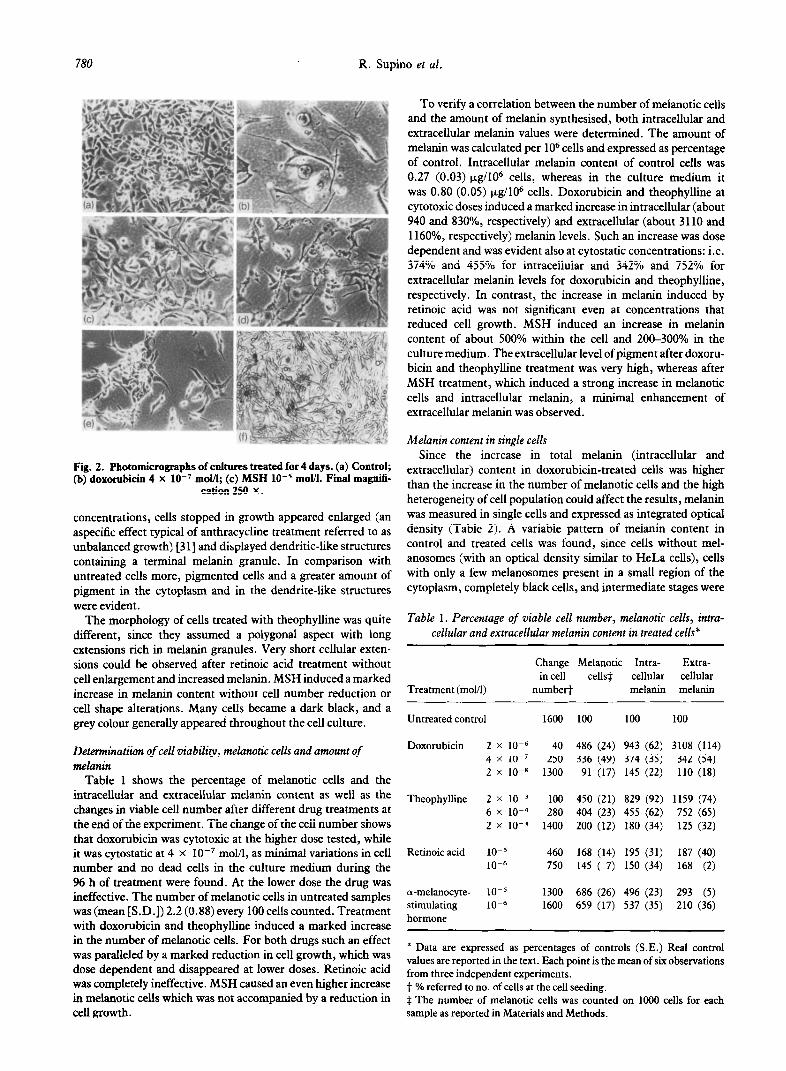
Fig. 2. Photomicrographs of cultures treated for 4 days. (a) Control; (b) doxorubicin 4 X lo-’ moUl; (c) MSH 10-s moV1. Final magnifi-
cation 250 X .
concentrations, cells stopped in growth appeared enlarged (an aspecific effect typical of anthracycline treatment referred to as unbalanced growth) [3 l] and displayed dendritic-like structures containing a terminal melanin granule. In comparison with untreated cells more, pigmented cells and a greater amount of pigment in the cytoplasm and in the dendrite-like structures were evident.
The morphology of cells treated with theophylline was quite different, since they assumed a polygonal aspect with long extensions rich in melanin granules. Very short cellular exten- sions could be observed after retinoic acid treatment without cell enlargement and increased melanin. MSH induced a marked increase in melanin content without cell number reduction or cell shape alterations. Many cells became a dark black, and a grey colour generally appeared throughout the cell culture.
Determinatiion of cell viability, melanotic cells and amount of melanin
Table 1 shows the percentage of melanotic cells and the intracellular and extracellular melanin content as well as the changes in viable cell number after different drug treatments at the end of the experiment. The change of the cell number shows that doxorubicin was cytotoxic at the higher dose tested, while it was cytostatic at 4 X IO-’ mol/l, as minimal variations in cell number and no dead cells in the culture medium during the % h of treatment were found. At the lower dose the drug was ineffective. The number of melanotic cells in untreated samples was (mean [S-D.]) 2.2 (0.88) every 100 cells counted. Treatment with doxorubicin and theophylline induced a marked increase in the number of melanotic cells. For both drugs such an effect was paralleled by a marked reduction in cell growth, which was dose dependent and disappeared at lower doses. Retinoic acid was completely ineffective. MSH caused an even higher increase in melanotic cells which was not accompanied by a reduction in cell growth.
To verify a correlation between the number of melanotic cells and the amount of melanin synthesised, both intracellular and extracellular melanin values were determined. The amount of melanin was calculated per lo6 cells and expressed as percentage of control. Intracellular melanin content of control cells was 0.27 (0.03) &g/IO6 cells, whereas in the culture medium it was 0.80 (0.05) pg/106 cells. Doxorubicin and theophylline at cytotoxic doses induced a marked increase in intracellular (about 940 and 830%, respectively) and extracellular (about 3110 and 1160%, respectively) melanin levels. Such an increase was dose dependent and was evident also at cytostatic concentrations: i.e. 374% and 455% for intracellular and 342% and 752% for extracellular melanin levels for doxorubicin and theophylline, respectively. In contrast, the increase in melanin induced by retinoic acid was not significant even at concentrations that reduced cell growth. MSH induced an increase in melanin content of about 500% within the cell and 20&300% in the culture medium. The extracellular level of pigment after doxoru- bicin and theophylline treatment was very high, whereas after MSH treatment, which induced a strong increase in melanotic cells and intracellular melanin, a minimal enhancement of extracellular melanin was observed.
Melanin content in single cells Since the increase in total melanin (intracellular and
extracellular) content in doxorubicin-treated cells was higher than the increase in the number of melanotic cells and the high heterogeneity of cell population could affect the results, melanin was measured in single cells and expressed as integrated optical density (Table 2). A variable pattern of melanin content in control and treated cells was found, since cells without mel- anosomes (with an optical density similar to HeLa cells), cells with only a few melanosomes present in a small region of the cytoplasm, completely black cells, and intermediate stages were
Table 1. Percentage of viable cell number, melanotic cells, intra- cellular and extracellular melanin content in treated cells*
Change Melanotic Intra- Extra- in cell cells* cellular cellular
Treatment (moY1) numbed melanin melanin
Untreated control 1600 100 100 100
Doxorubicin 2 x 10-h 40 486 (24) 943 (62) 3108 (114) 4 x 10⁻⁷ 250 336 (49) 374 (35) 342 (54) 2 x 10-B 1300 91 (17) 145 (22) 110 (18)
Theophylline 2 x 10⁻³ 100 450 (21) 829 (92) 1159 (74) 6 x 1O-4 280 404 (23) 455 (62) 752 (65) 2 x 10-d 1400 200 (12) 180 (34) 125 (32)
Retinoic acid 10-S 460 168 (14) 195 (31) 187 (40) IO-6 750 145 ( 7) 150 (34) 168 (2)
cY-melanocyte- 10-5 1300 686 (26) 496 (23) 293 (5) stimulating IO-6 1600 659 (17) 537 (35) 210 (36) hormone
* Data are expressed as percentages of controls (S.E.) Real control values are reported in the text. Each point is the mean of six observations from three independent experiments. t % referred to no. of cells at the cell seeding. 3 The number of melanotic cells was counted on 1000 cells for each sample as reported in Materials and Methods.
Doxorubicin and Differentiation 781
Table 2. Relative distribution of cells with different melanin content*
IOD CLASSt
Treatment (Molil) I II III
Control 50 33 17
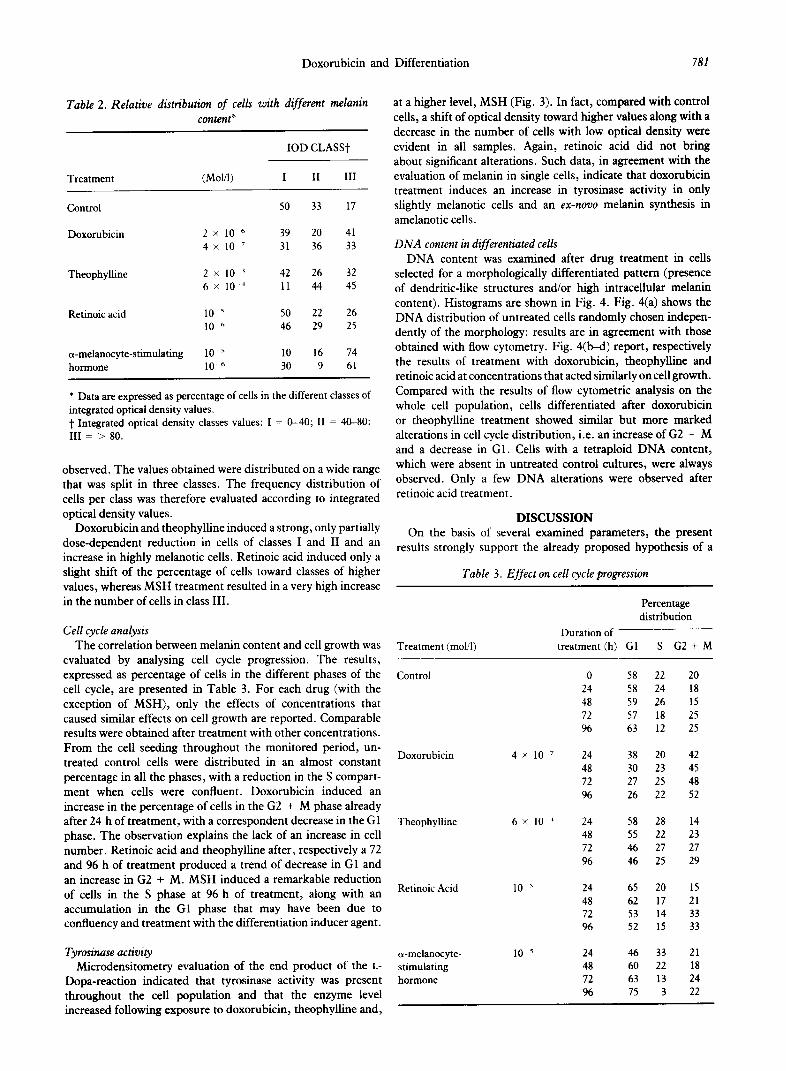
at a higher level, MSH (Fig. 3). In fact, compared with control cells, a shift of optical density toward higher values along with a decrease in the number of cells with low optical density were evident in all samples. Again, retinoic acid did not bring about significant alterations. Such data, in agreement with the evaluation of melanin in single cells, indicate that doxorubicin treatment induces an increase in tyrosinase activity in only slightly melanotic cells and an ex-novo melanin synthesis in amelanotic cells.
Doxorubicin 2 x 10 h 39 20 41 4 x 10 ’ 31 36 33 DNA content in differentiated cells
Theophylline 2 x 10 3 42 26 32 6 x 10 ’ 11 44 45
Retinoic acid 10 5 50 22 26 10 h 46 29 25
a-melanocyte-stimulating 10 5 10 16 74 hormone 10 h 30 9 61
* Data are expressed as percentage of cells in the different classes of integrated optical density values. t Integrated optical density classes values: I = O-40; II = 40-80; III = > 80.
observed. The values obtained were distributed on a wide range that was split in three classes. The frequency distribution of cells per class was therefore evaluated according to integrated optical density values.
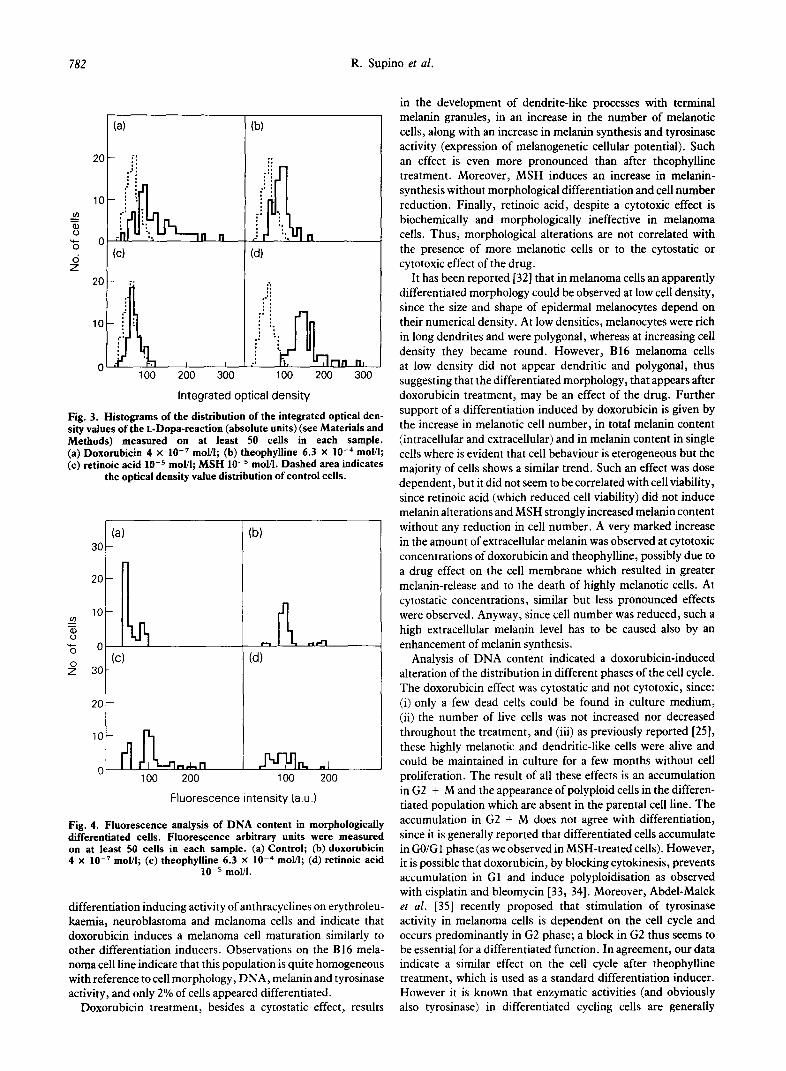
DNA content was examined after drug treatment in cells selected for a morphologically differentiated pattern (presence of dendritic-like structures and/or high intracellular melanin content). Histograms are shown in Fig. 4. Fig. 4(a) shows the DNA distribution of untreated cells randomly chosen indepen- dently of the morphology: results are in agreement with those obtained with flow cytometry. Fig. 4(b-d) report, respectively the results of treatment with doxorubicin, theophylline and retinoic acid at concentrations that acted similarly on cell growth. Compared with the results of flow cytometric analysis on the whole cell population, cells differentiated after doxorubicin or theophylline treatment showed similar but more marked alterations in cell cycle distribution, i.e. an increase of G2 + M and a decrease in Gl. Cells with a tetraploid DNA content, which were absent in untreated control cultures, were always observed. Only a few DNA alterations were observed after retinoic acid treatment.
Doxorubicin and theophylline induced a strong, only partially dose-dependent reduction in cells of classes I and II and an increase in highly melanotic cells. Retinoic acid induced only a slight shift of the percentage of cells toward classes of higher values, whereas MSH treatment resulted in a very high increase in the number of cells in class III.
DISCUSSION On the basis of several examined parameters, the present
results strongly support the already proposed hypothesis of a
Table 3. Effect on cell cycle progression
Cell cycle analysis The correlation between melanin content and cell growth was
evaluated by analysing cell cycle progression. The results, expressed as percentage of cells in the different phases of the cell cycle, are presented in Table 3. For each drug (with the exception of MSH), only the effects of concentrations that caused similar effects on cell growth are reported. Comparable results were obtained after treatment with other concentrations. From the cell seeding throughout the monitored period, un- treated control cells were distributed in an almost constant percentage in all the phases, with a reduction in the S compart- ment when cells were confluent. Doxorubicin induced an increase in the percentage of cells in the G2 + M phase already after 24 h of treatment, with a correspondent decrease in the Gl phase. The observation explains the lack of an increase in cell number. Retinoic acid and theophylline after, respectively a 72 and 96 h of treatment produced a trend of decrease in Gl and an increase in G2 + M. MSH induced a remarkable reduction of cells in the S phase at 96 h of treatment, along with an accumulation in the Gl phase that may have been due to confluency and treatment with the differentiation inducer agent.
Treatment (molil)
Percentage distribution
Duration of treatment (h) Gl S G2+M
Control 0 58 22 20 24 58 24 18 48 59 26 15 72 57 18 25 96 63 12 25
Doxorubicin 4 X 10 ’ 24 38 20 42 48 30 23 45 72 27 25 48 96 26 22 52
Theophylline 6 x 10 -I 24 58 28 14 48 55 22 23 72 46 27 27 96 46 25 29
Retinoic Acid 10 T 24 65 48 62 72 53 96 52
20 17 14 15
33 22 13 3
15 21 33 33
Tyrosinase activity Microdensitometry evaluation of the end product of the L-
Dopa-reaction indicated that tyrosinase activity was present throughout the cell population and that the enzyme level increased following exposure to doxorubicin, theophylline and,
a-melanocyte- stimulating hormone
10 5 24 46 48 60 72 63 96 75
21 18 24 22
782 R. Supino et al.
(a) ,b)
:: :: -.a
i i
; :
: ’ n. I: : :, :. I a_
d)
Integrated optical density
Fig. 3. Histograms of the distribution of the integrated optical den- sity values of the L-Dopa-reaction (absolute units) (see Materials and Methods) measured _ on at least 50 cells in each sample. (a) Doxorubicin 4 x lo-’ mol/I; (b) theophylline 6.3 x lo-“ mol/l; (c) retinoic acid 10e5 mol/I; MSH 10e5 mol/I. Dashed area indicates
the optical density value distribution of control cells.
30 (a’ c
20
1 10
co =
8
IJ@-
% 0
z” 30 (c)
20
t
Ib)
Ml
lo-
0 n Lrl rL “I
100 200 100 200 J
Fluorescence intensity (a.u.)
Fig. 4. Fluorescence analysis of DNA content in morphologically differentiated cells. Fluorescence arbitrary units were measured on at least 50 cells in each sample. (a) Control; (b) doxorubicin 4 x lo-’ mot/I; (c) theophylline 6.3 X 10m4 moVI; (d) retinoic acid
10m5 mol/l.
differentiation inducing activity of anthracyclines on erythroleu- kaemia, neuroblastoma and melanoma cells and indicate that doxorubicin induces a melanoma cell maturation similarly to other differentiation inducers. Observations on the B16 mela- noma cell line indicate that this population is quite homogeneous with reference to cell morphology, DNA, melanin and tyrosinase activity, and only 2% of cells appeared differentiated.
in the development of dendrite-like processes with terminal melanin granules, in an increase in the number of melanotic cells, along with an increase in melanin synthesis and tyrosinase activity (expression of melanogenetic cellular potential). Such an effect is even more pronounced than after theophylline treatment. Moreover, MSH induces an increase in melanin- synthesis without morphological differentiation and cell number reduction. Finally, retinoic acid, despite a cytotoxic effect is biochemically and morphologically ineffective in melanoma cells. Thus, morphological alterations are not correlated with the presence of more melanotic cells or to the cytostatic or cytotoxic effect of the drug.
It has been reported [32] that in melanoma cells an apparently differentiated morphology could be observed at low cell density, since the size and shape of epidermal melanocytes depend on their numerical density. At low densities, melanocytes were rich in long dendrites and were polygonal, whereas at increasing cell density they became round. However, B16 melanoma cells at low density did not appear dendritic and polygonal, thus suggesting that the differentiated morphology, that appears after doxorubicin treatment, may be an effect of the drug. Further support of a differentiation induced by doxorubicin is given by the increase in melanotic cell number, in total melanin content (intracellular and extracellular) and in melanin content in single cells where is evident that cell behaviour is eterogeneous but the majority of cells shows a similar trend. Such an effect was dose dependent, but it did not seem to be correlated with cell viability, since retinoic acid (which reduced cell viability) did not induce melanin alterations and MSH strongly increased melanin content without any reduction in cell number. A very marked increase in the amount of extracellular melanin was observed at cytotoxic concentrations of doxorubicin and theophylline, possibly due to a drug effect on the cell membrane which resulted in greater melanin-release and to the death of highly melanotic cells. At cytostatic concentrations, similar but less pronounced effects were observed. Anyway, since cell number was reduced, such a high extracellular melanin level has to be caused also by an enhancement of melanin synthesis.
Analysis of DNA content indicated a doxorubicin-induced alteration of the distribution in different phases of the cell cycle. The doxorubicin effect was cytostatic and not cytotoxic, since: (i) only a few dead cells could be found in culture medium, (ii) the number of live cells was not increased nor decreased throughout the treatment, and (iii) as previously reported [25], these highly melanotic and dendritic-like cells were alive and could be maintained in culture for a few months without cell proliferation. The result of all these effects is an accumulation in G2 + M and the appearance of polyploid cells in the differen- tiated population which are absent in the parental cell line. The accumulation in G2 + M does not agree with differentiation, since it is generally reported that differentiated cells accumulate in GO/G 1 phase (as we observed in MSH-treated cells). However, it is possible that doxorubicin, by blocking cytokinesis, prevents accumulation in Gl and induce polyploidisation as observed with cisplatin and bleomycin [33, 341. Moreover, Abdel-Malek et al. [35] recently proposed that stimulation of tyrosinase activity in melanoma cells is dependent on the cell cycle and occurs predominantly in G2 phase; a block in G2 thus seems to be essential for a differentiated function. In agreement, our data indicate a similar effect on the cell cycle after theophylline treatment, which is used as a standard differentiation inducer. However it is known that enzymatic activities (and obviously
Doxorubicin treatment, besides a cytostatic effect, results also tyrosinase) in differentiated cycling cells are generally
Doxorubicin and Differentiation 783
effective in the Gl phase (similar to the results observed in MSH-treated cells). It is therefore also possible that the very high enzyme level found after doxorubicin treatment is due to the presence of more differentiated cells with a double content of DNA in the Gl phase. Our results also indicate that tyrosinase is present throughout the cell population and that activation of the enzyme by doxorubicin, theophylline or MSH results in an increase in melanin level in already melanotic cells and in an ex- noon melanin synthesis in amelanotic cells [3, 8, 111.
Taken together, our results indicate that B16 melanoma cells treated with doxorubicin appear more differentiated than untreated cells. However, at the present state-of-the-art, we cannot definitively conclude whether such a phenomenon is due exclusively to an induction of differentiation or whether the presence in the parental population of few partially differentiated and less drug-sensitive cells has influenced our experiments. The differentiated pattern can probably be attributed to a multiple phenomenon where induction of cell membrane alter- ations, cell cycle alterations, and an attempt of differentiation involving melanin and tyrosinase activity are involved together.
I
5.
6.
7.
8.
9.
10.
11.
12.
13.
14.
15.
Mufson RA, Fisher PB, Weinstein IB. Effect of phorbol ester tumor promoters on the expression of melanogenesis in B16 mela- noma cells. Cancer Res 1979,39,3915-3919. Dexter TJ, Bennett DC. Differentiation apparently repressed by the nucleus. Exp Cell Res 1987,168,255-264. l’awelek JM. Factors regulating growth and pigmentation of mela- noma cells.3 Znvesr Dermaroll976,66,201-209. Raz A. B16 melanoma cell variants: irreversible inhibition ofgrowth and induction of morphologic differentiation by anthracycline anti- biotics. 3 Nat1 Cancerfnst 1982,68,629-638. Laskin JD, Piccinini L, Engelhardt DL, Weinstein IB. Control of melanin synthesis and secretion by Bl6iC3 melanoma cells. 3 Cell Physioll982,443,481-486. Wick MW. The relevance of pigment cell biology to melanoma. In: Veronesi U, Cascinelli N, Santinami M, eds. C&neous Melanoma. Academic Press, New York, 1987.15-20. Halaban R, Pomerantz SH,‘Marshall S, Lambert DT, Lerner AB. Regulation of tyrosinase in human melanocytes grown in culture. 3 CellBiol1983,97,48&488. Fuller BB, Iman DS, Lunsford JB. Comparison of tyrosinase levels in amelanotic and melanotic melanoma cell cultures by a competitive enzyme-linked immunoadsorbent assay and by immunotitration analysis. 3 Cell Physiol 1988, 134, 149-154. Abdel-Malek ZA, Swope VB, Amornsiripanitch N, Nordlund JJ. In vitro modulation of proliferation and melanization of S91 melanoma cells by prostaglandins. Cancer Res 19X7,47.3141-3146. Nordenberg J, Wasserman L, Beer YE, et al. Growth inhibition of murine melanoma by butyric acid and dimethylsulfoxide. Exp. Cell Res 1986,162,77-85. Wong C; Pawelek J. Melanocyte-stimulating hormone promotes activation of pre-existing tyrosinase molecules in Cloudman S91 melanoma cells. Nature 1975,255,644-646. White R, Hanson GC, Hu F. Tyrosinase maturation and nigment expression in B16 melanoma: relation to theophylline treatment and intracellular cvclic AMP. 7 Cell Phvsioll979.99.441-450. Giuffre L, Schreyer M, Mach JP, Carrel1 S. Cyclic’ AMP induces differentation in vitro of human melanoma cells. Cancer 1988, 61, 1132-1141. Lotan R, Carralero D, Lotan D, Raz A. Biochemical and immuno- logical characterization of K-1735P melanoma galactoside-binding Iectins and their modulation by differentiation inducers. Cancer Res 1989,49,1261-1268. Hosoi J, Etsuko A, Suda T, Kuroki T. Regulation of melanin synthesis of B16 mouse melanoma cells by a-25-dihydroxy vitamin
16.
17.
18.
19.
20.
21.
22.
23.
24.
25.
26.
27.
28.
29.
30.
31.
32.
33.
34.
35.
Edward M, Gold JA, MacKie RM. Different susceptibilities of melanoma cells to reintoic acid-induced changes in melanotic expression. Biochem Biophys Res 1988,155,773-778. Supino R, Gibelli N, Zunino F. Induction of differentiation of friend murine erythroleukemia cells by poly-L-lysine and dauno- rubicin-poly-L-lysine conjugate. 3 Narl Cancer Znst 1986, 77, 453-457. Tonini GP, Radzioch D, Gronberg A, Clayton M, Blasi E, Benetton G, Varesio L. Erythroid differentiation and modulation of c-rnyc expression induced by antineoplastic drugs in the human leukemic cell line K562. Cancer Res 1987,47,4544-4547. Jeannesson P, Trentesaux C, Gerard B, Jardillier JC, Ross KL, Tokes ZA. Induction oferythroid differentiation in human leukemic K-562 cells by membrane-directed action of adriamycin covalently bound to microspheres. Cancer Res 1990,50, 1231-1236. Lollini PL, De Giovanni C, Del Re B, er al. Myogenic differentiation of human rhabdomyoscarcoma cells induced in virm by antineoplas- tic drugs. Cancer Res 1989,49,3631-3636. Rocchi I’, Ferreri AM, Simone G, Prodi G. Epirubicin-induced differentiation of human neuroblastoma cells in vitro. Anticancer Res 1987,7,247-250. Bagnara GP, Rocchi I’, Bonsi L, Valvassori L, Marini M, Prodi G. The in vitro effect of epirubicin on human normal and leukemic hemopoietic cells. Anricanrer Res 1987,7, 1197-1200. Supino R, Prosperi E, Formellli F, Mariani M, Parmiani G. Characterization of a doxorubicin-resistant murine melanoma line: studies on cross-resistance and its circumvention. Br3 Cancer 1986, 54,33-42. Formelli F, Rossi C, Supino R, Parmiani G. In vivo characterization of a doxorubicin resistant B16 melanoma line. Br 7 Cancer 1986. 54,223-233. Mariani M, Supino R. Morphological alterations induced by doxorubicin in B16 melanoma cells. Cancer Lett 1990.51.209-212. Whittaker JR. Changes in melanogenesis during the differentiation of chick retinal pigment cell in culture. DenBioi1963,8,99-127. Croce AC, Bottiroli G, Prosueri E, Suoino R. Stoward PI. Limi- tations of the quantitative cytochemical
. , assay of catechol oxidase in
melanoma cells. Histochemy 1988,20,595-602. Crissman HA, Steinkamp JA. Rapid, one step staining procedures for analysis of cellular DNA and protein bv single and dual laser flow cytometry. Cgometty 1982,3,84%X . - Lindmo T, Steen HB. Characteristics of a simple, high-resolution flow cytometer based on a new flow configuration. BiophysJ 1979, 28.33-44. Dean PN. Methods of data analysis in flow cytometry. In: Van Dilla MA, Dean PN, Laerum D, Melamed MR. eds. Flow Cvtometrv: Instrumentation and Data’ Analysis. London, Academic Press, 1985, 195-221. Cohen LS, Stedzinki GP. Correlation between cell enlargement and nucleic acid and protein content of HeLa cells in unbalanced growth product by inhibitors of DNA synthesis. 3 Cell Physiol 1967, 69, 331-340. Szabo G, Flynn E. Morphological aspects of normal human melano- cytes. In: Veronesi U., Cascinelli N., Santinami M., eds. Cutaneous Melanoma. New York, Academic Press, 1987,127-138. Maresi V, Giordano PA, Mazzini G, er al. Influence of cis-dichloro- diamineplatinum on glioma cell morphology and ceil cycle kinetics in tissue culture. HisrorhemJ 1987,19,187-194. Barni S, Bernocchi G, Scherini E, Mares V. Growth and polyploidiz- ation of the liver of early postnatal rats treated with bleomycin. Cell Biol Znt Rep 1985,9,993. Abdel-Malek ZA, Swope VB, Trinkle LS, Nordlund JJ. Stimu- lation of Cloudman melanoma tyrosinase activity occurs predomi- nantly in G, phase of the cell cycle. Exp Cell Res 1989, 180, 198-208.
Acknowledgements--We thank Dr F. Zunino for help and advice and M. Azzini for technical help. This work was partly supported by grant -. 86.02610.44 ot CNK (Kome), Finalized Project Oncology. D’and retinoic acid. Cancer Res 1985,45, 1474-1478.
Copyright © 2022 FDOKUMEN