Comparative Analysis of Pre and Post Merger Era of Shareholders’ Wealth in Nigeria, Evidence from...
10
IOSR Journal of Business and Management (IOSR-JBM) e-ISSN: 2278-487X, p-ISSN: 2319-7668. Volume 16, Issue 11.Ver. IV (Nov. 2014), PP 12-21 www.iosrjournals.org www.iosrjournals.org 12 | Page Comparative Analysis of Pre and Post Merger Era of Shareholders’ Wealth in Nigeria, Evidence from Aiico Insurance Plc 1 Idode, Patrick Esiemogie, 2 Oladele, Rotimi, 3 Aworinde, Olayemi, 4 Aderemi, Adetunji Abdul-Azeez 1 Department of Economics, Accounting and Finance Bells University of Technology, Ota, Ogun State, Nigeria 2 Department of Accounting Adekunle Ajasin University, Akungba Akoko, Ondo State Nigeria 3 Accountancy Department Federal Polytechnic Ado, Ado Ekiti, Ekiti State 4 Department of Economics and Financial Studies Fountain University, Osogbo Osun State Abstract: This study compared shareholders wealth in pre and post mergers era using a selected insurance company in Nigeria as a case study. In order to achieve the objectives of the study, historical data was generated from 2001 to 2012 periods from the financial statement of AIICO Insurance Plc. The data was analyzed using descriptive statistics specifically line graph was used to determine trend in insurance company’s profit and t- test was used to determine the significant difference in shareholders wealth in pre and post mergers and acquisitions era This study found that there was an increase in the profit of insurance company and an insignificantly decreased in ROCE, DPS, EPS, NPM after the mergers and acquisitions exercise. Therefore the study concluded that mergers and acquisitions lead to increase in profit of insurance companies and decrease in returns to shareholders. This study recommended among others that even though mergers and acquisitions boost profit, evidence shows that the wealth of shareholders declined insignificantly after the mergers and acquisitions exercise. Therefore, shareholders should not only look at the returns on their funds, but also bother about the safety and protection of their funds. Finally, regulatory bodies like Securities and Exchange Commission (SEC) and National Insurance Commission (NICOM) should ensure that the insurance companies do not make their shareholders worse- off than they were before the mergers and acquisitions exercise through effective monitoring. Keywords: Merger, Acquisition, shareholders – wealth, Pre and Post Acquisition era I. Introduction Mergers and acquisitions is the area of corporate finances, management and strategy dealing with purchasing and/or joining with other companies. In a merger, two organizations join forces to become a new business, usually with a new name. Because the companies involved are typically of similar size and stature, the term merger of equals is sometimes used. In an acquisition, on the other hand, one business buys a second and generally smaller company which may be absorbed into the parent organi zation or run as a subsidiary”. Margaret (2013). Literally, “merger is absorption of one or more companies by a single existing company. It can also be referred to as an act or process of purchasing equity shares (ownership shares) of one or more companies by a single existing company” Gaurav (2012). As a result of this arrangement, a new company is thereby formed. Also mergers may be seen as a form of acquisition which refers to the process of blending together of two or more companies to form an entity under one name. “Acquisition is the purchase of one business or company by another company or other business entity. Such purchase may be of 100%, or nearly 100%, of the assets or ownership equity of the acquired entity” Wikipedia (2013). “It can also be seen as a corporate action in which a company buys most, if not all, of the target company’s ownership stakes in order to assume control of the target firm” Investopedia (2013). Mergers and acquisition have become a worldwide commercial or business phenomenon; they are popularly employed by investors especially in the advanced economies of the world to engender large and financially viable companies, which in turn facilitate the rapid growth and development of their economies. On the other hand, they are also employed in developing countries like Nigeria, where the unfolding scenario today requires the pooling together of resources for more optimal use in order to ensure economic rationalization, economics of scale, survival and profitable growth”. Ifeanyi (2011). Objectives of the study The main objective of this study is to compare the shareholders wealth in the pre and post mergers and acquisitions era in the insurance sector of Nigerian economy using Aiico insurance PLC as a case study.
-
Upload
independent -
Category
Documents
-
view
3 -
download
0
Transcript of Comparative Analysis of Pre and Post Merger Era of Shareholders’ Wealth in Nigeria, Evidence from...
IOSR Journal of Business and Management (IOSR-JBM)
e-ISSN: 2278-487X, p-ISSN: 2319-7668. Volume 16, Issue 11.Ver. IV (Nov. 2014), PP 12-21 www.iosrjournals.org
www.iosrjournals.org 12 | Page
Comparative Analysis of Pre and Post Merger Era of
Shareholders’ Wealth in Nigeria, Evidence from Aiico Insurance
Plc
1Idode, Patrick Esiemogie,
2Oladele, Rotimi,
3Aworinde, Olayemi,
4Aderemi, Adetunji Abdul-Azeez
1Department of Economics, Accounting and Finance Bells University of Technology, Ota, Ogun State, Nigeria 2Department of Accounting Adekunle Ajasin University, Akungba Akoko, Ondo State Nigeria
3Accountancy Department Federal Polytechnic Ado, Ado Ekiti, Ekiti State 4Department of Economics and Financial Studies Fountain University, Osogbo Osun State
Abstract: This study compared shareholders wealth in pre and post mergers era using a selected insurance
company in Nigeria as a case study. In order to achieve the objectives of the study, historical data was
generated from 2001 to 2012 periods from the financial statement of AIICO Insurance Plc. The data was
analyzed using descriptive statistics specifically line graph was used to determine trend in insurance company’s profit and t- test was used to determine the significant difference in shareholders wealth in pre and post mergers
and acquisitions era This study found that there was an increase in the profit of insurance company and an
insignificantly decreased in ROCE, DPS, EPS, NPM after the mergers and acquisitions exercise. Therefore the
study concluded that mergers and acquisitions lead to increase in profit of insurance companies and decrease in
returns to shareholders. This study recommended among others that even though mergers and acquisitions
boost profit, evidence shows that the wealth of shareholders declined insignificantly after the mergers and
acquisitions exercise. Therefore, shareholders should not only look at the returns on their funds, but also bother
about the safety and protection of their funds. Finally, regulatory bodies like Securities and Exchange
Commission (SEC) and National Insurance Commission (NICOM) should ensure that the insurance companies
do not make their shareholders worse- off than they were before the mergers and acquisitions exercise through
effective monitoring.
Keywords: Merger, Acquisition, shareholders – wealth, Pre and Post Acquisition era
I. Introduction Mergers and acquisitions is the area of corporate finances, management and strategy dealing with
purchasing and/or joining with other companies. In a merger, two organizations join forces to become a new
business, usually with a new name. Because the companies involved are typically of similar size and stature, the
term merger of equals is sometimes used. In an acquisition, on the other hand, one business buys a second and
generally smaller company which may be absorbed into the parent organization or run as a subsidiary”.Margaret
(2013).
Literally, “merger is absorption of one or more companies by a single existing company. It can also be referred to as an act or process of purchasing equity shares (ownership shares) of one or more companies by a
single existing company” Gaurav (2012). As a result of this arrangement, a new company is thereby formed.
Also mergers may be seen as a form of acquisition which refers to the process of blending together of two or
more companies to form an entity under one name.
“Acquisition is the purchase of one business or company by another company or other business entity.
Such purchase may be of 100%, or nearly 100%, of the assets or ownership equity of the acquired entity”
Wikipedia (2013). “It can also be seen as a corporate action in which a company buys most, if not all, of the
target company’s ownership stakes in order to assume control of the target firm” Investopedia (2013).
Mergers and acquisition have become a worldwide commercial or business phenomenon; they are
popularly employed by investors especially in the advanced economies of the world to engender large and
financially viable companies, which in turn facilitate the rapid growth and development of their economies. On the other hand, they are also employed in developing countries like Nigeria, where the unfolding scenario today
requires the pooling together of resources for more optimal use in order to ensure economic rationalization,
economics of scale, survival and profitable growth”. Ifeanyi (2011).
Objectives of the study
The main objective of this study is to compare the shareholders wealth in the pre and post mergers and
acquisitions era in the insurance sector of Nigerian economy using Aiico insurance PLC as a case study.
Comparative Analysis of Pre and Post Merger Era of Shareholders’ Wealth in Nigeria, Evidence from
www.iosrjournals.org 13 | Page
Other specific objectives are:
1. To determine whether merger and acquisition will have positive influence on shareholders wealth.
2. To examine the wealth of shareholders in the insurance company’s pre- merger and post- merger era.
3. To explore the trend of the profit of insurance company from 2001 to 2012.
Research Questions 1. Do mergers and acquisitions influence shareholders wealth positively? 2. Are there differences in shareholders wealth in the insurance company’s pre- merger and post- merger
era?
3. What has been the trend of profit of insurance company from 2001 to 2012?
II. Review Of Relevant Literature Bruner (2004) posited that true synergies create value for shareholders by harvesting benefits from
mergers that they would be unable to gain on their own. Akhigbe and Madura (2001) investigate how the market
revalues the acquirer, target, and rival insurance companies in response to merger announcements. They find
that the target, acquirer and rival insurance companies experience favourable valuation effects at merger announcements. BarNiv and Hathorn (1997), posit that accounting and financial information can explain merger
or insolvency decisions in the industry. The study emphasizes that a timely merger can serve as a viable
alternative to insolvency. A logic analysis of solvent and insolvent insurers is performed to generate the
probability of insolvency for each merged insurer. Timely mergers serve as an alternative to insolvency for 20%
to 46% of the merged insurers, which is higher than that found in other industries.
Floreani and Rigamonti (2001) examine the stock market valuation of mergers in the insurance
industry between 1996 and 2000 in Europe and in the US. They form a sample of 56 deals in which the
acquiring company is listed. Insurance companies’ mergers enhance value for bidder shareholders. Over the
event window (-20, +2), the average abnormal returns for acquiring firms is 3.65%. The abnormal returns
increase with the relative size of deal value. Mergers occurring between insurance companies located in the
same European country are not valued positively by the market, while cross-border deals appear to increase shareholder’s wealth. The analysis of a sub-sample of listed bidders and targets reveals that the combined
insurance companies experience a 5.27% gain over the (-20, +2) event window and, consistent with previous
findings, target shareholders substantially increase their wealth.
Boubakri, Dionne, and Triki (2008) examine the long run performance of mergers and acquisitions
transactions in the property-liability insurance industry. Specifically, they investigate whether such transactions
create value for the bidders’ shareholders, and assess how corporate governance mechanisms, internal and
external, affect such performance. The results show that mergers and acquisitions create value in the long run as
buy and hold abnormal returns are positive and significant after 3 years.
Cummins and Weiss (2004) investigate whether mergers and acquisitions in the European insurance
market create value for shareholders by studying the stock price impact of mergers and acquisitions transactions
on target and acquiring firms. The analysis shows that European mergers and acquisitions created small negative
cumulative average abnormal returns CAARs) for acquirers (generally less than 1%) and substantial positive CAARs for targets (in the range of 12% to 15%). Cross-border transactions were value-neutral for acquirers,
whereas within-border transactions led to significant value loss (approximately 2%) for acquirers. For targets,
both cross-border and within-border transactions led to substantial value creation.
Fields, Fraser and Kolari (2007) examine the viability of bank/insurer combinations for US and non-US
mergers between 1997 and 2002. They find positive gains and no significant risk shifts for shareholders of
bidding firms, and that higher CEO stock ownership results in less positive gains for shareholders.
Operating performance studies attempt to identify the sources of gains from mergers and to determine
whether the expected gains at announcement are ever actually realized. If mergers truly create value for
shareholders, the gains should eventually show up in the firms’ cash flows. These studies generally focus on
accounting measures of profitability, such as return on assets and operating margins. Ravenscraft and Scherer
(1989) and Healy, Palepu and Ruback (1992) are two operating performance studies that have been particularly influential in reinforcing perceptions about the gains to acquiring firms. These studies reach different
conclusions about gains from mergers.
III. Methodology The target population for this study comprised of all insurance companies in Nigeria that got involved
in mergers and acquisitions, from this population a sample size of an insurance company was selected (Aiico
insurance company, NFI insurance plc, Lamda Company limited to become Aiico insurance plc).
This study relied extensively on secondary data covering 2001 to 2012 for indicating various
performances; the periods were purposely selected to enable us compare six year pre mergers and acquisitions
Comparative Analysis of Pre and Post Merger Era of Shareholders’ Wealth in Nigeria, Evidence from
www.iosrjournals.org 14 | Page
with six year post mergers and acquisitions period. The data used for this study was obtained from the published
annual reports and final accounts of the selected insurance company of various years. This study adopted a
simple ratio analysis to obtain the data needed; the data are represented in a tabulated form.
The data were analyzed using percentage analysis specifically investment/ shareholding analysis and
profitability analysis to measure shareholders wealth, insurance company performance and trend analysis. In an
attempt to test pre and post mergers and acquisitions on shareholders wealth, using specifically investment
analysis to determine how profitable and secured shareholders investments are and profitability analysis to evaluate the performance of insurance company six years before the merger exercise (using 2001- 2006 as the
pre- merger period) comparing it with the performance of the insurance company six years after the merger
period (using 2007-2012 as the post merger period). This study employed both descriptive and inferential
statistics in analyzing the data. Descriptive statistics is very useful in summarizing any collected data so as to
help in coming with precise and accurate conclusions. On the other hand, in order to draw inference on
comparison between pre and post mergers and acquisitions influence on shareholders wealth, paired sample t-
test was used. The method enables us to examine whether for each measure of performance, the average values
of shareholders wealth differed significantly from pre- merger to the post- merger periods. The formula for t-
statistics is given below;
T = 1 − 2
1 − 2
Where;
1 = Mean of Pre- mergers and Acquisitions period.
2 = Mean of Post- mergers and Acquisitions period.
δ = Standard Deviation of both periods
IV. Results And Findings This section presents, analysed and interpreted data collected for this study.
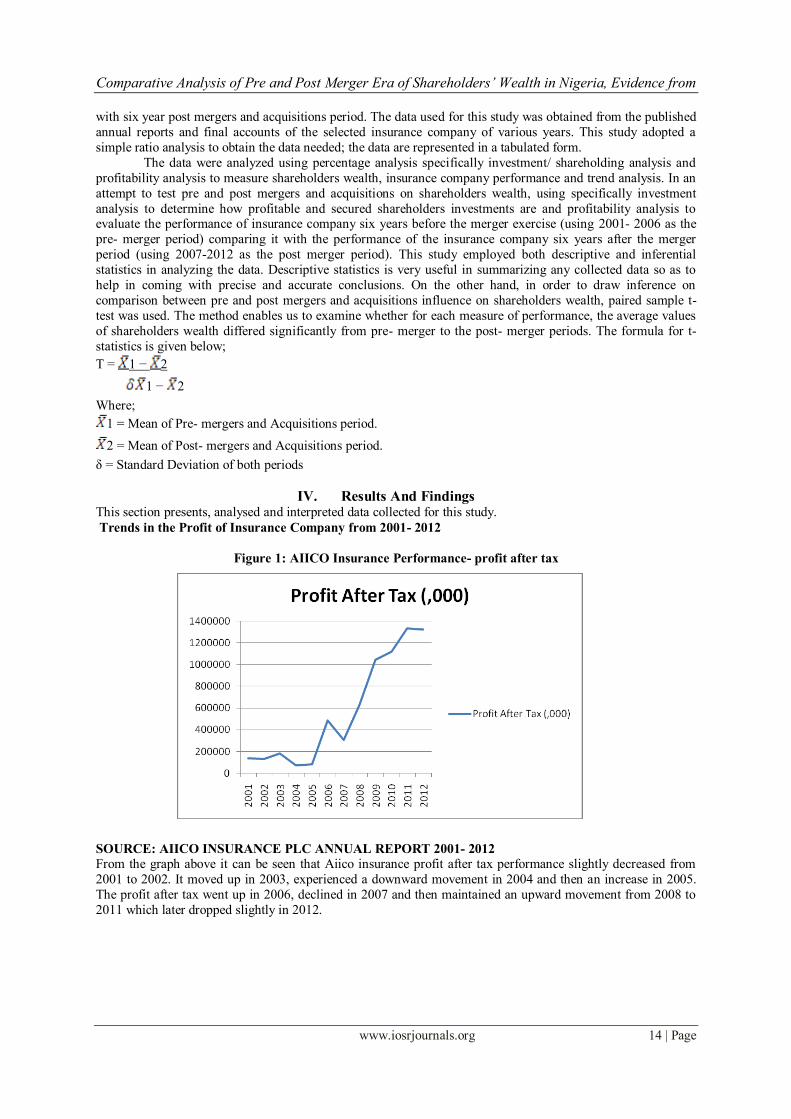
Trends in the Profit of Insurance Company from 2001- 2012
Figure 1: AIICO Insurance Performance- profit after tax
SOURCE: AIICO INSURANCE PLC ANNUAL REPORT 2001- 2012
From the graph above it can be seen that Aiico insurance profit after tax performance slightly decreased from
2001 to 2002. It moved up in 2003, experienced a downward movement in 2004 and then an increase in 2005.
The profit after tax went up in 2006, declined in 2007 and then maintained an upward movement from 2008 to
2011 which later dropped slightly in 2012.
Comparative Analysis of Pre and Post Merger Era of Shareholders’ Wealth in Nigeria, Evidence from
www.iosrjournals.org 15 | Page
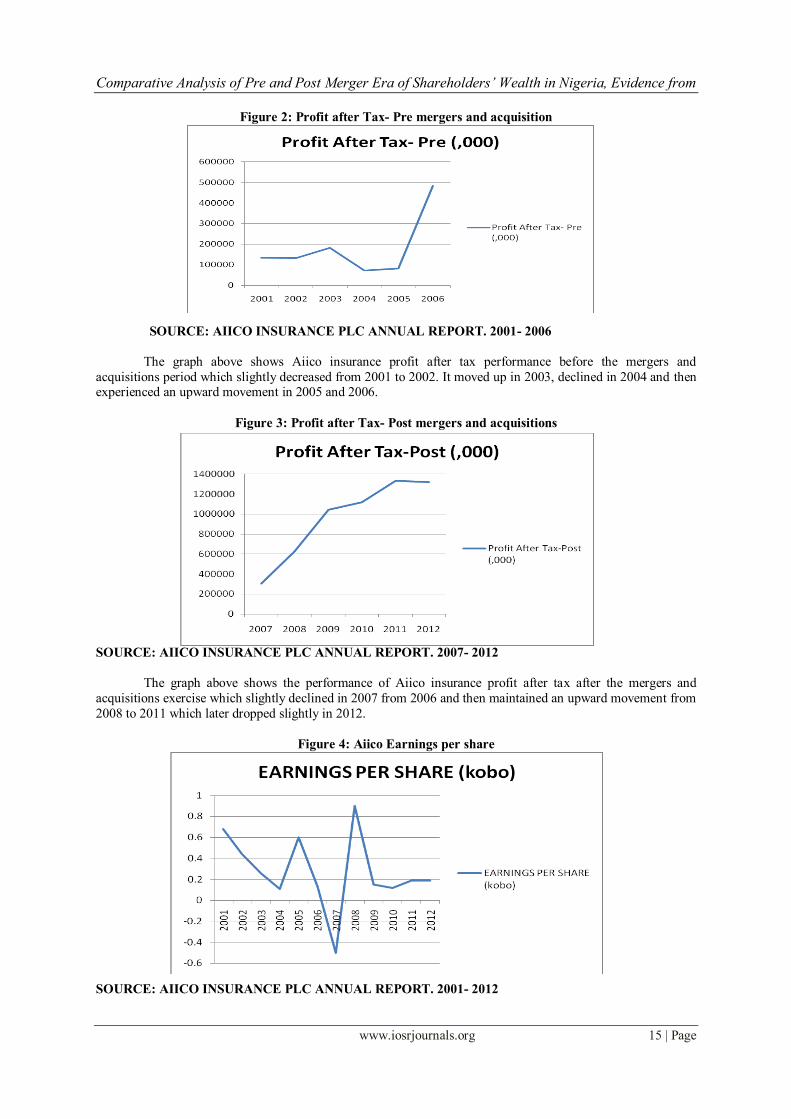
Figure 2: Profit after Tax- Pre mergers and acquisition
SOURCE: AIICO INSURANCE PLC ANNUAL REPORT. 2001- 2006
The graph above shows Aiico insurance profit after tax performance before the mergers and
acquisitions period which slightly decreased from 2001 to 2002. It moved up in 2003, declined in 2004 and then experienced an upward movement in 2005 and 2006.
Figure 3: Profit after Tax- Post mergers and acquisitions
SOURCE: AIICO INSURANCE PLC ANNUAL REPORT. 2007- 2012
The graph above shows the performance of Aiico insurance profit after tax after the mergers and
acquisitions exercise which slightly declined in 2007 from 2006 and then maintained an upward movement from
2008 to 2011 which later dropped slightly in 2012.
Figure 4: Aiico Earnings per share
SOURCE: AIICO INSURANCE PLC ANNUAL REPORT. 2001- 2012
Comparative Analysis of Pre and Post Merger Era of Shareholders’ Wealth in Nigeria, Evidence from
www.iosrjournals.org 16 | Page
From the graph above, the continuous downward movement from 2001- 2004 of Aiico insurance
earnings per share performance can be noticed. It increased in 2005 and then dropped from 2006- 2007 which
later went up in 2008. As at 2009 and 2010, the EPS declined. An upward movement in 2011 was experienced
which slightly dropped in 2012.
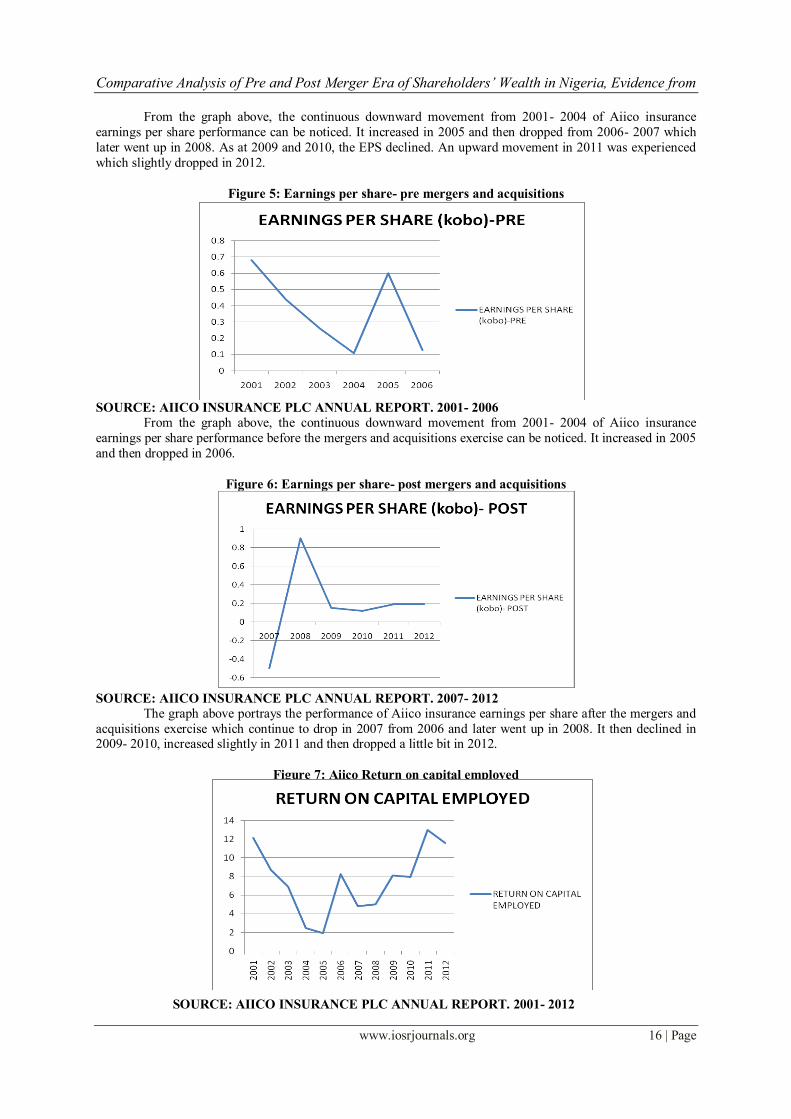
Figure 5: Earnings per share- pre mergers and acquisitions
SOURCE: AIICO INSURANCE PLC ANNUAL REPORT. 2001- 2006
From the graph above, the continuous downward movement from 2001- 2004 of Aiico insurance
earnings per share performance before the mergers and acquisitions exercise can be noticed. It increased in 2005
and then dropped in 2006.
Figure 6: Earnings per share- post mergers and acquisitions
SOURCE: AIICO INSURANCE PLC ANNUAL REPORT. 2007- 2012
The graph above portrays the performance of Aiico insurance earnings per share after the mergers and
acquisitions exercise which continue to drop in 2007 from 2006 and later went up in 2008. It then declined in 2009- 2010, increased slightly in 2011 and then dropped a little bit in 2012.
Figure 7: Aiico Return on capital employed
SOURCE: AIICO INSURANCE PLC ANNUAL REPORT. 2001- 2012
Comparative Analysis of Pre and Post Merger Era of Shareholders’ Wealth in Nigeria, Evidence from
www.iosrjournals.org 17 | Page
Looking at the graph above, it indicated that the return on capital employed of Aiico insurance kept
falling on a gradual basis between 2001- 2005 and then picked up from 2006- 2009 which later dropped in 2010.
It increased in 2011 and fell in 2012.
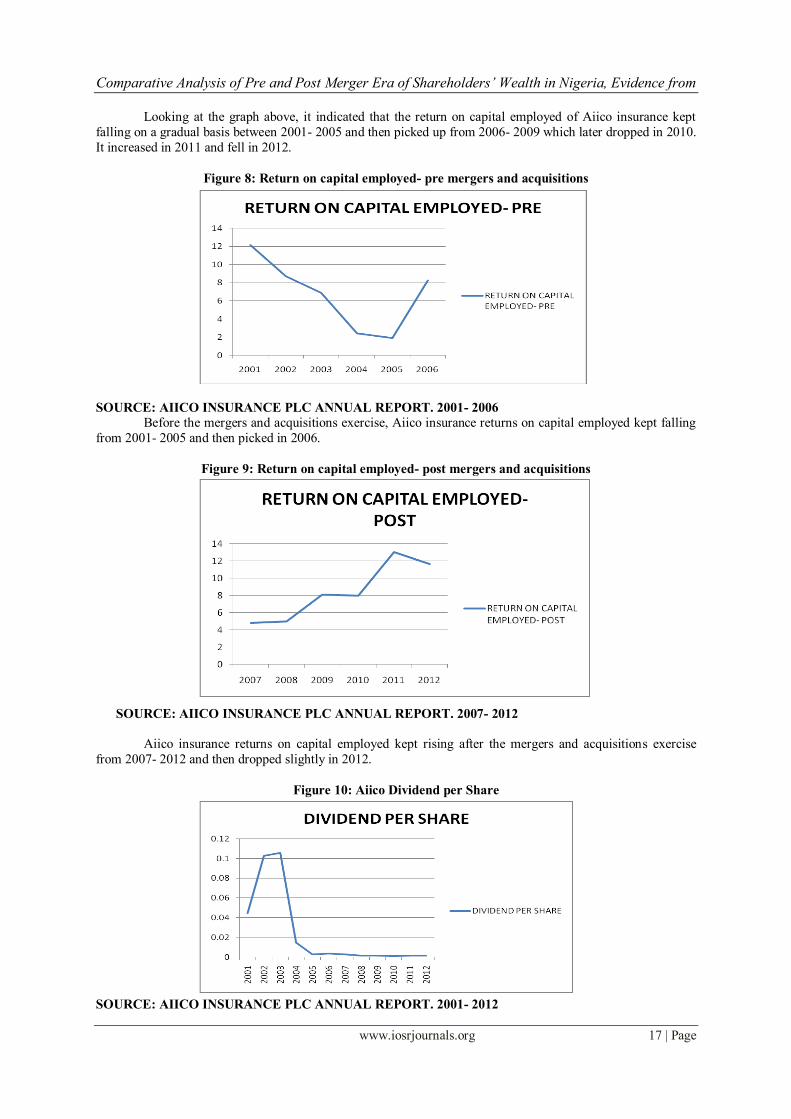
Figure 8: Return on capital employed- pre mergers and acquisitions
SOURCE: AIICO INSURANCE PLC ANNUAL REPORT. 2001- 2006
Before the mergers and acquisitions exercise, Aiico insurance returns on capital employed kept falling
from 2001- 2005 and then picked in 2006.
Figure 9: Return on capital employed- post mergers and acquisitions
SOURCE: AIICO INSURANCE PLC ANNUAL REPORT. 2007- 2012
Aiico insurance returns on capital employed kept rising after the mergers and acquisitions exercise
from 2007- 2012 and then dropped slightly in 2012.
Figure 10: Aiico Dividend per Share
SOURCE: AIICO INSURANCE PLC ANNUAL REPORT. 2001- 2012
Comparative Analysis of Pre and Post Merger Era of Shareholders’ Wealth in Nigeria, Evidence from
www.iosrjournals.org 18 | Page
It can be discerned from the graph above that the dividend per share of Aiico insurance maintained an
increment from 2001- 2003 which then continued to drop from 2004- 2010. It later increased slightly in 2011
and 2012.
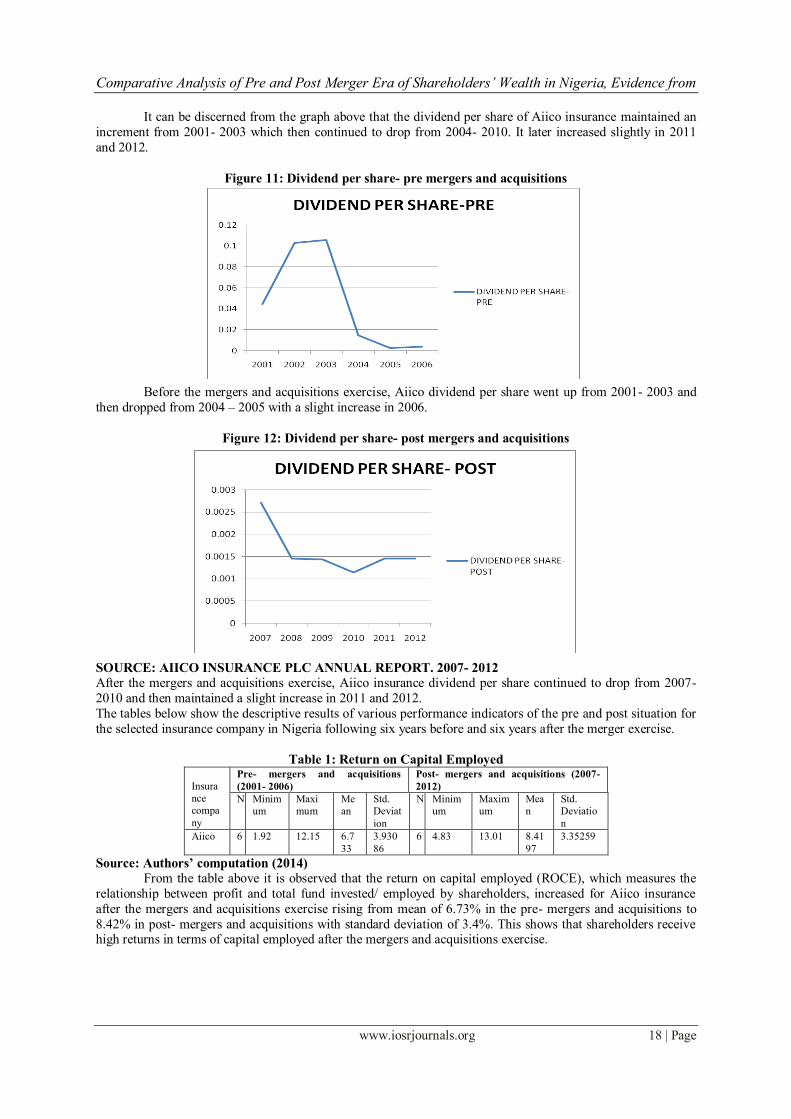
Figure 11: Dividend per share- pre mergers and acquisitions
Before the mergers and acquisitions exercise, Aiico dividend per share went up from 2001- 2003 and
then dropped from 2004 – 2005 with a slight increase in 2006.
Figure 12: Dividend per share- post mergers and acquisitions
SOURCE: AIICO INSURANCE PLC ANNUAL REPORT. 2007- 2012
After the mergers and acquisitions exercise, Aiico insurance dividend per share continued to drop from 2007-
2010 and then maintained a slight increase in 2011 and 2012.
The tables below show the descriptive results of various performance indicators of the pre and post situation for
the selected insurance company in Nigeria following six years before and six years after the merger exercise.
Table 1: Return on Capital Employed
Insura
nce
compa
ny
Pre- mergers and acquisitions
(2001- 2006)
Post- mergers and acquisitions (2007-
2012)
N Minim
um
Maxi
mum
Me
an
Std.
Deviat
ion
N Minim
um
Maxim
um
Mea
n
Std.
Deviatio
n
Aiico 6 1.92 12.15 6.7
33
3.930
86
6 4.83 13.01 8.41
97
3.35259
Source: Authors’ computation (2014)
From the table above it is observed that the return on capital employed (ROCE), which measures the
relationship between profit and total fund invested/ employed by shareholders, increased for Aiico insurance
after the mergers and acquisitions exercise rising from mean of 6.73% in the pre- mergers and acquisitions to
8.42% in post- mergers and acquisitions with standard deviation of 3.4%. This shows that shareholders receive high returns in terms of capital employed after the mergers and acquisitions exercise.
Comparative Analysis of Pre and Post Merger Era of Shareholders’ Wealth in Nigeria, Evidence from
www.iosrjournals.org 19 | Page
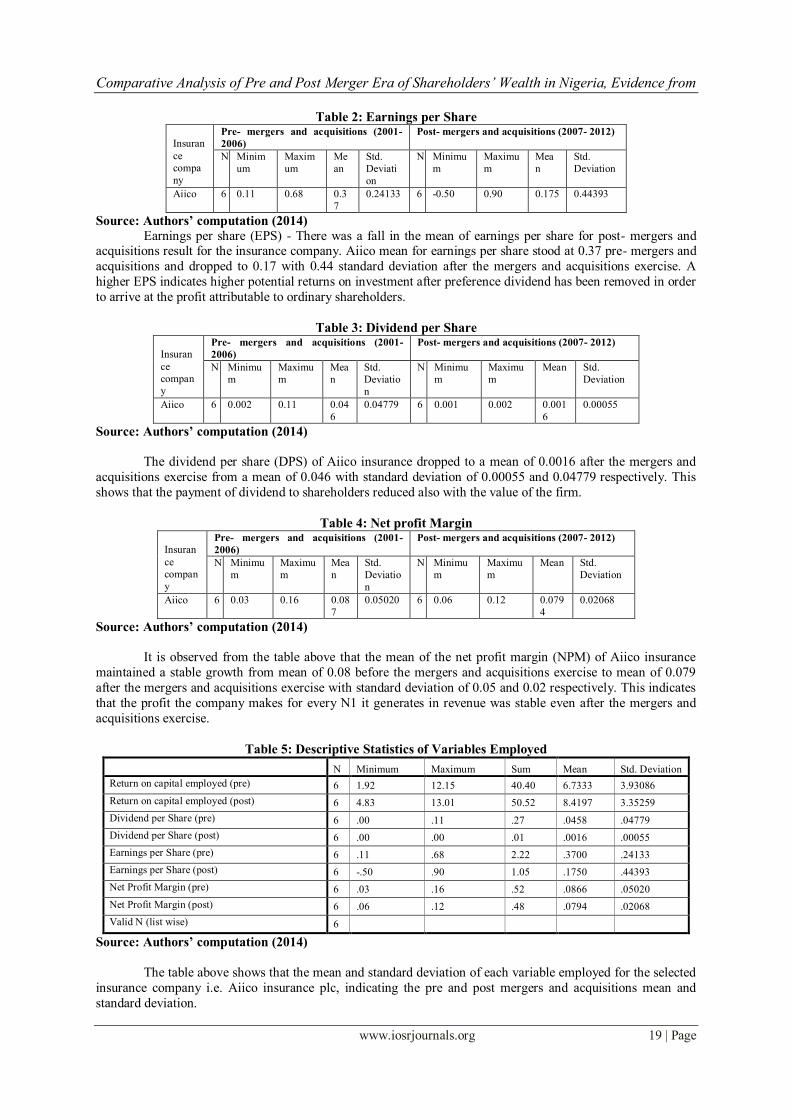
Table 2: Earnings per Share
Insuran
ce
compa
ny
Pre- mergers and acquisitions (2001-
2006)
Post- mergers and acquisitions (2007- 2012)
N Minim
um
Maxim
um
Me
an
Std.
Deviati
on
N Minimu
m
Maximu
m
Mea
n
Std.
Deviation
Aiico 6 0.11 0.68 0.3
7
0.24133 6 -0.50 0.90 0.175 0.44393
Source: Authors’ computation (2014)
Earnings per share (EPS) - There was a fall in the mean of earnings per share for post- mergers and acquisitions result for the insurance company. Aiico mean for earnings per share stood at 0.37 pre- mergers and
acquisitions and dropped to 0.17 with 0.44 standard deviation after the mergers and acquisitions exercise. A
higher EPS indicates higher potential returns on investment after preference dividend has been removed in order
to arrive at the profit attributable to ordinary shareholders.
Table 3: Dividend per Share
Insuran
ce
compan
y
Pre- mergers and acquisitions (2001-
2006)
Post- mergers and acquisitions (2007- 2012)
N Minimu
m
Maximu
m
Mea
n
Std.
Deviatio
n
N Minimu
m
Maximu
m
Mean Std.
Deviation
Aiico 6 0.002 0.11 0.04
6
0.04779 6 0.001 0.002 0.001
6
0.00055
Source: Authors’ computation (2014)
The dividend per share (DPS) of Aiico insurance dropped to a mean of 0.0016 after the mergers and
acquisitions exercise from a mean of 0.046 with standard deviation of 0.00055 and 0.04779 respectively. This
shows that the payment of dividend to shareholders reduced also with the value of the firm.
Table 4: Net profit Margin
Insuran
ce
compan
y
Pre- mergers and acquisitions (2001-
2006)
Post- mergers and acquisitions (2007- 2012)
N Minimu
m
Maximu
m
Mea
n
Std.
Deviatio
n
N Minimu
m
Maximu
m
Mean Std.
Deviation
Aiico 6 0.03 0.16 0.08
7
0.05020 6 0.06 0.12 0.079
4
0.02068
Source: Authors’ computation (2014)
It is observed from the table above that the mean of the net profit margin (NPM) of Aiico insurance
maintained a stable growth from mean of 0.08 before the mergers and acquisitions exercise to mean of 0.079
after the mergers and acquisitions exercise with standard deviation of 0.05 and 0.02 respectively. This indicates
that the profit the company makes for every N1 it generates in revenue was stable even after the mergers and
acquisitions exercise.
Table 5: Descriptive Statistics of Variables Employed
N Minimum Maximum Sum Mean Std. Deviation
Return on capital employed (pre) 6 1.92 12.15 40.40 6.7333 3.93086
Return on capital employed (post) 6 4.83 13.01 50.52 8.4197 3.35259
Dividend per Share (pre) 6 .00 .11 .27 .0458 .04779
Dividend per Share (post) 6 .00 .00 .01 .0016 .00055
Earnings per Share (pre) 6 .11 .68 2.22 .3700 .24133
Earnings per Share (post) 6 -.50 .90 1.05 .1750 .44393
Net Profit Margin (pre) 6 .03 .16 .52 .0866 .05020
Net Profit Margin (post) 6 .06 .12 .48 .0794 .02068
Valid N (list wise) 6
Source: Authors’ computation (2014)
The table above shows that the mean and standard deviation of each variable employed for the selected
insurance company i.e. Aiico insurance plc, indicating the pre and post mergers and acquisitions mean and
standard deviation.
Comparative Analysis of Pre and Post Merger Era of Shareholders’ Wealth in Nigeria, Evidence from
www.iosrjournals.org 20 | Page
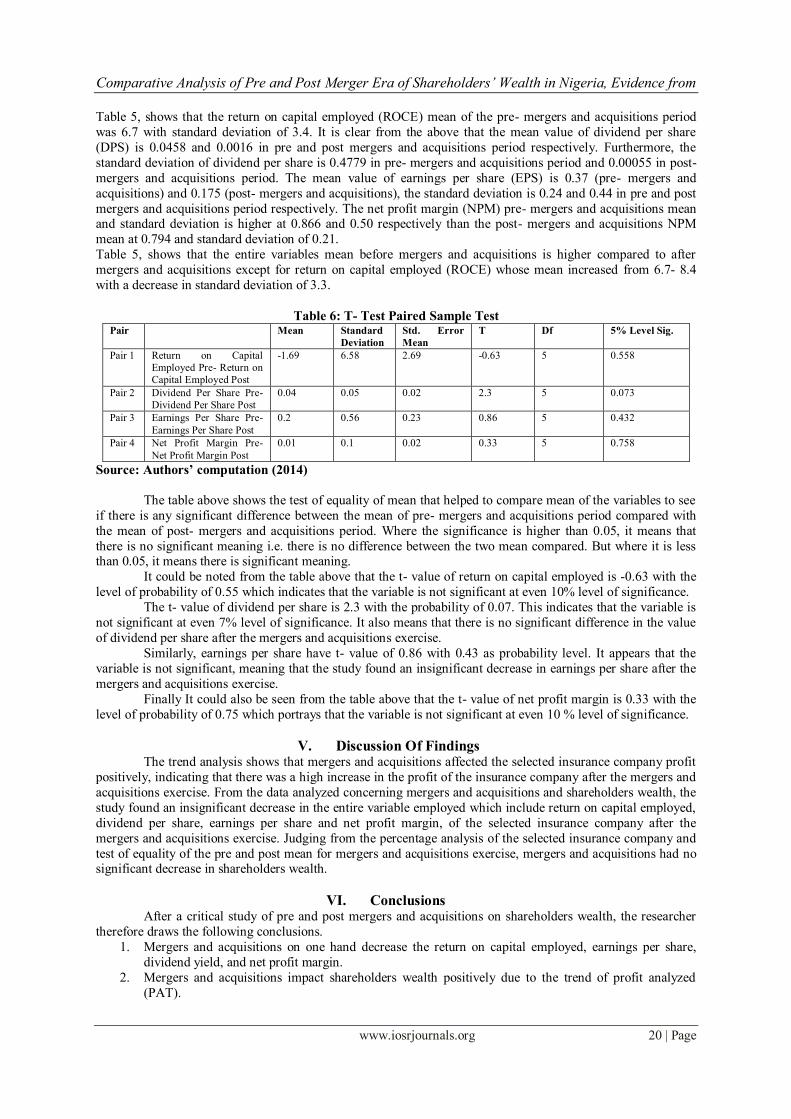
Table 5, shows that the return on capital employed (ROCE) mean of the pre- mergers and acquisitions period
was 6.7 with standard deviation of 3.4. It is clear from the above that the mean value of dividend per share
(DPS) is 0.0458 and 0.0016 in pre and post mergers and acquisitions period respectively. Furthermore, the
standard deviation of dividend per share is 0.4779 in pre- mergers and acquisitions period and 0.00055 in post-
mergers and acquisitions period. The mean value of earnings per share (EPS) is 0.37 (pre- mergers and
acquisitions) and 0.175 (post- mergers and acquisitions), the standard deviation is 0.24 and 0.44 in pre and post
mergers and acquisitions period respectively. The net profit margin (NPM) pre- mergers and acquisitions mean and standard deviation is higher at 0.866 and 0.50 respectively than the post- mergers and acquisitions NPM
mean at 0.794 and standard deviation of 0.21.
Table 5, shows that the entire variables mean before mergers and acquisitions is higher compared to after
mergers and acquisitions except for return on capital employed (ROCE) whose mean increased from 6.7- 8.4
with a decrease in standard deviation of 3.3.
Table 6: T- Test Paired Sample Test Pair Mean Standard
Deviation
Std. Error
Mean
T Df 5% Level Sig.
Pair 1 Return on Capital
Employed Pre- Return on
Capital Employed Post
-1.69 6.58 2.69 -0.63 5 0.558
Pair 2 Dividend Per Share Pre-
Dividend Per Share Post
0.04 0.05 0.02 2.3 5 0.073
Pair 3 Earnings Per Share Pre-
Earnings Per Share Post
0.2 0.56 0.23 0.86 5 0.432
Pair 4 Net Profit Margin Pre-
Net Profit Margin Post
0.01 0.1 0.02 0.33 5 0.758
Source: Authors’ computation (2014)
The table above shows the test of equality of mean that helped to compare mean of the variables to see
if there is any significant difference between the mean of pre- mergers and acquisitions period compared with
the mean of post- mergers and acquisitions period. Where the significance is higher than 0.05, it means that
there is no significant meaning i.e. there is no difference between the two mean compared. But where it is less than 0.05, it means there is significant meaning.
It could be noted from the table above that the t- value of return on capital employed is -0.63 with the
level of probability of 0.55 which indicates that the variable is not significant at even 10% level of significance.
The t- value of dividend per share is 2.3 with the probability of 0.07. This indicates that the variable is
not significant at even 7% level of significance. It also means that there is no significant difference in the value
of dividend per share after the mergers and acquisitions exercise.
Similarly, earnings per share have t- value of 0.86 with 0.43 as probability level. It appears that the
variable is not significant, meaning that the study found an insignificant decrease in earnings per share after the
mergers and acquisitions exercise.
Finally It could also be seen from the table above that the t- value of net profit margin is 0.33 with the
level of probability of 0.75 which portrays that the variable is not significant at even 10 % level of significance.
V. Discussion Of Findings The trend analysis shows that mergers and acquisitions affected the selected insurance company profit
positively, indicating that there was a high increase in the profit of the insurance company after the mergers and
acquisitions exercise. From the data analyzed concerning mergers and acquisitions and shareholders wealth, the
study found an insignificant decrease in the entire variable employed which include return on capital employed,
dividend per share, earnings per share and net profit margin, of the selected insurance company after the
mergers and acquisitions exercise. Judging from the percentage analysis of the selected insurance company and
test of equality of the pre and post mean for mergers and acquisitions exercise, mergers and acquisitions had no significant decrease in shareholders wealth.
VI. Conclusions After a critical study of pre and post mergers and acquisitions on shareholders wealth, the researcher
therefore draws the following conclusions.
1. Mergers and acquisitions on one hand decrease the return on capital employed, earnings per share,
dividend yield, and net profit margin.
2. Mergers and acquisitions impact shareholders wealth positively due to the trend of profit analyzed
(PAT).
Comparative Analysis of Pre and Post Merger Era of Shareholders’ Wealth in Nigeria, Evidence from
www.iosrjournals.org 21 | Page
3. Mergers and acquisitions lead to wealth creation, more employment generation and ensure safety of
shareholders and investors funds.
VII. Recommendations Mergers and acquisitions are good for insurance company’s profitability but evidence shows that
shareholders wealth still reduced insignificantly. This implies that profit and huge capital do not necessarily
make a good and sound insurance company, what makes a sound insurance company is really how effective and
efficient the management of the insurance company is deploying or utilizing the available resources. For
mergers and acquisitions to achieve the desired goals, it must be financially sound; parties involved should
examine the negotiation terms and the purpose of the merger and acquisition. This is why the recommendation
of this study will centre on how shareholders can benefit from the increased profit;
1) To ensure the successful implementation of the mergers and acquisitions exercise, a merger
manager should be appointed to ensure that matters that may lead to de- merger (dis- integration
after merger) are properly addressed.
2) Shareholders should not only look at the returns on their funds (profit), they should also bother
about the safety and protection of their funds. This is one way to promote market discipline. 3) Regulatory bodies like Securities and Exchange Commission (SEC), National Insurance
Commission (NICOM) should improve on regulatory roles to ensure that the insurance company
does not make their shareholders worse off than they were before the mergers and acquisitions
exercise.
Reference [1]. Akhigbe, A, and Madura, J. 2001, “Intra-Industry Signals Resulting from Insurance Company Mergers,” Journal of Risk and
Insurance 68: 489-505.
[2]. BarNiv R. and Hathorn J. (1997) “The merger or insolvency alternative in the insurance Industry” Journal of risk and insurance 64 ,
pp. 89-113.
[3]. Bruner, R.F. (2004), Applied Mergers & Acquisitions, John Wiley & Sons, Hoboken, New Jersey.
[4]. Boubakri, N., Dionne, G. and Triki, T.(2008), Consolidation and Value Creation in the Insurance Industry: The Role of
Governance, Journal of Banking and Finance, 32(1): 56-68.
[5]. Cummins J.D., Tennyson, S. and Weiss, M.A. (1999) “Consolidation and efficiency in the US life Insurance industry” Journal of
banking and finance 23, pp.325-357.
[6]. Fields, L. P, Fraser, D.R. & Kolari, J.W. (2007a). Bidder returns in Bancassurance Mergers: Is there evidence of synergy? Journal
of Banking and Finance, 31:3646- 3662.http://dx.doi.org/10.1016/j.jbankfin.2007.01.014
[7]. Floreani, A., and Rigamonti, S. (2001) “Mergers and Shareholders’ Wealth in the Insurance Industry.”Working paper, Universita
Cattolica del S. Cuore. (March 2001).
[8]. Gaurav, A. (2012) April 23rd
, “Definition of Merger”.
[9]. Healy, P. M., Palepu ,K.G, and Ruback, R. S. 1992. “Does Corporate Performance Improve after Mergers?” Journal of Financial
Economics, 31, pp. 135-175.
[10]. Ifeanyi, I. (2011). “An overview of Mergers and Acquisitions of companies”, 26 April, extracted From the Lawyers Chronicle.
[11]. Investopedia (2013). “Definition of Acquisition”, extracted on 19th November. Margaret, R. (2013). March, “Mergers and
Acquisitions”.
[12]. Ravenscraft, D. J., and Scherer, F. M. 1989. “The Profitability of Mergers,” Journal of Industrial Economics, 7, pp. 101-116.
[13]. Wikipedia (2013) Org/ wiki/ mergers and acquisitions history, extracted on 28th November 2013.