
Comparative analysis of acute and chronic corticosteroid pharmacogenomic effects in rat liver:...
19
METHODOLOGY ARTICLE Open Access Comparative analysis of acute and chronic corticosteroid pharmacogenomic effects in rat liver: Transcriptional dynamics and regulatory structures Tung T Nguyen 1 , Richard R Almon 4,5,6 , Debra C DuBois 4,5 , William J Jusko 4,6 , Ioannis P Androulakis 2,3* Abstract Background: Comprehensively understanding corticosteroid pharmacogenomic effects is an essential step towards an insight into the underlying molecular mechanisms for both beneficial and detrimental clinical effects. Nevertheless, even in a single tissue different methods of corticosteroid administration can induce different patterns of expression and regulatory control structures. Therefore, rich in vivo datasets of pharmacological time- series with two dosing regimens sampled from rat liver are examined for temporal patterns of changes in gene expression and their regulatory commonalities. Results: The study addresses two issues, including (1) identifying significant transcriptional modules coupled with dynamic expression patterns and (2) predicting relevant common transcriptional controls to better understand the underlying mechanisms of corticosteroid adverse effects. Following the orientation of meta-analysis, an extended computational approach that explores the concept of agreement matrix from consensus clustering has been proposed with the aims of identifying gene clusters that share common expression patterns across multiple dosing regimens as well as handling challenges in the analysis of microarray data from heterogeneous sources, e.g. different platforms and time-grids in this study. Six significant transcriptional modules coupled with typical patterns of expression have been identified. Functional analysis reveals that virtually all enriched functions (gene ontologies, pathways) in these modules are shown to be related to metabolic processes, implying the importance of these modules in adverse effects under the administration of corticosteroids. Relevant putative transcriptional regulators (e.g. RXRF, FKHD, SP1F) are also predicted to provide another source of information towards better understanding the complexities of expression patterns and the underlying regulatory mechanisms of those modules. Conclusions: We have proposed a framework to identify significant coexpressed clusters of genes across multiple conditions experimented from different microarray platforms, time-grids, and also tissues if applicable. Analysis on rich in vivo datasets of corticosteroid time-series yielded significant insights into the pharmacogenomic effects of corticosteroids, especially the relevance to metabolic side-effects. This has been illustrated through enriched metabolic functions in those transcriptional modules and the presence of GRE binding motifs in those enriched pathways, providing significant modules for further analysis on pharmacogenomic corticosteroid effects. Background Glucocorticoids (GC) are a class of steroid hormones pre- sent in almost every animal cell, playing a central role in a wide range of physiological responses [1]. Because of their potent anti-inflammatory and immunosuppressive effects, synthetic glucocorticoids referred as corticosteroids (CS) (e.g. methylprednisolone - MPL) have been used widely in pharmacology as a therapeutic option for a wide range of autoimmune and inflammatory diseases [2,3]. However, beneficial effects are derived from magnifying the physio- logical actions of endogenous glucocorticoids, causing a variety of side effects following long-term treatment with this class of drugs e.g. hyperglycemia, dyslipidemia, arter- iosclerosis, muscle wasting, and osteoporosis [4-7]. The physiological and pharmacological effects of corticoster- oids are complex and manifest themselves with expression * Correspondence: [email protected] 2 Biomedical Engineering Department, Rutgers University, Piscataway, New Jersey, USA Full list of author information is available at the end of the article Nguyen et al. BMC Bioinformatics 2010, 11:515 http://www.biomedcentral.com/1471-2105/11/515 © 2010 Nguyen et al; licensee BioMed Central Ltd. This is an Open Access article distributed under the terms of the Creative Commons Attribution License (http://creativecommons.org/licenses/by/2.0), which permits unrestricted use, distribution, and reproduction in any medium, provided the original work is properly cited.
Transcript of Comparative analysis of acute and chronic corticosteroid pharmacogenomic effects in rat liver:...
METHODOLOGY ARTICLE Open Access
Comparative analysis of acute and chroniccorticosteroid pharmacogenomic effects in rat liver:Transcriptional dynamics and regulatory structuresTung T Nguyen1, Richard R Almon4,5,6, Debra C DuBois4,5, William J Jusko4,6, Ioannis P Androulakis2,3*
Abstract
Background: Comprehensively understanding corticosteroid pharmacogenomic effects is an essential step towardsan insight into the underlying molecular mechanisms for both beneficial and detrimental clinical effects.Nevertheless, even in a single tissue different methods of corticosteroid administration can induce differentpatterns of expression and regulatory control structures. Therefore, rich in vivo datasets of pharmacological time-series with two dosing regimens sampled from rat liver are examined for temporal patterns of changes in geneexpression and their regulatory commonalities.
Results: The study addresses two issues, including (1) identifying significant transcriptional modules coupled withdynamic expression patterns and (2) predicting relevant common transcriptional controls to better understand theunderlying mechanisms of corticosteroid adverse effects. Following the orientation of meta-analysis, an extendedcomputational approach that explores the concept of agreement matrix from consensus clustering has beenproposed with the aims of identifying gene clusters that share common expression patterns across multiple dosingregimens as well as handling challenges in the analysis of microarray data from heterogeneous sources, e.g.different platforms and time-grids in this study. Six significant transcriptional modules coupled with typical patternsof expression have been identified. Functional analysis reveals that virtually all enriched functions (gene ontologies,pathways) in these modules are shown to be related to metabolic processes, implying the importance of thesemodules in adverse effects under the administration of corticosteroids. Relevant putative transcriptional regulators(e.g. RXRF, FKHD, SP1F) are also predicted to provide another source of information towards better understandingthe complexities of expression patterns and the underlying regulatory mechanisms of those modules.
Conclusions: We have proposed a framework to identify significant coexpressed clusters of genes across multipleconditions experimented from different microarray platforms, time-grids, and also tissues if applicable. Analysis onrich in vivo datasets of corticosteroid time-series yielded significant insights into the pharmacogenomic effects ofcorticosteroids, especially the relevance to metabolic side-effects. This has been illustrated through enrichedmetabolic functions in those transcriptional modules and the presence of GRE binding motifs in those enrichedpathways, providing significant modules for further analysis on pharmacogenomic corticosteroid effects.
BackgroundGlucocorticoids (GC) are a class of steroid hormones pre-sent in almost every animal cell, playing a central role in awide range of physiological responses [1]. Because of theirpotent anti-inflammatory and immunosuppressive effects,synthetic glucocorticoids referred as corticosteroids (CS)
(e.g. methylprednisolone - MPL) have been used widely inpharmacology as a therapeutic option for a wide range ofautoimmune and inflammatory diseases [2,3]. However,beneficial effects are derived from magnifying the physio-logical actions of endogenous glucocorticoids, causing avariety of side effects following long-term treatment withthis class of drugs e.g. hyperglycemia, dyslipidemia, arter-iosclerosis, muscle wasting, and osteoporosis [4-7]. Thephysiological and pharmacological effects of corticoster-oids are complex and manifest themselves with expression
* Correspondence: [email protected] Engineering Department, Rutgers University, Piscataway, NewJersey, USAFull list of author information is available at the end of the article
Nguyen et al. BMC Bioinformatics 2010, 11:515http://www.biomedcentral.com/1471-2105/11/515
© 2010 Nguyen et al; licensee BioMed Central Ltd. This is an Open Access article distributed under the terms of the Creative CommonsAttribution License (http://creativecommons.org/licenses/by/2.0), which permits unrestricted use, distribution, and reproduction inany medium, provided the original work is properly cited.
changes of many genes across multiple tissues [8-10]. Ithas been observed that even in a single tissue differentdosing regimens of CS administration can induce differentpatterns of expression [11-13]. As such genes with similarexpression profiles under acute CS administration maynot exhibit similar expression patterns during continuousinfusion, pointing to the possibility of alternative regula-tory mechanisms. Therefore, a better understanding ofcorticosteroid pharmacogenomic effects from multipledosing regimens are very valuable not only to reveal thetranscriptional dynamics under different patterns of inputperturbations but also to provide an insight into theunderlying molecular mechanisms of action, for both ben-eficial and detrimental effects, and thus for the optimiza-tion of clinical therapies.It has been noted that genes affected by CS include both
immunosuppressive genes, mostly associated with thera-peutic effects, and metabolic genes often associated withadverse effects whose regulation is mainly controlled byglucocorticoid receptor gene mediated pathways [6].Unbound CS binds with cytosolic free glucocorticoidreceptors (GR) releasing it from the heat shock complexallowing dimerization and translocation into the nucleuswhere it binds to glucocorticoid response element (GRE)of the target genes, leading to enhancement or inhibitionof the target gene expression. As a result, long-term treat-ment with corticosteroids results in sustained up- ordown-regulation of numerous genes, leading to a newsteady state which might be the basis for occurrence ofadverse effects. However, it has also been noted thatchronic infusion of CS causes a sustained down-regulationof the receptor (mRNA and thus protein) [14,15]. Whileseveral alternative mechanisms have been proposed[16-18] it is still not understood why drug effects remainstrong although GR mRNA is down-regulated to the pointof almost being eliminated. A plausible explanation is thatbesides direct regulation through GRE binding sites in the5’ regulatory regions of genes, there are changes in expres-sion that are also the indirect results of effects due tochanges in expression of transcription factors (TFs) thatact as secondary biosignals directly or indirectly modulat-ing the transcription of genes [15,19,20]. Thus, along withidentification of expression patterns, predicted regulatorycontrol structures are also an essential source of informa-tion towards understanding corticosteroid effects.
In this study we address the question as to whether(1) significant transcriptional modules coupled withcomplex patterns of mRNA changes across multipledosing regimens of corticosteroids and (2) their com-mon regulatory controls can be computationally identi-fied. Hypothetically, transcriptional modules that aresignificantly coexpressed under different dosing regi-mens will be important gene clusters for further analysistowards better understanding of both beneficial andadverse effects of corticosteroids, especially the meta-bolic side-effects since these patterns are survived undera long-term treatment of corticosteroids. The hypothesisexplored here is that if two or more genes have thesame temporal expression profiles in response to differ-ent dosing regimens, they are more likely to share somecommon regulatory mechanisms. The liver was selectedbecause of its major role in both the physiological effica-cious and adverse effects of corticosteroids e.g. alteringthe expression of serum proteins that regulate immune/inflammatory responses [21], enhancing the expressionof liver enzymes involved in metabolic effects (gluconeo-genesis and lipid metabolism) [22].However, rich in vivo datasets of pharmacological
time-series across multiple dosing regimens are oftenobtained from different microarray platforms andtime-sets [11,23], leading to a problematical issue forcomputational analysis [24-26]. As an example, in astudy comparing normal and chronic lymphocytic leu-kemia B-cells, Wang et al. [27] identified only 9 differ-entially expressed genes across all three studies, whencombining results from three different platforms, whilethere are at least 1,172 differentially expressed genes ineach individual platform. In general, there are twoimportant issues relevant to the analysis of dataderived from different platforms: (i) genes may be pre-sent in one platform but not in the other, and (ii)genes present on both platforms may not be repre-sented by the same probes. Since different microarrayplatforms do not contain the same probesets, and evendo not have a similar hardware design and sample pro-cessing protocols, standard analyses may not yieldcomparable expression level quantifications across plat-forms, leading to many challenges for computationalmodels aiming at the analysis of microarray data fromheterogeneous sources [25,28,29].
Table 1 Effectiveness of the approach on synthetic data
Synthetic data Number of selected genes Number of clusters Accuracy* (Adjusted Rand-index)
Dataset 1 174/400 4 100.0%
Dataset 2 368/400 6 100.0%
Dataset 3 395/400 6 100.0%
Dataset 4 378/400 6 100.0%
*: The accuracy is only estimated on the selected domain.
Nguyen et al. BMC Bioinformatics 2010, 11:515http://www.biomedcentral.com/1471-2105/11/515
Page 2 of 19
A number of approaches have been proposed and aregenerally classified into two main categories: (1) inte-grate raw expression profiles from different studies intoone dataset so that available computational models canbe directly applied, and (2) develop and/or utilize a unit-less statistic as a primary analysis and then combine theresult through a meta-level analysis. The former cate-gory can be further divided into two sub-classes, namelycombining raw data through a normalization and/ortransformation procedure [30-33] and pooling raw infor-mation from common probes that can be mapped to thesame Unigene clusters or full-length mRNA transcripts[34-37]. However, these approaches are not generalenough to make data from different platforms fullycompatible [25,38]. Since combining data across differ-ent platforms remains a serious challenge, meta-analysis- the second category - has been identified as a morepopular technique in order to combine results, and thusdata, from a number of independent studies [39,40].The assumption here is that while the raw expressionlevels from different platforms may not be comparable,the results of the primary analysis should be. However,almost all prior studies has focused on the discovery ofgenes that are differentially expressed in conjunctionwith standard models such as effect size models [41-43],Bayesian models [44,45].Consequently, in order to identify significant clusters
of genes that share common expression patterns acrossmultiple dosing regimens, we extend our prior study[46] in the aspect of (i) producing an agreement matrix(AM) that describes the agreement levels of co-expres-sion of genes across multiple conditions and (ii) succes-sively searching clusterable subsets to infer all such geneclusters. The approach follows the concept of meta-ana-lysis to avoid the limitation of incompatible data acrossmultiple datasets from different platforms (also differenttissues, time-grids, as well as lab-protocols when applic-able). The unitless statistic, expressing the confidencelevel of co-expression is the agreement level of clusterassignments drawn from multiple clustering runs. Thereremain a number of open critical issues associated witha single clustering run (e.g. the input number of clusters[47,48], the biases and assumptions of distance metricsand/or clustering methods [49], cluster significance[50]), and thus consensus clustering coupled with theexamination of AM distribution has been designed withthe aims of reducing aforementioned limitations [46,51].Once the AM is obtained for each condition indepen-dently (e.g. each dosing regimen in this case), an averageagreement matrix is calculated to estimate the confi-dence levels of coexpression between genes across mul-tiple conditions, thus combining data from differentdatasets into a single input for the next analysis. For theanalysis at the meta-level, we extend the selection and
clustering processes (also proposed in [46]) to identifyall possible clusters of genes that are highly coexpressedwith the average AM above as the input. As such theseclusters of genes will share common patterns of expres-sion across multiple dosing regimens. Additionally, dueto the selection of all possible patterns of expressionseveral clusters may have similar expression patternsand thus we also provide a heuristic as an optional pro-cedure to merge such similar clusters based on a criter-ion of maximizing the total homogeneity and separationof selected clusters. Subsequently, we analyze promoterregions of genes in every cluster in order to predictputative transcriptional regulators, aiming at providinganother source of information towards better under-standing those complex patterns of expression and theunderlying regulatory mechanisms of corticosteroideffects.Our results demonstrate that the proposed computa-
tional approach is highly effective on both synthetic andreal data. When applying the approach to real time-ser-ies datasets (acute/chronic corticosteroid administration[11,23]), selected patterns of transcriptional responsesare enriched in a biological sense with relevant putative-regulatory controls and significant metabolic pathwaysin each pattern. Computational results are further vali-dated predicated upon literature evidence.
Methods1. DatasetsSynthetic dataA number of synthetic datasets from the open literature areutilized to assess our approach for finding common sets ofgenes that are highly coexpressed across multiple condi-tions. Specifically, we used a series of four high-noise 20-timepoint sine-format synthetic datasets with differentnumber of replicates at each time-point (1, 3, 4, and 20respectively) from [52,53]. Each dataset contain five sepa-rate sets with 400 genes allocated equally in 6 classes, eachof which contains the same list of genes but has differentpatterns across five conditions. For each set, in the first stepthe data are generated according to an artificial pattern F(i,t, l) which shows the values for gene i at time-point t incluster l; four of six clusters follow the sine function i.e. F(i, t, l) = sin(2πt/10 - wl) (wl is some random phase shiftbetween 0 and 2π), and the other two follow the non-peri-odic linear function (F (i, t, 5) = t/20 and F(i, t, 6) = -t/20),i = 1,...,400, t = 1,...,20, l = 1,...,4. In the second step, let x(i,t, r) be the error-added value for gene i, time-point t andrepeat; x(i, t, r) is randomly drawn from a normal distribu-tion N(μ, s) where μ is the value of the synthetic pattern F(i, t, l) and s is equal to lsit (sit is randomly extractedfrom measurement errors observed in the yeast galactosedata [54] and l is the multiplicative factor that controls thenoise level). High-noise synthetic data are generated with l
Nguyen et al. BMC Bioinformatics 2010, 11:515http://www.biomedcentral.com/1471-2105/11/515
Page 3 of 19
= 6 [53]. Datasets are downloaded from the links providedin synthetic data in Additional File 1.Acute corticosteroid administrationForty-seven male ADX Wistar rats weighting from 225to 250 g underwent right jugular vein cannulation underlight ether anesthesia 1 day before the study [23]. Forty-three rats were injected with a single intravenous bolusdose of methylprednisolone (MPL) of 50 mg/kg. Ani-mals were sacrificed by exsanguinations under anesthe-sia and liver samples were harvested at 0.25, 0.5, 0.75, 1,2, 4, 5, 5.5, 6, 7, 8, 12, 18, 30, 48, and 72 after dosing.The sampling time points were selected based on preli-minary studies describing GR dynamics and enzymeinduction in liver. Four untreated rats were sacrificed atrandom times and nominally considered as 0 h controls.The gene expression was obtained via the AffymetrixRG-U34A array which consists of 8,799 probesets. Thedata are publicly available through the GEO OmnibusDatabase under the accession number GDS253.Chronic corticosteroid administrationIn a similar experiment model, forty rats were given 0.3mg/kg/hr infusions of MPL over 168 h via an Azletpump [11]. The pump drug solutions were prepared foreach rat based on its predose body weight. Animals weresacrificed at various times up to 7 days; specifically thetime-points included are 6, 10, 13, 18, 24, 36, 48, 72, 96,and 168 h. A control group of four animals wasimplanted with a saline-filled pump and killed at varioustimes throughout the 7-day study period. Unlike the pre-vious experiment, the microarray platform for this data-set is the RAE230A which consists of 15,923 probesets.The data are publicly available through the GEO Omni-bus Database under the accession number GDS972.All protocols followed the Principles of Laboratory
Animal Care (Institute of Laboratory Animal Resources,1996) and were approved by the University at BuffaloInstitutional Animal Care and Use Committee.
2. Identifying critical transcriptional modulesThe general computational problem can be brieflydefined as follows. We are given a set of N genes
G gi i
N= { } =1and K conditions. For each condition k,
every gene is characterized by one or more time-seriesexpression profiles with Rki corresponding probesets
over Tk time-points G g g g r R g g k Kk ki i
Nki ki
rki ki
rkitr
t
Tk= { } = ∈{ } = { } == =1 11, , , , , ..., .
The question then becomes to search for clusters ofgenes that are highly coexpressed across all K conditionswith a confidence level δ. The term ‘highly coexpressed’is used in the sense that ∀ ∈ ∧( ) ≥=∑g g C
KP g gi j k i jk
K, , 1
1 where C
denotes a, yet to be determined, cluster and Pk(gi ∧ gj) isthe confidence level that two gene profiles i and j areclustered together in condition k; a gene profile includes
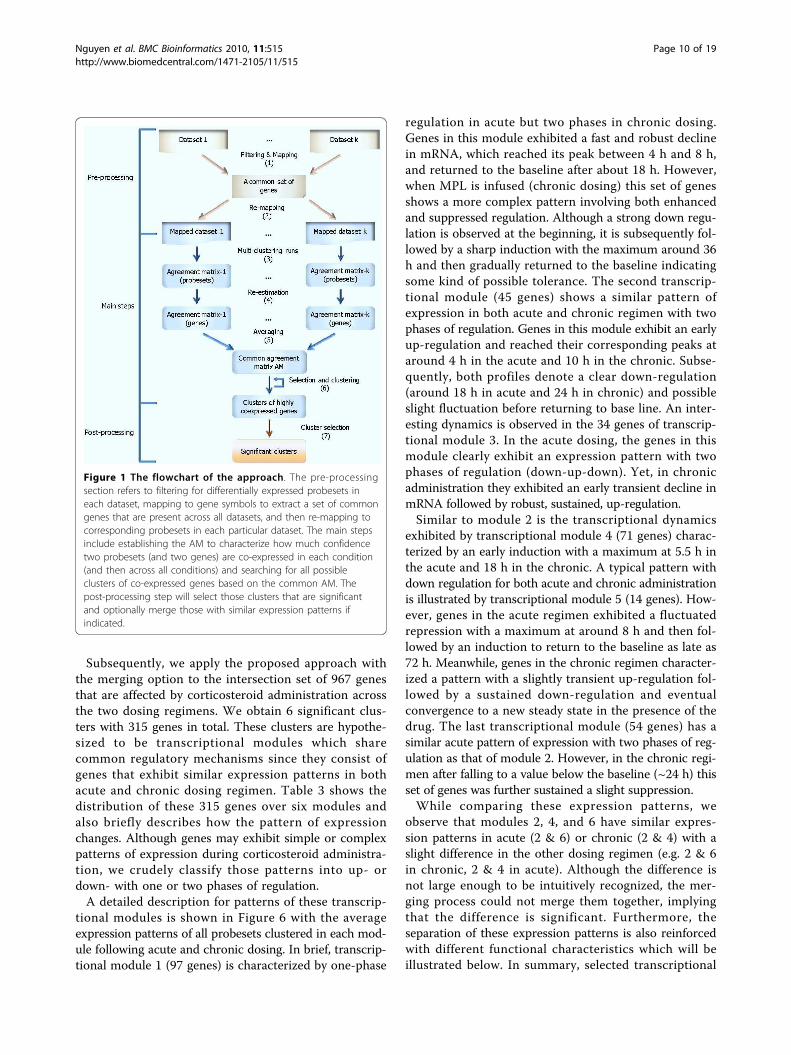
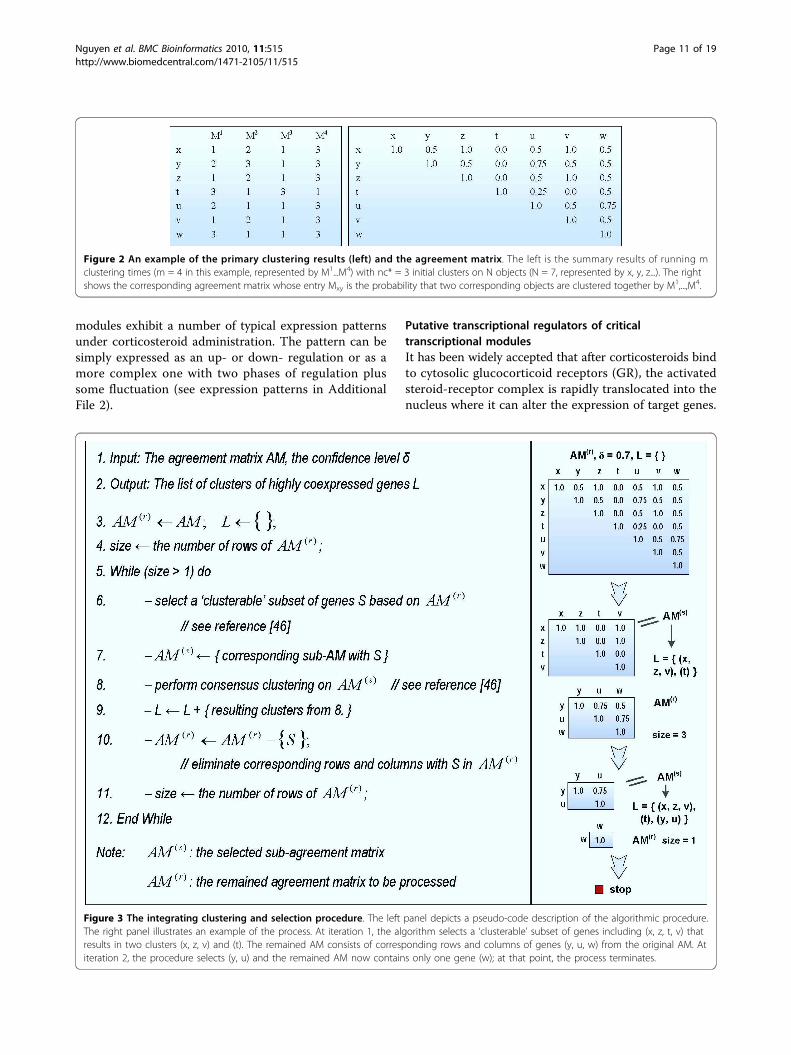
sets of corresponding probesets Rki of gene i in condi-tion k, k = 1,...,K. The subscripts {i, j}, t, k, r indicate the{gene id}, time, condition, and probesets respectively. Itshould be also noted that in this work, we used threedifferent terms to refer to the same object (e.g. a set ofgenes that are coexpressed across multiple conditions):‘cluster’ when designing the algorithm, ‘pattern’ whenexhibiting the expression changes, and ‘module’ whencharactering the biological function. The frameworkcontains several step displayed in Figure 1.The pre-processing stepEach dataset is pre-filtered to identify differentiallyexpressed probesets. Since we would like to identifygene clusters with common expression patterns acrossmultiple conditions, input datasets must contain thesame set of genes. Thus using the respective platforminformation, probesets in each dataset are mapped to alist of genes and then the intersection across those genelists is evaluated to extract a common set of geneswhich are differentially expressed across multiple condi-tions (i.e. datasets). However, genes are sometimes char-acterized by multiple probesets whose expressionprofiles may be similar or sometimes different, but notidentical. These probesets can be considered as repli-cates of expression profiles for a gene and thus takingan average expression profiles across all these probesetsto characterize for the expression profile of the genemay lose useful potential information. Therefore, fromthe common set of genes we re-map genes to corre-sponding probesets in each dataset with the respectiveplatform before starting the analysis.Construction of the agreement matrixThe agreement matrix (AM) quantifies the likelihoodthat two objects (x, y) are assigned to the same cluster(Figure 2). If m clustering runs are performed on thedata, each entry (termed ‘agreement level’) will showthe frequency with which two objects are assigned tothe same cluster over ‘m’ clustering runs. The AMentries are defined as follows:
Mm
M x y
where M x yif x and y are clustered to
xyh
h
m
h
=
=
=∑1
1
1
( )
( )
( , )
( , ) ggether when running method M
otherwise
h( )
0
⎧⎨⎪
⎩⎪
(1)
In addition to the various clustering methods thatwere utilized, different distance metrics (Euclidean,Pearson correlation, and Manhattan [55]) are alsoexplored in order to attenuate the biases associated withindividual distance metrics. In our implementation, weare using hierarchical clustering (hclust), divisive analy-sis clustering (diana), fuzzy analysis clustering (fanny),partitioning around medoid (pam) with Pearson correla-tion and Manhattan metric, k-means (kmeans), fuzzy c-
Nguyen et al. BMC Bioinformatics 2010, 11:515http://www.biomedcentral.com/1471-2105/11/515
Page 4 of 19

means (cmeans), self-organizing map (som), and model-based clustering (mclust) with Euclidean metric as thecore clustering methods (supported by R packages)[56-61]. Since clustering results are highly dependent onthe input number of clusters (nc), the sensitivity of theAM as a function of nc was examined to find a ‘sugges-tive’ number of clusters (nc*) for each particular dataset.After identifying nc* based on the procedure in ourprior work [46], all clustering runs are repeated with nc*to produce the final AM for further analysis (see moredetails in [46]).If two probesets (x, y) are clustered together, it is
implied that their expression profiles are similar under aspecific condition k. Therefore, the fraction of times(Mxy) they are clustered together over multiple cluster-ing runs can be considered as the confidence level thatthey are coexpressed since Mxy, by construction, aims ateliminating method-specific biases and assumptions.Subsequently, we calculate the average agreement levelsbetween sets of corresponding probesets of any twogenes to estimate the confidence level that those twogenes are coexpressed in a specific condition. The AMentries in condition k is re-estimated as follows
AMR R
M i j Nijk
ki kjxy
y Rx R kjki
( ) , , , ...,= =∈∈∑∑1
1 (2)
With the assumption that the unitless statistics, i.e. theconfidence level of co-expression, is comparable acrossmultiple conditions and different platforms [37], we esti-mate the confidence level of co-expression between twogenes across multiple conditions by taking the average.While combining raw data remain challenges, the esti-mation of a unitless statistics provides a simple but effi-cient combination of heterogeneous data for furtheranalyses.
AMK
AM i j Nij ijk
k
K
= ==
∑11
1
( ), , , ..., (3)
As a result, we obtain an agreement matrix whoseentries exhibit a quantity that shows how confidentgenes are coexpressed. This will be the input for theselection and clustering process.Selection and clusteringWith the hypothesis that the more clusterable the datais the more biologically relevant it is, we applied ourpreviously proposed procedure to select a more‘hypothetically clusterable’ subset from the entire set ofgenes [46]. The main hypothesis underlying the selec-tion is that AM entries associated with genes at the‘hypothetical’ core of an expression pattern (or a cluster)will be consistently grouped together over multiple
clustering runs. This should be manifested by highcorresponding values in the AM, whereas genes belong-ing to the ‘hypothetical’ core of two clearly distinct clus-ters are associated with consistently low AM entries. Onthe contrary, cluster assignments associated with genesat cluster boundaries or between clusters would be verysensitive to the method used and thus they would haverelatively moderate agreement levels with other genes.As a result, with a user-defined confidence level δgenes associated with moderate AM entries
(1 − < < AMijk( ) ) are eliminated to produce a more
‘clusterable’ subset of genes (δ = 70% in this study). Theprocess starts removing genes associated with the high-est number of moderate AM entries and then updatesthe AM for the next loop until no moderate AM entryexists. The corresponding subset of genes is now consid-ered as a ‘hypothetically clusterable’ subset since anytwo genes are highly coexpressed or non-coexpressedwith the confidence level at least δ. Subsequently, weused the concept of consensus clustering [51,62,63] todivide the subset of genes into a number of clusters byapplying the hierarchical clustering with the selectedAM as input data. The algorithm starts with every genefilling a cluster and then grouping two clusters into anew one for each loop so that any pair of genes belong-ing to a new cluster always has an agreement levelgreater than or equal to δ. The iteration is stoppedwhen no more new cluster is formed (see more detailsin [46]).However, since there should be existed clusters of
genes located closely to other clusters in the data andthe input number of clusters for the core analysis isonly a suggestive one, those clusters may not be com-pletely separated. As a result, although genes that belongto those clusters are identified as highly coexpressed,their relationship to genes in other clusters cannot beuniquely determined. Therefore, some significant clus-ters may be not included in the selected subset due tothe constraint of ‘clusterable’ selection. Since we wouldlike to obtain all significant patterns of expression, theprocedure of selection and clustering is repeated on theremoved domain. The removed domain consists of a setof unselected genes whose coexpression levels are stillhigh as quantified agreement levels in the original AM.After extracting the sub-agreement matrix correspond-ing to the set of unselected genes, the entire process ofselection and clustering is applied again with the sameconfidence level δ as before. The procedure is reiterateduntil no more clusters of genes are recognized. Figure 3presents the pseudo-code of the procedure and anexample to illustrate the process.Furthermore, due to the nature of clustering, trivial
clusters may be identified in the final results. In order
Nguyen et al. BMC Bioinformatics 2010, 11:515http://www.biomedcentral.com/1471-2105/11/515
Page 5 of 19
to exclude such trivial clusters, each cluster C isassigned with a simple hypothetical quantity called ‘clus-ter significance’ which represents how large the clusteris in this study. We then create the distribution of clus-ter significance on random data to estimate the clustersignificance threshold corresponding to a user-definedthreshold p-value for cluster selection. Without loss ofgenerality we select K = 1 for the random data andassume that each probeset in the mapped dataset D cor-respond to a gene. The suggestive number of clustersnc* for D is searched with the process in [46]. Subse-quently, D is randomly resampled (permutation plusconvex-hull [50]) a number of times (nr), for each ofwhich the entire process starting from building the AMwith the same nc* to extracting clusters of highly coex-pressed genes is repeated and the resulting random clus-ters are returned. After that, the procedure estimates thecluster significance, which is simply the cluster-size inthis study, for these random clusters and constructs adistribution of cluster significance. The correspondingp-value of cluster significance cs is defined as the num-ber of random clusters whose significance is greaterthan cs over the total number of clusters identified in nrresamples:
pvalue csclusters with cluster significance cs
random cl( ) =
≥∑
uusters∑ . As
a result, given a threshold p-value (p-value = 0.05 inthis study), the corresponding cluster significancethreshold is inferred (Figure 4) and only clusters withsignificance greater than this threshold are selected.Merging similar patternsBecause of the nature of the approach, it is quite rea-sonable to expect that the clustering process can breakout patterns of expression into several sub-patterns.Thus, we repeat the process on the eliminated domainsto extract all possible significant clusters, resulting inthat several clusters may have a similar expression pat-tern but are separated into two or more clusters.Because cluster homogeneity reflects the similarity ofexpression profiles within a given cluster and clusterseparation quantifies how effectively expression profilesare discriminated, we provide an optional heuristic in
order to merge similar patterns together according tothe criterion of maximizing sum of homogeneity andseparation of all final output clusters. Starting with allsignificantly selected clusters, the procedure searches fora combination of two similar patterns so that their com-bination will generate a maximal increase of the sum ofhomogeneity and separation of all current clusters aftermerging those two patterns. The process is repeateduntil no more combinations are found i.e. any new com-bination always reduces the sum of homogeneity andseparation. Eventually, a list of significant expressionpatterns that characterize the underlying transcriptionalresponses is generated. The metric used during the eva-luation of the heuristic is quantified as follows:
max max ( )C C
homogeneity separationK n
H CK n n
S Ck p
pk
k+{ } = +−( )∑∑1 2
1 pp q
p qk
k p
ki kjg g C g g
C
H Csim g g
i j p i j
, ;
( ),
, ;
( )⎧⎨⎪
⎩⎪
⎫⎬⎪
⎭⎪
=( )
<
∈ ≠
∑∑∑
||| || || ||; ( , )
,
|| ||
;
C CS C C
dis g g
Cp pk p q
ki kjg C g C
p
i k j l
−( ) =( )
∈ ∈∑1 ||| ||
;
( , ) , ; ,’
C
sim g gR R
similarity g g dis g
q
ki kjki kj
kir
kjr
ki= ( )1gg
R Rdissimilarity g g
p n q
kjki kj
kir
kjr( ) = ( )
= =
1
1 1
, ;
,..., , , ...,
’
nn k K r R r Rki kj, , ..., , , ’= ∈ ∈1
(4)
where C is the current set of selected clusters
C Cp p
n= { } =1
and n is the current number of clusters;
Hk (Cp) is the homogeneity of cluster Cp in condition kand Sk(Cp, Cq) is the separation between cluster Cp andCq in condition k; sim(gki, gkj) and dis(gki, gkj) are theaverage similarity and dissimilarity (or distance) respec-tively between all probesets of gene i and gene j in con-dition k. Similarity is measured by the Pearsoncorrelation coefficient and dissimilarity is estimated bythe Pearson correlation distance.
3. Predicting putative transcriptional regulatorsPromoter identificationPromoters of genes are extracted from a rich database ofpromoter information with a default length (500 bpupstream and 100 bp downstream of the transcriptionstart site) if there is no experimentally defined length assuggested by Genomatix [64]. In order to identify puta-tive transcriptional regulators, we explore the basicunderlying assumption of comparative genomics which
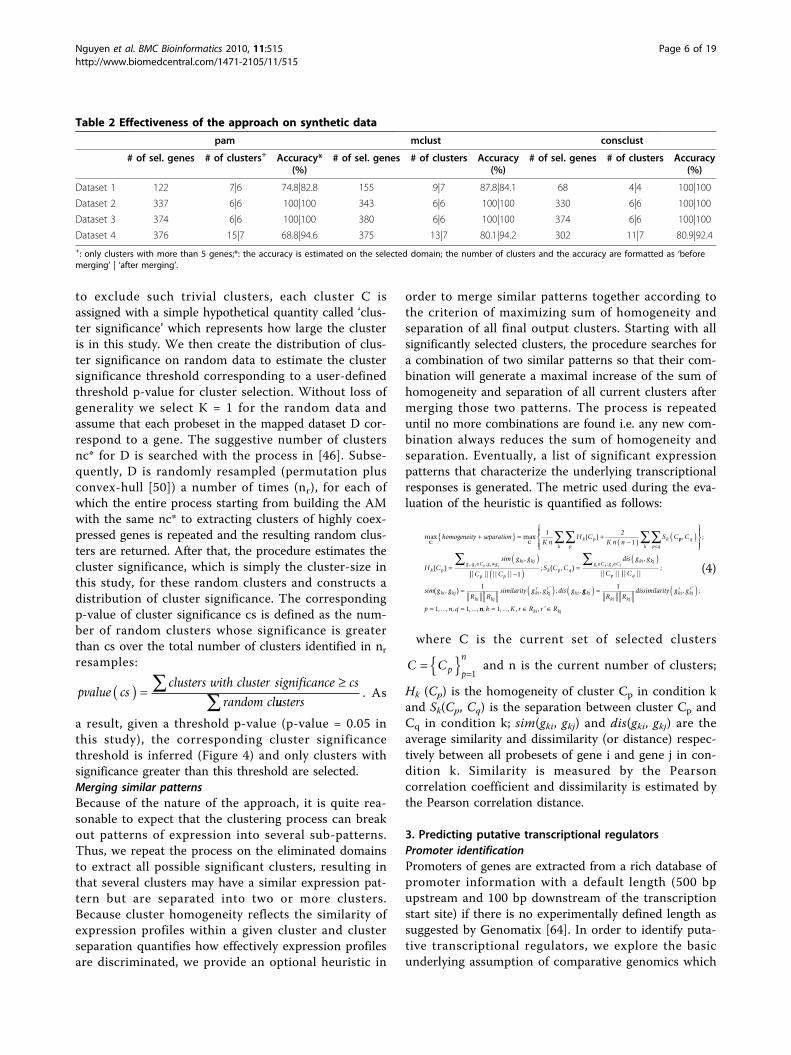
Table 2 Effectiveness of the approach on synthetic data
pam mclust consclust
# of sel. genes # of clusters+ Accuracy*(%)
# of sel. genes # of clusters Accuracy(%)
# of sel. genes # of clusters Accuracy(%)
Dataset 1 122 7|6 74.8|82.8 155 9|7 87.8|84.1 68 4|4 100|100
Dataset 2 337 6|6 100|100 343 6|6 100|100 330 6|6 100|100
Dataset 3 374 6|6 100|100 380 6|6 100|100 374 6|6 100|100
Dataset 4 376 15|7 68.8|94.6 375 13|7 80.1|94.2 302 11|7 80.9|92.4+: only clusters with more than 5 genes;*: the accuracy is estimated on the selected domain; the number of clusters and the accuracy are formatted as ‘beforemerging’ | ‘after merging’.
Nguyen et al. BMC Bioinformatics 2010, 11:515http://www.biomedcentral.com/1471-2105/11/515
Page 6 of 19

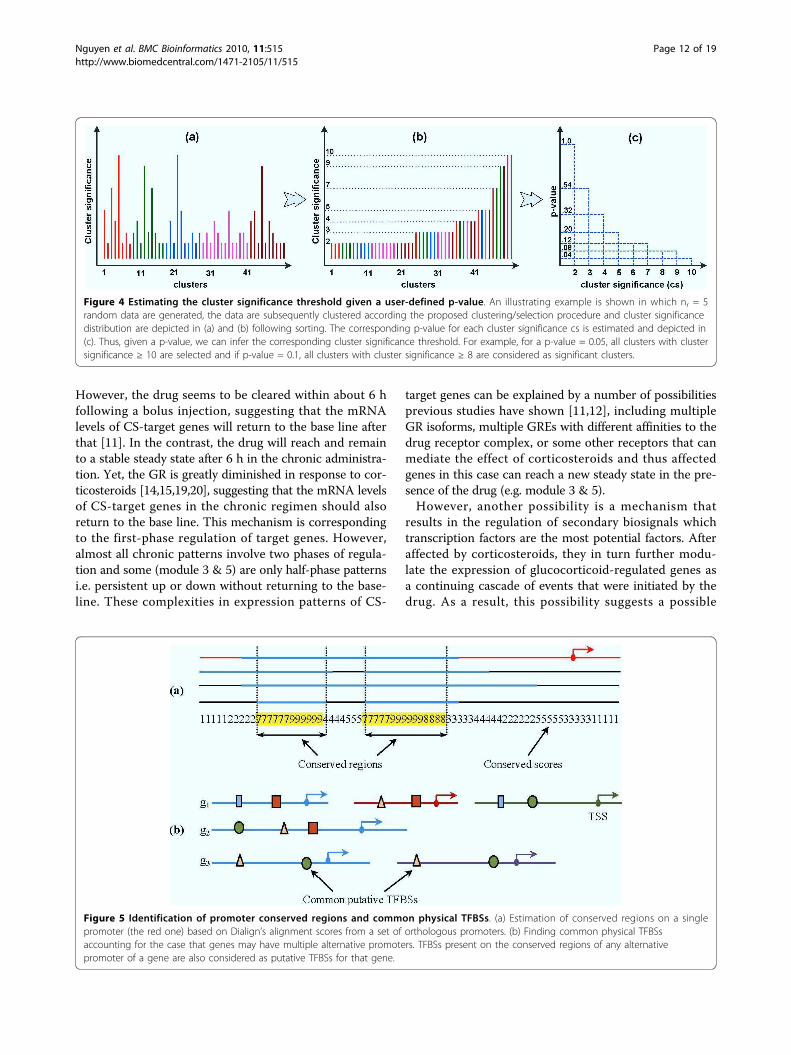
states that functional regions evolve in a constrainedfashion and thus at a lower rate than non-functionalregions [65,66]. It implies that conserved regions in aset of orthologous sequences survive due to their specialfunctional implications i.e. TFBSs located on these con-served regions will be more promising as functionalbinding sites and thus associated TF families are morerelevant to our context. Therefore, each promoter ischaracterized by a set of promoters from orthologousgenes of other vertebrate species, if available (e.g. Homosapiens, Mus musculus, Macaca mulatta, Pan troglo-dytes, Equus caballus, Bos Taurus, Gallus gallus, etc.).To be consistent in the search for conserved regions onpromoter sequences in order to identify putative tran-scription factor binding sites (TFBSs) we eliminate thosethat do not consist of more than two orthologouspromoters.Putative functional binding sitesIn order to identify conserved regions for each promoterDIALIGN [67] was used to perform multiple sequencealignments with the input sequences including eachsequence as well as its orthologous promoters. DIA-LIGN was selected because it has many applications incomparative genomics [68]. Also, a recent benchmarkstudy for the alignment of non-coding DNA sequenceshas concluded that it can produce alignments with highsensitivity as well as specificity to detect constrainedsites [69]. Following the alignment among orthologouspromoter sequences, we relied on the conserved scoresreturning from DIALIGN (with the similarity thresholdof diagonals or corresponding segments involved at least5 bases) to locate conserved regions which are definedas sub-sequences that are longer than 10 bp and con-tinuously scored greater than the average score of allthe alignment’s conserved scores (Figure 5a).We next apply MatInspector [70] to scan for all physi-
cal TFBSs and only those that overlap with the con-served regions selected above are kept for furtheranalysis. We used a common core similarity 0.75 andutilized the optimal matrix similarity threshold for eachposition weight matrix (a corresponding profile ofTFBSs) suggested from MatBase, Genomatix [64] whichensure that a minimum number of matches are foundin non-regulatory sequences i.e. the false positivematches is minimized. However, a gene may have
multiple alternative promoters [71] and virtually in allcases, it is not known which promoter of the gene isactivated. Therefore, all putative TFBSs detected fromall alternative promoters of a gene are considered ascandidates to infer putative transcriptional regulators forthe gene. Subsequently, we estimate the common levelof each candidate above in each corresponding moduleand select those TFBSs present more than a commonthreshold (70% in this study) (Figure 5b). Associated TFfamilies with those selected TFBSs are inferred and con-sidered as transcriptional regulators for correspondingtranscriptional modules.
Results and DiscussionMethod evaluation on synthetic dataIn order to evaluate the effectiveness of the proposedapproach, we use synthetic data with known class struc-ture as described earlier. The process of evaluation isrepeated four times with four different datasets that arecreated with different number of replicates for each time-point (1, 3, 4, and 20 respectively). In each time, we usefive high-noise sets as the data for five conditions (K = 5),each of which has 400 genes distributed across 6 clusters;each cluster has different patterns across five conditionsbut has the same set of gene ids. We set the same para-meters for all evaluation in this study and also for theanalysis on real time-series datasets, specifically the con-fidence level of coexpression δ = 70% and p-value = 0.05for the selection of significant clusters. Furthermore, thetesting process on synthetic data is done without themerging option. Without loss of generality, we assumethat each gene has only one probeset in this evaluation.The performance of the approach is assessed through itsability to recover the number of cluster structures andthe list of gene ids identified in each cluster. We use theadjusted Rand index [53,72] which is a statistic that mea-sures the extent of concurrence between the clusteringresults and the underlying known class structure to eval-uate the approach’s performance in identifying gene clus-ters that are coexpressed across multiple conditions. Thelarger the Rand index is, the higher the agreementbetween the results and prior knowledge of cluster struc-ture. The number of selected genes, recovered clusterstructures and the accuracy on the selected domain arelisted in Table 1.
Table 3 Characterization of significant transcriptional modules
Transcriptional modules 1 2 3 4 5 6
Number of genes 97 45 34 71 14 54
Expression pattern in acute* DD UU U DD U D UU D UU DD DD UU U DD U
Expression pattern in chronic* D UU D U DD U UUUU U DD U DDDD UU DD
*: Patterns consist of one-phase regulation (up-down/down-up), two-phase regulation (up-down-up/down-up-down) or simply up- or down-regulation. Details arelisted in expression patterns in Additional File 2.
Nguyen et al. BMC Bioinformatics 2010, 11:515http://www.biomedcentral.com/1471-2105/11/515
Page 7 of 19
Due to the fact that these datasets are high-noise syn-thetic data, some cluster structures may be missed whenthere is only one measurement at each time-point. How-ever, when the number of replicates is increased, thenumber of cluster structures is recovered. As discussedin our previous study [73], this is a reasonable observa-tion due to the effect of gene expression replicates onclustering performance. Additionally, we also examinean alternative approach which is more intuitive in iden-tifying gene clusters that are coexpressed across multipleconditions. Instead of performing a meta-analysis toavoid the limitation of incompatible data across differentplatforms, we can separately identify significant clustersof genes that are coexpressed in each condition (set ofdata) and then obtain the intersection among these geneclusters across all conditions. In this experiment, weused pam [60], mclust [57], and consensus clustering(consclust) [46] as standard single clustering methods toidentify clusters in each set of data, for which nc* = 6 isthe input number of clusters. We then simply took theintersection between clusters from set to set and onlykeep those clusters that contain more than 5 genes assignificant clusters for the final estimation of accuracy.The number of selected genes, number of clusters, andaccuracy on the selected domain are listed in Table 2.In general, this approach selects a smaller number of
genes with an equal or greater number of cluster struc-tures, resulting in lower accuracy. As an example, ineach set of dataset 4 there are two cluster structures
that are not clearly identifiable. As a result, a singleclustering methods (even consensus clustering) may failto properly separate them in each set, leading to thesituation where the intersection between clusters fromset to set divides those cluster structures into many sub-clusters with a small number of genes. On the contrary,by taking the average of the co-expression levels acrossmultiple sets, the relationship of whether two genes arecoexpressed across multiple conditions can be recov-ered. Consequently, our proposed approach is moreadvantage, resulting in a final highly correct classifica-tion as illustrated in Table 1. Furthermore, since thissimpler alternative approach produces many resultingclusters, we also attempted to apply the proposed mer-ging process to reduce the number of clusters as well asimprove the accuracy if applicable. However, its testingperformance is still not as high as that of our proposedapproach although we do not apply the merging processfor the proposed approach in this test. Additionally, thealternative approach is highly sensitive with the initialnumber of clusters. For instance, when we constantlyset nc* = 7 and test on dataset 3, without the mergingoption our approach still recovers the correct number ofcluster structures with high accuracy: (number ofselected genes, number of clusters, accuracy) = (386, 6,100%) whereas ‘pam’ approach yields (366, 13, 87.8%),‘mclust’ provides (360, 11, 82.3%), and ‘consclust’ does(351, 7, 98.3%). Since this information is not availablefor real datasets, the more sensitive with it the less
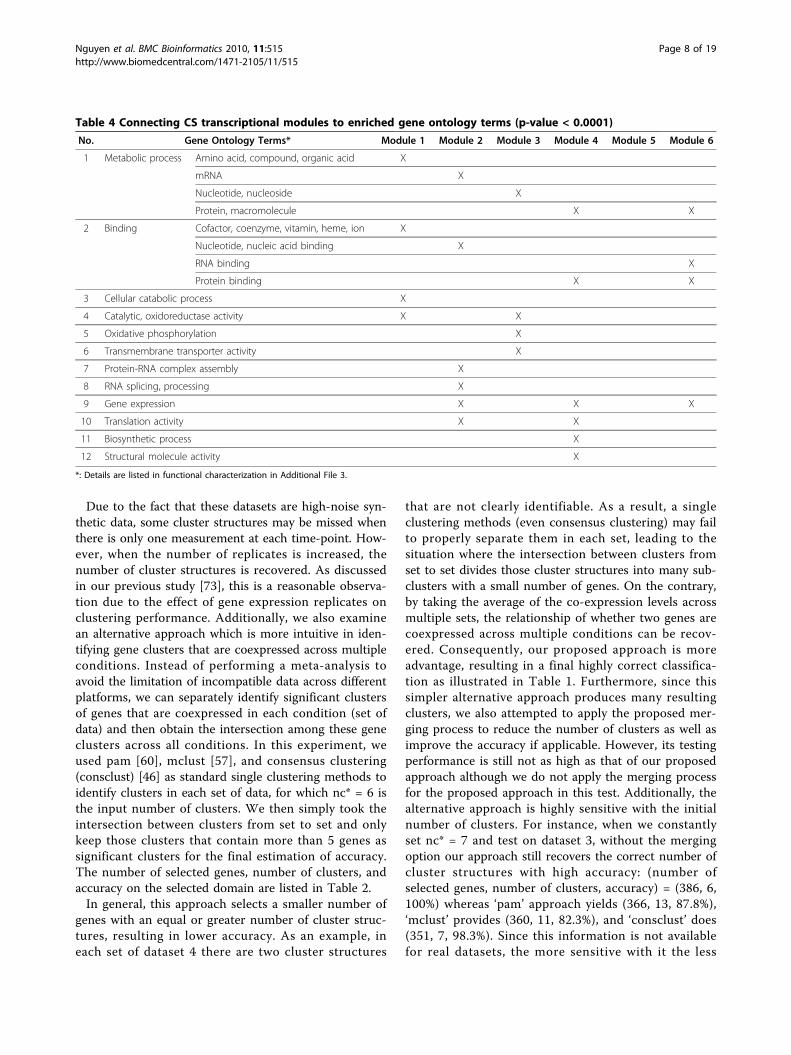
Table 4 Connecting CS transcriptional modules to enriched gene ontology terms (p-value < 0.0001)
No. Gene Ontology Terms* Module 1 Module 2 Module 3 Module 4 Module 5 Module 6
1 Metabolic process Amino acid, compound, organic acid X
mRNA X
Nucleotide, nucleoside X
Protein, macromolecule X X
2 Binding Cofactor, coenzyme, vitamin, heme, ion X
Nucleotide, nucleic acid binding X
RNA binding X
Protein binding X X
3 Cellular catabolic process X
4 Catalytic, oxidoreductase activity X X
5 Oxidative phosphorylation X
6 Transmembrane transporter activity X
7 Protein-RNA complex assembly X
8 RNA splicing, processing X
9 Gene expression X X X
10 Translation activity X X
11 Biosynthetic process X
12 Structural molecule activity X
*: Details are listed in functional characterization in Additional File 3.
Nguyen et al. BMC Bioinformatics 2010, 11:515http://www.biomedcentral.com/1471-2105/11/515
Page 8 of 19
robust the approach is. Therefore, by taking the averageof the co-expression levels between two genes acrossmultiple datasets, our proposed approach provides morerobust results.
Acute vs. Chronic CS administrationFor the analysis of corticosteroid administration, the pre-processing step (Figure 1) is performed to provide corre-sponding mapped datasets. The datasets are first filteredfor differentially expressed probesets using ANOVA tech-nique (p-value < 0.05) implemented in R [74] and also cus-tomized by our previous work for easy uses [46]. 2,920probesets in the acute and 4,361 probesets in the chronicare selected for further analysis. To obtain the commonset of genes across two conditions, these probesets are
mapped into sets of genes based on the correspondingplatform information. 2,920 differentially expressed probe-sets in the acute are mapped into a set of 2,340 genes and4,361 probesets in the chronic are mapped into anotherset of 4,076 genes. The intersection of these two gene-setsyields 967 genes in common for both dosing regimens.From this common gene set, the re-mapping process sub-sequently returns a corresponding set of 1,314 probesetsfor the acute and a set of 1,112 probesets for the chronicdata. All datasets (including synthetic data) are pre-pro-cessed with the model in our previous study to estimatethe ‘true’ expression profiles that are integrated withpotential information in replicates instead of simply takingthe average expression profiles [73]. The suggestive num-ber of clusters nc* for both datasets is 7.
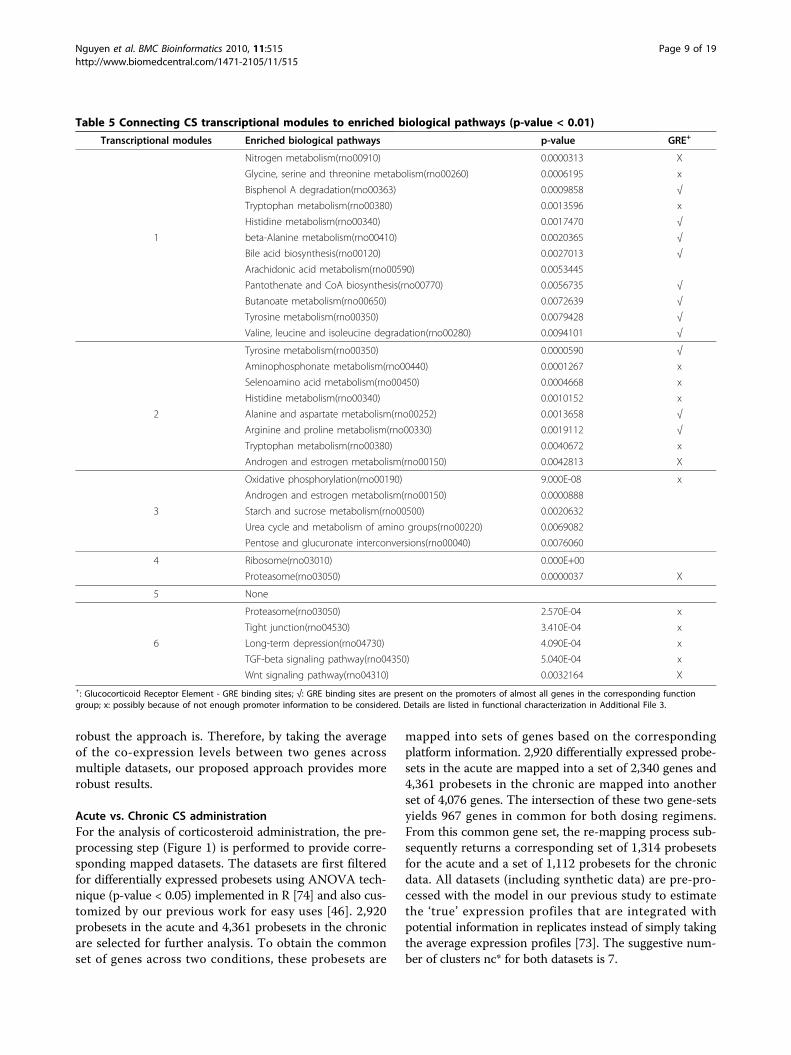
Table 5 Connecting CS transcriptional modules to enriched biological pathways (p-value < 0.01)
Transcriptional modules Enriched biological pathways p-value GRE+
Nitrogen metabolism(rno00910) 0.0000313 X
Glycine, serine and threonine metabolism(rno00260) 0.0006195 x
Bisphenol A degradation(rno00363) 0.0009858 √
Tryptophan metabolism(rno00380) 0.0013596 x
Histidine metabolism(rno00340) 0.0017470 √
1 beta-Alanine metabolism(rno00410) 0.0020365 √
Bile acid biosynthesis(rno00120) 0.0027013 √
Arachidonic acid metabolism(rno00590) 0.0053445
Pantothenate and CoA biosynthesis(rno00770) 0.0056735 √
Butanoate metabolism(rno00650) 0.0072639 √
Tyrosine metabolism(rno00350) 0.0079428 √
Valine, leucine and isoleucine degradation(rno00280) 0.0094101 √
Tyrosine metabolism(rno00350) 0.0000590 √
Aminophosphonate metabolism(rno00440) 0.0001267 x
Selenoamino acid metabolism(rno00450) 0.0004668 x
Histidine metabolism(rno00340) 0.0010152 x
2 Alanine and aspartate metabolism(rno00252) 0.0013658 √
Arginine and proline metabolism(rno00330) 0.0019112 √
Tryptophan metabolism(rno00380) 0.0040672 x
Androgen and estrogen metabolism(rno00150) 0.0042813 X
Oxidative phosphorylation(rno00190) 9.000E-08 x
Androgen and estrogen metabolism(rno00150) 0.0000888
3 Starch and sucrose metabolism(rno00500) 0.0020632
Urea cycle and metabolism of amino groups(rno00220) 0.0069082
Pentose and glucuronate interconversions(rno00040) 0.0076060
4 Ribosome(rno03010) 0.000E+00
Proteasome(rno03050) 0.0000037 X
5 None
Proteasome(rno03050) 2.570E-04 x
Tight junction(rno04530) 3.410E-04 x
6 Long-term depression(rno04730) 4.090E-04 x
TGF-beta signaling pathway(rno04350) 5.040E-04 x
Wnt signaling pathway(rno04310) 0.0032164 X+: Glucocorticoid Receptor Element - GRE binding sites; √: GRE binding sites are present on the promoters of almost all genes in the corresponding functiongroup; x: possibly because of not enough promoter information to be considered. Details are listed in functional characterization in Additional File 3.
Nguyen et al. BMC Bioinformatics 2010, 11:515http://www.biomedcentral.com/1471-2105/11/515
Page 9 of 19
Subsequently, we apply the proposed approach withthe merging option to the intersection set of 967 genesthat are affected by corticosteroid administration acrossthe two dosing regimens. We obtain 6 significant clus-ters with 315 genes in total. These clusters are hypothe-sized to be transcriptional modules which sharecommon regulatory mechanisms since they consist ofgenes that exhibit similar expression patterns in bothacute and chronic dosing regimen. Table 3 shows thedistribution of these 315 genes over six modules andalso briefly describes how the pattern of expressionchanges. Although genes may exhibit simple or complexpatterns of expression during corticosteroid administra-tion, we crudely classify those patterns into up- ordown- with one or two phases of regulation.A detailed description for patterns of these transcrip-
tional modules is shown in Figure 6 with the averageexpression patterns of all probesets clustered in each mod-ule following acute and chronic dosing. In brief, transcrip-tional module 1 (97 genes) is characterized by one-phase
regulation in acute but two phases in chronic dosing.Genes in this module exhibited a fast and robust declinein mRNA, which reached its peak between 4 h and 8 h,and returned to the baseline after about 18 h. However,when MPL is infused (chronic dosing) this set of genesshows a more complex pattern involving both enhancedand suppressed regulation. Although a strong down regu-lation is observed at the beginning, it is subsequently fol-lowed by a sharp induction with the maximum around 36h and then gradually returned to the baseline indicatingsome kind of possible tolerance. The second transcrip-tional module (45 genes) shows a similar pattern ofexpression in both acute and chronic regimen with twophases of regulation. Genes in this module exhibit an earlyup-regulation and reached their corresponding peaks ataround 4 h in the acute and 10 h in the chronic. Subse-quently, both profiles denote a clear down-regulation(around 18 h in acute and 24 h in chronic) and possibleslight fluctuation before returning to base line. An inter-esting dynamics is observed in the 34 genes of transcrip-tional module 3. In the acute dosing, the genes in thismodule clearly exhibit an expression pattern with twophases of regulation (down-up-down). Yet, in chronicadministration they exhibited an early transient decline inmRNA followed by robust, sustained, up-regulation.Similar to module 2 is the transcriptional dynamics
exhibited by transcriptional module 4 (71 genes) charac-terized by an early induction with a maximum at 5.5 h inthe acute and 18 h in the chronic. A typical pattern withdown regulation for both acute and chronic administrationis illustrated by transcriptional module 5 (14 genes). How-ever, genes in the acute regimen exhibited a fluctuatedrepression with a maximum at around 8 h and then fol-lowed by an induction to return to the baseline as late as72 h. Meanwhile, genes in the chronic regimen character-ized a pattern with a slightly transient up-regulation fol-lowed by a sustained down-regulation and eventualconvergence to a new steady state in the presence of thedrug. The last transcriptional module (54 genes) has asimilar acute pattern of expression with two phases of reg-ulation as that of module 2. However, in the chronic regi-men after falling to a value below the baseline (~24 h) thisset of genes was further sustained a slight suppression.While comparing these expression patterns, we
observe that modules 2, 4, and 6 have similar expres-sion patterns in acute (2 & 6) or chronic (2 & 4) with aslight difference in the other dosing regimen (e.g. 2 & 6in chronic, 2 & 4 in acute). Although the difference isnot large enough to be intuitively recognized, the mer-ging process could not merge them together, implyingthat the difference is significant. Furthermore, theseparation of these expression patterns is also reinforcedwith different functional characteristics which will beillustrated below. In summary, selected transcriptional
Figure 1 The flowchart of the approach. The pre-processingsection refers to filtering for differentially expressed probesets ineach dataset, mapping to gene symbols to extract a set of commongenes that are present across all datasets, and then re-mapping tocorresponding probesets in each particular dataset. The main stepsinclude establishing the AM to characterize how much confidencetwo probesets (and two genes) are co-expressed in each condition(and then across all conditions) and searching for all possibleclusters of co-expressed genes based on the common AM. Thepost-processing step will select those clusters that are significantand optionally merge those with similar expression patterns ifindicated.
Nguyen et al. BMC Bioinformatics 2010, 11:515http://www.biomedcentral.com/1471-2105/11/515
Page 10 of 19
modules exhibit a number of typical expression patternsunder corticosteroid administration. The pattern can besimply expressed as an up- or down- regulation or as amore complex one with two phases of regulation plussome fluctuation (see expression patterns in AdditionalFile 2).
Putative transcriptional regulators of criticaltranscriptional modulesIt has been widely accepted that after corticosteroids bindto cytosolic glucocorticoid receptors (GR), the activatedsteroid-receptor complex is rapidly translocated into thenucleus where it can alter the expression of target genes.
Figure 2 An example of the primary clustering results (left) and the agreement matrix. The left is the summary results of running mclustering times (m = 4 in this example, represented by M1...M4) with nc* = 3 initial clusters on N objects (N = 7, represented by x, y, z...). The rightshows the corresponding agreement matrix whose entry Mxy is the probability that two corresponding objects are clustered together by M1,...,M4.
Figure 3 The integrating clustering and selection procedure. The left panel depicts a pseudo-code description of the algorithmic procedure.The right panel illustrates an example of the process. At iteration 1, the algorithm selects a ‘clusterable’ subset of genes including (x, z, t, v) thatresults in two clusters (x, z, v) and (t). The remained AM consists of corresponding rows and columns of genes (y, u, w) from the original AM. Atiteration 2, the procedure selects (y, u) and the remained AM now contains only one gene (w); at that point, the process terminates.
Nguyen et al. BMC Bioinformatics 2010, 11:515http://www.biomedcentral.com/1471-2105/11/515
Page 11 of 19
However, the drug seems to be cleared within about 6 hfollowing a bolus injection, suggesting that the mRNAlevels of CS-target genes will return to the base line afterthat [11]. In the contrast, the drug will reach and remainto a stable steady state after 6 h in the chronic administra-tion. Yet, the GR is greatly diminished in response to cor-ticosteroids [14,15,19,20], suggesting that the mRNA levelsof CS-target genes in the chronic regimen should alsoreturn to the base line. This mechanism is correspondingto the first-phase regulation of target genes. However,almost all chronic patterns involve two phases of regula-tion and some (module 3 & 5) are only half-phase patternsi.e. persistent up or down without returning to the base-line. These complexities in expression patterns of CS-
target genes can be explained by a number of possibilitiesprevious studies have shown [11,12], including multipleGR isoforms, multiple GREs with different affinities to thedrug receptor complex, or some other receptors that canmediate the effect of corticosteroids and thus affectedgenes in this case can reach a new steady state in the pre-sence of the drug (e.g. module 3 & 5).However, another possibility is a mechanism that
results in the regulation of secondary biosignals whichtranscription factors are the most potential factors. Afteraffected by corticosteroids, they in turn further modu-late the expression of glucocorticoid-regulated genes asa continuing cascade of events that were initiated by thedrug. As a result, this possibility suggests a possible
Figure 4 Estimating the cluster significance threshold given a user-defined p-value. An illustrating example is shown in which nr = 5random data are generated, the data are subsequently clustered according the proposed clustering/selection procedure and cluster significancedistribution are depicted in (a) and (b) following sorting. The corresponding p-value for each cluster significance cs is estimated and depicted in(c). Thus, given a p-value, we can infer the corresponding cluster significance threshold. For example, for a p-value = 0.05, all clusters with clustersignificance ≥ 10 are selected and if p-value = 0.1, all clusters with cluster significance ≥ 8 are considered as significant clusters.
Figure 5 Identification of promoter conserved regions and common physical TFBSs. (a) Estimation of conserved regions on a singlepromoter (the red one) based on Dialign’s alignment scores from a set of orthologous promoters. (b) Finding common physical TFBSsaccounting for the case that genes may have multiple alternative promoters. TFBSs present on the conserved regions of any alternativepromoter of a gene are also considered as putative TFBSs for that gene.
Nguyen et al. BMC Bioinformatics 2010, 11:515http://www.biomedcentral.com/1471-2105/11/515
Page 12 of 19
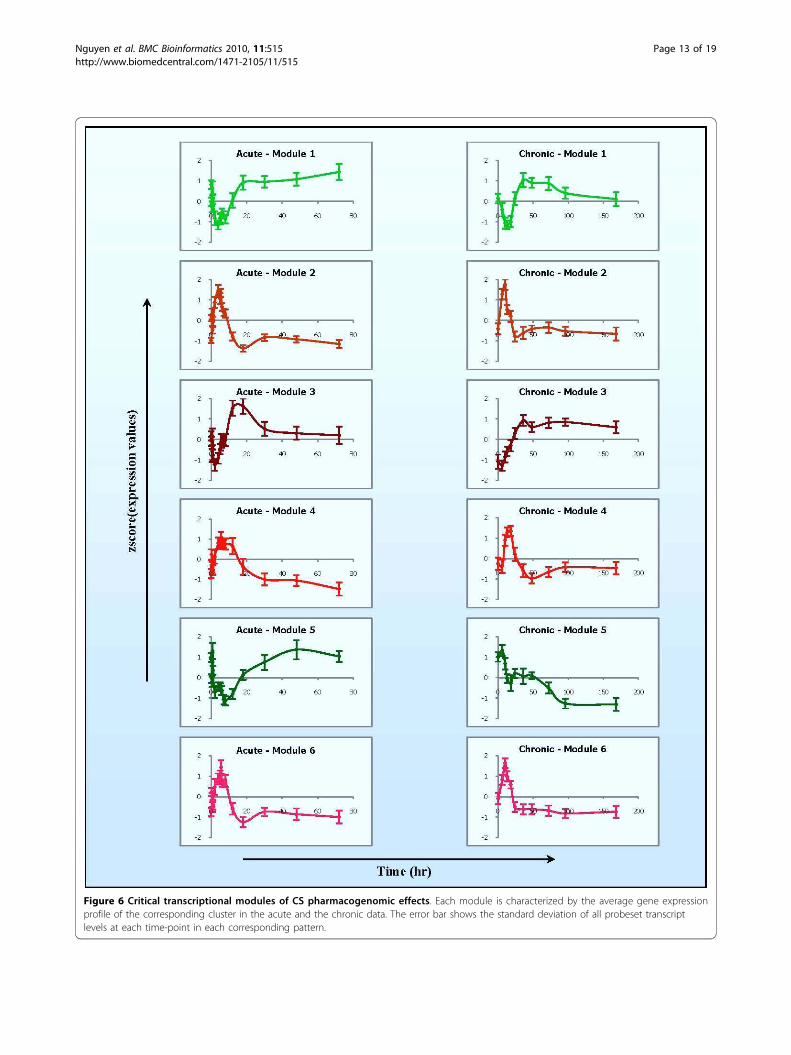
Figure 6 Critical transcriptional modules of CS pharmacogenomic effects. Each module is characterized by the average gene expressionprofile of the corresponding cluster in the acute and the chronic data. The error bar shows the standard deviation of all probeset transcriptlevels at each time-point in each corresponding pattern.
Nguyen et al. BMC Bioinformatics 2010, 11:515http://www.biomedcentral.com/1471-2105/11/515
Page 13 of 19
interpretation of the complexities in expression changesof multiple CS-target genes with the second phase ofregulation (e.g. module 1, 2, 4, and 6). In order to revealsome underlying regulatory mechanism of these selectedtranscriptional modules, we start analyzing the promoterregions of genes to search for significant putative tran-scriptional regulators as well as possible relationshipsof regulation. The hypothesis we explore here is that iftwo or more genes have similar temporal profiles inresponse to multiple dosing regimens, they are morelikely to share some common regulatory mechanisms.For the 315 genes in six transcriptional modules, we
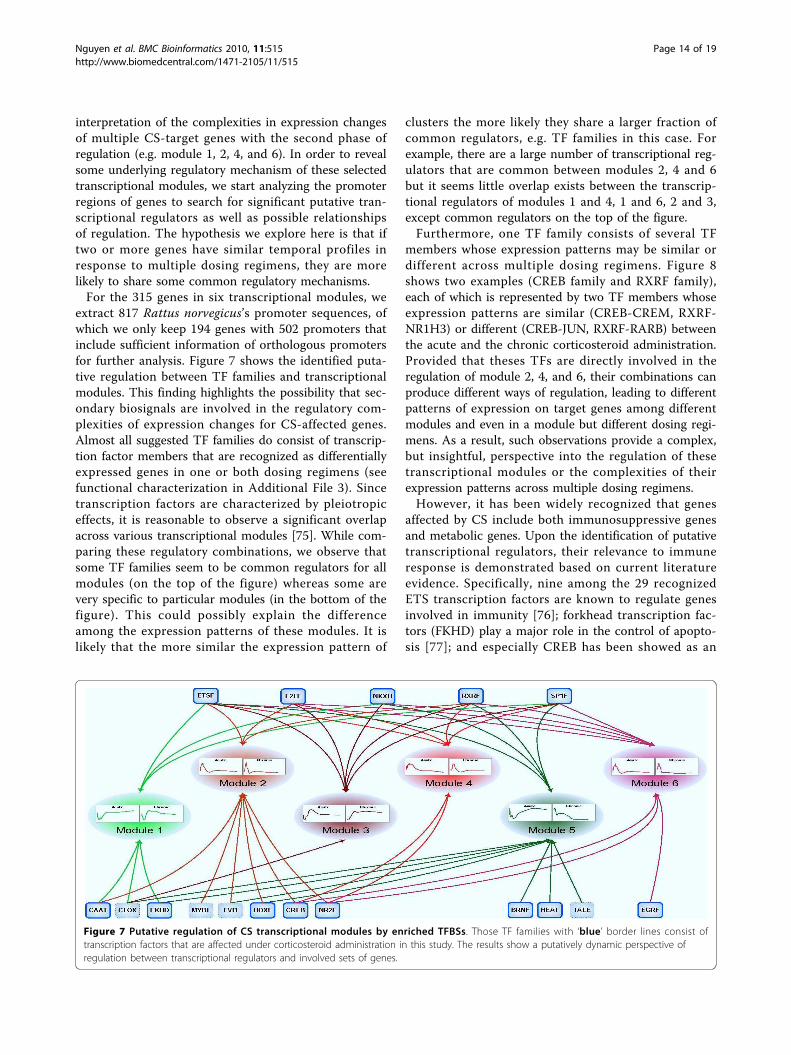
extract 817 Rattus norvegicus’s promoter sequences, ofwhich we only keep 194 genes with 502 promoters thatinclude sufficient information of orthologous promotersfor further analysis. Figure 7 shows the identified puta-tive regulation between TF families and transcriptionalmodules. This finding highlights the possibility that sec-ondary biosignals are involved in the regulatory com-plexities of expression changes for CS-affected genes.Almost all suggested TF families do consist of transcrip-tion factor members that are recognized as differentiallyexpressed genes in one or both dosing regimens (seefunctional characterization in Additional File 3). Sincetranscription factors are characterized by pleiotropiceffects, it is reasonable to observe a significant overlapacross various transcriptional modules [75]. While com-paring these regulatory combinations, we observe thatsome TF families seem to be common regulators for allmodules (on the top of the figure) whereas some arevery specific to particular modules (in the bottom of thefigure). This could possibly explain the differenceamong the expression patterns of these modules. It islikely that the more similar the expression pattern of
clusters the more likely they share a larger fraction ofcommon regulators, e.g. TF families in this case. Forexample, there are a large number of transcriptional reg-ulators that are common between modules 2, 4 and 6but it seems little overlap exists between the transcrip-tional regulators of modules 1 and 4, 1 and 6, 2 and 3,except common regulators on the top of the figure.Furthermore, one TF family consists of several TF
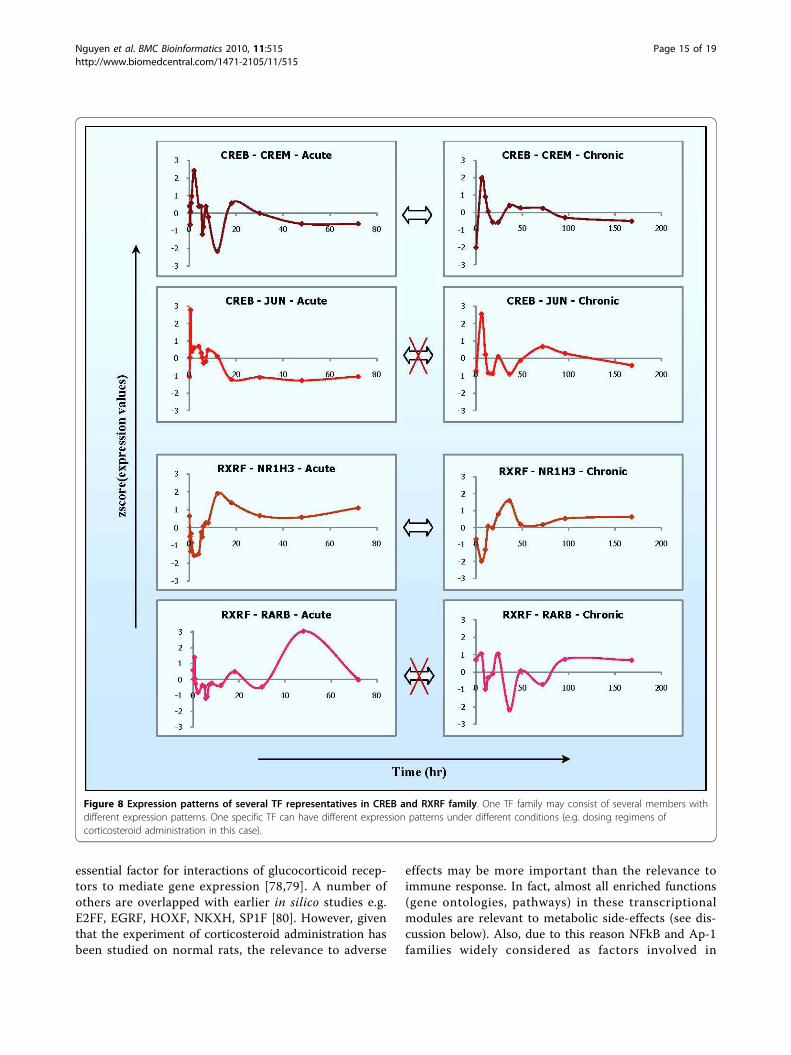
members whose expression patterns may be similar ordifferent across multiple dosing regimens. Figure 8shows two examples (CREB family and RXRF family),each of which is represented by two TF members whoseexpression patterns are similar (CREB-CREM, RXRF-NR1H3) or different (CREB-JUN, RXRF-RARB) betweenthe acute and the chronic corticosteroid administration.Provided that theses TFs are directly involved in theregulation of module 2, 4, and 6, their combinations canproduce different ways of regulation, leading to differentpatterns of expression on target genes among differentmodules and even in a module but different dosing regi-mens. As a result, such observations provide a complex,but insightful, perspective into the regulation of thesetranscriptional modules or the complexities of theirexpression patterns across multiple dosing regimens.However, it has been widely recognized that genes
affected by CS include both immunosuppressive genesand metabolic genes. Upon the identification of putativetranscriptional regulators, their relevance to immuneresponse is demonstrated based on current literatureevidence. Specifically, nine among the 29 recognizedETS transcription factors are known to regulate genesinvolved in immunity [76]; forkhead transcription fac-tors (FKHD) play a major role in the control of apopto-sis [77]; and especially CREB has been showed as an
Figure 7 Putative regulation of CS transcriptional modules by enriched TFBSs. Those TF families with ‘blue’ border lines consist oftranscription factors that are affected under corticosteroid administration in this study. The results show a putatively dynamic perspective ofregulation between transcriptional regulators and involved sets of genes.
Nguyen et al. BMC Bioinformatics 2010, 11:515http://www.biomedcentral.com/1471-2105/11/515
Page 14 of 19
essential factor for interactions of glucocorticoid recep-tors to mediate gene expression [78,79]. A number ofothers are overlapped with earlier in silico studies e.g.E2FF, EGRF, HOXF, NKXH, SP1F [80]. However, giventhat the experiment of corticosteroid administration hasbeen studied on normal rats, the relevance to adverse
effects may be more important than the relevance toimmune response. In fact, almost all enriched functions(gene ontologies, pathways) in these transcriptionalmodules are relevant to metabolic side-effects (see dis-cussion below). Also, due to this reason NFkB and Ap-1families widely considered as factors involved in
Figure 8 Expression patterns of several TF representatives in CREB and RXRF family. One TF family may consist of several members withdifferent expression patterns. One specific TF can have different expression patterns under different conditions (e.g. dosing regimens ofcorticosteroid administration in this case).
Nguyen et al. BMC Bioinformatics 2010, 11:515http://www.biomedcentral.com/1471-2105/11/515
Page 15 of 19
inflammation are not present as direct transcriptionalregulators for these sets of genes. Furthermore, we iden-tify a number of transcriptional regulators known to becritical factors in metabolic syndrome including obesity,dyslipidemia, hypertension, insulin resistance, etc. e.g.RXRF [81], FKHD [82], SP1F [83]. For instance, thedeletion of RXR in mouse liver results in abnormalitiesof all metabolic pathways regulated by retinoid X recep-tors heterodimers [84]; FoxOs, members of FKHDfamily, are able to increase hepatic glucose production,decrease insulin secretion, and affect glucose or lipidmetabolism [82].
Functional characterization of critical transcriptionalmodulesSince selected transcriptional modules consist of sets ofgenes that are coexpressed across all dosing regimens,we hypothesize that these genes are more likely involvedin critical functions following the drug treatment. Con-sequently, we search for enriched functions in thesemodules to explore the functional effects of corticoster-oids on target genes as well as evaluate the importanceof the selected modules. Using ArrayTrack [85], we firstidentify the gene ontology terms (GO) that are signifi-cant in each transcriptional module (p-value < 0.0001,at least 5 genes). We then classify them into super-cate-gories (so-called main functions) based on the branch ofmolecular function and biological process in the GOtree. Table 4 lists the distribution of main functionsacross selected transcriptional modules. In general, allmodules are involved in metabolic processes and bind-ing category (except module 5 since it is too small toinclude significant GO terms). Some modules seem toshare almost all main functions e.g. module 2, 4 and 6whereas others seem to share less e.g. module 2 and 3,3 and 4, or 3 and 6. However, they are shown to havedifferent roles with specific functions in those maincategories. For example although module 2 and 4 areinvolved in metabolic processes and binding, module 2is associated with RNAs and nucleotides whereasmodule 4 is specialized in proteins and macro-mole-cules. These functional differences (coupled with path-way analysis in Table 5) can be linked to thesimilarities/differences in their corresponding expressionpatterns, strengthening the phenomenon that they areclassified as distinct transcriptional modules althoughtheir expression patterns are not intuitively separated.However, the most important conclusion drawn fromthis analysis is that all these transcriptional modulesconsist of components that participate in metabolic pro-cesses, implying that they include genes that experiencemetabolic effects under corticosteroid administration.Using ArrayTrack, we also searched for enriched path-
ways in these transcriptional modules (p-value < 0.01).
A large proportion of significant pathways selected ineach module are metabolic pathways of amino acidmetabolism or biosynthesis, providing another supportthat selected transcriptional modules are critical andable to capture metabolic side effects for further analy-sis. Table 5 shows significant pathways in each tran-scription module.It is generally accepted that expression levels of many
CS-affected genes are mediated through the bindingmotifs, called GREs - glucocorticoid response elements,on their control regions. We thus examine the presenceof this binding site on the promoter of genes in each ofthe enriched pathways in order to assess the possibleeffect of GRE of metabolic functions. However, suchGREs are short (5-9 bp) and fairly degenerate, leading tomatches occurring by chance alone thus not implyingany kind of functionality. In order to address this issue,after extracting gene promoters from the Genomatixdatabase we identified conserved regions across sets oforthologous promoters. As a result, those matcheslocated on these conserved regions would be more reli-able estimates of functional binding sites.Although it is currently believed that GREs are com-
posed of two hexamers with a three-nucleotide random-hinge region in between, the general consensus is thattowards one hexamer, namely TGTTCT [10]. We there-fore search for this motif on conserved promoter regionsacross orthologous promoters of the selected genes. Theresults are shown in Table 5 and detailed information isprovided in additional files in functional characterizationin Additional File 3. In general, almost all metabolic path-ways contain genes with the GRE binding sites, implyingthat these genes are more likely to be directly regulated bythe complex between corticosteroids and glucocorticoidreceptors. Additionally, we also examine how frequentlythe GRE binding sites are present on the control regionsof all selected genes (315 genes). Furthermore, we deter-mined that given a background set of 2,000 randomlyselected genes, the frequency of GREs in a set of genes issimilar to that in the random set (~20%), implying thatnot all genes in those modules are directly regulated bythe drug and that the presence of GRE binding sites onthe control regions of genes in enriched pathways is verysignificant and not random.
ConclusionsIn summary, we have proposed a systematic computa-tional approach that can identify critical transcriptionalmodules coupled with their common regulatory controlsunder the CS administration. The approach provides aframework to handle challenging issues related to differ-ent platforms, time-grids, genes with multiple probesets,and also different tissues if applicable. Even if the data-sets across multiple conditions are present on the same
Nguyen et al. BMC Bioinformatics 2010, 11:515http://www.biomedcentral.com/1471-2105/11/515
Page 16 of 19
platform, time-grid and tissue, the approach is still use-ful since genes contain multiple probesets and estima-tion of a single gene profile by taking the average acrossthese probesets may lose some useful information. How-ever, the analysis may be limited due to the small com-mon set of genes across different platforms.The computational effectiveness of the approach has
been demonstrated on synthetic data. When applying toreal time-series datasets, the approach not only yieldscritical transcriptional modules but also provides aninsight into the complexities of regulation of expressionpatterns. These complexities are further analyzed bytechniques in promoter analysis and functional analysisto deduce useful information of transcriptional regula-tors and enriched metabolic pathways, providing a bet-ter understanding towards regulatory mechanisms andadverse pharmacogenomic effects of corticosteroids.
Additional material
Additional file 1: Provide links to sources of synthetic datasets usedin this study.
Additional file 2: Provide detailed results of six significanttranscriptional modules, including gene ids, cluster ids, probesetids and corresponding ‘true’ expression profiles of identifiedprobesets in response to acute and chronic corticosteroidadministration respectively.
Additional file 3: Provide detailed results of functional analysis,including gene ontology, pathway enrichment, binding information,and corresponding expression profiles of transcription factorsfound in the study.
AcknowledgementsTTN and IPA acknowledge financial support from the NIH under grantGM082974 and the EPA under grant GAD R 832721-010. RRA, DCD and WJJacknowledge financial support from the NIH under grant GM 2421.
Author details1BioMaPS Institute for Quantitative Biology, Rutgers University, Piscataway,New Jersey, USA. 2Biomedical Engineering Department, Rutgers University,Piscataway, New Jersey, USA. 3Chemical & Biochemical EngineeringDepartment, Rutgers University, Piscataway, New Jersey, USA. 4Departmentof Pharmaceutical Sciences, State University of New York at Buffalo, Buffalo,New York, USA. 5Department of Biological Sciences, State University of NewYork at Buffalo, Buffalo, New York, USA. 6New York State Center of Excellencein Bioinformatics and Life Sciences, Buffalo, New York, USA.
Authors’ contributionsTTN designed the algorithms and experiments, devised and implementedthe algorithms. RRA, DCD and WJJ reviewed the material and contributed tothe discussion. IPA organized the activities and structured the approach. Allauthors read and approved the final manuscript.
Received: 4 February 2010 Accepted: 14 October 2010Published: 14 October 2010
References1. Rhen T, Cidlowski JA: Antiinflammatory action of glucocorticoids–new
mechanisms for old drugs. N Engl J Med 2005, 353(16):1711-1723.2. Barnes PJ: Corticosteroid effects on cell signalling. Eur Respir J 2006,
27(2):413-426.
3. Baxter JD: Advances in glucocorticoid therapy. Adv Intern Med 2000,45:317-349.
4. Bialas MC, Routledge PA: Adverse effects of corticosteroids. Adverse DrugReact Toxicol Rev 1998, 17(4):227-235.
5. Frauman AG: An overview of the adverse reactions to adrenalcorticosteroids. Adverse Drug React Toxicol Rev 1996, 15(4):203-206.
6. Schacke H, Docke WD, Asadullah K: Mechanisms involved in the sideeffects of glucocorticoids. Pharmacol Ther 2002, 96(1):23-43.
7. Locsey L, Asztalos L, Kincses Z, Gyorfi F, Berczi C: Dyslipidaemia andhyperlipidaemia following renal transplantation. Int Urol Nephrol 1996,28(3):419-430.
8. Almon RR, Dubois DC, Jin JY, Jusko WJ: Pharmacogenomic responses ofrat liver to methylprednisolone: an approach to mining a rich microarraytime series. Aaps J 2005, 7(1):E156-194.
9. Almon RR, DuBois DC, Piel WH, Jusko WJ: The genomic response ofskeletal muscle to methylprednisolone using microarrays: tailoring datamining to the structure of the pharmacogenomic time series.Pharmacogenomics 2004, 5(5):525-552.
10. Almon RR, Lai W, DuBois DC, Jusko WJ: Corticosteroid-regulated genes inrat kidney: mining time series array data. Am J Physiol Endocrinol Metab2005, 289(5):E870-882.
11. Almon RR, DuBois DC, Jusko WJ: A microarray analysis of the temporalresponse of liver to methylprednisolone: a comparative analysis of twodosing regimens. Endocrinology 2007, 148(5):2209-2225.
12. Almon RR, DuBois DC, Yao Z, Hoffman EP, Ghimbovschi S, Jusko WJ:Microarray analysis of the temporal response of skeletal muscle tomethylprednisolone: comparative analysis of two dosing regimens.Physiol Genomics 2007, 30(3):282-299.
13. Yao Z, Hoffman EP, Ghimbovschi S, Dubois DC, Almon RR, Jusko WJ:Mathematical modeling of corticosteroid pharmacogenomics in ratmuscle following acute and chronic methylprednisolone dosing. MolPharm 2008, 5(2):328-339.
14. Ramakrishnan R, DuBois DC, Almon RR, Pyszczynski NA, Jusko WJ:Pharmacodynamics and pharmacogenomics of methylprednisoloneduring 7-day infusions in rats. J Pharmacol Exp Ther 2002, 300(1):245-256.
15. Sun YN, DuBois DC, Almon RR, Jusko WJ: Fourth-generation model forcorticosteroid pharmacodynamics: a model for methylprednisoloneeffects on receptor/gene-mediated glucocorticoid receptor down-regulation and tyrosine aminotransferase induction in rat liver. JPharmacokinet Biopharm 1998, 26(3):289-317.
16. Dong Y, Poellinger L, Gustafsson JA, Okret S: Regulation of glucocorticoidreceptor expression: evidence for transcriptional and posttranslationalmechanisms. Mol Endocrinol 1988, 2(12):1256-1264.
17. Oakley RH, Cidlowski JA: Homologous down regulation of theglucocorticoid receptor: the molecular machinery. Crit Rev Eukaryot GeneExpr 1993, 3(2):63-88.
18. Vedeckis WV, Ali M, Allen HR: Regulation of glucocorticoid receptorprotein and mRNA levels. Cancer Res 1989, 49(8):2295s-2302s.
19. Almon RR, DuBois DC, Brandenburg EH, Shi W, Zhang S, Straubinger RM,Jusko WJ: Pharmacodynamics and pharmacogenomics of diversereceptor-mediated effects of methylprednisolone in rats usingmicroarray analysis. J Pharmacokinet Pharmacodyn 2002, 29(2):103-129.
20. Sun YN, DuBois DC, Almon RR, Pyszczynski NA, Jusko WJ: Dose-dependence and repeated-dose studies for receptor/gene-mediatedpharmacodynamics of methylprednisolone on glucocorticoid receptordown-regulation and tyrosine aminotransferase induction in rat liver. JPharmacokinet Biopharm 1998, 26(6):619-648.
21. Morand EF, Leech M: Glucocorticoid regulation of inflammation: the plotthickens. Inflamm Res 1999, 48(11):557-560.
22. Andrews RC, Walker BR: Glucocorticoids and insulin resistance: oldhormones, new targets. Clin Sci (Lond) 1999, 96(5):513-523.
23. Jin JY, Almon RR, DuBois DC, Jusko WJ: Modeling of corticosteroidpharmacogenomics in rat liver using gene microarrays. J Pharmacol ExpTher 2003, 307(1):93-109.
24. Hardiman G: Microarray platforms–comparisons and contrasts.Pharmacogenomics 2004, 5(5):487-502.
25. Jarvinen AK, Hautaniemi S, Edgren H, Auvinen P, Saarela J, Kallioniemi OP,Monni O: Are data from different gene expression microarray platformscomparable? Genomics 2004, 83(6):1164-1168.
26. Pedotti P, t Hoen PA, Vreugdenhil E, Schenk GJ, Vossen RH, Ariyurek Y, deHollander M, Kuiper R, van Ommen GJ, den Dunnen JT, et al: Can subtle
Nguyen et al. BMC Bioinformatics 2010, 11:515http://www.biomedcentral.com/1471-2105/11/515
Page 17 of 19
changes in gene expression be consistently detected with differentmicroarray platforms? BMC Genomics 2008, 9:124.
27. Wang J, Coombes KR, Highsmith WE, Keating MJ, Abruzzo LV: Differencesin gene expression between B-cell chronic lymphocytic leukemia andnormal B cells: a meta-analysis of three microarray studies. Bioinformatics2004, 20(17):3166-3178.
28. Morris JS, Yin G, Baggerly KA, Wu C, Zhang L: Pooling information acrossdifferent studies and oligonucleotide microarray chip types to identifyprognostic genes for lung cancer. Methods of Microarray Data Analysis IVNew York: Springer-Verlag 2005, 51-664.
29. Irizarry RA, Warren D, Spencer F, Kim IF, Biswal S, Frank BC, Gabrielson E,Garcia JG, Geoghegan J, Germino G, et al: Multiple-laboratory comparisonof microarray platforms. Nat Methods 2005, 2(5):345-350.
30. Jiang H, Deng Y, Chen HS, Tao L, Sha Q, Chen J, Tsai CJ, Zhang S: Jointanalysis of two microarray gene-expression data sets to select lungadenocarcinoma marker genes. BMC Bioinformatics 2004, 5:81.
31. Kim KY, Ki DH, Jeong HJ, Jeung HC, Chung HC, Rha SY: Novel and simpletransformation algorithm for combining microarray data sets. BMCBioinformatics 2007, 8:218.
32. Park T, Yi SG, Shin YK, Lee S: Combining multiple microarrays in thepresence of controlling variables. Bioinformatics 2006, 22(14):1682-1689.
33. Shabalin AA, Tjelmeland H, Fan C, Perou CM, Nobel AB: Merging twogene-expression studies via cross-platform normalization. Bioinformatics2008, 24(9):1154-1160.
34. Carter SL, Eklund AC, Mecham BH, Kohane IS, Szallasi Z: Redefinition ofAffymetrix probe sets by sequence overlap with cDNA microarrayprobes reduces cross-platform inconsistencies in cancer-associated geneexpression measurements. BMC Bioinformatics 2005, 6:107.
35. Lu J, Lee JC, Salit ML, Cam MC: Transcript-based redefinition of groupedoligonucleotide probe sets using AceView: high-resolution annotationfor microarrays. BMC Bioinformatics 2007, 8:108.
36. Mecham BH, Klus GT, Strovel J, Augustus M, Byrne D, Bozso P, Wetmore DZ,Mariani TJ, Kohane IS, Szallasi Z: Sequence-matched probes produceincreased cross-platform consistency and more reproducible biologicalresults in microarray-based gene expression measurements. Nucleic AcidsRes 2004, 32(9):e74.
37. Morris JS, Wu C, Coombes KR, Baggerly KA, Wang J, Zhang L: Alternativeprobeset definitions for combining microarray data across studies usingdifferent versions of affymetrix oligonucleotide arrays. Meta-Analysis inGenetics New York: Chapman-Hall 2006, 1-214.
38. Kuo WP, Jenssen TK, Butte AJ, Ohno-Machado L, Kohane IS: Analysis ofmatched mRNA measurements from two different microarraytechnologies. Bioinformatics 2002, 18(3):405-412.
39. Ramasamy A, Mondry A, Holmes CC, Altman DG: Key issues in conductinga meta-analysis of gene expression microarray datasets. PLoS Med 2008,5(9):e184.
40. Ghosh D, Barette TR, Rhodes D, Chinnaiyan AM: Statistical issues andmethods for meta-analysis of microarray data: a case study in prostatecancer. Funct Integr Genomics 2003, 3(4):180-188.
41. Choi JK, Yu U, Kim S, Yoo OJ: Combining multiple microarray studies andmodeling interstudy variation. Bioinformatics 2003, 19(Suppl 1):i84-90.
42. Hu P, Greenwood CM, Beyene J: Integrative analysis of multiple geneexpression profiles with quality-adjusted effect size models. BMCBioinformatics 2005, 6:128.
43. Stevens JR, Doerge RW: Combining Affymetrix microarray results. BMCBioinformatics 2005, 6:57.
44. Conlon EM, Song JJ, Liu A: Bayesian meta-analysis models for microarraydata: a comparative study. BMC Bioinformatics 2007, 8:80.
45. Liang Y, Kelemen A: Bayesian models and meta analysis for multipletissue gene expression data following corticosteroid administration. BMCBioinformatics 2008, 9:354.
46. Nguyen TT, Nowakowski RS, Androulakis IP: Unsupervised selection ofhighly coexpressed and noncoexpressed genes using a consensusclustering approach. Omics 2009, 13(3):219-237.
47. Monti STP, Mesirov J, Golub T: Consensus Clustering: A Resampling-BasedMethod for Class Discovery and Visualization of Gene ExpressionMicroarray Data. Mach Learn 2003, 52:91-118.
48. Yan M, Ye K: Determining the number of clusters using the weightedgap statistic. Biometrics 2007, 63(4):1031-1037.
49. Belacel N, Wang Q, Cuperlovic-Culf M: Clustering methods for microarraygene expression data. OMICS 2006, 10(4):507-531.
50. Munneke B, Schlauch KA, Simonsen KL, Beavis WD, Doerge RW: Addingconfidence to gene expression clustering. Genetics 2005,170(4):2003-2011.
51. Strehl A, Ghosh J: Cluster Ensembles A Knowledge Reuse Framework forCombining Multiple Partitions. Journal on Machine Learning Research 2002,3:583-617.
52. Medvedovic M, Yeung KY, Bumgarner RE: Bayesian mixture model basedclustering of replicated microarray data. Bioinformatics 2004,20(8):1222-1232.
53. Yeung KY, Medvedovic M, Bumgarner RE: Clustering gene-expression datawith repeated measurements. Genome Biol 2003, 4(5):R34.
54. Ideker TTV, Ranish JA, Christmas R, Buhler J, Eng JK, Bumgarner RE,Goodlett DR, Aebersold R, Hood L: Integrated genomic and proteomicanalyses of a systemically perturbed metabolic network. Science 2001,292:929-934.
55. Gibbons FD, Roth FP: Judging the quality of gene expression-basedclustering methods using gene annotation. Genome Res 2002,12(10):1574-1581.
56. Dimitriadou E, Hornik K, Leisch F, Meyer D, Weingessel A: e1071: MiscFunctions of the Department of Statistics. R packages 2006.
57. Fraley Raftery A: mclust: Model-Based Clustering/Normal MixtureModeling. R packages 2007.
58. Gentleman RC, Carey VJ, Bates DM, Bolstad B, Dettling M, Dudoit S, Ellis B,Gautier L, Ge Y, Gentry J, et al: Bioconductor: open software developmentfor computational biology and bioinformatics. Genome Biol 2004, 5(10):R80.
59. Ihaka R, Gentleman R: R: A Language for Data Analysis and Graphics. JComp Graphical Statistics 1996, 5(3):299-314 [http://www.R-project.org].
60. Maechler M, Rousseeuw P, Struyf A, Hubert M: cluster: Cluster AnalysisBasics and Extensions. R packages 2005.
61. Yan J: som: Self-Organizing Map. R packages 2004.62. Laderas T, McWeeney S: Consensus framework for exploring microarray
data using multiple clustering methods. Omics 2007, 11(1):116-128.63. Swift S, Tucker A, Vinciotti V, Martin N, Orengo C, Liu X, Kellam P:
Consensus clustering and functional interpretation of gene-expressiondata. Genome Biol 2004, 5(11):R94.
64. Genomatix. [http://www.genomatix.de].65. Doniger SW, Huh J, Fay JC: Identification of functional transcription factor
binding sites using closely related Saccharomyces species. Genome Res2005, 15(5):701-709.
66. Hardison RC: Conserved noncoding sequences are reliable guides toregulatory elements. Trends Genet 2000, 16(9):369-372.
67. Morgenstern B: DIALIGN 2: improvement of the segment-to-segmentapproach to multiple sequence alignment. Bioinformatics 1999,15(3):211-218.
68. Schmollinger M, Nieselt K, Kaufmann M, Morgenstern B: DIALIGN P: fastpair-wise and multiple sequence alignment using parallel processors.BMC Bioinformatics 2004, 5:128.
69. Pollard DA, Bergman CM, Stoye J, Celniker SE, Eisen MB: Benchmarkingtools for the alignment of functional noncoding DNA. BMC Bioinformatics2004, 5:6.
70. Cartharius K, Frech K, Grote K, Klocke B, Haltmeier M, Klingenhoff A,Frisch M, Bayerlein M, Werner T: MatInspector and beyond: promoteranalysis based on transcription factor binding sites. Bioinformatics 2005,21(13):2933-2942.
71. Singer GA, Wu J, Yan P, Plass C, Huang TH, Davuluri RV: Genome-wideanalysis of alternative promoters of human genes using a custompromoter tiling array. BMC Genomics 2008, 9:349.
72. Hubert L, Arabie P: Comparing partitions. J Classification 1985, 2(1):193-218.73. Nguyen TT, Almon RR, DuBois DC, Jusko WJ, Androulakis IP: Importance of
replication in analyzing time-series gene expression data: Corticosteroiddynamics and circadian patterns in rat liver. BMC Bioinformatics 2010,(accepted).
74. Pavlidis P: Using ANOVA for gene selection from microarray studies ofthe nervous system. Methods 2003, 31(4):282-289.
75. Rodriguez-Caso C, Medina MA, Sole RV: Topology, tinkering and evolutionof the human transcription factor network. Febs J 2005,272(24):6423-6434.
76. Gallant S, Gilkeson G: ETS transcription factors and regulation ofimmunity. Arch Immunol Ther Exp (Warsz) 2006, 54(3):149-163.
Nguyen et al. BMC Bioinformatics 2010, 11:515http://www.biomedcentral.com/1471-2105/11/515
Page 18 of 19
77. Coffer PJ, Burgering BM: Forkhead-box transcription factors and their rolein the immune system. Nat Rev Immunol 2004, 4(11):889-899.
78. McKay LI, Cidlowski JA: CBP (CREB binding protein) integrates NF-kappaB(nuclear factor-kappaB) and glucocorticoid receptor physical interactionsand antagonism. Mol Endocrinol 2000, 14(8):1222-1234.
79. Sulser F: The role of CREB and other transcription factors in thepharmacotherapy and etiology of depression. Ann Med 2002,34(5):348-356.
80. Hutton JJ, Jegga AG, Kong S, Gupta A, Ebert C, Williams S, Katz JD,Aronow BJ: Microarray and comparative genomics-based identification ofgenes and gene regulatory regions of the mouse immune system. BMCGenomics 2004, 5(1):82.
81. Shulman AI, Mangelsdorf DJ: Retinoid x receptor heterodimers in themetabolic syndrome. N Engl J Med 2005, 353(6):604-615.
82. Nakae J, Oki M, Cao Y: The FoxO transcription factors and metabolicregulation. FEBS Lett 2008, 582(1):54-67.
83. Solomon SS, Majumdar G, Martinez-Hernandez A, Raghow R: A critical roleof Sp1 transcription factor in regulating gene expression in response toinsulin and other hormones. Life Sci 2008, 83(9-10):305-312.
84. Wan YJ, An D, Cai Y, Repa JJ, Hung-Po Chen T, Flores M, Postic C,Magnuson MA, Chen J, Chien KR, et al: Hepatocyte-specific mutationestablishes retinoid X receptor alpha as a heterodimeric integrator ofmultiple physiological processes in the liver. Mol Cell Biol 2000,20(12):4436-4444.
85. Tong W, Cao X, Harris S, Sun H, Fang H, Fuscoe J, Harris A, Hong H, Xie Q,Perkins R, et al: ArrayTrack–supporting toxicogenomic research at the U.S. Food and Drug Administration National Center for ToxicologicalResearch. Environ Health Perspect 2003, 111(15):1819-1826.
doi:10.1186/1471-2105-11-515Cite this article as: Nguyen et al.: Comparative analysis of acute andchronic corticosteroid pharmacogenomic effects in rat liver:Transcriptional dynamics and regulatory structures. BMC Bioinformatics2010 11:515.
Submit your next manuscript to BioMed Centraland take full advantage of:
• Convenient online submission
• Thorough peer review
• No space constraints or color figure charges
• Immediate publication on acceptance
• Inclusion in PubMed, CAS, Scopus and Google Scholar
• Research which is freely available for redistribution
Submit your manuscript at www.biomedcentral.com/submit
Nguyen et al. BMC Bioinformatics 2010, 11:515http://www.biomedcentral.com/1471-2105/11/515
Page 19 of 19