Community Health
119
Community Health NEEDS ASSESSMENT 2019 VENTURA COUNTY’S
-
Upload
khangminh22 -
Category
Documents
-
view
1 -
download
0
Transcript of Community Health

Community HealthNEEDS ASSESSMENT 2019
VENTURA COUNTY’S

2Ventura County Community Health Needs Assessment 2019
SECTION 1
Executive Summary1.1 Introduction 4
1.2 Summary of Findings 4
1.3 Prioritized Areas 4
SECTION 2
Frameworks Contributing to the Community Health Needs Assessment Process
2.1 The Ideal Healthy Community 5
2.2 Healthy People 2020 6
2.3 County Health Rankings and Roadmaps 6
2.4 Organizational Community Health Needs Assessment Requirements 6
SECTION 3
Introduction3.1 Ventura County Community Health Needs Assessment Collaborative
(VCCHNAC) 7
3.2 Mission 8
3.3 Service Area 8
3.4 Collaborative Structure 8
3.5 Distribution of CHNA report 8
3.6 Priority Health Needs and Impact from Prior CHNA 10
3.7 Evaluation of Progress since Prior CHNA 11
3.8 Consultants 11
3.9 Authors 11
SECTION 4
Profile of Ventura County4.1 Demographic Profile 12
4.1.1 Population 12
4.1.2 Age 13
4.1.3 Race/Ethnicity 13
4.1.4 Language Spoken at Home 14
4.1.5 Education 14
4.1.6 Income 16
4.1.7 Employment 17
4.2 Social Determinants of Health 18
4.2.1 Poverty 18
4.2.2 Food Insecurity 20
4.2.3 Transportation 21
4.2.4 Housing 22
4.3 Crime and Safety 23
4.4 Built Environment Profile 23
4.5 Environmental Profile 24
4.6 Clinical Profile: Hospitalization and Emergency Room Utilization Rates 25
4.7 Life Expectancy in Ventura County, 2015-17 28
4.8 Mortality and Years of Life Lost (Premature Death), 2015-2017 29
4.8.1 Premature Deaths from Cancer 31
4.8.2 Premature Deaths from Coronary Heart Disease 32
4.8.3 Premature Deaths from Accidents (Unintentional Injuries) 33
4.8.4 Drug-Induced Premature Deaths 34
4.8.5 Premature Deaths due to Suicide 34
4.8.6 Average Years of Life Lost per Premature Death 35
SECTION 5
Disparities5.1 SocioNeeds Index 36
5.2 Index of Disparity 36
SECTION 6
Primary Data Collection6.1 Community Survey Key Findings 39
6.2 Key Informant and Focus Group Discussion Findings 44
Barriers to Health Care 44
Inadequate or no insurance coverage 44
Lack of Appointments 45
Lack of Awareness 45
Inadequacy of Culturally Competent Care 45
Bureaucracy 46
Contents

3Ventura County Community Health Needs Assessment 2019
SECTION 7
Data Synthesis and Prioritization7.1 Data Synthesis 47
7.2 Prioritized Significant Health Needs 48
7.2.1 Improve Access to Health Services 49
7.2.2 Reduce the Impact of Behavioral Health Issues 55
7.2.3 Improve Health and Wellness for Older Adults 61
7.2.4 Reduce the Burden of Chronic Disease 64
7.2.5 Address Social Needs 71
7.3 Community Resources to Address Priority Health Issues 74
7.4 Conclusion 74
APPENDIX A. Ventura County’s Impact Report: Evaluation since Prior CHNA 75
APPENDIX B. Methodology 81Secondary Data Methodology: Secondary Data Sources 81
Secondary Data Sources & Analysis 82
Secondary Data Scoring 82
Index of Disparity 82
Data Considerations 82
Race/Ethnic and Special Population Groupings 82
Zip Codes and Zip Code Tabulation Areas 82
Secondary Data Scoring 83
Comparison to a Distribution of County Values: Within State and Nation 83
Comparison to Values: State, National, and Targets 83
Trend over Time 83
Missing Values 83
Indicator Scoring 83
Topic Scoring 83
Data Scoring Results 84
Primary Data Methodology 105
Primary Data Methods & Analysis 105
Community Survey 105
Key Informant Interviews 105
Focus Groups and Focus Group Profiles 105
Ventura County Key Informant Interview Questionnaire 106
Ventura County Focus Group Discussion Questions 106
Community Survey (English) 107
Community Survey (Spanish) 108
APPENDIX C. Prioritization Process 110Prioritization Survey 113
Prioritization Matrix Packet and Instructions 114
APPENDIX D. Community Resources 115Ventura County 115
Ventura County 2-1-1 Resources 115
APPENDIX E: IRS Guidelines for Form 990, Schedule H Compliance 116
References 117
Contents

4Ventura County Community Health Needs Assessment 2019
1.1 Introduction
The Ventura County Community Health Needs Assessment Collaborative (VCCHNAC) is pleased to present its 2019 Community Health Needs Assessment (CHNA). As federally required by the Affordable Care Act, this report provides an overview of the methods and process used to identify and prioritize significant health needs in the Ventura County CHNA Collaborative (VCCHNAC)’s service area. The Ventura County CHNA Collaborative partnered with Conduent Healthy Communities Institute (HCI) to conduct the CHNA. The goal of this report is to offer a meaningful understanding of the most pressing health needs across VCCHNAC’s service area, as well as to guide planning efforts to address those needs. VCCHNAC believes that “health starts long before illness, in our homes, schools and jobs; that all Ventura County residents should have the opportunity to make choices that allow them to live a long, healthy life, regardless of their income, education or ethnic background.” (A New Way to Talk about Social Determinants of Health” RWJF Vulnerable Populations Portfolio, 2010). Special attention has been given to the needs of vulnerable populations, unmet health needs or gaps in services, and input from the community. Findings from this report will be used to identify, develop, and target the Ventura County CHNA Collaborative initiatives to provide and connect residents with resources to improve health outcomes and quality of life in Ventura County.
Executive Summary
1.2 Summary of Findings
The CHNA findings in this report result from the extensive analysis of primary and secondary data sources; over 241 indicators from national and state data sources were included in the second-ary analysis and primary data was collected from community leaders, non-health professionals, community based organizations, community members and populations with unmet health needs and/or populations experiencing health disparities. The main source for the secondary data, or data that has been previously collected by the government and other health agencies to inform health planning, is the Health Matters in Ventura County platform, a publicly available data platform. That platform can be found here: http://www.healthmattersinvc.org/
1.3 Prioritized Areas
To thrive, everyone in the community needs to be given the opportunity to live a long, healthy life, regardless of his or her background or socioeconomic status. The conditions of the physical environment where people live, learn, work and play present a wide range of health risks and outcomes. The VCCHNAC is committed to supporting environments that protect and promote the health and well-being of res-idents equitably.
The CHNA describes barriers to experiencing health and wellness in the community and provides information neces-sary to all levels of stakeholders to build upon each other’s work in a coordinated manner. The VCCHNAC has developed a multi-sectoral partnership with the objective of breaking down siloes in healthcare and identifying intersecting is-sues that impact the county population that all the health agencies in the partnership serve. Based on the results of this assessment, VCCHNAC has categorized the identified priorities into broad cross-cutting issues that not only drive multiple outcomes, but that will offer many opportunities to the partners to address barriers to health and leverage shared resources. With these objectives in mind, the follow-ing five encompassing topics were identified by VCCHNAC as priorities to implement:
• Improve Access to Health Services • Reduce the Impact of Behavioral Health Issues• Improve Health and Wellness for Older Adults • Reduce the Burden of Chronic Disease• Address Social Needs
VCCHNAC has established clear priorities based on the results of this CHNA to improve health outcomes for the residents of Ventura County. VCCHNAC will develop strat-egies to address these priorities through implementation and community health improvement planning beginning in 2019. In collaboration with community stakeholders and residents, VCCHNAC hopes to realize its vision of becoming the healthiest county in the nation by 2030.
Through an examination of the primary and sec-ondary data, the following top health needs were identified:
• Access to Health Services
• Alcoholism• Asthma• Cancer• Diabetes• Drug Abuse
(including prescription drugs)
• Food Insecurity and Poor Nutrition
• Housing and Homelessness
• Lack of Pre-Natal Care and Breastfeeding Support
• Mental Health• Older Adults and
Aging

5Ventura County Community Health Needs Assessment 2019
The Ventura County Community Health Needs Assessment Collaborative (VCCHNAC) assessment process was based upon established public health frameworks that guide goal setting for all stakeholders engaged in the task of building healthy communities. These guiding frameworks are discussed below.
2.1 The Ideal Healthy Community
The World Health Organization defines health as “a complete state of physical, mental and social well-being, and not merely the absence of disease or infirmity.” The VCCHNAC borrows and utilizes this same definition of health, previously adapt-ed and refined by Ventura County Public Health (VCPH) in the 2016 Community Health Assessment (CHA) developed by the department. The model framework of an ideal Healthy Community is outlined in the diagram below and illustrates dynamic interactions between various personal, social and environmental factors in determining an individual’s health as well as the different points of intervention for organizations working in health promotion.
Healthy Community
Healthy Social and Physical Environment
Healthy Families
Population Health
OutcomesQuality of Life
DiseaseDeath
Life Expectancy
A Healthy Community provides for a quality and sustainable environment, adequate levels of economic and social development, health and social equity, social
relationships that are supportive and respectful, and meets the basic needs of everyone across the lifespan.
Ventura County Public Health Model for a Healthy Community
Safe Neighborhoods and Communities
Cultural Norms
Economic Opportunity
Housing Individual/Genetic Risk Factors
Health Behaviors and
Conditions
Quality Preventative and Clinical Care
Mental/Behavioral Health
Health Impact Assessments
Community HealthAssessment
Public Health’s Role in Addressing Social
Determinants:
§ Advocating for and defining public policy to achieve health equity
§ Coordinated interagency efforts
§ Creating organizational environments that enable change
Last Revised 2019
Health in All Policies
CollectiveImpactPublic Health’s Role in
Addressing Social Determinants:
§ Data Collection, monitoring and surveillance
§ Population-based interventions to address health factors
§ Community Engagement and capacity building
Health Equity
Education
Food Security
Media
The VCPH model for a Healthy Community helps to define those social and envi-ronmental conditions as well as public health actions — policies and community resources — that can be taken to begin to address them.
POPULATION HEALTH OUTCOMES – VCPH monitors population health outcomes such as quality of life, risk factors of and numbers of cases of disease, life expectancy, and death to assess the health of families in Ventura County.
HEALTHY FAMILIES – Families need access to quality preventive and health care, including mental and behavioral health services. The health of a family is affected by individual/genetic risk factors as well as health behaviors and conditions, never-theless VCPH realizes that healthy social and physical environments play a greater role for a family in achieving overall health.
HEALTHY SOCIAL AND PHYSICAL ENVIRONMENT – Safe and affordable housing can support occupants throughout their life stages, promote health and safety, and support mental and emotional health. Cultural norms can influence beliefs about health care, behaviors that contribute to food choices, attitudes regarding mental health and values concerning social status. Living in poverty and being unemployed are associated with poor physical and mental health outcomes across all races and ethnicities. Neighborhood characteristics have significant impact on health outcomes because they influence an individual’s ability to adopt behaviors that promote health. People in low income neighborhoods often have less access to affordable, healthy food options, and have more access to cheap fast-food outlets. People with higher levels of educational attainment consistently experience lower risks for a wide array of illnesses and increased life expectancy. Exposure to media, especially among youth, may affect health behaviors such as substance use, sexual activity, and eating habits. VCPH wants to address these social determinants of health by utilizing data to inform policy, engaging community residents and partner organizations, building capacity, and creating organizational environments that enable change to achieve a healthy community.
HEALTHY COMMUNITY – According to the Centers for Disease Control and Pre-vention (CDC), ‘health equity’ is achieved when every person has the opportunity to “attain his or her full health potential” and no one is “disadvantaged from achieving this potential because of social position or other socially determined circumstances.” Per the CDC, health equity is achieved when every person has the opportunity to “attain his or her full health potential” and no one is “disadvantaged from achieving this potential because of social position or other socially determined circumstances.” VCPH is committed to conducting periodic community health assessments and utilizing the Health in All Policies (HiAP) framework to improve the accountability of decision-makers to recognize the health impacts at all levels of policy-making.
Frameworks Contributing to the Community Health Needs Assessment Process

6Ventura County Community Health Needs Assessment 2019
VCPH will collaborate more with existing stakeholders and engage non-traditional stakeholders because it is only through collective impact that we can begin to make changes necessary to improve the health and well-being of residents and make Ventura County a Healthy Community.
To improve population health outcomes, we need to shift the focus from addressing health factors to addressing the social and environmental determinants of health. VCCHNAC reaffirms the model of VCPH and believes that a Healthy Community provides a quality and sustainable environment adequate levels of economic and social development, health and social equity, social relationships that are supportive and respectful, and meets the basic needs of everyone across the lifespan.
2.2 Healthy People 2020
Healthy People 2020 (HP2020) creates a strategic framework that unites health promotion and disease prevention issues under a single umbrella. It provides us with the opportunity to engage a wide variety of stakeholders to achieve the objectives set forth and guides national research, program planning and policy adoption to promote health and prevent disease.
Most importantly, this framework requires tracking of data-driven outcomes to monitor progress and focus our interventions. The fundamental goal of HP 2020 is that we have a society in which all people live long, healthy lives. To achieve this goal, Ventura County must think about how the social environment, physical environment, biology and genetics, access to health services and individual be-havior all play a role in population-based health outcomes. Within this assessment, VCCHNAC is striving to identify population health disparities categorized by race/ethnicity, socioeconomic status, gender, age, disability status, sexual orientation and geographic location.
VCCHNAC will be evaluating and monitoring the Healthy People 2030 topics and objectives as they become available.
2.3 County Health Rankings and Roadmaps
The Population Health Institute from the University of Wisconsin has developed county health rankings by state, including California (University of Wisconsin Popu-lation Health Institute, 2012, 2013, 2014, 2015, 2016, 2017, 2018, and 2019). These
rankings are broken down into two categories: health factors and health outcomes. Health factors (i.e. educational attainment and access to care) and health outcomes (i.e. disease and death) help to measure the current health status of a population.
VCCHNAC, in partnership with VCPH, will work toward making Ventura County the healthiest county in the state and nation by 2030. Per the County Health Rank-ings, in 2019, Ventura County ranked 9th out of 57 counties in California for health outcomes and 18th for health factors. Ventura County has been declining in the health factors ranking for the last few years, and this is largely driven by physical environment indicators such as air pollution particulate matter, housing issues, and transportation. There is still much work to be done to improve overall health and well-being.
2.4 Organizational Community Health Needs Assessment Requirements
Health Assessments have been conducted by health agencies — hospitals, local health departments, and Federally Qualified Health Centers (FQHCs) — for many years individually to guide their work in communities. The Patient Protection and Affordable Care Act (PPACA), tax-exempt 501 (c)(3) requires hospitals to conduct a Community Health Needs Assessment (CHNA) every three years with input from public health experts and community members, and develop and adopt an imple-mentation strategy. At the same time, local health departments that are preparing for the Public Health Accreditation Board (PHAB) process are required to conduct strategic planning, including a Community Health Assessment conducted every five years, and a corresponding Community Health Improvement Plan (CHIP). Section 330 of the Public Health Service Act (42 U.S.C. §254b), the authorizing leg-islation of the Health Resources & Services Administration’s (HRSA) Health Center Program, requires health centers to perform a similar exercise to demonstrate the need for health services, a shortage of personal health services, and commitment to operate where the greatest number of individuals residing in the service area can be reached. These coinciding requirements of health agencies offer an ideal opportunity for hospitals, health centers and health departments to work together in defining priorities and addressing health challenges within the community they share. The opportunity to align goals and combine resources and efforts is what led to the development of the VCCHNAC, which together commissioned the as-sessment defined in this report.
Frameworks Contributing to the Community Health Needs Assessment Process

7Ventura County Community Health Needs Assessment 2019
3.1 Ventura County Community Health Needs Assessment Collaborative (VCCHNAC)
The Ventura County CHNA Collaborative (VCCHNAC) is a formal, charter-bound partnership of seven health agencies that came together in June 2018 to participate in the development of a joint CHNA exercise and report. The agencies that constitute the VCCHNAC are given below:
• Adventist Health Simi Valley
• Camarillo Health Care District
• Clinicas Del Camino Real, Inc.
• Community Memorial Hospital
• Ojai Valley Community Hospital
• St. John’s Regional Medical Center, Dignity Health
• St. John’s Pleasant Valley Hospital, Dignity Health
• Ventura County Health Care Agency Community Health Center
• Ventura County Public Health
FIGURE 1: LOCATION OF VCCHNAC PARTNERS WITHIN VENTURA COUNTY
Source: Google Map on Health Matters in Ventura County
The first collaborative CHNA is documented in this report and will be published every three years or as per Internal Revenue Service (IRS), the Health Resources and Services Administration’s (HRSA) Health Center Compliance Manual, Section 330 of the Public Health Service Act, and Public Health Accreditation Board (PHAB) requirements. The VCCHNAC will work to develop implementation strategies, to be included in each member organization’s individual Community Health Improve-ment Plans (CHIP)/Implementation Strategies (IS), that align with CHNA identified health priorities and focus on achieving health equity. Together, these agencies will support health advocacy, education, prevention, and partnerships that extend the care continuum for medically underserved and vulnerable populations.
Introduction

8Ventura County Community Health Needs Assessment 2019
3.2 Mission
The mission of the VCCHNAC is to enhance partnerships between Ventura County Public Health, area hospitals, healthcare providers, special health care district, and health systems to improve population health outcomes in Ventura County. These partnerships are necessary to accomplish the shared vision of working collabora-tively on a single, comprehensive CHNA that satisfies all reporting requirements and streamlines the assessment process, so resources may be focused on developing strategies for improvement of the identified health priorities. This will result in a collaborative approach to addressing population health and benefit the commu-nities being served.
3.3 Service Area
With the purpose of jointly addressing health challenges of residents and serving communities with impactful solutions that leverage shared resources and coordinate care, the seven health agencies that make up the VCCHNAC have come together in defining their service area as the County of Ventura.
FIGURE 2: ZIP CODE TABULATED AREAS WITHIN VENTURA COUNTY
Source: Health Matters in Ventura County
3.4 Collaborative Structure
The Ventura County Community Health Needs Assessment Collaborative (VCCHNAC) is the decision-making entity for the 2019 Community Health Needs Assessment and is chaired by the Epidemiologist at Ventura County Public Health. Primary representatives for the organizations included in the charter are as follows:
Erin Slack, MPH, Ventura County Public Health — Epidemiologist
Will Garand, Community Memorial Health System — Vice President, Planning & Managed Care
George West, St. John’s Regional Medical Center and St. John’s Pleasant Valley Hospital, Dignity Health System — Service Area Vice President, Mission Integration
Kathryn Stiles, Adventist Health Simi Valley — Director of Community Integration
Matthew Tufte, Ventura County Health Care Agency Community Health Center — Hospital Nurse Manager, Case Management
Rachel Cox, Clinicas Del Camino Real, Inc. — Operations Manager
Sue Tatangelo, Camarillo Health Care District — Chief Resource Officer
3.5 Distribution of CHNA report
To meet the requirements of the IRS regulations 501(r) for charitable hospitals, hospitals are required to make the Community Health Needs Assessment (CHNA) and Implementation Strategy (IS) available publicly through print copies and on the internet. Public comment is also solicited and documented. In keeping with these regulations, the three hospitals that now comprise the VCCHNAC made available their hospital’s previous CHNA and IS to the public via the following websites:
Adventist Health Simi Valley
2016 CHNA:
• https://www.adventisthealth.org/documents/community-benefit/Simi-Valley-2016-Community-Health-Needs-Assessment.pdf
2017 Implementation Plan:
• https://www.adventisthealth.org/documents/simivalley/community-benefit/Final_2017_CHP_SimiValley_Revised_2.pdf
Introduction

9Ventura County Community Health Needs Assessment 2019
Community Memorial Health System
2016 CHNA:
• https://www.cmhshealth.org/wp-content/uploads/2018/03/CHNA_2016.pdf
2017 Implementation Plan:
• http://www.cmhshealth.org/wp-content/uploads/2018/03/CHNA_Implementation_2016.pdf
St. John’s Regional Medical Center and St. John’s Pleasant Valley Hospital, Dignity Health
2016 CHNA:
• https://www.dignityhealth.org/-/media/cm/media/documents/CHNA/CHNA-St-Johns-Regional.ashx?la=en&hash=1FA2BBD89FF21354D547F85ECE7FC58680781BCC
• https://www.dignityhealth.org/-/media/cm/media/documents/CHNA/CHNA-St-Johns-Pleasant-Valley.ashx?la=en
2016 Implementation Plan:
• https://www.dignityhealth.org/-/media/cm/media/documents/Implementation-Strategies/2016-Implementation-St-Johns-Regional.ashx?la=en&hash=4C4968480D44FCADC2EB570551ED031C24F8FCC8
• https://www.dignityhealth.org/-/media/cm/media/documents/Implementation-Strategies/2016-Implementation-St-Johns-Pleasant-Valley.ashx?la=en&hash=55379A7EAF9828303220EBC6FABCAEA17492081E
In fulfillment of public health accreditation requirements Ventura County Public Health also conducted a Community Health Assessment which was followed by the development of a Community Health Improvement Plan. Both documents were made available online.
Ventura County Public Health
2017 Community Health Assessment:
• http://www.healthmattersinvc.org/content/sites/ventura/PH_CHA_Booklet_DIGITAL_4_2017-05-12_2.pdf
2018-2020 Community Health Improvement Plan:
• http://www.healthmattersinvc.org/content/sites/ventura/PH_CHA_Booklet_DIGITAL_4_2017-05-12_2.pdf
Each website allows for members of the community to submit comments via e-mail. Additionally, Dignity Health, which includes St. John’s Regional Medical Center and St. John’s Pleasant Valley Hospital, distributed the 2016 CHNAs to public through community health events, key collaborators and stakeholders, the city councils of Oxnard and Camarillo, the Ventura County Board of Supervisors, the Catholic Bishop of the Archdiocese & Pastoral Region along with other religious leaders in the community, local newspapers, physicians employed by the health system, and to various human services organizations and agencies through the hospital monthly on-site networking meeting.
Adventist Health Simi Valley (AHSV) printed paper copies and distributed to inter-nal departments, outpatient centers and key community stakeholders including board members, and community leaders. The hospital also provided contact information on the system website and on the CHNA back cover for requesting printed copies of the report. Excess reports were made available at the front desk of the hospital, in the marketing department, in the community integration office and some of the outpatient centers. Finally, Adventist Simi Valley distributed copies digitally to all AHSV associates and internal stakeholders including physicians, volunteers, new employees, and key non-profit partners.
All partners made opportunities available to community members to read the report and provide comments. No comments or feedback were received on the preceding CHNAs at the time this report was written.
Introduction

10Ventura County Community Health Needs Assessment 2019
3.6 Priority Health Needs and Impact from Prior CHNA
Given below is a synopsis of the priorities that were earmarked for action by the different health agencies that constitute VCCHNAC.
TABLE 1: PAST PRIORITIES OF VENTURA COUNTY COMMUNITY HEALTH NEEDS ASSESSMENT COLLABORATIVE PARTNERS
PAST PRIORITIZED HEALTH TOPICS VENTURA COUNTY COMMUNITY HEALTH NEEDS ASSESSMENT COLLABORATIVE PARTNERS
Mental Health (Childhood, Adult, and/or Seniors) VCPH CMHS (Ojai) CMHS (West Ventura) St. John’s Regional MedicalSt. John’s Pleasant Valley Hospital
AHSV Clinicas
Cancer/Cancer Screening VCPH CMHS (Ojai) CMHS (West Ventura) St. John’s Regional Medical AHSV Clinicas
Substance Use VCPH CMHS (Ojai) CMHS (West Ventura) AHSV Clinicas
Seniors Access to Care CMHS (Ojai) CMHS (West Ventura) St. John’s Regional MedicalSt. John’s Pleasant Valley Hospital
Clinicas
Education VCPH CMHS (Ojai) CMHS (West Ventura)
Poverty VCPH CMHS (Ojai) CMHS (West Ventura)
Access to Health Care Services CMHS (Ojai) CMHS (West Ventura) St. John’s Regional Medical Clinicas
Chronic Health Conditions (Diabetes, Obesity, Cardiovascular Disease)
CMHS (West Ventura) St. John’s Regional MedicalSt. John’s Pleasant Valley Hospital
AHSV Clinicas
Nutrition CMHS (Ojai) CMHS (West Ventura) St. John’s Pleasant Valley Hospital
Clinicas
Access to Health Insurance VCPH Clinicas
Homeless Health Issues CMHS (West Ventura) St. John’s Regional Medical
Oral Health CMHS (Ojai) CMHS (West Ventura) Clinicas
Increasing Affordable Housing/Safe homes and families
VCPH CMHS (Ojai)
Physical Health/Health and Wellness VCPH St. John’s Regional Medical
Transportation CMHS (Ojai) Clinicas
Decrease Hospitalization during End of Life VCPH
Reduce Preventable Hospitalizations VCPH Clinicas
Maternal Health VCPH
Most of the health topics prioritized in the previous reports relate with the priorities identified for the current CHNA; thus VCCHNAC will be building upon efforts of previous years. A detailed table describing the strategies/action steps and indicators of success for each of the preceding priority health topics can be found in APPENDIX A. Ventura County’s Impact Report: Evaluation since Prior CHNA.
Introduction

11Ventura County Community Health Needs Assessment 2019
3.7 Evaluation of Progress since Prior CHNA
The CHNA process should be viewed as a three-year cycle (Figure 3). An important part of that cycle is revisiting the progress made on priority topics from previous CHNAs. By reviewing the actions taken to address priority areas and evaluating the impact of these actions in the community, an organization can better focus and target its efforts during the next CHNA cycle.
FIGURE 3: CHNA PROCESS
Analyze Data & Community Input
Prioritize Health Needs
CHNA Report & Implementation
StrategyImplement
Evaluate Actions Taken
3 Year Cycle
3.8 Consultants
The Ventura County Community Health Needs Assessment Collaborative (VCCHNAC) commissioned Conduent Healthy Communities Institute (HCI) to conduct its 2019 Community Health Needs Assessment. HCI works with clients across most states in the U.S. to drive improved community health outcomes by assessing needs, developing focused strategies, identifying appropriate intervention programs, establishing progress monitoring systems, and implementing performance evalu-ation processes. Working with diverse clients nationwide has contributed to HCI’s national knowledge base of population health solutions. In addition, by engaging directly with clients and communities through the primary data collection process and final workshops, HCI works on behalf of clients to build trust between and among organizations and their communities.
To learn more about Conduent Healthy Communities Institute, please visit https://www.conduent.com/community-population-health/.
3.9 Authors
Report author from VCCHNAC: Erin Slack, MPH, Ventura County Public Health Epidemiologist
Report authors from Conduent HCI: Anindita Fahad, MPH, MA Ahalya Prakash, MPH
Report Writing Assistance at Conduent HCI: Andrew Juhnke, MPH Zack Flores
Introduction

12Ventura County Community Health Needs Assessment 2019
Located in southern California, Ventura County has a land area of 1,843.1 square miles which encompasses 10 cities, 13 census-designated places, and 15 other unincorporated communities. In 2018, Ventura County’s population had a median age of 37.5 and a median household income of $81,972. In Ventura County, 50.5% of the population is female, 6.0% are below 5 years of age, 23.2% are below 18 years and 15.0% are 65 years and above. Among county residents, 42,012 have veteran status. 38.6% of the people in Ventura County speak a non-English language, and 22.5% are foreign born. The median property value in Ventura County is $520,300 and the homeownership rate is 63.2%. The percent of households with a computer is 90.9% and with a broadband internet subscription is 85.1% (United States Census Bureau, 2018).
4.1 Demographic Profile
The following section explores the demographic profile of Ventura County. Demo-graphics are an integral part of describing the community and its population, and critical to forming further insights into the health needs of the community in order to best plan for improvement. All Ventura County residents should have the oppor-tunity to make the choices that allow them to live a long, healthy life, regardless of their income, education, or ethnic background. Unfortunately, some population groups don’t have the same opportunities to be as healthy as others; these groups may experience more inequities and thus require different approaches and supports to health improvement.
All demographic estimates are sourced from the U.S. Census Bureau’s (a) 2017 population estimates or (b) 2013-2017 American Community Survey, or (c) 2019 Claritas Pop-Facts®, unless otherwise indicated. The Pop-Facts data set provides current year (2019) estimates using the 2010 Census and the incorporation of newly available ACS data. Periods of measurement and sources for the data discussed are given in these sections if they are not mentioned elsewhere in the tables and figures enclosed within the report.
4.1.1 Population
According to 2019 Claritas Pop-Facts, Ventura County has a population of 859,967. Figure 4 illustrates the population size in Ventura County by zip code. The most populated zip codes are 93033 (Oxnard), 93065 (Simi Valley), 93030 (Oxnard), and 93063 (Simi Valley) with population totals of 83,972, 74,815, 62,482, and 56,653.
FIGURE 4: POPULATION BY ZIP CODE, 2019
Source: Claritas Pop-Facts
Profile of Ventura County

13Ventura County Community Health Needs Assessment 2019
Table 2 presents the U.S. Census Bureau population estimates in Ventura County by year for 2014, 2015, 2016, and 2017. Ventura County experienced a slight pop-ulation growth in the 4-year time period with a growth rate of 1.1%. This is less than the California and US growth rate of 2.2%.
TABLE 2: TOTAL POPULATION: PAST FOUR YEARS, 2014-2017
Total Population
2014 2015 2016 2017Percent Change
2014-2017
Ventura County
844,749 848,925 851,096 854,223 1.1%
California 38,701,278 39,032,444 39,296,476 39,536,653 2.2%
United States
318,622,525 321,039,839 323,405,935 325,719,178 2.2%
Source: American Community Survey
4.1.2 Age
Distribution of age impacts the healthcare needs of a population. Economic means, work status, and entitlement program eligibility are based on age which can affect an individual’s ability to access preventive health care services. Figure 5 shows the Ventura County population by age as compared to the age distribution for the state of California. Overall, Ventura County’s age distribution is similar to California. Notably, Ventura has a lower percentage of its population between 25 to 44 years of age, compared to California. However, the percentage of the population aged 45 and above is slightly greater in Ventura than in California.
FIGURE 5: POPULATION BY AGE, 2019
6.1%
6.3%
6.6%
4.2%
4.0%
5.5%
13.3%
12.3%
13.1%
13.1%
9.2%
4.4%
1.9%
6.3%
6.4%
6.4%
4.0%
4.0%
5.5%
14.7%
13.3%
12.9%
12.1%
8.6%
4.1%
1.8%
0.0% 2.0% 4.0% 6.0% 8.0% 10.0% 12.0% 14.0% 16.0%
0-4
5-9
10-14
15-17
18-20
21-24
25-34
35-44
45-54
55-64
65-74
75-84
85+
County: Ventura State: California
Source: Claritas Pop-Facts
4.1.3 Race/Ethnicity
Figure 6 shows the racial and ethnic distribution of Ventura County. The majority of the population is comprised of White (Non-Hispanic), with 41.4% of the population and Hispanics with 42.9% of the population. The Asian population accounts for 7.8% of the population, followed by two or more races with 3.5% of the population, Black or African American with 2.3% of the population, American Indian and Alaska Native with 1.9% of the population, and lastly Native Hawaiian and Other Pacific Islander with 0.3% of the population.
Profile of Ventura County

14Ventura County Community Health Needs Assessment 2019
FIGURE 6: VENTURA COUNTY POPULATION BY RACE/ETHNICITY, 2017
1.9%7.8%
2.3% 0.3%
3.5%
41.4%
42.9%
American Indian and Alaska Native
Asian
Black or African American
Native Hawaiian and Other Pacific Islander
Two or More Races
White
Hispanic
Source: U.S. Census Population Estimates
Table 3 presents a closer examination of population trends over a span of four years. Overall, Ventura County has experienced a slight increase in share of residents identifying as Hispanic from 2014 to 2017. There is a slight decrease in residents identifying as White with 43% of the population in 2014 to 41.4% of the population in 2017.
TABLE 3: POPULATION BY RACE/ETHNICITY: PAST FOUR YEARS
Ventura County
2014 2015 2016 2017
American Indian and Alaska Native 1.8% 1.8% 1.8% 1.9%
Asian 7.4% 7.5% 7.7% 7.8%
Black or African American 2.2% 2.2% 2.3% 2.3%
Native Hawaiian and Other Pacific Islander 0.3% 0.3% 0.3% 0.3%
Two or More Races 3.3% 3.3% 3.4% 3.5%
White 43.0% 42.5% 42.0% 41.4%
Hispanic 41.9% 42.3% 42.6% 42.9%
Source: U.S. Census Population Estimates
4.1.4 Language Spoken at Home
Figure 7 shows the percent of the population that speaks a language other than English at home, comparing the values for Ventura County with the California state value and the national value. According to the American Community Survey, between 2013-2017 Ventura County’s proportion was less than the state average, with 38.6% of the population speaking another language other than English at home, but greater than the national value. 15.3% of population 5 years and above speak English ‘less than very well’ (American Community Survey, 2013-2017). This measurement indicates where there may be language or cultural barriers to accessing health care.
FIGURE 7: POPULATION AGE 5+ SPEAKING LANGUAGE OTHER THAN ENGLISH AT HOME, 2013-2017
38.6%
44.0%
21.3%
0.0% 5.0% 10.0% 15.0% 20.0% 25.0% 30.0% 35.0% 40.0% 45.0% 50.0%
Ventura County
California
United States
Ventura County California United States
Source: American Community Survey
4.1.5 Education
Educational attainment is one of the key factors that affects the health status of a community. Educational attainment helps to dictate future employment. Employment influences income, healthy behaviors, health seeking behaviors, and health literacy which is the ability and ease with which a person can seek, access and use health information and navigate the health system. Figure 8 displays the educational attain-ment for population age 25+ with a high school degree or higher in Ventura County. All levels of educational attainment are fairly similar between Ventura County and California state values. Notably, high school degree attainment in Ventura County (18.7%), is slightly lower compared to the California state value (20.6%), However, having some college education (23.0%) and associates degree attainment (9.1%) is higher in Ventura County compared to California state values (21.4% and 7.7%).
Profile of Ventura County

15Ventura County Community Health Needs Assessment 2019
FIGURE 8: EDUCATIONAL ATTAINMENT, 2019
9.8%
6.4%
18.7%
23.0%
9.1%
20.4%
8.6%
2.4%
1.8%
9.8%
7.9%
20.6%
21.4%
7.7%
20.5%
8.3%
2.3%
1.6%
0.0% 5.0% 10.0% 15.0% 20.0% 25.0%
Less than 9th Grade
Some High School, No Diploma
High School Grad
Some College, No Degree
Associates Degree
Bachelor's Degree
Master's Degree
Professional Degree
Doctorate Degree
County: Ventura State: California
Source: Claritas Pop-Facts
Figure 9 depicts the population age 25+ with less than a high school graduation at the granular level, with darker blue regions indicating a greater percentage of individuals with less than a high school graduation. From this map, the areas with the highest percent and number of individuals without a high school degree are 93033 (45.4%; 22,641), 93040 (36.4%; 384), 93060 (33.8%; 7,238), 93030 (33.5%; 12,759), and 93015 (32.8%; 3,865).
FIGURE 9: POPULATION AGE 25+ WITH LESS THAN HIGH SCHOOL GRADUATION, 2019
Source: Claritas Pop-Facts
Profile of Ventura County

16Ventura County Community Health Needs Assessment 2019
4.1.6. Income
Median household income reflects the relative affluence and prosperity of an area. Areas with higher median household incomes are likely to have a greater share of educated residents and lower unemployment rates.
Figure 10 compares the median household income values for Ventura County to the median household income value for California and the United States. Ventura had a median household income above the state value and the national value. Ventura County had an estimated median household income of approximately $81,972, which was more than $10,000 higher than the median household income of Cali-fornia and more than $20,000 higher than the national value of $57,652.
FIGURE 10: MEDIAN HOUSEHOLD INCOME, 2013-2017
$81,972
$67,169
$57,652
Ventura County
California
United States
Ventura County California United States
Source: American Community Survey
Figure 11 shows the percentage of people living below the poverty level by race and ethnicity. All race/ethnic groups in Ventura County have higher median household incomes in comparison to California state values. The Asian population has the greatest difference with the median at $120,190 in Ventura County and $98,690 in California. Hispanic populations have the smallest difference among all of the race/ethnic groups, with the median household income of $67,431 in Ventura County compared to $57,170 in California.
FIGURE 11: MEDIAN HOUSEHOLD INCOME BY RACE/ETHNICITY, 2019
$87,749
$80,185
$77,241
$120,190
$76,833
$69,692
$86,762
$67,431
$79,734
$52,304
$54,509
$98,690
$74,034
$54,319
$73,897
$57,170
$0 $20,000 $40,000 $60,000 $80,000 $100,000 $120,000 $140,000
White
Black/African American
American Indian/Alaskan Native
Asian
Native Hawaiian/Pacific Islander
Some Other Race
2+ Races
Hispanic/Latino
County: Ventura State: California
Source: Claritas Pop-Facts
Per the 5-year average from the 2017 American Community Survey, the median household income was $87,680 for 2-person households, $104,321 for 4-person households, $92,871 for 6-person households, and $98,059 for 7+ person house-holds. Looking at Figure 12, the regions with the darker shades of blue indicate zip codes with high median household incomes, while the lighter shades indicate low median household incomes. The zip code with the highest median household income in Ventura County is 91377 ($129,721), while the zip code with the lowest median household income is 93040 ($48,750).
Profile of Ventura County

17Ventura County Community Health Needs Assessment 2019
FIGURE 12: MEDIAN HOUSEHOLD INCOME BY ZIP CODE, 2013-2017
Source: American Community Survey
4.1.7 Employment
A high rate of unemployment has personal and societal effects. During periods of unemployment, individuals are likely to feel severe economic strain and mental stress. Unemployment is also related to access to health care, as many individuals receive health insurance through their employer. A high unemployment rate places strain on financial support systems, as unemployed persons qualify for unemploy-ment benefits and food stamp programs.
Table 4 lists the industries that employ civilian population 16 years and over in Ventura County. Approximately 19.4% of civilians are employed by educational services, health care and social assistance and 11.7% by professional, scientific, and management, and administrative and waste management services. Additionally, 11.5% of civilians are employed by the agriculture (including forestry, fishing and hunting, and mining) and construction sectors together, while 10.6% work in the retail trade and 10.5% in the manufacturing sector.
TABLE 4: INDUSTRY OF WORK FOR THE CIVILIAN EMPLOYED POPULATION 16 YEARS AND OVER
Occupation Number Percent
Agriculture, forestry, fishing and hunting, and mining 23720 5.7
Construction 24010 5.8
Manufacturing 43138 10.5
Wholesale trade 12412 3.03
Retail trade 43707 10.6
Transportation and warehousing, and utilities 13137 3.2
Information 9857 2.4
Finance and insurance, and real estate and rental and leasing 31928 7.7
Professional, scientific, and management, and administrative and waste management services 47984 11.7
Educational services, and health care and social assistance 79897 19.4
Arts, entertainment, and recreation, and accommodation and food services 39273 9.5
Other services, except public administration 21366 5.2
Public administration 19750 4.8
Total: 410179
Source: American Community Survey 2013-2017
Figure 13 depicts the percent of civilians, 16 years of age and older, who are un-employed as a percent of the civilian labor force. Overall, Ventura County’s unem-ployment rate slightly decreased between April 2017 and October 2018. There were some fluctuations, with a small increase in October 2017 from 4.0% to 4.2%, followed by a drop to 3.3%. In October 2018, the rate of unemployment was 3.7%, slightly higher than the national unemployment rate of 3.5%, but less than the state unemployment rate of 4.0%.
Profile of Ventura County

18Ventura County Community Health Needs Assessment 2019
FIGURE 13: UNEMPLOYED WORKERS IN CIVILIAN LABOR FORCE, APRIL 2017 - OCTOBER 2018
4.0%
4.2%
3.3%
3.7%
4.5%4.3%
3.8%4.0%
4.1%
3.9%
3.7%
3.5%
3.0%
3.2%
3.4%
3.6%
3.8%
4.0%
4.2%
4.4%
4.6%
Apr-17 Oct-17 Apr-18 Oct-18
Ventura County California United States
Source: U.S. Bureau of Labor Statistics
4.2 Social Determinants of Health
Health conditions are determined by the neighborhoods, schools, communities and workplaces of individuals. Healthy People 2020 defines social determinants of health as conditions in which people are born, grow, live, work, and age that affect a wide range of health outcomes and risks. The social determinants of health partly explain why some people are healthier than others, and generally why some people are not as healthy as they could be. Resources that address the social determinants of health and improve quality of life can have a significant impact on population health outcomes. Examples of these resources include access to education, public safety, affordable housing, availability of healthy foods, and local emergency and health services.
Understanding the different social determinants in a service area can lead to poten-tial programs and services that work to improve disparities within that community. Programs that address the social determinants such as targeted outreach to people living alone, translation services for people with limited English proficiency, and universal job training for entry level positions can help to improve the overall health of the community. This section explores the social and economic determinants of health in Ventura County. These social determinants and other factors help build the context of the service area to allow for better understanding of the results of both primary and secondary data.
4.2.1 Poverty
In 2019, the federal poverty guideline was $25,750 for a family of four (U.S. Depart-ment of Health and Human Services, 2019). Federal assistance programs use the guidelines (or percentage multiples of the guidelines — for instance, 125 percent or 185 percent of the guidelines) in determining eligibility include Head Start, the Supplemental Nutrition Assistance Program (SNAP), the National School Lunch Program, the Low-Income Home Energy Assistance Program, and the Children’s Health Insurance Program.
As shown in Figure 14, Ventura County has lower rates of poverty compared to the state and national poverty rates. Ventura County has a poverty rate of 10.3%, while state and national rates of poverty are 15.1% and 14.6% respectively.
FIGURE 14: PEOPLE LIVING BELOW POVERTY LEVEL, 2013-2017
10.3%
15.1%
14.6%
0.0% 2.0% 4.0% 6.0% 8.0% 10.0% 12.0% 14.0% 16.0%
Ventura County
California
United States
Source: American Community Survey
United Way of California has arrived at an estimate of the amount of income required to meet basic needs (the “Real Cost Budget”) for a given household type in a specific community. The Real Cost Measure builds a bare-bones budget that reflects con-strained yet reasonable choices for essential expenses: housing, food, transportation, health care, taxes and child care. According to United Way’s report ‘Struggling to Stay Afloat’, one in three households in California, over 3.3 million families—including those with income well above the Federal Poverty Level—struggle every month to meet basic needs. United Way of California estimates that an income of at least $77,493 was required to meet the basic needs (housing, food, transportation, health care, taxes, and child care) for a family of four, with two adults and two children, in Ventura
Profile of Ventura County

19Ventura County Community Health Needs Assessment 2019
County; this figure is $75,740 for California (United Way of California, 2018). This is more than three times the federal poverty level for a family of four. This threshold of affordability is referred to as the Real Cost Measure (RCM). In Ventura County, 72% of residents with education levels below high school, 64% of households headed by single females, 49% of Hispanic households and 52% of foreign born, non-citizen households are living below the RCM. By the same estimates, a family of four (two adults, one infant, one school age child) would need to hold more than three full time, minimum-wage jobs to achieve economic security.
According to Figure 15, the rate of people living below poverty level in Ventura County has a downward trend, similar to the state and national trends. However, the overall percentage of Ventura County’s population living below poverty across all four years is less than the state and national values. In 2014, Ventura County had a poverty rate of 11.3%, which dropped in 2015 to 9.6% and has remained stable from 2015 to 2017, with a slight decrease in 2017 to 9.3%. In comparison, the poverty rate in Ventura County is 4% less than both state and national values.
FIGURE 15: PEOPLE LIVING BELOW POVERTY LEVEL, 2014-2017
11.3%
9.6% 9.5% 9.3%
16.4%15.3%
14.3%13.3%
15.5%14.7%
14.0%13.4%
8.0%9.0%
10.0%11.0%12.0%13.0%14.0%15.0%16.0%17.0%
2014 2015 2016 2017
Ventura County California USA
Source: American Community Survey
Figure 16 depicts the percentage of individuals living below poverty broken up by sub-county geographies. The dark blue regions indicate zip codes with the highest levels of poverty in the county while lighter shades represent lower rates of poverty. The Ventura County zip code with the largest proportion of population living below poverty is 93033 (19.9%), followed by 93015 (19.1%), 93030 (16.3%), 93060 (16.1%), and 93001 (15.7%).
FIGURE 16: PEOPLE LIVING BELOW POVERTY LEVEL, 2013-2017
Source: American Community Survey
Examining the context of poverty more deeply, Figure 17 shows the percentage of people living below poverty level by race and ethnicity in comparison to state and national values. The race/ethnic group with the greatest percentage of its population living in poverty is the American Indian or Alaskan Native with 19.6%, as compared to 14.9% of the White (non-Hispanic) population. The Hispanic population has the second highest percentage with 16.6% % living below poverty level. All race and ethnicity groups are below state and national levels.
Profile of Ventura County

20Ventura County Community Health Needs Assessment 2019
FIGURE 17: PEOPLE LIVING BELOW POVERTY LEVEL BY RACE/ETHNICITY, 2013-2017
19.6%
5.5%
14.5%
16.6%
5.0%
14.9%
9.2%
6.1%
23.0%
11.6%
24.2%
21.9%
16.0%
10.1%
15.3%
23.6%
27.6%
12.3%
26.2%
23.4%
20.1%
10.6%
19.3%
25.4%
0.0% 5.0% 10.0% 15.0% 20.0% 25.0% 30.0%
American Indian or Alaska Native
Asian
Black or African American
Hispanic or Latino
Native Hawaiian or Other Pacific Islander
White, non-Hispanic
Two or More Races
Other
Ventura County California United States
Source: American Community Survey
According to the American Community Survey, in 2013-2017, 14.4% of children in Ventura County were living below the federal poverty level. This is lower than the proportion of children living below the poverty level in California (20.8%) and the United States (20.3%). Examining this by race, American Indian or Alaska Native children and Hispanic or Latino children had the highest disparity, with 33% of American Indian or Alaska Native children living under poverty and 21.2% of His-panic or Latino children living below poverty. In terms of geographic area, 93033 had the greatest percentage of people under the age of 18 living below the federal poverty level (30.2%). The zip codes 93015 (26.8%), 93030 (24.7%), and 93060 (23.0%) also fell in the upper quartile among regions in Ventura County.
In 2013-2017, 6.9% of individuals aged 65 and over were living below the federal poverty level in Ventura County. This is lower than the California value (10.2%) and the United States value (9.3%). Examining by race/ethnicity, those who identify as Hispanic or Latino, some other race, and two or more races had significantly worse rates than the overall value, with 10.8% of the Hispanic or Latino population aged
65 or over living below poverty, 12.0% for those identifying as some other race, and 12.9% for those who are two or more races. Examining rates broken up by zip code, the highest proportion of individuals aged 65 and over living below poverty was in 93030 at 13.3%. 93033 (12.7%) also fell in the upper quartile among regions in Ventura County.
The Gini index measures income distribution among the residents of a specified geography. A value of zero indicates perfect equality of income (all households having equal income) and a value of one indicates perfect inequality (one household having all the income). A value of 0.5 indicates an even distribution of incomes. The Gini index for Ventura County is 0.4478 (United States Census Bureau, 2019), pointing to a small size population that has lower incomes than the rest of the county residents. Low income affects housing stability, food access, healthcare spending, healthcare access and health status of residents. These disparities correspond with race/ethnicity, languages spoken, foreign-born status and women headed households among other factors. It is likely that these income related disparities are contributing strongly to the poorer health outcomes in the county.
4.2.2 Food Insecurity
Food insecurity is defined as the disruption of food intake or eating patterns because of lack of money and other resources. Food insecurity, and the resulting hunger, is associated with disability, lack of adequate employment and racial and ethnic disparities. It leads to intake of nutritionally deficient but high calorie foods that cause obesity, diabetes, heart disease, high blood pressure, and hyperlipidemia. Food assistance programs, such as the National School Lunch Program (NSLP), the Women, Infants, and Children (WIC) program, and the Supplemental Nutrition Assistance Program (SNAP) address food insecurity in vulnerable populations by delivering food benefits. Food Insecurity is discussed in greater detail in SECTION 7: Data Synthesis and Prioritization.
Figure 18 describes the percent of the population in Ventura County that has ex-perienced food insecurity, compared to state and national rates. Overall, there is a downward trend in the food insecurity rate across all three populations. Ventura County has a lower food insecurity in comparison to the state and the nation. In 2016, Ventura County had a Food Insecurity rate of 7.9%, about 4.0% less than the state value and 5.0% less than the national value. Between 2013 and 2016, the food insecurity rate in Ventura County has dropped 2.5%, from 10.4% in 2013 to 7.9% in 2016.
Profile of Ventura County

21Ventura County Community Health Needs Assessment 2019
FIGURE 18: FOOD INSECURITY RATE, 2013-2016
10.4%9.4%
8.2% 7.9%
15.0%13.9%
12.5%11.7%
15.8% 15.4%
13.7%12.9%
6.0%
8.0%
10.0%
12.0%
14.0%
16.0%
18.0%
2013 2014 2015 2016
Ventura County California United States
Source: Feeding America
4.2.3 Transportation
Public transportation offers mobility, particularly to people without cars. Transit can help bridge the spatial divide between people and jobs, services, and training opportunities. Public transportation also reduces fuel consumption, minimizes air pollution, and relieves traffic congestion. Walking to work helps protect the environment, while also providing the benefit of daily exercise.
Figure 19 shows the percent of workers who drive alone to work by zip code. The darkest shaded regions on the map indicate zip codes with the highest proportion of workers who drive alone to work. Within Ventura County, the area with the larg-est percentage of individuals that drove alone to work is zip code 93035 at 84.2%. Other regions in the upper quartile are 91361 (82.6%), 91377 (82.2%), 91362 (82.2%), and 93010 (81.7%), 93004 (81.4%), and 93021 (81.2%). Driving alone to work can have long lasting impacts on health, affecting aspects such as active living, pollution, and accidents due to vehicle collisions.
FIGURE 19: WORKERS WHO DRIVE ALONE TO WORK, 2013-2017
Source: American Community Survey, 2013-2017
With regards to households without a vehicle (Figure 20), 4.4% of households in Ventura County do not have a car. The map below depicts the percentage of house-holds by zip code that do not have a vehicle. Areas shaded in dark blue indicate zip codes in the highest quartile, while the regions with light blue shading represent lower quartiles. The zip code with the highest proportion of households without a car is 93060 (6.9%) and 93030 (6.9%), followed by 93003 (6.7%), 93001 (6.6%), and 93004 (6.2%). Residents in these locations may be more likely to experience difficulties accessing services in Ventura County.
Profile of Ventura County

22Ventura County Community Health Needs Assessment 2019
FIGURE 20: HOUSEHOLDS WITHOUT A VEHICLE, 2013-2017
Source: American Community Survey, 2013-2017
4.2.4 Housing
High costs of homeownership with a mortgage can strain both homeowners and the local housing market. With a limited income, paying a high rent may not leave enough money for other expenses such as food, transportation, and medical services. Moreover, high rent reduces the proportion of income a household can allocate to savings each month.
Figure 21 shows renters spending 30% or more of household income on rent in Ventura County. Overall, 57.8% of individuals in Ventura County spend 30% or more of their household income on rent. This is greater than the California value of 56.0% and the United States value of 50.6%. The map shows the zip codes that fall in the upper quartile are 93004 (65.2%), 93015 (65.1%), 93021 (65.0%), 93033 (64.7%), and 93023 (63.5%).
FIGURE 21: RENTERS SPENDING 30% OR MORE OF HOUSEHOLD INCOME ON RENT, 2013-2017
Source: American Community Survey
Profile of Ventura County

23Ventura County Community Health Needs Assessment 2019
4.3 Crime and Safety
Safe neighborhoods that are free of crime help to create opportunities for healthy eating and active living. Creating these opportunities in all neighborhoods will help to reduce health disparities within Ventura County. Crime ridden communities in-crease incidence of childhood trauma, impacting lifelong health. Violence impacts the health of individuals, families, and communities; safe communities that provide opportunities to be active and eat well support people in making healthy choices.
From 2015-2017, there were 82 deaths due to homicides in Ventura County from 2015-2017, with an average of 57.5 years of life lost per death from homicides. There were 261.5 violent crimes per 100,000 persons in 2017 (Figure 22), defined as a crime in which the offender uses or threatens to use violent force upon the victim, including homicide, forcible rape, robbery, and aggravated assault. There has been a rising, but non-significant, trend for the county since 2009. In 2015-2017, 6% of youth self-reported being members of gangs, in comparison of 4.7% of youth in the state (California Healthy Kids Survey).
FIGURE 22: VIOLENT CRIME RATE PER 100,000 POPULATION, 2014-2017
222.9255.3 256.8 261.5
391.0426.5
444.4 450.7
100.0
200.0
300.0
400.0
500.0
2014 2015 2016 2017
Ventura County California
Source: California Department of Justice (2014-2017)
4.4 Built Environment Profile
Communities that are designed to be walkable provide health, social and economic benefits. Safe neighborhoods and workplaces make communities healthier because residents are more likely to walk and bike to work and school to improve their fitness and overall health. Healthy communities are marked with adequate public places to play and be active, access to affordable healthy foods, and streetscapes designed to prevent injury. Proximity to exercise opportunities, such as parks and recreation facilities, has been linked to an increase in physical activity among residents, which is important for enhancing quality of life and improve life expectancy. Moreover, it reduces the risk of cardiovascular disease, diabetes, and some cancers.
Per the American Community Survey (2013-2017), only 1.8% of residents walked to work in Ventura County. Let’s Get Healthy California (LGHC2022) has the target of increasing the percentage of residents that walk to work to 5.6% by 2022.
Figure 23 depicts the percentage of individuals who live reasonably close to a park or a recreational facility in Ventura County compared to the state and national values. In 2018, 97.0% of residents in Ventura County reported having access to exercise opportunities. This proportion is greater than the state and national values of 89.6% and 83.1%.
FIGURE 23: ACCESS TO EXERCISE OPPORTUNITIES, 2018
97.0%
89.6%
83.1%
75.0% 80.0% 85.0% 90.0% 95.0% 100.0%
Ventura County
California
United States
Source: County Health Rankings (2018)
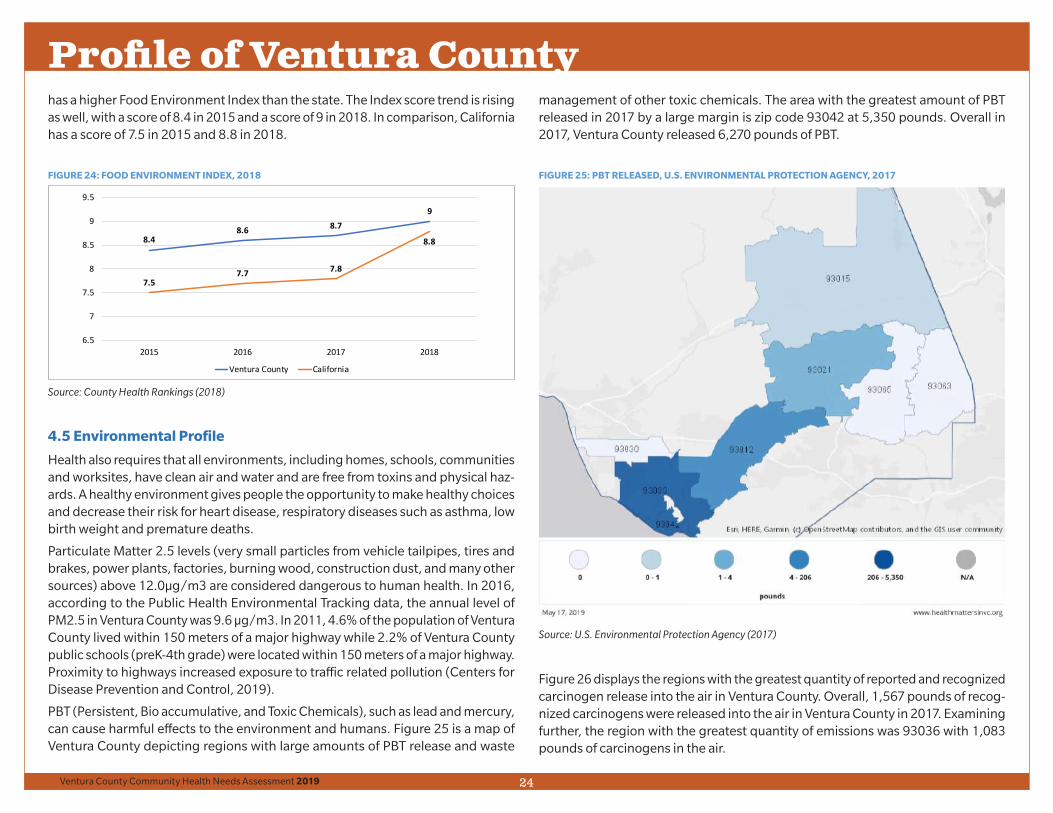
The Food Environment Index combines two measures of food access — the percent-age of the population that is low income and has low access to a grocery store and the percentage of the population that does not have access to a reliable source of food. Figure 24 shows the trend over four years of Food Environment Index values in Ventura County and California. Index scores range from 0 to 10, with 0 being the worst and 10 being the best. Looking at the graph below, Ventura County, overall,
Profile of Ventura County
24Ventura County Community Health Needs Assessment 2019
has a higher Food Environment Index than the state. The Index score trend is rising as well, with a score of 8.4 in 2015 and a score of 9 in 2018. In comparison, California has a score of 7.5 in 2015 and 8.8 in 2018.
FIGURE 24: FOOD ENVIRONMENT INDEX, 2018
8.48.6 8.7
9
7.57.7 7.8
8.8
6.5
7
7.5
8
8.5
9
9.5
2015 2016 2017 2018
Ventura County California
Source: County Health Rankings (2018)
4.5 Environmental Profile
Health also requires that all environments, including homes, schools, communities and worksites, have clean air and water and are free from toxins and physical haz-ards. A healthy environment gives people the opportunity to make healthy choices and decrease their risk for heart disease, respiratory diseases such as asthma, low birth weight and premature deaths.
Particulate Matter 2.5 levels (very small particles from vehicle tailpipes, tires and brakes, power plants, factories, burning wood, construction dust, and many other sources) above 12.0µg/m3 are considered dangerous to human health. In 2016, according to the Public Health Environmental Tracking data, the annual level of PM2.5 in Ventura County was 9.6 µg/m3. In 2011, 4.6% of the population of Ventura County lived within 150 meters of a major highway while 2.2% of Ventura County public schools (preK-4th grade) were located within 150 meters of a major highway. Proximity to highways increased exposure to traffic related pollution (Centers for Disease Prevention and Control, 2019).
PBT (Persistent, Bio accumulative, and Toxic Chemicals), such as lead and mercury, can cause harmful effects to the environment and humans. Figure 25 is a map of Ventura County depicting regions with large amounts of PBT release and waste
management of other toxic chemicals. The area with the greatest amount of PBT released in 2017 by a large margin is zip code 93042 at 5,350 pounds. Overall in 2017, Ventura County released 6,270 pounds of PBT.
FIGURE 25: PBT RELEASED, U.S. ENVIRONMENTAL PROTECTION AGENCY, 2017
Source: U.S. Environmental Protection Agency (2017)
Figure 26 displays the regions with the greatest quantity of reported and recognized carcinogen release into the air in Ventura County. Overall, 1,567 pounds of recog-nized carcinogens were released into the air in Ventura County in 2017. Examining further, the region with the greatest quantity of emissions was 93036 with 1,083 pounds of carcinogens in the air.
Profile of Ventura County

25Ventura County Community Health Needs Assessment 2019
FIGURE 26: RECOGNIZED CARCINOGENS RELEASED INTO AIR, 2017
Source: U.S. Environmental Protection Agency (2017)
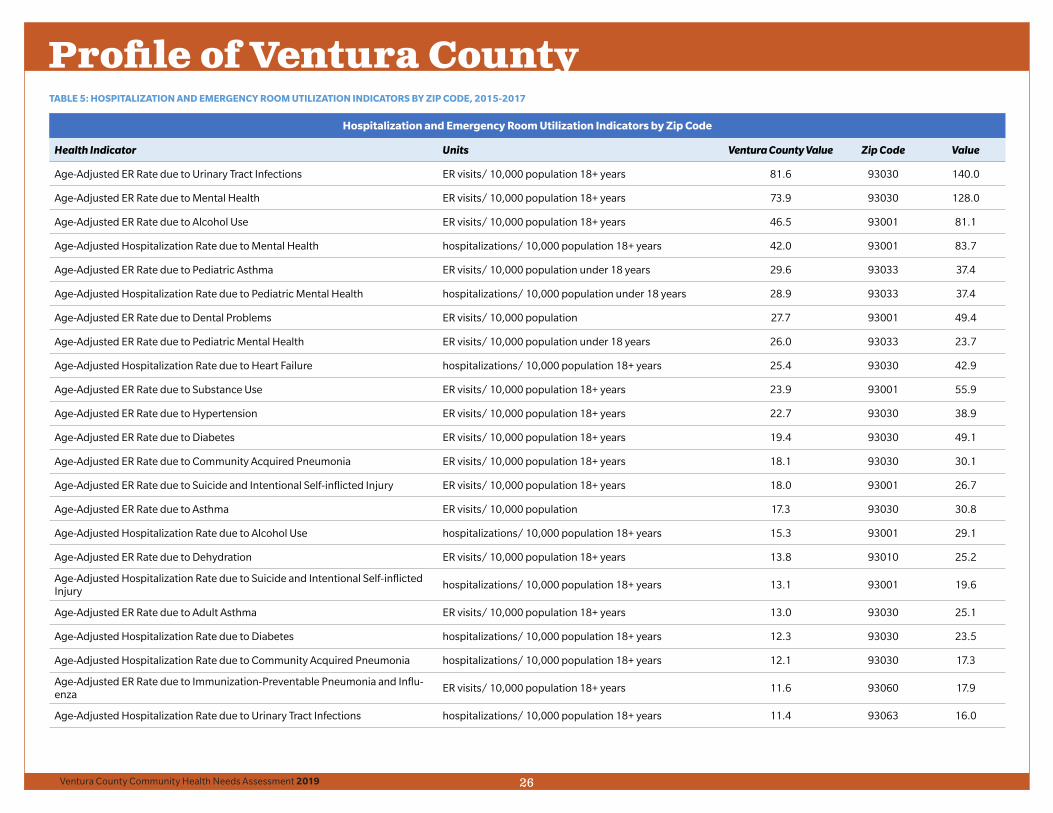
4.6 Clinical Profile: Hospitalization and Emergency Room Utilization Rates
Collected through the California Office of Statewide Health Planning and Develop-ment, the tables below identify Hospitalization and Emergency Room Utilization rates for 2015-2017 in Ventura County. Table 5 provides the Ventura County value as well as the zip code with the highest ER visit rate or hospitalization rate for each indicator. Table 6 displays the number of hospitalization and emergency room utilization indicators by zip code with the highest rate. Based on the tables below,
Oxnard (93030) is the most heavily impacted, with high rates appearing in 14 of the indicators. The topics include indicators related to asthma, diabetes, heart disease, infectious diseases, and mental health. Second, most heavily impacted is 93001 with 8 indicators and 93040 with 6 indicators.
Profile of Ventura County
26Ventura County Community Health Needs Assessment 2019
TABLE 5: HOSPITALIZATION AND EMERGENCY ROOM UTILIZATION INDICATORS BY ZIP CODE, 2015-2017
Hospitalization and Emergency Room Utilization Indicators by Zip Code
Health Indicator Units Ventura County Value Zip Code Value
Age-Adjusted ER Rate due to Urinary Tract Infections ER visits/ 10,000 population 18+ years 81.6 93030 140.0
Age-Adjusted ER Rate due to Mental Health ER visits/ 10,000 population 18+ years 73.9 93030 128.0
Age-Adjusted ER Rate due to Alcohol Use ER visits/ 10,000 population 18+ years 46.5 93001 81.1
Age-Adjusted Hospitalization Rate due to Mental Health hospitalizations/ 10,000 population 18+ years 42.0 93001 83.7
Age-Adjusted ER Rate due to Pediatric Asthma ER visits/ 10,000 population under 18 years 29.6 93033 37.4
Age-Adjusted Hospitalization Rate due to Pediatric Mental Health hospitalizations/ 10,000 population under 18 years 28.9 93033 37.4
Age-Adjusted ER Rate due to Dental Problems ER visits/ 10,000 population 27.7 93001 49.4
Age-Adjusted ER Rate due to Pediatric Mental Health ER visits/ 10,000 population under 18 years 26.0 93033 23.7
Age-Adjusted Hospitalization Rate due to Heart Failure hospitalizations/ 10,000 population 18+ years 25.4 93030 42.9
Age-Adjusted ER Rate due to Substance Use ER visits/ 10,000 population 18+ years 23.9 93001 55.9
Age-Adjusted ER Rate due to Hypertension ER visits/ 10,000 population 18+ years 22.7 93030 38.9
Age-Adjusted ER Rate due to Diabetes ER visits/ 10,000 population 18+ years 19.4 93030 49.1
Age-Adjusted ER Rate due to Community Acquired Pneumonia ER visits/ 10,000 population 18+ years 18.1 93030 30.1
Age-Adjusted ER Rate due to Suicide and Intentional Self-inflicted Injury ER visits/ 10,000 population 18+ years 18.0 93001 26.7
Age-Adjusted ER Rate due to Asthma ER visits/ 10,000 population 17.3 93030 30.8
Age-Adjusted Hospitalization Rate due to Alcohol Use hospitalizations/ 10,000 population 18+ years 15.3 93001 29.1
Age-Adjusted ER Rate due to Dehydration ER visits/ 10,000 population 18+ years 13.8 93010 25.2
Age-Adjusted Hospitalization Rate due to Suicide and Intentional Self-inflicted Injury
hospitalizations/ 10,000 population 18+ years 13.1 93001 19.6
Age-Adjusted ER Rate due to Adult Asthma ER visits/ 10,000 population 18+ years 13.0 93030 25.1
Age-Adjusted Hospitalization Rate due to Diabetes hospitalizations/ 10,000 population 18+ years 12.3 93030 23.5
Age-Adjusted Hospitalization Rate due to Community Acquired Pneumonia hospitalizations/ 10,000 population 18+ years 12.1 93030 17.3
Age-Adjusted ER Rate due to Immunization-Preventable Pneumonia and Influ-enza
ER visits/ 10,000 population 18+ years 11.6 93060 17.9
Age-Adjusted Hospitalization Rate due to Urinary Tract Infections hospitalizations/ 10,000 population 18+ years 11.4 93063 16.0
Profile of Ventura County

27Ventura County Community Health Needs Assessment 2019
Hospitalization and Emergency Room Utilization Indicators by Zip Code
Health Indicator Units Ventura County Value Zip Code Value
Age-Adjusted ER Rate due to COPD ER visits/ 10,000 population 18+ years 11.4 93030 21.9
Age-Adjusted Hospitalization Rate due to COPD hospitalizations/ 10,000 population 18+ years 10.4 93001 15.6
Age-Adjusted ER Rate due to Uncontrolled Diabetes ER visits/ 10,000 population 18+ years 9.6 93030 25.2
Age-Adjusted Hospitalization Rate due to Dehydration hospitalizations/ 10,000 population 18+ years 8.8 93063 12.7
Age-Adjusted Hospitalization Rate due to Substance Use hospitalizations/ 10,000 population 18+ years 7.8 93001 14.1
Age-Adjusted Hospitalization Rate due to Long-Term Complications of Diabetes
hospitalizations/ 10,000 population 18+ years 6.9 93030 14.6
Age-Adjusted ER Rate due to Long-Term Complications of Diabetes ER visits/ 10,000 population 18+ years 4.4 93030 10.6
Age-Adjusted Hospitalization Rate due to Pediatric Asthma hospitalizations/ 10,000 population under 18 years 4.4 93033 5.2
Age-Adjusted Hospitalization Rate due to Short-Term Complications of Diabetes
hospitalizations/ 10,000 population 18+ years 3.3 93004 5.3
Age-Adjusted Hospitalization Rate due to Asthma hospitalizations/ 10,000 population 3.0 93030 4.6
Age-Adjusted Hospitalization Rate due to Adult Asthma hospitalizations/ 10,000 population 18+ years 2.6 93030 4.9
Age-Adjusted Hospitalization Rate due to Hypertension hospitalizations/ 10,000 population 18+ years 2.493065 93063 93030
3.5
Age-Adjusted Hospitalization Rate due to Uncontrolled Diabetes hospitalizations/ 10,000 population 18+ years 2.0 93030 4.2
Age-Adjusted Hospitalization Rate due to Immunization-Preventable Pneumonia and Influenza
hospitalizations/ 10,000 population 18+ years 1.7 93021 2.9
Age-Adjusted Hospitalization Rate due to Hepatitis hospitalizations/ 10,000 population 18+ years 1.5 93030 3.2
Age-Adjusted ER Rate due to Hepatitis ER visits/ 10,000 population 18+ years 0.7 93030 1.6
Source: California Office of Statewide Health Planning and Development
Profile of Ventura County

28Ventura County Community Health Needs Assessment 2019
TABLE 6: NUMBER OF HOSPITALIZATION INDICATORS BY ZIP CODE WITH HIGHEST RATE, 2015-2017
Number of Hospitalization Indicators by Zip Code with Highest Rate
Zip Code Hospitalization Indicator Count
93030 20
93001 9
93033 4
93063 3
93010 1
93060 1
93021 1
93065 1
93004 1
Source: California Office of Statewide Health Planning and Development
4.7 Life Expectancy in Ventura County, 2015-17
Life expectancy is a measure of population’s longevity and overall health. Americans born today can expect to live 78.6 years (Kochanek, Murphy, Xu, & Tejada-Vera, 2016); Ventura County residents born today can expect to live 82.0 years, 3.4 years longer than the United States average. Females in Ventura County can expect to live an average of 4.6 years longer than their male counterparts (84.3 years versus 79.7 years). Figure 27 shows that Asians (Non-Hispanic) living in Ventura County enjoy the longest life expectancy of any race/ethnic group, followed by Whites (Non-Hispanic), Hispanics, and then African Americans/Blacks (Non-Hispanic); this disparity in life expectancy by race/ethnic group is consistent with national life expectancy trends except that in the United States, Hispanics have a life expectancy 3.3 years longer than Whites (Non-Hispanic).
Profile of Ventura CountyBetter mortality outcomes in the Hispanic population nationally, as compared to Whites (Non-Hispanic) and African Americans/Blacks (Non-Hispanic), have been attributed to the healthy migrant effect which hypothesizes that Hispanics who immigrate can do so because of their better health. Culturally, the Hispanic family structure, lifestyle behaviors and social support networks may be considered a protective factor against the effects of low socioeconomic status in this population (Kochanek, Murphy, Xu, & Tejada-Vera, 2016).
In Ventura County, from 2012-2014, life expectancy for the Hispanic population (83.4 years) was longer than for Whites (Non-Hispanic) (81.2 years). However, from 2015-2017, Whites (Non-Hispanic) (83.7 years) had a longer life expectancy than Hispanics (83.3 years), but there was not a statistically significant difference. Hispanic life expectancy only decreased by 0.1 years, but White (Non-Hispanic) life expectancy increased by 2.5 years and the increase was statistically significant. This decrease in life expectancy for the Hispanic population and increase for the White (Non-Hispanic) population may be due in part to underreporting of Hispanic ethnicity on the death certificate; this is estimated to be 3.3% nationally. Asians had a statistically significantly longer life expectancy than all other race/ethnic groups and African Americans/Blacks (Non-Hispanic) had a statistically significantly shorter life expectancy than all other race/ethnic groups.
FIGURE 27: LIFE EXPECTANCY BY RACE/ETHNICITY FOR VENTURA COUNTY, 2015-2017
86.4
80.1
83.3
83.7
88.3
83.1
85.6
85.8
84.0
77.1
81.0
81.6
Asian (NH)
Black (NH)
Hispanic (Any Race)
White (NH)
Asian (NH)
Black (NH)
Hispanic (Any Race)
White (NH)
Asian (NH)
Black (NH)
Hispanic (Any Race)
White (NH)
Ove
ral
l0
00
Fem
ale
00
0M
ale
00
0
Source: Vital Records Business Intelligence System (deaths 2015-2017) and Claritas Popfacts (2016), analysis by Ventura County Public Health, April 2019
Mal
eFe
mal
eO
vera
ll

29Ventura County Community Health Needs Assessment 2019
Disparities in life expectancy also exist by geographic area. Figure 28 shows that place matters when it comes to better health and mortality outcomes. Residents in Thousand Oaks/Westlake (91361) had the highest life expectancy in the county of 86.6 years (89.2 years for females and 83.7 years for males). Residents of Oak View (93022) had the lowest life expectancy in the county of 79.1 years (81.9 years for females and 76.6 years for males). This is a seven-and-a-half-year difference in life expectancy between these two zip codes. In the United States, lower income is associated with lower life expectancy; there is a 14.6-year difference in the life expectancy between the richest 1% and the poorest 1% of Americans; even among the poorest individuals, there are geographic differences in life expectancy (Chetty R, 2016). For example, lower income individuals from different zip codes may have different life expectancy depending on the prevalence of smoking or other high-risk behaviors. There were twelve zip codes in Ventura County that had a lower life expectancy than the overall county average. In general, zip codes with residents that benefit from higher socioeconomic status have a higher life expectancy than those residents with lower socioeconomic status.
FIGURE 28: LIFE EXPECTANCY BY ZIP CODE, 2015-2017
79.180.280.680.881.181.481.581.581.881.981.982.082.082.282.482.782.983.2
84.284.8
85.886.286.6
93022 - Oak View93003 - Ventura93015 - Fillmore
93060 - Santa Paula93023 - Ojai
93063 - Simi Valley (Santa Susana)93010 - Camarillo
93030 - Oxnard93033 - Oxnard
93065 - Simi Valley93041 - Port Hueneme
93001 - VenturaVentura County93004 - Ventura
91360 - Thousand Oaks93036 - Oxnard
93021 - Moorpark93035 - Oxnard
91362 - Thousand Oaks/Westlake91320 - Thousand Oaks/Newbury Park
91377 - Oak Park93012 - Camarillo
91361 - Thousand Oaks/Westlake
Source: Vital Records Business Intelligence System (deaths 2015-2017) and Claritas Popfacts (2016), analysis by Ventura County Public Health, April 2019
4.8 Mortality and Years of Life Lost (Premature Death), 2015-2017
Mortality trends help to drive public health priorities. The 10 leading causes of death in Ventura County from 2015-2017 were cancer, coronary heart disease, Alzheimer’s disease, stroke, accidents, chronic lower respiratory disease, diabetes, drug-induced deaths, chronic liver disease and cirrhosis, and suicides. Figure 29 compares the leading causes of death in Ventura County to those in California and in the United States. Cancer is the leading cause of death in both Ventura County and California, but heart disease is the leading cause of death in the United States. Per the National Center for Health Statistics, deaths due to heart disease have been declining since 1985, while deaths due to cancer have been on the rise; cancer is already the leading cause of death in 22 states in America including California. As the population is living longer, more people will be diagnosed with cancer; this is driving some of the shift in the mortality statistics.
In Ventura County, Alzheimer’s disease is the 3rd leading cause of death, but it is the 4th and 6th leading cause of death in California and the United States, respectively. There was a statistically significant increase in the rate of Alzheimer’s deaths from 2012-2014 to 2015-2017 in Ventura County; the rate was also statistically signifi-cantly higher than the state of California. From 2012-2014 to 2015-2017, there was a 42.7% increase in deaths due to Alzheimer’s disease but a 52.4% decrease in the number of deaths due to dementia in Ventura County.
Deaths due to influenza and pneumonia do not make the top 10 in Ventura County, however drug-induced deaths rank higher in Ventura County than in California and the United States. Accidents followed by chronic lower respiratory disease are the 5th and 6th leading causes of death in Ventura County and California, but rank 3rd and 4th in the United States.
Profile of Ventura County

30Ventura County Community Health Needs Assessment 2019
FIGURE 29: LEADING CAUSES OF DEATH, 2015-2017 (VC AND CA) AND 2016 (US)
Leading Causes of Death, 2015-17 (VC and CA) and 2016 (US)
Rank Ventura County California United States
1 All Cancers All Cancers Diseases of the Heart
2 Coronary Heart Disease Coronary Heart Disease All Cancers
3 Alzheimer’s DiseaseCerebrovascular Disease (Stroke)
Accidents (Unintentional Injuries)
4Cerebrovascular Disease (Stroke)
Alzheimer’s DiseaseChronic Lower Respiratory Disease
5Accidents (Unintentional Injuries)
Accidents (Unintentional Injuries)
Cerebrovascular Disease (Stroke)
6Chronic Lower Respiratory Disease
Chronic Lower Respiratory Disease
Alzheimer’s Disease
7 Diabetes Diabetes Diabetes
8 Drug-Induced Deaths Influenza-Pneumonia Influenza-Pneumonia
9Chronic Liver Disease and Cirrhosis
Drug-Induced Deaths Kidney Disease
10 SuicideChronic Liver Disease and Cirrhosis
Suicide
Source: Vital Records Business Intelligence System (deaths 2015-2017) and Claritas Popfacts (2016), anal-ysis by Ventura County Public Health, April 2019 for Ventura County. County Health Status Profiles (deaths 2015-2017 for California). National Vital Statistics Reports, Deaths: Final Data for 2016, United States
Because the leading causes of death do not change significantly from year to year, they are not as helpful in shaping emerging public health policy. Although the lead-ing causes of death are often related to behaviors such as lack of physical activity, poor nutrition, and tobacco and/or alcohol use, the social determinants of health such as income, education, and access to affordable and safe housing play a huge role in health and wellness and should be considered when implementing public health policy to address mortality trends (Sillies, 2009).
Therefore, VCPH decided to take another approach to analyzing the mortality data by looking at years of life lost (YLL). Leading causes of deaths tend to show how the aging population is dying while YLL analysis shows how young people are dying, which moves the focus upstream in terms of prevention. The World Health Organization (WHO) has calculated a standard expected YLL that changes based upon the age at a person’s death (Department of Health Statistics and Information Systems, 2013). For example, if someone died within the first year of life, their YLL would be 91.94 years.
However, if someone made it to 92 years, then their YLL would be 6.55 years. The WHO standard expected YLL assumes the first person could have lived to be 91.94 years old, and the second could have lived to be 98.55 years (since he or she was already 92).
There were 16,978 deaths in Ventura County from 2015-2017, and each death was assigned YLL based upon age at death. This data was used to calculate the Age-Ad-justed YLL rate per 100,000 population per year, YLL per year, and average YLL per death for Ventura County residents. A premature death occurs when someone does not reach their achievable life expectancy; there were 112,045 years of life lost due to premature death per year from 2015-2017 in Ventura County (65,216 YLL for males and 46,829 YLL for females). The Age-Adjusted YLL rate per 100,000 population per year was 12,129 for all causes of death (15,225 for males and 9,292 for females). On average, there were 19.8 years of life lost per death from 2015-2017 among Ventura County residents (22.7 years for males and 16.8 years for females).
Figure 30 shows the leading causes of premature death in Ventura County based upon the Age-Adjusted YLL rate per 100,000 population per year. Cancer and coro-nary heart disease still have the top spots in terms of premature death because they accounted for 37.9% of all deaths from 2015-2017. Accidental deaths ranked 2nd for premature deaths, up from 5th in terms of leading causes death. Drug-induced deaths were the 4th leading cause of premature death, up from 8th. Suicide was the 7th leading cause of premature death, up from 10th. Motor vehicle traffic crashes were not among the top 10 leading causes of death, but they did make the top 10 for the leading causes of premature death.
FIGURE 30: AGE-ADJUSTED YEARS OF LIFE LOST RATE PER 100,000 POPULATION PER YEAR, 2015-2017
375.5
381.7
420.6
441.4
469.0
516.1
653.2
1,295.8
1,339.6
3,094.6
0 500 1000 1500 2000 2500 3000 3500
Motor Vehicle Traffic Crashes (N/A)
Diabetes (7)
Alzheimer's Disease (3)
Suicide (10)
Chronic Lower Respiratory Disease (6)
Cerebrovascular Disease (Stroke) (4)
Drug-Induced Deaths (8)
Coronary Heart Disease (2)
Accidents (Unintentional Injuries) (5)
All Cancers (1)
Source: Vital Records Business Intelligence System (deaths 2015-2017) and Claritas Popfacts (2016), analysis by Ventura County Public Health, April 2019
Profile of Ventura County

31Ventura County Community Health Needs Assessment 2019
Figure 31 shows the leading causes of premature death for males and females based upon the Age-Adjusted YLL rate per 100,000 population per year from 2015-2017. The top 3 leading causes of premature death are the same for both males and fe-males. However, accidents were 2nd for females and 3rd for males. Drug induced deaths were the 4th leading cause of death for males resulting in an average of 47.2 years of life lost per death. Alzheimer’s disease was still the 5th leading cause of premature death for women, but only resulted in an average of 8.8 years of life lost.
FIGURE 31: LEADING CAUSES OF PREMATURE DEATH, 2015-2017
Leading Causes of Premature Death, 2015-2017
Rank Ventura County Male Female
1 All Cancers All Cancers All Cancers
2Accidents (Unintentional Injuries)
Coronary Heart DiseaseAccidents (Unintentional Injuries)
3 Coronary Heart DiseaseAccidents (Unintentional Injuries)
Coronary Heart Disease
4 Drug-Induced Deaths Drug-Induced DeathsCerebrovascular Disease (Stroke)
5Cerebrovascular Disease (Stroke)
Suicide Alzheimer’s Disease
6Chronic Lower Respiratory Disease
Motor Vehicle Traffic Crashes
Chronic Lower Respiratory Disease
7 Suicide Firearm-Related Deaths Drug-Induced Deaths
8 Alzheimer’s DiseaseCerebrovascular Disease (Stroke)
Diabetes
9 Diabetes DiabetesChronic Liver Disease and Cirrhosis
10Motor Vehicle Traffic Crashes
Chronic Lower Respiratory Disease
Motor Vehicle Traffic Crashes
Source: Vital Records Business Intelligence System (deaths 2015-2017) and Claritas Popfacts (2016), analysis by Ventura County Public Health, April 2019
4.8.1 Premature Deaths from Cancer
Cancer was the leading cause of both death and premature death in Ventura County from 2015-2017. Figure 32 shows the Age-Adjusted YLL rate per 100,000 population per year from all cancers combined. Males had a higher rate of premature death from cancer than females. African Americans/Blacks (Non-Hispanic) experienced the highest premature death rate, due to cancer, of any race/ethnic group followed by Whites (Non-Hispanic), Hispanics, and then Asians (Non-Hispanic).
Males lost an average of 21.8 years due to all cancers compared to 22.3 years for females. Hispanics had the highest average years of life lost per death from all can-cers (26.7 years) followed African Americans/Blacks (Non-Hispanic) (24.0 years), Asians (Non-Hispanic) (22.0 years), and then Whites (Non-Hispanic) (20.7 years). On average, there were 22.0 years of life lost per death from cancer for all race/ethnic groups combined.
FIGURE 32: ALL CANCERS - AGE-ADJUSTED YEARS OF LIFE LOST RATE PER 100,000 POPULATION PER YEAR, 2015-2017
2,741.0
3,981.8
1,956.4
2,520.5
2,852.3
3,433.2
3,094.6
White
AfAm/Black
Asian
Hisp/Lat
Female
Male
VenturaCounty
Source: Vital Records Business Intelligence System (deaths 2015-2017) and Claritas Popfacts (2016), analysis by Ventura County Public Health, April 2019
Figure 33 shows the Age-Adjusted YLL rate per 100,000 population per year by type of cancer. Lung cancer had the highest premature death rate and resulted in an average of 20.3 years of life lost per death. Breast cancer had the second highest premature death rate and resulted in an average of 24.9 years of life lost per death.
Profile of Ventura County

32Ventura County Community Health Needs Assessment 2019
FIGURE 33: CANCER - AGE-ADJUSTED YEARS OF LIFE LOST RATE PER 100,000 POPULATION PER YEAR, 2015-2017
106.1
141.3
152.0
164.1
248.8
284.6
294.6
466.9
520.0
Ovarian Cancer
Kidney Cancer
Liver Cancer
Brain Cancer
Pancreatic Cancer
Prostate Cancer
Colorectal Cancer
Female Breast Cancer
Lung Cancer
Source: Vital Records Business Intelligence System (deaths 2015-2017) and Claritas Popfacts (2016), analysis by Ventura County Public Health, April 2019
Figure 34 shows the average years of life lost per death by gender and race/ethnicity for all cancers, lung cancer, and breast cancer. Hispanics had the highest average years of life lost for all cancers (26.7 years). African Americans/Blacks (Non-Hispanic) had the highest average years of life lost for breast cancer (29.3 years), but Hispan-ics (29.1 years) and Asians (Non-Hispanic) (29.2 years) also had a higher average years of life lost compared to Whites (Non-Hispanic) (23.8 years) for breast cancer.
FIGURE 34: AVERAGE YEARS OF LIFE LOST PER DEATH, 2015-2017
20.7
24.0
22.0
26.7
22.3
21.8
22.0
20.1
18.9
19.2
21.2
19.8
20.8
20.3
23.8
29.3
29.2
29.1
24.9
0.0
24.9
White
AfAm/Black
Asian
Hisp/Lat
Female
Male
VenturaCounty
Breast Cancer Lung Cancer All Cancers
Source: Vital Records Business Intelligence System (deaths 2015-2017) and Claritas Popfacts (2016), analysis by Ventura County Public Health, April 2019
4.8.2 Premature Deaths from Coronary Heart Disease
Coronary heart disease (CHD) was the second leading cause of both death and premature death in Ventura County from 2015-17. Figure 35 shows the Age-Adjust-ed YLL rate per 100,000 population per year from CHD. Males had a higher rate of premature death from CHD than females. African Americans/Blacks (Non-Hispanic) experienced the highest premature death rate of any race/ethnic group followed Whites (Non-Hispanic), Hispanics, and then Asians (Non-Hispanic). Males lost an average of 18.2 years due to CHD compared to 11.9 years for females. Hispanics had the highest average years of life lost per death from CHD (19.0 years) followed African Americans/Blacks (Non-Hispanic) (18.4 years), Whites (Non-Hispanic) (14.8 years), and then Asians (Non-Hispanic) (14.3 years). On average, there were 15.6 years of life lost per death from CHD.
Profile of Ventura County

33Ventura County Community Health Needs Assessment 2019
FIGURE 35: CORONARY HEART DISEASE - AGE-ADJUSTED YEARS OF LIFE LOST RATE PER 100,000 POPULATION PER YEAR, 2015-2017
1,147.8
1,394.6
953.4
1,105.4
715.7
1,978.0
1,295.8
White
AfAm/Black
Asian
Hisp/Lat
Female
Male
VenturaCounty
Source: Vital Records Business Intelligence System (deaths 2015-2017) and Claritas Popfacts (2016), analysis by Ventura County Public Health, April 2019
FIGURE 36: CORONARY HEART DISEASE - AVERAGE YEARS OF LIFE LOST PER DEATH, 2015-2017
14.8
18.4
14.3
19
11.9
18.2
15.6
White
AfAm/Black
Asian
Hisp/Lat
Female
Male
VenturaCounty
Source: Vital Records Business Intelligence System (deaths 2015-2017) and Claritas Popfacts (2016), analysis by Ventura County Public Health, April 2019
4.8.3 Premature Deaths from Accidents (Unintentional Injuries)
Deaths due to accidents (unintentional injuries) were the 3rd leading cause of premature death, up from 5th as a leading cause of death. Figure 37 shows that males were more likely than females to die a premature death due to an accident
(unintentional injury); males lost an average of 42.6 years per death while females lost an average of 33.4 years per death. Hispanics were more likely than Whites (Non-Hispanics) and Asians to die a premature death due to an accident (uninten-tional injury); Hispanics lost an average of 49.4 years per accidental death compared to 35.1 years for Whites (Non-Hispanic) and 31.4 years for Asians.
FIGURE 37: ACCIDENTS- AGE-ADJUSTED YEARS OF LIFE LOST RATE PER 100,000 POPULATION PER YEAR, 2015-2017
1,078.8
535.8
1,241.1
726.4
1,947.5
1,339.6
White
Asian
Hisp/Lat
Female
Male
VenturaCounty
Source: Vital Records Business Intelligence System (deaths 2015-2017) and Claritas Popfacts (2016), analysis by Ventura County Public Health, April 2019
FIGURE 38: ACCIDENTS - AVERAGE YEARS OF LIFE LOST PER DEATH, 2015-2017
658.6
465.1
407.3
891.3
653.2
White
Hisp/Lat
Female
Male
VenturaCounty
Source: Vital Records Business Intelligence System (deaths 2015-2017) and Claritas Popfacts (2016), analysis by Ventura County Public Health, April 2019
Profile of Ventura County

34Ventura County Community Health Needs Assessment 2019
4.8.4 Drug-Induced Premature Deaths
Drug-induced deaths were the 4th leading cause of premature death, up from 8th as a leading cause of death. Figure 39 shows that males were more likely than females to die a premature death due to drug exposure; males lost an average of 47.1 years per death while females lost an average of 41.2 years per death. Whites (Non-Hispanics) were more likely than Hispanics to die a premature death due to drug exposure; however, Hispanics lost an average of 54.2 years per drug-induced death compared to 44.2 years for Whites (Non-Hispanic).
FIGURE 39: DRUG-INDUCED DEATHS - AGE-ADJUSTED YEARS OF LIFE LOST RATE PER 100,000 POPULATION PER YEAR, 2015-2017
658.6
465.1
407.3
891.3
653.2
White
Hisp/Lat
Female
Male
VenturaCounty
Source: Vital Records Business Intelligence System (deaths 2015-2017) and Claritas Popfacts (2016), analysis by Ventura County Public Health, April 2019
FIGURE 40: DRUG-INDUCED - AVERAGE YEARS OF LIFE LOST PER DEATH, 2015-2017
44.2
54.2
41.2
47.1
45.1
White
Hisp/Lat
Female
Male
VenturaCounty
Source: Vital Records Business Intelligence System (deaths 2015-2017) and Claritas Popfacts (2016), analysis by Ventura County Public Health, April 2019
4.8.5 Premature Deaths due to Suicide
Suicide was the 7th leading cause of premature death, up from 10th as a leading cause of death. Figure 41 shows that males were more likely than females to die a premature death due to suicide; Figure 42 shows males lost an average of 40.8 years per death while females lost an average of 42.4 years per death. Whites (Non-Hispanics) were more likely than Hispanics to die a premature death due to suicide, however, Hispanics lost an average of 53.5 years per death due to suicide compared to 39.1 years for Whites (Non-Hispanic).
Profile of Ventura County

35Ventura County Community Health Needs Assessment 2019
FIGURE 41: SUICIDE - AGE-ADJUSTED YEARS OF LIFE LOST RATE PER 100,000 POPULATION PER YEAR, 2015-2017
488.5
186.2
197.4
690.1
441.4
White
Hisp/Lat
Female
Male
VenturaCounty
Source: Vital Records Business Intelligence System (deaths 2015-2017) and Claritas Popfacts (2016), analysis by Ventura County Public Health, April
FIGURE 42: PREMATURE DEATH DUE TO SUICIDE, YEARS OF LIFE LOST PER DEATH, 2015-2017
39.1
53.5
42.4
40.8
42.1
White
Hisp/Lat
Female
Male
VenturaCounty
Source: Vital Records Business Intelligence System (deaths 2015-2017) and Claritas Popfacts (2016), analysis by Ventura County Public Health, April 2019
4.8.6. Average Years of Life Lost per Premature Death
Figure 43 shows the top ten causes of premature death in terms of the average years of life lost per death in Ventura County. Homicide has the highest average years of life lost per death at 57.5 years, which increases to 62.9 years for Hispanics. Firearm related deaths have the second highest average years of life lost per death at 45.9 years, followed by drug-induced deaths at 45.1 years, motor-vehicle crashes at 44.5 years, suicide at 41.2 years, and accidents (unintentional injuries) at 39.5 years.
These causes of death are preventable; this is how the younger population is dying in Ventura County. Although access to health care may play a role in a small pro-portion of these deaths in terms of access to behavioral health services for those addicted to substances or suffering from mental health issues, in large part, these deaths are related to conditions influenced by the social determinants of health such as safe neighborhoods, educational opportunities, poverty status, and the built environment. To create a healthy Ventura County, it is imperative to expand the public health focus upstream in terms of prevention, from a priority on providing access to health services to include an emphasis on addressing social determinants and creating healthy communities.
FIGURE 43: AVERAGE YEARS LIFE LOST PER DEATH, 2015-2017
25.0
30.5
31.4
32.4
39.5
41.2
44.5
45.1
45.9
57.5
Ovarian Cancer (124)
Chronic Liver Disease and Cirrhosis (326)
Chronic viral hepatitis C (48)
Brain Cancer (139)
Accidents (Unintentional Injuries) (876)
Suicide (282)
Motor Vehicle Traffic Crashes (215)
Drug-Induced Deaths (375)
Firearm-Related Deaths (174)
Homicide (82)
Source: Vital Records Business Intelligence System (deaths 2015-2017) and Claritas Popfacts (2016), analysis by Ventura County Public Health, April 2019. The number by the cause of death refers to the number of deaths that occurred
Profile of Ventura County

36Ventura County Community Health Needs Assessment 2019
5.1 SocioNeeds Index
All communities can be described by various social and economic factors that are well known to be strong determinants of health outcomes, as discussed previously. Healthy Communities Institute developed the SocioNeeds Index to easily compare multiple socioeconomic factors across geographies. This index incorporates estimates for six different social and economic determinants of health — income, poverty, unemployment, occupation, educational attain-ment, and linguistic barriers — that are associated with poor health outcomes including preventable hospitalizations and premature death. Within Ventura County, zip codes are ranked based on their index value to identify the relative levels of need. Those geographic areas with the highest values (from 0-100) are estimated to have the highest socioeconomic need which can be correlated with preventable hospitalizations and premature death (Healthy Communities Institute, 2019).
Figure 44 shows that Oxnard (93030, 93033 and 93036), Santa Paula (93060), Fillmore (93015), and Port Hueneme (93041) are the areas within the county that have the highest socioeconomic needs. In general, the areas of the county with higher socioeconomic needs (highlighted above) have a lower average life expectancy than the average of 82.0 years for Ventura County residents. Conversely, those areas with lower socioeconomic needs such as Oak Park (93777) and Thousand Oaks/Westlake (91361 and 91362) both have life ex-pectancies of 85+ years.
FIGURE 44: SOCIONEEDS INDEX, VENTURA COUNTY, 2019
Source: Health Matters in Ventura County
Disparities

37Ventura County Community Health Needs Assessment 2019
5.2 Index of Disparity
Critical components in assessing the needs of a community are identifying barriers and disparities in health care. Additionally, the identification of barriers and disparities will help inform and focus strategies for addressing the prioritized health needs for Ventura County. Healthy Communities Institute developed the Index of Disparity, a tool used to summarize disparities across groups within a population across all indicators.
The tables below identify secondary data health indicators with race/ethnic disparities in Ventura County. Table 7 lists the indicators with the greatest, significant race/ethnic dis-parities and highlights the groups that were impacted. Table 8 displays the number of significant health indicators for each race/ethnic group. Black and African American populations had the greatest impact, with disparities in 19 indicators. This is followed by the White population, with disparities in 16 indicators, and the Hispanic or Latino population, with disparities in 11 indicators.
Upon further examination, the Black or African American pop-ulation is predominately experiencing disparities related to asthma, diabetes, dental care, mental health and substance abuse. Among the significant health indicators, Age-Adjusted Emergency Room (ER) Rate due to Pediatric Asthma has the highest disparity in Black or African American individuals, with 97.6 ER visits per 10,000 population. This is in comparison to the Ventura County rate of 29.6 ER visits per 10,000 population. The White population is experiencing disparities in mental health, substance abuse, and asthma. Among the significant health indicators, Age-Adjusted ER rate due to Mental Health had the greatest disparity, with 88.5 ER visits per 10,000 population in the White Population, compared to the Ventura County overall value of 73.9 ER visits per 10,000 population. The Hispanic or Latino population is experiencing disparities in poverty, dia-betes, and substance abuse (alcohol). This population had the greatest disparity in teens who have used alcohol, with 53.5% of teens reporting use of alcohol in Ventura County, compared to the overall value of 35.9%.
Disparities
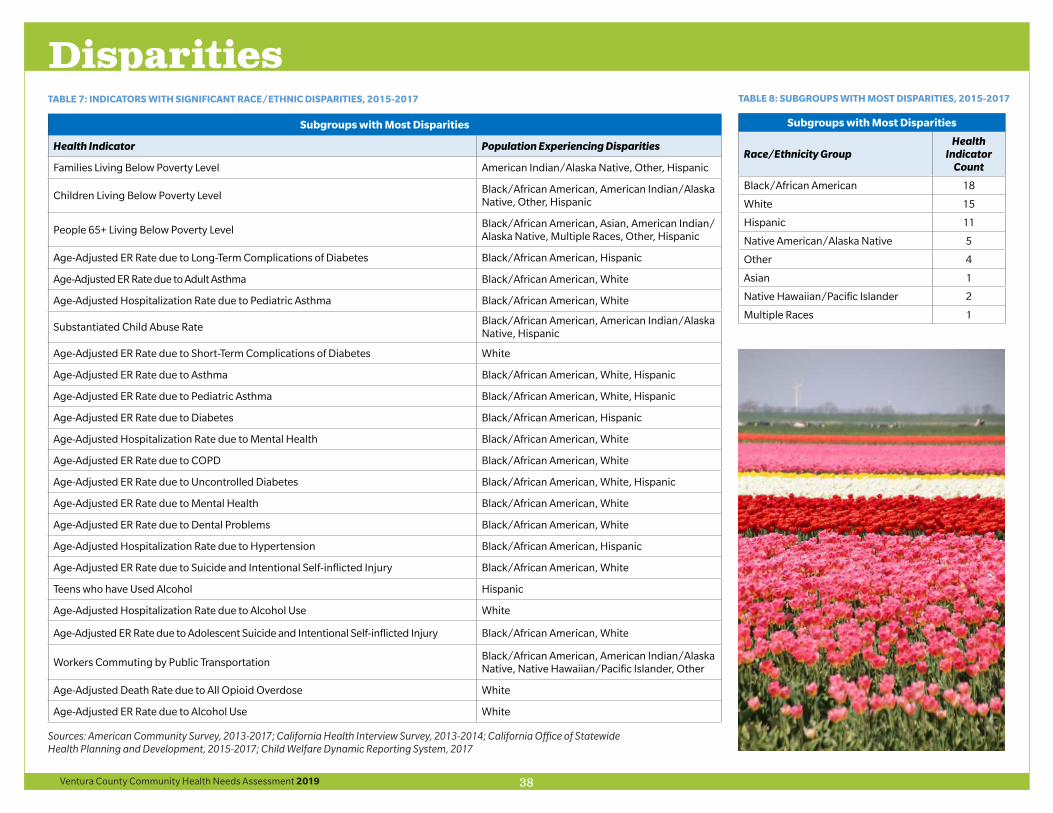
38Ventura County Community Health Needs Assessment 2019
TABLE 7: INDICATORS WITH SIGNIFICANT RACE/ETHNIC DISPARITIES, 2015-2017
Subgroups with Most Disparities
Health Indicator Population Experiencing Disparities
Families Living Below Poverty Level American Indian/Alaska Native, Other, Hispanic
Children Living Below Poverty LevelBlack/African American, American Indian/Alaska Native, Other, Hispanic
People 65+ Living Below Poverty LevelBlack/African American, Asian, American Indian/ Alaska Native, Multiple Races, Other, Hispanic
Age-Adjusted ER Rate due to Long-Term Complications of Diabetes Black/African American, Hispanic
Age-Adjusted ER Rate due to Adult Asthma Black/African American, White
Age-Adjusted Hospitalization Rate due to Pediatric Asthma Black/African American, White
Substantiated Child Abuse RateBlack/African American, American Indian/Alaska Native, Hispanic
Age-Adjusted ER Rate due to Short-Term Complications of Diabetes White
Age-Adjusted ER Rate due to Asthma Black/African American, White, Hispanic
Age-Adjusted ER Rate due to Pediatric Asthma Black/African American, White, Hispanic
Age-Adjusted ER Rate due to Diabetes Black/African American, Hispanic
Age-Adjusted Hospitalization Rate due to Mental Health Black/African American, White
Age-Adjusted ER Rate due to COPD Black/African American, White
Age-Adjusted ER Rate due to Uncontrolled Diabetes Black/African American, White, Hispanic
Age-Adjusted ER Rate due to Mental Health Black/African American, White
Age-Adjusted ER Rate due to Dental Problems Black/African American, White
Age-Adjusted Hospitalization Rate due to Hypertension Black/African American, Hispanic
Age-Adjusted ER Rate due to Suicide and Intentional Self-inflicted Injury Black/African American, White
Teens who have Used Alcohol Hispanic
Age-Adjusted Hospitalization Rate due to Alcohol Use White
Age-Adjusted ER Rate due to Adolescent Suicide and Intentional Self-inflicted Injury Black/African American, White
Workers Commuting by Public TransportationBlack/African American, American Indian/Alaska Native, Native Hawaiian/Pacific Islander, Other
Age-Adjusted Death Rate due to All Opioid Overdose White
Age-Adjusted ER Rate due to Alcohol Use White
Sources: American Community Survey, 2013-2017; California Health Interview Survey, 2013-2014; California Office of Statewide Health Planning and Development, 2015-2017; Child Welfare Dynamic Reporting System, 2017
TABLE 8: SUBGROUPS WITH MOST DISPARITIES, 2015-2017
Subgroups with Most Disparities
Race/Ethnicity GroupHealth
Indicator Count
Black/African American 18
White 15
Hispanic 11
Native American/Alaska Native 5
Other 4
Asian 1
Native Hawaiian/Pacific Islander 2
Multiple Races 1
Disparities

39Ventura County Community Health Needs Assessment 2019
6.1 Community Survey Key Findings
The source of all the figures included in this section is the Community Health Assessment Survey (2019), designed and disseminated by the Ventura County Community Health Needs Assessment Collaborative. A total of 2,722 responses were collected. The sample size met the conditions of 95% confidence interval and had a margin of error of 1.88%. This was a convenience sample, which means results may be vulnerable to selection bias. The results are generalizable to the population of Ventura County.
Of the total survey participants, 84.6% (N = 2303) completed the survey in English and 15.4% (N=419) completed the survey in Spanish. The average age of respon-dents was 48.3 years. Respondents were more likely to be female than male (78.5% female versus 21.5% male), married or co-habitating (62.4%), and owned their house (79.5%). Figure 45 below shows the breakdown of respondents by ethnic group with which they identify most. The bulk of the survey participants were of White or Caucasian and Hispanic or Latino race/ethnicity (42.6% and 40.5% respectively) but an effort was made to include vulnerable populations such as indigenous people from southern Mexico (Oaxaca, Guerrero etc.) who comprised 3% of those surveyed. Figure 46 shows most survey participants were college graduates (62.1%) while 22.2% had high school diploma or GED and 9.6% had a high school education or less.
FIGURE 45: RACE/ETHNIC BREAKDOWN OF SURVEY PARTICIPANTS Figure 45
Figure 46
African American/Black
1%Asian/Pacific Islander
4%
Hispanic/Latino41%
Indigenous (Oaxaca, Guerrero, etc.)
3%Native American
1%
White/Caucasian43%
Mixed Race (two or more races)
4%
Other 3%
FIGURE 46: EDUCATION ATTAINMENT OF SURVEY PARTICIPANTS
6.10%
9.60%
22.20%
62.10%
Other
Less than high school
High school diploma or GED
College degree or higher
Primary Data Collection

40Ventura County Community Health Needs Assessment 2019
Figure 47 shows the industries or businesses that employ survey participants. Al-most one-third were employed by Healthcare (31.0%) and another quarter (24.2%) were Government employees. The survey covered vulnerable populations; 6.4% were employed by the Agricultural sector while another 1.8% were employed by the construction industry.
FIGURE 47: BUSINESS OR INDUSTRY THAT EMPLOYS SURVEY PARTICIPANTS
Figure 47
Figure 48
62.1%
22.2%
9.6%
6.1%
College degree or higher
High school diploma or GED
Less than high school
Other
31.0%
24.2%
23.0%
6.5%
6.4%
4.2%
2.1%
1.8%
0.5%
0.3%
Healthcare
Government
Other
Education
Agriculture
Food Service or Retail
Technology
Construction
Transportation
Military
Figure 48 tracks the type of housing occupied by survey participants. The majority lived in their own house or apartment (79.5%). Another 18.7% lived in their family member’s or friend’s house. The survey was able to reach out to homeless individ-uals who constituted 1.7% of all the participants.
FIGURE 48: HOUSING TYPE OCCUPIED BY SURVEY PARTICIPANTS
Figure 49
Figure 50
79.5%
16.1%
2.6%
1.7%
0.1%
Your own house or apartment
Family member's house or apartment
Friend's house or apartment
Homeless (please indicate where you sleep)
Hotel/motel
69.0%
16.3%
14.0%
9.3%
6.1%
1.1%
0.2%
Health insurance (e.g. private insurance, Blue Shield, HMO)
Medi-Cal
Medicare
Pay cash (no insurance)
Other
Veterans Administration
Indian Health Services
As shown in Figure 49, 69% of the survey participants pay for healthcare with their own insurance, while Medi-Cal, Medicare and cash payment (16.3%, 14.0% and 9.3%) accounts for the insurance coverage of most of the other participants.
FIGURE 49: INSURANCE COVERAGE OF SURVEY PARTICIPANTS
Figure 49
Figure 50
79.5%
16.1%
2.6%
1.7%
0.1%
Your own house or apartment
Family member's house or apartment
Friend's house or apartment
Homeless (please indicate where you sleep)
Hotel/motel
69.0%
16.3%
14.0%
9.3%
6.1%
1.1%
0.2%
Health insurance (e.g. private insurance, Blue Shield, HMO)
Medi-Cal
Medicare
Pay cash (no insurance)
Other
Veterans Administration
Indian Health Services
Perception of personal health is indicative of the quality of life in the community. Most of the survey participants (58.3%) rate themselves as “very healthy” or “healthy” (Figure 50). However, approximately 1 in 11 of those surveyed reported themselves as “unhealthy” or “very unhealthy”.
FIGURE 50: RATING OF PERSONAL HEALTH BY SURVEY PARTICIPANTS
Figure 51
2.7%
6.5%
11.6%
32.6%
46.7%
Very unhealthy
Unhealthy
Very healthy
Somewhat healthy
Healthy
Primary Data Collection

41Ventura County Community Health Needs Assessment 2019
Most survey respondents rated Ventura County as a “somewhat healthy” or “healthy” community (80.7%).The data collected from the following questions was cross-ref-erenced with the primary and secondary data collected to determine the priority health issues for Ventura County residents.
• What do you think makes a “Healthy Community?” (Choose the three options that most improve the quality of life in a community.)
• What do you think are the three most important “health problems” in our community? (Those problems which have the greatest impact on overall community health.)
• What do you think are the three most important “risky behaviors” in our community? (Those behaviors which have the greatest impact on overall community health.)
Figure 51 and Figure 52 below show the top responses for what makes a healthy community in 2019 and 2016. Access to health care was the number one response for survey participants and has remained so consistently for the past 4 years, but there is a shift in priorities toward housing, low crime, economic opportunities and clean environment indicating a rising precedence of social and economic factors that are the underlying causes of poor health in communities.
FIGURE 51: FACTORS THAT IMPROVE LIFE IN THE COMMUNITY
79.7%
46.2%
46.1%
44.6%
42.2%
41.1%
36.1%
35.7%
34.9%
27.4%
24.6%
22.2%
21.0%
18.7%
17.3%
15.2%
13.2%
12.4%
11.7%
8.0%
6.9%
4.9%
Access to health Care
Affordable housing
Low crime/safeneighborhoods
Good jobs and healthyeconomy
Clean environment
Good schools
Access to organizationswhich provide community…
Healthy behaviors andlifestyles
Safe places to exercise
Good place to raise children
Strong family life
Access to transportation
Parks and recreation
Good place to grow older
Religious or spiritual values
Caregiver support andeducation
Low level of child abuse
Excellent race relations
Arts and cultural events
Low infant deaths
Low adult death and diseaserate
Other
Primary Data Collection

42Ventura County Community Health Needs Assessment 2019
FIGURE 52: COMPARISON OF FACTORS THAT IMPROVE LIFE IN THE COMMUNITY
Rank 2016 2019
1 Access to health care Access to health care
2 Clean Environment Affordable Housing
3 Good Schools Low crime/safe neighborhoods
4Healthy Behaviors and Lifestyles
Good jobs and healthy economy
5Low crime/safe neighborhoods
Clean Environment
Source: Community Health Assessment Survey, 2016 and 2019
Figure 53 and Figure 54 below show the top responses for the most important health problems within the community. Mental health followed by high healthcare costs, cancer, diabetes, and aging complications ranked as the top five health priorities. The selection of mental health and aging problems appear to be reflective of issues that are also shown in secondary data analysis.
FIGURE 53: STATED HEALTH PRIORITIES FOR SURVEY PARTICIPANTS
49.9%
42.8%
39.5%
35.4%
29.7%
27.1%
24.1%
21.1%
19.3%
18.9%
18.7%
18.1%
13.1%
11.9%
11.6%
11.5%
11.3%
11.2%
10.0%
10.0%
9.6%
9.4%
7.5%
7.3%
6.8%
6.3%
6.1%
5.4%
5.2%
5.0%
5.0%
4.7%
4.5%
2.4%
2.2%
Mental health problems (e.g.…
High healthcare costs (e.g.…
Cancers
Diabetes
Aging complications (e.g.…
Poor housing conditions or…
Lack of good paying jobs
Heart disease and stroke
Environmental Exposures…
High blood pressure
Domestic Violence
Child abuse / neglect
Other
Caregiver stress
Lack of sufficient food or…
Multiple chronic conditions
Lack of information to make…
Lack of educational…
Dental problems
Lack of free early childhood…
Natural disasters (e.g.…
Suicide
Firearm-related injuries
Lack of transportation for…
Teenage pregnancy
Infectious Diseases (e.g.…
Homicide
HIV / AIDS
Rape/sexual assault
Respiratory/lung disease
Sexually Transmitted…
Language access/lack of…
Motor vehicle crash injuries
Lack of access to prenatal…
Infant Death/Stillborn
Primary Data Collection

43Ventura County Community Health Needs Assessment 2019
FIGURE 54: COMPARISON OF STATED HEALTH PRIORITIES IN THE COMMUNITY
Rank 2016 2019
1 Cancer Mental health problems
2 Diabetes High healthcare costs
3 Child abuse/neglect Cancer
4 Mental health problems Diabetes
5 Lack of good paying jobs Aging complications
Source: Community Health Assessment Survey, 2016 and 2019
Drug abuse, alcohol abuse, being overweight/obese, poor eating habits, and lack of exercise were the top five responses to the most important risk behaviors reported for Ventura County and did not vary significantly from the previous health assess-ment survey (Figure 55 and Figure 56). The reported risky behaviors corroborate secondary data analysis results for the county.
FIGURE 55: RISKY BEHAVIORS RANKED IN THE COMMUNITY
Figure 55
72.7%
64.2%
62.2%
51.7%
42.2%
37.8%
31.5%
22.4%
21.2%
21.0%
19.0%
15.6%
14.6%
6.4%
6.0%
Drug abuse
Alcohol Abuse
Being overweight/obese
Poor eating habits
Lack of exercise
Prescription Drug Abuse
Tobacco/e-cigarette use
Dropping out of school
Not getting "shots" to prevent disease
Racism
Lack of family planning (e.g. not using birth control)
Unsafe sex
Lack of adequate sleep
Not using seat belts/child safety seats
Other
FIGURE 56: COMPARISON OF STATED RISKY BEHAVIORS IN THE COMMUNITY
Rank 2016 2019
1 Drug abuse Drug abuse
2 Alcohol abuse Alcohol abuse
3 Being overweight/obese Being overweight/obese
4 Poor eating habits Poor eating habits
5 Racism Lack of exercise
Source: Community Health Assessment Survey, 2016 and 2019
Primary Data Collection

44Ventura County Community Health Needs Assessment 2019
6.2 Key Informant and Focus Group Discussion Findings
One of the key objectives of this assessment was to engage the community, in-cluding vulnerable populations, physicians, and other service providers to share their perceptions on health needs for Ventura County residents. Key informant interviews and focus group discussions help to develop a deeper understanding for the reasons behind the health data seen in the previous sections. It also served to identify the high priorities among VCCHNAC members and stakeholders. In the case of the key informants, the interviews touched upon many issues that were specific to their area of work, especially with vulnerable populations, whereas the focus group discussions with community members focused on age, race and/or gender issues related to accessing healthcare and barriers to access. Any findings, arising from the interviews, group discussion, or review of other recently conducted assessments in the county that pertain to the prioritized health needs are discussed in SECTION 7: Data Synthesis and Prioritization. The issue that was high concern, cross-cutting with all participants and with the widest reaching implications was Barriers to Healthcare. It is discussed here in detail.
Barriers to Health Care
Focus group participants and key informants reported many instances of county residents being unable to access healthcare in a timely manner, get quality service which included an understanding of their cultural beliefs, and receive treatment instructions in a language that they understood clearly. Barriers mentioned by the participants included:
Inadequate or no insurance coverage
Lack of insurance was particularly an issue for Agricultural Workers while, in general, inadequacy of insurance was more mentioned in the context of dental care. In an Oral Health Assessment conducted for the Oral Health Advisory Committee, by Ventura County Public Health (known hereafter as they Oral Health Assessment) in 2018, lack of a dental home and the inability to afford care due to the cost of treatment were the main reasons cited for not accessing preventive dental care. Having to pay when a person has no insurance—or for benefits not fully covered by Denti-Cal—received the highest mentions by group participants. Lack of dental and vision coverage by Medicare was also quoted by older adult group participants for low utilization of these services.
High cost of healthcare and of accessing healthcare
All group participants, even those that had health coverage, reported the prohibitive cost of treatment, medications, and screenings as a high concern. This was most true for dental treatment where patient financial concerns were described as having to pay for the part of the treatment Denti-Cal does not cover, and having “excessive” sliding fee scales at dental clinics. While children’s coverage was largely deemed satisfactory, the benefit coverage for adults was labeled unsatisfactory due to the treatment cost. To quote the report, “The majority of adults without any form of coverage shared that they could not even pay the lower end of the fee-charging clinics’ sliding fee schedules; when offered the opportunity to apply for a loan (through the clinic in some cases), most declined because they either had “bad credit” or knew they couldn’t make the payments”. This concern was reaffirmed by health care providers at one of the hospitals covered by this assessment who stated that clients are not accessing care because they do not have the money to pay the out-of-pockets costs for co-pays and prescription drugs.
The high cost of healthcare was felt even more acutely by individuals earning just a living wage. Per the interviewed providers, low-wage earners who have health coverage were not able to access healthcare because their jobs do not provide time off to seek care. Clinics have inflexible clinic hours, especially specialty care, which made weekend and after-hour appointments impossible. Seeking healthcare came with additional financial burden of loss of pay for taking the day off and the additional cost of transportation and child-care. Hidden costs like co-pays and cost of medication or treatment not entirely covered by their health plans added to the financial burdens.
Primary Data Collection

45Ventura County Community Health Needs Assessment 2019
Transportation
An important factor in accessing healthcare is physical location and transportation. Per hospital-based key informants, distance and location of services was stated as an important reason for not availing healthcare by clients.
“The county is spread out and there is lots of traffic, so face to face visits are not always realistic”
Lack of Providers
Even with an adequate number of providers in the county, denial of service and unwillingness of providers to accept a variety of insurance plans to administer care to patients was reported to be a barrier.
Many of the dentists interviewed for the Oral Health Assessment also reported that they did not accept Denti-Cal due to low reimbursement rates. Further, many dental offices did not accept children younger than 3 years because they were neither trained nor equipped to manage young children, limiting the number of dentists that were available for pediatric care.
Lack of Appointments
Group participants stated the unavailability of appointments as a strong barrier to accessing healthcare, especially for mental, oral and all types of specialty care. Seeking preventive or non-urgent care took between 2 to 6 weeks, according to the group of Older Adults. To quote a participant:
“Specialty clinics do not keep cancelation lists, so the clients must continually call into the office to see if there is an appointment available”
Lack of Awareness
The group discussions revealed that clients were not aware of their coverage eligi-bility if they had no insurance and when they had a dental and/or medical home, the extent of their coverage. Community dental clinics provide safety net dental care for Ventura County’s low-income population; awareness of them was found to be uneven, as reported by the Oral Health Assessment. Because their knowledge and experience of healthcare was from their home country, new immigrants were
not aware of the free screenings and care for which they were eligible. According to young Hispanic women, no one availed themselves of pre-natal care back home because it was not a recommended service nor was it provided. In the groups of Older Adults and low-income minority women, many were not aware of all the preventive services that were recommended and covered by insurance. As a result, preventive services were reported to be underutilized by this category of health utilizers.
Another lack of awareness, reported by group participants as well as key informants, was regarding resources available in Ventura County. A group conducted among Head Start stakeholders pointed to a need for Local School District Resource Officers to identify families who have children in need and align the family with community resources for aid.
Inadequacy of Culturally Competent Care
The quality of care received by minorities and other vulnerable populations (like homeless and LGBTQ) covered by this and other recent assessments was a factor of the appropriateness of language in which the services were delivered as well as the relationships of trust and respect between provider and patient. A few African Americans that attended the groups mentioned suffering poorer quality treatment than others. The Mixteco population interviewed especially stated they felt fearful or embarrassed when going to appointments and uncomfortable speaking to the nurses, because they did not think they would be understood. Many providers admitted that there were language barriers because certain services were only offered in or translation available through a phone-based service. The hospitals and other service providers did not have the capacity for dedicated clinical staff that spoke other languages.
A Community Mental Health Needs Assessment published by Ventura County Be-havioral Health in February 2019 stated one of the most frequent barriers quoted for mental health was the fear of being mistreated by a provider. Providers were also aware of this barrier.
“Within the Latino community, I would say trust is an issue, especially with those of us who do charge for services or need to collect financial verification documents”
Primary Data Collection

46Ventura County Community Health Needs Assessment 2019
Bureaucracy
An excess of paperwork that needed to be completed to access services and strict eligibility rules dissuaded persons who were most in need of services from accessing them. The paperwork was reported to not only take time but be difficult to under-stand and complete for individuals with limited health literacy/literacy and spoken English language skills. Lack of client-centeredness of service programs which discharged “non-compliant” clients without attempting to address the factors that make them non-compliant (e.g. transportation issues, lack of child care, medical issues) was another such barrier.
Fear and Stigma
Key Informants reported that federal policies regarding immigration and immigrants had served to create a climate of fear and racial profiling that made delivery of health care difficult to such populations. As stated in the Oral Health Assessment, “This is a step backward after many years of encouraging people to sign up for health insurance and obtain regular medical and dental care”. There was a concurrent ac-knowledgement among key informants that undocumented workers were needed in the county, due to agricultural sector being one of the largest employers in Ventura County, and they would need access to services. To quote a provider:
“Immigration concerns, especially in the last year or so, are such that families are afraid; some don’t even want to venture out of their neighborhoods”With diverse populations come different cultural beliefs. Hispanics in group dis-cussions reported a stigma for accessing preventive, mental and maternal health services. Cultural norms discourage breastfeeding, with mixed messaging from family members regarding holding/spoiling a child too much and pumping breast milk at work was not accommodated. Hispanic participants also mentioned that it is embarrassing to seek care for “something in their head,” and this denial is nor-malized in the family environment where treatment was the last resort. The fatalism (“if something bad has to happen, it is the will of God”) in combination of the belief that if it is not hurting, everything is alright has been well documented in Hispanic populations. This was reported in the groups done for the Oral Health Assessment where a lack of knowledge about dental importance was tied to traditions.
“Your parents never went to the dentist until they had tooth pain so you don’t.”
Recommendations based on Key Informants and Group Interviews:
• A population focus on Older Adults, minorities and homeless for healthcare initiatives: their poorer outcomes, in comparison to the general population, is driving many of the indicators in which the county is performing poorly compared to other counties.
• A provider referral management system which enables providers to refer their patients to other medical or social service providers as well as make appointments for the patients from their health information system.
• Flexible appointment schedules that facilitate weekend and extended clinic hours.
• Hire community health navigators who speak the language, are culturally similar and can help educate, coordinate care and act as a bridge between the health systems and population groups experiencing fear and mistrust of health providers.
• Consider voluntarily adopting the National Culturally and Linguistically Appro-priate Services Standards within organizations that provide services to Hispanics.
• Perform social screening at all Care Points (all service providers in the county that may come in contact with indigent patients) and link to resources to offset exacerbating social conditions like housing, transportation, food etc.
Primary Data Collection

47Ventura County Community Health Needs Assessment 2019
7.1 Data Synthesis
Primary and secondary data were collected, analyzed, and synthesized and warning indicators in conjunction with topic areas demonstrating strong evidence of need were used to identify the significant community health needs in the Ventura County Service Area. The data synthesis process is illustrated in Figure 57.
FIGURE 57: VISUAL OF DATA SYNTHESIS APPROACH
All forms of data have strengths and limitations. Secondary data, key informant inter-views and community survey were treated as three separate sources of data. In pri-mary data, topic areas demonstrating strong evidence of need were the health needs discussed with greatest intensity and frequency during key informant interviews and focus groups, as well as the highest ranked health needs and quality of life conditions in the community survey. The secondary data were analyzed using data scoring, which identified health areas of need based on the values of indicators for each topic area (APPENDIX B. Methodology). Table 9 displays the data scores for Health and Quality of Life Topics for Ventura County.
TABLE 9: RANKED HEALTH AND QUALITY OF LIFE TOPIC SCORES, VENTURA COUNTY
Health and Quality of Life Topics Score
Other Chronic Diseases 2.26
Substance Abuse 1.66
Heart Disease & Stroke 1.64
Older Adults & Aging 1.63
Other Conditions 1.56
Access to Health Services 1.55
Transportation 1.54
Children’s Health 1.50
Mental Health & Mental Disorders 1.49
Teen & Adolescent Health 1.48
Education 1.47
Environment 1.43
Exercise, Nutrition, & Weight 1.32
Immunizations & Infectious Diseases 1.31
Prevention & Safety 1.29
Oral Health 1.29
Diabetes 1.27
Mortality Data 1.23
Cancer 1.16
Environmental & Occupational Health 1.15
Public Safety 1.15
Respiratory Diseases 1.12
Women’s Health 1.11
Maternal, Fetal & Infant Health 1.10
Men’s Health 1.04
Wellness & Lifestyle 1.01
Social Environment 0.87
Economy 0.84
Source: Conduent Healthy Communities Institute, 2019
Data Synthesis and Prioritization

48Ventura County Community Health Needs Assessment 2019
The data synthesis process of Conduent HCI usually examines the topic scores of top health need areas and the quality of life areas from the sec-ondary data which demonstrate strong evidence of need, as determined by the highest weighted data scoring results from across the entire county Service Area. The Conduent HCI data scoring process, which categorizes over 241 indicators for the county under 28 topic scores, is explained in detail in APPENDIX B. Methodology. Comparison scores range from 0-3, where 0 indicates the best outcome and 3 the worst.
In the case of Ventura County, no topic but ‘Other Chronic Diseases’ demonstrated high need by displaying comparison scores between 2 and 3 (Table 9: Ranked Health and Quality of Life topic Scores, Ventura County). The low comparison topic scores can be explained by the fact that Ventura County is largely a ‘healthy’ county, as discussed earlier in in SECTION 4: Profile of Ventura County, with the income and education levels of its residents placing the population above the state average. However, there is increasing diversity because of changes in population trends in the county and some indications that certain populations are experiencing significant health disparities. (4.2 Social Determinants of Health and 5.2 Index of Disparity). Thus, a need was felt to examine individual indictors with warning comparison scores between 1.5 and 2.5 that were contrib-uting to the county’s poorer performing metrics, with the aim of isolating those disparities in the county.
7.2 Prioritized Significant Health Needs
To gain a comprehensive understanding of the significant health needs for Ventura County, the findings from the primary data and the secondary data were compared and studied together. A two-step process for prioritization was followed; it is explained in detail in APPENDIX C. Pri-oritization Process. The Ventura County Community Health Needs Assessment Collaborative (VCCHNAC) used a triangulated approach to identify significant health needs for Ventura County. For many of the health topics, evidence of need was present across multiple data sources (viz. secondary data and most/all sources of primary data). For other health topics the evidence was present in secondary data; however it was made a priority based on the strength and increasing trends of the indicator and the recognition that these health priorities were being driven by systemic social and economic conditions and disparities that the VCCHNAC have committed to addressing in their combined efforts. The commitment of VCCHNAC can be seen in the prioritization criteria that were chosen to rank health topics through a survey taken by 14 member partners of the VCCHNAC. The chosen criteria demonstrate a desire to address the root causes of health disparities and build an element of social justice in how healthcare is delivered in the county. The criteria included the following:
• Correction of social or economic inequalities that contribute to poor health
• Potential to impact multiple problems with solution and benefit the community at large
• Availability and commitment from leadership in the involved organizations
• Health problem impacts other health outcomes and/or is a driver of other conditions
The health topics that were indicated by primary and secondary data as topics of concern for the county are shown in the Venn diagram (Figure 58) and are discussed in further detail below.
Data Synthesis and Prioritization

49Ventura County Community Health Needs Assessment 2019
FIGURE 58: DATA SYNTHESIS RESULTS
On April 23, 2019, 25 stakeholders of the VCCHNAC convened in an all-day exercise to review the data synthesis results and prioritize the significant health issues that arose through this analysis. Through this exercise, five priority health areas were defined for subsequent implementation planning by the VCCHNAC Collaborative. These five health priorities are:
• Improve Access to Health Services
• Reduce the Impact of Behavioral Health Issues
• Improve Health and Wellness for Older Adults
• Reduce the Burden of Chronic Disease
• Address Social Needs
The following section will dive deeper into each of these health topics to under-stand how findings from the secondary and primary data led to each health topic becoming a priority health issue for VCCHNAC. For each prioritized health need, key information is presented; secondary data scores are noted for indicators of concern; community input is described; and recommendations that arose from the key informant and group interviews are presented.
7.2.1 Improve Access to Health Services
Access to Health Care Services is a strong and recurring theme throughout the report and in the primary and secondary data reviewed. Access to healthcare was the most important factor that improved quality of life chosen in the community input survey by 79.7% participants; it was also the most mentioned theme in the key informant and group interviews. Access to health is an important factor in determining health outcomes and includes coverage, physical access, health literacy and relationships of trust with physicians (Office of Disease Prevention and Health Promotion, 2019).
TABLE 10: TOPIC SCORES FOR ACCESS TO HEALTH SERVICES FOR VENTURA COUNTY
Health Topic Covered Indicators within Topic Score (**indicator shows a significant race/ethnic disparity)
Topic Score
Access to Health Services Indicators: Non-Physician Primary Care Provider Rate, Adults Delayed or had Difficulty Obtaining Care, People Delayed or had Difficulty Obtaining Care, Children with Health Insurance, Children who Visited a Dentist, Adults Needing and Receiving Behavioral Health Care Services, Adults with Health Insurance: 18-64, People with a Usual Source of Health Care, Primary Care Pro-vider Rate, Dentist Rate
1.55
The topic data score of Access to Health Services was 1.55 (Table 10) which is the midpoint of the range used where 0 indicates the best outcome and 3 the worst. However, the topic score encompassed warning indicators that had higher scores. Table 11 highlights the issue of access in the percent of adults in Ventura County that delayed or had difficulty obtaining care. Given that the number of primary care, mental health and dental providers are comparable if not better than California aver-ages, the barriers to healthcare access are likely reasons for this high priority need.
Data Synthesis and Prioritization

50Ventura County Community Health Needs Assessment 2019
TABLE 11: INDICATOR SCORES FOR ACCESS TO HEALTH SERVICES
ScoreAccess to Health Services
UnitsVentura County
CaliforniaMeasurement
Period
2.17Non-Physician Primary Care Provider Rate
providers/ 100,000
population34.5 52.2 2017
2.00Adults Delayed or had Difficulty Obtaining Care
percent 26.7 21.2 2013-2014
2.00People Delayed or had Difficulty Obtaining Care
percent 12.1 10.1 2016-2017
1.81Children with Health Insurance
percent 96.0 96.9 2017
1.67Children who Visited a Dentist
percent 73.4 78.7 2013-2014
1.56Adults Needing and Receiving Behavioral Health Care Services
percent 60.0 60.9 2016-2017
1.50Adults with Health Insur-ance: 18-64
percent 89.7 88.7 2015-2017
Medical costs in the United States are extremely high, so people without health insurance may not be able to afford medical treatment or prescription drugs. They are also less likely to get routine checkups and screenings, so if they do become ill they will not seek treatment until the condition is more advanced and therefore more difficult and costly to treat. Many small businesses are unable to offer health insurance to employees due to rising health insurance premiums. Cost of health-care is one reason for disparities in access to services. Let’s Get Healthy California reports that the average annual family out-of-pocket spending in California, over time, for families including premiums, co-pays, deductibles and co-insurance for services and prescription drugs was $3,955 for Whites, $3,456 for Asians, $1,969 for Hispanics and $1,946 for Blacks in 2017.
The Healthy People 2020 national health target is to increase the proportion of people with health insurance to 100%. Per the 2013-2017 American Community Survey, 90% of the population of Ventura County has health insurance coverage but 9.3% of the population under 65 years have no insurance coverage. According to the same source, the least percent of insured (Figure 59) were found in Saticoy (72.5%), Meiners Oaks (73.3%), Oxnard (73.5%), El Rio (74.4%), Santa Paula (77.0%), and Oak View (77.4%).
FIGURE 59: ADULTS WITH HEALTH INSURANCE: 19+, 2013-2017
98.8%92.3%91.9%
87.8%74.4%
82.9%99.4%
73.3%85.9%
91.5%96.2%
77.4%80.4%
73.5%89.5%
83.2%87.0%
77.0%96.2%
87.9%72.5%
90.3%90.4%
Bell CanyonCamarillo
Casa ConejoChannel Islands Beach
El RioFillmore
Lake SherwoodMeiners Oaks
Mira MonteMoorparkOak ParkOak View
OjaiOxnard
PiruPort Hueneme
San Buenaventura (Ventura)Santa Paula
Santa Rosa ValleySanta Susana
SaticoySimi Valley
Thousand Oaks
Source: American Community Survey
The percentage of uninsured children 0-18 years was 5.3% from 2013-2017, but adults 19-64 years were more likely to be uninsured at 15.4%. Females were less likely to be uninsured than males (9.5% of females versus 12.2% of males). The percent of Hispanics or Latinos that were uninsured was more than 3 times the percent of Whites (non-Hispanic) that were uninsured in Ventura County from 2013-2017 (18.5% of Hispanics versus 5.1% of Whites). Ventura County had one primary care physicians for every 1,310 patients and one dentist for every 1,130 patients in 2016 (County Health Rankings and Roadmaps, 2019).
With regards to delays or difficulty receiving needed care, 26.7% of adults over the age of 18 in Ventura County reported having to delay or not receive care they felt they needed from 2013-2014. This is due to a variety of reasons, including but not limited to cost, availability of services, difficulty with appointments, lack of transportation, inability to access. Within Ventura County, zip code 91320 had the highest percentage of adults who delayed or had difficulty obtaining care, at 29.1% (Figure 60). Zip codes 93003 (29.0%) and 93063 (28.8%) also had high rates for this measure. All zip codes except 93033 (22.2%), 93030 (23.6%), 93036 (23.7%), and 93060 (24.0%) had greater than a quarter of their adult population who delayed or did not access care they needed.
Data Synthesis and Prioritization

51Ventura County Community Health Needs Assessment 2019
FIGURE 60: ADULTS DELAYED OR HAD DIFFICULTY OBTAINING CARE, 2013-2014
Source: California Health Interview Survey
In 2013-2017, 31.5% of people had public health coverage; 57.3% of those below 138 percent of the poverty threshold were covered. (American Consumer Survey, 2013-2017). This includes the federal programs of Medicare, Medicaid, and VA Health Care (provided through the Department of Veterans Affairs); the Children’s Health Insurance Program (CHIP); and California state health plans. In 2017, Oxnard city has over one third (34.9%) of its residents who only have public health insurance, while the percentage for Ventura city is 27.1%. Camarillo, however, only has 13.3% of its residents with solely public coverage (American Consumer Survey, 2017).
The 500 Cities Project provides estimates for chronic disease risk factors, health outcomes, and clinical preventive services for the largest 500 cities in the United States, including Oxnard, Simi Valley, Thousand Oaks and Ventura. In 2016, these cities all had between 60% and 70% of their adult residents who reported having visited a doctor for a routine checkup within the past year (Figure 61). Thousand Oaks had the highest percentage at 66.9%, while Oxnard had the lowest percentage (60.9%) of the four cities. All four cities had higher percentages of adults who had a routine check in 2016 than they had in 2014, showing a slight increase over time in adults who are visiting a doctor for preventive care.
FIGURE 61: ADULTS WHO HAVE HAD A ROUTINE CHECKUP, 2016
Source: 500 Cities Project, Centers for Disease Control and Prevention
Data Synthesis and Prioritization

52Ventura County Community Health Needs Assessment 2019
The 2017 American Community Survey 5 year averages show that 34.6% of those who lack insurance in Ventura County live below the 138% poverty limit (United States Census Bureau, 2019); these individuals are covered through Medicaid ex-pansion in California and through Medi-Cal should have access to safety net clinics. There are an additional 48.7% that live between 138% and 399% of the poverty limit and are not likely to be covered by employer plans or make living wages that would pay for health insurance. 60% of those uninsured have annual household incomes below $74,999. 72.2% of those that have no insurance are Latino or Hispanic, 52.9% are foreign born and 5.58% have a disability (United States Census Bureau, 2019).
Community Input regarding Barriers to Healthcare has been elaborated upon in Barriers to Health Care in SECTION 6: Primary Data Collection. In summary, lack of insurance/adequate insurance coverage, cost of co-pays, lack of convenient appointments, lack of culturally competent care, unacceptance of Medi- and Denti-Cal by provider due to low reimbursement rates, low awareness of benefits and coverage, fear of federal immigration policies and stigma were the main themes that emerged for low access to healthcare. For instance, children from birth through age 18 are covered with family income levels up to 266 percent of federal poverty limit and pregnant women qualify with incomes up to 213 percent (Medicaid, 2019). There were many female minority group participants who were unaware of this benefit available to them and did not access pre-natal care.
Most of the group participants in this assessment who spoke strongly about health-care access prioritized ease of accessing care and quality of care received as issues rather than coverage per se. These findings are consistent with findings reported by all the recent community assessments conducted in the county. A Community Health Needs Assessment, conducted by Clinicas del Camino Real, Inc. in 2017, mentions a local study that found that only 40% of Zapotec and Mixteco speaking populations were able to find transportation to cover their healthcare needs and 80% of new arrivals owned no transportation at all. Emergency room utilization rates among Clinicas patients was high, with 39% approximately having visited the ER at least once. Among ER Users, the range of visits in the year was between 1-10 visits.
As mentioned in this report, it is a goal of the VCCHNAC to address the differences in health outcomes among groups in Ventura County that have social, economic, and/or environmental disadvantages. These differences, or ‘disparities’, adversely affect groups of people who have systematically experienced greater obstacles to health based on their racial or ethnic group; religion; socioeconomic status; gender; age; mental health; cognitive, sensory, or physical disability; sexual orientation or gender identity; geographic location; or other characteristics historically linked to
discrimination or exclusion (U.S. Department of Health and Human Services, 2008). The CHNA assessment found disparities in access to healthcare and in quality of care for asthma and lack of pre-natal care and breastfeeding support and elaborates on these conditions below for illustrative purposes.
Asthma
Broken down by zip code in Ventura County, Figure 62 depicts Age-Adjusted ER rates due to Asthma in populations 18 years and older. Reducing exposure to poor housing conditions, traffic pollution, secondhand smoke and other factors impacting air quality can help prevent asthma and asthma attacks. Asthma is a manageable chronic disease for most with proper education, household allergen mitigation and self-management of treatment through inhalers. The overall county value for this indicator is 13.0 ER visits per 10,000 population. The region with the highest ER rate due to asthma is 93040. Zip codes in the upper quartile also include 93022 and 93030. In comparison to other indicators, ER rates due to Adult Asthma has the greatest disparity between the overall county value and the highest zip code value. This is indicative of strong disparities in prevalence related to race, access to treatment and mitigation techniques.
Data Synthesis and Prioritization

53Ventura County Community Health Needs Assessment 2019
FIGURE 62: AGE-ADJUSTED AGE RATE DUE TO ASTHMA
Source: California Office of Statewide Planning and Development
In Ventura County, there are race/ethnic disparities in rates of pediatric asthma related ER visits. In fact, all Age-Adjusted Asthma Rates for the county are higher for Blacks than Whites (Table 12). While Blacks have higher rates for asthma in general, asthma is a chronic disease that is well controlled through self-medication, school based management programs, education, and home-mitigation. The high asthma rates are likely to be indicative of disparities in cost and access to the healthcare system, primary care physicians, and preventive health services in addition to quality of chronic and regular care for different populations. With regard to quality of care, feelings of not being treated equally and not receiving similar degrees of care were mentioned by minority group participants.
Data Synthesis and Prioritization

54Ventura County Community Health Needs Assessment 2019
TABLE 12: INDICATOR SCORES FOR ASTHMA
Score Environmental & Occupational Health UnitsVentura County
CaliforniaMeasurement
PeriodHigh Race Disparity *
1.61 Adults with Asthma percent 15.7 15.0 2016-2017
1.61 Asthma: Medicare Population percent 7.7 7.5 2015
1.14 Age-Adjusted ER Rate due to Asthma ER visits/10,000 population 17.3 25.1 2015-2017 Black*, White (20.7), API*, Hisp (18.2)
1.14 Age-Adjusted ER Rate due to Pediatric AsthmaER visits/10,000 population
under 18 years29.6 40.5 2015-2017 Black*, White (36.4), API*, Hisp (32.5)
0.92 Age-Adjusted ER Rate due to Adult AsthmaER visits/10,000 population
18+ years13.0 19.7 2015-2017 Black*, White (15.3), API*, Hisp (13.2)
0.92Age-Adjusted Hospitalization Rate due to Adult Asthma
hospitalizations/ 10,000 population 18+ years
2.6 3.8 2015-2017
0.92 Age-Adjusted Hospitalization Rate due to Asthmahospitalizations/ 10,000
population3.0 5.0 2015-2017
0.92Age-Adjusted Hospitalization Rate due to Pediatric Asthma
hospitalizations/ 10,000 pop-ulation under 18 years
4.4 8.2 2015-2017 Black*, White (6.1) Hisp (4.2)
Lack of Pre-Natal Care and Breastfeeding Support
Access to health care for subpopulations of women of childbearing age was also identified as a disparity through primary data collection. Lack of prenatal care in the first trimester and lack of breastfeeding support were key themes from both focus group participants and key informants. This sentiment was expressed by young minority women, who had many service providers but were still not educated about their coverage and rights adequately to be able to utilize services such as dental care during pregnancy, pre-natal care, and drug screening during pregnancy.
African Americans were the least likely of all race/ethnic groups to initiate early prenatal care at 79.8%; Asians (87.6%), Hispanics (82.1%), Pacific Islanders (100%), and Whites (90.3%) were all more likely to initiate prenatal care in the 1st trimester. Younger mothers were also less likely to initiate early prenatal care (69.3% of 15-19 year old versus 86.0% of mothers 20+ years). Women with Medi-Cal, no insurance and other/Governmental insurance. were less likely to receive prenatal care; Me-di-Cal deliveries accounted for over 60% of the mothers that did not receive pre-natal care in the first trimester (Vital Records Business Intelligence System, 2018). Undocumented women may not have access to health insurance when they find out they are pregnant causing a delay in prenatal care initiation. Participants of this
assessment also indicated that it was difficult for women to leave work, especially agricultural workers, to access care.
The in-hospital breastfeeding of newborns data for 2017 presented by In-Hospital Breastfeeding Initiation Data (California Department of Public Health), shows that Hispanic mothers (71.2%) have the lowest uptake of exclusive breastfeeding, fol-lowed by Asian American (72.1%), African Americans (78.3%) and Whites (84.2%). Exclusive breastfeeding includes newborns who received breast milk only; any breastfeeding includes newborns who were breastfed exclusively and those who received both breast milk and formula. Not only is breast milk linked to immunity and low body mass index in later life for breastfed children, but breastfeeding also offers health advantages to mothers, such as reducing the risk of breast and ovarian cancer, cardiovascular disease, and diabetes.
Race/ethnic disparities also exist in terms of breastfeeding initiation within Ventura County. Women who report giving birth in hospitals that support breastfeeding in the county more likely to exclusively breastfeed at three months postpartum. Figure 63 shows exclusive breastfeeding rates 24-48 hours post-delivery for Ventura County residents by race/ethnicity. Overall, 86.8% of White (Non-Hispanic) mothers compared to 68.3%% of Hispanic mothers were exclusively breastfeeding post-
Data Synthesis and Prioritization
*subgroup suppressed to meet confidentiality requirements for de-identification of PHI

55Ventura County Community Health Needs Assessment 2019
delivery. At every facility, Whites (Non-Hispanic) are more likely to breastfeed than Hispanics. According to the Maternal Infant Health Assessment Survey (2013-2015), this disparity continues out three months postpartum; 47.4% of White (Non-Hispanic) mothers are breastfeeding 3 months postpartum compared to 24.6% of Hispanic mothers. Primary data collection efforts showed that cultural norms in the Hispanic community often discourage breastfeeding and that practices both prior to and post-delivery are creating barriers to successful breastfeeding. Lower income mothers must return to work sooner and often have jobs in the agricultural industry where the workplace environment makes it more difficult to continue breastfeeding.
FIGURE 63: EXCLUSIVE BREASTFEEDING BY ETHNICITY AND FACILITY, 2017
3
Source: In Hospital Breastfeeding Initiation, California Department of Public Health, 2017.
Infant Health -Exclusive Breastfeeding by Ethnicity and Facility, 2017
CommunityMemorial Los Robles Santa Paula Simi Valley St. John's VCMC Ventura
CountyWhite 91.4% 78.9% 97.3% 85.5% 86.8% 72.4% 86.8%Hispanic 76.3% 58.2% 86.1% 77.2% 68.3% 66.7% 68.3%
0.0%
10.0%
20.0%
30.0%
40.0%
50.0%
60.0%
70.0%
80.0%
90.0%
100.0%
Source: In Hospital Breastfeeding Initiation, California Department of Public Health, 2017
Recommendations for Access to Healthcare based on all data:
• Implement the 9 Steps to Breastfeeding Friendly at ambulatory sites throughout the county; the Women, Infant, and Children Program offers technical assistance during implementation.
• Increase access to lactation consultants, including those that speak multiple languages, both in the hospital and after discharge.
• Engage Childhood Disability and Prevention Program providers in providing breastfeeding support to mothers when they come in for their childhood screenings.
• Provide insurance enrollment assistance on-site before and after school for parents and students.
• Utilize community health workers (CHWs) to provide insurance enrollment assistance for residents in communities with lower insurance rates; the CHWs should connect with community leaders in low-income communities to find the best location for assistance to be provided.
• Provide opportunities for increasing health literacy in the population.
• Expand the Health Care for All program.
• Expand clinic hours beyond 5 pm and on the weekends.
• Explore policies that would allow employer pay coverage for preventive care so that employees could access care during their workday.
• Ensure that all pediatric asthma patients have an asthma action plan, which specifies what type of medicines to take and when.
7.2.2 Reduce the Impact of Behavioral Health Issues
Health encompasses behavioral health as a means of achieving quality of life through self-rated mental health, overall participation in society and feeling of well-being (Office of Disease Prevention and Health Promotion, 2019). Drug Abuse (including prescription drugs), Alcoholism and Mental Health among adults and adolescents were identified as topics of concern for community members and key informants indicating that Behavioral Issues were significant in Ventura County. Table 13 in-cludes all the indicators that were taken into account to yield the topic scores for Drug Abuse (including prescription drugs), Alcoholism and Mental Health. Mental health and substance use are closely related. Untreated social and emotional health issues often lead to drug and alcohol abuse as a form of self-medication. Substance
Data Synthesis and Prioritization

56Ventura County Community Health Needs Assessment 2019
abuse and mental illness have both been linked to brain deficits, genetics, and early exposure to stress or trauma (National Institute on Drug Abuse, 2010).
TABLE 13: TOPIC SCORES FOR BEHAVIORAL HEALTH TOPICS
Health Topic
Covered Indicators within Topic Score(**indicator shows a significant race/ethnic disparity)
Topic Score
Mental Health
Indicators: **Age-Adjusted ER Rate due to Adolescent Suicide and Inten-tional Self-inflicted Injury, Adults Needing Help With Mental, Emotional or Substance Abuse Problems, Age-Adjusted Hospitalization Rate due to Pedi-atric Mental Health, Age-Adjusted Hospitalization Rate due to Suicide and Intentional Self-inflicted Injury, **Age-Adjusted ER Rate due to Suicide and Intentional Self-inflicted Injury, Depression: Medicare Population, Age-Ad-justed ER Rate due to Pediatric Mental Health, Adults Needing and Receiving Behavioral Health Care Services, Alzheimer’s Disease or Dementia: Medicare Population, Youth Depression, **Age-Adjusted ER Rate due to Mental Health, Age-Adjusted Hospitalization Rate due to Adolescent Suicide and Intention-al Self-inflicted Injury, **Age-Adjusted Hospitalization Rate due to Mental Health, Age-Adjusted Death Rate due to Suicide, Frequent Mental Distress
1.49
Drug Abuse
Indicators: Age-Adjusted ED Visit Rate due to Heroin Overdose, Age-Ad-justed Death Rate due to Heroin Overdose, Age-Adjusted Death Rate due to Prescription Opioid Overdose, Age-Adjusted Death Rate due to Synthetic Opioid Overdose (excluding Methadone), Age-Adjusted Death Rate due to All Opioid Overdose, Age-Adjusted Hospitalization Rate due to Heroin Overdose, Age-Adjusted ER Rate due to Substance Use, Age-Adjusted Hospitalization Rate due to Opioid Overdose (excluding Heroin), Teens who have Ever Used Inhalants: 11th Graders, Teens who have Ever Used Inhalants: 7th Graders, Teens who have Ever Used Inhalants: 9th Graders, Teens who have Ever Used Recreational Prescription Drugs: 11th Graders, Teens who have Ever Used Recreational Prescription Drugs: 9th Graders, Teens who Use Alcohol or Drugs: 7th Graders, Teens who Use Alcohol or Drugs: 9th Graders, Age-Ad-justed ED Visit Rate due to Opioid Overdose (excluding Heroin), Age-Adjust-ed ED Visit Rate due to All Drug Overdose, Age-Adjusted Death Rate due to Drug Use, Opioid Prescription Rate, Age-Adjusted Hospitalization Rate due to All Drug Overdose, Age-Adjusted Long Acting or Extended Release Opioid Prescription Rate to Opioid Naive Residents, Death Rate due to Drug Poi-soning, Opioid Prescription Patients, Teens who Smoke: 11th Graders, Teens who Smoke: 7th Graders, Teens who Use Marijuana: 11th Graders, Teens who Smoke: 9th Graders, Teens who Use Alcohol or Drugs: 11th Graders, Teens who Use Marijuana: 7th Graders, Teens who Use Marijuana: 9th Graders, Alcohol-Impaired Driving Deaths, Adults who Smoke
1.66
Alco-holism
Indicators: Liquor Store Density, Adults who Binge Drink: Year, Age-Adjusted ER Rate due to Alcohol Use, Age-Adjusted Hospitalization Rate due to Alcohol Use, Teens who Binge Drink: 11th Graders, Teens who Use Alcohol or Drugs: 7th Graders, Teens who Use Alcohol or Drugs: 9th Graders, Teens who Use Alcohol: 7th Graders, Teens who have Used Alcohol, Teens who Use Alcohol: 11th Grad-ers, Age-Adjusted Hospitalization Rate due to Substance Use, Teens who Use Alcohol or Drugs: 11th Graders, Teens who Use Alcohol: 9th Graders
1.66
Substance Abuse
Drug and alcohol abuse were identified as the most important risky behaviors affecting Ventura County residents in 2019 by 72% and 64.2% respectively of all participants of the community input survey. Prescription drug abuse was also mentioned by 37.8% survey participants. As discussed previously, drug-induced deaths accounted for 653.2 years of life lost per death between 2015 and 2017 and was the 4th leading cause of premature death in Ventura County due to the young age of those that lose their lives from drug use.
As shown in Table 14, there are several warning comparison indicators related to Substance Abuse (including Drug Abuse and Alcoholism) with data scores equal to or greater than 2.00 while indicators for Mental Health ranged from 1.50 to 1.86. The table illustrates the age adjusted death rates in Ventura County from heroin overdose, opioid overdose, synthetic opioid overdose (excluding Methadone), and prescription opioid overdose are twice or more than the rates for California residents. The Age-Adjusted Hospitalization Rate due to Heroin Overdose and Age-Adjusted ED Visit Rate due to Heroin Overdose in Ventura County in 2016 and 2017 respectively were also more than double the rate for the state.
Data Synthesis and Prioritization

57Ventura County Community Health Needs Assessment 2019
TABLE 14: INDICATOR SCORES FOR SUBSTANCE ABUSE, VENTURA COUNTY
Score Substance Abuse UnitsVentura County
CaliforniaMeasurement
Period
2.44 Liquor Store Density stores/ 100,000 population 15.5 10.1 2015
2.33 Age-Adjusted ED Visit Rate due to Heroin Overdose Rate per 100,000 residents 24.0 9.9 2017
2.11 Adults who Binge Drink: Year percent 41.4 34.7 2015
2.11 Age-Adjusted Death Rate due to Heroin Overdose deaths/ 100,000 population 3.3 1.4 2017
2.11 Age-Adjusted Death Rate due to Prescription Opioid Overdose Rate per 100,000 residents 6.9 3.2 2017
2.11 Age-Adjusted Death Rate due to Synthetic Opioid Overdose (excluding Methadone) Rate per 100,000 residents 2.8 1.1 2017
2.08 Age-Adjusted ER Rate due to Alcohol Use ER visits/ 10,000 population 18+ years 46.5 41.1 2015-2017
2.00 Age-Adjusted Death Rate due to All Opioid Overdose Rate per 100,000 residents 9.1 4.5 2017
2.00 Age-Adjusted Hospitalization Rate due to Heroin Overdose Rate per 100,000 residents 4.2 1.8 2016
The liquor store density in Ventura County is above the state average at 15.5 stores per 100,000 population compared to 10.1 for the state and 10.5 for the country. The percentage of adults who binge drank in 2015 (41.4%) as well as Age-Adjusted ER Rate due to Alcohol Use (46.5 ER visits/ 10,000 population 18+ years) were higher than the state data (34.7% and 41.1 ER visits/ 10,000 population 18+ years). In Ventura County, from 2013-2017, 32% of all motor-vehicle related deaths involved alcohol intoxication (County Health Rankings and Roadmaps, 2019).
In adolescents, health behavior patterns formed early in life play a crucial role in health throughout the lifespan. Adolescents that begin drinking before the age of 15 are four times more likely to become dependent on alcohol later in life (National Institute on Alcohol Abuse and Alcoholism, 2016). Per the California Healthy Kids Survey from 2015-17, 18% of 7th graders and 30% of 9th graders had used drugs or alcohol in Ventura County; compare this to 7.2% 7th graders and 19.7% 9th graders in California. 35.9% of teens in Ventura County have used alcohol compared to 23.3% of Californian teens. This number is much higher in Hispanics (53.5%) compared to 20.1% of White teens in the county. By the 11th grade, 13% of Ventura teens are binge drinkers, 4% have used inhalants and 17% have used recreational prescription drugs.
Unfortunately, some female adults who engage in alcohol and drug use do so during their pregnancies. Based on previous screening results from the Perinatal Substance Use Screening Program in Ventura County, it is estimated that 26% of
mothers screen positive on the 4P’s Plus Screening Tool for using tobacco, alcohol, or other drugs in the month before they knew that they were pregnant. Of those mothers approximately 49% continue to use tobacco, alcohol, or other drugs after they find out they were pregnant. In 2018, there were 9,035 births to Ventura County mothers. Using the data from the 4P’s screening, it is estimated that 2,349 of the 9,035 babies may have been exposed to alcohol or other drugs before their mother knew she was pregnant, and 1,151 babies may have continued to be exposed after their mother knew she was pregnant. Perinatal substance use may prevent these babies from getting the healthy beginning that they deserve.
Per key informants interviewed at a health system, there are a lack of providers and treatment facilities in Ventura County to be able to deal with the substance abuse issues. Clients in need of rehabilitation often need to be sent outside of the county for services which creates a barrier to receive the care. Key informants at another hospital stated that hospitals are losing the battle with prescription drug abuse even though they have never worked as hard to combat the problem; 10 years ago, the focus was on pain management, and now there is an opioid epidemic. 20% of the illicit prescription drugs on the street come from hospital and physician office diversion. Getting providers enrolled in the Controlled Substance Utilization Review and Evaluation System (CURES) is a labor-intensive process which makes the issue very complex to address. According to the key informants, emergency services calls
Data Synthesis and Prioritization

58Ventura County Community Health Needs Assessment 2019
for alcohol and drug abuse are increasing. There are a lot of resources deployed (i.e. ambulance, police, and fire), but there is not a lot that each of these entities can do to address the calls. A past strategy that had worked successfully was encouraging emergency room physicians to only provide enough pain medicine for 3 days post visit so that the patient can follow-up with their primary care provider.
Recommendations for Substance Abuse based on all data:
• Provide education to community members and providers on drug addiction as opposed to drug abuse
• Implement universal, county-wide screening for perinatal and parental substance use utilizing the 4P’s Plus© Screening Tool.
• Public health nursing can provide home visitation services and support for those mothers that screen 4P’s Plus© positive.
• Utilize the Families Facing the Future curriculum designed for families with parents who are addicted to drugs; it is most appropriate for parents enrolled in a methadone treatment clinic and aims to prevent relapse as well as reduce the likelihood of substance abuse among the children.
• Facilitate Community Partnerships and Provider Training to Increase Service Capacity and Access to Long-Term Treatment for Individuals With Heroin Addiction.
Mental Health
Mental Health was named as the one of the five most important “health problems” in the community by almost 50% of the community input survey participants in this assessment. Mental and emotional wellbeing is essential to overall health. Positive mental health allows individuals to realize their potential, cope with the stresses of life, work productively, and make meaningful contributions to their communities. Mental illness is associated with higher probability of many chronic conditions, in-cluding obesity, diabetes, and cardiovascular disease, and contributes to premature death (De Hert, 2011). Table 15 lists those mental health indicators that had high or ‘warning’ scores for Ventura County.
Per the ‘Community Mental Health Needs Assessment’ released by Ventura County Behavioral Health in February 2019, a survey of 4,772 participants were asked to assess their own overall mental health on a five-point scale from poor to excellent. 67% of respondents rated themselves as having good, very good, or excellent
overall mental health, while the remaining 33% rated their overall mental health as fair or poor. In the same survey, 29% of survey participants indicated they had thought about or attempted suicide. Additionally, about 33% of survey respondents indicated they had needed mental health services in the past 12 months, and 42% of them indicated that a close family member of theirs had needed mental health services in that time period.
TABLE 15: INDICATOR SCORES FOR MENTAL HEALTH
ScoreMental Health & Men-tal Disorders
UnitsVentura County
CaliforniaMeasurement
Period
1.86
Age-Adjusted ER Rate due to Adolescent Suicide and Intentional Self-inflicted Injury
ER visits/ 10,000 population aged
10-1739.2 34.4 2015-2017
1.78
Adults Needing Help With Mental, Emotional or Substance Abuse Problems
percent 17.9 17.5 2016-2017
1.75Age-Adjusted Hospi-talization Rate due to Pediatric Mental Health
hospitalizations/ 10,000 popu-
lation under 18 years
28.9 25.4 2015-2017
1.75
Age-Adjusted Hospi-talization Rate due to Suicide and Intentional Self-inflicted Injury
hospitalizations/ 10,000 popula-tion 18+ years
13.1 13.7 2015-2017
1.69
Age-Adjusted ER Rate due to Suicide and Intentional Self-inflicted Injury
ER visits/ 10,000 population 18+
years18.0 17.4 2015-2017
1.67Depression: Medicare Population
percent 14.6 14.3 2015
1.58Age-Adjusted ER Rate due to Pediatric Mental Health
ER visits/ 10,000 population un-
der 18 years26.0 31.9 2015-2017
1.56Adults Needing and Receiving Behavioral Health Care Services
percent 60.0 60.9 2016-217
1.50Alzheimer’s Disease or Dementia: Medicare Population
percent 9.1 9.3 2015
Data Synthesis and Prioritization

59Ventura County Community Health Needs Assessment 2019
Depression, which is a risk factor in suicide, is a highly prevalent issue in Ventura County, particularly among youth. Per the California Healthy Kids Survey (2015-2017), 32.0% of youth reported suffering from depression. In 2015 to 2017, the Age-Adjusted Emergency Room (ER) Rate due to Adolescent Suicide and Intentional Self-inflicted Injury in Ventura County was 39.2 per ER visits/ 10,000 population aged 10-17. While the rates of ER visits and hospitalization due to mental health and related problems were comparable to California, a total of 441.4 years of life were lost in 2015-2017 per 100,000 population per year due to suicides in Ventura County.
Suicide was the 7th leading cause of premature death, up from 10th as a leading cause of death from 2015-2017 in Ventura County. Males were more likely than fe-males to die a premature death due to suicide. Whites (Non-Hispanics) were more likely than Hispanics to die a premature death due to suicide, however, Hispanics lost an average of 53.5 years per death due to suicide compared to 39.1 years for Whites (Non-Hispanic).
Figure 64 shows the Age-Adjusted ER Rate due to Mental Health in Ventura County, by zip code. The overall rate in Ventura County is 73.9 ER visits per 10,000 population. In comparison, 93030 has the highest rate in Ventura County with 128.0 ER visits due to Mental Health per 10,000 population. Other zip codes in the upper quartile include 93022, 93001, 93010, and 93041. This indicator had the highest county and zip code rates among all of the hospitalization indicators and it had one of the greatest disparities between the overall county value and the highest zip code value.
FIGURE 64: AGE-ADJUSTED ER RATE DUE TO MENTAL HEALTH, 2015-2017
Source: California Office of Statewide Planning and Development
The ratio of mental health providers in Ventura County is one per 290 patients which is higher than the state average of one per 310 patients (County Health Rankings and Roadmaps, 2019). However, this data masks the distribution of mental health providers. There are 3 areas within Ventura County that have been designated as Health Professional Shortage Areas (HPSAs), Medically Underserved Areas (MUAs) and Medically Underserved Populations (MUPs) for mental health (HRSA, 2018). In the survey commissioned by the Ventura County Behavioral Health quoted above, respondents were asked about availability, wait times, cultural competency, and ease of access for clients given the currently “in place” mental health services within Ventura County. Almost half (49%) rated “capacity” as poor. 26% of survey
Data Synthesis and Prioritization

60Ventura County Community Health Needs Assessment 2019
participants said they had not received needed mental health services and 35% said a family member had not received them. In the report, Providers identified transportation, awareness of and availability of services, and location of services as the greatest barriers to receiving mental health services.
The Community Mental Health Needs Assessment commissioned by the Ventura County Behavioral Health conducted 15 focus groups among vulnerable popula-tions of African Americans, Asian / Pacific Islanders, Hispanics, Homeless, LGBTQ+, Mixteco, Older Adults and Transitional Age Youth. The assessment found that the self-reported overall mental health rating, suicidal ideation or attempts, and sub-stance use was higher in Homeless, LGBTQ+ and African Americans, while most apart from Older Adults experienced cultural and/or linguistic inappropriateness in the services they received. Mixteco speaking groups and Homeless emerged as the populations that were the most vulnerable due to their lack of ability to access healthcare due to economic, cultural, linguistic and political/legal factors.
Focus group participants brought up issues regarding a need for more behavioral health providers and services in the community as well as barriers they faced in accessing mental health services. Some participants said they or their family mem-bers have had to attend several different institutions to get the care they needed, and that the services they received did not satisfy them, since they felt they did not receive the appropriate attention and they felt that they had been disrespected, abused or experienced racial discrimination.
To quote some of the participants from the report:
“Excellent patient care is possible when there is enough staff. When there is minimal staff, there is minimal care.”
“We need more therapists and psychiatrists desperately. Our appointments are booked out too far.”
“Clients have transportation and language barriers. The process is too lengthy and most clients give up and decide not to follow through with therapy. The ones that do go through the process are then placed on a waiting list due to the low number of bilingual therapists available. When they finally get called to set up therapy, they are no longer interested.”
“Our indigenous community is the one that seek less of these types of services or resources… The first barrier is definitely the language, and the biggest barrier is the fear of these clinics asking for your legal status. The men that are affected normally don’t seek for the help they need. Most of them are afraid that they could be seen as weak, they don’t want to be seen vulnerable.”
Older adult participants of a focus group discussion conducted in this assessment stated the mental health challenges facing them were the co-morbidities of men-tal health and dementia/Alzheimer’s, with lack of education or support for family members on how to deal with these issues compounding the problem; lack of re-sources for treatment of mental health issues for Older Adults and lack of emphasis on screening as Providers do not often screen for mental health issues; and social isolation associated with loneliness. As one participant put it:
“People who are socially isolated can’t get out and experience life like other adults. They are alone and need more hands-on care.”
Key informants stated that teens and young adults were unable to seek care because they are still on their parents’ insurance and do not want the parents to see a claim for mental health services. The key informants suggested that seeking mental health services should not require parent consent after 12 years of age similar to STD and reproductive services in California.
Recommendations for Mental Health based on all data:
• Increase the number of agencies that have been trained on safeTALK which teaches participants to recognize and engage persons who might be having thoughts of suicide and connect them with community resources.
• Increase access to cognitive behavioral therapy to help residents dealing with depression, including the Blues Program which is a group therapy method for adolescents with elevated depression symptoms.
• Promote more support and services for depression, including women suffering from postpartum depression.
Data Synthesis and Prioritization

61Ventura County Community Health Needs Assessment 2019
• Increase training in mental health first aid in the community.
• Establish Mental Health Navigation through a one-stop-shop (a resource center or hotline) that would help consumers and providers navigate the mental health services landscape.
• Care coordination among medical and mental health including VCBH, other county agencies, law enforcement, non-profits and private health facilities so that consumers can be triaged to the appropriate services.
• Education and outreach for school children to reduce stigma and identify those eligible for early intervention.
• Mitigate depression in Older Adults through home based depression care man-agement that includes active screening and trained depression care managers and collaborative care that links primary care providers, patients, and mental health specialists.
7.2.3 Improve Health and Wellness for Older Adults
As adults live longer, they are likely to suffer from chronic conditions, multiple health issues and require care, causing a burden on the healthcare system as well as families. Older Adults are more likely to suffer from adverse health outcomes the topic score for Older Adults and Aging was 1.63 (Table 16), where 0 indicates the best outcome and 3 the worst. This topic had 7 indicators, with warning comparison scores for Older Adults and Aging ranging from 2 to 2.61 (Depression, a warning comparison indicator is included within Mental Health is shown in Table 15).
TABLE 16: TOPIC SCORES FOR OLDER ADULTS AND AGING
Health Topic
Covered Indicators within Topic Score (**indicator shows a significant race/ethnic disparity)
Topic Score
Aging Problems
Indicators: Osteoporosis: Medicare Population, Hyperlipidemia: Medicare Population, Rheumatoid Arthritis or Osteoarthritis: Medicare Population, Stroke: Medicare Population, Atrial Fibrillation: Medicare Population, Can-cer: Medicare Population, Chronic Kidney Disease: Medicare Population, Mammography Screening: Medicare Population, Depression: Medicare Population, Ischemic Heart Disease: Medicare Population, Asthma: Medi-care Population, Diabetes: Medicare Population, Alzheimer’s Disease or Dementia: Medicare Population, Heart Failure: Medicare Population, Hy-pertension: Medicare Population, People 65+ with Low Access to a Grocery Store, COPD: Medicare Population, People 65+ Living Below Poverty Level, People 65+ Living Alone
1.63
Table 17 shows the prevalence of certain health conditions for Ventura County resi-dents enrolled in Medicare in 2014 which were higher than the state average. Close to half of all Medicare enrollees had hyperlipidemia (45.4%), followed by rheuma-toid arthritis or osteoarthritis (30.1%), atrial fibrillation (8.2%), and cancer (8.0%).
TABLE 17: INDICATOR SCORES FOR OLDER ADULTS AND AGING
Score Older Adults & Aging UnitsVentura County
CaliforniaMeasurement
Period
2.61Osteoporosis: Medicare Popu-lation
percent 7.4 6.7 2015
2.33Hyperlipidemia: Medicare Population
percent 45.5 41.5 2015
2.33Rheumatoid Arthritis or Osteo-arthritis: Medicare Population
percent 30.1 27.6 2015
2.33 Stroke: Medicare Population percent 4.1 3.7 2015
2.28Atrial Fibrillation: Medicare Population
percent 8.2 7.3 2015
2.06 Cancer: Medicare Population percent 8.0 7.5 2015
Taking care of another individual on a regular basis has an impact on the mental and physical well-being of the caregiver over time. Approximately 28.6% of survey participants reported taking care of a friend or family member above 65 years old, with a disability or with dementia (Figure 65).
FIGURE 65: CAREGIVING BY SURVEY PARTICIPANTS
68.1%
16.3%
7.3%
5.0%
4.8%
3.1%
0.0% 10.0% 20.0% 30.0% 40.0% 50.0% 60.0% 70.0% 80.0%
No
Yes, for a person 65 or older
Yes, for a person under 65 years old with a disability
Yes, for a person 65 or older with dementia
Other
Yes, for a child (under 18) with a disability
Do you provide regular care or assistance (unpaid) to a friend or family member who has a health problem or disability?
Data Synthesis and Prioritization

62Ventura County Community Health Needs Assessment 2019
Residents that are 65+ years make up 15.6% of the population of Ventura County in 2019, but the California Department of Finance estimates that those residents 65+ years will account for 23.7% of the population in 2060, when Ventura County is projected to have over one million residents as compared to 859,967 in 2019. As the size of the aging population increases, the demand on health care services and the type of services needed will also change over time. Let’s Get Healthy California identifies maintaining dignity and independence in the aging population focus over its ten-year plan to improve population health in California.
Residents over age 65 years living alone may be at risk for social isolation and loneliness which has been associated with poor health outcomes (Perissinotto CM, 2012). Aging adults living alone may lack social support, have inadequate assistance in emergency situations, and are at high risk for institutionalization or losing their independent life style. Living alone should not be equated with being lonely or isolated, but many older people who live alone are vulnerable due to social isolation, poverty, disabilities, lack of access to care, or inadequate housing.
The figure below shows the percent of adults 65+ years who were living alone in Ventura County from 2013-17 per the American Community Survey. This ranged from 10.1% of adults 65+ years living in Oxnard (93033) to 30.4% of adults 65+ years in Ventura (93004).
FIGURE 66: PEOPLE 65+ LIVING ALONE, 2013-2017
Source: Claritas Pop-Facts® (2019)
Older Adults tend to often have more than one health condition, requiring multiple treatments from different doctors. Chronic conditions require treatments that are long drawn and the management of various symptoms, complications, interactions, side-effects and medications. Patients who have multiple conditions also risk devel-oping mental health conditions such as depression, isolation, and financial stress as do their care givers. From a healthcare standpoint, prevention and recurrence of co-morbidities (or diseases that go hand-in-hand because they share risk factors) is important. With proper training, chronic disease patients can be taught to manage their health conditions and decrease their chances of having co-morbidities.
Data Synthesis and Prioritization

63Ventura County Community Health Needs Assessment 2019
Secondary data have shown that Older Adults have a high prevalence of chronic diseases in Ventura County. A further examination of the data shows high prevalence of co-morbidities. Among All Fee-for-Service Beneficiaries of Medicaid and Medicare in Ventura County, 29.7% have 2 to 3 conditions, 21.2% have 4 to 5 conditions, and 16% have 6+ conditions. These figures are comparable to the national data. In Medicare beneficiaries 65+ and over in the county, 29.2% have 2 to 3 chronic conditions, 21.7% have 4 to 5 conditions and 16.6% have 6+ conditions (Centers for Medicaid and Medicare Services, 2017); (Dartmouth Atlas Project, 2016).
In 2016, there were 69,901 Medicare beneficiaries in Ventura County and the adjusted rate Medicare spending per beneficiary was $10,371.56 per beneficiary for Parts A and B as compared to the state average cost of $9,868.60 (Dartmouth Atlas Project, 2019). The same data sources gives the number of Medicare patients readmitted within 30 days of discharge following medical admission for Post-Acute Care in 2015 as 14,945; number of patients having an emergency room visit within 30 days of discharge following surgical admission 14,180. Health care costs are an important indicator of a health system’s efficiency and affordability, and these costs must be balanced against the quality of health care provided in order to improve the efficiency of health care delivery. This makes a strong business case for addressing chronic diseases through healthy eating and active living, coordinated care and complex care management strong. It also presents an opportunity for healthcare systems to provide cross-cutting care and follow-up to simultaneously manage multiple conditions and better utilize limited resources.
While examining this topic through primary data, it was apparent it was not cov-erage (Medicare is the default insurance for all adults 65+) but physical access (transportation, appointment availability for specialty care, etc.), cost of co-pays/prescription drugs, quality of care and denial of service that were issues among this population. To offset the cost of co-pays, Older Hispanics reported making trips to Mexico to get prescription drugs. Per key informants interviewed at the Community Memorial Hospital System, the cost of prescription medications is accelerating at a rapid pace and driving up the cost of healthcare at all levels; there has been a 9% increase per year in the cost of generic drugs. Transportation was a very strongly professed barrier for Older Adults. Not only was their mobility an issue due to an inability to drive or rely on others for rides, but when they were covered by their insurance for ride-shares, the distance from their home to the curb-pickup and from the curb to within the hospital posed a challenge. Inadequate bus connections, not having a vehicle, having an unreliable vehicle, or having to pay someone else to drive to appointments were barriers stated by other group participants.
Within the Older Adults group, a lack of providers that accepted Medicare due to low reimbursement rates to providers was a very strong theme. To quote older participants:
“Medicare Advantage plans offer several types of ser-vices to try to entice enrollment including things like Silver Sneakers, Respite Care, etc. Even though these are member benefits, some are not available in Ventu-ra County because service providers do not get reim-bursed adequately from Medicare for these services. Providers are not able to continue to offer the services, so the members are not receiving their covered benefit”
Older Adults expressed a need for care coordination among their providers to reduce the chances that they were being over-medicated, taking unnecessary drugs and facing potential drug interactions. As they put it:
“We think that all medical providers are coordinating care, but this is not the case in most instances”
Older Adults expressed a need for advocates to help manage their health care. Many Older Adults said they needed more education about the benefits available through Medicare Advantage. Key informants quoted the need for more resource guides such as the Area Agency on Aging Resource Guide while others proposed targeted advertising to Older Adults such as the infomercials by Cottage Hospital.
Recommendations for reducing the burden of disease in Older Adults based on all data:
• Screen for and stratify patients at high risk of developing multiple chronic con-ditions.
• Train non-medical health care service providers in Complex Care Management to Improve patients’ functional health status, including adherence to treatment plans; enhance coordination of care in the medical neighborhood and social en-vironment; eliminate duplication of services and increase alignment of services and goals; and reduce the need for expensive medical services.
• Implement Care Plans to empower patients with knowledge of their own condi-tions and advocate for themselves; to assist in care coordination; and managing patients with multiple conditions
Data Synthesis and Prioritization
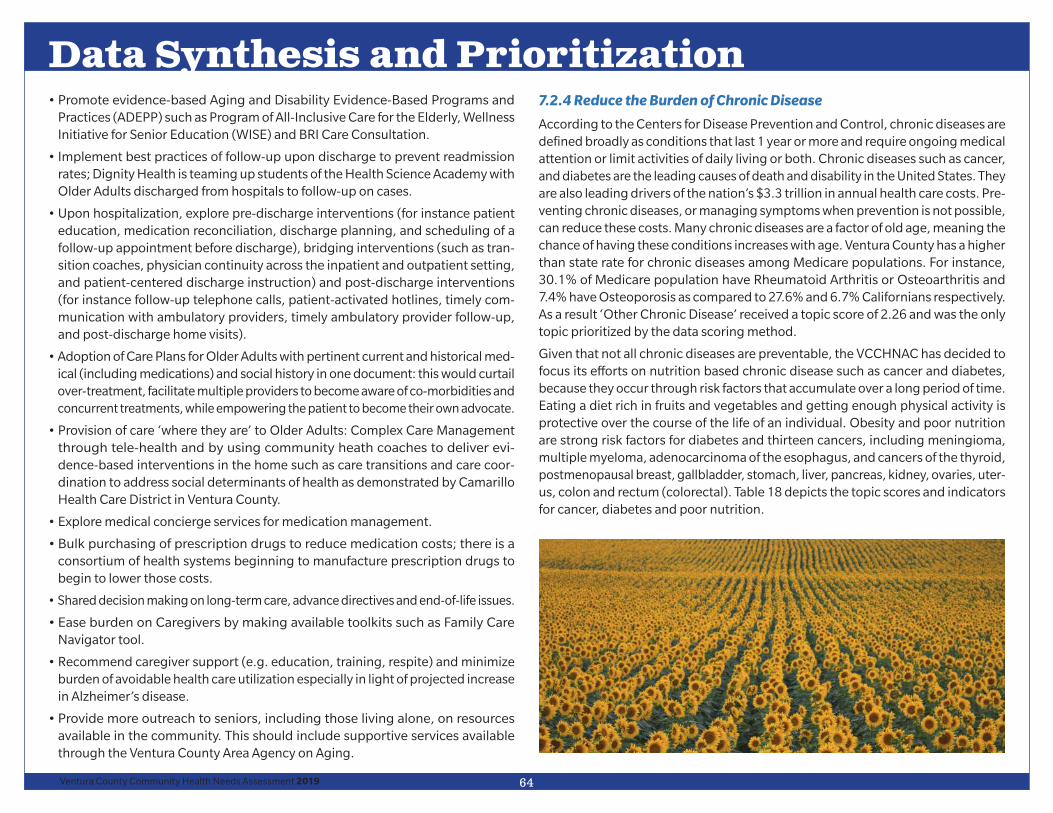
64Ventura County Community Health Needs Assessment 2019
• Promote evidence-based Aging and Disability Evidence-Based Programs and Practices (ADEPP) such as Program of All-Inclusive Care for the Elderly, Wellness Initiative for Senior Education (WISE) and BRI Care Consultation.
• Implement best practices of follow-up upon discharge to prevent readmission rates; Dignity Health is teaming up students of the Health Science Academy with Older Adults discharged from hospitals to follow-up on cases.
• Upon hospitalization, explore pre-discharge interventions (for instance patient education, medication reconciliation, discharge planning, and scheduling of a follow-up appointment before discharge), bridging interventions (such as tran-sition coaches, physician continuity across the inpatient and outpatient setting, and patient-centered discharge instruction) and post-discharge interventions (for instance follow-up telephone calls, patient-activated hotlines, timely com-munication with ambulatory providers, timely ambulatory provider follow-up, and post-discharge home visits).
• Adoption of Care Plans for Older Adults with pertinent current and historical med-ical (including medications) and social history in one document: this would curtail over-treatment, facilitate multiple providers to become aware of co-morbidities and concurrent treatments, while empowering the patient to become their own advocate.
• Provision of care ‘where they are’ to Older Adults: Complex Care Management through tele-health and by using community heath coaches to deliver evi-dence-based interventions in the home such as care transitions and care coor-dination to address social determinants of health as demonstrated by Camarillo Health Care District in Ventura County.
• Explore medical concierge services for medication management.
• Bulk purchasing of prescription drugs to reduce medication costs; there is a consortium of health systems beginning to manufacture prescription drugs to begin to lower those costs.
• Shared decision making on long-term care, advance directives and end-of-life issues.
• Ease burden on Caregivers by making available toolkits such as Family Care Navigator tool.
• Recommend caregiver support (e.g. education, training, respite) and minimize burden of avoidable health care utilization especially in light of projected increase in Alzheimer’s disease.
• Provide more outreach to seniors, including those living alone, on resources available in the community. This should include supportive services available through the Ventura County Area Agency on Aging.
7.2.4 Reduce the Burden of Chronic Disease
According to the Centers for Disease Prevention and Control, chronic diseases are defined broadly as conditions that last 1 year or more and require ongoing medical attention or limit activities of daily living or both. Chronic diseases such as cancer, and diabetes are the leading causes of death and disability in the United States. They are also leading drivers of the nation’s $3.3 trillion in annual health care costs. Pre-venting chronic diseases, or managing symptoms when prevention is not possible, can reduce these costs. Many chronic diseases are a factor of old age, meaning the chance of having these conditions increases with age. Ventura County has a higher than state rate for chronic diseases among Medicare populations. For instance, 30.1% of Medicare population have Rheumatoid Arthritis or Osteoarthritis and 7.4% have Osteoporosis as compared to 27.6% and 6.7% Californians respectively. As a result ‘Other Chronic Disease’ received a topic score of 2.26 and was the only topic prioritized by the data scoring method.
Given that not all chronic diseases are preventable, the VCCHNAC has decided to focus its efforts on nutrition based chronic disease such as cancer and diabetes, because they occur through risk factors that accumulate over a long period of time. Eating a diet rich in fruits and vegetables and getting enough physical activity is protective over the course of the life of an individual. Obesity and poor nutrition are strong risk factors for diabetes and thirteen cancers, including meningioma, multiple myeloma, adenocarcinoma of the esophagus, and cancers of the thyroid, postmenopausal breast, gallbladder, stomach, liver, pancreas, kidney, ovaries, uter-us, colon and rectum (colorectal). Table 18 depicts the topic scores and indicators for cancer, diabetes and poor nutrition.
Data Synthesis and Prioritization

65Ventura County Community Health Needs Assessment 2019
TABLE 18: TOPIC SCORES FOR CHRONIC DISEASES
Health Topics Covered Indicators within Topic Score (**indicator shows a significant race/ethnic disparity)
Topic Score
Poor Nutrition Indicators: Food Insecure Children Likely Ineligible for Assistance, Farmers Market Density, 5th Grade Students who are at a Healthy Weight or Underweight, Child and Teen Fruit Consumption, Fast Food Restaurant Density, Adult Fast Food Consumption, Chil-dren with Low Access to a Grocery Store, Grocery Store Density, People with Low Access to a Grocery Store, 7th Grade Students who are Physically Fit, 9th Grade Students who are at a Healthy Weight or Underweight, Adults who are Overweight or Obese, People 65+ with Low Access to a Grocery Store, Recreation and Fitness Facilities, Teens who Eat Breakfast, Teens who Engage in Regular Physical Activity, Adults Who Are Obese, Adults who Walk Regularly, Low-Income and Low Access to a Grocery Store, Adults who Drink Sugar-Sweetened Beverages, Households with No Car and Low Access to a Grocery Store, Access to Exercise Opportu-nities, Food Environment Index, Child Food Insecurity Rate, Food Insecurity Rate
1.32
Diabetes Indicators: Diabetes: Medicare Population, Age-Adjusted Death Rate due to Diabetes, Age-Adjusted ER Rate due to Uncontrolled Diabetes, Age-Adjusted Hospitalization Rate due to Diabetes, Age-Adjusted Hospitalization Rate due to Uncontrolled Diabetes, Adults with Diabetes, Age-Adjusted ER Rate due to Diabetes, Age-Adjusted ER Rate due to Short-Term Complications of Diabe-tes, Age-Adjusted Hospitalization Rate due to Long-Term Com-plications of Diabetes, Age-Adjusted Hospitalization Rate due to Short-Term Complications of Diabetes, Age-Adjusted ER Rate due to Long-Term Complications of Diabetes
1.27
Cancer Indicators: Cancer: Medicare Population, Mammography Screening: Medicare Population, Oral Cavity and Pharynx Cancer Incidence Rate, Breast Cancer Incidence Rate, Age-Adjusted Death Rate due to Prostate Cancer, Age-Adjusted Death Rate due to Cancer, Colon Cancer Screening, Age-Adjusted Death Rate due to Colorectal Cancer, Age-Adjusted Death Rate due to Lung Cancer, Cervical Cancer Incidence Rate, Prostate Cancer Incidence Rate, Age-Adjusted Death Rate due to Breast Cancer, Colorectal Cancer Incidence Rate, Lung and Bronchus Cancer Incidence Rate
1.16
Poor Nutrition
Nutrition is an essential component in the growth and body structure over the life course of individuals. What people eat influences cancer and diabetes risk, either because of present carcinogens or due to the effect on hormones and metabolism on growth and obesity. There is strong evidence that obesity and rapid growth en-hance the risk of cancer. Per a research paper, the prevention of chronic diseases such as diabetes and cancer should start before conception; mothers should start pregnancy with a healthy weight and avoid excessive or low weight gain during pregnancy. Key micronutrients are important for normal embryonic development and fetal growth. Thus, cancer prevention efforts should begin prior to conception and continue through all stages of the life course (Uauy R, 2005).
Breast milk, as illustrated in Section on Lack of Pre-Natal Care and Breastfeeding Support, and childhood nutrition are integral to maintaining a healthy weight and getting the micronutrients that regulate critical body processes. In Ventura County, only 73.1% of 7th grade students, 59.1% of 9th graders and 59.5% of 11 Graders consumed breakfast in the past day per the California Healthy Kids Survey (2013-2015) published by Kidsdata.Org. Children in low-income households are at higher risk of poor nutrition, which can have long-term, negative health consequences. Undernourishment can adversely affect children’s cognitive development, and consumption of unhealthful foods (e.g., fast food and sugar-sweetened bever-ages) is linked to weight gain and obesity. In Ventura County, 42.4% of children between 2-17 years ate fast food two or more times in the past week (UCLA Center for Health Policy Research, California Health Interview Survey, 2015-2016). The 2014-2015 rate of child and teen fruit consumption is 63.1% (Table 19). However, the California Health Interview Survey, 2015-2016 estimates that only 38.6% of 2-11 year old children eat five or more servings of fruits and vegetables (excluding juice and fried potatoes) daily.
Physical activity is also essential in maintaining a healthy weight. Let’s Get Healthy California (LGHC) measures childhood fitness by the percentage of children who score 6 out of 6 on the required California school FITNESSGRAM® test. This six-part test is used to evaluate levels of fitness that offer protection from disease related to inactivity. The healthy habits established as children influence the adoption of healthy habits into adulthood. From 2016-2017, only 24.8% of 5th graders in Ven-tura County met all six fitness requirements, a figure that is comparable to state values (24.9%). The LGHC target is 36%. This improved to 29.8% for 7th graders and 38.2% for 9th graders in Ventura County.
Data Synthesis and Prioritization

66Ventura County Community Health Needs Assessment 2019
TABLE 19: INDICATOR SCORES FOR CHILD HEALTH AND NUTRITION
ScoreChildren’s Nutrition & Health
UnitsVentura County
CaliforniaMeasurement
Period
2.39Food Insecure Children Likely Ineligible for Assistance
percent 37.0 33.0 2016
1.81Children with Health Insurance
percent 96.0 96.9 2017
1.785th Grade Students who are at a Healthy Weight or Underweight
percent 58.3 59.5 2017-2018
1.78Child and Teen Fruit Consumption
percent 63.1 64.3 2014-2015
1.50Children with Low Access to a Grocery Store
percent 4.0 2015
0.17Child Food Insecurity Rate
percent 16.1 19.0 2016
Table 19 displays the indicators of concern associated with children’s health and nutrition. In 2015, only 4% of the households with children had low access to grocery stores with fresh foods, and the 2017-2018 data for 5th graders indicates that a little more than half (58.3%) had a healthy body weight. Children in poverty are hard-pressed to meet their basic nutritional requirements when their families may not be able to consistently provide a balanced and varied diet because of socioeconomic factors. SNAP (Supplemental Nutrition Assistance Program) or Cal-Fresh in California is a federal-assistance program that provides low-income families with electronic benefit transfers (EBTs) that can be used to purchase food. The purpose of the program is to assist low-income households in obtaining ade-quate and nutritious diets. In Ventura County, 67.1% of households with children receive SNAP. This includes 100% of households with children in zip code 93043, 84.1% in 93033, 77.8% in 93021 and 76.3% in 93036 (Health Matters in Ventura County, 2019). Food Insecurity will be discussed in greater detail below.
Single-parent females often struggle the most to provide their children with an adequate diet; 5,564 (or 2% of all households) female headed households with children under 18 years received food stamps in the past 12 months, accord-ing to 2013-2017 American Community Survey 5-Year Estimates. United Ways estimates that 64% of households headed by single mothers live below the real cost measure (United Ways of California, 2018).
In Ventura County, 96% of children are covered by health insurance indicating that 4% may not have access to regular care and routine monitoring of healthy body weight; this despite the provisions of Medicaid through Medi-Cal and the Children’s Health Insurance Program (CHIP) which extend health coverage to children in poor families with modest incomes too high to qualify for Medicaid, indicating a gap in awareness and/or care.
Recommendations to address Poor Nutrition based on all data:
• Pursuing implementation of programs and policies to promote nutrition in child care and early education settings, such as the federal Child and Adult Care Food Program, which provides nutritious meals and snacks to children in day care (Centers for Disease Control and Prevention, 2019).
• Increasing participation in public nutrition programs, including SNAP (CalFresh in California), school breakfast, school lunch, afterschool nutrition, and summer food service; for example, encouraging schools to offer breakfast after the start of the school day and to provide free meals for all students, which can be fully reimbursed for high-poverty schools through service options such as the Community Eligibility Provision (Food Research and Action Center, 2017).
Diabetes
Though diabetes received a topic score of 1.27 in data scoring, where a score of 0 re-flects the best outcomes and a score of 3 the worst outcomes, it was the fourth most important health priority mentioned by community survey participants (35.4%). Dia-betes was also the 7th leading cause of death in Ventura County from 2015-17, and the 9th leading cause of premature death. Diabetes leads to 381.7 Age-Adjusted Years of Life Lost Rate per 100,000 population per year. According the Centers for Disease and Prevention, people with diabetes are twice as likely to have heart disease or a stroke as people without diabetes and at an earlier age.
Table 20 shows the emergency room visits and hospitalizations for diabetes which are potentially preventable through access to high-quality outpatient care. Compared to U.S. and other county values, none of the Diabetes Indicators this Assessment reports on have values above 1.5 (where 0 indicates the best outcome and 3 the worst) meaning they are of low concern or priority. In Ventura County, according to the data given below, the Age-Adjusted Rates for ER visits (9.6 per 10,000 population 18+) and Hospitaliza-tions (2 per 10,000 population 18+) due to Uncontrolled Diabetes are lower than the California values.
Data Synthesis and Prioritization

67Ventura County Community Health Needs Assessment 2019
TABLE 20: TOPIC SCORES ON DIABETES
Score Diabetes UnitsVentura County
CaliforniaMeasurement
Period
1.42 Age-Adjusted Death Rate due to Diabetes deaths/ 100,000 population 18.8 20.7 2014-2016
1.36 Age-Adjusted ER Rate due to Uncontrolled Diabetes ER visits/ 10,000 population 18+ years 9.6 12.8 2015-2017
1.36 Age-Adjusted Hospitalization Rate due to Diabetes hospitalizations/ 10,000 population 18+ years 12.3 15.5 2015-2017
1.36 Age-Adjusted Hospitalization Rate due to Uncontrolled Diabetes hospitalizations/ 10,000 population 18+ years 2.0 2.5 2015-2017
1.28 Adults with Diabetes percent 8.3 9.9 2016-2017
1.25 Age-Adjusted ER Rate due to Diabetes ER visits/ 10,000 population 18+ years 19.4 26.9 2015-2017
1.14 Age-Adjusted ER Rate due to Short-Term Complications of Diabetes ER visits/ 10,000 population 18+ years 0.4 0.6 2015-2017
1.14 Age-Adjusted Hospitalization Rate due to Long-Term Complications of Diabetes hospitalizations/ 10,000 population 18+ years 6.9 8.6 2015-2017
1.14 Age-Adjusted Hospitalization Rate due to Short-Term Complications of Diabetes hospitalizations/ 10,000 population 18+ years 3.3 4.3 2015-2017
0.92 Age-Adjusted ER Rate due to Long-Term Complications of Diabetes ER visits/ 10,000 population 18+ years 4.4 6.6 2015-2017
In 2017, per the California Health Interview Survey, the adult obesity rates for Ventura County (23.8%) were comparable to the state value (26.4%). According to the same source, in 2016-2017, 8.3% of adults in Ventura County have diabetes; this figure was 20.6% for adults over 65+ years. Diabetes prevalence was 26.4% in 2017 in the Medicare population, per Centers for Medicaid and Medicare data (Health Matters in Ventura County), a rate that is comparable to other counties in the state. Figure 67 displays the prevalence of diabetes by zip codes. The zip codes with rates higher or equal to county values were 93060 (9.2%), 93033 (8.9%), and 93030 (8.3%).
FIGURE 67: ADULTS WITH DIABETES, VENTURA COUNTY, 2013-2014
Source: California Health Interview Survey, 2013-2014; also Health Matters in Ventura County
Data Synthesis and Prioritization

68Ventura County Community Health Needs Assessment 2019
Figure 68 depicts Ventura County data for some of the factors responsible for adult obesity and diabetes, by age. In Ventura County, among adults 65+ that have a Body Mass Index (BMI) greater than or equal to 30.0, 20% are obese, 5% live in unsafe neighborhoods; and 16% lack access to fruits and vegetables.
FIGURE 68: COMPARISON OF AGE ACROSS RELATED INDICATORS FOR VENTURA, 2015
Source: Let’s Get Healthy California, 2015
Figure 69 shows the Age-Adjusted ER Rate due to Diabetes in Ventura County, by zip code. The overall rate in Ventura County is 19.4 ER visits per 10,000 population. In comparison, 93030 has the highest rate in Ventura County with 49.1 ER visits due to Diabetes per 10,000 population. Other zip codes in the upper quartile include 93033 (31.7 ER visits per 10,000 population) and 93036 (27.8 ER visits per 10,000 population). This indicator had one of the largest disparities between the overall county value and the highest zip code value.
FIGURE 69: AGE-ADJUSTED ER RATE DUE TO DIABETES, 2015-2017
Source: California Office of Statewide Planning and Development
Data Synthesis and Prioritization

69Ventura County Community Health Needs Assessment 2019
Diabetes is the leading cause of Chronic Kidney Disease, lower-limb amputations, and adult-onset blindness in the United States. In 2013, the annual total costs in California attributable to diabetes for persons 65+ was $9,343.7 million in direct costs and $4,141.3 million in indirect costs. The total cost per person with diabetes was $12,176 (Centers for Disease Control and Prevention, 2013). Since Medicare makes preventive procedures and screening available at no cost to enrollees, the coverage rates of preventive services tells the story of enrollees’ access to care. Per the Dartmouth Atlas Project, in 2015, 74.8% (crude-rate) of diabetic Medicare en-rollees age 65-75 received blood lipids testing; 64.4% had their eye exam; 81.94% had HbA1c Testing. The Age-Adjusted ER rate due to Diabetes is the highest value and needs to be addressed because diabetes prevalence and it’s complications like foot ulcers, amputations and end-stage renal disease are the primary drivers of increasing healthcare costs in the country. A Health Policy Brief estimated that California spent up to $565 million in 2014 on diabetic foot ulcers and related care (Jonathan Labovitz, Gerald Kominski, & James Godwin, 2017).
Recommendations for Diabetes based on all data:
• Measure patients’ weight, height, and body mass index, and counsel them on keeping a healthy weight and its role in cancer prevention.
• Refer patients with obesity to intensive programs that include a variety of activities to help people manage their weight.
• Connect patients and families with community services to help them have easier access to healthy food and ways to be active.
• Implement combined diet and physical activity promotion programs to prevent type 2 diabetes among people at increased risk.
• Provide team-based care for diabetes through health systems to improve patients’ blood glucose (measured using HbA1c levels), blood pressure, and lipid levels.
Cancers
Cancer was the third most important health priority among the participants (39.5%) of the community input survey and is a health condition that has a high economic burden on communities. Based on secondary data analysis, the topic score for can-cer was 1.6 where scores range from 0 to 3, and 0 indicates the best outcome and 3 the worst. Table 21 lists the indicators for cancer and highlights cancer in Medicare populations, breast cancer, and oro-pharyngeal cancer. Cancer was the leading cause of both death and premature death in Ventura County from 2015-2017. Males lost
an average of 21.8 years due to all cancers compared to 22.3 years for females. Female breast cancer and colorectal cancer resulted in the loss of 466.9 and 294.6 years per 100,000 population per year. Hispanics had the highest average years of life lost per death from all cancers (26.7 years) followed African Americans/Blacks (Non-Hispanic) (24.0 years), Asians (Non-Hispanic) (22.0 years), and then Whites (Non-Hispanic) (20.7 years). On average, there were 22.0 years of life lost per death from cancer for all race/ethnic groups combined.
Data Synthesis and Prioritization

70Ventura County Community Health Needs Assessment 2019
TABLE 21: INDICATOR SCORES ON CANCER
SCORE CANCER UNITS VENTURA COUNTY CALIFORNIA MEASUREMENT PERIOD
2.06 Cancer: Medicare Population percent 8.0 7.5 2015
1.78 Mammography Screening: Medicare Population percent 59.5 59.5 2015
1.78 Oral Cavity and Pharynx Cancer Incidence Rate cases/ 100,000 population 11.5 10.3 2011-2015
1.72 Breast Cancer Incidence Rate cases/ 100,000 females 130.6 121.5 2011-2015
1.56 Age-Adjusted Death Rate due to Prostate Cancer deaths/ 100,000 males 19.9 19.6 2014-2016
1.44 Age-Adjusted Death Rate due to Cancer deaths/ 100,000 population 143.3 140.2 2014-2016
1.17 Colon Cancer Screening percent 68.0 68.1 2009
1.06 Age-Adjusted Death Rate due to Colorectal Cancer deaths/ 100,000 population 12.7 12.8 2014-2016
0.89 Age-Adjusted Death Rate due to Lung Cancer deaths/ 100,000 population 27.3 28.9 2014-2016
0.83 Cervical Cancer Incidence Rate cases/ 100,000 females 6.7 7.2 2011-2015
0.83 Prostate Cancer Incidence Rate cases/ 100,000 males 99.2 101.2 2011-2015
0.50 Age-Adjusted Death Rate due to Breast Cancer deaths/ 100,000 females 17.0 19.1 2014-2016
0.33 Colorectal Cancer Incidence Rate cases/ 100,000 population 33.8 36.2 2011-2015
0.33 Lung and Bronchus Cancer Incidence Rate cases/ 100,000 population 40.9 43.3 2011-2015
The Age-Adjusted Rates for Cancer in Ventura County is 414.3 per 100,000 and is falling (National Cancer Institute, 2011-2015). Conduent HCI’s Index of Disparity reports no disparities related to cancer. The rate of new cases of Cancer in White in the county (427.9 per 100,000 population) is higher than the rate of new cases is Blacks (386.8 per 100,000 population). In Ventura County, 8% of the Medicare population had cancer in 2015 as compared to 7.6% in the state (Table 21) and is higher than both the state and national rates. Cancers related to overweight and obesity are on the rise and increased 7% between 2005 and 2014 in the United States while the rate of non-obesity related cancers is declining. In 2014, about 2 in 3 occurred in adults 50- to 74-years-old that were due to obesity (Centers for Disease Control and Prevention, 2017). In Ventura County, California from 2012-2016, there were 18,960 new cases of cancer. For every 100,000 people, 408.77 cancer cases were reported. Over those years, there were 6,535 people who died of cancer. For every 100,000 people in Ventura County, California, 142.23 died of cancer (California Cancer Registry, 2012-2016).
Many older adults do not receive the recommended screening tests for cancer and other clinical preventive services (Jensen, Salloum, Hu, Ferdows, & Tarraf, 2015; White et al., 2017). Screening for cancers can help catch cancers at an early stage when treatment is more likely to be successful, increasing the survivability of the person. Community-clinical linkages or services that help patients navigate health systems act as bridges between communities and health care providers and can reduce barriers to accessing such services (Kietzman, et al., 2019). Socioeconom-ic factors may influence the receipt of health services and cancer risk behaviors through pathways that have not been fully explored. Per the Health Matters in Ventura County, the breast cancer screening rate among Medicare patients in the county is 59.5%, a decreasing but non-significant trend; this rate is equal to the state value. Given the provision to cover mammograms with no cost sharing under the Affordable Care Act and most other health plans, this data indicates that the awareness of the full provisions of the ACA are either not known or not exercised.
Data Synthesis and Prioritization

71Ventura County Community Health Needs Assessment 2019
Recommendations for Nutrition Related Cancer based on all data:
• Expand offerings such as Chronic Disease Self-Management Program (CDSMP) within the county like Diabetes Self-Management (DSMP), Cancer: Thriving and Surviving, and Tomando Control de su Salud
• Implement interventions to increase community access to cancer screening: reducing structural barriers and reducing client out-of-pocket costs.
• Introduce interventions to increase provider delivery of screening services through health systems: provider assessment and feedback, provider incentives, and provider reminders.
• Increase community demand for cancer screening: client reminders, client incentives, small media, mass media, group education, and one-on-one education and best practices such as Flu-Fit Clinics.
Recommendations for reducing the burden of Chronic Disease based on all data:
• Screen for and stratify patients at high risk of developing multiple chronic conditions.
• Provide comprehensive tele-health interventions to supplement the care of adults who have chronic diseases affected by diet, such as cardiovascular disease and diabetes. These interventions are designed to improve two or more patient dietary behaviors (e.g., sodium, fat, or fruit/vegetable intake).
• Train non-medical health care service providers in Complex Care Management to Improve patients’ functional health status, including adherence to treatment plans; enhance coordination of care in the medical neighborhood and social environment; eliminate duplication of services and increase alignment of services and goals; and reduce the need for expensive medical services.
• Implement Care Plans to empower patients with knowledge of their own conditions and advocate for themselves; to assist in care coordination; and managing patients with multiple conditions.
7.2.5 Address Social Needs
Increasingly, health care professionals are recognizing the connection between unmet basic social and economic needs such as food, housing, and transportation and the health of their patients. One of the first steps to addressing social needs is assessing the gaps in service and the population that have the highest needs.
Housing and Food Insecurity are overarching issues that were found in the key informant interviews and focus group discussions to impact all vulnerable popu-lations. These were either conditions that drove health problems or made health problems more severe due to their existence. Table 22 lists the topic scores for housing (1.58) and food security (2.39), where 0 indicates the best outcome and 3 the worst. Table 23 provides the scores of some of the indicators of concern for both these topics. The sections below will elaborate on the status of housing and food insecurity in Ventura County.
TABLE 22: TOPIC SCORES OF SOCIAL NEEDS
Health TopicCovered Indicators within Topic Score (**indicator shows a significant race/ethnic disparity)
Topic Score
Housing and Food Insecurity
Indicators: Severe Housing Problem, Homeownership, Renters Spending 30% or More of Household Income on Rent
Food insecure children ineligible for assistance
1.58
2.39
TABLE 23: INDICATOR SCORES FOR SOCIAL NEEDS
Score Economy UnitsVentura County
CaliforniaMeasurement
Period
2.39Food Insecure Children Likely Ineligible for Assistance
percent 37.0 33.0 2016
2.06Renters Spending 30% or More of Household Income on Rent
percent 57.8 56.0 2013-2017
Data Synthesis and Prioritization

72Ventura County Community Health Needs Assessment 2019
Housing and Homelessness
Affordable housing and housing stability are important drivers of positive health outcomes. Stable housing is associated with economic stability and quality of life. Poor housing conditions or lack of housing were named as one of the 5 most important health priorities of Ventura County by 27.1% community input survey respondents in 2019, while 46.1% stated that affordable housing was important in improving life in the community.
Ventura County is one of the least affordable counties in the country for renters. Demand outstrips supply and minority and special needs households are more likely affected because they do not have transportation to get to the newer con-struction areas. Of all the persons residing in Public Housing in Ventura County in 2014, 64% were Hispanics, 30% were Non-Hispanic White and 27% were Elderly (County of Ventura Community Development Division, 2015). The median gross rent for 2013-2017 time period was $1,643 (Bureau, QuickFacts Ventura County, California, 2019). As seen in Table 23, 57.8% of renters spent 30% or more of the household income on rent, indicating they had fewer funds for other social needs such food, transportation and healthcare. Percentage of low-income renters who pay more than 50% of their income on housing costs was the highest in zip codes 93030, 93036, 93042 and 93043 (Public Health Alliance of Southern California, 2019); 26,050 renters in Ventura County face this high cost burden (Office of Policy Development and Research , 2011-2015).
California also has the highest number of chronically homelessness in the country. Between 2013 and 2017, California has seen 13.3% change in total homelessness (United States Department of Housing and Urban Development , 2017). Per the Homeless Management Information System data of the United States Department of Housing and Urban Development, the one-year estimate of sheltered homeless, between October 2016 and September 2017, was 150,630 households.
According to the recently published ‘Homeless Count and Subpopulation Survey – Ventura County 2018’ report, there were 1,299 adults and children who were home-less during the point-in-time count. To quote the report, “This number represents a 147 person or 12.8% increase when compared to the number of homeless persons who were counted in 2017, which was 1,152. The 1,299 persons counted in 2018 represents the first homeless count increase when compared to the previous year. Of the 1,299 persons counted in 2018, 821 or 63.2% were unsheltered (meaning ‘living in a place not meant for human habitation, such as cars, parks, sidewalks, abandoned buildings; on the street’). The cities of Oxnard and Ventura account for nearly two thirds (65.4%) of the 1,299 homeless persons (515 persons representing 40.0% and 335 persons representing 26%, respectively). The City of Simi Valley
again had the third highest population of homeless (143 persons representing 11%) followed by the City of Thousand Oaks (80 persons representing 6%)”. Table 24 lists the total number of unsheltered and sheltered persons for each city.
TABLE 24: THE TOTAL NUMBER OF UNSHELTERED AND SHELTERED PERSON IN TIME COUNT - VENTURA COUNTY, 2007-2018
Jurisdiction 2007 2009 2010 2011 2012 2013 2014 2015 2016 2017 2018
Camarillo 10 13 15 29 30 27 38 35 24 27 49
Filmore 5 4 5 10 16 13 6 7 6 0 2
Moorpark 13 7 1 7 5 9 15 7 4 7 3
Ojai 82 60 52 40 41 43 62 40 29 19 31
Oxnard 671 679 520 638 522 645 379* 603 584 461 335
Port Hueneme 9 1 9 6 12 17 13 22 7 18 19
Santa Paula 97 91 54 50 60 34 31 20 56 35 44
Simi Valley 163 303 229 226 284 211 194 202 99 105 143
Thousand Oaks 81 147 106 87 90 121 130 83 104 102 80
Ventura 588 623 601 570 701 519 495 334 300 301 516
Unincorporated 242 265 223 209 175 135 86 64 58 77 77
total: 1,961 2,193 1,815 1,872 1,936 1,774 1,449 1,417 1,271 1,152 1,299
*This number was artificially low due to an unresolved reporting discrepancy and the winter warming shelter being located in Ventura
Source: Ventura County 2019, Homeless Count and Subpopulation Survey: Final Report
Homeless persons lack healthcare and have many barriers to accessing healthcare, including an array of medical and mental health issues. Per the Uniform Data System (Human Resources and Services Administration, 2017), 1.19% of all patients of Clin-icas Del Camino Real, Inc. and 13.77% of Ventura County Health Services Agency Health Center (VCHSAHC) patients were homeless. Data analysis performed on UDS data by VCHSAHC found 43.6% of all homeless patients were overweight or obese, 26.4% had hypertension, 14.7% had diabetes, 13.88% suffered from depression and another 13% had anxiety including Post-Traumatic Stress Disorder. The Ventura County Community Mental Health Needs Assessment found a high proportion of mental illness and substance use in homeless individuals which in turn negatively impacted their health seeking behaviors for fear of legal consequences. Stigma, shame and embarrassment with seeking services, a lack of trust with providers and law-enforcement, and self-doubt were the main barriers in seeking health, per the report. To quote homeless focus group participants of the mental health assessment:
Data Synthesis and Prioritization

73Ventura County Community Health Needs Assessment 2019
“You reach out and you get turned down a lot because you are homeless or because you don’t look clean, or you have some shoes that don’t look brand new. You are judged a lot. And, just because you’re homeless, doesn’t mean you are a bad person…”
“But you know, a lot of these homeless people struggle. It’s just the thing is they’re afraid to call somebody for help because they’re afraid they’re going to get arrested because they’re on drugs. That’s the main thing. People get scared to get help.”
The report recommends that homeless individuals may need specialized services or focused outreach, since these groups may experience less access to mental health services overall, whether through the perception that they can’t afford it, or because of the stigma associated with those two statuses.
Recommendations for Housing and Homelessness based on all data:
• Lack of affordable housing leaves community members living in conditions which are detrimental to their health. There is a need for creative housing solutions to provide safe, decent, affordable housing for working families, singles, and the most vulnerable populations that have mental and physical disabilities. Development of this type of housing may require land use policy changes that allow for the construction of “tiny homes” or those less than 150 square feet.
• Include the development of a year-round shelter that includes social services to help those in need.
• Most people do not live and work in the same community. Building a walkable community must not only include the infrastructure improvements, but the densification of employment that can support market rate housing nearby or improvement of public transportation that will enable individuals to commute to work places from housing faraway.
• Provision of temporary assistance to transitionally homeless individuals and families to stabilize them and prevent them from becoming chronically homeless individuals through Housing First and Rapid Re-Housing Policies and Programs.
• Decriminalizing Homelessness by passing policies that prevent incarceration of homeless persons for pan-handling or sleeping in public places, while providing services to prevent relapse in mental health or addiction; develop services for chronically homeless to include integrated care that includes mental health and substance abuse due to high prevalence of the co-morbidities
Food Insecurity
The U.S. Department of Agriculture (USDA) defines food insecurity as limited or uncertain availability of nutritionally adequate foods or uncertain ability to acquire these foods in socially acceptable ways. Children exposed to food insecurity are of particular concern given the implications scarce food resources pose to a child’s health and development. Children who are food insecure are more likely to be hos-pitalized and may be at higher risk for developing chronic diseases such as obesity, anemia and asthma as a result of their low quality diet. In addition, food-insecure children may also be at higher risk for behavioral and social issues including fighting, hyperactivity, anxiety, and bullying.
Per the 2013-2017 American Community Survey 5-Year Estimates, 67.1% or 12,857 households in Ventura County with children less than 18 years receive food stamps or SNAP benefits. In 2016, 16.1% children in Ventura County were food insecure, a decreasing trend. However, the proportion of food insecure children likely in-eligible for public assistance through programs such as Supplemental Nutrition Assistance Program (SNAP) is rising in the county and constitutes 37% of all food insecure children.
The maximum income level of a family of 4 to qualify for Cal-Fresh is $33,475 (Ben-efits.Gov, 2019). Yet, the Real Cost Measure (RCM) - which estimates the amount of income required to meet basic needs of food, housing, transportation, healthcare, child care etc. (the “Real Cost Budget”) for a given household type in a specific community - estimates that a family of 4 needs an annual income of $77,493 per year in Ventura County (United Ways of California, 2018). By these estimates, one in three or 18,455 households in Ventura County are below the Real Cost Measure in 2018 which might explain the rise in food insecurity among children who are ineligible for public assistance. Paradoxically, earning even marginally more money than the CalFresh eligibility limit disqualifies families from receiving benefits though the marginal income increase will not make healthy food options more affordable.
Lack of sufficient food or healthy food options was termed as one of the five highest health priorities in the county by 11.6%. In the focus group discussions, it was a strong theme mentioned by low income young mothers and agricultural workers
Data Synthesis and Prioritization

74Ventura County Community Health Needs Assessment 2019
where access to healthy food, refraining from fast- and processed foods, being able to read food labels, understand portion control, having good eating habits and will power to make the healthy choice were termed as essential behaviors to staying healthy. To quote some of the focus group participants:
“We need access to more healthy foods that cost lesser; this includes at the schools”
“The food trucks that come to the fields (where we work) need to have healthier food options
Per Key Informants:
“During work breaks, which are the law, they (agricultural and other workers) should be provided with information on nutrition recommendations. These could also be reviewed during new employee orientation (i.e. one 15-minute break will include a brief educational on health topics)”
“There needs to be better communication with the public about what the nutrition recommendations are. This should be available in the clinic or doctor’s wait-ing rooms recommendations for good nutrition and healthy habits”
Recommendations to address Food Insecurity based on all data:
• Increase awareness of and closed loop referrals (similar to The Family Financial Wellbeing Collaborative) to Ventura County resources like CalFresh/Food Stamps, WIC, Breastfeeding support, Free Lunch Programs available at school and Food Share among individuals requiring assistance by connecting them to services at different Care points (hospitals, other providers, social service organizations, non-profits and community based organizations etc.).
• Implement food insecurity and other social needs screening in the clinical environment.
• Case management and/or tracking of food insecure individuals referred to services to establish positive outcomes.
• Reduce stigma attached to hunger and food assistance, especially in schools.
• Increase options for community gardens and agriculture friendly zoning codes for housing communities.
• Expansion of Healthy Corner Initiative and ability to redeem food benefits for produce available at such stores.
• Increased awareness of USDA’s Summer Food Service Program (program that reimburses sponsors for administrative and operational costs to provide meals for children 18 years of age and younger during periods when they are out of school for fifteen (15) or more consecutive school days) in food insecure communities.
7.3 Community Resources to Address Priority Health Issues
VCPH has partnered with 211 Ventura County to connect residents to health infor-mation, social services, and referrals through their comprehensive resource data-base. This resource inventory is available publicly to all constituents of VCCHNAC and their partners. The community resources are searchable by topic area such as housing, food, income and expenses, transportation, education or by target population such a children and family, youth, and seniors. Therefore, VCPH has made a direct link to all of the resources available through 211 Ventura County on the Health Matters in Ventura County website through the resource library instead of publishing a list of resources that becomes outdated. The resource library will be seamlessly updated as 211 Ventura County updates their database. Links to the 211 Ventura County social need topics can also be accessed through the APPENDIX D. Community Resources in this report.
7.4 Conclusion
The preceding community needs assessment (CHNA) describes barriers to health faced by the community, throwing into focus its priority health issues and providing information necessary to all levels of stakeholders to build upon each other’s work and work in a coordinated, collaborative manner. Ventura County Community Health Needs Assessment Collaborative (VCCHNAC) has established clear priorities based on the results of this community health assessment to improve health outcomes for the residents of Ventura County. Over the next year, VCCHNAC organizations will work together on the development of strategies to address the priorities outlined in the report. These strategies will inform the hospital implementation plans and the Community Health Improvement Plan to be released in 2020 In collaboration with community stakeholders and residents, VCCHNAC hopes to realize its vision of becoming the healthiest county in the nation by 2030.
Data Synthesis and Prioritization

75Ventura County Community Health Needs Assessment 2019
Name of the Organization
Significant Health Need Identified in Preceding CHNA
Planned Activities to Address Health Needs Identified in Pre-ceding Implementation Strategy
Was Activity Implemented (Yes/No)
Results, Impact & Data Sources
Adventist Health Simi Valley (AHSV)
Access to Care · Heart and Stroke Care, Education and Prevention 2016; Stroke Program - community education and outreach
Yes · AHSV invested in the community’s only catheterization lab and gained STEMI receiving status with county EMS; bring life-saving interventions and preventative treatments to nearly 200,000 residents
· Education & Outreach program - LEARN GIVE SHARE Yes · An educational animated film, Life After was developed to educate and empower patients; kick-off event in 2017 event to distribute and utilize the short film, educational materials and exercise resis-tance bands, and training sessions for 2-step CPR
· Clinical rotations for Moorpark College Nursing Students Yes · Clinical training sites for allied health certifications for EMT, Radiol-ogy Tech, Surgical Tech, CAN
· Health Promotion Yes · Free Baby Care and Breastfeeding Classes
· Free heart, stroke and grief support groups
· Appointment of geriatric medicine physician Yes · $500,000 in supportive income to establish the physician
· Urgent care in an underserved area Yes
· Free screenings and tests Yes · Provide lab and radiology tests, mammograms and other screen-ings for patients referred to the hospital by The Free Clinic of Simi Valley
Cancer · Care coordination of ER services Yes · Provide EMR staff access to The Free Clinic of Simi Valley
Community Memorial Hospital System — Ojai Valley Community Hospital
Mental Health & Substance Abuse
· Telemedicine Service:
· Establish telemedicine services in ED to include telepsychiatry by collaborating with effort led by Healthcare Association of South-ern California (HASC) that includes discussions with Sterling Psychiatric Group and Dignity Health
· Investigate opportunity to provide telepsychiatric services in physician offices
Yes · Telemedicine for behavioral health launched
Behavioral Health · Enhance Access to Behavioral Health Providers: Explore specialty care collaboration to increase behavioral health capacity of Clini-cas del Camino Real
Yes · Planning meetings have occurred with Vista del Mar for devel-oping integrated behavioral health services at CMHS outpatient physician clinics
Substance Abuse · Opioid Prescribing Patterns to Reduce Opioid Overdose Related Deaths: Working with Emergency Department physicians and medical staff, set a general standard of prescribing opioid pain medication
Yes · CURES for inpatient & outpatient. Electronic prescribing imple-mented at outpatient hospital clinics for controlled substances. There are now three physicians certified to prescribe Suboxone for opioid dependence treatment
Senior needs · Independent living support Yes · Village to Village - CMHS will provide in-kind support and staff engagement to exploration and development efforts in the Ojai Valley and West Ventura
· Improve coordination of care: ACAV 2017 initiatives include ex-tensive use of Advance Care Planning tools and primary care phy-sician adoption of the Chronic Care Management service model
Yes · CMHS Ambulatory Medicine has re-launched Intensive Case Management. Chronic Care Management program has over 1,000 patients on service
APPENDIX A. Ventura County’s Impact Report: Evaluation since Prior CHNA

76Ventura County Community Health Needs Assessment 2019
Name of the Organization
Significant Health Need Identified in Preceding CHNA
Planned Activities to Address Health Needs Identified in Pre-ceding Implementation Strategy
Was Activity Implemented (Yes/No)
Results, Impact & Data Sources
High risk health conditions – heart disease, cancer, diabetes
· HEALTHaware chronic disease detection and screening pro-gram which focuses on promoting cardiac and vascular health. Programs are conducted on the Ventura hospital campus and surrounding areas but are open to Ojai Valley residents
Yes · Thousands of community members are touched every year through ongoing health education, support, free screenings and health assessments programs administered by CMHS. CMHS reports details on these activities through its annual community benefits filing
Access to primary care
· CFH: various activities including collaboration with Clinicas to enhance patient access to specialty care
Yes · Through technology investment and continuing partnership with Clinicas del Camino Real, the no-show rate for patient appoint-ments has dropped. This reduced the appointment backlog for all patients. Ongoing participation with Gold Coast Health Plan on initiative to improve “Children and Adolescents' Access to Primary Care Practitioners” and increase HEDIS scores for GCHP
· Graduate Medical Education: Various programs Yes · Graduate Medical Education primary care physician training has increased the number of first year residents over the years. CMHS continues to improve Resident training through faculty recruitment and local partnerships
· Free Primary Care Clinics run by GME residents Yes · The Graduate Medical Education program free clinic program remains active with continued exploration of how to enhance the services provided
Access to Special-ty Care & Trans-portation for Care
· Grow multi-specialty Practice · The Multi-specialty Practice in Ojai has grown in the number and variety of participating physicians through the Graduate Medical Education program and physician recruitment support from CMHS
Education to Defeat Poverty
· Student Connectedness with School: Collaborate with Ojai Unified School District to contribute to student motivation to graduate from high school. Activities will include participation in:
· Nordhoff High School Health Science Academy
· Career Day presentations
· CPR training
Yes · Activities in 2017 and 2018 include Career Day events, CPR/1st Aide education and student participation in disaster exercise at hospital
Obese/Over-weight Youth
· Fit Kids/Fit Ojai: CMHS will continue to provide programmatic and financial support
No · n/a
Oral Health · Enhance Access to Dental Care” Explore new specialty care col-laboration with Clinicas del Camino Real to address unmet dental care need
Yes · CMHS and Clinicas del Camino Real executives have discussed dental care needs. Clinicas is the largest employer of dentists in the State of California. CMHS participates with the United Way's Building Healthy Smiles campaign
Community Memorial Hospital
Mental Health & Substance Abuse
· Intensive Case Management to meet the needs of patients who demonstrate difficulty in managing their medical conditions in the community; to better support frequent hospital utilizers – both ER and inpatient; to pay special attention to the patient who has both complex medical issues coupled with complex psychosocial issues
Yes · CMHS re-launched the Intensive Case Management program in 2018
APPENDIX A. Ventura County’s Impact Report: Evaluation since Prior CHNA

77Ventura County Community Health Needs Assessment 2019
Name of the Organization
Significant Health Need Identified in Preceding CHNA
Planned Activities to Address Health Needs Identified in Pre-ceding Implementation Strategy
Was Activity Implemented (Yes/No)
Results, Impact & Data Sources
· Telemedicine Service to establish telemedicine services in ED to include telepsychiatry by collaborating with effort led by Health-care Association of Southern California (HASC) that includes discussions with Sterling Psychiatric Group and Dignity Health; and, investigate opportunity to provide telepsychiatric services in physician offices
Yes · Telemedicine for behavioral health launched
Enhance Access to Behavioral Health Providers
· Explore new specialty care collaboration to increase behavioral health capacity of Clinicas del Camino Real
Yes · Planning meetings have occurred with Vista del Mar for devel-oping integrated behavioral health services at CMHS outpatient physician clinics
Substance Abuse · Opioid Prescribing Patterns to Reduce Opioid Overdose Related Deaths: Working with Emergency Department physicians and medical staff, set a general standard of prescribing opioid pain medication
Yes · CURES for inpatient & outpatient. Electronic prescribing imple-mented at outpatient hospital clinics for controlled substances. There are now three physicians certified to prescribe Suboxone for opioid dependence treatment
Education to Defeat Poverty
· Student Connectedness with School: CMH collaborated with West Ventura schools to contribute to student motivation to grad-uate from high school. Activities included participation in:
· Ventura Unified School District’s Health Science and Medical Technology career track education in Patient Care
· Pacifica High School’s Health Science Academy
Yes · Stroke teaching at Balboa middle school with quizzes before and after the full period of the class: 360 students
High risk health conditions – heart disease, cancer, diabetes
· HEALTHaware chronic disease detection and screening program which focuses on promoting cardiac and vascular health. Con-tinue planned activities and explore collaboration with Camarillo Health District
Yes · Thousands of community members are touched every year through ongoing health education, support, free screenings and health assessments programs administered by CMHS. CMHS reports details on these activities through its annual community benefits filing
· Women's Health: Free breast and cervical cancer screening Yes · Thousands of community members are touched every year through ongoing health education, support, free screenings and health assessments programs administered by CMHS. CMHS reports details on these activities through its annual community benefits filing
Obesity/over-weight-at risk populations
· WEIGHTaware program: To deliver prediabetes education at schools
Yes · Thousands of community members are touched every year through ongoing health education, support, free screenings and health assessments programs administered by CMHS. CMHS reports details on these activities through its annual community benefits filing
Senior Care · Independent living support: Village to Village - CMHS will provide in-kind support and staff engagement to exploration and develop-ment efforts in the Ojai Valley and West Ventura
Yes · CMHS has partnered with the Camarillo Health Care District on a Person Centered Care initiative that includes in-home assessment, care coordination and referral to community-based service orga-nizations. CMHS continues to monitor the three year old Conejo Valley Village program in the eastern part of Ventura County with an eye towards building on that program's success
APPENDIX A. Ventura County’s Impact Report: Evaluation since Prior CHNA

78Ventura County Community Health Needs Assessment 2019
Name of the Organization
Significant Health Need Identified in Preceding CHNA
Planned Activities to Address Health Needs Identified in Pre-ceding Implementation Strategy
Was Activity Implemented (Yes/No)
Results, Impact & Data Sources
· Improve coordination of care: ACAV 2017 initiatives include ex-tensive use of Advance Care Planning tools and primary care phy-sician adoption of the Chronic Care Management service model
Yes · CMHS Ambulatory Medicine has re-launched Intensive Case Management. Chronic Care Management program has over 1,000 patients on service
Access to Health Care Services
· CFH: various activities including collaboration with Clinicas to enhance patient access to specialty care
Yes · Through technology investment and continuing partnership with Clinicas del Camino Real, the no-show rate for patient appoint-ments has dropped. This reduced the appointment backlog for all patients. Ongoing participation with Gold Coast Health Plan on initiative to improve “Children and Adolescents' Access to Primary Care Practitioners” and increase HEDIS scores for GCHP
· Graduate Medical Education Yes · Graduate Medical Education primary care physician training has increased the number of first year residents over the years. CMHS continues to improve Resident training through faculty recruitment and local partnerships
· Free Primary Care Clinics by GME residents Yes · The GME free clinic program remains active with continued explo-ration of how to enhance the services provided.
Oral Health · Enhance Access to Dental Care: Explore new specialty care col-laboration with Clinicas del Camino Real to address unmet dental care need
Yes · CMHS and Clinicas del Camino Real executives have discussed dental care needs. Clinicas is the largest employer of dentists in the State of California. /CMHS participates with the United Way's Building Healthy Smiles campaign
Homeless Health Issues
· Recuperative care in Ventura County: Two year pilot with HASC/National Health Foundation and the Salvation Army
Yes · Recuperative Care, defined as “short term care and case manage-ment provided to individuals recovering from an illness or injury that generally does not necessitate hospitalization, but would be exacerbated by their living conditions (e.g., street, shelter or other place not meant for human habitation).” 1.5 beds per day are well used through referrals from Ojai Hospital, Community Memorial Hospital and Kaiser. CMHS provides funding for this program
Geri-Psychiatric Inpatient Care
· West Ventura-based services: Facility planning process Yes · CMHS has an ongoing planning process for repurposing its Mountain Tower from acute inpatient to other uses. This includes architectural plans for a Geri-psychiatric unit
St. John’s Regional Medical Center
Obesity and Over-weight
· Senior Wellness: A community based exercise and education pro-gram that helps senior monitor their health and lead active lives.
Yes · 2,837 contacts in Walking Program. 1,521 blood pressure screen-ings. 1,216 blood glucose screenings.
· 84% of Walking Program participants with diabetes have achieved an HbA1C level of 7.5%. (2 participants do not have health insur-ance and cannot afford A1C tests. St. John’s will provide them free test in June 2019.)
· Total referrals for medical follow-up (to prevent a medical crisis/avoidable hospitalization): 26 elevated blood pressure tests 16 ele-vated blood sugar tests (at Walking Program and Senior Wellness Health Screenings in Oxnard and Camarillo Senior centers)
· Weekly Spanish Exercise Class and Exercise Smart Class · 66 classes provided.
· Managing A Healthy Weight: Classes that provide tools and prac-tice eating well and managing a healthy weight.
· 4 classes provided.
APPENDIX A. Ventura County’s Impact Report: Evaluation since Prior CHNA

79Ventura County Community Health Needs Assessment 2019
Name of the Organization
Significant Health Need Identified in Preceding CHNA
Planned Activities to Address Health Needs Identified in Pre-ceding Implementation Strategy
Was Activity Implemented (Yes/No)
Results, Impact & Data Sources
· Healthy Eating Classes: classes that offer practical alternatives and demonstration of healthy food choices such as Plant-Based Meal Planning, Eating for Your Brain, Eating for Good Health, Healthy Eating for Children, Reduce Blood Pressure with DASH Meal plans
· 7 classes were provided
Access to Health-care
· Brain Injury Center for Ventura County Yes · A Community Grant for Extended Care Transitions for the Cogni-tively Impaired for $47,320
Homeless Health Issues
· Community Action of Ventura County Yes · A Community Grant for Homeless Dental Services Project for $18,200
· Interface Children & Family Services Yes · A Community Grant to 2-1-1 Ventura County Homeless Services Outreach and Coordination Services for $36,400
· Housing Stability/Assistance Yes · 152 people received housing/rent assistance @ $23,219
Diabetes and Pre-diabetes
· D.E.E.P.®: A 6 week class based program with follow-up to assist people in managing their diabetes/avoiding diabetes if they are pre-diabetic
Yes · One new bilingual volunteer was trained in DEEP curriculum
· Offered 2 Spanish Diabetes Education and Empowerment Evi-dence-Based Workshops and 3 in English.
· Participants demonstrated increased knowledge of diabetes and how to manage diabetes as evidenced by a comparison of pre and post class tests. Participants also provided very positive feedback to their experience of the material
· Diabetes Support Group: Both English and Spanish language support groups to assist people with managing their diabetes after they have taken the D.E.E.P.® classes.
· 13 number of meetings.
· Healthy Cooking and Tasting Classes: A quarterly demonstration of healthy cooking at SJRMC led by Community Health Education staff, physicians and Dietary Dept. staff
· 6 classes were provided.
Cardiovascular Health
· CHAMP® (Congestive Heart Active Management Program): a remote telephonic medical home for those diagnosed with Heart Failure
Yes · 92% of the participants enrolled in CHAMP® will not be re-admit-ted to any hospital within 90 days for Congestive Heart Failure Exacerbation—measured quarterly:
· FY19 Q-1, 75 enrolled with 0 HF readmissions—goal met
· FY19 Q-2, 62 enrolled with 4 HF readmission—goal met
· FY19 Q-3 100 enrolled with 4 HF readmissions—goal met
· Healthy Cooking and Tasting Classes: A quarterly demonstration of healthy cooking led by physicians and Dietary Dept. staff
· 6 classes provided.
Cancers · St. John’s Cancer Center of Ventura County: Offered free multiple programs for those diagnosed with cancer and their families, to provide support to survivors and education to members of the community regarding cancers, cancer risks and testing. Programs include: Oncology Nutrition, Patient Navigation, LMFT Counsel-ing, Support Groups, Relaxation Therapy, Tai Chi, Lymphedema, Yoga, Wigs, Prosthesis and Art Therapies
Yes · At community education events more than 90% of the time our attendees commented top learning more than one modifiable tool to help them decreasetheir own cancer risk, this includes nutrition modifications, increase exercise, increase sleep, decrease sugar intake, stop smoking, decrease red meat intake, decrease stress and implement relaxation techniques
APPENDIX A. Ventura County’s Impact Report: Evaluation since Prior CHNA

80Ventura County Community Health Needs Assessment 2019
Name of the Organization
Significant Health Need Identified in Preceding CHNA
Planned Activities to Address Health Needs Identified in Pre-ceding Implementation Strategy
Was Activity Implemented (Yes/No)
Results, Impact & Data Sources
Social Determi-nants of Poor Health
· Health Ministries Basic Needs Programs: A group of activities that provides healthy food/groceries and hot meals weekly to the poor and rent/housing and utilities assistance to those in need
· 13,802 hot meals served.
· 23,532 contacts & 4,958 people (unduplicated) served at the Food Pantry 200,409 lbs. of food distributed (gross weight—100 tons).
· 1,663 articles of clothing distributed.
· 534 pairs of NEW shoes were collected & distributed
· 73 people received utilities emergency assistance @ $3,813.40
· More than 225 people received financial counseling
St. John’s Pleasant Valley Hospital
Obesity and Overweight
· Managing A Healthy Weight Class: Class provides tools and prac-tice in eating well and managing a healthy weight.
Yes · 1 class provided.
· Healthy Eating Classes: classes that offer practical alternatives and demonstration of healthy food choices such as Plant-Based Meal Planning, Dash – Meal Planning to Reduce Blood Pressure, Healthy Eating Classes for children
Yes · 3 classes were provided.
Access to Healthcare
· Brain Injury Center of Ventura County Yes · A Community Grant for Extended Care Transitions for the Cogni-tively Impaired for $17,680
Homeless Health Issues
· Community Action of Ventura County Yes · A Community Grant for Homeless Dental Services Project for $6,800
· Interface Children & Family Services Yes · A Community Grant to 2-1-1 Ventura County Homeless Services Outreach and Coordination Services for $13,600
Diabetes and Pre-diabetes
· D.E.E.P.®: A 6 week class based program with follow-up to assist people in managing their diabetes/ avoiding diabetes if they are pre-diabetic
Yes · One class was presented in English
· Participants demonstrated increased knowledge of diabetes and how to manage diabetes as evidenced by a comparison of pre and post class tests. Participants also provided very positive feedback to their experience of the materials
Cardiovascular Health
· CHAMP® (Congestive Heart Active Management Program): a remote telephonic medical home for those diagnosed with Heart Failure
Yes · 92% of the participants enrolled in CHAMP® will not be re-admit-ted to any hospital within 90 days for Congestive Heart Failure Exacerbation—measured quarterly:
· FY19 Q-1, 29 enrolled with 1 HF readmissions—goal met
· FY19 Q-2, 31 enrolled with 0 HF readmission—goal met
· FY19 Q-3, 25 enrolled with 0 HF readmissions—goal met
Cancers · St. John’s Cancer Center of Ventura County: Offered free multiple programs for those diagnosed with cancer and their families, to provide support to survivors and education to members of the community regarding cancers, cancer risks and testing. Programs include: Oncology Nutrition, Patient Navigation, LMFT Counsel-ing, Support Groups, Relaxation Therapy, Tai Chi, Lymphedema, Yoga, Wigs, Prosthesis and Art Therapies
Yes · At community education events more than 90% of the time our attendees commented top learning more than one modifiable tool to help them decrease their own cancer risk, this includes nutrition modifications, increase exercise, increase sleep, decrease sugar intake, stop smoking, decrease red meat intake, decrease stress and implement relaxation techniques
APPENDIX A. Ventura County’s Impact Report: Evaluation since Prior CHNA

81Ventura County Community Health Needs Assessment 2019
Two types of data were used in this assessment: primary and secondary data. Primary data are data that have been collected for the purposes of this commu-nity assessment. Primary data were obtained through a community survey, focus groups, and key informant interviews.
Secondary data are health indicator data that have already been collected by public sources such as government health departments. Each type of data was analyzed using a unique methodology. Findings were organized by health topics and then synthesized for a comprehensive overview of the health needs in the Ventura County Community Health Needs Assessment Collaborative (VCCHNAC) service area.
Secondary Data Methodology: Secondary Data Sources
The main source for the secondary data, or data that have been previously col-lected, is the community indicator database maintained by Conduent Healthy Communities Institute. The following is a list of both local and national sources used in Ventura County’s Community Health Needs Assessment:
Ventura County
1. American Community Survey
2. American Lung Association
3. California Department of Education (California Assessment of Student Performance and Progress, Fitnessgram)
4. California Department of Justice
5. California Department of Public Health
6. California Department of Public Health, Immunization Branch
7. California Department of Public Health, STD Control Branch
8. California Health Interview Survey
9. California Healthy Kids Survey
10. California Office of Statewide Health Planning and Development
11. California Opioid Overdose Surveillance Dashboard
12. California Secretary of State
13. California State Highway Patrol
APPENDIX B. METHODOLOGY
14. Centers for Medicare & Medicaid Services
15. Child Welfare Dynamic Report System
16. Controlled Substance Utilization Review and Evaluation System
17. County Health Rankings
18. Feeding America
19. Institute for Health Metrics and Evaluation
20. Lucile Packard Foundation for Children’s Health
21. National Cancer Institute
22. National Center for Education Statistics
23. National Environmental Public Health Tracking Network
24. The Dartmouth Atlas of Health Care
25. U.S. Bureau of Labor Statistics
26. U.S. Census - County Business Patterns
27. U.S. Department of Agriculture - Food Environment Atlas
28. U.S. Environmental Protection Agency
Additional secondary data sources were used to supplement the county profiles and priority area sections of this report:
• California Department of Public Health, In-Hospital Breastfeeding Report
• California Healthy Place Index
• Uniform Data System (UDS) 2017 Report

82Ventura County Community Health Needs Assessment 2019
SECONDARY DATA SOURCES & ANALYSIS
Secondary data used for this assessment were collected and analyzed from HCI’s community indicator database. This database, maintained by researchers and analysts at HCI, includes over 241 community indicators from at least 32 state and national data sources. HCI carefully evaluates sources based on the following three criteria: the source has a validated methodology for data collection and analysis; the source has scheduled, regular publication of findings; and the source has data values for small geographic areas or populations.
Secondary Data Scoring
HCI’s Data Scoring Tool® (Figure 70) was used to systematically summarize multiple comparisons in order to rank indicators based on highest need. For each indicator, the community value was compared to a distribution of California and US counties, state and national values, Healthy People 2020, and significant trends were noted. These comparison scores range from 0-3, where 0 indicates the best outcome and 3 the worst. Availability of each type of comparison varies by indicator and is dependent upon the data source, comparability with data collected for other communities, and changes in methodology over time. The comparison scores were summarized for each indicator, and indicators were then grouped into topic areas for a systematic ranking of community health needs. Please see APPENDIX B. Methodology for further details on the quantitative data scoring methodology as well as secondary data scoring results.
FIGURE 70: SUMMARY OF TOPIC SCORING ANALYSIS
Index of Disparity
An important part of the CHNA process is to identify health disparities, the needs of vulnerable populations, and unmet health needs or gaps in services. There were several ways in which subpopulation disparities were examined in the Ventura County Service Area. For secondary data health indicators, Conduent HCI’s Index of Disparity tool was utilized to see if there were large, negative, and concerning differences in indicator values between each subgroup data value and the overall county value. The Index of Disparity was run for the county, and the indicators with the highest race/ethnicity index value were found, with their associated subgroup with the negative disparity listed below in SECTION 5: Disparities.
Data Considerations
Several limitations of data should be considered when reviewing the findings presented in this report. Although the topics by which data are organized cover a wide range of health and health-related areas, data availability varies by health topic. Some topics contain a robust set of secondary data indicators, while others may have a limited number of indicators or limited subpopulations covered by those specific indicators.
Data scores represent the relative community health need according to the sec-ondary data for each topic and should not be considered to be a comprehensive result on their own. In addition, these scores reflect the secondary data results for the population as a whole, and do not represent the health or socioeconomic need that is much greater for some subpopulations. Moreover, many of the secondary data indicators included in the findings are collected by survey, and though specific methods are used to best represent the population at large, these measures are subject to instability, especially for smaller populations. The Index of Disparity is also limited by data availability, where indicator data varies based on the population groups and service areas being analyzed.
Race/Ethnic and Special Population Groupings
The secondary data presented in this report derive from multiple sources, which may present race and ethnicity data using dissimilar nomenclature. For consistency with data sources throughout the report, subpopulation data may use different terms to describe the same or similar groups of community members.
APPENDIX B. METHODOLOGY

83Ventura County Community Health Needs Assessment 2019
Zip Codes and Zip Code Tabulation Areas
This report presents both ZIP Code and ZIP Code Tabulation Area (ZCTA) data. ZIP Codes, which were created by the U.S. Postal Service to improve mail delivery service, are not reported in this assessment as they may change, include P.O. boxes or cover large unpopulated areas. This assessment cover ZCTAs or ZIP Code Tab-ulation Areas which were created by the U.S. Census Bureau and are generalized representations of ZIP Codes that have been assigned to census blocks.
Demographics for this report are sourced from the United States Census Bureau, which presents ZCTA estimates. Tables and figures in the Demographics section of this report reference ZIP Codes in title (for purposes of familiarity) but show values of ZCTAs. Data from other sources are labeled as such.
SECONDARY DATA SCORING
Data scoring is done in three stages:
For each indicator, in VCCHNAC’s service area is assigned a score based on its com-parison to other communities, whether health targets have been met, and the trend of the indicator value over time. These comparison scores range from 0-3, where 0 indicates the best outcome and 3 the worst. Availability of each type of comparison varies by indicator and is dependent upon the data source, comparability with data collected for other communities, and changes in methodology over time.
Indicators are categorized into topic areas and each topic area receives a score. Indicators may be categorized in more than one topic area. Topic scores are deter-mined by the comparisons of all indicators within the topic.
Comparison to a Distribution of County Values: Within State and Nation
For ease of interpretation and analysis, indicator data on the Community Dashboard is visually represented as a green-yellow-red gauge showing how the community is faring against a distribution of counties in the state or the United States. A distribu-tion is created by taking all county values within the state or nation, ordering them from low to high, and dividing them into three groups (green, yellow, red) based
on their order. Indicators with the poorest comparisons (“in the red”) scored high, whereas indicators with good comparisons (“in the green”) scored low.
Comparison to Values: State, National, and Targets
Each county is compared to the state value, the national value, and target values. Target values include the nation-wide Healthy People 2020 (HP2020) goals. Healthy People 2020 goals are national objectives for improving the health of the nation set by the Department of Health and Human Services’ (DHHS) Healthy People Initiative. For all value comparisons, the scoring depends on whether the county value is better or worse than the comparison value, as well as how close the county value is to the target value.
Trend over Time
The Mann-Kendall statistical test for trend was used to assess whether the county value is increasing over time or decreasing over time, and whether the trend is sta-tistically significant. The trend comparison uses the four most recent comparable values for the county, and statistical significance is determined at the 90% confi-dence level. For each indicator with values available for four time periods, scoring was determined by direction of the trend and statistical significance.
Missing Values
Indicator scores are calculated using the comparison scores, availability of which depends on the data source. If the comparison type is possible for an adequate proportion of indicators on the community dashboard, it will be included in the indicator score. After exclusion of comparison types with inadequate availability, all missing comparisons are substituted with a neutral score for the purposes of calculating the indicator’s weighted average. When information is unknown due to lack of comparable data, the neutral value assumes that the missing comparison score is neither good nor bad.
Indicator Scoring
Indicator scores are calculated as a weighted average of all included comparison scores. If none of the included comparison types are possible for an indicator, no score is calculated and the indicator is excluded from the data scoring results.
Topic Scoring
Indicator scores are averaged by topic area to calculate topic scores. Each indicator may be included in up to three topic areas if appropriate. Resulting scores range from 0-3, where a higher score indicates a greater level of need as evidenced by the data. A topic score is only calculated if it includes at least three indicators.
APPENDIX B. METHODOLOGY

84Ventura County Community Health Needs Assessment 2019
The health and quality of life topic areas are described and defined as follows:
Topic Area Description & Definition
Access to Health Services Indicators of or directly related to the availability and ease of access to adequate health services, including primary care, specialty care, oral health care, and mental health care
Children’s Health Indicators of or directly related to children’s physical or mental health
Diabetes Indicators of or directly related to the incidence, prevalence, mortality, screening, treatment, or management of diabetes
Disabilities Indicators of or directly related to the population affected by disabilities
Economy Indicators of or directly related to economic factors affecting of an individual’s health and quality of life, including income and poverty
Education Indicators of or directly related to education, specifically educational attainment, proficiency, and educational institutions
Environment Indicators of or directly related to the surroundings or conditions in which individuals live and operate, including the natural environment and man-made effects on environmental conditions
Environmental & Occupational Health Indicators of or directly related to the health effects of the physical environment, including those related to one’s occupation
Exercise, Nutrition, & Weight Indicators of or directly related to physical activity and diet behaviors or measures of healthy weight
Heart Disease & Stroke Indicators of or directly related to cardiovascular health
Immunizations & Infectious Diseases Indicators of or directly related to vaccinations, influenza & pneumonia, HIV/AIDS, STDs, TB, etc.
Maternal, Fetal & Infant Health Indicators of or directly related to the health of a mother or child before, during, and after pregnancy
Mental Health & Mental Disorders Indicators of or directly related to access to mental health care, prevalence of mental illness, and general mental health status
Older Adults & Aging Indicators of or directly related to health issues specific or especially pertinent to Older Adults (usually age 65+)
Oral Health Indicators of or directly related to access to oral health care, prevalence of oral diseases, and general oral health status
Prevention & Safety Indicators of or directly related to injury prevention
Respiratory Diseases Indicators of or directly related to any disease affecting the respiratory system, including asthma, COPD, lung cancer, and tuberculosis
Social Environment Indicators of or directly related to the immediate physical and social settings in which people live, including culture, institutions, and interpersonal interactions
Substance Abuse Indicators of or directly related to alcohol abuse, tobacco use, illegal substance use, and abuse of prescription drugs
Teen & Adolescent Health Indicators of or directly related to health behaviors and outcomes of adolescents (usually ages 12-17 or grades 7-12)
Transportation Indicators of or directly related to transportation and its effects on health and quality of life, notably with regards to access to care, commuting, and availability of needed services.
Data Scoring Results
The following tables list each indicator by topic area for VCCHNAC’s service area. Secondary data for this report are up to date as of April 3rd, 2019.
APPENDIX B. METHODOLOGY

85Ventura County Community Health Needs Assessment 2019
SCORE ACCESS TO HEALTH SERVICES UNITSVENTURA COUNTY
HP2020 California U.S.VC 2020
TargetMEASUREMENT
PERIODHIGH RACE DISPARITY*
Source
2.10 Non-Physician Primary Care Provider Rateproviders/ 100,000
population34.5 52.2 81.2 2017 17
1.95 Adults Delayed or had Difficulty Obtaining Care percent 26.7 21.2 2013-2014 8
1.95People Delayed or had Difficulty Obtaining Care
percent 12.1 4.2 10.1 2016-2017 8
1.78 Children with Health Insurance percent 96.0 100.0 96.9 95.0 2017 1
1.65 Children who Visited a Dentist percent 73.4 78.7 2013-2014 8
1.55Adults Needing and Receiving Behavioral Health Care Services
percent 60.0 60.9 2016-2017 8
1.45 Adults with Health Insurance: 18-64 percent 89.7 100.0 88.7 83.3 2015-2017 8
1.40 People with a Usual Source of Health Care percent 86.5 95.0 86.2 2016-2017 8
1.10 Primary Care Provider Rateproviders/ 100,000
population76.8 78.1 75.5 2015 17
0.45 Dentist Ratedentists/ 100,000
population88.5 82.4 67.4 2016 17
SCORE CANCER UNITSVENTURA COUNTY
HP2020 California U.S.VC 2020
TargetMEASUREMENT
PERIODHIGH RACE DISPARITY*
Source
2.00 Cancer: Medicare Population percent 8.0 7.5 7.8 2015 14
1.75Mammography Screening: Medicare Popula-tion
percent 59.5 59.5 63.2 2015 24
1.75 Oral Cavity and Pharynx Cancer Incidence Ratecases/ 100,000 popu-
lation11.5 10.3 11.6 2011-2015 21
1.70 Breast Cancer Incidence Rate cases/ 100,000 females 130.6 121.5 124.7 2011-2015 21
1.55Age-Adjusted Death Rate due to Prostate Cancer
deaths/ 100,000 males 19.9 21.8 19.6 2014-2016 5
1.45 Age-Adjusted Death Rate due to Cancerdeaths/ 100,000 pop-
ulation143.3 161.4 140.2 2014-2016 5
1.20 Colon Cancer Screening percent 68.0 68.1 2009 8
1.10Age-Adjusted Death Rate due to Colorectal Cancer
deaths/ 100,000 pop-ulation
12.7 14.5 12.8 2014-2016 5
0.95 Age-Adjusted Death Rate due to Lung Cancerdeaths/ 100,000 pop-
ulation27.3 45.5 28.9 2014-2016 5
0.90 Cervical Cancer Incidence Rate cases/ 100,000 females 6.7 7.3 7.2 7.5 2011-2015 21
APPENDIX B. METHODOLOGY

86Ventura County Community Health Needs Assessment 2019
SCORE CANCER UNITSVENTURA COUNTY
HP2020 California U.S.VC 2020
TargetMEASUREMENT
PERIODHIGH RACE DISPARITY*
Source
0.90 Prostate Cancer Incidence Rate cases/ 100,000 males 99.2 101.2 109.0 2011-2015 21
0.60 Age-Adjusted Death Rate due to Breast Cancerdeaths/ 100,000
females17.0 20.7 19.1 2014-2016 5
0.45 Colorectal Cancer Incidence Ratecases/ 100,000 popu-
lation33.8 39.9 36.2 39.2 2011-2015 21
0.45 Lung and Bronchus Cancer Incidence Ratecases/ 100,000 popu-
lation40.9 43.3 60.2 2011-2015 21
SCORE CHILDREN’S HEALTH UNITSVENTURA COUNTY
HP2020 California U.S.VC 2020
TargetMEASUREMENT
PERIODHIGH RACE DISPARITY*
Source
2.30Food Insecure Children Likely Ineligible for Assistance
percent 37.0 33.0 20.0 2016 18
1.905th Grade Students who are at a Healthy Weight or Underweight
percent 58.3 59.5 65.1 2017-2018 3
1.78 Children with Health Insurance percent 96.0 100.0 96.9 95.0 2017 1
1.75 Child and Teen Fruit Consumption percent 63.1 64.3 2014-2015 8
1.73Age-Adjusted Hospitalization Rate due to Pediatric Mental Health
hospitalizations/ 10,000 population
under 18 years28.9 25.4 2015-2017 10
1.73Teens who have Ever Used Inhalants: 11th Graders
percent 4.0 1.8 2015-2017 9
1.73Teens who have Ever Used Inhalants: 7th Graders
percent 4.0 1.5 2015-2017 9
1.73Teens who have Ever Used Inhalants: 9th Graders
percent 4.0 1.9 2015-2017 9
1.73Teens who have Ever Used Recreational Pre-scription Drugs: 11th Graders
percent 17.0 3.3 2015-2017 9
1.73Teens who have Ever Used Recreational Pre-scription Drugs: 9th Graders
percent 12.0 2.9 2015-2017 9
1.65 Children who Visited a Dentist percent 73.4 78.7 2013-2014 8
1.58Age-Adjusted ER Rate due to Pediatric Mental Health
ER visits/ 10,000 popu-lation under 18 years
26.0 31.9 2015-2017 10
1.50 Children with Low Access to a Grocery Store percent 4.0 2015 27
1.25 Kindergartners with Required Immunizations percent 95.9 95.1 2017 6
1.18 Age-Adjusted ER Rate due to Pediatric AsthmaER visits/ 10,000 popu-
lation under 18 years29.6 40.5 2015-2017
Black*, White (36.4), API*, Hisp (32.5)
10
APPENDIX B. METHODOLOGY
*subgroup suppressed to meet confidentiality requirements for de-identification of PHI

87Ventura County Community Health Needs Assessment 2019
SCORE CHILDREN’S HEALTH UNITSVENTURA COUNTY
HP2020 California U.S.VC 2020
TargetMEASUREMENT
PERIODHIGH RACE DISPARITY*
Source
0.98Age-Adjusted Hospitalization Rate due to Pediatric Asthma
hospitalizations/ 10,000 population
under 18 years4.4 8.2 2015-2017
Black*, White (6.1), Hisp (4.2)
10
0.95 Children and Teens with Asthma percent 12.6 14.2 2009Black*, White (16.1),
Asian (21.3), Mult (8.5), Hisp (8.8)
8
0.95 Substantiated Child Abuse Rate cases/ 1,000 children 5.3 7.5 7.2 2017Black*, White (3.5),
AIAN*, API*, Hisp (6.9)
15
0.30 Child Food Insecurity Rate percent 16.1 19.0 17.9 2016 18
SCORE DIABETES UNITSVENTURA COUNTY
HP2020 California U.S.VC 2020
TargetMEASUREMENT
PERIODHIGH RACE DISPARITY*
Source
1.60 Diabetes: Medicare Population percent 26.1 25.3 26.5 2015 14
1.43 Age-Adjusted Death Rate due to Diabetesdeaths/ 100,000 pop-
ulation18.8 20.7 21.1 2014-2016 5
1.38Age-Adjusted ER Rate due to Uncontrolled Diabetes
ER visits/ 10,000 popu-lation 18+ years
9.6 12.8 2015-2017Black*, White (10.4),
API*, Hisp (15.6)10
1.38Age-Adjusted Hospitalization Rate due to Diabetes
hospitalizations/ 10,000 population 18+ years
12.3 15.5 2015-2017 10
1.38Age-Adjusted Hospitalization Rate due to Uncontrolled Diabetes
hospitalizations/ 10,000 population 18+ years
2.0 2.5 2015-2017 10
1.30 Adults with Diabetes percent 8.3 9.9 2016-2017 8
1.28 Age-Adjusted ER Rate due to DiabetesER visits/ 10,000 popu-
lation 18+ years19.4 26.9 2015-2017
Black*, White (21.2), API*, Hisp (31.7)
10
1.18Age-Adjusted ER Rate due to Short-Term Com-plications of Diabetes
ER visits/ 10,000 popu-lation 18+ years
0.4 0.6 2015-2017 White (0.6) Hisp (0.2) 10
1.18Age-Adjusted Hospitalization Rate due to Long-Term Complications of Diabetes
hospitalizations/ 10,000 population 18+ years
6.9 8.6 2015-2017 10
1.18Age-Adjusted Hospitalization Rate due to Short-Term Complications of Diabetes
hospitalizations/ 10,000 population 18+ years
3.3 4.3 2015-2017 10
0.98Age-Adjusted ER Rate due to Long-Term Com-plications of Diabetes
ER visits/ 10,000 popu-lation 18+ years
4.4 6.6 2015-2017Black*, White (4.8),
API*, Hisp (7.2)10
APPENDIX B. METHODOLOGY
*subgroup suppressed to meet confidentiality requirements for de-identification of PHI

88Ventura County Community Health Needs Assessment 2019
SCORE ECONOMY UNITSVENTURA COUNTY
HP2020 California U.S.VC 2020
TargetMEASUREMENT
PERIODHIGH RACE DISPARITY*
Source
2.30Food Insecure Children Likely Ineligible for Assistance
percent 37.0 33.0 20.0 2016 18
2.00Renters Spending 30% or More of Household Income on Rent
percent 57.8 56.0 50.6 2013-2017 1
1.50 Severe Housing Problems percent 24.6 27.9 18.8 2010-2014 17
1.40 Unemployed Workers in Civilian Labor Force percent 3.7 3.9 3.5 November 2018 25
1.30 Students Eligible for the Free Lunch Program percent 41.9 49.0 40.4 2016-2017 22
1.20 Homeownership percent 59.7 50.2 56.0 2013-2017 1
1.20 Low-Income and Low Access to a Grocery Store percent 3.3 2015 27
0.83Persons with Disability Living in Poverty (5-year)
percent 17.5 25.5 27.1 2013-2017 1
0.80 Youth not in School or Working percent 1.7 2.1 2.1 2013-2017 1
0.65 People Living 200% Above Poverty Level percent 73.3 66.1 67.2 2013-2017 1
0.50 People 65+ Living Below Poverty Level percent 6.9 10.2 9.3 2013-2017
Black (11.5) White (5.4) Asian (8.2) AIAN (11.1) NHPI (0) Mult
(12.9) Other (12) Hisp (10.8)
1
0.50 People Living Below Poverty Level percent 10.3 15.1 14.6 2013-2017 1
0.45 Per Capita Income dollars 35771 33128 31177 2013-2017 1
0.40 Children Living Below Poverty Level percent 14.4 20.8 20.3 15.2 2013-2017
Black (15.7) White (5.3) Asian (5.1) AIAN
(33.3) NHPI (4.5) Mult (8) Other (16.7)
Hisp (21.2)
1
0.30 Child Food Insecurity Rate percent 16.1 19.0 17.9 2016 18
0.30 Families Living Below Poverty Level percent 7.1 11.1 10.5 2013-2017
Black (7.1) White (3.4) Asian (5) AIAN (16) NHPI (0) Mult (7.8) Other (10.6)
Hisp (13.3)
1
0.30 Median Household Income dollars 81972 67169 57652 2013-2017 1
0.15 Food Insecurity Rate percent 7.9 11.7 12.9 11.0 2016 18
APPENDIX B. METHODOLOGY

89Ventura County Community Health Needs Assessment 2019
SCORE EDUCATION UNITSVENTURA COUNTY
HP2020 California U.S.VC 2020
TargetMEASUREMENT
PERIODHIGH RACE DISPARITY*
Source
1.85 Student-to-Teacher Ratio students/ teacher 23.1 23.4 16.5 2016-2017 22
1.6511th Grade Students Proficient in English/Language Arts
percent 51.5 56.0 2018 3
1.65 5th Grade Students Proficient in Math percent 32.3 36.0 2018 3
1.65 6th Grade Students Proficient in Math percent 33.5 37.5 2018 3
1.60 2nd Grade Students Proficient in Math percent 60.0 65.0 2013 3
1.503rd Grade Students Proficient in English/Lan-guage Arts
percent 44.9 48.2 2018 3
1.50 3rd Grade Students Proficient in Math percent 45.7 48.9 2018 3
1.504th Grade Students Proficient in English/Lan-guage Arts
percent 46.7 48.7 2018 3
1.50 4th Grade Students Proficient in Math percent 40.6 42.9 2018 3
1.505th Grade Students Proficient in English/Lan-guage Arts
percent 47.7 49.4 2018 3
1.506th Grade Students Proficient in English/Lan-guage Arts
percent 44.8 47.8 2018 3
1.507th Grade Students Proficient in English/Lan-guage Arts
percent 47.6 50.2 2018 3
1.50 7th Grade Students Proficient in Math percent 34.8 37.3 2018 3
1.508th Grade Students Proficient in English/Lan-guage Arts
percent 46.6 49.1 2018 3
1.50 8th Grade Students Proficient in Math percent 35.7 36.9 2018 3
1.402nd Grade Students Proficient in English/Lan-guage Arts
percent 52.0 56.0 2013 3
1.35 11th Grade Students Proficient in Math percent 31.5 31.4 2018 3
1.28 High School Graduation percent 85.7 87.0 82.7 84.6 86.6 2016-2017 3
1.28 Youth Connectedness to School percent 47.0 42.1 2015-2017 9
0.75 People 25+ with a Bachelor’s Degree or Higher percent 32.6 32.6 30.9 2013-2017 1
APPENDIX B. METHODOLOGY

90Ventura County Community Health Needs Assessment 2019
SCORE ENVIRONMENT UNITSVENTURA COUNTY
HP2020 California U.S.VC 2020
TargetMEASUREMENT
PERIODHIGH RACE DISPARITY*
Source
2.35 Liquor Store Densitystores/ 100,000 popu-
lation15.5 10.1 10.5 2015 26
1.80 Daily Dose of UV Irradiance Joule per square meter 3466.0 3216.0 2015 23
1.80 Farmers Market Densitymarkets/ 1,000 popu-
lation0.0 2016 27
1.80 Number of Extreme Precipitation Days days 32.0 2016 23
1.80 Recognized Carcinogens Released into Air pounds 1567 2017 28
1.65 Annual Ozone Air Quality grade F 2014-2016 2
1.65 Fast Food Restaurant Densityrestaurants/ 1,000
population0.7 2014 27
1.60 PBT Released pounds 6270 2017 28
1.50 Children with Low Access to a Grocery Store percent 4.0 2015 27
1.50 Grocery Store Densitystores/ 1,000 popula-
tion0.2 2014 27
1.50 People with Low Access to a Grocery Store percent 15.9 2015 27
1.50 Severe Housing Problems percent 24.6 27.9 18.8 2010-2014 17
1.40 Months of Mild Drought or Worse months per year 8.0 2016 23
1.40 Number of Extreme Heat Days days 27.0 2016 23
1.40 Number of Extreme Heat Events events 7.0 2016 23
1.40 Weeks of Moderate Drought or Worse weeks per year 52.0 2016 23
1.35 People 65+ with Low Access to a Grocery Store percent 2.1 2015 27
1.35 Recreation and Fitness Facilitiesfacilities/ 1,000 popu-
lation0.1 2014 27
1.20 Low-Income and Low Access to a Grocery Store percent 3.3 2015 27
1.05Households with No Car and Low Access to a Grocery Store
percent 0.7 2015 27
0.95 Annual Particle Pollution grade A 2014-2016 2
0.80 Access to Exercise Opportunities percent 97.0 89.6 83.1 99.5 2018 17
0.45 Food Environment Index index 9.0 8.8 7.7 2018 17
APPENDIX B. METHODOLOGY

91Ventura County Community Health Needs Assessment 2019
SCOREENVIRONMENTAL & OCCUPATIONAL HEALTH
UNITSVENTURA COUNTY
HP2020 California U.S.VC 2020
TargetMEASUREMENT
PERIODHIGH RACE DISPARITY*
Source
1.60 Adults with Asthma percent 15.7 15.0 2016-2017 8
1.60 Asthma: Medicare Population percent 7.7 7.5 8.2 2015 14
1.18 Age-Adjusted ER Rate due to AsthmaER visits/ 10,000 pop-
ulation17.3 25.1 2015-2017
Black*, White (20.7), API*, Hisp (18.2)
10
1.18 Age-Adjusted ER Rate due to Pediatric AsthmaER visits/ 10,000 popu-
lation under 18 years29.6 40.5 2015-2017
Black*, White (36.4), API*, Hisp (32.5)
10
0.98 Age-Adjusted ER Rate due to Adult AsthmaER visits/ 10,000 popu-
lation 18+ years13.0 19.7 2015-2017
Black*, White (15.3), API*, Hisp (13.2)
10
0.98Age-Adjusted Hospitalization Rate due to Adult Asthma
hospitalizations/ 10,000 population 18+ years
2.6 3.8 2015-2017 10
0.98Age-Adjusted Hospitalization Rate due to Asthma
hospitalizations/ 10,000 population
3.0 5.0 2015-2017 10
0.98Age-Adjusted Hospitalization Rate due to Pediatric Asthma
hospitalizations/ 10,000 population
under 18 years4.4 8.2 2015-2017
Black*, White (6.1), Hisp (4.2)
10
SCORE EXERCISE, NUTRITION, & WEIGHT UNITSVENTURA COUNTY
HP2020 California U.S.VC 2020
TargetMEASUREMENT
PERIODHIGH RACE DISPARITY*
Source
2.35 Workers who Walk to Work percent 1.8 3.1 2.7 2.7 2013-2017 1
2.30Food Insecure Children Likely Ineligible for Assistance
percent 37.0 33.0 20.0 2016 18
1.905th Grade Students who are at a Healthy Weight or Underweight
percent 58.3 59.5 65.1 2017-2018 3
1.80 Farmers Market Densitymarkets/ 1,000 popu-
lation0.0 2016 27
1.75 Child and Teen Fruit Consumption percent 63.1 64.3 2014-2015 8
1.65 Fast Food Restaurant Densityrestaurants/ 1,000
population0.7 2014 27
1.55 Adult Fast Food Consumption percent 67.7 65.6 2016 8
1.50 Children with Low Access to a Grocery Store percent 4.0 2015 27
1.50 Grocery Store Densitystores/ 1,000 popula-
tion0.2 2014 27
1.50 People with Low Access to a Grocery Store percent 15.9 2015 27
APPENDIX B. METHODOLOGY
*subgroup suppressed to meet confidentiality requirements for de-identification of PHI

92Ventura County Community Health Needs Assessment 2019
SCORE EXERCISE, NUTRITION, & WEIGHT UNITSVENTURA COUNTY
HP2020 California U.S.VC 2020
TargetMEASUREMENT
PERIODHIGH RACE DISPARITY*
Source
1.45 7th Grade Students who are Physically Fit percent 66.4 63.6 2017-2018 3
1.459th Grade Students who are at a Healthy Weight or Underweight
percent 66.6 62.7 2017-2018 3
1.35 Adults Who Are Obese percent 23.8 30.5 26.4 21.6 2017 8
1.35 Adults who are Overweight or Obese percent 60.3 60.4 2017 8
1.35 People 65+ with Low Access to a Grocery Store percent 2.1 2015 27
1.35 Recreation and Fitness Facilitiesfacilities/ 1,000 popu-
lation0.1 2014 27
1.35 Teens who Eat Breakfast percent 66.3 62.8 2011-2013 9
1.35 Teens who Engage in Regular Physical Activity percent 74.1 68.5 2011-2012 8
1.20 Adults who Walk Regularly percent 34.2 33.0 2013-2014 8
1.20 Low-Income and Low Access to a Grocery Store percent 3.3 2015 27
1.05 Adults who Drink Sugar-Sweetened Beverages percent 14.3 17.4 2013-2014 8
1.05Households with No Car and Low Access to a Grocery Store
percent 0.7 2015 27
0.80 Access to Exercise Opportunities percent 97.0 89.6 83.1 99.5 2018 17
0.45 Food Environment Index index 9.0 8.8 7.7 2018 17
0.30 Child Food Insecurity Rate percent 16.1 19.0 17.9 2016 18
0.15 Food Insecurity Rate percent 7.9 11.7 12.9 11.0 2016 18
SCORE HEART DISEASE & STROKE UNITSVENTURA COUNTY
HP2020 California U.S.VC 2020
TargetMEASUREMENT
PERIODHIGH RACE DISPARITY*
Source
2.25 Hyperlipidemia: Medicare Population percent 45.5 41.5 44.6 2015 14
2.25 Stroke: Medicare Population percent 4.1 3.7 4.0 2015 14
2.20 Atrial Fibrillation: Medicare Population percent 8.2 7.3 8.1 2015 14
1.80 High Blood Pressure Prevalence percent 29.2 26.9 29.0 24.2 2017 8
1.73Age-Adjusted Death Rate due to Cerebrovascu-lar Disease (Stroke)
deaths/ 100,000 pop-ulation
35.7 34.8 35.3 37.2 2014-2016 5
1.65Age-Adjusted Hospitalization Rate due to Heart Attack
hospitalizations/ 10,000 population 35+ years
24.9 23.6 2014 23
APPENDIX B. METHODOLOGY

93Ventura County Community Health Needs Assessment 2019
SCORE HEART DISEASE & STROKE UNITSVENTURA COUNTY
HP2020 California U.S.VC 2020
TargetMEASUREMENT
PERIODHIGH RACE DISPARITY*
Source
1.65 Ischemic Heart Disease: Medicare Population percent 26.2 23.6 26.5 2015 14
1.58 Age-Adjusted ER Rate due to HypertensionER visits/ 10,000 popu-
lation 18+ years22.7 26.7 2015-2017 10
1.58Age-Adjusted Hospitalization Rate due to Heart Failure
hospitalizations/ 10,000 population 18+ years
25.4 29.2 2015-2017 10
1.58Age-Adjusted Hospitalization Rate due to Hypertension
hospitalizations/ 10,000 population 18+ years
2.4 3.3 2015-2017Black*, White (2.3),
API*, Hisp (3)10
1.50 Adults with Heart Disease percent 6.2 5.9 2013-2014 8
1.40 Age-Adjusted Death Rate due to Heart Attacksdeaths/ 100,000 pop-
ulation50.9 50.7 2015 23
1.40 Heart Failure: Medicare Population percent 13.1 12.9 13.5 2015 14
1.40 Hypertension: Medicare Population percent 52.5 49.6 55.0 2015 14
1.38 Age-Adjusted ER Rate due to Heart FailureER visits/ 10,000 popu-
lation 18+ years6.6 9.9 2015-2017 10
0.88Age-Adjusted Death Rate due to Coronary Heart Disease
deaths/ 100,000 pop-ulation
80.7 103.4 89.1 96.8 2014-2016 5
SCORE IMMUNIZATIONS & INFECTIOUS DISEASES UNITSVENTURA COUNTY
HP2020 California U.S.VC 2020
TargetMEASUREMENT
PERIODHIGH RACE DISPARITY*
Source
1.73Age-Adjusted ER Rate due to Immuniza-tion-Preventable Pneumonia and Influenza
ER visits/ 10,000 popu-lation 18+ years
11.6 12.5 2015-2017 10
1.73Age-Adjusted Hospitalization Rate due to Immunization-Preventable Pneumonia and Influenza
hospitalizations/ 10,000 population 18+ years
1.7 1.7 2015-2017 10
1.58Age-Adjusted ER Rate due to Community Acquired Pneumonia
ER visits/ 10,000 popu-lation 18+ years
18.1 21.1 2015-2017 10
1.50Persons Living and Diagnosed with HIV who are in Care
percent 74.2 73.2 2016 5
1.48Age-Adjusted Hospitalization Rate due to Hepatitis
hospitalizations/ 10,000 population 18+ years
1.5 1.4 2015-2017 10
1.45 Chlamydia Incidence Ratecases/ 100,000 popu-
lation332.7 552.2 284.8 2017 7
1.45 Congenital Syphilis Incidence Ratecases/ 100,000 live
births10.0 58.2 2017 7
1.45Death Rate Among Persons with Diagnosed HIV Infection
deaths/ 100,000 pop-ulation
2.8 4.4 2016 5
APPENDIX B. METHODOLOGY
*subgroup suppressed to meet confidentiality requirements for de-identification of PHI

94Ventura County Community Health Needs Assessment 2019
SCORE IMMUNIZATIONS & INFECTIOUS DISEASES UNITSVENTURA COUNTY
HP2020 California U.S.VC 2020
TargetMEASUREMENT
PERIODHIGH RACE DISPARITY*
Source
1.33 Tuberculosis Incidence Ratecases/ 100,000 popu-
lation3.0 1.0 5.2 2.8 2017 5
1.30 Gonorrhea Incidence Ratecases/ 100,000 popu-
lation83.5 190.3 2017 7
1.25 Kindergartners with Required Immunizations percent 95.9 95.1 2017 6
1.20Reported Incidence of Persons Diagnosed with HIV/AIDS: 13+
cases/ 100,000 popula-tion 13+ years
138.4 391.7 2013-2015 5
1.20 Syphilis Incidence Ratecases/ 100,000 popu-
lation6.1 16.8 2017 7
1.13 Age-Adjusted ER Rate due to HepatitisER visits/ 10,000 popu-
lation 18+ years0.7 0.7 2015-2017 10
1.13Age-Adjusted Hospitalization Rate due to Com-munity Acquired Pneumonia
hospitalizations/ 10,000 population 18+ years
12.1 13.0 2015-2017 10
1.10 HIV Incidence Ratecases/ 100,000 popu-
lation5.3 12.9 2016 5
0.73Age-Adjusted Death Rate due to Influenza and Pneumonia
deaths/ 100,000 pop-ulation
9.0 14.3 14.6 2014-2016 5
SCORE MATERNAL, FETAL & INFANT HEALTH UNITSVENTURA COUNTY
HP2020 California U.S.VC 2020
TargetMEASUREMENT
PERIODHIGH RACE DISPARITY*
Source
1.53 Infant Mortality Rate deaths/ 1,000 live births 4.8 6.0 4.6 5.9 4.3 2013-2015 5
1.45 Congenital Syphilis Incidence Ratecases/ 100,000 live
births10.0 58.2 2017 7
1.43 Any In-Hospital Breastfeeding percent 96.4 2017 5
1.43 Exclusive In-Hospital Breastfeeding percent 75.4 2017 5
1.25 Mothers who Received Early Prenatal Care percent 83.6 77.9 83.3 87.5 2014-2016 5
1.23 Babies with Very Low Birth Weight percent 1.2 1.4 1.2 1.4 2013 5
0.93 Preterm Births percent 8.3 9.4 8.8 11.4 7.6 2013 20
0.90 Mothers who Breastfeed percent 96.1 81.9 93.8 2014-2016 5
0.83 Teen Birth Rate: 15-19live births/ 1,000
females aged 15-1916.5 17.6 22.3 2014-2016 5
0.68 Babies with Low Birth Weight percent 6.1 7.8 6.8 8.1 2014-2016 5
APPENDIX B. METHODOLOGY

95Ventura County Community Health Needs Assessment 2019
SCORE MEN’S HEALTH UNITSVENTURA COUNTY
HP2020 California U.S.VC 2020
TargetMEASUREMENT
PERIODHIGH RACE DISPARITY*
Source
1.55Age-Adjusted Death Rate due to Prostate Cancer
deaths/ 100,000 males 19.9 21.8 19.6 2014-2016 5
0.90 Prostate Cancer Incidence Rate cases/ 100,000 males 99.2 101.2 109.0 2011-2015 21
0.80 Life Expectancy for Males years 79.8 78.6 76.7 2014 19
SCORE MENTAL HEALTH & MENTAL DISORDERS UNITSVENTURA COUNTY
HP2020 California U.S.VC 2020
TargetMEASUREMENT
PERIODHIGH RACE DISPARITY*
Source
1.83Age-Adjusted ER Rate due to Adolescent Suicide and Intentional Self-inflicted Injury
ER visits/10,000 popu-lation aged 10-17
39.2 34.4 2015-2017Black*, White (50.7),
API*, Hisp (26.6)10
1.80Adults Needing Help With Mental, Emotional or Substance Abuse Problems
percent 17.9 17.5 17.5 2016-2017 8
1.73Age-Adjusted Hospitalization Rate due to Pediatric Mental Health
hospitalizations/ 10,000 population
under 18 years28.9 25.4 2015-2017 10
1.73Age-Adjusted Hospitalization Rate due to Suicide and Intentional Self-inflicted Injury
hospitalizations/ 10,000 population 18+ years
13.1 13.7 2015-2017 10
1.68Age-Adjusted ER Rate due to Suicide and Intentional Self-inflicted Injury
ER visits/10,000 popu-lation 18+ years
18.0 17.4 2015-2017Black*, White (22.8),
API*, Hisp (11.6)10
1.65 Depression: Medicare Population percent 14.6 14.3 16.7 2015 14
1.58Age-Adjusted ER Rate due to Pediatric Mental Health
ER visits/ 10,000 popu-lation under 18 years
26.0 31.9 2015-2017 10
1.55Adults Needing and Receiving Behavioral Health Care Services
percent 60.0 60.9 2016-2017 8
1.50Alzheimer’s Disease or Dementia: Medicare Population
percent 9.1 9.3 9.9 2015 14
1.43 Youth Depression percent 32.0 32.3 2015-2017 9
1.38 Age-Adjusted ER Rate due to Mental HealthER visits/ 10,000 popu-
lation 18+ years73.9 88.3 2015-2017
Black*, White (88.5), AIAN*, API (24), Hisp
(69.9)10
1.28Age-Adjusted Hospitalization Rate due to Adolescent Suicide and Intentional Self-inflict-ed Injury
hospitalizations/ 10,000 population aged
10-1712.0 13.8 2015-2017 10
1.28Age-Adjusted Hospitalization Rate due to Mental Health
hospitalizations/ 10,000 population 18+ years
42.0 48.6 2015-2017Black*, White (49.6),
AIAN*, API*, Hisp (25.1)
10
APPENDIX B. METHODOLOGY
*subgroup suppressed to meet confidentiality requirements for de-identification of PHI

96Ventura County Community Health Needs Assessment 2019
SCORE MENTAL HEALTH & MENTAL DISORDERS UNITSVENTURA COUNTY
HP2020 California U.S.VC 2020
TargetMEASUREMENT
PERIODHIGH RACE DISPARITY*
Source
1.23 Age-Adjusted Death Rate due to Suicidedeaths/ 100,000 pop-
ulation10.9 10.2 10.4 13.2 2014-2016 5
0.75 Frequent Mental Distress percent 10.4 10.6 15.0 2016 17
SCORE OLDER ADULTS & AGING UNITSVENTURA COUNTY
HP2020 California U.S.VC 2020
TargetMEASUREMENT
PERIODHIGH RACE
DISPARITY*Source
2.50 Osteoporosis: Medicare Population percent 7.4 6.7 6.0 2015 14
2.25 Hyperlipidemia: Medicare Population percent 45.5 41.5 44.6 2015 14
2.25Rheumatoid Arthritis or Osteoarthritis: Medi-care Population
percent 30.1 27.6 30.0 2015 14
2.25 Stroke: Medicare Population percent 4.1 3.7 4.0 2015 14
2.20 Atrial Fibrillation: Medicare Population percent 8.2 7.3 8.1 2015 14
2.00 Cancer: Medicare Population percent 8.0 7.5 7.8 2015 14
1.80 Chronic Kidney Disease: Medicare Population percent 17.4 17.9 18.1 2015 14
1.75Mammography Screening: Medicare Popula-tion
percent 59.5 59.5 63.2 2015 24
1.65 Depression: Medicare Population percent 14.6 14.3 16.7 2015 14
1.65 Ischemic Heart Disease: Medicare Population percent 26.2 23.6 26.5 2015 14
1.60 Asthma: Medicare Population percent 7.7 7.5 8.2 2015 14
1.60 Diabetes: Medicare Population percent 26.1 25.3 26.5 2015 14
1.50Alzheimer’s Disease or Dementia: Medicare Population
percent 9.1 9.3 9.9 2015 14
1.40 Heart Failure: Medicare Population percent 13.1 12.9 13.5 2015 14
1.40 Hypertension: Medicare Population percent 52.5 49.6 55.0 2015 14
1.35 People 65+ with Low Access to a Grocery Store percent 2.1 2015 27
0.65 COPD: Medicare Population percent 8.0 8.9 11.2 2015 14
0.50 People 65+ Living Below Poverty Level percent 6.9 10.2 9.3 2013-2017
Black (11.5) White (5.4) Asian (8.2) AIAN (11.1) NHPI (0) Mult
(12.9) Other (12) Hisp (10.8)
1
0.45 People 65+ Living Alone percent 21.2 22.8 26.2 2013-2017 1
APPENDIX B. METHODOLOGY

97Ventura County Community Health Needs Assessment 2019
SCORE ORAL HEALTH UNITSVENTURA COUNTY
HP2020 California U.S.VC 2020
TargetMEASUREMENT
PERIODHIGH RACE DISPARITY*
Source
1.75 Oral Cavity and Pharynx Cancer Incidence Ratecases/ 100,000 popu-
lation11.5 10.3 11.6 2011-2015 21
1.65 Children who Visited a Dentist percent 73.4 78.7 2013-2014 8
1.38 Age-Adjusted ER Rate due to Dental ProblemsER visits/ 10,000 pop-
ulation27.7 36.1 2015-2017
Black*, White (34.5), AIAN*, API*, Hisp
(27.7)10
0.45 Dentist Ratedentists/ 100,000
population88.5 82.4 67.4 2016 17
SCORE OTHER CHRONIC DISEASES UNITSVENTURA COUNTY
HP2020 California U.S.VC 2020
TargetMEASUREMENT
PERIODHIGH RACE DISPARITY*
Source
2.50 Osteoporosis: Medicare Population percent 7.4 6.7 6.0 2015 14
2.25Rheumatoid Arthritis or Osteoarthritis: Medi-care Population
percent 30.1 27.6 30.0 2015 14
1.80 Chronic Kidney Disease: Medicare Population percent 17.4 17.9 18.1 2015 14
SCORE OTHER CONDITIONS UNITSVENTURA COUNTY
HP2020 California U.S.VC 2020
TargetMEASUREMENT
PERIODHIGH RACE DISPARITY*
Source
1.73 Age-Adjusted ER Rate due to DehydrationER visits/ 10,000 popu-
lation 18+ years13.8 13.8 2015-2017 10
1.58Age-Adjusted Hospitalization Rate due to Urinary Tract Infections
hospitalizations/ 10,000 population 18+ years
11.4 10.9 2015-2017 10
1.53Age-Adjusted Hospitalization Rate due to Dehydration
hospitalizations/ 10,000 population 18+ years
8.8 9.6 2015-2017 10
1.38Age-Adjusted ER Rate due to Urinary Tract Infections
ER visits/ 10,000 popu-lation 18+ years
81.6 96.9 2015-2017 10
SCORE PREVENTION & SAFETY UNITSVENTURA COUNTY
HP2020 California U.S.VC 2020
TargetMEASUREMENT
PERIODHIGH RACE DISPARITY*
Source
1.50 Severe Housing Problems percent 24.6 27.9 18.8 2010-2014 17
1.45 Death Rate due to Drug Poisoningdeaths/ 100,000 pop-
ulation13.7 11.8 16.9 2014-2016 17
0.98Age-Adjusted Death Rate due to Unintentional Injuries
deaths/ 100,000 pop-ulation
30.8 36.4 30.3 43.2 2014-2016 5
APPENDIX B. METHODOLOGY
*subgroup suppressed to meet confidentiality requirements for de-identification of PHI

98Ventura County Community Health Needs Assessment 2019
SCORE PUBLIC SAFETY UNITSVENTURA COUNTY
HP2020 California U.S.VC 2020
TargetMEASUREMENT
PERIODHIGH RACE DISPARITY*
Source
1.73 Youth Gang Membership percent 6.0 4.7 2015-2017 9
1.35 Violent Crime Ratecrimes/ 100,000 pop-
ulation261.5 450.7 2017 4
1.25 Alcohol-Impaired Driving Deaths percent 28.8 29.4 29.3 2012-2016 17
0.95 Substantiated Child Abuse Rate cases/ 1,000 children 5.3 7.5 7.2 2017Black*, White (3.5) AIAN*, API*, Hisp
(6.9)15
0.90 Bicycle-Involved Collision Ratecollisions/ 100,000
population20.4 32.7 2015 13
0.78Age-Adjusted Death Rate due to Motor Vehicle Traffic Collisions
deaths/ 100,000 pop-ulation
7.5 12.4 8.8 11.0 2014-2016 5
SCORE RESPIRATORY DISEASES UNITSVENTURA COUNTY
HP2020 California U.S.VC 2020
TargetMEASUREMENT
PERIODHIGH RACE DISPARITY*
Source
1.73Age-Adjusted ER Rate due to Immuniza-tion-Preventable Pneumonia and Influenza
ER visits/ 10,000 popu-lation 18+ years
11.6 12.5 2015-2017 10
1.73Age-Adjusted Hospitalization Rate due to Immunization-Preventable Pneumonia and Influenza
hospitalizations/ 10,000 population 18+ years
1.7 1.7 2015-2017 10
1.60 Adults with Asthma percent 15.7 15.0 2016-2017 8
1.60 Asthma: Medicare Population percent 7.7 7.5 8.2 2015 14
1.58Age-Adjusted ER Rate due to Community Acquired Pneumonia
ER visits/ 10,000 popu-lation 18+ years
18.1 21.1 2015-2017 10
1.33 Tuberculosis Incidence Ratecases/ 100,000 popu-
lation3.0 1.0 5.2 2.8 2017 5
1.28 Age-Adjusted ER Rate due to COPDER visits/ 10,000 popu-
lation 18+ years11.4 17.1 2015-2017
Black*, White (12.9), API*, Hisp (8.5)
10
1.18 Age-Adjusted ER Rate due to AsthmaER visits/ 10,000 pop-
ulation17.3 25.1 2015-2017
Black*, White (20.7), API*, Hisp (18.2)
10
1.18 Age-Adjusted ER Rate due to Pediatric AsthmaER visits/ 10,000 popu-
lation under 18 years29.6 40.5 2015-2017
Black*, White (36.4), API*, Hisp (32.5)
10
1.18Age-Adjusted Hospitalization Rate due to COPD
hospitalizations/ 10,000 population 18+ years
10.4 13.0 2015-2017 10
1.13Age-Adjusted Hospitalization Rate due to Com-munity Acquired Pneumonia
hospitalizations/ 10,000 population 18+ years
12.1 13.0 2015-2017 10
APPENDIX B. METHODOLOGY
*subgroup suppressed to meet confidentiality requirements for de-identification of PHI

99Ventura County Community Health Needs Assessment 2019
SCORE RESPIRATORY DISEASES UNITSVENTURA COUNTY
HP2020 California U.S.VC 2020
TargetMEASUREMENT
PERIODHIGH RACE DISPARITY*
Source
0.98 Age-Adjusted ER Rate due to Adult AsthmaER visits/ 10,000 popu-
lation 18+ years13.0 19.7 2015-2017
Black*, White (15.3), API*, Hisp (13.2)
10
0.98Age-Adjusted Hospitalization Rate due to Adult Asthma
hospitalizations/ 10,000 population 18+ years
2.6 3.8 2015-2017 10
0.98Age-Adjusted Hospitalization Rate due to Asthma
hospitalizations/ 10,000 population
3.0 5.0 2015-2017 10
0.98Age-Adjusted Hospitalization Rate due to Pediatric Asthma
hospitalizations/ 10,000 population
under 18 years4.4 8.2 2015-2017
Black*, White (6.1) Hisp (4.2)
10
0.95 Age-Adjusted Death Rate due to Lung Cancerdeaths/ 100,000 pop-
ulation27.3 45.5 28.9 2014-2016 5
0.95 Children and Teens with Asthma percent 12.6 14.2 2009Black*, White (16.1)
Asian (21.3) Mult (8.5) Hisp (8.8)
8
0.73Age-Adjusted Death Rate due to Influenza and Pneumonia
deaths/ 100,000 pop-ulation
9.0 14.3 14.6 2014-2016 5
0.65 COPD: Medicare Population percent 8.0 8.9 11.2 2015 14
0.45 Lung and Bronchus Cancer Incidence Ratecases/ 100,000 popu-
lation40.9 43.3 60.2 2011-2015 21
SCORE SOCIAL ENVIRONMENT UNITSVENTURA COUNTY
HP2020 California U.S.VC 2020
TargetMEASUREMENT
PERIODHIGH RACE DISPARITY*
Source
1.95 Mean Travel Time to Work minutes 26.6 28.8 26.4 2013-2017 1
1.73 Youth Gang Membership percent 6.0 4.7 2015-2017 9
1.28 Youth Connectedness to School percent 47.0 42.1 2015-2017 9
1.25 Voter Turnout: Presidential Election percent 82.0 75.3 2016 12
1.20 Homeownership percent 59.7 50.2 56.0 2013-2017 1
0.95 Substantiated Child Abuse Rate cases/ 1,000 children 5.3 7.5 7.2 2017Black (11.9) White
(3.5) AIAN (6.1) API (0.5) Hisp (6.9)
15
0.80 Single-Parent Households percent 27.2 31.4 33.3 2013-2017 1
0.80 Youth not in School or Working percent 1.7 2.1 2.1 2013-2017 1
0.75 People 25+ with a Bachelor’s Degree or Higher percent 32.6 32.6 30.9 2013-2017 1
0.50 People Living Below Poverty Level percent 10.3 15.1 14.6 2013-2017 1
APPENDIX B. METHODOLOGY
*subgroup suppressed to meet confidentiality requirements for de-identification of PHI

100Ventura County Community Health Needs Assessment 2019
SCORE SOCIAL ENVIRONMENT UNITSVENTURA COUNTY
HP2020 California U.S.VC 2020
TargetMEASUREMENT
PERIODHIGH RACE DISPARITY*
Source
0.45 People 65+ Living Alone percent 21.2 22.8 26.2 2013-2017 1
0.45 Per Capita Income dollars 35771 33128 31177 2013-2017 1
0.40 Children Living Below Poverty Level percent 14.4 20.8 20.3 15.2 2013-2017
Black*, White (5.3), Asian (5.1) AIAN*,
NHPI*, Mult*, Other, (16.7), Hisp (21.2)
1
0.30 Median Household Income dollars 81972 67169 57652 2013-2017 1
SCORE SUBSTANCE ABUSE UNITSVENTURA COUNTY
HP2020 California U.S.VC 2020
TargetMEASUREMENT
PERIODHIGH RACE DISPAR-
ITY*Source
2.35 Liquor Store Densitystores/ 100,000 popu-
lation15.5 10.1 10.5 2015 26
2.25Age-Adjusted ED Visit Rate due to Heroin Overdose
Rate per 100,000 residents
24.0 9.9 2017 11
2.05 Adults who Binge Drink: Year percent 41.4 34.7 2015 8
2.05Age-Adjusted Death Rate due to Heroin Over-dose
deaths/ 100,000 pop-ulation
3.3 1.4 2017 11
2.05Age-Adjusted Death Rate due to Prescription Opioid Overdose
Rate per 100,000 residents
6.9 3.2 2017 11
2.05Age-Adjusted Death Rate due to Synthetic Opioid Overdose (excluding Methadone)
Rate per 100,000 residents
2.8 1.1 2017 11
2.03 Age-Adjusted ER Rate due to Alcohol UseER visits/ 10,000 popu-
lation 18+ years46.5 41.1 2015-2017
Black*, White (58.3), AIAN*, API*, Hisp
(42.1)10
1.95Age-Adjusted Death Rate due to All Opioid Overdose
Rate per 100,000 residents
9.1 4.5 2017White (13.54) Hisp
(5.17)11
1.95Age-Adjusted Hospitalization Rate due to Heroin Overdose
Rate per 100,000 residents
4.2 1.8 2016 11
1.83 Age-Adjusted ER Rate due to Substance UseER visits/ 10,000 popu-
lation 18+ years23.9 21.1 2015-2017 10
1.83Age-Adjusted Hospitalization Rate due to Alcohol Use
hospitalizations/ 10,000 population 18+ years
15.3 12.3 2015-2017Black*, White (18.8),
API*, Hisp (11.8)10
1.80Age-Adjusted Hospitalization Rate due to Opioid Overdose (excluding Heroin)
Rate per 100,000 residents
10.7 8.5 2016 11
1.73 Teens who Binge Drink: 11th Graders percent 13.0 11.6 2015-2017 9
APPENDIX B. METHODOLOGY
*subgroup suppressed to meet confidentiality requirements for de-identification of PHI

101Ventura County Community Health Needs Assessment 2019
SCORE SUBSTANCE ABUSE UNITSVENTURA COUNTY
HP2020 California U.S.VC 2020
TargetMEASUREMENT
PERIODHIGH RACE DISPAR-
ITY*Source
1.73Teens who have Ever Used Inhalants: 11th Graders
percent 4.0 1.8 2015-2017 9
1.73Teens who have Ever Used Inhalants: 7th Graders
percent 4.0 1.5 2015-2017 9
1.73Teens who have Ever Used Inhalants: 9th Graders
percent 4.0 1.9 2015-2017 9
1.73Teens who have Ever Used Recreational Pre-scription Drugs: 11th Graders
percent 17.0 3.3 2015-2017 9
1.73Teens who have Ever Used Recreational Pre-scription Drugs: 9th Graders
percent 12.0 2.9 2015-2017 9
1.73 Teens who Use Alcohol or Drugs: 7th Graders percent 18.0 7.2 2015-2017 9
1.73 Teens who Use Alcohol or Drugs: 9th Graders percent 30.0 19.7 2015-2017 9
1.73 Teens who Use Alcohol: 7th Graders percent 7.0 5.1 2015-2017 9
1.70 Teens who have Used Alcohol percent 35.9 23.3 2013-2014White (20.1) Hisp
(53.5)8
1.65Age-Adjusted ED Visit Rate due to Opioid Over-dose (excluding Heroin)
Rate per 100,000 residents
11.6 10.3 2017 11
1.60Age-Adjusted ED Visit Rate due to All Drug Overdose
Rate per 100,000 residents
126.8 117.3 2017 11
1.58 Teens who Use Alcohol: 11th Graders percent 24.0 22.5 2015-2017 9
1.55 Age-Adjusted Death Rate due to Drug Usedeaths/ 100,000 pop-
ulation13.4 11.3 12.2 2014-2016 5
1.53 Opioid Prescription Rateprescriptions per
10,000 population421.0 43313 16
1.50Age-Adjusted Hospitalization Rate due to All Drug Overdose
Rate per 100,000 residents
52.4 49.7 2016 11
1.50Age-Adjusted Long Acting or Extended Release Opioid Prescription Rate to Opioid Naive Residents
per 100,000 population 1.4 1.4 2017 11
1.45 Death Rate due to Drug Poisoningdeaths/ 100,000 pop-
ulation13.7 11.8 16.9 2014-2016 17
1.43Age-Adjusted Hospitalization Rate due to Substance Use
hospitalizations/ 10,000 population 18+ years
7.8 5.0 2015-2017 10
1.43 Opioid Prescription Patients percent 3.3 43313 16
1.43 Teens who Smoke: 11th Graders percent 4.0 4.3 2015-2017 9
1.43 Teens who Smoke: 7th Graders percent 1.0 1.0 2015-2017 9
APPENDIX B. METHODOLOGY

102Ventura County Community Health Needs Assessment 2019
SCORE SUBSTANCE ABUSE UNITSVENTURA COUNTY
HP2020 California U.S.VC 2020
TargetMEASUREMENT
PERIODHIGH RACE DISPAR-
ITY*Source
1.43 Teens who Use Marijuana: 11th Graders percent 16.0 16.7 2015-2017 9
1.28 Teens who Smoke: 9th Graders percent 2.0 2.6 2015-2017 9
1.28 Teens who Use Alcohol or Drugs: 11th Graders percent 9.0 29.4 2015-2017 9
1.28 Teens who Use Alcohol: 9th Graders percent 13.0 14.6 2015-2017 9
1.28 Teens who Use Marijuana: 7th Graders percent 3.0 5.1 2015-2017 9
1.28 Teens who Use Marijuana: 9th Graders percent 8.0 9.5 2015-2017 9
1.25 Alcohol-Impaired Driving Deaths percent 28.8 29.4 29.3 2012-2016 17
0.60 Adults who Smoke percent 6.1 12.0 11.0 2016-2017 8
SCORE TEEN & ADOLESCENT HEALTH UNITSVENTURA COUNTY
HP2020 California U.S.VC 2020
TargetMEASUREMENT
PERIODHIGH RACE DISPARITY*
Source
1.83Age-Adjusted ER Rate due to Adolescent Sui-cide and Intentional Self-inflicted Injury
ER visits/ 10,000 popu-lation aged 10-17
39.2 34.4 2015-2017Black*, White (50.7),
API*, Hisp (26.6)10
1.73 Teens who Binge Drink: 11th Graders percent 13.0 11.6 2015-2017 9
1.73Teens who have Ever Used Inhalants: 11th Graders
percent 4.0 1.8 2015-2017 9
1.73Teens who have Ever Used Inhalants: 7th Graders
percent 4.0 1.5 2015-2017 9
1.73Teens who have Ever Used Inhalants: 9th Graders
percent 4.0 1.9 2015-2017 9
1.73Teens who have Ever Used Recreational Pre-scription Drugs: 11th Graders
percent 17.0 3.3 2015-2017 9
1.73Teens who have Ever Used Recreational Pre-scription Drugs: 9th Graders
percent 12.0 2.9 2015-2017 9
1.73 Teens who Use Alcohol or Drugs: 7th Graders percent 18.0 7.2 2015-2017 9
1.73 Teens who Use Alcohol or Drugs: 9th Graders percent 30.0 19.7 2015-2017 9
1.73 Teens who Use Alcohol: 7th Graders percent 7.0 5.1 2015-2017 9
1.73 Youth Gang Membership percent 6.0 4.7 2015-2017 9
1.70 Teens who have Used Alcohol percent 35.9 23.3 2013-2014White (20.1) Hisp
(53.5)8
1.58 Teens who Use Alcohol: 11th Graders percent 24.0 22.5 2015-2017 9
APPENDIX B. METHODOLOGY
*subgroup suppressed to meet confidentiality requirements for de-identification of PHI

103Ventura County Community Health Needs Assessment 2019
SCORE TEEN & ADOLESCENT HEALTH UNITSVENTURA COUNTY
HP2020 California U.S.VC 2020
TargetMEASUREMENT
PERIODHIGH RACE DISPARITY*
Source
1.45 7th Grade Students who are Physically Fit percent 66.4 63.6 2017-2018 3
1.459th Grade Students who are at a Healthy Weight or Underweight
percent 66.6 62.7 2017-2018 3
1.43 Teens who Smoke: 11th Graders percent 4.0 4.3 2015-2017 9
1.43 Teens who Smoke: 7th Graders percent 1.0 1.0 2015-2017 9
1.43 Teens who Use Marijuana: 11th Graders percent 16.0 16.7 2015-2017 9
1.43 Youth Depression percent 32.0 32.3 2015-2017 9
1.35 Teens who Eat Breakfast percent 66.3 62.8 2011-2013 9
1.35 Teens who Engage in Regular Physical Activity percent 74.1 68.5 2011-2012 8
1.28Age-Adjusted Hospitalization Rate due to Adolescent Suicide and Intentional Self- inflicted Injury
hospitalizations/ 10,000 population aged
10-1712.0 13.8 2015-2017 10
1.28 Teens who Smoke: 9th Graders percent 2.0 2.6 2015-2017 9
1.28 Teens who Use Alcohol or Drugs: 11th Graders percent 9.0 29.4 2015-2017 9
1.28 Teens who Use Alcohol: 9th Graders percent 13.0 14.6 2015-2017 9
1.28 Teens who Use Marijuana: 7th Graders percent 3.0 5.1 2015-2017 9
1.28 Teens who Use Marijuana: 9th Graders percent 8.0 9.5 2015-2017 9
1.28 Youth Connectedness to School percent 47.0 42.1 2015-2017 9
0.95 Children and Teens with Asthma percent 12.6 14.2 2009Black (34.6) White (16.1) Asian (21.3)
Mult (8.5) Hisp (8.8)8
0.83 Teen Birth Rate: 15-19live births/ 1,000
females aged 15-1916.5 17.6 22.3 2014-2016 5
APPENDIX B. METHODOLOGY

104Ventura County Community Health Needs Assessment 2019
SCORE TRANSPORTATION UNITSVENTURA COUNTY
HP2020 California U.S.VC 2020
TargetMEASUREMENT
PERIODHIGH RACE DISPARITY*
Source
2.35 Workers who Walk to Work percent 1.8 3.1 2.7 2.7 2013-2017 1
1.95 Mean Travel Time to Work minutes 26.6 28.8 26.4 2013-2017 1
1.95 Workers who Drive Alone to Work percent 78.2 73.6 76.4 2013-2017 1
1.90 Workers Commuting by Public Transportation percent 1.3 5.5 5.2 5.1 2013-2017
Black (2.6) White (1) Asian (1.1) AIAN (3.4)
NHPI (5) Mult (1.4) Other (3) Hisp (1.4)
1
1.45 Solo Drivers with a Long Commute percent 34.3 39.3 34.7 2012-2016 17
1.05Households with No Car and Low Access to a Grocery Store
percent 0.7 2015 27
0.90 Bicycle-Involved Collision Ratecollisions/ 100,000
population20.4 32.7 2015 13
0.78Age-Adjusted Death Rate due to Motor Vehicle Traffic Collisions
deaths/ 100,000 pop-ulation
7.5 12.4 8.8 11.0 2014-2016 5
SCORE WELLNESS & LIFESTYLE UNITSVENTURA COUNTY
HP2020 California U.S.VC 2020
TargetMEASUREMENT
PERIODHIGH RACE DISPARITY*
Source
1.75Self-Reported General Health Assessment: Good or Better
percent 81.6 83.1 2016-2017 8
1.20 Insufficient Sleep percent 32.6 34.5 38.0 2016 17
0.80 Life Expectancy for Females years 83.5 83.0 81.5 2014 19
0.80 Life Expectancy for Males years 79.8 78.6 76.7 2014 19
0.75 Frequent Physical Distress percent 10.1 10.9 15.0 2016 17
SCORE WOMEN’S HEALTH UNITSVENTURA COUNTY
HP2020 California U.S.VC 2020
TargetMEASUREMENT
PERIODHIGH RACE DISPARITY*
Source
1.75Mammography Screening: Medicare Popula-tion
percent 59.5 59.5 63.2 2015 24
1.70 Breast Cancer Incidence Rate cases/ 100,000 females 130.6 121.5 124.7 2011-2015 21
0.90 Cervical Cancer Incidence Rate cases/ 100,000 females 6.7 7.3 7.2 7.5 2011-2015 21
0.80 Life Expectancy for Females years 83.5 83.0 81.5 2014 19
0.60 Age-Adjusted Death Rate due to Breast Cancerdeaths/ 100,000
females17.0 20.7 19.1 2014-2016 5
APPENDIX B. METHODOLOGY

105Ventura County Community Health Needs Assessment 2019
Primary Data Methodology
Primary Data Methods & Analysis
Community input for VCCHNAC was collected to expand upon the information gathered from the secondary data. The entire process was undertaken by the VCCHNAC membership. Primary data used in this assessment consisted of a com-munity survey in English and Spanish, focus groups and key informant interviews. The survey instruments and interview questions are enclosed below. .
Community Survey
Since one of the most valuable ways to learn about the health of a community is by reaching out to the different constituents in the community, including residents, VCCHNAC prioritized local participation for this community health needs assess-ment and improvement planning cycle. A sample community health survey from the National Association of County and City Health Officials (NACCHO) was adapted for this process and input from Ventura County residents was collected online. This survey consisted of 20 questions related to top health needs in the community, factors which most improve life in a community, and behaviors which have the greatest impact on overall community health besides some personal health and demographic questions. The full survey can be found here. The community survey was distributed online through SurveyMonkey® from January 8th through March 25th of 2019. The survey was made available in both English and Spanish. Paper surveys were also made available and answers to the paper survey were entered into the SurveyMonkey tool.
Key Informant Interviews
To expand upon the information gathered from the secondary data, key informant interviews were conducted to collect community input. Interviewees who were asked to participate were recognized as having expertise in public health, special knowledge of community health needs and/or represented the broad interest of the community served by the hospital and health department, and/ or could speak to the needs of medically underserved or vulnerable populations. Sixteen Key Informant Interviews and four group discussions with stakeholders, involving 53 participants, were conducted from October 2018 through March 2019.
The 16 interviews and 4 focus groups were conducted in-person and by telephone, each ranging from 30 – 60 minutes in length. During the interviews, questions were asked to learn about the interviewee’s background and organization, biggest health needs and barriers of concern in the community, as well as the impact of health issues on vulnerable populations. A list of the questions asked during the interviews can be found in Primary Data Methodology.
Each interview was transcribed by the interviewer, so much of the conversation was captured verbatim, and then analyzed qualitatively so as to code the transcripts according to a list of major health and quality of life topics. Input from key informants is included in each relevant health need topic area detailed in SECTION 6: Primary Data Collection and SECTION 7: Data Synthesis and Prioritization of this report.
Organizations of Key Informant Interview Participants· Access TLC Home Health and Hospice
· Camarillo Health Care District
· Child Development Resources of Ventura County
· Community Memorial Care Connections
· Conejo Valley Unified School District
· Dignity Health Healthy Communications Board
· First5 Ventura County
· Oxnard Police Department
· Oxnard Union High School District
· Ventura County Behavioral Health
· Ventura County Office of Education
· Ventura County Sheriff’s Office
· Ventura Post-Acute Care
· Village Family Services
· California State University Channel Islands
· Cancer Support Community
· City of Oxnard
· Community Memorial Health System Board of Directors
· Dignity Health Board of Directors
· Dignity Health System
· National Alliance on Mental Illness
· Oxnard School District
· Seaview Independent Physician Organization
· Ventura County Community Foundation
· Ventura County Public Health
· Ventura County Transportation Commission
· Ventura Unified School District
APPENDIX B. METHODOLOGY

106Ventura County Community Health Needs Assessment 2019
Focus Groups and Focus Group Profiles
Five focus groups, including 58 participants, took place between July 2018 and March 2019. The groups were organized and facilitated by the Epidemiologist and Health Equity Director of Ventura County Public Health. Participants were recruited using multiple modes: direct recruitment by partner community based organizations, email invitations, flyers, and social media postings. Each focus group included both a facilitator and a note taker from VCPH to capture the conversation verbatim. A list of the questions asked during the focus groups can be found in Primary Data Methodology. The focus group transcripts and notes were analyzed qualitatively so as to code the transcripts according to a list of major health and quality of life topics. Input from focus group participants is included in each relevant health need topic area detailed in SECTION 6: Primary Data Collection and SECTION 7: Data Synthesis and Prioritization of this report.
TABLE 25: FOCUS GROUP PROFILES
Number Gender Age Race Type of Group City/Zip CodeNumber of participants
Group 1 F 31-62Hispanic, White
Low Income Santa Paula 12
Group 2,3 F, M 26-53 Hispanic Low Income93035, 93030, 93036, 93035
27
Group 4 M 35-77White, Hispan-ic, Asian
Older Adults Many Zip codes 11
Group 5 F,M 25-58Hispanic, White
Agricultural Workers
93033, 93030, 93036, 93015, 93035
8
Total- 5 58
Ventura County Key Informant Interview Questionnaire
• Based on your experience, what are the barriers to addressing the health prob-lems and risky behaviors identified through the survey?
• Has your organization done anything to address these issues?
• What do you think hospitals/health systems/public health departments can do to address these issues that they are not doing right now?
Ventura County Focus Group Discussion Questions
• What do you think makes a healthy community?
• In our community health assessment survey, mental health problems, high healthcare costs, cancer, aging complications, and poor housing conditions/lack of housing were identified as the most important health problems? Do you agree? What is missing from this list?
• What does access to healthcare mean to you? Transportation, clinic hours, long-waits for appointments?
• What do you think needs to be changed to improve health in Ventura County? What would be most useful to you?
APPENDIX B. METHODOLOGY

107Ventura County Community Health Needs Assessment 2019
Community Survey (English)
Please take a minute to complete the survey below. The purpose of this survey is to get your opinions about how to improve the health of Ventura County residents. Your feedback is very important to us!
Community Health Survey 2019
oAccess to health care (e.g., having a regular doctor, insurance coverage)o Access to organizations which provide community services (e.g. food
banks, shelters, screenings, free vaccinations etc.)oAccess to transportationoAffordable housingoArts and cultural eventsoCaregiver support and educationoClean environmentoExcellent race relationsoGood jobs and healthy economyoGood place to raise childrenoGood place to grow olderoOther (please specify)
oGood schoolsoHealthy behaviors and lifestylesoLow adult death and disease ratesoLow crime / safe neighborhoodsoLow infant deathsoLow level of child abuseoParks and recreationoReligious or spiritual valuesoSafe places to exercise (e.g. walk, ride a bicycle, or ride a horse)oStrong family life
1. What do you think makes a “Healthy Community?” These are the factors which most improve life in acommunity. (Choose the five options that are most important to you.)
oAging complications (e.g. dementia, falls, social isolation etc.) oCancersoCaregiver stressoChild abuse / neglect oDental problemsoDiabetesoDomestic Violenceo Environmental Exposures (e.g. pesticides, smoke etc.) oFirearm-related injuriesoHeart disease and strokeoHigh blood pressureoHIV / AIDS oHigh healthcare costs (e.g. insurance, co-pays, prescriptions) oHomicideoInfant Death/StillbornoInfectious Diseases (e.g. hepatitis, TB, etc.)oLack of access to prenatal care for expectant mothers oOther (please specify)
oLack of educational opportunitieso Lack of free early childhood education for families in needoLack of good paying jobso Lack of information to make correct health decisionsoLanguage access/lack of interpretersoLack of sufficient food or healthy food optionsoLack of transportation for medical needso Mental health problems (e.g. trauma, depression, bipolar etc.)oMotor vehicle crash injuriesoMultiple chronic conditionso Natural disasters (e.g. wildfires, tsunamis, earthquakes, etc.)oPoor housing conditions or lack of housingoRape/sexual assaultoRespiratory/lung diseaseoSexually Transmitted Diseases or Infections (STDs or STIs)oSuicideoTeenage pregnancy
2. What do you think are the five most important “health problems” in our community? These are problemswhich have the greatest impact on overall community health. (Choose the five options that are most important to you.)
3. What changes need to be made to address the health problems that you have identified in the previousquestion?
4. What programs are already in place to address the health problems that you have identified in the previousquestion?
oAlcohol abuseoBeing overweight/obese oDropping out of school oDrug abuseoLack of adequate sleepoLack of exerciseoPoor eating habits oOther (please specify
oNot getting “shots” to prevent disease oRacismoTobacco/e-cigarette use oLack of family planning (e.g. not using birth control)oNot using seat belts / child safety seats oPrescription Drug Abuse oUnsafe sex
5. What do you think are the five most important “risky behaviors” in our community? (Choose the five behaviors whichyou think have the greatest impact on overall community health.)
6. What programs are already in place to address the risky behaviors that you have identified in the previousquestion?
11. Please provide the zip code for your address:
12. Where do you currently live (select one)?oYour own house or apartment oFamily member’s house or apartment oHotel/motel oFriend’s house or apartment oHomeless (please indicate where you sleep)
13. Please provide your age:
14. SexoFemale oMale oTransgender
Please answer the following questions so we can see how different types of people feel about local health issues in Ventura County.
15. Marital Status:oMarried / co-habiting oNot married / Single oOther (please specify)
16. Education:oLess than high school oHigh school diploma or GED oCollege degree or higher oOther (please specify)
oPay cash (no insurance) oHealth insurance (e.g., private insurance, Blue Shield, HMO) oMedi-Cal oMedicare oVeterans’ Administration oIndian Health Services oOther (please specify)
17. How do you pay for your health care? (check all that apply)
18. What kind of business or industry do you work in? oAgriculture oConstruction oEducation oFood Service or Retail oGovernment oHealthcare oMilitary oTechnology oTransportation oOther (please specify)
19. Ethnic group you most identify with: oAfrican American / Black oAsian / Pacific Islander oHispanic / Latino oIndigenous (Oaxaca, Guerrero, etc.) oNative American oWhite / Caucasian oMixed Race (two or more races) oOther (please specify)
20. What is your current annual household income? oLess than $20,000 o$20,000-$34,999 o$35,000-$49,999 o$50,000-$74,999 o$75,000-$99,999 oOver $100,000
8. Ventura County is a good place to live and raise children. oStrongly Agree oAgree oNeither Agree or Disagree oDisagree oStrongly Disagree
9. How would you rate your own personal health? oVery unhealthy oUnhealthy oSomewhat healthy oHealthy oVery healthy
10. Do you provide regular care or assistance (unpaid) to a friend or family member who has a health problem or disability?
oNo oYes, for a person 65 or older oYes, for a person 65 or older with dementia oYes, for a person under 65 years old with a disability oYes, for a child (under 18) with a disability oOther (please specify)
7. What changes need to be made to address the risky behaviors that you have identified in the previous question?
APPENDIX B. METHODOLOGY

108Ventura County Community Health Needs Assessment 2019
11. Please provide the zip code for your address:
12. Where do you currently live (select one)?oYour own house or apartment oFamily member’s house or apartment oHotel/motel oFriend’s house or apartment oHomeless (please indicate where you sleep)
13. Please provide your age:
14. SexoFemale oMale oTransgender
Please answer the following questions so we can see how different types of people feel about local health issues in Ventura County.
15. Marital Status:oMarried / co-habiting oNot married / Single oOther (please specify)
16. Education:oLess than high school oHigh school diploma or GED oCollege degree or higher oOther (please specify)
oPay cash (no insurance) oHealth insurance (e.g., private insurance, Blue Shield, HMO) oMedi-Cal oMedicare oVeterans’ Administration oIndian Health Services oOther (please specify)
17. How do you pay for your health care? (check all that apply)
18. What kind of business or industry do you work in? oAgriculture oConstruction oEducation oFood Service or Retail oGovernment oHealthcare oMilitary oTechnology oTransportation oOther (please specify)
19. Ethnic group you most identify with: oAfrican American / Black oAsian / Pacific Islander oHispanic / Latino oIndigenous (Oaxaca, Guerrero, etc.) oNative American oWhite / Caucasian oMixed Race (two or more races) oOther (please specify)
20. What is your current annual household income? oLess than $20,000 o$20,000-$34,999 o$35,000-$49,999 o$50,000-$74,999 o$75,000-$99,999 oOver $100,000
8. Ventura County is a good place to live and raise children. oStrongly Agree oAgree oNeither Agree or Disagree oDisagree oStrongly Disagree
9. How would you rate your own personal health? oVery unhealthy oUnhealthy oSomewhat healthy oHealthy oVery healthy
10. Do you provide regular care or assistance (unpaid) to a friend or family member who has a health problem or disability?
oNo oYes, for a person 65 or older oYes, for a person 65 or older with dementia oYes, for a person under 65 years old with a disability oYes, for a child (under 18) with a disability oOther (please specify)
7. What changes need to be made to address the risky behaviors that you have identified in the previous question?
APPENDIX B. METHODOLOGY
Community Survey (Spanish)
Por favor tome un minuto para responder a esta encuesta. El propósito de esta encuesta es de obtener su opinión sobre cómo mejorar la salud de los residentes del condado de Ventura. Su opinión es muy importante para nosotros.
Encuesta de Salud Comunitaria 2019
o Acceso a servicios de salud (como tener acceso a un doctor regular, seguro médico)
o Acceso a organizaciones que proveen servicios comunitarios(como despensa, alojamiento, exámenes, vacunas gratuitas)
o Acceso al transporteo Viviendas asequibleso Artes y eventos culturaleso Apoyo y educación de los cuidadoreso Ambiente limpioo Excelentes relaciones racialeso Buenos empleos y buena economíao Buen lugar para criar a los niñoso Buen lugar para envejecero Otro/a: (favor de elaborar)
oBuenas escuelasoEstilo de vida y comportamientos saludablesoBajas tasas de muerte y enfermedad de adultosoMenos crimen/comunidades segurasoBajo nivel de muertes infantilesoBajo nivel de abuso infantiloParques y recreaciónoValores religiosos o espiritualesoLugares seguros para hacer ejercicio (como caminar, andar en
bicicleta, o montar a caballo)oBuena vida familiar
1. ¿Qué cree usted que forma una “comunidad saludable?” Estos son los factores que tienen mayor impactopara mejorar la calidad de vida en una comunidad. (Elija las cinco opciones que son más importantes para usted.)
oComplicaciones de envejecimiento (como la demencia, las caídas, elaislamiento social, etc.)
oCánceroEstrés del cuidadoroAbuso infantil/negligenciaoProblemas dentalesoDiabetesoViolencia DomesticaoExposiciones en el medio ambiente (pesticidas, humo) oLesiones relacionadas a las armas de fuegooEnfermedad cardíaca y derrame cerebraloAlta presión arterialoVIH/SIDAoAlto costo de cuidado médico (seguro, copagos)oHomicidiooMuerte infantil/malpartooEnfermedades infecciosas (hepatitis, tuberculosis)oFalta de acceso a cuidado prenatal para mujeres embarazadas oOtro/a: (favor de elaborar)
o Falta de oportunidades educacionaleso Falta de educación en la niñez temprana, gratuita para familias con
necesidado Falta de empleos de buen pagoo Falta de alfabetización para hacer decisiones de saludo Falta de intérpretes/acceso de lenguajeo Falta de información suficiente u opciones saludableso Falta de transporte para necesidades médicaso Problemas de salud mental (trauma, depresión, bipolar etc.)o Lesiones de accidentes automovilísticoso Múltiples condiciones crónicaso Desastres naturales (incendios, maremoto, terremotos, etc.)o Condiciones de vivienda deficienteso Violación/Asalto sexualo Enfermedades respiratorias y pulmonareso Infecciones de transmisión sexualo Suicidioo Embarazo adolescente
2. ¿Qué cree usted que son los “problemas de salud” más importantes en nuestra comunidad? Estos son los problemasque tienen el mayor impacto en la salud general de la comunidad. (Elija las cinco opciones que son más importantes para usted.)
3. ¿Qué cambios deben hacerse para atender los problemas de salud y comportamientos de riesgo que ustedha identificado en la pregunta previa?
4. ¿Qué programas ya existen para abordar con los problemas de salud y los comportamientos de riesgo queusted ha identificado en la pregunta previa?
oAbuso de alcoholoEstar sobrepeso/obesooEl abandono escolar oAbuso de drogasoFalta de sueňo adecuado oFalta de ejerciciooMalos hábitos de alimentaciónoOtro/a: (favor de elaborar)
oNo conseguir “vacunas” para prevenir la enfermedadoRacismooUso de tabaco/cigarro electrónicooNo utilizar anticonceptivosoNo utilizar cinturones de seguridad / asientos para niños oAbuso de medicamentos recetadoso Relaciones sexuales sin protección contra infecciones de transmisión
sexual
5. ¿Qué cree usted que son los cinco “comportamientos de riesgo” más importantes en nuestra comunidad?(Elija los cinco comportamientos que usted opina tienen el mayor impacto en la salud general de una comunidad.)
6. ¿Qué programas ya existen para abordar con los problemas de salud y los comportamientos d riesgo queusted ha identificado en la pregunta previa?

109Ventura County Community Health Needs Assessment 2019
Por favor tome un minuto para responder a esta encuesta. El propósito de esta encuesta es de obtener su opinión sobre cómo mejorar la salud de los residentes del condado de Ventura. Su opinión es muy importante para nosotros.
Encuesta de Salud Comunitaria 2019
o Acceso a servicios de salud (como tener acceso a un doctor regular, seguro médico)
o Acceso a organizaciones que proveen servicios comunitarios(como despensa, alojamiento, exámenes, vacunas gratuitas)
o Acceso al transporteo Viviendas asequibleso Artes y eventos culturaleso Apoyo y educación de los cuidadoreso Ambiente limpioo Excelentes relaciones racialeso Buenos empleos y buena economíao Buen lugar para criar a los niñoso Buen lugar para envejecero Otro/a: (favor de elaborar)
oBuenas escuelasoEstilo de vida y comportamientos saludablesoBajas tasas de muerte y enfermedad de adultosoMenos crimen/comunidades segurasoBajo nivel de muertes infantilesoBajo nivel de abuso infantiloParques y recreaciónoValores religiosos o espiritualesoLugares seguros para hacer ejercicio (como caminar, andar en
bicicleta, o montar a caballo)oBuena vida familiar
1. ¿Qué cree usted que forma una “comunidad saludable?” Estos son los factores que tienen mayor impactopara mejorar la calidad de vida en una comunidad. (Elija las cinco opciones que son más importantes para usted.)
oComplicaciones de envejecimiento (como la demencia, las caídas, elaislamiento social, etc.)
oCánceroEstrés del cuidadoroAbuso infantil/negligenciaoProblemas dentalesoDiabetesoViolencia DomesticaoExposiciones en el medio ambiente (pesticidas, humo) oLesiones relacionadas a las armas de fuegooEnfermedad cardíaca y derrame cerebraloAlta presión arterialoVIH/SIDAoAlto costo de cuidado médico (seguro, copagos)oHomicidiooMuerte infantil/malpartooEnfermedades infecciosas (hepatitis, tuberculosis)oFalta de acceso a cuidado prenatal para mujeres embarazadas oOtro/a: (favor de elaborar)
o Falta de oportunidades educacionaleso Falta de educación en la niñez temprana, gratuita para familias con
necesidado Falta de empleos de buen pagoo Falta de alfabetización para hacer decisiones de saludo Falta de intérpretes/acceso de lenguajeo Falta de información suficiente u opciones saludableso Falta de transporte para necesidades médicaso Problemas de salud mental (trauma, depresión, bipolar etc.)o Lesiones de accidentes automovilísticoso Múltiples condiciones crónicaso Desastres naturales (incendios, maremoto, terremotos, etc.)o Condiciones de vivienda deficienteso Violación/Asalto sexualo Enfermedades respiratorias y pulmonareso Infecciones de transmisión sexualo Suicidioo Embarazo adolescente
2. ¿Qué cree usted que son los “problemas de salud” más importantes en nuestra comunidad? Estos son los problemasque tienen el mayor impacto en la salud general de la comunidad. (Elija las cinco opciones que son más importantes para usted.)
3. ¿Qué cambios deben hacerse para atender los problemas de salud y comportamientos de riesgo que ustedha identificado en la pregunta previa?
4. ¿Qué programas ya existen para abordar con los problemas de salud y los comportamientos de riesgo queusted ha identificado en la pregunta previa?
oAbuso de alcoholoEstar sobrepeso/obesooEl abandono escolar oAbuso de drogasoFalta de sueňo adecuado oFalta de ejerciciooMalos hábitos de alimentaciónoOtro/a: (favor de elaborar)
oNo conseguir “vacunas” para prevenir la enfermedadoRacismooUso de tabaco/cigarro electrónicooNo utilizar anticonceptivosoNo utilizar cinturones de seguridad / asientos para niños oAbuso de medicamentos recetadoso Relaciones sexuales sin protección contra infecciones de transmisión
sexual
5. ¿Qué cree usted que son los cinco “comportamientos de riesgo” más importantes en nuestra comunidad?(Elija los cinco comportamientos que usted opina tienen el mayor impacto en la salud general de una comunidad.)
6. ¿Qué programas ya existen para abordar con los problemas de salud y los comportamientos d riesgo queusted ha identificado en la pregunta previa?
11. Favor de proveer el código postal de su domicilio:
12. ¿Dónde vive actualmente? (Elija uno)oSu propia casa o apartamentooCasa o apartamento de un familiar oHotel/moteloCasa o apartamento de un amigooDesamparado (Por favor indique dónde duerme)
13. Favor de proveer su edad:
14. Sexo:oFemeninooMasculinooTransgénero
Favor de contestar las siguientes preguntas para saber como diferentes tipos de personas opinan sobre temas de salud locales en el condado de Ventura.
15. Estado civil:oCasado(a) / co-habitandooSoltero(a)oOtro/a: (favor de elaborar)
16. Educación:oMenos que la escuela secundaria oDiploma de escuela secundaria o GEDoTítulo universitario o superior oOtro/a: (favor de elaborar)
oEn efectivo (no seguro)oSeguro médico(seguro privado,BlueShield,HMO)oMedi-CaloMedicareoAdministración de VeteranosoServicios de Salud a Indios Nativos oOtro/a: (favor de elaborar)
17. ¿Cómo paga por su cuidado médico?(Marque todo lo que corresponda)
18. ¿En qué tipo de industria o negocio trabaja?oAgriculturaoConstrucciónoEducaciónoServicio de alimentos o ventas oGobiernooCuidado de la saludoMilitaroTecnologíaoTransporteoOtro/a: (favor de elaborar)
19. Grupo étnico con el que más se identifica:oAfroamericano / NegrooAsiático / Isleño del PacificooHispano(a) / Latino(a)oIndígenas (Oaxaca, Guerrero, etc.)oNativo AmericanooBlanco / CaucásicooOtro/a: (favor de elaborar)
20. ¿Cuál es su ingreso familiar anual actual?oMenos de $20,000o$20,000-$34,999o$35,000-$49,999o$50,000-$74,999o$75,000-$99,999 oMás de $100,000
8. El condado de Ventura es un buen lugar para vivir y crear niños.o Definitivamente estoy de acuerdoo De acuerdoo Ni de acuerdo ni desacuerdoo No estoy de acuerdoo Definitivamente no estoy de acuerdo
9. ¿Cómo calificaría su salud personal?oMuy poco saludable oPoco saludableoAlgo saludableoSaludableoMuy saludable
10. ¿Proporciona cuidado o asistencia regular, (sin paga) a un amigo o familiar que tiene un problema odiscapacidad?
oNooSí, para una persona de 65 años o mayoroSí, para una persona de 65 años o mayor con demenciaoSí, para una persona menor de 65 años con una discapacidadoSí, para un niño/a (menor de 18 años) con una discapacidadoOtro/a: (favor de elaborar)
7. ¿Qué cambios deben hacerse para atender los problemas de salud y comportamientos de riesgo que ustedha identificado en la pregunta previa?
APPENDIX B. METHODOLOGY

110Ventura County Community Health Needs Assessment 2019
In order to focus efforts on a smaller number of the most significant community issues, the prioritiza-tion process followed was conducted in a number of steps. As a first step, fourteen representatives from the Ventura County Community Health Needs Assessment Collaborative participated in an on-line survey to determine the criteria that was to be used to prioritize the twelve significant health needs identified through the secondary and primary data analyses. Responses were solicited to twenty criteria and participants were asked to rate each on a 5-point weighted scale from ‘not important’ (score = 0) to ‘very important’ (score = 5). As a result of this exercise, four weighted criteria emerged and are given below:
• Correction of social or economic inequalities that contribute to poor health
• Potential to impact multiple problems with solution and benefit the community at large
• Availability and commitment from leadership in the involved organizations
• Health problem impacts other health outcomes and/or is a driver of other conditions
As a second step, an in-person prioritization exer-cise was conducted on April 23, 2019 and partic-ipants were given the packet (shown below) with instructions on how to prioritize the significant health topics that had risen to the top as a result of the CHNA assessment.
Completion of the prioritization matrix packet re-sulted in numerical scores for each health need that corresponded to how well each health need met the criteria for prioritization. The weight de-rived from the online survey were applied to the ranks and final scores were ranked from highest to lowest (Table 26).
APPENDIX C. PRIORITIZATION PROCESS

111Ventura County Community Health Needs Assessment 2019
TABLE 26: PRIORITIZED HEALTH NEEDS
Correction of social or economic inequalities that contribute to poor health
Potential to impact multiple problems with solution and benefit the community at large
Availability and commitment from leadership in the involved organizations
Health problem impacts other health outcomes and/or is a driver of other conditions
Total
Weights 4.62 4.54 4.46 4.46
Food Insecurity 42 194.04 44 199.76 36 160.56 44 196.24 11.73
Access to Health Services 36 166.32 43 195.22 45 200.7 39 173.94 11.50
Poor Nutrition 38 175.56 41 186.14 34 151.64 43 191.78 11.02
Diabetes 34 157.08 40 181.6 40 178.4 40 178.4 10.87
Housing and Homelessness 45 207.9 40 181.6 26 115.96 42 187.32 10.82
Mental Health 37 170.94 41 186.14 32 142.72 41 182.86 10.67
Aging Problems 33 152.46 41 186.14 38 169.48 38 169.48 10.59
Lack of Prenatal Care and Breastfeeding Support 37 170.94 37 167.98 35 156.1 38 169.48 10.38
Drug Abuse 34 157.08 34 154.36 25 111.5 39 173.94 9.33
Alcoholism 31 143.22 31 140.74 24 107.04 37 165.02 8.69
Cancer 26 120.12 33 149.82 33 147.18 29 129.34 8.54
Asthma 29 133.98 25.00 113.5 27 120.42 30 133.8 7.84
The results of the process above, however, were not found to have yielded a result that was either aligned to perceived health challenges in Ventura County or to priorities of the VCCHNAC partner organizations. A second prioritization process was thus followed. Each of the participants was distributed $120 of fake currency and asked to distribute the funds among the twelve priorities. Participants were given liberty to deploy the funds as they saw fit amongst the priorities. The objective of the exercise was to simulate real life conditions often faced by decision makers in health agencies who have limited resources at their disposal and a plethora of health priorities to address. The results of the process are given in Table 27.
APPENDIX C. PRIORITIZATION PROCESS

112Ventura County Community Health Needs Assessment 2019
TABLE 27: FINAL RESULTS OF PRIORITIZATION EXERCISE
Health Topics Dollar Value
Access to Health Services 520
Mental Health 250
Aging Problems 205
Diabetes 200
Cancer 175
Food Insecurity 145
Poor Nutrition 140
Housing and Homelessness 95
Lack of Prenatal Care and Breastfeeding Support 80
Drug Abuse 25
Alcoholism 0
Asthma 0
The results of this exercise were definitive and proved satisfactory to the members of the VCCHNAC. While this exercise made it clear that certain topics like access to care, mental health, aging problems, diabetes and cancer had predominance over other issues, it was also apparent to the partners that the other factors were drivers or root causes for many health conditions that exist in Ventura County. A decision was thus made to categorize these topics into five logical groups broad enough to encompass drivers of health conditions which would create equal op-portunities for health in Ventura County and allow for implementation strategies that will be responsive to efforts of all the agencies involved in delivering them, be it a federally qualified health clinic, a hospital, special health care district or a government health division. The five priorities have equal weightage and are listed here:
• Improve Access to Health Services
• Reduce the Impact of Behavioral Health Issues
• Improve Health and Wellness for Older Adults
• Reduce the Burden of Chronic Disease
• Address Social Needs
APPENDIX C. PRIORITIZATION PROCESS

113Ventura County Community Health Needs Assessment 2019
Prioritization Survey
APPENDIX C. PRIORITIZATION PROCESS

114Ventura County Community Health Needs Assessment 2019
Prioritization Matrix Packet and Instructions
This packet will help you assess each of the pressing health needs identified by Conduent HCI’s data analysis, and how each of those health needs relate to the criteria set forth by you through the survey for prioritizing health topics in your service area. For each health need you will score how well you believe the health need meets the criteria. After you have completed the ranking, please submit your results. The results of all participants will be manually collated and aggregated with those of other participants to show the group’s collective ranking of the most pressing health needs in your service area.
Health Need
Correction of social or economic inequalities that contribute to
poor health
1 – Will not correct social or economic inequalities
3 – Will correct social or economic inequalities
Potential to impact multiple problems with solution and
benefit the community at large
1 – will not impact multiple problems
3 – will impact multiple problems
Availability and commitment from leadership in the involved
organizations
1 – Commitment and buy-in from leadership does not exist
3 – Commitment and buy-in from leadership exists
Health problem impacts other health outcomes and/or is a driver of other
conditions
1 – Health problem is not a root cause of other health outcomes
3 – Health problem is a root cause of other health outcomes
TOTAL
Access to Health Services
Mental Health
Drug Abuse
Alcoholism
Aging Problems
Housing and Homelessness
Cancer
Food Insecurity
Poor Nutrition`
Diabetes
Asthma
Lack of Prenatal Care
APPENDIX C. PRIORITIZATION PROCESS
INSTRUCTIONS
Given below is a list of Health Topics that have emerged as priorities for Ventura County through the Data Synthesis exercise. On the following page, score each health need for how well it meets each criteria:
1=does not meet criteria through 3=meets criteria

115Ventura County Community Health Needs Assessment 2019
The following is a list of community resources developed through documentation of mentions by community input participants in conjunction to those accessed through the 2-1-1 website for Ventura County.
APPENDIX D. COMMUNITY RESOURCES
Ventura County
1. Adult Protective Services
2. Alcoholics Anonymous
3. American Cancer Association
4. American Diabetes Association
5. American Heart Association
6. American Kidney Fund
7. ARC of Ventura County
8. Blinded Veterans Association
9. Boys and Girls Club
10. Cal Fresh
11. Cal Works
12. Cancer Care
13. Cancer Support Community
14. Catholic Charities
15. Children’s Home Society of California
16. City of Hope
17. Clinicas Del Camoino Real, INC.
18. Department of Veteran Affairs
19. El Concilio Family Learning Centers
20. El Consulado Mexicano
21. Food Share, Inc.
22. Gold Coast Health Plan
23. Great Smoke Out
24. Health Well Foundation
25. Healthcare Foundation for Ventura County
26. Heroin Taskforce
27. Hillmont
28. Homeless Prevention and Rapid Re-Housing Program (HPRP)
29. Knights of Columbus Lords F
30. Livingston Memorial Visiting Nurse Association
31. Los Robles Hospital
32. Marcelle Erian Cancer Foundation
33. Narcotics Anonymous
34. National Alliance on Mental Illness
35. National Children’s Cancer Society
36. Not One More
37. Operation Homefront
38. Oxnard Senior Centers
39. Project Understanding
40. Public Health Tobacco Reduction Program
41. Rancho Simi Park District
42. Safe Harbor
43. Samaritan Center
44. Sierra Vista Family Medical Clinic
45. Simi Valley Free Clinic
46. Simi Valley Hospital
47. Tarzana Rehab Center
48. Tri-County Regional Center
49. United Way 211 Hotline
50. Ventura Active Adult Program
51. Ventura County Behavioral Health
52. Ventura County Healthcare Agency
53. Ventura County Public Health
54. Ventura County Social Services
55. Vista Del Mar
56. West County Obesity Prevention Coalition
57. Westminster Free Clinic
58. Work for Warriors
Ventura County 2-1-1 Resources
1. Children & Family
2. Crisis Services
3. Education
4. Food
5. Health Care
6. Housing & Homeless Service
7. Income & Expenses
8. Legal Assistance
9. Mental Health
10. Post Incarceration Reentry Services
11. Seniors
12. Substance Abuse
13. Transportation
14. Youth

116Ventura County Community Health Needs Assessment 2019
RequirementSection and Page Number(s) in written CHNA Report
The CHNA report adopted for the hospital facility by an authorized body of the hospital facility must include:
A definition of the community served by the hospital facility Section 3.3
A description of how the community served was determined Section 3.3
A description of the process and methods used to conduct the CHNA, and Appendix B
A description of how the hospital facility solicited and took into account input received from persons who represent the broad interests of the com-munity it serves
Appendix B3
A prioritized description of the significant health needs of the community identified through the CHNA along with
A description of the process and criteria used in identifying certain health needs as significant and prioritizing those significant health needs Section 7, Appendix C
A description of the resources potentially available to address the significant health needs Appendix E
An evaluation of the impact of any actions that were taken, since the hospital facility finished conducting its immediately preceding CHNA, to ad-dress significant health needs identified in the hospital facility’s prior CHNA
Appendix A
A hospital facility’s CHNA report will be considered to describe the process and methods used to conduct the CHNA if the CHNA report
Describes the data and other information used in the assessment Section 5-8
Describes the methods of collecting and analyzing this data and information, and Appendix B
Identifies any parties with whom the hospital collaborated, or contracted for assistance Section 3.8
A hospital facility’s CHNA report* will be considered to describe how the hospital facility took into account input received from persons who represent the broad interest of the community it serves if it
Summarizes any input provided by such persons and how and over what time period such input was provided Appendix B, Section 6, Section 7.2
Provides the names of any organizations providing input, and Appendix B
Describes the medically underserved, low-income, or minority populations being represented by organizations or individuals that provided input Throughout the report
JOINT CHNA: This section to be completed only if your hospital facility conducted a joint CHNA**. A hospital facility may conduct its CHNA in collaboration with other organizations and facilities including, but not limited to: related and unrelated hospital organizations and facilities; for-profit and government hospitals; governmental department; and non-profit organizations. However, every hospital facility must document its CHNA in a separate CHNA report unless it adopts a joint CHNA report.
A joint CHNA report produced for the hospital facility and one or more of the collaborating facilities and/or organizations is permitted provided that the following conditions are met
Yes
The joint CHNA report includes all required content Yes
The joint CHNA report is clearly identified as applying to the hospital facility, and Yes
All of the collaborating hospital facilities and organizations included in the joint CHNA report define their community to be the same Yes
APPENDIX E. IRS GUIDELINES FOR FORM 990, SCHEDULE H COMPLIANCE

117Ventura County Community Health Needs Assessment 2019
Benefits.Gov. (2019). CalFresh. Retrieved from Benefits.Gov: https://www.benefits.gov/benefit/1228
Bureau, U. S. (2019). 2013-2017 American Community Survey 5-Year Estimates. Retrieved from American Fact Finder: https://factfinder.census.gov/faces/nav/jsf/pages/searchresults.xhtml?refresh=t#none
Bureau, U. S. (2019, May 8). QuickFacts Ventura County, California. Retrieved from Census.Gov: https://www.census.gov/quickfacts/venturacountycalifornia
California Cancer Registry. (2012-2016). California Cancer Registry. https://www.cancer-rates.info/ca/
California Department of Public Health. (2013-2014). MIHA Data Snapshot, Ventura County, 2013-2014. Retrieved from Maternal Infant Health Assessment: http://www.cdph.ca.gov/data/surveys/MIHA/MIHASnapshots/SnapshotCoVentura2013-2014.pdf
California Department of Public Health. (2017). Birth Statistical Data Tables. Retrieved from California Department of Public Health Data and Statistics: https://www.cdph.ca.gov/data/statistics/Documents/VSC-2014-0202.pdf
California Food Policy Advocates. (2013). The benefits of breakfast: Health and academics. . Retrieved from BreakfastFirst: http://breakfastfirst.org/wp-content/uploads/2014/06/BenefitOfBreakfast-Factsheet-2013.pdf
Centers for Disease Control and Prevention. (2013). Economic Burden. Retrieved from Diabetes State Burden Toolkit: https://nccd.cdc.gov/Toolkit/DiabetesBurden/TotalCost
Centers for Disease Control and Prevention. (2015, June 4). Physical Activity. Retrieved from Centers for Disease Control and Prevention: https://www.cdc.gov/physicalactivity/basics/adults/
Centers for Disease Control and Prevention. (2016, August 15). Adult Obesity Causes & Consequences. Retrieved from Centers for Disease Control and Prevention: https://www.cdc.gov/obesity/adult/causes.html
Centers for Disease Control and Prevention. (2016, April). Adverse Childhood Experiences (ACEs). Retrieved from Centers for Disease Control and Prevention: https://www.cdc.gov/violenceprevention/acestudy/index.html
Centers for Disease Control and Prevention. (2017). Cancers Associated with Overweight and Obesity Make up 40 percent of Cancers Diagnosed in the United States
Centers for Disease Control and Prevention. (2017, January 25). Childhood Obesity Facts. Retrieved from Healthy Schools: https://www.cdc.gov/healthyschools/obesity/facts.htm
Centers for Disease Control and Prevention. (2017, February). Most Recent Asthma Data. Retrieved from Centers for Disease Control and Prevention: https://www.cdc.gov/asthma/most_recent_data.htm
Centers for Disease Prevention and Control. (2019). Environmental Public Health Tracking. Retrieved from Environmental Public Health Tracking - Information by Location: https://ephtracking.cdc.gov/DataExplorer/?query=16F809E7-BD81-4A24-8588-F6A3A62B866E&fips=6111&allyears=1#/
Centers for Medicaid and Medicare Services. (2017). Multiple Chronic Conditions. Retrieved from CMS.Gov: https://www.cms.gov/Research-Statistics-Data-and-Systems/Statistics-Trends-and-Reports/Chronic-Conditions/MCC_Main.html
Chetty R, S. M. (2016). The Association Between Income and Life Expectancy in the United States, 2001-2014. JAMA, 1750-1766.
County Health Rankings and Roadmaps. (2019). Ventura County Health Rankings. Retrieved from County Health Rankings and Roadmaps.org: http://www.countyhealthrankings.org/app/california/2019/rankings/ventura/county/outcomes/overall/snapshot
County of Ventura Community Development Division. (2015). Ventura County - Regional Analysis of Impediments to Fair Housing Choice
Dartmouth Atlas Project. (2016). Medicare Reimbursements. Retrieved from Dartmouth Atlas Project: https://www.dartmouthatlas.org/interactive-apps/medicare-reimbursements/#county
REFERENCES

118Ventura County Community Health Needs Assessment 2019
De Hert, M. e. (2011). Physical illness in patients with severe mental disorders. I. Prevalence, impact of medications and disparities in health care. World Psychiatry, 52-77.
Department of Health Statistics and Information Systems. (2013). WHO methods and data sources for global burden of disease estimates 2000-2011. Geneva: World Health Organization.
Duncan, G. (2010, May 24). Breaking the poverty cycle. Retrieved from UCI News: https://news.uci.edu/feature/breaking-the-poverty-cycle/
Duncan, G. M.-D. (2014). Boosting Family Income to Promote Child Development. Future of Children, 99-120.Healthy Communities Institute. (2016, June 20). Data Scoring Tool. Retrieved from Health Matters in Ventura County: www.healthmattersinvc.org
Healthy Communities Institute. (2019). SocioNeeds Index. Retrieved from Health Matters in Ventura County: http://www.healthmattersinvc.org/index.php?module=indicators&controller=index&action=socioneeds
Healthy Places Index. (2016). Retrieved from California Association of Public Hospitals and Health Systems: https://healthyplacesindex.org/wp-content/uploads/2017/12/2016_global_payment_program.pdf
HRSA. (2018). HRSA Fact Sheet, FY 2018 - Ventura, California. Retrieved from HRSA: file:///C:/Users/20811331/Downloads/HDW_FactSheet%20(1).pdf
Human Resources and Services Administration. (2017). 2017 Health Center Program Awardee Data. Retrieved from HRSA Health Center Program Awardee Data: https://bphc.hrsa.gov/uds/datacenter.aspx?q=d&year=2017&state=CA#glist
Jonathan Labovitz, D., Gerald Kominski, P., & James Godwin, B. (2017). Podiatric Services Could Reduce Costs of Treating Diabetes Complications in California by $97 Million. Health Policy Brief, http://healthpolicy.ucla.edu/publications/Documents/PDF/2017/podiatricservices-brief-jun2017.pdf.
Kochanek, K., Murphy, S., Xu, J., & Tejada-Vera, B. (2016). Deaths: Final Data for 2014. National Vital Statistics Reports, 1-122.
Let’s Get Healthy California. (2019). Retrieved from Let’s Get Healthy California: https://letsgethealthy.ca.gov/
Let’s Get Healthy California Task Force. (2016). Let’s Get Healthy California - The Story. Retrieved from Let’s Get Healthy California: http://www.chhs.ca.gov/LGHC/___Let%27s%20Get%20Healthy%20California%20Task%20Force%20Final%20Report.pdf
Medicaid. (2019, June). California and the ACA’s Medicaid expansion. Retrieved from HealthInsurance.org: https://www.healthinsurance.org/california-medicaid/
Office of Disease Prevention and Health Promotion. (2019). Access to Health Services. Retrieved from Health People 2020: https://www.healthypeople.gov/2020/topics-objectives/topic/Access-to-Health-Services
Office of DIsease Prevention and Health Promotion. (2019). Access to Health Services. Retrieved from Health People 2020: https://www.healthypeople.gov/2020/topics-objectives/topic/Access-to-Health-Services
Office of Disease Prevention and Health Promotion. (2019). HealthyPeople.gov. Retrieved from Healthy People 2020: https://www.healthypeople.gov/2020/topics-objectives/topic/health-related-quality-of-life-well-being
Office of Policy Development and Research. (2011-2015). Consolidated Planning/CHAS Data - Ventura County. Retrieved from Consolidated Planning/CHAS Data: https://www.huduser.gov/portal/datasets/cp.html
Office of Statewide Health Planning and Development. (2016, June 14). Preventable Hospitalizations in California. Retrieved from Office of Statewide Health Planning and Development: https://www.oshpd.ca.gov/documents/HID/PH/1999-2008/PH-Report-9908.pdf
Office of Women’s Health, U.S. Department of Health and Human Services. (2012, July 16). Prenatal Care. Retrieved from Office on Women’s Health: https://www.womenshealth.gov/publications/our-publications/fact-sheet/prenatal-care.html
Perissinotto CM, S. C. (2012). Loneliness in older persons: a predictor of functional decline and death. Arch Intern Med, 1078-83.
REFERENCES

119Ventura County Community Health Needs Assessment 2019
Public Health Alliance of Southern California. (2019). Low-Income Renter Severe Housing Cost Burden. Retrieved from The California Healthy Places Index: https://map.healthyplacesindex.org/
Sillies, M. (2009). The Casual Effect of Education on Health: Evidence from the United Kingdom. Economics of Education Review, 122-128.
Syed, S. T. (2017). Traveling Towards Disease: Transportation Barriers to Health Care Access. Journal of Community Health, 976-993.
U.S. Department of Health and Human Services. (2008). Phase i Report: Recommendations for the framework and format of Healthy People 2020. Retrieved from Developing Healthy People 2020: https://www.healthypeople.gov/sites/default/files/PhaseI_0.pdf
U.S. Department of Health and Human Services. (2019, May 16). Poverty Guidelines. Retrieved from U.S. Department of Health and Human Service: https://aspe.hhs.gov/2019-poverty-guidelines
Uauy R, S. N. (2005). Diet, nutrition, and the life-course approach to cancer prevention. J Nutr. 2005 Dec;135(12 Suppl):2934S-2945S. doi: 10.1093/jn/135.12.2934S.
United States Census Bureau. (2018, May 8). QuickFacts Ventura County, California. Retrieved from Census.Gov: https://www.census.gov/quickfacts/venturacountycalifornia
United States Census Bureau. (2019). SELECTED CHARACTERISTICS OF HEALTH INSURANCE COVERAGE IN THE UNITED STATES. Retrieved from 2013-2017 American Community Survey 5-Year Estimates: https://factfinder.census.gov/faces/tableservices/jsf/pages/productview.xhtml?pid=ACS_17_5YR_S2701&prodType=table
United States Department of Housing and Urban Development . (2017). 2017 AHAR: Part 1 - PIT Estimates of Homelessness in the U.S. Retrieved from HUD Exchange: https://www.hudexchange.info/resource/5639/2017-ahar-part-1-pit-estimates-of-homelessness-in-the-us/
REFERENCES
United States Department of Housing and Urban Development. (2017). 2017 AHAR: Part 1 - PIT Estimates of Homelessness in the U.S. Retrieved from HUD Exchange: https://www.hudexchange.info/resource/5639/2017-ahar-part-1-pit-estimates-of-homelessness-in-the-us/
United States Department of Housing and Urban Development. (2017). CoC_Dash_CoC_CA-611-2018_CA_2017.pdf. HUD.
United Ways of California. (2018). Ventura. Retrieved from The Real Cost Measure in California: https://www.unitedwaysca.org/images/StrugglingToGetBy/County_Profiles/Ventura_County.pdf
Vital Records Business Intelligence System. (2018). Vital Records Business Inteligence System.