Communication Technology and Reports on Political Violence
13
Political Research Quarterly 2017, Vol. 70(1) 19–31 © 2016 University of Utah Reprints and permissions: sagepub.com/journalsPermissions.nav DOI: 10.1177/1065912916670272 journals.sagepub.com/home/prq Article Recent technological and methodological innovations offer improved access to information from conflict zones that previously were hidden from view. The ability to collect and analyze event data provides contemporary scholars with opportunities to explore micro-level mech- anisms of repression, mobilization, and strategies of vio- lence (K. Gleditsch, Metternich, and Ruggeri 2014). Yet, we know little about possible bias in the data provided by projects such as the Uppsala Conflict Data Program (UCDP), Armed Conflict Location & Event Data Project (ACLED), or the Political Instability Task Force Worldwide Atrocities Dataset. In contrast to the extensive literature on bias in newspaper-sourced data (Earl et al. 2004; Fleeson 2003; Franzosi 1987; Galtung and Ruge 1965; Snyder and Kelly 1977; Woolley 2000), there have been few efforts to explore the quality of “Big Data” in the Internet age (notable exceptions include Price and Ball 2014; Weidmann 2015, 2016). In this paper, we investigate whether access to com- munication technology can account for spatial variation with regard to the quality in conflict data. Drawing on the media studies literature (Domingo and Paterson 2011; Fenton 2010), we expect journalists who directly can be in contact with primary sources through Internet and mobile phones will be able to provide more detailed reports about political violence. Considering that details are essential for data collection projects to identify perpetrators, severity, and targets for political violence (Kreutz 2015b), we contend that even a marginal improve- ment in quality may substantially influence information used in much contemporary conflict scholarship. In par- ticular, our study may be important for the growing inter- est in whether modern communication technology assists organized crime, terrorism, or insurgency (Andreas 2002; Pierskalla and Hollenbach 2013; Shapiro and Weidmann 2015; Weimann 2006). If, as we expect, information about violence is better reported in areas with developed com- munication structures, then we cannot know whether tech- nological advancement actually does increase violence or if such correlations are spurious. Empirically, we focus on the quality of reporting political violence in Africa from 2008 to 2010. There are three reasons for this. First, Africa is the region that, together with Asia, has experienced the most armed conflicts in the post–Cold War era. 1 Second, Africa is becoming known as “the mobile continent” due to 670272PRQ XX X 10.1177/1065912916670272Political Research QuarterlyCroicu and Kreutz research-article 2016 1 Uppsala University, Sweden 2 Stockholm University, Sweden Corresponding Author: Joakim Kreutz, Department of Political Science, Stockholm University, Stockholm, Sweden. Email: [email protected] Communication Technology and Reports on Political Violence: Cross-National Evidence Using African Events Data Mihai Croicu 1 and Joakim Kreutz 2 Abstract The spread of Internet and mobile phone access around the world has implications for both the processes of contentious politics and subsequent reporting of protest, terrorism, and war. In this paper, we explore whether political violent events that occur close to modern communication networks are systematically better reported than others. Our analysis approximates information availability by the level of detail provided about the date of each political violent event in Africa from 2008 to 2010 and finds that although access to communication technology improves reporting, the size of the effect is very small. Additional investigation finds that the effect can be attributed to the ability of journalists to access more diverse primary sources in remote areas due to increased local access to modern communication technology. Keywords communication technology, conflict event data, media bias, civil war, spatial analysis, data quality
-
Upload
khangminh22 -
Category
Documents
-
view
4 -
download
0
Transcript of Communication Technology and Reports on Political Violence

Political Research Quarterly2017 Vol 70(1) 19 ndash31copy 2016 University of UtahReprints and permissions sagepubcomjournalsPermissionsnavDOI 1011771065912916670272journalssagepubcomhomeprq
Article
Recent technological and methodological innovations offer improved access to information from conflict zones that previously were hidden from view The ability to collect and analyze event data provides contemporary scholars with opportunities to explore micro-level mech-anisms of repression mobilization and strategies of vio-lence (K Gleditsch Metternich and Ruggeri 2014)
Yet we know little about possible bias in the data provided by projects such as the Uppsala Conflict Data Program (UCDP) Armed Conflict Location amp Event Data Project (ACLED) or the Political Instability Task Force Worldwide Atrocities Dataset In contrast to the extensive literature on bias in newspaper-sourced data (Earl et al 2004 Fleeson 2003 Franzosi 1987 Galtung and Ruge 1965 Snyder and Kelly 1977 Woolley 2000) there have been few efforts to explore the quality of ldquoBig Datardquo in the Internet age (notable exceptions include Price and Ball 2014 Weidmann 2015 2016)
In this paper we investigate whether access to com-munication technology can account for spatial variation with regard to the quality in conflict data Drawing on the media studies literature (Domingo and Paterson 2011 Fenton 2010) we expect journalists who directly can be in contact with primary sources through Internet and mobile phones will be able to provide more detailed reports about political violence Considering that details are essential for data collection projects to identify
perpetrators severity and targets for political violence (Kreutz 2015b) we contend that even a marginal improve-ment in quality may substantially influence information used in much contemporary conflict scholarship In par-ticular our study may be important for the growing inter-est in whether modern communication technology assists organized crime terrorism or insurgency (Andreas 2002 Pierskalla and Hollenbach 2013 Shapiro and Weidmann 2015 Weimann 2006) If as we expect information about violence is better reported in areas with developed com-munication structures then we cannot know whether tech-nological advancement actually does increase violence or if such correlations are spurious
Empirically we focus on the quality of reporting political violence in Africa from 2008 to 2010 There are three reasons for this First Africa is the region that together with Asia has experienced the most armed conflicts in the postndashCold War era1 Second Africa is becoming known as ldquothe mobile continentrdquo due to
670272 PRQXXX1011771065912916670272Political Research QuarterlyCroicu and Kreutzresearch-article2016
1Uppsala University Sweden2Stockholm University Sweden
Corresponding AuthorJoakim Kreutz Department of Political Science Stockholm University Stockholm SwedenEmail Joakimkreutzstatsvetsuse
Communication Technology and Reports on Political Violence Cross-National Evidence Using African Events Data
Mihai Croicu1 and Joakim Kreutz2
AbstractThe spread of Internet and mobile phone access around the world has implications for both the processes of contentious politics and subsequent reporting of protest terrorism and war In this paper we explore whether political violent events that occur close to modern communication networks are systematically better reported than others Our analysis approximates information availability by the level of detail provided about the date of each political violent event in Africa from 2008 to 2010 and finds that although access to communication technology improves reporting the size of the effect is very small Additional investigation finds that the effect can be attributed to the ability of journalists to access more diverse primary sources in remote areas due to increased local access to modern communication technology
Keywordscommunication technology conflict event data media bias civil war spatial analysis data quality
20 Political Research Quarterly 70(1)
its embrace of digital media over (previously under-developed) infrastructure suggesting that communication technology may be particularly important in this region (Hersman 2013) Third most published research on spa-tial variation in armed conflict is focusing on Africa as the early version of UCDP Georeferenced Conflict Event Data (UCDP-GED Sundberg and Melander 2013) and projects such as ACLED (Raleigh et al 2010) and Social Conflict in Africa Database (SCAD Salehyan et al 2012) primarily provide data from this continent
This paper differs from earlier work on event data quality as we are neither comparing information from different datasets (Eck 2012 Restrepo Spagat and Vargas 2006) nor data collected with competing method-ologies (Davenport and Ball 2002 Price and Ball 2014 Weidmann 2015) Instead we use the precision scores assigned to each event in the UCDP-GED (Sundberg and Melander 2013) which indicate the level of detail of available information This measure is not produced following some estimation technique but represents the specific information in the coded material about when and where an event occurs We focus on the temporal precision approximating that events with information about the specific date are better reported than those reported as only within a given week month or year
The next section outlines how new communication technology should facilitate more detailed reporting on political violence events before we describe our research design Following an analysis of 2369 events in Africa from 2008 to 2010 we find a statistically significant and robust correlation between reporting quality and access to communication technology although the size of the effect is relatively small We then extend the analysis by explor-ing the original sources that offer information about polit-ical violence and find that contemporary reporting is less dependent on official statements and instead relies upon eyewitness accounts more than in the pre-Internet era The final section concludes and discusses the implica-tions of these findings for future scholarship
Spatial Bias in Political Violence Data
Existing research on reporting contentious politics has identified two sources of bias The first which is the focus for this article relates to the ability of media to access information about a given event while the second relates to the deliberate-strategic selection of which events are reported and how these are described (Earl et al 2004 Galtung and Ruge 1965) The spatial location may influence both the ability and the willingness to report about a particular event
Most of the information provided by international media from conflict zones is collected by news bureaus with limited resources This means that events that occur closer to major political centers are likely to receive more
coverage simply because reporters have better access to witnesses which should improve reporting both in terms of output and quality (Fleeson 2003 Weidmann 2015) This differs from
distant sources who are less able to navigate the local terrain (physically but also politically and socially) Outsiders are less able to identify events less able to understand who the combatants are and less able to know where the best informants can be found Distant sources may find themselves relying on the ones most readily available but farthest from the events of interest (Davenport 2010 70)
It has also been argued that access to information should be influenced by government censorship and other restrictions on free movement although existing empirical evidence about this factor has so far been inconclusive On one hand studies show that terrorism is probably underreported in countries with limited press freedom (Drakos and Gofas 2006) and threats and vio-lence on journalists reduced the coverage of human rights abuses in Guatemala (Davenport and Ball 2002) On the other hand other findings indicate that dangerous security environments in general do not reduce news coverage (Urlacher 2009) and media in both Mexico and Uganda have refused to bow to government intimi-dation (Lawson 2002 Ocitti 2005)
The final factor that determines media content is deci-sions by news editors about what the audience is likely to be interested in This is partly influenced by the nature of the story where violent and unexpected developments usually are preferred but also by the location of the event The threshold for what is considered newsworthy increases with distance meaning that minor protests close to the publication outlet may be given as much attention as exceptionally dramatic events far away (Myers and Caniglia 2004 Smith et al 2001)
New Technology Brings New News Reporting
Communication scholars have suggested that the devel-opment of modern communication technology has funda-mentally changed the nature of news media (Severin and Tankard 2010) What is important to remember though is that the ldquonews mediardquo are not a unified and coherent entity with consistent output across time and space but a diverse set of actors and practices sensitive to competi-tion and technological change (Fleeson 2003 Mitchelstein and Boczkowski 2009 Pavlik 2000) As in any competi-tive market one of the most influential instigators of change is innovations that facilitate high-quality news gathering at a lower cost such as the introduction of new communication technology This influences both the means of news gathering (the input of information) and the means of publishing (the output) Therefore as shown
Croicu and Kreutz 21
in Figure 1 it is not surprising that the amount of reports of violence does not perfectly correlate with the actual fluctuations of violent events
Journalistic practices have undergone a substantial shift following the development of Internet and mobile phone networks Using modern communication technol-ogy reporters can now faster and easier gather informa-tion through direct contact with witnesses rather than having to physically travel to the location of the event after-the-fact Although this has influenced journalists everywhere the impact of new technologies on reporting has been particularly profound in areas where access to information previously was restricted and difficult such as in states characterized by lower economic devel-opment where also political violence is more likely Anecdotal evidence from Zambia and South Africa sug-gest that Internet access provides ordinary people with new channels to improve communication with centers of power including the mainstream media (Goldfain and Van der Merwe 2006 Spitulnik 2002)
New technology also offer journalists access to new sources of information as outlets such as Twitter YouTube wikis and blogs provide opportunities for sources to anonymously provide documentation about events This approach has for example been extensively used by civilians reporting atrocities by criminal gangs and government agents in Mexico in recent years (Kirchner 2014)
Increasing globalization and the spread of the Internet has not only influenced the ways that reporters collect information it has also had a substantial impact on the process of publishing The previous practice where stories were sold to and published by set-format media (newspa-pers radio and television) has been superseded in the era of Internet publishing by outlets without space constraints (Domingo and Paterson 2011) This has removed one of the most influential sources for systematic bias on whether political violence is reported as the role of the news editor as a ldquogatekeeperrdquo has been reduced (Schudson 1989)
Indeed news agencies in the Internet age are no longer forced to exclude reports but on the contrary encouraged to provide more output In the contemporary news cycle news bureaus compete about being the first to offer ldquobreaking storiesrdquo and journalists are expected to provide multiple versions of the same story where the updates add details when these become available This has led to an increased use of the Internet for information gathering from for example tweets blogs and social media as this may provide more unique details than official press conferences (Farhi 2009)
We contend that the combined effect of all these different effects from the development of new commu-nication technology has created variation in the quality of information available about political violence events Reporting will be substantively better in areas where
journalists easily can seek out information through Internet and mobile phone networks
Empirical Investigation
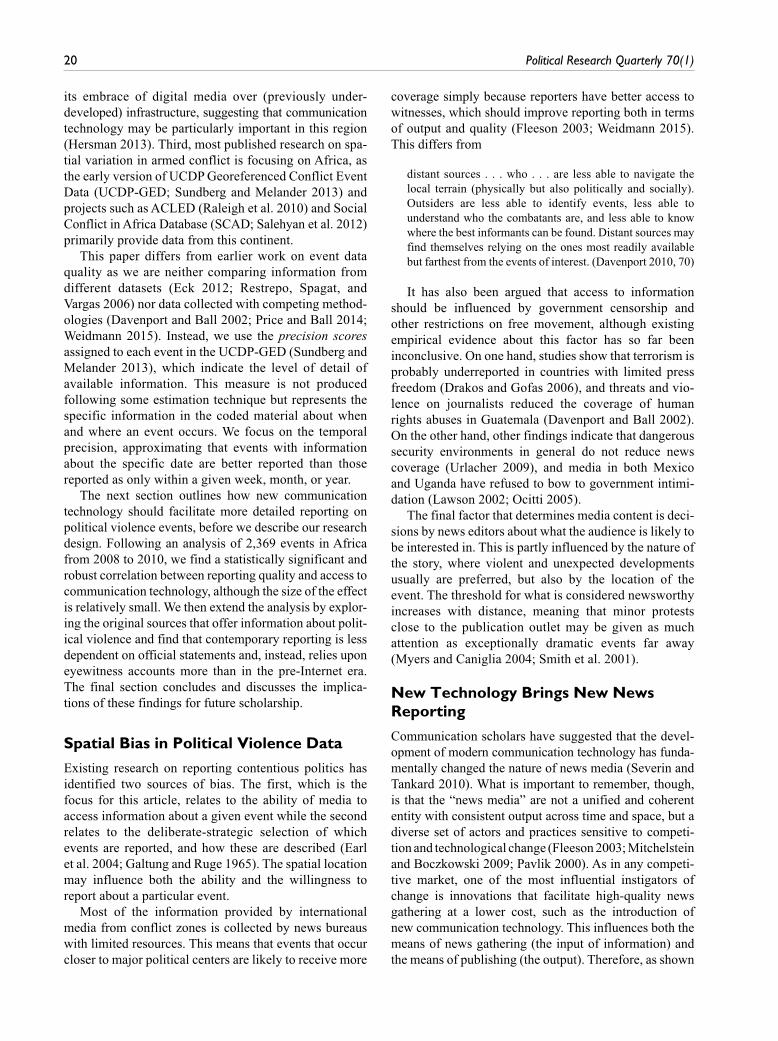
Figure 2 visualizes the data we employ for our empirical analysis It is worth noting that the use of modern com-munication technology in Africa is rarely limited by individualrsquos ownership of computers or mobile phones In addition to commercial options for getting online studies have shown that mobile phones and computers often are shared among members in the local community (Atton and Mabweazara 2011)
In this paper we use information from events of all different types of violence covered by UCDP-GED (Sundberg and Melander 2013) This means that we are exploring the reporting of events regardless of whether these constitute part of an armed conflict between states andor rebels (N P Gleditsch et al 2002) non-state conflict (including communal violence Sundberg Eck and Kreutz 2012) or one-sided violence against civilians (Eck and Hultman 2007)2 As we are interested in the spatial variation in reporting quality we need to focus on events for which the location is confidently reported Thus our analysis is restricted to the observations where we know that the report contains sufficient information to locate the event confidently at an exact townvillage or within a 25 km radius from the exact location
Figure 1 Newswire articles on political violence in Africa (1989ndash2010) compared with total number of UCDP-GED eventsThe 1999 increase in number of articles is partly due to the inclusion of AFP reporting for Africa in Factiva UCDP = Uppsala Conflict Data Program GED = Georeferenced Conflict Event Data AFP = Agence France Presse
22 Political Research Quarterly 70(1)
Dependent Variable
The dependent variable for our analysis consists of a previously underused facet of the UCDP-GED namely the precision score given to the quality of information provided about each event The coding of this score is straightforward and directly based on the actual infor-mation provided in the news material Table 1 summa-rizes the criteria for coding precision scores (Sundberg Lindgren and Padskocimaite 2011)
For our analysis we recode the summary temporal precision score as 6 giving us a scale with 1 as the most detailed information and 6 as the least specific The information behind these scores comes from the follow-ing process Every year UCDP extract and collect infor-mation from a large amount of news media content including (for Africa) outlets such as Africa Confidential and the African Research Bulletin as well as reports from international and national nongovernmental organi-zations (NGOs) and other sources However many NGO investigations use the work of locally based journalists For example the sources used for the annual human rights reports by the US State Department and Amnesty International are composed of a combination of stories reported in local media and onsite investigations (Kreutz 2015a)
For each political violent event coded into the UCDP-GED dataset coders assign precision scores that reflect on the level of detail in the reports about where (where precision) and when (date precision) the event occurred If there are multiple reports about the same event UCDP always uses the most detailed and disaggregated infor-mation meaning that ldquopoorrdquo confidence scores should only be assigned for events where detailed reports are lacking
Thus our dependent variable is the confidence score for the temporal precision of the event We consider reports on when an event occurred to constitute a cross-national comparable ldquohard factrdquo that we do not expect to be sensitive to political or editorial pressures that other-wise may influence the narrative of an event (Davenport 2010) Figure 3 shows the correlation matrix between spatial and temporal precision in our data indicating substantial variation for the dependent variable in our sample
Independent Variable Internet Access
Internet access is determined by the local geography and the distance between an eyewitness and the nearest Internet node For this we use the Maxmind GeoIP database (the version released on December 1 2010) which constitutes a global dataset assigning geographi-cal information to every known Internet Protocol (IPv4) address in use3 These data are typically used by web-related industries for customizing or restricting content and advertising in various geographic areas
The spatial resolution of the data is the city while the best data point coarseness claimed is the individual IP address Independent studies of the accuracy of
Table 1 UCDP Precision Scores
Temporal information
0 Summary event1 Exact day of the event known2 Event can be located within a 2ndash6 day period3 Event can be located within a given week4 Event can be located within a given month5 Event can be located within a given year
Spatial information
1 Exact location of the event is known2 Event occurred within a ca 25 km radius around a known point3 Event occurred in a given second order administrative division4 Event occurred in a given first order administrative division5 Spatial reference for the event is a linearpolygon reference point6 Event occurred within a given country7 Event occurred in international water or airspace
UCDP = Uppsala Conflict Data Program
Figure 2 Map showing Internet access UCDP-GED data and road distancesUCDP = Uppsala Conflict Data Program GED = Georeferenced Conflict Event Data
Croicu and Kreutz 23
IP geolocation databases has indicated a 40 percent to 60 percent accuracy rate in matching individual locations with an area (11 matching) within 100 km from the actual location of the assigned IP address In Africa Maxmind claims an accuracy of between 38 percent and 89 percent for 11 matching (MaxMind 2013 Poese et al 2011 Shavitt and Zilberman 2011) We do not consider this seemingly low reliability a major concern because of the extremely demanding requirements of such tests which are modeled on the typical commercial usage that is the ability to precisely identify the exact location of a random individual IP address As we are interested in the Internet point-of-presence (ie the location of Internet access) which is a much coarser measure (approximately 4 orders of magnitude) than the individual IP address we assume that aggregation mitigates most identified 11 errors4
Calculating Distances
To link the location of a political violence event with Internet access we measure the distance between event and Internet nodes in two ways The first is the great circle distance (geodesic distance) calculated using PostGis 201 on the WGS84 spheroid and expressed in kilometers (ie the shortest possible straight-line route between event and Internet access point) while the sec-ond is the shortest possible road distance between event and the closest Internet node5 The two measures differ substantially with different closest points of Internet access for more than 20 percent of events in our sample (483 out of 2369)
To calculate road distances we use gRoads dataset version 1 (CIESIN-ITOS-NASA SEDAC 2013) an open-source global road-network dataset Distances between events and Internet nodes are calculated with Dijkstrarsquos algorithm using pgRouting 20 (pgRouting Project 2013) with a tolerance level of 001 decimal degrees (approxi-mately 08ndash12 km depending on latitude and longitude) This tolerance level is on the same magnitude as twice the stated standard error of the gRoads dataset (ie at least 2 times 300 m) to avoid misspecification due to potential gRoads coding errors6 For points not located on a road the nearest road was used as a starting point and the dis-tance to that road added to the calculation Furthermore distances were not calculated for events located more than 50 km away from any road (excluding less than 5 of total events)
The gRoads data also provide information on the quality of the individual roads which is useful for our purpose to measure individualsrsquo access to the Internet We impose a penalty on roads classified as ldquotrailsrdquo where we expect traveling speed to be ten times slower than on proper even poor-quality roads7 As distance calculations on a dataset as large as gRoads are com-putationally intensive we identified potential closest nodes candidates through a sliding window approach with an expanding sub-setting buffer around each data point The buffer grew by a radius of 1 decimal degree at a time stopping when five suitable Internet nodes (to which distances could be calculated) were identified For analysis purposes the decimal logarithm was taken from all distances as we expect the effect follows a logarithmic function rather than a linear one
Statistical Technique
We model the relationship between the distance to Internet access and quality of information about political violence events as a proportional odds ordinal logistic regression (Fullerton 2009 Long and Cheng 2004) The probability of the temporal precision confidence score being a value m with 1 le m le 6 is estimated as follows
Pr y m x
cdf x m
cdf m x
cdf
logistic
logistic
logi=( ) =
minus( ) =
minus( ) minus|
τ β
τ β
1 1
sstic
logistic
m x m
cdf m x m
τ β
τ β
minus minus( ) lt lt
minus minus minus( ) =
1 1 6
1 1 6
where x is the covariate vector β is the associated coefficient vector for the covariates τ is the unknown cutoff point between precision scores and cdflogistic is the cumulative logistic density function (Fullerton 2009 Long and Cheng 2004) As we assume a single process determining the probabilities the coefficient vector does
Figure 3 Proportions of eventsrsquo spatial and temporal precision
24 Political Research Quarterly 70(1)
not vary across the six equations producing proportional slopes (Fullerton 2009)
As we only have one data point for Internet access locations we subset the UCDP-GED to only include data for the 2008ndash2010 period treating it as fully cross-sectional data8
Control Variables
A consistent finding in existing literature on media selection bias is that more violent events are given more attention (Price and Ball 2014) We therefore include a variable indicating the total annual intensity of the specific armed conflict non-state conflict one-sided vio-lence interaction (or dyad) which the event belongs to as well as the fatality estimate for the specific event We are also interested in whether Internet access overlaps with other forms of modern communication technology including mobile phones which feature more promi-nently in existing research (Dafoe and Lyall 2015)9 The data on mobile phone coverage are obtained from a high-quality print map produced by the GSM Association and Europa Technologies in January 2009 (GSM Association and Europa Technologies 2009) extracted through both geographic information systems (GIS) specific digitiza-tion and vectorization techniques (zones of coverage and lack of coverage) as well as a support vector machine-based algorithm The support vector machine was used for categorization of pixels in buckets corresponding to coverage and lack of coverage10
Our dependent variable temporal precision scores exhibits a small degree of geographic auto-correlation with a clustering tendency (Moranrsquos I of 054)11 motivating the inclusion of a simple spatiotemporal lagged term consisting of the number of previously reported fatalities from events in the past seven days within a 25 km radius12 To control for local economic development we include information on local gross domestic product (regional GDP Nordhaus 2006) col-lected on a 1 times 1 degree cell (extracted from PrioGrid v101 Tollefsen Strand and Buhaug 2012) We also control for country-level media censorship using the annual Freedom House (FH 2012) freedom of the press score Finally to control for the possibility that commu-nication technology simply is a proxy for urban areas we measure geographic features in two ways The first is the distance in minutes to the nearest location with 50000 inhabitants or more using data provided by the European Commission (Nelson 2008) and the second is the proportion of mountainous terrain in a 05 times 05 degree cell where the political violence occurred (Tollefsen Strand and Buhaug 2012) Not surprisingly we find a strong negative correlation between urbanization and mountainous terrain so to
avoid multicollinearity we include these variables in different estimations13
Results
Our expectation is that better access to communication technology correlates with more detailed reports of polit-ical violence The dependent variable in all models in Table 2 is the quality in reporting the temporal location of an event with 1 being the best and 6 being the worst The explanatory variable (distance to closest Internet node) is measured as road distance in Models 1 to 5 and as geodesic distance in Models 6 to 10
Across all models we find that the quality of informa-tion that is the precision about events decreases with distance from Internet nodes in line with our expecta-tions Results are similar regardless of how we calculate distance and consistently statistically significant on at least 95 percent confidence interval (CI) One benefit of the ordered logit is the possibility to interpret information about whether the correlation is statistically significant only in some part of the scale (ie potentially the best or worst reported events) We find however that the dis-tance to Internet node is statistically significant for each single step Our findings are robust when controlling for the severity of violence both measured on a yearly basis and for the specific event the local level of preceding violence urbanization mountainous terrain local eco-nomic development and press freedom
In Models 4 and 9 we include the dichotomous mea-sure of mobile phone coverage and find that the Internet distance remains statistically significant However a sep-arate regression (see the appendix at httpprqsagepubcomsupplemental) where we replace Internet informa-tion with mobile phone coverage also correlates with better reporting suggesting that our finding indeed shows the effect of the communication process rather than the particular means used
While our study identifies a robust statistically sig-nificant correlation the size of the effect is relatively small To estimate the size of the effect we build on Model 4 in Table 1 and run 1000 simulations for each 01 increase of logged road distance between 10 (10 km the cutoff point in the data) and 32 (approx 1585 km close to the maximum observed value in the data) giving us a total of 32000 simulations14 The dyad severity is set to low (the most common observation type) with all other values in the model held at their observed means15
Figure 4 shows the simulated predicted probabilities of obtaining the best (single- day specified) and worst (summary event) precision confidence scores as a func-tion of road distance to the closest Internet node The blue (top) lines indicate the predicted probability that a given event is coded with the best temporal confidence while
Croicu and Kreutz 25
the red lines show the predicted probability of the event given the least detailed precision The reason that the pre-dicted probability is much higher for getting the ldquobestrdquo precision is because our data consist of already coded and scrutinized events rather than all news articles This means that our findings should be interpreted in light of
the knowledge that even the ldquoworstrdquo reported data are still reports deemed sufficiently reliable to be coded into UCDP-GED
For events that occur at 10 road km from an Internet node the predicted probability that reports identify the day of the event (highest precision) is 774 (CI = [0735 0811]) However for events 100 road km away from an Internet node the predicted probability of such detail reporting decreases to 727 (CI = [0699 0753]) For events with the least precision we identify the opposite trend as distance increases from the Internet nodes The predicted probability of an event being reported in a summary (lowest possible precision) is 059 (CI = [0029 0099]) close to Internet nodes but increases to 74 (CI = [0041 0111]) at 100 km distance16
Turning to the control variables some findings war-rant discussion First there hasmdashto our knowledgemdashnot before been any systematic studies whether violence in more urban areas actually is better reported than in the countryside There are claims of a consistent ldquourban biasrdquo in identifying instances of political violence (Kalyvas 2004) although it has also been pointed out that insurgent activity in cities may be difficult to parse out from sur-rounding noise (Staniland 2010) Our study covers more forms of political violence than civil strife but the find-ings in Table 2 provide mixed support regarding the effect of urbanization Violence closer to major cities is reported with lower precision but this is not consistently statisti-cally significant
Table 2 Quality of Reporting and Internet Access
DV Temporal precision
Model
(1) (2) (3) (4) (5) (6) (7) (8) (9) (10)
Internet node (road) 0293 (0082)
0255 (0085)
0430 (0113)
0427 (0113)
0281 (0089)
Internet node (geodesic) 0246 (0088)
0210 (0091)
0343 (0120)
0344 (0120)
0246 (0095)
Dyad severity (total) 0460 (0111)
0475 (0113)
0471 (0116)
0453 (0117)
0426 (0117)
0490 (0111)
0501 (0113)
0495 (0116)
0474 (0117)
0443 (0117)
Event severity 0019 (0002)
0018 (0002)
0018 (0002)
0019 (0002)
0019 (0002)
0019 (0002)
0019 (0002)
0019 (0002)
Mobile phone coverage 0155 (0127)
0164 (0127)
Severity prior week 0002 (0002)
0001 (0002)
0002 (0002)
0002 (0002)
0001 (0002)
0001 (0002)
0001 (0002)
0002 (0002)
Local GDP minus0043 (0073)
minus0045 (0073)
0040 (0071)
minus0047 (0073)
minus0050 (0073)
0031 (0071)
Press censorship 0003 (0006)
0000 (0006)
minus0003 (0006)
0004 (0006)
0001 (0006)
minus0002 (0006)
Distance to city minus0001 (0000)
minus0001 (0000)
minus0001 (0000)
minus0001 (0000)
Mountains 0640 (0158)
0649 (0159)
Observations 2118 2118 2111 2111 2111 2118 2118 2111 2111 2111
DV = dependent variable GDP = gross domestic product Output from ordinal logistic regression with standard errors in paranthesisp lt 1 p lt 05 p lt 01
Figure 4 Predicted probabilities based on road distance
26 Political Research Quarterly 70(1)
The second notable finding is with regard to severity of violence and reporting quality a factor regularly argued as making events more newsworthy and hence better reported (Galtung and Ruge 1965 Price and Ball 2014) In both of our tables however we find the oppo-site relationshipmdashthe precision of reporting decreases for more violent events as well as for conflicts where the overall interaction is more violent We suspect that this may be caused by our focus solely on lethal violence in contrast with much of the literature on newsworthiness that focuses on the size of protests (Earl et al 2004 Herkenrath and Knoll 2011 Oliver and Myers 1999 Smith et al 2001)
Is Communication Technology the Reason
Our statistical analysis finds a small but statistically sig-nificant spatial variation regarding the quality of report-ing of political violence and that this correlates with distance to Internet access To explore whether this vari-ation can be explained by the suggested mechanism of better information provision through modern communi-cation technology we now take a closer qualitative look at the sources attributed to in the actual reports
We revisited the background text of the UCDP-GED events and coded the collected information about original sources To systematize these data we group the sources into four broad categories First we refer to ldquoofficial sourcesrdquo when the original source was the government (eg military spokesperson police minis-ter local administration etc) or a dissident organization (eg rebel group or a media outlet controlled by a rebel group) second ldquojournalistsrdquo are reporters with unclear neutral or unknown allegiance (eg a national private television or radio station a Reuters correspondent etc) third ldquootherrdquo sources include international organi-zations NGOs or foreign governments and finally ldquoeyewitnessesrdquo (eg a local bystander)
We basically expect a greater risk of political bias when media reports are based on ldquoofficial sourcesrdquo while
the use of ldquoeyewitnessesrdquo should improve the quality of reporting To see if there has been a change over time that can be attributed to improved communication technol-ogy we combine this information from 2008 to 2010 with UCDP-GED events from 1992ndash1993 In this period access to the World Wide Web was basically nonexistent in Africa (or for that matter in most of the world) An additional advantage for our purposes is that the event data covering 1992ndash1993 were collected by UCDP-GED during 2008ndash2010 meaning the use of the same human coders definitions sources and methodology which means that inter-coder reliability issues are unlikely to affect the comparison
Figure 5 shows the distribution of original sources for reports on political violence in 1993ndash1994 and 2008ndash2010 In the earlier period the vast majority of events (679) were reported by ldquoofficial sourcesrdquo directly linked to the belligerent parties This contrasts with the paucity of information collected from eyewit-nesses or locals which only contributes to 164 percent of reports In the post-Internet time period we find a telling difference In 2008ndash2010 the number of reports originat-ing with eyewitnesses is almost equal to that originating from official sources (414 vs 417) This finding is consistent with a common claim with regard to the spread of communication technology across Africa that it will offer opportunities for a wider range of citizens to pro-vide information about local conditions (Aker and Mbiti 2010 Mudhai Tettey and Banda 2009 Ocitti 2005 Spitulnik 2002) We find a similar trend toward more detailed reporting over time in the UCDP-GED dataset overall as an increasing proportion of events are coded with higher precision scores In 1989 only 574 percent of events are attributed to an individual day while this was possible for 7514 percent events in 201017
If the spread of communication technology over time leads to data improvements then we should expect a sim-ilar variation with regard to different types of original sources and data quality also within the modern data We find this is the case The data points situated near Internet nodes are almost exclusively reported using two types of
Figure 5 Original sources for reporting in the 1992ndash1993 sample and the 2008ndash2010 sample
Croicu and Kreutz 27
primary sources The first is extremely brief official notes and communiqueacutes from actors involved in the vio-lence such as for example the military the police or rebel groups The second though consists of more detailed highly descriptive narratives that provide in-depth insights regarding the actions by different actors and the temporal ordering of the violence Much of this latter type of information (more than 50 in areas under 150 km) is reported by sources identified as residents protest participants interviewees local journalists writ-ing opinion pieces local community leaders anonymous officials interviewed directly by the media and even blogs that is informal mostly independent organiza-tions and individuals
As distance increases from Internet nodes these types of in-depth narratives about specific events become less common and the original sources for information are almost exclusively spokespersons of warring organiza-tions official communiqueacutes police and army officials and so on that is actors directly involved in violence When local narratives disappear these ldquoofficialrdquo versions dominate available information As a consequence of this lack of information from local sources the quality of information decreases including the ability to code such ldquohard factsrdquo as the day of a given event
Conclusion
Our study shows that there is variation in how well polit-ical violence is reported across space Events that occur in areas where journalists with ease can receive informa-tion are better reported than events in the periphery As modern communication technology has spread across the world reporters are now able to easily access information directly from eyewitnesses and locals rather than rely solely on governmental press briefings This means that media now provide richer more detailed narratives of events that offer a better understanding of the processes of political violence
What implications do our findings have for interpreting existing scholarship or the design of new research proj-ects First the heterogeneous nature of political violence data should be taken under serious consideration for anal-yses of event data with a long time span as the quality of information is markedly different in the ldquobefore Internetrdquo and ldquoafter (with) Internetrdquo time periods We therefore advise researchers to proceed with caution when using longitudinal samples of event data and to always account for temporal dependency in analyses Our findings also suggest that studies exploring whether Internet connec-tions or mobile phone networks facilitate violence need to acknowledge the possibility of selection bias
Second our investigation also provides some good news for the emerging field of cross-national micro-level
studies of political violence and particularly for users of the UCDP data collection effort The small effect size between reports where information is readily available and where it is not suggests that findings from inter- spatial (panel) studies using contemporary data generally should not be overly influenced by reporting bias Considering that many studies aggregate violent events into district or grid-cell structures to merge with explana-tory variables a take-away from this exercise is in line with the recommendation of Weidmann (2015) that these data can be trusted as accurate at district level or within a 50 times 50 km radius
Third our study provides support for the claim that news media over time have improved in their capacity of capturing political violence This may be relevant for the debate on a global decline of conflict and other forms of political violence Our findings suggest that contemporary news datamdashat least in the last decademdashcapture sufficient information about minor instances of violence which means that we can be relatively confi-dent that conflict data sources are providing a good overview of current instances of global armed conflict For earlier years even just a few decades ago then information is more uncertain and it is likely that even more cases of low-level conflict may be missing as we move farther back in time (Kreutz 2015b)
The fourth and more worrying implication of our findings is that we find that the quality of information declines in more violent conflicts A possible reason for this is that in excessively violent settings there are too many events to report leaving less time to investigate the details of the violence It could also be that the high risk of reporting and the destruction of infrastructure in such situ-ations means that fewer reporters are in a position to even seek information Case studies have alluded to this includ-ing that news reports are particularly poor when violence escalates quickly (Davenport and Ball 2002 Restrepo Spagat and Vargas 2006) and influenced by which actor controls a certain territory (Price and Ball 2014) The current conflict in Syria has drawn attention to the impor-tant role of reporting for scholarsrsquo access to conflict data (Powers and OrsquoLoughlin 2015) and we hope that our findings can inspire further advances in this research field
Fifth and finally this paper has added to what is start-ing to become compelling evidence in favor of treating data quality as equally important to theory and methodol-ogy in contemporary scholarship This includes a contin-ued attention toward identifying bias in the data employed for analysis both through case-specific inquires and in cross-national settings We think it is of particular impor-tance that such studies explore countries more at risk for conflict as well as censorship and poor working condi-tions for journalists rather than only the United States or Western Europe
28 Political Research Quarterly 70(1)
Acknowledgment
The authors would like to thank Nils Weidmann Suso Baleato Mike Spagat Erik Melander and the Uppsala Conflict Data Program Han Dorussen and participants of the ENCoRe work-shop in Konstanz 2013 editors and anonymous reviewers for helpful comments and suggestions
Declaration of Conflicting Interests
The author(s) declared no potential conflicts of interest with respect to the research authorship andor publication of this article
Funding
The author(s) disclosed receipt of the following financial support for the research authorship andor publication of this article Joakim Kreutz is grateful for support from the Swedish Institute of International Affairs
Notes
1 In 1990ndash2013 there were 372 conflict-years in Asia 308 in Africa 115 in the Middle East 67 in the Americas and 62 in Europe (Themneacuter and Wallensteen 2014)
2 We include events from conflicts below the aggregate twenty-five deathsyear threshold and ldquounclearrdquo armed conflicts where the incompatibility criteria are loosened (see Kreutz 2015b for the benefits of this)
3 Maxmind accounts for 3525991153 individual Internet Protocol (IPv4) addresses out of a maximum possible number of 3706452992 (Internet Assigned Numbers Authority [IANA] 2013 Internet Corporation for Assigned Names and Numbers [ICANN] 2011) A more in-depth discussion of the Maxmind dataset is presented in the appendix at httpprqsagepubcomsupplemental
4 For robustness tests we retain the number of identified Internet hosts in a single location as a measure of Internet pervasiveness Another concern is the unknown prob-ability that the dataset fails to identify Internet points-of-presence altogether (ie not assigning even one location to such points) While this cannot be determined due to lack of ldquoreal worldrdquo data outside extremely small survey-based samples in the developed world we estimate this probability as extremely small as the active detection techniques employed for gathering the data have a failure function that is inversely proportional with the density of active Internet connections (Poese et al 2011 Shavitt and Zilberman 2011) and Africa (the area under study) has by far the lowest Internet penetration figures in the world (Kim 2010)
5 International borders are not taken into consideration given the porous nature of and significant interaction across national boundaries in Africa
6 Given a stated error of 300 m two roads intersecting in real life may be displayed in the dataset at most 600 m apart Furthermore contiguous segments of road in real life may not be displayed as contiguous in the dataset especially at ldquobreaking pointsrdquo for data sources such as borders
7 The 10times penalty relationship approximates a general walk-ing speed for humans at around 5 to 6 kmh while a car would on average travel at 50 to 60 kmh on a non-tarmac road Our findings are robust for using the road data with-out this surface quality specification
8 Our findings are robust for the use of only 2010 Uppsala Conflict Data Program Georeferenced Conflict Event UCDP-GED Data Furthermore Maxmind data have little temporal variation Comparing the Maxmind data version we use with the version released on September 10 2013 (almost three years later) indicates less than 0975 percent change in locations coded
9 For individuals to access the Internet with mobile phones they must obviously be close to an Internet access point
10 The model was trained on both the pixel itself and neigh-boring pixels and both the unprocessed map and the pro-cessed data are available with our replication material
11 Moranrsquos I indicates the level of global spatial dependency of a variable that is the tendency of values of a point to be correlated with values situated nearby Moranrsquos I can take values on a scale of minus1 to +1 with 0 indicating no spatial correlation (random disposition) and plusmn1 indicating perfect negative respectively positive correlation (Tiefelsdorf 2006)
12 We choose 25 km based on the UCDP definitions for precision scores but our results are robust for the use of 50 km and thirty days as well as for an alternative specifi-cation consisting of the number of events inside the same spatiotemporal window We also explored the inclusion of a thin plate smoothing spline (Wood 2003 Zhukov 2012) or dynamic spatial ordered models (Wang and Kockelman 2009) However they proved to be difficult to adapt to the event as the unit of analysis rather than to the typical spatial location (ie village area grid-cell administrative unit) as very frequently multiple events with different precision scores share a single location leading to a prob-lem of underfitting the models
13 Our findings are robust for the use of a variable of local (spot) population density see the appendix at httpprqsagepubcomsupplemental
14 Simulations were performed using the Zelig (Imai King and Lau 2008) R package
15 Our findings are robust for excluding ldquosummaryrdquo events from the analysis and regardless of which ldquoprecisionrdquo-step we choose for the post-estimation we find similar results
16 Results are similar for geodesic distances the probabil-ity of a ldquosingle-dayrdquo event based on Model 9 decreases from 763 (confidence interval [CI] = [0721 0800]) at 10 km distance to 723 (CI = [0691 0752]) at 100 km The probability of a summary event increases from 063 (CI = [0030 0105]) to 074 (CI = [0042 0112])
17 For the full trend of the relative distribution in precision scores from 1989 to 2010 see the appendix at httpprqsagepubcomsupplemental
Supplemental Material
Replication data and additional analyses are available at httpsucdpuuse and httpsdataverseharvardedudataversejkreutz
Croicu and Kreutz 29
ReferencesAker Jenny C and Isaac M Mbiti 2010 ldquoMobile Phones
and Economic Development in Africardquo The Journal of Economic Perspectives 24 (3) 207ndash32
Andreas Peter 2002 ldquoTransnational Crime and Economic Globalizationrdquo In Transnational Organized Crime and International Security edited by Mats Berdal and Moacutenica Serrano 37ndash52 London Lynne Rienner
Atton Chris and Hayes Mabweazara 2011 ldquoNew Media and Journalism Practice in Africa An Agenda for Researchrdquo Journalism 12 (6) 667ndash73
Center for International Earth Science Information Network (CIESIN) Information Technology Outreach Service at Columbia University (ITOS) NASA Socioeconomic Data and Application Center (SEDAC) 2013 ldquoGlobal Roads Open Access Data Set Version 1 (gROADSv1)rdquo httpsedacciesincolumbiaedudatasetgroads-global-roads-open-access-v1
Dafoe Allan and Jason Lyall 2015 ldquoFrom Cell Phones to Conflict Reflections on the Emerging ICTndashPolitical Conflict Research Agendardquo Journal of Peace Research 52 (3) 401ndash13
Davenport Christian 2010 Media Bias Perspective and State Repression The Black Panther Party New York Cambridge University Press
Davenport Christian and Patrick Ball 2002 ldquoViews to a Kill Exploring the Implications of Source Selection in the Case of Guatemalan State Terror 1977ndash1995rdquo Journal of Conflict Resolution 46 (3) 427ndash50
Domingo David and Chris Paterson 2011 Making Online News Vol 2 Newsroom Ethnographies in the Second Decade of Internet Journalism New York Peter Lang
Drakos Konstantinos and Andreas Gofas 2006 ldquoThe Devil You Know but Are Afraid to Face Underreporting Bias and Its Distorting Effects on the Study of Terrorismrdquo Journal of Conflict Resolution 50 (5) 714ndash35
Earl Jennifer Andrew Martin John D McCarthy and Sarah A Soule 2004 ldquoThe Use of Newspaper Data in the Study of Collective Actionrdquo Annual Review of Sociology 3065ndash80
Eck Kristine 2012 ldquoIn Data We Trust A Comparison of UCDP GED and ACLED Conflict Events Datasetsrdquo Cooperation and Conflict 47 (1) 124ndash41
Eck Kristine and Lisa Hultman 2007 ldquoOne-Sided Violence against Civilians in War Insights from New Fatality Datardquo Journal of Peace Research 44 (2) 233ndash46
Farhi Paul 2009 ldquoThe Twitter Explosionrdquo American Journalism Review 31 (3) 26ndash31
Fenton Natalie 2010 New Media Old News Journalism and Democracy in the Digital Age London SAGE
Fleeson Lucinda 2003 ldquoBureau of Missing Bureausrdquo American Journalism Review 2532ndash40
Franzosi Roberto 1987 ldquoThe Press as a Source of Socio-Historical Data Issues in the Methodology of Data Collection from Newspapersrdquo Historical Methods A Journal of Quantitative and Interdisciplinary History 20 (1) 5ndash16
Freedom House 2012 ldquoFreedom of the Pressrdquo httpsfreedomhouseorgreportfreedom-pressfreedom-press-2012 (accessed September 9 2016)
Fullerton Andrew S 2009 ldquoA Conceptual Framework for Ordered Logistic Regression Modelsrdquo Sociological Methods amp Research 38 (2) 306ndash47
Galtung Johan and Mari Holmboe Ruge 1965 ldquoThe Structure of Foreign News The Presentation of the Congo Cuba and Cyprus Crises in Four Norwegian Newspapersrdquo Journal of Peace Research 2 (1) 64ndash90
Gleditsch Kristian Skrede Nils W Metternich and Andrea Ruggeri 2014 ldquoData and Progress in Peace and Conflict Researchrdquo Journal of Peace Research 51 (2) 301ndash14
Gleditsch Nils Petter Peter Wallensteen Mikael Eriksson Margareta Sollenberg and Haringvard Strand 2002 ldquoArmed Conflict 1946ndash2001 A New Datasetrdquo Journal of Peace Research 39 (5) 615ndash37
Goldfain K and N Van der Merwe 2006 ldquoThe Role of a Political Blog The Case of wwwcommentarycozardquo Communicare Journal for Communication Sciences in Southern AfricaCommunicare Tydskrif vir Kommunikasiewetenskappe in Suider-Afrika 25 (1) 103ndash24
GSM Association and Europa Technologies 2009 ldquoGSM World Coverage 2009rdquo Technical Report Mobile World Congress February 16ndash19 Barcelona Europa Technologies and GSM Association
Herkenrath Mark and Alex Knoll 2011 ldquoProtest Events in International Press Coverage An Empirical Critique of Cross-National Conflict Databasesrdquo International Journal of Comparative Sociology 52 (3) 163ndash80
Hersman Eric 2013 ldquoThe Mobile Continentrdquo Stanford Social Innovation Review 11 (2) 30ndash31
Imai Kosuke Gary King and Olivia Lau 2008 ldquoToward a Common Framework for Statistical Analysis and Developmentrdquo Journal of Computational and Graphical Statistics 17 (4) 892ndash913
Internet Assigned Numbers Authority 2013 ldquoRFC6890 IANA IPv4 Special-Purpose Address Registryrdquo httpstoolsietforghtmlrfc6890 (accessed September 9 2016)
Internet Corporation for Assigned Names and Numbers 2011 ldquoAvailable Pool of Unallocated IPv4 Internet Addresses Now Completely Emptiedrdquo httpwwwicannorgennewspressreleasesrelease-03feb11-enpdf (accessed November 20 2013)
Kalyvas Stathis N 2004 ldquoThe Urban Bias in Research on Civil Warsrdquo Security Studies 13 (3) 160ndash90
Kim Chaiho 2010 A Study of Internet Penetration Percents of Africa Using Digital Divide Models In Technology Management for Global Economic Growth (PICMET) 2010 Proceedings of PICMETrsquo10 New York IEEE 1ndash11
Kirchner Lauren 2014 ldquoMedia as Both Weapon and Defense in the Mexican Drug Warrdquo Pacific Standard March 11 httpwwwpsmagcomnavigationhealth-and-behaviormedia-weapon-defense-mexican-drug-war-76243
Kreutz Joakim 2015a ldquoSeparating Dirty War from Dirty Peace Revisiting the Conceptualization of State Repression in Quantitative Datardquo European Political Science 14 (4) 458ndash72
Kreutz Joakim 2015b ldquoThe War That Wasnrsquot There Managing Unclear Cases in Conflict Datardquo Journal of Peace Research 52 (1) 120ndash24
30 Political Research Quarterly 70(1)
Lawson Chappell H 2002 Building the Fourth Estate Democratization and the Rise of a Free Press in Mexico Berkeley University of California Press
Long J Scott and Simon Cheng 2004 ldquoRegression Models for Categorical Outcomesrdquo In Handbook of Data Analysis edited by Melissa A Hardy and Alan Bryman 259ndash84 London SAGE
MaxMind 2013 ldquoMaxMind GeoIPrdquo httpwwwmaxmindcomencity (accessed November 20 2013)
Mitchelstein Eugenia and Pablo J Boczkowski 2009 ldquoBetween Tradition and Change A Review of Recent Research on Online News Productionrdquo Journalism 10 (5) 562ndash86
Mudhai Okoth Fred Wisdom Tettey and Fackson Banda 2009 ldquoNew Media and Democracy in AfricamdashA Critical Interjectionrdquo In African Media and the Digital Public Sphere edited by Okoth Fred Mudhai Wisdom Tettey and Fackson Banda 1ndash21 Basingstoke Palgrave Macmillan
Myers Daniel J and Beth Schaefer Caniglia 2004 ldquoAll the Rioting Thatrsquos Fit to Print Selection Effects in National Newspaper Coverage of Civil Disorders 1968ndash1969rdquo American Sociological Review 69 (4) 519ndash43
Nelson Andrew 2008 ldquoEstimated Travel Time to the Nearest City of 50000 or More People in Year 2000rdquo Global Environment Monitoring Unit-Joint Research Centre of the European Commission Ispra Italy httpforobsjrceceuropaeuproductsgam (accessed September 9 2016)
Nordhaus William D 2006 ldquoGeography and Macroeconomics New Data and New Findingsrdquo Proceedings of the National Academy of Sciences 103 (10) 3510ndash17
Ocitti Jim 2005 Press Politics and Public Policy in Uganda The Role of Journalism in Democratization New York Edwin Mellen
Oliver Pamela E and Daniel J Myers 1999 ldquoHow Events Enter the Public Sphere Conflict Location and Sponsorship in Local Newspaper Coverage of Public Events 1rdquo American Journal of Sociology 105 (1) 38ndash87
Pavlik John 2000 ldquoThe Impact of Technology on Journalismrdquo Journalism Studies 1 (2) 229ndash37
pgRouting Project 2013 ldquopgRouting Extensions for PostGISrdquo httppgroutingorg (accessed September 9 2016)
Pierskalla Jan H and Florian M Hollenbach 2013 ldquoTechnology and Collective Action The Effect of Cell Phone Coverage on Political Violence in Africardquo American Political Science Review 107 (2) 207ndash24
Poese Ingmar Steve Uhlig Mohamed Ali Kaafar Benoit Donnet and Bamba Gueye 2011 ldquoIP Geolocation Databases Unreliablerdquo ACM SIGCOMM Computer Communication Review 41 (2) 53ndash56
Powers Shawn and Ben OrsquoLoughlin 2015 ldquoThe Syrian Data Glut Rethinking the Role of Information in Conflictrdquo Media War amp Conflict 8 (2) 172ndash80
Price Megan and Patrick Ball 2014 ldquoBig Data Selection Bias and the Statistical Patterns of Mortality in Conflictrdquo SAIS Review of International Affairs 34 (1) 9ndash20
Raleigh Clionadh Andrew Linke Haringvard Hegre and Joakim Karlsen 2010 ldquoIntroducing ACLED An Armed Conflict
Location and Event Datasetrdquo Journal of Peace Research 47 (5) 651ndash60
Restrepo Jorge A Michael Spagat and Juan F Vargas 2006 ldquoThe Severity of the Colombian Conflict Cross-Country Datasets versus New Micro-Datardquo Journal of Peace research 43 (1) 99ndash115
Salehyan Idean Cullen S Hendrix Jesse Hamner Christina Case Christopher Linebarger Emily Stull and Jennifer Williams 2012 ldquoSocial Conflict in Africa A New Databaserdquo International Interactions 38 (4) 503ndash11
Schudson Michael 1989 ldquoThe Sociology of News Productionrdquo Media Culture amp Society 11 (3) 263ndash82
Severin Werner J and James W Tankard 2010 Communication Theories Origins Methods and Uses in the Mass Media New York Longman
Shapiro Jacob N and Nils B Weidmann 2015 ldquoIs the Phone Mightier than the Sword Cell Phones and Insurgent Violence in Iraqrdquo International Organization 69 (2) 247ndash74
Shavitt Yuval and Noa Zilberman 2011 ldquoA Geolocation Databases Studyrdquo IEEE Journal on Selected Areas in Communications 29 (10) 2044ndash56
Smith Jackie John D McCarthy Clark McPhail and Boguslaw Augustyn 2001 ldquoFrom Protest to Agenda Building Description Bias in Media Coverage of Protest Events in Washington DCrdquo Social Forces 79 (4) 1397ndash423
Snyder David and William R Kelly 1977 ldquoConflict Intensity Media Sensitivity and the Validity of Newspaper Datardquo American Sociological Review 42 (1) 105ndash23
Spitulnik Debra 2002 ldquoMobile Machines and Fluid Audiences Rethinking Reception through Zambian Radio Culturerdquo In Media Worlds Anthropology on New Terrain edited by Faye D Ginsburg Lila Abu-Lughod and Brian Larkin 337ndash54 Berkeley University of California Press
Staniland Paul 2010 ldquoCities on Fire Social Mobilization State Policy and Urban Insurgencyrdquo Comparative Political Studies 43 (12) 1623ndash49
Sundberg Ralph and Erik Melander 2013 ldquoIntroducing the UCDP Georeferenced Event Datasetrdquo Journal of Peace Research 50 (4) 523ndash32
Sundberg Ralph Kristine Eck and Joakim Kreutz 2012 ldquoIntroducing the UCDP Non-State Conflict Datasetrdquo Journal of Peace Research 49 (2) 351ndash62
Sundberg Ralph Mathilda Lindgren and Ausra Padskoci-maite 2011 ldquoUCDP Geo-Referenced Event Dataset (GED) Codebook Version 15rdquo httpwwwsamfakuuse digitalAssets8383721_ucdp_ged_v10-codebookpdf
Themneacuter Lotta and Peter Wallensteen 2014 ldquoArmed Conflicts 1946ndash2013rdquo Journal of Peace Research 51 (4) 541ndash54
Tiefelsdorf Michael 2006 Modelling Spatial Processes The Identification and Analysis of Spatial Relationships in Regression Residuals by Means of Moranrsquos I Lecture Notes in Earth Sciences Vol 87 Berlin Springer
Tollefsen Andreas Foroslash Haringvard Strand and Halvard Buhaug 2012 ldquoPRIO-GRID A Unified Spatial Data Structurerdquo Journal of Peace Research 49 (2) 363ndash74
Croicu and Kreutz 31
Urlacher Brian R 2009 ldquoWolfowitz Conjecture A Research Note on Civil War and News Coveragerdquo International Studies Perspectives 10 (2) 186ndash97
Wang Xiaokun and Kara M Kockelman 2009 ldquoApplication of the Dynamic Spatial Ordered Probit Model Patterns of Land Development Change in Austin Texasrdquo Papers in Regional Science 88 (2) 345ndash65
Weidmann Nils B 2015 ldquoOn the Accuracy of Media Based Event Datardquo Journal of Conflict Resolution 59 (6) 1129ndash49
Weidmann Nils B 2016 ldquoA Closer Look at Reporting Bias in Conflict Event Datardquo American Journal of Political Science 60 (1) 206ndash18
Weimann Gabriel 2006 ldquoVirtual Disputes The Use of the Internet for Terrorist Debatesrdquo Studies in Conflict amp Terrorism 29 (7) 623ndash39
Wood Simon N 2003 ldquoThin Plate Regression Splinesrdquo Journal of the Royal Statistical Society Series B (Statistical Methodology) 65 (1) 95ndash114
Woolley John T 2000 ldquoUsing Media-Based Data in Studies of Politicsrdquo American Journal of Political Science 44 (1) 156ndash73
Zhukov Yuri M 2012 ldquoRoads and the Diffusion of Insurgent Violence The Logistics of Conflict in Russiarsquos North Caucasusrdquo Political Geography 31 (3) 144ndash56
20 Political Research Quarterly 70(1)
its embrace of digital media over (previously under-developed) infrastructure suggesting that communication technology may be particularly important in this region (Hersman 2013) Third most published research on spa-tial variation in armed conflict is focusing on Africa as the early version of UCDP Georeferenced Conflict Event Data (UCDP-GED Sundberg and Melander 2013) and projects such as ACLED (Raleigh et al 2010) and Social Conflict in Africa Database (SCAD Salehyan et al 2012) primarily provide data from this continent
This paper differs from earlier work on event data quality as we are neither comparing information from different datasets (Eck 2012 Restrepo Spagat and Vargas 2006) nor data collected with competing method-ologies (Davenport and Ball 2002 Price and Ball 2014 Weidmann 2015) Instead we use the precision scores assigned to each event in the UCDP-GED (Sundberg and Melander 2013) which indicate the level of detail of available information This measure is not produced following some estimation technique but represents the specific information in the coded material about when and where an event occurs We focus on the temporal precision approximating that events with information about the specific date are better reported than those reported as only within a given week month or year
The next section outlines how new communication technology should facilitate more detailed reporting on political violence events before we describe our research design Following an analysis of 2369 events in Africa from 2008 to 2010 we find a statistically significant and robust correlation between reporting quality and access to communication technology although the size of the effect is relatively small We then extend the analysis by explor-ing the original sources that offer information about polit-ical violence and find that contemporary reporting is less dependent on official statements and instead relies upon eyewitness accounts more than in the pre-Internet era The final section concludes and discusses the implica-tions of these findings for future scholarship
Spatial Bias in Political Violence Data
Existing research on reporting contentious politics has identified two sources of bias The first which is the focus for this article relates to the ability of media to access information about a given event while the second relates to the deliberate-strategic selection of which events are reported and how these are described (Earl et al 2004 Galtung and Ruge 1965) The spatial location may influence both the ability and the willingness to report about a particular event
Most of the information provided by international media from conflict zones is collected by news bureaus with limited resources This means that events that occur closer to major political centers are likely to receive more
coverage simply because reporters have better access to witnesses which should improve reporting both in terms of output and quality (Fleeson 2003 Weidmann 2015) This differs from
distant sources who are less able to navigate the local terrain (physically but also politically and socially) Outsiders are less able to identify events less able to understand who the combatants are and less able to know where the best informants can be found Distant sources may find themselves relying on the ones most readily available but farthest from the events of interest (Davenport 2010 70)
It has also been argued that access to information should be influenced by government censorship and other restrictions on free movement although existing empirical evidence about this factor has so far been inconclusive On one hand studies show that terrorism is probably underreported in countries with limited press freedom (Drakos and Gofas 2006) and threats and vio-lence on journalists reduced the coverage of human rights abuses in Guatemala (Davenport and Ball 2002) On the other hand other findings indicate that dangerous security environments in general do not reduce news coverage (Urlacher 2009) and media in both Mexico and Uganda have refused to bow to government intimi-dation (Lawson 2002 Ocitti 2005)
The final factor that determines media content is deci-sions by news editors about what the audience is likely to be interested in This is partly influenced by the nature of the story where violent and unexpected developments usually are preferred but also by the location of the event The threshold for what is considered newsworthy increases with distance meaning that minor protests close to the publication outlet may be given as much attention as exceptionally dramatic events far away (Myers and Caniglia 2004 Smith et al 2001)
New Technology Brings New News Reporting
Communication scholars have suggested that the devel-opment of modern communication technology has funda-mentally changed the nature of news media (Severin and Tankard 2010) What is important to remember though is that the ldquonews mediardquo are not a unified and coherent entity with consistent output across time and space but a diverse set of actors and practices sensitive to competi-tion and technological change (Fleeson 2003 Mitchelstein and Boczkowski 2009 Pavlik 2000) As in any competi-tive market one of the most influential instigators of change is innovations that facilitate high-quality news gathering at a lower cost such as the introduction of new communication technology This influences both the means of news gathering (the input of information) and the means of publishing (the output) Therefore as shown
Croicu and Kreutz 21
in Figure 1 it is not surprising that the amount of reports of violence does not perfectly correlate with the actual fluctuations of violent events
Journalistic practices have undergone a substantial shift following the development of Internet and mobile phone networks Using modern communication technol-ogy reporters can now faster and easier gather informa-tion through direct contact with witnesses rather than having to physically travel to the location of the event after-the-fact Although this has influenced journalists everywhere the impact of new technologies on reporting has been particularly profound in areas where access to information previously was restricted and difficult such as in states characterized by lower economic devel-opment where also political violence is more likely Anecdotal evidence from Zambia and South Africa sug-gest that Internet access provides ordinary people with new channels to improve communication with centers of power including the mainstream media (Goldfain and Van der Merwe 2006 Spitulnik 2002)
New technology also offer journalists access to new sources of information as outlets such as Twitter YouTube wikis and blogs provide opportunities for sources to anonymously provide documentation about events This approach has for example been extensively used by civilians reporting atrocities by criminal gangs and government agents in Mexico in recent years (Kirchner 2014)
Increasing globalization and the spread of the Internet has not only influenced the ways that reporters collect information it has also had a substantial impact on the process of publishing The previous practice where stories were sold to and published by set-format media (newspa-pers radio and television) has been superseded in the era of Internet publishing by outlets without space constraints (Domingo and Paterson 2011) This has removed one of the most influential sources for systematic bias on whether political violence is reported as the role of the news editor as a ldquogatekeeperrdquo has been reduced (Schudson 1989)
Indeed news agencies in the Internet age are no longer forced to exclude reports but on the contrary encouraged to provide more output In the contemporary news cycle news bureaus compete about being the first to offer ldquobreaking storiesrdquo and journalists are expected to provide multiple versions of the same story where the updates add details when these become available This has led to an increased use of the Internet for information gathering from for example tweets blogs and social media as this may provide more unique details than official press conferences (Farhi 2009)
We contend that the combined effect of all these different effects from the development of new commu-nication technology has created variation in the quality of information available about political violence events Reporting will be substantively better in areas where
journalists easily can seek out information through Internet and mobile phone networks
Empirical Investigation
Figure 2 visualizes the data we employ for our empirical analysis It is worth noting that the use of modern com-munication technology in Africa is rarely limited by individualrsquos ownership of computers or mobile phones In addition to commercial options for getting online studies have shown that mobile phones and computers often are shared among members in the local community (Atton and Mabweazara 2011)
In this paper we use information from events of all different types of violence covered by UCDP-GED (Sundberg and Melander 2013) This means that we are exploring the reporting of events regardless of whether these constitute part of an armed conflict between states andor rebels (N P Gleditsch et al 2002) non-state conflict (including communal violence Sundberg Eck and Kreutz 2012) or one-sided violence against civilians (Eck and Hultman 2007)2 As we are interested in the spatial variation in reporting quality we need to focus on events for which the location is confidently reported Thus our analysis is restricted to the observations where we know that the report contains sufficient information to locate the event confidently at an exact townvillage or within a 25 km radius from the exact location
Figure 1 Newswire articles on political violence in Africa (1989ndash2010) compared with total number of UCDP-GED eventsThe 1999 increase in number of articles is partly due to the inclusion of AFP reporting for Africa in Factiva UCDP = Uppsala Conflict Data Program GED = Georeferenced Conflict Event Data AFP = Agence France Presse
22 Political Research Quarterly 70(1)
Dependent Variable
The dependent variable for our analysis consists of a previously underused facet of the UCDP-GED namely the precision score given to the quality of information provided about each event The coding of this score is straightforward and directly based on the actual infor-mation provided in the news material Table 1 summa-rizes the criteria for coding precision scores (Sundberg Lindgren and Padskocimaite 2011)
For our analysis we recode the summary temporal precision score as 6 giving us a scale with 1 as the most detailed information and 6 as the least specific The information behind these scores comes from the follow-ing process Every year UCDP extract and collect infor-mation from a large amount of news media content including (for Africa) outlets such as Africa Confidential and the African Research Bulletin as well as reports from international and national nongovernmental organi-zations (NGOs) and other sources However many NGO investigations use the work of locally based journalists For example the sources used for the annual human rights reports by the US State Department and Amnesty International are composed of a combination of stories reported in local media and onsite investigations (Kreutz 2015a)
For each political violent event coded into the UCDP-GED dataset coders assign precision scores that reflect on the level of detail in the reports about where (where precision) and when (date precision) the event occurred If there are multiple reports about the same event UCDP always uses the most detailed and disaggregated infor-mation meaning that ldquopoorrdquo confidence scores should only be assigned for events where detailed reports are lacking
Thus our dependent variable is the confidence score for the temporal precision of the event We consider reports on when an event occurred to constitute a cross-national comparable ldquohard factrdquo that we do not expect to be sensitive to political or editorial pressures that other-wise may influence the narrative of an event (Davenport 2010) Figure 3 shows the correlation matrix between spatial and temporal precision in our data indicating substantial variation for the dependent variable in our sample
Independent Variable Internet Access
Internet access is determined by the local geography and the distance between an eyewitness and the nearest Internet node For this we use the Maxmind GeoIP database (the version released on December 1 2010) which constitutes a global dataset assigning geographi-cal information to every known Internet Protocol (IPv4) address in use3 These data are typically used by web-related industries for customizing or restricting content and advertising in various geographic areas
The spatial resolution of the data is the city while the best data point coarseness claimed is the individual IP address Independent studies of the accuracy of
Table 1 UCDP Precision Scores
Temporal information
0 Summary event1 Exact day of the event known2 Event can be located within a 2ndash6 day period3 Event can be located within a given week4 Event can be located within a given month5 Event can be located within a given year
Spatial information
1 Exact location of the event is known2 Event occurred within a ca 25 km radius around a known point3 Event occurred in a given second order administrative division4 Event occurred in a given first order administrative division5 Spatial reference for the event is a linearpolygon reference point6 Event occurred within a given country7 Event occurred in international water or airspace
UCDP = Uppsala Conflict Data Program
Figure 2 Map showing Internet access UCDP-GED data and road distancesUCDP = Uppsala Conflict Data Program GED = Georeferenced Conflict Event Data
Croicu and Kreutz 23
IP geolocation databases has indicated a 40 percent to 60 percent accuracy rate in matching individual locations with an area (11 matching) within 100 km from the actual location of the assigned IP address In Africa Maxmind claims an accuracy of between 38 percent and 89 percent for 11 matching (MaxMind 2013 Poese et al 2011 Shavitt and Zilberman 2011) We do not consider this seemingly low reliability a major concern because of the extremely demanding requirements of such tests which are modeled on the typical commercial usage that is the ability to precisely identify the exact location of a random individual IP address As we are interested in the Internet point-of-presence (ie the location of Internet access) which is a much coarser measure (approximately 4 orders of magnitude) than the individual IP address we assume that aggregation mitigates most identified 11 errors4
Calculating Distances
To link the location of a political violence event with Internet access we measure the distance between event and Internet nodes in two ways The first is the great circle distance (geodesic distance) calculated using PostGis 201 on the WGS84 spheroid and expressed in kilometers (ie the shortest possible straight-line route between event and Internet access point) while the sec-ond is the shortest possible road distance between event and the closest Internet node5 The two measures differ substantially with different closest points of Internet access for more than 20 percent of events in our sample (483 out of 2369)
To calculate road distances we use gRoads dataset version 1 (CIESIN-ITOS-NASA SEDAC 2013) an open-source global road-network dataset Distances between events and Internet nodes are calculated with Dijkstrarsquos algorithm using pgRouting 20 (pgRouting Project 2013) with a tolerance level of 001 decimal degrees (approxi-mately 08ndash12 km depending on latitude and longitude) This tolerance level is on the same magnitude as twice the stated standard error of the gRoads dataset (ie at least 2 times 300 m) to avoid misspecification due to potential gRoads coding errors6 For points not located on a road the nearest road was used as a starting point and the dis-tance to that road added to the calculation Furthermore distances were not calculated for events located more than 50 km away from any road (excluding less than 5 of total events)
The gRoads data also provide information on the quality of the individual roads which is useful for our purpose to measure individualsrsquo access to the Internet We impose a penalty on roads classified as ldquotrailsrdquo where we expect traveling speed to be ten times slower than on proper even poor-quality roads7 As distance calculations on a dataset as large as gRoads are com-putationally intensive we identified potential closest nodes candidates through a sliding window approach with an expanding sub-setting buffer around each data point The buffer grew by a radius of 1 decimal degree at a time stopping when five suitable Internet nodes (to which distances could be calculated) were identified For analysis purposes the decimal logarithm was taken from all distances as we expect the effect follows a logarithmic function rather than a linear one
Statistical Technique
We model the relationship between the distance to Internet access and quality of information about political violence events as a proportional odds ordinal logistic regression (Fullerton 2009 Long and Cheng 2004) The probability of the temporal precision confidence score being a value m with 1 le m le 6 is estimated as follows
Pr y m x
cdf x m
cdf m x
cdf
logistic
logistic
logi=( ) =
minus( ) =
minus( ) minus|
τ β
τ β
1 1
sstic
logistic
m x m
cdf m x m
τ β
τ β
minus minus( ) lt lt
minus minus minus( ) =
1 1 6
1 1 6
where x is the covariate vector β is the associated coefficient vector for the covariates τ is the unknown cutoff point between precision scores and cdflogistic is the cumulative logistic density function (Fullerton 2009 Long and Cheng 2004) As we assume a single process determining the probabilities the coefficient vector does
Figure 3 Proportions of eventsrsquo spatial and temporal precision
24 Political Research Quarterly 70(1)
not vary across the six equations producing proportional slopes (Fullerton 2009)
As we only have one data point for Internet access locations we subset the UCDP-GED to only include data for the 2008ndash2010 period treating it as fully cross-sectional data8
Control Variables
A consistent finding in existing literature on media selection bias is that more violent events are given more attention (Price and Ball 2014) We therefore include a variable indicating the total annual intensity of the specific armed conflict non-state conflict one-sided vio-lence interaction (or dyad) which the event belongs to as well as the fatality estimate for the specific event We are also interested in whether Internet access overlaps with other forms of modern communication technology including mobile phones which feature more promi-nently in existing research (Dafoe and Lyall 2015)9 The data on mobile phone coverage are obtained from a high-quality print map produced by the GSM Association and Europa Technologies in January 2009 (GSM Association and Europa Technologies 2009) extracted through both geographic information systems (GIS) specific digitiza-tion and vectorization techniques (zones of coverage and lack of coverage) as well as a support vector machine-based algorithm The support vector machine was used for categorization of pixels in buckets corresponding to coverage and lack of coverage10
Our dependent variable temporal precision scores exhibits a small degree of geographic auto-correlation with a clustering tendency (Moranrsquos I of 054)11 motivating the inclusion of a simple spatiotemporal lagged term consisting of the number of previously reported fatalities from events in the past seven days within a 25 km radius12 To control for local economic development we include information on local gross domestic product (regional GDP Nordhaus 2006) col-lected on a 1 times 1 degree cell (extracted from PrioGrid v101 Tollefsen Strand and Buhaug 2012) We also control for country-level media censorship using the annual Freedom House (FH 2012) freedom of the press score Finally to control for the possibility that commu-nication technology simply is a proxy for urban areas we measure geographic features in two ways The first is the distance in minutes to the nearest location with 50000 inhabitants or more using data provided by the European Commission (Nelson 2008) and the second is the proportion of mountainous terrain in a 05 times 05 degree cell where the political violence occurred (Tollefsen Strand and Buhaug 2012) Not surprisingly we find a strong negative correlation between urbanization and mountainous terrain so to
avoid multicollinearity we include these variables in different estimations13
Results
Our expectation is that better access to communication technology correlates with more detailed reports of polit-ical violence The dependent variable in all models in Table 2 is the quality in reporting the temporal location of an event with 1 being the best and 6 being the worst The explanatory variable (distance to closest Internet node) is measured as road distance in Models 1 to 5 and as geodesic distance in Models 6 to 10
Across all models we find that the quality of informa-tion that is the precision about events decreases with distance from Internet nodes in line with our expecta-tions Results are similar regardless of how we calculate distance and consistently statistically significant on at least 95 percent confidence interval (CI) One benefit of the ordered logit is the possibility to interpret information about whether the correlation is statistically significant only in some part of the scale (ie potentially the best or worst reported events) We find however that the dis-tance to Internet node is statistically significant for each single step Our findings are robust when controlling for the severity of violence both measured on a yearly basis and for the specific event the local level of preceding violence urbanization mountainous terrain local eco-nomic development and press freedom
In Models 4 and 9 we include the dichotomous mea-sure of mobile phone coverage and find that the Internet distance remains statistically significant However a sep-arate regression (see the appendix at httpprqsagepubcomsupplemental) where we replace Internet informa-tion with mobile phone coverage also correlates with better reporting suggesting that our finding indeed shows the effect of the communication process rather than the particular means used
While our study identifies a robust statistically sig-nificant correlation the size of the effect is relatively small To estimate the size of the effect we build on Model 4 in Table 1 and run 1000 simulations for each 01 increase of logged road distance between 10 (10 km the cutoff point in the data) and 32 (approx 1585 km close to the maximum observed value in the data) giving us a total of 32000 simulations14 The dyad severity is set to low (the most common observation type) with all other values in the model held at their observed means15
Figure 4 shows the simulated predicted probabilities of obtaining the best (single- day specified) and worst (summary event) precision confidence scores as a func-tion of road distance to the closest Internet node The blue (top) lines indicate the predicted probability that a given event is coded with the best temporal confidence while
Croicu and Kreutz 25
the red lines show the predicted probability of the event given the least detailed precision The reason that the pre-dicted probability is much higher for getting the ldquobestrdquo precision is because our data consist of already coded and scrutinized events rather than all news articles This means that our findings should be interpreted in light of
the knowledge that even the ldquoworstrdquo reported data are still reports deemed sufficiently reliable to be coded into UCDP-GED
For events that occur at 10 road km from an Internet node the predicted probability that reports identify the day of the event (highest precision) is 774 (CI = [0735 0811]) However for events 100 road km away from an Internet node the predicted probability of such detail reporting decreases to 727 (CI = [0699 0753]) For events with the least precision we identify the opposite trend as distance increases from the Internet nodes The predicted probability of an event being reported in a summary (lowest possible precision) is 059 (CI = [0029 0099]) close to Internet nodes but increases to 74 (CI = [0041 0111]) at 100 km distance16
Turning to the control variables some findings war-rant discussion First there hasmdashto our knowledgemdashnot before been any systematic studies whether violence in more urban areas actually is better reported than in the countryside There are claims of a consistent ldquourban biasrdquo in identifying instances of political violence (Kalyvas 2004) although it has also been pointed out that insurgent activity in cities may be difficult to parse out from sur-rounding noise (Staniland 2010) Our study covers more forms of political violence than civil strife but the find-ings in Table 2 provide mixed support regarding the effect of urbanization Violence closer to major cities is reported with lower precision but this is not consistently statisti-cally significant
Table 2 Quality of Reporting and Internet Access
DV Temporal precision
Model
(1) (2) (3) (4) (5) (6) (7) (8) (9) (10)
Internet node (road) 0293 (0082)
0255 (0085)
0430 (0113)
0427 (0113)
0281 (0089)
Internet node (geodesic) 0246 (0088)
0210 (0091)
0343 (0120)
0344 (0120)
0246 (0095)
Dyad severity (total) 0460 (0111)
0475 (0113)
0471 (0116)
0453 (0117)
0426 (0117)
0490 (0111)
0501 (0113)
0495 (0116)
0474 (0117)
0443 (0117)
Event severity 0019 (0002)
0018 (0002)
0018 (0002)
0019 (0002)
0019 (0002)
0019 (0002)
0019 (0002)
0019 (0002)
Mobile phone coverage 0155 (0127)
0164 (0127)
Severity prior week 0002 (0002)
0001 (0002)
0002 (0002)
0002 (0002)
0001 (0002)
0001 (0002)
0001 (0002)
0002 (0002)
Local GDP minus0043 (0073)
minus0045 (0073)
0040 (0071)
minus0047 (0073)
minus0050 (0073)
0031 (0071)
Press censorship 0003 (0006)
0000 (0006)
minus0003 (0006)
0004 (0006)
0001 (0006)
minus0002 (0006)
Distance to city minus0001 (0000)
minus0001 (0000)
minus0001 (0000)
minus0001 (0000)
Mountains 0640 (0158)
0649 (0159)
Observations 2118 2118 2111 2111 2111 2118 2118 2111 2111 2111
DV = dependent variable GDP = gross domestic product Output from ordinal logistic regression with standard errors in paranthesisp lt 1 p lt 05 p lt 01
Figure 4 Predicted probabilities based on road distance
26 Political Research Quarterly 70(1)
The second notable finding is with regard to severity of violence and reporting quality a factor regularly argued as making events more newsworthy and hence better reported (Galtung and Ruge 1965 Price and Ball 2014) In both of our tables however we find the oppo-site relationshipmdashthe precision of reporting decreases for more violent events as well as for conflicts where the overall interaction is more violent We suspect that this may be caused by our focus solely on lethal violence in contrast with much of the literature on newsworthiness that focuses on the size of protests (Earl et al 2004 Herkenrath and Knoll 2011 Oliver and Myers 1999 Smith et al 2001)
Is Communication Technology the Reason
Our statistical analysis finds a small but statistically sig-nificant spatial variation regarding the quality of report-ing of political violence and that this correlates with distance to Internet access To explore whether this vari-ation can be explained by the suggested mechanism of better information provision through modern communi-cation technology we now take a closer qualitative look at the sources attributed to in the actual reports
We revisited the background text of the UCDP-GED events and coded the collected information about original sources To systematize these data we group the sources into four broad categories First we refer to ldquoofficial sourcesrdquo when the original source was the government (eg military spokesperson police minis-ter local administration etc) or a dissident organization (eg rebel group or a media outlet controlled by a rebel group) second ldquojournalistsrdquo are reporters with unclear neutral or unknown allegiance (eg a national private television or radio station a Reuters correspondent etc) third ldquootherrdquo sources include international organi-zations NGOs or foreign governments and finally ldquoeyewitnessesrdquo (eg a local bystander)
We basically expect a greater risk of political bias when media reports are based on ldquoofficial sourcesrdquo while
the use of ldquoeyewitnessesrdquo should improve the quality of reporting To see if there has been a change over time that can be attributed to improved communication technol-ogy we combine this information from 2008 to 2010 with UCDP-GED events from 1992ndash1993 In this period access to the World Wide Web was basically nonexistent in Africa (or for that matter in most of the world) An additional advantage for our purposes is that the event data covering 1992ndash1993 were collected by UCDP-GED during 2008ndash2010 meaning the use of the same human coders definitions sources and methodology which means that inter-coder reliability issues are unlikely to affect the comparison
Figure 5 shows the distribution of original sources for reports on political violence in 1993ndash1994 and 2008ndash2010 In the earlier period the vast majority of events (679) were reported by ldquoofficial sourcesrdquo directly linked to the belligerent parties This contrasts with the paucity of information collected from eyewit-nesses or locals which only contributes to 164 percent of reports In the post-Internet time period we find a telling difference In 2008ndash2010 the number of reports originat-ing with eyewitnesses is almost equal to that originating from official sources (414 vs 417) This finding is consistent with a common claim with regard to the spread of communication technology across Africa that it will offer opportunities for a wider range of citizens to pro-vide information about local conditions (Aker and Mbiti 2010 Mudhai Tettey and Banda 2009 Ocitti 2005 Spitulnik 2002) We find a similar trend toward more detailed reporting over time in the UCDP-GED dataset overall as an increasing proportion of events are coded with higher precision scores In 1989 only 574 percent of events are attributed to an individual day while this was possible for 7514 percent events in 201017
If the spread of communication technology over time leads to data improvements then we should expect a sim-ilar variation with regard to different types of original sources and data quality also within the modern data We find this is the case The data points situated near Internet nodes are almost exclusively reported using two types of
Figure 5 Original sources for reporting in the 1992ndash1993 sample and the 2008ndash2010 sample
Croicu and Kreutz 27
primary sources The first is extremely brief official notes and communiqueacutes from actors involved in the vio-lence such as for example the military the police or rebel groups The second though consists of more detailed highly descriptive narratives that provide in-depth insights regarding the actions by different actors and the temporal ordering of the violence Much of this latter type of information (more than 50 in areas under 150 km) is reported by sources identified as residents protest participants interviewees local journalists writ-ing opinion pieces local community leaders anonymous officials interviewed directly by the media and even blogs that is informal mostly independent organiza-tions and individuals
As distance increases from Internet nodes these types of in-depth narratives about specific events become less common and the original sources for information are almost exclusively spokespersons of warring organiza-tions official communiqueacutes police and army officials and so on that is actors directly involved in violence When local narratives disappear these ldquoofficialrdquo versions dominate available information As a consequence of this lack of information from local sources the quality of information decreases including the ability to code such ldquohard factsrdquo as the day of a given event
Conclusion
Our study shows that there is variation in how well polit-ical violence is reported across space Events that occur in areas where journalists with ease can receive informa-tion are better reported than events in the periphery As modern communication technology has spread across the world reporters are now able to easily access information directly from eyewitnesses and locals rather than rely solely on governmental press briefings This means that media now provide richer more detailed narratives of events that offer a better understanding of the processes of political violence
What implications do our findings have for interpreting existing scholarship or the design of new research proj-ects First the heterogeneous nature of political violence data should be taken under serious consideration for anal-yses of event data with a long time span as the quality of information is markedly different in the ldquobefore Internetrdquo and ldquoafter (with) Internetrdquo time periods We therefore advise researchers to proceed with caution when using longitudinal samples of event data and to always account for temporal dependency in analyses Our findings also suggest that studies exploring whether Internet connec-tions or mobile phone networks facilitate violence need to acknowledge the possibility of selection bias
Second our investigation also provides some good news for the emerging field of cross-national micro-level
studies of political violence and particularly for users of the UCDP data collection effort The small effect size between reports where information is readily available and where it is not suggests that findings from inter- spatial (panel) studies using contemporary data generally should not be overly influenced by reporting bias Considering that many studies aggregate violent events into district or grid-cell structures to merge with explana-tory variables a take-away from this exercise is in line with the recommendation of Weidmann (2015) that these data can be trusted as accurate at district level or within a 50 times 50 km radius
Third our study provides support for the claim that news media over time have improved in their capacity of capturing political violence This may be relevant for the debate on a global decline of conflict and other forms of political violence Our findings suggest that contemporary news datamdashat least in the last decademdashcapture sufficient information about minor instances of violence which means that we can be relatively confi-dent that conflict data sources are providing a good overview of current instances of global armed conflict For earlier years even just a few decades ago then information is more uncertain and it is likely that even more cases of low-level conflict may be missing as we move farther back in time (Kreutz 2015b)
The fourth and more worrying implication of our findings is that we find that the quality of information declines in more violent conflicts A possible reason for this is that in excessively violent settings there are too many events to report leaving less time to investigate the details of the violence It could also be that the high risk of reporting and the destruction of infrastructure in such situ-ations means that fewer reporters are in a position to even seek information Case studies have alluded to this includ-ing that news reports are particularly poor when violence escalates quickly (Davenport and Ball 2002 Restrepo Spagat and Vargas 2006) and influenced by which actor controls a certain territory (Price and Ball 2014) The current conflict in Syria has drawn attention to the impor-tant role of reporting for scholarsrsquo access to conflict data (Powers and OrsquoLoughlin 2015) and we hope that our findings can inspire further advances in this research field
Fifth and finally this paper has added to what is start-ing to become compelling evidence in favor of treating data quality as equally important to theory and methodol-ogy in contemporary scholarship This includes a contin-ued attention toward identifying bias in the data employed for analysis both through case-specific inquires and in cross-national settings We think it is of particular impor-tance that such studies explore countries more at risk for conflict as well as censorship and poor working condi-tions for journalists rather than only the United States or Western Europe
28 Political Research Quarterly 70(1)
Acknowledgment
The authors would like to thank Nils Weidmann Suso Baleato Mike Spagat Erik Melander and the Uppsala Conflict Data Program Han Dorussen and participants of the ENCoRe work-shop in Konstanz 2013 editors and anonymous reviewers for helpful comments and suggestions
Declaration of Conflicting Interests
The author(s) declared no potential conflicts of interest with respect to the research authorship andor publication of this article
Funding
The author(s) disclosed receipt of the following financial support for the research authorship andor publication of this article Joakim Kreutz is grateful for support from the Swedish Institute of International Affairs
Notes
1 In 1990ndash2013 there were 372 conflict-years in Asia 308 in Africa 115 in the Middle East 67 in the Americas and 62 in Europe (Themneacuter and Wallensteen 2014)
2 We include events from conflicts below the aggregate twenty-five deathsyear threshold and ldquounclearrdquo armed conflicts where the incompatibility criteria are loosened (see Kreutz 2015b for the benefits of this)
3 Maxmind accounts for 3525991153 individual Internet Protocol (IPv4) addresses out of a maximum possible number of 3706452992 (Internet Assigned Numbers Authority [IANA] 2013 Internet Corporation for Assigned Names and Numbers [ICANN] 2011) A more in-depth discussion of the Maxmind dataset is presented in the appendix at httpprqsagepubcomsupplemental
4 For robustness tests we retain the number of identified Internet hosts in a single location as a measure of Internet pervasiveness Another concern is the unknown prob-ability that the dataset fails to identify Internet points-of-presence altogether (ie not assigning even one location to such points) While this cannot be determined due to lack of ldquoreal worldrdquo data outside extremely small survey-based samples in the developed world we estimate this probability as extremely small as the active detection techniques employed for gathering the data have a failure function that is inversely proportional with the density of active Internet connections (Poese et al 2011 Shavitt and Zilberman 2011) and Africa (the area under study) has by far the lowest Internet penetration figures in the world (Kim 2010)
5 International borders are not taken into consideration given the porous nature of and significant interaction across national boundaries in Africa
6 Given a stated error of 300 m two roads intersecting in real life may be displayed in the dataset at most 600 m apart Furthermore contiguous segments of road in real life may not be displayed as contiguous in the dataset especially at ldquobreaking pointsrdquo for data sources such as borders
7 The 10times penalty relationship approximates a general walk-ing speed for humans at around 5 to 6 kmh while a car would on average travel at 50 to 60 kmh on a non-tarmac road Our findings are robust for using the road data with-out this surface quality specification
8 Our findings are robust for the use of only 2010 Uppsala Conflict Data Program Georeferenced Conflict Event UCDP-GED Data Furthermore Maxmind data have little temporal variation Comparing the Maxmind data version we use with the version released on September 10 2013 (almost three years later) indicates less than 0975 percent change in locations coded
9 For individuals to access the Internet with mobile phones they must obviously be close to an Internet access point
10 The model was trained on both the pixel itself and neigh-boring pixels and both the unprocessed map and the pro-cessed data are available with our replication material
11 Moranrsquos I indicates the level of global spatial dependency of a variable that is the tendency of values of a point to be correlated with values situated nearby Moranrsquos I can take values on a scale of minus1 to +1 with 0 indicating no spatial correlation (random disposition) and plusmn1 indicating perfect negative respectively positive correlation (Tiefelsdorf 2006)
12 We choose 25 km based on the UCDP definitions for precision scores but our results are robust for the use of 50 km and thirty days as well as for an alternative specifi-cation consisting of the number of events inside the same spatiotemporal window We also explored the inclusion of a thin plate smoothing spline (Wood 2003 Zhukov 2012) or dynamic spatial ordered models (Wang and Kockelman 2009) However they proved to be difficult to adapt to the event as the unit of analysis rather than to the typical spatial location (ie village area grid-cell administrative unit) as very frequently multiple events with different precision scores share a single location leading to a prob-lem of underfitting the models
13 Our findings are robust for the use of a variable of local (spot) population density see the appendix at httpprqsagepubcomsupplemental
14 Simulations were performed using the Zelig (Imai King and Lau 2008) R package
15 Our findings are robust for excluding ldquosummaryrdquo events from the analysis and regardless of which ldquoprecisionrdquo-step we choose for the post-estimation we find similar results
16 Results are similar for geodesic distances the probabil-ity of a ldquosingle-dayrdquo event based on Model 9 decreases from 763 (confidence interval [CI] = [0721 0800]) at 10 km distance to 723 (CI = [0691 0752]) at 100 km The probability of a summary event increases from 063 (CI = [0030 0105]) to 074 (CI = [0042 0112])
17 For the full trend of the relative distribution in precision scores from 1989 to 2010 see the appendix at httpprqsagepubcomsupplemental
Supplemental Material
Replication data and additional analyses are available at httpsucdpuuse and httpsdataverseharvardedudataversejkreutz
Croicu and Kreutz 29
ReferencesAker Jenny C and Isaac M Mbiti 2010 ldquoMobile Phones
and Economic Development in Africardquo The Journal of Economic Perspectives 24 (3) 207ndash32
Andreas Peter 2002 ldquoTransnational Crime and Economic Globalizationrdquo In Transnational Organized Crime and International Security edited by Mats Berdal and Moacutenica Serrano 37ndash52 London Lynne Rienner
Atton Chris and Hayes Mabweazara 2011 ldquoNew Media and Journalism Practice in Africa An Agenda for Researchrdquo Journalism 12 (6) 667ndash73
Center for International Earth Science Information Network (CIESIN) Information Technology Outreach Service at Columbia University (ITOS) NASA Socioeconomic Data and Application Center (SEDAC) 2013 ldquoGlobal Roads Open Access Data Set Version 1 (gROADSv1)rdquo httpsedacciesincolumbiaedudatasetgroads-global-roads-open-access-v1
Dafoe Allan and Jason Lyall 2015 ldquoFrom Cell Phones to Conflict Reflections on the Emerging ICTndashPolitical Conflict Research Agendardquo Journal of Peace Research 52 (3) 401ndash13
Davenport Christian 2010 Media Bias Perspective and State Repression The Black Panther Party New York Cambridge University Press
Davenport Christian and Patrick Ball 2002 ldquoViews to a Kill Exploring the Implications of Source Selection in the Case of Guatemalan State Terror 1977ndash1995rdquo Journal of Conflict Resolution 46 (3) 427ndash50
Domingo David and Chris Paterson 2011 Making Online News Vol 2 Newsroom Ethnographies in the Second Decade of Internet Journalism New York Peter Lang
Drakos Konstantinos and Andreas Gofas 2006 ldquoThe Devil You Know but Are Afraid to Face Underreporting Bias and Its Distorting Effects on the Study of Terrorismrdquo Journal of Conflict Resolution 50 (5) 714ndash35
Earl Jennifer Andrew Martin John D McCarthy and Sarah A Soule 2004 ldquoThe Use of Newspaper Data in the Study of Collective Actionrdquo Annual Review of Sociology 3065ndash80
Eck Kristine 2012 ldquoIn Data We Trust A Comparison of UCDP GED and ACLED Conflict Events Datasetsrdquo Cooperation and Conflict 47 (1) 124ndash41
Eck Kristine and Lisa Hultman 2007 ldquoOne-Sided Violence against Civilians in War Insights from New Fatality Datardquo Journal of Peace Research 44 (2) 233ndash46
Farhi Paul 2009 ldquoThe Twitter Explosionrdquo American Journalism Review 31 (3) 26ndash31
Fenton Natalie 2010 New Media Old News Journalism and Democracy in the Digital Age London SAGE
Fleeson Lucinda 2003 ldquoBureau of Missing Bureausrdquo American Journalism Review 2532ndash40
Franzosi Roberto 1987 ldquoThe Press as a Source of Socio-Historical Data Issues in the Methodology of Data Collection from Newspapersrdquo Historical Methods A Journal of Quantitative and Interdisciplinary History 20 (1) 5ndash16
Freedom House 2012 ldquoFreedom of the Pressrdquo httpsfreedomhouseorgreportfreedom-pressfreedom-press-2012 (accessed September 9 2016)
Fullerton Andrew S 2009 ldquoA Conceptual Framework for Ordered Logistic Regression Modelsrdquo Sociological Methods amp Research 38 (2) 306ndash47
Galtung Johan and Mari Holmboe Ruge 1965 ldquoThe Structure of Foreign News The Presentation of the Congo Cuba and Cyprus Crises in Four Norwegian Newspapersrdquo Journal of Peace Research 2 (1) 64ndash90
Gleditsch Kristian Skrede Nils W Metternich and Andrea Ruggeri 2014 ldquoData and Progress in Peace and Conflict Researchrdquo Journal of Peace Research 51 (2) 301ndash14
Gleditsch Nils Petter Peter Wallensteen Mikael Eriksson Margareta Sollenberg and Haringvard Strand 2002 ldquoArmed Conflict 1946ndash2001 A New Datasetrdquo Journal of Peace Research 39 (5) 615ndash37
Goldfain K and N Van der Merwe 2006 ldquoThe Role of a Political Blog The Case of wwwcommentarycozardquo Communicare Journal for Communication Sciences in Southern AfricaCommunicare Tydskrif vir Kommunikasiewetenskappe in Suider-Afrika 25 (1) 103ndash24
GSM Association and Europa Technologies 2009 ldquoGSM World Coverage 2009rdquo Technical Report Mobile World Congress February 16ndash19 Barcelona Europa Technologies and GSM Association
Herkenrath Mark and Alex Knoll 2011 ldquoProtest Events in International Press Coverage An Empirical Critique of Cross-National Conflict Databasesrdquo International Journal of Comparative Sociology 52 (3) 163ndash80
Hersman Eric 2013 ldquoThe Mobile Continentrdquo Stanford Social Innovation Review 11 (2) 30ndash31
Imai Kosuke Gary King and Olivia Lau 2008 ldquoToward a Common Framework for Statistical Analysis and Developmentrdquo Journal of Computational and Graphical Statistics 17 (4) 892ndash913
Internet Assigned Numbers Authority 2013 ldquoRFC6890 IANA IPv4 Special-Purpose Address Registryrdquo httpstoolsietforghtmlrfc6890 (accessed September 9 2016)
Internet Corporation for Assigned Names and Numbers 2011 ldquoAvailable Pool of Unallocated IPv4 Internet Addresses Now Completely Emptiedrdquo httpwwwicannorgennewspressreleasesrelease-03feb11-enpdf (accessed November 20 2013)
Kalyvas Stathis N 2004 ldquoThe Urban Bias in Research on Civil Warsrdquo Security Studies 13 (3) 160ndash90
Kim Chaiho 2010 A Study of Internet Penetration Percents of Africa Using Digital Divide Models In Technology Management for Global Economic Growth (PICMET) 2010 Proceedings of PICMETrsquo10 New York IEEE 1ndash11
Kirchner Lauren 2014 ldquoMedia as Both Weapon and Defense in the Mexican Drug Warrdquo Pacific Standard March 11 httpwwwpsmagcomnavigationhealth-and-behaviormedia-weapon-defense-mexican-drug-war-76243
Kreutz Joakim 2015a ldquoSeparating Dirty War from Dirty Peace Revisiting the Conceptualization of State Repression in Quantitative Datardquo European Political Science 14 (4) 458ndash72
Kreutz Joakim 2015b ldquoThe War That Wasnrsquot There Managing Unclear Cases in Conflict Datardquo Journal of Peace Research 52 (1) 120ndash24
30 Political Research Quarterly 70(1)
Lawson Chappell H 2002 Building the Fourth Estate Democratization and the Rise of a Free Press in Mexico Berkeley University of California Press
Long J Scott and Simon Cheng 2004 ldquoRegression Models for Categorical Outcomesrdquo In Handbook of Data Analysis edited by Melissa A Hardy and Alan Bryman 259ndash84 London SAGE
MaxMind 2013 ldquoMaxMind GeoIPrdquo httpwwwmaxmindcomencity (accessed November 20 2013)
Mitchelstein Eugenia and Pablo J Boczkowski 2009 ldquoBetween Tradition and Change A Review of Recent Research on Online News Productionrdquo Journalism 10 (5) 562ndash86
Mudhai Okoth Fred Wisdom Tettey and Fackson Banda 2009 ldquoNew Media and Democracy in AfricamdashA Critical Interjectionrdquo In African Media and the Digital Public Sphere edited by Okoth Fred Mudhai Wisdom Tettey and Fackson Banda 1ndash21 Basingstoke Palgrave Macmillan
Myers Daniel J and Beth Schaefer Caniglia 2004 ldquoAll the Rioting Thatrsquos Fit to Print Selection Effects in National Newspaper Coverage of Civil Disorders 1968ndash1969rdquo American Sociological Review 69 (4) 519ndash43
Nelson Andrew 2008 ldquoEstimated Travel Time to the Nearest City of 50000 or More People in Year 2000rdquo Global Environment Monitoring Unit-Joint Research Centre of the European Commission Ispra Italy httpforobsjrceceuropaeuproductsgam (accessed September 9 2016)
Nordhaus William D 2006 ldquoGeography and Macroeconomics New Data and New Findingsrdquo Proceedings of the National Academy of Sciences 103 (10) 3510ndash17
Ocitti Jim 2005 Press Politics and Public Policy in Uganda The Role of Journalism in Democratization New York Edwin Mellen
Oliver Pamela E and Daniel J Myers 1999 ldquoHow Events Enter the Public Sphere Conflict Location and Sponsorship in Local Newspaper Coverage of Public Events 1rdquo American Journal of Sociology 105 (1) 38ndash87
Pavlik John 2000 ldquoThe Impact of Technology on Journalismrdquo Journalism Studies 1 (2) 229ndash37
pgRouting Project 2013 ldquopgRouting Extensions for PostGISrdquo httppgroutingorg (accessed September 9 2016)
Pierskalla Jan H and Florian M Hollenbach 2013 ldquoTechnology and Collective Action The Effect of Cell Phone Coverage on Political Violence in Africardquo American Political Science Review 107 (2) 207ndash24
Poese Ingmar Steve Uhlig Mohamed Ali Kaafar Benoit Donnet and Bamba Gueye 2011 ldquoIP Geolocation Databases Unreliablerdquo ACM SIGCOMM Computer Communication Review 41 (2) 53ndash56
Powers Shawn and Ben OrsquoLoughlin 2015 ldquoThe Syrian Data Glut Rethinking the Role of Information in Conflictrdquo Media War amp Conflict 8 (2) 172ndash80
Price Megan and Patrick Ball 2014 ldquoBig Data Selection Bias and the Statistical Patterns of Mortality in Conflictrdquo SAIS Review of International Affairs 34 (1) 9ndash20
Raleigh Clionadh Andrew Linke Haringvard Hegre and Joakim Karlsen 2010 ldquoIntroducing ACLED An Armed Conflict
Location and Event Datasetrdquo Journal of Peace Research 47 (5) 651ndash60
Restrepo Jorge A Michael Spagat and Juan F Vargas 2006 ldquoThe Severity of the Colombian Conflict Cross-Country Datasets versus New Micro-Datardquo Journal of Peace research 43 (1) 99ndash115
Salehyan Idean Cullen S Hendrix Jesse Hamner Christina Case Christopher Linebarger Emily Stull and Jennifer Williams 2012 ldquoSocial Conflict in Africa A New Databaserdquo International Interactions 38 (4) 503ndash11
Schudson Michael 1989 ldquoThe Sociology of News Productionrdquo Media Culture amp Society 11 (3) 263ndash82
Severin Werner J and James W Tankard 2010 Communication Theories Origins Methods and Uses in the Mass Media New York Longman
Shapiro Jacob N and Nils B Weidmann 2015 ldquoIs the Phone Mightier than the Sword Cell Phones and Insurgent Violence in Iraqrdquo International Organization 69 (2) 247ndash74
Shavitt Yuval and Noa Zilberman 2011 ldquoA Geolocation Databases Studyrdquo IEEE Journal on Selected Areas in Communications 29 (10) 2044ndash56
Smith Jackie John D McCarthy Clark McPhail and Boguslaw Augustyn 2001 ldquoFrom Protest to Agenda Building Description Bias in Media Coverage of Protest Events in Washington DCrdquo Social Forces 79 (4) 1397ndash423
Snyder David and William R Kelly 1977 ldquoConflict Intensity Media Sensitivity and the Validity of Newspaper Datardquo American Sociological Review 42 (1) 105ndash23
Spitulnik Debra 2002 ldquoMobile Machines and Fluid Audiences Rethinking Reception through Zambian Radio Culturerdquo In Media Worlds Anthropology on New Terrain edited by Faye D Ginsburg Lila Abu-Lughod and Brian Larkin 337ndash54 Berkeley University of California Press
Staniland Paul 2010 ldquoCities on Fire Social Mobilization State Policy and Urban Insurgencyrdquo Comparative Political Studies 43 (12) 1623ndash49
Sundberg Ralph and Erik Melander 2013 ldquoIntroducing the UCDP Georeferenced Event Datasetrdquo Journal of Peace Research 50 (4) 523ndash32
Sundberg Ralph Kristine Eck and Joakim Kreutz 2012 ldquoIntroducing the UCDP Non-State Conflict Datasetrdquo Journal of Peace Research 49 (2) 351ndash62
Sundberg Ralph Mathilda Lindgren and Ausra Padskoci-maite 2011 ldquoUCDP Geo-Referenced Event Dataset (GED) Codebook Version 15rdquo httpwwwsamfakuuse digitalAssets8383721_ucdp_ged_v10-codebookpdf
Themneacuter Lotta and Peter Wallensteen 2014 ldquoArmed Conflicts 1946ndash2013rdquo Journal of Peace Research 51 (4) 541ndash54
Tiefelsdorf Michael 2006 Modelling Spatial Processes The Identification and Analysis of Spatial Relationships in Regression Residuals by Means of Moranrsquos I Lecture Notes in Earth Sciences Vol 87 Berlin Springer
Tollefsen Andreas Foroslash Haringvard Strand and Halvard Buhaug 2012 ldquoPRIO-GRID A Unified Spatial Data Structurerdquo Journal of Peace Research 49 (2) 363ndash74
Croicu and Kreutz 31
Urlacher Brian R 2009 ldquoWolfowitz Conjecture A Research Note on Civil War and News Coveragerdquo International Studies Perspectives 10 (2) 186ndash97
Wang Xiaokun and Kara M Kockelman 2009 ldquoApplication of the Dynamic Spatial Ordered Probit Model Patterns of Land Development Change in Austin Texasrdquo Papers in Regional Science 88 (2) 345ndash65
Weidmann Nils B 2015 ldquoOn the Accuracy of Media Based Event Datardquo Journal of Conflict Resolution 59 (6) 1129ndash49
Weidmann Nils B 2016 ldquoA Closer Look at Reporting Bias in Conflict Event Datardquo American Journal of Political Science 60 (1) 206ndash18
Weimann Gabriel 2006 ldquoVirtual Disputes The Use of the Internet for Terrorist Debatesrdquo Studies in Conflict amp Terrorism 29 (7) 623ndash39
Wood Simon N 2003 ldquoThin Plate Regression Splinesrdquo Journal of the Royal Statistical Society Series B (Statistical Methodology) 65 (1) 95ndash114
Woolley John T 2000 ldquoUsing Media-Based Data in Studies of Politicsrdquo American Journal of Political Science 44 (1) 156ndash73
Zhukov Yuri M 2012 ldquoRoads and the Diffusion of Insurgent Violence The Logistics of Conflict in Russiarsquos North Caucasusrdquo Political Geography 31 (3) 144ndash56
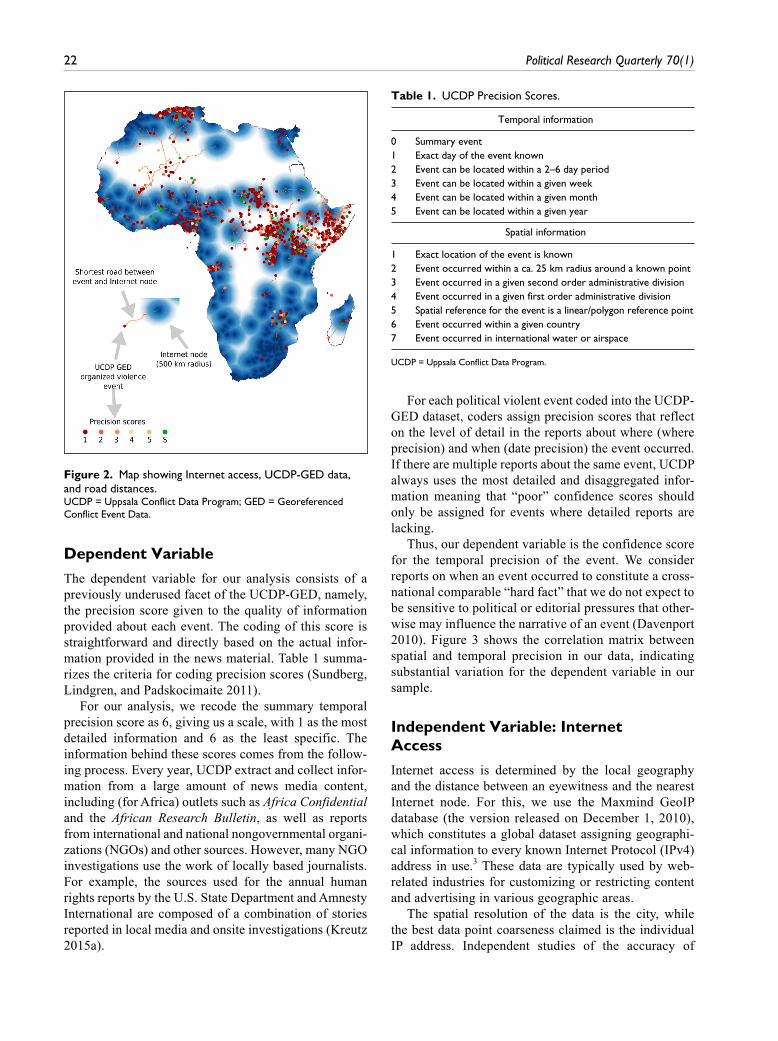
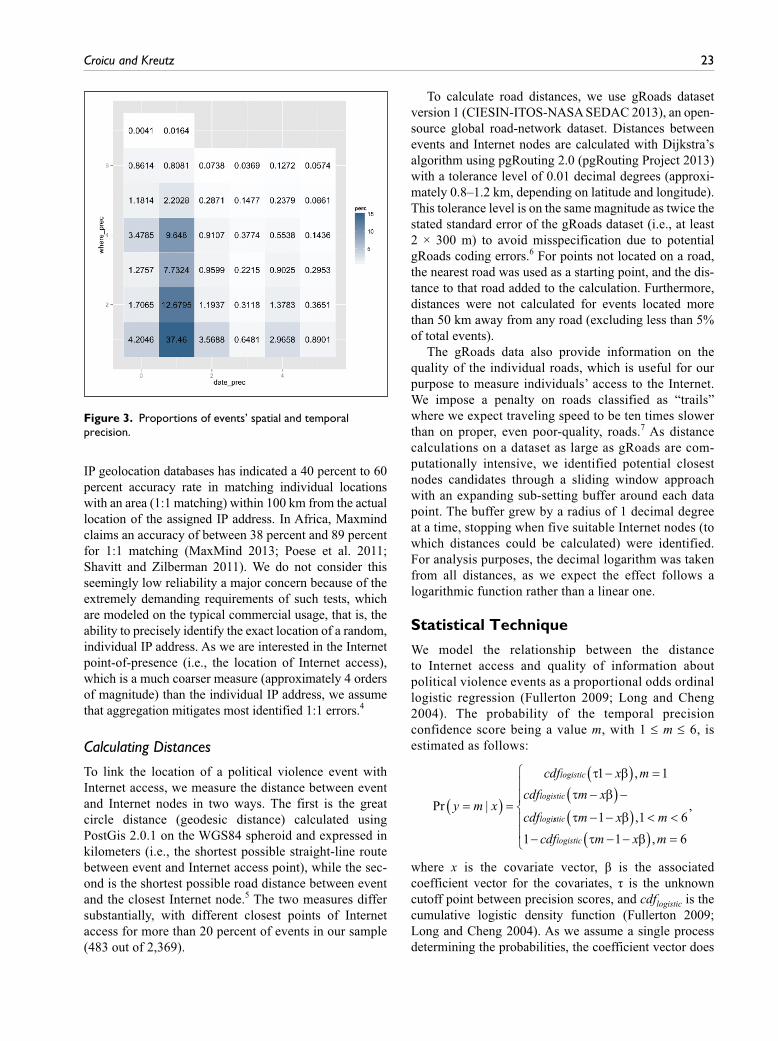
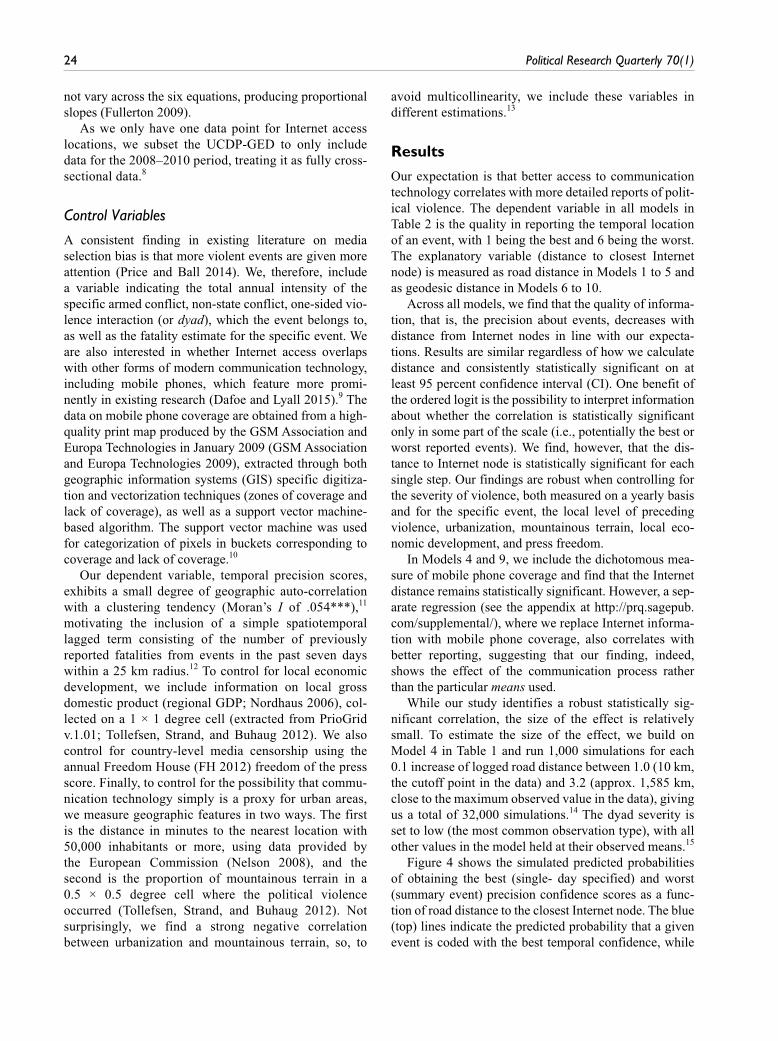
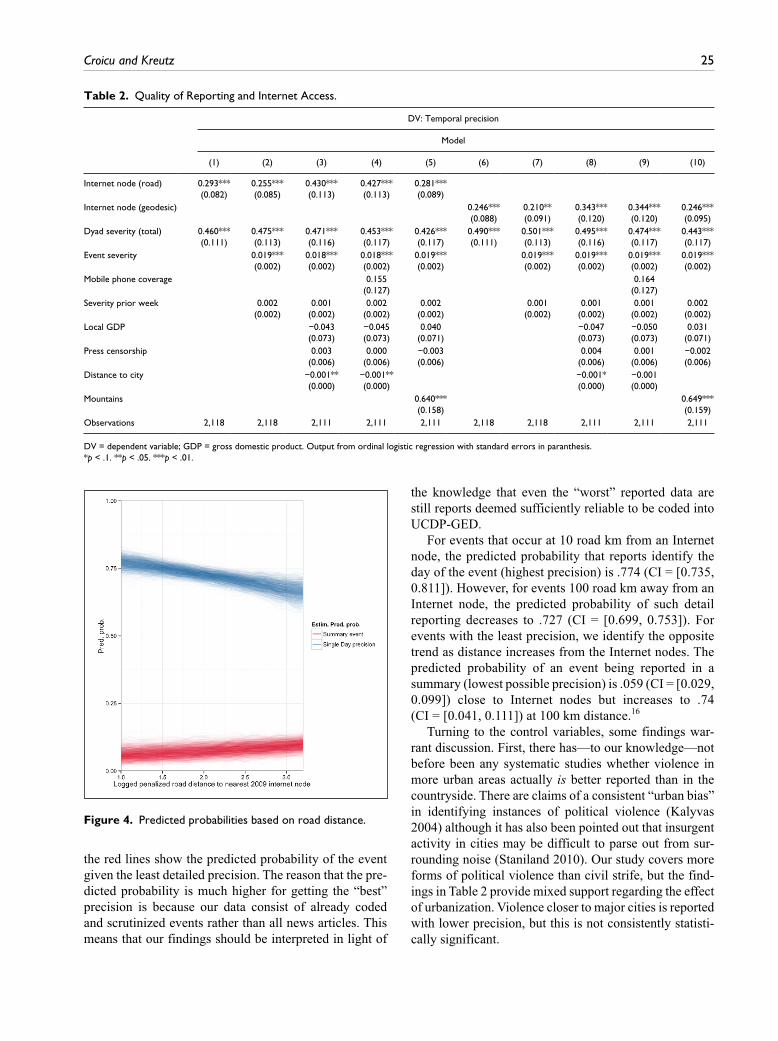
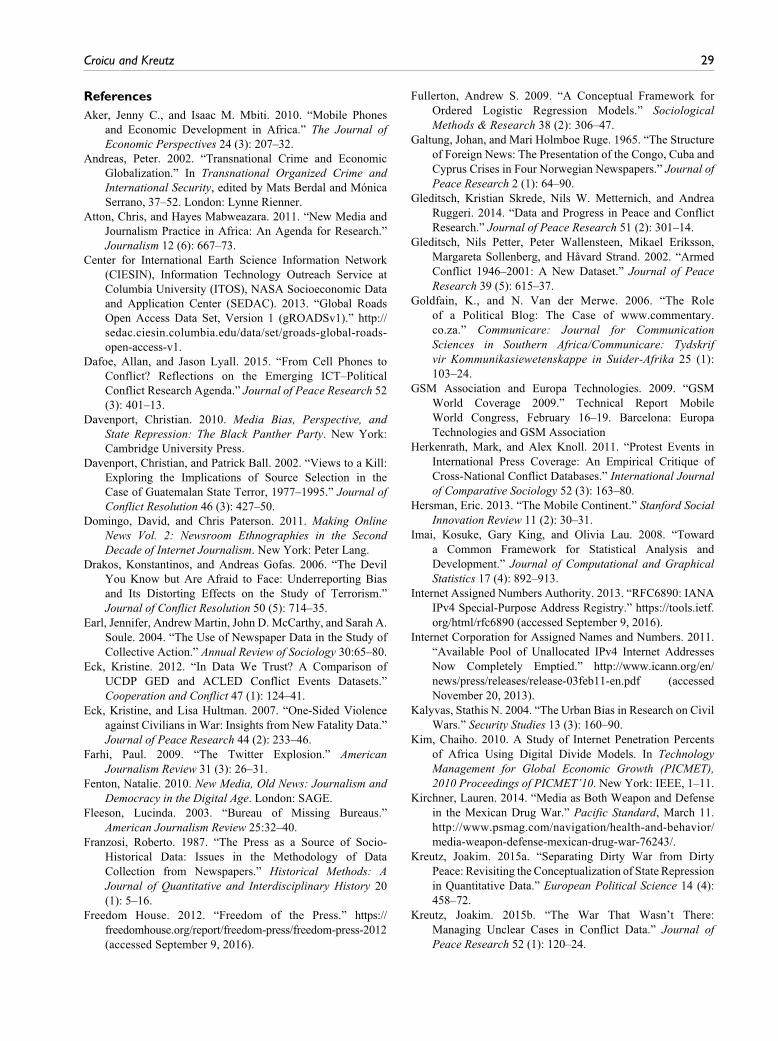