Common Ownership in the US Pharmaceutical Industry
69
Barcelona GSE Working Paper Series Working Paper nº 1216 Common Ownership in the US Pharmaceutical Industry: A Network Analysis Albert Banal-Estañol Melissa Newham Jo Seldeslachts November 2020
-
Upload
khangminh22 -
Category
Documents
-
view
3 -
download
0
Transcript of Common Ownership in the US Pharmaceutical Industry

Barcelona GSE Working Paper Series
Working Paper nº 1216
Common Ownership in the US Pharmaceutical Industry:
A Network Analysis Albert Banal-Estañol
Melissa Newham Jo Seldeslachts
November 2020

1
Common Ownership in the US Pharmaceutical Industry:
A Network Analysis1
Albert Banal-Estanol,2 Melissa Newham3 and Jo Seldeslachts4
October 22, 2020
Forthcoming in the Antitrust Bulletin 66, 1, Spring 2021
Symposium title: Common Ownership: Illuminating a Great 21st Century Antitrust Debate
Guest Editors: Einer Elhauge; Sumit K. Majumdar; Martin C. Schmalz
1 We thank Einer Elhauge, Sumit Majumdar and Martin Schmalz for their insightful
comments. We further thank Jonas Nieto for his excellent research assistance.
2 Universitat Pompeu Fabra, Barcelona GSE and City University London. Email:
[email protected]. Banal-Estanol acknowledges financial support from the
Spanish Ministry of Economy and Competitiveness, through the Severo Ochoa
Programme for Centres of Excellence in R&D (SEV-2015-0563) and project ECO2016-
76998-P and from the Fundacion Ramon Areces (CISP15S3712).
3 KU Leuven and DIW Berlin. Email: [email protected]. Newham
acknowledges financial support through project 1103419N from the Flemish Science
Foundation (FWO).
4 Corresponding author. KU Leuven and DIW Berlin. Email:
[email protected]. Seldeslachts acknowledges financial support through
project G.0573.15 from the Flemish Science Foundation (FWO).

2
Abstract: We investigate patterns in common ownership networks between firms that
are active in the US pharmaceutical industry for the period 2004-2014. Our main findings
are that “brand firms” —i.e. firms that have R&D capabilities and launch new drugs—
exhibit relatively dense common ownership networks with each other that further increase
significantly in density over time, whereas the network of “generic firms” —i.e. firms
that primarily specialize in developing and launching generic drugs— is much sparser
and stays that way over the span of our sample. Finally, when considering the common
ownership links between brands firms, on the one hand, and generic firms, on the other,
we find that brand firms have become more connected to generic firms over time. We
discuss the potential antitrust implications of these findings.
Keywords: Common ownership networks, pharmaceutical companies, competition,
innovation
JEL codes: G23, K21, L11, L41, L65
3
1. Introduction
Investors’ holdings in multiple firms give rise to what is known as “common
ownership.” Common ownership is widespread in the US pharmaceutical industry. In
2014, for instance, the largest investor in the three largest pharmaceutical companies
(Johnson & Johnson, Merck & Co and Pfizer) was the same (BlackRock). This is the rule,
not the exception. These three pharmaceutical companies share other large institutional
investors, and are thus connected to each other, as well as to numerous other
pharmaceutical companies, through so-called “common ownership links.”5
Common ownership links between pharmaceutical companies might have
important implications for competition and innovation in this crucial industry. By
bringing innovative treatments to the market, or by making treatments more widely
accessible, the pharmaceutical industry makes an important contribution to global health
and economic development. At the same time, the industry often generates controversies
related to pricing and product development. A well-functioning pharmaceutical industry
in general, and the consequences of common ownership in particular, are thus key
concerns for policy making and antitrust.
In this article we study the common ownership links between firms that are active
in US pharmaceutical markets in the period 2004 - 2014 and discuss the implications of
our findings for innovation incentives, entry, pricing and collusion. There is both
5 Institutional investors manage other people’s money by buying equity in companies
(such a pension funds, sovereign wealth funds, insurance companies and investment
funds). They typically seek to build diversified portfolios by investing in multiple
companies, often within the same industry.
4
anecdotal and empirical evidence, reported further below, showing that large institutional
investors weigh in on pharmaceutical companies’ strategic decision-making. Given that
these investors are both influential and, as we will show, have ownership stakes in
multiple firms within the same market, the common ownership links between
pharmaceutical companies could have important implications for competition and
innovation.
We make use of network analysis to describe the structure and characteristics of
common ownership networks and calculate how central, or influential, actors are in the
network.6 We make a distinction between “brand firms”, that have R&D capabilities and
launch new drugs on to the market, and “generic firms”, that produce bioequivalent
replications of brand-name drugs once these drugs come off patent. We study the
6 There are surprisingly few papers that make use of network analysis to study common
ownership patterns. A notable exception is Vitali, Glattfelder and Battison, who use
network analysis to study investor networks in a large sample of transnational
corporations. See Stefania Vitali, James B. Glattfelder & Stefano Battiston, The
Network of Global Corporate Control, 10 PLOS ONE 6 (2011). Network analysis has
been applied to other settings in the academic literature e.g. networks in the venture
capital industry see Yael V. Hochberg, Alexander Ljungqvist & Yang Lu. Whom you
know matters: Venture capital networks and investment performance. 62 J. FIN. 251
(2007); interorganizational ties see Mark S. Mizruchi & Joseph Galaskiewicz. Networks
of interorganizational relations. 22 SOC. MET’D. & RES. 46 (1993); and networks
between US firms that advocate for free trade see Michael Dreiling & Derek Darves,
Corporate unity in American trade policy: A network analysis of corporate-dyad
political action, 116 AM. J. SOC. 1514 (2011).
5
evolution of common ownership networks between brand firms and generic firms
separately, as well as the (bipartite) network of brand firms on the one hand and generic
firms on the other. We make use of two common ownership measures, which determine
links on the basis of individual or joint levels of ownership by common investors. An
individual common ownership link between two companies occurs when there is at least
one investor in both companies with an ownership stake of more than 5pct.. A joint
common ownership link occurs when investors common to both firms collectively are the
majority owners.
We find that, although brand companies are already fairly well connected at the
start of our sample, they become almost fully connected through common ownership links
at the end of the sample. This is true for both measures of common ownership, although
we observe a less dramatic change when using the joint measure, in part because the
network was already highly connected at the beginning of the sample. If large institutional
investors do exert influence, as the anecdotal evidence below indicates, then this
increasing connectivity may have a non-negligible and increasing impact on innovation
incentives. If institutional investors effectively assert their power in pharmaceutical
companies, this increasingly dense network might further lead to a softening of
competition between brand firms’ products. Furthermore, as the evolution of the network
partly depends on the ownership measure used, the effects of common ownership might
depend on whether common investors exert individual or joint influence.
Alongside higher levels of connectivity between brand firms, the average measure
of centrality, which indicates how influential individual firms are within the common
ownership network, has risen. Interestingly, at the beginning of the sample, the most
central firms were not necessarily the largest (e.g. Biogen and Allergan). On the contrary,
6
the most central firms towards the end of the sample are also the largest (e.g. Johnson &
Johnson).
The network of brand companies remains, even at the end of the sample, relatively
asymmetric. Indeed, some of the largest pharmaceutical companies, such as Sanofi,
Novartis and Roche, remain without any strong links in 2014. This is in part because of
the presence of large non-common investors in these companies. Although several brand
companies, such as Johnson & Johnson and Pfizer, have a large and similar centrality
value in 2014, several others have low values (or even zero). Thus, brand firm centrality
has not only increased over time, as the common ownership network has become more
connected, but it has also become more dispersed. The combination of a rise in centrality
for the most connected companies and, at the same time, higher dispersion overall might
result in these central players becoming even more powerful.
In comparison to the brand network, the generic firm network is much sparser and
it becomes less connected over time. Further, as compared to brand companies, the size
of the shareholdings of the top common investors in generic companies —although larger
in 2004— is smaller in 2014. Consequently, the average level of centrality for generic
firms is much lower than the average for brand firms at the end of the sample. While this
is unlikely to have an impact on innovation —generic companies mainly imitate brand
products— it indicates that competition between generics is less affected by common
ownership.
Finally, the number of common ownership links between brand companies, on the
one hand, and generic companies, on the other, has increased substantially over time.
Most brand-generic pairs were not connected at the beginning of the sample, and even
some of the largest brands, such as Pfizer, had zero connections with the generics. At the
end of our sample there are a number of strong connections between brands and generics.
7
Most of the large brands, such as Johnson & Johnson and Pfizer, have a large number of
links by 2014. Similarly, some of the generics, such as Impax and Perrigo, have a high
number of connections with brand firms, despite having limited links between each other,
and with other firms within the generic ownership network. The increased brand-generic
connectivity seems to have led to a decrease in generic entry, as common investors have
both an incentive and the ability to delay or block generics from entering the market of a
brand.7
This paper is structured as follows: Section 2 provides a background of the
pharmaceutical industry and provides anecdotal evidence of investors’ influence in the
pharmaceutical industry. Section 3 presents our data and a descriptive analysis. Section 4
undertakes a network analysis of the common ownership links in the pharmaceutical
industry. Section 5 lays out the antitrust implications of common ownership in the
pharmaceutical industry. Section 6 concludes.
2. Background
Before analysing common ownership patterns and their implications, this section
provides a brief overview of the typical pharmaceutical “life-cycle” which is important
for understanding how the industry, and thus how competition and innovation therein,
7 The impact of brand-generic links through common ownership on generic entry is
confirmed in Newham et al. See Melissa Newham, Jo Seldeslachts & Albert Banal
Estañol, Common Ownership and Market Entry: Evidence from Pharmaceutical
Industry (DIW Berlin Discussion Paper No. 1738, 2018), available at
http://ssrn.com/abstract=3194394

8
works.8 We then provide a definition of common ownership, and a few examples. Finally,
we report anecdotal and empirical evidence illustrating that common investors weigh in
on pharma companies’ strategic decisions.
2.1. Pharmaceutical industry
To bring new drugs to the market pharmaceutical firms must make significant
investments in research and development. In the early stages of drug development,
pharmaceutical companies engage in “drug discovery” to search for and discover new
compounds to treat a specific disease. Given the public nature of the drug approval
process, patents are typically issued on novel pharmacological compounds quite early in
the drug development process. They cover the active compound in a specific formulation
and for specific indications.
After many iterations, the final compound becomes a drug candidate. Thereafter,
with one or more optimized compounds in hand, researchers turn their attention to
extensive preclinical testing. In pre-clinical tests the compound is tested for toxicity and
safety. After completion of pre-clinical tests pharmaceutical firms prepare for the next
critical stage in the innovation process—drug development through clinical trials on
humans. To be considered for FDA approval a drug must pass through three “phases” of
clinical trials. This is typically a lengthy and expensive process.
In general, the R&D process for each drug is centered around its intended
therapeutic area — the disease the drug should target (e.g. Diabetes type II) — and its
‘Mechanism of Action’ (MoA) —the biochemical process through which the drug
8 For a more detailed overview see Darius N. Lakdawalla, Economics of the
pharmaceutical industry, 56 J. ECON. LIT. 397 (2018).

9
produces the desired effect (e.g. SGLT2 inhibitors). The combination of the MoA within
a therapeutic area has been used in practice to define “relevant markets” in competition
enforcement — both at the innovation and launched product stages — as drugs herein can
typically be substituted by general practitioners and patients.
During the process of drug research and development there is competition in the
“innovation space.” Pharmaceutical companies engage in a race with other firms who are
working on compounds to treat the same disease with a similar MoA. As rivals are often
working in parallel on similar targets, often applying the same fundamental knowledge
sourced from open science, the solutions they come up with may be similar.
Pharmaceutical companies typically want to be the first to market with a drug that uses a
new type of technology in order to profit from a first-to-market advantage.
Companies that produce novel drugs must apply for FDA approval through the
new drug application (NDA) procedure. Drugs that are declared safe and effective, and
are successfully approved by the FDA, are then launched on the market. Novel “brand-
name” drugs are afforded a number of regulatory protections, including the patent on the
key compound or active ingredient, which provide the company with a monopoly for their
specific drug for a period of time. Nevertheless, once in the market, the drug will compete
with other treatments that are substitutable from a therapeutic perspective, although not
identical (“brand-brand” and/or “intermolecular” competition).
Once the regulatory protections afforded to the drug have expired, the market is
open for generic entry. Generic firms produce bioequivalent copies of brand drugs and
are typically much lower in price. The process by which generic manufacturers can seek
approval from the FDA is set out in the Hatch-Waxman Act. The act allows the generic
applicant to apply for FDA approval by filing an abbreviated new drug application
(ANDA) whereby the generic applicant can rely on the efficacy and safety data generated
10
by the original innovator. The Hatch–Waxman Act also provides incentives for generic
manufacturers to challenge patents in court, under “Paragraph IV.” Once launched on the
market, generic drugs compete directly with the brand drug as they are essentially the
same product (“intramolecular” competition9). In our analysis we distinguish between
“brand firms” that have R&D capabilities and launch new drugs, and “generic firms” that
primarily specialize in generic drugs.
In the US, drug prices are negotiated on between individual health insurance plans
and the pharmaceutical company. While consumers may face some out-of-pocket
expenditures for drugs, the cost of medical treatments is primarily paid by health
insurance companies. High prescription drug prices are a concern for policy makers.10 A
number studies do not find that “brand-brand” competition effectively lowers list prices.11
Generic competition, on the other hand is crucial for lowering prices. For products with
a single generic producer, the generic average market price is 39pct. lower than the brand
average market price before generic competition. With six or more competitors, generic
9 Tracy L. Regan, Generic entry, price competition, and market segmentation in the
prescription drug market. 26 INT’L J. INDUS. ORG. 930 (2008).
10 E.g. see, Hannah Kuchler, Why prescription drugs cost so much more in America,
September 19, 2019. FINANCIAL TIMES. Available at:
https://www.ft.com/content/e92dbf94-d9a2-11e9-8f9b-77216ebe1f17
11 See Ameet Sarpatwari, Jonathan DiBello, Marie Zakarian, Mehdi Najafzadeh, &
Aaron S. Kesselheim. Competition and price among brand-name drugs in the same
class: A systematic review of the evidence, 7 PLOS MEDICINE (2019).

11
prices show price reductions of more than 95pct. compared to brand prices.12
Accordingly, promoting generic entry is an important policy goal for the FDA.13
2.2. Institutional investors and common ownership
Common ownership exists when an investor has a stake in two or more firms.
Table 1 shows the top five investors in the three largest pharmaceutical companies —
which are all brand firms— that operate in US markets in the period 2004-2014 (see the
data section below for more details on our sample). From this table it is clear that there
are a number of institutional investors, such as Vanguard and State Street, that are
common owners with shareholdings in all three firms in both 2004 and 2014. BlackRock
holds the number one position, with a stake of 5-7pct., in all three companies in 2014 (in
2004 Barclays Global Investors, which was taken over by Blackrock in 2009, was number
one or two in all three companies). A comparison between 2014 with 2004 also shows
the growth of Vanguard, both in terms of the size of its shareholdings and position.
12 See FDA website, New Evidence Linking Greater Generic Competition and Lower
Generic Drug Prices, available at: https://www.fda.gov/about-fda/center-drug-
evaluation-and-research-cder/generic-competition-and-drug-prices
13 See FDA website, Statement from FDA Commissioner Scott Gottlieb, M.D., on new
policy to improve access and foster price competition for drugs that face inadequate
generic competition [Press release]. 19 February 2019. available at:
https://www.fda.gov/news-events/press-announcements/statement-fda-commissioner-
scott-gottlieb-md-new-policy-improve-access-and-foster-price-competition

12
Table 1: Top five investors in top brand firms
Johnson & Johnson
2004 2014 State Street Global 5pct. BlackRock 6pct. Barclays Global Investors 4pct. Vanguard Group 6pct. Fidelity Investments 3pct. State Street Global 5pct. Robert Wood Johnson Foundation 2pct. Royal Bank of Canada 2pct. Vanguard Group 2pct. Fidelity Investments 2pct.
Merck & Co 2004 2014 Barclays Global Investors 4pct. BlackRock 6pct. State Street Global 3pct. Capital World Investors 6pct. Fidelity Investments 3pct. Wellington Management 5pct. Vanguard Group 2pct. Vanguard Group 5pct. Capital Group 2pct. State Street Global 4pct.
Pfizer 2004 2014 Fidelity Investments 4pct. BlackRock 7pct. Barclays Global Investors 4pct. Vanguard Group 5pct. State Street Global 3pct. State Street Global 4pct. Vanguard Group 2pct. Capital World Investors 2pct. Wellington Management 2pct. Wellington Management 2pct.
Table 2 shows the top five investors in the three largest generic firms that operate
in US markets in 2004 and 2014. Here too we see that BlackRock is an important common
owner with shareholdings in Endo International and Perrigo in 2014. However, in
comparison to the relatively stable ownership structure of brand companies in Table 1,
we see more changes in the identity and size of the shareholdings of the top shareholders
in generic firms. We further note that, especially in 2004, the largest investor in each
company has a sizeable stake. For instance, Kelso & Company has a stake of 66pct. in
Endo in 2004, and J.P. Morgan Chase has a stake of 27pct. in Sun Pharmaceutical in 2004.
The largest shareholders in brand firms have much smaller stakes (around 5-6pct.).

13
Furthermore, the identity of these top investors is different to the top investors in the
largest brand firms, especially for Sun Pharmaceutical.
Table 2: Top five investors in top generic firms
Endo International
2004 2014
Kelso & Company 66pct
. Capital Group 10pct
. Black Diamond Capital 8pct. Janus Capital Group 9pct. Royce & Associates 6pct. BlackRock 7pct. Barclays Global Investors 4pct. Vanguard Group 6pct. Fidelity Investments 3pct. Blue Ridge Capital 4pct.
Perrigo 2004 2014
Wellington Management 13pct
. BlackRock 7pct.
Royce & Associates 10pct
. Vanguard Group 6pct. Jandernoa (Michael J) 9pct. Fidelity Investments 5pct. Barclays Global Investors 7pct. State Street Global 4pct. Perkins Investment 6pct. Wellington Managment 3pct.
Sun Pharmaceutical 2004 2014
J.P. Morgan Chase 27pct
. Shanghvi (Dilip Shantilal) 11pct
.
ABF España Gestión 14pct
. Viditi Investment 10pct
.
Arisaig Partners (Asia) 14pct
. Tejaskiran Pharmachem Industries 9pct.
Aberdeen Asset Management 14pct
. Family Investment 9pct. HDFC Asset Management 4pct. Quality Investment 9pct.
2.3. Institutional investors’ influence in pharma
Despite having shareholdings of “only” 5-7pct., there is growing evidence that
institutional investors such as BlackRock and Vanguard engage in active discussions with
company management and boards with a view to influence companies’ long-term

14
strategies.14 Specifically, in pharmaceutical markets, institutional investors with common
holdings can be seen to take an active interest in the strategic decisions of companies. We
now provide some anecdotal evidence of this.
In 2016, a group of representatives of major US institutional investors including
Fidelity Investments, T. Rowe Price. and Wellington Management called a meeting with
top biotech executives and pharma lobbyists to demand firm leaders do a better job
defending their pricing.15 The meeting took place at a hotel conference room in Boston.
In 2019, BlackRock stated in their annual stewardship report that they engaged with
a number of pharmaceutical companies including Abbott, Abbvie, Bristol-Myers Squibb,
Pfizer, Novartis, Merck, GlaxoSmithKline, Johnson & Johnson, Sanofi, Biogen,
Allergan, Teva Pharmaceutical and Takeda.16 Similarly, State Street reported in their
14 See, e.g. Joseph A. McCahery, Zacharias Sautner & Laura T. Starks, Behind the
Scenes: The Corporate Governance Preferences of Institutional Investors. 71 J. FIN.
2905 (2016); Nathan Shekita, Interventions by Common Owners (Working paper,
2020), available at: https://papers.ssrn.com/sol3/papers.cfm?abstract_id=3658726.
15 See Caroline Chen, Mutual Fund Industry to Drugmakers: Stand Up and Defend
Yourself, BLOOMBERG NEWS, 2016, available at
https://www.bloomberg.com/news/articles/2016-05-09/ top-funds-said-to-tell-pharma-
leaders-to-defend-drug-pricing.
16 See INVESTMENT STEWARDSHIP ANNUAL REPORT, BLACKROCK, 2019, available at
https://www.blackrock.com/corporate/literature/publication/blk-annual-stewardship-
report-2019.pdf.

15
2019 annual stewardship report that they engaged with 64 pharmaceutical companies.17
The head of corporate governance at State Street Global Advisors stated that “Our size,
experience, and long term outlook provide us with corporate access and allow us to
establish and maintain an open and constructive dialogue with company management and
boards.”18
More recently, in relation to the COVID-19 crisis, institutional investors have openly
pushed for firms to collaborate with rivals and share information. In April 2020, a number
of asset managers, including BlackRock and Fidelity, announced that “they want drug
companies to put aside any qualms about collaborating with rivals.”19 BlackRock held
talks with pharmaceutical companies to discuss ways to develop and deploy treatments
by “working with industry competitors.” Separately, a group of 50 investors with over
$2.5 trillion in assets requested that companies share their findings related to the vaccine
and agree not to enforce the relevant patents. Since then a number of alliances have
formed to collaborate on treatments and vaccines for COVID-19.
17 See STEWARDSHIP REPORT, STATE STREET, 2019 available at
https://www.ssga.com/library-content/products/esg/annual-asset-stewardship-report-
2018-19.pdf
18 See Rakhi Kumar, Passive investment, active ownership, STATE STREET, 2014,
available at https://www.ft.com/content/7c5f8d60-ba91-11e3-b391-00144feabdc0.
19 See Attracta Mooney and Donato Mancini, Drugmakers urged to collaborate on
coronavirus vaccine, FINANCIAL TIMES, April, 2020, available at
https://www.ft.com/content/ b452ceb9-765a-4c25-9876-fb73d736f92a; Matt Levine,
Investors Want a Cure, Not a Winner, BLOOMBERG, April, 2020, available at https:
//www.bloomberg.com/opinion/articles/2020-04-24/investors-want-a-cure-not-a-winner

16
Institutional investors have also been involved in merger decisions in the
pharmaceutical industry. BlackRock is reported to have actively pushed for a merger
between the pharmaceutical firms AstraZeneca and Pfizer. BlackRock, the largest
institutional shareholder in AstraZeneca and also a top five shareholder in Pfizer at the
time, “urged the British pharma giant’s board to eventually re-engage in talks with Pfizer
Inc. over a possible deal.”20
3. Data and descriptive statistics
Our data comprises of publicly owned pharmaceutical firms (of any country of
origin) that were active in the US pharmaceutical market between 2004 and 2014.21
Information on which firms are active in the US pharma market is obtained from the FDA
20 See Hester Plumridge, AstraZeneca Shareholder Backs Board Rejection of Pfizer Bid,
WALL STREET JOURNAL, 2014, available at https://www.wsj.com/articles/ astrazeneca-
shareholder-blackrock-sides-with-board-on-rejecting-pfizer-bid-1400791061; Phil
Serafin & Mary Childs, BlackRock Is Said to Encourage Pfizer-AstraZeneca Talks,
BLOOMBERG, 2014, available at https://www.bloomberg.com/news/articles/2014-05-
22/blackrock-is-said-to-encourage-pfizer-astrazeneca-talks
21 This is the same database as used in the paper of Newham et al. (2018). See Melissa
Newham, Jo Seldeslachts & Albert Banal Estañol, Common Ownership and Market
Entry: Evidence from Pharmaceutical Industry (DIW Berlin Discussion Paper No.
1738, 2018), available at: http://ssrn.com/abstract=3194394. The data ends in 2014 due
to the workload of dynamically assigning ultimate owners to subsidiaries; see also
footnote 23 and references therein.

17
Orange Book.22 We obtain the ownership structure of the companies in our sample from
the Thomson Global Ownership Database. This database includes holdings of each
shareholder in publicly listed firms for every year-quarter. For US-listed firms Thomson
Reuters collects ownership information from 13F, 13D and 13G filings, and forms 3, 4,
and 5. For companies listed outside the US, information is sourced from stock exchange
filings, trade announcements, company websites, company annual reports and financial
newspapers. For each firm, for each quarter, in the period 2004-2014 we extracted data
on the shareholders that own at least 1pct. of the shares of the firm, and computed yearly
ownership averages of each shareholder in each firm.
This dataset has considerable advantages over to Thomson’s Spectrum database
used by most other papers on US common ownership. The Thomson’s Spectrum database
is limited to 13F filings, which contains only large investors in US companies, whereas
some pharma companies are not listed on a US stock market. Moreover, the Thomson’s
Spectrum database shows holdings assigned to the owner that filed the 13F. This is what
is commonly referred to as an “as-filed view.” Our database utilizes a “money-manager
view.” With this view, the database combines together one or more filings to link the
holdings to the actual firm that manages the investments. In other instances, it might break
22 The FDA Orange Book provides data on all launched pharmaceutical products in the
United States. We drop conglomerates such as GE and Procter & Gamble from the
sample as these firms focus on multiple markets and have launched relatively few
pharmaceutical products given their large size. In total the sample consists of 157
distinct pharmaceutical firms.
18
apart a single filing in order to accomplish the same. The holdings would then be assigned
to one or more of the managers listed on the file.23
We use data from the FDA Orange Book to classify firms as “brand” or “generic”
firms based on the type of drug that they have launched in the past. For each company
and each year, we calculate the firm’s share of successful NDA applications (launched
brands) relative to successful ANDA applications (launched generics). If a company
operates subsidiaries, we aggregate drug counts at the parent company level. For each
year we calculate the share of generic drugs out of all drugs launched by each company.
Thereafter, we calculate the average generic share of each company during the years in
which the company was active, within the time span 2004 – 2014. We categorize
companies based on this measure. Firms with an average generic share of 90pct. or more
are classified as “generic firms.” Remaining firms are classified as “brand firms.”24 Our
dataset also contains information on the total market value of the firm.
23 For a detailed explanation of our data and dynamic assignment of ultimate owners,
see data repository:
https://www.openicpsr.org/openicpsr/project/120781/version/V1/view attached to the
paper Albert Banal-Estañol, Jo Seldeslachts & Xavier Vives. Diversification, Common
Ownership, and Strategic Incentives. 110 Amer. Econ. Rev. 561 (2020).
24 Our categorization aims to label “generic firms” as those firms that have limited R&D
capabilities and focus almost entirely on producing generic drugs. A number of firms
engage in the production of both brand and generic drugs, and may do so within the
same company or may separate the activities in different subsidiaries. For example,
while the company Novartis is primarily focused on developing brand drugs, its
subsidiary Sandoz produces generic medications. Hybrid firms, such as Novartis, that

19
Table 3 presents the ten largest common shareholders for our sample of brand
firms at the start of our sample (2004) and at the end of our sample (2014). Firstly, it is
clear that the largest common investor in 2004 is Barclays. Barclays has a stake of at least
1pct. in 48 brand companies in 2004. In our sample there are 85 brand firms in total in
2004, thus Barclays holds a stake of at least 1pct. in more than 50pct. of all brand firms
in 2004. In 2009 BlackRock and Barclays merged which had an impact on BlackRock’s
size. BlackRock moves from being number 6 in 2004 to being number 1 in 2014 with a
stake in 68 brand companies in 2014.
In our sample there are 86 brand firms in total in 2014, thus BlackRock holds a
stake of at least 1pct. in 79pct. of all brand firms in 2014. In the firms where BlackRock
has an ownership stake of at least 1pct., the size of their stake is 2pct. on average in 2004,
and increases to 6pct. in 2014. This is enough to place BlackRock as the largest
shareholder in 14 companies in 2014 (up from 1 company in 2004). It is also evident that
there has been very little change in the identity of the top five largest common owners for
brand firms (apart from Barclays changing into Blackrock due to its merger). The top
owners are BlackRock (Barclays), Fidelity Investments, State Street Global, Vanguard
Group and Wellington Management.
Table 3: Top 10 common investors in brand firms
have strong R&D capabilities and have an average generic share of less than 90pct., are
classified as brand firms in our analysis. Our data shows that these hybrid companies
show very similar common ownership patterns to the pure brand companies, which is
why we classify them together.

20
Investor No. of shareholdings >1pct.
No. of shareholdings >5pct.
Average size of shareholding
No. of companies where investor is the largest
2004 Barclays Global Investors 48 4 3pct. 1 Fidelity Investments 41 16 5pct. 11 State Street Global 41 2 2pct. 2 Vanguard Group 39 0 2pct. 0 Wellington Management 31 11 5pct. 6 BlackRock 25 0 2pct. 1 Capital Group 24 11 6pct. 5 Northern Trust Global 23 0 1pct. 0 HarbourVest Partners 23 3 4pct. 2 Deutsche Bank 21 0 2pct. 0
2014
BlackRock 68 46 6pct. 14 Vanguard Group 65 32 4pct. 2 Fidelity Investments 53 26 5pct. 9 State Street Global 48 4 4pct. 1 Wellington Management 32 13 5pct. 3 Northern Trust Global 29 0 1pct. 0 Invesco 23 4 4pct. 1 T. Rowe Price 23 9 5pct. 3
Mellon Financial Corporation 21 0 1pct. 0 Royal Bank of Canada 19 1 2pct. 0
Table 4 presents the ten largest common shareholders for our sample of generic
firms at the start of our sample (2004) and at the end of our sample (2014). Comparing
Table 4 to Table 3, we can see some clear differences in terms of the identity and size of
the holdings of the common investors. Among the top common investors in 2004 is
Franklin Templeton (with an average shareholding of 9pct.), UTI Asset Management
(with an average shareholding of 24pct.) and HSBC Holdings (with an average
shareholding of 12pct.). Thus, in 2004 we find that common investors in generic firms
have large shareholdings in a selective set of firms. In 2014, these common investors with

21
large stakes disappear or take a cut in the average size of their shareholding. For example,
in 2014, the average shareholding size of Franklin Templeton declines to 5pct.. Common
investors have less coverage of generic firms in comparison to brand firms. In our sample
there are a total of 29 generic firms in 2004, and 35 generic firms in 2014. Vanguard and
BlackRock — the two largest common investors in generic firms in 2014 — have stakes
in 11 generic pharmaceutical firms (31pct. of all generic companies).
Table 4: Top 10 common investors in generic firms
Investor No. of shareholdings >1pct.
No. of shareholdings >5pct.
Average size of shareholding
No. of companies where investor is the largest
2004
Franklin Templeton 14 4 9pct. 2 UTI Asset Management 12 9 24pct. 6 Fidelity Investments 8 1 3pct. 1 Vanguard Group 8 0 2pct. 0 HSBC Holdings 8 5 12pct. 1 Barclays Global Investors 8 2 5pct. 0 State Street Global 7 0 2pct. 0 Invesco 6 0 2pct. 0 Reliance Capital 6 3 8pct. 0 J.P. Morgan Chase 6 3 10pct. 1
2014
Vanguard Group 11 4 4pct. 0
BlackRock 11 7 5pct. 2
Fidelity Investments 9 1 3pct. 0
State Street Global 7 0 3pct. 0 Dimensional Fund Advisors 7 0 2pct. 0
22
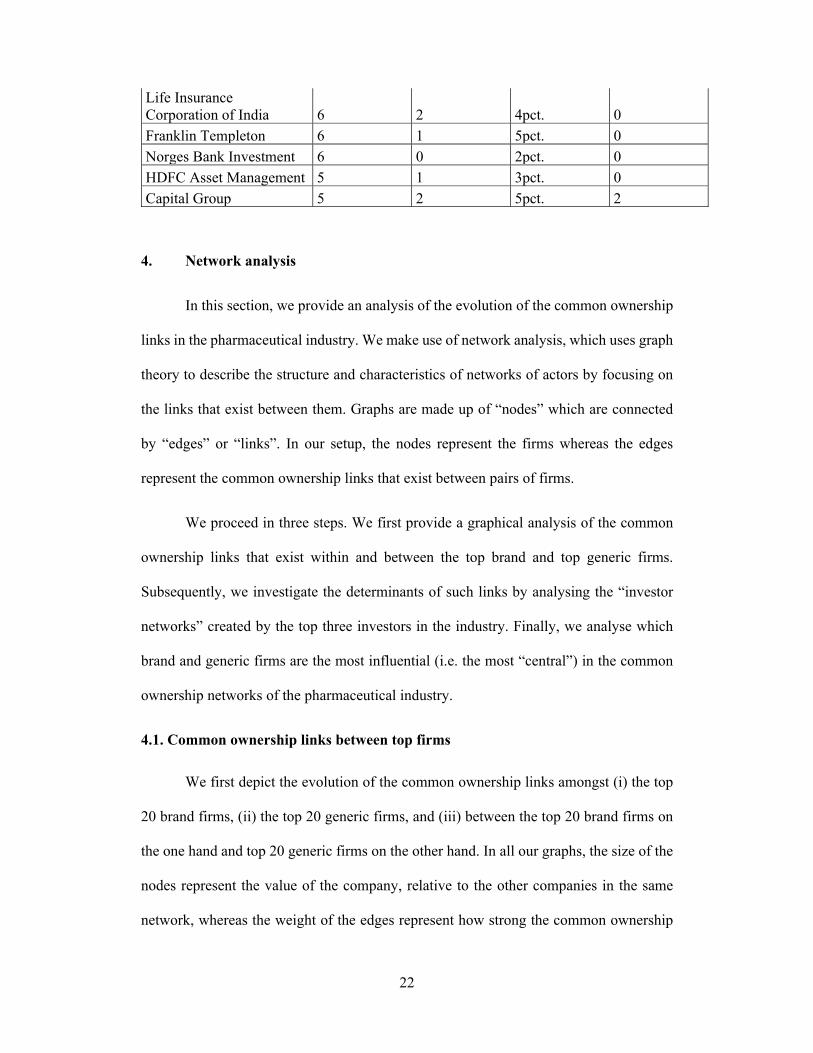
Life Insurance Corporation of India 6 2 4pct. 0
Franklin Templeton 6 1 5pct. 0
Norges Bank Investment 6 0 2pct. 0
HDFC Asset Management 5 1 3pct. 0
Capital Group 5 2 5pct. 2
4. Network analysis
In this section, we provide an analysis of the evolution of the common ownership
links in the pharmaceutical industry. We make use of network analysis, which uses graph
theory to describe the structure and characteristics of networks of actors by focusing on
the links that exist between them. Graphs are made up of “nodes” which are connected
by “edges” or “links”. In our setup, the nodes represent the firms whereas the edges
represent the common ownership links that exist between pairs of firms.
We proceed in three steps. We first provide a graphical analysis of the common
ownership links that exist within and between the top brand and top generic firms.
Subsequently, we investigate the determinants of such links by analysing the “investor
networks” created by the top three investors in the industry. Finally, we analyse which
brand and generic firms are the most influential (i.e. the most “central”) in the common
ownership networks of the pharmaceutical industry.
4.1. Common ownership links between top firms
We first depict the evolution of the common ownership links amongst (i) the top
20 brand firms, (ii) the top 20 generic firms, and (iii) between the top 20 brand firms on
the one hand and top 20 generic firms on the other hand. In all our graphs, the size of the
nodes represent the value of the company, relative to the other companies in the same
network, whereas the weight of the edges represent how strong the common ownership

23
connections are. We make use of two common ownership measures, which determine
links on the basis of (i) individual levels or (ii) joint levels of ownership.25
4.1.1 Common ownership networks among brand firms
Figure 1 provides a comparison of the network structure of the 20 most valuable
(“top 20”) brand firms, which are also the 20 most valuable firms overall, at the beginning
and end of the sample period, i.e. in 2004 and 2014 (Panels A and B, respectively). To
ease the comparison, we depict the firms that were in the top 20 in both years in the same
position (in green circles). We also include the top 20 companies in 2004 that drop from
the top 20 by 2014 (in blue diamonds) and, vice-versa, those that appear in the top 20 in
2014 but were not in the top 20 in 2004 (in purple diamonds). As a measure of the
common ownership link between two firms, we compute the number of individual
investors whose ownership stake is larger than 5pct. in both firms, i.e. the number of
common investors with more than 5pct. in both firms. A link between two firms exists if
they have at least one such common investor. The weight of the link between two firms
depends on the number of such common investors that the two firms share.26
25 All network plots are made using “nwcommands” See Thomas U. Grund,
nwcommands: Software Tools for the Statistical Modeling of Network Data in Stata
(2014). Available at: http://nwcommands.org
26 In formal terms, and denoting by 𝑠 , the ownership share of an investor i in firm j, the
“weight” of the link between any pair of firms j and j’ is given by
∑ І 𝑚𝑖𝑛 𝑠 , , 𝑠 , 0.05 where І 𝑥 is the indicator function that takes a value of 1
if the condition x is satisfied and a value of 0 if it is not. If the weight is 0 the link
between the pair of firms does not exist.

24
Figure 1: Common ownership network of the top 20 brand firms - Individual
ownership
Panel A: 2004

25
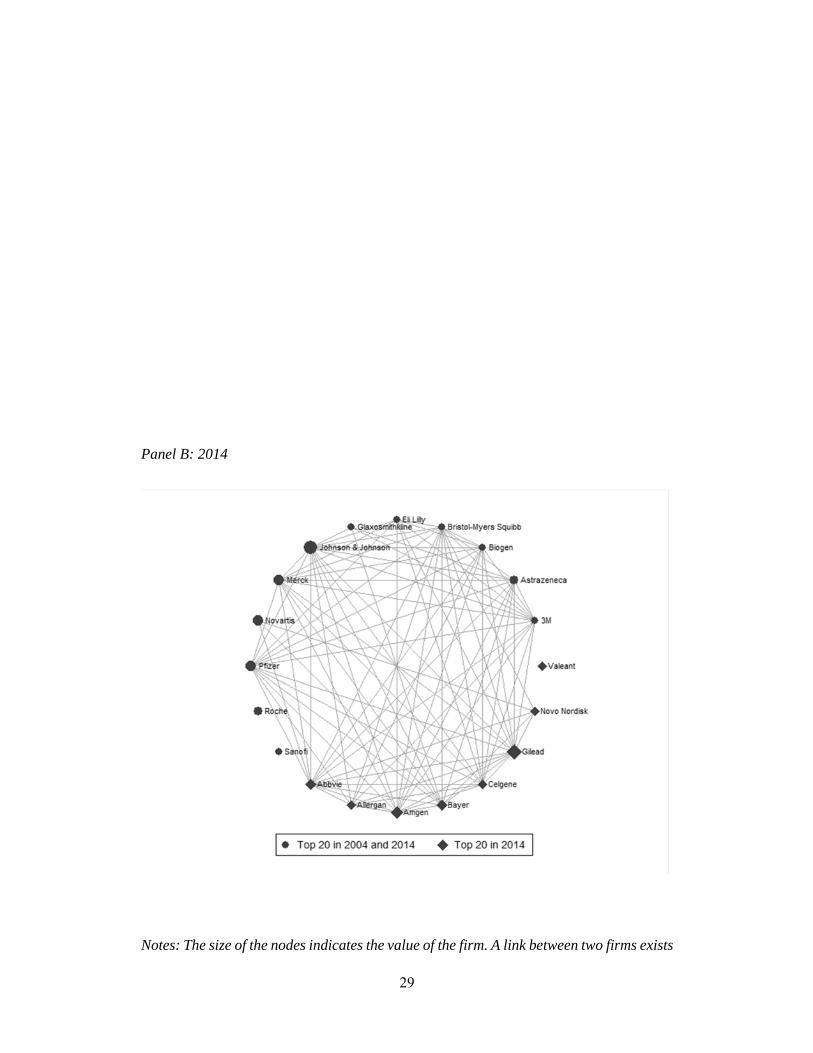
Panel B: 2014
Notes: The size of the nodes indicates the value of the firm. The weight (thickness) of the
edges represents the strength of the connections. A link between two firms exists if they
have at least one common investor with more than 5pct. in both firms. The weight of the

26
link between two firms depends on the number of such common investors that the two
firms share.
Figure 1 shows that the top brand firms have become more connected over time,
according to this measure of common ownership. As shown by Panel A, several pairs of
firms already had common investors, i.e. with more than 5pct. in both firms, in 2004. But
the links that existed in 2004 had relatively low weight, i.e. the firms have few investors
in common. Some of the largest firms, such as Pfizer or GlaxoSmithKline, had no
connections at all. There are, however, some firms that are highly connected. Perhaps
surprisingly, the most connected firms, such as Baxter or Cardinal, or the ones with
stronger links, such as Biogen and Forest, are relatively small within the set of top-20
companies. Similarly, if anything, most of the (smaller) firms that drop from the top 20
by 2014 are more connected than those that remain.27 In sum, the network in 2004 is not
only sparser as compared to 2014, but also more asymmetric.
As shown by Panel B, the network becomes almost fully connected by 2014. Some
firms, such as Pfizer, go from having no connection in 2004 to being almost fully
connected with all the other firms in 2014. The connections between firms also become
stronger. For example, in 2014 Johnson & Johnson and 3M have three common investors
with more than 5pct. in both firms. Interestingly though, some firms, such as Sanofi,
Novartis and Roche, remain without any links in 2014. Although to some extent present,
27 The majority of companies that exit the top 20 in 2014 were acquired. Schering
Plough was acquired by Merck in 2009. Genentech was acquired by Roche in 2009.
Forest was acquired by Actavis (now Allergan) in 2014. Novartis acquired a majority
stake in Alcon in 2010. Wyeth was acquired by Pfizer in 2009. Abbott, Cardinal and
Baxter still exist as independent companies.

27
the institutional investors in these firms have ownership stakes that do not reach the 5pct.
threshold, in part because of the presence of large non-common investors such as L’Oreal
in Sanofi, the Sandoz Family and the Novartis foundation in Novartis, and Novartis itself
as a shareholder in Roche. In sum, top brand firms become, according to the individual
measure of ownership, more connected over time with a few notable exceptions.
Figure 2 shows the network for a measure of joint ownership of the common
investors. This measure compares the ownership stakes of all the common investors in
relation to the ownership stakes of all the investors in our database. We consider two
companies linked if the common investors (>1pct. in the two firms) own, on average, in
the two firms, more shares than the non-common investors (>1pct. in just one of the two
firms); that is, if the sum of the ownership stakes of all the common investors is greater
than 50pct.. Note that there is no measure of the strength of the links in this network; the
link just exists or not (in this sense, it is an example of an “unweighted network”). We
make use of the same set of top 20 most valuable brand firms in 2004 and 2014, as in
Figure 1.28
28 In formal terms, and denoting by 𝑠 , the ownership share of an investor i in firm j, a
link between any pair of firms j and j’ exists if ∑ 𝑠 , 𝑠 , /2 0.5∈ where 𝐶 is
the set of “common investors” in that pair of firms j and j’, i.e. those investors i with
ownership stakes such that 𝑚𝑖𝑛 𝑠 , , 𝑠 , 0.01.

28
Figure 2: Common ownership network of the top 20 brand firms - Joint ownership
Panel A: 2004
29
Panel B: 2014
Notes: The size of the nodes indicates the value of the firm. A link between two firms exists

30
if the common investors (>1pct. in the two firms) own, on average, in the two firms, more
shares than the non-common investors (>1pct. in just one of the two firms).
Figure 2 shows that the common investors own more than half of all the (large)
shareholders in many pairs of firms, both in 2004 (Panel A) and 2014 (Panel B). The
network becomes even more connected over time. Novartis, for instance, had no
connections in 2004. But, in 2014, the common investors of Novartis and Bayer, for
instance, have more than 50pct. of the shares in both firms; the two firms become thus
connected according to our joint measure. This is true despite the fact that Novartis and
Bayer do not share any single individual investor holding more than 5pct. in both firms
(as shown in Figure 1 Panel B). In general, though, we observe a less dramatic change
when using the joint measure of common ownership than the individual one. Thus, the
effects of the evolution of common ownership may depend on whether common investors
have individual influence or if they do (or can) exert joint influence. For both measures,
some firms, such as Sanofi and Roche, remain without any links in 2014.
4.1.2 Common ownership networks among generic firms
Figure 3 replicates the network analysis of Figure 1 for the 20 most valuable
generic firms. First, we again use the number of common investors whose ownership
stake is larger than 5pct. in both firms as our measure of a common ownership link.
Figure 3: Common ownership network of the top 20 generic firms – Individual
ownership
Panel A: 2004

31
Panel B: 2014
32
Notes: The size of the nodes indicates the value of the firm. The weight (thickness) of the
edges represents the strength of the connections. A link between two firms exists if they
have at least one common investor with more than 5pct. in both firms. The weight of the
link between two firms depends on the number of such common investors that the two
firms share.
Figure 3 shows that the generic firms, contrary to the brand firms in Figure 1,
became less connected in 2014 relative to 2004. Sun Pharma, for instance, lost all the
connections it had in 2004, despite the fact that it became relatively larger. Overall, the
level of connectivity of the generic firms is substantially lower than the brands in both
years. Whereas the top brands are almost fully connected in 2014, the network of the
generic firms is sparse. Very few firms have connections with other firms, and even fewer
have connections with more than one investor. Only Perrigo, Impax and Endo have
relatively strong links with each other.
Figure 4 shows the generic network of common ownership using the joint
shareholding measure. We again take into account the ownership stakes of all the
common investors in relation to the ownership stakes of all the investors in our database.
We consider two companies linked if the sum of the ownership stakes of all the common
investors in the two firms is, on average, greater than 50pct..
Figure 4: Common ownership network of the top 20 generic firms – Joint ownership
Panel A: 2004

33
Panel B: 2014
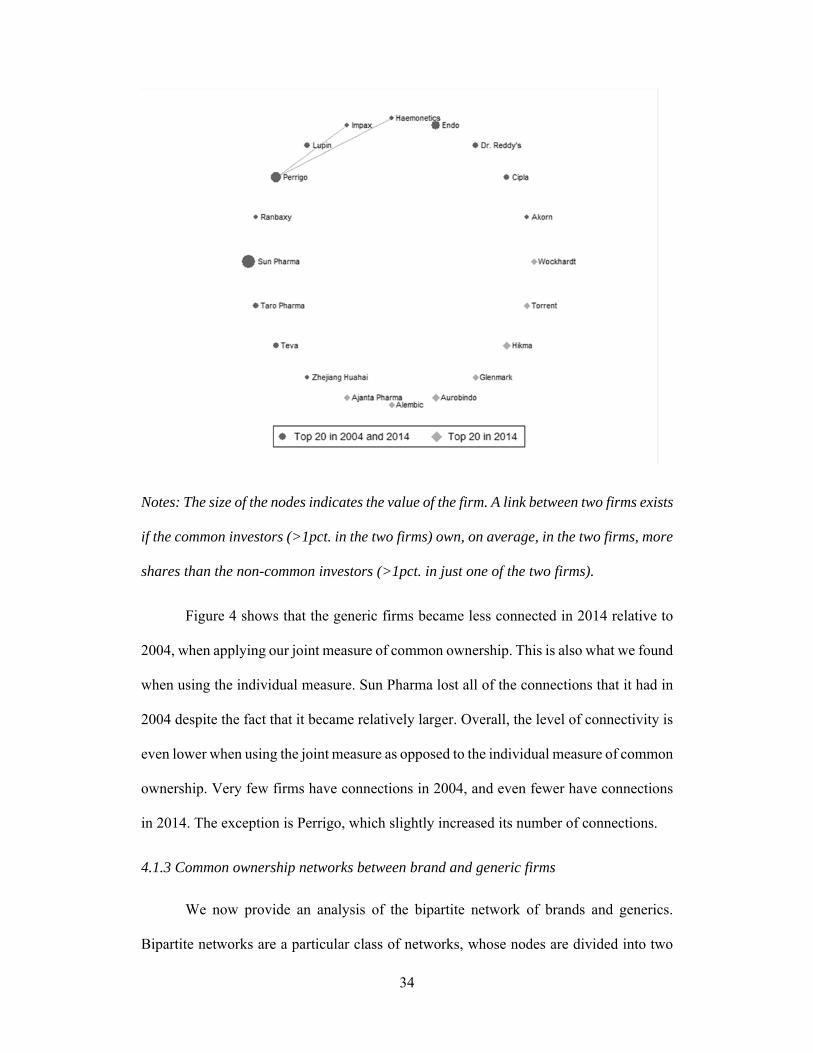
34
Notes: The size of the nodes indicates the value of the firm. A link between two firms exists
if the common investors (>1pct. in the two firms) own, on average, in the two firms, more
shares than the non-common investors (>1pct. in just one of the two firms).
Figure 4 shows that the generic firms became less connected in 2014 relative to
2004, when applying our joint measure of common ownership. This is also what we found
when using the individual measure. Sun Pharma lost all of the connections that it had in
2004 despite the fact that it became relatively larger. Overall, the level of connectivity is
even lower when using the joint measure as opposed to the individual measure of common
ownership. Very few firms have connections in 2004, and even fewer have connections
in 2014. The exception is Perrigo, which slightly increased its number of connections.
4.1.3 Common ownership networks between brand and generic firms
We now provide an analysis of the bipartite network of brands and generics.
Bipartite networks are a particular class of networks, whose nodes are divided into two

35
sets, and only connections between two nodes in different sets are allowed. As in the
previous analysis, we use two measures of common ownership: (i) individual ownership,
where the links reflect the number of investors whose ownership stake is larger than 5pct.
in both firms, and (ii) joint ownership, where a link exists if the sum of the ownership
stakes of all the common investors is greater than 50pct.. Note again that the size of the
nodes represents the value of the firm relative to the firms in the same network.
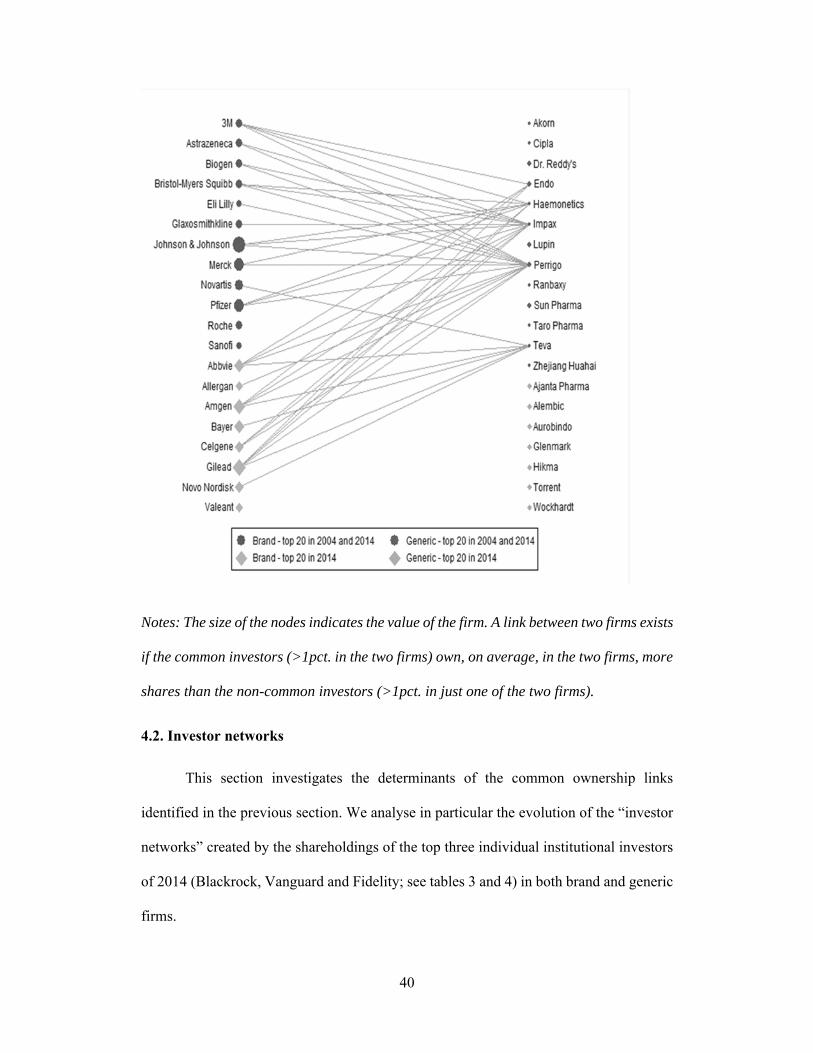
Figure 5: Bipartite network of brands and generics – Individual ownership
Panel A: 2004
36
Panel B: 2014

37
Notes: The size of the nodes indicates the value of the firm. The weight (thickness) of the
edges represents the strength of the connections. A link between two firms exists if they
have at least one common investor with more than 5pct. in both firms. The weight of the
link between two firms depends on the number of such common investors that the two
firms share.
Figure 5 shows that the brands and the generics became significantly more
connected over time when looking at individual levels of ownership. As shown by Panel
A, most brand-generic pairs were not connected in 2004, and in case they were, they only
had one investor in common. Even the largest brands, such as Pfizer, had zero connections
with the generics. Instead, as shown by Panel B, the number and the strength of the

38
connections between brands and generics increased in 2014. Most of the large brands,
such as Johnson & Johnson and Pfizer, have a large number of links. Some generics, such
as Impax and Perrigo, have a high number of connections too.
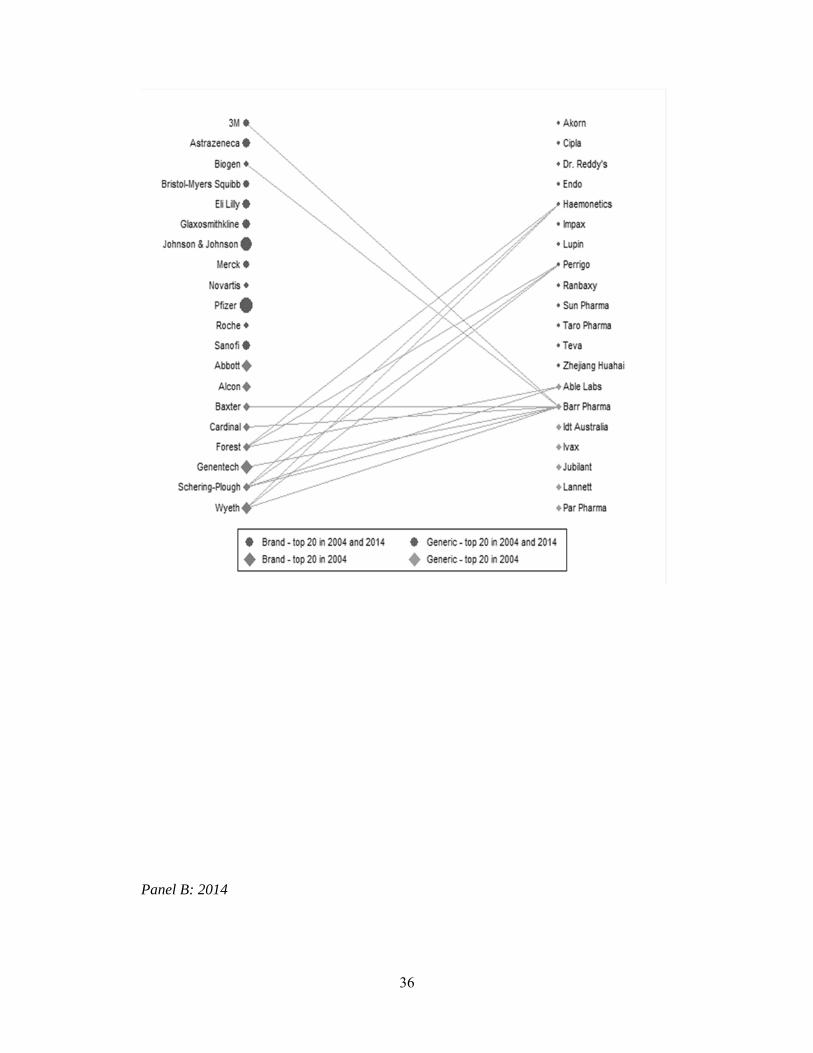
Figure 6 shows that, when considering common ownership networks based on the
joint measure, the same pattern emerges. Whereas in 2004 there were very few links
between brand and generic companies, in 2014, these links were much more numerous
(although fewer when compared to the common ownership network based on individual
ownership).
Figure 6: Bipartite network of brands and generics – Joint ownership
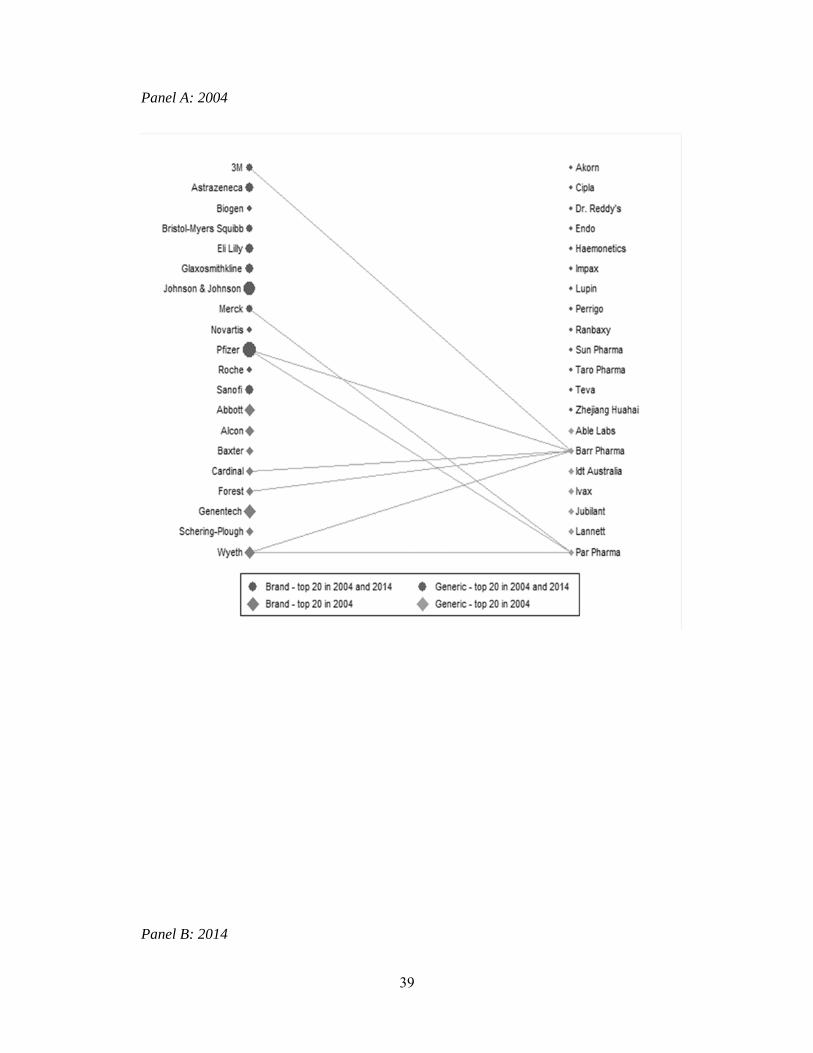
39
Panel A: 2004
Panel B: 2014
40
Notes: The size of the nodes indicates the value of the firm. A link between two firms exists
if the common investors (>1pct. in the two firms) own, on average, in the two firms, more
shares than the non-common investors (>1pct. in just one of the two firms).
4.2. Investor networks
This section investigates the determinants of the common ownership links
identified in the previous section. We analyse in particular the evolution of the “investor
networks” created by the shareholdings of the top three individual institutional investors
of 2014 (Blackrock, Vanguard and Fidelity; see tables 3 and 4) in both brand and generic
firms.
41
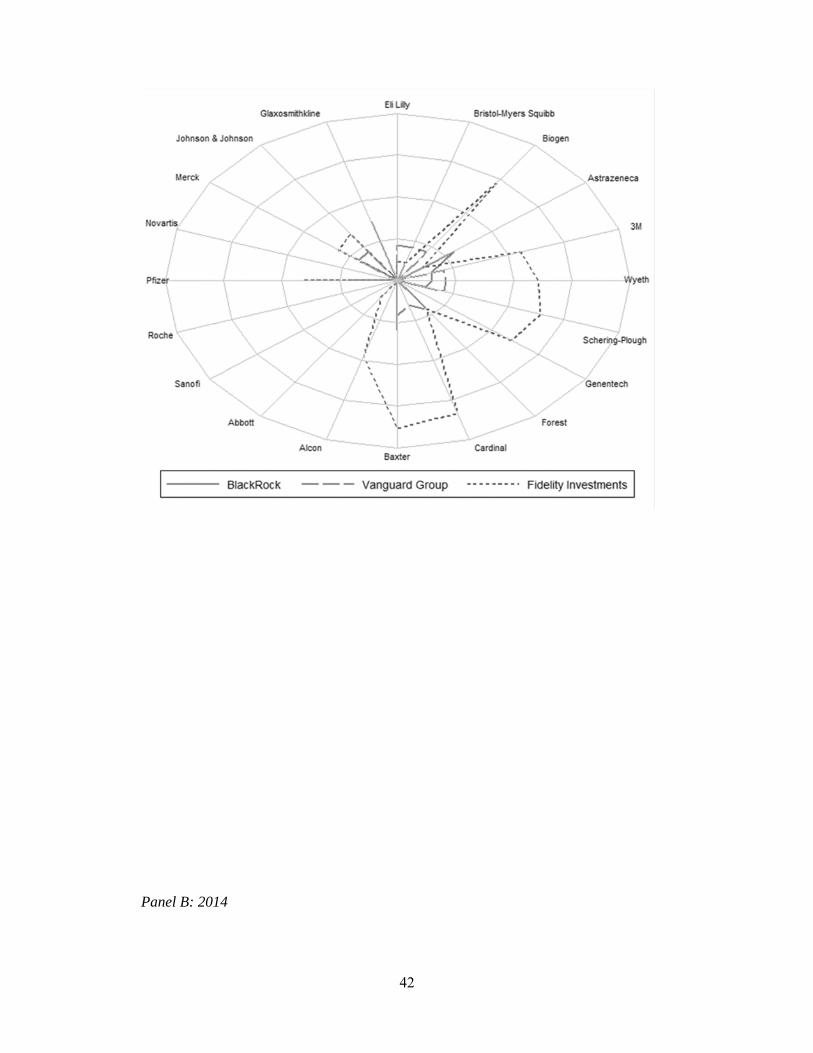
4.2.1 Brand firms’ investor network
Figure 7 represents the investor networks of Blackrock, Vanguard and Fidelity in
the top 20 brand firms, in the beginning (2004) and end of our sample (2014),
respectively. Each figure shows a “radar plot” of the ownership stakes. The axis tick
marks represent the levels of 2.5pct., 5pct., 7.5pct. and 10pct..29
Figure 7: Investor networks in brand firms
Panel A: 2004
29 All radar plots are made using “RADAR”: Adrian Mander, 2007. "RADAR: Stata
module to draw radar (spider) plots," Statistical Software Components S456829, Boston
College Department of Economics, revised 02 Sep 2018.
42
Panel B: 2014

43
Notes: The axis tick marks for each circle represent shareholding levels of 2.5pct., 5pct.,
7.5pct. and 10pct.
A comparison of Panel A with Panel B shows the significant growth of Blackrock
and Vanguard over time. Blackrock’s growth is partly due to the merger with Barclays
Global Investors in 2009. In 2004, Blackrock only had ownership stakes below 5pct.. In
2014 Blackrock owns significant stakes in many of the top pharmaceutical companies,
usually in the range of 5-7.5pct., but in some cases even close to 10pct.. In 2004,
Vanguard’s stakes are all below 2.5pct.. In 2014, Vanguard’s ownership stakes are
consistently around 5pct..
Fidelity owns a much lower number of blocks than Vanguard and BlackRock,
although they tend to be of a larger size in 2004. The holdings of Fidelity appear more

44
stable over time and have not experienced the same growth as Vanguard and BlackRock,
which have surpassed Fidelity in both number and average size of holdings.
4.2.2 Generic firms’ investor network
Figure 8 represents the investor networks of the top three investors in the top 20
generic firms in 2004 and 2014, respectively.
Figure 8: Investor networks in generic firms
Panel A: 2004

45
Panel B: 2014
Notes: The axis tick marks for each circle represent shareholding levels of 2.5pct., 5pct.,
7.5pct. and 10pct.
Comparing Figure 8 with Figure 7 shows much smaller investor networks in the
generics than in the brands. While increasing over time, in 2014 Blackrock and Vanguard
own significant stakes in just five of the top 20 generic firms. Fidelity owns even fewer
and smaller blocks in 2014 than it did in 2004.
4.3. Centrality in the brand and generic networks
We now analyse which are the most influential brand and generic firms in their
respective common ownership networks. In network analysis, influence is measured by
46
how “central” an individual node’s position is in the network, based on the existence and
strength of its links with other nodes.30
We proceed as follows. We first provide a definition of two standard measures of
centrality: degree and closeness centrality. As both of them depend on network size,
throughout this section, we consider the network of the 85 most valuable brands and the
network of the 25 most valuable generics in each year. Although the identity of the firms
in each network changes over time, the number (and thus the size of the network) remains
constant throughout the sample period.
We then provide a description of the centrality measures of the top 20 brand and
top 20 generic firms within each of their networks, both at the beginning and end of the
sample. Finally, we show the evolution of the mean and dispersion of the measure of
degree centrality for the whole set of firms in each of the two networks.
4.3.1 Definitions
We construct two centrality measures based on the concepts of degree and closeness
centrality. These concepts capture slightly different aspects of the firms’ roles in the
common ownership network. We provide a definition of each:
Degree centrality measures the number of relationships an actor in the network
has. The more ties, the more opportunities to interact and so the more influential,
or central, the actor is. Firms that have ties to many other firms may be in an
advantaged position. Since they have many ties, they are less dependent on any
30 See Linton C. Freeman. A set of measures of centrality based on betweenness.
SOCIOMETRY 35 (1977); Linton C. Freeman. Centrality in social networks conceptual
clarification. 1 SOC. NETWORKS 215 (1978).

47
other firm for information, for instance. Formally, degree centrality counts the
number of unique ties each firm has; that is, the number of unique firms with
which a firm has a link with. Naturally, as networks become more connected, the
average degree centrality across firms increases.
Closeness centrality is a measure based on the distance between nodes.31 Nodes
with high closeness centrality are close to all other nodes, that is, they can reach
all other nodes in only a few steps. In contrast, nodes with low closeness centrality
are far away from all other nodes. For unconnected nodes, we set the distance to
all the other nodes as the maximum distance in the network plus 10.
4.3.2. Firm-level and mean centrality measures
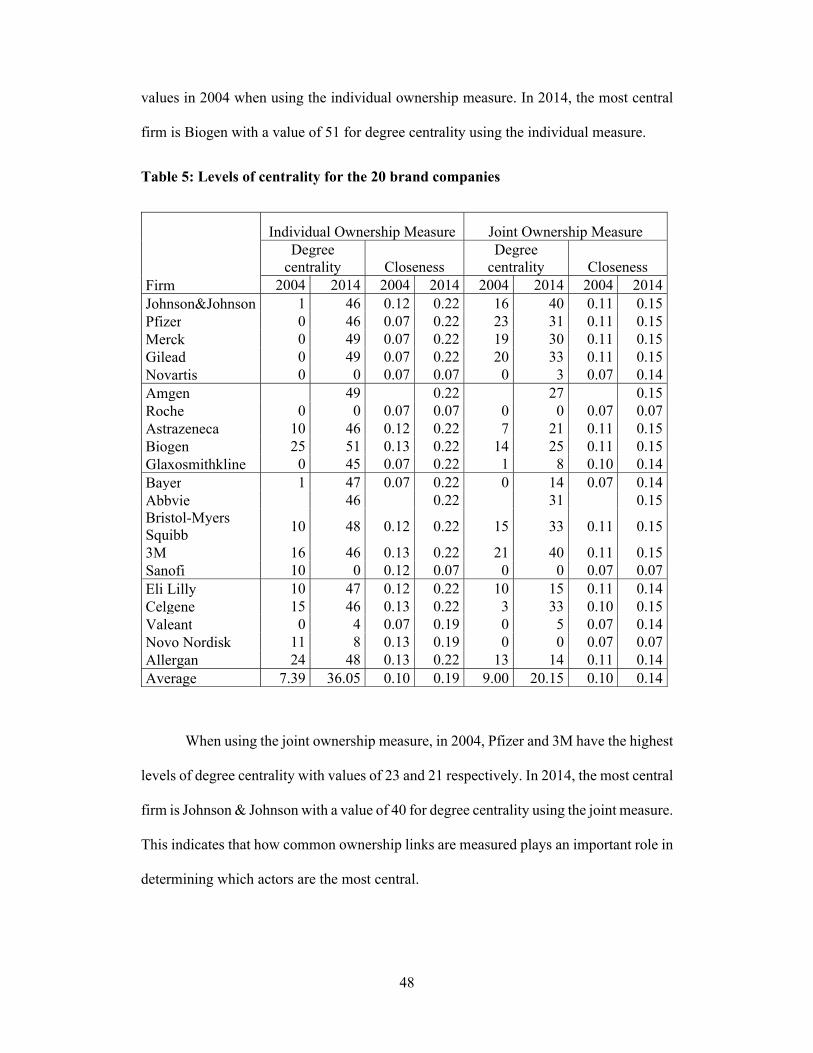
Table 5 shows the average degree and closeness centrality for each top 20 brand
company (calculated within the sample of 85 firms in the brand network), as compared
to the levels in 2004. The average value at the bottom of the table is the average amongst
the top 20 brand companies. We order firms by their size (market value) in 2014. We
again make use of the two measures of common ownership: individual and joint
ownership.
As we can see in Table 5, the average degree centrality for both ownership
measures has more than doubled between 2004 and 2014. There are differences in which
firms are the most central depending on the measure used. If we focus on the individual
ownership measure, in 2004, Biogen and Allergan have the highest levels of degree
centrality with values of 25 and 24 respectively. These two firms also have high closeness
31 For a formal definition see Section 13.2 in Thomas U. Grund (2014). nwcommands:
Software Tools for the Statistical Modeling of Network Data in Stata.
48
values in 2004 when using the individual ownership measure. In 2014, the most central
firm is Biogen with a value of 51 for degree centrality using the individual measure.
Table 5: Levels of centrality for the 20 brand companies
Individual Ownership Measure Joint Ownership Measure
Degree
centrality Closeness Degree
centrality Closeness Firm 2004 2014 2004 2014 2004 2014 2004 2014 Johnson&Johnson 1 46 0.12 0.22 16 40 0.11 0.15 Pfizer 0 46 0.07 0.22 23 31 0.11 0.15 Merck 0 49 0.07 0.22 19 30 0.11 0.15 Gilead 0 49 0.07 0.22 20 33 0.11 0.15 Novartis 0 0 0.07 0.07 0 3 0.07 0.14 Amgen 49 0.22 27 0.15 Roche 0 0 0.07 0.07 0 0 0.07 0.07 Astrazeneca 10 46 0.12 0.22 7 21 0.11 0.15 Biogen 25 51 0.13 0.22 14 25 0.11 0.15 Glaxosmithkline 0 45 0.07 0.22 1 8 0.10 0.14 Bayer 1 47 0.07 0.22 0 14 0.07 0.14 Abbvie 46 0.22 31 0.15 Bristol-Myers Squibb
10 48 0.12 0.22 15 33 0.11 0.15
3M 16 46 0.13 0.22 21 40 0.11 0.15 Sanofi 10 0 0.12 0.07 0 0 0.07 0.07 Eli Lilly 10 47 0.12 0.22 10 15 0.11 0.14 Celgene 15 46 0.13 0.22 3 33 0.10 0.15 Valeant 0 4 0.07 0.19 0 5 0.07 0.14 Novo Nordisk 11 8 0.13 0.19 0 0 0.07 0.07 Allergan 24 48 0.13 0.22 13 14 0.11 0.14 Average 7.39 36.05 0.10 0.19 9.00 20.15 0.10 0.14
When using the joint ownership measure, in 2004, Pfizer and 3M have the highest
levels of degree centrality with values of 23 and 21 respectively. In 2014, the most central
firm is Johnson & Johnson with a value of 40 for degree centrality using the joint measure.
This indicates that how common ownership links are measured plays an important role in
determining which actors are the most central.
49
Table 5 also shows that many of the top 20 brand firms have a similar number of
connections in 2014 based on the measure degree centrality for the individual measure
i.e. levels of degree centrality lie between 46 and 51. Still, some others, including large
firms such as Novartis and Roche, are not connected at all and thus have a level of degree
centrality of 0, both in 2004 and in 2014. The levels of degree centrality in 2004 were
substantially lower than in 2014: Johnson & Johnson had one connection whereas Pfizer
had none.
The differences across firms in terms of closeness centrality for both measures are
lower than for degree centrality. In addition, the differences between 2004 and 2014 are
smaller in the case of closeness than in the case of degree centrality.
Table 6 shows the degree and closeness centrality of the top 20 generic firms
within the 25-generic firm network in 2014, as compared to the levels of 2004. We again
order firms by 2014 market value, and include the averages at the bottom of the table.
The levels of degree centrality for the generics are substantially lower than for the
brand firms. For both measures, many generics have a degree of zero in 2014, including
the largest generic firm in our sample, Sun Pharma. The generic firm with most
connections in 2014, Endo, has 7 when using the individual measure, i.e. 29pct. of the
maximum number of connections possible in the generic network (24). By comparison,
15 out of the top 20 brand firms have more than 45 connections, i.e. 54pct. of the
maximum number of connections possible in the brand network (84). Moreover, the
average degree of centrality of generics is lower in 2014 than it was in 2004.

50
Table 6: Levels of centrality for the 20 generic companies
Individual Ownership Measure Joint Ownership Measure
Degree
centrality Closeness Degree
centrality Closeness Firm 2004 2014 2004 2014 2004 2014 2004 2014 Sun Pharma 3 0 0.10 0.08 4 0 0.11 0.08 Perrigo 3 6 0.08 0.11 0 2 0.08 0.09 Endo 1 7 0.08 0.11 0 0 0.08 0.08 Lupin 6 0 0.10 0.08 5 0 0.11 0.08 Dr. Reddy's 0 0 0.07 0.08 0 0 0.08 0.08 Teva 0 1 0.07 0.11 0 0 0.08 0.08 Cipla 6 1 0.10 0.09 6 0 0.11 0.08 Hikma 0 0.08 0 0.08 Taro Pharma 1 0 0.08 0.08 0 0 0.08 0.08 Ranbaxy 6 1 0.10 0.09 6 0 0.11 0.08 Aurobindo 5 0 0.10 0.08 4 0 0.11 0.08 Akorn 0 6 0.07 0.11 0 0 0.08 0.08 Glenmark 0 0.08 0 0.08 Torrent 6 0 0.10 0.08 6 0 0.11 0.08 Haemonetics 2 6 0.08 0.11 0 1 0.08 0.09 Impax 0 6 0.07 0.11 0 1 0.08 0.09 Wockhardt 6 0 0.10 0.08 5 0 0.11 0.08 Zhejiang Huahai 0 0 0.07 0.08 0 0 0.08 0.08 Alembic 0 0.08 0 0.08 Ajanta Pharma 0 0.08 0 0.08 Average 2.81 1.70 0.09 0.09 2.25 0.20 0.09 0.08
In sum, the measures of centrality are substantially higher in 2014 as compared to
2004 for the brand firms. For the generic firms, the opposite is true. Degree centrality is
not only much lower than for the brand firms in both years, but it is also lower in 2014
than it was in 2004. In the following subsection, we investigate more systematically the
evolution, over time, of average degree centrality for both measures of ownership.
4.3.3. Evolution of the mean and dispersion of the centrality measures over time
We now investigate the evolution of the mean and dispersion of centrality over
time in the brand and generic networks. We again make use of the two measures of
common ownership: individual and joint ownership. For simplicity, we focus on one of

51
the measures of centrality, degree centrality (the pattern is similar for closeness
centrality).
Figure 9 shows the average degree centrality for the 85 brand and the 25 generic
companies over the 2004-2014 period (brand on the right axis, and generics on the left),
for the two measures of common ownership: (individual in Panel A and joint in Panel B).
Figure 9: Average degree centrality of brand and generic firms over time (2004-
2014)
Panel A: Individual ownership measure

52
Panel B: Joint ownership measure
Note that there are important differences between the two sets of firms. Whereas
the average degree of the brand firms has increased substantially, the average degree
centrality of the generic firms has decreased over time. This is true for the individual
measure of ownership but it is especially the case for the joint measure of ownership.
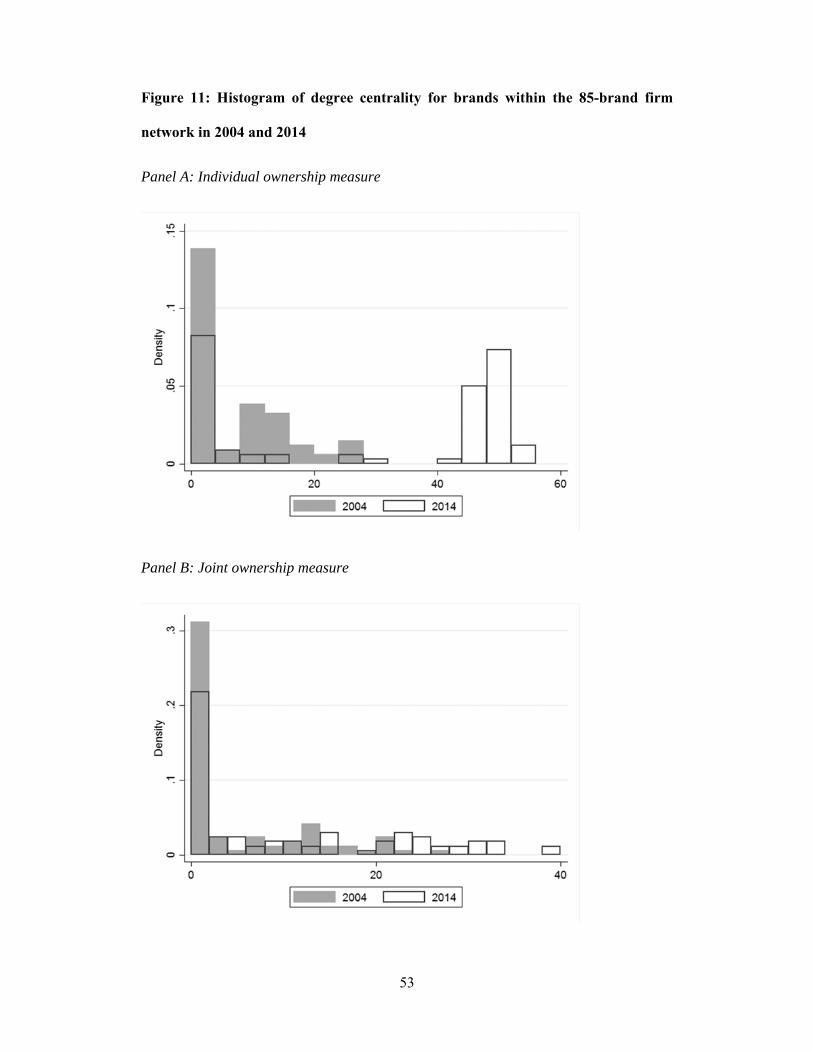
Figures 11 to 12 display the histograms of the measure of degree centrality in both
2004 and 2014 for the brand firms and generic firms respectively. Panel A shows the
individual ownership measure and Panel B shows the joint ownership measure.
53
Figure 11: Histogram of degree centrality for brands within the 85-brand firm
network in 2004 and 2014
Panel A: Individual ownership measure
Panel B: Joint ownership measure

54
Figure 11 shows that the dispersion of degree centrality across the brand firms has
increased in 2014 as compared to 2004, in both measures of ownership. A relatively large
number of firms still have zero connections and thus a degree centrality of zero in 2014.
But the highest levels of degree centrality become higher by 2014 relative to 2004.
Figure 12: Histogram of degree centrality for generics within the 25-generic firm
network in 2004 and 2014
Panel A: Individual ownership measure

55
Panel B: Joint ownership measure
The conclusions that can be drawn about the dispersion of the generic firm
network are sensitive to the measure of common ownership used. If we use the individual
common ownership measure, it appears that the dispersion of degree centrality across the
generic firms has increased slightly in 2014 as compared to 2004. A larger number of
firms have zero connections and thus a degree centrality of zero. The most connected
generics have a slightly higher number of connections in 2014 as compared to 2004.
However, if we use the joint measure, we find that centrality is limited to the range of 0-
2 in 2014, whereas in 2004 some generics had centrality measures in the range of 4-6.
These differences are explained by the fact that for generics, in 2004, there are common
owners present with large stakes (see Table 4) which create linkages in 2004 when we
use the joint ownership measure. With the absence of these investors in 2014, the common
ownership network for generic firms on the basis of the joint ownership measure is much
sparser (see Figure 4 Panel B).
56
5. Antitrust implications of common ownership in the pharmaceutical
industry
Our empirical analysis shows, generally, that the common ownership network
among brand companies has become denser and more complete over time, whereas that
of the generics is much sparser and becomes sparser over time. Finally, the bipartite
network between brand companies, on the one hand, and generic companies, on the other,
has become denser. This section discusses the antitrust implications of these patterns.32
We first discuss the implications of the dynamics of the brand firm network for
innovation, as brand companies engage in innovation investments with the aim to patent
new drugs --and enjoy rents from the resulting temporary monopoly. We then analyze the
consequences of the evolution of the bipartite network between brand and generic
companies on generic entry in markets where the brand no longer enjoys regulatory
protection. Thirdly, we discuss the implication of common ownership for prices in the
pharmaceutical industry. High drug prices are a major concern for policy makers in the
US: prescription drugs, responsible for 10pct. of all healthcare costs, represent one of the
fastest-growing areas of healthcare spending.33 Finally, we briefly discuss implications
for collusion.
32 For a full discussion of legal theories to tackle common ownership see Einer Elhauge,
How Horizontal Shareholding Harms Our Economy-And Why Antitrust Law Can Fix It.
10 HARV. BUS. L. REV. 207 (2020).
33 See Anne B. Martin, Micah Hartman, Benjamin Washington, Aaron Catlin, &
National Health Expenditure Accounts Team. National health spending: faster growth
in 2015 as coverage expands and utilization increases. 36 HEALTH AFF. 166 (2017).
57
5.1. Innovation
R&D is crucial for bringing new drugs to the market. Thus, whether common
ownership positively or negatively affects innovation in the pharmaceutical industry is a
key concern for policy makers. Common ownership between brand companies may, on
the one hand, enhance information sharing, generate synergies, and increase the
incentives to invest in R&D. On the other hand, common ownership may also incentivize
firms to innovate in a way that avoids head-on competition between each other in the
innovation space. We briefly discuss each of these possibilities in turn.
The increasingly dense common ownership network that we observe among brand
companies may be good for innovation for the following reasons. First, the common
ownership links may facilitate information sharing between connected firms. This can
bring in substantial benefits. Indeed, in the early stages of development, firms select
which R&D projects to bring into their R&D portfolio and test numerous lead molecules.
At this stage, connections with other firms may provide an opportunity for brand firms to
share each other’s knowledge bases. Indeed, Kostovetsky and Manconi find a higher
intensity of patent citations among firms that share institutional owners, suggesting that
common institutional investors can facilitate the diffusion of information among their
portfolio firms.34 In a similar vein, Ghosh and Morita show that cross-ownership, which
has elements in common with common ownership (see also below in the section on
34 See Leonard Kostovetsky & Alberto Manconi, Common Institutional Ownership and
Diffusion of Innovation (Working paper, April 2020) available at
https://ssrn.com/abstract=2896372.
58
pricing), can induce knowledge transfer between connected firms, thereby increasing
consumer surplus and/or total surplus under certain conditions.35
Common ownership links may also lead to more informal or formal innovation
collaborations, with the associated benefits. Indeed, sharing scientific personnel and/or
research labs that result in a combination of complementary assets may lead to synergies.
Similarly, collaboration may lead to the reduction of wasteful innovation duplication. He
and Huang, for instance, find evidence suggesting that institutional cross-ownership
facilitates explicit forms of collaboration, such as within-industry joint ventures and
strategic alliances, and that this improves innovation productivity.36 Geng, Hau and Lai
find furthermore that shareholder ownership overlap across firms with patent
complementarities correlates significantly with higher investment in innovation and more
success with patents.37
35 See Arghya Ghosh & Hodaka Morita, Knowledge Transfer and Partial Equity
Ownership. 48 RAND J. ECON. 1044 (2017).
36 See Jie Jack He & Jiekun Huang. Product market competition in a world of cross-
ownership: Evidence from institutional blockholdings. 30 REV. FIN. STUD. 2674 (2017).
Although there is evidence that research joint ventures, in turn, may facilitate collusion
in product markets. See Tomaso Duso, Lars-Hendrik Röller & Jo Seldeslachts,
Collusion through joint R&D: An empirical assessment. 96 REV. ECON. STAT. 349
(2014), and see Eric Helland & Michelle Sovinsky. Do Research Joint Ventures Serve a
Collusive Function? (Working paper, 2019) available at
https://papers.ssrn.com/sol3/papers.cfm?abstract_id=3336792
37 See Heng Geng, Harald Hau & Sandy Lai. Patent success, patent holdup, and the
structure of property rights (Working Paper, Sch. Econ. Finance, Vic. Univ. Wellingt.
59
Further, common ownership links between innovating pharma companies can
increase innovation by mitigating technology spillover problems. Indeed, companies
often hold back on costly innovation efforts since competitors may be able to imitate and
free ride on these efforts. If companies are commonly owned, then innovation spills over
to companies within the same network and may thus benefit the same owners. Supporting
this line of reasoning, Lopez and Vives show theoretically that horizontal common-
ownership links can mitigate firms' well-known disincentives to innovate that can arise
because of the technological spillovers.38 Antón, Ederer, Gine and Schmalz confirm
theoretically and empirically that common ownership may incentivize firms to engage in
more R&D. In particular, common ownership increases R&D when technological
spillovers are large relative to product market spillovers. If the reverse occurs, i.e., when
product market spillovers are larger, then common ownership reduces R&D. 39
Common ownership may also reduce competition in innovation. For example,
common ownership might negatively affect the number and/or the selection of R&D
projects pursued. As drugs pass through clinical trials, firms may re-optimize their
portfolio and decide which drugs to submit for FDA approval. Many development
projects are terminated, not due to safety or efficacy concerns, but due to commercial
2017) available at http://www.haraldhau.com/wp-content/uploads/Patent-Networks-
v261_full.pdf
38 See Ángel L. López & Xavier Vives. Overlapping ownership, R&D spillovers, and
antitrust policy. 127 J. POL. ECON (2019).
39 See Miguel Anton, Florian Ederer, Mireia Gine, & Martin C. Schmalz, Innovation:
The Bright Side of Common Ownership? (Working paper, 2018) available at
https://ssrn.com/abstract=3099578.
60
considerations. Large pharmaceutical firms often invest in 10–15 distinct research
programs that run simultaneously. In an effort to reduce competition, firms with common
investors may jointly pursue a similar line of research or terminate competing projects.
This is potentially to the detriment of consumers if it means that fewer drug variants are
available.
Recent research indicates that one of the motives for pharmaceutical firms to
engage in M&As is to neutralize potential competition. The idea is that an incumbent —
i.e., a company that has already launched a drug— has an incentive to acquire and
terminate projects in the development process if these projects have “overlap” with its
launched product (where overlap is defined as the same mechanism of action within a
therapeutic class). These acquisitions, where the incumbent acquires a nascent or
potential competitor in order to neutralize the competition have been termed “killer
acquisitions.” Cunningham, Ederer and Ma find that projects acquired by firms that have
an overlapping drug are 23.4 pct. less likely to have continued development activity.40
The presence of common ownership between two firms with overlapping drugs
may mitigate the need for a merger to achieve a similar effect. A recent paper that looks
at common ownership links in pharmaceutical start-ups by venture capital (VC)
companies, Li, Liu and Taylor find precisely this effect. 41 In particular, they examine
how a start-up responds after seeing a competitor make progress on a related drug project.
40 See Colleen Cunningham, Florian Ederer, & Song Ma. Killer Acquisitions. (Working
paper, 2019) available at https://papers.ssrn.com/sol3/papers.cfm?abstract_id=3241707.
41 See Xuelin Li, Tong Liu & Lucian A. Taylor, Do Venture Capitalists Stifle
Competition? (Jacobs Levy Equity Management Center for Quantitative Financial
Research Paper, May 28, 2020) available at: https://ssrn.com/abstract=3479439.
61
If the two startups share a common VC, the lagging startup is less likely to advance its
own project, which reduces competition between the startups. The authors find that these
anticompetitive effects are mostly present for technologically similar projects, early-stage
projects, and with VCs involved that have larger equity stakes and less-diversified
portfolios.
In sum, high common ownership among brand companies can have both positive
and negative effects on innovation in the pharmaceutical sector. Current theoretical and
empirical research highlights both sides. Research in this dimension is a promising
avenue for future research, especially in terms of identifying whether and under which
circumstances common ownership of firms with projects that have overlapping
mechanisms of action and similar therapeutic classes leads to better or worse innovation
outcomes.
5.2. Entry
Patented markets are the main source of revenue for brand companies. When the
patent expires —or when it is challenged in court42— and generic companies enter,
revenues for the brand decline dramatically (by as much as 90pct.). Therefore, brand
companies have a strong incentive to deter generic entry, or at least to delay generic entry
as long as possible. Entry induces losses to the brands and gains to the generics that are
42 A brand’s patent validity can be brought to court through a Paragraph IV challenge,
which is the section of the Hatch-Waxman act under which generic entrants dispute
pharmaceutical patents. See e.g. Eric Helland & Seth A. Seabury. Are settlements in
patent litigation collusive? Evidence from Paragraph IV challenges. (Working paper
No. w22194. National Bureau of Economic Research, 2016) available at:
https://www.nber.org/papers/w22194

62
highly asymmetric: a brand company loses much more after entry than a generic profits
after entry. Therefore, the joint payoff for brand and generic in holding off entry is clearly
positive.
Scott Morton reviews how direct ownership links between brand and generic firms
influences the likelihood of generic entry.43 She finds that generics owned by the original
innovator (i.e., the brand company) are less likely to enter the market. This hints that an
investor with shares in both the brand and generic may benefit from steering the generic
away from entering. Therefore, entry decisions of generics may crucially depend on the
joint ownership of generic and brand firms. Shareholdings in the brand provide common
investors with incentives to steer decisions towards joint profits and shareholdings in the
generic provide investors with the ability to influence such decisions.44
Newham, Seldeslachts and Banal-Estanol find that this is indeed the case. 45 They
analyze generic firms' entry decisions into pharmaceutical markets opened up by the end
of regulatory protection. They find that a higher level of common ownership between a
brand firm and a potential generic entrant is robustly linked with a lower probability of
generic entry, and that this effect is economically significant in the sense that overall
common ownership at the market level decreases the total number of generics in that
43 Fiona Scott Morton, Horizontal integration between brand and generic firms in the
pharmaceutical industry. 11 J. ECON. & MGMT STRAT. 135 (2002).
44 Also, see Eric A. Posner, Fiona M. Scott Morton & E. Glen Weyl. A proposal to limit
the anti-competitive power of institutional investors. 81 ANTITRUST L. J. 669 (2017).
45 See Melissa Newham, Jo Seldeslachts & Albert Banal Estañol, Common Ownership
and Market Entry: Evidence from Pharmaceutical Industry (DIW Berlin Discussion
Paper No. 1738, 2018), available at http://ssrn.com/abstract=3194394

63
market.46 This means that the increasingly dense bipartite network between brand
companies, identified in the previous section, is likely to lead to less generic entry.47
46 Related, Xie and Gerakos find that common ownership between brand and generic is
positively associated with the two parties entering into a settlement agreement where the
generic manufacturer stays out of the market. See Jin Xie & Joseph Gerakos,
Institutional Horizontal Shareholdings and Generic Entry in the Pharmaceutical
Industry (Tuck School of Business Working Paper No. 3285161), available at
https://papers.ssrn.com/sol3/papers.cfm?abstract_id=3285161. Hovenkamp & Lemus
further confirm that settlements after Paragraph IV challenges cause generics to stay out
of the market. See Erik Hovenkamp & J. Lemus. Delayed entry settlements at the patent
office. 54 INT’L REV. L. & ECON. 30 (2017).
47 There is also evidence from other industries that ownership structures affect entry.
Majumdar documents the relationship between horizontal ownership and entry in the
local telecommunication exchange segment in the US, and finds that dominant
ownership controllers experienced lower entry in their territories. See Sumit K.
Majumdar, Consequences of Oligopoly: Horizontal Ownership Concentration and
Telecommunications Sector Deterred Entry (Working paper, 2019).
64
5.3. Pricing
5.3.1. Unilateral effects
Commonly owned brand firms that commercialize drugs that are therapeutically
similar might have less incentives to unilaterally compete,48 due to various mechanisms49.
Indeed, as O’Brien and Salop note, the anticompetitive effects of common ownership are
similar to that of cross ownership in that common ownership can be understood to be
ownership in one firm, coupled with cross ownership in the others.50
First, firms that are largely owned by shareholders who also have sizeable stakes
in competitors might just simply act in these shareholders’ interest, which leads them –
rather than maximizing their own profits– to maximize the return of their shareholders’
48 Previous research in the airline and banking industries has pointed towards a positive
relationship between common ownership and prices. See Jose Azar, Sahil Raina &
Martin C. Schmalz, Ultimate Ownership and Bank Competition (Working paper, 2019),
available at: https://ssrn.com/abstract=2710252; Jose Azar, Martin C. Schmalz & Isabel
Tecu, Anticompetitive Effects of Common Ownership, 73 J. FIN. 1513, (2018).
49 For an overview of the mechanisms by which large horizontal shareholdings are
likely to influence corporate management see Einer Elhauge, The Causal Mechanisms
of Horizontal Shareholding, 82 OHIO STATE L.J. (forthcoming issue 2, 2021), available
at: https://ssrn.com/abstract=3370675
50 Patrick O’Brien & Steven Salop. Competitive effects of partial ownership: Financial
interest and corporate control. 67 ANTITRUST L. J. 559 (2000).

65
portfolios, in whose interest it might be to soften price competition.51 Further, while there
is evidence that institutional investors engage in active discussions with companies’
management,52 investors do not need to actively intervene to have an impact on the firms’
decisions. They may apply “selective omission” by encouraging actions that increase both
firm value and portfolio profits and remaining silent when this is not the case.53 Further,
they may design payment schemes for the top management to shape their incentives in a
way that leads to softer product market competition. Antón, Ederer, Giné and Schmalz
find that higher firm-level common ownership is linked to less performance-sensitive
incentives for CEOs and other top managers, which in turn may lead to softer
competition.54
Increases in common ownership links between brand and generic companies, as
we show in the bipartite network in the previous section, may also indirectly raise drug
51 José Azar. Portfolio diversification, market power, and the theory of the firm
(Working paper, 2017), available at
https://papers.ssrn.com/sol3/papers.cfm?abstract_id=2811221
52 See, e.g. Joseph A. McCahery, Zacharias Sautner & Laura T. Starks, Behind the
Scenes: The Corporate Governance Preferences of Institutional Investors. 71 J.
FIN. 2905 (2016).
53 See Scott C. Hemphill & Marcel Kahan, The Strategies of Anticompetitive Common
Ownership, 129 YALE L. J. 1392 (2020), available at https://ssrn.com/abstract=3210373
54 Miguel Antón, Florian Ederer, Mireia Giné & Martin C. Schmalz. Common
ownership, competition, and top management incentives (Working paper, 2020)
available at: https://florianederer.github.io/common_ownership.pdf
66
prices. Indeed, common ownership should reduce generic entry and, as shown by
previous research, the reduction of generic companies in the market increases prices.
In sum, both the increasingly linked brand network and brand-generic bipartite
graph suggest that price competition might have softened. This is an interesting area for
future research: to study how the link between common ownership affects prices through
the channel of entry; see e.g., Grabowski and Vernon for a study that links generic entry
to drug prices and Suzuki for a study that looks at the impact of differences in market
conditions (regulation) on prices through the channel of entry55
5.3.2. Coordinated effects
Our empirical results indicate that common networks among generics are sparse and,
if anything, have become sparser over time. While managers of commonly owned firms
may unilaterally engage in anti-competitive behavior, common ownership might also
induce coordinated action. Economic theory predicts that communication can facilitate
both coordination and monitoring defection from a common strategy.56 While many
forms of private communication are illegal, public information disclosure could serve as
an alternative coordinating and monitoring mechanism to achieve tacit collusion, as
55 Henry G. Grabowski & John M. Vernon. Brand loyalty, entry, and price competition
in pharmaceuticals after the 1984 Drug Act. 35 J. L. & Econ. (1992); Junichi Suzuki.
Land use regulation as a barrier to entry: evidence from the Texas lodging
industry. 54 Int'l Econ. Rev. (2013).
56 See Margaret C. Levenstein & Valerie Y. Suslow. What determines cartel success?
44 J. ECON. LIT. 43 (2006); George J. Stigler, A theory of oligopoly. 72 J. POL. ECON 44
(1964).
67
suggested by e.g. OECD.57 Indeed, Pawliczek, Skinner and Zechman find that higher
horizontal shareholding levels increase firm disclosures of information that can help firms
to coordinate.58
Rock and Rubinfeld provide a summary of how common ownership has an impact on
coordinated effects; we provide some elements of that discussion here.59 A key issue is
how ownership structure can affect the likelihood that a coordinated outcome will be
achieved, i.e., the relevant question is how common shareholders can have an influence
in coordinating outcomes. The article discusses a variety of ways in which a common
owner will be more conducive to collusion, by being, for example, a better “cartel
ringmaster” or “cartel initiator.” On the other hand, there are also a variety of ways in
which a common owner can be a poorer cartel organizer than a non-common owner.
Among generics, where we find sparse networks of common ownership, a large cartel
operating between the years of 2006 and 2016 is currently being investigated.60 It may
57 OECD, 2012. Unilateral disclosure of information with anticompetitive effects,
available at
http://www.oecd.org/daf/competition/Unilateraldisclosureofinformation2012.pdf.
58 Andrea A. Pawliczek, Nicole Skinner & Sarah L. C. Zechman. Facilitating tacit
collusion: A new perspective on common ownership and voluntary disclosure (Working
paper, 2019). available at: https://ssrn.com/abstract=3382324
59 Edward B. Rock and Daniel L. Rubinfeld, Common Ownership and Coordinated
Effects 83 ANTITRUST L.J. 201 (2020).
60 Christopher Rowland. Investigation of generic ‘cartel’ expands to 300 drugs, THE
WASHINGTON POST, December 10, 2018. available at

68
thus be that, in the pharmaceutical industry, common ownership and explicit collusion
are substitutes. However, we should be very careful when making this connection: the
generic pharmaceutical industry has a number of other characteristics that make cartels
more likely: homogenous products, and frequent interaction at industry trade fairs.
6. Conclusion
This paper documents the common ownership networks between companies that
operate in US pharma markets during the period 2004 – 2014. We show that common
ownership networks between brand companies are rather dense and complete, especially
at the end of our sample. Furthermore, the common ownership links between brand and
generic companies have become notably stronger.
While there is little direct evidence yet how these common ownership networks
might impact competition and innovation in pharmaceutical markets (with the notable
exception of the impact on generic entry), the presence of large institutional investors in
the industry is so wide-spread that it would be hard to believe that they have no material
impact. The further investigation of their influence in pharma markets is an exciting topic
for future research.
https://www.washingtonpost.com/business/economy/investigation-of-generic-cartel-
expands-to-300-drugs/2018/12/09/fb900e80-f708-11e8-863c-9e2f864d47e7_story.html