
The Failure of Sexting Criminalization: A Plea for the Exercise ...
Upload
khangminh22Category
view
1download
0
Note that this is a preprint has not been peer-reviewed.
Common measures or common metrics? A plea to
harmonize measurement results
Edwin de Beurs, PhD
Department of Clinical Psychology, Leiden University & Arkin GGZ, the Netherlands
Jan R. Boehnke, PhD
School of Health Sciences, University of Dundee, UK
Eiko I. Fried, PhD
Department of Clinical Psychology, Leiden University, the Netherlands
Key practitioner message:
• Converting raw scores from neuro-psychological assessments to common metrics
will ease the interpretation of test results among professionals and will facilitate
communication with patients receiving mental healthcare.
• Common metrics will clarify the severity of patients’ conditions and increase their
engagement with outcome data.
• Treatment progress (or lack thereof) can be more easily monitored, understood,
and communicated to by using common metrics.

Common measures or common metrics
2
Objective: There is a great variety of measurement instruments to assess similar
constructs in clinical research and practice. This complicates the interpretation of test
results and hampers the implementation of measurement-based care.
Method: For reporting and discussing test results with patients, we suggest converting
test results into universally applicable common metrics. Two well-established metrics
are reviewed: T-scores and percentile ranks. Their calculation is explained, their merits
and drawbacks are discussed, and recommendations for the most convenient
reference group are provided.
Results: We propose to (i) express test results as T-scores with the general population
as reference group and (ii) supplement these with percentile ranks, based on data from
clinical and population samples. The practical benefits are demonstrated using the
published data of four frequently used instruments for measuring depression: the CES-
D, PHQ-9, BDI-II, and the PROMIS depression measure.
Discussion: Recent initiatives have proposed to mandate a limited set of outcome
measures to harmonize clinical measurement. However, the selected instruments are
not without flaws and, potentially, this directive may hamper future instrument
development. We recommend to use common metrics as an alternative approach to
harmonize test results in clinical practice, as this will facilitate the integration of
measures in day-to-day practice.
Keywords: common metrics, T-score, percentile rank, self-report measures, test result,
depression

Common measures or common metrics
3
Introduction of the problem
Measurement is the most basic building block of scientific research. Since the days of
Wundt and Thurstone, measurement has played a prominent role in psychology and a
separate branch is dedicated to its research: psychometrics. The past decades have
seen a proliferation of measurement instruments for a broad range of psychological
constructs. There are at least 19 instruments to measure anger (Weidman et al., 2017),
and over 280 instruments have been developed to measure depression, many of which
are still in use (Fried, 2017; Santor et al., 2006). This is also reflected in little
consistency in use of measures in therapy outcome research as noted by Ogles (2013):
across 163 studies, authors used 435 unique outcome measures, of which 371 were
used only once in a study. This plethora of instruments, in combination with
questionable measurement practices, such as outcome switching (Weston et al., 2016)
and lack of transparency on how scores are derived from these measures (Weidman
et al., 2017), hampers the establishment of a consistent body of knowledge. It
complicates the comparison of results from various studies, and unnecessarily slows
down scientific progress (Flake & Fried, 2020).
In clinical practice, measurement instruments are increasingly used to aid the initial
evaluation of patients and to assess outcomes. Measurement-based care has been
called for repeatedly in numerous editorials and reviews (Boehnke & Rutherford, 2021;
Fortney et al., 2017; Harding et al., 2011; Lambert, 2007; Lewis et al., 2019; Snyder et
al., 2012). Paradoxically, the abundance of measurement instruments poses barriers
to their use in clinical practice (Fried, 2017; Santor et al., 2006). Firstly, the use of a
wide variety of instruments, each having its own metric, complicates communication
among professionals. For instance, severity of depression symptomatology expressed
in a score on the Beck Depression Inventory (BDI-II; Beck et al., 1996), with scores
ranging from 0 to 63, is not compatible with severity expressed in a score on the Patient
Health Questionnaire (PHQ-9; Kroenke & Spitzer, 2002), with scores ranging from 0 to
27. This complicates matters when a clinician using the BDI-II refers a patient to a
colleague more familiar with the PHQ-9. Secondly, communication about test results
between therapists and patients is complicated by the use of various metrics (Snyder
et al., 2019). Moreover, the knowledge gap between clinicians and patients widens,
when only clinicians are able to properly interpret test results. More patient
engagement, involvement, and shared decision making about the course of treatment

Common measures or common metrics
4
is called for (Patel et al., 2008), in part because this leads to better outcomes (Lambert
& Harmon, 2018). The knowledge gap may hinder patients in their attempts to obtain
a more equal role in the therapeutic process on their journey to recovery. Clear
information on the meaning of a test result and how much progress is made toward
treatment goals, will help to better involve patients, will grant them a more active role,
and will strengthen engagement with the information provided (Goetz, 2010). Finally,
the knowledge of measurement instruments and the specific psychometric properties
required for the interpretation of test scores, may hinder implementation in daily clinical
practice, and allow practitioners to maintain beliefs that standardized measures are not
as accurate as their clinical judgment (de Beurs et al., 2011).
A strategy to facilitate the interpretation of test results in clinical practice has been
around for many decades and is well-known: use of common metrics. With a metric
we mean a system or standard of measurement. Metrics describe the units in which
measurements are provided and interpreted. One example would be the metric system
which is used across a range of measurement domains as diverse as distance, volume,
and weight to describe amounts. In the case of psychological assessments use of a
common metric would involve the conversion of raw test scores into universally
applicable common metrics, such as standardized scores and percentile ranks, based
on normative samples (Kendall et al., 1999). Converting raw scores to common metrics
is discussed in many textbooks on psychological testing (Anastasi, 1968; Cronbach,
1984), but it is underused in clinical research and practice. An example of how use of
a common metric has worked out well is available in another area of psychological
assessment: the measurement of intellectual capacity. The IQ metric was developed
more than a century ago by Binet and Simon (1907) and has found universal
application; professional psychologists as well as the lay public understand the
meaning of IQ-scores, no matter the specific measurement instrument that was used.
Interpretation of test results in clinical practice would be much easier if their meaning
was as self-evident as IQ-test scores.
The remainder of the paper is structured as follows. First, we describe two candidate
metrics for universal application: T-scores and percentile ranks. Both are commonly
used in neuropsychological and educational research and are gaining popularity in
clinical assessment. Second, we describe the T-score metric and percentile ranks
metric in more detail, and present their main merits and drawbacks. We also describe

Common measures or common metrics
5
how they can be derived by various approaches, illustrate their use with measures for
depression, and discuss the choice of a proper reference group for these metrics.
Finally, we propose further steps required for widespread implementation and suggest
various subjects for future research.
Candidate metrics
Two options have been proposed: (1) Standard scores (z scores and their more
convenient alternatives, such as T-scores, stanines, and stens) and (2) percentile rank
scores (Crawford & Garthwaite, 2009; Ley, 1972).
Table 1 presents an overview of these metrics, their calculation, and some of their
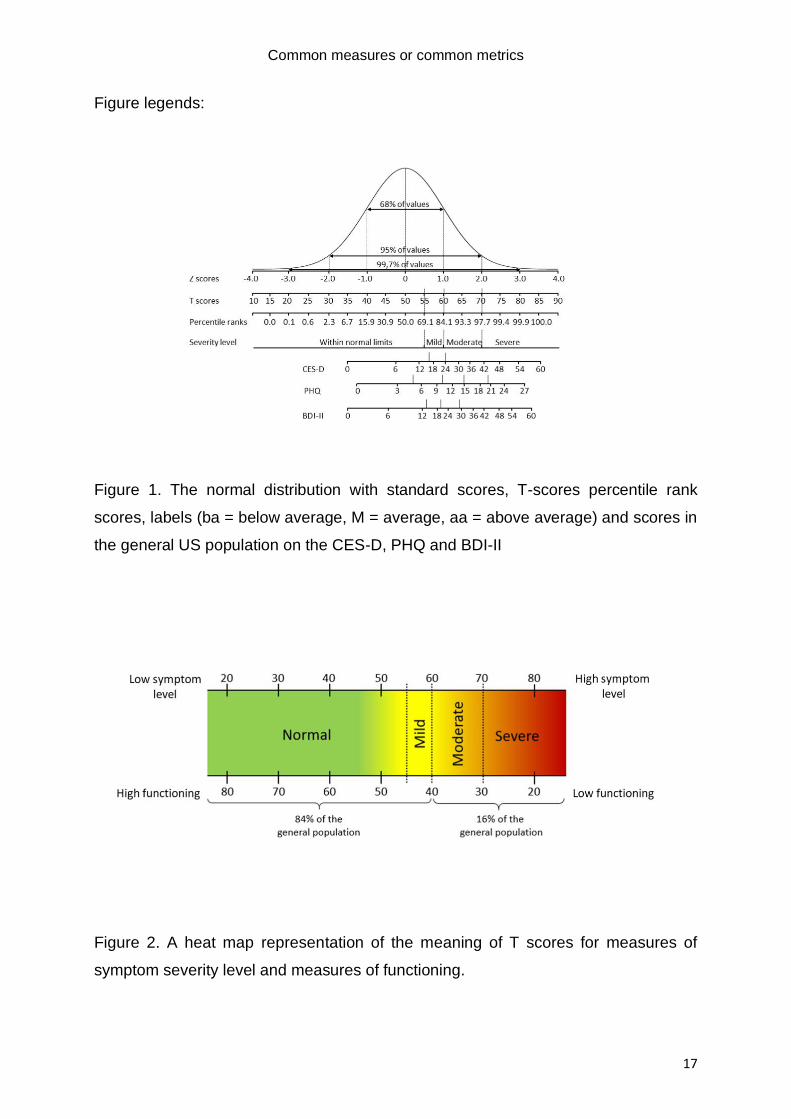
properties. Figure 1, adapted from Seashore (1955), shows the various metrics under
the normal distribution and provides labels for the interpretation of scores when used
as a severity indicator or screener. For example, in order to label levels of severity for
depression, the PROMIS group has followed the convention of dividing the general
population up in four segments (from bottom to top: 69.1%, 15.0%, 13.6%, and 2.3%,
respectively). Labels and corresponding T-scores are: “within normal limits” (T<55.0),
“mild” (T=55.0-59.9), “moderate” (T=60.0-69.9), and “severe” (T≥70.0)
(healthmeasures, n.d.). (See: https://www.healthmeasures.net/score-and-
interpret/interpret-scores/promis/promis-score-cut-points). As an illustration, Figure 1
also includes raw scores on the PHQ-9 (Kroenke & Spitzer, 2002), CES-D (Radloff,
1977), and BDI-II from the US population (Choi et al., 2014) to demonstrate how they
would translate into these metrics. For all three instruments, the raw score units are
stretched at the lower end, illustrating the negative skewness of the frequency
distribution of raw scores in the general population: Low scores are much more
common than high scores.
T-scores
T-scores, so named by McCall (1922) to honor the psychometric pioneers Thorndike,
Terman and Thurstone, are based on standardized or Z scores. Z scores are raw
scores converted to a standard scale with M = 0 and SD = 1 and are calculated based
on the mean and standard deviation of a reference group. Standardization to Z scores
yields inconvenient scores (with a range of -3 to 3 implying negative scores with several
decimals to denote sufficient precision) and alternatives have been put forth with a
more convenient format, such as stans, stanines and T-scores. Stans and stanines

Common measures or common metrics
6
yield a rather crude categorization of score levels and we left them out from further
consideration. T-scores are Z scores multiplied by 10 with 50 points added. They have
a mean of 50, a standard deviation of SD = 10, and range, in practice, from 20 to 80.
Figure 1 shows that a T-score of 80 is three standard deviations above the mean, a
score obtained by only 0.13% of the population, according to the cumulative normal
distribution. Thus, 99.7% of the population will score in the 20-80 range. T-scores have
become the metric of choice for commonly used measures in clinical assessment. To
cite Cronbach (1984): “Confusion results from the plethora of scales. In my opinion,
test developers should use the system with mean 50 and s.d. 10 unless there are
strong reasons for adopting a less familiar scale. (p. 100)”. Practical guidelines
regarding the interpretation of T-score levels have been established. At the onset of
treatment, most patients will have a T-score in the 65-75 range, and with treatment one
may aim for a score below 55, a reasonable cut-off on the T-score metric for recovery
on many instruments that measure the severity of psychopathology (Aschenbrand et
al., 2005; Cella et al., 2014; Recklitis & Rodriguez, 2007) and research suggests that
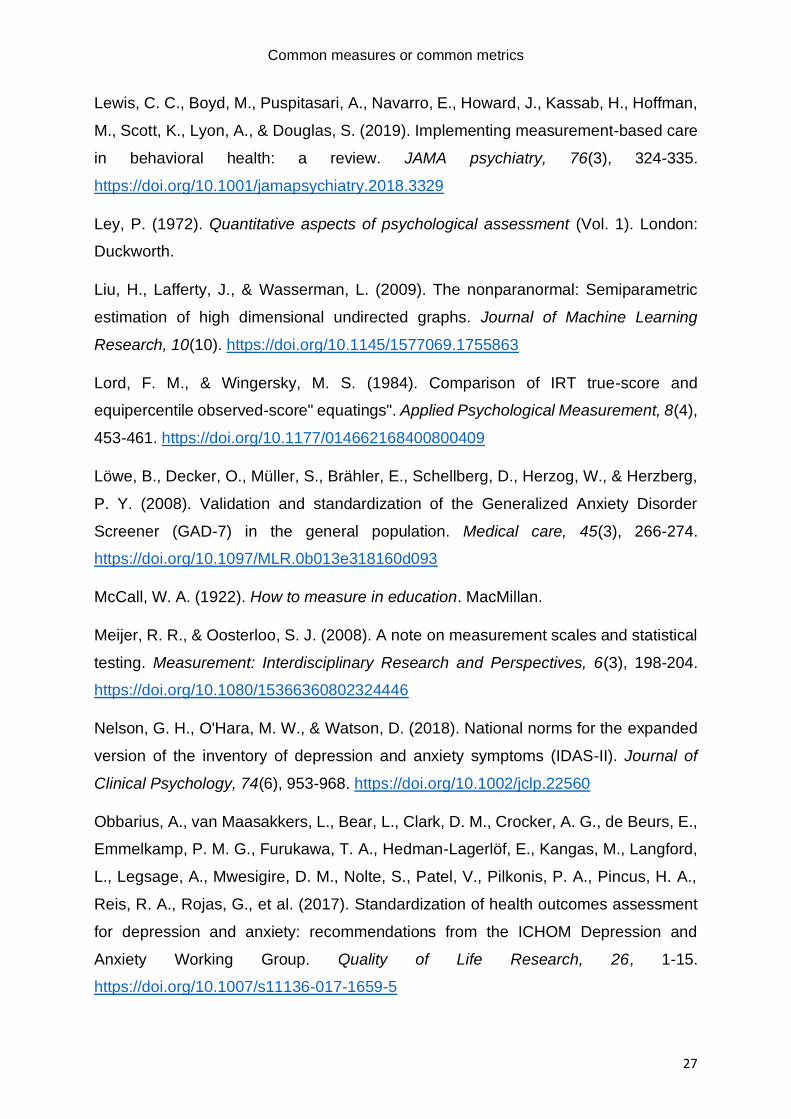
many patients prefer color coding of score levels according to a heat map of normed
scores (Brundage et al., 2015). Figure 2 illustrates how the meaning of T-scores can
be conveyed to patients or colleagues.
To obtain T-scores, various methods can be used. The most straightforward approach
is a conversion of raw scores to T-scores with a simple linear formula [T=10*(x-
m/sd)+50, where x is the raw score and m and sd the mean and standard deviation of
the reference population]. However, this is only feasible when the raw scores have a
normal distribution. If this condition is not met – which is quite common when clinical
measures are administered to the general population, yielding skewed and leptokurtic
distributions with an overrepresentation of low scores – the arithmetic mean and
standard deviation are inappropriate descriptors of the frequency distribution of scores
and the interpretation of the test result in standard scores is no longer straightforward.
However, deviations from normality in raw scores can be fixed in most cases by
transformations (Box & Cox, 1964; Liu et al., 2009). Another, more thorough approach
is to first establish normalized standard scores with regression-based norming
(Zachary & Gorsuch, 1985), and to convert these to T-scores (Lenhard & Lenhard,
2021). Statistical software is available in R (GAMLSS; Stasinopoulos et al., 2018) and
Timmerman et al. (2020) offers a detailed tutorial.

Common measures or common metrics
7
Recently, Item Response Theory (IRT)-based approaches to convert item responses
to legacy instruments into T-scores have gained popularity, using EAP-factor scores
or alternatives (Fischer & Rose, 2019). The result of the IRT-based approach applied
by Choi et al. (2014) to convert scores to the PROMIS metric (a T- score with the US
population as reference group) is illustrated for the CES-D, PHQ-9 and BDI-II in Figure
1. These approaches again require the assumption that the trait under study is normally
distributed. However, for non-normal distributions, commonly found when clinical traits
such as depression or anxiety are assessed in general population samples,
alternatives have been developed (Reise et al., 2018). As IRT factor scores are often
estimated as a standard score (M = 0.00, SD = 1.00), they can be easily converted into
T-scores with the linear formula in Table 1.
T-scores are well established in clinical psychometrics. They were chosen as a metric
by the PROMIS initiative, aimed at developing a new set of measures in health
research (Cella et al., 2007). Considerable work has been done in this area, for
instance by the Prosetta Stone initiative (Choi et al., 2014; Schalet et al., 2015). Here,
raw scores have been converted to the PROMIS T-score metric for many legacy
measures, assessing a wide variety of constructs, including depression (Choi et al.,
2014; Wahl et al., 2014), anxiety (Schalet et al., 2014), pain (Cook et al., 2015),
physical functioning (Oude Voshaar et al., 2019), fatigue (Friedrich et al., 2019), and
personality psychopathology (Zimmermann et al., 2020).
In practice, conversion based on percentile ranks (equipercentile linking) and IRT
based approaches tend to yield very similar results, as was demonstrated by Lord and
Wingersky (1984), Choi et al. (2014), and more recently by Schalet et al. (2021). The
T-scores metric has been linked to expert judgement regarding the severity of pain
interference, fatigue, anxiety, and depression for oncology patients (Cella et al., 2014).
Severity levels matched almost perfectly with the T-score metric: 60 differentiated
mildly from moderately symptomatic and 70 differentiated moderately from severely
symptomatic. Furthermore, T-scores on the Brief Symptom Inventory (Derogatis, 1975)
have been compared with the Clinical Global Impression (CGI; Guy, 1976), and an
improvement of 5 T-score points corresponded well with improvement according to the
CGI improvement rating (de Beurs et al., 2019).
To help clinicians who want to express a test score of a single patient as a common
metric, crosswalk tables have been published for many measures to convert raw

Common measures or common metrics
8
scores into T-scores (e.g., Batterham et al., 2018; Choi et al., 2014; Zimmermann et
al., 2020). Several user manuals for measures provide crosswalk tables, including the
Minnesota Multiphasic Personality Inventory (MMPI-2; Butcher et al., 1989), the Brief
Symptom Inventory (BSI; Derogatis, 1975), and the Child Behavior Checklist (CBCL;
Achenbach, 1991). The Prosetta Stone Initiative (https://www.prosettastone.org)
provides crosswalk tables for many measures to the PROMIS T-score, which is based
on the general US population. Further, a crosswalk formula allows for the arithmetic
conversion of raw scores to T-scores or percentile ranks. These formulas can be
established from cross-walk tables with statistical software, such as curve fitting in the
regression module of SPSS or the nls and nlstools packages for Non-linear Least
Squares modelling in R (Baty et al., 2015). An example of conversion by formula is
provided by Roelofs et al. (2013) and de Beurs et al. (de Beurs et al., Submitted)
Percentile rank scores
Contrasting standard scores, the percentile rank of a score ranges from 0 to 100,
indicating the percentage of cases that are less than that score. In other words,
percentile ranks denote with a score of 0 to 100 the relative position of the tested
person among their peers from a reference group in 101 intervals (Kurtz & Mayo,
1979). In clinical contexts, this may translate into a message to the patient, such as,
"At least 75% of our patients have a lower score at the onset of treatment.” As such,
percentile ranks are an easily understood representation of a test result, which helps
to convey its meaning to colleagues and patients. This may explain why percentile
ranks are widely used in educational assessment. Percentile ranks are also depicted
in Figure 1.
Percentile ranks are calculated with the formula in the last column of Table 1. When
normative data are available, the frequency of each raw score can be established with
PR = (CumF-(0.5*F))/N (Crocker & Algina, 1986). The cumulative frequency (CumF)
is the count of all scores less than or equal to the score of interest, F is the frequency
of the score of interest, and N is the number of observations. The metric is calculated
as the percentage of scores that fall below the score of interest plus half of those
obtaining exactly that score. Under the assumption of a normal distribution, percentile
ranks can be derived from z scores (and T-scores) according to the formula for the
cumulative normal probability, available as a statistical function in many software
packages (R, SPSS, STATA, MS Excel). The formula can also be approximated by the

Common measures or common metrics
9
logistic function, which describes a sigmoid curve: PR = 100/1+e(-1.75*Z), where Z is the
standard score or PR = 100/1+e(-0.175*T+8.75), and where T is the T-score.
The literature on using percentile ranks in clinical practice is limited. Crawford and
Garthwaite (2009) have propagated their use for clinical (neuro)psychological
application. Crawford and colleagues have published percentile rank scores and
confidence intervals for several depression and anxiety measures based on Australian
samples (Crawford et al., 2011) and UK samples (Crawford et al., 2009) and made a
computer program available to calculate these scores. They also published crosswalk
tables to convert raw scores into percentile ranks (Crawford et al., 2011; Crawford &
Henry, 2003). Recently, raw scores and percentile ranks were published for the
Inventory of Depression and Anxiety Symptoms (IDAS-II; Nelson et al., 2018).
T-scores and Percentile Ranks compared
A minimum requirement for a universally applicable metric is that it should be easy to
interpret and express in a straightforward manner how common or exceptional a test
result is (Snyder et al., 2012). The Cosmin checklist defines interpretability as “the
degree to which one can assign a qualitative meaning” to a score (Prinsen et al., 2018).
This would solve many of the issues of idiosyncratic scoring methods mentioned in the
introduction. The T-score denotes the commonness of a test result through its distance
from the mean of a reference group in standard units, where 50 represent the mean
and 10 points represent a standard deviation. The interpretation of the T-score requires
some knowledge from the test user regarding the normal distribution, such as the “68-
95-99.7” rule, the shorthand to remember that 68% of the scores fall within 1 SD from
the mean, 95% fall within 2 SDs, and 99,7% fall within 3 SDs (see Figure 1). A score
beyond T = 80 or below T = 20 is quite exceptional and only obtained by the highest
0,13% of the reference group. In contrast, percentile ranks denote the commonness of
a test result in a more intuitive way by expressing the score as the percentage of
respondents with a lower score.
T-scores are interval-scaled, assuming this is a reasonable assumption or given for
the original scores. In contrast, percentile rank scores are not equidistant and should
be considered as ordinal scores. For instance, a high percentile rank score (PR = 75)
corresponds to a T-score of 57, which expresses a modest distance from the mean of
50. In the high range the T-scores 65, 70, 75, and 80 correspond to 93.3, 97.7, 99.4,

Common measures or common metrics
10
and 99.9 (see Figure 1). Thus, percentile rank scores have markedly inequal units,
especially at the extremes, which results in underestimation of differences between
scores near the mean and overestimation of differences at the extremes.
Figure 3 shows, for a selection of raw BDI-II scores, their relation with T-scores and
clinical percentile ranks (only the even raw scores are shown). The relation between
normal distributed T-scores and percentile ranks follows a sigmoid curve, which
reflects the stretching of the percentile rank metric relative to the T-score metric at the
extremes (due to the bell shape of the normal distribution percentile rank intervals are
closer together at the middle of the scale than they are at the extremes, see also Figure
1).
When percentile rank scores are erroneously regarded as equidistant, conclusions
about the test result are often wrong. The biased perception of percentile ranks was
demonstrated in a study by Bowman (2002) with third-year undergraduate students,
who appeared inclined to overestimate percentile ranks above 80 or below 20 as quite
extreme test result (whereas under the normal curve PR=80 corresponds to T=58.4,
i.e., less than 1 SD removed from the mean, see Figure 1). Furthermore, given the
prevailing view around admissible transformations and their link with arithmetical and
statistical operations with percentile ranks, simple operations are not permissible, such
as calculating an average over a set of scores, or calculating a difference score
between repeated assessments. For some discussion of the topic, see Meijer and
Oosterloo (2008). Interestingly, this drawback interferes with the advantage of
percentile scores, that they are generally more intuitive to interpret.
We conclude that for the interpretation of test results and further processing of scores,
T-scores are the best choice, but for communication with colleagues and patients, we
recommend supplementing these with percentile ranks. This is because T-scores are
more versatile given their psychometric properties, but percentile ranks are more
intuitive to interpret. We further note that, as extreme percentile scores are susceptible
to misinterpretation, caution in communication is required.
Choosing appropriate reference groups
The two common metrics we propose, T-scores and percentile ranks, have the goal to
denote how common or exceptional a test result is. This requires an appropriate
reference group. What is appropriate depends on the question at hand: Do we want to

Common measures or common metrics
11
know a person’s severity level as compared to the general population, or as compared
to patients receiving mental healthcare? We provide different recommendations for T-
scores and percentile ranks. For T-scores used in broad, epidemiological mental
healthcare contexts that aim for a universally applicable metric, the general population
is the best choice, because if we assume underlying traits, general population
reference samples allow comparing any subgroup within, as well as any comparison
between subgroups with the same reference standard. For the same reason, in clinical
use, a universally applied metric should be normed in reference to the general
population. After all, it would be odd to norm IQ scores on persons with impaired
intellectual functioning or, at the other extreme, the intellectually gifted.
For percentile ranks, as for T-scores, the general population is the appropriate
reference for experimental, epidemiological, or clinical research. However, when it
comes to clinical practice, we recommend using a clinical reference group. This is
because patients, especially at the start of treatment, will often score among the
highest 5 to 10% of the general population sample (Löwe et al., 2008; Schulte-van
Maaren et al., 2013). Consequently, percentile rank scores based on the general
population will be quite limited in range when applied to treatment seeking patients,
making it difficult to distinguish patients from each other. Furthermore, at the extreme
ends of the percentile metric, a substantial change in raw score (or T-score) translates
into a small change in percentile rank. Thus, changes reflecting improvement during
treatment will be diminished when we use the percentile metric where most patients
score above 90. Expressing the score as a clinical percentile (i.e., relative to a
comparable clinical group), will yield more useful information. When the same BDI-II
raw scores are expressed in clinical percentiles, they range from PR=51.2 to
PR=100.0.
For more detailed communication with subclinical samples, where both reference
groups are justifiable (e.g., at the end of successful treatment), one could present both
a general population and clinical percentile. A report could state that a patient has a T-
score of 60, which is high compared to the general population (where 84% have a
lower score), but below average compared to other patients attending the clinic (only
33% have a lower score). The information offered will depend on the context, but we
caution against overloading the lay user with too much information, as this may be

Common measures or common metrics
12
confusing and runs counter to the principle of simplicity and minimalism of “less is
more” (Peters et al., 2007).
Illustration
To demonstrate the utility of common metrics, we provide as an example, the
crosswalk tables in Table 2. Data for Table 2 stem from Tables A1 to A3 of Choi,
Schalet, Cook, and Cella (2014). They provide crosswalk tables to convert raw scores
on three commonly used depression measures, the Center for Epidemiologic Studies
Depression scale CES-D, the PHQ-9, and the BDI-II to the PROMIS depression scale
T-score. For a selection of raw scores correspondence with the T-score metric is
shown, based on the US general population sample of PROMIS. Table 2 shows the
conversion of raw test scores to T-scores and percentile ranks, and the difference
between percentile rank scores based on the general population and the clinical
population. According to interpretation guidelines for the CES-D (Radloff, 1977), a
summed item raw score of 0-15 indicates absent to mild depression, 16-23 moderate,
and 24-60 or more indicates severe depression. The cut-off for caseness is ≥ 16; this
corresponds to a T-score of 56.2. For the PHQ-9, scores from 0 to 4 indicate minimal
depression, 5-9 mild, 10-14 moderate, 15-19 moderately severe, and 20-27 severe
depression (Kroenke & Spitzer, 2002). The proposed cut-off for caseness is ≥ 10,
corresponding with 59.9 on the T-score metric. Interpretation guidelines from the
manual of the BDI-II denote a total score of 0-13 as within the minimal range, 14-19 as
mild, 20-28 as moderate, and 29-63 as severe. A recent meta-analysis suggested ≥
18.2 as optimal cut-off for clinical caseness (von Glischinski et al., 2019). For these
three measures, caseness starts at T = 56 to 60, and the cut-off values between mild
and moderate depression generally coincide with T = 60, which was also proposed for
the T-score metric by the PROMIS group (www.promis.org). These cut-off values are
similar, but not equal which may be due to differences in operationalization of the
construct or differences between the normative samples.
For the BDI-II, we also added percentile ranks to Table 2 from a sample (N =7500) of
the Dutch general population (Roelofs et al., 2013) and a sample of patients (N = 9844)
seeking psychiatric care who participated in Routine Outcome Monitoring (de Beurs et
al., 2011). This clearly illustrates the difference between percentile ranks based on the
general population and on a clinical sample. A person with a raw score of 20 on the
BDI-II has a population-based percentile rank of PR-pop = 84.0 (among the highest

Common measures or common metrics
13
16% of the general population), but a PR-clin of 33.3 (the lowest 33% of the clinical
population). Someone else with a score of 26 has a population percentile rank of PR-
pop = 90.3 (the highest 10% of the population), but the clinical percentile rank is PR-
clin = 51.2, which indicates that a BDI-II score of 26 is close to the clinical median.
Discussion
The current practice of using a wide diversity of instruments for similar constructs in
psychological research contributes to weakly defined measurement, as opposed to the
strongly defined measurement of the physical sciences (Finkelstein, 2003). This
threatens the quality of our research and hampers progress. Among clinical
professionals, it may lead to a Babylonian confusion of tongues in communications
about the meaning of clinical test results. Finally, and the focus of our paper, it hampers
crucial communication between clinicians and their patients about the meaning of test
scores.
Common metrics are ready for implementation as the long history of references for
their justification above shows. In fact, they have already been implemented in Dutch
clinical practice (de Beurs, 2010), where “Delta T” has become a commonly used
metric to denote patients’ progress from pre- to posttest. Yet, we see two crucial areas
of further development, each with several suggestions. The first area is practical:
Common metrics should be used universally, and several steps ought to be taken to
make common metrics a reality. These include a better understanding of the need for
common metrics, and a demonstration of the utility of such metrics. We hope our
manuscript contributes in this regard. Another crucial step for practical implementation
is that crosswalk tables and figures become more easily available to demonstrate the
conversion of raw scores to T-scores. for instance, as a standard element of the
documentation of a measure. Furthermore, we need to establish crosswalk formulas
that can be built into software which administers and scores questionnaires.
Another area of improvement is psychometric research. While a detailed review of
remaining obstacles is beyond the scope of this article, we list four challenges here.
First, conversion of raw scores to T-scores based on the general population requires
normative data from community samples. Currently, such data are not available for all
measures. However, when using IRT methods, there are work-arounds, such as the
common-item approach or planned missing data designs, applicable when the scales

Common measures or common metrics
14
or datasets to be linked share sets of items. Furthermore, various approaches to
establish normalized T-scores (equipercentile linking, regression-based norming, IRT)
should be evaluated and compared. Additional research is needed to investigate
whether even more complex alternatives, such as calibrated projection (Schalet et al.,
2021; Thissen et al., 2015) are justified by a greater accuracy of the resulting T-scores.
Second, existing normative data are limited to specific countries. The PROMIS T-score
metric, for instance, is based on normative data of the US population. To test whether
we can apply this metric internationally requires collecting data in other countries and
comparing scores (Terwee et al., 2021). This will ease the international comparison of
treatment outcome research and make such data more relevant for practice contexts
as well. Third, the possible influence of translation of measures and their adaptations
to other languages and cultures needs to be investigated (Sousa & Rojjanasrirat, 2011;
van Widenfelt et al., 2005). We also need to study whether measures are invariant for
gender, age, education level, and/or socio-economic status, as influence of these
factors would imply that different norms (and T-scores and percentile ranks) may be
used for subgroups of respondents (Teresi et al., 2009). To accommodate this,
additional conversion formulas should be provided that include coefficients for gender,
age, etc., which may result from regression-based norming (Timmerman et al., 2020).
Furthermore, other external variables may need to be taken into account, such as the
cultural background of clients or aspects of their psychopathology (Böhnke &
Croudace, 2015). Finally, conversion to T-scores should correct for non-normality of
raw test scores, in order to end up with T-scores with genuine equal intervals. To do
so, conversion tables and formulas could be based on IRT approaches, the frequency
distribution of summed item scores (rank order-based normalization), or on other
normalization approaches. The approach that yields the best T-score metric warrants
further study (Kolen & Brennan, 2014).
The area of harmonizing mental health assessment is a key methodological issue and
finding solutions has recently been put on the policy agenda far beyond practical
solutions for clinical reporting and discussion, as is presented here. For instance,
mandating a limited set of instruments has been suggested as a solution (Wolpert,
2020). Plans were launched by the National Institute of Mental Health and the
Wellcome Trust to prescribe a limited set of measurement instruments for research
and outcomes assessment: the Patient Health Questionnaire (PHQ-9) for depression,

Common measures or common metrics
15
the General Anxiety Disorder self-report scale (GAD-7; Spitzer et al., 2006) for anxiety,
the Revised Child Anxiety and Depression Scale (RCADS-22; Chorpita et al., 2000)
for depression and anxiety in children and adolescents, and the World Health
Organization Disability Assessment Schedule (WHODAS; Farber et al., 2020) for
impact of disabilities on adult functioning. However, while increasing comparability and
interpretability of the results of research, this may have unintended negative
consequences(Patalay & Fried, 2020). The selected instruments are not without flaws
or drawbacks. For instance, the PHQ-9 and GAD-7 were developed to screen for
depression and anxiety in the general population, and not to track progress during
treatment. Both are quite brief, which limits their scope and diminishes their reliability
and accuracy, making them less suitable to monitor (statistical) reliable change
(Jacobson & Truax, 1991) in clinical practice, potentially leading to a premature
conclusion that no clinical change has been achieved. Also, mandated use of only a
few measures may hamper progress in measurement development, as it diminishes
the incentive to develop alternative assessment techniques, such as the PROMIS
initiative with Computer Adapted Testing (Cella et al., 2007), or improve upon prior
measures. Still, some harmonization of outcome measures in clinical practice is in
order and has stimulated important initiatives, such as the International Consortium for
Health Outcome Measurement (ICHOM), which proposes standard outcome sets for
medical conditions, including depression and anxiety (Obbarius et al., 2017). This will
help the proliferation of measurement-based care and may enhance the quality of
mental healthcare (Fortney et al., 2017; Kilbourne et al., 2018).
Another part of the literature builds on the key to a proper understanding of what we
aim for with common metrics: the difference between equating or merely expressing
scores on a common metric, which should not be confused with each other. Equating
test scores assumes that the same construct is being measured (Kolen & Brennan,
2004). In contrast, expressing scores on a common metric does not imply this
assumption and merely aims to align test results with a common metric for the
measurement of constructs that remain distinct, even if they are expressed on the
same metric. For example, a T-score of 60 for depression does not denote the same
thing as a T-score of 60 for anxiety, as the two constructs differ. In fact, one could even
state that a T-score of 60 on two depression measures, such as CES-D and BDI, does
not denote the same thing, given the considerable differences in content of these

Common measures or common metrics
16
instruments (Fried, 2017). Consequently, T-scores for different constructs should not
be directly compared, beyond the fact that they express how extraordinary the score
is in comparison to a reference group such as the general population. While such
scores carry crucial information, we caution against comparing or equating T-scores
(or percentile scores, for that matter) stemming from different constructs. For a person
who scores T = 65 on depression and T = 55 on anxiety, the proper interpretation and
message would be that the depression score deviates more from the general
population mean (1.5 SD) than the anxiety score (0.5 SD) or the depression score is
more exceptional than the anxiety score. This differs slightly but meaningfully from the
erroneous inference that the patient is more depressed than anxious. We see the
distinction between common metrics and common constructs illustrated in the research
literature on the PROMIS measures and PROMIS T-score metric. Various legacy
measures have been linked to PROMIS measures and can be converted with
crosswalk tables into a shared metric per construct, such as, depression (Choi et al.,
2014; Wahl et al., 2014), anxiety (Schalet et al., 2014), physical functioning (Schalet et
al., 2015; Voshaar et al., 2019), pain (Cook et al., 2015), personality pathology
(Zimmermann et al., 2020), psychological distress (Batterham et al., 2018), and fatigue
(Lai et al., 2014). Nevertheless, all PROMIS measures are scaled on the same metric:
US population-based T-scores. For convenience, scores on PROMIS measures all
share the same direction (a higher score represents more of the measured construct,
such as depression, pain, mobility, functioning, or quality of life), and are similarly color
coded in graphical output (green is normal, red is severe).
To conclude, use of common metrics, particularly population-based T-scores and
clinical percentile ranks, may aid to harmonize measurement practices in clinical
psychology research will be helpful for a proper interpretation of test results, enhance
the communication about tests results among professionals, and ease explanation of
their meaning to patients in mental healthcare.
Common measures or common metrics
17
Figure legends:
Figure 1. The normal distribution with standard scores, T-scores percentile rank
scores, labels (ba = below average, M = average, aa = above average) and scores in
the general US population on the CES-D, PHQ and BDI-II
Figure 2. A heat map representation of the meaning of T scores for measures of
symptom severity level and measures of functioning.

Common measures or common metrics
18
Figure 3. Selected raw scores on the BDI-II with T-scores (x-axis) and percentile rank
scores relative to the clinical population (y-axis); horizontal and vertical grid lines are
based on raw scores.

Common measures or common metrics
19
Table 1.
Metrics that can be used for test score standardization and harmonization
Calculation: M SD Usual range
Z score Z = (x-m)/s 0 1 -3 to 3
Stanine S = Z*2 + 5 5 2 1 to 9
Sten S = Z*2 + 5,5 5,5 2 1 to 10
T score T = Z *10 + 50 50 10 20 to 80
Percentile Rank 𝑃𝑅 =
CumF − (.5 ∗ F)
N
50 NA 0 to 100
N.B.: x = test raw score; m=average of the test raw scores; s=standard deviation of the
raw scores; CumF=Cumulative frequency; F=Frequency; N =total sample; NA = Not
Applicable;

Common measures or common metrics
20
Table 2. Raw scores, PROMIS T-scores, on the CESD, PHQ-9, and BDI-II (from Choi
et al., 2014) and BDI-II percentile scores based on Dutch population and clinical
samples.
CES-D PHQ-9 BDI-II
RS T RS T RS T PR-pop PR-clin
0
|-------no
to m
ild------|
34.5 0
|---min
ima
l---|
37.4 0
|----min
ima
l----|
34.9 10.1 0.5
2 41.1 1 42.7 2 42.3 26.7 1.7
4 44.7 2 45.9 4 46.2 38.5 3.4
6 47.5 3 48.3 6 48.9 48.6 5.5
8 49.8 4 50.5 8 51.0 57.3 7.9
10 51.7 5 |----m
ild-----|
52.5 10 52.7 64.1 10.8
12 53.4 6 54.2 12 54.2 69.7 14.5
14 54.8 7 55.8 14
|-mild
-|
55.6 74.4 18.4
16
|mo
de
rate
|
56.2 8 57.2 16 56.9 78.2 22.6
18 57.4 9 58.6 18 58.2 81.3 27.7
20 58.6 10
|--mo
de
rate
--|
59.9 20
|--mo
de
rate
--|
59.3 84.0 33.3
22 59.7 11 61.1 22 60.5 86.3 38.7
24
|-----------------------------se
ve
re------------
---------------------|
60.8 12 62.3 24 61.6 88.5 44.8
26 61.8 13 63.5 26 62.7 90.3 51.2
28 62.9 14 64.7 28 63.8 91.6 57.5
30 63.9 15
|mo
d. s
eve
re|
65.8 30
|--------------------------
se
ve
re--------------------
-----------|
64.8 92.7 63.6
32 64.9 16 66.9 32 65.8 94.0 69.2
34 66.0 17 68.0 34 65.8 95.2 74.0
36 67.0 18 69.2 36 67.6 96.0 78.3

Common measures or common metrics
21
38 68.1 19 70.3 38 68.9 96.8 82.5
40 69.2 20
|----------se
ve
re-------|
71.5 40 69.9 97.4 86.3
42 70.4 21 72.7 42 70.9 98.0 89.5
44 71.7 22 74.0 44 71.9 98.5 92.3
46 73.0 23 75.3 46 72.9 98.9 94.6
48 74.4 24 76.7 48 74.0 99.2 96.3
50 76.0 25 78.3 50 75.2 99.5 97.7
52 77.7 26 80.0 52 76.4 99.8 98.6
54 79.7 27 82.3 54 77.7 99.8 99.2
56 82.0 56 79.1 99.9 99.6
58 84.3 58 80.8 99.9 99.8
60 86.4 60 82.9 100.0 99.9
62 85.1 100.0 100.0
63 86.3 100.0 100.0
N.B.: RS = raw score; T = T score is PROMIS Depression scores (based on the US
general population). T-scores can be approximated by applying a rational function to
the raw score (RS): (T = 35.7 + (3.83*RS-0.0023*RS^2)/(1+0.13*RS-0.0012*RS^2);
Percentile ranks can be approximated from T scores with: PR-pop= -
2.9+103.7/(1+exp(-0.162(T-49.6))); PR-cl=1.0+100.7/(1+exp(-0.232*(T-62.7))).
References:
Achenbach, T. M. (1991). Manual for the Child Behavior Checklist 4-18 and 1991
profiles. Department of Psychiatry, University of Vermont.
Anastasi, A. (1968). Psychological Testing. Macmillan.

Common measures or common metrics
22
Aschenbrand, S. G., Angelosante, A. G., & Kendall, P. C. (2005). Discriminant Validity
and Clinical Utility of the CBCL With Anxiety-Disordered Youth. Journal of Clinical Child
& Adolescent Psychology, 34(4), 735-746.
https://doi.org/10.1207/s15374424jccp3404_15
Batterham, P. J., Sunderland, M., Slade, T., Calear, A. L., & Carragher, N. (2018).
Assessing distress in the community: psychometric properties and crosswalk
comparison of eight measures of psychological distress. Psychological Medicine,
48(8), 1316-1324. https://doi.org/10.1017/S0033291717002835
Baty, F., Ritz, C., & Baty, M. F. (2015). Package ‘nlstools’. Tools for Nonlinear
Regression Analysis. https://doi.org/10.18637/jss.v066.i05
Beck, A. T., Steer, R. A., & Brown, G. K. (1996). BDI-II Beck Depression Inventory
Manual (Vol. 2). The Psychological Corporation.
Binet, A., & Simon, T. (1907). Le développement de l’intelligence chez les enfants.
L'Annëe Psychologique, 14(1), 1-94.
https://doi.org/https://www.persee.fr/doc/psy_0003-5033_1907_num_14_1_3737
Boehnke, J. R., & Rutherford, C. (2021). Using feedback tools to enhance the quality
and experience of care. Quality of Life Research, 30(11), 3007-3013.
https://doi.org/10.1007/s11136-021-03008-8
Böhnke, J., & Croudace, T. J. (2015). Factors of psychological distress: clinical value,
measurement substance, and methodological artefacts. Social Psychiatry and
Psychiatric Epidemiology, 50(4), 515-524. https://doi.org/10.1007/s00127-015-1022-5
Bowman, M. L. (2002). The perfidy of percentiles. Archives of Clinical
Neuropsychology, 17(3), 295-303. https://doi.org/10.1016/S0887-6177(01)00116-0
Box, G. E., & Cox, D. R. (1964). An analysis of transformations. Journal of the Royal
Statistical Society: Series B (Methodological), 26(2), 211-243.
https://doi.org/https://www.jstor.org/stable/2984418
Brundage, M. D., Smith, K. C., Little, E. A., Bantug, E. T., Snyder, C. F., & The, P. R.
O. D. P. S. A. B. (2015). Communicating patient-reported outcome scores using
graphic formats: results from a mixed-methods evaluation. Quality of Life Research,
24(10), 2457-2472. https://doi.org/10.1007/s11136-015-0974-y

Common measures or common metrics
23
Butcher, J. N., Dahlstrom, W. G., Graham, J. R., Tellegen, A., & Kaemmer, B. (1989).
MMPI–2 (Minnesota Multiphasic Personality Inventory–2): Manual for administration
and scoring. University of Minnesota Press.
Cella, D., Choi, S., Garcia, S., Cook, K. F., Rosenbloom, S., Lai, J.-S., Tatum, D. S., &
Gershon, R. (2014). Setting standards for severity of common symptoms in oncology
using the PROMIS item banks and expert judgment. Quality of Life Research, 23(10),
2651-2661. https://doi.org/10.1007/s11136-014-0732-6
Cella, D., Gershon, R., Lai, J. S., & Choi, S. (2007). The future of outcomes
measurement: item banking, tailored short-forms, and computerized adaptive
assessment. Quality of Life Research, 16(Suppl 1), 133-141.
https://doi.org/10.1007/s11136-007-9204-6
Choi, S. W., Schalet, B., Cook, K. F., & Cella, D. (2014). Establishing a common metric
for depressive symptoms: Linking the BDI-II, CES-D, and PHQ-9 to PROMIS
Depression. Psychological Assessment, 26(2), 513-527.
https://doi.org/10.1037/a0035768
Chorpita, B. F., Yim, L., Moffitt, C., Umemoto, L. A., & Francis, S. E. (2000).
Assessment of symptoms of DSM-IV anxiety and depression in children: a revised
child anxiety and depression scale. Behaviour Research and Therapy, 38(8), 835-855.
https://doi.org/10.1016/S0005-7967(99)00130-8
Cook, K. F., Schalet, B. D., Kallen, M. A., Rutsohn, J. P., & Cella, D. (2015).
Establishing a common metric for self-reported pain: linking BPI Pain Interference and
SF-36 Bodily Pain Subscale scores to the PROMIS Pain Interference metric. Quality
of Life Research, 24(10), 2305-2318. https://doi.org/10.1007/s11136-014-0790-9
Crawford, J., Cayley, C., Lovibond, P. F., Wilson, P. H., & Hartley, C. (2011). Percentile
norms and accompanying Interval estimates from an australian general adult
population sample for self-report mood scales (BAI, BDI, CRSD, CES-D, DASS,
DASS-21, STAI-X, STAI-Y, SRDS, and SRAS). Australian Psychologist, 46(1), 3-14.
https://doi.org/10.1111/j.1742-9544.2010.00003.x
Crawford, J. R., & Garthwaite, P. H. (2009). Percentiles please: The case for
expressing neuropsychological test scores and accompanying confidence limits as

Common measures or common metrics
24
percentile ranks. The Clinical Neuropsychologist, 23(2), 193-204.
https://doi.org/10.1080/13854040801968450
Crawford, J. R., Garthwaite, P. H., Lawrie, C. J., Henry, J. D., MacDonald, M. A.,
Sutherland, J., & Sinha, P. (2009). A convenient method of obtaining percentile norms
and accompanying interval estimates for self-report mood scales (DASS, DASS-21,
HADS, PANAS, and sAD). British Journal of Clinical Psychology, 48(2), 163-180.
https://doi.org/10.1348/014466508X377757
Crawford, J. R., & Henry, J. D. (2003). The Depression Anxiety Stress Scales (DASS):
Normative data and latent structure in a large non-clinical sample. British Journal of
Clinical Psychology, 42(2), 111-131. https://doi.org/10.1348/014466503321903544
Crocker, L. M., & Algina, J. (1986). Introduction to classical and modern test theory.
Holt, Rinehart, and Winston. https://books.google.nl/books?id=tfgkAQAAMAAJ
Cronbach, L. J. (1984). Essentials of psychological testing (4th ed.). Harper & Row.
de Beurs, E. (2010). De genormaliseerde T-score, een 'euro' voor testuitslagen [The
normalised T-score: A euro for test results]. Maandblad Geestelijke Volksgezondheid,
65, 684-695. www.sbggz.nl
de Beurs, E., Carlier, I. V., & van Hemert, A. M. (2019). Approaches to denote
treatment outcome: Clinical Significance and Clinical Global Impression compared.
International Journal of Methods in Psychiatric Research, 28.
https://doi.org/10.1002/mpr.1797
de Beurs, E., den Hollander-Gijsman, M. E., van Rood, Y. R., van der Wee, N. J.,
Giltay, E. J., van Noorden, M. S., van der Lem, R., E., v. F., & Zitman, F. G. (2011).
Routine outcome monitoring in the Netherlands: Practical experiences with a web-
based strategy for the assessment of treatment outcome in clinical practice. Clinical
Psychology & Psychotherapy, 18(1), 1-12. https://doi.org/10.1002/cpp.696
de Beurs, E., Oudejans, S., & Terluin, B. (Submitted). A common measurement scale
for scores from self-report instruments in mental health care: T scores with a normal
distribution. European Journal of Psychological Assessment.
Derogatis, L. R. (1975). The Brief Symptom Inventory. Clinical Psychometric
Research.

Common measures or common metrics
25
Farber, G., Wolpert, M., & Kemmer, D. (2020). Common measures for Mental Health
Science: Laying the foundations. Wellcome Trust. Retrieved 11-1-2021 from
https://wellcome.ac.uk/sites/default/files/CMB-and-CMA-July-2020-pdf.pdf
Finkelstein, L. (2003). Widely, strongly and weakly defined measurement.
Measurement, 34(1), 39-48. https://doi.org/10.1016/S0263-2241(03)00018-6
Fischer, H. F., & Rose, M. (2019). Scoring depression on a common metric: a
comparison of EAP estimation, plausible value imputation, and full Bayesian IRT
modeling. Multivariate Behavioral Research, 54(1), 85-99.
https://doi.org/10.1080/00273171.2018.1491381
Flake, J. K., & Fried, E. I. (2020). Measurement Schmeasurement: Questionable
Measurement Practices and How to Avoid Them. Advances in Methods and Practices
in Psychological Science, 3(4), 456-465. https://doi.org/10.1177/2515245920952393
Fortney, J. C., Unützer, J., Wrenn, G., Pyne, J. M., Smith, G. R., Schoenbaum, M., &
Harbin, H. T. (2017). A tipping point for measurement-based care. Psychiatric
Services, 68(2), 179-188. https://doi.org/10.1176/appi.ps.201500439
Fried, E. I. (2017). The 52 symptoms of major depression: Lack of content overlap
among seven common depression scales. Journal of Affective Disorders, 208, 191-
197. https://doi.org/10.1016/j.jad.2016.10.019
Friedrich, M., Hinz, A., Kuhnt, S., Schulte, T., Rose, M., & Fischer, F. (2019).
Measuring fatigue in cancer patients: a common metric for six fatigue instruments.
Quality of Life Research, 28(6), 1615-1626. https://doi.org/10.1007/s11136-019-
02147-3
Goetz, T. (2010). It's time to redesign medical data [Presentation]. TEDMED.
Guy, W. (1976). "Clinical Global Impressions" ECDEU Assessment Manual for
Psychopharmacology, Revised. DHEW publication ADM 76-338. Government Printing
Office.
Harding, K. J., Rush, A. J., Arbuckle, M., Trivedi, M. H., & Pincus, H. A. (2011).
Measurement-based care in psychiatric practice: a policy framework for
implementation. Journal of Clinical Psychiatry, 72(8), 1136-1143.
https://doi.org/10.4088/JCP.10r06282whi

Common measures or common metrics
26
healthmeasures. (n.d.). https://www.healthmeasures.net/score-and-
interpret/interpret-scores/promis/promis-score-cut-points
Jacobson, N. S., & Truax, P. (1991). Clinical significance: A statistical approach to
defining meaningful change in psychotherapy research. Journal of Consulting and
Clinical Psychology, 59(1), 12-19. https://doi.org/10.1037//0022-006x.59.1.12
Kendall, P. C., Marrs-Garcia, A., Nath, S. R., & Sheldrick, R. C. (1999). Normative
comparisons for the evaluation of clinical significance. Journal of Consulting and
Clinical Psychology, 67(3), 285-299. https://doi.org/10.1037/0022-006X.67.3.285
Kilbourne, A. M., Beck, K., Spaeth-Rublee, B., Ramanuj, P., O'Brien, R. W., Tomoyasu,
N., & Pincus, H. A. (2018). Measuring and improving the quality of mental health care:
a global perspective. World Psychiatry, 17(1), 30-38.
https://doi.org/10.1002/wps.20482
Kolen, M. J., & Brennan, R. L. (2014). Test equating, scaling, and linking: Methods and
practices (3rd ed.). Springer Science & Business Media.
Kroenke, K., & Spitzer, R. L. (2002). The PHQ-9: a new depression diagnostic and
severity measure. Psychiatric Annals, 32(9), 509-515. https://doi.org/10.3928/0048-
5713-20020901-06
Kurtz, A. K., & Mayo, S. T. (1979). Percentiles and Percentile Ranks. In Statistical
Methods in Education and Psychology (pp. 145-163). Springer.
https://doi.org/10.1007/978-1-4612-6129-2_6
Lambert, M. J. (2007). Presidential address: What we have learned from a decade of
research aimed at improving psychotherapy outcome in routine care. Psychotherapy
Research, 17(1), 1-14. https://doi.org/10.1080/10503300601032506
Lambert, M. J., & Harmon, K. L. (2018). The merits of implementing routine outcome
monitoring in clinical practice. Clinical Psychology: Science and Practice, 25(4),
e12268. https://doi.org/10.1111/cpsp.12268
Lenhard, W., & Lenhard, A. (2021). Improvement of norm score quality via regression-
based continuous norming. Educational and Psychological Measurement, 81(2), 229-
261. https://doi.org/10.1177/0013164420928457
Common measures or common metrics
27
Lewis, C. C., Boyd, M., Puspitasari, A., Navarro, E., Howard, J., Kassab, H., Hoffman,
M., Scott, K., Lyon, A., & Douglas, S. (2019). Implementing measurement-based care
in behavioral health: a review. JAMA psychiatry, 76(3), 324-335.
https://doi.org/10.1001/jamapsychiatry.2018.3329
Ley, P. (1972). Quantitative aspects of psychological assessment (Vol. 1). London:
Duckworth.
Liu, H., Lafferty, J., & Wasserman, L. (2009). The nonparanormal: Semiparametric
estimation of high dimensional undirected graphs. Journal of Machine Learning
Research, 10(10). https://doi.org/10.1145/1577069.1755863
Lord, F. M., & Wingersky, M. S. (1984). Comparison of IRT true-score and
equipercentile observed-score" equatings". Applied Psychological Measurement, 8(4),
453-461. https://doi.org/10.1177/014662168400800409
Löwe, B., Decker, O., Müller, S., Brähler, E., Schellberg, D., Herzog, W., & Herzberg,
P. Y. (2008). Validation and standardization of the Generalized Anxiety Disorder
Screener (GAD-7) in the general population. Medical care, 45(3), 266-274.
https://doi.org/10.1097/MLR.0b013e318160d093
McCall, W. A. (1922). How to measure in education. MacMillan.
Meijer, R. R., & Oosterloo, S. J. (2008). A note on measurement scales and statistical
testing. Measurement: Interdisciplinary Research and Perspectives, 6(3), 198-204.
https://doi.org/10.1080/15366360802324446
Nelson, G. H., O'Hara, M. W., & Watson, D. (2018). National norms for the expanded
version of the inventory of depression and anxiety symptoms (IDAS-II). Journal of
Clinical Psychology, 74(6), 953-968. https://doi.org/10.1002/jclp.22560
Obbarius, A., van Maasakkers, L., Bear, L., Clark, D. M., Crocker, A. G., de Beurs, E.,
Emmelkamp, P. M. G., Furukawa, T. A., Hedman-Lagerlöf, E., Kangas, M., Langford,
L., Legsage, A., Mwesigire, D. M., Nolte, S., Patel, V., Pilkonis, P. A., Pincus, H. A.,
Reis, R. A., Rojas, G., et al. (2017). Standardization of health outcomes assessment
for depression and anxiety: recommendations from the ICHOM Depression and
Anxiety Working Group. Quality of Life Research, 26, 1-15.
https://doi.org/10.1007/s11136-017-1659-5

Common measures or common metrics
28
Ogles, B. M. (2013). Measuring Change in Psychotherapy Research. In M. J. Lambert
(Ed.), Bergin and Garfield's Handbook of Psychotherapy and Behavior Change (pp.
134-166).
Oude Voshaar, M., Vonkeman, H., Courvoisier, D., Finckh, A., Gossec, L., Leung, Y.,
Michaud, K., Pinheiro, G., Soriano, E., & Wulfraat, N. (2019). Towards standardized
patient reported physical function outcome reporting: linking ten commonly used
questionnaires to a common metric. Quality of Life Research, 28(1), 187-197.
https://doi.org/10.1007/s11136-018-2007-0
Patalay, P., & Fried, E. I. (2020). Editorial Perspective: Prescribing measures:
unintended negative consequences of mandating standardized mental health
measurement. Journal of Child Psychology and Psychiatry, n/a(n/a).
https://doi.org/10.1111/jcpp.13333
Patel, S. R., Bakken, S., & Ruland, C. (2008). Recent advances in shared decision
making for mental health. Current Opinion in Psychiatry, 21(6), 606-6012.
https://doi.org/10.1097/YCO.0b013e32830eb6b4
Peters, E., Dieckmann, N., Dixon, A., Hibbard, J. H., & Mertz, C. K. (2007). Less Is
more in presenting quality information to consumers. Medical Care Research and
Review, 64(2), 169-190. https://doi.org/10.1177/10775587070640020301
Prinsen, C. A. C., Mokkink, L. B., Bouter, L. M., Alonso, J., Patrick, D. L., de Vet, H. C.
W., & Terwee, C. B. (2018). COSMIN guideline for systematic reviews of patient-
reported outcome measures. Qual Life Res, 27(5), 1147-1157.
https://doi.org/10.1007/s11136-018-1798-3
Radloff, L. S. (1977). The CES-D scale: a self-report depression scale for research in
the general population. Applied Psychological Measurement, 1, 385-401.
https://doi.org/10.1177/014662167700100306
Recklitis, C. J., & Rodriguez, P. (2007). Screening childhood cancer survivors with the
brief symptom inventory-18: classification agreement with the symptom checklist-90-
revised. Psycho-Oncology, 16(5), 429-436. https://doi.org/10.1002/pon.1069
Reise, S. P., Rodriguez, A., Spritzer, K. L., & Hays, R. D. (2018). Alternative
Approaches to Addressing Non-Normal Distributions in the Application of IRT Models

Common measures or common metrics
29
to Personality Measures. Journal of Personality Assessment, 100(4), 363-374.
https://doi.org/10.1080/00223891.2017.1381969
Roelofs, J., van Breukelen, G., de Graaf, L. E., Beck, A. T., Arntz, A., & Huibers, M. J.
H. (2013). Norms for the Beck Depression Inventory (BDI-II) in a large Dutch
community sample. Journal of Psychopathology and Behavioral Assessment, 35(1),
93-98. https://doi.org/10.1007/s10862-012-9309-2
Santor, D. A., Gregus, M., & Welch, A. (2006). FOCUS ARTICLE: Eight Decades of
Measurement in Depression. Measurement: Interdisciplinary Research and
Perspectives, 4(3), 135-155. https://doi.org/10.1207/s15366359mea0403_1
Schalet, B. D., Cook, K. F., Choi, S. W., & Cella, D. (2014). Establishing a common
metric for self-reported anxiety: Linking the MASQ, PANAS, and GAD-7 to PROMIS
Anxiety. Journal of Anxiety Disorders, 28(1), 88-96.
https://doi.org/10.1016/j.janxdis.2013.11.006
Schalet, B. D., Lim, S., Cella, D., & Choi, S. W. (2021). Linking Scores with Patient-
Reported Health Outcome Instruments: A validation study and comparison of three
linking methods. Psychometrika, 86(3), 717-746. https://doi.org/10.1007/s11336-021-
09776-z
Schalet, B. D., Revicki, D. A., Cook, K. F., Krishnan, E., Fries, J. F., & Cella, D. (2015).
Establishing a common metric for physical function: Linking the HAQ-DI and SF-36 PF
subscale to PROMIS® Physical Function. Journal of General Internal Medicine,
30(10), 1517-1523. https://doi.org/10.1007/s11606-015-3360-0)
Schulte-van Maaren, Y. W., Carlier, I. V., Zitman, F. G., van Hemert, A. M., de Waal,
M. W., van der Does, A. W., van Noorden, M. S., & Giltay, E. J. (2013). Reference
values for major depression questionnaires: the Leiden Routine Outcome Monitoring
Study. Journal of affective disorders, 149(1-3), 342-349.
https://doi.org/10.1016/j.jad.2013.02.009
Seashore, H. G. (1955). Methods of Expressing Test Scores. Test Service Bulletin, 48,
7-10. https://doi.org/ https://eric.ed.gov/?id=ED079347
Snyder, C., Smith, K., Holzner, B., Rivera, Y. M., Bantug, E., Brundage, M., Weber, D.,
Basch, E., Aaronson, N., Reeve, B., Velikova, G., Heckert, A., Stotsky-Himelfarb, E.,
Chauhan, C., Hoffman, V., Ganz, P., Barbera, L., Frank, E., Smith, M. L., et al. (2019).

Common measures or common metrics
30
Making a picture worth a thousand numbers: recommendations for graphically
displaying patient-reported outcomes data. Quality of Life Research, 28(2), 345-356.
https://doi.org/10.1007/s11136-018-2020-3
Snyder, C. F., Aaronson, N. K., Choucair, A. K., Elliott, T. E., Greenhalgh, J., Halyard,
M. Y., Hess, R., Miller, D. M., Reeve, B. B., & Santana, M. (2012). Implementing
patient-reported outcomes assessment in clinical practice: a review of the options and
considerations. Quality of Life Research, 21(8), 1305-1314.
https://doi.org/10.1007/s11136-011-0054-x
Sousa, V. D., & Rojjanasrirat, W. (2011). Translation, adaptation and validation of
instruments or scales for use in cross-cultural health care research: a clear and user-
friendly guideline. Journal of Evaluation in Clinical Practice, 17(2), 268-274.
https://doi.org/10.1111/j.1365-2753.2010.01434.x
Spitzer, R. L., Kroenke, K., Williams, J. B., & Löwe, B. (2006). A brief measure for
assessing generalized anxiety disorder: the GAD-7. Archives of Internal Medicine,
166(10), 1092-1097. https://doi.org/10.1001/archinte.166.10.1092
Stasinopoulos, M. D., Rigby, R. A., & Bastiani, F. D. (2018). GAMLSS: a distributional
regression approach. Statistical Modelling, 18(3-4), 248-273.
https://doi.org/10.1177/1471082X18759144
Teresi, J. A., Ocepek-Welikson, K., Kleinman, M., Eimicke, J. P., Crane, P. K., Jones,
R. N., Lai, J. S., Choi, S. W., Hays, R. D., Reeve, B. B., Reise, S. P., Pilkonis, P. A., &
Cella, D. (2009). Analysis of differential item functioning in the depression item bank
from the Patient Reported Outcome Measurement Information System (PROMIS): An
item response theory approach. Psychological Science Quarterly, 51(2), 148-180.
http://www.ncbi.nlm.nih.gov/pubmed/20336180
Terwee, C. B., Crins, M. H. P., Roorda, L. D., Cook, K. F., Cella, D., Smits, N., &
Schalet, B. D. (2021). International application of PROMIS computerized adaptive
tests: US versus country-specific item parameters can be consequential for individual
patient scores. Journal of Clinical Epidemiology, 134, 1-13.
https://doi.org/10.1016/j.jclinepi.2021.01.011
Thissen, D., Liu, Y., Magnus, B., & Quinn, H. (2015). Extending the use of
multidimensional IRT calibration as projection: Many-to-one linking and linear

Common measures or common metrics
31
computation of projected scores. In L. A. van der Ark, D. M. Bolt, W.-C. Wang, J. A.
Douglas, & S.-M. Chow (Eds.), Quantitative Psychology Research (Vol. 140, pp. 1-16).
Springer.
Timmerman, M. E., Voncken, L., & Albers, C. J. (2020). A tutorial on regression-based
norming of psychological tests with GAMLSS. Psychological Methods.
https://doi.org/10.1037/met0000348
van Widenfelt, B. M., Treffers, P. D., de Beurs, E., Siebelink, B. M., & Koudijs, E.
(2005). Translation and cross-cultural adaptation of assessment instruments used in
psychological research with children and families. Clinical Child and Family
Psychology Review, 8(2), 135-147. https://doi.org/10.1007/s10567-005-4752-1
von Glischinski, M., von Brachel, R., & Hirschfeld, G. (2019). How depressed is
“depressed”? A systematic review and diagnostic meta-analysis of optimal cut points
for the Beck Depression Inventory revised (BDI-II). Quality of Life Research, 28(5),
1111-1118. https://doi.org/10.1007/s11136-018-2050-x
Wahl, I., Löwe, B., Bjorner, J. B., Fischer, F., Langs, G., Voderholzer, U., Aita, S. A.,
Bergemann, N., Brähler, E., & Rose, M. (2014). Standardization of depression
measurement: a common metric was developed for 11 self-report depression
measures. Journal of Clinical Epidemiology, 67(1), 73-86.
https://doi.org/10.1016/j.jclinepi.2013.04.019
Weidman, A. C., Steckler, C. M., & Tracy, J. L. (2017). The jingle and jangle of emotion
assessment: Imprecise measurement, casual scale usage, and conceptual fuzziness
in emotion research. Emotion, 17(2), 267. https://doi.org/10.1037/emo0000226
Weston, J., Dwan, K., Altman, D., Clarke, M., Gamble, C., Schroter, S., Williamson, P.,
& Kirkham, J. (2016). Feasibility study to examine discrepancy rates in prespecified
and reported outcomes in articles submitted to <em>The BMJ</em>. BMJ Open, 6(4),
e010075. https://doi.org/10.1136/bmjopen-2015-010075
Wolpert, M. (2020). Funders agree first common metrics for mental health science.
https://www.linkedin.com/pulse/funders-agree-first-common-metrics-mentalhealth-
science-wolpert

Common measures or common metrics
32
Zachary, R. A., & Gorsuch, R. L. (1985). Continuous norming: Implications for the
WAIS‐R. Journal of Clinical Psychology, 41(1), 86-94. https://doi.org/10.1002/1097-
4679(198501)41:1<86::AID-JCLP2270410115>3.0.CO;2-W
Zimmermann, J., Müller, S., Bach, B., Hutsebaut, J., Hummelen, B., & Fischer, F.
(2020). A common metric for self-reported severity of personality disorder.
Psychopathology, 53(3), 168-178. https://doi.org/10.1159/000507377
Declarations:
Conflict of interest:
The authors have no conflict of interest to declare.
Contributions:
EdeB wrote the first draft of the manuscript and analyzed the data that were added to
Table 2. EIF and JRB commented and improved the manuscript.
Data Availability Statement
Predominantly previously published data were used for this manuscript. A Pre-test
Routine Outcome Monitoring data from a clinical sample of a mental healthcare
institute (Rivierduinen in Leiden) was used to add a column to Table 2. The Medical
Ethical Boards of the Leiden University Medical Center approved use of anonymized
data that were collected routinely in clinical practice. Patients gave informed consent
for anonymized use of their data.
Copyright © 2022 FDOKUMEN