sistem pentadbiran tradisional yang terdapat di sabah dan ...

Biological Conservation 167 (2013) 396–404
Contents lists available at ScienceDirect
Biological Conservation
journal homepage: www.elsevier .com/locate /b iocon
Combining human preference and biodiversity priorities for marineprotected area site selection in Sabah, Malaysia
0006-3207/$ - see front matter � 2013 Elsevier Ltd. All rights reserved.http://dx.doi.org/10.1016/j.biocon.2013.09.002
⇑ Corresponding author. Tel.: +1 604 822 2731; fax: +1 604 822 8934.E-mail addresses: [email protected] (L.C.L. Teh), [email protected]
(L.S.L. Teh), [email protected] (R. Jumin).
1 In this paper, ‘community based approach’ and ‘community consultatused interchangeably to refer to a planning process that involvedstakeholders, including community members. It does not imply that thprocess was initiated and driven by community members alone.
Lydia C.L. Teh a,⇑, Louise S.L. Teh a, Robecca Jumin b
a Fisheries Centre, University of British Columbia, AERL, 2202 Main Mall, Vancouver, British Columbia V6T 1Z4, Canadab WWF-Malaysia, Suite 1-6-W11, 6th Floor, CPS Tower, Centre Point Complex, 88000 Kota Kinabalu, Sabah, Malaysia
a r t i c l e i n f o a b s t r a c t
Article history:Received 7 June 2012Received in revised form 28 August 2013Accepted 1 September 2013Available online xxxx
Keywords:Fishers’ spatial preferencesFuzzy logicMarine spatial managementMarine protected area zoningSabah, MalaysiaCommunity consultation
High human reliance on marine resources in developing countries is a challenge for implementing marineprotected areas, which usually seek to limit or restrict fishing in selected areas. Fishers’ spatial prefer-ences should be considered during the site selection process, but biodiversity considerations are gener-ally the primary focus. The Protected Area Suitability Index (PASI) is a fuzzy logic spatial planning toolthat combines human preferences and conservation criteria to assess the suitability of marine sites forbeing protected from fishing and other extractive use. We apply the PASI in zoning a marine sanctuaryin Sabah, Malaysia, with the objectives of (i) assessing the PASI’s ability to capture fishers’ spatial prefer-ences; and (ii) comparing the nuances of community based and fuzzy logic approaches in spatial plan-ning. There was overlap in sites chosen for protection by both approaches, and multi-dimensionalscaling results suggest that the PASI captures fishers’ preferences. Community consultations enable directintegration of local knowledge to fill gaps in scientific knowledge, but can be time consuming and expen-sive. The PASI is an alternative to data and labour intensive conservation planning tools that are currentlyavailable, and can be particularly useful for zoning marine protected areas in data poor developing coun-tries where conservation requires quick action.
� 2013 Elsevier Ltd. All rights reserved.
1. Introduction regulations is thus seen as a key factor in achieving successful bio-
Marine protected areas are used for multiple purposes – theycan help to mitigate human threats to the coastal ecosystem (Halp-ern et al., 2008), address biodiversity loss (Sala and Knowlton,2006), restore fisheries and ecosystem processes (Sumaila et al.,2000; Russ et al., 2004; McClanahan et al., 2007; Goñiet al., 2008), and generate socio-economic benefits (Unsworthet al., 2010; Mwaipopo, 2008; Govan, 2009). The use of MPAs is ris-ing globally (Wood et al., 2008), and in recent years, MPAs havefeatured prominently in marine conservation agendas for biodiver-sity rich areas in the developing world. For example, the Coral Tri-angle is a multi-national effort to establish networks of MPAs inSoutheast Asia and western Oceania (CTI Secretariat, 2009).
High human reliance on marine resources in developing coun-tries is a challenge for implementing MPAs, which specifically seekto limit or restrict fishing in selected areas. Indeed, theories on theecological effects of marine protected areas are based on the con-dition that no fishing takes place within MPA borders (Wardet al., 2001). Carrying on with conservation without addressingsocio-economic complexities is liable to be met with limited suc-cess (Mascia, 2003; Cinner, 2007). Community support for MPA
logical and socio-economic outcomes (Crawford, 2009).Community participation in MPA planning has generally been
associated with more supportive attitudes (Crawford, 2009; Vers-leijen and Hoorweg, 2009) towards the MPA and hence highercompliance. Zoning plans that do not get widespread support canbe difficult to implement; for example, conflicts over access toresources may arise (Lewis, 1996), or fishers may ignore zoningregulations (Mora et al., 2006; Crawford, 2009). The opinions andpreferences of communities are thus an important considerationwhen prioritising sites for protection. However, incorporatingcommunity preferences to MPA spatial planning is often an adhoc process, whereas researchers tend to favour a systematicapproach to planning MPAs (Ban, 2008). Typically, systematic plan-ning involves designing MPAs to achieve specific targets in repre-senting biodiversity, species, and habitats (Margules et al., 2002;Leslie, 2005). This process is frequently facilitated by software thatis supported by academic institutions or environmental non-gov-ernmental organizations (NGO).
Community based1 and systematic planning approaches to MPAdesign each have their drawbacks. Even where MPAs have been
ions’ aremultiplee entire

Fig. 1. Pulau Banggi lies off the northern coast of Sabah in East Malaysia.
L.C.L. Teh et al. / Biological Conservation 167 (2013) 396–404 397
formed with community participation, internal conflicts within thecommunity can erode the system (Russ and Alcala, 1999). In addi-tion, community based site selection outcomes may not capturethe full range of biodiversity and ecological features that are neces-sary to sustain the marine ecosystem. On the other hand, systematicplanning for representation relies heavily on data availability, thelack of which may delay the entire process (Grantham et al.,2009). In developing countries, this is probably the biggest challenge,notwithstanding the fact that socio-economic data are even rarer tocome across than biological data; hence, systematic planning forrepresentation may overlook social aspects that are relevant tocommunities.
A practical approach to prioritising sites for marine protectedareas would thus be one that incorporates communities’ spatialpreferences within a systematic planning framework. Here, weadopt the Protected Area Suitability Index (PASI), a fuzzy logic spa-tial planning tool which fulfills such a role (Teh and Teh, 2011; Tehet al., 2012b). We aim to assess the PASI’s ability to capture fishers’spatial preferences, and to provide insights on zoning approachesthat address both human and biodiversity needs. To this extent,we compare the process and outcome of a community based ap-proach to MPA site selection with that of applying the PASI. We ex-plore the nuances of each approach using a case study of theMaliangin Sanctuary in Pulau Banggi, Sabah, East Malaysia, as thebasis for the comparison (Fig. 1).
1.1. Background
The Malaysian state of Sabah is located within the Coral Trian-gle, which is one of the most biodiversity rich marine regions in the
world. However, it is also one of the most threatened, as the com-bined stressors of overfishing, widespread use of destructive fish-ing methods, coastal development and pollution are putting 85%of coral reefs in the region at risk of degradation and loss (Burkeet al., 2012).
In 2003, the Sabah government agreed to a proposal to gazettethe Tun Mustapha Park (TMP), a multi-use marine managed areathat will cover approximately 1.1 million hectares in Sabah’snorthern coast. This marine region is home to endangered speciessuch as dugongs (Rajamani, 2009) and marine turtles (Hardinget al., 2001), and serves as a corridor linking the South China Seaand Sulu Sea for migratory species. At the same time, roughly80,000 people live within the proposed TMP, most of who makea full or partial living from the sea (Jumin and Kassem, undated).There is little to no management of marine resource use withinthe TMP, which is most clearly illustrated by Malthusian overfish-ing in Pulau Banggi (Teh and Sumaila, 2007). As such, the formalgazettement of the TMP by the Sabah government will providean avenue for marine conservation and sustainable marine re-source use in the region. The TMP will implement a zoning systemto accommodate varied values and uses of the TMP, including bio-diversity protection and sustainable fisheries.
Pulau Banggi is the main island group within the TMP, with atotal area of about 700 km2 (Anon, 2003). It is comprised of twolarge islands and numerous smaller outlying islands. It is sparselypopulated, and fishing is the primary economic activity and pro-vides the main source of protein for the majority of coastal house-holds. In 2006, efforts were initiated to begin prioritising marinesites in Pulau Banggi for protection, i.e., closed to fishing. Manyfishers in Pulau Banggi have limited flexibility to adapt to changes

Fig. 2. Maliangin fishing ground is outlined by the dotted line, and the locations of assessment sites are marked by circles. Shaded areas indicate coral reefs. The map is notdrawn to scale, and the fishing ground boundary and all site locations are approximate.
398 L.C.L. Teh et al. / Biological Conservation 167 (2013) 396–404
in access to their existing fishing grounds (Teh et al., 2012a), andmay be negatively impacted by closures of their current fishinggrounds.
Maliangin Besar island (hereafter referred to as Maliangin) waschosen as the first pilot site in Pulau Banggi for designing andimplementing a zoning system. The process of creating the newMaliangin Sanctuary was led by WWF-Malaysia (hereafter referredto as WWF), in partnership with the state departments Sabah Parksand Sabah Department of Fisheries. Local communities were alsoinvolved, and the Maliangin Island Community Association (MICA)was formed to represent local interests and facilitate the creationof Maliangin Sanctuary. The purpose of Maliangin Sanctuary wasto demonstrate the benefits of a co-managed (i.e. joint manage-ment by MICA and WWF) marine protected area to the local fishingcommunities of Banggi and the wider region. Specific objectivesincluded demonstrating possible spill-over effects, improvingbiodiversity, and generating socio-economic benefits to localcommunities.
2. Methods
2.1. Study site
Maliangin is less than 2 km2 in size, and is located about 5 kmsouthwest of the main island of Banggi. In 2006, there were about12 fishers on Maliangin, who fished daily in the waters surround-ing the island. In addition, fishers from neighbouring villages onBanggi, and occasionally fishers from outside Banggi, also fishednear Maliangin. The waters surrounding Maliangin were not sub-ject to any access restrictions, and Maliangin fishers generally ex-pressed no inclination to prohibit fishers from other villages fromfishing close to their village. However, Maliangin fishers did com-plain occasionally about commercial trawlers and purse seiners
that fished too close inshore near their village (Teh et al., 2007).In addition, the former head of the village, who still resides onthe island, claimed to have monitored and patrolled the area di-rectly in front of his house for illegal fishing activities such as fishbombing and cyanide fishing.
Maliangin fishers fish primarily with hook and line, followed bytraps and spears. They conduct single-day trips from wooden boatspowered by inboard engines that are typically 7 horsepower insize. On average, Maliangin fishers catch 5.6 kg of fish per trip,which comprise of demersal reef fish and reef associated pelagics(Teh et al., 2007). Fish catches are sold daily to one of several localfish buyers. Maliangin fishers are especially interested in trollingfor spanish mackerel (Scomberomorus commerson) and catchinglive coral grouper (Plectropomus leopardus), of which the latter isspecifically targeted to supply the regional live reef fish trade. Dur-ing certain times of the year, fishers and/or members of theirhousehold glean for sea cucumbers and other invertebrates atMaliangin Kecil island, which is approximately 1 km southwestof Maliangin. Sea cucumbers are cooked and dried by the fishersfor sale to the mainland, while other gleaned organisms such asurchins and clams are kept for consumption at home or sold atthe local market.
Maliangin fishers fish within an area referred to as Malianginfishing ground (MFG), which covers an area of roughly 22 km2
(Fig. 2). On average, Maliangin fishers made about 95% of their fish-ing trips within 4 km from Maliangin island (Teh et al., 2012a). Ingeneral, fishers fish over patch and fringing reefs in the MFG thatare 8–30 m deep, while gill netters from other villages occasionallyfish over muddy substrate. Maliangin fishers started fishing full-time in the 1980s after the decline of the copra industry, whichhad been the main economic activity for island residents. Prior tothat, fishing was done at a subsistence level. MFG has thus beenused continuously by fishers from Maliangin for at least the past30 years.

Fig. 3. The final configuration of no take zones (zones 1–3) within the Maliangin Sanctuary, where boundaries of no take zones are demarcated by bold solid lines. The dottedlines show the original proposed boundary of zone 3, which was subsequently altered to exclude S7. Shaded areas indicate coral reefs. This map is reproduced from an originalcreated by WWF-Malaysia. This map is not drawn to scale, thus Sanctuary boundaries may not be exactly as shown on the original.
2 As of July 2013 the currency conversion rate was 1 MYR = 0.31 USD.
L.C.L. Teh et al. / Biological Conservation 167 (2013) 396–404 399
2.2. Community based approach
The process for designing Maliangin Sanctuary began in 2006when WWF initialized consultations with representatives fromMaliangin and three neighbouring communities to identify poten-tial sites for protection. Prior to this, fishers’ spatial use patternswere not well understood. Existing criterion for site prioritisationwas WWF’s aim to achieve a 30% coral reef representation in thesanctuary, with minimal displacement of fishing activities.
The Maliangin Island Community Association (MICA) was for-mally established in 2010. It is co-chaired by the village head ofMaliangin and has 10 serving community members in addition totwo secretaries and a treasurer. Consultation meetings were usu-ally organized by the local WWF team and held at the mainlandtown of Kudat, an hour’s ferry ride from Banggi. Representativesof WWF and MICA attended all meetings, including the WWF mar-ine conservation manager and local field officers, and MICA chairand 2–3 community members. Aside from formal meetings, MICAmembers and other fishers also discussed Maliangin Sanctuary is-sues informally with WWF field officers who regularly visited theisland for outreach activities and biodiversity surveys.
Two rounds of consultations led to the first proposal drawn byWWF outlining the boundary of Maliangin Sanctuary (Fig. 3). Inthis first proposal, zone 1 incorporated two areas identified bythe communities as suitable sites for protection, including the areamonitored by the former village head of Maliangin, while zones 2and 3 were identified by WWF specifically to meet their coral reeftarget. The first proposal was rejected by the communities becauseof the inclusion of an important fishing ground, S7, in zone 3 whereno fishing was allowed. In addition, Maliangin fishers were worriedabout their ability to access Maliangin Kecil island which was in-cluded within zone 3. Further rounds of negotiations with MICAensued over the sanctuary boundary. In 2009, a compromise wasreached wherein the boundary of zone 3 was altered to excludeS7, yet still retain enough coral reefs to meet WWF’s target(Fig. 3). This version of Maliangin Sanctuary was accepted by MICA,and knowledge of its existence is slowly spreading to other com-munities in Banggi. We use this version of Maliangin Sanctuaryas the basis for our comparative analysis.
2.3. Fuzzy logic approach
We used the spatial planning tool PASI to determine the suit-ability of study sites for being protected, i.e., closed to fishing.The PASI is a fuzzy expert system that facilitates protected area siteselection by identifying sites that minimize socio-economic impacton fishers, yet satisfy conservation criteria (Teh and Teh, 2011; Tehet al., 2012b). For this study, PASI input data were sourced frompublished literature and field surveys conducted by the first andsecond authors in 2007 and 2009 (Table 1). Twelve sites withinthe MFG (S1–S12) were selected for assessment, based largely onthe availability of input data. All study sites are used for fishingat least periodically by some fishers.
Sites are assigned a suitability score based on two subcompo-nents- fishing value (FV) and conservation value (CV). Sites are as-sessed a score on a scale of 0–10 in each subcomponent, where 0 isnot suitable for protection and 10 is very suitable for protection.Then, both subcomponent scores are weighted according to a userdefined proportion and summed to a total final suitability scorefrom 0 to 10. In this paper, ‘index score’ will be used to denote totalfinal suitability score while ‘FV’ and ‘CV’ scores refer to scores fromthe respective subcomponents. We scale all suitability scores to al-low for comparability across time. Index scores are scaled to twoanchor points, the best (low FV and high CV) and worst (high FVand low CV) case scenario outcomes. Finally, all numerical scoresare mapped to four classes of site suitability – low, moderate, high,and very high.
The fishing value (FV) subcomponent measures how desirable asite is for fishing from a fisher’s point of view, and is determined bythe spatial attributes catch (kg trip�1), distance (km), depth (m),net revenue (MYR trip�1),2 and crowding (number of boats in vicin-ity). The PASI aims to avoid selecting fishers’ preferred fishinggrounds in order to minimize fisher displacement, thus the higherthe preference for a site, the lower its suitability for protection. Ahigh score in the FV subcomponent means high site suitability forprotection and inversely low fisher preference for that site. Coral

Table 1Input values (average ± variance) of Maliangin Sanctuary sites S1–S12 for Scenarios 1 and 2. Attributes marked by ‘�’ apply to Scenario 2 only.
Attribute Input value Data source
Catch (kg trip�1) 5.6 ± 2.2 Catch logs, interviewsDistance (km) 2.8 ± 1.6 Google earth mapDepth (m) 24 ± 11 Interviews, nautical chartsNet revenue (MYR trip�1) 30 ± 12 Catch logs, interviewsCrowding (No. of boats) 4.3 ± 2.6 Catch logs, interviewsEndangered species (1–10) 5.3 ± 1.8 Interviews, personal observation, Rajamani (2009)Seagrass presence (Yes/No) n/a Interviews, personal observation, Rajamani and Marsh (2010)Coral cover (%)� 33 ± 19 Harding et al. (2001), Koh et al. (2002), Lee and Chou (2003), Tanzil and Chou (2004)Fish abundance (No. 100 m�2)� 31 ± 18 Harding et al. (2001), Koh et al. (2002), Lee and Chou (2003), Tanzil and Chou (2004)
400 L.C.L. Teh et al. / Biological Conservation 167 (2013) 396–404
cover (% hard coral cover), fish abundance (No. of fish 100 m�2),presence of seagrass (yes/no) and frequency of endangered species(scale of 1–10) are used as biodiversity surrogates in the conserva-tion value subcomponent. The higher a site’s CV score, the higherits suitability for protection.
Fuzzy logic deals with degrees of truth- unlike binary logic,where an input either belongs or does not belong to a category, in-puts in a fuzzy logic system can assume membership in more thanone category. The degree of membership is a number between 0and 1 that is assigned by membership functions, and can bethought of as the possibility of belonging to a particular category.For example, a depth of 6 m is assigned to the fuzzy category ‘shal-low’ with 0.2 degree of possibility, and to category ‘little deep’ with0.3 degree of possibility. Fuzzified inputs then trigger specific heu-ristic rules that relate a given condition (e.g., If catch is high) withan outcome of site suitability (e.g., Then suitability is low). A con-fidence factor ranging between 0 (no confidence) and 1 (high con-fidence) is attached to each rule, whereby the confidence factorexpresses belief in the strength of the expressed outcome, or therelative importance of the rule.
We allocated a 50/50 percent split in the contribution of theFV and CV subcomponents to the index score. Rules wereweighted to reflect the relative importance of attributes in fishers’spatial decision making. As well, there was a subjective elementin the weightings that reflected the degree of confidence wehad in the outcomes expressed by the rules. For example, fishersare typically concerned about distance when selecting fishinggrounds, with the majority having strong preference for stayingclose to home and avoiding far places (Teh et al., 2012a,b). Hence,the heuristic rules relating ‘far’ and ‘near’ distances to theirrespective suitability outcomes were allocated weights of 1.3 Ruleconfidence weightings were assigned as follows: Crowding (all suit-ability outcomes) = 0.25; catch and net revenue (all suitability out-comes) = 0.5, distance (very near, very far) = 0.75; distance (near,far) = 1; depth (shallow, little deep, deep) = 0.75; depth (verydeep) = 0.25; endangered species (all suitability outcomes) = 0.5;coral cover and fish abundance (all suitability outcomes) = 0.75.Finally, the presence of sea grass triggered ‘high’ and ‘very high’suitability outcomes with 0.5 confidence.
We considered two scenarios to account for limited biodiver-sity data (Table 1). Scenario 1 ‘megafauna’ included all attributesin the FV subcomponent and the attributes endangered speciesand seagrass presence in the CV subcomponent. Scenario 2 ‘reefhealth’ applied to 4 sites, S1–S4 only. These sites had all attri-butes in the FV subcomponent and the same CV attributes as Sce-nario 1, with the addition of coral cover and fish. Scenario 2 wasincluded to investigate how data quantity and quality affect PASIresults.
3 See Teh and Teh (2011) for list of heuristic rules relating site attributes tosuitability outcomes.
2.4. Comparing community based approach with fuzzy logic approach
2.4.1. ProcessThe process of zoning Maliangin Sanctuary by the community
and fuzzy logic approaches was evaluated on the following criteria:(i) time commitment; (ii) financial and personnel needs; (iii) localknowledge integration; and (iv) stakeholder power distribution.The first two criteria evaluate the logistical efficiency of the zoningprocess – less time commitment and lower financial burden canfacilitate timely implementation of conservation actions. In datapoor conditions local knowledge can supply information for fillingscientific knowledge gaps (Thornton and Maciejewski Scheer,2012). As such, it is important that there is a mechanism for inte-grating local knowledge during the zoning process. The final crite-rion (iv) addresses the need for equity in the representation ofstakeholders’ interests such that process outcomes are balanced.
2.4.2. OutcomeWe assessed the overlap in sites selected for protection from
the community approach and the fuzzy logic approach. To do this,we used the community map as the basis for comparison, then cal-culated the number of convergently classified sites divided by thetotal number of sites (Ban, 2008). Sites that were selected for pro-tection from the community approach are those within the no fishzones on Fig. 3. For the fuzzy logic approach, we considered siteswith scores of more than 6 to be adequate for protection. Six wasdefined as the minimum cut off score for protection as it was theaverage value of the upper quartile of the set of suitability scoresfrom scenario 1, scenario 2, and the FV subcomponent.
We calculated Cohen’s kappa statistic in SPSS to test for inter-relatedness between the two approaches. The kappa statistic is achance-corrected measure of agreement that examines the degreeto which two raters concur in their assignment of N items into xcategories. In this case, the community and fuzzy logic approachesare the two raters, which assign 12 sites into 2 categories of protec-tion – protected and not protected. Only results from scenario 1were used, as the number of sites in scenario 2 was insufficientfor statistical testing.
2.4.3. PASI and fisher preference representationWe conducted a multidimensional scaling (MDS) analysis using
PRIMER 5 software to examine if attributes used in the PASI tocharacterise sites delineate fishers’ site preferences. MDS is a mul-tivariate statistic technique used for qualitatively exploring simi-larities in a set of data. Input variables to the MDS were catch,distance, depth, net revenue, and crowding. Similarity was mea-sured as the Euclidean distance between pairs of samples, in thiscase, the similarity between sites. MDS ordination maps the posi-tion of each site such that those that are similar are positionedclose together, while those that are less similar are positionedfurther apart.
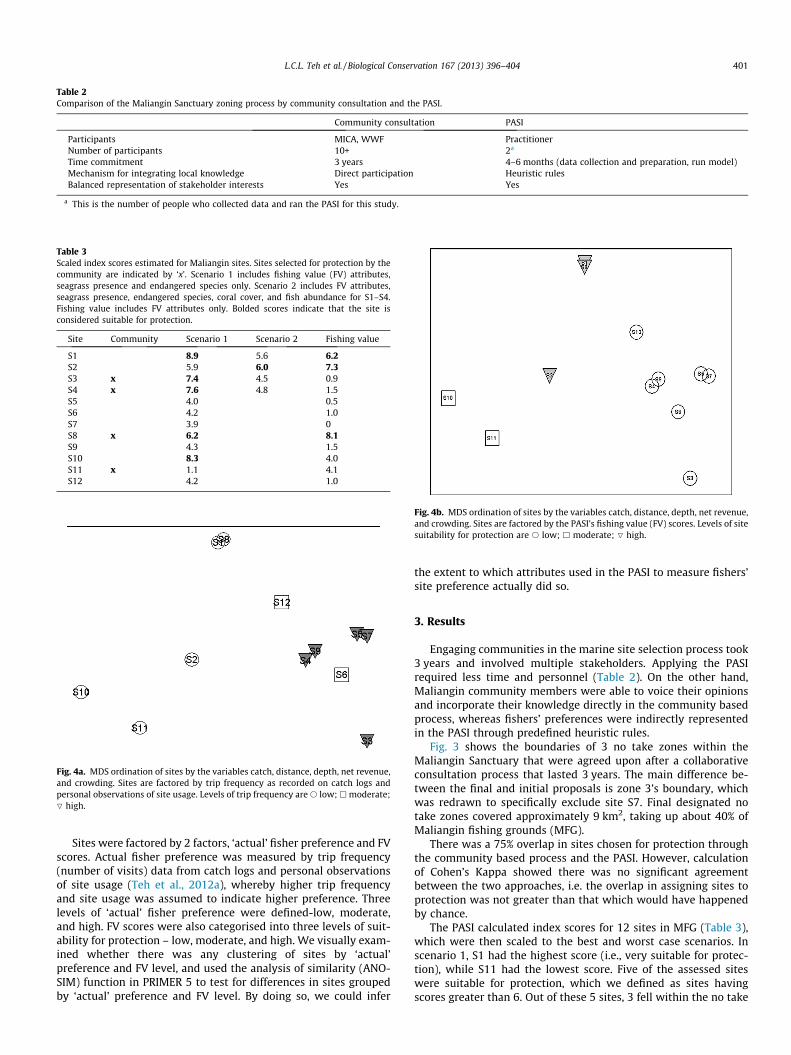
Table 2Comparison of the Maliangin Sanctuary zoning process by community consultation and the PASI.
Community consultation PASI
Participants MICA, WWF PractitionerNumber of participants 10+ 2a
Time commitment 3 years 4–6 months (data collection and preparation, run model)Mechanism for integrating local knowledge Direct participation Heuristic rulesBalanced representation of stakeholder interests Yes Yes
a This is the number of people who collected data and ran the PASI for this study.
Table 3Scaled index scores estimated for Maliangin sites. Sites selected for protection by thecommunity are indicated by ‘x’. Scenario 1 includes fishing value (FV) attributes,seagrass presence and endangered species only. Scenario 2 includes FV attributes,seagrass presence, endangered species, coral cover, and fish abundance for S1–S4.Fishing value includes FV attributes only. Bolded scores indicate that the site isconsidered suitable for protection.
Site Community Scenario 1 Scenario 2 Fishing value
S1 8.9 5.6 6.2S2 5.9 6.0 7.3S3 x 7.4 4.5 0.9S4 x 7.6 4.8 1.5S5 4.0 0.5S6 4.2 1.0S7 3.9 0S8 x 6.2 8.1S9 4.3 1.5S10 8.3 4.0S11 x 1.1 4.1S12 4.2 1.0
Fig. 4a. MDS ordination of sites by the variables catch, distance, depth, net revenue,and crowding. Sites are factored by trip frequency as recorded on catch logs andpersonal observations of site usage. Levels of trip frequency are s low; h moderate;O high.
Fig. 4b. MDS ordination of sites by the variables catch, distance, depth, net revenue,and crowding. Sites are factored by the PASI’s fishing value (FV) scores. Levels of sitesuitability for protection are s low; h moderate; O high.
L.C.L. Teh et al. / Biological Conservation 167 (2013) 396–404 401
Sites were factored by 2 factors, ‘actual’ fisher preference and FVscores. Actual fisher preference was measured by trip frequency(number of visits) data from catch logs and personal observationsof site usage (Teh et al., 2012a), whereby higher trip frequencyand site usage was assumed to indicate higher preference. Threelevels of ‘actual’ fisher preference were defined-low, moderate,and high. FV scores were also categorised into three levels of suit-ability for protection – low, moderate, and high. We visually exam-ined whether there was any clustering of sites by ‘actual’preference and FV level, and used the analysis of similarity (ANO-SIM) function in PRIMER 5 to test for differences in sites groupedby ‘actual’ preference and FV level. By doing so, we could infer
the extent to which attributes used in the PASI to measure fishers’site preference actually did so.
3. Results
Engaging communities in the marine site selection process took3 years and involved multiple stakeholders. Applying the PASIrequired less time and personnel (Table 2). On the other hand,Maliangin community members were able to voice their opinionsand incorporate their knowledge directly in the community basedprocess, whereas fishers’ preferences were indirectly representedin the PASI through predefined heuristic rules.
Fig. 3 shows the boundaries of 3 no take zones within theMaliangin Sanctuary that were agreed upon after a collaborativeconsultation process that lasted 3 years. The main difference be-tween the final and initial proposals is zone 3’s boundary, whichwas redrawn to specifically exclude site S7. Final designated notake zones covered approximately 9 km2, taking up about 40% ofMaliangin fishing grounds (MFG).
There was a 75% overlap in sites chosen for protection throughthe community based process and the PASI. However, calculationof Cohen’s Kappa showed there was no significant agreementbetween the two approaches, i.e. the overlap in assigning sites toprotection was not greater than that which would have happenedby chance.
The PASI calculated index scores for 12 sites in MFG (Table 3),which were then scaled to the best and worst case scenarios. Inscenario 1, S1 had the highest score (i.e., very suitable for protec-tion), while S11 had the lowest score. Five of the assessed siteswere suitable for protection, which we defined as sites havingscores greater than 6. Out of these 5 sites, 3 fell within the no take

Table 4Results of one-way ANOSIM test comparing similarity in sites by fishers’ ‘actual’preference levels. Significant results are bolded, where significance was set at p = 0.05.
R value p Value
Global test 0.457 0.006Pairwise testsLow, high 0.738 0.008Low, moderate 0.291 0.095High, moderate �0.109 0.571
Table 5Results of one-way ANOSIM test comparing similarity in sites by their FV score levels.Significant results are bolded, where significance was set at p = 0.05.
R value p Value
Global test 0.906 0.001Pairwise testsHigh, low 0.857 0.008High, moderate 0.667 0.2Low, moderate 1.0 0.028
402 L.C.L. Teh et al. / Biological Conservation 167 (2013) 396–404
zones determined by the collaborative consultation. Of the 7 sitesscored as being not suitable for protection by the PASI, 1 was pro-tected in a no take zone determined by the community approach.In scenario 2, only 1 site out of 4 was assessed by the PASI as beingsuitable for protection. None of the selection agreed with the deci-sion of the community approach.
Multidimensional scaling showed delineation in sites that werehighly preferred when factored by ‘actual’ fisher preference(Fig. 4a). There was also clustering to the right hand side of theMDS plot by sites with low suitability when factored by FV scores(Fig. 4b). ANOSIM tests indicated a significant difference betweensites factored by ‘actual’ fisher preference (p < 0.01, R = 0.457)(Table 4), and a significant difference between sites factored byFV scores (p < 0.01, R = 0.906) (Table 5). In both cases, sites catego-rized as low appeared to be most dissimilar from the high andmoderate sites. The R values suggest a strong difference amongsites factored by FV scores, and a moderate difference when siteswere factored by actual fisher preference.
4. Discussion and conclusion
Community support is a crucial element for successful MPAimplementation, and there is growing recognition that humanpreferences have to be integrated directly into the MPA site prior-itisation process (Ferse et al., 2010). At the same time, systematicplanning methods have gained support in the marine spatial plan-ning community, but tend to emphasize biodiversity aspects. Weaddressed this gap by assessing PASI’s ability to capture fishers’spatial preferences, and by comparing the process and outcomeof community based and systematic (PASI) approaches.
Fishing value (FV) scores (i.e. based on fishing value attributesonly) generated by the PASI appeared to be reflective of fishers’actual fishing location preferences. Fishers’ concern about gainingaccess to Maliangin Kecil island was correspondingly reflected inthe low FV score for S3. Their very high preference for S7 was con-firmed by the site’s scaled FV score of 0, meaning that the PASIrated it even less suitable for protection than the worst case sce-nario. Sites S5 and S9 also achieved low FV scores, which is notunexpected as along with S7, these three sites have the reputationof being fishing grounds with ‘‘lots of fish’’ among local fishers(Teh, unpublished interview data). The community selected twosites contained within zone 1 as their choice for a no fishing area.
S8 fell within zone 1 and was similarly scored as being highly suit-able for protection based on its FV score of 8.1.
Multidimensional scaling (MDS) showed that a certain combi-nation of catch, distance, depth, net revenue, and crowding distin-guished highly ‘actual’ preferred sites from other sites. Thepatterns observed in Figs. 4a and b suggest that (i) The PASI’s FVscores infer fishers’ actual preferences, as measured by how fre-quently they visit a site; and (ii) the suite of attributes in the FVsubcomponent captures underlying factors that influence fishers’actual site preferences.
Time and financial resources are important considerations dur-ing conservation planning, with faster processes typically moredesirable. The community based approach required a significantlylonger time to produce final results compared to the PASI. The3 year consultation period had the potential to alienate fishers,who tend not to be future-oriented (Teh et al., 2013), and in thepast had lost interest in projects such as seaweed farming whichwas perceived to be labourious and yield insufficient income(Teh, personal observation). Furthermore, taking time away fromfishing to attend meetings incurred an opportunity cost to fishers.If extended over a long period of time, initial minor inconveniencescan potentially sour people’s attitudes and willingness to partici-pate in consultations. For this study, the longest phase of the PASIprocess was the primary data collection period, which took placeover two intervals in 2007 and 2009. This phase can be consider-ably shortened depending on data availability for the site(s) inquestion. Subsequent model calibration and data processing inthe PASI can be performed relatively quickly, depending on the de-gree of customization and number of assessed sites.
The PASI can in fact be used as a facilitation tool during commu-nity consultations to help planners visualize feasible alternativesand anticipate stakeholders’ responses – this may avert the pro-posal of potentially contentious areas. For example, the designa-tion of no take zones in Maliangin Sanctuary might have beenquicker if S7 had not been included in the initial proposal. This ap-proach may shorten the time, personnel, and financial resourcesthat have to be dedicated towards community consultations. Weemphasize however, that the PASI be used as a complement to,not substitute for, the consultation process itself.
Participatory approaches enable stakeholders to incorporatelocal or traditional knowledge into the decision making process.Maliangin fishers’ selection of sites was driven by local knowledgeof fish distribution and movement, seasonal weather conditions,and fish abundance, among other conditions. For instance, de-pleted near-shore reef and rocky habitat in zone 1 was proposedby MICA as fishers seldom fish in that area, whereas deeper reefsand stretches of water known to be used by Spanish Mackerel wereleft out of MICA’s proposal. While local knowledge is integrated inthe PASI through its use of heuristic rules, the model relies on prox-ies and generalities which may not capture stakeholders’ responsesin certain situations. Heuristic rules can be adjusted by PASI usersto be more representative of local conditions, but remain an indi-rect interpretation of stakeholders’ internal knowledge and beliefs.
Fishing and conservation interests are represented in the resultsof both community consultation and PASI approaches. Malianginfishers’ strong objection to losing their fishing ground in the vicin-ity of S7 resulted in the redrawing of zone 3, demonstrating thatthere was some sharing of power between MICA and WWF repre-sentatives. However, despite fishers’ high preference for S3, the sitewas included within a no fishing zone because of extensive coralcover in the area, as well as the importance of Maliangin Kecil is-land as a turtle nesting ground. This suggests that compromiseswere made during consultations to balance conservation and fish-ers’ interests. PASI results showed a similar trend, whereby S3earned relatively high index scores that ranged from 4.5 to 7.4 inscenarios 2 and 1 respectively, but had a low FV score. When the

L.C.L. Teh et al. / Biological Conservation 167 (2013) 396–404 403
conservation subcomponent of S7 was considered, its index scorein scenario 1 rose to a moderately suitable level of 3.9, as opposedto 0 when only fishing value attributes were considered.
PASI scenario 1 index scores indicated that there were threesuitable sites for protection that were not selected for protectionduring community consultations. These sites, S1, S2, and S10, areused infrequently by fishers, based on the number of trips takento S1 and S2 from catch log records, as well as personal observa-tions of fishing activity at S10. S10 may be an appropriate candi-date site for protection as its proximity to shore facilitatescompliance and enforcement efforts (Crawford, 2009; Jupiter andEgli, 2011), and it contains some seagrass habitat (Rajamani,2009) used by endangered species such as dugongs, which havebeen sighted and/or caught within the vicinity (The Star Online,2009). However, designating S10 as a no fishing zone blocks fish-ers’ access to Maliangin Kecil island, which is frequently used forgleaning, making S10 less appropriate for closure. Although infre-quently used, S1 may be more suitable for seasonal closure asthe vicinity of the site becomes important during the annual south-west monsoon when it offers fishers a relatively safe and shelteredplace to fish.
The PASI’s weighting system allows users to allocate varyingimportance levels to fishing and biodiversity interests; in thisstudy both FV and CV subcomponents were allocated 50% contri-bution to total suitability outcome (index score). The split in FVand CV weightings is transparent and easily adjusted. Site suit-ability scores produced by a passive tool like PASI are more likelyto be viewed as a neutral proposal for zoning, rather than polar-ized ‘ours’ versus ‘their’ proposal. This can encourage more mean-ingful stakeholder involvement, and develop communities’ trustin, and commitment to the marine protected area creation pro-cess (Sesabo et al., 2006; Ferse et al., 2010). On the other hand,power relations in participatory processes are not always equallydistributed, and community involvement has sometimes beenused simply as a means for planners with pre-defined objectivesto obtain community agreement (Few, 2001). Without existinggoodwill between MICA and WWF, it is feasible that powerdynamics may have shifted in favour of the WWF, who havethe advantage of financial, technological, and scientific resourcesover the MICA.
Data gaps can delay progress towards conservation, but evenopportunistic placement of marine reserves without complete sci-entific knowledge can still fulfill ecological requirements (Hansenet al., 2011). At the time of this study there was limited data oncoral cover and fish abundance within Maliangin Sanctuary; theavailable data were sourced from underwater surveys conductedin the early 2000s, and as such may not have been representativeof current coral reef health conditions. We thus omitted thesetwo data sets in running scenario 1 (megafauna). Index scores fromscenario 1 indicated 75% agreement in site selection outcome withthe no take fishing zone agreed upon by MICA and the WWF. Albeitnot statistically significant, this overlap suggests that absent datado not necessarily negate the overall value of results nor shouldthey delay decision-making; hence, the PASI is useful even in datapoor situations.
Imperfect scientific knowledge may be overcome in a commu-nity based process where stakeholders bring different information,perspectives, and priorities to the table (van den Hove, 2000). Themain issue of contention during meetings was the inclusion of S7within a no fishing zone. Site S7 is highly important to Malianginfishers and much time was committed to ensuring its exclusionfrom a no fishing zone. Conservation interest in coral reefs wasspecifically to obtain a targeted 30% representation within Malian-gin Sanctuary, with less emphasis on reef health indicators such ascoral cover and fish abundance. Limited knowledge on the two reefhealth indicators thus did not hinder discussions as it was not the
primary focus of stakeholders. This effect can be simulated to someextent in the PASI by decreasing coral cover and fish abundancerule weightings from their current value of 0.75 to reflect theirlower relative importance in contributing to the final outcome.
When coral cover and fish abundance data were included inscenario 2 (biodiversity), the index scores of 3 out of the 4 siteswith additional data decreased such that they dropped from beinginitially considered suitable for protection in scenario 1 to beingunsuitable in scenario 2. The ambiguity in results that arose fromthe inclusion of additional attributes highlights the issues of dataquality and quantity, both which add uncertainty in using planningtools like the PASI. Taking the results of systematic planning toolsat face value without understanding the nature of data upon whichoutput was derived, in this case reef health data which may nolonger be representative of existing conditions, can potentially leadto mistaken conclusions. This is especially the case in MPA zoningexercises where it is not uncommon to use 50 and up to 100 s oflayers of data. A single set of questionable data can skew outcomesyet may not be detected by users. Uncertainties arising from ques-tionable or the lack of data may be better dealt with in a consulta-tion setting (van den Hove, 2000), where participants can jointlydecide on how to treat imperfect information based on their expec-tations of outcomes, understanding of relevant impacts and issues,and tolerance for the unknown.
Users should be aware of some limitations in the use and inter-pretation of PASI and its outcomes. First, index scores should beviewed relative to each other and not as absolute values. In thissense, the actual values that define ‘high’ or ‘low’ suitability areless important; rather, it is the user’s interpretation of the scorewithin the context of local conditions that is key. Second, theway that users choose to define categories (for e.g., the numberof kilometers that is considered ‘near’ or ‘far’) and assign confi-dence weighting to heuristic rules can change the suitability score.Therefore, PASI results from one zoning exercise are not directlycomparable to results from another process, unless all modelparameters are identical. Even then, variation in the social andenvironmental context in which the different zoning exercises oc-cur may make straight comparisons impractical. A sensitivity anal-ysis of the PASI showed that its structure was robust (Teh et al.,2012a,b). Estimated site suitability scores were insensitive to theremoval of individual as well as cumulative numbers of attributes,and only deviated minimally when heuristic rules were systemat-ically disabled.
Incorporating stakeholders’ interests in marine protected areasite selection is an important step in attaining conservation and re-source use objectives. Community consultations are thorough butmay not be practical time wise and financially when conservationaction is urgently needed. The PASI is a useful alternative to exist-ing conservation planning tools/software (e.g. Ecotrust, marxan)because it does not overly rely on data availability, and it explicitlyincorporates human dimension and biodiversity attributes. It canbe most useful for zoning processes where there is high humanreliance on marine resources and lack of socio-economic and bio-diversity data, and where there is urgency for results to be pro-duced. The PASI can facilitate progress towards a solution, butshould not be used as a final solution in itself.
References
Anon, 2003. Profail Daerah Kecil Banggi Tahun 2003. Pejabat Daerah Kecil Banggi.Ban, N., 2008. Multiple perspectives for envisioning marine protected areas. PhD
thesis, University of British Columbia, 217 pp.Burke, L., Reytar, K., Spalding, M., Perry, A., 2012. Reefs at Risk Revisited in the Coral
Triangle. World Resources Institute, Washington, DC, 72 pp.Cinner, J.E., 2007. Designing marine reserves to reflect local socioeconomic
conditions: lessons from long-enduring customary management systems.Coral Reefs 26, 1035–1045.

404 L.C.L. Teh et al. / Biological Conservation 167 (2013) 396–404
Crawford, B.R., 2009. Factors influencing the success of community-based marineprotected areas in North Sulawesi Indonesia. PhD thesis, University of RhodeIsland, 301 pp.
Ferse, S.C.A., Costa, M.M., Manez, K.S., Adhuri, D.S., Glaser, M., 2010. Allies, notaliens: increasing the role of local communities in marine protected areaimplementation. Environ. Conserv. 37, 23–34.
Few, 2001. Containment and counter-containment: planner/community relationsin conservation. Geograph. J. 167, 111–124.
Goñi, R., Adlerstein, S., Alvarez-Berastegui, A., Forcada, A., Reñones, O., Criquet, G.,Polti, S., Cadiou, G., Valle, C., Lenfant, P., Bonhomme, P., Pérez-Ruzafa, A.,Sánchez-Lizaso, J.L., García-Charton, J.A., Bernard, G., Stelzenmüller, V., Planes,S., 2008. Spillover from six western Mediterranean marine protected areas:evidence from artisanal fisheries. Mar. Ecol. Prog. Ser. 366, 159–174.
Govan, H., 2009. Achieving the potential of locally managed marine areas in theSouth Pacific. SPC Trad. Mar. Res. Manage. Knowledge Inform. Bull. 25, 16–25.
Grantham, H., Wilson, K., Moilanen, A., Rebelo, T., Possingham, H., 2009. Delayingconservation actions for improved knowledge: how long should we wait. Ecol.Lett. 12, 293–301.
Halpern, B.S., Walbridge, S., Selkoe, K.A., Kappel, C.V., Micheli, F., D’Agrosa, C., Bruno,J.F., Casey, K.S., Ebert, C., Fox, H.E., Fujita, R., Heinemann, D., Lenihan, H.S.,Madin, E.M.P., Perry, M.T., Selig, E.R., Spalding, M., Steneck, R., Watson, R., 2008.Global Map of human impact on marine ecosystems. Science 319, 948–952.
Hansen, G.J.A., Ban, N.C., Jones, M.L., Kaufman, L., Panes, H.M., Yasué, M., Vincent,A.C.J., 2011. Hindsight in marine protected area selection: a comparison ofecological representation arising from opportunistic and systematicapproaches. Biol. Conserv. 144, 1866–1875.
Harding, S., Lowery, C., Wesson, H., Colmer, M., Daw, T., 2001. The Pulau Banggiproject for coral reef biodiversity: 1st annual report (July 1999–September2000). Greenforce, London, United Kingdom, 67+31 pp.
Jumin, R., Kassem, K., undated. Ecosystem-based Management in a proposed marineprotected area: Tun Mustapha Park, Sabah. <http://www.mengo.org/resources_articles/mengo_ebm_in_kudat_pca_alim_roj_krk.pdf>. (accessed29.05.12).
Jupiter, S.D., Egli, D.P., 2011. Ecosystem-based management in Fiji: successes andchallenges after five years of implementation. J. Mar. Biol., 14 pp. (Article ID940765, doi:10.1155/2011/940765).
Koh, L., Chou, L., Tun, K., 2002. The status of coral reefs of Pulau Banggi and itsvicinity, Sabah, based on surveys in June 2002. REST Technical Report 2/02.National University of Singapore, Singapore, pp. 36.
Lee, W., Chou, L. 2003. The status of coral reefs of Pulau Banggi and its vicinity,Sabah, based on surveys in June 2003. REST Technical Report 2/03. NationalUniversity of Singapore, Singapore, 31pp.
Leslie, H.M., 2005. A synthesis of marine conservation planning approaches.Conserv. Biol. 19, 1701–1713.
Lewis, C., 1996. Managing conflicts in protected areas. IUCN, Gland, Switzerland,Cambridge, UK, xii+100pp.
Margules, C.R., Pressey, R.L., Williams, P.H., 2002. Representing biodiversity: dataand procedures for identifying priority areas for conservation. J. Biosci. 27, 309–326.
Mascia, M.B., 2003. The human dimension of coral reef marine protected areas:recent social science research and its policy implications. Conserv. Biol. 17, 630–632.
McClanahan, T.R., Graham, N.A.J., Calnan, J.M., MacNeil, M.A., 2007. Toward pristinebiomass: reef fish recovery in coral reef marine protected areas in Kenya. Ecol.Appl. 17, 1055–1067.
Mora, C.S., Andrefouet, S., Costello, M.J., Kranenburg, C., Rollo, A., Veron, J., Gaston,K.J., Myers, R.A., 2006. Coral reefs and the global network of marine protectedareas. Science 312, 1750–1751.
Mwaipopo, R.N., 2008. The social dimensions of Marine Protected Areas: A casestudy of the Mafia Island Marine Park in Tanzania. Samudra Monograph,International Collective in Support of Fishworkers, Chennai, pp. 38.
Rajamani, L., 2009. The conservation biology of the dugong (Dugong dugon) and itsseagrass habitat in Sabah, Malaysia: a basis for conservation planning. PhDthesis, Universiti Sabah Malaysia, 288pp.
Rajamani, L., Marsh, H., 2010. Using parallel regional-and local-scale initiatives toinform conservation management of rare wildlife: a case study of the dugongDugong dugon in Sabah, Malaysia. Endang. Spec. Res. 13, 17–23.
Russ, G.R., Alcala, A.C., 1999. Management histories of Sumilon and Apo MarineReserves, Philippines, and their influence on national marine resource policy.Coral Reefs 18, 307–319.
Russ, R., Alcala, A.C., Maypa, A.P., Calumpong, H.P., White, A.T., 2004. Marine reservebenefits local fisheries. Ecol. Appl. 14, 597–606.
Sala, E., Knowlton, N., 2006. Global marine biodiversity trends. Ann. Rev. Environ.Res. 31, 93–122.
Secretariat, C.T.I., 2009. Regional Plan of Action–Coral Triangle Initiative on coralreefs, fisheries and food security (CTI-CFF). Interim Coral Triangle InitiativeSecretariat, Jakarta.
Sesabo, J.K., Lang, H., Tol, R.S.J., 2006. Perceived attitude and marine protected areas(MPAs) establishment: why households’ characteristics matter in coastalresources conservation initiatives in Tanzania. Working Paper FNU-99,Hamburg University and Centre for Marine and Atmospheric Sciences, 39pp.
Sumaila, U.R., Guénette, S., Alder, J., Chuenpagdee, R., 2000. Addressing ecosystemeffects of fishing using marine protected areas. ICES J. Mar. Sci. 57, 752–760.
Tanzil, J.I., Chou, L., 2004. The status of coral reefs of Pulau Banggi, Pulau Malawaliand the vicinity, Sabah, based on surveys in June 2004. REST Technical ReportNo. 6. National University of Singapore, Singapore, pp. 52.
Teh, L., Sumaila, U.R., 2007. Malthusian overfishing in Pulau Banggi? Mar. Policy 31(4), 451–457.
Teh, L.C.L., Teh, L.S.L., 2011. A fuzzy logic approach to marine spatial management.Environ. Manage. 47 (4), 536–545.
Teh, L.S.L., Zeller, D., Cabanban, A., Teh, L.C.L., Sumaila, U.R., 2007. Seasonality andhistoric trends in the reef fisheries of Pulau Banggi, Sabah, Malaysia. Coral Reefs26 (2), 251–263.
Teh, L.C.L., Teh, L.S.L., Meitner, M.J., 2012a. Preferred resource spaces and fisherflexibility: implications for spatial management of small-scale fisheries. Hum.Ecol. 40, 213–226.
Teh, L.C.L., Teh, L.S.L., Pitcher, T.J., 2012b. A tool for site prioritisation of marineprotected areas under data poor conditions. Mar. Policy 36 (6), 1290–1300.
Teh, L.S.L., Teh, L.C.L., Sumaila, U.R., Cheung, W.L., 2013. Time discounting and theoverexploitation of coral reefs. Environ. Resour. Econ. 2013, 1–24.
The Star Online, 2009. Bajau fishermen save rare dugong. The Star Online, <http://thestar.com.my/news/story.asp?file=/2009/12/17/nation/5319917&sec=nation>(accessed 30.08.11).
Thornton, T.F., Maciejewski Scheer, A., 2012. Collaborative engagement of local andtraditional knowledge and science in marine environments: a review. Ecol. Soc.17 (3), 8.
Unsworth, R., Cullen, L., Pretty, J., Smith, D., Bell, J., 2010. Economic and subsistencevalues of the standing stocks of seagrass fisheries: potential benefits of no-fishing marine protected area management. Ocean Coast. Manag. 53, 218–224.
van den Hove, S., 2000. Participatory approaches to environmental policy-making:the European Commission Climate Policy Process as a case study. Ecol. Econ. 33,457–472.
Versleijen, N., Hoorweg, J., 2009. Marine conservation: the voice of the fishers. In:Hoorweg, J., Muthiga, N. (Eds.), Advances in coastal ecology: People, processesand ecosystems in Kenya. African Studies Centre, Leiden, pp. 79–98.
Ward, T.J., Heinemann, D., Evans, N., 2001. The role of marine reserves as fisheriesmanagement tools: a review of concepts, evidence and internationalexperience. Dept. of Agriculture, Fisheries & Forestry, Bureau of RuralSciences, Australia, 192pp.
Wood, L.J., Fish, L., Laughren, J., Pauly, D., 2008. Assessing progress towards globalmarine protection targets: shortfalls in information and action. Oryx 42, 340–351.
Copyright © 2022 FDOKUMEN