Combining distribution modelling and non-invasive genetics to improve range shift forecasting
9
Ecological Modelling 297 (2015) 171–179 Contents lists available at ScienceDirect Ecological Modelling journa l h om epa ge: www.elsevier.com/locate/ecolmodel Combining distribution modelling and non-invasive genetics to improve range shift forecasting Frederico Mestre a,∗ , Ricardo Pita a , Joana Paupério b , Filipa M.S. Martins b , Paulo Célio Alves b,c,d , António Mira a , Pedro Beja b a CIBIO/InBio, Centro de Investigac ¸ ão em Biodiversidade e Recursos Genéticos, Pólo de Évora, Universidade de Évora, Núcleo da Mitra, Apartado 94, 7002-554 Évora, Portugal b CIBIO-UP, Centro de Investigac ¸ ão em Biodiversidade e Recursos Genéticos, Universidade do Porto, InBIO Laboratório Associado, Campus Agrário de Vairão, 4485-661 Vairão, Portugal c Departamento de Biologia, Faculdade de Ciências da Universidade do Porto, Rua do Campo Alegre s/n, 4169-007 Porto, Portugal d Wildlife Biology Program, University of Montana, Missoula, MT 59812, USA a r t i c l e i n f o Article history: Received 23 June 2014 Received in revised form 18 October 2014 Accepted 17 November 2014 Keywords: Climate change Ecological niche Microtus cabrerae Range margins Range shift Cytochrome-b gene a b s t r a c t Forecasting species range shifts under climate change is critical to adapt conservation strategies to future environmental conditions. Ecological niche models (ENMs) are often used to achieve this goal, but their accuracy is limited when species niches are inadequately sampled. This problem may be tackled by com- bining ENM with field validation to fine-tune current species distribution, though the traditional methods are often time-consuming and the species ID inaccurate. Here we combine ENM with novel field validation methods based on non-invasive genetic sampling to forecast range shifts in the globally near-threatened Cabrera vole (Microtus cabrerae). Using occurrence records mapped at 10 km × 10 km resolution, we built the first ENM (ENM1) to estimate the current species distribution. We then selected 40 grid squares with no previous data along the predicted range margins, and surveyed suitable habitats through presence- sign searches. Faecal samples visually assigned to the species were collected for genetic identification based on the mitochondrial cytochrome-b gene, which resulted in 19 new grid squares with confirmed presence records. The second model (ENM2) was built by adding the new data, and species distribution maps predicted by each model under current and future climate change scenarios were compared. Both models had high predictive ability, with strong influence of temperature and precipitation. Although current distribution ranges predicted by each model were quite similar, the range shifts predicted under climate change differed greatly when using additional field data. In particular, ENM1 overlooked areas identified as important by ENM2 for species conservation in the future. Overall, results suggest that combining ENM with non-invasive genetics may provide a cost-effective approach in studies regarding species conservation under environmental change. © 2014 Elsevier B.V. All rights reserved. 1. Introduction There is growing evidence that many species will change their current ranges in response to climate change. These range shifts, may have multiple conservation implications on, for instance, the design of reserve networks (Hannah, 2008; Hannah et al., 2002), assisted colonization approaches (Hoegh-Guldberg et al., 2008), and habitat restoration priorities (Mawdsley et al., 2009). ∗ Corresponding author. Tel.: +351 282338232. E-mail address: [email protected] (F. Mestre). Species range shifts are caused by the expansion or contrac- tion of favourable climatic conditions, and typically emerge from extinction–colonization processes mostly driven by the species physiological tolerances, dispersal abilities, and habitat availabil- ity along their distribution limits (Anderson et al., 2009; Thomas, 2010; Walther et al., 2002). Generally, species tend to occupy newly available patches at their expanding margins, being more likely to become locally extinct at the retracting margin (Anderson et al., 2009). Support for such climate-induced range dynamics in many plants and animals has led to the recognition that effective conservation planning should move from a static to a dynamic approach. Accurate projections on potential species distribution http://dx.doi.org/10.1016/j.ecolmodel.2014.11.018 0304-3800/© 2014 Elsevier B.V. All rights reserved.
-
Upload
universityofevora -
Category
Documents
-
view
1 -
download
0
Transcript of Combining distribution modelling and non-invasive genetics to improve range shift forecasting

Ct
FPa
7b
4c
d
a
ARRA
KCEMRRC
1
cmt22
h0
Ecological Modelling 297 (2015) 171–179
Contents lists available at ScienceDirect
Ecological Modelling
journa l h om epa ge: www.elsev ier .com/ locate /eco lmodel
ombining distribution modelling and non-invasive geneticso improve range shift forecasting
rederico Mestrea,∗, Ricardo Pitaa, Joana Paupériob, Filipa M.S. Martinsb,aulo Célio Alvesb,c,d, António Miraa, Pedro Bejab
CIBIO/InBio, Centro de Investigac ão em Biodiversidade e Recursos Genéticos, Pólo de Évora, Universidade de Évora, Núcleo da Mitra, Apartado 94,002-554 Évora, PortugalCIBIO-UP, Centro de Investigac ão em Biodiversidade e Recursos Genéticos, Universidade do Porto, InBIO Laboratório Associado, Campus Agrário de Vairão,485-661 Vairão, PortugalDepartamento de Biologia, Faculdade de Ciências da Universidade do Porto, Rua do Campo Alegre s/n, 4169-007 Porto, PortugalWildlife Biology Program, University of Montana, Missoula, MT 59812, USA
r t i c l e i n f o
rticle history:eceived 23 June 2014eceived in revised form 18 October 2014ccepted 17 November 2014
eywords:limate changecological nicheicrotus cabrerae
ange marginsange shiftytochrome-b gene
a b s t r a c t
Forecasting species range shifts under climate change is critical to adapt conservation strategies to futureenvironmental conditions. Ecological niche models (ENMs) are often used to achieve this goal, but theiraccuracy is limited when species niches are inadequately sampled. This problem may be tackled by com-bining ENM with field validation to fine-tune current species distribution, though the traditional methodsare often time-consuming and the species ID inaccurate. Here we combine ENM with novel field validationmethods based on non-invasive genetic sampling to forecast range shifts in the globally near-threatenedCabrera vole (Microtus cabrerae). Using occurrence records mapped at 10 km × 10 km resolution, we builtthe first ENM (ENM1) to estimate the current species distribution. We then selected 40 grid squares withno previous data along the predicted range margins, and surveyed suitable habitats through presence-sign searches. Faecal samples visually assigned to the species were collected for genetic identificationbased on the mitochondrial cytochrome-b gene, which resulted in 19 new grid squares with confirmedpresence records. The second model (ENM2) was built by adding the new data, and species distributionmaps predicted by each model under current and future climate change scenarios were compared. Bothmodels had high predictive ability, with strong influence of temperature and precipitation. Although
current distribution ranges predicted by each model were quite similar, the range shifts predicted underclimate change differed greatly when using additional field data. In particular, ENM1 overlooked areasidentified as important by ENM2 for species conservation in the future. Overall, results suggest thatcombining ENM with non-invasive genetics may provide a cost-effective approach in studies regardingspecies conservation under environmental change.© 2014 Elsevier B.V. All rights reserved.
. Introduction
There is growing evidence that many species will change theirurrent ranges in response to climate change. These range shifts,ay have multiple conservation implications on, for instance,
he design of reserve networks (Hannah, 2008; Hannah et al.,002), assisted colonization approaches (Hoegh-Guldberg et al.,008), and habitat restoration priorities (Mawdsley et al., 2009).
∗ Corresponding author. Tel.: +351 282338232.E-mail address: [email protected] (F. Mestre).
ttp://dx.doi.org/10.1016/j.ecolmodel.2014.11.018304-3800/© 2014 Elsevier B.V. All rights reserved.
Species range shifts are caused by the expansion or contrac-tion of favourable climatic conditions, and typically emerge fromextinction–colonization processes mostly driven by the speciesphysiological tolerances, dispersal abilities, and habitat availabil-ity along their distribution limits (Anderson et al., 2009; Thomas,2010; Walther et al., 2002). Generally, species tend to occupynewly available patches at their expanding margins, being morelikely to become locally extinct at the retracting margin (Anderson
et al., 2009). Support for such climate-induced range dynamics inmany plants and animals has led to the recognition that effectiveconservation planning should move from a static to a dynamicapproach. Accurate projections on potential species distribution
1 Mode
rfe
tZoamnaAqooepotTupo
ctsdnssni(dwdot2gmaBsrr
isde(te(lwceLctisS
72 F. Mestre et al. / Ecological
anges, should allow the conservation of both present-day anduture biodiversity (Fuller et al., 2011; Hannah et al., 2002; Petersont al., 2011).
Ecological niche models (ENMs) are commonly used to assesshe relation between the species and the environment (Guisan andimmermann, 2000), evaluating the existing fundamental nichef the species (Peterson et al., 2011). While these models provide
valuable tool for designing policies to lessen the effects of cli-ate change on biodiversity (e.g. Peterson et al., 2011), they are
ot impervious to some potential biases and uncertainties (Bealend Lennon, 2012; Hanspach et al., 2011; Rocchini et al., 2011).
primary source of uncertainty underlying ENM is related to theuality and quantity of species occurrence data. Small sample sizesr inadequate spatial coverage decreases the statistical confidencef correlations underlying niche models (Wiens et al., 2009, and ref-rences therein). Uncertainties in occurrence information may bearticularly common along range margins, where the species mightccur at lower densities (Hengeveld and Haeck, 1982), increasinghe risk of erroneous results and predictions (Hanspach et al., 2011).hese uncertainties may have important implications for the eval-ation of the ecological niche, and for the computation of accuraterojections of current and future distributions, particularly in rarer elusive species which are difficult to sample.
Although interactive modelling and ground validation samplingan provide a useful method to fine-tune current species distribu-ion ranges, its implications in forecasting species range shifts aretill largely unexplored, often because field surveys are logisticallyifficult, inaccurate, and time-consuming. In this context, novelon-invasive genetic techniques may provide a fast and effectiveolution to assess the impact of combining ENM and post-modellingampling on species range shift forecasting. The combination ofon-invasive genetic sampling with DNA-based tests for species
dentification, highly improved the efficiency of using field signsfaeces, hair, feathers, etc.) for determining species presence andistribution (see e.g. Beja-Pereira et al., 2009; Waits, 2004). Inhat concerns small mammals, for instance, reliable occurrenceata typically require relatively demanding field sampling efforts,ften involving intensive capture campaigns, or owl pellet dissec-ion (e.g. Landete-Castillejos et al., 2000; Mira et al., 2008; Pita et al.,006, 2007, 2011). Recently, it has been shown that non-invasiveenetic sampling of small mammals (e.g. using faecal samples)ay provide a promising alternative to monitor populations, by
llowing the indirect identification of species (Alasaad et al., 2011;arbosa et al., 2013). However, to the best of our knowledge, notudy has yet combined ENM and non-invasive genetics to refineange shifts estimates, and so the potential value of this approachemains untested.
Here, we evaluate the impact of combining ENMs with non-nvasive genetic sampling at the range margins in forecasting rangehifts of a rodent species, for which range margins are poorlyefined. Specifically, we focus on the Cabrera vole Microtus cabr-rae, a near threatened species endemic to the Iberian PeninsulaFernandes et al., 2008), which is restricted to wet herbaceous habi-ats (Luque-Larena and López, 2007; Pita et al., 2006, 2011; Santost al., 2005, 2006). This species typically occurs at very low densitiesFernández-Salvador et al., 2005), and often persists as metapopu-ations in highly fragmented agricultural and pastoral landscapes,
here patch-level extinction–colonization events are relativelyommon (Pita et al., 2007). Recent studies suggested that the Cabr-ra vole is a climate-sensitive species (Araújo et al., 2011, 2012;aplana and Sevilla, 2013), implying that its conservation shouldonsider the dynamic and uncertain effects of climate change. Iden-
ification of effective conservation actions for the Cabrera voles hindered by difficulties to survey the species using traditionalampling approaches such as live-trapping (e.g. Fernández-alvador et al., 2005; Pita et al., 2007). Although presence signs (e.g.lling 297 (2015) 171–179
runways on grasses, faeces) have been successfully used to surveythis vole (e.g. Garrido-García et al., 2009; Pita et al., 2006, 2007), theapproach may be limited in situations of sympatry with other volespecies producing similar signs (e.g., the field vole, Microtus agrestis,in Northern Iberia). Here we combine ecological niche modellingand recent DNA-based tests for species ID using faecal samples toforecast range shifts of rare and elusive species. In particular weaimed to (i) fine-tune the distribution limits of the Cabrera vole inIberia, using non-invasive genetic sampling at the range margins;(ii) predict the species range shifts under future climate conditions,and evaluate the effect of the new occurrence records on such fore-casts; (iii) assess the impacts of climate change on the conservationof the Cabrera vole, in the light of the new distribution model pre-dictions. Results of the study were then used to discuss the potentialof non-invasive genetics to improve the value of ENM in guidingconservation action.
2. Materials and methods
2.1. Study design
We followed an approach similar to Guisan et al. (2006),using spatial predictions from ecological niche models (henceforthENM1) to guide new surveys of the Cabrera vole, and then usingthe data from these surveys to improve the initial models (ENM2).In contrast to Guisan et al. (2006), however, we have concentratedsurveys at the range margins rather than throughout the speciesrange (Fig. 1), aiming to gain a better representation of the extremesof the climatic niche. Sampling was conducted in Portugal, whichincludes a large proportion of the overall species range, and whereprevious surveys have been mostly based in owl pellet analysis(Mira et al., 2008), and far less intensive that those carried out inSpain (e.g. Fernández-Salvador, 2007; Garrido-García et al., 2013).Therefore, it was possible that range margins for the species wereparticularly ill-defined in Portugal, which could have serious conse-quences on the prediction errors of distribution models (Hanspachet al., 2011). Surveys were based on the detection of the charac-teristic faeces of the species, which were collected and identifiedunequivocally using molecular techniques (see below). The distri-bution models produced with the baseline data (ENM1) and thenew dataset (ENM2) were then compared in terms of influentialvariables, and spatial forecasts under current and predicted futureclimatic scenarios.
2.2. Data sources
Presence data of Cabrera vole across its entire current range(the Iberian Peninsula) were obtained from all available literaturesources documenting the occurrence of the species between 1970and 2011 (see Fig. 1a; Table A1 in Appendix A) and recorded in a10 km × 10 km UTM grid (Universal Transverse Mercator). Of the6153 available squares, the species occurred in 391. We used datacollected over a relatively large time span, because we wanted tomaximize the size and spatial representativity of the occurrencesdataset, which is essential for accurate species distribution mod-elling (Feeley and Silman, 2011). Although this procedure caused amismatch between the species distribution data (1970–2011) andthe climate data (1950–2000), the overlap between the two timeperiods was very large (30 years), and the mismatch was suffi-ciently small (11 years) to make it unlikely to affect significantlythe modelling results (Roubicek et al., 2010).
Variables of current climatic conditions were obtained fromthe WorldClim website (http://www.worldclim.org/and Hijmanset al., 2005) and consisted of interpolations of observed datafor the time period between 1950 and 2000. Variables of future
F. Mestre et al. / Ecological Modelling 297 (2015) 171–179 173
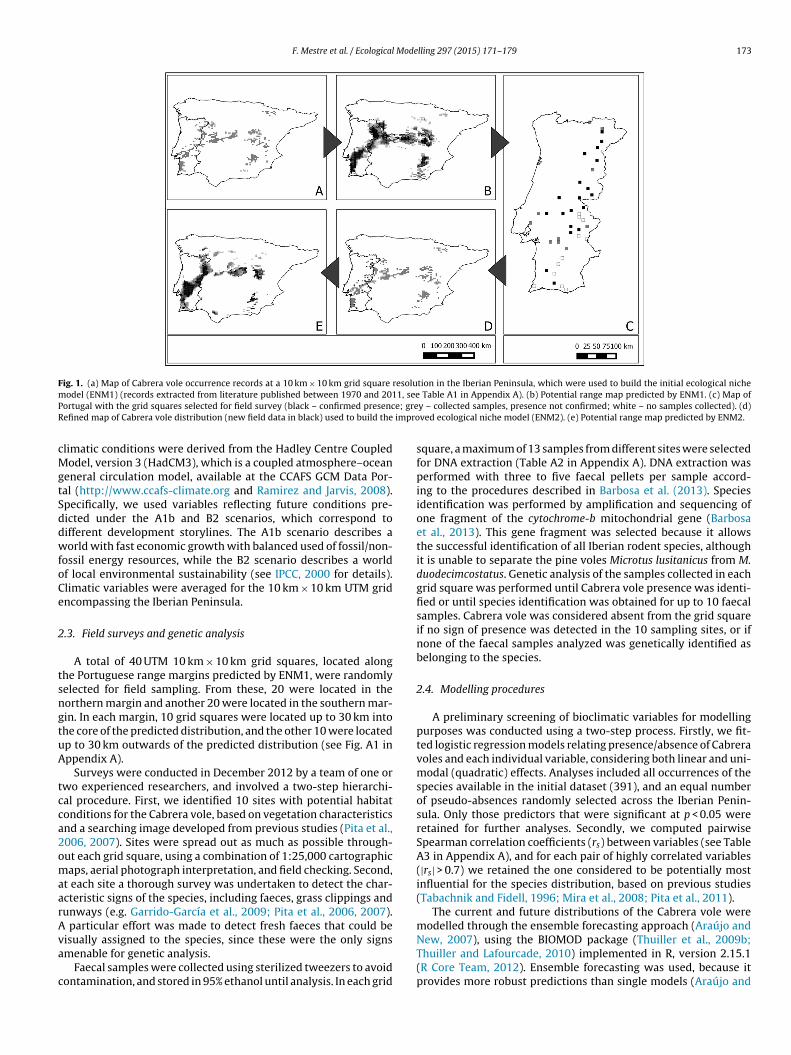
Fig. 1. (a) Map of Cabrera vole occurrence records at a 10 km × 10 km grid square resolution in the Iberian Peninsula, which were used to build the initial ecological nichem 1, seeP e; greR impro
cMgtSddwfoCe
2
tsngtuA
tcca2omaarAva
c
odel (ENM1) (records extracted from literature published between 1970 and 201ortugal with the grid squares selected for field survey (black – confirmed presencefined map of Cabrera vole distribution (new field data in black) used to build the
limatic conditions were derived from the Hadley Centre Coupledodel, version 3 (HadCM3), which is a coupled atmosphere–ocean
eneral circulation model, available at the CCAFS GCM Data Por-al (http://www.ccafs-climate.org and Ramirez and Jarvis, 2008).pecifically, we used variables reflecting future conditions pre-icted under the A1b and B2 scenarios, which correspond toifferent development storylines. The A1b scenario describes aorld with fast economic growth with balanced used of fossil/non-
ossil energy resources, while the B2 scenario describes a worldf local environmental sustainability (see IPCC, 2000 for details).limatic variables were averaged for the 10 km × 10 km UTM gridncompassing the Iberian Peninsula.
.3. Field surveys and genetic analysis
A total of 40 UTM 10 km × 10 km grid squares, located alonghe Portuguese range margins predicted by ENM1, were randomlyelected for field sampling. From these, 20 were located in theorthern margin and another 20 were located in the southern mar-in. In each margin, 10 grid squares were located up to 30 km intohe core of the predicted distribution, and the other 10 were locatedp to 30 km outwards of the predicted distribution (see Fig. A1 inppendix A).
Surveys were conducted in December 2012 by a team of one orwo experienced researchers, and involved a two-step hierarchi-al procedure. First, we identified 10 sites with potential habitatonditions for the Cabrera vole, based on vegetation characteristicsnd a searching image developed from previous studies (Pita et al.,006, 2007). Sites were spread out as much as possible through-ut each grid square, using a combination of 1:25,000 cartographicaps, aerial photograph interpretation, and field checking. Second,
t each site a thorough survey was undertaken to detect the char-cteristic signs of the species, including faeces, grass clippings andunways (e.g. Garrido-García et al., 2009; Pita et al., 2006, 2007).
particular effort was made to detect fresh faeces that could be
isually assigned to the species, since these were the only signsmenable for genetic analysis.Faecal samples were collected using sterilized tweezers to avoidontamination, and stored in 95% ethanol until analysis. In each grid
Table A1 in Appendix A). (b) Potential range map predicted by ENM1. (c) Map ofy – collected samples, presence not confirmed; white – no samples collected). (d)ved ecological niche model (ENM2). (e) Potential range map predicted by ENM2.
square, a maximum of 13 samples from different sites were selectedfor DNA extraction (Table A2 in Appendix A). DNA extraction wasperformed with three to five faecal pellets per sample accord-ing to the procedures described in Barbosa et al. (2013). Speciesidentification was performed by amplification and sequencing ofone fragment of the cytochrome-b mitochondrial gene (Barbosaet al., 2013). This gene fragment was selected because it allowsthe successful identification of all Iberian rodent species, althoughit is unable to separate the pine voles Microtus lusitanicus from M.duodecimcostatus. Genetic analysis of the samples collected in eachgrid square was performed until Cabrera vole presence was identi-fied or until species identification was obtained for up to 10 faecalsamples. Cabrera vole was considered absent from the grid squareif no sign of presence was detected in the 10 sampling sites, or ifnone of the faecal samples analyzed was genetically identified asbelonging to the species.
2.4. Modelling procedures
A preliminary screening of bioclimatic variables for modellingpurposes was conducted using a two-step process. Firstly, we fit-ted logistic regression models relating presence/absence of Cabreravoles and each individual variable, considering both linear and uni-modal (quadratic) effects. Analyses included all occurrences of thespecies available in the initial dataset (391), and an equal numberof pseudo-absences randomly selected across the Iberian Penin-sula. Only those predictors that were significant at p < 0.05 wereretained for further analyses. Secondly, we computed pairwiseSpearman correlation coefficients (rs) between variables (see TableA3 in Appendix A), and for each pair of highly correlated variables(|rs| > 0.7) we retained the one considered to be potentially mostinfluential for the species distribution, based on previous studies(Tabachnik and Fidell, 1996; Mira et al., 2008; Pita et al., 2011).
The current and future distributions of the Cabrera vole weremodelled through the ensemble forecasting approach (Araújo and
New, 2007), using the BIOMOD package (Thuiller et al., 2009b;Thuiller and Lafourcade, 2010) implemented in R, version 2.15.1(R Core Team, 2012). Ensemble forecasting was used, because itprovides more robust predictions than single models (Araújo and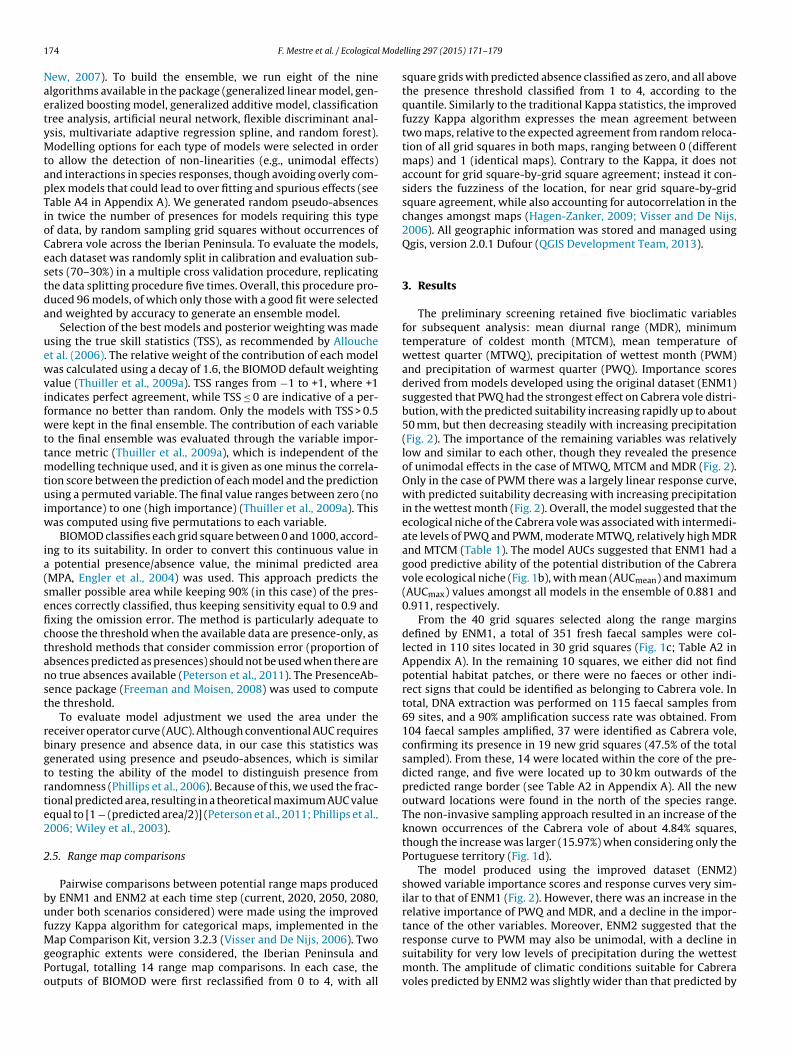
1 Mode
NaetyMtapTioCestda
uewvifwttmtuiw
ia(sefictanst
rbgtrte2
2
bufMgPo
74 F. Mestre et al. / Ecological
ew, 2007). To build the ensemble, we run eight of the ninelgorithms available in the package (generalized linear model, gen-ralized boosting model, generalized additive model, classificationree analysis, artificial neural network, flexible discriminant anal-sis, multivariate adaptive regression spline, and random forest).odelling options for each type of models were selected in order
o allow the detection of non-linearities (e.g., unimodal effects)nd interactions in species responses, though avoiding overly com-lex models that could lead to over fitting and spurious effects (seeable A4 in Appendix A). We generated random pseudo-absencesn twice the number of presences for models requiring this typef data, by random sampling grid squares without occurrences ofabrera vole across the Iberian Peninsula. To evaluate the models,ach dataset was randomly split in calibration and evaluation sub-ets (70–30%) in a multiple cross validation procedure, replicatinghe data splitting procedure five times. Overall, this procedure pro-uced 96 models, of which only those with a good fit were selectednd weighted by accuracy to generate an ensemble model.
Selection of the best models and posterior weighting was madesing the true skill statistics (TSS), as recommended by Allouchet al. (2006). The relative weight of the contribution of each modelas calculated using a decay of 1.6, the BIOMOD default weighting
alue (Thuiller et al., 2009a). TSS ranges from −1 to +1, where +1ndicates perfect agreement, while TSS ≤ 0 are indicative of a per-ormance no better than random. Only the models with TSS > 0.5ere kept in the final ensemble. The contribution of each variable
o the final ensemble was evaluated through the variable impor-ance metric (Thuiller et al., 2009a), which is independent of the
odelling technique used, and it is given as one minus the correla-ion score between the prediction of each model and the predictionsing a permuted variable. The final value ranges between zero (no
mportance) to one (high importance) (Thuiller et al., 2009a). Thisas computed using five permutations to each variable.
BIOMOD classifies each grid square between 0 and 1000, accord-ng to its suitability. In order to convert this continuous value in
potential presence/absence value, the minimal predicted areaMPA, Engler et al., 2004) was used. This approach predicts themaller possible area while keeping 90% (in this case) of the pres-nces correctly classified, thus keeping sensitivity equal to 0.9 andxing the omission error. The method is particularly adequate tohoose the threshold when the available data are presence-only, ashreshold methods that consider commission error (proportion ofbsences predicted as presences) should not be used when there areo true absences available (Peterson et al., 2011). The PresenceAb-ence package (Freeman and Moisen, 2008) was used to computehe threshold.
To evaluate model adjustment we used the area under theeceiver operator curve (AUC). Although conventional AUC requiresinary presence and absence data, in our case this statistics wasenerated using presence and pseudo-absences, which is similaro testing the ability of the model to distinguish presence fromandomness (Phillips et al., 2006). Because of this, we used the frac-ional predicted area, resulting in a theoretical maximum AUC valuequal to [1 − (predicted area/2)] (Peterson et al., 2011; Phillips et al.,006; Wiley et al., 2003).
.5. Range map comparisons
Pairwise comparisons between potential range maps producedy ENM1 and ENM2 at each time step (current, 2020, 2050, 2080,nder both scenarios considered) were made using the improveduzzy Kappa algorithm for categorical maps, implemented in the
ap Comparison Kit, version 3.2.3 (Visser and De Nijs, 2006). Twoeographic extents were considered, the Iberian Peninsula andortugal, totalling 14 range map comparisons. In each case, theutputs of BIOMOD were first reclassified from 0 to 4, with all
lling 297 (2015) 171–179
square grids with predicted absence classified as zero, and all abovethe presence threshold classified from 1 to 4, according to thequantile. Similarly to the traditional Kappa statistics, the improvedfuzzy Kappa algorithm expresses the mean agreement betweentwo maps, relative to the expected agreement from random reloca-tion of all grid squares in both maps, ranging between 0 (differentmaps) and 1 (identical maps). Contrary to the Kappa, it does notaccount for grid square-by-grid square agreement; instead it con-siders the fuzziness of the location, for near grid square-by-gridsquare agreement, while also accounting for autocorrelation in thechanges amongst maps (Hagen-Zanker, 2009; Visser and De Nijs,2006). All geographic information was stored and managed usingQgis, version 2.0.1 Dufour (QGIS Development Team, 2013).
3. Results
The preliminary screening retained five bioclimatic variablesfor subsequent analysis: mean diurnal range (MDR), minimumtemperature of coldest month (MTCM), mean temperature ofwettest quarter (MTWQ), precipitation of wettest month (PWM)and precipitation of warmest quarter (PWQ). Importance scoresderived from models developed using the original dataset (ENM1)suggested that PWQ had the strongest effect on Cabrera vole distri-bution, with the predicted suitability increasing rapidly up to about50 mm, but then decreasing steadily with increasing precipitation(Fig. 2). The importance of the remaining variables was relativelylow and similar to each other, though they revealed the presenceof unimodal effects in the case of MTWQ, MTCM and MDR (Fig. 2).Only in the case of PWM there was a largely linear response curve,with predicted suitability decreasing with increasing precipitationin the wettest month (Fig. 2). Overall, the model suggested that theecological niche of the Cabrera vole was associated with intermedi-ate levels of PWQ and PWM, moderate MTWQ, relatively high MDRand MTCM (Table 1). The model AUCs suggested that ENM1 had agood predictive ability of the potential distribution of the Cabreravole ecological niche (Fig. 1b), with mean (AUCmean) and maximum(AUCmax) values amongst all models in the ensemble of 0.881 and0.911, respectively.
From the 40 grid squares selected along the range marginsdefined by ENM1, a total of 351 fresh faecal samples were col-lected in 110 sites located in 30 grid squares (Fig. 1c; Table A2 inAppendix A). In the remaining 10 squares, we either did not findpotential habitat patches, or there were no faeces or other indi-rect signs that could be identified as belonging to Cabrera vole. Intotal, DNA extraction was performed on 115 faecal samples from69 sites, and a 90% amplification success rate was obtained. From104 faecal samples amplified, 37 were identified as Cabrera vole,confirming its presence in 19 new grid squares (47.5% of the totalsampled). From these, 14 were located within the core of the pre-dicted range, and five were located up to 30 km outwards of thepredicted range border (see Table A2 in Appendix A). All the newoutward locations were found in the north of the species range.The non-invasive sampling approach resulted in an increase of theknown occurrences of the Cabrera vole of about 4.84% squares,though the increase was larger (15.97%) when considering only thePortuguese territory (Fig. 1d).
The model produced using the improved dataset (ENM2)showed variable importance scores and response curves very sim-ilar to that of ENM1 (Fig. 2). However, there was an increase in therelative importance of PWQ and MDR, and a decline in the impor-tance of the other variables. Moreover, ENM2 suggested that the
response curve to PWM may also be unimodal, with a decline insuitability for very low levels of precipitation during the wettestmonth. The amplitude of climatic conditions suitable for Cabreravoles predicted by ENM2 was slightly wider than that predicted by
F. Mestre et al. / Ecological Modelling 297 (2015) 171–179 175
F e bioclW line)
i
EA
2oaFr2miaiI
TMdtm
ig. 2. Response curves (predicted suitability) of the Cabrera vole to variation in five show the response curves estimated using the original dataset (ENM1; solid
mportance scores of variables are indicated in the top-right corner of each panel.
NM1 (Table 1). The predictive ability of ENM2 (AUC = 0.885 andUCmax = 0.908) was similar to that of ENM1.
The model projections of ENM1 and ENM2 for 2020, 2050 and080 revealed considerable reduction in the potential distributionf the Cabrera vole under both climate change scenarios considered,lthough B2 scenario had less dramatic effects than A1b (Fig. 3, andig. A2 in Appendix A). Pairwise comparisons between predictedange maps generated by ENM1 and ENM2 from the present up to080 indicated that there was a general tendency for a decrease inap similarity, showing that the further in the future the projection
s made, the more dissimilar outputs are produced (Table 2, Fig. 3,nd Fig. A2 in Appendix A). Differences between maps were largestn Portugal, where the supplementary field data were collected.n general, the predictions of ENM1 for future conditions failed to
able 1inimum and maximum values of each variable, for all the grid squares in the study ar
ata) before and after non-invasive sampling at range margins, and for the models ENMemperature of the wettest quarter (◦C); MTCM – minimum temperature of the coldest
onth (mm).
Variable Study area Occ. Data (initial) ENM
Min Max Min Max Min
PWQ 15.0 314.0 19.4 180.1 18.3MTWQ 0.3 20.0 1.3 15.4 1.3MTCM −8.8 9.0 −4.7 8.3 −4.8MDR 5.3 12.9 8.3 12.4 8.4PWM 31.8 246.1 41.5 178.8 41.5
imatic variables, as assessed through ensemble modelling implemented in BIOMD.and using the dataset incorporating new survey data (ENM2; hatched line). The
identify potentially suitable areas that were identified using ENM2.For instance, ENM2 predicts under the scenario B2 that the Cabreravole will maintain a considerable range in south-western Portugal,while this area is deemed largely unsuitable by ENM1.
4. Discussion
Our empirical example focusing on the Cabrera vole supportsthe view that a combination of ENM fitting and field surveys basedon non-invasive genetic sampling provides a relatively simple and
effective approach to refine estimates of species occurrences inpoorly surveyed areas, thus contributing to improve range predic-tions under current and future climatic conditions (Guisan et al.,2006; Feeley and Silman, 2011). To the best of our knowledge, thisea (Iberian Peninsula), and for the grid squares with confirmed occurrences (Occ.1 and ENM2. PWQ – precipitation of the warmest quarter (mm); MTWQ – meanmonth (◦C); MDR – mean diurnal range (◦C); PWM – precipitation of the wettest
1 Occ. Data (final) ENM2
Max Min Max Min Max
180.1 19.4 180.1 17.9 163.2 12.9 1.3 15.4 1.3 14.3 8.3 −4.1 8.3 −4.8 8.4 12.4 8.3 12.4 8.1 12.4 132.5 41.5 178.8 41.5 145.1

176 F. Mestre et al. / Ecological Modelling 297 (2015) 171–179
F – topc ce; D
sbhcome
TRitt
ig. 3. Model projections for the studied time steps and climate scenarios. Currentolumn): from 2020 (top) to 2080 (bottom). Light grey – only ENM1 predicts presen
tudy provided the first application of this approach, which shoulde particularly useful for rare, elusive, and patchily distributedabitat specialist species, such as the Cabrera vole, which are diffi-ult to sample using traditional methods (e.g. direct counts, camera
r live trapping, etc.). Our study also suggested that the approachay be particularly useful to clarify species occurrences at rangedges, where species often occur at low density and are difficult to
able 2esults of range map comparison of models ENM1 and ENM2 using fuzzy Kappa
ndex, at the scale of the Iberian Peninsula and Portugal. Current: model projectedo the current climatic conditions; A1 and B2: IPCC climatic scenario with the respec-ive years.
Climate scenario/time step Portugal Iberian Peninsula
Current 0.579 0.635A1b-2020 0.553 0.559A1b-2050 0.291 0.449A1b-2080 0.149 0.337B2-2020 0.433 0.509B2-2050 0.464 0.500B2-2080 0.260 0.326
; Scenario A1b (left column): from 2020 (top) to 2080 (bottom); Scenario B2 (rightark grey – only ENM2 predicts presence; Black – both models predict presence.
detect. This clarification may then provide a major contribution toimprove estimates of species niche breadth, which may have majorconsequences for ENM predictions (Gaston, 2003; Hanspach et al.,2011).
Although field surveys carried out during this study covered onlypart of the species range margin, this is unlikely to have affectedour key results in a significant way. We recognize, however, thatthis limitation may have resulted in an incomplete coverage ofthe species ecological niche, which might have contributed to theunderestimation of the total area potentially suitable for the speciesunder future climatic conditions (Peterson et al., 2011). Anotherpotential problem was that field surveys were focused exclusivelyon range margins, and so likely false negatives within the core rangewere not corrected. However, this is somewhat less problematic,since the environmental conditions within the core distribution arealready sufficiently represented by the high number of occurrencerecords registered in this area.
Finally, it should be stressed that the forecasted range shiftswere based exclusively on climatic variables, ignoring for instancethat landscape composition and fragmentation also affects distri-butions (e.g., Reino et al., 2013), and that species with relatively

Mode
st2ssa
s(l5rwwveviiPtnplimtt
nituwdimtwmabpwztwtsseltutcsd
fdtdtpt
F. Mestre et al. / Ecological
mall dispersal capability such as the Cabrera vole may be unableo track the spatial changes in habitat suitability (e.g., Clobert et al.,014). As a consequence, forecasts based solely on climate pos-ibly provided only the maximum area potentially usable by thepecies, which will likely be trimmed by additional environmentalnd species-specific life history factors.
The field surveys guided by ENM1 allowed the identification ofeveral new presence records of the Cabrera vole, most of which73.6%) were within the previously known range of the species andikely reflected lack of previous sampling in those areas. However,0% of the 10 sites surveyed up to 30 km north of the known speciesange also yielded new presence records, whereas no new sitesere found outwards of the southern range border. It is uncertainhether these new records were a consequence of surveying pre-
iously undersampled areas, or whether they represent a recentxpansion northwards, as it has been documented for other Iberianertebrates (Moreno-Rueda et al., 2012). Without further data its impossible to decide between these two alternatives, thought should be noted that previous studies on the Cabrera vole inortugal have been carried out in the southern half of the coun-ry (see Pita et al., 2014, and references therein), and thus theorthern range margin has remained very poorly defined until theresent study. Also, Cabrera voles in the north of their range over-
ap with field voles, which produce presence signs that are virtuallyndistinguishable without recently developed non-invasive genetic
ethods (Barbosa et al., 2013). As a consequence, it is more likelyhat new presence records reflect previous undersampling, ratherhan recent range shifts.
The models developed with (ENM2) or without (ENM1) theew presence records produced broadly similar results, point-
ng out a strong climatic control on the current distribution ofhe Cabrera vole. Also, they both highlighted a particularly strongnimodal response to precipitation during the warmest quarter,ith suitability for Cabrera voles peaking at about 50 mm, andeclining with either reductions or increases in precipitation dur-
ng this period. Clear unimodal responses were also found for theean temperature of the wettest quarter and the mean diurnal
emperature range, while weaker evidence for unimodal effectsas also apparent for the minimum temperature of the coldestonth and the precipitation of the wettest month. These results
re largely in line with a previous study on the Cabrera vole distri-ution in Portugal, which underlined a unimodal response to totalrecipitation, and suggested that the species is closely associatedith thermo-Mediterranean and meso-Mediterranean bioclimatic
ones (Mira et al., 2008). This justifies the absence of the species inhe Atlantic regions of northern Spain and north-western Portugal,here precipitation is higher and more evenly distributed across
he year than in Mediterranean Iberia. On the other hand, thepecies is also largely absent from the drier and hotter regions ofouth-eastern Portugal, eastern Spain, and the northern and south-rn plateaus of the Iberian Peninsula, where precipitation is veryow during the warmest quarter, and temperatures are low in win-er. Reasons for these apparently strict climatic preferences arenknown at present, but studies at the local scale suggest thathe Cabrera vole may live in a delicate balance to avoid very dryonditions dehydrating their wet herbaceous habitats during theummer, as well as very wet conditions flooding habitat patchesuring the winter (Pita et al., 2011).
The models ENM1 and ENM2 also produced broadly similarorecasts of Cabrera vole distribution under future climatic con-itions, though there were also relevant differences between thewo. In terms of similarities, both models were consistent in pre-
icting that the Cabrera vole range will strongly contract, ratherhan suffering the pronounced northward range shift that has beenredicted for other species (Araújo et al., 2011). In fact, only smallo modest increases in favourability are expected in the north of thelling 297 (2015) 171–179 177
range up to the year 2080, which are unlikely to compensate thesevere reductions that will likely occur in the south. Furthermore,both models forecast that the distribution of the Cabrera vole willbecome increasingly fragmented in the future. In fact, although atpresent the species seems to have large and continuous areas ofclimatically suitable habitat, after 2020 the range is expected toreduce progressively to relatively small and disconnected nuclei.This likely reflects the degradation of climatic conditions, includ-ing for instance the reduction of precipitation in summer months,which will lead to suitable conditions being retained only in just afew and isolated climatic refugia.
Despite these similarities, the models ENM1 and ENM2 differedin forecasts regarding the magnitude of range contraction and frag-mentation, as well as differing in the identification of the areas thatwill remain suitable in the future. The differences are particularlylarge in the Portuguese sector of the species distribution, whereENM1 predicts a far greater decline in suitability than ENM2. Forinstance, in the B2 scenario for 2080, the model ENM1 predictsthat the species in Portugal will be restricted to two small areas,whereas model ENM2 predicts high suitability in a relatively largearea, which can be even recognized as one of the strongholds forthe species in the future. The large differences between modelsobserved in Portugal are probably a consequence of concentratingthe new surveys in the country, thereby achieving a more com-plete coverage of the particular climatic conditions under whichthe species occur in there. In fact, climatic conditions in Portugaland Spain tend to be different, which causes errors when mod-els built with data from one country are transferred to the other(Barbosa et al., 2009).
The substantial differences between ENM1 and ENM2 in rangeforecasts might seem puzzling, given that only about 5% more pres-ence squares were added to the dataset. This may be a consequenceof a more thorough coverage of the niche achieved by sampling inPortugal, where the species was undersampled and climatic con-ditions differ from that in Spain. Another important factor is thatsampling was concentrated at the range margins, where climaticconditions tend to be different from the core range (Sexton et al.,2009), and thus have a strong effect on ecological niche models(Hanspach et al., 2011). In fact, local populations at range marginsare often restricted to sub-optimal habitats (Gaston, 2003) which,although representing a minor part of the species’ environmentalranges, are essential to assess fine-scale distributional details, andto produce more realistic predictions regarding species responsesto climate change (Sexton et al., 2009). This suggests that improve-ments in model outputs could still be achieved by further refiningthe Spanish range of the species, despite the recent surveys carriedout therein (Garrido-García et al., 2013).
In terms of conservation, results from our modelling exercisesuggest that the Cabrera vole may be severely at risk due to cli-mate change. In the one hand, the future range of the species ispredicted to be much smaller than at present, thereby making theCabrera vole much more vulnerable to other pervasive threats suchas the degradation of habitats due to agricultural intensification(Pita et al., 2014). Fragmentation should further deteriorate theconservation status, because small and isolated populations havea high risk of extinction due to both deterministic and stochasticprocesses (Fahrig, 2003; Fischer & Lindenmayer, 2007). The limitedevidence available suggests that the dispersal range of the Cabr-era vole is low (Pita et al., 2007), making it unlikely that locallyextinct or declining populations can be rescued by dispersal fromneighbouring populations (Fahrig, 2003; Fischer & Lindenmayer,2007). To counteract these processes, a high conservation priority
should be given to safeguard suitable habitats in areas where thespecies is predicted to retain climatically favourable conditions inthe future. This includes for instance the large area identified inthe south of Portugal, as well as the suitable areas in the regions of
1 Mode
Ctee
lpsioeiTtEninbagc
A
ttRtP(hEOtEIcfeti
A
i2
R
A
A
A
A
A
A
78 F. Mestre et al. / Ecological
astilla y León and Aragón. Results also suggest the need to revisehe conservation status attributed by the IUCN Red List (Fernandest al., 2008), raising it from near-threatened to one of the threat-ned categories.
Overall, our study supports the view that combining eco-ogical niche modelling and non-invasive genetic sample mayrovide a cost-effective approach to improve predictions of rangehifts under climate change. Model-guided surveys based on non-nvasive genetics may be particularly useful to reduce the incidencef false absences, particularly along range margins where localnvironmental conditions may include extremes of species ecolog-cal niches (Comte and Grenouillet, 2013; Hanspach et al., 2011).his should help improving the accuracy and reliability of predic-ions regarding the current and future species ranges, by basingNM development on datasets representative of the full climaticiche of the species (Feeley and Silman, 2011). In turn, this should
mprove the applicability of model results to conservation plan-ing, by providing a more reliable identification of areas that wille critical for a species in the future. Given the decreasing costsnd the global increases in expertise, we believe that non-invasiveenetic sampling should find and increasingly important role in theontext of species distribution modelling.
cknowledgments
This study was funded by European Social Funds andhe Portuguese Foundation for Science and Technologyhrough the fellowships to FM (SFRH/BD/73768/2010), andP (SFRH/BPD/73478/2010). It was also partially supported byhe European Regional Development Fund (ERDF) through COM-ETE programme, and Portuguese national funds through FCTPTDC/BIA-BEC/105110/2008 and PTDC/AAG-MAA/3227/2012). JPas a post-doctoral grant funded by the project “Genomics andvolutionary Biology” co-financed by North Portugal Regionalperational Programme 2007/2013 (ON.2–O Novo Norte), under
he National Strategic Reference Framework (NSRF), through theRDF. The EDP Biodiversity Chair supported PB. We are grateful tonês Leitão, Paulo Alves, Pedro Costa and Vânia Salgueiro for theirollaboration in the field work, to Soraia Barbosa and Clara Ferreiraor collaboration in genetic analyses, and to Robert P. Anderson forarly discussions and revision of the manuscript. Finally, we thankhe suggestions made by two anonymous reviewers, which greatlymproved the manuscript.
ppendix A. Supplementary data
Supplementary data associated with this article can be found,n the online version, at http://dx.doi.org/10.1016/j.ecolmodel.014.11.018.
eferences
lasaad, S., Sánchez, A., Marchal, J.A., Píriz, A., Garrido-García, J.A., Carro, F., Romero,I., Soriguer, R.C., 2011. Efficient identification of Microtus cabrerae excrementsusing noninvasive molecular analysis. Conserv. Genet. Resour. 3, 127–129,http://dx.doi.org/10.1007/s12686-010-9306-2.
llouche, O., Tsoar, A., Kadmon, R., 2006. Assessing the accuracy of species distribu-tion models: prevalence, kappa and the true skill statistic (TSS). J. Appl. Ecol. 43,1223–1232, http://dx.doi.org/10.1111/j.1365-2664.2006.01214.x.
nderson, B.J., Akc akaya, H.R., Araújo, M.B., Fordham, D.A., Martinez-Meyer, E.,Thuiller, W., Brook, B.W., 2009. Dynamics of range margins for metapopula-tions under climate change. Proc. R. Soc. B 276, 1415–1420, http://dx.doi.org/10.1098/rspb.2008.1681.
raújo, M.B., New, M., 2007. Ensemble forecasting of species distributions. TrendsEcol. Evol. 22, 42–47, http://dx.doi.org/10.1111/j.1365-2699.2006.01584.x.
raújo, M.B., Guilhaumon, F., Neto, D.R., Pozo, I., Calmaestra, R., 2011. Impactos,
Vulnerabilidad y Adaptación al Cambio Climático de la Biodiversidad Espanola.2 Fauna de Vertebrados. Dirección general de medio Natural y Política Forestal.Ministerio de Medio Ambiente, y Medio Rural y Marino, Madrid.raújo, M.B., Guilhaumon, F., Neto, D.R., Pozo, I., Calmaestra, R., 2012. Biodiversidadee alterac ões Climáticas/Biodiversidad y alteraciones Climáticas. Ministério da
lling 297 (2015) 171–179
Agricultura, do Mar, do Ambiente e do Ordenamento do Território & Ministeriode Agricultura, Alimentación y Medio Ambiente, Lisboa/Madrid.
Barbosa, A.M., Real, R., Mario Vargas, J., 2009. Transferability of environ-mental favourability models in geographic space: the case of the Iberiandesman (Galemys pyrenaicus) in Portugal and Spain. Ecol. Model. 220,747–754.
Barbosa, S., Paupério, J., Searle, J.B., Alves, P.C., 2013. Genetic identification ofIberian rodent species using both mitochondrial and nuclear loci: applica-tion to noninvasive sampling. Mol. Ecol. Resour. 13, 43–56, http://dx.doi.org/10.1111/1755-0998.12024.
Beale, C.M., Lennon, J.J., 2012. Incorporating uncertainty in predictive species dis-tribution modelling. Philos. Trans. R. Soc. B 367, 247–258, http://dx.doi.org/10.1098/rstb.2011.0178.
Beja-Pereira, A., Oliveira, R., Alves, P.C., Schwartz, M.K., Luikart, G., 2009.Advancing ecological understandings through technological transformationsin non-invasive genetics. Mol. Ecol. Resour. 9, 1279–1301, http://dx.doi.org/10.1111/j.1755-0998.2009.02699.x.
Clobert, J., Baguette, M., Benton, T.G., Bullock, J.M. (Eds.), 2014. Dispersal Ecologyand Evolution. Oxford University Press, Oxford, p. 496.
Comte, L., Grenouillet, G., 2013. Species distribution modelling and imperfect detec-tion: comparing occupancy versus consensus methods. Divers. Distrib. 19,996–1007, http://dx.doi.org/10.1111/ddi.12078.
Engler, R., Guisan, A., Rechsteiner, L., 2004. An improved approach for predict-ing the distribution of rare and endangered species from occurrence andpseudo-absence data. J. Appl. Ecol. 41, 263–274, http://dx.doi.org/10.1111/j.0021-8901.2004.00881.x.
Fahrig, L., 2003. Effects of habitat fragmentation on biodiversity. Ann. Rev. Ecol. Evol.Syst. 34, 487–515.
Feeley, K.J., Silman, M.R., 2011. Keep collecting: accurate species distribution mod-elling requires more collections than previously thought. Divers. Distrib. 17,1132–1140, http://dx.doi.org/10.1111/j.1472-4642.2011.00813.x.
Fernandes, M., Pita, R., Mira, A., 2008. Microtus cabrerae. The IUCN Red List of Threat-ened Species. Version 2014.2, Available from: www.iucnredlist.org (accessed02.08.14).
Fernández-Salvador, R., 2007. Microtus cabrerae, Thomas, 1906. Topillo de Cabrera.In: Palomo, J.L., Gisbert, J., Blanco, J.C. (Eds.), Atlas y Libro Rojo de los mamíferosterrestres de Espana. Dirección General para la Biodiversidad. SECEM-SECEMU,Madrid, pp. 429–433.
Fernández-Salvador, R., Ventura, J., Garcia-Perea, R., 2005. Breeding patterns anddemography of a population of the Cabrera vole, Microtus cabrerae. Anim. Biol.55, 147–161, http://dx.doi.org/10.1163/1570756053993497.
Fischer, J., Lindenmayer, D.B., 2007. Landscape modification and habitat fragmenta-tion: a synthesis. Global Ecol. Biogeogr. 16, 265–280.
Freeman, E.A., Moisen, G., 2008. PresenceAbsence: an R package forpresence-absence model analysis. J. Stat. Softw. 23, 1–31, Available from:http://www.jstatsoft.org/v23/i11 (accessed 26.09.12).
Fuller, R.A., Ladle, R.J., Whittaker, R.J., Possingham, H., 2011. Planning for persis-tence in a changing world. In: Ladle, R.J., Whittaker, R.J. (Eds.), ConservationBiogeography. Wiley-Blackwell, Oxford, pp. 163–189.
Garrido-García, J., Soriguer, R., Serrano, D.P.A., Pardávila, X., 2009. A revision ofthe distribution of Cabrera’s vole (Microtus cabrerae Thomas 1906) in Andalu-sia (southern Spain). Hystrix Ital. J. Mammal. 19, 121–131, http://dx.doi.org/10.4404/hystrix-19.2-4422.
Garrido-García, J.A., Rosário, I.T., Gisbert, J., García-Perea, R., Cordero, A.I., López-Alabau, A., Mathias, M.L., Mira, A., Pita, P., Santos, S., Sendra-Pérez, I., Vicente,V., Soriguer, R.C., 2013. Revisión a nivel ibérico de la distribución del topillode Cabrera o iberón, Iberomys cabrerae (Thomas, 1906). Galemys 25, 35–49,http://dx.doi.org/10.7325/Galemys.2013.A4.
Gaston, K.J., 2003. The structure and dynamics of geographic ranges. In: Oxford Seriesin Ecology and Evolution, 1st ed. Oxford University Press, Oxford, pp. 280.
Guisan, A., Zimmermann, N.E., 2000. Predictive habitat distributionmodels in ecology. Ecol. Model. 135, 147–186, http://dx.doi.org/10.1016/s0304-3800(00)00354-9.
Guisan, A., Broennimann, O., Engler, R., Vust, M., Yoccoz, N.G., Lehmann,A., Zimmermann, N.E., 2006. Using niche-based models to improve thesampling of rare species. Conserv. Biol. 20, 501–511, http://dx.doi.org/10.1111/j.1523-1739.2006.00354.x.
Hagen-Zanker, A., 2009. An improved fuzzy kappa statistic that accounts forspatial autocorrelation. Int. J. Geogr. Inf. Sci. 23, 61–73, http://dx.doi.org/10.1080/13658810802570317.
Hannah, L., 2008. Protected areas and climate change. Ann. N. Y. Acad. Sci. 1134,201–212, http://dx.doi.org/10.1196/annals.1439.009.
Hannah, L., Midgley, G.F., Lovejoy, T., Bond, W.J., Bush, M.L.J.C., Lovett, J.C., Scott, D.,Woodward, F.I., 2002. Conservation of biodiversity in a changing climate. Con-serv. Biol. 16, 264–268, http://dx.doi.org/10.1046/j.1523-1739.2002.00465.x.
Hanspach, J., Kühn, I., Schweiger, O., Pompe, S., Klotz, S., 2011. Geographical pat-terns in prediction errors of species distribution models. Glob. Ecol. Biogeogr.20, 779–788, http://dx.doi.org/10.1111/j.1466-8238.2011.00649.x.
Hengeveld, R., Haeck, J., 1982. The distribution of abundance: I. Measurements. J.Biogeogr. 9, 303–316.
Hijmans, R.J., Cameron, S.E., Parra, J.L., Jones, P.G., Jarvis, A., 2005. Very high res-
olution interpolated climate surfaces for global land areas. Int. J. Climatol. 25,1965–1978, http://dx.doi.org/10.1002/joc.1276.Hoegh-Guldberg, O., Hughes, L., McIntyre, S., Lindenmayer, D.B., Parmesan, C.,Possingham, H.P., Thomas, C.D., 2008. Assisted colonization and rapid climatechange. Science 321, 345–346, http://dx.doi.org/10.1126/science.1157897.
Mode
I
L
L
L
M
M
M
P
P
P
P
P
P
Q
R
R
ties. Proc. Natl. Acad. Sci. 106, 19729–19736, http://dx.doi.org/10.1073/pnas.
F. Mestre et al. / Ecological
PCC, 2000. IPCC Special Report – Emission Scenarios, Summary for Policymakers.Intergovernmental Panel on Climate Change.
andete-Castillejos, T., Andrés-Abellán, M., Argandona, J.J., Garde, J., 2000. Distribu-tion of the Cabrera vole (Microtus cabrerae) in its first reported areas reassessedby live trapping. Biol. Conserv. 94, 127–130, http://dx.doi.org/10.1016/S0006-3207(99)00167-6.
aplana, C., Sevilla, P., 2013. Documenting the biogeographic history ofMicrotus cabrerae through its fossil record. Mammal Rev. 43, 109–322,http://dx.doi.org/10.1111/mam.12003.
uque-Larena, J.J., López, P., 2007. Microhabitat use of wild-ranging Cabrera volesMicrotus cabrerae as revealed by live trapping. Eur. J. Wildlife Res. 53, 221–225,http://dx.doi.org/10.1007/s10344-006-0084-9.
awdsley, J.R., O’Malley, R., Ojima, D.S., 2009. A review of climate-change adaptationstrategies for wildlife management and biodiversity conservation. Conserv. Biol.23, 1080–1089, http://dx.doi.org/10.1111/j.1523-1739.2009.01264.x.
ira, A., Marques, C.C., Santos, S.M., Rosário, I.T., Mathias, M.L., 2008. Environmen-tal determinants of the distribution of the Cabrera vole (Microtus cabrerae)in Portugal: implications for conservation. Mammal. Biol. Z. Säugetierkd. 73,102–110, http://dx.doi.org/10.1016/j.mambio.2006.11.003.
oreno-Rueda, G., Pleguezuelos, J.M., Pizarro, M., Montori, A., 2012. Northwardshifts of the distributions of Spanish reptiles in association with climate change.Conserv. Biol. 26, 278–283.
eterson, A.T., Soberón, J., Pearson, R.G., Anderson, R.P., Nakamura, M., Martinez-Meyer, E., Araújo, M.B., 2011. Ecological Niches and Geographical Distributions,1st ed. Princeton University Press, New Jersey.
hillips, S.J., Anderson, R.P., Schapire, R.E., 2006. Maximum entropy modeling ofspecies geographic distributions. Ecol. Model. 190, 231–259, http://dx.doi.org/10.1016/j.ecolmodel.2005.03.026.
ita, R., Mira, A., Beja, P., 2006. Conserving the Cabrera vole, Microtus cabrerae, inintensively used Mediterranean landscapes. Agric. Ecosyst. Environ. 115, 1–5,http://dx.doi.org/10.1016/j.agee.2005.12.002.
ita, R., Beja, P., Mira, A., 2007. Spatial population structure of the Cabrera volein Mediterranean farmland: the relative role of patch and matrix effects. Biol.Conserv. 134, 383–392, http://dx.doi.org/10.1016/j.biocon.2006.08.026.
ita, R., Mira, A., Beja, P., 2011. Assessing habitat differentiation between coexistingspecies: the role of spatial scale. Acta Oecol. 37, 124–132, http://dx.doi.org/10.1016/j.actao.2011.01.006.
ita, R., Mira, A., Beja, P., 2014. Microtus cabrerae (Rodentia: Cricetidae). MammalianSpecies 46, http://dx.doi.org/10.1644/912.1 (in press).
GIS Development Team, 2013. QGIS Geographic Information System. Open SourceGeospatial Foundation Project, Available from: http://qgis.osgeo.org (accessed22.10.13).
Core Team, 2012. R: A Language and Environment for Statistical Comput-ing. R Foundation for Statistical Computing, Vienna, Austria, Available from:
http://www.R-project.org/ (accessed 26.09.12).amirez, J., Jarvis, A., 2008. High Resolution Statistically Downscaled Future Cli-mate Surfaces. International Center for Tropical Agriculture (CIAT); CGIARResearch Program on Climate Change, Agriculture and Food Security (CCAFS),Cali, Colombia.
lling 297 (2015) 171–179 179
Reino, L., Beja, P., Araújo, M.B., Dray, S., Segurado, P., 2013. Does local habitat frag-mentation affect large-scale distributions? The case of a specialist grassland bird.Divers. Distrib. 19, 423, http://dx.doi.org/10.1111/ddi.12019.
Rocchini, D., Hortal, J., Lengyel, S., Lobo, J.M., Jimenez-Valverde, A., Ricotta, C., Bac-aro, G., Chiarucci, A., 2011. Accounting for uncertainty when mapping speciesdistributions: the need for maps of ignorance. Prog. Phys. Geogr. 35, 211–226,http://dx.doi.org/10.1177/0309133311399491.
Roubicek, A.J., VanDerWal, J., Beaumont, L.J., Pitman, A.J., Wilson, P., et al., 2010. Doesthe choice of climate baseline matter in ecological niche modelling? Ecol. Model.221, 2280–2286.
Santos, S.M., Rosário, I.T., Mathias, M.L., 2005. Microhabitat preference of the Cabreravole in a Mediterranean cork oak woodland of Southern Portugal. Vie Mileu 55,53–59.
Santos, S.M., Simões, M.P., da Luz Mathias, M., Mira, A., 2006. Vegetationanalysis in colonies of an endangered rodent, the Cabrera vole (Microtus cabr-erae), in southern Portugal. Ecol. Res. 21, 197–207, http://dx.doi.org/10.1007/s11284-005-0104-3.
Sexton, J.P., McIntyre, P.J., Angert, A.L., Rice, K.J., 2009. Evolution and ecol-ogy of species range limits. Annu. Rev. Ecol. Evol. Syst. 40, 415–436,http://dx.doi.org/10.1146/annurev.ecolsys.110308.120317.
Tabachnik, B.G., Fidell, L.S., 1996. Using Multivariate Statistics, 3rd ed. Harper CollinsPublishers Inc., New York.
Thomas, C.D., 2010. Climate, climate change and range boundaries. Divers. Distrib.16, 488–495, http://dx.doi.org/10.1111/j.1472-4642.2010.00642.x.
Thuiller, W., Lafourcade, B., 2010. BIOMOD: Species/Climate Modelling Func-tions. R Package Version 1.1-6/r250, Available from: http://R-Forge.R-project.org/projects/biomod/ (accessed 26.09.12).
Thuiller, W., Lafourcade, B., Araújo, M.B., 2009a. ModOperating Manual for BIOMOD.Université Joseph Fourier, Laboratoire d’Ecologie Alpine.
Thuiller, W., Lafourcade, B., Engler, R., Araújo, M.B., 2009b. BIOMOD – a plat-form for ensemble forecasting of species distributions. Ecography 32, 369–373,http://dx.doi.org/10.1111/j.1600-0587.2008.05742.x.
Visser, H., De Nijs, T., 2006. The map comparison kit. Environ. Model. Softw. 21,346–358, http://dx.doi.org/10.1016/j.envsoft.2004.11.013.
Waits, L.P., 2004. Using Noninvasive Genetic Sampling to Detect and Estimate Abun-dance of Rare Wildlife Species. In: Thompson, W.L. (Ed.), Sampling Rare orElusive Species: Concepts, Designs, and Techniques for Estimating PopulationParameters. Island Press, Washington, pp. 211–228.
Walther, G.R., Post, E., Convey, P., Menzel, A., Parmesan, C., Beebee, T.J., Fromentin,J., Hoegh-Guldberg, O., Bairlein, F., 2002. Ecological responses to recent climatechange. Nature 416, 389–395, http://dx.doi.org/10.1038/416389a.
Wiens, J.A., Stralberg, D., Jongsomjit, D., Howell, C.A., Snyder, M.A., 2009. Niches,models, and climate change: assessing the assumptions and uncertain-
0901639106.Wiley, E.O., McNyset, K.M., Peterson, A.T., Robins, C.R., Stewart, A.M., 2003. Niche
modeling and geographic range predictions in the marine environment using amachine-learning algorithm. Oceanography 16, 120–127.