Combined Analytical Study on Chemical Transformations and ...
20
Citation: Kravos, A.; Žgajnar Gotvajn, A.; Lavrenˇ ciˇ c Štangar, U.; Malinovi´ c, B.N.; Prosen, H. Combined Analytical Study on Chemical Transformations and Detoxification of Model Phenolic Pollutants during Various Advanced Oxidation Treatment Processes. Molecules 2022, 27, 1935. https:// doi.org/10.3390/molecules27061935 Academic Editors: Stefan Leonidov and Stefan Leonidov Tsakovski Received: 31 January 2022 Accepted: 13 March 2022 Published: 16 March 2022 Publisher’s Note: MDPI stays neutral with regard to jurisdictional claims in published maps and institutional affil- iations. Copyright: © 2022 by the authors. Licensee MDPI, Basel, Switzerland. This article is an open access article distributed under the terms and conditions of the Creative Commons Attribution (CC BY) license (https:// creativecommons.org/licenses/by/ 4.0/). molecules Article Combined Analytical Study on Chemical Transformations and Detoxification of Model Phenolic Pollutants during Various Advanced Oxidation Treatment Processes Aleksander Kravos 1 , Andreja Žgajnar Gotvajn 1 , Urška Lavrenˇ ciˇ c Štangar 1 , Borislav N. Malinovi´ c 2 and Helena Prosen 1, * 1 University of Ljubljana, Faculty of Chemistry and Chemical Technology, 1000 Ljubljana, Slovenia; [email protected] (A.K.); [email protected] (A.Ž.G.); [email protected] (U.L.Š.) 2 University of Banja Luka, Faculty of Technology, 78000 Banja Luka, Bosnia and Herzegovina; [email protected] * Correspondence: [email protected]; Tel.: +386-1-479-8556 Abstract: Advanced oxidation processes (AOPs) have been introduced to deal with different types of water pollution. They cause effective chemical destruction of pollutants, yet leading to a mixture of transformation by-products, rather than complete mineralization. Therefore, the aim of our study was to understand complex degradation processes induced by different AOPs from chemical and ecotoxicological point of view. Phenol, 2,4-dichlorophenol, and pentachlorophenol were used as model pollutants since they are still common industrial chemicals and thus encountered in the aquatic environment. A comprehensive study of efficiency of several AOPs was undertaken by using instrumental analyses along with ecotoxicological assessment. Four approaches were compared: ozonation, photocatalytic oxidation with immobilized nitrogen-doped TiO 2 thin films, the sequence of both, as well as electrooxidation on boron-doped diamond (BDD) and mixed metal oxide (MMO) anodes. The monitored parameters were: removal of target phenols, dechlorination, transformation products, and ecotoxicological impact. Therefore, HPLC–DAD, GC–MS, UHPLC–MS/MS, ion chromatography, and 48 h inhibition tests on Daphnia magna were applied. In addition, pH and total organic carbon (TOC) were measured. Results show that ozonation provides by far the most suitable pattern of degradation accompanied by rapid detoxification. In contrast, photocatalysis was found to be slow and mild, marked by the accumulation of aromatic products. Preozonation reinforces the photocatalytic process. Regarding the electrooxidations, BDD is more effective than MMO, while the degradation pattern and transformation products formed depend on supporting electrolyte. Keywords: chlorophenols; Daphnia magna; electrooxidation; ozonation; phenol; photocatalysis 1. Introduction Today’s highly chemicalized world is far from reaching toxic-free environment. For example, in 2021 European Environment Agency reported that alarming share of European freshwaters during 2013–2019 had excessive levels of pesticides [1]. In a broader sense, less than 38% of waters are claimed to have good status and 75–96% of European seas exhibit contamination issues [2]. The latter points to a fact that no balance between anthropogenic pressure and waters’ self-cleaning capabilities is yet established, even though more than 90% of urban wastewater across the EU is thought to be collected and treated [3]. Therefore, there is a growing commitment to understand and manage pollution, especially with persistent organic micropollutants. Phenol and chlorophenols (CPs) are representative examples of a wider group of phenolic pollutants. Their presence in the environment is due to intensive historical use, drinking water chlorination, biodegradation of organochlorinated chemicals, and Molecules 2022, 27, 1935. https://doi.org/10.3390/molecules27061935 https://www.mdpi.com/journal/molecules
-
Upload
khangminh22 -
Category
Documents
-
view
1 -
download
0
Transcript of Combined Analytical Study on Chemical Transformations and ...
�����������������
Citation: Kravos, A.; Žgajnar
Gotvajn, A.; Lavrencic Štangar, U.;
Malinovic, B.N.; Prosen, H.
Combined Analytical Study on
Chemical Transformations and
Detoxification of Model Phenolic
Pollutants during Various Advanced
Oxidation Treatment Processes.
Molecules 2022, 27, 1935. https://
doi.org/10.3390/molecules27061935
Academic Editors: Stefan Leonidov
and Stefan Leonidov Tsakovski
Received: 31 January 2022
Accepted: 13 March 2022
Published: 16 March 2022
Publisher’s Note: MDPI stays neutral
with regard to jurisdictional claims in
published maps and institutional affil-
iations.
Copyright: © 2022 by the authors.
Licensee MDPI, Basel, Switzerland.
This article is an open access article
distributed under the terms and
conditions of the Creative Commons
Attribution (CC BY) license (https://
creativecommons.org/licenses/by/
4.0/).
molecules
Article
Combined Analytical Study on Chemical Transformations andDetoxification of Model Phenolic Pollutants during VariousAdvanced Oxidation Treatment ProcessesAleksander Kravos 1, Andreja Žgajnar Gotvajn 1 , Urška Lavrencic Štangar 1 , Borislav N. Malinovic 2 andHelena Prosen 1,*
1 University of Ljubljana, Faculty of Chemistry and Chemical Technology, 1000 Ljubljana, Slovenia;[email protected] (A.K.); [email protected] (A.Ž.G.);[email protected] (U.L.Š.)
2 University of Banja Luka, Faculty of Technology, 78000 Banja Luka, Bosnia and Herzegovina;[email protected]
* Correspondence: [email protected]; Tel.: +386-1-479-8556
Abstract: Advanced oxidation processes (AOPs) have been introduced to deal with different types ofwater pollution. They cause effective chemical destruction of pollutants, yet leading to a mixture oftransformation by-products, rather than complete mineralization. Therefore, the aim of our studywas to understand complex degradation processes induced by different AOPs from chemical andecotoxicological point of view. Phenol, 2,4-dichlorophenol, and pentachlorophenol were used asmodel pollutants since they are still common industrial chemicals and thus encountered in theaquatic environment. A comprehensive study of efficiency of several AOPs was undertaken by usinginstrumental analyses along with ecotoxicological assessment. Four approaches were compared:ozonation, photocatalytic oxidation with immobilized nitrogen-doped TiO2 thin films, the sequenceof both, as well as electrooxidation on boron-doped diamond (BDD) and mixed metal oxide (MMO)anodes. The monitored parameters were: removal of target phenols, dechlorination, transformationproducts, and ecotoxicological impact. Therefore, HPLC–DAD, GC–MS, UHPLC–MS/MS, ionchromatography, and 48 h inhibition tests on Daphnia magna were applied. In addition, pH and totalorganic carbon (TOC) were measured. Results show that ozonation provides by far the most suitablepattern of degradation accompanied by rapid detoxification. In contrast, photocatalysis was found tobe slow and mild, marked by the accumulation of aromatic products. Preozonation reinforces thephotocatalytic process. Regarding the electrooxidations, BDD is more effective than MMO, while thedegradation pattern and transformation products formed depend on supporting electrolyte.
Keywords: chlorophenols; Daphnia magna; electrooxidation; ozonation; phenol; photocatalysis
1. Introduction
Today’s highly chemicalized world is far from reaching toxic-free environment. Forexample, in 2021 European Environment Agency reported that alarming share of Europeanfreshwaters during 2013–2019 had excessive levels of pesticides [1]. In a broader sense, lessthan 38% of waters are claimed to have good status and 75–96% of European seas exhibitcontamination issues [2]. The latter points to a fact that no balance between anthropogenicpressure and waters’ self-cleaning capabilities is yet established, even though more than90% of urban wastewater across the EU is thought to be collected and treated [3]. Therefore,there is a growing commitment to understand and manage pollution, especially withpersistent organic micropollutants.
Phenol and chlorophenols (CPs) are representative examples of a wider group ofphenolic pollutants. Their presence in the environment is due to intensive historicaluse, drinking water chlorination, biodegradation of organochlorinated chemicals, and
Molecules 2022, 27, 1935. https://doi.org/10.3390/molecules27061935 https://www.mdpi.com/journal/molecules
Molecules 2022, 27, 1935 2 of 20
their importance in the chemical industry [4–7]. Phenol and some CPs are hyper-volumeproduction chemicals, according to OECD. What is more, pentachlorophenol is believedto be the most common chlorinated industrial chemical in the EU [8]. In general, highacute toxicity and genotoxicity are reported, especially for polychlorinated CPs and theirdegradation products. Nevertheless, total global production of commercial CPs is estimatedto tens of kilotons per year and phenol’s production is only slightly less [9]. Used in industry,phenols are prevalent components of industrial wastewaters. Thus, they are continuouslytransferred into ecosystems and they accumulate in the sediments, as well as biota, wherethey appear to be ubiquitous. CPs in surface waters reach 2–2000 ng/L [5]; phenols, on theother hand, yet higher concentrations.
Advanced oxidation processes (AOPs) become well-established technology for watertreatment in the last decades. Phenol concentrations > 5 mg/L [10] or even considerablysmaller concentrations of CPs that are found in wastewaters are, in practice, biologicallynon-degradable, but their removal has been proven to be quickly achieved by many physicalmethods [4], wet-oxidations, ozonation, and many homo-/heterogenic AOPs so far, whichinclude additions of catalysts and/or electro-, photo- or sonochemical treatment [6,7,11–14].Considerable research has been taking place also regarding removal of other phenolicpollutants, e.g., nitrophenols, by AOPs that use sustainable materials [6,15]. Nevertheless,despite being optimized and highly effective for the removal of target phenols, completemineralization is usually not readily achieved by most of the AOPs. Therefore, theirchemical pathways from removal of parent compound to the mineralization in connectionwith the assessment of biological effects remain only rarely studied. For example, the latteraspect has so far been in the case of CPs reviewed by Karci, focusing on Fenton oxidationand UV/H2O2 treatment [6].
Ozonation (OZ) is a ‘quasi’ AOP that has one of the longest histories of use andresearch, reaching far back in the 20th century. A considerable amount of work has been re-ported so far on the removal of phenol (PHN) [16–20], 2,4-dichlorophenol (DCP) [18,21,22]and pentachlorophenol (PCP) [22–25], some reviewed, for example, by Pera-Titus et al. [12]Studies in majority concluded that OZ exhibits high effectivity in removal of target phenoland CPs by progressive formation of multiple C–O and C=O bonds before or after destruc-tion of aromatic ring, as well as cleavage of labile C–Cl, C–H, and C–C bonds. This ispossible through molecular or radical mechanism [14]. Yet only the minority of studies onOZ assess ecotoxicity specifically on water flea Daphnia magna [26] or study transformationproducts (TPs) by wide variety of analytical techniques [18–21,23], especially by massspectrometry. One important study on degradation pathways—with a wide repertoire ofidentified TPs—was reported and discussed by Oputu et al. [20] A variety of TPs havebeen identified so far; the most significant and abundant already in the previous twodecades [18,22,27,28].
The synthesis of advanced materials is a driving force for the development of new,increasingly more effective AOPs. Photocatalysis (PC) stands out as a perspective tech-nology. A wide variety of photocatalysts are being assessed, but TiO2-based are by farthe most prevailing. Use of immobilized (less researched) TiO2 thin films on varioussupports, e.g., glass, metal oxides, and fibres, represents a new alternative to the use ofconventional powder forms. Photocatalysts can be, moreover, easily doped with, e.g.,Pt, Sb, N, C, thus reinforcing photoactivity [11,29]. Focusing on immobilized TiO2, themajority of research is placed on kinetics and target removal of PHN with optimizationsof process parameters [30,31], such as those reported by Nickheslat et al. [32], Dougnaet al. [33] or Sampaio et al. [34] According to our knowledge, only a minority of studiesfocuses on DCP [35,36] or PCP removal [36,37]. Moreover, assessments of ecotoxicity orinduced chemical transformations are absent; only basic TPs (e.g., hydroxyphenols, organicacids) were identified solely by HPLC–UV [11,31,33,37].
During OZ of phenols, highly oxidized and hydrophilic ring-opening products, suchas simple carboxylic acids, are selectively formed but accumulated. Their degradation

Molecules 2022, 27, 1935 3 of 20
could be faster by subsequent PC. Such complementarity has been stimulating interest inthe sequential method (SQ) [38,39], but research on it is scarce, according to our survey.
AOPs are continuously being developed to reach a ‘low-cost, high-tech, chemical-free’ideal. One such opportunity has been seen in electrochemical oxidation (EO), by whichdegradation is achieved at mild conditions during electrolysis [7,13]. Lab-scale optimiza-tions of parameters—using boron-doped diamond [40–42] or metal-oxide [41–44] anodesin different supporting electrolytes—to reach optimal phenol removal efficiency versusenergy consumption are being widely reported. Meanwhile, monitoring the evolution andtoxicity of formed TPs is highly disregarded. Significant research on this matter (PHNonly) has been, for example, performed by Jiang et al. [40], Barısçı et al. [44], Amado-Piñaet al. [17], and Xing et al. [41], again mainly using HPLC–UV.
There is a lack of knowledge of induced degradation processes and pathways, forwhich there are no in-depth studies and comparisons available. As so, we focused onprofound analyses of degradation processes of PHN, DCP and PCP induced by: OZ; PCwith N-doped TiO2 thin films on glass plates (N-TiO2
im.) and photooxidation (PO); SQ(OZ followed by PC); and EO either with boron-doped diamond (BDD) or mixed-metaloxide RuO2-IrO2 (MMO) anode in two different supporting electrolytes. A wide range ofanalytical techniques were applied to obtain information about parent phenol removal,degradation progressivity, mineralization, and dechlorination, along with evolution of TPs.Moreover, ecotoxicological insight was gained by assessing ecotoxicity of treated fractionson water flea Daphnia magna for the first time for some of the above AOPs.
2. Materials and Methods2.1. Chemicals and AOP Treatment
Chemicals. All the chemicals in the present study were bought from Sigma-Aldrich(Steinheim, Germany), Fluka (Seelze, Switzerland), Merck (Darmstadt, Germany), Kemika(Zagreb, Croatia), Fisher Scientific (Loughborough, UK), etc. Purity was at least p.a. orwas not less than 98%. Further details about standards, reagents, solvents, materials forAOPs, and additional chemicals for identification can be found in Supplementary Materials(Section S1).
General AOP treatment procedure. Prepared test mixture (Table 1) was transferred into areactor and treated with the selected method. During treatment, sampling was performedat exact time intervals. Collected aliquots (2–20 mL) were stored in plastic vials in freezer at−20 ◦C. Detailed descriptions of procedures are accessible in the Supplementary Materials(Sections S2–S5). PCP solutions were always prepared in concentrations less or equal toapproximately 10 mg/L due to poor solubility in water.
AOP materials & configurations. During ozonation, the gaseous mixture O2/O3 was con-tinuously introduced in the reactor containing test solutions. Photocatalysis was achievedby using N-doped TiO2 synthesized by the sol-gel method from a TiCl4 precursor. It wasimmobilized on glass plates in the form of thin films using the dip-coating technique. Aphotocell with a continuous flow of O2 placed in a UVA-illuminator was used. Electrooxi-dation was achieved in an electrochemical cell with a mesh-type anode (BDD, MMO) andcathode (stainless steel). For details see the Supplementary Materials (Sections S2–S5).
Table 1. List of test mixtures in ultrapure water (MQ) containing 10 or 50 mg/L phenol (PHN),2,4-dichlorophenol (DCP) or pentachlorophenol (PCP) treated with several AOPs, namely, ozonation(OZ), photocatalysis (PC), photooxidation (PO) ozonation followed by photocatalysis (sequentialmethod, SQ), electrooxidation (EO) either with BDD or MMO anode in supporting electrolyte.
No. AOP Phenols Approx. conc.(mg/L)
Solvent;Initial pH
Max. TT(min)
1 OZ PHN 10 MQ; 860DCP 10
PCP 10

Molecules 2022, 27, 1935 4 of 20
Table 1. Cont.
2 OZ PHN 50 MQ; 88DCP 50
3 OZ PHN, DCP, PCP 10, 10, 10 (mix) MQ; 8 3
4 PC & PO PHN 50 MQ, 8180/300DCP 50
PHN 10DCP 10PCP 10
5 SQ PHN 20 MQ; 80.2 (OZ);180 (PC)
DCP 20PCP 10
6 EO/BDDEO/MMO
PHNPHN
5050 2 g/L NaCl; 6 60
120
7 EO/BDDEO/MMO
PHNPHN
5050 2 g/L Na2SO4; 6 160
160
2.2. Instrumental Analysis
High-performance liquid chromatography coupled to diode-array UV detection. HPLC–DAD(HPLC System 1100 Series, Agilent Technologies, Santa Clara, CA, USA) was used fordetermination of target phenols (PHN, DCP, PCP) and chosen TPs (hydroquinone, catechol,tetrachlorohydroquinone), semiquantitative estimation of p-benzoquinone, and a numberof chromatographic peaks (with UV-absorptivity). The used column was Kinetex XB-C18,150 mm × 4.6 mm, 5 µm, 100 Å (Phenomenex, Torrance, CA, USA) and guard columnGemini-C18, (Phenomenex, Torrance, CA, USA). Flow rate was 0.7 mL/min. ConditionsI were: mobile phase A—10% acetic acid in MQ; B—acetonitrile; separation programme(min-%A/%B): 0–90/10, 3–90/10, 10–60/40, 17–20/80, 23–20/80, 24–90/10, 25–90/10,2 min post time; UV-Vis detection at 254, 270, 285, 305 nm. Conditions II were: mobilephase A—10 mM H3PO4 in MQ; B—acetonitrile; separation programme (min-%A/%B):0–100/0, 6–100/0, 9–40/60, 12–20/80, 15–20/80, 16–100/0, 17–100/0, 2 min post time;UV-Vis detection at 254 and 210 nm.
Ultra-high-pressure liquid chromatography coupled to mass spectrometry. Specific TPs weretracked by LC–MS/MS (Vanquish LC System, TSQ Quantis, Thermo Fisher Scientific,Waltham, MA, USA) with negative electrospray ionization. The column, guard column andflow rate were the same as in HPLC–DAD. Mobile phase composition was A—0.1% formicacid in MQ and B—acetonitrile; separation programme (min-%A/%B): 0–90/10, 3–90/10,10–60/40, 17–20/80, 23–20/80, 24–90/10, 25–90/10, 2 min post time. For MS analysis,N2 (Messer, Bad Soden, Germany, 99.999%) was used as sheath/aux/sweep gas (AU):70/24/0.5. The ion source was at 385 ◦C and the nebulizer gas was at 520 ◦C. Capillaryvoltage was set to −200 V. Spectra were recorded in TIC full Q3 scan mode (m/z 61–355)with no source fragmentation nor collision-induced dissociations in collision cell.
Gas chromatography coupled to mass spectrometry. Volatile and semipolar products wereselectively extracted by solid-phase microextraction (SPME) by immersion of the CAR-PDMS, PA or PEG fibre (Supelco, Bellefonte, PA, USA) for 30 min at 30 ◦C in a 5 mL samplewith 0.2 mL of 0.1 M H2SO4 added. Liquid–liquid extraction (LLE) in ethyl acetate andn-hexane was also conducted. Either LLE or SPME extracts were analysed by GC–MS(FOCUS GC, ISQ, Thermo Fisher Scientific, Waltham, MA, USA). Conditions I were: DB-624 column (30 m × 0.25 mm, 1 µm, Agilent J&W, Folsom, CA, USA); He flow was set to0.8 mL/min; splitless injection with surge mode; inlet temperature 260 ◦C; temperatureprogramme (50 ◦C, 5 min; 110 ◦C, 10 ◦C/min; 210 ◦C, 15 ◦C/min, 3 min; 230 ◦C, 10 ◦C/min,8 min; 240 ◦C, 10 ◦C/min, 10 min; 250 ◦C, 10 ◦C/min); ion source temperature 250 ◦C; MStransfer temperature 250 ◦C; MS was operated in TIC mode in the range m/z 42–350. LLEextracts were also analysed with GC–MS/MS (TRACE 1300 GC, TSQ 9000, Thermo Fisher
Molecules 2022, 27, 1935 5 of 20
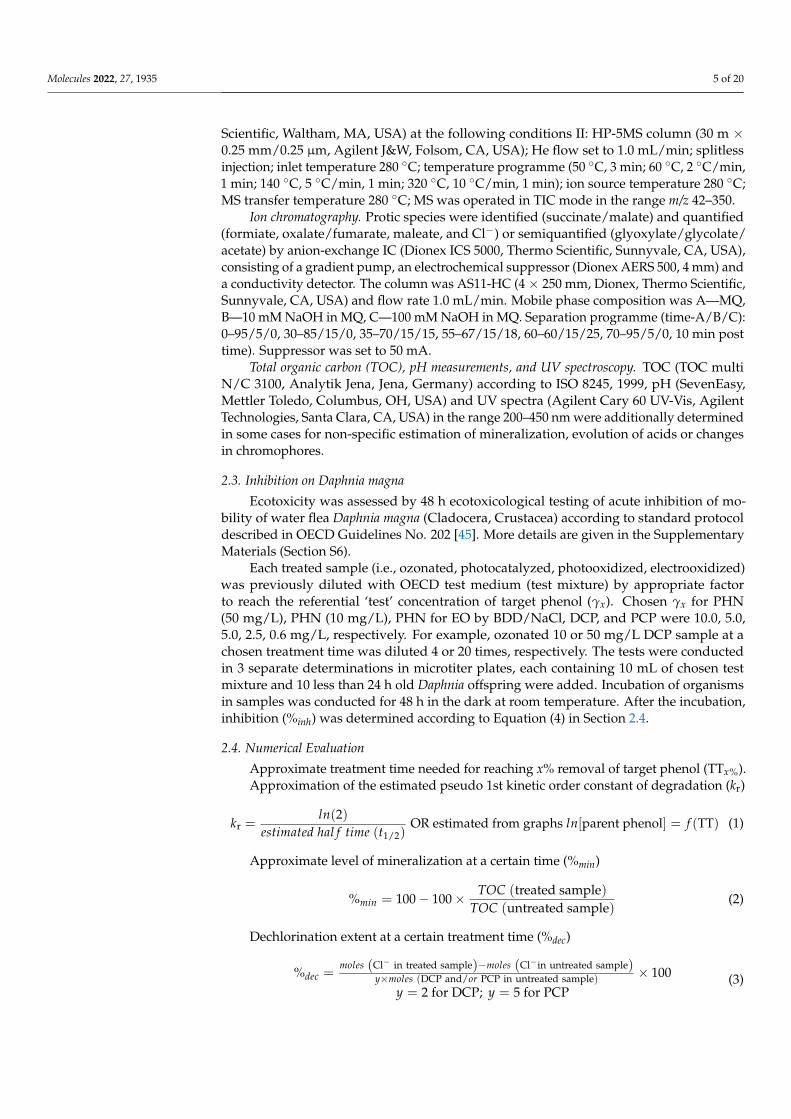
Scientific, Waltham, MA, USA) at the following conditions II: HP-5MS column (30 m ×0.25 mm/0.25 µm, Agilent J&W, Folsom, CA, USA); He flow set to 1.0 mL/min; splitlessinjection; inlet temperature 280 ◦C; temperature programme (50 ◦C, 3 min; 60 ◦C, 2 ◦C/min,1 min; 140 ◦C, 5 ◦C/min, 1 min; 320 ◦C, 10 ◦C/min, 1 min); ion source temperature 280 ◦C;MS transfer temperature 280 ◦C; MS was operated in TIC mode in the range m/z 42–350.
Ion chromatography. Protic species were identified (succinate/malate) and quantified(formiate, oxalate/fumarate, maleate, and Cl−) or semiquantified (glyoxylate/glycolate/acetate) by anion-exchange IC (Dionex ICS 5000, Thermo Scientific, Sunnyvale, CA, USA),consisting of a gradient pump, an electrochemical suppressor (Dionex AERS 500, 4 mm) anda conductivity detector. The column was AS11-HC (4 × 250 mm, Dionex, Thermo Scientific,Sunnyvale, CA, USA) and flow rate 1.0 mL/min. Mobile phase composition was A—MQ,B—10 mM NaOH in MQ, C—100 mM NaOH in MQ. Separation programme (time-A/B/C):0–95/5/0, 30–85/15/0, 35–70/15/15, 55–67/15/18, 60–60/15/25, 70–95/5/0, 10 min posttime). Suppressor was set to 50 mA.
Total organic carbon (TOC), pH measurements, and UV spectroscopy. TOC (TOC multiN/C 3100, Analytik Jena, Jena, Germany) according to ISO 8245, 1999, pH (SevenEasy,Mettler Toledo, Columbus, OH, USA) and UV spectra (Agilent Cary 60 UV-Vis, AgilentTechnologies, Santa Clara, CA, USA) in the range 200–450 nm were additionally determinedin some cases for non-specific estimation of mineralization, evolution of acids or changesin chromophores.
2.3. Inhibition on Daphnia magna
Ecotoxicity was assessed by 48 h ecotoxicological testing of acute inhibition of mo-bility of water flea Daphnia magna (Cladocera, Crustacea) according to standard protocoldescribed in OECD Guidelines No. 202 [45]. More details are given in the SupplementaryMaterials (Section S6).
Each treated sample (i.e., ozonated, photocatalyzed, photooxidized, electrooxidized)was previously diluted with OECD test medium (test mixture) by appropriate factorto reach the referential ‘test’ concentration of target phenol (γx). Chosen γx for PHN(50 mg/L), PHN (10 mg/L), PHN for EO by BDD/NaCl, DCP, and PCP were 10.0, 5.0,5.0, 2.5, 0.6 mg/L, respectively. For example, ozonated 10 or 50 mg/L DCP sample at achosen treatment time was diluted 4 or 20 times, respectively. The tests were conductedin 3 separate determinations in microtiter plates, each containing 10 mL of chosen testmixture and 10 less than 24 h old Daphnia offspring were added. Incubation of organismsin samples was conducted for 48 h in the dark at room temperature. After the incubation,inhibition (%inh) was determined according to Equation (4) in Section 2.4.
2.4. Numerical Evaluation
Approximate treatment time needed for reaching x% removal of target phenol (TTx%).Approximation of the estimated pseudo 1st kinetic order constant of degradation (kr)
kr =ln(2)
estimated hal f time (t1/2)OR estimated from graphs ln[parent phenol] = f (TT) (1)
Approximate level of mineralization at a certain time (%min)
%min = 100− 100× TOC (treated sample)TOC (untreated sample)
(2)
Dechlorination extent at a certain treatment time (%dec)
%dec =moles (Cl− in treated sample)−moles (Cl−in untreated sample)
y×moles (DCP and/or PCP in untreated sample) × 100y = 2 for DCP; y = 5 for PCP
(3)
Molecules 2022, 27, 1935 6 of 20
Normalized relative amount of chosen transformation product (< product >)
< product > =peak area in chromatogram (chosen product)
the biggest peak area (chosen product in the same set of samples)(4)
Relative descriptor of a chosen transformation product (RD)
RDprod. =γ (product in treated sample)×molar mass (parent phenol)
E f f×a×γ (parent phenol in untreated sample)×molar mass (product)
(E f f =γ (parent phenol in treated sample)
γ (parent phenol in untreated sample) )(5)
Complete theoretical conversion ‘C6H5–xOClx→ a chosen product’ (a is 3 and 6 for oxalicand formic acid, respectively) is assumed, regardless of other chemical transformationsand changes in the volume of test mixture due to sampling during AOP treatment.
Acute 48-h mobility inhibition with water flea Daphnia magna (%inh)
%inh =No. of immobilized Daphnia after incubation
No. of Daphnia in the test mixture at the beginning× 100 (6)
3. Results and Discussion
The motivation was to fully understand complex degradation processes of phenol(PHN), 2,4-dichlorophenol (DCP), and pentachlorophenol (PCP) in different matrices fromchemical and ecotoxicological point of view. A focus was placed on profound analyses oftreated fractions. This allowed a comparison of four approaches for chemical degradation:ozonation (OZ), photocatalytic oxidation with immobilized N-doped TiO2 thin films onglass supports (PC), their sequence (SQ), and anodic electrooxidations (EO) by BDD andMMO anode, thus covering a wide range of three advanced technologies.
In order to collect data on target degradation progress, dechlorination, mineraliza-tion, changes in pH, chemical transformations, and evolution of selected by-products,numerous analytical methods and procedures were applied. Such as: HPLC–DAD, pHmeasurement, TOC determinations, UV spectroscopy, solid-phase microextraction (SPME)or liquid–liquid extraction (LLE) followed by GC–MS or GC–MS/MS, UHPLC–MS/MS,ion chromatography (IC), and ecotoxicological mobility inhibition tests on Daphnia magnawater flea. All of these are further described in the following section.
3.1. Removal of Target Phenols, Mineralization, and Progressivity
To describe the efficiency of the removal, we used several descriptors that are explainedin Section 2.4, namely: treatment time (TT) needed for reaching > 95% target phenolremoval (TT>95%), estimated pseudo first-order kinetics constant (kr; Equation (1)), andlevel of mineralization (%min; Equation (2)).
Ozonation (OZ). Results indicate that at the initial pH of 8, a favourable degradationprocess of phenols is possible, which includes rapid target degradation, depending ontheir chemical structure (correlation with nucleophilicity, mechanism, and intermediates),medium complexity (competition for O3 consumption), and initial concentrations (substrateloads). All of that is reflected in Figure 1a and is in agreement with the literature [12,18].In all cases, pseudo first-order kinetics could be approximated, e.g., estimated pseudofirst-order constants (kr) for PHN and DCP in separate solutions reached 0.6 and 2.1 min−1
(50 mg/L), respectively, whereas for the mixture they were 1.9, 2.8, and 4.9 min−1 forPHN, DCP, and PCP, respectively. The approximate TT>95% were 4, 2, and ~0.1 min forPHN, DCP (50 mg/L), and PCP (10 mg/L), respectively (Figure 1a). The higher the initialconcentration or the greater the amount of co-substrates (see OZ of mixture), the longerTT>95%. Described progressivity was primarily reflected in: (i) a sudden drop of pHfrom 8 to 3–4, with the formation of organic acids; (ii) compounds detected by HPLC–DAD (e.g., absorption decline < 255 nm, as well as evolution of extra polar products withminimum retention); and (iii) an increase in the number of IC peaks (showing a quick

Molecules 2022, 27, 1935 7 of 20
evolution of protic species), presented in the Supplementary Materials (Section S2.1). SinceOZ proceeds in acidic medium, reactions of substrates with O3 were assumed to be takingpart on the gas–liquid interface, especially in the early stage [24,27]. Reaching stronglyacidic pH was thought to greatly influence degradation process. Mineralization was, onthe other hand, not readily achieved. For example, only 50, 40, and 40%min for PHN, DCP,and PCP (10 mg/L), respectively, was measured after 10 min.
Molecules 2022, 27, x FOR PEER REVIEW 7 of 21
phenol removal (TT>95%), estimated pseudo first-order kinetics constant (kr; Equation (1)), and level of mineralization (%min; Equation (2)).
Ozonation (OZ). Results indicate that at the initial pH of 8, a favourable degradation process of phenols is possible, which includes rapid target degradation, depending on their chemical structure (correlation with nucleophilicity, mechanism, and intermediates), medium complexity (competition for O3 consumption), and initial concentrations (substrate loads). All of that is reflected in Figure 1a and is in agreement with the literature [12,18]. In all cases, pseudo first-order kinetics could be approximated, e.g., estimated pseudo first-order constants (kr) for PHN and DCP in separate solutions reached 0.6 and 2.1 min−1 (50 mg/L), respectively, whereas for the mixture they were 1.9, 2.8, and 4.9 min−1 for PHN, DCP, and PCP, respectively. The approximate TT>95% were 4, 2, and ⁓0.1 min for PHN, DCP (50 mg/L), and PCP (10 mg/L), respectively (Figure 1a). The higher the initial concentration or the greater the amount of co-substrates (see OZ of mixture), the longer TT>95%. Described progressivity was primarily reflected in: (i) a sudden drop of pH from 8 to 3–4, with the formation of organic acids; (ii) compounds detected by HPLC–DAD (e.g., absorption decline < 255 nm, as well as evolution of extra polar products with minimum retention); and (iii) an increase in the number of IC peaks (showing a quick evolution of protic species), presented in the Supplementary Material (Section S2.1). Since OZ proceeds in acidic medium, reactions of substrates with O3 were assumed to be taking part on the gas–liquid interface, especially in the early stage [24,27]. Reaching strongly acidic pH was thought to greatly influence degradation process. Mineralization was, on the other hand, not readily achieved. For example, only 50, 40, and 40%min for PHN, DCP, and PCP (10 mg/L), respectively, was measured after 10 min.
Legend: ― PHN, ― DCP, ― PCP.
Figure 1. Treatment time for reaching > 95% removal (see Section 2.4) of phenol (PHN), 2,4-dichlorophenol (DCP) and pentachlorophenol (PCP) (TT>95% in min) after treatment with (a) ozonation (OZ), and (b) photocatalysis (PC), sequential method (SQ), and electrooxidation with BDD anode in NaCl (BDD/NaCl) and Na2SO4 (BDD/Na2SO4) (note: numbers in parentheses are initial concentrations in mg/L).
Photocatalysis (PC) and photooxidation (PO). In general, selective, robust, and rapid degradation is considered for OZ, while mild and slow degradation is known for PC. Data concerning PC (i.e., UV/O2/TiO2im. system) indicate up to a 100-times longer treatment time (reaching few hours) than those characteristic for OZ (reaching few minutes). TT also depends on specific parameters, such as number of C‒Cl bonds [35,36] and initial concentration [35]. This is in accordance with [12,27] which reported that PC is significantly less efficient than OZ. For example, estimated kr was 0.01, 0.02, and 0.03 min−1 for PHN, DCP, and PCP (10 mg/L), respectively, but 0.005 and 0.008 min−1 for PHN and
Figure 1. Treatment time for reaching > 95% removal (see Section 2.4) of phenol (PHN), 2,4-dichlorophenol (DCP) and pentachlorophenol (PCP) (TT>95% in min) after treatment with (a) ozona-tion (OZ), and (b) photocatalysis (PC), sequential method (SQ), and electrooxidation with BDDanode in NaCl (BDD/NaCl) and Na2SO4 (BDD/Na2SO4) (note: numbers in parentheses are initialconcentrations in mg/L).
Photocatalysis (PC) and photooxidation (PO). In general, selective, robust, and rapiddegradation is considered for OZ, while mild and slow degradation is known for PC. Dataconcerning PC (i.e., UV/O2/TiO2
im. system) indicate up to a 100-times longer treatmenttime (reaching few hours) than those characteristic for OZ (reaching few minutes). TTalso depends on specific parameters, such as number of C–Cl bonds [35,36] and initialconcentration [35]. This is in accordance with [12,27] which reported that PC is significantlyless efficient than OZ. For example, estimated kr was 0.01, 0.02, and 0.03 min−1 for PHN,DCP, and PCP (10 mg/L), respectively, but 0.005 and 0.008 min−1 for PHN and DCP(50 mg/L), respectively. Therefore, TT>95% are above the 3-h time range. By increasing thenumber of C–Cl bonds and initial concentration, removal was faster (Figure 1b), whichshows phenols’ reactivity. PCP has the greatest number of labile C–Cl bonds, the smallestpKa, and the highest UVA absorptivity (at 365 nm); therefore, its degradation was thefastest. PO (i.e., UV/O2 system; absence of N-TiO2
im.) was found to be the least effectiveand the slowest, since removal efficiency was up to 500 times lower than for PC. This isespecially true in the case of PHN where only 2% removal was reached after 5 h treatment.In addition, estimated kr were <10−5, <10−3, and 0.006 min−1 for PHN, DCP (50 mg/L), andPCP (10 mg/L), respectively (Figure 2). Effect of UV light was, therefore, the highest in thecase of PCP (90% removal reached after 5 h) due to the progressive breakage of C–Cl bondson the aromatic ring. Mineralization after >180 min of PC treatment was estimated to be 60,70, and 60% for PHN, DCP, and PCP (10 mg/L), respectively, whereas no mineralizationwas induced by PO. UV spectroscopical data on PC of PHN and DCP (50 mg/L) furthersupport the facts described above, as there was a slow decrease in characteristic peakabsorptivity (270 nm for PHN, 285 nm for DCP) during treatment. Finally, assessment ofHPLC and IC chromatogram peaks may give overall conclusion that PC and PO processesare more selective, and less dynamic in contrast to OZ (see Supplementary MaterialsSection S3.1).

Molecules 2022, 27, 1935 8 of 20
Molecules 2022, 27, x FOR PEER REVIEW 8 of 21
DCP (50 mg/L), respectively. Therefore, TT>95% are above the 3-h time range. By increasing the number of C–Cl bonds and initial concentration, removal was faster (Figure 1b), which shows phenols’ reactivity. PCP has the greatest number of labile C‒Cl bonds, the smallest pKa, and the highest UVA absorptivity (at 365 nm); therefore, its degradation was the fastest. PO (i.e., UV/O2 system; absence of N-TiO2im.) was found to be the least effective and the slowest, since removal efficiency was up to 500 times lower than for PC. This is especially true in the case of PHN where only 2% removal was reached after 5 h treatment. In addition, estimated kr were <10−5, <10−3, and 0.006 min−1 for PHN, DCP (50 mg/L), and PCP (10 mg/L), respectively (Figure 2). Effect of UV light was, therefore, the highest in the case of PCP (90% removal reached after 5 h) due to the progressive breakage of C‒Cl bonds on the aromatic ring. Mineralization after > 180 min of PC treatment was estimated to be 60, 70, and 60% for PHN, DCP, and PCP (10 mg/L), respectively, whereas no mineralization was induced by PO. UV spectroscopical data on PC of PHN and DCP (50 mg/L) further support the facts described above, as there was a slow decrease in characteristic peak absorptivity (270 nm for PHN, 285 nm for DCP) during treatment. Finally, assessment of HPLC and IC chromatogram peaks may give overall conclusion that PC and PO processes are more selective, and less dynamic in contrast to OZ (see Supplementary Materials Section S3.1).
Legend: Inner circle (PO) ▮ PO of PHN ▮ PO of DCP ▮ PO of PCP Outer circle (EO) ▮ MMO/NaCl of PHN ▮ MMO/Na2SO4 of PHN
Figure 2. Maximum removal % of phenol (PHN), 2,4-dichlorophenol (DCP), and pentachlorophenol (PCP) achieved by 300 min of photooxidation (PO), 120 min of electrooxidation with MMO in NaCl, and 160 min with MMO in Na2SO4.
Sequential method (SQ). In the case of SQ, a direct comparison to PC or OZ alone is not possible due to different initial concentrations used in experiments. Nevertheless, experiments show a contrast between OZ and PC, where OZ was considerably faster (Figure 1b), as already discussed. For example, a 0.2 min ‘flash’ of OZ removed almost all PCP and approximately 75% of DCP and 25% of PHN. So, SQ may provide a faster option as opposed to slow PC. Examples of chromatograms are given in the Supplementary Materials (Section S4.1). On the other hand, it should be noted that during OZ, the pH suddenly dropped to < 6 while, interestingly, during PC the pH did not change significantly.
Electrooxidation (EO). Only PHN degradation (50 mg/L) was investigated by EO. Removal was the fastest in NaCl as the supporting electrolyte. In the case of BDD/NaCl, TT>95% was only below 35 min (Figure 1b) but chlorinated aromatics were formed which were almost completely removed after 60 min. Whereas in the case of MMO, TT>95% was up to 120 min; also due to mild polychlorination (Figure 2). The process was the most progressive with BDD, which can be estimated also from HPLC chromatograms. On the other hand, EO in Na2SO4 was slower, selective, and less dynamic. Less HPLC–DAD-detectable peaks were generated in comparison to EO/NaCl (see the Supplementary Materials, Section S5.1). If BDD and MMO are compared, treatment with BDD was effective on a long run, as 96% removal after 160 min was achieved (Figure 1b). In contrast, an MMO anode provided only less than 10% removal (Figure 2). Data are comparable to the literature [17,40,44].
Figure 2. Maximum removal % of phenol (PHN), 2,4-dichlorophenol (DCP), and pentachlorophenol(PCP) achieved by 300 min of photooxidation (PO), 120 min of electrooxidation with MMO in NaCl,and 160 min with MMO in Na2SO4.
Sequential method (SQ). In the case of SQ, a direct comparison to PC or OZ alone isnot possible due to different initial concentrations used in experiments. Nevertheless,experiments show a contrast between OZ and PC, where OZ was considerably faster(Figure 1b), as already discussed. For example, a 0.2 min ‘flash’ of OZ removed almostall PCP and approximately 75% of DCP and 25% of PHN. So, SQ may provide a fasteroption as opposed to slow PC. Examples of chromatograms are given in the SupplementaryMaterials (Section S4.1). On the other hand, it should be noted that during OZ, the pHsuddenly dropped to <6 while, interestingly, during PC the pH did not change significantly.
Electrooxidation (EO). Only PHN degradation (50 mg/L) was investigated by EO.Removal was the fastest in NaCl as the supporting electrolyte. In the case of BDD/NaCl,TT>95% was only below 35 min (Figure 1b) but chlorinated aromatics were formed whichwere almost completely removed after 60 min. Whereas in the case of MMO, TT>95%was up to 120 min; also due to mild polychlorination (Figure 2). The process was themost progressive with BDD, which can be estimated also from HPLC chromatograms.On the other hand, EO in Na2SO4 was slower, selective, and less dynamic. Less HPLC–DAD-detectable peaks were generated in comparison to EO/NaCl (see the SupplementaryMaterials, Section S5.1). If BDD and MMO are compared, treatment with BDD was effectiveon a long run, as 96% removal after 160 min was achieved (Figure 1b). In contrast, anMMO anode provided only less than 10% removal (Figure 2). Data are comparable to theliterature [17,40,44].
3.2. Dechlorination of Chlorophenols
Monitoring of Cl− concentration allowed us to track the breakage of C–Cl bonds,referred to as dechlorination. From it, the overall amount of remaining chlorinated com-pounds can be estimated. The applied descriptor was the dechlorination extent (%dec),explained in Section 2.4 (Equation (3)).
Ozonation. During OZ, fast (<3 min) and complete dechlorination could be observed.Curves for dechlorination extent (Figure 3) are in all cases of the same shape, marked by afast increase in Cl− concentration, but more steady changes in the later stage of OZ. Thispoints to the probability that more labile C–Cl bonds on C atoms that are part of aromaticstructures (Ar–Cl) are quickly broken. The same is valid for OZ of mixture, where 100%combined dechlorination of PCP and DCP was reached after only 3–4 min (data not shown).All in all, non-chlorinated TPs were in the majority expected during and after OZ, whichis favourable.
Photocatalysis and photooxidation. During PC, the dechlorination process was muchslower than in OZ, expanding to 2–5 h (Figure 3), which is proportional to slower removalefficiency (see Section 3.1). For example, in the first hour of PC there was still >50% ofchlorinated organic compounds (including non-degraded DCP and PCP), and then fromthe third hour onwards, most of the chlorine was already in the form of Cl−, which isfavourable (Figure 3). Nevertheless, long-term dechlorination efficiency could be predictedsince more than 80%dec was achieved after a 5-h treatment. In the PO experiments, cleavages
Molecules 2022, 27, 1935 9 of 20
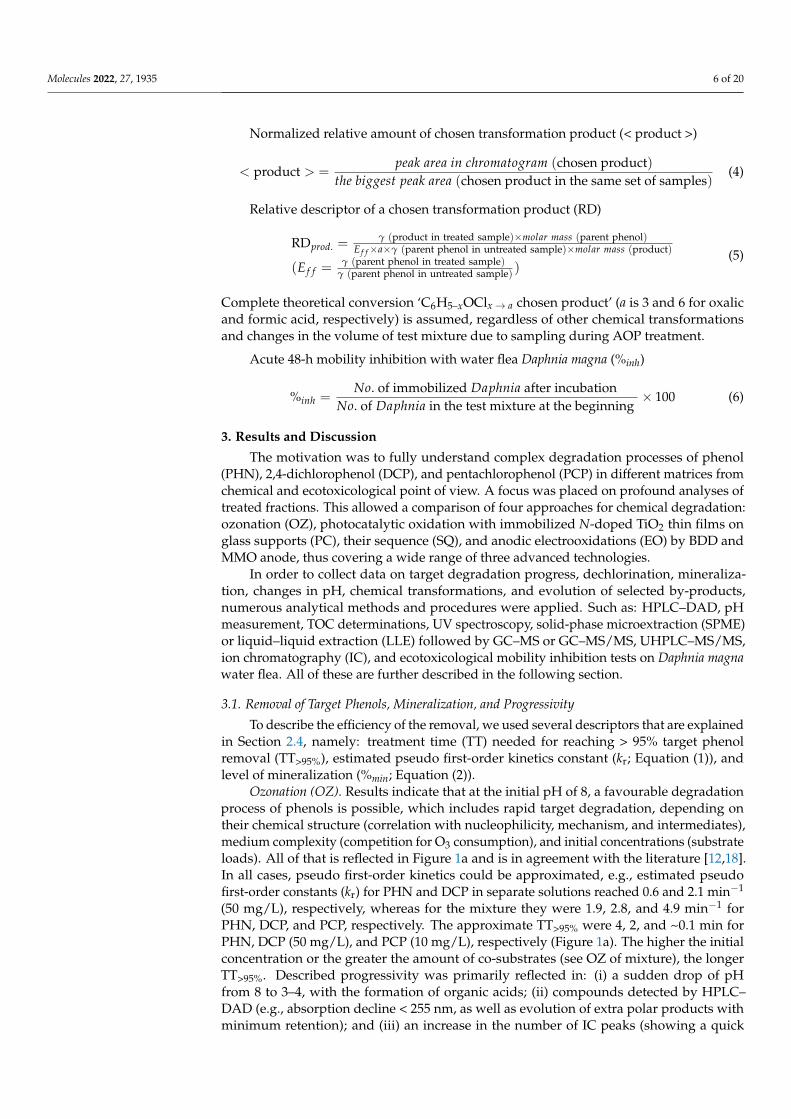
of C–Cl also occurred, especially in the case of PCP, rather than DCP (Figure 3b), suggestingthat UVA irradiation plays an important role not only in PCP removal but also in itsdechlorination (<60%dec reached after 5 h). In comparison, Gunlazuardi and Lindu [37]reported on the much slower PCP’s release of Cl− ions.
Molecules 2022, 27, x FOR PEER REVIEW 9 of 21
3.2. Dechlorination of Chlorophenols Monitoring of Cl− concentration allowed us to track the breakage of C‒Cl bonds,
referred to as dechlorination. From it, the overall amount of remaining chlorinated compounds can be estimated. The applied descriptor was the dechlorination extent (%dec), explained in Section 2.4 (Equation (3)).
Ozonation. During OZ, fast (<3 min) and complete dechlorination could be observed. Curves for dechlorination extent (Figure 3) are in all cases of the same shape, marked by a fast increase in Cl− concentration, but more steady changes in the later stage of OZ. This points to the probability that more labile C‒Cl bonds on C atoms that are part of aromatic structures (Ar‒Cl) are quickly broken. The same is valid for OZ of mixture, where 100% combined dechlorination of PCP and DCP was reached after only 3–4 min (data not shown). All in all, non-chlorinated TPs were in the majority expected during and after OZ, which is favourable.
Legend: ▮ OZ, ▮ SQ, ▮ PC (10 mg/L), ▮ PC (50 mg/L), ▮ PO. Note: In the case of sequential method (SQ), 1st point represents Cl⁻ concentration after ozonation (OZ).
Figure 3. Dechlorination (i.e., conversion of organic chlorine into chloride; see Equation (3) in Section 2.4) of (a) 2,4-dichlorophenol (DCP) and (b) pentachlorophenol (PCP) during ozonation (OZ), photocatalysis (PC), photooxidation (PO), and sequential method (SQ).
Photocatalysis and photooxidation. During PC, the dechlorination process was much slower than in OZ, expanding to 2–5 h (Figure 3), which is proportional to slower removal efficiency (see Section 3.1). For example, in the first hour of PC there was still >50% of chlorinated organic compounds (including non-degraded DCP and PCP), and then from the third hour onwards, most of the chlorine was already in the form of Cl−, which is favourable (Figure 3). Nevertheless, long-term dechlorination efficiency could be predicted since more than 80%dec was achieved after a 5-h treatment. In the PO experiments, cleavages of C‒Cl also occurred, especially in the case of PCP, rather than DCP (Figure 3b), suggesting that UVA irradiation plays an important role not only in PCP removal but also in its dechlorination (<60%dec reached after 5 h). In comparison, Gunlazuardi and Lindu [37] reported on the much slower PCP’s release of Cl− ions.
Sequential method. Similar to removal efficiency (Figure 1), OZ with subsequent PC also reinforced dechlorination process (Figure 3). With 0.2 min of OZ, it was possible to declare >60%dec and fast dechlorination. However, with subsequent PC, the process steadily slowed down.
3.3. Transformation Products and Possible Degradation Pathways 3.3.1. General Identification
Several analytical techniques were applied to separate and identify the transformation products (TPs) forming during treatment: HPLC–DAD, UHPLC–MS/MS, liquid–liquid extraction (LLE) or solid-phase microextraction (SPME) followed by GC–
Figure 3. Dechlorination (i.e., conversion of organic chlorine into chloride; see Equation (3) inSection 2.4) of (a) 2,4-dichlorophenol (DCP) and (b) pentachlorophenol (PCP) during ozonation (OZ),photocatalysis (PC), photooxidation (PO), and sequential method (SQ).
Sequential method. Similar to removal efficiency (Figure 1), OZ with subsequent PCalso reinforced dechlorination process (Figure 3). With 0.2 min of OZ, it was possible todeclare >60%dec and fast dechlorination. However, with subsequent PC, the process steadilyslowed down.
3.3. Transformation Products and Possible Degradation Pathways3.3.1. General Identification
Several analytical techniques were applied to separate and identify the transformationproducts (TPs) forming during treatment: HPLC–DAD, UHPLC–MS/MS, liquid–liquidextraction (LLE) or solid-phase microextraction (SPME) followed by GC–MS, LLE followedby GC–MS/MS, and IC (see Section 2.2). A list of some identified TPs is given in Table 2,where they are numbered from A1 to D16. A part of TPs were identified by severalanalytical techniques, while some of them only by one of the applied techniques, thuslowering the identification certainty.
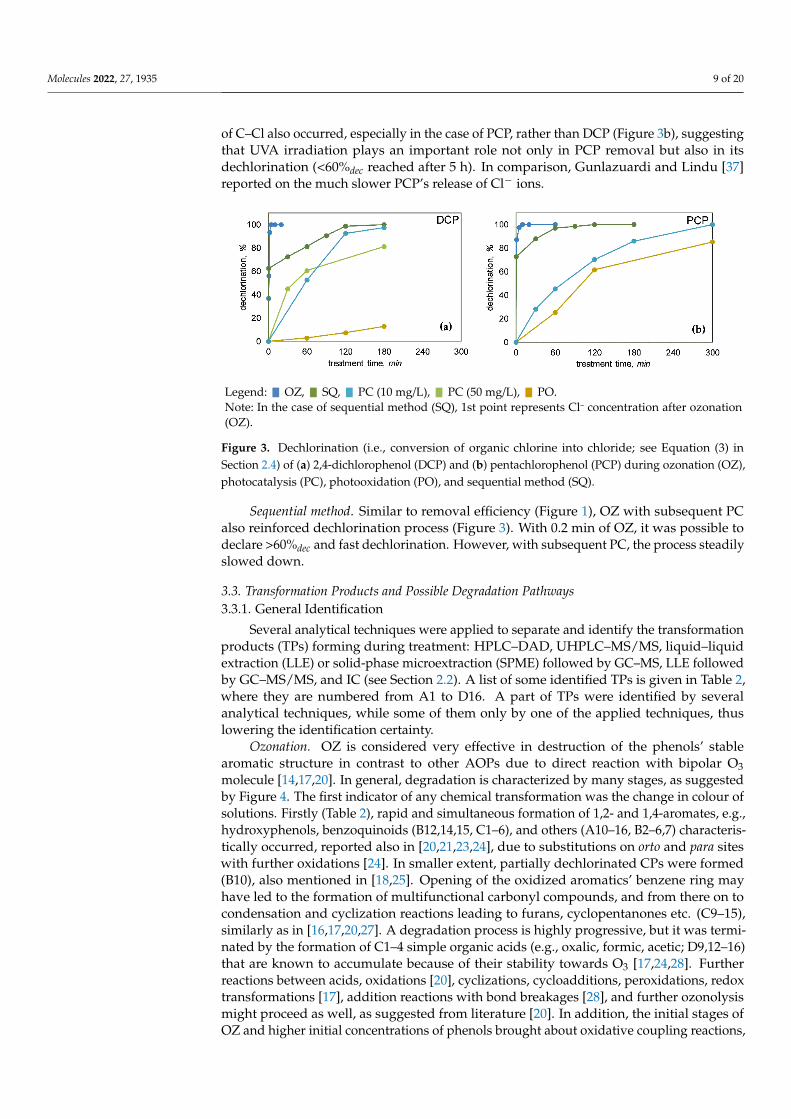
Ozonation. OZ is considered very effective in destruction of the phenols’ stablearomatic structure in contrast to other AOPs due to direct reaction with bipolar O3molecule [14,17,20]. In general, degradation is characterized by many stages, as suggestedby Figure 4. The first indicator of any chemical transformation was the change in colour ofsolutions. Firstly (Table 2), rapid and simultaneous formation of 1,2- and 1,4-aromates, e.g.,hydroxyphenols, benzoquinoids (B12,14,15, C1–6), and others (A10–16, B2–6,7) characteris-tically occurred, reported also in [20,21,23,24], due to substitutions on orto and para siteswith further oxidations [24]. In smaller extent, partially dechlorinated CPs were formed(B10), also mentioned in [18,25]. Opening of the oxidized aromatics’ benzene ring mayhave led to the formation of multifunctional carbonyl compounds, and from there on tocondensation and cyclization reactions leading to furans, cyclopentanones etc. (C9–15),similarly as in [16,17,20,27]. A degradation process is highly progressive, but it was termi-nated by the formation of C1–4 simple organic acids (e.g., oxalic, formic, acetic; D9,12–16)that are known to accumulate because of their stability towards O3 [17,24,28]. Furtherreactions between acids, oxidations [20], cyclizations, cycloadditions, peroxidations, redoxtransformations [17], addition reactions with bond breakages [28], and further ozonolysismight proceed as well, as suggested from literature [20]. In addition, the initial stages ofOZ and higher initial concentrations of phenols brought about oxidative coupling reactions,
Molecules 2022, 27, 1935 10 of 20
resulting in formation of chlorinated and/or polyhydroxylated coupling products in traces(most probably phenoxyphenols, biphenyls, dibenzodioxins and others; A1–5,7). Their m/zwith isotopic fingerprints were specifically detected by UHPLC–MS/MS (Table 2) due togood ionization by negative ESI and are therefore only suggested as possible, but those TPswere highlighted also by Oputu et al. [20] and Hirvonen et al. [22]. The respective productswere more numerous in the case of OZ of CPs. For example, number of coupling productswas 1 and 8 for PHN and DCP, respectively. These reactions were also non-specificallyconfirmed by a sudden drop in pH and by number and peak types detected by HPLC–DAD and IC. The above highlighted and many other transformations are described also inliterature [6,16,18–21,24,28], especially recently by Oputu et al. in 2020 [20]. For example,decrease in absorption < 255 nm indicated a rapid formation of simple acyclic compounds,such as organic acids.
Molecules 2022, 27, x FOR PEER REVIEW 10 of 21
MS, LLE followed by GC–MS/MS, and IC (see Section 2.2). A list of some identified TPs is given in Table 2, where they are numbered from A1 to D16. A part of TPs were identified by several analytical techniques, while some of them only by one of the applied techniques, thus lowering the identification certainty.
Ozonation. OZ is considered very effective in destruction of the phenols’ stable aromatic structure in contrast to other AOPs due to direct reaction with bipolar O3 molecule [14,17,20]. In general, degradation is characterized by many stages, as suggested by Figure 4. The first indicator of any chemical transformation was the change in colour of solutions. Firstly (Table 2), rapid and simultaneous formation of 1,2- and 1,4-aromates, e.g., hydroxyphenols, benzoquinoids (B12,14,15, C1–6), and others (A10–16, B2–6,7) characteristically occurred, reported also in [20,21,23,24], due to substitutions on orto and para sites with further oxidations [24]. In smaller extent, partially dechlorinated CPs were formed (B10), also mentioned in [18,25]. Opening of the oxidized aromatics’ benzene ring may have led to the formation of multifunctional carbonyl compounds, and from there on to condensation and cyclization reactions leading to furans, cyclopentanones etc. (C9–15), similarly as in [16,17,20,27]. A degradation process is highly progressive, but it was terminated by the formation of C1–4 simple organic acids (e.g., oxalic, formic, acetic; D9,12–16) that are known to accumulate because of their stability towards O3 [17,24,28]. Further reactions between acids, oxidations [20], cyclizations, cycloadditions, peroxidations, redox transformations [17], addition reactions with bond breakages [28], and further ozonolysis might proceed as well, as suggested from literature [20]. In addition, the initial stages of OZ and higher initial concentrations of phenols brought about oxidative coupling reactions, resulting in formation of chlorinated and/or polyhydroxylated coupling products in traces (most probably phenoxyphenols, biphenyls, dibenzodioxins and others; A1–5, A7). Their m/z with isotopic fingerprints were specifically detected by UHPLC–MS/MS (Table 2) due to good ionization by negative ESI and are therefore only suggested as possible, but those TPs were highlighted also by Oputu et al. [20] and Hirvonen et al. [22]. The respective products were more numerous in the case of OZ of CPs. For example, number of coupling products was 1 and 8 for PHN and DCP, respectively. These reactions were also non-specifically confirmed by a sudden drop in pH and by number and peak types detected by HPLC–DAD and IC. The above highlighted and many other transformations are described also in literature [6,16,18–21,24,28], especially recently by Oputu et al. in 2020 [20]. For example, decrease in absorption < 255 nm indicated a rapid formation of simple acyclic compounds, such as organic acids.
Description: aromatic coupling products (C6+) ⇆ parent phenol (C6) → hydroxyphenols, benzoquinoid species and condensates (C6) → C4–6 organic acids or condensation products → C2–3 unsaturated organic acids → simple C1–3 saturated organic acids.
Figure 4. General scheme of the suggested degradation process during ozonation (partially adopted from [6,16–21,24,28]).
Figure 4. General scheme of the suggested degradation process during ozonation (partially adoptedfrom [6,16–21,24,28]).
Photocatalysis and photooxidation. In the literature, target identifications of TPs in PCare prevailing, using only HPLC–UV. A look into identified TPs (Table 2) suggests thatPC was incapable to efficiently open the aromatic ring. Thus, there was a prevalence ofreactions on the aromatic ring [27]. For example, degradation was marked by formation ofbenzoquinones, hydroxyphenols (B10,12,14,15), less chlorinated chlorophenols (B10) [36],as well as dimers, adducts, biphenyls or phenoxyphenols which are thought to be productof (oxidative) coupling, i.e., formations of C–O and C–C bonds (A1–5,7). These predomi-nated in the first 2 h of PC, and mostly in the case of PO, so their formation was acceleratedby UVA irradiation. The formation of all mentioned aromatics was a result of radicalhydroxylations, photoinduced oxidations, reductive/hydroxylative dechlorinations, andother substitution reactions. Consequently, CPs, hydroxyphenols, and benzoquinones areby far the most frequently identified in the literature, such as hydroquinone (C4), catechol(C6) and p-benzoquinone (C2) [11,31,33,37]. UVA irradiation plays a significant role in thecleavage of C–Cl bonds and coupling reactions, but only the presence of photocatalystallows for increased destruction of aromatic structures. Radical reactions induce also othertransformations, such as photooxidations, cyclizations, coupling reactions, and conden-sations resulting in evolution of simpler compounds, e.g., hydroxycyclopentanediones(C13,14), reported also in [35]. Cyclized organic oxygen derivatives (C11,13,14, D1), and or-ganic acids (D9) also appeared during PC, but in very low concentrations, and are reportedalso in [11,12]. As dechlorination was slow, more chlorinated aromatics were detected.In the case of PC of PHN, UV spectroscopy showed a gradual increase in the secondary

Molecules 2022, 27, 1935 11 of 20
absorption peak ranging 280–310 nm, which could have possibly indicated the formation ofvarious quinoid or condensed aromatic species. During treatment, the overall absorptivitygradually decreased, and the absorption peaks were no longer clearly defined. Moreover,there were less HPLC–DAD peaks, which would indicate formation of simple non-aromaticcompounds.
Sequential method. TPs in SQ treated samples were similar to those in OZ which werethen further degraded by PC (Table 2). Interestingly, there were fewer coupling productsdetected although they are otherwise typical of PC; possibly because of preozonation.
Electrooxidation. As already mentioned, EO in electrolyte NaCl is the most effec-tive for the removal of PHN, yet the least successful since there was unfavourable for-mation of chlorinated aromatics due to in situ electrogeneration of chlorinating agents.In the case of BDD/NaCl, chlorinated aromatics (mostly chlorophenols, B10, reportedalso by Chatzisymeo et al. [43]) were preferentially formed (Table 2). However, after60 min they were broken down into chlorinated carbonyl compounds and polychloro-hydrocarbons (C8–10,14,16, D2,3,6–8,10,11), e.g., chloroform, tetra/pentachloropropenes,tetrachloroetene, tetrachlorocyclopropanes, etc. Thus, ring-opening reactions effectivelyoccurred. MMO/NaCl treatment was characterized by an even greater generation ofchlorinated aromatics which were accumulated (A1–5,7, B10,12, C3). For example, evenafter 120 min of EO they still prevailed; contrarily, in the case of BDD they were quicklydegraded. Despite extensive and rapid target degradation of PHN in NaCl, we cannotspeak of a successful process.
On the other hand, slower EO in Na2SO4 provided more acceptable chemical trans-formations. Non-chlorinated, hydroxylated and/or highly oxidized aromatics were pref-erentially formed (Table 2), such as hydroquinone, catechol, p-benzoquinone, and or-ganic acids [40,44], as well as some coupling products. On the long run, aromatic ringmight have been opened. MMO was an exception since progressivity was slower. Thus,p-benzoquinone accumulated in a relatively big proportion. Moreover, there were fewerTPs identified than during EO/NaCl. In addition, probably relatively greater amount ofp-benzoquinone was generated by MMO than by BDD, as estimated from peak areas inHPLC–DAD. Hydroquinone, catechol, p-benzoquinone, and organic acids (e.g., fumaric,oxalic, maleic) formation were in majority identified by target analysis with HPLC–UV alsoin the literature [17,40,42,44].

Molecules 2022, 27, 1935 12 of 20
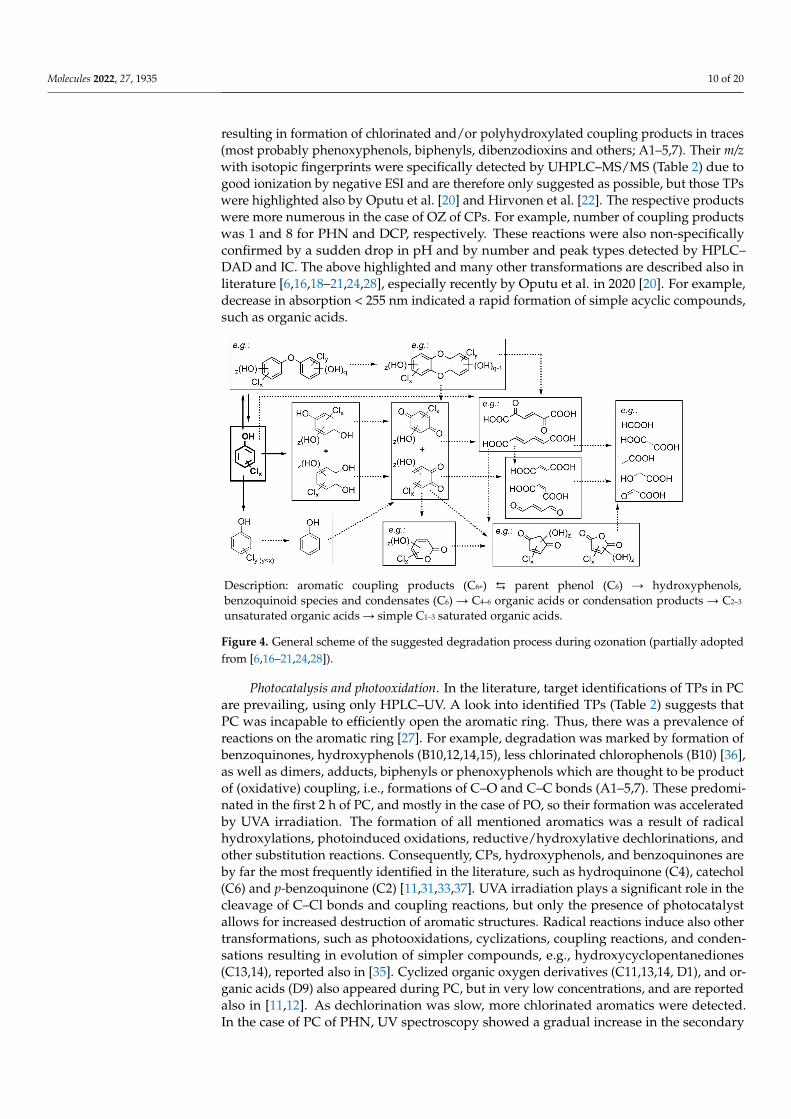
Table 2. Transformation by-products (TPs) of phenol (PHN), 2,4-dichlorophenol (DCP), pen-tachlorophenol (PCP) and their mixture during ozonation (OZ), photocatalysis (PC; #1), photooxida-tion (PO; #2), sequential method (SQ), and electrooxidation (EO) with BDD (#3) and MMO (#4) anodein NaCl and Na2SO4 (for decription of table’s structure and colours, see footnotes).
Molecules 2022, 27, x FOR PEER REVIEW 12 of 21
sequential method (SQ), and electrooxidation (EO) with BDD (#3) and MMO (#4) anode in NaCl and
Na2SO4 (for decription of table’s structure and colours, see footnotes).
A B C D
1
1,2 2 1,2 1
3,4
2
1,2 2 1,2 1
3,4 3,4 3,4 3
3
1,2 1,2 2 1,2 1,2
3,4 3 3,4 3
4
1,2 1,2 2 1
3,4 3 3,4 3,4
5
1,2 2 1
3,4
6
1 1
3 3 3,4 3 3
7
1,2 2 1,2
3,4 3 3,4 3 3
8
3 3 3
9
1 1
3 3
10
1,2 1,2
3,4 3 3 3
11
3
12
1,2
3,4 3,4
13
1 1 1
3,4 3
14
1 1,2 1 1,2 1,2 1,2
3,4 3,4 3,4 3
15
1,2 1 1 1
16
1 1,2 1,2 1,2
3 3 3
Descriptive
sub-tables:
Colours: ▮ ‒ Confirmed or ▮ ‒ suggested structure.

Molecules 2022, 27, 1935 13 of 20
3.3.2. Monitoring of the Selected Products
Hydroquinone (HQ), catechol (CT), tetrachlorohydroquinone (TH), and organic acids(oxalic, OX; formic acid, FO) were quantified from their respective calibration curves ob-tained by HPLC–DAD and IC (Figures 5 and 6). By IC, acetic/glyoxylic/glycolic, maleic,succinic/malic, propionic, lactic, fumaric acid (FM; note: coelution with oxalic acid but dif-ferentiated by HPLC–DAD) could also be detected. Relative abundance of p-benzoquinone(BQ), as well as other identified TPs was monitored according to Equation (4) (Section 2.4).
Molecules 2022, 27, x FOR PEER REVIEW 13 of 21
3.3.2. Monitoring of the Selected Products Hydroquinone (HQ), catechol (CT), tetrachlorohydroquinone (TH), and organic
acids (oxalic, OX; formic acid, FO) were quantified from their respective calibration curves obtained by HPLC–DAD and IC (Figures 5 and 6). By IC, acetic/glyoxylic/glycolic, maleic, succinic/malic, propionic, lactic, fumaric acid (FM; note: coelution with oxalic acid but differentiated by HPLC–DAD) could also be detected. Relative abundance of p-benzoquinone (BQ), as well as other identified TPs was monitored according to Equation (4) (Section 2.4).
Legend: ― [HQ], ― [CT], ― [TH], - - - < BQ >, - - - < PHN >, - - - < DCP >, - - - < PCP > (notation [product] represents concentration in mg/L, whereas notation <product> represents relative amount in %). Note: ‘−30 min’ in graphs (e) and (f) actually represents 0.2 min OZ.
Figure 5. Concentrations (left y-axis) of hydroquinone (HQ), catechol (CT), and tetrachlorohydroquinone (TH), and normalized relative amount (right y-axis; see Equation (4) in Section 2.4) of parent phenols (PHN, DCP, PCP) and p-benzoquinone (BQ) during (a) ozonation of phenol (PHN) (50 mg/L); (b) ozonation of mixture (10 mg/L each); (c) photocatalysis of PHN (10 mg/L); (d) photocatalysis and photooxidation of pentachlorophenol (PCP) (10 mg/L); (e) sequential method of PHN (approximately 20 mg/L); (f) sequential method of PCP (approximately 10 mg/L).
Figure 5. Concentrations (left y-axis) of hydroquinone (HQ), catechol (CT), and tetrachlorohydro-quinone (TH), and normalized relative amount (right y-axis; see Equation (4) in Section 2.4) of parentphenols (PHN, DCP, PCP) and p-benzoquinone (BQ) during (a) ozonation of phenol (PHN) (50 mg/L);(b) ozonation of mixture (10 mg/L each); (c) photocatalysis of PHN (10 mg/L); (d) photocatalysis andphotooxidation of pentachlorophenol (PCP) (10 mg/L); (e) sequential method of PHN (approximately20 mg/L); (f) sequential method of PCP (approximately 10 mg/L).
Molecules 2022, 27, 1935 14 of 20
Molecules 2022, 27, x FOR PEER REVIEW 14 of 21
Ozonation. The results generally show that organic acids were rapidly formed during OZ (mostly oxalic, but also formic, maleic, and acetic/glyoxylic/glycolic acid); those were slowly degraded afterwards (Figure 6). Monitoring of aromatic representatives (HQ, CT, TH, BQ; Figure 5a,b) indicate that their formation was favourable only in the initial OZ stages, which means that the aromatic ring was later opened due to ozonolysis, resulting in acyclic compounds and/or their condensates. Interestingly, HQ evolution was more fa-vourable than CT’s (Figure 5a,b).
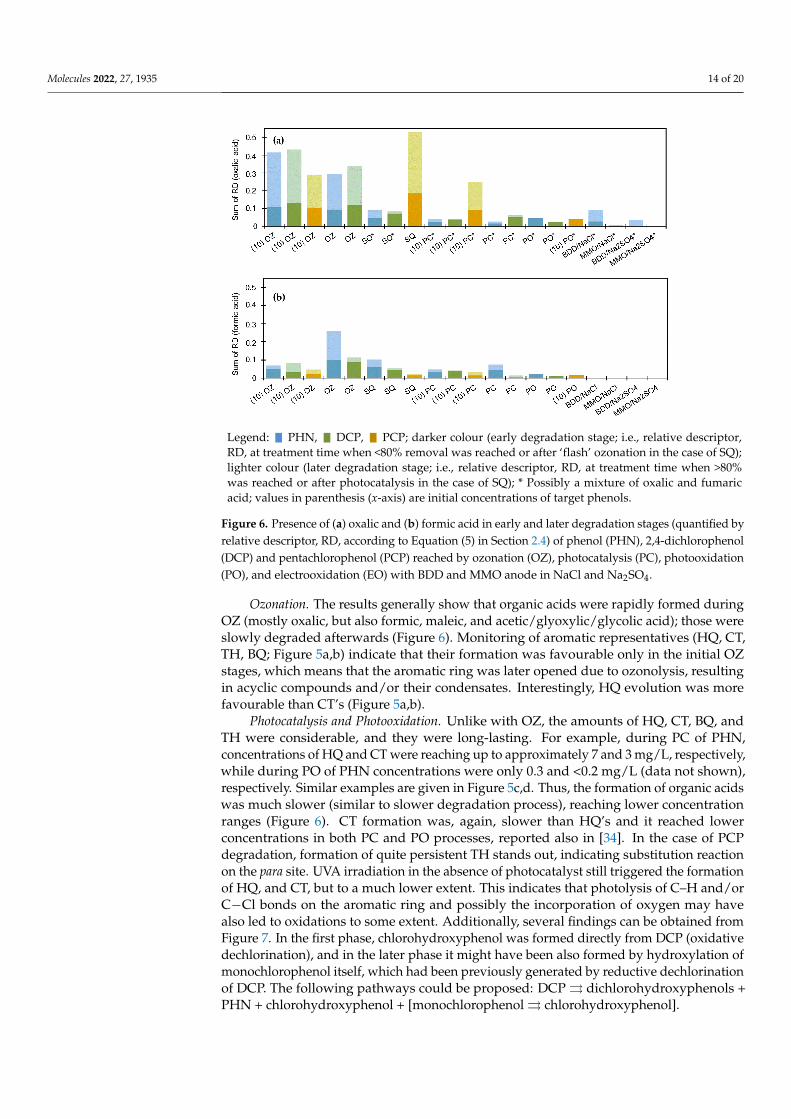
Legend: ▮ PHN, ▮ DCP, ▮ PCP; darker colour (early degradation stage; i.e., relative descriptor, RD, at treatment time when <80% removal was reached or after ‘flash’ ozonation in the case of SQ); lighter colour (later degradation stage; i.e., relative descriptor, RD, at treatment time when >80% was reached or after photocatalysis in the case of SQ); * Possibly a mixture of oxalic and fumaric acid; values in parenthesis (x-axis) are initial concentrations of target phenols.
Figure 6. Presence of (a) oxalic and (b) formic acid in early and later degradation stages (quantified by relative descriptor, RD, according to Equation (5) in Section 2.4) of phenol (PHN), 2,4-dichlorophenol (DCP) and pentachlorophenol (PCP) reached by ozonation (OZ), photocatalysis (PC), photooxidation (PO), and electrooxidation (EO) with BDD and MMO anode in NaCl and Na2SO4.
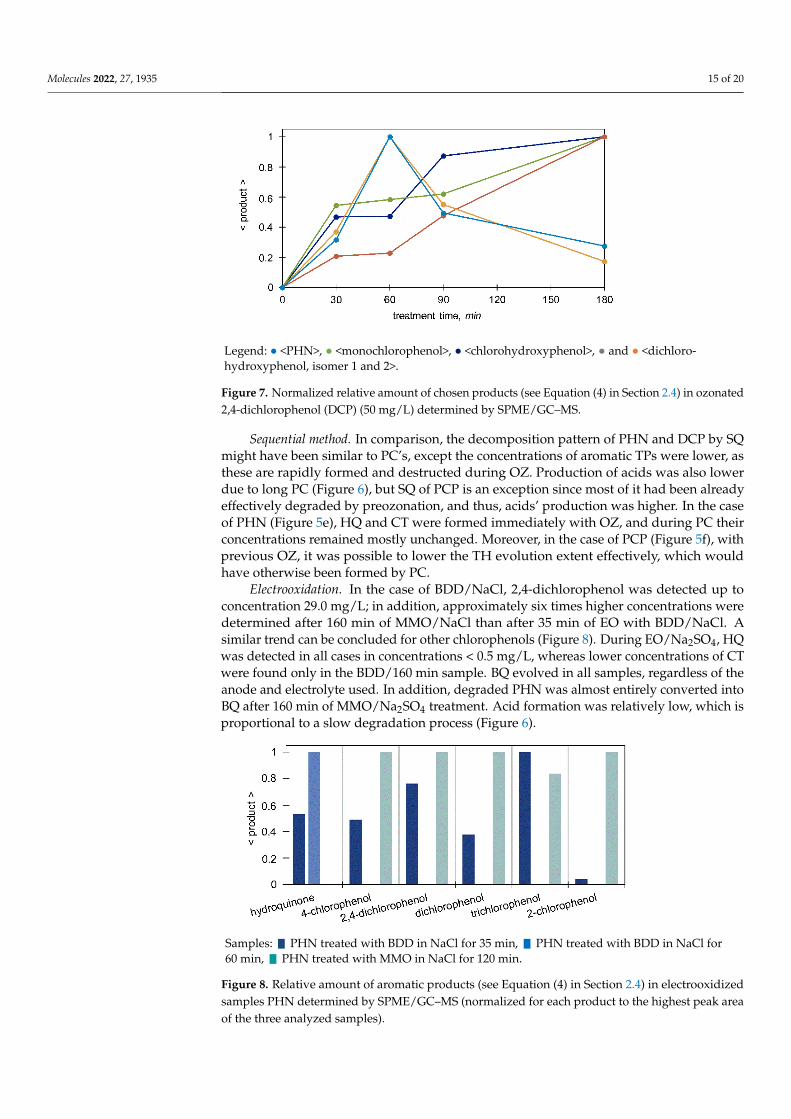
Photocatalysis and Photooxidation. Unlike with OZ, the amounts of HQ, CT, BQ, and TH were considerable, and they were long-lasting. For example, during PC of PHN, concentra-tions of HQ and CT were reaching up to approximately 7 and 3 mg/L, respectively, while during PO of PHN concentrations were only 0.3 and < 0.2 mg/L (data not shown), respec-tively. Similar examples are given in Figure 5c,d. Thus, the formation of organic acids was much slower (similar to slower degradation process), reaching lower concentration ranges (Figure 6). CT formation was, again, slower than HQ’s and it reached lower concentrations in both PC and PO processes, reported also in [34]. In the case of PCP degradation, formation of quite persistent TH stands out, indicating substitution reaction on the para site. UVA ir-radiation in the absence of photocatalyst still triggered the formation of HQ, and CT, but to a much lower extent. This indicates that photolysis of C‒H and/or C−Cl bonds on the aro-matic ring and possibly the incorporation of oxygen may have also led to oxidations to some extent. Additionally, several findings can be obtained from Figure 7. In the first phase, chlo-rohydroxyphenol was formed directly from DCP (oxidative dechlorination), and in the later phase it might have been also formed by hydroxylation of monochlorophenol itself, which had been previously generated by reductive dechlorination of DCP. The following path-ways could be proposed: DCP ⇉ dichlorohydroxyphenols + PHN + chlorohydroxyphenol + [monochlorophenol ⇉ chlorohydroxyphenol].
Figure 6. Presence of (a) oxalic and (b) formic acid in early and later degradation stages (quantified byrelative descriptor, RD, according to Equation (5) in Section 2.4) of phenol (PHN), 2,4-dichlorophenol(DCP) and pentachlorophenol (PCP) reached by ozonation (OZ), photocatalysis (PC), photooxidation(PO), and electrooxidation (EO) with BDD and MMO anode in NaCl and Na2SO4.
Ozonation. The results generally show that organic acids were rapidly formed duringOZ (mostly oxalic, but also formic, maleic, and acetic/glyoxylic/glycolic acid); those wereslowly degraded afterwards (Figure 6). Monitoring of aromatic representatives (HQ, CT,TH, BQ; Figure 5a,b) indicate that their formation was favourable only in the initial OZstages, which means that the aromatic ring was later opened due to ozonolysis, resultingin acyclic compounds and/or their condensates. Interestingly, HQ evolution was morefavourable than CT’s (Figure 5a,b).
Photocatalysis and Photooxidation. Unlike with OZ, the amounts of HQ, CT, BQ, andTH were considerable, and they were long-lasting. For example, during PC of PHN,concentrations of HQ and CT were reaching up to approximately 7 and 3 mg/L, respectively,while during PO of PHN concentrations were only 0.3 and <0.2 mg/L (data not shown),respectively. Similar examples are given in Figure 5c,d. Thus, the formation of organic acidswas much slower (similar to slower degradation process), reaching lower concentrationranges (Figure 6). CT formation was, again, slower than HQ’s and it reached lowerconcentrations in both PC and PO processes, reported also in [34]. In the case of PCPdegradation, formation of quite persistent TH stands out, indicating substitution reactionon the para site. UVA irradiation in the absence of photocatalyst still triggered the formationof HQ, and CT, but to a much lower extent. This indicates that photolysis of C–H and/orC−Cl bonds on the aromatic ring and possibly the incorporation of oxygen may havealso led to oxidations to some extent. Additionally, several findings can be obtained fromFigure 7. In the first phase, chlorohydroxyphenol was formed directly from DCP (oxidativedechlorination), and in the later phase it might have been also formed by hydroxylation ofmonochlorophenol itself, which had been previously generated by reductive dechlorinationof DCP. The following pathways could be proposed: DCP ⇒ dichlorohydroxyphenols +PHN + chlorohydroxyphenol + [monochlorophenol ⇒ chlorohydroxyphenol].
Molecules 2022, 27, 1935 15 of 20
Molecules 2022, 27, x FOR PEER REVIEW 15 of 21
Sequential method. In comparison, the decomposition pattern of PHN and DCP by SQ might have been similar to PC’s, except the concentrations of aromatic TPs were lower, as these are rapidly formed and destructed during OZ. Production of acids was also lower due to long PC (Figure 6), but SQ of PCP is an exception since most of it had been already effectively degraded by preozonation, and thus, acids’ production was higher. In the case of PHN (Figure 5e), HQ and CT were formed immediately with OZ, and during PC their concentrations remained mostly unchanged. Moreover, in the case of PCP (Figure 5f), with previous OZ, it was possible to lower the TH evolution extent effectively, which would have otherwise been formed by PC.
Legend: ● <PHN>, ● <monochlorophenol>, ● <chlorohydroxyphenol>, ● and ● <dichloro-hydroxyphenol, isomer 1 and 2>.
Figure 7. Normalized relative amount of chosen products (see Equation (4) in Section 2.4) in ozo-nated 2,4-dichlorophenol (DCP) (50 mg/L) determined by SPME/GC–MS.
Electrooxidation. In the case of BDD/NaCl, 2,4-dichlorophenol was detected up to con-centration 29.0 mg/L; in addition, approximately six times higher concentrations were de-termined after 160 min of MMO/NaCl than after 35 min of EO with BDD/NaCl. A similar trend can be concluded for other chlorophenols (Figure 8). During EO/Na2SO4, HQ was detected in all cases in concentrations <0.5 mg/L, whereas lower concentrations of CT were found only in the BDD/160 min sample. BQ evolved in all samples, regardless of the anode and electrolyte used. In addition, degraded PHN was almost entirely converted into BQ after 160 min of MMO/Na2SO4 treatment. Acid formation was relatively low, which is proportional to a slow degradation process (Figure 6).
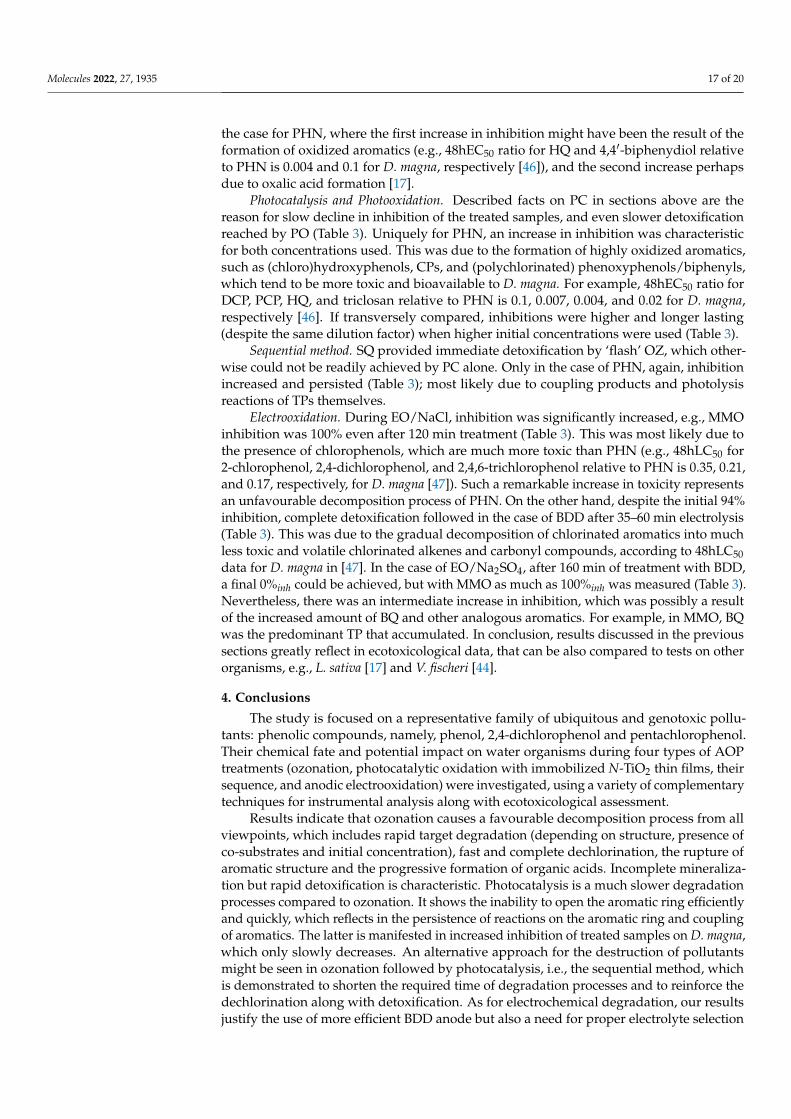
Samples: ▮ PHN treated with BDD in NaCl for 35 min, ▮ PHN treated with BDD in NaCl for 60 min, ▮ PHN treated with MMO in NaCl for 120 min.
Figure 8. Relative amount of aromatic products (see Equation (4) in Section 2.4) in electrooxidized samples PHN determined by SPME/GC–MS (normalized for each product to the highest peak area of the three analyzed samples).
Figure 7. Normalized relative amount of chosen products (see Equation (4) in Section 2.4) in ozonated2,4-dichlorophenol (DCP) (50 mg/L) determined by SPME/GC–MS.
Sequential method. In comparison, the decomposition pattern of PHN and DCP by SQmight have been similar to PC’s, except the concentrations of aromatic TPs were lower, asthese are rapidly formed and destructed during OZ. Production of acids was also lowerdue to long PC (Figure 6), but SQ of PCP is an exception since most of it had been alreadyeffectively degraded by preozonation, and thus, acids’ production was higher. In the caseof PHN (Figure 5e), HQ and CT were formed immediately with OZ, and during PC theirconcentrations remained mostly unchanged. Moreover, in the case of PCP (Figure 5f), withprevious OZ, it was possible to lower the TH evolution extent effectively, which wouldhave otherwise been formed by PC.
Electrooxidation. In the case of BDD/NaCl, 2,4-dichlorophenol was detected up toconcentration 29.0 mg/L; in addition, approximately six times higher concentrations weredetermined after 160 min of MMO/NaCl than after 35 min of EO with BDD/NaCl. Asimilar trend can be concluded for other chlorophenols (Figure 8). During EO/Na2SO4, HQwas detected in all cases in concentrations < 0.5 mg/L, whereas lower concentrations of CTwere found only in the BDD/160 min sample. BQ evolved in all samples, regardless of theanode and electrolyte used. In addition, degraded PHN was almost entirely converted intoBQ after 160 min of MMO/Na2SO4 treatment. Acid formation was relatively low, which isproportional to a slow degradation process (Figure 6).
Molecules 2022, 27, x FOR PEER REVIEW 15 of 21
Sequential method. In comparison, the decomposition pattern of PHN and DCP by SQ might have been similar to PC’s, except the concentrations of aromatic TPs were lower, as these are rapidly formed and destructed during OZ. Production of acids was also lower due to long PC (Figure 6), but SQ of PCP is an exception since most of it had been already effectively degraded by preozonation, and thus, acids’ production was higher. In the case of PHN (Figure 5e), HQ and CT were formed immediately with OZ, and during PC their concentrations remained mostly unchanged. Moreover, in the case of PCP (Figure 5f), with previous OZ, it was possible to lower the TH evolution extent effectively, which would have otherwise been formed by PC.
Legend: ● <PHN>, ● <monochlorophenol>, ● <chlorohydroxyphenol>, ● and ● <dichloro-hydroxyphenol, isomer 1 and 2>.
Figure 7. Normalized relative amount of chosen products (see Equation (4) in Section 2.4) in ozonated 2,4-dichlorophenol (DCP) (50 mg/L) determined by SPME/GC–MS.
Electrooxidation. In the case of BDD/NaCl, 2,4-dichlorophenol was detected up to concentration 29.0 mg/L; in addition, approximately six times higher concentrations were determined after 160 min of MMO/NaCl than after 35 min of EO with BDD/NaCl. A similar trend can be concluded for other chlorophenols (Figure 8). During EO/Na2SO4, HQ was detected in all cases in concentrations <0.5 mg/L, whereas lower concentrations of CT were found only in the BDD/160 min sample. BQ evolved in all samples, regardless of the anode and electrolyte used. In addition, degraded PHN was almost entirely converted into BQ after 160 min of MMO/Na2SO4 treatment. Acid formation was relatively low, which is proportional to a slow degradation process (Figure 6).
Samples: ▮ PHN treated with BDD in NaCl for 35 min, ▮ PHN treated with BDD in NaCl for 60 min, ▮ PHN treated with MMO in NaCl for 120 min.
Figure 8. Relative amount of aromatic products (see Equation (4) in Section 2.4) in electrooxidized samples PHN determined by SPME/GC–MS (normalized for each product to the highest peak area of the three analyzed samples).
Figure 8. Relative amount of aromatic products (see Equation (4) in Section 2.4) in electrooxidizedsamples PHN determined by SPME/GC–MS (normalized for each product to the highest peak areaof the three analyzed samples).

Molecules 2022, 27, 1935 16 of 20
3.4. Detoxification Estimated from Acute Ecotoxicity Tests with Daphnia magna
Detoxification of pollutants is the ultimate goal of all degradation technologies, andnot just the removal of parent phenols. Therefore, tests on aquatic invertebrates, suchas water fleas, are extremely important, as these organisms frequently come into contactwith pollutants, which can affect the whole freshwater ecosystem. The advantage of theapplied tests is the ability to non-specifically evaluate the inhibitory and biological effectsof mixtures of all known and also unknown TPs. Results are shown in Table 3, showingdetermined 48-h acute inhibition of the mobility of Daphnia magna (see Equation (6) inSection 2.4) after incubation of test organisms in diluted samples (AOP-treated phenols).
Table 3. Comparison of the inhibition (%inh) on D. magna organisms (i.e., detoxification extent; seeEquation (6) in Section 2.4) of treated phenol (PHN), 2,4-dichlorophenol (DCP), pentachlorophenol(PCP), and mixture solutions with ozonation (OZ), photocatalysis (PC), photooxidation (PO), sequen-tial method (SQ) and electrooxidation with BDD and MMO in NaCl and N2SO4 at different treatmenttimes (TT).
PHN TT0% TT0–25% TT25–50% TT50–100% >TT100%
OZ (50 mg/L)
OZ (10 mg/L)
PC (50 mg/L)
PC (10 mg/L)
PO
SQ OZ PC PC PC
BDD/NaCl
MMO/NaCl
BDD/Na2SO4
MMO/Na2SO4
DCP TT0% TT0–25% TT25–50% TT50–100% >TT>100%
OZ (50 mg/L)
OZ (10 mg/L)
PC (50 mg/L)
PC (10 mg/L)
PO
SQ OZ OZ OZ & PC PC
PCP TT0% TT0–25% TT25–50% TT50–100% >TT>100%
OZ
PC
PO
SQ OZ OZ OZ & PC PC
Mixture TT0% TT0–25% TT25–50% TT50–100% >TT>100%
OZ *
Legend: z < 20%inh, z 20−39%inh, z 40−59%inh, z 60−79%inh, z > 80%inh; z – not determined. Note: Notations ‘OZ’and ‘PC’ were added in SQ. * TTx% for PHN degradation.
Ozonation. Rapid and complete dechlorination (see [21,24]), high preference to breakdown phenols’ aromatic ring and progressive formation of accumulative organic acids, seenas a sudden drop in pH [16–18,27], are the reasons for rapid detoxification (Table 3). OZallowed for quick detoxification which was achieved after less than 1 min treatment, whichis similar to findings in [26]. This is true for OZ of 50 and also 10 mg/L of chosen phenols(Table 3). Moreover, inhibition on D. magna did not increase during treatment, which meansthat less toxic TPs—relative to DCP and PCP—were formed (Table 3). However, this is not
Molecules 2022, 27, 1935 17 of 20
the case for PHN, where the first increase in inhibition might have been the result of theformation of oxidized aromatics (e.g., 48hEC50 ratio for HQ and 4,4′-biphenydiol relativeto PHN is 0.004 and 0.1 for D. magna, respectively [46]), and the second increase perhapsdue to oxalic acid formation [17].
Photocatalysis and Photooxidation. Described facts on PC in sections above are thereason for slow decline in inhibition of the treated samples, and even slower detoxificationreached by PO (Table 3). Uniquely for PHN, an increase in inhibition was characteristicfor both concentrations used. This was due to the formation of highly oxidized aromatics,such as (chloro)hydroxyphenols, CPs, and (polychlorinated) phenoxyphenols/biphenyls,which tend to be more toxic and bioavailable to D. magna. For example, 48hEC50 ratio forDCP, PCP, HQ, and triclosan relative to PHN is 0.1, 0.007, 0.004, and 0.02 for D. magna,respectively [46]. If transversely compared, inhibitions were higher and longer lasting(despite the same dilution factor) when higher initial concentrations were used (Table 3).
Sequential method. SQ provided immediate detoxification by ‘flash’ OZ, which other-wise could not be readily achieved by PC alone. Only in the case of PHN, again, inhibitionincreased and persisted (Table 3); most likely due to coupling products and photolysisreactions of TPs themselves.
Electrooxidation. During EO/NaCl, inhibition was significantly increased, e.g., MMOinhibition was 100% even after 120 min treatment (Table 3). This was most likely due tothe presence of chlorophenols, which are much more toxic than PHN (e.g., 48hLC50 for2-chlorophenol, 2,4-dichlorophenol, and 2,4,6-trichlorophenol relative to PHN is 0.35, 0.21,and 0.17, respectively, for D. magna [47]). Such a remarkable increase in toxicity representsan unfavourable decomposition process of PHN. On the other hand, despite the initial 94%inhibition, complete detoxification followed in the case of BDD after 35–60 min electrolysis(Table 3). This was due to the gradual decomposition of chlorinated aromatics into muchless toxic and volatile chlorinated alkenes and carbonyl compounds, according to 48hLC50data for D. magna in [47]. In the case of EO/Na2SO4, after 160 min of treatment with BDD,a final 0%inh could be achieved, but with MMO as much as 100%inh was measured (Table 3).Nevertheless, there was an intermediate increase in inhibition, which was possibly a resultof the increased amount of BQ and other analogous aromatics. For example, in MMO, BQwas the predominant TP that accumulated. In conclusion, results discussed in the previoussections greatly reflect in ecotoxicological data, that can be also compared to tests on otherorganisms, e.g., L. sativa [17] and V. fischeri [44].
4. Conclusions
The study is focused on a representative family of ubiquitous and genotoxic pollu-tants: phenolic compounds, namely, phenol, 2,4-dichlorophenol and pentachlorophenol.Their chemical fate and potential impact on water organisms during four types of AOPtreatments (ozonation, photocatalytic oxidation with immobilized N-TiO2 thin films, theirsequence, and anodic electrooxidation) were investigated, using a variety of complementarytechniques for instrumental analysis along with ecotoxicological assessment.
Results indicate that ozonation causes a favourable decomposition process from allviewpoints, which includes rapid target degradation (depending on structure, presence ofco-substrates and initial concentration), fast and complete dechlorination, the rupture ofaromatic structure and the progressive formation of organic acids. Incomplete mineraliza-tion but rapid detoxification is characteristic. Photocatalysis is a much slower degradationprocesses compared to ozonation. It shows the inability to open the aromatic ring efficientlyand quickly, which reflects in the persistence of reactions on the aromatic ring and couplingof aromatics. The latter is manifested in increased inhibition of treated samples on D. magna,which only slowly decreases. An alternative approach for the destruction of pollutantsmight be seen in ozonation followed by photocatalysis, i.e., the sequential method, whichis demonstrated to shorten the required time of degradation processes and to reinforce thedechlorination along with detoxification. As for electrochemical degradation, our resultsjustify the use of more efficient BDD anode but also a need for proper electrolyte selection
Molecules 2022, 27, 1935 18 of 20
since the latter affect chemical transformations. Phenol removal is by far the fastest andmost efficient in electrolyte NaCl, but it is accompanied by unfavourable formation of chlo-rinated transformation products. On the other hand, less effective degradation yet morefavourable reactions and detoxification trends are provided by electrooxidation in Na2SO4.
Such a multidisciplinary approach to research the chemical degradation of pollutantsinduced by various AOPs is important for environmental protection. The use of manyaspects of sample analysis with the combined expertise of analytical chemistry, environ-mental chemistry, environmental engineering, materials science, and ecotoxicology is rarelyreported in the literature but is essential for evaluation of any AOP. In the future, in-depthresearch shall be performed in the field of (i) combination of complementary AOPs, such asozonation followed by photocatalysis, in order to develop optimal sequential AOPs and to,therefore, minimize their limitations. Furthermore, (ii) there is also a necessity to assessphenols’ fate during treatment with AOPs in (semi)real matrices, suchlike model and realwaste/surface waters. Finally, (iii) their natural chemical transformations and stability shallbe investigated so as to model their real persistency.
Supplementary Materials: The following supporting information can be downloaded at: https://www.mdpi.com/article/10.3390/molecules27061935/s1, Table S1: Process parameters used forozonation; Figure S1: HPLC–DAD chromatograms of (a) ozonation of DCP (initial conc. ~50 mg/L)at TT 0 min, (b) at TT 1.5 min, and (c) at TT 4 min, as well as (d) IC chromatograms at TT 0.5 min,and (e) at TT 4 min; Table S2: Process parameters used for photocatalysis and photooxidation(reference [48]); Figure S2: HPLC–DAD chromatograms of photocatalytic treatment of (a) PHN (initialconc. ~50 mg/L) at TT 180 min, of (b) DCP (initial conc. ~50 mg/L) at TT 90 min, and of (c) PCP (initialconc. ~10 mg/L) at TT 180 min, as well as (d) IC chromatogram of photocatalytic treatment of DCP(initial conc. ~50 mg/L) at TT 180 min; Figure S3: HPLC–DAD chromatograms of photooxidation of(a) PHN (initial conc. ~50 mg/L) at TT 180 min, (b) DCP (initial conc. ~50 mg/L) at 180 min, and of(c) PCP (initial conc. ~10 mg/L) at TT 180 min, as well as (d) IC chromatogram of photooxidation ofDCP (initial conc. ~50 mg/L) at TT 180 min; Figure S4: HPLC–DAD chromatograms of the sequentialmethod of: (a) PHN after flash ozonation and (b) after 120 min of photocatalysis; (c) DCP (initial conc.~20 mg/L) after flash ozonation and (d) after 120 min of photocatalysis; Table S3: Process parametersused for anodic electrooxidations; Figure S5: HPLC–DAD chromatograms of electrooxidation of PHN(initial conc. ~50 mg/L) (a) by BDD in Na2SO4 at TT 160 min, (b) by MMO in Na2SO4 at TT 160 min,(c) by BDD in NaCl at TT 35 min, (d) by BDD in NaCl at TT 60 min, and (e) by MMO in NaCl at TT120 min; Figure S6: General procedure of ecotoxicity tests following OECD Guidelines No. 202.
Author Contributions: Conceptualization, A.K. and H.P.; methodology, A.K. and H.P.; software,A.K.; validation, A.K., A.Ž.G., U.L.Š., B.N.M. and H.P.; formal analysis, A.K.; investigation, A.K.;resources, A.Ž.G., U.L.Š., B.N.M. and H.P.; data curation, A.K.; writing—original draft preparation,A.K.; writing—review and editing, A.Ž.G., U.L.Š., B.N.M. and H.P.; visualization, A.K.; supervision,A.Ž.G., U.L.Š. and H.P.; project administration, H.P.; funding acquisition, A.Ž.G., U.L.Š., B.N.M. andH.P. All authors have read and agreed to the published version of the manuscript.
Funding: This research was funded by Slovenian Research Agency through research programmesP1-0153 (Research and development of analytical methods and procedures), P1-0134 (Chemistry forsustainable development), P2-0191 (Chemical engineering), and bilateral research project ARRS-BI-BA/19-20-040.
Institutional Review Board Statement: Not applicable.
Data Availability Statement: The data presented in this study are available on request from thecorresponding author.
Acknowledgments: Gratitude is expressed to Boštjan Žener for the synthesis and supply of theTiO2-based catalyst used in experiments.
Conflicts of Interest: The authors declare no conflict of interest. The funders had no role in the designof the study; in the collection, analyses, or interpretation of data; in the writing of the manuscript, orin the decision to publish the results.
Sample Availability: Not applicable.
Molecules 2022, 27, 1935 19 of 20
Abbreviations
AOP (advanced oxidation process), BDD (boron-doped diamond), BQ (p-benzoquinone), CP(chlorophenol), CT (catechol), DCP (2,4-dichlorophenol), EO (electrooxidation), FM (fumaric acid),FO (formic acid), HQ (hydroquinone), MMO (mixed-metal oxide), MQ (ultrapure water), OX (oxalicacid), OZ (ozonation), PCP (pentachlorophenol), PHN (phenol), PO (photooxidation), SQ (sequentialmethod, i.e., ozonation followed by photocatalysis), RD (relative descriptor calculated by Equation(5) in Section 2.4), TH (tetrachlorohydroquinone), TOC (total organic carbon), TP (transformationby-product), TT and TTx% (treatment time and treatment time for reaching x% phenol removal).
References1. New Indicator on Pesticides in European Waters (European Environment Agency, EEA News). Available online: https://www.
eea.europa.eu/ims/pesticides-in-rivers-lakes-and (accessed on 1 January 2022).2. European Environment Agency. Contaminants in Europe’s Seas: Moving towards a Clean, Non-Toxic Marine Environment, 1st ed.;
(Report No 25/2018); Reker, J., Ed.; Publications Office of the European Union: Copehnagen, Denmark, 2018; pp. 8, 49–55.[CrossRef]
3. Waste Water Treatment Improves in Europe but Large Differences Remain (European Environment Agency, EEA News). Availableonline: https://www.eea.europa.eu/highlights/waste-water-treatment-improves-in (accessed on 1 January 2022).
4. Garba, Z.N.; Zhou, W.; Lawan, I.; Xiao, W.; Zhang, M.; Wang, L.; Chen, L.; Yuan, Z. An overview of chlorophenols as contaminantsand their removal from wastewater by adsorption: A review. J. Environ. Manag. 2019, 241, 59–75. [CrossRef] [PubMed]
5. Czaplicka, M. Sources and transformations of chlorophenols in the natural environment. Sci. Total Environ. 2004, 322, 21–39.[CrossRef] [PubMed]
6. Karci, A. Degradation of chlorophenols and alkylphenol ethoxylates, two representative textile chemicals, in water by advancedoxidation processes: The state of the art on transformation products and toxicity. Chemosphere 2014, 99, 1–18. [CrossRef]
7. Villegas, L.G.C.; Mashhadi, N.; Chen, M.; Mukherjee, D.; Taylor, K.E.; Biswas, N. A Short Review of Techniques for PhenolRemoval from Wastewater. Curr. Pollut. Rep. 2016, 2, 157–167. [CrossRef]
8. European Environment Agency. Industrial Waste Water Treatment—Pressures on Europes’s Environment, 1st ed.; No 23/2018; Granger,M., Ed.; Publications Office of the European Union: Copehnagen, Denmark, 2019; p. 39. [CrossRef]
9. Igbinosa, E.O.; Odjadjare, E.E.; Chigor, V.N.; Igbinosa, I.H.; Emoghene, A.O.; Ekhaise, F.O.; Igiehon, N.O.; Idemudia, O.G.Toxicological profile of chlorophenols and their derivatives in the environment: The public health perspective. Sci. World J. 2013,2013, 460215. [CrossRef]
10. Espinoza-Montero, P.J.; Vasquez-Medrano, R.; Ibanez, J.G.; Frontana-Uribe, B.A. Efficient Anodic Degradation of Phenol Paired toImproved Cathodic Production of H2O2 at BDD Electrodes. J. Electrochem. Soc. 2013, 160, G3171–G3177. [CrossRef]
11. Ahmed, S.; Rasul, M.G.; Martens, W.N.; Brown, R.; Hashib, M.A. Heterogeneous photocatalytic degradation of phenols inwastewater: A review on current status and developments. Desalination 2010, 261, 3–18. [CrossRef]
12. Pera-Titus, M.; García-Molina, V.; Baños, M.A.; Giménez, J.; Esplugas, S. Degradation of chlorophenols by means of advancedoxidation processes: A general review. Appl. Catal. B Environ. 2004, 47, 219–256. [CrossRef]
13. Teodosiu, C.; Gilca, A.F.; Barjoveanu, G.; Fiore, S. Emerging pollutants removal through advanced drinking water treatment: Areview on processes and environmental performances assessment. J. Clean. Prod. 2018, 197, 1210–1221. [CrossRef]
14. Wang, J.; Chen, H. Catalytic ozonation for water and wastewater treatment: Recent advances and perspective. Sci. Total Environ.2020, 704, 135249. [CrossRef]
15. Mangindaan, D.; Lin, G.Y.; Kuo, C.J.; Chien, H.W. Biosynthesis of silver nanoparticles as catalyst by spent coffee ground/recycledpoly(ethylene terephthalate) composites. Food Bioprod. Process. 2020, 121, 193–201. [CrossRef]
16. Suzuki, H.; Araki, S.; Yamamoto, H. Evaluation of advanced oxidation processes (AOP) using O3, UV, and TiO2 for the degradationof phenol in water. J. Water Process Eng. 2015, 7, 54–60. [CrossRef]
17. Amado-Piña, D.; Roa-Morales, G.; Barrera-Díaz, C.; Balderas-Hernandez, P.; Romero, R.; Martín del Campo, E.; Natividad, R.Synergic effect of ozonation and electrochemical methods on oxidation and toxicity reduction: Phenol degradation. Fuel 2017,198, 82–90. [CrossRef]
18. Poznyak, T.; Vivero, J. Degradation of aqueous phenol and chlorinated phenols by ozone. Ozone Sci. Eng. 2005, 27, 447–458.[CrossRef]
19. Jaramillo-Sierra, B.; Mercado-Cabrera, A.; Peña-Eguiluz, R.; Hernández-Arias, A.N.; López-Callejas, R.; RodríGuez-Méndez, B.G.;Valencia-Alvarado, R. Assessing some advanced oxidation processes in the abatement of phenol aqueous solutions. Environ. Prot.Eng. 2019, 45, 23–38. [CrossRef]
20. Oputu, O.U.; Fatoki, O.S.; Opeolu, B.O.; Akharame, M.O. Degradation Pathway of Ozone Oxidation of Phenols and Chlorophenolsas Followed by LC-MS-TOF. Ozone Sci. Eng. 2020, 42, 294–318. [CrossRef]
21. Van Aken, P.; Van den Broeck, R.; Degrève, J.; Dewil, R. The effect of ozonation on the toxicity and biodegradability of 2,4-dichlorophenol-containing wastewater. Chem. Eng. J. 2015, 280, 728–736. [CrossRef]

Molecules 2022, 27, 1935 20 of 20
22. Hirvonen, A.; Trapido, M.; Hentunen, J.; Tarhanen, J. Formation of hydroxylated and dimeric intermediates during oxidation ofchlorinated phenols in aqueous solution. Chemosphere 2000, 41, 1211–1218. [CrossRef]
23. Quispe, C.; Valdés, C.; Delgadillo, A.; Villaseñor, J.; Cheel, J.; Pecchi, G. Toxicity studies during the degradation of pentachlorophe-nol by ozonation in the presence of MnO2/TiO2. J. Chil. Chem. Soc. 2018, 63, 4090–4097. [CrossRef]
24. Hong, P.K.A.; Zeng, Y. Degradation of pentachlorophenol by ozonation and biodegradability of intermediates. Water Res. 2002,36, 4243–4254. [CrossRef]
25. Anotai, J.; Wuttipong, R.; Visvanathan, C. Oxidation and detoxification of pentachlorophenol in aqueous phase by ozonation.J. Environ. Manag. 2007, 85, 345–349. [CrossRef] [PubMed]
26. Trapido, M.; Hirvonen, A.; Veressinina, Y.; Hentunen, J.; Munter, R. Ozonation, ozone/UV and UV/H2O2 degradation ofchlorophenols. Ozone Sci. Eng. 1997, 19, 75–96. [CrossRef]
27. Beltrán, F.J.; Rivas, F.J.; Gimeno, O. Comparison between photocatalytic ozonation and other oxidation processes for the removalof phenols from water. J. Chem. Technol. Biotechnol. 2005, 80, 973–984. [CrossRef]
28. Turhan, K.; Uzman, S. Removal of phenol from water using ozone. Desalination 2008, 229, 257–263. [CrossRef]29. Zangeneh, H.; Zinatizadeh, A.A.L.; Habibi, M.; Akia, M.; Hasnain Isa, M. Photocatalytic oxidation of organic dyes and pollutants
in wastewater using different modified titanium dioxides: A comparative review. J. Ind. Eng. Chem. 2015, 26, 1–36. [CrossRef]30. Scotti, R.; D’Arienzo, M.; Morazzoni, F.; Bellobono, I.R. Immobilization of hydrothermally produced TiO2 with different phase
composition for photocatalytic degradation of phenol. Appl. Catal. B Environ. 2009, 88, 323–330. [CrossRef]31. Arana, J.; Dona-Rodriguez, J.M.; Portillo-Carrizo, D.; Fernández-Rodríguez, C.; Pérez-Pena, J.; Gonzalez Diaz, O.; Navio, J.A.;
Macias, M. Applied Catalysis B: Environmental Photocatalytic degradation of phenolic compounds with new TiO2 catalysts.Appl. Catal. B Environ. 2010, 100, 346–354. [CrossRef]
32. Nickheslat, A.; Amin, M.M.; Izanloo, H.; Fatehizadeh, A.; Mousavi, S.M. Phenol photocatalytic degradation by advancedoxidation process under ultraviolet radiation using titanium dioxide. J. Environ. Public Health 2013, 2013, 815310. [CrossRef]
33. Dougna, A.A.; Gombert, B.; Kodom, T.; Djaneye-Boundjou, G.; Boukari, S.O.B.; Leitner, N.K.V.; Bawa, L.M. Photocatalytic removalof phenol using titanium dioxide deposited on different substrates: Effect of inorganic oxidants. J. Photochem. Photobiol. A Chem.2015, 305, 67–77. [CrossRef]
34. Sampaio, M.J.; Silva, C.G.; Silva, A.M.T.; Vilar, V.J.P.; Boaventura, R.A.R.; Faria, J.L. Photocatalytic activity of TiO2-coated glassraschig rings on the degradation of phenolic derivatives under simulated solar light irradiation. Chem. Eng. J. 2013, 224, 32–38.[CrossRef]
35. Gar Alalm, M.; Samy, M.; Ookawara, S.; Ohno, T. Immobilization of S-TiO2 on reusable aluminum plates by polysiloxane forphotocatalytic degradation of 2,4-dichlorophenol in water. J. Water Process Eng. 2018, 26, 329–335. [CrossRef]
36. Yin, L.; Shen, Z.; Niu, J.; Chen, J.; Duan, Y. Degradation of Pentachlorophenol and 2,4-Dichlorophenol by Sequential Visible-LightDriven Photocatalysis and Laccase Catalysis. Environ. Sci. Technol. 2010, 44, 9117–9122. [CrossRef] [PubMed]
37. Gunlazuardi, J.; Lindu, W.A. Photocatalytic degradation of pentachlorophenol in aqueous solution employing immobilized TiO2supported on titanium metal. J. Photochem. Photobiol. A Chem. 2005, 173, 51–55. [CrossRef]
38. Ratnawati, R.; Enjarlis, E.; Husnil, Y.A.; Christwardana, M.; Slamet, S. Degradation of Phenol in Pharmaceutical Wastewater usingTiO2/Pumice and O3/Active Carbon. Bull. Chem. Reac. Eng. Cat. 2020, 15, 146–154. [CrossRef]
39. Xie, Y.; Chen, Y.; Yang, J.; Liu, C.; Zhao, H.; Cao, H. Distinct synergetic effects in the ozone enhanced photocatalytic degradationof phenol and oxalic acid with Fe3+/TiO2 catalyst. Chin. J. Chem. Eng. 2018, 26, 1528–1535. [CrossRef]
40. Jiang, H.; Dang, C.; Liu, W.; Wang, T. Radical attack and mineralization mechanisms on electrochemical oxidation of p-substitutedphenols at boron-doped diamond anodes. Chemosphere 2020, 248, 126033. [CrossRef]
41. Xing, X.; Ni, J.; Zhu, X.; Jiang, Y.; Xia, J. Maximization of current efficiency for organic pollutants oxidation at BDD, Ti/SnO2-Sb/PbO2, and Ti/SnO2-Sb anodes. Chemosphere 2018, 205, 361–368. [CrossRef]
42. Weiss, E.; Groenen-Serrano, K.; Savall, A. A comparison of electrochemical degradation of phenol on boron doped diamond andlead dioxide anodes. J. Appl. Electrochem. 2008, 38, 329–337. [CrossRef]
43. Chatzisymeon, E.; Fierro, S.; Karafyllis, I.; Mantzavinos, D.; Kalogerakis, N.; Katsaounis, A. Anodic oxidation of phenol onTi/IrO2 electrode: Experimental studies. Catal. Today 2010, 151, 185–189. [CrossRef]
44. Barısçı, S.; Turkay, O.; Öztürk, H.; Seker, M.G. Anodic Oxidation of Phenol by Mixed-Metal Oxide Electrodes: Identification ofTransformation By-Products and Toxicity Assessment. J. Electrochem. Soc. 2017, 164, E129–E137. [CrossRef]
45. OECD. Test No. 202: Daphnia sp. Acute Immobilisation Test. In OECD Guidelines for the Testing of Chemicals; Section 2; OECDPublishing: Paris, France, 2004; pp. 1–12. [CrossRef]
46. Results of Eco-Toxicity Tests of Chemicals Conducted by Ministry of the Environment in Japan. Available online: https://www.env.go.jp/chemi/sesaku/02e.pdf (accessed on 13 October 2020).
47. Martins, J.; Teles, L.O.; Vasconcelos, V. Assays with Daphnia magna and Danio rerio as alert systems in aquatic toxicology. Environ.Int. 2007, 33, 414–425. [CrossRef] [PubMed]
48. Žener, B.; Matoh, L.; Carraro, G.; Miljevic, B.; Korošec, R.C. Sulfur-, nitrogen- and platinum-doped titania thin films with highcatalytic efficiency under visible-light illumination. Beilstein J. Nanotechnol. 2018, 9, 1629–1640; (in Supplementary Materials).[CrossRef] [PubMed]