
Combination of SEC/MALS experimental procedures and theoretical analysis for studying the solution...
22
Combination of SEC/MALS experimental procedures and theoretical analysis for studying the solution properties of macromolecules M. Pilar Tarazona * , Enrique Saiz Departamento de Quı ´mica Fı ´sica, Universidad de Alcala ´, 28871 Alcala ´ de Henares, Spain Abstract Size-exclusion chromatography (SEC) with dual detection, i.e., employing refractive index (RI) and multiangle light-scattering (MALS) detectors, has been applied to study the solution properties of two very different polymer – solvent systems at 25 jC: poly(N-vinylcarbazole) (PVCz) in an organic solvent THF that is a very good solvent and a system under h conditions that is formed by polyvinylpyrrolidone (PVP) in water containing a 0.1 M concentration of NaNO 3 . In both cases, the analysis of a single highly polydisperse sample obtained by free radical polymerization is enough for obtaining molecular weight and radius of gyration calibration curves, molecular weight distributions (MWD) (and thus, molecular weight averages), molecular dimensions, scaling laws coefficients and unperturbed dimensions. Extrapolation to h conditions produces values of the characteristic ratio of the unperturbed dimensions C n = hr 2 i o /nl 2 = 15.9 and 14, respectively, for PVCz and PVP. Unperturbed dimensions are also theoretically calculated with different models such as Kuhn equivalent chain, worm-like chain and rotational isomeric states model. Conformational parameters required for this last model were taken from the literature in the case of PVCz; however, they are calculated by molecular dynamics simulations in the case of PVP. Theoretical values obtained with the RIS model are in good agreement with the experimental results. D 2003 Elsevier Science B.V. All rights reserved. Keywords: Size-exclusion chromatography; Solution properties; Molecular dimension; Conformational proper- ties; Poly(N-vinylcarbazole); Polyvinylpyrrolidone; Molecular dynamics 1. Introduction Size-exclusion chromatography (SEC), coupled with molecular weight-sensitive detec- tors, is the most widely used technique for determining the absolute molecular weight 0165-022X/03/$ - see front matter D 2003 Elsevier Science B.V. All rights reserved. doi:10.1016/S0165-022X(03)00075-7 * Corresponding author. E-mail address: [email protected] (M.P. Tarazona). www.elsevier.com/locate/jbbm J. Biochem. Biophys. Methods 56 (2003) 95 – 116
-
Upload
independent -
Category
Documents
-
view
2 -
download
0
Transcript of Combination of SEC/MALS experimental procedures and theoretical analysis for studying the solution...

www.elsevier.com/locate/jbbm
J. Biochem. Biophys. Methods 56 (2003) 95–116
Combination of SEC/MALS experimental
procedures and theoretical analysis for studying
the solution properties of macromolecules
M. Pilar Tarazona*, Enrique Saiz
Departamento de Quımica Fısica, Universidad de Alcala, 28871 Alcala de Henares, Spain
Abstract
Size-exclusion chromatography (SEC) with dual detection, i.e., employing refractive index (RI)
and multiangle light-scattering (MALS) detectors, has been applied to study the solution properties
of two very different polymer–solvent systems at 25 jC: poly(N-vinylcarbazole) (PVCz) in an
organic solvent THF that is a very good solvent and a system under h conditions that is formed by
polyvinylpyrrolidone (PVP) in water containing a 0.1 M concentration of NaNO3. In both cases, the
analysis of a single highly polydisperse sample obtained by free radical polymerization is enough for
obtaining molecular weight and radius of gyration calibration curves, molecular weight distributions
(MWD) (and thus, molecular weight averages), molecular dimensions, scaling laws coefficients and
unperturbed dimensions. Extrapolation to h conditions produces values of the characteristic ratio of
the unperturbed dimensions Cn = hr2io/nl2 = 15.9 and 14, respectively, for PVCz and PVP.
Unperturbed dimensions are also theoretically calculated with different models such as Kuhn
equivalent chain, worm-like chain and rotational isomeric states model. Conformational parameters
required for this last model were taken from the literature in the case of PVCz; however, they are
calculated by molecular dynamics simulations in the case of PVP. Theoretical values obtained with
the RIS model are in good agreement with the experimental results.
D 2003 Elsevier Science B.V. All rights reserved.
Keywords: Size-exclusion chromatography; Solution properties; Molecular dimension; Conformational proper-
ties; Poly(N-vinylcarbazole); Polyvinylpyrrolidone; Molecular dynamics
1. Introduction
Size-exclusion chromatography (SEC), coupled with molecular weight-sensitive detec-
tors, is the most widely used technique for determining the absolute molecular weight
0165-022X/03/$ - see front matter D 2003 Elsevier Science B.V. All rights reserved.
doi:10.1016/S0165-022X(03)00075-7
* Corresponding author.
E-mail address: [email protected] (M.P. Tarazona).

M.P. Tarazona, E. Saiz / J. Biochem. Biophys. Methods 56 (2003) 95–11696
distribution (MWD) and averaged molecular weights of synthetic and natural polymers
[1–3]. Light-scattering detectors are very useful since they provided absolute measure-
ment of molecular weight without requiring any calibration. Besides, these detectors are
very efficient, detecting aggregates even at low concentrations. Multiangle laser light
scattering (MALS) offers an added advantage: the determination of the molecular
dimensions of the polymer, in terms of the radius of gyration, from the angular dependence
of the scattered light [4,5]. This combination of molecular weight and dimensions of the
polymer chains can be used to obtain important information about size, shape and
conformation of polymer chains in solution [6].
A macromolecule can adopt many different conformations by rotation over the covalent
single bonds that form the chain skeleton [7]. In most circumstances, the interconversion
from one to another conformation is very easy, and the polymer changes among the
allowed conformations. Molecules that are moving among many different allowed
conformations are called random coils. Typical examples of random coil molecules are
synthetic polymers in solution or amorphous bulk state above its glass transition temper-
ature Tg. When the transit from one to another conformation becomes impossible, the
molecule stays ‘‘frozen’’ in one conformation and exhibits very different properties than
when it was in the random coil state. Examples of fixed conformations are polymers at low
temperature (below Tg), in crystalline state or biopolymers in native state.
In very diluted solutions, the intermolecular polymer–polymer interactions are negli-
gible, and the behavior of the sample is dictated by the balance among intramolecular
polymer–polymer and intermolecular polymer–solute interactions, which strongly depend
on the thermodynamic quality of the solvent. Thus, in the so-called good solvents, the
polymer–solvent is more favorable that the polymer–polymer, the polymeric chain tends to
solvate, minimizes the number of polymer–polymer contacts and produces a rather large
excluded volume. Extended conformations are therefore favored, and the polymer exhibits
high molecular dimensions. On the contrary, in poor solvents, the polymer–polymer
interactions are preferred over the polymer–solvent ones; the polymer units try to avoid
contact with the solvent, and the number of polymer–polymer contacts increases, producing
a collapse of the chain that gives rise to a negative value of the excluded volume. Compact
conformations are thus favored, and the polymer has much smaller molecular dimension
than in the previous case. When the quality of the solvent decreases below a certain limit, the
self-avoiding process among polymer and solute comes the point of producing phase
separation, and the polymer precipitates. Avery interesting intermediate situation is reached
when the polymer–solvent interactions exactly counterbalance the so-called long-range
polymer–polymer interactions, i.e., all intramolecular interactions except those taking place
among immediate neighbor units. Polymer–polymer and polymer–solvent contacts are then
equivalent as far as the interactions are concerned, the excluded volume vanishes and the
system is said to be in the unperturbed conditions or h (theta) conditions [8]. The molecular
dimensions are then intermediate among those obtained in good and in bad solvents.
Furthermore, the unperturbed conditions represent a very convenient situation for theoretical
calculations since the probability of existence of any given conformation depends only on a
few short-range interactions among neighbor units that are relatively easy to compute. This
is one of the reasons why experimental results are often measured or extrapolated to
unperturbed conditions in order to facilitate the comparison with theoretical values.

M.P. Tarazona, E. Saiz / J. Biochem. Biophys. Methods 56 (2003) 95–116 97
The radius of gyration hs2i is a very convenient magnitude to express the molecular
dimensions of a polymer chain because, in the first place, it can be directly obtained from
light-scattering data, and its definition is applicable to macromolecules of any shape
[7,9]. Furthermore, the value of hs2i for a given body, a polymer chain for instance, is
related to its mass by simple mathematical relationships, called scaling laws, whose
numerical parameters depend on the shape of the body. Thus, the analysis of exper-
imental values of hs2i as a function of molecular weight affords information on the shape
of the polymer chain.
Synthetic polymer samples are usually polydisperse, and therefore, the molecular
weights obtained with different techniques are different averages to which the scaling laws
can not be applied. It is in this context where the combination of SEC with MALS
becomes a very convenient procedure since it can analyze a highly polydisperse sample
providing simultaneous values of radius of gyration and molecular weight of the polymer
chains that abandon the column, which, provided that the efficiency of the separation
process is good, are practically monodisperse. Therefore, a single polydisperse sample
suffices for a full analysis that, on the other hand, becomes more accurate since it does not
depend on problematic fractionation procedures [10].
In the present work, we apply this technique to the conformational analysis of two
different polymer solutions. The first one was poly(N-vinylcarbazole) PVCz in THF at 25
jC, which is an example of polymer in a good solvent. The second solution was formed by
poly(N-vinylpyrrolidone) PVP in water containing a 0.1 M concentration of NaNO3 at the
same temperature of 25 jC at which the system is below (although close to) unperturbed
conditions. In both cases, a single polydisperse sample obtained by free radical polymer-
ization was enough for obtaining molecular weight averages and distributions, molecular
dimensions, coefficients for the scaling law, etc.
Unperturbed values of the molecular dimensions were analyzed in terms of two very
idealized theoretical models, namely, the Kuhn equivalent chain and the worm-like chain.
A more realistic calculation employing a rotational isomeric states model, whose
parameters depend on the chemical structure of the polymer, was also performed and
the results compared with the experimental values in order to gain a deeper understanding
of the shape and behavior of the samples.
2. Materials and methods
2.1. Measurements
Size-exclusion chromatography measurements were carried out using a Waters Asso-
ciates equipment with a model 510 pump, a U6K injector and a differential refractive
index (RI) detector model 410 (RI). The multiangle light-scattering (MALS) detector was
a DAWN DSP-F laser photometer from Wyatt Technology. The photometer was calibrated
with spectrometric-grade toluene (Scharlau). The normalization of its detectors in THF and
aqueous solution was performed with low-molecular-weight standard samples of poly-
styrene and dextran, respectively. The same polystyrene standard was used to determine
the interdetector volumes [4].

2.2. Materials
For organic SEC, two columns PLgel mixed B (Polymer Laboratories) in series
completed the equipment. The polymer PVCz was synthesized by radical polymerization
[11] and THF freshly distilled from sodium and benzophenone, filtered through a 0.2-AmFluoropore membrane and degassed, was used as eluent. The flow rate was 1.0 ml/min and
the temperature 25 jC. For aqueous SEC, two Ultrahydrogel Linear 6–13 Am were the
chromatographic columns, the eluent was a 0.1 M NaNO3 aqueous solution filtered
through a 0.2-Am cellulose membrane and degassed. The polymer PVP was a commercial
sample (Aldrich). The flow rate was 0.5 ml/min and the temperature 25 jC.
2.3. Coupled SEC and MALS
The basic light-scattering equation is [12]
Kc
DRh¼ 1þ 16p2
3k2hs2isin2 h
2
� �þ . . .
� �1
Mw
þ 2A2cþ . . .
� �ð1Þ
where DRh is the excess Rayleigh ratio, c is the concentration, k is the wavelength of the
incident light in the medium, h is the scattering angle and K is the optical constant given by
K ¼ 4p2n2
k40NA
dn
dc
� �2
ð2Þ
where k0 is the vacuum wavelength, n is the solvent refractive index, NA is Avogadro’s
number and dn/dc is the refractive index increment in the polymer solution.
The first parenthesis of Eq. (1) contains the terms of the particle form factor that take
into account the interferences among light scattered at different points within large
molecules, whereas the second parenthesis includes the nonideal terms arising from the
polymer–polymer interactions. Since the concentration used in SEC is very small (usually
1–5 mg/ml) and the samples are even more diluted through the column, the term 2A2c is
negligible, and thus, Eq. 1 simplifies to
Kc
DRh¼ 1
Mw
1þ 16p2
3k2hs2isin2 h
2
� �þ . . .
� �ð3Þ
The RI detector measures the concentration, whereas MALS detectors measure
simultaneously the light scattered at several angles, and a plot of Kc/DRh versus
sin2(h/2), Zimm plot, affords to calculate the molecular weight from the intercept and
the radius of gyration hs2i from the slope.
When a polydisperse polymer sample is used, the different fractions eluted (slices in the
chromatogram) are assumed to be of a single molecular weight [4]. Thus, M, hs2i and c aresimultaneously measured for each slice that elutes at volume vE. These data can be used to
obtain the calibration curves (M or hs2i versus vE), the molecular weight distribution,
MWD, and the scaling law of the polymer.
M.P. Tarazona, E. Saiz / J. Biochem. Biophys. Methods 56 (2003) 95–11698
M.P. Tarazona, E. Saiz / J. Biochem. Biophys. Methods 56 (2003) 95–116 99
3. Results
3.1. Chromatograms
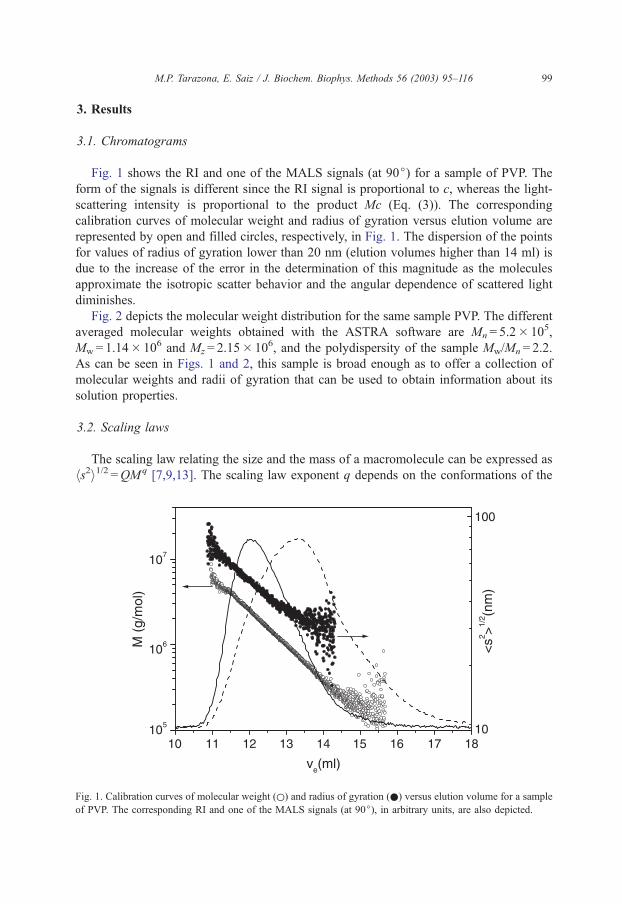
Fig. 1 shows the RI and one of the MALS signals (at 90j) for a sample of PVP. The
form of the signals is different since the RI signal is proportional to c, whereas the light-
scattering intensity is proportional to the product Mc (Eq. (3)). The corresponding
calibration curves of molecular weight and radius of gyration versus elution volume are
represented by open and filled circles, respectively, in Fig. 1. The dispersion of the points
for values of radius of gyration lower than 20 nm (elution volumes higher than 14 ml) is
due to the increase of the error in the determination of this magnitude as the molecules
approximate the isotropic scatter behavior and the angular dependence of scattered light
diminishes.
Fig. 2 depicts the molecular weight distribution for the same sample PVP. The different
averaged molecular weights obtained with the ASTRA software are Mn = 5.2� 105,
Mw = 1.14� 106 and Mz = 2.15� 106, and the polydispersity of the sample Mw/Mn = 2.2.
As can be seen in Figs. 1 and 2, this sample is broad enough as to offer a collection of
molecular weights and radii of gyration that can be used to obtain information about its
solution properties.
3.2. Scaling laws
The scaling law relating the size and the mass of a macromolecule can be expressed as
hs2i1/2 =QMq [7,9,13]. The scaling law exponent q depends on the conformations of the
Fig. 1. Calibration curves of molecular weight (o) and radius of gyration (.) versus elution volume for a sample
of PVP. The corresponding RI and one of the MALS signals (at 90j), in arbitrary units, are also depicted.
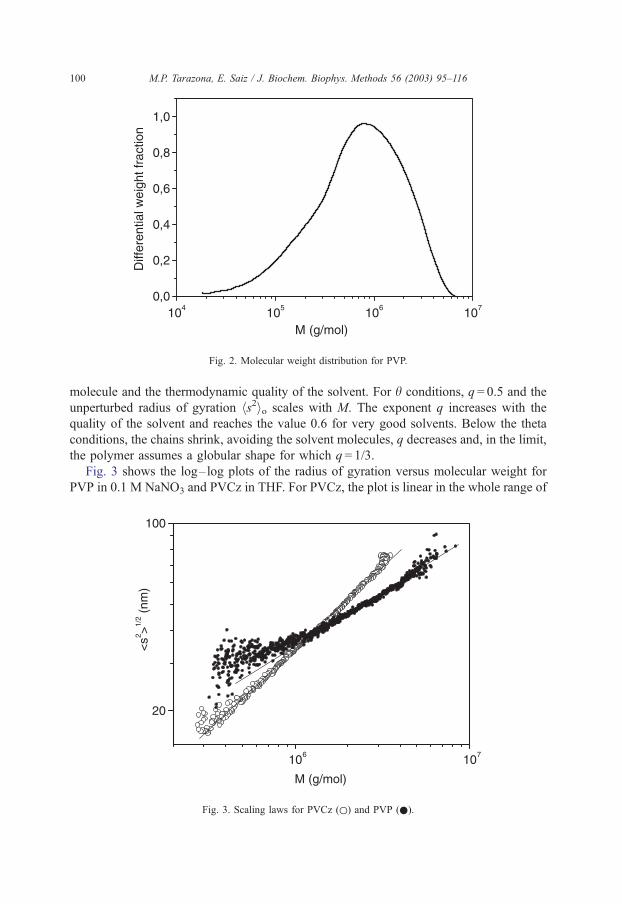
Fig. 2. Molecular weight distribution for PVP.
M.P. Tarazona, E. Saiz / J. Biochem. Biophys. Methods 56 (2003) 95–116100
molecule and the thermodynamic quality of the solvent. For h conditions, q = 0.5 and the
unperturbed radius of gyration hs2io scales with M. The exponent q increases with the
quality of the solvent and reaches the value 0.6 for very good solvents. Below the theta
conditions, the chains shrink, avoiding the solvent molecules, q decreases and, in the limit,
the polymer assumes a globular shape for which q = 1/3.
Fig. 3 shows the log–log plots of the radius of gyration versus molecular weight for
PVP in 0.1 M NaNO3 and PVCz in THF. For PVCz, the plot is linear in the whole range of
Fig. 3. Scaling laws for PVCz (o) and PVP (.).

M.P. Tarazona, E. Saiz / J. Biochem. Biophys. Methods 56 (2003) 95–116 101
molecular weights, and the slope provides q = 0.61F 0.01, indicating that the polymer
behaves as a random coil in a very good solvent. For PVP, the plot shows a slight
curvature at low molecular weights. The slope of the linear part yields q= 0.40F 0.02,
indicating that the polymer chains are random coils under h conditions.
3.3. Unperturbed dimensions for PVCz
As explained above, the dimensions of a polymer in a good solvent are perturbed due to
the excluded volume effects and can be related to the unperturbed dimensions through the
chain expansion factor, a:
hs2i ¼ a2hs2io ð4Þ
The expansion factor depends on the polymer chain, the quality of the solvent and the
molecular weight. The expansion factor is unity in two circumstances: first, at hconditions, when the dimensions of the chain are the unperturbed dimensions, and second,
at the limit of such a low molecular weight that the interaction between segments of the
same chain is not possible. The dependence of the expansion factor on molecular weightM
can be used to extrapolate results obtained in perturbed condition to h conditions [10].
However, the dependence is complex, and several theoretical and empirical expressions
can be founded in the literature. For polymers in good solvents, a widely used expression
is the Stockmayer–Fixman [14]
a3 ¼ 1þ CM 1=2 ð5Þ
The combination of Eqs. (4) and (5) affords:
hs2iM
� �3=2
¼ hs2ioM
� �3=2
ð1þ CM 1=2Þ ð6Þ
This equation is similar to the well-known extrapolation of Stockmayer–Fixman [14]
for viscosity measurements, and the intercept provides (hs2io/M)3/2.
The Fixman [15] extrapolation is defined in Eq. (7), and provides hs2io/M as the
intercept:
hs2iM
¼ hs2ioM
þ 0:0299Bhs2ioM
� ��1=2
M 1=2 ð7Þ
The last equation used in this work is due to Kurata et al. [16]:
hs2iM
¼ hs2ioM
þ 0:0286BgðaÞ M
hs2i1=2
!ð8Þ
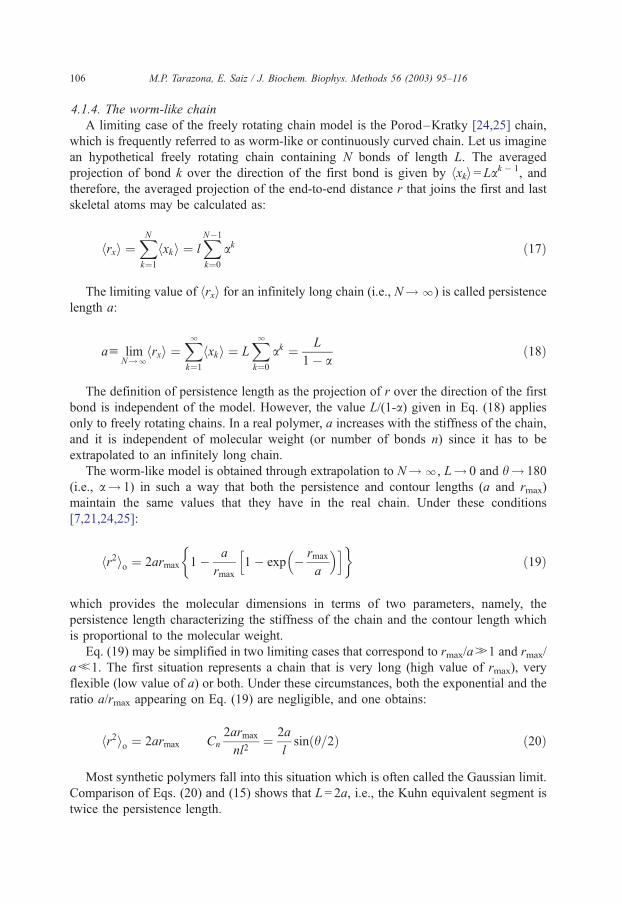
The three plots are represented in Fig. 4. There is good concordance between the three
extrapolations, and the mean value of hs2io/M is 6.5F 0.1�10� 4 nm2 mol g� 1.
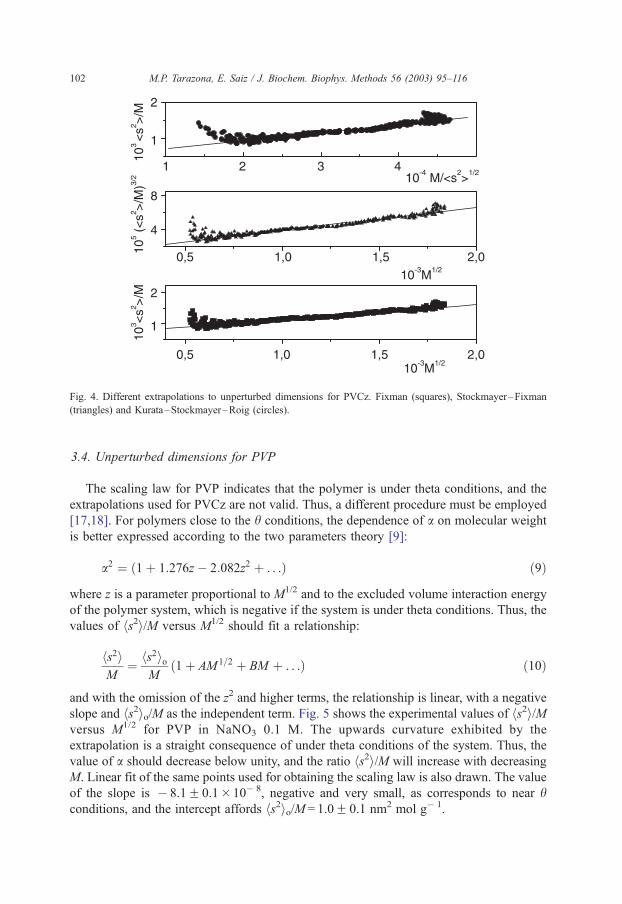
Fig. 4. Different extrapolations to unperturbed dimensions for PVCz. Fixman (squares), Stockmayer–Fixman
(triangles) and Kurata–Stockmayer–Roig (circles).
M.P. Tarazona, E. Saiz / J. Biochem. Biophys. Methods 56 (2003) 95–116102
3.4. Unperturbed dimensions for PVP
The scaling law for PVP indicates that the polymer is under theta conditions, and the
extrapolations used for PVCz are not valid. Thus, a different procedure must be employed
[17,18]. For polymers close to the h conditions, the dependence of a on molecular weight
is better expressed according to the two parameters theory [9]:
a2 ¼ ð1þ 1:276z� 2:082z2 þ . . .Þ ð9Þ
where z is a parameter proportional to M1/2 and to the excluded volume interaction energy
of the polymer system, which is negative if the system is under theta conditions. Thus, the
values of hs2i/M versus M1/2 should fit a relationship:
hs2iM
¼ hs2ioM
ð1þ AM 1=2 þ BM þ . . .Þ ð10Þ
and with the omission of the z2 and higher terms, the relationship is linear, with a negative
slope and hs2io/M as the independent term. Fig. 5 shows the experimental values of hs2i/Mversus M1/2 for PVP in NaNO3 0.1 M. The upwards curvature exhibited by the
extrapolation is a straight consequence of under theta conditions of the system. Thus, the
value of a should decrease below unity, and the ratio hs2i/M will increase with decreasing
M. Linear fit of the same points used for obtaining the scaling law is also drawn. The value
of the slope is � 8.1F 0.1�10� 8, negative and very small, as corresponds to near hconditions, and the intercept affords hs2io/M = 1.0F 0.1 nm2 mol g� 1.

Fig. 5. Extrapolation to unperturbed dimensions for PVP.
M.P. Tarazona, E. Saiz / J. Biochem. Biophys. Methods 56 (2003) 95–116 103
3.5. Characteristic ratio
The ratio hs2io/M is independent of molecular weight, and thus, it could be used as a
characteristic parameter of a given polymer chain. However, other related magnitudes such
as characteristic ratio or persistence length are more frequently used for characterizing the
chain. The characteristic ratio Cn is defined by the ratio of the unperturbed dimensions to
the dimensions of a freely jointed chain and can be calculated from the extrapolated values
of hs2io/M as [7]:
Cn ¼hr2ionl2
¼ 6Mo
2l2hs2ioM
ð11Þ
where n is the number of bonds, each one of them having a length l = 0.154 nm in the
present work, hr2io the unperturbed value of the mean square end-to-end distance and Mo
the molecular weight of the repeat unit. The hr2io = 6hs2io relationship valid for flexible
chains was used in the above equation. The value of Cn obtained for PVCz (Table 1) is in
very good agreement with the values for different solvents reported in the literature, which
Table 1
Parameters for the Kuhn equivalent chain (N and L) and the worm-like chain (rmax and a) obtained from the
experimental values of Cn
Parameter PVCz PVP
Cn (experimental) 15.9 14
N/n 0.043 0.049
L (nm) 2.95 2.60
rmax/n (nm) 0.128 0.128
a (nm) 1.48 1.30
All the valence angles of the chain were assumed to be 112j for the calculation of rmax.

M.P. Tarazona, E. Saiz / J. Biochem. Biophys. Methods 56 (2003) 95–116104
range from 15 to 16 [19]. For PVP, the value obtained is slightly higher than that obtained
for viscosity measurements in water, 12.3 [19]. However, the unperturbed dimensions of
this polymer strongly depend on the solvent used [20].
4. Theoretical analysis
The molecular dimensions of a polymeric chain can also be theoretically calculated in
terms of molecular parameters such as bond lengths, bond angles, rotational states and
conformational energies, see Fig. 6. Unfortunately, a polymer chain is too complicated as
to allow a fully realistic calculation so that any theoretical approach is based on the use of
models that represent the actual chain in a more or less idealized manner.
4.1. Simple models
4.1.1. The freely jointed chain
The simplest of all models is the freely jointed chain [7,21] that represents the
polymeric chain by a set of n bonds, each one of them having a length l (both n and l
being the actual values on the real chain), joined in linear succession, the angles at the
bond junctions being free to assume all values with equal probability and the rotation
about bonds being likewise free. It is trivial to prove that, with these assumptions, the
averaged molecular dimension are given by:
hr2io ¼ 6hs2io ¼ nl2 ð12Þ
The result indicates that the square of the unperturbed molecular dimensions scale with
n, or with the molecular weight, as measured values in fact do. However, actual values of
hr2io or hs2io are noticeably larger than those obtained with this simple model, indicating
that the real polymers are more rigid than what the model assumes. In fact, this model is
employed as reference, and thus, the characteristic ratio Cn measures the discrepancy
between the actual and idealized dimensions.
4.1.2. The Kuhn equivalent chain
However, since the freely jointed chain is a very simple model that employs only one
structural parameter (namely, the bond length l), besides the number of skeletal bonds,
Fig. 6. A rough sketch of a polymeric chain shown in its all trans conformation. Skeletal atoms are numbered
from 1 through n+ 1. Skeletal bonds are numbered from 1 to n so that bond i links atoms i� 1 and i. Rotational
angle /i is defined as the dihedral angle formed by the planes defined by bonds i� 1,i with i,i + 1. A set of values
for all rotational angles excluding the first and last ones, i.e., {/2, /3,. . ., /n� 1}, is referred to as a conformation
of the chain.

M.P. Tarazona, E. Saiz / J. Biochem. Biophys. Methods 56 (2003) 95–116 105
which is proportional to the molecular weight, it is also very appealing for the
representation of real macromolecules, even if the parameters have to be adjusted in
order to reproduce the actual chain dimensions. The procedure employed was devised by
Kuhn [22] and consists of replacing the actual number n and length l of the skeletal bonds
by adjusted values N and L computed in such a way that, when employed within the
model, will reproduce the actual values of square averaged and maximum end-to-end
distances of the polymer, i.e.:
hr2io ¼ NL2 rmax ¼ NL ð13Þand therefore:
L ¼ hr2iormax
N ¼ r2max
hr2ioð14Þ
The maximum length rmax is customarily referred to as length of the fully extended
chain or contour length, and it is taken to be the maximum achievable length without
unphysical distortion of the molecular geometry [23], which is often identified with the
length of the all-trans conformation. Assuming that all the skeletal bond angles have the
same value h, rmax = nlsin(h/2). On the other hand, the value of hr2io can be written as
hr2io =Cnnl2, and therefore, Eq. (14) may be expressed as:
L ¼ Cn
sinðh=2Þ l N ¼ ½sinðh=2Þ2
Cn
n ð15Þ
so that L>l and N < n, i.e., fewer bonds but longer than the real ones are required to
reproduce the actual dimensions of the chain.
A freely jointed chain containing N bonds of length L is often referred to as equivalent
to the real chain of n bonds with length l. Table 1 shows the values of L and the ratios N/n
calculated according to Eq. (15) from the experimental results of Cn for the polymers
studied in this work.
4.1.3. The freely rotating chain
The freely jointed chain model can be improved by incorporation of real features of the
polymer chain [17,21], the most obvious one being a fixed value for the bond angle h.Thus, the freely rotating chain model represents the polymer by a set of n bonds of length l
joined successively with a constant value h of the angle at the junctions. Rotational angles
/, however, may adopt any value from 0j to 360j with the same probability. Again, it is
very easy to prove that for this model:
hr2io ¼ nl21þ a1� a
� 2að1� anÞnð1� aÞn
� �cnl2
1þ a1� a
Cn ¼1þ a1� a
� 2að1� anÞnð1� aÞn c
1þ a1� a
ð16Þ
with a = cos(p� h) =� cos(h). The approximations in Eq. (16) represent the asymptotic
limits for large values of n. In many polymers, hc 112j, ac 0.37 and the model gives
Cnc 2.2.
4.1.4. The worm-like chain
A limiting case of the freely rotating chain model is the Porod–Kratky [24,25] chain,
which is frequently referred to as worm-like or continuously curved chain. Let us imagine
an hypothetical freely rotating chain containing N bonds of length L. The averaged
projection of bond k over the direction of the first bond is given by hxki = Lak� 1, and
therefore, the averaged projection of the end-to-end distance r that joins the first and last
skeletal atoms may be calculated as:
hrxi ¼XNk¼1
hxki ¼ lXN�1
k¼0
ak ð17Þ
The limiting value of hrxi for an infinitely long chain (i.e., N!l) is called persistence
length a:
au limN!l
hrxi ¼Xlk¼1
hxki ¼ LXlk¼0
ak ¼ L
1� að18Þ
The definition of persistence length as the projection of r over the direction of the first
bond is independent of the model. However, the value L/(1-a) given in Eq. (18) applies
only to freely rotating chains. In a real polymer, a increases with the stiffness of the chain,
and it is independent of molecular weight (or number of bonds n) since it has to be
extrapolated to an infinitely long chain.
The worm-like model is obtained through extrapolation to N!l, L! 0 and h! 180
(i.e., a! 1) in such a way that both the persistence and contour lengths (a and rmax)
maintain the same values that they have in the real chain. Under these conditions
[7,21,24,25]:
hr2io ¼ 2armax 1� a
rmax
1� exp � rmax
a
� h i� ð19Þ
which provides the molecular dimensions in terms of two parameters, namely, the
persistence length characterizing the stiffness of the chain and the contour length which
is proportional to the molecular weight.
Eq. (19) may be simplified in two limiting cases that correspond to rmax/aH1 and rmax/
ab1. The first situation represents a chain that is very long (high value of rmax), very
flexible (low value of a) or both. Under these circumstances, both the exponential and the
ratio a/rmax appearing on Eq. (19) are negligible, and one obtains:
hr2io ¼ 2armax Cn
2armax
nl2¼ 2a
lsinðh=2Þ ð20Þ
Most synthetic polymers fall into this situation which is often called the Gaussian limit.
Comparison of Eqs. (20) and (15) shows that L= 2a, i.e., the Kuhn equivalent segment is
twice the persistence length.
M.P. Tarazona, E. Saiz / J. Biochem. Biophys. Methods 56 (2003) 95–116106
M.P. Tarazona, E. Saiz / J. Biochem. Biophys. Methods 56 (2003) 95–116 107
The second limit corresponds to chains being very short (low value of rmax), very rigid
(high a) or both, and it is called rigid rod limit. Under these conditions, the exponential
appearing in Eq. (19) can be expanded in series, and the equation simplifies to:
hr2io ¼ r2max Cn ¼r2max
nl2¼ nsin2ðh=2Þ ð21Þ
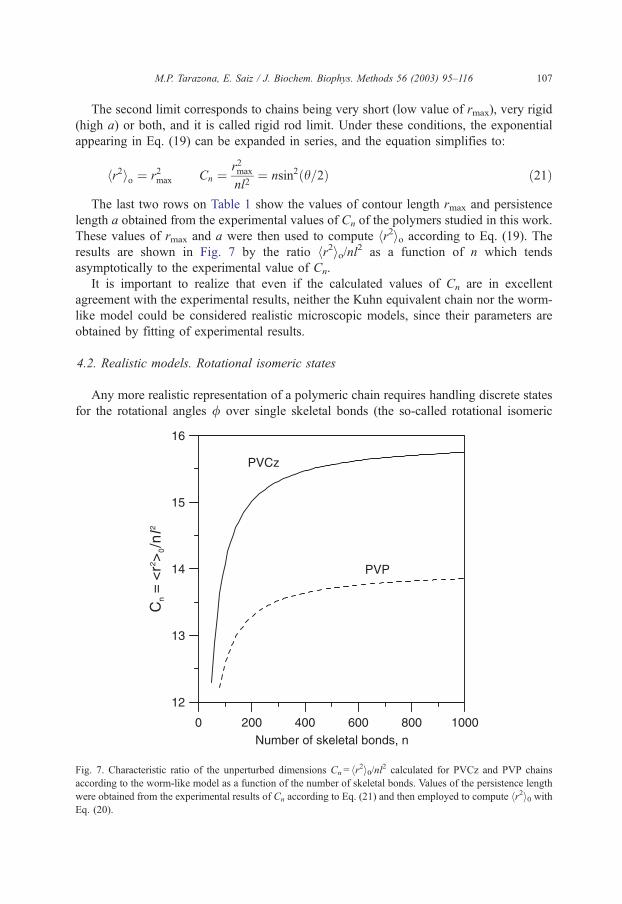
The last two rows on Table 1 show the values of contour length rmax and persistence
length a obtained from the experimental values of Cn of the polymers studied in this work.
These values of rmax and a were then used to compute hr2io according to Eq. (19). The
results are shown in Fig. 7 by the ratio hr2io/nl2 as a function of n which tends
asymptotically to the experimental value of Cn.
It is important to realize that even if the calculated values of Cn are in excellent
agreement with the experimental results, neither the Kuhn equivalent chain nor the worm-
like model could be considered realistic microscopic models, since their parameters are
obtained by fitting of experimental results.
4.2. Realistic models. Rotational isomeric states
Any more realistic representation of a polymeric chain requires handling discrete states
for the rotational angles / over single skeletal bonds (the so-called rotational isomeric
Fig. 7. Characteristic ratio of the unperturbed dimensions Cn= hr2i0/nl2 calculated for PVCz and PVP chains
according to the worm-like model as a function of the number of skeletal bonds. Values of the persistence length
were obtained from the experimental results of Cn according to Eq. (21) and then employed to compute hr2i0 withEq. (20).
M.P. Tarazona, E. Saiz / J. Biochem. Biophys. Methods 56 (2003) 95–116108
states [7,21,26–29]) with probabilities dictated by Boltzmann factors of their correspond-
ing conformational energy. Thus, the probability of finding the chain in a conformation cdefined by a set of values of the rotational angles {/2, /3,. . ./n� 1} is given by:
Pc ¼ Z�1exp � Eð/2 . . ./n�1ÞkT
� �ð22Þ
where E(/2. . . /n� 1) represents the potential energy of the polymeric chain in the cconformation and Z represents the partition function, i.e., the sum of Boltzmann’s factors
for all the allowed conformations.
Unfortunately, it is impossible to compute the probabilities of all the allowed
conformations according to Eq. (22), and consequently, some approximations have to
be used, the most frequent one being to write the energy as a sum of contributions:
Eð/2 . . ./n�1Þ ¼ E0 þ E1 þ E2 þ . . .þ En�2 ð23Þ
where Ek is called k-order interaction and represents the sum of all contributions to the
conformational energy that depend on the simultaneous orientation of k consecutive
rotational angles. Thus, for instance, E0 contains contributions such as bond-stretching or
angle-bending energies which do not depend on any rotational angle and therefore is a
constant term for all the conformations. On the contrary, the interaction between first and
last skeletal atoms depends on all rotatable bonds and consequently will be one of the
contributions to En� 2.
The approximation consists of truncating the sum given by Eq. (23) beyond a certain
order, i.e., taking Ek= 0 for k larger than a predetermined value, t. Of course, as the
truncation value t increases, the computed energy approaches its true value given by Eq.
(23), and therefore, the model becomes more realistic. Unfortunately, the complexity of the
model also increases (and rather fast) with the value of t. For instance, taking t= 0, i.e.,
assuming than the only nonzero term in Eq. (23) is E0, reverts to the freely rotating chain,
since all the conformations will have the same energy and, consequently, the same
probability.
A value t= 1 (only zero- and first-order interactions are taken into account) produces a
model customarily called chain with restricted and uncorrelated rotations. This model is
slightly more realistic than the freely rotating chain, although it is not good enough for
most applications.
Probably the best balance between complication and realism of the model [7,21,26–30]
is attained with t = 2 that disregards interactions of order higher than 2 (the so-called long-
range interactions). The resulting model is called chain with restricted and neighbors-
correlated rotations, and it is by far the most frequently used for realistic calculations. It is
important to realize that intramolecular long-range interactions appearing in Eq. (23) are
compensated by intermolecular interactions with a theta-solvent or with other chains in the
amorphous bulk state. Consequently, this model provides an excellent approximation for
polymers in unperturbed conditions.
Assuming that long-range interactions are neglected, the polymeric chain may be
treated as a set of n pairs of bonds whose rotations are correlated but independent from
those of all other pairs. The procedure employed to develop the model is usually called
M.P. Tarazona, E. Saiz / J. Biochem. Biophys. Methods 56 (2003) 95–116 109
matrix multiplication scheme [7,21,26–30] because it consists of applying the rules of
matrix multiplication to compute any desired property of the chain. Thus, assuming that
each skeletal bond of the chain has m allowed states (frequently the three staggered ones,
namely trans, gauche and negative gauche) represented by a, b,. . ., m, the statistical
weights of each allowed conformation for the pair of bonds i� 1,i may be written as a
matrix of dimensions v� m whose general element ucv = exp(�Ecv/kT) is the Boltzmann
factor of the energy (up to second-order interactions only) of the conformation obtained
when bond i� 1 is in rotational state c and bond i is in the v. These energies and their
corresponding statistical weight may be calculated for model compounds having the
structure of a diad, or a small oligomer, of the real chain employing molecular mechanics,
molecular dynamics, quantum mechanics, etc. However, sometimes they are also treated
as adjustable parameters to be optimized by comparison between calculated and measured
values of some properties of the polymer.
Once the U statistical weight matrices for all distinct pairs of bonds within the chain are
known, the conformational partition function of a chain containing n bonds is obtained as:
Z ¼ U1
Yn�1
i¼2
Ui
" #Un ð24Þ
where U1 is a row of one unity followed by m� 1 zeros and Un is a column of v unities.
On a similar way, the probability for the pair of bonds i� 1,i within a chain containing
n bonds being in rotational states cv may be computed as:
Pcv ¼ Z�1U1
Yi�1
k¼2
Uk
" #U 0
i
Yn�1
k¼iþ1
Uk
" #Un ð25Þ
where Ui0 is obtained from matrix Ui by replacing all its elements by zero except element
ucv which is left unchanged.
Most of the properties of the polymer chain in a given conformation can be calculated
by the serial product of generator matrices constructed in such a way that their product
generates all the terms required to compute the desired magnitude [7,21,26–30]. Statistical
averages over all the allowed conformations may be obtained by combining the generator
and statistical weight matrices to produce supermatrices whose serial product performs all
the required averages. Alternatively, Eq. (25) may be used to compute the a priori
probability for all the allowed orientations of all pairs of bonds contained in the polymeric
chain. Monte Carlo procedures are then employed to generate conformations of the chain
according to those probabilities. The desired magnitude is computed for each one of the
generated conformations, and the results are finally averaged.
In the case of vinyl polymers, three rotational isomers are usually allowed, i.e., trans,
gauche and negative gauche. However, when the side group is bulky and roughly planar,
as it occurs in the cases of PVCz and PVP, all the conformations containing negative
gauche orientations produce severe seteric repulsions that precludes those conformations
[31]. On the other hand, three different kinds of pairs of bonds have to be considered
within these chains, see Fig. 8. The first kind is the interdiad CH2–CHR–CH2 pairs of
bonds, i.e., bonds meeting at the CHR group such as i� 2,i� 1, i,i + 1 or i + 2,i+ 3 in Fig.
8 The statistical weight matrices for this kind of pair are customarily represented by UV.
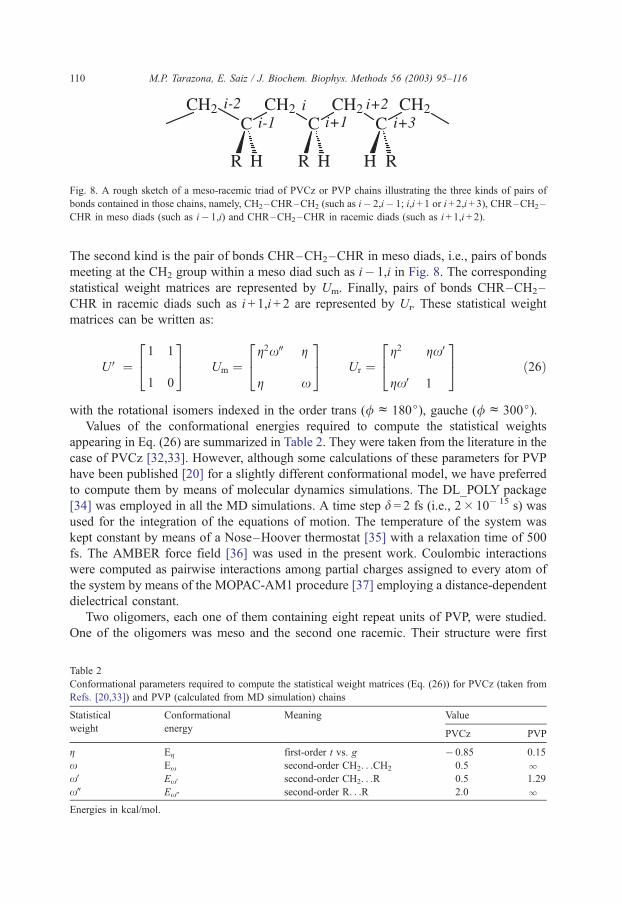
Fig. 8. A rough sketch of a meso-racemic triad of PVCz or PVP chains illustrating the three kinds of pairs of
bonds contained in those chains, namely, CH2–CHR–CH2 (such as i� 2,i� 1; i,i + 1 or i+ 2,i + 3), CHR–CH2–
CHR in meso diads (such as i� 1,i) and CHR–CH2–CHR in racemic diads (such as i + 1,i + 2).
M.P. Tarazona, E. Saiz / J. Biochem. Biophys. Methods 56 (2003) 95–116110
The second kind is the pair of bonds CHR–CH2–CHR in meso diads, i.e., pairs of bonds
meeting at the CH2 group within a meso diad such as i� 1,i in Fig. 8. The corresponding
statistical weight matrices are represented by Um. Finally, pairs of bonds CHR–CH2–
CHR in racemic diads such as i + 1,i+ 2 are represented by Ur. These statistical weight
matrices can be written as:
UV ¼1 1
1 0
24
35 Um ¼
g2xW g
g x
24
35 Ur ¼
g2 gxV
gxV 1
24
35 ð26Þ
with the rotational isomers indexed in the order trans (/c 180j), gauche (/c 300j).Values of the conformational energies required to compute the statistical weights
appearing in Eq. (26) are summarized in Table 2. They were taken from the literature in the
case of PVCz [32,33]. However, although some calculations of these parameters for PVP
have been published [20] for a slightly different conformational model, we have preferred
to compute them by means of molecular dynamics simulations. The DL_POLY package
[34] was employed in all the MD simulations. A time step d = 2 fs (i.e., 2� 10� 15 s) was
used for the integration of the equations of motion. The temperature of the system was
kept constant by means of a Nose–Hoover thermostat [35] with a relaxation time of 500
fs. The AMBER force field [36] was used in the present work. Coulombic interactions
were computed as pairwise interactions among partial charges assigned to every atom of
the system by means of the MOPAC-AM1 procedure [37] employing a distance-dependent
dielectrical constant.
Two oligomers, each one of them containing eight repeat units of PVP, were studied.
One of the oligomers was meso and the second one racemic. Their structure were first
Table 2
Conformational parameters required to compute the statistical weight matrices (Eq. (26)) for PVCz (taken from
Refs. [20,33]) and PVP (calculated from MD simulation) chains
Statistical Conformational Meaning Value
weight energyPVCz PVP
g Eg first-order t vs. g � 0.85 0.15
x Ex second-order CH2. . .CH2 0.5 lxV ExV second-order CH2. . .R 0.5 1.29
xW ExW second-order R. . .R 2.0 l
Energies in kcal/mol.

M.P. Tarazona, E. Saiz / J. Biochem. Biophys. Methods 56 (2003) 95–116 111
optimized by minimizing the energy as a function of all internal coordinates, i.e., bond
lengths, bond angles and torsions. The MD simulation was then started. The first part of
the simulation was a thermostating process in which the temperature of the system was
raised from 0 to 300 K with increments of 50 K and allowing 500 fs for equilibration at
each new temperature. After the working temperature was reached, the simulation was
continued for 4 ns during which the rotational states of the three CHR–CH2–CHR pairs of
bonds at the center of the oligomer were recorded with intervals of 100 fs, thus producing
1.2� 105 conformations for this kind of bond pairs. Two pairs of bonds were disregarded
at each extreme of the oligomer to avoid end effects. The analysis of the recorded
conformations consisted of counting how many times along the MD trajectory the pair of
bonds adopted a given value. That number divided by the total number of analyzed
conformations provides the probability of occurrence for that conformation. The results are
shown in Fig. 9.
Inspection of the probability surface for the meso diad (top panel on Fig. 9) reveals that
only the symmetrically equivalent tg and gt conformations are allowed for this pair of
bonds which indicates that second order weights x and xW appearing, respectively, in gg
and tt conformations are very small, i.e., their corresponding energies very high. Under
these circumstances and as far as the meso diad is concerned, the value of g is irrelevant
since both allowed states have the same statistical weight according to Eq. (26). In the case
of the racemic diad (lower panel on Fig. 9), the allowed conformations are tt which
represents a fraction of ca. 0.34 of the total conformations, gg with a fraction of about
0.56, and the equivalent tg and gt, each one of them with a fraction of ca. 0.05. These
results, together with the expression of Ur given in Eq. (26) indicates that g2c 0.34/0.56
and gxVc 0.05/0.56 and, since the calculations were performed at 300 K, Egc 0.15,
ExV = 1.29, both in kcal/mol. The values of these conformational energies are summarized
in the last column of Table 2.
It is interesting to compare the numerical values of the statistical weight matrices for
PVCz and PVP once their corresponding values of conformational energies have been
introduced. After renormalization, these matrices are:
UmðPVCzÞ ¼0:063 0:445
0:445 0:047
24
35 UrðPVCzÞ ¼
0:789 0:082
0:082 0:047
24
35
UmðPVPÞ ¼0:000 0:500
0:500 0:000
24
35 UrðPVPÞ ¼
0:338 0:050
0:050 0:562
24
35
ð27Þ
The conformational characteristics imposed by these matrices are similar (after all, both
PVCz and PVP are vinyl polymers with bulky and roughly planar side groups). However,
there are some significant differences arising from the fact that the carbazole group is
planar while the pyrrolidone group contains H atoms going out the plane of the ring. Thus,
two consecutive carbazole groups could minimize their interaction by aligning parallel to
each other, while in the case of pyrrolidone group, this minimization is not possible, and
consequently the conformations tt and gg are not allowed in the meso diad of the PVP
chain. At any rate, the helical tg conformation is the preferred one (in the case of PVCz) or
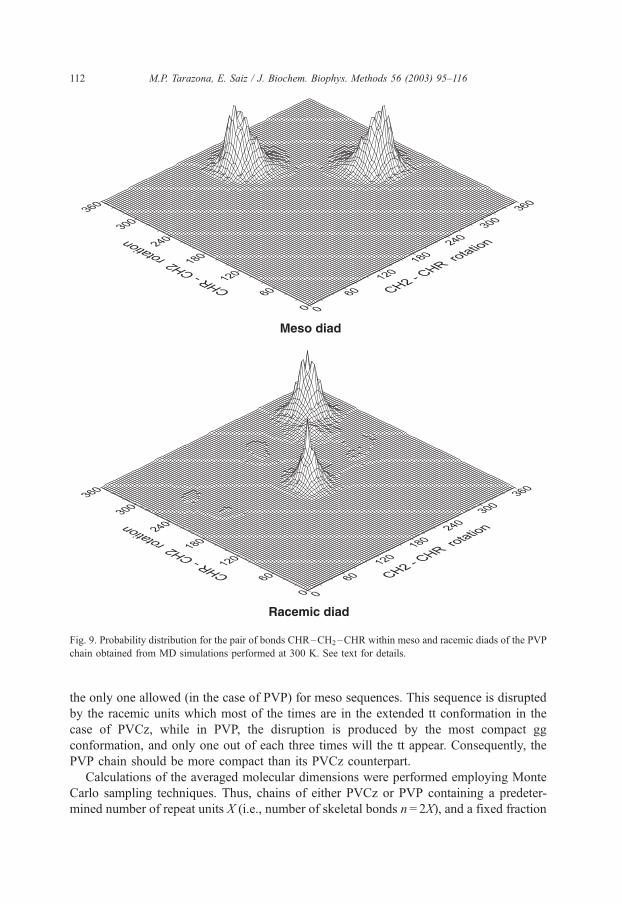
Fig. 9. Probability distribution for the pair of bonds CHR–CH2–CHR within meso and racemic diads of the PVP
chain obtained from MD simulations performed at 300 K. See text for details.
M.P. Tarazona, E. Saiz / J. Biochem. Biophys. Methods 56 (2003) 95–116112
the only one allowed (in the case of PVP) for meso sequences. This sequence is disrupted
by the racemic units which most of the times are in the extended tt conformation in the
case of PVCz, while in PVP, the disruption is produced by the most compact gg
conformation, and only one out of each three times will the tt appear. Consequently, the
PVP chain should be more compact than its PVCz counterpart.
Calculations of the averaged molecular dimensions were performed employing Monte
Carlo sampling techniques. Thus, chains of either PVCz or PVP containing a predeter-
mined number of repeat units X (i.e., number of skeletal bonds n = 2X), and a fixed fraction

M.P. Tarazona, E. Saiz / J. Biochem. Biophys. Methods 56 (2003) 95–116 113
of meso units wm with random placement of meso and racemic centers was generated.
Then, Eqs. (25) and (27) were employed to compute the a priori probabilities for all the
allowed orientations of each pair of bonds within the generated chain. Next, 1000 different
conformations of the chain were produced according to those a priori probabilities and
their molecular dimensions evaluated by serial products of generator matrices. The
generation of the chains was repeated 1000 times thus providing a total number of 106
conformations for each polymer. Values of the averages over all those conformations are
given below. The standard error on those averages amounted to ca. 1%. Calculations were
performed at 300 K for chains with number of repeat units X ranging from 10 to 300 and
wm = 0.2 for PVCz and 0.5 for PVP which are the approximate content of meso units in
samples of those polymers obtained by free radical polymerization [20,32,33].
Values of the squared end-to-end vector hr2io computed as explained above were
converted into the characteristic ratio Cn and are shown in Fig. 10 as a function of the
number of repeat units X. As this figure indicates, Cn increases with X for short chains and
tends to asymptotic limits of ca. 16.5 and 11.0, respectively, for PVCz and PVP at
moderately long chains with ca. Xc 200. The value obtained for PVCz is in very good
agreement with the experimental result. However, in the case of PVP, the theoretical result
is smaller than the experimental one.
The averages of the end-to-end vector hri and its components in a coordinate system
affixed to the first bond of the chain are represented as function of X in Fig. 11. By
definition, the hxi component is the persistence length a. However, when applied to freely
Fig. 10. Values of the characteristic ratio of the unperturbed dimensions as a function of the number of repeat units
calculated at 300 K with the RIS model for PVCz and PVP chains.

Fig. 11. Averages of the end-to-end vector hri and its components in the coordinate system affixed to the first
skeletal bond as a function of the number for repeat units calculated at 300 K with the RIS model for PVCz (solid
lines) and PVP (dot lines). hri: (E); hxi: (.); hyi: (x); hzi: (+).
M.P. Tarazona, E. Saiz / J. Biochem. Biophys. Methods 56 (2003) 95–116114
rotating chains, hyi and hzi components vanish and the value of a is independent of the
orientation of the coordinate system. This is not the case in more rigid chains as Fig. 11
indicates. Consequently, the persistence length obtained by identifying a with hxi woulddepend on the orientation of the first bond. For this reason, it is more convenient to employ
the value of the modulus hri that is usually referred to as the persistence vector, which doesnot depend on the coordinate system. It can be observed in Fig. 6 that hri and its
components reach constant values for rather short chains, i.e., Xc 50. The values of hri,hxi and hyi components are roughly twice in the case of PVCz than their counterparts in
the PVP chain. However, the hzi component is larger, in absolute value, for PVP. Thus, the
box defined by the three components is much closer to a cube in the case of PVP than in
PVCz, and therefore, the average shape of this polymer is much closer to globular than in
the case of PVCz.
5. Conclusions
The SEC–MALS technique affords a complete analysis of the solution properties of a
polymer solution, including the extrapolation of molecular dimensions to unperturbed
conditions, employing just a single polydisperse sample. The procedure has been applied
to study solutions of PVCz in THF and PVP in water with 0.1 M concentration of NaNO3,

M.P. Tarazona, E. Saiz / J. Biochem. Biophys. Methods 56 (2003) 95–116 115
both at 25 jC, as examples of systems which are, respectively, above and below
unperturbed conditions. Values of the unperturbed dimensions were also obtained with
a realistic RIS model which allows a better understanding of the behavior of these two
polymeric chains. Theoretical results are in very good agreement with the experimental
values in the case of PVCz, although the agreement is poorer in the case of PVP.
Acknowledgements
Financial support from projects BQU2001-1158 and UAH2002/34 are gratefully
acknowledged.
References
[1] Trathnigg B. Determination of MWD and chemical composition of polymers by chromatographic tech-
niques. Prog Polym Sci 1995;20:615–50.
[2] Potschka M, Dubin PL, editors. Strategies in size exclusion chromatography. Washington, DC: American
Chemical Society; 1996.
[3] Barth HG, Boyes BE, Jackson C. Size exclusion chromatography and related separation techniques. Anal
Chem 1998;70:251R–78R.
[4] Wyatt PJ. Light scattering and the absolute characterization of macromolecules. Anal Chim Acta 1993;271:
1–40.
[5] Wyatt PJ. Mean square radius of molecules and secondary instrumental broadening. J Chromatogr 1993;
648:27–32.
[6] Laguna MTR, Medrano R, Plana MP, Tarazona MP. Polymer characterization by size-exclusion chroma-
tography with multiple detection. J Chromatogr, A 2001;919:13–9.
[7] Flory PJ. Statistical mechanics of chain molecules. New York: Wiley; 1969.
[8] The unperturbed conditions in a polymer solution represent a combination of nature of polymer, nature of
solvent and temperature. However, pure polymers in either liquid or amorphous (above Tg) states are always
in unperturbed conditions because inter- and intramolecular interactions cancel each other out.
[9] Yamakawa H. Modern theory of polymer solutions. New York: Harper & Row; 1971.
[10] Burdalo J, Medrano R, Saiz E, Tarazona MP. A simple method to determine unperturbed dimensions of
polymers using size exclusion chromatography and multiangle light scattering. Polymer 2000;41:1615–20.
[11] Gallego J, Perez-Foullerat D, Mendicuti F, Mattice WL. Configuration conducive to the formations of
intramolecular excimers in poly(N-vinylcarbazole) and its copolymers. J Polym Sci, Part B: Polym Phys
2001;39:1272–6.
[12] Huglin MB, editor. Light scattering from polymer solutions. London: Academic Press; 1972.
[13] De Gennes PG. Scaling concepts in polymer physics. Ithaca, NY: Cornell Univ Press; 1979.
[14] Stockmayer WH, Fixman M. On the estimation of unperturbed dimensions from intrinsic viscosities.
J Polym Sci C1 1963;1:137–41.
[15] Fixman M. Excluded volume in polymer chains. J Chem Phys 1955;23:1656–9.
[16] Kurata M, Stockmayer WH, Roig A. Excluded-volume effect of linear polymer molecules. J Chem Phys
1960;33:151.
[17] Laguna MTR, Saiz E, Tarazona MP. Solution properties of poly[diphenoxy phosphazene] below the htemperature obtained by SEC/MALLS. Polymer 2000;41:7993–8000.
[18] Laguna MTR, Tarazona MP. Solution properties of poly[bis(piperidino) phosphazene] by size exclusion
chromatography and multiangle light scattering. Polymer 2001;42:1751–6.
[19] Brandrup J, Immergut EH, Grulke EA, editors. Polymer handbook. 4th ed. New York: Wiley; 1999.
[20] Tarazona MP, Saiz E, Gargallo L, Radic D. Conformational characteristics of poly(vinylpyrrolidone).
Solvent-dependence of the chain dimensions. Makromol Chem, Theory Simul 1993;2:697–710.
M.P. Tarazona, E. Saiz / J. Biochem. Biophys. Methods 56 (2003) 95–116116
[21] Mattice WL, Suter UW. Conformational theory of large molecules. The rotational isomeric state model in
macromolecular systems. New York: Wiley-Interscience; 1994.
[22] Kuhn W. The relation between molecular size, statistical molecular shape and elastic properties of highly
polymerized substances. Kolloid Z 1936;76:258–71;
Molecular configuration and crystalline orientation as causes of rubber-like elasticity. Kolloid Z 1939;87:
3–12.
[23] The expression ‘‘Fully extended chain’’ is sometimes interpreted in a very literal way and its length taken to
be rmax = nl2, i.e., the length of the chain when all bond angles are forced to open to 180j. The term sin(h/2)
in Eq. (15) is then unity, and the values obtained for N and L are different, although Eq. (14) still holds true.
[24] Porod G. The mean separation of chain ends in threadlike molecules. Monatsh Chem 1949;80:251–5.
[25] Kratky O, Porod G. X-ray investigations of dissolved chain molecules. Rec Trav Chim 1949;68:1106–22.
[26] Volkenstein MV. Configurational statistics of polymeric chains. New York: Interscience; 1963.
[27] Birshtein TM, Ptitsyn OB. Conformations of macromolecules. New York: Interscience; 1966.
[28] Nagai K. Non-Gaussian character of real polymer chains. J Chem Phys 1963;38:924–33.
[29] Flory PJ. Foundations of rotational isomeric state theory and general methods for generating configurational
averages. Macromolecules 1974;7:381–92.
[30] Riande E, Saiz E. Dipole moments and birefringence of polymers. New York: Prentice-Hall; 1992.
[31] Sundararajan PR, Flory PJ. Configurational characteristics of poly(methyl methacrylate). J Am Chem Soc
1974;96:5025.
[32] Laguna MTR, Gallego J, Mendicuti F, Saiz E, Tarazona MP. Solution properties of poly(N-vinylcarbazole)
and its copolymers with methyl methacrylate. Macromolecules 2002;35:7782–90.
[33] Abe A, Kobayashi H, Kawamura TM, Date M, Uryu T, Matsuzaki K. Statistical properties of the N-
vinylcarbazole chain as estimated from NMR analysis. Macromolecules 1988;21:3414.
[34] T.R. Forester, W. Smith, DL_POLY (Ver. 2.10). Daresbury Laboratory, Daresbury, Warrington WA4 4AD,
England.
[35] Allen MP, Tildesley DJ. Computer simulation of liquids. Oxford: Clarendon; 1987.
[36] Cornell WD, Cieplak P, Bayly CL, Gould IR, Merz KM, Ferguson DMD, et al. A second generation
force field for the simulation of proteins, nucleic acids, and organic molecules. J Am Chem Soc 1995;117:
5179–97.
[37] MOPAC, Quantum Chemistry Program Exchange, Department of Chemistry, Indiana University,
Bloomington, IN.