COLLEGE OF ENGINEERING AND ARCHITECTURE
226
FINAL PROJECT REPORT " ON The Development of a Chemical Kinetic Measurement Apparatus and the Determination of the Reaction Rate Constants For Lithium-Lead/Steam Interaction Prepared by: Dr. Paul Orlean Biney Department of Mechanical Engineering PROCESSED FROM BEST AVAILABLE COPY COLLEGE OF ENGINEERING AND ARCHITECTURE Mechanical Engineering Department Prairie View A&M University Prairie View, Texas 77446
-
Upload
khangminh22 -
Category
Documents
-
view
1 -
download
0
Transcript of COLLEGE OF ENGINEERING AND ARCHITECTURE

FINAL PROJECT REPORT "ON
The Development of a ChemicalKinetic Measurement Apparatus and
the Determination of the Reaction Rate ConstantsFor
Lithium-Lead/Steam Interaction
Prepared by:Dr. Paul Orlean Biney
Department of Mechanical Engineering
PROCESSED FROM BEST AVAILABLE COPY
COLLEGE OF ENGINEERING AND ARCHITECTUREMechanical Engineering Department
Prairie View A&M UniversityPrairie View, Texas 77446

PREPARED FOR THE U.S. DEPARTMENT OF ENERGY UNDERGRANT NUMBER DE-FG05-90ER54107
FINAL PROJECT REPORTON
The Development of a ChemicalKinetic Measurement Apparatus and
the Determination of the Reaction Rate Constants .For
Lithium-Lead/Steam Interaction
Prepared by:Dr. Paul Orlean Biney
Department of Mechanical EngineeringP.O. Box 397
Prairie View, TX. 77446Telephone: 409-857-4023
Fax: 409-857-2222
Submitted to the
OFFICE OF FUSION ENERGYDEPARTMENT OF ENERGY
Through the
Prairie View A&M Research FoundationP.O. Box 3578
College Station, Texas 77843March 1995
- . . p . f P . . PROCESSED FROM BEST AVAILABLE COPYFunded Project Period09/21/90-3/31/95
PRINCIPAL INVESTIGATOR
Paul Orleans Biney, Ph. D.Assoc. Professor and HeadMechanical Engineering Dept.
i ! 1
DISTRIBUTION OF THIS DOCUMENT IS UNLIMrTED
DISCLAIMER
This report was prepared as an account of work sponsored by an agency of the UnitedStates Government Neither the United States Government nor any agency thereof, norany of their employees, make any warranty, express or implied, or assumes any legal liabili-ty or responsibility for the accuracy, completeness, or usefulness of any information, appa-ratus, product, or process disclosed, or represents that its use would not infringe privatelyowned rights. Reference herein to any specific commercial product, process, or service bytrade name, trademark, manufacturer, or otherwise does not necessarily constitute orimply its endorsement, recommendation, or favoring by the United States Government orany agency thereof. The views and opinions of authors expressed herein do not necessar-ily state or reflect those of the United States Government or any agency thereof.

DISCLAIMER
Portions of this document may be illegiblein electronic image products. Images areproduced from the best available originaldocument

Acknowledgments
On behalf of Prairie View A&M University, I would like to extend the College's sincere
appreciation and thanks to Dr. Donald Priester and Ms. Angela Sistrunk for their patience,
guidance and support through the period of this research. Dr. P. 0. Biney fully
acknowledges the effort, devotion, and the time. Dr. Donald Prister invested in traveling
to Prairie View A&M University to initiate the project in 1991.
We look forward to a continued corporation between Dr. P. 0. Biney, the Mechanical
Engineering Department at PVAMU and the DOE office of Fusion Technology.
I will also extend my deepest appreciation to all the undergraduate students who
participated in the project, with special thanks to Qing-yuan Li, who put in a great amount
of time to complete the experiments and the analyses, and for using the subject of the
research for his M.S. Thesis, which he successfully completed in August, 1995.
Professor Michael Corradini, Dr. Lioyd S. Nelson and Joseph D. Krueger of the Fusion
Technology Institute at the University of Wisconsin deserve special mention for their
cooperation in supplying high purity lithium-lead for the completion of this work.
We are also very grateful to Dr. Kathy McCarthy of the Fusion Safety Program at the
INEL for funding the work on the preparation of the lithium-lead for the research.

Table of Contents
Page
Acknowledgments i
Table of Contents ii
List of Figures v
List of Tables • vii
Abstract viii
Nomenclature x
I. Introduction 1
A. Background 1
B. Literature Review 3
C. Objective and Scope 10
II. Preliminary Design of Experimental System 12
A. Experimental Test Matrix 12
B. Preliminary Determination of Hydrogen Gas Pressure in Gas Region
of Upper Chamber. 14
C. Intermediate Experimental System 15
D. Initial Testing of Intermediate Experimental System 24
E. Final Experimental System Design 26
HI. Data Acquisition and Control Hardware 31
A. Control of Solenoid Valves 34
B. Control of Liquid Metal Temperature 34
C. Control of Upper Water Temperature 34
D. Pressure Transducers 35
E. Data Acquisition and Control Program 35
IV. Calibration and Testing of Experimental Hardware 40
A. Initial System Test 40
B. Calibration of Upper Gas Volume 40
C. Upper Chamber Pressure Test 42
V. Modifications of Experimental Set-Up and Procedures 44
A. Modifications of the Experimental Matrix 44
B. Modifications of Experimental Set-Up 44
C. Experimental Procedures 47
VI. Results of the Experiments 53
A. Descriptions of the Raw Data. 53
B. Data Analysis 58
1. Thermodynamics Method 59
2. Results of Thermodynamics Method of Analysis 66
3. Heat Transfer Method 70
4. Transformation of Results 74
5. Results of Heat Transfer Method of Analysis 77
6. Determination of Reaction Rate Constants 85
7. Determination of the Hydrogen generation Equation 93
8. Determination of the Hydrogen generation Rate Equation 93
HI

VII. Error Analysis
V m . Summary of Results and Conclusions
IX. Problems Encountered During Period of Research 1 08
References110
Appendix A. Listing of Data Acquisition and Control Program 112
Appendix B. Graphical Presentation of Experimental Results 120
Appendix C. Listing of Data Analysis Program 1 7 3
Appendix D. Hydrogen Generated from Tests j 8 5
Appendix E. Results of Linearization from Tests 200
Appendix F. Determination of Theoretical Hydrogen Pressure 210
IV

List of Figures
Figure 1.1 Four Possible Contact Mode 2
Figure 1.2 Large Scale Lithium-Lead/Steam Reaction Test Chamber 6
Figure 1.3 Rate of Hydrogen Generation for LinPbg3, Li7Pb2 and Li
Reacted with Water Steam 7
Figure 2.1 "Conceptual System Design 17
Figure 2.2 Details of Internal Cooling Channel in Lower Flange 18
Figure 2.3 Details of Lower Reaction Vessel 19
Figure 2.4 Details of Lower Furnace 20
Figure 2.5 Details of Upper Vessel 22
Figure 2.6 Pneumatic Controlled Butterfly Valve 23
Figure 2.7 Partial Assembly of Preliminary System 25
Figure 2.8 Final Design Details of Lower Vessel 27
Figure 2.9 Final Design Details of Upper Vessel 28
Figure 2.10 Assembly of Final Experimental System 30
Figure 3.1 The Simplified Schematic control diagram. 33
Figure 3.2 Simplified Flow Chart of Data Acquisition and Control program 39
Figure 4.1 Setup for Calibrating Upper Gas Volume 41
Figure 5.1 Modifications of the Experimental Set-up 45
Figure 5.2 Reactor Chamber 48
Figure 6.1 System Pressure as a Function of Time (L09,N36) 54
Figure 6.2 Upper & Lower Water / Gas Temperature (L09) 55
Figure 6.3 Upper & Lower Water / Gas Temperature (N36) 56
v

Figure 6.4 Liquid Metal Temperature as a Function of Time (L09) 60
Figure 6.5. Hydrogen Generation as a Function of Time (L20) 68
Figure 6.6 System Pressure as a Function of Time (L20) 69
Figure 6.7 Heat Transfer Model
Figure 6.8 Hydrogen Generation per Unit Reacted Metal Volume 79
Figure 6.9 Hydrogen Generation per Unit Reacted Metal Volume (L06) 80
Figure 6.10 Transformation of Hydrogen Generation per Unit ReactedMetal Volume (L05)
Figure 6.11 Transformation of Hydrogen Generation per Unit ReactedMetal Volume (L06)
Figure 6.12 Hydrogen Generation as a Function of Time (L05) 83
Figure 6.13 Hydrogen Generation as a Function of Time (L06) 84
Figure 6.14 Linearization of Equation (73) and Fitting Equation 87
Figure 6.15 Hydrogen Generation Linearized by Equation (78) for Test (L2O)....9O
Figure 6.16a Graph of Constant ( a ) in Equation (67) Versus Liquid MetalTemperature q.
Figure 6.16b Graph of Constant (/?) in Equation (67) Versus Liquid MetalTemperature Q«
Figure 6.17 Corrected Hydrogen Generation as a Function of Time (L20) 94
Figure 6.18 Corrected Hydrogen Generation as a Function of Time (L14) 95
Figure 6.19 Corrected Hydrogen Generation as a Function of Time (L23) 96
Figure 6.20 Hydrogen Generation Rate as a Function of Time (L14) 97
Figure 6.21 Hydrogen Generation Rate as a Function of Time (L07) 98
Figure 6.22 Hydrogen Generation Rate as a Function of Time (LI 5) 99

Figure C1 Average of Hydrogen Generation Rate per Unit Area forLiPb and Water Reaction 106
List of Tables
Table 1.1 Summary of Hydrogen Generation viii
Table 2.1 Final Experimental Test Matrix for
Lithium-lead/Water Reaction 13
Table 2.2 Theoretical Pressure of Hydrogen Generated for
Lii7Pb83 / Water Reaction 15
Table 2.3 Design Specifications for Cooling Coil 26
Table 3.1 Analog Input/Output Features of Data Acquisition and
Control System 31Table 3.2 Digital Input/Output and Power Control Features of Data
Acquisition and Control System 32
Table 3.3 Summary of Controlled Equipment and Relays 36
Table 3.4 Summary of Thermocouples and Channel Connections 36
Table 3.5 Description of the Six Phases of Each Lii7Pb83/Water
Reaction Experiment 37
Table 4.1 Summary of Upper Chamber Calibration results 42
Table 5.1 Test Matrix of Experiments 44
Table 6.1 Hydrogen Generated from The Lithium-Lead Tests 67
Table 6.2 The Reacted Metal Volume from The Lithium-Lead Tests 76
Table 6.3 The Average Moles of Hydrogen Generation 88
Table 6.4 Coefficients Calculated from The Lithium-Lead Tests 89
Table 7.1 The Errors in Measurement System 101
Table 7.2 The Error of Hydrogen Generation 103
Vll
Abstract
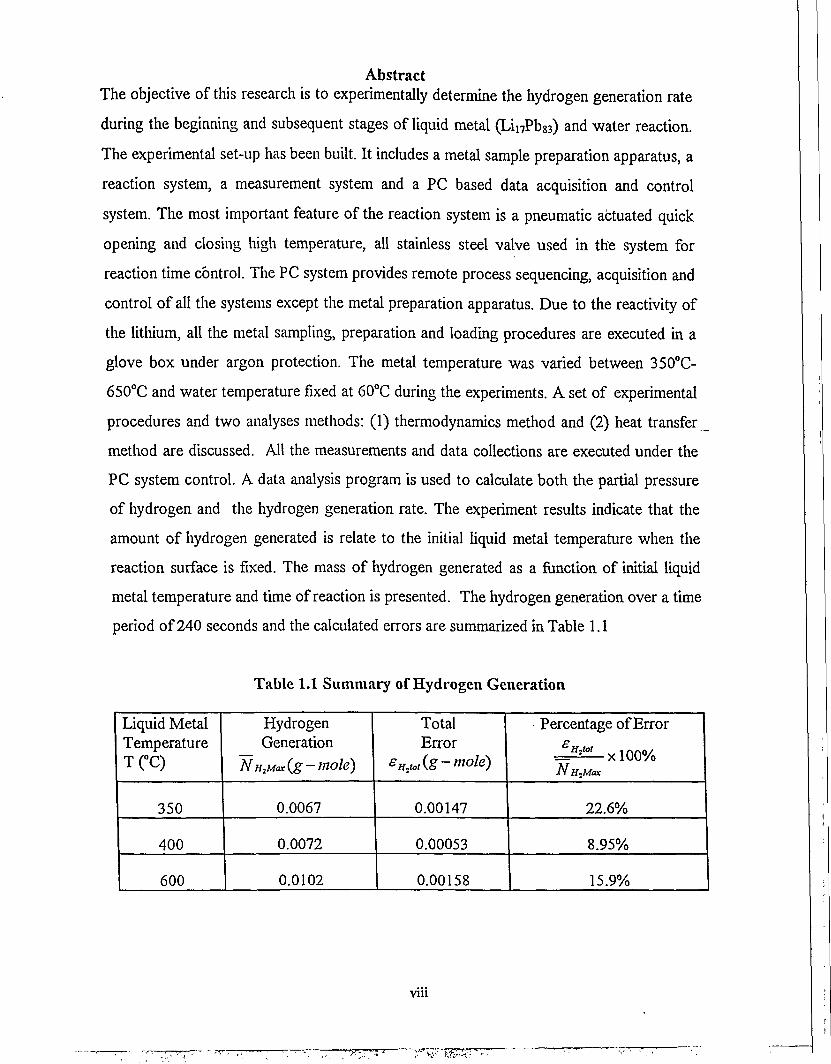
The objective of this research is to experimentally determine the hydrogen generation rate
during the beginning and subsequent stages of liquid metal (Lii7Pb83) and water reaction.
The experimental set-up has been built. It includes a metal sample preparation apparatus, a
reaction system, a measurement system and a PC based data acquisition and control
system. The most important feature of the reaction system is a pneumatic actuated quick
opening and closing high temperature, all stainless steel valve used in the system for
reaction time control. The PC system provides remote process sequencing, acquisition and
control of all the systems except the metal preparation apparatus. Due to the reactivity of
the lithium, all the metal sampling, preparation and loading procedures are executed in a
glove box under argon protection. The metal temperature was varied between 350°C-
650°C and water temperature fixed at 60°C during the experiments. A set of experimental
procedures and two analyses methods: (1) thermodynamics method and (2) heat transfer
method are discussed. All the measurements and data collections are executed under the
PC system control. A data analysis program is used to calculate both the partial pressure
of hydrogen and the hydrogen generation rate. The experiment results indicate that the
amount of hydrogen generated is relate to the initial liquid metal temperature when the
reaction surface is fixed. The mass of hydrogen generated as a function of initial liquid
metal temperature and time of reaction is presented. The hydrogen generation over a time
period of 240 seconds and the calculated errors are summarized in Table 1.1
Table 1.1 Summary of Hydrogen Generation
Liquid MetalTemperatureT(°C)
350
400
600
HydrogenGeneration
N^Maxig-mole)
0.0067
0.0072
0.0102
TotalError
0.00147
0.00053
0.00158
Percentage of Error
_fHj"* xl00%
22.6%
8.95%
15.9%
Vlll

The maximum amount of hydrogen generation ranged from 0.0064 g-mole at 350°C to
0.0102 g-mole at 600°C over a time period of 240 seconds. The maximum hydrogen
generation rate range was from 0.0025 g-mole/sec (350°C) to 0.0045 g-mole/sec ( 600°C)
at the beginning of the reaction phase. The average hydrogen generation flux ranged from
0.0551 g-mole/m2sec (35O°C) to 0.0838 g-mole/m2 sec (600°C) over a time period of 240
seconds.
The Arrhenius reaction rate constants in the equation ——— = B*&XD( )aredt VK RT
determined from the experimental rate curves. The constant B as a function of time was
determined to be,B = 4*a*;0*(//'- |)*exp[-a(//')], where A=0.052025 (g-mole), cc=0.28
(sec"1), p=0.68 and AE=1.0336xl05(J/g-mole).
IX

Nomenclature
Cp Heat capacity (kJ/kg K)
LGP Gas pressure in the lower chamber (bar)
LGT Gas temperature in the lower chamber (°C)
LMT Liquid metal temperature (°C)
LWT Water temperature in the lower chamber (°C)
M Mass (gm)
m.w Molecule weight (gm/mole)
N Moles (g-mole)
Pardn Argon pressure in lower chamber during countdown phase (bar)
P^p Argon pressure in upper chamber during countdown phase (bar)
PC-DAS PC-Data Acquisition and Control System
PH Partial pressure of hydrogen (bar)
PH o Water vapor pressure (bar)
Pgai Saturated pressure (bar)
p«ys (t) System pressure was measured as function of time (bar)
P«y»dn System pressure in lower chamber during coun tdown phase (bar)
P»y.up System pressure in upper chamber during coun tdown phase (bar)
R Molar gas constant (83.14395 bar cm3 /g-mole K )
Tga,(t) Gas temperature was measured as function o f t ime (°C)
TgaSdn Gas temperature in lower chamber during coun tdown phase (°C)
Tgasup Gas temperature in upper chamber during coun tdown phase (°C)
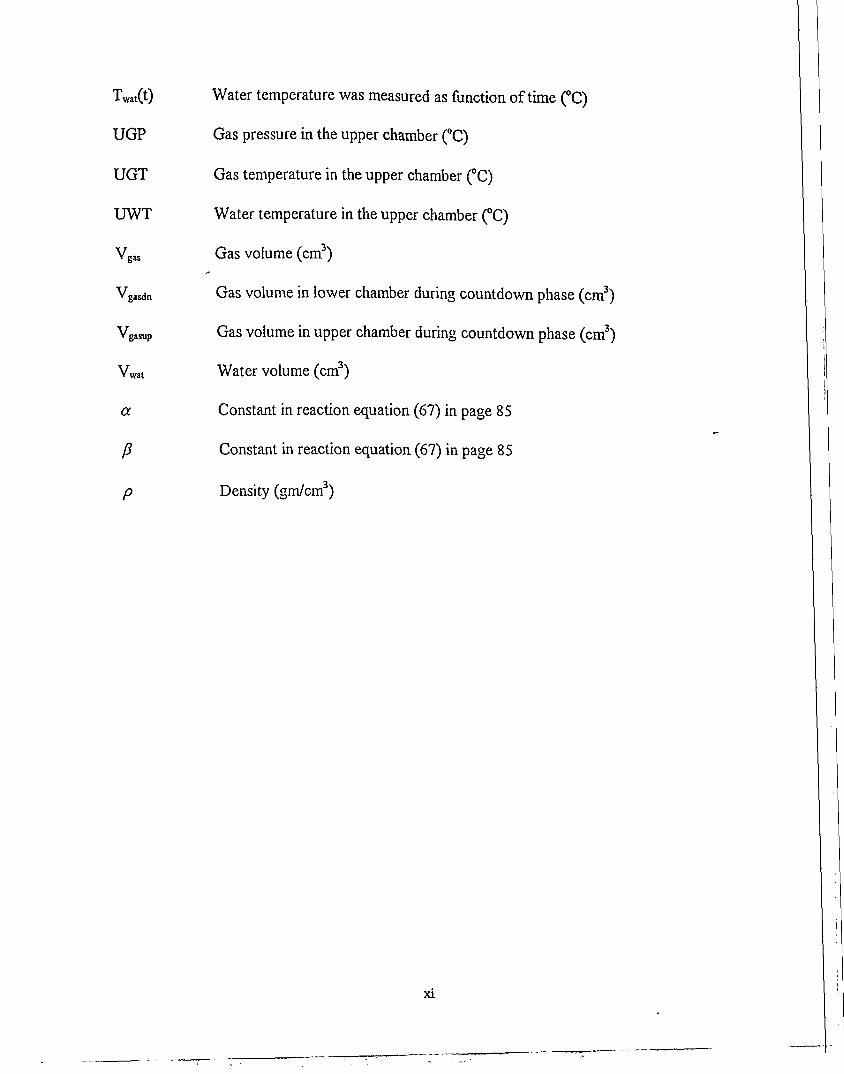
TWat(t) Water temperature was measured as function of t ime (°C)
U G P Gas pressure in the upper chamber (°C)
U G T Gas temperature in the upper chamber (°C)
U W T Water temperature in the upper chamber (°C)
Vgas Gas volume (cm3)
Vgasdn Gas volume in lower chamber during countdown phase (cm3)
Vgasup Gas volume in upper chamber during countdown phase (cm3)
VWai Water volume (cm3)
a Constant in reaction equation (67) in page 85
P Constant in reaction equation (67) in page 85
p Density (gm/cm3)
X I

I. Introduction
The main purpose of this research is to determine the chemica. kinetics of the Hthium
.ead/water interaction by conducting a series of small scale e x p e r t s and to deve.op the
theoretical groundwork to analyze the result of the experiments.
A. Background
In its genera, design, fcsion power reactors use tritium as thcir principal fuel. The tritium
» bred by capturing neutrons from the fosion reaction in a blanket containing lithium in
some form which inc.ude liquid lithium meta,, .ithium-lead alloy Li17Pb83, Hthium-iead
compound (Li7Pb2), lithium oxide (Li.O), and lithium based ceramics [,] [ 2 ] . Along with'
.heir breeding capabuities, the blanket represents the primary fcsion energy heat sink and
heat transfer medium. Lithium-lead is being considered as the breeder and coota , since it
has a h,gh tritium breeding ratio, good neutron mul,ipIication and acceptable corrosion
rates. Water could be present as an auxiliary cooling fluid o r „ t h e w o r f c m g fluid for ^
power cycle. It is necessary to consider aecidenta. contact of these .iquid metals and
water m their fcsion application. For various accident sequences between the molten
meta. breeder and the water, four contact modes (coolant injection mode, metal pouring
mode, spray mode and water pouring mode) are possible, and described below.
(i) Coolant Injection Contact Mode
The coolant injection contact mode occurs after a tube rupture in a Hquid metal steam
generator due to the high pressure injection of the steam/water into the low pressure Uquid
metal as shown in Figure 1.1a. This contact mode is characterized by rapid mixing, due to
the initially enormous pressure difference between the two species.

WATER iLIQUID METAL
EC*
LIQUID
V v
\ v
• !\ V
V •>
V v
\ :
\ :
\ s
y\
:\• \
• \
: \
jm\hb
ITERATOR
a.Coolant Injection Contact Modeb. Metal Pouring Contact Mode
• X ^ ^ S ^ WATfR COOIKD CHICIO
c Spray Contact Mode d. Water Pouring Contact Mode
Figure 1.1 Four Possible Contact Mode

(ii) Metal Pouring Contact Mode
The metal pouring contact mode occurs in a fusion reactor, after a severe accident in
which molten metal is poured from a ruptured component into a stagnant pool of water in
the containment vessel as shown in Figure Lib. This contact mode would be
characterized by less rapid mixing than the coolant injection contact mode, because the
two species are initially at the same pressure.
(iii) Spray Contact Mode
The spray contact mode occurs after the rupture of water and breeder-blanket tubes in the
vacuum vessel (i.e. central cell), resulting in a spray of these reactants into a common
volume as shown in Figure 1.1c. This contact mode is of special concern in a fusion
reactor because the major radioactive inventory resides within the vacuum vessel. One
may consider this contact mode to be a subset of the previous two, because it is due to -
the simultaneous injection of the liquid metal breeder and water into a common volume.
(iv) Water Pouring Contact Mode
The water pouring contact mode occurs when the liquid metal and the water come into
contact such that the reaction limited their interfacial area of contact is constant. In this
research we only consider the last contact mode with its hydrogen production from the
interaction with water as shown in Figure 1. Id.
B. Literature Review
In an European research program, based at the European Communities Joint Research
Center, ISPRA Italy, a series of small scale liquid lithium-lead alloy/water tests were
performed to investigate hydrogen generation during the liquid metal/water interaction.
These included the two experiments described below.
(i) Small Scale Experiments
1. The liquid metal drop experiments

beaker, open to air, and partially filled with water r41
- - m , a d stream was 350° C, a , the J l« consisted of pouHng a SO, C stream of ^ m t 0 o ^
e x p _ , the •ithium-.ead and water interacted in an indisoernible J ^ H Z
expenments, bObb.es formed as the stream of , iq u i d meta, flowed to the b l m of
— , These bubb.es consisted m O s t l y of steam and entrained a ,: r o f t h e 'gn.ted above the water surface with a fine b u m e r flame. A, a .ater stage, the h,hi
. n s on the bottom of the beaker, became coated with a thin bubbt fi,m w h i l ^
became detached as iarger bubb.es. These bubb.es cou.d be ignited with fl I T
R e p e a t these two tests, but in a Cosed vesse., the rise in pressure measured T 2
^ •>««• W. in these experiment, the contact mode is pouring B q u M meta. into water
« e reac ,on surface area varied with time during e x p e r t s and the hydrogen g e ^
a o vaned with time. The hydrogen generation rate ca^.0. be d o t t e d c
expenment but we can use this resuit to estimate the amount of hydrogen generate .^
^xpen . . Wepatternedourwo.onthe.ast contact mode (pouring l r o n t ^
:
2. The liquid metal/steam interaction.
The experiments were designed to faci,i«a,e the measurement of the average rate of
r = f v a r i o u ; b r e e d e r materiaU with steam [ 5 , T h e reaction was . i U a J Z i g
- a m through a heated test chamber contai.ng the breeder samp.es. Tests have bee
performed with three different breeder material ,iquid Li l7Pb83, ^ ^ t e m p e r a t u r e s
from 3,0- C to 450" C; so,id and ,iquid Li7Pb2, with initia. temperatures from 550« C to

850° C; and liquid Li, with initial temperatures from 700° C to 900° C. After the steam
passed over the exposed surface of a breeder sample, the resulting steam and hydrogen
mixture was passed through a condenser, which separated the unreacted water from the
gas mixture. The free hydrogen was then collected. By measuring the amount of
hydrogen collected, the average rate of reaction could be inferred. The results of these
experiments are summarized in Figure 1.3 [5]. This figure shows that the rate of reaction
of steam with LinPbss is a function of the initial breeder temperatures and shows an
approximate range of hydrogen generation that can help us to estimate the matrix of our
experiment. The hydrogen generation rate is a function of time during the reaction.
However, in this experiment, the hydrogen generation cannot be measured in a short time
interval. We cannot use this method to determine the hydrogen generation rate. A wide
range of small scale lithium lead alloy/water experiments performed in Europe lead to the
conclusions that the extent of the hydrogen generation is a function of initial liquid metal
temperature and contact area.
(ii). Large Scale Experiments
A series of large scale lithium-lead and lithium/material compatibility experiments were
performed at the Hanford Engineering Development Laboratory (HDEDL) in Richland,
Washington [6]. The experimental program consisted of three liquid metal/material
groups; liquid metal/atmosphere (air, nitrogen, and carbon dioxide atmospheres), liquid
metal/steam, and liquid metal/concrete. The experimental conditions were chosen to
reflect the conditions of postulated accident scenarios. Accident scenarios considered
included rupture of breeder material lines or modules allowing breeder material spillage to
containment cells, and rupture of coolant lines to allow coolant breeder material contact.
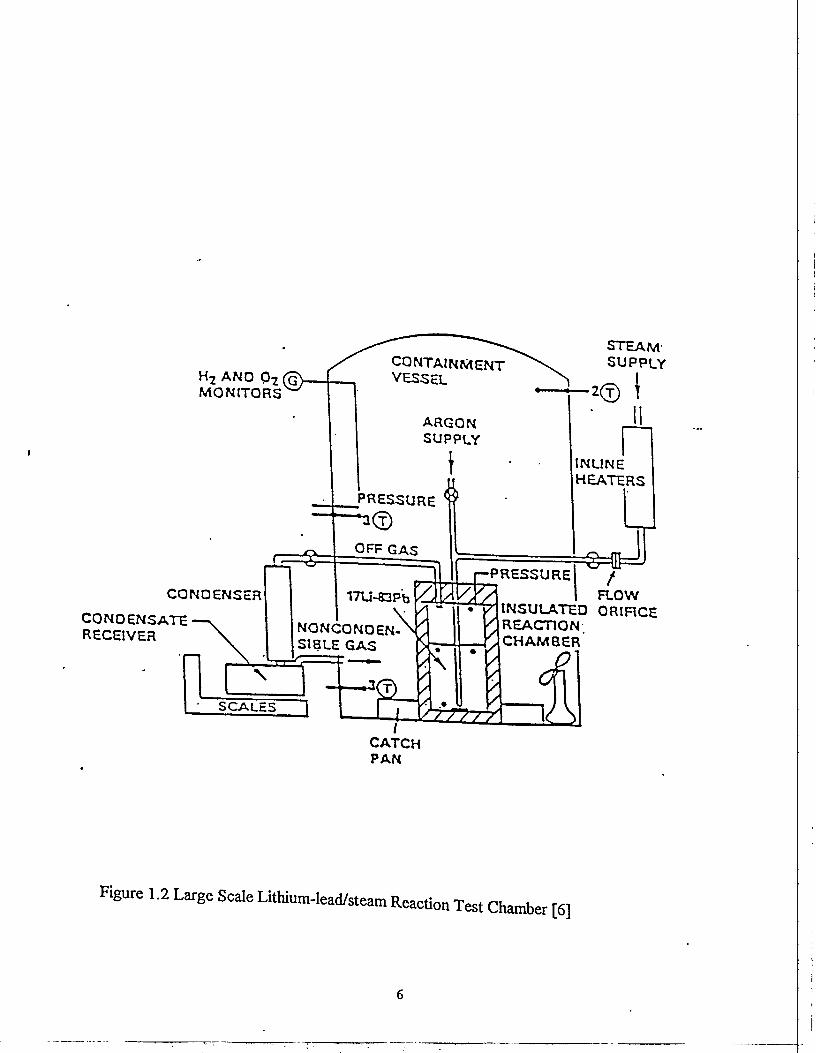
The lithium-lead/steam reaction test consisted of injecting 335° C superheated steam at
about 7 gm/sec into a 200 kg pool of 500° C lithium-lead for 325 seconds. A schematic of
the experimental apparatus used in the test is given in Figure 1.2 [6]. The open reaction
chamber was placed in a containment vessel containing an argon atmosphere. The
reaction chamber was covered with three inches of insulation to minimize heat loss. The
reaction chamber was vented by a line that passed through a condenser.
H2 AND Q2
MONITORS
CONDENSATERECEIVER
CONTAINMENTVESSEL
ARGONSUPPLY
INLINEHEATERS
PRESSURET
PRESSURE! /I FLOW
INSULATED ORIFICEREACTIONCHAMBER
NONCONOEN-SIBLE GAS
CONOENSER
CATCHPAN
Figure 1.2 Large Scale Lithium-Iead/steam Reaction Test Chamber [6]

oow
o£i
D)
< S* - <CO
CC
co
<Dc(D
c(D
o
10
0.1
0.01
I
I I
300 350 400 450 500 550 600 650 700 750 800 850 900Temperature (C)
Figure 1.3 Rates of Hydrogen Generation for LiPb an,d Li Reacted with Water Steam [5]
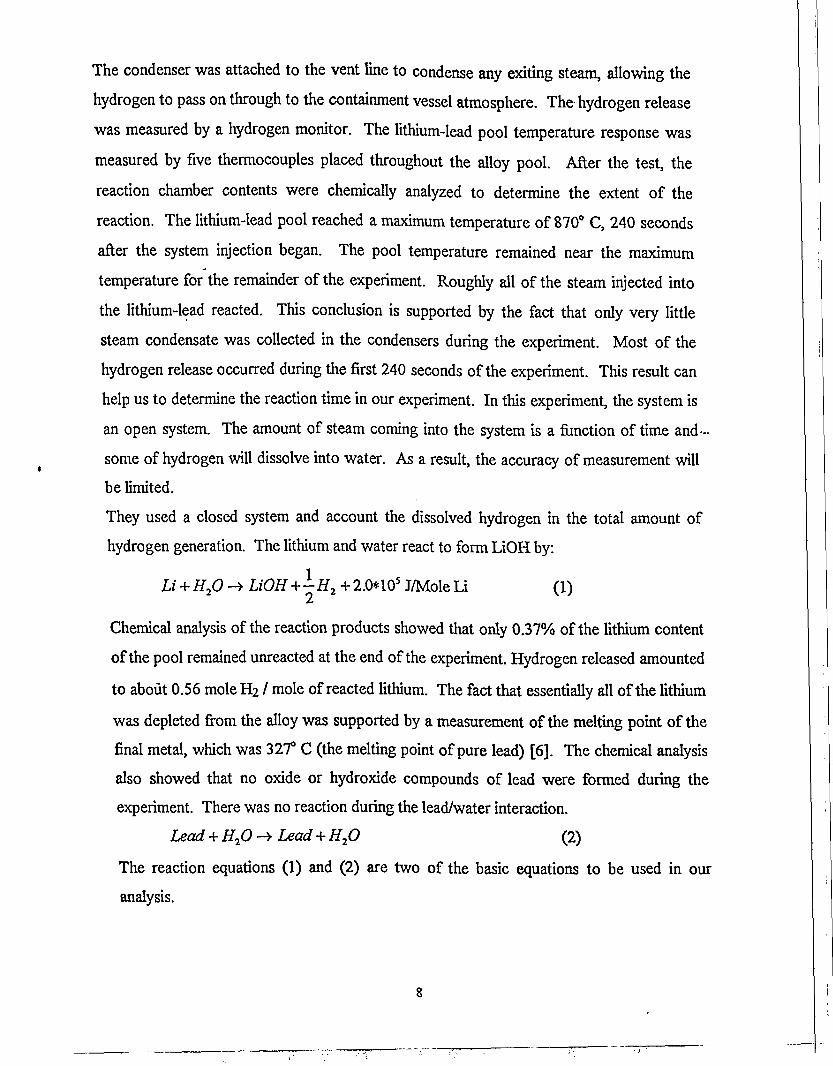
The condenser was attached to the vent line to condense any exiting steam, allowing the
hydrogen to pass on through to the containment vessel atmosphere. The-hydrogen release
was measured by a hydrogen monitor. The lithium-lead pool temperature response was
measured by five thermocouples placed throughout the alloy pool. After the test, the
reaction chamber contents were chemically analyzed to determine the extent of the
reaction. The lithium-lead pool reached a maximum temperature of 870° C, 240 seconds
after the system injection began. The pool temperature remained near the maximum
temperature for the remainder of the experiment. Roughly all of the steam injected into
the lithium-lead reacted. This conclusion is supported by the fact that only very little
steam condensate was collected in the condensers during the experiment. Most of the
hydrogen release occurred during the first 240 seconds of the experiment. This result can
help us to determine the reaction time in our experiment. In this experiment, the system is
an open system. The amount of steam coming into the system is a function of time and-
some of hydrogen will dissolve into water. As a result, the accuracy of measurement will
be limited.
They used a closed system and account the dissolved hydrogen in the total amount of
hydrogen generation. The lithium and water react to form LiOH by:
Li + H2O ->• LiOH+-H2 + 2.0*10s J/Mole Li (1)
Chemical analysis of the reaction products showed that only 0.37% of the lithium content
of the pool remained unreacted at the end of the experiment. Hydrogen released amounted
to about 0.56 mole H2 / mole of reacted lithium. The fact that essentially all of the lithium
was depleted from the alloy was supported by a measurement of the melting point of the
final metal, which was 327° C (the melting point of pure lead) [6]. The chemical analysis
also showed that no oxide or hydroxide compounds of lead were formed during the
experiment. There was no reaction during the lead/water interaction.
Lead + H2O -> Lead + H2O (2)
The reaction equations (1) and (2) are two of the basic equations to be used in our
analysis.

Other small scale experiments were performed by J P
Th, expenment was performed with a ciosed l o w p r e s s u r e ( < 2 . 0 b a r )
reaction surfcce are, !n the experiments, the extent of reaction was found tothe range of l ra, ia, l i q u i d m e t a I t e m p e r a t u r e s ^ ^ ^
r ^ g e n a, 200 . was nT«0 6 . mole/m . For the W C initial iiquid m e t a I t e m p e r a t u r e ^ fte _ ^
temperature tests, the average mass of hydrogen at 200 s was ,0.7 +/- lM mMm> m i
for the 350' C initia, ,iquid meta, temperature tests, the average mass of hydrogen a, M 0 .
was, ,0+M.,6m0 ,^ . In theseexPe r imen, s , ,he,argeerrorwasdue,on1easuremen .system error. The ,ow pressure range « 2 b a r ) I i m i t e d ^
» e _ n t . The pressure transducer reso.ution is .imited. I f we reduce the gas vo,um
- * e system, that w i I, increase the accuracy of pressure measurement. Tnelfore 2
system ,des,gned to operate around 7 bar which is the M range of the transducer used
Th.s will increase the accuracy as much as possible.
(iii) Liquid Metal Transport Reaction Model
A Uquid meta, transport reaction mode, was modified by P. O. Biney [ 8 ] to estimate the
reaction.coefficient ( AS) in the Arrhenius equation D^
based on the premise tha, Ae rate of reaction during LiPb/water interaction is c o n t r o l
hy the rate of di^sion of Othium atoms and products L i20 or UOH in the Uquid J
Thus the rate of the reaction at the inact ion surface wU, be far greater than the rate of
difiuston of lithium to the interaction surface.
The Hquid meta, transport reaction mode, is based on the Mowing assumptions- (,) the
reaction occurs on,y at the surface, (2) the system is assumed to be one dimension* (3)
the concentration of lead is assumed to be constant throughout the interaction since ,n r

are 83 atoms of lead to 17 atoms of lithium in the
Ce2et:r«he reaction are idea,, (6) once reaction b e ^ f '
interaction surface is zero, and (7) there is n 1 " " ^ " "„ , „ . . , u
K> 1$ n ° b u I k m™& mthin the liquid metal pool
Fgure u shows the reference coordinate system used for the model. In the n j
— „ surface is shown located a distance » from t h e b o t o m o f fte , J ^
ool. H y p o t h e c concentrations of the products and recants are a,so indicaL ^
Sure. AvaporflmofthicknessC, ) ^ shown above the interaction surface and p ^
of subcooled water above the vapor film.
Using this reference coordinate and modified model, the vatae of reason constant
in the Axrhenius equation ^ . . « p ( - f ) was estimated. AS is , 0 9 x I 0 > J / m o l e
for li.hium-.ead/water interaction and it is independent of initial liquid meta. temperature.
C. Objectives and Scope
The objectives of this research are:
1. To make design improvements in an existing experimental setup and to develop a
set of experimental procedure for studying liquid metal/water reactions.
2. To develop mathematical models for predicting the hydrogen generation rateduring LInPbg3/water reaction.
3. To determine the hydrogen generation rate and the empirical chemical kineti<
reaction rate constants from the hydrogen generation curve during lithi'
lead/water reaction.
cs
:um
10
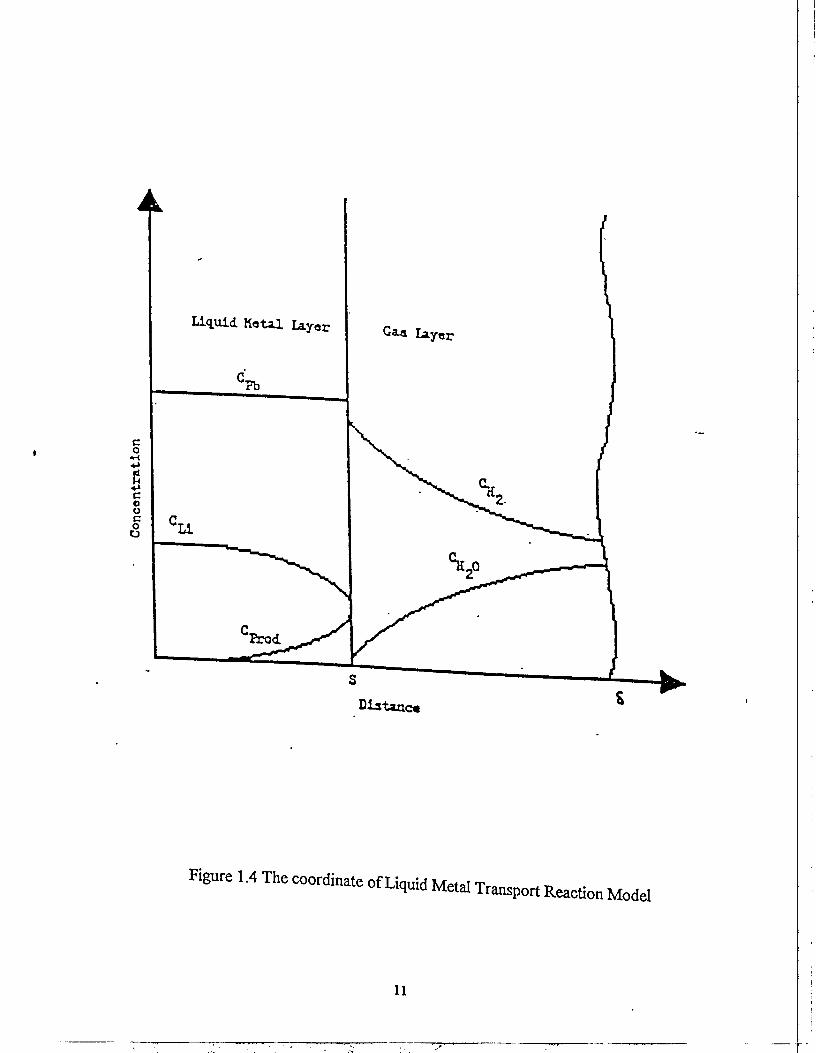
Figure 1.4 The coordinate of Liquid Metal Trans-port Reaction Model
11

n. PRELIMINARY DESIGN OF EXPERIMENTAL SYSTEM
In this chapter, the details of an initial experimental setup will be presented. Additional
changes made in the setup for the final experiments will also be discussed.
A. Experimental Test Matrix
To enable us to determine the operating condition of the system to be designed, a detailed
experimental matrix was initially developed. The matrix has been modified to enable only
the most important parameters 10 be varied. The primary experimental variables are:
1. Initial Liquid Metal Temperature
2. Initial Water Temperature Timv
3. Initial System Pressure Piue
4. Total reaction time tr and
5. Initial Mass of liquid Metal M!m (de-emphasized)
To ensure that the surface area for reaction is constant throughout an experiment, the area
was selected to be the maximum that prevents Taylor instability. These instability waves
can grow if the characteristic length of the liquid metal surface is greater the Taylor
wavelength (X) [10]. This wavelength ( 2 ) is calculated using.
\ g*Ap
where
a is water surface tension 58.9*10~3 N/m (at water temperature 100°C),
g is gravity acceleration 9.807 m/s2,
Ap is density difference 960.6 kg/m3 between water and water vapor at (100°C).
Since, for our experiment, the Taylor wavelength equals 2.721 cm, we used a tube of 2.54
cm inside diameleras the liquid metal chamber. Thus the liquid metal surface is impervious
to Taylor instabilities, which implies that the contact area will remain relatively constant
throughout the experiment.
12

The Secondary variables measured included,
1. Reaction product gas temperature Tug.
2. Reaction product gas pressure Pug.
3. Liquid Metal Temperature T)m (t) (350°C-650°C).
4. Lower gas chamber volume V|g.
5. Low gas chamber pressure P|8.
6. Lower gas chamber temperature Tim.
7. Initial Upper Gas Chamber Volume V;ug.
The final experimental test matrix for lithium lead/water reaction is shown in Table 2.1.
Table 2.1 Final Experimental Test Matrix for Lithium-IeadAVater Reactionwith Fixed Reaction Area (5.06 cm2)
Liquid Metal
Temperature
350
350
400
400
400
500
500
500
600
600
650
650
Initial Water
Temperature
°C
90
70
60
90
90
90
70
90
90
70
90
70
Reaction
Time
s
5,10,20,200
5,10,20,200
5,10,20,200
5,10,20,200
5,10,20,200
5,10,20,200
5,10,20,200
5,10,20,200
5,10,20,200
5,10,20,200
5,10,20,200
5,10,20,200
Liquid Metal
Mass
gm
60
60
60
60
30
60
60
30
60
60
60
60
13

B. Preliminary Determination of Hydrogen Gas Pressure in the Gas Region of theUpper Chamber
In order to provide estimates of gas pressures and concentration of hydrogen gas in the
gas region, a preliminary analysis was made to obtain the range of hydrogen gas
concentration and partial pressures that may be encountered in the course of the
experiment. The analysis was based on the following:
1. The mass of liquid metal initially in the lower reaction vessel shown in Figure 2.1 was
known.
2. The percent of metal reacted was varied from 5% to 100% (a typical range for such
nonmixing reactions).
3. The upper chamber gas region volume shown in Figure 2.1 was varied by varying the
water level in the upper chamber (of diameter 3.81 cm) to produce gas volume heights
of from 5 cm to 25 cm.
4. Saturated liquid is assumed to be in the upper chamber, and the gas temperature was
assumed to be 100 °C.
The above information were used in conjunction with the chemical reaction equation for
lithium-lead (LinPb83)/water reaction to determine the theoretical partial pressure of
hydrogen generation during the reaction. The details of the calculation are given in
Appendix F. Table 2.2 gives sample calculation results for (LinPbg3)/water reaction.
From Table 2.2, it is evident that in addition to serving as a reactant and condensing
medium for any water vapor generated as a result of the reaction, the water in the upper
chamber shown in Figure 2.1 also can be used to control the partial pressure of the
hydrogen produced in the upper gas region by varying its column height. In doing so, we
can also have control over the partial pressure of the hydrogen and therefore its
concentration. These calculation results also provided us with the upper bounds of
pressures to be expected in the system, and this information was used in designing for the
minimum thickness of both the upper and lower vessels.
14
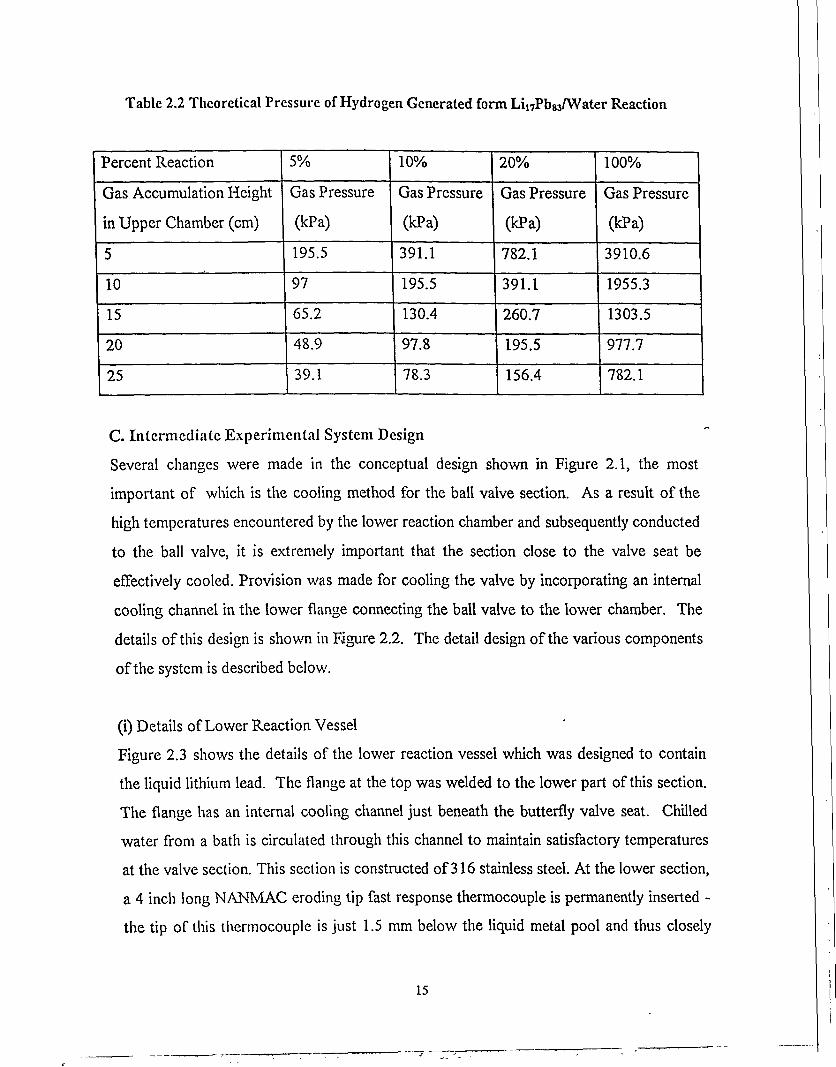
Table 2.2 Theoretical Pressure of Hydrogen Generated form LinPb83/Water Reaction
Percent Reaction
Gas Accumulation Height
in Upper Chamber (cm)
5
10
15
20
25
5%
Gas Pressure
(kPa)
195.5
97
65.2
48.9
39.1
10%
Gas Pressure
(kPa)
391.1
195.5
130.4
97.8
78.3
20%
Gas Pressure
(kPa)
782.1
391.1
260.7
195.5
156.4
100%
Gas Pressure
(kPa)
3910.6
1955.3
1303.5
977.7
782.1
C. Intermediate Experimental System Design
Several changes were made in the conceptual design shown in Figure 2.1, the most
important of which is the cooling method for the ball valve section. As a result of the
high temperatures encountered by the lower reaction chamber and subsequently conducted
to the ball valve, it is extremely important that the section close to the valve seat be
effectively cooled. Provision was made for cooling the valve by incorporating an internal
cooling channel in the lower flange connecting the ball valve to the lower chamber. The
details of this design is shown in Figure 2.2. The detail design of the various components
of the system is described below.
(i) Details of Lower Reaction Vessel
Figure 2.3 shows the details of the lower reaction vessel which was designed to contain
the liquid lithium lead. The flange at the top was welded to the lower part of this section.
The flange has an internal cooling channel just beneath the butterfly valve seat. Chilled
water from a bath is circulated through this channel to maintain satisfactory temperatures
at the valve section. This section is constructed of 316 stainless steel. At the lower section,
a 4 inch long NANMAC eroding tip fast response thermocouple is permanently inserted -
the tip of this thermocouple is just 1.5 mm below the liquid metal pool and thus closely
15
measures the l i (Jd metal t e n u r e . All basic dimensions of t h e , o w e r r e a c t i o n
are provided in Figure 2.3.
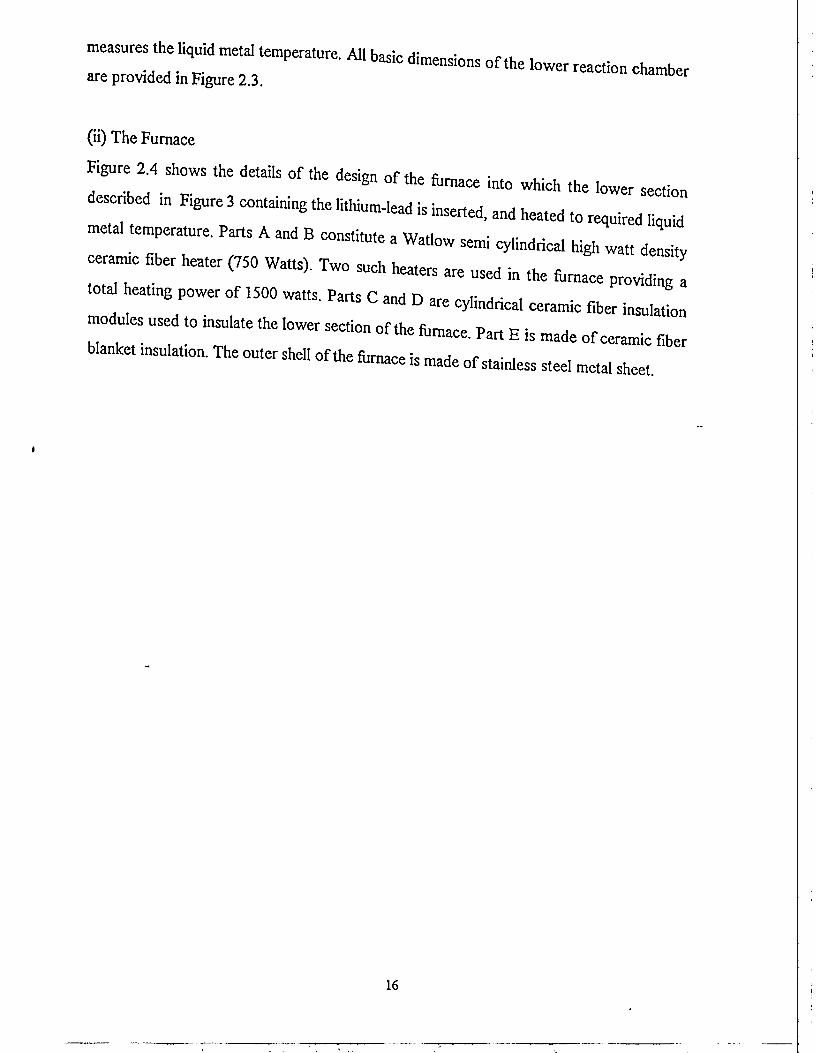
(ii) The Furnace
Figure:2A shows the de,ai,s of ,he design of t h e & r n a c e in tQ w M c h ^
1 7 " ̂ 3 COtii h '^t e m « . Pans A and B constitute a Wat,ow serai cyHndrica. high watt
fiber h r a t e r ( 7 5 0 W a H s , T w o ^ h e a (( 7 5 0
.ota eafng power of !500 watts. Parts C and D are cy l i n d r i c a I c e r a m i c f l b e r ^
modu.es used to insu.ate the iower section of the & mace. Pan E is made of ceramic fber
bianket .nsu.at.on. The outer shell of the taace is made of stainless steel metal sheet
16

DlttAcquisitionSyittm
Computtr
t.A.:;.^
ConttantTempvnturabath '
\
Praliura Tramducar
Lowar FUnga
Solanold Valva
Liquid Mt t i l
Argon CyKndar.
Lowar Furnace
Collection Vataal
Figure 2.1 Conceptual System Design
17
Controlttr

COLD WATER INLET
INTERNAL WATER CHANNEL
INTERNAL COOLINGCHANNEL
All dtmonilotu «ro In Inchot
Figure 2.2 Detail, of .nterna. Cooling Channel inLower Flange.
18

TC PORT
ARGON INLET
316 stainless steel vessel
All dimensions »re In Inches
Figure 2.3 Details of Lower Reaction Vessel
19

A—Heater Coil
B---lnsulation
A and B—Heater Assembly
C and D-Cylindrical Ceramic Fiber Insulation
E—Ceramic Fiber Blanket Insulation
All dtmenilont »ra In Inches
Figure 2.4 Details of Lower Furnace Design
20

(iii) Upper Vessel Details
The upper vessel, constructed with 316 stainless steel is shown in figure 2.5. Initially,
space V contains saturated water vapor, whose temperature is measured using a adjustable
probe NANMAC right angle thermocouple (not shown) connected to port A, which also
eventually measures the upper gas temperature once reaction is initiated. A second
thermocouple connected to port C measures the temperature of the water in the upper
chamber. A convection coil is connected to ports E and F, and hooked to a constant
temperature bath and is used to control the initial temperature of the water. The upper
chamber is bolted to the butterfly valve through a flange F.
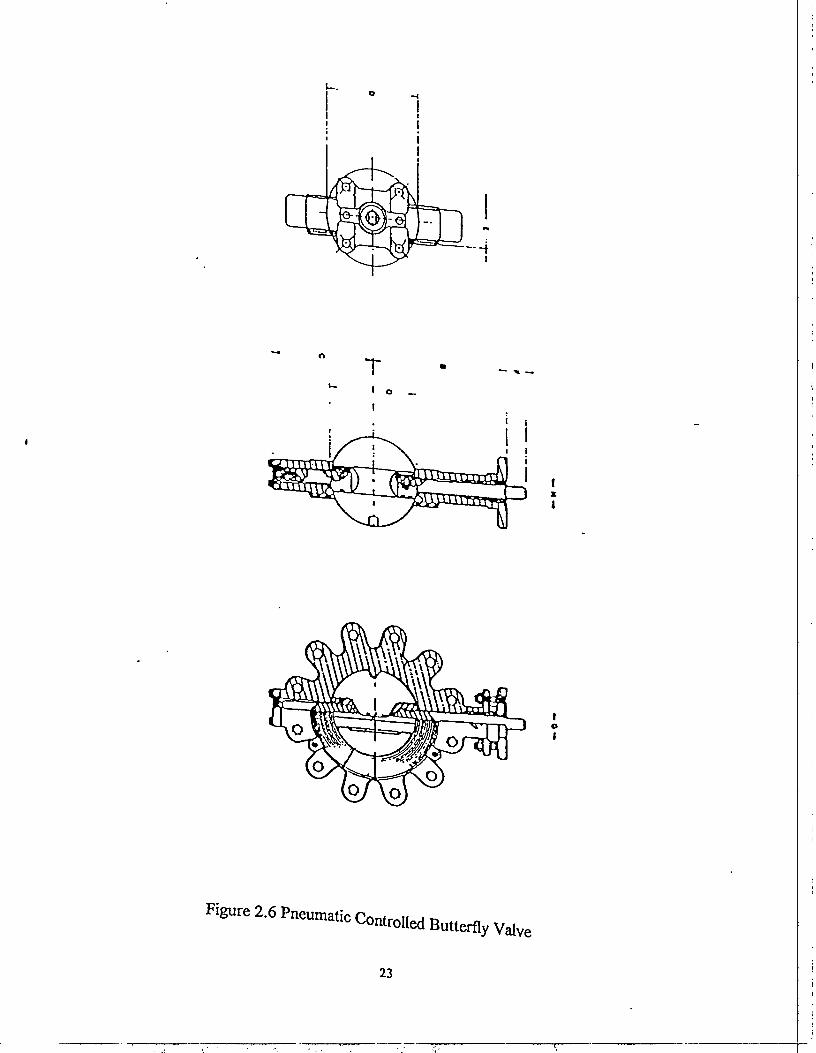
(iv) Mid-Section Butterfly Valve
A pneumatic controlled 2-1/2 inch size 316 stainless steel butterfly valve, shown in Figure
2.6, separated the lower reaction chamber from the upper collection chamber. The valve is "
an ANSI class 300 high temperature valve, the valve was chosen due to its negligible
leakage characteristic, sealing capacity and cycle time (250 ms). The upper and lower
sections of the apparatus are connected to the butterfly valve through a flange with graf oil
gaskets used to prevent leakage. The flange connection also facilitates easy disconnection
of the lower portion of the apparatus for the purpose of loading and unloading the liquid-
metal into and out of the vessel in a glove box. To ensure that the butterfly valve and its
actuator are operated within their specified temperature range, the valve section is water-
cooled internally as described earlier.
(v) Design of Convection Coil
The experimental determination of the rate of hydrogen production during Lithium-
Lead/Water reaction involves two distinct stages, the heating stage and the reaction stage.
During the heating stage, the lower portion of the apparatus is electrically heated to melt
the lithium-lead and to bring it to the required initial temperature, TLM. The reaction stage
begins when the butterfly valve is opened and water from the upper chamber makes
contact with the liquid metal in the lower section. This stage ends when the butterfly valve
is closed at the end of a pre-determined reaction time, tR.
21

1/8 holt
1/8 tube direct weld
for pressure transducer
UGP
UWT TC connection hote
FLANGE
1M hole (orCoil connection
36.0
All dimension* In Inchat
Figure 2.6 Details of Upper Vessel
22
T1
1o _
j1
iii
I tzt
IoI
Figure 2.6 Pneumatic Contro,,ed Butted va,ve
23

Duong * e heatmg stage, it is important to ensure that both the butterfly va!ve and the
.ectnca, res,s,ance heating e.emen,s are maintained within their stated operating
temperature range. !t is a,so important to ensure that right s i z e heaters and adeouat
•nsutan ,s provided to obtain a reasonable heating , i r a e ( 3 M 5 m i n u t e s , T h e s e ^
at a hea, transfer analysis be done a, the ear,y design stages of the system to ensure that
t c system under des.gn wil, satisfy the retired constraints. A two-dimensional finite
element analyse was used to ana,yze the heat transfer characteristics of the lower portion
of the apparatus during the heating stag. During the heating stage of the experiment, heat
•s transferred from the lower chamber to the upper chamber, and subsequent* by
oonvecfon to the water in that chamber. This hea, has to be removed to maintain I
constant water temperature in the upper chamber. The description below gives summary
of analyses performed to ensure ,ha, the convection coil selected has adequate he*
ransfer area to remove this heat. Finite e,ement ana,vsis described earlier indicated a tota,
of 375 Watts of heat will have to be removed. Based on this a number of constant
temperature baths were reviewed to provide the cooling capacity and flow. Also the pump
characteristics of the baths were noted. From the experimental test matrix given earlier I
Table 1, the temperature of the pool of water outside the coil ranges from 60°C to 90°C
The above information, together with an assumed bulk inlet temperature of 5°C at the inlet
of the coil were used to estimate the heat transfer area, the .ength of tube required, the
head loss m the cooling coil circuit and the flow rate for the given system characteristics
The results of the coil design calculator are summarized in Table 2 3
Figure 2.7 shows a partial assembly of the fcmace, the lower reaction chamber, the mid-
secfon pneumatic controlled butterfly valve, the cooling coil and the upper coHection
chamber.
D. Initial Testing of Intermediate Experimental System
The assemb.y of the experimental setup shown in Figure 2.7 was completed. The firs, tes,
performed was ,he sys,em pressure ,es,s, and during tins test, i, was found tha, the
system cou.d not hold pressure. Systematic pressure ,es, performed on the
md,vdual component indicated a welding imperfection on the cooling coil
24

Upper gas pressuretransducer (UGP)
, Upper water temperature
Lower water thermocouple
Circulating watersolenoid valve (CWV)
Upper Charobi: water
Upper gas thermocouple (UGTI
" " < ! n o W v " v «
Upper water furnace (UWF)
Upper Reaction Vessel
Argon outlet• valve
Argo bottle
Lower ga, p r e t I U
transducer (LGP)
Gas/water collection tank
Throttla valve
Liquid rnetel furnace
Figure 2.7 Partial Assamb.y of PreHminary System
25
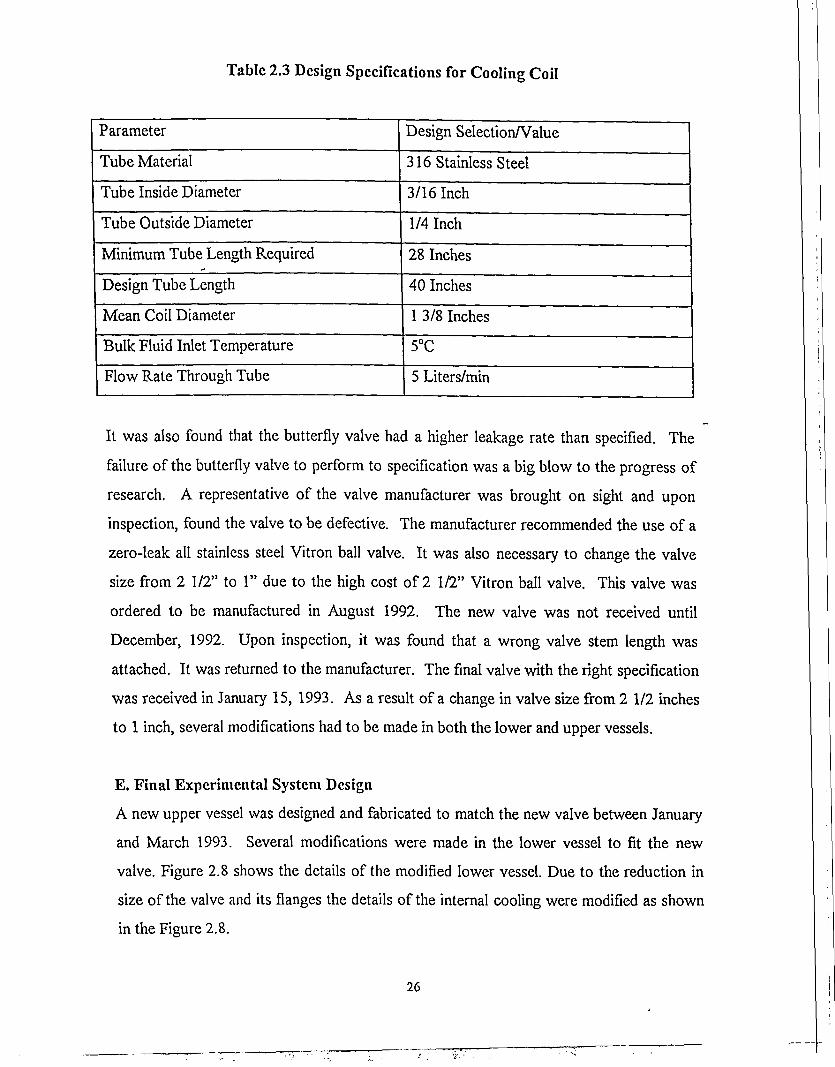
Table 2.3 Design Specifications for Cooling Coil
Parameter
Tube Material
Tube Inside Diameter
Tube Outside Diameter
Minimum Tube Length Required
Design Tube Length
Mean Coil Diameter
Bulk Fluid Inlet Temperature
Flow Rate Through Tube
Design Selection/Value
316 Stainless Steel
3/16 Inch
1/4 Inch
28 Inches
40 Inches
1 3/8 Inches
5°C
5 Liters/min
It was also found that the butterfly valve had a higher leakage rate than specified. The
failure of the butterfly valve to perform to specification was a big blow to the progress of
research. A representative of the valve manufacturer was brought on sight and upon
inspection, found the valve to be defective. The manufacturer recommended the use of a
zero-leak all stainless steel Vitron ball valve. It was also necessary to change the valve
size from 2 1/2" to 1" due to the high cost of 2 1/2" Vitron ball valve. This valve was
ordered to be manufactured in August 1992. The new valve was not received until
December, 1992. Upon inspection, it was found that a wrong valve stem length was
attached. It was returned to the manufacturer. The final valve with the right specification
was received in January 15, 1993. As a result of a change in valve size from 2 1/2 inches
to 1 inch, several modifications had to be made in both the lower and upper vessels.
E. Final Experimental System Design
A new upper vessel was designed and fabricated to match the new valve between January
and March 1993. Several modifications were made in the lower vessel to fit the new
valve. Figure 2.8 shows the details of the modified lower vessel. Due to the reduction in
size of the valve and its flanges the details of the internal cooling were modified as shown
in the Figure 2.8.
26

•••KM::
" dia coolingchannel
4.30Modified Flange
Weld neck machined off.8" dia. cooling channels
drilled in flange as shown
Diameter of two holes
n inches
Figure 2.8 Final Design Details of Lower V,essel
27

Tapped holefit thermocouple
provided
l£0.25
1/4" Top Plate
0.75'
1/4" drill hole1/4" 316 ss tubeto be attachedand welded
3/16" hole -for thermocouple /fitting to be welded
t = ptpe or platethickness
1 Both ends of pipeBottom edge of topplate.
%-tPreparation forWelding
•vr*
1/8" drill hole
1/8" 316 ss tube
to be attached and welded
f1/4" drillhole1/4" 316 ss tubeto be attachedand welded
All dimensions in inches
12"
1/4" hole
Fitting to bewelded over hole
3/16" hole'or thermocouplefitting to be welded
Figure 2.9 Fina, Design Da,a«s of Upper Vesse,
28
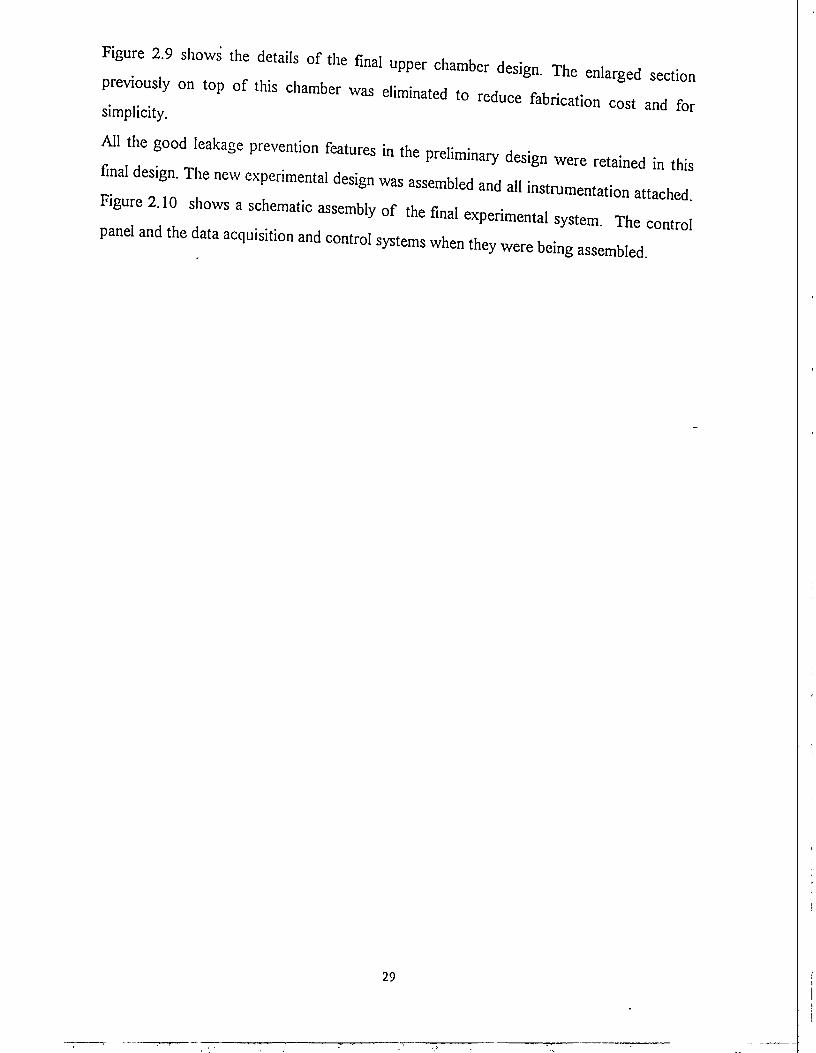
ZZon top of lhis chamber was diminated to reduceZZ.Ail the good leakage prevention features in t h e p r e l i m i n a ^ d e s i g n w e r e
na> des,gn. T e new eXperimenta, des i g n w a s a s s e m b l e d a n d ,„ ^ ^
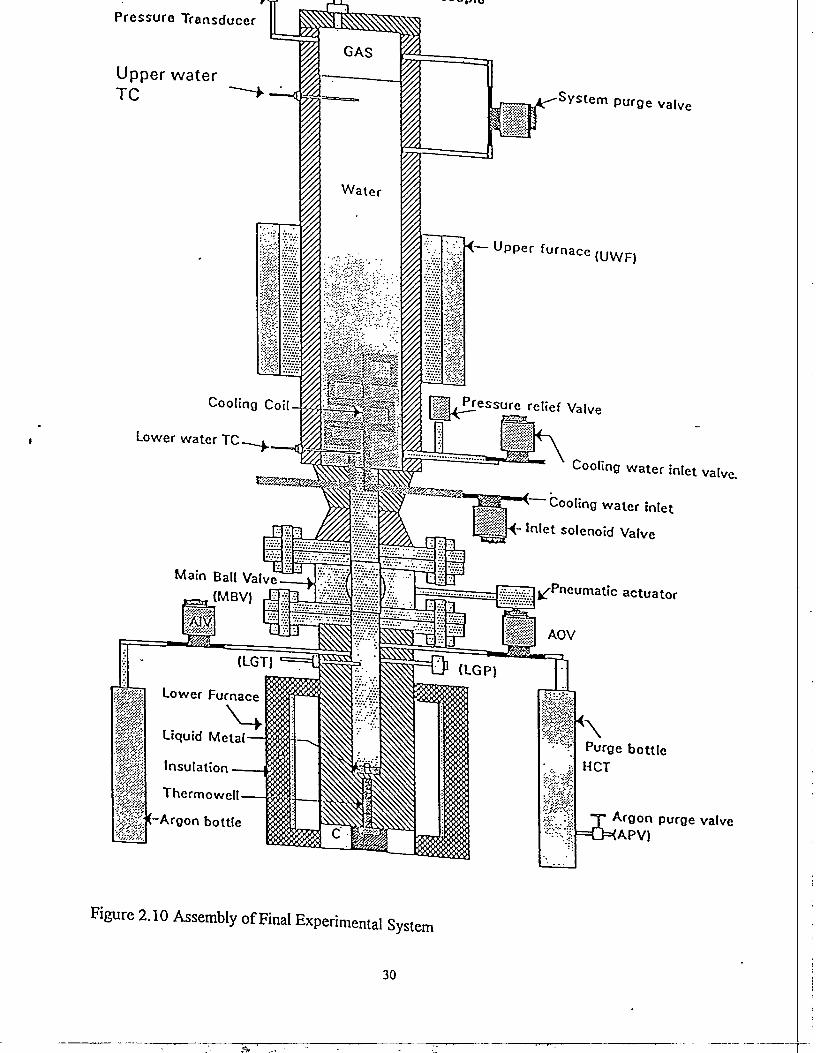
Rgure Z,o shows a schematie a W f
P v m a l uallin w a s ass™Wed and all instrumentation atl
figure 2.10 shows a schematic assembly of the final experimental system The ,
pane, and the data acquisition and contro, systems when they were being assembled.
_
29
Pressure Transducer
Upper waterTC r System purge valve
\ir— Upper furnace(UVVF)
Lower Furnace
Liquid Metal
Pressure relief Valve
giTACooling water inlet valve.
IWi,
Insulation
Thermowell-
((-Argon bottle
> Cooling water inlet
-<- Inlet solenoid Valve
^^TJ^Pneumat ic actuator
AOV
I - r Argon purge valve
Figure 2.10 Assembly of Final Experimental System
30

III. DATA ACQUISITION AND CONTROL HARDWARE
In this chapter, the details of an initial experimental will be presented. Additional changes
made in the setup for the final experiments will also be discussed.
At the heart of the data acquisition and control system is a Keithly Model 575-2
Measurement and Control unit. A summary of the analog input/output and digital
input/output features of the unit are given in Tables 3.1 and 3.2 respectively.
Table 3.1 Analog Input/Output Features of Data Acquisition and Control System
Feature
Speed
Resolution
Full Scale Ranges
Channels
Analog Output Channels
Output Ranges
Resolution
Description/Range
50,000 Readings/s
16 Bits
+100 mV, +200 mV, +500 mV
+1 V, +2 V, +5 V, +10 V
8 Differential
16 Single Ended Plus
8 Additional Single Ended
2, Single Ended
+10 V, +5 V, +2 V, +1 V
13 Bits
31
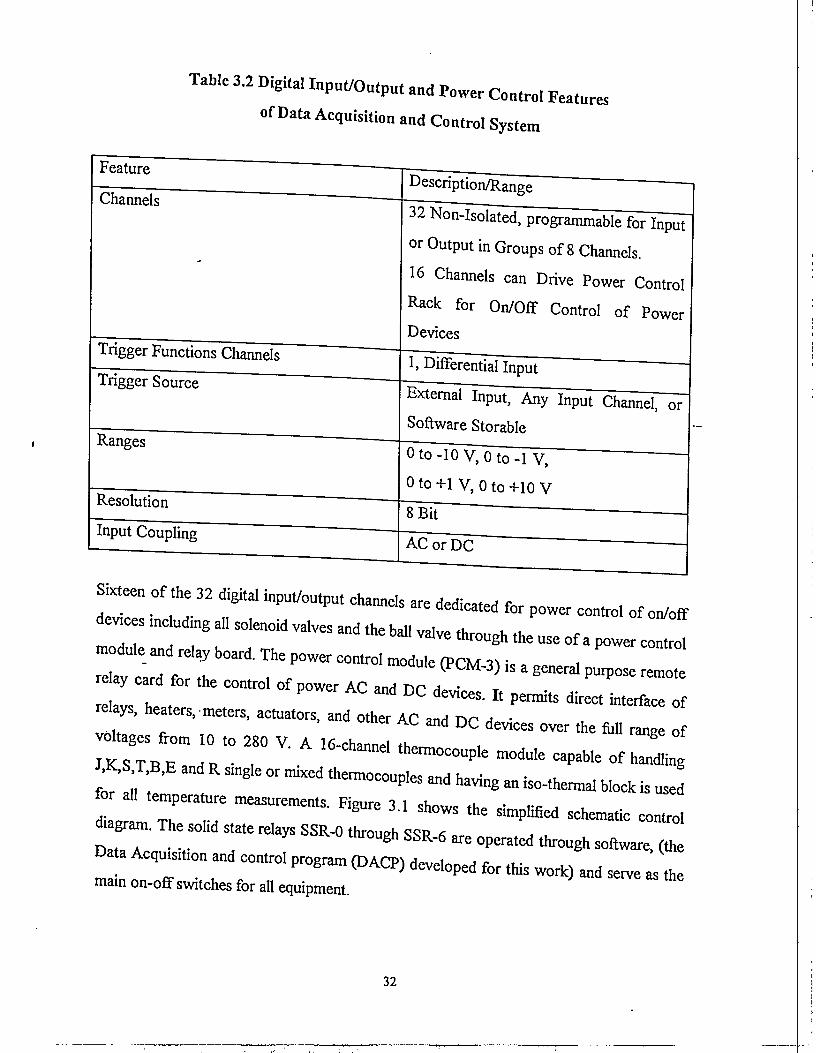
Table 3.2 Digital Input/Output and Power Control Features
of Data Acquisition and Control Syste
Feature
Channels
Trigger Functions Channels
Trigger Source
Ranges
Resolution
Input Coupling
tern
Description/Range
32 Non-Isolated, programmable for Input
or Output in Groups of 8 Channels.
16 Channels can Drive Power Control
Rack for On/Off Control of Power
Devices
1, Differential Input
External Input, Any Input Channel, orSoftware Storable
Oto-lOV, Oto-1 V,
0 to +1 V, 0 to +10 V
8 Bit
AC or DC
Sixteen of the 32 digital input/output channels are dedicated for power control of on/off
devices including all solenoid valves and the ball valve through the use of a power control
module and relay board. The power control module (PCM-3) is a general purpose remote
relay card for the control of power AC and DC devices. It permits direct interface of
relays, heaters, meters, actuators, and other AC and DC devices over the full range of
voltages from 10 to 280 V. A 16-channeI thermocouple module capable of handling
J,K,S,T,B,E and R single or mixed thermocouples and having an iso-thermal block is used
for all temperature measurements. Figure 3.1 shows the simplified schematic control
diagram. The solid state relays SSR-0 through SSR-6 are operated through software, (the
Data Acquisition and control program (DACP) developed for this work) and serve as the
main on-off switches for all equipment.
32

UGT 570 MEASUREMENT SYSTEM1>GP TO AMM-2
UWT T0AIM7
LWT T0AIM7
LGT TO AIM7LGP TO AMM2
LMT
TO AIM7
USV 3-WAY SOLENOID VALVE
MBV-MAIN BALL VALVE
USV-UPPER SOLENOID VALVE
AOV-ARGON OUTLET VALVE
AIV-ARGON INLET VALVE
LWH-LOWER WATER HEATER
UWH- UPPER WATER HEATER
PT -PRESSURE TRANSDUCERTC -THERMOCOUPLEUWT-UPPER WATER TC
LWT-LOWER WATER TEMP.UGP- UPPER GAS PTLGT-LOWER GAS PTLMT-LIQUID METAL TCSSR«= SOLID STATE RELAYMR-MECH. RELAY
AIM7 TC MODULE
UWT DETAILS
TERMINAL BLOCK
TEMP. C0NT.-2
sn-
Figure 3.1 Simplified Schematic Control Diagram33

A. Control of Solenoid Valves
« " * « « of «he cooling coil/flange c i r c u l a t i n g
^ ^ ^ (OAV),,heUpPe,purgvalve (UPV), and .he main bal, v a l v e (MBV) respec(^ ^ P ^
duration of operation of these valves are done through DACP.
B. Control of Liquid Metal Temperature
Liquid me.a. .hermocouple (LMT) reads ,he ,iquid me.al temperature. LMT t e n s e s on
a .ermmal strip from where two sets of .hermocoup.e extension wires take off, one se, to a
temperature oon.ro.ler (Temp. Cent,!) and the other set to the temperature measurement
module ,n the 575-2 DAC System. The preset , iq u i d metal temperature is programmed
•mo Temp. Cont-1, and this controller uses the temperature output of the LMT to con.ro.
•he ,iquid metal heater LMH, and thus the ,iquid metal temperature. LMH could not be
d.rectly connected .0 SSR-I due .0 .he high current puUed hy .he heater. High line current
sohd state relay (SSR-10) was initially connected between SSR-l and the heater, thereby
enabling SSR-l ,0 energize SSR-10 , 0 turn the LMH 0 , That arrangement did not w o *
due ,0 the .eakage current of the two solid s.a.es relays SSR-! and SSR-10. It became
necessary to install a mechanical relay MR-2 between SSR-l and SSR-10. The signal to
energize SSR-l is obtained from the temperature reading on the lower furnace
thermocouple (LFT) which reads the heater surface temperature that has been preset ,0
protect the heater dement from overheating. As long as the experiment has been initiated
and LFT ,s below the se, point, the DAP energizes SSR-! which in turn energizes MR-2
and MR-2 energizes SSR-10. The dynamic control of Kquid meta. temp tough on/off
power regulation of LMT is done by the programmable temperature controller Temp
Cont.-l. H"
C. Control of upper water temperature
The control of the upper water temperature is identical to the control of the Uquid metal
temperature. The solid s,a.e relays involved are SSR-O, MR-1, SSR-9 and ,empera.ure
34
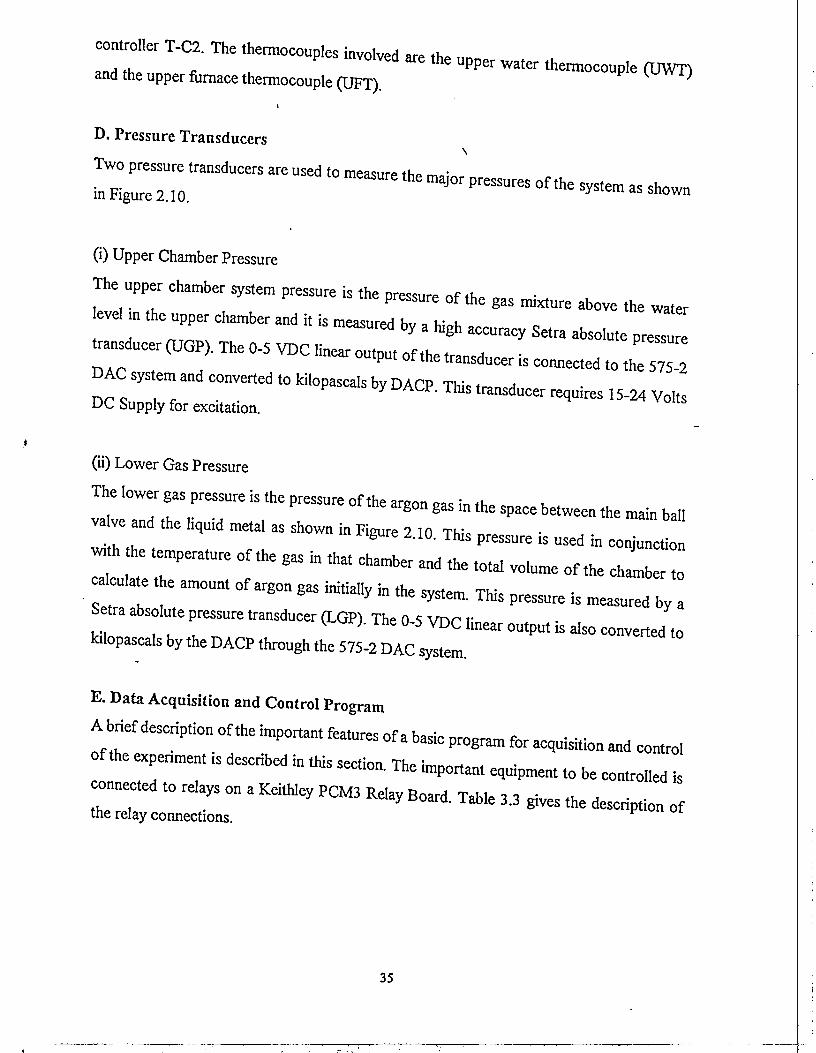
controller T-C2. The thermocouples involved are the upper water thermocouple (UWT)and the upper furnace thermocouple (UFT).
i
D. Pressure Transducers x
Two pressure transducers are used to measure the major pressures of the system as shownin Figure 2.10.
(i) Upper Chamber Pressure
The upper chamber system pressure is the pressure of the gas mixture above the water
level in the upper chamber and it is measured by a high accuracy Setra absolute pressure
transducer (UGP). The 0-5 VDC linear output of the transducer is connected to the 575-2
DAC system and converted to kilopascals by DACP. This transducer requires 15-24 Volts
DC Supply for excitation.
(ii) Lower Gas Pressure
The lower gas pressure is the pressure of the argon gas in the space between the main ball
valve and the liquid metal as shown in Figure 2.10. This pressure is used in conjunction
with the temperature of the gas in that chamber and the total volume of the chamber to
calculate the amount of argon gas initially in the system. This pressure is measured by a
Setra absolute pressure transducer (LGP). The 0-5 VDC linear output is also converted to
kilopascals by the DACP through the 575-2 DAC system.
E. Data Acquisition and Control Program
A brief description of the important features of a basic program for acquisition and control
of the experiment is described in this section. The important equipment to be controlled is
connected to relays on a Keithley PCM3 Relay Board. Table 3.3 gives the description of
the relay connections.
35
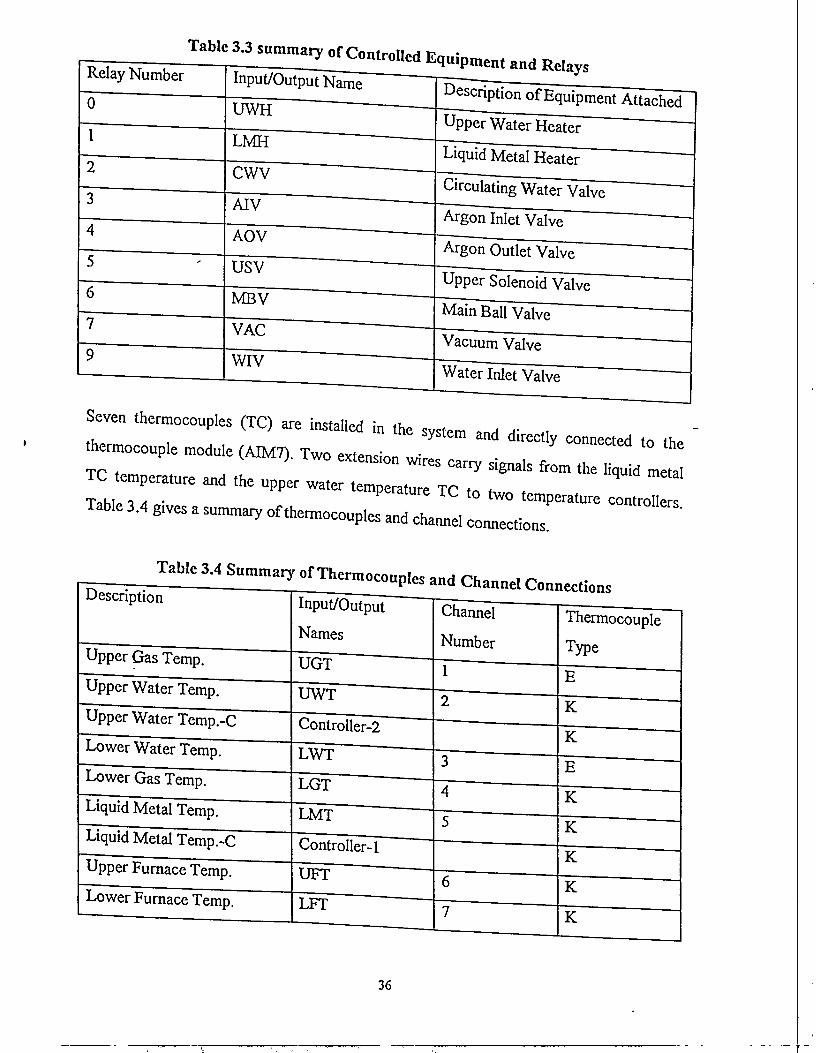
Table 3.3
Relay Number
0~
and Relays
Description of Equipment Attached
Upper Water Heater
Liquid Metal Heater
Circulating Water Valve
Argon Inlet Valve
Argon Outlet Valve
Upper Solenoid Valve
Main Ball Valve
Vacuum Valve
Water Inlet Valve
Seven thermocouples (TC) are installed in the s v ^ m A ,• ,•i, y e m a n d d i r e c t y connected tn th -thermocouple module (AIM7) Two extension • "nnected to theTO t™ , , 6S C a r i y S i g n a l s from ^ e liquid metalTC temperature and the U p p e r water temperature TC to tw •T*uu-iA - t w o temPerature controllersTable 3.4 glVes a summary of thermocouples and channel connections.
Description
Upper Gas Temp.
Upper Water Temp.
Upper Water Temp.-C
Lower Water Temp.
Lower Gas Temp.
Liquid Metal Temp.
Liquid Metal Temp.-C
Upper Furnace Temp.
Lower Furnace Temp.
Input/Output
Names
UGT
UWT
Controller^
LWT
LGT
LMT
Controller-1
UFT
LFT
Channel
Number
1
~2
Thermocouple
Type
1"
YK"
K"
36

The two setra pressure transducers are directly connected to the AMM2 master module.
Each experiment is divided into six phases, and Table 3.5 gives the summary of the
important features of these phases.
Phase 1
During this phase, the upper water, the liquid metal heater and the circulating bath are
turned on to heat the water in the upper chamber to a pre-determined temperature at
which time a vacuum pump is used to control the pressure to obtain a saturated liquid in
the upper chamber.
Phase 2
This phase involves activation of the liquid metal heater and the liquid metal heated to a
pre-determined temperature.
Table 3.5 Description of the Six Phases of Each Lithium-lead/Water Reaction
Experiment
Phase #
1
2
3
A
5
o
Phase Description
Upper Water Heating
Liquid Metal Heating
Water & Metal Temp.
Control
Countdown to
Reaction
Chemical Reaction
Equilibrium Period
Time Interval
Between
leadings (sec)
20
20
20
1
.2
20
^o. of Data
acquired
Maximum)
100
150
90
60
100
100
Data
Saved for
Analysis
x
x
Data
Not
Saved
X
37

Phase 3
This phase involves controlling the upper water and
are w,th,n a given toierance of their preset vaiues. This step was found- , r — ' « " » " accessary for
Hhe e v e n t s to ensure an accurate generation of tne reaction r a te
different experiments with identical values nF.t, r M
temperature, When these two temperatures ar & " " ^ " " "
Phase 4
This is the count down phase. There is a 60 seconds countdown, during which aU
pressures and temperatures are read eve , , second and stored ,ater. Tne aver ^ I
^ - o f reading,. used to estab,iSh the initia, conditions in the sys,em. Parti u,ariy
I™ d t r - a ; pressure of the argon gas in the iow- ̂ . ^ * -dos a t t h t l m e , „ u s e d tQ d e t e r m i n e t h e a m o u m ^ ^ ^̂ ^
the 60 seconds countdown, the fifth phase is initiated.Phase 5
This phase, the reaction phase, begins with the automatic opening of t h e main bail vaive
the reaction. The va,ve remains open for a preset reaction time period after
*> valve Coses, i»dicating end of reaction. AII temperature and pressure readies
recorded and saved during the reaction phase.
Phase 6
Phase 6 involves recording of pressure and all temperatures inchamber
h, phase ,s used to obtain the average vatue of* , tota. an,oun, of hydrogen genera, j
dunng the reaction ,ime period. Pigure 3 , g i v e s a simpIif ied flow L of H ^ a
Aequ1s It lonandContro1Program .ThecompIe teProgramiS8iVen inAppend ixB
38

CONTROL HEATERELEMENT TEMPERATURESWITHIN LMITS
CLOSE ARGON OUTLET& INLET VALVES
You Continjib-?-
Yes
READ ALL DATA CHANNELSFOR COUNTDOWN PHASE
CONTROL HEATERELEMENT TEMPERATURESWITHIN LIMITS
No
FOR PHASE 5(REACTION PHASE)
CLOSE MAIN BALL VALVE
TURN OFF BOTH HEATERS
TURN OFF CIRCULATOR
OPEN ARGON EXIT VALVE
READ UPPER CHAMBERDATA CHANNELS FOR
PHASE 6
TURN OFF ALL OTHEREQUIPMENT
REACTION IS OVER
TRANSFER ALL DATA FROMDATA ARRAYS TO DISK
Figure 3.2 Simplified Flow Chart of Data Acquisition and Control Program
39

IV. CALIBRATION AND TESTING OF EXPERIMENTAL HARDWARE
In this chapter, the details of an initial calibration of the experimental setup will be
presented.
A. Initial System Test
The initial system tests performed included a check of continuity of all electrical
connections, testing of all instruments with and without the use of data acquisition and
control system, calibration of upper and lower vessel volumes.
B. Calibration of Upper Gas Volume
In order to obtain an accurate measurement of the gas space above the water in the upper"
chamber, it was necessary to accurately calibrate of calculate the volume and to determine
the mean and standard deviation of the measurement for statistical analysis of the final
experimental data. Figure 4.1 shows the experimental set up for calibration of the upper
gas volume. With the upper solenoid valve (USV) closed, upper pressure transducer
(UGP) and upper gas thermocouple (UGT) removed, the upper chamber is filled (through
valves A and B) with water until the system is completely filled. The chamber is slowly
drained through valves A and B into a finely graduated cylinder. The volumes and mass of
water collected at different water levels on finely graduated indicator on the upper
chamber are recorded. The measured results are then compared to the calculated results
obtain from dimensions of the vessel and tubes. Table 4.1 summarizes the results of the
upper chamber calibration tests. The experimental values of the volumes agree well with
those calculated using vessel and tube dimensions. In the useful water level range of 0-9
inches, the maximum standard deviation is 0.5 cc. Thus all upper gas volumes will be
repeated as xxx.xx + 0.50 cc. The total volume of the space in upper chamber was
measured to be 1384 cc. The calculated value obtained from system dimensions is 1386
cc. The volume used in all calculations is the average of the two, 1385.0 cc + 1 cc.
40

UPPER GAS TC •
GRADUATED SCALE
PRESSURE TRANSDUCERTRANSPARENT GLASS TUBE
WATER LEVEL INDICATOR
MANUALVALVE
BALL VALVE
3-WAY SOLENOID VALVE
FILLING SOLENOIDVALVE
MANUAL VALVE
VALVE ACTUATOR
T
7ALOWER VESSEL
Figure 4.1 Setup for Calibrating Upper Gas Volume
41
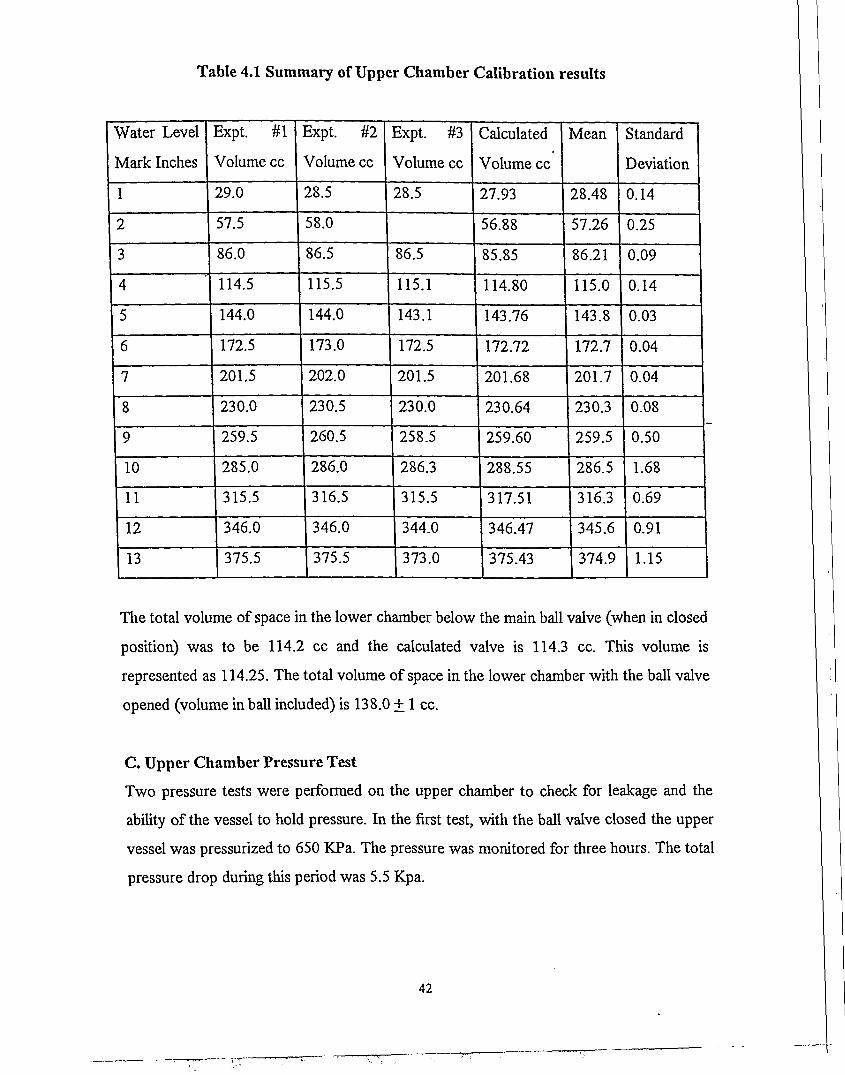
Table 4.1 Summary of Upper Chamber Calibration results
Water Level
Mark Inches
1
2
3
4
5
6
7
8
9
10
11
12
13
Expt. #1
Volume cc
29.0
57.5
86.0
114.5
144.0
172.5
201.5
230.0
259.5
285.0
315.5
346.0
375.5
Expt. #2
Volume cc
28.5
58.0
86.5
115.5
144.0
173.0
202.0
230.5
260.5
286.0
316.5
346.0
375.5
Expt. #3
Volume cc
28.5
86.5
115.1
143.1
172.5
201.5
230.0
258.5
286.3
315.5
344.0
373.0
Calculated
Volume cc
27.93
56.88
85.85
114.80
143.76
172.72
201.68
230.64
259.60
288.55
317.51
346.47
375.43
VIean
28.48
57.26
86.21
115.0
143.8
172.7
201.7
230.3
259.5
286.5
316.3
345.6
374.9
Standard
Deviation
0.14
0.25
0.09
0.14
0.03
0.04
0.04
0.08
0.50
1.68
0.69
0.91
1.15
The total volume of space in the lower chamber below the main ball valve (when in closed
position) was to be 114.2 cc and the calculated valve is 114.3 cc. This volume is
represented as 114.25. The total volume of space in the lower chamber with the ball valve
opened (volume in ball included) is 138.0 + 1 cc.
C. Upper Chamber Pressure Test
Two pressure tests were performed on the upper chamber to check for leakage and the
ability of the vessel to hold pressure. In the first test, with the ball valve closed the upper
vessel was pressurized to 650 KPa. The pressure was monitored for three hours. The total
pressure drop during this period was 5.5 Kpa.
42
IB the second test, the upper chamber was fiUed with water ,o a .eve. just below the purge
.me and the system pressurized to 650 KPa. After three hours, the pressure drop was 0 52
KPa, well within the tolerance of the pressure transducer accuracy. From ,he pressure test
we were satisfied with the ability of the experimental set-up hold pressure over expended
period of time.
43

V. Modifications of Experimental Set-Up and Procedures
In this chapter, all the final modifications made on the experimental set-up are discussed
The modifications described were to simplify t h e experimental procedure and also to
increase the accuracy and repeatability of the measurements.
A Modifications of the Experimental Matrix
From the literature review, the main experimental variables are liquid metal temperature
and the area of reaction surface. The lower chamber temperature (>350°C) is much higher
then the water temperature (60°C) and the mass of the stainless steel lower chamber (7 8
kg) is much more than the mass of water (1.38 kg). Therefore we can neglect the effect of
changing the water temperature within 30°C during the liquid metal/water interaction. We
modified the test matrix to that shown in Table 5.1.
Table 5.1 Test Matrix of Experiments
Liquid MetalTemperatureTO
Initial WaterTemperature
C
B Modifications of Experimental Set-Up
The modifications were made in: (1) the experimental apparatus, (2) the data acquisition
and control programs, (3) the water circulation system, (4) the vacuum system, and (5)
the argon supply system. The modified experimental setup is shown in Figure 5.1
44

UGT:Upper Gas Temperature
UGP:Upper Gis Pressure
UWT:Upp«r Wittr Tcmpercturt
WIV:Wi(er Inlet Vilve
WHT;Wt(er Healer Tempertture
MBV:Miin Bill Vtlve
LGT:Lower G n Tempers tur<AOV:Arjn Outlet Valve
EXB:Exh(uste Bottle
EXV:Exh<ust« Vilvt
MHT:Metal Heater Temperature
WOV
ASV
WOV:W»t«r Outlet Valve
ASV: Argon Supply Valve
LWT:Low«c Water Temperature
AIV:Argn Inlet Valve
LGP:Lower Gas pressure
LMT:Liquid Metal Temperature
VACV:Vacuum Valve
VACB:Vacuum Battle
WCL: Water CollectorWCIR:Water Circulator
Figure.5.1 Modification of experimental Set-Up
45

r * "*• """•""" *"' -»'"'- - •-•
rr- ::countdown phaS, " " " P ° r t 1 0 1 1 Unffl - b ^ " S «f the
There was a furnace on the upper portion that heinM
c h a m h p T . temperature at the bottom of upper
H M ^^etomeasurethelowervln «^ heater temperatures. We added a vacuum system to fte e.peHmenta! setup t
»e.uded a v a c u u m p u m p > , y a c u u m ^ ^ ^ ^ P ^
Before the heating phase of the experiment, the ,ower portion was to be purged by the
^ s u p p y s y s t e m . We added a argon balance ,ine to the top of upper po io usin
argon,pp,y system to balan, the pressures of upper and ,ower chambers after j £
The upper water and the lithium-lead temperatures are monitored and controlled by the
PC based data acqu,sIt,on and contro, system. When these temperatures attain their
46

predetermined values, the test is started by the system automatically. From this moment
all the temperatures, pressures and time are recorded by this system until the end of the
equilibrium phase of the test.
The modification in this part included using the interactive mode in the control program to
help us choose the starting point of countdown phase. Before countdown the PC-DAS
system will ask:"Do you want to continue?" If not, you can go back to change preset
values or stop the test.
C Experimental Procedures
We developed an uncomplicated and consistent procedure to perform the experiment that
is repeatable for all tests. A set of ordered steps was developed. The impetus behind these
is our desire for safety and to eliminate as many extraneous variables as possible. The -
experiments are run in pairs, one with lithium-lead, and a control test using pure lead.
Both of them are performed under identical conditions using the same procedure. Our
intention is to use the liquid metal temperature difference of the lithium-lead test and
control tests to calculate hydrogen generation per unit volume. For this reason, the
apparatus is loaded and assembled in the same manner for both tests. The liquid metal and
upper water temperatures are set and controlled by the PC-based data acquisition and
control system for both the lithium and the lead tests. The main experimental variables are
the initial liquid metal, time and the area of reaction surface. In this experimental set-up,
the area of reaction surface is fixed. The amount of hydrogen generated is, therefore a
function of the liquid metal temperature and time. Ultimately, this meant that the tests
varied from one to the other only by choosing the different initial liquid metal temperature.
(i) Preparation of the Experiments
The LinPb83 alloy is supplied by the Fusion Technology Institute, Department of Nuclear
Engineering and Engineering Physics, University of Wisconsin at Madison, in a reactor
chamber shown in Figure 5.2.
47

316 stainless
steel chamber
9.25
All dimensions are' in inches
2.75
Figure 5.2 Reactor Chamber [11]
48
The reactor vessels are heated in a glove box under argon atmosphere and cast into small
cylindrical test samples (D = 1.0 inch, L = 0.5 inch).
The sample is loaded into the lower portion of the system shown in Figure 5.1. The
lithium-lead tests require a much more complicated procedure for loading. Because of the
chemically reactive nature of the lithium-lead with many of the atmospheric gases, the
lithium-lead had to be removed from its container and placed into the lower portion of the
apparatus in a glove box under argon atmosphere.
The top of the lower portion is sealed by plastic film before being removed from the glove
box. In the case of the control tests this involved nothing more than dropping a measured
amount of lead shot into the lower chamber
Before the lower portion is bolted onto the bottom of the upper portion of the apparatus,
we make sure that all the system is at room temperature (25°C). The thermocouples
(LGT, LMT), pressure transducer(LGP), argon lines are connected to the inlet and outlet
valves (AIV, AOV) at the lower portion of the apparatus.
The system is purged by argon for 5 minutes and the film is removed after the argon flow
is initiated (open AIV, AOV, EXV). The main ball valve (MBV) is closed after this.
A vacuum pump (VACP) is used to evacuate the reservoir bottle (VACB) to an absolute
pressure of 0.05 bar low enough to enable us perform the two minute induced boiling
(Put=0.1994bar)at60°C.
The liquid metal furnace is raised and the lower chamber is enclosed by the lower furnace.
(ii) Procedure for Running the Experiments
When all the preparations are finished, the experiment is started by running a program
LIPBTST4 (listed in Appendix A) that reads and controls the liquid metal temperature
(LMT), Lower furnace temperature (MHT), upper and lower water temperature (UWT,
LWT), Lower and upper gas temperature (LGT, UGT) and water heater temperature
49

(WHT), upper and lower gas pressure (UGP LGP^ Tt ;c . i . J. . v^^r.iAj^;. it is also used to record these data at
desired time intervals.
The heating phase of the experiment is initiated. This phase consists of simply running the
program to turn on the liquid metal heater (LMH), upper water heater (UWH) and open
the water inlet and outlet valves (WIV, WOV) to fill the upper portion of the apparatus
wth distilled water, and to circulate the water to control its temperature the
temperatures are controlled and maintained at their desired values by the PC-DAS The
water circulation system (WCIR) is able to heat the water to Us desired temperature
before the liquid metal furnace raises the liquid metal temperature to the given value.
Since the furnace heater is always operated at ISM w A CI yaaucu ai ljuo w, the furnace temperature as a
function of time is controlled by the PC-DAS identically for all the tests.
When the upper water temperature (UWT) and liquid metal temperature (LMT) are
neanng their preset values, the dissolved air in the water is removed by closing water inlet
valve (WIV) and opening vacuum valve (VACV) to induce boiling below 0 1994 bar
Tta ,s done by controlling vacuum valve to keep upper gas pressure below the saturated
pressure corresponding to the water temperature (60°C) and maintaining the boiling for
about two minutes. During this procedure, water vapor and liquid water come out from
the upper chamber and condense in the water collector (WCL). Since the water
temperature, vacuum pressure and induced boiling times are the same for all tests the
water volume fa the water collector could approximately be enroled to be the same for
all the tests. This means that the water volume for all the tests is the same. An argon
supply line is connected to the upper (ASV) and lower chamber (AIV) which is used to
balance the pressure in the two chambers. Before balancing the pressure, the leakage is
checked by pressurizing the system to 6 bar for 5 minutes to find out if there is any
pressure decrease. After the leakage test, the argon supply Une pressure is adjusted to thedesired value by using a pressure regulator.
50
When kqmd metal and upper water temperatures reach the desired value, a 30 second
countdown phase is started manually on the PC-DAS. All the valves (WOV ASV WIV
AIV, AOV, EXV, VACV) are closed, and the system variables consisting of toe (,)'
hquid metal temperature (LMT), upper gas temperature (UGT), upper water temperature
(UWT), lower gas temperature (LWT), upper gas pressure (OGP), lower gas pressure
(LGP), lower gas temperature (LGT), lower furnace temperature (LFT) are recorded
Since the system then becomes closed, the water and covering argon gas reach an
equilibrium. The initial temperatures and pressures are measured to evaluate the mass of
argon in the upper and lower chambers during this phase. At the end of the countdown
phase, the initial water and liquid metal temperatures are still at desired values; the mass of
argon, water and liquid metal are fixed; and the system pressure is knowm. The main ball
valve (MBV) is ready to be opened for the initiation of the interaction.
When the main ball valve is opened, the reaction phase begins, without interference for a
preset period of lime (usually 4 minutes). After that, the main ball valve is closed and the
argon outlet and exhaust valve (AOV, EXV) are opened two seconds after main ball valve
is closed.
The upper chamber comes into equilibrium within 3.5 minutes after the ball valve is
closed. During this period the lower chamber temperature increases a little. After this
period the furnace heaters (UWH, LMH) are turned off.
After the last phase, the PC-DAS transfers all the data into three data files. They are
COUNTD.DAT which contains the data for countdown period, REACTION.DAT which
contains data for reaction period and EQUIL.DAT which contains data for equilibriumperiod.
When the system returns to room temperature, we measure the water volume trapped in
vacuum line and in the water collection vessel which came out from the system when
vacuum was produced during induced boiling.
51

The last step in the experimental procedure is to prepare the apparatus for the next test
The only noteworthy part of this process b the removal of the lower portion of the
apparatus. Because the liquid metal is frozen into the lower chamber, it has to be drilled
52

VL Results of The Experiments
A. Descriptions of The Raw Data
A graphical library of the data for 16 lithium-lead tests and 5 control tests is given in
Appendix B. This collection of graphs shows the data from the pressure transducers and
thermocouples during the interaction for each experiments.
We shall discuss the experimental results of lithium-lead test number L09 and lead test
number N36 in detail. The discussion to be made on these selected experiments are
typical of all the other fifteen lithium-lead and five pure lead experiments. These two tests
were characterized by an initial water temperature of 60° C and an initial liquid metal
temperature of 400° C. The system pressures of the two tests as functions of time are ""
shown in Figure 6.1. Right after the main ball valve is opened, and the interaction is
initiated, the system pressure rises continuously to a maximum value in about 50 sec. and
then the pressure drops to an equilibrium value in about 190 seconds. The maximum
pressure depends upon the initial conditions
The thermocouples' data from test L09 and N36 are plotted in Figures 6.2 and 6.3. In
Figures 6.2, the lower gas temperature (LGT) is much higher then the lower water
temperature (LWT) before the reaction phase. Right after the main ball value is opened,
the lower water temperatures drops nearly to the lower water temperature. Then the lower
gas temperature immediately rises to the saturation temperature (120°C, system pressure
of 2 bar). The lower water temperature rises a little slower than the lower gas ••
temperature. The upper gas and water temperature (UGT, UWT) basically maintain at
60°C during reaction phase.
53

3.5
LiPb Test (L091 T=-4<50 (C), M=<36.5
(bar
CD
essi
Q.
ECD
CO
CO
2.5
2
1.5
1
0.5
0-^0
(C), M=«45.0
30 60 90 120 150 180 210
Time (sec)
Figure 6.1 System Pressure as a Function of Time (L09 & N36)
240
54
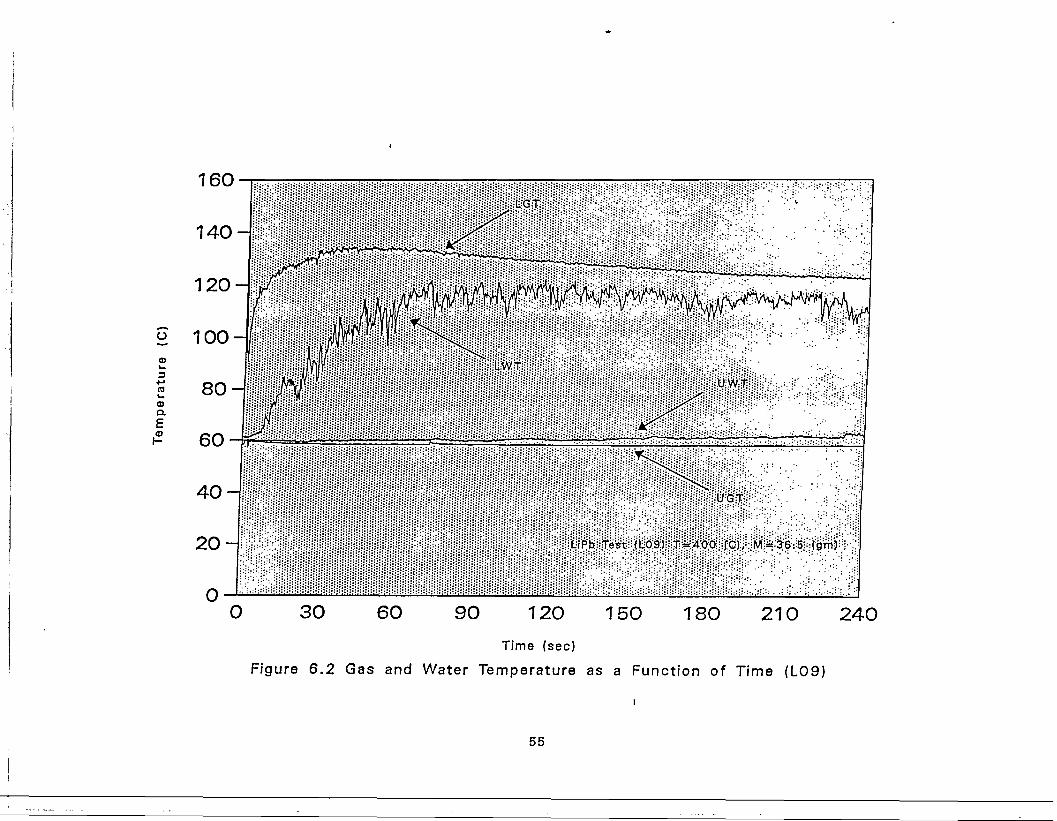
160
140
120
uffi
3+••CO
a>Q.
£
100
80
60
4 0
20-
0
LiPb test <L09) T«400 fC), tflffl)
30 60 90 120 150 180 210 240
Time (sec)
Figure 6.2 Gas and Water Temperature as a Function of Time (L09)
55

500
400
100
0
T*400 (C), M«45.0[gm)
o03
3+-»CO<DQ.
E03
300-
200 H
llllSllSIIIIIill
0 30 60 90 120 150 180 210 240
Time (sec)
Figure 6.3 Liquid Metal Temperature as a Function of Time (L09 & N36)
56

All these phenomena are interpreted below. After the main ball valve is opened, the water
comes to the lower chamber that causes the lower gas temperature drops to the lower
water temperature. Then the water pours onto the liquid metal surface, the water begins
to boil rapidly and a large burst of water vapor is formed that causes the system pressure
(UGP, LGP), and the lower gas temperature to rise rapidly. At the same time, the higher
temperature and pressure gas from the lower portion of the apparatus bubbles through the
water column and rises to the top of the apparatus. The upper gas pressure is read by the
transducer ana* the upper gas temperature read by thermocouple which are located on the
top of the apparatus. Since the lower water temperature rises continuously and the upper
gas and water temperatures basically remain at 60°C, we believe that the burst of vapor is
cooled by the water and condensed after it bubbles through the water.
The graphs in Figure 6.3 show the responses of the liquid metal temperatures (LMT)."
They show that the liquid metal temperature of the lead test falls faster than lithium-lead
test at the beginning, and become almost parallel after 60 sec. The liquid metal
temperature differences between the two tests remain constant until the main ball valve is
closed.
Before we discuss the calculation of the hydrogen mass, we compare the data graphs of
lithium-lead test L09 shown in Figures 6.1, 6.2 and 6.3 to the data graphs from the
corresponding lead test N36 shown in Figure 6.1 and 6.3, which were performed under
the same initial conditions (60 °C water and 400 °C liquid metal temperature). Comparing
the liquid metal temperature of the two tests shown in Figure 6.3, we notice that the liquid
metal temperature of the lithium-lead test is consistently greater than the liquid metal
temperature of the lead test. The gas and water temperature response are nearly the same
for both tests, liquid metal temperature difference between the two tests is due to the heat
generated during Iithium-lead/water reaction . The temperature difference between the
two tests depends upon the initial liquid metal temperature. At high initial liquid metal
temperatures (650 °C) the difference is about 50°C. At low initial liquid metal
temperatures (350 °C) the difference is about 30°C.
57

In Figure 6.1 and 6.2, we notice that the system pressure drops along with lower gas
temperate from a maximum value to an equilibrium value after 50 seconds and the lower
water temperature rises from 60°C to saturation temperature at the same time. We
believe that the system pressure drop is due to the lower gas temperature drop. The
thermal capacity of the lower portion is fixed by the initial liquid metal temperature. For
low initial liquid metal temperature (350°C-500°C) experiments, after 50 seconds, the heat
transferred from lower chamber to lower gas is less than the heat absorbed by water from
lower gas.
B. Data Analysis
During the experiments, water is poured onto the exposed surface of a small lithium-lead
pool. Since the experiments are small scale (e.g. the contact area is small), the result
should provide the hydrogen generation rate per unit area. From the result of the
experiment, we find that the system pressure, gas and water temperatures are functions of
time. We need to find the partial pressure of hydrogen and the amount of hydrogen
dissolved in the water. Then we can determine the rate of hydrogen generation as
function of time during the lithium-lead/water reaction. We also need to determine the
Arrhenius reaction rate constants in the equation (1) from the hydrogen generation curve.
A 7 = A , e x p ( - | | ) (1)
(i) Description of Analysis Method
The reaction equations for the lithium-lead and the lead/water interactions are given by.
Li + H2O -> LiOH + -H2 + 2.0*105 J/Mole Li (2)
Lead + H2O -» Lead + H2O (3)
Two analysis method can be employed. These are: (1) Thermodynamics Method and (2)
Heat Transfer Method. They are used to evaluate hydrogen generation rate during the
reaction time by analyzing the raw pressure and temperature data from the experiments.
58
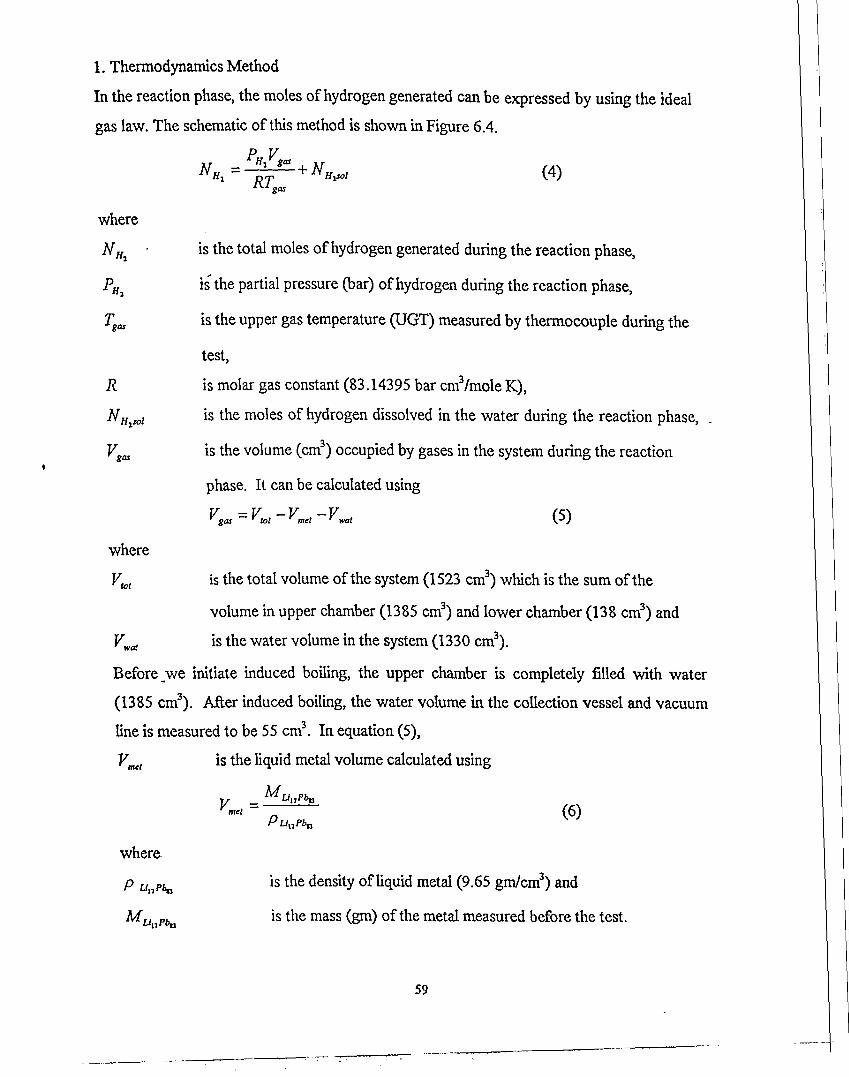
1. Thermodynamics Method
In the reaction phase, the moles of hydrogen generated can be expressed by using the ideal
gas law. The schematic of this method is shown in Figure 6.4.
P V(4)BT.gas
where
R
,sol
gas
is the total moles of hydrogen generated during the reaction phase,
is" the partial pressure (bar) of hydrogen during the reaction phase,
is the upper gas temperature (UGT) measured by thermocouple during the
test,
is molar gas constant (83.14395 bar cmVmole K),
is the moles of hydrogen dissolved in the water during the reaction phase,
is the volume (cm3) occupied by gases in the system during the reaction
phase. It can be calculated using
'gas = 'tot ~ 'met ~ 'vat (p)
where
V.tot
wat
is the total volume of the system (1523 cm3) which is the sum of the
volume in upper chamber (1385 cm3) and lower chamber (138 cm3) and
is the water volume in the system (1330 cm3).
Before we initiate induced boiling, the upper chamber is completely filled with water
(1385 cm3). After induced boiling, the water volume in the collection vessel and vacuum
line is measured to be 55 cm3. In equation (5),
metis the liquid metal volume calculated using
Mr"met
where
P uxlpb
Mr, p,
(6)
is the density of liquid metal (9.65 gm/cm3) and
is the mass (gm) of the metal measured before the test.
59
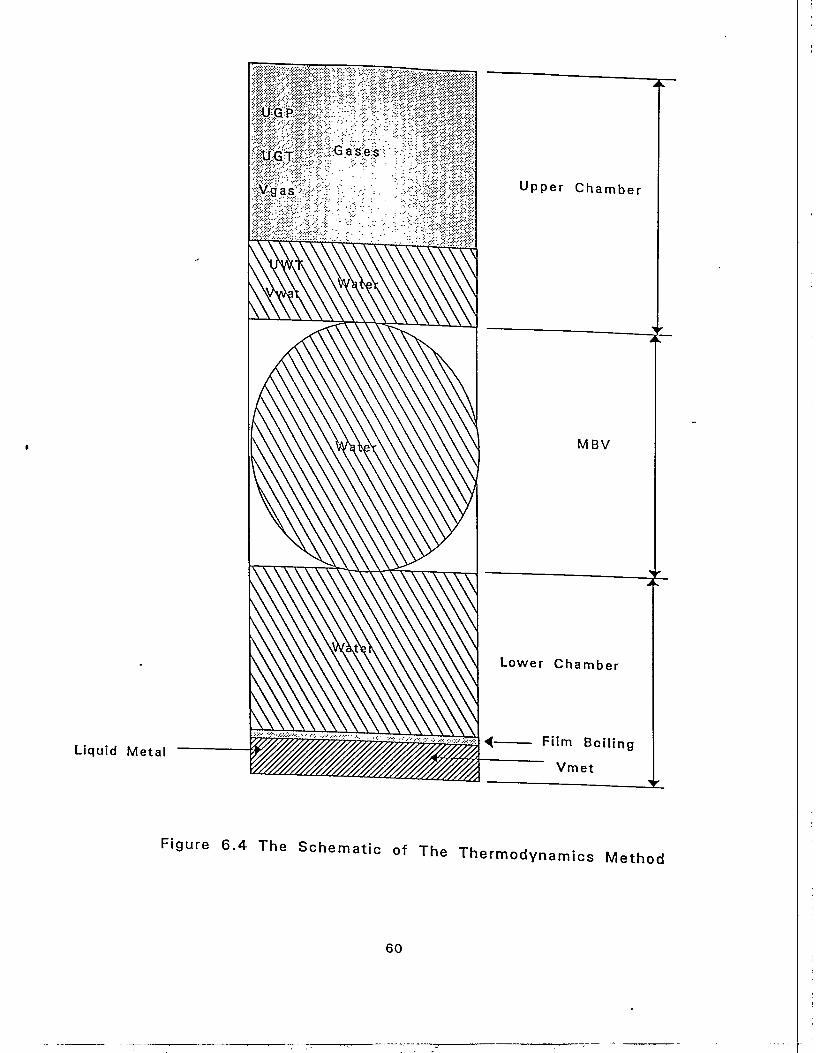
Liquid Metal
UGP
UGT Gases
Vgas Upper Chamber
MBV
Lower Chamber
4 Film Boiling
Vmet
Figure 6.4 The Schematic of The Thermodynamics Method
60

In equation (4), the partial pressure of hydrogen PHj can be obtained from the measured
system pressure Pvs which is composed of the partial pressures.
P^PH^P^P^ ' (7)
Thus PHi is calculated using
•Of, = Vtys ~ "ar ~ *HXO ( 8 )
where
Pvs is the system pressure (UGP) measured during the test,
PHjO is the partial pressure of water vapor which is equal to the saturation
pressure of water at the measured gas layer temperature (UGT) during the
reaction phase and
Par is the partial pressure of argon which is calculated using the idea gas law.
(9)gas
where Vgas, Tgas and R are as previously defined,
Narsoi is the moles of argon dissolved in the water during the reaction phase and
N^ is the total moles of argon in the system.
The total moles of argon N^ can be calculated from the system initial conditions. In the
countdown phase, argon would fill the free volume above the liquid metal in the lower
chamber and it would occupy the region above the water along with water vapor and a
small amount would be dissolved in the water in the upper chamber. Using the ideal gas
law, the moles of argon can mathematically be expressed as:
Nar = Nanip+Nardn (10)
where
N^p is the moles of argon in the upper chamber during the countdown phase,
' s ^ e moles of argon in the lower chamber calculated using
P V7Vardn ~
61

where R is as previously defined,
T^ is the .ower gas temperature (LGT) measured during the countdown phase
^ is the gas volume in lower chamber calculated using
gasdn -Vtotdn ~^met / J Q ^
w h e r e vmei is as previously defined,
V* is the measured total volume of lower chamber (138 cm3).In equation (11),
JU is the partial pressure of argon in the lower chamber measured during the
countdown phase. Because argon is the only g a s in the l o w e r c h a m b e r
countdown phase, the partia! pressure of argon equals the measured lower region systemDressure P . a nr>\ b ay&icmpressure P^ (LGP).
P = Pardn * sysdn r -i o \
We substitute equations (13) and (12) into equation (1!) to get the moles of argon N
m the lower chamber during the countdown phase.In P.rmntinn ftf)\
is the moles of argon in the upper chamber, it can be calculated using
In equation (10),
P Vhf =_f2LJff!L
arvparvp RT ^^^oiup (14-)
where R is as previously defined,
*-+ - is the moles of argon dissolved in the water during the countdown phase,
JU is the upper gas temperature (UGT) measured during the countdown
phase,
yn is the gas volume in the upper chamber during the countdown phase. It is
the water volume (55 cm') which came out of the upper chamber duringthe induced boiling.
Pmr is the partial pressure of argon in the upper chamber. During the
countdown phase, we have argon and water vapor in the upper chamber. The partial
62

pressure of argon can be obtained from the measured ,mnmeasured upper region system pressure P
which is composed of the partial pressures.
where
jysup
P = P -Pamp •'jyiup r H-fiup /"ic\
is the upper region system pressure (UGP) measured during the countdown
phase and
* W is,the partial pressure of water vapor which equals the saturation pressure
of water at the measured gas layer temperature (UGT) during the countdown phase
In equation (14), the mo.es of argon dissolved in the w a t e r ^ , , , can be evaluated using
the following equation,
arsolup — -X-arupN H^o Q ^ X
where
NHlO is the moles of water in the system calculated using
N _PHlO*Vwat
m.wtHiO (17)
where
PHIO is the density of water and
m- wiHto is molecular weight of water.
In equation (16),
Xmr - is the solubility of argon which is a function of the water temperature and
the partial pressure of argon in upper chamber during the countdown phase. By Henry's
law, ,he solubility of gas is directly proportional to the partial pressure of that gas [9]
Smce at saturation temperature the solubility of a gas in a liquid equals 0, and since we
know the solubility of argon in water at 25 °C and 1 atm only, then the solubility of argonin water can be expressed as:
Pw h e r e Pan,P is as previously defined in equation (15)
atm
63

C,\atm) is a constant (3.7*1(T7 Molelt/Molew,t)
PaOn is the atmosphere pressure (1.013 bar),
T*aup ls t h e w a t e r temperature measured during the countdown phase and
TsatuP i s t h e w a t e r saturation temperature evaluated at the measured upper region
system pressure Pysap during countdown phase.
Ttahip = 373.998*(P^up)°-07144015 -273.15
where Pvm is'as previously defined. We substitute these back into equation (18),
equation (17) and equation (16) step by step to get Narsolup, then this and equation (15)
can be substituted back into equation (14) to get the moles of argon N^ in the upper
chamber during countdown phase. By now, the moles of argon in upper chamber Nanip
and lower chamber Nordn are known. The total moles of argon Nar is calculated using -
equation (10). With the initial moles of argon Nar in the system known, the partial
pressure of argon in the reaction phase can be calculated using equation (9). The only
unknown in equation (9) is the moles of argon dissolved in the water Narsol during
reaction phase. It can be evaluated using the following equation
Nanol = XJfHfi (19)
where NHjO is previously defined and
Xar is the solubility of argon which is a function of the water temperature and
the partial pressure of argon in all the system during the reaction phase. The solubility of
argon in water can be expressed as:
%J) £ (20)
whereXar(25"C,latm) and Patm is as previously defined,
Twl is the water temperature measured during the reaction phase and
TM is the water saturation temperature evaluated at the measured system
pressure Pm during the reaction phase.
64

^ = 373.998* (PVf)007144015 -273.15
We substitute them back into equation (20) and (19).
- 25° C)Patm"">° ( 2 2 )
The dissolved moles of argon becomes a function of the partial pressure of argon This
can be substituted into equation (9) to obtain the partial pressure of argon directly
because we only need to know the partial pressure of argon Par.
r- (23)$as
^-25°C)Pj"^T^
After the partial pressure of argon Par is known, the partial pressure of hydrogen PH is
calculated using equation (8). With the partial pressure of hydrogen P^ known, the only
unknown in equation (4) is the moles of hydrogen dissolved in the water N^ during the
reaction phase. It can be evaluated using the following equation
where NHiO is as previously defined and
XHl is the solubility of hydrogen which is a function of the water temperature
and the partial pressure of hydrogen in all the system during reaction phase. The solubility
of hydrogen in water can be expressed as:
XHi = ZHj(25°C,Wm)-gkzZkLik ,25,&at-25°QP^ ( 2 5 )
where P ^ , Potmi T^ and Ttat are as previously defined and
XHl (25° C,la(m) is a constant (1.7*10~7).
We substitute />„,, />„,, TM r,0, and XHi(2S'C,la,m) baekinto equation(25) and XHi
NHfi into equation (24), then the dissolved moles of hydrogen Ntt^, is known. By now,
all the variables in equation (4): ^ ( t ) , //„,„,(,), r < _ ( 0 are knovm as function of time!
65

These can be substituted into equation (4) to obtain the hydrogen generation as function
of time.
P
^ ( 0
The hydrogen generation rate as a function of time is calculated using
dNHi(t) = A^CO-A^CO
dl (2 — f i
where
NHx (/,) is the moles of hydrogen generation calculated at /, and
NHj (t2) is the moles of hydrogen generation calculated at t2.
Finally the results of the hydrogen generation rate is divided by the area of the liquid
metal surface to get the reaction rate per unit area.
All the variables are involved in the thermodynamics method of analysis, except the liquid
metal temperature T1Mt.
2. Results of Thermodynamics Method of Analysis
We have developed a FORTRAN program named COMPUTEl that is based on the
equations (2) to (27) in the last section. The program listed in Appendix C, was used to
analyze the raw data. We used the same program to calculate hydrogen generation for
lithium-lead test and lead test. From equation (3), we know that there is no hydrogen
generated in lead test. We used the hydrogen generation calaulated from lead test to
calibrate the hydrogen generation calulated from lithium-lead test. This calibration is done
using the hydrogen generation of lithium-lead test minus hydrogen generation caculated
from lead test. A graphical library of the calibrated hydrogen generation computed by the
program for 14 lithium-lead tests is given in Appendix D. This collection of graphs
shows the moles of hydrogen generation for each tests. We shall discuss the experimental
results of lithium-lead test number L14 in detail. The discussion to be made on this
selected experiment is typical of all the other thirteen lithium-lead experiments. This test
was characterized by an initial water temperature of 60° C and an initial liquid metal
66

temperature of 600° C. • The hydrogen generation of this test as a function of time is
shown in Figure 6.5. Right after the main ball valve is opened, and the interaction is
initiated, the hydrogen generation rises continuously to a maximum value in about 90 sec.
and then the moles of hydrogen drops to an equilibrium value in about 150 sec. The
maximum value of hydrogen generation depends upon the initial conditions exhibiting the
same type of behavior as the system pressure shown in Figure 6.6. The calibrated
hydrogen generation for each of the lithium-lead tests are summarized in Table 6.1
Table 6.1 Calibrated Hydrogen Generation for The Lithium-Lead Tests
Expt#
LOlL04L05L06L07L08L09L l lL12L14L15L20L21L22L23
Type
Lithium-Lead TestLithium-Lead TestLithium-Lead TestLithium-Lead TestLithium-Lead TestLithium-Lead TestLithium-Lead TestLithium-Lead TestLithium-Lead TestLithium-Lead TestLithium-Lead TestLithium-Lead TestLithium-Lead TestLithium-Lead TestLithium-Lead Test
T
CO400350350350400500400600600600350650600600500
Vlass
(g)37.546.551.056.040.053.536.544.038.049.035.041.041.035.041.0
(Mole)
0.0059940.0083030.0020340.0074540.0073840.0085030.0082480.0080500.0107260.0125560.0064100.0058700.0087600.0111000.004820
67

O£
i
3cCDTOO
0.014
0.012-^
L?Pb Test (L14) T=600 (C), jVI=49<0 (gm)
60 90 120 150 180 210 240Time (sec)
Figure 6.5 Corrected Hydrogen Generation as a Function of Time (L14)
68

6 -
2 -
1 -
0
LfPb Test (L14) T=600 (C), M=49.0 (gm)
Lead Test (N32) T=600 (C), M=45.0:(gm)
0 30 60 90 120 150 180 210 240Time (sec)
Figure 6.6 System Pressure as a Function of Time (L14 & N32)
69

3. Heat Transfer Method
From the reaction equation (2) and (3)
Li + H2O -> LiOH+-H2 + 2.0*10s J/Mole Li (2)
Lead + H2O -> Lead + H2O (3)
it is seen that the hydrogen generation was accompanied by heat. Since the heat
generation is proportional to moles of hydrogen generated, the relation between hydrogen
generation and heat generation is represented as
NHl=C*Q (28)
where
C = 2.5*10^ Mole/J at680°C (29)The hydrogen generation rate is then given by
We use a cylindrical control volume as Figure 6.7 to derive the necessary equations for
this method. In the control volume, we can assume that the heat transfer is about Z axis
symmetric. On the Z axis, the heat transfer occurs only along the Z direction. We can,
therefore simplify the three dimension problem into one dimension problem. The energy
equation in one dimension (Z) is given by
1 dT(Z,t) =ldq d2T(Z,t)kdt dZ2 K 'a dl kdt dZ2
where"
k is the thermal conductivity of LinPbg3,
a is the thermal difiusivity of Lii7Pbg3,
T(Z, t) is the liquid metal temperature as a function of Z and time.
/ is time.
— is unit volume heat generation.dl
70

The Control Volume
Figure 6.7 Heat Transfer Model
71

In equation (30)
dt dt "act (32)
where Vreact is the reacted metal volume.
For Lithium-Lead test, we denote the variables by using the subscript L as show below
=idgk di
(33)a dt k dt dZ1
For Lead test, we denote the variables by using the subscript P as show below
±fSi-o d2Tp
From the result of the experiment, we postulate that the liquid metal temperature
difference between the lithium-lead and control test is due to the lithium-lead/water
reaction. We subtract equation (34) from equation (33), and solve the resultant equation
for dq/dt to get:
d2TP)] ( 3 5 )
The first term in the bracket of equation (35) can be written in the form
\ dTL dTP ld(TL-Tp)_ldTL-dTP
a dt dt a dt a dt
a t2~tx
(36)
In the control volume shown in Figure 6.7, the liquid metal is uniform and the thermal
conductivity of the liquid metal k is much higher than the thermal conductivity in the gas.
We can assume that the temperature at the time /, along the Z axis has linear distribution.
The temperature differences ATL and ATp along the Z axis are constant for lithium-lead
test and lead test.
7i(z3,o-W2,O=W2,',)-W,,',) (37)
7>(Z3,/,)-7;(Z2>/I) = rp(Z2,/1)-rp(Z1,r l) (38)
72

The heat flux in Z direction is calculated using equation
dT(Z,t)q"(Z,t) = -
dZ
We substitute equation (37) and (38) into equation (39)
AZ AZ
(39)
(40)
(41)
(42)
(43)
(44)
The second term in the bracket of equation. (3 5) can be written in the form
AZ
AZ
AZ
AZ
The heat flux is also a constant for identical test.
d2TL
dTL dTP
dZ
dZ2 dZ2 dZ
Substitute equation (39) into equation (45) to get
(45)
dZ dZ
- [qP" (2) - qP" (1)] (46)k AZ
We substitute equation (44) into equation (46). Equation (46) is equal to zero and
equation (35) becomes
dq(Z,t) = k dTL(Z,i) dTP(Z,t) = k d[TL(Z,t)~TP(Z,t)]dt a dl dt a dt
_k[TL(Z2,t2)-Tp(Z2,i2)]-[TL(Z2,tx)-Tp(Z2,t1)]
a i2-tx
(47)
where
k_a
(48)
73
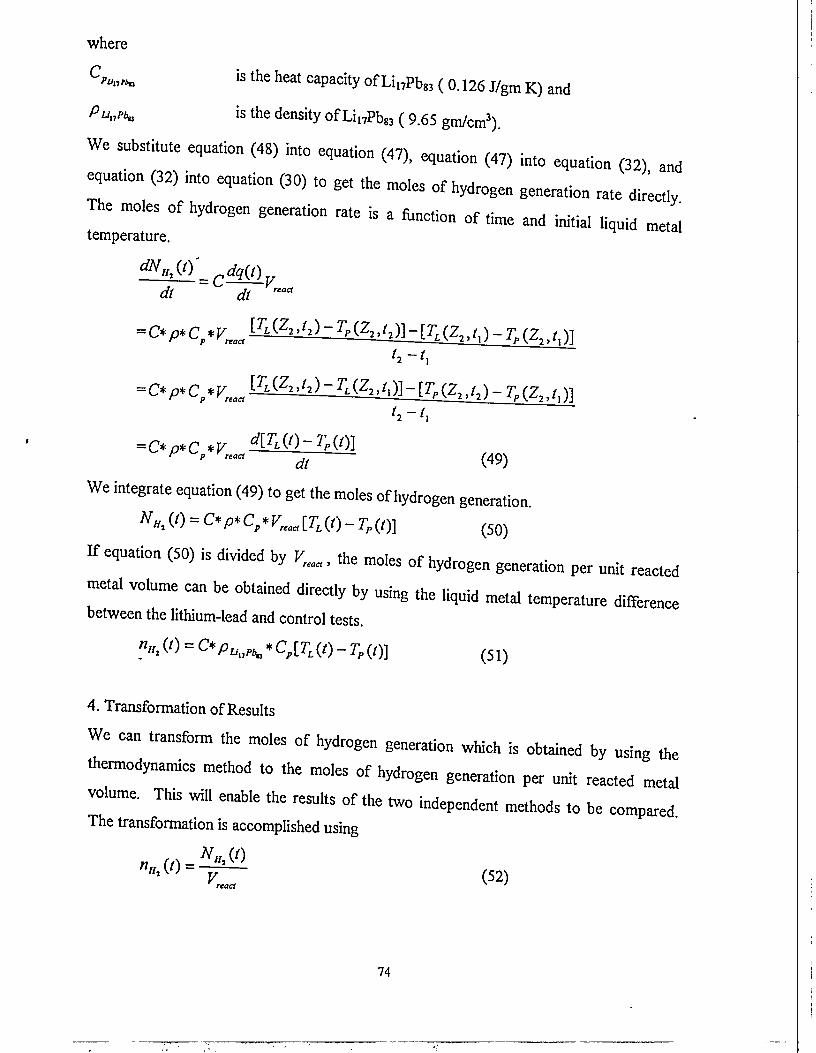
where
Cis the heat capacity of Li17Pb83 ( 0.126 J/g m K ) and
PuaPba is the density of Li17Pb83 ( 9.65 gm/cm3).
We substitute equation (48) into equation (47), equation (47) into equation (32) and
equation (32) into equation (30) to get the moles of hydrogen generation rate directly
The moles of hydrogen generation rate is a Action of time and initial liquid metaltemperature.
c
dl dt "act
TP(Z2,l2)-TP{Z2,t,)]12-1X
= C*p*Cp*Vreact LK)
dt p W J (49)
We integrate equation (49) to get the moles of hydrogen generation.
NHl (0 = C*p*Cp*Vrtact[TL(t) - TP(l)] (50)
If equation (50) is divided by Vreact, the moles of hydrogen generation per unit reacted
metal volume can be obtained directly by using the liquid metal temperature difference
between the lithium-lead and control tests.
n*% (0 = & PullPba *Cp[TL (0 - TP (I)] (51)
4. Transformation of Results
We can transform the moles of hydrogen generation which is obtained by using the
thermodynamics method to the moles of hydrogen generation per unit reacted metal
volume. This will enable the results of the two independent methods to be compared.
The transformation is accomplished using
#ir (0«*,(') = - 7 T ^ (52)
f r*nrt
74

where
NH2 it) is the moles of hydrogen generation obtained using the
thermodynamics method and
VreM is the reacted metal volume during the reaction phase (cm3).
The reacted metal volume Vreact is calculated using
"act (53)
where p U a P b a is previously defined,
^("««ta )uaa is t h e mass of reacted lithium-lead.
The mass of reacted Kthium-lead A / ^ ^ ^ is calculated using
- mf (54)
where
MW~* i s t h e reacted mass of lithium,
mfu is the mass fraction of lithium in the lithium-lead Li17Pb83.
The reacted lithium MlU)nag is calculated using
MWK^Nu*m.wLi ( 5 5 )
where
m.wu is the molecular weight of lithium (6.941 gm/mole) and
Nu is the reacted moles of lithium.
From the reaction equation (2), the reaction moles ratio of hydrogen to lithium iis
Nu 2
then
NHimAX = 2NU
where NHiMax is the maximum moles of hydrogen generation listed in Table 1 obtained by
thermodynamics method.
75

i s t h e maximum moles of hydrogen generation listed in Table 1 obtained by
thermodynamics method.
In equation (54), the mass fraction of lithium mfu is calculated using
m.Wj, 17
- — (57)Y mr 83IPb fit O J
m.wpb
where
Y.—— is the atom ratio of the lithium-lead Lii7Pb83 (17/83),
m.wPb is the molecular weight of lead (207.2 gm/mole)
mfn is the mass fraction of lead in the lithium-lead Lii7Pbg3.
The sum of the mass fractions is equal to 1
mfn+mfn=l (58)
We substitute equate (55) into (54)
83 m.wpb
\-mf —mffu 17 m.wu
fu
u
17 m.wu 17 6.941We substitute equations (59) into (58), then (58) into (57), step by step to equation (53)
y
and Vreact is listed in Table 6.2.
We substitute Vreact and NHi (t) which is calculated by the thermodynamics method into
equation (52) to get the moles of hydrogen generation per unit reacted metal volume. We
76
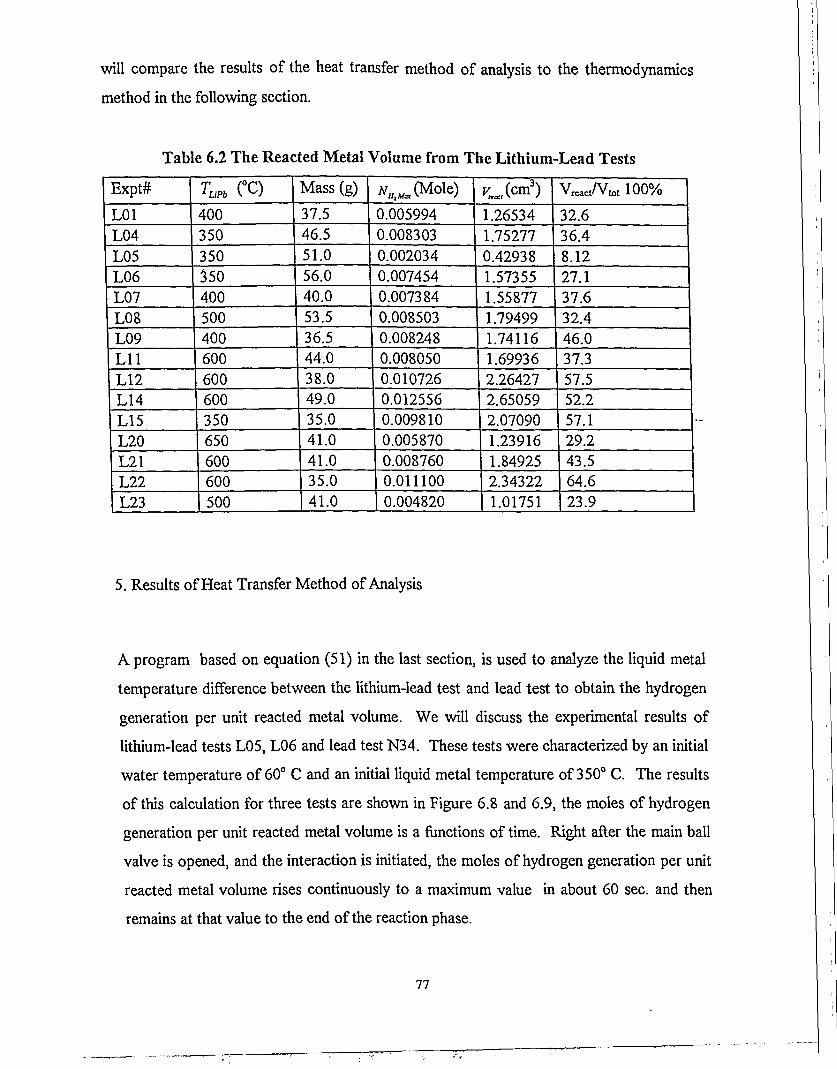
will compare the results of the heat transfer method of analysis to the thermodynamics
method in the following section.
Expt#
L01L04L05L06L07L08L09LllL12L14L15L20L21L22L23
Table 6.2 The
T (°C
400350350350400500400600600600350650600600500
Reacted Metal Volume from
) Vlass (g)
37.546.551.056.040.053.536.544.038.049.035.041.041.035.041.0
A^(Mole)
0.0059940.0083030.0020340.0074540.0073840.0085030.0082480.0080500.0107260.0125560.0098100.0058700.0087600.0111000.004820
The Lithium-Lead Tests
^ , ( c m 3 )1.265341.752770.429381.573551.558771.794991.741161.699362.264272.650592.070901.239161.849252.343221.01751
V^t/Vtot 100%
32.636.48.1227.137.632.446.037.357.552.257.129.243.564.623.9
5. Results of Heat Transfer Method of Analysis
A program based on equation (51) in the last section, is used to analyze the liquid metal
temperature difference between the lithium-lead test and lead test to obtain the hydrogen
generation per unit reacted metal volume. We will discuss the experimental results of
lithium-lead tests L05, L06 and lead test N34. These tests were characterized by an initial
water temperature of 60° C and an initial liquid metal temperature of 350° C. The results
of this calculation for three tests are shown in Figure 6.8 and 6.9, the moles of hydrogen
generation per unit reacted metal volume is a functions of time. Right after the main ball
valve is opened, and the interaction is initiated, the moles of hydrogen generation per unit
reacted metal volume rises continuously to a maximum value in about 60 sec. and then
remains at that value to the end of the reaction phase.
77
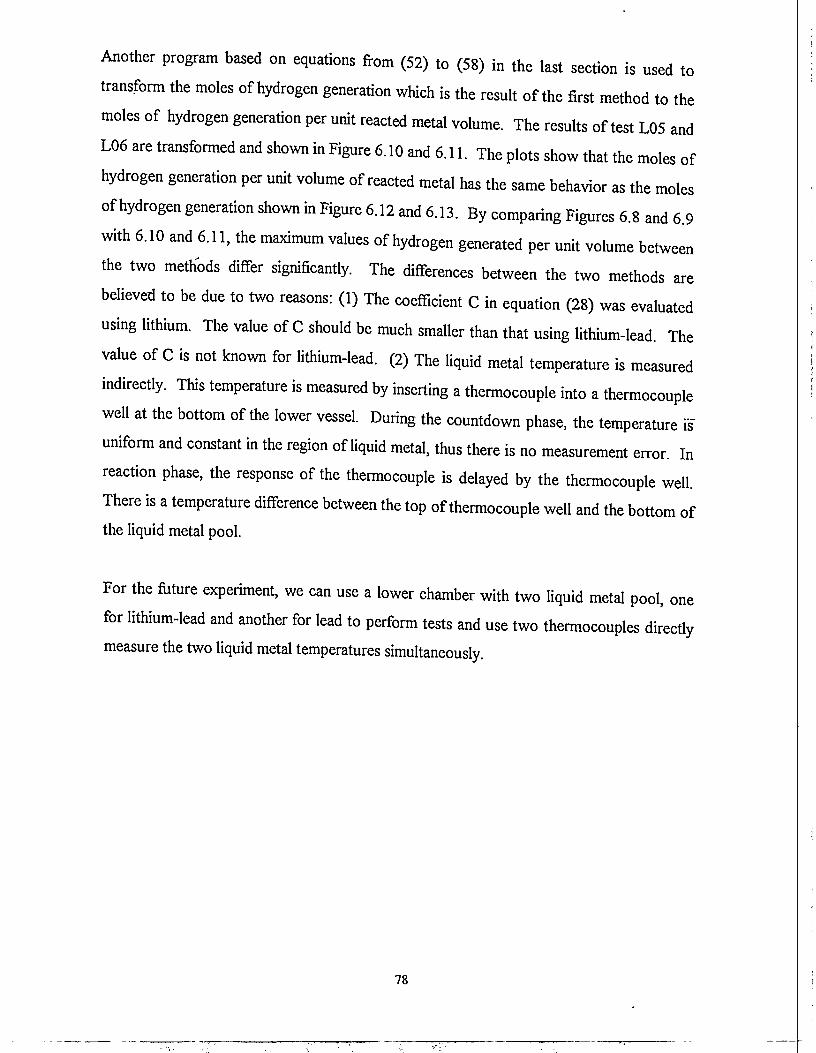
Another program based on equations from (52) to (58) in the last section is used to
transform the moles of hydrogen generation which is the result of the first method to the
moles of hydrogen generation per unit reacted metal volume. The results of test LOS and
L06 are transformed and shown in Figure 6.10 and 6.11. The plots show that the moles of
hydrogen generation per unit volume of reacted metal has the same behavior as the moles
of hydrogen generation shown in Figure 6.12 and 6.13. By comparing Figures 6.8 and 6.9
with 6.10 and 6.11, the maximum values of hydrogen generated per unit volume between
the two methods differ significantly. The differences between the two methods are
believed to be due to two reasons: (1) The coefficient C in equation (28) was evaluated
using lithium. The value of C should be much smaller than that using lithium-lead. The
value of C is not known for lithium-lead. (2) The liquid metal temperature is measured
indirectly. This temperature is measured by inserting a thermocouple into a thermocouple
well at the bottom of the lower vessel. During the countdown phase, the temperature is
uniform and constant in the region of liquid metal, thus there is no measurement error. In
reaction phase, the response of the thermocouple is delayed by the thermocouple well.
There is a temperature difference between the top of thermocouple well and the bottom of
the liquid metal pool.
oneFor the future experiment, we can use a lower chamber with two liquid metal pool,
for lithium-lead and another for lead to perform tests and use two thermocouples directly
measure the two liquid metal temperatures simultaneously.
78

0.00025
0.0002
'E
CDQ.
TJCD
CO
CD
cCDC3>
C
og
eyd
r
X
EoCD
[Mol
E
caCD
2
ted
0(0CD
DC
0.00015
0.0001
0.00005
0 _i^==iiiiiiiiim=iiiii
0 30 60 90 120
Time (sec)
Figure 6.8 Hydrogen Generation as a function of Time
Analized by Heat Transfer Method (L05)
79
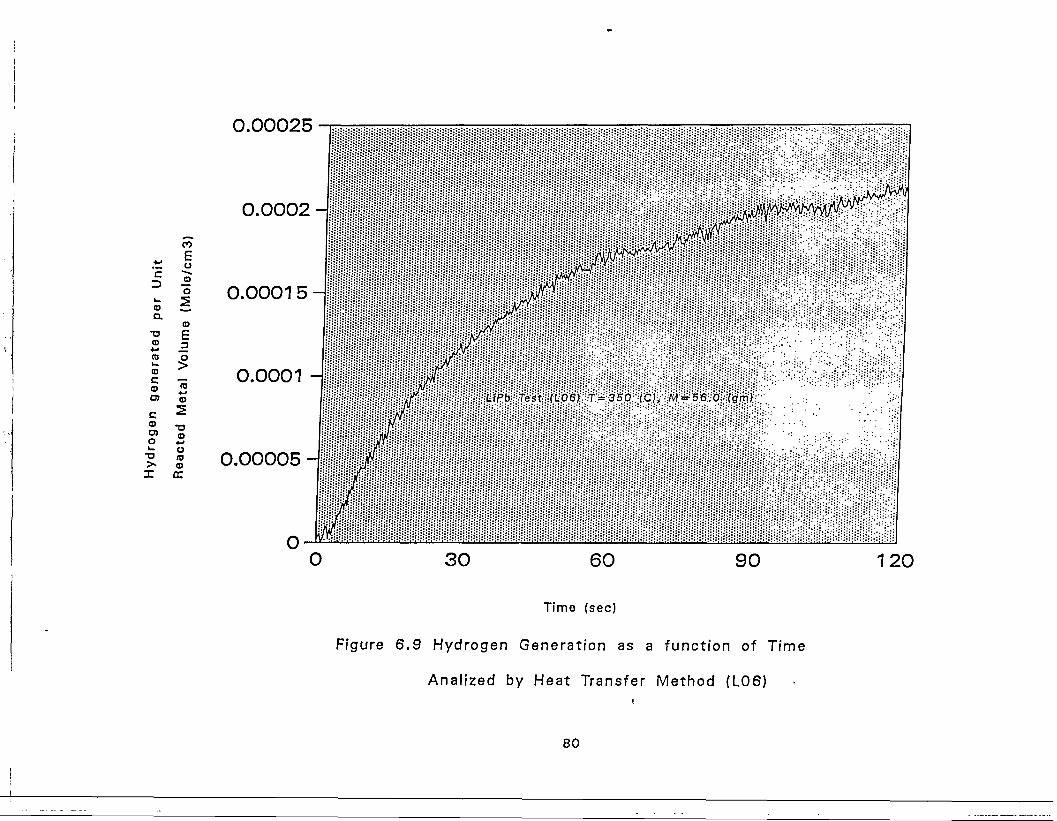
CO
~ eCD
aTJCO
(0
CD
cCD
cCDU>O
•a> •
X
o5CD
EO
^*
15CD
TJCD•-•OroCD
a:
0.00025
0.0002
0.0001 5
0.0001
0.00005
o
iiiliipiillliliiiiiii;jiiipijljjiiiijiiijljii
iiiiijjijiijjiiijjl
0 3 0 60
Time (sec)
90 120
Figure 6.9 Hydrogen Generation as a function of Time
Analized by Heat Transfer Method (L06)
80

Uni
t
CDaco
CDcCD
cCDCOO
•a
I
COE0/9
-mol
CO
CDE
>"cOCD
coo
a:
0.006987
0.004658
0.002329-
-0.0116450
LiPb Test (L05) =r^SSo;(C)-;.M=4O.O (gm)
30 90 12060
Time (sec)
Figure 6.10 Corrected Hydrogen Generation as a Function of Timei
Transformed from Thermodynamics Method (L05)
81

cD
COQ .cocC(1)cCDCDcCDD)O»
CO
oE3CD
E
CO+->CD
•aCD
t>COCO
tr
0.005084
0.003813
0.002542
0.001271
-0.001271
-0.002542
LiPb Test (L06) T=C50 (CJ, M=56.0 (gm)
0 120
Figure 6.11 Corrected Hydrogen Generation as a Function of Timet
Transform from Thermodynamics Method (L06)
82
J5o£6)cCD
O
•a
0.003
0.002 - LiPb Test (L05) T=350 (C), M=40.0 (gm)
-0.004 -i
-0.00560
Time (sec)120
Figure 6.12 3 Corrected Hydrogen Generation as a Function of Time
Analyzed by Thermodynamics Method (L05)
83
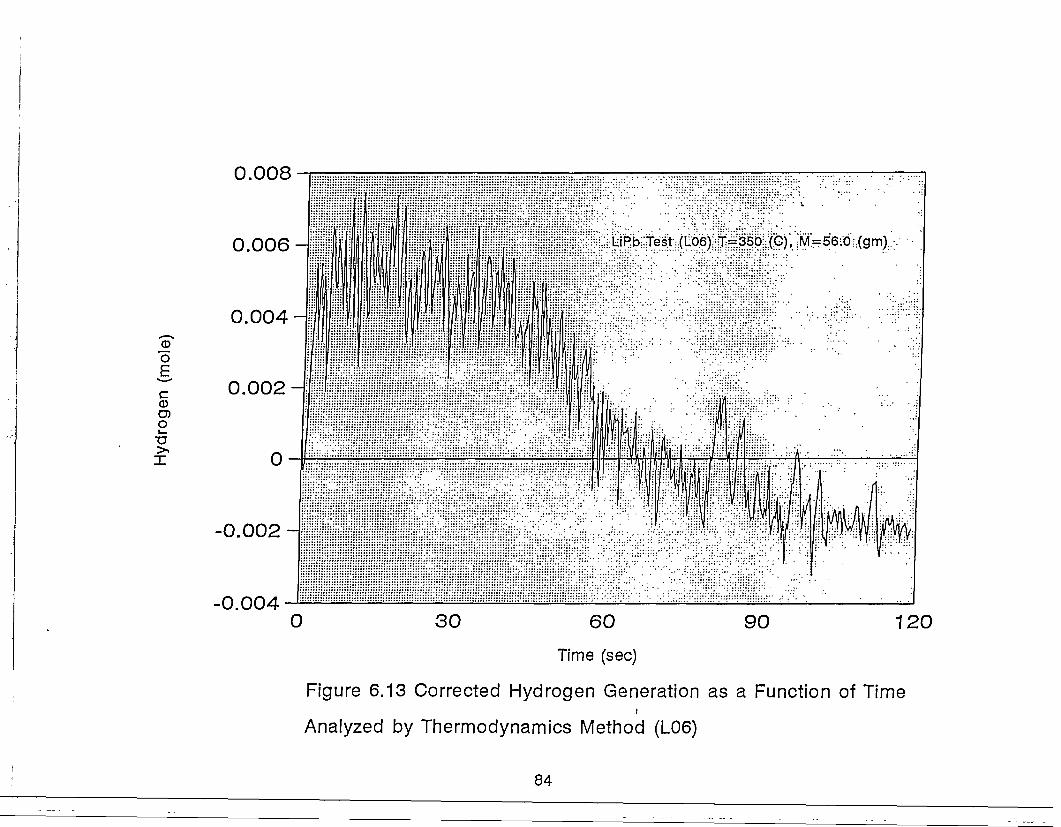
O
cCDD)O
0.008
0.006
0.004-
0.002
LiPb Test (L06) T=350 (C), M=56;d;;(gm);.
-0.002
-0.0043 0 9060
Time (sec)
Figure 6.13 Corrected Hydrogen Generation as a Function of Time
Analyzed by Thermodynamics Method (L06)
120
84
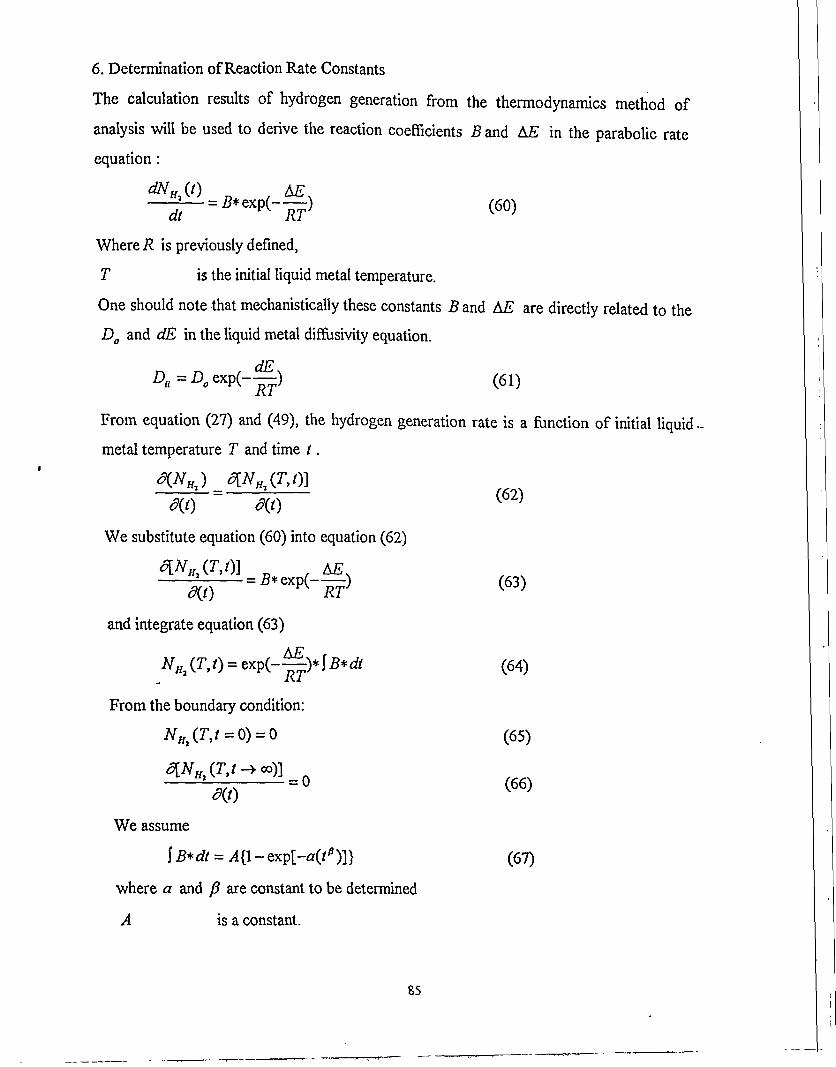
6. Determination of Reaction Rate Constants
The calculation results of hydrogen generation from the thermodynamics method of
analysis will be used to derive the reaction coefficients B and AE in the parabolic rate
equation:
^ ~) (60)
Where R is previously defined,
T is the initial liquid metal temperature.
One should note that mechanistically these constants B and AE are directly related to the
Do and dE in the liquid metal difrusivity equation.
DH=Dotxp(-—) (61)
From equation (27) and (49), the hydrogen generation rate is a function of initial liquid •
metal temperature T and time i.
( 6 2 )
We substitute equation (60) into equation (62)
( 6 3 )
and integrate equation (63)A C
^ ( 7 * . 0 = exp(-—)*lB*dt (64)
From the boundary condition:
^ ( r , r = o) = o (65)
fl^ (7-,/->«>)]
3® - ° (66)
We assume
\B*d( = A{\- exp[-a(^)]} (67)
where a and fi are constant to be determined
A is a constant.
85
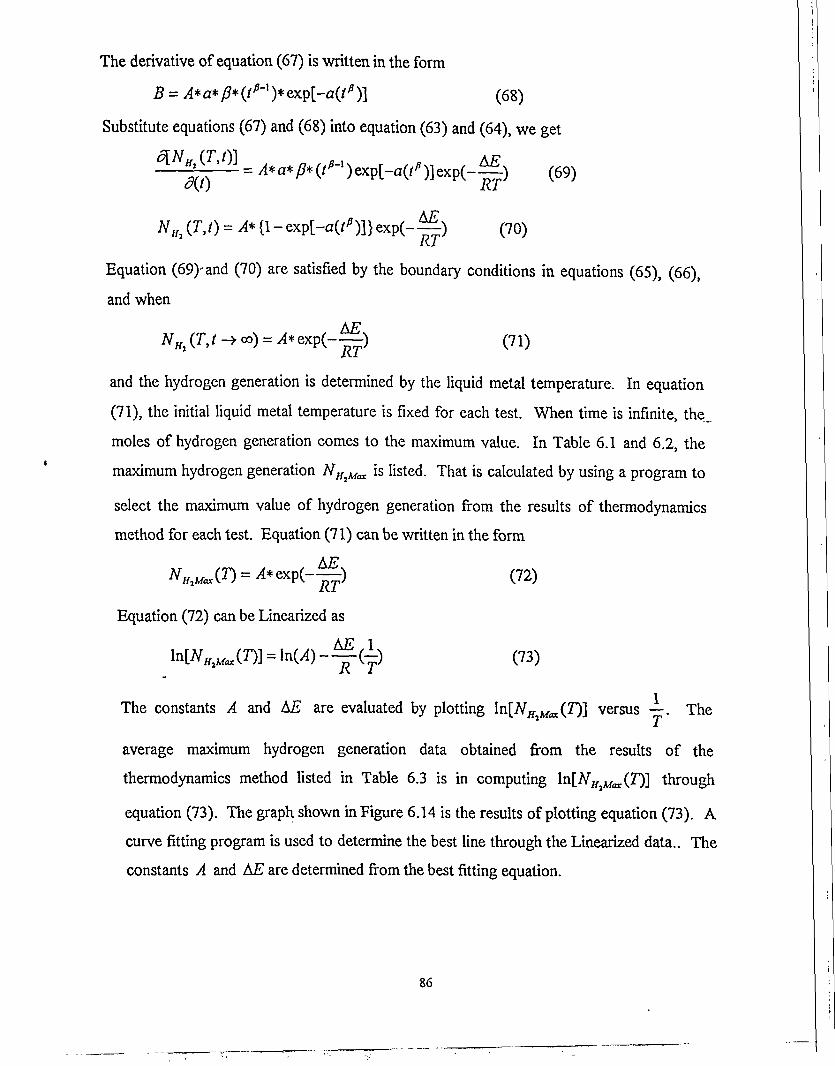
The derivative of equation (67) is written in the form
B - A* a* (3* (lp-x )* exp[-a(tfi)] (68)
Substitute equations (67) and (68) into equation (63) and (64), we get
(69)
(70)
Equation (69)-and (70) are satisfied by the boundary conditions in equations (65), (66),
and whenA IT*
NHi(T,t-> co) = A* exp(~—) (71)
and the hydrogen generation is determined by the liquid metal temperature. In equation
(71), the initial liquid metal temperature is fixed for each test. When time is infinite, the_
moles of hydrogen generation comes to the maximum value. In Table 6.1 and 6.2, the
maximum hydrogen generation NHjUax is listed. That is calculated by using a program to
select the maximum value of hydrogen generation from the results of thermodynamics
method for each test. Equation (71) can be written in the form
AE) (72))
Equation (72) can be Linearized as
2 ^ i ) (73)
The constants A and AE are evaluated by plotting \ri[NKMac(T)] versus —. The
average maximum hydrogen generation data obtained from the results of the
thermodynamics method listed in Table 6.3 is in computing ln[NHMax(T)] through
equation (73). The graph shown in Figure 6.14 is the results of plotting equation (73). A
curve fitting program is used to determine the best line through the Linearized data.. The
constants A and AE are determined from the best fitting equation.
86

£OJI•z.
-1 -
- 2 -
- 3 -
- 4 -
- 5 -
-6
Smoothed by Fitting
ln[NH2max]
i i i i i i r̂ i i i
1.083 1.133 1.183 1.233 1.283 1.333 1.383 1.433 1.483 1.533 1.583(1/T)x1000
Figure 6.14 Linearization of Equation (73)and Fitting Equation
87

Table 6.3 The Average Moles of Hydrogen Generation
T (°£)
350+273.15400+273.15600+273.15
#*,*« (mole)
0.00670.00720.0102
HNHiMax(T)]
-5.005647753-4.933674253-4.585367559
VT0.0016047500.0014855520.001145278
From equation (73) and fitting equation
Y = -2.956027 - 1243.82X
where
lnA = -2.956027
AER
= 1243.82
the coefficients are
A = 0.052025203
and
AE = 1.03416*105
(Mole)
(J/Mole)
where R is molar gas constant. Now we discuss the constants a and-/? in equation (70).
We substitute equation (72) into equation (70) to get
NHi(T,f) _
N(74)
HjMax
Then
< HjMax
H (T,t)
•fV
(75)
where
88
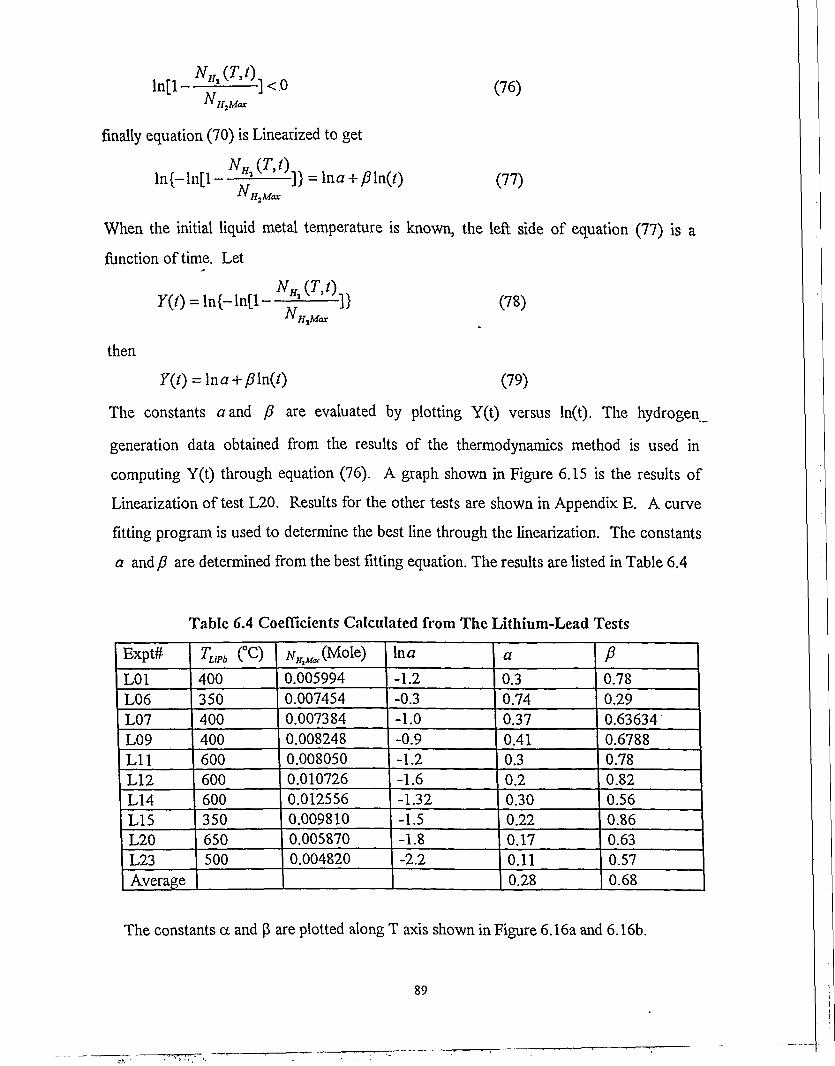
vg,(r,O. (76)
finally equation (70) is Linearized to get
N(77)
HMax
When the initial liquid metal temperature is known, the left side of equation (77) is a
function of time. Let
NH,Max
then
(78)
(79)
The constants a and /? are evaluated by plotting Y(t) versus ln(t). The hydrogen _
generation data obtained from the results of the thermodynamics method is used in
computing Y(t) through equation (76). A graph shown in Figure 6.15 is the results of
Linearization of test L20. Results for the other tests are shown in Appendix E. A curve
fitting program is used to determine the best line through the linearization. The constants
a and/? are determined from the best fitting equation. The results are listed in Table 6.4
Table 6.4 Coefficients Calculated from The Lithium-Lead Tests
Expt#
L01L06L07L09LllL12L14L15L20L23Average
Tm (°C)400350400400600600600350650500
^ « ( M o l e )0.0059940.0074540.0073840.0082480.0080500.0107260.0125560.0098100.0058700.004820
In a
-1.2-0.3-1.0-0.9-1.2-1.6-1.32-1.5-1.8-2.2
a
0.30.740.370.410.30.20.300.220.170.110.28
P0.780.290.63634"0.67880.780.820.560.860.630.570.68
The constants a and P are plotted along T axis shown in Figure 6.16a and 6.16b.
89

1.5
1 -
LiPb Test (L14) T=600 (C), M=49.0 (gm)
3E
CM
CMIZ
0.5
0
-0.5-
-1
-1.5
Irt{-1rrf1-NH2(t)/NH2max]}«lna+Blntlna»-1.088302517
\ B^0.6327454
Smoothed by Fitting Equation
0.5 1 2.5 3.51.5 2
In (t)
Figure 6.15 Hydrogen Generation Linearized by Equation (78) for Test (L14)
90

0.8
(L06)
0.6
a 0.4(L07)
(L09)
fLo-n
Average a=0.28;
0.2 -T
0 I I I I I I I I I I I I I I I I I I I I I I I I I I I I I I I I I ) I 1 I I I I I I I I I I I I I I 1 I I I I I
350 370 390 410 430 450 470 490 510 530 550 570 590 610 630 650Temperature (C)
Figure 6.16a Constant (a) Distrabution along Temperature Axis
91

0-15)0-O1)
(L09)
Average B=0.68.;(L12)
^ •
(L11)
0 . 2 -
0
(LOT) (L2
(L23) (L14)
' | • '• i | i i i | i i i | i i i | i i i | i i i •] i i i | i i i -| i i — r | 1 — I - , |
350 370 390 410 430 450 470 490 510 530 550 570 590 610 630 650Temperature (C)
Figure 6.16b Constant (B) Distrabution alorig Temperature Axis
92

From the two. graphs, we notice that the constants a and p are independent of
temperature. We remove the discrete points and calculate the average of the constant a
and p listed in Table 6.4
7. Determination of the Hydrogen Generation Equation
The average of the constants a and/? listed in Table 6.3, are used to determine the
hydrogen generation equation. All the terms in equation (70) are known, the moles of
hydrogen generation equation is:
NHt (T, t) = 0.052* {1 - exp[-0.28(O]} e x p ( - ^ y ^ l ) (80)
The hydrogen generation are calculated using equation (80) with different liquid metal
temperature (350°C-600°C) and within 240 sec. The results are shown in Figure 6.17,6.18,
and 6.19. These figures also show the hydrogen generation as evaluated with test L14,
L07, LI 5. Equation (80) reproduces the general shape of the test data, except for the
hydrogen leakage.
8. Determination of the Hydrogen Generation Rate Equation
All the coefficients in equate (80) are substituted into equation (69).
= 0.052*0.28*0.68* (?-°32)exp[-0.28(r0(i8)]exp(- L 2 4 3 8*1 ( ) 3)
Three figures shown in Figure 6.20, 6.21 and 6.22, are calculated using equation (81) with
different temperature (350°C-600°C) and within 240 sec. These figures also show the
hydrogen generation rate as evaluated with test LI 4, L07, LI 5. Finally the results of the
hydrogen generation rate should be divided by the area of the liquid metal surface to get
the reaction rate per unit area.
93

a>o•
cCD
O
0.014
0 . 0 1 2 -Reproduced by Equatiort (80)
LiPbTest (L14) T=600 (C), M=49,0 (gm)
30 60 90 120 150 180 210 240Time (sec)
Figure 6.17 Corrected Hydrogen Generation as a Function of Time (L14)
94

0.01
Reproduced by Equation (80)
LiPb Test (L07) T=400 (C), M=40.0 (gm):
"' n ̂w^Vi/y^^
0 30 60 90 120 150 180 210 240
Time (sec)
Figure 6.18 Corrected Hydrogen Generation1 as a Function of Time (L07)
95
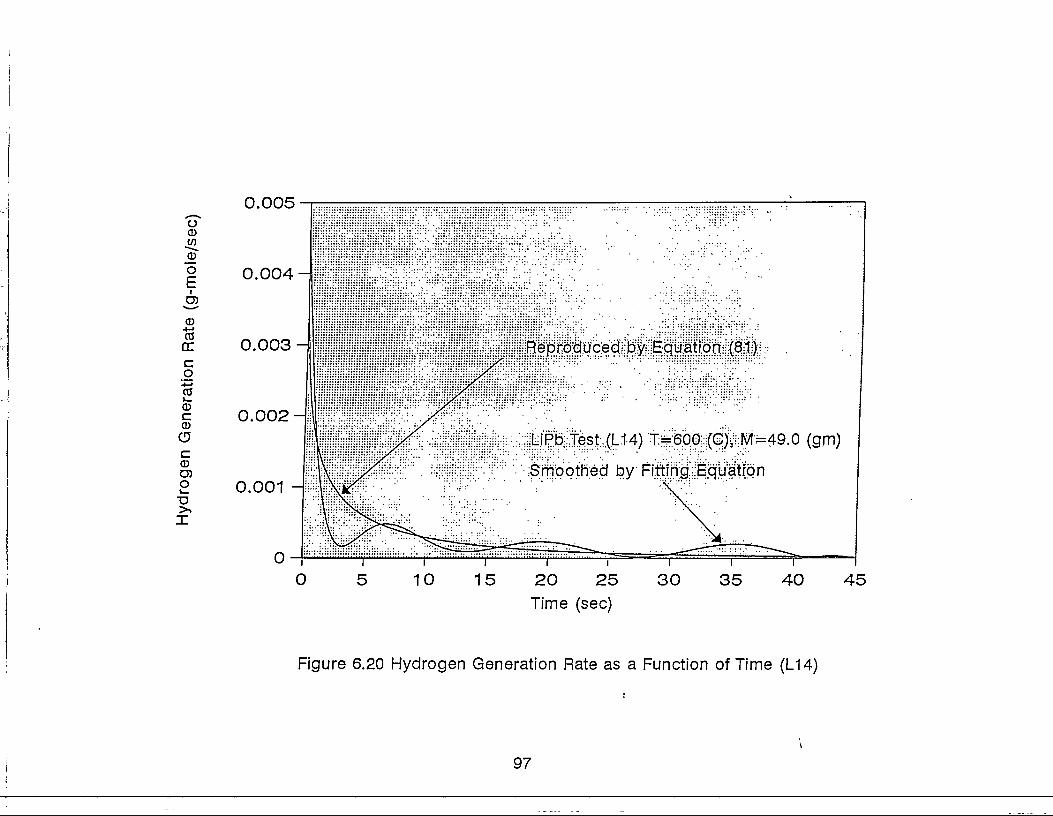
o
CD
JDoE
t
CDco•gCD
CD
c<DO3O
0.005
0.004
a: 0.003
0.002
0.001 -
00
Reproduced by Equation (81)
LiPb Test
Smoothed by Fitting
5 10 15 20 25 30 35 40 45
^6p;0;:;(Gp:M-49.O (gm)
Time (sec)
Figure 6.20 Hydrogen Generation Rate as a Function of Time (L14)
97
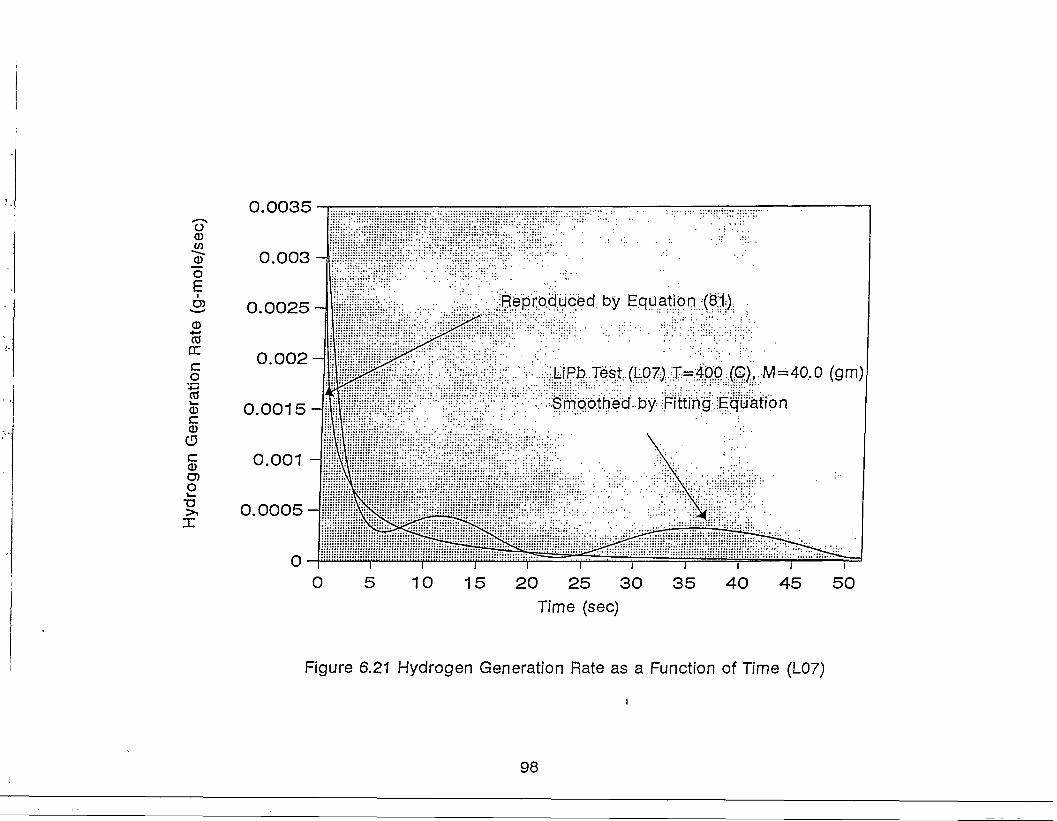
oCD
o£3CDtooccotsCDcCD
(5cCDO)O
Reproduced by Equatidn (8;1:): .
LiPb Test (UQ7^T.=ffl,:M.;:M=4CX0 ( g m
Smoothed by ;F:itti:rig:;.£qu::a1:ion
10 15 20 25 30 35
Time (sec)
45 50
Figure 6.21 Hydrogen Generation Rate as a Function of Time (L07)
98

0.003o0)
•2 0.0025 -oE
©
cog0)c
dO
0.002
0.0015
0.001
0.0005
Reproduced by Equation (81)
LtPb Test (L15) T=350 (C), M=35::p
Smoothed by Fitting Equation
i i i i5 10 15 20 25 30 35 40 45 50 55
Time (sec)
Figure 6.22 Hydrogen Generation Rate as a Function of Time (L15)
99
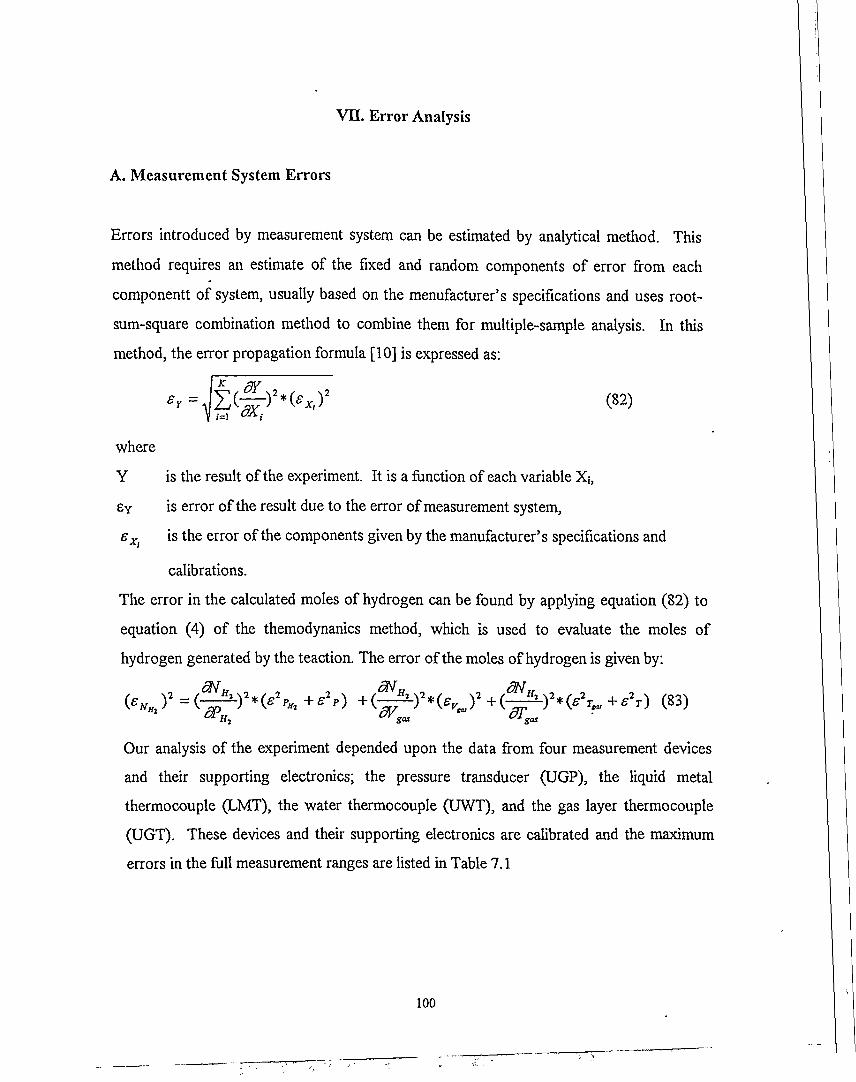
VII. Error Analysis
A. Measurement System Errors
Errors introduced by measurement system can be estimated by analytical method. This
method requires an estimate of the fixed and random components of error from each
componentt of system, usually based on the menufacturer's specifications and uses root-
sum-square combination method to combine them for multiple-sample analysis. In this
method, the error propagation formula [10] is expressed as:
(82)
where
Y is the result of the experiment. It is a function of each variable Xj,
£y is error of the result due to the error of measurement system,
eX) is the error of the components given by the manufacturer's specifications and
calibrations.
The error in the calculated moles of hydrogen can be found by applying equation (82) to
equation (4) of the themodynanics method, which is used to evaluate the moles of
hydrogen generated by the teaction. The error of the moles of hydrogen is given by:
-Y*(e\+e2T) (83)
Our analysis of the experiment depended upon the data from four measurement devices
and their supporting electronics; the pressure transducer (UGP), the liquid metal
thermocouple (LMT), the water thermocouple (UWT), and the gas layer thermocouple
(UGT). These devices and their supporting electronics are calibrated and the maximum
errors in the full measurement ranges are listed in Table 7.1
100

Table 7.1 The Errors in Measurement System
Devices
Pressure transducer (UGP)
Liquid Metal Thermocouple (LMT)
Water Thermocouple (UWT)
Gas Thermocouple (UGT)
Graduated Cylinder
DAS for Temperature Measurement
DAS for Pressure Measurement
Leakage
Type
Setra 204
K
K
E
TEKK
AIM7
AMM2
Maximum Error
SPHI = 1.4*10"2 (bar)
sT = 3.05 (°C)
sTwm = 2.2 (°C)
sTm = 1.7 CO
sv = 1.0 (cm3)
eT = 0.25 (°O
ep = 1.4*10~3 (bar)
ePi = 1.16* 10"4 (bar)
From equation (4)
cP» RT.XHj(25° C,la(m)
(Tsal-Twat) wat
gas(Tsal-25°C)Palm m.wtHiO
where
gar
R
got
is the gas volume in system (193 cm3)
is the gas constant (83.14395 bar cmVmole K)
is the gas temperature (60+273.15°K)
JJ% (25° Claim) is constant (1.7*10"7 )
lsat
lwat
aim
'wat
m.wt H-fi
is the water saturation temperature (160°C, at 6 bar)
is the water temperature (60°C)
is the atmosphere pressure (1.03 bar)
is the density of water (1.0098-4.86871 *10'4*60oC)
is the water volume (1330 cm3)
is the molecular weight of water (18.02 gm/mole)
(84)
101

Substitute them into equation (84)
( ^ ) 2 ( 2 2 2 (g.mole2)
From equation (4)
<Vgas R (Tgasy
(— th -y*^ 2 ^ +^2r) = 7.8*10-8
and
gas-
where
PWj is the maximum partial pressure of hydrogen measured in the system (6bar),
gas
then
(eNitj f = l.l*10"8 + 7.8*KT8 + 4.6*10-8 = 1.35*10~7 (g-mole2)
Finally, the maximum error of hydrogen generation due to measuremental devices is:
£Nni =0.000367 (g-mole)
B. The Error in Experimental Results
The propagation formula [10] can be used to evaluate the error of the mean moles of
hydrogen for the group of tests at each initial liquid metal temperature. The error in the
mean moles of hydrogen is related to the errors in the moles of hydrogen from each test
by:
102

1 p(87)
where
e
K
**, (0
where
is error of the mean moles of hydrogen from tests,
is the numbers of tests,
is error of the moles of hydrogen from the (i)th test calculated using
••H ( 0 = NH Max (/) - NH^MOX (88)
NHiMax (/)
using
is the maximum moles of hydrogen from the (i)th test,
is average of the maximum moles of hydrogen from K tests calculated
(89)1=1
Referring to the maximum moles of hydrogen from the (i)th test NH Max(f) listed in Table
6.1 and the average of the maximum moles of hydrogen from K tests NH2MOX listed in
Table 6.3, the error of the mean moles of hydrogen is calculated using equation (86) from
the results of the thermodynamics method and listed in Table 7.2.
Table 7.2 The Error of Calibrated Hydrogen Generation
LMT
T
350400600
Average
JfHlMaX
(mole)
0.00670.00720.0102
Error
(mole)
0.001470.000530.00158
ExperimentError
Himea" *100%
22.0%7.4%15.5%
EquipmentError
- "2 *100%NHlMax
3.34%2.45%3.59%
Combined Error
/ 2 , 2
N H-iMax
22.6%8.95%15.9%
103

. Summary of Results and Conclusions
A. Summary of Results
One experimental setup was used to perform 17 lithium-lead and 15 lead experiments in
the hydrogen generation rate study. The mass range of lithium-lead samples was from
35.0 gm to 56.0 gm. The initial liquid metal temperature range was from 350°C to 650°C.
The initial water temperature was 60°C. The maximum amount of hydrogen generation
ranged from 0.0067+0.00147 g-mole at 350 °C to 0.0102±0.00158 g-mole at 600 °C over
a time period of 240 seconds. The average hydrogen generation per unit area ranged from'
13.2 g-mole/m2 at 350 °C to 20.1 g-mole/m2 at 600 °C. The maximum amount of
hydrogen generation rate range was from 0.0025 mole/sec (350°C) to 0.0045 mole/sec
(600°C) at the beginning of the reaction phase. The average hydrogen flux ranged from
0.0551 g-mole/m2 sec (350°C) to 0.0838 g-mole/m2 sec (600°C) over a time period of 240
second.
Two methods were developed to analyze the raw data from the experiments. The
thermodynamics method was the main method used in the analysis to determine the
hydrogen generation, hydrogen generation rate, and the reaction rate constants. The heat
transfer method is simpler then the thermodynamics. However it needs an accurate value
of the C evaluated using lithium-lead. Since this condition was not satisfied, we did not
get reasonable result from the heat transfer method.
Three graphical libraries were plotted to show the results of experiments and analysis in
Appendix B, D and E.
Four reaction coefficients were determined from the hydrogen generation curve. In the
parabolic rate equation,
104

ir (0 AE*a =ff*exp(-—)
where the constants B actually is a function of time,
B = A*a*8*(t/}-')*exp[-a((fi)]
and the values of A, a and /? determined from the experimental results are
A = 0.052025 (g-mole),
a = 0.28 (sec'1),
J3 = 0.68 (constant)
and
A£ = 1.0336*105 (J/g-mole)
This reaction coefficient (A£ = 1.03*10s) is compared with the modified reaction
constant (AE - 1.09* 10s) which is introduced in the literature review. They are nearly the
same. The hydrogen flux are compared with the Herzog's results which is introduced in
the literature review. They are in the same range shown in Figure C. 1.
B. Conclusions:
1. The modified experimental setup can be used to determine the extent of the lithium-
lead/water reaction by measuring water, gas and liquid metal temperature and gas
pressure. From the results of analysis, the experiments can be repeated under identical
conditions in this system.
2. The extent of reaction was found to vary over the range of initial liquid metal
temperatures between 350° C and 650° C. The g-moles of hydrogen generation is a
function of time and liquid metal temperature.
105

oCD
COC\J
O
E
X
co
*••-»COu0)c0)
c0
O
0.
0.08
0.06
0.04
0.02
0300
Results from Our Tests
Results from Herzog's Test
350 400 450 500 550 600 650
Temperature (C)
Figure C 1 Average Hydrogen Generation Flux for LiPb and Water Reaction [7]
106
3. Analysis of the g-moles of hydrogen data about 240 seconds from the lithium-lead tests
showed that the hydrogen generation equation and the Arrhenius reaction rate constants
can be determined from the g-moles of hydrogen generation curve.
4. The developed hydrogen generation and hydrogen generation rate equations can be
used to predicate the hydrogen generation and hydrogen generation rate during
reaction.
C. Recommendations:
1. It is recommended that the further experiments be done using a lower chamber with
two liquid metal pool, one for lithium-lead and another for lead. Two thermocouples
should be used to directly measure the two liquid metal temperatures simultaneously. In
this way, we can use two methods to evaluate hydrogen generation and the coefficient C
in equation (28).
2. It is recommended that before and after each experiment, the samples of the metal
should be analyzed by chemical method to find how many lithium reacted. The result of
chemical analysis can be used to correct the maximum value of hydrogen generation from
the thermodynamics and heat transfer methods of analysis.
107

IX. PROBLEMS ENCOUNTERED DURING PERIOD OF RESEARCH
Problems Encountered
Two major problems were encountered during the first six month of the project, all being
the result of the project contract date occurring almost a month after beginning of the
semester. The principal investigator was unable to obtain release time to actively work on
the project in the Fall Semester of 1990 (August 28-December 31, 1990) because of the
late contract date. A College technician could not be assigned to work on the project in.
the Fall Semester of 1990 as result of the late contract date. We could also not get the
college technician to work on the project in the Spring Semester of 1991 (January-May
1991) due to heavy work load already being assigned by the college. In the summer of
1992, a technician was assigned to the project. By this time all the design and equipment
acquisition had been completed. The complete system (including lower and upper
chambers, all heaters, solenoid valves, butterfly valve and the data acquisition system) was
assembled. In July 1992, pressure leakage test was conducted on the vessels and the
butterfly valve was found to be leaking in the closed position. Also the cooling coil had
defective welding joint. Upon discussion with the valve manufacturer, the butterfly valve
was returned, and a zero leakage all metal valve was ordered in august 1992 for
replacement. The valve size for this valve had to be charged to 1" due to cost. The valve
was not received until January 15 1993. The change in the valve size necessitated
redesign of the upper chamber and modifications in the lower chamber. The modifications
and assembly of the new system were completed in march, 1993 and successfully tested.
A Supply of lithium-lead was received from Oakridge National Lab in July 1993. From
August through October 1993, a set up for melting and pouring the Lii7Pb83 was
constructed. In November 1993, a faulty valve in the LinPbg3 melt-pouring set up resulted
108

» sp,U of the metal causing the metal to contaminated. Several unsuccessful attempts were
made to get a new l i r f f c , supply from Oakridge. A supple of Li13PbB was no, received
untU we made arrangement with Fusion Technology Institute at the University of
Wisconsin in October ,994. D , Uoyd Nelson delivered the much needed quality supple of
the hthium-lead metal in November 1994. Actual experiments was started in November
.994 and completed in May ,995. Experimental analysis and final report preparation was
completed in August 1995.
109

References
[1] R. Buxbaum, "A Chemical Theory Analysis of the Solution Thermodynamics of
Oxygen, Nitrogen, and Hydrogen in Lead-Rich LiPb Mixtures," Journal of the
Less-Common Metals 97 (1984): p. 27-38.
D. W. Jeppson, L. D. Muhlstein, and S. Cohen, "Fusion Reactor Breeder Safety[2]
[3]
Compatibility Studies," Nuclear Technology/Fusion (Sept. 1983): p. 278-287.
G. Kuhlborsch, H. Dietz, and D. Droste, The Chemical Behavior of Eutectic
Lithium-Lead Alloy Lii7Pb83 in Comparison with pure Lithium," Commission of
the European Communities Joint Research Center Report, Ispra, Italy, (Oct. 1984).
[4] G. Kuhlborsch and F. Reiter, "Physical Properties of Lil7Pb83 Related to its Use
as a Fusion Reactor Blanket Material," Nuclear Engineering Design/Fusion 1,
(1984): p. 195-203.
[5] H. M. Kottowski and G. Grossi, "Investigation of Eutectic LiPb-Water
Interactions in Constraint Geometry at Variable System Pressures," Commission of
the European Communities Joint Research Center Report, Ispra Italy, (Oct. 1983).
[6] D. W. Jeppson and L. D. Muhlstein, "Safety Considerations of Lithium Lead Alloy
as a Fusion Reactor Breeding Material," Hanford Engineering Development
Laboratory Report HEDL-SA 3223-FP, (1985).
[7] J. P. Herzog, "Lithium-Lead/water interactions: Experiments and Analysis", Ph.D.
Dissertation, Fusion Technology Institute, Nuclear Engineering and Engineering
Physics Department, University of Wisconsin-Madison.
110
[8] P. O. Biney, " Development of a Chemical Kinetic Measurement Apparatus and
the Determination of the Reaction Rate Constants for Lithium-Lead /Water
Interaction". Prepared for D. 0. E (April, 1993). Mechanical Engineering
Department, Prairie View A&M University.
[9] W. Masterton, E. Slowinski, Chemical Principles (Philadelphia: W. B. Saunders
Co., 1977) p. 292.
[ 10] Robert J. Moffat, "Describing the Uncertanities in Experimental Results".
Experimental Thermal and Fluid Science 1988; 1: 3-17.
[11] Lioyd S. nelson, Joseph D. Krueger and Michael L. Corradini, "Preparation of
Kilogram Quantities of the 83 a/o Lead-17 a/o Lithium Eutectic Alloy". Fusion
Technology Institute, Department of Nuclear Engineering and Engineering
Physics, University of Wisconsin-Madison, (November 1994)
i l l

10 REM20 REM *30 REM *40 REM *50 REM *60 REM *65 REM **67 REM **69 REM *70 REM
APPENDIX A
LISTING OF DATA ACQUISITION AND CONTROL PROGRAM
**************************************
DATA ACQUISITION AND CONTROL PROGRAM FOR LITHIUM-LEAD/WATERREACTION EXPERIMENTAL RESEARCH
DEVELOPED BYDR. PAUL ORLEANS BINEY
JANUARY 1993MODIFIED BY
QING-YUAN LI
JANUARY 1995
100 REM * SET RELAY NUMBERS FOR DIGITAL RELAY CONTROLLED EQUIPMENT110 REM * ALL RELAYS ARE ON PCM3, WHICH IS THE 16 CHANNEL AC/DC POWER120 REM * CONTROL BOARD.
140 REM * RELAY # IONAME DESCRIPTION OF EQUIPMENT ATTACHED144 REM * 0 UWH UPPER WATER HEATER150 REM * 1 LMH LOWER LIQUID METAL HEATER160 REM * 2 CWV COOLING WATER SOLENOID VALVE170 REM * 3 AIV ARGON INLET SOLENOID VALVE (LOWER)*180 REM * 4 AOV ARGON OUTLET SOLENOID VALVE190 REM * 5 USV UPPER SOLENOID VALVE (ASV FOR UPPER)*200 REM * 6 MBV MAIN BALL VALVE ACTUATOR210 REM * 7 VAC VACUUM VALVES220 REM * 9 WIV WATER INLET VALVE
230 REM * THERMOCOUPLES DESCRIPTION AND IONAMES ASSIGNED
***
**
240 REM *250 REM *260 REM *270 REM *280 REM *290 REM *300 REM *310 REM *
320 REM *340 REM *350 REM *360 REM *370 REM *380 REM *390 REM *400 REM *
ALL THERMOCOUPLES ARE ON AIM7 BOARDIONAME: IS THE INPUT/OUTPUT NAME ASSIGNED IN CONFIGURATION FILETYPE : IS THE THERMOCOUPLE TYPEGAIN : IS THE PRODUCT OF LOCAL GAIN (100) AND GLOBAL GAINWTMAX : IS THE ANTICIPATED MAXIMUM WORKING TEMPERATUREVMAX : IS THE MAXIMUM OUTPUT VOLTAGE FROM TC AFTER GAIN IS
APPLIED. THE VOLTAGE CORRESPONDS TO THAT AT WTMAXAIM7
DESCRIPTIONUPPER GAS TEMP.LOWER GAS TEMP.UPPER WATER TEMP.LOWER WATER TEMP.UPPER FURNACE TEMPLOWER FURNACE TEMPLIQUID METAL TEMP.
IONAME CHANNELUGTLGTUWTLWTUFTLFTLMT
1423675
TYPE GAIN WTMAXE 1000 150CK 200 1000C
1000 150C1000 150C200 1200C200 1200C
KEKKK 200 1000C
VMAX9.8680V8.2536V6.1370V9.8 680V9.7656V9.7656V8.2536V
420 REM * PRESSURE TRANSDUCER DESCRIPTION AND IONAMES ASSIGNED IN430 REM * CONFIGURATION FILE440 REM * AMM2450 REM * DESCRIPTION IONAME CHANNEL TYPE GAIN WPMAX VMAX460 REM *470 REM * UPPER GAS PRESSURE UGP 1 ABS 2 100 PSI 10.00V475 REM * LOWER GAS PRESSURE LGP 2 ABS 2 100 PSI 10.00V477 REM * *******************************************************************
481 REM * THE EXPERIMENT HAS FIVE MAJOR PHASES. THE DATA ACQUISITION *483 REM * AND CONTROL SYSTEM HAS BEEN SET UP TO AUTOMATICALL CONTROL *4 85 REM * ALL EVENTS AND GO THROUGH ALL FIVE PHASES WITHOUT OPERATOR *487 REM * INTERFACE. THE FOLLOWING ARE THE MAJOR VARIABLES THAT CAN *
112
489491492493494495496497498499500501502
REMREMREMREMREMREMREMREMREMREMREMREMREM
BE CHANGED IN THE PROGRAM IF NECESSARY BEFORE RUNNINGTHE PROGRAM.
* PHASE DESCRIPTION** 1 UPPER WATER HEATING* 2 LIQUID METAL HEATING* 3 COUNTDOWN TO REACTION* 4 CHEMICAL REACTION* 5 EQUILIBRIUM PERIOD
TIME INTERVAL BETWEEN DATA=BINT*IR*0.001 SECONDS
BACKGROUNDINTERVALVARIABLE
FGROUNDFGROUNGBINT3%BINT4%BINT5%
BACKGROUNDINTERVALVALUE30SEC30SEC102
200
NUMBEROF DATAVARIABLE
NDP3!NDP4!NDP5!
NUMBER *OF DATA*VALUE *
**
60. *100. *90. *
506 BINT3%=10507 BINT4%=2 „508 BINT5%=10512 NDP3!=100!513 NDP4!=1200!514 NDP5!=200!515 LP3!=1!516 LP4!=1! :517 LP5!=1! :518 DTSV=1519 BOILT=10.!520 RCDT=20.521 EQT=120.
: REM BACKGROUND INTERVAL FOR COUNTDOWN PHASE: REM BACKGROUND INTERVAL FOR REACTION PHASE: REM BACKGROUND INTERVAL FOR EQUILIBRIUM PHASE: REM NUMBER OF DATAPOINTS FOR COUNTDOWN PHASE: REM NUMBER OF DATAPOINTS FOR REACTION PHASE: REM NUMBER OF DATAPOINTS FOR EQUILIBRIUM PHASEREM NUMBER OF DATAPOINTS FOR COUNTDOWN PHASEREM NUMBER OF DATAPOINTS FOR REACTION PHASEREM NUMBER OF DATAPOINTS FOR EQUILIBRIUM PHASE
: REM TIME INTERVAL FOR CLOSURE/OPENING OF VALVES ( SEC): REM WATER BOILING TIME: REM COUNTDOWN TIME PERIOD: REM EQUILIBRIUM TIME PERIOD
523 REM * DEFINE EXPERIMENTAL VARIABLES
541 IR%=1005 42 ITESTNO=1
548 RTIME%=160.549 UWDT=2550 LMDT=2551 REM DTUH=25552 UFDT=2553 LFDT=2554 PTIME%=20555 PTIMEC%=20
: REM INTERRUPT RATE (FIXED FOR PROGRAM AT 100MSEC INTERVAL: REM TEST NUMBER (NEEDS TO BE CHANGED FOR EACH EXPERIMENT)
REM REACTION TIME FOR PARTICULAR EXPERIMENT: REM MAXIMUM ALLOWABLE ERROR IN UPPER WATER TEMPERATURE: REM MAXIMUM ALLOWABLE ERROR IN LIQUID METAL TEMPERATURE: REM MAXIMUM ALLOWABLE ERROR IN UPPER FURNACE TEMPERATURE: REM MAXIMUM ALLOWABLE ERROR IN UPPER FURNACE TEMPERATURE: REM MAXIMUM ALLOWABLE ERROR IN LOWER FURNACE TEMPERATURE: REM PAUSETIME IN SECONDS FOR FOREGROUND INTERVAL: REM PAUSETIME IN SECONDS FOR CONTROL TIME INTERVAL
556 CALL KDINIT600 DIM ONN%(1): DIM OFFF%(1): DIM TIM%(8): DIM TM#(8)602 DIM SIG1!(6),SIG2!(3),SIG3!(2)603 DIMUWHlA(l), UWHlB(l), UWHlC(l), UWHlD(l), UWHlE(l): PRINT LP!604 DIMLGHlA(l), LGHlB(l), LGHlC(l), LGH1D!(1)610 ONN%(0)=0: OFFF%(0)=1: ST%=10: LP!=1!620 UGP$="UGP": WIV$="WIV"622 CWV$="CWV": USV$="USV": UWH$="UWH": AIV$="AIV": AOV$="AOV"623 USV$="USV": UGT$="UGT": LGT$="LGT": LFT$="LFT": LMT$="LMT"624 LMH$="LMH": UFT$="UFT": LGP$="LGP": UWT$="UWT": LWT$="LWT"626 MBV$="MBV": CJUWLWT$="CJN,UWT,LWT": CJUGT$="CJN,UGT": VAC$="VAC"628 CJUFT$="CJN,UFT": CJLGT$="CJN,LGT": CJLMT$="CJN/LMT": CJLFT$="CJN,LFT"
630 REM CREATE DIGITAL ARRAYS FOR CONTROLLING VALVES AND HEATERS
650 CALL ARMAKE1("CWVOPEN%",1.,CWV$)660 CALL ARMAKE1("CWVCLOSE%",1.,CWV$)670 CALL ARMAKE1("USVOPEN%",1.,USV$)680 CALL ARMAKE1("USVCLOSE%",1.,USV$)690 CALL ARMAKE1("UWHONN%",1.,UWH$)700 CALL ARMAKE1("UWHOFFF%",1.,UWH$)702 CALL ARMAKE1("LMHONN%",1.,LMH$)705 CALL ARMAKE1("LMHOFFF%"/1.,LMH$)710 CALL ARMAKE1("AIVOPEN%",1.,AIV$)720 CALL ARMAKE1 ("AIVCLOSE%", 1.,AIV$)
113
730 CALL ARMAKE'("AOVOPEN%",1.,AOV$)740 CALL ARMAKE1 ("AOVCLOSE%",1.,AOV$)744 CALL ARMAKE1 ("MBVOPEN%", 1.,MBV$)74 6 CALL ARMAKE1("MBVCLOSE%",1.,MBV$)747 CALL ARMAKE1("VACONN%",1.,VAC$)748 CALL ARMAKE1("VACOFFF%",1., VAC$)749 CALL ARMAKE1 ("WIVOPEN% ", 1., WIV$)750 CALL ARMAKE1 ("WIVCLOSE%11,1. ,WIV$)
760 REM PUT DIGITAL VALUES OF ON/OFF INTO KDAC ARRAYS FOR DIGITAL CONNTROL770 REM OF VALVES AND HEATERS.
800 CALL ARPUT1 ("CWVOPEN%",1.,1., CWV$,1,ONN%{) , "CRAW. INT")810 CALL ARPUT' ("CWVCLOSE%",1.,1.,CWV$,1,OFFF%() , "CRAW. INT")820 CALL ARPUT1 ("USVOPEN%", 1., 1. ,USV$, 1, ONN% (), "CRAW. INT")825 CALL ARPUT1 ("USVCLOSE%", 1., 1.,USV$,1,OFFF% (), "CRAW. INT")830 CALL ARPUT1 ("UWHONN%", 1., 1. ,UWH$, 1, ONN%(), "CRAW. INT")840 CALL ARPUT' ("UWHOFFF%", 1., 1. ,UWH$, 1,OFFF% () , "CRAW. INT")845 CALL ARPUT' ("AIVOPEN%", 1., 1. ,AIV$, 1, ONN% () , "CRAW. INT")850 CALL ARPUT' ("AIVCLOSE%", 1., 1. ,AIV$, 1,OFFF% () , "CRAW. INT")860 CALL ARPUT1 ("AOVOPEN%", 1., 1. ,A0V$, 1, ONN% (), "CRAW. INT")870 CALL ARPUT1 ("AOVCLOSE%",1.,1.,AOV$,1,OFFF%() , "CRAW. INT")880 CALL ARPUT' ("MBVOPEN% ", 1., 1., MBV$, 1, ONN% () , "C RAW. INT")890 CALL ARPUT1 ("MBVCLOSE%", 1. , 1. ,MBV$, 1,OFFF% () , "CRAW. INT")891 CALL ARPUT' ("LMHONN%", 1. , 1. ,LMH$,1,ONN%(), "CRAW. INT")892 CALL ARPUT' ("LMHOFFF%",1.,1.,LMH$,1,OFFF%() , "CRAW. INT")8 93 CALL ARPUT1 ("VACONN% " , 1. ,l.,VAC$,l, ONN%(), "CRAW. INT")894 CALL ARPUT1 ("VACOFFF%", 1., 1. ,VAC$, 1,OFFF% {), "CRAW. INT")895 CALL ARPUT' ("WIVOPEN%", 1. , 1. ,WIV$, 1, ONN% () , "CRAW. INT")896 CALL ARPUT' ("WIVCLOSE%",1.,1.,WIV$,1,OFFF%() , "CRAW. INT")
O «? / Xr X\ JL 1st J«
898 PRINT "* INPUT UPPER WATER SETPOINT TEMPERATURE *"O w? ? Xr Xx ̂ X » J«
900 INPUT UWSETPT
Z? v JL Xrx»J-X^i X
902 PRINT "* INPUT LIQUID METAL SETPOINT TEMPERATURE *"v/ W *J Xr X\ JL X" Jfr
904 INPUT LMSETPT905 PRINT "UWSETPT,LMSETPT"/UWSETPT/LMSETPT906 PRINT "DO YOU WANT TO CHANGE? Y OR N?"907 INPUT ANS$908 IF (ANS$="Y" OR ANS$="y") THEN GOTO 897909 LFSETPT=LMSETPT+150 : REM LOWER FURNACE SETPOINT TEMPERATURE910 TSAT!=UWSETPT : REM BOILING TEMPERATURE AT LOWERED PRESSURE911 UFSETPT=UWSETPT : REM UPPER FURNACE SETPOINT TEMPERATURE
912 REM BEGIN DATA ACQUISITION AND CONTROL
922 PRINT " * THE ARGON INLET VALVE IS BEING CHECKED AND OPENED *"923 PRINT " * THEN AFTER 2 INTONS THE ARGON OUTLET VALVE IS CHECKED/OPENED*"924 PRINT " * THE COOLING WATER SOLENOID VALVE IS BEING CLOSED *"*/ £* w Xr Xx JL X i X
930 TNH=0: TIM%(0)=l932 CALL KDTIMER1(TIM%(),"UT","")940 CALL INTON1(IR%,"MIL")943 CALL BGWRITE' ("AIVOPEN%", AIV§, 1,1, "NT", "AIVSTAT")945 CALL KDTIMERRD1(TM#())947 IF TM#(0)*IR%/1000<DTSV GOTO 945948 CALL BGWRITE1 ("AOVOPEN%",AOV$,1,1,"NT", "AOVSTAT")949 CALL BGWRITE1("CWVOPEN%",CWV$,1,1,"NT","CWVSTAT")950 CALL BGWRITE'("WIVOPEN%",WIV$,1,1,"NT","WIVSTAT")953 PRINT " **********************************************'
114

954 PRINT " * THE UPPER WATER HEATER AND LIQUID METAL HEATER ARE *"955 PRINT " * BEING TURNED ON TO BEGIN THE INITIAL HEATING PHASE. *"956 PRINT '
960 CALL BGWRITE1 ("UWHONN%",UWH$,1,1,"NT","UWHSTAT")961 CALL BGWRITE1("LMHONN%",LMH$,1,1,"NT","LMHSTAT")962 UHST%=1970 CALL BGSTATUS'("CWVSTAT",ST%)982 IF ST% <> 0 GOTO 970983 PRINT "STATUS OF CWV IS ", ST%984 REM CALL INTOFF990 REM
992 PRINT994 PRINT " * ACQUIRING DATA FOR HEATING OF UPPER WATER AND LIQUID METAL *"995 print " * AND SIMULTANEOUS DATA ACQUISITION ON FOREGROUND. *"7̂ •? D XT X\ X IM x
998 CALL KDPAUSE1(PTIME%,"SEC")1000 CALL FGREAD1 ("CJN,UWT,UFT,LGT,LMT,LFT","NONE", SIG1! () , "C.THCU.K","NT")1010 CALL FGREAD1 ("CJN,LWT,UGT","NONE", SIG2! () , "C.THCU.E","NT")1020 CALL FGREAD1("UGP,LGP","NONE", SIG3!(),"C.VOLTS","NT")1176 REM ************ PRINT DATA *******1178 UFT1=SIG1!(2): LWT1=SIG2!(1): UWT1=SIG1!(1):UWAVG=0.5*(UWT1+LWT1)1179 UGP1=SIG3!(0)*20*6.8948E-2 : LGP1=SIG3!(1)*20*6.8948E-2: UGT1=SIG2!(2)1180 LGT1=SIG1!(3): LMT1=SIG1!(4): LFT1=SIG1!(5)1181 PRINT "UWT,LWT,UGT,UFT,UGP ARE ";UWT1;LWT1;UGT1;UFT1;UGP1;"bar"1182 PRINT "LFT1;LMT1;LGT1;LGP1";LFT1;LMT1;LGT1;LGP1;" bar"1183 IF( UFT1>UFSETPT+UFDT AND UHST%=1) THEN GOSUB 40001184 IF( UFTKUFSETPT-UFDT AND UHST%=0) THEN GOSUB 50001185 IF( LFT1>LFSETPT+LFDT AND LHST%=1) THEN GOSUB 4500118 6 IF{ LFTKLFSETPT-LFDT AND LHST%=0) THEN GOSUB 5500
1200 REM ********* PERFORM TEST TO DETERMINE IF WATER AND ***1210 REM ********* LIQUID METAL SETPOINT TEMPERATURES HAVE BEEN ATTAINED ***1212 IF (UWT1 >UWSETPT-UWDT AND UWT1<UWSETPT+UWDT) THEN PRINT "UPPER WATERTEMPERATURE IS WITHIN SETPOINT RANGE"1214 IF (LMT1 >LMSETPT-LMDT AND LMTKLMSETPT+LMDT) THEN PRINT "LIQUID METALTEMPERATURE IS WITHIN SETPOINT RANGE"1300 REM *** PERFORM MAJOR TEST TO CHECK IF BOTH WATER AND ***1310 REM *** METAL TEMPS ARE WITHIN RANGE ****1315 IF ABS(UWT1-UWSETPT)<UWDT AND ABS(LMT1-LMSETPT)<LMDT GOTO 13251320 GOTO 9981325 PRINT " LIQUID METAL AND UPPER WATER ARE AT PRESET TEMPS"1330 PRINT "UWT, LWT, LMT,UGP ARE "/UWT1/LWT1;LMT1;UGP1*2O.0*6.8948E-21335 PRINT " THE UPPER AND WATER INLET SOLENOID VALVES ARE BEING CLOSED"1340 PRINT " TO READY SYSTEM FOR INDUCED BOILING BY VACUUM PUMP1360 CALL BGWRITE1 ("WIVCLOSE%",WIV$, 1,1, "NT", "WIVSTAT2")1370 CALL BGWRITE1("CWVOPEN%", CWV$,1,1,"NT","CWVSTAT2")1380 PRINT "CLOSE ALL MANUAL VALVES ON CHAMBER EXCEPT THE UPPER BALL VALVE"1400 PRINT "CLOSE ALL MANUAL VALVES ON CHAMBER EXCEPT THE UPPER BALL VALVE"1411 PRINT " ***** 2 MINUTE BOILING, ACTIVATED BY DRAWING VACUUM ********1412 PRINT " ***** OVER THE UPPER GAS SPACE IS BEING INITIATED ******"X ^ X ^ Jtrr\XI*» X1415 PRINT "* DO YOU CLOSE WATER INLET AND OUTLET VALVE? *"1416 PRINT "* DO YOU OPEN UPPER VALVE AND VAC VALVE? *"1422 PRINT "* DO YOU WANT CONTINUE THE EXPERIMENT? Y OR N? *"X^^4 Jri\XWJ.
1426 INPUT ANS$1428 IF (ANS$="Y" OR ANS$="y") THEN GOTO 14651430 GOTO 8971470 TIM%(1)=11480 CALL KDTIMER'(TIM%(),"NT","")1490 CALL KDTIMERRD1(TM#())1500 CALL KDPAUSE1(PTIMEC%,"SEC")1510 CALL FGREAD1 ("CJN,UWT,UFT,LGT,LMT,LFT","NONE", SIG1!(),"C.THCU.K","NT")1520 CALL FGREAD1("CJN,LWT,UGT","NONE", SIG2!(),"C.THCU.E","NT")1530 CALL FGREAD'("UGP,LGP","NONE", SIG3!(),"C.VOLTS","NT")
115

1540 REM ************ PRINT DATA *******1550 UFT1=SIG1!(2): LWT1=SIG2!(1): UWT1=SIG1!(1):UWAVG=0.5*(UWT1+LWT1)1560 UGP1=SIG3!(0)*20*6.8948E-2 : LGP1=SIG3!(1)*20*6.8948E-2: UGT1=SIG2! (2)1570 LGT1=SIG1!(3): LMT1=SIG1!(4): LFT1=SIG1!(5)1572 PRINT "CONTROL THE VACUUM VALVE"1580 PRINT "UWT,LWT,UGT,UFT,UGP ARE ";UWT1;LWT1;UGT1;UFT1;UGP1;"bar"1582 PRINT "LFT1;LMT1;LGT1;LGP1";LFT1/LMT1;LGT1;LGP1/11 bar"1584 IF{ UFT1>UFSETPT+UFDT AND UHST%=1) THEN GOSUB 40001586 IF( UFTKUFSETPT-UFDT AND UHST%=0) THEN GOSUB 50001588 IF( LFT1>LFSETPT+LFDT AND LHST%=1) THEN GOSUB 45001590 IF( LFTKLFSETPT-LFDT AND LHST%=0) THEN GOSUB 55001592 TK=UWT1+273.151593 Xl=10.81166+8.897199E-3*TK-1.93160E-5*TK*TK+l.341150E-8*TK*TK*TK-4127.204/(TK-32.82)1594 PSAT=EXP(X1)1597 IF TM#(l)*IR%/1000 < BOILT GOTO 14901598 REM1600 PRINT " *** INDUCED BOILING COUNTDOWN TIME IS OVER "1610 PRINT "BEEPING TO REMIND OPERATOR TO SHUT UPPER BALL VALVE1612 PRINT " MANUALLY WITHIN ONE MINUTEA- v JL " *r I\ J* AM X
1615 PRINT "* DO YOU CLOSE UPPER VALVE AND VAC VALVE? *"1616 PRINT "* DO YOU CHECK THE VOLAGE OF MBV? IS IT 12 V? *"1622 PRINT "* DO YOU WANT CONTINUE THE EXPERIMENT? Y OR N? *"
1626 INPUT ANS$1628 IF (ANS$="Y" OR ANS$="y") THEN GOTO 16301629 GOTO 14111645 CALL BGWRITE1("AOVCLOSE%",AOV$,1,1,"NT","AOVSTAT2")1660 PRINT "CLOSE UPPER BALL VALVE MANUALLY"1934 PRINT " * A 60 SECONDS COUNTDOWN TIME IS BEING STARTED TO ACQUIRE * "1936 PRINT " * DATA FOR CALCULATING THE LOWER ARGON MASS AND FOR * "1938 PRINT " * ESTABLISHING INITIAL CONDITIONS * "J^ ̂ 7 ̂ X \J »̂ *»J»Xi A
2030 PRINT " ****** ACQUIRE DATA FOR COUNTDOWN *******"2040 PRINT-" ****** PHASE ON BACKGROUND GO **********"2050 REM ****** ACQUIRE UPPER DATA ******2052 TIM%(4)=12054 CALL KDTIMER1(TIM%(),"NT","")2060 CALL BGREAD1 ("UWHEAT3A",NDP3!,CJUWLWT$, BINT3%,"NONE",1,"NT","UWHDAT3A")2070 CALL BGREAD1 ("UWHEAT3B",NDP3!,CJUGT$,BINT3%, "NONE", 1, "NT","UWHDAT3B")2080 CALL BGREAD1("UWHEAT3C",NDP3!,CJUFT$,BINT3%,"NONE",1,"NT","UWHDAT3C")2090 CALL BGREAD1("UWHEAT3D",NDP3!,UGP$,BINT3%,"NONE",1,"NT","UWHDAT3D")2100 REM ****** ACQUIRE LOWER DATA ********2120 CALL BGREAD' {"LDAT2A",NDP3!,CJLGT$,BINT3%,"NONE",1,"NT","LDATA2A")2130 CALL BGREAD1("LDAT2B",NDP3!,CJLMT$,BINT3%,"NONE",1,"NT","LDATA2B")2140 CALL BGREAD1("LDAT2C",NDP3!,LGP$,BINT3%,"NONE",1,"NT","LDATA2C")2142 CALL BGREAD1("LDAT2D",NDP3!,LFT$,BINT3%,"NONE",1,"NT","LDATA2D")2144 CALL KDTIMERRD1(TM#())2146 IF TM#(4)*IR%/1000 < RCDT GOTO 21442147 CALL ARLASTP1("LDAT2D",LP3!)2200 REM2210 PRINT : PRINT " *** COUNTDOWN TIME IS OVER******"2220 PRINT " *** THE MAIN BALL VALVE IS BEING OPENED ****"2221 REM2222 CALL ARLASTP'("LDAT2C",LP3!)2230 CALL BGWRITE1("MBVOPEN%",MBV$,1,1,"NT","MBVSTAT1")2240 CALL BGHALT1("UWHDAT3A,UWHDAT3B,UWHDAT3C,UWHDAT3D","NT","HALT3")2250 CALL BGHALT1("LDATA2A,LDATA2B,LDATA2C,LDATA2D","NT","HALT4")2290 PRINT : PRINT " ****** ACQUIRING DATA FOR REACTION****"2300 PRINT " ****** PHASE ON BACKGROUND GO ****"2310 REM ****** ACQUIRE UPPER DATA ******2313 TIM%(5)=12314 CALL KDTIMER1(TIM%(),"NT","")2315 CALL KDTIMERRD1(TM#())2320 CALL BGREAD1("UWHEAT4A",NDP4!,CJUWLWT$,BINT4%,"NONE",1,"NT","UWHDAT4A")2330 CALL BGREAD1("UWHEAT4B",NDP4!,CJUGT$,BINT4%,"NONE",1,"NT","UWHDAT4B")
116

24602470248024902500
PRINTPRINTPRINTPRINTPRINT
CLOSURE"25102520
PRINTPRINT
II
tr
it
it
tt
it
II
* * *
* * *
* * *
* * *
* * *
* * *
2340 CALL BGREAD1 ("UWHEAT4C",NDP4 !, CJUFT$,BINT4%, "NONE", 1, "NT", "UWHDAT4C")2350 CALL BGREAD1 ("UWHEAT4D",NDP4 !, UGP$, BINT4%, "NONE", 1, "NT", "UWHDAT4D")2360 REM ****** ACQUIRE LOWER DATA ********2363 CALL BGREAD' ("LDAT3A", NDP4 !, CJLGT$, BINT4%, "NONE", 1, "NT", "LDATA3A")2364 CALL BGREAD1 ("LDAT3B",NDP4 !, CJLMT$, BINT4%, "NONE", 1, "NT", "LDATA3B")2365 CALL BGREAD1 ("LDAT3C",NDP4 ! ,LGP$, BINT4%, "NONE", 1, "NT", "LDATA3C")2366 CALL BGREAD1 ("LDAT3D",NDP4 ! ,LFT$, BINT4%, "NONE", 1, "NT", "LDATA3D")2430 CALL KDTIMERRD1(TM#())2440 IF TM#{5) * IR%/1000 < RTIME% GOTO 24302442 CALL ARLASTP1("LDAT3D",LP4!)2444 CALL BGHALT1 ("UWHDAT4A,UWHDAT4B,UWHDAT4C,UWHDAT4D", "NT", "HALT4")2446 CALL BGHALT1 ("LDATA3A,LDATA3B, LDATA3C,LDATA3D", "NT", "HALT5")
REACTION IS OVER "THE MAIN BALL VALVE IS BEING CLOSED "LIQUID METAL HEATER IS BEING TURNED OFF "UPPER WATER HEATER IS BEING TURNED OFF "ARGON OUTLET VALVE IS BEING OPENED 2 SEC AFTER BALL VALVE
SETTING-UP TO ACQUIRE UPPER CHAMBER DATA UNTIL EQUILIBRIUM"IS ACHIEVED "
2540 TIM%(6)=12550 CALL KDTIMER1 (TIM%(),"NT", "")2560 CALL BGWRITE1 ("MBVCLOSE%",MBV$,1,1, "NT","MBVSTAT3")2565 CALL BGWRITE'("AOVOPEN%",AOV$,1,1,"NT","AOVSTAT3")2570 CALL KDTIMERRD1(TM#())2580 IF TM#(6)*IR% < 2*DTSV GOTO 25702600 CALL BGWRITE1 ("LMHOFFF%",LMH$,1,1, "NT", "LMHSTAT3")2610 CALL BGWRITE1 ("UWHOFFF%",UWH$,1,1,"NT", "UWHSTAT3")2670 PRINT " **** SETTING UP TO ACQUIRE DATA UNTIL EQUILIBRIUM IS ATTAINED"2680 PRINT." ****** IN THE UPPER CHAMBER"2690 REM ****** ACQUIRE UPPER DATA ******2691 TIM%(7) = 12692 CALL KDTIMER1 (TIM%(),"NT", "")2693 CALL KDTIMERRD1(TM#())2700 CALL BGREAD1 ("UWHEAT5A",NDP5 !, CJUWLWT$,BINT5%, "NONE", 1, "NT", "UWHDAT5A")2710 CALL BGREAD1 ("UWHEAT5B",NDP5 !, CJUGT$, BINT5%, "NONE", 1, "NT", "UWHDAT5B")2720 CALL BGREAD1 {"UWHEAT5C",NDP5 !, CJUFT$, BINT5%, "NONE", 1, "NT", "UWHDAT5C")2730 CALL BGREAD1 ("UWHEAT5D",NDP5 ! ,UGP$, BINT5%, "NONE", 1, "NT", "UWHDAT5D")2740 REM ****** ACQUIRE LOWER DATA ********2750 CALL BGREAD1 ("LDAT4A",NDP5!,CJLGT$, BINT5%,"NONE",1,"NT","LDATA4A")2751 CALL BGREAD1 ("LDAT4B",NDP5!, CJLMT$, BINT5%, "NONE",1,"NT","LDATA4B")2753 CALL BGREAD1("LDAT4C",NDP5!,LGP$,BINT5%,"NONE",1,"NT","LDATA4C")2754 CALL BGREAD1 ("LDAT4D",NDP5!,LFT$,BINT5%, "NONE",1,"NT","LDATA4D")2795 CALL KDTIMERRD1(TM#())2797 IF TM#(7)*IR%/1000 < EQT GOTO 27952798 CALL ARLASTP' ("LDAT4D",LP5!)2799 CALL BGHALT1 ("UWHDAT5A,UWHDAT5B,UWHDAT5C,UWHDAT5D", "NT", "HALT6")2800 CALL BGHALT1 ("LDATA4A,LDATA4B,LDATA4C,LDATA4D", "NT", "HALT7")
2801 REM2802 PRINT2810 PRINT2820 PRINT2830 PRINT2840 REM2850 REM3220 PRINT3230 PRINT3240 PRINT
REACTION IS OVER FOLKS!
TRANSFERRIN ALL KDAC DATA ARRAYS TO DISK
REACTION IS OVER
LITHIUM-LEAD TEST NO ", ITESTNO, " IS OVER"RELOAD THE LOWER CHAMBER AND BEGIN A NEW TEST"
3260 PRINT "TRANSFERRING DATA ARRAYS FOR PHASES 3,4 AND 5 TO DISK FILE"3270 REM
3280 OPEN "COUNTD.DAT" FOR OUTPUT AS #13290 OPEN "REACTION.DAT" FOR OUTPUT AS #23300 OPEN "EQUIL.DAT" FOR OUTPUT AS #33301 PRINT "LP3,LP4,LP5";LP3!;LP4!;LP5!3302 FOR 1=1 TO LP3
117
3304 CALL ARGET1 ("UWHEAT3A", I!, I! ,UWT$, 1,UWH1A! (), "C.THCU.K")3306 CALL ARGET1("UWHEAT3A",I!,I!,LWT$,1,UWH1B!(),"C.THCU.E")3308 CALL ARGET1 ("UWHEAT3B",I!,I!,UGT$,1,UWH1C!(), "C.THCU.E")3310 CALL ARGET1 ("UWHEAT3C",I!,I!,UFT§,1,UWH1D!(), "C.THCU.K")3312 CALL ARGET1("UWHEAT3D",I!,I!,UGP$,1,UWH1E!(),"C.VOLTS")3314 CALL ARGET1 ("LDAT2A",I!, I!, LGT$, 1, LGH1A! (), "C.THCU.K11)3316 CALL ARGET1 ("LDAT2B",I!,I!,LMT$,1,LGH1B! (), "C.THCU.K11)3318 CALL ARGET1("LDAT2C",I!,I!,LGP$,1,LGH1C!(),"C.VOLTS")3322 UFT1=UWH1D! (0): LWT1=UWH1B!(0): UWT1=UWH1A!(0) :UWAVG=0.5*(UWT1+LWT1)3324 UGP1=UWH1E!(0)*20*6.8948E-2 : LGP1=LGH1C!(0) *20*6. 8948E-2: UGT1=UWH1C!(0)3326 LGT1=LGH1A!(0): LMT1=LGH1B!(0): LFT1=LGH1D!(0):UFT1=UWH1D!(0)3328 TIME3=BINT3%*(I-l)*IR%/10003330 PRINT #1, USING "###.##### "; TIME3; UGT1; LGT1; UWT1/LWT1; LMT1;UFT1;LFT1;UGP1;LGP13332 NEXT I
3340 FOR 1=1 TO LP43342 CALL ARGET'("UWHEAT4A",I!,I!,UWT$,1,UWH1A!(),"C.THCU.K")3344 CALL ARGET1 ("UWHEAT4A",I!,I!,LWT$,1,UWH1B!(), "C.THCU.E")3346 CALL ARGET1 ("UWHEAT4B",I!,I!,UGT$,1,UWH1C!(), "C.THCU.E")3348 !CALL ARGET1("UWHEAT4C",I!,I!,UFT$,1,UWH1D!(),"C.THCU.K")3350 CALL ARGET1 ("UWHEAT4D",I!,I!,UGP$,1,UWH1E!() , "C.VOLTS")3352 CALL ARGET1("LDAT3A",I!,I!,LGT$,1,LGH1A!(),"C.THCU.K")3354 CALL ARGET1("LDAT3B",I!,I!,LMT$,1,LGH1B!(),"C.THCU.K")3360 TIME4=BINT4%*(I-l)*IR%/10003362 UFT1=UWH1D!(0): LWT1=UWH1B!(0): UWT1=UWH1A!(0):UWAVG=0.5*(UWT1+LWT1)3364 UGP1=UWH1E!(0)*20*6.8948E-2 : LGP1=LGH1C!(0)*20*6.8948E-2: UGT1=UWH1C!(0)3366 LGT1=LGH1A! (0): LMT1=LGH1B!(0): LFT1=LGH1D!(0):UFT1=UWH1D! (0)3368 PRINT #2, USING "###.##### "; TIME4; UGT1; LGT1; UWT1;LWT1; LMT1;UFT1;LFT1;UGP1;LGP13369 NEXT I
3370 FOR 1=1 TO LP53372 CALL ARGET'("UWHEAT5A",I!,I!,UWT$,1,UWH1A!(),"C.THCU.K")3374 CALL ARGET ' ("UWHEAT5A",I !, I! ,LWT$, 1,UWH1B! (), "C.THCU.E")3376 CALL ARGET• ("UWHEAT5B",I!,I!,UGT$,1,UWH1C!(), "C.THCU.E")3378 CALL ARGET1("UWHEAT5C",I!,I!,UFT$,1,UWH1D!(),"C.THCU.K")3380 CALL ARGET' ("UWHEAT5D",I!,I!,UGP$,1,UWHIE!(), "C.VOLTS")
3382 REM ****** GET LOWER DATA *******3384 CALL ARGET1 ("LDAT4A", I!, I! ,LGT$, 1,LGH1A! (), "C.THCU.K11)3386 CALL ARGET1 ("LDAT4B", I !, I! ,LMT$, 1,LGH1B! (), "C.THCU.K")3388 CALL ARGET1("LDAT4C",I!,I!,LGP$,1,LGH1C!(),"C.VOLTS")3392 TIME5=BINT5%*(I-l)*IR%/10003393 UFT1=UWH1D!(0): LWT1=UWH1B!(0): UWT1=UWH1A!(0):UWAVG=0.5*(UWT1+LWT1)3394 UGP1=UWH1E! (0)*20*6.8948E-2 : LGP1=LGH1C!(0)*20*6.8948E-2: UGT1=UWH1C!(0)3395 LGT1=LGH1A! (0): LMT1=LGH1B!(0): LFT1=LGH1D!(0):UFT1=UWH1D! (0)
3396 PRINT #3, USING "###.##### "; TIME5; UGT1; LGT1; UWT1;LWT1; LMT1;UFT1;LFT1/UGP1;LGP13397 NEXT I3398 CALL INTOFF
34 60 PRINT " THAT^ THE END OF DATA ACQUISITION, FOLKS!"3480 END
4000 CALL BGWRITE1("UWHOFFF%"/UWH$,1,1,"NT","ST1")4100 UHST%=04200 RETURN
4500 CALL BGWRITE1("LMHOFFF%",LMH$,1,1,"NT","ST2")4 600 LHST%=04700 RETURN
5000 CALL BGWRITE1("UWHONN%"/UWH$,1,1,"NT","ST1")5100 UHST%=15200 RETURN
118

5700 RETURN
6000 CALL BGWRITE' ("VACONN%",VAC$,1 1 "NT» ..<-T1 ,M6100 UPST%=1 •?'•'•/•'•/ « l , S T 1 )
6200 RETURN
6500 CALL BGWRITE'("VACOFFF%",VAC$,1,1 »NT" "STVM6600 UPST%=0 -"J-ii-i « i , i>Tl )6700 RETURN
119
APPENDIX B
GRAPHICAL PRESENTATION OF EXPERIMENTAL RESULTS
The following 52 graphs contain a complete representation of the data drawn from 16
lithium-lead tests and 5 lead tests. The graphs are listed in the following table. The table
gives the page numbers in groups of the test. In each group, the order of the graphs are:
1. System Pressure. 2. Water and Gas Temperature. 3. Liquid Metal Temperature.
Experiment Number Page Number
L01 121-123
L03 124-125
L04 126-128
L05 129-131
L06 132-134
L07 135-137
L08 138-140
L09&N36 141-134
Ll l 145-147
L12 148-150
L14&N32 151-154
L15&N34 155-158
L20&N30 159-162
L21 163-165
L22 166-168
L23&N33 169-172
120
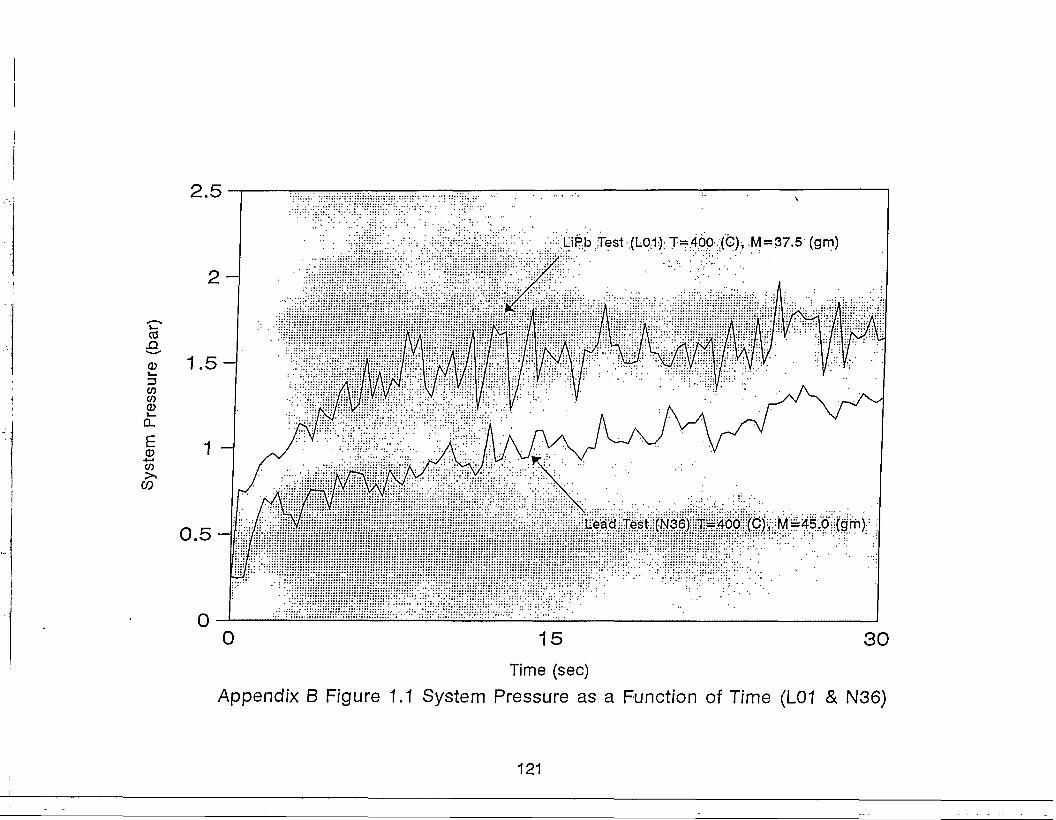
2.5
CO
CD
olECD+-*W> .
CO
LiPb Test (L0:1):T=f4pp,(G)i M=37.5 (gm)
15 30
Time (sec)
Appendix B Figure 1.1 System Pressure as a Function of Time (L01 & N36)
121

200
150-
0)
i(5Q.E
100-
5 0 -
00
LiPb Test (L09) T=400 (C), M-36.5 (gm)
UGT
15 3 0
Time (sec)Appendix B Figure 1.2 Gas and Water Temperature as a Function of Time (L01)
122

500
400
LtPb Test (L01) T=400 (C), M=37.S(gm)
0)V—
300
200
100-
00
Lead Test (N36) T=400 (C), M=45.0(gm)
3015
Time (sec)
Appendix B Figure 1.3 Liquid Metal Temperature as a Function of Time (L01 & N36)
123

2.5
CO
0)zsV)V)
£4 i
CO
LiPb Test :(L03.)"^«4pp:;(G)_,: M=43.0 (gm)
Lead,Testj(N36) T=400 (C),,M=45.0 (gm) .
15
Time (sec)
Appendix B Figure 2.1 System Pressure as a Function of Time (L03 & N36)
124

2.5
2 -
a>
E
0)
CO
1.5-
1 -
0.5-
00
LiPb Test(Lp4J f^^;;(C):,;M=46^5 (gm)..
Lead Test (N34) T=350 (C), M=45.0 (gm)
30 90 12060Time (sec)
Appendix B Figure 3.1 System Pressure as a Function of Time (L04 & N34)
126

CD
+-»CO<DQ .
e
1 HU ~
120-
100-
8 0 -
60- j
40 4
2 0 -
n
AWhJKI , / \
r IK LWT
LiPh Test (L04) T=-350 (CJ, M=46.5 (gm):.:.. )
^ ^ ^ ^
UWT
\U.GT
i
0 90 12060Time (sec)
Appendix B Figure 3.2 Gas and Water Temperature as a Function of Time (L04)
127
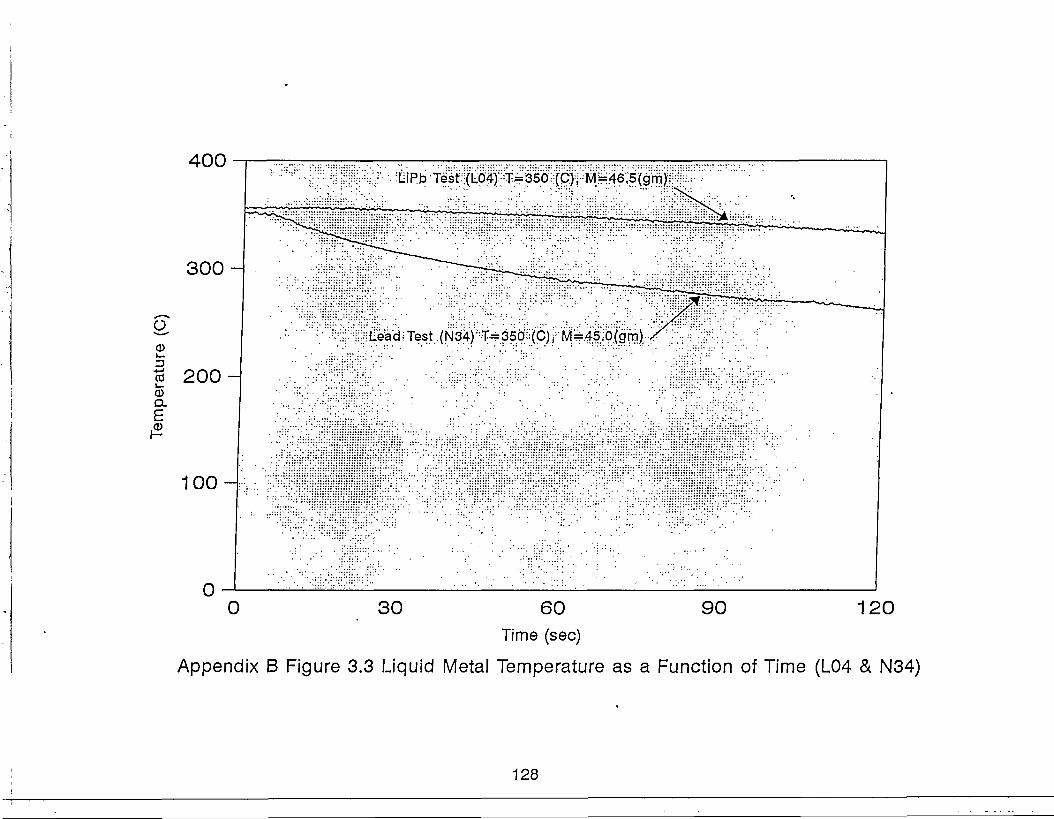
400
300-
0)
f 200o.
I100-
00
LiPb Test (L04) T=350 (C), M=46,5(gm)
Lead Test (N34) T=350 (C), M=45.0(gm)
30 90 12060Time (sec)
Appendix B Figure 3.3 Liquid Metal Temperature as a Function of Time (L04 & N34)
128
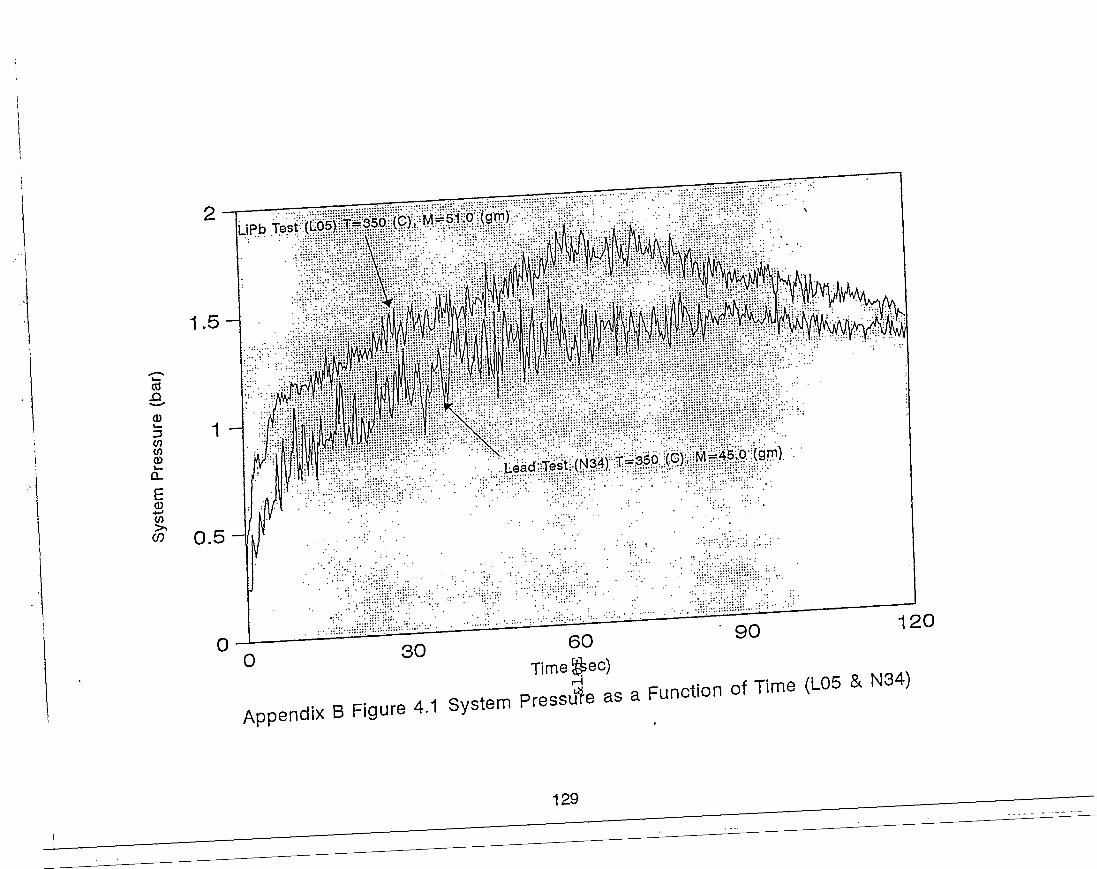
OS
.g,03
0-
co 0.5
Lead Test (N34) T-350 (0), M=45.0 (gm)
00
120
Appendix B Figure 4.1 System Pressure as aFunction of Time (LOS & N34)
129
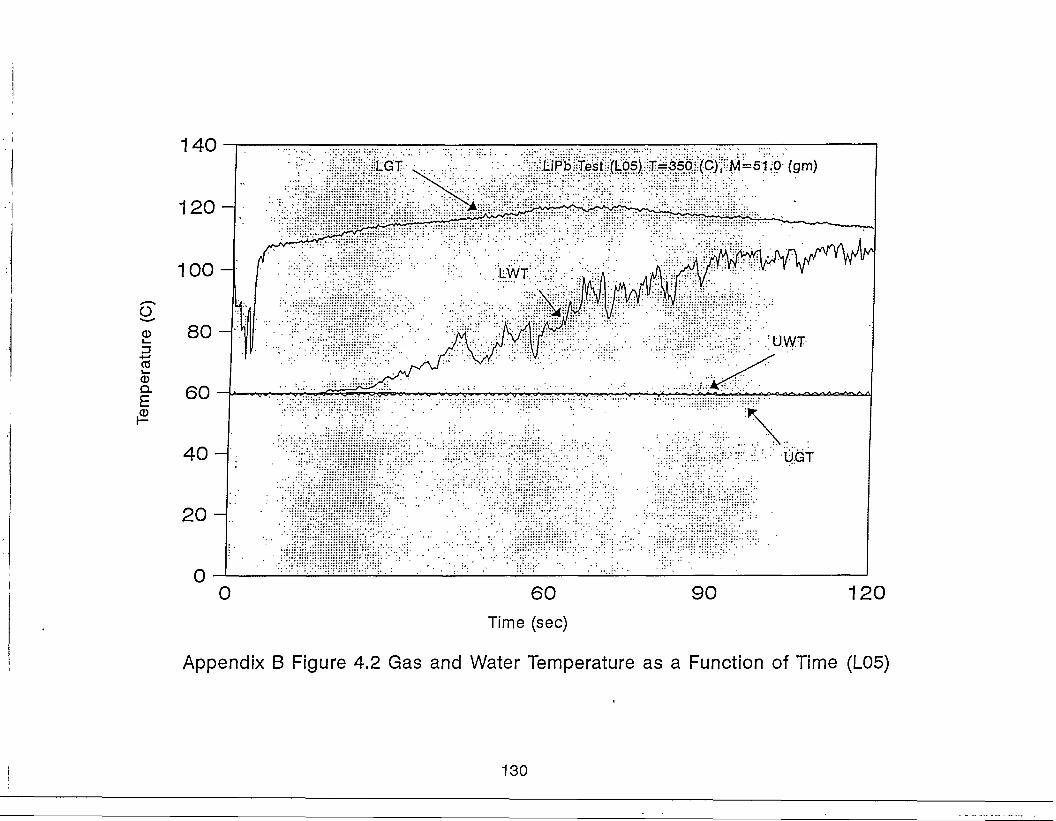
140
120-
100-
Qi
Q.
E
LiPb Test (L05) T=350 (C), M=51.0 (gm)
0 60Time (sec)
120
Appendix B Figure 4.2 Gas and Water Temperature as a Function of Time (L05)
130

400
300
LiPb Test (L05) T=350 (C), M=51,0(gm)
CD
f 200CDQ .
100
o-1
0
Lead Test (N34) T=350 (C), M=45.0(gm)
30 90 12060Time (sec)
Appendix B Figure 4.3 Liquid Metal Temperature as a Function of Time (L05 & N34)
131

nJ
0)
M
CD
CL
Eo
CO
LiPb Test (L06J T=350 (C),; M=56.0 (gm.
1.5
Lead Test (N34) T-350 (C), M = 45,0 ;(gm),
0.5
030 9060
Time (sec)
Appendix B Figure 5.1 System Pressure as a Function of Time (L06 & N34)
120
132
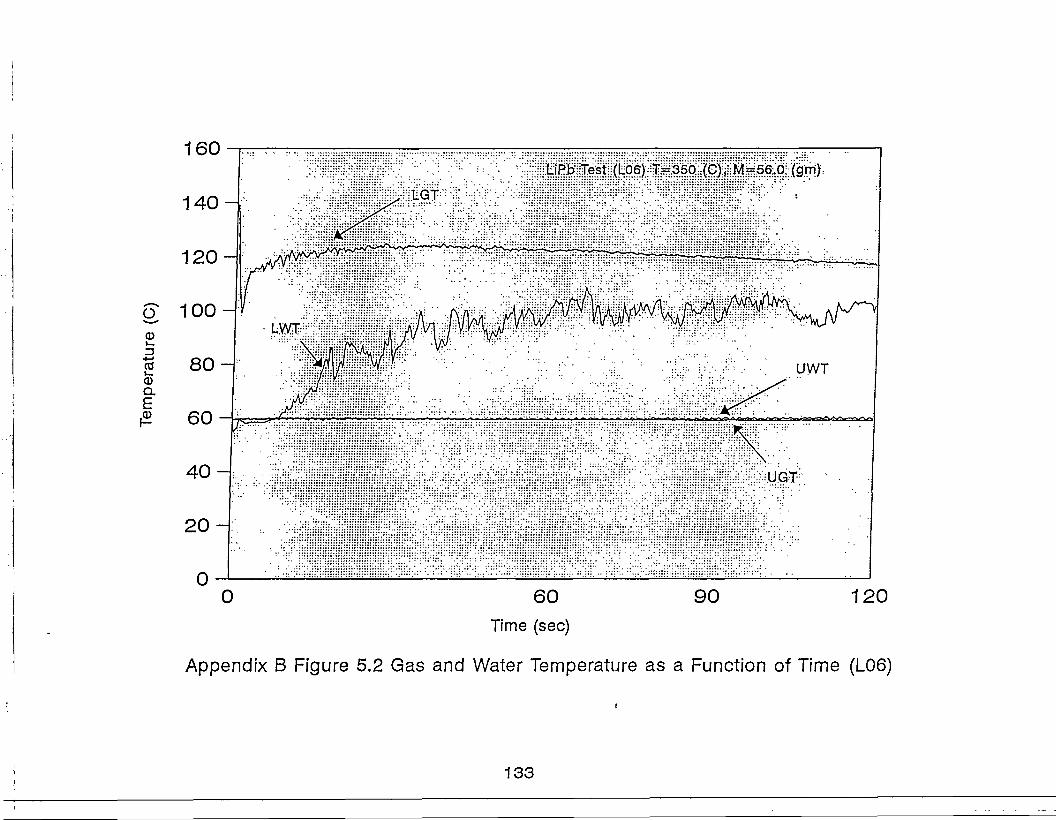
LiPb Test (L06 T=350 (C)( M=56.0 (gm)
0 12060Time (sec)
Appendix B Figure 5.2 Gas and Water Temperature as a Function of Time (L06)
133
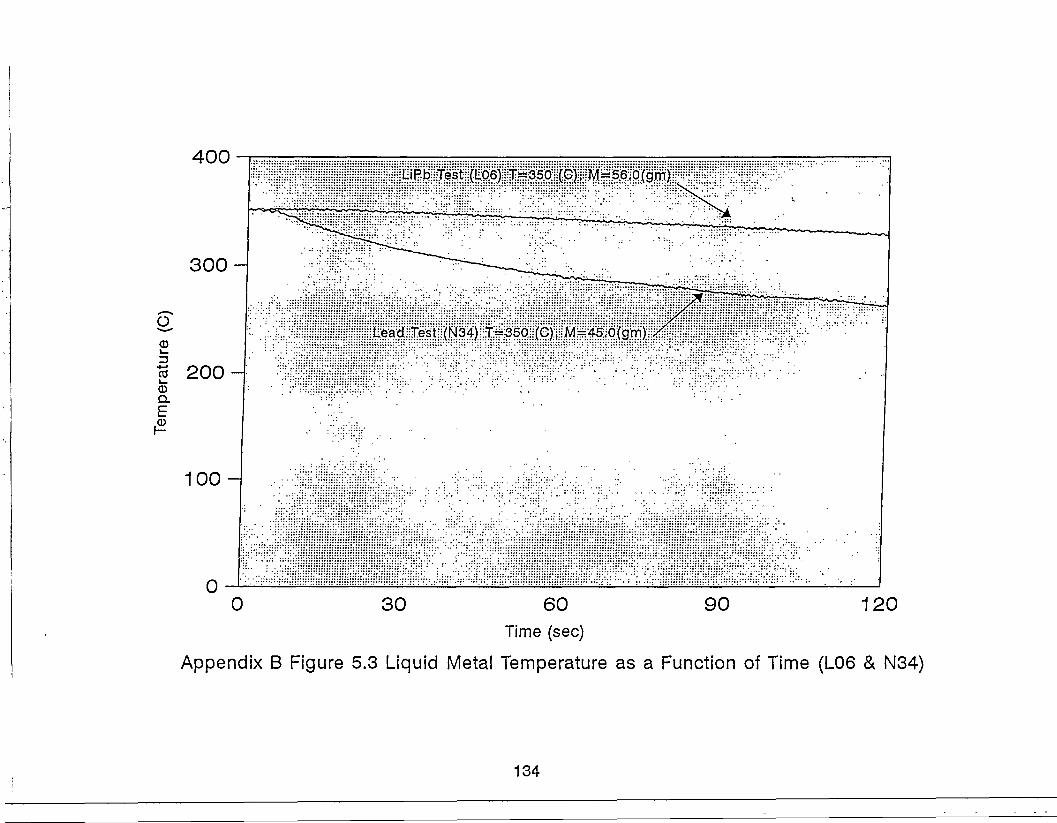
400
300-
•S 2 0 0 -
100-
00
iPb Test (L06) T=350 (G), M=^56.0(gm)
Lead Test (N34) 7=350 (C), M=45.0(gm)
30 90 12060Time (sec)
Appendix B Figure 5.3 Liquid Metal Temperature as a Function of Time (L06 & N34)
134

IDCO
8jnss9Jd
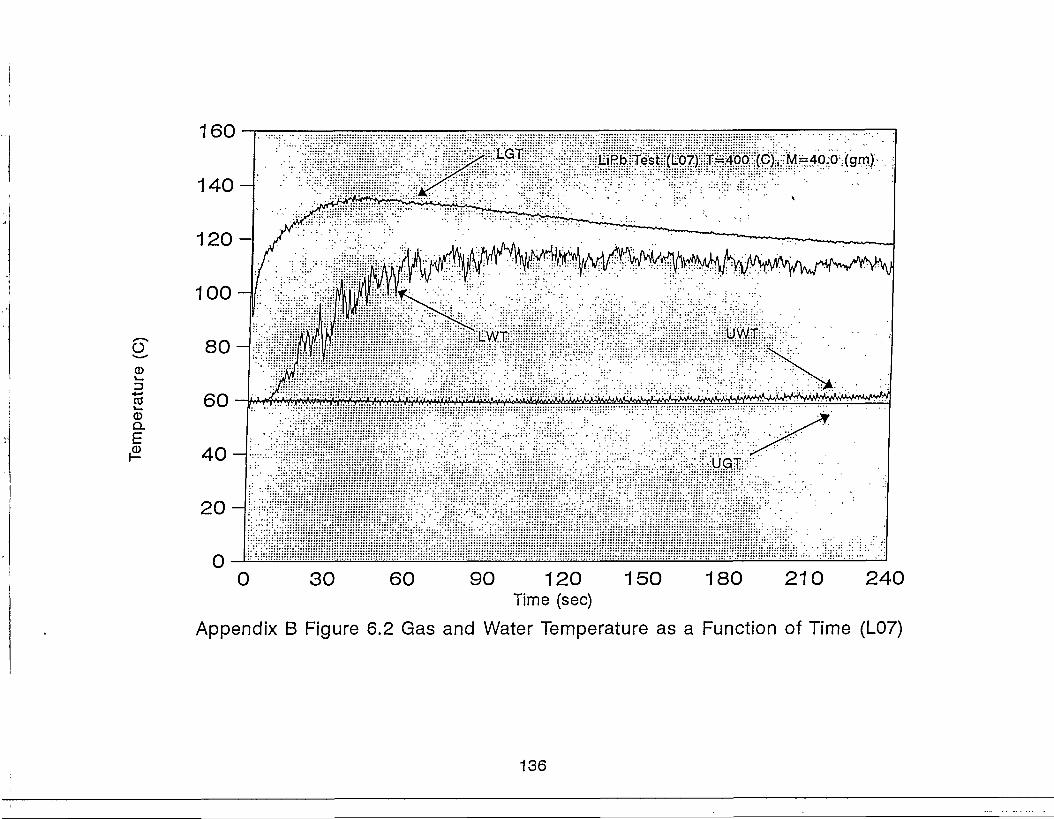
Q.
£
160
4 0 -
2 0 -
00
LGT LtPb Test (L07) T=400 (C), M=40.0
UGT
30 60 90 120 150 180 210 240Time (sec)
Appendix B Figure 6.2 Gas and Water Temperature as a Function of Time (L07)
136

500
400-
300-
fQ.
200-
100-
0
LiPb Test (L07) T=400 (C), M=40.0(gm)
Lead Test (N36) T=400 (CJ( M=45.0(gm)
0 30 60 90 120 150 180 210 240Time (sec)
Appendix B Figure 6.3 Liquid Metal Temperature as a Function of Time (L07 & N36)
137
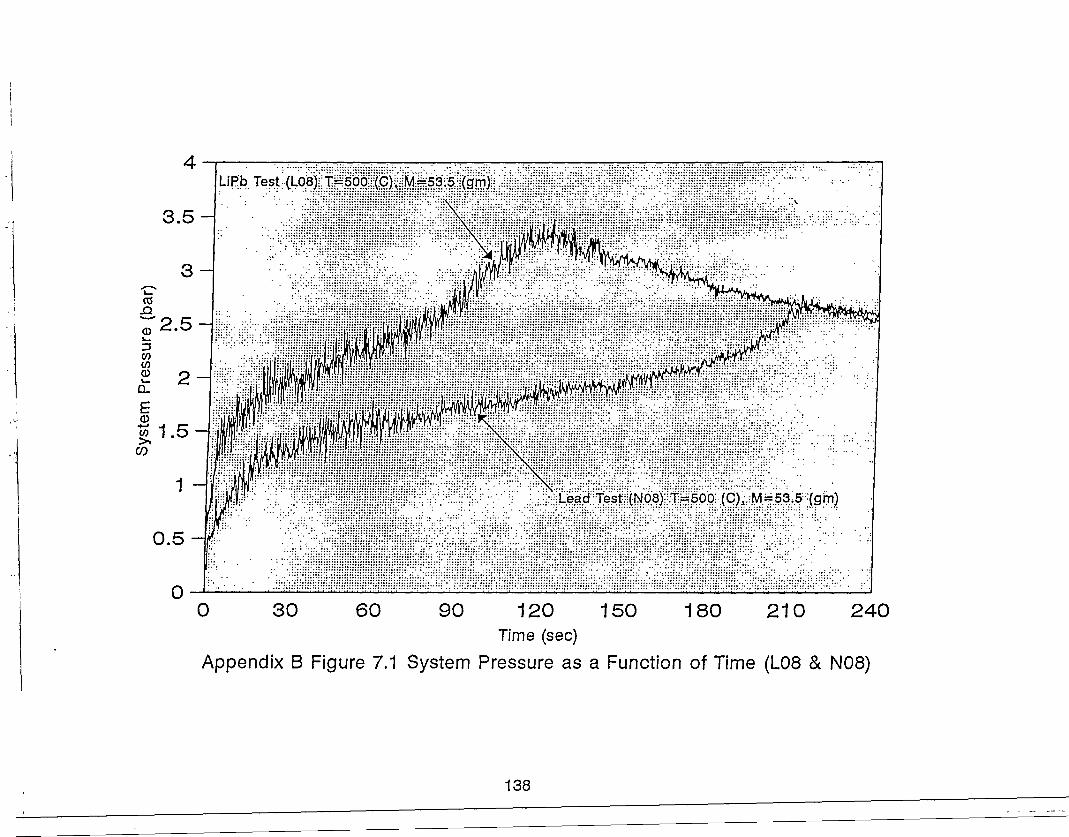
3.5-
LiPb Test (L08) T=500 (C), M=53.5 (gtn)
0
Lead Test (N08) T=500 (C), M=53.5 (gm)
60 90 120 150 180 210 240Time (sec)
Appendix B Figure 7.1 System Pressure as a Function of Time (L08 & N08)
138

iCDQ .
l
LIPbTest (L08) T=400 (C), M=53;5(grti)
0 60 90 120 150 180 210 240Time (sec)
Appendix B Figure 7.2 Gas and Water Temperature as a Function of Time (L08)
139
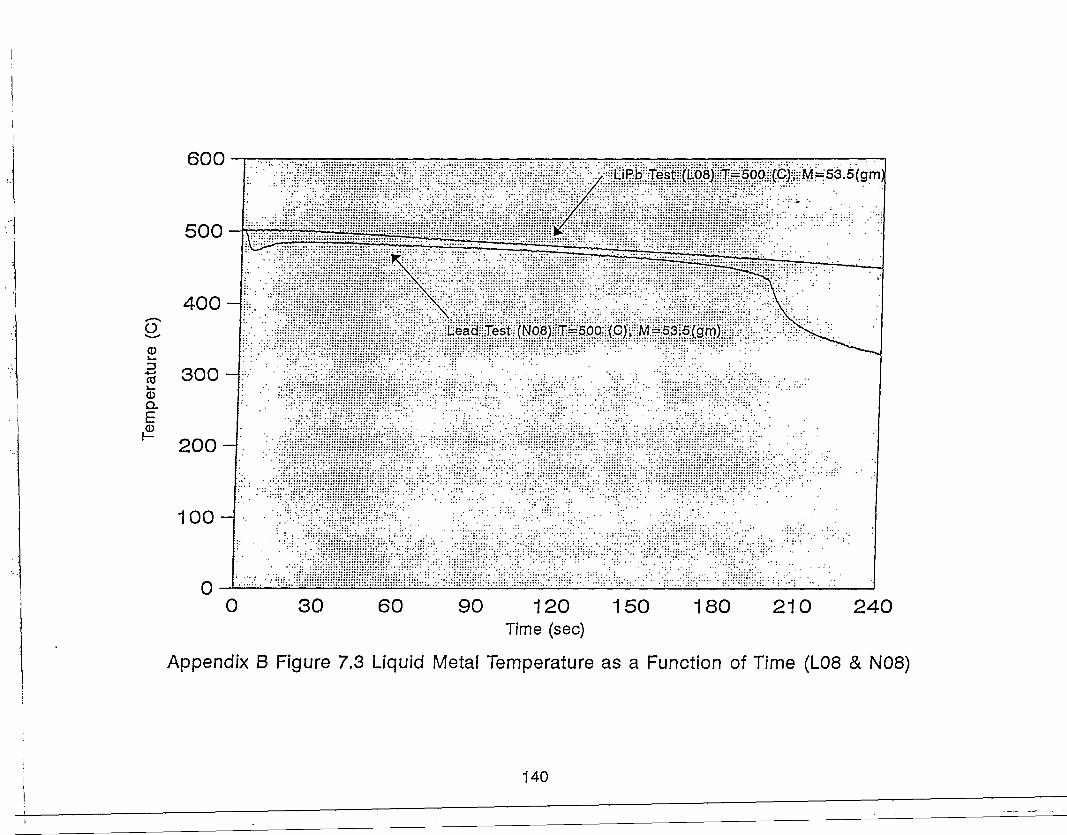
Q.
I
600
500-
400-
300
200
100-
0
LiPb Test (L08J T=500 (C), M=53.5(gm
Lead Test (N08) T=500 {C)» M=53.5[gm)
0 30 60 90 120 150 180 210 240Time (sec)
Appendix B Figure 7.3 Liquid Metal Temperature as a Function of Time (L08 & N08)
140
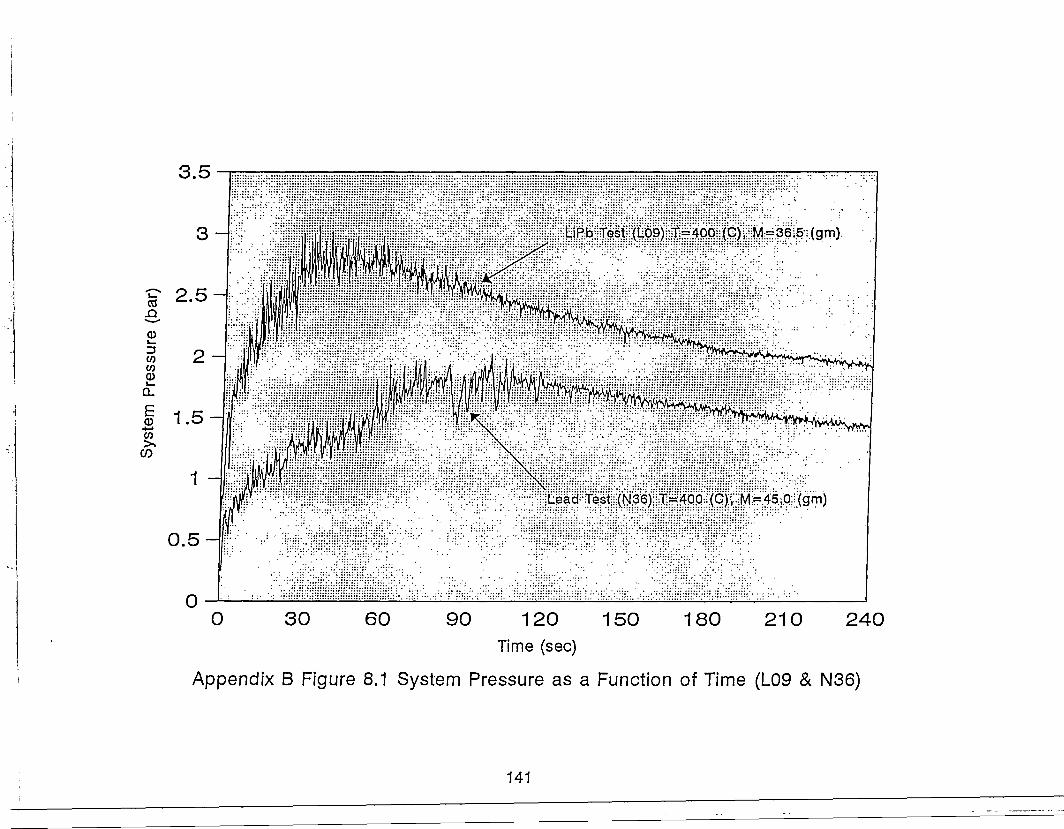
0.5
0
LiPb Test {L09) T=400 (C), M=36.5 (gm)
Lead Test (N36) T-400 (C), M = 45.0 (gm)
0 30 60 90 120 150 180 210 240Time (sec)
Appendix B Figure 8.1 System Pressure as a Function of Time (L09 & N36)
141
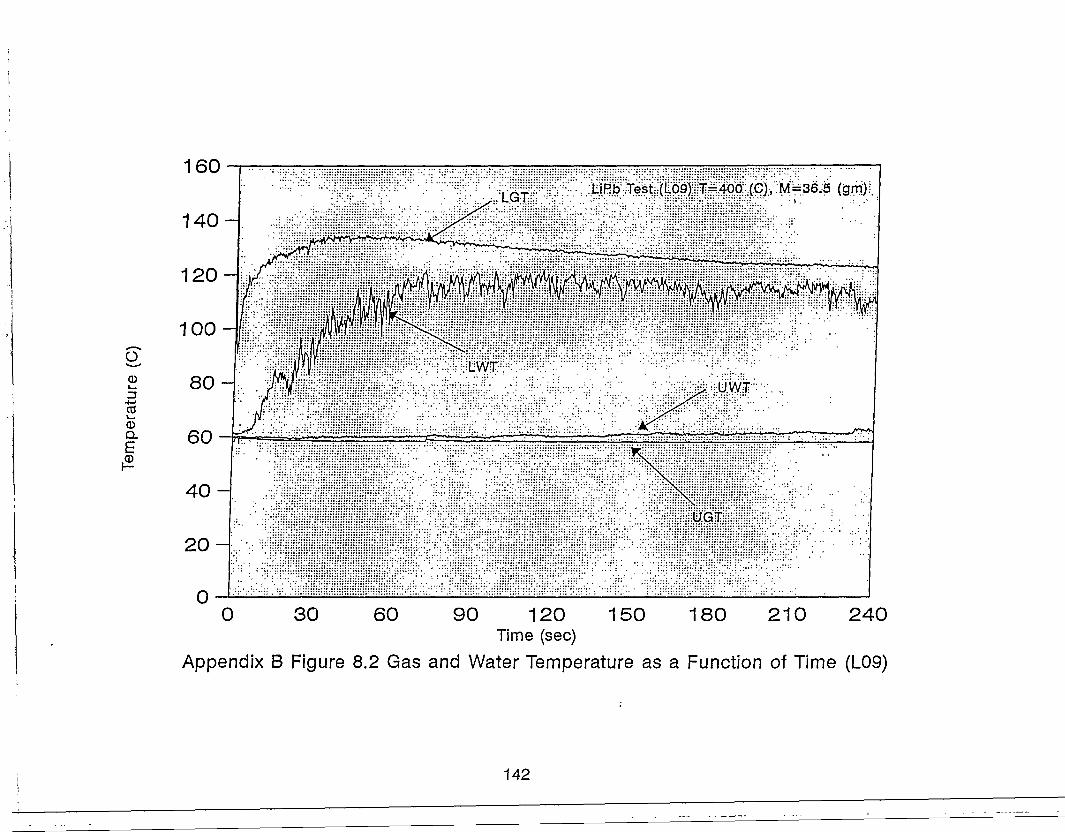
160
I—
4-*
CO
Q .
LiPb Test (L09) T=400 (C), M=36.5
30 60 180 210 24090 120 150Time (sec)
Appendix B Figure 8.2 Gas and Water Temperature as a Function of Time (L09)
142

a>
Q.
I
^ V f i F ^ ^
Lead Test (N36) T=400 (C), M*=45.0(gm)
30 60 90 120 150 180 210 240Time (sec)
Appendix B Figure 8.3 Gas and Water Temperature as a Function of Time (N36)
143

CD
ia.
ILead Test (N36) T=400 (C), M=45.0(gm)
0 30 60 90 120 150 180 210 240Time (sec)
Appendix B Figure 8.3 Gas and Water Temperature as a Function of Time (N36)
143

500
400-
LiPb Test (L09) T=400 (C), M=36.5(gm)
<D
i£
300
200
100
0
Lead Test (N36) T=400 (C),;M=45:q(grfi>
0 30 60 90 120 150 180 210 240Time (sec)
Appendix B Figure 8.4 Liquid Metal Temperature as a Function of Time (L09 & N36)
144

500
400
300-
IQ.
200-
100-
0
LiPb Test (L09) T=400 (C), M=3B.5(gm)
Lead Test (N36J T=400 (C), M=45.0(gmJ
0 30 60 90 120 150 180 210 240Time (sec)
Appendix B Figure 8.4 Liquid Metal Temperature as a Function of Time (L09 & N36)
144

6UPt> Test (L11) T=600 (C), M=44,5 (gm)
Lead Test (N32) T=600 (C), M=45.0 (gm)
0 30 60 90 120 150 180 210 • 240Time (sec)
Appendix B Figure 9.1 System Pressure as a Function of Time (L11 & N32)
145

250
0)
f
UPb Test (L11) T=600 (C), M=44.0
200-
150
100
5 0 -
90 120 150 180 . 210 240Time (sec)
Appendix B Figure 9.2 Gas and Water Temperature as a Function of Time (L11)
146
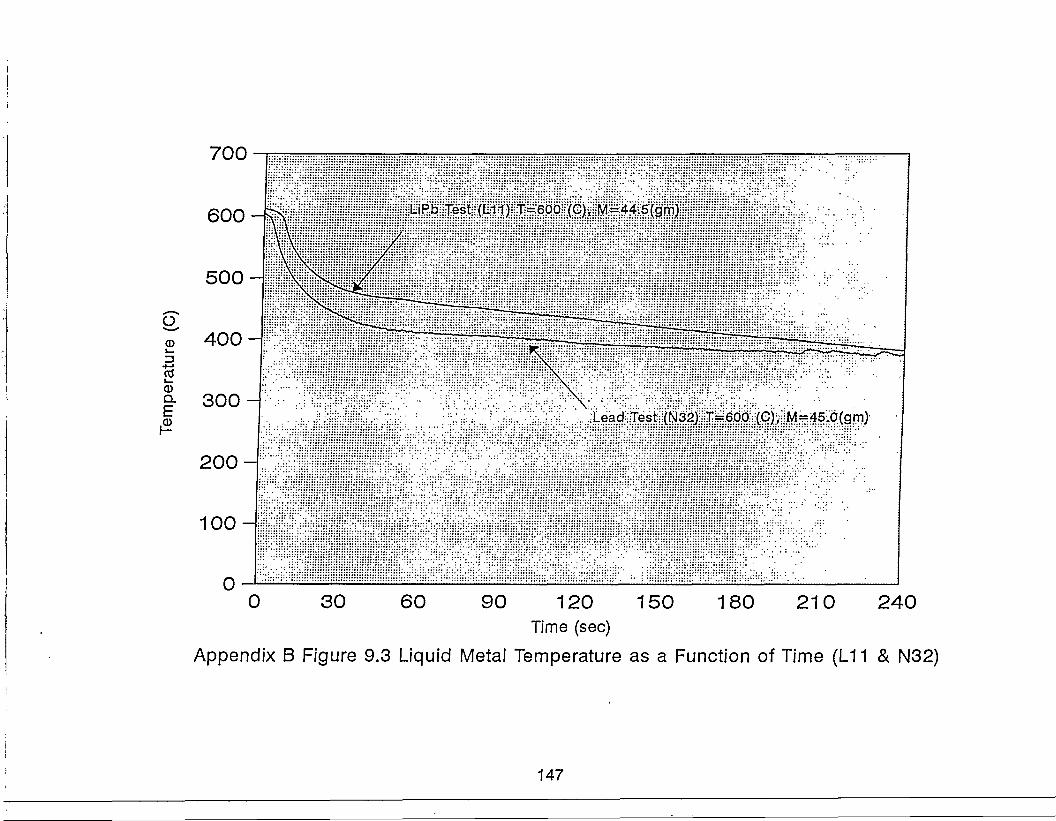
2+-<
a.E
700
600
500 H
400
300
200
100H
0
LiPb Test (L11) T^BOO (C)x M=44.5(gm)
Lead Test (N32J T=600 (C), M=45.0(gm)
0 30 60 90 120 150 180 210 240Time (sec)
Appendix B Figure 9.3 Liquid Metal Temperature as a Function of Time (L11 & N32)
147
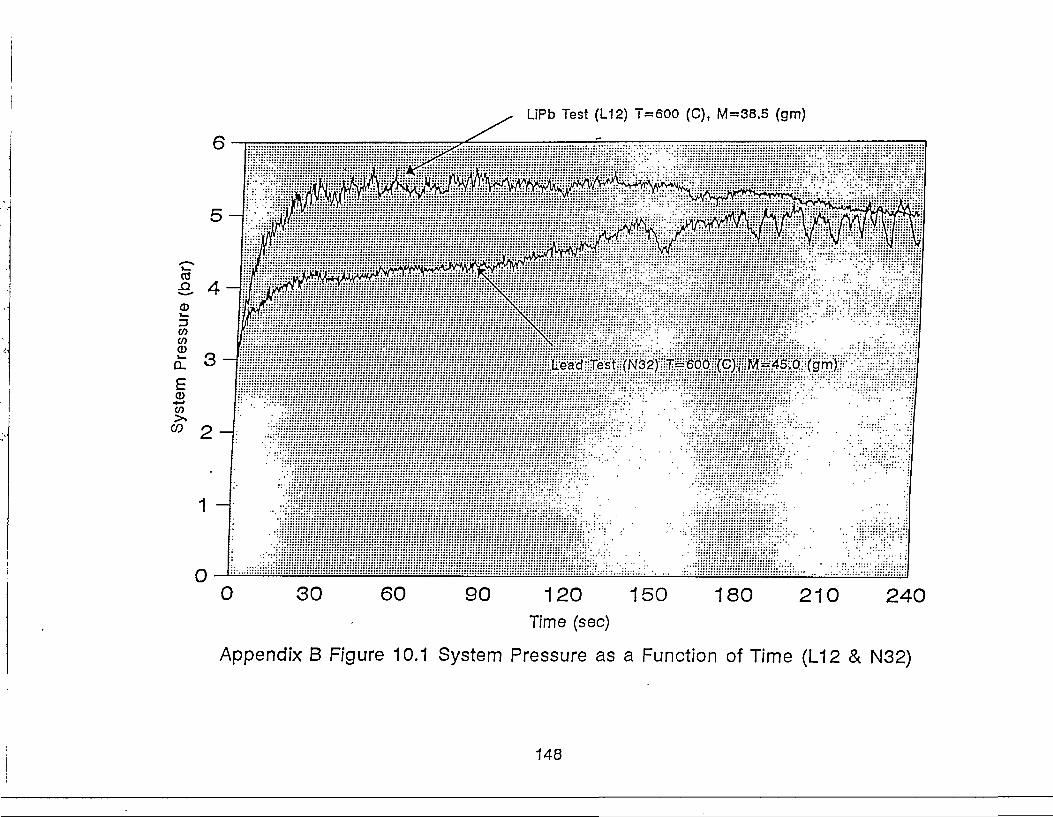
LiPb Test (L12) T=600 (C), M=38.5 (gm)
0 60 180 210 24090 120 150Time (sec)
Appendix B Figure 10.1 System Pressure as a Function of Time (L12 & N32)
148
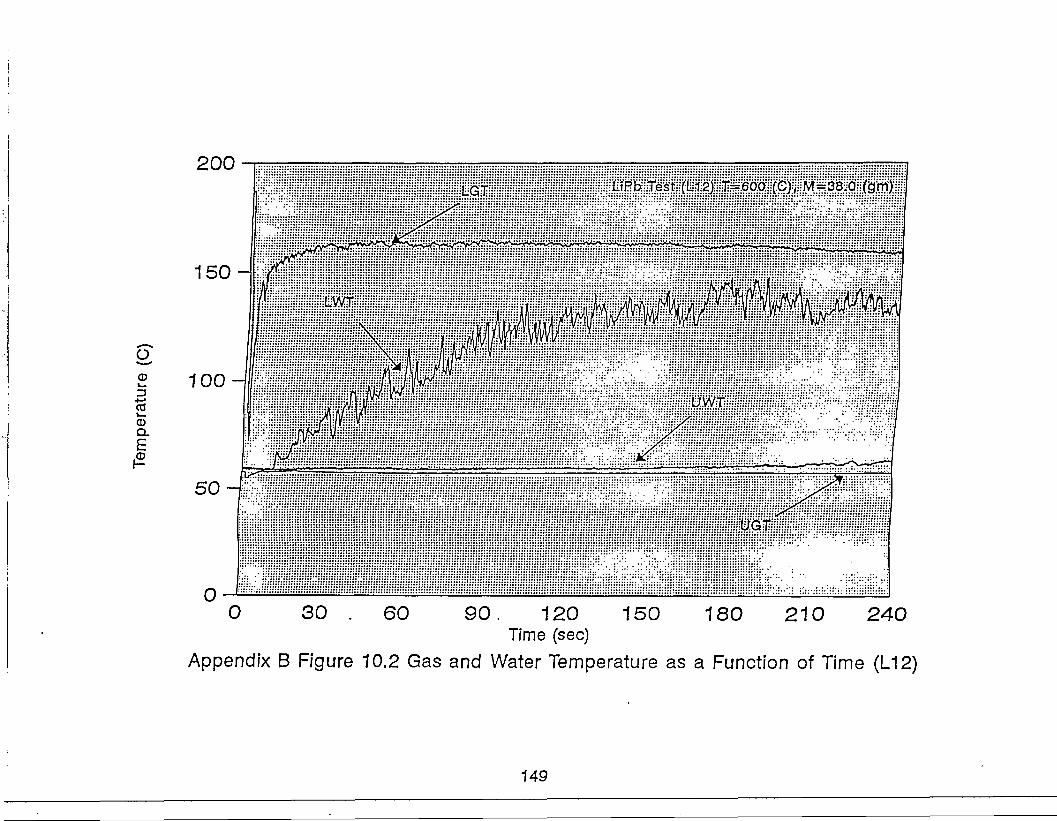
200
(Dv _
• • - •
03
Q.
I
150
100
LtPbTest (Li 2) l iBOilC
180 210 24090. 120 150Time (sec)
Appendix B Figure 10.2 Gas and Water Temperature as a Function of Time (L12)
149
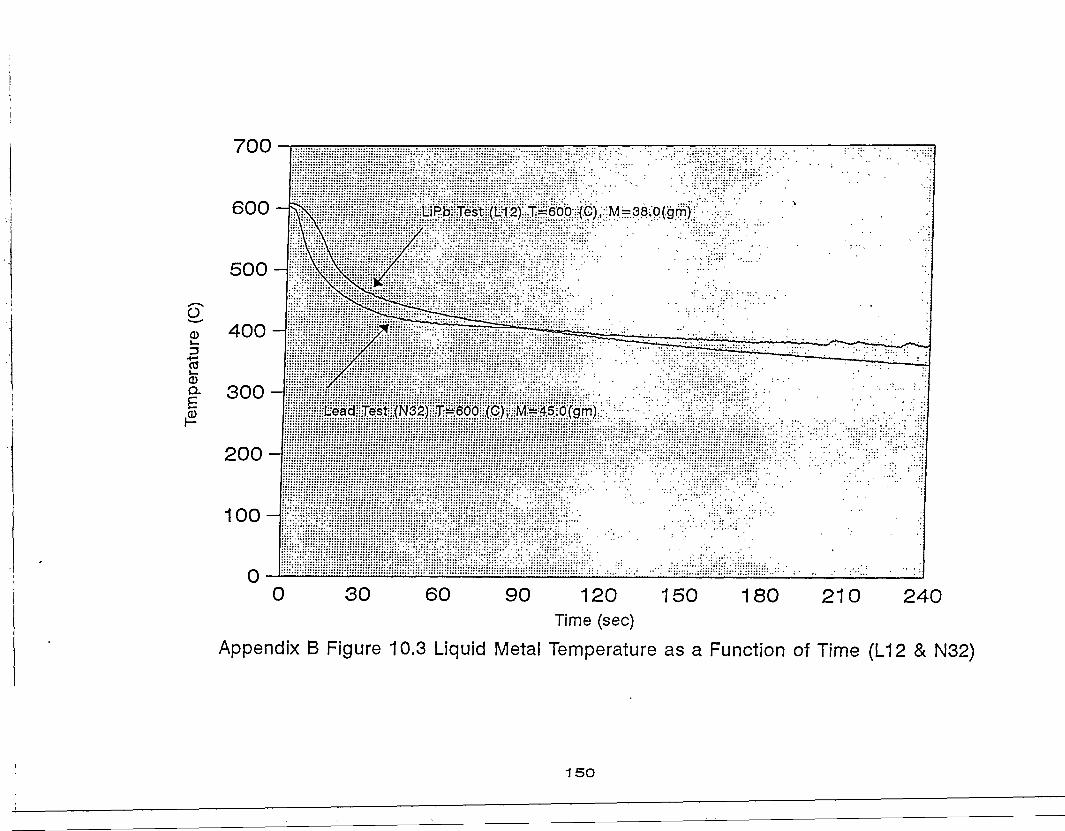
700
600
9.CD
100-
LiPb Test (L12) T^600 (C), M.=.3.8;p(gm)
Lead Test (N32) T=600 (C), M=45.0(gm)
30 60 90 120 150 180 210 240Time (sec)
Appendix B Figure 10.3 Liquid Metal Temperature as a Function of Time (L12 & N32)
150
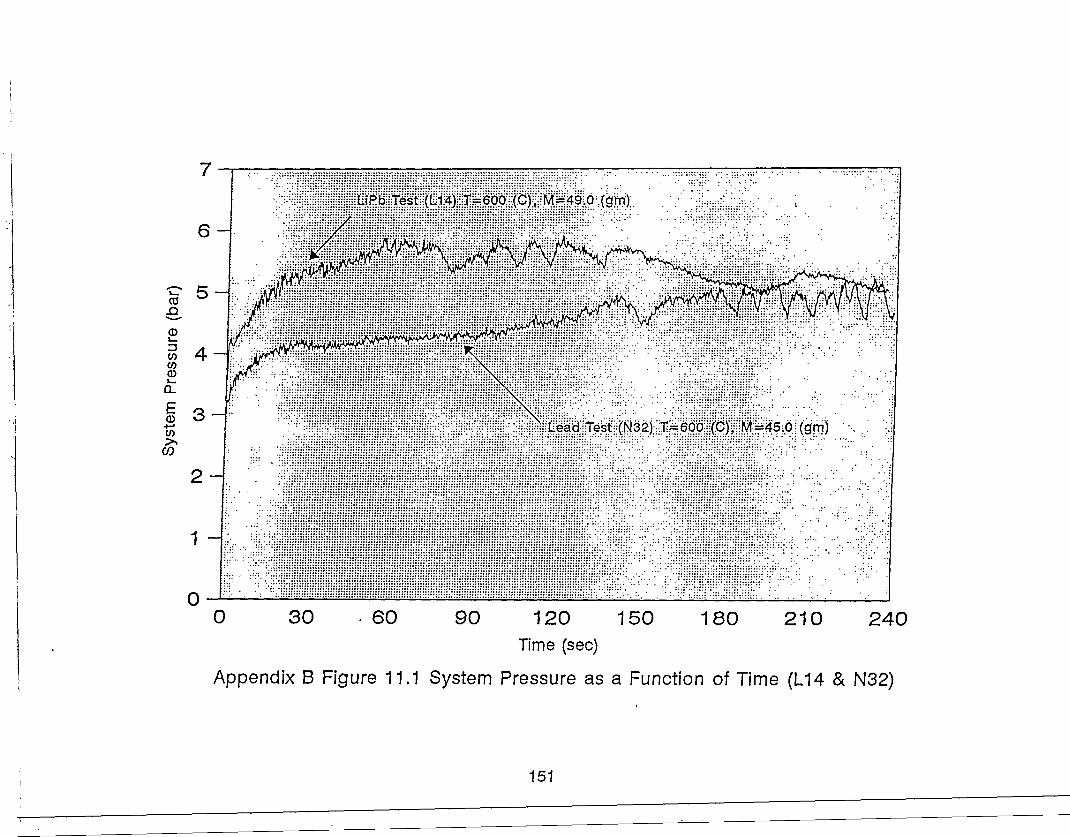
7LfPb Test (L14) T=600 (C), M=49.0 (gm)
Lead Test (N32) T=600 (C), M=45.0 (gm)
1 ~
00 30 • GO 90 120 150 180 210 240
Time (sec)
Appendix B Figure 11.1 System Pressure as a Function of Time (L14 & N32)
151
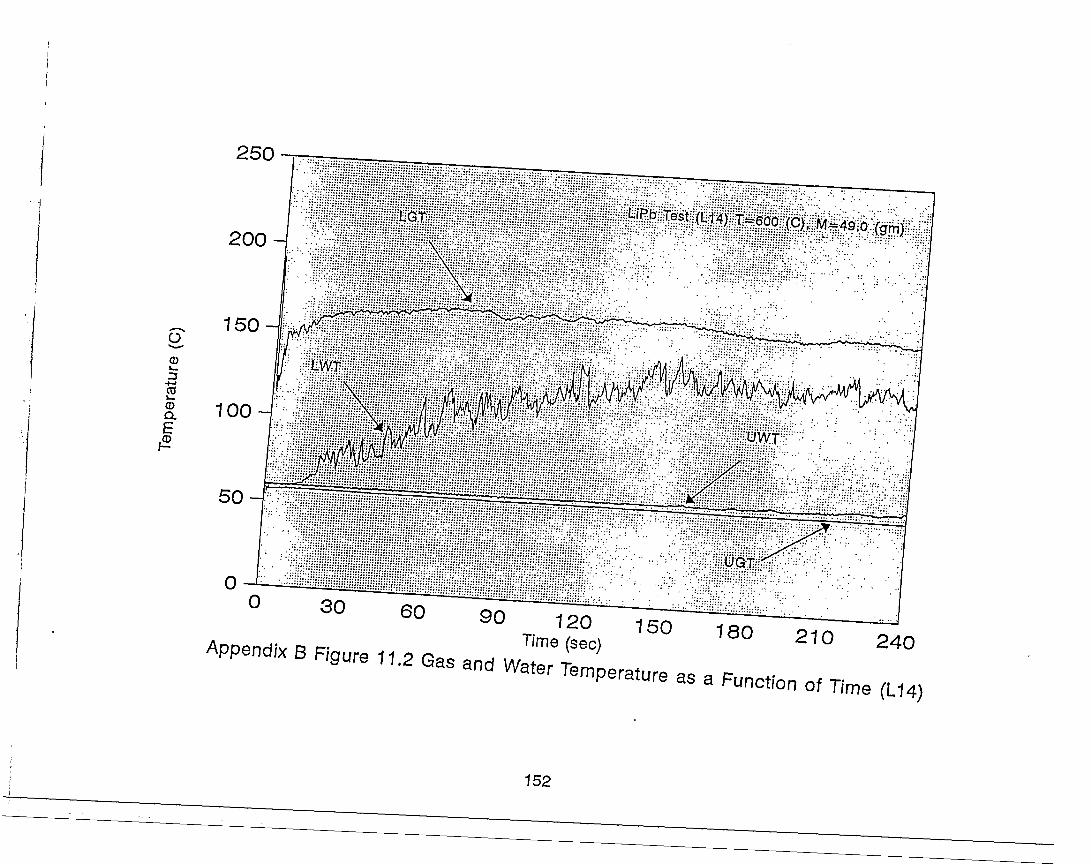
250
CDi_
+->2CD
aI
200
150
100
00 3 0 60 90 120 150
Temperature ,
180 210 240
a Function of Time (L14)
152

250
200
150
i_
Q.
E.0)
100-
Lead Test (N32) T=600 (C), M=45.0 <gm)
0 30 . 60 90 120 150 180 210 240Time (sec)
Appendix B Figure 11.3 Gas and Water Temperature as a Function of Time (N32)
153
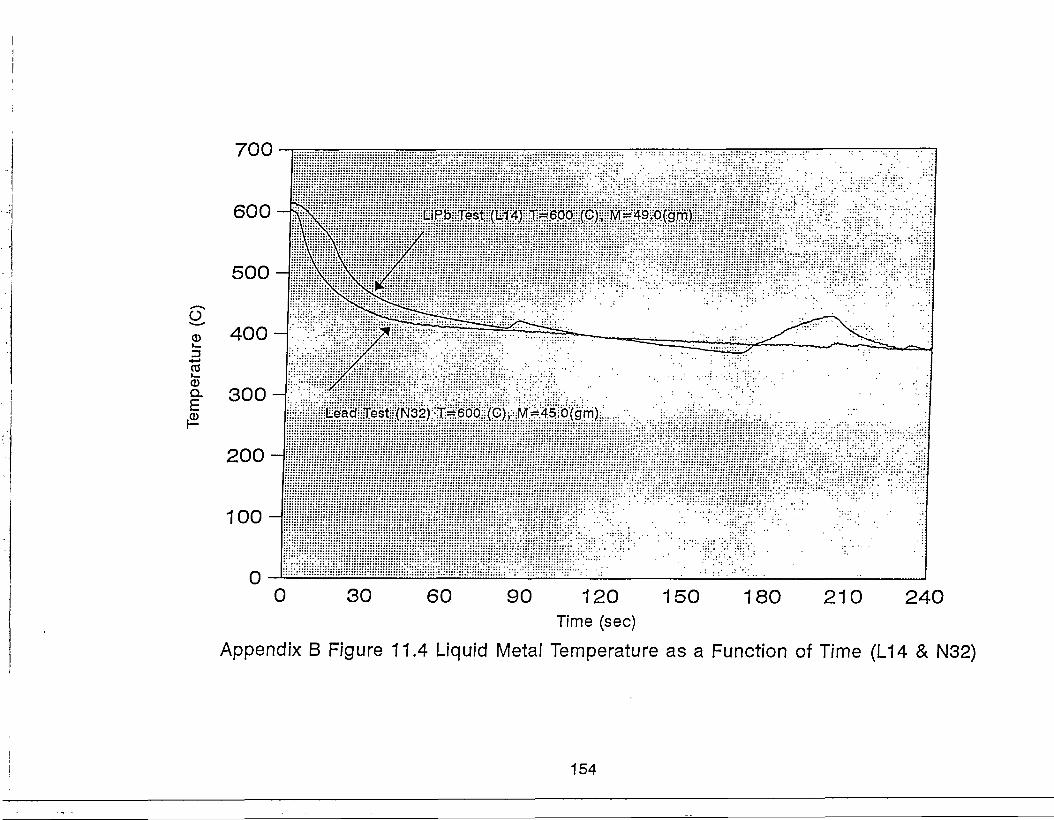
700
4 0 0 -
300
200
100-
0
LiPb Test (L14) T~600 fC), M=49.0(gm)
Lead Test (N32) T=600 (C), M=45.0(gm)
30 60 90 120 150 180 210 240Time (sec)
Appendix B Figure 11.4 Liquid Metal Temperature as a Function of Time (L14 & N32)
154
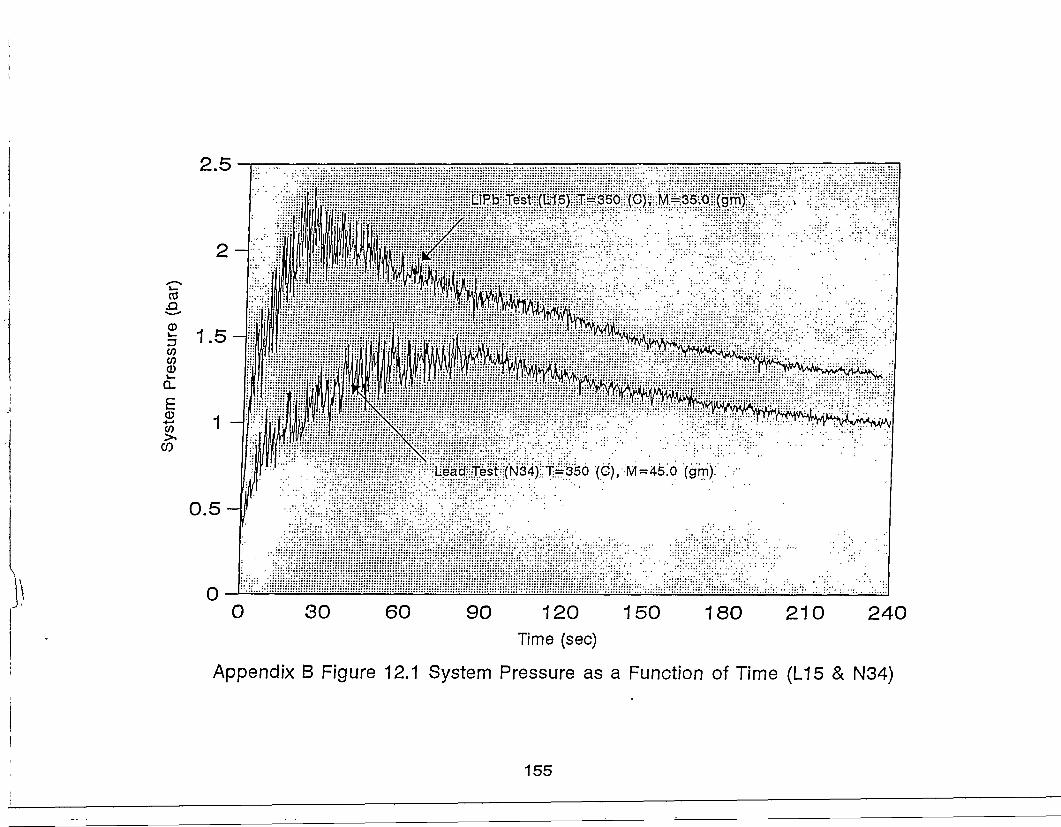
LiPb Test (US) T=350 (C)t M=35.0 (gm)
Lead Test (N34) T=350 (C), M=45.0 (gm)
0 30 60 90 120 150 180 210 240Time (sec)
Appendix B Figure 12.1 System Pressure as a Function of Time (L15 & N34)
155

COV -
a£
.0)
LiPb Test (L15) T=350 (C), N4=35.0 (gm)
30 60 180 210 24090 120 150Time (sec)
Appendix B Figure 12.2 Gas and Water Temperature as a Function of Time (L15)
156
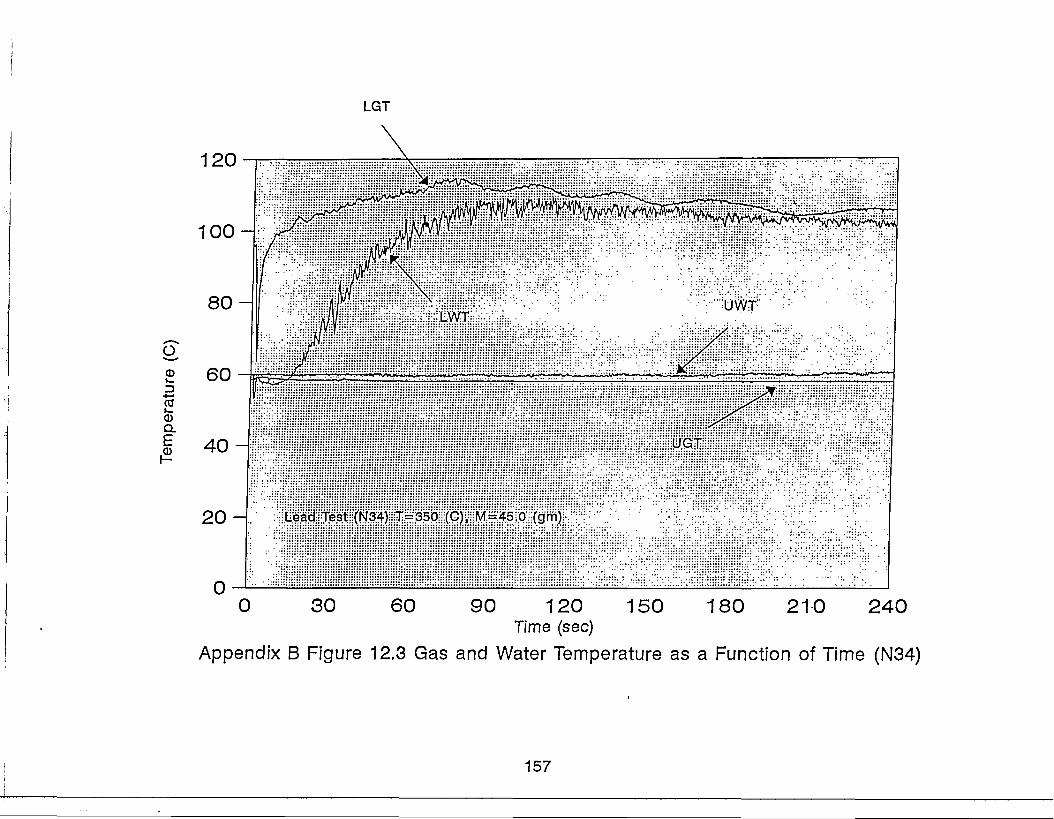
LGT
120
100-
8 0 -
2 60
CDQ.
Lead Test (N34) T=350 (C), M=45.0 (gm)
4 0 -
2 0 -
0 30 60 90 120 150 180 210 240Time (sec)
Appendix B Figure 12.3 Gas and Water Temperature as a Function of Time (N34)
157

400
300-
CD
CD200
100
0
LfPb Test (L15) T^350 (C), M=35.0(gm)
Lead Test (N34) T=350 (C), M=45.0(gm)
0 30 60 90 120 150 180 210 240Time (sec)
Appendix B Figure 12.4 Liquid Metal Temperature as a Function of Time (L15 & N34)
158
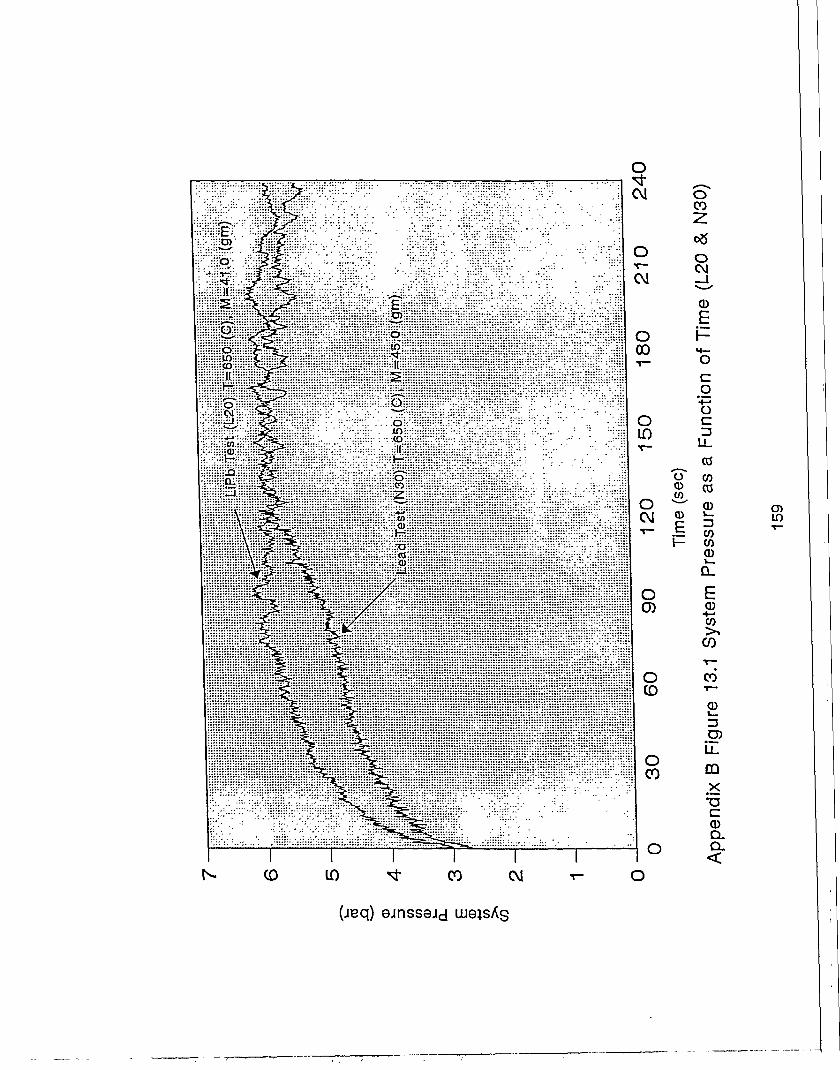
240
210
180
O10
N30
)(L
20 &
0
E
of T
iio
n:un
ct
oCO
o
oCM
O0)
O(0
©
Ei -
sur
to0
E0)"wCO
CO*T—
O)in
D)
CQ. X'"DCCDQ.Q.
(0
(jeq) ejnss9Jd
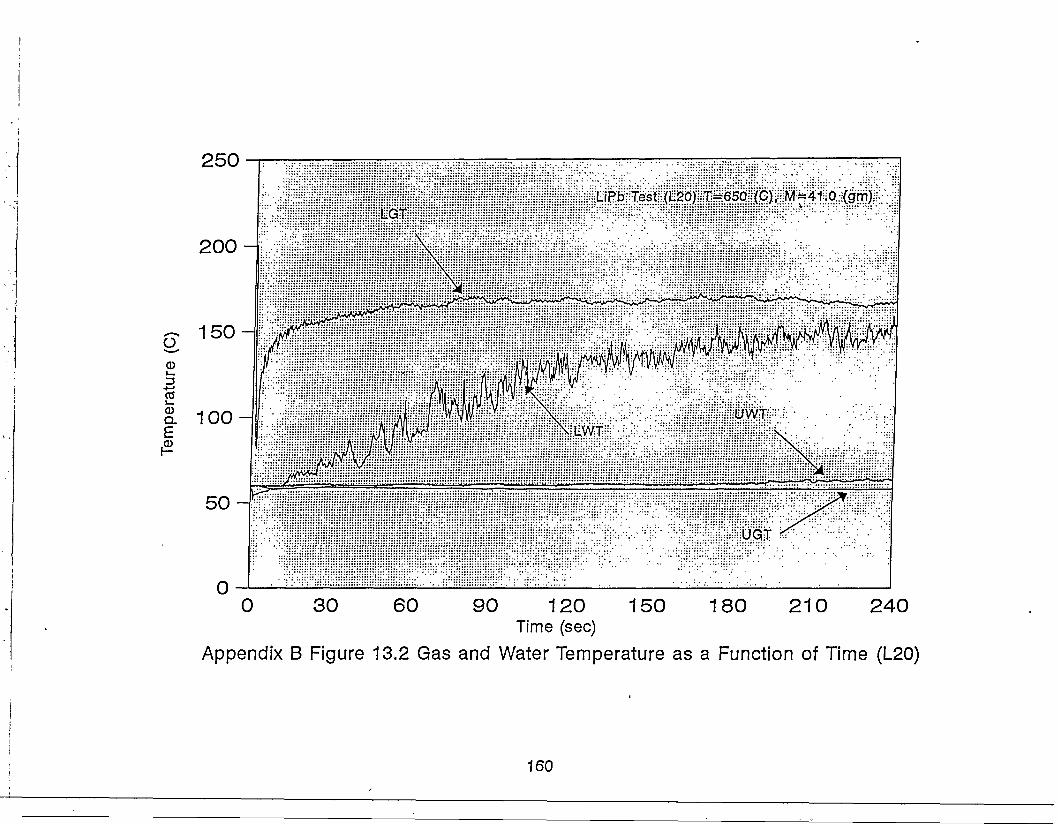
250
LGTLiPb Test (L20) T=650 <C), M=41.0 (gm)
0 60 90 120 150 180 210 240Time (sec)
Appendix B Figure 13.2 Gas and Water Temperature as a Function of Time (L20)
160

250
200
o
LGTLead Test (N30) T=650 (C), M=45.0 (gm)
U w i K ^ ^
0 30 . 60 90 . 120 150 180 210 240Time (sec)
Appendix B Figure 13.3 Gas and Water Temperature as a Function of Time (N30)
161
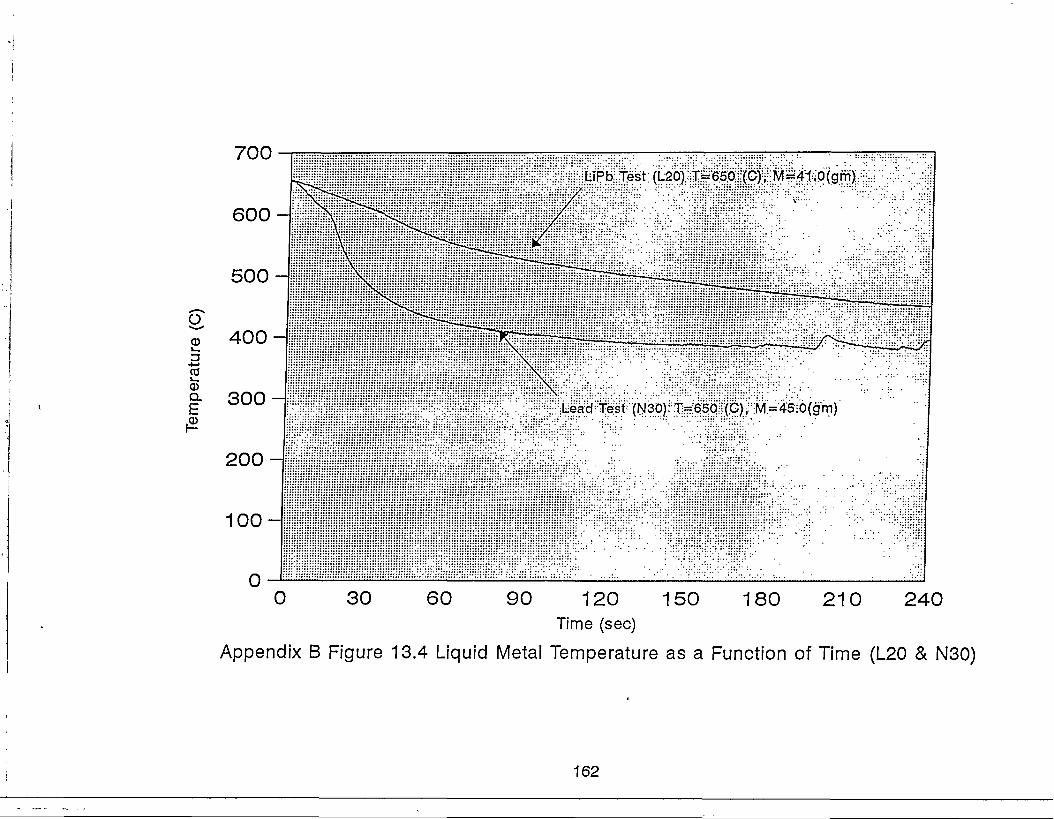
700
600-
500-
r 400-1
|- 300-1.0)
200-
100-
0
LfPb Test (L20) T=650 (C), M=41.0(gm)
Lead Test (N30) T*=650 (C), M = 45.0(gm)
0 30 60 90 120 150 180 210 240Time (sec)
Appendix B Figure 13.4 Liquid Metal Temperature as a Function of Time (L20 & N30)
162
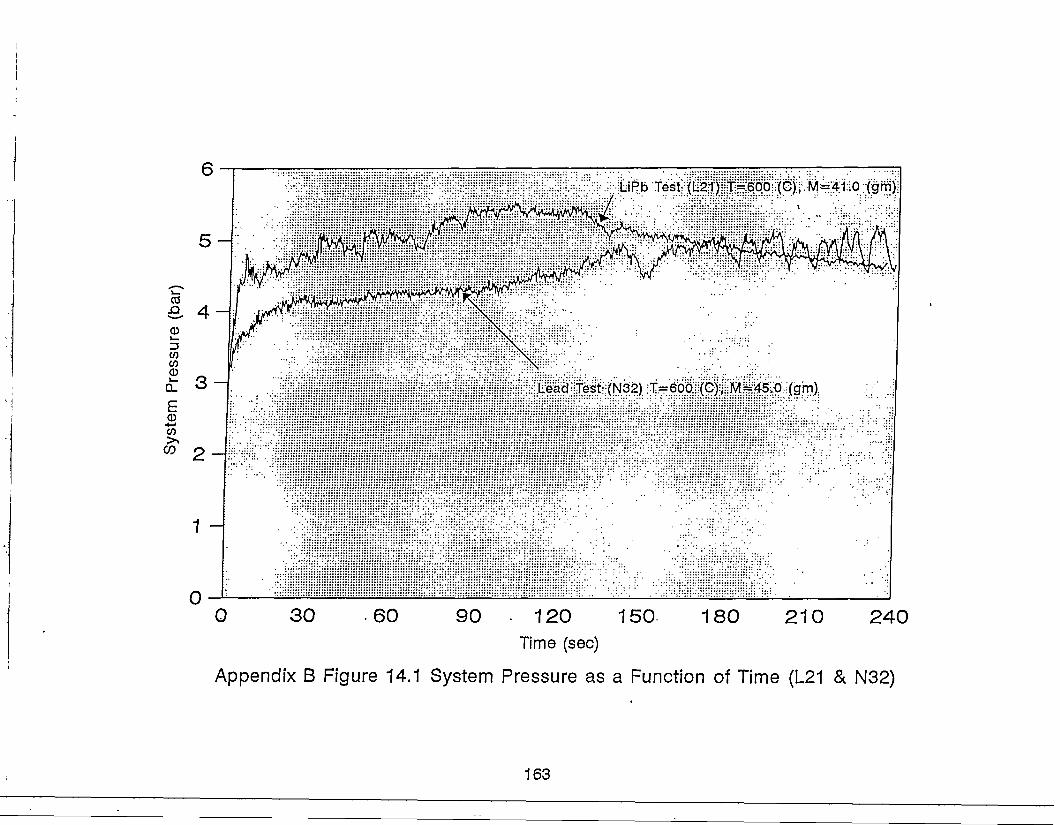
essu
EoCO
Lead Test (N32) T=600 (C), M=45,0 (gm)
1 -
0 30 60 90 120 150- 180 210 240Time (sec)
Appendix B Figure 14.1 System Pressure as a Function of Time (L21 & N32)
163

200
iQ.
I
150-
100-
LiPb Test (L21) T=600 (C), Mf=;41L:p
50-
30 60 24090 120 150 180 210Time (sec)
Appendix B Figure 14.2 Gas and Water Temperature as a Function of Time (L21)
164

700
Lead Test <N32) T=600 (C), M=45.0(gm)
90 120 150 180 210 240Time (sec)
Appendix B Figure 14.3 Liquid Metal Temperature as a Function of Time (L21 & N32)
165
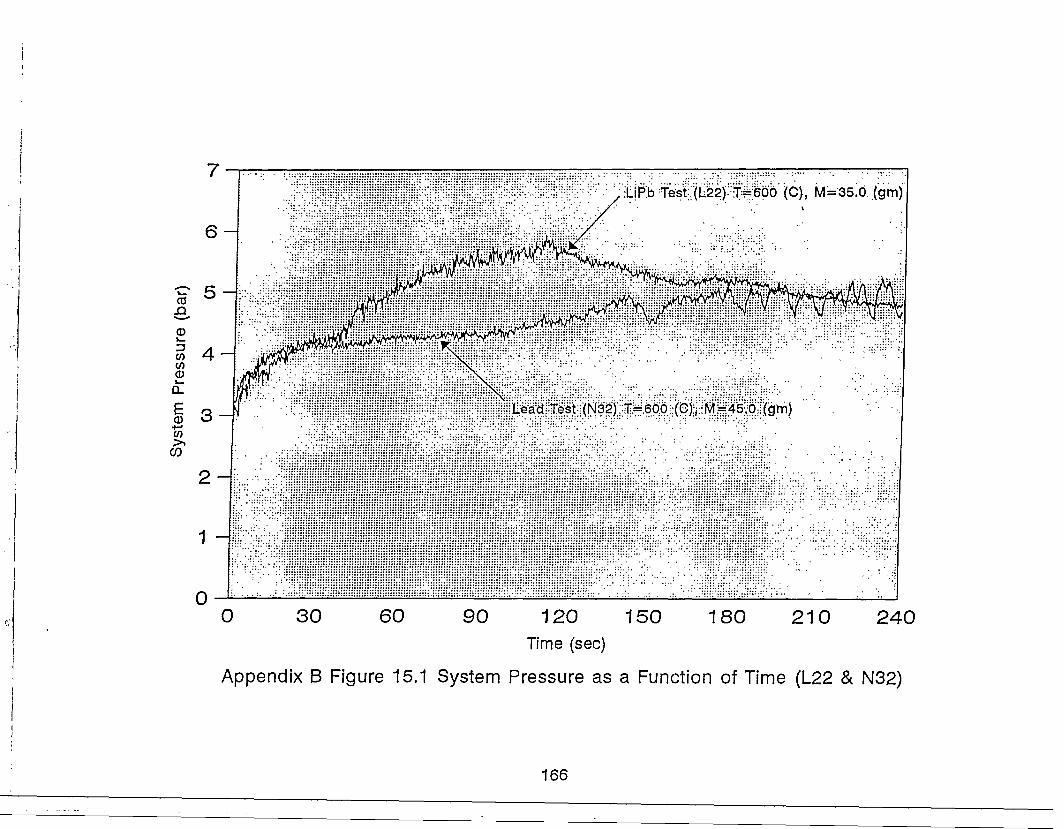
6 -
(bar
)
©
•ess
ui
Q.
E
Sys
1
5
4
3
2 -
1 -
0
Lead Test (N32) T=600 (C), M=45.0 (gm)
0 30 60 90 120 150 180 210 240Time (sec)
Appendix B Figure 15.1 System Pressure as a Function of Time (L22 & N32)
166

200
iI
150
100
LiPb Test (L22) T=600 (CJ, M=35.0 (gm)
5 0 -
30 60 90 120 150 180 210 240Time (sec)
Appendix B Figure 15.2 Gas and Water Temperature as a Function of Time (L22)
167

700
iE
600-<=
500
400
300
200
100-]
00
LiPb Test (L22) T-600 (C), M=35JD(gm)
Lead Test (N32) T=600 (C), M=45.0(gm)
30 60 90 120 150 180 210 240Time (sec)
Appendix B Figure 15.3 Liquid Metal Temperature as a Function of Time (L22 & N32)
168
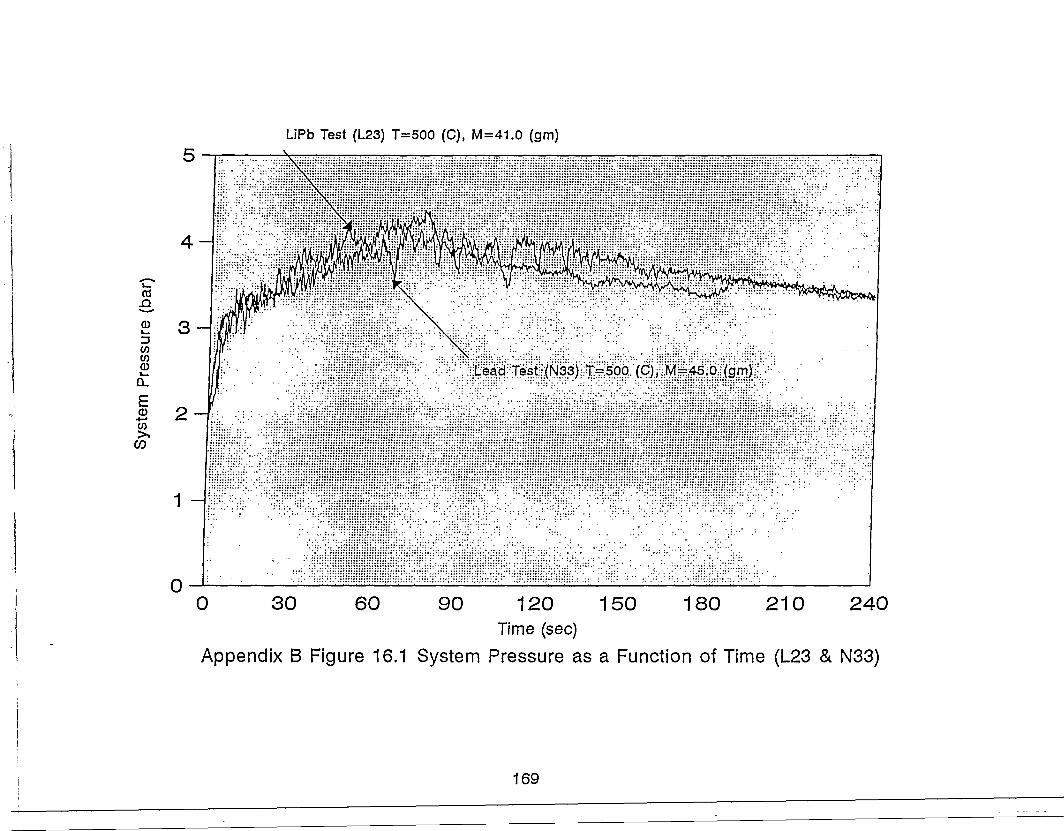
LiPb Test (L23) T=500 (C), M=41.0 (gm)
Lead Test (N33) T=500 (C), M=45.0 (gm)
90 120 150 180 210 240Time (sec)
Appendix B Figure 16.1 System Pressure as a Function of Time (L23 & N33)
169
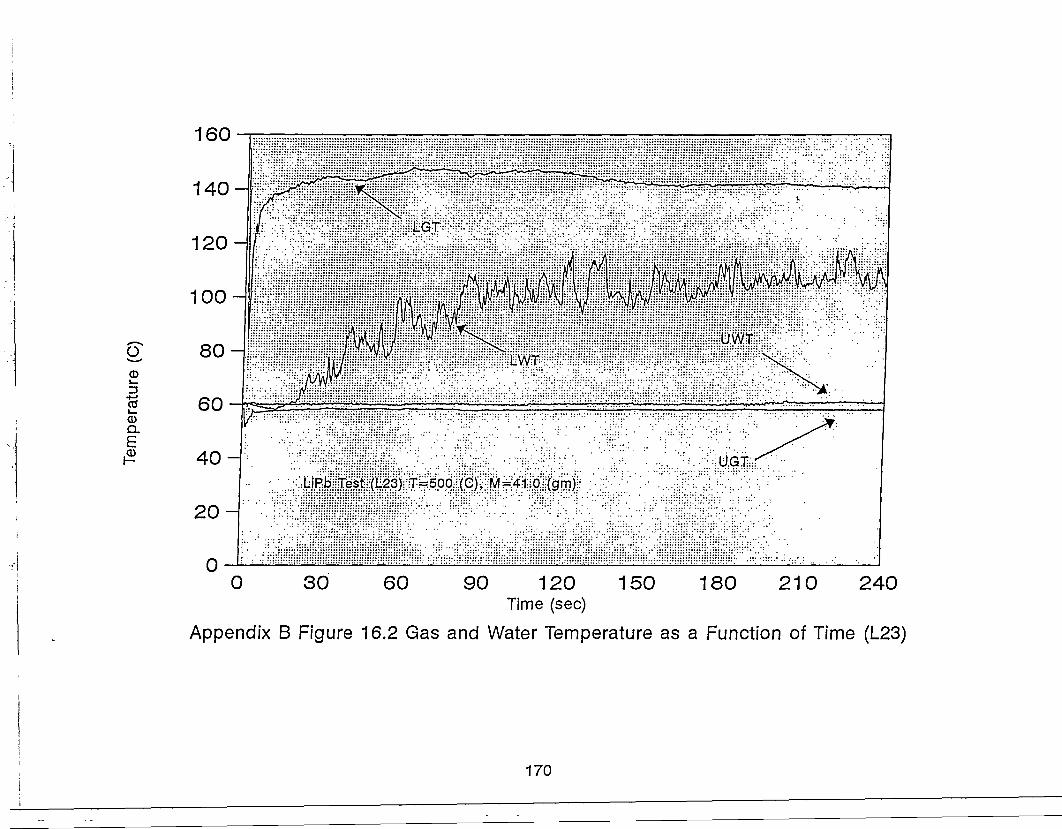
©
IQ.
E
160
40
20 H
00
LiPb Test (L23) T=500 (C), M=41.0 (gm)
30 60 180 210 24090 120 150Time (sec)
Appendix B Figure 16.2 Gas and Water Temperature as a Function of Time (L23)
170

160
ICD
a
I LiPb Test {N33) T=500 <C), M=45.0
90 120 150 180 210 240Time (sec)
Appendix B Figure 16.3 Gas and Water Temperature as a Function of Time (N33)
171

a
I
600
500
400
300
200
100
0
LiPbTest (L23) T=500 (C), M»41.0(gm)
Lead Test (N33) T=500 (C), M=45.0(gm)
0 30 60 90 120 150 180 210 240Time (sec)
Appendix B Figure 16.4 Liquid Metal Temperature as a Function of Time (L23 & N33)
172

APPENDIX C
LISTING OF DATA ANALYSIS PROGRAM
COMPUTE 1
C PROGRAMCC This program analyzes the experiment output. It reads in theC data from the countdown phase, the reaction phase and the equilibriumC phase from the datafiles COUNTD.DAT, REACTION.DAT and EQUIL.DATC respectively.CC It then calculates the initial pressure and temperatures in the upperC and lower chambers. It calculates the mass of argon initially in thelowerC chamber at the start of the experiment. The program thenC calculates the system pressure due to the water vaporC pressure and Argon pressure.CCC
IMPLICIT DOUBLE PRECISION ( A-H, M-Z )IMPLICIT INTEGER { I-L )
C REAL *8 TLM,PLG,TLW,TLGC
DIMENSION TIME(500) ,UGT(500),TLG(500),UWT(500),TLW(500)DIMENSION TLM(500),TUF(500),TLF(500),UGP(500),PLG(500)COMMON/FACTOR/C(9)
CHARACTER*15 FILENM1CHARACTER*15 FILENM2CHARACTER*15 FILENM3CHARACTER*15 FILEDPCHARACTER*1 RES PON
CCc***+* PROGRAM CONSTANTS *****c***** VUPFINAL IS THE FINAL GAS SPACE ABOVE LIQUID LEVEL AFTER EXPT.c***** MEASURED FROM THE LIQUID LEVEL GAUGE AFTER THE EXPERIMENT.c***** VDN = VOLUME OF THE LOWER CHAMBER BELOW THE LOWER FLANGEc***** VDEADl = VOLUME OF DEAD SPACE IN VALVEC***** VDEAD2 = VOLUME OF DEAD SPACE IN FLANGES AND THROUGH GASKETTHICKNESSC***** BELOW BALL OF CLOSED VALVEc***** VUPTOTAL = TOTAL VOLUME OF THE UPPER CHAMBERc***** FWL = FINAL WATER LEVEL IN INCHESC
VDEADl=22.86D0VDEAD2= 25.17D0VDN=90.09VUPTOTAL = 1385.DOILEAK=0
CC****CURVE FIT COEFFICIENTS FOR UPPER VOLUME AS FUNCTION OF WATER LEVELC ZO= -2.23958
173

C Zl= 28.9583UGV=55.00
C*** EQUATION FOR UPPER VOLUME AS A FUNCTION OF FINAL WATER LEVELC115 FORMAT (A)
WRITE (*,145)145 FORMAT(1OX,'The default initial upper gas volume is 55 cm3'
3 / 10X, 'Do you want to change this (y/n)?' )READ (*,115) RESPONIF ( ( RESPON .EQ. 'Y' ) .OR. ( RESPON .EQ. 'y' ) ) THENWRITE (*,150)
150 FORMAT ( 10X, 'Enter the new final water level (in)')READ (*,*) UGVENDIF"
C VUPFINAL=ZO+Z1*FWLCC **** INPUT THE LIQUID METAL MASS *****C
WRITE (6,125)125 FORMAT ( 10X, 'Enter the liquid metal mass (gm) ' )
READ (*,*) MASLIQDLIQ = 9.VGASDN = VDN - MASLIQ / DLIQ + VDEAD2
C VGASUPI = VUPFINAL - (VGASDN + VDEAD1)C VGASUPF = VUPFINALC VH2O=VUPTOTAL-VGASUPI
VGASUPI = UGVVH2O=VUPTOTAL-VGASUPIVGASUPF = UGV + (VGASDN + VDEAD1)RGAS = 83.14395
C Universal Gas Constant (bar/mole K)MWH2O = 18.02
C***** SATURATION PRESSURE FORMULA FACTORS *****C(l) = -7.691234564C(2) =C(3) =C(4) =C(5) =C(6) =C(7) =C(8) =C(9) =
-26.08023696-168.170654664.23285504-118.96462254.16711732020.975067601.D96.
C***** LOGICAL UNIT NUMBERS *****C IWRITE = 6C IREAD
IDATA1IDATA2IDATA3IDELTPITH2O :ITLM =IPRES ••
ISYSTIPCOMPIDOUTIPH2 =IMH2 =
= 6=9= 10= 11= 12= 1314= 15= '16= 17= 181920
C***** OUTPUT FILES *****OPEN ( ITH2O, FILE = 'TH2O.DAT')
174

OPENOPENOPENOPENOPEN
( ITLM, FILE = 'TLM.DAT')( IPRES, FILE = 'PRES.DAT')( ISYST, FILE = 'SYSTEM.TXT')( IPH2, FILE = 'PH2.DAT')( IMH2, FILE = 'MH2.DAT')
C***** INPUT SECTION *****FILENM1='COUNTD. DAT'FILENM2='REACTION. DAT'FILENM3='EQUIL. DAT'FILEDP='DELTP.DAT'
C FILENM='P.DAT'OPEN ( IDATA1, FILE = FILENM1)OPEN ( IDATA2, FILE = FILENM2)OPEN" ( IDATA3, FILE = FILENM3)
CIDTP = 1AREA = 5.0671STOT = MASLIQ / { DLIQ * AREA )
CTEQ = 600.WRITE (*,165) TEQ
165 FORMAT ( 10X, 'The time at which the mass of hydrogen is aver',1 'aged = ', 1P1G11.4, • sec1 / 10X, "Do you want to ',2 'change it (y/n)?1 )READ (*,115) RESPONIF ( ( RESPON .EQ. 'Y' ) .OR. ( RESPON .EQ. 'y' ) ) THENWRITE (*,170)
170 FORMAT ( 10X, 'Enter the new value of TEQ ' )READ (*,*) TEQEND IFIMHAVE = 0IFLAG = 0MH2SUM = 0.
CIPOUT = 0WRITE (*,175)
175 FORMAT ( 5X, 'Do you want the components of the pressure ',1 "saved (y/n)?' )READ (*,115) RESPONIF ( ( RESPON .EQ. 'Y' ) .OR. ( RESPON .EQ. 'y' ) ) THENOPEN ( IPCOMP, FILE = 'PCOMP.DAT')IPOUT = 1END IF
C200 CONTINUE
INITIAL EXPERIMENTAL DATA
cC In this section we read in the data for the countdown phase beforetheC valve is opened. We then calculate the average initial temperaturesandC pressure in both the upper and lower chambers.
1 = 0250 CONTINUEC
1 = 1 + 1C
175
READ (IDATA1,*,END=251)TIME(I)/UGT(I),TLG(I),UWT(I),TLW(I)1,TLM(I),TUF(I),TLF(I),UGP(I),PLG(I)
CC******* CONVERT PRESSURE FROM VOLTS TO BARSCC UGP(I)=UGP(I)*20.D0*6.8948D-2C PLG(I)=PLG(I)*20.D0*6.8948D-2CC
WRITE(*,*)TIME(I),UGT(I),TLG(I),UWT(I),TLW(I),TLM(I),UGP(I),PLG(I)
GO TO 250C
251 ICOUNt = IJCOUNT = ICOUNT - 1
c***** EVALUATE INITIAL LOWER GAS PRESSURE AND TEMPERATURE ******C***** AND THE INITIAL UPPER GAS PRESSURE AND TEMPERATURE *****c***** A N D THE INITIAL LIQUID METAL TEMPERATUREC ***** USING DATA FROM THE COUNTDOWN PHASE *****
L = 0SUMPLG=0*SUMTLG=0.SUMUGP = 0.SUMUGT = 0.SUMUWT = 0.SUMTLM = 0.
cC EVALUATE SUMSC
C
C
300CCC
DO 300 ISUMPLG =SUMTLG =
SUMUGP =SUMUGT =SUMUWT =SUMTLM =
CONTINUE
= 1, JCOUNTSUMPLG 4SUMTLG ^
•• SUMUGP H
= SUMUGT H= SUMUWT -= SUMTLM -
EVALUATE MEAN VALUES
• PLG(I)- TLG(I)
1- UGP(I)(• UGT(I)1- UWT(I)V TLM(I)
L=JCOUNTPDN = SUMPLG / DBLE( L )TDN = SUMTLG / DBLE( L )PUP = SUMUGP / DBLE( L )TUP = SUMUGT / DBLE( L )TH2OI = SUMUWT / DBLE( L )TLMI = SUMTLM / DBLE( L )
c***** EVALUATE STANDARD DEVIATIONS OF AVERAGED QUANTITIES *****SDVPDN = 0.SDVTDN = 0.
CSDVPUP = 0.SDVTUP = 0.SDVTH2 = 0.SDVTLM = 0.
CDO 350 I = 1,JCOUNT
176

SDVPDN = SDVPDN + ( PDN - PLG(I) ) * ( PDN - PLG(I) )SDVTDN = SDVTDN + ( TDN - TLG(I) ) * ( TDN - TLG(I) )
CSDVPUP = SDVPUP + ( PUP -UGP(I) ) * ( PUP - UGP(I) )SDVTUP = SDVTUP + ( TUP - UGT(I) ) * ( TUP - UGT(I) )SDVTH2 = SDVTH2 + ( TH20I - UWT(I) ) * ( TH20I - UWT(I) )SDVTLM = SDVTLM + ( TLMI - TLM(I) ) * ( TLMI - TLM(I) )
350 CONTINUESDVPDN = DSQRT{ SDVPDN / DBLE( JCOUNT ) )SDVTDN = DSQRT( SDVTDN / DBLE( JCOUNT ) )
CSDVPUP = DSQRT( SDVPUP / DBLE( JCOUNT ) )SDVTUP = DSQRT( SDVTUP / DBLE( JCOUNT ) )SDVTH2" = DSQRT( SDVTH2 / DBLE{ JCOUNT ) )SDVTLM = DSQRT( SDVTLM / DBLE( JCOUNT ) )
Cc***** EVALUATE INITIAL WATER VAPOR PRESSURE *****
TUPK = TUP + 273.15TDNK = TDN + 273.15
CCALL PSAT (TUPK, PVAPI )
Cc***** EVALUATE INITIAL ARGON MASS IN SOLUTION *****CC First we evaluate the initial Ar solubility and water density.
TSATK = 373.998 * ( PUP**(.07144015) )TSAT = TSATK - 273.15XAR = 3.7D-7 * (TSAT - TH2OI)*(PUP-PVAPI)/(TSAT-25.0)/I.013IF(XAR .LT.0.0) XAR=0.0DENH2O = 1.0098 - 4.86871D-4 * TH2OI
CMARSOL = XAR * VH2O * DENH2O / MWH2O
CMARUP = ( PUP - PVAPI ) * VGASUPI / (RGAS*TUPK)MARDOWN = PDN * VGASDN / (RGAS*TDNK )MAR = MARUP + MARDOWN + MARSOL
c***** OUTPUT INITIAL VALUES *****CC First we output problem parameters to the screen.
WRITE (*,400) FILENM1,FILENM2,FILENM3WRITE (ISYST,401) FILENMl,FILENM2,FILENM3
400 FORMAT ( /// 5X, 'For the system pressure files ', 3A12 / )401 FORMAT ( 5X, 'For the system pressure files ', 3A12 / )C
IF ( IDTP .EQ. 0 ) THENC WRITE (*,405) FILEDPC WRITE (ISYST,405) FILEDP405 FORMAT ( 5X, 'And the DELTAP pressure file ', A12 / )
END IFC
WRITE (*,410) TLMI, SDVTLM, TH2OI, SDVTH2, MASLIQ, STOTWRITE (ISYST,410) TLMI, SDVTLM, TH2OI, SDVTH2, MASLIQ, STOT
410 FORMAT( 5X, 'The experimental parameters are: '/1 5X, 'initial liquid metal temp. = ', 1P1G11.4, ' +/- ',2 1P1G11.4, ' C • /3 5X, 'initial water temperature = ', 1P1G11.4, • +/- ',4 1P1G11.4, ' C ' /5 5X, 'liquid metal mass = ', 1P1G11.4, ' gm '/6 5X, 'and the metal has a depth = ', 1P1G11.4, 'cm '/)
177

415
WRITE (*,415) TUP, SDVTUP, VGASUPI, TDN, VGASDNWRITE (ISYST,415) TUP, SDVTUP, VGASUPI, TDN, VGASDN
FORMAT(1OX,1234
'with initial upper Ar temp =1P1G11.4, ' C • /
10X, 'the upper gas layer volume ='with initial lower Ar temp =1 the lower gas layer volume =
10X,10X,
1P1G11.
1P1G11.1P1G11.1P1G11.
4,
4,4,4,
1 +/-
' cm31 C' cm3
T/
. /
V
420
WRITE (*,420) PUP, SDVPUP, PDN, SDVPDNWRITE (ISYST,420) PUP, SDVPUP, PDN, SDVPDN
FORMAT(10X, 'the initial upper pressure =2 1P1G11.4, ' bar ' /3 * 10X, 'the initial lower pressure =4 1P1G11.4, ' bar.' //)
425
1P1G11.4, ' +/-
1P1G11.4, ' +/ -
WRITE (*,425) MAR, MARUP, MARDOWN, MARSOLWRITE (ISYST,425) MAR, MARUP, MARDOWN, MARSOL
FORMAT(10X, 'the total argon mass = ', 1P1G11.4, • mole1/1 10X, 'the upper chamb argon mass= ', 1P1G11.4, ' mole1/1 10X, 'the lower chamb argon mass = ', 1P1G11.4, • mole1/1 10X, 'the argon mass in solution = ', 1P1G11.4, ' mole1/)
CC
CCC
Now to output the initial values to the data files.PAR = PUP - PVAPIMHLEAK = 0.IF ( IPOUT .EQ. 1 ) THENWRITE (IPCOMP,998) TIME(JCOUNT), PAR, PVAPI, MARSOL, MHLEAKEND IFPH2 = 0.MH2TOT = 0.WRITE (IPH2,999) TIME(JCOUNT), PH2WRITE (IMH2,999) TIME(JCOUNT), MH2TOT
TIMEO =0.0
C MAIN CALCULATIONAL LOOPC THIS SECTION READS IN THE DATA FOR THE REACTION PHASE AND CALCULATESC THE MASS OF HYDROGEN GENERATED DURING THE PHASE AS A FUNCTION OFC TIME. CORRECTION FOR LEAKAGE IS MADE USING LEAKAGE INFORMATIONC FROM A SEPARATE FILE
c***** D A T A INPUT SECTION *****C
K=0
2000 CONTINUEC
K=K+1
READ (IDATA2,*,END=2500)TIME1,TGAS1,TLG1,TH201,TLW1,TLM11 ,TUF1,TLF1,PRES1,PLG1
178

C ******* CONVERT PRESSURE FROM VOLTS TO BARS *******CC PRESl=PRESl*20.D0*6.8948D-2C PLG1 =PLGl*20.D0*6.8948D-2
C READ (IDATA,*,END=2500) TIME1, PRES1, TGAS1, TH2O1, TLM1CCc***** EVALUATE PVAP(TGASl) *****
TGASK = TGAS1 + 273.15C
CALL PSAT (TGASK,PVAP )CC***** EVALUATE ARGON MASS IN SOLUTION *****CC This is the argon that stays in solution as itc bubbles to the upper chamber.C
TSATK = 373.998 * ( PRES1**(.07144015) )TSAT = TSATK - 273.15XAR = 3.7D-7 *(TSAT - TH2O1)*(PRES1-PVAP)/(TSAT-25.0)/I.013DENH2O = 1.0098 - 4.86871D-4 * TH2O1IF(K.EQ.l) THENXAR=0.DOENDIF
CMARSOL = XAR * VH2O * DENH2O / MWH2O
c***** EVALUATE HYDROGEN MASS IN SOLUTION *****CC This is the hydrogen in solution.
XH2 = 1.7D-7 *(TSAT-TH2O1)*PH2/(TSAT-25.0)/I.013MH2SOL = XH2 * VH2O * DENH2O / MWH2O
c***** EVALUATE NEW ARGON MASS *****CC Here we calculate the new argon mass, which is lower due to leak-C age. But first we must estimate the leakage rate at the system pres-C sure.C **************** SET CONSTANTS TO ZERO ************
Al=0.0Bl=0.0Cl=0.0IF(ILEAK .GT. 0 ) THENDPDT = Al + Bl * PRES1 + Cl * PRES1 * PRES1IF ( DPDT .LT. 0. ) DPDT = 0.
CMAR = MAR - ( DPDT * ( PAR / ( PAR + PH2+PVAP ) ) * ( TIME11 - TIME0 ) * VGASUPF / ( RGAS * TGASK ) )
CC***** EVALUATE TOTAL HYDROGEN MASS TO HAVE LEAKED FROM SYSTEM *****
MHLEAK = MHLEAK + ( DPDT * ( PH2 / ( PAR + PH2+PVAP ) ) *1 ( TIME1 - TIME0 ) * VGASUPF / ( RGAS * TGASK ) )ENDIF
Cc***** UPDATE ARGON PRESSURE *****
PAR = ( MAR - MARSOL ) * RGAS * TGASK / VGASUPFCc***** EVALUATE HYDROGEN PRESSURE *****
PH2 = PRES1 - PAR - PVAP
179

PH2 = PRES1 - PAR - PVAP - DELPC - ( MH2S0L * RGAS * TGASK1 / VGASUPF )
CCCC***** EVALUATE TOTAL HYDROGEN MASS *****
MH2TOT = ( PH2 * VGASUPF / ( RGAS * TGASK ) ) + MH2SOL +1 MHLEAK
CCc***** OUTPUT NON-EQUILIBRIUM DATA *****
WRITE (ITH2O,997) TIME1, TH2O1, TGAS1WRITE (ITLM,999) TIME1, TLM1WRITE (IPRES,999) TIME1, PRES1WRITE. (IPH2,999) TIME1, PH2WRITE' (IMH2,999) TIME1, MH2TOTIF ( IDTP .EQ. 0 ) THEN
C WRITE (IDOUT,999) TIME1, DELPCEND IFIF ( IPOUT .EQ. 1 ) THENWRITE (IPCOMP,998) TIME1, PAR, PVAP, MARSOL, MHLEAK
END IFC
TIMEO = TIME1c***** E N D 0 F INNER LOOP *****C
GO TO 2000Cc***** E N D 0 F DELTAP COMPARISON LOOP *****C2500 CONTINUEC
C MAIN CALCULATIONAL LOOP FOR EQUILIBRIUM PHASEC THIS SECTION READS IN THE DATA FOR THE EQUILIBRIUM PHASE ANDCALCULATESC THE MASS OF HYDROGEN INVENTORY DURING THE PHASE AS A FUNCTION OFC TIME. CORRECTION FOR LEAKAGE IS MADE USING LEAKAGE INFORMATIONC FROM A SEPARATE FILE
c***** DATA INPUT SECTION *****C
TIME0=0.03000 CONTINUEC
READ (IDATA3,*,END=3500)TIME1,TGAS1,TLG1,TH201,TLW1,TLM11 ,TUF1,TLF1,PRES1,PLG1
CC ******* CONVERT PRESSURE FROM VOLTS TO BARS *******CC PRESl=PRESl*20.D0*6.8948D-2C PLG1 =PLGl*20.D0*6.8948D-2
180

C WRITE(ISYST,*)TIME,TGAS1,TLG1C READ (IDATA,*,END=2500) TIME1, PRES1, TGAS1, TH201, TLM1CCc***** EVALUATE PVAP(TGASl) *****
TGASK = TGAS1 + 273.15C
CALL PSAT (TGASK,PVAP )c***** EVALUATE ARGON MASS IN SOLUTION *****CC This is the argon that comes out of solution due to the risingC water temperature.
VH2O=VUPTOTAL-VGASUPFTSATK = 373.998 * ( PRES1**(.07144015) )TSAT = TSATK - 273.15XAR = 3.7D-7- *(TSAT-TH2Ol)*PAR/(TSAT-25.0)/1.013DENH2O = 1.0098 - 4.86871D-4 * TH2O1
CMARSOL = XAR * VH2O * DENH2O / MWH2O
c***** EVALUATE HYDROGEN MASS IN SOLUTION *****CC This is the hydrogen in solution.
XH2 = 1.7D-7 *(TSAT-TH2Ol)*PH2/{TSAT-25.0)/1.013MH2SOL = XH2 * VH2O * DENH2O / MWH2O
c***** EVALUATE NEW ARGON MASS *****CC Here we calculate the new argon mass, which is lower due to leak-C age. But first we must estimate the leakage rate at the system pres-C sure.Q **************** SET CONSTANTS TO ZERO ************
Al=0.0Bl=0.0Cl=0.0IF(ILEAK .GT. 0 ) THENDPDT = Al + Bl * PRES1 + Cl * PRES1 * PRES1IF { DPDT .LT. 0. ) DPDT = 0.
CMAR = MAR - ( DPDT * ( PAR / ( PAR + PH2+PVAP ) ) * ( TIME11 - TIME0 ) * VGASUPF / ( RGAS * TGASK ) )
Cc***** EVALUATE TOTAL HYDROGEN MASS TO HAVE LEAKED FROM SYSTEM *****
MHLEAK = MHLEAK + ( DPDT * ( PH2 / { PAR + PH2+PVAP ) ) *1 ( TIME1 - TIME0 ) * VGASUPF / ( RGAS * TGASK ) )ENDIF
c***** UPDATE ARGON PRESSURE *****PAR = ( MAR - MARSOL ) * RGAS * TGASK / VGASUPF
Cc***** EVALUATE HYDROGEN PRESSURE *****C
PH2 = PRES1 - PAR - PVAPWRITE(*,*)"PRES1, PAR, PVAP, PH2",PRES1,PAR,PVAP,PH2
CC PH2 = PRES1 - PAR - PVAP - DELPC - ( MH2SOL * RGAS * TGASKC 1 / VGASUPF )Cc***** EVALUATE TOTAL HYDROGEN MASS *****
MH2TOT = ( PH2 * VGASUPF / ( RGAS * TGASK ) ) + MH2SOL +1 MHLEAK
181
C WRITE(*,*)"MADE IT THIS FAR"C STOPCc+**+* EVALUATE AVERAGE HYDROGEN MASS AT TEQ *****c***** T H I S I S DONE BY AVERAGING THE TOTAL MASS BETWEEN ******c***** T H E T I M E INTERVAL TEQ-DTEQ AND TEQCCC
ccccccccccccccccc
( TEQ - DTEQ) ) ) THEN
) ) .AND. ( TIME1 .LE.
450123
DTEQ=2.0IF ( ( TIME1 .GE.
{ TEQ + DTEQIMHAVE = IMHAVE + 1MH2SUM = MH2SUM + MH2T0T
WRITE(ISYST,*)TIME1,MH2SUMELSEIF' ( ( TIME1 .GT. (TEQ ) ) .AND. (IFLAG .EQ.
0 )) THENIFLAG = 1MH2AVE = MH2SUM / DBLE( IMHAVE )
WRITE (*,450) TEQ, MH2AVEWRITE (ISYST,450) TEQ, MH2AVEFORMAT(10X, 'at time
1 sec ' /'the total mass of hydrogen =1 mole1 )
5X,
1P1G11.4,
1P1G11.4,
ENDEND
IFIF
OUTPUT DATA FROM NON-EQUILIBRIUM TO EQUILIBRIUM STATE *****WRITE (ITH2O,997) TIME1, TH2O1, TGAS1WRITE (ITLM,999) TIME1, TLM1WRITE (IPRES,999) TIME1, PRES1WRITE (IPH2,999) TIME1, PH2WRITE (IMH2,999) TIME1, MH2TOTIF ( IDTP .EQ. 0 ) THEN
WRITE (IDOUT,999) TIME1, DELPCEND IFIF ( IPOUT .EQ. 1 ) THENWRITE (IPCOMP,998) TIME1, PAR, PVAP, MARSOL, MHLEAK
END IF
TIMEO = TIME1c***** E N D OF INNER LOOP *****C
GO TO 3000Cc***** EN0 OF DELTAP COMPARISON LOOPC3500 CONTINUEC
MH2AVE = MH2SUM / DBLE( IMHAVE )
WRITE (*,450) TIME1, MH2AVE,MH2SOL,MHLEAKWRITE (ISYST,450) TIME1, MH2AVE,MH2SOL,MHLEAK
450 FORMAT(10X, 'at time = ', 1P1G11.4,1 ' sec ' /2 5X, 'the total mass of hydrogen = ', 1P1G11.4,3 ' mole' /2 5X, 'the total mass of hydrogen IN SOL = ', 1P1G11.4,3 ' mole' /
182

23
5X, 'the total mass of hydrogen LEAKEED = ', 1P1G11.41 mole1 ) ' '
*****
997 FORMAT ( 3(2X,1P1G11.4) )998 FORMAT ( 5(2X,1P1G11.4) )999 FORMAT ( 2(2X,1P1G11.4) )
c*****
cc
c
cc
OUTPUT FILES *****CLOSE (CLOSE (CLOSE |CLOSE 1CLOSE 1CLOSE iCLOSE iCLOSECLOSECLOSECLOSE
That'sEND
; ITH2O); ITLM)[ IPRES)[ ISYST)( IPH2)( IMH2)( IDATA1)( IDATA2)( IDATA3)( IPCOMP)( IDELTP)
all folks!
SUBROUTINE PSAT ( T,P )CC This subroutine evaluates the the saturation pressure of water,C in Bar, given the water temperature in Kelvin. This subroutine usesC a formula for the saturation line given in the ASME steam tables.C
IMPLICIT DOUBLE PRECISION ( A-H, M-Z )IMPLICIT INTEGER ( I-L )
CCOMMON / FACTOR / C(9)
Cc***** REDUCED TEMPERATURE *****
THETA = T / 647.3c***** FORMULA FACTORS *****
THETA1 = 1. - THETAC
NUMERl = 0.DO 100 I = 1, 5NUMERl = C(I) * ( THETA1 ** DBLE(I) ) + NUMERl
100 CONTINUEC
DENOM1 = 1. + C(6) * THETA1 + C(7) * THETA1 * THETA1C
DENOM2 = C(8) * THETA1 * THETA1 + C(9)c***** REDUCED PRESSURE *****
BETA = DEXP( NUMERl / ( DENOM1 * THETA ) - THETA1 / DENOM2 )
183
C***** SATURATION PRESSURE *****P = 221.2 * BETA
CC That's all folks!
RETURNEND
184
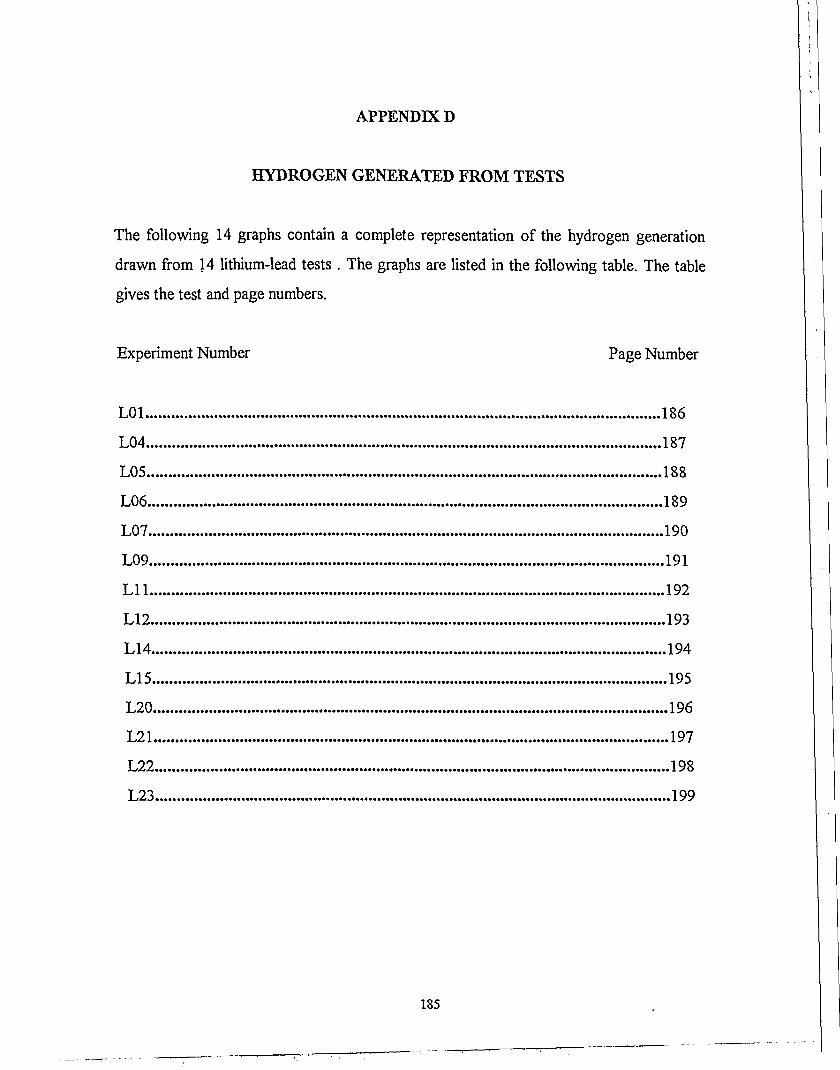
APPENDIX D
HYDROGEN GENERATED FROM TESTS
The following 14 graphs contain a complete representation of the hydrogen generation
drawn from 14 lithium-lead tests . The graphs are listed in the following table. The table
gives the test and page numbers.
Experiment Number Page Number
L01 186
L04 187
L05 188
L06 189
L07 190
L09 191
Ll l 192
L12 193
L14 194
L15 195
L20 196
L21 197
L22 198
L23 199
185

O
£
0
o
0.007
0.006-
0.005 -
0.001 -
LiPb Test (L01) T=400 (C)] M=37,5 (gm>;
15Time (sec)
30
Appendix E Figure 1 Corrected Hydrogen Generation as a Function of Time (L01)
186

0.01
LiPb Test (L04) T=350 (0), M=4e.5 (gm)
0 90 12060Time (sec)
Appendix E Figure 2 Corrected Hydrogen Generation as a Function of Time (L04)
187
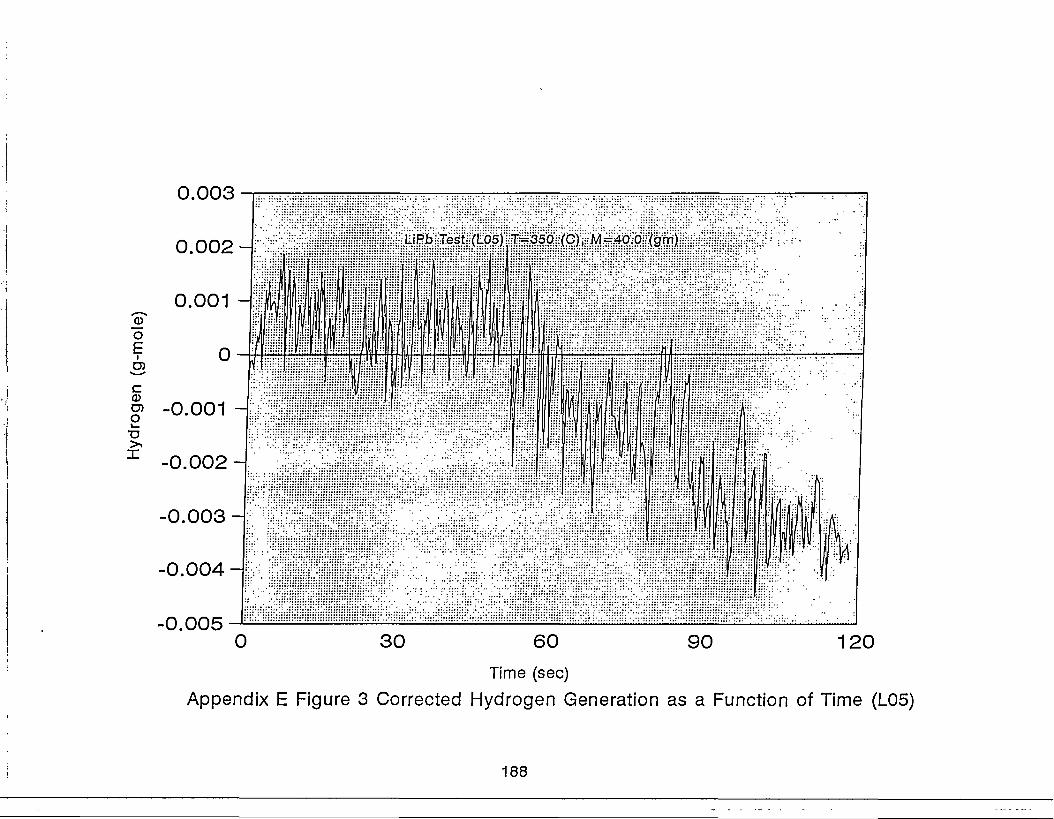
—oE6)c
g> -0.001
-0.0050
LiPb Test (L05) T=350 (C), M=40.0 (gm)
30 90 12060
Time (sec)
Appendix E Figure 3 Corrected Hydrogen Generation as a Function of Time (L05)
188
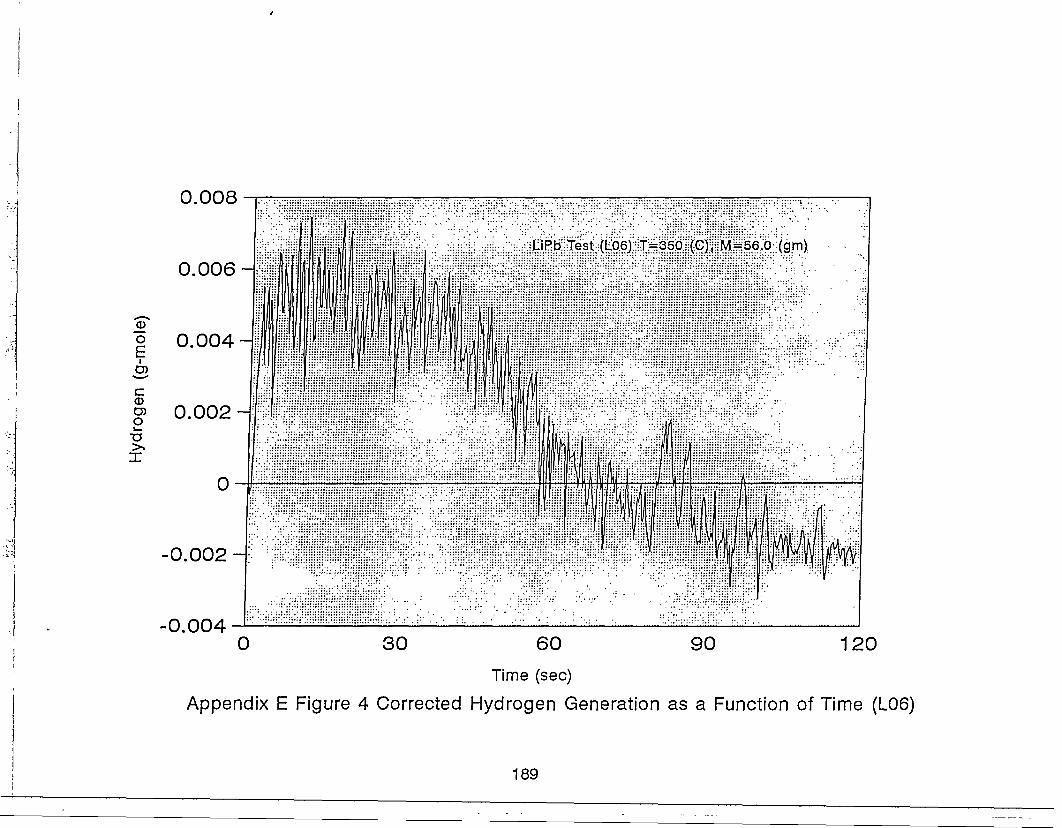
oEcCDCOO
0.008
0.006
0.004
0.002
-0.002 -
-0.004-1
LiPb Test (L.06J T=350 (C). M=56.0 (gm)
0 30 90 12060
Time (sec)
Appendix E Figure 4 Corrected Hydrogen Generation as a Function of Time (L06)
189

O
EI
3<x>oo
0.008
LiPb Test (L07> T=400 (C), M=40.0 (gm)
0.006-
0.004
0.002
00 30 60 90 120 150 180 210 240
Time (sec)
Appendix E Figure 5 Corrected Hydrogen Generation as a Function of Time (L07)
190

0.008649
O
i
3cCDO)O
0.007568-
0.006486 -
0.001081
0
UPb Test (LOS) T=400 (C), M=36.5 (gm)
30 60 90 120 150 180 210 240Time (sec)
Appendix E Figure 6 Corrected Hydrogen Generation as a Function of Time (L09)
191

0.01
oE
O•o
0.008
0.006
0.004
0.002
0
UPb Test (L11) T=600 (C), M=44<0 (gm)
0 30 60 90 120 150 180 210 240Time (sec)
Appendix E Figure 7 Corrected Hydrogen Generation as a Function of Time (L11)
192
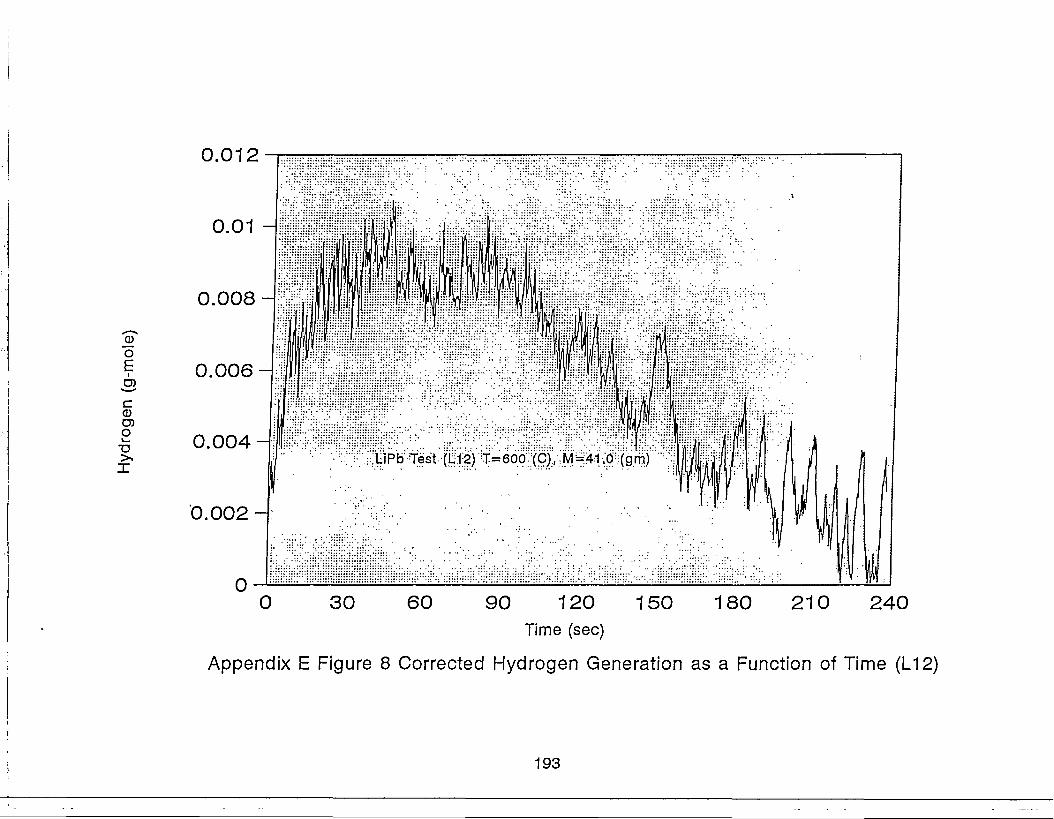
_oE3ca)o
0.012
0.01
0.008 -
0.006
0.004
0.002
LiPb Test (L12) T=600 (C), M=41.0 (gm)
0 30 60 90 120 150 180 210 240Time (sec)
Appendix E Figure 8 Corrected Hydrogen Generation as a Function of Time (L12)
193

_oEI
C
o
UPb Test (L14) T=600 (C), M=49<0 (gm)
0 30 60 90 120 150 180 210 240Time (sec)
Appendix E Figure 9 Corrected Hydrogen Generation as a Function of Time (L14)
194

O
£I
cO)
o
0.007
0.006-
LiPb Test (L15) T=350 (C), M=35.0 (gm)
120 150 180 210 240Time (sec)
Appendix E Figure 10 Corrected Hydrogen Generation as a Function of Time (L15)
195
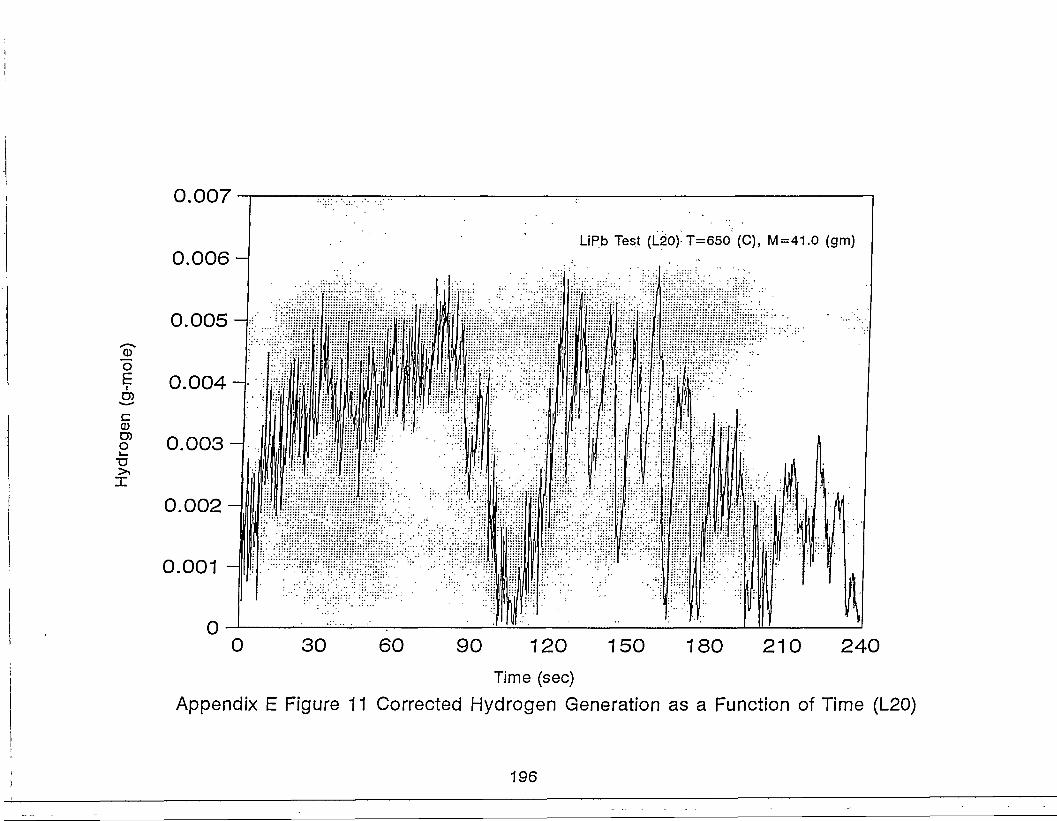
O
i
3cCDD)O
•o
LiPb Test (L^O) T=650 (C), M = 41.0 (gm)
120 150 180 210 240
Appendix E Figure 11 Corrected Hydrogen Generation as a Function of Time (L20)
196
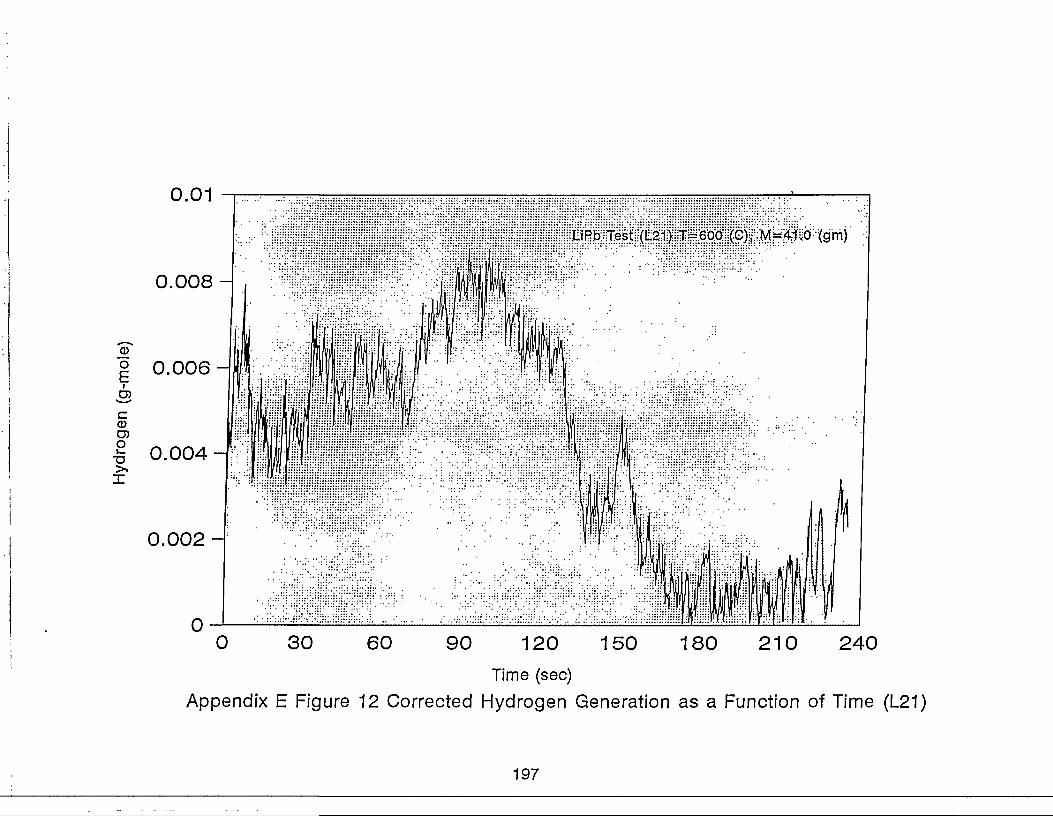
0.01
0.008-
0-1
UPJD Test (L21) T=600 (C), M=41,0 (gmj
0 30 60 90 120 150 180 210 240Time (sec)
Appendix E Figure 12 Corrected Hydrogen Generation as a Function of Time (L21)
197
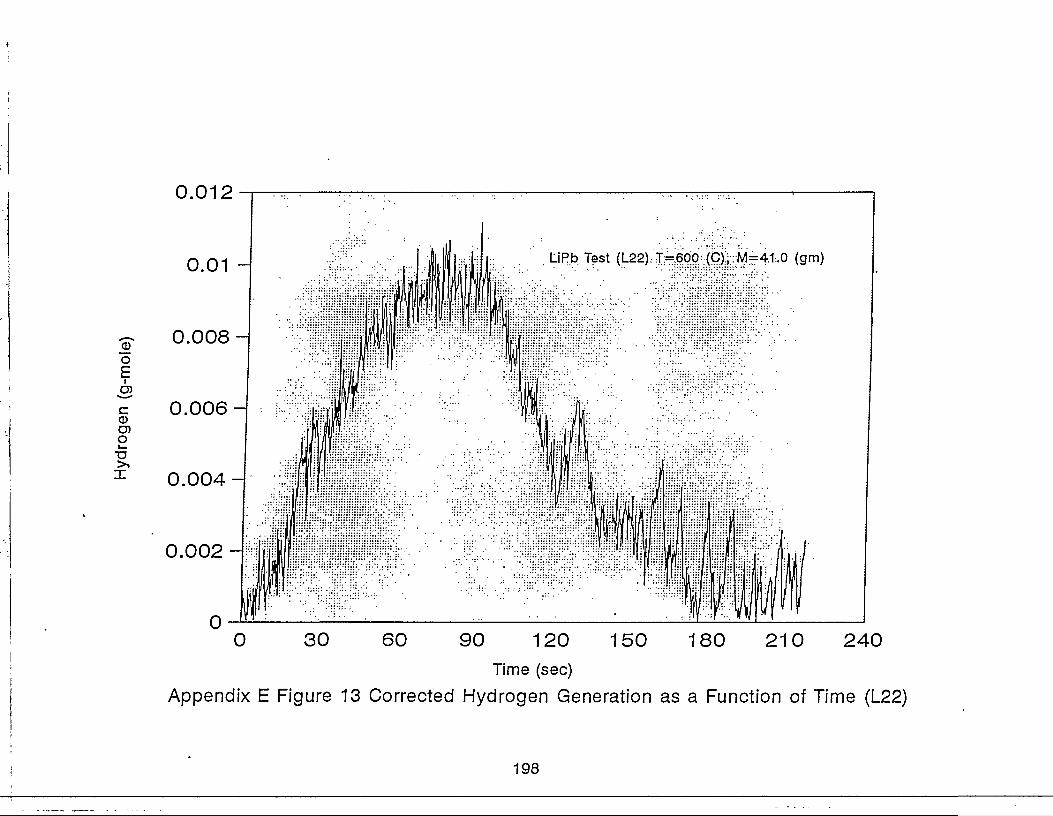
O
£t
3cQiD)O
0.012
0.01 -
0.008 -
0.006-
0.004-
0.002 -
LiPb Test (L22) T=600 (C), M=41.0 (gm)
0 30 60 90 120 150 180 210 240Time (sec)
Appendix E Figure 13 Corrected Hydrogen Generation as a Function of Time (L22)
198

O
E3D
O
0.006
0.005
0.004
0.003
0.002
0.001
0
LiPb Test (L23) T=500 (0), M=41.0 (gm)
0 30 60 90 120 150 180 210 240Time (sec)
Appendix E Figure 14 Corrected Hydrogen Generation as a Function of Time (L23)
199
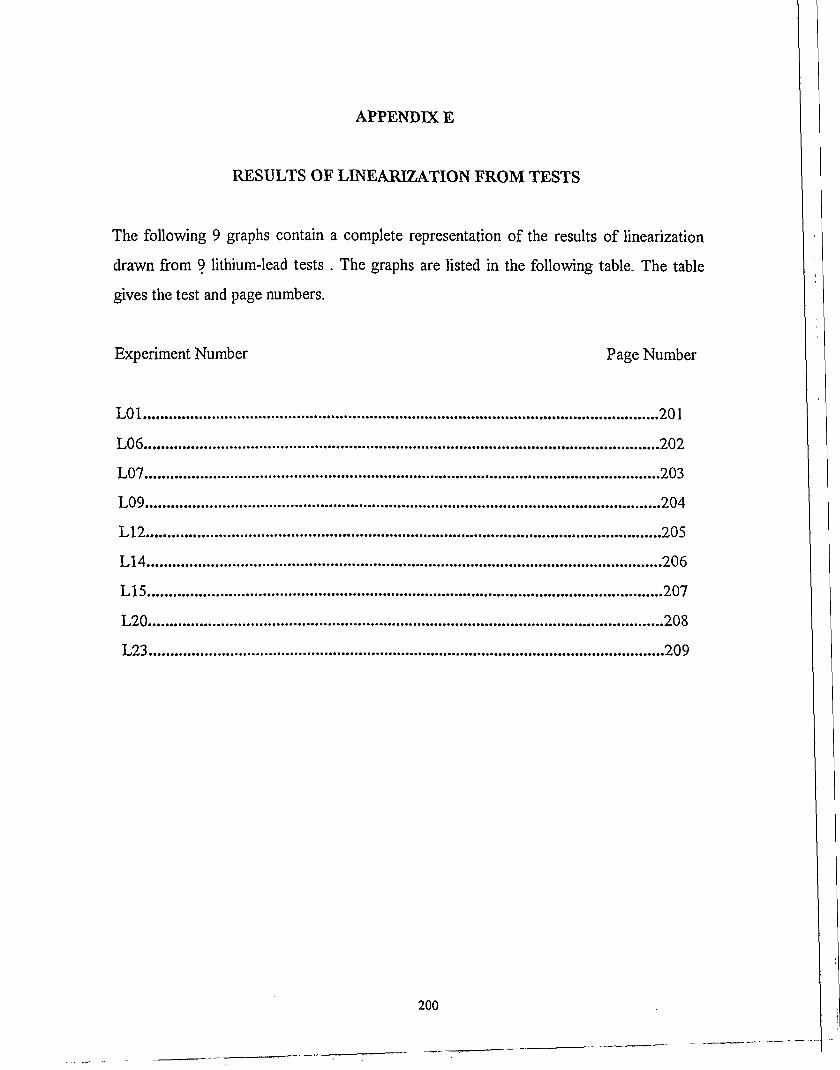
APPENDIX E
RESULTS OF LINEARIZATION FROM TESTS
The following 9 graphs contain a complete representation of the results of linearization
drawn from 9 lithium-lead tests . The graphs are listed in the following table. The table
gives the test and page numbers.
Experiment Number Page Number
L01 201
L06 202
L07 203
L09 204
L12 205
L14 206
L15 207
L20 208
L23 209
200
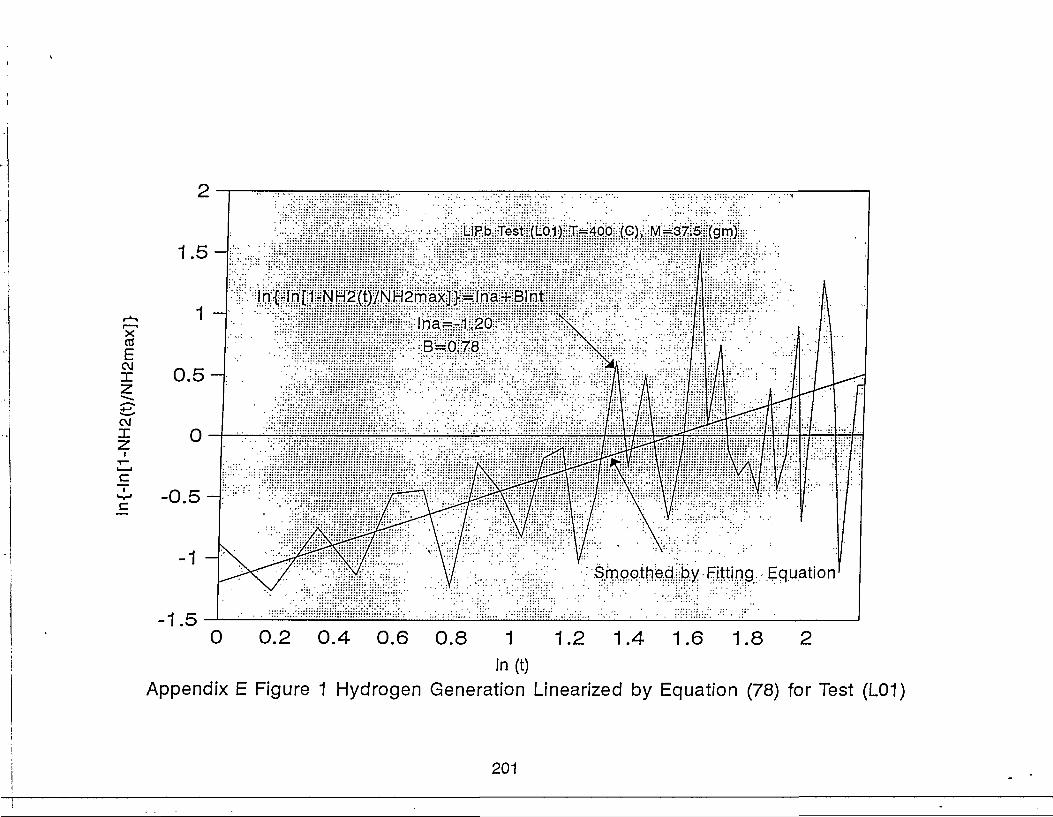
X
ECMIZ
1.5 H
1
0.5
0
LiPb Test (L01) T=400 (C), M=37.5 (gm)
In{-In[1-NH2(t)/NH2maxJ}=Ina+B!nt
Smoothed by Fitting Equation'
-1.50 0.2 0.4 0.6 0.8 1 1.2 1.4 1.6 1.8
ln(t)Appendix E Figure 1 Hydrogen Generation Linearized by Equation (78) for Test (L01)
201
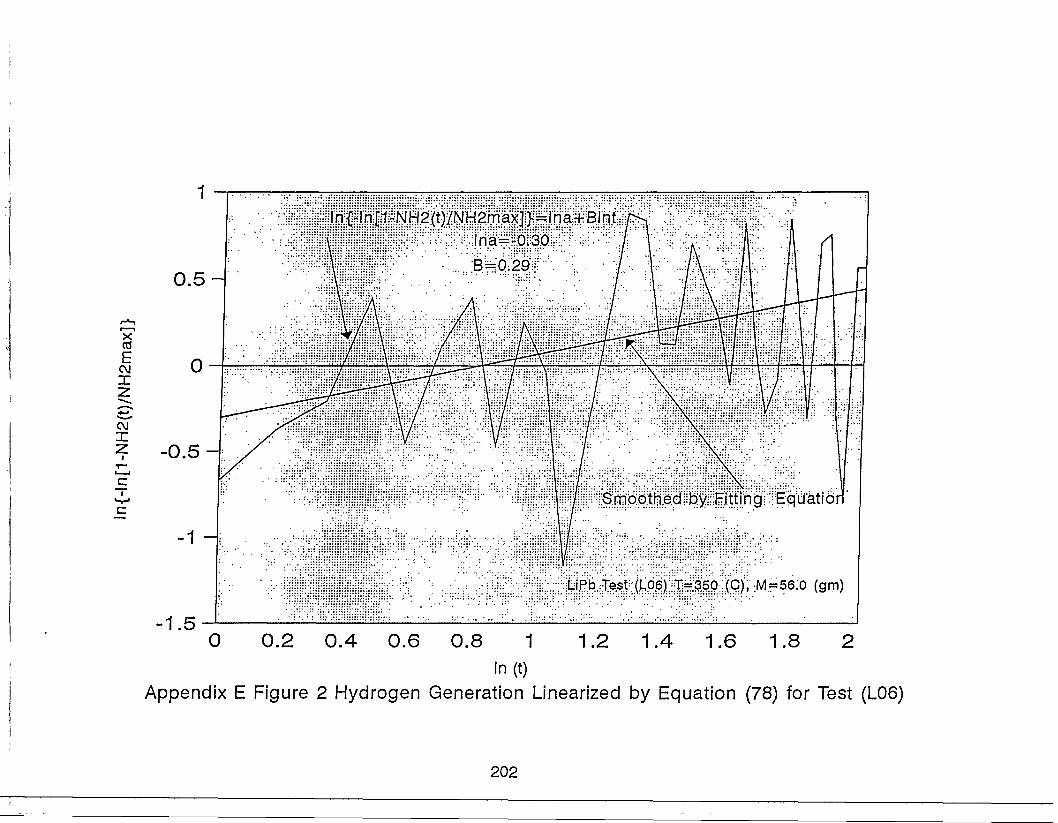
XCO
CMX2
CMX2
I
I
c
ln{-ln[1-NH2(t)/NH2max]}=lna+Blntlna=-0v30
B=0.29
Smoothed by Fitting Equatid
-0.5
-1.5
LiPb Test (L06) T=350 (C), M=56.0 (gm)
0 0.2 0.4 0.6 0.8 1 1.2 1.4 1.6 1.8ln(t)
Appendix E Figure 2 Hydrogen Generation Linearized by Equation (78) for Test (L06)
202

CMI
CVJI
2
1.5
1
0.5
0-
-0.5-
-1
-1.5
LiPb Test (L07) T=400 (C), M=40.0 (gm)
ln{-ln[1-NH2(t)/NH2max]} = lna+BInt!na=-1.0
B=0.64
Smoothed by Fitting Equation
0 0.2 0.4 0.6 0.8 1 1.2 1.4 1.6 1.8 2 2.2 2.4 2.6 2.8ln(t)
Appendix E Figure 3 Hydrogen Generation Linearized by Equation (78) for Test (L07)
203
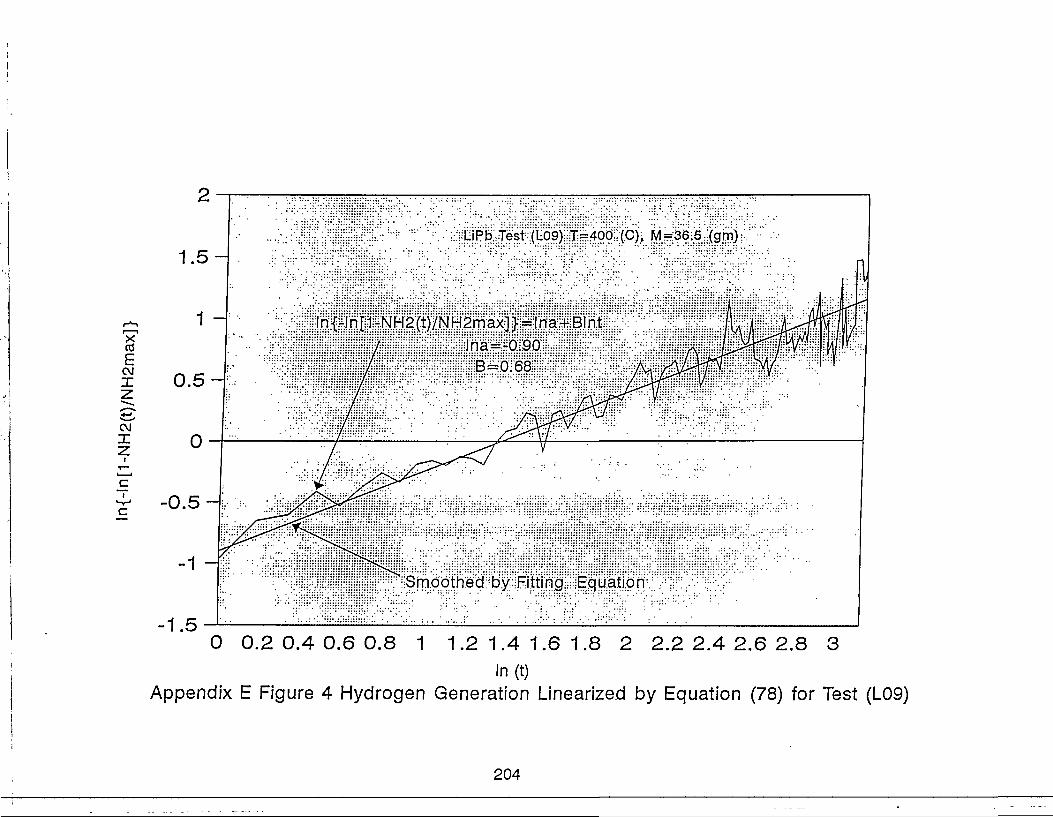
CVJX
CM
I>~rJ
C
LiPb Test (L09) T=400 (C), M=36.5 (gm)
ln{-ln[1-NH2(t)/NH2max]} = lna+Blntlna=-0.90
B=0.68
Smoothed by Fitting Equation
-1.50 0.2 0.4 0.6 0.8 1 1.21.41.61.8 2 2.22.42.62.8 3
ln(t)Appendix E Figure 4 Hydrogen Generation Linearized by Equation (78) for Test (L09)
204

X03
CMXz
CMX
I>-r-'
c
0
-1 -
-20
LiPb Test (L12) T=600 (C)> M=38.O (gm)
!n{-ln[1-NH2(t)/NH2max]}=!|na+Blntlna--1.6
Smoothed by Fitting Equation
0.5 1 1.5 2 2.5 3In (t)
Appendix E Figure 5 Hydrogen Generation Linearized by Equation (78) for Test (L12)
205

XCO
ECMIZCMXz
LiPb Test (L14) T=600 (C), M=49.0 (gm)
ln{-ln[1-NH2(t)/NH2max]} = lna+Blntlna=-1.32
B-0.56
Smoothed by Fitting Equation
-0.5
-1 -
-1.5-1
0 0.5 1 2.5 3.51.5 2In (t)
Appendix E Figure 6 Hydrogen Generation Linearized by Equation (78) for Test (L14)
206

LiPb Test (L15) T=350 (C), M=35.0 (gm)
inf!n[1-NH2(t)/NH2maxj}=lna+Blnt!na=-1.50
Smoothed by Fitting Equation
0 0.2 0.4 0.6 0.8 1 1.2 1.4 1.6 1.8 2 2.2 2.4ln(t)
Appendix E Figure 7 Hydrogen Generation Linearized by Equation (78) for Test (L15)
207

X(0
CMXz
CMX
LiPb Test (L20) T=650 (C), M=41,0 (gm)
ln{-ln[1-NH2(t)/NH2max]} =
lna--1,8
B=0.63
Smoothed by Fitting Equation
1 2.5 3.51.5 2In (t)
Appendix E Figure 8 Hydrogen Generation Linearized by Equation (78) for Test (L20)
208
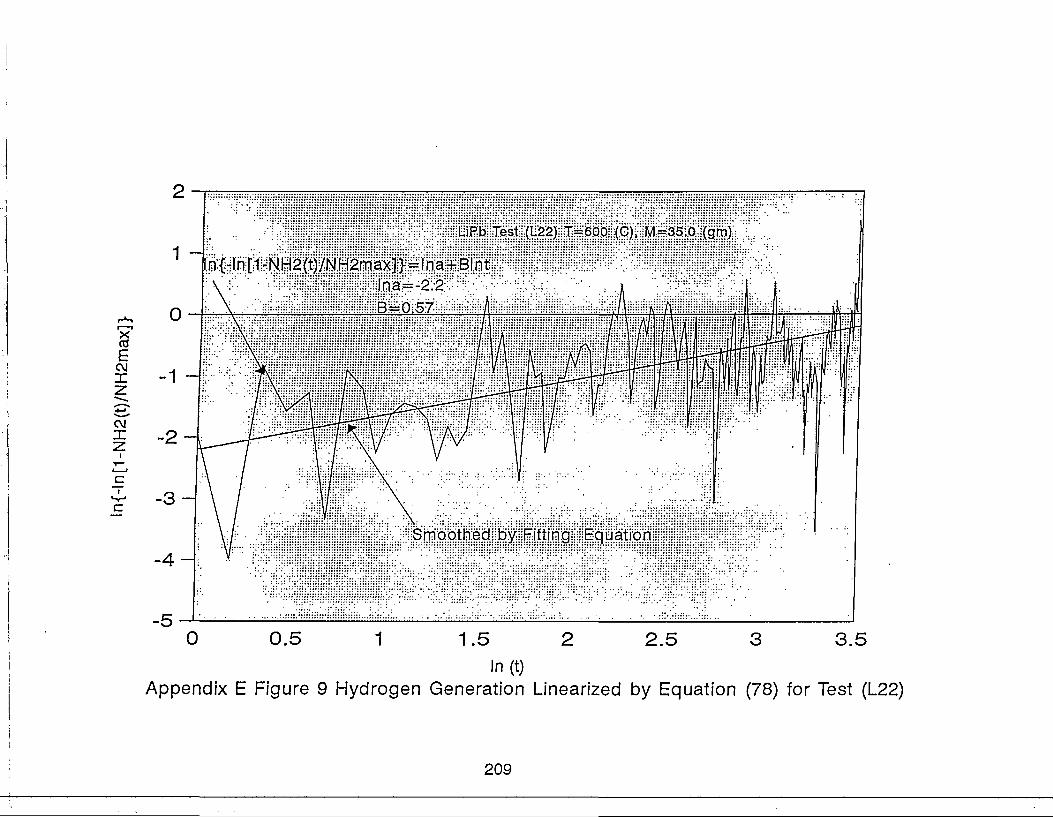
1 ~LiPb Test (L22) T=600 (C), M=35.0 (grrfl
0
n{-)nti-NH2(t)/NH2max]>=lna+B!nt\ lna=-2.2\ B=0.57
- 4 -
-5
Smoothed by Fitting Equation
0 0.5 1.5 2.5 3.5In (t)
Appendix E Figure 9 Hydrogen Generation Linearized by Equation (78) for Test (L22)
209

APPENDIX F
DETERMINATION OF THEORETICAL HYDROGEN PRESSURE
The chemical reaction equation is given by
+.11H2O -».l 7LiOH+.085H2
Here we have assumed there is enough water for the reaction to form lithium hydroxide.
Assuming the lithium-lead in the lower chamber has a depth of 1 cm, then the valveof the
metal is
= 7r*(2.54)2(l)/4
= 5.07cm3 = 5.07*10"6w3
The molecular weight of lithium lead is calculated using
=011*m.wtu
=0,17(7)+0.83(207)=173 kg
The density of lithium lead is then given by
The mass of lithium lead is then given by
= (10375.8%/m3)* (5.07)*
= 0.0526%
Mass of H2 Produced by reaction of ..0526 kg of Lii7Pb83 is given by
=0.17(0.0526)/173
210
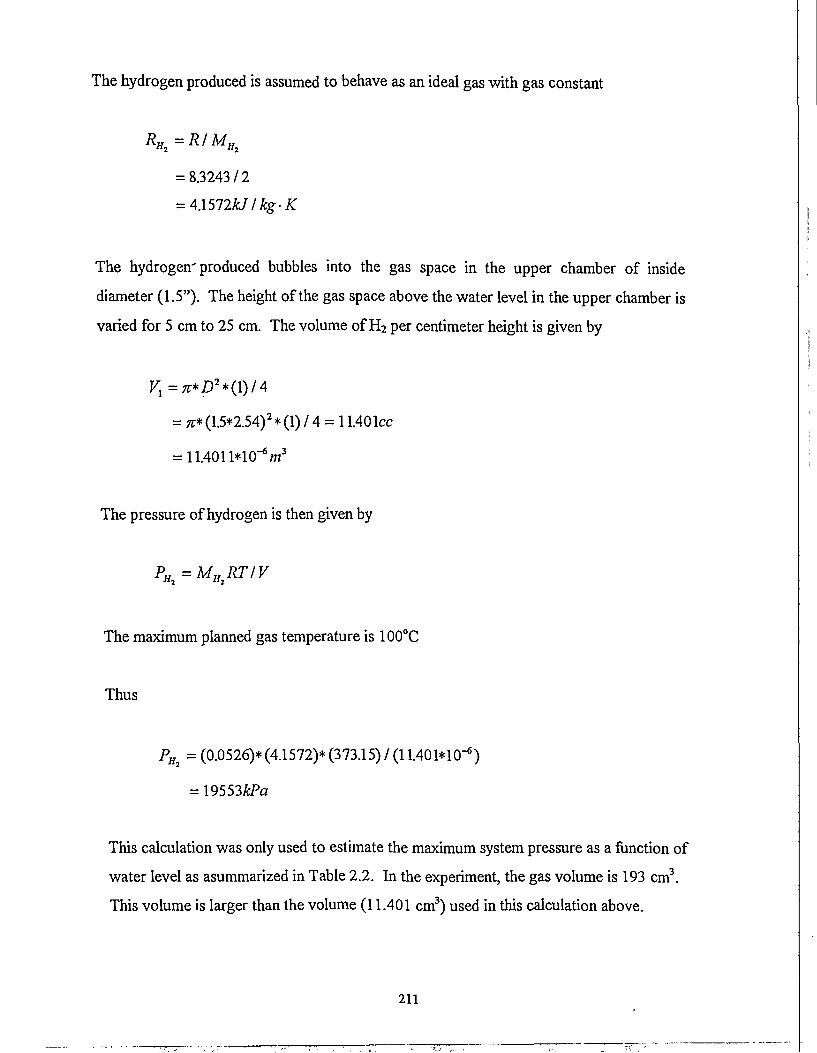
The hydrogen produced is assumed to behave as an ideal gas with gas constant
RHi=R/MHi
= 8.3243/2
= 4.\572kJ/kg-K
The hydrogen'produced bubbles into the gas space in the upper chamber of inside
diameter (1.5"). The height of the gas space above the water level in the upper chamber is
varied for 5 cm to 25 cm. The volume of H2 per centimeter height is given by
= n* (1.5*2.54)2 * (1) / 4 = 11.40 Ice
= 11.4011*1 O^w3
The pressure of hydrogen is then given by
PHl=MHRTIV
The maximum planned gas temperature is 100°C
Thus
PHi = (0.0526)*(4.1572)*(373.15)/(11.401*10-6)
=\9553kPa
This calculation was only used to estimate the maximum system pressure as a function of
water level as asummarized in Table 2.2. In the experiment, the gas volume is 193 cm3.
This volume is larger than the volume (11.401 cm3) used in this calculation above.
211