Cognition-aware Systems to Support Information Intake and ...
278
-
Upload
khangminh22 -
Category
Documents
-
view
2 -
download
0
Transcript of Cognition-aware Systems to Support Information Intake and ...


COGNITION-AWARE SYSTEMS TO SUPPORT
INFORMATION INTAKE AND LEARNING
Von der Fakultat fur Informatik, Elektrotechnik undInformationstechnik und dem Stuttgart Research Centre for
Simulation Technology (SRC SimTech) der UniversitatStuttgart zur Erlangung der Wurde eines Doktors der
Naturwissenschaften (Dr. rer. nat.) genehmigte Abhandlung
vorgelegt von
TILMAN VALENTIN DINGLERaus Wurzburg
Erstgutachter: Prof. Dr. Albrecht SchmidtZweitgutachter: Prof. Dr. Marc LangheinrichExterner Gutachter : Prof. Steve Whittaker, PhD.
Tag der mundlichen Prufung: 02.12.2016
Institut fur Visualisierung und Interaktive Systemeder Universitat Stuttgart
2016


Abstract iii
ABSTRACT
In today’s information society, knowledge is created at an ever-increasing pace.As a result, most of us face a constant pressure to consume information andacquire new knowledge. But information gain and learning require time andmental resources. While the proliferation of ubiquitous computing devices,such as smartphones, enables us to consume information anytime and anywhere,technologies are often disruptive rather than sensitive to the current user context.For example, mobile applications trigger a plethora of notifications throughout theday, which often causes interruptions and breaks users’ concentration. In addition,people exhibit different levels of concentration and cognitive capacity over thecourse of the day. During phases of low performance, the ability to concentrateis very limited, which negatively affects the effectiveness of information intake.Mobile applications do not take these variations in performance into account andoften overburden the user with information or cause boredom due to a lack ofstimulation.
In this thesis, we investigate how ubiquitous computing technologies can beused to help people deal with information intake and learning tasks throughcognitive context-awareness. By harvesting sensor and usage data from mobiledevices, we elicit people’s levels of attentiveness, receptiveness, and cognitiveperformance. We subsequently use this cognition-awareness in applications tohelp users process information more effectively. Through a series of lab studies,online surveys, and field experiments we explore and quantify users’ attention andcognitive performance during interaction with ubiquitous technologies. In ourresearch we address three types of context awareness: (1) the user’s momentarysituational context by detecting what information content the user engages with,(2) the cognitive context exhibited by the user’s momentary levels of attentivenessand engagement with technology, and (3) the user’s patterns of general alertnessand cognitive performance, which the user exhibits over the course of the day.We use these context factors to enhance systems with cognition-awareness andapply them to applications that support information intake and learning tasks.
In the course of this thesis, we develop three research probes with which weinvestigate how to build cognition- and content-aware systems. We provideempirical evidence for people being highly attentive to mobile phones, whichis why we chose smartphones as the main platform for our probes. We furtheruse context-awareness to detect moments of idleness and boredom, during whichusers engage with their mobile device to actively seek stimulation. More regularpatterns are exhibited in users’ circadian rhythms of alertness and cognitive

iv Abstract
performance, which describe systematic fluctuations because they depend on theuser’s internal body clock. We show how such chronobiological patterns can beelicited by conducting alertness tasks at different times of the day.
To validate our claim that such systems can support information intake andlearning scenarios we develop and test four other research probes showing the fea-sibility of using information about the user’s context to trigger content suggestionsduring opportune moments and adjust UIs in real-time to support reading tasks.Content suggestions in detected opportune moments (e.g., bored states) lead tohigher user acceptance and engagement than suggestions at random times. Thesuccess of these algorithms strongly depends on the content type and respectiveuser state. Hence, we present and validate a conceptual framework, which we useto create algorithms that derive and classify cognitive user states based on phoneusage patterns. Since people in high-alert states have more cognitive capacities,complex tasks can be handled more effectively. To explore direct applications ofthis hypothesis we build adaptive reading UIs that superimpose higher readingspeeds and therefore cause higher cognitive load while allowing for quicker taskcompletion time.
The tools and concepts described in this thesis allow researchers and applica-tion designers to build systems with cognition-awareness. Awareness of user’svariations in levels of attention, receptiveness, and cognitive performance allowssystems to trigger appropriate content suggestions, manage user interruptions,and adapt UIs in real-time to match tasks to the user’s cognitive capacities. Whilewe focus in our work on applications of these systems to support effective in-formation intake and processing throughout the day, our tools can prospectivelybe applied to a broad range of applications ranging from schedule alignmentaccording to the user’s internal body clock, stress prevention through sleep/wakeregulation, to recommending alertness-inducing activities.

Zusammenfassung v
ZUSAMMENFASSUNG
Die Geschwindigkeit, mit der sich Wissen vermehrt, nimmt immer mehr zu. In derheutigen Informationsgesellschaft nimmt der Druck stetig zu, dieser Entwicklungnachzukommen und sich standig neue Informationen und Wissen anzueignen.Jedoch erfordert Informationsgewinn und Lernen Zeit sowie mentale Anstrengung.Wahrend die Verbreitung von mobilen Endgeraten, wie etwa der Smartphones,es uns ermoglicht, Informationen jederzeit und uberall zu konsumieren, sind esdieselben Gerate, die uns oftmals durch Benachrichtigungen aus unserer aktuellenBeschaftigung reißen und uns somit in unserer Konzentration storen. Daruberhinaus unterliegt unsere Konzentrations- und Aufnahmefahigkeit im Tagesverlaufstarkeren Schwankungen. Solche Leistungsschwankungen werden von mobilenAnwendungen derzeit nicht mit ins Kalkul gezogen. Vielmehr wird der Benutzeroftmals mit einer Fulle von Informationen uberfordert oder im Gegenteil durcheinen Mangel von Anregung schlichtweg gelangweilt.
Die vorliegende wissenschaftliche Arbeit befasst sich mit der Nutzung vonubiquitaren Computertechnologien zur Unterstutzung von Informationsauf-nahme und Lerntatigkeiten mittels kognitivem Kontextbewusstsein. Aufgrundvon Nutzungs- und Sensorendaten von mobilen Geraten untersuchen wir dieMoglichkeit, das Aufmerksamkeits-, Aufnahmefahigkeits-, und kognitive Leis-tungsniveau des Benutzers zu erfassen. Anschließend beschaftigen wir uns mitAnwendungen, welche Nutzern helfen, Informationen effektiver zu verarbeiten.In einer Reihe von Laborstudien, Online-Umfragen und Feldversuchen erforschenwir das Aufmerksamkeitsniveau sowie die kognitive Leistungsfahigkeit von Be-nutzern wahrend sie mit ubiquitaren Computertechnologien interagieren. Dabeibeschaftigen wir uns in unserer Forschung mit drei Arten von Kontextbewusstsein:(1) dem momentanen Situationskontext des Nutzers durch Erfassung des Inhalts,mit dem sich der Benutzer auseinandersetzt, (2) dem kognitiven Kontext, gemes-sen an der Aufmerksamkeit, welche der Nutzer den Geraten schenkt, und (3)den allgemeinen Wachsamkeitsschwankungen des Nutzers uber den Tag. Mittelsdieser Kontextfaktoren sind wir in der Lage, Technologien mit Kognitionsbe-wusstsein auszustatten, welche diese wiederum nutzen konnen, um Nutzer beiInformationsaufnahme und Lerntatigkeiten zu unterstutzen.
Im Verlauf dieser Forschungsarbeit haben wir drei Prototypen entwickelt, anhandderer wir die Realisierbarkeit von kognitions- und inhaltsbewussten Geraten un-tersuchen. Wir liefern einen empirischen Beleg fur die hohe Aufmerksamkeit,die Nutzer ihren mobilen Geraten entgegenbringen. Des Weitern zeigen wir,wie wir aus der Auswertung von Kontextdaten Einsichten in Situationen gewin-

vi Zusammenfassung
nen, in denen Benutzer auf der Suche nach Anreizen zu ihren Geraten greifen.Weitaus systematischere Muster ergeben sich aus den circadianen Rhythmender Wachsamkeit und kognitiven Leistungsfahigkeit, welche die regelmaßigenFluktuationen beschreiben, die sich aus der inneren Uhr des Nutzers ergeben. Inunserer Arbeit zeigen wir auf, wie solche chronobiologischen Regelmaßigkeitendurch Vigilanztests auf mobilen Endgeraten uber den Tag verteilt gemessenwerden konnen.
Um die Anwendbarkeit solcher Systeme im Hinblick auf effektive Informations-aufnahme und Lernszenarien zu untersuchen haben wir vier weitere Prototypenentwickelt und getestet, welche dem Nutzer in geeigneten Momenten Inhalte vor-schlagen und Nutzerschnittstellen in Echtzeit so anzupassen, dass Lesetatigkeitenunterstutzt werden. Inhalte, die zu geeigneten Momenten—z.B. wenn der Nutzergelangweilt ist—vorgeschlagen wurden, fuhrten dazu, dass Nutzer diese eherannahmen und sich langer mit ihnen beschaftigen, als wenn diese zu willkurlichenZeiten vorgeschlagen wurden. Die Erfolgsrate solcher Erkennungsalgorithmenhangt stark von der Art des Inhalts und dem aktuellen Nutzerkontexts statt. Hierfurstellen wir ein konzeptionelles Rahmenwerk zur Entwicklung von Algorithmenvor, welche in der Lage sind, bestimmte kognitive Nutzerzustande anhand vonder Geratenutzung zu erkennen und vorherzusagen. Weil Menschen in Zustandenvon hoher Wachsamkeit mehr kognitive Kapazitaten aufweisen, konnen komple-xe Aufgaben effektiver abgearbeitet werden. Um direkte Anwendungen dieserHypothese zu untersuchen, haben wir eine Reihe von adaptiven, elektronischenLeseoberflachen entwickelt, welche dem Nutzer hohere Lesegeschwindigkeitenvorgeben und ihn somit kognitiv mehr fordern. Im Gegenzug wird somit dieLesezeit verkurzt.
Die in dieser Forschungsarbeit vorgestellten Werkzeuge und Konzepteermoglichen es Forschern und Systementwicklern, kognitionsbewusste Systemezu entwickeln. Kenntnisse uber die momentane kognitive Leistungsfahigkeit desNutzers befahigen solche Systeme, geeignete Inhalte vorzuschlagen, Unterbre-chungen durch Benachrichtigungen zu vermeiden, und die Komplexitat der Nut-zerschnittstelle an die aktuellen kognitiven Leistungsfahigkeiten des Nutzers an-zupassen. Wahrend sich die vorliegende Arbeit auf die Anwendung der entwickel-ten Systeme zur Verbesserung der Informationsaufnahme und -verarbeitung uberden Tagesverlauf konzentriert, konnen diese Systeme zukunftig in einer großenBandbreite von Anwendungsszenarien Einsatz finden—von Terminplanung imEinklang mit der inneren Uhr des Nutzers uber Vermeidung von Stressaufkommendurch Schlafregulation bis hin zu Empfehlungen von aktivierenden Tatigkeiten.

Acknowledgments vii
ACKNOWLEDGMENTS
The work described in this thesis was thought up, conducted and written up ina great number of different places in collaboration with an even greater numberof kindred minds. Numerous hypotheses, systems, and study designs originatedor at least benefited from countless conversations with colleagues, friends, andacquaintances, often over coffee and/or fermented beverages.
Foremost, I would like to thank Albrecht Schmidt, supervisor and superhuman, forpoaching me away from the Bay Area engineering madness and reintroducing meto the free-spirited world of academia; for always providing support and freedomto pursue this dissertation quest and having my back whenever bureaucracy struck.
I also owe gratitude to my external reviewers Marc Langheinrich—devil’s ad-vocate in the best sense—and Steve Whittaker who spontaneously cleared hisafternoon schedule for putting sense into this thesis’ story.
I would further like to thank Niels Henze, who taught me a great deal aboutacademic work-life, essential sarcasm, and whose feedback is as merciless as hissinging.
Alireza Sahami, the Persian prince who took me by the hand when my writingskill was still limited to source code and Tinder messaging.
Bastian Pfleging and Florian Alt, who made me feel welcome during my repatria-tion and both of which endured nightly tours through the streets of San Franciscoand were the first to welcome me on planet Stuttgart.
Thomas Kubitza, with whom I mounted planes and cranes, and made a decentliving off of numerous foosball opponents around the European bar scene.
Stefan Schneegass, BBQ instigator and favorite critic, who kindheartedly wel-comed me into his family.
Markus Funk—fellow cheese lover—for keeping me in touch with everythinghip.
Francisco Kiss—neighbor, colleague, dear friend—for our walks and talks, andwhisky-induced guitar sessions.
Tonja Machulla, for her sleep sacrifices, openness in discussions, and managementof her husband’s leeriness. Lewis Chuang, for his patience with me and his wife.
Yomna Abdelrahman, for keeping my blood sugars high.

viii Acknowledgments
Anja Mebus for her endless patience with a foreign specimen like me. MurielleNaud-Barthelmeß, for keeping the troops in line in the nicest of French officeregimes.
Patrick Bader, for enduring my office singing and eventually chiming in.
And all the rest of the hcilab troop who brightened my Stuttgart days: AlexandraVoit, Dominik Weber, Huy Viet Le, Jakob Karolus, Lars Lischke, Mariam Hassib,Mauro Avila, Miriam Greis, Pascal Knierim, Passant El Agroudy, Pawel Woz-niak, Romina Kettner, Rufat Rzayev, Sven Mayer, Oliver Korn, Thomas Kosch,Valentin Schwind, Katrin Wolf, Norman Pohl, and Nora Broy.
I also want to thank my external collaborators, such as the entire RECALL teamfrom the University of Lancaster, University of Essex, and the University ofLugano. Kai Kunze and Susana Sanchez, for building up the Japan connection.Martin Pielot, for inviting me to Telefonica R&D to work on anything but boringprojects and giving me a first-hand glimpse into the intricate workings of industryresearch. Dagmar Kern, for not getting tired of repeating a 70-participant study.
I was further lucky to meet and work with countless talented students. Especially,the works of Katrin Angerbauer, Johannes Knittel, and Rufat Rzayev found itsway into this thesis.
At last, but never least, I have drawn massive support from a colorful networkof extraordinary people I am lucky to call friends spanning from San Franciscoto Tarifa and Istanbul, where Tugce Tugalan—the artist of this book’s cover—resides.
And, to adequately conclude this list, I want to thank and honor the two people Iowe everything to: Gisela and Wolfgang Dingler, for unlimited love and support,patience and prudence, and some megatons of noodle salad to keep me afloat.

TABLE OF CONTENTS
List of Figures xiii
List of Tables xv
List of Acronyms xvii
I INTRODUCTION AND BACKGROUND 1
1 Introduction 31.1 Research Questions . . . . . . . . . . . . . . . . . . . . . . . . 61.2 Vision: Cognition-aware Systems . . . . . . . . . . . . . . . . 71.3 Challenges and Contribution . . . . . . . . . . . . . . . . . . . 101.4 Ethics . . . . . . . . . . . . . . . . . . . . . . . . . . . . . . . 161.5 Research Context . . . . . . . . . . . . . . . . . . . . . . . . . 181.6 Distribution of Work . . . . . . . . . . . . . . . . . . . . . . . 191.7 Thesis Outline . . . . . . . . . . . . . . . . . . . . . . . . . . . 21
2 Foundations 252.1 Ubiquitous Computing . . . . . . . . . . . . . . . . . . . . . . 252.2 Cognitive Psychology . . . . . . . . . . . . . . . . . . . . . . . 27
2.2.1 Perception . . . . . . . . . . . . . . . . . . . . . . . . 282.2.2 Memory . . . . . . . . . . . . . . . . . . . . . . . . . . 302.2.3 Cognition . . . . . . . . . . . . . . . . . . . . . . . . . 32
2.3 Learning . . . . . . . . . . . . . . . . . . . . . . . . . . . . . . 332.4 Context-Aware Computing . . . . . . . . . . . . . . . . . . . . 352.5 Cognition-Awareness . . . . . . . . . . . . . . . . . . . . . . . 372.6 Methodology . . . . . . . . . . . . . . . . . . . . . . . . . . . 44
2.6.1 Quantification and Analysis of Attention . . . . . . . . 452.6.2 Content-awareness between Devices . . . . . . . . . . . 45

x TABLE OF CONTENTS
2.6.3 Tools for Building Cognition-Aware Systems . . . . . . 462.6.4 Proof-of-Concept Applications . . . . . . . . . . . . . . 46
II ATTENTION RESEARCH 49
3 Human Attention 513.1 Related Work . . . . . . . . . . . . . . . . . . . . . . . . . . . 53
3.1.1 Attention to Devices . . . . . . . . . . . . . . . . . . . 533.2 Quantifying Attention . . . . . . . . . . . . . . . . . . . . . . . 56
3.2.1 Motivation . . . . . . . . . . . . . . . . . . . . . . . . 573.2.2 User Study . . . . . . . . . . . . . . . . . . . . . . . . 573.2.3 Phone-Usage Patterns . . . . . . . . . . . . . . . . . . 613.2.4 Discussion . . . . . . . . . . . . . . . . . . . . . . . . 633.2.5 Study Conclusion . . . . . . . . . . . . . . . . . . . . . 64
3.3 Detecting Stimulus-Seeking Moments . . . . . . . . . . . . . . 653.3.1 User Study . . . . . . . . . . . . . . . . . . . . . . . . 653.3.2 Discussion . . . . . . . . . . . . . . . . . . . . . . . . 793.3.3 Study Conclusion . . . . . . . . . . . . . . . . . . . . . 82
3.4 Chapter Summary . . . . . . . . . . . . . . . . . . . . . . . . . 83
4 Content-Awareness 874.1 Related Work . . . . . . . . . . . . . . . . . . . . . . . . . . . 894.2 Context-Aware Information Delivery . . . . . . . . . . . . . . . 91
4.2.1 Survey on Device Usage during TV Shows . . . . . . . 924.2.2 System Overview . . . . . . . . . . . . . . . . . . . . . 964.2.3 System Evaluation . . . . . . . . . . . . . . . . . . . . 1024.2.4 Discussion . . . . . . . . . . . . . . . . . . . . . . . . 1084.2.5 Study Conclusion . . . . . . . . . . . . . . . . . . . . . 111
4.3 Chapter Summary . . . . . . . . . . . . . . . . . . . . . . . . . 112
5 Cognition-Awareness 1135.1 Related Work . . . . . . . . . . . . . . . . . . . . . . . . . . . 1145.2 Eliciting the Circadian Rhythm of Alertness . . . . . . . . . . . 116
5.2.1 User Study . . . . . . . . . . . . . . . . . . . . . . . . 1185.2.2 Discussion . . . . . . . . . . . . . . . . . . . . . . . . 123

TABLE OF CONTENTS xi
5.2.3 Study Conclusion . . . . . . . . . . . . . . . . . . . . . 1245.3 A Conceptual Framework to Derive Cognitive States . . . . . . 125
5.3.1 Ground Truth Collection . . . . . . . . . . . . . . . . . 1255.3.2 Feature Extraction from Sensor Data . . . . . . . . . . . 1305.3.3 Training and Applying Prediction Models . . . . . . . . 1305.3.4 Applying the Framework: The Augmented Narrative . . 131
5.4 Chapter Summary . . . . . . . . . . . . . . . . . . . . . . . . . 133
III APPLICATIONS 135
6 Opportune Content Delivery 1376.1 Related Work . . . . . . . . . . . . . . . . . . . . . . . . . . . 1386.2 Micro-Learning Sessions Throughout the Day . . . . . . . . . . 140
6.2.1 System Design and Implementation . . . . . . . . . . . 1426.2.2 Controlled User Study . . . . . . . . . . . . . . . . . . 1456.2.3 In-the-wild Study . . . . . . . . . . . . . . . . . . . . . 1576.2.4 Discussion and Limitations . . . . . . . . . . . . . . . . 1616.2.5 Study Conclusion . . . . . . . . . . . . . . . . . . . . . 163
6.3 Using Predicted Boredom to Suggest Reading Content . . . . . 1646.4 Chapter Summary . . . . . . . . . . . . . . . . . . . . . . . . . 165
7 Adaptive Reading Interfaces 1697.1 Related Work . . . . . . . . . . . . . . . . . . . . . . . . . . . 1717.2 Reading Interfaces to Increase Reading Speed . . . . . . . . . . 176
7.2.1 Stimuli to Support Speed Reading . . . . . . . . . . . . 1767.2.2 Lab Study with Eye Tracker . . . . . . . . . . . . . . . 1787.2.3 Online Study . . . . . . . . . . . . . . . . . . . . . . . 1837.2.4 Implications . . . . . . . . . . . . . . . . . . . . . . . 1897.2.5 Study Conclusion . . . . . . . . . . . . . . . . . . . . . 190
7.3 Implicit Reading Support Through Eye Tracking . . . . . . . . 1917.3.1 Explicit and Implicit RSVP control . . . . . . . . . . . 1927.3.2 User Study . . . . . . . . . . . . . . . . . . . . . . . . 1937.3.3 Discussion and Limitations . . . . . . . . . . . . . . . . 1977.3.4 Study Conclusion . . . . . . . . . . . . . . . . . . . . . 197
7.4 Chapter Summary . . . . . . . . . . . . . . . . . . . . . . . . . 198

xii TABLE OF CONTENTS
IV CONCLUSION AND FUTURE WORK 201
8 Conclusion and Future Work 2038.1 Summary . . . . . . . . . . . . . . . . . . . . . . . . . . . . . 2038.2 Contribution and Results . . . . . . . . . . . . . . . . . . . . . 206
8.2.1 Quantification and Assessment of Users’ Attentiveness . 2068.2.2 Tools for Researching and Building Cognition-aware Sys-
tems . . . . . . . . . . . . . . . . . . . . . . . . . . . . 2078.2.3 Identification and Characterization of Opportune Mo-
ments for Content Delivery . . . . . . . . . . . . . . . . 2078.2.4 Implications for Adaptive Reading . . . . . . . . . . . . 208
8.3 Limitations . . . . . . . . . . . . . . . . . . . . . . . . . . . . 2088.4 Future Work . . . . . . . . . . . . . . . . . . . . . . . . . . . . 2108.5 Final Remarks . . . . . . . . . . . . . . . . . . . . . . . . . . . 213
V BIBLIOGRAPHY 215
Bibliography 217
Index 243
VI APPENDIX 243
Additional User Study Documents 245

LIST OF FIGURES
1.1 Contribution overview . . . . . . . . . . . . . . . . . . . . . . 13
2.1 Theoretical framework of attentional states . . . . . . . . . . . . 302.2 Memory types . . . . . . . . . . . . . . . . . . . . . . . . . . . 322.3 Circadian rhythm: general performance fluctuations . . . . . . . 44
3.1 Number of notifications per hour of the day . . . . . . . . . . . 593.2 Messages by messenger service. . . . . . . . . . . . . . . . . . 603.3 Average attentiveness by day . . . . . . . . . . . . . . . . . . . 623.4 Average attentiveness by hour . . . . . . . . . . . . . . . . . . 633.5 List of sensors permanently collected . . . . . . . . . . . . . . . 673.6 List of sensors collected when phone is unlocked . . . . . . . . 673.7 ESM probe to assess bored states . . . . . . . . . . . . . . . . . 683.8 Progress view indicating participant’s study completion status . 683.9 Histogram of ESM questionnaire responses. . . . . . . . . . . . 743.10 AUCROC performance of the RF classifier . . . . . . . . . . . 763.11 Precission-recall plot . . . . . . . . . . . . . . . . . . . . . . . 77
4.1 TVInsight app screenshots . . . . . . . . . . . . . . . . . . . . 884.2 Survey results: device types used for web searches . . . . . . . 934.3 Survey results: show types according to search categories . . . . 954.4 TVInsight server: admin view . . . . . . . . . . . . . . . . . . . 974.5 Screenshots showing Wikipedia articles and Google search results 1014.6 Study results: comprehension scores . . . . . . . . . . . . . . . 1054.7 Study results: app usage . . . . . . . . . . . . . . . . . . . . . 1064.8 Study results: subjective assessment . . . . . . . . . . . . . . . 106
5.1 Toolkit comprising of three tasks . . . . . . . . . . . . . . . . . 1175.2 PVT: performance variations . . . . . . . . . . . . . . . . . . . 1205.3 GNG: performance variations . . . . . . . . . . . . . . . . . . . 1205.4 MOT: performance variations . . . . . . . . . . . . . . . . . . . 1215.5 Conceptual framework to derive cognitive states . . . . . . . . . 1265.6 Ground truth collection through experience sampling . . . . . . 1275.7 Ground truth collection through observation . . . . . . . . . . . 1285.8 Ground truth collection through inference . . . . . . . . . . . . 1295.9 The augmented narrative: user study . . . . . . . . . . . . . . . 132

xiv LIST OF FIGURES
6.1 QuickLearn screenshots of app and interactive notifications . . . 1446.2 QuickLearn flashcards and multiple choice questions . . . . . . 1466.3 Subjective user ratings of weekly questionnaire . . . . . . . . . 1546.4 User assessments of engaging with microlearning sessions . . . 1546.5 User ratings of presentation mode . . . . . . . . . . . . . . . . 1566.6 Suggested reading content delivered through notifications . . . . 164
7.1 Kinetic stimulus: A moving line as underline effect. . . . . . . . 1777.2 RSVP: sequentially displaying words in one focal point. . . . . 1787.3 Scanpath visualization of reading freely. . . . . . . . . . . . . . 1827.4 Scanpath visualization of reading with the kinetic stimulus. . . . 1827.5 Scanpath visualization of reading with the RSVP stimulus. . . . 1837.6 Subjective feedback on reading stimuli . . . . . . . . . . . . . . 1887.7 RSVP reading with implicit eye gaze . . . . . . . . . . . . . . 1927.8 RSVP reading: study setup . . . . . . . . . . . . . . . . . . . . 195

LIST OF TABLES
1.1 Overview of research questions . . . . . . . . . . . . . . . . . . 71.2 Overview of prototypes . . . . . . . . . . . . . . . . . . . . . . 15
3.1 List of context features . . . . . . . . . . . . . . . . . . . . . . 723.2 List of usage features . . . . . . . . . . . . . . . . . . . . . . . 733.3 Feature ranking for predicting boredom . . . . . . . . . . . . . 78
5.1 Subjective user ratings . . . . . . . . . . . . . . . . . . . . . . 123
6.1 Participants’ language selections in controlled user study . . . . 1476.2 Context data collected from phone sensors . . . . . . . . . . . . 1486.3 Subjective user ratings . . . . . . . . . . . . . . . . . . . . . . 1536.4 List of elicited features related to context . . . . . . . . . . . . . 1596.5 List of elicited features related to usage . . . . . . . . . . . . . 1606.6 Feature ranking for predicting learning moments . . . . . . . . 161
7.1 System measurements for both reading conditions . . . . . . . . 196

xvi LIST OF TABLES

LIST OF ACRONYMS
ANOVA Analysis of VarianceAPI Application Programming InterfaceBCI Brain-Computer InterfaceBPM Beats per MinuteDVB-C Digital Video Broadcasting - CableEEG ElectroencephalographyECG ElectrocardiographyEDA Electrodermal ActivityEMG ElectromyographyEOG ElectrooculographyEPG Electronic Program GuideEMA Ecological Momentary AssessmentESM Experience Sampling MethodFA False AlarmfMRI Functional Magnetic Resonance ImagingfNIR Functional Near-Infrared SpectroscopyGNG Go/No-Go-TaskGSR Galvanic Skin ResponseHCI Human-Computer InteractionHRV Heart Rate VariabilityLR Logistic RegressionML Machine LearningMOT Multiple Object TrackingMOOC Massive Open Online Course

xviii LIST OF ACRONYMS
NASA-TLX NASA Task Load IndexNSF National Science FoundationPVT Psychomotoric Vigilance TaskRF Random ForestRQ Research QuestionRSVP Rapid Serial Visual PresentationRT Reaction TimeSVM Support Vector MachinesUI User InterfaceWPM Words per Minute

IINTRODUCTION AND
BACKGROUND


Chapter1Introduction
In recent decades we have undergone remarkable changes towards today’s infor-mation society. In 1981 Buckminster coined the theory of the knowledge doublingcurve: since the beginning of mankind the speed at which information doubleshas been getting increasingly faster [105]. From the invention of writing and thenof printing all the way to the advent of the World Wide Web, this development hasbeen accelerating.
The transition into a knowledge society requires us to effectively deal withthis information growth and constantly advance our learning. But acquiringnew knowledge, skills, and practices requires significant investments in timeand mental resources. People develop their innate strategies for taking in andprocessing new information: while self-driven learners, for example, cope verywell with learning tasks on their own, others prefer a more structured approachthrough regular courses and dedicated learning sessions. Information intakeand knowledge acquisition is a highly personal process, there is no one-size fitsall approach: people exhibit differences in aptitude, interest, and backgroundknowledge, which requires learning processes to become more customized to theindividual.
The National Academy of Engineering lists “Advance Personalized Learning” asone of 14 grand challenges for engineering in the 21st Century1. Current effortsto take into account individual learning styles make use of computer-supported
1 http://www.engineeringchallenges.org/

4 1 Introduction
instructions, often in the classroom or via the Web. An increasing supply oflearning platforms is available online, such as self-directed learning throughsoftware, web-based resources, and Massive Open Online Courses (MOOCs).Learning platforms adjust curricula to the individual’s needs and learning state:knowledge management systems, such as kahnacademy.org allow learners tokeep track of their progress and facilitate the interaction between learners andinstructors. Based on the personal learning history such platforms also employrecommender systems to suggest relevant learning content. Personalized learninghas attracted research, philanthropic, and commercial interest. According to areport from EdTechXGlobal and IBIS Capital, the global education technologymarket will grow 17% per year to 252bn USD by 20202, which further sparks thenumber of emanating online offerings.
Meanwhile, information has become more accessible through the proliferationof ubiquitous computing devices, such as laptops, phones, tablets, watches, andsmart eye-wear. Two Billion consumers have smartphones3 and wearable devicesare increasingly being commercialized, including wristbands, smart garments,watches and other fitness monitors: in 2016, 274.6 million wearable electronicdevices will presumably be sold worldwide, which constitutes an 18.4% growthrate compared to 2015 [139]. Mobile devices possess rich multimedia output capa-bilities and make information available to their users anytime, anywhere. Hence,information can be consumed and learning sessions can take place throughout theday even while people are on-the-go. Mobile applications have become popularfor reading (e.g., Kindle app), following the news (e.g., Feedly), and also aslearning tools for language vocabulary (e.g., Duolingo), digital flashcards (e.g.,Anki), and taking online courses (e.g., Udemy).
However, while these tools are being constantly available, users find themselveshighly receptive at some times during the day and unable to concentrate at othertimes. People exhibit different attentional phases throughout the day varyingbetween focused states, in which cognitive activities can be performed withease, and rather inattentive states, during which perception is constricted andcognitive processes run slower. While systems that assess users’ cognitive statesexist, for example, in automobiles where eye movements are tracked to monitordriver’s fatigue levels, they are limited to specific application scenarios. Mobileapplications on consumer devices do not take into account the user’s differentattentional phases and current cognitive context, thus either rely on explicit user
2 http://techcitynews.com/2016/05/26/report-edtech-spend-will-reach-252bn-2020/
3 http://www.emarketer.com/Article/2-Billion-Consumers-Worldwide-Smartphones-by-2016/1011694
5
action (e.g., waiting for the user to launch the app), or trigger reminders regardlessof the cognitive state the user is in, hence often causing interruptions. Similarly,interfaces on such devices do not automatically adapt to the cognitive capacitiesavailable and rather require users to explicitly customize the interface.
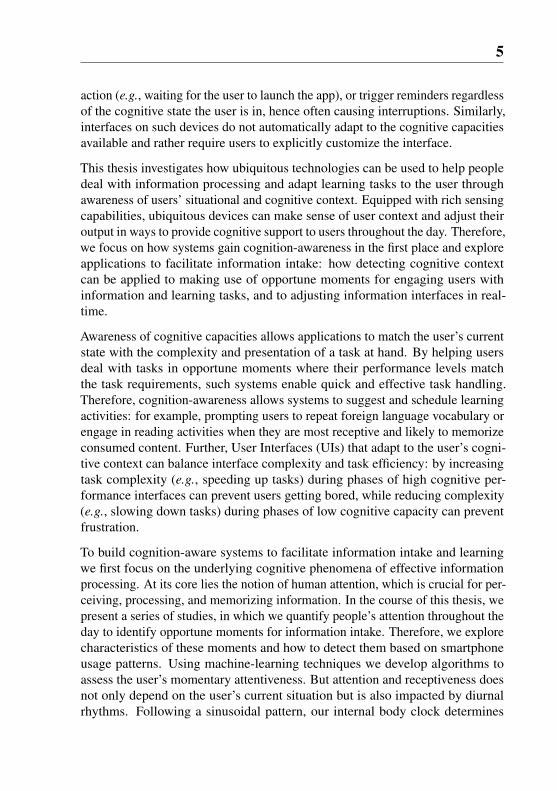
This thesis investigates how ubiquitous technologies can be used to help peopledeal with information processing and adapt learning tasks to the user throughawareness of users’ situational and cognitive context. Equipped with rich sensingcapabilities, ubiquitous devices can make sense of user context and adjust theiroutput in ways to provide cognitive support to users throughout the day. Therefore,we focus on how systems gain cognition-awareness in the first place and exploreapplications to facilitate information intake: how detecting cognitive contextcan be applied to making use of opportune moments for engaging users withinformation and learning tasks, and to adjusting information interfaces in real-time.
Awareness of cognitive capacities allows applications to match the user’s currentstate with the complexity and presentation of a task at hand. By helping usersdeal with tasks in opportune moments where their performance levels matchthe task requirements, such systems enable quick and effective task handling.Therefore, cognition-awareness allows systems to suggest and schedule learningactivities: for example, prompting users to repeat foreign language vocabulary orengage in reading activities when they are most receptive and likely to memorizeconsumed content. Further, User Interfaces (UIs) that adapt to the user’s cogni-tive context can balance interface complexity and task efficiency: by increasingtask complexity (e.g., speeding up tasks) during phases of high cognitive per-formance interfaces can prevent users getting bored, while reducing complexity(e.g., slowing down tasks) during phases of low cognitive capacity can preventfrustration.
To build cognition-aware systems to facilitate information intake and learningwe first focus on the underlying cognitive phenomena of effective informationprocessing. At its core lies the notion of human attention, which is crucial for per-ceiving, processing, and memorizing information. In the course of this thesis, wepresent a series of studies, in which we quantify people’s attention throughout theday to identify opportune moments for information intake. Therefore, we explorecharacteristics of these moments and how to detect them based on smartphoneusage patterns. Using machine-learning techniques we develop algorithms toassess the user’s momentary attentiveness. But attention and receptiveness doesnot only depend on the user’s current situation but is also impacted by diurnalrhythms. Following a sinusoidal pattern, our internal body clock determines
6 1 Introduction
hours of the day when we experience a particularly low or particularly strongsleep drive, which has a direct impact on our ability to focus. Hence, the secondaspect of cognition-aware systems is the detection of general patterns across theday—the so-called circadian rhythm of alertness and cognitive performance.
In the course of this research, we develop tools that can be used and applied byresearchers and system engineers to develop technologies capable of detectingusers’ cognitive context. Therefore, we create algorithms for detecting currentlevels of attentiveness and general patterns of alertness. We present cognition-awareness as an additional variable of context-aware computing. Further, wedevelop and test direct applications for such systems: the concepts and implemen-tations presented in this thesis enable users to engage with learning and readingactivities in opportune moments. We further explore dynamic reading interfaceswhose mental demand on the user can be adjusted by balancing reading speed,cognitive load, and comprehension. Thus, cognition-aware systems can suggestusers different reading modes according to different cognitive states. By adjustingwhen to engage users and how to present information processing tasks accordingto cognitive capacities, such systems customize information intake and learningon a deeply personal level.
1.1 Research Questions
To investigate the use of ubiquitous technologies to facilitate information intakeand learning three main aspects need to be considered, namely the user, the usercontext, and the application. Table 1.1 lists the corresponding research questions,which have driven the research presented in this thesis.
Attention is a crucial factor for effective information intake and digestion. There-fore, we first focus on human attention in a technology context and how it can bequantified across the day (Research Question (RQ)1). With the goal of identifyingopportune moments for information intake, we investigate the kind of states, inwhich users turn to their devices to seek stimulation. Here, we focus on the notionof boredom in a mobile context and whether such states can be detected based onphone usage patterns (RQ2).
Awareness of user states and intentions is a context dimension we further explorefrom two perspectives: first, we look at the current content the user engages withand how awareness of it can be used in multi-device environments to facilitateinformation intake and enrich the user experience (RQ3). The second context

1.2 Vision: Cognition-aware Systems 7
RQ Research Question ChapterHuman Attention
RQ1 How can users’ attentiveness be quantified across the day and reliably predicted from phone usage patterns? 3RQ2 Does boredom measurably affect phone usage and which usage characteristics are most prevalent during such states? 3
Context AwarenessRQ3 How can awareness of the content which the user is currently exposed to be used to augment the user experience? 4RQ4 How can technology be used to elicit the user’s circadian rhythm of alertness and cognitive performance? 5
ApplicationsRQ5 How can opportune moments for content delivery be used to foster information intake and learning? 6RQ6 How can reading UIs be adjusted in real-time to decrease or increase information bandwidth? 7
Table 1.1: Overview of research questions that build the base of this thesis.
dimension we look at is the user’s variations of diurnal alertness patterns acrossthe day. Depending on sleep routines and an innate bio-rhythm people exhibitchanging phases of high and low phases of alertness. Awareness of these phasescan inform technologies when to expect receptive user states and feed informa-tion accordingly. Hence, we investigate ways to elicit these diurnal changes ofalertness, also called circadian rhythms (RQ4). The combination of predictedattention levels based on device usage patterns and the knowledge of user’s circa-dian rhythms of cognitive performance adds cognition-awareness as an additionallayer to context-aware systems.
In the final part of this thesis, we focus on the application layer. Consideringcognition awareness as viable context dimension when users engage with tech-nology and in information consumption, we focus on the type of adjustmentstechnologies can undergo based on such awareness. First, we investigate howopportune moments for technology-triggered content delivery can help to suggestdifferent types of content (RQ5). Here, we focus on a language learning scenarioand information intake through reading. Since reading is the most predominantway of acquiring information on mobile devices, we further look at how UIscan dynamically adjust to the attentional and cognitive state of the user (RQ6).Besides studying different ways of adjusting information bandwidth while readingwe focus on providing user controls beyond mere cognition awareness. Here, weinvestigate implicit mechanisms to control the reading flow of a reading techniquecalled Rapid Serial Visual Presentation (RSVP).
1.2 Vision: Cognition-aware Systems
Education and continued learning are now more important than ever while weface challenges, such as moving towards a knowledge society, changing work

8 1 Introduction
environments, globalization, and the need for mutual tolerance and understanding.Meanwhile, technology is becoming more intertwined with our lives as devices,clothes, our environment and even our bodies become more and more equippedwith it. In the work presented here, we investigate how ubiquitous technologiescan be used to help people cope with the information growth and advance per-sonalized learning. We believe that such technologies can help people meet therising demands of our knowledge society, in which constant learning is crucial.In the following, we map out our vision of cognition-aware systems and how theycan facilitate information intake and learning throughout the day.
Technology’s ultimate goal is to support its users. The more a device knows aboutits user in terms of physical as well as psychological constraints and capabilities,the better it can provide assistance. A fully integrated device environment knowswhen to approach the user and how to do that in order to help users consume,process, and memorize information. It starts by detecting user states and iden-tifying opportune moments (the when) for technologies to actively approachusers and suggest different types of content (the what). The next step takesinto consideration the current device environment, its capabilities and displayparameters and adjusts the presentation of content so that it optimally fits theuser’s current physical and cognitive context (the how). An integrated systemkeeps track of information encountered and processed. This knowledge can helpadjust the presentation of new information items to build associations betweenrelated information. Then, repetition sessions can be scheduled in accordancewith learning theories to commit that information to long-term memory.
A holistically aware system, therefore, needs information on the user’s knowledgebackground, preferences, pending tasks, and cognitive states (across time), butalso about the environment (devices nearby) and the world (relevant information).It further provides mechanisms that allow users to customize the system and makemanual adjustments. The idea behind context-aware computing is to support usersin-situ according to their current situation. Cognition-aware systems focus on theuser’s mental state and current information processing capabilities to complementthis trend towards a holistic context awareness. Systems that know about highand low attention phases throughout the day are able to support and enhancecognition and human memory in multiple ways:
Task Scheduling
Knowledge about the user’s diurnal attention rhythms can inform systems toschedule tasks respectively across the day. By analyzing tasks and their cognitiverequirements they can be matched with the user’s attention phases. Matching is

1.2 Vision: Cognition-aware Systems 9
done with the goal of increasing the overall productivity of the user: complextasks are met with phases of higher concentration and can, therefore, be masteredmore effectively or in shorter amount of time; phases of lower concentration,on the other hand, can still be useful to perform daily chores, such as groceryshopping or answering routine emails, without wasting precious performancecapacity. Keeping task requirements and available cognitive capacities in balancecan help reduce boredom (in case of high capacity and low task demand) andfrustration (low capacity and high demand). Further, smart scheduling of taskscan help users to experience so-called flow states in a systematic way. Such flowstates have been described by Csikszentmihalyi [52] as situations in which theuser is fully immersed in the task at hand.
UI Adaption
Knowing about the user’s current cognitive capacity can further influence thepresentation of a task. The higher the user’s attention the more complexity couldbe displayed to allow a more efficient completion of the task. Reading activities,for example, can be sped up according to the user’s ability to concentrate whilemaking compromises on comprehension levels. A reading UI that adapts to thecurrent capacity to absorb information could allow users to effectively take in,process, and retain more information in a shorter amount of time. On the otherhand, an adaptive UI could also hide functionality during a design task when theuser is detected to be tired. In such a state decreased UI complexity could helpthe user focus on the task at hand.
Disruption Management
Cognition-aware systems could be further used to manage external interruptionsby keeping a tab on the user’s current state and the importance of incomingnotifications or alerts. In moments of high focus or task immersion notifications,incoming phone calls and other disruptions can be effectively delayed to moreopportune moments to not disturb the user’s flow. This can be beneficial for tasksthat need an uninterrupted string of thoughts, but also for situations, in whichinterruptions through technology are merely inappropriate, for example whenimmersed in a conversation with a friend or loved one. Distractions could furtherbe proactively prevented by blocking access to potentially distracting websites orapplications to protect periods of high focus.

10 1 Introduction
Self-Awareness
Self-awareness is the first step towards self-improvement. By eliciting diurnalattention patterns users can become aware of their own productive phases andhence make more informed decisions about their own task scheduling. Forinstance, when it comes to deciding when to schedule a reading session or whento deal with daily chores, such as doing laundry. Awareness of the potential lackof synchronicity between timetables and optimal cognitive performance can helpusers avoid frustration. Kreitzman and Foster [163] showed that working out ofsync with our individual circadian rhythms of performance can even be harmfulwith negative long-term consequences for our health and well-being.
Personal Assistance
Cognition-aware systems become truly personal assistants, which learn aboutusers’ patterns and schedule their days in their best interests. Such assistants,therefore, become the connective tissue between user, devices and the worldaround. High profile characters, such as top managers or head of states oftenhave access to an entire staff that focuses on managing their daily routines andstructuring their day as effective as possible. The resulting daily agenda entailsappointments and completion of tasks, but also sleep, nutrition, workout routine,information consumption, and other daily chores. By enabling technology to learnabout the habits, activities, and cognitive states of an individual user, we can buildsystems that go beyond simple context-aware applications. Cognition-awarenessallows us to build mobile personal assistants that accompany users throughouttheir day, detect their cognitive states and structure their task lists in a way so thateach task is matched by the optimal user state. Such systems have the potentialto help users be more effective at their tasks, increase their overall productivity,happiness (through reduced levels of frustration), and eventual well-being.
1.3 Challenges and Contribution
The life of today’s information workers requires people to keep up with anabundance of information on a daily basis. Meanwhile, our knowledge societydemands us to employ a habit of constant learning. While our time and resourcesare generally limited we need to look for ways to efficiently acquire new knowl-edge, skills, and practices. With the ubiquity of mobile devices, learning cantake place on-the-go—anytime and anywhere. Hence, we tackle the question

1.3 Challenges and Contribution 11
of how technology can help us in dealing with effective information intake andlearning throughout the day. In the course of this thesis we focus on three majorchallenges:
1. Technologies—even though becoming increasingly context-aware—dorarely consider users’ attention levels, receptiveness or cognitive capacities,all of which can change significantly across the day. The circadian rhythmof alertness and performance exhibits phases, in which people are moreconcentrated and can, therefore, be more productive than during othertimes of the day. However, technology does not take this into account andopportunities for effective knowledge transfer are missed. Instead, whilebeing unaware of potentially productive states, people often spend idlemoments looking for stimulation by aimlessly hopping between apps andservices. The challenge is how technology can extract diurnal user patternsand therefore gain awareness of circadian rhythms of attention in order topredict productive phases.
2. Reminders and alerts often do not consider the user’s current context. De-spite an existing body of research in delaying notifications, little of thesealgorithms have made it into consumer-level products. Hence, technologyoften exhibits a distracting nature where users are at risk of getting inter-rupted in their task flow or where they neglect their social environment.There is a clear dichotomy between the near-constant availability of andthrough mobile devices and the imminent disruptions that come with thisdevice ubiquity. Disruptions have been shown to have negative effects onproductivity [180], which raises the challenge of detecting and utilizingopportune moments for content delivery.
3. Little research has been conducted on how to increase or decrease infor-mation bandwidth according to users’ available cognitive capacities. Forinstance, in phases of high concentration, more information can be pro-cessed effectively, which in turn can lead to quicker task completion. Inlow concentration phases, on the other hand, decreased complexity canprevent frustration. Current UIs do rarely accommodate for adapting UIcomplexity to accommodate different cognitive states. Users have littlemeans to adjust interfaces to their cognitive capacities in order to get tasksdone more efficiently. Hence, the challenge lies in identifying possible UIadjustments as well as designing and developing effective user controls.
In this thesis, we tackle these challenges by bringing together theories fromthe field of cognitive psychology with technological capabilities. By applying

12 1 Introduction
memory and learning theories, utilizing ubiquitous sensing, near-constant deviceavailability and adjustable output capabilities we set out with the goal of:
1. Quantifying human attention and identifying cognitive performance pat-terns in a technological context to enhancing context-aware systems byadding a cognitive dimension.
2. Identifying opportune moments for content delivery and providing contentthat is relevant to the user’s context.
3. Creating adjustable information interfaces for users’ varying cognitivecapacities to absorb information more effectively and increase overall userproductivity.
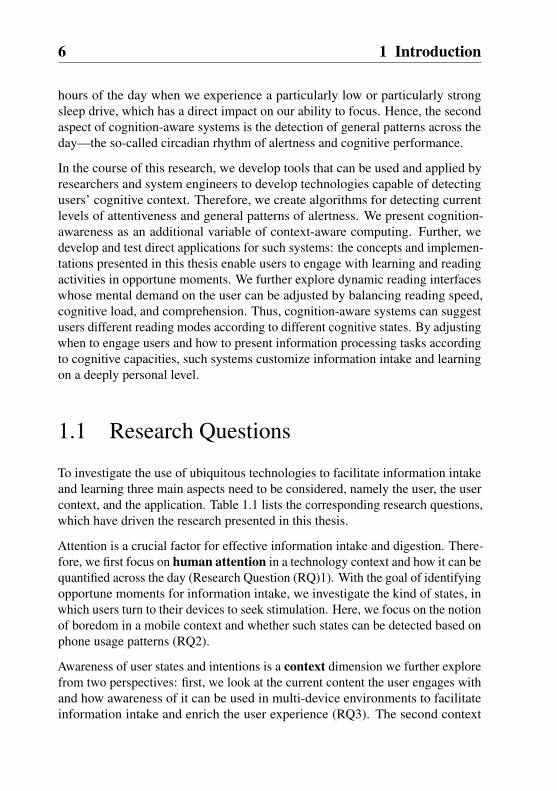
Our work focuses on the application layer and has its roots in the field of human-computer interaction (Human-Computer Interaction (HCI)), cognitive psychologyand algorithms (Machine Learning (ML)). Therefore, we take a human-centeredresearch approach by conducting formative studies, lab, and field experiments.In the course of this thesis, we present a series of user studies that allowed us tocollect meaningful feedback from users, as well as develop and test algorithmsand prototypes. Table 1.2 gives a summary of the prototypes created in the courseof this thesis. Towards achieving the aforementioned goals our experimentalapproach yields the following contribution, an overview of which is depicted inFigure 1.1:
(a) Quantification and Assessment of Users’ Attentiveness
In a field study, we collected ground truth for quantifying people’s attentivenessand receptiveness to interruptions. By applying a machine learning model topredict users’ attentiveness throughout the day we found that people are highlyattentive to messaging for most of their waking hours [79]. While phases ofinattentiveness only last for a few minutes, delay strategies for notifications oralerts are applicable without much risk of missing timely information. Therefore,alerts are often not required to regain user attention. In idle moments peopletend to turn to their phones seeking stimulation, hence we developed a detectionalgorithm to identify and predict these moments [214]. We used experiencesampling to identify times during the day, in which people are generally bored.We analyzed corresponding phone usage patterns and found features, such asthe recency of communication, usage intensity, time of day, and demographicinformation to be prominent indicators for bored vs. non-bored user states.

1.3 Challenges and Contribution 13
Attention
Context
Cognition-aware System
Framework
Context- & Cognition Detection Applications
Opportune Content Delivery
Tools
Attentiveness &
Boredom
UI Adjustments
Content Awareness
6 8 10 12 14 16 18 20 22 24
Hours
340
360
380
400
420
440
460
Re
ac
tio
n t
ime
in
ms
Psychomotor Vigilance Task (PVT) Circadian Rhythm
Alertness Toolkit
Figure 1.1: Contribution overview: research in human attention and context-aware systems build the bases for the creation of tools for cognition-awaresystems and applications.
Awareness of attentional states can be used for benign interventions, such astriggering content recommendations in form of reading or learning materials.
(b) Tools for Researching and Building Cognition-aware Systems
In-situ attention detection is helpful for delaying interruptions. However, in orderto effectively schedule tasks, technologies need to gain a more holistic awarenessof attentional patterns across the day. Therefore, we look into circadian rhythmsof alertness and performance and adopt a series of assessment tasks for beingcompleted on a mobile platform. We validate these tasks in a user study andshow how they can be used to extract a general model of the circadian rhythm ofalertness [85]. We release a mobile toolkit for eliciting that rhythm as an opensource library for HCI and psychology researchers for future work on buildingcognition-aware systems. We further present a framework for correlating tech-nology usage patterns to cognitive states in three steps: ground truth collection,

14 1 Introduction
feature extraction, and model training [68]. In subsequent studies, we validate theapproach to identify opportune moments for learning tasks and reading activities.
(c) Identification and Characterization of Opportune Moments forContent Delivery
Based on user context we set out to investigate opportune moments for informationintake and so-called microlearning tasks. Therefore, we look at language learningthroughout the day while people are on-the-go [87]. Being in transit and duringidle moments, reviewing foreign language vocabulary is well received and showsthe feasibility of scheduling learning tasks throughout the day without requiringusers to dedicate big chunks of time. We further apply our boredom detectionalgorithm to suggest reading content in opportune moments leading to morearticles being clicked and more time spent reading in states of boredom [214].
(d) Implications for Adaptive Reading
Phases of high concentration can be taken advantage of by either working onmore complex tasks or by tackling a task in a more efficient way. The higher theuser’s cognitive capacity, the more demanding a UI can be designed with the goalof increasing task efficiency and prevent boredom. Since reading is a primarychannel for information intake, we present a series of studies, in which we look atadaptive reading UIs. Therefore, we adapt speed reading techniques for electronicreading devices and assess the feasibility of actively guiding the user throughtext. Besides the established method of RSVP we introduce a kinetic stimulusthat effectively increases user’s reading speed while raising cognitive load andmaking compromises on text comprehension [86]. We show that increasing thereader’s information bandwidth in this way helps users to get through text fasterat moderate comprehension levels. Because a thorough understanding of a text isnot always essential, especially when it comes to the different types of readings,such techniques can be used to sift through information effectively and dealwith the daily reading load. To enable users to control reading flow in dynamicreading UIs we investigate implicit interaction through eye gaze. We show thatsuch reading support helps readers increase text comprehension as compared toexplicit touch controls [80].

1.3 Challenges and Contribution 15
Prototype Description Chapter
Borapp is an Android app we released on Google Play.The app records phone usage data and triggers ESMsurveys throughout the day, through which we collectground truth on users’ receptiveness towards mobilemessaging and self-assessed boredom states.
3
The Windows Phone app TVInsight proactively dis-plays relevant content in sync with the current TVprogram. By linking and retrieving additional con-tent from Wikipedia and Google searches this second-screen app enhances the user experience throughcontent-awareness.
4
Circog is a mobile toolkit we developed for theAndroid platform and which triggers alertness teststhroughout the day. We validated and released thetoolkit as open source library to allow researchers andapp developers to elicit users’ circadian rhythm ofalertness and cognitive performance.
5
QuickLearn is an Android app for reviewing foreignlanguage vocabulary throughout the day. It triggersinteractive notifications in form of flashcards and mul-tiple choice questions, which can be responded to di-rectly in the notification drawer. We deployed this appon Google Play to research opportune moments fordelivering learning content to users.
6
We implemented a kinetic stimulus as a web readinginterface that highlights the supposed reading posi-tion line by line on electronic reading devices andtherefore guides the reader’s eyes across text. By dic-tating reading speed of users cognitive load is induced,which serves as application scenario for UI adjust-ments based on user’s cognitive capacities. We com-pare its effectiveness to reading with RSVP.
7
For reading with RSVP on smartwatches we createdan Android application that receives commands from aPupil eye tracker to control the reading flow implicitlythrough the user’s eye gaze.
7
Table 1.2: Overview of prototypes created in the course of this thesis.

16 1 Introduction
1.4 Ethics
For most of the user studies described in this thesis, we followed the ethics processderived from a previous EU project, namely the pd-net project [170]. This processentails the submission of a detailed study plan document to a central platformwhere it was reviewed by our project partners prior to the experiment. An exampledocument, which we used for the QuickLearn study described in Section 6.2can be found in the Appendix. For so-called studies in-the-wild where we usedapplication stores to distribute our technology probes, we included a consentform that would be shown after its installation. The respective probe would notstart collecting data until users had given explicit consent. We provided furtherdetails with regard to the data types collected on accompanying websites (also seeAppendix). The studies depicted in Chapter 3 and 6 were conducted in a corporateenvironment and therefore followed an internal examination process. However,all studies reported here were conducted in accordance with the declaration ofHelsinki4.
Privacy
In the course of our research, we deployed a number of research probes thatcollected a vast amount of data from the users’ devices. This was necessarybecause many of the algorithms we developed required access to people’s phoneusage patterns. Getting people to agree to use apps and services that analyzetheir phone usage can be tricky and raises a number of privacy concerns. Ingeneral, algorithms that access such sensitive data to use them as a base forrecommendations and therefore influence user behavior need to be criticallyviewed. The benefit of granting such insights needs to outweigh the risks. Whilepeople are generally concerned about sharing their location information, thegains of using navigation services, for example, make people compromise ontheir private data policy. However, for many of the algorithms proposed in thisthesis data processing and ultimately state predictions can be done locally on theuser’s device. “Privacy by Design” has been proposed to ensure that attentionto privacy and security is paid throughout the engineering process of ubiquitoussystems [169]. One aspect of it is making sure that sensitive information doesnot leave the user’s device, but is processed in-place. Such an approach couldcertainly be applied by cognition-aware systems. For more power-intensive
4 http://www.wma.net/en/30publications/10policies/b3/index.html

1.4 Ethics 17
data analyses that exceed local device resources homomorphic encryption couldfurther be applied [109]. This scheme allows devices to encrypt data locally witha secret key and send it off to a server where arbitrary functions can be performedover it without description key. Hence, the user device is the only key holder andtherefore has sole access to its own data.
User Awareness
When technology tracks and accompanies our every step as well as thought, indi-viduals trigger non-deliberate events just by being in a certain location or feelinga certain way. The interaction with cognition-aware systems is not necessarilyclear from a user perspective. When a system behaves differently because of acertain cognitive trigger, the user may be unaware of having triggered such achange. Therefore, the classical user-centered design approach, where we followan iterative cycle comprising of studying, designing, building, and evaluatinga technology with the user, needs to be updated. Sellen et al. [242] speak of“folding human values into the research and design cycle”. The user remains atthe center of the design model, but broader implications across time will needto be considered as well. Storing personal data may be secure at the time, butdoes not guarantee its inviolability for the time to come. Potential risks andimplications should, therefore, be considered already during the design cycle ofnew technologies.
Developer Guidelines
Cognition-awareness and the resulting predictions can have an alienating effecton users. In the physical world, we are very much used to being influenced. Inthe digital world, this is still often controversial and considered manipulation.Examples of search results are one example. The big difference in our view isthe visibility of the technologies and the understandability of how it influencesour behavior for things in the physical world. As more and more things aroundus become computer controlled and more information we consume becomedigital, we have to face the issue that our experiences are strongly determined bysoftware. For cognition-aware systems, it is important to be aware of this fact andto understand that content suggestions may influence users. In order for users toaccept these systems, it is essential not to ’trick’ the user or manipulate them intoactions they would not want to do. The following basic rules give guidance ondesigning such systems:

18 1 Introduction
• empower the user to explore WHY certain information is presented andwhy other information is not presented
• make it apparent to WHAT contextual factors the information is adaptingand enable the user to personalize the adaptation
It is apparent that any information presented (or not presented) may impact theuser. At the same time providing information that is contextualized will easemany cognitive tasks. There is no silver bullet here, but it is central for developersto consciously make these decisions when creating the system and to make themexplicit in their system design.
1.5 Research Context
The work presented in this thesis was carried out over the course of about fouryears in the Human-Computer Interaction and Cognitive Systems group at theInstitute for Visualization and Interactive Systems. The group is located at theUniversity of Stuttgart under the supervision of Prof. Albrecht Schmidt. Furtherinput came from the Graduate School of the Simulation Technology Program atthe University of Stuttgart, which provided the author with the opportunity togather interdisciplinary input from both technical, but also humanistic fields, suchas philosophy. Several collaborations with experts from the field resulted in jointpublications that contributed to this thesis.
RECALL
The major part of this work was conducted within the EU project RECALL5 withfunding through the Future and Emerging Technologies (FET) programme withinthe 7th Framework Programme for Research of the European Commission, underFET grant number: 612933. In RECALL, four partner universities (University ofLancaster, University of Essex, Universita della Svizzera italiana, and Universityof Stuttgart) set out to re-define the notion of memory augmentation throughubiquitous technologies. By combining technological interventions with basicresearch questions in memory psychology, this 3-year research project (Nov.2013 - Oct. 2016) focused on investigating and enhancing the way people use
5 http://recall-fet.eu/

1.6 Distribution of Work 19
technology to remember and to externalize memory. The collaboration betweenproject partners resulted in conjoint publications [69, 6], among others at the CHI2016 conference [172]. Further, we jointly created and organized a workshopon “Mobile Cognition” at the International Conference on Human-ComputerInteraction with Mobile Devices and Services [72] in 2015.
Telefonica R&D
In 2014, the author spent four months as an intern at Telefonica R&D in Barcelona,Spain. There, he worked together with Martin Pielot under the supervision ofthe scientific director at Telefonica, Nuria Oliver. The work conducted there wasrelated to human attention research and is reflected in Section 3.3 and 6.3 of thisthesis. The collaboration resulted in a number of publications [79, 214] as wellas a patent filing.
Keio University, Japan
In the context of investigating knowledge acquisition points, the design and ex-ploration of interactive reading UIs became prevalent. The author of this thesisworked closely together with experts in the field of reading and eye trackingincluding Kai Kunze and Susana Sanchez from Keio University in Tokyo, Japan.Mutual visits throughout the four years of conducting this research lead to a num-ber of conjoint publications [86, 168, 231, 233, 145]. Together we successfullylaunched a continuing series of workshops on “Augmenting the Human Mind” atthe ACM International Joint Conference on Pervasive and Ubiquitous Computing[84, 167, 77].
1.6 Distribution of Work
Parts of this thesis have been published in scientific conferences, and workshops:[68], [79], [80], [85], [86], [87], [160], and [214].
Other publications in scientific journals, conferences, and workshops by theauthor that go beyond the scope of this thesis include topics, such as lifelogging [6,70, 172, 277], memory augmentation [69, 72, 76, 77, 81, 84, 167], reading onelectronic devices [8, 145, 168, 233], peripheral displays [71, 74, 75, 83, 267],

20 1 Introduction
context awareness [106, 231, 232], auditory displays [73, 78, 264], and others [82,164, 165, 166, 176, 240, 278].
In the following, the collaborative efforts and publications are listed that havelead to the respective research probes and user studies described in this thesis:
Chapter 3 - Human Attention. The study described in this chapter, whichlead to two publications at MobileHCI’15 [79] and Ubicomp’15 [214] respec-tively, was conducted during the author’s research internship in 2014 at TelefonicaR&D in Barcelona, Spain. Idea, concept, implementation, and data collectionstemmed from the two main paper authors Martin Pielot and Tilman Dinglerunder the general supervision of Nuria Olivier. For the data analysis and thetraining of the machine-learning model, we received significant support from JoseSan Pedro.
Section 4.2 - Context-Aware Information Delivery. This chapter is basedon the Master thesis project of Johannes Knittel [159] whom the author supervisedat the time and which resulted in a publication at TVX’16 [160]. Design andimplementation of the apparatus were lead by the student who ended up applyingthe resulting algorithm in his startup FlickStuff 6, which he co-founded right aftercompleting his thesis.
Section 5.2 - Eliciting the Circadian Rhythm of Alertness. This projectwas mainly driven by the author in collaboration with Tonja Machulla whoseinput regarding concept and study design were invaluable and who played a majorrole in the study evaluation and data analysis. Valuable input for concept andframing by Albrecht Schmidt resulted in a paper, which was published in theIMWUT’17 journal [85].
Section 6.2 - Micro-Learning Sessions Throughout the Day. App and studydesign were supported by the visiting researchers Jennifer Sykes and Chun-ChengChang whose stay was funded by the National Science Foundation (NSF). Theauthor mainly drove the concept, development, study, data analysis, and featureelicitation. Dominik Weber contributed his experience in Android programmingand Martin Pielot trained the machine-learning model to elicit the feature rank-ing. With the help of Niels Henze, the project resulted in a paper presented atMobileHCI’17 [87].
6 http://flickstuff.de/

1.7 Thesis Outline 21
Section 6.3 - Using Predicted Boredom to Suggest Reading Content. Thestudy was designed and main parts of the apparatus were developed during theauthor’s internship at Telefonica R&D. While the study was conducted by MartinPielot after the author had completed his internship, the data collection happenedin collaboration. Martin Pielot then finished the data analysis together with JoseSan Pedro under the supervision of Nuria Olivier. The results were published in aconjoint conference paper at Ubicomp’15 [214].
Section 7.2 - Dynamic Reading Interfaces to Increase Reading Speed. Theresearch around speed reading was mainly driven by the author under the supervi-sion of Albrecht Schmidt and with concept refinements by Kai Kunze. AlirezaSahami contributed significant parts of the data analysis, while Thomas Koschhelped with the implementation of the study apparatus. Results were published atAH’15 [86].
Section 7.3 - Implicit Reading Support Through Eye Tracking. Thisproject was conjointly conducted by all co-authors and resulted in a publica-tion at ISWC’16 [80].
1.7 Thesis Outline
This thesis comprises eight chapters and is divided into six parts, the last twoof which contain the bibliography and the appendix. The structure of the thesisclosely follows the emergence of contributions as they are depicted in Figure 1.1.In the first part, we motivate the work, point out the greater vision of cognition-aware systems, their importance for information intake, state our contribution inthis field, and describe the context, in which this research was carried out. Thesecond part contains the research we conducted with regard to the quantificationand detection of people’s attentional states. Here, we describe the studies thatlead to the presented tools and framework for building cognition-aware systems.In the third part, we apply these tools and concepts to applications to validate ourapproach and explore different application scenarios of cognition-aware systemswith regard to information intake and learning. The fourth part contains an overallsummary of the research contribution and discusses the overall approach andimplications of this thesis.

22 1 Introduction
Part I: Introduction and Background
Chapter 1 - Introduction The first chapter describes the motivation and visionfor cognition-aware systems, states the context, in which this thesis was conducted,lists the research questions, and summarizes the key challenges and contributionwe faced throughout our research.
Chapter 2 - Foundations In the second chapter, we introduce key concepts ofcognition and memory that shaped this research. Also, we present the most rele-vant related work, which is mainly situated in the field of ubiquitous computing,learning applications, and context-aware systems. Finally, we briefly map out ourapproach and methods used.
Part II: Attention Research
Chapter 3 - Human Attention Attention is crucial for effective informationintake and retention, which is why we first focus on how attention levels can bequantified, differentiated, and detected in a technology context. Therefore, wepresent a field study, in which we assessed states of engagement and boredom.
Chapter 4 - Context- and Content-awareness In this chapter, we focus onpeople’s situational context and how to detect and support activities, duringwhich people consume information. In a lab study, we investigate how content-awareness across devices can help enhance information intake and learning tasks.
Chapter 5 - Cognition-awareness People’s ability to focus varies throughoutthe day. This chapter describes our approach to elicit users’ circadian rhythms ofalertness and cognitive performance. We develop and validate a mobile toolkitand propose a conceptual framework for building cognition-aware systems.
Part III: Applications
Chapter 6 - Opportune Content Delivery In this chapter, we apply thetools and concepts developed in our research to implement and test applicationsthat identify opportune moments for content delivery throughout the day. Here,we specifically focus on delivering language learning and entertaining readingcontent.

1.7 Thesis Outline 23
Chapter 7 - Adaptive Reading Interfaces This chapter describes the conceptof an application scenario for cognition-aware systems. By adjusting reading UIsin real-time we investigate the interplay between cognitive load and reading taskefficiency. Therefore, we adapt speed reading techniques to reading on electronicdevices and explore implicit control of reading flow through eye gaze tracking.
Part IV: Conclusion and Future Work
Chapter 8 - Conclusion and Future Work In this chapter, we summarizethe findings and contribution of this thesis with regard to the research questionsposed in the beginning. We conclude with a reflection on our approach, point outfuture work, and reflect on implications of cognition-aware systems.

24 1 Introduction

Chapter2Foundations
The research presented in this thesis is rooted in the field of ubiquitous comput-ing and context-aware systems in the discipline of computer science. To buildcognition-aware systems and technologies that support information intake andlearning, we apply concepts and theories form the field of cognitive psychologywith a focus on perception, cognition, and memory.
2.1 Ubiquitous Computing
The most profound technologies are those that disappear. Theyweave themselves into the fabric of everyday life until they areindistinguishable from it.
Marc Weiser [268]
Ubiquitous computing is commonly described as the third wave of computing.In the late 1950s, the era of mainframes began, where one computer was sharedby several people. Only with the introduction of the Altair 8800 by MITSin 1975, personal computing started becoming prevalent, in which one personwas handling one computer. Nowadays, this has changed into a many-to-one
26 2 Foundations
relationship, where one user has a number of personal devices available, suchas laptops, phones, tablets, watches, eye-wear, or other devices with processingcapabilities. The ubiquity of these devices, that surrounds us marks the era ofUbiquitous Computing. Its very notion entails computing to appear anytime andanywhere.
As the inevitable consequence of the ubiquitous computing era, Weiser and Brownforesaw the coming age of calm technology: since we would soon be constantlysurrounded by technology - in walls, chairs, clothing, light switches, and cars- it will be futile to ”get them out of the way” [269]. This calmness wouldthen allow people to focus on being human. However, in an environment filledwith ubiquitous computing devices, various appliances compete for our attention.This can have detrimental effects on our ability to focus. In the following, wewill summarize previous work and challenges that arise from attention-seekingdevices.
Interruptions and Disruptions
Interruptions generally occur when a person is detracted from a current primarytask to another activity. Interruptions can occur in any setting, be it at work whenfocusing on a task, at home immersed in reading, or in transit when looking upthe quickest route to a destination. Some interruptions only require temporaryattention switches, while others—such as a colleague entering the office—cancompletely deter from the task at hand. This can go as far as forgetting about theresumption point of the primary task, which results in considerable time spenttrying to get back into the previous task. In other cases, an interrupted task mayeven never be resumed at all.
Distractions or disruptions that lead to an interrupted task can be caused byexternal (e.g., an incoming phone call) but also internal stimuli, i.e., throughself-interruptions. Self-interruptions occur in the absence of external triggers andare often a result of multitasking. While people who choose to self-interrupt werefound to assess their productivity higher at the end of the day than those whoget interrupted by notifications [181], frequent self-interruptions result in lowertask accuracy [4]. A study by Iqbal et al. [143] found that it takes people up to15 minutes to resume an activity after being interrupted by an incoming emailor instant messaging notification. However, another study found that 64% ofworkplace interruptions are indeed beneficial [202], so they can not be dismissedeasily.

2.2 Cognitive Psychology 27
Especially in the workplace, attentional states have been found to be related tomood and job performance. Mark et al. [180] investigated states, which makepeople more susceptible to distractions. Their results suggest that distractionsdepend on the user’s current state of mind where certain attentional states precedetheir susceptibility to distracting stimuli. People immersed in rote work (i.e.,engaged but not challenged) are more likely to be distracted by Facebook orface-to-face interactions, whereas focused states are often followed by moretime spent on email. They also found a connection between the number ofapplication switches and prolonged communication behavior: the more peoplehopped between applications, the longer time they spent on Facebook and email.And the more task switches, the more opportunities presented themselves for thiskind of distractions.
In mobile situations, additional environmental factors add to the list of possibledistractions while performing a task. Oulasvirta et al. [207] found that on mobiledevices users’ task-directed attention can become fragmented into spans lastingonly a few seconds. They proposed the Resource Competition Framework (RCF)to design for mobile user’s limited cognitive resources. Building on Wickens’Multiple Resource Theory [273] their framework puts mobile task demands inrelation to users’ cognitive resources. Such a framework is useful to consultbefore designing applications that require user interactions in mobile settings.
Despite their distracting nature the proliferation of ubiquitous computing de-vices allows us to engage with information throughout the day and location-independently. Information consumption and processing are therefore deeplyintertwined with our everyday life. However, we have limited time and resourcesto engage with the information available. There is simply too much informationout, but furthermore, our cognitive resources are generally limited.
2.2 Cognitive Psychology
In this Section, we give a brief overview of the most important concepts withregard to mental processes as they are important for effective information intakeand learning.

28 2 Foundations
2.2.1 Perception
We perceive and process information from our environment through our fivesenses of sight, hearing, smell, taste, and touch. Information is passed in theform of signals in the nervous system resulting from physical or chemical stimu-lation from these senses. Perception does not only entail the passive receipt ofthese signals but is impacted by other cognitive functions, such as memory andattention.
Attention
Everyone knows what attention is. It is taking possession of the mind,in clear and vivid form, of one out of what seems several simultaneouslypossible objects or trains of thought. Focalization, the concentration ofconsciousness are of its essence. It implies a withdrawal from somethings in order to deal effectively with others.
William James [274]
James’ essential attribute of attention is the mind’s ability to concentrate on onestimulus. Numerous sensations reach our sensors in every second we go about ourday: we hear the voice of our conversation partner over the street noise comingin through the window. Meanwhile, we focus our eyes on our partner’s facialexpression and make out details about gestures and mimics that elude to theemotional aspect of what she is saying. All this is happening while our sensesalso take in the temperature in the room, the positioning of our arms on thetable, our regular breathing, and incidental thoughts and associations comingto our mind. Each piece of this incoming information passes through a seriesof processing steps between its first perception to its processing and eventualconsolidation in long-term memory. The stages of sensual perception to focusedattention are connected to the three types of memory or memory functions:1) sensory buffers, 2) short-term or working memory, and 3) long-term memory.Each function is discussed in detail by Baddeley [12]. In each of these stages,information is selected or discarded, so only a small fraction of the original scenemakes it into our long-term memory [208]. Filtering is done through attention,where only the information is passed through that is of interest at a given time.Therefore, information that is not attended to, is lost. Schacter [234] called it

2.2 Cognitive Psychology 29
absent-mindedness, where attention is focused on any other stimulus but oneinformation. Hence, that information is not encoded correctly and later retrievalof it from memory is rendered impossible.
Attentional States
Mark et al. [182] presented a framework for classifying different attentionalstates in the context of work environments. They identified four distinct states,which can be aligned along the following two dimensions: engagement as themental state of absorption in an activity [235] and challenge as the amount ofmental effort being exerted to perform a task [131]. Figure 2.1 lists the fourresulting areas where the upper right quadrant one describes ’focus’ as a stateof high engagement and high challenge, the upper left quadrant two describesthe attentional state of ’rote’, where high engagement but little challenge cometogether (e.g. mechanical type of work or thinking), the lower left quadrant threeindicates the state of being ’bored’, i.e. low engagement and low challenge,and the lower right quadrant four shows situations of high challenge but lowengagement lead to a state of ’frustration’. In a study with 32 knowledge workersthey found that their focus peaked during mid-afternoon (2-3 p.m.) and boredomwas highest at the beginning of the day (9 a.m.) and early in the afternoon (1p.m.). These attentional states were associated with certain emotions or valences.Here, participants were happiest during rote work and happy but also stressedwhen being focused.
Concepts related to attentional states include cognitive absorption, mindfulness,or flow. Absorption refers to when people feel deeply immersed in an activity,which comes with enjoyment, a feeling of control, curiosity, and with beingoblivious to time passing [5]. Mindfulness is a psychological state with a strongfocus on the present moment [57]. Flow is described as being totally immersedin an activity where “nothing else seems to matter” [52]. It refers to a pleasantbut highly productive state, in which people feel challenged and stay within theboundaries of their skills.
Because perception and attention are vital for encoding and memorizing informa-tion, our memory is highly dependent on our attentional states.

30 2 Foundations
Figure 2.1: Theoretical framework of different attentional states by Mark etal. [182]
2.2.2 Memory
Neuroscience has made significant progress on revealing how the brain works,but there is still no complete understanding of how human memory functions.Information in the brain is stored in clusters of neurons, however, we do not knowhow, precisely, it is stored or encoded. In the following memory and its workingswill be presented as it is most commonly and simply understood [12].
While being responsible for encoding, storing, and retrieving information, mem-ory is also responsible for processing and acting on that data. Commonly, thereare three main types of memory:
1. Sensory Memory: originating from sensory organs, such as eyes and ears,the brain receives this raw information and typically retains it for less than500 milliseconds, but can store it for about 1 to 3 seconds. Sensory memoryagain is subdivided into iconic (visual), echoic (auditory), and haptic (touch)memory. Sensory memories decay quickly and are usually processedwithout conscious effort, which is also called preattentive processing (i.e.,prior to paying attention to the information). Here, only a subset of theinformation is made sense of, such as colors or shapes.

2.2 Cognitive Psychology 31
2. Short-term Memory: information is passed from sensory to short-termmemory where it can be processed for up to several minutes, throughrehearsal even up to several hours. Short-term memory is limited in itscapacity; Miller found that between 5 and 9 items can generally be kept inshort-term memory at a time [188]. This number can be increased, however,by a process called chunking, where items are grouped and remembered aschunks.
3. Long-term Memory: information in short-term memory is either thrownout or transferred to long-term memory where it is retained up to a lifetime.By rehearsing that information it becomes more likely that it will end uphere. Emotions, meaningful, and multiple associations can further increasethat chance.
A model of the brain and the distinction between implicit and explicit memorywas by Larry Ryan Squire [249]. He categorized memory into two distinct parts:implicit and explicit or declarative memory, where implicit refers to motor skillswhich reflect in performance rather than through remembering (e.g., riding abike or playing the guitar) and explicit refers to knowledge that we can describeand reflect on (e.g., knowing that eggs contain a high amount of protein). EndelTulving further proposed the distinction in explicit memory between episodic andsemantic memory [253] (see. Fig.2.2):
1. Episodic Memory: Episodic memory concerns personal experiences. Infor-mation stored here relate to a particular context, such as a time and place.”I remember the day writing up my thesis while watching the kitesurfersgo by,” is a statement that resembles a personal memory, which can triggerassociations to sensations, emotions, and other personal associations. Re-trieval of information stored in the episodic memory system can also affectand modify the memory system.
2. Semantic Memory: Semantic memory refers to principles and, such as theshape of a guitar, and therefore holds abstract knowledge about the worldindependent of its context.
Information processing takes place in three stages: 1) receiving and encodinginformation through sensory systems, 2) storing that information in long-termmemory and 3) retrieval of that information in the form of memories later on.Failure in one of these areas leads to what we call forgetting. With regard toknowledge acquisition and retention, forgetting is an undesirable trade, whose

32 2 Foundations
Memory
Declarative Implicit
Episodic Semantic
Figure 2.2: Types of memory and their relationship to each other.
root Schacter broke down into seven main causes [234], two of which are mostrelevant to our work:
1. Transience: information gets less accessible over time.
2. Absent-mindedness: due to a lack of attention, information when encoun-tered is not encoded correctly and therefore later memory retrieval is beingcompromised.
Memory holds the information through which we understand the world. It,therefore, affects our perception and also our cognitive processes.
2.2.3 Cognition
Cognition has been defined as those processes by which the sensory input istransformed, reduced, elaborated, stored, recovered, and used [198]. It, therefore,

2.3 Learning 33
entails the entirety of mental processing including incoming perceptual infor-mation, understanding, acquiring knowledge, memorizing, thought processing,retrieval, and thus the inner workings of our mind. Therefore, cognition com-prises the more specific cognitive processes of perception, attention, and memorymentioned above, and further encompasses the use of existing knowledge andalso the generation of new knowledge, hence learning.
Cognition and the workings of the mind have been studied as early as by theGreek philosophers, such as Aristotle. The term “cognition” goes back to the15th century where it depicted “thinking and awareness” [228]. In the era ofbehaviorism (early 20th century) the focus of investigations lied on observablebehavior. The mind was seen as a black box, where only input stimuli and outputbehavior could be observed and measured. Hence, in order to understand themind’s workings psychology studies attempted to establish a relationship betweeninputs and outputs.
A paradigm shift occurred between 1950 and 1960 where cognitivism was intro-duced. In response to behaviorism and the introduction of the computer, cogni-tivism focused on mental processes. The mind was viewed as a computer whereterms to describe internal processes were borrowed from the field of computerscience (e.g., memory, attentional bottleneck, perceptive capacity).
Another paradigm shift occurred from 1980 to 1990 with the rise of neuroscience.Computer usage had become commonplace in psychology and neuroimagingtechniques had undergone significant improvements. Scientists were now ableto focus on the brain’s activities. Since mental activity is a result of processesin the brain, neuroscientists focus on brain activities to gain insights into mentalprocesses. Today, a variety of methods exist to measure electrical activity, someof which we present later in this chapter. These methods help us draw conclusionson underlying cognitive processes, including attention and learning.
2.3 Learning
Learning is generally defined as the acquisition of knowledge and skills throughstudy, experience, or being taught. While there is a great number of learningtheories about information intake, processing, and memorization, we will brieflyfocus on a few concepts most relevant to our work. Baddeley et al. [12] andRevlin [228] give an in-depth overview of the topic.
Learning activities are often grouped into two categories [196]:

34 2 Foundations
• intentional learning: comprises activities specifically taken up for thepurpose of learning.
• incidental learning: learning happens without explicit intent, such aswhile watching a movie with a foreign language character in from whomthe viewer incidentally learns some phrases, for example.
Ubiquitous computing devices allow us to engage with information repetitionanytime, anywhere. Cai et al. [38], for instance, created an Instant Message webapplication where users can learn words during wait times of an ongoing chat.Trusty & Troung [252] built a browser extension that replaces a selected set ofEnglish words with their foreign translation. Their examples show the feasibilityof building learning applications with the specific goal of invoking incidentallearning sessions throughout the day.
Ebbinghaus [90] famously investigated the nature of forgetting. Hence, thememory of information declines exponentially if no attempt is made to retainit. To prevent such rapid decline, repetitions need to be spaced out in a waythat the information is encountered just when it is about to be forgotten [194].Emotions and other associations can strengthen the memory of an informationand therefore prolong the process of forgetting. Since people keep their mobiledevices commonly at arm’s reach for about 53% and within the same room for88% of the time [65], these devices offer great potential for spacing out learningsessions throughout the day, week, and month.
Microlearning
Microlearning is the technique of breaking down a learning task into a series ofquick learning interactions [20]. The, for example, daunting task of learning aforeign language could be broken down into numerous vocabulary learning units,grammar practices, pronunciation exercises, and so on. To yield optimal learningresults, these units need not only be frequent but also spaced out in a favorableway [111]. Spaced repetition is crucial since people exhibit—as aforementioned—a negatively exponential forgetting curve [90], which is why repetitions needto occur at increasingly spaced intervals. By displaying learning items just asthey are about to be forgotten we can make sure those items eventually end upand are accessible in long-term memory. Through microlearning these itemsbecome manageable and spaced repetition becomes feasible through the ubiquityof mobile devices.

2.4 Context-Aware Computing 35
Mobile devices provide a powerful platform for some forms of learning whereindividualization (or personalization) of learning content with ubiquitous accessis critical [161]. The portability of the mobile device along with the low cost ofretrieval makes them a great platform for microlearning. Ashbrook [9] demon-strated the importance of microinteractions, explaining that quick and easy accessto a device is important for promoting frequent use. Prior to the ubiquity of smart-phones, Cavus and Ibrahim sent SMS messages of English vocabulary words [42].Edge et al. [92] created a mobile app that takes advantage of GPS location sensorsto deliver contextual relevant vocabulary words. To ensure repeated exposure toa vocabulary word, Dearman & Truong [61] created a mobile app that displaysthe vocabulary word on the wallpaper of the phone. Especially vocabulary-basedmicrolearning experiments have shown to improve vocabulary acquisition andrecall [38, 92, 252]. Further, microlearning on a mobile device has accomplishedhigh user acceptance [32, 42].
Concluding, mobile applications provide numerous opportunities to engage withlearning content throughout the day. By spacing out learning content and repe-titions, they can counteract the effects of forgetting and provide quick learningsessions in between activities through microlearning units. Incidental learningcan further be fostered by learning in context: while mobile applications allowusers to learn anytime and anywhere, consuming contextually relevant learningcontent can be triggered by the user’s surrounding context [20].
2.4 Context-Aware Computing
A widely accepted definition of context was given by Anind Dey:
Context is any information that can be used to characterize the situationof an entity. An entity is a person, place, or object that is consideredrelevant to the interaction between a user and an application, includingthe user and application themselves.
Anind Dey [64]
By providing context information to computers Bowd et al. [3] state that wecan effectively “increase the richness of communication in human-computerinteraction and make it possible to produce more useful computational services”.

36 2 Foundations
In general, services support the user’s task. Dey [64] describes such tasks inthemselves as vital parts of context characterizing the user’s situation: “A systemis context-aware if it uses context to provide relevant information and/or servicesto the user, where relevancy depends on the user’s task.” Dey further includes theuser’s emotional and mental state (i.e., focus of attention) in his understandingof context [63]. Schmidt [238] regards the entity as part of a feedback loop: “Achange in the application will inevitably lead to a change in the context, perhapsas reaction to a changing situation.” This reciprocal relationship implies that achange in the application can lead to a change in the context. Thus, such changescan be invoked in users as well.
A primary concern of context-awareness for mobile systems is awareness of thephysical environment surrounding users and their devices. The key challenge ofthese systems is to record and make sense of contextual information. Advances insensing, inferring, and using context information have been made by looking atdifferent context dimensions, such as detecting people’s locations [265], but alsophysical activities [243], and affective states [127]. Based on the users’ location,for example, a navigation system can suggest routes to the nearest restaurant.Considering the time of day and lighting conditions, the device automaticallyadjusts the display’s brightness to make content more readable. In order toenter the restaurant the user simply steps in front of the motion detector of theautomatic door, which then slides open. These examples describe a network ofcontext-aware systems that surround us in our daily life.
In their work Schmidt et al. [239] explore various aspects of usage context andpropose a working model for context taking into account not only the physicalenvironment, but also human factors, such as information about the user, hersocial environment, and current task at hand. For learning tasks, it has beenproposed to consider various aspects of context to enable efficient acquisitionof skills and knowledge. Merriam et al. [187] proclaimed that “learning doesnot occur in a vacuum”, but is rather shaped by the context, culture, and tools.Wilson [275] proposed the notion of learning in context, also described as situatedcognition. He emphasized the importance of interaction among people, tools, andcontext within a learning situation. Lave [171] conducted ethnographic studieson situated learning, in which she found that learning is a reoccurring process,in which learners act and interact within their social situations. She looked athow mathematical equations were applied and solved in the real world, especiallyduring grocery shopping. There, grocery items, coupons, and social interactionswith other shoppers and store workers built the learning context and helped theunderstanding of concepts. Thus, real-world context with social relationships andtools at hand have a positive impact on learning.
2.5 Cognition-Awareness 37
Such insights from contextual learning suggest that using information from thereal world and taking advantage of devices in our environment as tools couldfoster learning. With the ubiquity of mobile devices and an increasing amount ofcontent consumed on electronic devices, new learning scenarios arise.
2.5 Cognition-Awareness
Context-aware computing traditionally entails input dimensions, such as the user’slocation, physical activity, task, and device environment. In this Section, we focuson related work that considers the cognitive context as part of the user context.Such context comprises aspects related to mental information processing, suchas attention, perception, memory, knowledge, or learning. Awareness of suchprocesses can help systems to adjust to users in different ways:
1. Increase information bandwidth: phases of high attention and receptivenesscan be utilized to push an optimized amount of content through a number ofmodality channels. Being highly alert allows people, for example, to moni-tor both visual and auditory channels and take advantage of simultaneousinformation streams.
2. Increase retention of information: by aligning information intake withphases of high concentration chances rise that this information makes itinto long-term memory. Absent-mindedness is one of the main reasons whya piece of information is not retained [234]. By tracking attention phasesand making information systems aware of these phases, they can adjust theirpresentation, information selection, and density accordingly. Detectingcognitive events, such as confusion, frustration, or realizations, such as “aha”moments, can help interface adjust in a way that they provide feedbackor guidance on task focus, and suggest strategies in training scenarios.For learning, such supportive systems could increase understanding andretention.
3. Notification management: based on the user’s cognitive states, interruptionscan be deferred [201]. In phases of high user focus, the system could adviseapplications to refrain from interrupting the user. Email alerts and phonecalls may be held back in such phases and the user’s flow state can bepreserved [52] to allow working in an effective manner.

38 2 Foundations
4. Preserving mental health: stress occurs when there is a mismatch betweentask requirements and the user’s cognitive capabilities [258]. Chronicallyhigh levels of mental load at the workplace can cause various health prob-lems, such as stress, depression, or burnout. Circadian disruptions canfurther have devastating consequences for the emergence of schizophre-nia [49] and diabetes [254].
In the following, we will give an overview of how cognitive states are commonlydetected and what challenges arise from these techniques.
Detecting Cognitive Activities
To provide a “window into our mind” [261] technologies need to be able tosense and infer cognitive activities, which naturally take place inside of theuser. Monitoring bio-signals with the help of sensors can give us indirect cluesabout different cognitive states. So-called bio-sensors can be highly specializedand are therefore only applicable under lab conditions, while others can beeasily integrated into personal devices. Such sensors typically fall in one of twocategories: invasive vs. non-invasive sensing, with invasive methods being mainlyfound in a medical context and hardly applicable in everyday consumer situations.Hence, we focus on non-invasive sensors with regard to their feasibility to informcontext-aware systems.
In the following we briefly summarize the most commonly applied bio-sensors inHCI research:
Electroencephalography (EEG)
Brain cells communicate via electrical impulses which can be detected throughelectrodes placed on people’s scalp. Since these impulses make up the brain’sactivity, they are commonly used in HCI especially for building Brain-ComputerInterfaces (BCIs). From these measures, we can assess which brain regions areactive during which kinds of tasks and also quantify the task workload. How-ever, Electroencephalography (EEG) requires rather expensive equipment andis tedious to set up. Low-cost devices with basic functionality and a reasonableform factor, such as the Emotiv7, are currently becoming more commercialized.BCIs are used in three major application areas [201]: (1) for interaction with
7 http://emotiv.com/

2.5 Cognition-Awareness 39
computers with thought input, (2) for evaluating interfaces and systems (based onhow hard someone has to work on a particular set of tasks), and (3) for adaptinguser interfaces according to brain activity measurements.
Functional Magnetic Resonance Imaging (fMRI)
Another way of detecting brain activity is using functional neuroimaging: duringcerebral activity, neurons require nutrients to generate energy and produce actionpotentials. Glucose, oxygen and other substances are therefore transported toactive neurons by means of blood perfusion. Hence, when a region of the brain isin use, blood flow to that area increases. Using a strong magnetic field FunctionalMagnetic Resonance Imaging (fMRIs) measure these changes in oxygenatedblood flow and display activated regions accordingly. Activated regions allow usto infer the type of cognitive activity associated with them. However, fMRIs arebulky machines and therefore not applicable for being used in everyday mobilesettings.
Functional Near-Infrared Spectroscopy (fNIR or fNIRS)
This technique is also based on the basic mechanism of functional neuroimag-ing. In contrast to magnetic resonance imaging, it uses light in the near-infraredspectrum to measure localized changes in oxygenated blood volume in the brain.Therefore, a ray of light is emitted at the scalp, half of which is absorbed bychromophores found in the nervous tissue. The compound of these chromophoresand therefore their light absorption depends on the current saturation with oxy-gen and other nutrients (hemoglobin is a strong light absorber). A receivingphoto detector captures the light wave resulting from the interaction with thechromophores. With respect to the original emitted, the characteristics of the lightwave received differ due to the absorption in the nervous tissue. Methods likeFunctional Near-Infrared Spectroscopy (fNIR) present a non-invasive, low-riskmethod for studying cerebral processes. In contrast to fMRIs, fNIRs devices areless bulky and can be integrated into wearables.
Eye Movements
Sensing cognition is not necessarily limited to observing what happens in thebrain. A number of physiological phenomena are caused by certain cognitiveactivities, which is why we can infer these activities by monitoring bio-signalsthat are not directly linked to the brain. Visual behavior, for example, is closely

40 2 Foundations
associated with cognitive processes, such as attention [177], relational mem-ory [120], and learning [129]. There are two common ways of sensing eyemovements, namely 1) via video-based computer vision techniques, and 2) viaElectrooculography (EOG). Video-based eye trackers generally use the eye’sreflection of infrared illumination combined with high-resolution cameras andcomputer vision techniques for pupil detection and movement tracking. EOG,on the other hand, uses electrodes to measure changes in the electrical potentialfield surrounding the eyes, introduced by eye movements. Both techniques arecapable of measuring the most important eye movement characteristics: fixations,saccades, and blinks. Early studies have shown the relationship between eyefixations and cognitive processes [149]. Others have focused on how saccadiceye movements and blinking are related to different levels of cognitive load [251].Eye blinks can be further influenced by environmental factors, such as humid-ity, temperature or brightness, but also be an indicator of physical activity [35]and fatigue [237]. Rayner [223] investigated eye movements with regard to theunderlying cognitive processes in reading and information processing. Otherworks have looked at inferring reader engagement, which is closely linked toattention [168]. Bulling et al. [33, 34] introduced eye movement analysis as anew modality for activity and recall recognition.
Physiological Sensors for Affective Computing
Although not necessarily directly related to cognitive activities, a range of physio-logical sensors can provide hints about a person’s affect, fatigue, or stress levels.In the following, we will briefly discuss the ones that are most commonly usedin HCI research and why they may make a valuable addition to cognition-awaresystems.
Early studies found that systematic changes in body temperature correlatewith diurnal variations in cognitive performance [157]. Spontaneous or inducedchanges in body temperature seem to have an inverse effect on reaction times,where an increase in body temperature leads to a decrease in reaction time. Kleit-man [158] based his findings on metabolic activity of the cells of the cerebralcortex and suggested that by increasing body temperature, thought processescould be indirectly sped up as well: he assessed people’s performance on cardsorting, mirror drawing, code transcription, and multiplication speed. Wever [272]later suggested that those diurnal rhythms were related to the circadian system inhumans. Influence of body temperature and internal biological time were foundto affect performance and alertness [190]. Since changes in body temperaturecan be very subtle, measurements were required through a rectal sensor. Later in

2.5 Cognition-Awareness 41
this Chapter, we will propose a less invasive technique to gather information onperformance and the circadian rhythm associated.
One of the most indicative measures for a person’s physiological state is theheart activity and performance. The heart rate is the number of times the heartcontracts in one minute and is usually reported in Beats per Minute (BPM). It canbe measured through a variety of methods: manually (i.e., by feeling a person’spulse on an artery), with a photocell sensor (e.g., photoreflectance or infraredsensor monitor), through video footage and video-processing algorithms [280], orby measuring the heart’s activation pulse through electrodes placed on the body(i.e., Electrocardiography (ECG)). If we take measures over a period of timewe can calculate a person’s Heart Rate Variability (HRV), which describeschanges in heart performance indicating how calm, excited, or exhausted thatperson is. The variability is often used to assess stress levels and mental load.Sensors can be placed on different body parts, such as on fingers, wrists, or on thechest, and is therefore feasible to be integrated into wearable devices. Similarly,electrodes placed along the body can also be used to measure electrical activity inmuscles and assess muscle tension (Electromyography (EMG)), which elicitssymptoms of excitement or stress.
Similar to heart rate, a person’s respiratory rate can be a measure of the currentphysiological state. It counts the breaths a person takes per minute, which candiffer across age groups and according to the general current health state (therespiratory rate for a healthy adult at rest ranges between 12 and 20 breaths perminute). Measured across a period of time the respiratory rate variability canbe an indication of stress levels. Respiration can be estimated from wearablesensor data, such as from ECG, but also elicited from video footage [280] oraccelerometer data.
Another strong indicator for stress or excitement levels is a person’sElectrodermal Activity (EDA) or skin conductance, which describes the abilityof the skin to conduct an electrical current. The sympathetic nervous systembasically controls the amount of sweat emitted, which causes variations in skinconductance. Sweat glands can be measured and used as an indication forpsychological or physiological arousal: if a person gets stressed, for example,the autonomic nervous system becomes aroused and causes an increased sweatgland activity, which in turn increases skin conductance. This technique is oftenused in lie-detectors. Skin conductance is also described as Galvanic Skin Re-sponse (GSR) and is fairly straight-forward to measure on different body parts.Hence, GSR sensors are feasible to be integrated into wearable devices and can,

42 2 Foundations
therefore, be used to assess emotional and sympathetic responses throughout theday.
Self-reports
Although not being a sensor in the literal sense, a lot of information aboutinner user state can be easily elicited by simply letting users assess their ownsituation. Daily diaries, for example, are used as a research methodology tomake people describe their impressions, feelings, and general environment. Formore in-situ feedback, experience sampling has been proposed and advancedwith the ubiquity of mobile devices and the possibility to record short statementsthroughout the day [50]. Hence, participants are asked to stop at certain timesduring the day and report on an experience in real-time. A convenient tool toassess cognitive load, which is more often used in lab settings, is the NASATask Load Index (NASA-TLX) [124]. In its original form, the NASA-TLXquestionnaire contains a workload assessment on six subscales with regard tomental demand, physical demand, temporal demand, performance, effort, andfrustration. These subscales are then individually weighted against each other bythe participant based on their perceived importance. However, for most cases, theassessment on the subscales is sufficient though and also individual subscales canbe dropped if they are less relevant to the task at hand. In these cases, the test isgenerally referred to as “Raw TLX” [123].
In-situ Elicitation of Cognitive States
As some of these cognitive assessment techniques show there are crucial chal-lenges in trying to obtain the cognitive context in an unobtrusive manner. Ontop of that, the neural dynamics of the brain are generally complex processes,which are hardly accessible for non-invasive measurement techniques. Most ofthe sensors described above need to be attached either to the human body (e.g.,EEG) or be placed in the environment (e.g., video cameras). In many cases suchdevices are bulky, which limits their portability and therefore their applicabilityin a mobile context. Another factor to consider is social acceptance. An fNIRsensor can be integrated into a headband placed on a person’s forehead, but thatdoes not necessarily make for an aesthetic appearance. Meanwhile, other sensors,such as rectal temperature sensors, are simply uncomfortable to wear throughoutthe day. An alternative approach is to associate observable activities with cog-nitive processes. Here, ubiquitous computing devices, such as the smartphone,can be used to track a wide range of activities. Such devices are also in close

2.5 Cognition-Awareness 43
proximity to their users for most time of the day and therefore can deliver quitean in-situ picture of a person’s daily doings. In our work, we investigate the useof ubiquitous computing devices to assess cognitive states on-the-fly by analyzingphone usage data. We show how such assessments can be made within a relativelyshort time window. More regular patterns of attention are exhibited by diurnalfluctuations of alertness—so-called circadian rhythms.
Circadian Computing
People’s alertness, attention, and vigilance are highly variable and subject tosystematic changes across the day [112, 156]. These fluctuations—in part causedby circadian rhythms—impact higher level cognitive capacities, including per-ception, memory, and executive functions. During phases of high alertness, weare able to perform tasks efficiently while during phases of low alertness we havetrouble concentrating.
According to the prevalent theory on sleep/wake regulation, variations in alertnessand sleep propensity are generated by two underlying processes: the sleep/wakehomeostasis and a circadian process [28]. The homeostatic process manifestsitself as a gradual decrease in alertness during wake periods. The longer we areawake, the stronger becomes the need for sleep. Alertness is further modulated bya circadian biological clock with a period length of about 24 hours. Following a si-nusoidal pattern, it determines hours of the day when we experience a particularlylow or particularly strong sleep drive. For many people, the alerting capability ofthe circadian process peaks in the late afternoon, thus partially counterbalancingthe accumulated sleep pressure from the homeostatic process. This is commonlyexperienced as heightened alertness towards the evening after a post-lunch dip inalertness and concentration.
These rhythms can be different from person to person, however, they occur inindividual, but distinct patterns. Figure 2.3 shows an exemplary curve with phasesof high attention in the morning, a decline in the early and a performance recoveryin the late afternoon, for example. The circadian rhythm of alertness and cognitiveperformance depends on a range of individual factors, such as sleep, nutrition,stress levels, or general health. Traditional methods to assess the circadian rhythminclude extensive lab experiments, which can take weeks of being in controlledenvironments. Other methods can be equally cumbersome or even unpleasant,such as sleep-wake protocols or physiological markers (e.g., dim light melatoninonset, rectal temperature monitoring, cortisol level measurements [135, 158]).

44 2 Foundations
Figure 2.3: The circadian rhythm describes systematic performance changesacross the day showing in our ability to concentrate and focus.
Current systems do not adapt to individuals’ variations in sleep/wake cyclesand the related diurnal patterns of alertness and cognitive performance. Instead,systems generally assume a constant level of cognitive performance and rarelyaccommodate for variations. In an attempt to reconstruct this rhythm in a moreconvenient and externally valid way, we will focus in this thesis on mobile devicesand their capabilities to collect alertness data in-the-wild.
2.6 Methodology
In this Section, we describe our approach to build, apply, and evaluate cognition-aware systems. In each step, we follow the user-centered research approach [88]by conducting a combination of formative studies, lab, and field experiments withpeople using our research probes being at the center of this process.

2.6 Methodology 45
2.6.1 Quantification and Analysis of Attention
At the core of information perception, processing, and memorization lie the abilityto focus and pay attention. Because mobile devices, such as smartphones, arenear-constantly available and have rich sensor capabilities, we start by measuringpeople’s attentiveness towards these devices. To capture phone usage and mea-sures of attentiveness throughout the day we conduct field studies because thisdata needs to be collected in-the-wild, where participants follow their everydayschedules and are not confined to an artificial experiment setting. Therefore, werelease our data collectors as mobile apps on Google Play and invite participantsto download and install them. Informed consent is given through the app and thecollected data is securely transmitted to our servers.
Besides phone usage data we collect subjective user assessments in the form ofExperience Sampling. Thus, the app prompts users throughout the day to fill ina quick survey about their current inclination towards boredom and other states.Again, these measures need to be collected in-the-wild, since we are interested inthese assessments in the context of participants’ everyday life.
2.6.2 Content-awareness between Devices
With the hypothesis that not only the attentive state but also knowledge aboutthe content that is currently being consumed by the user, can help to facilitateinformation intake, we investigate ways to enhance information intake throughcontent-awareness. Since TV consumption is a major form of information acquisi-tion, we investigate the use of second-screen apps to enrich information intake. Toelicit app features we first conduct an online survey, especially because it has thepotential to reach a large number of people from different geographical regionsto find out about TV watching habits and current use of second-screen apps. Wefurther consulted the literature regarding this topic and combine our results toelicit a feature backlog for the eventual application. Therefore, we develop asystem that harvests subtitles from TV programs in real-time to automaticallycreate additional content. We needed to develop a system that records streams ofsubtitles, performs keyword extractions, and gathers additional relevant contentthrough entity linking. Because the utility of this tool is highly dependent on thequality of the content generation, we evaluate the system with a pre-recorded,but real-world TV program. However, because we compare the use of the appto the traditional way of looking up information online, we conduct a controlledlab study with a repeated-measure design to limit the possibility of confounding

46 2 Foundations
variables, such as program content differences and user distractions. Measuresare not limited to the relevancy of the generated content but include subjectiveuser impressions and objective comprehension tests.
2.6.3 Tools for Building Cognition-Aware Systems
While we investigate the feasibility of analyzing the user’s momentary attentive-ness based on phone sensor data, there are also patterns in attention differencesdetermined by people’s internal body clocks. Knowledge of these diurnal pat-terns could inform cognition-aware systems about re-occurring productive phasesacross the day. Because these patterns occur in people’s everyday life we needto deploy our research probe in the field. Hence, we install our apparatus onpeople’s phone and collect quantitative alertness measures throughout the day.We further trigger surveys about the recent consumption of caffeinated drinks tobe able to account for the influence of caffeine on the alertness measures. Weconclude the study with a semi-structured interview where we ask participantsto rate the different app tasks according to their subjective impression regardinglikeability measures.
2.6.4 Proof-of-Concept Applications
To validate the tools developed in the first part of this thesis we integrate theminto two applications which suggest different types of content (learning andreading) in moments classified as opportune (i.e., bored). Because validationentails external validity we deploy our prototypes in the field. To collect moredetailed feedback we recruit a number of participants to download and use theseapps while collecting usage data and conducting interviews in between. Since weset out to train machine learning models on collected ground truth data we needto collect big amounts of phone usage data in order to get reliable results. Hence,we release the app on Google Play to the public, hence launch an in-the-wildexperiment.
In another application scenario, we envision cognition-aware systems to alsobe able to align their interfaces with the users’ current cognitive capacities. Toexplore potential interfaces for such adjustments we created dynamic readingUIs with the ability to superimpose variable reading speeds on the user. Tomeasure cognitive load and effects on eye movements we use the NASA TLXquestionnaire and a stationary eye tracker. Also, we measure text comprehension

2.6 Methodology 47
and subjective user assessments. To avoid distractions during the experimentwe conduct a controlled lab study, where participants come in and read with thedifferent reading UIs. To avoid confounds through differing reading skill or textdifficulty, we employ a repeated-measure design and counterbalance not onlythe two conditions (i.e., the reading stimuli) but also the allocation of text to thecondition. Further, to make sure comprehension questions are validated, we usetexts from an official corpus used by foreign language speakers to be tested onreading comprehension.
For the last study reported in this thesis, we investigate differences in implicit vs.explicit controls for adaptive reading UIs. Therefore we created an apparatus thatuses eye gaze tracking to determine whether a user looks at a smartwatch to reador not. To test our two conditions we conduct a repeated-measure lab study wherepeople wear the eye tracker and are asked to read different texts throughout thestudy. Again, we are interested in differences in text comprehension, which iswhy we need to control for confounding variables, such as distractions from theenvironment and text bias. However, because possible applications for implicitcontrol of reading flow through eye tracking include a reading-while-walkingscenario we introduce an artificial secondary task whose goal it is to introducecontrolled reading interruptions.
Concluding, the first part of the thesis resembles our approach to build technolo-gies for assessing and predicting cognitive states. Because these states occurmostly throughout the day and outside of the confinements of our lab, we conductthese studies in the field. The last part of the study comprises the application ofthese technologies for validation purposes and for investigating their feasibilityand utility. Here, we apply a mixed method approach of controlled lab studies,controlled user groups as well as public experiments in-the-wild.

48 2 Foundations

IIATTENTION RESEARCH


Chapter3Human Attention
Attention is generally described as the ability to concentrate on a specific stimuluswhile ignoring other perceivable information. It shows in our skill to focus on aconversation, a thought or a piece of text while blending out background noises,tactile impressions, and visual stimuli in our periphery. Hence, attention in itselfis the process of selecting one over a range of competing stimuli [114].
Despite being focused on one specific channel of information we are still ableto process competing channels in the background. Cherry [45] first defined theCocktail-Party Effect as the ability to switch attention between multiple auditorystreams, which allows people to ’tune into’ one channel while ’tuning out’ allothers. The effect gained its name from the scenario of a cocktail party wherepeople are focused on a single conversation while being able to make out thementioning one’s name in a nearby conversation.
We live in a world full of competing stimuli. In addition to our current physicalenvironment, we are subject to a range of technologies that constantly try tograb our attention. The sheer amount of devices and services providing accessto information as well as making requests for attention poses challenges to ourcognitive processing capacities. In our current age of information technologyinformation is produced and disseminated more quickly and more broadly thanever leading to what has become known as ’Information Overload’. The term firstintroduced in 1964 by social scientist Bertram Gross [118] describes an effectwhere the amount of input exceeds the processing capacity of an actor. Due to

52 3 Human Attention
the limited cognitive capability of a decision maker, for example, informationoverload can have detrimental effects on the quality of decisions [247].
However, we are drawn to our devices. Mobile phones, smartwatches, tablets,laptops, or connected TVs provide stimulation which is constantly available,even while on the go. Such devices are notorious for trying to grab our attentionthrough various alerts in form of auditory beeps, visual notifications, and hapticvibrations. But even when we are not interrupted, according to Nielsen, 45%of our smartphone usage time is devoted to self-stimulation by engaging withnews, entertainment, games, and social media8. This conditioning goes as faras that being alone with one’s own thoughts for longer periods of time has beenshown to cause aversive reactions. Being deterred from external stimulation haseven lead participants in a study to rather self-administer electric shocks than to”just think” [276]. Technology companies profit from and actively encourage thisconditioning since they monetize on users’ attention. Hence, in today’s so-called
’attention economy’ user attention has become a scarce resource [59].
With all these competing stimuli from services, technologies, and our environ-ment it becomes increasingly challenging to focus on the right kind of stimulus.The ability to focus is crucial for memory tasks. A lack of attention while beingexposed to incoming information is one of the main reasons for a bad mem-ory, because information is perceived, but can not be committed to long-termmemory [234]. Attention is influenced by a range of factors, such as the cur-rent environment, motivation, but also physical, cognitive, emotional, and socialconditions [271].
In this Chapter, we investigate the nature of attention in a technology contextas it is a crucial component for effective information intake. We first set outto understand how attention can be quantified in a mobile context. We furtherpresent an approach to identify idle, but attentive states. Therefore, we built asystem that automatically detects moments, in which people actively seek outstimulation.
The two research questions we target with our investigation in attention are:
• RQ1: How can users’ attentiveness be quantified across the day and reliablypredicted from phone usage patterns?
• RQ2: Does boredom measurably affect phone usage and which usagecharacteristics are most prevalent during such states?
8 http://www.nielsen.com/us/en/insights/news/2014/how-smartphones-are-changing-consumers-daily-routines-around-the-globe.html

3.1 Related Work 53
Parts of this Chapter are based on the following publications:
• T. Dingler and M. Pielot. I’ll be there for you: Quantifying attentivenesstowards mobile messaging. In Proceedings of the 17th InternationalConference on Human-Computer Interaction with Mobile Devices andServices, MobileHCI ’15, pages 1–5, New York, NY, USA, 2015. ACM
• M. Pielot, T. Dingler, J. S. Pedro, and N. Oliver. When attention is notscarce - detecting boredom from mobile phone usage. In Proceedingsof the 2015 ACM International Joint Conference on Pervasive andUbiquitous Computing, UbiComp ’15, pages 825–836, New York, NY,USA, 2015. ACM
3.1 Related Work
The work described in this Chapter is based on principles of perception andattention as described in Section 2.2, and more specifically on interruption man-agement and attentiveness towards devices.
3.1.1 Attention to Devices
In ubiquitous computing environments we are surrounded by a variety of devices:public displays, desktop computers, laptops, mobile phones, and increasinglywearable devices, such as smart watches and eyewear. Throughout the day we usethese technologies to communicate, access, create and disseminate information,be it in the office, at home, or on the go. The consequence of constantly beingsurrounded by such devices is that they compete for our attention: we continuallyswitch our attention between different devices and sources of information whiledoing different types of tasks. Especially the activity of information workers ischaracterized by frequent attention switches throughout the day.
A study by Dey et al. [65] found that people keep their smartphones within arm’sreach for about 53% and within the same room for 88% of the time. On dailybasis, users interact with their phones on average 58 times where 60% of theseinteractions constitute to quick glances since the phone remains locked [133].A study by Bohmer et al. [27] found that users spend about an hour a day ontheir phone just using apps. Meanwhile, they use an app on average for less

54 3 Human Attention
than 72 seconds at a time. Ferreira et al. [97] report that approximately 40% ofapplication launches last less than 15 seconds showing that interaction happens inbrief bursts of micro-usages. Such usage behavior shows the highly fragmentedattention users pay to their devices.
Interruption Management
Interruptions negatively affect people’s focus as they find it difficult to return to theactivity prior to a distraction [56, 141]. Depending on the current task condition,people may either ignore an interruption, delay attending or immediately turn to it.Interruptions occur in our salient physical environment but increasingly emanatefrom our digital devices, especially in the form of alerts and notifications [55].
Hence, different notification-delivery strategies have been proposed to minimizethe impact of interruptions: Horvitz et al. [137] proposed bounded deferral: ifa user is predicted to be busy, alerts are being held back until a more suitablemoment, but only for a maximum amount of time. In the context of mobile phones,Fischer et al. [99] found that opportune moments for delivering notifications occurright after the user has finished a task, such as writing a message. Previous work[209, 215, 216] has explored the use of mobile phone sensors and usage patterns,such as the user’s location or recency of interactions, to automatically predict suchopportune moments. Rosenthal et al. [230] created a classifier that learned fromthe user’s behavior when to mute the phone for incoming calls or notificationsin order to avoid embarrassing interruptions. After a learning period lasting twoweeks, the application applied the learned preferences and changed the ringervolume proactively based on the trained classifier.
However, bounded-deferral strategies may not work if there are many long phaseswithout opportune moments. It can be considered an ideal strategy only whenusers are typically attentive, and when phases of inattentiveness are brief. To seewhether this is the case, we conducted the first study described in this chapter todetermine the attentiveness of mobile phone users throughout the day. We theninvestigated the characteristics of opportune moments and how to identify them,which brought us to the notion of boredom.
Boredom and Stimuli-Seeking Moments
Fenichel [95] described boredom as a displeasure caused by a “lack of stimulationor inability to be stimulated thereto”. It often comes with a “pervasive lack of

3.1 Related Work 55
interest and difficulty concentrating on the current activity” [100]. Eastwood [89]highlights that “a bored person is not just someone who does not have anythingto do; it’s someone who is actively looking for stimulation but it is unable todo so”. When perceived as an undesirable state, boredom can instill an urge toescape the current situation [113]. This urge can cause people to actively seek outstimulation. Detecting these situations could lead us to such opportune moments,in which interruptions might be welcomed by users.
Boredom detection has been the focus of previous work. Bixler and D’Mello [24],for example, assessed boredom during writing tasks by logging keystrokes. Theycollected affect judgments from participants, in which boredom was named in26.4% of the cases, second most often after engagement (35.4%). They wereable to distinguish engagement-neutral and boredom-neutral states by looking atkeystrokes together with participants’ stable traits. Guo et al. [119] connectedusers’ web activities to their general susceptibility to distractions. They foundmouse movements, clicks, page scrolls, and other fine-grained interaction eventsto be indicators for boredom. Mark et al. [182] further showed how the typeof digital activity can be a strong predictor for the attentional state of a person,such as being focused or bored. They found that boredom was related to frequentwindow switches, surfing the Web, and the time of day. People using Facebookgenerally did not report being in a focused state. However, online communicationactivities, such as Facebook visits, can function as a quick break when people areengaged in work [179]. These brief moments of often self-induced distraction canhelp people to maintain emotional homeostasis while multitasking [180]. Home-ostasis defined as the ability of an organism to maintain an internal equilibriumis challenged as people get stressed, bored or frustrated. Hence, the attempt tomove to another activity is aimed at getting back to a balanced state. So peoplesometimes actively seek out distractions even during work. Such distractions areconsidered low cost in terms of cognitive resources required, they promise to befun, and leave the user in control over the duration of the interaction [179]. Theday of the week also seems to play a role when it comes to bored and focusedstates. Here, Mark et al. [182] found that people were both most focused andbored on Mondays compared to the rest of the week. Most rote work was doneon Thursdays.
Other work investigated affect detection based on device usage. Mobile socialinteractions and application usage seem to be closely linked to people’s mood.LiKamWa et al. [175] inferred mood (valence and arousal) from SMS, email,and call interactions, as well as from applications routinely used. Bogomolov etal. derived daily happiness [26] and stress [25] based on mobile phone usage,personality traits, and weather data. As formulated by Marks et al. [180] certain

56 3 Human Attention
attentional states are more susceptible to distractions than others. This opennessto interruptions was further shown to be related to the following device usagepatterns:
• time since recent device usage [10, 102]
• use of mobile phone messengers and the phone’s notification center [213]
• activity levels, such as switching windows [142, 182]
• use of keyboard and mouse [102, 142]
• ambient noise level as a proxy for activity levels around the user [102]
• semantic location (i.e. home or work) [211, 230]
• ringer mode as an indicator for how people want to manage interrup-tions [211, 230]
• time-dependent variables, such as the hour of the day or the day of theweek [10, 102, 138]
• proximity as an indicator for whether the phone’s screen is covered (i.e.,stowed away) or not [211, 213].
Previous work shows how attentional states, openness to interruption, and bore-dom measurably affect the way people pay attention to their devices. In thisChapter, we present two studies looking at how attention can be quantified acrossthe day and how we can identify such moments, in which users turn to theirdevice in search for stimulation. By understanding attention better in a technol-ogy context we aim to inform the design of attention-aware systems that adjustinformation delivery to the user’s current state. By knowing about opportunemoments to deliver content, interruptions can be mitigated and information ispresented at times when the recipient’s attention allows for active perception andprocessing of that information.
3.2 Quantifying Attention
Mobile devices, applications, and services require and attract people’s attention.But attention is generally limited and therefore valuable. Hence, in today’s

3.2 Quantifying Attention 57
attention economy human attention is treated as a scarce commodity [59]. Weset out to investigate how scarce it really is in a technology context and whetherit can be assessed in a quantified manner. Therefore, we looked at people’sattentiveness to their mobile phone across the day, and more specifically at theirmobile messaging behavior.
3.2.1 Motivation
People predominantly use their mobile phones for communication purposes bysending out SMS and using various types of messengers. In a 2011 survey,teenagers were found to exchange a median number of 60 messages per day [174].Due to these frequent interactions, people tend to expect responses to theirmessages within minutes [47]. To meet these expectations, people need to beattentive to their phones, which means checking and triaging new messagesquickly upon arrival. Usually, people do so within a few minutes [19, 215, 232],but such behavior ends up often interrupting current activities. Such interruptionscan exhibit negative effects, as it can be difficult to return to an activity priorto the interruption [56, 141]. Previous work has, therefore, proposed differentnotification-delivery strategies, such as bounded deferral [137], through whichalerts are not delivered immediately, but rather delayed until a more opportunemoment. These strategies only work, however, if sufficient opportune momentspresent themselves throughout the day. If messages are delayed for too long,the message content may become irrelevant and response times will increase,which in turn may violate expectations. If the maximum delay, on the otherhand, is too short, messages may be delivered too frequently leading again tointerruptions. Bounded deferral will, therefore, only be a viable strategy whenusers are generally attentive, and when phases of inattentiveness are kept brief.
To determine general attentiveness of smartphone users throughout the day, weconducted a study during which we collected phone-usage data from 42 mobilephone over the course of two weeks.
3.2.2 User Study
To be able to predict people’s general attentiveness to mobile messages, weconducted a study in which we assessed how quickly users triaged incomingmessages throughout the day. We, therefore, released a mobile app in 2014,through which we collected ground truth on the arrival time of messages and the

58 3 Human Attention
time until users attended to incoming messages. Additionally, the app recordedcontextual and phone usage data. Over the course of two consecutive weeks,we collected both ground truth and contextual data in order to train a machine-learning algorithm, with which we were able to determine users’ attentivenessto mobile messaging throughout the day. From the context data collected, weextracted 16 features, with which we trained our model. For each minute of theday, we predicted how quickly a user would attend to a message by applying themodel. Thus, the model helped us fill the gaps for all those moments where usersdid not actually receive any messages.
Participants
Through university mailing lists and from a study participant pool of TelefonicaR&D in Spain, we recruited 42 participants (45.2% male, 23.8% female, 31%did not report their gender) who reported their age to be on average 28.7 years(SD = 5.9). The majority of participants was living in Europe based on thedevices’ language and timezone settings.
Data Collection
Our Android app was designed as a background service that ran on participants’phones and collected data from sensor and phone events, such as the status of thescreen (on/off), data from the proximity sensor, access to the notification center,the ringer mode, the app in the foreground, and incoming notifications. Addition-ally, the app recorded Whenever an incoming message triggered a notification andwhen a notification was removed, including instances, in which messages wereread on another device. We focused on notifications from messenger applicationsfiltering out other types of notifications. Notifications that came in while therelated app was already in the foreground, were ignored as well. The ground truthinstances and the contextual data was recorded, stored locally, and sent to a serverwhenever a WIFI connection was available.
Procedure
After downloading and installing the app from Google Play participants wereasked to sign an informed consent form when the app was first launched. In it, we

3.2 Quantifying Attention 59
provided information on the study’s background and on the type of informationbeing collected. The app then instructed participants how to explicitly grantaccess to notifications data. For two consecutive weeks of data collection, wecompensated participants with a 20 EUR Amazon gift card.
Results
We collected a total of 55,824 messages from 42 participants. Figure 3.1 gives anoverview of the total number of messages received during the different hours ofthe day.
0"
1000"
2000"
3000"
4000"
0" 1" 2" 3" 4" 5" 6" 7" 8" 9" 10"11"12"13"14"15"16"17"18"19"20"21"22"23"
#"No%
fica%
ons"
Hour"of"the"day"
Figure 3.1: Total number of notifications per hour of the day (’0’ indicatesnotifications arrived between 0:00 and 1:00 o’clock, for example).
Participants received on average 66.8 (Mdn = 40) messages per day. Figure 3.2shows the distribution between different messenger apps. With 77.7% of themessages, WhatsApp dominated other messenger apps, while only 1.8% ofreceived messages constituted text messages. In Europe, WhatsApp has mostlysubstituted SMS messaging.
Attentiveness
Responsiveness is merely an indicator of when users actually respond to anincoming message. Attentiveness, on the other hand, includes the user beingaware of a message and having decided whether to act on or ignore it at the currenttime, a behavior also known as triaging. Because receivers’ actual responses alsodepend on factors, such as the sender-receiver relationship, or the importance

60 3 Human Attention
77%
7% 5% 2%
9% WhatsApp Telegram Facebook Messenger Text Messages / SMS Other
Figure 3.2: Messages by messenger service.
and urgency of the content, we focused on modeling attentiveness rather thanresponsiveness. Incoming messages could, therefore, be attended in three ways:
1. by checking the notification center, which shows sender and excerpt of themessage
2. by opening the corresponding messenger application and
3. by reading the message on a different device (e.g., WhatsApp messagescan be read in a browser window rather than on the phone).
The dataset we collected contained 38,180 (68.4%) messages that were firstattended to through the notification center and 14,134 (25.3%) that were attendedto through another device. The remaining 3,510 (6.3%) messages were firstattended to by opening the app they belonged to. Our participants attended tomessages within a median time of 2.08 minutes, 25% of the messages within 12.0seconds, 75% within 12.3 minutes, and 95% within 80.0 minutes.
We analyzed the time within which messages were attended to depending onwhether this was done through the notification center, the respective app, orthrough another device using a Kruskal-Wallis test. The test revealed a statisticallysignificant difference (X 2(2) = 2505.139, p < 0.001). Pairwise Mann-Whitneytests (Bonferroni-corrected) showed that messages were attended to quickerthrough the app (Mdn = 0.47 min, p < .001) or another device (Mdn = 0.75 min,p < .001) than through the notification center (Mdn = 3.2 min).

3.2 Quantifying Attention 61
3.2.3 Phone-Usage Patterns
To predict people’s attentiveness to mobile messaging throughout the day, wecreated a model similar to the one presented by Pielot et al. [215]. The modeluses 16 features based on the mobile phone sensor and event data: the screenstatus (on/off) and when this status last changed, the status of the proximity sensor(screen covered/not covered) and when it last changed, the time since the phonewas last unlocked, the time since the last message arrived, the number of pendingmessages, the time since the user last opened the notification center, the hour ofthe day, the day of the week, and the ringer mode.
We used the median delay (2.08 min.) between arrival and attendance of amessage for classifying attentiveness in a binary manner. We, therefore, labeledusers attentive when they triaged messages within these 2.08 minutes, otherwisewe labeled them as non-attentive. We then trained a Random Forest resulting ina 79.29% accuracy and k = .586. Precision and recall for being attentive were.771 and .828 respectively.
Attentiveness Throughout the Day
We applied the trained model to computationally estimate the times that peoplewere attentive throughout the day, minute by minute. We, therefore, went throughall sensor data and computed the state of each of the features for the beginning ofeach minute of the day, which constituted 86,400 states per day. We then appliedthe classifier for each state to predict participants’ attentiveness.
The model predicted participants to be attentive to messages on average for 50.5%(SD = 14.6%) of the full 24-hours of the day. The quartiles were 40% (1stQ),49% (median), and 55% (3rdQ). The majority of participants, therefore, attendedto messages within 2 minutes for 12.1 hours per day or 84.8 hours per week,which corresponds to 75.8% of the hours typically spent awake (if we assume anaverage of 8 hours of sleep).
Figure 3.3 depicts the average attentiveness throughout all days of the week.We found a statistically significant difference between the days of the week(F(6,20802) = 41.07, p < .001). Bonferroni-corrected pair-wise t-tests showedthat there were statistically significant differences between the weekdays and thedays of the weekend (p < .001): participants were, therefore, significantly moreattentive to incoming messages during the week (Mon - Fri) than during weekends(Sat, Sun). During the week, participants were predicted to be attentive 62%-67%

62 3 Human Attention
0
5
10
15
20
Mon Tue Wed Thu Fri Sat Sun
Atte
ntive
ness
(hou
rs)
Figure 3.3: Average attentiveness by day. Dashes indicate the median,diamonds the mean levels of attentiveness. A value of, e.g., 12 indicates that,on average, users are attentive to messages during 12 hours of the given day.
of the day, whereas on the weekend these numbers dropped to 45%-50%. Theaverage attentiveness for each hour of the day is shown in Figure 3.4. The medianpredicted attentiveness ranges from 0% at 4:00 am to a maximum of 83% at09:00 pm. Tests revealed a statistically significant differences (F(23,20875) =189.6, p < .001) as well: We found attentiveness to be highest during the evening,i.e., between 6:00 and 9:00 pm. With a median attentiveness of at least 80%, thiswas significantly higher than during the rest of the day (pair-wise comparisonsyielding at least p < .01, Bonferroni-corrected). Further, we found a statisticallysignificant difference between night time (0:00 - 8:00 am) and day time (10:00am - 11:00 pm) (all pair-wise comparisons yielding at least p < .001, Bonferroni-corrected). During nights and early mornings, median attentiveness was alwaysbelow 50%, whereas during the day, median attentiveness was always above 67%.
We then looked at the duration of periods in which participants were predicted notto be attentive to messages, i.e. inattentive. Calculating the quartiles, participantswere predicted to be back in an attentive state after 1, 2, and 5 minutes, in 25%,50%, and 75% of the cases respectively. When entering a state of being inattentiveto messages, participants, therefore, returned to a state of attentiveness most ofthe time after only a few minutes.

3.2 Quantifying Attention 63
●●●●●●●●●●●●●●●●●●●●●●●●●●●●●●●●●●●●●●●●●●●●●●●●●●●●●●●●●●●●●●●●●●●●●●●● ●●●●●●●●●●●●●●●●●●●●●●●●●●●●●●●●●●●●●●●●●
●●●●●●●●●●●●●●●●●●●●●●●●●●●●●●●●● ●
●●●●●●●●●●●●●●●●●●●●●●●●●●●●●●●●●●●●●●●●●●●●●●●●●●●●●●●●●●●●●●●●●●●●●●●●●●●●●●●●●●●●●0.00
0.25
0.50
0.75
1.00
0 1 2 3 4 5 6 7 8 9 10 11 12 13 14 15 16 17 18 19 20 21 22 23Hour of the day
Atte
ntive
ness
(%)
Figure 3.4: Average attentiveness by hour. The dash indicates the median,the cross the mean level of attentiveness. A value of .50 indicates that, onaverage, users would attend to messages within 2 minutes in 50% of the casesat a given hour.
3.2.4 Discussion
Based on the ground truth data we collected we trained a model that allowedus to predict people’s attentiveness towards mobile messaging throughout theday. It showed that people are attentive to messages 12.1 hours of the day, whileattentiveness is higher during week days than on weekends and people tend tobe more attentive during evenings. Phases of inattentiveness seem to last fora relatively short amount of time since our participants returned to attentivestates within 1-5 minutes in the majority (75% quantile) of cases. The model ofattentiveness we constructed performed with around 80% accuracy significantlybetter than the 70.6% reported in previous work by Pielot et al. [215] due to asubstantially larger data set (55,824 vs. 6,423 messages).
In 2006, a similar approach was taken by Avrahami and Hudson [11], who devel-oped statistical models to predict users’ responsiveness to incoming messages,which they used to compute the likelihood of receivers to respond to messageswithin a certain time period. They used a similar set of features, but the algorithmthey presented was limited to Desktop usage, which did not take into accountpeople’s messaging behavior while being mobile and was, therefore, limited toonly a subset of people’s day. Other researchers attempted to determine the timeinterval between the arrival and acting on incoming messages/notifications with 6minutes (average) for replying to SMS [19], 6 minutes (median) for attending tomessages [215], and 30 seconds (median) until a notification is clicked (if it isclicked) [232]. With a median of two minutes delay until attending to messages,the work presented here is in line with these findings and stresses that people

64 3 Human Attention
tend to attend to messages promptly. Most previous studies, however, only reportmeasures of central tendency. The findings presented here, in contrast, give amore detailed estimation of people’s attentiveness throughout the day. Hence,we provide insights into when people are more or less attentive and how longthese phases of inattentiveness last. Our finding that people spend about 12 hoursper day in highly attentive states further advances results reported by Dey etal. [65], who found in 2011 that phone users kept their within arm’s reach forabout 53% and in the same room for about 88% of the time. Keeping the phoneclose, therefore, also seems to lead to people attending new messages promptlyfor most parts of the day.
In 2013, Church and de Oliveira [47] reported that people exhibit high expecta-tions towards the responsiveness of their conversation partners in mobile mes-saging. Strategies to deliver notifications in opportune moments [137, 141, 209,216]—such as bounded-deferral, which may delay the delivery of messages—therefore, only work without violating expectations, if there is a sufficient numbersuch moments. Our findings suggest that this is, indeed, the case: we foundour participants to be attentive for large parts of their wake time and phases ofestimated non-attentiveness during daytime typically lasted for only 1-5 minutes.In a majority of the cases, there will hence be a suitable amount of opportune mo-ments sufficiently stacked together. Whether these moments are truly opportuneor whether people simply give their phones priority over other activities, such asmeetings or being out with friends, needs to be further investigated.
3.2.5 Study Conclusion
Our study on people’s attentiveness provides quantitative evidence for people’stendency to exhibit high levels of attentiveness towards mobile messaging duringlarge parts of the day: during 73.5% of their waking hours, people are highlyattentive, while phases of inattentiveness tend to last only for a few minutes.Our findings, therefore, inform the design and development of such applicationsas any method for intelligent notification delivery can expect a generally highlevel of attentiveness from their users. The concept of bounded deferral would,therefore, work well in 75% of the cases with a bound of 5 minutes.
We do, however, need a better understanding of the underlying causes for suchhigh levels of attentiveness, such as social pressure and positive reward loops.Therefore, we need ask questions, such as: how can we overcome such socialmechanisms in order to create spaces where phone users can retreat to and feelfree to think and reflect without external pressures? With being attentive to mobile

3.3 Detecting Stimulus-Seeking Moments 65
messaging for 12.1 hours per day, people spend a great deal paying attentionto their mobile devices. This made us wonder whether besides serving a needfor communication the mobile phone may be picked up as a distraction. And ifso, whether these moments, in which people turn to their phone to actively seekstimulation, could be predicted.
3.3 Detecting Stimulus-Seeking Moments
Despite the fact that the mobile phone is a major source of incoming distractionsthrough alerts and notifications, people seem to also actively seek out stimulationin idle moments. Situations in which people are, for example, waiting (e.g., forthe bus, in a supermarket queue) and turn to their phone to kill time are unique ina sense that they actively seek out information to be consumed often without aspecific goal in mind. Such behavior is especially common to battle temporarystates of boredom. We were interested if such behavior might show certainpatterns in phone usage characterized by, for example, frequent app switchesor briefly checking social media sites. Hence, we set out to explore how suchbehavior could be detected automatically by the phone’s sensors. Awareness ofstates, in which users actively seek out stimulation, could open up new ways ofdelivering and recommending content proactively.
In the following, we describe the design, implementation, and results of a two-week in-the-wild study, in which we collected over 40,000,000 phone usagelogs and 4398 boredom self-reports of 54 mobile phone users. From this vastamount of data, we were able to train a machine-learning model to predict statesof boredom with an accuracy of up to 82.9%
The research question we set out to answer was:
• RQ2: Does boredom measurably affect phone usage and which usagecharacteristics are most prevalent during such states?
3.3.1 User Study
To investigate whether states of boredom could be detected by analyzing mobilephone usage, we conducted an in-the-wild user study. A total of 54 participantsinstalled an app called Borapp on their mobile phones, which we developed

66 3 Human Attention
to collect data over the course of two weeks. Besides phone usage, the apprecorded ground truth data about users’ self-assessed states of boredom by usingthe Experience Sampling Method [50]. Our goal was to relate the phone’s usagedata to the boredom states reported by the users.
Method
Experience sampling entails prompting the user several times throughout theday to provide a subjective assessment of current activities or feelings. We usedmobile phone notifications to trigger mini surveys throughout the day asking aboutthe user’s current state of boredom. On a 5-item Likert-type scale (0=disagree,4=agree) participants answered the question: “To what extend do you agree to thefollowing statement: ’Right now, I feel bored.’?” (see Figure 3.7). Taking theseself-assessments as ground truth we analyzed phone usage data recorded aroundthe time of filling in these surveys. By extracting 35 features from phone sensordata we trained a machine-learning model which would allow us to predict boredvs. non-bored states.
Apparatus
To be able to prompt participants throughout the day we created Borapp, an appfor Android phones with OS 4.0 or newer. The app consisted of a data collectionservice, a notification trigger service, and the main view. The data collectorrecorded various phone sensor data, the background service was responsiblefor scheduling and triggering the ESM surveys, and the main view allowedparticipants to track their study progress.
To reduce battery drain we divided the sensor data collected into two groups:1) those that were permanently collected even when the screen was switchedoff, and 2) those that were only collected when the phone was in use, i.e., thescreen was on and unlocked. Table 3.5 shows the list of sensor data permanentlycollected, whereas sensors whose data was collected only when the phone wasunlocked is displayed in Table 3.6.
To allow these sensors to collect the data listed, participants had to explicitly grantinformation access to the Android Accessibility Services, to notifications, and tolocation information. Due to privacy restrictions, these sensors are not exposedby the standard Android API. Through the accessibility service, foregroundapplications could be monitored, while notification access let us track whichapplications post notifications and when.

3.3 Detecting Stimulus-Seeking Moments 67
Sensor DescriptionBattery Status Battery level ranging from 0-100%Notifications Time and type (app) of notificationScreen Events Screen turned on, off, and unlockedPhone Events Time of incoming and outgoing callsProximity Screen covered or notRinger Mode Silent, Vibration, NormalSMS Time of receiving, reading, and sending SMS
Figure 3.5: List of sensors permanently collected.
Sensor DescriptionAirplane Mode Whether phone in airplane modeAmbient Noise Noise in dB as sensed by the microphoneAudio Jack Phone connected to headphones or speakersCell Tower The cell tower the phone is connected toData Activity Number of bytes up/downloadedForeground app Package name of the app in foregroundLight Ambient light level in SI lux unitsScreen Orient Portrait or Landscape modeWifi Infos The WiFi network the phone is connected to
Figure 3.6: List of sensors only collected when the phone was unlocked.
Throughout the day a notification trigger service would fire notifications at semi-regular intervals. By clicking on these notifications users were taken to themini-survey shown in Figure 3.7. Notifications were fired on average six times aday. Probes were only triggered during the day to avoid disturbance and moreso when the phone was in use. Between probes answered we made sure at least60 minutes had passed. Each survey response was recorded with the currenttimestamp in order to be later connected to the phone usage logs.
Borapp provided the main view for participants to be able to track their progressthroughout the study. For successfully completing the study, the app needed tocollect 14 days of data and 84 (14x6) questionnaires had to be filled in. Figure 3.8depicts a screenshot of that view where the number of days and surveys completedwere listed.
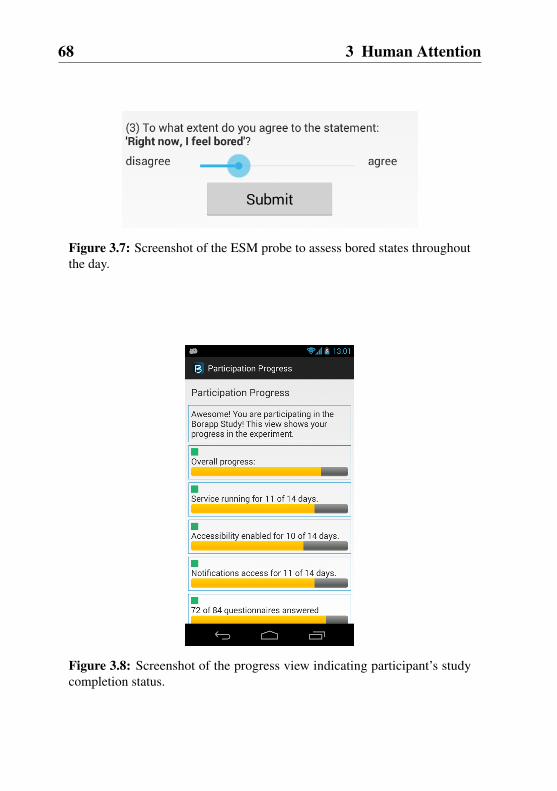
68 3 Human Attention
Figure 3.7: Screenshot of the ESM probe to assess bored states throughoutthe day.
Figure 3.8: Screenshot of the progress view indicating participant’s studycompletion status.
3.3 Detecting Stimulus-Seeking Moments 69
The app further provided detailed instructions about the study and device setupprocedure. This included an explanation of the data collected, the purpose of thestudy, a consent form, and voluntary survey collecting demographic data.
Collected sensor data was written to a log file on the mobile phone’s local storage.In regular intervals, the app checked whether the phone was connected to a Wifinetwork in order to upload the logs to our server and to avoid draining users’ dataplans.
Participants
After making the app available on Google Play, we distributed the link via auniversity mailing list as well as through a list containing volunteers from Spainwho had indicated their general interest in research studies. The study wasfurther disseminated through social network channels. We promoted the studyby advertising a 20 EUR reward for each participant who completed the study,which entailed 14 days of data collection.
After about one month of running the study, we stopped collecting data andcreated a snapshot of the data of those participants who had completed the studyuntil then. The raw dataset contained 43,342,860 data points from phone sensorsand 4,826 survey responses from 61 unique mobile devices. In seven cases surveyresponses barely varied, which we interpreted as participants who had not takenthe study seriously. After removing the data from these devices, we ended upwith 54 remaining participants and 4,398 valid self-reports. Participants providedbetween 84 and 173 (M = 110.3,SD = 25.8) self-reports each. 39 participantsreported their age in a range between 21 and 57 (M = 31.0,SD = 7.9) and tobe female in 11 and male in 23 cases. The remaining 19 participants eitherchose the ‘other’ option or simply did not disclose their gender, since providingdemographic information was optional. According to device locales (52% es ES,18% de DE, 13% en US) and timezones (79% UTC+1, 6% UTC+0 and 5%UTC+8), most participants were from Spain, Germany, and the United States.
Procedure
In June of 2014 we made Borapp publicly available for download on GooglePlay. The app was free to download and advertised through the email lists andsocial channels described. Since we were giving out money for successful studyparticipation we limited the maximum number of sign-ups to a 100. To ensurethat a participant was eligible for receiving the reward, the server conducted aparticipant count when the app was installed and first launched to check whether

70 3 Human Attention
the new user was among the first 100 signing up for the study. The eligibilitystatus was then directly communicated to the respective participant. However,people who were not eligible for the reward were informed by the app, but couldnevertheless take part in the study.
Upon installation and eligibility check the app led users through the setup process.The first screen explained the purpose and procedure of the study, detailed the datacollection process, provided contact information, and asked for explicit consent.The text explicitly stated what kind of personally identifiable information wewould collect, namely device location. In the next step, participants were askedto grant access to the Android Accessibility Services as well as to notificationsand provided detailed information on how to do that. The setup process wascompleted by an optional survey where participants could specify their age,gender, and leave their email address for reward collection. Once setup wascomplete the app started collecting sensor data and began triggering ESM probesvia the notification scheduler.
Upon completion of the study participants eligible to collect their reward weresent a 20 EUR Amazon voucher. Successful completion required users to enableaccessibility service and notification access, to keep the app running in thebackground for at least two weeks, and answer at least 84 ESM questionnaires.
Results
With 4398 filled in ESM questionnaires serving as ground truth and more than40,000,000 phone usage logs, we conducted the data analysis in form of a machine-learning classification task. This approach enabled us to explore the relationshipbetween different phone usage patterns and reported boredom and further allowedus to quantify the degree of which boredom can be inferred from mobile phoneusage.
Feature Elicitation
We identified 35 features related to phone-usage patterns in the following sevencategories:
1. Context: features relating to the phone’s current context.
2. Demographics: explicitly collected features relating to the user.
3. Time since last activity: features relating to activities and their last occur-rences.

3.3 Detecting Stimulus-Seeking Moments 71
4. Usage intensity: features based on direct phone usage.
5. External triggers: features related to phone events triggered from theoutside.
6. “Idling” : features related to short, but frequent interactions with the phonehinting towards less goal-oriented activities.
7. Usage type: features related to direct user interactions with intent.
Detailed descriptions of each feature are listed in Table 3.1 and Table 3.2 undertheir respective categories. Features, such as time since last phone call, or ringermode state, could be retrieved discretely at the time of the ground truth collection.Other features, such as battery drain or most used app, needed to be computedover a certain time window prior to the user submitting the subjective rating. Tochose a time window we experimented with different window sizes of 1, 5, 10,30, and 60 minutes in length. Here, we managed to achieve the best classificationresults with a 5-minute time window, i.e., for all feature we took into account howthe phone had been used five minutes before the respective ESM questionnairewas filled in.
For features related to the applications in the foreground or notifications triggeredwe used an app blacklist, that prevented, for example, system services from beingtaken into consideration (on some devices a notification event was triggeredevery time the keyboard was brought to the front, which we thereby effectivelyexcluded from our analysis). Linear models are highly sensitive to outliers, whichis why we checked numeric features for whether they required saturation, therebyremoving outliers beyond a certain threshold. However, we ended up with thenumeric features all having long-tail distributions, which means there were onlypositive outliers. Based on the skewness of each feature, we chose the appropriatepercentile out of 90%, 95%, and 99%, and used that as an upper limit. A numberof entries for features related to specific apps (e.g. last app in the foreground,most-used app, last notification) were sparse due to the fact that many of therecorded apps appeared only a few times or once in our overall dataset. Thatmade it difficult to properly learn the meaning of sparse elements. Hence, wereduced the dimensionality of these features by assigning rarely used apps tothe ‘other’ category. Again, this distribution was heavily skewed, which is whywe kept the ten most frequent applications and mapped the rest into the ‘other’category. For features describing application categories, we kept the three majorcategories (i.e., communication, productivity, and society) which accounted fortwo-thirds of entries.
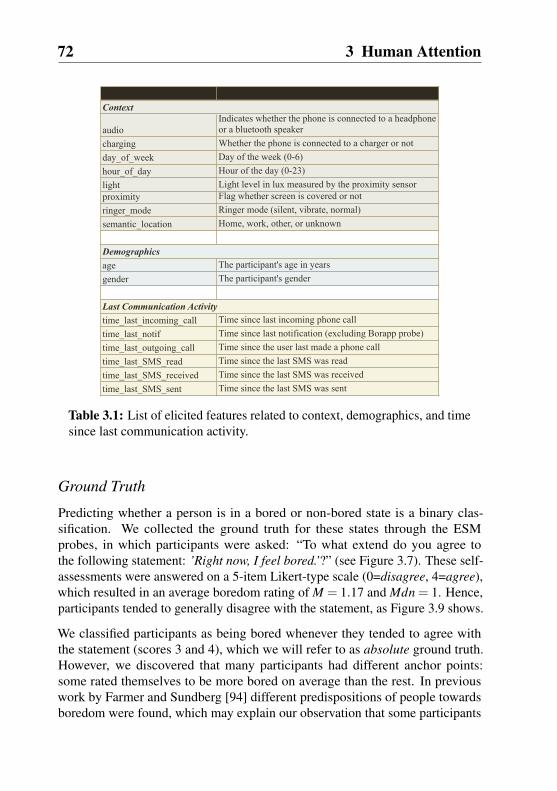
72 3 Human Attention
Feature Description
audioIndicates whether the phone is connected to a headphone or a bluetooth speaker
charging Whether the phone is connected to a charger or notday_of_week Day of the week (0-6)hour_of_day Hour of the day (0-23)light Light level in lux measured by the proximity sensorproximity Flag whether screen is covered or notringer_mode Ringer mode (silent, vibrate, normal)semantic_location Home, work, other, or unknown
age The participant's age in yearsgender The participant's gender
time_last_incoming_call Time since last incoming phone calltime_last_notif Time since last notification (excluding Borapp probe)time_last_outgoing_call Time since the user last made a phone calltime_last_SMS_read Time since the last SMS was readtime_last_SMS_received Time since the last SMS was receivedtime_last_SMS_sent Time since the last SMS was sent
Context
Demographics
Last Communication Activity
Table 3.1: List of elicited features related to context, demographics, and timesince last communication activity.
Ground Truth
Predicting whether a person is in a bored or non-bored state is a binary clas-sification. We collected the ground truth for these states through the ESMprobes, in which participants were asked: “To what extend do you agree tothe following statement: ’Right now, I feel bored.’?” (see Figure 3.7). These self-assessments were answered on a 5-item Likert-type scale (0=disagree, 4=agree),which resulted in an average boredom rating of M = 1.17 and Mdn = 1. Hence,participants tended to generally disagree with the statement, as Figure 3.9 shows.
We classified participants as being bored whenever they tended to agree withthe statement (scores 3 and 4), which we will refer to as absolute ground truth.However, we discovered that many participants had different anchor points:some rated themselves to be more bored on average than the rest. In previouswork by Farmer and Sundberg [94] different predispositions of people towardsboredom were found, which may explain our observation that some participants

3.3 Detecting Stimulus-Seeking Moments 73
Feature Description
battery_drain Average battery drain in time windowbattery_level Battery change during the last sessionbytes_received Number of bytes received during time windowbytes_transmitted Number of bytes transmitted during time window
time_in_comm_appsTime spent in communication apps, categorized to none, micro session, and full session
num_notifs Number of notifications received in time windowlast_notif Name of the app that created the last notificationlast_notif_category Category of the app that created the last notification
apps_per_minNumber of apps used in time-window divided by time the screen was on
num_apps Number of apps launched in time window before probenum_unlock Number of phone unlocks in time window prior to probetime_last_notif_access Time since the user last opened the notification centertime_last_unlock Time since the user last unlocked the phone
screen_orient_changesFlag whether there have been screen orientation changes in the time window
app_category_in_focus Category of the app in focus prior to the probeapp_in_focus App that was in focus prior to the probecomm_notifs_in_tw
Number of notifications from communication apps received in the time window prior to the probe
most_used_app Name of the app used most in the time windowmost_used_app_category Category of the app used most in the time windowprev_app_in_focus App in focus prior to app_in_focus
Usage (related to the type of usage)
Usage (related to usage intensity)
Usage (related to whether it was triggered externally)
Usage (related to the user being idling)
Table 3.2: List of elicited features related to usage intensity, external triggers,idling and type.
had a different baseline level of boredom. Hence, we chose this personalizedground truth to reflect whether participants were feeling more bored than usual.Therefore, we transformed the absolute responses into personalized z-Scores,where 0 indicates that the participant considered herself not bored as a baselineboredom level during the study. Consequently, samples with values over +.25were considered positive on this personalized scale, leaving us with a normalizedground truth. This distinction allowed us to derive how well we could predictwhether people were more bored than usual (normalized) vs. how bored theytended to be in general (absolute).

74 3 Human Attention
0
500
1000
1500
0 1 2 3 4
Freq
uenc
y
Agreement to "Right now, I feel bored" 0 = disagree, 4 = agree
Figure 3.9: Histogram of ESM questionnaire responses.
Thus, we ended up with two datasets depending on whether we consideredthe ground truth to be absolute or normalized. Out of the total 4398 boredomassessments using the normalized ground truth produced 1518 (34.5%) instancesclassified as bored, and 2880 (65.5%) instances classified as baseline. Thisdistribution is in line with boredom assessments reported by Goetz et al. [113],in which participants indicated to be bored in one-third of their responses. Incontrast, the dataset produced by using the absolute ground truth with its 446(10.1%) instances classified as bored was less balanced.
As mentioned earlier there seemed to be a general predisposition of people to-wards boredom, which affected their self-assessment scores. Bixler et al. [24]investigated the detection of affect and came to the conclusion that detectionaccuracy could be increased by taking users’ psychological traits into account.Hence, we disseminated a post-hoc survey with a 28-item Boredom PronenessScale (BPS) [94] to participants who had volunteered to leave their email address.Since this happened after the actual study had already been completed, we didnot receive responses from all participants. Out of 54, 22 participants completedthe survey. We added the resulting boredom proneness scores to participants’demographics and listed them as an additional feature to their self-reports. How-

3.3 Detecting Stimulus-Seeking Moments 75
ever, since our primary interest was in detecting moments, in which people usedtheir phone to kill time, i.e., their stimulation levels dropped, we chose the nor-malized ground truth for our primary data analysis without boredom pronenessinformation. We were hoping this modeling choice would increase our model’s ap-plicability in a sense that it would not require obtaining boredom proneness scoresbefore deployment and therefore was capable of detecting boredom deviationseven for people who were not prone to be bored.
Boredom Classification
For classifying user states into bored vs. non-bored, we used three differentclassification methods and compared their respective performances:
1. A linear classifier: L2-regularized Logistic Regression (Logistic Regression(LR)) [125].
2. A non-linear classifier: support Vector Machines with Radial Basis Func-tions kernel (Support Vector Machines (SVM)) [260].
3. An Ensemble Learning technique: Random Forest (RF) [30].
For each classifier, we used the same model-building methodology: a nestedcross-validation approach [43]. Thereby an inner loop performs a grid searchover the space of model hyper-parameters and selects the best performing values.At the same time, an outer loop measures the performance of the model found inthe inner loop. To prevent any positive bias when measuring the performance, thefold, which is being evaluated in each step of the outer loop, is not used for thetraining phase. In our analysis, we used 10-folds for the outer and 5-folds for theinner loop.
We achieved the best results with the Random Forest (RF) classifier. Similarto other ensemble learning methods, such as Boosting and Bagging, RFs usemultiple weak-learners and aggregate their results, thereby optimizing the bias-variance trade-off. RF makes use of decision trees as base classifiers, whichintroduce randomization in several stages: first, for each tree of the forest differentbootstrapped samples of the training data are used for its creation. Each node ofthat tree is then greedily split based on the best feature for only a random subsetof all the variables. This process prevents a too strong influence of correlationsbetween the different trees in the forest and helps to reduce the risk of over-fitting.The models created in this manner are inherently non-linear, tolerate outliers andimplicitly support categorical variables.

76 3 Human Attention
76.5%!
82.5%!
74.6%!
82.9%!
0.0% ! 20.0%! 40.0%! 60.0%! 80.0%! 100.0%!
normalized!
absolute!
full! full + proneness!
Figure 3.10: Area Under the ROC Curve (AUCROC) performance of the RFclassifier for all four datasets.
With about two-thirds of participants’ self-assessments being classified as notbored, we had to deal with an unbalanced dataset. The Area under a ROCcurve (AUCROC) is an accuracy metric that can handle such asymmetrical datasets, whereby ROC stands for Receiver Operating Characteristic. Consideringboredom proneness and the absolute as well as normalized ground truth we endedup with 4 datasets. Figure 3.10 shows the resulting classification performancesof RF for all of these datasets in comparison. Using the absolute ground truthproduced consistently better performance than using the normalized ground truth.Boredom proneness slightly reduced the variance.
Figure 3.11 depicts the precision-recall curve for our primary data set, i.e., nor-malized ground truth without boredom proneness. The model shows a highflexibility for choosing different classification thresholds in order to trade preci-sion for recall, which depends on the characteristics of the application setting.Scenarios, in which boredom detection is used to actively probe users, shouldprioritize precision to minimize the number of false positives, which may annoyusers. Here, precision levels of 70.1% (for over 30% recall), or 62.4% (for 50%recall) in less restrictive scenarios can be reached.

3.3 Detecting Stimulus-Seeking Moments 77
34.7% 42.8%
48.3% 52.1%
56.6% 62.4%
66.2% 70.1%
74.3% 76.3%
0%
20%
40%
60%
80%
100%
0% 20% 40% 60% 80% 100%
Prec
isio
n
Recall
Figure 3.11: Precision-recall plot for the primary data set (normalized groundtruth, no proneness).
Feature Analysis
Next, we set out to analyze which features were most meaningful to predict boredvs. non-bored states. Therefore, we used the RF to rank features according totheir importance for the classification by using a measure called Mean ImpurityDecrease. Since RFs consist of a number of decision trees, every tree node is acondition on a single feature, which effectively splits the dataset into two so thatsimilar response values end up in the same set. Impurity is the measure based onwhich the (locally) optimal condition is chosen. When training a tree, we can,therefore, compute how much each feature decreases the weighted impurity in atree. The impurity decrease from each feature can then be averaged across theforest and the features ranked according to this measure [30].
By applying this method, we computed the importance of each feature of ourprimary data set. The top 20 features and their importance measure are listedin Table 3.3 (Column: Import). By clustering these features into our groupsdepicted in Figure 3.1 and 3.2, we end up with the following most importantfeature categories:
• Recency of communication activity: last time a communication happenedvia phone or SMS and the last time a notification arrived (notifications werelargely generated by applications from the communication category).

78 3 Human Attention
• Intensity of recent usage: e.g., volume of internet traffic, number of phoneunlocks, and level of interactions with applications in the last five minutes.
• General usage intensity reflected by, e.g., battery drain, proximity sensorstates (i.e., phone screen covered or not), or time since last phone use.
• Context / time of day indicated by the hour of the day and light sensordata9.
• Demographics: participants’ age and gender.
Feature Import Correlation The more bored, the ..time_last_outgoing_call 0.0607 -0.143 less time passedtime_last_incoming_call 0.0580 0.088 more time passedtime_last_notif 0.0564 0.091 more time passedtime_last_SMS_received 0.0483 0.053 more time passedtime_last_SMS_sent 0.0405 -0.090 less time passedtime_last_SMS_read 0.0388 -0.013 less time passedlight 0.0537 -0.010 darkerhour_of_day 0.0411 0.038 laterproximity 0.0153 -0.186 less coveredgender (0=f, 1=m) 0.0128 0.099 more male (1)age 0.0093 n.a. +20s/40s, -30s
num_notifs 0.0123 0.061 more notificationstime_last_notif_cntr_acc 0.0486 -0.015 less time passedtime_last_unlock 0.0400 -0.007 less time passedapps_per_min 0.0199 0.024 more apps per minutenum_apps 0.0124 0.049 more appsbytes_received 0.0546 -0.012 less bytes receivedbytes_transmitted 0.0500 0.039 more bytes sentbattery_level 0.0268 0.012 the higherbattery_drain 0.0249 -0.014 the lower
Table 3.3: Most important features in the primary data set sorted by theirMean Impurity Decrease score. The bigger (i.e. more blue) the value, themore predictive the feature is for boredom.
To analyze the relationship between phone usage patterns and boredom, wefocused on the top 20 features. Therefore, we trained a Linear-Regression Modelto yield the sign (positive or negative) for each feature, which is depicted in the
9 The same physical sensor returns the ambient light levels and whether the phone screen is covered

3.3 Detecting Stimulus-Seeking Moments 79
Correlation column of Table 3.3. From these correlations we were able to drawthe following conclusions:
• Communication: participants tended to be more bored the more time hadpassed since having received the last phone call, SMS, or notification, andthe less time had passed since placing a phone call or sending an SMS.
• Notifications: the volume of notifications received in the last five minuteswas likely to be higher when being bored.
• Fiddling with the phone: boredom was found to be correlated with morephone usage: the phone screen was less likely to be covered (which, for ex-ample, happens when the phone is stowed away), more apps were used, thelast unlocking and checking for new notifications happened more recently,and the volume of data uploaded was higher when participants were bored.
• Data download and battery drain were lower when people were bored.
• Gender: men tended to be more bored than women.
• Age: for participants in their 20s and 40s boredom was higher than forparticipants in their 30s.
• Time of day: boredom was more likely the later it was in the day and thedarker the ambient lighting conditions.
Looking at how app usage correlated with boredom we found that applications,such as Instagram, email, settings, the built-in browser, and apps in the ’other’category were correlated most strongly with being bored. In contrast, commu-nication apps, such as Facebook, SMS, and Google Chrome, correlated withnon-bored states.
3.3.2 Discussion
Our goal was to investigate different states of user attention and whether we couldidentify situations, in which users explicitly turned to their mobile phone to killtime and actively seek stimulation. Our field study described provides empiricalevidence that 1) there are measurable phone usage patterns that allow us to inferboredom with acceptable accuracy and 2) states of boredom are especially relatedto communication activity, usage intensity, hour of the day, and demographics

80 3 Human Attention
Inferring Boredom
We trained a machine-learning model based on phone usage data from 54 partic-ipants that allowed us to distinguish bored vs. non-bored user states. Thereby,we investigated the impact of additional factors, namely whether we based ouranalysis on a normalized or absolute ground truth computed from participants’self-assessment scores. Our primary dataset produced a 74.6% AUCROC perfor-mance accuracy with normalized ground truth and without boredom pronenessfeatures. Using the absolute ground truth and the boredom proneness data ourmodel even reached 82.9% accuracy with the absolute ground truth data perform-ing consistently higher. This can be explained by the notion that higher boredomlevels lead to a higher agreement with the provided statement of feeling bored(scores of 3 and 4). In contrast, normalized boredom lowered the model’s detec-tion performance but allowed detection when people deviated from their baselinestate. To infer normalized boredom, user-dependent modeling was necessarysince people had different anchor points regarding their perceived boredom levels.
Adding boredom proneness had a minor effect on the prediction results, namelythat it decreased variance, i.e., it helped to make the model more stable. We foundthe effect to be not as pronounced as in related work by Biller and D’Mellos [24],which could be caused by our relatively small sample size of 22 (40.7% ofour participants). Matic et al. [185], however, recently presented a model forestimating boredom proneness based on phone usage, which could render adedicated questionnaire obsolete and be a means to reasonably include boredomproneness data in prediction models.
The caveat of such in-the-wild studies—like the one we conducted here—is thelack of control over the participant’s environment. While striving for ecologicalvalidity, possibly confounding factors are often overlooked or can simply not beidentified. In our case, participants filled in the ESM questionnaires throughoutthe day, but in convenient moments. While we asked them to deliver 84 responsesin total, participants were free to dismiss ESM probes of their own choosing. Howthey chose when to fill in a questionnaire might have introduced a bias we cannotdetect for certain: probes might have been rejected whenever users were deeplyfocused on other tasks, for example. Especially using the absolute ground truthdata may have amplified the effect of moments, in which the user was bored.
Our model’s accuracy, however, proved significant. Related work focused ondetecting happiness [26] and stress levels [25] throughout the day based on phoneusage data. To achieve reasonable results they needed to include additionalinformation about the user’s personality traits and external sources, such asweather, which was not needed for our model.

3.3 Detecting Stimulus-Seeking Moments 81
Indicators of Boredom
With the hypothesis that boredom is reflected in the way people use their mobilephones, we looked into specific usage patterns. Therefore, we analyzed the top20 indicative features, which were mostly related to five aspects, namely: recencyof communication activity, recent and general usage intensity, usage context,and basic demographics. Essentially, the more time had passed since a lastincoming communication and the more recently the user had reached out throughcommunication channels, such as placed a phone call or sent a message, the moreevidence accrued towards being bored. Hence, being reached out to seemed tomitigate, while conspicuously reaching out to people might have been a sign ofboredom. We were also able to relate boredom to common “fiddling with thephone” activities in the form of phone usage intensity, which confirms previouswork [31, 206] stating that people turn to their phones to kill time. With our work,we provide empirical evidence to solidify these claims and advance their findingsshowing that increased phone usage contributes to boredom detection.
We were further able to show that daytime had an effect on phases of boredom.Work by Mark et al. [182] showed that boredom levels vary throughout the dayand that boredom is generally lower during late working hours. Based on features,such as time of day and lighting conditions, we were able to corroborate thisfinding and show that states of boredom tend to become more frequent as the dayprogresses. Also, demographics including age and gender seem to play a role.We found boredom to be higher in men participating in our study. Age groups intheir 20s and 40s seem to show more signs of boredom than those in their 30s.Previous work has looked at the effect of age [270] and gender [16] as predictorsfor boredom in leisure time, which our findings are in line with.
The analysis described in our study is, however, limited to direct correlationsof features and boredom. There may not be any direct correlation betweensome features and the respective levels of boredom, but features may ratherbecome indicative when combined with others. Further, correlation does notimply causation: due to our observational approach, causal interpretations, suchas incoming messages relieving us from boredom, are of rather speculative nature.Phone usage is not the sole predictor of boredom states, however. Contextualfactors and demographics generally play into the mix.

82 3 Human Attention
3.3.3 Study Conclusion
We developed an approach to detect boredom based on how people use theirphone throughout the day. Therefore, we conducted an in-the-wild study with54 participants using the Experience Sampling Method to collect ground truthon boredom states and explore related phone usage context. The most indicativefeatures for predicting states of boredom were recency of communication, usageintensity, time of day, and demographic information. By using machine-learningwe created a model that was able to predict moments, in which users where boredvs. non-bored with an accuracy between 74.6% and 82.9%.
Such moments could be used for benign interventions, such as sending proactiverecommendations. Boredom as a trigger could inform the design of mobilerecommender systems with a better understanding of when and how to engageusers:
• Providing content suggestions in moments of boredom: e.g., articles toread or videos to watch.
• Making boredom-curing activity suggestions, such as contacting friends.
• Instead of suggesting killing time activities users could also be remindedto (re-)engage with planned activities: e.g., clear the backlog of a todo orread-later list.
• Helping people make use of boredom beyond online recommendations byfostering introspection, reflection, and creativity. A possible suggestion, forexample, could be to leave the phone alone for a while or even automaticallyswitch it off.
• Preventing interruptions by, for example, blocking incoming communica-tion requests in situations in which people are not bored, but focused.
Future investigations could focus on mapping out the numerous possibilities thatboredom or engagement detection can provide. Technology could help makethe best of these moments or attempt to intervene. In fact, we will come backto this idea in chapter 6, where we will discuss delivering content in opportunemoments.

3.4 Chapter Summary 83
3.4 Chapter Summary
In this Chapter, we investigated people’s attention in a technological context.Attention is a crucial factor for effective information intake and digestion. There-fore, we focused on how people attend to their mobile phones throughout the dayand whether we can detect usage patterns that reveal underlying cognitive states,such as focus or boredom.
In a first step, we analyzed people’s attentiveness towards mobile messaging ascommunication is one of the most prevalent mobile phone activities. Resultsshow that people are highly attentive to messages for more than 12 hours of theday, which is most of the waking time. We further found that attentiveness ishigher during the week than on weekends, as well as during the evening hours.Even when people are being found to be inattentive, they tend to return to anattentive state within 1-5 minutes in the majority (75% quantile) of cases. Ourdata shows that intelligent notification delivery, such as bounded deferral, isthus applicable. On the one hand, holding back messages in inattentive statesprevents users from being interrupted from a current task at hand. And on theother hand, there seem to be sufficient opportune moments, in which users bringtheir attention back to the phone so that delayed delivery will not negativelyimpact the handling of urgent messages. We base this insight on a classificationmodel we developed, which performed with almost 80% accuracy to reliablypredict users’ attentiveness from phone usage patterns, which confirms RQ1.
With incoming messages and notifications being external stimuli that try to grabthe user’s attention we were further interested in situations, in which peoplepick up their phones to actively seek stimulation. Such moments stem frominternal triggers and may be characterized by a general susceptibility and desirefor targeted distractions. We found these situations being generally associatedwith boredom. Hence, we investigated whether these specific states could bedetected based on phone usage patterns. We combined the logging of phoneusage data of 54 participants over the course of two weeks with the collection ofself-reports on momentary boredom levels. By training a Random Forest classifierwith data on 35 features related to phone usage we were able to predict bored vs.non-bored user states with up to 82.9% accuracy, which allowed us to endorseRQ2.
An analysis of the top 20 predictive features yielded that most phone usagepatterns were mostly related to recency of communication activities, phone usageintensity, time of day, and demographic information. Hence, we found usagecharacteristics that could be linked to users being in a bored or stimulus-seeking

84 3 Human Attention
state. Table 3.3 summarizes the most indicative 20 features and therefore answersthe second part of RQ2.
There is a certain temptation to constantly refer to our mobile devices that connectus with the pulse of available information. Whether it is a good idea to beconstantly connected, is the basis of broad discussions. Before electronic devicesbecame ubiquitous it was possible for us to disconnect from online informationspaces, but now we find ourselves being inevitably alerted by our devices. Ina previous study [232] we investigated the nature of notifications on mobilephones and analyzed which types were highly valued or easily dismissed. Wefound notifications related to messaging, people, and upcoming events to bemost appreciated. The resulting design guidelines advise developers on howto balance the informing and disruptive nature of notifications. But even whenmobile devices remain silent, our studies show that people are drawn to checkvarious information sources in all kinds of situations. Whether this is considered abliss for productivity or the beginning of an unruly attention fragmentation makesfor a controversial debate. Our studies have shown that attention is literally notscarce and people frequently check and re-check the information delivered bytheir devices. Whether we can make positive use of this behavior and nudge userstowards more productive or mindful activities will be an interesting challenge forfuture applications. “The cure to boredom is curiosity” –a quote by the Americanwriter Dorothy Parker- points toward an important function of boredom: boredomis an innate indicator for a state, which is not sufficiently satisfying and thereforenudges us to leap to action. Hence, boredom can urge us to initiate creativeprocesses and self-reflection [263].
In our attention economy, however, there is a commercial value in knowing whenpeople are receptive to stimulation. Pushing advertisements in situations whereusers are willing to absorb their content, creates interesting business cases. Adnetworks could charge advertisers according to the recipients’ attention levels.Users, on the other hand, might be more willing to skim through ads whendowntime occurs and might welcome the idea of being left alone when they arefocused on other things.
Engagement studies, such as our boredom study, show how attentional statesare linked to people’s current activities. Insights into when a person is boredor focused can provide us with a better understanding of when people are moreproductive and when downtime occurs. This can also be used to inform the designof tools and interfaces to promote a better experience when mobile, but also inthe workplace. During highly focused states, for example, devices in the user’senvironment could be advised to prevent interruptions, unless they are of high

3.4 Chapter Summary 85
priority or contribute to the current strand of work. An uninterrupted focus is cru-cial for learning tasks as absent-mindedness is fatal for successfully committinginformation to long-term memory. Proactive and situated recommendations couldadvise users to engage with information optimizing for receptiveness.
Such systems could push the user to work on yet another todo-list item evenduring idle times. They could also remind users to use these minutes to call up anold friend. Or maybe, the device could recommend being switched off entirely.Sometimes being with ourselves and with our innate thoughts might create thekind of calm we need to escape our busy daily routines and re-charge our mentalcapacities.

86 3 Human Attention

Chapter4Content-Awareness
In Chapter 3 we investigated to what extent users pay attention to their phonesand analyzed the context in which they seek stimulation through their devices. Inthis Chapter we focus on the specific content people currently engage with andhow awareness of such content can be used to support information intake.
While people often seek out information on their mobile phones in parallel toother activities, such behavior has become especially prevalent when watchingTV. Most of the so-called second-screen apps provide additional information andservices for a specific TV program and app content is mostly manually curatedby the program or app publishers. On the one hand manual content curation iscostly for publishers, and on the other hand dedicated apps need to be installedbefore usage and leave the user with a fragmented app landscape. In this Chapterwe assess the feasibility of creating a single application that detects the currentcontent being watched and delivers automatically generated relevant informationto improve the TV experience in real-time. Thus, we eliminate the need formanual content curation and users are no longer required to install a dedicatedapp for each program or show. Therefore, we developed an extended entitylinking algorithm to extract important keywords from subtitle streams, whichwe link to highly relevant Wikipedia articles and Google search results. Theseautomatically generated contents are then delivered through our second-screenapp called TVInsight (Fig. 4.1), which displays this additional information in acontext-sensitive way, namely in line with the program and program positionthat is currently being watched. In a user study, we evaluated our system withregard to its effects on the user’s TV experience, comprehension of the program’s

88 4 Content-Awareness
Figure 4.1: TVInsight is a second-screen app that shows additional programinformation by triggering web searches and Wikipedia look-ups in real-timeand in line with the current program being watched. Left: general programinformation. Right: Wikipedia content according to people appearance.
content, and level of distraction as compared to conventional look-ups performedon a second device.
In this chapter we address the following research question:
• RQ3: How can awareness of the content which the user is currently exposedto be used to augment the user experience?
This chapter is based on the following publication:
• J. Knittel and T. Dingler. Mining subtitles for real-time content gen-eration for second-screen applications. In Proceedings of the ACMInternational Conference on Interactive Experiences for TV and OnlineVideo, TVX ’16, pages 93–103, New York, NY, USA, 2016. ACM

4.1 Related Work 89
4.1 Related Work
The work described in this chapter is generally rooted in the field of context-awarecomputing, and more specifically related to research regarding second-screenapps and entity linking.
Second-screen Apps
Some first guidelines for second-screen apps were formulated by Robertson etal. [229] who introduced a system connecting a Personal Digital Assistant (PDA)with a television device, where the TV was used more as an additional screen realestate. Utilizing the hardware of each connected device creates synergy effectsthat extend the experience of each device by itself. Cruickshank et al. [51] alsolooked at using a PDA as a second-screen device for browsing the TV programand changing channels.
In recent years a multitude of second-screen apps have commercially entered themarket. They provide additional content, invite users to participate in real-timesurveys, or comprise social features, such as social check-ins or sharing content.The market is fragmented with numerous shows and channels offering theirproprietary second-screen app, mostly tailored to run on mobile devices. Geerts etal. [108] found that a general second-screen app is preferable with regard to everyshow providing its innate application while barriers to find additional programinformation should be kept at a minimum. Second-screen content should notsolely mirror the program’s content, but provide additional information. Further,the program progress should be taken into account.
By splitting functionality across devices the issue of diverting attention becamemore prevalent. Fleury et al. [101] found that users generally appreciate second-screen apps to draw their attention to additional content, but this should be done inunobtrusive ways. Van Cauwenberge et al. [257] looked into media multitaskingand how using a search engine to answer questions while watching a documentaryaffects comprehension. They found that the increased cognitive load by usingthe search engine as a secondary task caused participants to not being able tocomprehensively recite the facts of the documentary and performed worse oncomprehension tests. A study by Google reported that 22% of second-screenusage was complementary to the current program [115].
According to a survey conducted by Nandakumar et al. [195] about 27% of TVshow-related searches concern the characters and their relations, closely followed

90 4 Content-Awareness
by searches about the plot with 23%. With a companion second screen prototypethey showed synchronized and context-sensitive information mainly about thecharacters and found that this enhanced comprehension when used by first-timeviewers of a late-season episode.
Content Linking
To reduce distractions, attempts have been made to automatically detect the TVprogram currently running in the background. Chuang et al. [46] developeda smartphone app using audio fingerprinting to recognize the current show inorder to provide additional content by analyzing the video- and audio stream.While most additional content is manually curated, especially for canned userstudies, Castillo et al. [41] presented an approach for automatically analyzingsubtitles to find relevant news articles for a news program as well as musictitles through mining song lyrics. Their algorithm was used in Yahoo!’s serviceIntoNow which was discontinued in 2014. Additional content can further becreated by linking existing and relevant content together. Allan [7] formulatedthe need for automated procedures to link paragraphs to relevant documents inan automated way. Redondo et al. [226] performed named entity recognition onsubtitles for news broadcasts and used structured data from DBpedia to generatea comprehensive set of relevant context items.
A comprehensive overview of common entity linking features was given byShen et al. [244] who came to the conclusion that most algorithms were highlydomain specific. Mihalecea et al. [53] presented a linking model integratingWikipedia articles. To increase recall and precision values, other works haveincluded PageRank values [178], the number of incoming links, or a combinationof different features and classifiers [96]. Odijk et al. [203] made specific useof subtitles for linking Wikipedia articles by using a context graph based on thedynamic assembly of anchor phrases. However, the analysis of their approachwas based on a curated set of well-defined topics but lacked an evaluation ’in thewild’.
Subtitles are traditionally used to make content accessible to people with hearingimpairments. They have increasingly been subject to research focusing on wordfrequency analysis [147, 154, 199] showing that subtitles approximate spokenlanguage. Hayati et al. [126] showed that displaying subtitles in foreign languagemovies improves auditory comprehension when shown in native as well as inforeign languages. Similarly, Mitterer et al. [189] found that subtitles in a foreignlanguage support language perception and strengthen vocabulary. Kovacs et

4.2 Context-Aware Information Delivery 91
al. [162] developed a video player for foreign language learners which enhancedthe traditional subtitles display by allowing users to jump back and forth throughthe video by clicking on the corresponding subtitle. Brasel et al. [29] investigateddisplaying advertisements in users’ native language with subtitles and their effectson eye movements and recall showing that participants were able to recall moreof the advertisement brands shown. However, they also showed a negative effectfor recalling visual program elements.
Concluding, people seem to use a great number of apps and browser-basedstrategies to look up information based on the TV program they currently watch.But at this point, there is not a comprehensive solution proactively providingrelevant content across TV programs. Manual curation would be unfeasible,which is why we focus on automated content generation techniques. By harvestingthe availability of subtitles we present an approach in this Chapter for an entitylinking algorithm for automatically generating additional program content. Thesolution we propose is independent of any particular channel or show. It preventsthe user from having to download a variety of apps, but at the same time offershighly topic-relevant content. By proactively retrieving content, users have theinformation at their fingertips as they launch the app rather than having to activelylook for content. This reduces potential diversion from the actual TV program.Limited distractions should benefit the TV experience—e.g., through immersion—and improve content comprehension. Inspired by previous work in languagelearning we explore learning scenarios as application cases for context-sensitivesecond-screen apps.
4.2 Context-Aware Information Delivery
The ubiquity of mobile devices increasingly affects our TV experience. 90% ofsmartphone owners use their mobile device while watching TV, about 50% of thisgroup browses the web while 30% use it for looking up additional informationabout the show, topic, and people involved [200]. People often use a seconddevice, i.e., phone or tablet, for looking up keywords online and gather additionalinformation with relevance to the current TV program. In 2012 the PEW ResearchCenter assessed the parallel usage of second-screen devices while watching TVand the relevance of that activity to the current program [245]: from almost 2000participants, 22% used their cell phone to check facts mentioned in the program,35% visited a related website, 20% looked up relevant social comments, and 19%posted their own comments about the program they were watching. However, the

92 4 Content-Awareness
process of looking up relevant information can be quite slow, cumbersome and iserror-prone; coming up with appropriate search keywords, getting the spellingright, and individually evaluating each search result can be time-consuming andrequires mental effort, which diverts attention away from the current show.
The majority of commercial second-screen apps focus on one particular showor program. These apps are often hosted by the TV station itself or by anexclusive partner, so access to content is restricted to the particular app. Userswho follow more than one show end up with a fragmented collection of apps ontheir devices. For content providers, on the other hand, curation can be expensivewhile content can be extracted in an automated way by intelligently linkingexisting resources together. Such an approach is cheaper and further allowslive-shows to be augmented with additional information.
An increasing number of TV stations broadcast subtitles alongside their program.These subtitles bear great potential for content extraction algorithms since theycontain crucial information about topics and people involved. Such contentscan be used to augment the TV experience independent of the channel usersare watching. Additional information can be purely informative, but can alsobe of educational use, especially while consuming foreign language shows, asthey are often watched with the goal of language acquisition. Castillo et al. [41],for example, proposed a system that automatically analyzed subtitles to findrelevant news articles for a given news program. Most systems and studies,however, are based on a very topic-specific domain, therefore limiting theirgeneral applicability in a diverse TV program environment.
In the following we report on an online survey we conducted to gather userrequirements, the development of the application, and a final comprehensiveuser study assessing the effects on users’ TV experience, comprehension of theprogram’s content, and potential distractions compared to conventional look-upsperformed on a second device.
4.2.1 Survey on Device Usage during TV Shows
To elicit features for a second-screen app we conducted an online survey inFebruary of 2015 focusing on how people go about web searches while watchingTV. We set out to analyze what type of information are looked up, on whichdevices and the timing of these searches. We were further interested in howpeople took advantage of subtitles, how frequently they used them, why and forwhich type of shows.

4.2 Context-Aware Information Delivery 93
Figure 4.2: Types of devices used for web searches and the timing of thesearches relative to the show watched.
We, therefore, set up an online survey using LimeSurvey10 running on one ofour university servers. After a brief explanation of the purpose of the surveyand granting consent for the data collection, participants were redirected to threeblocks of questions focusing on demographics, TV information search, and usageof subtitles. The survey was announced through university mailing lists andsocial networks. Over the course of two weeks, we recorded responses from 136participants (60 females) with a mean age of 27 (SD = 8.4). 54% indicated to bestudents while 41% were working professionals. 40% stated they watched TVon daily basis, 88% at least once per week. Filling in the survey took less than 5minutes.
Results
The data collected provides insights into how people search the web while watch-ing TV as well as in what way they make use of subtitles.
Web Search
Of our survey participants, 19.9% stated they had looked up something onlinerelated to a TV show in the last 24 hours, 58% within the last week, and 80%within the last month. As to what they were searching for, 48.5% named peoplethat were mentioned in the program, 28.7% searched for a terminology or hada specific question, and 10.3% looked up the current show’s topic. Figure 4.2depicts the device types used during triggering searches and at which point in
10 http://limesurvey.org/
94 4 Content-Awareness
time: most people used their Smartphone (42.6%) or Laptop/PC (41.9%) to lookup information, mostly while watching the show (56.6%). Figure 4.3 shows theprogram types in which participants usually use web searches according to whatsearch category (terminology/question, people, topic) they look for. Participantsindicated to mostly search the web during TV shows (33.5%), movies (19.1%) anddocumentaries (11.8%). Especially during shows and movies, people seem to lookup people, during documentaries, there is a tendency to look up terminologies.As to where people end up when looking up such information, 61% indicatedWikipedia as number one while 10.3% named movie portals, such as IMDb11,and only about 3% end up on the direct website of the TV channel or program.Most survey participants agreed that searches would not take too much time andusually satisfied their information need.
Subtitle Usage
Direct usage of subtitles was rather uncommon among participants. In Germany,where most survey participants resided, foreign media content is usually dubbed,which might explain this practice. More than 40% indicated to have never or morethan a year ago made use of subtitles. 33% stated they had activated subtitleswithin the last month, only 8.8% within the last 24 hours. Subtitles seemedto be mostly used in movies (45.4%) and TV shows (38%), sometimes duringdocumentaries (9.3%). In 84% of the usage cases, the program watched containedforeign language content, in 40% they were explicitly used for language learningpurposes, the same amount accounted for a better understanding of acoustics.
Discussion and Feature Elicitation
Many consumers use secondary devices while watching TV for looking upadditional program information mostly concerning people and the correspondingtopic. Smartphones and Laptops seem to be the preferred devices, which confirmsprevious findings. The majority of web searches leads to Wikipedia whereadditional information about people and topics is to be found. It makes sense thento populate a second screen app with contents from or direct links to Wikipedia.Participants noted that they often did not launch web searches due to not havingcorrectly heard a name or not knowing the wording of a topic. Thus, a secondscreen app should be aware of the program context including content specificsso that additional information can be provided as it becomes relevant to thecurrent program position. Not surprisingly, subtitles seem to be mainly used to
11 http://www.imdb.com/

4.2 Context-Aware Information Delivery 95
6
6
12
0 10
News Broadcast
(n/a)
Quiz Program
Show Event
Magazine Program
Other
Other
Chat-Show
Sport Event
Feature Film
Documentary
Fictional Series
Term
inol
ogy
or Q
uesti
onPe
ople
Topi
c of
TV-
Broa
dcas
t
Chat-Show
Sport Event
Feature Film
Documentary
Fictional Series
Fictional Series
News Broadcast
(n/a)
Quiz Program
Magazine Program
Other
Chat-Show
Feature Film
Documentary
1
1
2
3
4
4
6
6
12
1
1
1
2
2
2
3
4
5
19
26
1
1
1
2
4
5
0 5 10 15 20 25 30
Topi
c of
TV-
Broa
dcas
t
Figure 4.3: Types of shows according to search categories.

96 4 Content-Awareness
support comprehension of foreign language content. As related research states,subtitles often distract from the visuals. They do, however, provide importantcontent keywords, which can be used as a starting point for web searches. Asecond-screen app can take advantage of the information contained in subtitles toautomatically collect and provide additional information in real-time.
4.2.2 System Overview
Based on the insights from the online survey, we designed and implemented thesecond-screen app TVInsight. It provides additional information to the currentTV program independent from the type of program or channel. Therefore, itneeds to be aware of the current program context, i.e., its content, the position,trigger automated web searches, and compile the resulting information into acomprehensive and easily accessible second screen experience.
Content Generation
An increasing amount of TV programs are broadcast with subtitle streams to makecontent accessible for people with hearing impairments. Our goal was to developan entity linking algorithm specifically designed for real-time analysis of subtitlesthat works across a wide range of different TV-programs and genres. There arepublicly available subtitle databases, such as opensubtitles.org12, but they usuallyfocus on movies and TV series and miss out on popular TV-program formats,such as live shows, chat shows, news broadcast, or documentaries. Hence, wedeveloped a software which directly receives data streams from a TV tuner todecode and store subtitles broadcast via Teletext. Our system taps into cable TVstreams using a Digital Video Broadcasting - Cable (DVB-C) extension card. Foreach transponder, the respective MPEG-2 transport stream multiplexes variousdata, video, and audio streams. We decode the Teletext streams and filter outpackets containing subtitles. We further receive the Electronic Program Guide(EPG), which our software uses to associate subtitles with the corresponding TVprogram and store additional meta data.
Our software is written in C# and runs on a server which currently receives 30TV channels. An admin interface (see Fig.4.4) shows current TV programs andmost recently extracted subtitles. Here we can also tune to different frequenciesor scan the transponder to list available channels.
12 https://www.opensubtitles.org

4.2 Context-Aware Information Delivery 97
Figure 4.4: Admin view of the server software showing current TV programsand most recently extracted subtitles.
We intended to train our algorithm on a broad spectrum of TV programs. Hence,we let our server collect data over the course of four months, which resulted in45.000 hours of programs with subtitles from 30 channels and a corpus of 136million words in total. A word frequency analysis yielded about one millionunique words (no stemming applied) and more than 200.000 words that appearedmore than ten times. We focused on German channels, but similar corpora can becreated using channels in other languages.
Entity Linking
Entity Linking describes the process of retrieving and linking phrases to respectivecounterparts in knowledge databases. We created an algorithm that continuouslyanalyzes incoming subtitles in real-time and finds corresponding content onWikipedia. To do this, we downloaded the publicly available german Wikipediacontent13 (˜14GB), from which we extracted the links between articles, clearedout redundancies, extracted titles, definitions, images, and marked people entities.We wrote the algorithm from scratch in C#. Our approach is made up of threeconsecutive steps:
13 http://dumps.wikimedia.org/dewiki/latest

98 4 Content-Awareness
1. Extracting Candidates
Similar to previous approaches like that of Odijk et al. [203], we used the col-lection of anchor texts (the displayed text linked to a specific page) to extractpotential candidates. This step produced quite a number of candidates sincecommonly used words like ’this’ and ’here’ are often used as anchor texts withinWikipedia. On the other hand, anchor texts provide an extensive and high-qualitylist of synonyms and variant spellings of the same topic. We used stop words toimmediately reduce the number of very unspecific candidates.
2. Selecting Target Page
For each candidate, there may be multiple possible destination pages. The page towhich the corresponding anchor text was most often linked to within Wikipedia,was picked as the first-page candidate. In most cases, this was already the besttarget page. Garcia et al. [96] achieved a combined accuracy of 75% on severalambiguous data sets this way. To improve this, we took into account contextualinformation: to determine the second page candidate we intersected the contextsets, comprised of the words of the first paragraph of the article on the one side,and the most recent words in the subtitle stream (sliding window approach) onthe other side (ignoring stop words). The page whose intersection contained theleast common words was considered the second candidate (if applicable). Weused the word frequency of the generated subtitle or Wikipedia corpus, whicheverwas higher, to determine the least common word. In case there was a second-pagecandidate, a neural network decided which one was more relevant. To train thenetwork, we manually annotated a set of about 2000 items which were randomlypicked instances from our recorded set. Thus, we first extracted the candidatesfrom our vast subtitle database, selected those with two-page candidates, filteredout very common anchor texts like ’this’, and manually annotated a subset ofrandomly picked candidates.
3. Determining Candidates To Be Linked
For each candidate and its chosen target page, we used a second neural network todecide whether an annotation between candidate and target site should take place.As stated before, the number of candidates extracted in the first step was ratherlarge, thus, we had to narrow it down to items that were considered particularlyrelevant to the respective scene. Again, to train the network we randomly pickedabout 3500 candidates from our subtitle collection, performed the disambiguationand manually marked the items that should be linked.

4.2 Context-Aware Information Delivery 99
Features
For the neural network classifiers, we elicited the following set of features basedon previous work by Odijk et al. [203] and Fernandez et al. [96]. We further addedsome features to make the algorithm better suited for the analysis of subtitles.
• Word frequencies of anchor text and context intersection based on oursubtitle corpus and Wikipedia.
• Probability that anchor text is linked to this page.
• Probability that anchor text is an anchor within Wikipedia.
• Indegree: how often the page is being linked within Wikipedia.
• Outdegree: number of anchor links on the page.
• Is the TV program mentioned on the page?
• Is the anchor text equal to the page name?
• Does the first paragraph contain the anchor text?
• Similarity metrics between anchor text and page title as well as contextwords and page title.
Performance
Our approach produced an in-memory directed word graph to efficiently extractthe candidates and retrieve target page candidates. The run time of the classifierwas negligible. Our implementation needed approximately 25GB of memory, butprocessed subtitles extremely fast since the time complexity lied in approximatelyO(1) per word. We optimized for performance rather than memory usage sinceavailable memory was less of an issue running the system in a cloud environment.
Results
To the best of our knowledge, our approach is the first one based on a compre-hensive dataset taken from subtitles of a great variety of TV program genres.In contrast to previous work, we made heavy use of domain knowledge aboutsubtitles, including relative word frequencies of the subtitle corpus and metainformation about the corresponding TV program. Our approach for processingsubtitles outperformed the one by Odijk et al. [203] with precision= 0.79 and

100 4 Content-Awareness
recall= 0.77 vs. R-Precision= 0.71. The reported precision and recall valuesof our approach were the respective means of the 5-fold cross-validation runs.Further limitations of Odijk et al. are the presentation of multiple possible desti-nation sites rather than definite decisions and the fact that their training data issolely based on manually annotated and topic-separated content from talkshows,which generally limits the external validity of their approach.
The Second-Screen App: TVInsight
The purpose of the entity linking algorithm described is to provide relevantWikipedia articles based on an analysis of the current TV program’s subtitles.The resulting articles are delivered through a second-screen app - which wecalled TVInsight - with the goal of supporting web-based searches during TVconsumption. Therefore, we created a native Windows Phone 8.1 applicationwhich proactively displays relevant content (see Figure 4.1.
The front-end contains four menu items where consumers can choose betweendifferent categories of information (see Fig.4.1 and 4.5):
• Info: general information about the current TV program including channel,program times and a short description (as provided by the EPG).
• People: Wikipedia articles regarding people entities including an articlepreview and portrait picture. A tap opens the corresponding Wikipediapage in a browser view.
• Wiki: topic-relevant Wikipedia articles including an article preview.
• Google: keyword suggestions relevant to the current program. A tap opensup a browser view showing a list of corresponding Google results.
As subtitles are broadcast and received by our server, they are processed in real-time and the generated content is timestamped. The keyword search suggestionsare based on the anchor texts of the detected annotations. Our goal is to offer afeed of articles that convey a much richer and more content-focused experiencecompared to traditional program information services (e.g. mobile EPG solutions),since we extract people and topic entities from the program and not just fromofficial cast listings and shortened summaries. For synchronizing the app contentwith the currently watched TV channel, Chuang et al. [46] proposed audiofingerprinting. To ensure stable and equal conditions among all study sessions ofour study, however, we recorded the documentaries in advance and synchronized

4.2 Context-Aware Information Delivery 101
Figure 4.5: TVInsight shows Wikipedia articles relevant to the current TVtopic (left) and extracted keywords to launch a corresponding Google search(right).
the video player with the app content according to the current viewing positionthrough the network connection. As incoming subtitles were processed in real-time by the server, content was pushed out to the app synchronously.
Scenarios
Here we want to depict two scenarios showing how additional content deliveredthrough our second-screen app can be used to augment TV programs and the userexperience. By providing background information, the TV content shown can bebetter put into context by the user. Such context helps to build mental associationsbetween new and existing information and increases the chance for long-termretention. The following scenarios explore this idea with an educational purposein mind.

102 4 Content-Awareness
Language Learning
Learning language vocabulary is very much topic-driven. The vocabulary re-quired to go grocery shopping is different from the vocabulary of a geopoliticaldiscussion. An obvious extension of our second-screen app is using the keywordsextracted from subtitles of foreign TV shows to compile a word list that reflectsthe topic of the show and can be used in-situ or post-hoc for studying.
General Knowledge Acquisition
The information need of regular TV consumers is pronounced [37, 200]. Resultsfrom our online study also show that users often act on cues provided by theTV program to trigger further searches. The conventional approach is to try toremember, for example, the name of a person in order to start a web search atsome point bearing the risk of either forgetting to actually perform the search lateron or misspelling the keyword. Previous work showed an increased cognitiveload when search tasks were performed while watching, which made people missimportant information [257]. Our second-screen app based on automated keywordextraction from subtitles allows us to retrieve and display or store importantentities for later look-up. While the app proactively triggers web searches andretrieves, for example, relevant Wikipedia articles, contents displayed can bebookmarked for later review while minimizing interruptions in the current TVexperience.
4.2.3 System Evaluation
To evaluate the utility of our approach and quantify the effects on consumers’ TVexperience, we conducted a user study in which we applied our entity linkingapproach to automatically display relevant contents from Wikipedia in synchro-nization with the current TV program. We were especially interested in objectiveas well as subjective effects on program comprehension and the utility of a proac-tive provision of additional content. In contrast to previous works we did notmanually select the content stream but used the actual output of our contentgeneration algorithm applied on an actual TV broadcast. We conducted this userstudy with the following four hypotheses in mind:
• H1: Using TVInsight leads to better comprehension of the current pro-gram’s contents based on objective assessments.

4.2 Context-Aware Information Delivery 103
• H2: Using TVInsight leads to better comprehension of the current pro-gram’s contents based on subjective assessments.
• H3: Using TVInsight is less distracting than manually searching the webusing the Smartphone browser app.
• H4: Using TVInsight leads to a better user experience than using theSmartphone browser app for look-ups.
To compare our approach we tested TVInsight against a baseline (no tools avail-able) and the smartphone’s browser search capabilities. Participants were askedto watch different documentaries while being able to use the available tools foradditional content retrieval.
Method
For this study we employed a repeated-measure design with the tool available forweb searches as the independent variable, which resulted in the following threeconditions:
• A: No tools available (baseline): participants watching a documentarywithout a secondary device.
• B: Smartphone browser: participants were given a Smartphone with In-ternet access and asked to use web searches as they saw fit to retrieveadditional information.
• C: TVInsight app: participants were given a Smartphone equipped with ourprototype and asked to use it as they saw fit.
To avoid learning effects between conditions we counterbalanced the sequence ofconditions between participant. Furthermore, the order of the documentaries, adbreaks and questions were randomized to mitigate the influence of participants’preferences and reduce learning effects.
In each condition, participants were asked to watch a documentary. As dependentvariables, we measured comprehension in the shape of multiple-choice ques-tionnaires about the documentary content and applied a memory test up to aweek after the study. Comprehension questions were designed with regard totesting literal (recalling what has been explicitly stated in the text) and inferentialcomprehension (requires readers to understand relationships that are not explicitly

104 4 Content-Awareness
stated in the text) [17]. Each test consisted of 15 questions with three levelsof difficulty: easy, intermediate, and advanced questions, which we assertedduring pilot studies. The memory test consisted of statements which requiredsimple true/false responses. Further, we collected subjective feedback througha questionnaire after each study condition as well as through a semi-structuredinterview at the end of the study.
Participants
We recruited 30 participants (9 female) with a mean age of 22.5 (SD = 4.0) yearsthrough university mailing lists and social networks. From our participants, 93%indicated German to be their first language, 76% reported to at least occasion-ally watch TV. The total study took about an hour, for which we compensatedparticipants with 10 EUR.
Apparatus
During the study, all participants were seated in the same room in front of a22-inch monitor connected to a notebook on which they watched the documen-taries, answered the questionnaires and provided subjective feedback. Therefore,we created a proprietary .NET program through which we made sure that theallocation between documentaries, condition, and the viewing sequence wascounterbalanced. Questionnaires were directly applied to that same software. Forthe app and browser condition, we handed out a Microsoft Lumia 640 on whichour TVInsight prototype was running as described above. The software furthertook care of the time synchronization between the played documentary video anddelivering the content to the mobile app in real-time to avoid glitches and ensureequally stable conditions for all participants.
Procedure
After participants signed the consent form, we explained the nature of the studyand sat them down in front of the screen where we collected basic demographicinformation through an opening questionnaire. To give an idea of how the com-prehension test will look like, three sample questions not related to the followingtopics were shown. Before each condition we made sure participants could famil-iarize themselves with the tool at hand and were instructed to use the tool as theysaw fit during the documentary in order to improve their comprehension scorelater on. In each condition participants were asked to watch a 10 min documentaryin which we embedded two commercial breaks, 1 min each, in order to simulate

4.2 Context-Aware Information Delivery 105
Combined
Doc1
Doc2
Doc3
0 % 20 % 40 % 60 % 80 % 100 %
76 %
77 %
72 %
78 %
79 %
77 %
81 %
81 %
78 %
76 %
73 %
87 %
70 %
80 %
64 %
69 %
ABC - Combined A - No Device B - Browser C - App
Figure 4.6: Percentage of correctly answered comprehension questions,segmented by condition and documentary.
a somewhat realistic TV experience. Ad blocks were equally spaced throughoutthe documentary. The content of the ad breaks had nothing to do with the respec-tive documentary and solely served as a time break for participants to use thesecond-screen device. The documentaries were in German and included topicsabout birds of prey, a recent naval accident, and about the history of a publishinghouse. They all aired on the same TV channel several weeks ago. We made surethat no participant had watched any of them before. At the end of a documentaryparticipants had a 30-second window to finish their current web or app searchbefore the comprehension test started. Comprehension questions were designedsolely based on the content of the respective documentaries and before the entitylinking algorithm was applied to generate the actual second-screen content. Theoutput of the algorithm was deliberately left unmodified to simulate a real-timecontent extraction setting, thus, some of the articles and search suggestions wereevidently irrelevant. The content of the app was synchronized with the viewingexperience based on the display time of the respective subtitle lines. We didnot allow the use of the app or browser while filling in the comprehension test.After each comprehension test participants were asked to provide a subjectiveassessment of their comprehension and experience with the tool at hand in form ofa 5-point Likert-type scale as depicted in Figure 4.8. After having completed allthree condition blocks, we asked participants to provide feedback on the overall

106 4 Content-Awareness
Block 1 Ad Break 1 Block 2 Ad Break 2 Block 3 Finish0
50%
100%
67 % 80 % 43 % 60 % 27 % 33 %90 % 97 % 63 % 97 % 53 % 63 %
B Browser C App
engagedparticipants
Figure 4.7: App and browser usage across time including advertisementbreaks.
experience, what they liked and didn’t like about the TVinsight App and for whichtypes of programs they could imagine using it. After seven to eight days time wecalled participants via phone to answer 18 quick questions taken from the pool ofcomprehension test questions, but this time the questions were transformed intotrue/false statements.
Results
Figure 4.8: Subjective assessment after each condition in form of 5-scaleLikert-type scales with I totally agree on the left and I don’t agree on theright. The orange color depicts the median, yellow the interquatile area.
The selected documentaries contained a mean number of 839 words (SD = 54),from which our entity linking algorithm extracted a total of 67 (M = 22.3,SD =2.5) relevant and 9 (M = 3,SD = 1) irrelevant Wikipedia articles, resulting in a

4.2 Context-Aware Information Delivery 107
88.2% hit rate. The Benjamini-Hochberg procedure [134] was applied with afalse discovery rate level of 0.05 to account for multiple testing.
Device Usage
Figure 4.7 shows the usage of both smartphone browser and TVInsight appsplit in content blocks, ad breaks, and post-documentary searches across alldocumentaries. TVinsight was used continuously more often than the browser(c2 = 25.7, p< 0.001, Pearson’s chi-squared test) which is statistically significant.During ad breaks the usage of the TVinsight app is significantly more pronouncedthan during the documentary (c2 = 7.1, p < 0.01, Pearson’s chi-squared test),the same holds for using the browser. Participants used TVInsight in 97% of adbreaks whereas only 80% used the browser during the first ad and 60% duringthe second.
Comprehension Scores
Figure 4.6 gives a detailed overview of the comprehension scores for each condi-tion and documentary. Using the TVInsight app results in a statistically significantdecrease in performance on the comprehension tests compared to no deviceusage (t = 3.05, p < 0.003, paired Student’s t test) and to using the browser(t = 2.57, p < 0.008). Using the browser had no impact on the test scores com-pared to the baseline. Looking at the results by documentary, participants did notdiffer significantly between the three conditions, whereas the scores of the appusers dropped significantly on the other two conditions.
Subjective Feedback
Figure 4.8 lists the results of the Likert-scale statements with participants’ sub-jective feedback with regard to the tool available (Browser or TVInsight). Whenusing TVInsight participants reported a better subjective comprehension of theprogram content than when using the smartphone’s browser for searches. Thisdifference was statistically significant (Mann-Whitney U = 679, p < 0.001). Aswith regard to ease of use, the app was rated significantly better than using thebrowser (Mann-Whitney U = 782, p < 0.001). Perceived distraction was sig-nificantly higher when using TVInsight than when the browser (Mann-WhitneyU = 829, p < 0.001). When asked at the end of the study which tool (or no toolat all) they preferred for being able to answer the comprehension questions, 40%chose TVInsight and just 7% the browser.

108 4 Content-Awareness
Memory Test
Most participants left us their phone number with a preferred timeslot for beingcalled for the final memory test a week after the study. We reached 20 out of30 participants. The percentage of correctly answered questions on the baselinecondition dropped from 78% to 73% compared to a slight increase from 64% to66% on condition C (TVinsight app). However, neither change in the memoryscores was statistically significant.
Qualitative Assessment
Overall, participants agreed that using real-time look-ups contributes to the userexperience while watching TV. Especially the mechanism of delivering contentright in time when the respective topic or person was mentioned on the programwas positively mentioned in the interviews by 9 participants, while 6 explicitlystated they liked that the app ”allows for quick results/access”. The majorityrated the app content as informative and well fitting, only 7% disagreed. Theuser interface was described by 12 participants as ”clearly structured” and
“easy to use”. “Inappropriate topics” and “too few people entities” were themost common negative remarks made about the content. As things to improveparticipants mentioned a stronger integration of contents with regard to the Googlesearch keywords. Instead of routing the user to the external browser application,search results should be directly integrated into the app, similar to the Wikipediaarticles. Also, there is room for improvement with regard to personalization,e.g., through dynamic bookmarks or a customizable entity menu. As to whichtypes of programs participants could imagine TVInsight to be especially useful,documentaries were mentioned 21 times, quiz shows or news 8 times respectively,sports 4 times, and movies and entertainment 3 times. Rather inappropriate TVformats would be movies (mentioned 15 times), entertainment shows (3) or TVseries (2).
4.2.4 Discussion
Due to the size of our data corpus and our extended entity linking approach,articles extracted from Wikipedia were relevant, which our hit rate of 88% con-firmed. Also, participants overwhelmingly stated that articles were a good fitfor the documentaries. Further, the real-time aspect of proactively showing ad-ditional content with the current program was well received, which created anoverall positive TV experience when using TVInsight. Also, the content of the
4.2 Context-Aware Information Delivery 109
documentary turned out to be more relevant in order to answer the comprehensionquestions. Compared to traditional web searches with the smartphone browser,our second-screen app scored higher both in objective usage measure, but also insubjective ratings.
The extent of how to use the available tools, however, was up to participants inorder to self-select an optimal strategy for multitasking. This lead to an imbalancebetween the browser and app usage with our app ending up being much morefrequently used. Some participants barely used the browser for web searcheswhich is why there are few measured differences between the use of no tools andthe browser. One reason for rejecting the browser may be the fact that searchkeywords need to be formulated by the user whereas TVInsight continuouslypresented new keywords along with the current program. Hence, extended usageof TVInsight also took effect in the comprehension scores, which is why we needto reject our first hypothesis (H1). The objective comprehension scores, therefore,confirm the distracting nature of second-screen applications.
TVInsight was perceived as more distracting than the browser. However, this doesnot allow us to fully reject H3, especially due to the relative imbalance betweenapp and browser usage. When there is no need to actively type and search forkeywords, more time is spent in browsing available contents. Furthermore, userswere not alerted to new second-screen content, it just appeared. Neate et al. [197]found that users would like to be actively notified of new content, preferably withan auditory icon or visual indicator on the TV itself. However, both methods arenot feasible for independent second-screen apps with automatically generatedcontent. The extensive usage may also be due to some novelty effect, whichcauses the app to be more appealing than the actual documentary. Long-termstudies in real-world scenarios will be able to give more insights into the natureof distraction.
Since there was a tendency of increasing subjective comprehension of the TVcontent through our TVInsight app, we were able to find evidence in favor ofH2. This is certainly a reason why many participants found the app was helpfulfor completing the comprehension test. The well-received app usability and thepositive feedback regarding the real-time feature of proactively pushing additionalcontent to the second-screen benefited the overall user experience, which allowsus to confirm H4; the content relevance and the notion of real-time delivery ofadditional content lead to a better user experience than using the smartphonebrowser for look-ups.
We performed the study on documentaries since they are a natural fit to observelearning effects from an educational standpoint. It should be noted, however, that

110 4 Content-Awareness
our content extraction algorithm was not specifically optimized for documentaries.Rather, the training set was sourced from a variety of different program genres.Hence, it is reasonable to assume that the participants’ ratings and opinionstowards the displayed information generalize to other types of programs.
The perceived distraction varied greatly which suggests that the capacity tomultitask strongly depended on the individual. Hence, users should be in controlof adjusting information density and focus.
While many participants criticized irrelevant content, there was hardly any com-ment about missing topics. This indicates that precision is more important thanrecall when evaluating content retrieval algorithms for second screen use cases.
We were not able to detect any statistically significant differences between condi-tions with regard to the memory scores, but users of TVInsight tended to performequally well in the direct comprehension tests and the memory test a week later.Participants using the browser or no tool at all, on the other hand, tended toperform worse in the memory than in the comprehension test. Further studieswill need to be conducted to assess the long-term utility of TVInsight, especiallywhen equipped with bookmarking features, where users could save or even sharecontent as they watch it. We are further in the process of developing TVInsightwith another focus on integrating audio fingerprinting for automatic channelrecognition. This feature will be vital before further studies in the large can beconducted by releasing TVInsight on mobile app stores.
Concluding, based on insights from our study we derived the following five designguidelines for context-aware second-screen applications:
1. Synchronization: second-screen content should be sensitive to the currentprogram context and be delivered in real-time.
2. Bookmarks: in order to strengthen memory and support learning scenarios,users should be given the chance to save content for later retrieval. Thereal-time aspect allows users to bookmark content while watching ratherthan pushing it to later where it is potentially already forgotten.
3. Less is more: too much information distracts users, which is why a second-screen app user interface should be clearly structured with a focus onessential information, but with the option to have users look for deepercontent if they so wish.
4. Precision > Recall: irrelevant content distracts users and harms the overalluser experience more than possibly missing information.

4.2 Context-Aware Information Delivery 111
5. Personalization: the need for information and the capacity to multitaskstrongly depend on the individual. Hence, users should be in control ofadjusting information density and focus.
4.2.5 Study Conclusion
Second-screen apps have become increasingly popular in recent years. Instead ofrequiring users to install numerous different apps tailored to each of their favoriteTV shows, we proposed a context-sensitive second-screen app that creates addi-tional content automatically by linking existing resources and pushing that contentto the user in real-time when it is most relevant. We, therefore, described an entitylinking algorithm that extracts keywords from live subtitles and uses Wikipediato provide additional program information. Having built a large database withdata from 30 TV stations over the course of four months, we were able to ex-tract particularly relevant content. The utility of the prototype was confirmed inour user study where we investigated its effect on user experience and contentcomprehension. The resulting insights can be used by app developers to createsecond-screen apps that take advantage of existing content resources, and bear thepotential to keep user distraction at a minimum by proactively providing contentin a context-sensitive way. By expanding the number of TV stations recorded bythe server the subtitle corpus can be refined in order to improve the entity linkingand therefore the relevancy of the provided contents. Additional resources, suchas social network chatter, historical archives, current news articles, or productdatabases can further be linked to provide users with a holistic second-screenexperience.
Our prototype shows the feasibility of a technology that picks up contextualclues from the environment and augments the user’s current experience withrelevant information. We believe such techniques could be used to augment notonly TV experiences, but also lectures, meetings, and conversations, wherevertechnology can access real-time audio or another type of content stream in orderto trigger contextual queries. The study described in this chapter focused onexternal context, i.e., information from the environment, in order to supportinformation intake. Another way of thinking about context is taking into accountthe user’s internal processes. In Chapter 3 we already discussed how attentioncan be tracked and predicted in a technology context. In the next section, wedescribe our approach to go one step further and investigate how technology candetect and make use of users’ cognitive states. By considering both external (e.g.,

112 4 Content-Awareness
content options) and internal (e.g., receptiveness) context, technology can helpbring the two together and optimize for efficient information intake.
4.3 Chapter Summary
In this chapter we investigated the use of knowledge about the content, whichthe user is currently engaged with, to support people absorbing information.Awareness of the content at the time of exposure allows systems to providerelevant services. Our motivation was to investigate whether providing additionalbackground information helps people put content better into context. Suchcontext linking allows users to create mental associations between existing andnew information, which increases the probability for long-term retention.
We set out to test our assumption by developing a system for augmenting theTV experience. While watching TV people often turn towards so-called second-screen applications to look up additional information about the current program.By making use of subtitles our system extracts keywords through an advancedentity linking algorithm. These keywords are then linked to additional onlineresources, such as relevant articles on Wikipedia, which are sent to and displayedby a corresponding mobile app. We assessed the utility of using such an appin a lab study. With 88% of the automatically generated content being highlyrelevant, our entity linking algorithm outperformed previous approaches. Besidesusing neural networks for linking entities such performance was due to the highvolume corpus of 45,000 hours of TV shows which we collected over the courseof four months. The lab study yielded effects on user experience and contentcomprehension, which demonstrates the feasibility of using content awareness asa context dimension to enhance information intake (RQ3). We derived a set ofguidelines that can be used to build context-sensitive second-screen apps, whoseapplicability is not necessarily limited to the special use case of TV consumption.Real-time synchronization between content displayed, bookmarking capabilities,and taking into account user preferences can help users create content associationsbeyond what is displayed on a primary device. By providing additional servicesin line with the content that users momentarily engage with, the research probewe developed serves as an example of technologies that exhibit context- andcontent-awareness.

Chapter5Cognition-Awareness
So far we have investigated users’ context with regard to attentiveness towardstheir mobile phones and to the content, they currently engage with. While suchfactors allow us to infer information about people’s cognitive states at the time,there are other aspects that influence cognitive performance. People’s alertness,attention, and vigilance are highly variable and subject to systematic changesacross the day. These fluctuations—in part caused by circadian rhythms—impacthigher level cognitive capacities, such as perception, memory, and executivefunctions.
In this Chapter, we investigate ways to measure these rhythms and introduce thenotion of considering the user’s cognitive states as part of the context. Cognition-aware systems detect different aspects of mental information processing, suchas engagement, cognitive load, memory, knowledge, and learning [36]. For ef-fective information intake, the cognitive state of the user is crucial. Whetherinformation is effectively processed and retained long-term or whether it is barelybrought to the user’s attention highly depends on the user’s current capability tofocus [234]. By identifying productive phases during the day, cognition-awaresystems can suggest times of the day to engage with information consumption.Awareness of cognitive states can further be used for task scheduling to sup-port work rhythms [21], preventing interruptions [138, 180], and inducing flowstates [52].
Typical methods that extract patterns from diurnal fluctuations in alertness levelsare time-intensive and take place in artificial lab settings. For less intrusive

114 5 Cognition-Awareness
and time-consuming elicitation of these patterns, we created a toolkit that canbe deployed on mobile devices. In this Chapter, we present a study, in whichwe elicit users’ circadian rhythm of alertness. To allow researchers and systembuilders to create cognition-aware systems we released the toolkit as open sourcelibrary, that can be integrated into existing applications and games.
Patterns of alertness levels across the day provide systems with a general aware-ness of diurnal fluctuations of users’ cognitive capacities. These patterns can becombined with information about the momentary cognitive state based on thecurrent user context. In the second part of this Chapter, we present a conceptualframework for building algorithms that detect users’ momentary states. Theframework is derived from our approach to detect bored states (Section 3.3), butallows for more general applicability.
In this Chapter, we address the following research question:
• RQ4: How can technology be used to elicit the user’s circadian rhythm ofattention and cognitive performance?
Parts of this chapter are based on the following (pending) publications:
• T. Dingler, A. Schmidt, and T. Machulla. Building cognition-awaresystems: A mobile toolkit for extracting time-of-day fluctuations ofcognitive performance. volume 1, pages 47:1–47:15, New York, NY,USA, Sept. 2017. ACM
• T. Dingler. Cognition-aware systems as mobile personal assistants. InACM, editor, Adjunct Proceedings of the 2015 ACM International JointConference on Pervasive and Ubiquitous Computing and Proceedingsof the 2015 ACM International Symposium on Wearable Computers,UbiComp/ISWC ’15 Adjunct, New York, NY, USA, 2016. ACM
5.1 Related Work
While an in-depth introduction to cognition-aware systems can be found inSection 2.5, this Chapter more specifically refers to related work in sleep/wakeregulation and circadian rhythm elicitation.

5.1 Related Work 115
Human cognitive performance is affected by sleep-wake homeostatic and by aninternal circadian rhythm. Kleitman [156] was among the first to establish alink between cognitive performance, chronobiology, and sleep. He found speedand accuracy of cognitive performance to follow diurnal variations with highestperformances in the afternoon and poorest in the early morning. In later studies,he noticed that performance is dependent on body temperature [158].
Traditional methods to assess the circadian rhythm include extensive lab experi-ments, which can take weeks of being in controlled environments. Other methodscan be equally cumbersome or even unpleasant, such as sleep-wake protocols orphysiological markers (e.g., dim light melatonin onset, rectal temperature moni-toring, cortisol level measurements [135, 158]). To measure people’s alertnesslevel in a less invasive way, the psychomotor vigilance task (PVT) has beenproposed [67]. It measures the simple reaction time to a visual stimulus. In itsoriginal version, the task lasts ten minutes and is thus a test of vigilance (theability to sustain attention over time) as much as a test of psychomotor speed.During the task a visual stimulus is presented randomly every two to six seconds.While the original experiment setup uses a physical button [67] to provide aresponse, an implementation for touchscreens using the touch down event hasbeen proposed by Kay et al. [152].
Abdullah et al. [2] recently demonstrated the general feasibility of using PVTin-the-wild to measure diurnal alertness fluctuations. They showed alertnessfluctuations by harvesting mobile phone data with influencing factors being time,body clock type, sleep, and caffeine intake. Murnane et al. [192] correlated thesesame fluctuations with mobile app usage patterns.
To the best of our knowledge, our current work is the first to provide a robuststatistical model that specifies the contribution of time-of-day to different perfor-mance measures and relates the measured fluctuations in alertness to prevalenttheories of sleep/wake regulation. We investigate an in-the-wild approach to elicitperformance variations based on three quick tasks performed on users’ smart-phones, with which we aim to eliminate the need for extensive time and resourcesspent on sleep labs studies or artificial tasks. By having created and releaseda toolkit we allow measurements of cognitive performance to be included in awide range of applications and games, which allows researchers and applicationbuilders to add cognition-awareness to their systems.

116 5 Cognition-Awareness
5.2 Eliciting the Circadian Rhythm of Alert-ness
To extract patterns of diurnal alertness fluctuations, we created and validated atest battery that can be deployed on mobile devices. It consists of three sustainedattention tasks as described below (see Figure 5.1). To validate this test battery,we built an Android app (Android version 4.1 or higher) that administers the tasksas well as a number of short questionnaires concerning the users’ demographics,sleep, and alertness self-assessment. The app prompts the user at random timesduring the day through notifications to complete the test battery. The time betweentask reminders is between 60 and 90 minutes. To respect sleep times notificationsare only scheduled between 8 am and 9 pm. We included a logging mechanismthat saves measurements locally on the device and transmits the logs to a remoteserver when a WIFI connection is available.
We selected three tasks for inclusion into the toolkit - a psychomotor vigilancetask (PVT), a go/no-go task (GNG), and a multiple object tracking task (MOT).We wanted to assess the tasks for their utility as quick measurement tools thatcause as little interruption to users’ daily routine as possible. We, therefore,limited the first two tasks to about one minute each and the MOT to two minutes.The PVT is the gold standard for assessing alertness levels. It measures thesimple reaction time to a visual stimulus. In its original version, the task laststen minutes and is thus a test of vigilance (the ability to sustain attention overtime) as much as a test of psychomotor speed [67]. During the task a visualstimulus is presented randomly every 2 to 6 seconds (see Figure 5.1, left). Whilethe original experiment setup uses a physical button [67] to provide a response,our touchscreen implementation uses the touch down event as proposed by Kayet al. [152]. The GNG task falls into the class of choice reaction time paradigms.It uses two or more distinguishable stimuli, each associated with a unique answeroption - in our case, a plain green circle, for which the participant needs to performa speeded touch down gesture (”go” trial) and a patterned circle, for which thisbehavior needs to be inhibited (”no-go” trial, shown in Figure 5.1, middle).Hence, this task measures reaction time, as well as executive functioning. In ourimplementation, we use between 8 and 12 stimuli, approximately half of whichare no-go stimuli, appearing at random intervals of 1 to 8 seconds. If ignored,stimuli are shown for a maximum of three seconds. The MOT is a strenuoussustained attention task that requires participants to divide their attention acrossmultiple moving objects [219]. In our implementation, eight blue circles areshown. A subset of four target circles briefly flashes to indicate the objects to be

5.2 Eliciting the Circadian Rhythm of Alertness 117
Figure 5.1: Our toolkit comprises three tasks to measure alertness and cogni-tive performance variations across the day: a Psychomotoric Vigilance Task(left), a Go/No-Go task (middle), and a Multiple Object Tracking task (right).
tracked (see Figure 5.1, right). Then, all circles start moving in random, but lineardirections. After ten seconds the circles stop and the test person has to identifythe target circles. The task is repeated five times, the performance measure is thenumber of correctly identified targets.
We released the app and the contained toolkit library under an open source licenseon Github14. By including it in their source code, application builders can registertheir application to collect performance measurements. These can either beprovided by their own application (i.e., reaction times in games) or, alternatively,one of the toolkit tasks can be triggered to collect these measurements over time.Their application can further request the user’s current performance state. If theapplication has already collected enough measurements (usually across a week),an individual assessment of the user’s performance is returned. As long as thereare not sufficient data points available to derive a robust individual model of theuser’s performance fluctuations, the library returns a generic version model (asdescribed in this paper) adapted to the user’s current timezone.
14 https://github.com/til-d/circog

118 5 Cognition-Awareness
5.2.1 User Study
We conducted a user study to validate the effectiveness of the three attention tasksregarding their ability to measure systematic fluctuations in alertness within ashort duration of time. Since our goal was to measure fluctuations across the daywe opted for an in-the-wild study, where participants were asked to perform theaforementioned tasks in their daily context. As dependent variables, we collectedtask performances together with the time of day when the tasks were completed,subjective sleep and alertness assessments, and task preferences.
Procedure
We recruited 12 participants (4 female, mean age: 24 (SD = 2.67)) throughuniversity mailing lists. All participants were briefed about the purpose of thestudy and provided informed consent. The task order was randomized each timethe app was opened. A service kept running in the background that managedthe posting of notifications to remind users to perform the task sequences fromtime to time, up to six times a day. The prompts were shown in the notificationdrawer until clicked or dismissed. A click on the notification launched the tasksequence. Before the first task sequence of the day, a survey was shown withquestions about the user’s wake-up time, the number of hours slept and rated thequality of sleep (1=poor, 5=very good). Each task sequence was preceded by ashort self-assessment regarding “How alert are you feeling right now?” (1=supersleepy, 5=super alert) and a checkbox labeled “I had a caffeinated drink withinthe last hour”. The study ran for a total of 14 days; participants were free tostart at any time by installing the app and completing the tasks for at least sevendays. We awarded 50 cents for each task sequence completed at a maximum ofsix sequences per day, resulting in up to 42 EUR. At the end of the study, we sentout a questionnaire to assess participants’ subjective impressions of the differenttask types. For each task, we collected Likert-style feedback on participants’evaluation of task difficulty, exhaustion, and fun.
Results
In the following, we analyze each task according to its effectiveness to measuresystematic changes in cognitive performance across the day. We further providean assessment of the influence of caffeine, sleep and the accuracy of participants’

5.2 Eliciting the Circadian Rhythm of Alertness 119
self-assessments, where applicable. On average, participants performed the taskson nine days (SD = 3.9) with a minimum of 2 and a maximum of 13 days,resulting in a total of 367 PVT, 364 GNG, and 367 MOT tasks. We removedincomplete tasks and data points, for which the subjective alertness rating wasmissing.
We examined all performance measures for the influence of the sleep/wakehomeostatic and the circadian process. The homeostatic process should manifestitself in a performance deterioration with time spent awake. For instance, simplereaction times in the PVT should increase throughout the day. Therefore, we firstexamined the data for a linear trend over time. Trend analysis was performedby fitting a linear mixed model to the raw data with the measure of interest asthe dependent variable and the fixed factors time of measurement, self-ratedalertness, consumption of a caffeinated drink in the previous hour, sleep duration,and self-rated sleep quality as well as the random factor subject. p-values wereobtained by using a likelihood ratio test of the full model against a null modelwithout the fixed effect of interest. If this comparison was non-significant, thefixed effect was excluded from further analysis. We did not find any significantinteraction effects between the studied factors.
If a linear trend of time was found, it was removed from the data before furtheranalysis. In a next step, we looked for variations in performance due to thecircadian process. The circadian process should result in non-linear variations ofcognitive performance across the day. For instance, performance should declinein the early afternoon and improve towards the early evening. For this analysis,we fitted a second linear mixed model with the ordered categorical predictorvariable hour of the day as a fixed factor and subject as a random factor. Foreach fit, we report the results of an omnibus test (Analysis of Variance (ANOVA);indicates whether performance differs between any two-hour slots of the day)as well as contrasts between successive hours (indicate whether performancechanges between hour x and hour x + 1). The level of significance was adjustedfor multiple comparisons using the Holm-Bonferroni procedure. In the following,we first report the influence of time/hour of day on the different measures ofperformance, followed by an analysis of the influence of the control variables.
Variability of Performance Measures across the Day
Psychomotoric Vigilance Task (PVT). Figure 5.2 shows average reactions times(Reaction Time (RT)) as a function of time. We find that participants’ RT increaseby 1.9 ms (± 0.7) per hour of day (time: c2(1) = 6.7, p = 0.009), a performancedeterioration reflecting the homeostatic process. After this linear relationship

120 5 Cognition-Awareness
6 8 10 12 14 16 18 20 22 24
Hours
340
360
380
400
420
440
460
Re
ac
tio
n t
ime
in
ms
Psychomotor Vigilance Task (PVT)
Figure 5.2: Performance variations across the day in blue: mean reactiontimes from the Psychomotor Vigilance Task (PVT). Error bars indicate thestandard error of the mean. The red line depicts a linear fit to the data.
6 8 10 12 14 16 18 20 22 24
Hours
0
0.05
0.1
0.15
0.2
0.25
0.3
Fa
lse
Ala
rm R
ati
o
Go/No-Go (GNG)
Figure 5.3: Mean false alarm ratio from the the Go/No-Go (GNG)task.

5.2 Eliciting the Circadian Rhythm of Alertness 121
6 8 10 12 14 16 18 20 22 24
Hours
0.65
0.7
0.75
0.8
0.85
0.9
Pe
rce
nta
ge
co
rre
ct
Multiple Object Tracking (MOT)
Figure 5.4: Percentage of correctly identified targets from the MultipleObject Tracking (MOT) task.
is removed from the data, we find a significant effect of hour (F(16,3175.3) =1.8, p = 0.016), indicating that there are further differences in RT performanceacross the day. In particular, there is a significant increase of 54 ms from 1 to2 pm (t(3173.6) = 3.3, p < 0.001). Mean RT are highest just after 2 pm andlowest after 10 pm (399 ms vs. 316 ms). This agrees with previous reportsregarding a post-lunch dip in alertness and performance [259] as well as reportsof improved performance towards the evening in younger adults (which oursample predominately consists of).
We further find that consuming a caffeinated drink decreased RT on averageby 17.6 ms (± 13.7 ms; c2(1) = 10.8, p = 0.001) and that subjective alertnessratings are a significant predictor of PVT RT: RT decreases by 10.4 ms (± 4) perlevel of alertness rating (c2(1) = 5.8, p = 0.015).
Go/No-Go-Task (GNG). For the GNG task we analyzed RT as well as falsealarm rates. False alarms are ”go” responses to ”no-go” stimuli. Both indicesshow a pattern similar to the PVT RT. Figure 5.3 shows the average false alarm(False Alarm (FA)) rate across the day. For the RT, there is a linear increase of0.8 ms/hour throughout the day, resulting in an overall difference of about 13 msacross a typical period awake. Additionally, there is a pronounced deteriorationof performance in the early afternoon. However, in contrast to the PVT, neitherthe linear increase in RT is significant (c2(1) = 0.6, p = 0.44) nor are there anysignificant differences in performance between consecutive hours.

122 5 Cognition-Awareness
A possible reason for this finding is that the GNG task is subject to speed-accuracytrade-offs. When participants are compromised in their alertness, they may eitherdecrease their reaction speed or compensate by keeping the same level of reactivitybut concede to making more false positive decisions – that is, reacting to non-target stimuli. To test this hypothesis, we performed a linear mixed effect modelanalysis with RT as the dependent variable and false positive rate as a fixed andsubject as a random factor. We find strong indication of a speed-accuracy trade-off: as the false positive rate increases from 0 to 1, RT decreases by 129.6 ms(c2(1) = 9.6, p = 0.002). Further, we find that participants become increasinglylikely to make a FA as the day progresses (c2(1) = 4.3, p = 0.038, FA increaseby 3% (± 2%) per hour of day). This reflects increasing impulsivity, that is, afailure to inhibit wrong responses.
Fluctuations in the FA rate can result from changes in perceptual sensitivity orfrom adjustments in participants’ answer patterns. To distinguish between thesetwo possibilities, we analyzed the data using signal detection theory [117], whichallows for the joined analysis of RT and the false positive rate in terms of twomeasures: d-prime and criterion. d-prime measures sensitivity. It indicates howwell an observer discriminates between signal and noise (in our case, betweentarget and non-target stimuli). The criterion is a measure of response bias, or inother words, the tendency to react over the tendency to not react. It is importantto note that a change in criterion is a purely behavioral adjustment with noconcomitant perceptual change.
Our analysis reveals that participants’ response tendency does not change sig-nificantly over the day - neither is there a linear shift in criterion (c2(1) =2.3, p = 0.129) nor does the criterion change within successive hours. How-ever, we find that sensitivity varies: d-prime decreases by 0.015 per hour of day(c2(1) = 4.2, p = 0.04). This means that participants loose in their ability todiscriminate between stimuli as homeostatic sleep pressure accumulates.
Multiple Object Tracking (MOT). Figure 5.4 shows the average proportion ofmissed targets. We find no evidence for performance to worsen linearly through-out the day (c2(1) = 0.01, p = 0.91). However, we find significant differencesbetween successive hour bins. In particular, there is a significant improvement inperformance between 3 and 4 pm (z(365) = �4.1, p < 0.001) just after perfor-mance had reached its daily low, when 25.6% (±16.6%) of targets are misidenti-fied. Performance is best in the morning at 8 am, when only 12.9% of the targetsare misidentified.

5.2 Eliciting the Circadian Rhythm of Alertness 123
Table 5.1: Subjective user ratings in 7 point likert-style: 0 = totally disagree,6 = completely agree (median values with SD)
Subjective Feedback
For evaluating participants’ subjective assessments of the tasks regarding diffi-culty, exhaustion, and fun (0 = totally disagree, 6 = completely agree) we appliedFriedman tests with post-hoc analyses using Wilcoxon signed-rank tests with aBonferroni-corrected significance level set at p < 0.017.
Table 5.1 gives an overview of participants’ subjective feedback. There was a sta-tistically significant difference in perceived task difficulty (c2 = 10.7, p= 0.005)with MOT (Mdn = 3.5,SD = 1.71) being rated more difficult than PVT (Mdn =1,SD = 0.79,Z = �2.68, p = 0.007). With regard to perceived exhaustion,we found a statistically significant difference (c2 = 6.9, p = 0.032) with MOT(Mdn= 3,SD= 1.8) being rated as more exhausting than PVT (Mdn= 1.5,SD=0.7,Z = �2.413, p = 0.016). As to which task was the most fun to completewe did not find any statistically significant difference (c2 = 5.243, p = 0.073),but MOT reached the highest rating (Mdn = 5,SD = 2.49). 90% of participantsexplicitly stated to prefer the MOT task (GNG: 10%, PVT: 0%).
5.2.2 Discussion
Our validation study shows the tasks’ feasibility to extract circadian fluctuationsand a homeostatic decrease in performance across the day. To be as unobtrusiveas possible we limited all tasks to 1-2 minutes in duration, which at the sametime limited the amount of data collected. Nevertheless, using the PVT we foundboth effects, while the GNG showed a linear decrease in performance and theMOT resulted in circadian variations. As alertness decreases we find slowerprocessing speed in the PVT, the GNG shows poor target discrimination anddecreased response inhibition as evident in impulsive responding, and the MOTshows a decrease in the ability to divide attention across space. We confirm thatPVT is most economical as it provides the most data in the shortest time. It

124 5 Cognition-Awareness
is, however, subjectively rated worst, likely due to its monotonous and simplenature. Adding GNG and MOT to our toolkit provides a more holistic assessmentof cognitive performance. They extend simple alertness assessments by addinghigher cognitive functions (such as executive control and divided attention).Subjectively, participants preferred MOT and GNG as they are perceived to bemore challenging. In contrast to the PVT, their nature allows them to be adaptedin terms of their difficulty and the challenge they pose to the user. This makesthem attractive to be integrated into applications and even games. Their metrics(hit/miss and reaction time) can be obtained through a variety of mechanisms, suchas game performance or typing behavior. Integration of such metric collectionin other applications will allow us to build implicit, cognition-aware systems,where explicit measurement that requires users to interrupt ongoing activities maybecome obsolete.
5.2.3 Study Conclusion
We developed a mobile toolkit for assessing alertness and cognitive performanceof users by using a combination of three tasks. The toolkit allows those tasksto be performed in-the-wild and effectively extracts circadian fluctuations and ahomeostatic decrease in performance across the day. We show that with a smalldataset and with the sensitive statistical methods we applied we can reconstructusers’ circadian rhythm of alertness and cognitive performance. We released thetoolkit as an open source library to allow researchers in psychology and medicine,as well as application builders, to create cognition-aware systems. Systems thatare aware of users’ performance rhythms can adapt interface complexity andinformation bandwidth to match the user’s current state. Due to the task variety,similar metrics can be collected in games and applications and therefore makedata collection even less obtrusive.
In future work, we are planning on collecting phone usage data along withcognitive alertness metrics. Using the performance assessments as ground truthwe can train models that predict the user’s alertness based on the individual’scircadian rhythms. In the last part of this Chapter, we will present and discuss aframework for obtaining cognitive states and building machine-learning modelsto predict those states in-situ.

5.3 A Conceptual Framework to Derive Cognitive States 125
5.3 A Conceptual Framework to Derive Cog-nitive States
When measuring cognitive states and activities we need to rely on indirect observa-tion, inference, and self-reports. Therefore, we adapted a classic machine-learningapproach to a framework for building algorithms capable of detecting and pre-dicting cognitive states. This is basically done by correlating sensor data withan observed user state through supervised machine-learning techniques. Theframework depicted in Figure 5.5 entails three steps:
1. Collecting ground truth together with context sensor data.
2. Extracting features from that sensor data.
3. Training and applying classification and prediction models.
In the following each of these three steps will be described in more detail alongwith a few examples.
5.3.1 Ground Truth Collection
To be able to correlate context data gathered from ubiquitous sensors to cognitivestates, we need a labeled dataset. Such a dataset consists of feature entries anda corresponding label containing the ground truth. The ground truth entails theexistent cognitive state of interest (e.g., current level alertness) at a certain timewith the simultaneous occurrence of feature characteristics. Such ground truthin form of the user’s current cognitive state can be assessed in three ways: 1)through self-reports, 2) direct observation, or 3) inference.
Self-reports
Self-assessments are a widely used way to collect information about users’ feel-ings, thoughts, activities, and experiences without having to invest much timeand resources building a complex recognition system. Assessments can takethe form of daily diaries or users can be asked to stop at certain times duringthe day to give an assessment of their momentary experience. This method isalso called the Experience Sampling Method (ESM) or Ecological Momentary

126 5 Cognition-Awareness
Ground Truth
1
2
3
Sensor Data
Feature Elicitation
Training Prediction Model
Self-reports
Observation
Inference
Battery Status Screen Events Phone Events Notifications Data Activity Proximity Ringer Mode SMS Location ….
Context
Day of week Hour of day Phone in silent mode Semantic location Lighting condition …
Usage
Battery drain Time spent communicating App switches App categories used # of phone unlocks …
…
Bayesian Network
Random Forest
Support Vector Machine …
Figure 5.5: Conceptual framework to derive cognitive states in three steps:1) collecting ground truth together with sensor data, 2) extracting meaningfulfeatures from the data collected to create a labeled dataset, and 3) trainingprediction models that can be integrated in applications.
Assessment (EMA). Experience sampling is used to gather in-situ feedbackin the form of short statements. With the availability of mobile devices, suchstatements can easily be collected throughout the day [50]. The immediacy ofthese short self-assessments reduces the cognitive biases associated with otherrecall-based self-report techniques, such as interviews, surveys, or diaries. Ex-perience sampling has been shown to have both internal and external validity,however, the interruptions caused by the sampling process have been recognizedas an issue [130].
In a ubiquitous computing setting, there are two general approaches to triggerESM probes: interval- and event-triggered. Self-assessment surveys can betriggered through notifications, for example, in regular intervals, e.g., everywaking hour, or based on device events, such as phone unlocks or incoming

5.3 A Conceptual Framework to Derive Cognitive States 127
Figure 5.6: Ground truth collection in form of experience sampling prompt-ing users to provide self assessments.
phone calls. Intille et al. [140] recently presented an experience sampling methodfor smartwatches, in which they found that interactions on the watch throughoutthe day have a high compliance rate, but are also perceived as highly distractive.Distractions and interruptions caused by triggered self-assessments should be keptto a minimum, which is why on mobile devices an ESM probe should contain onlya limited number of questions. Likert-style ratings (e.g., “right now I feel bored”(Figure 5.6)) and multiple choice questions are preferable to free text answers,especially on mobile devices where text input is rather cumbersome. Also, self-reports can be subject to individuals’ biases and (un-)intended falsifications.
Observation
A more reliant way of collecting ground truth without the risk of interruptingthe user is through direct observation. Since this technique is rarely feasiblewhen conducting field studies in-the-wild, we often need to resort to implicitobservation. Through logging user actions on mobile devices, for example, we can

128 5 Cognition-Awareness
Figure 5.7: Ground truth collection in form of observing or logging whatusers actually do (e.g. app interactions).
document user behavior in everyday context without interruptions. For example,we can directly record app usage behavior on users’ mobile phones (Figure 5.7))in order to gather information about what times during the day users consumenews, engage with games, or communicate with peers. Boehmer et al. [27]describe an approach to analyze mobile app usage across the day by logginguser data and also taking into account contextual information, such as location.However, many behaviors or intents are not directly observable. A lot of useractions happen in the real world and are not directly captured by mobile sensors,which is why we at times need to rely on inferences from sensor data rather thanfrom observable behavior.
Inference
As opposed to inferences from observable behavior, inferences from sensor dataare made on a lower level abstraction. Physical activity, for example, can bederived from accelerometer data (Figure 5.8), where movement patterns can

5.3 A Conceptual Framework to Derive Cognitive States 129
Figure 5.8: Ground truth collection in form of inferring user states or activi-ties from raw data (e.g., accelerometer data showing sleep, walk or runningactivities (src.: [221]).
be mapped to activities, such as standing, walking, running, climbing stairs,and brushing teeth [221]. Therefore, classifiers are applied in order to extractthe ground truth in form of discrete states from raw sensor data. The AWAREframework by Ferreira et al. [98] gives researchers a tool to obtain and pre-processmobile phone sensor data to derive user activities. Similarly, Mathur et al. [184]used EEG data to collect ground truth on user engagement to correlate it in asecond step to mobile phone usage. Thus, making inferences from sensor datarequires an intermediate step of pre-processing that data in order to extract groundtruth states.
When collecting ground truth data either through self-reports, observation, orinference, we record additional context data through mobile sensors as theyare present in phones and wearables; these typically possess rich sensing capa-bilities, are near-constantly available, and provide means through ApplicationProgramming Interfaces (APIs), for example, to access sensor states, observeuser interactions, and use the device’s output capabilities to provide users withfeedback and prompt for explicit user input. Examples of sensor data can beacceleration, lighting conditions, phone usage intensity, apps being used, or times-tamps. So whenever the ground truth is collected by one of these three means, wetake a snapshot of the available sensor data at the point of collection. Sometimesit makes sense to take into consideration the sensor data in a certain time interval(e.g., 5 minutes) before or after the ground truth is being collected.

130 5 Cognition-Awareness
5.3.2 Feature Extraction from Sensor Data
Sensor data provides us with contextual information, based on which we cannow define features that may be relevant to analyze in co-occurrence with theground truth collected, i.e., the cognitive state. A feature is described as anindividual measurable property of a phenomenon observed [23]. A phenomenonas measured by sensors can be the source for multiple features: from a timestamp,for example, we can extract multiple features, such as the month of the year, theday of the week, or the hour of the day. Similarly, app usage data gives us insightsnot only into the kind of app, used, but also contains information about the appcategory (e.g., news, games, productivity apps), usage duration, sequence, andfrequency. Defining informative, discriminating and independent features is a vitalstep for training effective models. It often requires experimenting with multiplepossibilities and combining automated techniques with intuition and domainknowledge. The goal of defining and extracting features is to produce a labeleddataset, in which each feature is listed in combination with the characteristics ofother features along with the co-occurring ground truth as a label.
5.3.3 Training and Applying Prediction Models
With this labeled data set we can now set out to build detection and predictionmodels. By using machine-learning techniques we can reconstruct distinct usagepatterns that correlate with the user’s cognitive state as described by the groundtruth. For the work described in this thesis, we have achieved good results withRandom Forest classifiers or Decision Trees depending on the types of datacollected [87, 214]. Weka [136] has proven to be a powerful software offering avariety of tools for analyzing data, training algorithms and exporting predictionmodels. The more data available for training these models, the better the accuracyof the prediction. Once the cognitive state in question can be detected anddistinguished with sufficient accuracy, we can export the prediction model andintegrate it into live systems (e.g., mobile phone apps) where its applicability canbe tested in the wild.
This overall procedure focuses on creating general prediction models, but oncewe have a proof-of-concept of mapping ground truth to sensor data, the trainingof the algorithm can also be conducted on the fly with users’ personal datasets.Therefore, the system needs to continue collecting ground truth along with sensordata in order to train these models in-situ. Hence, individual prediction modelsare feasible to be created and applied directly on the user’s device, which has the

5.3 A Conceptual Framework to Derive Cognitive States 131
additional advantage of privacy by design, since no data necessarily need to leavethe user’s device.
5.3.4 Applying the Framework: The Augmented Nar-rative
We applied the aforementioned framework to an experiment in measuring readerengagement while reading text [168]. Based on physiological sensors, such aseye movements, skin temperature, heart rate, and GSR or EDA we investigatedwhether it is possible to detect how immersed people were in the texts they werereading. Not only could this give us valuable information about the current textand the reader’s levels of interest, but also allow us to adapt the reading UI inreal-time by staging interventions to bring the reader’s diverted attention back tothe text. Reliable detection would allow electronic reading interfaces to take intoaccount readers’ engagement levels by providing, for example, additional textualinformation in engaged states or try to bring back readers’ attention by addingsound effects to trigger mental imagery.
Ground Truth and Sensor Data Collection
In the experiment we had five readers (3 female) with a mean age of 29 (SD = 3)read six different texts of different presumed engagement levels. For ground truthcollection we assessed participants’ level of immersion in the text by applyingan immersion questionnaire after reading each text as proposed by Jennett etal. [148]: in this questionnaire participants self-reported their subjective levels ofempathy, frustration, boredom, and enjoyment on a Likert-style rating scale from1 to 5. Each text was further rated by participants according to their subjectiveengagement. Along with the self-reports on immersion as ground truth, wecollected contextual data by equipping study participants with a temperaturesensor mounted on the nose and behind the ear, attaching a sensor to a fingerand a heart rate monitor to the wrist (see Figure 5.9). Additionally, we attacheda Tobii EyeX eye tracker to the bottom of the screen, on which the texts wereshown, in order to record eye movements.
Feature Extraction
Hence, for each of the six texts, we collected ground truth on readers’ immersionand engagement along with contextual data in form of physiological sensor data.

132 5 Cognition-Awareness
Figure 5.9: Study participant reading on tablet while collecting temperature,GSR, heart rate, and eye movement data.
In the next step we extracted a range of features from the sensor data: for one,we extracted nose temperature changes over time and calculated the slope ofthe temperature curve using linear regression, which showed to be a significantindicator for engaging vs. non-engaging texts over all users (p = 0.03,F = 0.84).From the eye movement data we extracted blink frequencies and calculated thefrequency change over time, which also turned out to be a significant indicatorfor engaging vs. non-engaging texts (p = 0.05,F = 0.96). Further features weextracted and that looked promising were: number of fixations, the median offixation duration, variance of fixation duration, and the number of saccades thatwere not in the main reading axis. Since we did not find strong correlationsbetween engagement levels and GSR or heart rate data, we did not use them asfeatures for the classification.
Classification
Based on the features extracted we trained a support vector machine (SVM) witha radial basis kernel. Therefore we applied a leave-one-out user independentstrategy by training the model on the data provided by four users and testing iton the remaining one. We approached the classification as a two-class problem:engaging vs. non-engaging. Further, we trained a second SVM to assign anengagement value from 1 to 6 (1=low, 6=high engagement) to each text by

5.4 Chapter Summary 133
training on five texts and testing on the remaining. The goal was to automaticallysort the texts according to user preferences based on engagement scores.
In a leave-one-out cross-validation the SVM classifier was able to predict textengagement correctly. The relative rating of texts according to predicted engage-ment scores worked for 3 out of the 5 users (60%). The two users, for whichsorting did not work, had the most bored and most engaged ratings correctlyclassified, but the remaining text ratings were falsely classified. Due to the sim-plification of reading engagement and the small sample size we refrain fromclaiming to have produced a reliable reading engagement predictor. However, theexperiment served as a proof-of-concept for the framework we applied.
5.4 Chapter Summary
In this Chapter, we considered the user’s cognitive state as an additional dimen-sion of context. Being in a fatigued or in a highly focused mental state has animpact on how information can be received, processed, and retained. By beingaware of users’ current states technology can adapt information selection andpresentation in ways to match users’ processing capacities. Inferring cognitivestates by using bio-signals is often invasive and cumbersome. In Chapter 3 wediscussed utilizing people’s near-constantly available mobile phones in orderto detect moments of low and high attention. In this Chapter we focused onmore long-term patterns of cognitive performance across the day, thereby lay-ing the groundwork for RQ4: through alertness task tracking we were able toreconstruct people’s circadian rhythm of alertness and cognitive performance,which generally describes the diurnal changes in the ability to concentrate. Weargue that by providing technologies with an awareness of users’ cognitive statesapplications can adapt to users’ current cognitive capacities. Information inter-faces, for example, could be adjusted according to the user’s current cognitivecapacity: in phases of high concentration, complex information can be efficientlydisplayed, whereas in phases of low concentration complexity can be removedto prevent information overload and frustration. Systems that are aware of theuser’s circadian rhythms can provide support in scheduling tasks across the day,manage interruptions, and help users become more self-aware of their diurnalrhythms. Since circadian disruptions have shown to be related to the emergenceof schizophrenia and diabetes [49, 254], self-awareness through such systemscould help people take preventive measures.
134 5 Cognition-Awareness
For supporting researchers and application builders to create cognition-awaresystems we presented two tools: 1) a mobile toolkit comprising a sequenceof tasks designed to elicit users’ circadian rhythm of alertness and cognitiveperformance and 2) a conceptual framework comprising three steps for buildingalgorithms that detect cognitive states from contextual sensor data. In the nextpart of this thesis, we present concepts and our applications of the presented toolsand show how they can be used to facilitate effective information intake.

IIIAPPLICATIONS


Chapter6Opportune Content Delivery
In Chapter 3 and 4 we laid the groundwork for detecting attention levels as anawareness dimension for context-aware systems. Technologies with the abilityto assess different user states, such as being alert, receptive, tired, or bored, canuse this information to facilitate information intake. While the user’s capacity tofocus influences the ability to process information effectively, current attentionlevels can be used to determine the timing of when to deliver particular typesof information. In this Chapter, we present two research probes, in which weinvestigate content delivery in opportune moments as a direct application forsystems with cognition-awareness.
We specifically focus on systems that proactively push content to the user. Basedon the user’s receptiveness to such content suggestions we gain insights into whatmakes moments opportune for delivering different types of content. We apply theprediction algorithm developed in Section 3.3 to establish links between differentcognitive states and the user’s openness to content suggestions.
While previous work has looked at making sense of users’ mobile phone activitiesto predict human interruptibility [11, 102, 215], we focus on predicting people’sgeneral openness to different content suggestions, namely learning content inform of foreign language vocabulary and articles to engage in reading activities.Hence, we built a language learning app to trigger vocabulary reviews throughoutthe day. This investigation indentifies opportune moments for delivering learningcontent. We further report on a study conducted together with Pielot et al. [214],

138 6 Opportune Content Delivery
in which we applied our boredom prediction algorithm to suggest reading articlesof general interest in situations of detected boredom.
In this Chapter, we address the following research question:
• RQ5: How can opportune moments for content delivery used to fosterinformation intake and learning?
Parts of this chapter are based on the following (pending) publications:
• T. Dingler, D. Weber, M. Pielot, J. Cooper, C.-C. Chang, and N. Henze.Language learning on-the-go: Opportune moments and design of mo-bile microlearning sessions. In Proceedings of the 19th InternationalConference on Human-Computer Interaction with Mobile Devices andServices, MobileHCI ’17, pages 28:1–28:12, New York, NY, USA,2017. ACM
• M. Pielot, T. Dingler, J. S. Pedro, and N. Oliver. When attention is notscarce - detecting boredom from mobile phone usage. In Proceedingsof the 2015 ACM International Joint Conference on Pervasive andUbiquitous Computing, UbiComp ’15, pages 825–836, New York, NY,USA, 2015. ACM
6.1 Related Work
The work in this chapter is mainly inspired by and based on previous researchin learning theories (see Section 2.2), technology-mediated learning, and workregarding user attention and interruptions.
The Effects of Repetition on Vocabulary Learning
Research has shown that the extent to which vocabulary gains are made is posi-tively related to the number of times language learners encountered each vocab-ulary word [266]. Incidental vocabulary learning is a gradual process in whichgains are made in small increments with repeated encounters needed to achievefull knowledge of a word [193]. In addition to repetition, word review can be
6.1 Related Work 139
enhanced with proper spacing. Spacing effects refer to the retention advantage forinformation that is repeated in a distributed fashion relative to information thatis repeated in a massed fashion [39]. Dempster [62] demonstrated that languagelearners retained a greater number of vocabulary words when words presentedwere distributed and spaced apart instead of being presented in succession. Spac-ing effects not only apply within a learning session but also between sessions.Bahrick & Phelps [13] demonstrated that words were better retained when studiedand re-learned at 30-day intervals when compared to 1-day or 0-day intervals.
The use of computers greatly enhances spaced repetition vocabulary learning. Itis a lot easier for a computer to keep a record of individual learner’s performanceand control the sequencing of vocabulary words appropriately. Language learnerswho study with physical flashcards need to monitor their own learning progress,in turn running the risk of inefficient learning [194]. A study conducted byNakata [194] has shown that students were able to recall more vocabulary wordsusing the computer when compared to word lists.
Flashcard and Multiple Choice Learning
Unlike lesson-oriented learning, flashcards operate at the granularity of facts (e.g.,word translation) and measure the learner’s ability to provide the correct responsein the presence of a stimulus [92]. The use of flashcard is a common way to learnvocabulary as it allows the user to group difficult words together and allow themto be reviewed more frequently than easy words [194]. Furthermore, flashcardsenhance vocabulary learning by reducing the list effect where learners tend torecall words more easily due to the order they appear on the word list.
Numerous researchers have explored microlearning applications based on flash-card presentation. Basoglu and Akdemir [18] had students use a mobile phonewith a flashcard vocabulary application. Results indicated that using mobilephones as a vocabulary learning tool is more effective than one of the traditionalvocabulary learning tools. Edge et al. [91] created a mobile flashcard applicationwith an adaptive spaced repetition algorithm.
Multiple choice learning has not been extensively applied to mobile devices.Vocabulary skills, however, are commonly assessed through multiple choicetests [225]. Primarily, multiple choice quizzes highlight deficiencies in languageacquisition, thereby providing a similar baseline as flashcard learning.
140 6 Opportune Content Delivery
Notifications & Interruptions
Microlearning mobile applications have shown a lot of promise and potential toimprove vocabulary learning, however, microlearning research studies typicallyare not optimized for sustained or continuous use. One way to promote sustaineduse of the app is through push notifications, however, the language learning appmust also compete with numerous notifications pushed by other apps. There isresearch suggesting that frequent push notifications cause interruptions and caninduce stress [281]. Increased number of notifications was also associated withincreased negative emotions [212].
The stress and frustration induced by frequent and interruptive push notificationscan be reduced. Studies have shown that pushing a notification during a breakpointreduces frustration [141] and are dealt with significantly more quickly [99].Strategies, such as bounded deferral, have been proposed to hold beck alerts whenthe user is predicted to be busy until more suitable moments [137]. Poppinga etal. [216] collected data from smartphone sensors and applied machine learningmodels to automatically predict and identify such opportune moments to triggernotifications.
These studies show that learning gains can be made with repeated exposure andlearning sessions can be broken down into small chunks of quick interactions pre-sented on a mobile device. Mobile applications geared toward learning, however,need to compete for the attention of the user who may have hundreds of otherapps installed. This research investigates how to best design a mobile learningapplication as well as systematic push notification in order to promote prolongedand sustained mobile learning sessions.
6.2 Micro-Learning Sessions Throughoutthe Day
Learning new skills, knowledge, and practices are often limited by a lack oftime, motivation, and resources. Quests, such as learning to program or a foreignlanguage, are daunting tasks that require learners to dedicate large chunks of timeon regular basis. According to The Foreign Service Institute (FSI) of the USDepartment of State15, it can take up to 750 class hours (30 weeks) for a native
15 http://web.archive.org/web/20071014005901/http://www.nvtc.gov/lotw/months/november/learningExpectations.html

6.2 Micro-Learning Sessions Throughout the Day 141
English speaker to become proficient in German. Many language learners simplycannot fulfill such time commitments or lack the motivation to spend such a greatdeal of time and resources on intensive or immersive instructions.
While most products require learners to dedicate large chunks of time on aregular basis, mobile apps are often designed to support microlearning sessions.Microlearning sessions break down a learning task into a series of quick learninginteractions, thereby reducing learning units to more manageable chunks that canbe completed, for example, during idle moments, such as waiting for the bus orstanding in line at the supermarket. Since most people keep their smartphone inreach most of the time, this opens up the possibility to engage in short learningtasks spaced out throughout the day as users are on the go. In addition to enablingpeople who cannot dedicate large chunks of time to learn a new language, researchin psychology found that repetitions are more effective than dedicated long streaksof learning [54].
However, how to best design for such microlearning sessions is still an openquestion. Due to the anytime-anywhere capabilities of mobile devices, researcherscommonly suggest that microlearning is a great tool to convert spare time intosomething productive [22, 32, 262]. Further, since some people may need nudgesto keep learning a language, notifications can be used to turn users’ attention tothe device. Since notifications recently allowed for interactive content, they canalso allow users to quickly deal with short tasks [14], such as reviewing a fewwords of foreign language vocabulary, hence engaging in microlearning sessions.Yet, it remains unclear whether mobile users prefer learning a new languageduring short transient moments like during their commute on a train. Also, itremains unclear how such notification-triggered sessions should be designed,specifically, when they should be triggered and how the interactive notificationsshould look like.
We report on our development of QuickLearn, an app to explore and comparedifferent designs of microlearning sessions. Through interactive notifications, theapp invites learners to frequently review language content. Word exercises canbe attended to directly in the notification drawer or through self-initiated usersessions (see Figure 6.1). We assess the feasibility of notification triggers, presen-tation modes, and interaction modality with regard to microlearning sessions. Inthis chapter we present our findings from a mixed method user study: a controlledlab experiment and an in-the-wild study contributing the following:
1. Investigation of context factors of microlearning in mobile settings.

142 6 Opportune Content Delivery
2. Assessment of the feasibility of using interactive notifications for learningsessions, which last shorter than app launches.
3. The comparison of two vocabulary review methods: flashcards vs. mul-tiple choice, of which flashcards tend to be better suited for new wordacquisitions.
4. Exploration of using idle moments as an opportunity for learning andmemory strengthening.
6.2.1 System Design and Implementation
We developed a vocabulary trainer for Android devices. The application runson Android phones with OS 4.3 or newer and provides two distinct modes: oneallowed users to actively open the app and review vocabulary and the otherconsisted of a background service that initiated notifications to remind users toreview vocabulary. On its first launch, the app shows a consent form explainingwhat kind of data will be collected and for which purpose. After explicitly statingtheir consent, users are guided through the permission granting process whichconsists of giving access to the Android Accessibility Services and allowing theapp to access notifications. This is needed to inform the notification schedulealgorithm and take into account the users’ activities to trigger notifications. Inthe final step, the app asks the user to specify age, gender, and optionally leavean e-mail address. Users are also asked to indicate their mother tongue (L1), tochose the language they want to learn (L2), and what their current proficiencylevel in this language is. Since the application supports five languages, we askedusers to choose the language they are most comfortable with in case their mothertongue is not available. Once the setup is completed, the background service isstarted and the app shows the first set of vocabulary.
User-Initiated Learning Sessions
The application can be opened at any time by selecting the application icon. Uponstart, it launches an activity that shows words to review in sets of three. Aftereach set, users are asked if they want to continue with the next set of words or toquit the application. The design intended to support the notion of short learningsessions to give users the feeling of completion and accomplishment in minimumtime.

6.2 Micro-Learning Sessions Throughout the Day 143
System-Initiated Learning Sessions
While the application can be explicitly launched by the user, an additional servicerunning in the background that initiates learning sessions by triggering notifi-cations. These notifications remind the user to review a set of vocabulary. Thereview can be done directly in the notification area, thereby avoiding the need toopen the application and enforcing a context switch. By adding buttons to thenotification, users are able to interact with the notification’s content, which is whywe consider them interactive notifications. The app can also be directly launchedby clicking on the notification itself.
In Section 3.3 we identified moments, in which people tended to be bored andcorrelated them with phone usage. In these bored or stimuli-seeking moments,people may be more open to suggestions made by the phone and therefore moreopen to external interruptions. Since the success of micro-learning stronglydepends on peoples’ willingness to engage in learning tasks during opportunemoments, boredom might be such an opportune state to study language vocabulary.To examine this hypothesis, we applied the model described in Chapter 3.3 andintegrated the boredom classifier into the notification trigger algorithm. Themodel uses features, such as the recency of communications, demographics, orintensity of recent phone usage to estimate whether the phone user is boredomwith an accuracy of 74.5% AUCROC. The notification trigger mechanism worksas follows: whenever the user turns the phone’s screen on, the app service tried toschedule a notification. Therefore, it checked whether a notification was alreadyscheduled or whether the minimum time of 20 minutes since the last postednotification had elapsed. To not disturb users during the night, the notificationsare only posted between 11 pm and 7 am. If these conditions were met, a timeoutwas scheduled with a random delay between 10 seconds and 5 minutes. Whenthe timeout runs out, the classifier estimates the user’s boredom state. In case theuser was detected to be bored, the notification is posted. If the boredom state ispredicted to be negative, the notification is only posted in 1 out of 9 cases. In pilottests, we found that this makes roughly sure that an equal amount of notificationsis posted for each of the two boredom states (bored and non-bored). In case theapp is already in the foreground, no notification is posted.
User Interface Design
Words are presented in two display modalities: flashcards and multiple choice.The modality is randomly assigned when the app is first launched. The flashcard

144 6 Opportune Content Delivery
Figure 6.1: QuickLearn allows users to engage in microlearning sessions(left) or nudges the user to re-visit vocabulary through system-initiated, inter-active notifications (right).
method consists of a series of screens, beginning with the presentation of a foreignnoun with no translation (see Figure 6.2). Users can then click “translate” toview the translation and are then instructed to acknowledge whether they hadalready known the word (“knew it”) or had had no previous knowledge of theword (“did not know”). This way, the words that are tagged as previously knownby the user can be separated from the words that needed additional practice.
In the multiple choice modality, a foreign word was shown to the user whilelisting three suggestions for translation (see Figure 6.2): a random order of wordsincluding the correct translation as well as two decoy translations randomlyretrieved from the vocabulary set. The three options are arranged in a randomorder. Users then have to choose which translation they believe to be correct. Theapplication provides immediate feedback on whether the selection was corrector wrong. Correctly guessed words are tagged accordingly and have a lowerfrequency of repetition than those that were guessed wrong.
Word List
We used a vocabulary list consisting of common English nouns originally takenfrom the British National Corpus16, similar to Cai et al. [38]. The list compriseshigh-frequency English nouns since in second language learning nouns are typ-ically acquired before verbs and are less context-dependent. We used GoogleTranslate to translate these words into Spanish, French, German, and Arabic. Fi-
16 http://www.natcorp.ox.ac.uk

6.2 Micro-Learning Sessions Throughout the Day 145
nally, two native speakers manually went through the list and corrected inaccuratetranslations and flagged highly ambiguous words. The final word list consists of476 nouns in each language. The translations are uni-directional, meaning thata word was reviewed by being presented in its foreign translation (L2) beforerevealing it in the user’s comfort language (L1).
Word Scheduling
Vocabulary words are delivered in sets of three, providing obvious stopping pointsshould the user feel inclined to stop. After each set of words, users are asked ifthey wanted to continue or quit. A mechanism of spacing words for repetition wasemployed using a variation of the Leitner style schedule [111]: this schedule isbased on the principle of spaced repetition. Given that humans exhibit a negativelyexponential forgetting curve [90], repetitions need to occur at increasingly spacedintervals. Hence, new words are encountered just as they are about to be forgotten.So, whenever the user reviews a word, it is tagged as either correctly or incorrectlyguessed. In the flashcard modality, this is done by admitting to having knownthe word or not. In the multiple choice modality, this is automatically done byevaluating the given answer. When the app is first launched, the word list is beingrandomized. With every word review, the app goes sequentially through that list.If a word is seen for the first time and guessed correctly it is appended to thevery end of the word list. If this word is guessed incorrectly, it is replicated andspaced throughout the remaining wordlist in positions 4, 8, 16, 32, ... and so onuntil the end of the word list is reached. Whenever a word is encountered that isrepresented multiple times in the list, it is simply removed regardless of beingguessed correctly or incorrectly, hence making sure that the list does not growindefinitely.
6.2.2 Controlled User Study
To gain insights into the use of microlearning sessions for language acquisitions,we conducted a user study where we explicitly recruited participants to use theapp over a course of two weeks.

146 6 Opportune Content Delivery
Figure 6.2: The multiple choice modality via app (top) and notification(bottom) showing three possible answers and correct response (left), andthe flashcard modality via app and notification displaying initial screen andtranslation screen (right).
Method
We collected usage data from 17 participants who installed the app under oursupervision and returned after each week to fill in a survey and being interviewedabout their experiences. Regarding the vocab review methods, we used a repeatedmeasure design with the review method being the independent variable. Wecounterbalanced the starting condition so that half of the participants started usingthe app with flashcards, and another half started out with using multiple choiceanswers. After seven days, the method changed automatically. As dependentvariables, we collected app logs, general phone usage data as listed in Table 6.2,and information about the notifications triggered by the app. We assessed lan-guage learning effects by administering vocabulary tests after each week. Finally,participants were asked to provide subjective user feedback and comprehensivecomments during the final semi-structured interview.
Participants
We initially recruited 19 participants (9 female) through university mailing listsand personal connections with ages ranging between 22 and 44 (M = 28,SD =5.2) years. One participant needed to be excluded from the quantitative analysisdue to technical reasons, and another because he had his phone stolen during thestudy. Most of the remaining 17 participants were students, of which 9 indicated

6.2 Micro-Learning Sessions Throughout the Day 147
Language None Elementary Limited Professional Full
German 1 2 2 2 0English 0 0 1 0 0Spanish 1 3 0 0 0French 2 2 1 0 0
Table 6.1: Number of participants and their selection of their target languageproficiency in the controlled user study.
German to be their first language, 1 French, 2 Arabic, 2 English, and 3 Spanish.Table 6.1 shows an overview of their target languages and their current proficiencylevels. Three participants indicated to be currently enrolled in a second languagecourse.
Data Collection
Once the setup was complete, the app started the notification schedule service asdescribed above. It also included a log system where every app interaction wastracked: whenever the app was opened by the user, how it was launched (clickingthe application icon, the notification, or direct interaction in the notification),which words were reviewed and with which review method. Further, we collectedcontext parameters, such as time and location. Both sensor and usage data weresent to our servers through a secure connection. To prevent straining users’data plans, the app stored the collected data locally and transmitted only whenconnected through WiFi. As for whenever a notification was triggered, interactedwith, dismissed or ignored, and whenever the app was explicitly launched, welogged the current boredom state as predicted by the classifier.
Procedure
We invited participants to our lab, where we walked them through the purposeof the study and had them fill in an initial survey collecting demographic dataas well as their language preferences and previous knowledge. We explainedthe types of data that would be collected and how this data would be transmittedand stored. Then, we installed the app on their phone, went through the setupprocedure and had them complete the first set of words. We explained about the

148 6 Opportune Content Delivery
Phone Context
ringer mode mute, vibration, ringer
charging mode unplugged, charging
battery status related to usage intensity
display orientation portrait or landscape mode, orientation changes
light sensor changes in lightness allow us to derive whether phone is covered (carried in a pocket or taken out)
proximity sensor phone in pocket
location GPS data allows the inference of locations visited, and in-place vs. on-the-go states
motion significant motion sensor, change of position
Phone Usage
Calls incoming, outgoing
SMS incoming, outgoing
Notifications received, dismissed, ignored, interacted with
Screen on/off events
Unlocks phone unlocks
Data usage upload/download
Applications applications in foreground, switches, usage duration
�1
Table 6.2: Context data collected from phone sensors.
app’s intention to post notifications and explicitly asked users to not feel obligedto answer every incoming app notification, but rather deal with them as foundconvenient. We counterbalanced the review mode to start with either the flashcardor multiple choice mode. This first setup meeting took about 15 minutes, afterwhich participants used the app for seven consecutive days.
A week later we invited them back to take a vocabulary test and to fill in a survey.The test was dynamically created for each participant and contained only wordsthat fulfilled the following condition: each word listed had been reviewed bythe user and had been guessed incorrectly when first encountered. This waywe tried to make sure that we tested only new words that were unknown to theuser before using the app. The test would list the word in the second language(L2) and ask the participant to type in its translation (L1), thus employing arecognition task. We specifically did not list multiple choices or had participantsself-assess their performance like in the flashcard review mode because we wantedto test whether the words had actually been memorized irrespective of the reviewmode. The survey consisted of the eleven 5-point Likert-style questions listedin Table 6.3 asking about the subjective experience with the notifications, thelearning in general and its perceived effectiveness. The last part of the surveywas a text-based feedback form asking about what participants liked, disliked,and would improve about the app. Depending on the number of words that had

6.2 Micro-Learning Sessions Throughout the Day 149
to be reviewed, filling in the survey took up to 15 minutes. The filling in of thesurvey was done under the supervision of an experimenter, in some cases wherepeople could not come in after seven days, we sent them an online link to thesurvey with the explicit request not to use any auxiliary sources for filling in thevocabulary test. For the next seven days, the app changed its vocabulary reviewmode to flashcard or multiple choice respectively.
After another seven days of app, usage had passed, we asked participants to comein for a final wrap-up session where we applied another vocabulary test. Wordspresented in this test fulfilled the same condition described above and were wordsthat had only been encountered in the second week of the study. This way wemade sure that each vocabulary test contained words reviewed in one reviewmode respectively. Finally, participants attended a final semi-structured interviewcontaining 16 questions.
Hence, in total participants came in three times. For the initial setup and theintermediate session after one week we compensated them with 5 EUR each, andanother 10 EUR for completing the study after two weeks, accumulating in a totalof 20 EUR for their entire participation in the study.
Results
In the following, we report the results with regard to the learning success, notifi-cation interaction, user ratings and qualitative feedback as given by participants.
Learning
After two weeks of casual usage, each participant had encountered on average 523words (Mdn = 331,SD = 477.14). Of those, on average 223 (Mdn = 196,SD =127.2) words were unique (not repeat-words) and 55 previously unknown (Mdn=39,SD = 53.91). We categorized words as new or unknown when they had beenmarked as “did not know” or incorrectly answered when encountered for the firsttime. Participants completed on average 56 learning sessions (Mdn = 45.5,SD =31.26). In total we recorded 557 learning sessions with an average of 10 wordsreviewed (Mdn= 3,SD= 19.31) in 3 word sets per session (Mdn= 1,SD= 6.43).A learning sessions took between 1second and 20minutes (M = 48.8sec,Mdn =19.2,SD = 1.62min). In the vocabulary tests, users translated 35 previouslyunknown words (64%) correctly into the foreign language despite never havinghad to type an actual word during the study. These 35 words (Mdn = 20,SD =

150 6 Opportune Content Delivery
26.3) account for about 18 new words learned per week. The user who wasexposed to the most new words (76) translated 32 correctly to L2.
Learning through notifications vs. through the app
Over the course of two weeks, participants reviewed on average 451 words(Mdn = 257,SD = 473,7) through the app, and 72 words (Mdn = 70,SD = 40.3)directly through notifications. On average, 39 (SD=25.08) learning sessions werecompleted by actively launching the app and 21 (SD=19.5) sessions by interactingthrough notifications. A Wilcoxon signed-rank test showed that statistically signif-icant more reviews took place through an explicit app launch than through notifica-tion interaction (Z =�2.510, p = 0.012). Similarly, significantly more sessionswere completed within the app than through notifications (Z = �2.476, p =0.013). Participants spent on average 23.7 seconds (Mdn = 11.4,SD = 92.9) pernotification session vs. 59.8 seconds (Mdn = 27.5,SD = 97.3) per app session.A Wilcoxon signed-rank test showed that notification sessions lasted significantlyshorter (Z = �2.510, p = 0.12). In notification sessions, participants reviewedbetween 2 and 15 words (M = 3.5,Mdn = 3,SD = 1.6) and in app sessions be-tween 1 and 216 words (M = 13.3,Mdn = 5,SD = 22.5) per learning session.Significantly more words were reviewed per app session than per notificationsession (Z =�2.746, p = 0.006).
Learning through flashcards vs. multiple choice
Participants reviewed on average 271 words (Mdn = 117,SD = 375.3) withflashcards, and 252 words (Mdn = 137.5,SD = 255.3) directly through noti-fications. On average, 27.8 learning sessions (Mdn = 22.5,SD = 20.7) werecompleted with flashcards and 28.4 (Mdn = 28.5,SD = 16.2) sessions with mul-tiple choice. A Wilcoxon signed-rank test showed no statistical significancebetween the number of words reviewed (Z =�.784, p = 0.433), nor between thenumber of learning sessions completed per condition (Z = �.550, p = 0.582).Participants spent on average 51 seconds (Mdn = 17.8,SD = 115.3) per flash-card session compared to 46 seconds (Mdn = 20.5,SD = 75.6) per multiplechoice session. In flashcard sessions, participants reviewed between 1 and216 words (M = 10.3,Mdn = 3,SD = 21.4) and in multiple choice sessionsbetween 1 and 121 words (M = 10.3,Mdn = 3,SD = 17) per learning session.A Wilcoxon signed-rank test showed no statistical significance for the averagesession duration , nor for the average number of words reviewed per condition(Z =�.863, p = 0.388). For the flashcard condition participants recalled a me-dian of 10 (3 to 13) previously unknown words, and a median of 5 (1 to 12) in the
6.2 Micro-Learning Sessions Throughout the Day 151
multiple choice condition. A Wilcoxon signed-rank test yielded no statisticallysignificant differences between conditions, (Z = �1.023, p = 0.306), despitea tendency of participants to perform better recalling words learned throughflashcards.
Learning Locations
Of in total 556 recorded learning sessions across two weeks, we registered 105(18.9%) sessions having been completed at home, while 59 (10.6%) havingbeen completed at work, 209 (37.6%) took place at other and 183 (32.9%) atunknown locations. Semantic locations were estimated based on where usersspent most of their time during waking/sleep hours. Participants reviewed onaverage 257 (SD = 605.5) words at home, 57 (SD = 101.2) at work, and 219(SD = 242.5) in transit (i.e. “other”). We applied a Friedman test with a post-hoc analysis using a Wilcoxon signed-rank test with a Bonferroni-correctedsignificance level set at p < 0.017. There was a statistically significant differencein where participants reviewed the most words (c2 = 11.375, p = 0.003). Thepost-hoc analysis revealed a statistically significant difference between the numberof words reviewed in transit compared to at work (Z =�2.937, p = 0.003), butno significant difference between work and home (Z = �2.043, p = 0.041) orhome and transit (Z =�1.448, p = 0.148). However, there is a tendency towardsmore words reviewed at home (MD = 48) than at work (MD = 23) and morereviewed in transit (MD = 134) than at home or work. Users learned more wordsin transit, regardless of the review type (flashcards vs. multiple choice).
We further looked at the locations, in which more words were reviewed throughnotifications or in-app sessions: With regard to interactive notifications therewas a statistically significant difference in locations (c2 = 9.475, p = 0.009).The post-hoc analysis revealed a statistically significant difference between thenumber of words reviewed in transit compared to at work (Z =�2.585, p = 0.01),but no significant difference between work and home (Z =�1.884, p = 0.06) orhome and transit (Z = 1.139, p = 0.255). There was a tendency towards morewords reviewed through notifications at home (MD = 5,SD = 35.8) than at work(MD = 1,SD = 13.6) and more app reviews in transit (MD = 18,SD = 32.1)than at home or work. Similarly, there was a statistically significant difference inwhere participants used the app directly to review words (c2 = 11.460, p= 0.003).The post-hoc analysis revealed a statistically significant difference between thenumber of words reviewed through the app in transit compared to at work (Z =�2.844, p = 0.004), but no significant difference between work and home (Z =�1.578, p = 0.115) or home and transit (Z = �1.306, p = 0.191). Here, therealso was a tendency towards more words reviewed through in-app usage at home

152 6 Opportune Content Delivery
(MD = 13,SD = 507.6) than at work (MD = 12,SD = 94) and more app reviewsin transit (MD = 89,SD = 193) than at home or work.
Boredom as Trigger
To explore whether people are more open to learning vocabulary when they arebored, we analyzed the data we collected in situations of presumed boredom andnon-boredom. We consider the boredom estimation as the independent variableof a quasi-experimental design with two conditions: bored vs. normal. Thedependent variables were (1) click-through rate: the fraction of times that peopleclicked on the notifications created by QuickLearn, and (2) words per session: thenumber of words learned in a session. First, we cleaned up the data by removingparticipants who received less than 20 notifications and/or who clicked on lessthan 5 of them. For the lab study, 15 of the 19 participants passed this filter.
Click-Through Rates In the data set of the lab study, we did not find differ-ences between the fraction of notifications that the participants clicked in eachcondition. In the bored condition, scores ranged from 6% to 87% (M = 31.2,SD = 22.4). In the normal condition, scores ranged from 2% to 88% (M = 35.2,SD = 25.4). A Levene’s test showed that variance of the scores of the two condi-tions was sufficiently equal to use parametric tests (F(1,28) = .17, p = .68). Adependent t-test revealed no significant effect (t(14) =�.8, p = .43).
Words Per Session We did not find differences between the average word thatthe participants learned per session. In the bored condition, scores ranged from 0to 8 words (M = 6.07, SD = 4.33). In the normal condition, scores ranged from3 to 74 words (M = 12.87, SD = 17.89). A Levene’s test showed that varianceof the scores of the two conditions was sufficiently equal to use parametrictests (F(1,28) = 1.47, p = .20). A dependent t-test revealed no significant effect(t(14) =�1.69, p = .11).
User Ratings
Table 6.3 contains the results from the intermediate and final survey taken af-ter each week of app usage. Questions differed for each week except for theassessment of how participants rated the current learning mode. The ratingswere given on a 5-point Likert-style scale with 0 indicating “I strongly dis-agree” and 4 “I strongly agree”. Results show that the app was very wellreceived, in particular, the notifications acting as reminders to review vocab-ulary (Mdn = 3,SD = 0.97) and the interaction possibility through the notifi-cation drawer (Mdn = 3,SD = 1.22). Fig. 6.3 shows box plots for a selection
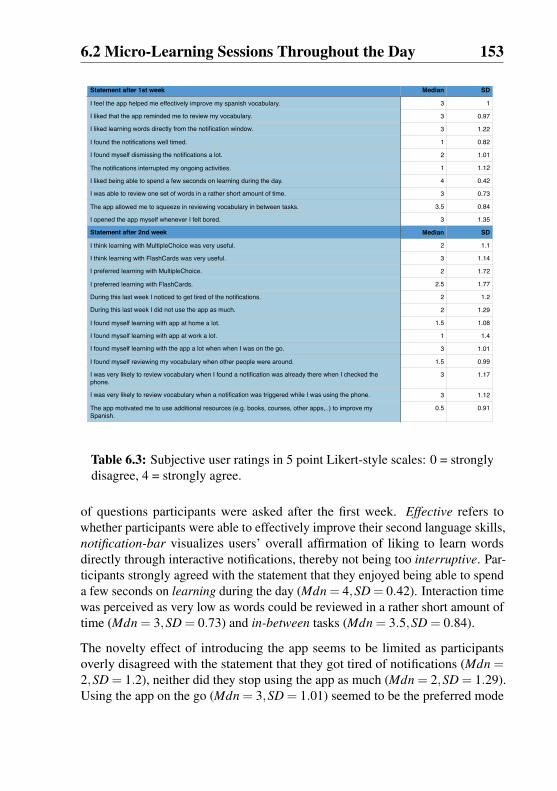
6.2 Micro-Learning Sessions Throughout the Day 153
Statement after 1st week Median SD
I feel the app helped me effectively improve my spanish vocabulary. 3 1
I liked that the app reminded me to review my vocabulary. 3 0.97
I liked learning words directly from the notification window. 3 1.22
I found the notifications well timed. 1 0.82
I found myself dismissing the notifications a lot. 2 1.01
The notifications interrupted my ongoing activities. 1 1.12
I liked being able to spend a few seconds on learning during the day. 4 0.42
I was able to review one set of words in a rather short amount of time. 3 0.73
The app allowed me to squeeze in reviewing vocabulary in between tasks. 3.5 0.84
I opened the app myself whenever I felt bored. 3 1.35
Statement after 2nd week Median SD
I think learning with MultipleChoice was very useful. 2 1.1
I think learning with FlashCards was very useful. 3 1.14
I preferred learning with MultipleChoice. 2 1.72
I preferred learning with FlashCards. 2.5 1.77
During this last week I noticed to get tired of the notifications. 2 1.2
During this last week I did not use the app as much. 2 1.29
I found myself learning with app at home a lot. 1.5 1.08
I found myself learning with app at work a lot. 1 1.4
I found myself learning with the app a lot when when I was on the go. 3 1.01
I found myself reviewing my vocabulary when other people were around. 1.5 0.99
I was very likely to review vocabulary when I found a notification was already there when I checked the phone.
3 1.17
I was very likely to review vocabulary when a notification was triggered while I was using the phone. 3 1.12
The app motivated me to use additional resources (e.g. books, courses, other apps,..) to improve my Spanish.
0.5 0.91
�1
Table 6.3: Subjective user ratings in 5 point Likert-style scales: 0 = stronglydisagree, 4 = strongly agree.
of questions participants were asked after the first week. Effective refers towhether participants were able to effectively improve their second language skills,notification-bar visualizes users’ overall affirmation of liking to learn wordsdirectly through interactive notifications, thereby not being too interruptive. Par-ticipants strongly agreed with the statement that they enjoyed being able to spenda few seconds on learning during the day (Mdn = 4,SD = 0.42). Interaction timewas perceived as very low as words could be reviewed in a rather short amount oftime (Mdn = 3,SD = 0.73) and in-between tasks (Mdn = 3.5,SD = 0.84).
The novelty effect of introducing the app seems to be limited as participantsoverly disagreed with the statement that they got tired of notifications (Mdn =2,SD = 1.2), neither did they stop using the app as much (Mdn = 2,SD = 1.29).Using the app on the go (Mdn = 3,SD = 1.01) seemed to be the preferred mode

154 6 Opportune Content Delivery
Figure 6.3: User ratings from 0 = strongly disagree to 4 = strongly agreetaken from the first week’s questionnaire, where we assessed learning effec-tiveness, utility of learning through the notification bar, the notifications’interruptiveness, learning in small chunks throughout the day, and being ableto schedule sessions in-between tasks.
Figure 6.4: Results from subjective user assessment of where they foundthemselves engaging with microlearning sessions.
as compared to at home (Mdn = 1.5,SD = 1.08) or at work (Mdn = 1,SD = 1.4),as depicted in Fig. 6.4.
There was a statistically significant difference in where participants reportedhaving used QuickLearn (c2 = 9.333, p = 0.009). No statistically significantdifferences were detected between work and home (Z = �0.677, p = 0.498),transit and home (Z =�1.840, p = 0.066), or transit and work (Z =�2.271, p =0.023). However, there was a tendency of more people indicating transit to be thepreferred place where they found themselves reviewing vocabulary.

6.2 Micro-Learning Sessions Throughout the Day 155
Qualitative Measures
After each week, participants filled in a survey, which—besides testing vocabularyrecall and collecting the subjective user ratings—contained free-form questions,where participants could leave qualitative feedback.
Most participants (N=9) positively commented on the ease of word access andvocab interaction through the notification bar: P1 stated “I didn’t consciouslyrealize that I was learning. Since it was such short periods of time.” P6 com-mented on the notifications’ reminder function: “I liked that it reminded meto invest some time. A reminder to do something useful.” Eight participantsagreed on idle moments where notification interactions were welcome, e.g., while
“fooling around on my phone.” (P1), “after finishing a task on the phone” (P7) or“whenever I was alone or doing something boring.” (P8). Most participant (N=9)explicitly rejected the notion that notifications for microlearning were perceivedas a disruption. “It’s not disruptive and allows me to continue easily with what Iwas doing” (P14) while another observed “you don’t have to leave the currentapp, therefore you don’t lose the focus” (P7). Also, it was generally well receivedto combine pro-active reminders with the possibility to launch the app explic-itly: “I can open it whenever I want, but at the same time, it reminds me to keeplearning” (P16). Further, participants welcomed the brevity of the interactions:
“Takes pretty much no time to learn something new” (P18). The short interactionsseemed to convey a feeling of accomplishment: “I was motivated to use the appbecause it was easy and not time-consuming” (P13) and “sets of three wordsgive me a sense of achievement” (P15). Participants found opportune momentsfor learning when they were, for example, “pulling out the phone to just checkthe time and there was a notification there, I would do a couple of words” (P1).Also here it became clearer that users welcomed notifications while engagedin information consumption rather than actively doing something on the phone:“when the browser was opened and I was reading unspecifically, then it would fit.It did not fit when I was concretely doing something, such as calendar entries”(P10). With regards to the question where participants were most likely to reviewvocabulary, a majority indicated public transportation and while in-transit to bemost fitting, also waiting situations, such as in between breaks at the gym or atthe bus stop.
Six participants found themselves explicitly opening the app in waiting situations:“Mostly when I was on the train or when I was waiting. Wasting time.” (P5),and “when I am on the lift alone. When I am waiting, queuing for some reason:supermarket, doctor’s appointment [...]” (P8). Five participants welcomed thereminders while they were using the phone (“While reading emails I was also

156 6 Opportune Content Delivery
Figure 6.5: Participants’ subjective rating of presentation modes: Flashcardsvs. MultpleChoice on a 0 - 4 Likert-style scale.
doing some words on the side” (P6)) while others (N=4) preferred reminders tobe triggered when they were not paying attention to their phone (“When I wasnot using the phone, or right after I was using the phone” (P10)).
Multiple participants (N=5) complained about the battery drain of the app. Sincewe collected a great variety of sensor data, this affected battery drainage in anoticeable way. Multiple choice seemed to polarize participants’ opinions. Someliked its “game-like character” (P10), but a majority (N=9) saw problems withcognates, i.e. words that look similar in different languages, and the problem ofbeing able to guess a lot of the words: “My level of Spanish is not really high, butmultiple choice often allows me to guess the answer to words I have never seenbefore, given my knowledge of French” (P14) and “Multiple choice options arecertainly not optimal to learn vocabulary, though okay for the quick interactions”(P16). However, as Fig. 6.5 shows there was barely a difference between learnerspreferring Flashcards over MultipleChoice. Some participants (N=4) commentednegatively on the timing of the notifications, for example when they had justchecked their phone only to be reminded to review their vocabulary after puttingit away: “sometimes notifications were delayed and came after I just checked thetime” (P17).
As for app improvements, six participants mentioned the limited choice of vo-cabulary and how they would like to add custom words or choose their ownword topics. As for review modes, four participants requested text entry quizzes,speech output for pronunciation, sentence examples, or adding articles to nouns.One feature consistently requested was a way to track their learning progress.

6.2 Micro-Learning Sessions Throughout the Day 157
6.2.3 In-the-wild Study
To increase our body of context sensor data we released QuickLearn free todownload on Google Play. This part of the study comprises data from users inthe wild. We collected sensor data as well as boredom prediction results andcollected subjective app feedback through in-app surveys.
Participants
Besides releasing the app on Google Play, we launched a corresponding websiteand Facebook page to be able to promote the app through social channels. Oneyear after the app release in September 2015, we registered 83 active users, 19of which being lab-study participants, of which decided to keep using the appfor a while beyond the study. While 28 indicated to be female, 55 reported tobe male. The reported mean age was 31 (SD = 11.7) and according to the mostfrequent device locales (35 en-US, 9 de-DE, 18 en-GB, 27 other) and timezones,most users were accordingly from the U.S., Germany, and UK. While 20 selectedGerman as their mother tongue, 39 chose English, 11 Arabic, 7 French, and 6Spanish. As a target language, 25 chose to study English, 23 Spanish, 13 German,18 French, and 4 Arabic.
Procedure
After downloading the app users went through the setup procedure consisting ofagreeing to the terms on the consent form and granting the application access tothe Android Accessibility Service as well as to notifications. Users were askedto provide their age, gender, language preference, and current proficiency. Thedisplay modality was randomly assigned when the app was first launched. Incontrast to the controlled study, the modality changed every three days.
Results
In total, 14,632 notifications were triggered, of which 2765 (18.9%) were in-teracted with. Further, we registered 1435 app launches resulting in more than19,000 words reviewed.

158 6 Opportune Content Delivery
Boredom as Trigger
After cleaning up the data similar to the lab study we ended up with 16 participantswho provided valid data sets.
Click-Through Rates In the data set of the in-the-wild study, we neither founddifferences between the click-through rates. In the bored condition, scores rangedfrom 2% to 81% (M = 20.69, SD= 21.91). In the normal condition, scores rangedfrom 0% to 50% (M = 18.75, SD = 15.92). A Levene’s test showed that varianceof the scores of the two conditions was sufficiently equal to use parametric tests(F(1,30) = .33, p = .57). A dependent t-test revealed no significant differencesbetween the groups (t(15) = .38, p = .71).
Words Per Session In the data set of the in-the-wild study, we neither founddifferences between the click-through rates. In the bored condition, scoresranged from 1 to 49 words (M = 7.71, SD = 11.49). In the normal condition,scores ranged from 2 to 21 words (M = 6.71, SD = 5.02). A Levene’s testshowed that variance of the scores of the two conditions was sufficiently equalto use parametric tests (F(1,32) = .55, p = .46). A dependent t-test revealed nosignificant differences between the groups (t(16) = .49, p = .63). In summary,we found no evidence to indicate whether phases of boredom are better or worsefor microlearning.
Opportune Moments for Language Learning
To be able to analyze context factors that are most opportune for language learning,the QuickLearn application collected usage logs as depicted in Table 6.2. Fromthis log data, we elicited 36 features (listed in Table 6.4 and 6.5) from 14,632instances of notifications sent to 37 different participants. The features werecalculated according to a five minutes time window prior to each notification beingtriggered, e.g., the number of phones unlocks five minutes before the notificationwas triggered. We had previously filtered out participants who received less than20 notifications and interacted with less than five of those. By using machine-learning techniques we assessed the importance of these features to predictwhether a participant would react to a notification by starting a quick learningsession.
To rank the features, we built a model with XGBoost [44], a state-of-the-art gra-dient boosting regression tree algorithm which has performed exceptionally wellin recent competitions17. XGBoost creates a ranking of the feature importance
17 https://github.com/dmlc/xgboost/tree/master/demo#machine-learning-challenge-winning-solutions

6.2 Micro-Learning Sessions Throughout the Day 159
Category Feature Description
Context charging Whether the phone is connected to a charger or notContext day_of_week Day of the week (0-6)Context hour_of_day Hour of the day (0-23)Context light Light level in lux measured by the proximity sensorContext proximity Flag whether screen is covered or notContext ringer_mode Ringer mode (silent, vibrate, normal)Context semantic_location Home, work, other, or unknownContext is_at_home User classified as being homeContext is_at_work User classified as being at work
Demographics age The participant's age in yearsDemographics gender The participant's gender
Last Activity time_last_incoming_call_accepted Time since last incoming phone call was acceptedLast Activity time_last_incoming_call_denied Time since last incoming phone call was rejectedLast Activity time_last_notif Time since last notification (excluding Borapp probe)Last Activity time_last_outgoing_call Time since the user last made a phone callLast Activity time_last_SMS_received Time since the last SMS was receivedLast Activity time_last_SMS_sent Time since the last SMS was sent
Context
Demographics
Last Communication Activity
Table 6.4: List of elicited features related to context, demographics, and timesince last communication activity.
when building the model. The importance is defined by the fraction of times thata feature was chosen to be used in a tree. To build the model, we used XGBoost’sstandard configuration, with one exception: in the standard configuration, theclassifier tended strongly towards a positive prediction, while only 18.9% of thenotifications had led to learning sessions. Hence, we reduced scale pos weight bythe factor 0.25, thereby increasing the penalty for false positives. The resultingmodel achieved a precision of 0.43, a recall of 0.712, and an F1-score of 0.526.Compared to the baseline, notifications posted by such a classifier would haveresulted in a theoretical increase in the conversion rate by 2.21 times.
Table 6.6 shows the importance of the 10 best predictors as reported by theXGBoost model. We further analyzed the correlations between those ten featuresand the ground truth via Spearman’s Rank correlation. Positive predictions of theclassifier had significant, non-negligible correlations with:
• Less time passed since the phone had been last unlocked last.(r =�0.303, p < 0.001)

160 6 Opportune Content Delivery
Feature Description
Usage Intensity battery_drain Average battery drain in time window
Usage Intensity time_in_comm_appsTime spent in communication apps, categorized to none, micro session, and full session
Usage External num_notifs Number of notifications received in time windowUsage External last_notif Name of the app that created the last notificationUsage External last_notif_category Category of the app that created the last notification
Usage Idling apps_per_minNumber of apps used in time-window divided by time the screen was on
Usage Idling num_apps Number of apps launched in time window prior to probeUsage Idling num_unlock Number of phone unlocks in time window prior to probeUsage Idling time_last_notif_access Time since the user last opened the notification centerUsage Idling time_last_unlock Time since the user last unlocked the phoneUsage Idline num_screen_on Number of screen on events in time window
Usage Type screen_orient_changesFlag whether there have been screen orientation changes in the time window
Usage Type app_category_in_focus Category of the app in focus prior to the probeUsage Type app_in_focus App that was in focus prior to the probeUsage Type comm_notifs_in_tw
Number of notifications from communication apps received in the time window prior to the probe
Usage Type app_category_in_focus_comm Current app in focus is communication appUsage Type most_used_app Name of the app used most in the time windowUsage Type most_used_app_category Category of the app used most in the time windowUsage Type prev_app_in_focus App in focus prior to app_in_focus
Usage (related to the type of usage)
Usage (related to usage intensity)
Usage (related to whether it was triggered externally)
Usage (related to the user being idling)
Table 6.5: List of elicited features related to usage intensity, external triggers,idling and type.
• Higher age.(r = 0.144, p < 0.001)
• More apps used during the last 5 minutes.(r = 0.213, p < 0.001)
• Less time passed since the last access of the notification center.(r =�0.186, p < 0.001)
• More screen unlocks during the last 5 minutes.(r = 0.264, p < 0.001)
• Not having received a notification in the last 5 minutes.(r = 0.109, p < 0.001)
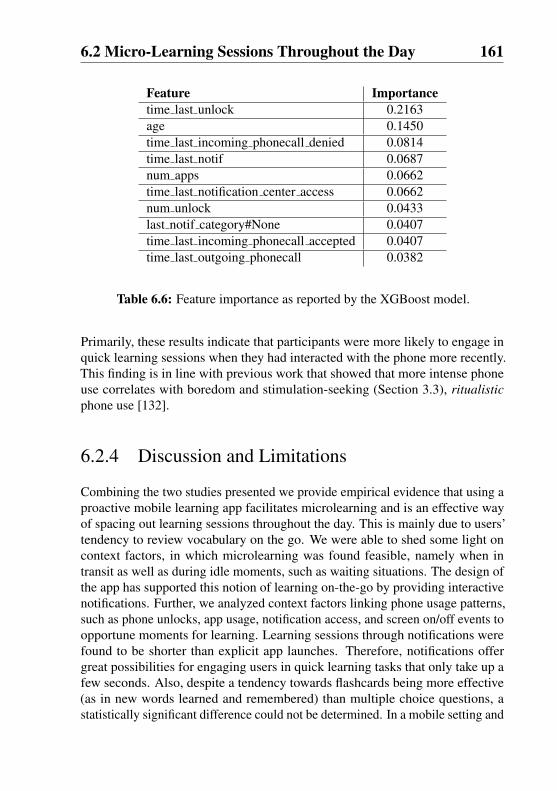
6.2 Micro-Learning Sessions Throughout the Day 161
Feature Importancetime last unlock 0.2163age 0.1450time last incoming phonecall denied 0.0814time last notif 0.0687num apps 0.0662time last notification center access 0.0662num unlock 0.0433last notif category#None 0.0407time last incoming phonecall accepted 0.0407time last outgoing phonecall 0.0382
Table 6.6: Feature importance as reported by the XGBoost model.
Primarily, these results indicate that participants were more likely to engage inquick learning sessions when they had interacted with the phone more recently.This finding is in line with previous work that showed that more intense phoneuse correlates with boredom and stimulation-seeking (Section 3.3), ritualisticphone use [132].
6.2.4 Discussion and Limitations
Combining the two studies presented we provide empirical evidence that using aproactive mobile learning app facilitates microlearning and is an effective wayof spacing out learning sessions throughout the day. This is mainly due to users’tendency to review vocabulary on the go. We were able to shed some light oncontext factors, in which microlearning was found feasible, namely when intransit as well as during idle moments, such as waiting situations. The design ofthe app has supported this notion of learning on-the-go by providing interactivenotifications. Further, we analyzed context factors linking phone usage patterns,such as phone unlocks, app usage, notification access, and screen on/off events toopportune moments for learning. Learning sessions through notifications werefound to be shorter than explicit app launches. Therefore, notifications offergreat possibilities for engaging users in quick learning tasks that only take up afew seconds. Also, despite a tendency towards flashcards being more effective(as in new words learned and remembered) than multiple choice questions, astatistically significant difference could not be determined. In a mobile setting and

162 6 Opportune Content Delivery
with regard to users often finding themselves killing time with the phone positiveaspects of MultipleChoice seem to be the game-like mechanism and the pleasureof guessing as stated by study participants. When notifications were triggeredout of predicted boredom situations, we were not able to detect a statisticallysignificant difference when compared to non-bored situations. Therefore, thestudy did not find conclusive evidence whether people are more likely to engagein micro-learning tasks depending on whether they are bored or not. Whileboredom is characterized as a state in which people seek stimulation—hencemight be open for the suggestion to learn vocabulary—it is also characterizedas the inability to find stimulation in current activities [89]. While people whoare currently experiencing boredom might, in theory, have the time to engage inmicrolearning, they may not be able to get up the energy or may not expect thestimulation they desire from this mentally demanding task. It may be worthwhile,however, to investigate users’ receptiveness of other content types suggested inmoments of detected boredom.
By analyzing phone usage context we provide an assessment of opportune mo-ments for scheduling learning sessions. Proactive learning reminders were es-pecially welcomed when the phone had been recently used as the correlationswith phone unlock and app usage patterns show. Also, the higher participants’age, the more likely they would engage with learning content. Unfortunately, thenature of the in-the-wild-study and the limited knowledge of our users prevents usfrom drawing clear causal relationships here. However, by updating the boredomclassifier with our innate model we could boost acceptance rates of the app’slearning reminders by more than factor 2.
For a one-year in-the-wild study we registered relatively low usage numbers.Besides the fact that we did not actively push the app’s popularity, its data settingsand therefore privacy implications might have had a deterrent effect. Obviously,our apparatus does not suffice to teach a foreign language to a learner. Werather focused on foreign language vocabulary as a proof-of-concept application.However, due to the well-received notion of microlearning sessions throughout theday, such technology could pose as a complement to existing learning techniques.For example, combined with an e-Reader or audiobook application, new wordsfrom articles the user has read could automatically be placed into the learning cueand spaced out in systematic repetitions in order to help users eventually committhem to long-term memory.

6.2 Micro-Learning Sessions Throughout the Day 163
6.2.5 Study Conclusion
Microlearning in combination with ubiquitous technologies bears great potentialfor learners who naturally lack time and motivation to tackle a daunting task,such as learning a foreign language. In our work, we set out to explore differentaspects of microlearning as a tool on-the-go, namely presentation mode, automaticreminders, interaction modalities, and learning context. Therefore, we createdan Android app, with which users learned on average 18 new words per weekby being exposed to about 37 words per day: whether in relatively quick wordreviews through the notification bar or through longer sessions through explicitapp launches. Our results show that people were more open to engaging inquick learning sessions when they are on-the-go. Both notification interactionsand in-app sessions registered more word reviews when people were in transitcompared to at home or at work. We see microlearning as a complement toexisting learning techniques: throughout the day we read various articles, makenotes, and try to remember new information encountered. As part of a greaterknowledge management system, small learning units can be provided to usersin idle moments. In this work, we showed the feasibility of such an approach,but the possibilities are far greater when, for example, external resources areconnected. Collaborative platforms, such as Anki18, for example, offer a greatsource for flashcards that can be fed into a microlearning system, such as theone proposed here. Through intelligent scheduling of repetitions and smartertriggers for reminders, such technology can help users make use of idle moments,commit knowledge to long-term memory and therefore increase their personaleffectiveness.
While predicted states boredom did not seem to correlate with opportune momentsfor learning we showed that training a classifier with context information retrievedfrom the phone’s sensors can more than double compliance rates. As discussed,learning activities may be too mentally demanding as to be a preferred activityin states of boredom. To validate and apply the boredom detection algorithmdeveloped in Section 3.3, together with Pielot et al. [214], we conducted a studyon triggering suggestions of light reading material based on predicted states ofboredom.
18 http://ankisrs.net/

164 6 Opportune Content Delivery
Figure 6.6: The app Borapp2 triggered notifications throughout the day toinvite users to read BuzzFeed articles in bored and non-bored states.
6.3 Using Predicted Boredom to SuggestReading Content
Here, we report on a study we conducted together with Pielot et al. [214] in2015, which followed the initial user study, in which we developed the boredomprediction algorithm described in Section 3.3. The main goal of this study wasto assess whether users were more receptive to suggested reading content whenpredicted to be bored. In contrast to the QuickLearn study, in which we suggestedlearning content, light-weight reading articles were randomly selected from thenews app Buzzfeed19. Therefore, a new version of Borapp called Borapp2 wasreleased on GooglePlay, which suggested reading articles throughout the day.
For this study, 16 users living in Central Europe between 16 and 51 years old(Mdn= 39, M = 36.31, SD= 9.37) were explicitly recruited to install and use theapp over the course of at least two weeks. The app was equipped with the boredomdetection algorithm, which analyzed the features described in Table 3.1 and 3.2locally on the mobile device in order to classify users to be bored or non-boredvia a Random Forest classifier. Throughout the day the app triggered notifications,which suggested users to open the Buzzfeed news app. The notifications containedthe title of the most recent Buzzfeed article and prompted the user to click in orderto read the article (see Figure 6.6). Notifications were scheduled with a delayof up to five minutes when the phone screen was turned on in case 30 minuteshad passed since the last notification. Before triggering the notification, the appchecked whether the user was currently classified as bored or not. To provide abalanced dataset the app made sure to trigger a similar amount of notificationsfor each boredom condition. The app removed notifications that were ignored bythe user for more than five minutes.
19 www.buzzfeed.com
6.4 Chapter Summary 165
Using the participants’ receptiveness with regard to the notifications triggeredas the dependent measure, the experiment yielded two measurements: 1) theclick-ratio, which described the number of notifications clicked in a conditiondivided by the total number of notifications presented in this condition. And 2) theengagement-ratio, which additionally described how long users spent reading thesuggested article after opening it. Users were regarded as being engaged whenthey spent at least 30 seconds with the suggested content.
Over the course of twelve days (the first two days were excluded from the dataanalysis to exclude a novelty bias) participants had received 941 content sugges-tions in form of notifications (M = 60.81, SD = 38.27). Participants were pre-dicted to be bored in 48.0% of these cases. We found that users were more likelyto click on suggested content (Mdn = 20.5% vs. Mdn = 8%) and more likelyto spend more than 30 seconds engaging with it (Mdn = 15% vs. Mdn = 4%)when they were predicted to be bored. Differences in bored vs. non-bored statesfor both measures in terms of click-ratio (z =�2.102, p = .018, r =�.543) andengagement-ratio (z =�2.102, p = .018, r =�.511) were statistically significantwith large effect sizes. These results show the feasibility of delivering readingcontent in opportune moments, namely when predicted to be bored.
6.4 Chapter Summary
In this Chapter, we presented applications that take into account the current userstate and context to deliver content suggestions throughout the day. While webuilt upon the algorithms and methods developed in Chapter 3 and 4 we furtherexplored characteristics of opportune moments for delivering learning and read-ing content. For the first field study reported in this Chapter, we built a foreignlanguage vocabulary trainer that triggered learning reminders throughout the day.To analyze opportune moments for delivering learning content we collected appusage data along with context information from the phones’ sensor data. Further,we collected subjective user feedback through surveys and interviews. Resultsshow that moments, which users spend in transit or idle (e.g., in waiting situa-tions) present opportunities for quick learning sessions, so-called microlearningsessions. Because of the ubiquity of mobile devices such sessions can be triggeredthroughout the day, allowing users to fill idle times and memorizing informationthrough spaced-out repetition. Analyzing sensor context factors we found thatphone usage patterns such as phone unlocks, app usage, notification access, andscreen on/off events can be used to predict such opportune moments for learning.Our classifier reached a recall rate of 71.2%.

166 6 Opportune Content Delivery
While we were interested in investigating the link between moments of predictedboredom and a willingness to engage with learning content, we were not able tofind any reliable correlation between the two. However, when training a machine-learning algorithm with the context data collected during the study we wouldbe—in theory—able to more than double the compliance rate. This lets us assumethat moments of boredom might be different from moments, in which learningactivities were appreciated by users.
We further looked at the design of learning triggers by comparing flashcardsto multiple choice learning. For both modes, we used interactive notificationswhich could be handled in the notification drawer rather than requiring the user toexplicitly launch the app. This allowed users to engage in brief microinteractionsthroughout the day, which study participants appreciated. The ease of accessto learning content allowed participants to briefly engage with learning tasks inbetween other activities.
We applied the framework presented in Section 5.3 as follows: 1) we derived ourground truth by observation, i.e., from log data. Therefore, we used instances,in which users either proactively opened the app or clicked the notifications as awillingness to engage in learning activities. Instances, in which notifications wereignored or dismissed we considered as unwillingness to learn. 2) We elicited aset of 36 features in order to 3) train a machine-learning model for predictingopportune moments for delivering learning content.
We also investigated the suggestion of reading content. Therefore, we integratedour boredom prediction algorithm into a mobile app that suggested articles froma popular news app throughout the day. A field study we conducted showed thatusers were more likely to engage with content suggestions and spent more timereading when predicted to be bored.
These two studies show the overall feasibility of delivering content to usersin opportune moments, i.e., moments in which users are open to follow thesesuggestions and engage in activities related to information intake and learning.With regard to RQ5 we investigated how such moments could be determined andfollowing our proposed framework for developing cognition-aware systems, wewere able to validate our approach on an application level. By triggering learningreminders we analyzed users’ receptiveness to content suggestions in order topredict user engagement based on phone usage data. Similar studies could explorethe nature of different content types and their respective user context: besideslearning foreign vocabulary and reading news articles, application categories,such as games and entertainment apps could be explored. Lee et al. [173] recentlyproposed a context-aware application scheduler, which preloads background

6.4 Chapter Summary 167
applications as they are predicted to be relevant to the user at the time. Whileproactive recommenders, in general, run the risk of patronizing users, predictivesystems can be used to engage and re-engage users with services, contents, andapps. However, transparency and appropriate intervention mechanism should beconsidered to allow users to control such proactive services.
Detecting opportune moments for content delivery can further be used to instillnew habits: through context analysis (e.g., daily wait-time at the bus stop) ap-plications could learn when to successfully trigger certain reminders and henceuse such moments for systematically pushing content related to a certain topic orrelated to a certain skill to the user. Such an approach could lead to instilling newhabits in people since habits are triggered by context and therefore become deeplyingrained [279]. An example would be a daily foreign vocabulary repetitiontaking place every morning at the bus stop. The advantage of habits is that even ifthe technology seizes to remind its user or is simply not available at the time, thedesired behavior could still be successfully triggered.

168 6 Opportune Content Delivery

Chapter7Adaptive Reading Interfaces
Reading is an activity mostly taken up for information gain and pleasure. Withthe rise of the information age, we face a great amount of information on a dailybasis. With the introduction of multimedia, information is tailored more broadlyto our various senses. However, reading remains the primary channel to consumeinformation. The skill to read and absorb information efficiently has become vitalin both the private and professional sector. We specifically focus in this Chapteron reading because of its function in information consumption. The effectivenessof committing information from its perception to memory is highly impacted byour current ability to concentrate. Attention levels are therefore a vital factor forreading activities. While Chapter 6 focused on detecting opportune moments forcontent delivery, in this Chapter we explore how reading content can be adjustedto support users taking in that information effectively.
To cope with the ever-growing amount of textual information to consume, dif-ferent techniques have been proposed to increase reading efficiency. Reiner etal. [224] recently summarized these efforts concluding with a clear assessmentthat language skill is at the core of reading speed. In order to increase speedwhile maintaining high comprehension, readers need to become more skilledlanguage users. Advanced language skills imply increased vocabulary, whichallows readers to quickly grasp the gist of a text while being able to comprehendmore of the arguments presented. There is a general trade-off between speed andaccuracy. If a thorough understanding of a text is not the goal, then deliberatelyincreasing reading speed allows the reader to get through text faster at a moderatecomprehension level.

170 7 Adaptive Reading Interfaces
However, comprehension levels also depend on the reader’s mental state andability to focus. Increasing reading speed while trying to maintain high com-prehension levels increases cognitive strain. High focus generally supports ourinformation bandwidth, therefore we can process information more effectively instates of high concentration. In contrast, when cognitive capacities run low, moretext pushed at us will result in more information remaining unprocessed. Thisabsent-mindedness during information intake leads to information not committedto memory and therefore not retrievable [234].
Currently, people have little awareness and even less control over how to adjusttheir reading flow. In this Chapter, we investigate how reading UIs can be adjustedin real-time to match the user’s cognitive capacities. First, we look at commonmethods to dynamically display text in order to modulate reading speed. Basedon a review of previous work in the field we propose a dynamic reading UI thatuses a kinetic stimulus to guide readers’ eye movements and speeds up theirreading. We evaluate its effectiveness compared to alternative methods withregard to text comprehension and users’ mental load. Then, we focus on readingin ubiquitous device environments, where text is increasingly read on wearabledevices, such as smartwatches and smart eyewear. With their limited screen sizes,such devices pose a challenge to effective information consumption. Hence, weapplied dynamic reading UIs, such as Rapid Serial Visual Presentation (RSVP),to allow information intake on-the-go. User control over reading speed is vital,which is why we explored different interaction concepts for manipulating readingflow. Hence, we investigated both implicit and explicit interaction techniques forreading control.
The research probes presented in this Chapter are examples of how systems canadjust the information bandwidth according to their users’ cognitive capacities.This can either be done by providing user controls through explicit interactiontechniques or by using implicit bio-signals, such as eye movement data, to adjustinformation interfaces. Cognition-aware systems can help match the attentionalrequirements of a reading interface with the user’s cognitive state in order toprevent frustration in case of highly complex contents or to avoid boredom in caseof simple materials. In this chapter we, therefore, investigate adaptive readinginterfaces that facilitate readers’ information intake, addressing the followingresearch question:
• RQ6: How can information displays and more specifically reading UIs beadjusted in real-time to decrease or increase information bandwidth?

7.1 Related Work 171
Parts of this chapter are based on the following publications:
• T. Dingler, A. S. Shirazi, K. Kunze, and A. Schmidt. Assessment ofstimuli for supporting speed reading on electronic devices. In Proceed-ings of the 6th Augmented Human International Conference, AH ’15,pages 117–124, New York, NY, USA, 2015. ACM
• T. Dingler, R. Rzayev, V. Schwind, and N. Henze. Rsvp on the go -implicit reading support on smart watches through eye tracking. InACM, editor, Proceedings of the 2015 ACM International Joint Con-ference on Pervasive and Ubiquitous Computing and Proceedings ofthe 2015 ACM International Symposium on Wearable Computers, Ubi-Comp/ISWC ’15, New York, NY, USA, 2016. ACM
7.1 Related Work
Our investigation is based on previous work on reading interfaces, interactiontechniques, eye tracking and further inspired by speed reading approaches as theyare applied by speed readers and commercially taught.
The Reading Process
Reading is a psychomotor activity during which our eyes move across visuallydisplayed text. During those movements—called saccades—vision is mainlysuppressed [186]. Hence, information is only acquired during the period of timewhen the eyes remain fairly still—called fixations. Although there are exceptionsto this where information can be acquired during these eye movements [255],in most cases our eyes move too quickly across a visual stimulus so that onlya blur would be perceived. An average fixation in reading lasts for about 225-250ms [223], but depending on factors such as reading skill, language familiarity,and text complexity fixation duration can vary considerably. The average saccadelength is 7-9 letters for readers of English and similar writing systems, whichalso can significantly differ. Another important component of reading is so-calledregressions, i.e., saccades in the opposite of the reading direction, which occurabout 10-15% of the reading time. Regressions are important indicators of textcomprehension (e.g., many regressions occur in particularly difficult texts) and

172 7 Adaptive Reading Interfaces
differ from return sweeps, which describe larger saccades from right-to-left inorder to get from the end of one line to the beginning of the next. The trackingof eye movements can give us insights into people’s reading skills and also textdifficulty: more difficult text generally leads to longer fixations, shorter saccades,and more regressions. Frequent readers typically read at a rate of 200-400 wordsper minutes (wpm), but skilled readers are reported to reach much higher readingspeeds. These speeds highly depend on a number of factors, such as the reader’slanguage proficiency and level of concentration, but also on the text’s complexityand typographical aspects.
Cognitive Effects of Reading
Stanovich and Cunningham [250] identified the “Matthew effect” with regardto reading, which describes the concept of a rich-get-richer and poor-get-poorerphenomenon. Hence, poor readers tend to expose themselves to less text thantheir more skilled peers, thereby increasingly corrupting their reading skill level.They showed that much of what we read directly influences our language skillsand the size of our vocabulary. This is due to the fact that written language islexically much richer than spoken language. So sheer reading volume comes witha higher exposure to rich language and hence enriches readers’ language skills.Boosted language skills again contribute to the development of higher cognitivefunctions like reasoning and judgment [205] and also lead to a greater generalknowledge about the world. Pronin et al. [218] linked the acceleration of thoughtprocesses in a series of experiments to joy-enhancing effects, rapid reading beingone of those methods used for accelerating thought. Hence, we started lookinginto ways to help people read faster and more.
Increasing Reading Efficiency (Speed Reading)
Evelyn Wood, creator of the Evelyn Wood Method [104] and one of the pioneersof speed reading, was supposedly capable of reading 6000 words a minute.Techniques she developed and applied were:
• Reading groups of words rather than single words, therefore, she needed totrain her peripheral perception.
• Avoiding involuntary rereading of passages.

7.1 Related Work 173
• Use of a finger or pointer to trace lines of text while eliminating sub-vocalization (i.e., reading out loud in reader’s head).
Wood noticed that the sweeping motion of her hand across a page caught her eyes’attention and helped them move more smoothly. Hence, the hand or finger couldbe used as a pacer. This insight inspired us to design an equivalent for electronicdevices in form of a kinetic stimulus.
Hansen [121] reports on a series of studies on reading comprehension with rapidreaders trained in the Evelyn Wood method. Her results showed that rapid readerswere superior in comprehension of relational aspects of text and were able torecall significantly more information than normal readers due to the fact that theywere able to read the material more than once given a time constraint. In otherwords, when normal readers and speed readers were given the same amount oftime to read a text, the speed readers covered more of the material and their recallindicated comprehension of the gist of the passage. They especially tended torecall more idea clusters than normal readers, but less detail about each idea.Other studies on the Wood method reported that average comprehension levelswent down as reading rate increased [40, 93, 116]. Just and Carpenter [150], onthe other hand, show that training speed reading can increase the comprehensionlevel of higher level information even on faster reading speeds. Yet, the increasesalso depend on text types and difficulty. They show that easy texts can be readvery fast without loss in comprehension. Together with Rayner et al. [224]they give a comprehensive overview of the processes of speed reading. Bothcome to the conclusion that there is a trade-off between reading speed and textcomprehension. In order to maintain high comprehension while reading faster,readers need to practice reading and therefore become more skilled languageusers. However, Rayner et al. also point out that speed reading or skimmingtext is feasible if a thorough text understanding is not the goal. Hence, moderatecomprehension may be acceptable for being able to read through certain textsmore quickly.
A series of studies have focused on how to best display text on computer screensand mobile devices: while limited screen size poses a challenge for readingUIs, reading performance has been shown to generally increase with bigger fontsize, which also affects the readers’ subjective preference and lowers levels ofperceived difficulty [15, 58]. Reading while performing a secondary task, suchas walking, has further shown to decrease reading performance while increasingcognitive load [236, 256]. Also, there is a variety of commercial tools available

174 7 Adaptive Reading Interfaces
that facilitate reading on the web: Readability20, for example, used as a browserplugin cleans up web pages and displays content in a more readable manner.Another example is the BeeLine Reader21, which aims at smoother line breaktransitions by guiding the user’s eye through a color code from one line to thenext. While these tools may facilitate reading on electronic screens they do notnecessarily nudge readers to increase their reading speed.
Rapid Serial Visual Presentation (RSVP)
RSVP, a term coined by Forster [103], is an experimental model for examiningtemporal characteristics of attention. With this method users focus on visual itemsbeing continuously presented in the same place. High information transfer ratesare thus possible because the need for saccadic eye movements is eliminated.
For electronic devices RSVP allows space to be traded for time and hence canbe used to support information browsing and search tasks on small displays [60].However, the capability of the human visual system seems to be the limiting factorin the application of RSVP. Presentation rate and the visual similarity of stimulihave been shown to influence the effectiveness of RSVP streams [217]. Subse-quent targets are often missed especially when they occur in rapid succession(180-450ms), which Raymond et al. [222] described as attentional blink. Whenusers are engaged in a secondary task, more stimuli are potentially missed. Thisis specifically critical for reading activities, where missing parts of a sentencemay severely inhibit readers’ text comprehension.
Masson [183] reported reading studies using RSVP, in which participants wereoften able to correctly outline the essence of a passage without necessarily re-calling specific words. Schotter et al. [241] on the other hand presented findingsof how repressing regressions in reading, which RSVP effectively does, hinderstext comprehension, especially when dealing with ambiguous sentence structures.Hedin and Lindgren [128] examined reading on mobile devices using RSVP inregard to reading comprehension and efficiency. In a user study, they comparedreading with RSVP vs. reading with scrolling using different reading speeds.They found that with RSVP speed and comprehension is high, but that users aregenerally uncomfortable with the technique.
20 http://www.readability.com/
21 http://www.beelinereader.com/

7.1 Related Work 175
There are different modes of RSVP as described by Spence [248], however, forreading activities we focus on the sequential presentation of words in one spot,as it was used more recently by the commercial application spritz22 for a textpresentation technique on mobile phones and smart watches. Georgiev [110]investigated reading speeds—including via RSVP—on mobile devices and com-pared reading on a PC screen with reading on paper. Top reading speeds wereachieved on computer screens with a font size of 14pt and on paper. In our work,we apply these findings and focus on the effects of RSVP with the facilitation ofspeed reading in mind.
Gaze-based Reading Interaction
First work on gaze-based interaction focused on the user-computer dialogue in anatural and unobtrusive way [146]. Kern et al. [153] investigated the feasibilityof using eye tracking to facilitate the resumption of an interrupted task: theydeveloped a system that provided visual placeholders to highlight the last gazeposition which allowed users to efficiently switch between tasks. Hansen et al.[122] added gaze tracking to smartwatches to allow hands-free interaction throughgaze gestures. Dickie et al. [66] introduced a platform for sensing eye contacton mobile screens based on an infrared camera system. They further discusseda reading application using RSVP and controlling the reading flow through eyegaze. However, the application was neither implemented nor tested.
Concluding, various reading methods have been proposed to increase readingspeed or to accommodate for certain devices’ characteristics. While there is atrade-off between reading speed and text comprehension, not every text neces-sarily needs to be processed in full detail depending on the readers’ goals. Also,reading performance depends on the reader’s current ability to concentrate: inphases of high cognitive performance, text can be read faster and more effectivelyprocessed than in times of low attention levels. Reading with high speed andconcentration, therefore, affects the reader’s mental load. Awareness of readers’attention and cognitive performance levels can inform reading UIs to dynamicallyadjust text display and keep the mental load in balance. Hence, we explored theadjustment of reading UIs by dynamically increasing users’ reading speed andmeasuring the effects on cognitive load. We begin with the report of a study tocompare dynamic speed reading UIs.
22 http://www.spritzinc.com/

176 7 Adaptive Reading Interfaces
7.2 Reading Interfaces to Increase ReadingSpeed
Naturally, over the course of time people develop their innate reading, skimmingand skipping strategies. Speed reading techniques are a much-discussed topicthat has gained many followers over the last decades. Studies conducted are oftendisputed but agree on a natural trade-off between reading speed and comprehen-sion levels. Various techniques are taught by books and seminars that allegedlyenable speed reading, such as by Frank [104]. RSVP has been proposed as areading technique to push a reader through a text by displaying single or groups ofwords sequentially in one focal point. Recent Web apps have spurred excitementaround the prospect of achieving higher speed reading by effectively reducing eyemovements (saccades). Other common techniques include the use of a kineticstimulus (such as a moving hand, pen or finger) to guide a reader consistentlyacross lines of text.
To investigate whether such techniques can be applied to reading on electronicdevices and to explore their feasibility, we assessed two stimuli: 1) the RSVPmethod by using the open source framework Squirt23 and 2) a kinetic stimulusin form of a dynamic text underline effect. Here, we present two consecutiveuser studies: first, we report on a lab study in which we collected data about eyemovements, mental load and comprehension levels of 24 participants and second,we collected subjective feedback data from 108 participants in an online readingexperiment.
In this Section, we 1) describe the application of speed reading techniques toreading on electronic devices, 2) introduce a kinetic stimulus in order to activelyincrease users’ reading speed, and 3) investigate the effects of RSVP and the ki-netic stimulus on text comprehension, mental load, eye movements and subjectiveperception.
7.2.1 Stimuli to Support Speed Reading
We implemented two stimuli with the goal of increasing reading speed by guidingthe user’s eye. We built our prototypes with a combination of HTML5, CSS andJavaScript to make our system not only run in the lab but also on the web to makeit accessible to a broad pool of study participants.
23 http://squirt.io/

7.2 Reading Interfaces to Increase Reading Speed 177
Figure 7.1: Kinetic stimulus: A moving line as underline effect.
The first stimulus is modeled after the idea of swiping the user’s finger or a penacross a text in order to keep a constant reading flow [104]. Initially, we hadseveral prototypes of stimuli suggesting a constant motion across the screen. Byconducting pilot studies and questioning independent researchers we decided touse the technique of dynamically underlining lines of text as a kinetic stimulus forthe user study. Using the HTML5 canvas element we implemented this dynamicline placed under a line of text that moves from left to right at a predeterminedspeed (Figure 7.1). Hereby not the entire line moves, but the left beginning of theline moves to the right end only underlining words that are still up for reading.This is intended to keep the eyes focused on the current line and avoid jumps ofthe eye between lines as well as regressions. Once the stimulus reaches the endof one line, the next line is underlined and the stimulus starts to run again. Theentire text is visible at all times and the stimulus moves from left to right and lineto line.
The second stimulus is modeled after the RSVP method where one word isdisplayed at a time at a focal point. We based our implementation on the javascriptopen source code of Squirt. It basically takes as input a text and a reading speed inwords per minute (wpm) and displays this text word by word in the middle of thescreen (see Figure 7.2). A blue letter marks the position where the reader’s eyeis supposed to focus on. This letter roughly marks the first third of the charactersequence, since in western cultures the perceptual span is skewed to the right,hence we perceive more letters to the right than to the left of our focus point[144]. The mark should suggest the eyes to keep their focus on this focal area.The script analyzes the text upfront and dynamically assigns a viewing duration

178 7 Adaptive Reading Interfaces
Figure 7.2: RSVP: sequentially displaying words in one focal point.
to each word, hence words with more characters are presented slightly longer.After a slight delay to prepare the reader, the presentation of words is quicklyincreased to its target speed. The same goes for words at the end of a sentence toindicate the beginning of a new one. The entire text is not displayed upfront andafter finishing cycling through the text, the application closes its text window.
After a series of pilot studies where we raised readers’ normal reading speed byvarying amounts using both stimuli, we settled on an increase to 150%, since itseemed both significant and feasible. To assess the effectiveness of the system weconducted two user studies: 1) a lab study with 24 participants and a stationaryeye tracker and 2) an online study to collect subjective feedback on the two speedreading stimuli.
7.2.2 Lab Study with Eye Tracker
First, we carried out a lab study to assess the effect of sped-up kinetic and RSVPstimuli on reading performance of users. We recruited 24 participants (22 male,2 female) with an average age of 23 (SD = 2.28) years. We reached out topotential participants through university mailing lists and social networks. Mostparticipants were students all of which indicated German to be their first language.Five participants indicated previous exposure to speed reading techniques.
Methodology
We designed the study using a between-subject measure design with the readingstimuli as the only independent variable. The stimuli comprised two levels:kinetic and RSVP. Participants were asked to read four rounds of text with one

7.2 Reading Interfaces to Increase Reading Speed 179
corresponding stimulus, for each stimulus condition we had 12 participants. Asdependent variables, we measured text comprehension and mental load usingthe NASA-TLX questionnaire [124] after each round of reading. Using the eyetracker we also recorded average fixation durations and number of fixations aswell as regressions calculated from saccades.
Apparatus
The study was conducted using the system described above. To record partici-pants’ eye movements we used the stationary SMI RED250 eye tracker with asampling rate of 120 Hz. For study purposes, we integrated the browser-basedprototype into a task sequence as defined in the study software of the eye tracker.To ensure the validity of measuring text comprehension we used an official text setfrom the TestDaF institute24, which focuses on the development and applicationof tests to assess language proficiency of German as a foreign language. Each textcomprised on average 583 (SD=19.8) words and came with a list of ten questionsfor measuring the readers’ text comprehension.
Procedure
After explaining the purpose of the study, the participant was asked to sign theconsent form. We then randomly assigned the participant to one of the twoconditions. We calibrated the eye tracker and conducted a test to assure the eyetracker worked properly, after which the actual experiment was started. In theinitial phase, we provided a text, which participants were asked to read as baselinecondition without using any of our stimuli in order to calculate participants’regular reading speed (wpm). In the following, the participant read four texts infour rounds with 150% of her regular wpm rate. At the end of each round, shewas asked to answer ten comprehension questions and fill in the NASA-TLXquestionnaire. The study, including a short debriefing session, took approximately60 minutes per participant.
Results
In the following, we present both quantitative and qualitative results.
24 https://www.testdaf.de

180 7 Adaptive Reading Interfaces
Mental Load
We analyzed differences in mental load between the two groups using the RAW-TLX scores. The homogeneity of variances was not violated (p > .05). Theindependent t-test revealed no significant difference in the mental load betweenthe two stimuli in any round (t(22) = .889, p = .38). The average mental loadacross all rounds for the kinetic stimulus was 64.80 (SD = 4.81) and for theRSVP was 67.41 (SD = 4.35). Further, we investigated how the mental loadchanged between the first and last round within each stimulus. For the kinetic,the t-test showed that the mental load decreased significantly from the first round(M = 74.41,SD = 11.18) to the last round (M = 61.75,SD = 19.7) , t(11) =3.22, p = .008,r = .70. The effect size estimate indicates that the change inthe mental load created by using the kinetic stimulus was a large and thereforesubstantial effect. No significant difference were found for the RSVP stimulus(t(11) = 1.72, p = .11). The average mental load for the first round was 70.75(SD = 8.89) and for the last round was 63.58 (SD = 19.30).
Comprehension
We compared the number of correct answers for each text to assess users’ textcomprehension. The statistical analysis of the two stimuli revealed no significantdifference (t(22) = .62, p = .40). The average number of correct answers usingthe kinetic stimulus was 5.48 (SD = 1.63) and using the RSVP stimulus was5.18 (SD = 1.72). Further, we investigated the comprehension scores betweenthe first and fourth round of each stimulus. For both stimuli the t-test revealedthat comprehension increased significantly (kinetic stimulus: t(11) = 2.80, p =.01,r = .65; RSVP stimulus: t(11) = 2.75, p = .01,r = .64). The effect sizeestimates indicate a large and substantial effect. The average correct answer usingthe kinetic stimulus increased from 5.25 (SD = 1.48) in the first round to 6.08(SD = 1.67) in the final round. Using the RSVP stimulus, the average number ofcorrect answers was increased from 4.58 (SD = 1.431) to 6.0 (SD = 1.65).
Fixations & Regressions
We further analyzed the fixation and regression information collected by the eyetracker during the study. Fixations can be a measure to assess engagement ordifficulties in extracting information [149]. The average number of fixationsfor the kinetic stimulus was 381.31 (SD = 63.22) and for the RSVP stimuluswas 119.73 (SD = 66.98). Such a significant difference between the two stimuliwas expected due to the nature of RSVP where the user focuses on a singlepoint instead of moving eyes across a text. Further, we assessed the number of

7.2 Reading Interfaces to Increase Reading Speed 181
fixations and the average fixation duration between the first and fourth roundof each stimulus. The t-test revealed no significant differences neither for thekinetic (number of fixations: t(11) =�.07, p = .95, fixation duration: t(11) =�1.50, p = .16), nor for RSVP (number of fixations: t(11) = �.08, p = .94,fixation duration: t(11) = .49, p = .63) stimulus. For the kinetic stimulus’ firstround, the number of fixations was 379 (SD = 66.4) with an average fixationduration of 241.25 ms (SD = 29.82), for the fourth round, the number of fixationswas 379.92 (SD = 66.1) with an average fixation duration of 248.9 ms (SD =36.40). During the first round of the RSVP condition, the number of fixations was118 (SD = 78.2) with an average fixation duration of 1044.07 ms (SD = 352.22).In the fourth round, the number of fixations was 119.42 (SD = 49.1) with anaverage fixation duration of 996.1 ms (SD = 385.5).
We also evaluated the regression information collected while reading the textsusing the kinetic stimulus between first and fourth round. We define regressions aseye movements opposite to the reading direction. While regressions are negligiblewhen using RSVP, in normal reading they generally indicate re-reading of wordsor entire sentences and hence slow down the reading process overall. The t-test revealed the regression decreased significantly from the first round (M =16.42,SD = 11.15) to the last round (M = 11.25,SD = 7.1), t(11) = 2.877, p =.01,r = .65. The effect size reveals that using the kinetic stimulus has a substantialeffect on eye regressions while reading a text.
Qualitative Assessment
Taking a look at scan path visualizations of the eye tracking data of participantsusing different stimuli we notice some interesting differences. In scan pathvisualizations each eye fixation is represented by a circle. The longer the durationof the fixation, the bigger the circle’s radius. A line represents a saccade betweentwo fixations. Figure 7.3 shows the scan path of a participant freely reading a textwithout any of our two stimuli present. Fixation durations are quite variable anda number of line jumps as well as regressions can be noticed. Figure 7.4 depictsthe scan path of that same participant directly thereafter when using the kineticstimulus at 150% of her initially measured reading speed. Fixations seem morewidely spread, which is probably due to the nature of the kinetic stimulus movingacross all text. Figure 7.5 shows the scan path of a participant reading with theRSVP stimulus. Far fewer, but longer fixations on the central focus are presented.

182 7 Adaptive Reading Interfaces
Figure 7.3: Scanpath visualization of reading freely.
Figure 7.4: Scanpath visualization of reading with the kinetic stimulus.
Discussion
Looking at the significantly decreasing strain on mental load after using the kineticstimulus for a while, we conclude a strong learning effect while using this method.The same applies to the significant increases in comprehension. Initially, usersseem challenged by having a stimulus dictate them where to read and at whichspeed, but they adjust relatively quickly, i.e., over the course of four trials. Wefurther observed significantly fewer regressions after using the kinetic stimulusfor a while. The eyes seem to adjust to following the stimulus and regressionsare effectively reduced. The fact that, in accordance with fewer regressions, we

7.2 Reading Interfaces to Increase Reading Speed 183
Figure 7.5: Scanpath visualization of reading with the RSVP stimulus.
also measured increasing comprehension levels contradicts findings of Schotteret al. [241], which is probably due to the nature of the text types used. Schotter etal. deliberately focused on ambiguous sentence structures in their studies. Whendesigning such studies it is crucial to not only pay attention to the nature of thetexts used, but also to the difficulty of assessing text comprehension. We optedfor a solution in which the text came with pre-defined comprehension tests as theyare used in assessing language proficiency. Hence, they require not an only literaltranslation, but also transfer skills. When reviewing the test results we realizedthese type of questions were anything but trivial. However, we are positive thatconsidering certain text types, comprehension goals and given that users take intoaccount a practice phase, using such stimuli for reading is feasible.
7.2.3 Online Study
To collect more in-depth data on user perception aspects of the presented stimuliwe conducted an online study targeted at a broader audience. A total of 108participants (72 male, 34 female, 2 without gender indication) between 12 and69 years old (M = 27.9,SD = 8.3) fully completed the study. We disseminatedthe study across university mailing lists, social networks and personal contacts inother research facilities across U.S. and Europe. German was indicated to be thefirst language by 78 study participants, 30 reported it to be English. Participants’background ranged from students to engineers, business-related professions, andlawyers.

184 7 Adaptive Reading Interfaces
Methodology
The study followed a repeated-measure design, so all participants were exposedto both conditions: RSVP and kinetic as independent variables. For each stimulusparticipants were asked to read a short paragraph of text comprising 284 wordseach. As dependent variables, we collected subjective feedback in form of aLikert-style scale and free-text survey. The texts used for the study were takenfrom literature (”The Trial” by F. Kafka) and from a popular blog to ensuretext diversity. We provided both English and German versions, self-selected byparticipants. Average time to complete the online study was M=8.5 (SD = 4.8)minutes, variations depending on individuals’ baseline reading speed and the timethey took for filling in the surveys.
Apparatus
We used again the basic web implementation of the stimuli as described above.Additionally, we used a server running PHP as the backend to collect and storethe corresponding data. We designed a survey to be filled in after each condition.In the consent form, we collected basic demographic information, while a finalsurvey was used to collect general feedback.
Procedure
On the landing page of the online study participants were asked to select theirpreferred language suggesting, i.e., English and German. After, they were redi-rected to a consent form explaining the background of the study and where theycould enter their demographics including age, gender, and profession. The firststep comprised the assessment of general reading speed: participants were askedto fully read a paragraph of 521 words taken from ”Alice in Wonderland” byL. Carroll. Completion time was measured from when they clicked on ’Start’,on which the actual text appeared until they clicked on ’Finished’. From thismeasurement, we calculated their reading speed in Words per Minute (WPM),which was taken as baseline speed. From there we randomly assigned bothstimulus and text order and increased participants’ reading speed by 150% to amaximum of 600 wpm. This cap seemed necessary to ensure that especially theRSVP condition did not completely overburden readers who might have read theinitial text for speed assessment in overly rapid manner.

7.2 Reading Interfaces to Increase Reading Speed 185
In the next step, for each stimulus one paragraph of text was read and five ques-tions were answered using a 5-point Likert-style scale (1=strongly disagree, 5=strongly agree). Questions targeted subjective perceptions of text comprehension,reading comfort, exhaustion by reading, support in speeding up reading rates andperceived reading duration. After the last condition participants were directed toa final survey with three free-text questions where they could state their generalpreference for any of the stimuli. The questions aimed at eliciting what type oftexts participants could imagine using the presented reading techniques for andon what kind of devices. In the last text box, we asked for general feedback andcomments.
Results
Study participants on average reached 386 wpm (SD = 194) during the speedassessment task. Hence, for the study, we increased the stimuli speed on averageto about 512 wpm (SD = 107). For 42 participants (38.9%) we capped the readingspeed at 600 wpm.
Figure 7.6 comprises the results of the list of questions we asked after each stimu-lus condition. A Wilcoxon Signed-Rank test revealed that there is a significantdifference in rating of subjective text comprehension (Z =�2.18, p = .03), speedreading support (Z =�4.15, p = .0001), reading comfort (Z =�3.04, p = .002),and perceived duration (Z = �4.09, p = .001). In these four aspects, RSVPwas rated higher than the kinetic stimulus. The rating of exhaustion showed nosignificant difference.
In the final survey, 42.6% participants indicated to prefer the RSVP stimulus,36.1% preferred kinetic, whereas 21.3% indicated no preference.
Text & Device Types
For the final survey of the study participants were asked to fill in for which typesof text and devices they could imagine using these stimuli. For each stimulusdifferent types of text and devices could be named. In total, we collected 106recommendations for text types and 121 recommendations for device types. Toidentify the preferred types of text and devices for each stimulus, two researchersindependently analyzed the free texts provided by the participants and categorizedthem. Then, the researchers crosschecked their categories and agreed on a set oftext types and device types. In total four types of text, namely: short texts, books,technical literature and news were derived. The top three types of text participants
186 7 Adaptive Reading Interfaces
mentioned for the kinetic stimulus being useful for were: books (30%), technicalliterature (23%), and news (15%). For RSVP, short texts were ranked highest(31%), then books (25%) and news (20%).
Regarding device types that may be fit for using the two stimuli for, 6 typeswere identified in total: smartwatch, smartphone, tablet, e-reader, head-mounteddisplay and PC/laptop. The top three device types mentioned for the kineticstimulus were e-reader (47%), tablet (45%) and PC/laptop (34%). The devicesmentioned to be fit for RSVP were smartphones (68%), smartwatches (27%) andtablets (17%).
Qualitative Feedback
Looking at the general comments and feedback participants left in form of freetext, we get a broader picture of subjective perception of using such sped-upstimuli for reading. Many participants doubted to have fully understood the textsbut also stated that for unimportant text little comprehension may be acceptable.Others indicated having lost the context because of a moment of inattention or dueto the fast speed of the stimulus. At least with the kinetic stimulus, some were ableto catch up again, but with the costs of having missed some details in between.Many participants found the kinetic stimulus initially confusing while one of theproblems with RSVP seemed to be a lack of sense of how far into the text thereader already was and how much more there was to come. One participant stated
”the surrounding sentence is missing”, which shares the general assessment ofothers in the difficulty to put the single words into the overall context. However,one participant stated that sequential reading turns boring stories into interestingones because she found ”fun in being challenged not to miss the context of asingle word”.
One participant expressed her desire to go through different paragraphs withdifferent reading speeds as to use her imagination in crucial parts of a story.There were quite some complaints about the lack of manual control: ”The kineticmethod would be reasonable if it had some sort of ‘pause’ functionality”. Onecomment stated ”Speed reading is not about reading every word.” Similarly,another one stated that there needs to be the chance to get an oversight of the textwhile reading. Further, the techniques should allow skipping entire sentences orparagraphs. We also had participants who complained about the slowness of thestimulus, since we had a cap on 600 wpm for study purposes.
Numerous ideas to improve on the stimuli were brought forward as well. Forexample, the kinetic stimulus should be used for types of text where readers

7.2 Reading Interfaces to Increase Reading Speed 187
are inclined to easily digress (e.g., mandatory texts/emails at work), especiallyfor ”long passages I just need to get through”. Another participant imaginedthe idea of using a kinetic stimulus for collective reading as well as on publicdisplays. Further, it could be useful on large screens with lots of text as some sortof ”reading guide”. Other application scenarios for the kinetic stimulus includedhighlighting and re-reading of important sentences/take-aways. RSVP, on theother hand, could be used for one-line ad screens at the bottom of cellphonescreens or for displaying stock prices. Some participants mentioned that difficultwords would need longer display time than others. One participant stated RSVPto be potentially useful for proofreading text.
Many comments focused on the issue of the speed of the stimuli in particularas well as increasing reading speed in general. One participant indicated thekinetic stimulus being ”too fast compared with my comfortable speed zone”. Agreat number of users mentioned that they would appreciate using the stimuli at aslower speed. Some felt especially pressured by the RSVP stimulus as if ”beingin a challenge”. To conclude, one participant stated ”reading is more than simplya speedy transfer of data. Any ’quality reading’ - at whatever speed - requiresthat the reader first understand the reading, next remember it, then analyze orintellectualize it from various reference points - in other words, think about thereading”. Whereas another one summarized his comments with ”Reading shouldbe for fun, and not a race”.
Discussion
As can be seen from the general comments left by participants, the stimulitriggered some mixed feelings in user perception. Whereas in terms of measuresthe RSVP stimulus was clearly preferred to the kinetic stimulus, comments mostlyrevolved around the feasibility of the kinetic approach, given some sort of usercontrol. However, findings seem to convey various application scenarios for bothstimuli. In that sense, the kinetic stimulus was generally preferred to be used forrather long passages that require a certain amount of concentration. The RSVPstimulus, on the other hand, seems to be more suitable for short texts.
Further, users seem to prefer the kinetic stimulus when reading on sufficientlylarge displays as compared to RSVP, which they find feasible for small displayslike on smartwatches or smartphones. Tablets seem to be the type of device thatsplits the categories: in case of larger available screen estate, RSVP was preferred;in case of smaller, the kinetic technique. This indicates that reading using twocomplementary devices as demonstrated by Piazza et al. [210] can make sense.
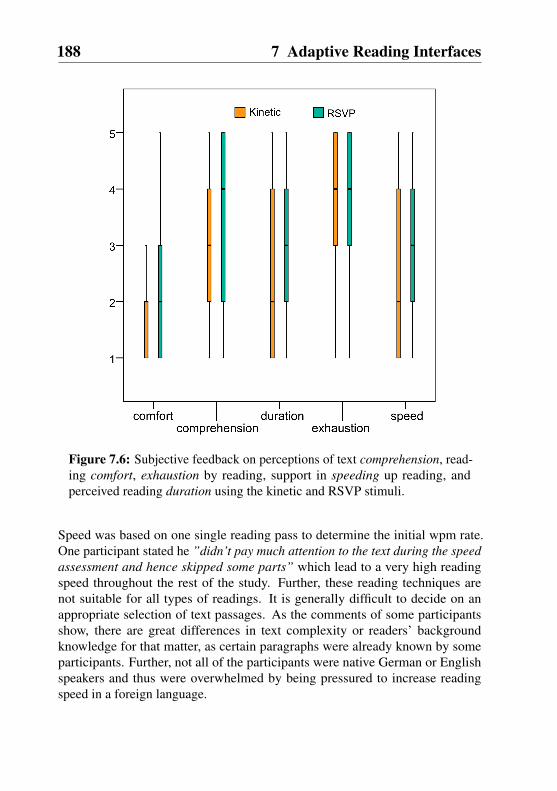
188 7 Adaptive Reading Interfaces
Figure 7.6: Subjective feedback on perceptions of text comprehension, read-ing comfort, exhaustion by reading, support in speeding up reading, andperceived reading duration using the kinetic and RSVP stimuli.
Speed was based on one single reading pass to determine the initial wpm rate.One participant stated he ”didn’t pay much attention to the text during the speedassessment and hence skipped some parts” which lead to a very high readingspeed throughout the rest of the study. Further, these reading techniques arenot suitable for all types of readings. It is generally difficult to decide on anappropriate selection of text passages. As the comments of some participantsshow, there are great differences in text complexity or readers’ backgroundknowledge for that matter, as certain paragraphs were already known by someparticipants. Further, not all of the participants were native German or Englishspeakers and thus were overwhelmed by being pressured to increase readingspeed in a foreign language.

7.2 Reading Interfaces to Increase Reading Speed 189
7.2.4 Implications
We set out with the goal to assess the feasibility of applying speed reading tech-niques to reading activities on electronic devices. Our qualitative analysis showsthat the act of enforcing higher reading speeds seems to have an alienating effecton users, especially when reading naturally comes with the idea of pleasure and re-laxation. However, despite initial discomfort, we observed quick learning effectsthat lowered mental load and increased comprehension rates, which naturally godown when initially using such techniques. These findings encourage us to lookinto how such techniques can be further developed to lower the entry barrier forusers to, slowly, but not drastically, pick up and increase their regular readingspeed. Therefore, we identified a number of issues that need to be consideredwhen designing such techniques:
Control
As we have learned from the qualitative feedback, it is crucial for users to remainin control over their choice of reading technique as well as over their currentreading speed. Hence, possibilities to stop, start and pause stimuli need to beprovided. Further, speed reading does not necessarily imply reading word byword. Hence, stimuli should take into account the users’ inclination to skip wordsor entire paragraphs.
Retaining Oversight
What comes naturally to conventional books is a challenge for electronic readinginterfaces: a sense of size, position, and oversight. When reading throughan actual book, the page location and arrangement conveys a feeling of thewhereabouts of the reader in the story. In ebooks, for example, this intuition islost, even more so when using the RSVP stimulus as we have seen. Since a singleeye fixation provides a view of the world that is roughly elliptical (about 200degrees wide and 130 degrees high) [144], we can us this knowledge to adjust thenumber of words being displayed at once and make entire word groups graspablewith one fixation, instead of displaying only one word at a time. Further, for textcomprehension it seems crucial to be aware of the context of a word, sentence,even of the entire paragraph and hence adequate features should be provided.

190 7 Adaptive Reading Interfaces
Context-dependent Variability of Techniques
Different types of text require the reader to use different reading speeds. In suchcases reading speed can depend on various factors, such as linguistic complexityor density of content, but also on the reading goals. In the first case, extractinglanguage semantics could help as well as using reading models, such as [227],to dynamically adjust the speed of the stimulus. In the second case, readersshould have the means to either push through a text or be allowed to skip certainparts where 100% comprehension may not be required, but skimming is accept-able. Further, device types should be taken into account since display size is animportant factor for the choice of stimuli.
Taking into Account User Diversity
Reading is a highly complex psychomotor skill. There is a great variety of factorsthat influence reading performance, such as the reader’s general backgroundknowledge, familiarity with the language or with the type of text, and also eyemobility, attention span and current level of fatigue. Learning about users’ readinghabits can yield great adaption variability. Also, taking into account bio-feedbackto dynamically pause stimuli or adjust reading speed may be feasible. Oliveira andGuimaraes [204] presented a tool to assess mental workload from EEG signalsand adjust reading parameters, such as text size, contrast and presentation speed inreal-time. In case of high mental workload, text presentation can be slowed downto reduce discomfort and on the other hand accelerated to make use of availablemental resources. Further, eye tracking can be used to take bio-feedback intoaccount and dynamically pause stimuli or adjust reading speed in real-time. Asone study participant stated: ”the kinetic [stimulus] could be a lot better if it werecombined with gaze detection – this would allow me to flip back and re-process asentence that I had missed. [...] It could auto adjust the speed, rather than justplowing on regardless”.
7.2.5 Study Conclusion
In this study, we investigated reading UIs that can be adapted in real-time tosupport information intake and assessed effects on cognitive load. Such adaptionscan take place according to the user’s current state of concentration, for example,by balancing text throughput with the user’s current cognitive capacities. We

7.3 Implicit Reading Support Through Eye Tracking 191
evaluated two approaches to increase reading speed on electronic devices byapplying a kinetic and an RSVP stimulus to text. Therefore, we implementedan animated line that moves through the text as well as an RSVP stimulus,each moving at 150% of the reader’s regular speed. In two user studies, wecollected quantitative and qualitative data on the effects and feasibility of suchstimuli. Despite users being initially alienated by the approach, results show quicklearning effects in adjusting reading speed, lowering mental load and increasingtext comprehension levels. We concluded with a set of design guidelines forapplications using such reading techniques: therefore users should be able tocontrol their speed and mode of reading and be allowed to retain oversight.Readers’ individual preferences and reading goals should be taken into accountas well as the different types of text and particularities of devices. By combiningeye tracking with natural language processing, systems can detect the reader’sskill level, automatically assess the peculiarities of text types and adjust the textdisplay accordingly. Hence, such systems can offer different reading strategies tofacilitate reading tasks according to the user’s current cognitive state and readinggoal.
In the next Section, we focus on the notion of controlling the reading flow througheye tracking. Eye movements are strong indicators of user interest and cognitiveactivity. Hence, we present another application of cognition-aware systems thatprocess eye movement data and adjust the reading UI in real-time to supportinformation intake.
7.3 Implicit Reading Support Through EyeTracking
As we have assessed in the previous Section, reading with RSVP requires highuser attention since words are flashed in rapid sequence. This makes readingwhile performing an additional task, such as walking, challenging. Even smalldistractions cause users to briefly look up from the screen and hence lose part ofthe currently displayed sentence.
To avoid missing vital text parts, controls are required to pause and resumethe flashing of words. RSVP is typically controlled using explicit user input.However, pressing a button or performing a gesture requires time, attention andaccuracy. Explicit input can, therefore, be challenging for short and frequentinterruptions. Looking up from the screen while walking to adjust the walking
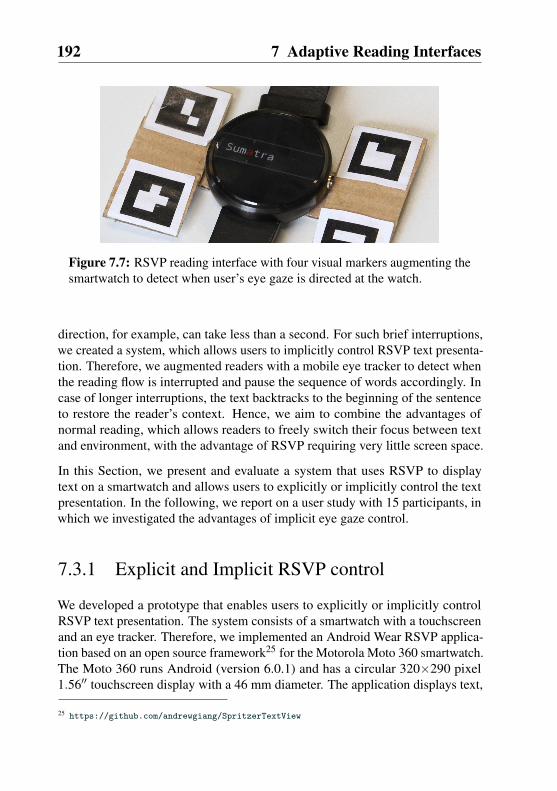
192 7 Adaptive Reading Interfaces
Figure 7.7: RSVP reading interface with four visual markers augmenting thesmartwatch to detect when user’s eye gaze is directed at the watch.
direction, for example, can take less than a second. For such brief interruptions,we created a system, which allows users to implicitly control RSVP text presenta-tion. Therefore, we augmented readers with a mobile eye tracker to detect whenthe reading flow is interrupted and pause the sequence of words accordingly. Incase of longer interruptions, the text backtracks to the beginning of the sentenceto restore the reader’s context. Hence, we aim to combine the advantages ofnormal reading, which allows readers to freely switch their focus between textand environment, with the advantage of RSVP requiring very little screen space.
In this Section, we present and evaluate a system that uses RSVP to displaytext on a smartwatch and allows users to explicitly or implicitly control the textpresentation. In the following, we report on a user study with 15 participants, inwhich we investigated the advantages of implicit eye gaze control.
7.3.1 Explicit and Implicit RSVP control
We developed a prototype that enables users to explicitly or implicitly controlRSVP text presentation. The system consists of a smartwatch with a touchscreenand an eye tracker. Therefore, we implemented an Android Wear RSVP applica-tion based on an open source framework25 for the Motorola Moto 360 smartwatch.The Moto 360 runs Android (version 6.0.1) and has a circular 320⇥290 pixel1.5600 touchscreen display with a 46 mm diameter. The application displays text,
25 https://github.com/andrewgiang/SpritzerTextView

7.3 Implicit Reading Support Through Eye Tracking 193
which is shown word by word with a specially colored letter serving as a focalpoint for the reader’s eyes to focus on (see Figure 7.7). The number of wordsshown per minute (e.g., 200 wpm) can be freely selected from the application’ssetting.
Users explicitly control the text flow through the touchscreen of the smartwatch:reading can be paused and resumed through simple taps (Figure 7.8 (left)). Toallow readers restore the reading context, the text presentation goes back to thebeginning of the current sentence in case of longer pauses (i.e., longer than 5 sec-onds). We use an eye tracker to enable implicit control over the text presentation(Figure 7.8 (right)). For tracking the user’s eye movements, we use the Pupil Proeye tracker by Kassner et al. [151], which comes with a 3d-printed frame and asoftware package for calibration, gaze detection, and surface registration. Themodular eye tracker consists of a 120 Hz head-mounted monocular camera witha resolution of 640⇥480 pixels and a world camera with 30 Hz which deliversthe video stream in FullHD. We attached four visual markers, each with a size of20 mm⇥ 20 mm, to the bezels of the smartwatch screen (see Figure 7.7), whichallow the software to determine whether the eye gaze is directed inside or outsideof the marked rectangle, i.e., users look at the smartwatch display or not. The gapbetween markers constitutes 14 mm (vertically) and 64 mm (horizontally) so thatthe diameter of the registered virtual surface corresponds to the diameter of thewatch interface. The eye tracker communicates with the smartwatch using thePupil Capture software26, which entails the Pupil Server plugin for broadcastingeye gaze data over a network. The Android Wear application on the smartwatchreceives the data stream and determines whether the user is currently looking atthe watch or not. Hence, the reading flow pauses when the user looks away andautomatically resumes when the user looks back at the watch. In case of a longerreading pause (longer than five seconds), the reading position is further reset tothe beginning of the current sentence.
7.3.2 User Study
To compare explicit with implicit control of RSVP reading flow we conducteda user study where participants read texts with the system described above. Wehypothesized that an adaptive reading interface taking into account the user’s eyegaze would lead to higher text comprehension and reading confidence.
26 https://github.com/pupil-labs/pupil

194 7 Adaptive Reading Interfaces
Study Design
We employed a repeated-measures design with the RSVP control modality beingthe independent variable resulting in two conditions: 1) manual control throughtouch interaction (tap) and 2) implicit control through eye gaze (eye gaze). Foreach condition, we introduced a secondary task: while reading on the smartwatch,participants were asked to monitor words displayed on a desktop monitor infront of them. Shown words were either countries or city names. If a wordwas a country name, participants had to press a button on the keyboard. Citynames had to be ignored. Words were shown for 10 to 15 seconds. As dependentvariables we measured 1) overall task completion time, 2) comprehension scores,3) tracked eye movements (i.e., reading pauses), 4) errors on the secondary task,i.e., number of countries missed, and 5) measured mental load using a NASATLX questionnaire after each condition.
Procedure
After welcoming and introducing participants to the purpose of the study we askedthem to sign a consent form and recorded demographic data. We then introducedthe RSVP reading interface on the smartwatch and set up the mobile eye tracker,which required a brief calibration for each participant. We explicitly asked to keepthe arm wearing the watch rather still so that it remained in the camera view of themobile eye tracker. After they had familiarized themselves with the interface andthe available controls, we assigned participants to a starting condition. We thenasked them to read while completing the secondary task, whereas we instructedthem to treat both tasks as equally important. After each text, we administereda 10-item comprehension test. For each condition, participants read two texts,after which they completed a NASA TLX questionnaire. We counterbalancedboth the sequence of conditions via latin-square as well as the allocation betweentasks and reading texts. All texts were taken from a collection used for English asa Second Language (ESL) learners, an adaption from [220]. These texts camewith a predefined set of ten comprehension questions per text and comprised ofaverage 548 words (SD = 2.87). Since participants read two texts per condition,the maximum comprehension score per condition was 20. The study took about50 minutes per participant, which was concluded with a final questionnaire.

7.3 Implicit Reading Support Through Eye Tracking 195
Figure 7.8: Participant reading a text on a smartwatch while monitoring cityor country names on a secondary display. Left: the reading flow is controlledexplicitly through touch. Right: the reading flow is controlled implicitlythrough eye gaze.
Participants
We recruited 15 participants (11 males, 4 females) through a university mailinglist. With a mean age of 26.5 years (SD = 3.5) most had a background in IT orwere university students. All reported English to be their second language, 3were wearing contact lenses (20%), 5 glasses (33.3%). 8 of them indicated tobe familiar with the RSVP reading technique (53.3%), 8 were wearing watcheson a regular basis (53.3%), none of which were smartwatches. Participants wererewarded 10 EUR for taking part in the study.
Results
Each participant read in total four texts, two in each condition. Table 7.1 summa-rizes the descriptive system measurements.
Objective Measures
A Wilcoxon Signed-Ranks Test revealed that the median of the comprehensionscores for the eye gaze condition (Md = 18) was significantly higher than forthe tap condition (Md = 16), Z = 74.5, p = .041. Thus, participants had a better

196 7 Adaptive Reading Interfaces
explicitinteraction
implicitinteraction
Md M SD Md M SDNumber ofpauses 8 13.5 11.73 29 30.9 6.14
Percentage ofmissed countries 0 14.02 18.54 6.25 9.84 12.59
Num. of mistakeson secondary task 0 0.6 0.74 1 0.93 1.22
Task completiontimes (second) 297.2 313.3 46.4 352.4 354.1 45.3
ComprehensionScores 16 15.86 1.88 18 17.33 1.67
Table 7.1: System measurements for both conditions: explicit (touch) andimplicit (eye gaze).
understanding of the read text when reading with implicit control using the eyetracker. Another Wilcoxon Signed-Ranks Test also revealed that the median of theaverage number of pauses for the tap condition (Md = 8) was significantly lowerthan for the eye gaze condition (Md = 29), Z = 105.0, p = .001. In sum, partici-pants made 9 mistakes on the secondary task, i.e., cities were selected instead ofcountries, during the tap condition (Md = 0) and 14 mistakes during the eye gazecondition (Md = 1). We found no statistically significant differences between thepercentage share of missed countries while tapping (M = 14.019,SD = 18.539)vs. while using eye gaze (M = 9.842,SD = 12.599), t(14) = 1.549, p = .144,r =.842. There was a statistically significant difference between task completiontimes for the tap condition (in seconds: M = 313.3,SD = 46.4) and the eye gazecondition (M = 354.1,SD = 45.3), t(14) = �2.383, p = .032,r = .044, whereparticipants took more time when reading with implicit control over the textpresentation.
Subjective Feedback
As for the subjective assessment through the Nasa TLX questionnaire, a student t-test showed no statistically significant difference between the tap condition (M =10.278,SD = 2.564) and eye gaze condition (M = 10.289,SD = 2.293), t(14) =�.014, p = .989,r = .190. Thus, we found no effect of the control mechanism onthe perceived mental load. In the final questionnaire, most participants reportedthe frequent taps to pause the text to be annoying and hence preferred the support

7.3 Implicit Reading Support Through Eye Tracking 197
through eye gaze. However, they felt a lack of control, since the implicit pausesentailed no noticeable feedback.
7.3.3 Discussion and Limitations
Comprehension was higher for implicit than for touch interaction. Therefore,eye gaze interaction seems to be less distracting than when explicitly havingto control the reading flow, which confirms, our hypothesis. While the averagenumber of pauses was also higher in the eye gaze condition, switches betweentasks seem to have been done with ease: participants reported in the explicitinteraction condition that they sometimes looked up without pausing the text flowin order to take a brief glance at the secondary screen. Hence, they compromisedon text comprehension, whereas the eye gaze interaction implied a pause duringa quick glance. This is also what contributed to the overall increase in taskcompletion time. The monitoring task we employed as a secondary task wasmeant as a distraction task. Because of the eye tracker’s sensitivity to large headmotions, we refrained from having participants perform a walking task. Withmore robust trackers we would like to test our hypothesis in the context of anavigational and therefore spacial task. Although we designed the eye gazeinteraction with RSVP in mind, a similar approach could be taken to controlthe flow of automatic scrolling through text displayed on a conventional readinginterface. Other reading techniques as proposed in the previous chapter could alsobenefit from eye gaze tracking to dynamically adjust reading speed, for example.Further, we envision front-facing cameras soon to be able to detect the user’s eyegaze which will render the mobile eye tracker obsolete and allow for more widelyapplied eye gaze interactions, also for reading UIs.
7.3.4 Study Conclusion
For investigating the adjustment of reading UIs through implicit user feedbackwe built a working prototype that controls the reading flow in RSVP by trackingthe user’s eye gaze. When reading on mobile devices screen size is limited anddistractions from the environment can hinder the reading flow and negativelyaffect comprehension. Context- and cognition-awareness systems can adjust theirreading UIs to compensate for this effects: by automatically pausing the readingflow when users are detected to be distracted we are able to facilitate informationintake. In a user study, we compared the implicit interaction through eye gaze

198 7 Adaptive Reading Interfaces
with explicit user controls. Results show that gaze interaction is more effectivethan having users explicitly pause and resume reading through touch. Hence,tracking and processing eye movements in real-time can be used to create moreeffective reading UIs that support reading in distractive environments.
7.4 Chapter Summary
In this Chapter, we explored reading as an application scenario for using aware-ness of users’ cognitive capacities to support information intake. Since informa-tion is consumed to great parts in the form of text, we investigated how readinginterfaces can be adjusted according to readers’ cognitive capacities. Thereforewe explored dynamic adjustments of reading UIs that allow readers to regulatetheir reading speed and reading flow. An increase in reading speed generallyimplies an increase in cognitive demand and compromises on text comprehen-sion. Such compromises can be acceptable if a text does not necessarily need tobe processed in full detail, but rather with regard to its gist. In phases of highuser alertness more cognitively demanding tasks are feasible, hence an adaptivereading UI can invite readers to read at faster rates.
To investigate the relationship between reading speed, imposed cognitive demand,and text comprehension we conducted two user studies, in which we assessed theuse of two different reading methods: 1) we developed a kinetic stimulus in formof a moving line that guides the user’s eyes across text and 2) we used RSVPto show words sequentially at a focal point. Both methods superimpose readingspeed on the reader and can dynamically be adjusted. In a controlled lab study, weassessed these methods with regard to increased reading speed, namely 150% ofreaders’ normal reading rates. We found substantial learning effects for perceivedmental load and text comprehension: when reading with our kinetic stimulusmental load was initially high when it was introduced, but was significantlydecreased over the course of four short texts. Similarly, comprehension rates wentup over time for both the kinetic and the RSVP condition. Since eye movementpatterns (i.e., number and duration of fixations) remained mainly the same, theimprovements were likely due to cognitive adjustments. In the second study, wecollected subjective feedback through a web experiment, which also revealedthat users initially felt challenged by being dictated how to read. While RSVPwas seen as appropriate for reading a rather short text, the kinetic stimulus couldbe used for longer text where a larger display is required. We derived a set ofdesign implications for adaptive reading UIs that comprise recommendations for

7.4 Chapter Summary 199
providing readers with flow and speed controls, allowing them to retain oversightof text position, providing a variability of reading methods and speeds that alsodepend on the text to read, and taking into account individual user characteristics,such as preferences, reading skill, and current cognitive capacity.
Eye movements are strong indicators of user interest and cognitive activity. Hence,in the second part of this Chapter, we addressed the implicit control of readingflow based on eye gaze. Therefore, we equipped readers with a mobile eyetracker and assessed their ability to read on smartwatches while being engagedin a secondary task. While reading when being on-the-go, we are exposed to adistracting environment and possibly need to navigate that environment at thesame time. Due to the rapid flashing of visual stimuli when reading with RSVP,single words can easily be missed and even more so when the reader is engagedin a secondary task, such as walking. Hence, we used a mobile eye tracker toinform the reading UI when the reader focuses on the text or elsewhere. Theinterface then pauses, resumes or resets the text dynamically in order to supportthe reader. In a lab study, we investigated the effects of gaze-aware reading UIson text comprehension, secondary task performance, and reading time. Comparedto explicit controls provided by a touch interface, implicit adjustment of theinterface lead to higher comprehension rates while performance on the secondarytask was comparable. The implicitly controlled interface introduced more pausesin the reading flow compared to the explicit condition, in which readers oftendid not pause the text to quickly deal with a secondary task and hence missedsome keywords resulting in lower comprehension rates. The study showed thefeasibility of using eye gaze to inform reading UIs about readers’ focus andprovide in-situ reading support.
Concluding, there is a general trade-off between reading speed and comprehen-sion. In this Chapter, we showed that speed reading stimuli can be used duringreading to enforce higher reading speed, which mentally strains the reader. Toanswer RQ6 we developed a set of reading UIs that allow the dynamic controlof reading speed and reading flow in real-time. Cognition-awareness can beused in systems to proactively regulate these parameters according to the user’scurrent cognitive state. The goal of matching reading mode with the currentcognitive state text is to allow readers to read more efficiently (or more leisurely)by balancing the cognitive load, reading throughput and retention.

200 7 Adaptive Reading Interfaces

IVCONCLUSION AND
FUTURE WORK


Chapter8Conclusion and Future Work
In this thesis, we investigated how ubiquitous technologies can be used to help peo-ple deal with information intake and learning tasks through cognition-awareness.Through a series of lab studies and field experiments, we explored human atten-tion and user context while interacting with ubiquitous technologies and howawareness of users’ cognitive context can be applied to a range of applications.In the following, we provide a summary of the research presented, outline thecontribution with regard to the research questions, and conclude with an outlookon future research directions.
8.1 Summary
As knowledge grows at an ever-increasing pace, people face the constant challengeto consume information and acquire new knowledge. While ubiquitous computingdevices are deeply ingrained in our lives and therefore provide information accessanytime and anywhere, our attention is generally limited. One of the main reasonsfor failing to remember a piece of information is what Schacter [234] describes asabsent-mindedness at the point of encountering that information. When attentionis not focused, information is not encoded correctly and therefore not memorized.Hence, attention is a crucial piece of effective information intake and processing.In Chapter 3 we started out by investigating people’s attention in a technologicalcontext. Posing the question “How can users’ attentiveness be quantified across

204 8 Conclusion and Future Work
the day and reliably predicted from phone usage patterns?” (RQ1) we conducteda field study collecting data on mobile messaging behavior and related phoneusage. Results showed that people are highly attentive to messages throughoutthe day and that phases of inattentiveness are generally brief. However, the factthat people spend a lot of attention to their devices does not say much aboutwhy they turn to their phones and in what kind of attentional states. We wereespecially interested in idle moments, in which users engage with their mobiledevice actively seeking stimulation. Hence, we investigated the question “Doesboredom measurably affect phone usage and which usage characteristics aremost prevalent in such states?” (RQ2). Assuming that people would be morereceptive to engage with content suggestions in such moments of boredom, weconducted a field study using Experience Sampling and collected correspondingphone usage data. By training a machine-learning model we were able to predictphases of boredom with 82.9% accuracy and identified usage characteristics, suchas the recency of communication activities, phone usage intensity, time of day,and demographic information to give most prevalent indications for predictingphases of boredom. The prediction model elicited would be the basis for furthercontent suggestion studies described in Chapter 6.
The engagement studies we conducted, show how attentional states are linkedto people’s mobile device activities. In the next step, we focused the user’ssituational context to support information intake. Chapter 4 considered context inthe form of content-awareness: this investigation aimed to answer the question“How can awareness of the content which the user is currently exposed to beused to augment the user experience?” (RQ3). Tools that proactively provideadditional information and explanations to complement the content can supportusers building out multiple associations and therefore helps to memorize thatcontent. Such tools or applications need to be able to detect the content consumedin real-time and across device boundaries. Hence, we built a system to augmentthe TV experience that taps into the stream of subtitles, extracts keywords, andprovides additional information by retrieving content from Wikipedia and Googlesearches. These contents are displayed on the user’s second-screen phone app andturn out to be highly relevant, thereby enhancing the subjective TV experience.
Having explored user context in terms of current attentiveness and content con-sumed, in a next step we focused on more regular patterns of attention as they aredictated by our internal body clock. These diurnal fluctuations impact the users’levels of alertness and cognitive performance in the course of the day. Beingaware of these circadian rhythm can inform technologies to adapt informationselection and presentation in ways to match users’ current processing capacities.To answer the question “How can technology be used to elicit the user’s circadian

8.1 Summary 205
rhythm of attention and cognitive performance?” (RQ4) we adapted a sequenceof three cognitive tasks to a mobile context. With data from a mobile field study,we were able to recreate a general model of people’s attentional fluctuationsacross the day. We open-sourced the system in order to allow future psychologyexperiments to be conducted in-the-wild, and which we see as a starting point forbuilding cognition-aware systems. We envision such cognition-awareness to helpbuild applications that schedule tasks during respective phases of the day andadjust interface complexity and information bandwidth to match the user’s cur-rent state. Hence, in phases of high concentration complex information could beefficiently displayed, whereas in phases of low concentration complexity could beremoved to prevent information overload and frustration. Besides the open-sourcetoolkit, we presented a conceptual framework based on our learning from theattention elicitation study based on phone usage data. The framework describes athree-step approach to building algorithms that detect cognitive states of interest:(1) it maps out how to collect ground truth data, (2) elicit meaningful features,and (3) train machine-learning models that can be integrated into applications.To validate this approach we focused in the next step on concrete applicationscenarios of cognition-aware systems.
This final part of the thesis (Chapter 6 and 7) presents a series of research probesthat explore the application of systems that take into account users’ currentattentiveness and cognitive capacities. In Chapter 6 we report on two studies inwhich we explored content recommendations in opportune moments. To answerthe question “How can opportune moments for content delivery be used to fosterinformation intake and learning?” (RQ5) we built two mobile systems, withwhich we investigated characteristics of such moments for learning and reading.While we used our previously developed boredom prediction algorithm to triggercontent suggestions, we did not find sufficient evidence for a correlation betweenboredom and opportune moments of learning. However, based on collected phoneusage data and ground truth in the form of compliance rates to learning triggers,we trained another prediction model and elicited indicating features. Whensuggesting entertaining reading content during phases of predicted boredom, wenoted users were more open and more engaged with the content than duringnon-bored phases.
Besides the identification of opportune moments for delivering intake, we alsoexplored how content can be adjusted in real-time to match levels of high orlow cognitive load. The higher the user’s current cognitive capacities, the moreprospective applications can take advantage of an increased information band-width. In Chapter 7 we, therefore, explored adaptive reading UIs, with whichwe investigated the interplay between reading speed and text comprehension. To

206 8 Conclusion and Future Work
answer the question “How can information displays and more specifically readingUIs be adjusted in real-time to increase or decrease information bandwidth?”(RQ6) we investigated so-called speed reading interfaces, both of which allowthe UI to superimpose reading speed on the user. Hence, we applied RSVP toreading as it had been suggested as a feasible reading technique on small-screendisplays. We further introduced a kinetic stimulus that helped guide the reader’seyes across text thereby effectively increasing reading speed. In order to maintaintext comprehension, a high user focus is required, which is why such readingtechniques are not always feasible. Awareness of concentrated states can helpusers pick a corresponding reading strategy to optimize their information intakein a given state. Since during reading activities tracking eye gaze can informsystems about the user’s focus of attention, we investigated implicit eye gazeinteraction in the context of RSVP reading. In a lab study, we found implicit eyegaze interaction to lead to higher text comprehension than explicit touch controlsfor pausing and resuming reading flow.
8.2 Contribution and Results
In the course of this thesis, we followed an experimental approach to answersix research questions that were targeted at investigating ways to use ubiquitouscomputing devices that take into account their users’ cognitive states to supporteffective information intake and retention. In the following we will brieflysummarize the five key contributions made:
8.2.1 Quantification and Assessment of Users’ Atten-tiveness
Our study on mobile messaging behavior (see Section 3.2) showed that peopleare highly attentive to messaging, namely for 73.5% of their waking hours, whichconstitutes for more than twelve hours per day. Phases of inattentiveness aretypically brief and only last for a few minutes, which renders delay strategiesfor notifications or alerts feasible. Such strategies can, therefore, be applied toavoid user disruption during those inattentive phases, while the risk that importantinformation might be missed is negligible. There are numerous cases where alertsare not required to bring back user attention to the device. In idle moments peopleturn to their phones seeking stimulation. To detect such phases of boredom we

8.2 Contribution and Results 207
conducted a field study (see Section 3.3), which allowed us to build a predictionalgorithm capable of distinguishing bored vs. non-bored with an accuracy ofclose to 83%. Our examination of corresponding phone usage data showedthat detecting states of boredom is feasible by looking at the most prominentfeatures, such as the recency of communication, usage intensity, time of day,and demographic information. Phone awareness of such moments can be usedfor benign interventions, such as sending content recommendations in form ofreading or learning materials.
8.2.2 Tools for Researching and Building Cognition-aware Systems
Based on our studies in Chapter 3 we derived a framework in Section 5.3 withwhich researchers can build cognition-aware systems in the context of ubiquitouscomputing. The framework can be used to relate cognitive states to technology us-age patterns by combining user assessments or inferences with machine learning.By collecting ground truth together with context sensor data (step 1), extractingfeatures from that sensor data (step 2) and training and applying classifiers (step3) we can build machine models based on usage correlations to detect and predictuser behavior and states. We demonstrated how ground truth collection by Experi-ence Sampling (Section 3.3) and observation (Section 6.2) results in rich data sets.We further presented a mobile system that adapted standard tests from previousstudies in psychology and deployed them in a mobile field study. We showedthe effectiveness of using mobile tasks to assess people’s cognitive capacitiesthroughout the day and elicit their circadian rhythm of alertness. Over the courseof a single week, we were able to elicit a general model of people’s circadianrhythm of alertness and performance, which in previous works took either signifi-cantly longer or was significantly more cumbersome to attain. Awareness of users’diurnal performance variations across the day can help inform systems about theuser’s current cognitive state. To help researchers build such cognition-awaresystems we released our system as an open source project.
8.2.3 Identification and Characterization of Oppor-tune Moments for Content Delivery
By applying the proposed framework we conducted a series of studies (describedin Chapter 6) to investigate the nature of opportune moments for information

208 8 Conclusion and Future Work
intake in two ways: vocabulary learning and reading activities. We showedthe feasibility of mobile devices promoting microlearning through proactivereminders whose scheduling can be trained based on observed phone usagepatterns. Microlearning tasks are especially well received when people are on thego and face idle moments, such as waiting in line for the supermarket. As forfinding reading slots during the day mobile devices can not only be used to remindus to work on our reading list, but also select reading content based on the currentuser context. Awareness of current time available and phone usage patterns canhelp match user situation and reading material. In a related study (see Section 6.3)we used our boredom detection algorithm to successfully recommend randomreading articles to users in states of boredom. In such predicted states userswere shown to be significantly more likely to open and engage with suggestedcontent on their mobile phones. Hence, we validated the application of theproposed framework for building cognition-aware systems and its feasibility forgaining insights into the relationship of different cognitive states and related useractivities.
8.2.4 Implications for Adaptive Reading
Our studies about dynamically adapting reading UIs have shown that the readers’information intake can be influenced by using reading stimuli. Besides the estab-lished method of RSVP, we introduced a kinetic stimulus which allows readers tokeep the entire text line in view while providing eye guidance (Section 7.2). Thereis a trade-off between speed and comprehension, but if a thorough understandingof a text is not the goal, increasing reading speed allows the reader to get throughtext faster at a moderate comprehension level. Reading speed has an effect onthe reader’s mental load. Cognitive load, in turn, depends on the user’s currentcognitive capacities. Hence, reading interfaces with cognition-awareness couldadjust their cognitive demand to optimize for information bandwidth betweeninterface and user. Therefore, we proposed implicit and explicit ways to controlreading speed: implicitly through eye tracking, which we showed to be morefeasible than explicit user control through touch (Section 7.3).
8.3 Limitations
Throughout the course of our research we have been taking an empirical approachby conducting lab studies (e.g., to assess mental load and text comprehension)

8.3 Limitations 209
and in-the-wild deployments (to take user context in the real world into account).The lab studies (e.g., in Section 7.2) were necessary to isolate the effects of ourprobes on the user. But with regard to cognition-awareness and daily informationintake external validity would be limited in lab environments due to artificialsettings and limited time constraints. This is the reason why we took most ofour prototypes to the wild by conducting field studies. By doing so we gave up acertain amount of control over our variables and causal relationships that mightexist between user behavior and our measures, which we might not be able todetect. However, since most of our probes require users to exhibit everyday usagepatterns, this approach was vital.
To infer cognitive states we correlated user behavior with the ground truth wecollected. This ground truth may not always reflect the complexity of cognitiveinteractions, but is rather a simplified abstraction. Relying on user’s self-reportscan introduce users’ biases and misconceptions. Observing usage patterns andmaking inferences from user activity may be confounded by external influences.On the other hand, the correlations we identified may not be directly resulting fromthe respective cognitive states, but features may rather become indicative whencombined with others. Researchers applying our proposed framework shouldbe aware of these potential pitfalls. However, as our validation studies showed,application of prediction models might still work despite possibly confoundedunderlying relations. Also, correlation does not imply causation, so we have to becareful when making statements about the exact relationships between features.
Device usage is also rarely the sole predictor of cognitive states. People’s focusis influenced by a number of aspects, such as sleep, general fitness, nutrition orenvironmental factors. However, the nature of our applied research approach ismore focused on the application layer, rather than claiming to uncover psycholog-ical truths. For systems to become cognition-aware, monitoring context factorshave shown to be sufficient for indicating states of attention and receptiveness.
We created prediction models based on general usage patterns, not based onindividuals’ data. This may be sufficient for proof-of-concept prototyping, butfuture models and algorithms should consider continuously learning from theuser’s behavior in order to adapt to individual and possibly changing usagepatterns.
While the applications presented in part III are linked in theory to cognition-aware system triggers, a fully integrated system for eliciting cognitive states toadjusting the UI, for example, requires thorough design and evaluation. Thisincludes privacy implications that such sensitive data collection implies. Further,by adjusting UIs to cognitive state such adjustments may change the user state in

210 8 Conclusion and Future Work
return. The investigation of this feedback loop—and the corresponding search fora “sweet spot”—between user and application (as suggested by Schmidt [238])will need to be picked up by future work for which this thesis provides a startingpoint.
8.4 Future Work
This thesis provides a set of tools for future research on cognition-aware systems.While we focused on their applications for supporting information intake andlearning, we came across a number of application scenarios and use cases thesemight be used for. Also, during the course of our research on building these toolsand applications, we identified several additional research challenges which arebeyond the scope of this thesis. In the following, we will lay out how futureresearch and development can be continued immediately, mid-term, and morelong-term.
Research projects that can be immediately picked up concern the application ofthe tools provided by our work for more general validation purposes, but alsofor applying them to new application scenarios. The conceptual framework, forexample, can be applied to elicit and predict a range of user behavior and states.While we mainly focused on attention and receptiveness, future experimentscould focus on relating phone usage patterns to different emotions and affects.Mottelson and Hornbaek [191] showed the feasibility of eliciting positive affectfrom smartphone sensor data linked to movement. Using experience samplingor an analysis of current writing style (using language processing) could providesystems with further insights into the user’s current mood and emotional state.While emotions impact memorization [12] users may be more inclined to certainactivities in negative vs. positive emotional states. The same accounts for quietor aroused states. A related research question concerns the relationship betweenpeople’s individual chronotypes and the emotional patterns that unfold across theday. If such patterns can reliably be elicited, systems aware of users’ affects canschedule activities across the day, recommending to engage in communicationtasks, for example, in phases of positive affect. The range of possible applicationsshould be explored in more detail. While we focused on content suggestionsin the form of learning and reading content, receptiveness to suggestions to gofor a run or call a friend, for example, might be inherently different. Furtherimplications for the advertising industry should be investigated: since in ourattention economy commercial services compete for being noticed, receptive

8.4 Future Work 211
states are worth exploring for their economic value. Advertisers might be willingto pay higher prices for ad impressions triggered during attentive rather thaninattentive states.
The mobile toolkit we presented in Section 5.2 can also be the basis for futureinvestigations into a) how to apply awareness of user alertness and cognitiveperformance in different applications but also on b) how to elicit these circadianrhythms in more implicit ways. Performance measures, such as reaction timeand error rates when trying to inhibit or follow a stimulation can be integrated ingaming applications, where the player’s performance in a game such as “Whack-a-Mole”27 could be used to elicit the circadian rhythm of alertness. The spatialtask in the form of multiple object tracking, which we applied, can be found ingames, such as “Air Commander”28, hence different game designs and mechanicsshould be explored to record such performance measures throughout the day. Thefeasibility of this approach would need to be tested and mechanisms to be appliedthat invite players to play the game during different times of the day rather onlywhen they feel like it and explicitly launch the game.
Research projects with a more mid-term time horizon (ca. 3-4 years) could focuson how to integrate a network of devices that record activities and derive cognitivestates. Arising challenges include how an ecosystem of devices could be realizedthat applies cognition-awareness, communicates beyond device boundaries andsplits up learning tasks across devices and times of the day. For example, key-words could be extracted from a foreign language article that the user reads ona tablet while commuting to work in the morning. The smartphone then invitesthe user to review these words in opportune moments throughout the day. Theserepetitions can be spaced out over time so that these words are transmitted tolong-term memory. Pronunciation exercises are then scheduled at night whenusers sit in front of a laptop equipped with a microphone and where they canspeak freely. Such interweaved systems entail a networked system architecture in-cluding wearables, phones, and stationary devices and require research in contextsensing, cross-device task sharing, application scenarios, and social acceptability.Such an integrated research project provides the basis for a ubiquitous personalassistance system that accompanies users throughout their day and helps themwith scheduling pending tasks according to their situational and cognitive context.Future research on this topic further entails disruption management and how sucha personal device ecosystem can help users manage interruptions throughout theday, stay focused, but communicate interruptibility in opportune moments.
27 https://play.google.com/store/apps/details?id=com.feasy.game.MoleWhack
28 https://play.google.com/store/apps/details?id=com.gunrose.aircommander

212 8 Conclusion and Future Work
As we pointed out in our ethical considerations, making sure we provide reliableprivacy and security features, is essential for the long-term acceptance of suchsystems. Initially, rule-based learning rather than black-box machine learningcould help foster user acceptance. If users can relate to why certain recommen-dations are triggered at certain times and can further confirm or dismiss theirusefulness, these systems can learn from this feedback loop and increase usercomfort. Future research that focuses on privacy and security should investigatehow to make cognition-aware systems secure, transparent, and socially acceptable.By applying concepts, such as privacy by design and homomorphic encryptionusers might be more willing to grant technologies comprehensive access to theirpersonal data, habits, and behavioral patterns.
As for long-term time horizon (10 years) we see as main challenge the wideproliferation of the technologies and vision proposed in this thesis to be highlydependent on user acceptance. While applications like adjustable reading UIs arealready commercially being spread by companies, such as Spritz29, a cognition-aware ecosystem of devices is much more privacy invading. Location sharing,for example, has been a highly controversial topic and continues to be so tothis day, but the advantages are increasingly dominating the concerns: we shareour location for efficient navigation, for area explorations, being able to meetup with friends, or being alerted about potential dangers in our surroundings.Cognition-aware systems face similar challenges and need to be proven usefulfirst.
While we provide first investigations in applying such tools to learning and readingtasks, a fully developed system that comprehensively supports users with theirinformation tasks throughout the day, could boost an entire society’s productivitylevel. Beyond awareness of circadian rhythms of cognitive performance, researchcould address the question of how technologies can stage interventions throughawareness and thus induce favorable cognitive states. Just like people drink acup of coffee when they start to feel tired, technologies could detect fatigueand proactively help users to change their current state. This is similar to whatmeditation or mindfulness practices already propose in order to increase generalfocus or wind down after a long day of work. A study by Solberg et al. [246] hasshown that meditation can help obtain physical and mental stability and boost theperformance of athletes in shooting competitions. More recently, systems havebeen proposed that support users’ mental preparedness [107] or induce creativestates [1], but systems could go beyond single use cases and schedule a varietyof interventions throughout the day to help users get to and remain in highly
29 http://spritzinc.com/

8.5 Final Remarks 213
productive states. Such potentially invasive systems are clearly controversial andhence a research plan would need to include assessments of long-term effects ontheir users including behavior changes and potential health impact. Chronicallyhigh levels of mental load have been shown to cause various health problems,such as stress, depression, and burnout [258]. Future research in this directionwould need to look at the long-term feasibility and implications of such systemson people’s levels of health, productivity, and comfort.
8.5 Final Remarks
When developing tools for augmenting cognitive processes the question comes upwhether technology enhances our cognitive aptitude or helps to build and improveinnate skills. The difference between these two notions becomes apparent whenthe tool is removed. Does the skill persist?
Clark and Chalmers [48] coined the term active externalism describing the activerole our environment plays for our cognitive processes. They argue that cognitionis not limited to the physical boundaries of our skull. External objects play acrucial role in cognitive processes, such as memory retrieval, linguistic processes,or skill acquisition. For example, we use our fingers to augment our workingmemory in calculations or use pen and paper to perform multiplications. Whilethe brain is performing operations it delegates some of its workload to its externalenvironment. Kirsh and Maglio [155] demonstrated how performing actions in theworld can lead to quicker solutions of certain cognitive and perceptual problemsthan performing them mentally. They showed how physically rotating a shape by90�, for example, could be done in about 100 ms, plus 200 ms required to press arespective button. In contrast, mentally rotating the shape took about 1000 ms.They distinguish pragmatic actions—where the world is altered because somephysical change is desirable for its own sake—from epistemic actions, in whichthe world is altered to aid and augment cognitive processes, such as recognitionor search, i.e., to understand the world. In the rotating shape example that wouldmean a person gains knowledge about the world (does the shape fit an appropriateslot?) by pragmatic action (physically rotating the shape) quicker than throughepistemic action (rotating the shape in the head). Hence, tools and technologiesaugment our cognitive processes and our understanding of the world. Obviouslysuch knowledge gain remains even if the tool is removed. In other tasks, such asperforming a tricky calculation, a calculator becomes coupled with the personas a tool. According to Clark and Chalmers [48] such coupling is considered

214 8 Conclusion and Future Work
an externally augmented cognitive process, which is sufficient if the tools (therelevant capacities) are generally available when they are needed: “In effect, theyare part of the basic package of cognitive resources that I bring to bear on theeveryday world. These systems cannot be impugned simply on the basis of thedanger of discrete damage, loss, or malfunction, or because of any occasionaldecoupling: the biological brain is in similar danger, and occasionally losescapacities temporarily in episodes of sleep, intoxication.” [48] Hence, extendedcognition is considered to be a core cognitive process, not an add-on extra.
The increasing spread of ubiquitous computing devices supports this notion.Devices are portable, ingrained in our everyday life and therefore near-constantlyavailable. Hence, the functions and support they provide become part of oureveryday cognitive processes including looking up information, noting somethingdown, and sharing it. The notion of extended cognition is taken to the nextlevel by some of the ideas and prototypes presented in this thesis. Context- andcognition-aware systems support the user in-situ according to current abilitiesand aptitudes. Proactive recommendations and content suggestions as describedin Chapter 6 match content to the user’s real-time processing capabilities andtherefore facilitate information intake and processing. Seamless support maybecome so ingrained in our everyday life that the cognitive boost we receivethrough them becomes self-evident and may only be noticed when the tools err orfail. But since these technologies are built on people’s innate circadian rhythmand productive phases, we could argue that even if the technology failed them,it might succeed in instilling productive habits. So even if the content was nolonger pushed proactively, formed habits and awareness might cause users toactively seek out activities that match their current cognitive state. Similarly, forthe adaptive reading, UIs presented, enhanced reading skill is applicable also foroffline reading. The kinetic stimulus, for example, has the potential to school eyemovements which endure even if the stimulus is absent. Also, one could expectthat by using such tools, the overall reading volume is increased over time, whichhas been shown to lead to an increase in vocabulary and therefore advance wordprocessing capabilities [250], and innate cognitive skill.

VBIBLIOGRAPHY


BIBLIOGRAPHY
[1] S. Abdullah, M. Czerwinski, G. Mark, and P. Johns. Shining (blue) lighton creative ability. In Proceedings of the 2016 ACM International JointConference on Pervasive and Ubiquitous Computing, UbiComp ’16, pages793–804, New York, NY, USA, 2016. ACM.
[2] S. Abdullah, E. L. Murnane, M. Matthews, M. Kay, J. A. Kientz, G. Gay,and T. Choudhury. Cognitive rhythms: unobtrusive and continuous sensingof alertness using a mobile phone. In Proceedings of the 2016 ACMInternational Joint Conference on Pervasive and Ubiquitous Computing,pages 178–189. ACM, 2016.
[3] G. D. Abowd, A. K. Dey, P. J. Brown, N. Davies, M. Smith, and P. Steggles.Towards a better understanding of context and context-awareness. InInternational Symposium on Handheld and Ubiquitous Computing, pages304–307. Springer, 1999.
[4] R. F. Adler and R. Benbunan-Fich. Self-interruptions in discretionarymultitasking. Computers in Human Behavior, 29(4):1441–1449, 2013.
[5] R. Agarwal and E. Karahanna. Time flies when you’re having fun: Cog-nitive absorption and beliefs about information technology usage. MISquarterly, pages 665–694, 2000.
[6] P. E. Agroudy, T. Machulla, R. Rzayev, T. Dingler, M. Funk, A. Schmidt,G. Ward, and S. Clinch. Impact of reviewing lifelogging photos on recallingepisodic memories. In Proceedings of the 2016 ACM International JointConference on Pervasive and Ubiquitous Computing: Adjunct, UbiComp’16, pages 1014–1019, New York, NY, USA, 2016. ACM.
[7] J. Allan. Automatic hypertext construction. Technical report, CornellUniversity, 1995.

218 BIBLIOGRAPHY
[8] K. Angerbauer, T. Dingler, D. Kern, and A. Schmidt. Utilizing the effects ofpriming to facilitate text comprehension. In Proceedings of the 33rd AnnualACM Conference Extended Abstracts on Human Factors in ComputingSystems, CHI EA ’15, pages 1043–1048, New York, NY, USA, 2015.ACM.
[9] D. L. Ashbrook. Enabling mobile microinteractions. 2010.
[10] D. Avrahami and S. E. Hudson. Responsiveness in instant messaging:predictive models supporting inter-personal communication. In Proc. CHI
’06. ACM, 2006.
[11] D. Avrahami and S. E. Hudson. Responsiveness in instant messaging: pre-dictive models supporting inter-personal communication. In Proceedingsof the SIGCHI conference on Human Factors in computing systems, pages731–740. ACM, 2006.
[12] A. Baddeley, A. Eysenck, and M. Anderson. Memory, 2009.
[13] H. P. Bahrick and E. Phelphs. Retention of spanish vocabulary over 8 years.Journal of Experimental Psychology: Learning, Memory, and Cognition,13(2):344, 1987.
[14] N. Banovic, C. Brant, J. Mankoff, and A. Dey. Proactivetasks: The short ofmobile device use sessions. In Proceedings of the 16th International Con-ference on Human-computer Interaction with Mobile Devices & Services,MobileHCI ’14, pages 243–252, New York, NY, USA, 2014. ACM.
[15] L. Barnard, J. S. Yi, J. A. Jacko, and A. Sears. An empirical compari-son of use-in-motion evaluation scenarios for mobile computing devices.International Journal of Human-Computer Studies, 62(4):487–520, 2005.
[16] L. A. Barnett and S. W. Klitzing. Boredom in free time: Relationships withpersonality, affect, and motivation for different gender, racial and ethnicstudent groups. Leisure Sciences, 28(3):233–244, 2007.
[17] D. Basaraba, P. Yovanoff, J. Alonzo, and G. Tindal. Examining the struc-ture of reading comprehension: do literal, inferential, and evaluative com-prehension truly exist? Reading and Writing, 26(3):349–379, 2013.
[18] E. B. Basoglu and O. Akdemir. A Comparison of Undergraduate Students’English Vocabulary Learning: Using Mobile Phones and Flash Cards.Turkish Online Journal of Educational Technology - TOJET, 9(3):1–7, July2010.

BIBLIOGRAPHY 219
[19] A. Battestini, V. Setlur, and T. Sohn. A large scale study of text-messaginguse. In Proc. MobileHCI ’10, pages 229–238. ACM, 2010.
[20] J. S. Beaudin, S. S. Intille, E. M. Tapia, R. Rockinson, and M. E. Mor-ris. Context-sensitive microlearning of foreign language vocabulary on amobile device. In European Conference on Ambient Intelligence, pages55–72. Springer, 2007.
[21] J. B. Begole, J. C. Tang, R. B. Smith, and N. Yankelovich. Work rhythms:analyzing visualizations of awareness histories of distributed groups. InProceedings of the 2002 ACM conference on Computer supported cooper-ative work, pages 334–343. ACM, 2002.
[22] C. BenMoussa. Workers on the move: New opportunities through mobilecommerce. Stockholm mobility roundtable, pages 22–23, 2003.
[23] C. M. Bishop et al. Pattern recognition and machine learning, vol. 1springer.New York, (4):12, 2006.
[24] R. Bixler and S. D’Mello. Detecting boredom and engagement duringwriting with keystroke analysis, task appraisals, and stable traits. In Proc.IUI ’13. ACM, 2013.
[25] A. Bogomolov, B. Lepri, M. Ferron, F. Pianesi, and A. S. Pentland. Dailystress recognition from mobile phone data, weather conditions and individ-ual traits. In Proc. MM ’14. ACM, 2014.
[26] A. Bogomolov, B. Lepri, and F. Pianesi. Happiness recognition frommobile phone data. In Proc SOCIALCOM ’13. IEEE Computer Society,2013.
[27] M. Bohmer, B. Hecht, J. Schoning, A. Kruger, and G. Bauer. Fallingasleep with angry birds, facebook and kindle: A large scale study onmobile application usage. In Proceedings of the 13th International Confer-ence on Human Computer Interaction with Mobile Devices and Services,MobileHCI ’11, pages 47–56, New York, NY, USA, 2011. ACM.
[28] A. A. Borbely. A two process model of sleep regulation. In HumanNeurobiology, volume 1, pages 195–204. Springer-Verlag, 1982.
[29] S. A. Brasel and J. Gips. Enhancing television advertising: same-languagesubtitles can improve brand recall, verbal memory, and behavioral intent.Journal of the Academy of Marketing Science, 42(3):322–336, 2014.

220 BIBLIOGRAPHY
[30] L. Breiman. Random forests. Machine Learning, 45(1):5–32, 2001.
[31] B. Brown, M. McGregor, and D. McMillan. 100 days of iphone use:Understanding the details of mobile device use. In Proc MobileHCI ’14.ACM, 2014.
[32] P. A. Bruck, L. Motiwalla, and F. Foerster. Mobile Learning with Micro-content: A Framework and Evaluation. Bled, Slovenia, June 2012.
[33] A. Bulling and D. Roggen. Recognition of visual memory recall processesusing eye movement analysis. In Proceedings of the 13th internationalconference on Ubiquitous computing, pages 455–464. ACM, 2011.
[34] A. Bulling, J. A. Ward, and H. Gellersen. Multimodal recognition ofreading activity in transit using body-worn sensors. ACM Transactions onApplied Perception (TAP), 9(1):2, 2012.
[35] A. Bulling, J. A. Ward, H. Gellersen, and G. Troster. Eye movement analy-sis for activity recognition using electrooculography. IEEE transactionson pattern analysis and machine intelligence, 33(4):741–753, 2011.
[36] A. Bulling and T. O. Zander. Cognition-aware computing. IEEE PervasiveComputing, 13(3):80–83, July 2014.
[37] K. Busemann and F. Tippelt. Second screen: Parallelnutzung von fernsehenund internet. Media Perspektiven, 7:408–416, 2014.
[38] C. J. Cai, P. J. Guo, J. Glass, and R. C. Miller. Wait-learning: LeveragingConversational Dead Time for Second Language Education. CHI EA ’14,pages 2239–2244, New York, NY, USA, 2014. ACM.
[39] S. K. Carpenter and E. L. DeLosh. Application of the testing and spacingeffects to name learning. Applied Cognitive Psychology, 19(5):619–636,2005.
[40] R. P. Carver. Sense and nonsense in speed reading. Revrac Publications,1971.
[41] C. Castillo, G. De Francisci Morales, and A. Shekhawat. Online matchingof web content to closed captions in intonow. In Proceedings of the 36thInternational ACM SIGIR Conference on Research and Development inInformation Retrieval, SIGIR ’13, pages 1115–1116, New York, NY, USA,2013. ACM.

BIBLIOGRAPHY 221
[42] N. Cavus and D. Ibrahim. m-Learning: An experiment in using SMS to sup-port learning new English language words. British Journal of EducationalTechnology, 40(1):78–91, Jan. 2009.
[43] G. C. Cawley and N. L. Talbot. On over-fitting in model selection andsubsequent selection bias in performance evaluation. J. Mach. Learn. Res.,11:2079–2107, Aug. 2010.
[44] T. Chen and C. Guestrin. XGBoost: a scalable tree boosting system. InProc. of the ACM SIGKDD Int. Conf. on Knowledge Discovery and DataMining (KDD), pages 785–794, 2016.
[45] E. C. Cherry. Some experiments on the recognition of speech, with oneand with two ears. The Journal of the acoustical society of America,25(5):975–979, 1953.
[46] Y.-L. Chuang, C.-W. Liao, W.-S. Chen, W.-T. Chang, S.-H. Cheng, Y.-C. Zeng, and K.-H. Chan. Use second screen to enhance tv viewingexperiences. In Cross-Cultural Design. Methods, Practice, and CaseStudies, pages 366–374. Springer, 2013.
[47] K. Church and R. de Oliveira. What’s up with whatsapp? comparing mo-bile instant messaging behaviors with traditional sms. In Proc. MobileHCI
’13. ACM, 2013.
[48] A. Clark and D. Chalmers. The extended mind. analysis, 58(1):7–19,1998.
[49] S. Cohrs. Sleep disturbances in patients with schizophrenia. CNS drugs,22(11):939–962, 2008.
[50] S. Consolvo and M. Walker. Using the experience sampling method toevaluate ubicomp applications. IEEE Pervasive Computing, 2(2):24–31,2003.
[51] L. Cruickshank, E. Tsekleves, R. Whitham, A. Hill, and K. Kondo. Makinginteractive tv easier to use: Interface design for a second screen approach.The Design Journal, 10(3):41–53, 2007.
[52] M. Csikszentmihalyi. The flow experience and its significance for humanpsychology. 1988.
[53] A. Csomai and R. Mihalcea. Linking documents to encyclopedic knowl-edge. Intelligent Systems, IEEE, 23(5):34–41, 2008.

222 BIBLIOGRAPHY
[54] W. L. Cull et al. Untangling the benefits of multiple study opportunities andrepeated testing for cued recall. Applied Cognitive Psychology, 14(3):215–235, 2000.
[55] E. Cutrell, M. Czerwinski, and E. Horvitz. Notification, disruption, andmemory: Effects of messaging interruptions on memory and performance.2001.
[56] M. Czerwinski, E. Horvitz, and S. Wilhite. A diary study of task switchingand interruptions. In Proc. CHI ’04. ACM, 2004.
[57] E. Dane. Paying attention to mindfulness and its effects on task perfor-mance in the workplace. Journal of Management, 2010.
[58] I. Darroch, J. Goodman, S. Brewster, and P. Gray. The effect of age andfont size on reading text on handheld computers. In IFIP Conference onHuman-Computer Interaction, pages 253–266. Springer, 2005.
[59] T. H. Davenport and J. C. Beck. The attention economy: Understandingthe new currency of business. Harvard Business Press, 2013.
[60] O. de Bruijn and R. Spence. Rapid serial visual presentation: a space-timetrade-off in information presentation. In Advanced visual interfaces, pages189–192, 2000.
[61] D. Dearman and K. Truong. Evaluating the Implicit Acquisition of SecondLanguage Vocabulary Using a Live Wallpaper. CHI ’12, pages 1391–1400,New York, NY, USA, 2012. ACM.
[62] F. N. Dempster. Effects of variable encoding and spaced presentations onvocabulary learning. Journal of Educational Psychology, 79(2):162, 1987.
[63] A. K. Dey. Context-aware computing: The cyberdesk project. In Pro-ceedings of the AAAI 1998 Spring Symposium on Intelligent Environments,pages 51–54, 1998.
[64] A. K. Dey. Providing architectural support for building context-awareapplications. PhD thesis, Georgia Institute of Technology, 2000.
[65] A. K. Dey, K. Wac, D. Ferreira, K. Tassini, J.-H. Hong, and J. Ramos.Getting closer: an empirical investigation of the proximity of user to theirsmart phones. In Proceedings of the 13th international conference onUbiquitous computing, pages 163–172. ACM, 2011.

BIBLIOGRAPHY 223
[66] C. Dickie, R. Vertegaal, C. Sohn, and D. Cheng. eyelook: Using attentionto facilitate mobile media consumption. In Proc. of UIST ’05, pages103–106, New York, NY, USA, 2005. ACM.
[67] D. F. Dinges and J. W. Powell. Microcomputer analyses of performanceon a portable, simple visual rt task during sustained operations. Behaviorresearch methods, instruments, & computers, 17(6):652–655, 1985.
[68] T. Dingler. Cognition-aware systems as mobile personal assistants. InACM, editor, Adjunct Proceedings of the 2015 ACM International JointConference on Pervasive and Ubiquitous Computing and Proceedings ofthe 2015 ACM International Symposium on Wearable Computers, Ubi-Comp/ISWC ’15 Adjunct, New York, NY, USA, 2016. ACM.
[69] T. Dingler, P. E. Agroudy, H. V. Le, A. Schmidt, E. Niforatos, A. Bexheti,and M. Langheinrich. Multimedia memory cues for augmenting humanmemory. IEEE MultiMedia, 23(2):4–11, Apr 2016.
[70] T. Dingler, P. E. Agroudy, G. Matheis, and A. Schmidt. Reading-basedscreenshot summaries for supporting awareness of desktop activities. InProceedings of the 7th Augmented Human International Conference 2016,AH ’16, pages 27:1–27:5, New York, NY, USA, 2016. ACM.
[71] T. Dingler, T. Bagg, Y. Grau, N. Henze, and A. Schmidt. ucanvas: Aweb framework for spontaneous smartphone interaction with ubiquitousdisplays. In Human-Computer Interaction–INTERACT 2015, pages 402–409. Springer, 2015.
[72] T. Dingler, A. Bexheti, E. Niforatos, and F. Alt. Workshop on mobile cog-nition: Using mobile devices to enhance human cognition. In Proceedingsof the 17th International Conference on Human-Computer Interaction withMobile Devices and Services Adjunct, MobileHCI ’15, pages 970–973,New York, NY, USA, 2015. ACM.
[73] T. Dingler and S. Brewster. Audiofeeds: A mobile auditory application formonitoring online activities. In Proceedings of the 18th ACM InternationalConference on Multimedia, MM ’10, pages 1067–1070, New York, NY,USA, 2010. ACM.
[74] T. Dingler, M. Funk, and F. Alt. Interaction proxemics: Combiningphysical spaces for seamless gesture interaction. In Proceedings of the4th International Symposium on Pervasive Displays, PerDis ’15, pages107–114, New York, NY, USA, 2015. ACM.
224 BIBLIOGRAPHY
[75] T. Dingler, C. Giebler, U. Kunze, T. Wurtele, N. Henze, and A. Schmidt.Memory displays: Investigating the effects of learning in the periphery.In Proceedings of the 5th ACM International Symposium on PervasiveDisplays, PerDis ’16, pages 118–123, New York, NY, USA, 2016. ACM.
[76] T. Dingler and N. Henze. That’s the dog from my wedding – algorithmsfor memory shaping. In Proceedings of the CHI Workshop on DesigningTechnology for Major Life Events, 2014, 2014.
[77] T. Dingler, K. Kunze, E. Niforatos, C. Gurrin, I. Giannopolos, A. Dengel,and K. Kise. Wahm 2016: 3rd workshop on ubiquitous technologies foraugmenting the human mind. In Proceedings of the 2016 ACM Interna-tional Joint Conference on Pervasive and Ubiquitous Computing: Adjunct,UbiComp ’16, pages 1010–1013, New York, NY, USA, 2016. ACM.
[78] T. Dingler, J. Lindsay, and B. N. Walker. Learnability of sound cues forenvironmental features: Auditory icons, earcons, spearcons, and speech.Proceedings of the 14th International Conference on Auditory Display,Paris, France, pages 1–6, 2008.
[79] T. Dingler and M. Pielot. I’ll be there for you: Quantifying attentivenesstowards mobile messaging. In Proceedings of the 17th InternationalConference on Human-Computer Interaction with Mobile Devices andServices, MobileHCI ’15, pages 1–5, New York, NY, USA, 2015. ACM.
[80] T. Dingler, R. Rzayev, V. Schwind, and N. Henze. Rsvp on the go -implicit reading support on smart watches through eye tracking. In ACM,editor, Proceedings of the 2015 ACM International Joint Conference onPervasive and Ubiquitous Computing and Proceedings of the 2015 ACMInternational Symposium on Wearable Computers, UbiComp/ISWC ’15,New York, NY, USA, 2016. ACM.
[81] T. Dingler, A. Sahami Shirazi, and N. Henze. There is more to wellbe-ing than health data – holistic lifelogging through memory capture. InProceedings of the CHI Workshop on Beyond Quantified Self: Data forWellbeing, 2014, 2014.
[82] T. Dingler and A. Schmidt. A real-time bidding platform for public displays.In Proceedings of the 4th International Symposium on Pervasive Displays,PerDis ’15, pages 245–246, New York, NY, USA, 2015. ACM.
[83] T. Dingler and A. Schmidt. Peripheral displays to support human cog-nition. In Peripheral Interaction, pages 167–181. Springer InternationalPublishing, 2016.

BIBLIOGRAPHY 225
[84] T. Dingler, A. Schmidt, K. Kunze, M. Langheinrich, N. Davies, andN. Henze. Wahm 2014: workshop on ubiquitous technologies for augment-ing the human mind. In Proceedings of the 2014 ACM International JointConference on Pervasive and Ubiquitous Computing: Adjunct Publication,pages 1339–1345. ACM, 2014.
[85] T. Dingler, A. Schmidt, and T. Machulla. Building cognition-aware sys-tems: A mobile toolkit for extracting time-of-day fluctuations of cognitiveperformance. volume 1, pages 47:1–47:15, New York, NY, USA, Sept.2017. ACM.
[86] T. Dingler, A. S. Shirazi, K. Kunze, and A. Schmidt. Assessment of stimulifor supporting speed reading on electronic devices. In Proceedings of the6th Augmented Human International Conference, AH ’15, pages 117–124,New York, NY, USA, 2015. ACM.
[87] T. Dingler, D. Weber, M. Pielot, J. Cooper, C.-C. Chang, and N. Henze.Language learning on-the-go: Opportune moments and design of mobilemicrolearning sessions. In Proceedings of the 19th International Confer-ence on Human-Computer Interaction with Mobile Devices and Services,MobileHCI ’17, pages 28:1–28:12, New York, NY, USA, 2017. ACM.
[88] I. DIS. 9241-210: 2010. ergonomics of human system interaction-part 210:Human-centred design for interactive systems. International Standardiza-tion Organization (ISO). Switzerland, 2009.
[89] J. D. Eastwood, A. Frischen, M. J. Fenske, and D. Smilek. The unen-gaged mind: Defining boredom in terms of attention. Perspectives onPsychological Science, 7(5):482–495, 2012.
[90] H. Ebbinghaus. Memory: A contribution to experimental psychology.Number 3. University Microfilms, 1913.
[91] D. Edge, S. Fitchett, M. Whitney, and J. Landay. MemReflex: AdaptiveFlashcards for Mobile Microlearning. MobileHCI ’12, pages 431–440,New York, NY, USA, 2012. ACM.
[92] D. Edge, E. Searle, K. Chiu, J. Zhao, and J. A. Landay. MicroMandarin:Mobile Language Learning in Context. CHI ’11, pages 3169–3178, NewYork, NY, USA, 2011. ACM.
[93] E. Ehrlich. Opinions differ on speed reading. NEA Journal, 52:43–44,1963.

226 BIBLIOGRAPHY
[94] R. Farmer and N. D. Sundberg. Boredom proneness: The developmentand correlates of a new scale. J. Pers. Asses, 50(1):4–17, 1986.
[95] O. Fenichel. On the psychology of boredom. Columbia University Press,1951.
[96] N. Fernandez Garcia, J. Arias Fisteus, and L. Sanchez Fernandez. Com-parative evaluation of link-based approaches for candidate ranking inlink-to-wikipedia systems. Journal of Artificial Intelligence Research,pages 733–773, 2014.
[97] D. Ferreira, J. Goncalves, V. Kostakos, L. Barkhuus, and A. K. Dey.Contextual experience sampling of mobile application micro-usage. InProceedings of the 16th international conference on Human-computerinteraction with mobile devices & services, pages 91–100. ACM, 2014.
[98] D. Ferreira, V. Kostakos, and A. K. Dey. Aware: mobile context instru-mentation framework. Frontiers in ICT, 2:6, 2015.
[99] J. E. Fischer, C. Greenhalgh, and S. Benford. Investigating episodesof mobile phone activity as indicators of opportune moments to delivernotifications. In Proc. MobileHCI ’11. ACM, 2011.
[100] C. D. Fisherl. Boredom at work: A neglected concept. Human Relations,46(3):395–417, 1993.
[101] A. Fleury, J. S. Pedersen, M. Baunstrup, and L. B. Larsen. Interactive tv:Interaction and control in second-screen tv consumption. In 10th EuropeanInteractive TV Conference, pages 104–107, 2012.
[102] J. Fogarty, S. E. Hudson, C. G. Atkeson, D. Avrahami, J. Forlizzi,S. Kiesler, J. C. Lee, and J. Yang. Predicting human interruptibility withsensors. ACM Trans. Comput.-Hum. Interact., 12(1):119–146, Mar 2005.
[103] K. I. Forster. Visual perception of rapidly presented word sequences ofvarying complexity. Perception & Psychophysics, 8(4):215–221, 1970.
[104] S. D. Frank. Remember Everything You Read: The Evelyn Wood 7-DaySpeed Reading & Learning Program. HarperCollins, 1992.
[105] R. Fuller. Buckminster. critical path. St, Martin1s Press, New York, 1981.
[106] M. Funk, T. Dingler, J. Cooper, and A. Schmidt. Stop helping me - i’mbored!: Why assembly assistance needs to be adaptive. In Adjunct Proceed-ings of the 2015 ACM International Joint Conference on Pervasive and

BIBLIOGRAPHY 227
Ubiquitous Computing and Proceedings of the 2015 ACM InternationalSymposium on Wearable Computers, UbiComp/ISWC ’15 Adjunct, pages1269–1273, New York, NY, USA, 2015. ACM.
[107] K. Futami, T. Terada, and M. Tsukamoto. Success imprinter: A methodfor controlling mental preparedness using psychological conditioned in-formation. In Proceedings of the 7th Augmented Human InternationalConference 2016, page 11. ACM, 2016.
[108] D. Geerts, R. Leenheer, D. De Grooff, J. Negenman, and S. Heijstraten. Infront of and behind the second screen: Viewer and producer perspectiveson a companion app. In Proceedings of the 2014 ACM InternationalConference on Interactive Experiences for TV and Online Video, TVX ’14,pages 95–102, New York, NY, USA, 2014. ACM.
[109] C. Gentry. A fully homomorphic encryption scheme. PhD thesis, StanfordUniversity, 2009.
[110] T. Georgiev. Investigation of the user’s text reading speed on mobiledevices. In Proceedings of the 13th International Conference on ComputerSystems and Technologies, pages 329–336. ACM, 2012.
[111] R. Godwin-Jones. Emerging technologies from memory palaces to spacingalgorithms: approaches to secondlanguage vocabulary learning. Language,Learning & Technology, 14(2):4, 2010.
[112] N. Goel, H. Van Dongen, and D. Dinges. Circadian rhythms in sleepiness,alertness, and performance. Principles and practice of sleep medicine,5:445–55, 2011.
[113] T. Goetz, A. C. Frenzel, N. C. Hall, U. E. Nett, R. Pekrun, and A. A. Lip-nevich. Types of boredom: An experience sampling approach. Motivationand Emotion, 38(3):401–419, 2014.
[114] E. B. Goldstein, M. Ritter, and G. Herbst. Wahrnehmungspsychologie,volume 2. Spektrum Akademischer Verlag Heidelberg, 2002.
[115] Google. The new multi-screen world:understanding cross-platform con-sumer behavior. 2012.
[116] R. G. Graf. Speed reading: Remember the tortoise. Psychology Today,7(7):112–13, 1973.
[117] D. Green and J. Swets. Signal detection theory and psychophysics. 1966.New York, 888:889, 1966.

228 BIBLIOGRAPHY
[118] B. M. Gross. The managing of organizations: The administrative struggle,volume 2. [New York]: Free Press of Glencoe, 1964.
[119] Q. Guo, E. Agichtein, C. L. A. Clarke, and A. Ashkan. In the moodto click? towards inferring receptiveness to search advertising. In Proc.WI-IAT ’09. IEEE Computer Society, 2009.
[120] D. E. Hannula and C. Ranganath. The eyes have it: hippocampal activitypredicts expression of memory in eye movements. Neuron, 63(5):592–599,2009.
[121] D. M. Hansen. A discourse structure analysis of the comprehension ofrapid readers. 1975.
[122] J. P. Hansen, F. Biermann, E. Møllenbach, H. Lund, J. S. Agustin, andS. Sztuk. A gazewatch prototype. In Proc. of MobileHCI ’15, pages615–621, New York, NY, USA, 2015. ACM.
[123] S. G. Hart. Nasa-task load index (nasa-tlx); 20 years later. In Proceedingsof the human factors and ergonomics society annual meeting, volume 50,pages 904–908. Sage Publications, 2006.
[124] S. G. Hart and L. E. Staveland. Development of nasa-tlx (task load index):Results of empirical and theoretical research. Advances in psychology,52:139–183, 1988.
[125] T. Hastie, R. Tibshirani, and J. Friedman. The Elements of StatisticalLearning. Springer Series in Statistics. Springer New York Inc., New York,NY, USA, 2001.
[126] A. Hayati and F. Mohmedi. The effect of films with and without subtitleson listening comprehension of efl learners. British Journal of EducationalTechnology, 42(1):181–192, 2011.
[127] J. Healey, L. Nachman, S. Subramanian, J. Shahabdeen, and M. Morris.Out of the lab and into the fray: towards modeling emotion in everydaylife. In International Conference on Pervasive Computing, pages 156–173.Springer, 2010.
[128] B. Hedin and E. Lindgren. A comparison of presentation methods forreading on mobile phones. Distributed Systems Online, IEEE, 8(6):2–2,2007.
[129] J. J. Heisz and D. I. Shore. More efficient scanning for familiar faces.Journal of Vision, 8(1):9–9, 2008.

BIBLIOGRAPHY 229
[130] J. M. Hektner, J. A. Schmidt, and M. Csikszentmihalyi. Experiencesampling method: Measuring the quality of everyday life. Sage, 2007.
[131] F. Herzberg, B. Mausner, and B. B. Snyderman. The motivation to work,volume 1. Transaction publishers, 2011.
[132] A. Hiniker, S. N. Patel, T. Kohno, and J. A. Kientz. Why would youdo that? predicting the uses and gratifications behind smartphone-usagebehaviors. In Proceedings of the 2016 ACM International Joint Conferenceon Pervasive and Ubiquitous Computing, UbiComp ’16, pages 634–645,New York, NY, USA, 2016. ACM.
[133] D. Hintze, R. D. Findling, S. Scholz, and R. Mayrhofer. Mobile deviceusage characteristics: The effect of context and form factor on locked andunlocked usage. In Proceedings of the 12th International Conference onAdvances in Mobile Computing and Multimedia, pages 105–114. ACM,2014.
[134] Y. Hochberg and Y. Benjamini. Controlling the False Discovery Rate : aPractical and Powerful Approach to Multiple Testing. Journal of the RoyalStatistical Society. Series B (Methodological), 57(1):289–300, 1995.
[135] W. A. Hofstra and A. W. de Weerd. How to assess circadian rhythm inhumans: a review of literature. Epilepsy & Behavior, 13(3):438–444, 2008.
[136] G. Holmes, A. Donkin, and I. H. Witten. Weka: A machine learningworkbench. In Intelligent Information Systems, 1994. Proceedings of the1994 Second Australian and New Zealand Conference on, pages 357–361.IEEE, 1994.
[137] E. Horvitz, J. Apacible, and M. Subramani. Balancing awareness and inter-ruption: Investigation of notification deferral policies. In User Modeling2005, pages 433–437. Springer, 2005.
[138] E. Horvitz, P. Koch, R. Sarin, J. Apacible, and M. Subramani1.Bayesphone: Precomputation of context-sensitive policies for inquiryand action in mobile devices. In Proc UM ’05, 2005.
[139] G. Inc. Gartner says worldwide wearable devices sales to grow 18.4percent in 2016. http://www.gartner.com/newsroom/id/3198018,2016. Last accessed: November 16, 2017.
[140] S. Intille, C. Haynes, D. Maniar, A. Ponnada, and J. Manjourides. µema:Microinteraction-based ecological momentary assessment (ema) using a

230 BIBLIOGRAPHY
smartwatch. In Proceedings of the 2016 ACM International Joint Confer-ence on Pervasive and Ubiquitous Computing, pages 1124–1128. ACM,2016.
[141] S. T. Iqbal and B. P. Bailey. Effects of intelligent notification managementon users and their tasks. In Proc. CHI ’08. ACM, 2008.
[142] S. T. Iqbal and B. P. Bailey. Oasis: A framework for linking notificationdelivery to the perceptual structure of goal-directed tasks. ACM Trans.Comput.-Hum. Interact., 17(4):15:1–15:28, Dec 2010.
[143] S. T. Iqbal and E. Horvitz. Disruption and recovery of computing tasks:field study, analysis, and directions. In Proceedings of the SIGCHI con-ference on Human factors in computing systems, pages 677–686. ACM,2007.
[144] D. E. Irwin. Fixation location and fixation duration as indices of cognitiveprocessing. The interface of language, vision, and action: Eye movementsand the visual world, pages 105–134, 2004.
[145] S. Ishimaru, T. Dingler, K. Kunze, K. Kise, and A. Dengel. Readinginterventions: Tracking reading state and designing interventions. InProceedings of the 2016 ACM International Joint Conference on Pervasiveand Ubiquitous Computing: Adjunct, UbiComp ’16, pages 1759–1764,New York, NY, USA, 2016. ACM.
[146] R. J. K. Jacob. What you look at is what you get: Eye movement-basedinteraction techniques. In Proc. of CHI ’90, pages 11–18, New York, NY,USA, 1990. ACM.
[147] N. Janssen and H. A. Barber. Phrase frequency effects in language produc-tion. PLoS ONE7, 2012.
[148] C. Jennett, A. L. Cox, P. Cairns, S. Dhoparee, A. Epps, T. Tijs, andA. Walton. Measuring and defining the experience of immersion in games.International journal of human-computer studies, 66(9):641–661, 2008.
[149] M. A. Just and P. A. Carpenter. Eye fixations and cognitive processes.Cognitive psychology, 8(4):441–480, 1976.
[150] M. A. Just and P. A. Carpenter. The psychology of reading and languagecomprehension. Allyn & Bacon, 1987.

BIBLIOGRAPHY 231
[151] M. Kassner, W. Patera, and A. Bulling. Pupil: An Open Source Platformfor Pervasive Eye Tracking and Mobile Gaze-based Interaction. In Proc.of UbiComp ’14 Adjunct, New York, USA, 2014. ACM Press.
[152] M. Kay, K. Rector, S. Consolvo, B. Greenstein, J. O. Wobbrock, N. F.Watson, and J. A. Kientz. Pvt-touch: adapting a reaction time test fortouchscreen devices. In 2013 7th International Conference on PervasiveComputing Technologies for Healthcare and Workshops, pages 248–251.IEEE, 2013.
[153] D. Kern, P. Marshall, and A. Schmidt. Gazemarks: Gaze-based visualplaceholders to ease attention switching. In Proc. of CHI ’10, pages2093–2102, New York, NY, USA, 2010. ACM.
[154] E. Keuleers, M. Brysbaert, and B. New. Subtlex-nl: A new measure fordutch word frequency based on film subtitles. Behavior research methods,42(3):643–650, 2010.
[155] D. Kirsh and P. Maglio. On distinguishing epistemic from pragmatic action.Cognitive science, 18(4):513–549, 1994.
[156] N. Kleitman. Studies on the physiology of sleep. American Journal ofPhysiology–Legacy Content, 66(1):67–92, 1923.
[157] N. Kleitman. Studies on the physiology of sleep: Viii. diurnal variation inperformance. Am J Physiol, 104:449–456, 1933.
[158] N. Kleitman, S. Titelbaum, and P. Feiveson. The effect of body tempera-ture on reaction time. American Journal of Physiology–Legacy Content,121(2):495–501, 1938.
[159] J. Knittel. Automatic Content Generation for Second Screen Apps UsingSubtitles to Enhance the Learning Experience. published.
[160] J. Knittel and T. Dingler. Mining subtitles for real-time content generationfor second-screen applications. In Proceedings of the ACM InternationalConference on Interactive Experiences for TV and Online Video, TVX ’16,pages 93–103, New York, NY, USA, 2016. ACM.
[161] A. T. Korucu and A. Alkan. Differences between m-learning (mobilelearning) and e-learning, basic terminology and usage of m-learning ineducation. Procedia-Social and Behavioral Sciences, 15:1925–1930, 2011.

232 BIBLIOGRAPHY
[162] G. Kovacs. Smart subtitles for language learning. In CHI ’13 ExtendedAbstracts on Human Factors in Computing Systems, CHI EA ’13, pages2719–2724, New York, NY, USA, 2013. ACM.
[163] L. Kreitzman and R. Foster. The Rhythms Of Life: The Biological ClocksThat Control the Daily Lives of Every Living Thing. Profile books, 2011.
[164] T. Kubitza, N. Pohl, T. Dingler, and A. Schmidt. Webclip: a connectorfor ubiquitous physical input and output for touch screen devices. InProceedings of the 2013 ACM international joint conference on Pervasiveand ubiquitous computing, pages 387–390. ACM, 2013.
[165] T. Kubitza, N. Pohl, T. Dingler, S. Schneegass, C. Weichel, and A. Schmidt.Ingredients for a new wave of ubicomp products. IEEE Pervasive Comput-ing, (3):5–8, 2013.
[166] T. Kubitza, A. Schmidt, N. Pohl, D. Petrelli, T. Dingler, and N. Dulake.Tools and methods for creating interactive artifacts. In Proceedings ofthe 8th International Conference on Tangible, Embedded and EmbodiedInteraction, pages 385–388. ACM, 2014.
[167] K. Kunze, T. Dingler, N. Henze, K. Kise, and Y. Sato. 2nd workshop onubiquitous technologies to augment the human mind: Towards the knowl-edge log. In Proceedings of the 2015 ACM International Joint Conferenceon Pervasive and Ubiquitous Computing and Proceedings of the 2015ACM International Symposium on Wearable Computers, UbiComp ’15,pages 1213–1216, New York, NY, USA, 2015. ACM.
[168] K. Kunze, S. Sanchez, T. Dingler, O. Augereau, K. Kise, M. Inami, andT. Tsutomu. The augmented narrative: Toward estimating reader en-gagement. In Proceedings of the 6th Augmented Human InternationalConference, AH ’15, pages 163–164, New York, NY, USA, 2015. ACM.
[169] M. Langheinrich. Privacy by design-principles of privacy-aware ubiquitoussystems. In International conference on Ubiquitous Computing, pages273–291. Springer, 2001.
[170] M. Langheinrich, A. Schmidt, N. Davies, and R. Jose. A practical frame-work for ethics: the pd-net approach to supporting ethics compliance inpublic display studies. In Proceedings of the 2nd ACM InternationalSymposium on Pervasive Displays, pages 139–143. ACM, 2013.
[171] J. Lave. Cognition in practice: Mind, mathematics and culture in everydaylife. Cambridge University Press, 1988.

BIBLIOGRAPHY 233
[172] H. V. Le, S. Clinch, C. Sas, T. Dingler, N. Henze, and N. Davies. Impact ofvideo summary viewing on episodic memory recall - design guidelines forvideo summarizations. In ACM, editor, Proceedings of the SIGCHI Con-ference on Human Factors in Computing Systems, volume 34 of CHI ’16,New York, NY, USA, 2016. ACM.
[173] J. Lee, K. Lee, E. Jeong, J. Jo, and N. B. Shroff. Context-aware applicationscheduling in mobile systems: What will users do and not do next? InProceedings of the 2016 ACM International Joint Conference on Pervasiveand Ubiquitous Computing, UbiComp ’16, pages 1235–1246, New York,NY, USA, 2016. ACM.
[174] A. Lenhart. Teens, smartphones & texting. Technical report, PewResearchInternet Project, 2012.
[175] R. LiKamWa, Y. Liu, N. D. Lane, and L. Zhong. Moodscope: Buildinga mood sensor from smartphone usage patterns. In Proc. MobiSys ’13.ACM, 2013.
[176] L. Lischke, T. Dingler, S. Schneegass, A. Schmidt, M. van der Vaart, andP. Wozniak. Parallel exhibits: Combining physical and virtual exhibits. InNODEM 2014 CONFERENCE & EXPO ENGAGING SPACES, 2014.
[177] S. P. Liversedge and J. M. Findlay. Saccadic eye movements and cognition.Trends in cognitive sciences, 4(1):6–14, 2000.
[178] C. Makris, Y. Plegas, and E. Theodoridis. Improved text annotation withwikipedia entities. In Proceedings of the 28th Annual ACM Symposium onApplied Computing, SAC ’13, pages 288–295, New York, NY, USA, 2013.ACM.
[179] G. Mark, S. Iqbal, M. Czerwinski, and P. Johns. Capturing the mood:facebook and face-to-face encounters in the workplace. In Proceedingsof the 17th ACM conference on Computer supported cooperative work &social computing, pages 1082–1094. ACM, 2014.
[180] G. Mark, S. Iqbal, M. Czerwinski, and P. Johns. Focused, aroused, but sodistractible: Temporal perspectives on multitasking and communications.In Proceedings of the 18th ACM Conference on Computer SupportedCooperative Work & Social Computing, pages 903–916. ACM, 2015.
[181] G. Mark, S. Iqbal, M. Czerwinski, P. Johns, and A. Sano. Email duration,batching and self-interruption: Patterns of email use on productivity andstress. In Proceedings of CHI, 2016.
234 BIBLIOGRAPHY
[182] G. Mark, S. T. Iqbal, M. Czerwinski, and P. Johns. Bored mondays andfocused afternoons: The rhythm of attention and online activity in theworkplace. In Proceedings of the 32Nd Annual ACM Conference onHuman Factors in Computing Systems, CHI ’14, pages 3025–3034, NewYork, NY, USA, 2014. ACM.
[183] M. E. Masson. Conceptual processing of text during skimming and rapidsequential reading. Memory & Cognition, 11(3):262–274, 1983.
[184] A. Mathur, N. D. Lane, and F. Kawsar. Engagement-aware computing:modelling user engagement from mobile contexts. In Proceedings of the2016 ACM International Joint Conference on Pervasive and UbiquitousComputing, pages 622–633. ACM, 2016.
[185] A. Matic, M. Pielot, and N. Oliver. Boredom-computer interaction: Bore-dom proneness and the use of smartphone. In Proc. UbiComp ’15. ACM,2015.
[186] E. Matin. Saccadic suppression: a review and an analysis. Psychologicalbulletin, 81(12):899, 1974.
[187] S. B. Merriam, R. S. Caffarella, and L. M. Baumgartner. Learning inadulthood: A comprehensive guide. John Wiley & Sons, 2012.
[188] G. A. Miller. The magical number seven, plus or minus two: Some limitson our capacity for processing information. Psychological review, 63(2):81,1956.
[189] H. Mitterer and J. M. McQueen. Foreign subtitles help but native-languagesubtitles harm foreign speech perception. PloS one, 4(11):e7785, 2009.
[190] T. H. Monk and J. Carrier. A parallelism between human body temperatureand performance independent of the endogenous circadian pacemaker.Journal of biological rhythms, 13(2):113–122, 1998.
[191] A. Mottelson and K. Hornbæk. An affect detection technique using mobilecommodity sensors in the wild. In Proceedings of the 2016 ACM Interna-tional Joint Conference on Pervasive and Ubiquitous Computing, pages781–792. ACM, 2016.
[192] E. L. Murnane, S. Abdullah, M. Matthews, M. Kay, J. A. Kientz, T. Choud-hury, G. Gay, and D. Cosley. Mobile manifestations of alertness: Connect-ing biological rhythms with patterns of smartphone app use. In Proceedingsof the 18th International Conference on Human-Computer Interaction with

BIBLIOGRAPHY 235
Mobile Devices and Services, MobileHCI ’16, pages 465–477, New York,NY, USA, 2016. ACM.
[193] W. E. Nagy and P. A. Herman. Breadth and depth of vocabulary knowledge:Implications for acquisition and instruction. The nature of vocabularyacquisition, 19:35, 1987.
[194] T. Nakata. English vocabulary learning with word lists, word cards andcomputers: Implications from cognitive psychology research for optimalspaced learning. ReCALL, 20(01):3–20, 2008.
[195] A. Nandakumar and J. Murray. Companion apps for long arc tv series:Supporting new viewers in complex storyworlds with tightly synchronizedcontext-sensitive annotations. In Proceedings of the 2014 ACM Interna-tional Conference on Interactive Experiences for TV and Online Video,TVX ’14, pages 3–10, New York, NY, USA, 2014. ACM.
[196] I. S. Nation. Learning vocabulary in another language. Ernst KlettSprachen, 2001.
[197] T. Neate, M. Jones, M. Evans, and R. Bbc. Mediating Attention for SecondScreen Companion Content. In Proceedings of the 33rd Annual ACMConference on Human Factors in Computing Systems, CHI ’15, pages3103–3106, New York, NY, USA, 2015. ACM.
[198] U. Neisser. Cognitive psychology. Appleton-Century-Crofts, New York,NY, USA, 1967.
[199] B. New, M. Brysbaert, J. Veronis, and C. Pallier. The use of film subtitlesto estimate word frequencies. Applied Psycholinguistics, 28(04):661–677,2007.
[200] J. Nielsen. The digital consumer. Online Resource by The Nielsen Com-pany, pages 1–28, 2014. Last accessed: November 16, 2017.
[201] A. Nijholt and D. Tan. Playing with your brain: brain-computer interfacesand games. In Proceedings of the international conference on Advances incomputer entertainment technology, pages 305–306. ACM, 2007.
[202] B. O’Conaill and D. Frohlich. Timespace in the workplace: Dealing withinterruptions. In Conference companion on Human factors in computingsystems, pages 262–263. ACM, 1995.

236 BIBLIOGRAPHY
[203] D. Odijk, E. Meij, and M. de Rijke. Feeding the second screen: Semanticlinking based on subtitles. In Proceedings of the 10th Conference onOpen Research Areas in Information Retrieval, OAIR ’13, pages 9–16,Paris, France, France, 2013. Le Centre de Hautes Etudes InternationalesD’Iinformatique Documentaire.
[204] I. Oliveira and N. Guimaraes. A tool for mental workload evaluation andadaptation. In Proceedings of the 4th Augmented Human InternationalConference, AH ’13, pages 138–141, New York, NY, USA, 2013. ACM.
[205] D. R. Olson. Intelligence and literacy: The relationships between intelli-gence and the technologies of representation and communication. Practicalintelligence, pages 338–360, 1986.
[206] A. Oulasvirta, T. Rattenbury, L. Ma, and E. Raita. Habits make smartphoneuse more pervasive. Personal and Ubiquitous Computing, 16(1):105–114,2012.
[207] A. Oulasvirta, S. Tamminen, V. Roto, and J. Kuorelahti. Interaction in4-second bursts: The fragmented nature of attentional resources in mobilehci. In Proceedings of the SIGCHI Conference on Human Factors inComputing Systems, CHI ’05, pages 919–928, New York, NY, USA, 2005.ACM.
[208] H. E. Pashler. Attention. Psychology Press, 1998.
[209] V. Pejovic and M. Musolesi. Interruptme: Designing intelligent promptingmechanisms for pervasive applications. In Proc. UbiComp ’14. ACM,2014.
[210] T. Piazza, M. Fjeld, G. Ramos, A. Yantac, and S. Zhao. Holy smartphonesand tablets, batman!: mobile interaction’s dynamic duo. In Proceedings ofthe 11th Asia Pacific Conference on Computer Human Interaction, pages63–72. ACM, 2013.
[211] M. Pielot. Large-scale evaluation of call availability prediction. In Proc.UbiComp ’14, 2014.
[212] M. Pielot, K. Church, and R. de Oliveira. An in-situ study of mobile phonenotifications. In Proc. MobileHCI ’14, 2014.
[213] M. Pielot, R. de Oliveira, H. Kwak, and N. Oliver. Didn’t you see mymessage? predicting attentiveness to mobile instant messages. In Proc.CHI ’14. ACM, 2014.

BIBLIOGRAPHY 237
[214] M. Pielot, T. Dingler, J. S. Pedro, and N. Oliver. When attention is notscarce - detecting boredom from mobile phone usage. In Proceedings ofthe 2015 ACM International Joint Conference on Pervasive and UbiquitousComputing, UbiComp ’15, pages 825–836, New York, NY, USA, 2015.ACM.
[215] M. Pielot, H. Kwak, R. de Oliveira, and N. Oliver. Didn’t you see mymessage? predicting attentiveness in mobile instant messaging. In Proc.CHI ’14, 2014.
[216] B. Poppinga, W. Heuten, and S. Boll. Sensor-based identification ofopportune moments for triggering notifications. Pervasive Computing,13:22–29, 2014.
[217] M. C. Potter and E. I. Levy. Recognition memory for a rapid sequence ofpictures. Journal of experimental psychology, 81(1):10, 1969.
[218] E. Pronin, E. Jacobs, and D. M. Wegner. Psychological effects of thoughtacceleration. Emotion, 8(5):597, 2008.
[219] Z. W. Pylyshyn and R. W. Storm. Tracking multiple independent targets:Evidence for a parallel tracking mechanism. Spatial vision, 3(3):179–197,1988.
[220] E. Quinn and I. S. P. Nation. Speed reading: A course for learners ofEnglish. Oxford University Press, 1974.
[221] N. Ravi, N. Dandekar, P. Mysore, and M. L. Littman. Activity recognitionfrom accelerometer data. In AAAI, volume 5, pages 1541–1546, 2005.
[222] J. E. Raymond, K. L. Shapiro, and K. M. Arnell. Temporary suppressionof visual processing in an rsvp task: An attentional blink? Journal ofExperimental Psychology: Human perception and performance, 18(3):849,1992.
[223] K. Rayner. Eye movements in reading and information processing: 20years of research. Psychological bulletin, 124(3):372, 1998.
[224] K. Rayner, E. R. Schotter, M. E. Masson, M. C. Potter, and R. Treiman. Somuch to read, so little time how do we read, and can speed reading help?Psychological Science in the Public Interest, 17(1):4–34, 2016.
[225] J. Read. Assessing vocabulary. Cambridge university press Cambridge,2000.
238 BIBLIOGRAPHY
[226] J. L. Redondoio Garcia, L. De Vocht, R. Troncy, E. Mannens, and R. Van deWalle. Describing and contextualizing events in tv news show. In Proceed-ings of the 23rd International Conference on World Wide Web, WWW ’14Companion, pages 759–764, New York, NY, USA, 2014. ACM.
[227] E. D. Reichle, K. Rayner, and A. Pollatsek. The ez reader model of eye-movement control in reading: Comparisons to other models. Behavioraland brain sciences, 26(04):445–476, 2003.
[228] R. Revlin. Cognition: Theory and practice. Palgrave Macmillan, 2012.
[229] S. Robertson, C. Wharton, C. Ashworth, and M. Franzke. Dual deviceuser interface design: Pdas and interactive television. In Proceedings ofthe SIGCHI Conference on Human Factors in Computing Systems, CHI’96, pages 79–86, New York, NY, USA, 1996. ACM.
[230] S. Rosenthal, A. K. Dey, and M. Veloso. Using decision-theoretic experi-ence sampling to build personalized mobile phone interruption models. InProc. Pervasive ’11. Springer-Verlag, 2011.
[231] A. Sahami Shirazi, N. Henze, T. Dingler, K. Kunze, and A. Schmidt.Upright or sideways?: Analysis of smartphone postures in the wild. InProceedings of the 15th international conference on Human-computerinteraction with mobile devices and services, pages 362–371. ACM, 2013.
[232] A. Sahami Shirazi, N. Henze, T. Dingler, M. Pielot, D. Weber, andA. Schmidt. Large-scale assessment of mobile notifications. In Pro-ceedings of the SIGCHI Conference on Human Factors in ComputingSystems, CHI ’14, pages 3055–3064, New York, NY, USA, 2014. ACM.
[233] S. Sanchez, T. Dingler, H. Gu, and K. Kunze. Embodied reading: Amultisensory experience. In Proceedings of the 2016 CHI ConferenceExtended Abstracts on Human Factors in Computing Systems, CHI EA ’16,pages 1459–1466, New York, NY, USA, 2016. ACM.
[234] D. L. Schacter. The seven sins of memory: insights from psychology andcognitive neuroscience. American psychologist, 54(3):182, 1999.
[235] W. B. Schaufeli, M. Salanova, V. Gonzalez-Roma, and A. B. Bakker. Themeasurement of engagement and burnout: A two sample confirmatoryfactor analytic approach. Journal of Happiness studies, 3(1):71–92, 2002.
[236] B. Schildbach and E. Rukzio. Investigating selection and reading perfor-mance on a mobile phone while walking. In Proc. of MobileHCI ’10, pages93–102, New York, NY, USA, 2010. ACM.
BIBLIOGRAPHY 239
[237] R. Schleicher, N. Galley, S. Briest, and L. Galley. Blinks and saccades asindicators of fatigue in sleepiness warnings: looking tired? Ergonomics,51(7):982–1010, 2008.
[238] A. Schmidt. Ubiquitous computing-computing in context. PhD thesis,Lancaster University, 2003.
[239] A. Schmidt, M. Beigl, and H.-W. Gellersen. There is more to context thanlocation. Computers & Graphics, 23(6):893 – 901, 1999.
[240] S. Schneegass, B. Pfleging, T. Dingler, and A. Schmidt. Interaction spaces:Interactive spatial areas to control smart environments. In Mensch &Computer, pages 333–336, 2013.
[241] E. R. Schotter, R. Tran, and K. Rayner. Don’t believe what you read(only once) comprehension is supported by regressions during reading.Psychological science, page 0956797614531148, 2014.
[242] A. Sellen, Y. Rogers, R. Harper, and T. Rodden. Reflecting human valuesin the digital age. Communications of the ACM, 52(3):58–66, 2009.
[243] G. D. M. Serugendo, A. A. V. Castro, D. Konstantas, L. Liang, D. Zheng-yu, G. Thyagaraju, U. P. Kulkarni, A. R. Yardi, G. H. Canepa, A. J. Molina,et al. Activity-based computing. IEEE Pervasive Computing, 7(2):58–61,2008.
[244] W. Shen, J. Wang, and J. Han. Entity linking with a knowledge base:Issues, techniques, and solutions. Knowledge and Data Engineering, IEEETransactions on, 27(2):443–460, 2015.
[245] A. Smith and J. L. Boyles. The rise of the ”connected viewer”. PewInternet & American Life Project, 2012.
[246] E. Solberg, K. Berglund, O. Engen, O. Ekeberg, and M. Loeb. The effectof meditation on shooting performance. British journal of sports medicine,30(4):342–346, 1996.
[247] C. Speier, J. S. Valacich, and I. Vessey. The influence of task interruption onindividual decision making: An information overload perspective. DecisionSciences, 30(2):337–360, 1999.
[248] R. Spence. Rapid, serial and visual: a presentation technique with potential.Information visualization, 1(1):13–19, 2002.

240 BIBLIOGRAPHY
[249] L. R. Squire. Declarative and nondeclarative memory: Multiple brain sys-tems supporting learning and memory. Journal of cognitive neuroscience,4(3):232–243, 1992.
[250] K. E. Stanovich and A. E. Cunningham. What reading does for the mind.Journal of Direct Instructions, 1(2):137–149, 2001.
[251] E. Stuyven, K. Van der Goten, A. Vandierendonck, K. Claeys, andL. Crevits. The effect of cognitive load on saccadic eye movements.Acta psychologica, 104(1):69–85, 2000.
[252] A. Trusty and K. N. Truong. Augmenting the web for second languagevocabulary learning. In Proceedings of the SIGCHI Conference on HumanFactors in Computing Systems, CHI ’11, pages 3179–3188, New York, NY,USA, 2011. ACM.
[253] E. Tulving. Episodic and semantic memory 1. Organization of Memory.London: Academic, 381(4), 1972.
[254] T. Tuomi, C. L. Nagorny, P. Singh, H. Bennet, Q. Yu, I. Alenkvist, B. Iso-maa, B. Ostman, J. Soderstrom, A.-K. Pesonen, et al. Increased melatoninsignaling is a risk factor for type 2 diabetes. Cell metabolism, 2016.
[255] W. R. Uttal and P. Smith. Recognition of alphabetic characters duringvoluntary eye movements. Perception & Psychophysics, 3(4):257–264,1968.
[256] K. Vadas, N. Patel, K. Lyons, T. Starner, and J. Jacko. Reading on-the-go:a comparison of audio and hand-held displays. In Proceedings of the8th conference on Human-computer interaction with mobile devices andservices, pages 219–226. ACM, 2006.
[257] A. Van Cauwenberge, G. Schaap, and R. Van Roy. “tv no longer commandsour full attention”: Effects of second-screen viewing and task relevance oncognitive load and learning from news. Computers in Human Behavior,38:100–109, 2014.
[258] G. van Daalen, T. M. Willemsen, K. Sanders, and M. J. van Veldhoven.Emotional exhaustion and mental health problems among employees doing”people work”: The impact of job demands, job resources and family-to-work conflict. International archives of occupational and environmentalhealth, 82(3):291–303, 2009.

BIBLIOGRAPHY 241
[259] H. P. Van Dongen and D. F. Dinges. Circadian rhythms in fatigue, alertness,and performance. Principles and practice of sleep medicine, 20:391–9,2000.
[260] V. N. Vapnik. The Nature of Statistical Learning Theory. Springer-VerlagNew York, Inc., New York, NY, USA, 1995.
[261] B. M. Velichkovsky and J. P. Hansen. New technological windows intomind: There is more in eyes and brains for human-computer interaction.In Proceedings of the SIGCHI conference on Human factors in computingsystems, pages 496–503. ACM, 1996.
[262] M. Virvou and E. Alepis. Mobile educational features in authoring toolsfor personalised tutoring. Computers & Education, 44(1):53–68, 2005.
[263] S. J. Vodanovich. On the possible benefits of boredom: A neglected areain personality research. Psychology and Education: An InterdisciplinaryJournal, 2003.
[264] B. N. Walker, J. Lindsay, A. Nance, Y. Nakano, D. K. Palladino, T. Din-gler, and M. Jeon. Spearcons (speech-based earcons) improve navigationperformance in advanced auditory menus. Human Factors: The Journal ofthe Human Factors and Ergonomics Society, 55(1):157–182, 2013.
[265] R. Want, A. Hopper, V. Falcao, and J. Gibbons. The active badge locationsystem. ACM Transactions on Information Systems (TOIS), 10(1):91–102,1992.
[266] S. Webb. The effects of repetition on vocabulary knowledge. Appliedlinguistics, 28(1):46–65, 2007.
[267] D. Weber, A. Voit, T. Dingler, M. Kallert, and N. Henze. Assessment of anunobtrusive persuasive system for behavior change in home environments.In Proceedings of the 5th ACM International Symposium on PervasiveDisplays, PerDis ’16, pages 245–246, New York, NY, USA, 2016. ACM.
[268] M. Weiser. The computer for the 21st century. Scientific american,265(3):94–104, 1991.
[269] M. Weiser and J. S. Brown. The coming age of calm technology. In Beyondcalculation, pages 75–85. Springer, 1997.
[270] E. Weissinger, L. L. Caldwell, and D. L. Bandalos. Relation between intrin-sic motivation and boredom in leisure time. Leisure Sciences, 14(4):317–325, 1992.

242 BIBLIOGRAPHY
[271] K. Westhoff and C. Hagemeister. Konzentrationsdiagnostik. PabstLengerich, 2005.
[272] R. A. Wever. The circadian system of man: results of experiments undertemporal isolation. Springer Science & Business Media, 2013.
[273] C. D. Wickens. Processing resources and attention. Multiple-task perfor-mance, 1991:3–34, 1991.
[274] J. William. Principles of psychology. Hardpress Limited, 2013.
[275] A. L. Wilson. The promise of situated cognition. New directions for adultand continuing education, 1993(57):71–79, 1993.
[276] T. D. Wilson, D. A. Reinhard, E. C. Westgate, D. T. Gilbert, N. Ellerbeck,C. Hahn, C. L. Brown, and A. Shaked. Just think: The challenges of thedisengaged mind. Science, 345(6192):75–77, 2014.
[277] K. Wolf, Y. Abdelrahman, D. Schmid, T. Dingler, and A. Schmidt. Effectsof camera position and media type on lifelogging images. In Proceedings ofthe 14th International Conference on Mobile and Ubiquitous Multimedia,MUM ’15, pages 234–244, New York, NY, USA, 2015. ACM.
[278] K. Wolf, S. Schneegass, N. Henze, D. Weber, V. Schwind, P. Knierim,S. Mayer, T. Dingler, Y. Abdelrahman, T. Kubitza, M. Funk, A. Mebus,and A. Schmidt. Tuis in the large: Using paper tangibles with mobiledevices. In Proceedings of the 33rd Annual ACM Conference ExtendedAbstracts on Human Factors in Computing Systems, CHI EA ’15, pages1579–1584, New York, NY, USA, 2015. ACM.
[279] W. Wood and D. T. Neal. A new look at habits and the habit-goal interface.Psychological review, 114(4):843, 2007.
[280] H.-Y. Wu, M. Rubinstein, E. Shih, J. V. Guttag, F. Durand, and W. T.Freeman. Eulerian video magnification for revealing subtle changes in theworld. 2012.
[281] S. Yoon, S.-s. Lee, J.-m. Lee, and K. Lee. Understanding notification stressof smartphone messenger app. In Proceedings of the extended abstracts ofthe 32nd annual ACM conference on Human factors in computing systems- CHI EA ’14, CHI EA ’14, pages 1735–1740, New York, NY, USA, 2014.ACM.

VIAPPENDIX


Additional User StudyDocuments
• Consent form used for the controlled QuickLearn study (Section 6.2).
• An example RECALL Ethics Worksheet for the controlled QuickLearnstudy (Section 6.2) following the ethics process [170], which we appliedfor all user studies under RECALL.
• Consecutive screenshots of the kinetic stimulus as it was used in our userstudy(Section 7.2).

Study:QuickLearnParticipantID:________
InformedConsentThankyouforyourparticipationinourstudy.Pleasereadthefollowinginformationcarefully.AcopyisavailablethroughtheQuickSpanishapplicationforfuturereference.Experiment:PromotingLanguage-LearningThroughSmartphoneApplicationIdentifyingopportunemomentsforlanguagelearning.Description:Volunteeringinthistwo-weekuserstudyinvolvesusingalanguagelearningapplicationonyourAndroidsmartphone.Thestudyisdedicatedtounderstandingoptimalmomentsanddifferentinterfacedesignsforlanguageacquisition.Forthetwo-weekdurationofthestudy,variousaspectsofyourphoneusageisbeingprocessed.Weguaranteethatyourdatawillbestoredsecurelyandanonymously.Participationiscompletelyvoluntaryandyouarefreetodropoutofthisstudyatanypointintime.Compensation:Youwillbecompensatedwith5€ateachofthethreevisitsduringthestudy.Anadditional5€willbegivenatthefinalvisitifyouattendallthreesessionsresultinginatotalof20€.Experimenters:TilmanDingler,UniversitätStuttgart,[email protected],UniversityofWashington,[email protected],UniversityofMinnesota,cooperj@umn.eduPleasedonothesitatetocontactusifyouhavequestionsorconcerns.Thanks!
246 Additional Documents

Study:QuickLearnParticipantID:________
Consent Form
❏ I have read and understood the information above. ❏ I have understood the purpose of this study and I agree to participate. ❏ I have understood that I can cancel my participation at any point in time.
Participant ID ________________________ (filled in by the experimenter)
Signatures
Participant __________________________ Date ______________
Experimenter __________________________ Date ______________
Additional Documents 247

RECALL Feb2015 EthicsWorksheet
RECALLEthicsWorksheetThisworksheetdocumentsaparticularexperimentwithinRECALLthat iscoveredbyoneormoreStudyProcessTemplates(SPTs).Itisusedfordocumentationpurposesandformspartofthecorrespondingdeliverableinwhichthisexperimenttookplace.IthelpsresearcherswithinRECALLtoensurethatallpersonalinformationcollectedandprocessedinRECALListreatedinaccordancewiththeproject’sethicalguidelinesandthefeedbackfromitsethicaladvisoryboard(EAB).
StudyInformation
4.1 StudyTitleGiveaconcisetitletoyourstudythatdescribestheparticularproblemyouareinvestigatinginyourexperimentand/orfieldstudy.
DetectingOpportuneMomentsofLearningthroughLanguageAcquisitionApplication
4.1 BriefDescriptionDescribeyourexperimentinafewsentences(nomorethan3-4sentences).Thedescriptionshouldincludetheproblemyouaretryingtoaddressandthemethodsyouareplanningtouse.
Weinvestigatewhetherapreviouslyestablishedboredomdetectionalgorithmcanbeleveragedtopromoteproductivityonsmartphones(e.g.,languagelearning)duringperiodsofpredictedboredom.Additionalphoneusagewillbeloggedtodeterminewhetherfactorsoutsideofboredomleadtoopportunemomentsoflearning.Usersoftheappwillbeaskedtoengageinalanguage-learningtaskthatteachesforeignlanguagewordsintwomethods;flashcardsandmultiple-choice.Wewillmeasurethenumberofwordsthatuserslearnatthecloseofeachweekduringacontrolledtwo-weekstudyandadditionallyreleasetheapponGooglePlayforabroaderaudience.
4.2 PlannedDurationHowlong(start,finish,duration)doyouplantoruntheseexperimentsand/orfieldstudiesfor?
10.09.15–Sep.’16
4.3 WorkPackageWhatRECALLworkpackage(s)doesthisworkfallin?
WP2,WP4,WP5
ProjectStaff
4.4 PrincipleResearcher,InstitutionWhoaretheprincipleresearchersresponsibleforthisexperiment/study(incl.institution)?
248 Additional Documents

RECALL Feb2015 EthicsWorksheet
TilmanDingler(UniversityofStuttgart)
4.5 OtherStaff(ProjectMembers)Nameallpersonnelinvolvedinthissetofexperiments/fieldstudies.Thismayalsoincludeprojectmembersfromotherinstitutions,
DominikWeber(UniversityofStuttgart)NielsHenze(UniversityofStuttgart)
4.6 ExternalStaffNameallpersonnelinvolvedinthissetofexperiments/fieldstudies.Thismayalsoincludeprojectmembersfromotherinstitutions,aswellasexternalresearchers.
Chun-ChengChang(UniversityofWashington)JenniferCooper(UniversityofMinnesota)
AimsandMethods
4.7 GoalsandResearchQuestionsWhatarethegoalsofthisresearcheffort?Whatresearchquestionsdoyouhopetobeabletoanswerwiththissetofexperiments?Pleasebeasspecificaspossible.
Thegoalofthestudyistoevaluatethevocablearninggainsmadeineachofthelanguagelearningapplicationdeliverymethods(i.e.,flashcard,multiplechoice)duringdifferenttimingconditions(i.e.,boredomdetection,random).Theadditionalconditionofuser-initiatedusagewillbecomparedtoanexistingboredomdetectionalgorithminanattempttouncoveradditionalmeasuresofopportunemomentsformicrolearningbasedonwhentheuserchoosestoengageinthelanguage-learningapplication.Wehopetoanswerthequestionofwhetherperiodsofboredomleadtolearningopportunitiesorifthereareotherconditionsthatleadtotheseopportunities.Thesequestionswillbeansweredintwoways,onebypushingnotificationstousersduringperiodsofpredictedboredom,wecanseewhethertheyparticipateinlearningathigherratethanduringotherrandomtimes;andtwo,logdatafromphoneusageshouldrevealpatternsthatwilldictatethebesttimestoprovideopportunitiesforproductivityfortheuser.
4.8 EnvisionedMethods(PlannedExperimentsandStudies)Describethesetofexperimentsand/orfieldstudiesthatyouareplanningtoconductwithinthescopeofthisresearcheffort.Ifthereisanordertotheexperiments,enumeratetheminorder.Otherwiselistthemasbulletpointsinnoparticularorder.Beasspecificaspossible(e.g.insteadof“interviews”write“onlineinterviewsthroughSurveyMonkey”or“Studentfocusgroupsoncampus”…
Additional Documents 249

RECALL Feb2015 EthicsWorksheet
System-Initiated:Repeated-measuresdesign,whereeachstudentwillbeexposedtoeachofthefourindependentvariables:1)Boredom-detected:flashcard2)Boredom-detected:multiple-choice3)Random:flashcard4)Random:multiple-choiceUser-initiated:Correlationalanalyseswillbeconductedandtheresultswillcontributetothe“groundtruth”foropportunemomentsoflearning.
4.9 StudyTypeandIDSelectthetypeofstudyandifappropriateenterareferencetotheguidelinesused.IftheexperimentdoesnotfitintooneoftheexistingRECALLcategoriesselect“Other”andcontactthecoordinatorinordertoverifyifadditionalEABinputisneeded.
DocumentID:Clickheretoentertext.(seeRECALLWiki)
LifeloggingExperiment(seeguidelines) ControlledVolunteerStudies(seeguidelines) PublicTrials(seeguidelines) Others(describeandcontactcoordinatorincaseadditionalethicsadvicereq.):
Clickheretoentertext.
4.10 AdequacyofMethodsBrieflyexplainwhytheexperimentalmethodsindicatedaboveareadequatefortheresearchquestions
-AControlledstudybecausewewanttomanipulatecertainvariableswhilesimultaneouslymeasuringthelearninggainsduringspecifiedtimeperiods-Anin-the-wildstudytocollectfeedbackfromabroaderuserbasenecessarytotrainanewmachine-learningalgorithmforclassifyingopportunemomentsforlearning
4.11 SubjectsandRecruitmentProcess(ifany)Whoarethesubjectsofyourresearch,andhowareyouplanningtorecruitthem?Beasspecificaspossible.Notethatyoumightnotrequirerecruitmentifyouaresimplyplanningobservationsinpublic.
-TheexperimenterspersonallyrecruitsubjectsandreleasetheapponGooglePlay
250 Additional Documents

RECALL Feb2015 EthicsWorksheet
4.12 DatatobeCollectedWhatinformationareyoucollectinginyourexperiments?Trytobeasinclusiveandspecificaspossible,listingallpotentialdatatypesthatyoumightbeinterestedincollecting.Ifyouarenotcollectingidentifiableinformationfromyoursubjects,statethishere,butstilllistthe(anonymous)datathatyouareplanningtocollect.
-Quizscores-Generallogdatafromcellphone-Subjectivefeelings(survey/interview)-Demographics
RisksandPrecautions
4.13 PotentialRisksTrytoenvisiontherisksthatyourdatacollectionmightposetoyourdatasubjects.WhatifthedatayoucollectedwouldwindupontheInternet,togetherwithyoursubjects’realnameandcontactinfo?Couldtheysufferproblemsatworkiftheiremployerswouldfindthisinformation?Whatifhackerswouldbeabletobreakintoyoursystemandstealyourdatacollection?Wouldtheybeabletocommitcriminalactswiththisinformation?
-Limitedriskforparticipantssincewegathermostlyuncriticaldata-Datacollectionisanonymized
4.14 PlannedPrecautionsGiventherisksyouidentifiedinquestion4.13,whatprecautionswillbetakenbyyouandyourteaminordertopreventdataleakage?Trytobeasspecificaspossible.Youcanalsorefertoyourdescriptionofdatastorageinthenextsection.
-Anonymizeddatacollection.-Doubleconsentform:1)in-personconsent,2)in-appconsent
Additional Documents 251

RECALL Feb2015 EthicsWorksheet
DataStorageandProcessing
4.15 StorageLocationsDescribewhereeachofthedataenumeratedunder3.6willbestored.Alsoconsiderpotentialbackupprocesses.
-Localfileservers-Regularbackups
4.16 AccessControlExplainhowaccesstothedataisregulated.Trytobeasspecificaspossible.UsetheRECALLGuidetoSecureStorageDocumentforguidance,butmakesuretodescribeyouractualimplementationoftheseguidelineshere.
-Onlyresearchersdirectlyinvolvedintheprojecthaveaccesstodata
4.17 DataProcessingDescribehowthecollecteddatawillbeused.Whatkindofstatisticswillbeassembled,whatkindofqualitativeinformationextracted,whatkindofinformationcombined?
-Classicdataevaluationofqualitativekeyperformanceindicators.
4.18 DataAnonymizationIfsomeorallofyourdatawillbeanonymizedorpseudonymized,explainhowyoudothis.Whatalgorithmswillbeusedfortheanonymization,andwhatguaranteesdotheyoffer?Howarepseudonymousidentifiersgeneratedandwhereislookupinformation(ifany)forthosepseundonymizerskept?
-eachparticipantisassignedananonymizedhashnumber(Detailssee:http://tilmanification.org/quicklearn.html)
4.19 DataRetentionHowlongwillyoukeeppersonallyidentifiableinformation(PII)?
NoPIIwillbekept 6monthsafterstudyfinishes
6monthsafterresultshavebeenfirstpublished* 6monthsafterRECALLfinishes
Others(describe):Clickheretoentertext.*Orwithin6monthsafterRECALLfinishes,ifresultsarenotpublisheduntilendoftheproject
252 Additional Documents

RECALL Feb2015 EthicsWorksheet
EthicalChecklistUsethechecklistbelowforaquickoverviewoftheethicalissuesinyourplannedexperiment.
Aspect Yes No 1. InformedConsentFormNeeded?
Ifyes,attach.Ifno,justifyonattachedsheet.
2. DeceptionUsed?Ifyes,justifyonattachedsheet.
3. PrivateInformationcollected?(c.f.to4.13.forlistofdataitems)
4. SubjectsRemunerated?Ifyes,writeamounthere:
5. InvolvementofChildren,Patients,PeoplewithCognitiveDisorders?Ifyouansweryestothisquestion,youmustexplicitlyconsultwiththeEAB!
6. InternalIRBReviewNeeded?Ifyes,attachfeedbackafterobtained
WorksheetVersioningProvidedate,authorship,andchangesmadetothisspecificworksheetinthehistorytablebelow.
Date Author Comment 12.07.15 JenniferCooper v0.1 14.07.15 TilmanDingler v0.2 10.09.15 TilmanDingler v.0.3
Additional Documents 253

RECALL February 6th 2014 B3. Ethical Issues
ETHICAL ISSUES TABLE
YES PAGE
Informed Consent
1. Does the proposal involve children? NO
2. Does the proposal involve patients? NO
3. Does the proposal involve persons not able to give consent? NO
4. Does the proposal involve adult healthy volunteers? YES
Biological research
5. Does the proposal involve Human Genetic Material? NO
6. Does the proposal involve Human biological samples? NO
7. Does the proposal involve Human biological data collection? NO
8. Does the proposal involve Human Embryos? NO
9. Does the proposal involve Human Foetal Tissue or Cells? NO
10. Does the proposal involve Human Embryonic Stem Cells? NO
Privacy
11. Does the proposal involve processing of genetic information or personal data (e.g. health, sexual lifestyle, ethnicity, political opinion, religious or philosophical conviction)
NO
12. Does the proposal involve tracking the location or observation of people without their knowledge?
NO
Research on Animals
13. Does the proposal involve research on animals? NO
14. Are those animals transgenic small laboratory animals? NO
15. Are those animals transgenic farm animals? NO
16. Are those animals cloned farm animals? NO
17. Are those animals non-human primates? NO
Research Involving Developing Countries
18. Is any part of the research carried out in countries outside of the European Union and FP7 Associated states?
NO
Dual Use
19. Does the research have direct military application NO
20. Does the research have the potential for terrorist abuse NO
ICT Implants
21. Does the proposal involve clinical trials of ICT implants? NO
(IF NONE) I CONFIRM THAT NONE OF THE ABOVE ISSUES APPLY TO MY PROPOSAL
254 Additional Documents
Additional Documents 255