
COAL-BASED POWER NORMS - Centre for Science and ...
120
COAL-BASED POWER NORMS WHERE DO WE STAND TODAY? A CSE Report
-
Upload
khangminh22 -
Category
Documents
-
view
1 -
download
0
Transcript of COAL-BASED POWER NORMS - Centre for Science and ...
COAL-BASEDPOWERNORMS
WHERE DO WE STAND TODAY?
A CSE Report

Writers: Soundaram Ramanathan, Sugandha Arora and Vinay Trivedi
Editor: Souparno Banerjee
Design: Ajit Bajaj
Layouts: Kirpal Singh, Vijayendra Pratap Singh
Production: Rakesh Shrivastava, Gundhar Das
© 2020 Centre for Science and Environment
Material from this publication can be used, but with acknowledgement.
Maps in this report are indicative and not to scale.
Citation: Soundaram Ramanathan, Sugandha Arora and Vinay Trivedi, 2020, ‘Coal-Based Power Norms: Where do we stand today’, Centre for Science and Environment, New Delhi
Published byCentre for Science and Environment41, Tughlakabad Institutional AreaNew Delhi 110 062Phone: +91-11-40616000Fax: 91-11-29955879E-mail: [email protected] Website: www.cseindia.org
For private circulation only
Shakti Sustainable Energy Foundation (Shakti) seeks to facilitate India’s transition to a sustainable energy future by aiding the design and implementation of policies in the following sectors: clean power, energy efficiency, sustainable urban transport, climate policy and clean energy finance.
The views/analysis expressed in this report/document do not necessarily reflect the views of Shakti Sustainable Energy Foundation. The Foundation also does not guarantee the accuracy of any data included in this publication nor does it accept any responsibility for the consequences of its use.
A CSE Report
COAL-BASEDPOWERNORMS
WHERE DO WE STAND TODAY?
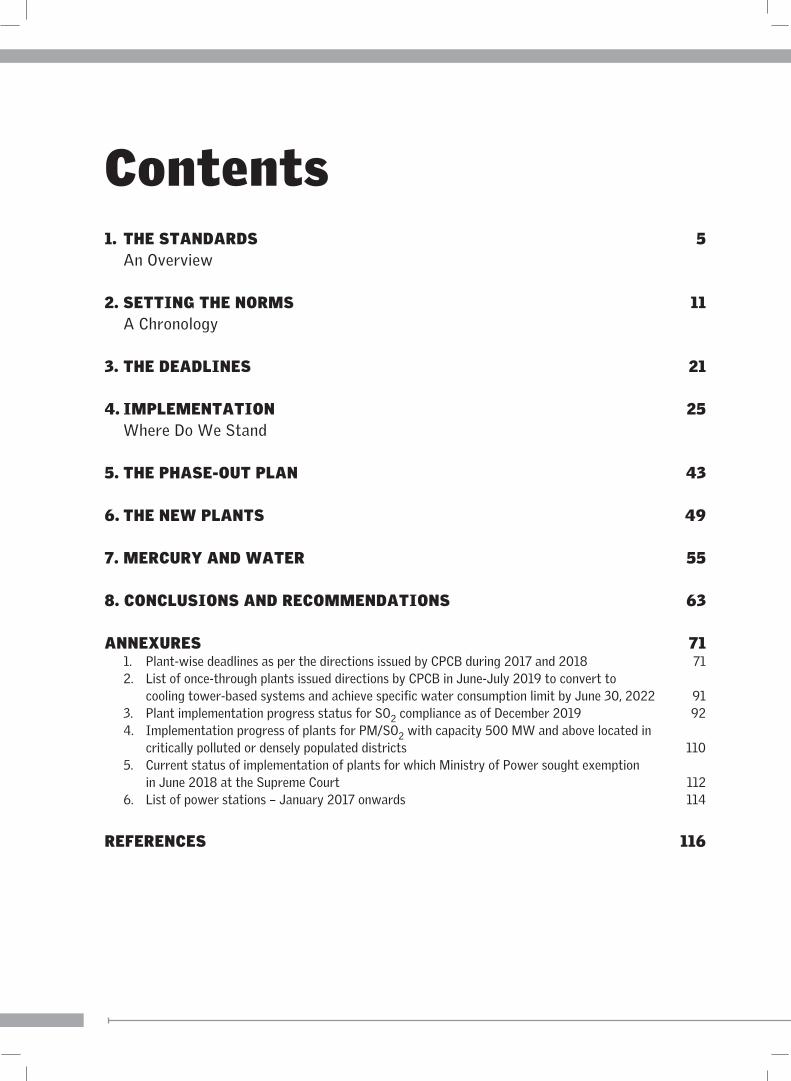
Contents 1. THE STANDARDS 5 An Overview
2. SETTING THE NORMS 11 A Chronology
3. THE DEADLINES 21
4. IMPLEMENTATION 25 Where Do We Stand
5. THE PHASE-OUT PLAN 43
6. THE NEW PLANTS 49
7. MERCURY AND WATER 55
8. CONCLUSIONS AND RECOMMENDATIONS 63
ANNEXURES 71 1. Plant-wise deadlines as per the directions issued by CPCB during 2017 and 2018 71 2. List of once-through plants issued directions by CPCB in June-July 2019 to convert to cooling tower-based systems and achieve specific water consumption limit by June 30, 2022 91 3. Plant implementation progress status for SO2 compliance as of December 2019 92 4. Implementation progress of plants for PM/SO2 with capacity 500 MW and above located in critically polluted or densely populated districts 110 5. Current status of implementation of plants for which Ministry of Power sought exemption in June 2018 at the Supreme Court 112 6. List of power stations – January 2017 onwards 114
REFERENCES 116
5
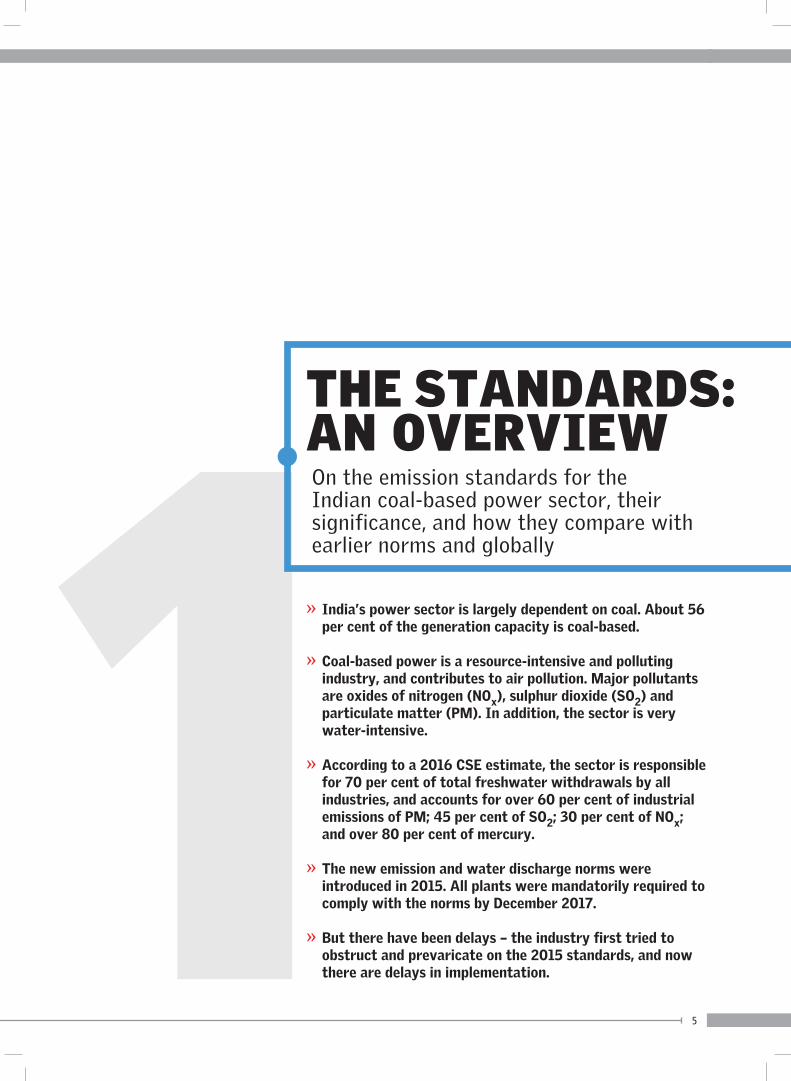
1» India’s power sector is largely dependent on coal. About 56 per cent of the generation capacity is coal-based.
» Coal-based power is a resource-intensive and polluting industry, and contributes to air pollution. Major pollutants are oxides of nitrogen (NOx), sulphur dioxide (SO2) and particulate matter (PM). In addition, the sector is very water-intensive.
» According to a 2016 CSE estimate, the sector is responsible for 70 per cent of total freshwater withdrawals by all industries, and accounts for over 60 per cent of industrial emissions of PM; 45 per cent of SO2; 30 per cent of NOx; and over 80 per cent of mercury.
» The new emission and water discharge norms were introduced in 2015. All plants were mandatorily required to comply with the norms by December 2017.
» But there have been delays – the industry first tried to obstruct and prevaricate on the 2015 standards, and now there are delays in implementation.
THE STANDARDS: AN OVERVIEWOn the emission standards for the Indian coal-based power sector, their significance, and how they compare with earlier norms and globally
6
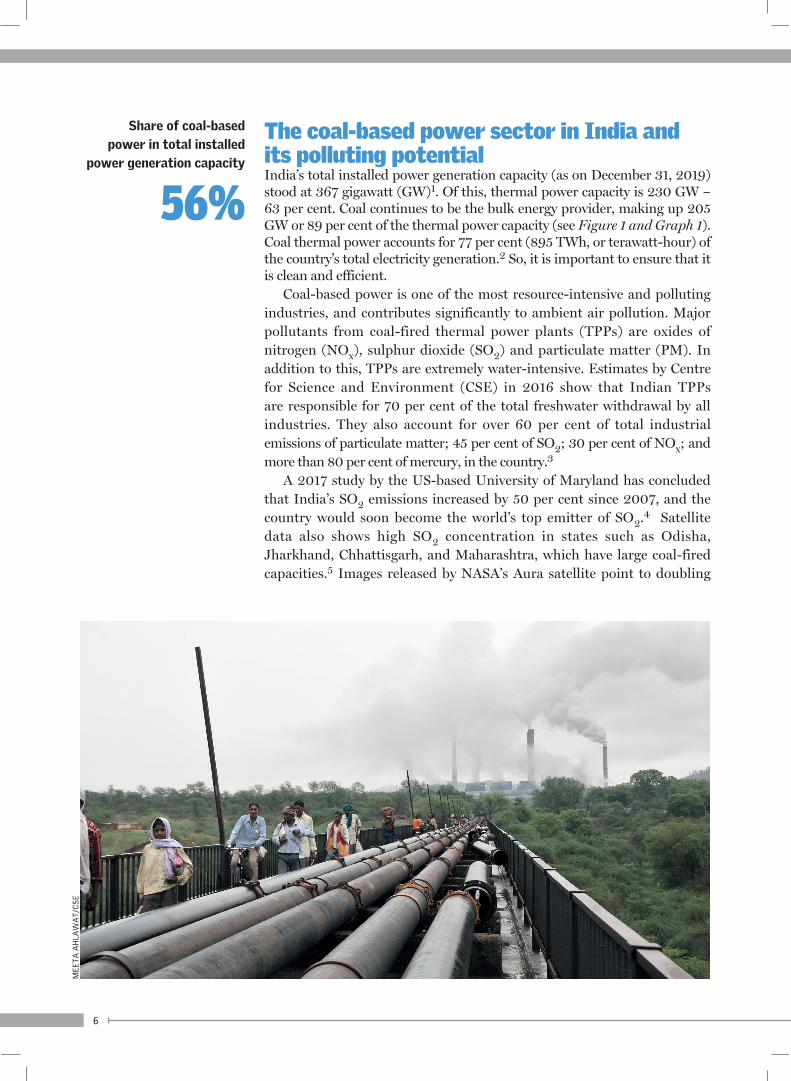
The coal-based power sector in India and its polluting potentialIndia’s total installed power generation capacity (as on December 31, 2019) stood at 367 gigawatt (GW)1. Of this, thermal power capacity is 230 GW – 63 per cent. Coal continues to be the bulk energy provider, making up 205 GW or 89 per cent of the thermal power capacity (see Figure 1 and Graph 1). Coal thermal power accounts for 77 per cent (895 TWh, or terawatt-hour) of the country’s total electricity generation.2 So, it is important to ensure that it is clean and efficient.
Coal-based power is one of the most resource-intensive and polluting industries, and contributes significantly to ambient air pollution. Major pollutants from coal-fired thermal power plants (TPPs) are oxides of nitrogen (NOx), sulphur dioxide (SO2) and particulate matter (PM). In addition to this, TPPs are extremely water-intensive. Estimates by Centre for Science and Environment (CSE) in 2016 show that Indian TPPs are responsible for 70 per cent of the total freshwater withdrawal by all industries. They also account for over 60 per cent of total industrial emissions of particulate matter; 45 per cent of SO2; 30 per cent of NOx; and more than 80 per cent of mercury, in the country.3
A 2017 study by the US-based University of Maryland has concluded that India’s SO2 emissions increased by 50 per cent since 2007, and the country would soon become the world’s top emitter of SO2.4 Satellite data also shows high SO2 concentration in states such as Odisha, Jharkhand, Chhattisgarh, and Maharashtra, which have large coal-fired capacities.5 Images released by NASA’s Aura satellite point to doubling
Share of coal-based power in total installed
power generation capacity
56%
ME
ET
A A
HLA
WA
T/C
SE
7
C O A L - B A S E D P O W E R N O R M S
of SO2 concentrations in India from 2005 to 2012.6 This scenario has arisen due to a lack of effective control measures in India.
It is clear that the sector needs urgent interventions to control pollution. Technologies to control particulate matter, sulphur dioxide and nitrogen oxide emissions are mature. They are being used across the world for a range of coal quality and operating conditions. So, even if ‘clean coal’ is an oxymoron, it is possible – given the extensive use of coal-based energy, it is vital that this source be as clean as necessary. This, even as the country moves aggressively towards using renewable sources. This is critical for curbing local pollution in cities and more importantly, in the regions where these plants are located.
Capacity, ownership and age of plantsCoal-based plants are located in 17 states, with Chhattisgarh, Maharashtra and Uttar Pradesh being the ones with the largest installed capacities. By December 2019, the private sector held the maximum share followed by state-owned plants (see Figure 2: Share of installed capacity based on ownership).
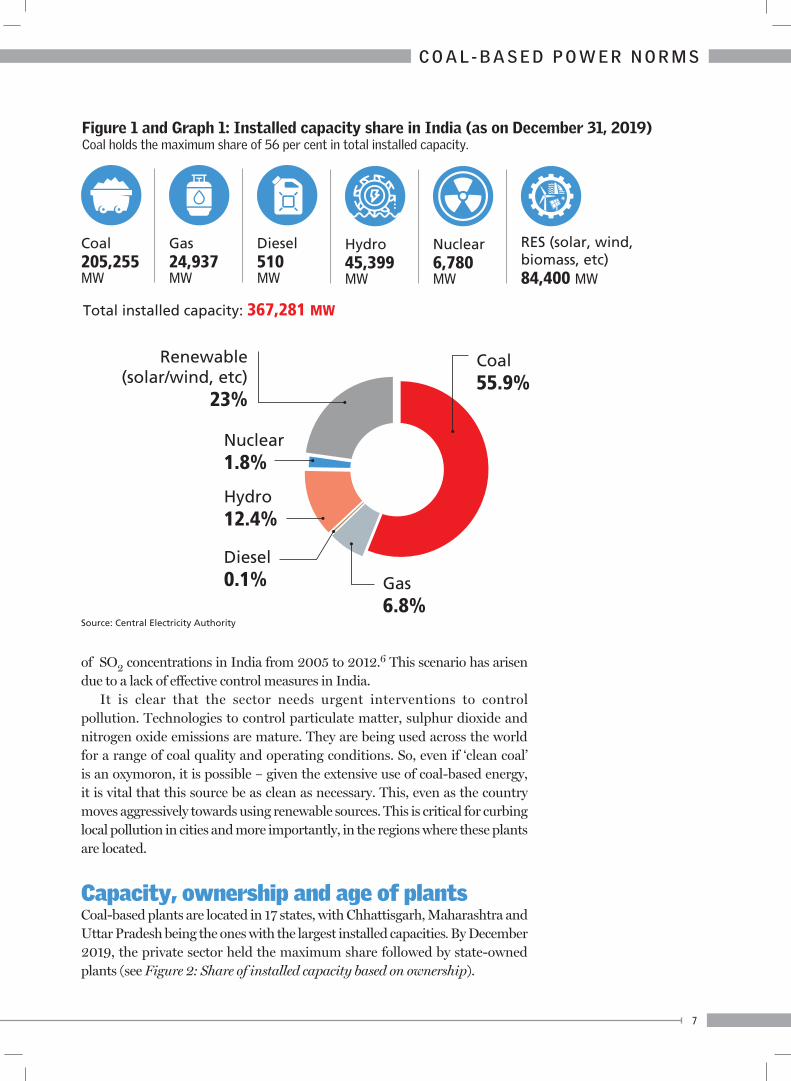
Figure 1 and Graph 1: Installed capacity share in India (as on December 31, 2019) Coal holds the maximum share of 56 per cent in total installed capacity.
Coal205,255 MW
Hydro45,399 MW
Gas24,937 MW
Nuclear6,780 MW
Diesel510 MW
RES (solar, wind, biomass, etc)84,400 MW
Total installed capacity: 367,281 MW
Renewable (solar/wind, etc)
23%
Nuclear 1.8%
Hydro 12.4%
Diesel 0.1% Gas
6.8%
Coal 55.9%
Source: Central Electricity Authority

8
Unit size
Up to 250 MW
> 250 and < 500 MW
500 MW and< 650 MW
650 MW and above
> 35
9
0
0.5
0
26-35
16.15
0
7.0
0
16-25
12.95
0.6
7
0
3-15
20.78
14.71
55.29
38.39
0-2
1.95
2.67
1.7
16.16
Total (in GW)
61
18
72
55
Age distribution in years
Source: Centre for Science and Environment’s (CSE) 2019 analysis
Table 1 and Graph 2: Capacity versus age distributionOverall, India has a relatively young fleet: around 64 per cent (132 GW) of the capacity is less than a decade old. About 73 per cent (150 GW) is less than 15 years old. About 16 per cent (33 GW) is older than 25 years. Of the 33 GW of older capacity units, a major share (about 76 per cent) belongs to small units of up to 250 MW and less.
140
120
100
80
60
40
20
0>35
1023 20.8
129.2
22
26-35 16-25 3-15 0-2
Cap
acit
y (i
n G
W)
Age distribution (in years)
The two most important parameters to decide which pollution control options are the most appropriate are age and size of the unit. Bulk of the Indian coal-based thermal power sector comprises of large and relatively new units (see Table 1 and Graphs 2-4). Decisions to make significant investments in pollution control equipment in stations that have exceeded their useful design life (+25 years) must be considered taking into account plant efficiency, cost of power production and environmental impacts.
The coming of the 2015 standardsCSE’s 2015 Green Rating Project study on the thermal power sector – Heat on Power – had highlighted the huge scope for improvement in this industry’s environmental performance. The study report recommended tightening of norms to help bring down pollution levels.8
In a long overdue action, on December 7, 2015, the Union Ministry of Environment, Forest and Climate Change (MoEF&CC) introduced stricter environmental standards for coal-based TPPs under the Environment (Protection) Act, 1986.
Till 2015, power plants in India were required to meet only the PM emission norms – this was less stringent than similar norms in China, the US and Europe. There were no national regulations for SO2, NOx and mercury emissions from power plants. Standards were specified only for the chimney height to ensure the flue gas, which is loaded with these pollutants, was dispersed. This dispersion was meant to limit incremental ambient concentration. However, increasing levels of pollution from other sources, combined with a sharp growth in thermal power generation, had made this control method inadequate.
Figure 2: Share of installed capacity based on ownership (December 2019)Of the total 205 GW of coal-based capacity, the share of the Central, state and private sectors is about 30 per cent, 32 per cent and 37 per cent, respectively.7
Central62 GW
Source: National Power Portal
State67 GW
Private76 GW
9
C O A L - B A S E D P O W E R N O R M S
6
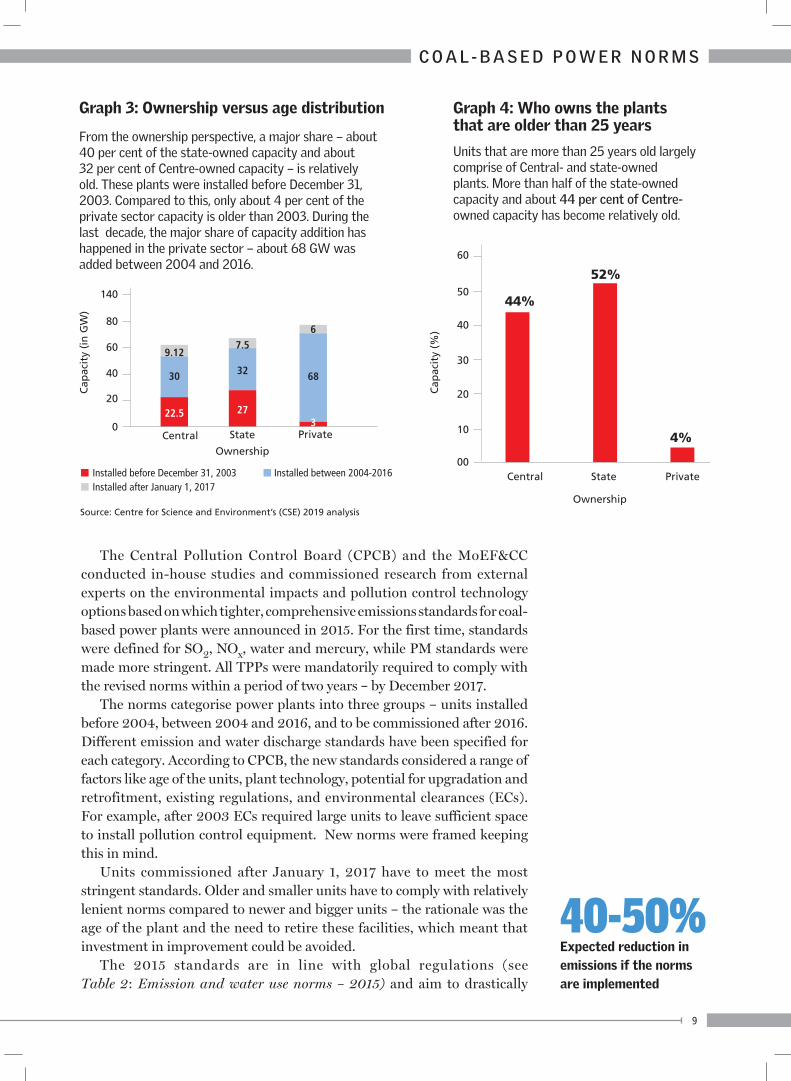
Graph 3: Ownership versus age distribution
From the ownership perspective, a major share – about 40 per cent of the state-owned capacity and about 32 per cent of Centre-owned capacity – is relatively old. These plants were installed before December 31, 2003. Compared to this, only about 4 per cent of the private sector capacity is older than 2003. During the last decade, the major share of capacity addition has happened in the private sector – about 68 GW was added between 2004 and 2016.
140
80
60
40
20
0
Cap
acit
y (i
n G
W)
Central
30
22.5
68
3State Private
7.59.12
Installed before December 31, 2003Installed after January 1, 2017
Installed between 2004-2016
32
27
Graph 4: Who owns the plants that are older than 25 years
Units that are more than 25 years old largely comprise of Central- and state-owned plants. More than half of the state-owned capacity and about 44 per cent of Centre-owned capacity has become relatively old.
Central State Private
60
50
40
30
20
10
00
Cap
acit
y (%
)
Ownership
Ownership
44%
52%
4%
Source: Centre for Science and Environment’s (CSE) 2019 analysis
The Central Pollution Control Board (CPCB) and the MoEF&CC conducted in-house studies and commissioned research from external experts on the environmental impacts and pollution control technology options based on which tighter, comprehensive emissions standards for coal-based power plants were announced in 2015. For the first time, standards were defined for SO2, NOx, water and mercury, while PM standards were made more stringent. All TPPs were mandatorily required to comply with the revised norms within a period of two years – by December 2017.
The norms categorise power plants into three groups – units installed before 2004, between 2004 and 2016, and to be commissioned after 2016. Different emission and water discharge standards have been specified for each category. According to CPCB, the new standards considered a range of factors like age of the units, plant technology, potential for upgradation and retrofitment, existing regulations, and environmental clearances (ECs). For example, after 2003 ECs required large units to leave sufficient space to install pollution control equipment. New norms were framed keeping this in mind.
Units commissioned after January 1, 2017 have to meet the most stringent standards. Older and smaller units have to comply with relatively lenient norms compared to newer and bigger units – the rationale was the age of the plant and the need to retire these facilities, which meant that investment in improvement could be avoided.
The 2015 standards are in line with global regulations (see Table 2: Emission and water use norms – 2015) and aim to drastically
40-50%Expected reduction in emissions if the norms are implemented
10
reduce emissions of PM, SO2 and NOx. In addition, they will require power plants to sharply curtail freshwater use. According to rough estimates, the implementation of these standards can cut down emission of particulate matter (PM) by 35 per cent, sulphur dioxide (SO2) by 80 per cent and nitrogen oxides (NOx) by 42 per cent.9
While the new tighter emissions regulations are a welcome step, a lot needs to be done to ensure compliance. Timelines are tight, but they were achievable when the norms were announced. Subsequent chapters discuss the progress made so far in implementing these norms.
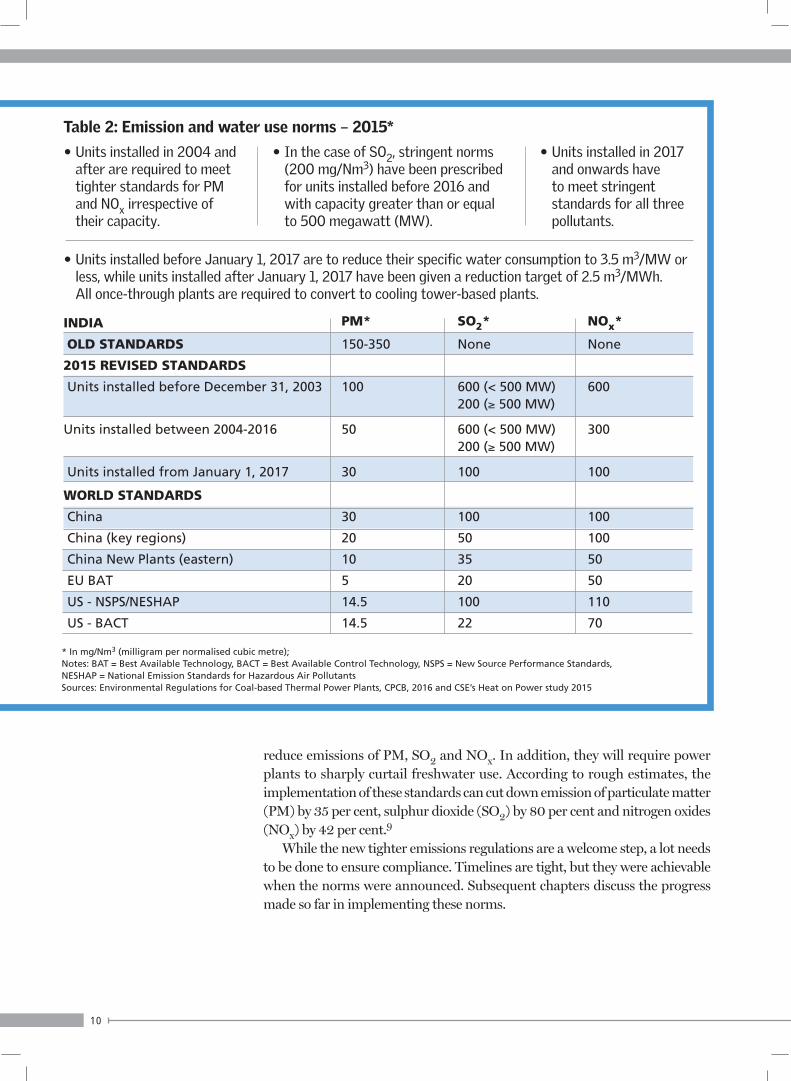
Table 2: Emission and water use norms – 2015*
• Units installed in 2004 and after are required to meet tighter standards for PM and NOx irrespective of their capacity.
• In the case of SO2, stringent norms (200 mg/Nm3) have been prescribed for units installed before 2016 and with capacity greater than or equal to 500 megawatt (MW).
• Units installed in 2017 and onwards have to meet stringent standards for all three pollutants.
• Units installed before January 1, 2017 are to reduce their specific water consumption to 3.5 m3/MW or less, while units installed after January 1, 2017 have been given a reduction target of 2.5 m3/MWh. All once-through plants are required to convert to cooling tower-based plants.
* In mg/Nm3 (milligram per normalised cubic metre); Notes: BAT = Best Available Technology, BACT = Best Available Control Technology, NSPS = New Source Performance Standards, NESHAP = National Emission Standards for Hazardous Air Pollutants Sources: Environmental Regulations for Coal-based Thermal Power Plants, CPCB, 2016 and CSE’s Heat on Power study 2015
INDIA
OLD STANDARDS
2015 REVISED STANDARDS
Units installed before December 31, 2003
Units installed between 2004-2016
Units installed from January 1, 2017
WORLD STANDARDS
China
China (key regions)
China New Plants (eastern)
EU BAT
US - NSPS/NESHAP
US - BACT
PM*
150-350
100
50
30
30
20
10
5
14.5
14.5
SO2*
None
600 (< 500 MW) 200 (≥ 500 MW)
600 (< 500 MW)200 (≥ 500 MW)
100
100
50
35
20
100
22
NOx*
None
600
300
100
100
100
50
50
110
70
11
C O A L - B A S E D P O W E R N O R M S
2SETTING THE NORMS: A CHRONOLOGYOn what transpired and when, from 2015 till the time of going to press
» 2015. CSE recommends revision of the sector’s emission norms. The environment ministry notifies new norms, and wants them implemented by 2017.
» 2017. Action plan to implement the norms submitted by Ministry of Power. 2022 agreed to as new deadline, and the Supreme Court urged to accept the plan.
» 2018. Sparring begins in Court between the Ministry of Power and EPCA, with EPCA insisting on a 2020 deadline.
» On pricing, the power ministry tags the new norms as a “change in law” event: the cost increase due to installation of pollution control technologies will be passed on to the consumer in the tariffs.
» Power plants agree in Supreme Court to comply by 2022. EPCA urges the court to direct that non-compliant plants be pushed to the bottom of the merit order despatch.
» 2018-2019: Specific water consumption standards revised.
12
February 2015: Heat on Power, CSE’s report on green rating of India’s coal-based thermal power plants (TPPs), is released.1 The report strongly recommends revision of the industry’s emission norms.
December 7, 2015: The Union Ministry of Environment, Forest and Climate Change (MoEF&CC) notifies new norms.2 Says the norms must be implemented by 2017.3,4
September 21, 2016: The Union Ministry of Power (MoP) constitutes a committee under the Central Electricity Authority (CEA) to prepare an action plan for the implementation of the new norms (see Box: The MoP 2016 committee).
June 30, 2017: The MoEF&CC receives a phase-in plan from the MoP for implementation of the norms. What the plan says:» SO2: FGD implementation for 145 GW capacity to be completed within
seven years (2017-2024) in a phased manner.» PM: The compliance for PM norm to follow the same timeline as that
of SO2.» NOx: For plants installed before December 31, 2003, the Ministry
requests a period of three years to achieve the specified standard of 600 mg/Nm3. For other plants, it seeks a relaxed norm of 600 mg/Nm3 (in place of 300 and 100 mg/Nm3) and extension of three years, after the amendment is made.
September 1, 2017: In a meeting between the two ministries, the MoEF&CC and MoP, it is decided that the MoP plan with an implementation time-line of seven years (up to 2024) was too delayed – instead, it should be implemented by 2022 with respect to all the pollutants. It is also decided that a revised implementation plan would be submitted by the MoP.
The new deadline for implementation
2022
The MoP 2016 committeeThe MoP’s committee included members from the Central Electricity Authority (CEA), Ministry of Coal, MoEF&CC, Central Pollution Control Board (CPCB), Power System Operation Corporation (POSOCO), National Thermal Power Corporation (NTPC), and Damodar Valley Corporation (DVC). The committee met twice, on October 21 and December 13, 2016, to shortlist the names of plants requiring upgradation, analyse space constraints, recommend broad solutions for individual units, and develop the phase-in plan.
A list of power stations with data on PM emission levels and key recommendations – whether they should opt for ESP retrofit or FGD installation – was circulated among the Regional Power Committees (RPCs), which were asked to provide timelines for installation of pollution control equipment by the end of February 2017.
13
C O A L - B A S E D P O W E R N O R M S
Water consumption norm amended
2018
October 10, 2017: The MoP submits a revised action plan to implement new emission norms, according to which:» SO2: FGD implementation plan of 161.4 GW (415 units) to be completed
by 2022.» PM: ESP upgradation plan of 64.5 GW (273 units) to be completed by
2022.» NOx: Implementation by 2022.
Some other concerns highlighted by the revised plan were:» Height of the chimney: Installation of FGD systems will require lining
of existing stacks to prevent corrosion. However, the lining of the stacks will entail a long shut-down. Amendment to the existing stack height norms is needed urgently so that environmentally compliant units can construct shorter stacks while FGD installation is in progress.
» Seawater-based FGD: Revised standards do not make a distinction between seawater-based thermal power stations and sweet water-based thermal power stations. Seawater-based plants should be exempted from meeting the norms.
November 17, 2017: In Supreme Court, the Amicus Curiae in the ongoing case on air pollution in Delhi and other cities urges the apex court to “direct the implementation of the 2015 emission standards for power plants as per schedule – by December 2017”.
December 11, 2017: The Central Pollution Control Board (CPCB) issues directions to power plants as per the deadlines agreed upon by the two ministries.
December 12, 2017: MoEF&CC files an affidavit in Supreme Court presenting the implementation plan and recommending that the deadline of December 2022 should be accepted. The affidavit also asks the Court to allow it to review and modify the NOx and water consumption standards for plants installed after January 2017 (see Box: Amendments in the 2015 water use standards).
Amendments in the 2015 water use standardsOn June 28, 2018, the MoEF&CC issued an amendment to its notification dated December 7, 2015 – in this, the water consumption limit of 2.5 m3/MWh for new plants installed after January 1, 2017 was revised to 3 m3/MWh. The amendment also said that sea water-based once-through plants are to be exempted from conversion to cooling tower-based systems.
Answering the query on why the specific water consumption norms were revised, the CEA said the water consumption limit of 2.5 m3/MWh was very stringent. Initially, it was suggested that the norm should be increased to 2.7 m3/MWh. But as the operation of the FGD would require an additional water of 0.3 m3/MWh, the limit was reviewed and revised upward.

14
December 2017: The CEA uploads Standard Technical Specifications for retrofitting wet limestone-based FGD systems in a typical 2 x 500 MW TPP.5
February 14, 2018: The Environment Pollution (Prevention and Control) Authority (EPCA) submits its Report No 81 to the court.6 The report recommends the following: » Deadlines for all plants to meet emission norms should be advanced to
2020 from 2022; PM and NOx norms should be met by 2018-19 and SO2, by 2020.
» Schedule for implementing the standards should priortise plants located in critically polluted areas and with high population density – these plants should be required to meet standards by 2019-2020.
» MoEF&CC and CPCB may be asked to review the technical feasibility of the NOx standard of 100 mg/Nm3 – however, there should be no change in the NOx standard of 300 mg/Nm3.
» All plants installed after January 2017 must meet the PM and NOx norms at the time of commissioning, and the SO2 norms by 2019.
» Water standards should not be revised – however, plants located in coastal areas can be exempted.The EPCA also flags the importance of an effective compliance and
monitoring system; it adds that the data generated from the continuous emission monitoring (CEMs) should be used for regulatory controls.
As shut-down of non-compliant plants is found to be difficult because of power demand, the EPCA recommends that there should be a penalty of Rs 1 lakh per day per non-compliant pollutant – estimates indicate that assuming (on an average) three non-compliant pollutants, a unit would need to pay Rs 11 crore every year, till it met the standard. This would be a deterrent and help push for compliance.
March 28, 2018: The MoEF&CC files an affidavit in Supreme Court7 in response to the EPCA’s Report No 81. What it said:» The present schedule of 2022 is already extremely challenging, since it
takes three years to install an FGD system. In units where both FGD and ESP are required, these will be set up simultaneously to avoid shutting down the plants twice.
» A total of 8,966.50 MW (82 units) have been identified for retirement by March 2019.
» NOx control will be done by 2022 in accordance with the revised plan submitted by the MoP. But this would be dependent on the revision of the standard. NTPC is conducting studies to assess the technical feasibility for 100 mg/Nm3 (see Box: Implications of the revision of the NOx standard).
» Plants above 25 years of age where FGD and emission control is not possible should be allowed to function for a limited number of hours in a year.
EPCA’s Report 81 submitted to Supreme Court
2018

15
C O A L - B A S E D P O W E R N O R M S
Implications of the revision of the NOx standardThe Ministry of Power had proposed the upward revision of the NOx standard – from 300 mg/Nm3 to 450 mg/Nm3 – conditional to its meeting the 2021-22 deadline for thermal power emission norms. It was agreed that the CPCB would examine this further. On May 17, 2019, the report of the CPCB was considered by the MoEF&CC in its meeting. The report, based on the CPCB-NTPC joint monitoring report in seven units of four thermal power plants during the period February 13, 2019 to April 2, 2019, found that out of the seven monitored units, five were complying with NOx emission standards of 300 mg/Nm3 at full load. Some units did not comply during partial load operations even after combustion monitoring.
The meeting also considered the assurance provided by BHEL that NOx emission level of 450 mg/Nm3 can be achieved by combustion modification. It found that there were operational issues with the use of SNCR technology for NOx reduction, as it required urea and ammonia the amounts of which could differ based on types of boiler and other parameters. Given all this, the joint committee decided that it would recommend the revision of NOx norms from 300 mg/Nm3 to 450 mg/Nm3 for plants installed between January 1, 2004 and December 31, 2016. It did not agree to revise the 100 mg/Nm3 standard for newer plants.
While the Supreme Court has accepted the recommendations of this committee on August 5, 2019, the notification has not yet been issued to amend the 2015 standard revising the NOx standard upwards.
For plants installed post-2017 – where the NOx standard is 100 mg/Nm3 – the NTPC has conducted pilot projects using technologies for abatement. Its report, completed in mid-2019, is yet to be reviewed.
» The Court should allow extension of Environmental Clearance (EC) of those plants which have been commissioned or are yet to be commissioned post-January 2017 – this is when the 2015 notification specifies that new plants, post-January 2017, would be required to meet the new norms before commissioning.
» The Court should allow 49 plants (12,144 MW) to continue functioning even though they cannot meet the water consumption standard.
CPCB-CEA NOx emission monitoring results (mg/Nm3)
509Adani Power, Rajasthan Limited, Kawai: Unit 1
71-286 (31-42% load)Mahatma Gandhi TPS, CLP,
Jhajjar: Unit 1
320-227.8 (31-42% load)Mahatma Gandhi TPS, CLP,
Jhajjar: Unit 2
522.7 (50% load) and 92-282 (100% load)
Naba power, Rajpura, Punjab unit 1
584Adani Power, Rajasthan Limited, Kawai: Unit 2
202.6NTPC Mouda Super TPS,
Nagpur: Unit 3
178.95NTPC Mouda Super TPS,
Nagpur: Unit 4
16
April 6, 2018: The CPCB sends Section 5 notices to all the remain-ing plants that were not included in the first set of directions of December 2017.
April 17, 2018: The EPCA submits Report No 84 in response to the MoEF&CC affidavit. What it says:» It is possible to advance the deadlines. NOx and PM norms can be met
in an annual shutdown or with an advanced FGD phase-in time period, if done simultaneously.
» There is no clarity on 34,623 MW of installed capacity. These plants are not included in the phase-in plan for FGD – the ministry needs to clarify.
» There should be no relaxation in meeting water norms. Indian plants are water guzzlers; they should not be allowed to continue functioning without reducing their water consumption.
» The Court should not accept the MoEF&CC’s request to allow units less than 25 years old to continue functioning without meeting the stan-dards.
» The Court should not accept the ministry’s request to allow plants over 25 years of age, where FGD and emission control is not possible, to continue functioning for a limited number of hours in a year.
May 30, 2018: The Ministry of Power sends a letter to the CEA (titled ‘Mechanism for implementation of new environmental norms for TPPs.....’), which says the new norms are a “change in law” event, and the cost increase that will happen due to installation of pollution control technologies, shall be “passed through” (passed on to the consumer) in tariffs by the CERC (see Box: Pricing – recommendations and resolution).
June 28, 2018: The MoEF&CC revises specific water consumption norms from 2.5 to 3 m3/MWh for plants installed after January 1, 2017. It exempts plants that are using sea water.
July 3, 2018: The MoP files an affidavit before the court, in response to EPCA’s Report No 84.8 It contends:» The phase-in plan cannot be advanced – furthermore, simultaneous
tendering may lead to spike in cost of FGD and cost of electricity could increase.
» FGD systems can help reduce PM levels. Hence, ESP upgradation may not be required in many units. Thus, PM and SO2 compliance can be done simultaneously to lower the expenditure.
» NOx measures will also be taken at the same time, along with FGD installation. In India, especially with respect to high ash content in coal, there are no proven technologies for such stringent NOx norms – hence, pilot projects have been initiated. Any further decision would be taken based on the results of these projects.
» A break-up of 34,623 MW has been provided as requested by the EPCA
Ministry of Power says cost increase due to
new norms will be met by tariff hike
2018

17
C O A L - B A S E D P O W E R N O R M S
Pricing – recommendations and resolutionThe question of financing for the investment required to meet the norms remains one of the main concerns. The additional investment to install pollution control systems will increase the cost of generation and, eventually, result in a tariff hike.
The cost of power and increase in tariffs have to be approved in India by the electricity regulatory commissions (ERCs). These are Central and state level agencies to which petitions for approval of investments and tariff hikes are made by generation companies (GENCOS). However, ambiguities exist amongst the ERCs on the provisions under which these additional capital investments for installation of emission control technologies and subsequent tariff revision can be allowed. Additionally, there are variations in the procedures adopted at various ERCs which further complicate the process.
Accordingly, the Central Electricity Regulatory Commission (CERC) and state ERCs sought guidance from the Ministry of Power on this matter. In May 2018, the ministry issued directions to the CERC under Section 107 of the Electricity Act, 2003 that the new environmental norms of 2015 qualify as a “change in law” event – this means that investments in pollution control technologies to meet the 2015 norms will be covered by tariff increase. In other words, the power plants can “pass-through” – the cost of the investment made can be passed on to the customers through an increase in tariff.
This would be applicable for all power plants, except those whose tariffs had been determined after December 2015 (after the notification of the 2015 emission standard) or their power purchase agreement was signed after the standard had been approved. In all other cases, “the additional cost implication due to installation or upgradation of various emission control systems and its operational cost to meet the new environment norms would be considered for being pass-through in tariff by the commission”, says the May 30, 2018 direction from the MoP.
Individual power plants have to approach the state or Central ERC to get in-principle approval to go ahead with the investments. By March 2019, CSE had surveyed the status of these petitions at the CERC and eight SERCs (which account for 60 per cent of the TPP capacity), and found that only 20 per cent of the plants had filed for increased tariff. This should have increased subsequently, but data for it is not available.
In September 2018, the CEA made recommendations to incentivise the early installation of pollution control equipment. According to this, the increase in variable cost for installation of FGD was expected to be in the range of paise 2.71 to paise 6.68 – less than Re 1/unit. Therefore, according to the CEA, the increase in variable cost would have a minor impact on the merit order despatch.
The CEA, however, has said that there is a need to provide incentives for early adoption of pollution control systems. It points out that while the cost of implementing the pollution systems would not be considered in the merit order despatch, the CERC would devise a methodology for supplementary tariff determination, separately from normal tariff, so that installation of FGD and other systems would have no bearing on the merit order despatch till March 31, 2022 – the date when all plants have to meet the deadline.
18
and these pertain to plants which are already compliant with SO2 norms or where FGD has been installed
» Plants, which have completed 25 years of operational life and where FGD installation and pollution control equipment is not possible should be allowed to operate for a limited number of hours.
» Some of the plants which were set up after 2017, received clearance before the new norms came; these units have been included in the phase-in plan. They deserve an extension of EC.
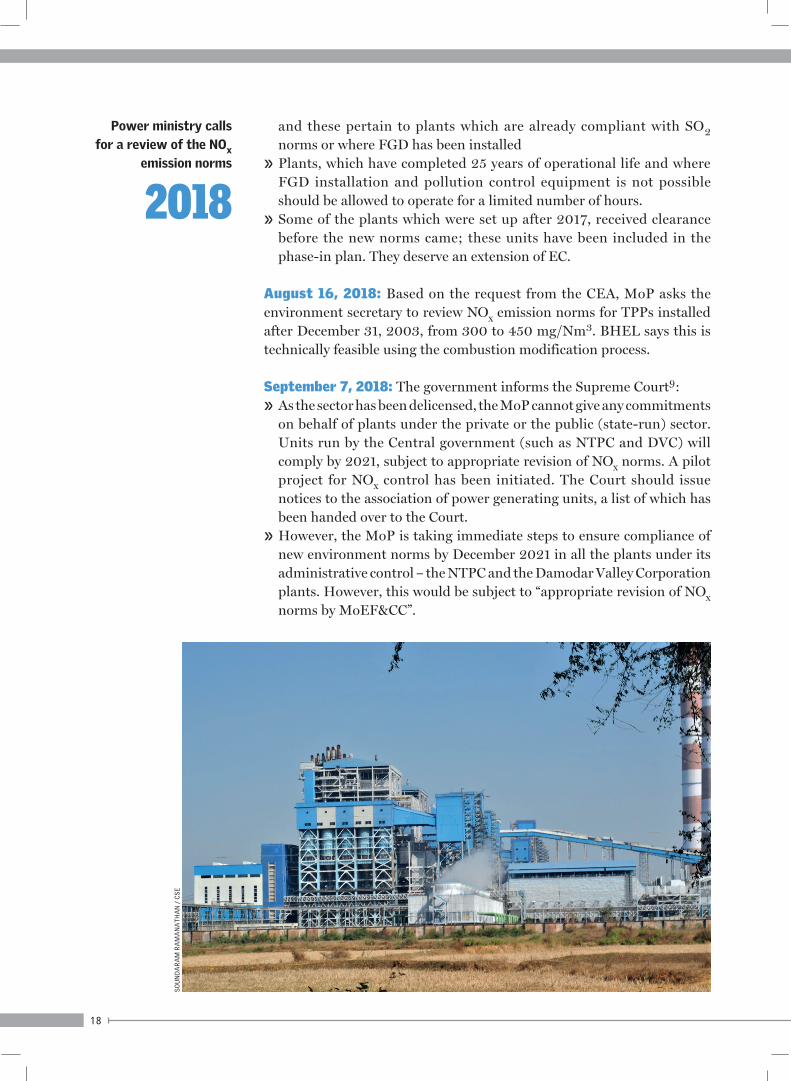
August 16, 2018: Based on the request from the CEA, MoP asks the environment secretary to review NOx emission norms for TPPs installed after December 31, 2003, from 300 to 450 mg/Nm3. BHEL says this is technically feasible using the combustion modification process.
September 7, 2018: The government informs the Supreme Court9:» As the sector has been delicensed, the MoP cannot give any commitments
on behalf of plants under the private or the public (state-run) sector. Units run by the Central government (such as NTPC and DVC) will comply by 2021, subject to appropriate revision of NOx norms. A pilot project for NOx control has been initiated. The Court should issue notices to the association of power generating units, a list of which has been handed over to the Court.
» However, the MoP is taking immediate steps to ensure compliance of new environment norms by December 2021 in all the plants under its administrative control – the NTPC and the Damodar Valley Corporation plants. However, this would be subject to “appropriate revision of NOx norms by MoEF&CC”.
Power ministry calls for a review of the NOx
emission norms
2018S
OU
ND
AR
AM
RA
MA
NA
TH
AN
/ C
SE
19
C O A L - B A S E D P O W E R N O R M S
November 2018: Private power producers file affidavits through their Association of Power Producers, saying:» They cannot advance the deadline to 2020 as suggested by the EPCA
– however, they are committed to adhering to the implementation schedule by 2022, as proposed by the CEA and accepted by the CPCB.
» They need assurance from CERC/SERCs on tariff increase so that they can raise funds from the market. The tariff increment of 50 paise per unit will have to be passed through by the CERC/SERCs so that the plants remain viable; also, the increase in cost would make the plants lose their positions under the merit order despatch. Therefore, this cost should be paid through the National Clean Energy Fund – the cess imposed on coal.
» The MoEF&CC should finalise regulations for disposal of surplus unutilised gypsum – waste produced from the FGD plants.
» Plants commissioned beginning February 2017 should be given more time to comply with the norms and must be brought into the ambit of the CEA phase-out plan – effectively asking for time till 2022.
December 12, 2018: Supreme Court hears the matter regarding the final agreement on the schedule for implementation by all power plants. It directs:“The learned Amicus informs us that during the meeting it was agreed that in terms of the affidavit filed by the power plants, they would comply with the notified emission as per the revised schedule by 2022. With regard to any deterrence for non-compliance of notified emission norms, MoP and MoEF&CC are looking into the matter with special emphasis on relegating the non-compliant power plant to the bottom of the merit order despatch.” (see Box: Merit order despatch).
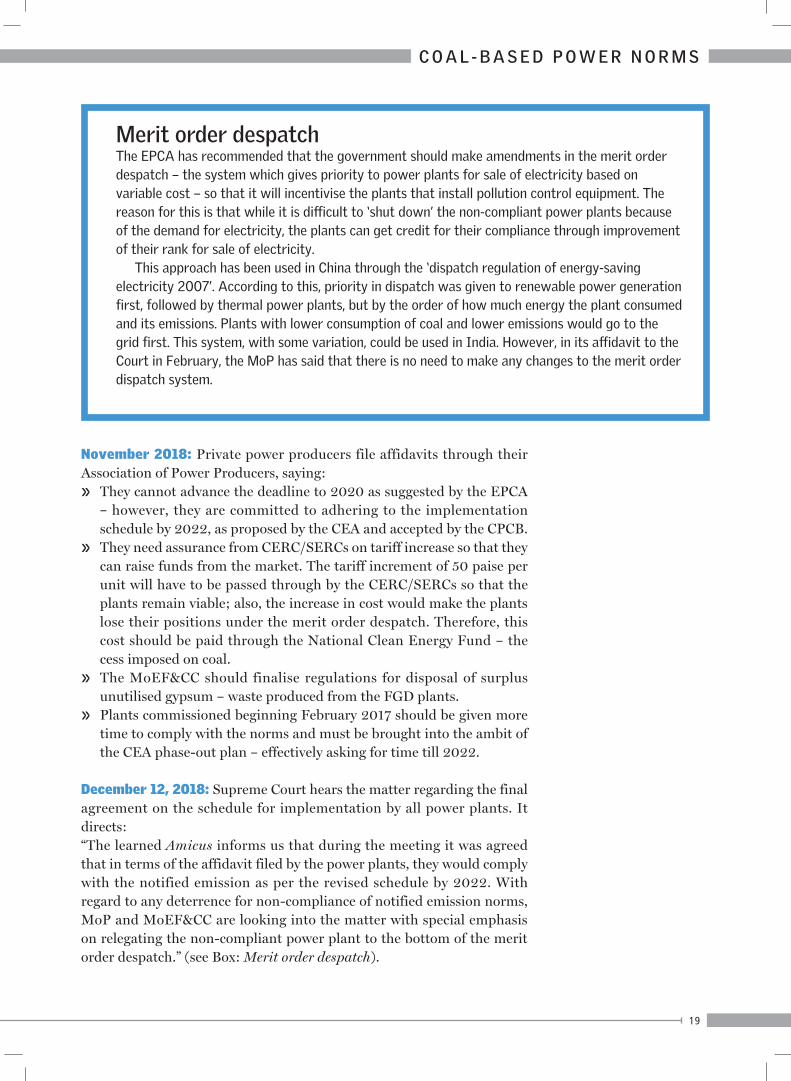
Merit order despatchThe EPCA has recommended that the government should make amendments in the merit order despatch – the system which gives priority to power plants for sale of electricity based on variable cost – so that it will incentivise the plants that install pollution control equipment. The reason for this is that while it is difficult to ‘shut down’ the non-compliant power plants because of the demand for electricity, the plants can get credit for their compliance through improvement of their rank for sale of electricity.
This approach has been used in China through the ‘dispatch regulation of energy-saving electricity 2007’. According to this, priority in dispatch was given to renewable power generation first, followed by thermal power plants, but by the order of how much energy the plant consumed and its emissions. Plants with lower consumption of coal and lower emissions would go to the grid first. This system, with some variation, could be used in India. However, in its affidavit to the Court in February, the MoP has said that there is no need to make any changes to the merit order dispatch system.
20
May 17, 2019: The MoP and MoEF&CC agree in principle to revise the NOx norms from 300 mg/Nm3 to 450 mg/Nm3 for TPPs installed between January 1, 2004 and December 31, 2016 (see Box: Implications of the revision of the NOx standard).
August 5, 2019: The Supreme Court, taking cognisance of the minutes of the meeting of May 17, 2019, says action should be taken on the basis of the consensus that has been reached.
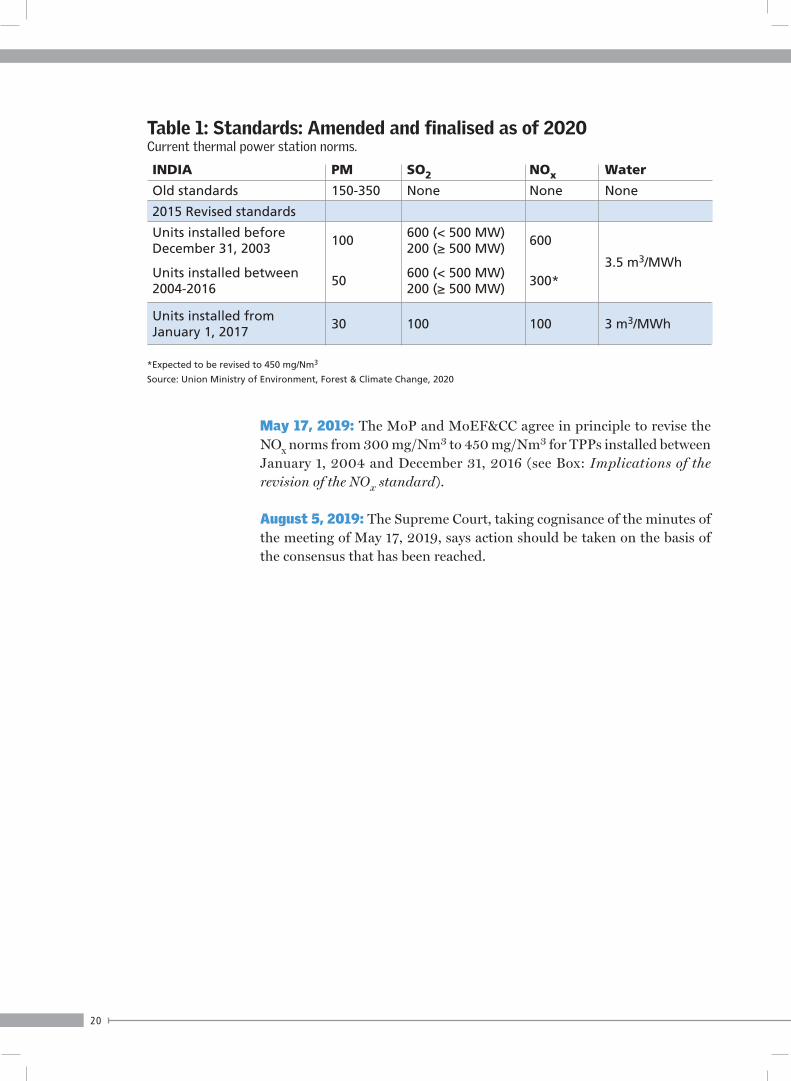
INDIA PM SO2 NOx Water
Old standards 150-350 None None None
2015 Revised standards
Units installed before December 31, 2003
100600 (< 500 MW)200 (≥ 500 MW)
600
3.5 m3/MWhUnits installed between 2004-2016
50600 (< 500 MW)200 (≥ 500 MW)
300*
Units installed from January 1, 2017
30 100 100 3 m3/MWh
Current thermal power station norms.
*Expected to be revised to 450 mg/Nm3
Source: Union Ministry of Environment, Forest & Climate Change, 2020
Table 1: Standards: Amended and finalised as of 2020
21
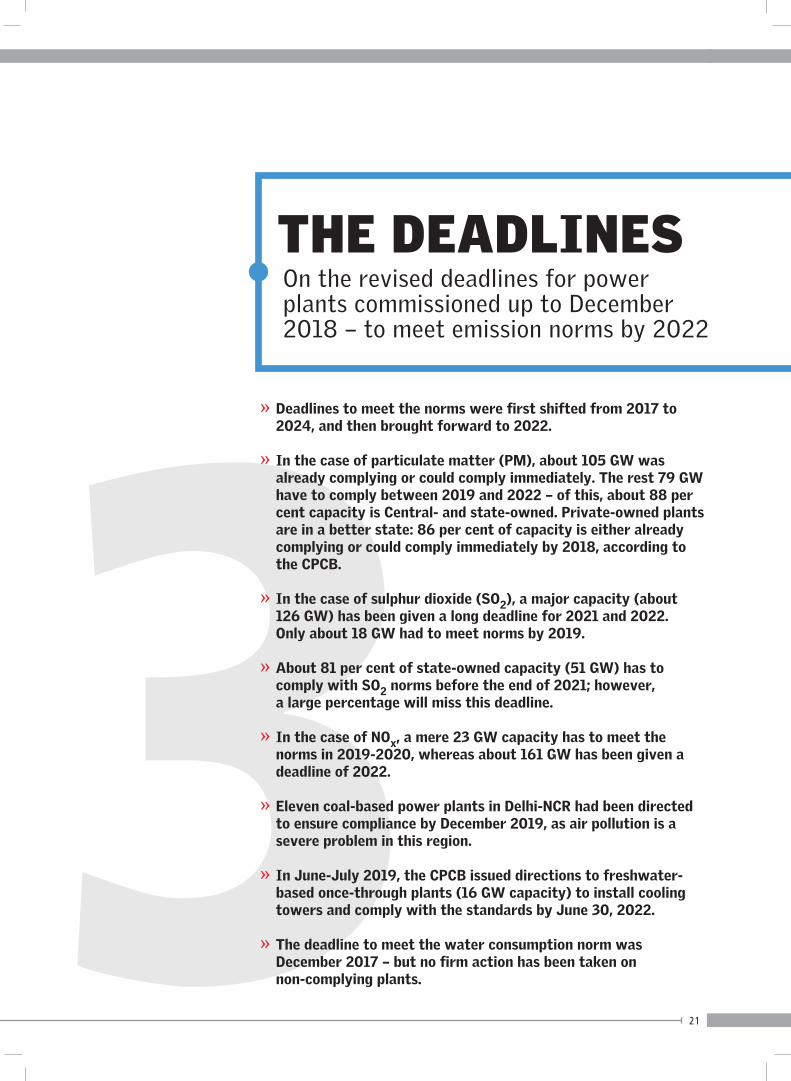
3THE DEADLINESOn the revised deadlines for power plants commissioned up to December 2018 – to meet emission norms by 2022
» Deadlines to meet the norms were first shifted from 2017 to 2024, and then brought forward to 2022.
» In the case of particulate matter (PM), about 105 GW was already complying or could comply immediately. The rest 79 GW have to comply between 2019 and 2022 – of this, about 88 per cent capacity is Central- and state-owned. Private-owned plants are in a better state: 86 per cent of capacity is either already complying or could comply immediately by 2018, according to the CPCB.
» In the case of sulphur dioxide (SO2), a major capacity (about 126 GW) has been given a long deadline for 2021 and 2022. Only about 18 GW had to meet norms by 2019.
» About 81 per cent of state-owned capacity (51 GW) has to comply with SO2 norms before the end of 2021; however, a large percentage will miss this deadline.
» In the case of NOx, a mere 23 GW capacity has to meet the norms in 2019-2020, whereas about 161 GW has been given a deadline of 2022.
» Eleven coal-based power plants in Delhi-NCR had been directed to ensure compliance by December 2019, as air pollution is a severe problem in this region.
» In June-July 2019, the CPCB issued directions to freshwater-based once-through plants (16 GW capacity) to install cooling towers and comply with the standards by June 30, 2022.
» The deadline to meet the water consumption norm was December 2017 – but no firm action has been taken on non-complying plants.
22
The national timelinesThe CPCB’s deadlines for meeting the norms are being discussed in these series of graphics. The unit-wise deadlines for meeting PM, SO2 and NOx norms have been included in Annexures. The list was compiled based on directions issued by CPCB to individual plants during 2017-2018.1
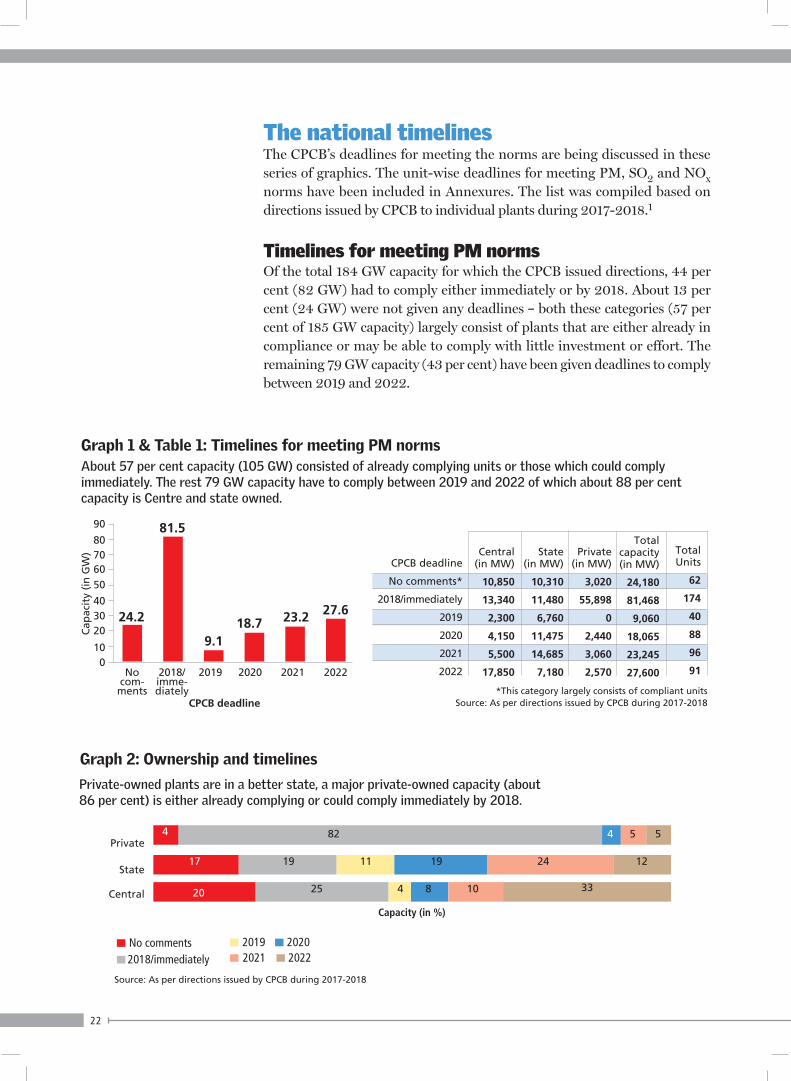
Timelines for meeting PM normsOf the total 184 GW capacity for which the CPCB issued directions, 44 per cent (82 GW) had to comply either immediately or by 2018. About 13 per cent (24 GW) were not given any deadlines – both these categories (57 per cent of 185 GW capacity) largely consist of plants that are either already in compliance or may be able to comply with little investment or effort. The remaining 79 GW capacity (43 per cent) have been given deadlines to comply between 2019 and 2022.
24.2
81.5
9.118.7 23.2 27.6
Cap
acit
y (i
n G
W)
CPCB deadline
No com-
ments
20192018/imme- diately
2020 2021 20220
10
203040
50
607080
90
*This category largely consists of compliant units Source: As per directions issued by CPCB during 2017-2018
Graph 1 & Table 1: Timelines for meeting PM norms
Graph 2: Ownership and timelines
About 57 per cent capacity (105 GW) consisted of already complying units or those which could comply immediately. The rest 79 GW capacity have to comply between 2019 and 2022 of which about 88 per cent capacity is Centre and state owned.
Private-owned plants are in a better state, a major private-owned capacity (about 86 per cent) is either already complying or could comply immediately by 2018.
CPCB deadline
No comments*
2018/immediately
2019
2020
2021
2022
Central(in MW)
10,850
13,340
2,300
4,150
5,500
17,850
State (in MW)
10,310
11,480
6,760
11,475
14,685
7,180
Private(in MW)
3,020
55,898
0
2,440
3,060
2,570
Totalcapacity(in MW)
24,180
81,468
9,060
18,065
23,245
27,600
TotalUnits
62
174
40
88
96
91
Source: As per directions issued by CPCB during 2017-2018
Central
State
Private
Capacity (in %)
No comments2018/immediately
2019 20202021 2022
82
19
25 4 8 10 33
11 19 24 12
5 54 4
17
20
23
C O A L - B A S E D P O W E R N O R M S
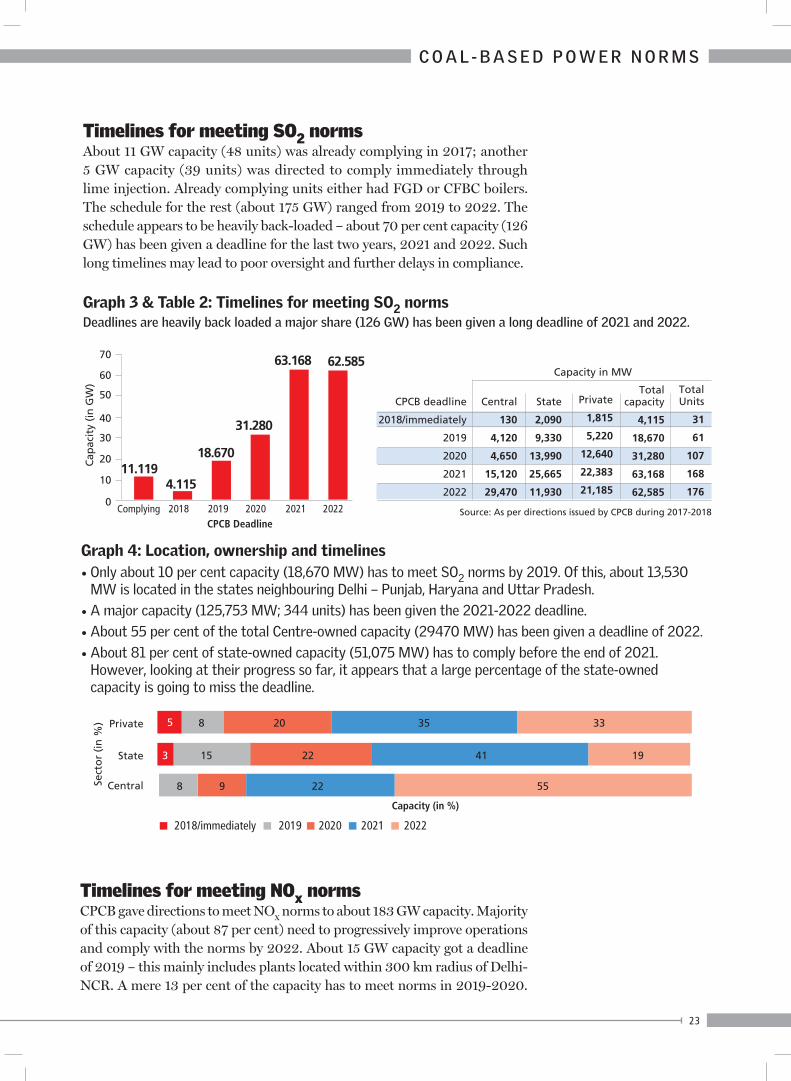
Timelines for meeting SO2 normsAbout 11 GW capacity (48 units) was already complying in 2017; another 5 GW capacity (39 units) was directed to comply immediately through lime injection. Already complying units either had FGD or CFBC boilers. The schedule for the rest (about 175 GW) ranged from 2019 to 2022. The schedule appears to be heavily back-loaded – about 70 per cent capacity (126 GW) has been given a deadline for the last two years, 2021 and 2022. Such long timelines may lead to poor oversight and further delays in compliance.
Graph 3 & Table 2: Timelines for meeting SO2 normsDeadlines are heavily back loaded a major share (126 GW) has been given a long deadline of 2021 and 2022.
11.11918.670
31.280
63.168 62.585
4.115
Complying 2018 2019 2020 2021 20220
10
20
30
40
50
60
70
Cap
acit
y (i
n G
W)
CPCB DeadlineSource: As per directions issued by CPCB during 2017-2018
CPCB deadline
2018/immediately
2019
2020
2021
2022
Central
130
4,120
4,650
15,120
29,470
State
2,090
9,330
13,990
25,665
11,930
Private
1,815
5,220
12,640
22,383
21,185
Totalcapacity
4,115
18,670
31,280
63,168
62,585
Total Units
31
61
107
168
176
Capacity in MW
Graph 4: Location, ownership and timelines• Only about 10 per cent capacity (18,670 MW) has to meet SO2 norms by 2019. Of this, about 13,530
MW is located in the states neighbouring Delhi – Punjab, Haryana and Uttar Pradesh.
• A major capacity (125,753 MW; 344 units) has been given the 2021-2022 deadline.
• About 55 per cent of the total Centre-owned capacity (29470 MW) has been given a deadline of 2022.
• About 81 per cent of state-owned capacity (51,075 MW) has to comply before the end of 2021. However, looking at their progress so far, it appears that a large percentage of the state-owned capacity is going to miss the deadline.
Central
State
Private
Capacity (in %)
Sect
or
(in
%) 8
15
9 22 55
22 41 19
20 35 33
2018/immediately 2019 2020 2021 2022
5
3
8
Timelines for meeting NOx normsCPCB gave directions to meet NOx norms to about 183 GW capacity. Majority of this capacity (about 87 per cent) need to progressively improve operations and comply with the norms by 2022. About 15 GW capacity got a deadline of 2019 – this mainly includes plants located within 300 km radius of Delhi-NCR. A mere 13 per cent of the capacity has to meet norms in 2019-2020.

24
Given the fact that many of the plants need to only optimise combustion or install low-NOx burners (LNBs) or over fire air (OFA) systems, which can be done during annual overhauls, a major percentage can comply within the next one-two years. Despite this, a large percentage has been unnecessarily given a long deadline of 2022.
If implemented rigorously, the standards can drastically reduce emissions of NOx, SO2 and PM and make power plants water efficient. But CSE’s research and analysis shows that even after extension of timelines, a large proportion of the capacity is going to miss the deadlines – especially for SO2 – and this is bad for our environment.
Water consumption deadlines: ignoredThe deadline to meet the water consumption norm was December 2017 – but no firm action has been taken on non-complying plants. While extension of deadlines for meeting emission norms has been granted, for which relevant justification was put forth by the ministry in court and each unit was thereafter given individual timelines, in the case of water there has never been any such discussion on compliance.
It was only in January 2019 that the CPCB asked thermal power plants to submit their specific water consumption data on a quarterly basis starting from October-December 2018. Based on the data obtained, the plants which were not meeting the specific water consumption limit, were asked to submit time-targeted action plans for achieving the limit. In June-July 2019, the CPCB issued directions to freshwater-based once-through plants (16 GW capacity) to install cooling towers and comply with the standards by June 30, 2022. The plants were also directed to submit six monthly progress reports on actions taken on compliance.
However, the status of a majority of the plants – which have already installed cooling towers – is not known. It is not clear whether other non-complying plants (apart from once-though plants) have been issued any directions.
158
160
2019 2020 20220
20
4060
80100120140
160
180
Cap
acit
y (i
n G
W)
CPCB Deadline Source: As per directions issued by CPCB during 2017-2018
Graph 5 & Table 3: Timelines for meeting NOx normsA major capacity has to comply with the norms by 2022.
CPCB deadline
Central (MW)
State (MW)
Private (MW)
Total capacity
(MW)
Total units
2019 4,120 6,730 4,700 15,490 55
2020 1,330 5,590 1,180 8,100 60
2022 49,040 49,556 61,372 1,59,968 436
25
C O A L - B A S E D P O W E R N O R M S
4On progress of implementation and the likelihood of compliance in future – as found by a CSE survey
» In the case of particulate matter, 97 GW capacity is complying, while upgradation is underway in another 14 GW. Total compliance and non-compliance could not be ascertained as no information was available on the status of progress of an additional 69 GW capacity.
» In the case of SO2, a mere 16 GW capacity has complied; 32 GW has awarded tenders; 125 GW is still at the preliminary stages of feasibility study and tenders; and another 9 GW has no plans for installation. It is highly unlikely for units still at preliminary stages or with no plan to meet the 2022 deadline even if they awarded the tenders now.
» It takes at least two years for a station to complete FGD construction. Hence, a coal-based power project with a 2022 deadline should have begun construction by 2019.
» Centre-owned plants appear to be leading in implementation of SO2 norms, followed by privately-owned ones. State-owned units have made no progress on implementation – only one plant has awarded tenders so far.
» In NOx, current implementation progress data for a majority of the capacity is unavailable.
IMPLEMENTATION: WHERE DO WE STAND
26
CSE has surveyed the progress of implementation of the norms across the country. Based on what we found, we assessed whether the plants would be able to comply with the norms within the given deadlines. Data on the progress of implementation was collected from a variety of sources – the Central Electricity Authority’s (CEA) quarterly reports,1,2 field surveys conducted by CSE in some states, state electricity regulatory commissions (SERCs), information available in the public domain, and consultations with industry experts and equipment manufacturers.
For many plants, implementation progress data on PM and NOx control was not available. However, FGD/DSI installation progress data could be obtained from the CEA quarterly reports. This data was further analysed to understand the future compliance likelihood of various units.
Particulate matter (PM)In 2017-18, the CPCB sent directions to plants which were not complying with PM emission norms and set deadlines for them. However, there is no further information about these plants in the public domain. To understand what was the status with respect to PM, CSE – in its survey and assessment – has assumed that all the other plants and units that were not served the notice for compliance, are already meeting the standard or are compliant.
In addition, data has been accessed from the following sources: the NTPC, DVC and a few private thermal power plants have given submissions to the Ministry of Power (MoP) about their compliance to PM standards. The CEA provides data on the status of emission control in TPPs in the Delhi-NCR airshed, and emissions data for some plants located in other states have been obtained from the CPCB – all these have been included in the CSE assessment.
Surveys have been conducted in the key coal-based thermal power states – Madhya Pradesh, Maharashtra and Uttar Pradesh – to assess their compliance. The data from this is also included in our final assessment, so that we have a full picture of the status, what is current and what needs to be done.
Compliance and non-compliance as per deadline» No comments/comply immediately/2018: About 24 GW capacity has
been given no deadlines (see Table 1: PM compliance and non-compliance – according to deadline), and another 81 GW had to comply immediately by 2018 – both these categories (making up 57 per cent of the capacity) consist of plants that were either already complying or could easily comply with minor upgradations. As per current status, 78 per cent of this category has already complied. Status of another 20 per cent is not known.
» Deadline (2019-22): Another 79 GW capacity has been given a deadline between 2019 and 2022 – of this, about 16 GW has complied and ESP upgradation is planned/underway in 13 GW. Status of the major proportion (about 48 GW) is still not known (see Table 1). CSE also analysed the implementation progress of NTPC units separately based on the year of deadline (see Table 2: Is NTPC meeting the PM norms?)
Capacity which has to meet PM norms between
2019 and 2022
79 GW

27
C O A L - B A S E D P O W E R N O R M S
Table 1: PM compliance and non-compliance – according to deadline97 GW capacity is known to be complying and upgradation is underway in another 14 GW; there seems to be no information available on the status of progress of about 69 GW. Therefore, total compliance and non-compliance could not be ascertained. Of the 69 GW for which status is unknown, almost half (47 per cent) is state-owned. For transparency, the status of implementation should be made public for all the units.
CPCB deadline (PM) Deadline-wise current status (MW)
DeadlineTotal capacity (MW) Progress made
Capacity (MW)
No comments 24,180
Complying 21,390
ESP upgradation planned/underway
1,670
Status not known 700
To retire/RSD 420
2018/immediately 81,468
Complying 60,373
Status not known 20,960
To retire/RSD 135
2019 9,060
Complying 2,620
ESP upgradation planned/underway
2,220
Status not known 3,800
Retired 420
2020 18,065
Complying 1,430
ESP upgradation planned/underway
1,160
Status not known 15,255
To retire/RSD 220
2021 23,245
Complying 5,320
ESP upgradation planned/underway
6,050
Status not known 11,455
To retire/RSD 420
2022 27,600
Complying 6,500
ESP upgradation planned/underway
3,615
Status not known 16,945
To retire/RSD 540
Note: This analysis includes plants that were issued directions by the CPCB during 2017-18, RSD = Reserve shut downSource: CSE analysis, 2020
Overall status irrespective of
deadlines (MW)
97,633 MW (53%)Total
complying
14,715 MW (8%)ESP
upgradation planned/
underway
69,115 MW (38%)
Status not known
2,155 MW (1%)To retire /
Retired/RSD
28
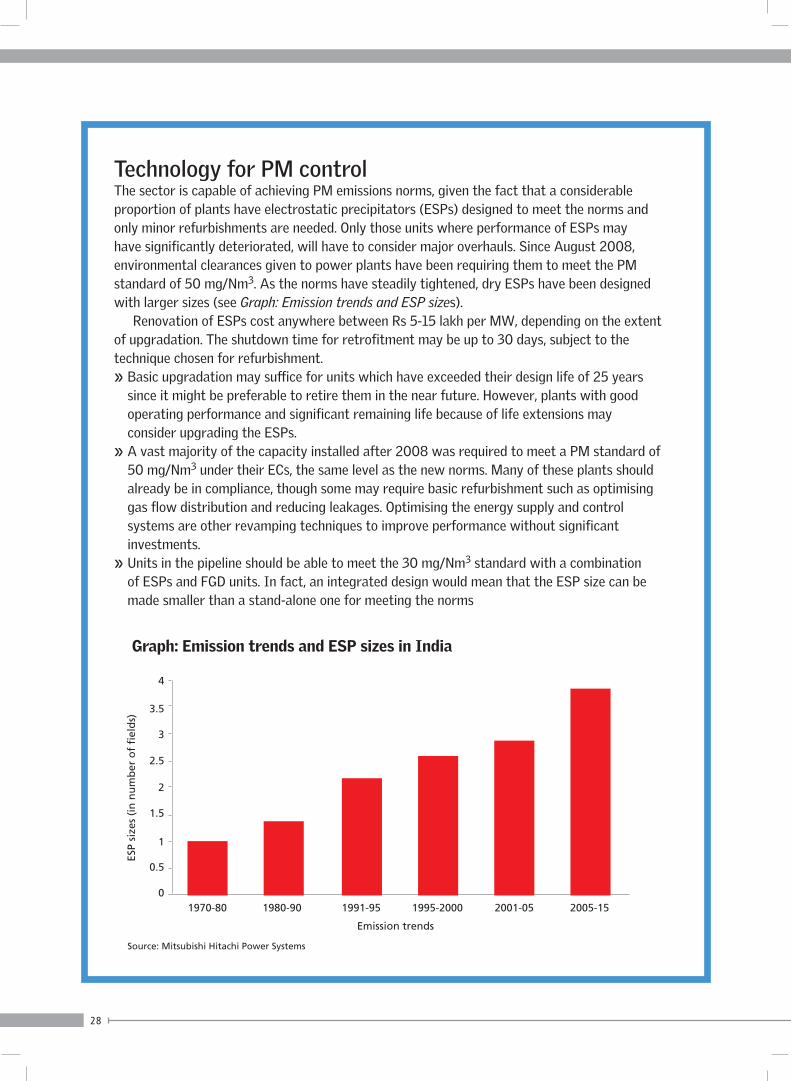
Technology for PM controlThe sector is capable of achieving PM emissions norms, given the fact that a considerable proportion of plants have electrostatic precipitators (ESPs) designed to meet the norms and only minor refurbishments are needed. Only those units where performance of ESPs may have significantly deteriorated, will have to consider major overhauls. Since August 2008, environmental clearances given to power plants have been requiring them to meet the PM standard of 50 mg/Nm3. As the norms have steadily tightened, dry ESPs have been designed with larger sizes (see Graph: Emission trends and ESP sizes).
Renovation of ESPs cost anywhere between Rs 5-15 lakh per MW, depending on the extent of upgradation. The shutdown time for retrofitment may be up to 30 days, subject to the technique chosen for refurbishment. » Basic upgradation may suffice for units which have exceeded their design life of 25 years
since it might be preferable to retire them in the near future. However, plants with good operating performance and significant remaining life because of life extensions may consider upgrading the ESPs.
» A vast majority of the capacity installed after 2008 was required to meet a PM standard of 50 mg/Nm3 under their ECs, the same level as the new norms. Many of these plants should already be in compliance, though some may require basic refurbishment such as optimising gas flow distribution and reducing leakages. Optimising the energy supply and control systems are other revamping techniques to improve performance without significant investments.
» Units in the pipeline should be able to meet the 30 mg/Nm3 standard with a combination of ESPs and FGD units. In fact, an integrated design would mean that the ESP size can be made smaller than a stand-alone one for meeting the norms
ESP
size
s (i
n n
um
ber
of
fiel
ds)
0
0.5
1
1.5
2
2.5
3
3.5
4
1970-80 1980-90 1991-95 1995-2000 2001-05 2005-15
Graph: Emission trends and ESP sizes in India
Source: Mitsubishi Hitachi Power Systems
Emission trends

29
C O A L - B A S E D P O W E R N O R M S
Sulphur dioxide (SO2)For SO2 control and compliance, a large proportion of the non-compliant units are considering partial or full flue gas desulphurisation (FGD), while a few of the smaller capacity and older units are opting for DSI technology. The Central Electricity Authority (CEA) is monitoring the status of implementation of FGD in plants. It provides quarterly data on the progress made by plants to meet the standard. This gives us the most updated and authoritative information; CEA quarterly report of October 2019 has been used in this assessment.
CPCB deadline (PM) Deadline-wise current status (MW)
DeadlineTotal capacity (MW) Progress made
Capacity (MW)
No comments 10,350
Complying 8,850
ESP upgradation planned/underway
1,000
Status not known 500
2018/Immediately 8,120
Complying 7,620
Status not known 500
2019 200 Complying 200
2020 3,440
Complying 770
ESP upgradation planned/underway
500
Status not known 2,170
2021 4,000
Complying 2,000
ESP upgradation planned/underway
2,000
2022 15,350
Complying 5,130
ESP upgradation planned/underway
3,210
Status not known 7,010
Table 2: Is NTPC meeting the PM norms? 59 per cent capacity (24,570 MW) is currently complying, while the status of another 25 per cent is unknown. » No comments/2018/immediately: Of the 18,470 MW capacity, 89 per cent is currently complying, ESP
upgradation is underway in another 5 per cent and the status of the remaining 5 per cent is not known. » Deadline (2019-22): Of the 22,990 MW capacity, 35 per cent is currently complying, ESP upgrdation is
planned/underway in another 25 per cent, and status of the remaining 40 per cent is unknown.
Note: This analysis includes plants that were issued directions by CPCB during 2017-18Source: CSE analysis, 2020
24,570 MW (59%)Total
complying
6,710 MW (16%)
ESP upgradation
planned/underway
10,180 MW (25%)
Status not known
Current status irrespective of deadlines (MW)
30
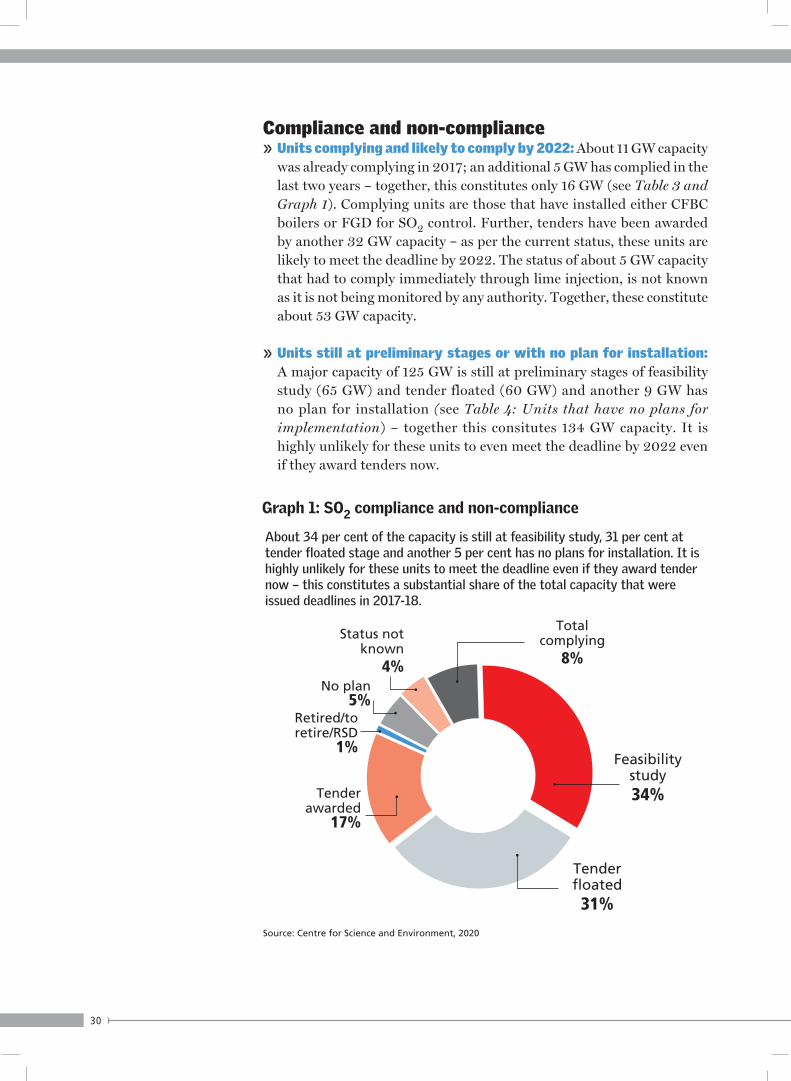
Compliance and non-compliance » Units complying and likely to comply by 2022: About 11 GW capacity
was already complying in 2017; an additional 5 GW has complied in the last two years – together, this constitutes only 16 GW (see Table 3 and Graph 1). Complying units are those that have installed either CFBC boilers or FGD for SO2 control. Further, tenders have been awarded by another 32 GW capacity – as per the current status, these units are likely to meet the deadline by 2022. The status of about 5 GW capacity that had to comply immediately through lime injection, is not known as it is not being monitored by any authority. Together, these constitute about 53 GW capacity.
» Units still at preliminary stages or with no plan for installation: A major capacity of 125 GW is still at preliminary stages of feasibility study (65 GW) and tender floated (60 GW) and another 9 GW has no plan for installation (see Table 4: Units that have no plans for implementation) – together this consitutes 134 GW capacity. It is highly unlikely for these units to even meet the deadline by 2022 even if they award tenders now.
Tender awarded
17%
Retired/to retire/RSD
1%
No plan 5%
Status not known
4%
Total complying
8%
Feasibility study34%
Tender floated31%
About 34 per cent of the capacity is still at feasibility study, 31 per cent at tender floated stage and another 5 per cent has no plans for installation. It is highly unlikely for these units to meet the deadline even if they award tender now – this constitutes a substantial share of the total capacity that were issued deadlines in 2017-18.
Source: Centre for Science and Environment, 2020
Graph 1: SO2 compliance and non-compliance

31
C O A L - B A S E D P O W E R N O R M S
Note: Above analysis includes plants that were issued directions by CPCB during 2017-18*Progress status as of October 2019Source: CEA, 2019 and CSE analysis, 2020
Already complying (in 2017) 11,119 MW
CPCB deadline 179,818 MW
CPCB deadline (SO2) Deadline-wise current status (MW)
DeadlineTotal capacity (MW) Progress made
Capacity (MW)
2018/comply immediately through lime injection 4,115
Complying 500
Feasibility study 500
Status not known – these plants were required to do lime injection; their status is not clear and is not being monitored
3,115
2019 18,670
Complying 1,320
Tender awarded 3,520
Tender floated 8,150
Feasibility study 3,020
No plan 1,950
Retired/to retire 600
Status not known 110
2020 31,280
Complying 720
Tender awarded 2,760
Tender floated 6,140
Feasibility study 12,890
No plan 4,840
Retired/to retire/RSD 660
Status not known 3,270
2021 63,168
Complying 630
Tender awarded 10,070
Tender floated 21,465
Feasibility study 29,683
No plan 1,320
2022 62,585
Complying 1,740
Tender awarded 16,250
Tender floated 24,175
Feasibility study 18,870
No plan 1,050
Status not known 500
190,937 190,937
Table 3: SO2 compliance and non-compliance – according to deadline*Only about 16 GW capacity has complied as per current status. Of the 18 GW capacity that had to comply in 2019, only 1.3 GW has complied. A large capacity (125 GW) is still at preliminary stages and has not yet awarded contracts. Looking at the current scenario, a major share of the capacity is going to miss the deadlines.
16,029 MW (8%)Total
complying
32,600 MW (17%)Tender
awarded
64,963 MW (34%)
Feasibility study
59,930 MW (31%)
Tender floated
1,260 MW (1%)
Retired/to retire/RSD
9,160 MW (5%)
No plan
6,995 MW (4%)
Status not known
Current status irrespective of deadlines (MW)
32
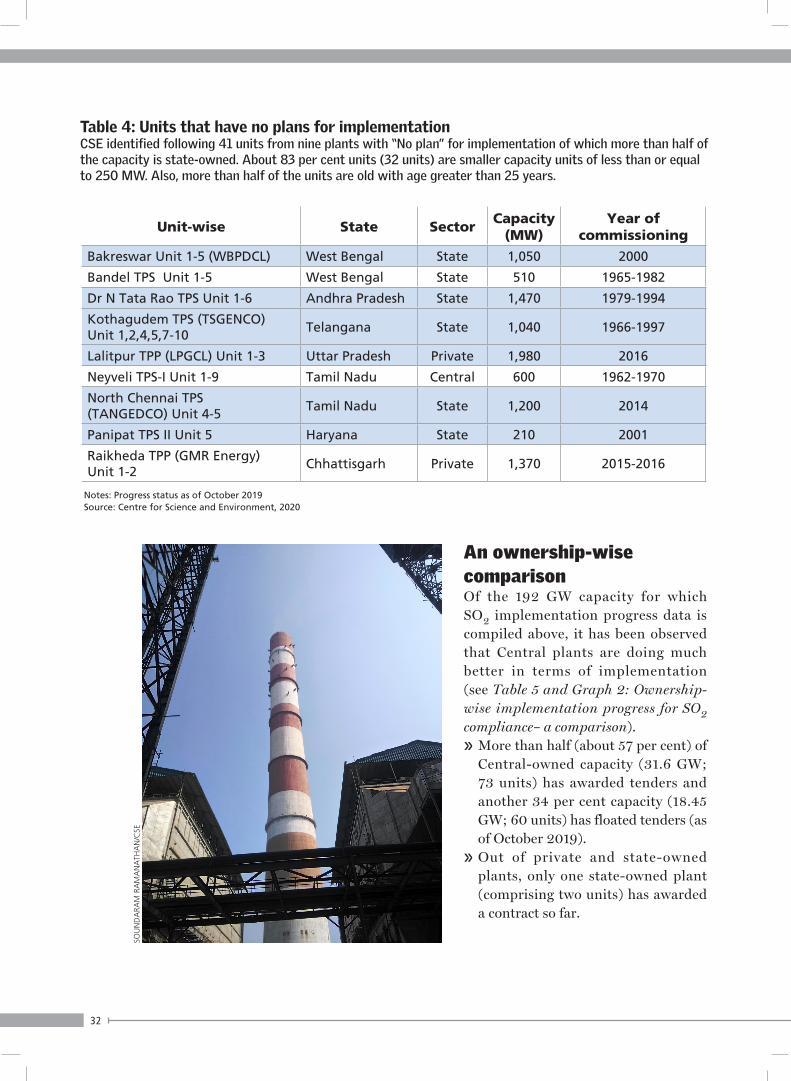
An ownership-wise comparison Of the 192 GW capacity for which SO2 implementation progress data is compiled above, it has been observed that Central plants are doing much better in terms of implementation (see Table 5 and Graph 2: Ownership-wise implementation progress for SO2 compliance– a comparison). » More than half (about 57 per cent) of
Central-owned capacity (31.6 GW; 73 units) has awarded tenders and another 34 per cent capacity (18.45 GW; 60 units) has floated tenders (as of October 2019).
» Out of private and state-owned plants, only one state-owned plant (comprising two units) has awarded a contract so far.
Unit-wise State SectorCapacity
(MW)Year of
commissioning
Bakreswar Unit 1-5 (WBPDCL) West Bengal State 1,050 2000
Bandel TPS Unit 1-5 West Bengal State 510 1965-1982
Dr N Tata Rao TPS Unit 1-6 Andhra Pradesh State 1,470 1979-1994
Kothagudem TPS (TSGENCO) Unit 1,2,4,5,7-10
Telangana State 1,040 1966-1997
Lalitpur TPP (LPGCL) Unit 1-3 Uttar Pradesh Private 1,980 2016
Neyveli TPS-I Unit 1-9 Tamil Nadu Central 600 1962-1970
North Chennai TPS (TANGEDCO) Unit 4-5
Tamil Nadu State 1,200 2014
Panipat TPS II Unit 5 Haryana State 210 2001
Raikheda TPP (GMR Energy) Unit 1-2
Chhattisgarh Private 1,370 2015-2016
Table 4: Units that have no plans for implementationCSE identified following 41 units from nine plants with “No plan” for implementation of which more than half of the capacity is state-owned. About 83 per cent units (32 units) are smaller capacity units of less than or equal to 250 MW. Also, more than half of the units are old with age greater than 25 years.
Notes: Progress status as of October 2019 Source: Centre for Science and Environment, 2020
SOU
ND
ARA
M R
AM
AN
ATH
AN
/CSE
33
C O A L - B A S E D P O W E R N O R M S
Technology for SO2 controlIndian coal contains sulphur in the range of 0.2-0.7 per cent by weight. With this kind of sulphur content, it is estimated that coal-based power plants in India emit SO2 in the range of 800 mg/Nm3 to 1,600 mg/Nm3.
SO2 emissions can be controlled at three stages:» Pre-combustion: Reducing sulphur content in the coal through coal washing» During combustion: Injecting sorbents in the boiler (CFBC)» Post-combustion: Flue gas treatment using Flue Gas Desulphurisation (FGD) system or dry sorbent
injection technology (DSI)FGD is a control device used by coal-fired power plants across the world to remove SO2 from
exhaust gases from the boiler using an alkaline reagent. The flue gas after removing SO2 is then released into the atmosphere. The first FGD system was installed at the Battersea power station of the London Power Company in the 1930s . FGD is a mature technology today with a large number of installations across USA, Europe and China.
There are two main types of FGD systems:Wet FGD process: Most FGDs installed across the world are of this type, with an SO2 removal efficiency of more than 90 per cent. Based on the reagent, this is further divided into three sub categories – seawater-based FGD, ammonia-based FGD, and limestone-based FGD.
Seawater FGD systems need lesser capital investment compared to the other systems; their operating costs are also lower as they require no reagent for operation. In limestone-based systems, limestone slurry is pumped into the vessel to dissolve SO2 in the flue gas. Gypsum is generated as waste, which can be used as a fertiliser or a construction material. The limestone-based wet FGD systems require an additional 0.2-0.3 m3/MWh water.
Wet FGD is techno-economically feasible for inland power stations, while ammonia-based FGDs are not very popular because the reagent (ammonia) is considerably more expensive and hazardous than limestone. There is a risk of ammonia slip – ammonia releasing into the atmosphere without any reaction taking place in the FGD system, which is a major environmental concern. Hence, limestone-based wet FGD is a preferred option because the reagent is easily available, inexpensive and can be easily handled.
Dry and semi-dry FGD process: This involves sorbent injection in furnace or duct and spray drier absorber (SDA). The reagent used is slaked lime or limestone. For small power generation units (< = 250 MW), a removal efficiency of 50-60 per cent is sufficient to meet the norms if the SO2 emissions are in the range of 800-1,000 mg/Nm3. In such a case, dry sorbent injection (DSI) systems can suffice. DSI utilises calcium-based (calcium hydroxide) and sodium-based (sodium bicarbonate) sorbents to remove SO2. DSI provides a feasible alternative for units that would not find it cost-effective to invest in a wet or dry FGD system. Also, the erection and commissioning period is around one year. Sorbent injection generates extra dust loads on the electrostatic precipitator (ESP), thus necessitating some level of retrofits. Appropriate action for ESPs should, therefore, be undertaken simultaneously.
34
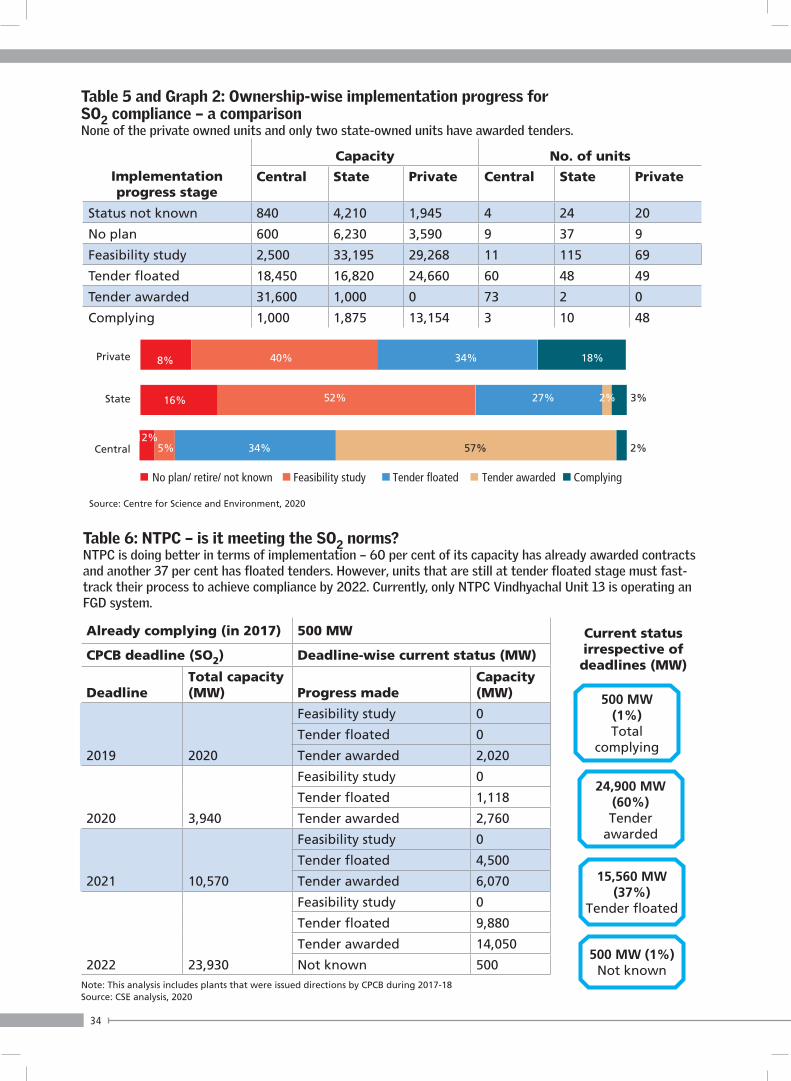
Table 5 and Graph 2: Ownership-wise implementation progress for SO2 compliance – a comparisonNone of the private owned units and only two state-owned units have awarded tenders.
Implementation progress stage
Capacity No. of units
Central State Private Central State Private
Status not known 840 4,210 1,945 4 24 20
No plan 600 6,230 3,590 9 37 9
Feasibility study 2,500 33,195 29,268 11 115 69
Tender floated 18,450 16,820 24,660 60 48 49
Tender awarded 31,600 1,000 0 73 2 0
Complying 1,000 1,875 13,154 3 10 48
No plan/ retire/ not known Feasibility study Tender floated Tender awarded Complying
Private
State
Central
40%8%
16%
12%
52%
34% 57%5%
27% 2% 3%
2%
34% 18%
Source: Centre for Science and Environment, 2020
Already complying (in 2017) 500 MW
CPCB deadline (SO2) Deadline-wise current status (MW)
DeadlineTotal capacity (MW) Progress made
Capacity (MW)
2019 2020
Feasibility study 0
Tender floated 0
Tender awarded 2,020
2020 3,940
Feasibility study 0
Tender floated 1,118
Tender awarded 2,760
2021 10,570
Feasibility study 0
Tender floated 4,500
Tender awarded 6,070
2022 23,930
Feasibility study 0
Tender floated 9,880
Tender awarded 14,050
Not known 500
Table 6: NTPC – is it meeting the SO2 norms? NTPC is doing better in terms of implementation – 60 per cent of its capacity has already awarded contracts and another 37 per cent has floated tenders. However, units that are still at tender floated stage must fast-track their process to achieve compliance by 2022. Currently, only NTPC Vindhyachal Unit 13 is operating an FGD system.
Note: This analysis includes plants that were issued directions by CPCB during 2017-18Source: CSE analysis, 2020
500 MW (1%)Total
complying
24,900 MW (60%)Tender
awarded
15,560 MW (37%)
Tender floated
500 MW (1%)Not known
Current status irrespective of deadlines (MW)
35
C O A L - B A S E D P O W E R N O R M S
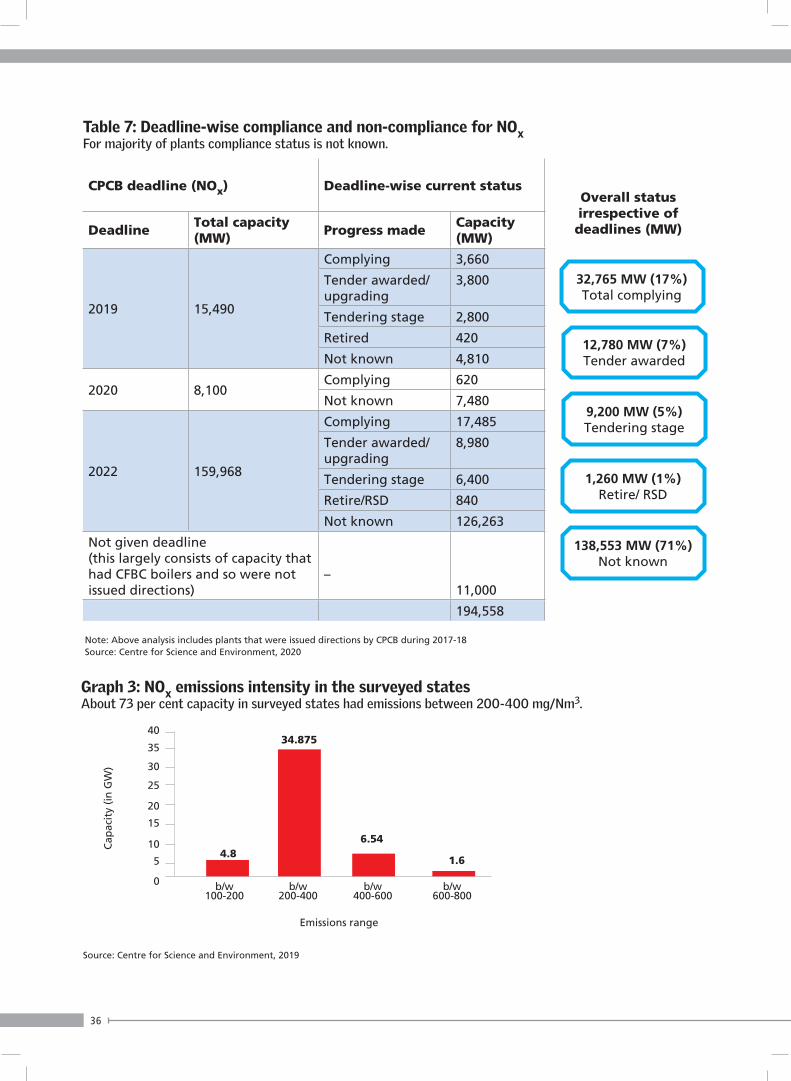
Nitrogen oxide (NOx)There is little information available for NOx standard implementation. For this assessment, we have used data provided by NTPC/DVC to the Supreme Court and the surveys conducted by CSE in key states. As the notification revising the limit to 450 mg/Nm3 has not been issued, it is assumed that the plants have to meet the 2015 standard of 300 mg/Nm3.
Based on surveys conducted by CSE in few states, it was observed that the emissions for most of the plants normally fall within 200-400 mg/Nm3 – these plants have installed either low NOx burners (LNBs) or over fire air (OFA) systems or both. Therefore, with the revision of norms from 300 to 450 mg/Nm3, such plants will be in compliance (see Table 7 and Graph 3: NOx emissions intensity in the surveyed states).
Plants commissioned after January 1, 2017 have to meet a stringent norm of 100 mg/Nm3 – this cannot be achieved by a mere installation of OFAs and low-NOx burners. What is needed are effective technologies like SCR/SNCR. However, the power industry is unsure about the effectiveness of SCR for high dust loading (over 90 g/Nm3) which is typical to India. Also, SCR systems require ammonia as a reagent. The availability, transportation and handling of ammonia is another bottleneck. According to the power industry, SCR equipment have been working under dust load of less than 60-70 g/Nm3. The National Thermal Power Corporation (NTPC) has been working on pilot projects (eight SCR and two SNCR) that will have a cyclone prior to SCR/SNCR to bring down the dust levels to test its suitability for Indian coal. However, the results and status of these pilot projects have not been disclosed yet.
No plan, and in polluted zonesStatus of non-complying units at feasibility study/tender floated/no plan stage which are located in critically polluted or densely populated (over 400 persons/sq km) areas, and have a capacity of 500 MW and above» About 134 GW of the non-complying capacity is at feasibility study/
tender floated/no plan stage. Of this, more than half (72 GW; 245 units) is located in critically polluted or densely populated regions.
» Of this 72 GW, about 53 GW (62 units) capacity comprises of units which are 500 MW and above.
» Since the extent of pollution is proportional to the capacity of the unit and the adverse health impact is more in critically polluted or densely populated regions, these units must fast-track their implementation process to achieve compliance.
» But since these units have not yet awarded tenders, it is highly unlikely for them to meet the compliance by 2022.
36
Cap
acit
y (i
n G
W)
b/w 100-200
b/w 200-400
b/w 400-600
b/w 600-800
0
5
10
15
20
25
30
35
40
Graph 3: NOx emissions intensity in the surveyed statesAbout 73 per cent capacity in surveyed states had emissions between 200-400 mg/Nm3.
Source: Centre for Science and Environment, 2019
4.8
34.875
6.54
1.6
Emissions range
Table 7: Deadline-wise compliance and non-compliance for NOxFor majority of plants compliance status is not known.
CPCB deadline (NOx) Deadline-wise current status
DeadlineTotal capacity (MW)
Progress madeCapacity (MW)
2019 15,490
Complying 3,660
Tender awarded/ upgrading
3,800
Tendering stage 2,800
Retired 420
Not known 4,810
2020 8,100Complying 620
Not known 7,480
2022 159,968
Complying 17,485
Tender awarded/ upgrading
8,980
Tendering stage 6,400
Retire/RSD 840
Not known 126,263
Not given deadline(this largely consists of capacity that had CFBC boilers and so were not issued directions)
–11,000
194,558
Note: Above analysis includes plants that were issued directions by CPCB during 2017-18Source: Centre for Science and Environment, 2020
32,765 MW (17%)Total complying
12,780 MW (7%)Tender awarded
9,200 MW (5%)Tendering stage
1,260 MW (1%)Retire/ RSD
138,553 MW (71%)Not known
Overall status irrespective of deadlines (MW)
37
C O A L - B A S E D P O W E R N O R M S
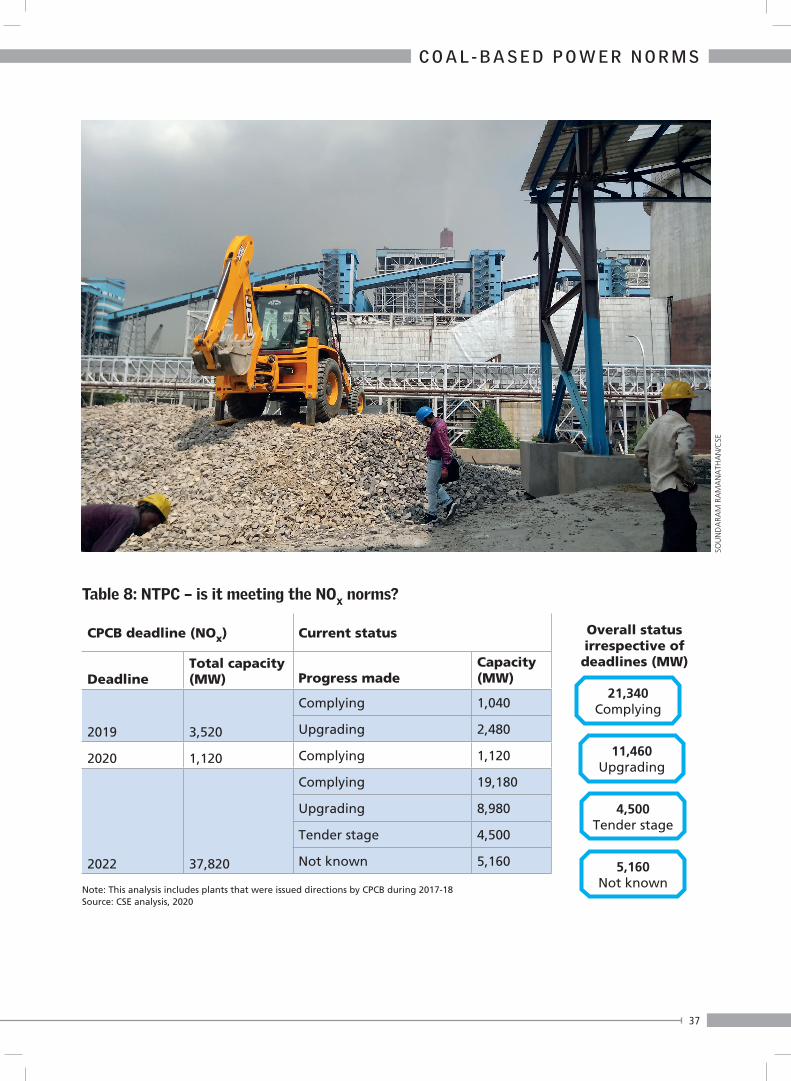
CPCB deadline (NOx) Current status
DeadlineTotal capacity (MW) Progress made
Capacity (MW)
2019 3,520
Complying 1,040
Upgrading 2,480
2020 1,120 Complying 1,120
2022 37,820
Complying 19,180
Upgrading 8,980
Tender stage 4,500
Not known 5,160
Table 8: NTPC – is it meeting the NOx norms?
Note: This analysis includes plants that were issued directions by CPCB during 2017-18Source: CSE analysis, 2020
21,340Complying
11,460Upgrading
4,500Tender stage
5,160 Not known
Overall status irrespective of deadlines (MW)
SOU
ND
ARA
M R
AM
AN
ATH
AN
/CSE
38
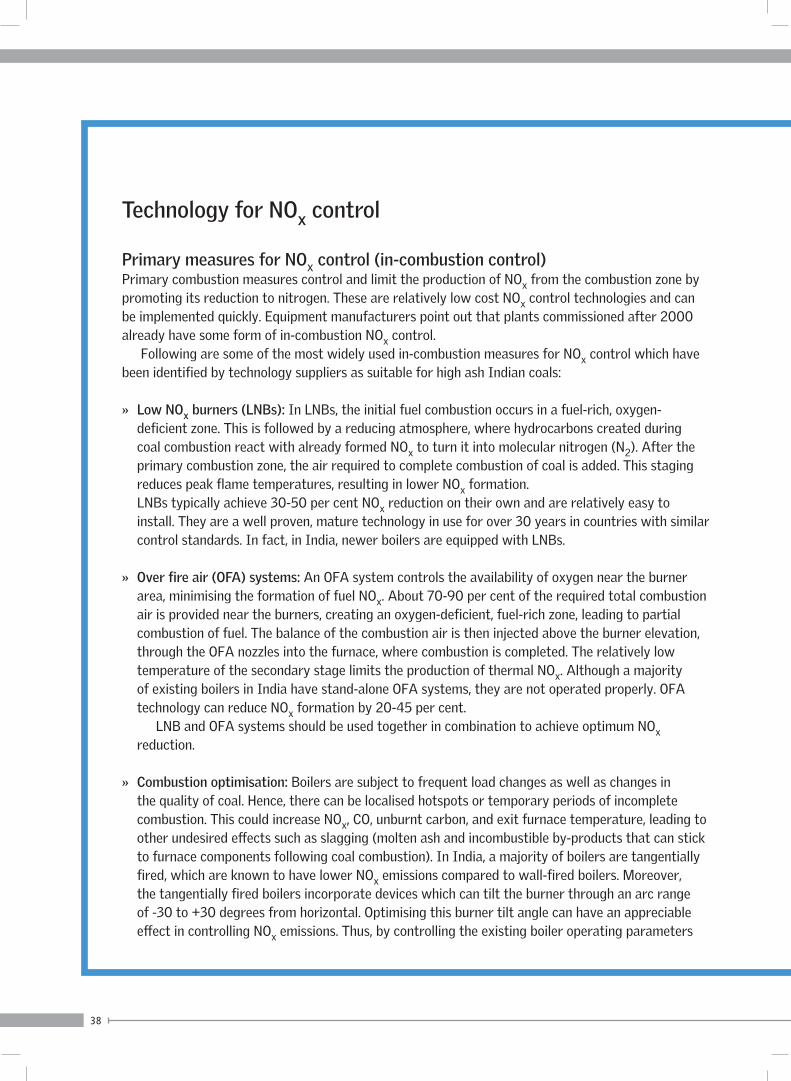
Technology for NOx control
Primary measures for NOx control (in-combustion control)Primary combustion measures control and limit the production of NOx from the combustion zone by promoting its reduction to nitrogen. These are relatively low cost NOx control technologies and can be implemented quickly. Equipment manufacturers point out that plants commissioned after 2000 already have some form of in-combustion NOx control.
Following are some of the most widely used in-combustion measures for NOx control which have been identified by technology suppliers as suitable for high ash Indian coals:
» Low NOx burners (LNBs): In LNBs, the initial fuel combustion occurs in a fuel-rich, oxygen-deficient zone. This is followed by a reducing atmosphere, where hydrocarbons created during coal combustion react with already formed NOx to turn it into molecular nitrogen (N2). After the primary combustion zone, the air required to complete combustion of coal is added. This staging reduces peak flame temperatures, resulting in lower NOx formation. LNBs typically achieve 30-50 per cent NOx reduction on their own and are relatively easy to install. They are a well proven, mature technology in use for over 30 years in countries with similar control standards. In fact, in India, newer boilers are equipped with LNBs.
» Over fire air (OFA) systems: An OFA system controls the availability of oxygen near the burner area, minimising the formation of fuel NOx. About 70-90 per cent of the required total combustion air is provided near the burners, creating an oxygen-deficient, fuel-rich zone, leading to partial combustion of fuel. The balance of the combustion air is then injected above the burner elevation, through the OFA nozzles into the furnace, where combustion is completed. The relatively low temperature of the secondary stage limits the production of thermal NOx. Although a majority of existing boilers in India have stand-alone OFA systems, they are not operated properly. OFA technology can reduce NOx formation by 20-45 per cent. LNB and OFA systems should be used together in combination to achieve optimum NOx reduction.
» Combustion optimisation: Boilers are subject to frequent load changes as well as changes in the quality of coal. Hence, there can be localised hotspots or temporary periods of incomplete combustion. This could increase NOx, CO, unburnt carbon, and exit furnace temperature, leading to other undesired effects such as slagging (molten ash and incombustible by-products that can stick to furnace components following coal combustion). In India, a majority of boilers are tangentially fired, which are known to have lower NOx emissions compared to wall-fired boilers. Moreover, the tangentially fired boilers incorporate devices which can tilt the burner through an arc range of -30 to +30 degrees from horizontal. Optimising this burner tilt angle can have an appreciable effect in controlling NOx emissions. Thus, by controlling the existing boiler operating parameters
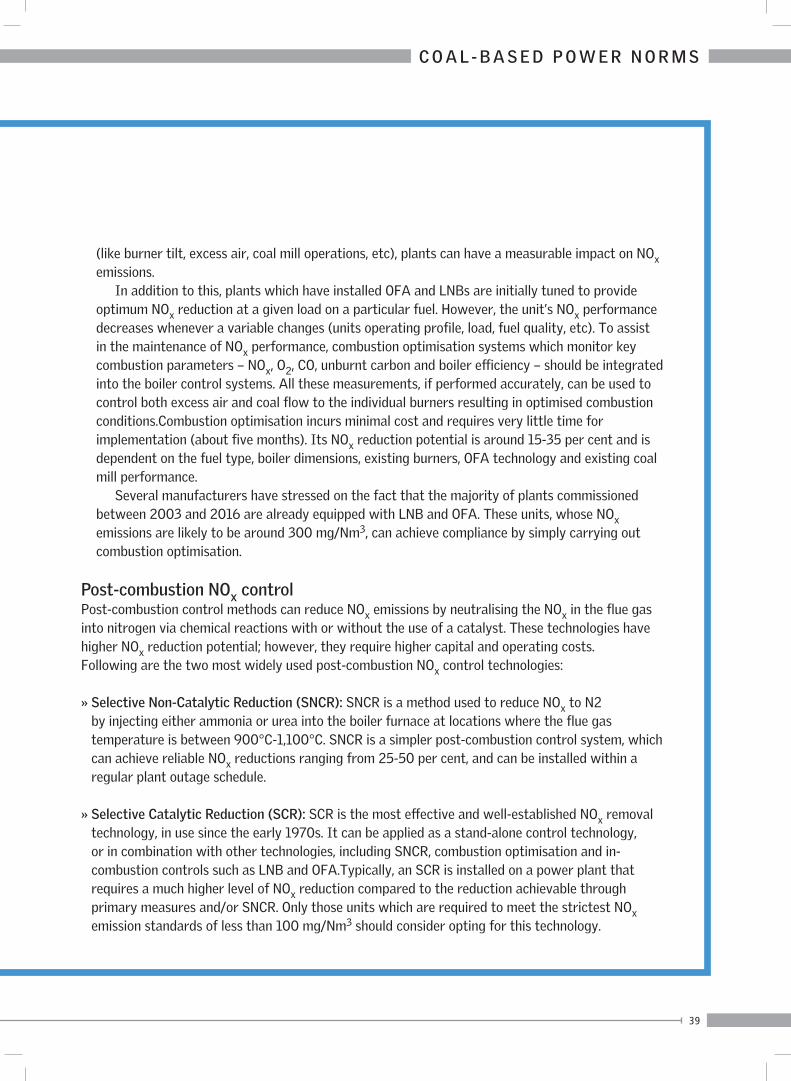
39
C O A L - B A S E D P O W E R N O R M S
(like burner tilt, excess air, coal mill operations, etc), plants can have a measurable impact on NOx emissions. In addition to this, plants which have installed OFA and LNBs are initially tuned to provide optimum NOx reduction at a given load on a particular fuel. However, the unit’s NOx performance decreases whenever a variable changes (units operating profile, load, fuel quality, etc). To assist in the maintenance of NOx performance, combustion optimisation systems which monitor key combustion parameters – NOx, O2, CO, unburnt carbon and boiler efficiency – should be integrated into the boiler control systems. All these measurements, if performed accurately, can be used to control both excess air and coal flow to the individual burners resulting in optimised combustion conditions.Combustion optimisation incurs minimal cost and requires very little time for implementation (about five months). Its NOx reduction potential is around 15-35 per cent and is dependent on the fuel type, boiler dimensions, existing burners, OFA technology and existing coal mill performance. Several manufacturers have stressed on the fact that the majority of plants commissioned between 2003 and 2016 are already equipped with LNB and OFA. These units, whose NOx emissions are likely to be around 300 mg/Nm3, can achieve compliance by simply carrying out combustion optimisation.
Post-combustion NOx control Post-combustion control methods can reduce NOx emissions by neutralising the NOx in the flue gas into nitrogen via chemical reactions with or without the use of a catalyst. These technologies have higher NOx reduction potential; however, they require higher capital and operating costs. Following are the two most widely used post-combustion NOx control technologies:
» Selective Non-Catalytic Reduction (SNCR): SNCR is a method used to reduce NOx to N2 by injecting either ammonia or urea into the boiler furnace at locations where the flue gas temperature is between 900°C-1,100°C. SNCR is a simpler post-combustion control system, which can achieve reliable NOx reductions ranging from 25-50 per cent, and can be installed within a regular plant outage schedule.
» Selective Catalytic Reduction (SCR): SCR is the most effective and well-established NOx removal technology, in use since the early 1970s. It can be applied as a stand-alone control technology, or in combination with other technologies, including SNCR, combustion optimisation and in-combustion controls such as LNB and OFA.Typically, an SCR is installed on a power plant that requires a much higher level of NOx reduction compared to the reduction achievable through primary measures and/or SNCR. Only those units which are required to meet the strictest NOx emission standards of less than 100 mg/Nm3 should consider opting for this technology.
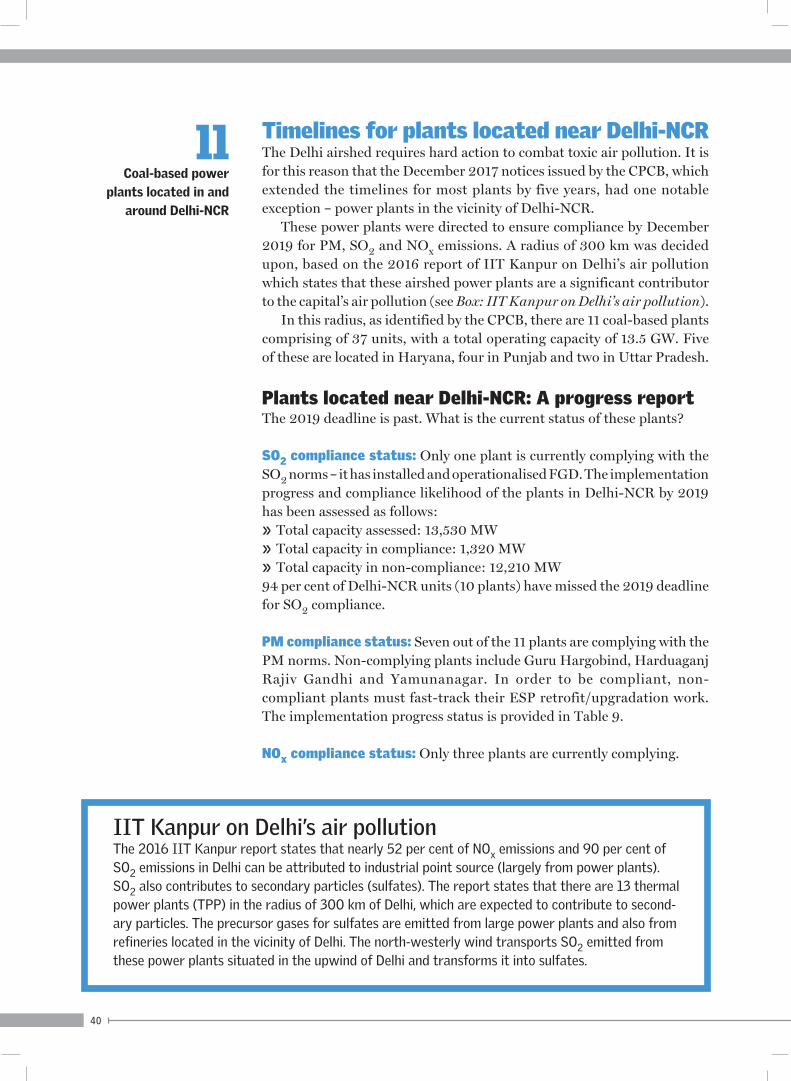
40
Timelines for plants located near Delhi-NCRThe Delhi airshed requires hard action to combat toxic air pollution. It is for this reason that the December 2017 notices issued by the CPCB, which extended the timelines for most plants by five years, had one notable exception – power plants in the vicinity of Delhi-NCR.
These power plants were directed to ensure compliance by December 2019 for PM, SO2 and NOx emissions. A radius of 300 km was decided upon, based on the 2016 report of IIT Kanpur on Delhi’s air pollution which states that these airshed power plants are a significant contributor to the capital’s air pollution (see Box: IIT Kanpur on Delhi’s air pollution).
In this radius, as identified by the CPCB, there are 11 coal-based plants comprising of 37 units, with a total operating capacity of 13.5 GW. Five of these are located in Haryana, four in Punjab and two in Uttar Pradesh.
Plants located near Delhi-NCR: A progress reportThe 2019 deadline is past. What is the current status of these plants?
SO2 compliance status: Only one plant is currently complying with the SO2 norms – it has installed and operationalised FGD. The implementation progress and compliance likelihood of the plants in Delhi-NCR by 2019 has been assessed as follows:» Total capacity assessed: 13,530 MW» Total capacity in compliance: 1,320 MW» Total capacity in non-compliance: 12,210 MW94 per cent of Delhi-NCR units (10 plants) have missed the 2019 deadline for SO2 compliance.
PM compliance status: Seven out of the 11 plants are complying with the PM norms. Non-complying plants include Guru Hargobind, Harduaganj Rajiv Gandhi and Yamunanagar. In order to be compliant, non-compliant plants must fast-track their ESP retrofit/upgradation work. The implementation progress status is provided in Table 9.
NOx compliance status: Only three plants are currently complying.
IIT Kanpur on Delhi’s air pollutionThe 2016 IIT Kanpur report states that nearly 52 per cent of NOx emissions and 90 per cent of SO2 emissions in Delhi can be attributed to industrial point source (largely from power plants). SO2 also contributes to secondary particles (sulfates). The report states that there are 13 thermal power plants (TPP) in the radius of 300 km of Delhi, which are expected to contribute to second-ary particles. The precursor gases for sulfates are emitted from large power plants and also from refineries located in the vicinity of Delhi. The north-westerly wind transports SO2 emitted from these power plants situated in the upwind of Delhi and transforms it into sulfates.
11Coal-based power
plants located in and around Delhi-NCR
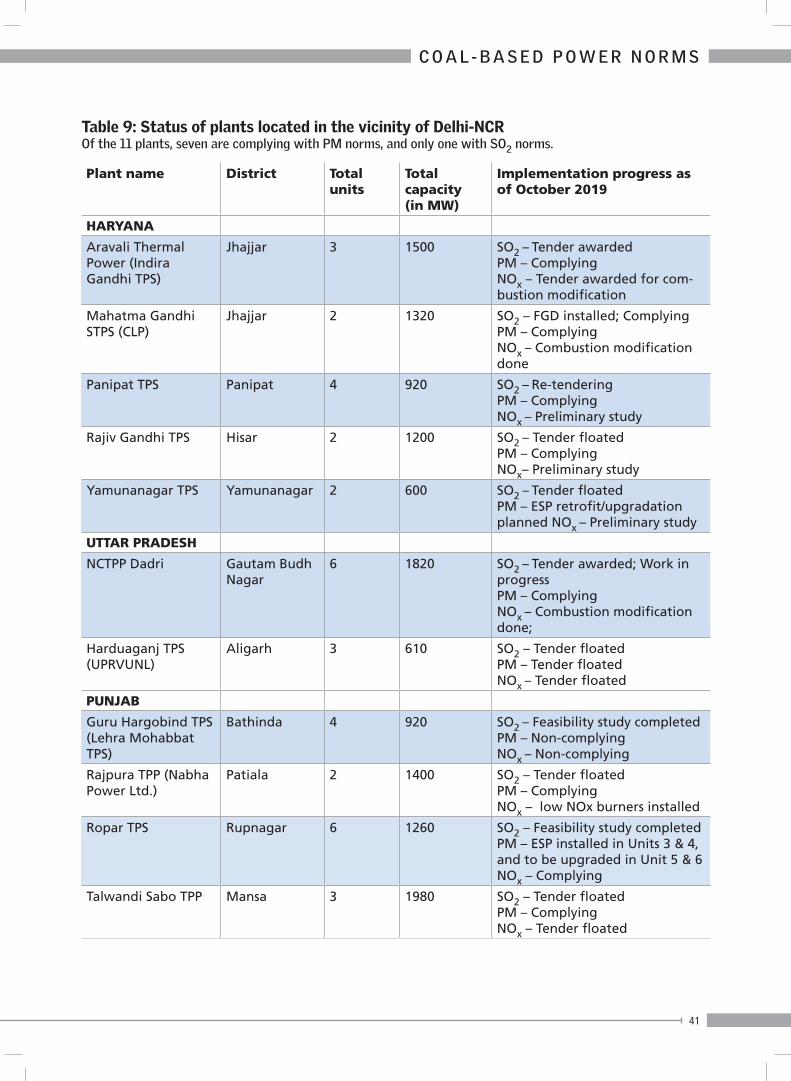
41
C O A L - B A S E D P O W E R N O R M S
Plant name District Total units
Total capacity (in MW)
Implementation progress as of October 2019
HARYANA
Aravali Thermal Power (Indira Gandhi TPS)
Jhajjar 3 1500 SO2 – Tender awarded PM – Complying NOx – Tender awarded for com-bustion modification
Mahatma Gandhi STPS (CLP)
Jhajjar 2 1320 SO2 – FGD installed; Complying PM – Complying NOx – Combustion modification done
Panipat TPS Panipat 4 920 SO2 – Re-tendering PM – Complying NOx – Preliminary study
Rajiv Gandhi TPS Hisar 2 1200 SO2 – Tender floated PM – Complying NOx– Preliminary study
Yamunanagar TPS Yamunanagar 2 600 SO2 – Tender floated PM – ESP retrofit/upgradation planned NOx – Preliminary study
UTTAR PRADESH
NCTPP Dadri Gautam Budh Nagar
6 1820 SO2 – Tender awarded; Work in progress PM – Complying NOx – Combustion modification done;
Harduaganj TPS (UPRVUNL)
Aligarh 3 610 SO2 – Tender floated PM – Tender floated NOx – Tender floated
PUNJAB
Guru Hargobind TPS (Lehra Mohabbat TPS)
Bathinda 4 920 SO2 – Feasibility study completed PM – Non-complying NOx – Non-complying
Rajpura TPP (Nabha Power Ltd.)
Patiala 2 1400 SO2 – Tender floated PM – Complying NOx – low NOx burners installed
Ropar TPS Rupnagar 6 1260 SO2 – Feasibility study completed PM – ESP installed in Units 3 & 4, and to be upgraded in Unit 5 & 6 NOx – Complying
Talwandi Sabo TPP Mansa 3 1980 SO2 – Tender floated PM – Complying NOx – Tender floated
Table 9: Status of plants located in the vicinity of Delhi-NCROf the 11 plants, seven are complying with PM norms, and only one with SO2 norms.
42
Delhi-NCR plants – retirement plansDelhi and its surrounding 300-km area had 2,140 MW (15 units in four power stations) of capacity, which was commissioned before 1990. Of this, all except 420 MW (two units in one power station) has been retired.
NTPC Badarpur: Since August 2015, the NTPC Badarpur plant had been operating at a partial load. Only two 210-MW units had been operational; since early November 2015, only one 210-MW unit has functioned. The station was inefficient and had been generating expensive power. The EPCA had advised the station to close down. Delhi’s discoms and the government wanted to surrender the power allocation, but were unable to do so due to constraints in transmission lines.
A new inter-state transmission line (ISTS) was commissioned in 2018 to solve the constraint after repeated advice by the EPCA. As committed, the station retired in October 2018 after four decades of operation.
Guru Gobind Singh STPS: This Ropar power station is past its design life. The management was planning to close it down and replace it with super-critical units. However, the closure decision has been taken only for two of the units (due to uneconomic power generation). The closure spurred protests by the employee’s union, though the state government managed to withstand them by offering a rehabilitation package. Apart from upgrading to meet the emission norms, the plant has to also install a cooling tower to meet the new water norms.
Guru Nanak Dev TPP: Since 2014, the plant had been operating for an average of only 15 days in a year. The monthly expenditure to maintain this came to Rs 1,300 crore. Hence, the state government, in 2017, announced closure of the plant. The plant is spread across 2,200 acre in the middle of Bhatinda city – no decision has been taken yet on alternative use of this land.
Rajghat Thermal Power Station: The Rajghat station had been in a reserve shutdown mode since 2014. Its closure was pending settlement of issues such as affixing of the residual value, employee relocation etc. In mid-2019, the Delhi government finally decided to ‘officially’ shut down the plant. The 45-acre land area of the power station will be used to build a 5,000-kW solar park.
420 MWCapacity waiting to be
retired (out of 2,140 MW) in Delhi and its surrounding
300-km area
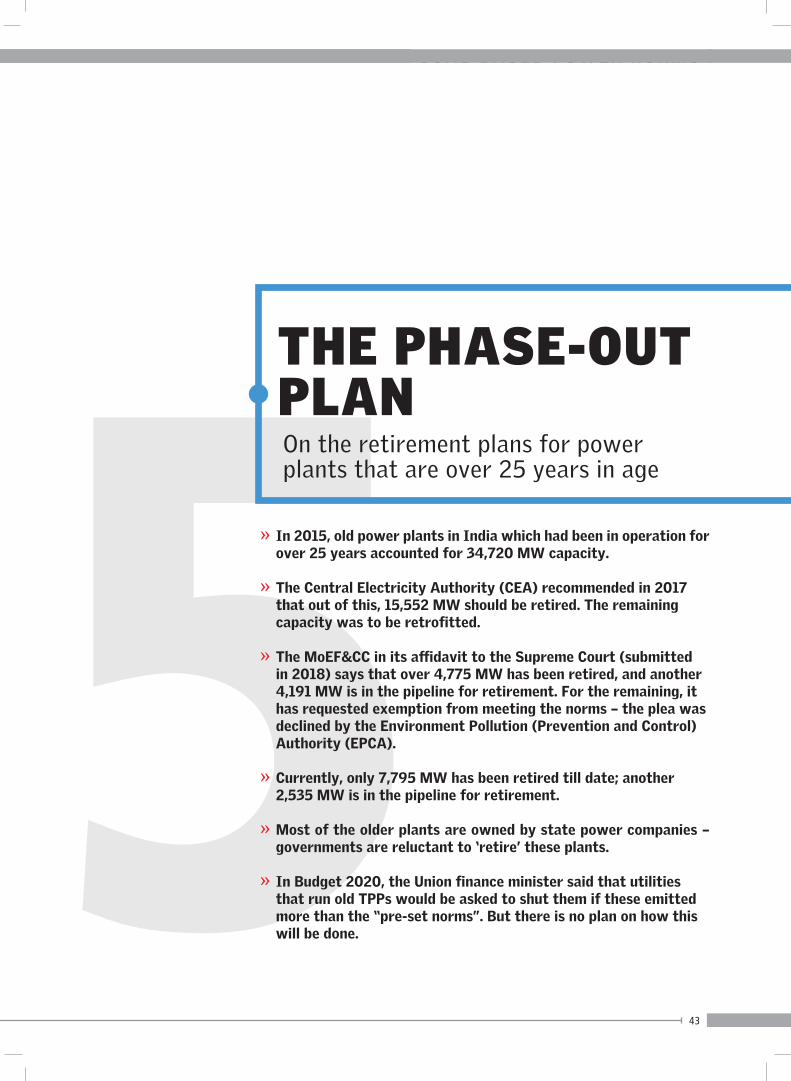
43
C O A L - B A S E D P O W E R N O R M S
5On the retirement plans for power plants that are over 25 years in age
» In 2015, old power plants in India which had been in operation for over 25 years accounted for 34,720 MW capacity.
» The Central Electricity Authority (CEA) recommended in 2017 that out of this, 15,552 MW should be retired. The remaining capacity was to be retrofitted.
» The MoEF&CC in its affidavit to the Supreme Court (submitted in 2018) says that over 4,775 MW has been retired, and another 4,191 MW is in the pipeline for retirement. For the remaining, it has requested exemption from meeting the norms – the plea was declined by the Environment Pollution (Prevention and Control) Authority (EPCA).
» Currently, only 7,795 MW has been retired till date; another 2,535 MW is in the pipeline for retirement.
» Most of the older plants are owned by state power companies – governments are reluctant to ‘retire’ these plants.
» In Budget 2020, the Union finance minister said that utilities that run old TPPs would be asked to shut them if these emitted more than the “pre-set norms”. But there is no plan on how this will be done.
THE PHASE-OUT PLAN
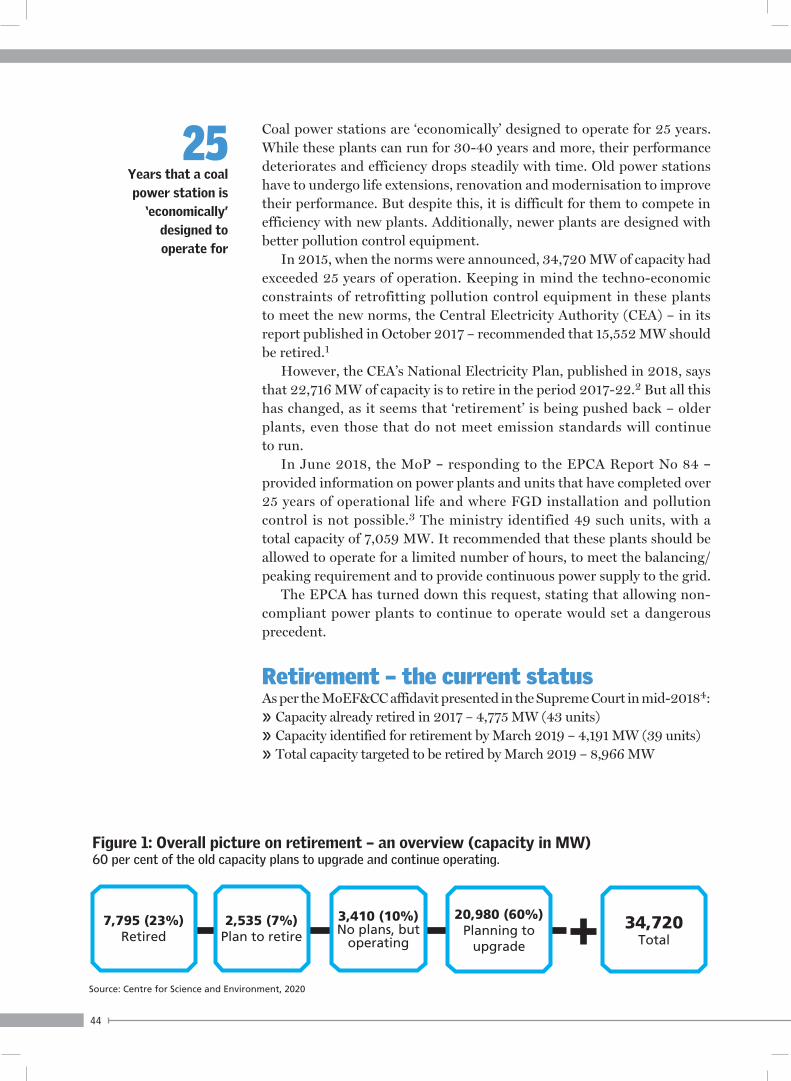
44
Coal power stations are ‘economically’ designed to operate for 25 years. While these plants can run for 30-40 years and more, their performance deteriorates and efficiency drops steadily with time. Old power stations have to undergo life extensions, renovation and modernisation to improve their performance. But despite this, it is difficult for them to compete in efficiency with new plants. Additionally, newer plants are designed with better pollution control equipment.
In 2015, when the norms were announced, 34,720 MW of capacity had exceeded 25 years of operation. Keeping in mind the techno-economic constraints of retrofitting pollution control equipment in these plants to meet the new norms, the Central Electricity Authority (CEA) – in its report published in October 2017 – recommended that 15,552 MW should be retired.1
However, the CEA’s National Electricity Plan, published in 2018, says that 22,716 MW of capacity is to retire in the period 2017-22.2 But all this has changed, as it seems that ‘retirement’ is being pushed back – older plants, even those that do not meet emission standards will continue to run.
In June 2018, the MoP – responding to the EPCA Report No 84 – provided information on power plants and units that have completed over 25 years of operational life and where FGD installation and pollution control is not possible.3 The ministry identified 49 such units, with a total capacity of 7,059 MW. It recommended that these plants should be allowed to operate for a limited number of hours, to meet the balancing/peaking requirement and to provide continuous power supply to the grid.
The EPCA has turned down this request, stating that allowing non-compliant power plants to continue to operate would set a dangerous precedent.
Retirement – the current statusAs per the MoEF&CC affidavit presented in the Supreme Court in mid-20184:» Capacity already retired in 2017 – 4,775 MW (43 units)» Capacity identified for retirement by March 2019 – 4,191 MW (39 units)» Total capacity targeted to be retired by March 2019 – 8,966 MW
Figure 1: Overall picture on retirement – an overview (capacity in MW)60 per cent of the old capacity plans to upgrade and continue operating.
Source: Centre for Science and Environment, 2020
7,795 (23%)Retired
20,980 (60%)Planning to
upgrade
34,720Total
2,535 (7%)Plan to retire
3,410 (10%)No plans, but
operating
25Years that a coal power station is
‘economically’ designed to operate for
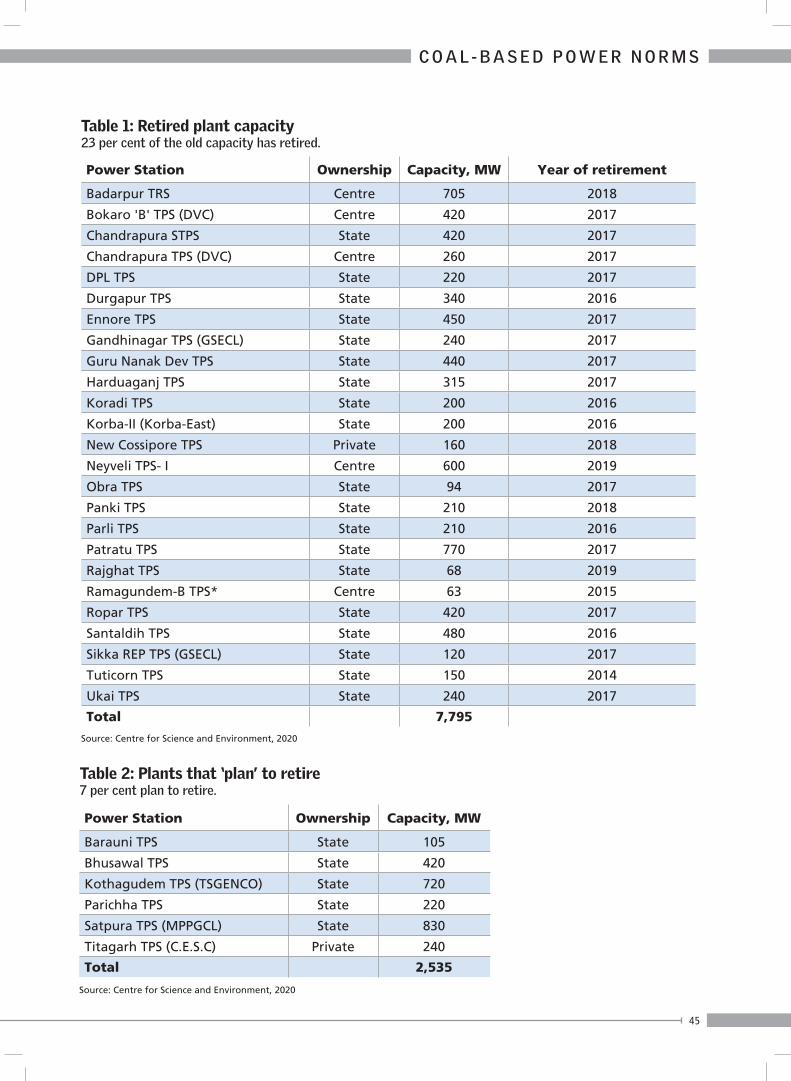
45
C O A L - B A S E D P O W E R N O R M S
Source: Centre for Science and Environment, 2020
Power Station Ownership Capacity, MW Year of retirement
Badarpur TRS Centre 705 2018
Bokaro 'B' TPS (DVC) Centre 420 2017
Chandrapura STPS State 420 2017
Chandrapura TPS (DVC) Centre 260 2017
DPL TPS State 220 2017
Durgapur TPS State 340 2016
Ennore TPS State 450 2017
Gandhinagar TPS (GSECL) State 240 2017
Guru Nanak Dev TPS State 440 2017
Harduaganj TPS State 315 2017
Koradi TPS State 200 2016
Korba-II (Korba-East) State 200 2016
New Cossipore TPS Private 160 2018
Neyveli TPS- I Centre 600 2019
Obra TPS State 94 2017
Panki TPS State 210 2018
Parli TPS State 210 2016
Patratu TPS State 770 2017
Rajghat TPS State 68 2019
Ramagundem-B TPS* Centre 63 2015
Ropar TPS State 420 2017
Santaldih TPS State 480 2016
Sikka REP TPS (GSECL) State 120 2017
Tuticorn TPS State 150 2014
Ukai TPS State 240 2017
Total 7,795
Source: Centre for Science and Environment, 2020
Table 1: Retired plant capacity23 per cent of the old capacity has retired.
Table 2: Plants that ‘plan’ to retire7 per cent plan to retire.
Power Station Ownership Capacity, MW
Barauni TPS State 105
Bhusawal TPS State 420
Kothagudem TPS (TSGENCO) State 720
Parichha TPS State 220
Satpura TPS (MPPGCL) State 830
Titagarh TPS (C.E.S.C) Private 240
Total 2,535
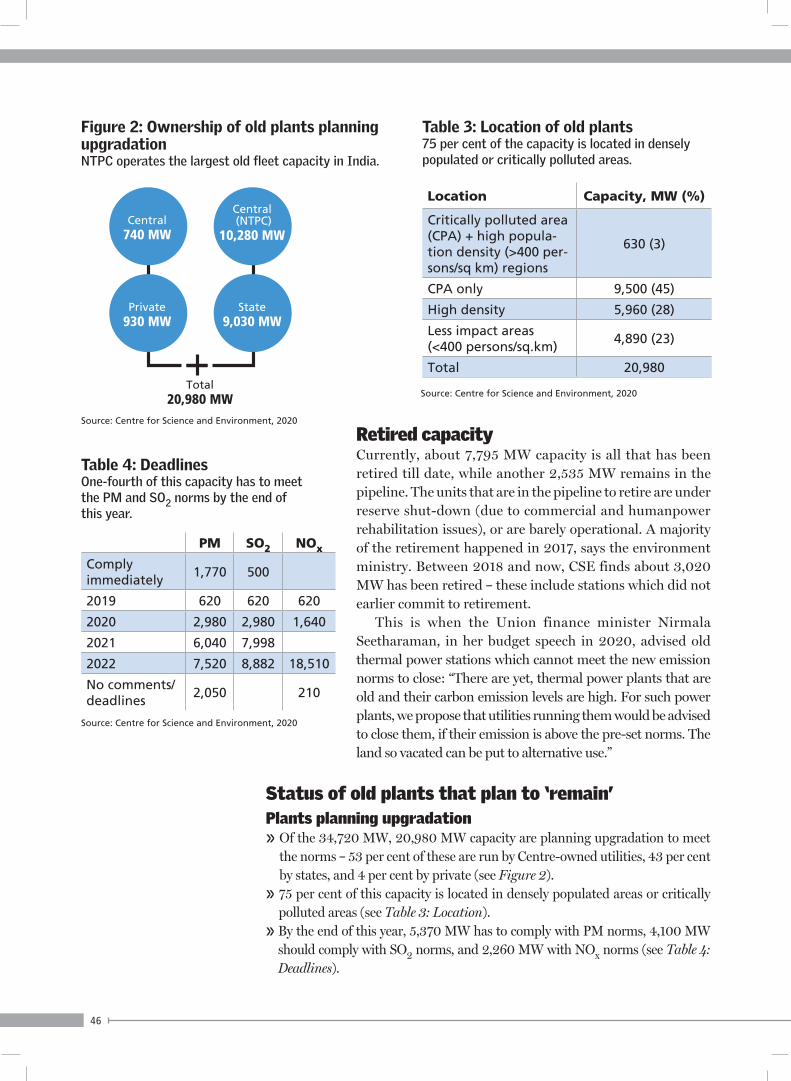
46
Figure 2: Ownership of old plants planning upgradationNTPC operates the largest old fleet capacity in India.
Central740 MW
Private930 MW
Total20,980 MW
Central (NTPC)
10,280 MW
State9,030 MW
Source: Centre for Science and Environment, 2020
Source: Centre for Science and Environment, 2020
Location Capacity, MW (%)
Critically polluted area (CPA) + high popula-tion density (>400 per-sons/sq km) regions
630 (3)
CPA only 9,500 (45)
High density 5,960 (28)
Less impact areas (<400 persons/sq.km)
4,890 (23)
Total 20,980
Table 3: Location of old plants75 per cent of the capacity is located in densely populated or critically polluted areas.
Retired capacityCurrently, about 7,795 MW capacity is all that has been retired till date, while another 2,535 MW remains in the pipeline. The units that are in the pipeline to retire are under reserve shut-down (due to commercial and humanpower rehabilitation issues), or are barely operational. A majority of the retirement happened in 2017, says the environment ministry. Between 2018 and now, CSE finds about 3,020 MW has been retired – these include stations which did not earlier commit to retirement.
This is when the Union finance minister Nirmala Seetharaman, in her budget speech in 2020, advised old thermal power stations which cannot meet the new emission norms to close: “There are yet, thermal power plants that are old and their carbon emission levels are high. For such power plants, we propose that utilities running them would be advised to close them, if their emission is above the pre-set norms. The land so vacated can be put to alternative use.”
Status of old plants that plan to ‘remain’Plants planning upgradation» Of the 34,720 MW, 20,980 MW capacity are planning upgradation to meet
the norms – 53 per cent of these are run by Centre-owned utilities, 43 per cent by states, and 4 per cent by private (see Figure 2).
» 75 per cent of this capacity is located in densely populated areas or critically polluted areas (see Table 3: Location).
» By the end of this year, 5,370 MW has to comply with PM norms, 4,100 MW should comply with SO2 norms, and 2,260 MW with NOx norms (see Table 4: Deadlines).
Source: Centre for Science and Environment, 2020
PM SO2 NOx
Comply immediately
1,770 500
2019 620 620 620
2020 2,980 2,980 1,640
2021 6,040 7,998
2022 7,520 8,882 18,510
No comments/deadlines
2,050 210
Table 4: Deadlines One-fourth of this capacity has to meet the PM and SO2 norms by the end of this year.
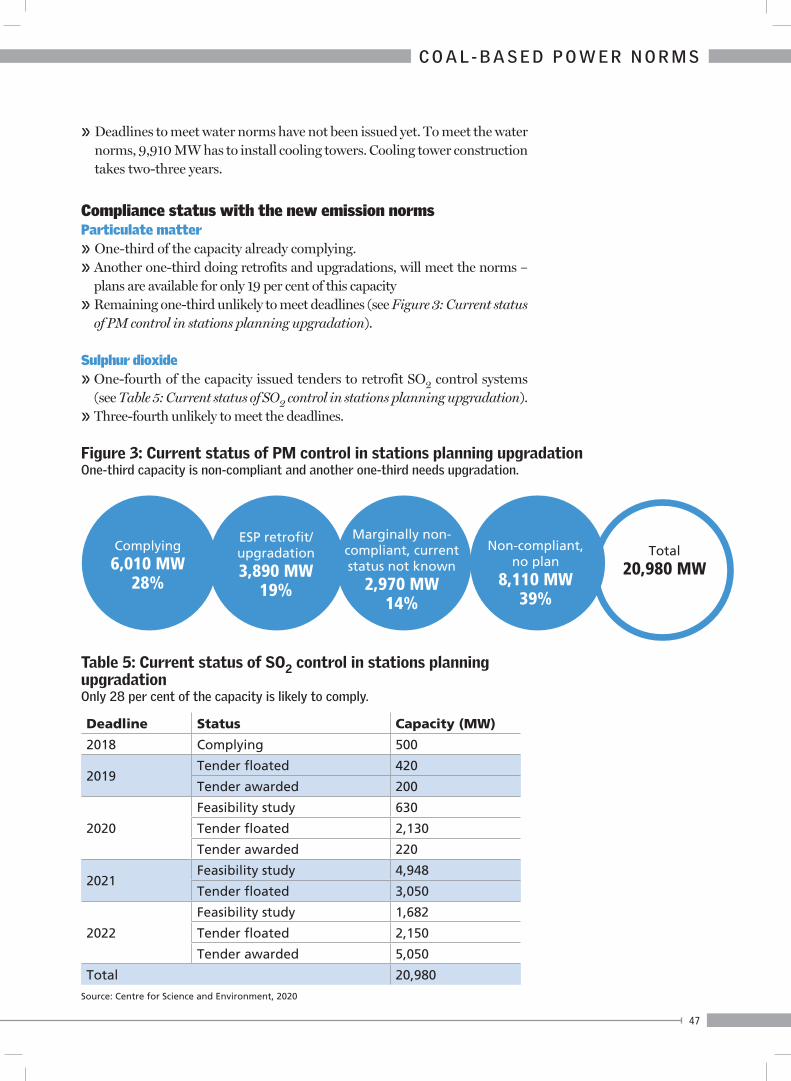
47
C O A L - B A S E D P O W E R N O R M S
» Deadlines to meet water norms have not been issued yet. To meet the water norms, 9,910 MW has to install cooling towers. Cooling tower construction takes two-three years.
Compliance status with the new emission normsParticulate matter» One-third of the capacity already complying. » Another one-third doing retrofits and upgradations, will meet the norms –
plans are available for only 19 per cent of this capacity» Remaining one-third unlikely to meet deadlines (see Figure 3: Current status
of PM control in stations planning upgradation).
Sulphur dioxide » One-fourth of the capacity issued tenders to retrofit SO2 control systems
(see Table 5: Current status of SO2 control in stations planning upgradation). » Three-fourth unlikely to meet the deadlines.
Figure 3: Current status of PM control in stations planning upgradationOne-third capacity is non-compliant and another one-third needs upgradation.
Deadline Status Capacity (MW)
2018 Complying 500
2019Tender floated 420
Tender awarded 200
2020
Feasibility study 630
Tender floated 2,130
Tender awarded 220
2021Feasibility study 4,948
Tender floated 3,050
2022
Feasibility study 1,682
Tender floated 2,150
Tender awarded 5,050
Total 20,980
Table 5: Current status of SO2 control in stations planning upgradationOnly 28 per cent of the capacity is likely to comply.
Complying6,010 MW
28%
ESP retrofit/ upgradation3,890 MW
19%
Marginally non-compliant, current status not known
2,970 MW14%
Non-compliant, no plan
8,110 MW39%
Total20,980 MW
Source: Centre for Science and Environment, 2020
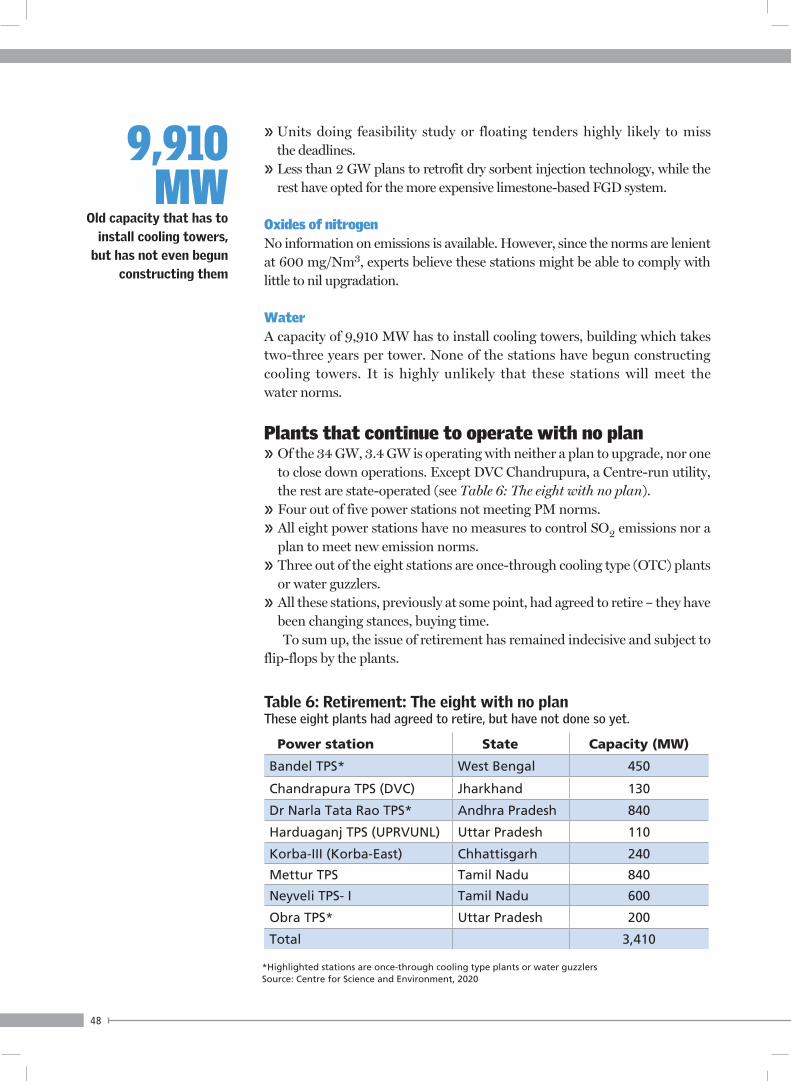
48
» Units doing feasibility study or floating tenders highly likely to miss the deadlines.
» Less than 2 GW plans to retrofit dry sorbent injection technology, while the rest have opted for the more expensive limestone-based FGD system.
Oxides of nitrogen No information on emissions is available. However, since the norms are lenient at 600 mg/Nm3, experts believe these stations might be able to comply with little to nil upgradation.
Water A capacity of 9,910 MW has to install cooling towers, building which takes two-three years per tower. None of the stations have begun constructing cooling towers. It is highly unlikely that these stations will meet the water norms.
Plants that continue to operate with no plan» Of the 34 GW, 3.4 GW is operating with neither a plan to upgrade, nor one
to close down operations. Except DVC Chandrupura, a Centre-run utility, the rest are state-operated (see Table 6: The eight with no plan).
» Four out of five power stations not meeting PM norms.» All eight power stations have no measures to control SO2 emissions nor a
plan to meet new emission norms.» Three out of the eight stations are once-through cooling type (OTC) plants
or water guzzlers.» All these stations, previously at some point, had agreed to retire – they have
been changing stances, buying time.To sum up, the issue of retirement has remained indecisive and subject to
flip-flops by the plants.
Power station State Capacity (MW)
Bandel TPS* West Bengal 450
Chandrapura TPS (DVC) Jharkhand 130
Dr Narla Tata Rao TPS* Andhra Pradesh 840
Harduaganj TPS (UPRVUNL) Uttar Pradesh 110
Korba-III (Korba-East) Chhattisgarh 240
Mettur TPS Tamil Nadu 840
Neyveli TPS- I Tamil Nadu 600
Obra TPS* Uttar Pradesh 200
Total 3,410
Table 6: Retirement: The eight with no planThese eight plants had agreed to retire, but have not done so yet.
*Highlighted stations are once-through cooling type plants or water guzzlersSource: Centre for Science and Environment, 2020
9,910 MW
Old capacity that has to install cooling towers,
but has not even begun constructing them
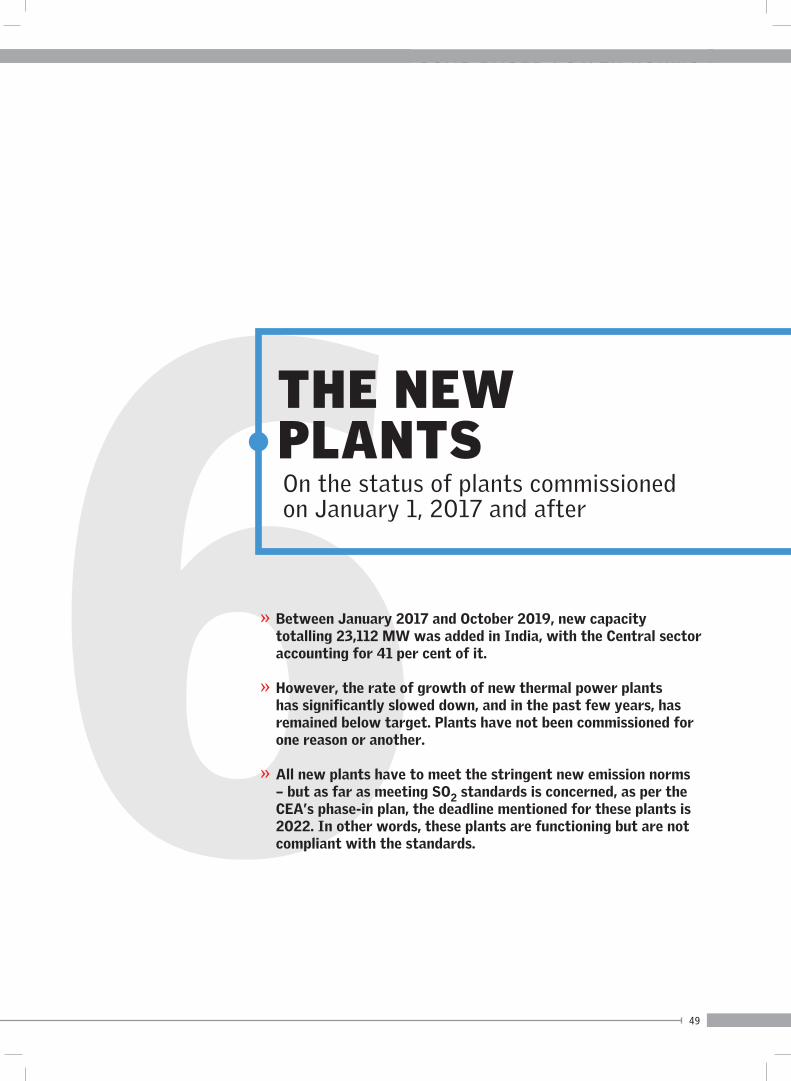
49
C O A L - B A S E D P O W E R N O R M S
6On the status of plants commissioned on January 1, 2017 and after
» Between January 2017 and October 2019, new capacity totalling 23,112 MW was added in India, with the Central sector accounting for 41 per cent of it.
» However, the rate of growth of new thermal power plants has significantly slowed down, and in the past few years, has remained below target. Plants have not been commissioned for one reason or another.
» All new plants have to meet the stringent new emission norms – but as far as meeting SO2 standards is concerned, as per the CEA’s phase-in plan, the deadline mentioned for these plants is 2022. In other words, these plants are functioning but are not compliant with the standards.
THE NEW PLANTS
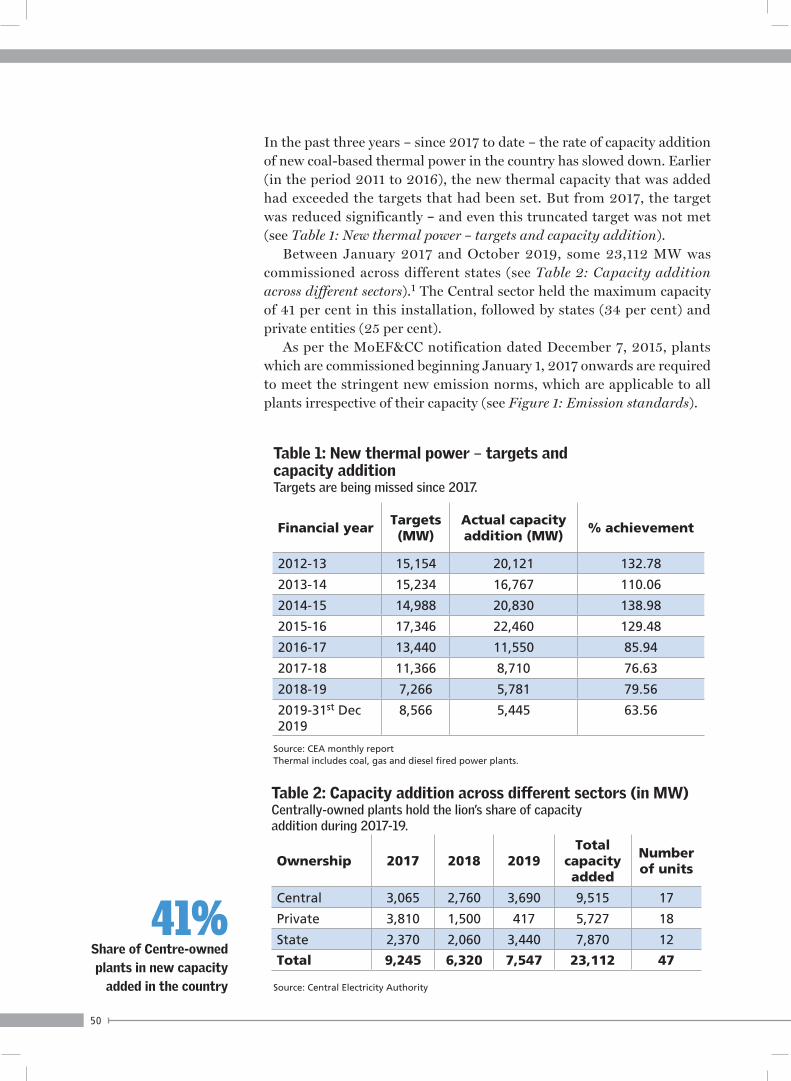
50
In the past three years – since 2017 to date – the rate of capacity addition of new coal-based thermal power in the country has slowed down. Earlier (in the period 2011 to 2016), the new thermal capacity that was added had exceeded the targets that had been set. But from 2017, the target was reduced significantly – and even this truncated target was not met (see Table 1: New thermal power – targets and capacity addition).
Between January 2017 and October 2019, some 23,112 MW was commissioned across different states (see Table 2: Capacity addition across different sectors).1 The Central sector held the maximum capacity of 41 per cent in this installation, followed by states (34 per cent) and private entities (25 per cent).
As per the MoEF&CC notification dated December 7, 2015, plants which are commissioned beginning January 1, 2017 onwards are required to meet the stringent new emission norms, which are applicable to all plants irrespective of their capacity (see Figure 1: Emission standards).
Financial year Targets (MW)
Actual capacity addition (MW)
% achievement
2012-13 15,154 20,121 132.78
2013-14 15,234 16,767 110.06
2014-15 14,988 20,830 138.98
2015-16 17,346 22,460 129.48
2016-17 13,440 11,550 85.94
2017-18 11,366 8,710 76.63
2018-19 7,266 5,781 79.56
2019-31st Dec 2019
8,566 5,445 63.56
Table 1: New thermal power – targets and capacity additionTargets are being missed since 2017.
Source: CEA monthly reportThermal includes coal, gas and diesel fired power plants.
Ownership 2017 2018 2019Total
capacity added
Number of units
Central 3,065 2,760 3,690 9,515 17
Private 3,810 1,500 417 5,727 18
State 2,370 2,060 3,440 7,870 12
Total 9,245 6,320 7,547 23,112 47
Table 2: Capacity addition across different sectors (in MW)Centrally-owned plants hold the lion’s share of capacity addition during 2017-19.
Source: Central Electricity Authority
41%Share of Centre-owned plants in new capacity
added in the country

51
C O A L - B A S E D P O W E R N O R M S
Pollution control technologies – implementation status Meeting stringent norms for PM and SO2 does not require any new innovations in technology. For PM, ESPs can meet standards of 30 mg/Nm3. For meeting SO2 standards of 100 mg/Nm3, wet limestone FGD is the preferred technology. Plants installed near coastal areas could opt for sea water-based FGD. However, the NOx standard of 100 mg/Nm3 cannot be achieved by combustion optimisation alone – hence, new technologies like SCR/SNCR will be required.
Till December 2019, the CPCB had not issued PM, SO2, and NOx directions/deadlines to the plants commissioned in 2018 (except one unit) and for units comissioned in 2019.2
Figure 1: Emission standardsApplicable to all plants commissioned on and after January 1, 2017.
PM (mg/Nm3)
30SO2 (mg/Nm3)
100NOx (mg/Nm3)
100
Specific water consumption
(m3/MWh)
3**Initially, the standard was 2.5 m3/MWh. It was revised to 3 m3/MWh.
CSE
PH
OTO
ARC
HIV
ES
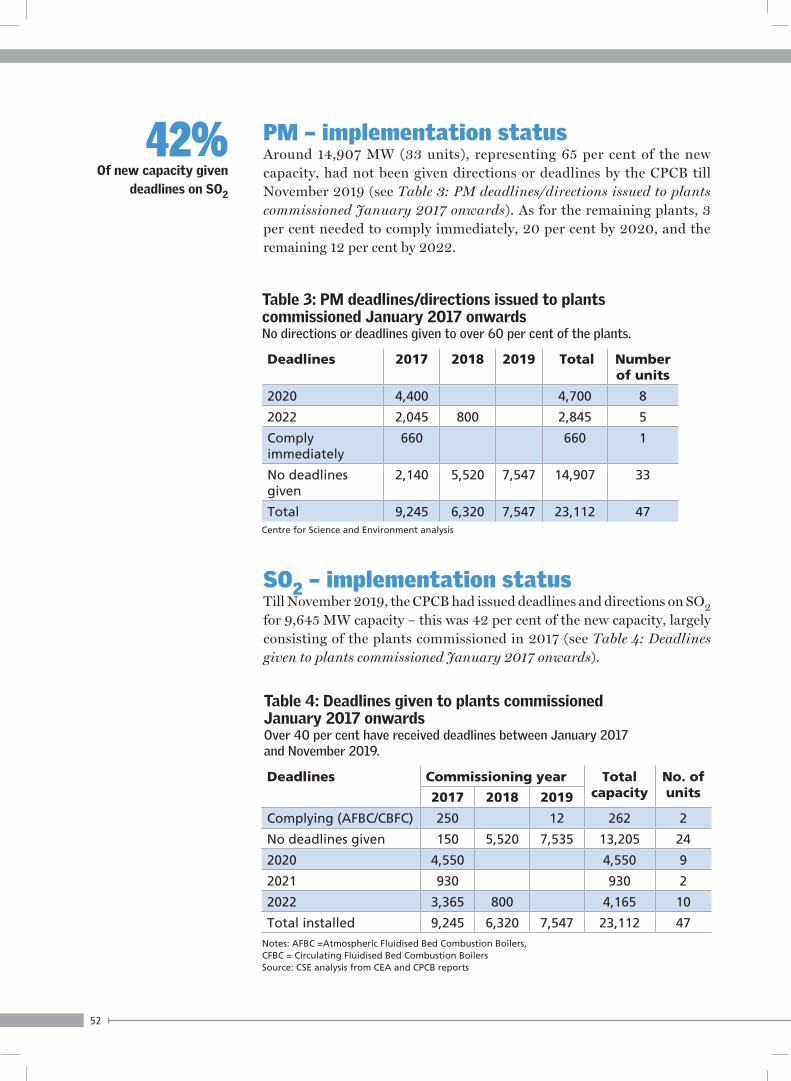
52
PM – implementation statusAround 14,907 MW (33 units), representing 65 per cent of the new capacity, had not been given directions or deadlines by the CPCB till November 2019 (see Table 3: PM deadlines/directions issued to plants commissioned January 2017 onwards). As for the remaining plants, 3 per cent needed to comply immediately, 20 per cent by 2020, and the remaining 12 per cent by 2022.
Deadlines 2017 2018 2019 Total Number of units
2020 4,400 4,700 8
2022 2,045 800 2,845 5
Comply immediately
660 660 1
No deadlines given
2,140 5,520 7,547 14,907 33
Total 9,245 6,320 7,547 23,112 47
Table 3: PM deadlines/directions issued to plants commissioned January 2017 onwardsNo directions or deadlines given to over 60 per cent of the plants.
Deadlines Commissioning year Total capacity
No. of units2017 2018 2019
Complying (AFBC/CBFC) 250 12 262 2
No deadlines given 150 5,520 7,535 13,205 24
2020 4,550 4,550 9
2021 930 930 2
2022 3,365 800 4,165 10
Total installed 9,245 6,320 7,547 23,112 47
Table 4: Deadlines given to plants commissioned January 2017 onwardsOver 40 per cent have received deadlines between January 2017 and November 2019.
Notes: AFBC =Atmospheric Fluidised Bed Combustion Boilers, CFBC = Circulating Fluidised Bed Combustion BoilersSource: CSE analysis from CEA and CPCB reports
42%Of new capacity given
deadlines on SO2
SO2 – implementation statusTill November 2019, the CPCB had issued deadlines and directions on SO2 for 9,645 MW capacity – this was 42 per cent of the new capacity, largely consisting of the plants commissioned in 2017 (see Table 4: Deadlines given to plants commissioned January 2017 onwards).
Centre for Science and Environment analysis
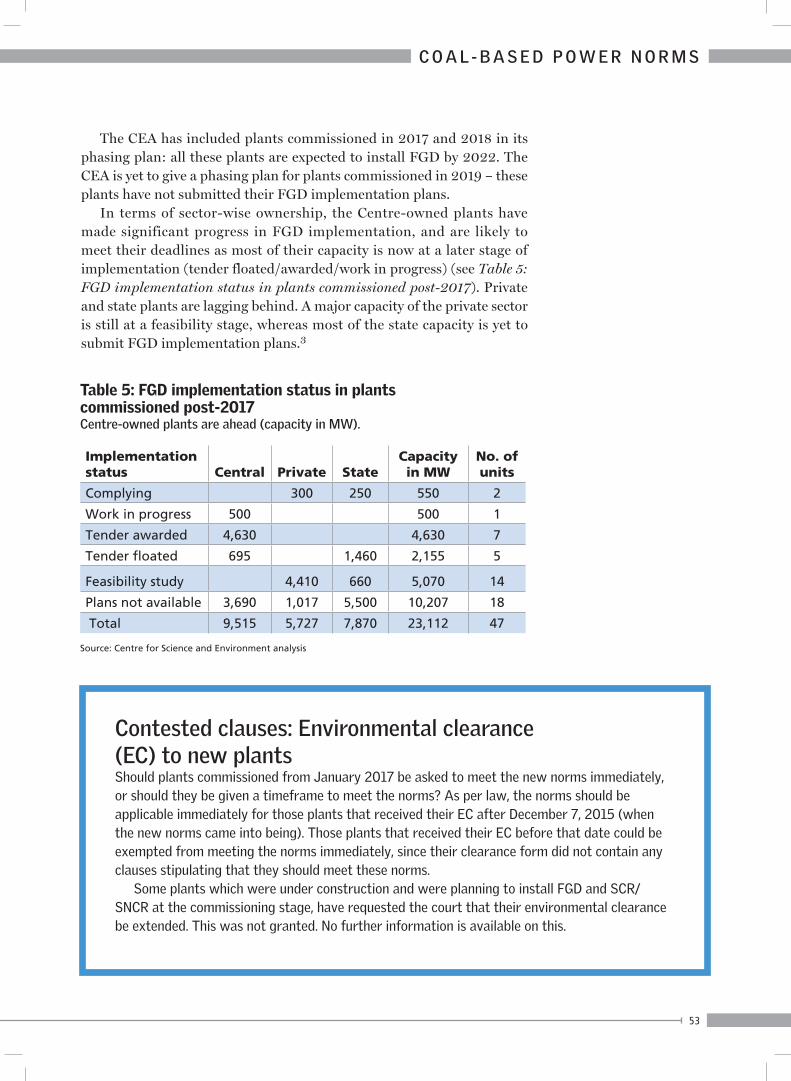
53
C O A L - B A S E D P O W E R N O R M S
The CEA has included plants commissioned in 2017 and 2018 in its phasing plan: all these plants are expected to install FGD by 2022. The CEA is yet to give a phasing plan for plants commissioned in 2019 – these plants have not submitted their FGD implementation plans.
In terms of sector-wise ownership, the Centre-owned plants have made significant progress in FGD implementation, and are likely to meet their deadlines as most of their capacity is now at a later stage of implementation (tender floated/awarded/work in progress) (see Table 5: FGD implementation status in plants commissioned post-2017). Private and state plants are lagging behind. A major capacity of the private sector is still at a feasibility stage, whereas most of the state capacity is yet to submit FGD implementation plans.3
Contested clauses: Environmental clearance (EC) to new plantsShould plants commissioned from January 2017 be asked to meet the new norms immediately, or should they be given a timeframe to meet the norms? As per law, the norms should be applicable immediately for those plants that received their EC after December 7, 2015 (when the new norms came into being). Those plants that received their EC before that date could be exempted from meeting the norms immediately, since their clearance form did not contain any clauses stipulating that they should meet these norms.
Some plants which were under construction and were planning to install FGD and SCR/SNCR at the commissioning stage, have requested the court that their environmental clearance be extended. This was not granted. No further information is available on this.
Implementation status Central Private State
Capacity in MW
No. of units
Complying 300 250 550 2
Work in progress 500 500 1
Tender awarded 4,630 4,630 7
Tender floated 695 1,460 2,155 5
Feasibility study 4,410 660 5,070 14
Plans not available 3,690 1,017 5,500 10,207 18
Total 9,515 5,727 7,870 23,112 47
Table 5: FGD implementation status in plants commissioned post-2017Centre-owned plants are ahead (capacity in MW).
Source: Centre for Science and Environment analysis
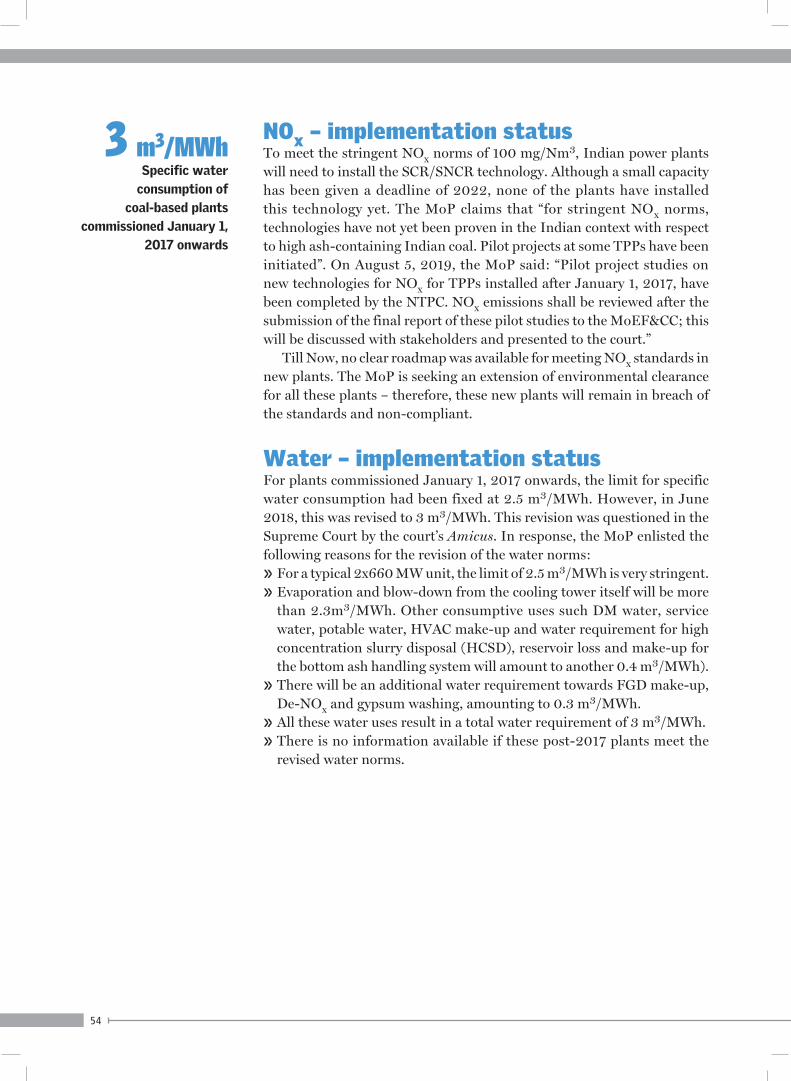
54
NOx – implementation statusTo meet the stringent NOx norms of 100 mg/Nm3, Indian power plants will need to install the SCR/SNCR technology. Although a small capacity has been given a deadline of 2022, none of the plants have installed this technology yet. The MoP claims that “for stringent NOx norms, technologies have not yet been proven in the Indian context with respect to high ash-containing Indian coal. Pilot projects at some TPPs have been initiated”. On August 5, 2019, the MoP said: “Pilot project studies on new technologies for NOx for TPPs installed after January 1, 2017, have been completed by the NTPC. NOx emissions shall be reviewed after the submission of the final report of these pilot studies to the MoEF&CC; this will be discussed with stakeholders and presented to the court.”
Till Now, no clear roadmap was available for meeting NOx standards in new plants. The MoP is seeking an extension of environmental clearance for all these plants – therefore, these new plants will remain in breach of the standards and non-compliant.
Water – implementation statusFor plants commissioned January 1, 2017 onwards, the limit for specific water consumption had been fixed at 2.5 m3/MWh. However, in June 2018, this was revised to 3 m3/MWh. This revision was questioned in the Supreme Court by the court’s Amicus. In response, the MoP enlisted the following reasons for the revision of the water norms:» For a typical 2x660 MW unit, the limit of 2.5 m3/MWh is very stringent. » Evaporation and blow-down from the cooling tower itself will be more
than 2.3m3/MWh. Other consumptive uses such DM water, service water, potable water, HVAC make-up and water requirement for high concentration slurry disposal (HCSD), reservoir loss and make-up for the bottom ash handling system will amount to another 0.4 m3/MWh).
» There will be an additional water requirement towards FGD make-up, De-NOx and gypsum washing, amounting to 0.3 m3/MWh.
» All these water uses result in a total water requirement of 3 m3/MWh.» There is no information available if these post-2017 plants meet the
revised water norms.
3 m3/MWhSpecific water
consumption of coal-based plants
commissioned January 1, 2017 onwards
55
C O A L - B A S E D P O W E R N O R M S
7On what the norms stipulate for these two elements
MERCURY AND WATER
» Mercury is one of the most toxic contaminants known to humans. Coal-fired power plants are the biggest source of mercury emissions.
» India is one of the world’s mercury hotspots, and coal-based power plants account for 80 per cent of the country’s mercury emissions.
» India’s energy sector consumed 576 million tonne of coal in 2017-18; based on this, the annual mercury release works out to be about 160 metric tonne.
» In December 2015, the environment ministry set the standard for mercury emissions from coal-based power plants at 0.03 mg/Nm3.
» Environment ministry says all units are likely to meet mercury emission norms after installation of pollution control equipment (ESP, FGD, and SCR) as a co-benefit, within the same timelines.
» Water use by TPPs is another area of concern – 44 per cent of existing coal power plants and 45 per cent of proposed plants are located/proposed in areas with high to extremely high levels of water stress. In many cases, the very existence of these power plants is leading to water stress in the regions where they are located.
» In a business-as-usual scenario, 70 per cent of India’s thermal power plants will face high water stress by 2030.
» The MoEF&CC notified water standards in 2015 for power plants. In 2018, it amended the norm and set it at 3 m3/MWh for new plants installed after January 1, 2017. But in the absence of timelines, plants continue with business-as-usual.
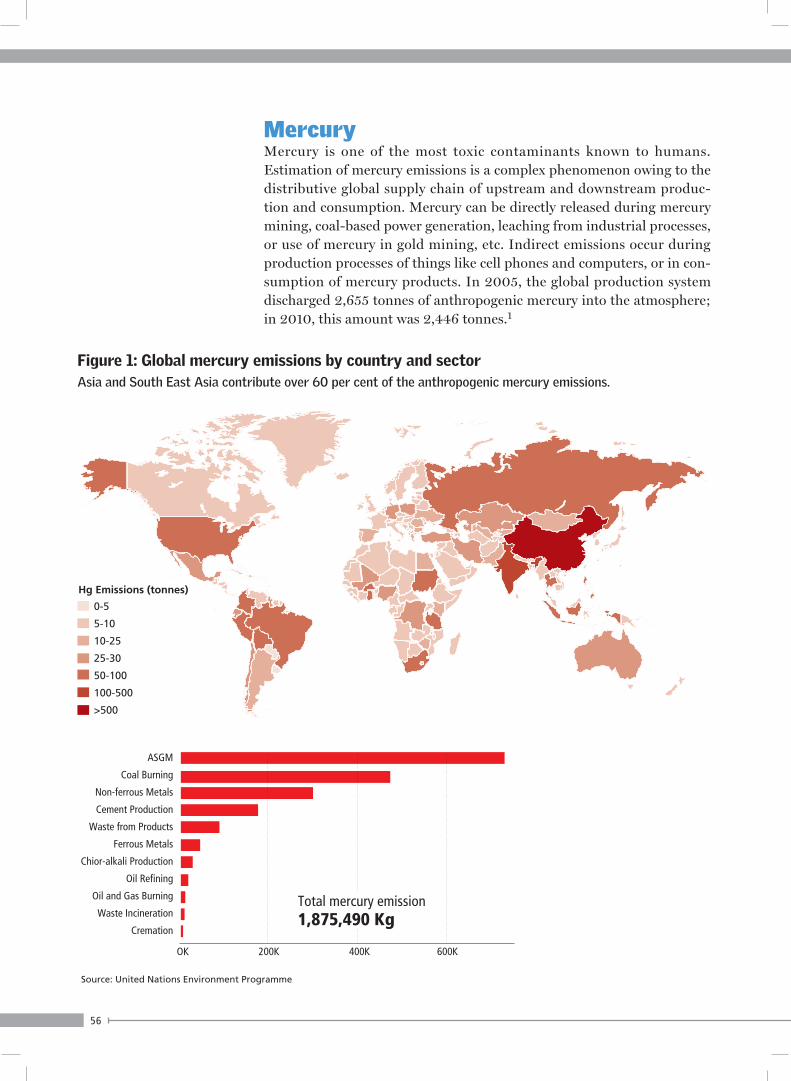
56
MercuryMercury is one of the most toxic contaminants known to humans. Estimation of mercury emissions is a complex phenomenon owing to the distributive global supply chain of upstream and downstream produc-tion and consumption. Mercury can be directly released during mercury mining, coal-based power generation, leaching from industrial processes, or use of mercury in gold mining, etc. Indirect emissions occur during production processes of things like cell phones and computers, or in con-sumption of mercury products. In 2005, the global production system discharged 2,655 tonnes of anthropogenic mercury into the atmosphere; in 2010, this amount was 2,446 tonnes.1
Hg Emissions (tonnes)
0-5
5-10
10-25
25-30
50-100
100-500
>500
Figure 1: Global mercury emissions by country and sectorAsia and South East Asia contribute over 60 per cent of the anthropogenic mercury emissions.
ASGM
Coal Burning
Non-ferrous Metals
Cement Production
Waste from Products
Ferrous Metals
Chior-alkali Production
Oil Refining
Oil and Gas Burning
Waste Incineration
Cremation
OK 200K 400K 600K
Total mercury emission1,875,490 Kg
Source: United Nations Environment Programme
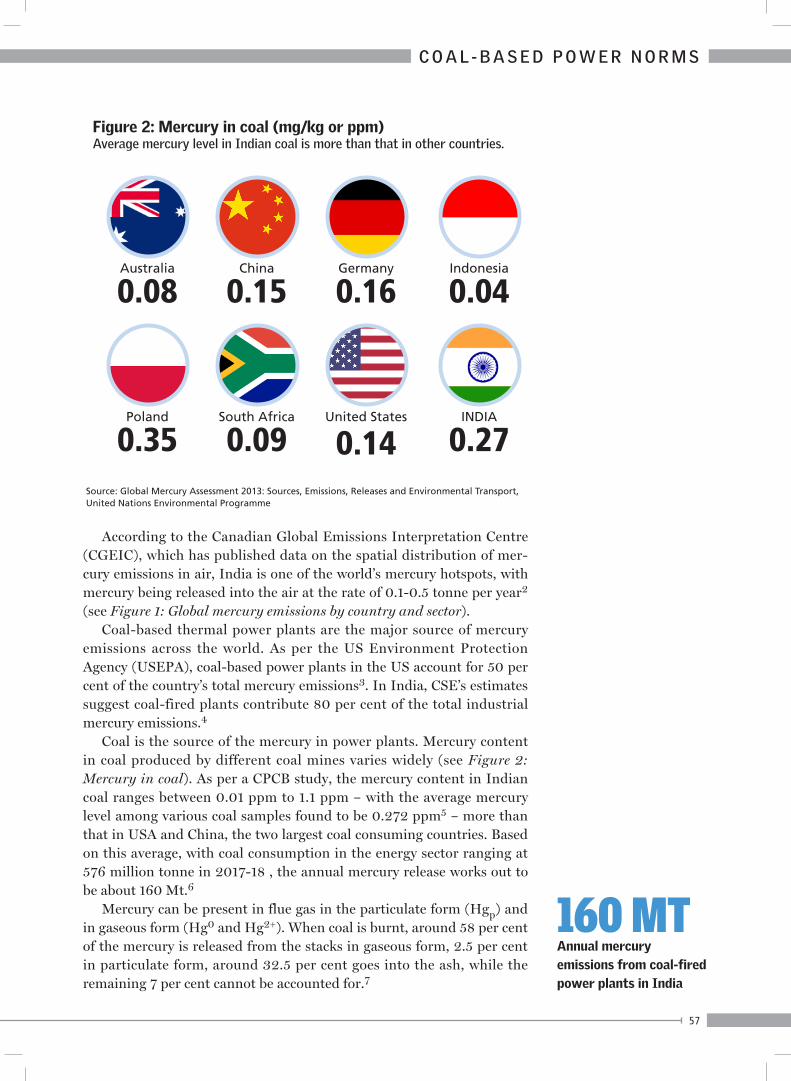
57
C O A L - B A S E D P O W E R N O R M S
According to the Canadian Global Emissions Interpretation Centre (CGEIC), which has published data on the spatial distribution of mer-cury emissions in air, India is one of the world’s mercury hotspots, with mercury being released into the air at the rate of 0.1-0.5 tonne per year2 (see Figure 1: Global mercury emissions by country and sector).
Coal-based thermal power plants are the major source of mercury emissions across the world. As per the US Environment Protection Agency (USEPA), coal-based power plants in the US account for 50 per cent of the country’s total mercury emissions3. In India, CSE’s estimates suggest coal-fired plants contribute 80 per cent of the total industrial mercury emissions.4
Coal is the source of the mercury in power plants. Mercury content in coal produced by different coal mines varies widely (see Figure 2: Mercury in coal). As per a CPCB study, the mercury content in Indian coal ranges between 0.01 ppm to 1.1 ppm – with the average mercury level among various coal samples found to be 0.272 ppm5 – more than that in USA and China, the two largest coal consuming countries. Based on this average, with coal consumption in the energy sector ranging at 576 million tonne in 2017-18 , the annual mercury release works out to be about 160 Mt.6
Mercury can be present in flue gas in the particulate form (Hgp) and in gaseous form (Hg0 and Hg2+). When coal is burnt, around 58 per cent of the mercury is released from the stacks in gaseous form, 2.5 per cent in particulate form, around 32.5 per cent goes into the ash, while the remaining 7 per cent cannot be accounted for.7
Figure 2: Mercury in coal (mg/kg or ppm)Average mercury level in Indian coal is more than that in other countries.
Australia
0.08
Poland
0.35
China
0.15
South Africa
0.09
Germany
0.16
United States
0.14
Indonesia
0.04
INDIA
0.27Source: Global Mercury Assessment 2013: Sources, Emissions, Releases and Environmental Transport, United Nations Environmental Programme
160 MTAnnual mercury emissions from coal-fired power plants in India
58
Standards for mercuryTill December 2015, there were no standards in India for controlling mercury in coal-based power plants. In December 2015, the MoEF&CC set the standard at 0.03 mg/Nm3. This standard is applicable to all units (irrespective of vintage and size), except those that were installed before 2003 and were <500 MW in size.
Other countries have moved proactively on controlling mercury emissions. China has realised significant reductions with the introduction of standards on mercury, along with stringent norms to cut down on PM, SO2 and NOx. Even in USA, ever since the introduction of the Mercury and Air Toxics Standards (MATS) Rule in 2011 and its full implementation in 2016, mercury emissions have reduced drastically by 81.7 per cent. The USEPA has found that the standards have helped avoid 10,863 premature deaths across the US in 2016, while creating nearly US $89.4 billion in health benefits.8 In Texas alone, the MATS helped avoid 1,200 premature
Controlling mercury There are two broad approaches to mercury control:
Multi-pollutant control: In this method, mercury capture is enhanced in existing/new SO2, NOx and PM control devices.
Indian power plants bank on conventional pollution control systems (ESPs, FGD and SCR) for the re-duction of mercury in flue gas. The removal is based on mercury speciation in the flue gas. Mercury can be present in flue gas in particulate and gaseous forms (see Table: Forms of mercury in flue gas and their removal method).
Particulate-bound mercury can be absorbed by dust collectors – ESPs; gaseous Hg2+ is soluble in water, so it can be absorbed by wet scrubbing system, which is wet FGDs. Gaseous Hg0 is stable and not soluble in water, and hence, goes into the atmosphere directly with the flue gas. The amount of Hg0 released will depend on the proportion of Hg0 and Hg2+ in gaseous mercury: this usually varies widely, as it primarily depends on coal types, combustion conditions, temperatures and gas composition.
Installation of SCR/SNCR systems can further reduce mercury emissions – this technology oxidises certain proportions of Hg0 to Hg2+ which can then be absorbed in wet scrubbing. Overall, mercury removal efficiency with FGD and ESP is around 24 per cent. This can be increased to 38 per cent with SCR . As per other studies, for different ESP, FGD and SCR configurations, reduction in mercury can range from 31 per cent to 54 per cent depending on coal inputs .
Thus, implementation of pollution control technologies for controlling PM, SO2 and NOx can also control mercury emissions. But it is important to measure and estimate the emissions before making this claim.

59
C O A L - B A S E D P O W E R N O R M S
Table: Forms of mercury in flue gas and their removal method
Mercury species Form Removal method
HgP Particulate-bound mercury
Can be removed by dust collector (ESPs or filter bags)
Hg2+ Gaseous Soluble in water and can be removed by wet scrubbing system; can also be absorbed by particulate-bound mercury, hence a dust collector can be used
Hg0 Gaseous Elemental mercury is relatively stable and insoluble in water so difficult to be collected by dust collector and wet scrub-bing system, hence goes into atmosphere directly; some proportion of the elemental mercury can be oxidised to Hg2+ which is water-soluble.
HgT Total mercury
deaths in 2016 – nearly 11 per cent of all avoided premature deaths estimated for that year – as well as US $9.7 billion in health benefits .
In February 2018, the MoEF&CC submitted to the Supreme Court that “all units are likely to meet mercury emission norms after installation of pollution control equipment (ESP, FGD and SCR) as a co-benefit”. It means the timelines for meeting the mercury norms will follow the FGD installation timelines.
It is important to mention here that proper mercury emission monitoring is crucial to understand the mercury speciation in coal and flue gas, and the possible reduction in mercury from various configurations of ESPs, FGD and SCR. However, the MoEF&CC has not yet mandated sensors or other devices to measure mercury emissions in plants. A few new plants (like Rattan India Amaravati, in Nagpur, Maharashtra) have taken the initiative to install CEMS to measure their mercury emissions.
0.03 mg/Nm3Standard for mercury emission from coal-based thermal power plants
60
WaterWith increasing water stress in many parts of India, conflicts between industries and local communities have intensified. Forty-four per cent of existing coal power plants and 45 per cent of the proposed plants are located/proposed in areas with high to extremely high levels of water stress9; in many cases, the very existence of these power plants is leading to water stress in the regions where they are located.
The states in India where these plants are located include Maharashtra, Uttar Pradesh, Gujarat, Andhra Pradesh, Rajasthan, Tamil Nadu, Haryana and Punjab, among others. Due to the scarcity of water, power plants in these states are forced to shut down during certain times of the year.
Power plants account for over half of India’s total domestic water requirement. The water withdrawal of a once-through plant can range from 70-200 m3/MWh. On the other hand, plants that have cooling towers consume an average of 4 m3/MWh (see Box: OTC vs CT).
To curtail water consumption of coal-based power plants, the MoEF&CC notified water standards in 2015 for power plants as follows:» Plants installed before 2017: specific water consumption of
3.5 m3/MW.» Plants installed after January 1, 2017: specific water consumption of
2.5 m3/MWh and were expected to achieve zero discharge.» All once-through plants: to install cooling towers and achieve specific
water consumption of 3.5 m3/MWh or less.
OTC verses CT
Power plants are water guzzlers – water is the input used mainly for cooling requirements of the plants. Roughly, 80 per cent of the water demand of a thermal plant is in its cooling tower; 18 per cent in its ash handling; and 2 per cent in process and drinking.
Traditionally, plants take large amounts of freshwater, use it to cool and for their process, and then discharge it. This is the once-through-cooling system (OTC). These plants withdraw enormous amounts of water, most of which is returned to the source (with around 1 per cent lost in evaporation), but at higher temperatures than at the draw. The water withdrawal of a once-through plant can be 70-200 m3/MWh. However, from 1999, the once-through cooling (OTC) plants have been disallowed, so India has a legacy of old and extremely polluting plants using this system. What makes it worse is that this older generation of plants is located in densely populated areas – the water they discharge exacerbates the pollution impact. About 90 per cent of the water use by this sector is by OTC-based power stations.
In the cooling tower (CT) system, the water input is much reduced and the loss is based on evaporation. Plants that use freshwater and have cooling towers consume, on an average, 4 m3/MWh. CT systems require higher auxiliary power consumption – around 1 per cent of the gross gener-ation – which reduces the amount of power that can be sold and increases the variable cost.
44%Of existing coal power plants located in areas
of high water stress
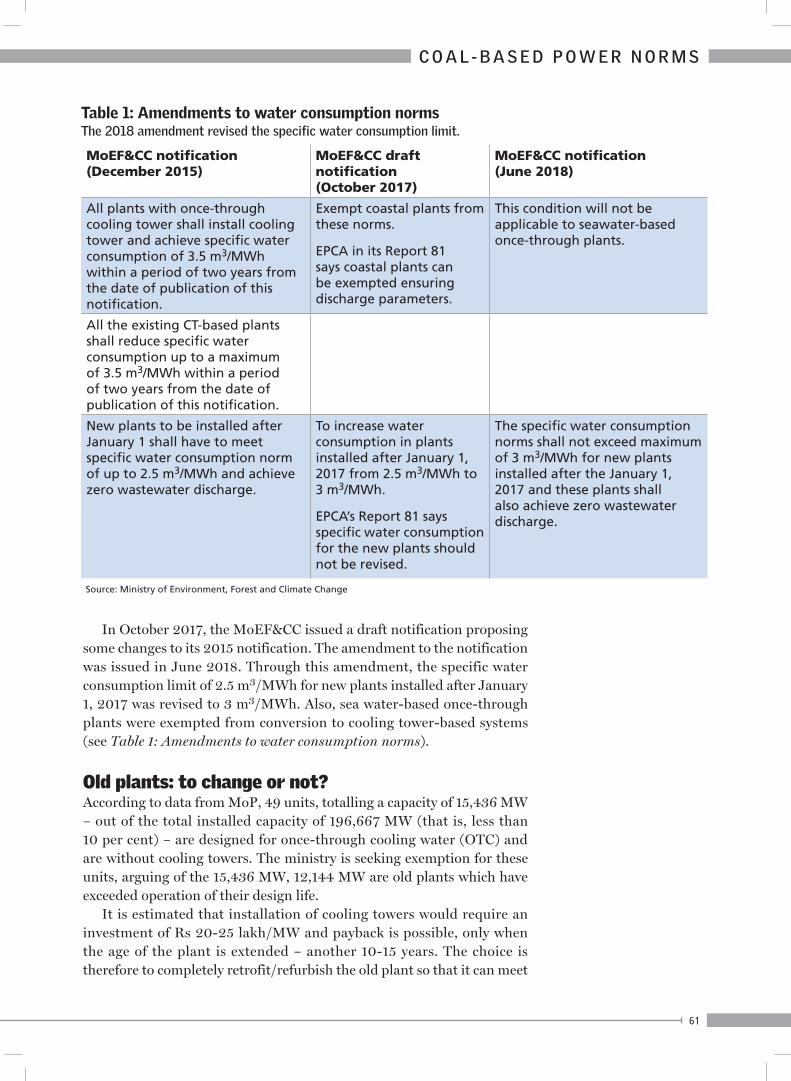
61
C O A L - B A S E D P O W E R N O R M S
In October 2017, the MoEF&CC issued a draft notification proposing some changes to its 2015 notification. The amendment to the notification was issued in June 2018. Through this amendment, the specific water consumption limit of 2.5 m3/MWh for new plants installed after January 1, 2017 was revised to 3 m3/MWh. Also, sea water-based once-through plants were exempted from conversion to cooling tower-based systems (see Table 1: Amendments to water consumption norms).
Old plants: to change or not?According to data from MoP, 49 units, totalling a capacity of 15,436 MW – out of the total installed capacity of 196,667 MW (that is, less than 10 per cent) – are designed for once-through cooling water (OTC) and are without cooling towers. The ministry is seeking exemption for these units, arguing of the 15,436 MW, 12,144 MW are old plants which have exceeded operation of their design life.
It is estimated that installation of cooling towers would require an investment of Rs 20-25 lakh/MW and payback is possible, only when the age of the plant is extended – another 10-15 years. The choice is therefore to completely retrofit/refurbish the old plant so that it can meet
MoEF&CC notification (December 2015)
MoEF&CC draft notification (October 2017)
MoEF&CC notification (June 2018)
All plants with once-through cooling tower shall install cooling tower and achieve specific water consumption of 3.5 m3/MWh within a period of two years from the date of publication of this notification.
Exempt coastal plants from these norms.
EPCA in its Report 81 says coastal plants can be exempted ensuring discharge parameters.
This condition will not be applicable to seawater-based once-through plants.
All the existing CT-based plants shall reduce specific water consumption up to a maximum of 3.5 m3/MWh within a period of two years from the date of publication of this notification.
New plants to be installed after January 1 shall have to meet specific water consumption norm of up to 2.5 m3/MWh and achieve zero wastewater discharge.
To increase water consumption in plants installed after January 1, 2017 from 2.5 m3/MWh to 3 m3/MWh.
EPCA’s Report 81 says specific water consumption for the new plants should not be revised.
The specific water consumption norms shall not exceed maximum of 3 m3/MWh for new plants installed after the January 1, 2017 and these plants shall also achieve zero wastewater discharge.
Source: Ministry of Environment, Forest and Climate Change
Table 1: Amendments to water consumption normsThe 2018 amendment revised the specific water consumption limit.
62
all standards – PM/SO2/NOx and water – or to retire these plants. The option cannot be to allow these older plants to continue to pollute.
In fact, most of the older power plants are located in critically polluted areas/and or densely populated areas. Even NTPC’s Farakka, which is located in a low-population and relatively low pollution area had to close down (March 2016) because of shortage of water. Clearly, water stress will only grow.
In addition, these older plants are extremely inefficient, and so their cost of operation is already high. When the cost of emission control or water conservation is added, these plants will become unviable.
Water norms – implementation plansSpecific water consumption norms for power plants came in 2015. All plants were required to meet the norms within two years of the notification – by December 2017. As the deadline to meet the norms ended on December 7, 2017, the CPCB wrote to all power plants stating, among other things, that “the timeline for compliance of water consumption limit shall also be finalised in consultation with the plants”. Since then, no such timelines have come up for the plants to follow.
In such a scenario, many plants continue to flout the norms.10 Plants have failed to report their specific water consumption correctly to authorities. The SWC figures are self-reported by plants to pollution control boards. These, or the status, have not been verified either by the state pollution control boards or any other independent agencies. CSE has noted that specific water consumption of many plants as specified in their consent to operate was not updated according to the water consumption limit of 3.5 m3/MWh set by the CPCB.
In addition, several consent to operate documents had errors or unclear rationale with respect to water use for domestic, ash handling and fire-fighting purposes. Huge variations have been observed in percentage of freshwater consumed for ash handling by various plants depending on the extent of recycling being carried out for ash handling and leakages in the ash water pipelines carrying ash slurry from plant to ash dykes. In such a scenario, plants might continue to under-report and operate with specific water consumption higher than the limit, leading to excessive water wastages by the sector. There is an urgent need for a robust monitoring and implementation plan for these plants.
Rs 20-25
lakh per MW cost of installing a cooling
tower
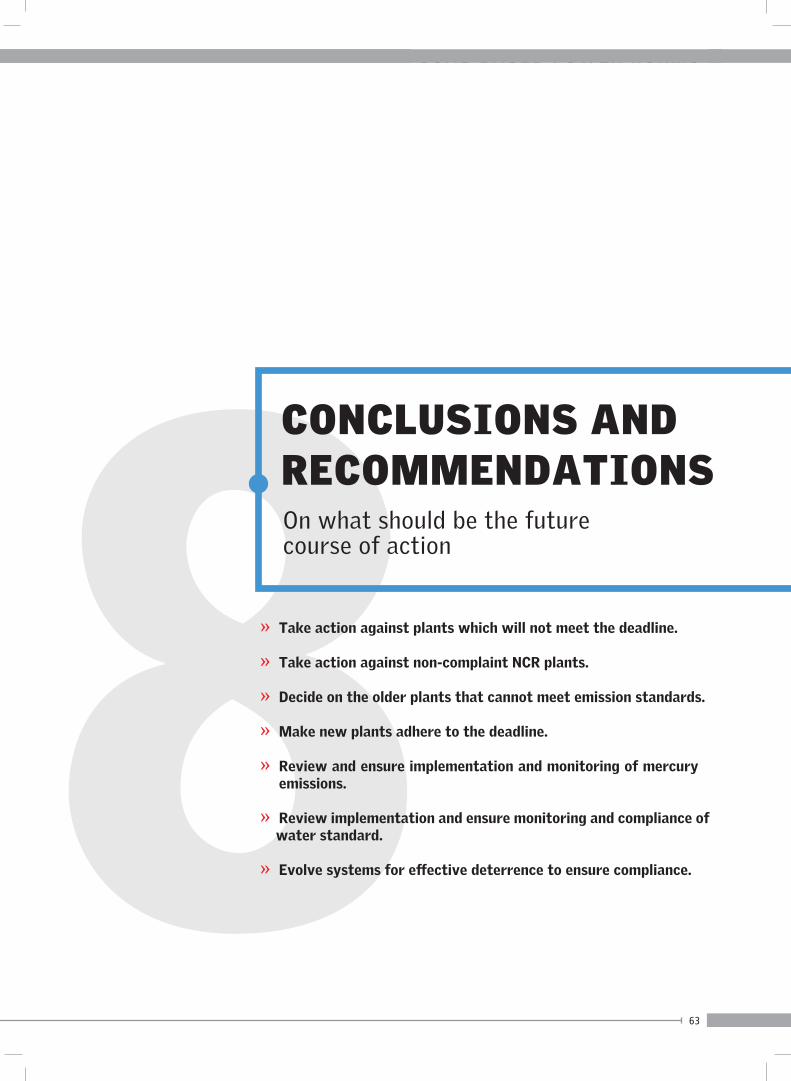
63
C O A L - B A S E D P O W E R N O R M S
8On what should be the future course of action
» Take action against plants which will not meet the deadline.
» Take action against non-complaint NCR plants.
» Decide on the older plants that cannot meet emission standards.
» Make new plants adhere to the deadline.
» Review and ensure implementation and monitoring of mercury emissions.
» Review implementation and ensure monitoring and compliance of water standard.
» Evolve systems for effective deterrence to ensure compliance.
CONCLUSIONS AND RECOMMENDATIONS
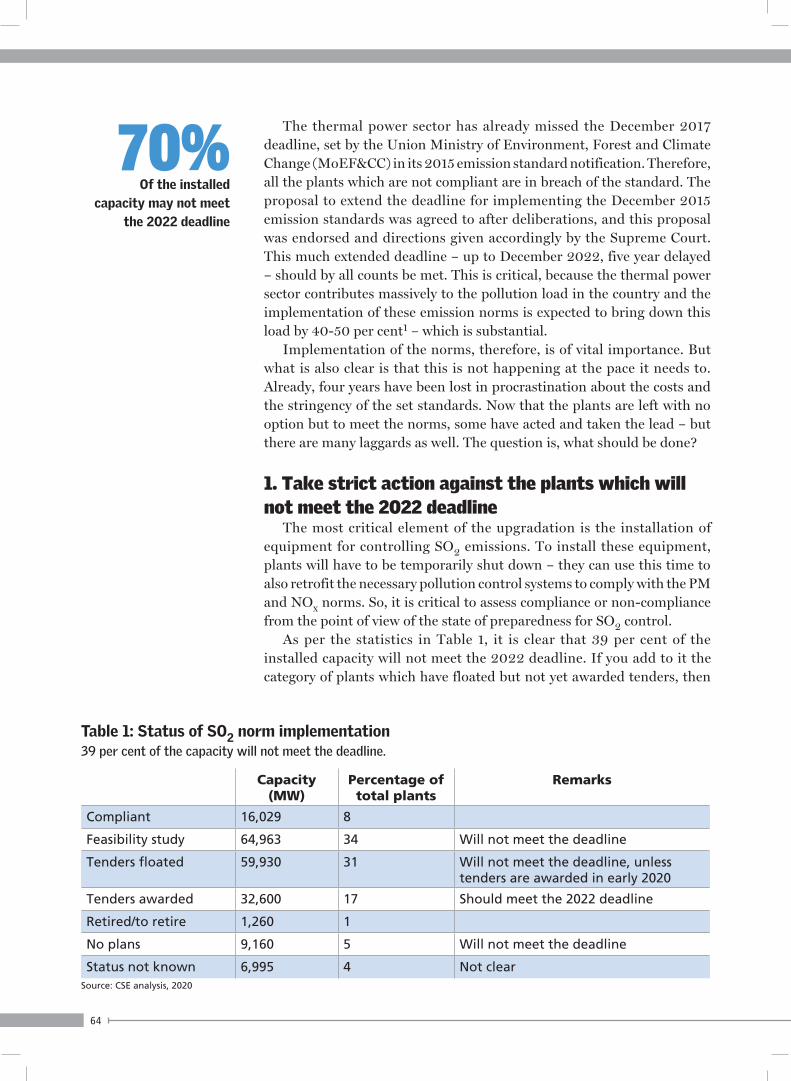
64
The thermal power sector has already missed the December 2017 deadline, set by the Union Ministry of Environment, Forest and Climate Change (MoEF&CC) in its 2015 emission standard notification. Therefore, all the plants which are not compliant are in breach of the standard. The proposal to extend the deadline for implementing the December 2015 emission standards was agreed to after deliberations, and this proposal was endorsed and directions given accordingly by the Supreme Court. This much extended deadline – up to December 2022, five year delayed – should by all counts be met. This is critical, because the thermal power sector contributes massively to the pollution load in the country and the implementation of these emission norms is expected to bring down this load by 40-50 per cent1 – which is substantial.
Implementation of the norms, therefore, is of vital importance. But what is also clear is that this is not happening at the pace it needs to. Already, four years have been lost in procrastination about the costs and the stringency of the set standards. Now that the plants are left with no option but to meet the norms, some have acted and taken the lead – but there are many laggards as well. The question is, what should be done?
1. Take strict action against the plants which will not meet the 2022 deadline
The most critical element of the upgradation is the installation of equipment for controlling SO2 emissions. To install these equipment, plants will have to be temporarily shut down – they can use this time to also retrofit the necessary pollution control systems to comply with the PM and NOx norms. So, it is critical to assess compliance or non-compliance from the point of view of the state of preparedness for SO2 control.
As per the statistics in Table 1, it is clear that 39 per cent of the installed capacity will not meet the 2022 deadline. If you add to it the category of plants which have floated but not yet awarded tenders, then
Table 1: Status of SO2 norm implementation39 per cent of the capacity will not meet the deadline.
Capacity (MW)
Percentage of total plants
Remarks
Compliant 16,029 8
Feasibility study 64,963 34 Will not meet the deadline
Tenders floated 59,930 31 Will not meet the deadline, unless tenders are awarded in early 2020
Tenders awarded 32,600 17 Should meet the 2022 deadline
Retired/to retire 1,260 1
No plans 9,160 5 Will not meet the deadline
Status not known 6,995 4 Not clearSource: CSE analysis, 2020
70%Of the installed
capacity may not meet the 2022 deadline
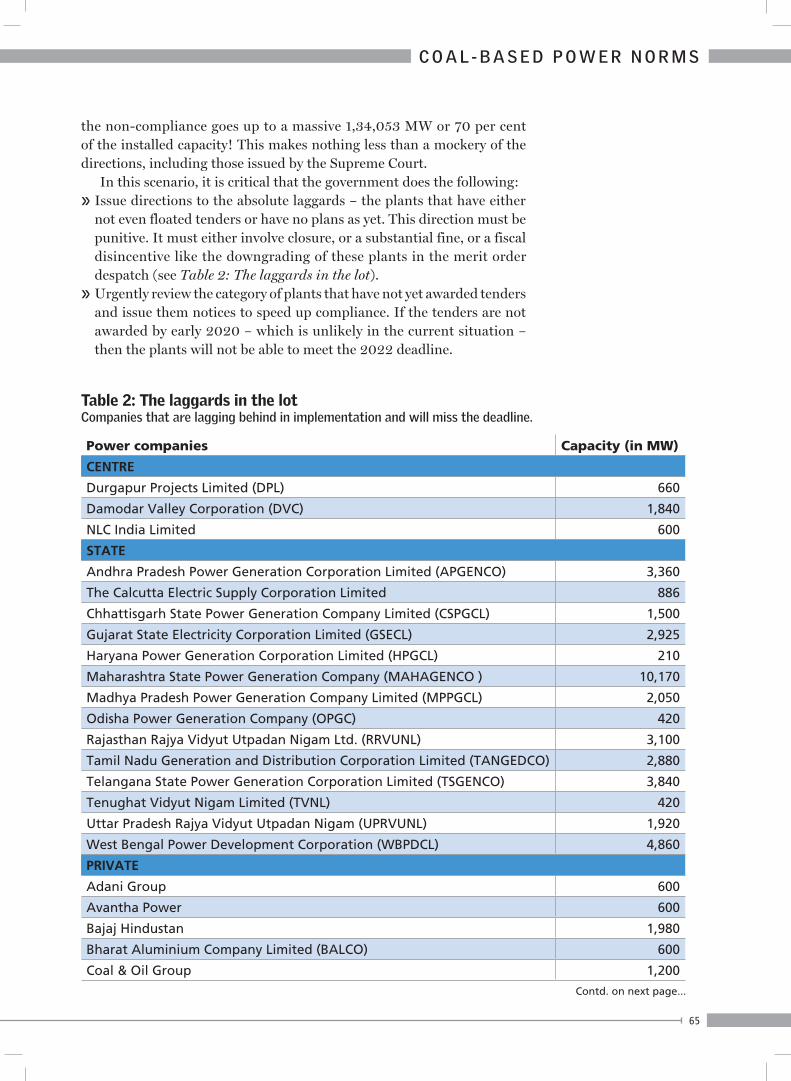
65
C O A L - B A S E D P O W E R N O R M S
the non-compliance goes up to a massive 1,34,053 MW or 70 per cent of the installed capacity! This makes nothing less than a mockery of the directions, including those issued by the Supreme Court.
In this scenario, it is critical that the government does the following:» Issue directions to the absolute laggards – the plants that have either
not even floated tenders or have no plans as yet. This direction must be punitive. It must either involve closure, or a substantial fine, or a fiscal disincentive like the downgrading of these plants in the merit order despatch (see Table 2: The laggards in the lot).
» Urgently review the category of plants that have not yet awarded tenders and issue them notices to speed up compliance. If the tenders are not awarded by early 2020 – which is unlikely in the current situation – then the plants will not be able to meet the 2022 deadline.
Table 2: The laggards in the lotCompanies that are lagging behind in implementation and will miss the deadline.
Power companies Capacity (in MW)
CENTRE
Durgapur Projects Limited (DPL) 660
Damodar Valley Corporation (DVC) 1,840
NLC India Limited 600
STATE
Andhra Pradesh Power Generation Corporation Limited (APGENCO) 3,360
The Calcutta Electric Supply Corporation Limited 886
Chhattisgarh State Power Generation Company Limited (CSPGCL) 1,500
Gujarat State Electricity Corporation Limited (GSECL) 2,925
Haryana Power Generation Corporation Limited (HPGCL) 210
Maharashtra State Power Generation Company (MAHAGENCO ) 10,170
Madhya Pradesh Power Generation Company Limited (MPPGCL) 2,050
Odisha Power Generation Company (OPGC) 420
Rajasthan Rajya Vidyut Utpadan Nigam Ltd. (RRVUNL) 3,100
Tamil Nadu Generation and Distribution Corporation Limited (TANGEDCO) 2,880
Telangana State Power Generation Corporation Limited (TSGENCO) 3,840
Tenughat Vidyut Nigam Limited (TVNL) 420
Uttar Pradesh Rajya Vidyut Utpadan Nigam (UPRVUNL) 1,920
West Bengal Power Development Corporation (WBPDCL) 4,860
PRIVATE
Adani Group 600
Avantha Power 600
Bajaj Hindustan 1,980
Bharat Aluminium Company Limited (BALCO) 600
Coal & Oil Group 1,200
Contd. on next page...
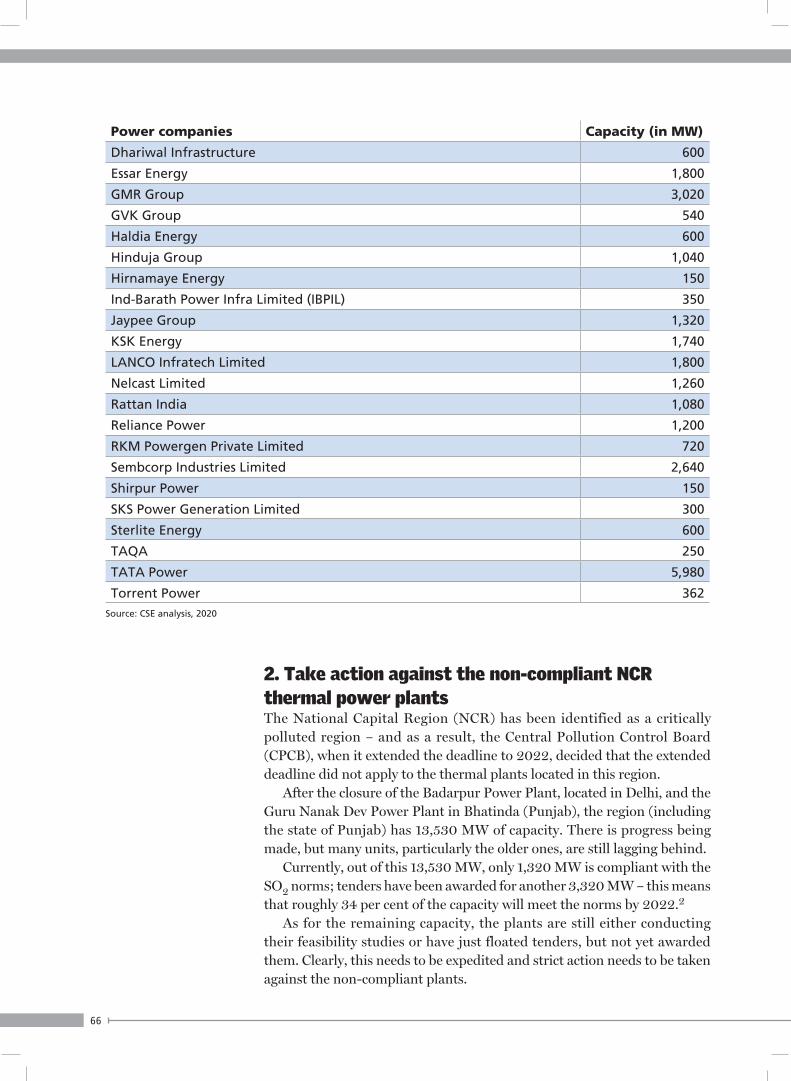
66
2. Take action against the non-compliant NCR thermal power plantsThe National Capital Region (NCR) has been identified as a critically polluted region – and as a result, the Central Pollution Control Board (CPCB), when it extended the deadline to 2022, decided that the extended deadline did not apply to the thermal plants located in this region.
After the closure of the Badarpur Power Plant, located in Delhi, and the Guru Nanak Dev Power Plant in Bhatinda (Punjab), the region (including the state of Punjab) has 13,530 MW of capacity. There is progress being made, but many units, particularly the older ones, are still lagging behind.
Currently, out of this 13,530 MW, only 1,320 MW is compliant with the SO2 norms; tenders have been awarded for another 3,320 MW – this means that roughly 34 per cent of the capacity will meet the norms by 2022.2
As for the remaining capacity, the plants are still either conducting their feasibility studies or have just floated tenders, but not yet awarded them. Clearly, this needs to be expedited and strict action needs to be taken against the non-compliant plants.
Power companies Capacity (in MW)
Dhariwal Infrastructure 600
Essar Energy 1,800
GMR Group 3,020
GVK Group 540
Haldia Energy 600
Hinduja Group 1,040
Hirnamaye Energy 150
Ind-Barath Power Infra Limited (IBPIL) 350
Jaypee Group 1,320
KSK Energy 1,740
LANCO Infratech Limited 1,800
Nelcast Limited 1,260
Rattan India 1,080
Reliance Power 1,200
RKM Powergen Private Limited 720
Sembcorp Industries Limited 2,640
Shirpur Power 150
SKS Power Generation Limited 300
Sterlite Energy 600
TAQA 250
TATA Power 5,980
Torrent Power 362Source: CSE analysis, 2020
67
C O A L - B A S E D P O W E R N O R M S
3. Take urgent decisions regarding the older plants that cannot meet emission standards and should be retired/refurbished to use alternative fuels There is no clarity on the ‘retirement’ of older and polluting thermal power plants. In the Budget 2020, the Finance Minister has recommended that utilities that run old thermal power plants would be asked to shut them down if they “emitted more than the pre-set norms”.
In 2017, the Central Electricity Authority (CEA) had recommended that of the 34,720 MW thermal power plants that were aged over 25 years (as of 2015 when the emission norms were notified), roughly half would have to be retired (15,552) and the rest retrofitted. In 2018, it revised the number upwards, recommending in its National Electricity Plan that 22,716 MW should be retired between 2017 and 2022.3
As of December 2019, some 7,795 MW had been retired and 2,535 MW more was in the pipeline – this accounts for roughly 30 per cent of the over-25 year old plants. Out of the 34,720 MW, 20,980 MW capacity will be upgraded to meet the new emission standards – which is a challenge, particularly when it comes to compliance with the SO2 and water standards. The bulk of the over-25 year old ‘remaining’ capacity is with the National Thermal Power Corporation (NTPC) and the state power sector.4
It is our assessment that over 70 per cent of these older generation plants that are not scheduled for retirement, will not meet the SO2 standards by 2022. Therefore, they will be in breach of the extended deadline.
Given the fact that these plants have completed their designed age, the question also arises whether the investment in emission technologies is feasible or cost-effective. These plants will have to pay back the investment by continuing to operate, which will be at higher costs and with higher pollution levels.
There is also the question of water. Around 10,000 MW of the older plants operate using once-through cooling systems, and it will be a challenge to install cooling towers in them. With water scarcity being a real and urgent concern, this continued non-compliance should not be treated lightly.
Therefore, the question is what should be done with older and more polluting thermal power plants. It is a difficult question to answer, because there are issues of livelihood of the workers in these plants, and issues concerning the power requirement that these plants meet. But it is equally clear that these plants, which do not and will not be able to meet the emission standards, should not be allowed to operate.
This is where governments will need to work to find alternatives – change the fuel from coal to less polluting options. These are undoubtedly limited, given that the price of natural gas is not competitive with coal. It is also unclear if the land on which the thermal power plant is located can be converted to generate renewable energy. There could also be other alternatives – from gasification plants using biomass to ultra-modern
22,716 MWCapacity that must be retired between 2017 and 2022, says CEA
68
municipal waste processing plants. It would be important to review the options, but it must be ensured that plants that are old or polluting or resource wasteful, do not continue to operate.
4. Post-2017 power plants must adhere to the deadline or face closureThere cannot be any excuse for delays in the case of new plants, constructed after the notification was issued in December 2015. While the older generation plants have to retrofit the emission technologies, the new-gen plants have no such reason to delay implementation of the emission standards.
However, they have. They have already got an extension on meeting the deadline till 2022. This must be non-negotiable.
The silver lining is that growth of new coal-based thermal plants seems to be slowing down: power plants remain on the books, but have not been commissioned for one reason or the other. India is adding much less capacity of coal-based power plants – down from 22,460 MW addition in 2015-16 to 5,781 MW in 2018-19. The trend remains the same in 2019-20.5 This is partly because of the slowing down of the economy, but it is also because there is a scaling up of renewable energy sources.
But it does mean that all the new plants must adhere to stringent emission standards – so even as we close the old aged plants and the new-generation plants take over the energy supply, these must not add to the problem of pollution.
The power generation industry is asking for relaxation in the NOx standards – set at 100mg/Nm3 for plants built after 2017. It argues that the plants cannot meet this stringent standard. This does not speak well about the state of our domestic industry. The fact is that other countries, such as China, the EU and the US, have equivalent or even tighter standards. The technology for NOx control exists and India’s thermal power industry will have to work towards adapting and making it work.
Already, the industry has managed to get a relaxation in the standard for water consumption – from the 2.5 m3/MWh to 3 m3/MWh – arguing that this was too stringent and difficult to achieve. But the fact is that such standards are designed to get industry to go the extra mile, to do more than business-as-usual – to build plants for the future. This generation of thermal power stations are to last the country for the next 25 years – well into the period when climate change impacts will increase and become even more catastrophic. So, building the new-gen plant, which is resource-efficient – both in terms of the use of coal and water – cannot and should not be too much to demand.
The effort has to be two-fold: one, to build the cleanest and most efficient new-generation coal plants and two, to build power generation capacity which is cleaner than coal and less damaging to the local and global environment.
SlowdownIn addition of new
capacity in the country in the period 2018-20
69
C O A L - B A S E D P O W E R N O R M S
5. Review the implementation of mercury emissions. Issue directions to power companies to include regular monitoring of mercury The 2015 emission standards for thermal power, for the first time, included norms for emissions of mercury. Mercury is present in coal in varying degrees, based on the location and the mine from where the coal is sourced. When coal is burnt, around 58 per cent of the mercury is released from the stacks in gaseous form; 2.5 per cent in particulate form; and around 32.5 per cent as ash, while the remaining is largely unaccounted for.
Indian power plants argue that they will be able to control mercury emissions when they upgrade their pollution equipment to meet the 2015 standard for other pollutants such as PM, SO2 and NOx. These pollution abatement devices – ESP, FGD and SCR – will also control mercury emissions.
This may well be the case. But the only way we will know whether this works is when power companies are directed to monitor mercury on regular basis. Currently, the MoEF&CC has not issued any such direction. This needs to be done – and urgently – so that there is a baseline for mercury emissions before and after the pollution control measures have been taken.
6. Review implementation of water standard; based on this, issue directions for monitoring and complianceWater stress is an urgent reality in the country. Power plants are huge guzzlers of water. In the current system of once-through, the water is abstracted from inland water bodies and then discharged at high temperatures and with losses. Power companies are well aware of the risk of water crisis in their business – many plants have been forced to shut down because of shortage of water or conflict with local communities over its use in times of drought. Therefore, water conservation is in the best interest of the companies.
The 2015 standard has notified water consumption standard for coal-based power plants and has directed that all plants that were based on once-through cooling (OTC) should mandatorily shift to cooling towers. This would reduce water consumption anywhere from 70-200 m3/MWh to 3.5 m3/MWh – a huge saving for this scarce and contested resource.
Subsequently, the thermal plants based near the coast were given an exemption, because their water was drawn from the sea, where it was returned with conditions to ensure that it would not damage marine fauna and flora.
However, there is no information if the plants have adhered to this new standard. The only information that is in the public domain is based on the affidavit filed by the Ministry of Power seeking exemption for older generation power plants from making this change in technology – from OTC to cooling towers – arguing scarcity of land and lack of finances.
From OTCTo cooling towers is the change in technology that is required for reducing water consumption in this sector
70
The 2015 direction of the CPCB to all power plants only said that the timeline for compliance with the water standard would be finalised in consultation with the plants. Since then, there is no information on the implementation of this critical norm.
It is urgent that each plant should be required to file compliance with the 2015 direction on water consumption and to set up a robust monitoring system which ensures that this is being done.
7. Evolve systems for effective deterrence that will ensure compliance with the 2015 standardIt is clear that this sector which provides an essential service – that of power and electricity – is difficult to shut down. Pollution Acts have limited power to order closure. Even in times of power surplus, shutting down power plants could lead to local outages. Therefore, we need different systems for deterrence: one, in which there is both an incentive for the first movers – the plants that invest in upgrading their technologies and so reduce their emissions – and a disincentive for the laggards, who continue to pollute and compromise public health.
The cost of public health because of the air toxins must be included in the economics of electricity supply. These systems could be evolved through changes in the merit order despatch, which gives a rank to the power plants for supply of electricity in the grid based on the lowest variable cost. The other option is through stiff penalties that would also increase the variable cost of each unit of power supplied and so push down the power plant in the merit rank.
Otherwise, the polluter will not pay. We will pay with our health.
NeededDifferent systems
for deterrence

71
Annexures
Annexure 1: Plant-wise deadlines as per the directions issued by CPCB during 2017 and 2018
Plant Name SectorUnit No.
Capacity (MW)
Year of Commissioning
SO2Deadline PM Deadline NOx
Deadline
ANDHRA PRADESH
Dr. N.TATA RAO TPS (APGENCO)
State
1 210 1979 2020 2020 2020
2
210 1980 2020 2020 2020
3 210 1989 2020 2020 2020
4 210 1990 2020 2020 2020
5 210 1994 2020 2020 2020
6 210 1994 2020 2020 2020
7 500 2009 2020 2020 2022
Meenakshi Energy Pvt. Ltd. (THAMMINAPATNAM)
Private1 150 2012 Complying
2 150 2013 Complying
Nelcast Energy Corporation Ltd. (PAINAMPURAM)
Private
1 660 2015 2021 Comply
immediately2022
2 600 2015 2021 Comply
immediately2022
RAYALASEEMA State
1 210 1994 2021 2021 2022
2 210 1995 2021 2021 2022
3 210 2007 2020 2020 2022
4 210 2007 2021 2021 2022
5 210 2010 2020 2020 2022
Sembcorp Gayatri Power Ltd Private
1 660 2016 2021Comply
immediately2022
2 660 2017 2021Comply
immediately2022
NTPC Simhadri Central
1 500 2002 2022 no comments 2022
2 500 2002 2022 no comments 2022
3 500 2011 2022 2022 2022
4 500 2012 2022 2022 2022
Simhapuri Energy Pvt. Ltd. Private
1 150 2012 Complying
2 150 2012 Complying
3 150 2012 Complying
4 150 2012 Complying
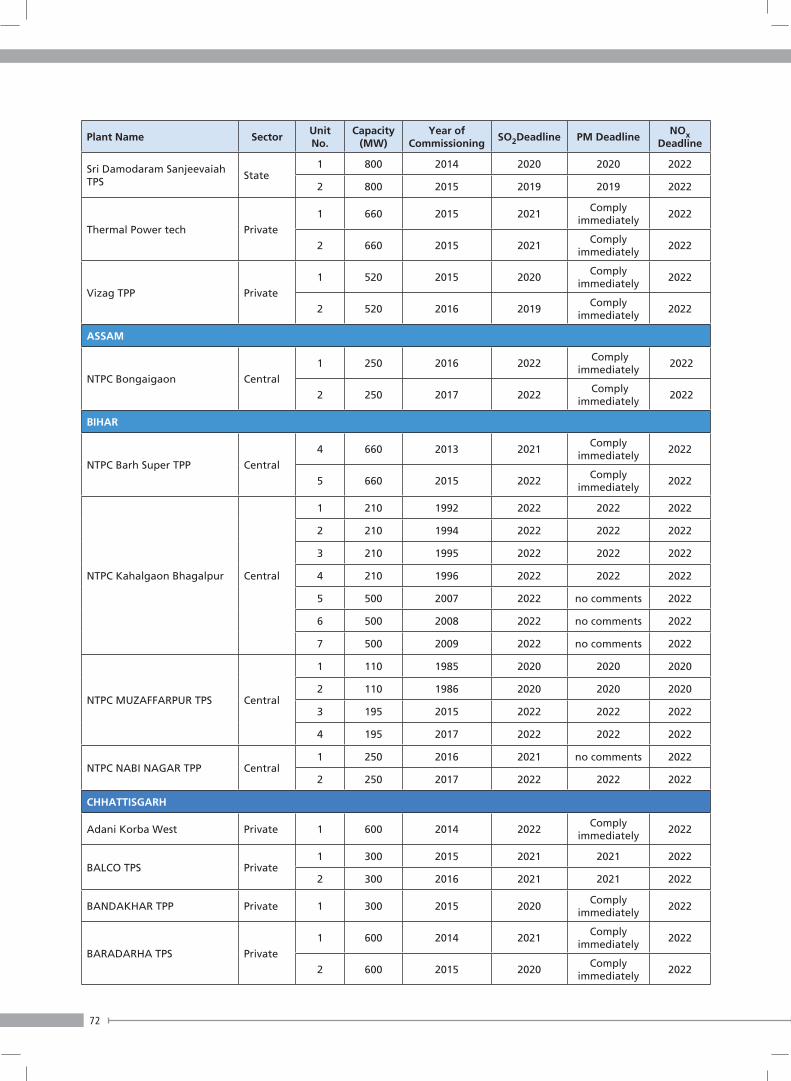
72
Plant Name SectorUnit No.
Capacity (MW)
Year of Commissioning
SO2Deadline PM Deadline NOx
Deadline
Sri Damodaram Sanjeevaiah TPS
State1 800 2014 2020 2020 2022
2 800 2015 2019 2019 2022
Thermal Power tech Private
1 660 2015 2021Comply
immediately2022
2 660 2015 2021Comply
immediately2022
Vizag TPP Private
1 520 2015 2020Comply
immediately2022
2 520 2016 2019Comply
immediately2022
ASSAM
NTPC Bongaigaon Central
1 250 2016 2022 Comply
immediately 2022
2 250 2017 2022 Comply
immediately 2022
BIHAR
NTPC Barh Super TPP Central
4 660 2013 2021Comply
immediately2022
5 660 2015 2022Comply
immediately2022
NTPC Kahalgaon Bhagalpur Central
1 210 1992 2022 2022 2022
2 210 1994 2022 2022 2022
3 210 1995 2022 2022 2022
4 210 1996 2022 2022 2022
5 500 2007 2022 no comments 2022
6 500 2008 2022 no comments 2022
7 500 2009 2022 no comments 2022
NTPC MUZAFFARPUR TPS Central
1 110 1985 2020 2020 2020
2 110 1986 2020 2020 2020
3 195 2015 2022 2022 2022
4 195 2017 2022 2022 2022
NTPC NABI NAGAR TPP Central1 250 2016 2021 no comments 2022
2 250 2017 2022 2022 2022
CHHATTISGARH
Adani Korba West Private 1 600 2014 2022Comply
immediately2022
BALCO TPS Private1 300 2015 2021 2021 2022
2 300 2016 2021 2021 2022
BANDAKHAR TPP Private 1 300 2015 2020Comply
immediately2022
BARADARHA TPS Private
1 600 2014 2021Comply
immediately2022
2 600 2015 2020Comply
immediately2022
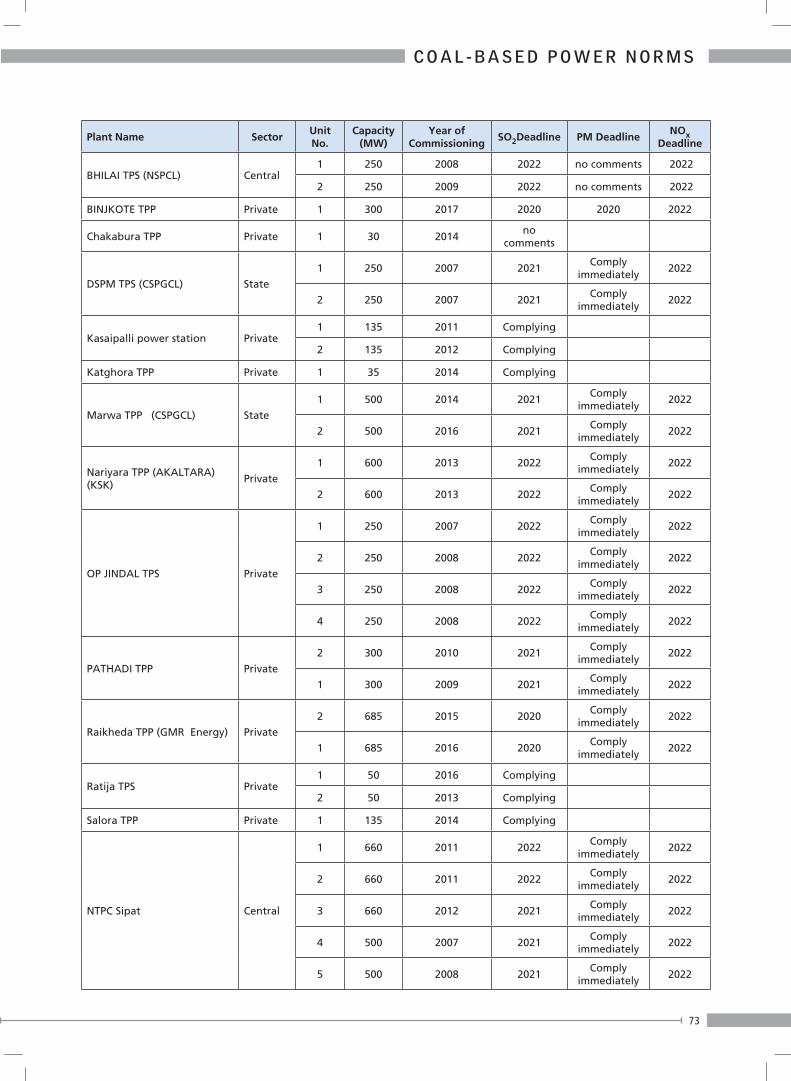
73
C O A L - B A S E D P O W E R N O R M S
Plant Name SectorUnit No.
Capacity (MW)
Year of Commissioning
SO2Deadline PM Deadline NOx
Deadline
BHILAI TPS (NSPCL) Central1 250 2008 2022 no comments 2022
2 250 2009 2022 no comments 2022
BINJKOTE TPP Private 1 300 2017 2020 2020 2022
Chakabura TPP Private 1 30 2014no
comments
DSPM TPS (CSPGCL) State
1 250 2007 2021Comply
immediately2022
2 250 2007 2021Comply
immediately2022
Kasaipalli power station Private1 135 2011 Complying
2 135 2012 Complying
Katghora TPP Private 1 35 2014 Complying
Marwa TPP (CSPGCL) State
1 500 2014 2021Comply
immediately2022
2 500 2016 2021Comply
immediately2022
Nariyara TPP (AKALTARA) (KSK)
Private
1 600 2013 2022Comply
immediately2022
2 600 2013 2022Comply
immediately2022
OP JINDAL TPS Private
1 250 2007 2022Comply
immediately2022
2 250 2008 2022Comply
immediately2022
3 250 2008 2022Comply
immediately2022
4 250 2008 2022Comply
immediately2022
PATHADI TPP Private
2 300 2010 2021Comply
immediately2022
1 300 2009 2021Comply
immediately2022
Raikheda TPP (GMR Energy) Private
2 685 2015 2020Comply
immediately2022
1 685 2016 2020Comply
immediately2022
Ratija TPS Private1 50 2016 Complying
2 50 2013 Complying
Salora TPP Private 1 135 2014 Complying
NTPC Sipat Central
1 660 2011 2022Comply
immediately2022
2 660 2011 2022Comply
immediately2022
3 660 2012 2021Comply
immediately2022
4 500 2007 2021Comply
immediately2022
5 500 2008 2021Comply
immediately2022
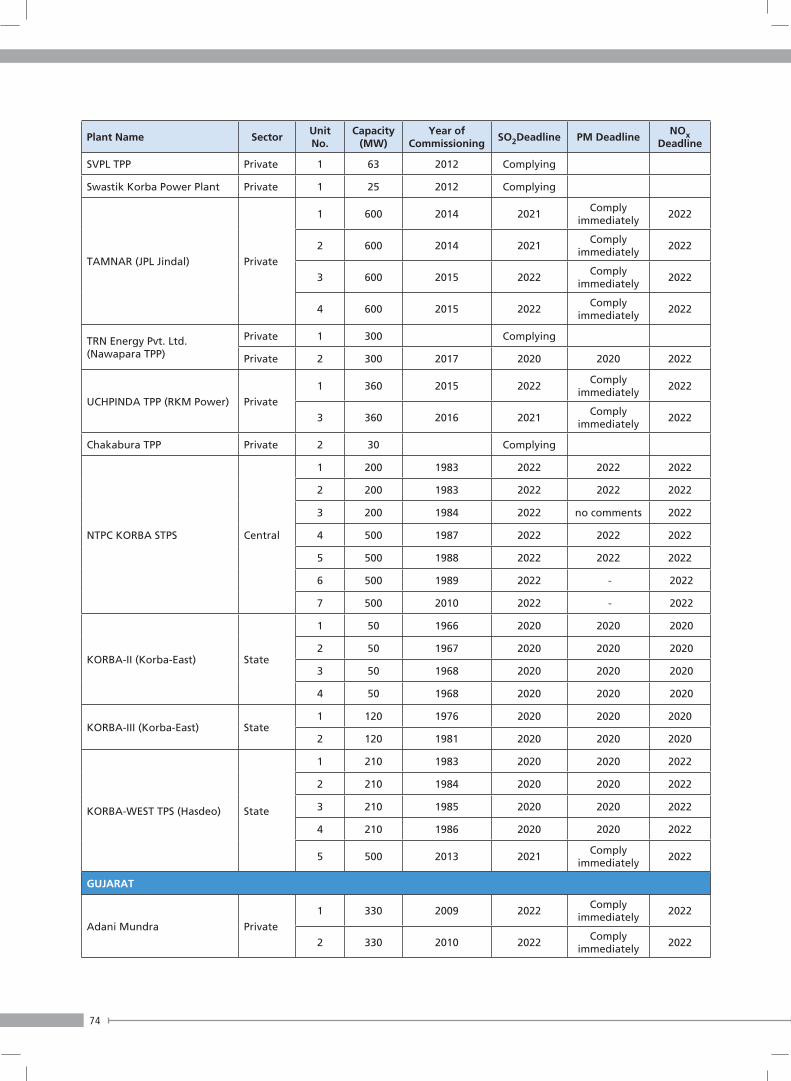
74
Plant Name SectorUnit No.
Capacity (MW)
Year of Commissioning
SO2Deadline PM Deadline NOx
Deadline
SVPL TPP Private 1 63 2012 Complying
Swastik Korba Power Plant Private 1 25 2012 Complying
TAMNAR (JPL Jindal) Private
1 600 2014 2021Comply
immediately2022
2 600 2014 2021Comply
immediately2022
3 600 2015 2022Comply
immediately2022
4 600 2015 2022Comply
immediately2022
TRN Energy Pvt. Ltd. (Nawapara TPP)
Private 1 300 Complying
Private 2 300 2017 2020 2020 2022
UCHPINDA TPP (RKM Power) Private
1 360 2015 2022Comply
immediately2022
3 360 2016 2021Comply
immediately2022
Chakabura TPP Private 2 30 Complying
NTPC KORBA STPS Central
1 200 1983 2022 2022 2022
2 200 1983 2022 2022 2022
3 200 1984 2022 no comments 2022
4 500 1987 2022 2022 2022
5 500 1988 2022 2022 2022
6 500 1989 2022 - 2022
7 500 2010 2022 - 2022
KORBA-II (Korba-East) State
1 50 1966 2020 2020 2020
2 50 1967 2020 2020 2020
3 50 1968 2020 2020 2020
4 50 1968 2020 2020 2020
KORBA-III (Korba-East) State1 120 1976 2020 2020 2020
2 120 1981 2020 2020 2020
KORBA-WEST TPS (Hasdeo) State
1 210 1983 2020 2020 2022
2 210 1984 2020 2020 2022
3 210 1985 2020 2020 2022
4 210 1986 2020 2020 2022
5 500 2013 2021Comply
immediately2022
GUJARAT
Adani Mundra Private
1 330 2009 2022Comply
immediately2022
2 330 2010 2022Comply
immediately2022
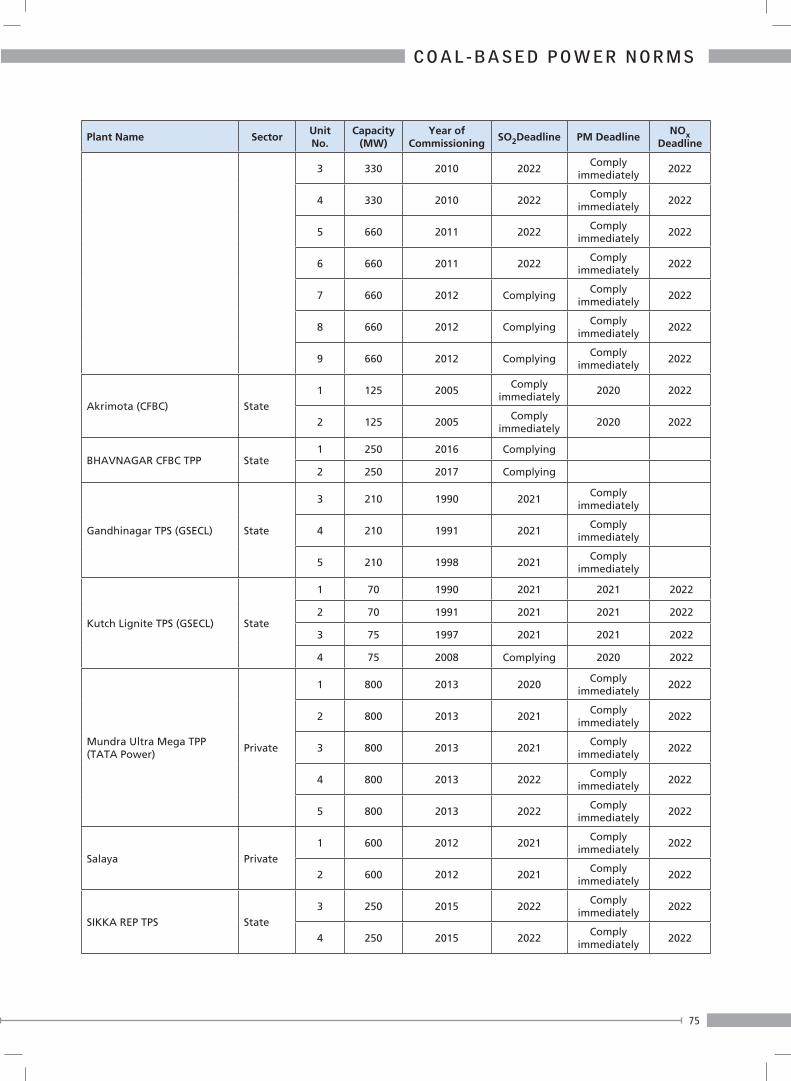
75
C O A L - B A S E D P O W E R N O R M S
Plant Name SectorUnit No.
Capacity (MW)
Year of Commissioning
SO2Deadline PM Deadline NOx
Deadline
3 330 2010 2022Comply
immediately2022
4 330 2010 2022Comply
immediately2022
5 660 2011 2022Comply
immediately2022
6 660 2011 2022Comply
immediately2022
7 660 2012 ComplyingComply
immediately2022
8 660 2012 ComplyingComply
immediately2022
9 660 2012 ComplyingComply
immediately2022
Akrimota (CFBC) State
1 125 2005Comply
immediately2020 2022
2 125 2005Comply
immediately2020 2022
BHAVNAGAR CFBC TPP State1 250 2016 Complying
2 250 2017 Complying
Gandhinagar TPS (GSECL) State
3 210 1990 2021Comply
immediately
4 210 1991 2021Comply
immediately
5 210 1998 2021Comply
immediately
Kutch Lignite TPS (GSECL) State
1 70 1990 2021 2021 2022
2 70 1991 2021 2021 2022
3 75 1997 2021 2021 2022
4 75 2008 Complying 2020 2022
Mundra Ultra Mega TPP (TATA Power)
Private
1 800 2013 2020Comply
immediately2022
2 800 2013 2021Comply
immediately2022
3 800 2013 2021Comply
immediately2022
4 800 2013 2022Comply
immediately2022
5 800 2013 2022Comply
immediately2022
Salaya Private
1 600 2012 2021Comply
immediately2022
2 600 2012 2021Comply
immediately2022
SIKKA REP TPS State
3 250 2015 2022Comply
immediately2022
4 250 2015 2022Comply
immediately2022
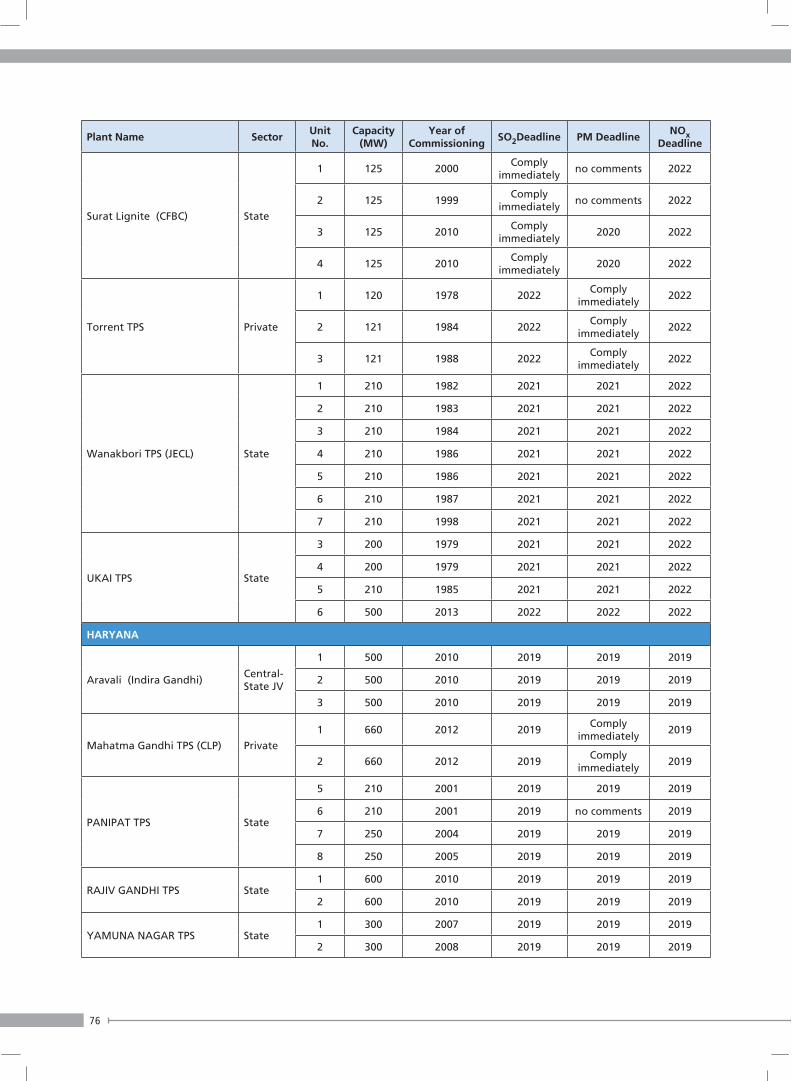
76
Plant Name SectorUnit No.
Capacity (MW)
Year of Commissioning
SO2Deadline PM Deadline NOx
Deadline
Surat Lignite (CFBC) State
1 125 2000Comply
immediatelyno comments 2022
2 125 1999Comply
immediatelyno comments 2022
3 125 2010Comply
immediately2020 2022
4 125 2010Comply
immediately2020 2022
Torrent TPS Private
1 120 1978 2022Comply
immediately2022
2 121 1984 2022Comply
immediately2022
3 121 1988 2022Comply
immediately2022
Wanakbori TPS (JECL) State
1 210 1982 2021 2021 2022
2 210 1983 2021 2021 2022
3 210 1984 2021 2021 2022
4 210 1986 2021 2021 2022
5 210 1986 2021 2021 2022
6 210 1987 2021 2021 2022
7 210 1998 2021 2021 2022
UKAI TPS State
3 200 1979 2021 2021 2022
4 200 1979 2021 2021 2022
5 210 1985 2021 2021 2022
6 500 2013 2022 2022 2022
HARYANA
Aravali (Indira Gandhi) Central-State JV
1 500 2010 2019 2019 2019
2 500 2010 2019 2019 2019
3 500 2010 2019 2019 2019
Mahatma Gandhi TPS (CLP) Private
1 660 2012 2019Comply
immediately2019
2 660 2012 2019Comply
immediately2019
PANIPAT TPS State
5 210 2001 2019 2019 2019
6 210 2001 2019 no comments 2019
7 250 2004 2019 2019 2019
8 250 2005 2019 2019 2019
RAJIV GANDHI TPS State1 600 2010 2019 2019 2019
2 600 2010 2019 2019 2019
YAMUNA NAGAR TPS State1 300 2007 2019 2019 2019
2 300 2008 2019 2019 2019
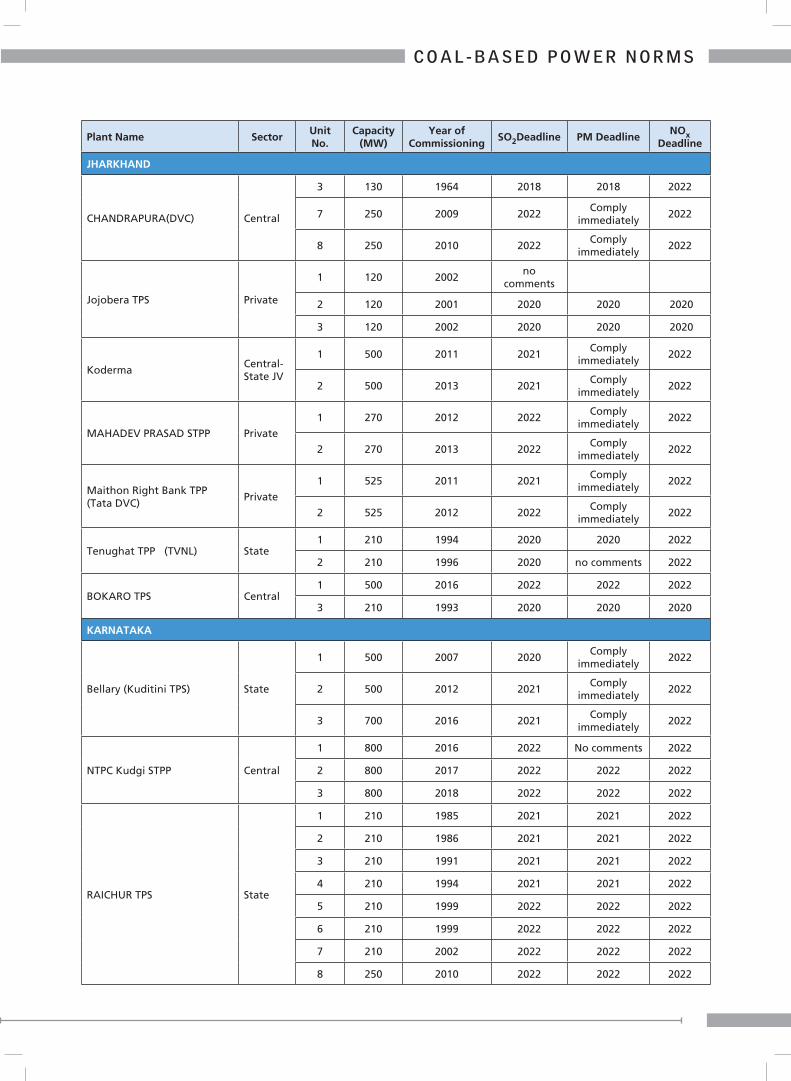
C O A L - B A S E D P O W E R N O R M S
Plant Name SectorUnit No.
Capacity (MW)
Year of Commissioning
SO2Deadline PM Deadline NOx
Deadline
JHARKHAND
CHANDRAPURA(DVC) Central
3 130 1964 2018 2018 2022
7 250 2009 2022Comply
immediately2022
8 250 2010 2022Comply
immediately2022
Jojobera TPS Private
1 120 2002no
comments
2 120 2001 2020 2020 2020
3 120 2002 2020 2020 2020
Koderma Central-State JV
1 500 2011 2021Comply
immediately2022
2 500 2013 2021Comply
immediately2022
MAHADEV PRASAD STPP Private
1 270 2012 2022Comply
immediately2022
2 270 2013 2022Comply
immediately2022
Maithon Right Bank TPP (Tata DVC)
Private
1 525 2011 2021Comply
immediately2022
2 525 2012 2022Comply
immediately2022
Tenughat TPP (TVNL) State1 210 1994 2020 2020 2022
2 210 1996 2020 no comments 2022
BOKARO TPS Central1 500 2016 2022 2022 2022
3 210 1993 2020 2020 2020
KARNATAKA
Bellary (Kuditini TPS) State
1 500 2007 2020Comply
immediately2022
2 500 2012 2021Comply
immediately2022
3 700 2016 2021Comply
immediately2022
NTPC Kudgi STPP Central
1 800 2016 2022 No comments 2022
2 800 2017 2022 2022 2022
3 800 2018 2022 2022 2022
RAICHUR TPS State
1 210 1985 2021 2021 2022
2 210 1986 2021 2021 2022
3 210 1991 2021 2021 2022
4 210 1994 2021 2021 2022
5 210 1999 2022 2022 2022
6 210 1999 2022 2022 2022
7 210 2002 2022 2022 2022
8 250 2010 2022 2022 2022
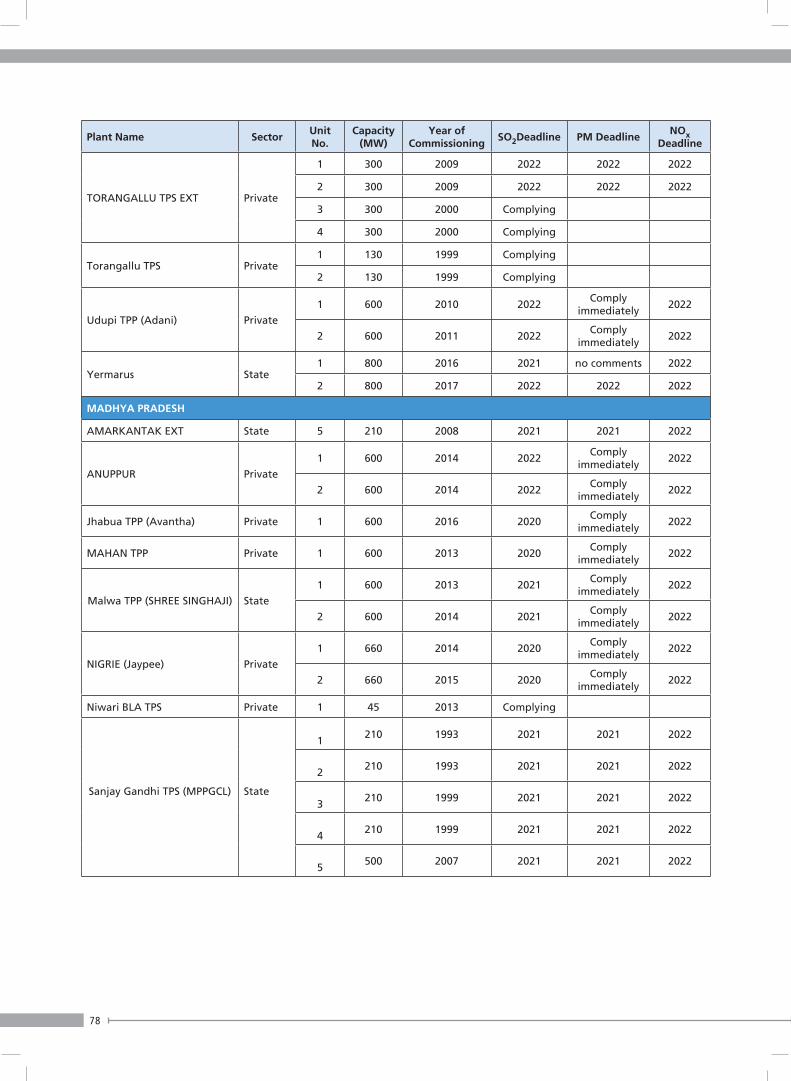
78
Plant Name SectorUnit No.
Capacity (MW)
Year of Commissioning
SO2Deadline PM Deadline NOx
Deadline
TORANGALLU TPS EXT Private
1 300 2009 2022 2022 2022
2 300 2009 2022 2022 2022
3 300 2000 Complying
4 300 2000 Complying
Torangallu TPS Private1 130 1999 Complying
2 130 1999 Complying
Udupi TPP (Adani) Private
1 600 2010 2022Comply
immediately2022
2 600 2011 2022Comply
immediately2022
Yermarus State1 800 2016 2021 no comments 2022
2 800 2017 2022 2022 2022
MADHYA PRADESH
AMARKANTAK EXT State 5 210 2008 2021 2021 2022
ANUPPUR Private
1 600 2014 2022Comply
immediately2022
2 600 2014 2022Comply
immediately2022
Jhabua TPP (Avantha) Private 1 600 2016 2020Comply
immediately2022
MAHAN TPP Private 1 600 2013 2020Comply
immediately2022
Malwa TPP (SHREE SINGHAJI) State
1 600 2013 2021Comply
immediately2022
2 600 2014 2021Comply
immediately2022
NIGRIE (Jaypee) Private
1 660 2014 2020Comply
immediately2022
2 660 2015 2020Comply
immediately2022
Niwari BLA TPS Private 1 45 2013 Complying
Sanjay Gandhi TPS (MPPGCL)
State
1
210 1993 2021 2021 2022
2
210 1993 2021 2021 2022
3
210 1999 2021 2021 2022
4
210 1999 2021 2021 2022
5
500 2007 2021 2021 2022
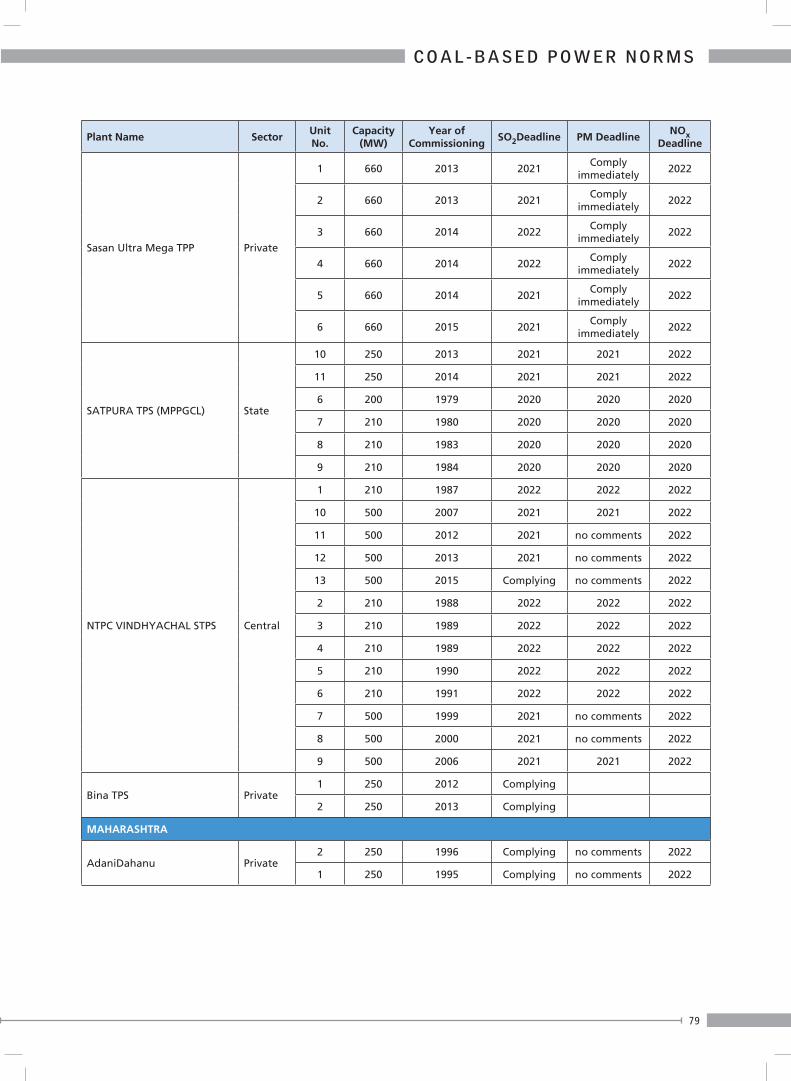
79
C O A L - B A S E D P O W E R N O R M S
Plant Name SectorUnit No.
Capacity (MW)
Year of Commissioning
SO2Deadline PM Deadline NOx
Deadline
Sasan Ultra Mega TPP Private
1 660 2013 2021Comply
immediately2022
2 660 2013 2021Comply
immediately2022
3 660 2014 2022Comply
immediately2022
4 660 2014 2022Comply
immediately2022
5 660 2014 2021Comply
immediately2022
6 660 2015 2021Comply
immediately2022
SATPURA TPS (MPPGCL) State
10 250 2013 2021 2021 2022
11 250 2014 2021 2021 2022
6 200 1979 2020 2020 2020
7 210 1980 2020 2020 2020
8 210 1983 2020 2020 2020
9 210 1984 2020 2020 2020
NTPC VINDHYACHAL STPS Central
1 210 1987 2022 2022 2022
10 500 2007 2021 2021 2022
11 500 2012 2021 no comments 2022
12 500 2013 2021 no comments 2022
13 500 2015 Complying no comments 2022
2 210 1988 2022 2022 2022
3 210 1989 2022 2022 2022
4 210 1989 2022 2022 2022
5 210 1990 2022 2022 2022
6 210 1991 2022 2022 2022
7 500 1999 2021 no comments 2022
8 500 2000 2021 no comments 2022
9 500 2006 2021 2021 2022
Bina TPS Private1 250 2012 Complying
2 250 2013 Complying
MAHARASHTRA
AdaniDahanu Private2 250 1996 Complying no comments 2022
1 250 1995 Complying no comments 2022
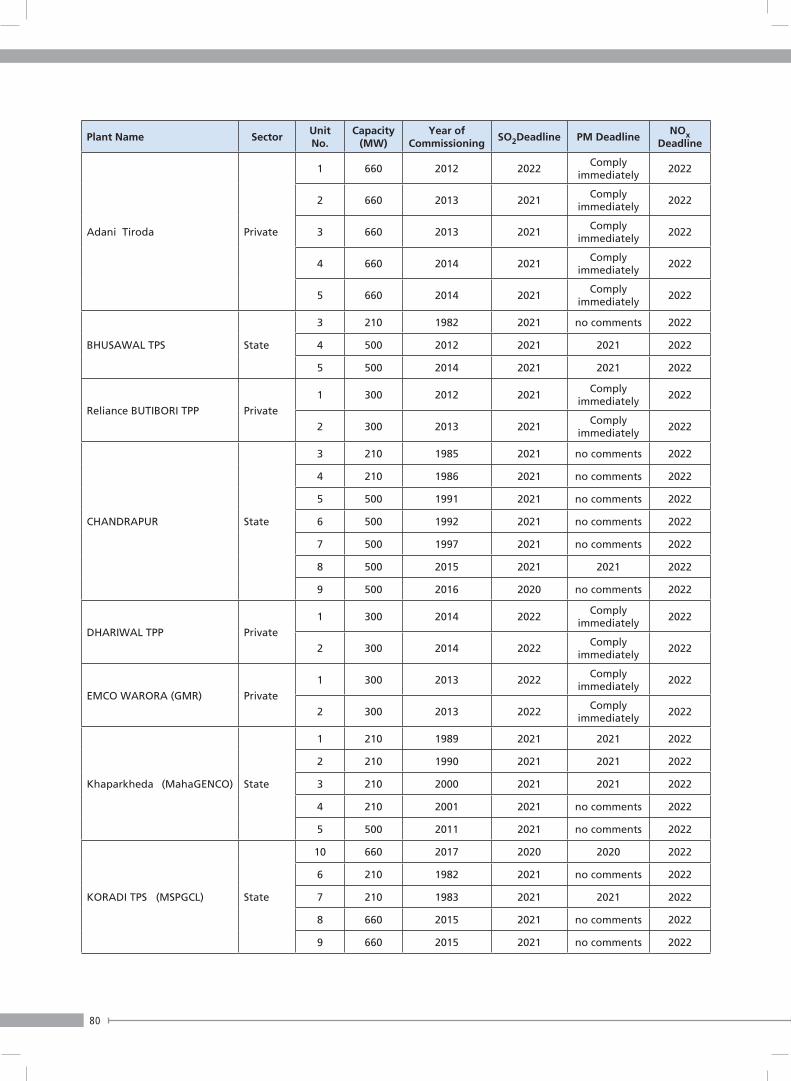
80
Plant Name SectorUnit No.
Capacity (MW)
Year of Commissioning
SO2Deadline PM Deadline NOx
Deadline
Adani Tiroda Private
1 660 2012 2022Comply
immediately2022
2 660 2013 2021Comply
immediately2022
3 660 2013 2021Comply
immediately2022
4 660 2014 2021Comply
immediately2022
5 660 2014 2021Comply
immediately2022
BHUSAWAL TPS State
3 210 1982 2021 no comments 2022
4 500 2012 2021 2021 2022
5 500 2014 2021 2021 2022
Reliance BUTIBORI TPP Private
1 300 2012 2021Comply
immediately2022
2 300 2013 2021Comply
immediately2022
CHANDRAPUR State
3 210 1985 2021 no comments 2022
4 210 1986 2021 no comments 2022
5 500 1991 2021 no comments 2022
6 500 1992 2021 no comments 2022
7 500 1997 2021 no comments 2022
8 500 2015 2021 2021 2022
9 500 2016 2020 no comments 2022
DHARIWAL TPP Private
1 300 2014 2022Comply
immediately2022
2 300 2014 2022Comply
immediately2022
EMCO WARORA (GMR) Private
1 300 2013 2022Comply
immediately2022
2 300 2013 2022Comply
immediately2022
Khaparkheda (MahaGENCO) State
1 210 1989 2021 2021 2022
2 210 1990 2021 2021 2022
3 210 2000 2021 2021 2022
4 210 2001 2021 no comments 2022
5 500 2011 2021 no comments 2022
KORADI TPS (MSPGCL) State
10 660 2017 2020 2020 2022
6 210 1982 2021 no comments 2022
7 210 1983 2021 2021 2022
8 660 2015 2021 no comments 2022
9 660 2015 2021 no comments 2022
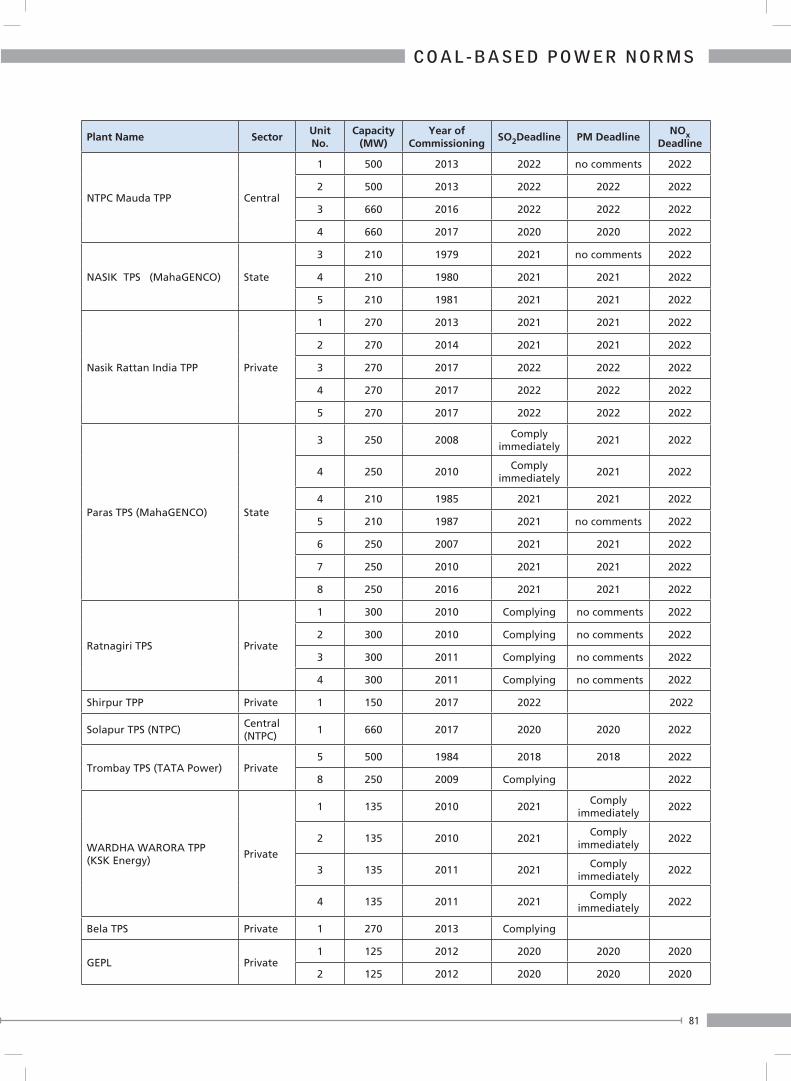
81
C O A L - B A S E D P O W E R N O R M S
Plant Name SectorUnit No.
Capacity (MW)
Year of Commissioning
SO2Deadline PM Deadline NOx
Deadline
NTPC Mauda TPP Central
1 500 2013 2022 no comments 2022
2 500 2013 2022 2022 2022
3 660 2016 2022 2022 2022
4 660 2017 2020 2020 2022
NASIK TPS (MahaGENCO) State
3 210 1979 2021 no comments 2022
4 210 1980 2021 2021 2022
5 210 1981 2021 2021 2022
Nasik Rattan India TPP Private
1 270 2013 2021 2021 2022
2 270 2014 2021 2021 2022
3 270 2017 2022 2022 2022
4 270 2017 2022 2022 2022
5 270 2017 2022 2022 2022
Paras TPS (MahaGENCO) State
3 250 2008Comply
immediately2021 2022
4 250 2010Comply
immediately2021 2022
4 210 1985 2021 2021 2022
5 210 1987 2021 no comments 2022
6 250 2007 2021 2021 2022
7 250 2010 2021 2021 2022
8 250 2016 2021 2021 2022
Ratnagiri TPS Private
1 300 2010 Complying no comments 2022
2 300 2010 Complying no comments 2022
3 300 2011 Complying no comments 2022
4 300 2011 Complying no comments 2022
Shirpur TPP Private 1 150 2017 2022 2022
Solapur TPS (NTPC) Central (NTPC)
1 660 2017 2020 2020 2022
Trombay TPS (TATA Power) Private5 500 1984 2018 2018 2022
8 250 2009 Complying 2022
WARDHA WARORA TPP (KSK Energy)
Private
1 135 2010 2021Comply
immediately2022
2 135 2010 2021Comply
immediately2022
3 135 2011 2021Comply
immediately2022
4 135 2011 2021Comply
immediately2022
Bela TPS Private 1 270 2013 Complying
GEPL Private1 125 2012 2020 2020 2020
2 125 2012 2020 2020 2020

82
Plant Name SectorUnit No.
Capacity (MW)
Year of Commissioning
SO2Deadline PM Deadline NOx
Deadline
Mihan TPS Private 1 271 Complying
ODISHA
DERANG TPS (JITPL) Private
1 600 2014 2021Comply
immediately2022
2 600 2015 2021Comply
immediately2022
IB VALLEY TPS State1 210 1994 2021 2021 2022
2 210 1995 2021 2021 2022
Ind-Barath TPS Private 1 350 2016 2022 2022 2022
KAMALANGA TPS (GMR) Private
1 350 2013 2021Comply
immediately2022
2 350 2013 2021Comply
immediately2022
3 350 2014 2021Comply
immediately2022
Sterlite Energy Ltd. Private
1 600 2010no
comments
2 600 2010 2022Comply
immediately2022
3 600 2010no
comments
4 600 2010no
comments
NTPC Talcher (Old) TPS Central
1 60 1969 2020 2020 2020
2 60 1967 2020 2020 2020
3 60 1968 2020 2020 2020
4 60 1968 2020 2020 2020
5 110 1983 2020 2020 2020
6 110 1982 2020 2020 2020
NTPC TalcherKaniha Central
1 500 1995 2022 no comments 2022
2 500 1996 2022 no comments 2022
3 500 2003 2022 no comments 2022
4 500 2003 2022 no comments 2022
5 500 2004 2022 2022 2022
6 500 2005 2022 2022 2022
PUNJAB
GH TPS (LEH.MOH.) State
1 210 1997 2019 2019 2019
2 210 1998 2019 2019 2019
3 250 2008 2019 2019 2019
4 250 2008 2019 2019 2019
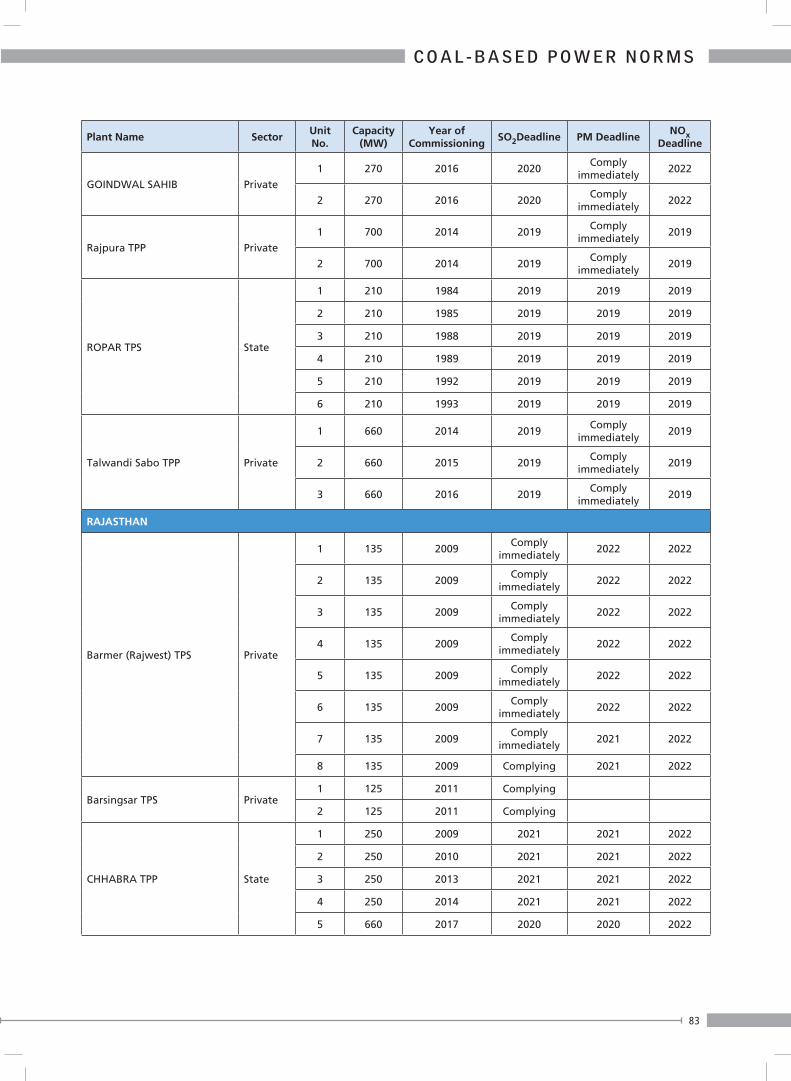
83
C O A L - B A S E D P O W E R N O R M S
Plant Name SectorUnit No.
Capacity (MW)
Year of Commissioning
SO2Deadline PM Deadline NOx
Deadline
GOINDWAL SAHIB Private
1 270 2016 2020Comply
immediately2022
2 270 2016 2020Comply
immediately2022
Rajpura TPP Private
1 700 2014 2019Comply
immediately2019
2 700 2014 2019Comply
immediately2019
ROPAR TPS State
1 210 1984 2019 2019 2019
2 210 1985 2019 2019 2019
3 210 1988 2019 2019 2019
4 210 1989 2019 2019 2019
5 210 1992 2019 2019 2019
6 210 1993 2019 2019 2019
Talwandi Sabo TPP Private
1 660 2014 2019Comply
immediately2019
2 660 2015 2019Comply
immediately2019
3 660 2016 2019Comply
immediately2019
RAJASTHAN
Barmer (Rajwest) TPS Private
1 135 2009Comply
immediately2022 2022
2 135 2009Comply
immediately2022 2022
3 135 2009Comply
immediately2022 2022
4 135 2009Comply
immediately2022 2022
5 135 2009Comply
immediately2022 2022
6 135 2009Comply
immediately2022 2022
7 135 2009Comply
immediately2021 2022
8 135 2009 Complying 2021 2022
Barsingsar TPS Private1 125 2011 Complying
2 125 2011 Complying
CHHABRA TPP State
1 250 2009 2021 2021 2022
2 250 2010 2021 2021 2022
3 250 2013 2021 2021 2022
4 250 2014 2021 2021 2022
5 660 2017 2020 2020 2022
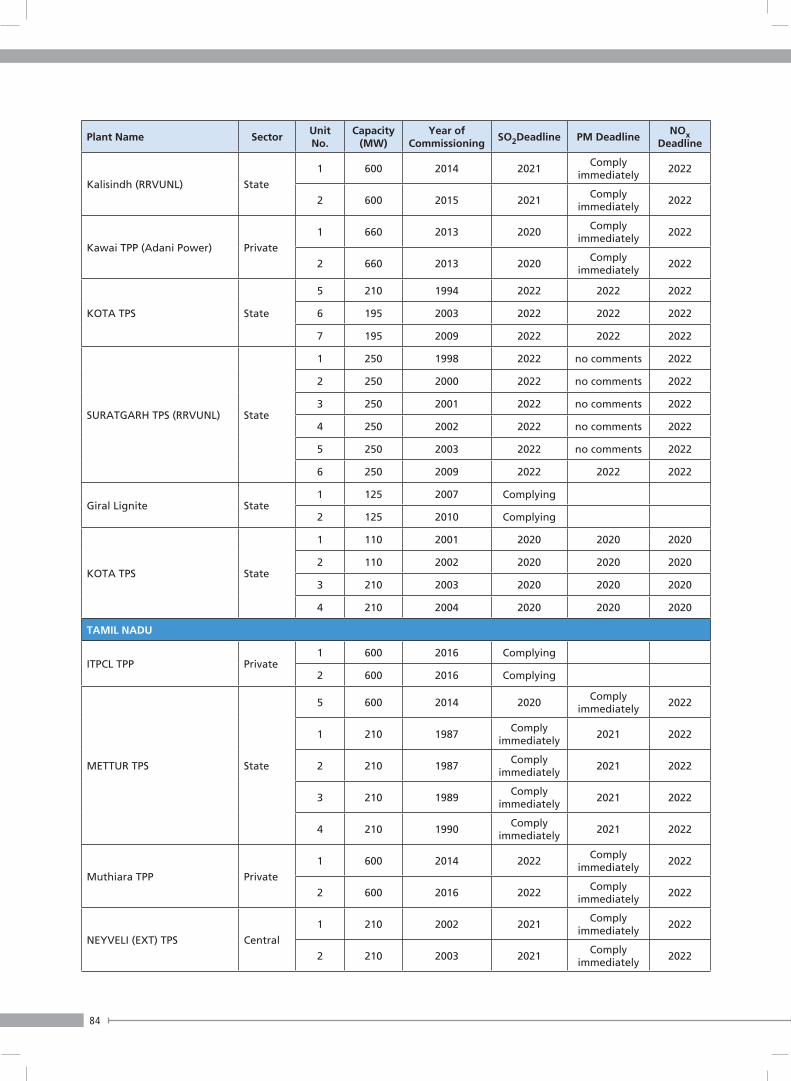
84
Plant Name SectorUnit No.
Capacity (MW)
Year of Commissioning
SO2Deadline PM Deadline NOx
Deadline
Kalisindh (RRVUNL) State
1 600 2014 2021Comply
immediately2022
2 600 2015 2021Comply
immediately2022
Kawai TPP (Adani Power) Private
1 660 2013 2020Comply
immediately2022
2 660 2013 2020Comply
immediately2022
KOTA TPS State
5 210 1994 2022 2022 2022
6 195 2003 2022 2022 2022
7 195 2009 2022 2022 2022
SURATGARH TPS (RRVUNL) State
1 250 1998 2022 no comments 2022
2 250 2000 2022 no comments 2022
3 250 2001 2022 no comments 2022
4 250 2002 2022 no comments 2022
5 250 2003 2022 no comments 2022
6 250 2009 2022 2022 2022
Giral Lignite State1 125 2007 Complying
2 125 2010 Complying
KOTA TPS State
1 110 2001 2020 2020 2020
2 110 2002 2020 2020 2020
3 210 2003 2020 2020 2020
4 210 2004 2020 2020 2020
TAMIL NADU
ITPCL TPP Private1 600 2016 Complying
2 600 2016 Complying
METTUR TPS State
5 600 2014 2020Comply
immediately2022
1 210 1987Comply
immediately2021 2022
2 210 1987Comply
immediately2021 2022
3 210 1989Comply
immediately2021 2022
4 210 1990Comply
immediately2021 2022
Muthiara TPP Private
1 600 2014 2022Comply
immediately2022
2 600 2016 2022Comply
immediately2022
NEYVELI (EXT) TPS Central
1 210 2002 2021Comply
immediately2022
2 210 2003 2021Comply
immediately2022
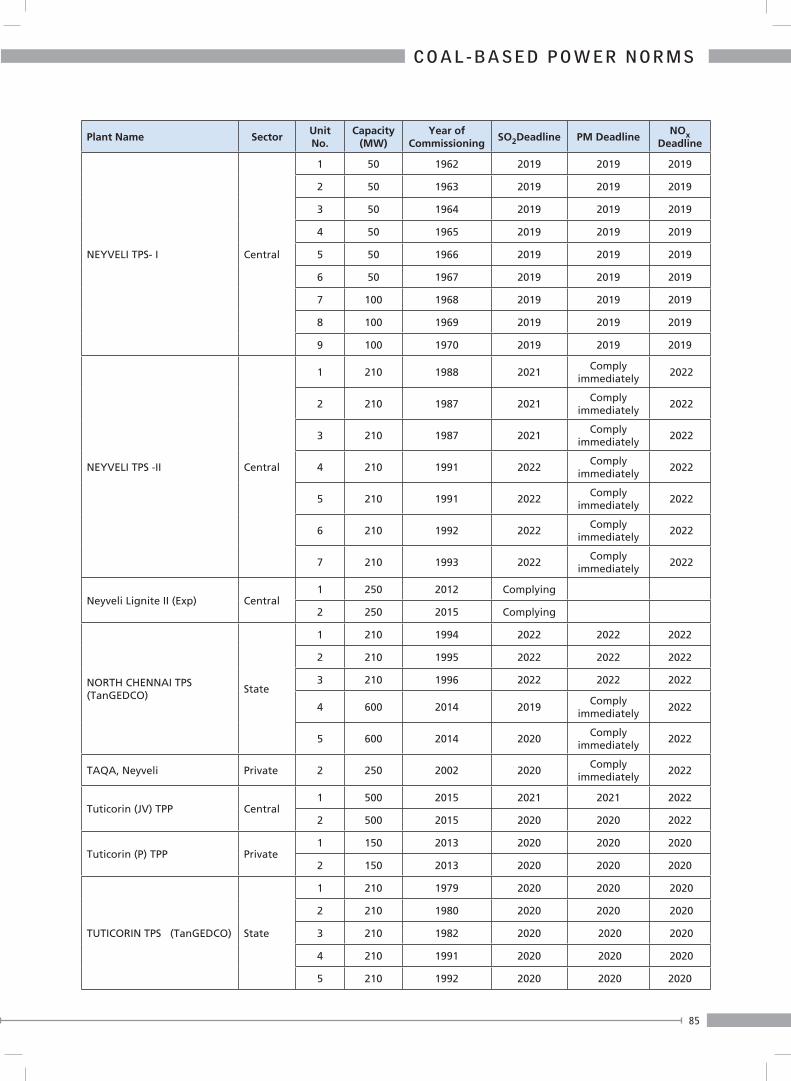
85
C O A L - B A S E D P O W E R N O R M S
Plant Name SectorUnit No.
Capacity (MW)
Year of Commissioning
SO2Deadline PM Deadline NOx
Deadline
NEYVELI TPS- I Central
1 50 1962 2019 2019 2019
2 50 1963 2019 2019 2019
3 50 1964 2019 2019 2019
4 50 1965 2019 2019 2019
5 50 1966 2019 2019 2019
6 50 1967 2019 2019 2019
7 100 1968 2019 2019 2019
8 100 1969 2019 2019 2019
9 100 1970 2019 2019 2019
NEYVELI TPS -II Central
1 210 1988 2021Comply
immediately 2022
2 210 1987 2021Comply
immediately 2022
3 210 1987 2021Comply
immediately 2022
4 210 1991 2022Comply
immediately 2022
5 210 1991 2022Comply
immediately 2022
6 210 1992 2022Comply
immediately 2022
7 210 1993 2022Comply
immediately 2022
Neyveli Lignite II (Exp) Central1 250 2012 Complying
2 250 2015 Complying
NORTH CHENNAI TPS (TanGEDCO)
State
1 210 1994 2022 2022 2022
2 210 1995 2022 2022 2022
3 210 1996 2022 2022 2022
4 600 2014 2019Comply
immediately2022
5 600 2014 2020Comply
immediately2022
TAQA, Neyveli Private 2 250 2002 2020Comply
immediately2022
Tuticorin (JV) TPP Central1 500 2015 2021 2021 2022
2 500 2015 2020 2020 2022
Tuticorin (P) TPP Private1 150 2013 2020 2020 2020
2 150 2013 2020 2020 2020
TUTICORIN TPS (TanGEDCO) State
1 210 1979 2020 2020 2020
2 210 1980 2020 2020 2020
3 210 1982 2020 2020 2020
4 210 1991 2020 2020 2020
5 210 1992 2020 2020 2020
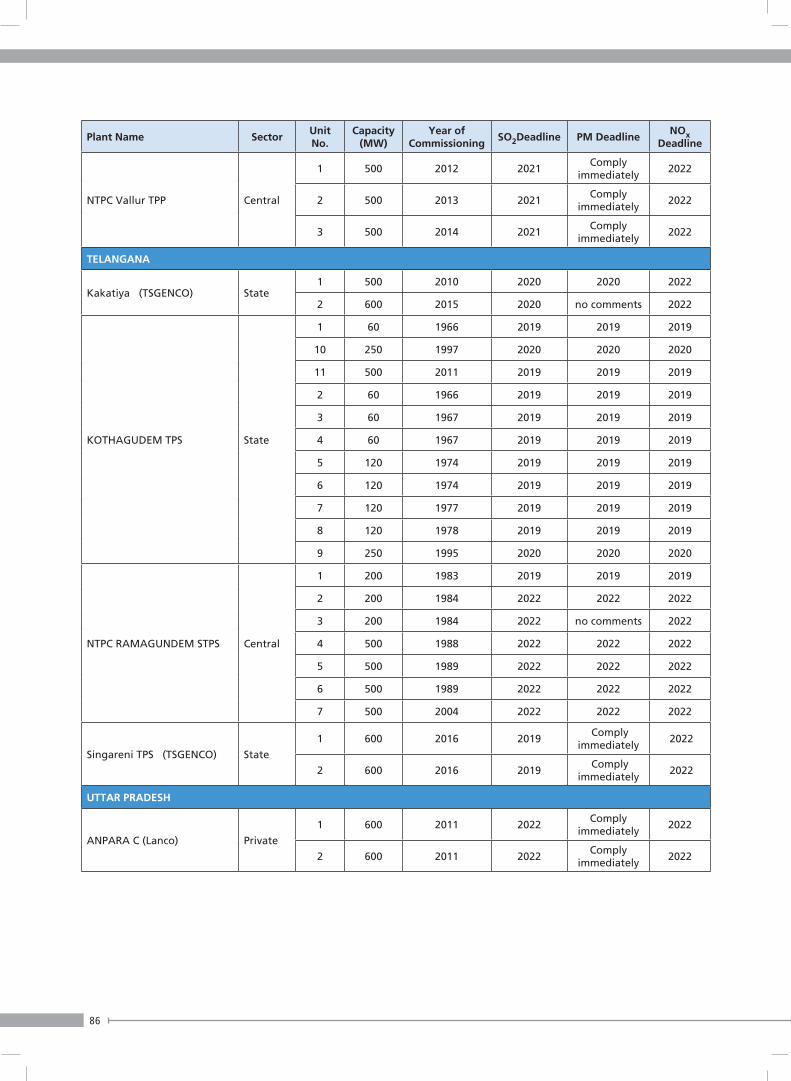
86
Plant Name SectorUnit No.
Capacity (MW)
Year of Commissioning
SO2Deadline PM Deadline NOx
Deadline
NTPC Vallur TPP Central
1 500 2012 2021Comply
immediately2022
2 500 2013 2021Comply
immediately2022
3 500 2014 2021Comply
immediately2022
TELANGANA
Kakatiya (TSGENCO) State1 500 2010 2020 2020 2022
2 600 2015 2020 no comments 2022
KOTHAGUDEM TPS State
1 60 1966 2019 2019 2019
10 250 1997 2020 2020 2020
11 500 2011 2019 2019 2019
2 60 1966 2019 2019 2019
3 60 1967 2019 2019 2019
4 60 1967 2019 2019 2019
5 120 1974 2019 2019 2019
6 120 1974 2019 2019 2019
7 120 1977 2019 2019 2019
8 120 1978 2019 2019 2019
9 250 1995 2020 2020 2020
NTPC RAMAGUNDEM STPS Central
1 200 1983 2019 2019 2019
2 200 1984 2022 2022 2022
3 200 1984 2022 no comments 2022
4 500 1988 2022 2022 2022
5 500 1989 2022 2022 2022
6 500 1989 2022 2022 2022
7 500 2004 2022 2022 2022
Singareni TPS (TSGENCO) State
1 600 2016 2019 Comply
immediately 2022
2 600 2016 2019 Comply
immediately 2022
UTTAR PRADESH
ANPARA C (Lanco) Private
1 600 2011 2022Comply
immediately2022
2 600 2011 2022Comply
immediately2022
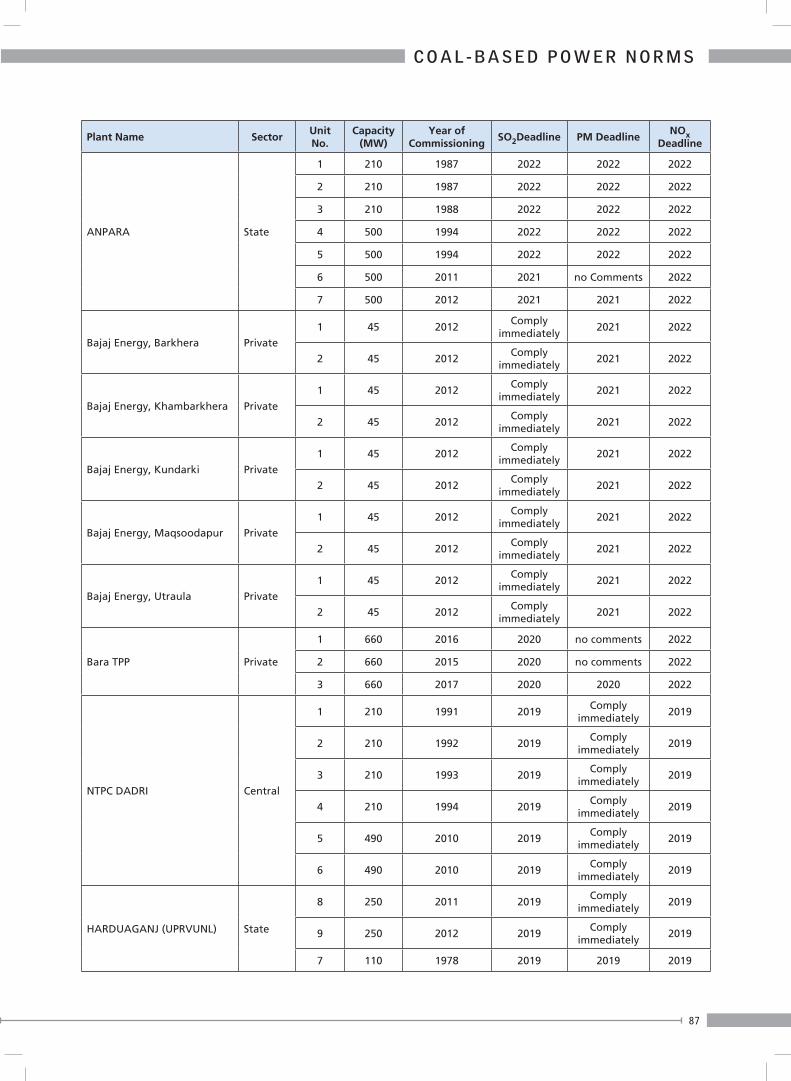
87
C O A L - B A S E D P O W E R N O R M S
Plant Name SectorUnit No.
Capacity (MW)
Year of Commissioning
SO2Deadline PM Deadline NOx
Deadline
ANPARA State
1 210 1987 2022 2022 2022
2 210 1987 2022 2022 2022
3 210 1988 2022 2022 2022
4 500 1994 2022 2022 2022
5 500 1994 2022 2022 2022
6 500 2011 2021 no Comments 2022
7 500 2012 2021 2021 2022
Bajaj Energy, Barkhera Private
1 45 2012Comply
immediately2021 2022
2 45 2012Comply
immediately2021 2022
Bajaj Energy, Khambarkhera Private
1 45 2012Comply
immediately2021 2022
2 45 2012Comply
immediately2021 2022
Bajaj Energy, Kundarki Private
1 45 2012Comply
immediately2021 2022
2 45 2012Comply
immediately2021 2022
Bajaj Energy, Maqsoodapur Private
1 45 2012Comply
immediately2021 2022
2 45 2012Comply
immediately2021 2022
Bajaj Energy, Utraula Private
1 45 2012Comply
immediately2021 2022
2 45 2012Comply
immediately2021 2022
Bara TPP Private
1 660 2016 2020 no comments 2022
2 660 2015 2020 no comments 2022
3 660 2017 2020 2020 2022
NTPC DADRI Central
1 210 1991 2019Comply
immediately2019
2 210 1992 2019Comply
immediately2019
3 210 1993 2019Comply
immediately2019
4 210 1994 2019Comply
immediately2019
5 490 2010 2019Comply
immediately2019
6 490 2010 2019Comply
immediately2019
HARDUAGANJ (UPRVUNL) State
8 250 2011 2019Comply
immediately2019
9 250 2012 2019Comply
immediately2019
7 110 1978 2019 2019 2019
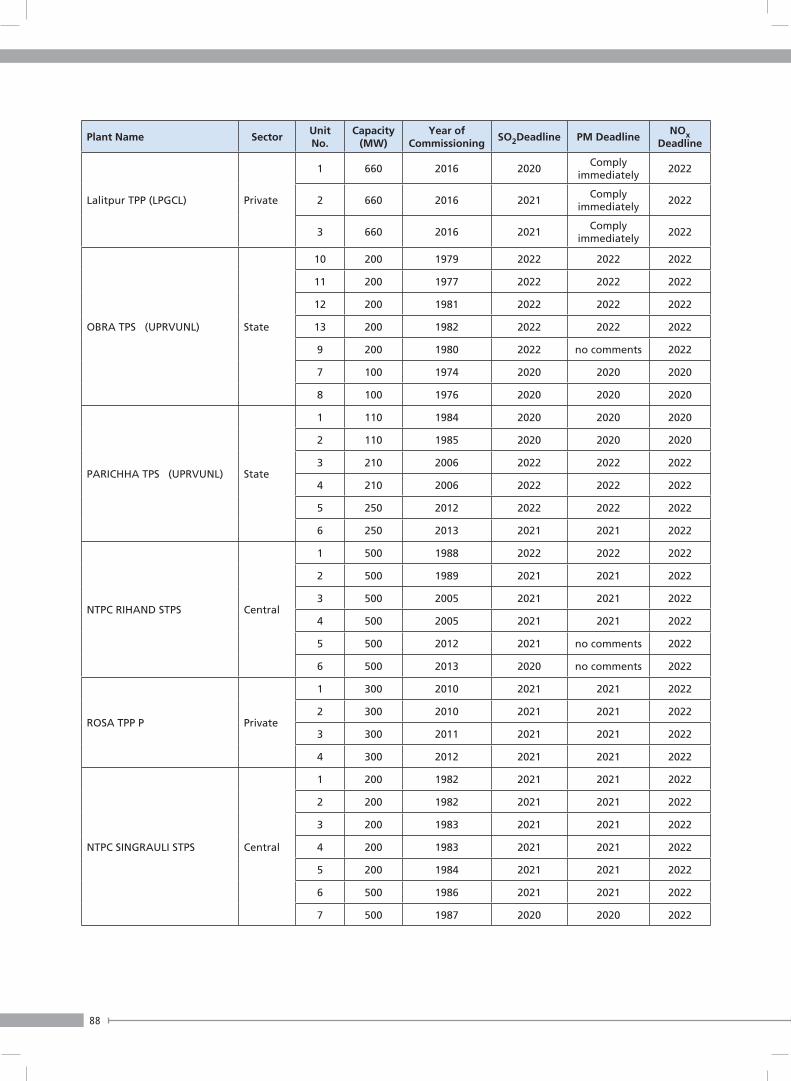
88
Plant Name SectorUnit No.
Capacity (MW)
Year of Commissioning
SO2Deadline PM Deadline NOx
Deadline
Lalitpur TPP (LPGCL) Private
1 660 2016 2020Comply
immediately2022
2 660 2016 2021Comply
immediately2022
3 660 2016 2021Comply
immediately2022
OBRA TPS (UPRVUNL) State
10 200 1979 2022 2022 2022
11 200 1977 2022 2022 2022
12 200 1981 2022 2022 2022
13 200 1982 2022 2022 2022
9 200 1980 2022 no comments 2022
7 100 1974 2020 2020 2020
8 100 1976 2020 2020 2020
PARICHHA TPS (UPRVUNL) State
1 110 1984 2020 2020 2020
2 110 1985 2020 2020 2020
3 210 2006 2022 2022 2022
4 210 2006 2022 2022 2022
5 250 2012 2022 2022 2022
6 250 2013 2021 2021 2022
NTPC RIHAND STPS Central
1 500 1988 2022 2022 2022
2 500 1989 2021 2021 2022
3 500 2005 2021 2021 2022
4 500 2005 2021 2021 2022
5 500 2012 2021 no comments 2022
6 500 2013 2020 no comments 2022
ROSA TPP P Private
1 300 2010 2021 2021 2022
2 300 2010 2021 2021 2022
3 300 2011 2021 2021 2022
4 300 2012 2021 2021 2022
NTPC SINGRAULI STPS Central
1 200 1982 2021 2021 2022
2 200 1982 2021 2021 2022
3 200 1983 2021 2021 2022
4 200 1983 2021 2021 2022
5 200 1984 2021 2021 2022
6 500 1986 2021 2021 2022
7 500 1987 2020 2020 2022
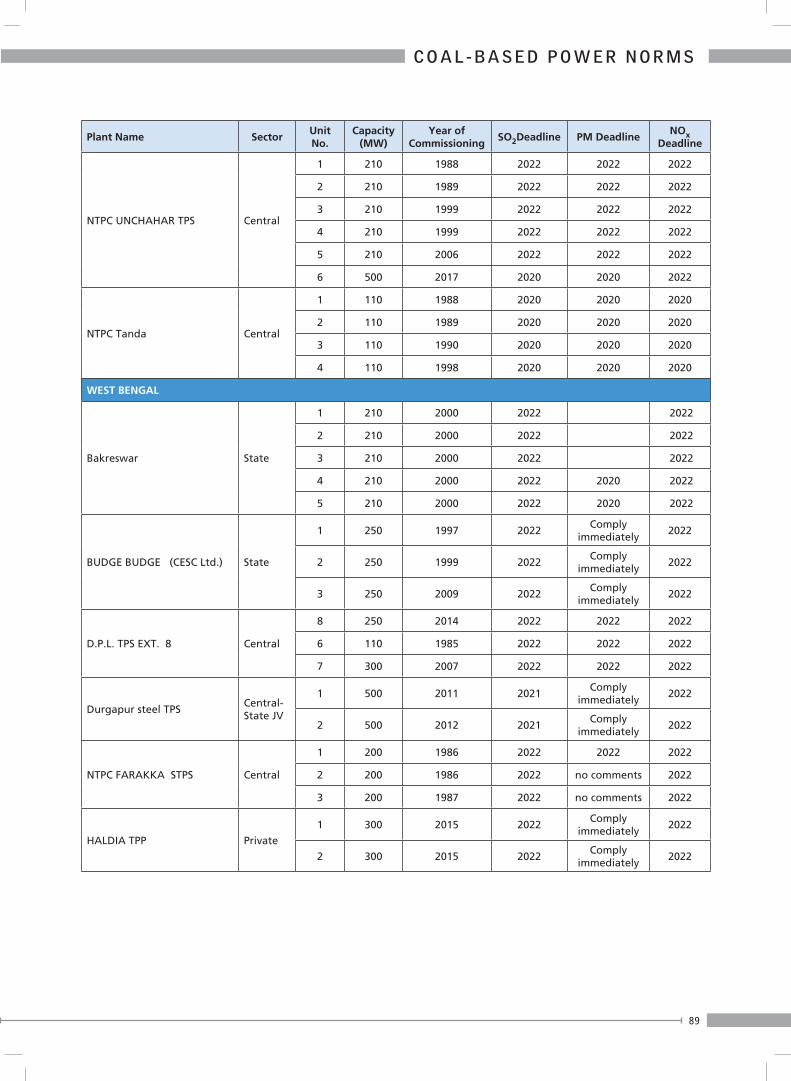
89
C O A L - B A S E D P O W E R N O R M S
Plant Name SectorUnit No.
Capacity (MW)
Year of Commissioning
SO2Deadline PM Deadline NOx
Deadline
NTPC UNCHAHAR TPS Central
1 210 1988 2022 2022 2022
2 210 1989 2022 2022 2022
3 210 1999 2022 2022 2022
4 210 1999 2022 2022 2022
5 210 2006 2022 2022 2022
6 500 2017 2020 2020 2022
NTPC Tanda Central
1 110 1988 2020 2020 2020
2 110 1989 2020 2020 2020
3 110 1990 2020 2020 2020
4 110 1998 2020 2020 2020
WEST BENGAL
Bakreswar State
1 210 2000 2022 2022
2 210 2000 2022 2022
3 210 2000 2022 2022
4 210 2000 2022 2020 2022
5 210 2000 2022 2020 2022
BUDGE BUDGE (CESC Ltd.) State
1 250 1997 2022Comply
immediately2022
2 250 1999 2022Comply
immediately2022
3 250 2009 2022Comply
immediately2022
D.P.L. TPS EXT. 8 Central
8 250 2014 2022 2022 2022
6 110 1985 2022 2022 2022
7 300 2007 2022 2022 2022
Durgapur steel TPS Central-State JV
1 500 2011 2021Comply
immediately2022
2 500 2012 2021Comply
immediately2022
NTPC FARAKKA STPS Central
1 200 1986 2022 2022 2022
2 200 1986 2022 no comments 2022
3 200 1987 2022 no comments 2022
HALDIA TPP Private
1 300 2015 2022Comply
immediately2022
2 300 2015 2022Comply
immediately2022

90
Plant Name SectorUnit No.
Capacity (MW)
Year of Commissioning
SO2Deadline PM Deadline NOx
Deadline
KOLAGHAT TPS (WBPDCL) State
1 210 1993 2022 2022 2022
2 210 1990 2021 2021 2022
3 210 1985 2021 2021 2022
4 210 1984 2022 2022 2022
5 210 1993 2021 2021 2022
6 210 1991 2021 2021 2022
Mejia TPS Central-State JV
1 210 1996 2022 2022 2022
2 210 1997 2022 2022 2022
3 210 1998 2022 2022 2022
4 210 2004 2022 2022 2022
5 250 2007 2022 2022 2022
6 250 2007 2022 2022 2022
7 500 2012 2021 2021 2022
8 500 2012 2021 2021 2022
Raghunathpur (Stage ) TPP Central-State JV
1 600 2014 2022Comply
immediately2022
2 600 2016 2022Comply
immediately2022
SAGARDIGHI TPS (WBPDCL) State
1 300 2008 2020 2020 2022
2 300 2007 2021 2021 2022
3 500 2016 2022 no comments 2022
4 500 2016 2020 no comments 2022
5 250 2007 2021 2021 2022
6 250 2011 2021 2021 2022
SOUTHERN REPL, TPS State
1 68 1991 2022Comply
immediately2022
2 68 1990 2021Comply
immediately2022
BANDEL TPS State
2 60 1965 2020 2020 2020
4 60 1967 2020 2020 2020
5 210 1982 2020 2020 2020
1 60 1965 2020 2020 2020
3 60 1966 2020 2020 2020
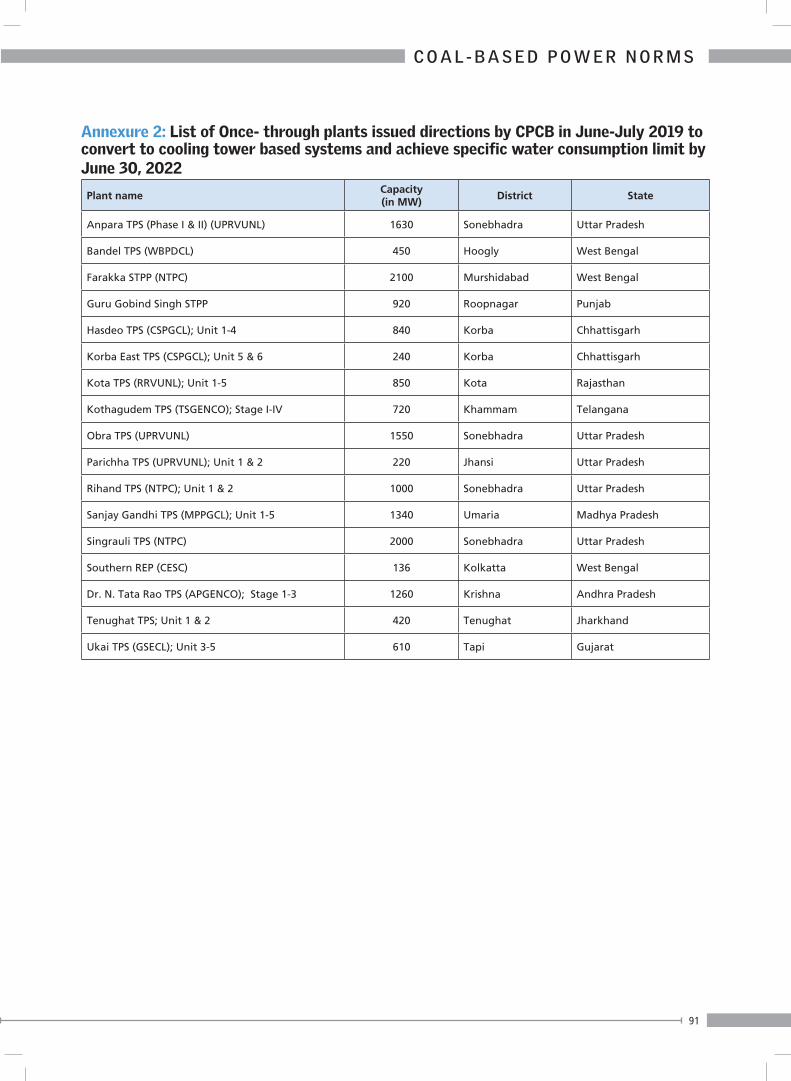
91
C O A L - B A S E D P O W E R N O R M S
Annexure 2: List of Once- through plants issued directions by CPCB in June-July 2019 to convert to cooling tower based systems and achieve specific water consumption limit by June 30, 2022
Plant nameCapacity (in MW)
District State
Anpara TPS (Phase I & II) (UPRVUNL) 1630 Sonebhadra Uttar Pradesh
Bandel TPS (WBPDCL) 450 Hoogly West Bengal
Farakka STPP (NTPC) 2100 Murshidabad West Bengal
Guru Gobind Singh STPP 920 Roopnagar Punjab
Hasdeo TPS (CSPGCL); Unit 1-4 840 Korba Chhattisgarh
Korba East TPS (CSPGCL); Unit 5 & 6 240 Korba Chhattisgarh
Kota TPS (RRVUNL); Unit 1-5 850 Kota Rajasthan
Kothagudem TPS (TSGENCO); Stage I-IV 720 Khammam Telangana
Obra TPS (UPRVUNL) 1550 Sonebhadra Uttar Pradesh
Parichha TPS (UPRVUNL); Unit 1 & 2 220 Jhansi Uttar Pradesh
Rihand TPS (NTPC); Unit 1 & 2 1000 Sonebhadra Uttar Pradesh
Sanjay Gandhi TPS (MPPGCL); Unit 1-5 1340 Umaria Madhya Pradesh
Singrauli TPS (NTPC) 2000 Sonebhadra Uttar Pradesh
Southern REP (CESC) 136 Kolkatta West Bengal
Dr. N. Tata Rao TPS (APGENCO); Stage 1-3 1260 Krishna Andhra Pradesh
Tenughat TPS; Unit 1 & 2 420 Tenughat Jharkhand
Ukai TPS (GSECL); Unit 3-5 610 Tapi Gujarat
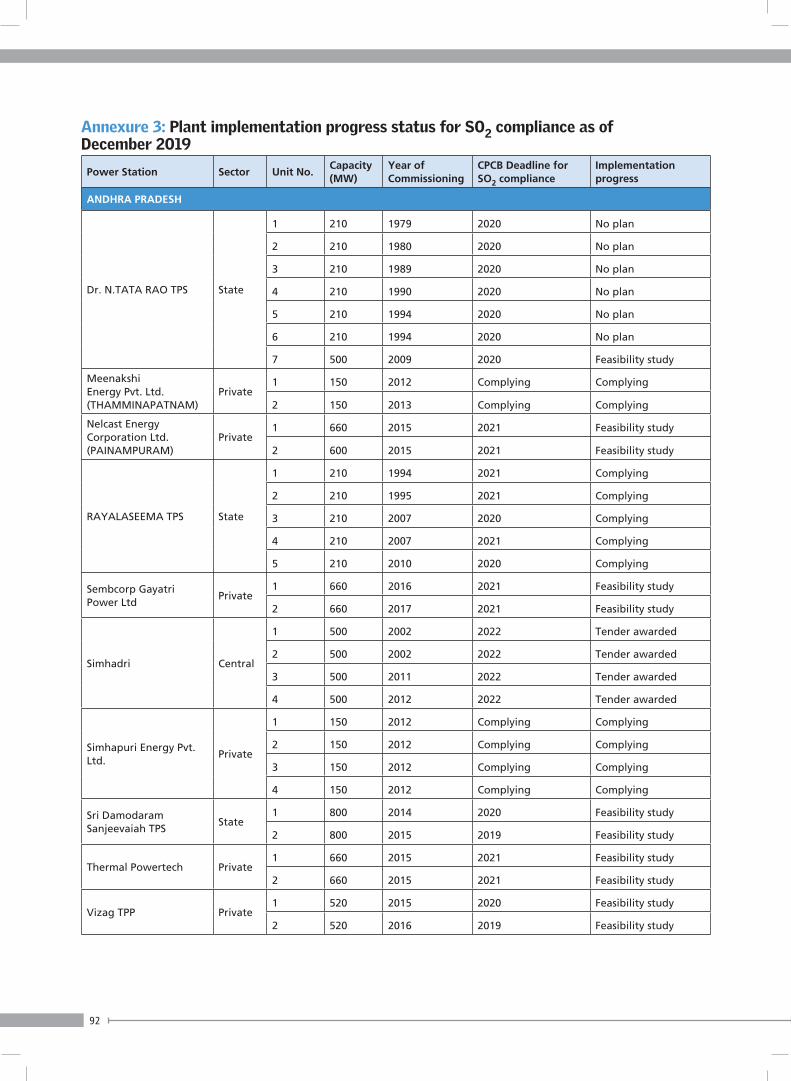
92
Annexure 3: Plant implementation progress status for SO2 compliance as of December 2019
Power Station Sector Unit No.Capacity (MW)
Year of Commissioning
CPCB Deadline for SO2 compliance
Implementation progress
ANDHRA PRADESH
Dr. N.TATA RAO TPS State
1 210 1979 2020 No plan
2 210 1980 2020 No plan
3 210 1989 2020 No plan
4 210 1990 2020 No plan
5 210 1994 2020 No plan
6 210 1994 2020 No plan
7 500 2009 2020 Feasibility study
Meenakshi Energy Pvt. Ltd. (THAMMINAPATNAM)
Private1 150 2012 Complying Complying
2 150 2013 Complying Complying
Nelcast Energy Corporation Ltd. (PAINAMPURAM)
Private1 660 2015 2021 Feasibility study
2 600 2015 2021 Feasibility study
RAYALASEEMA TPS State
1 210 1994 2021 Complying
2 210 1995 2021 Complying
3 210 2007 2020 Complying
4 210 2007 2021 Complying
5 210 2010 2020 Complying
Sembcorp Gayatri Power Ltd
Private1 660 2016 2021 Feasibility study
2 660 2017 2021 Feasibility study
Simhadri Central
1 500 2002 2022 Tender awarded
2 500 2002 2022 Tender awarded
3 500 2011 2022 Tender awarded
4 500 2012 2022 Tender awarded
Simhapuri Energy Pvt. Ltd.
Private
1 150 2012 Complying Complying
2 150 2012 Complying Complying
3 150 2012 Complying Complying
4 150 2012 Complying Complying
Sri Damodaram Sanjeevaiah TPS
State1 800 2014 2020 Feasibility study
2 800 2015 2019 Feasibility study
Thermal Powertech Private1 660 2015 2021 Feasibility study
2 660 2015 2021 Feasibility study
Vizag TPP Private1 520 2015 2020 Feasibility study
2 520 2016 2019 Feasibility study
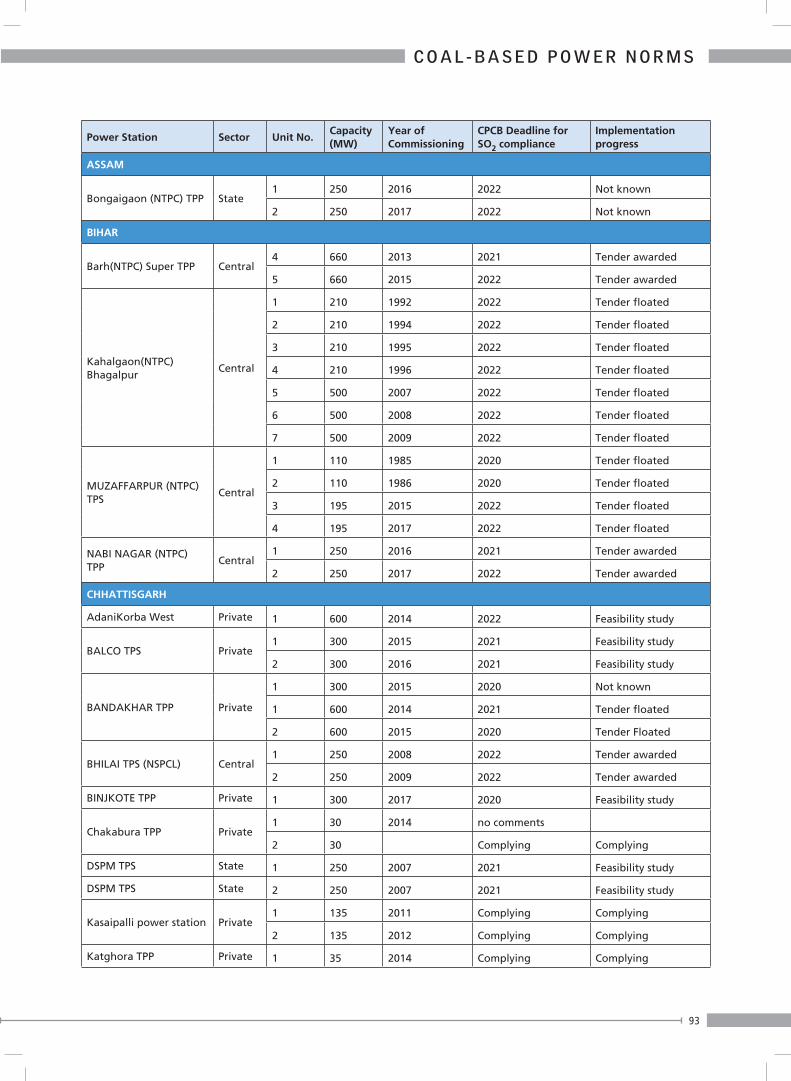
93
C O A L - B A S E D P O W E R N O R M S
Power Station Sector Unit No.Capacity (MW)
Year of Commissioning
CPCB Deadline for SO2 compliance
Implementation progress
ASSAM
Bongaigaon (NTPC) TPP State1 250 2016 2022 Not known
2 250 2017 2022 Not known
BIHAR
Barh(NTPC) Super TPP Central4 660 2013 2021 Tender awarded
5 660 2015 2022 Tender awarded
Kahalgaon(NTPC) Bhagalpur
Central
1 210 1992 2022 Tender floated
2 210 1994 2022 Tender floated
3 210 1995 2022 Tender floated
4 210 1996 2022 Tender floated
5 500 2007 2022 Tender floated
6 500 2008 2022 Tender floated
7 500 2009 2022 Tender floated
MUZAFFARPUR (NTPC) TPS
Central
1 110 1985 2020 Tender floated
2 110 1986 2020 Tender floated
3 195 2015 2022 Tender floated
4 195 2017 2022 Tender floated
NABI NAGAR (NTPC) TPP
Central1 250 2016 2021 Tender awarded
2 250 2017 2022 Tender awarded
CHHATTISGARH
AdaniKorba West Private 1 600 2014 2022 Feasibility study
BALCO TPS Private1 300 2015 2021 Feasibility study
2 300 2016 2021 Feasibility study
BANDAKHAR TPP Private
1 300 2015 2020 Not known
1 600 2014 2021 Tender floated
2 600 2015 2020 Tender Floated
BHILAI TPS (NSPCL) Central1 250 2008 2022 Tender awarded
2 250 2009 2022 Tender awarded
BINJKOTE TPP Private 1 300 2017 2020 Feasibility study
Chakabura TPP Private1 30 2014 no comments
2 30 Complying Complying
DSPM TPS State 1 250 2007 2021 Feasibility study
DSPM TPS State 2 250 2007 2021 Feasibility study
Kasaipalli power station Private1 135 2011 Complying Complying
2 135 2012 Complying Complying
Katghora TPP Private 1 35 2014 Complying Complying
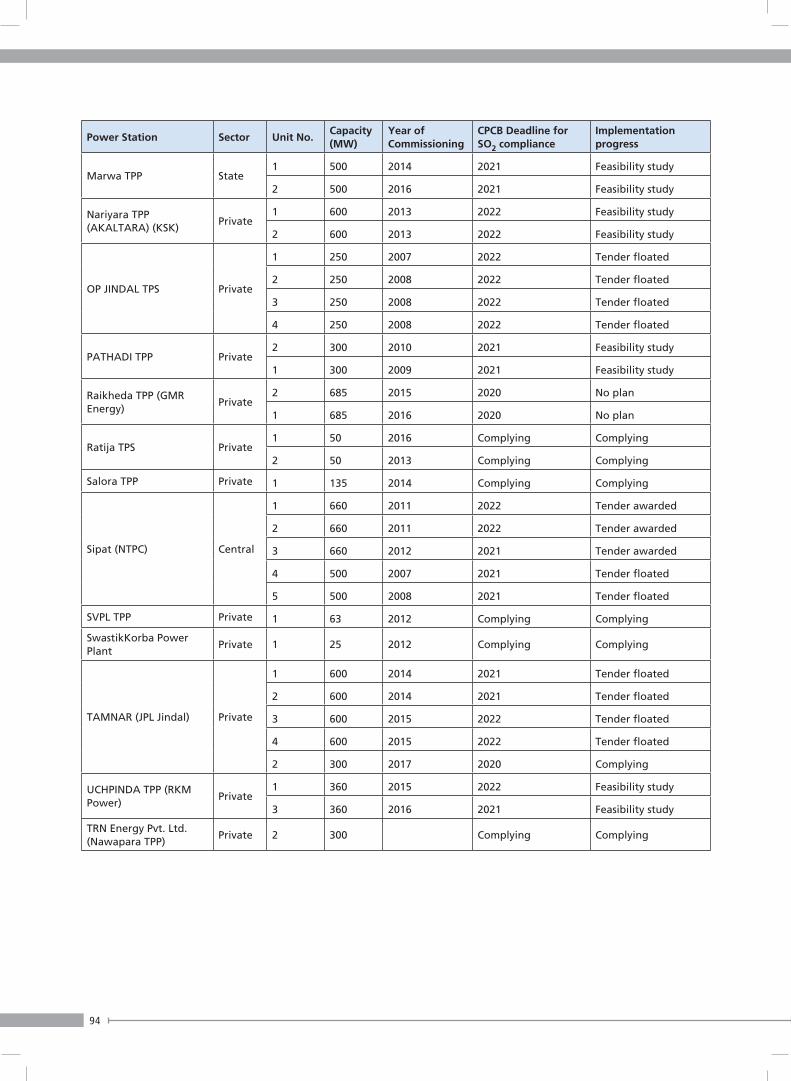
94
Power Station Sector Unit No.Capacity (MW)
Year of Commissioning
CPCB Deadline for SO2 compliance
Implementation progress
Marwa TPP State1 500 2014 2021 Feasibility study
2 500 2016 2021 Feasibility study
Nariyara TPP (AKALTARA) (KSK)
Private1 600 2013 2022 Feasibility study
2 600 2013 2022 Feasibility study
OP JINDAL TPS Private
1 250 2007 2022 Tender floated
2 250 2008 2022 Tender floated
3 250 2008 2022 Tender floated
4 250 2008 2022 Tender floated
PATHADI TPP Private2 300 2010 2021 Feasibility study
1 300 2009 2021 Feasibility study
Raikheda TPP (GMR Energy)
Private2 685 2015 2020 No plan
1 685 2016 2020 No plan
Ratija TPS Private1 50 2016 Complying Complying
2 50 2013 Complying Complying
Salora TPP Private 1 135 2014 Complying Complying
Sipat (NTPC) Central
1 660 2011 2022 Tender awarded
2 660 2011 2022 Tender awarded
3 660 2012 2021 Tender awarded
4 500 2007 2021 Tender floated
5 500 2008 2021 Tender floated
SVPL TPP Private 1 63 2012 Complying Complying
SwastikKorba Power Plant
Private 1 25 2012 Complying Complying
TAMNAR (JPL Jindal) Private
1 600 2014 2021 Tender floated
2 600 2014 2021 Tender floated
3 600 2015 2022 Tender floated
4 600 2015 2022 Tender floated
2 300 2017 2020 Complying
UCHPINDA TPP (RKM Power)
Private1 360 2015 2022 Feasibility study
3 360 2016 2021 Feasibility study
TRN Energy Pvt. Ltd. (Nawapara TPP)
Private 2 300 Complying Complying
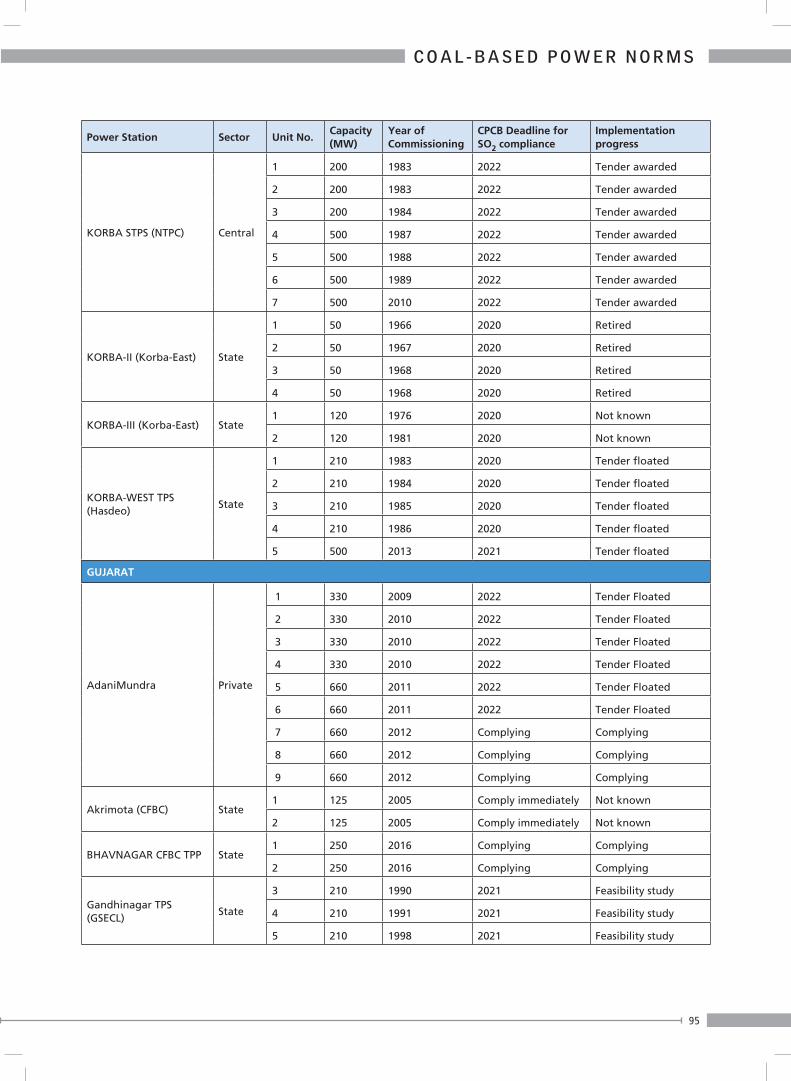
95
C O A L - B A S E D P O W E R N O R M S
Power Station Sector Unit No.Capacity (MW)
Year of Commissioning
CPCB Deadline for SO2 compliance
Implementation progress
KORBA STPS (NTPC) Central
1 200 1983 2022 Tender awarded
2 200 1983 2022 Tender awarded
3 200 1984 2022 Tender awarded
4 500 1987 2022 Tender awarded
5 500 1988 2022 Tender awarded
6 500 1989 2022 Tender awarded
7 500 2010 2022 Tender awarded
KORBA-II (Korba-East) State
1 50 1966 2020 Retired
2 50 1967 2020 Retired
3 50 1968 2020 Retired
4 50 1968 2020 Retired
KORBA-III (Korba-East) State1 120 1976 2020 Not known
2 120 1981 2020 Not known
KORBA-WEST TPS (Hasdeo)
State
1 210 1983 2020 Tender floated
2 210 1984 2020 Tender floated
3 210 1985 2020 Tender floated
4 210 1986 2020 Tender floated
5 500 2013 2021 Tender floated
GUJARAT
AdaniMundra Private
1 330 2009 2022 Tender Floated
2 330 2010 2022 Tender Floated
3 330 2010 2022 Tender Floated
4 330 2010 2022 Tender Floated
5 660 2011 2022 Tender Floated
6 660 2011 2022 Tender Floated
7 660 2012 Complying Complying
8 660 2012 Complying Complying
9 660 2012 Complying Complying
Akrimota (CFBC) State1 125 2005 Comply immediately Not known
2 125 2005 Comply immediately Not known
BHAVNAGAR CFBC TPP State1 250 2016 Complying Complying
2 250 2016 Complying Complying
Gandhinagar TPS (GSECL)
State
3 210 1990 2021 Feasibility study
4 210 1991 2021 Feasibility study
5 210 1998 2021 Feasibility study
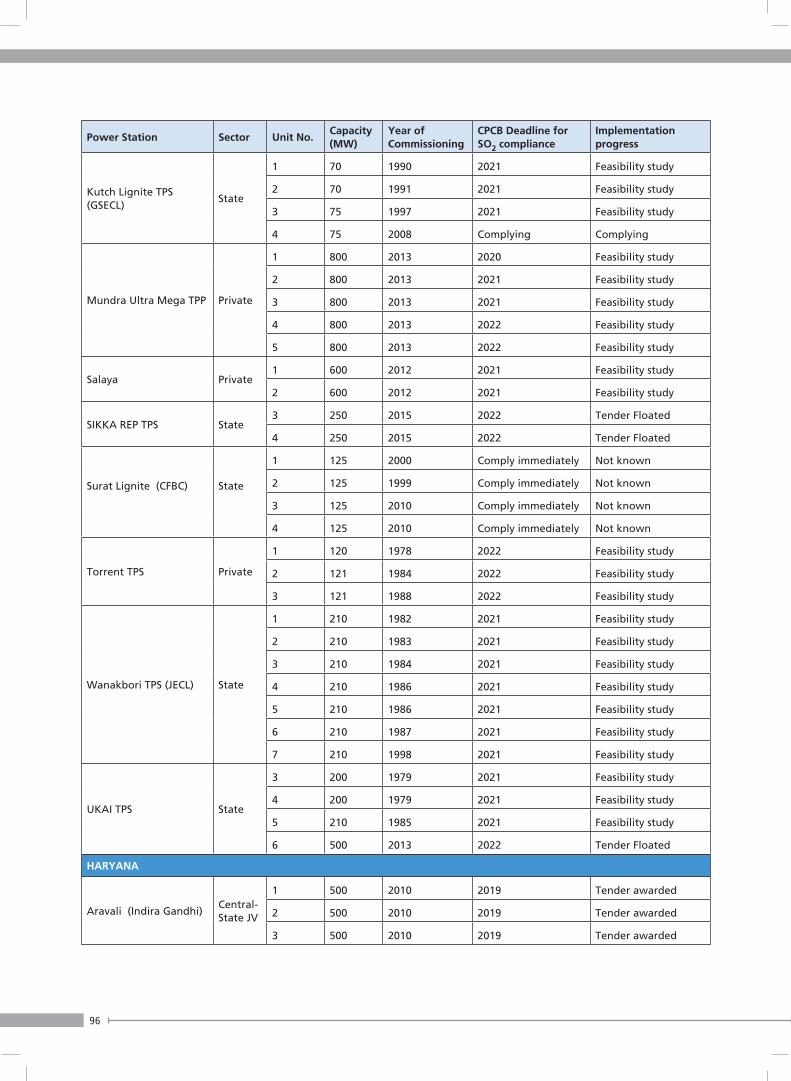
96
Power Station Sector Unit No.Capacity (MW)
Year of Commissioning
CPCB Deadline for SO2 compliance
Implementation progress
Kutch Lignite TPS (GSECL)
State
1 70 1990 2021 Feasibility study
2 70 1991 2021 Feasibility study
3 75 1997 2021 Feasibility study
4 75 2008 Complying Complying
Mundra Ultra Mega TPP Private
1 800 2013 2020 Feasibility study
2 800 2013 2021 Feasibility study
3 800 2013 2021 Feasibility study
4 800 2013 2022 Feasibility study
5 800 2013 2022 Feasibility study
Salaya Private1 600 2012 2021 Feasibility study
2 600 2012 2021 Feasibility study
SIKKA REP TPS State3 250 2015 2022 Tender Floated
4 250 2015 2022 Tender Floated
Surat Lignite (CFBC)
State
1 125 2000 Comply immediately Not known
2 125 1999 Comply immediately Not known
3 125 2010 Comply immediately Not known
4 125 2010 Comply immediately Not known
Torrent TPS Private
1 120 1978 2022 Feasibility study
2 121 1984 2022 Feasibility study
3 121 1988 2022 Feasibility study
Wanakbori TPS (JECL) State
1 210 1982 2021 Feasibility study
2 210 1983 2021 Feasibility study
3 210 1984 2021 Feasibility study
4 210 1986 2021 Feasibility study
5 210 1986 2021 Feasibility study
6 210 1987 2021 Feasibility study
7 210 1998 2021 Feasibility study
UKAI TPS State
3 200 1979 2021 Feasibility study
4 200 1979 2021 Feasibility study
5 210 1985 2021 Feasibility study
6 500 2013 2022 Tender Floated
HARYANA
Aravali (Indira Gandhi) Central-State JV
1 500 2010 2019 Tender awarded
2 500 2010 2019 Tender awarded
3 500 2010 2019 Tender awarded
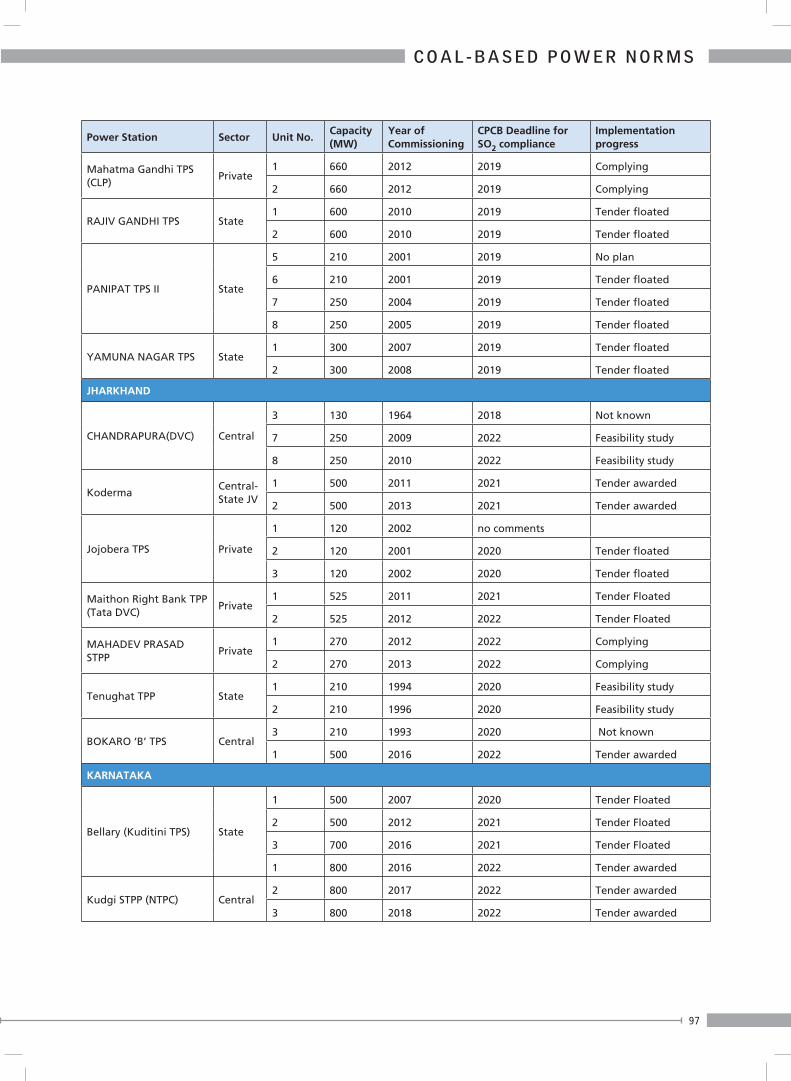
97
C O A L - B A S E D P O W E R N O R M S
Power Station Sector Unit No.Capacity (MW)
Year of Commissioning
CPCB Deadline for SO2 compliance
Implementation progress
Mahatma Gandhi TPS (CLP)
Private1 660 2012 2019 Complying
2 660 2012 2019 Complying
RAJIV GANDHI TPS State1 600 2010 2019 Tender floated
2 600 2010 2019 Tender floated
PANIPAT TPS II State
5 210 2001 2019 No plan
6 210 2001 2019 Tender floated
7 250 2004 2019 Tender floated
8 250 2005 2019 Tender floated
YAMUNA NAGAR TPS State1 300 2007 2019 Tender floated
2 300 2008 2019 Tender floated
JHARKHAND
CHANDRAPURA(DVC) Central
3 130 1964 2018 Not known
7 250 2009 2022 Feasibility study
8 250 2010 2022 Feasibility study
Koderma Central-State JV
1 500 2011 2021 Tender awarded
2 500 2013 2021 Tender awarded
Jojobera TPS Private
1 120 2002 no comments
2 120 2001 2020 Tender floated
3 120 2002 2020 Tender floated
Maithon Right Bank TPP (Tata DVC)
Private1 525 2011 2021 Tender Floated
2 525 2012 2022 Tender Floated
MAHADEV PRASAD STPP
Private1 270 2012 2022 Complying
2 270 2013 2022 Complying
Tenughat TPP State1 210 1994 2020 Feasibility study
2 210 1996 2020 Feasibility study
BOKARO ‘B’ TPS Central3 210 1993 2020 Not known
1 500 2016 2022 Tender awarded
KARNATAKA
Bellary (Kuditini TPS) State
1 500 2007 2020 Tender Floated
2 500 2012 2021 Tender Floated
3 700 2016 2021 Tender Floated
1 800 2016 2022 Tender awarded
Kudgi STPP (NTPC) Central2 800 2017 2022 Tender awarded
3 800 2018 2022 Tender awarded
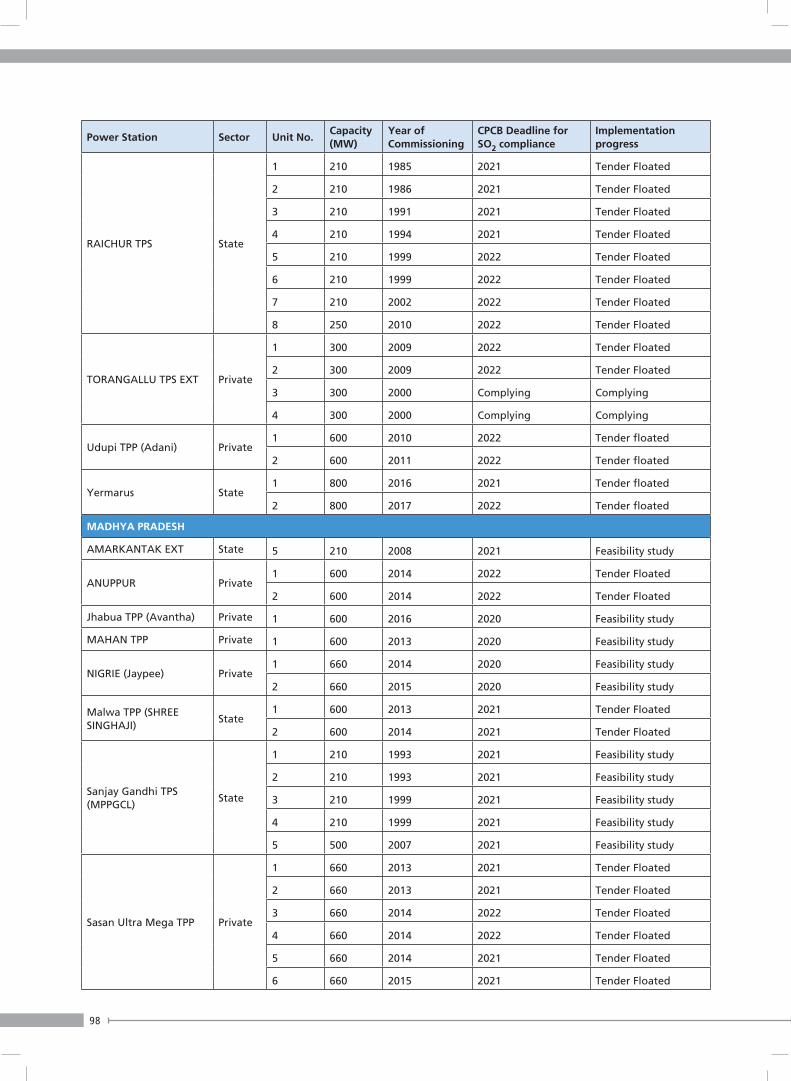
98
Power Station Sector Unit No.Capacity (MW)
Year of Commissioning
CPCB Deadline for SO2 compliance
Implementation progress
RAICHUR TPS State
1 210 1985 2021 Tender Floated
2 210 1986 2021 Tender Floated
3 210 1991 2021 Tender Floated
4 210 1994 2021 Tender Floated
5 210 1999 2022 Tender Floated
6 210 1999 2022 Tender Floated
7 210 2002 2022 Tender Floated
8 250 2010 2022 Tender Floated
TORANGALLU TPS EXT Private
1 300 2009 2022 Tender Floated
2 300 2009 2022 Tender Floated
3 300 2000 Complying Complying
4 300 2000 Complying Complying
Udupi TPP (Adani) Private1 600 2010 2022 Tender floated
2 600 2011 2022 Tender floated
Yermarus State1 800 2016 2021 Tender floated
2 800 2017 2022 Tender floated
MADHYA PRADESH
AMARKANTAK EXT State 5 210 2008 2021 Feasibility study
ANUPPUR Private1 600 2014 2022 Tender Floated
2 600 2014 2022 Tender Floated
Jhabua TPP (Avantha) Private 1 600 2016 2020 Feasibility study
MAHAN TPP Private 1 600 2013 2020 Feasibility study
NIGRIE (Jaypee) Private1 660 2014 2020 Feasibility study
2 660 2015 2020 Feasibility study
Malwa TPP (SHREE SINGHAJI)
State1 600 2013 2021 Tender Floated
2 600 2014 2021 Tender Floated
Sanjay Gandhi TPS (MPPGCL)
State
1 210 1993 2021 Feasibility study
2 210 1993 2021 Feasibility study
3 210 1999 2021 Feasibility study
4 210 1999 2021 Feasibility study
5 500 2007 2021 Feasibility study
Sasan Ultra Mega TPP Private
1 660 2013 2021 Tender Floated
2 660 2013 2021 Tender Floated
3 660 2014 2022 Tender Floated
4 660 2014 2022 Tender Floated
5 660 2014 2021 Tender Floated
6 660 2015 2021 Tender Floated
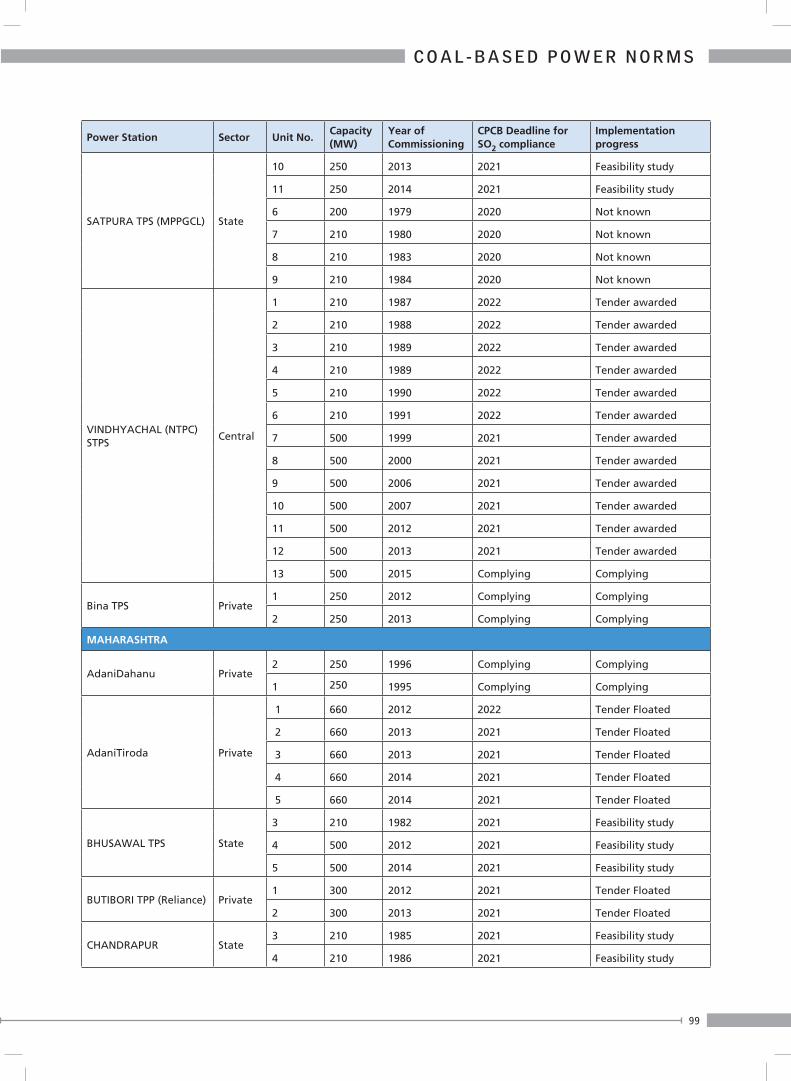
99
C O A L - B A S E D P O W E R N O R M S
Power Station Sector Unit No.Capacity (MW)
Year of Commissioning
CPCB Deadline for SO2 compliance
Implementation progress
SATPURA TPS (MPPGCL) State
10 250 2013 2021 Feasibility study
11 250 2014 2021 Feasibility study
6 200 1979 2020 Not known
7 210 1980 2020 Not known
8 210 1983 2020 Not known
9 210 1984 2020 Not known
VINDHYACHAL (NTPC) STPS
Central
1 210 1987 2022 Tender awarded
2 210 1988 2022 Tender awarded
3 210 1989 2022 Tender awarded
4 210 1989 2022 Tender awarded
5 210 1990 2022 Tender awarded
6 210 1991 2022 Tender awarded
7 500 1999 2021 Tender awarded
8 500 2000 2021 Tender awarded
9 500 2006 2021 Tender awarded
10 500 2007 2021 Tender awarded
11 500 2012 2021 Tender awarded
12 500 2013 2021 Tender awarded
13 500 2015 Complying Complying
Bina TPS Private1 250 2012 Complying Complying
2 250 2013 Complying Complying
MAHARASHTRA
AdaniDahanu Private2 250 1996 Complying Complying
1 250 1995 Complying Complying
AdaniTiroda Private
1 660 2012 2022 Tender Floated
2 660 2013 2021 Tender Floated
3 660 2013 2021 Tender Floated
4 660 2014 2021 Tender Floated
5 660 2014 2021 Tender Floated
BHUSAWAL TPS State
3 210 1982 2021 Feasibility study
4 500 2012 2021 Feasibility study
5 500 2014 2021 Feasibility study
BUTIBORI TPP (Reliance) Private1 300 2012 2021 Tender Floated
2 300 2013 2021 Tender Floated
CHANDRAPUR State3 210 1985 2021 Feasibility study
4 210 1986 2021 Feasibility study

100
Power Station Sector Unit No.Capacity (MW)
Year of Commissioning
CPCB Deadline for SO2 compliance
Implementation progress
DHARIWAL TPP Private1 300 2014 2022 Feasibility study
2 300 2014 2022 Feasibility study
EMCO WARORA (GMR) Private1 300 2013 2022 Feasibility study
2 300 2013 2022 Feasibility study
Khaparkheda State
1 210 1989 2021 Feasibility study
2 210 1990 2021 Feasibility study
3 210 2000 2021 Feasibility study
4 210 2001 2021 Feasibility study
5 500 2011 2021 Feasibility study
KORADI TPS State6 210 1982 2021 Feasibility study
7 210 1983 2021 Feasibility study
CHANDRAPUR State
5 500 1991 2021 Feasibility study
6 500 1992 2021 Feasibility study
7 500 1997 2021 Feasibility study
8 500 2015 2021 Feasibility study
9 500 2016 2020 Feasibility study
KORADI TPS State
10 660 2017 2020 Feasibility study
8 660 2015 2021 Feasibility study
9 660 2015 2021 Feasibility study
Mauda(NTPC) TPP Central
1 500 2013 2022 Tender awarded
2 500 2013 2022 Tender awarded
3 660 2016 2022 Tender awarded
4 660 2017 2020 Tender awarded
NASIK TPS State
3 210 1979 2021 Feasibility study
4 210 1980 2021 Feasibility study
5 210 1981 2021 Feasibility study
Nasik Rattan India TPP Private
1 270 2013 2021 Tender floated
2 270 2014 2021 Feasibility study
3 270 2015 2022 Feasibility study
4 270 2015 2022 Feasibility study
5 270 2015 2022 Feasibility study
Paras TPS (MahaGENCO) State3 250 2008 Comply immediately Feasibility study
4 250 2010 Comply immediately Feasibility study

101
C O A L - B A S E D P O W E R N O R M S
Power Station Sector Unit No.Capacity (MW)
Year of Commissioning
CPCB Deadline for SO2 compliance
Implementation progress
PARLI TPS State
4 210 1985 2021 Feasibility study
5 210 1987 2021 Feasibility study
6 250 2007 2021 Feasibility study
7 250 2010 2021 Feasibility study
8 250 2016 2021 Feasibility study
Ratnagiri TPS Private
1 300 2010 Complying Complying
2 300 2010 Complying Complying
3 300 2011 Complying Complying
4 300 2011 Complying Complying
Shirpur TPP Private 1 150 2017 2022 Feasibility study
Solapur TPS (NTPC) Central 1 660 2017 2020 Tender awarded
Trombay TPS (TATA Power)
Private8 250 2009 Complying Complying
5 500 1984 2018 Complying
WARDHA WARORA TPP Private
1 135 2010 2021 Feasibility study
2 135 2010 2021 Feasibility study
3 135 2011 2021 Feasibility study
4 135 2011 2021 Feasibility study
Bela TPS Private 1 270 2013 Complying Complying
Mihan TPS Private 1 271 Complying Complying
GEPL Private1 125 2012 2020 Not known
2 125 2012 2020 Not known
ODISHA
IB VALLEY TPS State1 210 1994 2021 Feasibility study
2 210 1995 2021 Feasibility study
Ind-Barath TPS Private 1 350 2016 2022 Feasibility study
KAMALANGA TPS (GMR)
Private
1 350 2013 2021 Feasibility study
2 350 2013 2021 Feasibility study
3 350 2014 2021 Feasibility study
DERANG TPS (JITPL) Private1 600 2014 2021 Tender floated
2 600 2015 2021 Tender Floated
Sterlite Energy Ltd. Private
1 600 2010 no comments -
2 600 2010 2022 Feasibility study
3 600 2010 no comments -
4 600 2010 no comments -
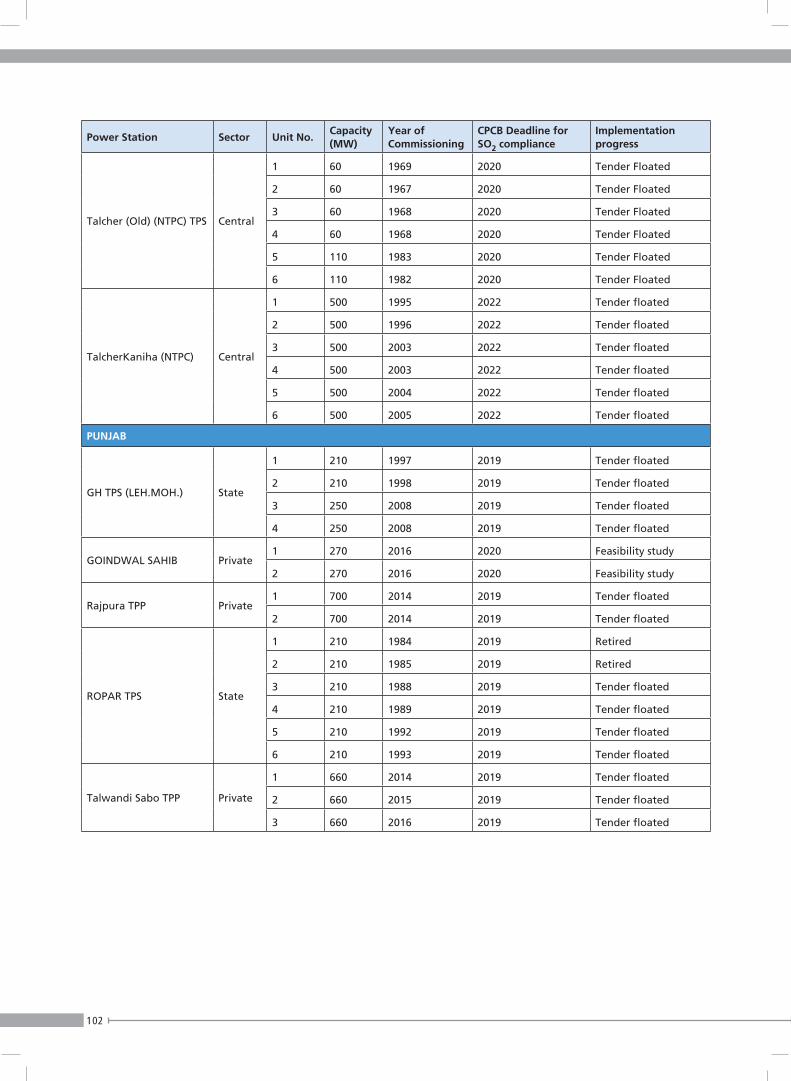
102
Power Station Sector Unit No.Capacity (MW)
Year of Commissioning
CPCB Deadline for SO2 compliance
Implementation progress
Talcher (Old) (NTPC) TPS Central
1 60 1969 2020 Tender Floated
2 60 1967 2020 Tender Floated
3 60 1968 2020 Tender Floated
4 60 1968 2020 Tender Floated
5 110 1983 2020 Tender Floated
6 110 1982 2020 Tender Floated
TalcherKaniha (NTPC) Central
1 500 1995 2022 Tender floated
2 500 1996 2022 Tender floated
3 500 2003 2022 Tender floated
4 500 2003 2022 Tender floated
5 500 2004 2022 Tender floated
6 500 2005 2022 Tender floated
PUNJAB
GH TPS (LEH.MOH.) State
1 210 1997 2019 Tender floated
2 210 1998 2019 Tender floated
3 250 2008 2019 Tender floated
4 250 2008 2019 Tender floated
GOINDWAL SAHIB Private1 270 2016 2020 Feasibility study
2 270 2016 2020 Feasibility study
Rajpura TPP Private1 700 2014 2019 Tender floated
2 700 2014 2019 Tender floated
ROPAR TPS State
1 210 1984 2019 Retired
2 210 1985 2019 Retired
3 210 1988 2019 Tender floated
4 210 1989 2019 Tender floated
5 210 1992 2019 Tender floated
6 210 1993 2019 Tender floated
Talwandi Sabo TPP Private
1 660 2014 2019 Tender floated
2 660 2015 2019 Tender floated
3 660 2016 2019 Tender floated
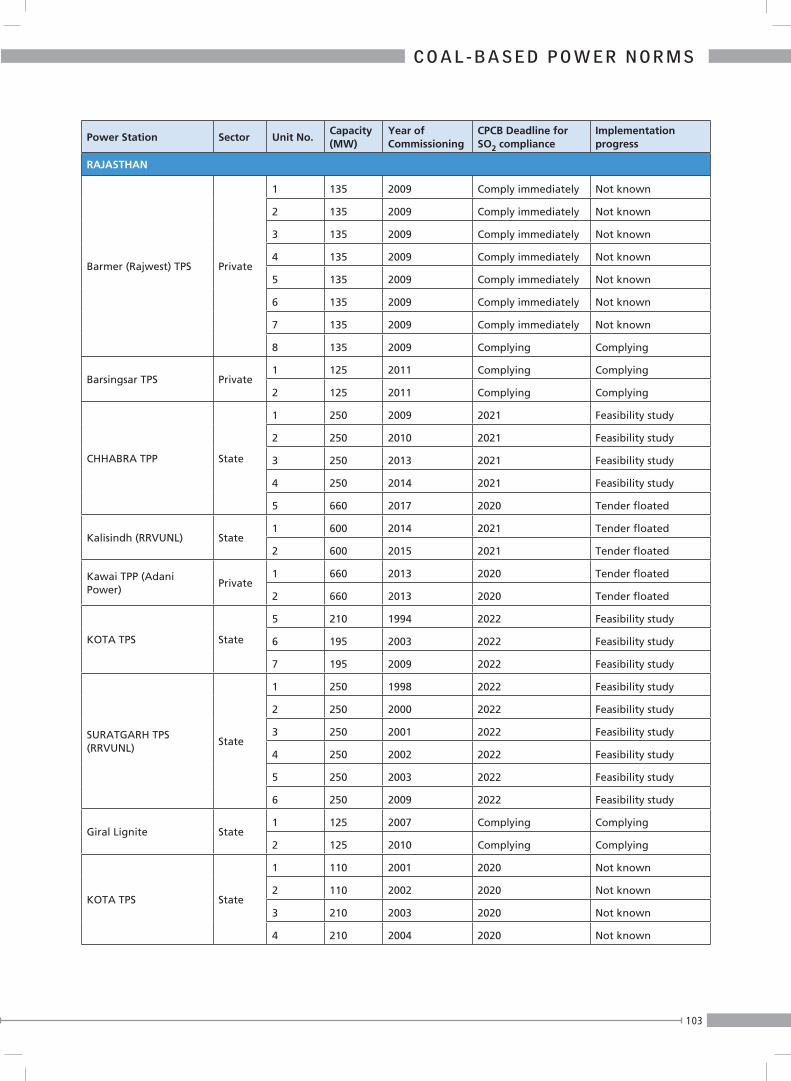
103
C O A L - B A S E D P O W E R N O R M S
Power Station Sector Unit No.Capacity (MW)
Year of Commissioning
CPCB Deadline for SO2 compliance
Implementation progress
RAJASTHAN
Barmer (Rajwest) TPS Private
1 135 2009 Comply immediately Not known
2 135 2009 Comply immediately Not known
3 135 2009 Comply immediately Not known
4 135 2009 Comply immediately Not known
5 135 2009 Comply immediately Not known
6 135 2009 Comply immediately Not known
7 135 2009 Comply immediately Not known
8 135 2009 Complying Complying
Barsingsar TPS Private1 125 2011 Complying Complying
2 125 2011 Complying Complying
CHHABRA TPP State
1 250 2009 2021 Feasibility study
2 250 2010 2021 Feasibility study
3 250 2013 2021 Feasibility study
4 250 2014 2021 Feasibility study
5 660 2017 2020 Tender floated
Kalisindh (RRVUNL) State1 600 2014 2021 Tender floated
2 600 2015 2021 Tender floated
Kawai TPP (Adani Power)
Private1 660 2013 2020 Tender floated
2 660 2013 2020 Tender floated
KOTA TPS State
5 210 1994 2022 Feasibility study
6 195 2003 2022 Feasibility study
7 195 2009 2022 Feasibility study
SURATGARH TPS (RRVUNL)
State
1 250 1998 2022 Feasibility study
2 250 2000 2022 Feasibility study
3 250 2001 2022 Feasibility study
4 250 2002 2022 Feasibility study
5 250 2003 2022 Feasibility study
6 250 2009 2022 Feasibility study
Giral Lignite State1 125 2007 Complying Complying
2 125 2010 Complying Complying
KOTA TPS State
1 110 2001 2020 Not known
2 110 2002 2020 Not known
3 210 2003 2020 Not known
4 210 2004 2020 Not known
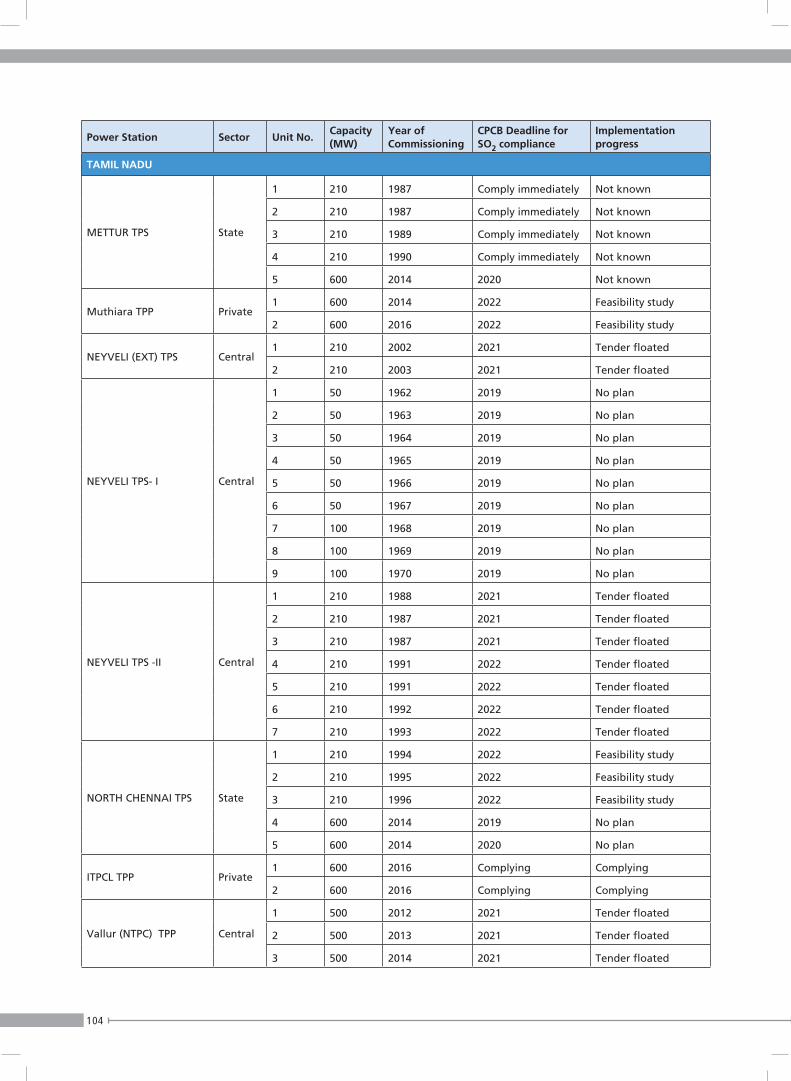
104
Power Station Sector Unit No.Capacity (MW)
Year of Commissioning
CPCB Deadline for SO2 compliance
Implementation progress
TAMIL NADU
METTUR TPS State
1 210 1987 Comply immediately Not known
2 210 1987 Comply immediately Not known
3 210 1989 Comply immediately Not known
4 210 1990 Comply immediately Not known
5 600 2014 2020 Not known
Muthiara TPP Private1 600 2014 2022 Feasibility study
2 600 2016 2022 Feasibility study
NEYVELI (EXT) TPS Central1 210 2002 2021 Tender floated
2 210 2003 2021 Tender floated
NEYVELI TPS- I Central
1 50 1962 2019 No plan
2 50 1963 2019 No plan
3 50 1964 2019 No plan
4 50 1965 2019 No plan
5 50 1966 2019 No plan
6 50 1967 2019 No plan
7 100 1968 2019 No plan
8 100 1969 2019 No plan
9 100 1970 2019 No plan
NEYVELI TPS -II Central
1 210 1988 2021 Tender floated
2 210 1987 2021 Tender floated
3 210 1987 2021 Tender floated
4 210 1991 2022 Tender floated
5 210 1991 2022 Tender floated
6 210 1992 2022 Tender floated
7 210 1993 2022 Tender floated
NORTH CHENNAI TPS State
1 210 1994 2022 Feasibility study
2 210 1995 2022 Feasibility study
3 210 1996 2022 Feasibility study
4 600 2014 2019 No plan
5 600 2014 2020 No plan
ITPCL TPP Private1 600 2016 Complying Complying
2 600 2016 Complying Complying
Vallur (NTPC) TPP Central
1 500 2012 2021 Tender floated
2 500 2013 2021 Tender floated
3 500 2014 2021 Tender floated

105
C O A L - B A S E D P O W E R N O R M S
Power Station Sector Unit No.Capacity (MW)
Year of Commissioning
CPCB Deadline for SO2 compliance
Implementation progress
TAQA, Neyveli Private 2 250 2002 2020 Feasibility study
Tuticorin (JV) TPP Central1 500 2015 2021 Tender floated
2 500 2015 2020 Tender floated
Tuticorin (P) TPP Private1 150 2013 2020 Tender floated
2 150 2013 2020 Tender floated
TUTICORIN TPS State
1 210 1979 2020 Feasibility study
2 210 1980 2020 Feasibility study
3 210 1982 2020 Feasibility study
4 210 1991 2020 Feasibility study
5 210 1992 2020 Feasibility study
TELANGANA
Kakatiya State1 500 2010 2020 Feasibility study
2 600 2015 2020 Feasibility study
KOTHAGUDEM TPS State
1 60 1966 2019 No plan
2 60 1966 2019 No plan
3 60 1967 2019 Retired
4 60 1967 2019 No plan
5 120 1974 2019 No plan
6 120 1974 2019 Rertired
7 120 1977 2019 No plan
8 120 1978 2019 No plan
9 250 1995 2020 No plan
10 250 1997 2020 No plan
11 500 2011 2019 Feasibility study
RAMAGUNDEM STPS (NTPC)
Central
1 200 1983 2019 Tender awarded
2 200 1984 2022 Tender awarded
3 200 1984 2022 Tender awarded
4 500 1988 2022 Tender awarded
5 500 1989 2022 Tender awarded
6 500 1989 2022 Tender awarded
7 500 2004 2022 Tender floated
Singareni TPS State1 600 2016 2019 Feasibility study
2 600 2016 2019 Feasibility study
UTTAR PRADESH
ANPARA C (Lanco) Private1 600 2011 2022 Feasibility study
2 600 2011 2022 Feasibility study
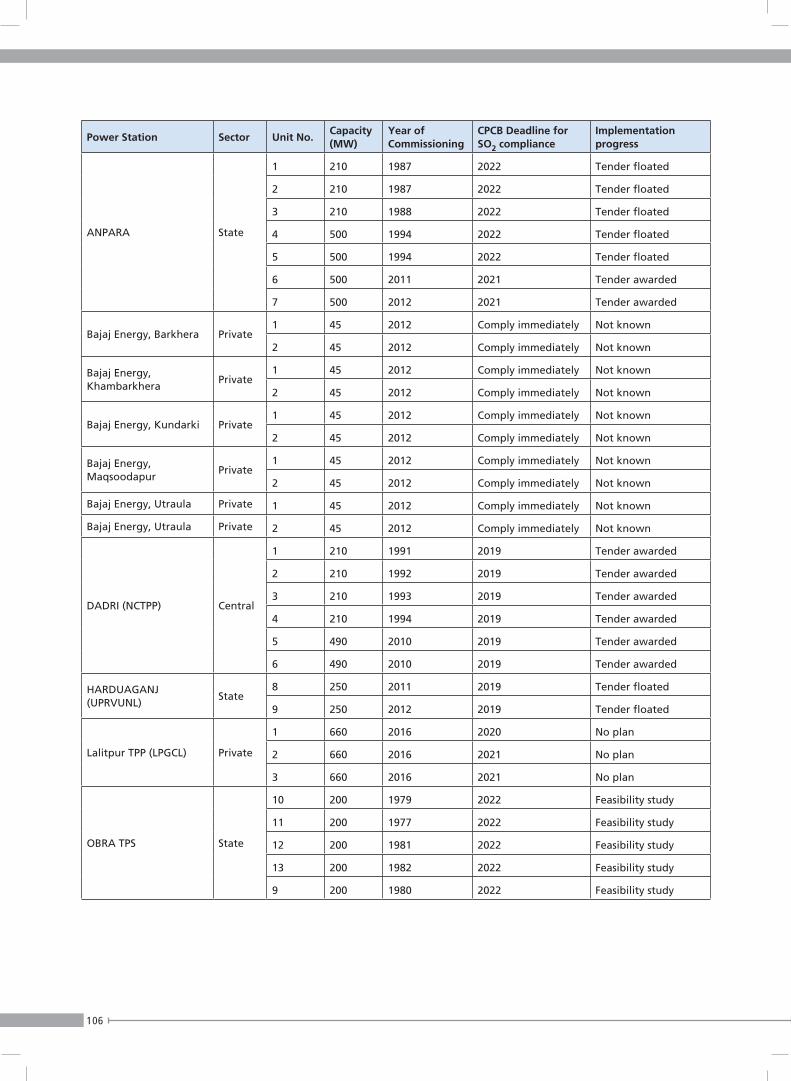
106
Power Station Sector Unit No.Capacity (MW)
Year of Commissioning
CPCB Deadline for SO2 compliance
Implementation progress
ANPARA State
1 210 1987 2022 Tender floated
2 210 1987 2022 Tender floated
3 210 1988 2022 Tender floated
4 500 1994 2022 Tender floated
5 500 1994 2022 Tender floated
6 500 2011 2021 Tender awarded
7 500 2012 2021 Tender awarded
Bajaj Energy, Barkhera Private1 45 2012 Comply immediately Not known
2 45 2012 Comply immediately Not known
Bajaj Energy, Khambarkhera
Private1 45 2012 Comply immediately Not known
2 45 2012 Comply immediately Not known
Bajaj Energy, Kundarki Private1 45 2012 Comply immediately Not known
2 45 2012 Comply immediately Not known
Bajaj Energy, Maqsoodapur
Private1 45 2012 Comply immediately Not known
2 45 2012 Comply immediately Not known
Bajaj Energy, Utraula Private 1 45 2012 Comply immediately Not known
Bajaj Energy, Utraula Private 2 45 2012 Comply immediately Not known
DADRI (NCTPP) Central
1 210 1991 2019 Tender awarded
2 210 1992 2019 Tender awarded
3 210 1993 2019 Tender awarded
4 210 1994 2019 Tender awarded
5 490 2010 2019 Tender awarded
6 490 2010 2019 Tender awarded
HARDUAGANJ (UPRVUNL)
State8 250 2011 2019 Tender floated
9 250 2012 2019 Tender floated
Lalitpur TPP (LPGCL) Private
1 660 2016 2020 No plan
2 660 2016 2021 No plan
3 660 2016 2021 No plan
OBRA TPS State
10 200 1979 2022 Feasibility study
11 200 1977 2022 Feasibility study
12 200 1981 2022 Feasibility study
13 200 1982 2022 Feasibility study
9 200 1980 2022 Feasibility study
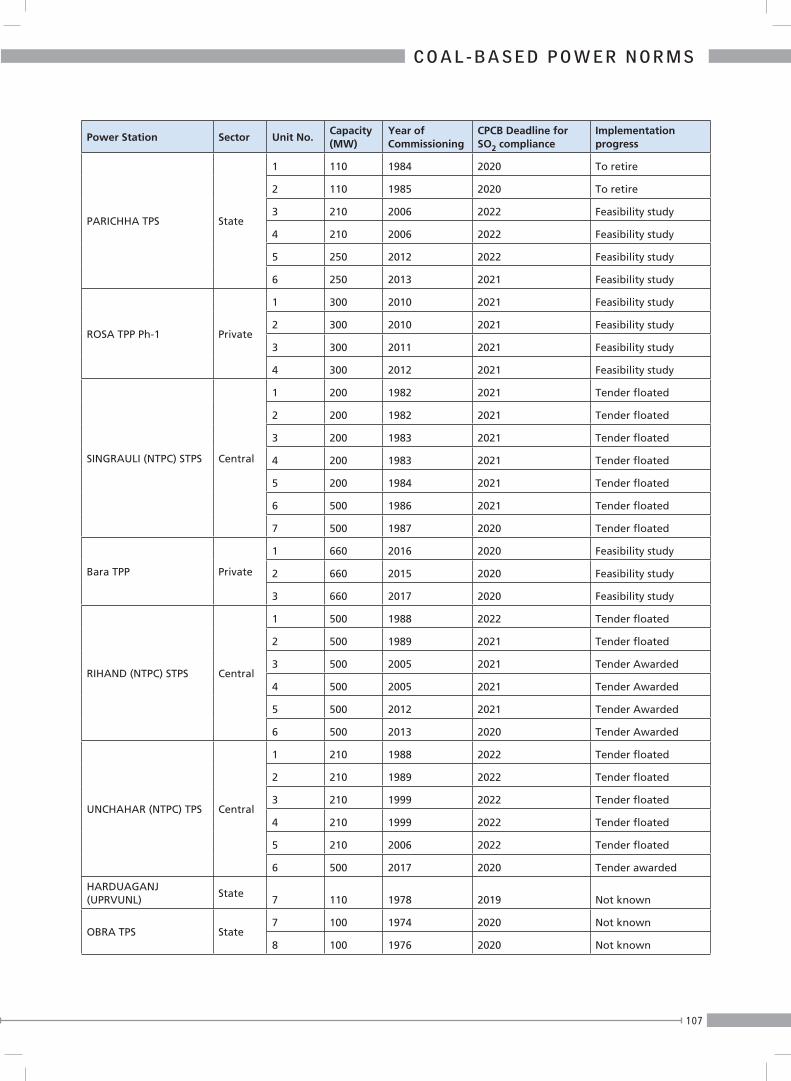
107
C O A L - B A S E D P O W E R N O R M S
Power Station Sector Unit No.Capacity (MW)
Year of Commissioning
CPCB Deadline for SO2 compliance
Implementation progress
PARICHHA TPS State
1 110 1984 2020 To retire
2 110 1985 2020 To retire
3 210 2006 2022 Feasibility study
4 210 2006 2022 Feasibility study
5 250 2012 2022 Feasibility study
6 250 2013 2021 Feasibility study
ROSA TPP Ph-1 Private
1 300 2010 2021 Feasibility study
2 300 2010 2021 Feasibility study
3 300 2011 2021 Feasibility study
4 300 2012 2021 Feasibility study
SINGRAULI (NTPC) STPS Central
1 200 1982 2021 Tender floated
2 200 1982 2021 Tender floated
3 200 1983 2021 Tender floated
4 200 1983 2021 Tender floated
5 200 1984 2021 Tender floated
6 500 1986 2021 Tender floated
7 500 1987 2020 Tender floated
Bara TPP Private
1 660 2016 2020 Feasibility study
2 660 2015 2020 Feasibility study
3 660 2017 2020 Feasibility study
RIHAND (NTPC) STPS Central
1 500 1988 2022 Tender floated
2 500 1989 2021 Tender floated
3 500 2005 2021 Tender Awarded
4 500 2005 2021 Tender Awarded
5 500 2012 2021 Tender Awarded
6 500 2013 2020 Tender Awarded
UNCHAHAR (NTPC) TPS Central
1 210 1988 2022 Tender floated
2 210 1989 2022 Tender floated
3 210 1999 2022 Tender floated
4 210 1999 2022 Tender floated
5 210 2006 2022 Tender floated
6 500 2017 2020 Tender awarded
HARDUAGANJ (UPRVUNL)
State7 110 1978 2019 Not known
OBRA TPS State7 100 1974 2020 Not known
8 100 1976 2020 Not known
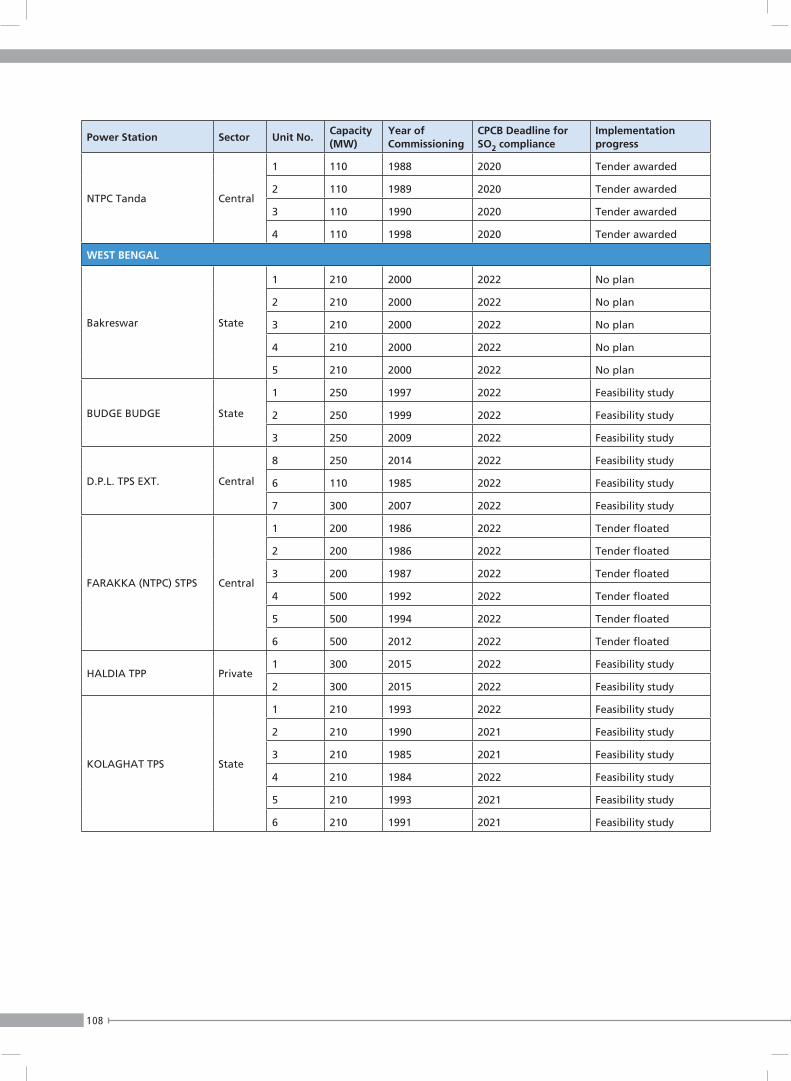
108
Power Station Sector Unit No.Capacity (MW)
Year of Commissioning
CPCB Deadline for SO2 compliance
Implementation progress
NTPC Tanda Central
1 110 1988 2020 Tender awarded
2 110 1989 2020 Tender awarded
3 110 1990 2020 Tender awarded
4 110 1998 2020 Tender awarded
WEST BENGAL
Bakreswar State
1 210 2000 2022 No plan
2 210 2000 2022 No plan
3 210 2000 2022 No plan
4 210 2000 2022 No plan
5 210 2000 2022 No plan
BUDGE BUDGE State
1 250 1997 2022 Feasibility study
2 250 1999 2022 Feasibility study
3 250 2009 2022 Feasibility study
D.P.L. TPS EXT. Central
8 250 2014 2022 Feasibility study
6 110 1985 2022 Feasibility study
7 300 2007 2022 Feasibility study
FARAKKA (NTPC) STPS Central
1 200 1986 2022 Tender floated
2 200 1986 2022 Tender floated
3 200 1987 2022 Tender floated
4 500 1992 2022 Tender floated
5 500 1994 2022 Tender floated
6 500 2012 2022 Tender floated
HALDIA TPP Private1 300 2015 2022 Feasibility study
2 300 2015 2022 Feasibility study
KOLAGHAT TPS State
1 210 1993 2022 Feasibility study
2 210 1990 2021 Feasibility study
3 210 1985 2021 Feasibility study
4 210 1984 2022 Feasibility study
5 210 1993 2021 Feasibility study
6 210 1991 2021 Feasibility study
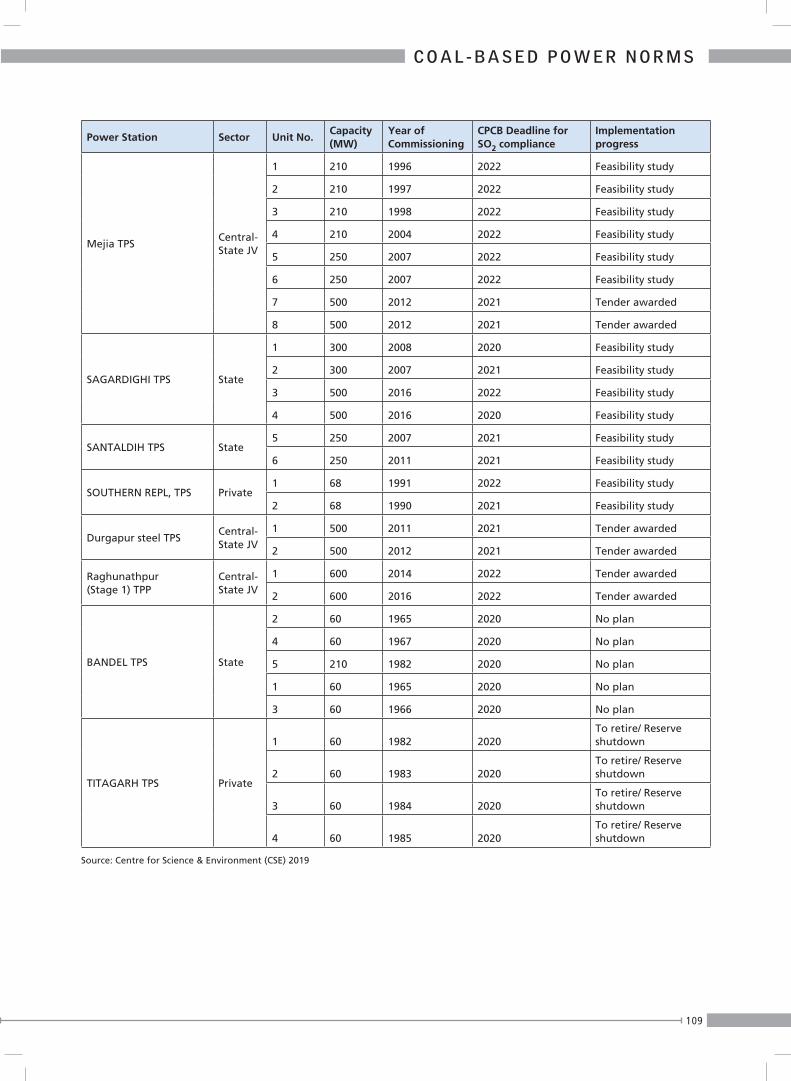
109
C O A L - B A S E D P O W E R N O R M S
Power Station Sector Unit No.Capacity (MW)
Year of Commissioning
CPCB Deadline for SO2 compliance
Implementation progress
Mejia TPS Central-State JV
1 210 1996 2022 Feasibility study
2 210 1997 2022 Feasibility study
3 210 1998 2022 Feasibility study
4 210 2004 2022 Feasibility study
5 250 2007 2022 Feasibility study
6 250 2007 2022 Feasibility study
7 500 2012 2021 Tender awarded
8 500 2012 2021 Tender awarded
SAGARDIGHI TPS State
1 300 2008 2020 Feasibility study
2 300 2007 2021 Feasibility study
3 500 2016 2022 Feasibility study
4 500 2016 2020 Feasibility study
SANTALDIH TPS State5 250 2007 2021 Feasibility study
6 250 2011 2021 Feasibility study
SOUTHERN REPL, TPS Private1 68 1991 2022 Feasibility study
2 68 1990 2021 Feasibility study
Durgapur steel TPS Central-State JV
1 500 2011 2021 Tender awarded
2 500 2012 2021 Tender awarded
Raghunathpur (Stage 1) TPP
Central-State JV
1 600 2014 2022 Tender awarded
2 600 2016 2022 Tender awarded
BANDEL TPS State
2 60 1965 2020 No plan
4 60 1967 2020 No plan
5 210 1982 2020 No plan
1 60 1965 2020 No plan
3 60 1966 2020 No plan
TITAGARH TPS Private
1 60 1982 2020To retire/ Reserve shutdown
2 60 1983 2020To retire/ Reserve shutdown
3 60 1984 2020To retire/ Reserve shutdown
4 60 1985 2020To retire/ Reserve shutdown
Source: Centre for Science & Environment (CSE) 2019
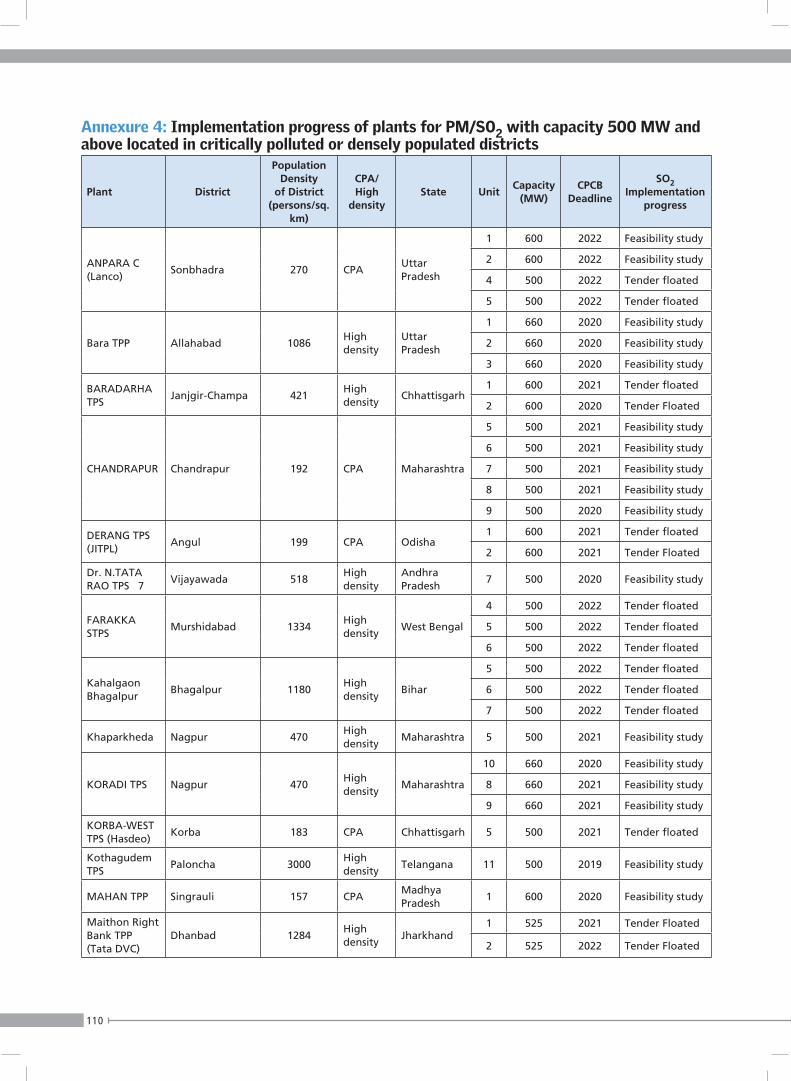
110
Annexure 4: Implementation progress of plants for PM/SO2 with capacity 500 MW and above located in critically polluted or densely populated districts
Plant District
Population Density
of District (persons/sq.
km)
CPA/ High
densityState Unit
Capacity (MW)
CPCB Deadline
SO2 Implementation
progress
ANPARA C (Lanco)
Sonbhadra 270 CPAUttar Pradesh
1 600 2022 Feasibility study
2 600 2022 Feasibility study
4 500 2022 Tender floated
5 500 2022 Tender floated
Bara TPP Allahabad 1086High density
Uttar Pradesh
1 660 2020 Feasibility study
2 660 2020 Feasibility study
3 660 2020 Feasibility study
BARADARHA TPS
Janjgir-Champa 421High density
Chhattisgarh1 600 2021 Tender floated
2 600 2020 Tender Floated
CHANDRAPUR Chandrapur 192 CPA Maharashtra
5 500 2021 Feasibility study
6 500 2021 Feasibility study
7 500 2021 Feasibility study
8 500 2021 Feasibility study
9 500 2020 Feasibility study
DERANG TPS (JITPL)
Angul 199 CPA Odisha1 600 2021 Tender floated
2 600 2021 Tender Floated
Dr. N.TATA RAO TPS 7
Vijayawada 518High density
Andhra Pradesh
7 500 2020 Feasibility study
FARAKKA STPS
Murshidabad 1334High density
West Bengal
4 500 2022 Tender floated
5 500 2022 Tender floated
6 500 2022 Tender floated
Kahalgaon Bhagalpur
Bhagalpur 1180High density
Bihar
5 500 2022 Tender floated
6 500 2022 Tender floated
7 500 2022 Tender floated
Khaparkheda Nagpur 470High density
Maharashtra 5 500 2021 Feasibility study
KORADI TPS Nagpur 470High density
Maharashtra
10 660 2020 Feasibility study
8 660 2021 Feasibility study
9 660 2021 Feasibility study
KORBA-WEST TPS (Hasdeo)
Korba 183 CPA Chhattisgarh 5 500 2021 Tender floated
Kothagudem TPS
Paloncha 3000High density
Telangana 11 500 2019 Feasibility study
MAHAN TPP Singrauli 157 CPAMadhya Pradesh
1 600 2020 Feasibility study
Maithon Right Bank TPP (Tata DVC)
Dhanbad 1284High density
Jharkhand1 525 2021 Tender Floated
2 525 2022 Tender Floated
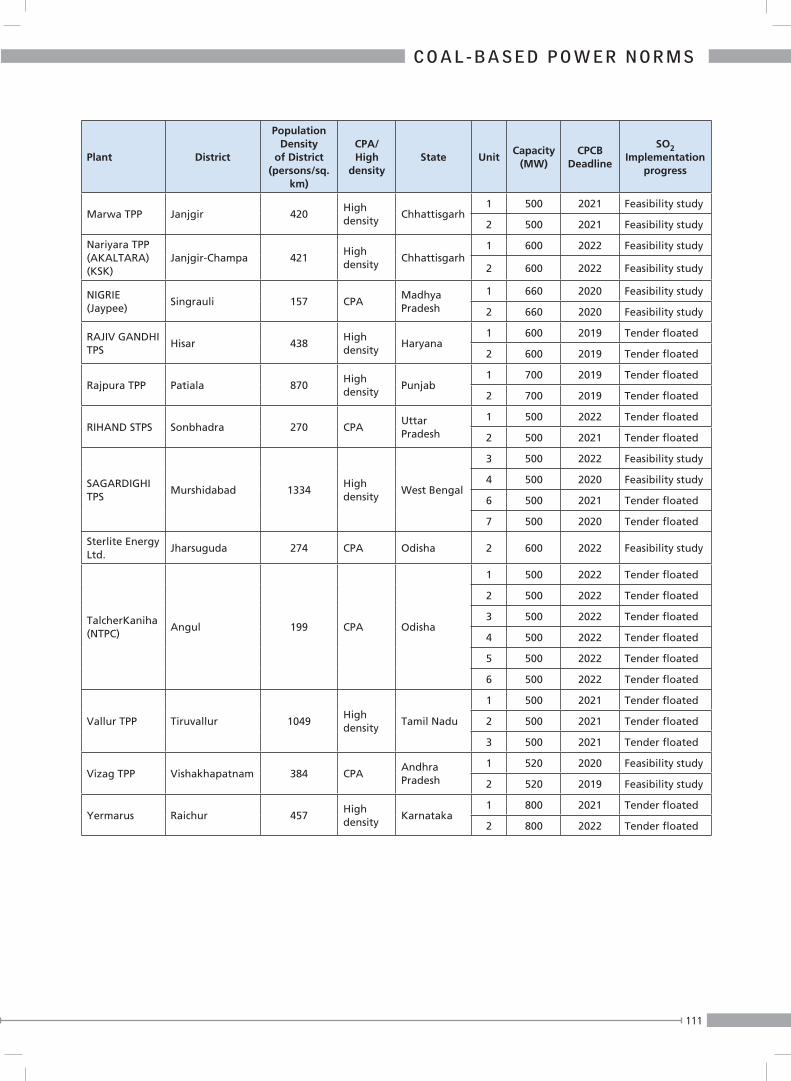
111
C O A L - B A S E D P O W E R N O R M S
Plant District
Population Density
of District (persons/sq.
km)
CPA/ High
densityState Unit
Capacity (MW)
CPCB Deadline
SO2 Implementation
progress
Marwa TPP Janjgir 420High density
Chhattisgarh1 500 2021 Feasibility study
2 500 2021 Feasibility study
Nariyara TPP (AKALTARA) (KSK)
Janjgir-Champa 421High density
Chhattisgarh1 600 2022 Feasibility study
2 600 2022 Feasibility study
NIGRIE (Jaypee)
Singrauli 157 CPAMadhya Pradesh
1 660 2020 Feasibility study
2 660 2020 Feasibility study
RAJIV GANDHI TPS
Hisar 438High density
Haryana1 600 2019 Tender floated
2 600 2019 Tender floated
Rajpura TPP Patiala 870High density
Punjab1 700 2019 Tender floated
2 700 2019 Tender floated
RIHAND STPS Sonbhadra 270 CPAUttar Pradesh
1 500 2022 Tender floated
2 500 2021 Tender floated
SAGARDIGHI TPS
Murshidabad 1334High density
West Bengal
3 500 2022 Feasibility study
4 500 2020 Feasibility study
6 500 2021 Tender floated
7 500 2020 Tender floated
Sterlite Energy Ltd.
Jharsuguda 274 CPA Odisha 2 600 2022 Feasibility study
TalcherKaniha (NTPC)
Angul 199 CPA Odisha
1 500 2022 Tender floated
2 500 2022 Tender floated
3 500 2022 Tender floated
4 500 2022 Tender floated
5 500 2022 Tender floated
6 500 2022 Tender floated
Vallur TPP Tiruvallur 1049High density
Tamil Nadu
1 500 2021 Tender floated
2 500 2021 Tender floated
3 500 2021 Tender floated
Vizag TPP Vishakhapatnam 384 CPAAndhra Pradesh
1 520 2020 Feasibility study
2 520 2019 Feasibility study
Yermarus Raichur 457High density
Karnataka 1 800 2021 Tender floated
2 800 2022 Tender floated

112
Annexure 5: Current Status of implementation of plants for which Ministry of Power sought exemption in June 2018 at the Supreme Court
A. Plants whose age is less than 25 years
Brief:
Current status Capacity in MW (%)
Retired 210 (1)
No plan but operating 1,040 (75)
Planning to upgrade 320 (24)
List:
Table: Status of stations less than 25 years which sought exemptionStation Unit size Capacity (MW) Current status
BOKARO `B` TPS 1x210 210 Retired
Dr. N.TATA RAO TPS 2x210 420 No plan
GEPL TPP Ph-I 2x60 120 Not known
KOTHAGUDEM TPS (NEW) 2x250 500 No plan
ROPAR TPS 1x210 210 Tender floated
TANDA TPS 1x110 110 Tender awarded
Total 1,360
B. Plants whose age is less than 25 years
Brief:
Current status Capacity in MW (%)
Retired 1,259 (18)
Plan to retire 345 (5)
No plan but operating 1,500 (21)
Planning to upgrade 3,955 (56)
Total 7,059
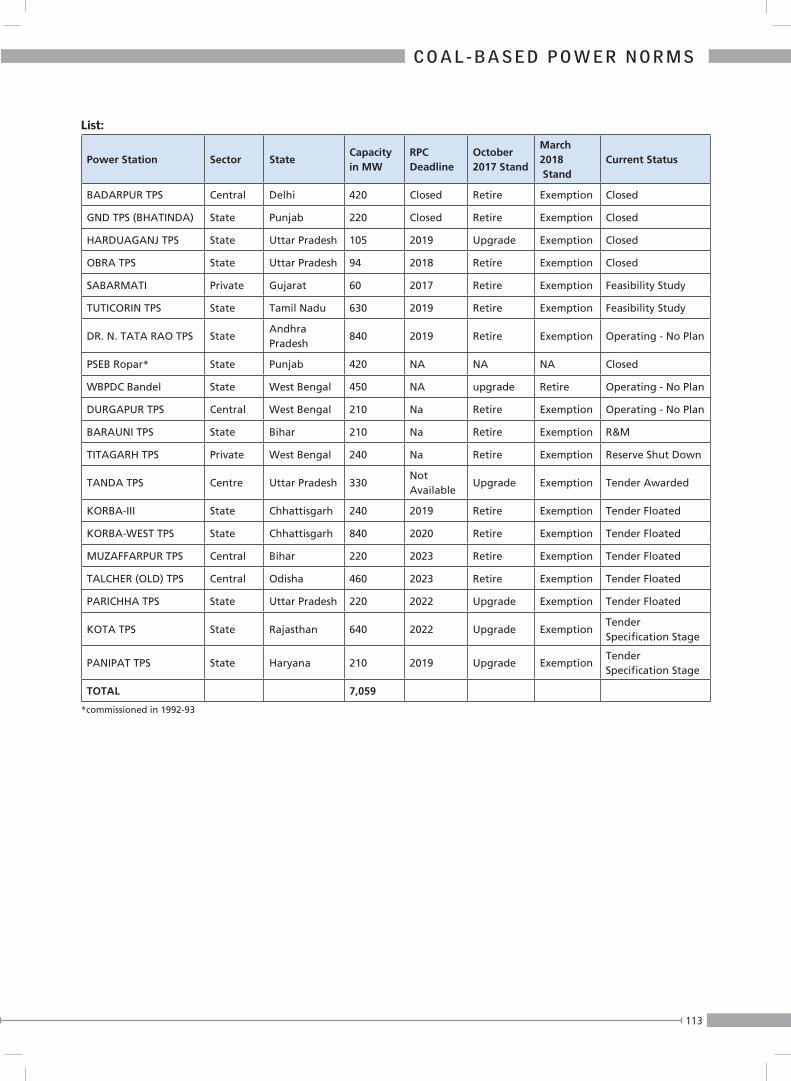
113
C O A L - B A S E D P O W E R N O R M S
List:
Power Station Sector StateCapacity in MW
RPC Deadline
October 2017 Stand
March 2018 Stand
Current Status
BADARPUR TPS Central Delhi 420 Closed Retire Exemption Closed
GND TPS (BHATINDA) State Punjab 220 Closed Retire Exemption Closed
HARDUAGANJ TPS State Uttar Pradesh 105 2019 Upgrade Exemption Closed
OBRA TPS State Uttar Pradesh 94 2018 Retire Exemption Closed
SABARMATI Private Gujarat 60 2017 Retire Exemption Feasibility Study
TUTICORIN TPS State Tamil Nadu 630 2019 Retire Exemption Feasibility Study
DR. N. TATA RAO TPS StateAndhra Pradesh
840 2019 Retire Exemption Operating - No Plan
PSEB Ropar* State Punjab 420 NA NA NA Closed
WBPDC Bandel State West Bengal 450 NA upgrade Retire Operating - No Plan
DURGAPUR TPS Central West Bengal 210 Na Retire Exemption Operating - No Plan
BARAUNI TPS State Bihar 210 Na Retire Exemption R&M
TITAGARH TPS Private West Bengal 240 Na Retire Exemption Reserve Shut Down
TANDA TPS Centre Uttar Pradesh 330Not Available
Upgrade Exemption Tender Awarded
KORBA-III State Chhattisgarh 240 2019 Retire Exemption Tender Floated
KORBA-WEST TPS State Chhattisgarh 840 2020 Retire Exemption Tender Floated
MUZAFFARPUR TPS Central Bihar 220 2023 Retire Exemption Tender Floated
TALCHER (OLD) TPS Central Odisha 460 2023 Retire Exemption Tender Floated
PARICHHA TPS State Uttar Pradesh 220 2022 Upgrade Exemption Tender Floated
KOTA TPS State Rajasthan 640 2022 Upgrade ExemptionTender Specification Stage
PANIPAT TPS State Haryana 210 2019 Upgrade ExemptionTender Specification Stage
TOTAL 7,059
*commissioned in 1992-93
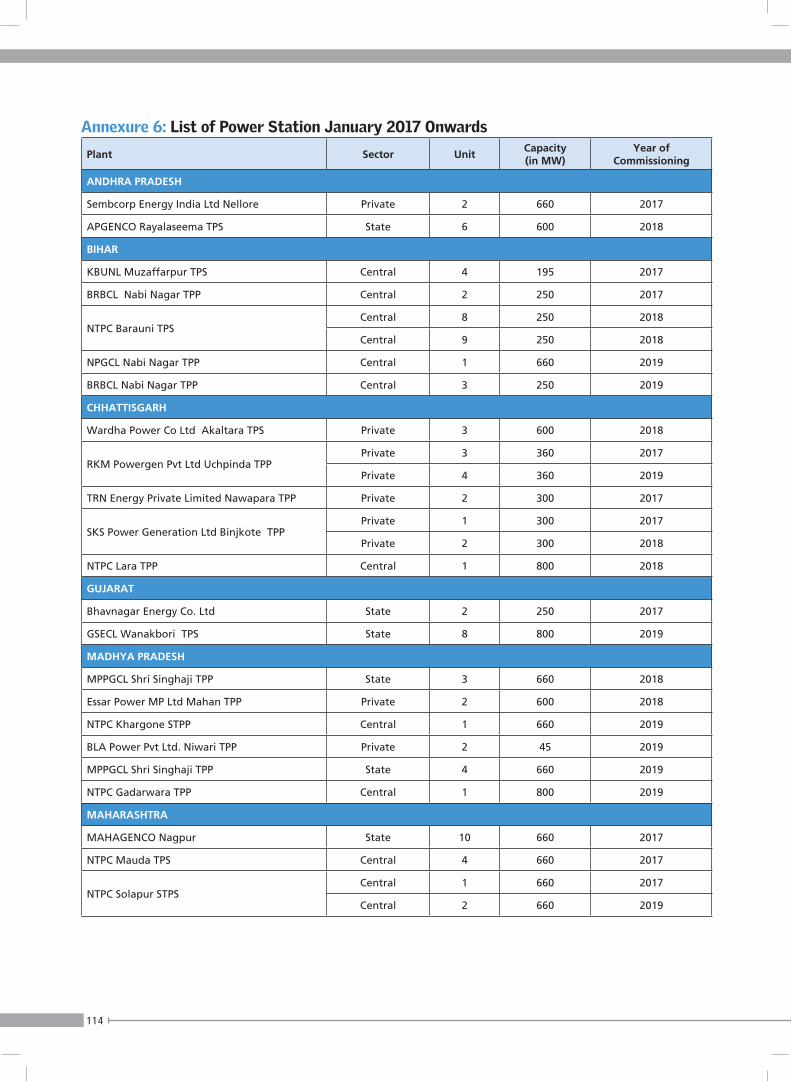
114
Annexure 6: List of Power Station January 2017 Onwards
Plant Sector UnitCapacity (in MW)
Year of Commissioning
ANDHRA PRADESH
Sembcorp Energy India Ltd Nellore Private 2 660 2017
APGENCO Rayalaseema TPS State 6 600 2018
BIHAR
KBUNL Muzaffarpur TPS Central 4 195 2017
BRBCL Nabi Nagar TPP Central 2 250 2017
NTPC Barauni TPS Central 8 250 2018
Central 9 250 2018
NPGCL Nabi Nagar TPP Central 1 660 2019
BRBCL Nabi Nagar TPP Central 3 250 2019
CHHATTISGARH
Wardha Power Co Ltd Akaltara TPS Private 3 600 2018
RKM Powergen Pvt Ltd Uchpinda TPP Private 3 360 2017
Private 4 360 2019
TRN Energy Private Limited Nawapara TPP Private 2 300 2017
SKS Power Generation Ltd Binjkote TPP Private 1 300 2017
Private 2 300 2018
NTPC Lara TPP Central 1 800 2018
GUJARAT
Bhavnagar Energy Co. Ltd State 2 250 2017
GSECL Wanakbori TPS State 8 800 2019
MADHYA PRADESH
MPPGCL Shri Singhaji TPP State 3 660 2018
Essar Power MP Ltd Mahan TPP Private 2 600 2018
NTPC Khargone STPP Central 1 660 2019
BLA Power Pvt Ltd. Niwari TPP Private 2 45 2019
MPPGCL Shri Singhaji TPP State 4 660 2019
NTPC Gadarwara TPP Central 1 800 2019
MAHARASHTRA
MAHAGENCO Nagpur State 10 660 2017
NTPC Mauda TPS Central 4 660 2017
NTPC Solapur STPS Central 1 660 2017
Central 2 660 2019
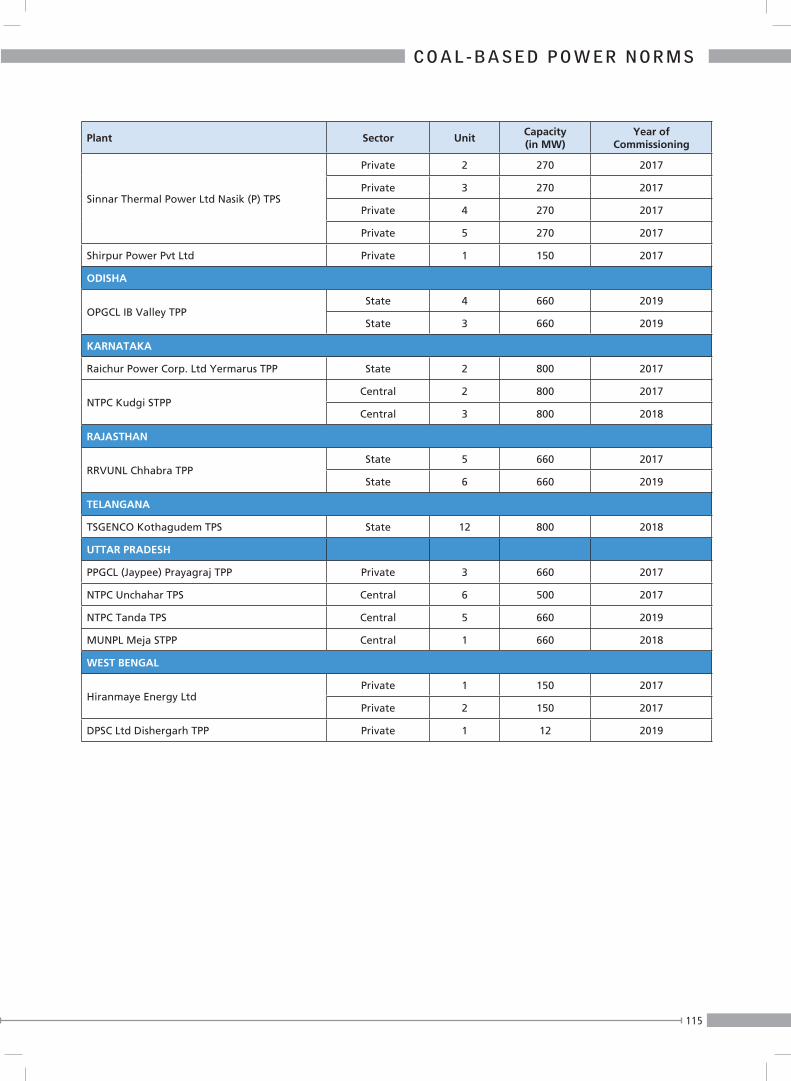
115
C O A L - B A S E D P O W E R N O R M S
Plant Sector UnitCapacity (in MW)
Year of Commissioning
Sinnar Thermal Power Ltd Nasik (P) TPS
Private 2 270 2017
Private 3 270 2017
Private 4 270 2017
Private 5 270 2017
Shirpur Power Pvt Ltd Private 1 150 2017
ODISHA
OPGCL IB Valley TPP State 4 660 2019
State 3 660 2019
KARNATAKA
Raichur Power Corp. Ltd Yermarus TPP State 2 800 2017
NTPC Kudgi STPP Central 2 800 2017
Central 3 800 2018
RAJASTHAN
RRVUNL Chhabra TPP State 5 660 2017
State 6 660 2019
TELANGANA
TSGENCO Kothagudem TPS State 12 800 2018
UTTAR PRADESH
PPGCL (Jaypee) Prayagraj TPP Private 3 660 2017
NTPC Unchahar TPS Central 6 500 2017
NTPC Tanda TPS Central 5 660 2019
MUNPL Meja STPP Central 1 660 2018
WEST BENGAL
Hiranmaye Energy LtdPrivate 1 150 2017
Private 2 150 2017
DPSC Ltd Dishergarh TPP Private 1 12 2019

116
Chapter 1: The Standards – An Overview1. Annon. (2019). Power Sector at a Glance ALL INDIA. Retrieved from https://powermin.nic.in/: https://
powermin.nic.in/en/content/power-sector-glance-all-india.2. Annon. (2019-2020). National Power Portal Retrived from https://npp.gov.in/3. Priyavrat Bhati and Soundaram Ramanathan. (2016). Clearing the Air, New Delhi: Centre for Science and
Environment.4. Li, C., McLinden, C., Fioletov, V., Krotkov, N., Carn, S., Joiner, J., Streets, D., He, H., Ren, X., Li, Z. and
Dickerson, R.R., 2017. India is overtaking China as the world’s largest emitter of anthropogenic sulfur dioxide. Scientific reports, 7(1), pp.1-7.
5. Li, C., McLinden, C., Fioletov, V., Krotkov, N., Carn, S., Joiner, J., Streets, D., He, H., Ren, X., Li, Z. and Dickerson, R.R., 2017. India is overtaking China as the world’s largest emitter of anthropogenic sulfur dioxide. Scientific reports, 7(1), pp.1-7.
6. Lu, Zifeng, David G. Streets, Benjamin de Foy, and Nickolay A. Krotkov. “Ozone Monitoring Instrument observations of interannual increases in SO2 emissions from Indian coal-fired power plants during 2005–2012.” Environmental science & technology 47, no. 24 (2013): 13993-14000.
7. Annon. (2019). All India installed capacity (in MW) of power stations. (2019). Retrieved from http://cea.nic.in/: http://www.cea.nic.in/reports/monthly/installedcapacity/2019/installed_capacity-03.pdf
8. Priyavrat Bhati, S. K. (2015). Heat on Power. New Delhi: Centre for Science and Environment.9. Priyavrat Bhati and Soundaram Ramanathan, 2017, Using the National Clean Energy Fund to Clean Coal
Power Plants, Centre for Science and Environment, New Delhi.
Chapter 2: Setting the Norms – A Chronology1. Priyavrat Bhati, S. K., et al. (2015). Heat on Power. New Delhi: Centre for Science and Environment.2. CSE welcomes proposed changes in emission and other norms for thermal power plants. 2015. https://
www.cseindia.org/cse-welcomes-proposed-changes-in-emission-and-other-norms-for-thermal-power-plants-5846.
3. Directions issued by Central Pollution Control Board, 2017; https://www.cpcb.nic.in/cpcb-directions-5ep.php.
4. Hasan, Rashid. “Ammendment Environment (Protection) Act, 1986 (29 of 1986).” S.O. 3305 (E) Notification 2015. New Delhi, Delhi: Ministry of Environment, Forest, and Climate Change, Government of India, December 2017.
5. Siwal, P D. Standard Technical Specification for Retrofit of Wet Limestone Based Flue Gas Desulphurisation (FGD) System in a Typical 2 X 500 MW thermal power plant. New Delhi: Central Electricity Authority, 2019.
6. NCR, Environment Pollution (Prevention and Control) Authority for Pollution Control. Report No 81 Recommended action and schedule for the expeditious implementation of the 7.12.2015 emission standards for thermal power plants (TPPs), which was to be complied within 2 years, that is, by 8.12.2017. New Delhi: Ministry of Environment, Forest and Climate Change, 2018.
References

117
C O A L - B A S E D P O W E R N O R M S
7. M.C. Mehta versus Union of India & Ors., Writ Petition (Civil) No.13029 of 1985 (Supreme Court of India March 27, 2018).
8. NCR, Environment Pollution (Prevention and Control) Authority for Pollution Control. Report no.84 Second report on schedule for the expeditious implementation of the 7.12.2015 emission standards for thermal power plants. New Delhi: Ministry of Environment and Forests, 2018.
9. M.C. Mehta versus Union of India & Ors. Writ Petition (Civil) No.13029 of 1985 (Supreme Court of India, 11 October 2018).
Chapter 3: The Deadlines1. Board, Central Pollution Control. “Letter .” Directions under Section 5 of the Environment (Protection) Act,
1986 regarding compliance of emission limit notified vide notification No.S.O.3305 (E) dated 07.12.2015 - reg. New Delhi: Central Pollution Control Board, 2017.
Chapter 4: Implementation – Where Do We Stand1. B.C.Mallick. (2020). FGD - ESP Implementation Status of Thermal Power Plants located in NCR (Jan
2020). New Delhi: Central Electricity Authority.2. B.C. Mallick. (2020). Unit-wise FGD implementation status and the summary sheet. New Delhi: Central
Electricity Authority.
Chapter 5: The Phase-out Plan1. Priyavrat Bhati and Rohit Pathania, 2018, No Room for Delay: Analysis of CEA Plans to Implement New
Norms for Coal Power Plants, Centre for Science and Environment, New Delhi.2. Mhaske, S.P., and Siwal, D.P, eds. 2018. National Electricity Plan: Central Electricity Authority. http://www.cea.nic.in/reports/committee/nep/nep_jan_2018.pdf3. M.C. Mehta versus Union of India & Ors., Writ Petition (Civil) No.13029 of 1985 (Supreme Court of
India August 1, 2019).4. M.C. Mehta versus Union of India & Ors., Writ Petition (Civil) No.13029 of 1985 (Supreme Court of
India August 16, 2018).
Chapter 6: The New Plants1. M.P. Singh. (2019). Monthly report on broad status of thermal power projects in the country. New Delhi:
Central Electricity Authority.2. Board, C. P. (2017). Letter . Directions under Section 5 of the Environment (Protection) Act, 1986
regarding compliance of emission limit notified vide notification No.S.O.3305 (E) dated 07.12.2015 - reg. New Delhi: Central Pollution Control Board.
3. M.P. Singh. (2019). Review of progress of thermal power projects under execution in the country. New Delhi: Central Electricity Authority.
Chapter 7: Mercury and Water1. Liang, S., Wang, Y., Cinnirella, S. and Pirrone, N., 2015. Atmospheric mercury footprints of
nations. Environmental science & technology, 49(6), pp.3566-3574.2. V.K. Rai, N. (Vol. 2 Issue 11, November - 2013). Mercury emissions control from coal fired thermal
power plants in India:Critical review & suggested Policy measures. International Journal of Engineering Research & Technology (IJERT), 1748-1766.
3. EPA. (2019). Mercury and Air Toxics Standards. Retrieved from https://www.epa.gov/mats/cleaner-power-plants#controls.
118
4. Priyavrat Bhati and Soundaram Ramanathan. (2016). Clearing the Air, New Delhi: Centre for Science and Environment.
5. Gautam, S. P. (2009). Mercury - Environmental implications and toxicity. New Delhi: Central Pollution Control Board.
6. Poddar, J. (2019). Energy Statistics 2019. New Delhi: Ministry of Statistics and Programme implementation.7. Priyavrat Bhati and Soundaram Ramanathan. (2016). Clearing the Air, New Delhi: Centre for Science and
Environment.8. Berkenpas, M. B., Rubin, E., Smith, D. N., & Gibbon, G. A. (2001). Preliminary cost and performance
models for mercury control at coal-fired power plants.9. Luo, T. (2018). 40% of India’s Thermal Power Plants Are in Water-Scarce Areas, Threatening Shutdowns.
Retrieved from https://www.wri.org/: https://www.wri.org/blog/2018/01/40-indias-thermal-power-plants-are-water-scarce-areas-threatening-shutdowns
10. Shripad Dharmadhikary, S. R. (2019). Widespread non-compliance as thermal power plants don’t meet water use norms. Retrieved from https://www.downtoearth.org.in/: https://www.downtoearth.org.in/news/water/widespread-non-compliance-as-thermal-power-plants-don-t-meet-water-use-norms-65391
11. Kalsotra, R. (2016). New Environmental Norms for the Power Sector . Proceedings and Recommendations of the Stakeholder Workshop Organized by CSE 7 September 2016. New Delhi: Centre for Science and Environment .
12. R, J. K. (2017). Pipe dreams Treated sewage will not solve coal power’s water problems. Chennai: Greenpeace India.
Chapter 8: Conclusions and Recommendations 1. Priyavrat Bhati and Soundaram Ramanathan (2016), Clearing the Air, Centre for Science and
Environment, New Delhi2. Mallick B C (2020), Status of compliance with new environmental norms of plants located in the NCR
region, Central Electricity Authority, New Delhi 3. Sharma et al (2018), National Electricity Plan, Central Electricity Authority, New Delhi (http://www.
cea.nic.in/reports/committee/nep/nep_jan_2018.pdf)4. Priyavrat Bhati (2016), Shutting Old Capacity: The 34-GW Question, Centre for Science and
Environment, New Delhi5. Sharma et al (2019-2020), Executive Summary on Power Sector-Monthly report, Central Electricity
Authority, New Delhi (http://cea.nic.in/reports/monthly/executivesummary/2020/exe_summary-01.pdf)

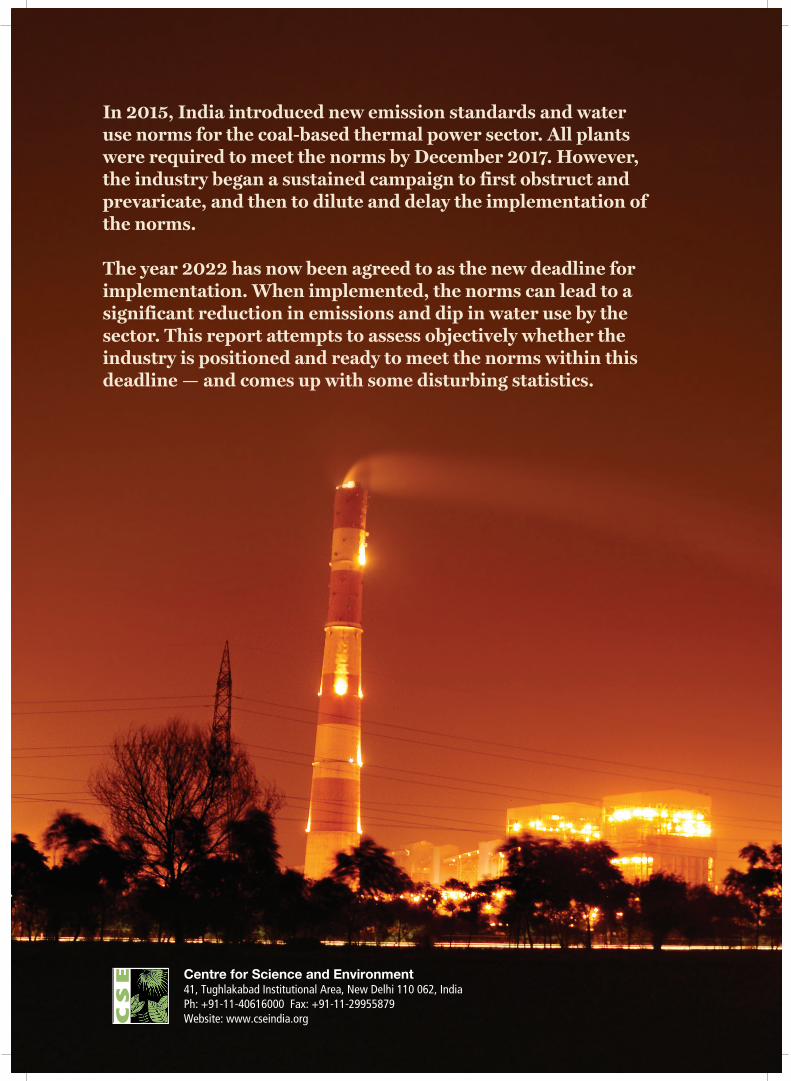
In 2015, India introduced new emission standards and water use norms for the coal-based thermal power sector. All plants were required to meet the norms by December 2017. However, the industry began a sustained campaign to first obstruct and prevaricate, and then to dilute and delay the implementation of the norms.
The year 2022 has now been agreed to as the new deadline for implementation. When implemented, the norms can lead to a significant reduction in emissions and dip in water use by the sector. This report attempts to assess objectively whether the industry is positioned and ready to meet the norms within this deadline — and comes up with some disturbing statistics.
Centre for Science and Environment41, Tughlakabad Institutional Area, New Delhi 110 062, India Ph: +91-11-40616000 Fax: +91-11-29955879Website: www.cseindia.org