A Multi-Step CNN-Based Estimation of Aircraft Landing Gear ...
Upload
khangminh22Category
view
1download
0
State of the Nation Survey, August 2006
Preliminary Findings
Lokniti: Programme for Comparative DemocracyCentre for the Study of Developing Societies
29 Rajpur Road, Delhi 110 054, Ph: 23942199; Fax: 23943450
(Sponsored by CNN-IBN and The Hindu)
1
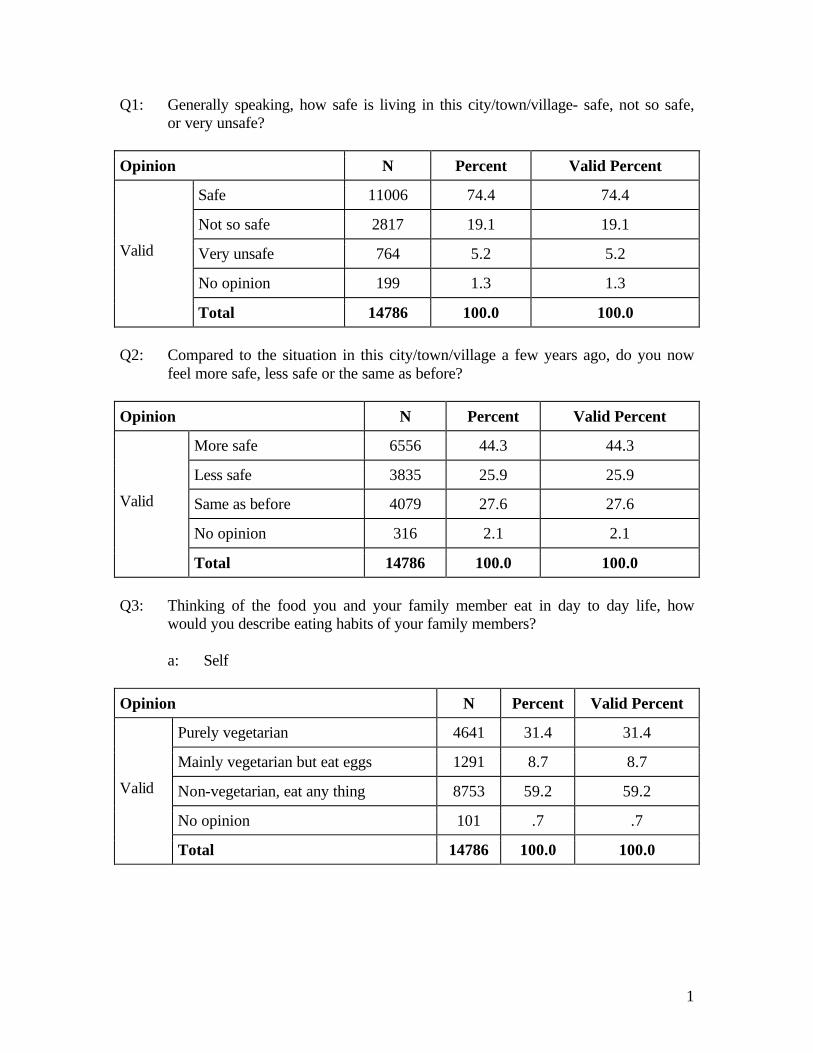
Q1: Generally speaking, how safe is living in this city/town/village- safe, not so safe, or very unsafe?
Opinion N Percent Valid Percent
Safe 11006 74.4 74.4
Not so safe 2817 19.1 19.1
Very unsafe 764 5.2 5.2
No opinion 199 1.3 1.3
Valid
Total 14786 100.0 100.0 Q2: Compared to the situation in this city/town/village a few years ago, do you now
feel more safe, less safe or the same as before?
Opinion N Percent Valid Percent
More safe 6556 44.3 44.3
Less safe 3835 25.9 25.9
Same as before 4079 27.6 27.6
No opinion 316 2.1 2.1
Valid
Total 14786 100.0 100.0 Q3: Thinking of the food you and your family member eat in day to day life, how
would you describe eating habits of your family members?
a: Self
Opinion N Percent Valid Percent
Purely vegetarian 4641 31.4 31.4
Mainly vegetarian but eat eggs 1291 8.7 8.7
Non-vegetarian, eat any thing 8753 59.2 59.2
No opinion 101 .7 .7
Valid
Total 14786 100.0 100.0

2
b: Spouse
Opinion N Percent Valid Percent
Purely vegetarian 4328 29.3 29.3
Mainly vegetarian but eat eggs 1207 8.2 8.2
Non-vegetarian, eat any thing 8304 56.2 56.2
No opinion 947 6.4 6.4
Valid
Total 14786 100.0 100.0
c: Father
Opinion N Percent Valid Percent
Purely vegetarian 4438 30.0 30.0
Mainly vegetarian but eat eggs 1019 6.9 6.9
Non-vegetarian, eat any thing 8174 55.3 55.3
No opinion 1155 7.8 7.8
Valid
Total 14786 100.0 100.0
d: Mother
Opinion N Percent Valid Percent
Purely vegetarian 5087 34.4 34.4
Mainly vegetarian but eat eggs 923 6.2 6.2
Non-vegetarian, eat any thing 7732 52.3 52.3
No opinion 1044 7.1 7.1
Valid
Total 14786 100.0 100.0

3
Q4: Now I will read out names of few eating items. For each one would you say, during last ten years the level of consumption in your family has increased, remained same or decreased?
a: Milk for children
Opinion N Percent Valid Percent
Increased 7552 51.1 51.1
Same as before 4012 27.1 27.1
Decreased 2638 17.8 17.8
No opinion 584 3.9 3.9
Valid
Total 14786 100.0 100.0
b: Pulses (Daal)
Opinion N Percent Valid Percent
Increased 7784 52.6 52.6
Same as before 4780 32.3 32.3
Decreased 1983 13.4 13.4
No opinion 239 1.6 1.6
Valid
Total 14786 100.0 100.0
c: Cereals (Wheat, Rice e.t.c)
Opinion N Percent Valid Percent
Increased 8874 60.0 60.0
Same as before 4358 29.5 29.5
Decreased 1318 8.9 8.9
No opinion 236 1.6 1.6
Valid
Total 14786 100.0 100.0
4
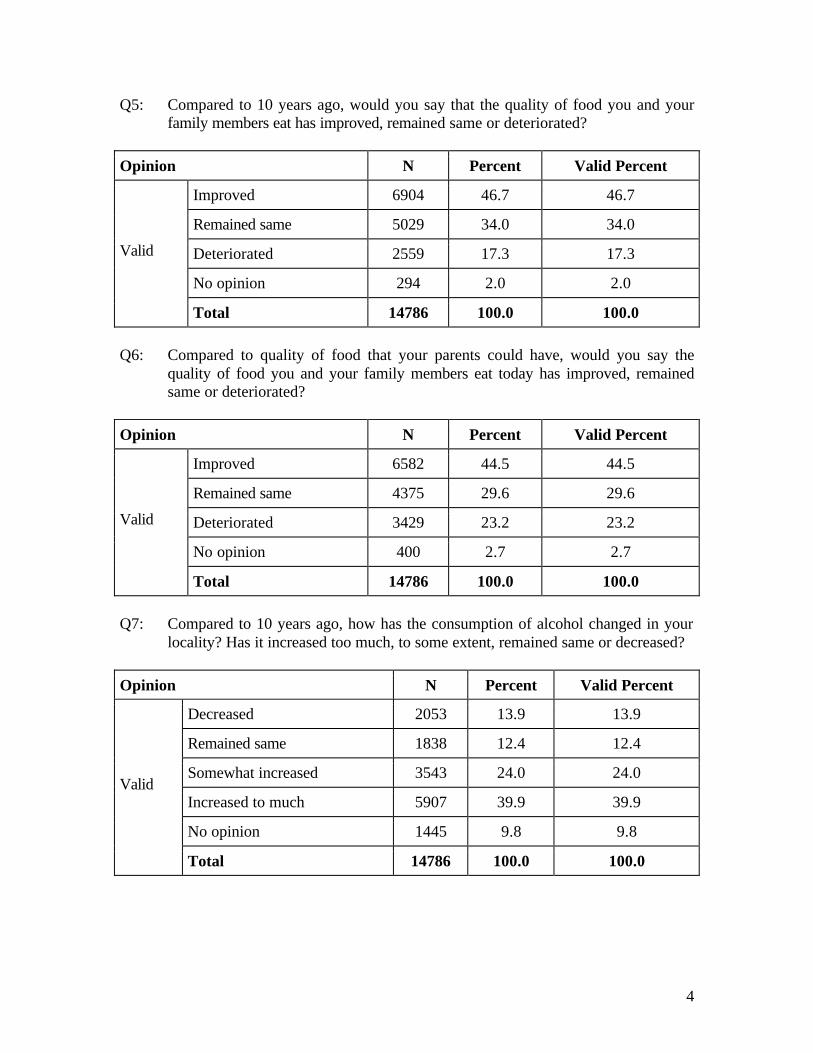
Q5: Compared to 10 years ago, would you say that the quality of food you and your family members eat has improved, remained same or deteriorated?
Opinion N Percent Valid Percent
Improved 6904 46.7 46.7
Remained same 5029 34.0 34.0
Deteriorated 2559 17.3 17.3
No opinion 294 2.0 2.0
Valid
Total 14786 100.0 100.0 Q6: Compared to quality of food that your parents could have, would you say the
quality of food you and your family members eat today has improved, remained same or deteriorated?
Opinion N Percent Valid Percent
Improved 6582 44.5 44.5
Remained same 4375 29.6 29.6
Deteriorated 3429 23.2 23.2
No opinion 400 2.7 2.7
Valid
Total 14786 100.0 100.0 Q7: Compared to 10 years ago, how has the consumption of alcohol changed in your
locality? Has it increased too much, to some extent, remained same or decreased?
Opinion N Percent Valid Percent
Decreased 2053 13.9 13.9
Remained same 1838 12.4 12.4
Somewhat increased 3543 24.0 24.0
Increased to much 5907 39.9 39.9
No opinion 1445 9.8 9.8
Valid
Total 14786 100.0 100.0

5
Q8: What is your opinion about the performance of the present Congress party led coalition government at the Centre? Are you satisfied or dissatisfied with it?
Opinion N Percent Valid Percent
Fully satisfied 3528 23.9 23.9
Somewhat satisfied 5057 34.2 34.2
Somewhat dissatisfied 1453 9.8 9.8
Fully dissatisfied 1752 11.8 11.8
No opinion 2996 20.3 20.3
Valid
Total 14786 100.0 100.0 Q9: Thinking of the expectation that you had from Congress led UPA govt. when it
was formed, would you say that the govt. has performed according to your expectation, better than expectation or worse than expectation?
Opinion N Percent Valid Percent
According to expectation 3993 27.0 27.0
Better than expectation 2436 16.5 16.5
Worse than expectation 4234 28.6 28.6
No opinion 4123 27.9 27.9
Valid
Total 14786 100.0 100.0 Q10: Now I will read out names of few items. You tell me, how often do you consume
them almost daily, once or twice a week, once or twice a month, rarely or never?
a: Tea/Coffee
Opinion N Percent Valid Percent
Almost daily 11397 77.1 77.1
Once or twice a week 1016 6.9 6.9
Once or twice a month 373 2.5 2.5
Rarely 1105 7.5 7.5
Never 895 6.1 6.1
Valid
Total 14786 100.0 100.0

6
b: Cold drinks
Opinion N Percent Valid Percent
Almost daily 613 4.1 4.1
Once or twice a week 1557 10.5 10.5
Once or twice a month 1856 12.6 12.6
Rarely 4198 28.4 28.4
Never 6562 44.4 44.4
Valid
Total 14786 100.0 100.0
c: Milk
Opinion N Percent Valid Percent
Almost daily 5936 40.1 40.1
Once or twice a week 2495 16.9 16.9
Once or twice a month 1171 7.9 7.9
Rarely 2655 18.0 18.0
Never 2529 17.1 17.1
Valid
Total 14786 100.0 100.0
d: Alcohol
Opinion N Percent Valid Percent
Almost daily 505 3.4 3.4
Once or twice a week 632 4.3 4.3
Once or twice a month 803 5.4 5.4
Rarely 1913 12.9 12.9
Never 10933 73.9 73.9
Valid
Total 14786 100.0 100.0

7
d: Biri/Cigarate
Opinion N Percent Valid Percent
Almost daily 3099 21.0 21.0
Once or twice a week 593 4.0 4.0
Once or twice a month 306 2.1 2.1
Rarely 1150 7.8 7.8
Never 9638 65.2 65.2
Valid
Total 14786 100.0 100.0 Q11: Now I would like you to compare the present Congress party led UPA
government at the Centre with the previous BJP led NDA government. Which of these governments would you consider better?
Opinion N Percent Valid Percent
UPA Govt. 5263 35.6 35.6
NDA Govt. 3540 23.9 23.9
Both equally good 1583 10.7 10.7
Both equally bad 1097 7.4 7.4
No opinion 3303 22.3 22.3
Valid
Total 14786 100.0 100.0 Q12: If you were choose any one leader from different parties as Prime Minister of the
country whom would you like to choose?
Name of the Prime Minister N Percent Valid Percent
Sonia Gandhi 4148 28.1 33.0
Manmohan Singh 1776 12.0 14.1
Priyanka Gandhi 99 .7 .8
Rahul Gandhi 316 2.1 2.5
N.D. Tiwari 28 .2 .2
Arjun Singh 31 .2 .2
Valid
Pranab Mukherjee 16 .1 .1

8
Name of the Prime Minister N Percent Valid Percent
Shivraj Patil 56 .4 .4
P. Chidambaran 36 .2 .3
Gulam Nabi Azad 34 .2 .3
Digvijay Singh 14 .1 .1
Sharad Pawar 142 1.0 1.1
Laloo Prasad Yadav 149 1.0 1.2
M. Karunakaran 128 .9 1.0
Sheila Dixit 2 .0 .0
Atal Bihari Vajpayee 2695 18.2 21.5
L.K. Advani 280 1.9 2.2
Narendra Modi 94 .6 .7
Arun Jaitly 3 .0 .0
Sushma Swaraj 26 .2 .2
Rajnath Singh 30 .2 .2
Vasundhara Raje Scindia 18 .1 .1
Mamata Banerjee 10 .1 .1
George Farnandes 4 .0 .0
Nitish Kumar 67 .5 .5
Bal Thackeray 39 .3 .3
Chandrababu Naidu 114 .8 .9
Jyoti Basu 132 .9 1.1
Buddhodeb Bhattacharya 40 .3 .3
Prakash Karat 14 .1 .1
Brinda Karat 2 .0 .0
Sitaram Yechury 4 .0 .0
V.S. Achuthanandan 5 .0 .0
Somnath Chatterjee 13 .1 .1
A.B. Bardhan 1 .0 .0
9
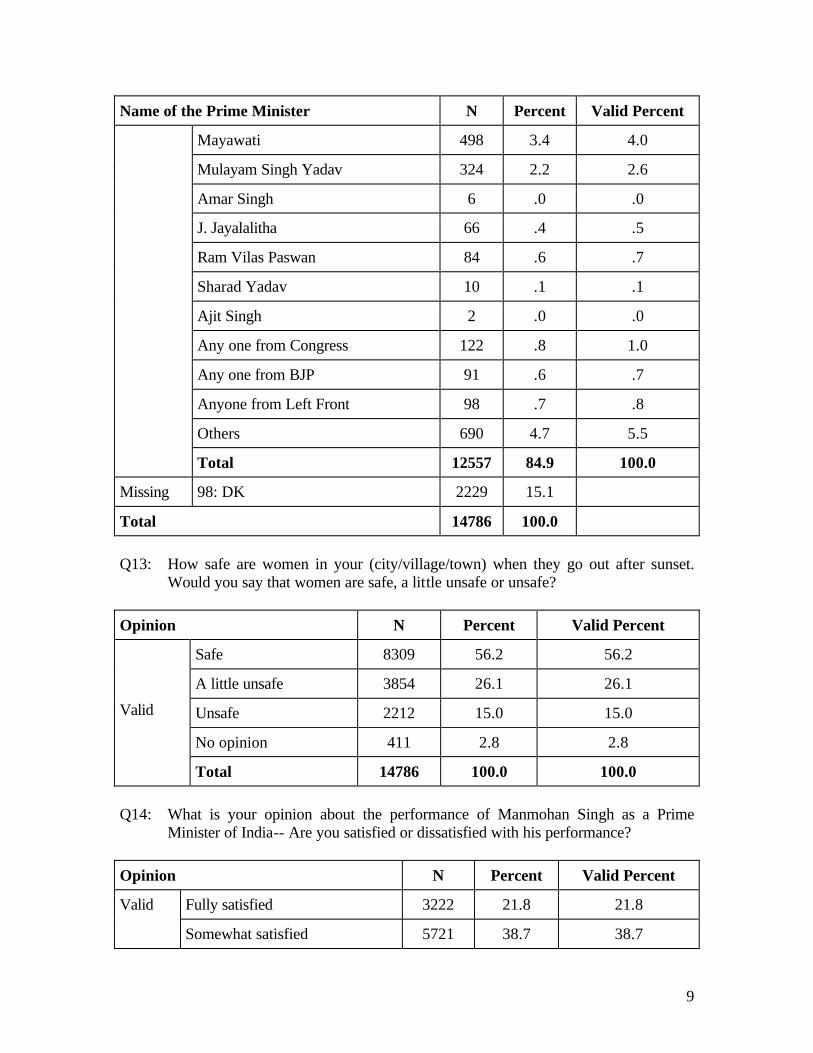
Name of the Prime Minister N Percent Valid Percent
Mayawati 498 3.4 4.0
Mulayam Singh Yadav 324 2.2 2.6
Amar Singh 6 .0 .0
J. Jayalalitha 66 .4 .5
Ram Vilas Paswan 84 .6 .7
Sharad Yadav 10 .1 .1
Ajit Singh 2 .0 .0
Any one from Congress 122 .8 1.0
Any one from BJP 91 .6 .7
Anyone from Left Front 98 .7 .8
Others 690 4.7 5.5
Total 12557 84.9 100.0
Missing 98: DK 2229 15.1
Total 14786 100.0 Q13: How safe are women in your (city/village/town) when they go out after sunset.
Would you say that women are safe, a little unsafe or unsafe?
Opinion N Percent Valid Percent
Safe 8309 56.2 56.2
A little unsafe 3854 26.1 26.1
Unsafe 2212 15.0 15.0
No opinion 411 2.8 2.8
Valid
Total 14786 100.0 100.0 Q14: What is your opinion about the performance of Manmohan Singh as a Prime
Minister of India-- Are you satisfied or dissatisfied with his performance?
Opinion N Percent Valid Percent
Fully satisfied 3222 21.8 21.8 Valid
Somewhat satisfied 5721 38.7 38.7

10
Opinion N Percent Valid Percent
Somewhat dissatisfied 1342 9.1 9.1
Fully dissatisfied 1355 9.2 9.2
No opinion 3146 21.3 21.3
Total 14786 100.0 100.0 Q15: In your opinion should the present Congress party led coalition govt. at the Centre
get a second chance to rule?
Opinion N Percent Valid Percent
No 4134 28.0 28.0
Yes 6298 42.6 42.6
Too early to say 1527 10.3 10.3
No opinion 2827 19.1 19.1
Valid
Total 14786 100.0 100.0 Q16: Have you heard about the recent bomb blast in Mumbai?
Opinion N Percent Valid Percent
No 5095 34.5 34.5
Yes 8764 59.3 59.3
No opinion 927 6.3 6.3 Valid
Total 14786 100.0 100.0 Q17: Some people say that Pakistan is the real force behind terrorist activities in India-
do you agree or disagree?
Opinion N Percent Valid Percent
Strongly agree 5080 34.4 34.4
Somewhat agree 2825 19.1 19.1
Somewhat disagree 591 4.0 4.0
Fully disagree 852 5.8 5.8
Valid
No opinion 5438 36.8 36.8

11
Opinion N Percent Valid Percent
Total 14786 100.0 100.0
a: (If strongly or somewhat agree), What should government do about Pakistan’s involvement Some people say that India should attack all terrorist bases in Pakistan. Other says that India should put international and military pressure on Pakistan and still others say that India should solve it through dialogues with Pakistan?
Opinion N Percent Valid Percent
Should attack terrorist bases 3208 21.7 21.7
Put international and military pressure 1497 10.1 10.1
Through dialogues 2465 16.7 16.7
No opinion 735 5.0 5.0
NA 6881 46.5 46.5
Valid
Total 14786 100.0 100.0 Q18: If you compare the present Congress led UPA govt. with the previous BJP led
NDA govt. which of these would you say is best suited to solve the problem of terrorism?
Opinion N Percent Valid Percent
UPA govt. 4145 28.0 28.0
NDA govt. 3495 23.6 23.6
Both 1995 13.5 13.5
None 1557 10.5 10.5
No opinion 3594 24.3 24.3
Valid
Total 14786 100.0 100.0 Q19: What is your opinion about the performance of the ruling party in State? Are you
satisfied or dissatisfied with it? Andhra Pradesh: Performance of the Congress party
Opinion N Percent Valid Percent
Valid Fully satisfied 306 29.9 29.9

12
Opinion N Percent Valid Percent
Somewhat satisfied 307 30.0 30.0
Somewhat dissatisfied 88 8.6 8.6
Fully dissatisfied 198 19.3 19.3
No opinion 126 12.3 12.3
Total 1025 100.0 100.0
Assam: Performance of the Congress party
Opinion N Percent Valid Percent
Fully satisfied 76 14.6 14.6
Somewhat satisfied 343 65.7 65.7
Somewhat dissatisfied 75 14.4 14.4
Fully dissatisfied 17 3.3 3.3
No opinion 11 2.1 2.1
Valid
Total 522 100.0 100.0
Bihar: Performance of the JD(U) Allies
Opinion N Percent Valid Percent
Fully satisfied 760 60.6 60.6
Somewhat satisfied 381 30.4 30.4
Somewhat dissatisfied 39 3.1 3.1
Fully dissatisfied 56 4.5 4.5
No opinion 18 1.4 1.4
Valid
Total 1254 100.0 100.0
Gujarat: Performance of the BJP
Opinion N Percent Valid Percent
Fully satisfied 210 31.5 31.5
Somewhat satisfied 202 30.3 30.3
Somewhat dissatisfied 73 10.9 10.9
Fully dissatisfied 47 7.0 7.0
Valid
No opinion 135 20.2 20.2
13
Opinion N Percent Valid Percent
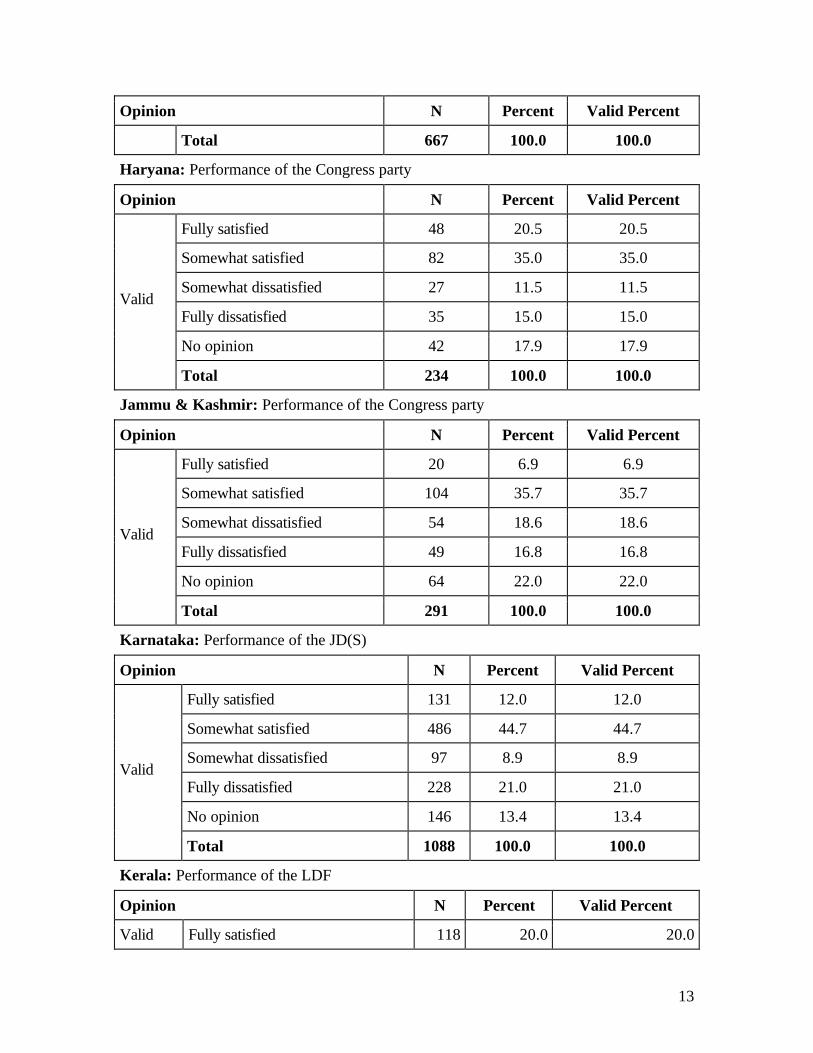
Total 667 100.0 100.0
Haryana: Performance of the Congress party
Opinion N Percent Valid Percent
Fully satisfied 48 20.5 20.5
Somewhat satisfied 82 35.0 35.0
Somewhat dissatisfied 27 11.5 11.5
Fully dissatisfied 35 15.0 15.0
No opinion 42 17.9 17.9
Valid
Total 234 100.0 100.0
Jammu & Kashmir: Performance of the Congress party
Opinion N Percent Valid Percent
Fully satisfied 20 6.9 6.9
Somewhat satisfied 104 35.7 35.7
Somewhat dissatisfied 54 18.6 18.6
Fully dissatisfied 49 16.8 16.8
No opinion 64 22.0 22.0
Valid
Total 291 100.0 100.0
Karnataka: Performance of the JD(S)
Opinion N Percent Valid Percent
Fully satisfied 131 12.0 12.0
Somewhat satisfied 486 44.7 44.7
Somewhat dissatisfied 97 8.9 8.9
Fully dissatisfied 228 21.0 21.0
No opinion 146 13.4 13.4
Valid
Total 1088 100.0 100.0
Kerala: Performance of the LDF
Opinion N Percent Valid Percent
Valid Fully satisfied 118 20.0 20.0

14
Opinion N Percent Valid Percent
Somewhat satisfied 233 39.4 39.4
Somewhat dissatisfied 69 11.7 11.7
Fully dissatisfied 71 12.0 12.0
No opinion 100 16.9 16.9
Total 591 100.0 100.0
Madhya Pradesh: Performance of the BJP
Opinion N Percent Valid Percent
Fully satisfied 175 23.2 23.2
Somewhat satisfied 296 39.3 39.3
Somewhat dissatisfied 93 12.4 12.4
Fully dissatisfied 111 14.7 14.7
No opinion 78 10.4 10.4
Valid
Total 753 100.0 100.0
Maharashtra: Performance of the Congress party
Opinion N Percent Valid Percent
Fully satisfied 257 22.0 22.0
Somewhat satisfied 512 43.8 43.8
Somewhat dissatisfied 82 7.0 7.0
Fully dissatisfied 122 10.4 10.4
No opinion 196 16.8 16.8
Valid
Total 1169 100.0 100.0
Orissa: Performance of the BJD
Opinion N Percent Valid Percent
Fully satisfied 116 19.4 19.4
Somewhat satisfied 266 44.4 44.4
Somewhat dissatisfied 73 12.2 12.2
Fully dissatisfied 35 5.8 5.8
Valid
No opinion 109 18.2 18.2

15
Opinion N Percent Valid Percent
Total 599 100.0 100.0
Punjab: Performance of the Congress party
Opinion N Percent Valid Percent
Fully satisfied 99 28.8 28.8
Somewhat satisfied 109 31.7 31.7
Somewhat dissatisfied 48 14.0 14.0
Fully dissatisfied 62 18.0 18.0
No opinion 26 7.6 7.6
Valid
Total 344 100.0 100.0
Rajasthan: Performance of the BJP
Opinion N Percent Valid Percent
Fully satisfied 196 27.2 27.2
Somewhat satisfied 182 25.3 25.3
Somewhat dissatisfied 74 10.3 10.3
Fully dissatisfied 170 23.6 23.6
No opinion 98 13.6 13.6
Valid
Total 720 100.0 100.0
Tamil Nadu: Performance of the DMK Allies
Opinion N Percent Valid Percent
Fully satisfied 524 46.7 46.7
Somewhat satisfied 331 29.5 29.5
Somewhat dissatisfied 47 4.2 4.2
Fully dissatisfied 81 7.2 7.2
No opinion 139 12.4 12.4
Valid
Total 1122 100.0 100.0
Uttar Pradesh: Performance of the Samajwadi party
Opinion N Percent Valid Percent
Valid Fully satisfied 483 19.6 19.6

16
Opinion N Percent Valid Percent
Somewhat satisfied 647 26.2 26.2
Somewhat dissatisfied 247 10.0 10.0
Fully dissatisfied 710 28.8 28.8
No opinion 378 15.3 15.3
Total 2465 100.0 100.0
West Bengal: Performance of the Left Front
Opinion N Percent Valid Percent
Fully satisfied 332 32.5 32.5
Somewhat satisfied 383 37.5 37.5
Somewhat dissatisfied 104 10.2 10.2
Fully dissatisfied 87 8.5 8.5
No opinion 115 11.3 11.3
Valid
Total 1021 100.0 100.0
Delhi: Performance of the Congress party
Opinion N Percent Valid Percent
Fully satisfied 30 18.6 18.6
Somewhat satisfied 50 31.1 31.1
Somewhat dissatisfied 25 15.5 15.5
Fully dissatisfied 44 27.3 27.3
No opinion 12 7.5 7.5
Valid
Total 161 100.0 100.0
Jharkhand: Performance of the BJP
Opinion N Percent Valid Percent
Fully satisfied 31 7.3 7.3
Somewhat satisfied 125 29.3 29.3
Somewhat dissatisfied 57 13.4 13.4
Fully dissatisfied 88 20.7 20.7
Valid
No opinion 125 29.3 29.3

17
Opinion N Percent Valid Percent
Total 426 100.0 100.0
Chattishgarh: Performance of the BJP
Opinion N Percent Valid Percent
Fully satisfied 119 35.6 35.6
Somewhat satisfied 106 31.7 31.7
Somewhat dissatisfied 23 6.9 6.9
Fully dissatisfied 49 14.7 14.7
No opinion 37 11.1 11.1
Valid
Total 334 100.0 100.0 Q20: If you were to choose any one leader from different parties as the Chief Minister
of the states, whom would you like to choose? Andhra Pradesh
Preferred Chief Minister N Percent Valid Percent
N Chandrababu Naidu 403 39.3 40.5
Y S Rajashekhara Reddy 469 45.8 47.1
K Chandrashekhara Rao 26 2.5 2.6
S. Jaipal Reddy 1 .1 .1
Others 96 9.4 9.6
Valid
Total 995 97.1 100.0
Missing Not answered 30 2.9
Total 1025 100.0
Assam
Preferred Chief Minister N Percent Valid Percent
Tarun Gogoi 271 51.9 52.3
Brindaban Goswami 68 13.0 13.1
Sarat Sinha 21 4.0 4.1
Prafulla Kumar Mahanta 12 2.3 2.3
Valid
Hema Prabha Saikia 3 .6 .6

18
Preferred Chief Minister N Percent Valid Percent
Pramod Gogoi 5 1.0 1.0
Others 138 26.4 26.6
Total 518 99.2 100.0
Missing Not answered 4 .8
Total 522 100.0
Bihar
Preferred Chief Minister N Percent Valid Percent
Laloo Prasad Yadav 164 13.1 13.2
Rabri Devi 81 6.5 6.5
Ram Vilas Paswan 123 9.8 9.9
Nitish Kumar 794 63.3 63.7
George Fernandes 1 .1 .1
Sushil Modi 9 .7 .7
Shatrughan Sinha 12 1.0 1.0
Jaggannath Mishra 10 .8 .8
Others 53 4.2 4.3
Valid
Total 1247 99.4 100.0
Missing Not answered 7 .6
Total 1254 100.0
Gujarat
Preferred Chief Minister N Percent Valid Percent
Narendra Modi 302 45.3 52.2
Keshubhai Patel 38 5.7 6.6
Suresh Mehta 5 .7 .9
Kanshiram Rana 2 .3 .3
Shankarsingh Waghela 110 16.5 19.0
Amarsingh Choudhary 5 .7 .9
Valid
Madhavsingh Solanki 15 2.2 2.6

19
Preferred Chief Minister N Percent Valid Percent
Ahmed atel 9 1.3 1.6
Others 92 13.8 15.9
Total 578 86.7 100.0
Missing Not answered 89 13.3
Total 667 100.0
Haryana
Preferred Chief Minister N Percent Valid Percent
Om Prakash Chautala 90 38.5 41.7
Ajay Choutala 2 .9 .9
Bhajan Lal 15 6.4 6.9
Bhupinder Singh Hooda 78 33.3 36.1
Randeep Singh Surjewala 1 .4 .5
Kishan Singh Sangwan 5 2.1 2.3
Rao Birender Singh 1 .4 .5
Others 24 10.3 11.1
Valid
Total 216 92.3 100.0
Missing Not answered 18 7.7
Total 234 100.0
Jammu & Kashmir
Preferred Chief Minister N Percent Valid Percent
Mufti Mohammed Sayeed 28 9.6 9.6
Mehbooba Mufti 5 1.7 1.7
Farooq Abdullah 19 6.5 6.5
Omar Abdullah 16 5.5 5.5
Ghulam Nabi Azad 59 20.3 20.3
Mangal Ram Sharma 1 .3 .3
Bhim Singh 1 .3 .3
Valid
Others 162 55.7 55.7

20
Preferred Chief Minister N Percent Valid Percent
Total 291 100.0 100.0
Karnataka
Preferred Chief Minister N Percent Valid Percent
HD Kumara Swamy 129 11.9 11.9
Dharm Singh 108 9.9 10.0
Malikarjun Kharge 134 12.3 12.4
Margaret Alva 6 .6 .6
M Veerappa Molly 12 1.1 1.1
Ananth Kumar 68 6.3 6.3
B S Yedurlyappa 111 10.2 10.3
H D Deve Gowda 41 3.8 3.8
S M Krishna 235 21.6 21.8
Vijay Mallya 3 .3 .3
Others 233 21.4 21.6
Valid
Total 1080 99.3 100.0
Missing Not answered 8 .7
Total 1088 100.0
Kerala
Preferred Chief Minister N Percent Valid Percent
K Karunakaran 13 2.2 2.2
A K Antony 68 11.5 11.6
Oommen Chandy 111 18.8 18.9
V S Achuthanandan 249 42.1 42.3
Pinarayi Vijayan 9 1.5 1.5
Palloli Mohammed Kutty 4 .7 .7
Vayalar Ravi 1 .2 .2
Others 133 22.5 22.6
Valid
Total 588 99.5 100.0

21
Preferred Chief Minister N Percent Valid Percent
Missing Not answered 3 .5
Total 591 100.0
Madhya Pradesh
Preferred Chief Minister N Percent Valid Percent
Uma Bharati 240 31.9 33.9
Sunderlal Patwa 14 1.9 2.0
Kailash Joshi 1 .1 .1
Shivraj Singh Chauhan 108 14.3 15.3
Digvijay Singh 105 13.9 14.8
Kamal Nath 22 2.9 3.1
Subhash Yadav 22 2.9 3.1
Jamuna Devi 2 .3 .3
Jyotiraditya Scindia 6 .8 .8
Arjun Singh 9 1.2 1.3
Others 179 23.8 25.3
Valid
Total 708 94.0 100.0
Missing Not answered 45 6.0
Total 753 100.0
Maharashtra
Preferred Chief Minister N Percent Valid Percent
Sharad Pawar 70 6.0 7.4
Bal Thackeray 36 3.1 3.8
Sushilkumar Shinde 38 3.3 4.0
Vilasrao Deshmukh 247 21.1 26.2
Shivraj Patil 1 .1 .1
R R Patil 144 12.3 15.3
Chhagan Bhujbal 3 .3 .3
Valid
Vijaysingh Mohite Patil 7 .6 .7

22
Preferred Chief Minister N Percent Valid Percent
Jayant Patil 5 .4 .5
Gopinath Munde 64 5.5 6.8
Uddhav Thackeray 9 .8 1.0
Manohar Joshi 28 2.4 3.0
Narayan Rane 47 4.0 5.0
Raj Thackeray 25 2.1 2.7
Others 218 18.6 23.1
Total 942 80.6 100.0
Missing Not answered 227 19.4
Total 1169 100.0
Orissa
Preferred Chief Minister N Percent Valid Percent
Naveen Patnaik 354 59.1 84.5
Bijay Mahapatra 2 .3 .5
Dilip Ray 1 .2 .2
Juel Oraon 2 .3 .5
J B Patnaik 16 2.7 3.8
Hemananda Biswal 2 .3 .5
Giridhar Gamang 9 1.5 2.1
K P Singh Deo 1 .2 .2
Others 32 5.3 7.6
Valid
Total 419 69.9 100.0
Missing Not answered 180 30.1
Total 599 100.0
Punjab
Preferred Chief Minister N Percent Valid Percent
Capt. Amrinder Singh 148 43.0 49.8 Valid
Rajinder Kaur Bhattal 14 4.1 4.7

23
Preferred Chief Minister N Percent Valid Percent
Prakash Singh Badal 68 19.8 22.9
Simranjit Singh Mann 1 .3 .3
Balramji Dass Tandon 2 .6 .7
Others 64 18.6 21.5
Total 297 86.3 100.0
Missing Not answered 47 13.7
Total 344 100.0
Rajasthan
Preferred Chief Minister N Percent Valid Percent
Vasundhara Raje 192 26.7 28.4
Gulab Chand Kataria 30 4.2 4.4
Ashok Gehlot 300 41.7 44.3
Shiv Charan Mathur 2 .3 .3
Girija Vyas 4 .6 .6
B.D. Kalla 12 1.7 1.8
Sheesh Ram Ola 13 1.8 1.9
Others 124 17.2 18.3
Valid
Total 677 94.0 100.0
Missing Not answered 43 6.0
Total 720 100.0
Tamil Nadu
Preferred Chief Minister N Percent Valid Percent
M Karunanidhi 531 47.3 48.9
J Jayalalitha 248 22.1 22.8
S Ramdoss 20 1.8 1.8
E.V.K.S. Elangovan 11 1.0 1.0
M.K. Stalin 46 4.1 4.2
Valid
V. Gopalaswami(Vaiko) 4 .4 .4

24
Preferred Chief Minister N Percent Valid Percent
Vijaykant 130 11.6 12.0
Dayanaidhi Maran 16 1.4 1.5
P. Chidambaran 10 .9 .9
Others 70 6.2 6.4
Total 1086 96.8 100.0
Missing Not answered 36 3.2
Total 1122 100.0
Uttar Pradesh
Preferred Chief Minister N Percent Valid Percent
Mulayam Singh Yadav 721 29.2 31.5
Akhilesh Yadav 25 1.0 1.1
Amar Singh 8 .3 .3
Rajnath Singh 190 7.7 8.3
Kalyan Singh 170 6.9 7.4
Om Prakash Singh 6 .2 .3
Kalraj Mishra 6 .2 .3
Lalji Tandon 6 .2 .3
Keshri Nath Tripathi 1 .0 .0
Mayawati 820 33.3 35.9
Salman Khursid 14 .6 .6
Rahul Gandhi 63 2.6 2.8
Priyanka Gandhi 36 1.5 1.6
Ajit Singh 17 .7 .7
Others 203 8.2 8.9
Valid
Total 2286 92.7 100.0
Missing Not answered 179 7.3
Total 2465 100.0

25
West Bengal
Preferred Chief Minister N Percent Valid Percent
Buddhadeb Bhattacharya 561 54.9 60.1
Jyoti Basu 86 8.4 9.2
Mamata Banerjee 83 8.1 8.9
Pranab Mukherjee 64 6.3 6.9
Somen Mitra 1 .1 .1
Adhir Ranjan Chowdhury 24 2.4 2.6
Tapan Sikdar 11 1.1 1.2
Subhash Chakraborty 1 .1 .1
Others 102 10.0 10.9
Valid
Total 933 91.4 100.0
Missing Not answered 88 8.6
Total 1021 100.0
Delhi
Preferred Chief Minister N Percent Valid Percent
Sheila Dixit 86 53.4 54.4
Jagdish Tytler 1 .6 .6
Prem Singh 2 1.2 1.3
Sahib Singh Verma 6 3.7 3.8
Sushma Swaraj 12 7.5 7.6
Others 51 31.7 32.3
Valid
Total 158 98.1 100.0
Missing Not answered 3 1.9
Total 161 100.0
Jharkhand
Preferred Chief Minister N Percent Valid Percent
Arjun Munda 74 17.4 18.8 Valid
Babulal Marandi 100 23.5 25.4

26
Preferred Chief Minister N Percent Valid Percent
Shibu Soren 100 23.5 25.4
Yashwant Sinha 2 .5 .5
Thomas Hansda 3 .7 .8
Inder Singh Namdhari 3 .7 .8
Others 111 26.1 28.2
Total 393 92.3 100.0
Missing Not answered 33 7.7
Total 426 100.0
Chattishgarh
Preferred Chief Minister N Percent Valid Percent
Raman Singh 94 28.1 30.3
Dilip Singh Judeo 37 11.1 11.9
Ramesh Bais 4 1.2 1.3
V.C. Shukla 3 .9 1.0
Ajit Jogi 124 37.1 40.0
S.C. Shukla 1 .3 .3
Mahendra Karma 4 1.2 1.3
Others 43 12.9 13.9
Valid
Total 310 92.8 100.0
Missing Not answered 24 7.2
Total 334 100.0 Q21: I will read out some things that people feel insecure about these days. Tell me,
how insecure do you personally feel about the following—Very insecure, somewhat insecure or not at all insecure?
a: Theft/robbery
Opinion N Percent Valid Percent
Valid Very insecure 5413 36.6 36.6

27
Opinion N Percent Valid Percent
Somewhat insecure 4179 28.3 28.3
Not at all insecure 4219 28.5 28.5
No opinion 975 6.6 6.6
Total 14786 100.0 100.0
b: Riots/Mob violence
Opinion N Percent Valid Percent
Very insecure 4175 28.2 28.2
Somewhat insecure 3632 24.6 24.6
Not at all insecure 5121 34.6 34.6
No opinion 1858 12.6 12.6
Valid
Total 14786 100.0 100.0
c: Militants/Terrorist attack?
Opinion N Percent Valid Percent
Very insecure 3980 26.9 26.9
Somewhat insecure 2434 16.5 16.5
Not at all insecure 4600 31.1 31.1
No opinion 3772 25.5 25.5
Valid
Total 14786 100.0 100.0
d: Global/International terrorism
Opinion N Percent Valid Percent
Very insecure 3244 21.9 21.9
Somewhat insecure 2089 14.1 14.1
Not at all insecure 4484 30.3 30.3
No opinion 4969 33.6 33.6
Valid
Total 14786 100.0 100.0

28
Q22: What is your opinion about the Chief Minister of the state- Are you satisfied or dissatisfied with his/her performance?
Andhra Pradesh: Performance of the Y.S. Rajasekhara Reddy
Opinion N Percent Valid Percent
Fully satisfied 341 33.3 33.3
Somewhat satisfied 288 28.1 28.1
Somewhat dissatisfied 80 7.8 7.8
Fully dissatisfied 219 21.4 21.4
No opinion 97 9.5 9.5
Valid
Total 1025 100.0 100.0
Assam: Performance of the Tarun Kumar Gogoi
Opinion N Percent Valid Percent
Fully satisfied 88 16.9 16.9
Somewhat satisfied 325 62.3 62.3
Somewhat dissatisfied 85 16.3 16.3
Fully dissatisfied 17 3.3 3.3
No opinion 7 1.3 1.3
Valid
Total 522 100.0 100.0
Bihar: Performance of the Nitish Kumar
Opinion N Percent Valid Percent
Fully satisfied 780 62.2 62.2
Somewhat satisfied 386 30.8 30.8
Somewhat dissatisfied 33 2.6 2.6
Fully dissatisfied 44 3.5 3.5
No opinion 11 .9 .9
Valid
Total 1254 100.0 100.0
Gujarat: Performance of the Narendra Modi
Opinion N Percent Valid Percent
Fully satisfied 225 33.7 33.7 Valid
Somewhat satisfied 194 29.1 29.1

29
Opinion N Percent Valid Percent
Somewhat dissatisfied 70 10.5 10.5
Fully dissatisfied 47 7.0 7.0
No opinion 131 19.6 19.6
Total 667 100.0 100.0
Haryana: Performance of the Bhupinder Singh Hooda
Opinion N Percent Valid Percent
Fully satisfied 63 26.9 26.9
Somewhat satisfied 82 35.0 35.0
Somewhat dissatisfied 21 9.0 9.0
Fully dissatisfied 32 13.7 13.7
No opinion 36 15.4 15.4
Valid
Total 234 100.0 100.0
Jammu & Kashmir: Performance of the Ghulam Nabi Azad
Opinion N Percent Valid Percent
Fully satisfied 34 11.7 11.7
Somewhat satisfied 85 29.2 29.2
Somewhat dissatisfied 63 21.6 21.6
Fully dissatisfied 46 15.8 15.8
No opinion 63 21.6 21.6
Valid
Total 291 100.0 100.0
Karnataka: Performance of the H. D. Kumaraswamy
Opinion N Percent Valid Percent
Fully satisfied 156 14.3 14.3
Somewhat satisfied 451 41.5 41.5
Somewhat dissatisfied 134 12.3 12.3
Fully dissatisfied 191 17.6 17.6
No opinion 156 14.3 14.3
Valid
Total 1088 100.0 100.0

30
Kerala: Performance of the V.S. Achutanandan
Opinion N Percent Valid Percent
Fully satisfied 139 23.5 23.5
Somewhat satisfied 259 43.8 43.8
Somewhat dissatisfied 50 8.5 8.5
Fully dissatisfied 64 10.8 10.8
No opinion 79 13.4 13.4
Valid
Total 591 100.0 100.0
Madhya Pradesh: Performance of the Shivraj Singh Chouhan
Opinion N Percent Valid Percent
Fully satisfied 194 25.8 25.8
Somewhat satisfied 314 41.7 41.7
Somewhat dissatisfied 56 7.4 7.4
Fully dissatisfied 98 13.0 13.0
No opinion 91 12.1 12.1
Valid
Total 753 100.0 100.0
Maharashtra: Performance of the Vilasrao Deshmukh
Opinion N Percent Valid Percent
Fully satisfied 304 26.0 26.0
Somewhat satisfied 477 40.8 40.8
Somewhat dissatisfied 76 6.5 6.5
Fully dissatisfied 114 9.8 9.8
No opinion 198 16.9 16.9
Valid
Total 1169 100.0 100.0
Orissa: Performance of the Navin Patnaik
Opinion N Percent Valid Percent
Fully satisfied 139 23.2 23.2
Somewhat satisfied 279 46.6 46.6
Valid
Somewhat dissatisfied 70 11.7 11.7
31
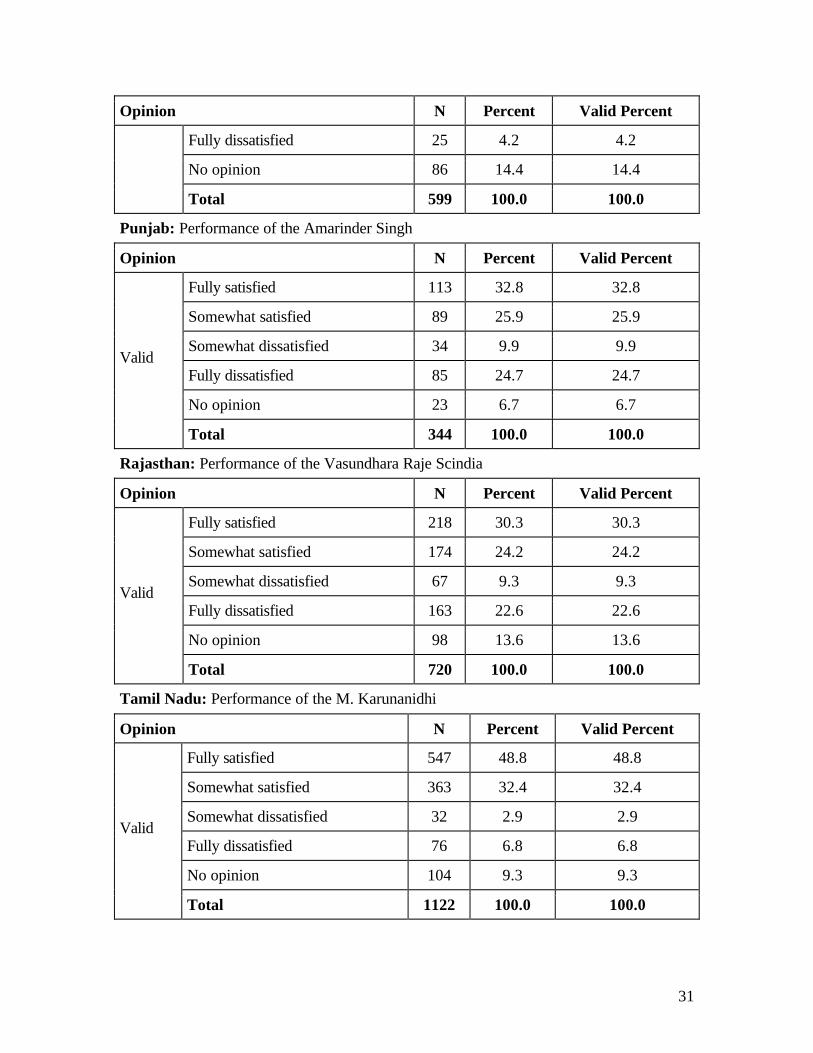
Opinion N Percent Valid Percent
Fully dissatisfied 25 4.2 4.2
No opinion 86 14.4 14.4
Total 599 100.0 100.0
Punjab: Performance of the Amarinder Singh
Opinion N Percent Valid Percent
Fully satisfied 113 32.8 32.8
Somewhat satisfied 89 25.9 25.9
Somewhat dissatisfied 34 9.9 9.9
Fully dissatisfied 85 24.7 24.7
No opinion 23 6.7 6.7
Valid
Total 344 100.0 100.0
Rajasthan: Performance of the Vasundhara Raje Scindia
Opinion N Percent Valid Percent
Fully satisfied 218 30.3 30.3
Somewhat satisfied 174 24.2 24.2
Somewhat dissatisfied 67 9.3 9.3
Fully dissatisfied 163 22.6 22.6
No opinion 98 13.6 13.6
Valid
Total 720 100.0 100.0
Tamil Nadu: Performance of the M. Karunanidhi
Opinion N Percent Valid Percent
Fully satisfied 547 48.8 48.8
Somewhat satisfied 363 32.4 32.4
Somewhat dissatisfied 32 2.9 2.9
Fully dissatisfied 76 6.8 6.8
No opinion 104 9.3 9.3
Valid
Total 1122 100.0 100.0
32
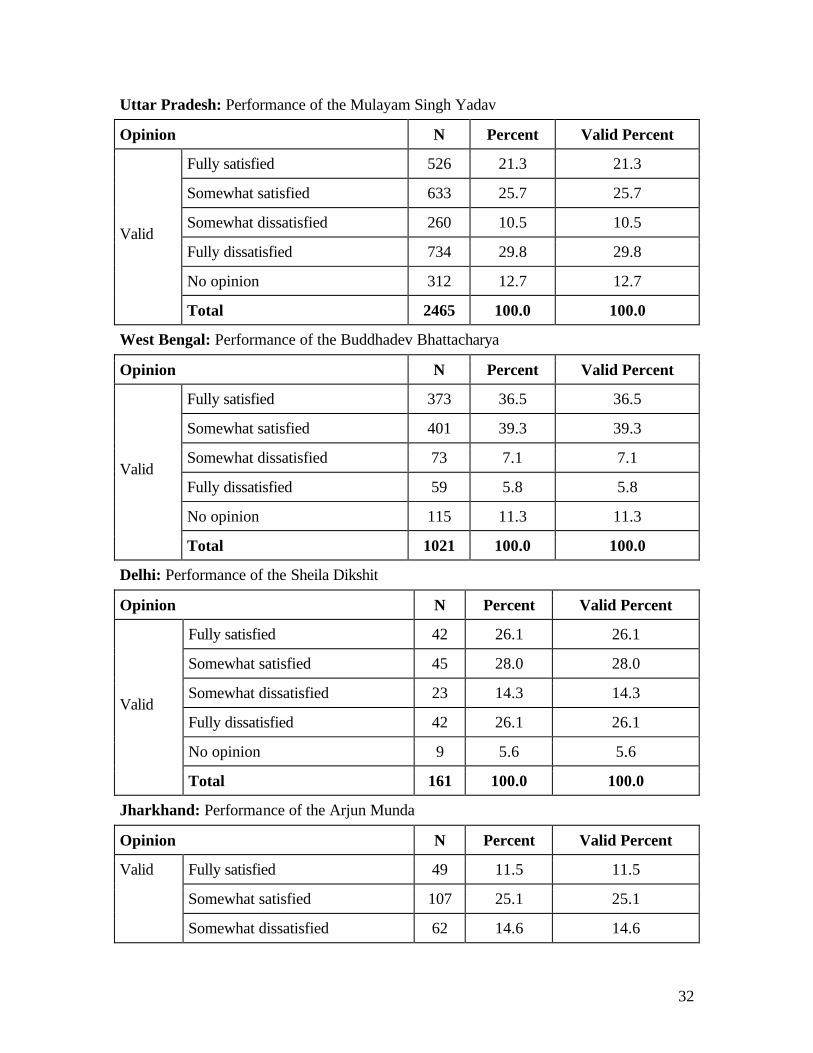
Uttar Pradesh: Performance of the Mulayam Singh Yadav
Opinion N Percent Valid Percent
Fully satisfied 526 21.3 21.3
Somewhat satisfied 633 25.7 25.7
Somewhat dissatisfied 260 10.5 10.5
Fully dissatisfied 734 29.8 29.8
No opinion 312 12.7 12.7
Valid
Total 2465 100.0 100.0
West Bengal: Performance of the Buddhadev Bhattacharya
Opinion N Percent Valid Percent
Fully satisfied 373 36.5 36.5
Somewhat satisfied 401 39.3 39.3
Somewhat dissatisfied 73 7.1 7.1
Fully dissatisfied 59 5.8 5.8
No opinion 115 11.3 11.3
Valid
Total 1021 100.0 100.0
Delhi: Performance of the Sheila Dikshit
Opinion N Percent Valid Percent
Fully satisfied 42 26.1 26.1
Somewhat satisfied 45 28.0 28.0
Somewhat dissatisfied 23 14.3 14.3
Fully dissatisfied 42 26.1 26.1
No opinion 9 5.6 5.6
Valid
Total 161 100.0 100.0
Jharkhand: Performance of the Arjun Munda
Opinion N Percent Valid Percent
Fully satisfied 49 11.5 11.5
Somewhat satisfied 107 25.1 25.1
Valid
Somewhat dissatisfied 62 14.6 14.6

33
Opinion N Percent Valid Percent
Fully dissatisfied 104 24.4 24.4
No opinion 104 24.4 24.4
Total 426 100.0 100.0
Chattishgarh: Performance of the Raman Singh
Opinion N Percent Valid Percent
Fully satisfied 139 41.6 41.6
Somewhat satisfied 90 26.9 26.9
Somewhat dissatisfied 22 6.6 6.6
Fully dissatisfied 53 15.9 15.9
No opinion 30 9.0 9.0
Valid
Total 334 100.0 100.0 Q23: Would you like that the present ruling party government in the state should get
another chance to rule? Andhra Pradesh: Should get another chance to Congress party?
Opinion N Percent Valid Percent
No 401 39.1 39.1
Yes 487 47.5 47.5
No opinion 137 13.4 13.4 Valid
Total 1025 100.0 100.0
Assam: Should get another chance to Congress party?
Opinion N Percent Valid Percent
No 190 36.4 36.4
Yes 315 60.3 60.3
No opinion 17 3.3 3.3 Valid
Total 522 100.0 100.0

34
Bihar: Should get another chance to JD(U) Allies?
Opinion N Percent Valid Percent
No 296 23.6 23.6
Yes 920 73.4 73.4
No opinion 38 3.0 3.0 Valid
Total 1254 100.0 100.0
Gujarat: Should get another chance to BJP?
Opinion N Percent Valid Percent
No 168 25.2 25.2
Yes 327 49.0 49.0
No opinion 172 25.8 25.8 Valid
Total 667 100.0 100.0
Haryana: Should get another chance to Congress party?
Opinion N Percent Valid Percent
No 78 33.3 33.3
Yes 87 37.2 37.2
No opinion 69 29.5 29.5 Valid
Total 234 100.0 100.0
Jammu & Kashmir: Should get another chance to Congress party?
Opinion N Percent Valid Percent
No 62 21.3 21.3
Yes 128 44.0 44.0
No opinion 101 34.7 34.7 Valid
Total 291 100.0 100.0
Karnataka: Should get another chance to JD(S)?
Opinion N Percent Valid Percent
No 612 56.3 56.3 Valid
Yes 268 24.6 24.6
35
Opinion N Percent Valid Percent
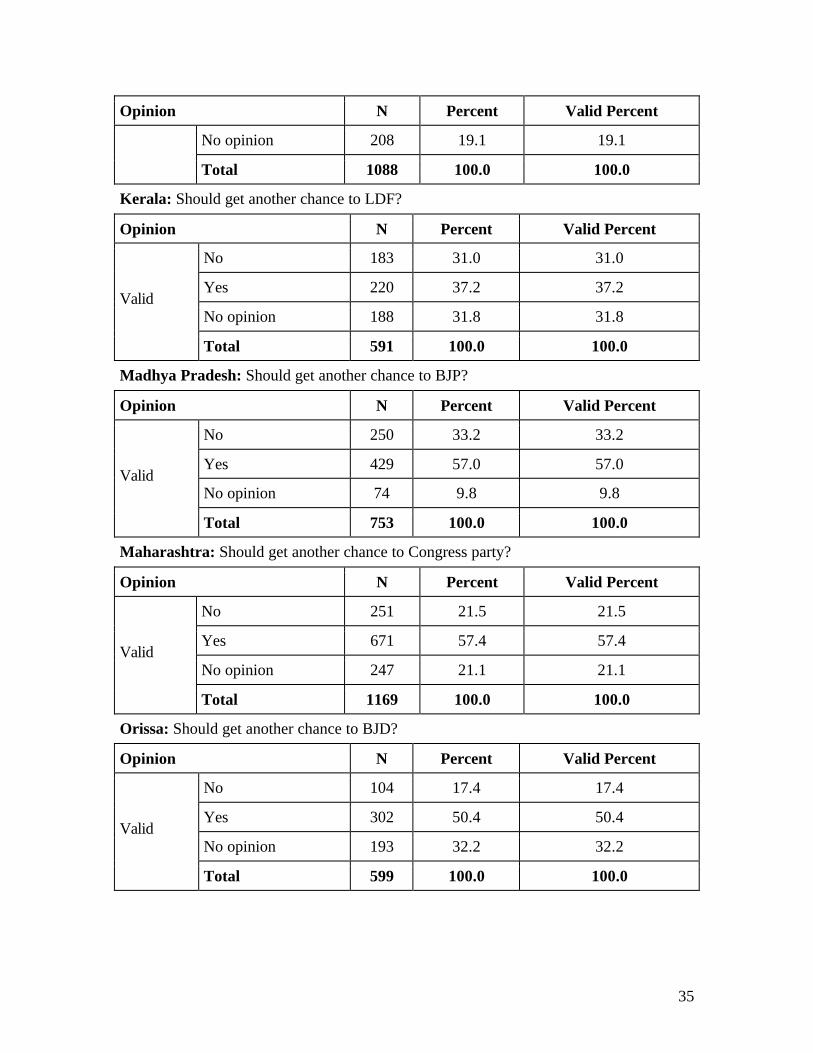
No opinion 208 19.1 19.1
Total 1088 100.0 100.0
Kerala: Should get another chance to LDF?
Opinion N Percent Valid Percent
No 183 31.0 31.0
Yes 220 37.2 37.2
No opinion 188 31.8 31.8 Valid
Total 591 100.0 100.0
Madhya Pradesh: Should get another chance to BJP?
Opinion N Percent Valid Percent
No 250 33.2 33.2
Yes 429 57.0 57.0
No opinion 74 9.8 9.8 Valid
Total 753 100.0 100.0
Maharashtra: Should get another chance to Congress party?
Opinion N Percent Valid Percent
No 251 21.5 21.5
Yes 671 57.4 57.4
No opinion 247 21.1 21.1 Valid
Total 1169 100.0 100.0
Orissa: Should get another chance to BJD?
Opinion N Percent Valid Percent
No 104 17.4 17.4
Yes 302 50.4 50.4
No opinion 193 32.2 32.2 Valid
Total 599 100.0 100.0

36
Punjab: Should get another chance to Congress party?
Opinion N Percent Valid Percent
No 124 36.0 36.0
Yes 180 52.3 52.3
No opinion 40 11.6 11.6 Valid
Total 344 100.0 100.0
Rajasthan: Should get another chance to BJP?
Opinion N Percent Valid Percent
No 309 42.9 42.9
Yes 284 39.4 39.4
No opinion 127 17.6 17.6 Valid
Total 720 100.0 100.0
Tamil Nadu: Should get another chance to DMK Allies?
Opinion N Percent Valid Percent
No 270 24.1 24.1
Yes 635 56.6 56.6
No opinion 217 19.3 19.3 Valid
Total 1122 100.0 100.0
Uttar Pradesh: Should get another chance to Samajwadi party?
Opinion N Percent Valid Percent
No 1189 48.2 48.2
Yes 820 33.3 33.3
No opinion 456 18.5 18.5 Valid
Total 2465 100.0 100.0
West Bengal: Should get another chance to Left Front?
Opinion N Percent Valid Percent
No 193 18.9 18.9
Yes 632 61.9 61.9
Valid
No opinion 196 19.2 19.2

37
Opinion N Percent Valid Percent
Total 1021 100.0 100.0
Delhi: Should get another chance to Congress party?
Opinion N Percent Valid Percent
No 52 32.3 32.3
Yes 80 49.7 49.7
No opinion 29 18.0 18.0 Valid
Total 161 100.0 100.0
Jharkhand: Should get another chance to BJP?
Opinion N Percent Valid Percent
No 148 34.7 34.7
Yes 147 34.5 34.5
No opinion 131 30.8 30.8 Valid
Total 426 100.0 100.0
Chattishgarh: Should get another chance to BJP?
Opinion N Percent Valid Percent
No 123 36.8 36.8
Yes 163 48.8 48.8
No opinion 48 14.4 14.4 Valid
Total 334 100.0 100.0 Q24: Now I will ask about the changes that have taken place in the country since the
UPA government at the Centre. You tell me, in the last two and a half years have the conditions regarding these matters improved, same as before or deteriorated?
a: Curbing corruption
Opinion N Percent Valid Percent
Improved 2902 19.6 19.6
Same as before 4686 31.7 31.7
Valid
Deteriorated 4349 29.4 29.4

38
Opinion N Percent Valid Percent
No opinion 2849 19.3 19.3
Total 14786 100.0 100.0
b: Controlling prices
Opinion N Percent Valid Percent
Improved 2206 14.9 14.9
Same as before 3341 22.6 22.6
Deteriorated 7250 49.0 49.0
No opinion 1989 13.5 13.5
Valid
Total 14786 100.0 100.0
c: National security
Opinion N Percent Valid Percent
Improved 2587 17.5 17.5
Same as before 4797 32.4 32.4
Deteriorated 3380 22.9 22.9
No opinion 4022 27.2 27.2
Valid
Total 14786 100.0 100.0
d: Employment opportunities
Opinion N Percent Valid Percent
Improved 2342 15.8 15.8
Same as before 4138 28.0 28.0
Deteriorated 5309 35.9 35.9
No opinion 2997 20.3 20.3
Valid
Total 14786 100.0 100.0
39
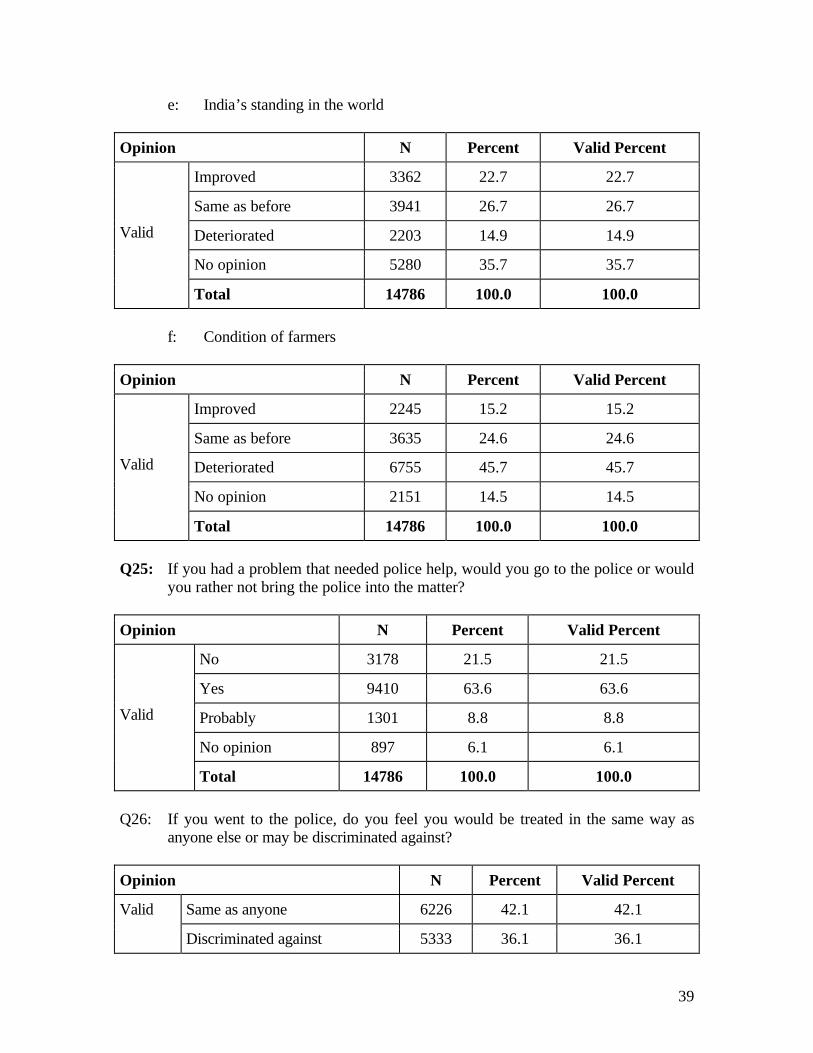
e: India’s standing in the world
Opinion N Percent Valid Percent
Improved 3362 22.7 22.7
Same as before 3941 26.7 26.7
Deteriorated 2203 14.9 14.9
No opinion 5280 35.7 35.7
Valid
Total 14786 100.0 100.0
f: Condition of farmers
Opinion N Percent Valid Percent
Improved 2245 15.2 15.2
Same as before 3635 24.6 24.6
Deteriorated 6755 45.7 45.7
No opinion 2151 14.5 14.5
Valid
Total 14786 100.0 100.0 Q25: If you had a problem that needed police help, would you go to the police or would
you rather not bring the police into the matter?
Opinion N Percent Valid Percent
No 3178 21.5 21.5
Yes 9410 63.6 63.6
Probably 1301 8.8 8.8
No opinion 897 6.1 6.1
Valid
Total 14786 100.0 100.0 Q26: If you went to the police, do you feel you would be treated in the same way as
anyone else or may be discriminated against?
Opinion N Percent Valid Percent
Same as anyone 6226 42.1 42.1 Valid
Discriminated against 5333 36.1 36.1

40
Opinion N Percent Valid Percent
No opinion 3227 21.8 21.8
Total 14786 100.0 100.0 Q27: Now I will read out two statements on various issues. Tell me whether you agree
with statement first(1) or statement second (2)? a: 1: Terrorist activities in India are a result of failure of the government; 2:
Government is doing its best to control over terrorist activities.
Opinion N Percent Valid Percent
Agree with first 5656 38.3 38.3
Agree with second 4723 31.9 31.9
No opinion 4407 29.8 29.8 Valid
Total 14786 100.0 100.0 b: 1: The Government should ban the consumption of alcohol; 2: Those who like to
drink should not be prevented
Opinion N Percent Valid Percent
Agree with first 10789 73.0 73.0
Agree with second 2634 17.8 17.8
No opinion 1363 9.2 9.2 Valid
Total 14786 100.0 100.0 c: 1: The government should suppressed the Naxallites because they use violence; 2:
The government should negotiate with the Naxallites because they raise demands for the poor.
Opinion N Percent Valid Percent
Agree with first 5359 36.2 36.2
Agree with second 3984 26.9 26.9
No opinion 5443 36.8 36.8 Valid
Total 14786 100.0 100.0

41
d: 1: Some seats should be reserved for students belonging to backward castes in higher education institutes; 2: Such a reservation should not take place because reserving seats for students of backward caste will lead to loss of merit and quality.
Opinion N Percent Valid Percent
Agree with first 6849 46.3 46.3
Agree with second 3478 23.5 23.5
No opinion 4459 30.2 30.2 Valid
Total 14786 100.0 100.0
e: 1: The government’s new treaty with the US is a wise step because it will help India to have powerfull ally like the USA; 2: The government has surrendered national interest to the USA.
Opinion N Percent Valid Percent
Agree with first 4358 29.5 29.5
Agree with second 2748 18.6 18.6
No opinion 7680 51.9 51.9 Valid
Total 14786 100.0 100.0
f: 1: Terrorism get support from Muslim community within the country; 2: Terrorists have no religion and it is unfair to blame any community for what they do.
Opinion N Percent Valid Percent
Agree with first 5100 34.5 34.5
Agree with second 4648 31.4 31.4
No opinion 5038 34.1 34.1 Valid
Total 14786 100.0 100.0

42
Q28: There are different opinions among people regarding Manmohan Singh as a Prime Minister. Some people say that the Sonia Gandhi should replace Manmohan Singh as Prime Minister others say that Manmohan Singh should continue as Prime Minister, still there are some people who say that Sonia Gandhi should nominate someone else from the Congress Party to replace Manmohan Singh as Prime Minister. What is your opinion?
Opinion N Percent Valid Percent
Sonia Gandhi herself becomes Prime Minister 5264 35.6 35.6
Manmohan Singh should continue as Prime Minister 3598 24.3 24.3
Someone else from Congress should replace Manmohan Singh 1433 9.7 9.7
No opinion 4491 30.4 30.4
Valid
Total 14786 100.0 100.0 Q29: Now I will read out names of few Indian leaders. You tell me, how much do you
have in them? I will show you a ladder with 10 steps. If you place at step 1 those leaders on whom you have a great deal of trust and step 10 those leaders on whom you have no trust then where would you place ……..
a: Chief Minister b: State Leader 1 c: State Leader 2 States
Name Trust Name Trust Name Trust
Andhra Pradesh Y.S.Rajasekhara Reddy
77.03 Y S Rajasekhara Reddy 78.38 Chandrababu Naidu 43.09
Assam Tarun Kumar Gogoi 79.87 Brindaban Goswami 59.48 Prafulla Kumar Mahanta 37.86
Bihar Nitish Kumar 89.25 Laloo Prasad Yadav 60.07 Ram Vilas Paswan 63.53
Gujarat Narendra Modi 78.59 Shankar Singh Vaghela 62.92 Keshubhai Patel 61.09
Haryana Bhupinder Singh Hooda
71.06 Om Prakash Chauthala 70.51 Bhajan Lal 44.89
Jammu & Kashmir Ghulam Nabi Azad 74.68 Mufti Mohammed Sayeed
45.68 Omar Abdullah 47.43
Karnataka H D Kumaraswamy 60.68 Deve Gowda 57.00 Siddaramaiah 68.68
Kerala V S Achutanandan 81.27 Oommen chandy 75.18 A.K.Antony 71.41
Madhya Pradesh Shivraj Singh Chouhan
68.36 Digvijay Singh 60.90 Uma Bharti 74.59
Maharashtra Vilasrao Deshmukh 72.29 Gopinath Munde 62.17 Narayan Rane 57.14
Orissa Navin Patnaik 82.09 Janaki Ballabh Patnaik 55.47 Biswabhusan Harichandan
61.89
Punjab Amarinder Singh 73.38 Prakash Singh Badal 65.99 Simranjit Singh Mann 53.82

43
a: Chief Minister b: State Leader 1 c: State Leader 2 States
Name Trust Name Trust Name Trust
Rajasthan Vasundhara Raje Scindia
65.74 Ashok Gehlot 70.50 Lalit Kishore Chaturvedi 58.19
Tamil Nadu M. Karunanidhi 80.84 Jayalalithaa 70.18 Ramadoss 56.56
Uttar Pradesh Mulayam Singh Yadav
64.32 Mayawati 73.41 Rajnath Singh 63.51
West Bengal Buddhadev Bhattacharya
80.61 Mamata Banerjee 44.48 Jyoti Basu 72.09
Delhi Sheila Dikshit 68.63 Madan Lal Khurana 63.60 Sahib Singh Verma 51.52
Jharkhand Arjun Munda 60.57 Babu Lal Marandi 72.25 Shibhu Soren 62.69
Chattishgarh Raman Singh 69.75 Ajit Jogi 69.34 Dilip Singh Judeo 65.51
* The trust figure is the mean score of over all trust scale by 10 to 100. Step 1 stands for 100 scale where as step 10 stands 10 scale.
Overall Trust State
d: Manmohan Singh e: Atal Bihari Vajpayee f: Sonia Gandhi g: L.K. Advani
Andhra Pradesh 71.74 62.68 72.58 46.22
Assam 78.96 73.98 75.33 53.32
Bihar 78.38 82.43 81.08 60.96
Gujarat 66.07 68.57 72.30 61.29
Haryana 76.43 83.85 68.82 36.36
Jammu & Kashmir 74.26 83.36 76.41 45.84
Karnataka 74.75 72.66 79.25 55.41
Kerala 76.60 63.10 73.59 46.31
Madhya Pradesh 68.27 76.80 73.26 47.80
Maharashtra 76.04 73.08 82.19 54.32
Orissa 73.48 81.58 72.78 61.71
Punjab 85.41 68.79 73.83 42.55
Rajasthan 70.80 72.91 73.00 53.81
Tamil Nadu 69.96 61.12 75.80 51.48
Uttar Pradesh 68.21 72.54 74.53 52.89
West Bengal 71.41 59.11 69.27 37.98
Delhi 79.11 81.49 81.02 62.69
Jharkhand 67.70 82.69 74.88 61.81
Chattishgarh 68.32 77.30 74.79 49.46
Total 72.96 72.25 75.60 52.70 * The trust figure is the mean score of over all trust scale by 10 to 100. Step 1 stands for 100 scale where as step 10 stands 10 scale.

44
Q30: (If rural) The Govt. has started distributing job cards to people who are willing to do casual labour under NREG Act. Have you heard about it?
Opinion N Percent Valid Percent
No 6937 46.9 46.9
Yes 4382 29.6 29.6
NA 3467 23.4 23.4 Valid
Total 14786 100.0 100.0
a: (If yes) Do you have such a job card?
Opinion N Percent Valid Percent
No 3478 23.5 79.4
Yes 904 6.1 20.6 Valid
Total 4382 29.6 100.0
Missing NA 10404 70.4
Total 14786 100.0 Q31: Have you heard about the Naxalites? (Use local name if any for Naxallites)
Opinion N Percent Valid Percent
No 6640 44.9 44.9
Yes 8146 55.1 55.1 Valid
Total 14786 100.0 100.0 Q32: Have you heard about Osama-bin-Laden?
Opinion N Percent Valid Percent
No 5882 39.8 39.8
Yes 8648 58.5 58.5
No opinion 256 1.7 1.7 Valid
Total 14786 100.0 100.0

45
Q33: Have you heard about LTTE?
Opinion N Percent Valid Percent
No 9677 65.4 65.4
Yes 4691 31.7 31.7
No opinion 418 2.8 2.8 Valid
Total 14786 100.0 100.0 Q34: Have you heard about controversy on Office of profit?
Opinion N Percent Valid Percent
No 11099 75.1 75.1
Yes 3568 24.1 24.1
No opinion 119 .8 .8 Valid
Total 14786 100.0 100.0 Q35: Looking to your needs and the needs of your household, how much income per
month do you think you must have to meet your needs?
Desired Income N Percent Valid Percent
0-2500 2965 20.1 20.2
2501-5000 6132 41.5 41.7
5001-10000 3898 26.4 26.5
10001-20000 1372 9.3 9.3
Above 20000 346 2.3 2.4
Valid
Total 14713 99.5 100.0
Missing NA 73 .5
Total 14786 100.0
Q36: Over the past one year, how often did you or any member of your family had to
go without two proper meals a day – often, sometimes or never??
Opinion N Percent Valid Percent
Valid Often 1071 7.2 7.2

46
Opinion N Percent Valid Percent
Sometimes 3799 25.7 25.7
Never 9394 63.5 63.5
No opinion 522 3.5 3.5
Total 14786 100.0 100.0 Q37: (If urban) How often do you or your family go for eating out in restaurant/hotel-
daily, once or twice a week, once or twice a months rarely or never?
Opinion N Percent Valid Percent
Daily 62 .4 1.8
Once or twice a week 287 1.9 8.3
Once or twice a months 445 3.0 12.8
Rarely 966 6.5 27.9
Never 1325 9.0 38.2
No opinion 382 2.6 11.0
Valid
Total 3467 23.4 100.0
Missing NA 11319 76.6
Total 14786 100.0 Q38: If Lok Sabha Elections held tomorrow, which party would you vote for?
Parties N Percent Valid Percent
Congress 5589 37.8 41.0
BJP 3220 21.8 23.6
JD(U) 287 1.9 2.1
CPI 141 1.0 1.0
CPI(M) 794 5.4 5.8
BSP 671 4.5 4.9
NCP 189 1.3 1.4
Valid
Samajwadi Party 476 3.2 3.5

47
Parties N Percent Valid Percent
RJD(Laloo) 198 1.3 1.5
LNJP(Paswan) 93 .6 .7
KEC(M) 4 .0 .0
IUML 23 .2 .2
TRS 24 .2 .2
DMK 296 2.0 2.2
PMK 17 .1 .1
JMM 63 .4 .5
RPI 1 .0 .0
AUDF 17 .1 .1
Samata 2 .0 .0
Shiv Sena 63 .4 .5
BJD 137 .9 1.0
Akali Dal 75 .5 .5
AIADMK 182 1.2 1.3
Trinamool Congress 87 .6 .6
TDP 314 2.1 2.3
DMDK 57 .4 .4
DPI 8 .1 .1
AGP(P) 5 .0 .0
JD(S) 105 .7 .8
RLD(Ajit Singh) 5 .0 .0
INLD(Chautala) 38 .3 .3
ARC 1 .0 .0
AJSU 3 .0 .0
CPI(ML) 47 .3 .3
FBL 17 .1 .1
RSP 14 .1 .1
48
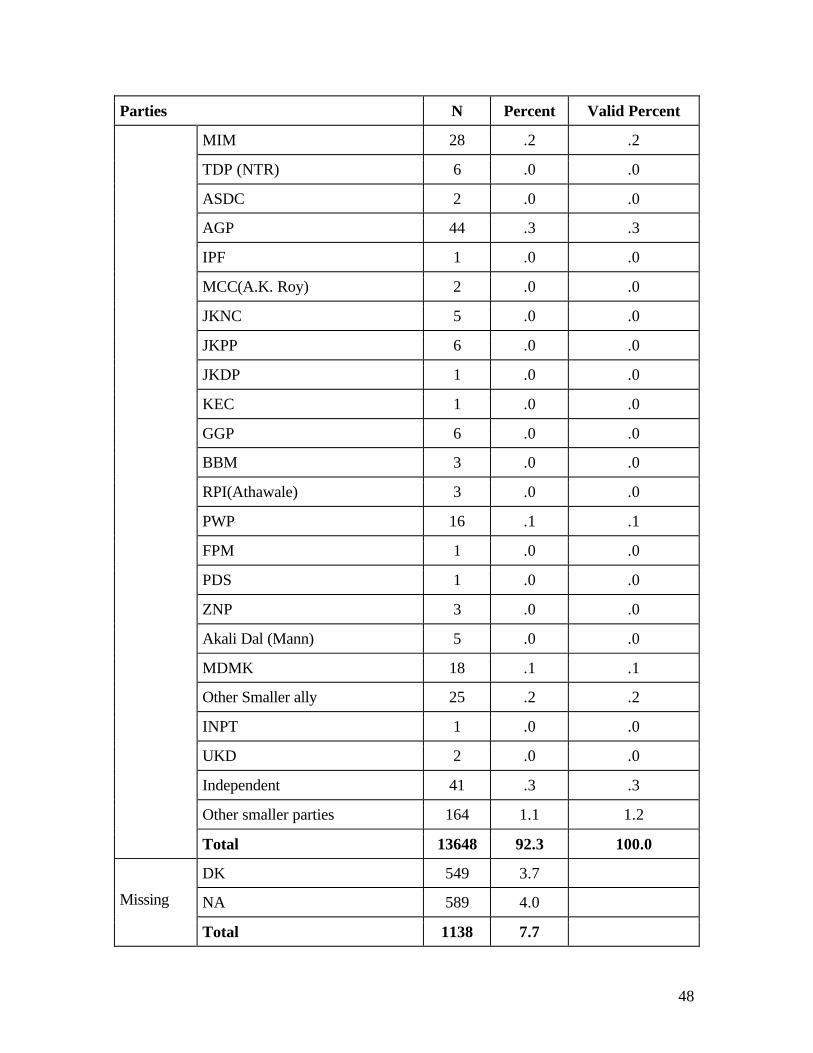
Parties N Percent Valid Percent
MIM 28 .2 .2
TDP (NTR) 6 .0 .0
ASDC 2 .0 .0
AGP 44 .3 .3
IPF 1 .0 .0
MCC(A.K. Roy) 2 .0 .0
JKNC 5 .0 .0
JKPP 6 .0 .0
JKDP 1 .0 .0
KEC 1 .0 .0
GGP 6 .0 .0
BBM 3 .0 .0
RPI(Athawale) 3 .0 .0
PWP 16 .1 .1
FPM 1 .0 .0
PDS 1 .0 .0
ZNP 3 .0 .0
Akali Dal (Mann) 5 .0 .0
MDMK 18 .1 .1
Other Smaller ally 25 .2 .2
INPT 1 .0 .0
UKD 2 .0 .0
Independent 41 .3 .3
Other smaller parties 164 1.1 1.2
Total 13648 92.3 100.0
DK 549 3.7
NA 589 4.0 Missing
Total 1138 7.7
49
Parties N Percent Valid Percent
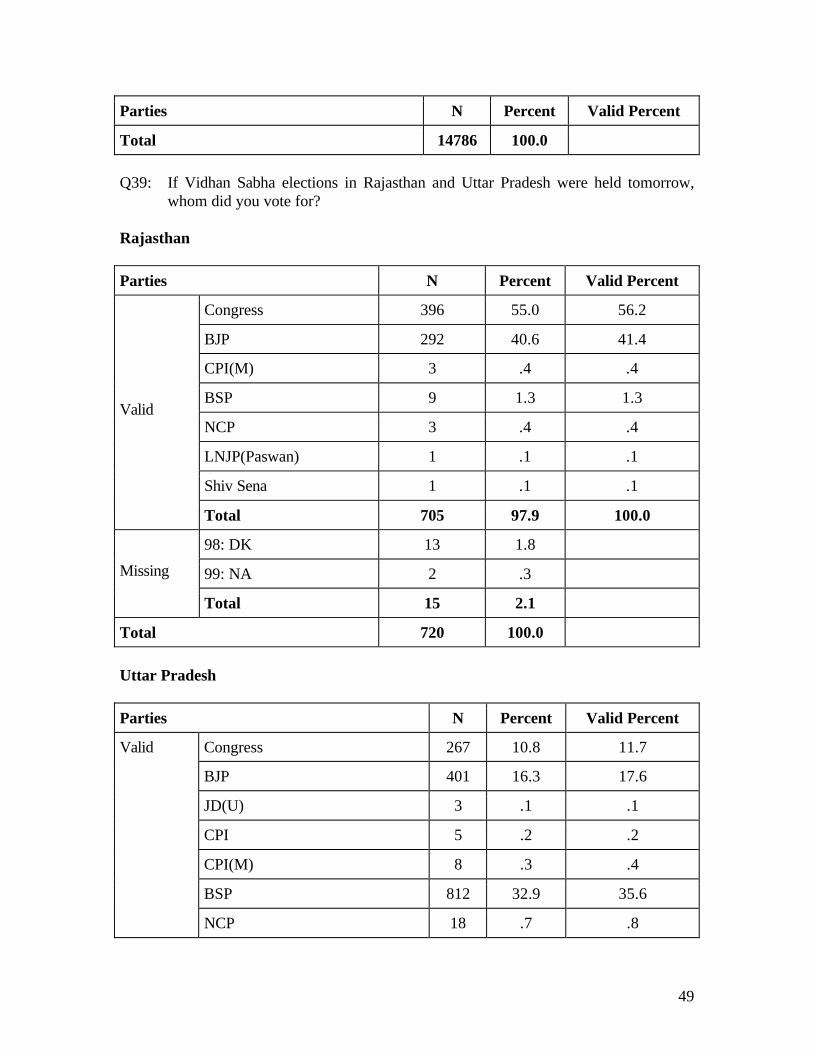
Total 14786 100.0 Q39: If Vidhan Sabha elections in Rajasthan and Uttar Pradesh were held tomorrow,
whom did you vote for? Rajasthan
Parties N Percent Valid Percent
Congress 396 55.0 56.2
BJP 292 40.6 41.4
CPI(M) 3 .4 .4
BSP 9 1.3 1.3
NCP 3 .4 .4
LNJP(Paswan) 1 .1 .1
Shiv Sena 1 .1 .1
Valid
Total 705 97.9 100.0
98: DK 13 1.8
99: NA 2 .3 Missing
Total 15 2.1
Total 720 100.0 Uttar Pradesh
Parties N Percent Valid Percent
Congress 267 10.8 11.7
BJP 401 16.3 17.6
JD(U) 3 .1 .1
CPI 5 .2 .2
CPI(M) 8 .3 .4
BSP 812 32.9 35.6
Valid
NCP 18 .7 .8

50
Parties N Percent Valid Percent
Samajwadi Party 682 27.7 29.9
LNJP(Paswan) 1 .0 .0
IUML 1 .0 .0
TRS 1 .0 .0
AIADMK 1 .0 .0
JD(S) 1 .0 .0
RLD(Ajit Singh) 17 .7 .7
FBL 1 .0 .0
MIM 1 .0 .0
TDP (NTR) 1 .0 .0
JKNC 2 .1 .1
RSMD 1 .0 .0
ZNP 3 .1 .1
OGP 1 .0 .0
SDF 1 .0 .0
Other Smaller ally 6 .2 .3
UKD 1 .0 .0
Independent 3 .1 .1
Other smaller parties 44 1.8 1.9
Total 2283 92.6 100.0
98: DK 76 3.1
99: NA 106 4.3 Missing
Total 182 7.4
Total 2465 100.0

51
BACKGROUND INFORMATION B1: How regularly do you read newspaper- daily, frequently, occasionally, rarely or
never?
Opinion N Percent Valid Percent
Daily 3495 23.6 23.6
Frequently 1547 10.5 10.5
Occasionally 1037 7.0 7.0
Rarely 1660 11.2 11.2
Never 6667 45.1 45.1
No opinion 380 2.6 2.6
Valid
Total 14786 100.0 100.0 B1: How regularly do you listen to news on radio- daily, frequently, occasionally,
rarely or never?
Opinion N Percent Valid Percent
Daily 2744 18.6 18.6
Frequently 1786 12.1 12.1
Occassionally 1171 7.9 7.9
Rarely 2234 15.1 15.1
Never 6553 44.3 44.3
No opinion 298 2.0 2.0
Valid
Total 14786 100.0 100.0 B1: How regularly do you watch news on T.V.- daily, frequently, occasionally, rarely
or never?
Opinion N Percent Valid Percent
Daily 4458 30.2 30.2
Frequently 1849 12.5 12.5
Occasionally 1204 8.1 8.1
Valid
Rarely 1949 13.2 13.2

52
Opinion N Percent Valid Percent
Never 5078 34.3 34.3
No opinion 248 1.7 1.7
Total 14786 100.0 100.0 B4: How often do you practice-prayer/puja/namaj- daily, weekly, on festivals or
never?
Opinion N Percent Valid Percent
Daily 8140 55.1 55.1
Weekly 2709 18.3 18.3
Only on festivals 2970 20.1 20.1
Never 669 4.5 4.5
No opinion 298 2.0 2.0
Valid
Total 14786 100.0 100.0 B5: What is your age?
Age group N Percent Valid Percent
Up to 25 years 2118 14.3 14.3
26-35 years 4470 30.2 30.2
36-45 years 3490 23.6 23.6
46-55 years 2266 15.3 15.3
Above 55 years. 2442 16.5 16.5
Valid
Total 14786 100.0 100.0
B6: Gender
Gender N Percent Valid Percent
Male 8193 55.4 55.4
Female 6593 44.6 44.6 Valid
Total 14786 100.0 100.0

53
B7: What is your marital status?
Marital Status N Percent Valid Percent
Married 12856 86.9 86.9
Unmarried 1443 9.8 9.8
Living with someone, but unmarried 17 .1 .1
Divorced/Separated 46 .3 .3
Widowed 345 2.3 2.3
NA 79 .5 .5
Valid
Total 14786 100.0 100.0 B8: Till what level have you studied?
Education (Respondent) N Percent Valid Percent
Non literate 4821 32.6 32.6
Below primary 1450 9.8 9.8
Primary pass/Middle fail 2043 13.8 13.8
Middle pass/Matric fail 1783 12.1 12.1
Matric 1873 12.7 12.7
College no-degree 1231 8.3 8.3
Graduate 1066 7.2 7.2
Post Graduate 348 2.4 2.4
Professional degrees 121 .8 .8
NA 50 .3 .3
Valid
Total 14786 100.0 100.0
a: Till what level have your father studied?
Education (Father) N Percent Valid Percent
Non literate 9259 62.6 62.6 Valid
Below primary 1204 8.1 8.1

54
Education (Father) N Percent Valid Percent
Primary pass/Middle fail 1291 8.7 8.7
Middle pass/Matric fail 874 5.9 5.9
Matric 1006 6.8 6.8
College no-degree 427 2.9 2.9
Graduate 439 3.0 3.0
Post Graduate 138 .9 .9
Professional degrees 53 .4 .4
NA 95 .6 .6
Total 14786 100.0 100.0
b: Till what level your mother studied?
Education (Mother) N Percent Valid Percent
Non literate 11315 76.5 76.5
Below Primary 1003 6.8 6.8
Primary pass/Middle fail 889 6.0 6.0
Middle pass/Matric fail 498 3.4 3.4
Matric 521 3.5 3.5
College no-degree 232 1.6 1.6
Graduate 133 .9 .9
Post Graduate 45 .3 .3
Professional degrees 25 .2 .2
NA 125 .8 .8
Valid
Total 14786 100.0 100.0 B9: What is your main occupation?
Occupation (Respondent) N Percent Valid Percent
Scientist 12 .1 .1 Valid
Engineers 30 .2 .2

55
Occupation (Respondent) N Percent Valid Percent
Doctors 28 .2 .2
Lawyers 40 .3 .3
Accountants 27 .2 .2
College/University teachers 72 .5 .5
Writers 17 .1 .1
Modern Artist 14 .1 .1
Other higher professional 28 .2 .2
Science and engineering technician 13 .1 .1
Computer operator 21 .1 .1
Alternative doctors 8 .1 .1
Medical Technician 21 .1 .1
School teachers 212 1.4 1.4
Nursery teachers 63 .4 .4
Folk and commercial artist 1 .0 .0
Priests 24 .2 .2
Other lower professionals 36 .2 .2
Elected officials (Central/State) 10 .1 .1
Elected officials (District) 14 .1 .1
Managers 28 .2 .2
Officials Class-I 18 .1 .1
Officials Class-II 27 .2 .2
Class-III Employee (Clerical) 127 .9 .9
Superintendents 17 .1 .1
Traditional clerks 31 .2 .2
Class IV employee 128 .9 .9
Other administrative workers 52 .4 .4
Big businessmen 27 .2 .2
Medium businessmen 164 1.1 1.1

56
Occupation (Respondent) N Percent Valid Percent
Small businessmen 539 3.6 3.6
Petty business 185 1.3 1.3
Hawkers 67 .5 .5
Sales Executive 41 .3 .3
Salespersons 39 .3 .3
Shop Assistants 65 .4 .4
Rentire 11 .1 .1
Other businessmen 75 .5 .5
Waiters 26 .2 .2
Dhobi 27 .2 .2
Barbers 37 .3 .3
Ayahs, Maids, Domestic servants 37 .3 .3
Chowkidars 28 .2 .2
Sweepers 24 .2 .2
Other service workers 142 1.0 1.0
Mechanics 176 1.2 1.2
Electricians 62 .4 .4
Jewellers 18 .1 .1
Tailors 141 1.0 1.0
Weavers 69 .5 .5
Shoemakers 40 .3 .3
Blacksmiths 25 .2 .2
Carpainters 90 .6 .6
Other skilled workers 142 1.0 1.0
Miners 20 .1 .1
Measons 33 .2 .2
Potters 22 .1 .1
Stone-cutter and carvers 31 .2 .2

57
Occupation (Respondent) N Percent Valid Percent
Furniture, basket, mat makers 19 .1 .1
Rickshaw-pullars 60 .4 .4
Unskilled labourers 434 2.9 2.9
Other semi-skilled and unskilled workers 195 1.3 1.3
Owner-cultivators 20+ Acres 125 .8 .8
Owner-cultivators 10-20 Acres 204 1.4 1.4
Owner-cultivators 5-10 Acres 395 2.7 2.7
Owner-cultivators 1-5 Acres 1219 8.2 8.2
Owner-cultivators 0-1 Acre 410 2.8 2.8
Tenant Cultivators. 5+ acres 82 .6 .6
Tenant Cultivators 0-5 acres 435 2.9 2.9
Plantation workers 98 .7 .7
Agricultural labourers 2257 15.3 15.3
Other Agricultural Workers 384 2.6 2.6
House-wife/husband 3646 24.7 24.7
Students 358 2.4 2.4
Employee seekers 152 1.0 1.0
Unemployed workers 105 .7 .7
Other occupation 178 1.2 1.2
Political activists 22 .1 .1
Unidentifiable 54 .4 .4
N.A. 432 2.9 2.9
Total 14786 100.0 100.0
a: (If the respondent is not the main earner) What is/has been the main occupation of the respondent’s father?
Occupation (Father) N Percent Valid Percent
Valid Scientist 14 .1 .1

58
Occupation (Father) N Percent Valid Percent
Engineers 19 .1 .1
Doctors 31 .2 .2
Lawyers 30 .2 .2
Accountants 21 .1 .1
College/University teachers 43 .3 .3
Writers 5 .0 .0
Modern Artist 7 .0 .0
Other higher professional 101 .7 .7
Science and engineering technician 10 .1 .1
Computer operator 1 .0 .0
Alternative doctors 11 .1 .1
Medical Technician 15 .1 .1
School teachers 128 .9 .9
Nursery teachers 45 .3 .3
Folk and commercial artist 1 .0 .0
Priests 18 .1 .1
Other lower professionals 29 .2 .2
Elected officials (Central/State) 11 .1 .1
Elected officials (District) 10 .1 .1
Managers 17 .1 .1
Officials Class-I 18 .1 .1
Officials Class-II 47 .3 .3
Class-III Employee (Clerical) 125 .8 .8
Superintendents 15 .1 .1
Traditional clerks 38 .3 .3
Class IV employee 84 .6 .6
Other administrative workers 58 .4 .4
Big businessmen 30 .2 .2

59
Occupation (Father) N Percent Valid Percent
Medium businessmen 147 1.0 1.0
Small businessmen 389 2.6 2.6
Petty business 122 .8 .8
Hawkers 40 .3 .3
Sales Executive 13 .1 .1
Salespersons 17 .1 .1
Shop Assistants 28 .2 .2
Rentire 17 .1 .1
Other businessmen 67 .5 .5
Waiters 13 .1 .1
Dhobi 26 .2 .2
Barbers 41 .3 .3
Ayahs, Maids, Domestic servants 9 .1 .1
Chowkidars 18 .1 .1
Sweepers 15 .1 .1
Other service workers 101 .7 .7
Mechanics 118 .8 .8
Electricians 40 .3 .3
Jewellers 15 .1 .1
Tailors 109 .7 .7
Weavers 59 .4 .4
Shoemakers 33 .2 .2
Blacksmiths 19 .1 .1
Carpainters 74 .5 .5
Other skilled workers 112 .8 .8
Miners 12 .1 .1
Measons 28 .2 .2
Potters 17 .1 .1

60
Occupation (Father) N Percent Valid Percent
Stone-cutter and carvers 25 .2 .2
Furniture, basket, mat makers 19 .1 .1
Rickshaw-pullars 52 .4 .4
Unskilled labourers 343 2.3 2.3
Other semi-skilled and unskilled workers 188 1.3 1.3
Owner-cultivators 20+ Acres 127 .9 .9
Owner-cultivators 10-20 Acres 313 2.1 2.1
Owner-cultivators 5-10 Acres 550 3.7 3.7
Owner-cultivators 1-5 Acres 1529 10.3 10.3
Owner-cultivators 0-1 Acre 606 4.1 4.1
Tenant Cultivators. 5+ acres 105 .7 .7
Tenant Cultivators 0-5 acres 569 3.8 3.8
Plantation workers 63 .4 .4
Agricultural labourers 1942 13.1 13.1
Other Agricultural Workers 344 2.3 2.3
House-wife/husband 86 .6 .6
Students 9 .1 .1
Employee seekers 16 .1 .1
Unemployed workers 43 .3 .3
Other occupation 376 2.5 2.5
Political activists 13 .1 .1
Unidentifiable 107 .7 .7
N.A. 4680 31.7 31.7
Total 14786 100.0 100.0 B10: What is your Caste/Jati-biradari/Tribe name?
Caste/Jati-biradari/Tribe N Percent Valid Percent
Bhamin 801 5.4 5.4

61
Caste/Jati-biradari/Tribe N Percent Valid Percent
Bhumihar 153 1.0 1.0
Rajput 545 3.7 3.7
Kayasthas 239 1.6 1.6
Vaishya 281 1.9 1.9
Jain 69 .5 .5
Punjabi Khatri 40 .3 .3
Sindhi 19 .1 .1
Other Upper Caste 293 2.0 2.0
Jat 260 1.8 1.8
Reddy 79 .5 .5
Kamma 75 .5 .5
Nair 124 .8 .8
Marathas 250 1.7 1.7
Patel 137 .9 .9
Raju 16 .1 .1
Velama 29 .2 .2
Kapu 109 .7 .7
Other PP 104 .7 .7
Gujjar 125 .8 .8
Yadav 756 5.1 5.1
Kurmi/Gowda 397 2.7 2.7
Lodh/Munuru Kapu 170 1.1 1.1
Koeri/Mudiraj 178 1.2 1.2
Vokkaliga/Kalinga 236 1.6 1.6
Lingayat/Thorpu Kapu 210 1.4 1.4
Gaderia/Koopula Velama 138 .9 .9
Kunbi 186 1.3 1.3
Other Peasant OBC 365 2.5 2.5

62
Caste/Jati-biradari/Tribe N Percent Valid Percent
Bunkar/Padmasali 90 .6 .6
Darzee/Meera 49 .3 .3
Thatihar 9 .1 .1
Lakhera/Boya 23 .2 .2
Badhai/Kamsali 129 .9 .9
Kumhar 101 .7 .7
Lohar/Kanchar 116 .8 .8
Sunar 61 .4 .4
Medara 5 .0 .0
Other Craftsmen 96 .6 .7
Kewat/Pallekari 162 1.1 1.1
Dhobi/Rajaka 106 .7 .7
Nai/Mangali 144 1.0 1.0
Teli/Gandla 324 2.2 2.2
Jogi/Dudekula 39 .3 .3
Traders OBC 62 .4 .4
Toddy Tappers/Perika 168 1.1 1.1
Landless Labourers/Bhartraju 108 .7 .7
Entertaining caste/Kalavanthulu 22 .1 .2
Other Service OBC 301 2.0 2.1
Chamar/Jatav/Madigas 1083 7.3 7.3
Balmiki/Bhangi 133 .9 .9
Pasi/Pano/Adi Andhra 275 1.9 1.9
Rajbanshis/Mala 128 .9 .9
Namasudras/Mahar/Malajangam 273 1.8 1.9
Dhobi/Telli 86 .6 .6
Dom/Sindhollu 31 .2 .2
Nomadic 91 .6 .6

63
Caste/Jati-biradari/Tribe N Percent Valid Percent
Lowest SC 70 .5 .5
Other SC 394 2.7 2.7
Mina/Sugali/Boro 171 1.2 1.2
Bhil/Yerukula/Karbi 62 .4 .4
Gond/Koya/Abor 42 .3 .3
Oraon/Konda Dhora/Miri 65 .4 .4
Kamars/Irular/Nega/Yanadi 1 .0 .0
Santhal/Paniyan/Mizo/Boya 87 .6 .6
Munda/Kuruba/Khasi/Savara 68 .5 .5
Andh/Malyali/Chakma/Jatapu 67 .5 .5
Naikda/Nayaka/Kuki/Chenchu 47 .3 .3
Other Sts 437 3.0 3.0
Ashraf 378 2.6 2.6
Mughal 184 1.2 1.3
Rajput Muslim 72 .5 .5
Other Upper caste(Muslim) 117 .8 .8
Peasants+Traders 109 .7 .7
Craftsmen+Weavers 215 1.5 1.5
Service muslims 161 1.1 1.1
Muslim Dalit 10 .1 .1
Other Muslim OBC 138 .9 .9
Muslim no caste 354 2.4 2.4
Jat sikh 135 .9 .9
Khatri Sikh 38 .3 .3
OBC Sikh 11 .1 .1
Sikh no caste 19 .1 .1
Upper Christian 61 .4 .4
OBC Christian 90 .6 .6

64
Caste/Jati-biradari/Tribe N Percent Valid Percent
Dalit Christian 25 .2 .2
Christian no caste 25 .2 .2
Other Minorities 7 .0 .0
Buddhists 5 .0 .0
Dalit Buddhist 11 .1 .1
Hindu no caste 29 .2 .2
No religion no caste 14 .1 .1
NA 468 3.1 3.1
Total 14786 100.0 100.0
a: What is your caste group?
Caste group N Percent Valid Percent
SC 3009 20.4 20.4
ST 1196 8.1 8.1
OBC 5908 40.0 40.0
Others 4673 31.6 31.6
Valid
Total 14786 100.0 100.0 B11: Which religion do you follow?
Religion N Percent Valid Percent
Hindu 11861 80.2 80.2
Muslim 1808 12.2 12.2
Christian 412 2.8 2.8
Sikh 312 2.1 2.1
Buddhist 122 .8 .8
Jain 50 .3 .3
Parsi 5 .0 .0
Valid
Others 216 1.5 1.5
65
Religion N Percent Valid Percent
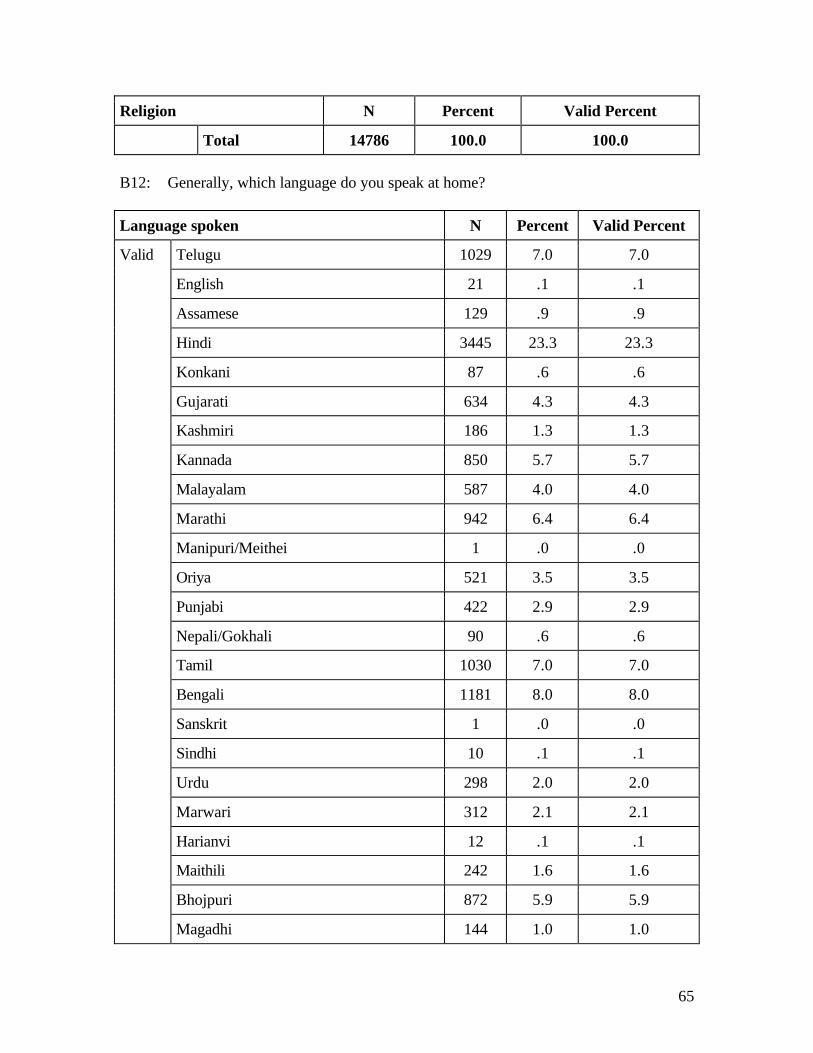
Total 14786 100.0 100.0 B12: Generally, which language do you speak at home?
Language spoken N Percent Valid Percent
Telugu 1029 7.0 7.0
English 21 .1 .1
Assamese 129 .9 .9
Hindi 3445 23.3 23.3
Konkani 87 .6 .6
Gujarati 634 4.3 4.3
Kashmiri 186 1.3 1.3
Kannada 850 5.7 5.7
Malayalam 587 4.0 4.0
Marathi 942 6.4 6.4
Manipuri/Meithei 1 .0 .0
Oriya 521 3.5 3.5
Punjabi 422 2.9 2.9
Nepali/Gokhali 90 .6 .6
Tamil 1030 7.0 7.0
Bengali 1181 8.0 8.0
Sanskrit 1 .0 .0
Sindhi 10 .1 .1
Urdu 298 2.0 2.0
Marwari 312 2.1 2.1
Harianvi 12 .1 .1
Maithili 242 1.6 1.6
Bhojpuri 872 5.9 5.9
Valid
Magadhi 144 1.0 1.0

66
Language spoken N Percent Valid Percent
Dhundari 60 .4 .4
Braj 55 .4 .4
Hadauti 30 .2 .2
Mewari 107 .7 .7
Bhili 1 .0 .0
Bundelkhandi 60 .4 .4
Gondi 12 .1 .1
Malwi 48 .3 .3
Begheli 98 .7 .7
Nimari 60 .4 .4
Santhali 70 .5 .5
Halbi 4 .0 .0
Oraon 5 .0 .0
Bus 1 .0 .0
Muwda 3 .0 .0
Chhattisgadhi 259 1.8 1.8
Garhwali 2 .0 .0
Kumaoni 2 .0 .0
Awadhi 61 .4 .4
Mahaswi 2 .0 .0
Kulvi 3 .0 .0
Kinnauri 14 .1 .1
Pahari 8 .1 .1
Ladakhi 21 .1 .1
Naga 2 .0 .0
Dogri 110 .7 .7
Nissi/Daffia 1 .0 .0
Ao 1 .0 .0

67
Language spoken N Percent Valid Percent
Konyak 3 .0 .0
Bhutia 1 .0 .0
Bodo 54 .4 .4
Karbi 2 .0 .0
Mishing 38 .3 .3
Tripuri 2 .0 .0
Other Indian Language 250 1.7 1.7
Other South Asian Language 2 .0 .0
Other European Language 1 .0 .0
DK 5 .0 .0
NA 282 1.9 1.9
Total 14786 100.0 100.0 B13: Area/Locality
Area/Locality N Percent Valid Percent
Village 11319 76.6 76.6
Town(Below 1 Lakh) 1491 10.1 10.1
City (above 1 Lakh) 1481 10.0 10.0
Metropolitan city(above 10 lakhs) 495 3.3 3.3
Valid
Total 14786 100.0 100.0
a: (If town/city) Type of house where R lives.
Type of house N Percent Valid Percent
NA 11462 77.5 77.5
House/Flat/Bungalow with 4 or more bedrooms 344 2.3 2.3
House/Flat with 3 or 4 Bedrooms 350 2.4 2.4
Valid
House/Flat with 2 bedrooms (with kitchen and bathrooms) 614 4.2 4.2
68
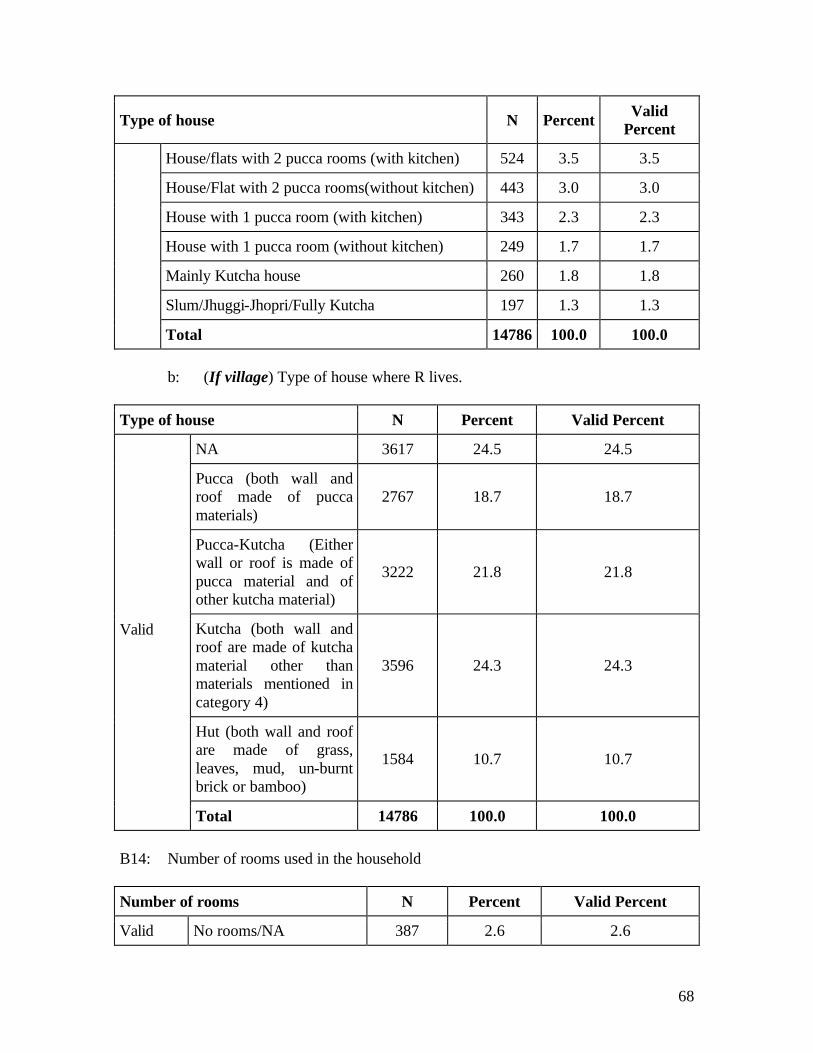
Type of house N Percent Valid Percent
House/flats with 2 pucca rooms (with kitchen) 524 3.5 3.5
House/Flat with 2 pucca rooms(without kitchen) 443 3.0 3.0
House with 1 pucca room (with kitchen) 343 2.3 2.3
House with 1 pucca room (without kitchen) 249 1.7 1.7
Mainly Kutcha house 260 1.8 1.8
Slum/Jhuggi-Jhopri/Fully Kutcha 197 1.3 1.3
Total 14786 100.0 100.0
b: (If village) Type of house where R lives.
Type of house N Percent Valid Percent
NA 3617 24.5 24.5
Pucca (both wall and roof made of pucca materials)
2767 18.7 18.7
Pucca-Kutcha (Either wall or roof is made of pucca material and of other kutcha material)
3222 21.8 21.8
Kutcha (both wall and roof are made of kutcha material other than materials mentioned in category 4)
3596 24.3 24.3
Hut (both wall and roof are made of grass, leaves, mud, un-burnt brick or bamboo)
1584 10.7 10.7
Valid
Total 14786 100.0 100.0 B14: Number of rooms used in the household
Number of rooms N Percent Valid Percent
Valid No rooms/NA 387 2.6 2.6

69
Number of rooms N Percent Valid Percent
One 2178 14.7 14.7
Two 4905 33.2 33.2
Three 3011 20.4 20.4
Four 2315 15.7 15.7
Five 921 6.2 6.2
Six 543 3.7 3.7
Seven 200 1.4 1.4
Eight 180 1.2 1.2
Nine and above 146 1.0 1.0
Total 14786 100.0 100.0
B15: Total number of family members living in the household.
a: Adults
Adults N Percent Valid Percent
Blank/NA 332 2.2 2.2
One 347 2.3 2.3
Two 3812 25.8 25.8
Three 2708 18.3 18.3
Four 3333 22.5 22.5
Five 1780 12.0 12.0
Six 1290 8.7 8.7
Seven 509 3.4 3.4
Eight 369 2.5 2.5
Nine and above 306 2.1 2.1
Valid
Total 14786 100.0 100.0

70
b: Children
Children N Percent Valid Percent
Blank/NA 2006 13.6 13.6
One 2102 14.2 14.2
Two 4325 29.3 29.3
Three 2951 20.0 20.0
Four 1636 11.1 11.1
Five 756 5.1 5.1
Six 467 3.2 3.2
Seven 236 1.6 1.6
Eight 130 .9 .9
Nine and above 177 1.2 1.2
Valid
Total 14786 100.0 100.0 B16: Do you or your family member have the following:
a: Car/Jeep/Van/Tractor
Car/Jeep/Van/Tractor N Percent Valid Percent
No 13715 92.8 92.8
Yes 1071 7.2 7.2 Valid
Total 14786 100.0 100.0
b: Colour or B/W Television
Colour or B/W Television N Percent Valid Percent
No 7439 50.3 50.3
B/W 4277 28.9 28.9
Colour 3070 20.8 20.8 Valid
Total 14786 100.0 100.0

71
c: Scooter/Motorcycle/Mopet
Scooter/Motorcycle/Mopet N Percent Valid Percent
No 11084 75.0 75.0
Yes 3702 25.0 25.0 Valid
Total 14786 100.0 100.0
d: Telephone/Mobile Phone
Telephone/Mobile Phone N Percent Valid Percent
No 10157 68.7 68.7
Yes 4629 31.3 31.3 Valid
Total 14786 100.0 100.0
e: Electric fan/cooler
Electric fan/cooler N Percent Valid Percent
No 6758 45.7 45.7
Yes 8028 54.3 54.3 Valid
Total 14786 100.0 100.0
f: Bicycle
Bicycle N Percent Valid Percent
No 5589 37.8 37.8
Yes 9197 62.2 62.2 Valid
Total 14786 100.0 100.0
g: Radio/Transistor
Radio/Transistor N Percent Valid Percent
No 8057 54.5 54.5
Yes 6729 45.5 45.5 Valid
Total 14786 100.0 100.0

72
h: Pumping set
Pumping set N Percent Valid Percent
No 12413 84.0 84.0
Yes 2373 16.0 16.0 Valid
Total 14786 100.0 100.0
i: Fridge
Fridge N Percent Valid Percent
No 12480 84.4 84.4
Yes 2306 15.6 15.6 Valid
Total 14786 100.0 100.0 B17: Total monthly household income
Monthly household income N Percent Valid Percent
Up to Rs. 1000 3660 24.8 24.8
Rs. 1001- Rs. 2000 3508 23.7 23.7
Rs. 2001- Rs. 3000 2550 17.2 17.2
Rs. 3001- Rs. 4000 1373 9.3 9.3
Rs. 4001- Rs. 5000 1237 8.4 8.4
Rs. 5001- Rs. 10,000 1539 10.4 10.4
Rs. 10,001- Rs. 20,000 603 4.1 4.1
Rs. 20,001 and above 145 1.0 1.0
NA 171 1.2 1.2
Valid
Total 14786 100.0 100.0

73
Additional Questions (to be asked from respondents whose age is between 18 to 29 years)
Q1: What is your employment status?
Opinion N Percent Valid Percent
Student, not looking for job 373 11.4 11.4
Student, looking for employment 425 13.0 13.0
Partially employed 750 22.9 22.9
Fully employed 562 17.2 17.2
No opinion 1163 35.5 35.5
Valid
Total 3273 100.0 100.0
a: (If partially or fully employed) To what extent are you satisfied or dissatisfied with your job?
Opinion N Percent Valid Percent
Fully satisfied 296 9.0 9.0
Somewhat satisfied 547 16.7 16.7
Somewhat dissatisfied 136 4.2 4.2
Fully dissatisfied 257 7.9 7.9
No opinion 76 2.3 2.3
NA 1961 59.9 59.9
Valid
Total 3273 100.0 100.0 Q2: If you had a choice what kind of employment would you prefer- your own work
or salaried job?
Opinion N Percent Valid Percent
Own work 1035 31.6 31.6
Salaried job 1492 45.6 45.6
No opinion 746 22.8 22.8 Valid
Total 3273 100.0 100.0

74
Q3: Now I will read out a few things. You tell me, do you personally own any of the following things:
a: Mobile phone
Mobile phone N Percent Valid Percent
No 2068 63.2 63.2
Yes 585 17.9 17.9
No opinion 620 18.9 18.9 Valid
Total 3273 100.0 100.0
b: Two wheeler(Motor Cycle/Scooter/Moped)
Two wheeler N Percent Valid Percent
No 2054 62.8 62.8
Yes 569 17.4 17.4
No opinion 650 19.9 19.9 Valid
Total 3273 100.0 100.0
c: Internet connection
Internet connection N Percent Valid Percent
No 2383 72.8 72.8
Yes 110 3.4 3.4
No opinion 780 23.8 23.8 Valid
Total 3273 100.0 100.0 Q4: Thinking of 5 close friends, tel me how many of them are from:
a: The opposite sex
Friends from opposite sex N Percent Valid Percent
No friends 1362 41.6 41.6
One friends 385 11.8 11.8
Valid
Two friends 548 16.7 16.7

75
Friends from opposite sex N Percent Valid Percent
Three friends 261 8.0 8.0
Four friends 113 3.5 3.5
All five friends 90 2.7 2.7
No response 514 15.7 15.7
Total 3273 100.0 100.0
b: From your own/caste community
Friends from own caste-community N Percent Valid Percent
No friends 501 15.3 15.3
One friends 183 5.6 5.6
Two friends 580 17.7 17.7
Three friends 611 18.7 18.7
Four friends 346 10.6 10.6
All five friends 423 12.9 12.9
No response 629 19.2 19.2
Valid
Total 3273 100.0 100.0 Q5: How frequently do you discuss poitics with your friends and colleagues-often,
occassionally or never?
Opinion N Percent Valid Percent
Often 373 11.4 11.4
Occassionally 1182 36.1 36.1
Never 1087 33.2 33.2
No opinion 631 19.3 19.3
Valid
Total 3273 100.0 100.0

76
Q6: What is 15th August?
Opinion N Percent Valid Percent
Incorrect 1025 31.3 31.3
Correct 2248 68.7 68.7 Valid
Total 3273 100.0 100.0
Q7: In which year did India get Independence?
Opinion N Percent Valid Percent
Incorrect 1320 40.3 40.3
Correct 1953 59.7 59.7 Valid
Total 3273 100.0 100.0 Q8: Have you heard about ‘The Emergency’ imposed in the country in 1975?
Opinion N Percent Valid Percent
No 2399 73.3 73.3
Yes 874 26.7 26.7 Valid
Total 3273 100.0 100.0 Q9: I am reading out few things. You tell me, how often do you do them-almost
daily, once or twice a week, once or twice a month, rarely or never?
a: Watch cinema in a theatre
Opinion N Percent Valid Percent
Almost daily 117 3.6 3.6
Once or twice a week 332 10.1 10.1
Once or twice a month 670 20.5 20.5
Rarely 915 28.0 28.0
Never 1239 37.9 37.9
Valid
Total 3273 100.0 100.0

77
b: Watch entertainment/sports on T.V.
Opinion N Percent Valid Percent
Almost daily 956 29.2 29.2
Once or twice a week 491 15.0 15.0
Once or twice a month 225 6.9 6.9
Rarely 530 16.2 16.2
Never 1071 32.7 32.7
Valid
Total 3273 100.0 100.0
c: Use internet
Opinion N Percent Valid Percent
Almost daily 105 3.2 3.2
Once or twice a week 114 3.5 3.5
Once or twice a month 109 3.3 3.3
Rarely 261 8.0 8.0
Never 2684 82.0 82.0
Valid
Total 3273 100.0 100.0
d: Read a book other than syllabus/examination book
Opinion N Percent Valid Percent
Almost daily 306 9.3 9.3
Once or twice a week 314 9.6 9.6
Once or twice a month 232 7.1 7.1
Rarely 509 15.6 15.6
Never 1912 58.4 58.4
Valid
Total 3273 100.0 100.0
78
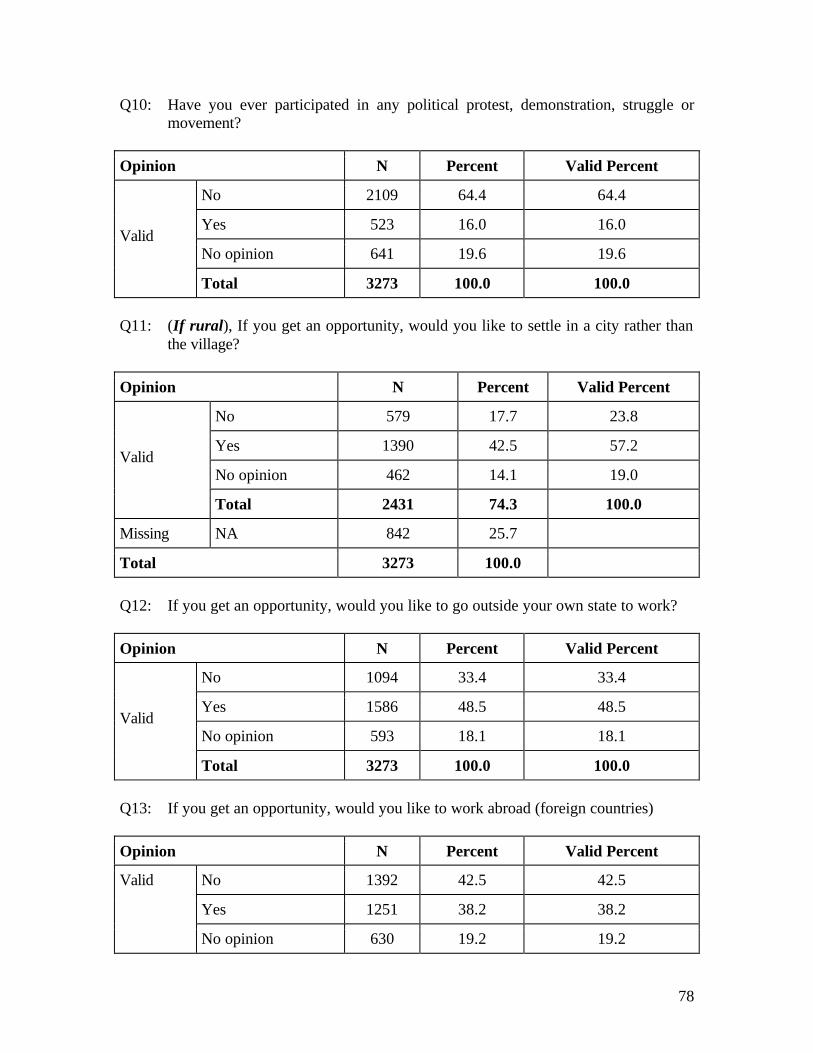
Q10: Have you ever participated in any political protest, demonstration, struggle or movement?
Opinion N Percent Valid Percent
No 2109 64.4 64.4
Yes 523 16.0 16.0
No opinion 641 19.6 19.6 Valid
Total 3273 100.0 100.0 Q11: (If rural), If you get an opportunity, would you like to settle in a city rather than
the village?
Opinion N Percent Valid Percent
No 579 17.7 23.8
Yes 1390 42.5 57.2
No opinion 462 14.1 19.0 Valid
Total 2431 74.3 100.0
Missing NA 842 25.7
Total 3273 100.0 Q12: If you get an opportunity, would you like to go outside your own state to work?
Opinion N Percent Valid Percent
No 1094 33.4 33.4
Yes 1586 48.5 48.5
No opinion 593 18.1 18.1 Valid
Total 3273 100.0 100.0 Q13: If you get an opportunity, would you like to work abroad (foreign countries)
Opinion N Percent Valid Percent
No 1392 42.5 42.5
Yes 1251 38.2 38.2
Valid
No opinion 630 19.2 19.2

79
Opinion N Percent Valid Percent
Total 3273 100.0 100.0
Q14: Now I will read out two statements on various issues. Tell me whether you agree
with statement first (1) or statement second (2) a: 1: In matters of marriage, boys and girls may be consulted, however final
decision should be taken by parents; 2: In matters of marriage though the parents may be consulted, final decision should be left to boys/girls themselves.
Opinion N Percent Valid Percent
Agree with first 1889 57.7 57.7
Agree with second 831 25.4 25.4
No opinion 553 16.9 16.9 Valid
Total 3273 100.0 100.0 b: 1: After marriage if the son leave his parents’ house and settle down on his own, it
is beneficial for all; 2: According to our social traditions, even after marriage the son should say stay with parents.
Opinion N Percent Valid Percent
Agree with first 619 18.9 18.9
Agree with second 2084 63.7 63.7
No opinion 570 17.4 17.4 Valid
Total 3273 100.0 100.0 c: 1: In our society, meeting/dating of boys and girls should be restricted before
marriage; 2: In modern society, there should be no restriction on meeting/dating of boys and girls even before marriage.
Opinion N Percent Valid Percent
Agree with first 1542 47.1 47.1
Agree with second 1081 33.0 33.0
No opinion 650 19.9 19.9 Valid
Total 3273 100.0 100.0

80
d: 1: In our society marriages must take place within one’s own caste-community; 2: In the present time, there is nothing wrong if boys and girls of different caste-community marry.
Opinion N Percent Valid Percent
Agree with first 1922 58.7 58.7
Agree with second 778 23.8 23.8
No opinion 573 17.5 17.5 Valid
Total 3273 100.0 100.0 e: 1: It is the duty of the children to look after their parents when they grow old; 2:
In the changed society, old parents should look after themselves.
Opinion N Percent Valid Percent
Agree with first 2531 77.3 77.3
Agree with second 198 6.0 6.0
No opinion 544 16.6 16.6 Valid
Total 3273 100.0 100.0 Q15: If you could get citizenship of USA, would you give up your Indian citizenship?
Opinion N Percent Valid Percent
No 2087 63.8 63.8
Yes 387 11.8 11.8
No opinion 799 24.4 24.4 Valid
Total 3273 100.0 100.0 Q16: Do you believe in God?
Opinion N Percent Valid Percent
No 230 7.0 7.0
Yes 2541 77.6 77.6
No opinion 502 15.3 15.3 Valid
Total 3273 100.0 100.0

81
Q17: Which one of the following three statements do you agree with most?
Opinion N Percent Valid Percent
Democracy is preferable to any other kind of government 1562 47.7 47.7
In certain situation, a dictatorial government can be preferable to a democratic one
204 6.2 6.2
It doesn’t matter to matter to people like me whether we have democratic or non-democratic governance
253 7.7 7.7
No opinion 1254 38.3 38.3
Valid
Total 3273 100.0 100.0 Q18: Now I am reading out names of few personalities of India. For each of them, you
tell me, to what extent do you see them as your ideal- Very much, Somewhat or Not at all?
a: Medha Patkar
Opinion N Percent Valid Percent
Very much 406 12.4 12.4
Somewhat 539 16.5 16.5
Not at all 388 11.9 11.9
Not heard 1940 59.3 59.3
Valid
Total 3273 100.0 100.0
b: Bhagat Singh
Opinion N Percent Valid Percent
Very much 1383 42.3 42.3
Somewhat 627 19.2 19.2
Not at all 267 8.2 8.2
Not heard 996 30.4 30.4
Valid
Total 3273 100.0 100.0

82
c: Dr. Ambedkar
Opinion N Percent Valid Percent
Very much 1408 43.0 43.0
Somewhat 628 19.2 19.2
Not at all 300 9.2 9.2
Not heard 937 28.6 28.6
Valid
Total 3273 100.0 100.0
d: Mahatma Gandhi
Opinion N Percent Valid Percent
Very much 2016 61.6 61.6
Somewhat 459 14.0 14.0
Not at all 176 5.4 5.4
Not heard 622 19.0 19.0
Valid
Total 3273 100.0 100.0
e: Amartya Sen
Opinion N Percent Valid Percent
Very much 537 16.4 16.4
Somewhat 488 14.9 14.9
Not at all 430 13.1 13.1
Not heard 1818 55.5 55.5
Valid
Total 3273 100.0 100.0
f: Mother Teresa
Opinion N Percent Valid Percent
Very much 1377 42.1 42.1 Valid
Somewhat 522 15.9 15.9

83
Opinion N Percent Valid Percent
Not at all 233 7.1 7.1
Not heard 1141 34.9 34.9
Total 3273 100.0 100.0
g: Abdul Kalam
Opinion N Percent Valid Percent
Very much 1526 46.6 46.6
Somewhat 562 17.2 17.2
Not at all 206 6.3 6.3
Not heard 979 29.9 29.9
Valid
Total 3273 100.0 100.0
h: Indira Gandhi
Opinion N Percent Valid Percent
Very much 1734 53.0 53.0
Somewhat 611 18.7 18.7
Not at all 254 7.8 7.8
Not heard 674 20.6 20.6
Valid
Total 3273 100.0 100.0
i: Dhirubhai Ambani
Opinion N Percent Valid Percent
Very much 620 18.9 18.9
Somewhat 520 15.9 15.9
Not at all 469 14.3 14.3
Not heard 1664 50.8 50.8
Valid
Total 3273 100.0 100.0

84
j: Veer Savarkar
Opinion N Percent Valid Percent
Very much 453 13.8 13.8
Somewhat 434 13.3 13.3
Not at all 384 11.7 11.7
Not heard 2002 61.2 61.2
Valid
Total 3273 100.0 100.0 Q19: What do you think will be the economic condition of you or your family in the
coming few years? Would you say it will become better, remained same or become worse? (probe further whether ‘much better’ or ‘better’ or ‘much worse’ or ‘worse’)
Opinion N Percent Valid Percent
Much better 623 19.0 19.0
Better 1362 41.6 41.6
Same 472 14.4 14.4
Worse 138 4.2 4.2
Much worse 30 .9 .9
No opinion 648 19.8 19.8
Valid
Total 3273 100.0 100.0
Q20: Thinking about the next few years, do you think the economic condition of India will become better or become worse? (probe further whether ‘much better’ or ‘better’ or ‘much worse’ or ‘worse’)
Opinion N Percent Valid Percent
Much better 658 20.1 20.1
Better 1249 38.2 38.2
Same 301 9.2 9.2
Worse 140 4.3 4.3
Much worse 21 .6 .6
No opinion 904 27.6 27.6
Valid
Total 3273 100.0 100.0
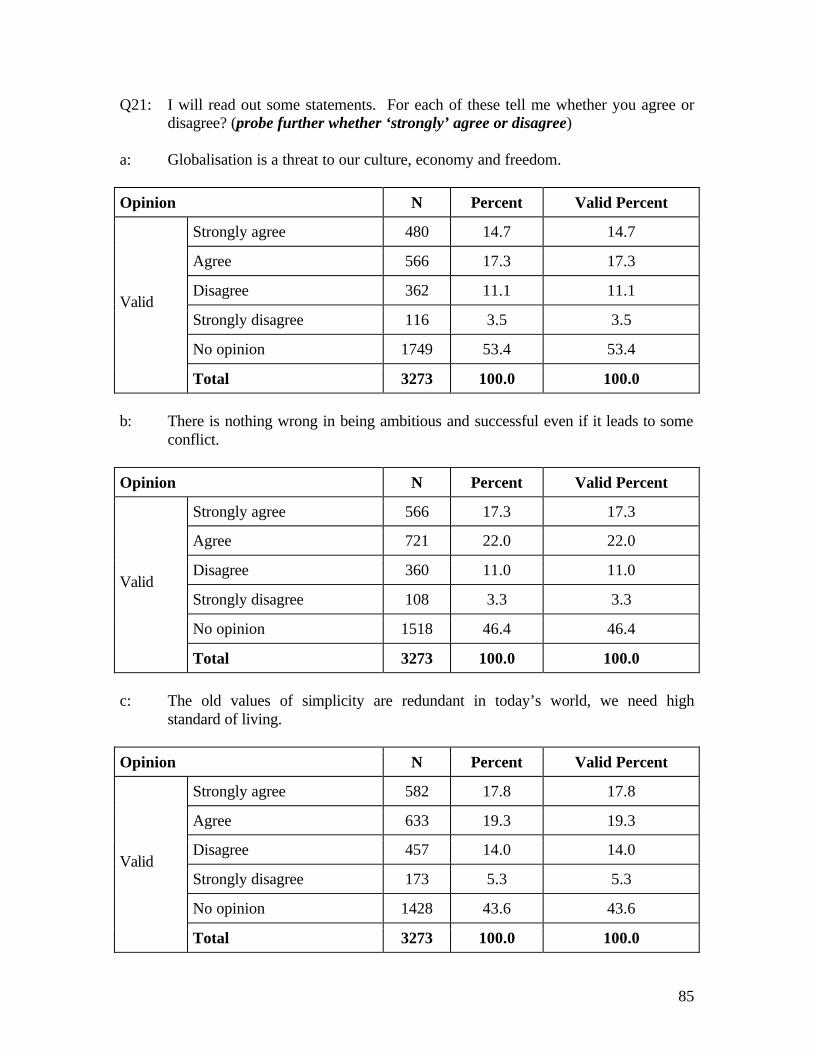
85
Q21: I will read out some statements. For each of these tell me whether you agree or disagree? (probe further whether ‘strongly’ agree or disagree)
a: Globalisation is a threat to our culture, economy and freedom.
Opinion N Percent Valid Percent
Strongly agree 480 14.7 14.7
Agree 566 17.3 17.3
Disagree 362 11.1 11.1
Strongly disagree 116 3.5 3.5
No opinion 1749 53.4 53.4
Valid
Total 3273 100.0 100.0 b: There is nothing wrong in being ambitious and successful even if it leads to some
conflict.
Opinion N Percent Valid Percent
Strongly agree 566 17.3 17.3
Agree 721 22.0 22.0
Disagree 360 11.0 11.0
Strongly disagree 108 3.3 3.3
No opinion 1518 46.4 46.4
Valid
Total 3273 100.0 100.0 c: The old values of simplicity are redundant in today’s world, we need high
standard of living.
Opinion N Percent Valid Percent
Strongly agree 582 17.8 17.8
Agree 633 19.3 19.3
Disagree 457 14.0 14.0
Strongly disagree 173 5.3 5.3
No opinion 1428 43.6 43.6
Valid
Total 3273 100.0 100.0

86
Q22: Now I will read out few statements about the future of India. Tell me, 20 years from now how likely are those to happen- very likely, likely, not likely, or not at all likely to happen?
a: India will become a global superpower.
Opinion N Percent Valid Percent
Very likely 1175 35.9 35.9
Likely 767 23.4 23.4
Not likely 158 4.8 4.8
Not at all likely 68 2.1 2.1
No opinion 1105 33.8 33.8
Valid
Total 3273 100.0 100.0
b: India will remain one of the poorest countries in the world.
Opinion N Percent Valid Percent
Very likely 162 4.9 4.9
Likely 312 9.5 9.5
Not likely 886 27.1 27.1
Not at all likely 777 23.7 23.7
No opinion 1136 34.7 34.7
Valid
Total 3273 100.0 100.0 c: Indians and Pakistanis will be free to travel in each other’s country without visa
restriction.
Opinion N Percent Valid Percent
Very likely 264 8.1 8.1
Likely 394 12.0 12.0
Not likely 534 16.3 16.3
Not at all likely 651 19.9 19.9
No opinion 1430 43.7 43.7
Valid
Total 3273 100.0 100.0

87
d: India will break up into many small countries.
Opinion N Percent Valid Percent
Very likely 156 4.8 4.8
Likely 250 7.6 7.6
Not likely 625 19.1 19.1
Not at all likely 950 29.0 29.0
No opinion 1292 39.5 39.5
Valid
Total 3273 100.0 100.0
e: India will remain a secular country.
Opinion N Percent Valid Percent
Very likely 1180 36.1 36.1
Likely 633 19.3 19.3
Not likely 158 4.8 4.8
Not at all likely 119 3.6 3.6
No opinion 1183 36.1 36.1
Valid
Total 3273 100.0 100.0 Q23: Now I will read out a few anxieties, which young people generally face these
days. You tell me to what extent are you anxious about the following – great extent, somewhat, not much or not at all?
a: Employment/Career
Opinion N Percent Valid Percent
Great extent 1540 47.1 48.8
Somewhat 601 18.4 19.1
Not much 176 5.4 5.6
Not at all 143 4.4 4.5
No opinion 694 21.2 22.0
Valid
Total 3154 96.4 100.0
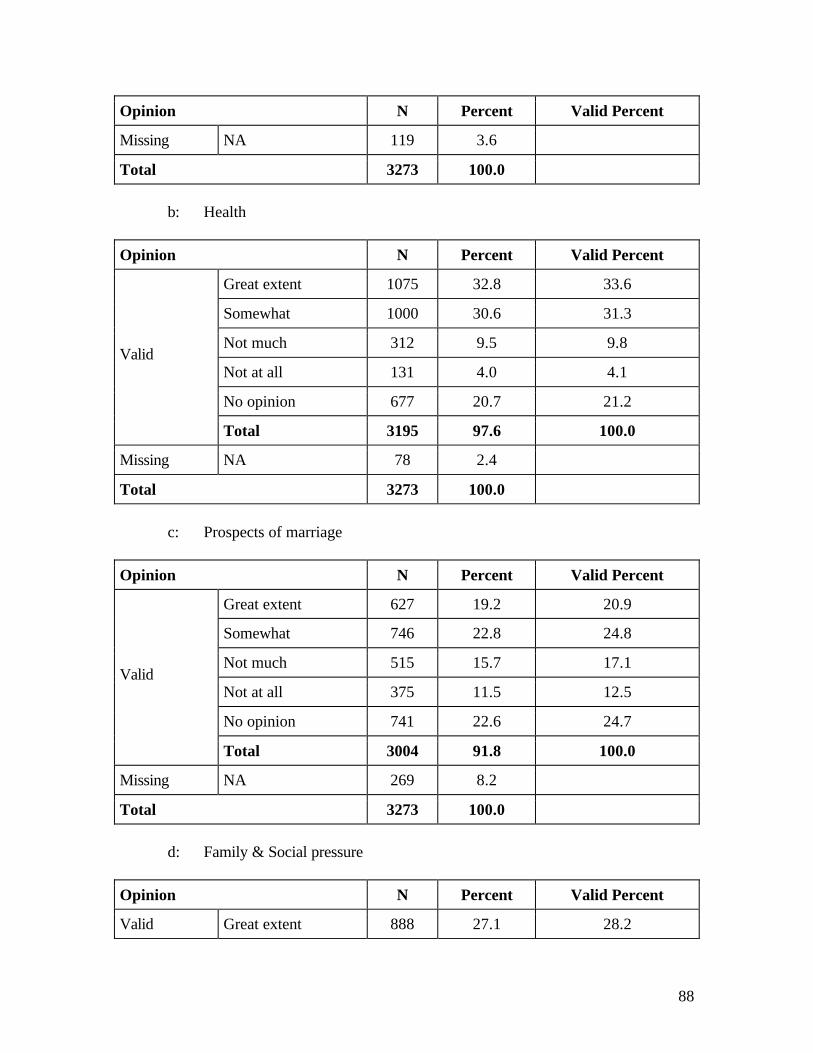
88
Opinion N Percent Valid Percent
Missing NA 119 3.6
Total 3273 100.0
b: Health
Opinion N Percent Valid Percent
Great extent 1075 32.8 33.6
Somewhat 1000 30.6 31.3
Not much 312 9.5 9.8
Not at all 131 4.0 4.1
No opinion 677 20.7 21.2
Valid
Total 3195 97.6 100.0
Missing NA 78 2.4
Total 3273 100.0
c: Prospects of marriage
Opinion N Percent Valid Percent
Great extent 627 19.2 20.9
Somewhat 746 22.8 24.8
Not much 515 15.7 17.1
Not at all 375 11.5 12.5
No opinion 741 22.6 24.7
Valid
Total 3004 91.8 100.0
Missing NA 269 8.2
Total 3273 100.0
d: Family & Social pressure
Opinion N Percent Valid Percent
Valid Great extent 888 27.1 28.2

89
Opinion N Percent Valid Percent
Somewhat 806 24.6 25.6
Not much 380 11.6 12.0
Not at all 292 8.9 9.3
No opinion 788 24.1 25.0
Total 3154 96.4 100.0
Missing NA 119 3.6
Total 3273 100.0 Q24: What is Valentine Day?
Opinion N Percent Valid Percent
Incorrect 827 25.3 25.3
Correct 1405 42.9 42.9
Not heard 1041 31.8 31.8 Valid
Total 3273 100.0 100.0
Copyright © 2022 FDOKUMEN