Cnicus benedictus Oil as a Raw Material for Biodiesel - MDPI
16
sustainability Article Cnicus benedictus Oil as a Raw Material for Biodiesel: Extraction Optimization and Biodiesel Yield Petronela Lina Matei 1 , Cristina Busuioc 1 , Niculina Ionescu 2 , Anicuta Stoica-Guzun 1 and Nicoleta-Aurelia Chira 2, * Citation: Matei, P.L.; Busuioc, C.; Ionescu, N.; Stoica-Guzun, A.; Chira, N.-A. Cnicus benedictus Oil as a Raw Material for Biodiesel: Extraction Optimization and Biodiesel Yield. Sustainability 2021, 13, 13193. https://doi.org/10.3390/su132313193 Academic Editor: Shashi Kant Bhatia Received: 3 November 2021 Accepted: 25 November 2021 Published: 29 November 2021 Publisher’s Note: MDPI stays neutral with regard to jurisdictional claims in published maps and institutional affil- iations. Copyright: © 2021 by the authors. Licensee MDPI, Basel, Switzerland. This article is an open access article distributed under the terms and conditions of the Creative Commons Attribution (CC BY) license (https:// creativecommons.org/licenses/by/ 4.0/). 1 Faculty of Applied Chemistry and Material Science, University POLITEHNICA of Bucharest, 011061 Bucharest, Romania; [email protected] (P.L.M.); [email protected] (C.B.); [email protected] (A.S.-G.) 2 Laboratory of Plant Multiplication, Plant Breeding and Seed Multiplication Department, National Agricultural Research and Development Institute (NARDI), 915200 Fundulea, Romania; [email protected] * Correspondence: [email protected]; Tel.: +40-723-217-507 Abstract: Cnicus benedictus fruits were used as raw material to extract oil, and the resulting oil was converted into biodiesel. Two extraction methods were tested: batch extraction, and ultrasound assisted extraction. Response surface methodology was considered for the optimization of the process efficiency. The selected key independent variables were temperature, extraction time, and solid/liquid ratio for batch extraction and ultrasound intensity, temperature, and extraction time for the ultrasound assisted extraction, respectively. The optimal working conditions are different for the two extraction techniques, with respect to temperature, solid/liquid ratio, and extraction time, respectively, leading to higher extraction efficiency in the case of the ultrasound-assisted extraction. Cnicus benedictus oil obtained under the optimal extraction conditions was further esterified with methanol under acid catalysis to yield biodiesel. The biodiesel was characterized through 1 H-NMR and the main fuel properties were determined. Keywords: Cnicus benedictus oil; blessed thistle; ultrasound assisted extraction; response surface methodology; Box–Behnken design; biodiesel 1. Introduction Blessed thistle (Cnicus benedictus L.) is a well-known medicinal plant which belongs to the Asteraceae family, and has been used for centuries in traditional medicine due to its complex composition. All of the parts of Cnicus benedictus (CB) are used as extracts, mainly to enhance bile secretion, to stimulate appetite and digestion, mainly due to its high content of cnicin, a sesquiterpene lactone [1–3]. CB extracts also possess antimicrobial, cytotoxic, anti-inflammatory, and wound healing effects [4,5], which may be attributed to the high tannin content, up to 8% in the whole herb [6]. Recently, CB was reported as an alternative oil crop in central Europe, with fruit yields of approximately 2.0–2.5 t/ha, as well as good oil yields of 500–700 kg/ha. The oil content of CB fruits was reported to range between 23–29.2% [7]. It is important to mention, based on literature studies, that the main constituent of CB oil is linoleic acid; this oil is also rich in and α-tocopherol [2,7]. CB is a crop which has demonstrated a great adaptability to different environmental conditions, and it was proposed to be cultivated for restoration of eroded zones [8]. The role of minor crops has been reconsidered in Europe by the scientific community due to the fact that these crops could diversify the agricultural production for medicinal and industrial applications. CB is one of these crops, and its preservation and cultivation is on the agenda of different European countries [9]. Romania was recognized as offering very good conditions for CB cultivation [7]. In addition, CB oil could be used for biodiesel production. The importance of obtaining biodiesel from new sources of raw materials is a topical issue [10], and CB oil could be regarded as an alternative to other natural sources. Sustainability 2021, 13, 13193. https://doi.org/10.3390/su132313193 https://www.mdpi.com/journal/sustainability
-
Upload
khangminh22 -
Category
Documents
-
view
0 -
download
0
Transcript of Cnicus benedictus Oil as a Raw Material for Biodiesel - MDPI
sustainability
Article
Cnicus benedictus Oil as a Raw Material for Biodiesel:Extraction Optimization and Biodiesel Yield
Petronela Lina Matei 1, Cristina Busuioc 1 , Niculina Ionescu 2, Anicuta Stoica-Guzun 1 andNicoleta-Aurelia Chira 2,*
�����������������
Citation: Matei, P.L.; Busuioc, C.;
Ionescu, N.; Stoica-Guzun, A.; Chira,
N.-A. Cnicus benedictus Oil as a Raw
Material for Biodiesel: Extraction
Optimization and Biodiesel Yield.
Sustainability 2021, 13, 13193.
https://doi.org/10.3390/su132313193
Academic Editor: Shashi Kant Bhatia
Received: 3 November 2021
Accepted: 25 November 2021
Published: 29 November 2021
Publisher’s Note: MDPI stays neutral
with regard to jurisdictional claims in
published maps and institutional affil-
iations.
Copyright: © 2021 by the authors.
Licensee MDPI, Basel, Switzerland.
This article is an open access article
distributed under the terms and
conditions of the Creative Commons
Attribution (CC BY) license (https://
creativecommons.org/licenses/by/
4.0/).
1 Faculty of Applied Chemistry and Material Science, University POLITEHNICA of Bucharest,011061 Bucharest, Romania; [email protected] (P.L.M.); [email protected] (C.B.);[email protected] (A.S.-G.)
2 Laboratory of Plant Multiplication, Plant Breeding and Seed Multiplication Department,National Agricultural Research and Development Institute (NARDI), 915200 Fundulea, Romania;[email protected]
* Correspondence: [email protected]; Tel.: +40-723-217-507
Abstract: Cnicus benedictus fruits were used as raw material to extract oil, and the resulting oil wasconverted into biodiesel. Two extraction methods were tested: batch extraction, and ultrasoundassisted extraction. Response surface methodology was considered for the optimization of theprocess efficiency. The selected key independent variables were temperature, extraction time, andsolid/liquid ratio for batch extraction and ultrasound intensity, temperature, and extraction timefor the ultrasound assisted extraction, respectively. The optimal working conditions are different forthe two extraction techniques, with respect to temperature, solid/liquid ratio, and extraction time,respectively, leading to higher extraction efficiency in the case of the ultrasound-assisted extraction.Cnicus benedictus oil obtained under the optimal extraction conditions was further esterified withmethanol under acid catalysis to yield biodiesel. The biodiesel was characterized through 1H-NMRand the main fuel properties were determined.
Keywords: Cnicus benedictus oil; blessed thistle; ultrasound assisted extraction; response surfacemethodology; Box–Behnken design; biodiesel
1. Introduction
Blessed thistle (Cnicus benedictus L.) is a well-known medicinal plant which belongsto the Asteraceae family, and has been used for centuries in traditional medicine due toits complex composition. All of the parts of Cnicus benedictus (CB) are used as extracts,mainly to enhance bile secretion, to stimulate appetite and digestion, mainly due to itshigh content of cnicin, a sesquiterpene lactone [1–3]. CB extracts also possess antimicrobial,cytotoxic, anti-inflammatory, and wound healing effects [4,5], which may be attributed tothe high tannin content, up to 8% in the whole herb [6]. Recently, CB was reported as analternative oil crop in central Europe, with fruit yields of approximately 2.0–2.5 t/ha, aswell as good oil yields of 500–700 kg/ha. The oil content of CB fruits was reported to rangebetween 23–29.2% [7]. It is important to mention, based on literature studies, that the mainconstituent of CB oil is linoleic acid; this oil is also rich in and α-tocopherol [2,7]. CB is acrop which has demonstrated a great adaptability to different environmental conditions,and it was proposed to be cultivated for restoration of eroded zones [8]. The role of minorcrops has been reconsidered in Europe by the scientific community due to the fact that thesecrops could diversify the agricultural production for medicinal and industrial applications.CB is one of these crops, and its preservation and cultivation is on the agenda of differentEuropean countries [9]. Romania was recognized as offering very good conditions for CBcultivation [7]. In addition, CB oil could be used for biodiesel production. The importanceof obtaining biodiesel from new sources of raw materials is a topical issue [10], and CB oilcould be regarded as an alternative to other natural sources.
Sustainability 2021, 13, 13193. https://doi.org/10.3390/su132313193 https://www.mdpi.com/journal/sustainability
Sustainability 2021, 13, 13193 2 of 16
A recent study conducted in North Dakota (USA) demonstrated that CB has a goodproductivity in marginal lands, and the biodiesel properties are acceptable for industrialpurposes [8]. The importance of extraction methods for vegetal oils and technologies forobtaining biodiesel also draw researchers’ attention [11]. For this reason, not only shouldagronomical studies be continuing, but also the extraction conditions of CB oil shouldbe improved, with the aim of increasing the extraction yield. The oil is extracted fromCB fruits mainly by pressing at 40–50 ◦C, resulting as a light yellow green to dark yellowoil [7].
Ultrasound-assisted extraction (UAE) is seen as an option to standard solid-liquidextraction, being acknowledged as an effective technique to enhance the extraction yield,especially by a drastic reduction of the extraction time in the case of targeted naturalcompounds [12,13]. Given its reproducibility, UAE has been used to recover compoundsfrom various vegetal matrices [14,15]. Ultrasounds improve the solvent infiltration intothe plant material, by displacing the cell walls, hence accelerating the release of targetedsubstances into the solvent [16,17]. Since ultrasounds of vegetal materials interactions arenot fully understood at present, new studies are necessary to find the optimal experimentalconditions for UAE. Statistical methods such as response surface methodology (RSM) areoften used to search for the optimal conditions of a process, particularly if there are severalparameters and interactions which could influence the system evolution. By reducing thenumber of experimental trials which should be carried out to assess the interactions amonginfluencing variables, RSM reduces the efforts and the experimental costs [18,19]. TheBox–Behnken design (BBD) was chosen in this work as it implies a small number of runs,as compared to other statistical designs [19].
The aims of this study are: (1) characterization of the chemical structure of CB oil(fatty acids profile, technical quality, and nutritional quality indices); (2) presentation ofcomparative experimental data for batch extraction and UAE of CB oil, using n-hexaneas a solvent; and (3) synthesis and characterization of biodiesel from CB oil. The effectof process variables for extraction was studied and optimized using BBD. A desirabilityfunction was used for the optimization of the extraction in both cases. According to aliterature survey, a comparative study between different extraction methods of CB oil atthe same time as the synthesis and characterization of biodiesel obtained from CB oil hasnot yet been reported.
2. Materials and Methods2.1. Vegetal Material
Cnicus benedictus fruits were obtained from the National Agricultural Research andDevelopment Institute of Fundulea, Romania (NARDI-Fundulea), located in CalarasiCounty (Romania) in 2020, being used as a vegetal material. Solid impurities were manuallyremoved from CB fruits. The fruits were dried at 50 ◦C in a food dehydrator (Tribest SedonaExpress SDE-P6280, Anaheim, CA, USA). After drying, the fruits were stored at 4 ± 1 ◦Cin sealed plastic bags until oil extraction.
2.2. Extraction Techniques2.2.1. Soxhlet-Extraction
The initial oil content in CB fruits was determined using a laboratory Soxhlet extractorand n-hexane (Merck, Germany) of analytical reagent grade as a solvent. Approximately5 g of ground fruits were weighted and subjected to continuous (Soxhlet) extraction with100 mL n-hexane for 8 h. The extraction was performed in triplicate. The moisture contentof the fruits (5 ± 0.02%) was determined with a thermal balance (OHAUS MB23).
2.2.2. Batch Extraction
In a typical experiment, ground CB fruits were placed into a round bottom flask fittedwith a water condenser. A magnetic stirrer operated at 300 rpm with a heating plate, and atemperature controller (PT 1000 temperature sensor) was used to ensure effective contact
Sustainability 2021, 13, 13193 3 of 16
between the phases, and to establish the working temperature. After a predetermined time,the mixture was vacuum filtered and the solvent was removed under low pressure, using arotary evaporator. The independent variables were chosen after preliminary experimentsi.e., extraction time, solid/liquid ratio and working temperature. These values were variedaccording to BBD.
2.2.3. Ultrasound Assisted Extraction (UAE)
UAE was performed with a 500 W Ultrasonic Processors VCX Series (Sonics & Ma-terials, Inc., Newtown, CT, USA). Samples of dried and ground CB fruits were placed ina glass vessel close-fitting the US probe top diameter, equipped with a reflux condenser,and operated at different temperatures, extraction times, and amplitudes, according tothe experimental design (BBD). For all UAE trials, the solid/liquid ratio was kept at 1/16(g/mL).
The schematic flowchart of the methodology is presented in Scheme S1 (Supplemen-tary Material).
2.3. Analysis of Fatty Acid Profile of CB Oil
This analysis was carried on according to a previously reported method [20]. CB oilwas transesterified with methanol (14% BF3-MeOH solution was used as an acid catalyst)to obtain the corresponding fatty acid methyl esters (FAME) [20,21]. An Agilent 7890Bgas chromatograph (Agilent Technologies, USA) equipped with auto sampler, 5975 C VLMSD triple axis MS detector, and a Supelco SPTM 2560 capillary column (100 m length,0.25 mm inner diameter, and 0.2 µm film thickness) were used for FAME separationand identification. The carrier gas was helium (1.0 mL/min, split ratio 1:100) and theoven temperature ranged as follows: 140 ◦C (5 min), 140–240 ◦C (4 ◦C/min), and 240 ◦C(20 min). FAME solutions (FAME/CH2Cl2: 10µL/990µL) were injected, and the fattyacids were identified based on their retention times, as compared against a commercialstandard mixture (Supelco®37 Component FAME Mix). The fatty acid profile of CB oil wasdetermined based on the GC peak areas, adjusted by the response factors of the detector;these factors were calculated for each FAME taking methyl oleate as a reference. Theresponse factors were obtained as an average of five injections.
2.4. Determination of the Oil Quality Indices2.4.1. Peroxide Value (PV)
PV was determined by iodometric titration, based on the fact that I2 is stoichiometri-cally released by hydroperoxides from excess KI. The I2 formed was backtitrated with astandard Na2S2O3 solution in the presence of starch as an indicator [22].
2.4.2. Free Fatty Acids Value (FFA) and Acid Value (AV)
FFA was determined by titration of oil dissolved in ethanolic NaOH solution, usingphenolphthalein to observe the color shift. AV was determined from FFA by applying 1.99as a conversion factor for oleic acid: FFA (% oleic) × 1.99 = AV [23].
2.5. Fruits Morphology
CB dried fruit morphology was visualized before and after extraction by means of aFEI Quanta Inspect F Scanning Electron Microscope (SEM, FEI Company, Hillsboro, OR,USA). The operating conditions were as follows: secondary electron mode, 30 kV acceler-ating voltage, 10 mm working distance. All samples were gold coated by DC magnetronsputtering for 60 s prior to SEM examination in order to ensure surface conductivity [19].
2.6. Experimental Design and Statistical Analysis
Response surface methodology (RSM) using the Box–Behnken design (BBD) wasemployed to assess the influence of each process variable on the oil extraction yield fromCB fruits. RSM, an effective statistical technique, allows for the analysis of individual con-
Sustainability 2021, 13, 13193 4 of 16
tributions and interactions of independent variables on the response, and could accuratelydescribe the global process based on a limited number of runs [19]. BBD, which is oneof the most common rotatable models, was preferred for obtaining a polynomial model(second order) to explain the contribution of each process variable on the response (extrac-tion yield of CB oil). The obtained data were integrated into the following second-orderpolynomial model according to Equation (1), where Y is the response variable, β0 is theconstant term, βi are the linear coefficients, and βii and βij represent the quadratic andinteractive coefficients, respectively [19]:
Y = β0 + ∑ βixi + ∑ βiixi2 + ∑ βijxixj (1)
The STATISTICA 10 software package (Stat Soft Inc., Tulsa, OK, USA) was used forexperimental design analysis and data processing. Fisher’s F-test was applied to assessthe significance of the regression coefficients. The significant terms in the model, returnedafter regression analysis, were discovered using Pareto analysis of variance (ANOVA)for the responses. Three-dimensional response surface plots were used to illustrate theindependent variables interaction [19].
Extraction yield (response) determined using Equation (2), where Moil is the amountof oil (g), and Mdf is the mass of the dried fruits (g):
Y =MoilMd f
× 100 (2)
For batch extraction, Y1 denotes the extraction yield, and for UAE, the correspondingvariable is denoted as Y2.
The extraction conditions for batch and UAE were optimized using the desirabilityfunction, which transforms each response to a desirability value di between 1 and 0. Thevalue 1 corresponds to the ideal response value, and 0 to an undesirable response [15].
Box–Behnken Factorial Design for Batch Extraction
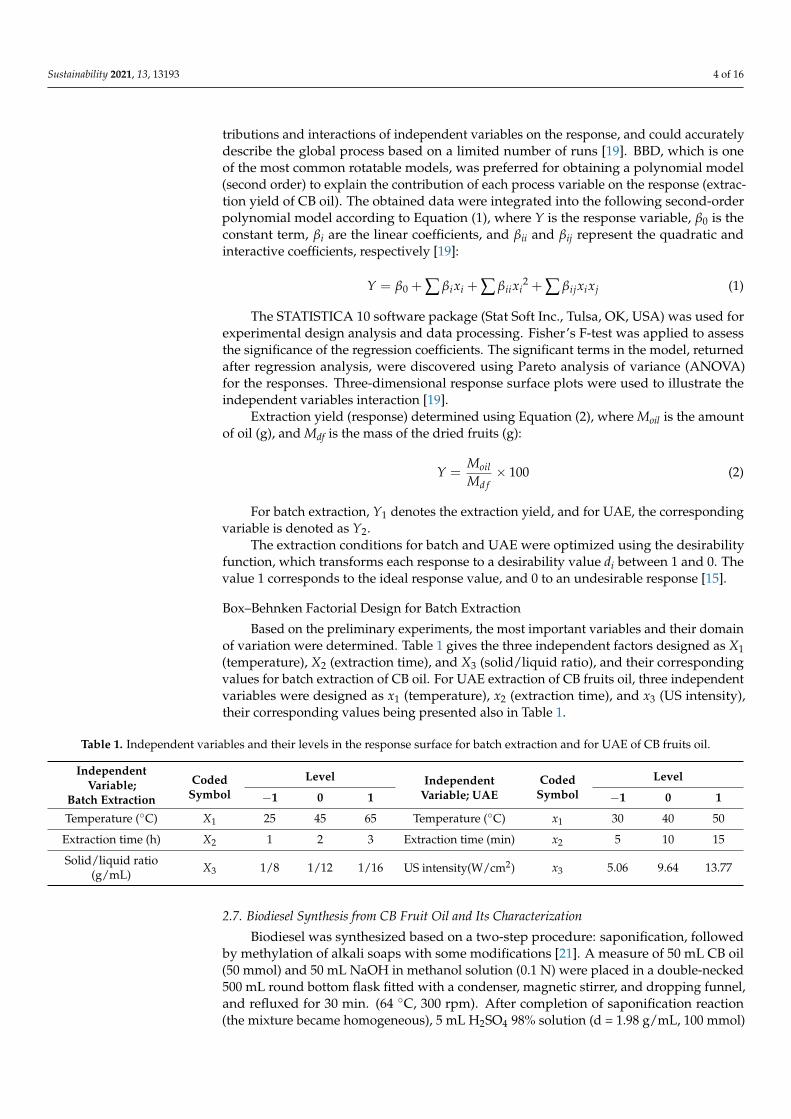
Based on the preliminary experiments, the most important variables and their domainof variation were determined. Table 1 gives the three independent factors designed as X1(temperature), X2 (extraction time), and X3 (solid/liquid ratio), and their correspondingvalues for batch extraction of CB oil. For UAE extraction of CB fruits oil, three independentvariables were designed as x1 (temperature), x2 (extraction time), and x3 (US intensity),their corresponding values being presented also in Table 1.
Table 1. Independent variables and their levels in the response surface for batch extraction and for UAE of CB fruits oil.
IndependentVariable;
Batch Extraction
CodedSymbol
Level IndependentVariable; UAE
CodedSymbol
Level
−1 0 1 −1 0 1
Temperature (◦C) X1 25 45 65 Temperature (◦C) x1 30 40 50
Extraction time (h) X2 1 2 3 Extraction time (min) x2 5 10 15
Solid/liquid ratio(g/mL) X3 1/8 1/12 1/16 US intensity(W/cm2) x3 5.06 9.64 13.77
2.7. Biodiesel Synthesis from CB Fruit Oil and Its Characterization
Biodiesel was synthesized based on a two-step procedure: saponification, followedby methylation of alkali soaps with some modifications [21]. A measure of 50 mL CB oil(50 mmol) and 50 mL NaOH in methanol solution (0.1 N) were placed in a double-necked500 mL round bottom flask fitted with a condenser, magnetic stirrer, and dropping funnel,and refluxed for 30 min. (64 ◦C, 300 rpm). After completion of saponification reaction(the mixture became homogeneous), 5 mL H2SO4 98% solution (d = 1.98 g/mL, 100 mmol)
Sustainability 2021, 13, 13193 5 of 16
dissolved in 50 mL was added dropwise through a dropping funnel, and the mixturewas maintained at reflux for 30 min. The reaction mixture was cooled to 25 ◦C and itsseparation into two phases (methyl esters and glycerol) indicated that the methylationhad occurred. Cold water (100 mL, approx. 4 ◦C) was added, and the flask contentswere transferred into a 500 mL separatory funnel. FAME were extracted three times with50 mL methylene chloride (d = 1.38 g/mL) portions. The combined organic extracts (lowerlayers) were washed with cold water until reaching a neutral pH, then dried on anhydrousMgSO4, and separated through centrifugation. Methylene chloride was removed witha rotary evaporator. Biodiesel was obtained (89.4% yield) as a light-yellow oil, and wascharacterized through 1H-NMR.
3. Results and Discussions3.1. CB Fruits Oil Characterization
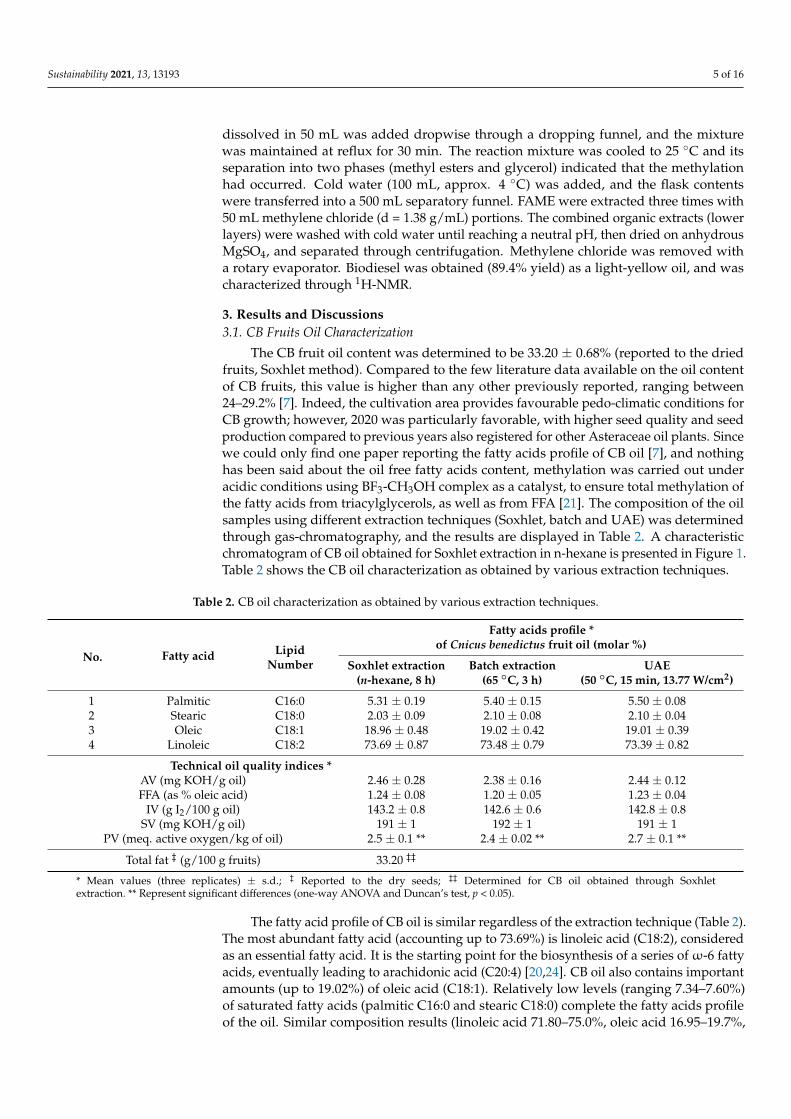
The CB fruit oil content was determined to be 33.20 ± 0.68% (reported to the driedfruits, Soxhlet method). Compared to the few literature data available on the oil contentof CB fruits, this value is higher than any other previously reported, ranging between24–29.2% [7]. Indeed, the cultivation area provides favourable pedo-climatic conditions forCB growth; however, 2020 was particularly favorable, with higher seed quality and seedproduction compared to previous years also registered for other Asteraceae oil plants. Sincewe could only find one paper reporting the fatty acids profile of CB oil [7], and nothinghas been said about the oil free fatty acids content, methylation was carried out underacidic conditions using BF3-CH3OH complex as a catalyst, to ensure total methylation ofthe fatty acids from triacylglycerols, as well as from FFA [21]. The composition of the oilsamples using different extraction techniques (Soxhlet, batch and UAE) was determinedthrough gas-chromatography, and the results are displayed in Table 2. A characteristicchromatogram of CB oil obtained for Soxhlet extraction in n-hexane is presented in Figure 1.Table 2 shows the CB oil characterization as obtained by various extraction techniques.
Table 2. CB oil characterization as obtained by various extraction techniques.
No. Fatty acid LipidNumber
Fatty acids profile *of Cnicus benedictus fruit oil (molar %)
Soxhlet extraction(n-hexane, 8 h)
Batch extraction(65 ◦C, 3 h)
UAE(50 ◦C, 15 min, 13.77 W/cm2)
1 Palmitic C16:0 5.31 ± 0.19 5.40 ± 0.15 5.50 ± 0.082 Stearic C18:0 2.03 ± 0.09 2.10 ± 0.08 2.10 ± 0.043 Oleic C18:1 18.96 ± 0.48 19.02 ± 0.42 19.01 ± 0.394 Linoleic C18:2 73.69 ± 0.87 73.48 ± 0.79 73.39 ± 0.82
Technical oil quality indices *AV (mg KOH/g oil) 2.46 ± 0.28 2.38 ± 0.16 2.44 ± 0.12FFA (as % oleic acid) 1.24 ± 0.08 1.20 ± 0.05 1.23 ± 0.04
IV (g I2/100 g oil) 143.2 ± 0.8 142.6 ± 0.6 142.8 ± 0.8SV (mg KOH/g oil) 191 ± 1 192 ± 1 191 ± 1
PV (meq. active oxygen/kg of oil) 2.5 ± 0.1 ** 2.4 ± 0.02 ** 2.7 ± 0.1 **
Total fat ‡ (g/100 g fruits) 33.20 ‡‡
* Mean values (three replicates) ± s.d.; ‡ Reported to the dry seeds; ‡‡ Determined for CB oil obtained through Soxhletextraction. ** Represent significant differences (one-way ANOVA and Duncan’s test, p < 0.05).
The fatty acid profile of CB oil is similar regardless of the extraction technique (Table 2).The most abundant fatty acid (accounting up to 73.69%) is linoleic acid (C18:2), consideredas an essential fatty acid. It is the starting point for the biosynthesis of a series ofω-6 fattyacids, eventually leading to arachidonic acid (C20:4) [20,24]. CB oil also contains importantamounts (up to 19.02%) of oleic acid (C18:1). Relatively low levels (ranging 7.34–7.60%)of saturated fatty acids (palmitic C16:0 and stearic C18:0) complete the fatty acids profileof the oil. Similar composition results (linoleic acid 71.80–75.0%, oleic acid 16.95–19.7%,
Sustainability 2021, 13, 13193 6 of 16
palmitic acid 5.95–6.67%, and stearic acid 2.72–3.29%) have recently been reported for CBcultivated in Germany [7]. No statistically significant differences were found betweendifferent extraction techniques regarding oil composition (one-way ANOVA).
Sustainability 2021, 13, x FOR PEER REVIEW 5 of 16
mixture became homogeneous), 5 mL H2SO4 98% solution (d = 1.98 g/mL, 100 mmol) dis-solved in 50 mL was added dropwise through a dropping funnel, and the mixture was maintained at reflux for 30 min. The reaction mixture was cooled to 25°C and its separa-tion into two phases (methyl esters and glycerol) indicated that the methylation had oc-curred. Cold water (100 mL, approx. 4 °C) was added, and the flask contents were trans-ferred into a 500 mL separatory funnel. FAME were extracted three times with 50 mL methylene chloride (d = 1.38 g/mL) portions. The combined organic extracts (lower layers) were washed with cold water until reaching a neutral pH, then dried on anhydrous MgSO4, and separated through centrifugation. Methylene chloride was removed with a rotary evaporator. Biodiesel was obtained (89.4% yield) as a light-yellow oil, and was characterized through 1H-NMR.
3. Results and Discussions 3.1. CB Fruits Oil Characterization
The CB fruit oil content was determined to be 33.20 ± 0.68% (reported to the dried fruits, Soxhlet method). Compared to the few literature data available on the oil content of CB fruits, this value is higher than any other previously reported, ranging between 24–29.2% [7]. Indeed, the cultivation area provides favourable pedo-climatic conditions for CB growth; however, 2020 was particularly favorable, with higher seed quality and seed production compared to previous years also registered for other Asteraceae oil plants. Since we could only find one paper reporting the fatty acids profile of CB oil [7], and nothing has been said about the oil free fatty acids content, methylation was carried out under acidic conditions using BF3-CH3OH complex as a catalyst, to ensure total methyla-tion of the fatty acids from triacylglycerols, as well as from FFA [21]. The composition of the oil samples using different extraction techniques (Soxhlet, batch and UAE) was deter-mined through gas-chromatography, and the results are displayed in Table 2. A charac-teristic chromatogram of CB oil obtained for Soxhlet extraction in n-hexane is presented in Figure 1. Table 2 shows the CB oil characterization as obtained by various extraction techniques.
Figure 1. Cnicus benedictus fruit oil (Soxhlet extraction, n-hexane, 8 h) chromatogram.
Table 2. CB oil characterization as obtained by various extraction techniques.
No. Fatty acid Lipid Number
Fatty acids profile* of Cnicus benedictus fruit oil‡ (molar %)
Soxhlet extraction (n-hexane, 8 h)
Batch extraction (65 °C, 3h)
UAE (50 °C, 15 min., 13.77 W/cm2)
1 Palmitic C16:0 5.31 ± 0.19 5.40 ± 0.15 5.50 ± 0.08 2 Stearic C18:0 2.03 ± 0.09 2.10 ± 0.08 2.10 ± 0.04 3 Oleic C18:1 18.96 ± 0.48 19.02 ± 0.42 19.01 ± 0.39
Figure 1. Cnicus benedictus fruit oil (Soxhlet extraction, n-hexane, 8 h) chromatogram.
With respect to the technical quality indices, CB oil has a relatively high IV (143.2 gI2/100 g oil), due to its high content of C18:2, and an SV of 191 mg KOH/g oil, whichconfirms the mainly C18 fatty acids oil composition.
It has been reported in the literature [25] that UAE may promote oxidative degradationof the biologically active compounds. This could constitute a considerable disadvantage ofthe UAE technique, restricting its utility. In this study, the evaluation of the contribution ofultrasounds on the lipid degradation during UAE was formulated based on specific oilquality indices (i.e., peroxide value PV, acid value AV, and the free fatty acids FFA). PV,AV and FFA were determined on three samples (one for each extraction technique, takingthe longest exposure time, temperature, and process intensity). According to Table 2, PVpresents statistically significant differences (p < 0.05) among the samples obtained throughSoxhlet, batch extraction, and UAE. However, no major peroxidation process occurredduring these experiments; only in the case of UAE did PV slightly increase from 2.5 meq.active oxygen/kg of oil (Soxhlet) to 2.7 meq. active oxygen/kg of oil (UAE), confirmingthat ultrasounds may increase lipid peroxidation. On the other hand, PV values were low,despite the high levels of PUFA; a possible explanation is that peroxidation was preventedor limited by three factors: (1) CB oil is naturally protected against peroxidation by its highlevels of tocopherols [7]; (2) short exposure time (max. 15 min.); and (3) temperature waskept at max. 50 ◦C. No important triacylglycerols hydrolysis occurred during extractions,with AV and FFA having close values (2.38–2.46 mg KOH/g oil and 1.20–1.24% expressedas oleic acid, respectively).
3.2. Extraction Yield of CB Oil Batch Extraction Optimized by RSM
Table 3 presents the experimental design for batch extraction and UAE of CB oil.
Sustainability 2021, 13, 13193 7 of 16
Table 3. BBD settings of independent variables and the experimental and predicted values for CB oil extraction efficiencyfor batch extraction (Y1) and extraction efficiency (Y2) for UAE, respectively.
RunX1 X2 X2 Y1 (%) Y2 (%)
x1 x2 x3 Experimental Predicted Experimental Predicted
1 −1 −1 0 23.02 23.11 29.48 29.202 −1 0 −1 23.12 23.13 28.51 28.443 −1 0 1 23.62 23.62 28.60 28.774 −1 1 0 23.88 23.77 31.07 31.245 0 −1 −1 23.22 23.11 28.56 28.906 0 −1 1 24.38 24.27 29.35 29.457 0 0 0 24.62 24.72 28.00 28.378 0 1 −1 24.02 24.12 30.44 30.339 0 1 1 24.84 24.94 31.88 31.5310 1 −1 0 24.44 24.55 30.98 30.8011 1 0 −1 24.26 24.25 29.39 29.2112 1 0 1 25.75 25.74 30.56 30.6213 1 1 0 25.68 25.58 32.00 32.2714 0 0 0 25.00 24.72 28.00 28.3715 0 0 0 24.50 24.72 28.20 28.3716 0 0 0 24.80 24.72 27.99 28.3717 0 0 0 24.68 24.72 28.10 28.37
The expression of Y1 (extraction yield for batch extraction) in terms of coded variablesis reflected as a second order model in Equation (3):
Y1 = 24.72 + 0.811X1 − 0.196X12 + 0.420X2 − 0.268X2
2 + 0.496X3 − 0.336X32
+0.095X1X2 + 0.247X1X3 − 0.085X2X3(3)
F-test, p-value and ANOVA were applied to verify the statistical significance of theregression model for the response surface second order model (Table 4).
Table 4. ANOVA test for Y1 response function (extraction yield) for batch extraction.
Term Sum ofSquares DF Mean
Square F-Value p-Value
Model 10.00263 9 1.1114 33.34328 0.000063 a
X1 5.26501 1 5.265013 145.4423 0.000271 a
X2 1.41120 1 1.411200 38.9834 0.003354 a
X3 1.97011 1 1.970112 54.4230 0.001800 a
X12 0.16216 1 0.162164 4.4797 0.101739
X22 0.30411 1 0.304112 8.4009 0.044188 a
X32 0.47606 1 0.476059 13.1508 0.022231 a
X1X2 0.03610 1 0.036100 0.9972 0.374495X1X3 0.24502 1 0.245025 6.7686 0.059943X2X3 0.02890 1 0.028900 0.7983 0.422089
Lack of Fit 0.08852 3 0.029508 0.8151 0.548753Pure Error 0.14480 4 0.036200
Total SS 10.23595 16R2 = 0.977 Adj R2 = 0.947 CV = 3.28
a Values are significant at p < 0.05.
It can be observed from Table 4 that the quadratic model is highly significant, with avery high F value of 33.343, and a low p-value < 0.000063. These values represent proof thatthe obtained model could accurately describe the relationship between the extraction yieldand the independent variables for CB oil extraction, in the case of batch extraction [19].
The high values of R2 (0.977) and of Adj R2 (0.947) suggest good correlation betweenexperimental and predicted values. Based on the value of Adj R2, only 5.3% of the totalvariation could not be explained by the proposed model. The coefficient of variance (CV)
Sustainability 2021, 13, 13193 8 of 16
is less than 5%, which supports the good fit of the mathematical model. Using the p-value(95% confidence level) to examine the significance of the model coefficients, the effectslower than 0.05 were considered significant. Consequently, it is evident that the extractionyield is influenced by the linear coefficients (X1, X2, and X3) and by the quadratic termsX2
2 and X32, the p-values being less than 0.5 for all these terms.
The simplified fitted quadratic model obtained by neglecting the non-significant terms(p-values > 0.05) in Equation (3) is described by Equation (4):
Y1 = 24.72 + 0.811X1 − 0.268X22 + 0.420 X2 + 0.496X3 − 0.336X3
2 (4)
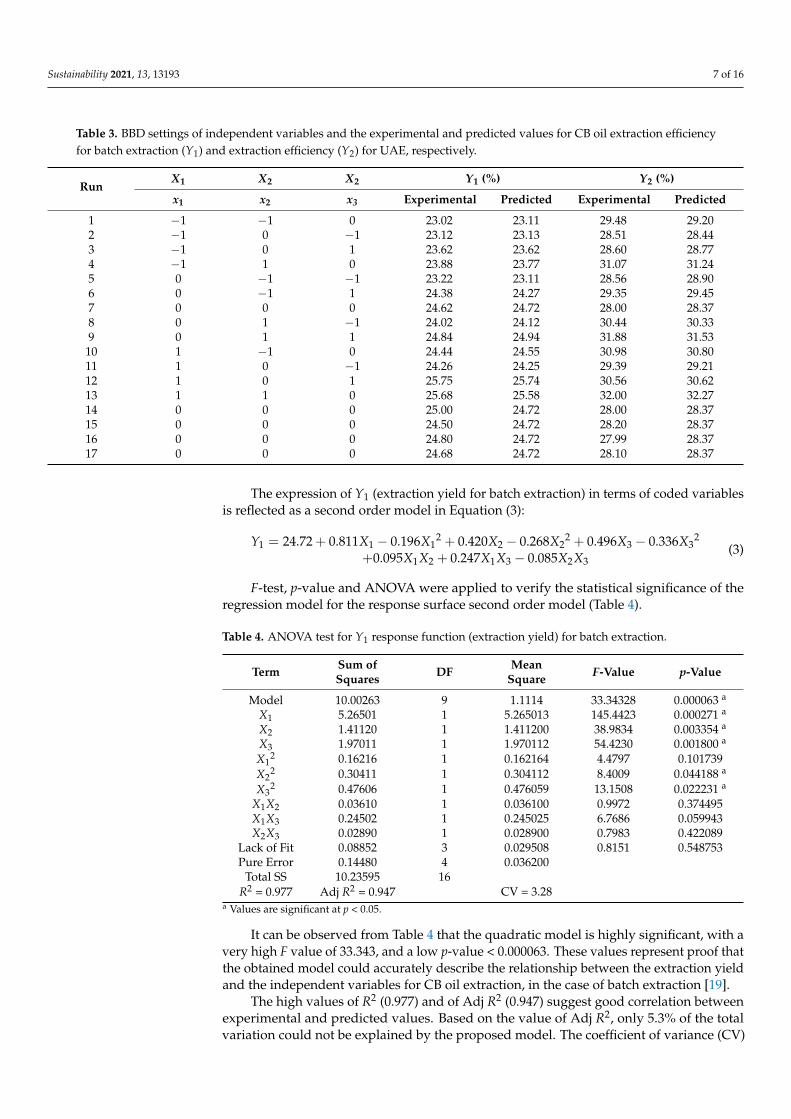
The influence of extraction parameters on the CB oil extraction efficiency were visual-ized using the response surface plots. From Figure 2a, it can be seen that both temperatureand solid/liquid ratio exhibit a significant effect upon extraction yield of CB oil; thisparameter is increasing with the increase of the two variables. Figure 2b represents theresponse surface plot of solid/liquid ratio and time. It can be observed that the solid/liquidratio has a more pronounced influence upon extraction yield in comparison with time.Figure 2c represents the response surface plot of the two independent variables extractiontime and temperature. It is evident that both variables are influencing the extraction yield,the maximum being attended for a high temperature and a long extraction time.
Sustainability 2021, 13, x FOR PEER REVIEW 8 of 16
variation could not be explained by the proposed model. The coefficient of variance (CV) is less than 5%, which supports the good fit of the mathematical model. Using the p-value (95% confidence level) to examine the significance of the model coefficients, the effects lower than 0.05 were considered significant. Consequently, it is evident that the extraction yield is influenced by the linear coefficients (X1, X2, and X3) and by the quadratic terms X22 and X32, the p-values being less than 0.5 for all these terms.
The simplified fitted quadratic model obtained by neglecting the non-significant terms (p-values > 0.05) in Equation (3) is described by Equation (4):
𝑌 = 24.72 + 0.811𝑋 − 0.268𝑋 + 0.420 𝑋 + 0.496𝑋 − 0.336𝑋 (4)
The influence of extraction parameters on the CB oil extraction efficiency were visu-alized using the response surface plots. From Figure 2a, it can be seen that both tempera-ture and solid/liquid ratio exhibit a significant effect upon extraction yield of CB oil; this parameter is increasing with the increase of the two variables. Figure 2b represents the response surface plot of solid/liquid ratio and time. It can be observed that the solid/liquid ratio has a more pronounced influence upon extraction yield in comparison with time. Figure 2c represents the response surface plot of the two independent variables extraction time and temperature. It is evident that both variables are influencing the extraction yield, the maximum being attended for a high temperature and a long extraction time.
Figure 2. (a), (b), (c) response surface plots for the influence of independent variables (coded symbols) of batch extraction on CB extraction yield, (d) desirability profile for optimal CB oil batch extraction parameters.
3.3. Desirability Optimization for CB Oil for Batch Extraction
Figure 2. (a–c) response surface plots for the influence of independent variables (coded symbols) of batch extraction on CBextraction yield, (d) desirability profile for optimal CB oil batch extraction parameters.
Sustainability 2021, 13, 13193 9 of 16
3.3. Desirability Optimization for CB Oil for Batch Extraction
Extraction efficiency of CB oil (batch extraction) was optimised by using the desirabil-ity function [26]. The values of optimal conditions were 1 for all variables: temperature(65 ◦C), time (3 h), and solid liquid ratio (1/16). The optimum value of Y1 was found to be25.75% in agreement with the experimental value determined in the same experimentalconditions (Y1exp = 26.00 ± 0.28%). Profiles for predicted oil extraction efficiency andthe desirability level of the influencing factors for optimal conditions in the case of batchextraction are presented in Figure 2d.
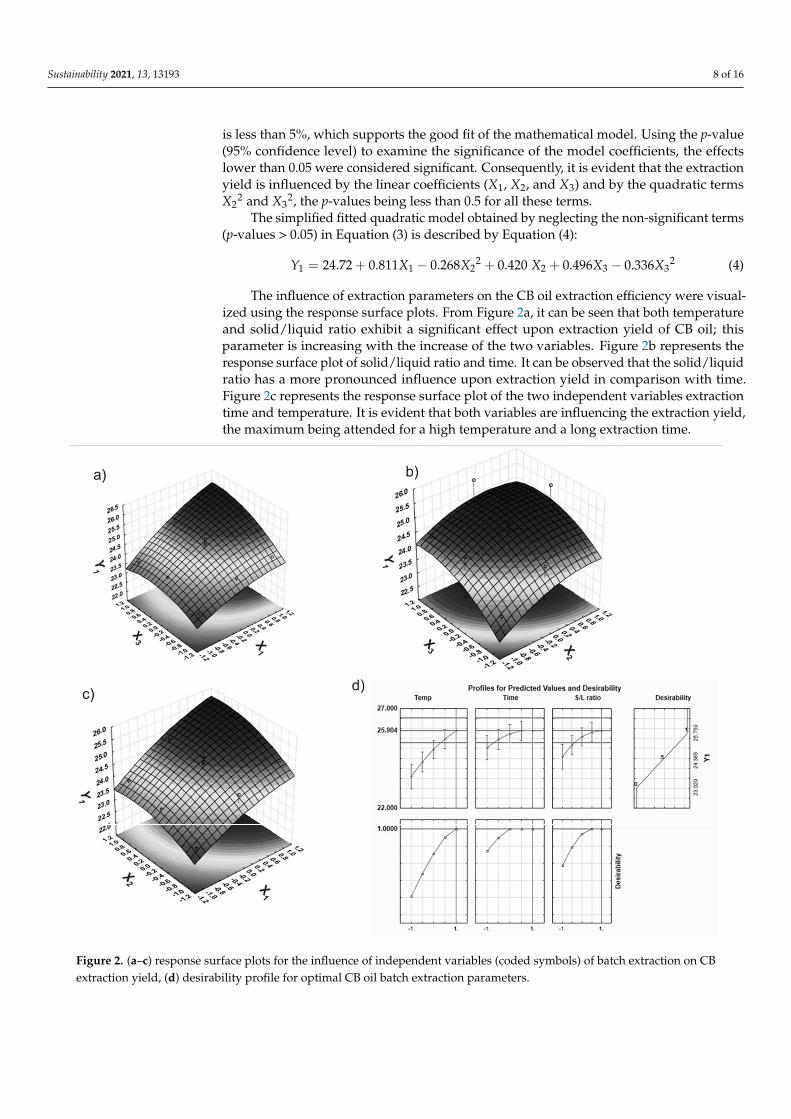
The morphology of CB fruits was examined through SEM before and after extractionusing different techniques: (a) Soxhlet extraction, and (b) batch extraction.
In Figure 3a,b a compact structure of the raw vegetal material is observed beforeextraction. After Soxhlet extraction (Figure 3c), the vegetal material appears more depletedas compared with batch extraction, which is in agreement with the lower extraction yieldin the case of the batch approach (Figure 3d).
Sustainability 2021, 13, x FOR PEER REVIEW 9 of 16
conditions (Y1exp = 26.00 ± 0.28%). Profiles for predicted oil extraction efficiency and the desirability level of the influencing factors for optimal conditions in the case of batch ex-traction are presented in Figure 2d.
The morphology of CB fruits was examined through SEM before and after extraction using different techniques: (a) Soxhlet extraction, and (b) batch extraction.
In Figure 3a,b a compact structure of the raw vegetal material is observed before ex-traction. After Soxhlet extraction (Figure 3c), the vegetal material appears more depleted as compared with batch extraction, which is in agreement with the lower extraction yield in the case of the batch approach (Figure 3d).
Figure 3. SEM images of the CB grinded fruits: (a,b) before extraction at different magnitudes; (c) after Soxhlet extraction, and (d) after batch extraction.
3.4. Extraction Yield of CB Oil UAE Optimized by RSM Equation (5) presents the second order model for Y2 (extraction yield for CB oil for
UAE) in terms of coded variables: 𝑌 = 24.418 + 0.677𝑥 + 0.787𝑥 + 0.886𝑥 + 1.664𝑥 + 0.418𝑥 + 0.0347𝑥− 0.220𝑥 𝑥 + 0.245𝑥 𝑥 + 0.222𝑥 𝑥 (5)
F-test, p-value, and ANOVA were applied to verify the statistical significance of the regression model for the response surface second order model (Table 5).
Table 5. ANOVA test for Y2 response function (extraction yield) for UAE.
Term Sum of Squares DF Mean Square F-Value p-Value Model 27.01459 9 0.138265 21.70919 0.000261 a
x1 3.67205 1 3.67205 21.08919 0.010089 a
x2 6.28351 1 6.28351 36.08725 0.003865 a
x3 1.40281 1 1.40281 8.05658 0.046943 a
x12 2.60953 1 2.60953 14.98694 0.017974 a
x22 11.66902 1 11.66902 67.01712 0.001213 a
x32 0.00508 1 0.00508 0.02920 0.872612
Figure 3. SEM images of the CB grinded fruits: (a,b) before extraction at different magnitudes; (c) after Soxhlet extraction,and (d) after batch extraction.
3.4. Extraction Yield of CB Oil UAE Optimized by RSM
Equation (5) presents the second order model for Y2 (extraction yield for CB oil forUAE) in terms of coded variables:
Y2 = 24.418 + 0.677x1 + 0.787x12 + 0.886x2 + 1.664x2
2 + 0.418x3 + 0.0347x32
−0.220x1x2 + 0.245x1x3 + 0.222x2x3(5)
Sustainability 2021, 13, 13193 10 of 16
F-test, p-value, and ANOVA were applied to verify the statistical significance of theregression model for the response surface second order model (Table 5).
Table 5. ANOVA test for Y2 response function (extraction yield) for UAE.
Term Sum of Squares DF MeanSquare F-Value p-Value
Model 27.01459 9 0.138265 21.70919 0.000261 a
x1 3.67205 1 3.67205 21.08919 0.010089 a
x2 6.28351 1 6.28351 36.08725 0.003865 a
x3 1.40281 1 1.40281 8.05658 0.046943 a
x12 2.60953 1 2.60953 14.98694 0.017974 a
x22 11.66902 1 11.66902 67.01712 0.001213 a
x32 0.00508 1 0.00508 0.02920 0.872612
x1x2 0.19360 1 0.19360 1.11188 0.351153x1x3 0.24010 1 0.24010 1.37893 0.305422x2x3 0.19802 1 0.19802 1.13729 0.346316
Lack of Fit 0.27138 3 0.09046 0.51952 0.691268Pure Error 0.69648 4 0.17412
Total SS 27.98245 16R2 = 0.9654 Adj R2 = 0.9209 CV = 4.5%
a Values are significant at p < 0.05.
The ANOVA analysis from Table 5 revealed that the model is statistically significant,with a very high F value of 21.709 at 95% confidence level. Since R2 and adjusted R2 arehigher than 0.90, we can conclude that the experimental results agree with the predictedvalues, a conclusion which is also supported by the results presented in Table 2. Only 7.91%of the total system variation could not be explained by the suggested model. The coefficientof variation (CV) has a low value (<5%), suggesting a high accuracy of the experiment.Neglection of non-significant terms (p-values > 0.05) in Equation (5) leads to a simplifiedfitted quadratic model, i.e., Equation (6):
Y2 = 24.418 + 0.677x1 + 0.787x12 + 0.886x2 + 1.664x2
2 + 0.418x3 (6)
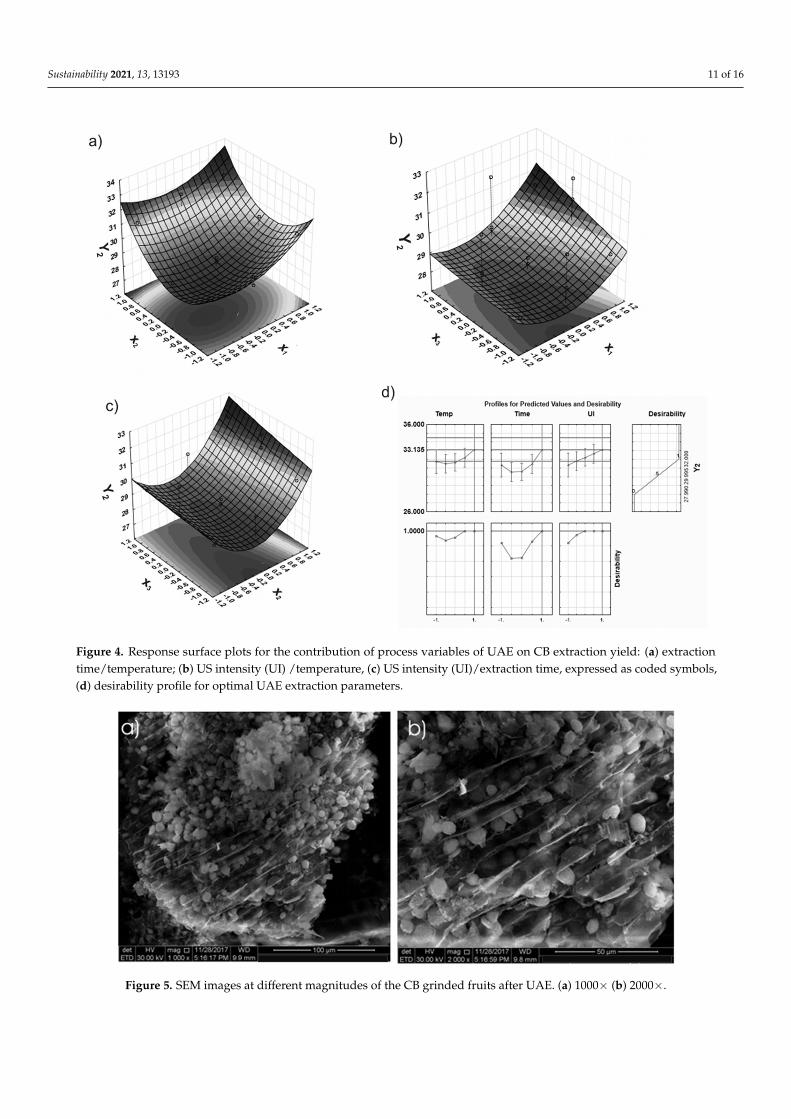
Figure 4 presents the response surface plot of extraction yield for UAE (Y2) as afunction of time, temperature, and US intensity. From Figure 4a,b it can be seen that theextraction time and temperature have a more pronounced influence upon extraction yield,in comparison with US intensity. The increase of the extraction time and temperaturefavours CB oil extraction in the case of UAE.
3.5. Desirability Optimization for CB Oil for UAE
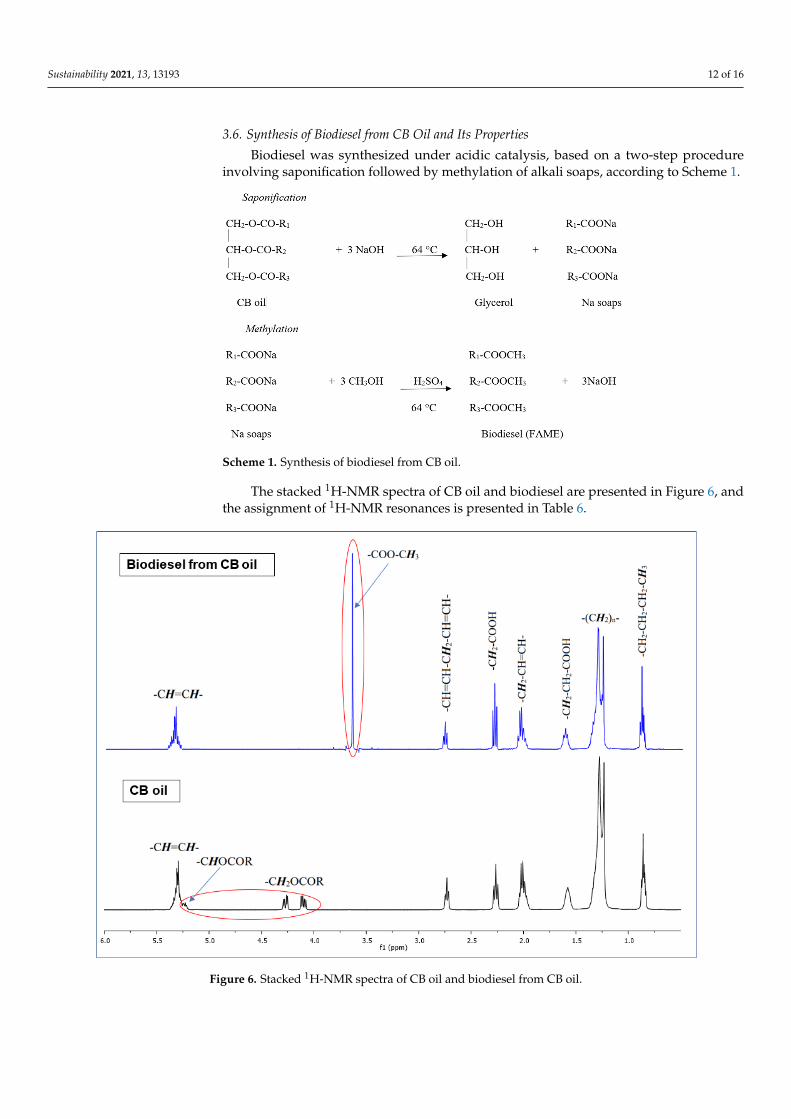
Extraction efficiency of CB oil (UAE) was also optimized by means of the desirabilityfunction. The values of optimal conditions were 1 for all variables: temperature (50 ◦C),time (15 min), and US intensity (13.77 W/cm2). The solid/liquid ratio was kept constantat 1/16 g/mL, as in the batch extraction experiment. The optimum value of Y2 wasfound to be 32 % in correlation with the experimental value, determined under similarworking conditions (Y2exp = 31.1 ± 0.44%). Profiles for predicted oil extraction yield andthe desirability level for the influencing factors for optimal conditions of UAE extractionare presented in Figure 4d. CB fruits were analysed through SEM after UAE, and theimages are presented in Figure 5. If we compare the images of the CB fruits after UAEwith those presented in Figure 3c,d, it is evident that the US produces oil depletion in thevegetal matrix.
Sustainability 2021, 13, 13193 11 of 16Sustainability 2021, 13, x FOR PEER REVIEW 11 of 16
Figure 4. Response surface plots for the contribution of process variables of UAE on CB extraction yield: (a) extraction time/temperature; (b) US intensity (UI) /temperature, (c) US intensity (UI) /extraction time, expressed as coded symbols, (d) desirability profile for optimal UAE extraction parameters.
3.5. Desirability Optimization for CB Oil for UAE Extraction efficiency of CB oil (UAE) was also optimized by means of the desirability
function. The values of optimal conditions were 1 for all variables: temperature (50 °C), time (15 min), and US intensity (13.77 W/cm2). The solid/liquid ratio was kept constant at 1/16 g/mL, as in the batch extraction experiment. The optimum value of Y2 was found to be 32 % in correlation with the experimental value, determined under similar working conditions (Y2exp = 31.1 ± 0.44%). Profiles for predicted oil extraction yield and the desira-bility level for the influencing factors for optimal conditions of UAE extraction are pre-sented in Figure 4d. CB fruits were analysed through SEM after UAE, and the images are presented in Figure 5. If we compare the images of the CB fruits after UAE with those presented in Figure 3c,d, it is evident that the US produces oil depletion in the vegetal matrix.
Figure 4. Response surface plots for the contribution of process variables of UAE on CB extraction yield: (a) extractiontime/temperature; (b) US intensity (UI) /temperature, (c) US intensity (UI)/extraction time, expressed as coded symbols,(d) desirability profile for optimal UAE extraction parameters.
Sustainability 2021, 13, x FOR PEER REVIEW 12 of 16
Figure 5. SEM images at different magnitudes of the CB grinded fruits after UAE.
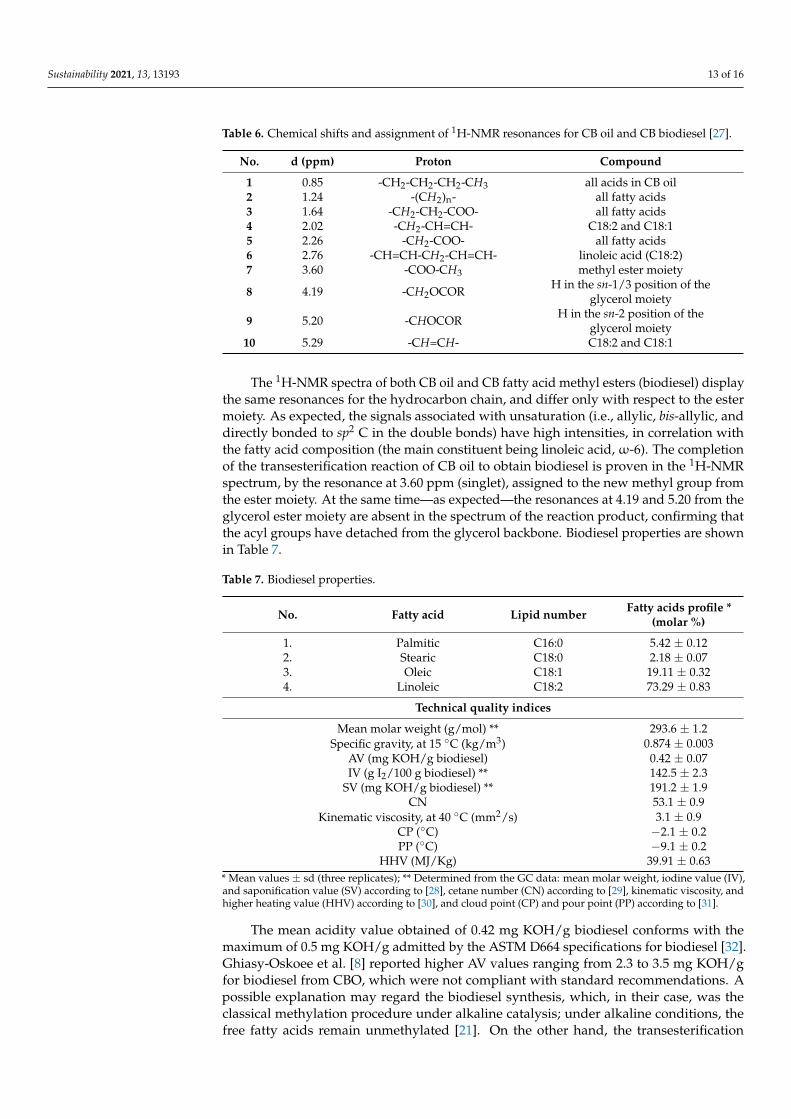
3.6. Synthesis of Biodiesel from CB Oil and Its Properties Biodiesel was synthesized under acidic catalysis, based on a two-step procedure in-
volving saponification followed by methylation of alkali soaps, according to Scheme 1.
Scheme 1. Synthesis of biodiesel from CB oil.
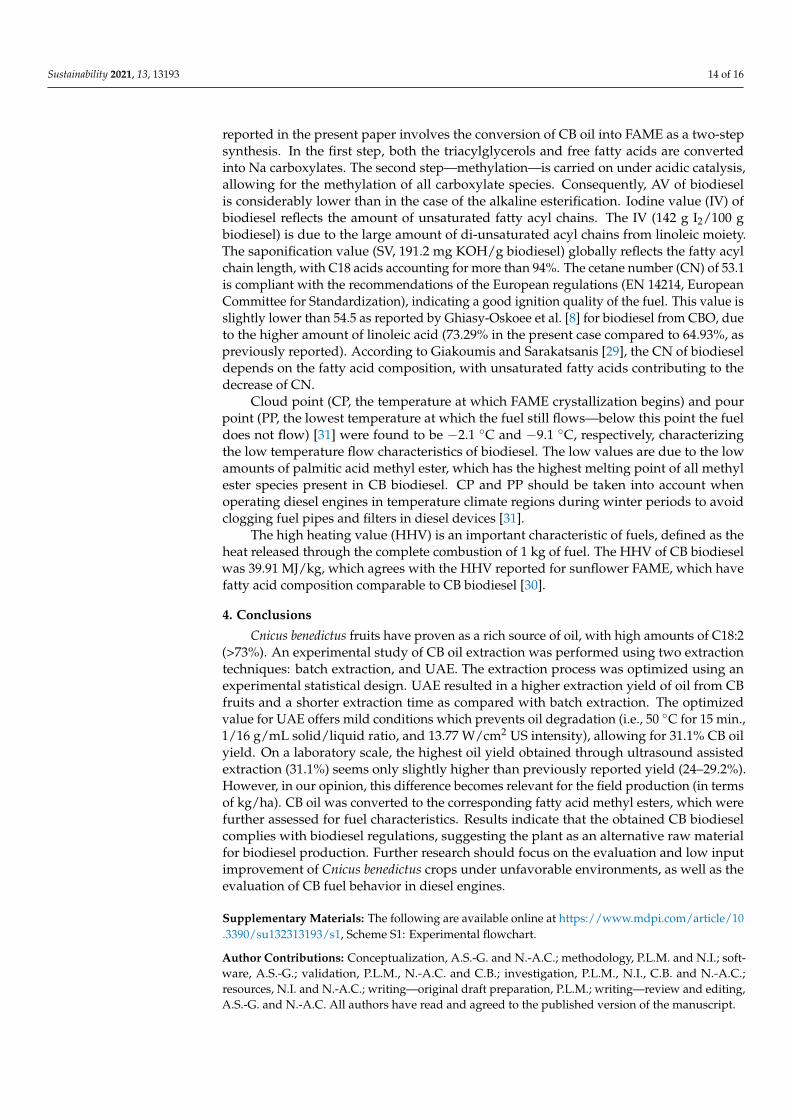
The stacked 1H-NMR spectra of CB oil and biodiesel are presented in Figure 6, and the assignment of 1H-NMR resonances is presented in Table 6.
Figure 5. SEM images at different magnitudes of the CB grinded fruits after UAE. (a) 1000× (b) 2000×.
Sustainability 2021, 13, 13193 12 of 16
3.6. Synthesis of Biodiesel from CB Oil and Its Properties
Biodiesel was synthesized under acidic catalysis, based on a two-step procedureinvolving saponification followed by methylation of alkali soaps, according to Scheme 1.
Sustainability 2021, 13, x FOR PEER REVIEW 12 of 16
Figure 5. SEM images at different magnitudes of the CB grinded fruits after UAE.
3.6. Synthesis of Biodiesel from CB Oil and Its Properties Biodiesel was synthesized under acidic catalysis, based on a two-step procedure in-
volving saponification followed by methylation of alkali soaps, according to Scheme 1.
Scheme 1. Synthesis of biodiesel from CB oil.
The stacked 1H-NMR spectra of CB oil and biodiesel are presented in Figure 6, and the assignment of 1H-NMR resonances is presented in Table 6.
Scheme 1. Synthesis of biodiesel from CB oil.
The stacked 1H-NMR spectra of CB oil and biodiesel are presented in Figure 6, andthe assignment of 1H-NMR resonances is presented in Table 6.
Sustainability 2021, 13, x FOR PEER REVIEW 13 of 16
Figure 6. Stacked 1H-NMR spectra of CB oil and biodiesel from CB oil.
Table 6. Chemical shifts and assignment of 1H-NMR resonances for CB oil and CB biodiesel [27].
No. δ ( ppm ) Proton Compound 1 0.85 -CH2-CH2-CH2-CH3 all acids in CB oil 2 1.24 -(CH2)n- all fatty acids 3 1.64 -CH2-CH2-COO- all fatty acids 4 2.02 -CH2-CH=CH- C18:2 and C18:1 5 2.26 -CH2-COO- all fatty acids 6 2.76 -CH=CH-CH2-CH=CH- linoleic acid (C18:2) 7 3.60 -COO-CH3 methyl ester moiety
8 4.19 -CH2OCOR H in the sn-1/3 position of the glycerol moiety
9 5.20 -CHOCOR H in the sn-2 position of the glycerol moiety 10 5.29 -CH=CH- C18:2 and C18:1
The 1H-NMR spectra of both CB oil and CB fatty acid methyl esters (biodiesel) dis-play the same resonances for the hydrocarbon chain, and differ only with respect to the ester moiety. As expected, the signals associated with unsaturation (i.e., allylic, bis-allylic, and directly bonded to sp2 C in the double bonds) have high intensities, in correlation with the fatty acid composition (the main constituent being linoleic acid, ω-6). The completion of the transesterification reaction of CB oil to obtain biodiesel is proven in the 1H-NMR spectrum, by the resonance at 3.60 ppm (singlet), assigned to the new methyl group from the ester moiety. At the same time—as expected—the resonances at 4.19 and 5.20 from the glycerol ester moiety are absent in the spectrum of the reaction product, confirming that the acyl groups have detached from the glycerol backbone. Biodiesel properties are shown in Table 7.
Figure 6. Stacked 1H-NMR spectra of CB oil and biodiesel from CB oil.
Sustainability 2021, 13, 13193 13 of 16
Table 6. Chemical shifts and assignment of 1H-NMR resonances for CB oil and CB biodiesel [27].
No. d (ppm) Proton Compound
1 0.85 -CH2-CH2-CH2-CH3 all acids in CB oil2 1.24 -(CH2)n- all fatty acids3 1.64 -CH2-CH2-COO- all fatty acids4 2.02 -CH2-CH=CH- C18:2 and C18:15 2.26 -CH2-COO- all fatty acids6 2.76 -CH=CH-CH2-CH=CH- linoleic acid (C18:2)7 3.60 -COO-CH3 methyl ester moiety
8 4.19 -CH2OCOR H in the sn-1/3 position of theglycerol moiety
9 5.20 -CHOCOR H in the sn-2 position of theglycerol moiety
10 5.29 -CH=CH- C18:2 and C18:1
The 1H-NMR spectra of both CB oil and CB fatty acid methyl esters (biodiesel) displaythe same resonances for the hydrocarbon chain, and differ only with respect to the estermoiety. As expected, the signals associated with unsaturation (i.e., allylic, bis-allylic, anddirectly bonded to sp2 C in the double bonds) have high intensities, in correlation withthe fatty acid composition (the main constituent being linoleic acid,ω-6). The completionof the transesterification reaction of CB oil to obtain biodiesel is proven in the 1H-NMRspectrum, by the resonance at 3.60 ppm (singlet), assigned to the new methyl group fromthe ester moiety. At the same time—as expected—the resonances at 4.19 and 5.20 from theglycerol ester moiety are absent in the spectrum of the reaction product, confirming thatthe acyl groups have detached from the glycerol backbone. Biodiesel properties are shownin Table 7.
Table 7. Biodiesel properties.
No. Fatty acid Lipid number Fatty acids profile *(molar %)
1. Palmitic C16:0 5.42 ± 0.122. Stearic C18:0 2.18 ± 0.073. Oleic C18:1 19.11 ± 0.324. Linoleic C18:2 73.29 ± 0.83
Technical quality indices
Mean molar weight (g/mol) ** 293.6 ± 1.2Specific gravity, at 15 ◦C (kg/m3) 0.874 ± 0.003
AV (mg KOH/g biodiesel) 0.42 ± 0.07IV (g I2/100 g biodiesel) ** 142.5 ± 2.3
SV (mg KOH/g biodiesel) ** 191.2 ± 1.9CN 53.1 ± 0.9
Kinematic viscosity, at 40 ◦C (mm2/s) 3.1 ± 0.9CP (◦C) −2.1 ± 0.2PP (◦C) −9.1 ± 0.2
HHV (MJ/Kg) 39.91 ± 0.63* Mean values ± sd (three replicates); ** Determined from the GC data: mean molar weight, iodine value (IV),and saponification value (SV) according to [28], cetane number (CN) according to [29], kinematic viscosity, andhigher heating value (HHV) according to [30], and cloud point (CP) and pour point (PP) according to [31].
The mean acidity value obtained of 0.42 mg KOH/g biodiesel conforms with themaximum of 0.5 mg KOH/g admitted by the ASTM D664 specifications for biodiesel [32].Ghiasy-Oskoee et al. [8] reported higher AV values ranging from 2.3 to 3.5 mg KOH/gfor biodiesel from CBO, which were not compliant with standard recommendations. Apossible explanation may regard the biodiesel synthesis, which, in their case, was theclassical methylation procedure under alkaline catalysis; under alkaline conditions, thefree fatty acids remain unmethylated [21]. On the other hand, the transesterification
Sustainability 2021, 13, 13193 14 of 16
reported in the present paper involves the conversion of CB oil into FAME as a two-stepsynthesis. In the first step, both the triacylglycerols and free fatty acids are convertedinto Na carboxylates. The second step—methylation—is carried on under acidic catalysis,allowing for the methylation of all carboxylate species. Consequently, AV of biodieselis considerably lower than in the case of the alkaline esterification. Iodine value (IV) ofbiodiesel reflects the amount of unsaturated fatty acyl chains. The IV (142 g I2/100 gbiodiesel) is due to the large amount of di-unsaturated acyl chains from linoleic moiety.The saponification value (SV, 191.2 mg KOH/g biodiesel) globally reflects the fatty acylchain length, with C18 acids accounting for more than 94%. The cetane number (CN) of 53.1is compliant with the recommendations of the European regulations (EN 14214, EuropeanCommittee for Standardization), indicating a good ignition quality of the fuel. This value isslightly lower than 54.5 as reported by Ghiasy-Oskoee et al. [8] for biodiesel from CBO, dueto the higher amount of linoleic acid (73.29% in the present case compared to 64.93%, aspreviously reported). According to Giakoumis and Sarakatsanis [29], the CN of biodieseldepends on the fatty acid composition, with unsaturated fatty acids contributing to thedecrease of CN.
Cloud point (CP, the temperature at which FAME crystallization begins) and pourpoint (PP, the lowest temperature at which the fuel still flows—below this point the fueldoes not flow) [31] were found to be −2.1 ◦C and −9.1 ◦C, respectively, characterizingthe low temperature flow characteristics of biodiesel. The low values are due to the lowamounts of palmitic acid methyl ester, which has the highest melting point of all methylester species present in CB biodiesel. CP and PP should be taken into account whenoperating diesel engines in temperature climate regions during winter periods to avoidclogging fuel pipes and filters in diesel devices [31].
The high heating value (HHV) is an important characteristic of fuels, defined as theheat released through the complete combustion of 1 kg of fuel. The HHV of CB biodieselwas 39.91 MJ/kg, which agrees with the HHV reported for sunflower FAME, which havefatty acid composition comparable to CB biodiesel [30].
4. Conclusions
Cnicus benedictus fruits have proven as a rich source of oil, with high amounts of C18:2(>73%). An experimental study of CB oil extraction was performed using two extractiontechniques: batch extraction, and UAE. The extraction process was optimized using anexperimental statistical design. UAE resulted in a higher extraction yield of oil from CBfruits and a shorter extraction time as compared with batch extraction. The optimizedvalue for UAE offers mild conditions which prevents oil degradation (i.e., 50 ◦C for 15 min.,1/16 g/mL solid/liquid ratio, and 13.77 W/cm2 US intensity), allowing for 31.1% CB oilyield. On a laboratory scale, the highest oil yield obtained through ultrasound assistedextraction (31.1%) seems only slightly higher than previously reported yield (24–29.2%).However, in our opinion, this difference becomes relevant for the field production (in termsof kg/ha). CB oil was converted to the corresponding fatty acid methyl esters, which werefurther assessed for fuel characteristics. Results indicate that the obtained CB biodieselcomplies with biodiesel regulations, suggesting the plant as an alternative raw materialfor biodiesel production. Further research should focus on the evaluation and low inputimprovement of Cnicus benedictus crops under unfavorable environments, as well as theevaluation of CB fuel behavior in diesel engines.
Supplementary Materials: The following are available online at https://www.mdpi.com/article/10.3390/su132313193/s1, Scheme S1: Experimental flowchart.
Author Contributions: Conceptualization, A.S.-G. and N.-A.C.; methodology, P.L.M. and N.I.; soft-ware, A.S.-G.; validation, P.L.M., N.-A.C. and C.B.; investigation, P.L.M., N.I., C.B. and N.-A.C.;resources, N.I. and N.-A.C.; writing—original draft preparation, P.L.M.; writing—review and editing,A.S.-G. and N.-A.C. All authors have read and agreed to the published version of the manuscript.
Sustainability 2021, 13, 13193 15 of 16
Funding: This research received no external funding. The APC was funded by the University PO-LITEHNICA of Bucharest through “Engineer in Europe” project, identified by no. 140/GP/19.04.2021,through the Romanian Ministry of Education fund for special situations financing.
Acknowledgments: The authors gratefully acknowledge Marta Stroescu for fruitful discussions andsuggestions regarding the optimization of oil extraction, and Steluta Radu from NARDI Fundulea forkindly providing the first batch of CB fruits.
Conflicts of Interest: The authors declare no conflict of interest. The funders had no role in the designof the study; in the collection, analyses, or interpretation of data; in the writing of the manuscript, orin the decision to publish the results.
References1. Ghiasy-Oskoee, M.; Agha Alikhani, M.; Sefidkon, F.; Mokhtassi-Bidgoli, A.; Ayyari, M. Blessed thistle agronomic and phytochem-
ical response to nitrogen and plant density. Ind. Crops Prod. 2018, 122, 566–573. [CrossRef]2. Al-Snafi, A.E. The Constituents and Pharmacology of Cnicus Benedictus-A Review. Pharm. Chem. J. 2016, 3, 129–135.3. Paun, G.; Neagu, E.; Albu, C.; Radu, G.L. Inhibitory potential of some Romanian medicinal plants against enzymes linked to
neurodegenerative diseases and their antioxidant activity. Pharmacogn. Mag. 2015, 11 (Suppl. 1), S110–S116. [PubMed]4. Szabó, I.; Pallag, A.; Bidar, C.F. The antimicrobial activity of the Cnicus benedictus L. extracts. An. Univ. Din Oradea Fasc. Biol. 2009,
Tom XVI 1, 126–128.5. Djamila, C.; Akym, A.; Faiza, M.; Chahinez, B.; Nacer-bey, N. Anatomical, phytochemical and pharmacological studies of roots of
Cnicus benedictus L. Int. J. Med. Plant Res. 2013, 2, 204–208.6. Maier, M.; Oelbermann, A.-L.; Renner, M.; Weidner, E. Screening of European medicinal herbs on their tannin content–New
potential tanning agents for the leather industry. Ind. Crops Prod. 2017, 99, 19–26. [CrossRef]7. Horn, G.; Kupfer, A.; Rademacher, A.; Kluge, H.; Kalbitz, J.; Eißner, H.; Drager, B. Cnicus benedictus as a potential low input oil
crop. Eur. J. Lipid Sci. Technol. 2015, 117, 561–566. [CrossRef]8. Ghiasy-Oskoee, M.; Hatterman-Valenti, H.; Monono, E.; Agha Alikhani, M. Blessed thistle a promising species on North Dakota,
USA marginal lands: Agronomic productivity, oil properties and biodiesel potential. Ecol. Eng. 2020, 155, 105908. [CrossRef]9. Baricevic, D.; Zupancic, A. Conservation of genetic resources of medicinal and aromatic plants in Europe. Rep. Netw. Coord. Group
Minor Crop. 1999, 16, 16–19.10. Supriyanto, E.; Sentanuhady, J.; Dwiputra, A.; Permana, A.; Muflikhun, M.A. The Recent Progress of Natural Sources and
Manufacturing Process of Biodiesel: A Review. Sustainability 2021, 13, 5599. [CrossRef]11. Zulqarnain; Ayoub, M.; Yusoff, M.H.M.; Nazir, M.H.; Zahid, I.; Ameen, M.; Sher, F.; Floresyona, D.; Budi Nursanto, E. A
ComprehensiveReview on Oil Extraction and Biodiesel Production Technologies. Sustainability 2021, 13, 788. [CrossRef]12. Chemat, F.; Rombaut, N.; Sicaire, A.-G.; Meullemiestre, A.; Fabiano-Tixier, A.-S.; Abert-Vian, M. Ultrasound assisted extraction of
food and natural products. Mechanisms, techniques, combinations, protocols and applications. A review. Ultrason. Sonochem.2017, 34, 540–560.
13. Pandey, A.; Belwal, T.; Chandra Sekar, K.; Bhatt, I.D.; Rawal, R.S. Optimization of ultrasonic-assisted extraction (UAE) of phenolicsand antioxidant compounds from rhizomes of Rheum moorcroftianum using response surface methodology (RSM). Ind. Crops Prod.2018, 119, 218–225. [CrossRef]
14. Nour, V.; Trandafir, I.; Cosmulescu, S. Optimization of ultrasound-assisted hydroalcoholic extraction of phenolic compoundsfrom walnut leaves using response surface methodology. Pharm. Biol. 2016, 54, 2176–2187. [CrossRef] [PubMed]
15. Chanioti, S.; Tzia, C. Optimization of ultrasound-assisted extraction of oil from olive pomace using response surface technology:Oil recovery, unsaponifiable matter, total phenol content and antioxidant activity. LWT-Food Sci. Technol. 2017, 79, 178–189.[CrossRef]
16. Baiano, A. Recovery of Biomolecules from Food Wastes—A Review. Molecules 2014, 19, 14821–14842. [CrossRef]17. Vinatoru, M.; Mason, T.J.; Calinescu, I. Ultrasonically assisted extraction (UAE) and microwave assisted extraction (MAE) of
functional compounds from plant materials. TrAC-Trend Anal. Chem. 2017, 97, 159–178. [CrossRef]18. Liu, Y.; Wei, S.; Liao, M. Optimization of ultrasonic extraction of phenolic compounds from Euryale ferox seed shells using
response surface methodology. Ind. Crops Prod. 2013, 49, 837–843. [CrossRef]19. Komartin, R.S.; Stroescu, M.; Chira, N.; Stan, R.; Stoica-Guzun, A. Optimization of oil extraction from Lallemantia iberica seeds
using ultrasound-assisted extraction. J. Food Meas. Charact. 2021, 15, 2010–2020. [CrossRef]20. Isopencu, G.; Stroescu, M.; Brosteanu, A.; Chira, N.; Pârvulescu, O.C.; Busuioc, C.; Stoica-Guzun, A. Optimization of ultrasound
and microwave assisted oil extraction from sea buckthorn seeds by response surface methodology. J. Food Proc. Eng. 2019, 42,e12947. [CrossRef]
21. Li, Y.; Watkins, B.A. Analysis of Fatty Acids in Food Lipids in Current Protocols in Food Analytical Chemistry; Wrolstad, R.E., Ed.; JohnWiley & Sons, Inc.: New York, NY, USA, 2001; Protocol D1.2.1-D1.2.15.
22. Pegg, R.B. Measurement of primary lipid oxidation products. In Handbook of Food Analytical Chemistry; Wrolstad, R.E., Acree, T.E.,Decker, E.A., Penner, M.H., Reid, D.S., Schwartz, S.J., Shoemaker, C.F., Smith, D.M., Sporns, P., Eds.; John Wiley & Sons, Inc.:Hoboken, NY, USA, 2004; pp. 531–564.
Sustainability 2021, 13, 13193 16 of 16
23. American Oil Chemists’ Society. AOCS Official Method Ca5a-40. Free Fatty Acid; A.O.C.S.: Champaign, IL, USA, 1993.24. Wanten, G.J.; Calder, P.C. Immune modulation by parenteral lipid emulsions. Am. J. Clin. Nutr. 2007, 85, 1171–1184. [CrossRef]
[PubMed]25. Pingret, D.; Fabiano-Tixier, A.-S.; Chemat, F. Degradation during application of ultrasound in food processing: A review. Food
Control 2013, 31, 593–606. [CrossRef]26. Candioti, L.V.; De Zan, M.M.; Cámara, M.S.; Goicoechea, H.C. Experimental design and multiple response optimization. Using
the desirability function in analytical methods development. Talanta 2014, 124, 123–128. [CrossRef] [PubMed]27. Knothe, G.; Kenar, J.A. Determination of the fatty acid profile by 1H-NMR Spectroscopy. Eur. J. Lipid Sci. Technol. 2004, 106, 88–96.
[CrossRef]28. Chira, N.; Todască, C.; Nicolescu, A.; Păunescu, G.; Rosca, S. Determination of the technical quality indices of vegetable oils by
modern physical techniques. UPB Sci. Bull. Ser. B 2009, 71, 3–12.29. Giakoumis, E.G.; Sarakatsanis, C.K. A Comparative Assessment of Biodiesel Cetane Number Predictive Correlations Based on
Fatty Acid Composition. Energies 2019, 12, 422. [CrossRef]30. Ramírez-Verduzco, L.F.; Rodríguez-Rodríguez, J.E.; del Rayo Jaramillo-Jacob, A. Predicting cetane number, kinematic viscosity,
density and higher heating value of biodiesel from its fatty acid methyl ester composition. Fuel 2012, 91, 102–111. [CrossRef]31. Sarin, A.; Arora, R.; Singh, N.P.; Sarin, R.; Malhotra, R.K.; Kundu, K. Effect of blends of Palm-Jatropha-Pongamia biodiesels on
cloud point and pour point. Energy 2009, 34, 2016–2021. [CrossRef]32. ASTM (American Society for Testing and Materials). Standard Specification for Biodiesel Fuel Blend Stock (B100) for Distillate Fuels;
Designation D 6751-09; ASTM: West Conshohocken, PA, USA, 2019.