The role of raw material differences in stone tool shape variation: an experimental assessment
16
The role of raw material differences in stone tool shape variation: an experimental assessment Metin I. Eren a, b, * , Christopher I. Roos c , Brett A. Story d , Noreen von Cramon-Taubadel e , Stephen J. Lycett e a Department of Anthropology, University of Missouri, Columbia, MO, 65211, USA b Department of Archaeology, Cleveland Museum of Natural History, Cleveland, OH 44106-1767, USA c Department of Anthropology, Southern Methodist University, Dallas, TX 75275, USA d Department of Civil and Environmental Engineering, Southern Methodist University, Dallas, TX 75275, USA e Department of Anthropology, University at Buffalo SUNY, 380 MFAC-Ellicott Complex, Buffalo, NY 14261-0005, USA article info Article history: Received 27 March 2014 Received in revised form 29 May 2014 Accepted 30 May 2014 Available online 12 June 2014 Keywords: Raw material Handaxes Experimental archaeology Acheulean Experiment abstract Lithic raw material differences are widely assumed to be a major determining factor of differences in stone tool morphology seen across archaeological sites, but the security of this assumption remains largely untested. Two different sets of raw material properties are thought to influence artifact form. The first set is internal, and related to mechanical flaking properties. The second set is external, namely the form (size, shape, presence of cortex) of the initial nodule or blank from which flakes are struck. We conducted a replication experiment designed to determine whether handaxe morphology was influ- enced by raw materials of demonstrably different internal and external properties: flint, basalt, and obsidian. The knapper was instructed to copy a “target” model handaxe, produced by a different knapper, 35 times in each toolstone type (n ¼ 105 handaxes). On each experimental handaxe, 29 size-adjusted (scale-free) morphometric variables were recorded to capture the overall shape of each handaxe in or- der to compare them statistically to the model. Both Principal Components Analysis (PCA) and a Multivariate Analysis of Variance (MANOVA) were used to determine if raw material properties were a primary determinate of patterns of overall shape differences across the toolstone groups. The PCA results demonstrated that variation in all three toolstones was distributed evenly around the model target form. The MANOVA of all 29 size-adjusted variables, using two different tests, showed no statistically signif- icant differences in overall shape patterns between the three groups of raw material. In sum, our results show that assuming the primacy of raw material differences as the predominant explanatory factor in stone tool morphology, or variation between assemblages, is unwarranted. © 2014 Elsevier Ltd. All rights reserved. 1. Introduction Understanding the role that stone raw materials played in lithic artifact form and assemblage variability is an issue fundamental to archaeological research in all times and places in which flaked stone technology was utilized. Indeed, raw material “quality” has long been cited as a potentially important factor influencing lithic artifact morphology (Abbott, 1911; Goodman, 1944). Despite the fact that “quality” is often a subjective, poorly defined characteristic of knappable stone, for which there is no consensus (Brantingham et al., 2000; Braun et al., 2009; Browne and Wilson, 2011), several lithic analysts have emphasized the role that stone raw material “quality” plays in artifact form. For instance, Andrefsky (1994:23) suggested that the “quality” of lithic raw materials is one of the two most important factors in the organization of stone technology (the other being lithic “abundance”), and that “the quality … of lithic raw materials played a direct role in prehistoric tool makers de- cisions to produce various types of stone tools.” Twenty years on, Manninen and Knutsson (2014:95) underscore this notion, stating that “when lithic technological organization is viewed as an inter- section of many varying dimensions, the properties and availability of raw materials can be considered the most important de- terminants in how these dimensions intersect within any organi- zational context.” The motivation for these inferences perhaps stems from the inevitable co-variation between particular stone raw materials and * Corresponding author. Department of Anthropology, University of Missouri, Columbia, MO 65211, USA. E-mail address: [email protected] (M.I. Eren). Contents lists available at ScienceDirect Journal of Archaeological Science journal homepage: http://www.elsevier.com/locate/jas http://dx.doi.org/10.1016/j.jas.2014.05.034 0305-4403/© 2014 Elsevier Ltd. All rights reserved. Journal of Archaeological Science 49 (2014) 472e487
Transcript of The role of raw material differences in stone tool shape variation: an experimental assessment

lable at ScienceDirect
Journal of Archaeological Science 49 (2014) 472e487
Contents lists avai
Journal of Archaeological Science
journal homepage: http: / /www.elsevier .com/locate/ jas
The role of raw material differences in stone tool shape variation: anexperimental assessment
Metin I. Eren a, b, *, Christopher I. Roos c, Brett A. Story d, Noreen von Cramon-Taubadel e,Stephen J. Lycett e
a Department of Anthropology, University of Missouri, Columbia, MO, 65211, USAb Department of Archaeology, Cleveland Museum of Natural History, Cleveland, OH 44106-1767, USAc Department of Anthropology, Southern Methodist University, Dallas, TX 75275, USAd Department of Civil and Environmental Engineering, Southern Methodist University, Dallas, TX 75275, USAe Department of Anthropology, University at Buffalo SUNY, 380 MFAC-Ellicott Complex, Buffalo, NY 14261-0005, USA
a r t i c l e i n f o
Article history:Received 27 March 2014Received in revised form29 May 2014Accepted 30 May 2014Available online 12 June 2014
Keywords:Raw materialHandaxesExperimental archaeologyAcheuleanExperiment
* Corresponding author. Department of AnthropoColumbia, MO 65211, USA.
E-mail address: [email protected] (M.I. Eren
http://dx.doi.org/10.1016/j.jas.2014.05.0340305-4403/© 2014 Elsevier Ltd. All rights reserved.
a b s t r a c t
Lithic raw material differences are widely assumed to be a major determining factor of differences instone tool morphology seen across archaeological sites, but the security of this assumption remainslargely untested. Two different sets of raw material properties are thought to influence artifact form. Thefirst set is internal, and related to mechanical flaking properties. The second set is external, namely theform (size, shape, presence of cortex) of the initial nodule or blank from which flakes are struck. Weconducted a replication experiment designed to determine whether handaxe morphology was influ-enced by raw materials of demonstrably different internal and external properties: flint, basalt, andobsidian. The knapper was instructed to copy a “target”model handaxe, produced by a different knapper,35 times in each toolstone type (n ¼ 105 handaxes). On each experimental handaxe, 29 size-adjusted(scale-free) morphometric variables were recorded to capture the overall shape of each handaxe in or-der to compare them statistically to the model. Both Principal Components Analysis (PCA) and aMultivariate Analysis of Variance (MANOVA) were used to determine if raw material properties were aprimary determinate of patterns of overall shape differences across the toolstone groups. The PCA resultsdemonstrated that variation in all three toolstones was distributed evenly around the model target form.The MANOVA of all 29 size-adjusted variables, using two different tests, showed no statistically signif-icant differences in overall shape patterns between the three groups of raw material. In sum, our resultsshow that assuming the primacy of raw material differences as the predominant explanatory factor instone tool morphology, or variation between assemblages, is unwarranted.
© 2014 Elsevier Ltd. All rights reserved.
1. Introduction
Understanding the role that stone raw materials played in lithicartifact form and assemblage variability is an issue fundamental toarchaeological research in all times and places in which flakedstone technology was utilized. Indeed, raw material “quality” haslong been cited as a potentially important factor influencing lithicartifact morphology (Abbott, 1911; Goodman, 1944). Despite thefact that “quality” is often a subjective, poorly defined characteristicof knappable stone, for which there is no consensus (Brantinghamet al., 2000; Braun et al., 2009; Browne and Wilson, 2011), several
logy, University of Missouri,
).
lithic analysts have emphasized the role that stone raw material“quality” plays in artifact form. For instance, Andrefsky (1994:23)suggested that the “quality” of lithic rawmaterials is one of the twomost important factors in the organization of stone technology (theother being lithic “abundance”), and that “the quality … of lithicraw materials played a direct role in prehistoric tool makers de-cisions to produce various types of stone tools.” Twenty years on,Manninen and Knutsson (2014:95) underscore this notion, statingthat “when lithic technological organization is viewed as an inter-section of many varying dimensions, the properties and availabilityof raw materials can be considered the most important de-terminants in how these dimensions intersect within any organi-zational context.”
The motivation for these inferences perhaps stems from theinevitable co-variation between particular stone raw materials and
M.I. Eren et al. / Journal of Archaeological Science 49 (2014) 472e487 473
particular tool forms (or lithic reduction strategies) at archaeolog-ical localities. As Brantingham et al. (2000:257) explain:
The assumption is that the ability to execute formal techno-logical designs is severely limited by the quality of the rawmaterial. Toolkits based on high quality raw materials arethought to be easier to design because fracture is easier tocontrol (Goodyear, 1989:3; Luedtke, 1992). In contrast, toolkitsbased on poor quality raw material are more difficult to designbecause fracture is unpredictable and results in severe, irrepa-rable errors during reduction. Even where low raw materialabundance would encourage formal technological design, rawmaterial quality is thought to be the overriding factor con-straining lithic technological organization.
While the archaeological co-variation between particular stonetypes and artifact morphologies certainly suggests thateeincertain times and placeseeraw material differences were an in-fluence on artifact morphology, it still remains to be determinedwhether raw material automatically influences stone tool formregardless of other input variables. The manner in which raw ma-terial interacts with other input variables can potentially beconceived of in two different ways. One of these is explicitlyidentified by Costa (2010:36) as “artificial forces” and by de la Torre(2011:788) as “technical incompetence.” This suggests that rawmaterial influenced stone artifact morphology because homininsdid not possess the knowledge, manual dexterity, skills, or incen-tive to tackle “challenging” raw materials. This hypothesis does notsuggest that raw material plays no role in artifact form, but insteadthat there is nothing inherent to specific “knappable” rock typesthat automatically or necessarily influences artifact morphology inspecific ways, and thus the source of artifact form ultimately lieswith hominins themselves.
The second hypothesis identified by Costa (2010:36) and de laTorre (2011:788), respectively, is “natural forces” or “raw materialconstraints” hypothesis (see also Sharon, 2008). This hypothesisposits that raw material “determines” artifact morphology becauseit is physically impossible to create similar tool forms via flint-knapping on substantially different raw materials. This hypothesisis different from the first because it suggests that rather than theinteraction of behavioral and cultural factors with physical/geological ones, the dominant source of artifact morphology liesexclusively within the raw material itself; i.e. there exist naturalraw material constraints that “dictate” artifact morphology.
It is plausible that the stone raw materials utilized by homininsmay have dictated which artifact forms they could ultimatelyproduce. When distinct isotropic rockseei.e. those generally free ofmajor cleavage planes or other inclusions that inhibit the freepassage of energyeeare compared directly, they often exhibitdiffering “internal” and/or “external” properties. Stone raw mate-rial “internal properties” consist of attributes relevant to the me-chanical process of crack initiation and propagation, i.e. elasticity,brittleness, hardness, homogeneity, granularity, and isotropy(Goodman, 1944; Callahan, 1979; Whittaker, 1994; Andrefsky,1998). “External properties” refer to the form (size, shape, surfaceregularity, cortex presence, etc.) of the initial nodule, block, orblank fromwhich flakes are struck (Ashton andMcNabb,1994; Erenet al., 2011a; Jennings et al., 2010; Smallwood, 2010). However,despite these factors, several recent archaeological studies havequestioned the automatic primacy of such constraints in deter-mining artifact form (e.g., Brantingham et al., 2000; Sharon, 2008;Archer and Braun, 2010; Costa, 2010; Clarkson, 2010; Smallwood,2012; Buchanan et al., 2014; Lycett and von Cramon-Taubadel,2014). As intimated above, there remains a distinct risk that rawmaterial factors are considered a dominant, if not sole, determinant
of stone artifact morphology purely as a result of the coincidencebetween different raw materials and different artifact morphol-ogies at different archaeological sites.
We are skeptical of the extent to which further studies of thearchaeological record alone can contribute to these debates. Forstone “constraints” to be tested, knowledge of both knapperintention and skill must be controlled (i.e. held constant acrossmaterials), and in prehistoric contexts these attributes remain un-known to the archaeologist. For instance, if a lithic analyst discoversa pattern in which thinner bifaces (on average) are made on “highquality” stone type A and thicker bifaces are made on “low quality”stone type B, it would be impossible to resolve whether (i) rawmaterial constrained artifact form, (ii) the knapper(s) did not havethe skill to make type B handaxes as thin as the type A ones, or (iii)there was some other behavioral or cultural reason that caused theknapper(s) to manufacture type B handaxes thicker than type Aones. For this reason, several lithic analysts have called for exper-imental tests to “document the impact of the properties of rawmaterials on theway inwhich particular tool types were produced”(Holdoway and Stern, 2004:55; see also Bar-Yosef et al., 2012:12).Indeed, over 70 years ago, Goodman (1944:431) advocated thatexperiments be conducted that examine “the degree to which thenature of the [stone] material in a person's hand may have guidedor limited the work done upon that material by the artisan.”
In response to these calls, Eren et al. (2011a) conducted a 20-month long lithic replication experiment to determine whether,with continuous practice, a knapper's advancing skill in preferentialLevallois flake production would be statistically identifiable if thehigh quality toolstone used was switched to a less tractable chert.Specific quantitative knapping goals were measured and assessedstatistically, and overall the results showed that factors associatedwith knapping skill, rather than raw material quality, were themain causes of success or failure in achieving the set knappinggoals. Although these results were inconsistent with the raw ma-terial constraints hypothesis, Eren et al. (2011a:2738) recognizedthe necessity of further experimental assessments. The two tool-stones used in the Eren et al. (2011a:2738) experiment contrastedin both their internal and external properties, but both materialscould be classified as “chert” in its broadest definition (Luedtke,1992) and thus differed less prominently in their internal flakingproperties than in their external properties. Furthermore, theknapping goals in that experiment involved individual morpho-logical or economic attributes rather than holisitic assessments ofgross morphology, leaving open to question the relationship be-tween stone raw material differences and overall stone tool form.
Here, directly expanding upon the experiments of Eren et al.(2011a), we report a replication experiment that tested directlywhether different stone raw material categories necessarilyconstrain artifact shape. The experiment examined three distinctstone raw materialseeflint, basalt, and obsidiandwhich possesseddifferent external and internal properties, and tested whether anyof these materials prevented a knapper from successfully copyingthe shape of a replica handaxe model similar to those producedduring the Late Acheulean. We chose this model for the exper-imenteeacknowledging that future work should examine othertool types and reduction strategieseefor two reasons. First, thisparticular tool type would provide a challenge to the knapperwithin the context of Lower Paleolithic technology (see e.g.,Callahan, 1979; Edwards, 2001; Schick, 1994; Winton, 2005). Sec-ond, the influence of rawmaterial differences on handaxe form hasbeen debated extensively (e.g., Isaac, 1977; Jones, 1979; Wynn andTierson, 1990; Roe, 1994; Schick, 1994; Clark, 2001; McPherron,2006; Sharon, 2008; Archer and Braun, 2010; Costa, 2010; Lycettand Bae, 2010; Gowlett, 2011; Bar-Yosef et al., 2012; Diez-Martinand Eren, 2012), and thus the present experiment will contribute

M.I. Eren et al. / Journal of Archaeological Science 49 (2014) 472e487474
directly to these widespread debates from a somewhat differentangle.
If, as predicted by the rawmaterial constraints hypothesis, stoneraw material differences determine handaxe form, then (1) thereshould be significant inter-group shape differences between two ormore raw material groups; and (2), one or more raw materialgroups should deviate significantly in shape from the model.Accordingly, we tested these predictions via a series of statisticalanalyses and a measurement protocol designed to capture thethree-dimensional shape of each handaxe, consisting of 29 size-adjusted morphometric variables.
2. Materials and methods
2.1. Knapping the handaxe dataset
An experienced knapper (MIE) was instructed to copy a modelhandaxe (Fig. 1) 35 times in three raw materials (flint, basalt, andobsidian) for a total sample of 105 handaxes (Fig. 2). To ensureindependence between the experimental knapper and the modelhe was copying, the model was produced by another experiencedknapper (SJL) on a flint raw material different than that used in theexperimental dataset. Themodel flint was procured from a beach inKent (UK), while the flint used for the experimental dataset(described below) was procured from an inland quarry approxi-mately 115 km north of this in Suffolk. To guarantee that theexperimental knapper was sufficiently challenged, and that anypotential raw material constraints were rigorously investigatedwithin the parameters of Lower Paleolithic handaxe technology, thetarget model deliberately exhibited high symmetry in both plan-and profile-view, possessed a high width-to-thickness ratio(W:T ¼ 3.33), and displayed relatively flat faces with noirregularities.
To ensure that learning over time did not confound results,materials were knapped rotationally (flint, basalt, and obsidian). Inorder to minimize fatigue factors, only three handaxes were pro-duced per day, with breaks between each nodule. Knapping thus
Fig. 1. The model handaxe produced by SJL on a flint raw material different than thatused in the experimental dataset. The model flint was procured from a beach in Kent(UK).
took place over a period of 35 days. The same set of knapping toolswas used throughout, which consisted of three moose antlers, asandstone hammerstone, and three granite hammerstones(Table 1).
2.2. Raw materials
The flint used for the experimental dataset was procured froman inland quarry near Bury St. Edmunds, in the county of Suffolk,UK (Fig. 3a). It was the only raw material that exhibited cortex, andmany of the flint nodules possessed outer surfaces that were over80% cortical. We also note that of the three raw materials, itpossessed the most natural flaws, with eight of the thirty-fivenodules possessing major cleavages, “concrete” inclusions, orcrystal pockets. The basalt was procured from the Partridge Creekarea of Yavapai county, Arizona, USA (Fig. 3b, left). Only three of thethirty-five nodules possessed a natural cleavage. The obsidian wasprocured from the Glass Buttes mountain range in Lake County,Oregon, USA (Fig. 3b, right), it was a flaw-free stone. These threeparticular raw materials were selected because the experimentalknapper was not familiar with them, and thus “previous experi-ence” was minimized as a potential confounding factor of inter-group comparisons. That said, the use of an experienced knapperwas vital to the experiment (MIE has 13 years of knapping expe-rience and can replicate a range of Paleolithic technologies with ahigh degree of accuracy). The use of a novice or intermediateknapper for this particular experiment could potentially obscurethe results in the event that handaxes from one or more raw ma-terial groups differed significantly from the model: it would beunclear whether inherent raw material “constraints” were drivingthe differences, or whether the novice or intermediate knapper didnot possess the knowledge or skill with which to approach the rawmaterials.
In order to move beyond the assumption that the properties ofthese stone raw materials were different merely because they aredifferent rock types, we conducted several different empirical testsand examinations to better understand how these raw materialsdiffered with regard to several of their external and internalproperties. Comparisons of external properties included the nodulesize and nodule shape. Comparisons of internal properties includedobservations from thin-sections, scanning electron microscopy offresh fracture surfaces, rebound hardness, and biaxial flexure.
2.2.1. External properties
2.2.1.1. Starting nodule size. The initial sizes of nodules across rawmaterial categories were compared using the geometric mean ofseven different dimensional variables taken on each nodule prior toreduction. The geometric mean is an appropriate measure of sizefor individual objects when using dimensional data (Jungers et al.,1995), and is preferable to mass when comparing across objects ofdiffering material due to potential differences in density. The sevendimensional variables used were maximum nodule length (in anyorientation), width at 25%, 50%, and 75% of length, and thickness at25%, 50%, 75% of length, where the latter six measurements were alltaken orthogonally to maximum length (Table 2). Fig. 4 shows thevariation in computed geometric mean values across the threedifferent raw material categories in the form of box plots.
If initial nodule sizes differ systematically across different rawmaterial categories, we would expect statistically significant dif-ferences in the computed geometric mean values across categories.Hence, the null hypothesis is that there would be no statisticaldifferences in the geometric mean values across the three differentcategories of raw material. This hypothesis was tested using aKruskaleWallis test, where a ¼ 0.05.

Fig. 2. All 105 replicated handaxes. Handaxe #1 is upper leftmost specimen, and the handaxes proceed in rows going from left to right. Handaxe #105 is lower rightmost specimen.Due to the angle at which this photograph was taken, the handaxes towards the top of the image look wider than they are in reality.
M.I. Eren et al. / Journal of Archaeological Science 49 (2014) 472e487 475
The KruskaleWallis test indicated highly significant differencesbetween the different raw material types (H ¼ 51.80; p < 0.0001).Hence, initial nodule sizes were not statistically equivalent acrossrawmaterial categories. Post-hoc ManneWhitney U tests indicatedthat all pairwise comparisons between raw material categorieswere highly significant (p < 0.0001), indicating that each raw ma-terial was statistically different in size from the others.
2.2.1.2. Starting nodule shape. An assessment of starting noduleshape differences across different raw material categories wasundertaken. Seven variables were used: maximum nodule length(in any orientation), width at 25%, 50%, and 75% of length, and
Table 1The only knapping tools used for the experimental replications.
Tool Mass (g) Length(mm)
Width(mm)
Thickness(mm)
Moose Antler 900 270 58 50Moose Antler 600 220 43 38Moose Antler 600 170 49 47Sandstone Hammerstone 1000 120 84 62Granite Hammerstone 800 100 89 62Granite Hammerstone 900 90 83 72Granite Hammerstone 300 60 60 53
thickness at 25%, 50%, and 75% of length, where the latter sixmeasurements were all taken orthogonally to maximum length(Table 2). To transform these dimensions into shape variables, eachvariable was size-adjusted using the geometric mean method (seebelow, Section 2.3.1).
If the initial shape of nodules differs across raw material cate-gories, then, statistically significant differences should be foundacross categories. This prediction was tested using a MANOVA(a ¼ 0.05) of all seven size-adjusted variables, using two differenttest statistics (Pillai's Trace and Wilks' Lambda).
MANOVA of size-adjusted shape variables for nodules indicatedhighly significant differences for the shape of nodules in differentcategories (Pillai's Trace: F ¼ 4.88, df ¼ 194, p < 0.0001; Wilks'Lambda: F ¼ 4.912, df ¼ 192, p < 0.0001). Post-hoc analyses (Bon-ferroni) indicated that all rawmaterial categories were significantlydifferent from each other on at least one variable, while all rawmaterial groups were significantly different from one other groupon a minimum of four variables.
2.2.2. Internal properties
2.2.2.1. Microscopic observations from thin-sections and fracturesurfaces. Four thin sections of each raw material category wereexamined for microstructure, fabric, and mineralogy in transmitted

Fig. 3. The flint used for the experimental dataset was procured from an inland quarrynear Bury St. Edmunds, in the county of Suffolk, UK (a). The basalt was procured fromthe Partridge Creek area of Yavapai county, Arizona, USA (b, left). The obsidian wasprocured from the Glass Buttes mountain range in Lake County, Oregon, USA (b, right).
M.I. Eren et al. / Journal of Archaeological Science 49 (2014) 472e487476
brightfield polarized and cross-polarized light at magnificationsranging from 7� to 200� on stereozoom and petrographic micro-scopes. We were primarily concerned with identifying the abun-dance and spatial distribution of mineral grains within the non-crystalline (obsidian and basalt) and crypto-crystalline (flint)matrices of the toolstone materials. Large, abundant, and closelyspaced crystalline minerals would pose discontinuities to thepropagation of force through the toolstone medium and shouldmake knapping a more unpredictable process, whereas small, rare,and widely spaced grains should make a material easier to knap.Additionally, the ventral surface of freshly removed flakes of eachraw material was examined without a coating in variable pressurescanning electron microscope (Leo-Zeiss 1450VPSE). In our SEM
Table 2Summary statistics of recorded morphometric data from the flint, basalt, and obsidian nodin millimeters (mm). SD ¼ standard deviation, Q1 ¼ quartile 1, Q3 ¼ quartile 3.
Flint (n ¼ 35) Mass Max. Length Width 25% Width 50%
Mean 4.4 242.3 136.7 167.5SD 1.5 28.7 30.3 26.1Minimum 2.0 190.0 80.0 124.0Q1 3.6 225.0 113.5 145.0Median 4.0 240.0 135.0 168.0Q3 5.0 255.0 162.0 183.0Maximum 9.0 340.0 200.0 235.0
Basalt (n ¼ 35) Mass Max. Length Width 25% Width 50%
Mean 6.3 291.9 153.9 172.8SD 1.5 35.9 29.1 25.3Minimum 3.1 240.0 107.0 126.0Q1 5.3 270.0 136.0 154.0Median 6.0 280.0 145.0 166.0Q3 7.3 305.0 172.5 195.5Maximum 10.8 390.0 219.0 227.0
Obsidian (n ¼ 35) Mass Max. Length Width 25% Width 50%
Mean 7.2 300.3 147.3 181.2SD 0.8 30.0 32.0 29.7Minimum 5.2 240.0 61.0 124.0Q1 6.7 280.0 134.0 168.0Median 7.3 300.0 151.0 181.0Q3 7.6 315.0 165.5 193.0Maximum 9.0 370.0 227.0 263.0
observations, we were particularly interested in observing thestructure of cleavage plains as a means of identifying the portion ofthe matrix through which force actually propagated and to whatextent crystalline minerals interfered with the transmission offorce.
The flint material used in this study varied considerably in thedegree of decalcification in correspondence with the macroscopiccolor of the material (Fig. 5). Black flint zones are predominantlyvery fine-grained microcrystalline quartz with rare (<5%)200e500 mm sized domains of chalcedonic quartz intergrowths,often as fossil pseudomorphs or as replacement features in etchedcalcite domains. Sub-rounded 100e150 mm micro-sparitic calcitedomains are extremely rare (<1%).
By contrast, dark gray flint zones are fossiliferous, calcareousmicrocrystalline quartz with common (10e15%) angular to sub-angular, etched micro-sparitic and micritic calcite fossil shell frag-ments and spherules of calcite infilled with microcrystalline quartz.These are generally fairly closely spaced with very fine sand-sizedgrains (up to 150 mm) typically spaced 50e100 mm apart whereassilt-sized grains (<63 mm) are typically spaced less than 25 mmapart.
Light gray zones of the flint are very heterogeneously decalcifiedmicrocrystalline quartz with rare (<5%) subangular, coarse(1000e2000 mm) sandy micritic limestone fragments and rare,angular microsparitic shell fragments that are widely spaced(>300 mm). At higher magnification, very fine (5e15 mm) micritegrains are widely dispersed (5e10% abundance, >100 mm spacing).Very coarse (1000e2000 mm), irregular zones of chalcedonic quartzare extremely rare (<1%).
Surprisingly, the “concrete” zones of the flint were the mostdecalcified of the flint zones. What appears to give the “concrete”zones their distinct character is the presence of uncommon (~2%)200e700 mm rounded voids and abundant, dark purple (PPL)isotropic (XPL) punctuations throughout. In PPL, the “concrete”zone has a dirty, pale brown speckled color to it and it is extremelydark in XPL (note that the gain is enhanced in Fig. 5 for the “con-crete” specimen in XPL to enhance the visibility of the micro-structure). Its microstructure, however, is predominantlydecalcified microcrystalline quartz with variable sized
ules. Mass was measured in kilograms (kg), all other measurements were measured
Width 75% Thickness 25% Thickness 50% Thickness 75%
138.2 71.2 74.7 68.127.2 16.3 15.8 15.680.0 43.0 49.0 40.0
120.0 58.5 65.0 57.0131.0 71.0 74.0 68.0165.0 82.0 83.0 75.0188.0 103.0 110.0 112.0
Width 75% Thickness 25% Thickness 50% Thickness 75%
140.9 77.2 80.9 76.128.7 20.5 18.4 16.199.0 48.0 52.0 45.0
124.0 61.5 68.5 66.0138.0 73.0 77.0 78.0152.0 94.0 86.5 85.5229.0 127.0 140.0 123.0
Width 75% Thickness 25% Thickness 50% Thickness 75%
156.9 98.6 107.9 99.736.3 26.8 18.2 22.099.0 43.0 70.0 60.0
133.5 85.5 94.5 86.5150.0 99.0 106.0 100.0177.5 116.5 118.5 115.5234.0 154.0 145.0 149.0

Fig. 4. Box plots of geometric mean values indicating raw size variation of initialnodules across different raw materials (box ranges indicate 25e75% quartiles withmedian values shown as bar within).
M.I. Eren et al. / Journal of Archaeological Science 49 (2014) 472e487 477
microcrystalline domains. Rare quartz pseudograins up to 35 mmalmost give this zone the character of a fine-grained quartzite.
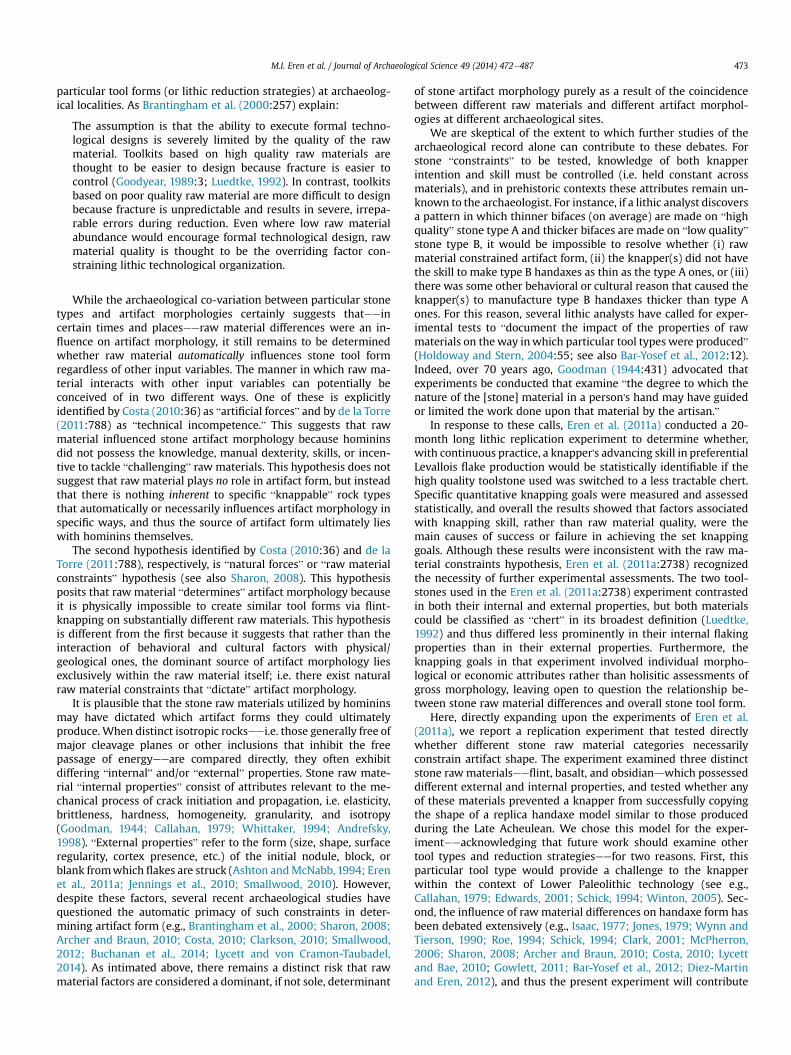
Fig. 6 illustrates the differences between the flint (black zone),basalt, and obsidian materials at 20�, 100�, and 200� magnifica-tion. The basalt is a fine-grained tholeiitic variety made up ofmostly of ~65 mm long laths of plagioclase (~50%) and a pale brown(ppl) isotropic, glassy groundmass (~30%). Phenocrysts of quartz(extremely rare) and pyroxene (up to 200e500 mm in size) make upthe remaining 20%. Phenocrysts typically occur in clusters of up to12 grains with typical spacing between clusters of roughly500e1100 mm. The obsidian is petrographically simple. It variesfrom 99 to 100% pale gray, isotropic glassy groundmass withextremely rare (0e1%) microphenocryst laths of plagioclase.
SEM observations (Fig. 7) of the flint flake indicated that thefracture preferentially occurred along crystal faces of the micro-crystalline quartz groundmass with microtopgraphic irregularitiescreated by non-quartz domains. In the basalt, fracture appears tohave preferentially occurred within the glassy groundmass, occa-sionally interrupted by plagioclase laths, whereas in the obsidian,the fracture surface is nearly perfectly smooth as the fracturepropagated through the glassy groundmass.
2.2.2.2. Fracture predictability (rebound hardness). Following Braunet al. (2009) we measured stone rebound hardness as a proxy for“fracture predictability,” an attribute directly relevant to stone toolproduction. Rocks that fracture predictably often possess threetraits (Crabtree, 1967; Domanski et al., 1994; Luedtke, 1992): (1)little or no crystalline macrostructure; (2) few impurities that couldpotentially interfere with fracture propagation; and (3) an overallsmall average crystal size. In this study, we quantitatively estimatedthis feature using the rebound hardness test. Rebound hardnessvalues increase as these three raw material traits intensify in de-gree, while a lower magnitude of any or all of these traits results inlower rebound hardness values. Rebound hardness values weremeasured with a Schmidt hammer (Proceq Silver Schmidt ConcreteTest Hammer PC, N-Type), which produces consistent, quantitativeresults comparable across rock types, and can be quickly and easilyapplied to large sample sizes which are then amenable to infer-ential statistics (Braun et al., 2009: 1607e1608).
We took 30 rebound hardness measurements from four nodulesurface types: cortical flint, non-cortical flint, basalt, and obsidian.A KruskaleWallis test returned a highly significant values for thesemeasurements across surface types (H ¼ 17.69, p ¼ 0.0005). Man-neWhitney pairwise comparisons of rebound hardness (Table 3,Fig. 8) indicated significant differences between these four surfacetypes, but also some interesting similarities. Basalt was significantlydifferent in rebound hardness from obsidian and non-cortical flint,but was similar to that of cortical flint. Obsidian was significantlydifferent from basalt and cortical flint, but was similar to that ofnon-cortical flint. Thus, while the raw materials are indeed mostlydifferent in terms of rebound hardness, we unexpectedly foundthat our experimental flint nodules possessed the qualities of bothbasalt and obsidian. The outside flint cortex was more like basalt,while the inner non-cortical flint was more like obsidian.
2.2.2.3. Biaxial flexure. A destructive biaxial flexure test is onemethod of mechanical evaluation and classification for raw mate-rials. Archaeologically, biaxial flexure has primarily been imple-mented inmechanical evaluation of ceramic sherds (Neupert, 1994;Beck, 2002). However, biaxial flexure is an appropriate test methodfor all planar specimens (plates or shells) with irregular geometry.Tensile tests and uniaxial bending tests are carried out on uniformtest specimens so that load application and support conditions donot cause undesirable effects. For example, irregular geometry canresult in a loss of stability in a traditional tensile or uniaxial bendingtest. Additionally, a specimen may be subject to unintended forcesand moments caused by eccentricity in support conditions andloading. The support conditions necessary for biaxial flexure reducethese deleterious effects by providing planar, rather than linear,boundary conditions.
A “ball-on-three-ball” biaxial flexure load apparatus was fabri-cated to support specimens and apply a concentrated load via theINSTRON 5582 load frame shown in Fig. 9a. Fig. 9b illustrates theapparatus in detail. Each rock plate specimen is placed atop threeball bearing supports on the bottom portion of the load apparatus;this configuration provides three points of contact and three cor-responding vertical reactions necessary for vertical equilibrium ofthe specimen regardless of geometry (Ritter et al., 1980). The load isapplied to the specimen through the single ball bearing on the topportion of the apparatus. The support bearings are located 25.4 mmequidistant from the center of the specimen. The concentrated loadaffects the central portion of the specimen bounded by the 25.4 mmradius. While specimens larger than this area experience someoverhang, the effects of such an overhang on specimens of this size,geometry and loading are minimal (Neupert, 1994). This setup re-duces inconsistencies of the loading and load distribution in eachspecimen. A safety barrier was placed around the loading apparatusand specimen during testing as seen in Fig. 10. This prevented thescattering of shattered fragments of each specimen at fracture.
The INSTRON5582 load frame has a capacity of 100 kN. A load cellrecorded the force applied to the specimen throughout the experi-ment. An extensometer was fixed to the apparatus to estimate thedisplacement of the rock plate under load. The experiments wereconducted in displacement control with a load rate of 1 mm/min.
Destructive biaxial flexure tests were performed on plate spec-imens of varying thicknesses for flint, basalt, and obsidian mate-rials. The characterizing quantity of interest in these tests was thepeak force applied to the specimen immediately prior to fracture.The peak force that a specimen can withstand is a function of theapplied load, material, and specimen geometry. In these experi-ments, the conditions of load application and support geometrywere held constant. The material properties and thicknesses werevaried.

Fig. 5. Thin-sections of flint which varied considerably in the degree of decalcification in correspondence with the macroscopic color of the material. See main text for descriptions.(For interpretation of the references to color in this figure legend, the reader is referred to the web version of this article.)
M.I. Eren et al. / Journal of Archaeological Science 49 (2014) 472e487478
The protocol for measuring the peak load force and specimenthickness was applied as follows:
(i) Place specimen on three support bearings and preload thespecimen (to approximately 20 N) so that contact is ensuredat the onset of testing.
(ii) Close safety barrier door and record initial preload.(iii) Load the specimen in displacement control at 1 mm/min
until fracture (indicated by instantaneous decrease in load).
(iv) Collect broken pieces and reconstruct the original specimen.(v) Use digital calipers to measure the thickness of each piece at
the point of fracture. Thickness measurement was recordedorthogonally to the long axis.
(vi) Average these thickness measurements to determine thespecimen thickness.
This protocol was performed for 15 samples of eachmaterial (45total specimens).
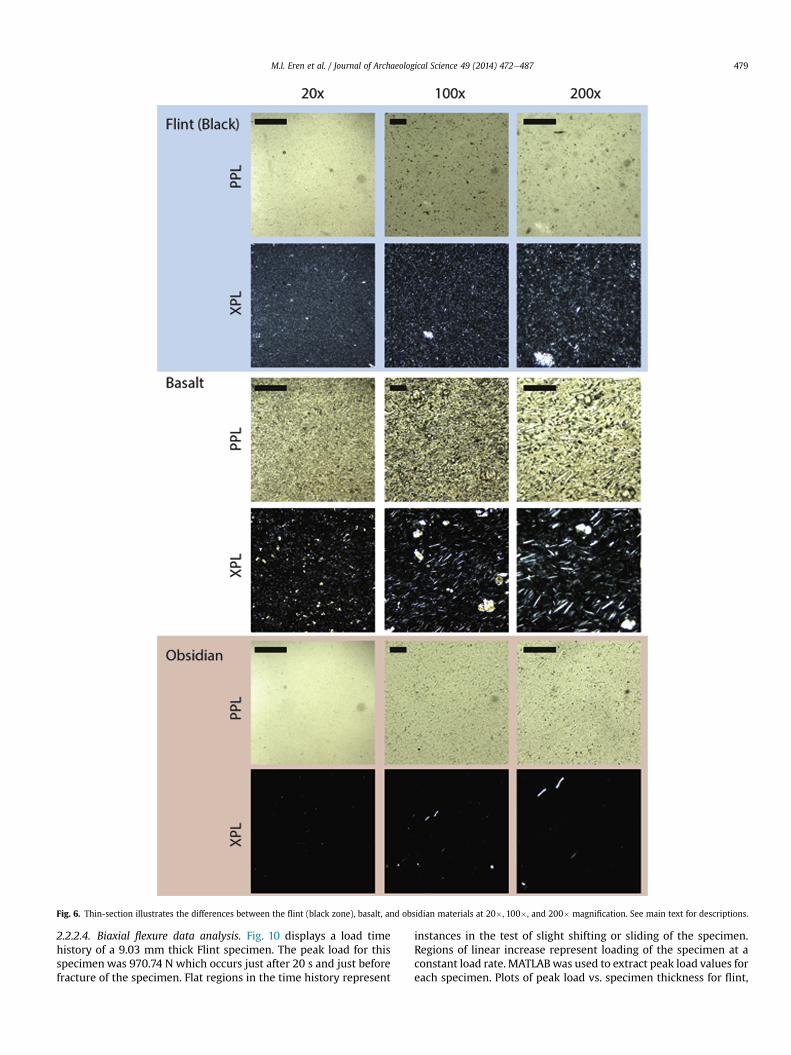
Fig. 6. Thin-section illustrates the differences between the flint (black zone), basalt, and obsidian materials at 20�, 100�, and 200� magnification. See main text for descriptions.
M.I. Eren et al. / Journal of Archaeological Science 49 (2014) 472e487 479
2.2.2.4. Biaxial flexure data analysis. Fig. 10 displays a load timehistory of a 9.03 mm thick Flint specimen. The peak load for thisspecimen was 970.74 N which occurs just after 20 s and just beforefracture of the specimen. Flat regions in the time history represent
instances in the test of slight shifting or sliding of the specimen.Regions of linear increase represent loading of the specimen at aconstant load rate. MATLABwas used to extract peak load values foreach specimen. Plots of peak load vs. specimen thickness for flint,
Fig. 7. SEM images of the flint, basalt, and obsidian. See main text for descriptions.
M.I. Eren et al. / Journal of Archaeological Science 49 (2014) 472e487480
basalt, and obsidian are shown in Fig. 11. Table 4 contains linearregression equations and R2 values for each material. The re-lationships between the peak load and thickness for each materialmay all be approximated by linear relationships, but the three re-lationships are distinct.
Eq. 1e3 in Table 3 distinguish the behavior of each of the threetypes of rawmaterials examined. Peak loads for each material were13.60 kN (t¼ 14.41mm) for flint,10.61 kN (t¼ 13.88mm) for basalt,and 11.64 kN (t ¼ 20.00 mm) for obsidian. The R2 values increasefrom flint to basalt to obsidian. This expected increase in R2 valuerepresents an increase in homogeneity and isotropy. The obsidian isessentially free of visible voids, discontinuities and defects andfracture load increases nearly linearly with thickness. The flintspecimens contained several defects and two specimens that variedby 0.14 mm in thickness experienced a 2.24 kN difference in peakload.
An additional measure of comparing the mechanical behavior ofthe three material types is to examine peak fracture loads forspecimens of different material and similar thickness. Table 5compares the average peak fracture load for specimens of all threematerials for two ranges of thickness. Here the percent differences inaverage peak load for differentmaterials of similar thicknesses rangeup to �26.88%. Hence, the three distinct equations of linearregression between peak load and thickness, along with the differ-ences in peak load values for similar specimens, indicate that theseraw materials were indeed mechanically distinct.
2.3. Main analyses
2.3.1. Handaxe shape assessmentFor every handaxe replica and the target model, a set of 29
morphometric variables was obtained (Fig. 12). Measurementswere obtained digitally by importing photographic images of eachreplica into Adobe Illustrator. Images were obtained with a FujifilmDSLR camera securely attached to a copystand (30� zoom lens:24e720 mm). A standardized orientation protocol was applied inorder to obtain homologous measurements. The orientation pro-tocol applied has previously been described by Schillinger et al.(2014), which is a modified version of that originally designed byCallow (1976). To implement the orientation protocol, themaximum length line for each handaxewas identified in plan-view.The terminus of this line at the more pointed end of the handaxedefined the “tip.” Thereafter, each handaxe model was orientatedthrough the tip such that the two longest orthogonal linesdiverging from a second length line (i.e. “length by orientation”)were both equal in length (see Schillinger et al., 2014:Fig. 3).
To obtain the dataset, a digital grid was placed onto each han-daxe image in both plan-view and profile-view (Fig. 12). Themeasurement grid was superimposed onto digital images of eachhandaxe so that the grid's central line was positioned directly onthe maximum length line (defined by orientation). Thereafter, theupper and lower boundaries of the grid were adjusted to the
maximum length dimensions of each handaxe. Horizontal lineswere positioned at equally-spaced distances (10% increments)along the length. Additional gridlines were placed at 5%, 15%, 85%,and 95% of length. These additional measurements were taken inorder to capture particular variation in shape around the “tip” and“base” of each handaxe. Profile-views were obtained by turning theorientated replica through an axis of 90� such that all thicknessmeasurements were taken orthogonal to the plan-view measure-ments. Grid boundaries were then repositioned on the maximumlength of each handaxe (Fig. 12). Maximum width and maximumthickness were also taken for each handaxe (Fig.12). Measurementswere subsequently obtained digitally using Adobe Illustrator.
In order to transform the dimensional data obtained into shapevariables, all morphometric data were size-adjusted using thegeometric mean method (Jungers et al., 1995; Lycett et al., 2006).This method of size-adjustment effectively removes scaling (i.e.size) variation between specimens by equalizing their volumes, yetretains their relevant shape data (Falsetti et al., 1993; Jungers et al.,1995). The geometric mean of a series of n variables (a1, a2, a3 … an)is equivalent to (a1 � a2 � a3 � … � an)1/n. Simply, the geometricmean is the nth root of the product of all n variables (Sokal andRohlf, 1995). The method proceeds on a specimen-by-specimenbasis, dividing each variable in turn by the geometric mean of thevariables to be size-adjusted. Hence, to implement the method, thegeometric mean of each handaxe was computed separately and,thereafter, each of the 29 morphometric variables were divided bythat particular handaxe's geometric mean. This was repeated for allhandaxes used in the analyses.
2.3.2. Handaxe shape assessment: predictionsIf, as predicted by the rawmaterial constraints hypothesis, stone
raw material differences determine handaxe form, then: (1) thereshould be statistically significant inter-group shape differencesbetween two or more raw material groups; and (2), one or moreraw material groups should deviate significantly in shape from themodel more so than other categories.
We tested the first prediction via a MANOVA of the 29 handaxeshape variables, where a ¼ 0.05 using two different test statistics(Pillai's Trace and Wilks' Lambda). In addition, we undertook aPrincipal Components Analysis (PCA) including the model handaxein order to visualize major shape variation among the three rawmaterial categories relative to the target model handaxe.
We formally tested the second prediction by computing multi-variate Euclidean distances between each replica handaxe and themodel using all resultant PC scores (i.e. 100% of variance explained).We tested for significant differences in average shape divergencebetween replicas and the model across the three raw materialcategories using a one-way ANOVA.
2.3.3. Production economyProduction economy, i.e. the efficiency by which original start-
ing mass is reduced within the context of defined knapping goals,

Table 3Linear regression of peak load vs. specimen thickness.
Eq. Linear regression R2 P
Basalt 1 y ¼ 0.913x � 4.74 0.828 <0.0001Flint 2 y ¼ 1.45x � 9.75 0.771 <0.0001Obsidian 3 y ¼ 0.734x � 2.79 0.947 <0.0001
Fig. 8. Boxplots of rebound hardness values across different raw material surfaces (boxranges indicate 25e75% quartiles, with median values shown as bar within).
Fig. 10. Example of applied load lime history for flint specimen.
M.I. Eren et al. / Journal of Archaeological Science 49 (2014) 472e487 481
may have been a specific motivating factor in the use of certainreduction strategies by hominins across time and space(Brantingham and Kuhn, 2001; Brantingham, 2010; Lycett andEren, 2013). Economic factors may be particularly relevant whenthe knapping goal is to produce an artifact of specific shape (Erenet al., 2011b), since because knapping is an inherently “reductive”process, the only correction strategy available to a knapper whenerrors of shape occur is to remove more material (i.e. mass)(Schillinger et al., 2014). Hence, in addition to analyzing handaxeshape, we also measured handaxe production economy. In theevent that no differences in handaxe shape were found (i.e. rawmaterial differences did not affect handaxe shape) this
Fig. 9. Experimental setup used for biaxial flexure testin
measurement was recorded to assess whether there were differ-ences in howmuch rawmaterial was used to achieve final handaxeshape. Production economy was computed by dividing the mass ofa finished handaxe by the mass of the original nodule fromwhich itwas knapped.
2.3.4. Production economy: predictionsIf raw material type is affecting production economy system-
atically (i.e. the amount of nodule mass consumed in producing thehandaxe copies differs across raw materials), we would expectstatistically significant differences for economy measures betweengroups. Hence, the null hypothesis is that there would be no sta-tistical differences in the production economy values computed fordifferent categories of raw material. This hypothesis was testedusing a KruskaleWallis test, where a ¼ 0.05. In addition, Levene'stest for homogeneity of variances was also applied (a ¼ 0.05).
3. Results
3.1. Handaxe shape assessment
Figs. 13 and 14 show the plan-view and profile-view of each rawmaterial's handaxe specimen with the least, average, and mostcopy-error is directly compared to the model.
g. (a) Axial load frame (b) Biaxial flexure apparatus.

Fig. 11. Peak Load vs. Specimen Thickness (a) Flint (b) Basalt (c) Obsidian.
M.I. Eren et al. / Journal of Archaeological Science 49 (2014) 472e487482
The MANOVA of all 29 size-adjusted variables showed no sig-nificant differences in overall shape across artifact groups made onthe three different categories of raw material (Pillai's Trace:F ¼ 0.902, df ¼ 150, p ¼ 0.668; Wilks' Lambda: F ¼ 0.893, df ¼ 148,p ¼ 0.684). Hence, handaxe shape was not significantly different inany of the three raw material categories.
Figs. 15 and 16 show the principal components plots of the firstthree PC scores (cumulatively accounting for 59.5% of total vari-ance) for all 105 replica handaxes plus the target model. As can beseen, the model falls close to the center of the distributionwith rawmaterial categories distributed around the target form.
Table 4Average peak force for differing specimen thicknesses across materials.
Thickness range Average peak force (kN) % Difference (inreference to flint)
Flint Basalt Obsidian Basalt Obsidian
9e11 mm 3.83 4.05 4.58 5.74 19.5813e15 mm 10.9 7.97 8.23 �26.88 �24.50
The ANOVA of the Euclidean distance divergences from themodel showed no significant differences across raw material cat-egories (F ¼ 1.886; p ¼ 0.157). Hence, none of the handaxe groupsdiffered from the model to a greater extent than the other groups.
3.2. Production efficiency assessment
The KruskaleWallis test indicated no significant differencesbetween the production economy measures for different raw ma-terial types (H¼ 2.947; p¼ 0.229). Hence, production economywas
Table 5ManneWhitney comparisons of hardness (rebound, Q values) values for differentraw materials.
Basalt Obsidian Non-cortical flint
Basalt e e e
Obsidian 0.003 e e
Non-cortical flint <0.001 0.314 e
Cortical Flint 0.877 0.016 0.004
Significant values are shown in bold. Initial KruskaleWallis test (p ¼ 0.0005).

Fig. 12. A digital grid was placed onto each handaxe image in both plan-view (a) and profile-view (b), as illustrated here by the handaxe model, resulting in 29 morphometricvariables. The yellow lines indicate maximumwidth (in a) and maximum thickness (in b). (For interpretation of the references to color in this figure legend, the reader is referred tothe web version of this article.)
Fig. 13. The model handaxe plan-view (left column) as compared to the handaxe specimen with the least, average, and most copy error from each raw material.
M.I. Eren et al. / Journal of Archaeological Science 49 (2014) 472e487 483

Fig. 14. The model handaxe profile-view (left column) as compared to the handaxe specimen with the least, average, and most copy error from each raw material.
M.I. Eren et al. / Journal of Archaeological Science 49 (2014) 472e487484
not significantly different across raw materials in terms of centraltendencies.
Levene's test for homogeneity of variances did, however, indi-cate statistical differences (p¼ 0.002). Fig. 17 shows the variation incomputed production efficiency values across the three differentraw material categories in the form of box plots. As can be seen inFig. 17, this difference in economy values in terms of variances isdriven by values recorded for basalt.
4. Discussion
Understanding the role that raw material plays in themorphology of artifact form has been debated for over a century.We thus designed a replication experiment to assess whether rawmaterial automatically influenced handaxe morphology by testingwhether an experienced knapper could copy a model handaxe onthree different raw materials: flint, basalt, and obsidian. Wedemonstrated that these toolstones differed substantially in boththeir external and internal properties via a series of laboratory tests,empirical observations, and statistical tests. If, as predicted by the
rawmaterial constraints hypothesis, stone rawmaterial differencesdetermine handaxe form, then (1) there should be significant inter-group shape differences between two ormore rawmaterial groups;and (2), one or more raw material groups should deviate to asignificantly greater extent in shape from the model than othergroups. We tested these predictions via a series of statistical ana-lyses and a measurement protocol designed to capture the overallshape of each handaxe, consisting of 29 size-adjusted morpho-metric variables. Our results showed no significant differences inoverall shape between the replicated artifacts made on the threeraw materials.
No differences in central tendencies between sets of measure-ments recording production efficiency were detected in our ana-lyses across differing rawmaterials. However, we did find statisticalevidence that use of certain raw materials (in this case basalt) maylead to greater variability of production economy. Raw materialfactors may, therefore, contribute to the variability of reductioneconomies seen in archaeological assemblages, but as our analysesalso show, these need not significantly affect measures of centraltendency. These economy results are particularly interesting given

Fig. 15. Plot of PCA results (29 size adjusted variables). PC1 ¼ 36.4% and PC2 ¼ 12.1% of total variance explained. Note position of model close to center of distribution.
M.I. Eren et al. / Journal of Archaeological Science 49 (2014) 472e487 485
that the initial sizes and shapes of the nodules were significantlydifferent across raw material categories. As Schillinger et al. (2014)noted recently, when a knapper attempts to copy the shape ofanother artifact and errors arise during this process, the onlystrategy by which a knapper can correct that error is to removemorematerial (i.e. moremass). Our results indicate that differencesin raw material categories were not significantly influencing sucherrors here in any systematic manner.
Fig. 16. Plot of PC1 (36.4% of variance explained) and PC3 (11.0% of v
It should be emphasized that these results do not imply that rawmaterials play no role inwithin- and between-assemblage patternsof morphological variation in stone tools. What they do, however,emphasize is the inherent danger of assuming that just becausemorphometric variables differ between sites and raw materials atthose sites differ, such differences can be glibly attributed to rawmaterial factors. Causation for raw material factors needs to bedetermined on a case-by-case basis, and must be made on the basis
ariance). Note position of model close to center of distribution.

Fig. 17. Box plots of production economy values across different raw materials (boxranges indicate 25e75% quartiles with median values shown as bar within). It isimportant to note that these production economy values are relevant only within thecontext and explicitly stated goals of the present experiment.
M.I. Eren et al. / Journal of Archaeological Science 49 (2014) 472e487486
of formal analysis not merely on the basis of casual observation orassociation.
One reason to be particularly cautious of informal assertionsthat raw material factors are determining tool morphology is thatrocks used to make stone tools are not necessarily a random sam-ple, an observation Lubbock (1865:33) made nearly 150 years ago.Recent studies have shown that living nonhuman apes can attendto tool properties such as mass and rigidity (Manrique et al., 2010;Schrauf et al., 2012). On the grounds of phylogenetic parsimony,there is no reason to assume that attendance to physical propertiesof rocks used for knapping was not used as selection criteria fortoolstones. Indeed, there is evidence that from at least Oldowantimes, hominins were selecting raw materials in a manner thatdiffers proportionally from their local availability (Stout et al., 2005;Harmand, 2009). Moreover, there is evidence that Oldowan hom-inins were selecting rock types based on the durability of flakes thatcould be produced (Braun et al., 2009). Given these considerations,it must be remembered that rocks used to make stone tools will inmost cases fit within a discrete band of variation in terms of theirphysical properties, thus in turn restricting the potential influencethat raw material properties have in determining within- andbetween-assemblage patterns of variation. Given these factors,there are no sound reasons to assume that rawmaterial factors willautomatically comprise the dominant source of within- andbetween-assemblage patterns of artifactual variation.
There has sometimes been the assumption that stone is not aparticularly “plastic” material, and so is potentially limited in itscapacity to reflect behavioral factors (e.g., Gero, 1989: 103e104).The reductive character of stone tool production certainly createsparticular internal dynamics that will potentially affect patterns ofvariation (Baumler, 1995; Schillinger et al., 2014). Indeed, there isevidence that an interplay between the particular reduction stra-tegies adopted by hominins and raw material factors may havetaken place in certain times and places, evincing a not invariantrelationship between behavioral and natural, lithological factors(Brantingham et al., 2000; Brantingham, 2003, 2010; Gurtov andEren, 2014). However, our results suggest that the potential forbehavior to countermand differences between the external andinternal properties of different raw material categories within thegeneral media of stone tool production is potentially a potent one.
It must again, however, be noted that we are not suggesting thatraw material plays no role in shaping stone tool attributes. Indeed,two factors stand out as noteworthy points in respect to the spe-cifics of our experimental results. Firstly, other technologieseefor
example, the production of Solutrean laurel leaf points or stone“daggers” during the Scandinavian Late Neolithiceemay be moresubservient to stone tool constraints than our results alone imply,the specialized character of such artifacts notwithstanding (Apel,2008; Aubry et al., 2008). Secondly, particular raw materials notconsidered hereeesuch as quartz or sandstone for instanceeemayhave more potent effects than indicated by the analyses we report.These caveats aside, however, our results caution against injudi-cious assumptions that merely because stonemedia at two or moresites differ, and metric attributes of artifacts found at those samesites differ, causation for the latter must reside in the former.Indeed, our results are in accordance with a range of archaeologicalstudies implying that factors other than raw materials must rigor-ously be sought to fully explain differences in the attributes ofclasses of stone artifacts found across time and space (e.g., Sharon,2008; Clarkson, 2010; Costa, 2010; Smallwood, 2012; Buchananet al., 2014; Lycett and von Cramon-Taubadel, 2014).
One cautionary implication must also, however, be emphasizedin the light of our results. As noted at the outset, as an alternative toa pure “constraints” hypothesis, raw material factors may haveinfluenced stone artifact morphology because hominins did notpossess the knowledge, manual dexterity, skills, or incentive totackle “challenging” raw materials. As noted, this hypothesis doesnot suggest that raw material plays no role in artifact form, butinstead that it cannot be assumed automatically that there areinherent lithological properties that definitively influence artifactmorphology in particular ways. In light of these considerations,what our results perhaps indicate is that rather than presuming apriori that rawmaterial is a dominant factor, a key issue is to try anddetermine how raw material effects are interacting with otherrelevant factors (Diez-Martin and Eren, 2012:338; Stout, 2005).Indeed, these results perhaps highlight that lithic analyticalmethods must be further refineddboth conceptually and in prac-tical termsdto take account of the simultaneous role that factorssuch as “skill,” “culture,” “rawmaterial,” and/or “reduction”may beplaying in generating within- and between-assemblage patterns ofvariation (Archer and Braun, 2010; Lycett and von Cramon-Taubadel, 2014). Certainly, an assumed preeminence for raw ma-terial “constraints” cannot be justified in light of our results.
Acknowledgments
We are grateful to Craig Ratzat of Neolithics and Alastair Key fortheir assistance in sourcing the raw material used in our analyses.Kerstin Schillinger provided technical assistance, for which we areindebted. The undertaking of this research was possible thanks tothe Leverhulme Trust, which awarded MIE an Early CareerFellowship (ECF-2011-567), and provided additional funding for allmaterials and procedures. MIE is grateful to Rebecca Catto, andMustafa, Kathleen, and Nimet Eren for their support.
References
Abbott, W.J.L., 1911. On the classification of the British Stone Age industries andsome new, and little known, well-marked horizons and cultures. J. R. Anthropol.Inst. 41, 458e480.
Andrefsky Jr., W., 1994. Raw-Material availability and the organization of technol-ogy. Am. Antiq. 59, 21e34.
Andrefsky, W., 1998. Lithics: Macroscopic Approaches to Analysis. Cambridge Uni-versity Press, Cambridge.
Apel, J., 2008. Knowledge, know-how, and raw material e the production ofLate Neolithic flint daggers in Scandinavia. J. Archaeol. Method Theory 15,91e111.
Archer, W., Braun, D.R., 2010. Variability in bifacial technology at Elandsfontein,Western cape, South Africa: a geometric morphometric approach. J. Archaeol.Sci. 37, 201e209.

M.I. Eren et al. / Journal of Archaeological Science 49 (2014) 472e487 487
Ashton, N., McNabb, J., 1994. Bifaces in perspective. In: Ashton, N., David, A. (Eds.),Stories in Stone: Lithic Studies Society Occasional Paper No.4. Lithic StudiesSociety, London, pp. 182e191.
Aubry, T., Bradley, B., Almeida, M., Walter, B., Neves, M., Pelegrin, J., Lenoir, M.,Tiffagom, M., 2008. Solutrean laurel leaf production at Maîtreaux: an experi-mental approach guided by techno-economic analysis. World Archaeol. 40,48e66.
Bar-Yosef, O., Eren, M.I., Yuan, J., Cohen, D., Li, Y., 2012. Were bamboo tools made inprehistoric Southeast Asia? An experimental view from South China. Quat. Int.269, 9e21.
Baumler, M.F., 1995. Principles and properties of lithic core reduction: implicationsfor Levallois technology. In: Dibble, H.L., Bar-Yosef, O. (Eds.), The Definition andInterpretation of Levallois Technology. Prehistory Press, Madison, Wisconsin,pp. 11e23.
Beck, M., 2002. The ball-on-three-ball test for tensile strength: refined methodol-ogy and results for three Hohkam ceramic types. Am. Antiq. 67, 558e569.
Brantingham, P.J., 2003. A neutral model of stone raw material procurement. Am.Antiq. 68, 487e509.
Brantingham, P.J., 2010. The mathematics of chaîne op�eratoires. In: Lycett, S.J.,Chauhan, P.R. (Eds.), New Perspectives on Old Stones: Analytical Approaches toPaleolithic Technologies. Springer, New York, pp. 183e206.
Brantingham, P.J., Kuhn, S.L., 2001. Constraints on Levallois core technology: amathematical model. J. Archaeol. Sci. 28, 747e761.
Brantingham, P.J., Olsen, J.W., Rech, J.A., Krivoshapkin, A.I., 2000. Raw materialquality and prepared core technologies in Northeast Asia. J. Archaeol. Sci. 27,255e271.
Braun, D.R., Plummer, T., Ferraro, J.V., Ditchfield, P., Bishop, L.C., 2009. Raw materialquality and Oldowan hominin toolstone preferences: evidence from KanjeraSouth, Kenya. J. Archaeol. Sci. 36, 1605e1614.
Browne, C., Wilson, L., 2011. Resource selection of lithic raw materials in the MiddlePalaeolithic in southern France. J. Hum. Evol. 61, 597e608.
Buchanan, B., O'Brien, M., Collard, M., 2014. Continent-wide or region-specific? Ageometric morphometrics-based assessment of variation in Clovis point shape.Archaeol. Anthropol. Sci. 6, 145e162.
Callahan, E., 1979. The basics of biface knapping in the eastern fluted point tradi-tion: a manual for flintknappers. Archaeol. East. N. Am. 7, 1e180.
Callow, P., 1976. The Lower and Middle Palaeolithic of Britain and Adjacent Areas ofEurope (PhD thesis). University of Cambridge, Cambridge.
Clark, J.D., 2001. Variability in primary and secondary technologies of the laterAcheulian in Africa. In: Milliken, S., Cook, J. (Eds.), A Very Remote Period Indeed:Papers on the Palaeolithic Presented to Derek Roe. Oxbow Books, Oxford,pp. 1e18.
Clarkson, C., 2010. Regional diversity within the core technology of the HowiesonsPoort techno-complex. In: Lycett, S.J., Chauhan, P.R. (Eds.), New Perspectives onOld Stones: Analytical Approaches to Paleolithic Technologies. Springer, NewYork, pp. 43e59.
Costa, A.G., 2010. A geometric morphometric assessment of plan shape in bone andstone Acheulean bifaces from the Middle Pleistocene site of Castel di Guido,Latium, Italy. In: Lycett, S.J., Chauhan, P.R. (Eds.), New Perspectives on OldStones: Analytical Approaches to Paleolithic Technologies. Springer, New York,pp. 23e41.
Crabtree, D.E., 1967. Notes on experiments in flintknapping: 3. The flintknappersraw materials. Tebiwa 10, 8e25.
de la Torre, I., 2011. The Early Stone Age lithic assemblages of Gadeb (Ethiopia) andthe Developed Oldowan/early Acheulean in East Africa. J. Hum. Evol. 60,768e812.
Diez-Martin, F., Eren, M.I., 2012. The Early Acheulean in Africa: past paradigms,current ideas, and future directions. In: Dominguez-Rodrigo, M. (Ed.), StoneTools and Fossil Bones: Debates in the Archaeology of Human Origins. Cam-bridge University Press, Cambridge, pp. 310e358.
Domanski, M., Webb, J., Boland, J., 1994. Mechanical properties of stone aretfactmaterials and the effect of heat treatment. Archeometry 36, 177e208.
Edwards, S.W., 2001. A modern knapper's assessment of the technical skills of theLate Acheulean biface workers at Kalambo Falls. In: Clark, J.D. (Ed.), KalamboFalls Prehistoric Site, vol. III. Cambridge University Press, Cambridge,pp. 605e611.
Eren, M.I., Lycett, S.J., Roos, C.I., Sampson, C.G., 2011a. Toolstone constraints onknapping skill: Levallois reductionwith two different raw materials. J. Archaeol.Sci. 38, 2731e2739.
Eren, M.I., Bradley, B.A., Sampson, C.G., 2011b. Middle Paleolithic skill-level and theindividual knapper: an experiment. Am. Antiq. 76, 229e251.
Falsetti, A.B., Jungers, W.L., Cole III, T.M., 1993. Morphometrics of the Callitrichidforelimb: a case study in size and shape. Int. J. Primatol. 14, 551e572.
Gero, J.M., 1989. Assessing social information in material objects: how well dolithics measure up? In: Torrence, R. (Ed.), Time, Energy and Stone Tools. Cam-bridge University Press, Cambridge, pp. 92e105.
Goodman, M.E., 1944. The physical properties of stone tool materials. Am. Antiq. 9,415e433.
Goodyear, A., 1989. A hypothesis for the use of cryptocrystalline raw materialsamong Paleoindian groups of North America. In: Ellis, C., Lothrop, J. (Eds.),Eastern Paleoindian Lithic Resource Use. Westview Press, Boulder, pp. 1e10.
Gowlett, J.A.J., 2011. The Empire of the Acheulean strikes back. In: Sept, J.,Pilbeam, D. (Eds.), Casting the Net Wide: Papers in Honor of Glynn Isaac and HisApproach to Human Origins Research. American School of Prehistoric Research,Cambridge, MA, pp. 93e114.
Gurtov, A.N., Eren, M.I., 2014. Lower Paleolithic bipolar reduction and hominin se-lection of quartz at Olduvai Gorge, Tanzania: what’s the connection? Quat. Int.322e323, 285e291.
Harmand, S., 2009. Variability in Raw Material Selectivity at the Late Pliocene sitesof Lokalalei, West Turkana, Kenya. In: Hovers, E., Braun, D.R. (Eds.), Interdisci-plinary Approaches to the Oldowan. Springer, Dordrecht, pp. 85e97.
Holdoway, S., Stern, N., 2004. A Record in Stone: the Study of Australia's FlakedStone Artefacts. Victoria Museum, Melbourne.
Isaac, G.L., 1977. Olorgesailie: Archaeological Studies of a Middle Pleistocene LakeBasin in Kenya. University of Chicago Press, Chicago.
Jennings, T.A., Pevny, C.D., Dickens, W.A., 2010. A biface and blade core efficiencyexperiment: implications for Early Paleoindian technological organisation.J. Archaeol. Sci. 37, 2155e2164.
Jones, P.R., 1979. Effects of raw material on biface manufacture. Science 204,835e836.
Jungers, W.L., Falsetti, A.B., Wall, C.E., 1995. Shape, relative size, and size adjust-ments in morphometrics. Yearb. Phys. Anthropol. 38, 137e161.
Lubbock, J., 1865. Prehistoric Times. Williams and Norgate, London.Luedtke, B.E., 1992. An Archaeologist's Guide to Chert and Flint. Institute of
Archaeology, University of California, Los Angeles.Lycett, S.J., Bae, C.J., 2010. The Movius Line controversy: the state of the debate.
World Archaeol. 42, 521e544.Lycett, S.J., Eren, M.I., 2013. Levallois economics: an examination of ‘waste’ pro-
duction in experimentally produced Levallois reduction sequences. J. Archaeol.Sci. 40, 2384e2392.
Lycett, S.J., von Cramon-Taubadel, N., 2014. Toward a “quantitative genetic”approach to lithic variation. J. Archaeol. Method Theory. http://dx.doi.org/10.1007/s10816-013-9200-9.
Lycett, S.J., von Cramon-Taubdel, N., Foley, R., 2006. A crossbeam co-ordinate caliperfor the morphometric analysis of lithic nuclei: a description, test, and empiricalexamples of application. J. Archaeol. Sci. 33, 847e861.
Manrique, H.M., Nam-mi Gross, A., Call, J., 2010. Great apes select tools on the basisof their rigidity. J. Exp. Psychol. Anim. Behav. Process. 36, 409e422.
McPherron, S., 2006. Variability in Acheulian handaxe morphology and its impli-cations for typology. In: Goren-Inbar, N., Sharon, G. (Eds.), Axe Age: AcheulianToolmaking: From Quarry to Discard (Approaches to Anthropological Archae-ology). Equinox Publishing, London, pp. 267e285.
Manninen, M., Knutsson, K., 2014. Lithic raw material diversification as an adaptivestrategy e technology, mobility, and site structure in Late Mesolithic north-ernmost Europe. J. Anthropol. Archaeol. 33, 84e98.
Neupert, M.A., 1994. Strength testing archaeological ceramics: a new perspective.Am. Antiq. 59, 709e723.
Ritter, J.E., Jakus, K., Batakis, A., Bandyopadhyay, N., 1980. Appraisal of biaxialstrength testing. J. Non-cryst. Solids 38e39, 419e424.
Roe, D.A., 1994. A metrical analysis of selected sets of handaxes and cleavers fromOlduvai Gorge. In: Leakey, M.D., Roe, D.A. (Eds.), Olduvai Gorge, vol. 5. Cam-bridge University Press, Cambridge, pp. 146e234.
Schick, K.D.,1994. TheMovius line reconsidered. In: Corruccini, R.S., Ciochon, R.L. (Eds.),Integrative Paths to the Past. Prentice Hall, Englewood Cliffs, NJ, pp. 569e596.
Schillinger, K., Mesoudi, A., Lycett, S.J., 2014. Copying error and the cultural evolu-tion of “additive” vs. “reductive” material traditions: an experimental assess-ment. Am. Antiq. 79, 128e143.
Schrauf, C., Call, J., Fuwa, K., Hirata, S., 2012. Do chimpanzees use weight to selecthammer tools? PLoS One 7, e41044.
Sharon, G., 2008. The impact of raw material on Acheulian large flake production.J. Archaeol. Sci., 1329e1344.
Smallwood, A., 2010. Clovis biface technology at the Topper site, South Carolina: evi-dence for variation and technological flexibility. J. Archaeol. Sci. 37, 2413e2425.
Smallwood, A., 2012. Clovis technology and settlement in the American Southeast:using biface analysis to evaluate dispersal models. Am. Antiq. 77, 689e713.
Sokal, R.R., Rohlf, F.J., 1995. Biometry. W.H. Freeman & Co, New York.Stout, D., 2005. The social and cultural context of stone-knapping skill acquisition.
In: Roux, V., Bril, B. (Eds.), Stone Knapping: the Necessary Conditions for aUniquely Hominin Behavior. McDonald Institute for Archaeological Research,Oxford, pp. 331e340.
Stout, D., Quade, J., Semaw, S., Rogers, M., Levin, N., 2005. Raw material selectivity ofthe earliest stone toolmakers at Gona, Afar, Ethiopia. J. Hum. Evol. 48, 365e380.
Whittaker, J.C., 1994. Flintknapping: Making and Understanding Stone Tools. Uni-versity of Texas Press, Austin.
Winton, V., 2005. An investigation of knapping-skill development in the manu-facture of Palaeolithic handaxes. In: Roux, V., Bril, B. (Eds.), Stone Knapping: theNecessary Conditions for a Uniquely Hominin Behavior. McDonald Institute forArchaeological Research, Oxford, pp. 109e116.
Wynn, T., Tierson, F., 1990. Regional comparison of the shapes of later Acheuleanhandaxes. Am. Anthropol. 92, 73e84.