Clustering of under-five mortality in the Navrongo HDSS in the Kassena-Nankana District of northern...
11
Clustering of under-five mortality in the Navrongo HDSS in the Kassena- Nankana District of northern Ghana Martin Adjuik*, Ernest Kanyomse, Felix Kondayire, George Wak and Abraham Hodgson Navrongo Health Research Centre, Navrongo, Upper East Region, Ghana Background: Under-five mortality is a major public health problem and one of the health indicators of health care in sub-Saharan Africa. In order to address inefficient health systems, there is a need to identify the spatial distribution of under-five mortality, especially areas of high mortality clustering. This study aimed to explore spatial and temporal clustering in under-five mortality in the Kassena-Nankana 1 District of the Upper East region. Methods: We used data from the Navrongo Health and Demographic Surveillance System in the Kassena- Nankana District of northern Ghana, which had an average population of 140,000 of which about 18,400 were under five years of age. We analysed under-five mortality in 49 villages during the period 19972006. We calculated total under-five mortality rates and investigated their geographical distributions. A spatial scan statistic was used to test for clustering of the mortality in both space and time. Results: Under-five mortality has been declining during the period. However, the data show a persistently higher than average clustering of mortality over the period among villages mainly in the north-eastern parts of the district. Conclusion: There is a higher than average under-five mortality clustering in the villages in the north-east of the district and this may suggest a relatively poor health care system despite the many health interventions that took place over time in the district, including the Community Health and Family Planning Project, whose impact may not have been felt in these parts of the district between 1995 and 2004. Keywords: poor health care; under-five mortality; clustering; demographic surveillance; space and spacetime scan statistic Received: 20 April 2010; Revised: 16 June 2010; Accepted: 29 June 2010; Published: 30 August 2010 U nder-five mortality is a major public health problem in sub-Saharan Africa. Decades of sustained child mortality reductions still see the mortality levels in some parts of Africa, though decreas- ing generally, to be relatively high (1). In some other countries there is still an increased trend in under-five mortality (2). The reasons for this are varied: low socio- economic conditions, poor immunisation provisions, low literacy and poor access to and utilisation of health care are a few examples. Environmental conditions like access to good water and toilet facilities are also contributing factors and, in particular, poor housing conditions that predispose to crowding. Strong mortality clustering in a community may indicate the presence of an unequal distribution of health and health-related resources and infrastructures. It also suggests a concentration of nutri- tional and sanitary behaviours harmful to the good health and longevity of children (3). Public health systems would need information on under-five mortality for efficient implementation of control programmes and policy (4). We set out to explore spatial and temporal clustering of under-five mortality in the Kassena-Nankana District of the Upper East region. We hypothesised that villages that had poor access to health services were more likely to have an excess of higher mortality than those with good access. The Navrongo Health and Demographic Surveillance System (NHDSS) (5) has been collecting demographic and geographic information for over 10 years and this affords the opportunity to assess spatial and temporal clustering of under-five mortality in the district. The NHDSS started with a baseline census of the rural district in 1993. The 1 In 2008, the Kassena-Nankana District was split into two districts: Kassena-Nankana West District and Kassena-Nankana East District. æ INDEPTH Mortality Clustering Supplement Global Health Action 2010. # 2010 Martin Adjuik et al. This is an Open Access article distributed under the terms of the Creative Commons Attribution- Noncommercial 3.0 Unported License (http://creativecommons.org/licenses/by-nc/3.0/), permitting all non-commercial use, distribution, and reproduction in any medium, provided the original work is properly cited. 15 Citation: Global Health Action Supplement 1, 2010. DOI: 10.3402/gha.v3i0.5233
-
Upload
independent -
Category
Documents
-
view
2 -
download
0
Transcript of Clustering of under-five mortality in the Navrongo HDSS in the Kassena-Nankana District of northern...

Clustering of under-five mortality inthe Navrongo HDSS in the Kassena-Nankana District of northern GhanaMartin Adjuik*, Ernest Kanyomse, Felix Kondayire,George Wak and Abraham Hodgson
Navrongo Health Research Centre, Navrongo, Upper East Region, Ghana
Background: Under-five mortality is a major public health problem and one of the health indicators of health
care in sub-Saharan Africa. In order to address inefficient health systems, there is a need to identify the
spatial distribution of under-five mortality, especially areas of high mortality clustering. This study aimed to
explore spatial and temporal clustering in under-five mortality in the Kassena-Nankana1 District of the
Upper East region.
Methods: We used data from the Navrongo Health and Demographic Surveillance System in the Kassena-
Nankana District of northern Ghana, which had an average population of 140,000 of which about 18,400
were under five years of age. We analysed under-five mortality in 49 villages during the period 1997�2006. We
calculated total under-five mortality rates and investigated their geographical distributions. A spatial scan
statistic was used to test for clustering of the mortality in both space and time.
Results: Under-five mortality has been declining during the period. However, the data show a persistently
higher than average clustering of mortality over the period among villages mainly in the north-eastern parts
of the district.
Conclusion: There is a higher than average under-five mortality clustering in the villages in the north-east of
the district and this may suggest a relatively poor health care system despite the many health interventions
that took place over time in the district, including the Community Health and Family Planning Project,
whose impact may not have been felt in these parts of the district between 1995 and 2004.
Keywords: poor health care; under-five mortality; clustering; demographic surveillance; space and space�time scan statistic
Received: 20 April 2010; Revised: 16 June 2010; Accepted: 29 June 2010; Published: 30 August 2010
Under-five mortality is a major public health
problem in sub-Saharan Africa. Decades of
sustained child mortality reductions still see the
mortality levels in some parts of Africa, though decreas-
ing generally, to be relatively high (1). In some other
countries there is still an increased trend in under-five
mortality (2). The reasons for this are varied: low socio-
economic conditions, poor immunisation provisions, low
literacy and poor access to and utilisation of health care
are a few examples. Environmental conditions like access
to good water and toilet facilities are also contributing
factors and, in particular, poor housing conditions that
predispose to crowding. Strong mortality clustering in a
community may indicate the presence of an unequal
distribution of health and health-related resources and
infrastructures. It also suggests a concentration of nutri-
tional and sanitary behaviours harmful to the good
health and longevity of children (3). Public health
systems would need information on under-five mortality
for efficient implementation of control programmes
and policy (4). We set out to explore spatial
and temporal clustering of under-five mortality in the
Kassena-Nankana District of the Upper East region. We
hypothesised that villages that had poor access to health
services were more likely to have an excess of higher
mortality than those with good access. The Navrongo
Health and Demographic Surveillance System (NHDSS)
(5) has been collecting demographic and geographic
information for over 10 years and this affords the
opportunity to assess spatial and temporal clustering of
under-five mortality in the district. The NHDSS started
with a baseline census of the rural district in 1993. The
1In 2008, the Kassena-Nankana District was split into two districts:Kassena-Nankana West District and Kassena-Nankana EastDistrict.
�INDEPTH Mortality Clustering Supplement
Global Health Action 2010. # 2010 Martin Adjuik et al. This is an Open Access article distributed under the terms of the Creative Commons Attribution-Noncommercial 3.0 Unported License (http://creativecommons.org/licenses/by-nc/3.0/), permitting all non-commercial use, distribution, and reproductionin any medium, provided the original work is properly cited.
15
Citation: Global Health Action Supplement 1, 2010. DOI: 10.3402/gha.v3i0.5233
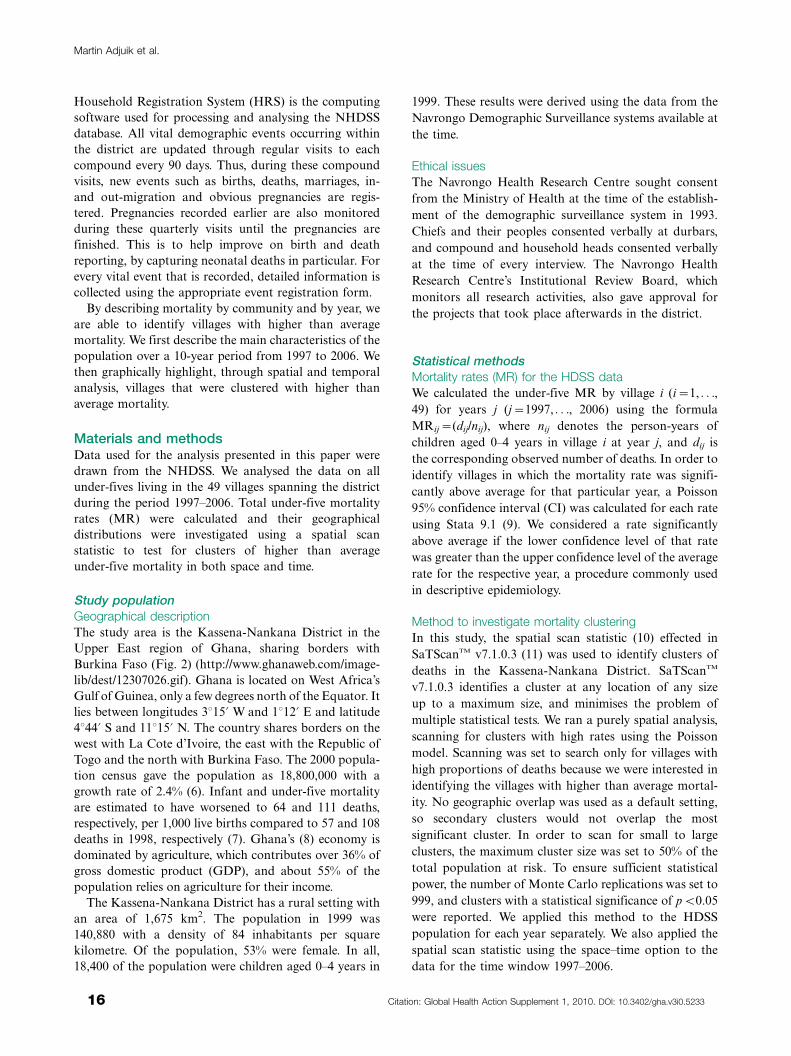
Household Registration System (HRS) is the computing
software used for processing and analysing the NHDSS
database. All vital demographic events occurring within
the district are updated through regular visits to each
compound every 90 days. Thus, during these compound
visits, new events such as births, deaths, marriages, in-
and out-migration and obvious pregnancies are regis-
tered. Pregnancies recorded earlier are also monitored
during these quarterly visits until the pregnancies are
finished. This is to help improve on birth and death
reporting, by capturing neonatal deaths in particular. For
every vital event that is recorded, detailed information is
collected using the appropriate event registration form.
By describing mortality by community and by year, we
are able to identify villages with higher than average
mortality. We first describe the main characteristics of the
population over a 10-year period from 1997 to 2006. We
then graphically highlight, through spatial and temporal
analysis, villages that were clustered with higher than
average mortality.
Materials and methodsData used for the analysis presented in this paper were
drawn from the NHDSS. We analysed the data on all
under-fives living in the 49 villages spanning the district
during the period 1997�2006. Total under-five mortality
rates (MR) were calculated and their geographical
distributions were investigated using a spatial scan
statistic to test for clusters of higher than average
under-five mortality in both space and time.
Study populationGeographical description
The study area is the Kassena-Nankana District in the
Upper East region of Ghana, sharing borders with
Burkina Faso (Fig. 2) (http://www.ghanaweb.com/image-
lib/dest/12307026.gif). Ghana is located on West Africa’s
Gulf of Guinea, only a few degrees north of the Equator. It
lies between longitudes 3815? W and 1812? E and latitude
4844? S and 11815? N. The country shares borders on the
west with La Cote d’Ivoire, the east with the Republic of
Togo and the north with Burkina Faso. The 2000 popula-
tion census gave the population as 18,800,000 with a
growth rate of 2.4% (6). Infant and under-five mortality
are estimated to have worsened to 64 and 111 deaths,
respectively, per 1,000 live births compared to 57 and 108
deaths in 1998, respectively (7). Ghana’s (8) economy is
dominated by agriculture, which contributes over 36% of
gross domestic product (GDP), and about 55% of the
population relies on agriculture for their income.
The Kassena-Nankana District has a rural setting with
an area of 1,675 km2. The population in 1999 was
140,880 with a density of 84 inhabitants per square
kilometre. Of the population, 53% were female. In all,
18,400 of the population were children aged 0�4 years in
1999. These results were derived using the data from the
Navrongo Demographic Surveillance systems available at
the time.
Ethical issues
The Navrongo Health Research Centre sought consent
from the Ministry of Health at the time of the establish-
ment of the demographic surveillance system in 1993.
Chiefs and their peoples consented verbally at durbars,
and compound and household heads consented verbally
at the time of every interview. The Navrongo Health
Research Centre’s Institutional Review Board, which
monitors all research activities, also gave approval for
the projects that took place afterwards in the district.
Statistical methodsMortality rates (MR) for the HDSS dataWe calculated the under-five MR by village i (i�1, . . .,
49) for years j (j�1997, . . ., 2006) using the formula
MRij�(dij/nij), where nij denotes the person-years of
children aged 0�4 years in village i at year j, and dij is
the corresponding observed number of deaths. In order to
identify villages in which the mortality rate was signifi-
cantly above average for that particular year, a Poisson
95% confidence interval (CI) was calculated for each rate
using Stata 9.1 (9). We considered a rate significantly
above average if the lower confidence level of that rate
was greater than the upper confidence level of the average
rate for the respective year, a procedure commonly used
in descriptive epidemiology.
Method to investigate mortality clustering
In this study, the spatial scan statistic (10) effected in
SaTScanTM v7.1.0.3 (11) was used to identify clusters of
deaths in the Kassena-Nankana District. SaTScanTM
v7.1.0.3 identifies a cluster at any location of any size
up to a maximum size, and minimises the problem of
multiple statistical tests. We ran a purely spatial analysis,
scanning for clusters with high rates using the Poisson
model. Scanning was set to search only for villages with
high proportions of deaths because we were interested in
identifying the villages with higher than average mortal-
ity. No geographic overlap was used as a default setting,
so secondary clusters would not overlap the most
significant cluster. In order to scan for small to large
clusters, the maximum cluster size was set to 50% of the
total population at risk. To ensure sufficient statistical
power, the number of Monte Carlo replications was set to
999, and clusters with a statistical significance of pB0.05
were reported. We applied this method to the HDSS
population for each year separately. We also applied the
spatial scan statistic using the space�time option to the
data for the time window 1997�2006.
Martin Adjuik et al.
16 Citation: Global Health Action Supplement 1, 2010. DOI: 10.3402/gha.v3i0.5233

ResultsFig. 1 shows a map of the study area in relation to the
national setting. Fig. 2 shows a chart of under-five
mortality with Poisson 95% CI in the whole district for
the period 1997�2006. There was a general decreasing
trend in mortality over this period with a rate of 35.8 per
1,000 person-years in 1997 and ending with 17.3 per
1,000 person-years in 2006. However, the rate for 2000
was as high as that for 2007 which was 36.9 per 1,000
person-years. The MR with their Poisson 95% CIs for
children under-five years for the period 1997�2006 for
each of the 49 villages constituting the Kassena-Nankana
District are shown in Table 1. MR that are significantly
higher than the average rate for that year have been
bolded in the table. In 1997, Kayoro in the western part
of the district had a mortality rate of 67.3 (CI: 47.2, 93.2)
deaths per 1,000 person-years compared to the district
average rate of 38.2 (CI: 35.5, 41.1) deaths per 1,000
person-years. In 1998, Azeaduma with 64.7 (CI: 38.9,
101.0) deaths per 1,000 person-years and Kaasi/Akaamo
with 72.3 (CI: 40.5, 119.0) deaths per 1,000 were above
the average mortality rate of 35.6 (CI: 33.0, 38.4) deaths
per 1,000 person-years. Both these villages are in the
eastern part of the district. In 2002, two villages with
mortality above the average mortality rate of 29.3 (CI:
26.9, 31.9) deaths per 1,000 person-years were Naga in
the south with 57.0 (38.2, 81.9) and Navio in the north
with 51.8 (CI: 34.9, 73.9) deaths per 1,000 person-years.
Pungu, which is close to Navrongo, the central part of the
district, had the highest mortality in 2004 with 34.1 (CI:
24.7, 45.9) deaths per 1,000 person-years compared to the
average mortality rate of 21 (CI: 19.0, 23.2) deaths per
1,000 person-years. The analysis also showed two villages
in 2006 with MR above the average mortality rate of 17.3
(CI: 15.4, 19.4) per 1,000 deaths person-years. These were
Naga with 37.5 (CI: 21.9, 60.1) and Nakolo in the north
with 37.1 (CI: 21.2, 60.2) deaths per 1,000 person-years.
Results of the space and space�time scan statisticUsing SaTScanTM v7.0.3, spatial analysis was done to
identify clusters of villages with significantly higher than
average mortality. Total under-five mortality in the
Kassena-Nankana District between 1997 and 2006 using
purely spatial analysis scanning for high rates are shown
in Table 2. Statistically significant clusters of higher
mortality (pB0.05) were identified in 1998, 1999, 2001,
2002 and 2003. In 1998, there were 22 villages of which
60 0 60 120 km
NKassena-Nankana District
Fig. 1. Map of Ghana showing the location of the Kassena-Nankana District.
Fig. 2. Mortality rates (with 95% CI) of under-five popula-
tion under surveillance from 1997 to 2006 in the Kassena-
Nankana District.
Spatial and temporal clustering in under-five mortality in the Kassena-Nankana District
Citation: Global Health Action Supplement 1, 2010. DOI: 10.3402/gha.v3i0.5233 17
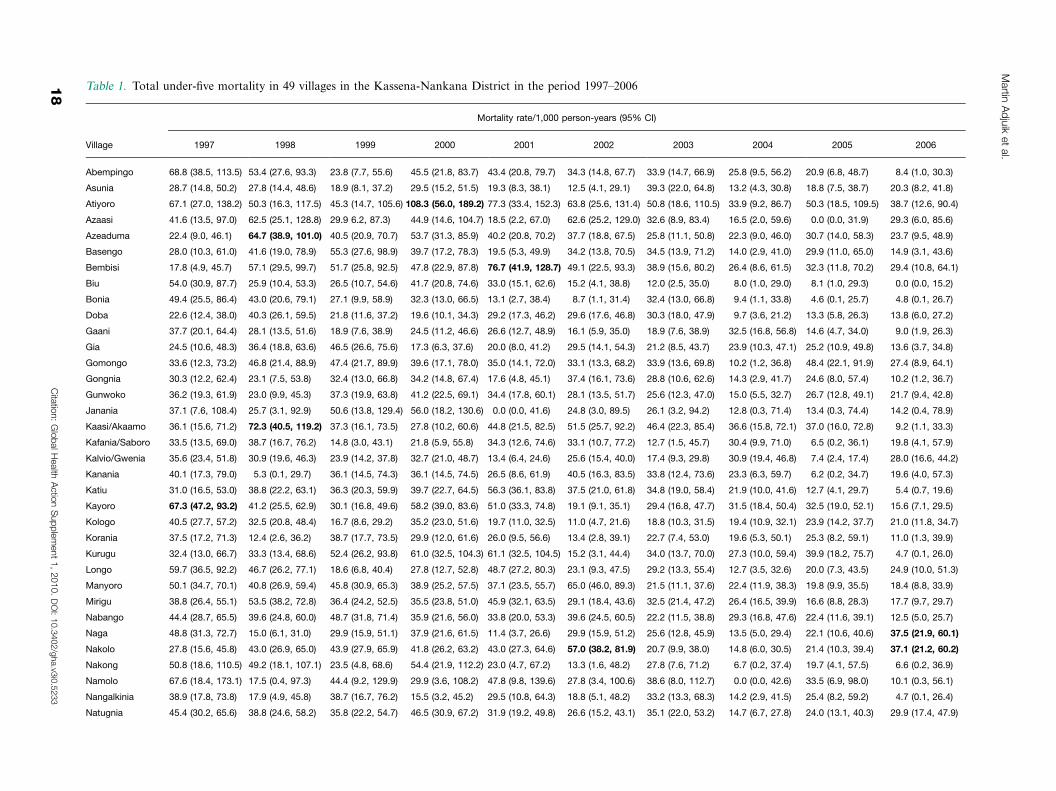
Table 1. Total under-five mortality in 49 villages in the Kassena-Nankana District in the period 1997�2006
Mortality rate/1,000 person-years (95% CI)
Village 1997 1998 1999 2000 2001 2002 2003 2004 2005 2006
Abempingo 68.8 (38.5, 113.5) 53.4 (27.6, 93.3) 23.8 (7.7, 55.6) 45.5 (21.8, 83.7) 43.4 (20.8, 79.7) 34.3 (14.8, 67.7) 33.9 (14.7, 66.9) 25.8 (9.5, 56.2) 20.9 (6.8, 48.7) 8.4 (1.0, 30.3)
Asunia 28.7 (14.8, 50.2) 27.8 (14.4, 48.6) 18.9 (8.1, 37.2) 29.5 (15.2, 51.5) 19.3 (8.3, 38.1) 12.5 (4.1, 29.1) 39.3 (22.0, 64.8) 13.2 (4.3, 30.8) 18.8 (7.5, 38.7) 20.3 (8.2, 41.8)
Atiyoro 67.1 (27.0, 138.2) 50.3 (16.3, 117.5) 45.3 (14.7, 105.6) 108.3 (56.0, 189.2) 77.3 (33.4, 152.3) 63.8 (25.6, 131.4) 50.8 (18.6, 110.5) 33.9 (9.2, 86.7) 50.3 (18.5, 109.5) 38.7 (12.6, 90.4)
Azaasi 41.6 (13.5, 97.0) 62.5 (25.1, 128.8) 29.9 6.2, 87.3) 44.9 (14.6, 104.7) 18.5 (2.2, 67.0) 62.6 (25.2, 129.0) 32.6 (8.9, 83.4) 16.5 (2.0, 59.6) 0.0 (0.0, 31.9) 29.3 (6.0, 85.6)
Azeaduma 22.4 (9.0, 46.1) 64.7 (38.9, 101.0) 40.5 (20.9, 70.7) 53.7 (31.3, 85.9) 40.2 (20.8, 70.2) 37.7 (18.8, 67.5) 25.8 (11.1, 50.8) 22.3 (9.0, 46.0) 30.7 (14.0, 58.3) 23.7 (9.5, 48.9)
Basengo 28.0 (10.3, 61.0) 41.6 (19.0, 78.9) 55.3 (27.6, 98.9) 39.7 (17.2, 78.3) 19.5 (5.3, 49.9) 34.2 (13.8, 70.5) 34.5 (13.9, 71.2) 14.0 (2.9, 41.0) 29.9 (11.0, 65.0) 14.9 (3.1, 43.6)
Bembisi 17.8 (4.9, 45.7) 57.1 (29.5, 99.7) 51.7 (25.8, 92.5) 47.8 (22.9, 87.8) 76.7 (41.9, 128.7) 49.1 (22.5, 93.3) 38.9 (15.6, 80.2) 26.4 (8.6, 61.5) 32.3 (11.8, 70.2) 29.4 (10.8, 64.1)
Biu 54.0 (30.9, 87.7) 25.9 (10.4, 53.3) 26.5 (10.7, 54.6) 41.7 (20.8, 74.6) 33.0 (15.1, 62.6) 15.2 (4.1, 38.8) 12.0 (2.5, 35.0) 8.0 (1.0, 29.0) 8.1 (1.0, 29.3) 0.0 (0.0, 15.2)
Bonia 49.4 (25.5, 86.4) 43.0 (20.6, 79.1) 27.1 (9.9, 58.9) 32.3 (13.0, 66.5) 13.1 (2.7, 38.4) 8.7 (1.1, 31.4) 32.4 (13.0, 66.8) 9.4 (1.1, 33.8) 4.6 (0.1, 25.7) 4.8 (0.1, 26.7)
Doba 22.6 (12.4, 38.0) 40.3 (26.1, 59.5) 21.8 (11.6, 37.2) 19.6 (10.1, 34.3) 29.2 (17.3, 46.2) 29.6 (17.6, 46.8) 30.3 (18.0, 47.9) 9.7 (3.6, 21.2) 13.3 (5.8, 26.3) 13.8 (6.0, 27.2)
Gaani 37.7 (20.1, 64.4) 28.1 (13.5, 51.6) 18.9 (7.6, 38.9) 24.5 (11.2, 46.6) 26.6 (12.7, 48.9) 16.1 (5.9, 35.0) 18.9 (7.6, 38.9) 32.5 (16.8, 56.8) 14.6 (4.7, 34.0) 9.0 (1.9, 26.3)
Gia 24.5 (10.6, 48.3) 36.4 (18.8, 63.6) 46.5 (26.6, 75.6) 17.3 (6.3, 37.6) 20.0 (8.0, 41.2) 29.5 (14.1, 54.3) 21.2 (8.5, 43.7) 23.9 (10.3, 47.1) 25.2 (10.9, 49.8) 13.6 (3.7, 34.8)
Gomongo 33.6 (12.3, 73.2) 46.8 (21.4, 88.9) 47.4 (21.7, 89.9) 39.6 (17.1, 78.0) 35.0 (14.1, 72.0) 33.1 (13.3, 68.2) 33.9 (13.6, 69.8) 10.2 (1.2, 36.8) 48.4 (22.1, 91.9) 27.4 (8.9, 64.1)
Gongnia 30.3 (12.2, 62.4) 23.1 (7.5, 53.8) 32.4 (13.0, 66.8) 34.2 (14.8, 67.4) 17.6 (4.8, 45.1) 37.4 (16.1, 73.6) 28.8 (10.6, 62.6) 14.3 (2.9, 41.7) 24.6 (8.0, 57.4) 10.2 (1.2, 36.7)
Gunwoko 36.2 (19.3, 61.9) 23.0 (9.9, 45.3) 37.3 (19.9, 63.8) 41.2 (22.5, 69.1) 34.4 (17.8, 60.1) 28.1 (13.5, 51.7) 25.6 (12.3, 47.0) 15.0 (5.5, 32.7) 26.7 (12.8, 49.1) 21.7 (9.4, 42.8)
Janania 37.1 (7.6, 108.4) 25.7 (3.1, 92.9) 50.6 (13.8, 129.4) 56.0 (18.2, 130.6) 0.0 (0.0, 41.6) 24.8 (3.0, 89.5) 26.1 (3.2, 94.2) 12.8 (0.3, 71.4) 13.4 (0.3, 74.4) 14.2 (0.4, 78.9)
Kaasi/Akaamo 36.1 (15.6, 71.2) 72.3 (40.5, 119.2) 37.3 (16.1, 73.5) 27.8 (10.2, 60.6) 44.8 (21.5, 82.5) 51.5 (25.7, 92.2) 46.4 (22.3, 85.4) 36.6 (15.8, 72.1) 37.0 (16.0, 72.8) 9.2 (1.1, 33.3)
Kafania/Saboro 33.5 (13.5, 69.0) 38.7 (16.7, 76.2) 14.8 (3.0, 43.1) 21.8 (5.9, 55.8) 34.3 (12.6, 74.6) 33.1 (10.7, 77.2) 12.7 (1.5, 45.7) 30.4 (9.9, 71.0) 6.5 (0.2, 36.1) 19.8 (4.1, 57.9)
Kalvio/Gwenia 35.6 (23.4, 51.8) 30.9 (19.6, 46.3) 23.9 (14.2, 37.8) 32.7 (21.0, 48.7) 13.4 (6.4, 24.6) 25.6 (15.4, 40.0) 17.4 (9.3, 29.8) 30.9 (19.4, 46.8) 7.4 (2.4, 17.4) 28.0 (16.6, 44.2)
Kanania 40.1 (17.3, 79.0) 5.3 (0.1, 29.7) 36.1 (14.5, 74.3) 36.1 (14.5, 74.5) 26.5 (8.6, 61.9) 40.5 (16.3, 83.5) 33.8 (12.4, 73.6) 23.3 (6.3, 59.7) 6.2 (0.2, 34.7) 19.6 (4.0, 57.3)
Katiu 31.0 (16.5, 53.0) 38.8 (22.2, 63.1) 36.3 (20.3, 59.9) 39.7 (22.7, 64.5) 56.3 (36.1, 83.8) 37.5 (21.0, 61.8) 34.8 (19.0, 58.4) 21.9 (10.0, 41.6) 12.7 (4.1, 29.7) 5.4 (0.7, 19.6)
Kayoro 67.3 (47.2, 93.2) 41.2 (25.5, 62.9) 30.1 (16.8, 49.6) 58.2 (39.0, 83.6) 51.0 (33.3, 74.8) 19.1 (9.1, 35.1) 29.4 (16.8, 47.7) 31.5 (18.4, 50.4) 32.5 (19.0, 52.1) 15.6 (7.1, 29.5)
Kologo 40.5 (27.7, 57.2) 32.5 (20.8, 48.4) 16.7 (8.6, 29.2) 35.2 (23.0, 51.6) 19.7 (11.0, 32.5) 11.0 (4.7, 21.6) 18.8 (10.3, 31.5) 19.4 (10.9, 32.1) 23.9 (14.2, 37.7) 21.0 (11.8, 34.7)
Korania 37.5 (17.2, 71.3) 12.4 (2.6, 36.2) 38.7 (17.7, 73.5) 29.9 (12.0, 61.6) 26.0 (9.5, 56.6) 13.4 (2.8, 39.1) 22.7 (7.4, 53.0) 19.6 (5.3, 50.1) 25.3 (8.2, 59.1) 11.0 (1.3, 39.9)
Kurugu 32.4 (13.0, 66.7) 33.3 (13.4, 68.6) 52.4 (26.2, 93.8) 61.0 (32.5, 104.3) 61.1 (32.5, 104.5) 15.2 (3.1, 44.4) 34.0 (13.7, 70.0) 27.3 (10.0, 59.4) 39.9 (18.2, 75.7) 4.7 (0.1, 26.0)
Longo 59.7 (36.5, 92.2) 46.7 (26.2, 77.1) 18.6 (6.8, 40.4) 27.8 (12.7, 52.8) 48.7 (27.2, 80.3) 23.1 (9.3, 47.5) 29.2 (13.3, 55.4) 12.7 (3.5, 32.6) 20.0 (7.3, 43.5) 24.9 (10.0, 51.3)
Manyoro 50.1 (34.7, 70.1) 40.8 (26.9, 59.4) 45.8 (30.9, 65.3) 38.9 (25.2, 57.5) 37.1 (23.5, 55.7) 65.0 (46.0, 89.3) 21.5 (11.1, 37.6) 22.4 (11.9, 38.3) 19.8 (9.9, 35.5) 18.4 (8.8, 33.9)
Mirigu 38.8 (26.4, 55.1) 53.5 (38.2, 72.8) 36.4 (24.2, 52.5) 35.5 (23.8, 51.0) 45.9 (32.1, 63.5) 29.1 (18.4, 43.6) 32.5 (21.4, 47.2) 26.4 (16.5, 39.9) 16.6 (8.8, 28.3) 17.7 (9.7, 29.7)
Nabango 44.4 (28.7, 65.5) 39.6 (24.8, 60.0) 48.7 (31.8, 71.4) 35.9 (21.6, 56.0) 33.8 (20.0, 53.3) 39.6 (24.5, 60.5) 22.2 (11.5, 38.8) 29.3 (16.8, 47.6) 22.4 (11.6, 39.1) 12.5 (5.0, 25.7)
Naga 48.8 (31.3, 72.7) 15.0 (6.1, 31.0) 29.9 (15.9, 51.1) 37.9 (21.6, 61.5) 11.4 (3.7, 26.6) 29.9 (15.9, 51.2) 25.6 (12.8, 45.9) 13.5 (5.0, 29.4) 22.1 (10.6, 40.6) 37.5 (21.9, 60.1)
Nakolo 27.8 (15.6, 45.8) 43.0 (26.9, 65.0) 43.9 (27.9, 65.9) 41.8 (26.2, 63.2) 43.0 (27.3, 64.6) 57.0 (38.2, 81.9) 20.7 (9.9, 38.0) 14.8 (6.0, 30.5) 21.4 (10.3, 39.4) 37.1 (21.2, 60.2)
Nakong 50.8 (18.6, 110.5) 49.2 (18.1, 107.1) 23.5 (4.8, 68.6) 54.4 (21.9, 112.2) 23.0 (4.7, 67.2) 13.3 (1.6, 48.2) 27.8 (7.6, 71.2) 6.7 (0.2, 37.4) 19.7 (4.1, 57.5) 6.6 (0.2, 36.9)
Namolo 67.6 (18.4, 173.1) 17.5 (0.4, 97.3) 44.4 (9.2, 129.9) 29.9 (3.6, 108.2) 47.8 (9.8, 139.6) 27.8 (3.4, 100.6) 38.6 (8.0, 112.7) 0.0 (0.0, 42.6) 33.5 (6.9, 98.0) 10.1 (0.3, 56.1)
Nangalkinia 38.9 (17.8, 73.8) 17.9 (4.9, 45.8) 38.7 (16.7, 76.2) 15.5 (3.2, 45.2) 29.5 (10.8, 64.3) 18.8 (5.1, 48.2) 33.2 (13.3, 68.3) 14.2 (2.9, 41.5) 25.4 (8.2, 59.2) 4.7 (0.1, 26.4)
Natugnia 45.4 (30.2, 65.6) 38.8 (24.6, 58.2) 35.8 (22.2, 54.7) 46.5 (30.9, 67.2) 31.9 (19.2, 49.8) 26.6 (15.2, 43.1) 35.1 (22.0, 53.2) 14.7 (6.7, 27.8) 24.0 (13.1, 40.3) 29.9 (17.4, 47.9)
Martin
Ad
juik
et
al.
18
Cita
tion:
Glo
balH
ealth
Actio
nS
up
ple
ment
1,
2010.
DO
I:10.3
402/g
ha.v3
i0.5
233

Table 1 (Continued)
Mortality rate/1,000 person-years (95% CI)
Village 1997 1998 1999 2000 2001 2002 2003 2004 2005 2006
Navio 50.8 (33.7, 73.4) 47.4 (31.0, 69.5) 42.4 (27.5, 62.6) 44.1 (28.8, 64.6) 40.7 (25.8, 61.1) 51.8 (34.9, 73.9) 33.4 (20.1, 52.2) 17.6 (8.4, 32.3) 21.5 (11.1, 37.6) 14.3 (6.2, 28.2)
Nawognia 21.4 (4.4, 62.7) 36.8 (13.5, 80.0) 33.7 (10.9, 78.6) 13.3 (1.6, 48.1) 13.8 (1.7, 49.8) 34.6 (11.2, 80.7) 0.0 (0.0, 27.0) 43.7 (16.0, 95.1) 0.0 (0.0, 25.8) 0.0 (0.0, 26.2)
Nayagenia 20.1 (8.7, 39.7) 28.3 (14.2, 50.7) 20.4 (8.8, 40.3) 25.7 (12.3, 47.2) 23.3 (10.7, 44.3) 14.7 (5.4, 32.0) 7.2 (1.5, 20.9) 27.2 (13.6, 48.7) 21.1 (9.1, 41.6) 21.0 (9.1, 41.4)
Nkwanta 56.4 (34.0, 88.1) 29.1 (13.3, 55.2) 26.2 (11.3, 51.6) 36.8 (18.4, 65.9) 28.9 (13.2, 54.8) 33.5 (16.1, 61.6) 38.0 (19.0, 67.9) 33.7 (16.2, 62.0) 29.5 (13.5, 56.0) 26 .1 (11.3, 51.4)
Nogsinia 28.0 (20.0, 38.1) 14.1 (8.5, 22.1) 22.3 (15.1, 31.9) 23.1 (15.7, 32.8) 18.7 (12.1, 27.6) 17.1 (10.8, 25.6) 19.8 (13.1, 28.9) 19.2 (12.7, 27.9) 12.1 (7.0, 19.3) 12.0 (7.0, 19.2)
Nyangnia 38.8 (18.6, 71.4) 37.9 (17.3, 72.0) 22.2 (7.2, 51.8) 57.7 (30.7, 98.6) 25.8 (9.5, 56.1) 26.0 (9.5, 56.6) 22.2 (7.2, 51.8) 13.6 (2.8, 39.8) 8.4 (1.0, 30.5) 0.0 (0.0, 16.5)
Nyangoligo 42.2 (21.8, 73.8) 50.9 (27.1, 87.1) 23.6 (8.7, 51.3) 29.3 (12.7, 57.7) 57.1 (31.2, 95.8) 17.4 (4.8, 44.7) 41.7 (20.0, 76.6) 8.1 (1.0, 29.1) 4.0 (0.1, 22.5) 3.9 (0.1, 21.9)
Paga 31.6 (22.4, 43.4) 35.4 (25.4, 48.0) 27.4 (18.6, 38.9) 39.0 (28.5, 52.2) 28.6 (19.7, 40.2) 24.5 (16.4, 35.1) 15.6 (9.4, 24.4) 15.1 (9.1, 23.7) 21.0 (13.8, 30.6) 13.9 (8.2, 21.9)
Pindaa 89.7 (24.4, 229.6) 49.4 (6.0, 178.5) 49.9 (6.0, 180.1) 22.5 (0.6, 125.1) 90.6 (24.7, 232.1) 21.9 (0.6, 121.8) 25.8 (0.7, 143.6) 0.0 (0.0, 87.7) 0.0 (0.0, 91.7) 13.9 (1.7, 50.2)
Pungu 37.6 (28.0, 49.4) 39.1 (29.2, 51.3) 35.5 (26.0, 47.3) 40.8 (30.6, 53.4) 19.5 (12.6, 28.7) 27.5 (19.3, 38.1) 20.2 (13.2, 29.6) 34.1 (24.7, 45.9) 24.0 (16.1, 34.5) 17.1 (10.4, 26.4)
Saboro 17.4 (3.6, 50.8) 16.6 (3.4, 48.6) 39.7 (16.0, 81.8) 41.1 (16.5, 84.7) 23.1 (6.3, 59.2) 31.1 (10.1, 72.6) 18.9 (3.9, 55.2) 12.0 (1.4, 43.2) 24.0 (6.6, 62.5) 30.4 (9.9, 70.8)
Vunania 42.3 (19.3, 80.3) 35.3 (14.2, 72.7) 25.5 (8.3, 59.5) 20.3 (5.5, 51.9) 49.8 (23.9, 91.7) 47.6 (21.8, 90.3) 5.4 (0.1, 30.2) 16.2 (3.3, 47.2) 10.8 (1.3, 39.1) 18.3 (3.8, 53.6)
Wuru 50.6 (16.4, 118.0) 0.0 (0.0, 41.8) 23.4 (2.8, 84.5) 21.3 (2.6, 76.9) 19.4 (2.4, 70.2) 30.4 (6.3, 88.9) 0.0 (0.0, 40.1) 0.0 (0.0, 40.1) 34.2 (7.1, 100.0) 39.4 (8.1, 115.2)
Yua 33.4 (18.7, 55.1) 37.6 (21.5, 61.0) 43.4 (25.7, 68.5) 62.3 (40.3, 91.9) 30.6 (15.8, 53.5) 37.0 (20.2, 62.1) 24.5 (11.8, 45.1) 23.6 (11.3, 43.4) 38.5 (22.0, 62.6) 19.1 (8.3, 37.7)
Average 38.2 (35.5, 41.1) 35.6 (33.0, 38.4) 32.2 (29.7, 34.9) 36.9 (34.2, 39.8) 30.9 (28.4, 33.5) 29.3 (26.9, 31.9) 25.0 (22.8, 27.4) 21.0 (19.0, 23.2) 20.6 (18.6, 22.8) 17.3 (15.4, 19.4)
Range [17.4, 89.7] [0, 72.3] [14.8, 55.3] [13.3, 108.3] [0, 90.6] [8.7, 65.0] [0, 50.8] [0, 43.8] [0, 50.3] [0, 39.4]
Note: Bold numbers in cells indicate mortality rates (pB0.05) significantly above average in the respective year.
Sp
atia
land
tem
pora
lclu
sterin
gin
und
er-five
morta
lityin
the
Kasse
na-N
anka
na
Distric
t
Cita
tion:
Glo
balH
ealth
Actio
nS
up
ple
ment
1,
2010.
DO
I:10.3
402/g
ha.v3
i0.5
233
19

20 were in the eastern part of the district. The cases
observed were 412 (341 expected) with a relative risk of
1.5. Twenty-one villages with a relative risk of 1.5 were
identified in 1999 with 362 cases (303 expected), 17 of the
villages in the east of the district. The statistically
significant clusters for 2001 and 2003 contained 18 and
17 villages, respectively, in the east of the district. The
cases in 2001 were 283 (219 expected) and a relative risk
of 1.5 and 200 cases (150 expected) and a relative risk of
1.6 in 2003. In 2002, the cluster identified to be
statistically significant comprised 22 villages and all but
one village were in the east. In 2000, the cluster
comprised 20 villages, with 371 observed cases (324
expected) and a relative risk of 1.3. These villages have
been consistently appearing as significant over the years.
The statistically significant cluster in 2004 was not
different from that in 2005, with almost the same villages
featuring. However, in 2006 the statistically significant
cluster with a p-value of 0.013 comprised only four
villages with 62 observed and 38 expected cases with a
relative risk of 1.73.
Table 3 shows the total under-five mortality in the
Kassena-Nankana District for 1997�2006 using space�time analysis scanning for high rates. Two villages were
located in the secondary cluster with a relative risk of
1.7, whereas the 19 villages were identified within the
primary cluster, also with a relative risk of 1.7 (Fig. 3).
The total number of deaths observed was 1,798 for the
primary cluster villages with the expected number of
deaths being 1,223, whereas in the secondary cluster,
211 deaths were observed with the expected number
being 124. All the villages in the primary cluster were
located in the eastern part of the district, whereas
the secondary cluster villages were in the west of the
district. Table 4 shows the number of deaths with their
person-years by village and year during the period of
Table 2. Total under-five mortality in the Kassena-Nankana District for 1997�2006 using purely spatial analysis scanning for
high rates
Year Type Location
Observed
cases
Expected
cases RR p-Value
1997 Most likely Kayoro 36 21 1.7 0.2
1998 Most likely Basengo, Gunwoko, Nyangoligo, Yua, Bembisi, Natugnia, Longo,
Kurugu, Nabango, Manyoro, Azeaduma, Gomongo, Mirigu, Kaasi/
Akaamo, Azaasi, Atiyoro, Navio, Nakolo, Nkwanta, Doba, Pungu,
Abempingo
412 341 1.5 0.001
1999 Most likely Manyoro, Gomongo, Natugnia, Nakolo, Navio, Nyangoligo, Gunwoko,
Mirigu, Basengo, Bembisi, Yua, Nabango, Longo Pungu, Azeaduma,
Kurugu, Azaasi, Paga Saboro, Namolo, Kaasi/Akaamo
362 303 1.5 0.001
2000 Most likely Gunwoko, Basengo, Nyangoligo, Yua, Bembisi, Natugnia, Longo,
Kurugu, Nabango, Manyoro, Gomongo, Mirigu, Azeaduma, Kaasi/
Akaamo, Azaasi, Atiyoro, Navio, Nakolo, Nkwanta, Pungu
371 324 1.3 0.041
2001 Most likely Basengo, Gunwoko, Nyangoligo, Yua, Bembisi, Natugnia, Longo,
Kurugu, Nabango, Manyoro, Azeaduma, Gomongo, Mirigu, Kaasi/
Akaamo, Azaasi, Atiyoro, Navio, Nakolo
283 219 1.5 0.001
2002 Most likely Basengo, Gunwoko, Nyangoligo, Yua, Bembisi, Natugnia, Longo,
Kurugu, Nabango, Manyoro, Azeaduma, Gomongo, Mirigu, Kaasi/
Akaamo, Azaasi, Atiyoro, Navio, Nakolo, Nkwanta, Doba, Pungu,
Abempingo
347 273 1.7 0.001
2003 Most likely Kurugu, Azeaduma, Longo, Kaasi/Akaamo, Bembisi, Nabango, Azaasi,
Atiyoro, Mirigu, Nkwanta, Gunwoko, Basengo, Abempingo, Nyango-
ligo, Doba, Gomongo, Natugnia
200 150 1.6 0.001
2004 Most likely Nkwanta, Atiyoro, Abempingo, Azaasi, Doba, Kaasi/Akaamo, Azea-
duma, Nabango, Kurugu, Mirigu, Longo, Janania, Nayagenia, Vunania,
Bembisi, Gaani, Pungu
174 140 1.4 0.053
2005 Most likely Gunwoko, Basengo, Nyangoligo, Yua, Bembisi, Natugnia, Longo,
Kurugu, Nabango, Manyoro, Gomongo, Mirigu Azeaduma, Kaasi/
Akaamo, Azaasi, Atiyoro, Navio, Nakolo, Nkwanta, Pungu
342 293 1.3 0.015
2006 Most likely Manyoro, Gomongo, Natugnia, Nakolo 62 38 1.75 0.013
Martin Adjuik et al.
20 Citation: Global Health Action Supplement 1, 2010. DOI: 10.3402/gha.v3i0.5233

the study. These data were used to calculate the rates
in Table 1.
DiscussionBetween 1999 and 2003, the under-five mortality rate
dropped significantly from 155 per 1,000 live births to 79
per 1,000 in Upper East region, while increasing in an
adjacent region with similar socio-economic conditions
(12).
Analysis of the data for the period 1997�2006 showed
an overall under-five mortality rate of 28.8 per 1,000
person-years for the Kassena-Nankana District. An
earlier study of cause-specific mortality in the period
1999�2002 gave a crude mortality rate of 15.6 per 1,000
person-years (13). Using data from that same study, we
calculated the under-five mortality as 34.1 per 1,000
person-years. However, the highest rate (38.2 per 1,000
person-years) was in 1997, while the lowest (17.3 per
Table 3. Total under-five mortality in the Kassena-Nankana District for 1997�2006 using space�time* analysis scanning for
high rates
Year Type Location
Observed
cases
Expected
cases RR p-Value
1997�2006 Most likely Basengo, Gunwoko, Nyangoligo, Yua, Bembisi, Natugnia, Longo,
Kurugu, Nabango, Manyoro, Azeaduma, Gomongo, Mirigu, Kaasi/
Akaamo, Azaasi, Atiyoro, Navio, Nakolo, Nkwanta
1,798 1,223 1.7 0.001
Secondary Kayoro, Katiu 211 124 1.7 0.001
*Space�time results indicate significantly higher clusters for the years 1997�2001.
#
#
# ##
#
#
#
#
#
#
#
#
#
#
#
#
#
#
#
#
#
#
##
#
#
#
#
#
#
#
#
#
#
#
#
#
#
#
#
#
#
#
#
#
# #
#
Ñ
Ñ
Ñ
Ñ
Ñ
Ñ
Ñ
Ñ
NAKONGNAKONG
GIA
YUA
WURU
PAGA
DOBA
NAGA
KATIU
BONIA
GAANI
PUNGU
NAVIO
LONGO
NAKONG
KAYORO
ASUNIA
PINDAA
SABORO
NAMOLO
KOLOGO
NAKOLO
MIRIGU
AZAASI
KURUGU
KANANIA
KORANIAGONGNIA
VUNANIA
GOMONGO
NKWANTA
NABANGO
ATIYORO
BEMBISI
GUNWOKO
NOGSINIAAZEADUMA
NATUGNIA
NAYAGENIA
ABEMPINGO
KALVIO_GWENIABASENGO
BIU
KAFANIA_SABORO
NYANGNIA
# VillagesDistrict boundaryRoads
Ñ Health facility
10 0 10 20 km
N
Burkina Faso
Bolgatanga District
Builsa District
Arc demarcartingvillages within the most likely cluster
Arc demarcating villageswithin the secondary cluster
Fig. 3. Map showing the locations of significant clusters of higher total under-five mortality between 1997 and 2005 in the
Kassena-Nankana District.
Spatial and temporal clustering in under-five mortality in the Kassena-Nankana District
Citation: Global Health Action Supplement 1, 2010. DOI: 10.3402/gha.v3i0.5233 21

Table 4. A record of deaths and person-years of the 49 villages in the Kassena-Nankana District in the period 1997�2006
Deaths per person-years by village during the 10-year period
Village 1997 1998 1999 2000 2001 2002 2003 2004 2005 2006
Abempingo 15/218 12/225 5/210 10/220 10/231 8/233 8/236 6/232 5/240 2/239
Asunia 12/418 12/431 8/424 12/407 8/414 5/400 15/382 5/379 7/373 7/345
Atiyoro 7/104 5/99 5/110 12/111 8/104 7/110 6/118 4/118 6/119 5/129
Azaasi 5/120 7/112 3/100 5/111 2/108 7/112 4/123 2/121 0/116 3/102
Azeaduma 7/313 19/294 12/296 17/317 12/299 11/292 8/310 7/314 9/293 7/295
Basengo 6/214 9/217 11/199 8/201 4/205 7/204 7/203 3/214 6/201 3/201
Bembisi 4/224 12/210 11/213 10/209 14/183 9/183 7/180 5/190 6/186 6/204
Biu 16/296 7/270 7/264 11/264 9/273 4/264 3/250 2/249 2/246 0/243
Bonia 12/243 10/233 6/222 7/217 3/228 2/230 7/216 2/214 1/217 1/208
Doba 14/619 25/620 13/597 12/612 18/616 18/608 18/594 6/617 8/599 8/579
Gaani 13/345 10/356 7/371 9/367 10/376 6/374 7/371 12/369 5/343 3/333
Gia 8/327 12/330 16/344 6/347 7/350 10/339 7/330 8/334 8/317 4/294
Gomongo 6/179 9/192 9/190 8/202 7/200 7/211 7/207 2/197 9/186 5/182
Gongnia 7/231 5/217 7/216 8/234 4/227 8/214 6/209 3/210 5/203 2/197
Gunwoko 13/359 8/348 13/348 14/340 12/349 10/356 10/391 6/399 10/375 8/368
Janania 3/81 2/78 4/79 5/89 0/89 2/81 2/77 1/78 1/75 1/71
Kaasi/Akaamo 8/221 15/208 8/214 6/216 10/223 11/214 10/215 8/219 8/216 2/217
Kafania/Saboro 7/209 8/207 3/203 4/183 6/175 5/151 2/158 5/164 1/154 3/151
Kalvio/Gwenia 27/759 23/745 18/752 24/733 10/749 19/741 13/745 22/712 5/672 18/644
Kanania 8/200 1/188 7/194 7/194 5/189 7/173 6/177 4/172 1/161 3/153
Katiu 13/419 16/412 15/413 16/403 24/426 15/400 14/402 9/410 5/392 2/368
Kayoro 36/535 21/510 15/498 29/498 26/509 10/525 16/544 17/540 17/523 9/578
Kologo 32/789 24/738 12/717 26/738 15/761 8/729 14/746 15/771 18/754 15/714
Korania 9/240 3/242 9/232 7/234 6/231 3/224 5/220 4/204 5/197 2/181
Kurugu 7/216 7/210 11/210 13/213 13/213 3/197 7/206 6/220 9/226 1/214
Longo 20/335 15/321 6/323 9/323 15/308 7/303 9/308 4/314 6/300 7/281
Manyoro 34/678 27/661 30/655 25/642 23/619 38/584 12/557 13/580 11/554 10/543
Mirigu 31/799 40/748 28/770 29/817 36/785 23/791 27/832 22/834 13/785 14/792
Nabango 25/563 22/555 26/534 19/530 18/533 21/530 12/541 16/546 12/536 7/560
Naga 24/491 7/465 13/435 16/423 5/439 13/434 11/429 6/444 10/453 17/453
Nakolo 15/540 22/512 23/523 22/527 23/534 29/509 10/483 7/473 10/467 16/431
Nakong 6/118 6/122 3/128 7/129 3/130 2/150 4/144 1/149 3/153 1/151
Namolo 4/59 1/57 3/68 2/67 3/63 2/72 3/78 0/87 3/89 1/99
Nangalkinia 9/231 4/224 8/207 3/194 6/203 4/213 7/211 3/211 5/197 1/211
Natugnia 28/617 23/593 21/586 28/602 19/596 16/602 22/626 9/614 14/583 17/568
Martin
Ad
juik
et
al.
22
Cita
tion:
Glo
balH
ealth
Actio
nS
up
ple
ment
1,
2010.
DO
I:10.3
402/g
ha.v3
i0.5
233

Table 4 (Continued)
Deaths per person-years by village during the 10-year period
Village 1997 1998 1999 2000 2001 2002 2003 2004 2005 2006
Navio 28/551 26/548 25/589 26/589 23/564 30/580 19/569 10/569 12/558 8/558
Nawognia 3/140 6/163 5/148 2/150 2/145 5/145 0/136 6/137 0/143 0/141
Nayagenia 8/397 11/388 8/391 10/389 9/386 6/409 3/419 11/405 8/379 8/380
Nkwanta 19/337 9/310 8/305 11/299 9/312 10/299 11/290 10/296 9/305 8/306
Nogsinia 40/1,430 19/1,344 30/1,343 31/1,342 25/1,335 23/1,348 27/1,361 27/1,406 17/1,410 17/1,415
Nyangnia 10/258 9/237 5/225 13/225 6/233 6/231 5/225 3/220 2/237 0/224
Nyangoligo 12/284 13/255 6/254 8/273 14/245 4/229 10/240 2/248 1/248 1/254
Paga 38/1,202 41/1,159 31/1,130 45/1,153 33/1,153 29/1,185 19/1,215 19/1,254 27/1,286 18/1,297
Pindaa 4/45 2/40 2/40 1/45 4/44 1/46 1/39 0/42 0/40 2/144
Pungu 51/1,358 52/1,329 46/1,298 53/1,299 25/1,284 36/1,307 26/1,287 43/1,261 29/1,206 20/1,172
Saboro 3/173 3/181 7/176 7/170 4/173 5/161 3/159 2/167 4/164 5/165
Vunania 9/213 7/198 5/196 4/197 10/201 9/189 1/184 3/186 2/185 3/164
Wuru 5/99 0/88 2/86 2/94 2/103 3/99 0/92 0/92 3/88 3/76
Yua 15/449 16/426 18/415 25/401 12/392 14/378 10/408 10/423 16/415 8/418
Sp
atia
land
tem
pora
lclu
sterin
gin
und
er-five
morta
lityin
the
Kasse
na-N
anka
na
Distric
t
Cita
tion:
Glo
balH
ealth
Actio
nS
up
ple
ment
1,
2010.
DO
I:10.3
402/g
ha.v3
i0.5
233
23

1,000 person-years) was in 2006, showing a relative
decline in mortality over the period. A temporal trend
in rates was realised after applying a Poisson regression of
the number of deaths per year. The results state that for
every unit increase in year, there was an 8.2% reduction,
95% CI (�9.2, �7.3) pB0.001, in the number of deaths
between 1997 and 2006 in the district. However, the jump
in the mortality rate for 2000 compared to 1998 and 1999
may be due to the outbreak of a cerebro-spinal meningitis
epidemic in the district, which also occurred in 1997. This
overall decline in mortality in the district may be
attributable to the many interventions being implemented
in the district by the Navrongo Health Research Centre
among which were the malaria intervention studies (14�16) and the Community Health and Family Planning
Project (CHFP) (17�19).
At the village level, the highest rates featured Pindaa
with 87.7 per 1,000 person-years for 1997 and Kassi/
Akaamo with 72.3 per 1,000 person-years for 1998. For
1999, it was Basengo with 55.3 per 1,000 person-years
and Atiyoro had 108.3 per 1,000 person-years for 2000.
For 2001 and 2002, it was Pindaa and Manyoro with 90.6
per 1,000 person-years and 65.0 per 1,000 person-years,
respectively. Atoyoro topped again in 2003 with 50.8 and
Nawognia had 43.7 per 1,000 person-years in 2004.
Atiyoro again had 50.3 per 1,000 person-years for 2005
and Wiru had 38.4 per 1,000 person-years for 2006. The
frequency of the recurring high mortality in the villages
of Pindaa and Atiyoro may indicate a problem with
access to health services or a socio-cultural phenomenon
that needs to be investigated further. However, there were
also villages with very low rates.
The results showing the spatial distribution of the
primary and secondary clusters over the period 1997�2006 indicate that the villages in the primary cluster were
mainly within the areas where there was no active
intervention by the CHFP project, located in the north-
eastern parts of the district. The CHFP project was testing
the effect of applying two different health delivery systems:
putting a Community Health Officer (CHO) in the
community as against putting a trained health volunteer
in a 2�2 factorial design. Thus, the district was demar-
cated into four cells: Cell I had health volunteers only, Cell
II had CHOs only, Cell III had CHOs and health
volunteers and Cell IV was a comparison cell.
The higher mortality shown in the two villages in the
secondary cluster was in Cell II in the west of the district
and could be because even though the CHO was
supposed to be living and working within the community,
this did not happen in reality in the early years between
1997 and 2001. This was an area far removed from
Navrongo, the capital of the district, where most of the
CHOs had their families. Therefore, they were not
available in the community during some days of the
week to administer health service delivery.
The continued decline in mortality in the district could
also be attributed to UNICEF’s Accelerated Child
Survival and Development Approach (ACSD), which
was implemented in the Upper East region (20). How-
ever, the ACSD package was applied to the whole region
and thus any spatial differences in mortality would be due
to other factors. The initial hypothesis that villages that
had poor access to health services were more likely to
have an excess of higher mortality than those with good
access had, in principle, not been rejected as villages
falling outside the primary cluster coincided with the cells
where intensive service delivery was taking place within
active cells of the CHFP project.
The authors acknowledge their inability to compare
the MR that have been reported in different units. The
data quoted from the national sources are per 1,000
live births whereas those calculated using the data from
the demographic surveillance system are per 1,000
person-years. Also, differences with respect to socio-
economic status, ethnic groupings and religion between
the villages have not been investigated. The suggested
association between the clustering of under-five mortality
and some of the interventions may need to be investigated
further.
In conclusion, the high MR in the villages of the north-
eastern part of the district may suggest a relatively poor
health care system compared to the rest of the district.
This may be due to the design of the CHFP project whose
impact was not felt in this part of the district. This
situation is hopefully changing with the new initiative by
the Ghana Health Service to introducing the Commu-
nity-based Health Planning and Services Initiative for
scaling-up service delivery innovation (CHPS) (21) in all
districts of the country.
Acknowledgements
Navrongo HDSS is a member of the INDEPTH Network. The
authors wish to thank the Navrongo Health Research Centre for
providing the data from the Health and Demographic Surveillance
System and the chiefs and people of the Kassena-Nankana District
for their cooperation in the collection of the demographic data. The
authors would also like to thank Dr. Osman Sankoh (INDEPTH
Network) who introduced the clustering analysis work and facili-
tated data analysis and Dr. Margaret Gyapong (Dodowa Health
Research Centre) who facilitated the scientific writing workshop.
Felicitations also go to Dr. Patricia Akweongo (School of Public
Health, University of Ghana) for reviewing the paper and giving
constructive suggestions. SaTScanTM is a trademark of Martin
Kulldorff. The SaTScanTM software was developed under the joint
auspices of (a) Martin Kulldorff, (b) the National Cancer Institute
and (c) Farzad Mostashari of the New York City Department of
Health and Mental Hygiene.
Conflict of interest and fundingThis work was supported by a grant from the INDEPTH
Network supported by the Hewlett Foundation.
Martin Adjuik et al.
24 Citation: Global Health Action Supplement 1, 2010. DOI: 10.3402/gha.v3i0.5233

References
1. Ewbank DC, Gribble JN. Effects of health programs on child
mortality in Sub-Saharan Africa. Working Group on the Effects
of Child Survival and General Health Programs on Mortality,
National Research Council; 2002. Available from: http://
www.nap.edu/catalog/2208.html ISBN: 208 pages, 6�9, paper
back (1993) [cited 14 February 2007].
2. Verdier-Chouchane A. Combating under-five mortality in
Africa. Policy Insights 2008; 65. Available from: http://www.
oecd.org/dev/insights [cited 15 June 2010].
3. Kuate-Defo B, Diallo K. Geography of child mortality cluster-
ing within African families. Health Place 2002; 8: 93�117.
4. Sankoh, OA, Ye Y, Sauerborn R, Muller O, Becher H.
Clustering of childhood mortality in rural Burkina Faso. Int J
Epidemiol 2001; 30: 485�92.
5. Nyarko P, Wontuo P, Nazzar A, Phillips J, Ngom P, Binka F.
Navrongo INDEPTH Monograph: Volume 1 Part C. Demo-
graphic Surveillance system, Ghana. Available from: http://
www.indepth-network.org/dss_site_profiles/navrongo.pdf [cited
14 February 2007].
6. General information about Ghana; 1999. Available from: http://
www.ghanaweb.com/GhanaHomePage/general/statistic.php [cited
14 February 2007].
7. Ghana Statistical Service (GSS), Noguchi Memorial Institute
for Medical Research (NMIMR), and ORC Macro. Ghana
Demographic and Health Survey 2003. Calverton, MD: GSS,
NMIMR, and ORC Macro; 2004.
8. General information about Ghana; economic indicators. Avail-
able from: http://www.ghanaweb.com/GhanaHomePage/econ
omy/statistics.php [cited 14 February 2007].
9. Stata v9.1 SE, StataCorp, College Station, TX, USA.
10. Kulldorff M. A spatial scan statistic. Commun Stat Theory
Methods 1997; 26: 1481�96.
11. SaTScanTM v7.0.3. Available from: http://www.satscan.org [cited
14 February 2007].
12. Ghana � Accelerated child survival and development approach
(ACSD). Available from: http://www.unicef.org/evaluation/files/
ghana.doc [cited 18 April 2010].
13. Adjuik M, Smith T, Clark S, Todd J, Garrib A, Kinfu Y, et al.
Cause-specific mortality rates in sub-Saharan Africa and
Bangladesh. Bull World Health Organ 2006; 84: 181�8.
14. Owusu-Agyei S, Smith T, Beck HP, Amenga-Etego L, Felger I.
Characteristics of severe anemia and its association with malaria
in young children of the Kassena-Nankana District of northern
Ghana. Am J Trop Med Hyg 2002; 66: 280�6.
15. Owusu-Agyei S, Fryauff DJ, Chandramohan D, Koram KA,
Binka FN, Nkrumah FK, et al. Seasonal malaria attack rates in
infants and young children in northern Ghana. Am J Trop Med
Hyg 2002; 67: 371�7.
16. Chandramohan D, Owusu-Agyei S, Carneiro I, Awine T,
Amponsa-Achiano K, Mensah N, et al. Cluster randomised
trial of intermittent preventive treatment for malaria in infants
in area of high, seasonal transmission in Ghana. BMJ 2005; 331:
727�33.
17. Binka FN, Nazzar A, Phillips JF. The Navrongo Community
Health and Family Planning Project. Stud Fam Plann 1995; 26:
121�39.
18. Debpuur C, Phillips JF, Jackson EF, Nazzar A, Ngom P, Binka
FN. The impact of the Navrongo Project on contraceptive
knowledge and use, reproductive preferences, and fertility. Stud
Fam Plann 2002; 33: 141�64.
19. Binka FN, Bawah AA, Phillips JF, Hodgson A, Adjuik M,
MacLeod B. Rapid achievement of the child survival millen-
nium development goal: evidence from the Navrongo experi-
ment in northern Ghana. Trop Med Int Health 2007; 12:
578�93.
20. UNICEF. Integrated approach to child survival achieving
important results. Available from: http://www.medicalnews
today.com/articles/24564.php [cited 14 February 2007].
21. Nyonator FK, Awoonor-Williams JK, Phillips JF, Jones TC
Miller RA. The Ghana community-based health planning and
services initiative for scaling up service delivery innovation.
Health Pol Plann 2005; 20: 25�34.
*Martin AdjuikNavrongo Health Research CentreP.O. Box 114NavrongoUpper East Region, GhanaEmail: [email protected]
Spatial and temporal clustering in under-five mortality in the Kassena-Nankana District
Citation: Global Health Action Supplement 1, 2010. DOI: 10.3402/gha.v3i0.5233 25