CLOSE PHOTOGRAMMETRY AND LASER SCANNING USING A MOBILE MAPPING SYSTEM FOR THE HIGH DETAILED SURVEY...
6
CLOSE PHOTOGRAMMETRY AND LASER SCANNING USING A MOBILE MAPPING SYSTEM FOR THE HIGH DETAILED SURVEY OF A HIGH DENSITY URBAN AREA S. Gandolfi a , M. Barbarella a , E. Ronci b , A. Burchi b a DISTART, Engineering Faculty, 40136 V.le Risorgimento 2 Bologna, ITALY - (stefano.gandolfi, maurizio.barbarella)@mail.ing.unibo.it b SITECO INFORMATICA SRL, 40132 Via Della Salute 14 Bologna, ITALY - (ronci, burchi)@sitecoinf.it ICWG V/I Integrated systems for mobile mapping KEY WORDS: Mobile Mapping System, GPS/INS, LIDAR, GIS, Adjustment ABSTRACT: The realization of an urban underground is a key issue for the development of any city, and it has to regard all problems linked to the project phase and the connections with many other works like railways, bus-lines and, specially for an ancient city like Bologna, historical buildings.For these reasons the Municipality of Bologna has committed the ultimate design of the underground line with a high standard level of precision; this aspect forces the Project Group to choose a survey method that has to be both accurate and not too expensive. In order to achieve a precise high resolution survey in a short time, a Mobile Mapping System vehicle has been used. The Road-Scanner” system is equipped with 2GPS+IMU sensors for navigation (Applanix POSLV), four cameras for close range photogrammetric survey and a Laser scanner FARO LS880. Moreover, in order to obtain good and homogeneous results a geodetic network (performed using GPS and topographic survey) has been made in some area along the track. In this contribute the authors, starting from the municipality requirements, describe all the performed work and analyze the obtained results. 1. INTRODUCTION During the last years the Municipality of Bologna (Italy) has been involved in the realisation of the first stretch of the urban underground. In the same period the high-speed railway project has been carried out in Italy. It also crosses the city of Bologna which is, for geographic reasons, a historical fundamental junction in the Italian railway traffic. This project is completely autonomous from the previous one but it is mandatory that the two projects share the same reference system and frame. For the realisation of this high detailed survey in very short time a Mobile Mapping System (MMS) has been used. The vehicle, using a satellite navigation system (GPS) assisted whit an Inertial Measurement Unit (IMU), permits to localise points surveyed both by photogrammetry and laser scanner directly in the Italian National Geodetic Reference Frame IGM’95 (derived from the ETRF89 System). 1.1 General Information on the surveyed area The project line length is about 7,5 km and links the Fair Centre and “Maggiore” Hospital. Obviously, the “Centrale” Railway Station and the City Centre are involved; a scheme of the track is shown in Figure 1. Even if the underground project is autonomous from the high speed railway project (TAV), there will be some relationships between the two projects. Therefore the Project Group has chosen to share the same reference system and the frame. The MMS surveys have been referred to the Italian National Geodetic Reference Frame IGM’95 (derived from the ETRF89 System). Figure 1. Underground track and stations The transformation between the two systems (TAV and GPS/ETRF89) was determined by classical approach . 1.2 Requested product In order to obtain a complete product the project specifications, requested by public administration, are very restrictive and the final product must correspond at least to the following points: 1. Sub-decimetre precision (both for planimetry and altimetry) 2. Final results must be referred to both TAV reference frame and UTM-ED50 frame 3. The drawings must contain the high detailed survey of the station areas and the inspection wells (10 inspection wells were provided for this project) 4. All the drawings must contain at least: A. Reference points and vertexes B. Buildings C. Fences 909
Transcript of CLOSE PHOTOGRAMMETRY AND LASER SCANNING USING A MOBILE MAPPING SYSTEM FOR THE HIGH DETAILED SURVEY...
CLOSE PHOTOGRAMMETRY AND LASER SCANNING USING A MOBILE MAPPING SYSTEM FOR THE HIGH DETAILED SURVEY OF A
HIGH DENSITY URBAN AREA
S. Gandolfi a, M. Barbarella a, E. Ronci b, A. Burchi b
a DISTART, Engineering Faculty, 40136 V.le Risorgimento 2 Bologna, ITALY - (stefano.gandolfi,
maurizio.barbarella)@mail.ing.unibo.it b SITECO INFORMATICA SRL, 40132 Via Della Salute 14 Bologna, ITALY - (ronci, burchi)@sitecoinf.it
ICWG V/I Integrated systems for mobile mapping
KEY WORDS: Mobile Mapping System, GPS/INS, LIDAR, GIS, Adjustment ABSTRACT: The realization of an urban underground is a key issue for the development of any city, and it has to regard all problems linked to the project phase and the connections with many other works like railways, bus-lines and, specially for an ancient city like Bologna, historical buildings.For these reasons the Municipality of Bologna has committed the ultimate design of the underground line with a high standard level of precision; this aspect forces the Project Group to choose a survey method that has to be both accurate and not too expensive. In order to achieve a precise high resolution survey in a short time, a Mobile Mapping System vehicle has been used. The Road-Scanner” system is equipped with 2GPS+IMU sensors for navigation (Applanix POSLV), four cameras for close range photogrammetric survey and a Laser scanner FARO LS880. Moreover, in order to obtain good and homogeneous results a geodetic network (performed using GPS and topographic survey) has been made in some area along the track. In this contribute the authors, starting from the municipality requirements, describe all the performed work and analyze the obtained results.
1. INTRODUCTION
During the last years the Municipality of Bologna (Italy) has been involved in the realisation of the first stretch of the urban underground. In the same period the high-speed railway project has been carried out in Italy. It also crosses the city of Bologna which is, for geographic reasons, a historical fundamental junction in the Italian railway traffic. This project is completely autonomous from the previous one but it is mandatory that the two projects share the same reference system and frame. For the realisation of this high detailed survey in very short time a Mobile Mapping System (MMS) has been used. The vehicle, using a satellite navigation system (GPS) assisted whit an Inertial Measurement Unit (IMU), permits to localise points surveyed both by photogrammetry and laser scanner directly in the Italian National Geodetic Reference Frame IGM’95 (derived from the ETRF89 System). 1.1 General Information on the surveyed area
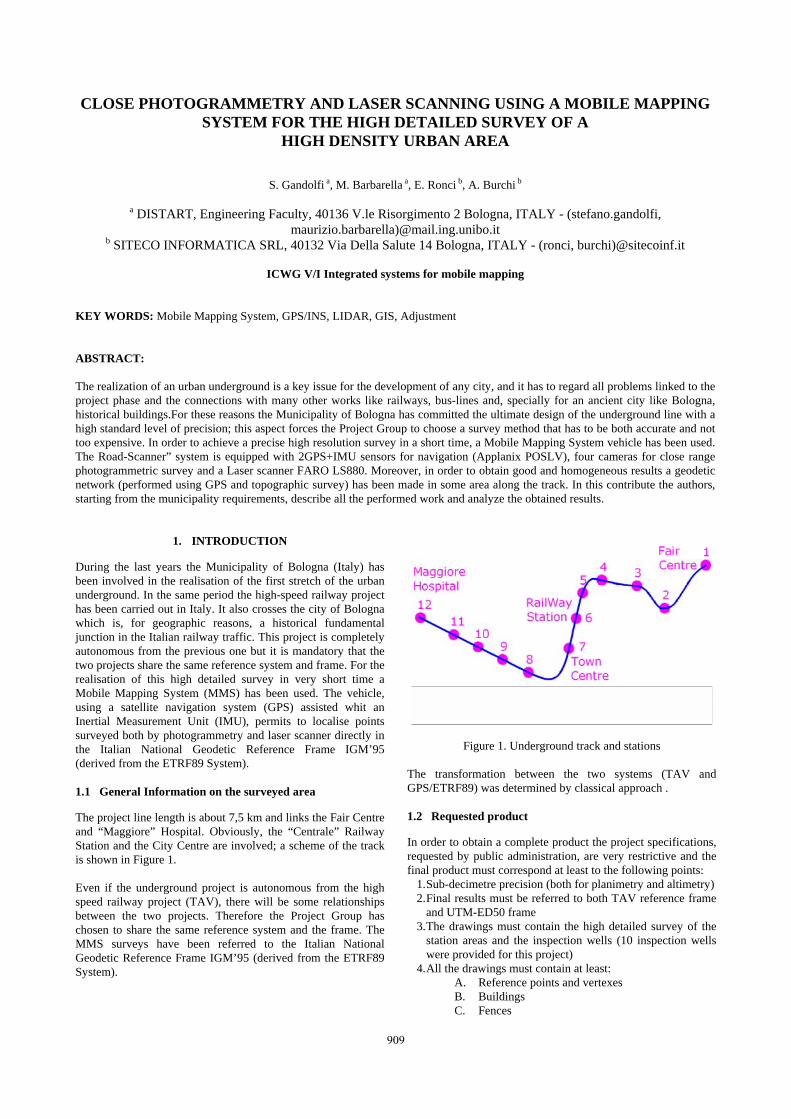
The project line length is about 7,5 km and links the Fair Centre and “Maggiore” Hospital. Obviously, the “Centrale” Railway Station and the City Centre are involved; a scheme of the track is shown in Figure 1. Even if the underground project is autonomous from the high speed railway project (TAV), there will be some relationships between the two projects. Therefore the Project Group has chosen to share the same reference system and the frame. The MMS surveys have been referred to the Italian National Geodetic Reference Frame IGM’95 (derived from the ETRF89 System).
Figure 1. Underground track and stations The transformation between the two systems (TAV and GPS/ETRF89) was determined by classical approach . 1.2 Requested product
In order to obtain a complete product the project specifications, requested by public administration, are very restrictive and the final product must correspond at least to the following points:
1. Sub-decimetre precision (both for planimetry and altimetry) 2. Final results must be referred to both TAV reference frame
and UTM-ED50 frame 3. The drawings must contain the high detailed survey of the
station areas and the inspection wells (10 inspection wells were provided for this project)
4. All the drawings must contain at least: A. Reference points and vertexes B. Buildings C. Fences
909
D. Works of art E. Sidewalks F. Road signs G. Manholes H. Traffic lights I. Trees J. Garages K. Private accesses L. Electric lines M. Generic Service Lines N. All not specified but helpful to the representation
of the territory
The time limit for the end of survey operation was not grater than 30 working days. For this reason the Project Group has moved from the starting idea of a classic survey to the possibility to use a Mobile Mapping System.
2. SURVEY EQUIPEMENT AND METHODOLOGY
2.1 Road-Scanner system
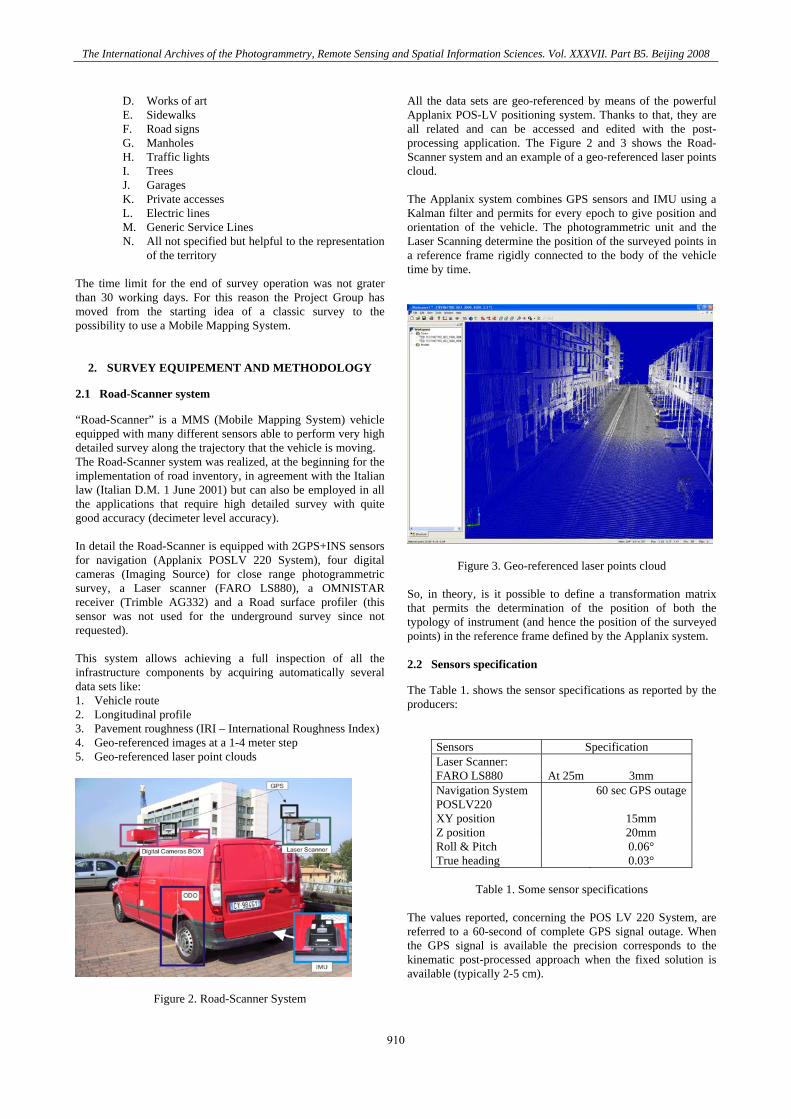
“Road-Scanner” is a MMS (Mobile Mapping System) vehicle equipped with many different sensors able to perform very high detailed survey along the trajectory that the vehicle is moving. The Road-Scanner system was realized, at the beginning for the implementation of road inventory, in agreement with the Italian law (Italian D.M. 1 June 2001) but can also be employed in all the applications that require high detailed survey with quite good accuracy (decimeter level accuracy). In detail the Road-Scanner is equipped with 2GPS+INS sensors for navigation (Applanix POSLV 220 System), four digital cameras (Imaging Source) for close range photogrammetric survey, a Laser scanner (FARO LS880), a OMNISTAR receiver (Trimble AG332) and a Road surface profiler (this sensor was not used for the underground survey since not requested). This system allows achieving a full inspection of all the infrastructure components by acquiring automatically several data sets like: 1. Vehicle route 2. Longitudinal profile 3. Pavement roughness (IRI – International Roughness Index) 4. Geo-referenced images at a 1-4 meter step 5. Geo-referenced laser point clouds
Figure 2. Road-Scanner System
All the data sets are geo-referenced by means of the powerful Applanix POS-LV positioning system. Thanks to that, they are all related and can be accessed and edited with the post-processing application. The Figure 2 and 3 shows the Road-Scanner system and an example of a geo-referenced laser points cloud. The Applanix system combines GPS sensors and IMU using a Kalman filter and permits for every epoch to give position and orientation of the vehicle. The photogrammetric unit and the Laser Scanning determine the position of the surveyed points in a reference frame rigidly connected to the body of the vehicle time by time.
Figure 3. Geo-referenced laser points cloud So, in theory, is it possible to define a transformation matrix that permits the determination of the position of both the typology of instrument (and hence the position of the surveyed points) in the reference frame defined by the Applanix system. 2.2 Sensors specification
The Table 1. shows the sensor specifications as reported by the producers:
Sensors Specification Laser Scanner: FARO LS880 At 25m 3mm Navigation System POSLV220
60 sec GPS outage
XY position 15mm Z position 20mm Roll & Pitch 0.06° True heading 0.03°
Table 1. Some sensor specifications
The values reported, concerning the POS LV 220 System, are referred to a 60-second of complete GPS signal outage. When the GPS signal is available the precision corresponds to the kinematic post-processed approach when the fixed solution is available (typically 2-5 cm).
The International Archives of the Photogrammetry, Remote Sensing and Spatial Information Sciences. Vol. XXXVII. Part B5. Beijing 2008
910
The digital camera resolution (1024x768) provides a good quality of the images collected and a suitable photogrammetric use of the images. 2.3 Survey products
The products obtained with the Road-Scanner are the following: 1. 3D-routes and topologically connected road graphs,
according to the GDF specifications and compatible with the most common Geographical Information Systems.
2. Facility management database, containing all the road components: road size, signs, posters, lamps, pavements, sidewalks, guard-rails, tunnels, retaining walls, etc.
3. Geo-referenced images acquired with the video system in JPEG or AVI format, used in the post-processing phase, are also delivered to the end user for virtual inspection of the road network. Virtual inspections through the consultations of movie are highly regarded by the public administration because they allow a quick and easy check of the status of the road network.
4. Road pavement roughness (IRI – International Roughness Index), surveyed with the Dynatest profiler certified ASTM E950 Class 1.
5. Road cross sections surveyed with the FARO helicoidal laser-scanner. The resulting sections have an angular range of 320°, and a distance range of 80 m, at a10-20 step (variable by vehicle speed). The clouds of scan-points are geo-referenced.
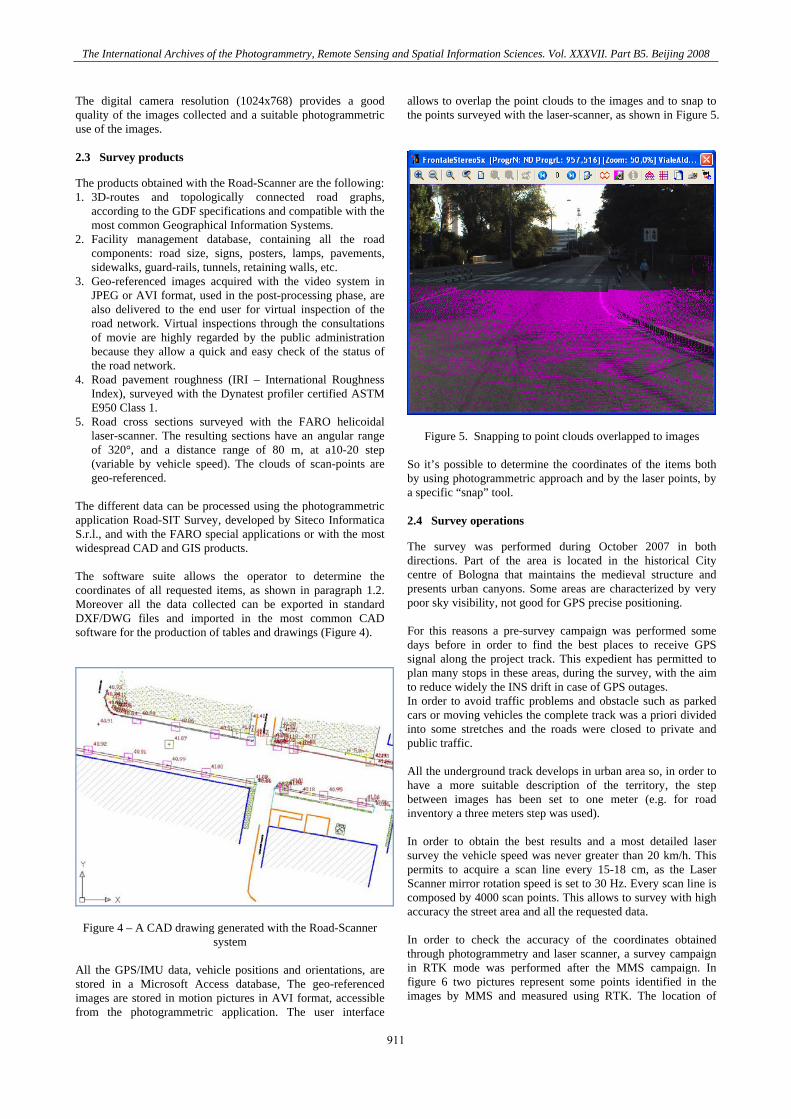
The different data can be processed using the photogrammetric application Road-SIT Survey, developed by Siteco Informatica S.r.l., and with the FARO special applications or with the most widespread CAD and GIS products. The software suite allows the operator to determine the coordinates of all requested items, as shown in paragraph 1.2. Moreover all the data collected can be exported in standard DXF/DWG files and imported in the most common CAD software for the production of tables and drawings (Figure 4).
Figure 4 – A CAD drawing generated with the Road-Scanner system
All the GPS/IMU data, vehicle positions and orientations, are stored in a Microsoft Access database, The geo-referenced images are stored in motion pictures in AVI format, accessible from the photogrammetric application. The user interface
allows to overlap the point clouds to the images and to snap to the points surveyed with the laser-scanner, as shown in Figure 5.
Figure 5. Snapping to point clouds overlapped to images So it’s possible to determine the coordinates of the items both by using photogrammetric approach and by the laser points, by a specific “snap” tool. 2.4 Survey operations
The survey was performed during October 2007 in both directions. Part of the area is located in the historical City centre of Bologna that maintains the medieval structure and presents urban canyons. Some areas are characterized by very poor sky visibility, not good for GPS precise positioning. For this reasons a pre-survey campaign was performed some days before in order to find the best places to receive GPS signal along the project track. This expedient has permitted to plan many stops in these areas, during the survey, with the aim to reduce widely the INS drift in case of GPS outages. In order to avoid traffic problems and obstacle such as parked cars or moving vehicles the complete track was a priori divided into some stretches and the roads were closed to private and public traffic. All the underground track develops in urban area so, in order to have a more suitable description of the territory, the step between images has been set to one meter (e.g. for road inventory a three meters step was used). In order to obtain the best results and a most detailed laser survey the vehicle speed was never greater than 20 km/h. This permits to acquire a scan line every 15-18 cm, as the Laser Scanner mirror rotation speed is set to 30 Hz. Every scan line is composed by 4000 scan points. This allows to survey with high accuracy the street area and all the requested data. In order to check the accuracy of the coordinates obtained through photogrammetry and laser scanner, a survey campaign in RTK mode was performed after the MMS campaign. In figure 6 two pictures represent some points identified in the images by MMS and measured using RTK. The location of
The International Archives of the Photogrammetry, Remote Sensing and Spatial Information Sciences. Vol. XXXVII. Part B5. Beijing 2008
911
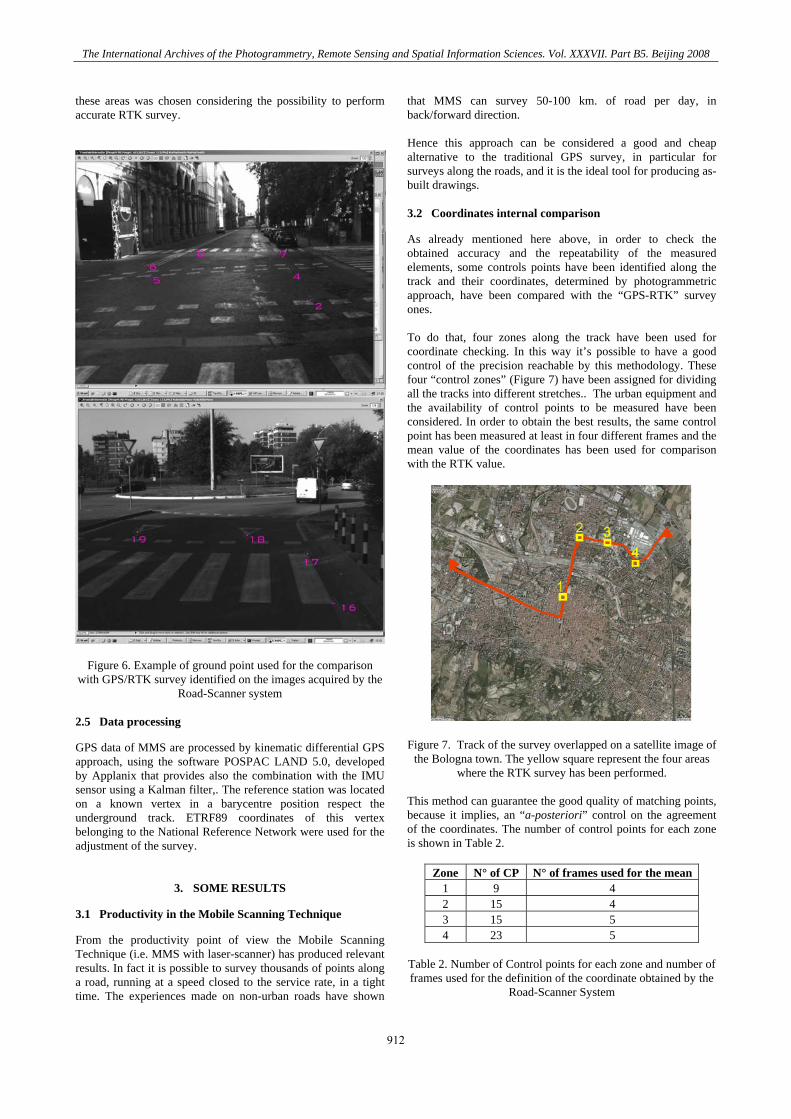
these areas was chosen considering the possibility to perform accurate RTK survey.
Figure 6. Example of ground point used for the comparison with GPS/RTK survey identified on the images acquired by the
Road-Scanner system 2.5 Data processing
GPS data of MMS are processed by kinematic differential GPS approach, using the software POSPAC LAND 5.0, developed by Applanix that provides also the combination with the IMU sensor using a Kalman filter,. The reference station was located on a known vertex in a barycentre position respect the underground track. ETRF89 coordinates of this vertex belonging to the National Reference Network were used for the adjustment of the survey.
3. SOME RESULTS
3.1 Productivity in the Mobile Scanning Technique
From the productivity point of view the Mobile Scanning Technique (i.e. MMS with laser-scanner) has produced relevant results. In fact it is possible to survey thousands of points along a road, running at a speed closed to the service rate, in a tight time. The experiences made on non-urban roads have shown
that MMS can survey 50-100 km. of road per day, in back/forward direction. Hence this approach can be considered a good and cheap alternative to the traditional GPS survey, in particular for surveys along the roads, and it is the ideal tool for producing as-built drawings. 3.2 Coordinates internal comparison
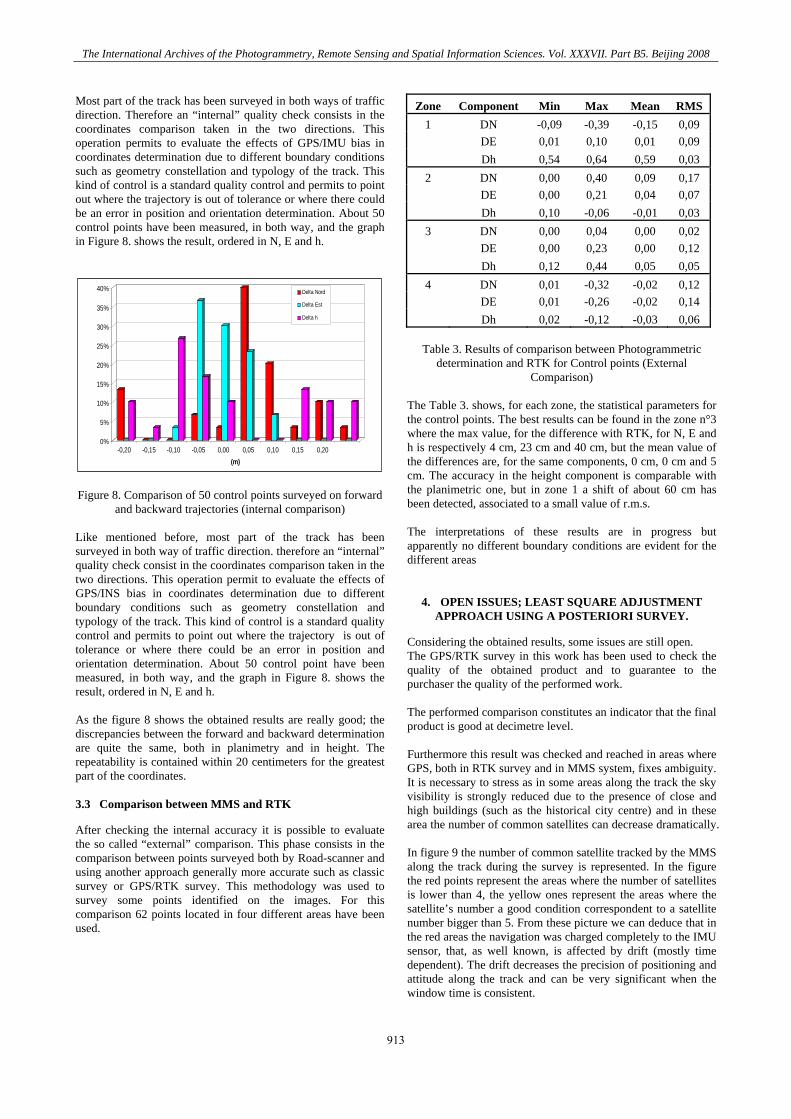
As already mentioned here above, in order to check the obtained accuracy and the repeatability of the measured elements, some controls points have been identified along the track and their coordinates, determined by photogrammetric approach, have been compared with the “GPS-RTK” survey ones. To do that, four zones along the track have been used for coordinate checking. In this way it’s possible to have a good control of the precision reachable by this methodology. These four “control zones” (Figure 7) have been assigned for dividing all the tracks into different stretches.. The urban equipment and the availability of control points to be measured have been considered. In order to obtain the best results, the same control point has been measured at least in four different frames and the mean value of the coordinates has been used for comparison with the RTK value.
Figure 7. Track of the survey overlapped on a satellite image of the Bologna town. The yellow square represent the four areas
where the RTK survey has been performed.
This method can guarantee the good quality of matching points, because it implies, an “a-posteriori” control on the agreement of the coordinates. The number of control points for each zone is shown in Table 2.
Zone N° of CP N° of frames used for the mean1 9 4 2 15 4 3 15 5 4 23 5
Table 2. Number of Control points for each zone and number of frames used for the definition of the coordinate obtained by the
Road-Scanner System
The International Archives of the Photogrammetry, Remote Sensing and Spatial Information Sciences. Vol. XXXVII. Part B5. Beijing 2008
912
Most part of the track has been surveyed in both ways of traffic direction. Therefore an “internal” quality check consists in the coordinates comparison taken in the two directions. This operation permits to evaluate the effects of GPS/IMU bias in coordinates determination due to different boundary conditions such as geometry constellation and typology of the track. This kind of control is a standard quality control and permits to point out where the trajectory is out of tolerance or where there could be an error in position and orientation determination. About 50 control points have been measured, in both way, and the graph in Figure 8. shows the result, ordered in N, E and h.
0%
5%
10%
15%
20%
25%
30%
35%
40%
-0,20 -0,15 -0,10 -0,05 0,00 0,05 0,10 0,15 0,20(m)
Delta Nord
Delta Est
Delta h
Figure 8. Comparison of 50 control points surveyed on forward and backward trajectories (internal comparison)
Like mentioned before, most part of the track has been surveyed in both way of traffic direction. therefore an “internal” quality check consist in the coordinates comparison taken in the two directions. This operation permit to evaluate the effects of GPS/INS bias in coordinates determination due to different boundary conditions such as geometry constellation and typology of the track. This kind of control is a standard quality control and permits to point out where the trajectory is out of tolerance or where there could be an error in position and orientation determination. About 50 control point have been measured, in both way, and the graph in Figure 8. shows the result, ordered in N, E and h. As the figure 8 shows the obtained results are really good; the discrepancies between the forward and backward determination are quite the same, both in planimetry and in height. The repeatability is contained within 20 centimeters for the greatest part of the coordinates. 3.3 Comparison between MMS and RTK
After checking the internal accuracy it is possible to evaluate the so called “external” comparison. This phase consists in the comparison between points surveyed both by Road-scanner and using another approach generally more accurate such as classic survey or GPS/RTK survey. This methodology was used to survey some points identified on the images. For this comparison 62 points located in four different areas have been used.
Zone Component Min Max Mean RMS1 DN -0,09 -0,39 -0,15 0,09 DE 0,01 0,10 0,01 0,09 Dh 0,54 0,64 0,59 0,032 DN 0,00 0,40 0,09 0,17 DE 0,00 0,21 0,04 0,07 Dh 0,10 -0,06 -0,01 0,033 DN 0,00 0,04 0,00 0,02 DE 0,00 0,23 0,00 0,12 Dh 0,12 0,44 0,05 0,054 DN 0,01 -0,32 -0,02 0,12 DE 0,01 -0,26 -0,02 0,14 Dh 0,02 -0,12 -0,03 0,06
Table 3. Results of comparison between Photogrammetric
determination and RTK for Control points (External Comparison)
The Table 3. shows, for each zone, the statistical parameters for the control points. The best results can be found in the zone n°3 where the max value, for the difference with RTK, for N, E and h is respectively 4 cm, 23 cm and 40 cm, but the mean value of the differences are, for the same components, 0 cm, 0 cm and 5 cm. The accuracy in the height component is comparable with the planimetric one, but in zone 1 a shift of about 60 cm has been detected, associated to a small value of r.m.s. The interpretations of these results are in progress but apparently no different boundary conditions are evident for the different areas
4. OPEN ISSUES; LEAST SQUARE ADJUSTMENT APPROACH USING A POSTERIORI SURVEY.
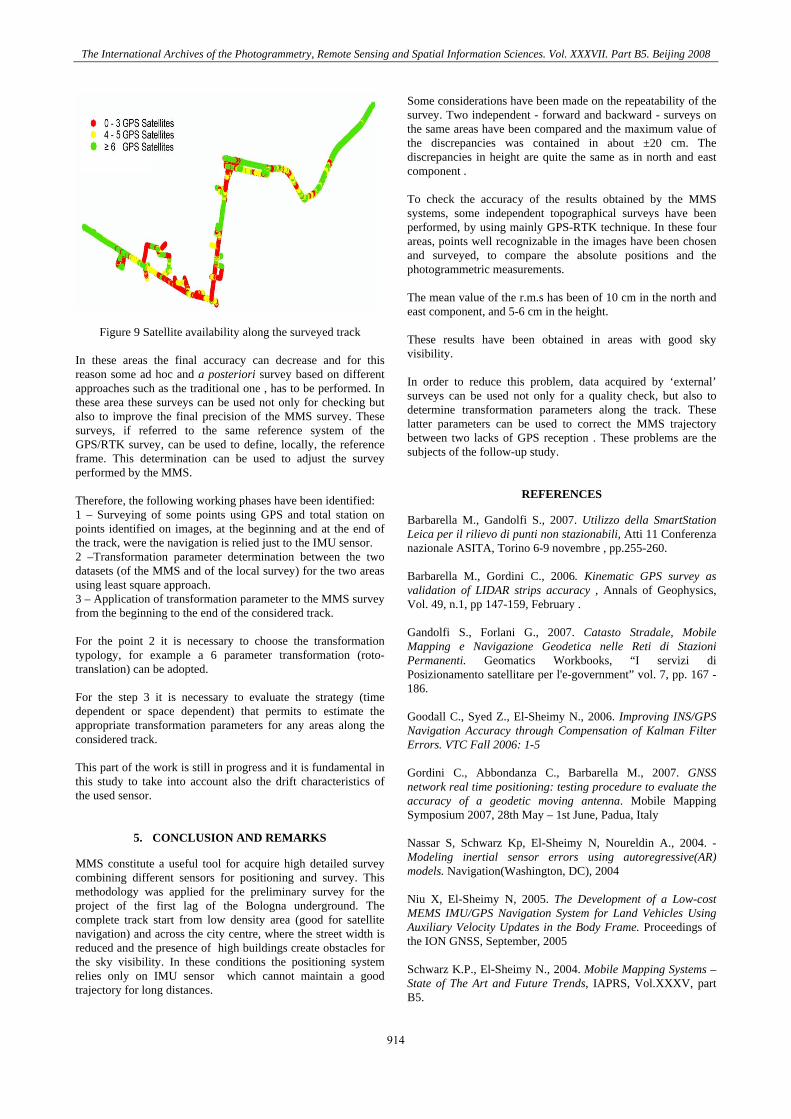
Considering the obtained results, some issues are still open. The GPS/RTK survey in this work has been used to check the quality of the obtained product and to guarantee to the purchaser the quality of the performed work. The performed comparison constitutes an indicator that the final product is good at decimetre level. Furthermore this result was checked and reached in areas where GPS, both in RTK survey and in MMS system, fixes ambiguity. It is necessary to stress as in some areas along the track the sky visibility is strongly reduced due to the presence of close and high buildings (such as the historical city centre) and in these area the number of common satellites can decrease dramatically. In figure 9 the number of common satellite tracked by the MMS along the track during the survey is represented. In the figure the red points represent the areas where the number of satellites is lower than 4, the yellow ones represent the areas where the satellite’s number a good condition correspondent to a satellite number bigger than 5. From these picture we can deduce that in the red areas the navigation was charged completely to the IMU sensor, that, as well known, is affected by drift (mostly time dependent). The drift decreases the precision of positioning and attitude along the track and can be very significant when the window time is consistent.
The International Archives of the Photogrammetry, Remote Sensing and Spatial Information Sciences. Vol. XXXVII. Part B5. Beijing 2008
913
The International Archives of the Photogrammetry, Remote Sensing and Spatial Information Sciences. Vol. XXXVII. Part B5. Beijing 2008
Some considerations have been made on the repeatability of the survey. Two independent - forward and backward - surveys on the same areas have been compared and the maximum value of the discrepancies was contained in about ±20 cm. The discrepancies in height are quite the same as in north and east component .
To check the accuracy of the results obtained by the MMS systems, some independent topographical surveys have been performed, by using mainly GPS-RTK technique. In these four areas, points well recognizable in the images have been chosen and surveyed, to compare the absolute positions and the photogrammetric measurements. The mean value of the r.m.s has been of 10 cm in the north and east component, and 5-6 cm in the height. Figure 9 Satellite availability along the surveyed track These results have been obtained in areas with good sky visibility.
In these areas the final accuracy can decrease and for this reason some ad hoc and a posteriori survey based on different approaches such as the traditional one , has to be performed. In these area these surveys can be used not only for checking but also to improve the final precision of the MMS survey. These surveys, if referred to the same reference system of the GPS/RTK survey, can be used to define, locally, the reference frame. This determination can be used to adjust the survey performed by the MMS.
In order to reduce this problem, data acquired by ‘external’ surveys can be used not only for a quality check, but also to determine transformation parameters along the track. These latter parameters can be used to correct the MMS trajectory between two lacks of GPS reception . These problems are the subjects of the follow-up study. REFERENCES Therefore, the following working phases have been identified:
1 – Surveying of some points using GPS and total station on points identified on images, at the beginning and at the end of the track, were the navigation is relied just to the IMU sensor.
Barbarella M., Gandolfi S., 2007. Utilizzo della SmartStation Leica per il rilievo di punti non stazionabili, Atti 11 Conferenza nazionale ASITA, Torino 6-9 novembre , pp.255-260.
2 –Transformation parameter determination between the two datasets (of the MMS and of the local survey) for the two areas using least square approach.
Barbarella M., Gordini C., 2006. Kinematic GPS survey as validation of LIDAR strips accuracy , Annals of Geophysics, Vol. 49, n.1, pp 147-159, February . 3 – Application of transformation parameter to the MMS survey
from the beginning to the end of the considered track. Gandolfi S., Forlani G., 2007. Catasto Stradale, Mobile
Mapping e Navigazione Geodetica nelle Reti di Stazioni Permanenti. Geomatics Workbooks, “I servizi di Posizionamento satellitare per l'e-government” vol. 7, pp. 167 -186.
For the point 2 it is necessary to choose the transformation typology, for example a 6 parameter transformation (roto-translation) can be adopted. For the step 3 it is necessary to evaluate the strategy (time dependent or space dependent) that permits to estimate the appropriate transformation parameters for any areas along the considered track.
Goodall C., Syed Z., El-Sheimy N., 2006. Improving INS/GPS Navigation Accuracy through Compensation of Kalman Filter Errors. VTC Fall 2006: 1-5
This part of the work is still in progress and it is fundamental in this study to take into account also the drift characteristics of the used sensor.
Gordini C., Abbondanza C., Barbarella M., 2007. GNSS network real time positioning: testing procedure to evaluate the accuracy of a geodetic moving antenna. Mobile Mapping Symposium 2007, 28th May – 1st June, Padua, Italy
5. CONCLUSION AND REMARKS Nassar S, Schwarz Kp, El-Sheimy N, Noureldin A., 2004. -
Modeling inertial sensor errors using autoregressive(AR) models. Navigation(Washington, DC), 2004 MMS constitute a useful tool for acquire high detailed survey
combining different sensors for positioning and survey. This methodology was applied for the preliminary survey for the project of the first lag of the Bologna underground. The complete track start from low density area (good for satellite navigation) and across the city centre, where the street width is reduced and the presence of high buildings create obstacles for the sky visibility. In these conditions the positioning system relies only on IMU sensor which cannot maintain a good trajectory for long distances.
Niu X, El-Sheimy N, 2005. The Development of a Low-cost MEMS IMU/GPS Navigation System for Land Vehicles Using Auxiliary Velocity Updates in the Body Frame. Proceedings of the ION GNSS, September, 2005 Schwarz K.P., El-Sheimy N., 2004. Mobile Mapping Systems – State of The Art and Future Trends, IAPRS, Vol.XXXV, part B5.
914