Clinical and Psychosocial Aspects of The Long Face ...
216
Clinical and Psychosocial Aspects of The Long Face Morphology Joseph S Antoun BDS (Otago) A thesis submitted for the degree of Doctor of Clinical Dentistry (Orthodontics) University of Otago Dunedin, New Zealand 2013
-
Upload
khangminh22 -
Category
Documents
-
view
4 -
download
0
Transcript of Clinical and Psychosocial Aspects of The Long Face ...

Clinical and Psychosocial Aspects of
The Long Face Morphology
Joseph S Antoun BDS (Otago)
A thesis submitted for the degree of
Doctor of Cl inical Dentistry (Orthodontics)
University of Otago
Dunedin, New Zealand
2013

!
Dedicated to all my family and friends,!!

! I
Acknowledgements
This work represents the product of my long journey, which would not have been
possible without the help of so many people whom I have had the pleasure to meet
and work with over the past few years.
It is with immense gratitude that I acknowledge the guidance and help of my primary
supervisor, Professor Mauro Farella. In truth, this work is the product of his extraordinary
vision, humility and support. I had the pleasure to know Mauro as a teacher,
collaborator, and close friend. During this time, he has granted me more time than he
can spare, a generosity of ideas, and unconditional support. If clarity of thinking or
counsel was needed – there was no better place to go.
I would also like to express my sincere gratitude to Professor Murray Thomson for his
help and thoughtful advice while carrying out this work. I am grateful to Murray for his
helpful suggestions and comments while reviewing my manuscript – his simplicity,
efficiency and clarity of writing are unparalleled!
I would also like to extend my warmest appreciation to Associate Professor Tony
Merriman for his support over the past few years. I thank Tony for opening my eyes to
the fascinating world of genetics! His passion and knowledge in this field are truly
contagious. In addition to Tony’s support, I would like to thank everyone at Merriman lab
for helping me along this journey.
There are perhaps too many people to acknowledge, but I would like to take this
opportunity to thank David French and Roberto Rongo for their friendship and help
throughout this project. I wish to thank Dave for his tireless effort in creating the website
– I know he spent many long nights rewriting programming code because of my
constantly changing ideas! I would like to thank Roberto for helping interview some of
the study participants while I was occupied in clinic – his suggestions and ideas have

! II
also been tremendously helpful. I also wish to thank Dr. Claire Cameron for her statistical
advice and help with some of the multivariate analysis.
I am also indebted to my many friends, colleagues, classmates, clinical tutors, and
general staff who supported me over the past three years. Without their help and
support, this would not have been possible. I thank you for all your motivation,
inspiration and support – I could not think of a better support crew than you!. I also wish
to thank the study participants and their families for making this project possible. I
would also like to acknowledge the financial support received from the New Zealand
Dental Association and the New Zealand Association of Orthodontists.
Last but not least, I would like to thank my family for their unconditional love and
support. I wish to thank my parents for their strong affection, sacrifices and presence in
my life – I am particularly grateful for my mother’s heartfelt prayers, and my father’s
support and encouragment. I thank my brother for always being there and for taking my
mind off work with countless funny stories. I also thank Diana, Nathan and Jayden for
continually bringing a smile to my face. I thank Ramez Ailabouni for his friendship and
support through the tough times. Finally, I thank God for giving me far more than I
deserve.
It is true that the beauty of life is to do something foolish, something creative and
something generous everyday… thanks to everyone who has pushed me to do so in
my life.
! III
Abstract
Introduction: The long face morphology is a relatively common presentation in
orthodontic patient populations, although the clinical and psychosocial features of this
condition are still unclear.
Objectives: To investigate and compare the: (1) cephalometric features; (2) oral
behaviour patterns; (3) and, oral health-related quality of life and functional limitations
between long (case) and normal (control) face individuals. A longer-term objective was
to establish a craniofacial database that could be used to investigate the association
between vertical facial patterns and selected candidate genes.
Materials and Methods: Eighty cases with a distinctively long face (mandibular plane
angle greater than 2 standard deviations, or 42 degrees) and eighty controls were
individually matched on age, gender, ethnicity, and treatment stage. Self-report and
clinical data were collected using an online database (www.longface.ac.nz). The self-
report measures included the oral behaviour checklist (OBC), the Oral Health Impact
Profile (OHIP-14), and the Jaw Functional Limitation Scale (JFLS-8). Moreover, a
comprehensive cephalometric analysis was carried out for each study participant.
Results: The sample had a mean chronological age of 17.2 years (SD = 4.6), with the
majority of the participants being female (65.0%), and of New Zealand European origin
(91.3%). In comparison with controls, long face individuals were characterised by a
significantly reduced posterior facial height and increased anterior facial height (P <
0.001). Nearly one-fifth of the long face sample had an anterior open-bite. In general, the
long face morphology was found to consist of at least 3-4 clusters (i.e. sub-phenotypes).
There were no significant differences in either the prevalence or mean number of
reported oral behaviours between long and normal face individuals. Long face
individuals had small but significantly higher overall and social domains scores of the

! IV
OHIP-14. On the other hand, there were little differences in functional limitations scores
between cases and controls (P > 0.05).
Conclusions: The long face morphology is not a single clinical entity but consists of
several distinct clusters that can be characterised using cephalometrics. Facial
morphology is not necessarily associated with jaw function or oral behaviour patterns.
Long face individuals, however, are more likely to self-report poorer oral health-related
quality of life, especially with respect to social interactions.
Keywords: Long face, craniofacial growth, cephalometrics, oral behaviours, quality of life

! V
Overview
The present work, which focuses on the clinical and psychosocial aspects of the long
face morphology, is divided into eight main chapters that are organised as follows:
Chapter 1 – General Introduction and Review of the Literature
A general overview of the long face morphology is presented in the first chapter. This
introductory chapter includes a review of the epidemiological, aetiological, and
morphological features of this particular growth pattern.
Chapter 2 – Core Methods and Materials
The methodological details of the present work are presented in the second chapter.
The chapter covers aspects of study design, data collection and statistical analysis. A
more detailed account of the methods used to investigate the study’s specific
objectives is provided in chapters 3, 4 and 5.
Chapter 3 – Cephalometric Features
The wide range of cephalometric features that have been attributed to the long face
morphology are reviewed in the third chapter. The method and materials section of this
chapter includes a description of the specific methods used to analyse and compare the
cephalometric features of the long face and control participants in the study. Findings
from this analysis are presented and discussed.
Chapter 4 – Oral Behaviour Patterns
The role of environmental risk factors in the aetiology of the long face morphology is
reviewed in the fourth chapter, especially as it relates to habitual masticatory activity oral
parafunctional habits. The method and materials section of this chapter includes a
description of the Oral Behaviour Checklist (OBC), which was used to collect data on
non-functional habits. Finally, the findings of the OBC analysis in both long face and
control participants are presented and discussed.

! VI
Chapter 5 – Oral Health-Related Quality of Life (OHRQoL) and Functional Limitations
The impact of the long face morphology on an individual’s quality of life is reviewed in
the fifth chapter. The method and materials section of this chapter includes a
description of the short form Oral Health Impact Profile (OHIP-14) and the Jaw Function
Limitation Scale (JFLS-8), used to assess OHRQoL and jaw function, respectively. The
OHIP-14 and JFLS-8 findings in the two study groups are presented and discussed.
Chapter 6 – General Discussion and Conclusion
The sixth and final chapter of this work includes a general discussion of the study’s
design and findings. In particular, the limitations of the present study and future
directions for research are highlighted.
Chapter 7 – References
Chapter 8 – Appendices

! VII
Table of Contents
1 Review of the Literature ............................................................................................................... 1
1.1 Nomenclature .................................................................................................................................................. 2
1.2 Prevalence .......................................................................................................................................................... 3
1.3 Clinical Features .............................................................................................................................................. 5
1.4 Cephalometric Features ............................................................................................................................ 7
1.5 Morphology and Growth Patterns ...................................................................................................... 8
1.5.1 Implant-based Studies and Mandibular Growth Rotations ........................................ 9
1.5.2 Longitudinal Studies of Vertical Facial Growth ............................................................... 13
1.6 Aetiological Factors ................................................................................................................................... 16
1.6.1 Growth Theories ................................................................................................................................. 16
1.6.2 Environmental Factors .................................................................................................................... 18
1.6.3 Genetic Factors ................................................................................................................................... 22
1.7 Psychosocial and Functional Impact .............................................................................................. 25
1.8 Summary .......................................................................................................................................................... 27
1.9 Study Hypotheses ....................................................................................................................................... 28
1.10 Study Objectives ....................................................................................................................................... 28
2 Core Methods and Materials .................................................................................................... 29
2.1 Research Approach .................................................................................................................................... 30
2.2 Overview of Study Design ..................................................................................................................... 30
2.3 Sample Selection ......................................................................................................................................... 31
2.3.1 Study Participants .............................................................................................................................. 31
2.3.2 Eligibility Criteria ................................................................................................................................. 31
2.3.3 Sample Size and Study Power ................................................................................................... 31
2.3.4 Classification and Recruitment of Cases .............................................................................. 32
2.3.5 Matching and Recruitment of Controls ............................................................................... 33
2.4 Data Collection ............................................................................................................................................. 33
2.4.1 Participant Questionnaires ........................................................................................................... 34
2.4.2 Cephalometric Data ......................................................................................................................... 34

! VIII
2.4.3 Assessor Calibration ......................................................................................................................... 35
2.4.4 Digitisation of Lateral Cephalograms .................................................................................... 35
2.4.5 Method Error ......................................................................................................................................... 36
2.5 Data Storage and Online Database ................................................................................................. 37
2.5.1 Development Process ..................................................................................................................... 37
2.5.2 Security Protocols .............................................................................................................................. 37
2.5.3 Layout and Features ......................................................................................................................... 38
2.6 Statistical Analysis ....................................................................................................................................... 43
2.7 Maori Consultation and Ethics ............................................................................................................ 43
2.8 Funding ............................................................................................................................................................. 43
3 Cephalometric Features ............................................................................................................ 44
Introduction ................................................................................................................................................... 45 3.1
Materials and Methods ............................................................................................................................ 48 3.2
3.2.1 Study Participants .............................................................................................................................. 48
3.2.2 Cephalometric Analysis ................................................................................................................. 48
3.2.3 Method Error ......................................................................................................................................... 48
3.2.4 Statistical Analysis .............................................................................................................................. 51
Results ................................................................................................................................................................ 52 3.3
3.3.1 Sociodemographic Characteristics and Treatment Status ...................................... 52
3.3.2 Cephalometric Features by Study Group ........................................................................... 53
3.3.3 Cephalometric Features by Open-bite Status ................................................................. 58
3.3.4 Predictors of Anterior Open-bite ............................................................................................. 62
3.3.5 Discriminant Function Analysis ................................................................................................. 65
3.3.6 Cluster Analysis ................................................................................................................................... 65
Discussion ........................................................................................................................................................ 69 3.4
3.4.1 Limitations of the Study ................................................................................................................ 69
3.4.2 Cephalometric Features of Long Face Individuals ........................................................ 70
3.4.3 Cephalometric Features of Open-bite Individuals ........................................................ 75
3.4.4 Clustering of the Long Face Morphology .......................................................................... 76
Conclusions .................................................................................................................................................... 77 3.5
4 Oral Behaviour Patterns ............................................................................................................. 78
Introduction ................................................................................................................................................... 79 4.1

! IX
Materials and Methods ............................................................................................................................ 82 4.2
4.2.1 Study Participants .............................................................................................................................. 82
4.2.2 Oral Behaviour Checklist ................................................................................................................ 82
4.2.3 Statistical Analysis .............................................................................................................................. 83
Results ................................................................................................................................................................ 84 4.3
4.3.1 Sociodemographic Characteristics and Treatment Status ...................................... 84
4.3.2 Oral Behaviour Checklist Score by Study Group ............................................................ 84
4.3.3 Oral Behaviour Checklist Score by Sex ................................................................................. 87
4.3.4 Oral Behaviour Checklist Score by Age ................................................................................ 92
4.3.5 Oral Behaviour Checklist Score by Treatment Status .................................................. 97
Discussion ...................................................................................................................................................... 102 4.4
4.4.1 Limitations of the Study .............................................................................................................. 102
4.4.2 Oral Behaviour Patterns and Vertical Facial Form ........................................................ 103
4.4.3 Oral Behaviour Patterns and Sex ............................................................................................ 106
Conclusions .................................................................................................................................................. 106 4.5
5 OHRQoL and Functional Limitations .................................................................................. 108
Introduction ................................................................................................................................................. 109 5.1
Materials and Methods .......................................................................................................................... 112 5.2
5.2.1 Study Participants ............................................................................................................................ 112
5.2.2 Oral Health-Related Quality of Life (OHRQoL) ............................................................... 112
5.2.3 Functional Limitations .................................................................................................................. 113
5.2.4 Statistical Analysis ............................................................................................................................ 113
Results .............................................................................................................................................................. 114 5.3
5.3.1 Socio-Demographic Characteristics and Treatment Status .................................. 114
5.3.2 Validation of the OHIP-14 using Locker’s global question ..................................... 114
5.3.3 Oral Health-Related Quality of Life (OHIP-14) ................................................................ 117
5.3.4 Jaw Function Limitation (JFLS-8) ........................................................................................... 122
Discussion ...................................................................................................................................................... 123 5.4
5.4.1 Self-Report Instruments ............................................................................................................... 123
5.4.2 Quality of Life in Long Face Individuals ............................................................................. 125
5.4.3 Functional Limitation in Long Face Individuals ............................................................ 127
5.4.4 Limitations of the Study .............................................................................................................. 128

! X
Conclusions .................................................................................................................................................. 129 5.5
6 General Discussion and Conclusions .................................................................................. 130
6.1 Summary of the Main Findings ........................................................................................................ 131
6.2 Methodological Limitations ............................................................................................................... 132
6.3 Defining a Long Face .............................................................................................................................. 134
6.4 Nature versus Nurture: Revisited ..................................................................................................... 136
6.5 Future Research Directions ................................................................................................................. 137
6.6 Conclusions .................................................................................................................................................. 138
7 References .................................................................................................................................... 140
8 Appendices .................................................................................................................................. 171
8.1 Cephalometric Landmark Definitions .......................................................................................... 172
8.2 Participant Questionnaire .................................................................................................................... 174
8.3 Normality and Variance Distributions .......................................................................................... 180
8.4 Maori Consultation ................................................................................................................................... 181
8.5 Ethical Approval ......................................................................................................................................... 183
8.6 Participants’ Information Sheet ........................................................................................................ 184
8.7 Participants’ Consent Forms .............................................................................................................. 191
8.8 Permission to use Patient Photographs ...................................................................................... 194
8.9 Permission to use Illustration ............................................................................................................. 195

! XI
List of Figures
Figure 1.1. A female patient presenting with some common features of the long face
morphology ......................................................................................................................................................................... 7
!Figure 1.2. Different types of mandibular rotations as determined by Björk’s implant
method. A, Forward rotation with the centre of rotation located at (I) tempromandibular
joints; (II) lower incisors; (III) and premolar region. B, Backward rotation with the centre of
rotation located at (I) tempromandibular joints; (II) and most distal molar .............................. 12
!Figure 2.1. Flow-chart of the matched case-control study design ................................................ 30
!Figure 2.2. Diagrammatic representation of the cephalometric measurements used to
classify vertical facial pattern. A, mandibular plane to cranial base angle; B, ratio of
posterior facial height to anterior facial height ........................................................................................... 32
!Figure 2.3. Optimisation of lateral cephalograms using the High Definition-Rendering
feature of Photoshop. A, Non-optimised radiograph. B, Digitally optimised and
enhanced radiograph; Note greater visibility of key landmarks such as Nasion and Point
B (arrows) ............................................................................................................................................................................. 35
!Figure 2.4. Cephalometric landmarks and measurements used in the study. A, Line
tracing illustrating the cephalometric landmarks used for the digitisation of the
cephalograms. B, Summary of the linear and angular measurements ........................................ 36
!Figure 2.5. The homepage of the website allowed easy access to the different parts of
the website, including the participant and orthodontist sections ................................................. 39
!Figure 2.6. Study participant interface of the online database. A and B, Example of the
study questionnaire (OHIP-14 and JFLS-8) that was available for participants to complete
online. The layout was designed to mimic the paper-based version of the questionnaire
................................................................................................................................................................................................... 40
!
! XII
Figure 2.7. Provider interface of the online database. A, Initiation of the enrolment
process of a new case. B, Summary of unmatched cases awaiting suitable controls. C, A
color-coded overview of all submitted participants, where matched cases/controls are
displayed in green, while unmatched cases are displayed in red ................................................... 41
!Figure 2.8. Eligibility check for submitted controls to ensure appropriate pairwise
matching ............................................................................................................................................................................. 42
!Figure 2.9. Administrator interface showing the database’s overview feature and
management tools ....................................................................................................................................................... 42
!Figure 3.1. Superimposition of each study group’s cephalometric tracings. Overall
tracing was superimposed on the anterior cranial base (S-N) and registered at sella;
maxillary tracing was superimposed on the maxillary plane (ANS-PNS); mandibular
tracing was superimposed on mandibular plane (Go-Me) for A, Controls; and B, Cases
................................................................................................................................................................................................... 49
!Figure 3.2. Average cephalometric tracing of each study group (± 1 standard deviation).
Overall tracing was superimposed on the anterior cranial base (S-N) and registered at
sella; maxillary tracing was superimposed on the maxillary plane (ANS-PNS); mandibular
tracing was superimposed on mandibular plane (Go-Me) for A, Controls; and B, Cases
................................................................................................................................................................................................... 50
!Figure 3.3. Dendrogram for the long face group. The x-axis represents each individual in
the long face group, whereas the y-axis represents the L2 dissimilarity distance between
individuals. .......................................................................................................................................................................... 66
!Figure 3.4. Descriptive diagrams of the four clusters. ............................................................................ 68
! XIII
List of Tables
Table 3.1. Sociodemographic characteristics by study group .......................................................... 52
!Table 3.2. Mean skeletal cephalometric measurements by study group .................................. 54
!Table 3.3. Mean dental cephalometric measurements by study group .................................... 56
!Table 3.4. Mean skeletal cephalometric measurements of cases with and without an
anterior open-bite ......................................................................................................................................................... 59
!Table 3.5. Mean dental cephalometric measurements of cases with and without an
anterior open-bite ......................................................................................................................................................... 61
!Table 3.6. Pearson’s correlation coefficients for the different cephalometric variables
used to assess vertical facial morphology ...................................................................................................... 63
!Table 3.7. Description of the three clusters .................................................................................................. 67
!Table 3.8. Description of the four clusters ..................................................................................................... 67
!Table 4.1. Prevalence, extent and severity of the OBC by study group ...................................... 84
!Table 4.2. Prevalence, extent and severity of frequent behaviours (“all the time” or “most
of time”) by OBC item and study group .......................................................................................................... 85
!Table 4.3. Prevalence, extent and severity of the OBC by sex ........................................................... 87
!Table 4.4. Prevalence and severity of frequent behaviours (“all the time” or “most of
time”) by OBC item and sex ..................................................................................................................................... 88
!Table 4.5. Prevalence of frequent oral behaviours (“all the time” or “most of time”) by
study group and sex .................................................................................................................................................... 90
!Table 4.6. Prevalence, extent and severity of the OBC by age group .......................................... 92

! XIV
Table 4.7. Prevalence, extent and severity of frequent behaviours (“all the time” or “most
of time”) by OBC item and age group .............................................................................................................. 93
!Table 4.8. Prevalence of frequent oral behaviours (“all the time” or “most of time”) by
study group and age group .................................................................................................................................... 95
!Table 4.9. Prevalence, extent and severity of the OBC by treatment status ............................ 97
!Table 4.10. Prevalence and severity of frequent behaviours (“all the time” or “most of
time”) by OBC item and treatment stage ....................................................................................................... 98
!Table 4.11. Prevalence of frequent oral behaviours (“all the time” or “most of time”) by
study group and treatment stage ..................................................................................................................... 100
!Table 5.1. Prevalence, severity and extent of OHIP-14 by Locker’s global question ......... 115
!Table 5.2. Severity, prevalence, and extent of OHIP-14 impacts by study group ............... 117
!Table 5.3. Distribution of responses and mean score of each OHIP-14 item by study
group ................................................................................................................................................................................... 118
!Table 5.4. Prevalence of 1+ impacts in each OHIP-14 subscale by study group ................ 120
!Table 5.5. Severity of impacts (mean score) in each OHIP-14 subscale by study group
................................................................................................................................................................................................. 121
!Table 5.6. Mean score of JFLS-8 by study group ..................................................................................... 122

! XV
List of Abbreviations
General
ANOVA Analysis of Variance
CI Confidence Interval
CPQ Child Perceptions Questionnaire
CPQ 11-14 Child Perceptions Questionnaire (shorten version)
DNA Deoxyribonucleic Acid
DPI Dots Per Inch
ECOHIS Early Childhood Oral Health Impact Scale
EMG Electromyography
FORENZAO Foundation for Orthodontic Research and Education, New
Zealand Association of Orthodontists
GH Growth Hormone
GHR Growth Hormone Receptor
h2 Heritability Estimate
IGF-I Insulin-like Growth Factor I
IGF-IR Insulin-like Growth Factor I Receptor
JA Joseph Antoun (study investigator)
JFLS Jaw Function Limitation Scale
JFLS-8 Jaw Function Limitation Scale (shortened version)
NZAO New Zealand Association of Orthodontists
MFIQ Mandibular Functional Impairment Questionnaire
OBC Oral Behaviour Checklist
OHIP Oral Health Impact Profile
OHIP-14 Oral Health Impact Profile (shortened version)
OHRQoL Oral Health-Related Quality of Life
OIDP Oral Impacts on Daily Performances index
RDC/TMD Research Diagnostic Criteria for Temporomandibular Disorders
SD Standard Deviation

! XVI
SNP Single Nucleotide Polymorphism
SQL Structured Query Language
TMJ Temporomandibular Joint
TMD Temporomandibular Disorders
VME Vertical Maxillary Excess
Cephalometric Landmarks
ANS Anterior Nasal Spine
Ar Articulare
Ba Basion
Co Condylion
Gn Gnathion
Go Gonion
L1 Mandibular incisor tip
L6 1st mandibular molar mesio-buccal cusp
Me Menton
Na Nasion
PNS Posterior Nasal Spine
Pt Pterygoid Point
S Sella
U1 Maxillary incisor tip
U6 1st maxillary mesio-buccal cusp
Cephalometric Measurements
AFH Distance between Nasion and Menton (mm); Total anterior facial
height
ANB Angle between Point A, Nasion and Point B (deg); Intermaxillary
relationship
ANS-Me Distance between ANS and Me (mm); Lower anterior facial height
ANS-Me/Na-Me Ratio between ANS-Me and Na-Me (%)
ANS-PNS, PP Distance between ANS and PNS (mm); Length of maxilla

! XVII
Ar-Go Distance between Articulare and Gonion (mm); Ramus height
Ar-Go-Me Angle between Articulare, Gonion and Menton (deg); Gonial
angle
Ar-Go/S-Go Ratio between Ar-Go and S-Go (%)
Co-Gn Distance between Condylion and Gnathion (mm): Length of
mandible
Co-Go Distance between Condylion and Gonion (mm): Height of
mandible
Co-Point A Distance between Condylion and Point A (mm): Mid-face depth
Go-Me Distance between Gonion and Menton (mm): Corpus length
Jarabak Ratio Equivalent to S-Go/Na-Me (%);
LFH Equivalent to ANS-Me (mm); Lower anterior facial height
MMPA Angle between ANS-PNS and Go-Me planes (deg); Maxillo-
mandibular plane angle
Na-ANS Distance between Nasion and ANS (mm): Upper anterior facial
height
Na-ANS/Na-Me Ratio between Na-ANS and Na-Me (%);
Na-ANS/ANS-Me Ratio between Na-ANS and ANS-Me (%);
Na-Me Distance between Nasion and Menton (mm): Total anterior facial
height
PFH Equivalent to S-Go (mm); Total posterior facial height
PFH/AFH Equivalent to S-Go/Na-Me (%); Jarabak ratio
S-Go Distance between Sella and Gonion (mm): Total posterior facial
height
S-Go/Na-Me Ratio between S-Go and Na-Me (%)
S-Na Distance between Sella and Nasion (mm): Length of anterior
cranial base
SNA Angle between SNa and Point A (deg); Position of maxilla relative
to anterior cranial base
SNB Angle between SNa and Point B (deg); Position of mandible
relative to anterior cranial base

! XVIII
SNMP Angle between SNa and Go-Me planes (deg); Mandibular plane
angle
UFH Equivalent to Na-ANS (mm); Upper anterior facial height
UFH/LFH Equivalent to Na-ANS/ANS-Me (%); Ratio of upper to lower facial
height
LPFH Equivalent to Ar-Go/S-Go (%); Ratio of lower to total posterior
facial height
Y-Axis Angle between S-Gn and Frankfort horizontal planes (deg);
Downs growth axis

! 1
1 Review of the Literature
Nomenclature
Prevalence
Clinical Features
Cephalometric Features
Morphology and Growth Patterns
Aetiological Factors
Psychosocial and Functional Impact
Summary
Study Hypotheses
Study Objectives

! 2
1.1 Nomenclature
Vertical facial form has traditionally been classified into two extreme groups despite the
fact that different terminologies are often used to describe each of these clinical entities.
A wide range of terms has been used for excessive vertical craniofacial growth, including
the long face syndrome (Schendel et al., 1976), idiopathic long face (Willmar, 1974),
vertical maxillary excess (Schendel et al., 1976), skeletal open-bite (Sassouni, 1969;
Subtelny and Sakuda, 1964), high angle (Isaacson et al., 1971), hyperdivergent (Schudy,
1964; Siriwat and Jarabak, 1985), dolichofacial (Collett and West, 1993), and adenoid face
(Quick and Gundlach, 1978). In contrast, reduced vertical facial growth has been labelled
as the short face syndrome (Opdebeeck and Bell, 1978), hypodivergent (Schudy, 1964),
and brachyfacial (Collett and West, 1993). Although these terms often refer to the same
clinical condition, the multiplicity of terms suggests considerable morphological
variation within each facial type (Schendel and Carlotti, 1985).
The use of a single well-defined term to describe a condition is desirable in clinical
research because different terminologies may reflect differences in phenotypic and
aetiological features. Very few researchers, however, have provided specific and reliable
definitions of the various terms used to describe excessive vertical craniofacial growth.
For the sake of consistency, the terms “long face” and “hyperdivergent” are used
interchangeably throughout the present work to describe a phenotype that consists of
a markedly obtuse cranial base to mandibular plane angle and/or a significantly reduced
posterior to anterior facial height. These two measurements are highly correlated, which
indicates that they are likely to measure the same phenotype (Dung and Smith, 1988;
Jacob and Buschang, 2011).
It is noteworthy that a large number of studies have focused on the open-bite variant of
the long face morphology. Not all hyperdivergent individuals, however, have an anterior
open-bite (Betzenberger et al., 1999; Fields et al., 1984). Nonetheless, the present work
will attempt to report the findings by open-bite status whenever possible.

! 3
1.2 Prevalence
The majority of studies to date have focused on the dental features associated with
different malocclusions, with very few investigating the prevalence of the underlying
skeletal pattern. However, a few studies have used orthodontic patient samples to
investigate the prevalence of the underlying skeletal pattern in patients with dentofacial
deformities.
Two of the largest studies that investigated the prevalence of skeletal facial types were
undertaken in the United States, and involved the evaluation of a large orthodontic-
based patient sample. The first study was carried out in the 1980s using a sample of
nearly 1,200 patients (Proffit et al., 1990), while the second was conducted nearly a
decade later using a slightly smaller sample of 872 patients (Bailey et al., 2001). In both
studies, the prevalence of the long face pattern was approximately 22%. This extreme
form of vertical craniofacial growth was also reported to be the second most common
cause for seeking and receiving orthodontic/surgical treatment (Proffit et al., 1990). The
main features of the long face pattern in these two studies was reported to occur
predominantly in the lower third of the face (81.5 and 76.8%, respectively); that is, below
the maxillary plane. Moreover, the authors estimated that approximately 220,000
individuals living in the United States at the time of these studies had a long face
pattern that warranted surgical correction (Bailey et al., 2001).
Similar findings have also been reported from other studies investigating the prevalence
of extreme vertical facial patterns in European- and Asian-based orthodontic samples.
Willems et al. (2001) retrospectively analysed the records of some 1,477 Belgian
orthodontic patients, and found that approximately 29% of the sample displayed a
vertical growth pattern, although no information was given on the specific prevalence
of the long face morphology. The prevalence of these vertical growth patterns differed
significantly according to Angle’s classification of malocclusion, with the highest
proportion occurring in the Class III sample (35%), followed by the Class I (32%), Class II
Division 1 (30%) and Division 2 (18%) groups. These findings were consistent with those

! 4
of another recent retrospective study investigating the occurrence of skeletal
malocclusions in a Brazilian sample (Boeck et al., 2011). In that study, approximately 33
per cent of the sample was described as having vertical maxillary excess, although no
significant difference was found among the three Angle classes.
Recently, Chew (2006) investigated the distribution of dentofacial deformities in an
ethnically diverse Asian population receiving orthognathic surgery. The study, which
involved 212 consecutive orthognathic patients, found that the overall prevalence of
vertical maxillary excess (VME) was nearly 22%, although significant differences existed
in the distribution of VME among the three Angle classes. The highest prevalence of
VME occurred in the Angle Class I (50%) and Class II malocclusions (48%), followed by
the Class III group (10%). In a similar retrospective study, Samman and colleagues (1992)
analysed the records of 300 consecutive Chinese patients, and found that the long face
pattern was the third most common type of dentofacial deformity (18%) following Class
III growth patterns (47%) and facial asymmetry (21%). Interestingly, the prevalence of the
long face morphology was markedly higher than the short face pattern (4%).
In contrast to institution-based samples, a lower prevalence of the long face pattern has
been reported in samples from private orthodontic practices. Siriwat and Jarabak (1985)
randomly selected 500 patients aged 8-12 years from the archives of an American
private practice, and found that nearly 10% of them exhibited a hyperdivergent growth
pattern. In contrast, hypodivergent and neutral growers represented 44 and 46% of the
sample, respectively. Hyperdivergent growth patterns were particularly common in
Angle Class III (19%) and Class I (13%) malocclusions. It is noteworthy that the authors of
that study used the Jarabak ratio (i.e. the ratio of the posterior to anterior facial height) to
classify facial type 1 . The observed differences in the prevalence of the long face
morphology among samples, especially those from university and private clinics, may
reflect differences in the type of patients that present for treatment with severe vertical
malocclusions being more likely to require orthodontic/surgical treatment in a hospital
or institution-based setting.
!!!!!!!!!!!!!!!!!!!!!!!!!!!!!!!!!!!!!!!!!!!!!!!!!!!!!!!!1 The same variable was used to select participants in the present work.!

! 5
Unfortunately, the majority of studies investigating extreme vertical facial patterns have
either focused predominantly on the dental features associated with the condition
and/or utilised convenience samples, which are not representative of the general
population. Moreover, occlusal anomalies, such as anterior open-bites, may not be a
valid indicator of this growth pattern because they are not always associated with the
long face morphology (Fields et al., 1984), and their prevalence is highly variable by age
(Subtelny and Sakuda, 1964). Finally, the classification of open-bites is not always
consistent between clinical and cephalometric analyses (Arat et al., 2008).
From an epidemiological perspective, these limitations have hindered the ability to
accurately determine the true prevalence of the long face phenotype in the general
population. Another important limitation of previous studies is the wide variability of
definitions used to identify long face individuals. The latter point raises an important
(but often overlooked) question: which clinical and/or radiographic features are best
indicative of the long face phenotype?
1.3 Clinical Features
The long face morphology is typically associated with a number of classical features
including a longer lower third of the face, facial retrognathism, depressed nasolabial
areas, excessive exposure of the maxillary teeth and gingiva, lip incompetence, narrow
palate, posterior cross-bites, and an anterior open-bite (Schendel et al., 1976). Facial
retrognathism, for example, gradually increases with facial divergence and mandibular
plane angle (Isaacson et al., 1971). Other features (such as a dolichocephalic cranium,
narrow nasal apertures, small temporal fossa, underdeveloped mandibular processes,
narrow and long mandibular symphysis, reduced chin prominence, and large teeth)
have also been reported in some individuals with the long face pattern (Sassouni, 1969).
Some of these facial and intra-oral features are clearly evident in Figure 1.1.
Similar features have also been reported in individuals with the so-called adenoid face.
These individuals often suffer from nasal obstruction as a result of enlarged adenoids,
and exhibit facial features that include an open-mouth posture (to facilitate oral

! 6
breathing), small and poorly developed nostrils, short upper lip, and a vacant facial
expression (McNamara, 1981). Intra-orally, mouth-breathers have generally been
described as having a V-shaped maxillary arch, high and narrow palatal vault, proclined
upper incisors, and a Class II occlusion (McNamara, 1981). It is no surprise, therefore, that
greater nasal resistance has been reported in some children with a long face
morphology and high/narrow palatal vaults (Linder-Aronson and Backstrom, 1960).
It is important to note, however, that the clinical features of the long face morphology
are not homogenous. Indeed, clinical practice suggests that a great deal of variation
exists in the phenotype of the long face morphology - it is simply not an “all or nothing”
trait. Anterior open bites, for instance, are only found in a limited proportion of
individuals with the long face morphology (Dung and Smith, 1988). Fields and
colleagues (1984) recognised this common misconception and pointed out that “not all
long faced patients have open-bites and not all open-bite patients are long faced”. The
reduced prevalence of anterior open-bites in long face individuals can be attributed to
the dentoalveolar compensatory mechanisms, which are capable of masking the
underlying skeletal pattern in a large proportion of individuals (Betzenberger et al.,
1999).

! 7
!Figure 1.1!A female patient presenting with some common features of the long face morphology. Note the greater lower anterior facial height, incompetent lips, posterior cross-bites, and anterior open-bite (with only a few occlusal contacts)!
1.4 Cephalometric Features
Until the early part of the last century, many clinicians believed that anterior open-bites
resulted from growth disturbances in the incisor region of the maxilla. However,
Hellman’s classical study of 43 open-bite individuals demonstrated that the areas most
responsible for this malocclusion included the total face, upper face, lower face, dental,
and ramus heights (Hellman, 1931). The smaller size of the mandibular ramus was
particularly evident in many of the skulls with anterior open-bites.
It is now clear that the majority of the growth disturbances that contribute to the long
face morphology occur below the maxillary plane (Fields et al., 1984; Isaacson et al.,
1971; Nahoum et al., 1972; Schendel et al., 1976; Silva Filho et al., 2010). The majority of
the latter studies have analysed the cephalometric features of long face individuals in
order to identify the exact areas responsible for this vertical growth pattern. In general,
the hyperdivergent pattern results from a combination of dentoalveolar and skeletal
features (Isaacson et al., 1971). A number of cephalometric variables that represent these

! 8
areas have therefore been associated with the long face morphology, including a lower
posterior facial height, greater total facial height, and larger lower anterior facial height,
gonial angle, and mandibular plane angle (Cangialosi, 1984; Nahoum et al., 1972;
Schendel et al., 1976).
Based on the conflicting findings of previous studies, it is clear that a great deal of
cephalometric variation exists within this phenotype, probably because of the
condition’s multifactorial aetiology (Cangialosi, 1984). Dung and Smith (1988) came to a
similar conclusion after evaluating the relationship between several cephalometric
variables commonly used to identify excessive vertical growth and open-bite
tendencies. The authors noted that variables such as the mandibular plane angle and
facial height ratios identified different types of patients. Moreover, a large number of
these variables were poor predictors of treatment response. Ethnic differences may
further increase the variability of this group, with Black Americans, for example, having
markedly different cephalometric features than their white counterparts (Harris et al.,
1977; Jones, 1989).
One of the main limitations of the studies discussed so far, however, is their
confinement to the open-bite variant of the long face morphology. It has already been
noted that excessive vertical facial development does not always predispose to an
anterior open-bite, and yet very limited studies have focused on the other variants of
the long face pattern. Further research is needed in this area to elucidate whether
different clusters of the hyperdivergent phenotype exist, either with or without an
anterior open-bite.
1.5 Morphology and Growth Patterns
Variations in mandibular size and shape are commonly associated with different facial
types. For instance, the relative size of the mandible is significantly smaller in growing
children with a hyperdivergent pattern than in those with either the normodivergent or
hypodivergent morphologies (Ferrario et al., 1999). The shape of the mandible is also
more variable in those with greater skeletal divergence, and differs from

! 9
normodivergent individuals at the gonial angle, alveolar process, posterior ramus
border, and mandibular plane (Ferrario et al., 1999). This type of cross-sectional study has
generally been useful for highlighting key differences in the morphological features of
the various facial types.
Craniofacial growth, however, is a slow and gradual process that is best studied using
longitudinal study designs. Indeed, most of our understanding of mandibular and facial
growth patterns has been derived from the evaluation of serial radiographic records.
Therefore, some of these important longitudinal growth studies will now be reviewed.
1.5.1 Implant-based Studies and Mandibular Growth Rotations
The classical implant studies of the 1950s and1960s were fundamental in understanding
facial growth mechanisms, and especially mandibular growth rotations. These studies,
which used tantalum pins implanted in the symphysis and body of the mandible, found
that the direction of condylar growth was often non-linear and highly variable between
individuals (Baumrind et al., 1992; Björk, 1963). Condylar growth was predominantly
responsible for the vertical growth of the mandible, although other areas (such as the
gonial angle and posterior symphysis) also underwent resorption and apposition
processes (Björk, 1955; Björk, 1963). These implant-based studies demonstrated that
vertical growth of the condyle was associated with a decrease of the gonial angle,
whereas sagittal-directed condylar growth resulted in an increased gonial angle (i.e.
high angle or long face phenotype). Moreover, the rate of condylar growth showed
wide inter-individual variation, although maximum growth generally coincided with the
pubertal peak (Björk, 1963).
The longitudinal nature of these implant studies allowed Björk to define two distinct
types of mandibular rotation, which he further classified into subgroups based on the
location of the mandible’s centre of rotation (Björk, 1969). The most common type of
mandibular remodelling was associated with a “forward rotation”, which often resulted
in either a normal or short face depending on the location of the centre of rotation
(Figure 2.2). Less commonly, the mandible was observed to undergo a “backward

! 10
rotation” that usually led to an increase in anterior facial height and the long face
pattern. In some cases of backward rotation, the mandible’s centre of rotation was
located at the temporomandibular joint and was associated with a flattening of the
middle cranial fossa that resulted in a raised mandibular articulation with the cranial
base (Björk, 1969). In these individuals, the reduced posterior face height led to the
backward rotation of an essentially normal mandible (Björk, 1969). In other cases of
backward rotation, the centre of mandibular rotation was located distal to the last
occluding molar and was commonly associated with sagittal and backward condylar
growth that resulted in increased growth along the length of the mandible (Björk, 1969).
Björk believed that the mandible rotated backwards in these individuals due to the
attachment of the muscle and ligaments that were continually stretched as the
mandible grew along its length (Björk, 1969).
It is clear from Björk’s work that mandibular rotations may lead to differential growth
patterns in anterior and posterior facial heights (Houston, 1988; Isaacson et al., 1977).
One theory for these differential rotations is the uncoordinated growth of the various
structural components that are involved in vertical facial development (Nanda, 1988),
which include lowering of the temporomandibular fossa, growth of the condyles, and
eruption of the posterior teeth (Nielsen, 1991). With respect to the latter, it has been
suggested that changes in gonial angle and ramus height occur in response to
dentoalveolar growth mechanisms (Enlow et al., 1982). Other authors have suggested
that dentoalveolar growth is essentially a secondary and compensatory adaptation to
the amount of available intermaxillary space (Houston, 1988). In support of the latter,
divergent growth patterns have been shown to occur even before the eruption of any
permanent teeth (Nanda, 1988). Fields and colleagues (Proffit and Fields, 1983) also
noted that the skeletal pattern of young children was well established before any
distinctive changes in the musculature had occurred.
In spite of Björk’s classic work on mandibular rotations, there is still considerable
controversy in the literature as to the key contributors to vertical facial growth, especially
the long face morphology. Nanda and colleagues (1988) used serial radiographic
records to study vertical facial growth in two groups of deep-bite and open-bite

! 11
individuals, and found that posterior facial height and ramus height were poor
indicators of facial type, in comparison with anterior facial height. As previously
mentioned, there is substantial evidence from cross-sectional studies to support or
refute these findings (Cangialosi, 1984; Nahoum et al., 1972; Nanda, 1988; Schendel et al.,
1976), although these may not be directly comparable to longitudinal studies (Nanda,
1988). It is noteworthy, however, that participants in that study were selected using the
lower anterior facial height, which is poorly correlated with measures such as posterior
facial height and mandibular plane angle (Dung and Smith, 1985).
In contrast, Karlsen (1997) investigated vertical growth in individuals with low and high
mandibular plane angles, and found that increased posterior facial height was positively
correlated with a forward matrix rotation. However, the two most interesting findings
from that study were the weak association between the lower anterior facial height and
mandibular rotation and the reduced proportion of true backward rotators. With respect
to the latter, no evidence of backward rotation was noted in the hyperdivergent group,
which included individuals with a mandibular plane angle greater than 40 degrees.
Interestingly, hyperdivergent individuals also exhibited a forward rotation, although the
magnitude of this rotation was considerably smaller than in the short face group.
Karlsen (1997) proposed that hyperdivergent individuals should be considered as
“forward hyporotators”, rather than true backward rotators. He attributed the steep
mandibular plane angle in long face individuals to inadequate forward matrix rotation
and a lack of posterior facial development.

! 12
!Figure 1.2. Different types of mandibular rotations as determined by Björk’s implant method. A, Forward rotation with the centre of rotation located at (I) tempromandibular joints; (II) lower incisors; (III) and premolar region. B, Backward rotation with the centre of rotation located at (I) tempromandibular joints; (II) and most distal molar. Reprinted from Am J Orthod, Vol. 55, A Björk, Prediction of mandibular growth rotation, pp. 585-599. Copyright 1969, with permission from Elsevier.
A
B

! 13
The lack of consensus in the literature on the cephalometric features and growth
mechanisms of the long face morphology is likely to be due to a number of reasons,
including: the type of study design used to evaluate vertical facial growth (cross-
sectional versus longitudinal); selection criteria used to define facial typology; and,
variability in the long face phenotype. The latter point is particularly important, since the
long face morphology is unlikely to be a single distinct clinical entity (Van Spronsen,
1993). For example, long face individuals can sometimes be characterised by a long
ramus and a moderately large mandibular plane angle (subtype I), as well as a short
ramus and a very steep mandibular plane angle (subtype II) (Opdebeeck et al., 1978).
Although Opdebeeck and colleagues (1978) proposed only two subtypes to describe
their sample of long face individuals, these findings were only based on nine study
participants. In reality, it is likely that these two extreme examples represent a small
subset of a broader spectrum of biological variation.
1.5.2 Longitudinal Studies of Vertical Facial Growth
Vertical facial height is usually established at an early age (Nanda, 1988), and is often
among the last dimensions of the face to cease growth (Pecora et al., 2008; Yavuz et al.,
2004). In fact, longitudinal studies have shown that vertical facial growth often continues
to undergo change well into adulthood (Akgul and Toygar, 2002; Behrents, 1985;
Bondevik, 2012). The growth pattern of the three facial types is also somewhat different
and can even be more pronounced than typical sex-related differences (Nanda, 1988).
For example, longitudinal growth records have shown that the palatomandibular and
mandibular plane angles in female open-bite patients are much greater than in male
deep-bite patients (Nanda, 1990). On the other hand, the cranial base angle does not
seem to be greatly affected by facial typology (Nanda, 1990).
Longitudinal growth studies have also demonstrated an association between facial
typology and pubertal growth spurts. In general, open-bite females are usually the first
to reach their maximum growth spurt, followed by deep-bite females, open-bite males
and deep-bite males (Nanda, 1988). Blanchette and colleagues (1996) also found that
the pubertal growth spurt occurred earlier in open-bite individuals, although their

! 14
analysis was mainly limited to soft tissue changes. In open-bite females, total anterior
facial height is generally the first vertical dimension to undergo peak pubertal growth,
followed by the upper anterior facial height, lower anterior facial height, ramus height
and posterior facial height (Nanda, 1988). In contrast, male open-bite patients generally
undergo peak pubertal growth in the posterior facial height, followed by ramus height,
upper anterior facial height, and total/lower anterior facial heights (Nanda, 1988). The
growth rate of the posterior and anterior face heights is especially associated with the
growth velocity of body height, at least in girls (van der Beek et al., 1996).
Longitudinal changes in anterior and posterior facial heights have been described using
a fourth degree polynomial model 2 (van der Beek et al., 1991). The prepubertal
minimum of anterior facial height was observed to occur at approximately 8.9 years,
while the pubertal maximum occurs at around 12.2 years. The prepubertal minimum of
posterior facial height appears to occur at a similar age of approximately 8.6 years,
whereas the pubertal maximum occurs at a slightly older age of around 13.1 years.
Differential growth in anterior and posterior facial heights, may, therefore explain the
continued reduction of the mandibular plane angle with age. Interestingly, no specific
growth spurt for the mandibular plane angle was identified in this study (van der Beek et
al., 1991).
Different dimensions of the face also show distinctive growth patterns. Nanda (1990)
studied the facial growth changes in 16 males and 16 females from ages 4 to 18 years,
and found that most angular measurements reduced in size with growth. These angular
cephalometric measurements included the mandibular plane angle, gonial angle, and
palatomandibular angle. Interestingly, some of these angular measurements showed
highly distinctive growth patterns between facial types. For instance, the mandibular
plane angle in male open-bite individuals reduced by only 2.5 degrees over the entire
follow-up period, whereas deep-bite individuals underwent nearly 6 degrees of
reduction. Although few significant differences were noted between the two facial
types (most likely due to Type II error), it is noteworthy that the mandibular plane angle
!!!!!!!!!!!!!!!!!!!!!!!!!!!!!!!!!!!!!!!!!!!!!!!!!!!!!!!!2 Polynomial models are fitted using the equation y = a4x4 + a3x3 + a2x2 + a1x + a0

! 15
was relatively small for all the study participants, and was more characteristic of a normal
facial type.
Growth-related changes in the vertical dimension have recently been investigated from
ages 10 to 15 years using a larger sample of 228 untreated adolescents (Jacob and
Buschang, 2011). In that study, the divergence pattern was estimated using the
percentiles of each cephalometric dimension, with hyperdivergent individuals being
defined as those above the 75th percentile. In contrast to the findings of Nanda and
colleagues (1990), the mandibular plane angle in this study underwent a similar
reduction in both hypodivergent and hyperdivergent individuals. The posterior to
anterior facial height ratio (PFH:AFH) and palatal plane angle also increased significantly
between the ages of 10 and 15 years (Jacob and Buschang, 2011). Interestingly, the
general growth pattern of the mandibular plane angle and the PFH:AFH ratio followed a
linear model, whereas the growth pattern of the upper to lower anterior facial height
ratio (UFH:LFH) followed a quadratic model (Jacob and Buschang, 2011).
Despite these growth-related changes, most individuals maintain their existing vertical
facial pattern during growth. Hyperdivergent children, for example, maintain the same
growth pattern in approximately 75-85% of cases, with one-third of those becoming
even more divergent (Jacob and Buschang, 2011). Bishara and Jakobsen (1985) also
found that over three-quarters of their study sample maintained the same facial type
from ages 5 to 25 years.
Vertical facial growth also continues past adolescence, with marked sexual dimorphism.
Females typically undergo a backward and downward rotation of the mandible, while
males experience a more forward rotation of the mandible (Pecora et al., 2008).
Bondevik (2012) also noted a posterior mandibular rotation in middle-age females, but
no significant change in males. Although total anterior facial height increased in both
sex groups, posterior facial height was significantly more increased in males. This
proportional increase in anterior and posterior facial height may therefore help explain
the relatively unchanged mandibular rotation in males. Nonetheless, it is clear from the

! 16
findings of these studies that vertical facial growth continues to occur throughout
adulthood, although to a lesser extent than during adolescence (Pecora et al., 2008).
1.6 Aetiological Factors
Variations in the long face morphology have so far been discussed in terms of skeletal
growth imbalances and mandibular rotations, although there still remains a great deal
of uncertainty as to what causes or “triggers” these growth patterns (Opdebeeck et al.,
1978). The multiplicity of growth theories suggests a complex multifactorial aetiology
that involves genetic, environmental and epigenetic regulation. The multifactorial
nature of the long face morphology entails a brief overview of growth control
mechanisms, followed by a more detailed discussion of the specific environmental and
genetic factors that have been implicated in the regulation of vertical craniofacial
growth.
1.6.1 Growth Theories
Growth control mechanisms play an important role in the regulation of craniofacial traits
and the aetiology of dentofacial anomalies. Previous theories have focused on either
genetic or environmental factors, although the importance of both components in facial
growth regulation is now well recognised.
Most of the early studies in this area focused on identifying the pacemaker for
craniofacial growth (Carlson, 2005). The remodelling theory, for instance, was based on
the fact that bone was the primary determinant of growth (Brash, 1934; Murray and
Selby, 1930). In subsequent theories, the emphasis shifted from bone to fibrous sutures
(Sicher, 1947), and from sutures to cartilage (Scott, 1953; Scott, 1956). The role of the
condylar cartilage in regulating mandibular growth was often investigated in these
classical growth studies. According to Scott, continued growth of the mandibular
cartilage played an important role in in the development of the facial skeleton after
growth at the nasal septum had ended (Scott, 1954). Further studies, however,

! 17
demonstrated that the condylar cartilage did not have the same intrinsic growth
potential of the nasal septum or the ephiphyseal plate (Copray et al., 1986).
Most craniofacial growth theories up to that point were based on the fundamental
principle that craniofacial growth was unchangeable (Carlson, 2005). However, the
introduction of the functional matrix theory in the 1960s represented a paradigmatic
shift in thinking with respect to the nature-versus-nurture debate. Moss’s functional
matrix theory had de-emphasised the role of the condylar cartilage as the primary
determinant of mandibular growth by demonstrating that the mandible was still
capable of functioning and growing, even after the removal of both condyles (Moss and
Rankow, 1968). Instead, the functional matrix theory argued that facial bones, such as
the mandible, were not a single unitary structure but consisted of various independent
skeletal units (Moss and Salentijn, 1969). The main role of these skeletal units was to
support their specific functional matrices, which included muscles, nerves, blood vessels
and functional spaces. Growth of these skeletal units was, therefore, a secondary
response to these functional matrices, and not a primary determinant of growth (Moss
and Salentijn, 1969). For instance, vertical craniofacial growth was believed to occur in
response to the functional demands of the matrices involved in vision, respiration,
olfaction, digestion and speech (Moss, 1964).
The beginning of the 1970s saw the introduction of new concepts that blended in
aspects of previous theories, such as the role of the nasal septum and muscles of
mastication. Van Limborgh postulated that multiple factors were involved in regulating
craniofacial growth, including intrinsic genetic factors; local (e.g. brain) and general
epigenetic (e.g. growth hormones) factors; and, local (e.g. muscles/habits) and general
environmental (e.g. nutrition) factors (Van Limborgh, 1970; Van Limborgh, 1972). The
servosystem theory of Petrovic also emphasised the function of both local and systemic
factors in the process of craniofacial growth (Carlson, 2005). According to that theory,
growth regulation of the mid-face and anterior cranial base was presumed to be under
hormonal regulation, while the mandible responded to both local function and
systemic hormones (Carlson, 2005).

! 18
As previously mentioned, most contemporary growth control theories nowadays
recognise the complex nature of genetic and environmental interactions in regulating
craniofacial growth (Roberts and Hartsfield, 2004). The following discussion will,
therefore, focus on the specific environmental and genetic factors that have so far been
implicated in vertical craniofacial development.
1.6.2 Environmental Factors
Several local environmental factors have been implicated in the aetiology of the long
face morphology, including diet consistency (Kiliaridis, 2006), parafunctional habits
(Cozza et al., 2005), and nasal obstruction (Linder-Aronson, 1970). The association
between muscle function and craniofacial development, in particular, has received
considerable attention over recent years. This relationship between form and function is
frequently evident in neuromuscular conditions such as myotonic dystrophy. These
individuals are typically characterised by muscular weakness of the facial muscles, a long
face pattern, and a significantly lower bite force (Kiliaridis et al., 1989; Ödman and
Kiliaridis, 1996). The occurrence of these features in both long face and myotonic
dystrophy patients has been used to illustrate the role of masticatory activity in
regulating vertical facial development (Kiliaridis et al., 1989).
The effect of the masticatory muscles in vertical craniofacial development has also been
demonstrated in animal models by altering their diet consistency. The use of soft diets
in these experimental studies has resulted in the altered composition and cross-
sectional area of muscle fibres (Kiliaridis et al., 1988; Langenbach et al., 2003). More
specifically, rats that are fed on soft diets display significantly lower muscle activity, an
increased proportion of the type IIB fibres (fatigue-susceptible), and a reduced cross-
sectional area of the superficial masseter muscle fibres (Kawai et al., 2010). Similar
findings have also been reported with respect to muscle composition (Kiliaridis et al.,
1988), weight (Ciochon et al., 1997), and fibre size (He, 2004; Langenbach et al., 2003).
Such structural and biological changes are believed to alter the tetanic tension within
the masticatory muscles, which can often lead to marked disturbances in the
development of the craniofacial complex (Kiliaridis and Shyu, 1988). One important
! 19
question, however, is whether one can extrapolate the findings from these animal
studies to humans.
Human investigations have generally yielded somewhat inconsistent findings in both
child and adult populations. Some studies have reported lower masticatory muscle
activity and maximal bite force in long face individuals (Abu Alhaija et al., 2010; García-Morales et al., 2003; Ingervall and Thilander, 1974; Ingervall and Helkimo, 1978; Serrao et
al., 2002; Tecco et al., 2007), while others have failed to demonstrate any significant
differences (Kiliaridis et al., 1993; Proffit and Fields, 1983; Vianna-Lara et al., 2009). The
cross-sectional area of the masticatory muscles has also been investigated in long face
individuals, and found to be approximately 30% smaller than in normal face adults (Van
Spronsen et al., 1992). In a similar study, however, Van Spronsen and colleagues (1996)
used MRI to investigate the orientation and moment arms of six masticatory muscles in
long- and normal-face adults, and found very similar force vectors and moment arms in
both groups.
In truth, the current state of evidence prevents one from differentiating what is cause
and what is effect. It is plausible that failure to gain jaw elevator strength may be the
consequence rather than the cause of the long face morphology (Proffit and Fields,
1983; Van Spronsen, 2010). The reduced size and intrinsic strength of the masticatory
muscles in long face individuals may, therefore, be due to disuse dystrophy, which
occurs during the skeletal development of these individuals (Van Spronsen, 2010).
Individuals with skeletal open-bites, for instance, have limited tooth contacts that may
result in lower jaw muscle strength (Bakke et al., 1992). In support of this theory, several
studies have found that the size of the masticatory muscles contributed more to the
variation in bite force than the underlying craniofacial morphology (Bakke et al., 1992;
Castelo et al., 2010; Raadsheer et al., 1999; Tuxen et al., 1999).
The effect of nasal obstruction on vertical craniofacial development is another
controversial subject. Enlarged adenoids and a narrow nasopharynx are common causes
of nasal obstruction that can prompt an individual to become a mouth breather (Linder-
Aronson, 1970). Many mouth-breathing children exhibit a lower tongue position in

! 20
order to maintain a vital pharyngeal airway (Koski and Lähdemäki, 1975), which is
believed to result in an imbalance in the muscular forces of the face (Subtelny, 1954).
Theoretically, the downward and forward tongue position needed for oral respiration
may also displace the mandible inferiorly and lead to an increase in vertical dimension
(Harvold et al., 1973; Harvold et al., 1981; Ricketts, 1968). The long face morphology of
mouth breathing children may also result from the effects of soft tissue stretching that
commonly occur when these individuals overextend their heads to compensate for
impaired nasal respiration (Solow and Kreiborg, 1977).
On the other hand, mouth breathing may be the effect rather than the cause of the
underlying skeletal pattern (Brash et al., 1929). In support of this theory, several authors
have found that long face individuals have a narrower nasopharynx than other facial
types (de Freitas et al., 2006; Memon et al., 2012; Woodside and Linder-Aronson, 1979). In
fact, both anterior and posterior facial heights appear to be positively correlated with all
the volumetric measurements of the airway, with the exception of the middle
pharyngeal third (Kim et al., 2010). A recent three-dimensional evaluation of the
pharyngeal airway failed to detect any volumetric difference between short, normal and
long face individuals however (Grauer et al., 2009).
Oral habits are another group of environmental factors that may interfere with normal
craniofacial development (Peres et al., 2007). Adverse oral habits can be broadly
classified into several categories including neuroses (e.g. infantile swallow and nail
biting), professional habits (e.g. reed use by musicians), and occasional habits (Josell,
1995). The latter group consists of a wide range of parafunctional habits, such as digit
and pacifier sucking, bottle-feeding, and bruxism. Oral habits may also include daytime
or nocturnal activities such as low-level clenching and swallowing (Farella et al., 2005).
Parafunctional habits are a particularly important risk factor for malocclusions because of
their frequent occurrence in young children (Bishara et al., 2006; Bosnjak et al., 2002; Dos
Santos et al., 2012).
Some oral habits, such as digit sucking, have been associated with the classical traits of
the long face morphology. Non-nutritive sucking in the first few years of life is

! 21
consistently associated with vertical malocclusions such as an anterior open bite
(Heimer et al., 2008; Katz et al., 2004; Peres et al., 2007). These non-nutritive sucking
habits are often not limited to the vertical plane, but may also affect the transversal
dimension, where they manifest as posterior cross-bites (Cozza et al., 2007; Melink et al.,
2010). The adverse effect of non-nutritive sucking is usually related to the duration of the
habit, with children using pacifiers between 12 months and 4 years being approximately
3.6 times more likely to develop an anterior open-bite than those who do not use these
devices (Peres et al., 2007). Moreover, it has been shown that most of these open-bites
persist into old age unless the habit is stopped (Bowden, 1966).
Without the use of serial cephalograms, however, it is difficult to understand the effects
of nonnutritive sucking habits on vertical craniofacial development. Interestingly, one
longitudinal study that evaluated serial cephalograms found a significantly greater
proportion of skeletal class II bases in children with persistent digit sucking habits
(Bowden, 1966). In that study, however, cephalometric landmarks (points A and B)
sensitive to dentoalveolar changes were used to record the relationship of the skeletal
bases and may, therefore, not be entirely representative of changes in the underlying
skeletal pattern. More recently, Thomaz and colleagues used anthropometric points to
describe facial morphology, and found a high prevalence of severe facial convexity in
adolescents who had been breastfed for relatively short periods and exhibited
prolonged mouth-breathing habits that persisted until after the age of 6 years (Thomaz
et al., 2012). Thus, it is possible that prolonged non-nutritive habits may have a profound
effect on vertical facial development.
In summary, there are a number of environmental factors that are associated with some
of the clinical features that are often seen in individuals with the long face morphology.
Many of these features develop at a very young age, however, and it is often difficult to
determine causality. Another important factor that also contributes to craniofacial
development is an individual’s underlying genetic predisposition.

! 22
1.6.3 Genetic Factors
Most human traits are the result of a complex interaction between genetic and
environmental factors, although the relative contribution of these two components may
differ for different conditions. The heritability of a trait is often investigated in twin
studies by determining the heritability estimate or concordance rate for a trait.
Heritability estimates (h2) typically represent the proportion of the total phenotypic
variation in a given sample that is contributed by genetic variation (Goodenough, 1984).
A heritability estimate can therefore be regarded as a ratio of genetic variation that
ranges from 1 (complete genetic control) to zero (complete environmental control)
(Harris, 2008). It is noteworthy, however, that heritability estimates can occasionally
exceed these theoretical thresholds if they include dominant gene effects and acquired
environmental effects (Harris and Johnson, 1991). Heritability estimates have been
widely used in twin studies to investigate the heritability of both dentoalveolar and
skeletal features.
A general view is that most skeletal traits are under moderately strong genetic influence,
whereas occlusal variation is largely acquired (Amini and Borzabadi-Farahani, 2009;
Harris and Johnson, 1991; Johannsdottir et al., 2005; King et al., 1993). In a longitudinal
study of 30 sibships, Harris and Johnston (1991) found considerably higher heritability
estimates for craniofacial traits than for occlusal traits. The median heritability estimates
for occlusal traits were 0.5 at age 4, 0.2 at age 14, and 0.1 at age 20. In contrast, the
heritability of craniofacial traits increased steadily from 0.6 at age 4 to 0.9 at age 14, with
no substantial change thereafter. These findings suggest that the heritability of
craniofacial and occlusal variables begin to diverge during the transition from the
deciduous to the permanent dentition.
The heritability of skeletal structures is not homogenous, with vertical traits reportedly
under stronger genetic influence than sagittal ones. Hunter (1965) investigated the
heritability of cephalometric traits in 37 monozygotic and 35 diazygotic twins, and
found that 11 of the 12 vertical measures had significant genetic dependence. These

! 23
findings support the notion that the strongest genetic influence is exerted on
measurements made parallel to the long axis of the body (Osborne and De George,
1959). Indeed, several studies have also found evidence of higher heritability among
vertical traits (Amini and Borzabadi-Farahani, 2009; Carels et al., 2001; Manfredi et al.,
1997; Peng et al., 2005), although others have either found no difference (Harris and
Johnson, 1991; Lundström and McWilliam, 1987; Lundström and McWilliam, 1988;
Savoye et al., 1998), or greater heritability among sagittal features (Jelenkovic et al.,
2008).
Different heritability estimates have also been reported for various vertical dimensions of
the face. For instance, the heritability of total face height is reported to range from 0.8
to 1.3 (Amini and Borzabadi-Farahani, 2009; Harris and Johnson, 1991; King et al., 1993;
Lundström and McWilliam, 1987; Manfredi et al., 1997; Nakata et al., 1974), while that of
the lower anterior face is between 0.9 and 1.6 (Amini and Borzabadi-Farahani, 2009;
Lundström and McWilliam, 1987; Manfredi et al., 1997). In contrast, the heritability of the
posterior and upper anterior face height ranges from 0.2 to 0.9 and 0.2 to 0.7,
respectively (Amini and Borzabadi-Farahani, 2009; Carels et al., 2001; Harris and Johnson,
1991; King et al., 1993; Lundström and McWilliam, 1987; Nakata et al., 1974).
It is noteworthy, however, that heritability studies have a number of limitations that may
account for some of the inconsistent findings reported in the literature (Harris, 2008).
Heritability estimates are relevant to only a specific sample at a specific point in time
(Harris, 2008). Since these estimates are typically derived under different environmental
conditions, it is difficult to generalise the findings from one sample to another, or even
within the same sample over a substantial period of time (Harris, 2008). Nonetheless,
heritability estimates are useful indicators of genetic influence as long as these
limitations are kept in mind when evaluating the literature.
That facial development is under some genetic control is not surprising, given the high
degree of similarity that is often seen between family members. Accordingly, more
attention has recently been directed at identifying the specific genes that are involved
in regulating this process. Several genetic studies have reported significant associations
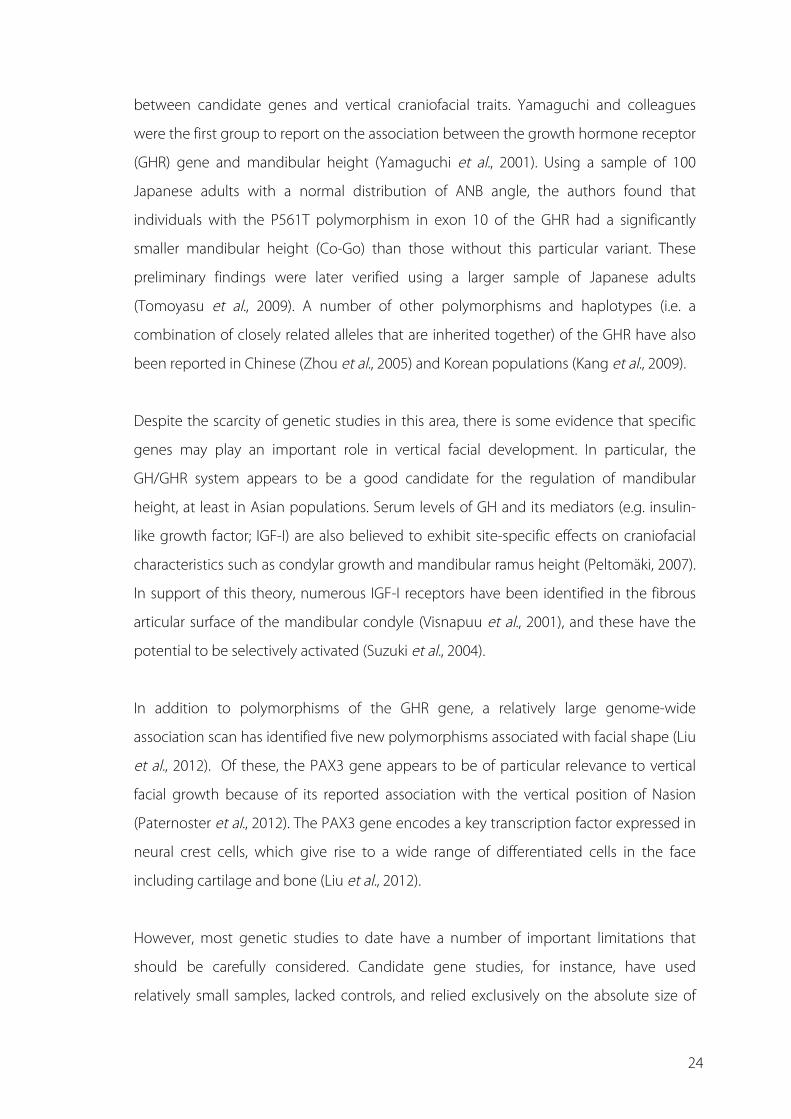
! 24
between candidate genes and vertical craniofacial traits. Yamaguchi and colleagues
were the first group to report on the association between the growth hormone receptor
(GHR) gene and mandibular height (Yamaguchi et al., 2001). Using a sample of 100
Japanese adults with a normal distribution of ANB angle, the authors found that
individuals with the P561T polymorphism in exon 10 of the GHR had a significantly
smaller mandibular height (Co-Go) than those without this particular variant. These
preliminary findings were later verified using a larger sample of Japanese adults
(Tomoyasu et al., 2009). A number of other polymorphisms and haplotypes (i.e. a
combination of closely related alleles that are inherited together) of the GHR have also
been reported in Chinese (Zhou et al., 2005) and Korean populations (Kang et al., 2009).
Despite the scarcity of genetic studies in this area, there is some evidence that specific
genes may play an important role in vertical facial development. In particular, the
GH/GHR system appears to be a good candidate for the regulation of mandibular
height, at least in Asian populations. Serum levels of GH and its mediators (e.g. insulin-
like growth factor; IGF-I) are also believed to exhibit site-specific effects on craniofacial
characteristics such as condylar growth and mandibular ramus height (Peltomäki, 2007).
In support of this theory, numerous IGF-I receptors have been identified in the fibrous
articular surface of the mandibular condyle (Visnapuu et al., 2001), and these have the
potential to be selectively activated (Suzuki et al., 2004).
In addition to polymorphisms of the GHR gene, a relatively large genome-wide
association scan has identified five new polymorphisms associated with facial shape (Liu
et al., 2012). Of these, the PAX3 gene appears to be of particular relevance to vertical
facial growth because of its reported association with the vertical position of Nasion
(Paternoster et al., 2012). The PAX3 gene encodes a key transcription factor expressed in
neural crest cells, which give rise to a wide range of differentiated cells in the face
including cartilage and bone (Liu et al., 2012).
However, most genetic studies to date have a number of important limitations that
should be carefully considered. Candidate gene studies, for instance, have used
relatively small samples, lacked controls, and relied exclusively on the absolute size of

! 25
the mandibular ramus as the sole indicator of vertical morphology. The external validity
of these studies is also limited because data were mainly collected from Asian
populations, which usually have different allelic frequencies and may have different
etiologies from their Caucasian counterparts. Moreover, the limited size of the samples
has also restricted the power of these studies to investigate the gene-environment
interactions that are likely to play an important role in vertical facial development.
The lower heritability of posterior facial height and its surrogates (e.g. ramus height) are
believed to be due to the effects of environmental factors. As mentioned previously,
masticatory function is commonly believed to play an important role in the dimensions
of the posterior face, with higher levels of activity being associated with less vertical
development (see previous section on muscle function). It is possible that the type and
consistency of diets within families may explain the high cultural effect often reported
for some posterior facial dimensions (Lundström and McWilliam, 1987). Similarly, upper
facial height may be strongly influenced by environmental factors such as breathing
mode, which is reported to affect vertical facial development (Linder-Aronson, 1970).
Interestingly, airway-related properties (such as the size of the pharyngeal space and the
thickness of the posterior nasopharyngeal wall) are also reported to be under strong
genetic influence (Billing et al., 1988).
In summary, vertical craniofacial traits appear to be under the influence of multiple
genes with minor effects, along with environmental factors (Carels et al., 2001; Savoye et
al., 1998). There is a need to identify the key genes involved in craniofacial development
using large-scale studies that employ well-defined measures of vertical facial form,
include valid controls, and are carried out in a wide range of populations.
1.7 Psychosocial and Functional Impact
The final section of this chapter will focus on the psychosocial and functional impact of
the long face morphology and its associated clinical features. Oral health-related quality
of life (OHRQoL) measures are often used to evaluate the impact of malocclusions on an
individual’s health and well being because they incorporate a wide array of domains,

! 26
including functional (e.g. mastication and speech), psychological (e.g. appearance and
self-esteem), social (e.g. communication and social interactions), and pain (Mehta and
Kaur, 2011). Although only a handful of studies have investigated OHRQoL in individuals
with long faces and anterior open-bites, there is some evidence that severe
malocclusions may have an adverse impact on quality of life, at least in the short term.
Foster Page and colleagues investigated the impact of malocclusions on OHRQoL in 430
adolescents aged 12 to 13 years, and found a distinct gradient in mean child
perceptions questionnaire score across categories of malocclusion severity (Foster Page
et al., 2005). Significant differences were found in the emotional and social well-being
domains, whereas no detectable differences were noted for the oral symptoms and
functional limitations sub-scales. Several other studies have also found similar findings in
different populations and age groups (Kok et al., 2004; Martins-Junior et al., 2012; O'Brien
et al., 2007; O'Brien et al., 2006). These studies suggest that malocclusions are more likely
to have a psychosocial impact on quality of life rather than a functional one (O'Brien et
al., 2007).
Individuals with the long face morphology may exhibit distinctive functional and
aesthetic manifestations, however. Several studies have investigated the effects of
different vertical facial proportions on the perceived attractiveness of the face. Johnston
and coworkers (Johnston et al., 2005) used social science students to rate the
attractiveness of 10 images with different proportions of lower anterior face height
(LAFH/TAFH), and found that images with greater lower anterior face height were rated
as the least attractive and the most in need of orthodontic treatment. Other authors
have also found individuals with long faces as being less attractive than those with
shorter face patterns (De Smit and Dermaut, 1984; Michiels and Sather, 1994).
Functionally, some individuals with the long face morphology may also have marked
anterior open-bites that lead to eating difficulties (Rusanen et al., 2010), and a higher
prevalence of OHRQoL impacts (Sardenberg et al., 2013). Moreover, these individuals
may also suffer from poorer masticatory performance and muscular fatigue (Gomes et
al., 2010).

! 27
In summary, the type and severity of malocclusions appears to be associated with oral
health-related quality of life. Long face individuals frequently have less attractive profiles
and anterior open-bites, which can affect aesthetics and function. It is plausible that the
aesthetic features and functional limitations of the long face morphology may have a
greater effect on an individual’s general well-being and quality of life.
1.8 Summary
The long face morphology is a relatively common presentation among orthodontic
patient populations, and is associated with a number of classical features that include a
greater lower facial height, anterior open-bite and a narrow palate. While excessive
vertical facial growth can often be recognised clinically, several cephalometric traits
(measures) are commonly used to classify the underlying vertical skeletal pattern as
normal (normodivergent), short (hypodivergent), or long (hyperdivergent). The
cephalometric features of the hyperdivergent profile typically include a greater total
facial height, and lower anterior facial height, gonial angle, and mandibular plane angle.
Both genetic and environmental factors have been associated with the aetiology of
excessive vertical facial development, although it is likely that more than one subtype of
the phenotype exists. Finally, the clinical features of the long face morphology are likely
to have some effect on the function and psychosocial wellbeing of an individual.

! 28
1.9 Study Hypotheses
It was hypothesised that long face individuals have distinctive craniofacial features, and
a higher prevalence of habitual masticatory muscle activity and oral habits. Moreover, it
was expected that long face individuals would have a reduced oral health-related
quality of life and greater functional impairments.
1.10 Study Objectives
The aims of the present study were the evaluation of: (1) the cephalometric
characteristics of normal and long face individuals (with and without anterior open-
bites); (2) the oral behaviour patterns (i.e. environmental factors) of normal and long face
individuals; (3) and, the oral health-related quality of life/functional limitations in normal
and long face individuals. A longer-term objective was to establish a craniofacial genetic
database that could be used in the future to investigate the association between vertical
facial patterns and selected candidate genes.
!

! 29
2 Core Methods and Materials
Research Approach
Sample Selection
Data Collection
Statistical Analysis
Ma ori Consultation and Ethics
Funding

! 30
2.1 Research Approach
A pairwise matched case-control study design was used to investigate environmental
factors and quality of life differences between long- (cases) and normal-face (controls)
individuals. This study design was also well suited for identifying genetic factors
(polymorphisms) underlying vertical craniofacial form (long-term objective).
2.2 Overview of Study Design
Eligible cases were identified from their pre-treatment cephalograms and invited to
participate in the study. Following the enrolment of a case, a matched control was
recruited from the same source population as the case. Data were collected by means of
a web-based database. An overview of the study design is presented in Figure 2.1.
!Figure 2.1!Flow-chart of the matched case-control study design!
Assessment of Pre-treatment Cephalograms
Identification of Potential Cases
Willingness to participate/informed consent & eligible?
Yes
Enrolment of Cases
Data Collection
Willingness to participate/informed consent & eligible?
Yes
Recruitment of Controls Matched for Age, Gender, Ethnicity,
and Treatment Stage

! 31
2.3 Sample Selection
2.3.1 Study Participants
Participants were recruited from previous and existing pools of patients treated at the
orthodontic clinic of the University of Otago (Dunedin, New Zealand). Eligible patients
were offered a free movie voucher as an incentive for participating in the study.
2.3.2 Eligibility Criteria
Inclusion criteria for cases and controls were: willingness to participate; provision of
informed consent; and, a good-quality pre-treatment cephalogram to assess cases and
controls (for more details on case/control selection, please refer to the next few
sections).
The same exclusion criteria applied to both cases and controls, and included: greater
than four missing permanent teeth (excluding third molars); inflammatory or
degenerative diseases of the temporomandibular joint (including pain); cleft lip and/or
palate; craniofacial syndromes; and history of facial fractures. On-going or previous
orthodontic treatment did not preclude participation in this study.
2.3.3 Sample Size and Study Power
Since the long-term plan of the study was to investigate the role of genetic factors in
vertical craniofacial growth, sample size was determined based on the power needed to
detect an association between the long face morphology and genes with moderate
effects. It was estimated that, with a minor allele frequency of 0.35, Type I error set at 5%,
and allocating 150 participants to each case/control group, the study would have 100%
power to detect an OR of 3; and 68% for an OR of 1.5. It was expected that
approximately 100 case-control pairs would be required for investigating the present
study’s objectives (environmental and psychosocial factors).

! 32
2.3.4 Classification and Recruitment of Cases
Pre-treatment lateral cephalograms were used to assess and classify the underlying
facial skeleton. One investigator (JA) assessed all the pre-treatment cephalograms stored
in the archives of the orthodontic clinic (approximately 1,200 cephalograms). The
University’s archives consisted predominantly of patients in active treatment and
retention phase (i.e. treated in the past 3 to 5 years). In addition, a small group of
patients were either awaiting treatment or had previously declined treatment.
Each headfilm was assessed using two cephalometric measurements that are
commonly employed for evaluating vertical facial form (Schendel et al., 1976): (1) the
mandibular plane to cranial base angle (S-N^Go-Me), and; (2) the ratio of posterior facial
height to total facial height (S-Go/N-Me, or the Jarabak Ratio). A diagrammatic
representation of these measurements is presented in Figure 2.2.
!Figure 2.2. Diagrammatic representation of the cephalometric measurements used to classify vertical facial pattern. A, mandibular plane to cranial base angle (S-N^Go-Me). B, ratio of posterior facial height to anterior facial height (S-Go/N-Me or Jarabak Ratio)
A B
S
N
S
N
Go
Me
Go
Me

! 33
Cephalograms of potential cases were selected from the orthodontic clinic’s archives if
the SN-MP angle was more than two standard deviations from the norm (>42 degrees),
and/or if the Jarabak ratio was less than 59%. These cut-off values used to define the
study groups were age-independent, similar for both sexes, and commonly used in
Caucasian populations (Bell et al., 1980; Riedel, 1952; Siriwat and Jarabak, 1985). Selected
cases were contacted initially by post and invited to participate in the study. Each
participant was then contacted by phone and an appointment was arranged if the
individual was willing to participate in the study. An information sheet outlining the
purpose and details of the study was provided to each participant at this one-off
appointment, and enrolment commenced if the participant/parents provided informed
consent.
2.3.5 Matching and Recruitment of Controls
Controls were identified from the same source as the cases and matched on sex,
ethnicity, age (± 1 year), and treatment stage (before treatment, <12 months treatment,
>12 months treatment, or after treatment). Pre-treatment cephalograms were again
used to assess and classify the underlying facial skeleton of suitable controls (see
previous section). Controls were deemed to have a normal facial type if the SN-MP angle
was within one standard deviation of the norm (>27 and <37), and/or the Jarabak ratio
was between 59 and 63%. Matched controls were enrolled in the study in a similar
manner to cases.
2.4 Data Collection
A wide range of data were collected for each study participant, including socio-
demographic details, cephalometric measurements, environmental and quality of life
questionnaires. In addition, DNA was collected by means of a blood or saliva sample for
future genetic analyses. In order to facilitate data collection, a central web-based
database was developed.

! 34
2.4.1 Participant Questionnaires
Socio-demographic data were collected from participants after enrolment in the study.
In addition, participants completed a self-report questionnaire that included items
relating to: (1) ancestry of the grandparents to ensure accurate matching of
case/controls; (2) an Oral Behaviours Checklist to assess non-functional oral habits
(Ohrbach et al., 2004); (3) a Jaw Functional Limitation Scale to assess impact on jaw
mobility and function (Ohrbach et al., 2008b); and (4) a short-form Oral Health Impact
Profile to assess impact on oral health-related quality of life (Slade, 1997). More details on
the nature and content of each questionnaire are provided under the “Methods and
Materials” section of the subsequent chapters (also see Appendix 7.1 for study
questionnaire).
The self-report questionnaire was completed during the one-off appointment.
Participants were instructed to complete the questionnaire based on their experiences
over the previous four weeks. No time limit was placed on completing it, and, if
clarification was needed about the definition or wording of an item, the investigator (JA)
provided some assistance but did not attempt to influence the participant’s responses.
2.4.2 Cephalometric Data
Pre-treatment lateral cephalograms were collected and then digitally scanned at a high
quality resolution using a professional-grade Epson Perfection V700 Photo scanner
(Epson, Japan). Radiographs were scanned at 300 DPI in an 8-bit grayscale format, with a
maximum size of 10x8 inches. Each radiograph was then digitally optimised using the
high definition-rendering feature of Adobe Photoshop (CS6, Adobe Systems Inc, San
Jose, CA, USA). This step was carried out in order to improve the visibility of the
radiographs and facilitate the localisation of anatomical landmarks (Figure 2.3).

! 35
!Figure 2.3. Optimisation of lateral cephalograms using the High Definition-Rendering feature of Photoshop. A, Non-optimised radiograph. B, Digitally optimised and enhanced radiograph; Note greater visibility of key landmarks such as Nasion and Point B (arrows)
2.4.3 Assessor Calibration
Prior to the digitisation of the cephalograms, the investigator (JA) underwent standard
calibration using a set of unrelated radiographs. This process involved familiarisation
with the definitions of the cephalometric landmarks used in the study (see Appendix 7.2
for a complete list of landmark descriptions). Calibration was carried out only once since
all of the study’s cephalograms were digitised over a short period (a few weeks).
2.4.4 Digitisation of Lateral Cephalograms
The digitised cephalograms of study participants were traced in alphabetical order using
Dolphin Imaging software (version 11.5, Dolphin Imaging Systems, Chatsworth, CA,
USA). Prior to digitisation, the demographic details of participants were masked on the
cephalograms in order to minimise the chances of the assessor identifying cases and
controls. Complete blinding was not possible, however, since the assessor could still
identify long face individuals based on their skeletal pattern. One assessor (JA) traced all
of the cephalograms in a dark room using the same high definition 27-inch computer
screen. An average outline of the right and left cephalometric structures was traced (if
present). Thirty linear and angular measurements were determined for each
A B

! 36
cephalogram (Figure 2.4). In order to minimise assessor fatigue, a few minutes of rest
were provided between tracings, and no more than 10 cephalograms were digitised per
day.
!Figure 2.4. Cephalometric landmarks and measurements used in the study. A, Line tracing illustrating the cephalometric landmarks used for the digitisation of the cephalograms. B, Summary of the linear and angular measurements
Overall, some 156 cephalograms were digitised and traced using Dolphin imaging
software. The hardcopy cephalograms of four participants from the control group were
unavailable at the time of digitisation and were, therefore, excluded from this part of the
study (handheld photographs of cephalograms were not considered of sufficient quality
to be included).
2.4.5 Method Error
The errors of the method were calculated from 20 randomly selected participants, with
ten chosen from each study group. A set of 11 measurements (SNA, SNB, ANB, SNMP,
MMPA, ANS-Me, N-Me, S-Go, Ar-Go, L1-MP, U1-PP) were re-assessed by the same
examiner (JA) after a memory washout period of at least twelve weeks. The method
A B
S
N
Go
Me
Ba
Co Or
ANS Ar
A
B
Pg
Pt
Cephalometric-Measurements-
SNA (deg) Na-Me (mm)
SNB (deg) Na-ANS (mm)
ANB (deg) ANS-Me (mm)
SNMP (deg) Na-ANS/Na-Me (%)
MMPA (deg) ANS-Me/Na-Me (%)
Y-Axis (deg) S-Go (mm)
Ar-Go-Me (deg) S-Go/Na-Me (%)
Ar-Go (mm) Ar-Go/S-Go (%)
Co-Go (mm) Overjet (mm)
S-N (mm) Overbite (mm)
ANS-PNS (mm) L1-MP (mm)
Go-Me (mm) U1-PP (mm)
Go-Gn (mm) L6-MP (mm)
Co-A point (mm) U6-PP (mm)
U6
L6 L1
U1

! 37
error for the ten measurements was calculated using Dahlberg’s formula (Dahlberg,
1940), which has been suggested as the best available method for assessing
cephalometric error (Battagel, 1993).
2.5 Data Storage and Online Database
A web-based database was developed in order to facilitate the matching procedure
between cases and controls, and to improve the efficiency of data storage and
management (www.longface.ac.nz).
2.5.1 Development Process
The website was developed using a free source code editor (version 6.1, Notepad++).
The front-end pages of the website were written in php language, while the back-end
processing was developed using a combination of php and SQL languages. All collected
data were stored in a free SQL database (MySQL). A computer science student assisted
with the development of the website.
2.5.2 Security Protocols
Different levels of security were implemented to permit various degrees of access to the
database. For example, participants were permitted to complete only the online study
questionnaires, while orthodontic providers were allowed to add/view/modify the
records of participants they had enrolled. The two sections of the website (participant
and orthodontist areas) were protected by unique usernames/passwords. Access to the
full contents of the SQL database was restricted through the web host’s security
protocols, with only the administrator (JA) having the required privileges to access these
data. Moreover, standard security measures were implemented to protect against the
insertion of rogue coding into the study’s online forms and questionnaires.

! 38
2.5.3 Layout and Features
The website consisted of two main areas: an orthodontist section (for
providers/researchers/administrators), and a participant section (for cases/controls).
Additional webpages were developed to publish general information about the
research project (under “About Us”), provide direct links to study forms such as
participant questionnaires and information packages (under “Resources”), and a contact
form with a direct email link to the study investigators (under “Contact Us”).
The participant section was accessible using a unique username/password that was
automatically generated once a patient was enrolled in the study. The username and
password were always in the form of the participant’s first name and surname,
respectively. Participants were given the option of completing the study questionnaire
either directly using the web-based database or via a paper-based questionnaire. The
website administrator (JA) subsequently entered the data from paper-based
questionnaires into the online database.
The online system automatically scanned each part of the questionnaire to ensure that
no items were left unanswered before proceeding to the next part of the form.
Responses to the questionnaires were stored as numerical values in the online database
and exported into an Excel spreadsheet using the administrator’s management tools.
The online questionnaire was also optimised for tablet use in order to improve the
efficiency of future data collection. A few screenshots of the main website and the
participant section are presented in Figures 2.5 and 2.6, respectively.

! 39
!Figure! 2.5.! The homepage of the website allowed easy access to the different parts of the website, including the participant and orthodontist sections
!
A

! 40
!Figure 2.6. Study participant interface of the online database. A and B, Example of the study questionnaire (OHIP-14 and JFLS-8) that was available for participants to complete online. The layout was designed to mimic the paper-based version of the questionnaire
The orthodontist section was designed to provide orthodontic providers with the
ability to enrol participants and submit clinical/radiographic data. Orthodontic providers
who expressed an interest in recruiting study participants were assigned a confidential
username and password (e.g. orthodontic postgraduate students). Providers were
allowed to submit new cases, view existing cases, and submit matched controls (Figure
2.7). Before enrolling a control, the system carried out a simple eligibility check to ensure
that the control: (1) was appropriately matched to the case (for
age/sex/ethnicity/treatment stage); and, (2) met the eligibility and cephalometric criteria
of a normal facial type (Figure 2.8). After the enrolment of participants, providers were
able to enter clinical and cephalometric data.
The study administrator had access to a complete overview of each participant’s status
within the study (Figure 2.9). For instance, the administrator could check for unmatched
cases, incomplete questionnaires, and delete participant names from the database once
B

! 41
all of the data had been collected (i.e. for security against personal identification). In
addition, the administrator was able to download an up-to-date copy of the
cephalometric and questionnaire data (i.e. SQL database) in the form of a Microsoft Excel
spread sheet.
!Figure 2.7. Provider interface of the online database. A, Initiation of the enrolment process of a new case. B, Summary of unmatched cases awaiting suitable controls. C, A color-coded overview of all submitted participants, where matched cases/controls are displayed in green, while unmatched cases are displayed in red
A
A
B
C

! 42
!Figure 2.8. Eligibility check for submitted controls to ensure appropriate pairwise matching (similar process for cases)
!Figure 2.9. Administrator interface showing the database’s overview feature and management tools

! 43
2.6 Statistical Analysis
Data were firstly analysed using conventional descriptive methods. The normality and
variance homogeneity of continuous variables were explored using Kolmogorov-
Smirnov Z and Levene Statistic tests, respectively (see Appendix 7.3 for the results of
these tests). Outliers in the data were also investigated using descriptive procedures.
Bivariate analysis was carried out using the Chi-square test, Fisher’s Exact test and One-
Way ANOVA as appropriate. Non-parametric tests (such as Kruskal Wallis and Mann-
Whitney U) were used whenever a continuous dependent variable was not normally
distributed. Data were analysed using the Statistical Package for the Social Sciences (ver
19.0; SPSS Inc, Chicago ILL), and STATA (ver 10.1; Stata Corp LP, College Station, Texas).
2.7 Ma ori Consultation and Ethics
Consultation with the Ngai Tahu Research Consultative Committee was carried out in
May 2011. The committee suggested recording self-reported ethnicity data, which was
eventually collected (See Appendix 7.4 for a copy of the Maori consultation letter).
The study was approved by the University of Otago’s Human Ethics Committee in June
2011 (11/196). Written and informed consent were collected from all study participants.
In addition, parental consent was obtained for study participants under the age of 17
years (See Appendix 7.5 for a copy of the ethics approval; Appendix 7.6 for participants’
information sheet; and, Appendix 7.7 for participant/parental consent forms).
2.8 Funding
The present study was supported by grants received from the New Zealand Dental
Research Foundation in 2011 and 2012, and the Education and Research Development
Group (ERDG)/ Foundation of Orthodontic Research and Education of the New Zealand
Association of Orthodontists Trust (FORENZAO) in 2012.

! 44
3 Cephalometric Features
Introduction
Materials and Methods
Results
Discussion
Conclusions

! 45
Introduction 3.1
Orthodontists have traditionally been concerned with the sagittal growth of the jaws,
although excessive vertical growth may also have important implications for treatment
mechanics and facial aesthetics. Indiscriminate use of intermaxillary elastics in non-
growing hyperdivergent patients, for instance, can exacerbate the vertical growth
pattern and rotate the mandible further posteriorly (Cangialosi, 1984; Creekmore, 1967;
Isaacson et al., 1971). Since the classification of extreme vertical craniofacial growth
seems desirable from a clinical point of view, several classification methods have been
proposed, including overbite extent (Beckmann et al., 1998; Cangialosi, 1984; Ceylan and
Eroz, 2001), cephalometric measurements (Ferrario et al., 1999; Isaacson et al., 1971;
Siriwat and Jarabak, 1985), morphological signs (Aki et al., 1994; Björk, 1969; Skieller et al.,
1984), visual observation (Fields et al., 1984; Opdebeeck et al., 1978; Silva Filho et al.,
2010), and mathematical models (Hammond et al., 2001). Unfortunately, the majority of
the commonly used cephalometric variables are poorly correlated and therefore do not
measure the same phenotypical attribute of vertical facial growth (Dung and Smith,
1988).
There are a number of distinctive differences in the skeletal morphology of
hyperdivergent, normodivergent and hyperdivergent individuals. The mandible of
hyperdivergent children is considerably smaller in size than the other two facial types,
with most of the differences occurring at the posterior ramus, gonial angle, alveolar
process, sigmoid notch, coronoid process and mandibular plane (Ferrario et al., 1999).
The cross-sectional areas of the alveolar processes, for example, are significantly smaller
in open-bite individuals (Beckmann et al., 1998), while the mandibular symphysis is often
higher and narrower (Ceylan and Eroz, 2001). In fact, morphological variation is often
evident within the same facial type, with some hyperdiverent individuals having a
distinctively long posterior facial height, while others have a considerably shorter
mandibular ramus (Opdebeeck et al., 1978).

! 46
The non-homogenous nature of the hyperdivergent morphology is not surprising,
however, with previous studies reporting conflicting data on the cephalometric features
of long face individuals. Although total and lower anterior facial height are commonly
greater in long face patients (Fields et al., 1984; Isaacson et al., 1971; Nahoum, 1971;
Nahoum et al., 1972; Nanda, 1988; Nanda, 1990; Subtelny and Sakuda, 1964), there is
marked variation in some of the other vertical attributes, such as upper and posterior
facial heights. Variation in the height of the mid-face is found in long face individuals,
and it may be either short (Nahoum, 1971) or within normal limits (Fields et al., 1984;
Nahoum, 1971; Schendel et al., 1976; Subtelny and Sakuda, 1964). Similarly, posterior
facial height may be either short (Cangialosi, 1984; Nahoum et al., 1972; Schendel et al.,
1976) or within normal limits (Nanda, 1988).
Dentoalveolar development is also highly variable in long face individuals, with studies
reporting greater dentoalveolar heights both anteriorly (Subtelny and Sakuda, 1964),
and posteriorly (Isaacson et al., 1971; Janson et al., 1994). On the other hand, some long
face individuals may often present with normal (Nahoum et al., 1972; Subtelny and
Sakuda, 1964), or even shorter dentoalveolar heights (Betzenberger et al., 1999; Isaacson
et al., 1971; Martina et al., 2005). Martina and colleagues (2005) evaluated the pre-
treatment cephalograms of 82 young adults and found that dentoalveolar heights were
positively influenced by lower anterior facial height, but negatively influenced by the
degree of jaw divergence. In other words, different cephalometric variables were
associated with different dentoalveolar features. Similar findings have also been
reported from child populations, which indicates that this relationship is often present
before vertical development ceases (Martina et al., 2009).
It is clear from previous studies that several forms of the long face morphology exist, and
that these are probably related to the wide range of environmental and genetic
influences on craniofacial growth. Aetiological factors such as enlarged adenoids (Harari
et al., 2010; Linder-Aronson, 1970), nasal allergies (Bresolin et al., 1983), weak masticatory
muscles (Abu Alhaija et al., 2010; Bakke et al., 1992; Tecco et al., 2007), oral habits (Cozza
et al., 2005), and genetic factors (Hartsfield, 2002) have all been implicated in the
development of the long face morphology. Unfortunately, previous studies have often

! 47
focused on identifying the cephalometric features of the open-bite variant despite the
fact that not all long face individuals present with these occlusal anomalies (Fields et al.,
1984). It is also noteworthy that a large proportion of these studies have not controlled
for sex- and/or ethnicity-specific differences between long face and control groups,
despite the fact that these demographic factors may play some role in craniofacial
development (Harris et al., 1977; Jones, 1989; Nanda, 1988).
With the notable exception of Field et al. (1984), few studies have investigated
cephalometric predictors of the long face morphology and its associated variants.
Furthermore, there has been no attempt to objectively identify and define the different
sub-phenotypes of the hyperdivergent morphology. Recently, Bui and colleagues (Bui et
al., 2006) identified five distinctive sub-types of the skeletal Class III malocclusions using
cluster and principal component analyses. Interestingly, two of these clusters were
characterised by a long face or high angle pattern (Bui et al., 2006). Clearly, there is a
need to carry out similar analyses in populations with a wide spectrum of vertical traits.
The aims of this chapter were therefore to: (1) investigate cephalometric differences
between long and normal face individuals after controlling for socio-demographic
characteristics; (2) evaluate cephalometric features of open-bite and non-openbite
cases; and (3) identify different variants or sub-phenotypes of the long face morphology.
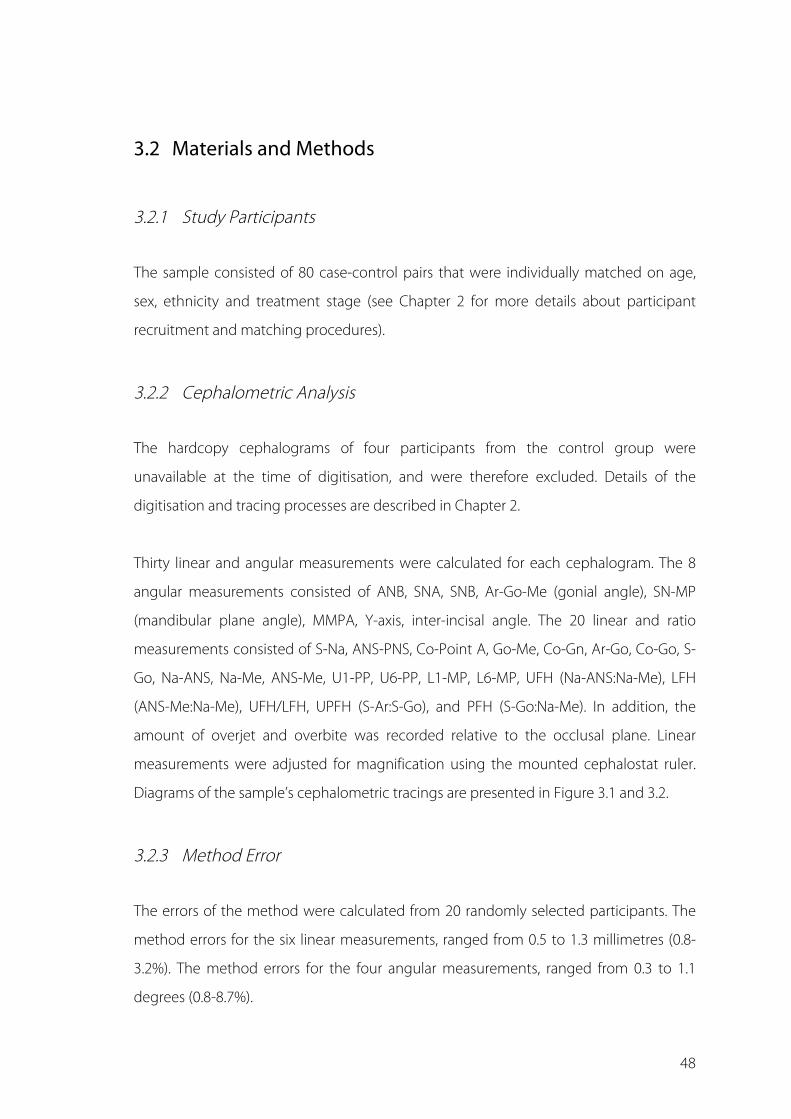
! 48
Materials and Methods 3.2
3.2.1 Study Participants
The sample consisted of 80 case-control pairs that were individually matched on age,
sex, ethnicity and treatment stage (see Chapter 2 for more details about participant
recruitment and matching procedures).
3.2.2 Cephalometric Analysis
The hardcopy cephalograms of four participants from the control group were
unavailable at the time of digitisation, and were therefore excluded. Details of the
digitisation and tracing processes are described in Chapter 2.
Thirty linear and angular measurements were calculated for each cephalogram. The 8
angular measurements consisted of ANB, SNA, SNB, Ar-Go-Me (gonial angle), SN-MP
(mandibular plane angle), MMPA, Y-axis, inter-incisal angle. The 20 linear and ratio
measurements consisted of S-Na, ANS-PNS, Co-Point A, Go-Me, Co-Gn, Ar-Go, Co-Go, S-
Go, Na-ANS, Na-Me, ANS-Me, U1-PP, U6-PP, L1-MP, L6-MP, UFH (Na-ANS:Na-Me), LFH
(ANS-Me:Na-Me), UFH/LFH, UPFH (S-Ar:S-Go), and PFH (S-Go:Na-Me). In addition, the
amount of overjet and overbite was recorded relative to the occlusal plane. Linear
measurements were adjusted for magnification using the mounted cephalostat ruler.
Diagrams of the sample’s cephalometric tracings are presented in Figure 3.1 and 3.2.
3.2.3 Method Error
The errors of the method were calculated from 20 randomly selected participants. The
method errors for the six linear measurements, ranged from 0.5 to 1.3 millimetres (0.8-
3.2%). The method errors for the four angular measurements, ranged from 0.3 to 1.1
degrees (0.8-8.7%).

! 49
!Figure 3.1 Superimposition of each study group’s cephalometric tracings. Overall tracing was superimposed on the anterior cranial base (S-N) and registered at sella; maxillary tracing was superimposed on the maxillary plane (ANS-PNS); mandibular tracing was superimposed on mandibular plane (Go-Me) for A, Controls; and B, Cases. Dolphin imaging software was used to trace the cephalograms of each group (version 11.5, Dolphin Imaging Systems, Chatsworth, CA).
A
B

! 50
!Figure 3.2.! Average cephalometric tracing of each study group (± 1 standard deviation). Overall tracing was superimposed on the anterior cranial base (S-N) and registered at sella; maxillary tracing was superimposed on the maxillary plane (ANS-PNS); mandibular tracing was superimposed on mandibular plane (Go-Me) for A, Controls; and B, Cases. Note the increased mandibular plane angle and variability in the height of the mandible in the cases. Dolphin imaging software was used to trace the cephalograms of each group (version 11.5, Dolphin Imaging Systems, Chatsworth, CA).
!""1"SD"Average"+"1"SD"
A
B

! 51
3.2.4 Statistical Analysis
Data were analysed using the same statistical tests outlined in Chapter 2. In addition,
Pearson’s correlation coefficients were computed for the cephalometric measurements
commonly used to assess vertical facial morphology. Discriminant function analysis was
carried out to determine whether the 28 cephalometric measurements (excluding the
two selection variables) were capable of differentiating between cases and controls.
Multivariate cluster analysis (complete linkage) was also carried out in the long face
group to identify any clinically distinct and meaningful sub-phenotypes.

! 52
Results 3.3
3.3.1 Sociodemographic Characteristics and Treatment Status
There were no significant differences between the study groups for any of the
sociodemographic characteristics (Table 3.1).
Table 3.1!Sociodemographic characteristics by study group
Variable Group Both combined
(n = 160) Cases (n = 80) Controls (n = 80)c
Mean Chronological Age (SD) 17.1 (4.5) 17.3 (4.6) 17.2 (4.6) Mean Cephalometric Age (SD) 13.7 (4.0) 14.0 (4.0) 13.8 (4.1) Sex (%) Male 28 (35.0) 28 (35.0) 56 (35.0) Female 52 (65.0) 52 (65.0) 104 (65.0) Ethnicity (%)a European 73 (91.3) 73 (91.3) 146 (91.3) Maori 2 (2.5) 2 (2.5) 4 (2.5) Polynesians 2 (2.5) 2 (2.5) 4 (2.5) Asian 1 (1.3) 2 (2.5) 3 (1.9) Latin American 1 (1.3) 0 (0.0) 1 (0.6) African 1 (1.3) 1 (1.3) 2 (1.3) Treatment Stage (%)b Before 18 (22.5) 19 (23.8) 37 (23.1) During 25 (31.3) 26 (32.5) 51 (31.9) After 37 (46.3) 35 (43.8) 72 (45.0) aOne Latin American case was matched with an Asian control bTwo case-control pairs were not matched according to treatment stage cFour controls were excluded from the analysis due to missing cephalograms The sample had a mean chronological age of 17.2 years (SD = 4.6), and an average
cephalometric age of 13.8 years (SD = 4.1). The majority of study participants were
female (65.0%), and of New Zealand European origin (91.3%). Approximately one-
quarter of the sample had not received fixed orthodontic appliances, although the
majority had completed treatment (45.0%).

! 53
3.3.2 Cephalometric Features by Study Group
The cephalometric features of long- and normal-face participants are presented in Table
3.2.

! 54
Table 3.2 Mean skeletal cephalometric measurements by study group (SD)
Variable Group Both combined
(n = 156) Difference between means
P-value Cases (n = 80) Controls (n = 76)
Angular measurements (deg) ANB 3.8 (2.7) 3.1 (3.1) 3.5 (3.0) 0.7 0.123 SNA 77.5 (4.0) 81.0 (4.3) 79.2 (4.5) 3.5 0.001 SNB 73.7 (3.8) 77.9 (4.6) 75.7 (4.6) 4.2 0.001 Ar-Go-Me 134.2 (6.2) 126.4 (4.7) 130.4 (6.8) 7.8 0.001 SN-MP 44.7 (4.5) 32.6 (3.7) 38.9 (7.3) 12.1 0.001 MMPA 34.9 (4.0) 25.7 (3.7) 30.4 (6.0) 9.2 0.001 Y-axis 63.2 (5.1) 59.5 (3.7) 61.4 (4.8) 3.7 0.001 Linear measurements (mm) S-Na 64.8 (3.6) 66.3 (4.4) 65.5 (4.1) 1.5 0.023 ANS-PNS 48.2 (3.1) 49.9 (3.6) 49.0 (3.4) 1.7 0.002 Co-Point A 77.2 (4.2) 81.2 (5.7) 79.2 (5.4) 4.0 0.001 Go-Me 65.2 (5.2) 67.0 (5.6) 66.1 (5.5) 1.8 0.048 Co-Gn 103.7 (7.4) 105.7 (7.9) 104.7 (7.7) 2.0 0.101 Ar-Go 38.5 (3.9) 43.6 (4.3) 41.0 (4.9) 5.1 0.001 Co-Go 47.4 (4.2) 52.3 (4.4) 49.8 (4.9) 4.9 0.001 S-Go 65.0 (5.3) 71.8 (5.4) 68.3 (6.3) 6.8 0.001 Na-Me 114.7 (7.3) 109.9 (7.7) 112.4 (7.8) 4.8 0.001 Na–ANS 50.3 (3.7) 48.9 (3.2) 49.7 (3.5) 1.4 0.011 ANS-Me 65.9 (5.3) 62.4 (5.7) 64.2 (5.8) 3.5 0.001 Ratio measurements (%) Na-ANS/Na–Me 43.2 (2.0) 44.0 (2.0) 43.6 (2.0) 0.8 0.012 ANS-Me/Na–Me 56.8 (2.0) 56.0 (2.0) 56.4 (2.0) 0.8 0.010 Na-ANS/ANS–Me 76.8 (7.7) 78.8 (6.2) 77.8 (7.1) 2.0 0.068 Ar-Go/S-Go 58.5 (4.4) 59.1 (3.9) 58.8 (4.2) 0.6 0.378 S-Go/Na-Me 57.1 (2.7) 65.8 (3.0) 61.3 (5.2) 8.7 0.001

! 55
Cases and controls had a mean mandibular plane angle of 44.7 (SD = 4.5) and 32.6 (SD =
3.7) degrees, respectively (p < 0.01). Hyperdivergent individuals were generally more
retrognathic than controls, although there was no significant difference in ANB angle (p
> 0.05). Vertically, cases had a significantly greater gonial angle, maxillo-mandibular
plane angle, Y-axis, anterior facial height, and smaller ramus and posterior facial heights
(p < 0.01). The largest mean difference between the study groups occurred for SNMP
(12.1 deg) and MMPA (9.2 deg), followed by PFH/AFH (8.7%) and Ar-Go-Me (7.8 deg). In
contrast, the smallest mean difference between the study groups occurred for UPFH (0.6
%) and ANB (0.7 deg).
Sexual dimorphism was noted for a number of cephalometric variables including seven
vertical measurements (Ar-Go, Co-Go, Co-Gn, Na-Me, Na-ANS, ANS-Me, S-Go; p < 0.05)
and three sagittal measurements (S-N, ANS-PNS, Co-A-point; p < 0.05).
As expected, cases had a significantly smaller, but mean positive overbite (p < 0.01;
Table 3.3).

! 56
Table 3.3 Mean dental cephalometric measurements by study group (SD)
Variable Group Both combined
(n = 156) Difference between means
P-value Cases (n = 80) Controls (n = 76)
Overjet (mm) 4.4 (3.3) 4.9 (3.0) 4.6 (3.1) 0.5 0.296 Overbite (mm) 1.4 (2.2) 2.7 (2.0) 2.0 (2.2) 1.3 0.001 U1 – PP (deg) 28.5 (2.5) 27.3 (3.0) 27.9 (2.8) 1.2 0.009 U6 – PP (deg) 21.5 (2.3) 21.5 (2.7) 21.5 (2.5) 0.0 0.971 L1 – MP (deg) 38.3 (3.3) 37.0 (3.4) 37.7 (3.4) 1.3 0.022 L6 – MP (deg) 26.6 (2.5) 27.2 (2.9) 26.9 (2.7) 0.6 0.178 Interincisal Angle (deg) 127.3 (11.0) 130.2 (11.9) 128.7 (11.5) 2.9 0.118

! 57
There were no significant differences between the study groups for overjet (p > 0.05).
Cases had significantly greater upper and lower anterior dental heights than controls (p
< 0.05), although no differences were noted in posterior dental heights (p < 0.05).

! 58
3.3.3 Cephalometric Features by Open-bite Status
Participants in the long face group were further classified according to the amount of
overbite (Open-bite < 0mm; Non-open-bite ! 0mm). The cephalometric features of
cases with and without an anterior open-bite are presented in Table 3.4.

! 59
Table 3.4 Mean skeletal cephalometric measurements of cases with and without an anterior open-bite (SD)
Variable Cases Both combined
(n = 80) Mean difference P-value
Open-bite (n = 19) Non-openbite (n= 61) Angular measurements (deg) ANB 2.3 (2.6) 4.3 (2.6) 3.8 (2.7) 2.0 0.006 SNA 77.1 (5.1) 77.7 (3.6) 77.5 (4.0) 0.6 0.608 SNB 74.8 (3.3) 73.4 (3.3) 73.7 (3.8) 1.4 0.162 Ar-Go-Me 136.4 (6.6) 133.6 (5.9) 134.2 (6.2) 2.8 0.082 SN-MP 46.5 (7.3) 44.2 (2.9) 44.7 (32.6) 2.3 0.049 MMPA 36.3 (5.5) 34.5 (3.3) 34.9 (4.0) 1.8 0.088 Y-axis 63.5 (6.5) 63.2 (4.6) 63.2 (5.1) 0.3 0.816 Linear measurements (mm) S-Na 65.0 (4.9) 64.8 (3.2) 64.8 (3.6) 0.2 0.793 ANS-PNS 47.8 (3.5) 48.3 (3.0) 48.2 (3.1) 0.5 0.502 Co-Point A 76.5 (4.5) 77.4 (4.2) 77.2 (4.2) 0.9 0.388 Go-Me 66.7 (6.3) 64.8 (4.8) 65.2 (5.2) 1.9 0.167 Co-Gn 106.1 (8.4) 103.0 (7.0) 103.7 (7.4) 3.1 0.106 Ar-Go 39.5 (4.8) 38.2 (3.6) 38.5 (3.9) 1.3 0.206 Co-Go 47.6 (4.7) 47.3 (4.1) 47.4 (4.2) 0.3 0.758 S-Go 65.9 (6.2) 64.7 (5.0) 65.0 (5.3) 1.2 0.388 Na–Me 117.5 (7.6) 113.8 (7.0) 114.7 (7.3) 3.7 0.051 Na–ANS 51.0 (3.9) 50.2 (3.7) 50.3 (3.7) 0.8 0.418 ANS-Me 68.0 (5.7) 65.3 (5.1) 65.9 (5.3) 2.7 0.049 Ratio measurements (%) Na-ANS/Na–Me 42.9 (2.5) 43.3 (1.8) 43.2 (2.0) 0.4 0.383 ANS-Me/Na–Me 57.1 (2.5) 56.7 (1.8) 56.8 (2.0) 0.4 0.392 Na-ANS/ANS–Me 75.3 (7.6) 77.2 (7.7) 76.8 (7.7) 1.9 0.348 Ar-Go/S-Go 59.7 (3.9) 58.2 (4.5) 58.5 (4.4) 1.5 0.182 S-Go/Na-Me 56.3 (3.9) 57.4 (2.1) 57.1 (2.7) 1.1 0.139

! 60
Nearly one-quarter (19 cases, or 23.8%) of the long face group had an anterior open-bite.
Non-openbite cases had a significantly greater ANB angle than their open-bite
counterparts. There was also a tendency for open-bite participants to have larger vertical
measurements, although none of these differences reached statistical significance other
than lower anterior facial height and mandibular plane angle, which were greater in the
open-bite group (p < 0.05).
The largest mean difference between the open-bite and non-openbite groups was for
N-Me (3.7 mm), while the lowest was for S-N (0.2 mm) and Co-Go (0.3 mm).
Open-bite participants also had significantly less overjet and overbite than non-
openbite cases (Table 3.5). The open-bite group had slightly smaller anterior and greater
posterior dental heights, although these differences were not statistically significant (p >
0.05).

! 61
Table 3.5 Mean dental cephalometric measurements of cases with and without an anterior open-bite (SD)
Variable Case Cases combined
(n = 80) Mean difference P-value
Open-bite (n = 19) Non-openbite (n= 61) Overjet (mm) 2.3 (2.8) 5.0 (3.2) 4.4 (3.3) 2.7 0.001 Overbite (mm) -1.7 (1.7) 2.3 (1.3) 1.4 (2.2) 4.0 0.001 U1 – PP (deg) 27.7 (2.5) 28.7 (2.5) 28.5 (2.5) 1.0 0.121 U6 – PP (deg) 22.2 (2.2) 21.2 (2.3) 21.5 (2.3) 1.0 0.100 L1 – MP (deg) 37.8 (3.7) 38.4 (3.1) 38.3 (3.3) 0.6 0.496 L6 – MP (deg) 27.2 (2.5) 26.5 (2.5) 26.6 (2.5) 0.7 0.292 Interincisal Angle (deg) 125.6 (12.5) 127.8 (10.6) 127.3 (11.0) 2.2 0.438

! 62
3.3.4 Predictors of Anterior Open-bite
Overbite was weakly to moderately correlated (0.2 to 0.4) with the six cephalometric
measurements that are commonly used to assess facial divergence (Table 3.6).

! 63
Table 3.6 Pearson’s correlation coefficients for the different cephalometric variables used to assess vertical facial morphology
SN-MP MMPA UFH/LFH UFH/TFH LFH/TFH PFH/TFH Overbite SN-MP --- 0.856a -0.164b -0.201b 0.205a -0.945a -0.335a
MMPA --- -0.464a -0.531a 0.535a -0.818a -0.378a
UFH/LFH --- 0.910a -0.911a 0.134c 0.251b
UFH/TFH --- -0.999a 0.165b 0.293a
LFH/TFH --- -0.170b -0.292a
PFH/TFH --- 0.300a
Overbite --- aP < 0.01 (two-tailed); bP < 0.05 (two-tailed); cP > 0.05 (two-tailed)

! 64
The highest correlations were found between SNMP, MMPA, and PFH/TFH (0.8 to 0.9);
and between UFH/LFH, UFH/TFH and LFH/TFH (0.9). The majority of the correlations
were significant, with the exception of UFH/LFH and PFH/LFH (p > 0.05).

! 65
3.3.5 Discriminant Function Analysis
A discriminant function analysis was carried out using the 28 cephalometric
measurements (excluding the two selection variables) to determine whether these were
capable of differentiating between cases and controls. All 28 measurements showed
good discriminative power, with only 3 out of the 156 participants being misclassified.
The likelihood ratio test (LRT) was statistically significant, indicating that the
discrimination was good and that the two groups were indeed distinct.
3.3.6 Cluster Analysis
The hierarchic cluster analysis technique carried out in the long face group identified
several clusters. The dendrogram presented in Figure 3.3 represents the distance of each
individual from the remaining sample (i.e. matrix of distance). Essentially, each individual
in this analysis is initially assigned to a separate group. These groups are then merged
based on proximity until a single group is formed (Manly, 1986). The “furthest
neighbour” method was used to define the proximity or closeness of individuals (i.e. L2
dissimilarity cut-off value). According to this technique, groups are merged if the most
distant individual in one group is within a specific proximity of the most distant
individual in another group (Manly, 1986). In the dendrogram below, all the individuals
are in separate groups at distance zero, with distinctive groups becoming apparent at
around distance twenty.
It is noteworthy that the selection of a L2 dissimilarity cut-off value is generally
subjective. However, the cut-off was initially chosen at three different points to produce
clusters of 3 (L2 = 70), 4 (L2 = 60), and 6 (L2 = 50). The craniofacial features of the
different clusters were then evaluated in order to identify distinctive and meaningful
sub-phenotypes. The analysis with four clusters appeared to provide the best
meaningful outcome. Models with larger numbers of clusters resulted in very small
groups due to the limited sample size.

! 66
!Figure 3.3.!Dendrogram for the long face group. The x-axis represents each individual in the long face group, whereas the y-axis represents the L2 dissimilarity distance between individuals.
A description of the model with the three clusters is presented in Table 3.7. Cluster 2
represented the most severely divergent group, with very short posterior facial height
and an open-bite. Cluster 3 was characterised by a small overbite, whereas Cluster 1 had
a small but positive overbite.
In the model with four clusters, the largest group in the previous model (Cluster 1) was
split into two smaller clusters, while Cluster 3 and 4 were retained (Table 3.8). These two
smaller groups (Cluster 1 and 2) differed mainly with respect to the length of the
anterior cranial base and lower anterior facial height.
The average cephalometric tracings for the four clusters are presented in Figure 3.4.
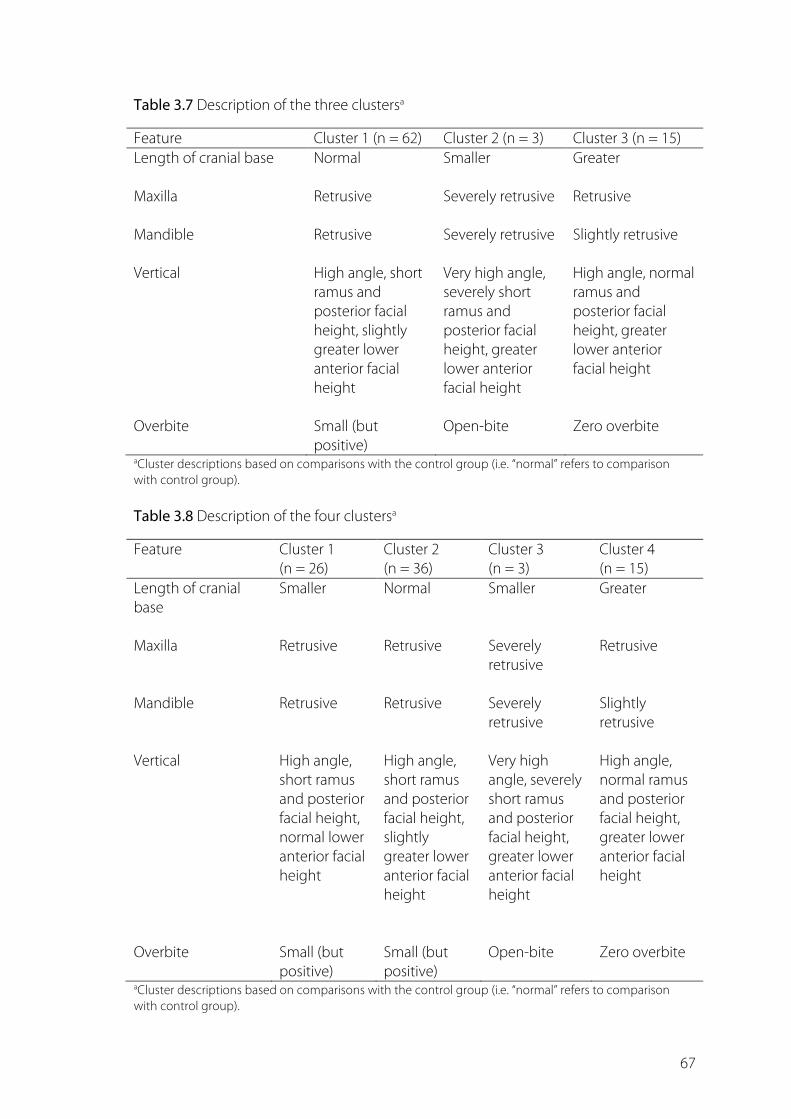
! 67
Table 3.7 Description of the three clustersa
Feature Cluster 1 (n = 62) Cluster 2 (n = 3) Cluster 3 (n = 15) Length of cranial base Normal Smaller Greater Maxilla Retrusive Severely retrusive Retrusive Mandible Retrusive Severely retrusive Slightly retrusive Vertical High angle, short
ramus and posterior facial height, slightly greater lower anterior facial height
Very high angle, severely short ramus and posterior facial height, greater lower anterior facial height
High angle, normal ramus and posterior facial height, greater lower anterior facial height
Overbite Small (but
positive) Open-bite Zero overbite
aCluster descriptions based on comparisons with the control group (i.e. “normal” refers to comparison with control group). Table 3.8 Description of the four clustersa
Feature Cluster 1 (n = 26)
Cluster 2 (n = 36)
Cluster 3 (n = 3)
Cluster 4 (n = 15)
Length of cranial base
Smaller Normal Smaller Greater
Maxilla Retrusive Retrusive Severely
retrusive Retrusive
Mandible Retrusive Retrusive Severely
retrusive Slightly retrusive
Vertical High angle,
short ramus and posterior facial height, normal lower anterior facial height
High angle, short ramus and posterior facial height, slightly greater lower anterior facial height
Very high angle, severely short ramus and posterior facial height, greater lower anterior facial height
High angle, normal ramus and posterior facial height, greater lower anterior facial height
Overbite Small (but
positive) Small (but positive)
Open-bite Zero overbite
aCluster descriptions based on comparisons with the control group (i.e. “normal” refers to comparison with control group).

! 68
Figure 3.4.!Descriptive diagrams of the four clusters. See Table 3.8 for more details about the cephalometric features
of each cluster.
Cluster 1 (n = 26)
Cluster 2 (n = 36)
Cluster 3 (n = 3)
Cluster 4 (n = 15)
A
B
C
D

! 69
Discussion 3.4
The purpose of this case-control study was to investigate the cephalometric features of
long face individuals using matched controls. A secondary objective was to determine
important predictors of the open-bite variant, and to identify clusters of the long face
phenotype. Data were obtained by digitising and tracing pre-treatment cephalograms
of previous and existing orthodontic patients. Several significant differences were found
between cases and controls in both the vertical and sagittal dimensions. Long face
individuals had a generally retrognathic maxilla and mandible, a significantly greater
anterior and smaller posterior facial height. Nearly a quarter of the long face sample had
an anterior open-bite, which was characterised by a significantly larger mandibular
plane angle and greater lower anterior facial height. Overbite, however, was poorly
correlated with all of the cephalometric variables that are commonly used to assess
vertical facial form. Finally, several distinct clusters of the long face morphology were
identified.
3.4.1 Limitations of the Study
The first consideration in cephalometric studies is the reliability of landmark
identification (Baumrind and Frantz, 1971), which can often lead to measurement errors.
In order to improve landmark visualisation, cephalograms were digitally enhanced and
magnified using dedicated graphical and cephalometric tracing software. Moreover, a
single calibrated investigator digitised and traced all of the cephalograms under
ambient lighting conditions (Houston, 1983). Other factors (such as assessor experience
and degree of skeletal discrepancy between the groups) were not expected to
significantly affect the accuracy of cephalometric measurements (Lau et al., 1997; Wah et
al., 1995). Overall, the method error of the study was low, and considered acceptable.
Another important factor in these studies is the risk of systematic bias, which may arise
due to magnification errors, poor inter-assessor reliability, and assessor bias (Houston,

! 70
1983). All of the cephalograms were taken using the same set-up and corrected for
magnification using a 50 millimetre mounted ruler. Moreover, the original radiographs
were scanned on a flatbed scanner to reduce the risk of distortion and magnification
errors that may arise from handheld cameras, especially for linear measurements (Collins
et al., 2007). For this reason, four participants with previously photographed
cephalograms, but who were missing original radiographs, were excluded from the
analysis. Scanned images of cephalograms are associated with only small amounts of
horizontal and vertical distortion fields that are clinically insignificant (Bruntz et al., 2006).
It was not possible, however, to blind the assessor during the digitisation of the
cephalograms since the underlying skeletal morphology was strongly indicative of the
study group. It is, therefore, plausible that knowing a participant’s study group may have
influenced the assessor’s judgement (Farella et al., 2012), especially with respect to
vertical cephalometric measurements. For instance, the assessor may have
subconsciously been more inclined to ascribe a longer lower anterior or smaller
posterior facial height based on the stereotypical features of an anterior open-bite
morphology. Personal identifiers, such as name and date of birth, were cropped from
the radiographs prior to digitisation, although this would not have prevented the
assessor from identifying a participant’s study group. Although the study investigators
considered cropping the radiographs to mask the anterior occlusion (i.e. degree of
overbite), this was deemed insufficient to prevent group identification and also
hindered the assessor’s ability to measure anterior variables. Finally, the radiographs of
both cases and controls were combined together and digitised in random order to
reduce assessor bias and systematic error (Houston, 1983).
3.4.2 Cephalometric Features of Long Face Individuals
The present study identified a number of important differences between the
cephalometric features of long and normal face individuals, both sagittally and vertically.
Although the two study groups did not differ with respect to ANB, long face individuals
had significantly smaller SNA and SNB angles. The retrognathic profile of hyperdivergent
cases in this study is consistent with the findings of some studies (Bishara and

! 71
Augspurger, 1975; Schendel et al., 1976; Subtelny and Sakuda, 1964; Taibah and Feteih,
2007), but not others (Beane et al., 2003). Fields and colleagues also found a similar
pattern to the present study in children and adults with long faces, although this was
not statistically significant (Fields et al., 1984). It is difficult to identify causal factors from
these cross-sectional studies, although the posterior positioning of the maxilla and
mandible in the craniofacial complex could theoretically be expected to wedge the jaws
apart and increase facial divergence (Isaacson et al., 1971). Conversely, a hyperdivergent
growth pattern is often associated with a backward and downward rotation of the
mandible, which would result in a posteriorly displaced B point and smaller SNB angle.
This theory is supported by the findings of some studies that have reported a
significantly smaller SNB angle in long face individuals, but not necessarily a smaller SNA
angle (Ellis and McNamara, 1984; Ellis et al., 1985; Silva Filho et al., 2010). In these studies,
the relative position of the maxilla to the cranial base was unaffected, while the
mandible was markedly retruded.
The relationship between the sagittal dimension of the craniofacial complex and vertical
facial development is made even clearer if one considers the linear dimensions of the
mandible and maxilla. A significantly shorter maxilla and mandibular body was found in
long face individuals, which is consistent with the smaller measurements of SNA and
SNB. In contrast, no difference was detected between the study groups in the length of
the mandible. Similar findings have been reported in adults with Class II malocclusions
(Ellis et al., 1985), but not Class III malocclusions, where a significantly greater mandibular
length has been noted (Ellis and McNamara, 1984). This is not surprising, however, since
a large proportion of New Zealand children exhibit a retrognathic mandible (Crowther
et al., 1997). Nonetheless, it is clear from these studies that the hyperdivergent pattern
may be associated with either a normal, prognathic or retrognathic skeletal pattern.
The anterior cranial base was also significantly shorter in long face individuals despite a
previous report suggesting a positive correlation between facial height and length of
the anterior cranial base (Kasai et al., 1995). It is noteworthy, however, that the findings
of that study were based on an ancient skull collection, and their modern-day relevance
is questionable (Antoun et al., 2013; manuscript submitted). Moreover, the discrepancy

! 72
in the findings of the two studies may reflect differences in growth pattern between
populations, as well as between facial types and skeletal morphologies. Nonetheless,
some studies have failed to detect a significant difference in the length of the anterior
cranial base between different facial types (Ellis and McNamara, 1984; Ellis et al., 1985;
Nahoum et al., 1972; Opdebeeck et al., 1978). It is noteworthy, however, that the majority
of these studies reported a similar pattern of a shorter cranial base in hyperdivegent
individuals.
In contrast, some studies have reported a significantly shorter anterior cranial base in
open-bite samples (Bishara and Augspurger, 1975; Richardson, 1969; Tsang et al., 1998),
while others have found a markedly shorter posterior cranial base (Subtelny and Sakuda,
1964; Tsang et al., 1998). The present study’s finding of a short maxilla and anterior
cranial base in long face individuals is not unusual, since growth of the maxilla is
normally associated with that of the cranial base (Kasai et al., 1995). Indeed, cases with
single suture synostoses (e.g. plagiocephaly) often exhibit a unilaterally short anterior
cranial base that is also associated with an asymmetrically short maxilla on the affected
side (Goodrich, 2005).
Long face participants in this study had particularly greater vertical measurements than
their matched controls. In fact, the two groups differed significantly in every linear and
angular vertical measurement, with the exception of Ar-Go/S-Go and UFH/LFH. That the
difference in posterior facial height between the groups was nearly twice that of lower
anterior facial height indicates that the present sample differed mainly with respect to
posterior facial height. Most studies have reported a consistently greater total and lower
anterior facial height (Fields et al., 1984; Isaacson et al., 1971; Nahoum, 1971; Nahoum et
al., 1972; Nanda, 1988; Nanda, 1990; Subtelny and Sakuda, 1964), although no clear
consensus exists with respect to the posterior and upper anterior facial heights.
Nahoum and colleagues reported a smaller upper facial height in their sample
(Nahoum, 1971), while other workers have found no significant difference between long
and normal face individuals in the size of the upper face (Beane et al., 2003; Fields et al.,
1984; Nahoum, 1971; Schendel et al., 1976; Subtelny and Sakuda, 1964). Posterior facial

! 73
height is also relatively variable in long face individuals (Beane et al., 2003; Cangialosi,
1984; Nahoum et al., 1972; Nanda, 1988; Schendel et al., 1976).
The variability in the size of the upper anterior and posterior facial heights is also evident
in the findings of heritability studies. A large proportion of these studies have reported a
wide range of heritability estimates for these two dimensions, indicating a variable
contribution of genetic and environmental factors between samples and across time
(Amini and Borzabadi-Farahani, 2009; Carels et al., 2001; Harris and Johnson, 1991; King
et al., 1993; Lundström and McWilliam, 1987; Nakata et al., 1974). Genetic and
environmental factors, such as diet consistency (masticatory activity) and breathing
mode, may partly explain the greater variability in upper anterior and posterior facial
heights (Hartsfield, 2002; Lundström and McWilliam, 1987). Although it is plausible that
the present sample varied with respect to these two underlying factors, no objective
data were recorded for breathing mode (e.g. rhinometry data), or masticatory activity
(e.g. EMG data). On the other hand, subjective evaluations of oral behaviours are
discussed in the following chapter, whereas genetic factors will be considered in future
work once a sufficient sample size is available for analysis.
There are a number of other factors that may have contributed to the differences in
vertical features between this sample and previous studies, especially with respect to
the upper anterior and posterior facial heights. The selection criterion for long face
individuals in the present study was based on the mandibular plane angle, whereas
other studies have used cephalometric variables such as overbite (Beane et al., 2003;
Beckmann et al., 1998; Cangialosi, 1984; Ceylan and Eroz, 2001), and the ratio of upper to
lower anterior facial height (Janson et al., 1994).
Different selection criteria are likely to result in distinctive groups of long face individuals
with relatively different vertical attributes. Indeed, Dung and Smith (1988) found weak
correlations among a number of cephalometric variables that are commonly used to
assess and classify hyperdivergent growth patterns. Findings from that study are
supported by the present work, which has also found particularly weak correlations
among the mandibular plane angle, overbite, and the ratio of upper to lower anterior

! 74
facial height. In fact, all the cephalometric variables analysed in this study were poor
indicators of the amount of overbite. Interestingly, Bishara and Augspurger (1975) used
the mandibular plane angle to classify the vertical growth pattern of young adult males,
and also found a greater upper anterior facial height among hyperdivergent individuals
than normodivergent and hypodivergent subjects.
Another factor that may have influenced the phenotypical features of this sample is the
severity of the vertical growth pattern that was selected. The long face participants in
this study were selected based on relatively stringent criteria (i.e. SNMP > 42 degrees; or,
more than two standard deviations of Riedel’s norms; Riedel, 1952), which resulted in a
sample with particularly high mandibular plane angles and markedly greater vertical
features. By comparison, some studies have selected long face participants with a mean
mandibular plane angle greater than one standard deviation from Riedel’s norm
(Ferrario et al., 1999; Isaacson et al., 1971).
It is noteworthy that this study included control participants who were individually
matched for age, sex and ethnicity. With the exception of Richardson (1969), who
employed a matched case-control design, most studies have often used control groups
with unspecified socio-demographic characteristics (Cangialosi, 1984; Ellis and
McNamara, 1984; Ellis et al., 1985; Nahoum et al., 1972; Subtelny and Sakuda, 1964), or
have failed to include a concurrent control group altogether (Schendel et al., 1976). This
is somewhat surprising, given that vertical growth patterns are influenced by sex and
ethnicity (de Freitas et al., 2007; Tsang et al., 1998), as well as age (Beane et al., 2003).
Indeed, sexual dimorphism was also evident within this study sample for 7 vertical and 3
sagittal cephalometric measurements.
Moreover, some authors have evaluated the cephalometric features of anterior open-
bites in adults with sagittal discrepancies using untreated Class I controls (Cangialosi,
1984; Nahoum et al., 1972). Although cases and controls in the present study were not
matched based on sagittal growth patterns, there were no significant differences
between the groups in ANB angle.

! 75
Finally, cases had a significantly larger anterior dental height than controls, although no
differences were noted for posterior dentoalveolar measurements. Janson et al (1994)
found positive correlations between the ratio of upper to lower anterior facial height
and both the anterior and posterior dentoalveolar heights. However, anterior
dentoalveolar heights alone explained nearly 40% of the variation in the ratio of upper
to lower anterior facial height (Janson et al., 1994).
3.4.3 Cephalometric Features of Open-bite Individuals
A large number of studies have investigated the cephalometric features of the open-
bite variant, although few have compared them with non-openbite hyperdivergent
individuals. Schendel and colleagues (1976) compared the cephalometric features of
open-bite and non-openbite individuals with vertical maxillary excess, and found that
the largest difference between the groups occurred in the posterior facial height. In
contrast, the greatest difference between these two groups in this study occurred in the
anterior dimension of the face. It is noteworthy, however, that the number of individuals
with open-bites in this study was relatively small and this may have affected the study’s
power to detect other important differences. Apart from the ANB angle, only the lower
anterior facial height and mandibular plane angle were significantly different between
those with and without anterior open-bites. This finding is consistent with other studies
that have found lower anterior facial height to be the main determinant of overbite in
long face individuals (Kuitert et al., 2006).
In addition to lower anterior facial height, the size and shape of the mandibular
symphysis appears to play an important role in the determination of overbite
(Beckmann et al., 1998). Unfortunately, the dimensions of the mandibular symphysis
were not evaluated in this study, although future research should focus on using
morphometric techniques (rather than linear measurements) to investigate this
relationship further.
That only one-quarter of the present sample had an anterior open-bite is probably due
to the dentoalveolar compensatory mechanisms that act to mask the underlying

! 76
skeletal pattern. In line with this study’s findings, Betzenberger and coworkers (1999)
also found that only 20% of high angle children had an anterior open-bite.
Dentoalveolar compensation in young children seems to occur due to an increase in
anterior dentoalveolar heights, whereas a relative decrease in posterior dentoalveolar
height is more likely to be the primary mechanism responsible for masking the
underlying vertical pattern in older children with permanent dentitions (Betzenberger et
al., 1999). Interestingly, open-bite cases in the present study had slightly larger posterior
and smaller anterior dentoalveolar heights. In these open-bite cases, it is likely that
dentoalveolar compensation was inadequate to mask the underlying vertical growth
pattern (especially since the skeletal features of open-bite and non-openbite cases were
somewhat similar).
3.4.4 Clustering of the Long Face Morphology
Several studies have utilised principal component and cluster analysis to identify sub-
phenotypes in Class III populations (Abu Alhaija and Richardson, 2003; Bui et al., 2006;
Uribe et al., 2013). Although most of these studies have found that the vertical
dimension of the face plays a role in the clustering of Class III samples, little is known
about the clustering patterns in an exclusively hyperdivergent population. A simple
cluster analysis (complete linkage) was utilised in this study, and identified between
three to six clusters within the long face group. The model with 6 clusters provided
more segregation of the phenotype, although the number of individuals in each group
was far too small to be clinically meaningful. It is likely that, with a larger sample size,
more clusters can be identified. Abu Alhaija and Richardson (2003) used a slightly larger
sample than this study and identified only three clusters, whereas Uribe and colleagues
(2013) utilised a sample of nearly 300 study participants to identify 5 clusters in their
Class III population. This study’s model (with 4 clusters) represents a good balance
between sample distribution and clinical discrimination, even though cluster 3 had only
three participants.
Cluster analysis is generally regarded as subjective (Uribe et al., 2013), although careful
evaluation of the clinical features of each cluster may result in meaningful sub-

! 77
phenotypes. It was noted that cluster 3, which consisted of only three individuals,
represented the most severe sub-phenotype. This group included individuals with a
severely short ramus, very steep mandibular plane angle and an anterior open-bite. In
contrast, clusters 1 and 2 were very similar to each other, but differed with respect to
anterior facial height and overjet. Finally, cluster 4 had a similar mandibular plane angle
to clusters 1/2, but exhibited a much flatter anterior cranial base and little overbite.
It is clear that the long face phenotype, as with many other craniofacial traits, is not a
single entity. This may partly explain some of the discordant findings of other studies
investigating bite force or EMG activity. The identification of distinctive and meaningful
clusters may, therefore, improve future study designs by reducing phenotype
heterogeneity. This may be particularly useful in genetic studies where clear and concise
phenotypes are essential (Bui et al., 2006).
Conclusions 3.5
Long face individuals selected based on the mandibular plane angle and/or PFH/AFH
have distinctively different cephalometric features from those of closely matched
controls. Although generally weak correlations were found between overbite and
cephalometric variables used to assess vertical facial morphology, open-bite cases were
characterised by a significantly greater mandibular plane angle and lower anterior facial
height. Finally, the long face morphology was found to consist of several clusters that
could potentially be used in future studies to reduce phenotype heterogeneity.!Further
work using larger samples is needed to investigate and characterise these sub-
phenotypes, however.

! 78
4 Oral Behaviour Patterns
Introduction
Materials and Methods
Results
Discussion
Conclusions

! 79
Introduction 4.1
Local environmental factors, such as weak masticatory muscles, have consistently been
associated with the long face morphology (Abu Alhaija et al., 2010; Ingervall and
Helkimo, 1978; Proffit et al., 1983; Serrao et al., 2002). Patients with myotonic dystrophy,
for example, exhibit a characteristically long facial pattern that is associated with
progressive weakness of the facial muscles (Kiliaridis et al., 1989; Ödman and Kiliaridis,
1996). On the other hand, individuals with short faces usually have significantly greater
maximal bite force (Proffit et al., 1983) and more muscle activity during chewing (Bakke
et al., 1992).
This association between masticatory muscle activity and facial morphology has often
been used to suggest a cause-effect relationship. In support of this theory, medieval
skulls are reported to have significant amounts of dental attrition and hypodivergent
facial patterns that are believed to result from diet-related muscular hyperfunction
(Varrela, 1990). A recent investigation of present-day adults with clinical signs of occlusal
wear has also found significantly smaller mandibular-palatal plane and gonial angles in
these individuals (Kiliaridis et al., 1995). Based on these findings, it has been suggested
that reduced function of the masticatory muscles may favour posterior rotation of the
mandible, and thus the development of the long face morphology (Varrela, 1990).
Nonetheless, the relationship between jaw function and facial typology is still somewhat
controversial due to the methodological limitations of previous research. A large
number of these studies have investigated masticatory muscle activity during functional
activities, such as chewing. Unfortunately, the use of specific “functional tasks” (e.g.
maximal clenching) to simulate masticatory function has typically been carried out in
laboratory settings and over short experimental periods that are not necessarily
representative of normal functional conditions (Farella et al., 2005). Moreover, the true
effects of these functional activities on vertical craniofacial form are questionable since
these oral behaviours are known to occur for relatively short periods of time (Kato et al.,
2006). In fact, the masticatory muscles are often engaged in a large proportion of non-

! 80
functional (habitual) activities (Kato et al., 2006), and low-amplitude bursts throughout
the day (Miyamoto et al., 1996; Miyamoto et al., 1999). The frequency of these muscle
bursts has also been reported to increase in individuals that are aware of tooth-
clenching habits (Katase-Akiyama et al., 2009). Since non-functional activities, such as
tooth clenching and other oral habits, occur relatively frequently (Kato et al., 2006), it is
plausible that they may also play a role in the aetiology of vertical craniofacial dysplasia.
Different types of non-functional habits have been associated with vertical craniofacial
form. Non-nutritive sucking habits, for instance, are believed to increase the likelihood of
an anterior open-bite in individuals with a long face morphology (Betzenberger et al.,
1999; Cozza et al., 2005). A recent study of three hundred children with anterior open-
bites found that approximately 60% had sucking habits or facial hyperdivergency, while
a third exhibited both traits (Cozza et al., 2005). In contrast, the prevalence of sucking
habits and facial hyperdivergence was approximately 9% in children without an anterior
open-bite. Although the criterion for classifying facial hyperdivergence was relatively
low in this study, it was concluded that both sucking habits and high-angle features
were significant risk factors for the development of an anterior open-bite in the mixed
dentition.
Habitual muscle activity, which includes low-level clenching and non-nutritive sucking
behaviours, has recently been assessed in the natural environment using portable EMG
recorders. Over a 3-hour observation period, children and adults with short faces were
reported to have significantly longer periods of jaw elevator muscle activity than their
long face counterparts (Ueda et al., 1998; Ueda et al., 2000). In contrast, Farella and
coworkers measured the EMG activity of the masticatory muscles over a longer 8-hour
period, and found no significant difference between long and short face individuals in
the frequency of activity periods or mean amplitude/duration (Farella et al., 2005).
Unfortunately, these studies used small samples due to the time-consuming and
complex nature of long-term EMG analysis. Moreover, these portable EMG recorders
have only been used to monitor waking-state behaviours even though recent data
suggest that short bursts of low-level activity occur in healthy individuals during the

! 81
night as well (Gallo et al., 1999). Nonetheless, the association between nocturnal muscle
activity and facial type is still largely unexplored (Farella et al., 2005). The recent
development of the self-report Oral Behaviour Checklist (OBC), however, may offer a
unique opportunity to collect a wide range of information on both daytime and
nocturnal habitual activity. One advantage of the OBC is its validation against a number
of EMG-recorded muscular behaviours, such as teeth clenching and tensing of the
masticatory muscles (Ohrbach et al., 2008c). Moreover, the simplicity and affordability of
this self-report measure supports it’s use in large samples.
The main objective of this chapter was, therefore, to compare the oral behaviours of
individuals with hyperdivergent and normodivergent morphologies using a simple and
non-invasive questionnaire (OBC). Since age and sex are known to affect muscle
function (Helkimo et al., 1977; Palinkas et al., 2010), the two study groups were matched
on these demographic characteristics. A secondary objective was to investigate whether
treatment status and other demographic characteristics influenced the occurrence of
these oral behaviours. It was hypothesised that long face individuals would have
different patterns of oral behaviour, which may partly explain their aberrant vertical
facial morphology.

! 82
Materials and Methods 4.2
4.2.1 Study Participants
The sample consisted of 80 case-control pairs that were individually matched on age,
sex, ethnicity and treatment stage (see Chapter 2 for more details about participant
recruitment and matching procedures).
4.2.2 Oral Behaviour Checklist
Study participants were asked to complete a short questionnaire that included items
relating to a wide range of oral behaviours. These items were part of the Oral Behaviour
Checklist (OBC), which is a self-report instrument used to identify excessive activity of
the masticatory muscles (Ohrbach et al., 2004). The 21-item questionnaire sought data
on items such as “Do you clench or press teeth together during waking hours?” and “Do
you hold, tighten, or tense muscles without clenching or bringing teeth together?”. The
questionnaire also included items that relate to non-nutritive sucking habits such as “Do
you bite objects such as hair, pipe, pencil, pens, fingers, and fingernails?”, and “Do you
place tongue between teeth?”. Two of the items were related to sleep-time behaviours,
while the other nineteen were related to wake-time behaviours.
Study participants recorded the frequency of each item using a 5-point Likert-type scale
(coded as “4= all of the time; 3= most of the time; 2 = sometimes; 1 = a few times; and, 0
= none of the time”). An individual’s overall score could range from 0 to 84. Study
participants were asked to complete the OBC based on their experiences over the
previous four weeks.
OBC scores were computed using three different methods: (1) prevalence or proportion
of participants reporting more than one oral behaviour, either “most of the time” or “all
of the time” (code 3 and 4); (2) extent or the number of oral behaviours reported, either

! 83
“most of the time” or “all of the time”; (3) and, severity or the total OBC score (calculated
by summing the scores of all 21 items).
The OBC has been reported to have good reliability for waking-state behaviours,
indicating that individuals understood the meaning and were able to replicate each
behaviour-related item regardless of how frequently they normally performed these
tasks (Markiewicz et al., 2006). The OBC has also been validated against a number of
EMG-recorded muscular behaviours (Ohrbach et al., 2008c).
4.2.3 Statistical Analysis
Data were analysed using the same statistical tests outlined in Chapter 2.

! 84
Results 4.3
4.3.1 Sociodemographic Characteristics and Treatment Status
The sociodemographic characteristics of the study sample have been described under
section 3.3.1.
4.3.2 Oral Behaviour Checklist Score by Study Group
The overall prevalence, extent and severity of frequent oral behaviours (reported “all the
time” or “most of time”) by study group are presented in Table 4.1.
Table 4.1 Prevalence, extent and severity of the OBC by study group
Measure Group Both combined
(n = 160) Cases (n = 80) Controls (n = 80) Prevalence: No. of participants reporting items most/all the time (%)
70 (87.5) 71 (88.8) 141 (88.1)
Extent: No. of items reported most/all the time (SD)
3.4 (2.5) 3.2 (2.8) 3.3 (2.7)
Severity: Mean OBC score (SD)
25.6 (9.0) 25.3 (9.9) 25.4 (9.4)
!Nearly 9 out of 10 participants reported carrying out one or more oral behaviours on a
frequent basis. The overall mean score of the OBC was approximately one-quarter of the
theoretical maximum score. There were no statistically significant differences in the
prevalence, extent or severity of the OBC scores between cases and controls (p > 0.05).
In addition, there were no statistically significant differences in the prevalence or severity
of each individual OBC item by study group (Table 4.2).

! 85
Table 4.2 Prevalence, extent and severity of frequent behaviours (“all the time” or “most of time”) by OBC item and study group
Items “How often do you do the following behaviours…”
Prevalence: No. of participants reporting items most/all the time (%) Severity: Mean OBC score (SD)
Cases (n= 80) Controls (n= 80) Cases (n= 80) Controls (n= 80) During sleep Clench or grind teeth 4 (5.0) 7 (8.8) 1.3 (0.6) 1.3 (0.6) Place pressure on the jaw 40 (50.0) 39 (48.8) 2.2 (0.9) 2.2 (0.9) While awake Grind teeth 2 (2.5) 1 (1.3) 1.1 (0.4) 1.2 (0.4) Clench teeth 6 (7.5) 2 (2.5) 1.4 (0.6) 1.3 (0.5) Touch or hold teeth together 7 (8.8) 9 (11.3) 1.4 (0.7) 1.4 (0.7)
Hold, tighten, or tense muscles without clenching 7 (8.8) 3 (3.8) 1.3 (0.6) 1.2 (0.5) Hold or jut jaw forward or to the side 3 (3.8) 3 (3.8) 1.3 (0.6) 1.3 (0.5) Press tongue forcibly against teeth 7 (8.8) 5 (6.3) 1.3 (0.6) 1.3 (0.6) Place tongue between teeth 8 (10.0) 6 (7.5) 1.4 (0.7) 1.4 (0.6) Bite, chew or play with tongue, cheeks, or lips 12 (15.0) 19 (23.8) 1.6 (0.7) 1.8 (0.8) Hold jaw in a rigid or tense position 0 (0.0) 2 (2.5) 1.1 (0.3) 1.1 (0.4) Hold objects between teeth (e.g. pens, fingernails) 12 (15.0) 14 (17.5) 1.6 (0.7) 1.7 (0.8) Use chewing gum 14 (17.5) 15 (18.8) 1.8 (0.7) 1.8 (0.8) Play musical instruments involving mouth 2 (2.5) 0 (0.0) 1.1 (0.3) 1.0 (0.1) Lean with hand on the jaw 33 (41.3) 30 (37.5) 2.2 (0.8) 2.2 (0.8)
Chew food on one side only 17 (21.3) 21 (26.3) 1.8 (0.8) 1.7 (0.9) Chew food between meals 44 (55.0) 35 (43.8) 2.4 (0.7) 2.3 (0.8) Sustained talking (e.g. customer service) 12 (15.0) 11 (13.8) 1.5 (0.8) 1.5 (0.7)
Sing 17 (21.3) 15 (18.8) 1.7 (0.8) 1.6 (0.8)
Yawn 20 (25.0) 14 (17.5) 2.0 (0.7) 1.9 (0.7)
Hold telephone between head and shoulders 5 (6.3) 8 (10.0) 1.2 (0.6) 1.3 (0.6)

! 86
Approximately half the sample reported “chewing food between meals” and “placing
pressure on the jaw [while asleep]”. A slightly larger proportion of cases than controls
reported “clenching” as a frequent oral behaviour (7.5%; p > 0.05). On the other hand,
the prevalence of “holding objects between teeth” was marginally higher in controls
than cases (17.5%; p > 0.05).
The data were also analysed by open-bite status, although no significant differences
between individuals with anterior open-bites and the rest of the study sample was
found for either the overall prevalence or severity of frequent oral behaviours. In fact, the
prevalence of frequent oral behaviours was slightly less in the open-bite sub-group
(78.9%), than in the control group (88.8%), or non-openbite cases (90.2%; p > 0.05).
! 87
4.3.3 Oral Behaviour Checklist Score by Sex
The prevalence, extent and severity of frequent oral behaviours were generally greater
in females than males (Table 4.3).
Table 4.3 Prevalence, extent and severity of the OBC by sex
Measure Sex Both combined
(n = 160) Male (n = 56) Female (n = 104) Prevalence (%) 46 (82.1) 95 (91.3) 141 (88.1) Extent (SD) 2.6 (2.2)a 3.7 (2.8) 3.3 (2.7) Severity (SD) 24.1 (7.7) 26.2 (10.2) 25.4 (9.4) aP < 0.05
Nearly 9 out of 10 females reported carrying out one or more oral behaviours on a
frequent basis. Moreover, females reported carrying out a significantly greater number
of frequent oral behaviours than males (p < 0.05).
There were a number of statistically significant differences in the prevalence and severity
of each individual OBC item by sex (Table 4.4).

! 88
Table 4.4 Prevalence and severity of frequent behaviours (“all the time” or “most of time”) by OBC item and sex
Items “How often do you do the following behaviours…”
Prevalence: No. of participants reporting items most/all the time (%) Severity: Mean OBC score (SD)
Male (n = 56) Female (n = 104) Male (n = 56) Female (n = 104) During sleep Clench or grind teeth 3 (5.4) 8 (7.7) 0.6 (0.9) 0.8 (1.0) Place pressure on the jaw 23 (41.1) 56 (53.8) 1.9 (1.3)a 2.4 (1.2)
While awake Grind teeth 2 (3.6) 1 (1.0) 0.5 (0.8) 0.4 (0.8) Clench teeth 2 (3.6) 6 (5.8) 1.0 (0.9) 1.1 (0.0) Touch or hold teeth together 2 (3.6)a 14 (13.5) 1.1 (0.9) 1.1 (1.1) Hold, tighten, or tense muscles without clenching 3 (5.4) 7 (6.7) 0.6 (0.9) 0.7 (1.0) Hold or jut jaw forward or to the side 1 (1.8) 5 (4.8) 1.1 (0.9)a 0.7 (0.9)
Press tongue forcibly against teeth 6 (10.7) 6 (5.8) 1.1 (1.0)b 0.7 (1.0)
Place tongue between teeth 3 (5.4) 11 (10.6) 1.2 (0.9) 0.9 (1.1) Bite, chew or play with tongue, cheeks, or lips 7 (12.5) 24 (23.1) 1.5 (0.9) 1.6 (1.2) Hold jaw in a rigid or tense position 0 (0.0) 2 (1.9) 0.5 (0.7) 0.4 (0.8) Hold objects between teeth (e.g. pens, fingernails) 9 (16.1) 17 (16.3) 1.5 (1.0) 1.4 (1.1) Use chewing gum 9 (16.1) 20 (19.2) 1.5 (1.1) 1.6 (1.1) Play musical instruments involving mouth 0 (0.0) 2 (1.9) 0.0 (0.2) 0.1 (0.6) Lean with hand on the jaw 16 (28.6)a 47 (45.2) 2.0 (1.1) 2.4 (1.0) Chew food on one side only 13 (23.2) 25 (24.0) 1.5 (1.2) 1.6 (1.2) Chew food between meals 28 (50.0) 51 (49.0) 2.5 (0.9) 2.4 (1.0) Sustained talking (e.g. customer service) 3 (5.4)a 20 (19.2) 1.0 (0.9) 1.3 (1.3) Sing 6 (10.7)a 26 (25.0) 0.8 (1.0)a 1.6 (1.3)
Yawn 7 (12.5)a 27 (26.0) 1.8 (0.7)a 2.1 (0.8)
Hold telephone between head and shoulders 4 (7.1) 9 (8.7) 0.5 (1.0)a 0.8 (1.0)
aP < 0.05; bP < 0.01

! 89
Females engaged in normal functions, such as “sustained talking”, “yawning” and
“singing”, more frequently than males (p < 0.05). Moreover, females were almost four
times more likely to “hold or touch their teeth together”, and twice as likely to “lean with
a hand on their jaw” than males (p < 0.05). On the other hand, the mean OBC score for
oral habits such as “holding or jutting the jaw forward or to the side” and “pressing the
tongue forcibly against the teeth” were significantly higher in males (p < 0.05).
Sex differences, however, were much less pronounced when the data were analysed by
study group (Table 4.5).

! 90
Table 4.5 Prevalence of frequent oral behaviours (“all the time” or “most of time”) by study group and sex
Items “How often do you do the following behaviours…”
Cases Controls Male (n = 28) Female (n = 52) Male (n = 28) Female (n = 52)
During sleep Clench or grind teeth 1 (3.6) 3 (5.8) 2 (7.1) 5 (9.6) Place pressure on the jaw 10 (35.7) 30 (57.7) 13 (46.4) 26 (50.0) While awake Grind teeth 1 (3.6) 1 (1.9) 1 (3.6) 0 (0.0) Clench teeth 0 (0.0) 6 (11.5) 2 (7.1) 0 (0.0) Touch or hold teeth together 1 (3.6) 6 (11.5) 1 (3.6) 8 (15.4) Hold, tighten, or tense muscles without clenching 1 (3.6) 6 (11.5) 2 (7.1) 1 (1.9) Hold or jut jaw forward or to the side 0 (0.0) 3 (5.8) 1 (3.6) 2 (2.8) Press tongue forcibly against teeth 4 (14.3) 3 (5.8) 2 (7.1) 3 (5.8) Place tongue between teeth 3 (10.7) 5 (9.6) 0 (0.0) 6 (11.5) Bite, chew or play with tongue, cheeks, or lips 2 (7.1) 10 (19.2) 5 (17.9) 14 (26.9) Hold jaw in a rigid or tense position 0 (0.0) 0 (0.0) 0 (0.0) 2 (3.8) Hold objects between teeth (e.g. pens, fingernails) 3 (10.7) 9 (17.3) 6 (21.4) 8 (15.4) Use chewing gum 6 (21.4) 8 (15.4) 3 (10.7) 12 (23.1) Play musical instruments involving mouth 0 (0.0) 2 (3.8) 0 (0.0) 0 (0.0) Lean with hand on the jaw 10 (35.7) 23 (44.2) 6 (21.4)a 24 (46.2)
Chew food on one side only 5 (17.9) 12 (23.1) 8 (28.6) 13 (25.0) Chew food between meals 13 (46.4) 31 (59.6) 15 (53.6) 20 (38.5) Sustained talking (e.g. customer service) 0 (0.0)b 12 (23.1) 3 (10.7) 8 (15.4) Sing 4 (14.3) 13 (25.0) 2 (7.1) 13 (25.0) Yawn 2 (7.1)b 18 (34.6) 5 (17.9) 9 (17.3) Hold telephone between head and shoulders 2 (7.1) 3 (5.8) 2 (7.1) 6 (11.5) aP < 0.05; bP < 0.01

! 91
Nearly half the females in the control group reported “leaning with their hand on the
jaw” (p < 0.05). In contrast, a significantly larger proportion of females in the long face
group reported “sustained talking” and “yawning”. There were a number of other
interesting sex-related differences between the study groups. Over 10% of females in
the long face group reported frequent “clenching”, whereas none of the females in the
control sample reported carrying out this activity. Moreover, nearly 1 in 10 females in the
long face group reported “holding, tightening, or tensing muscles without clenching”,
whereas only one female in the control sample reported this behaviour.

! 92
4.3.4 Oral Behaviour Checklist Score by Age
Study participants were divided into a younger and older age group based on the
median age of the sample (16.5 years). Data on the overall prevalence, extent and
severity of frequent oral behaviours by age group are presented in Table 4.6.
Table 4.6 Prevalence, extent and severity of the OBC by age group
Measure Age Group Both combined
(n = 160) Younger (n = 80) Older (n = 80) Prevalence (%) 71 (88.8) 70 (87.5) 141 (88.1) Extent (SD) 3.4 (2.6) 3.2 (2.8) 3.3 (2.7) Severity (SD) 24.8 (9.7) 26.1 (9.2) 25.4 (9.4)
The two age groups were very similar with respect to the overall prevalence, extent and
severity of frequent oral behaviours (p > 0.05). Nearly 90% of both age groups reported
carrying out one or more oral behaviours on a frequent basis.
Similarly, there were few differences in the prevalence, extent and severity of each
individual OBC item by age group (Table 4.7).

! 93
Table 4.7 Prevalence, extent and severity of frequent behaviours (“all the time” or “most of time”) by OBC item and age group
Items “How often do you do the following behaviours…”
Prevalence: No. of participants reporting items most/all the time (%) Severity: Mean OBC score (SD)
Younger (n = 80) Older (n = 80) Younger (n = 80) Older (n = 80) During sleep Clench or grind teeth 4 (5.0) 7 (8.8) 0.6 (0.9) 0.8 (1.1) Place pressure on the jaw 35 (43.8) 44 (55.0) 2.1 (1.3) 2.4 (1.2)
While awake Grind teeth 0 (0.0) 3 (3.8) 0.4 (0.7) 0.6 (0.9) Clench teeth 4 (5.0) 4 (5.0) 1.0 (1.0) 1.1 (0.9) Touch or hold teeth together 9 (11.3) 7 (8.8) 1.0 (1.1) 1.2 (1.0) Hold, tighten, or tense muscles without clenching 4 (5.0) 6 (7.5) 0.6 (0.9) 0.7 (1.0) Hold or jut jaw forward or to the side 3 (3.8) 3 (3.8) 0.9 (0.9) 0.8 (0.9) Press tongue forcibly against teeth 6 (7.5) 6 (7.5) 0.8 (1.0) 0.9 (1.0) Place tongue between teeth 10 (12.5) 4 (5.0) 1.1 (1.1) 0.9 (1.0) Bite, chew or play with tongue, cheeks, or lips 18 (22.5) 13 (16.3) 1.6 (1.1) 1.6 (1.0) Hold jaw in a rigid or tense position 1 (1.3) 1 (1.3) 0.4 (0.7) 0.5 (0.8) Hold objects between teeth (e.g. pens, fingernails) 15 (18.8) 11 (13.8) 1.5 (1.1) 1.4 (1.0) Use chewing gum 15 (18.8) 14 (17.5) 1.6 (1.1) 1.6 (1.1) Play musical instruments involving mouth 2 (2.5) 0 (0.0) 0.1 (0.7) 0.1 (0.3) Lean with hand on the jaw 37 (46.3) 26 (32.5) 2.4 (1.0) 2.1 (1.0) Chew food on one side only 19 (23.8) 19 (23.8) 1.6 (1.2) 1.6 (1.2) Chew food between meals 37 (46.3) 42 (52.5) 2.4 (1.0) 2.5 (0.9) Sustained talking (e.g. customer service) 8 (10.0) 15 (18.8) 0.9 (1.0)b 1.5 (1.3) Sing 22 (27.5)a 10 (12.5) 1.4 (1.4) 1.3 (1.2) Yawn 18 (22.5) 16 (20.0) 1.9 (0.8) 2.0 (0.7) Hold telephone between head and shoulders 7 (8.8) 6 (7.5) 0.6 (1.0) 0.8 (0.9) aP < 0.05; bP < 0.01

! 94
Nearly half of the younger participants reported “leaning with hand on the jaw” and
“chewing food between meals” (p > 0.05). On the other hand, over half of the older
participants reported “placing pressure on the jaw [while asleep]” (p > 0.05). Younger
participants were more likely to engage in normal functions such as singing (p < 0.05),
and sustained talking than older participants (p < 0.01).
Similar results were noted when the data were analysed by study group (Table 4.8).

! 95
Table 4.8 Prevalence of frequent oral behaviours (“all the time” or “most of time”) by study group and age group
Items “How often do you do the following behaviours…”
Cases Controls Younger (n = 80) Older (n = 80) Younger (n = 80) Older (n = 80)
During sleep Clench or grind teeth 1 (2.5) 3 (7.5) 3 (7.5) 4 (10.0) Place pressure on the jaw 16 (40.0) 24 (60.0) 19 (47.5) 20 (50.0) While awake Grind teeth 0 (0.0) 2 (5.0) 0 (0.0) 1 (2.5) Clench teeth 3 (7.5) 3 (7.5) 1 (2.5) 1 (2.5) Touch or hold teeth together 2 (5.0) 5 (12.5) 7 (17.5) 2 (5.0) Hold, tighten, or tense muscles without clenching 2 (5.0) 5 (12.5) 2 (5.0) 1 (2.5) Hold or jut jaw forward or to the side 1 (2.5) 2 (5.0) 2 (5.0) 1 (2.5) Press tongue forcibly against teeth 4 (10.0) 3 (7.5) 2 (5.0) 3 (7.5) Place tongue between teeth 5 (12.5) 3 (7.5) 5 (12.5) 1 (2.5) Bite, chew or play with tongue, cheeks, or lips 5 (12.5) 7 (17.5) 13 (32.5) 6 (15.0) Hold jaw in a rigid or tense position 0 (0.0) 0 (0.0) 1 (2.5) 1 (2.5) Hold objects between teeth (e.g. pens, fingernails) 8 (20.0) 4 (10.0) 7 (17.5) 7 (17.5) Use chewing gum 7 (17.5) 7 (17.5) 8 (20.0) 7 (17.5) Play musical instruments involving mouth 2 (5.0) 0 (0.0) 0 (0.0) 0 (0.0) Lean with hand on the jaw 18 (45.0) 15 (37.5) 19 (47.5) 11 (27.5)
Chew food on one side only 9 (22.5) 8 (20.0) 10 (25.0) 11 (27.5) Chew food between meals 19 (47.5) 25 (62.5) 18 (45.0) 17 (42.5) Sustained talking (e.g. customer service) 5 (12.5)b 7 (17.5) 3 (7.5) 8 (20.0) Sing 11 (27.5) b 6 (15.0) 11 (27.5) 4 (10.0) Yawn 11 (27.5)b 9 (22.5) 7 (17.5) 7 (17.5) Hold telephone between head and shoulders 2 (5.0) 3 (7.5) 5 (12.5) 3 (7.5) aP < 0.05; bP < 0.01

! 96
A larger proportion of younger cases reported “yawning” and “singing” most or all of the
time, whereas older participants reported “sustained talking” more often (p < 0.01).
There were no statistically significant differences between the two age groups in the
control sample. Despite not reaching statistical significance, a larger proportion of older
than younger participants in the control group reported frequent “touching or holding
of teeth together”. Moreover, nearly half of the younger participants in both groups
reported “leaning with hand on the jaw” (p > 0.05).

! 97
4.3.5 Oral Behaviour Checklist Score by Treatment Status
The overall prevalence, extent and severity of frequent oral behaviours (reported “all the
time” or “most of time”) by treatment stage are presented in Table 4.9.
Table 4.9 Prevalence, extent and severity of the OBC by treatment status
Measure
Treatment stage All Combined
(n = 160)
Before treatment
(n = 37)
During treatment
(n = 51)
After treatment
(n = 72) Prevalence (%) 34 (91.9) 43 (84.3) 64 (88.9) 141 (88.1) Extent (SD) 3.8 (3.0) 3.3 (2.7) 3.1 (2.4) 3.3 (2.7) Severity (SD) 26.5 (10.7) 25.7 (9.2) 24.7 (8.9) 9.4 (0.7)
There were no significant differences in any of these three measures across the different
treatment stages, although oral behaviours were generally more frequent in participants
who had not yet started orthodontic treatment.
There were a number of significant differences in the prevalence, extent and severity of
each individual OBC item by treatment stage (Table 4.10).

! 98
Table 4.10 Prevalence and severity of frequent behaviours (“all the time” or “most of time”) by OBC item and treatment stage
Items “How often do you do the following behaviours…”
Prevalence: No. of participants reporting items most/all the time (%) Severity: Mean OBC score (SD)
Before During After Before During After During sleep Clench or grind teeth 3 (8.1) 2 (3.9) 6 (8.3) 0.8 (1.0) 0.6 (0.9) 0.8 (1.0) Place pressure on the jaw 17 (45.9) 20 (39.2) 42 (58.3) 2.2 (1.3) 2.0 (1.2) 2.4 (1.3) While awake Grind teeth 0 (0.0) 0 (0.0) 3 (4.2) 0.4 (0.8) 0.5 (0.7) 0.5 (0.8) Clench teeth 3 (8.1) 2 (3.9) 3 (4.2) 1.1 (1.2) 1.0 (0.8) 1.0 (0.9) Touch or hold teeth together 5 (13.5) 4 (7.8) 7 (9.7) 1.2 (1.2) 1.1 (1.0) 1.1 (1.1) Hold, tighten, or tense muscles without clenching 3 (8.1) 4 (7.8) 3 (4.2) 0.8 (1.1) 0.8 (0.9) 0.5 (0.8) Hold or jut jaw forward or to the side 1 (2.7) 2 (3.9) 3 (4.2) 0.8 (0.9) 1.0 (0.9) 0.8 (0.9) Press tongue forcibly against teeth 3 (8.1) 5 (9.8) 4 (5.6) 0.9 (1.1) 1.0 (1.0) 0.7 (0.9) Place tongue between teeth 3 (8.1) 7 (13.7) 4 (5.6) 1.1 (1.1) 1.2 (1.1) 0.9 (1.0) Bite, chew or play with tongue, cheeks, or lips 9 (24.3) 8 (15.7) 14 (19.4) 1.6 (1.2) 1.5 (1.1) 1.6 (1.0) Hold jaw in a rigid or tense position 1 (2.7) 1 (2.0) 0 (0.0) 0.4 (0.8) 0.5 (0.8) 0.4 (0.6) Hold objects between teeth (e.g. pens, fingernails) 9 (24.3) 6 (11.8) 11 (15.3) 1.8 (1.1) 1.3 (1.1) 1.3 (1.1) Use chewing gum 7 (18.9) 5 (9.8) 17 (23.6) 1.7 (1.1)a 1.2 (1.1) 1.8 (1.0) Play musical instruments involving mouth 1 (2.7) 1 (2.0) 0 (0.0) 0.2 (0.7) 0.1 (0.6) 0.1 (0.3) Lean with hand on the jaw 22 (59.5)a 19 (37.3) 22 (30.6) 2.6 (1.0)a 2.2 (1.1) 2.1 (1.0) Chew food on one side only 5 (13.5)b 21 (41.2) 12 (16.7) 1.3 (1.1)b 2.1 (1.2) 1.4 (1.1) Chew food between meals 19 (51.4) 25 (49.0) 35 (48.6) 2.5 (0.8) 2.5 (1.1) 2.4 (0.9) Sustained talking (e.g. customer service) 3 (8.1) 5 (9.8) 15 (20.8) 0.9 (1.0)b 0.9 (1.0) 1.5 (1.3) Sing 11 (29.7)a 13 (25.5) 8 (11.1) 1.5 (1.4) 1.5 (1.3) 1.2 (1.1) Yawn 10 (27.0) 13 (25.5) 11 (15.3) 2.0 (0.9) 2.0 (0.9) 1.9 (0.6) Hold telephone between head and shoulders 4 (10.8) 6 (11.8) 3 (4.2) 0.7 (1.1) 0.9 (1.1) 0.6 (0.8) aP < 0.05; bP < 0.01

! 99
Over half of the participants in the pre-treatment group reported “leaning with hand on
the jaw” on a frequent basis (p < 0.05). Some activities (such as “chewing gum”) were
expectedly less common among participants undergoing treatment (p < 0.05). On the
other hand, activities (such as “chewing food on one side only”) were reported to be
more frequent during treatment. There were no significant differences in either the
prevalence or severity of “clenching” and “grinding” among the treatment stages (p >
0.05).
Similar patterns were also noted when the data were analysed by study group (Table
4.11).

! 100
Table 4.11 Prevalence of frequent oral behaviours (“all the time” or “most of time”) by study group and treatment stage
Items “How often do you do the following behaviours…”
Cases Controls Before
(n = 18) During (n = 25)
After (n = 37)
Before (n = 18)
During (n = 25)
After (n = 37)
During sleep Clench or grind teeth 1 (5.6) 1 (4.0) 2 (5.4) 2 (10.5) 1 (3.8) 4 (11.4) Place pressure on the jaw 9 (50.0) 9 (36.0) 22 (59.5) 8 (42.1) 11 (42.3) 20 (57.1) While awake Grind teeth 0 (0.0) 0 (0.0) 2 (5.4) 0 (0.0) 0 (0.0) 1 (2.9) Clench teeth 2 (11.1) 2 (8.0) 2 (5.4) 1 (5.3) 0 (0.0) 1 (2.9) Touch or hold teeth together 3 (16.7) 1 (4.0) 3 (8.1) 2 (10.5) 3 (11.5) 4 (11.4) Hold, tighten, or tense muscles without clenching 2 (11.1) 2 (8.0) 3 (8.1) 1 (5.3) 2 (7.7) 0 (0.0) Hold or jut jaw forward or to the side 0 (0.0) 1 (4.0) 2 (5.4) 1 (5.3) 1 (3.8) 1 (2.9) Press tongue forcibly against teeth 2 (11.1) 2 (8.0) 3 (8.1) 1 (5.3) 3 (11.5) 1 (2.9) Place tongue between teeth 1 (5.6) 4 (16.0) 3 (8.1) 2 (10.5) 3 (11.5) 1 (2.9) Bite, chew or play with tongue, cheeks, or lips 3 (16.7) 1 (4.0) 8 (21.6) 6 (31.6) 7 (26.9) 6 (17.1) Hold jaw in a rigid or tense position 0 (0.0) 0 (0.0) 0 (0.0) 1 (5.3) 1 (3.8) 0 (0.0) Hold objects between teeth (e.g. pens, fingernails) 5 (27.8) 2 (8.0) 5 (13.5) 4 (21.1) 4 (15.4) 6 (17.1) Use chewing gum 3 (16.7)c 1 (4.0) 10 (27.0) 4 (21.1) 4 (15.4) 7 (20.0) Play musical instruments involving mouth 1 (5.6) 1 (4.0) 0 (0.0) 0 (0.0) 0 (0.0) 0 (0.0) Lean with hand on the jaw 13 (72.2)b 10 (40.0) 10 (27.0) 9 (47.4) 9 (34.6) 12 (34.3) Chew food on one side only 3 (16.7)c 9 (36.0) 5 (13.5) 2 (10.5)d 12 (46.2) 7 (20.0) Chew food between meals 9 (50.0) 12 (48.0) 23 (62.2) 10 (52.6) 13 (50.0) 12 (34.3) Sustained talking (e.g. customer service) 1 (5.6) 5 (20.0) 6 (16.2) 2 (10.5)d 0 (0.0) 9 (25.7) Sing 6 (33.3)a 5 (20.0) 6 (16.2) 5 (26.3)d 8 (30.8) 2 (5.7) Yawn 6 (33.3) 6 (24.0) 8 (21.6) 4 (21.1)d 7 (26.9) 3 (8.6) Hold telephone between head and shoulders 1 (5.6) 3 (12.0) 1 (2.7) 3 (15.8) 3 (11.5) 2 (5.7) aP < 0.05; bP < 0.01; CP < 0.05 (Fisher’s Exact 2-sided Test); dP < 0.01 (Fisher’s Exact 2-sided Test)

! 101
Nearly three-quarters of pre-treatment cases (but fewer than half the controls) reported
“leaning with hand on the jaw” (p < 0.01). Frequent “chewing on one side” was more
prevalent during treatment in both groups, although “chewing gum” was significantly
less common in only the long face group (p < 0.05). Some daily activities (such as
“sustained talking”) were more prevalent among post-treatment controls (p < 0.01).

! 102
Discussion 4.4
The purpose of this part of the study was to investigate the oral behaviour patterns in
individuals with different facial morphologies. In particular, this chapter was designed to
investigate whether the oral behaviours of long face individuals differed from normal
controls with respect to the type and frequency of these oral habits. Information on
these habits was obtained using the Oral Behaviour Checklist, which is a 21-item
questionnaire that participants complete based on their experiences over the previous
four weeks. The present study’s findings suggest minimal differences in the prevalence,
extent and severity of oral habits between long and normal face individuals. In contrast,
a number of significant differences were noted with respect to sex.
4.4.1 Limitations of the Study
The present study included a number of limitations that should be addressed before
discussing the main findings. Firstly, participants were excluded based on ongoing TMJ
problems by asking them whether they experienced any recent pain around the
temporomandibular joint; however, no subjective or objective data were collected with
respect to other signs and symptoms such as clicking and crepitus. The inclusion of
participants with TMJ disorders (TMD) may confound the relationship between facial
type and OBC, since TMD is associated with both anterior open-bite and parafunctional
habits. On the one hand, myofascial pain and disc displacement are associated with a
range of parafunctional activities, including teeth clenching and grinding (Chen et al.,
2007; Michelotti et al., 2010; Rossetti et al., 2008). On the other hand, some TMDs are
associated with anterior open-bites (Pullinger et al., 1993; Sonnesen et al., 1998).
It is possible that some of the study’s participants may have had undiagnosed TMD or
condylar bone loss, and this could have affected the OBC score. Accurate diagnosis of
TMJ conditions can sometimes be difficult, especially in the absence of clear signs and
symptoms. For example, idiopathic condylar resorption is a generally asymptomatic

! 103
condition that often results in an anterior open-bite and a steep mandibular plane angle
(Posnick and Fantuzzo, 2007). These conditions, however, are unlikely to have affected
the findings because the proportion of individuals with anterior open-bites in the study
sample was relatively small, and any bias from this sub-group of participants would have
been expected to affect the OBC score of the long face group; this was simply not the
case. In fact, there were no significant differences in OBC score between individuals with
anterior open-bites and those with a positive overbite. Nonetheless, one cannot
objectively confirm that the study sample was completely free of TMDs.
Second, the OBC was originally developed for those with TMDs and not necessarily a
normal patient sample. Many of the items included in the OBC are specific risk factors of
TMD, including clenching, lip/cheek biting, and yawning (Feteih, 2006; Michelotti et al.,
2010; Miyake et al., 2004; Ugboko et al., 2005). On the other hand, low-level habitual
activity is reportedly different among vertical facial patterns (Ueda et al., 1998; Ueda et
al., 2000), with some oral habits (such as non-nutritive sucking) conferring a greater risk
for the development of an anterior open bite (Cozza et al., 2005). In particular, items
relating to “clenching” and “biting objects” could be expected to differ among facial
types. Moreover, the OBC has recently been validated for other conditions, including
non-TMD patient populations (Markiewicz et al., 2006; Ohrbach et al., 2008c). One
advantage of the OBC is that different behaviours have been shown to exhibit
distinctive electromyographic activity (Ohrbach et al., 2008c). In general, the OBC was
expected to be valid and reliable in the present study sample.
4.4.2 Oral Behaviour Patterns and Vertical Facial Form
There is substantial evidence of an association between masticatory muscle activity and
vertical facial form (Abu Alhaija et al., 2010; Ingervall and Helkimo, 1978; Proffit et al.,
1983; Serrao et al., 2002; Tecco et al., 2007), although there is still some controversy as to
the causal nature of this relationship (Van Spronsen, 2010). Previous studies, however,
have typically quantified this relationship using bite force measurements and EMG-
recorded activity, with very few reporting the frequency of these distinctive masticatory
behaviours in the natural environment. Using the OBC, there were no significant

! 104
differences in the prevalence, extent, or severity of oral behaviours between long and
normal face individuals. Oral behaviours, such as clenching and non-nutritive sucking,
were also remarkably similar in the two study groups. Finally, there were no significant
differences between cases and controls for either nocturnal or wake-time behaviours.
This is the first study to use the OBC in a sample with different vertical facial
morphologies and it is, therefore, difficult to compare the present findings with previous
reports. However, the use of portable EMG recorders in the natural environment has
provided some objective data on the activity and frequency of oral behaviours. Some of
these studies have found a significantly longer duration of masseter muscle activity in
hypodivergent individuals (Ueda et al., 2000), while others have failed to detect any
differences between facial types (Farella et al., 2005). Farella and colleagues (2005)
reported on the actual number of activity periods per hour, but found no difference
between short and long face individuals. There are two plausible reasons that may
explain these contradictory findings: (1) the severity of the long face phenotype; (2) and,
the number of occlusal contacts, or prevalence of anterior open-bites (Farella et al.,
2005). Interestingly, the average mandibular plane angle and prevalence of anterior
open-bite in this study was much higher than that reported by Farella and colleagues in
2005. Given that the present data support the findings of that latter study, it is unlikely
that either of these two factors play a major role in the pattern of oral behaviours among
facial types.
The similarity in oral behaviour patterns between facial types may be due to a specific
group’s reduced ability to recall these events. Although there is no reason to suspect
any difference in reporting behaviour between cases and controls, a large proportion of
healthy adults are often unaware of parafunctional habits such as clenching and
grinding (Panek et al., 2012). In order to reduce the chance of recall bias, participants
were instructed to report on oral behaviours carried out over a short period of time (i.e.
previous four weeks). In spite of this, participants in both groups may still have been
unaware of carrying out some of the more subtle oral behaviours.

! 105
Treatment stage is another important factor that may have influenced the pattern of
oral behaviour in this sample. Although cases and controls were matched based on
treatment stage, it is likely that the presence of fixed orthodontic appliances may have
altered the oral behaviour patterns of some individuals more than others. Several items
(such as “use chewing gum” and “chewing food on one side only”) were significantly
different among the three treatment stages (before, during and after orthodontic
therapy). Some of these oral behaviours are closely related to the restrictive nature of
fixed orthodontic appliances (e.g. chewing gum and leaning with hand on the jaw). In
general, there were few differences between the study groups with respect to
treatment stage, although pre-treatment cases were more likely to “lean with their hand
on the jaw”, while long face patients under treatment “chewed gum” considerably less
than their control counterparts. It is difficult to explain small differences in these
individual items by study group because of the limited number of participants in each
category. Indeed, there were no significant differences in oral behaviour patterns by
treatment stage when the entire sample was analysed together.
Clinically, the present data are not consistent with studies that have reported significant
changes in both dental and skeletal features after the prescription of jaw training
exercises to individuals with hyperdivergent morphologies (Bakke and Siersbaek-
Nielsen, 1990; Ingervall and Bitsanis, 1987; Parks et al., 2007; Sankey et al., 2000;
Spyropoulos, 1985). In general, the effects of these interventions have typically been of
small magnitude and not clinically significant. For instance, some studies have found a
mean (forward) mandibular rotation of only 1-2 degrees after at least one year of regular
muscle training (Ingervall and Bitsanis, 1987; Sankey et al., 2000). Findings from different
studies are also somewhat inconsistent, with some reporting significant skeletal effects
(Ingervall and Bitsanis, 1987; Sankey et al., 2000), but not others (Parks et al., 2007). The
lack of a strong effect in these studies may be partly explained by the findings of the
present study, where no association was found between habitual muscular activity and
vertical facial form.

! 106
4.4.3 Oral Behaviour Patterns and Sex
The overall number of oral behaviours reported “most or all of the time” was
considerably higher in the female group. More specifically, females were more likely to
place pressure on their jaw while asleep, touch or hold their teeth together, lean with
their hand on the jaw, hold the phone between the head and shoulders, and engage in
sustained talking, singing and yawning. The greater prevalence of some of these oral
habits in females is consistent with the findings of a previous study (Winocur et al.,
2006). In contrast, no significant differences were found in the occurrence of gum
chewing and tooth clenching between males and females. With respect to the latter,
the prevalence of tooth clenching in females is variable, with some authors reporting a
significant increase (Winocur et al., 2006), but not others (Chen et al., 2007).
It is possible that the greater prevalence of some of these oral habits in females may
predispose them to a greater risk of TMD. Indeed, both oral habits and being female are
reported risk factors for TMD and myofascial pain (Huang et al., 2002; List et al., 1999;
Michelotti et al., 2010; Miyake et al., 2004; Winocur et al., 2006). Recent research suggests,
however, that parafunctional habits are not necessarily associated with TMD in younger
populations (Emodi-Perlman et al., 2012). The findings of the present study cannot
support or refute either of these findings since no objective data were collected on
TMD. However, that tooth clenching, a common risk factor for TMD, was comparable in
both sexes does not support the theory of a greater risk of TMD among females in this
sample. On the other hand, the greater prevalence of oral habits among females may
reflect their greater propensity to self-report health issues such as pain-related
conditions (Dao and LeResche, 2000).
Conclusions 4.5
Contrary to expectation, self-reported oral behaviour patterns were remarkably similar in
both long and normal face individuals. The findings of the present study do not support
the association between habitual muscular activity and vertical facial form. There was a
greater prevalence of some oral habits among females, and these may represent risk

! 107
factors for TMD. Future research should, therefore, focus on identifying common risk
behaviours for TMD in long face individuals (with or without an anterior open-bite).

! 108
5 OHRQoL and Functional Limitations
Introduction
Materials and Methods
Results
Discussion
Conclusions

! 109
Introduction 5.1
Malocclusion severity has traditionally been assessed using clinical-based indices,
although recent emphasis on patient-centred care has seen a paradigmatic shift
towards self-report measures of oral health (Sischo and Broder, 2011). Orthodontic
problems do not generally fit the classical “health and disease” model, however, because
they are usually neither symptomatic nor debilitating (Cunningham and Hunt, 2001). In
fact, the majority of orthodontic patients seek treatment for aesthetic reasons, and this
may have an underlying psychosocial component (Tuominen and Tuominen, 1994).
Oral health-related quality of life (OHRQoL) measures are, therefore, well suited to
evaluating the impact of these malocclusions because they are based on an individual’s
subjective perceptions and experiences (Sischo and Broder, 2011). Moreover, these self-
report instruments are designed to incorporate a wide range of domains including
functional, psychological, and social aspects (Mehta and Kaur, 2011).
The recent use of these OHRQoL instruments in general and orthodontic samples has
shown that a large proportion of malocclusions have a significant impact on the
emotional and social well-being of an individual (Foster Page et al., 2005; Kok et al., 2004;
O'Brien et al., 2007; O'Brien et al., 2006), with a distinctive gradient reported in OHRQoL
scores across categories of malocclusion severity (Foster Page et al., 2005). On the other
hand, some studies have reported rather weak associations between malocclusion
severity and OHRQoL measures (Kok et al., 2004; Locker et al., 2007). Nonetheless, it has
been suggested that malocclusions are more likely to have a psychosocial impact on
quality of life, rather than a functional one (O'Brien et al., 2007). But, do all malocclusions
have the same effect on an individual’s quality of life?
Findings from a recent study suggest that OHRQoL scores are greater in the presence of
a significant malocclusion, but do not necessarily differ according to different types of
malocclusions, such as anterior crowding, increased overjet and hypodontia (O'Brien et
al., 2007). In contrast, other studies have found significantly higher Child Perceptions
Questionnaire (CPQ) scores in those with multiple missing teeth (Locker et al., 2010;

! 110
Wong et al., 2006), and greater overjet or anterior spacing (Johal et al., 2007; Sardenberg
et al., 2013). Bernabé and coworkers used a condition-specific OHRQoL instrument and
found significant differences between the three Angle classes, with Class II and Class III
malocclusions having a higher prevalence of impacts than those with Class I and normal
occlusions (Bernabe et al., 2008b). Unfortunately, vertical malocclusions were not
included in that study, and no lateral cephalograms were taken to investigate the
underlying skeletal discrepancy. Frejman and colleagues also reported significantly
higher OHIP-14 and self-esteem scores of a group of patients with a predominantly
Class III malocclusion (Frejman et al., 2012). The authors did not report on the individual
domains of the OHIP-14 scale or aspects of the skeletal pattern, however.
Very few studies have investigated the relationship between vertical malocclusions and
OHRQoL. Sardenberg and colleagues used the CPQ to investigate the impact of
malocclusion on OHRQoL in a large population-based sample of 1,204 Brazilian school
children aged 8 to 10 years, and found significant associations between anterior occlusal
anomalies, such as spacing and overjet, and OHRQoL (Sardenberg et al., 2013). A
considerable proportion of study participants with open-bites experienced high
impacts, although this was marginally insignificant statistically. Another recent study
investigating the prevalence of oral health impacts in patients with severe
malocclusions and dentofacial deformities also found that nearly two-thirds of the 151
adult patients had experienced an OHIP-14 impact during the previous month (Rusanen
et al., 2010). Statistically significant associations were reported for lateral cross-bites,
open bites, reverse overjet (i.e. Class III), and Class II malocclusions. In particular,
individuals with open-bites found eating to be uncomfortable.
It is noteworthy that the majority of malocclusions with a significant impact on OHRQoL
(such as greater overjet and anterior spacing) occur in the aesthetic zone of the mouth.
Long face individuals are also reported to have less attractive profiles and anterior open-
bites that can compromise aesthetics (De Smit and Dermaut, 1984; Johnston et al., 2005;
Michiels and Sather, 1994). They may also suffer from unique functional limitations that
can further compound their OHRQoL. In particular, long face individuals are reported to
have poorer masticatory performance, a slower rate of chewing, a higher frequency of

! 111
chewing cycles, and larger posterior displacement during eating than normal and short
face individuals (Gomes et al., 2010). These differences have been attributed to the lower
bite force found in long face individuals, which typically leads to greater muscular effort
and rapid fatigue (Gomes et al., 2010). Other types of malocclusions do not necessarily
involve these functional limitations, and those with them may, therefore, experience a
greater impact on their OHRQoL.
So far, no study has investigated the impact of vertical craniofacial form on OHRQoL. The
objective of the present chapter was, therefore, to evaluate the OHRQoL and functional
limitations of long and normal face individuals using a case-control study design. It was
hypothesised that long face participants would have relatively poorer OHRQoL and
greater functional limitations.
! 112
Materials and Methods 5.2
5.2.1 Study Participants
The sample consisted of 80 case-control pairs that were individually matched on age,
sex, ethnicity and treatment stage (see Chapter 2 for more details about participant
recruitment and matching procedures).
5.2.2 Oral Health-Related Quality of Life (OHRQoL)
Participants were asked to complete a study questionnaire that included the short-form
Oral Health Impact Profile or OHIP-14 (Slade, 1997). The OHIP-14 consists of fourteen
items that were derived from the original 49-item Oral Health Impact Profile (Slade and
Spencer, 1994). The fourteen items of the OHIP-14 are organised into seven domains
that relate to function, pain, physical disability, psychological discomfort, psychological
disability, social disability, and handicap.
Study participants reported the impact for each item using a 5-point Likert-type scale
(coded as “4= very often; 3= fairly often; 2 = occasionally; 1 = hardly ever; and, 0 =
never”). An individual’s overall score could range from 0 to 56, while domain scores
ranged from 0 to 8. A higher OHIP-14 score indicated a greater impact on OHRQoL.
Study participants were asked to complete the OHIP-14 based on their experiences over
the previous four weeks.
OHIP-14 scores were computed and reported as: (1) the prevalence or proportion of
participants reporting more than one impact (defined as “very often” or “fairly often”;
code 3 and 4); (2) the extent or the number of impacts reported; (3) and the severity or
the total OHIP-14 score (calculated by summing the scores of all 14 items).

! 113
In order to validate the OHIP-14, a global question was added to the study
questionnaire, and asked: “How would you describe the health of your teeth or mouth?”
(Locker, 2001). Responses to the global question were recorded as either “excellent”,
“very good”, “good”, “fair” or “poor”.
5.2.3 Functional Limitations
Participants were also asked to complete the Jaw Functional Limitation Scale (JFLS-8)
based on their experiences over the previous four weeks (Ohrbach et al., 2008a). The 8-
item questionnaire sought information on the degree of limitation involved in carrying
out normal daily tasks such as chewing tough food and swallowing.
Study participants reported the extent of functional limitation for each item using an
unmarked 10-centimetre visual analogue scale (VAS). Participants were asked to place a
vertical mark on the scale that was anchored by “no limitation or zero” at one end, and
“severe limitation or 10” at the other end. Study participants were also instructed not to
respond to an item if they avoided that specific activity for reasons other than a physical
limitation (e.g. a vegetarian that does not normally eat chicken meat – item 2). The VAS
for each item was measured by JA using digital calipers and recorded as a continuous
variable.
5.2.4 Statistical Analysis
Data were analysed using the same statistical tests outlined in Chapter 2.

! 114
Results 5.3
5.3.1 Socio-Demographic Characteristics and Treatment Status
The sociodemographic characteristics of the study sample have been described under
section 3.3.1.
5.3.2 Validation of the OHIP-14 using Locker’s global question
Respondents who rated their overall oral health as either “fair” or “poor” had the greatest
prevalence, severity and extent of OHIP-14 impacts (Table 5.1).

! 115
Table 5.1.!Prevalence, severity and extent of OHIP-14 by Locker’s global question!
Global question: “How would you describe the health of your teeth or mouth?”
Frequency (%) Severity: Mean OHIP-14 score (SD)
Prevalence: Number of participants reporting 1+ impacts (%)
Extent: Mean number of reported impacts (SD)
Excellent 11 (6.9) 7.9 (6.3) 4 (36.4) 0.5 (0.2) Very good 63 (39.4) 6.9 (5.8) 14 (22.2) 0.5 (0.2) Good 57 (35.6) 7.7 (6.6) 9 (15.8) 0.4 (0.1) Fair 25 (15.6) 12.2 (7.1) 12 (48.0) 1.2 (0.3) Poor 4 (2.5) 18.8 (4.1) 3 (75.0) 2.0 (0.8)

! 116
The magnitude of the three measures (severity, prevalence and extent) among the
“poor” respondents was nearly double that of the “fair” respondents. There were some
inconsistencies in the overall gradient, with those reporting “excellent” oral health
having slightly higher OHIP-14 impacts than the “very good” and “good” respondents.

! 117
5.3.3 Oral Health-Related Quality of Life (OHIP-14)
The overall prevalence, extent and severity of OHIP-14 impacts by study group are
presented in Table 5.2.
Table 5.2.!Severity, prevalence, and extent of OHIP-14 impacts by study group!
Measure Group Both combined
(n = 160) Cases (n = 80) Controls (n = 80) Prevalence (%) 22 (27.5) 20 (25.0) 42 (26.3) Extent (SD) 0.7 (0.1) 0.5 (0.1) 0.6 (1.2) Severity (SD) 9.3 (6.5)a 7.5 (6.8) 8.4 (6.7) aP < 0.05
Nearly one-quarter of the sample experienced one or more OHIP-14 impact. Cases had a
significantly greater mean OHIP-14 score than controls (p < 0.05), although no
significant difference was noted for either the prevalence or extent of OHIP-14 impacts.
The distribution of responses for each OHIP-14 item is presented in table 5.3.

! 118
Table 5.3.!Distribution of responses and mean score of each OHIP-14 item by study group
Items “Because of trouble with your teeth or mouth…”
Distribution of responses (%)a Never (0)/
Hardly ever (1) Occasionally (2)
Fairly often (3) / Very often (4)
Mean (SD)
Cases Controls Cases Controls Cases Controls Cases Controls Functional limitation Have you had trouble pronouncing any words? 70.0 85.0 23.8 12.5 6.3 2.5 1.4 (0.6) 1.2 (0.4) Have you felt that your sense of taste has worsened? 97.5 98.8 2.5 1.3 0.0 0.0 1.0 (0.2) 1.0 (0.1) Physical pain Have you had painful aching in your mouth? 60.0 73.8 32.5 18.8 7.5 7.5 1.5 (0.6) 1.3 (0.6) Have you found it uncomfortable to eat any foods? 72.5 76.3 23.8 21.3 3.8 2.5 1.3 (0.5) 1.3 (0.5) Psychological discomfort Have you been self-conscious? 63.7 75.0 26.3 10.0 10.0 15.0 1.5 (0.7) 1.4 (0.7) Have you felt tense? 82.5 83.8 12.5 13.8 5.0 2.5 1.2 (0.5) 1.2 (0.5) Physical disability Has your diet been unsatisfactory? 78.8 85.0 15.0 10.0 6.3 5.0 1.3 (0.6) 1.2 (0.5) Have you had to interrupt meals? 92.5 93.8 3.8 5.0 3.8 1.3 1.1 (0.4) 1.1 (0.3) Psychological disability Have you found it difficult to relax? 85.0 88.0 13.8 10.0 1.3 1.3 1.2 (0.4) 1.1 (0.4) Have you been a bit embarrassed? 76.3 78.8 18.8 12.5 5.0 8.8 1.3 (0.6) 1.3 (0.6) Social disability Have you been a bit irritable with other people? 81.3 87.5 8.8 11.3 10.0 1.3 1.3 (0.6) 1.1 (0.4) Have you had difficulty doing your usual jobs? 96.3 97.5 0.0 1.3 3.8 1.3 1.1 (0.4) 1.0 (0.3) Handicap Have you felt that life in general was less satisfying? 93.8 96.3 2.5 2.5 3.8 1.3 1.1 (0.4) 1.1 (0.3) Have you been totally unable to function? 98.8 100.0 1.3 0.0 0.0 0.0 1.0 (0.1) 1.0 (0.0) aCategories 0, 1 and 3,4 were combined to increase cell numbers !

! 119
In general, long face participants reported more problems with pronouncing words,
painful aches, self-consciousness, unsatisfactory diets, and irritability with other people
than controls. Approximately four in ten long face participants felt self-conscious (at
least occasionally) because of problems with their teeth or mouth. In contrast, some 15
per cent of normal face individuals felt self-conscious because of problems with their
teeth.
There were no significant differences in the prevalence of OHIP-14 impacts (“fairly” or
“very often”) in any of the 14 items between the two study groups (p > 0.05). However,
the prevalence of OHIP-14 impacts was greater among cases for eight items, the same
for four items, and higher in controls for two items.
The prevalence of impacts in each of the seven OHIP-14 sub-scales is presented in Table
5.4.

! 120
Table 5.4.!Prevalence of 1+ impacts in each OHIP-14 subscale by study group (%)!
OHIP-14 subscale Group Both combined
(n = 160) Cases (n = 80) Controls (n = 80) Functional Limitation 5 (6.3) 2 (2.5) 7 (4.4) Physical Pain 8 (10.0) 6 (7.5) 14 (8.8) Psychological discomfort 10 (12.5) 13 (16.3) 23 (14.4) Physical disability 8 (10.0) 4 (5.0) 12 (7.5) Psychological disability 5 (6.3) 7 (8.8) 12 (7.5) Social disability 8 (10.0)a 1 (1.3) 9 (5.6) Handicap 3 (3.8) 1 (1.3) 4 (2.5) Overall 22 (27.5) 20 (25.0) 42 (26.3) aP < 0.05
There were a slightly higher proportion of cases that reported one or more impacts in
the physical disability (10.0%), physical pain (10.0%), and functional limitation subscale
(6.3%). In particular, cases were significantly more likely to experience problems relating
to social disability (10.0%; p < 0.05).
When analysed by gender and treatment stage, there were no significant differences in
the prevalence of the OHIP-14 domains or overall score (p > 0.05).
Similarly, there were no significant differences in the mean OHIP-14 sub-scale scores
between the study groups (Table 5.5).

! 121
Table 5.5.!Severity of impacts (mean score) in each OHIP-14 subscale by study group (SD)!
OHIP-14 subscale Group Both combined
(n = 160) Cases (n = 80) Controls (n = 80) Functional Limitation
1.2 (1.2) 0.8 (0.9) 1.0 (1.1)
Physical Pain 2.2 (1.6) 1.9 (1.8) 2.0 (1.7) Psychological discomfort
1.8 (1.7) 1.6 (1.8) 1.7 (1.7)
Physical disability 1.2 (1.3) 0.9 (1.3) 1.1 (1.3) Psychological disability
1.4 (1.4) 1.2 (1.6) 1.3 (1.5)
Social disability 1.1 (1.4) 0.8 (1.2) 0.9 (1.3) Handicap 0.5 (0.9) 0.3 (0.7) 0.4 (0.8) Overall 9.3 (6.5)a 7.5 (6.8) 8.4 (6.7) aP < 0.05
Cases had a consistently higher mean OHIP-14 score in all seven domains, although this
was not statistically significant. The overall OHIP-14 score was significantly higher
among cases, however (p < 0.05).
When analysed by gender, there were no significant differences in any of the OHIP-14
domains or overall score between males and females (p > 0.05). However, there were
some differences according to treatment stage. Individuals undergoing treatment
reported the highest overall and physical pain scores, followed by those before
treatment and after treatment (p < 0.001).

! 122
5.3.4 Jaw Function Limitation (JFLS-8)
The mean score of JFLS-8 for cases and controls is presented in Table 5.6.
Table 5.6.!Mean score of JFLS-8 by study group (SD)!
Items Group Both combined
(n = 160) Cases (n = 80) Controls (n = 80) Chew tough food 2.7 (2.5) 2.0 (2.2) 2.3 (2.4) Chew chicken prepared in oven
3.7 (15.4) 3.4 (15.5) 3.5 (15.4)
Eat soft food not requiring chewing
2.0 (11.1) 0.6 (1.0) 1.3 (7.9)
Open wide enough to drink from a cup
1.0 (1.8) 0.9 (1.4) 1.0 (1.6)
Swallow 1.0 (1.5) 2.0 (11.0) 1.5 (7.9) Yawn 1.4 (2.1) 0.9 (1.4) 1.2 (1.8) Talk 1.1 (1.6) 0.8 (1.3) 0.9 (1.5) Smile 1.2 (1.7) 1.2 (1.9) 1.2 (1.8)
There were no significant differences in any of the eight items between the two study
groups (p > 0.05), although cases had a slightly higher mean score for most items. The
greatest limitation was reported for “chewing chicken prepared in an oven” and
“chewing tough food”, while the least discomfort occurred while “talking”. It is
noteworthy that the mean score for “eating soft food not requiring chewing” in the long
face group was the same as “chewing tough food” in the control sample.

! 123
Discussion 5.4
The purpose of this study was to investigate the impact of the long face morphology on
oral health-related quality of life and jaw function. This case-control study involved
administering a short questionnaire to 80 case-control pairs that were individually
matched on age, gender, ethnicity and treatment stage. The self-report data consisted
of the OHIP-14 and JFLS-8 questionnaires, which participants were instructed to
complete based on their experiences over the previous four weeks. The study’s findings
indicate few differences between the two groups, although the overall mean OHIP-14
score and the social disability subscale score were significantly greater in cases. There
were no significant differences in the JFLS-8 scores between the two study groups. It is
noteworthy that the present work is the first to measure these two outcomes
simultaneously in this population group.
5.4.1 Self-Report Instruments
The present study utilised two self-report instruments to assess the quality of life and
functional limitations in individuals with different facial morphologies. Although the
impact of malocclusions has traditionally been measured using clinical-based indices,
there is a growing trend of combining these indices with OHRQoL measures in order to
better evaluate a patient’s self-perception with his/her facial appearance (de Oliveira
and Sheiham, 2003; Tsakos et al., 2006).
A large number of self-report instruments have been used in orthodontics to evaluate
the impact of malocclusion and orthodontic treatment on OHRQoL. Of these, the short
form Oral Health Impact Profile (OHIP-14; Slade, 1997) is among the most frequently
used to assess the impact of orthodontic problems (Frejman et al., 2012; Rusanen et al.,
2010), and treatment on OHRQoL (Choi et al., 2010; de Oliveira and Sheiham, 2003;
Esperao et al., 2010; Lee et al., 2008). Other OHRQoL instruments that have also been
used in orthodontic samples include the Child Perceptions Questionnaire (CPQ 11-14;

! 124
Foster Page et al., 2005), the Early Childhood Oral Health Impact Scale (ECOHIS; Aldrigui
et al., 2011), and the Oral Impacts on Daily Performances index (OIDP; Bernabe et al.,
2008b).
However, the OHIP-14 is a simple and short questionnaire that has a number of
important properties, including good discriminative abilities in normal orthodontic
patient samples (de Oliveira and Sheiham, 2004), as well as in those with more severe
dentofacial deformities (Lee et al., 2007). Moreover, it has been validated for use across a
wide range of age groups, which makes it suitable for adolescent and adult orthodontic
populations (Goes, 2001). On the other hand, condition-specific instruments (such as the
OIDP) are reported to have superior discriminative abilities than the OHIP-14 in patients
with a normative need for orthodontic treatment (Bernabe et al., 2008a). One clear
advantage of the OHIP-14 is its widespread use in orthodontic samples, which permits
comparisons with other studies.
The assessment of jaw function is somewhat more difficult since a large proportion of
individuals are often not aware of their oral behaviours and habits (Panek et al., 2012).
The OHIP-14 includes a functional limitations domain that consists of 2 items relating to
difficulties with verbal communication and worsening of taste sensation. In addition, the
physical pain domain asks whether individuals had any painful aching in their mouth, or
whether they have experienced any discomfort eating food. Although the OHIP-14
covers a wide range of domains that relate to OHRQoL, differentiation between these
dimensions can often be difficult (John et al., 2004). The limited number of items used to
characterise each domain may affect the instrument’s ability to comprehensively
evaluate specific dimensions such as function.
Other self-report instruments that have been purposefully designed to evaluate jaw
function include the Research Diagnostic Criteria for Temporomandibular Disorders
(RDC/TMD), the Functional Limitation Checklist (Dworkin and LeResche, 1992), and the
Mandibular Functional Impairment Questionnaire (MFIQ; Stegenga et al., 1993). These
instruments were originally developed for patients with Temporomandibular disorders
(TMD), however, and have not been validated for other conditions (Ohrbach et al.,

! 125
2008a). Moreover, some of these scales were found to have inadequate definitions of
specific behaviours and overlapping content across domains (Ohrbach et al., 2008a).
The Jaw Functional Limitation Scale (JFLS) is another condition-specific instrument that
has recently been developed for patients with TMD (Ohrbach et al., 2008a). Unlike
previous scales, however, the JFLS has been validated for a range of oral conditions
including primary Sjögren syndrome, burning mouth syndrome, skeletal malocclusion,
and healthy dentitions (Larsson, 2010; Ohrbach et al., 2008b). More specifically, the JFLS
was validated for severe malocclusions such as open-bite and mandibular prognathism
(Ohrbach et al., 2008b). Although the JFLS-20 was originally validated for assessing three
distinct constructs (mastication, vertical jaw mobility, and emotional and verbal
expression), the short form version (JFLS-8) has also been shown to be a useful measure
of global functional limitation of the jaw (Ohrbach et al., 2008b). In summary, the JFLS-8
appears to be a useful self-report instrument for individuals with functional problems
(Larsson, 2010). So far, however, this instrument has not been used in a clinical setting to
assess patients with vertical skeletal malocclusions. The combined use of a generic
OHRQoL measure and a condition-specific functional scale was useful in this sample
since these individuals were expected to suffer from both aesthetic and functional
problems.
5.4.2 Quality of Life in Long Face Individuals
Few studies have investigated the impact of vertical facial form on OHRQoL. Although
the OHIP-14 has been used to investigate OHRQoL in children with open-bites there are
no studies directly relating to individuals with the long face morphology. Long face
participants in the present study had higher scores for the overall scale and social
disability subscale of the OHIP-14. These findings are supported by previous studies that
have reported greater impacts in the emotional and social domains of the CPQ (Foster
Page et al., 2005; Kok et al., 2004; O'Brien et al., 2007; O'Brien et al., 2006). Overall,
however, there were no differences in the 14-items or the remaining six domains of the
OHIP-14 scale. In fact, the prevalence of impacts in the control group was surprisingly
higher for the two psychosocial domains. This latter finding was somewhat unexpected

! 126
given that long face patients are reported to have markedly less attractive profiles (De
Smit and Dermaut, 1984; Johnston et al., 2005; Michiels and Sather, 1994). In turn, facial
attractiveness is believed to play an important role in social interactions and personality
development (Van der Geld et al., 2007). However, the exact definition of facial
attractiveness is not universal, with substantially divergent opinions between clinicians
and lay people (Cochrane et al., 1999; Prahl-Andersen et al., 1979).
There are a number of other reasons that may account for the lack of differences
between the two study groups. Firstly, it is possible that the selection criteria (e.g.
mandibular plane angle) used in the present study did not reflect important aesthetic or
functional concerns for the study participants. Lower anterior facial height, for instance,
has been reported to be an important predictor of facial attractiveness – even more so
than sagittal features (De Smit and Dermaut, 1984). Profiles with greater lower anterior
facial height are reported as the least attractive and the most in need of orthodontic
treatment (Johnston et al., 2005). The present sample differed primarily on the basis of
skeletal divergence and not necessarily with respect to the lower anterior facial height.
In fact, the lower anterior facial height in the cases was not much greater than controls.
The lack of a substantial difference in the anterior proportions of the face between the
study groups may, therefore, partly explain the similarity in OHIP-14 scores.
Another important factor is the perceived impact of other features of a malocclusion on
an individual’s OHRQoL. Although this study only investigated the impact of vertical
dysplasia, it is important to note that other occlusal features (such as lateral cross-bites
and anterior spacing) may also adversely affect an individual’s quality of life (Johal et al.,
2007; Rusanen et al., 2010; Sardenberg et al., 2013). The long face morphology is
somewhat unique in that it often consists of “characteristic” occlusal anomalies,
including anterior open-bites and lateral cross-bites (Schendel et al., 1976). The present
study did not objectively compare (or adjust for) the severity of the malocclusions in the
two study groups, although this is unlikely to be an issue given the lack of difference in
OHRQoL scores. Other studies have also encountered similar difficulties while
investigating the relationship between isolated features of a malocclusion and OHRQoL
(Rusanen et al., 2010).

! 127
Third, it is possible that the composition of the study sample may have masked
important differences in OHRQoL. The majority of the sample was either undergoing
orthodontic treatment or had completed treatment at the time of participation.
Orthodontic patients under treatment could be expected to have relatively worse
OHRQoL scores (Liu et al., 2011b; Locker, 2001), which may overshadow the type or
severity of a malocclusion. By the same token, patients who have completed
orthodontic treatment are also much more likely to be satisfied with their facial
appearance, especially if the treatment has addressed their main aesthetic concerns (e.g.
closure of an anterior open-bite). This theory seems consistent with previous studies
that have found significantly worse OHRQoL scores associated with occlusal anomalies
occurring in the aesthetic zone of the mouth (Rusanen et al., 2010; Sardenberg et al.,
2013). It is noteworthy, however, that patients with long face morphologies continue to
exhibit a similar vertical facial pattern irrespective of treatment status (except for
orthognathic surgery cases). Therefore, the inclusion of participants undergoing
treatment may not have completely masked the impact on OHRQoL that results from
excessive vertical facial growth.
Finally, the OHIP-14 may be less sensitive than other condition-specific measures for
detecting associations between malocclusion severity and OHRQoL (Liu et al., 2011a).
This type of instrument insensitivity can sometimes occur if the included items are not
prevalent or relevant in the target population – this often results in an increased
prevalence of no impacts (Sischo and Broder, 2011). The relatively high proportion of “no
impacts” in both study groups may, therefore, reflect the instrument’s poorer sensitivity
in this sample.
5.4.3 Functional Limitation in Long Face Individuals
There is some evidence that individuals with anterior open-bites may experience more
discomfort while eating (Rusanen et al., 2010). This finding is difficult to generalise to
long face populations, however, since open-bites do not always occur in these
individuals (Betzenberger et al., 1999; Fields et al., 1984). Nonetheless, long face
! 128
individuals exhibit significantly poorer masticatory muscle efficiency that is believed to
result in poorer masticatory performance, a slower rate of chewing, a higher frequency
of chewing cycles, and larger posterior displacement during eating than normal and
short face people (Gomes et al., 2010).
In this closely matched case-control study, there were no significant differences in either
the functional limitation subscale of the OHIP-14 or any of the JFLS-8 items between the
two groups. Interestingly, however, the mean score for “eating soft food not requiring
chewing” in the long face group was the same as “chewing tough food” in the control
sample. This finding indicates that long face participants may prefer softer food that is
more suited to their less efficient masticatory system.
Similar findings have been reported in young children with enlarged adenotonsillar
tissue who have comparable skeletal features to the typical long face individual (Valera
et al., 2003). Nearly three-quarters of these children with mouth-breathing habits
preferred soft, pasty food to solid food. In fact, only 20% of children with mouth
breathing habits ate meat naturally, in comparison with over 80% of the controls. Of the
remaining mouth breathers, some 36% ate only minced meat or sucked the meat, while
just under half those children avoided eating meat altogether. It is noteworthy, however,
that the different phenotype and considerably young age of these children prevent
direct comparisons with the present data. Nonetheless, those findings suggest that
some long face individuals may suffer from problems with mastication and deglutition.
5.4.4 Limitations of the Study
The present study has a number of limitations that deserve some discussion. As
previously mentioned, existing cases were recruited rather than new cases, which
meant that the OHRQoL did not solely reflect the vertical facial pattern, but also the
impact of orthodontic treatment. Although the case-control pairs were carefully
matched on treatment status, the inclusion of existing cases could have theoretically
worsened (e.g. participants during treatment) or improved (e.g. participants after
treatment) the overall OHRQoL scores. Moreover, the overall severity of the

! 129
malocclusions in each group was not evaluated in the present study and this may have
been a confounding factor. This latter issue is a common problem in studies such as the
present one, however (Rusanen et al., 2010). It could only be assumed that the groups
were more or less similar in this respect.
On the other hand, the study has a number of strengths, including the use of a global
question to validate the OHIP-14 (Locker, 2001). There was a generally consistent
gradient between the single-item global question and the OHIP-14. In other words,
participants that reported their overall oral health as “poor” or “fair” did in fact have the
highest OHIP-14 score (or worse OHRQoL). In general, the OHIP-14 was considered a
valid measure of how participants in this study sample viewed their general oral heath.
In addition, cases and controls were individually matched on age, gender, ethnicity and
treatment stage, which reduces the risk of these potential confounders.
Conclusions 5.5
Vertical facial morphology appears to have a small but significant overall effect on the
OHRQoL of an individual. The most important difference in the OHIP-14 scale between
long and normal face individuals occurs in the social disability domain, and not the
functional or psychological subscales. Data from the JFLS-8 scale suggest that long face
individuals may experience a similar degree of limitation when chewing either soft or
hard foods. Future studies, with larger samples, are needed to further elucidate the
relationship between facial type and OHRQoL/jaw function.

! 130
6 General Discussion and Conclusions
Summary of the Main Findings
Methodological Limitations
Defining a Long Face
Nature versus Nurture: Revisited
Future Research Directions
Conclusions

! 131
6.1 Summary of the Main Findings
The main objectives of this case-control study were to investigate and compare the (1)
cephalometric features; (2) oral behaviour patterns; (3) and, quality of life and functional
limitations between long (case) and normal (control) face individuals. A long-term
objective was to establish a craniofacial database that could be used to investigate the
association between vertical facial patterns and selected candidate genes. The study
involved the recruitment of 80 cases and 80 controls that were individually matched on
age, gender, ethnicity and treatment stage. Participants were asked to complete a short
study questionnaire that included the Oral Behaviour Checklist (OBC), Oral health Impact
Profile (OHIP-14), and the Jaw Function Limitation Scale (JFLS-8). Moreover, a
comprehensive cephalometric analysis was carried out for each study participant.
The first objective of the study was to define the cephalometric features of the long face
morphology and its subtypes. The present study identified a number of characteristic
features associated with the long face pattern, including a shorter ramus and posterior
facial height, retrognathic mandible and maxilla, and steep mandibular plane angle.
Open-bite individuals, in particular, had a significantly greater lower anterior facial
height and mandibular plane angle. The height of the posterior face in hyperdivergent
individuals is variable in the literature, although most studies have reported it to be
smaller than in normodivergent individuals (Cangialosi, 1984; Nahoum et al., 1972;
Schendel et al., 1976). In contrast, there is more uniform agreement regarding the larger
dimensions of the anterior facial height, especially with respect to the lower half of the
face (Fields et al., 1984; Isaacson et al., 1971; Nahoum, 1971; Nahoum et al., 1972; Nanda,
1988; Nanda, 1990; Subtelny and Sakuda, 1964). It is likely that the discrepancy in the
long face phenotype is related to the selection criteria used to define the condition,
since common cephalometric measures of facial type are often poorly correlated (Dung
and Smith, 1988). These differences may also arise due to the heterogeneous nature of
the long face morphology, with several clusters identified and described in the present
study.

! 132
With respect to the aetiology of the long face pattern, it was hypothesised that
individuals with a hyperdivergent pattern would exhibit a higher prevalence of oral
habits such as clenching and non-nutritive sucking. However, the present study found
very few differences in the overall prevalence, severity and extent of oral behaviours
between cases and controls. In fact, the majority of the differences in OBC items were
gender-related, with females more likely to report parafunctional habits such as non-
functional tooth contact. While some of these habits may explain the increased
susceptibility of females to TMD (Winocur et al., 2006), this study did not collect any
objective data in this respect. Although the OBC has been validated for non-TMD
populations (Markiewicz et al., 2006; Ohrbach et al., 2008c), this is the first study to use
the self-report questionnaire in individuals with different facial types. Therefore, it is
difficult to directly compare the present study’s findings with previously published data.
Finally, the impact of the long face morphology on daily function and OHRQoL was
evaluated. It was hypothesised that long face participants may have poorer OHRQoL
because of their greater functional limitations and relatively worse facial attractiveness.
The overall mean OHIP-14 and social domain scores of the long face group were, in fact,
significantly higher than the control sample. However, there were very few other
differences in the quality of life and functional limitation of long and normal face study
participants.
6.2 Methodological Limitations
As previously mentioned, there were very few differences in some of the study
outcomes between cases and controls. Although it is likely that the differences in both
oral behaviour and OHRQoL were genuinely minimal between the two study groups,
there are a number of methodological limitations that may have also influenced these
findings. First, the study’s power may have been insufficient to detect a significant
difference between the two study groups. The sample size was originally based on the
longer-term genetic objectives of the study (150 cases and 150 controls), which was also
believed to be sufficient for answering the present research questions. Unfortunately,
the study sample consisted of only 50 per cent of that estimated sample size. The

! 133
number of cases recruited in this study seems consistent with the reported prevalence
of hyperdivergent facial patterns in patient-based populations, which typically ranges
between 10 and 20% (Bailey et al., 2001; Proffit et al., 1990; Siriwat and Jarabak, 1985).
The 80 cases recruited in this study represents approximately 7% of the total
cephalograms that were available in the archives of the orthodontic clinic at the time of
the study. This recruitment rate is reasonable given the stringent inclusion/exclusion
criteria, severity of the phenotype (greater than 2 standard deviations), and highly-
specific matching criteria used in this study. It is noteworthy that all eligible cases at the
University of Otago’s orthodontic clinic were approached throughout the data
collection phase of the study. Another useful method to increase statistical power
would have been the matching of more than one control per case (e.g. 1 case: 2
controls). This was not attempted in the present study because of the restricted time
available for data collection, although this may be useful in the future.
Second, the majority of the study participants had completed orthodontic treatment,
and this may have affected some of the study’s findings. For example, long face
individuals may have experienced improved OHRQoL after alignment of their teeth
and/or closure of any anterior open-bites. Although treatment stage was analysed
separately whenever possible, this usually resulted in subgroups that were far too small
for detecting significant differences with a clinically relevant effect size. The inclusion of
existing cases in the present study was necessary given the scarcity of the target
phenotype. In the future, new cases should ideally be recruited in order to minimise the
effect of potential confounders and evaluate the true impact of vertical malocclusions
on factors such as quality of life.
Another reason for the lack of differences between the cases and controls in the present
study may have been due to the exclusive use of subjective instruments, which could
potentially be less sensitive to small changes in the dependent variable. It is important
to note, however, that some self-report measures (such as the OBC) have already been
validated using objective methods (Ohrbach et al., 2008c). The use of objective
instruments to measure environmental factors also has its own problems. Bite force
transducers, for instance, are often used to measure maximal bite force, but they are

! 134
known to suffer from large inter-individual variation due to a number of technical issues
such as the position of the transducer in the mouth and the amount of vertical
separation between the opposing teeth (Fields et al., 1986; Throckmorton et al., 1980). It
is clear that both subjective and objective measures are associated with some
limitations.
Finally, phenotype definition is likely to have had an important effect on the outcomes
of the present study - this subject is discussed separately under the next heading.
6.3 Defining a Long Face
Previous studies have used a wide range of cephalometric measurements to define the
long face morphology, including the mandibular plane angle (Bishara and Augspurger,
1975), ratio of upper to lower anterior facial height (Janson et al., 1994), and overbite
extent (Ceylan and Eroz, 2001). Moreover, several morphological signs have been
suggested as useful predictors of backward mandibular rotation (Björk, 1969; Skieller et
al., 1984). The mandibular plane angle and posterior to anterior facial height ratio were
used to select participants in the present study for a number of reasons. First, both of
these have been shown to identify a similar phenotype of the long face pattern (Dung
and Smith, 1988; Jacob and Buschang, 2011). It is clear from the literature that
craniofacial variation is largely heterogeneous, with some mandibular traits consisting of
several subtypes (Bui et al., 2006). Even though long face study participants were
selected based on these two highly correlated variables, there was still a considerable
degree of heterogeneity within the phenotype. This variability is likely to be lower than if
two poorly correlated selection variables (e.g. SN-MP and UFH/LFH) were used.
In the present study, the mandibular plane angle was used as the primary selection
criterion, followed by the ratio of the posterior to anterior facial height (Jarabak ratio).
Although a number of cephalometric variables can be used to identify the long face
morphology, the mandibular plane angle has the advantage of providing a true
indication of the mandibular plane with limited variation (Hocevar and Stewart, 1992).
Although some authors have suggested that the mandibular plane may not be a

! 135
suitable indicator of mandibular rotations (Björk, 1969), this seems more relevant for
predictive (rather than descriptive) purposes. The mandibular to palatal plane angle
(MP-PP) can also be used to classify different facial types, since a greater angle results in
a smaller upper facial height and greater lower anterior facial height (Nahoum, 1971).
However, the high correlation between the SN-MP and MP-PP is likely to have yielded a
similar phenotype of the long face morphology.
Alternative selection variables based on Porion or Condylion (such as FH-MP or Co-Go)
have poor reliability (Adenwalla et al., 1988). Cephalograms taken with the mouth open
may improve the identification of Condylion since the condyle becomes less obscured
by the temporal bone in this position (Adenwalla et al., 1988); however, these types of
headfilms are usually not possible in retrospective studies. On the other hand, the use of
morphological signs (such as shape of the mandibular border) to predict facial types is
not always consistent in individuals with less extreme vertical patterns (Leslie et al.,
1998), and this may have resulted in a considerable degree of error when selecting
controls.
Another advantage of these two selection variables is their frequent use in
cephalometric analyses. Both variables are represented by a number of commonly used
cephalometric landmarks: Sella, Gonion, Nasion and Menton. With the exception of
Gonion, these landmarks have been shown to exhibit generally good reliability
(Baumrind and Frantz, 1971). Since one of the (long-term) objectives of the study was to
continue recruiting cases and controls from external orthodontic providers, it was felt
that these two simple variables could improve the accuracy and efficiency of phenotype
identification/recruitment in the future.
Moreover, cases were selected if they varied by more than two standard deviations from
the average population values, and this resulted in a group of cases with an extremely
high mandibular plane angle. The choice of two standard deviations as a selection
criterion was expected to account for both morphological variation and measurement
error (Isaacson et al., 1971). This stringent selection criterion would theoretically ensure a
wide “margin of safety” that is more likely to reflect the intended phenotype rather than

! 136
the random variation associated with other factors such as landmark identification. Since
a large proportion of the study participants were adolescents, the selection of highly
divergent cases was also expected to reduce the risk of phenotype dilution (e.g.
reduction of SN-MP) that occurs with growth (Jacob and Buschang, 2011). Fortunately,
previous studies have shown that over two-thirds of hyperdivergent individuals
maintain their vertical facial pattern throughout active growth (Bishara and Jakobsen,
1985; Jacob and Buschang, 2011).
It is clear that further research is still needed to clearly define the long face morphology,
and more importantly, classify its various subtypes. Accurate descriptions of the long
face phenotype and its subtypes will play an important role in the identification of
relevant environmental and genetic aetiological factors. The impact of the transversal
dimension on facial morphology should also be considered in future studies.
6.4 Nature versus Nurture: Revisited
Over the past century, numerous theories, arguments and counter-arguments about the
origins of craniofacial growth have been proposed, debated and rejected (Carlson,
2005). Most contemporary theories nowadays recognise the importance of
environmental, epigenetic and genetic factors in regulating craniofacial growth (Roberts
and Hartsfield, 2004). Until recently, however, most research in this field has focused on
the role of local environmental factors in determining facial shape and form. In
particular, diet consistency (or masticatory muscle activity) and mouth breathing have
been suggested as possible causes of the long face morphology.
Recent research investigating the effect of oral breathing on facial growth illustrates the
intricate relationship between environmental and non-environmental factors. Short
periods of nasal obstruction in growing rats have been shown to result in marked
cephalometric and hormonal changes (Padzys et al., 2012), which include a significant
increase in basal corticosterone level, and a marked decrease in thyroid hormone
concentrations. This greater level of glucocorticoids has been suggested as the cause of
reduced craniofacial dimensions in experimental rats by reducing the activity of

! 137
osteoblasts and promoting apoptosis (Weinstein et al., 1998). Interestingly, the removal
of large tonsils and adenoids in children with obstructive sleep apnoea is also reported
to increase serum growth factor levels (Bar et al., 1999), which appears to coincide with
catch-up craniofacial growth (Peltomäki, 2007).
It is clear that the environmental and genetic factors involved in craniofacial growth do
not operate in vacuum but are part of a more complex process. Although the specific
effects of breathing mode were not investigated in the present work, this study’s
findings suggest that a combined environmental-genetic approach may offer the best
method for elucidating the aetiological factors involved in vertical craniofacial dysplasia.
6.5 Future Research Directions
One of the main objectives of the present study was to investigate the association
between masticatory muscle activity and vertical craniofacial form. Although a self-
report questionnaire was the only instrument used to measure the frequency of habitual
muscle activity, there was no evidence of such an association in this sample. Several
authors have also suggested that weak masticatory muscles may be the effect rather
than the cause of the long face morphology (Proffit and Fields, 1983; Van Spronsen,
2010). This raises an important, and still elusive question: What causes the long face
morphology?
Clearly, the answer is not simple and is likely to involve both environmental and genetic
factors. With respect to the latter, recent technological advances in molecular genetics
have opened new doors for understanding the underlying aetiology of many complex
diseases and traits. Indeed, several candidate genes have been reported for a wide
range of dental-related phenotypes, including residual ridge (Kim et al., 2012), and
external apical root resorption (Iglesias-Linares et al., 2013). The field of craniofacial
growth has also benefited from this rapidly growing molecular technology with the
identification of several candidate genes involved in facial growth regulation (see
Chapter 1 for a comprehensive review). Unfortunately, previous studies have often used
small samples, non-specific phenotypic definitions, and lacked control groups.

! 138
Moreover, the majority of these studies have been carried out using Asian-based
samples, and their findings may, therefore, not be applicable to other population
groups.
Future research should therefore focus on expanding our knowledge of the genetic
factors involved in craniofacial growth regulation. As part of this study, DNA samples
were collected and could be used to test for selected candidate genes, including the
GH/GHR/IGF-1 genes. The next challenge will involve the implementation of valid
objective and/or subjective instruments that can be used to concurrently measure a
wide range of environmental factors. For example, the use of wireless EMG recorders
may be useful for obtaining data on masticatory function of long and short face
individuals in the natural environment. These types of data may be used in future
multivariate analysis, along with potential candidate genes. There is already a wide
selection of potential genetic markers reported in the literature, although future animal
models should also be used to identify new candidate genes through gene expression
micro-assay kits. Indeed, a rat model designed to investigate gene expression in the
normal mandibular condyle is currently being established at the Sir John Walsh
Research Institute, University of Otago. In the future, knock-out and knock-down gene
models may also prove useful for understanding the effect of selected polymorphisms
on craniofacial growth (Ramirez-Yanez et al., 2005).
6.6 Conclusions
Our understanding of vertical craniofacial growth has significantly increased over the
past few decades, although several aspects of this developmental process still remain
unclear. The present study involved the successful development of a new online
craniofacial database that can be used to investigate both environmental and genetic
factors implicated in the aetiology of craniofacial dysplasia, and particularly the long face
morphology. This online database, which is still being used to recruit individuals with
vertical facial dysplasia, allows researchers to enrol and match participants, collect DNA
samples, and record clinical/self-report data. In the future, this database can easily be

! 139
expanded to include more facial phenotypes and customised to collect different types
of self-report and clinical data.
Based on the data collected from the 160 study participants enrolled in this study, the
following can be concluded:
1. Long face individuals selected based on the mandibular plane angle and/or
PFH/AFH have distinctively different cephalometric features in nearly every
vertical dimension than matched controls.
2. Open-bite individuals can be characterised by a significantly larger mandibular
plane angle and greater lower anterior facial height. There are also some
differences in dentoalveolar features that may mask an anterior open-bite,
although these were not found to be significant in the present study.
3. The long face morphology is not a single clinical entity but consists of several
clusters. Some of these subgroups have been described and should be used in
the design and analysis of future studies.
4. Long and normal face individuals have very similar oral behaviour patterns,
irrespective of treatment stage or age. The present data, therefore, do not
support the notion that long face individuals have different oral behaviour habits
from their normodivergent counterparts.
5. Long face individuals have small, but significantly higher overall and social
domains scores of the OHIP-14.
6. Facial morphology does not necessarily influence jaw function, with little
difference in the functional limitations between long and normal face
individuals.
In light of some methodological limitations, the investigation of these two
cephalometrically distinct groups revealed no major differences in terms of self-reported
behavioural and environmental factors. Although further work in this area should be
carried out using larger samples and incident cases, there is also a need to investigate
the genetic factors associated with facial morphology. Future research should therefore
focus on collecting both environmental and genetic data from the same individuals.

! 140
7 References

! 141
Abu Alhaija ES, Al Zo'ubi IA, Al Rousan ME, Hammad MM (2010). Maximum occlusal bite
forces in Jordanian individuals with different dentofacial vertical skeletal patterns. Eur J
Orthod 32(1):71-77.
Abu Alhaija ES, Richardson A (2003). Growth prediction in Class III patients using cluster
and discriminant function analysis. Eur J Orthod 25(6):599-608.
Adenwalla ST, Kronman JH, Attarzadeh F (1988). Porion and condyle as cephalometric
landmarks--an error study. Am J Orthod Dentofacial Orthop 94(5):411-415.
Akgul AA, Toygar TU (2002). Natural craniofacial changes in the third decade of life: a
longitudinal study. Am J Orthod Dentofacial Orthop 122(5):512-522.
Aki T, Nanda RS, Currier GF, Nanda SK (1994). Assessment of symphysis morphology as a
predictor of the direction of mandibular growth. Am J Orthod Dentofacial Orthop
106(1):60-69.
Aldrigui JM, Abanto J, Carvalho TS, Mendes FM, Wanderley MT, Bonecker M et al. (2011).
Impact of traumatic dental injuries and malocclusions on quality of life of young
children. Health Qual Life Outcomes 9:78.
Amini F, Borzabadi-Farahani A (2009). Heritability of dental and skeletal cephalometric
variables in monozygous and dizygous Iranian twins. Orthod Waves 68(2):72-79.
Antoun JS, Cameron C, Sew Hoy W, Herbison P, Farella M. Secular Trends in Craniofacial
Growth (2013). Submitted to Eur J Orthod.
Arat ZM, Akcam MO, Esenlik E, Arat FE (2008). Inconsistencies in the differential diagnosis
of open bite. Angle Orthod 78(3):415-420.
Bailey LJ, Haltiwanger LH, Blakey GH, Proffit WR (2001). Who seeks surgical-orthodontic
treatment: a current review. Int J Adult Orthodon Orthognath Surg 16(4):280-292.

! 142
Bakke M, Siersbaek-Nielsen S (1990). Training of mandibular elevator muscles in subjects
with anterior open bite. Eur J Orthod 2:502.
Bakke M, Tuxen A, Vilmann P, Jensen BR, Vilmann A, Toft M (1992). Ultrasound image of
human masseter muscle related to bite force, electromyography, facial morphology, and
occlusal factors. Scand J Dent Res 100(3):164-171.
Bar A, Tarasiuk A, Segev Y, Phillip M, Tal A (1999). The effect of adenotonsillectomy on
serum insulin-like growth factor-I and growth in children with obstructive sleep apnea
syndrome. J Pediatr 135(1):76-80.
Battagel JM (1993). A comparative assessment of cephalometric errors. Eur J Orthod
15(4):305-314.
Baumrind S, Frantz RC (1971). The reliability of head film measurements: 1. Landmark
identification. Am J Orthod 60(2):111-127.
Baumrind S, Ben-Bassat Y, Korn EL, Bravo LA, Curry S (1992). Mandibular remodeling
measured on cephalograms. 1. Osseous changes relative to superimposition on metallic
implants. Am J Orthod Dentofacial Orthop 102(2):134-142.
Beane RA, Reimann G, Phillips C, Tulloch C (2003). A cephalometric comparison of black
open-bite subjects and black normals. Angle Orthod 73(3):294-300.
Beckmann SH, Kuitert RB, Prahl-Andersen B, Segner D, The RP, Tuinzing DB (1998).
Alveolar and skeletal dimensions associated with overbite. Am J Orthod Dentofacial
Orthop 113(4):443-452.
Behrents RG (1985). Growth in the aging craniofacial skeleton: Center for Human Growth
and Development, University of Michigan.

! 143
Bell WH, Proffit WR, White RP (1980). Surgical correction of dentofacial deformities: WB
Saunders: Philadelphia, pp. 137-150.
Bernabe E, de Oliveira CM, Sheiham A (2008a). Comparison of the discriminative ability
of a generic and a condition-specific OHRQoL measure in adolescents with and without
normative need for orthodontic treatment. Health Qual Life Outcomes 6:64.
Bernabe E, Sheiham A, de Oliveira CM (2008b). Condition-specific impacts on quality of
life attributed to malocclusion by adolescents with normal occlusion and Class I, II and III
malocclusion. Angle Orthod 78(6):977-982.
Betzenberger D, Ruf S, Pancherz H (1999). The compensatory mechanism in high-angle
malocclusions: a comparison of subjects in the mixed and permanent dentition. Angle
Orthod 69(1):27-32.
Billing H, Leighton B, Linder-Aronson S, Lundström A, McWilliam J (1988). The
development of the pharyngeal space and lymphoid tissue on the posterior
nasopharyngeal wall—an assessment with regard to heritability. Eur J Orthod 10(1):106-
110.
Bishara SE, Augspurger EF, Jr. (1975). The role of mandibular plane inclination in
orthodontic diagnois. Angle Orthod 45(4):273-281.
Bishara SE, Jakobsen JR (1985). Longitudinal changes in three normal facial types. Am J
Orthod 88(6):466-502.
Bishara SE, Warren JJ, Broffitt B, Levy SM (2006). Changes in the prevalence of
nonnutritive sucking patterns in the first 8 years of life. Am J Orthod Dentofacial Orthop
130(1):31-36.
Björk A (1955). Facial growth in man, studied with the aid of metallic implants. Acta
Odontol Scand 13(1):9-34.

! 144
Björk A (1963). Variations in the growth pattern of the human mandible: longitudinal
radiographic study by the implant method. J Dent Res 42(1)Pt 2:400-411.
Björk A (1969). Prediction of mandibular growth rotation. Am J Orthod 55(6):585-599.
Blanchette ME, Nanda RS, Currier GF, Ghosh J, Nanda SK (1996). A longitudinal
cephalometric study of the soft tissue profile of short-and long face syndromes from 7
to 17 years. Am J Orthod Dentofacial Orthop 109(2):116-131.
Boeck EM, Lunardi N, Pinto Ados S, Pizzol KE, Boeck Neto RJ (2011). Occurrence of
skeletal malocclusions in Brazilian patients with dentofacial deformities. Braz Dent J
22(4):340-345.
Bondevik O (2012). Dentofacial changes in adults: a longitudinal cephalometric study in
22-33 and 33-43 year olds. J Orofac Orthop 73(4):277-288.
Bosnjak A, Vucicevic-Boras V, Miletic I, Bozic D, Vukelja M (2002). Incidence of oral habits
in children with mixed dentition. J Oral Rehabil 29(9):902-905.
Bowden BD (1966). A longitudinal study of the effects of digit- and dummy-sucking. Am
J Orthod 52(12):887-901.
Brash JC (1934). Some problems in the growth and developmental mechanics of bone.
Edinburgh Med J 41(5):305-387.
Brash JC, McKeag HTA, Scott JH (1929). The aetiology of irregularity and malocclusion of
the teeth: Dental board of the United Kingdom.
Bresolin D, Shapiro PA, Shapiro GG, Chapko MK, Dassel S (1983). Mouth breathing in
allergic children: its relationship to dentofacial development. Am J Orthod 83(4):334-340.

! 145
Bruntz LQ, Palomo JM, Baden S, Hans MG (2006). A comparison of scanned lateral
cephalograms with corresponding original radiographs. Am J Orthod Dentofacial
Orthop 130(3):340-348.
Bui C, King T, Proffit W, Frazier-Bowers S (2006). Phenotypic characterization of Class III
patients. Angle Orthod 76(4):564-569.
Cangialosi TJ (1984). Skeletal morphologic features of anterior open bite. Am J Orthod
85(1):28-36.
Carels C, Van Cauwenberghe N, Savoye I, Willems G, Loos R, Derom C et al. (2001). A
quantitative genetic study of cephalometric variables in twins. Clin Orthod Res 4(3):130-
140.
Carlson DS (2005). Theories of craniofacial growth in the postgenomic era. Semin Orthod
11(4):172-183.
Castelo PM, Pereira LJ, Bonjardim LR, Gavião MBD (2010). Changes in bite force,
masticatory muscle thickness, and facial morphology between primary and mixed
dentition in preschool children with normal occlusion. Ann Anat 192(1):23-26.
Ceylan I, Eroz UB (2001). The effects of overbite on the maxillary and mandibular
morphology. Angle Orthod 71(2):110-115.
Chen CY, Palla S, Erni S, Sieber M, Gallo LM (2007). Nonfunctional tooth contact in
healthy controls and patients with myogenous facial pain. J Orofac Pain 21(3):185-193.
Chew MT (2006). Spectrum and management of dentofacial deformities in a multiethnic
Asian population. Angle Orthod 76(5):806-809.

! 146
Choi WS, Lee S, McGrath C, Samman N (2010). Change in quality of life after combined
orthodontic-surgical treatment of dentofacial deformities. Oral Surg Oral Med Oral
Pathol Oral Radiol Endod 109(1):46-51.
Ciochon RL, Nisbett R, Corruccini R (1997). Dietary consistency and craniofacial
development related to masticatory function in minipigs. J Craniofac Genet Dev Biol
17(2):96-102.
Cochrane SM, Cunningham SJ, Hunt NP (1999). A comparison of the perception of facial
profile by the general public and 3 groups of clinicians. Int J Adult Orthodon Orthognath
Surg 14(4):291-295.
Collett AR, West VC (1993). Terminology of facial morphology in the vertical dimension.
Aust Dent J 38(6):480-481.
Collins J, Shah A, McCarthy C, Sandler J (2007). Comparison of measurements from
photographed lateral cephalograms and scanned cephalograms. Am J Orthod
Dentofacial Orthop 132(6):830-833.
Copray JCVM, Jansen HWB, Duterloo HS (1986). Growth and growth pressure of
mandibular condylar and some primary cartilages of the rat in vitro. Am J Orthod
Dentofacial Orthop 90(1):19-28.
Cozza P, Baccetti T, Franchi L, Mucedero M, Polimeni A (2005). Sucking habits and facial
hyperdivergency as risk factors for anterior open bite in the mixed dentition. Am J
Orthod Dentofacial Orthop 128(4):517-519.
Cozza P, Baccetti T, Franchi L, Mucedero M, Polimeni A (2007). Transverse features of
subjects with sucking habits and facial hyperdivergency in the mixed dentition. Am J
Orthod Dentofacial Orthop 132(2):226-229.

! 147
Creekmore TD (1967). Inhibition or stimulation of the vertical growth of the facial
complex, its significance to treatment. Angle Orthod 37(4):285-297.
Crowther P, Harkness M, Herbison P (1997). Orthodontic treatment need in 10-year-old
Dunedin schoolchildren. N Z Dent J 93(413):72-78.
Cunningham SJ, Hunt NP (2001). Quality of life and its importance in orthodontics. J
Orthod 28(2):152-158.
Dahlberg G (1940). Statistical methods for medical and biological students. Statistical
Methods for Medical and Biological Students.
Dao TT, LeResche L (2000). Gender differences in pain. J Orofac Pain 14(3):169-184;
discussion 184-195.
de Freitas LM, Pinzan A, Janson G, Freitas KM, de Freitas MR, Henriques JF (2007). Facial
height comparison in young white and black Brazilian subjects with normal occlusion.
Am J Orthod Dentofacial Orthop 131(6):706 e701-706.
de Freitas MR, Alcazar NM, Janson G, de Freitas KM, Henriques JF (2006). Upper and
lower pharyngeal airways in subjects with Class I and Class II malocclusions and different
growth patterns. Am J Orthod Dentofacial Orthop 130(6):742-745.
de Oliveira CM, Sheiham A (2003). The relationship between normative orthodontic
treatment need and oral health-related quality of life. Community Dent Oral Epidemiol
31(6):426-436.
de Oliveira CM, Sheiham A (2004). Orthodontic treatment and its impact on oral health-
related quality of life in Brazilian adolescents. J Orthod 31(1):20-27; discussion 15.
De Smit A, Dermaut L (1984). Soft-tissue profile preference. Am J Orthod 86(1):67-73.

! 148
Dos Santos RR, Nayme JG, Garbin AJ, Saliba N, Garbin CA, Moimaz SA (2012). Prevalence
of Malocclusion and Related Oral Habits in 5- to 6-year-old Children. Oral Health Prev
Dent 10(4):311-318.
Dung DJ, Smith RJ (1988). Cephalometric and clinical diagnoses of open bite tendency.
Am J Orthod Dentofacial Orthop 94(6):484-490.
Dworkin SF, LeResche L (1992). Research diagnostic criteria for temporomandibular
disorders: review, criteria, examinations and specifications, critique. J Craniomandib
Disord 6(4):301-355.
Ellis E, McNamara JA. (1984). Components of adult Class III open-bite malocclusion. Am J
Orthod 86(4):277-290.
Ellis E, McNamara JA, Lawrence TM (1985). Components of adult Class II open-bite
malocclusion. J Oral Maxillofac Surg 43(2):92-105.
Emodi-Perlman A, Eli I, Friedman-Rubin P, Goldsmith C, Reiter S, Winocur E (2012).
Bruxism, oral parafunctions, anamnestic and clinical findings of temporomandibular
disorders in children. J Oral Rehabil 39(2):126-135.
Enlow DH, Pfister C, Richardson E, Kuroda T (1982). An analysis of Black and Caucasian
craniofacial patterns. Angle Orthod 52(4):279-287.
Esperao PT, de Oliveira BH, de Oliveira Almeida MA, Kiyak HA, Miguel JA (2010). Oral
health-related quality of life in orthognathic surgery patients. Am J Orthod Dentofacial
Orthop 137(6):790-795.
Farella M, Michelotti A, Carbone G, Gallo LM, Palla S, Martina R (2005). Habitual daily
masseter activity of subjects with different vertical craniofacial morphology. Eur J Oral Sci
113(5):380-385.

! 149
Farella M, Ng D, Zhou M, De Silva H, De Silva RK (2012). Blinded versus unblinded
evaluations of orthodontic outcome: does it make a difference?. Eur J Orthod 34(5): e2-
e300.
Ferrario VF, Sforza C, De Franco DJ (1999). Mandibular shape and skeletal divergency. Eur
J Orthod 21(2):145-153.
Feteih RM (2006). Signs and symptoms of temporomandibular disorders and oral
parafunctions in urban Saudi Arabian adolescents: a research report. Head Face Med
2:25.
Fields H, Proffit W, Case J, Vig K (1986). Variables affecting measurements of vertical
occlusal force. J Dent Res 65(2):135-138.
Fields HW, Proffit WR, Nixon W, Phillips C, Stanek E (1984). Facial pattern differences in
long-faced children and adults. Am J Orthod 85(3):217-223.
Foster Page LA, Thomson WM, Jokovic A, Locker D (2005). Validation of the Child
Perceptions Questionnaire (CPQ 11-14). J Dent Res 84(7):649-652.
Frejman MW, Vargas IA, Rosing CK, Closs LQ (2012). Dentofacial Deformities Are
Associated With Lower Degrees of Self-Esteem and Higher Impact on Oral Health-
Related Quality of Life: Results From an Observational Study Involving Adults. J Oral
Maxillofac Surg 71(4):763-7.
Gallo LM, Gross SS, Palla S (1999). Nocturnal masseter EMG activity of healthy subjects in
a natural environment. J Dent Res 78(8):1436-1444.
García�Morales P, Buschang PH, Throckmorton GS, English JD (2003). Maximum bite
force, muscle efficiency and mechanical advantage in children with vertical growth
patterns. Eur J Orthod 25(3):265-272.

! 150
Goes P (2001). The prevalence and impact of dental pain in Brazilian schoolchildren and
their families (PhD), University of London.
Gomes SG, Custodio W, Faot F, Del Bel Cury AA, Garcia RC (2010). Masticatory features,
EMG activity and muscle effort of subjects with different facial patterns. J Oral Rehabil
37(11):813-819.
Goodenough U (1984). Genetics. 3rd ed. Philadelphia: Saunders. pp. 672 - 675.
Goodrich JT (2005). Skull base growth in craniosynostosis. Childs Nerv Syst 21(10):871-
879.
Grauer D, Cevidanes LS, Styner MA, Ackerman JL, Proffit WR (2009). Pharyngeal airway
volume and shape from cone-beam computed tomography: relationship to facial
morphology. Am J Orthod Dentofacial Orthop 136(6):805-814.
Hammond P, Hutton TJ, Nelson-Moon ZL, Hunt NP, Madgwick AJ (2001). Classifying
vertical facial deformity using supervised and unsupervised learning. Methods Inf Med
40(5):365-372.
Harari D, Redlich M, Miri S, Hamud T, Gross M (2010). The effect of mouth breathing
versus nasal breathing on dentofacial and craniofacial development in orthodontic
patients. Laryngoscope 120(10):2089-2093.
Harris EF, Johnson MG (1991). Heritability of craniometric and occlusal variables: a
longitudinal sib analysis. Am J Orthod Dentofacial Orthop 99(3):258-268.
Harris EF (2008). Interpreting heritability estimates in the orthodontic literature. Semin
Orthod 14(2):125-134.
Harris JE, Kowalski CJ, LeVasseur FA, Nasjleti CE, Walker GF (1977). Age and race as factors
in craniofacial growth and development. J Dent Res 56(3):266-274.

! 151
Hartsfield JK (2002). Development of the vertical dimension: nature and nuture. Semin
Orthod 8(3):113-119.
Harvold EP, Vargervik K, Chierici G (1973). Primate experiments on oral sensation and
dental malocclusions. Am J Orthod 63(5):494-508.
Harvold EP, Tomer BS, Vargervik K, Chierici G (1981). Primate experiments on oral
respiration. Am J Orthod 79(4):359-372.
He T (2004). Craniofacial morphology and growth in the ferret: effects from alteration of
masticatory function. Swed Dent J Suppl (165):1-72.
Heimer MV, Tornisiello Katz CR, Rosenblatt A (2008). Non-nutritive sucking habits, dental
malocclusions, and facial morphology in Brazilian children: a longitudinal study. Eur J
Orthod 30(6):580-585.
Helkimo E, Carlsson GE, Helkimo M (1977). Bite force and state of dentition. Acta Odontol
Scand 35(6):297-303.
Hellman M (1931). Open-bite. International Journal of Orthodontia, Oral Surgery and
Radiography 17(5):421-444.
Hocevar RA, Stewart MC (1992). A study of reference lines for mandibular plane angles.
Am J Orthod Dentofacial Orthop 102(6):519-526.
Houston WJ (1983). The analysis of errors in orthodontic measurements. Am J Orthod
83(5):382-390.
Houston WJ (1988). Mandibular growth rotations--their mechanisms and importance.
Eur J Orthod 10(4):369-373.

! 152
Huang GJ, LeResche L, Critchlow CW, Martin MD, Drangsholt MT (2002). Risk factors for
diagnostic subgroups of painful temporomandibular disorders (TMD). J Dent Res
81(4):284-288.
Hunter WS (1965). A study of the inheritance of craniofacial characteristics as seen in
lateral cephalograms of 72 like-sexed twins. Report of the congress European
Orthodontic Society.
Iglesias-Linares A, Yanez-Vico R, Moreno-Fernandez A, Mendoza-Mendoza A, Orce-
Romero A, Solano-Reina E (2013). Osteopontin gene SNPs (rs9138, rs11730582) mediate
susceptibility to external root resorption in orthodontic patients. Oral Dis doi:
10.1111/odi.12114 [Epub ahead of print].
Ingervall B, Thilander B (1974). Relation between facial morphology and activity of the
masticatory muscles. J Oral Rehabil 1(2):131-147.
Ingervall B, Helkimo E (1978). Masticatory muscle force and facial morphology in man.
Arch Oral Biol 23(3):203-206.
Ingervall B, Bitsanis E (1987). A pilot study of the effect of masticatory muscle training on
facial growth in long-face children. Eur J Orthod 9(1):15-23.
Isaacson JR, Isaacson RJ, Speidel TM, Worms FW (1971). Extreme variation in vertical facial
growth and associated variation in skeletal and dental relations. Angle Orthod 41(3):219-
229.
Isaacson RJ, Zapfel RJ, Worms FW, Erdman AG (1977). Effects of rotational jaw growth on
the occlusion and profile. Am J Orthod 72(3):276-286.
Jacob HB, Buschang PH (2011). Vertical craniofacial growth changes in French-Canadians
between 10 and 15 years of age. Am J Orthod Dentofacial Orthop 139(6):797-805.

! 153
Janson GR, Metaxas A, Woodside DG (1994). Variation in maxillary and mandibular molar
and incisor vertical dimension in 12-year-old subjects with excess, normal, and short
lower anterior face height. Am J Orthod Dentofacial Orthop 106(4):409-418.
Jelenkovic A, Poveda A, Susanne C, Rebato E (2008). Contribution of genetics and
environment to craniofacial anthropometric phenotypes in Belgian nuclear families.
Hum Biol 80(6):637-654.
Johal A, Cheung MY, Marcene W (2007). The impact of two different malocclusion traits
on quality of life. Br Dent J 202(2):E2.
Johannsdottir B, Thorarinsson F, Thordarson A, Magnusson TE (2005). Heritability of
craniofacial characteristics between parents and offspring estimated from lateral
cephalograms. Am J Orthod Dentofacial Orthop 127(2):200-207.
John MT, Hujoel P, Miglioretti DL, LeResche L, Koepsell TD, Micheelis W (2004).
Dimensions of oral-health-related quality of life. J Dent Res 83(12):956-960.
Johnston DJ, Hunt O, Johnston CD, Burden DJ, Stevenson M, Hepper P (2005). The
influence of lower face vertical proportion on facial attractiveness. Eur J Orthod
27(4):349-354.
Jones OG (1989). A cephalometric study of 32 North American black patients with
anterior open bite. Am J Orthod Dentofacial Orthop 95(4):289-296.
Josell SD (1995). Habits affecting dental and maxillofacial growth and development.
Dent Clin North Am 39(4):851-860.
Kang EH, Yamaguchi T, Tajima A, Nakajima T, Tomoyasu Y, Watanabe M et al. (2009).
Association of the growth hormone receptor gene polymorphisms with mandibular
height in a Korean population. Arch Oral Biol 54(6):556-562.

! 154
Karlsen AT (1997). Association between facial height development and mandibular
growth rotation in low and high MP-SN angle faces: a longitudinal study. Angle Orthod
67(2):103-110.
Kasai K, Moro T, Kanazawa E, Iwasawa T (1995). Relationship between cranial base and
maxillofacial morphology. Eur J Orthod 17(5):403-410.
Katase-Akiyama S, Kato T, Yamashita S, Masuda Y, Morimoto T (2009). Specific increase in
non-functional masseter bursts in subjects aware of tooth-clenching during
wakefulness. J Oral Rehabil 36(2):93-101.
Kato T, Akiyama S, Kato Y, Yamashita S, Masuda Y, Morimoto T (2006). The occurrence of
spontaneous functional and nonfunctional orofacial activities in subjects without pain
under laboratory conditions: a descriptive study. J Orofac Pain 20(4):317-24.
Katz CR, Rosenblatt A, Gondim PP (2004). Nonnutritive sucking habits in Brazilian
children: effects on deciduous dentition and relationship with facial morphology. Am J
Orthod Dentofacial Orthop 126(1):53-57.
Kawai N, Sano R, Korfage JAM, Nakamura S, Kinouchi N, Kawakami E et al. (2010).
Adaptation of rat jaw muscle fibers in postnatal development with a different food
consistency: an immunohistochemical and electromyographic study. J Anat 216(6):717-
723.
Kiliaridis S, Engström C, Thilander B (1988). Histochemical analysis of masticatory muscle
in the growing rat after prolonged alteration in the consistency of the diet. Arch Oral Biol
33(3):187-193.
Kiliaridis S, Shyu B (1988). Isometric muscle tension generated by masseter stimulation
after prolonged alteration of the consistency of the diet fed to growing rats. Arch Oral
Biol 33(7):467-472.

! 155
Kiliaridis S, Mejersjö C, Thilander B (1989). Muscle function and craniofacial morphology:
a clinical study in patients with myotonic dystrophy. Eur J Orthod 11(2):131-138.
Kiliaridis S, Kjellberg H, Wenneberg B, Engström C (1993). The relationship between
maximal bite force, bite force endurance, and facial morphology during growth: A cross-
sectional study. Acta Odontol Scand 51(5):323-331.
Kiliaridis S, Johansson A, Haraldson T, Omar R, Carlsson GE (1995). Craniofacial
morphology, occlusal traits, and bite force in persons with advanced occlusal tooth
wear. Am J Orthod Dentofacial Orthop 107(3):286-92.
Kiliaridis S (2006). The importance of masticatory muscle function in dentofacial growth.
Semin Orthod 12(2):110-119.
Kim JH, Oh MY, Paek J, Lee J (2012). Association between FGFR1OP2/wit3.0
polymorphisms and residual ridge resorption of mandible in Korean population. PLoS
One 7(8):e42734.
Kim YJ, Hong JS, Hwang YI, Park YH (2010). Three-dimensional analysis of pharyngeal
airway in preadolescent children with different anteroposterior skeletal patterns. Am J
Orthod Dentofacial Orthop 137(3):306 e1-11; discussion 306-307.
King L, Harris EF, Tolley EA (1993). Heritability of cephalometric and occlusal variables as
assessed from siblings with overt malocclusions. Am J Orthod Dentofacial Orthop
104(2):121-131.
Kok YV, Mageson P, Harradine NW, Sprod AJ (2004). Comparing a quality of life measure
and the Aesthetic Component of the Index of Orthodontic Treatment Need (IOTN) in
assessing orthodontic treatment need and concern. J Orthod 31(4):312-318; discussion
300-311.
! 156
Koski K, Lähdemäki P (1975). Adaptation of the mandible in children with adenoids. Am J
Orthod 68(6):660-665.
Kuitert R, Beckmann S, van Loenen M, Tuinzing B, Zentner A (2006). Dentoalveolar
compensation in subjects with vertical skeletal dysplasia. Am J Orthod Dentofacial
Orthop 129(5):649-657.
Langenbach G, Van De Pavert S, Savalle W, Korfage H, Van Eijden T (2003). Influence of
food consistency on the rabbit masseter muscle fibres. Eur J Oral Sci 111(1):81-84.
Larsson P (2010). Methodological studies of orofacial aesthetics, orofacial function and
oral health-related quality of life. Swed Dent J Suppl 204:11-98.
Lau PY, Cooke MS, Hägg U (1997). Effect of training and experience on cephalometric
measurement errors on surgical patients. Int J Adult Orthodon Orthognath Surg
12(3):204-213.
Lee S, McGrath C, Samman N (2007). Quality of life in patients with dentofacial deformity:
a comparison of measurement approaches. Int J Oral Maxillofac Surg 36(6):488-492.
Lee S, McGrath C, Samman N (2008). Impact of orthognathic surgery on quality of life. J
Oral Maxillofac Surg 66(6):1194-1199.
Leslie LR, Southard TE, Southard KA, Casko JS, Jakobsen JR, Tolley EA et al. (1998).
Prediction of mandibular growth rotation: assessment of the Skieller, Björk, and Linde-
Hansen method. Am J Orthod Dentofacial Orthop 114(6):659-667.
Linder-Aronson S, Backstrom A (1960). A comparison between mouth and nose
breathers with respect to occlusion and facial dimensions. Odontol Revy 11(4).
Linder-Aronson S (1970). Adenoids. Their effect on mode of breathing and nasal airflow
and their relationship to characteristics of the facial skeleton and the denition. A

! 157
biometric, rhino-manometric and cephalometro-radiographic study on children with
and without adenoids. Acta Otolaryngol Suppl 265:1-132.
List T, Wahlund K, Wenneberg B, Dworkin SF (1999). TMD in children and adolescents:
prevalence of pain, gender differences, and perceived treatment need. J Orofac Pain
13(1):9-20.
Liu F, van der Lijn F, Schurmann C, Zhu G, Chakravarty MM, Hysi PG et al. (2012). A
genome-wide association study identifies five loci influencing facial morphology in
Europeans. PLoS Genet 8(9):e1002932.
Liu Z, McGrath C, Hägg U (2011a). Associations between orthodontic treatment need
and oral health-related quality of life among young adults: does it depend on how you
assess them? Community Dent Oral Epidemiol 39(2):137-144.
Liu Z, McGrath C, Hägg U (2011b). Changes in oral health-related quality of life during
fixed orthodontic appliance therapy: an 18-month prospective longitudinal study. Am J
Orthod Dentofacial Orthop 139(2):214-219.
Locker D (2001). Oral health indicators and determinants for population health surveys.
Community Health Services Research Unit Toronto: University of Toronto.
Locker D, Jokovic A, Tompson B, Prakash P (2007). Is the Child Perceptions Questionnaire
for 11-14 year olds sensitive to clinical and self-perceived variations in orthodontic
status? Community Dent Oral Epidemiol 35(3):179-185.
Locker D, Jokovic A, Prakash P, Tompson B (2010). Oral health-related quality of life of
children with oligodontia. Int J Paediatr Dent 20(1):8-14.
Lundström A, McWilliam JS (1987). A comparison of vertical and horizontal
cephalometric variables with regard to heritability. Eur J Orthod 9(1):104-108.

! 158
Lundström A, McWilliam JS (1988). Comparison of some cephalometric distances and
corresponding facial proportions with regard to heritability. Eur J Orthod 10(1):27-29.
Manfredi C, Martina R, Grossi GB, Giuliani M (1997). Heritability of 39 orthodontic
cephalometric parameters on MZ, DZ twins and MN-paired singletons. Am J Orthod
Dentofacial Orthop 111(1):44.
Manly BFJ (1986). Multivariate Statistical Methods: a primer. Chapman and Hill Ltd, pp.
100 - 113.
Markiewicz MR, Ohrbach R, McCall WD, Jr. (2006). Oral behaviors checklist: reliability of
performance in targeted waking-state behaviors. J Orofac Pain 20(4):306-316.
Martina R, Farella M, Tagliaferri R, Michelotti A, Quaremba G, van Eijden TM (2005). The
Relationship between molar dentoalveolar and craniofacial heights. Angle Orthod
75(6):974-979.
Martina R, Cioffi I, Tagliaferri R, Michelotti A, Paduano S, Farella M (2009). Relationship
between molar dentoalveolar and craniofacial heights in children. Prog Orthod 10(2):64-
69.
Martins-Junior PA, Marques LS, Ramos-Jorge ML (2012). Malocclusion: social, functional
and emotional influence on children. J Clin Pediatr Dent 37(1):103-108.
McNamara JA (1981). Influence of respiratory pattern on craniofacial growth. Angle
Orthod 51(4):269-300.
Mehta A, Kaur G (2011). Oral health-related quality of life—the concept, its assessment
and relevance in dental research and education. Indian Journal of Dentistry 2(2):26-29.

! 159
Melink S, Vagner MV, Hocevar-Boltezar I, Ovsenik M (2010). Posterior crossbite in the
deciduous dentition period, its relation with sucking habits, irregular orofacial functions,
and otolaryngological findings. Am J Orthod Dentofacial Orthop 138(1):32-40.
Memon S, Fida M, Shaikh A (2012). Comparison of different craniofacial patterns with
pharyngeal widths. J Coll Physicians Surg Pak 22(5):302-306.
Michelotti A, Cioffi I, Festa P, Scala G, Farella M (2010). Oral parafunctions as risk factors
for diagnostic TMD subgroups. J Oral Rehabil 37(3):157-162.
Michiels G, Sather AH (1994). Determinants of facial attractiveness in a sample of white
women. Int J Adult Orthodon Orthognath Surg 9(2):95-103.
Miyake R, Ohkubo R, Takehara J, Morita M (2004). Oral parafunctions and association with
symptoms of temporomandibular disorders in Japanese university students. J Oral
Rehabil 31(6):518-523.
Miyamoto K, Yamada K, Ishizuka Y, Morimoto N, Tanne K (1996). Masseter muscle activity
during the whole day in young adults. Am J Orthod Dentofacial Orthop 110(4):394-398.
Miyamoto K, Ishizuka Y, Ueda HM, Saifuddin M, Shikata N, Tanne K (1999). Masseter
muscle activity during the whole day in children and young adults. J Oral Rehabil
26(11):858-864.
Moss ML (1964). Vertical growth of the human face. Am J Orthod 50(5):359-376.
Moss ML, Rankow RM (1968). The Role of the Functional Matrix in Mandibular Growth*.
Angle Orthod 38(2):95-103.
Moss ML, Salentijn L (1969). The primary role of functional matrices in facial growth. Am J
Orthod 55(6):566-577.

! 160
Murray PDF, Selby D (1930). Intrinsic and extrinsic factors in the primary development of
the skeleton. Roux Arch 15(2):197-234.
Nahoum HI (1971). Vertical proportions and the palatal plane in anterior open-bite. Am J
Orthod 59(3):273-282.
Nahoum HI, Horowitz SL, Benedicto EA (1972). Varieties of anterior open-bite. Am J
Orthod 61(5):486-492.
Nakata M, Yu P, Davis B, Nance WE (1974). Genetic determinants of cranio�facial
morphology: a twin study. Ann Hum Genet 37(4):431-443.
Nanda SK (1988). Patterns of vertical growth in the face. Am J Orthod Dentofacial Orthop
93(2):103-116.
Nanda SK (1990). Growth patterns in subjects with long and short faces. American
Journal of Orthodontics and Dentofacial Orthopedics 98(3):247-258.
Nielsen IL (1991). Vertical malocclusions: etiology, development, diagnosis and some
aspects of treatment. Angle Orthod 61(4):247-260.
O'Brien C, Benson PE, Marshman Z (2007). Evaluation of a quality of life measure for
children with malocclusion. J Orthod 34(3):185-193; discussion 176.
O'Brien K, Wright JL, Conboy F, Macfarlane T, Mandall N (2006). The child perception
questionnaire is valid for malocclusions in the United Kingdom. Am J Orthod Dentofacial
Orthop 129(4):536-540.
Ödman C, Kiliaridis S (1996). Masticatory muscle activity in myotonic dystrophy patients.
J Oral Rehabil 23(1):5-10.

! 161
Ohrbach R, Beneduce C, Markiewicz M, McCall WD (2004). Psychometric properties of
the Oral Behaviors Checklist: Preliminary findings. J Dent Res 83 (special issue):1194.
Ohrbach R, Granger C, List T, Dworkin S (2008a). Preliminary development and validation
of the Jaw Functional Limitation Scale. Community Dent Oral Epidemiol 36(3):228-236.
Ohrbach R, Larsson P, List T (2008b). The jaw functional limitation scale: development,
reliability, and validity of 8-item and 20-item versions. J Orofac Pain 22(3):219-230.
Ohrbach R, Markiewicz MR, McCall WD (2008c). Waking-state oral parafunctional
behaviors: specificity and validity as assessed by electromyography. Eur J Oral Sci
116(5):438-444.
Opdebeeck H, Bell WH (1978). The short face syndrome. Am J Orthod 73(5):499-511.
Opdebeeck H, Bell WH, Eisenfeld J, Mishelevich D (1978). Comparative study between
the SFS and LFS rotation as a possible morphogenic mechanism. Am J Orthod 74(5):509-
521.
Osborne RH, De George FV (1959). Genetic basis of morphological variation. An
evaluation and application of the twin study method. Harvard University Press.
Padzys GS, Tankosic C, Trabalon M, Martrette JM (2012). Craniofacial development and
physiological state after early oral breathing in rats. Eur J Oral Sci 120(1):21-28.
Palinkas M, Nassar MSP, Cecílio FA, Siéssere S, Semprini M, Machado-de-Sousa JP et al.
(2010). Age and gender influence on maximal bite force and masticatory muscles
thickness. Arch Oral Biol 55(10):797-802.
Panek H, Nawrot P, Mazan M, Bielicka B, Sumislawska M, Pomianowski R (2012).
Coincidence and awareness of oral parafunctions in college students. Community Dent
Health 29(1):74-77.

! 162
Parks LR, Buschang PH, Alexander RA, Dechow P, Rossouw PE (2007). Masticatory
exercise as an adjunctive treatment for hyperdivergent patients. Angle Orthod
77(3):457-462.
Paternoster L, Zhurov AI, Toma AM, Kemp JP, St Pourcain B, Timpson NJ et al. (2012).
Genome-wide association study of three-dimensional facial morphology identifies a
variant in PAX3 associated with nasion position. Am J Hum Genet 90(3):478-485.
Pecora NG, Baccetti T, McNamara JA, Jr. (2008). The aging craniofacial complex: a
longitudinal cephalometric study from late adolescence to late adulthood. Am J Orthod
Dentofacial Orthop 134(4):496-505.
Peltomäki T (2007). The effect of mode of breathing on craniofacial growth--revisited.
Eur J Orthod 29(5):426-429.
Peng J, Deng H, Cao CF, Ishikawa M (2005). Craniofacial morphology in Chinese female
twins: a semi-longitudinal cephalometric study. Eur J Orthod 27(6):556-561.
Peres KG, Barros AJ, Peres MA, Victora CG (2007). Effects of breastfeeding and sucking
habits on malocclusion in a birth cohort study. Rev Saude Publica 41(3):343-350.
Posnick JC, Fantuzzo JJ (2007). Idiopathic condylar resorption: current clinical
perspectives. J Oral Maxillofac Surg 65(8):1617-1623.
Prahl-Andersen B, Boersma H, van der Linden FP, Moore AW (1979). Perceptions of
dentofacial morphology by laypersons, general dentists, and orthodontists. J Am Dent
Assoc 98(2):209-212.
Proffit W, Fields H (1983). Occlusal forces in normal-and long-face children. J Dent Res
62(5):571-574.

! 163
Proffit W, Fields H, Nixon W (1983). Occlusal forces in normal-and long-face adults. J Dent
Res 62(5):566-570.
Proffit WR, Phillips C, Dann CT (1990). Who seeks surgical-orthodontic treatment? Int J
Adult Orthodon Orthognath Surg 5(3):153-160.
Pullinger AG, Seligman DA, Gornbein JA (1993). A multiple logistic regression analysis of
the risk and relative odds of temporomandibular disorders as a function of common
occlusal features. J Dent Res 72(6):968-979.
Quick CA, Gundlach KK (1978). Adenoid facies. Laryngoscope 88(2 Pt 1):327-333.
Raadsheer M, Van Eijden T, Van Ginkel F, Prahl-Andersen B (1999). Contribution of jaw
muscle size and craniofacial morphology to human bite force magnitude. J Dent Res
78(1):31-42.
Ramirez-Yanez GO, Smid JR, Young WG, Waters MJ (2005). Influence of growth hormone
on the craniofacial complex of transgenic mice. Eur J Orthod 27(5):494-500.
Richardson A (1969). Skeletal factors in anterior open-bite and deep overbite. Am J
Orthod 56(2):114-127.
Ricketts RM (1968). Respiratory obstruction syndrome. Am J Orthod 54(7):495-507.
Riedel RA (1952). The relation of maxillary structures to cranium in malocclusion and in
normal occlusion. The Angle orthodontist 22(3):142-145.
Roberts WE, Hartsfield JK (2004). Bone development and function: genetic and
environmental mechanisms. Semin Orthod 10(2):100-122.

! 164
Rossetti LM, Pereira de Araujo Cdos R, Rossetti PH, Conti PC (2008). Association between
rhythmic masticatory muscle activity during sleep and masticatory myofascial pain: a
polysomnographic study. J Orofac Pain 22(3):190-200.
Rusanen J, Lahti S, Tolvanen M, Pirttiniemi P (2010). Quality of life in patients with severe
malocclusion before treatment. Eur J Orthod 32(1):43-48.
Samman N, Tong AC, Cheung DL, Tideman H (1992). Analysis of 300 dentofacial
deformities in Hong Kong. Int J Adult Orthodon Orthognath Surg 7(3):181-185.
Sankey WL, Buschang PH, English J, Owen AH (2000). Early treatment of vertical skeletal
dysplasia: the hyperdivergent phenotype. Am J Orthod Dentofacial Orthop 118(3):317-
327.
Sardenberg F, Martins MT, Bendo CB, Pordeus IA, Paiva SM, Auad SM et al. (2013).
Malocclusion and oral health-related quality of life in Brazilian school children. Angle
Orthod 83(1):83-89.
Sassouni V (1969). A classification of skeletal facial types. Am J Orthod 55(2):109-123.
Savoye I, Loos R, Carels C, Derom C, Vlietinck R (1998). A genetic study of anteroposterior
and vertical facial proportions using model-fitting. Angle Orthod 68(5):467-470.
Schendel SA, Eisenfeld J, Bell WH, Epker BN, Mishelevich DJ (1976). The long face
syndrome: vertical maxillary excess. Am J Orthod 70(4):398-408.
Schendel SA, Carlotti AE (1985). Variations of total vertical maxillary excess. J Oral
Maxillofac Surg 43(8):590-596.
Schudy FF (1964). Vertical growth versus anteroposterior growth as related to function
and treatment. The Angle orthodontist 34(2):75-93.

! 165
Scott JH (1953). The cartilage of the nasal septum. Br Dent J 95:37-43.
Scott JH (1954). The growth of the human face. Proc R Soc Med 47(2):91-100.
Scott JH (1956). Growth at facial sutures. Am J Orthod 42(5):381-387.
Serrao G, Sforza C, Dellavia C, Antinori M, Ferrario VF (2002). Relation between vertical
facial morphology and jaw muscle activity in healthy young men. Prog Orthod 4(1):45-
51.
Sicher H (1947). The growth of the mandible. Am J Orthod Oral Surg 33(1):30-35.
Silva Filho OGd, Cardoso GC, Cardoso M, Capelozza Filho L (2010). Study of the
cephalometric features of Brazilian long face adolescents. Dental Press Journal of
Orthodontics 15(4):35 e31-35e12.
Siriwat PP, Jarabak JR (1985). Malocclusion and facial morphology is there a relationship?
An epidemiologic study. Angle Orthod 55(2):127-138.
Sischo L, Broder HL (2011). Oral health-related quality of life: what, why, how, and future
implications. J Dent Res 90(11):1264-1270.
Skieller V, Björk A, Linde-Hansen T (1984). Prediction of mandibular growth rotation
evaluated from a longitudinal implant sample. Am J Orthod 86(5):359-370.
Slade GD, Spencer AJ (1994). Development and evaluation of the Oral Health Impact
Profile. Community Dent Health 11(1):3-11.
Slade GD (1997). Derivation and validation of a short-form oral health impact profile.
Community Dent Oral Epidemiol 25(4):284-290.

! 166
Solow B, Kreiborg S (1977). Soft-tissue stretching: a possible control factor in craniofacial
morphogenesis. Scand J Dent Res 85(6):505-507.
Sonnesen L, Bakke M, Solow B (1998). Malocclusion traits and symptoms and signs of
temporomandibular disorders in children with severe malocclusion. Eur J Orthod
20(5):543-559.
Spyropoulos MN (1985). An early approach for the interception of skeletal open bite: a
preliminary report. J Pedod 9(3):200-209.
Stegenga B, de Bont LG, de Leeuw R, Boering G (1993). Assessment of mandibular
function impairment associated with temporomandibular joint osteoarthrosis and
internal derangement. J Orofac Pain 7(2):183-195.
Subtelny JD (1954). The Significance of Adenoid Tissue in Orthodontia*. Angle Orthod
24(2):59-69.
Subtelny JD, Sakuda M (1964). Open-bite: diagnosis and treatment. Am J Orthod
50(5):337-358.
Suzuki S, Itoh K, Ohyama K (2004). Local administration of IGF-I stimulates the growth of
mandibular condyle in mature rats. J Orthod 31(2):138-143.
Taibah SM, Feteih RM (2007). Cephalometric features of anterior open bite. World J
Orthod 8(2):145-152.
Tecco S, Caputi S, Tete S, Orsini G, Festa F (2007). Electromyographic activity of
masticatory, neck and trunk muscles of subjects with different mandibular divergence. A
cross-sectional evaluation. Angle Orthod 77(2):260-265.

! 167
Thomaz EB, Cangussu MC, Assis AM (2012). Maternal breastfeeding, parafunctional oral
habits and malocclusion in adolescents: a multivariate analysis. Int J Pediatr
Otorhinolaryngol 76(4):500-506.
Throckmorton GS, Finn RA, Bell WH (1980). Biomechanics of differences in lower facial
height. Am J Orthod 77(4):410-420.
Tomoyasu Y, Yamaguchi T, Tajima A, Nakajima T, Inoue I, Maki K (2009). Further evidence
for an association between mandibular height and the growth hormone receptor gene
in a Japanese population. Am J Orthod Dentofacial Orthop 136(4):536-541.
Tsakos G, Gherunpong S, Sheiham A (2006). Can oral health-related quality of life
measures substitute for normative needs assessments in 11 to 12-year-old children? J
Public Health Dent 66(4):263-268.
Tsang WM, Cheung LK, Samman N (1998). Cephalometric characteristics of anterior
open bite in a southern Chinese population. Am J Orthod Dentofacial Orthop
113(2):165-172.
Tuominen ML, Tuominen RJ (1994). Factors associated with subjective need for
orthodontic treatment among Finnish university applicants. Acta Odontol Scand
52(2):106-110.
Tuxen A, Bakke M, Pinholt E (1999). Comparative data from young men and women on
masseter muscle fibres, function and facial morphology. Arch Oral Biol 44(6):509-517.
Ueda HM, Ishizuka Y, Miyamoto K, Morimoto N, Tanne K (1998). Relationship between
masticatory muscle activity and vertical craniofacial morphology. Angle Orthod
68(3):233-238.

! 168
Ueda HM, Miyamoto K, Saifuddin M, Ishizuka Y, Tanne K (2000). Masticatory muscle
activity in children and adults with different facial types. Am J Orthod Dentofacial
Orthop 118(1):63-68.
Ugboko VI, Oginni FO, Ajike SO, Olasoji HO, Adebayo ET (2005). A survey of
temporomandibular joint dislocation: aetiology, demographics, risk factors and
management in 96 Nigerian cases. Int J Oral Maxillofac Surg 34(5):499-502.
Uribe LM, Vela KC, Kummet C, Dawson DV, Southard TE (2013). Phenotypic diversity in
white adults with moderate to severe Class III malocclusion. Am J Orthod Dentofacial
Orthop 144(1):32-42.
Valera FC, Travitzki LV, Mattar SE, Matsumoto MA, Elias AM, Anselmo-Lima WT (2003).
Muscular, functional and orthodontic changes in pre school children with enlarged
adenoids and tonsils. Int J Pediatr Otorhinolaryngol 67(7):761-770.
van der Beek MC, Hoeksma JB, Prahl-Andersen B (1991). Vertical facial growth: a
longitudinal study from 7 to 14 years of age. Eur J Orthod 13(3):202-208.
van der Beek MC, Hoeksma JB, Prahl-Andersen B (1996). Vertical facial growth and
statural growth in girls: a longitudinal comparison. Eur J Orthod 18(6):549-555.
Van der Geld P, Oosterveld P, Van Heck G, Kuijpers-Jagtman AM (2007). Smile
attractiveness. Self-perception and influence on personality. Angle Orthod 77(5):759-
765.
Van Limborgh J (1970). A new view of the control of the morphogenesis of the skull.
Acta Morphol Neerl Scand 8(2):143.
Van Limborgh J (1972). The role of genetic and local environmental factors in the control
of postnatal craniofacial morphogenesis. Acta Morphol Neerl Scand 10(1):37-47.

! 169
Van Spronsen P (1993). Masticatory muscles in normal and long-face humans.
Amsterdam, Academic Center for Dentistry Amsterdam (ACTA).
Van Spronsen P, Weijs W, Valk J, Prahl-Andersen B, Van Ginkel F (1992). A Comparison of
Jaw Muscle Cross-sections of Long-face and Normal Adults. J Dent Res 71(6):1279-1285.
Van Spronsen P, Weijs W, van Ginkel E, Prahl-Andersen B (1996). Jaw muscle orientation
and moment arms of long-face and normal adults. J Dent Res 75(6):1372-1380.
Van Spronsen P (2010). Long-face craniofacial morphology: Cause or effect of weak
masticatory musculature? Semin Orthod 16(2):99-117.
Varrela J (1990). Effects of attritive diet on craniofacial morphology: a cephalometric
analysis of a Finnish skull sample. Eur J Orthod 12(2):219-223.
Vianna-Lara MS, Caria PH, Tosello Dde O, Lara F, Amorim MM (2009). Electromyographic
activity of masseter and temporal muscles with different facial types. Angle Orthod
79(3):515-520.
Visnapuu V, Peltomäki T, Ronning O, Vahlberg T, Helenius H (2001). Growth hormone
and insulin-like growth factor I receptors in the temporomandibular joint of the rat. J
Dent Res 80(10):1903-1907.
Wah PL, Cooke MS, Hägg U (1995). Comparative cephalometric errors for orthodontic
and surgical patients. Int J Adult Orthodon Orthognath Surg 10(2):119-126.
Weinstein RS, Jilka RL, Parfitt AM, Manolagas SC (1998). Inhibition of osteoblastogenesis
and promotion of apoptosis of osteoblasts and osteocytes by glucocorticoids. Potential
mechanisms of their deleterious effects on bone. J Clin Invest 102(2):274-282.
Willems G, De Bruyne I, Verdonck A, Fieuws S, Carels C (2001). Prevalence of dentofacial
characteristics in a belgian orthodontic population. Clin Oral Investig 5(4):220-226.

! 170
Willmar K (1974). On Le Fort I osteotomy; A follow-up study of 106 operated patients
with maxillo-facial deformity. Scand J Plast Reconstr Surg 12:suppl 12:11-68.
Winocur E, Littner D, Adams I, Gavish A (2006). Oral habits and their association with
signs and symptoms of temporomandibular disorders in adolescents: a gender
comparison. Oral Surg Oral Med Oral Pathol Oral Radiol Endod 102(4):482-487.
Wong AT, McMillan AS, McGrath C (2006). Oral health-related quality of life and severe
hypodontia. J Oral Rehabil 33(12):869-873.
Woodside DG, Linder-Aronson S (1979). The channelization of upper and lower anterior
face heights compared to population standard in males between ages 6 to 20 years. Eur
J Orthod 1(1):25-40.
Yamaguchi T, Maki K, Shibasaki Y (2001). Growth hormone receptor gene variant and
mandibular height in the normal Japanese population. Am J Orthod Dentofacial Orthop
119(6):650-653.
Yavuz I, Ikbal A, Baydas B, Ceylan I (2004). Longitudinal posteroanterior changes in
transverse and vertical craniofacial structures between 10 and 14 years of age. Angle
Orthod 74(5):624-629.
Zhou J, Lu Y, Gao XH, Chen YC, Lu JJ, Bai YX et al. (2005). The growth hormone receptor
gene is associated with mandibular height in a Chinese population. J Dent Res
84(11):1052-1056.

! 171
8 Appendices
Cephalometric Landmark Definitions
Participant Questionnaire
Normality and Variance Distributions
Ma ori Consultation
Ethical Approval
Participants’ Information Sheets
Participants’ Consent Forms
Copyrights and Permissions

! 172
8.1 Cephalometric Landmark Definitions
Landmark Symbol Definition/Description
Skeletal Landmarks
Porion Pr The highest point on the roof of the left external auditory meatus (LB Higley, 1954). Machine Porion
(used in this study) refers to the most superior point on the metal rod of the cephalometer (RE Moyers,
1973).
Orbitale Or The most inferior point on the infraoribtal margin (A Björk, 1947)
Pteygoid Point Pt Lower lip of foramen rotundum (represents the position of the sphenoid bone). Most posterior superior
point on the outline of the pterygopalatine fossa (RM Ricketts, 1989).
Sella Turcica S The center of the pituitary fossa (TM Graber, 1975)
Nasion Na The junction of nasal and frontal bones (TM Graber, 1975)
Basion Ba Normal projection of the anterior border of the anterior border of the occipital foramen (endobasion)
on the occipital foramen line (A Björk, 1960).
Pogonion Pog The most anterior point on the mandible (WB Downs, 1948)
Gnathion Gn The most anterior inferior point in the lateral shadow of the chin. Gn usually best determined by
selecting the midpoint between Pog and Me on the contour of the chin (RE Moyers, 1973)

! 173
Menton Me The most inferior point on the symphysis of the mandible (TM Graber, 1975)
Gonion Go The mid-point of the angle of the mandible that is determined by bisecting the mandibular plane angle
and the plane passing through articulare and posterior ramus (ML Riolo, 1974)
Articulare Ar Junction of the posterior ramus plane and the superstructure of the skull (LB Higley, 1954)
Condylion Co The most posterior superior point on the condyle of the mandible (Modified RE Moyers, 1988)
Point A (Subspinale) A The deepest point on the premaxilla between ANS and prosthion (WB Downs, 1948)
Point B (Supramentale) B The deepest point on the mandible between infradentale and pogonion (WB Downs, 1948)
ANS ANS The most anterior point on the maxilla at the level of the palate (RE Moyes, 1988)
PNS PNS Most posterior point on the contour of the bony palate (V Sassouni, 1974)
Hyoid H Point at the anterior-superior margin of body of the hyoid (RM Ricketts, 1989)
Dental Landmarks
Upper Molar Tip U6 The anterior cusp tip of the maxillary first molar (ML Riolo, 1974)
Lower Molar Tip L6 The anterior cusp tip of the mandibular first molar (ML Riolo, 1974)
Lower Incisor Tip L1 Tip of incisal edge of anteriormost lower incisor (RM Ricketts, 1989)
Lower Incisor Apex LIA The root apex of the most prominent lower incisor (SN Bhatia and BC Leighton, 1993)
Upper Incisor Tip U1 Tip of incisal edge of anteriormost upper incisor (RM Ricketts, 1989)
Upper Incisor Apex UIA The root apex of the most prominent upper incisor (SN Bhatia and BC Leighton, 1993)
Modified from Viteporn, S., and A. E. Athanasious. "Anatomy, radiographic anatomy and cephalometric landmarks of craniofacial skeleton, soft tissue profile, dentition,
pharynx and cervical vertebrae." Orthodontic Cephalometry. London, England: Mosby International (1997): 21-62.
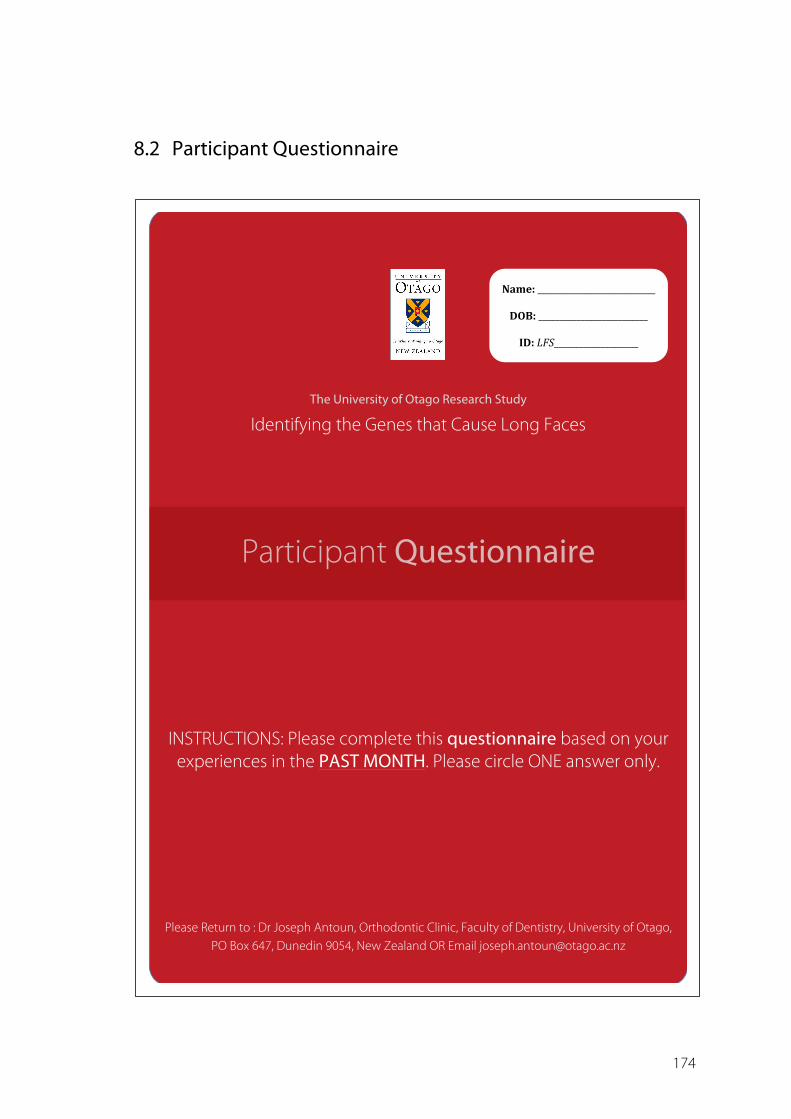
! 174
8.2 Participant Questionnaire
!
!
The University of Otago Research Study
Identifying the Genes that Cause Long Faces
Participant Questionnaire
INSTRUCTIONS: Please complete this questionnaire based on your experiences in the PAST MONTH. Please circle ONE answer only.
Please Return to : Dr Joseph Antoun, Orthodontic Clinic, Faculty of Dentistry, University of Otago,
PO Box 647, Dunedin 9054, New Zealand OR Email [email protected]
Name:!____________________________!!
DOB:!__________________________!!
ID:!LFS____________________!

! 175
OHIP-14 Questionnaire
!
The next few questions are about your oral health. For each of the questions below, please circle the answer that best applies to you during the past month. !!
Because of trouble with your teeth or mouth:
Have you had trouble pronouncing any words?
Never Hardly Ever Occasionally Fairly Often
Very Often
Have you felt that your sense of taste has worsened?
Never Hardly Ever Occasionally Fairly Often
Very Often
Have you had painful aching in your mouth?
Never Hardly Ever Occasionally Fairly Often
Very Often
Have you found it uncomfortable to eat any foods?
Never Hardly Ever Occasionally Fairly Often
Very Often
Have you been self-conscious? Never Hardly Ever Occasionally Fairly Often
Very Often
Have you felt tense? Never Hardly Ever Occasionally Fairly Often
Very Often
Has your diet been unsatisfactory? Never Hardly Ever Occasionally Fairly Often
Very Often
Have you had to interrupt meals? Never Hardly Ever Occasionally Fairly Often
Very Often
Have you found it difficult to relax? Never Hardly Ever Occasionally Fairly Often
Very Often
Have you been a bit embarrassed? Never Hardly Ever Occasionally Fairly Often
Very Often
Have you been a bit irritable with other people?
Never Hardly Ever Occasionally Fairly Often
Very Often
Have you had difficulty doing your usual jobs?
Never Hardly Ever Occasionally Fairly Often
Very Often
Have you felt that life in general was less satisfying?
Never Hardly Ever Occasionally Fairly Often
Very Often
Have you been totally unable to function?
Never Hardly Ever Occasionally Fairly Often
Very Often
! !

! 176
!
OBC Questionnaire
The next few questions are about certain oral habits and behaviours. !How often have you done each of the following behaviours during the past month? Please choose one the responses for each of the following. If the frequency of the behaviour varies, choose the higher option. !
How often do you do the following behaviours during sleep?!!
!
Clench or grind teeth when asleep None of the time
A few times Sometimes Most of the
time All of the
time
Sleep in a position that puts pressure on the jaw (e.g. on stomach or on the side)
None of the time
A few times Sometimes Most of the
time All of the
time
!
How often do you do the following behaviours while awake?!!
Grind teeth together during waking hours
None of the time
A few times Sometimes Most of the
time All of the
time
Clench or press teeth together during waking hours
None of the time
A few times Sometimes Most of the
time All of the
time
Touch or hold teeth together other than while eating (i.e. contact between upper and lower teeth)
None of the time
A few times Sometimes Most of the
time All of the
time
Hold, tighten, or tense muscles without clenching or bringing teeth together
None of the time
A few times Sometimes Most of the
time All of the
time
Hold or just push jaw forward or to the side
None of the time
A few times Sometimes Most of the
time All of the
time
Press tongue forcibly against teeth None of the time
A few times Sometimes Most of the
time All of the
time
Place tongue between teeth None of the time
A few times Sometimes Most of the
time All of the
time

! 177
!
OBC Questionnaire (continued)
Bite, chew or play with your tongue, cheeks, or lips
None of the time
A few times Sometimes Most of the
time All of the
time
Hold jaw in rigid or tense position, such as to brace or protect the jaw
None of the time
A few times Sometimes Most of the
time All of the
time
Hold between the teeth or bite objects such as hair, pipe, pencil, pens, fingers, fingernails, etc
None of the time
A few times Sometimes Most of the
time All of the
time
Use chewing gum None of the time
A few times Sometimes Most of the
time All of the
time
Play musical instrument that involves use of the mouth or jaw (e.g. woodwinds, brass, string instruments)
None of the time
A few times Sometimes Most of the
time All of the
time
Lean with your hand on the jaw, such as cupping or resting the chin in the hand
None of the time
A few times Sometimes Most of the
time All of the
time
Chew food on one side only None of the time
A few times Sometimes Most of the
time All of the
time
Eating between meals (i.e. food that requires chewing)
None of the time
A few times Sometimes Most of the
time All of the
time
Sustained talking (e.g. teaching, sales, customer service)
None of the time
A few times Sometimes Most of the
time All of the
time
Singing None of the time
A few times Sometimes Most of the
time All of the
time
Yawning None of the time
A few times Sometimes Most of the
time All of the
time
Hold telephone between your head and shoulders
None of the time
A few times Sometimes Most of the
time All of the
time
!

! 178
JFLS-8 Questionnaire
The next few questions are about your Jaw Function. For each of the items below, indicate the level of limitation during the past month. If the activity was completely avoided because it was too difficult, indicate “10”. If you avoided an activity for reasons other than pain or difficulty, then leave the item blank. Please place a vertical line on the scale below to indicate your level of limitation. !
Chew tough food
No Limitation (0) Severe Limitation (10)
Chew chicken (e.g. prepared in oven)
No Limitation (0) Severe Limitation (10)
East soft food requiring no chewing (e.g. mashed potatoes, apple sauce, pudding, pureed food)
No Limitation (0) Severe Limitation (10)
Open wide enough to drink from a cup
No Limitation (0) Severe Limitation (10)
Swallow
No Limitation (0) Severe Limitation (10)
Yawn
No Limitation (0) Severe Limitation (10)
Talk
No Limitation (0) Severe Limitation (10)
Smile
No Limitation (0) Severe Limitation (10)

! 179
!
Ethnicity Details
Just a few more things… Father’s Occupation (mainly) ___________________________________________________ Mother’s Occupation (mainly) __________________________________________________ Because this is a genetics study we need to accurately understand your genetic origin - the best way to do this is from the ethnic origin of your grandparents. Please fill in the following boxes for each of your grandparents. If you do not know their origin please indicate this with a question mark. Tick as many circles as you need within each box. Your Ethnicity: ______________________________________________________________
Paternal Grandfather (Father’s side) Paternal Grandmother
Maternal Grandfather (Mother’s side) Maternal Grandmother
If applicable, who are your iwi? ________________________________________
If from the Cook Island, what Island(s) are your grandparents from?
_________________________________________________________________

! 180
8.3 Normality and Variance Distributions (table contains P-values)
Measure Normality (Kolmogorov-Smirnov Z)
Homogeneity of Variance (Levene Statistic)
Statistic Tests Used
Case Control Combined OHIP-14 0.086 0.012 0.005 0.736 Non-parametric Oral Behaviour Checklist 0.996 0.535 0.578 0.764 Parametric Jaw Functional Limitation Scale Chew tough food 0.004 0.002 <0.0001 0.060 Non-parametric Chew chicken prepared in oven <0.0001 <0.0001 <0.0001 0.973 Non-parametric Eat soft food not requiring chewing <0.0001 <0.0001 <0.0001 0.054 Non-parametric Open wide enough to drink from a cup <0.0001 <0.0001 <0.0001 0.200 Non-parametric Swallow <0.0001 <0.0001 <0.0001 0.123 Non-parametric Yawn <0.0001 <0.0001 <0.0001 0.002 Non-parametric Talk <0.0001 <0.0001 <0.0001 0.274 Non-parametric Smile <0.0001 <0.0001 <0.0001 0.703 Non-parametric

! 181
8.4 Ma ori Consultation

! 182
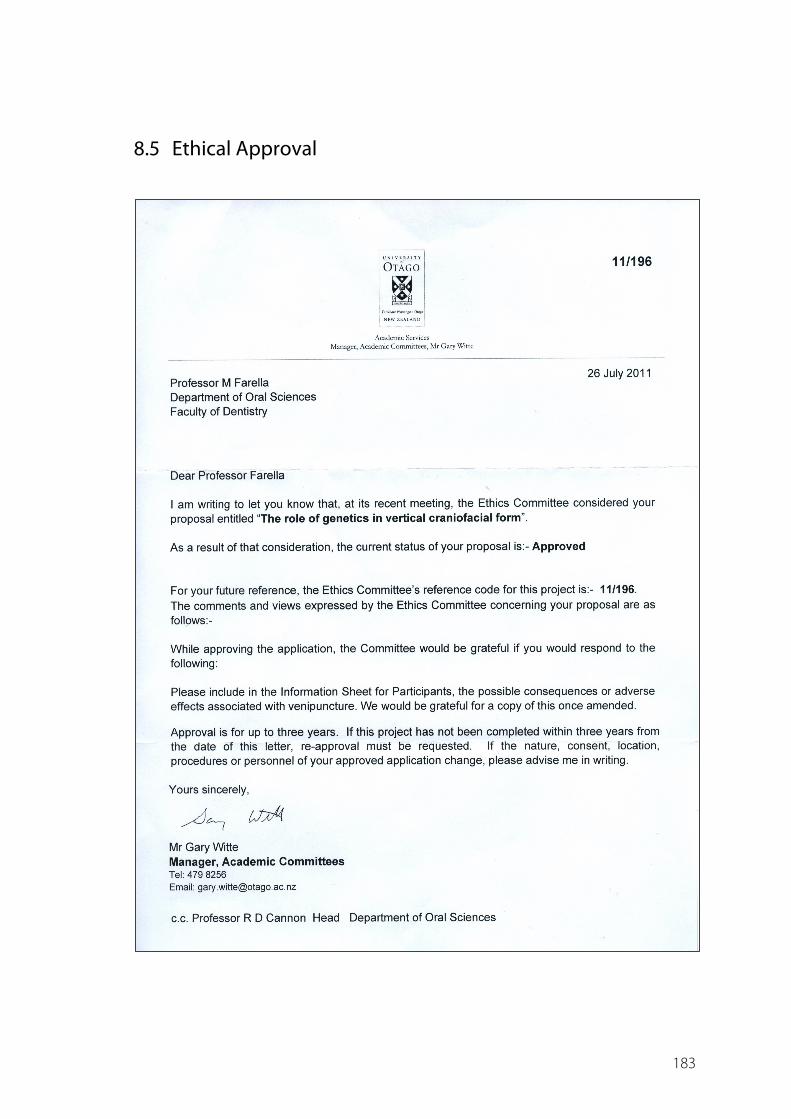
! 183
8.5 Ethical Approval

! 184
8.6 Participants’ Information Sheet
Reference Number 11/196 29/02/2012
Identifying the Genes that Cause Long Faces
INFORMATION SHEET FOR PARTICIPANTS or PARENTS / GUARDIANS
Thank you for showing an interest in this project. Please read this information sheet carefully before deciding whether or not to participate. If you decide to participate we thank you. If you decide not to take part there will be no disadvantage to you and we thank you for considering our request. What is the Aim of the Project? We are inviting you to take part in this study, which has been designed to help find the cause of long faces (increased vertical facial height). Although, the size and shape of a face varies markedly among people, long faces are typically difficult to treat and often represent a challenging clinical scenario for an orthodontist. Our genes are believed to play a role in controlling the growth of our faces. The purpose of this study is to find out which genes are responsible for controlling vertical facial height, and causing long faces. Understanding the underlying cause of this condition could potentially help us predict who are likely to develop long faces at an early age, and therefore improve or modify our current treatments. Other orthodontic and dental conditions that remain poorly understood may also benefit from this research. This project is being undertaken as part of the requirements for the Postgraduate Doctoral in Clinical Dentistry (Orthodontics) degree at the University of Otago. Who are we looking for? We are looking for orthodontic patients who are currently undergoing braces treatment or have already completed their treatment within the past five years. You will be invited to participate by your orthodontist if you meet the study’s selection requirement. We are searching for participants with both long and average-sized faces – your orthodontist will be able to identify this during the clinical examination as well

! 185
as from the routine head-film X-ray that is usually taken to help plan your orthodontic treatment. We are looking for approximately 100 participants in each group (long and average). Unfortunately, not everyone will be suitable for this study – patients with certain conditions (outlined below) may not be appropriate for our study as it may affect or distract us from what we are trying to find out. Your orthodontist will be able to check that you do not have any of these conditions, which include: having no back teeth on both sides (excluding wisdom teeth); inflammatory or degenerative diseases of the lower jaw joint; cleft lip and/or palate; craniofacial syndromes; and history of facial fractures. How will this help people with long faces? If you do have a long face, it is unlikely that participation in this research will be of any direct benefit to you. Medical advancements typically take a long time and while we need your help to improve our understanding of this condition and its treatments, any meaningful breakthroughs may not happen for several years to come. In the future, simple cheek swabs may help us identify individuals destined to develop excessively long faces at an early age. Knowing this can provide us with a clinically important window of opportunity to predict facial growth, and possibly, to provide personalized orthodontic treatments. As a personal “thank-you” for your time and effort in helping us with our study, we would like to offer you a small gift in the form of a Movie or Book voucher. What will you be asked to do? Should you agree to take part in this project, you will be asked to provide a sample of your blood for genetic testing (collected at a blood laboratory), or alternatively a saliva sample (collected at your orthodontist’s clinic). Blood samples are generally encouraged due to the higher quality of DNA that can be extracted from them. Good quality DNA will greatly help us find these genes that cause long faces. Either form of these DNA collection methods (blood or saliva sample) will only be carried out once. In addition to providing us with some personal information, such as age and ethnicity, you will also be kindly asked to answer a few questionnaires that relate to your oral habits, jaw function, daytime sleepiness patterns and quality of life. These questionnaires should take approximately 20 minutes to complete. If it happens that you may have multiple family members with the long face pattern, you and other family members will be invited to have some facial photographs taken. The purpose of this elective part of the study is to try and identify inheritance patterns within families. It is emphasised, however, that this part is optional and will not affect your participation in the study.

! 186
Please be aware that you may decide not to take part in the project without any disadvantage to yourself of any kind. What information will be collected and what will it be used for? We will collect personal information such as gender, ethnicity and age. Any family history of long-faces in your parents, siblings, grandparents, and other relatives will also be sought. In addition, we will collect clinical information from your orthodontist’s treatment records (such as number of teeth present, amount of overlap between your upper and lower teeth, etc) as well as from the questionnaires that you will answer (see above). This data will mainly help us during the analysis stages when we are trying to make sense of the results. If further information is required we may need to access your dental/orthodontic records – all of this information will stay strictly private. DNA will be extracted from blood or saliva samples as described previously. By-products from this procedure are usually disposed of using medical waste contractors (please indicate on the consent form if you would prefer that a suitable Karakia be used for disposing of this genetic material). The samples, which may be used to study any related genes in the future, will be stored and tested in Dr Merriman’s laboratory at the University of Otago in Dunedin. Serum will also be stored for analysis of inflammatory markers that are related to the condition. All DNA samples will be stored in Dr Merriman’s laboratory. The results of the project may be published and will be available in the University of Otago Library (Dunedin, New Zealand) but every attempt will be made to preserve your anonymity. You will also be offered the opportunity to review the main findings of the study through the project’s website. How will my data be stored and who will have access to it? The data collected will be securely stored in such a way that only those mentioned below will be able to gain access to it. Data and DNA samples obtained as a result of the research will be retained for up to 10 years in secure storage. Any personal information held on the participants [such as contact details] may be destroyed at the completion of the research even though the data derived from the research will, in most cases, be kept for much longer or possibly indefinitely. Only the research team will be able to access the above data and DNA samples; this includes the lead research supervisor, two supporting supervisors and the postdoctoral research student. No other external source, commercial or non-commercial, will have access to any personal data or information. Are there any risks? Having a blood sample taken may hurt a little and some people may get a small bruise at the site where the blood is withdrawn. Although very rare, this site may become

! 187
infected. Most people however have no problems with this routine procedure. If you have any bad experiences with giving blood samples, please let the nurse know beforehand so she can accommodate for your special circumstances. Can I change my mind and withdraw from the project? Yes you can. You may withdraw from participation in the project at any time and without any disadvantage to yourself of any kind. What if I have any Questions?
If you have any questions about our project, either now or in the future, please feel free to contact either:
Dr Joseph Antoun
Department of Oral Sciences
Faculty of Dentistry
University Tel: +64 3 479 7068
Email: [email protected]
Professor Mauro Farella
Department of Oral Sciences
Faculty of Dentistry
University Tel: +64 3 479 5852
Email: [email protected]
Climbing the Ladder, Together.
This study has been reviewed and approved by the University of Otago Human Ethics Committee. If you have any concerns about the ethical conduct of the research you may contact the Committee through
the Human Ethics Committee Administrator (ph 03 479 8256). Any issues you raise will be treated in confidence and investigated and you will be informed of the outcome.

! 188
Reference Number 11/196 29/02/2012
Finding the Genes that Cause Long Faces
INFORMATION SHEET FOR CHILD PARTICIPANTS
Thank you for agreeing to consider helping us out. This sheet will explain to you what we are trying to do and hopefully help you decide whether or not to participate. In either case, we thank you for considering our request. Remember, there is nothing wrong with not participating if that’s what you prefer. What are we trying to do? Just like height or weight, the size and shape of everyone’s face is different and we are trying to find out what causes some people to have long faces. People with long faces are usually harder to treat and we want to try and improve things. One of the causes of long faces is in our genes – each person has a unique code (known as DNA) which pre-determines how things usually develop. We are trying to find out which genes cause the long face so we can predict it better and improve our orthodontic treatments. With your help, we may also be able to look at other dental conditions that are controlled by our genes. This project is part of a university degree. Who are we looking for? We are looking for volunteers who are currently undergoing braces treatment or have already completed their treatment within the past

! 189
five years. Your orthodontist will let you know if you can help us with our study. We are looking for participants with both long and average-sized faces (about 100 in each group). How will this help people with long faces? If you do have a long-face, you probably won’t get much benefit from helping us out as anything we find will probably take a few years before can we make good use of it. But, hopefully, we will be able do simple tests in the future to predict who will develop a long face early on, and improve our treatment for this condition. So by helping us, you will really be helping future children with this condition. What will you be asked to do? We need two things from you – something to extract the DNA from, and some information about your dental habits, sleeping patterns etc. You’re DNA, which contains the genes we want to study, is found in either blood or saliva. We would like to take a very small sample of your blood to extract this DNA – this will involve you visiting a nurse or doctor who will do this for you. We prefer the DNA that we get from your blood as it helps us a lot more, but we can also collect some saliva instead if you really don’t want to give blood. Saliva samples involve spitting some of your saliva into a small tube – this can be done at your orthodontist’s clinic. We will only need to collect your DNA once (either blood or saliva). The second part involves answering a few questionnaires about your oral habits, jaw function, sleepiness patterns, etc. These questionnaires should take about 20 minutes to complete.
What will we do with your information?
We will use your DNA samples and other information you have given us to study the cause of long faces. It will be used to study any genes that cause this condition in the future, and will be stored and tested in Dr Merriman’s laboratory at the University of Otago in Dunedin (we may keep this information for up to 10 years).

! 190
We will write up the results from this study for our University work. The results may also be written up in journals and talked about at conferences, but your name will not be on anything written up about this study. Who will see my answers and other bits of information? Only the research team and the people we work with will look at the information you have kindly given to us. Can I change my mind and pull out from the project? Yes you can. You may pull out from participation in the project at any time and without any disadvantage to yourself of any kind.
What if I have any Questions?
If you have any questions about what we are doing, either now or in the future, please let us know:
Joseph Antoun
University Tel: +64 3 479 7068
Email: [email protected]
Mauro Farella
University Tel: +64 3 479 5852
Email: [email protected]

! 191
8.7 Participants’ Consent Forms
Reference Number 11/196 29/02/2012
Identifying the Genes that Cause Long Faces CONSENT FORM FOR PARTICIPANTS
I have read the Information Sheet concerning this project and understand what it is about. All my questions have been answered to my satisfaction. I understand that I am free to request further information at any stage.
I know that:
1. My participation in the project is entirely voluntary; 2. I am free to withdraw from the project at any time without any disadvantage; 3. At the conclusion of the project any raw data on which the results of the project depend will be
retained in secure storage for at least five years; 4. The results of the project may be published and will be available in the University of Otago Library
(Dunedin, New Zealand) but every attempt will be made to preserve my anonymity. 5. At the end of the study, I consent to any remaining samples being disposed of using: Standard disposal methods, OR; Disposed with appropriate karakia, 6. I am happy at being contacted again in the future No, I do not wish to be contacted again Yes, but I understand that I do not have to participate in any further studies
I agree to take part in this project. ....................................................................................................... ........................................................................................... (Signature of participant) (Date)
This study has been approved by the University of Otago Human Ethics Committee. If you have any concerns about the ethical conduct of the research you may contact the Committee through the Human Ethics Committee Administrator (ph 03 479 8256). Any issues you raise will be treated in
confidence and investigated and you will be informed of the outcome.
! 192
Reference Number 11/196 29/02/2012
Identifying the Genes that Cause Long Faces CONSENT FORM FOR PARENTS/GUARDIANS
I have read the Information Sheet concerning this project and understand what it is about. All my questions have been answered to my satisfaction. I understand that I am free to request further information at any stage.
I know that:-
1. My child’s participation in the project is entirely voluntary; 2. I am free to withdraw my child from the project at any time without any disadvantage; 3. My child will receive a small “thank-you” reward for their time and effort (movie or book voucher). 4. At the conclusion of the project any raw data on which the results of the project depend will be
retained in secure storage for at least five years; 5. The results of the project may be published and will be available in the University of Otago Library
(Dunedin, New Zealand) but every attempt will be made to preserve my child’s anonymity. 6. At the end of the study, I consent to any remaining samples of my child being disposed of using: Standard disposal methods, OR;
Disposed with appropriate karakia, I agree for my child to take part in this project. ........................................................................................................... ......................................................................... (Signature of parent/guardian) (Date)
........................................................................................................... (Name of child)
This study has been approved by the University of Otago Human Ethics Committee. If you have any concerns about the ethical conduct of the research you may contact the Committee through the Human Ethics Committee Administrator (ph 03 479 8256). Any issues you raise will be treated in
confidence and investigated and you will be informed of the outcome.

! 193
!
Reference Number 11/196 29/02/2012
Finding the Genes that Cause Long Faces CONSENT FORM FOR CHILD PARTICIPANTS
I have been told about this study and understand what it is about. All my questions have been answered in a way that makes sense.
I know that:
1. Participation in this study is voluntary, which means that I do not have to take part if I don’t want to and nothing will happen to me. I can also stop taking part at any time and don’t have to give a reason.
2. Anytime I want to stop, that’s okay. 3. If I don’t want to answer some of the questions, that’s fine. 4. If I have any worries or if I have any other questions, then I can talk about
these with the research team. 5. The paper and computer file with my answers will only be seen by the
research team and the people they work with. They will keep whatever I say private.
6. The researcher team will write up the results from this study for their
University work. The results may also be written up in journals and talked about at conferences. My name will not be on anything written up about this study.
I agree to take part in the study. ............................................................................. ........................................................... Signed Date

8.8 Permission to use Patient Photographs on Page 10
Permission form removed for reasons of confidentiality

! 195
8.9 Permission to use Illustration on Page 12
!
ELSEVIER LICENSE TERMS AND CONDITIONS
Aug 06, 2013
This is a License Agreement between Joseph S Antoun ("You") and Elsevier ("Elsevier") provided by Copyright Clearance Center ("CCC"). The license consists of your order details, the terms and conditions provided by Elsevier, and the payment terms and conditions. All payments must be made in full to CCC. For payment instructions, please see information listed at the bottom of this form.
Supplier Elsevier Limited The Boulevard,Langford Lane Kidlington,Oxford,OX5 1GB,UK
Registered Company Number
1982084
Customer name Joseph S Antoun
Customer address 316 Great King Street
Dunedin, 9016
License number 3178571433893
License date Jun 30, 2013
Licensed content publisher
Elsevier
Licensed content publication
American Journal of Orthodontics
Licensed content title Prediction of mandibular growth rotation
Licensed content author A. Björk
Licensed content date June 1969
Licensed content volume number
55
Licensed content issue number
6
Number of pages 15

! 196
Start Page 585
End Page 599
Type of Use reuse in a thesis/dissertation
Portion figures/tables/illustrations
Number of figures/tables/illustrations
1
Format both print and electronic
Are you the author of this Elsevier article?
No
Will you be translating? No
Order reference number
Title of your thesis/dissertation
Clinical & Psychosocial Aspects of The Long Face Morphology
Expected completion date Nov 2013
Estimated size (number of pages)
Elsevier VAT number GB 494 6272 12
Permissions price 0.00 USD
VAT/Local Sales Tax 0.0 USD / 0.0 GBP
Total 0.00 USD
Terms and Conditions
INTRODUCTION
1. The publisher for this copyrighted material is Elsevier. By clicking "accept" in connection with completing this licensing transaction, you agree that the following terms and conditions apply to this transaction (along with the Billing and Payment terms and conditions established by Copyright Clearance Center, Inc. ("CCC"), at the time that you opened your Rightslink account and that are available at any time at http://myaccount.copyright.com).