Structure of Interannual-to-Decadal Climate Variability in the Tropical Atlantic Sector
Upload
independentCategory
view
2download
0
1
West Palerang Water Futures Report Series 2012West Palerang Water Futures Report Series 2012West Palerang Water Futures Report Series 2012
This project was supported by Palerang Council from funding under the Australian Government’s Water for the Future initiative through the Strengthening Basin Communities program and ActewAGL’s Source Water Protection Program.
Climate Variability in Western Palerang Su Wild River Econtext
Report prepared for Palerang Council
May 2012
Climate variability in
Western Palerang
Report prepared for Palerang Council
Climate variability in Western Palerang
ii
Contents
PART A - Climate change from the global scale to the Palerang region ................................... 1
1 Background and scope ................................................................................................... 1 1.1 Scope of this report .............................................................................................. 1
2 Climate change in context .............................................................................................. 3
3 The global context .......................................................................................................... 4
4 Climate Change in Australia ............................................................................................ 9 4.1 Measuring climate change in Australia .............................................................. 10 4.2 Australian adaptation ......................................................................................... 18
5 Climate variability and climate change in the Palerang Region ................................... 20 5.1 Rainfall variability in NSW and ACT .................................................................... 22 5.2 Regional adaptation ........................................................................................... 27
Part B - Climate and climate change within the Murray Darling Basin in Palerang................ 29
6 Generating local climate data....................................................................................... 29 6.1 Generating the baseline data ............................................................................. 29 6.2 Generating the climate change scenarios .......................................................... 31 6.3 Achieving a fine resolution ................................................................................. 32
7 The study area .............................................................................................................. 34
8 Climate, variability and change in Western Palerang ................................................... 38 8.1 Maximum temperature ...................................................................................... 38 8.2 Minimum temperature ...................................................................................... 41 8.3 Rainfall ................................................................................................................ 44 8.4 Evaporation ........................................................................................................ 48
9 Discussion ..................................................................................................................... 51 9.1 Climate change adaptation for Western Palerang ............................................. 51
References .............................................................................................................................. 53
Climate variability in Western Palerang
iii
Appendices
Appendix A Climate modelling by locality ...................................................................... A-1 Appendix B Key terminology ........................................................................................ B-23
List of Figures
Figure 1: Past and future CO2 atmospheric concentration .......................................................................... 4 Figure 2: CO2 concentrations and Antarctic temperature over long historical periods ............................... 5 Figure 3: Global and continental temperature change ............................................................................... 5 Figure 4: Changes in key global climate parameters since 1973, compared with IPCC scenarios ............... 6 Figure 5: Thresholds for catastrophic climate change impacts revisited ..................................................... 8 Figure 6: Average annual daily maximum temperature 1961-1990 (°C) ................................................... 11 Figure 7: Trend in maximum temperature 1970-2010 (°C/10 years) ........................................................ 11 Figure 8: Average annual daily minimum temperature 1961-1990 (°C) .................................................... 12 Figure 9: Trend in minimum temperature 1970-2010 (°C/10 years) ......................................................... 12 Figure 10: Australian average rainfall, annual 1961-1990 ........................................................................... 14 Figure 11: Australian rainfall variability, annual 1900-2003 ........................................................................ 14 Figure 12: Trend in annual total rainfall 1970-2010 (mm/10 years)............................................................ 15 Figure 13: Trend in annual total rainfall 1900-2010 (mm/10 years)............................................................ 15 Figure 14: Australian average pan evaporation, annual 1975-2005 ............................................................ 17 Figure 15: Australian average actual evapotranspiration, annual 1960 to 1990 ......................................... 17 Figure 16: Trend in annual total pan evaporation 1970-2010 (mm/10 years) ............................................ 18 Figure 17: Map of the Australian Capital Region ......................................................................................... 20 Figure 18: Map of the Murray Darling Basin ............................................................................................... 21 Figure 19: Annual rainfall anomalies – New South Wales and ACT, 1900-2010 .......................................... 23 Figure 20: Change in annual average rainfall between the two periods 1900-1946 and 1947-2000 .......... 24 Figure 21: Annual rainfall distribution across the western catchments of Palerang LGA ............................ 25 Figure 22: Rainfall distribution, January, across the western catchments of Palerang ............................... 26 Figure 23: Rainfall distribution, July, across the western catchments of Palerang LGA .............................. 27 Figure 24: Water supplied by ACTEW to ACT/Queanbeyan & population (1999-2000 to 2004-05) ........... 28 Figure 25: Data points for generating Palerang rainfall grids ...................................................................... 30 Figure 26: Data points for generating Palerang temperature grids ............................................................. 31 Figure 27: Improving resolution of climate models ..................................................................................... 33 Figure 28: Study area reference map .......................................................................................................... 35 Figure 29: Google Earth image of the study area ........................................................................................ 36 Figure 30: Subcatchments ........................................................................................................................... 37 Figure 31: Mean annual maximum temperature (1975-2005) .................................................................... 39 Figure 32: Change in mean annual maximum temperature by 2030 (mid-point of model results) ............ 40 Figure 33: Mean annual minimum temperature (1975-2005) .................................................................... 42 Figure 34: Change in mean annual minimum temperature by 2030 (mid-point of model results) ............. 43 Figure 35: Annual rainfall (1975-2005) ........................................................................................................ 45 Figure 36: Change in annual rainfall by 2030 (mid-point of model results) ................................................ 46 Figure 37: Rainfall predictions – 2030 and 2050, 50th, 10th and 90th percentiles ..................................... 47 Figure 38: Annual evaporation (1975-2005) ................................................................................................ 49 Figure 39: Change in annual evaporation by 2030 (mid-point of model results) ........................................ 50
Climate variability in Western Palerang
iv
List of Tables
Table 1: Definitions of four key variables to measure climate change ..................................................... 10 Table 2: Comparing climate features at two localities ............................................................................. 34 Table 3: Bungendore climate analysis and modelling ............................................................................ A-2 Table 4: Burra climate analysis and modelling ....................................................................................... A-3 Table 5: Bywong climate analysis and modelling ................................................................................... A-4 Table 6: Captains Flat climate analysis and modelling ........................................................................... A-5 Table 7: Carwoola climate analysis and modelling ................................................................................. A-6 Table 8: Collector climate analysis and modelling ................................................................................. A-7 Table 9: Currawang climate analysis and modelling .............................................................................. A-8 Table 10: Forbes Creek climate analysis and modelling ........................................................................... A-9 Table 11: Googong climate analysis and modelling ............................................................................... A-10 Table 12: Hoskinstown climate analysis and modelling ......................................................................... A-11 Table 13: Lake George climate analysis and modelling .......................................................................... A-12 Table 14: Primrose Valley climate analysis and modelling ..................................................................... A-13 Table 15: Rossi climate analysis and modelling ...................................................................................... A-14 Table 16: Royalla climate analysis and modelling .................................................................................. A-15 Table 17: Sutton climate analysis and modelling ................................................................................... A-16 Table 18: Tarago climate analysis and modelling ................................................................................... A-17 Table 19: Tinderry climate analysis and modelling ................................................................................ A-18 Table 20: Urilla climate analysis and modelling ..................................................................................... A-19 Table 21: Wamboin climate analysis and modelling .............................................................................. A-20 Table 22: Williamsdale climate analysis and modelling ......................................................................... A-21 Table 23: Yarrow climate analysis and modelling .................................................................................. A-22 Table 24: Key terms used in climate change literature .......................................................................... B-23 Table 25: Terms for describing certainty of climate change predictions ............................................... B-24
Report prepared by Dr Su Wild-River (internal peer review by Raoul Craemer)
Climate modelling by Professor Michael Hutchinson and Dr Tingbao Xu
Palerang Maps by Palerang Council staff, Simon Holloway and Neville Plumb
Finalised August 2012
Disclaimer The information contained in this publication is intended for general use, to assist public
knowledge and discussion and to help improve the sustainable management of land, water and
vegetation. It includes general statements based on scientific research. Readers are advised and need
to be aware that this information may be incomplete or unsuitable for use in specific situations.
Before taking any action or decision based on the information in this publication, readers should seek
expert professional, scientific and technical advice. The authors and Econtext Pty Ltd do not assume
liability of any kind whatsoever resulting from any organisation or person’s use or reliance upon the
content of this publication.
Climate variability in Western Palerang
v
List of Abbreviations
°C Degrees Celcius
ABS Australian Bureau of Statistics
ACT Australian Capital Territory
ACR Australian Capital Region
BoM Bureau of Meteorology (Australia)
CSIRO Commonwealth Scientific and Industrial Research Organisation
DECCEW Department of Environment, Climate Change and Water (NSW)
GIS Geographical Information System
IPCC International Panel on Climate Change
Max Maximum
MDB Murray Darling Basin
Min Minimum
NSW New South Wales
Climate variability in Western Palerang
vi
Executive Summary
The challenges posed by climate change affect all of the world’s communities. Strategies for mitigating and adapting are being implemented internationally, nationally, and by regional and local communities. Such action is needed to avoid serious economic, social and environmental impacts.
The implications of climate change for Palerang are similar to those for its surrounding region. Hotter and drier conditions, with greater evaporation, more wind and extreme weather events are already occurring, and the best estimate from combined climate models is for these changes to intensify in the future. Extended dry periods are likely, and Palerang will most likely experience higher bushfire risks, more intense storms, heatwaves and other weather-related challenges in the future.
This project provides a unique, fine-detailed analysis of climate change impacts for Western Palerang. The results show significant spatial variation in climatic conditions within the study area, with distinctively different micro-climates in different places. Climatic vulnerability is lowest in the elevated, forested areas of the South and East, around Captains Flat. The lower-lying areas around Bungendore, Lake George and the headwaters of the Yass River get less rainfall, have higher evaporation and are more climatically vulnerable. These local variations within Palerang are predicted to increase with climate change so that areas that are already vulnerable to climate variability are likely to become even more so.
Early and effective adaptation can reduce the negative impacts of climate change. The climate resilience of existing buildings can be enhanced. New infrastructure can be located and designed to cope with intense conditions, and agricultural systems can be adapted to deal with hotter and drier conditions.
The results here will be synthesised with findings from reports being simultaneously prepared to consider population, water quality and water availability for Western Palerang. The resulting report will provide integrated recommendations to optimize water resource management for the areas of Palerang within the Murray Darling Basin.
Climate variability in Western Palerang
1
PART A - Climate change from the global scale to
the Palerang region
1 Background and scope
Palerang Council is undertaking a project under the Commonwealth Government’s Strengthening Basin Communities program. The aim of this project is to apply proven methodologies to assess the impacts of water allocations, increased climate variability, and population growth on the yield of sub-catchments within Western Palerang. Three major outputs are anticipated from the project:
1) A Snapshot on Sustainability report. This report will assess water availability, allocation and sustainable yield, taking into account four key factors:
a) Water resources – i.e. the water holding capacities, allocations, interceptions and extractions, farm dams, bores, and pumping from natural water courses.
b) Climate variability – i.e. the range of predicted changes to key climate variables impacting on water security, including rainfall, temperature, evaporation, extreme weather events and seasonal variations.
c) Population pressures – i.e. development trends and associated water impacts.
d) Water quality – reflecting the combined impact of the above three factors, and other factors, on turbidity, salinity and other water quality issues.
2) A Basin Strengthening Priorities report will integrate sustainability issues from the Snapshot on Sustainability report and consider them in a framework of scenario planning which allows the exploration of different policy settings and their likely outcomes.
3) Communications products will comprise fact sheets, presentations, workshops, web pages and other materials to encourage the local uptake of water management strategies suggested by the combined research outcomes.
1.1 Scope of this report
This report presents the range of predicted changes to key climate variables impacting on water security, including rainfall, evaporation, temperature, extreme weather events and seasonal variations.
The report describes historical and current climatic conditions and presents the results of climate modelling for upcoming decades. In this way it paints a detailed picture of likely local climate changes and their implications for water security both within West Palerang and further into the Murray Darling Basin (MDB).
The report is structured as follows.
Climate variability in Western Palerang
2
Part A presents published information about climate change. It:
summarises the features, impacts and adaptation to climate change at global, national and regional scales, and
covers four key climate variables that are used later to describe climate change in Palerang – minimum and maximum temperature, rainfall and evaporation.
Part B is an analysis of climate variability and climate change at the local scale of Western Palerang. It includes:
an overview of the study site, a description of the climate modelling undertaken for this report, results of modelling undertaken by researchers from the Fenner School of
Environment and Society at the Australian National University, and a discussion of results.
Climate variability in Western Palerang
3
2 Climate change in context
The Oxford English Dictionary defines climate as ‘the general weather conditions prevailing in an area over a long period’. The climate is characterised by a combination of regularity and change: regularity because based on historical experience some types of weather patterns can be expected to occur at the same time of year or to occur routinely in specific geographical locations; change because the climate is by its very nature continually in a state of flux (e.g., as manifested by the changing of the seasons).
Measuring climate change is difficult because of the inherent complexity of climate systems. Globally, the climate is influenced by the overall balance of heat entering and leaving the planet, and its storage in the earth’s systems including ocean, land, atmosphere and ice.
Each of these systems is complex and variable, but there is compelling evidence of change to these systems. Global warming is a key facet of climate change. It is broadly accepted that the changes that are occurring have the potential to be great enough to threaten human society and global ecosystems (Australian Academy of Science 2010; Fowler et al 2010; IPCC 2007 a, b, c, d; Richardson et al 2009; Richardson et al 2011; Cleugh et al 2011; InterAcademy Council 2007).
There is virtual consensus among experts on the causes of climate change. Climatic heat balances are strongly influenced by atmospheric greenhouse gases that absorb and emit infrared radiation. Atmospheric concentrations of greenhouse gases increased dramatically during the last century, largely due to human activities. The major contributor to global warming is an increased concentration of greenhouse gases within the Earth’s atmosphere. This is mostly from carbon dioxide released from the burning of fossil fuel, with lesser contributions from land use change, and methane and nitrous oxide primarily due to agriculture (IPCC 2007d).
The IPCC report also notes that difficulties remain in simulating and attributing observed temperature changes at smaller than continental scales, something that the current report is attempting to address in the context of the Palerang local government area.
Solving the problems associated with climate change involves two major responses – abatement and adaptation. Abatement involves reducing greenhouse gas emissions to delay or reduce the impact and magnitude of climate change. Adaptation reduces vulnerability to climate change, allowing communities to avoid or minimise its negative effects. The benefits of both strategies clearly outweigh their costs, and the earlier that action is taken, the lower the risks (Garnaut 2011). This report focuses on understanding climate change to assist Palerang Council with any abatement and adaptation strategies that it may be considering.
Climate variability in Western Palerang
4
3 The global context
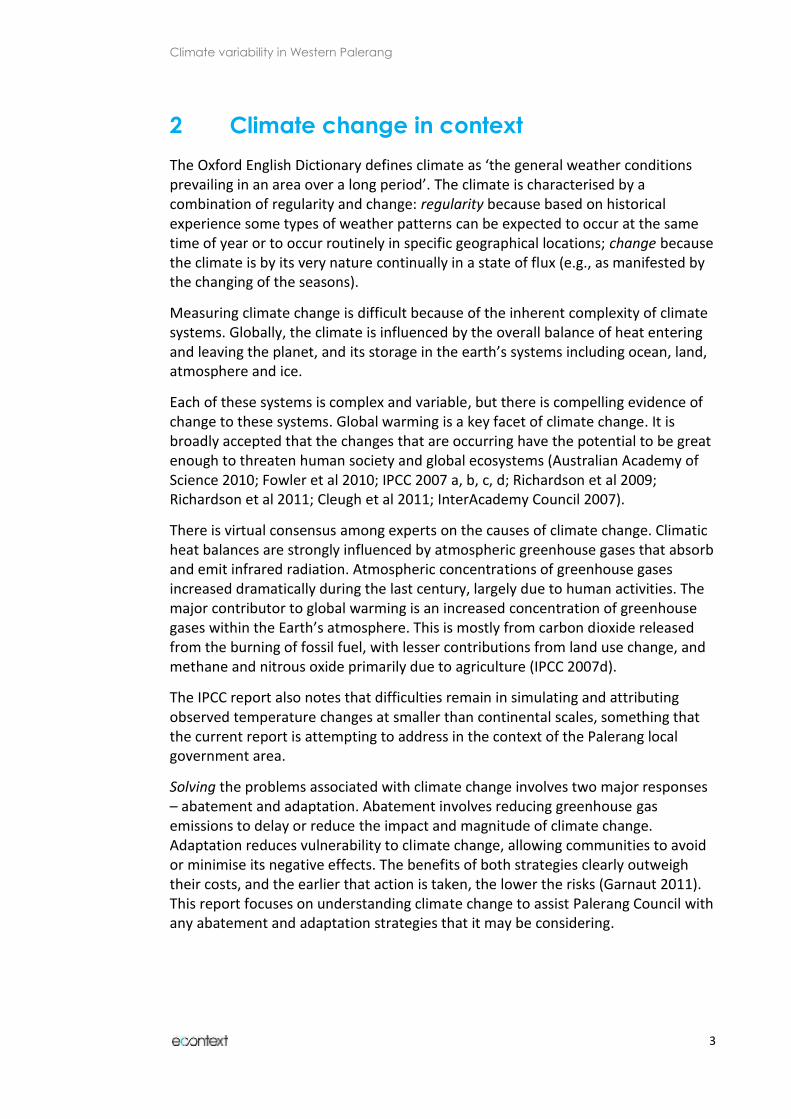
Figure 1 shows the rise of atmospheric CO2 since 1000 AD. Trends for other greenhouse gases show similar trends (IPCC 2001). Ice core records show that the current CO2 concentration of over 380 ppm are 36% higher than in pre-industrial times, almost entirely due to human activity.
Figure 1: Past and future CO2 atmospheric concentration
Source: IPCC 2001.
Figure 2 shows that this concentration is higher than at any other time in the past 649,000 years (IPCC 2007a). Fluctuations in temperature are shown by the red line and in the atmospheric concentration of carbon dioxide by the yellow line. The vertical red bar at the end is the increase in atmospheric carbon dioxide levels over the past two centuries and before 2007.
The human-induced changes to greenhouse gas concentrations have very likely led to the observed climate changes at the global scale. Warming of the global climatic system is unequivocal, and is evident in widespread temperature increases, especially in the northern hemisphere, rising sea levels, melting of ice caps, polar ice sheets, decreasing snow and ice and glacial extent.
It is very likely that cold days, cold nights and frosts have become less frequent, and that heat waves have increased (IPCC 2007, c; Fowler et al 2010; Richardson et al 2009). Figure 3 shows how these trends are occurring internationally, both on land and in the oceans.

Climate variability in Western Palerang
5
Figure 2: CO2 concentrations and Antarctic temperature over long historical periods
Source: EPA 2011, from IPCC 2007a.
Figure 3: Global and continental temperature change
Source: IPCC 2007b, p.11
Climate variability in Western Palerang
6
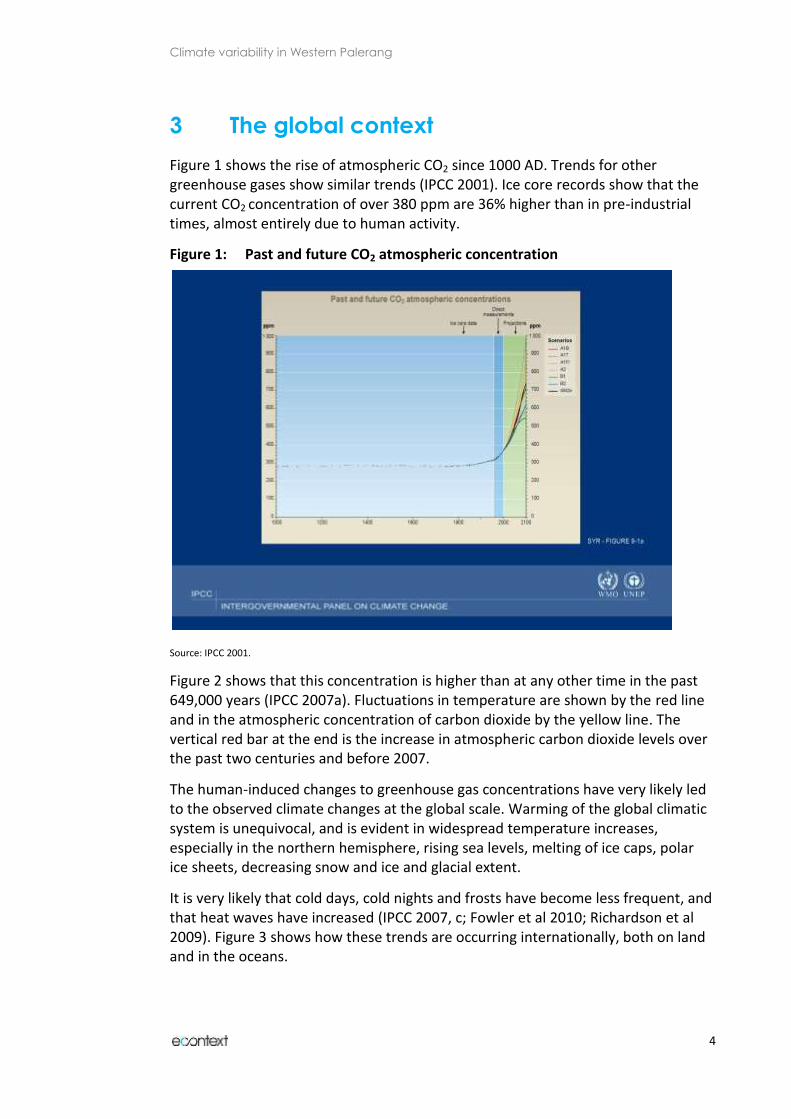
Two additional causes for concern at the global scale are worth noting. First, the most recent observations show that trends in greenhouse gas emissions and global warming are proceeding at the highest end of all of the prediction models, suggesting that climate change is accelerating more quickly than even the experts have previously predicted. This is shown in Figure 4 for CO2 concentrations, temperature and sea level rise (Rahmstorf et al 2011).
Figure 4: Changes in key global climate parameters since 1973, compared with IPCC scenarios
Source: Rahmstorf et al 2011, p. 709. IPCC scenarios are shown as dashed lines and gray ranges.
Climate variability in Western Palerang
7
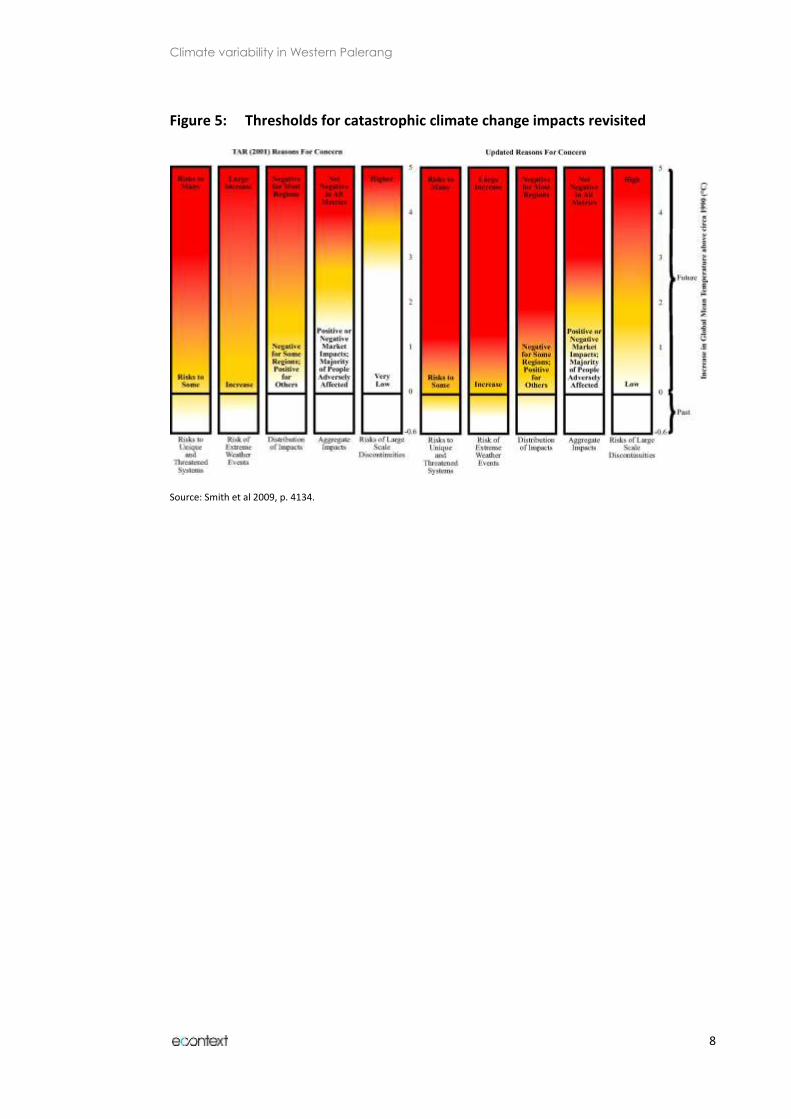
The second major reason for concern is that the impacts of climate change are likely to be more severe than was previously thought, for a given temperature rise. A two degree Celsius (°C) rise has previously been thought of as the threshold for catastrophic climate change but now it seems that catastrophic changes to several features will occur below that. On the left hand side of the ‘burning embers’ diagram (Figure 5 below) are the thresholds for catastrophic impacts on five systems that were published in 2001. On the right hand side are the updated thresholds, showing ‘high’ impacts occurring at lower temperature thresholds (Smith et al 2009).
A two degree Celsius global temperature rise is now considered to be practically unavoidable (Climate Commission, 2011 p. 16), so these two reasons for concern are expected to impact as follows:
risks to many unique and threatened systems of increased damage or irreversible loss. This will affect endangered species, unique ecosystems, biodiversity hotspots, tropical glaciers, small island states and indigenous communities,
large increase in the risk of extreme weather events with substantial consequences for societies and natural systems. Examples include increased frequency, intensity or consequences of heat waves, floods, droughts, wildfires and tropical cyclones,
a distribution of impacts which is negative for most regions, although some regions, countries and populations face greater harm than others,
aggregate damage which is net negative, including monetary damage, lives affected or lives lost, and
a moderate risk of large-scale discontinuities such as tipping points accompanied by very large impacts. Examples could include deglaciation of West Antarctic or Greenland ice sheets, and major changes in some components of climatic systems (Smith et al 2009, pp. 4134-4135).
Recognition of climate change at an international scale has led to global attempts to mitigate its affects by slowing the release of greenhouse gas emissions. The 2009 Copenhagen Climate Change Summit was the most high-ranking gathering to date on this issue. Although it failed to achieve the binding agreements that many commentators anticipated, all attending countries took note of the resulting Copenhagen Accord and 138 countries had signed it within months. Confirmation of emission reduction targets continues in many countries throughout the world, including Australia.
Climate variability in Western Palerang
8
Figure 5: Thresholds for catastrophic climate change impacts revisited
Source: Smith et al 2009, p. 4134.
Climate variability in Western Palerang
9
4 Climate Change in Australia
Climate change is predicted to impact most seriously and quickly in the Northern Hemisphere, but significant impacts will also be felt in the South. Broadly in Australia, the most significant predicted climate changes are:
average annual warming by 2030 of around 1 °C above 1990 temperatures, with warming of 1-1.2 °C inland and 0.7-0.9 on the coasts,
drying in southern areas of Australia, especially in winter, and in the southern and eastern areas in spring,
rain less often, but in more extreme intense rainfall events, especially in southern areas,
greater potential evaporation, and evapotranspiration leading to a decline in soil moisture, and
increased fire-weather risk due to warmer and drier conditions (Whetton 2011).
The apparently small magnitude of specific measures of climate change – like a one degree temperature rise – mask comparatively large resulting impacts on people and environments. This is because of the interaction between systems, such as a temperature, rain, evaporation and wind.
The following list of climate change impacts are already being felt to some extent in Australia. It is likely that each effect will increase as climatic shifts continue. Impacts include:
declining water supply reliability, due to reduced rainfall, increased evaporation. This will affect irrigation, domestic and industrial water supply and environmental flows. This is likely to be accompanied by an increase in demand, due to population growth,
infrastructure failure including urban drainage and sewerage systems, more blackouts, transport disruption and greater building damage. Higher temperatures, changes to groundwater and soil conditions, changed rainfall regimes and sea level rises could lead to further material degradation,
heatwaves, storms and floods are likely to impact on the health of Australians, including increased heat-related deaths,
biological processes such as infectious diseases and air pollution may impact negatively on health,
sea level rise combined with increased coastal populations leading to increases in the likely severity and frequency of coastal flooding, and
significant losses of unique Australian animal and plant species in sites such as the eastern alpine areas, Great Barrier Reef, Queensland Wet Tropics, Kakadu wetlands, south-western Australia, and Australia’s sub-Antarctic islands. Ecosystem function is likely to be disrupted, with ensuing loss of ecosystem services.

Climate variability in Western Palerang
10
4.1 Measuring climate change in Australia
Given the wide range of changes and impacts discussed above, it is clear that a large set of variables could be measured in order to understand climate change in a specific location. Later sections of this report focus on four key variables – maximum and minimum temperature, rainfall and evaporation. These were selected for this study as they are the smallest set giving a well-rounded picture of trends affecting water availability in the landscape. They are defined in the following table.
Table 1: Definitions of four key variables to measure climate change
Mean Maximum
Temperature
The average daily maximum air temperature, for each month or
season, and as an annual statistic, calculated over all years of record.
Mean Minimum
Temperature
The long-term average daily minimum air temperature observed during
a calendar month or season, and over the year.
Pan Evaporation A measurement combining the effects of temperature, humidity, solar
radiation and wind on the environmental demand for
evapotranspiration. Measured by the amount of evaporation from a
standard pan filled with water.
Rainfall Total precipitation recorded over a fixed interval (seasonal and annual).
Source: Bureau of Meteorology 2011.
The climate change trends to these variables described above are continuations of the changes that have already been observed, and which are shown on the following maps.
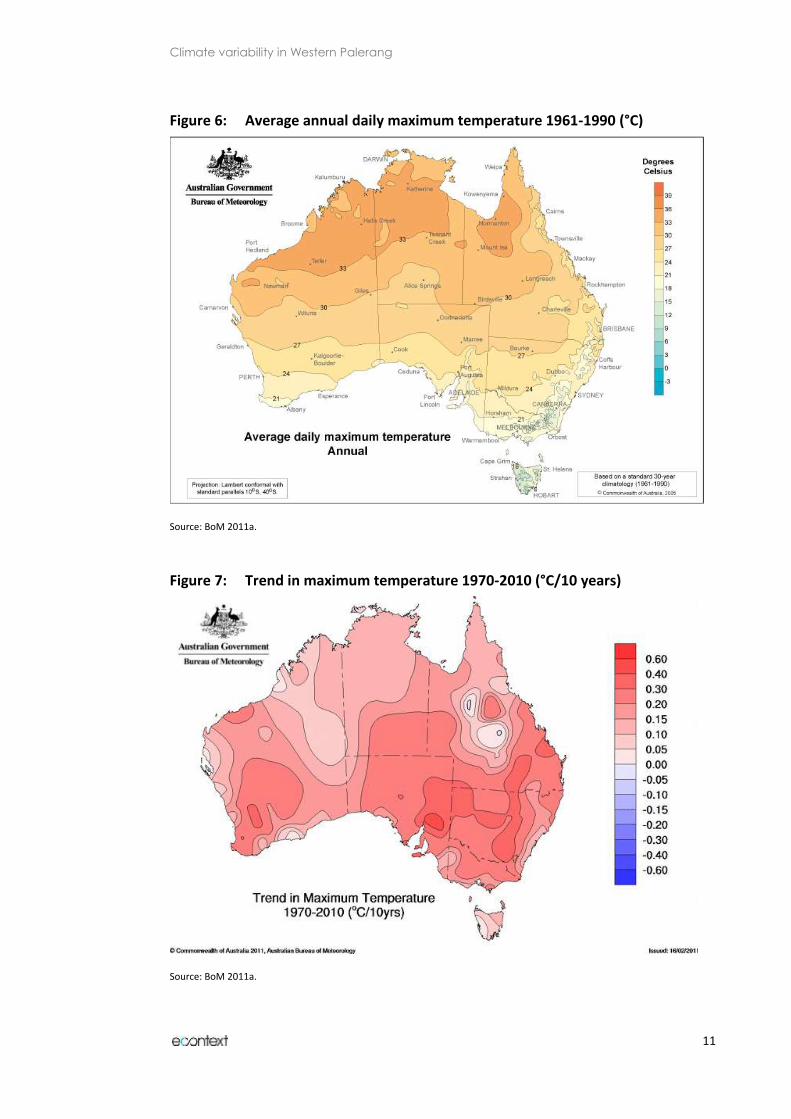
The clearest trends are in temperature, and consistent with theories of ‘global warming’, Australia is getting hotter. Figure 6 shows long-term average maximum temperature for Australia, and provides a background for analysis of climate change.
Figure 7 shows that in the forty years from 1970 to 2010 mean maximum temperature increased over the whole country. Temperature rises were greater in Southern and inland areas. Some Australian regions have experienced temperature increases of up to 2°C over the 50 years since 1960 (Braganza and Church 2011, p. 3).
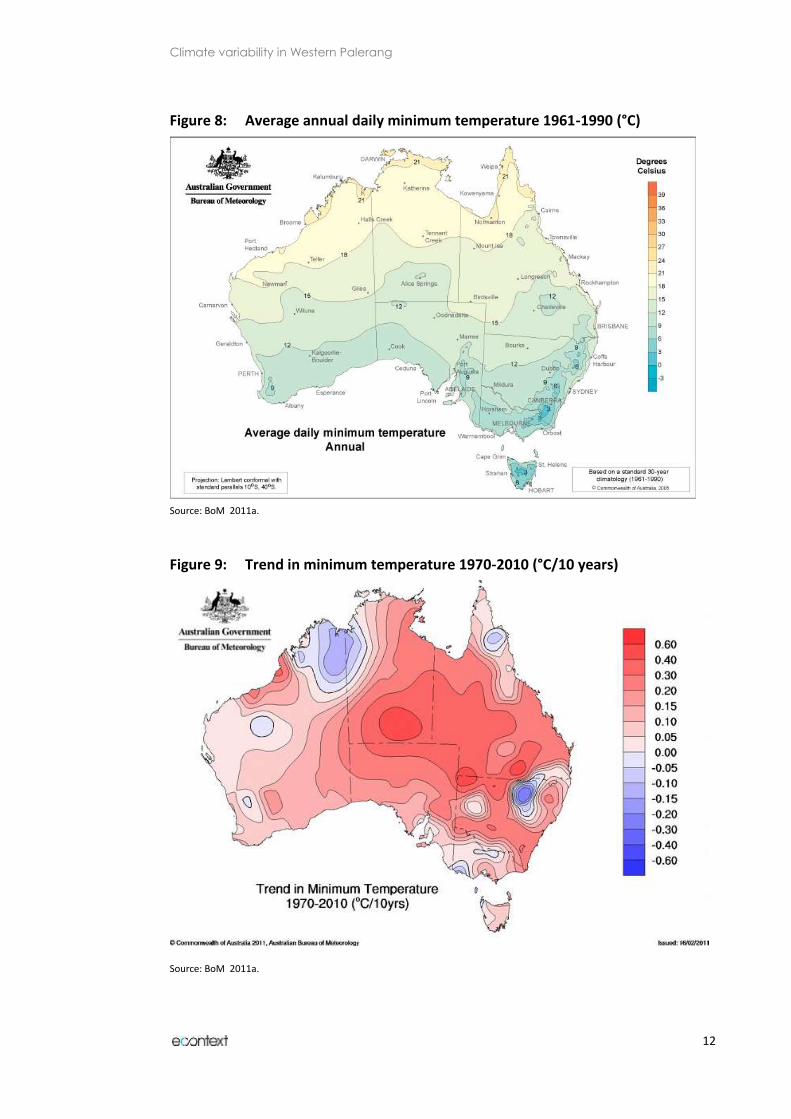
Figure 8 shows the long-term average minimum temperature for Australia.
Figure 9 shows trends in mean minimum temperature for 1970 to 2010. The mean minimum temperature has increased across most of Australia.
Climate variability in Western Palerang
11
Figure 6: Average annual daily maximum temperature 1961-1990 (°C)
Source: BoM 2011a.
Figure 7: Trend in maximum temperature 1970-2010 (°C/10 years)
Source: BoM 2011a.
Climate variability in Western Palerang
12
Figure 8: Average annual daily minimum temperature 1961-1990 (°C)
Source: BoM 2011a.
Figure 9: Trend in minimum temperature 1970-2010 (°C/10 years)
Source: BoM 2011a.
Climate variability in Western Palerang
13
Year-to-year rainfall variability is arguably the most notable feature of Australia’s climate. The variability is driven by several broad influences. The El Nino-Southern Oscillation (ENSO) drives a quasi-periodic climate pattern that occurs roughly every five years. ENSO causes warmer temperatures over the central and Eastern tropical Pacific Ocean, and associated rainfall reductions over Eastern and Northern Australia.
Other influences include the Indian Ocean Dipole, which interacts with ENSO and the Madden-Julian oscillation which affects different parts of the continent in different seasons. The patterns of rainfall related to each driver are highly variable, even though their characteristic regions do not change. In most regions, each driver accounts for up to 20 per cent of monthly rainfall variability.
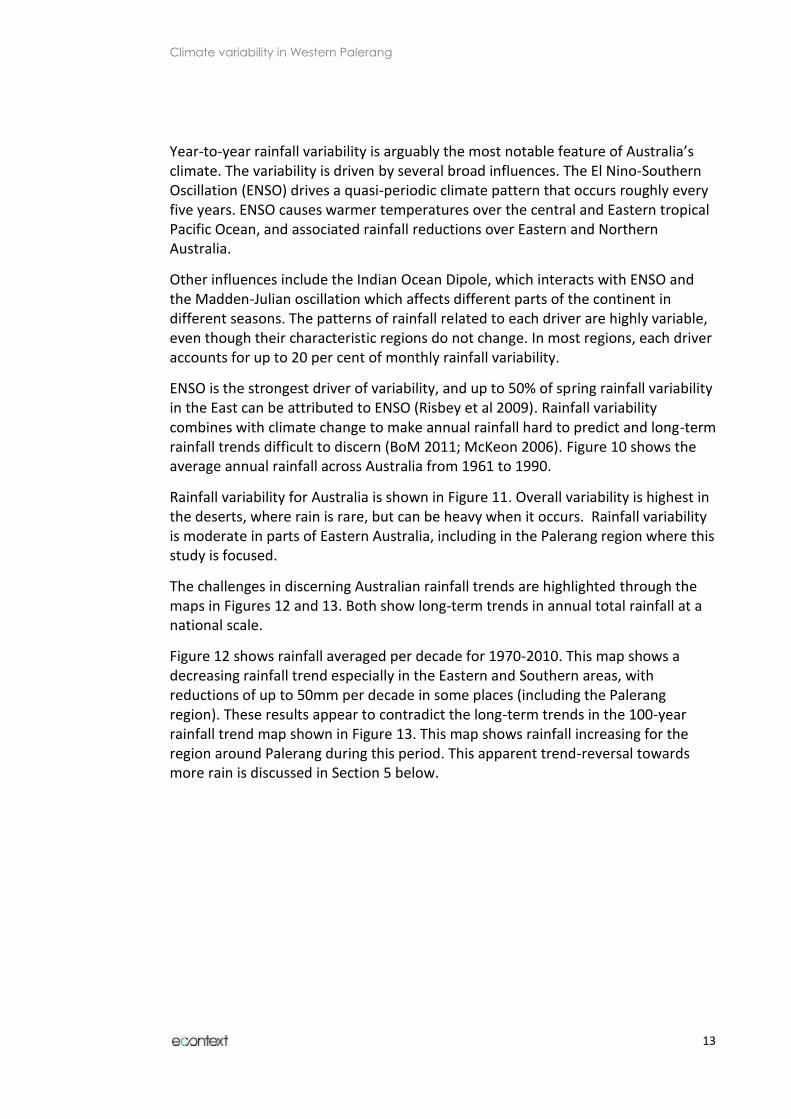
ENSO is the strongest driver of variability, and up to 50% of spring rainfall variability in the East can be attributed to ENSO (Risbey et al 2009). Rainfall variability combines with climate change to make annual rainfall hard to predict and long-term rainfall trends difficult to discern (BoM 2011; McKeon 2006). Figure 10 shows the average annual rainfall across Australia from 1961 to 1990.
Rainfall variability for Australia is shown in Figure 11. Overall variability is highest in the deserts, where rain is rare, but can be heavy when it occurs. Rainfall variability is moderate in parts of Eastern Australia, including in the Palerang region where this study is focused.
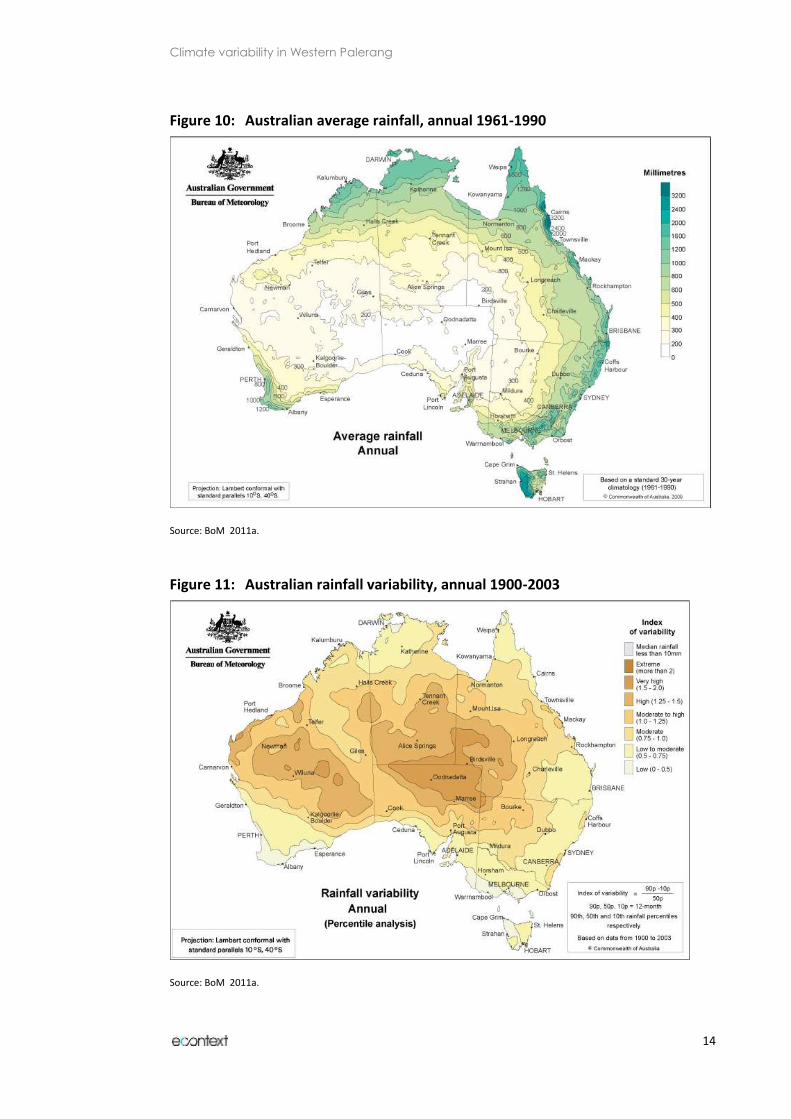
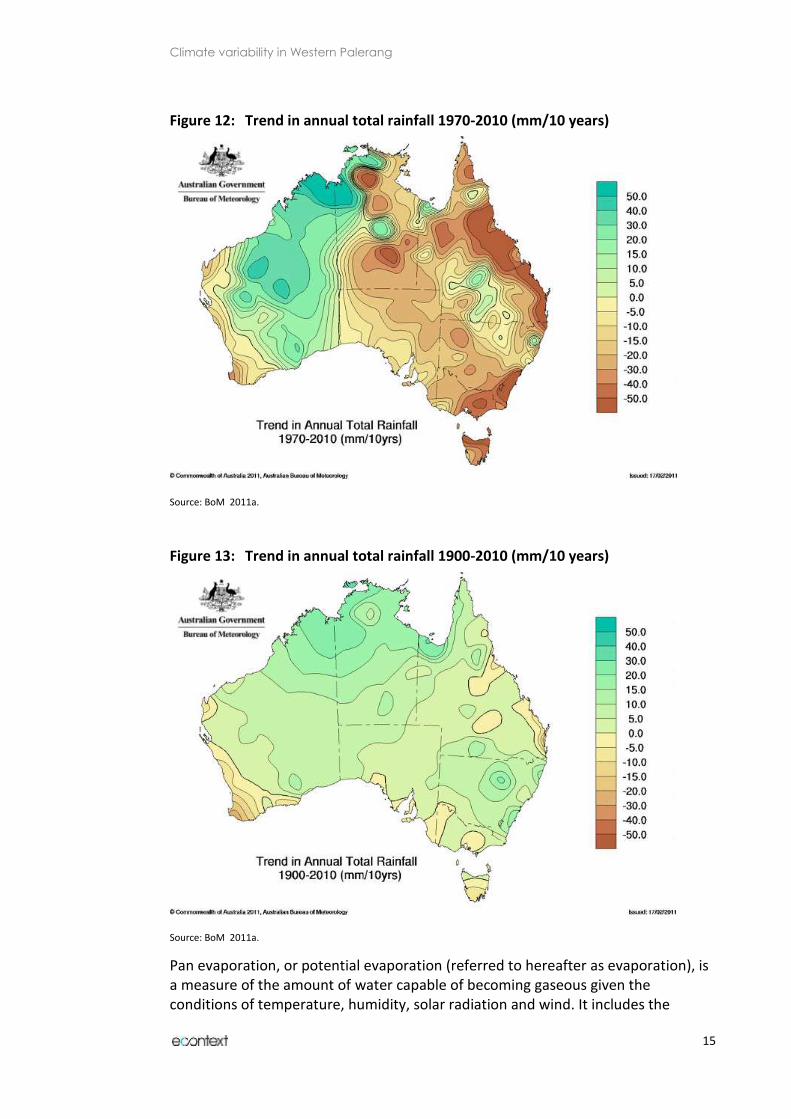
The challenges in discerning Australian rainfall trends are highlighted through the maps in Figures 12 and 13. Both show long-term trends in annual total rainfall at a national scale.
Figure 12 shows rainfall averaged per decade for 1970-2010. This map shows a decreasing rainfall trend especially in the Eastern and Southern areas, with reductions of up to 50mm per decade in some places (including the Palerang region). These results appear to contradict the long-term trends in the 100-year rainfall trend map shown in Figure 13. This map shows rainfall increasing for the region around Palerang during this period. This apparent trend-reversal towards more rain is discussed in Section 5 below.
Climate variability in Western Palerang
14
Figure 10: Australian average rainfall, annual 1961-1990
Source: BoM 2011a.
Figure 11: Australian rainfall variability, annual 1900-2003
Source: BoM 2011a.
Climate variability in Western Palerang
15
Figure 12: Trend in annual total rainfall 1970-2010 (mm/10 years)
Source: BoM 2011a.
Figure 13: Trend in annual total rainfall 1900-2010 (mm/10 years)
Source: BoM 2011a.
Pan evaporation, or potential evaporation (referred to hereafter as evaporation), is a measure of the amount of water capable of becoming gaseous given the conditions of temperature, humidity, solar radiation and wind. It includes the
Climate variability in Western Palerang
16
potential for both conversion of liquid water to water vapour, and also the evapotranspiration that can occur through plant photosynthesis. It is distinguished from actual evapotransporation which is that evapotranspiration which actually takes place under the condition of existing water supply.
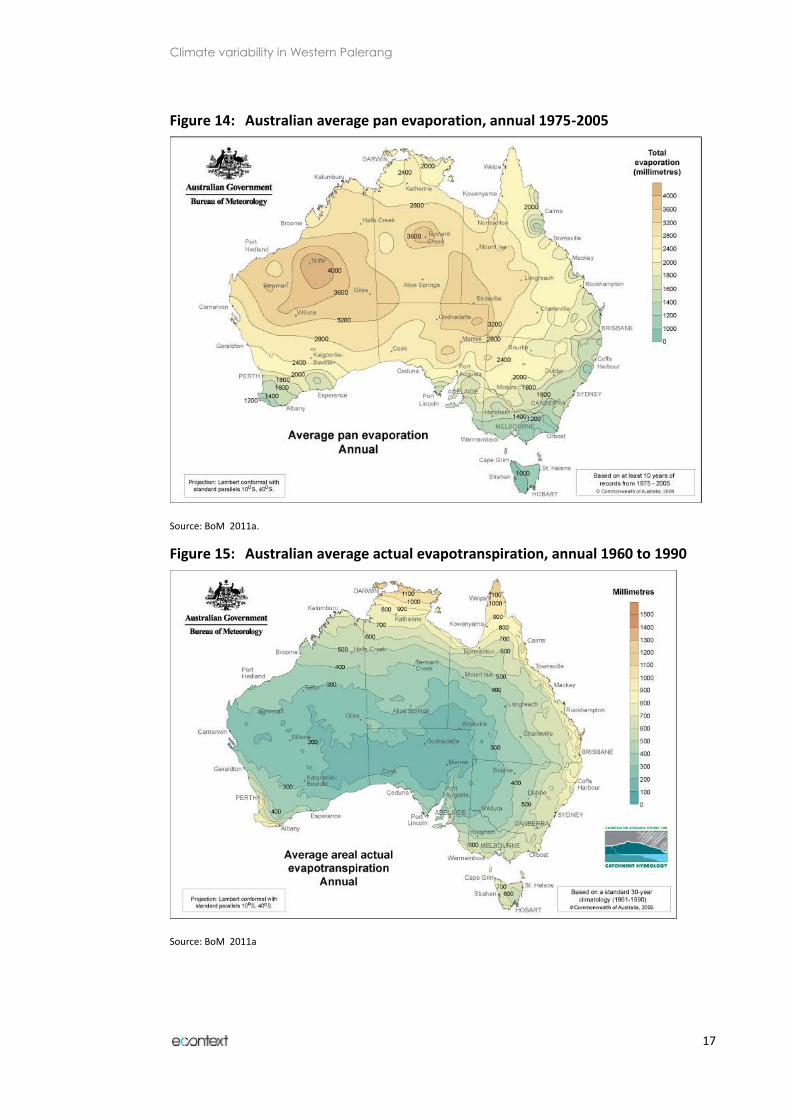
Figure 14 shows the long-term average patterns for evaporation across Australia. The potential for evaporation is highest in the hot, dry central deserts, and lower in the cooler Southern and Eastern areas. Actual evapotranspiration is shown in Figure 15. The different patterns are clearly evident here, with real evaporation highest in areas with the most available water – the tropical North and Eastern Australia, with another pocket in the South West.
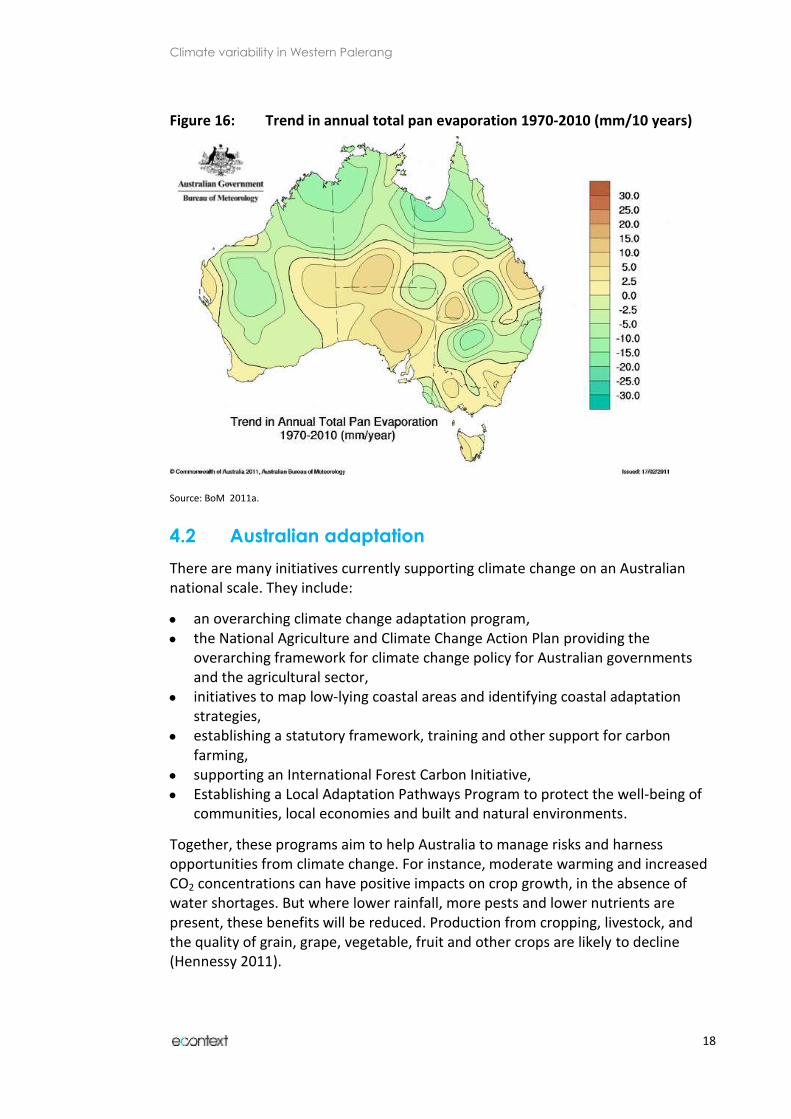
Evaporation in Australia has been is showing a slight overall downward trend both internationally and within Australia. This observation goes counter to the expectations of many analysts, as it would seem natural for evaporation to increase with temperature. ‘Global dimming’ – or a decline in solar radiation due to changed cloud properties and an increased atmospheric loading of human-induced aerosols is the likely cause (Gifford et al 2005, p.p.5-6).
Figure 16 shows Australian trends in evaporation (potential) from 1970 to 2010. Evaporation has increased in the Palerang region, during the same time period over which rainfall has declined. The combination of less rain and higher potential evaporation suggests conditions which will lead to drier landscapes.
Climate variability in Western Palerang
17
Figure 14: Australian average pan evaporation, annual 1975-2005
Source: BoM 2011a.
Figure 15: Australian average actual evapotranspiration, annual 1960 to 1990
Source: BoM 2011a
Climate variability in Western Palerang
18
Figure 16: Trend in annual total pan evaporation 1970-2010 (mm/10 years)
Source: BoM 2011a.
4.2 Australian adaptation
There are many initiatives currently supporting climate change on an Australian national scale. They include:
an overarching climate change adaptation program,
the National Agriculture and Climate Change Action Plan providing the overarching framework for climate change policy for Australian governments and the agricultural sector,
initiatives to map low-lying coastal areas and identifying coastal adaptation strategies,
establishing a statutory framework, training and other support for carbon farming,
supporting an International Forest Carbon Initiative,
Establishing a Local Adaptation Pathways Program to protect the well-being of communities, local economies and built and natural environments.
Together, these programs aim to help Australia to manage risks and harness opportunities from climate change. For instance, moderate warming and increased CO2 concentrations can have positive impacts on crop growth, in the absence of water shortages. But where lower rainfall, more pests and lower nutrients are present, these benefits will be reduced. Production from cropping, livestock, and the quality of grain, grape, vegetable, fruit and other crops are likely to decline (Hennessy 2011).
Climate variability in Western Palerang
19
Findings from this national adaptation work show that within Australia, the most sensitive areas, requiring earliest adaptation are “water, the natural environments, cities and infrastructure, the coastal zone and agriculture” (Stafford Smith and Ash 2011, p. 59).
Across Australia, the climate change adaptation strategies most relevant to inland Australian local governments include:
Protect ecosystems by actively managing long-lived species and enhancing the resilience of existing ecosystems.
Manage the impacts of heatwaves by supporting the elderly, providing heat-resistant transport and greening urban areas to reduce heat stress.
Protect energy supplies by installing heat-tolerant transformers, more resilient distributed energy systems and reducing demand in extremes.
Support sustainable food production by encouraging the use of drought-tolerant cultivars, changed planting practices and relocation.
Resist bushfires by approving fireproof building designs, putting better early warning systems in place and avoiding building approvals in risky places.
Enforce statutory requirements for limits to bores and farm dams and other water harvesting to within environmental limits. (Stafford Smith and Ash 2011. p. 64).
Climate variability in Western Palerang
20
5 Climate variability and climate change in
the Palerang Region
Like most Australian local governments, Palerang is a part of or member of many different regional entities (Wild-River 2006). The two regions that are most meaningful for this report are the Australian Capital Region (ACR) and the Murray Darling Basin (MDB).
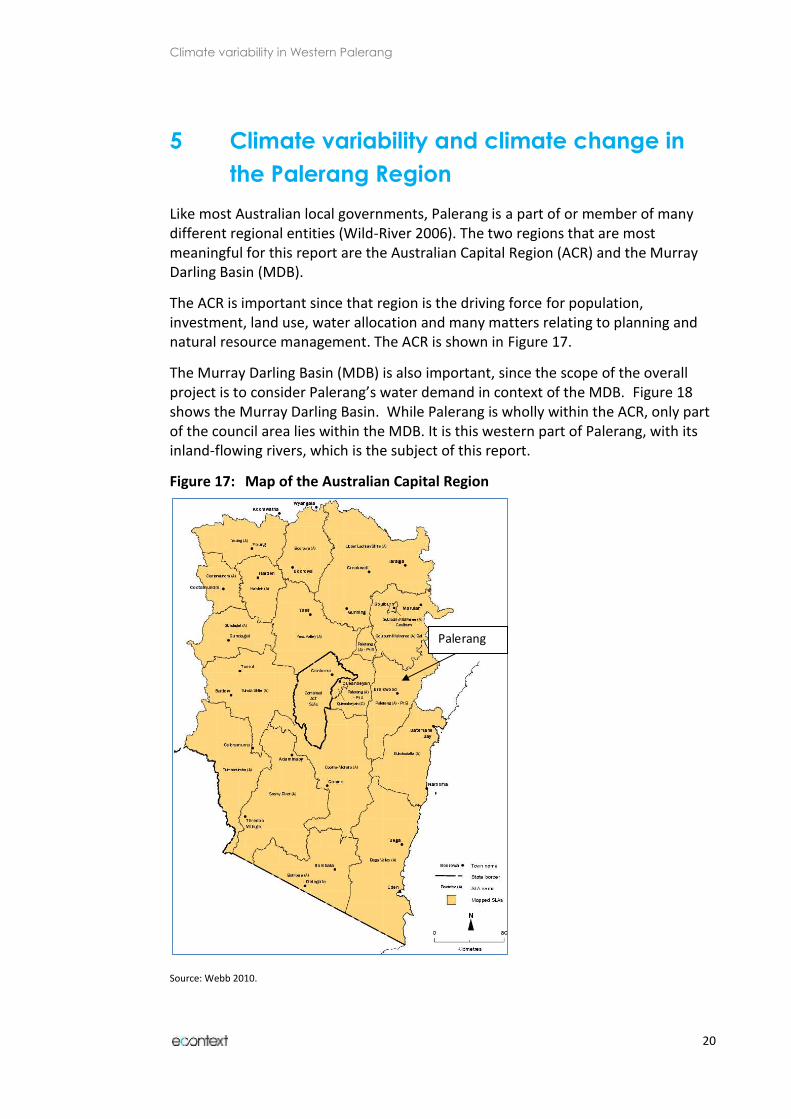
The ACR is important since that region is the driving force for population, investment, land use, water allocation and many matters relating to planning and natural resource management. The ACR is shown in Figure 17.
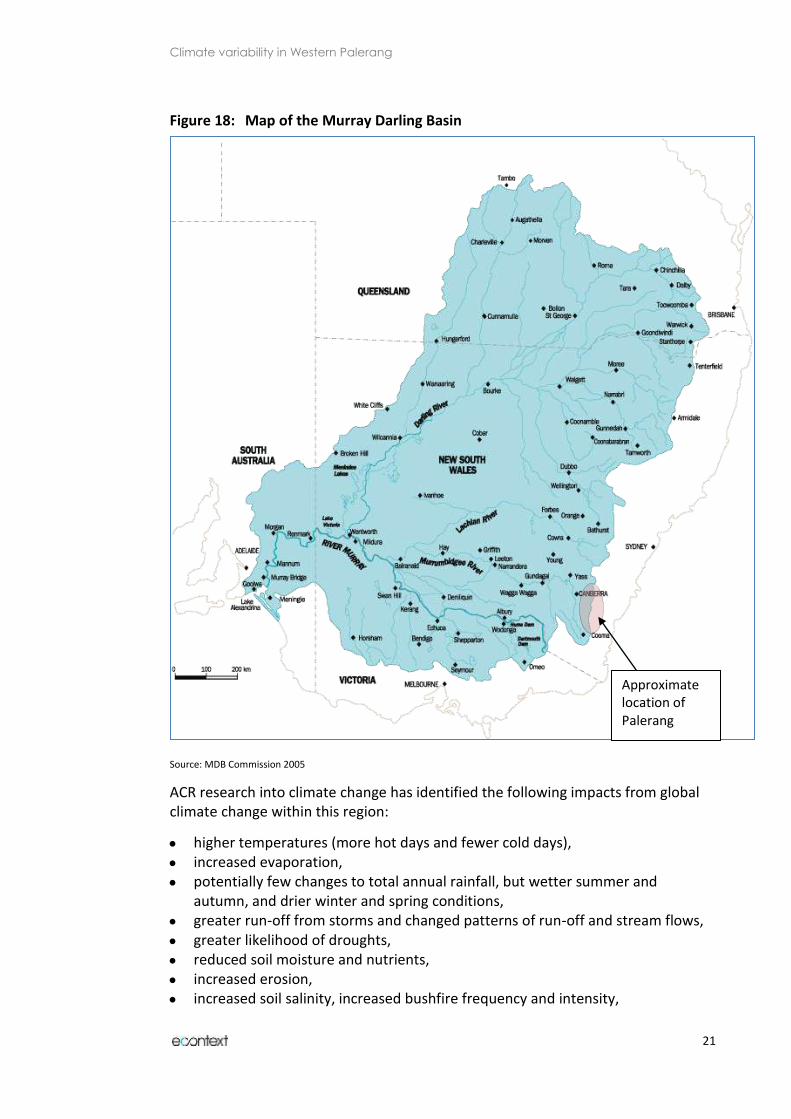
The Murray Darling Basin (MDB) is also important, since the scope of the overall project is to consider Palerang’s water demand in context of the MDB. Figure 18 shows the Murray Darling Basin. While Palerang is wholly within the ACR, only part of the council area lies within the MDB. It is this western part of Palerang, with its inland-flowing rivers, which is the subject of this report.
Figure 17: Map of the Australian Capital Region
Source: Webb 2010.
Palerang
Climate variability in Western Palerang
21
Figure 18: Map of the Murray Darling Basin
Source: MDB Commission 2005
ACR research into climate change has identified the following impacts from global climate change within this region:
higher temperatures (more hot days and fewer cold days),
increased evaporation,
potentially few changes to total annual rainfall, but wetter summer and autumn, and drier winter and spring conditions,
greater run-off from storms and changed patterns of run-off and stream flows,
greater likelihood of droughts,
reduced soil moisture and nutrients,
increased erosion,
increased soil salinity, increased bushfire frequency and intensity,
Approximate location of Palerang
Climate variability in Western Palerang
22
increased average wind-speeds especially in winter and spring,
in coastal areas, sea level rise, more storm surges and inundation, and
biodiversity losses (ACT 2007; Webb 2010; DECCW 2010).
Climate change predictions for the MDB are similar to the above, but climate vulnerability differs considerably across the basin. For instance, surface water availability is predicted to decrease across the entire basin but more so towards the lower reaches of the catchment. The less vulnerable Northern and Eastern areas face a lesser reduction of 9 per cent compared with 13 per cent in the more vulnerable West and South of the MDB (CSIRO 2008).
A local study undertaken on climate change at Braidwood (within Palerang, but to the East of the study site for this project) supports the results identified at the regional scale. Writing at the peak of the recent drought, Hosking (2007) analysed rainfall, temperature, runoff, evaporation, cloudiness, wind direction, wind run, soil dryness and resulting land carrying capacity. He concluded that hotter and drier conditions had reduced land stocking capacity by nearly 35 per cent over 20 years. He emphasised the impact of increased wind speed, and wind run in contributing to soil dryness, and recommended wind breaks and other measures to curtail the local impacts of such shifts.
5.1 Rainfall variability in NSW and ACT
This project’s focus on water availability makes it worthwhile further exploring rainfall variability around Palerang. Figure 19 is a graph showing annual rainfall anomalies. These are variations around the average rainfall, in this case taken as 552mm per year which was the average for NSW from 1961-2000. This graph of change over time shows that the past 110 years has been characterised by series of multiple, consecutive ‘wet’ and ‘dry’ decades.
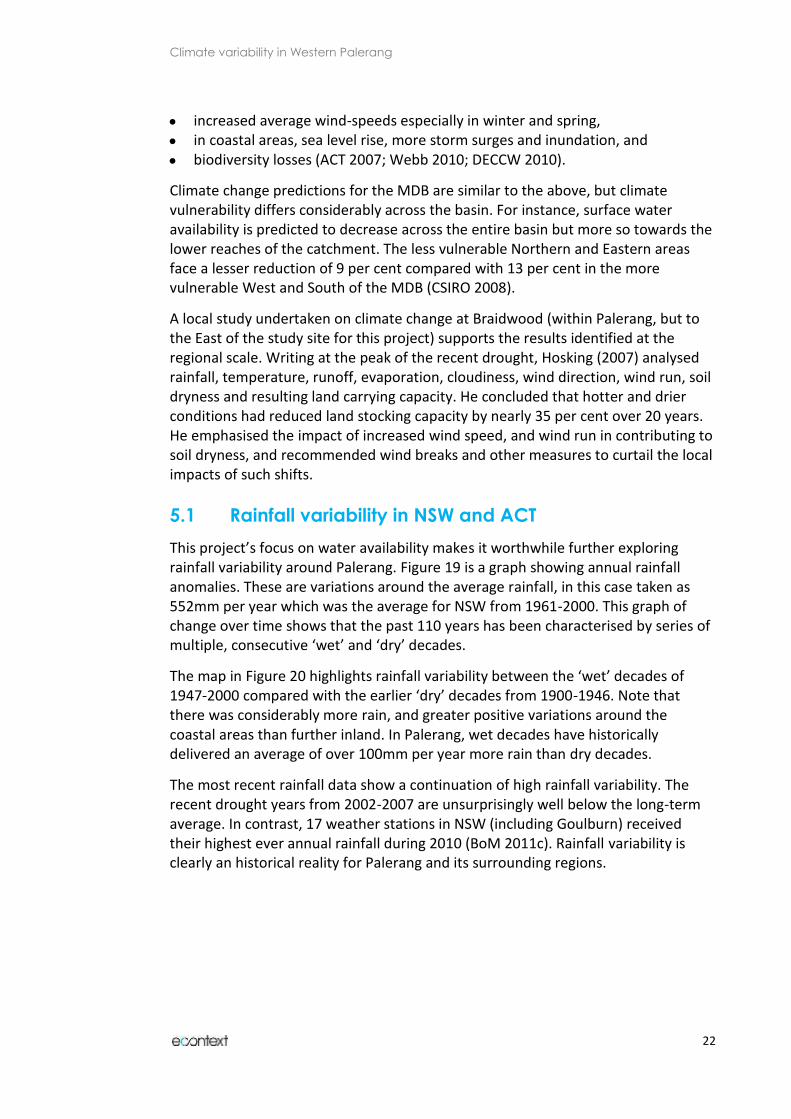
The map in Figure 20 highlights rainfall variability between the ‘wet’ decades of 1947-2000 compared with the earlier ‘dry’ decades from 1900-1946. Note that there was considerably more rain, and greater positive variations around the coastal areas than further inland. In Palerang, wet decades have historically delivered an average of over 100mm per year more rain than dry decades.
The most recent rainfall data show a continuation of high rainfall variability. The recent drought years from 2002-2007 are unsurprisingly well below the long-term average. In contrast, 17 weather stations in NSW (including Goulburn) received their highest ever annual rainfall during 2010 (BoM 2011c). Rainfall variability is clearly an historical reality for Palerang and its surrounding regions.

Climate variability in Western Palerang
23
Figure 19: Annual rainfall anomalies – New South Wales and ACT, 1900-2010
Sources: BoM 2011b; Wiles 2007.
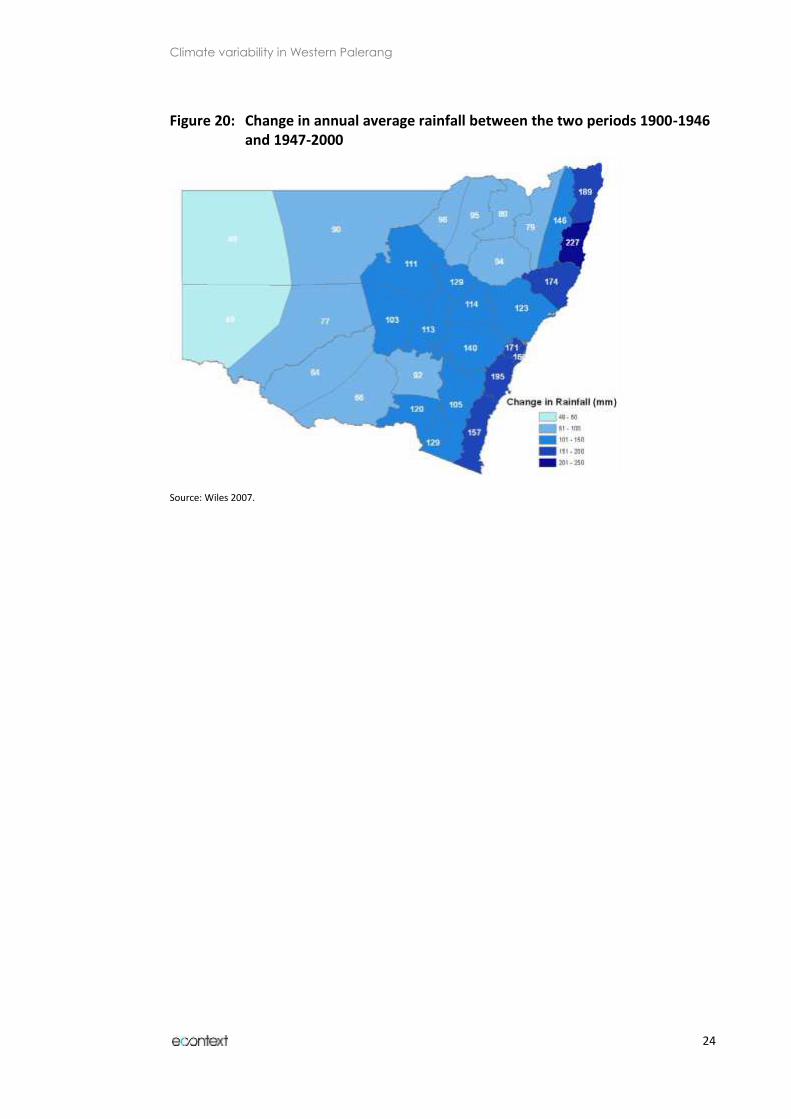
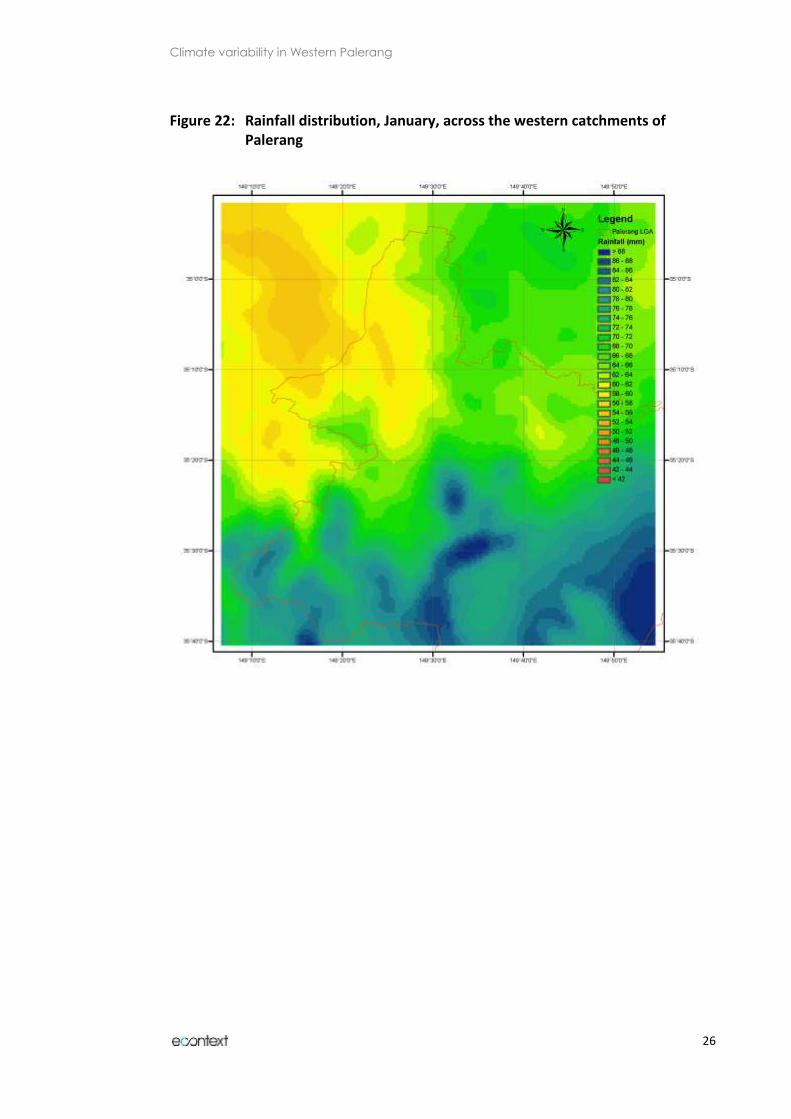
The spatial distribution of rainfall patterns within Western Palerang can partially be explained by the regional orographic effects. The broader scale influences on rainfall are evident by examining rainfall distribution beyond the boundaries of Palerang.
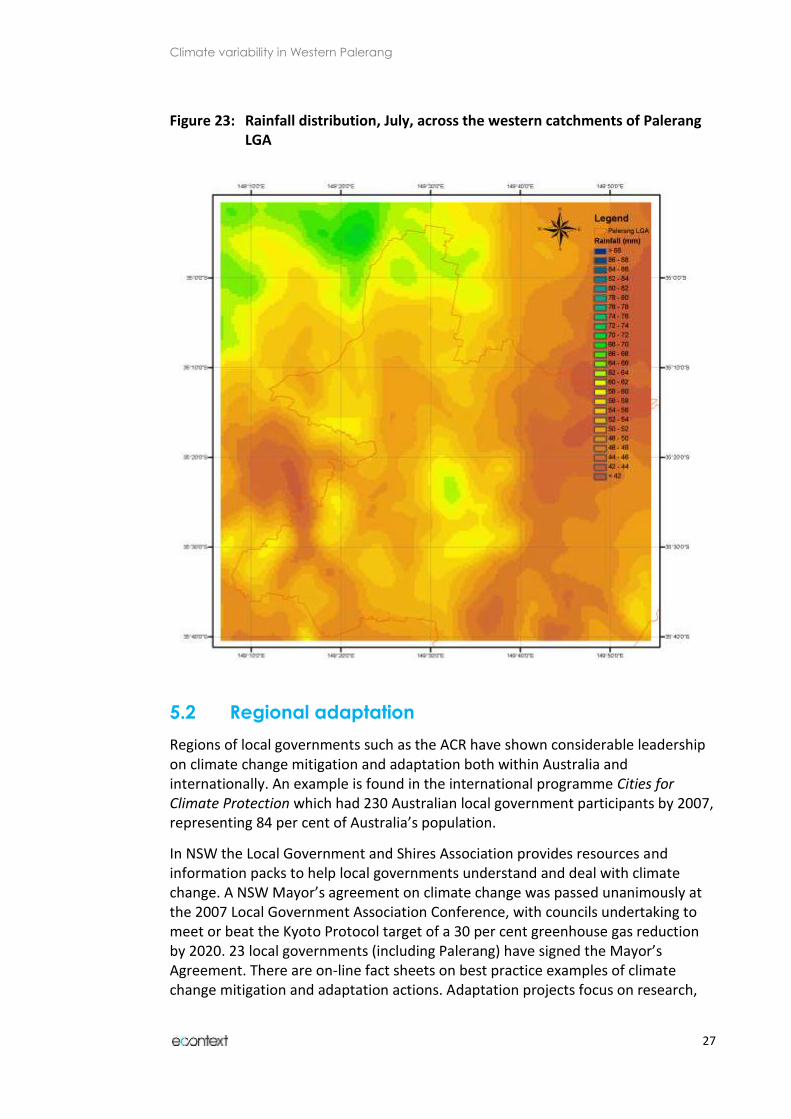
Figure 21 shows the influence on annual rainfall a rain shadow imposed by the Brindabella Ranges to the West. The maps also show what appears to be a significant rainfall gradient from the east due to orographic influences associated with the Great Dividing range. This gradient may also reflect maritime influences become increasingly depleted with distance from the coast. The seasonal differences in these topographic and marine influences are quite pronounced (Figure 22 and Figure 23) as a function of global and secondary (maritime and continental) circulations.
Climate variability in Western Palerang
24
Figure 20: Change in annual average rainfall between the two periods 1900-1946 and 1947-2000
Source: Wiles 2007.
Climate variability in Western Palerang
25
Figure 21: Annual rainfall distribution across the western catchments of Palerang LGA
Climate variability in Western Palerang
26
Figure 22: Rainfall distribution, January, across the western catchments of Palerang
Climate variability in Western Palerang
27
Figure 23: Rainfall distribution, July, across the western catchments of Palerang LGA
5.2 Regional adaptation
Regions of local governments such as the ACR have shown considerable leadership on climate change mitigation and adaptation both within Australia and internationally. An example is found in the international programme Cities for Climate Protection which had 230 Australian local government participants by 2007, representing 84 per cent of Australia’s population.
In NSW the Local Government and Shires Association provides resources and information packs to help local governments understand and deal with climate change. A NSW Mayor’s agreement on climate change was passed unanimously at the 2007 Local Government Association Conference, with councils undertaking to meet or beat the Kyoto Protocol target of a 30 per cent greenhouse gas reduction by 2020. 23 local governments (including Palerang) have signed the Mayor’s Agreement. There are on-line fact sheets on best practice examples of climate change mitigation and adaptation actions. Adaptation projects focus on research,
Climate variability in Western Palerang
28
planning, risk management, health service improvements, systems approaches and integrated water management (LGSA 2011).
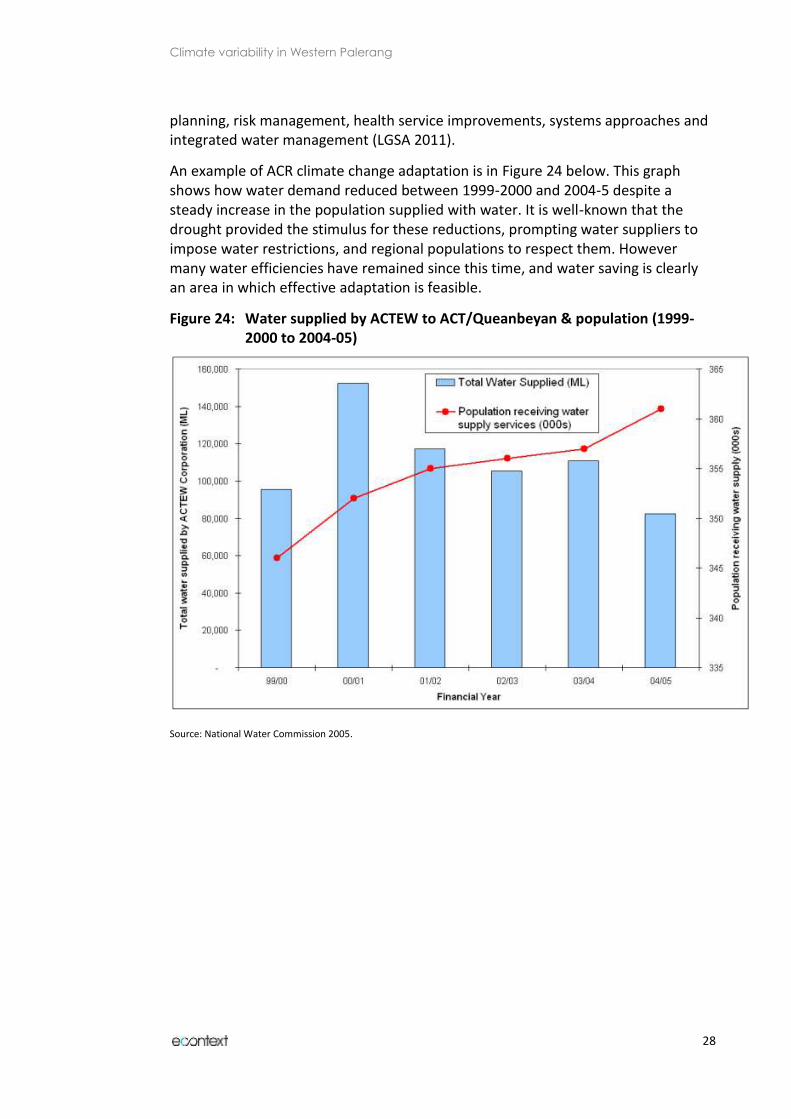
An example of ACR climate change adaptation is in Figure 24 below. This graph shows how water demand reduced between 1999-2000 and 2004-5 despite a steady increase in the population supplied with water. It is well-known that the drought provided the stimulus for these reductions, prompting water suppliers to impose water restrictions, and regional populations to respect them. However many water efficiencies have remained since this time, and water saving is clearly an area in which effective adaptation is feasible.
Figure 24: Water supplied by ACTEW to ACT/Queanbeyan & population (1999-2000 to 2004-05)
Source: National Water Commission 2005.
Climate variability in Western Palerang
29
Part B - Climate and climate change within the
Murray Darling Basin in Palerang1
Part B presents original data and findings. It first describes how this original research was conducted. It then presents a series of maps and other results showing the current climatic conditions for Western Palerang, and how climate change is likely to affect this area in the future.
This type of local level study is rarely done, and is highlighted in several reports as a key priority for future research (Richardson et al 2009, pp. 12-15; ACT 2007, p. 25; Cleugh et al 2011, pp. 56, 63, 68 and others). The value of local climate analysis is demonstrated strongly in these results, since it highlights the high spatial variability in historical climate conditions. This variability is likely to be accentuated through climate change, meaning that areas which already face the highest climate vulnerability will have this vulnerability increased in future years.
6 Generating local climate data
Climate modelling is achieved by applying well-tested models to specific locations. In this case, 30 years worth of local records for the Palerang region were fed into the worlds 23 best climate models. This resulted in a baseline showing current climatic conditions, and projections to 2030 and 2050 of likely future climate features.
6.1 Generating the baseline data
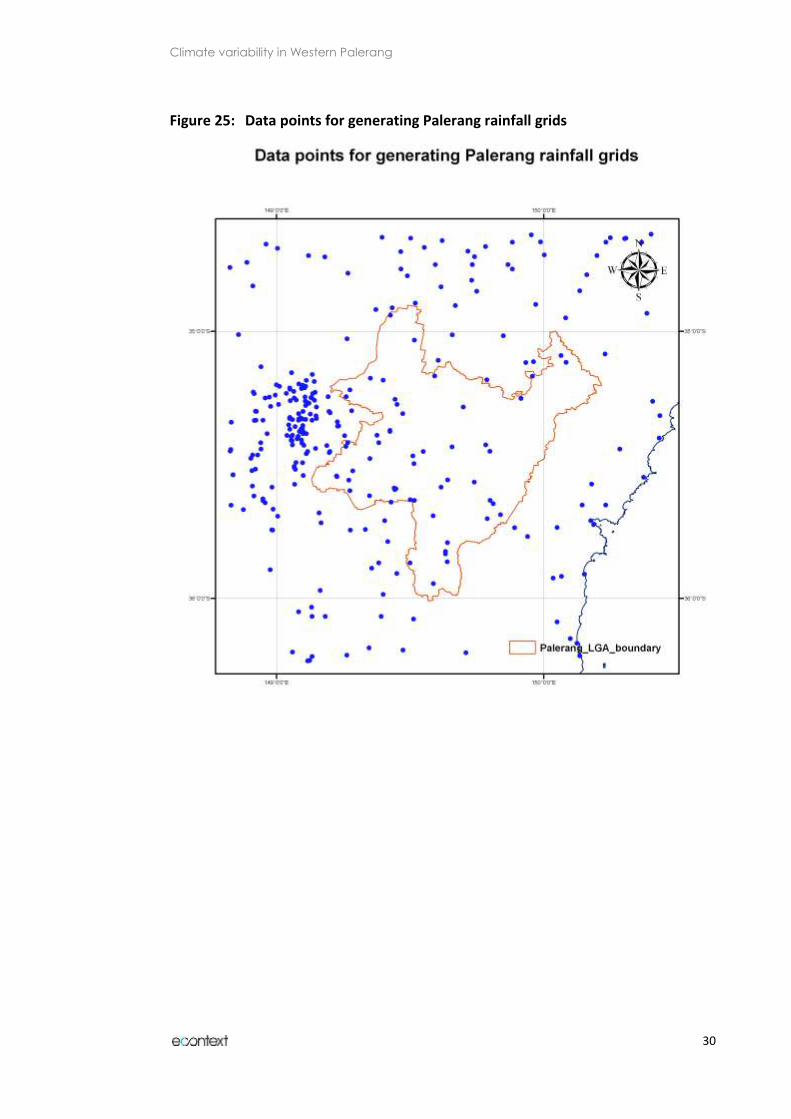
The first step in presenting local climate projections is to establish the baseline conditions on which change occurs. The baseline data used in the generation of the scenarios are monthly temperature and rainfall data collected by the Bureau of Meteorology over the period 1976-2005. Figure 25 shows the location of stations used to interpolate the monthly mean temperature and rainfall surfaces for the base period 1976-2005.
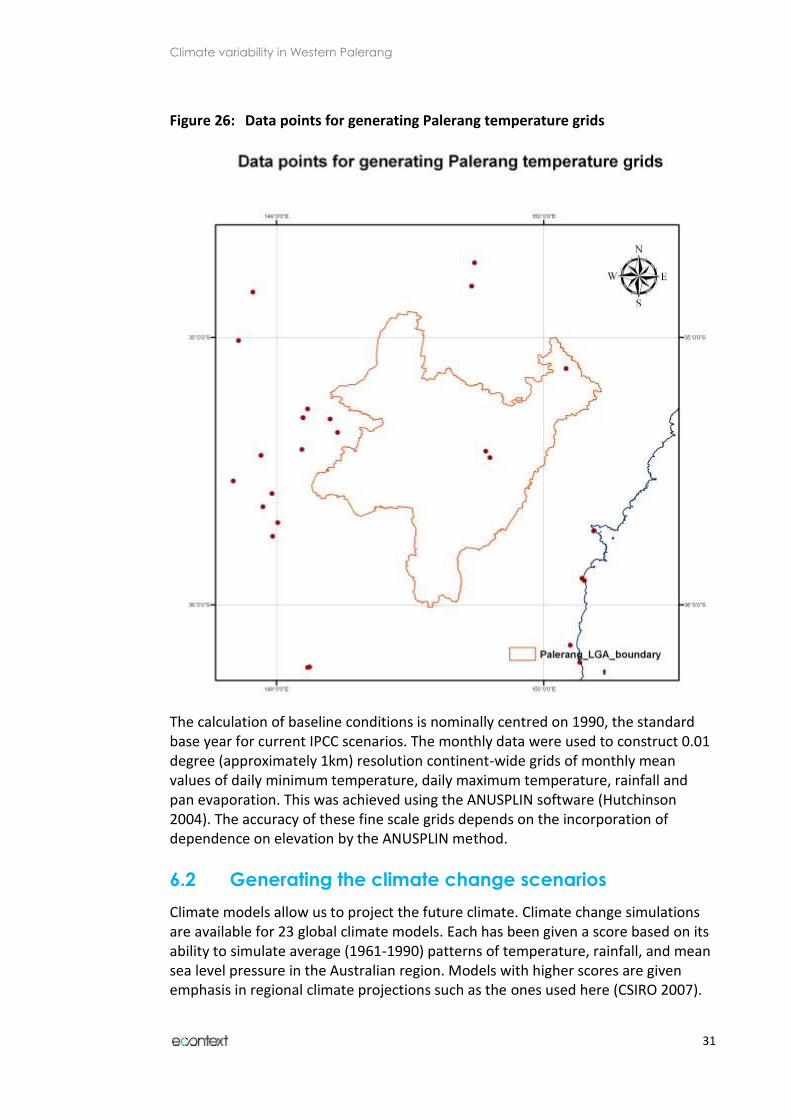
The surfaces are actually fitted to data for the whole of Australia but these maps give a reasonable indication of the stations that contributed to the Palerang climate means. There are fewer temperature stations than precipitation stations, but the interpolation makes use of the strong dependence on elevation, particularly for temperature, so that the interpolation errors for monthly mean temperatures are around 0.5 degrees, and for rainfall around 10-15%.
1 Part 6 is predominantly written by Professor Michael Hutchinson, Fenner School of Environment and Society, the Australian National University.
Climate variability in Western Palerang
30
Figure 25: Data points for generating Palerang rainfall grids
Climate variability in Western Palerang
31
Figure 26: Data points for generating Palerang temperature grids
The calculation of baseline conditions is nominally centred on 1990, the standard base year for current IPCC scenarios. The monthly data were used to construct 0.01 degree (approximately 1km) resolution continent-wide grids of monthly mean values of daily minimum temperature, daily maximum temperature, rainfall and pan evaporation. This was achieved using the ANUSPLIN software (Hutchinson 2004). The accuracy of these fine scale grids depends on the incorporation of dependence on elevation by the ANUSPLIN method.
6.2 Generating the climate change scenarios
Climate models allow us to project the future climate. Climate change simulations are available for 23 global climate models. Each has been given a score based on its ability to simulate average (1961-1990) patterns of temperature, rainfall, and mean sea level pressure in the Australian region. Models with higher scores are given emphasis in regional climate projections such as the ones used here (CSIRO 2007).
Climate variability in Western Palerang
32
The projections in this project are for climatic conditions in 2030 and 2050. There are two main sources of variation in the results. The uncertainties in the projected climate change in 2030 are mostly due to the differences between the results in the climate change models. Further into the future, uncertainties from differences in emission scenarios increase.
The scenarios were developed from the 10th, 50th and 90th percentile climate change grids for the A1FI greenhouse gas emission scenario, as prepared by CSIRO Marine and Atmospheric Research from the climate model outputs produced for the Fourth Assessment Report of the Intergovernmental Panel on Climate Change (IPCC 2007a). This scenario was chosen as being the one closest to currently observed accelerating trends in global greenhouse gas emissions. The A1 scenario is based on a future world of very rapid economic growth with a global population that peaks in the mid-century and declines thereafter. This scenario also envisages the rapid introduction of new and more efficient technologies. The F1 scenario assumes a technological emphasis on fossil-intensive energy sources (IPCC 2001; CSIRO 2007, Chapter 5).
The 50th percentile climate change grids represent the median amongst the available projections for each climate variable. As described in the Technical Report, the 10th and 90th percentiles provide a measure of uncertainty across the projections provided by the different climate models.
The temperature and rainfall projections are based on all 23 models. The projections in potential evaporation are based on the 14 models with the best results for these variables. Projections in temperature show reasonable agreement across the different models, with the median estimate of annual warming over Australia by 2030 of around 1.0°C, with warmings of around 0.7-0.9°C in coastal areas and 1-1.2°C inland.
Projected rainfall changes show greater uncertainty because the impacts of greenhouse gases on precipitation are less direct than for temperature. A key change to the atmospheric circulation is a pole-ward expansion of the Hadley circulation, which influences the exchange of air from the tropics to the mid-latitudes. This, together with an intensification of the hydrological cycle, tends to produce lower relative humidity and precipitation in the subtropics (the desert regions), extending to the mid-latitudes in some seasons.
6.3 Achieving a fine resolution
Most reporting of climate modelling is done at a relatively coarse geographical scale. The data provided by Xu and Hutchinson for this project enable especially fine-scaled analysis. Figure 27 shows the type of benefit that can be achieved through such a refinement. The four pictures show climate models for parts of Europe using the spatial sensitivity available in subsequent IPCC reports. The benefits of increasing the spatial sensitivity of models, from grids of hundreds of kilometres, is clear from this picture which shows the increasingly rich information portrayed in analyses with finer scales of resolution.

Climate variability in Western Palerang
33
Figure 27: Improving resolution of climate models
Source: IPCC 2007a. Figure 1.4.
Truly detailed spatial climate data analysis is still rare, and this project is making a valuable contribution in this area. Results here compare with a recent study of climate change vulnerability in the ACT, undertaken using 200km grids. In that project, all of Canberra was assumed to have the same elevation, latitude and longitude, along with the adjacent Brindabella Ranges (AECOMM 2010 p.4).
Each of the climate projections for this project has been modelled using 1km grids. The climate change percentile grids provided by CSIRO express changes relative to the 1990 base year, with temperature as simple differences (+ or -) and with rainfall and evaporation as percentage changes. These climate change grids were then applied to the monthly mean climate grids for the period 1976-2005 by the MTHCLIM module of the ANUCLIM software (Xu and Hutchinson 2011). This yielded projected monthly mean values of daily minimum temperature, daily maximum temperature, precipitation and pan evaporation for 2030 and 2050 and according to the A1FI greenhouse gas emission scenario (see also the results in Appendix A) (Hutchinson, M. 2011).
Climate variability in Western Palerang
34
7 The study area
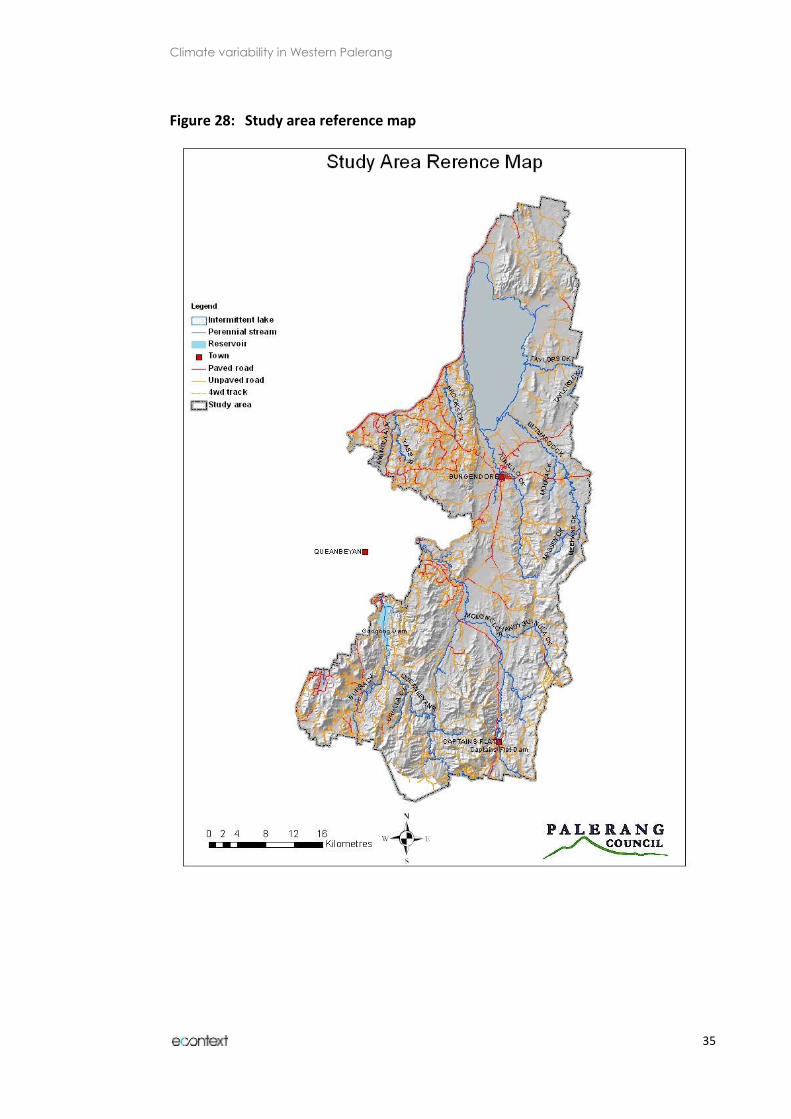
Palerang Council local government area extends to Lake George in the north, the Tallaganda State Forest in the south, Queanbeyan City to the west and the Morton and Budawang National Parks to the east.
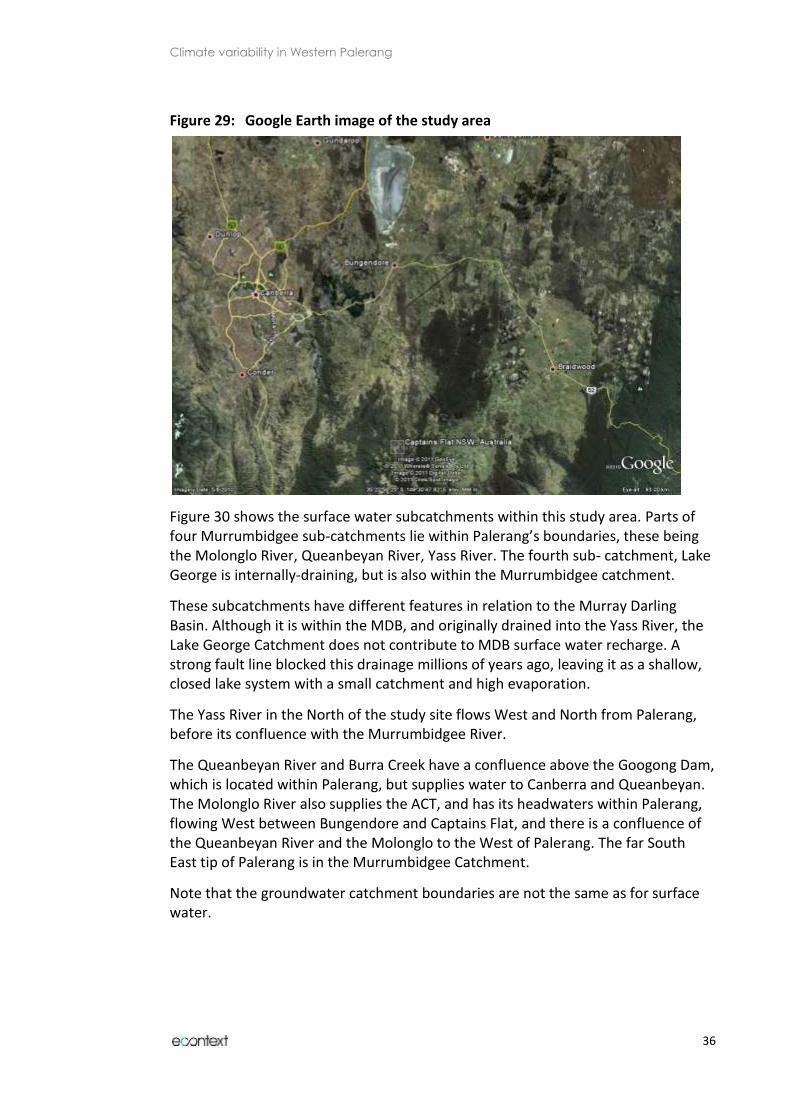
The study area for this project is shown in Figure 28. This is the Western half of Palerang Council which lies within the MDB at the headwaters of the Murrumbidgee catchment. Figure 29 is a Google Earth image showing (among other things) the distribution of forests in the study area.
There is significant geographic variability within the study area leading to different micro-climates. General principles governing climatic conditions explain much of the variation within this part of Palerang. All other things being equal:
temperatures are lower at higher elevations, because reduced air pressure causes air particles to expand and cool,
in Australia, rainfall is highest in the east, reducing West of the Great Dividing Range because the Pacific Ocean provides moisture for rainfall, which cools and precipitates as it is blown westwards and upwards (Manins 2001),
temperature is higher in the North and in central Australia than in the South and the circumference – especially in the East coast. The local influence of latitude and longitude is far lower than that of elevation.
temperatures are lower and rainfall higher in forested areas (Mackey et al. 2010, p. 39).
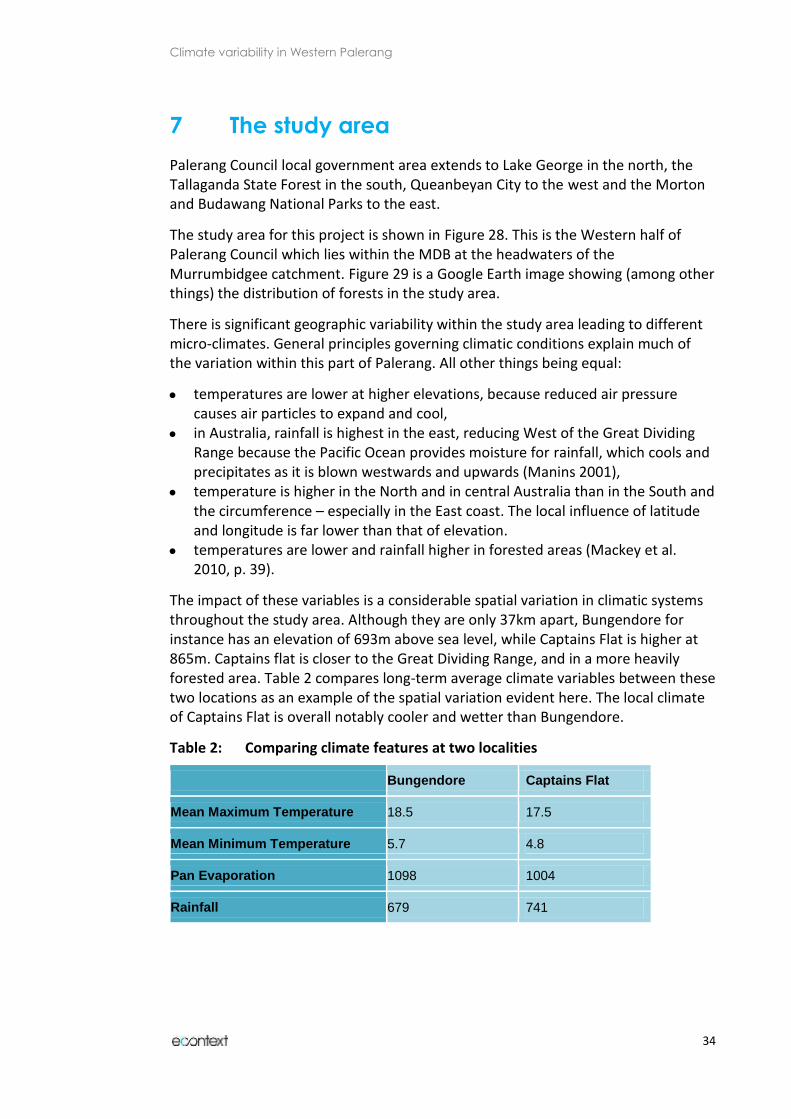
The impact of these variables is a considerable spatial variation in climatic systems throughout the study area. Although they are only 37km apart, Bungendore for instance has an elevation of 693m above sea level, while Captains Flat is higher at 865m. Captains flat is closer to the Great Dividing Range, and in a more heavily forested area. Table 2 compares long-term average climate variables between these two locations as an example of the spatial variation evident here. The local climate of Captains Flat is overall notably cooler and wetter than Bungendore.
Table 2: Comparing climate features at two localities
Bungendore Captains Flat
Mean Maximum Temperature 18.5 17.5
Mean Minimum Temperature 5.7 4.8
Pan Evaporation 1098 1004
Rainfall 679 741
Climate variability in Western Palerang
35
Figure 28: Study area reference map
Climate variability in Western Palerang
36
Figure 29: Google Earth image of the study area
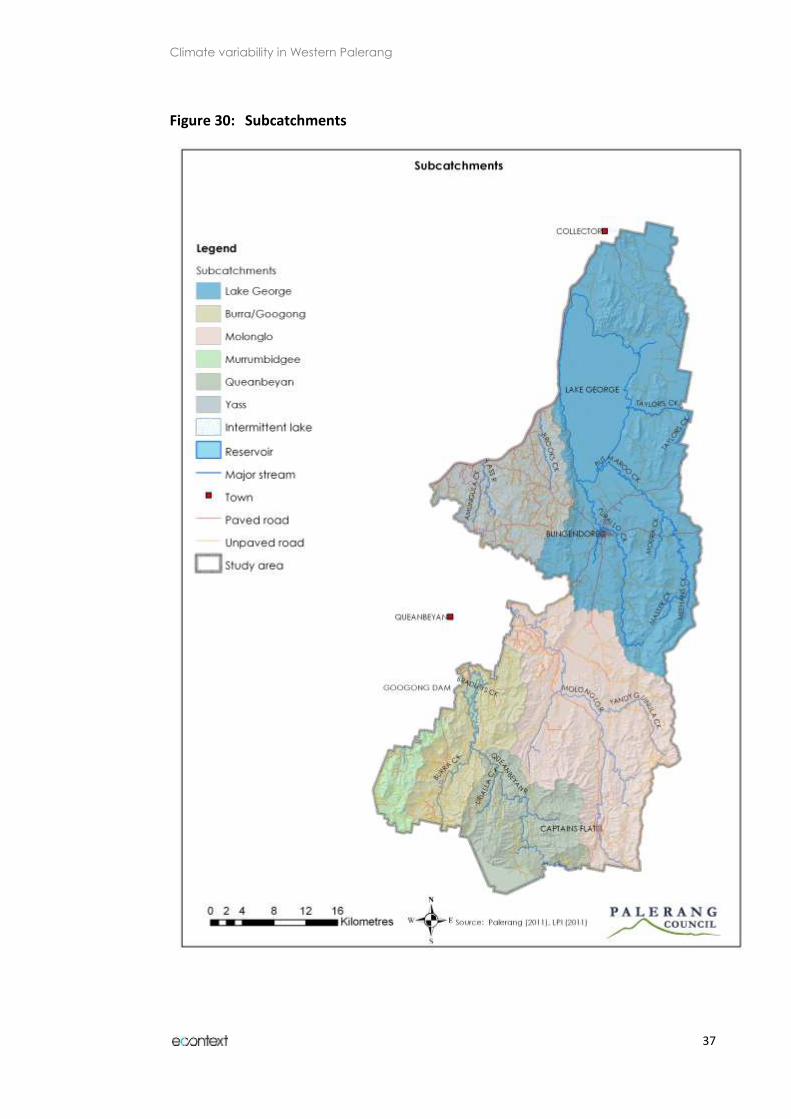
Figure 30 shows the surface water subcatchments within this study area. Parts of four Murrumbidgee sub-catchments lie within Palerang’s boundaries, these being the Molonglo River, Queanbeyan River, Yass River. The fourth sub- catchment, Lake George is internally-draining, but is also within the Murrumbidgee catchment.
These subcatchments have different features in relation to the Murray Darling Basin. Although it is within the MDB, and originally drained into the Yass River, the Lake George Catchment does not contribute to MDB surface water recharge. A strong fault line blocked this drainage millions of years ago, leaving it as a shallow, closed lake system with a small catchment and high evaporation.
The Yass River in the North of the study site flows West and North from Palerang, before its confluence with the Murrumbidgee River.
The Queanbeyan River and Burra Creek have a confluence above the Googong Dam, which is located within Palerang, but supplies water to Canberra and Queanbeyan. The Molonglo River also supplies the ACT, and has its headwaters within Palerang, flowing West between Bungendore and Captains Flat, and there is a confluence of the Queanbeyan River and the Molonglo to the West of Palerang. The far South East tip of Palerang is in the Murrumbidgee Catchment.
Note that the groundwater catchment boundaries are not the same as for surface water.
Climate variability in Western Palerang
37
Figure 30: Subcatchments

Climate variability in Western Palerang
38
8 Climate, variability and change in Western
Palerang
This report now presents results from climate analysis and modelling within the MDB area of Palerang. It presents results for maximum temperature, minimum temperature, rainfall and evaporation. In each case, a base map is provided, showing the long term climate features. It is followed by a ‘change map’, showing how climate change is predicted to affect the long-term climate patterns. Changes are shown using the best estimate for 2030. This median model results is the most robust of all of the climate change prediction models supplied to Palerang. For temperature and evaporation, these median 2030 maps show the continuation of strong, clear trends.
Additional maps are presented for rainfall, due to its greater variability. Rainfall projections (not just the change maps) are shown for 2030, and for 2050 at the 10th, 50th and 90th percentile for the range of IPCC scenarios.
Appendix A presents a full set of the modelled climate change data for each of 21 localities within Western Palerang. The tables show projections at the 10th, 50th and 90th percentiles for 2030 and 2050. A discussion of these combined results follows in Section 9.
8.1 Maximum temperature
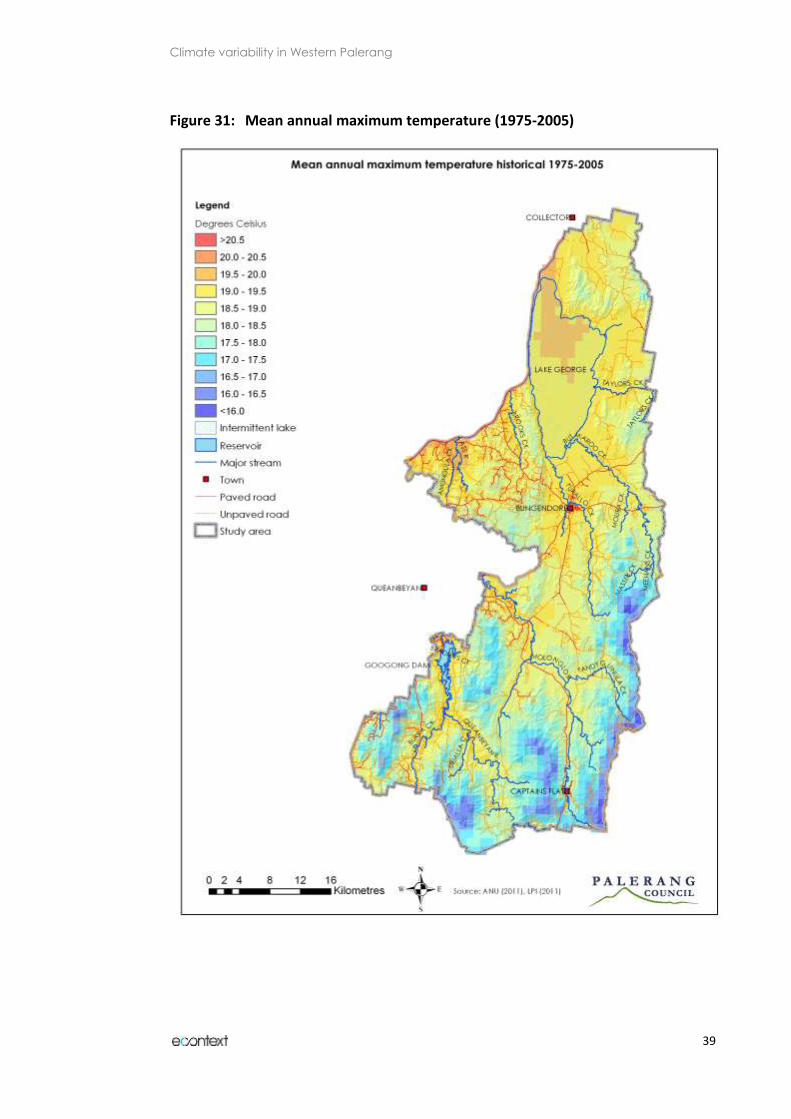
Figure 31 shows Western Palerang’s long-term average maximum temperatures. As described above, these results show the mean of daily maximum temperatures, averaged from 1975 to 2005.
There is considerable spatial variation within the study area. Hottest temperatures are recorded in the northern areas, which also have lower elevations. The northern parts of Lake George, and the Yass River reaches have the hottest temperatures, with annual maximum average temperatures above 20°C.
The areas of Western Palerang with the lowest average maximum temperatures are the higher-altitude areas to the South and East of the study area. These are also areas with denser forest cover, as can be seen from the Google Earth image in Figure 29. Average maximum temperatures here are up to four degrees lower, at 16°C.
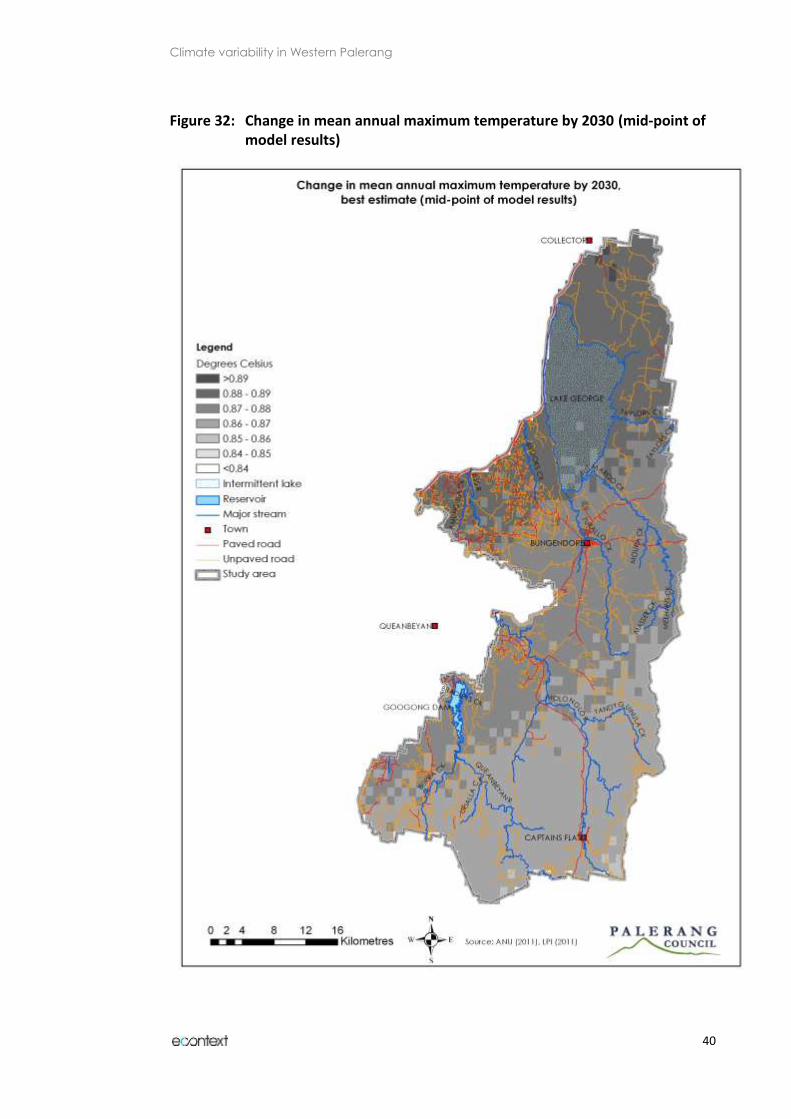
Figure 32 shows the best estimate of how climate changes will affect these baseline conditions by 2030. Results predict warming of annual average temperatures of around 0.8°C across all of the study area. Local warming is likely to be highest in the Northern and Western areas where maximum temperatures are already greater. Annual average increases are projected at over 0.88°C at the North of Lake George near Collector, and between 0.84 and 0.85°C to the South, around Captains Flat.
Climate variability in Western Palerang
39
Figure 31: Mean annual maximum temperature (1975-2005)
Climate variability in Western Palerang
40
Figure 32: Change in mean annual maximum temperature by 2030 (mid-point of model results)
Climate variability in Western Palerang
41
8.2 Minimum temperature
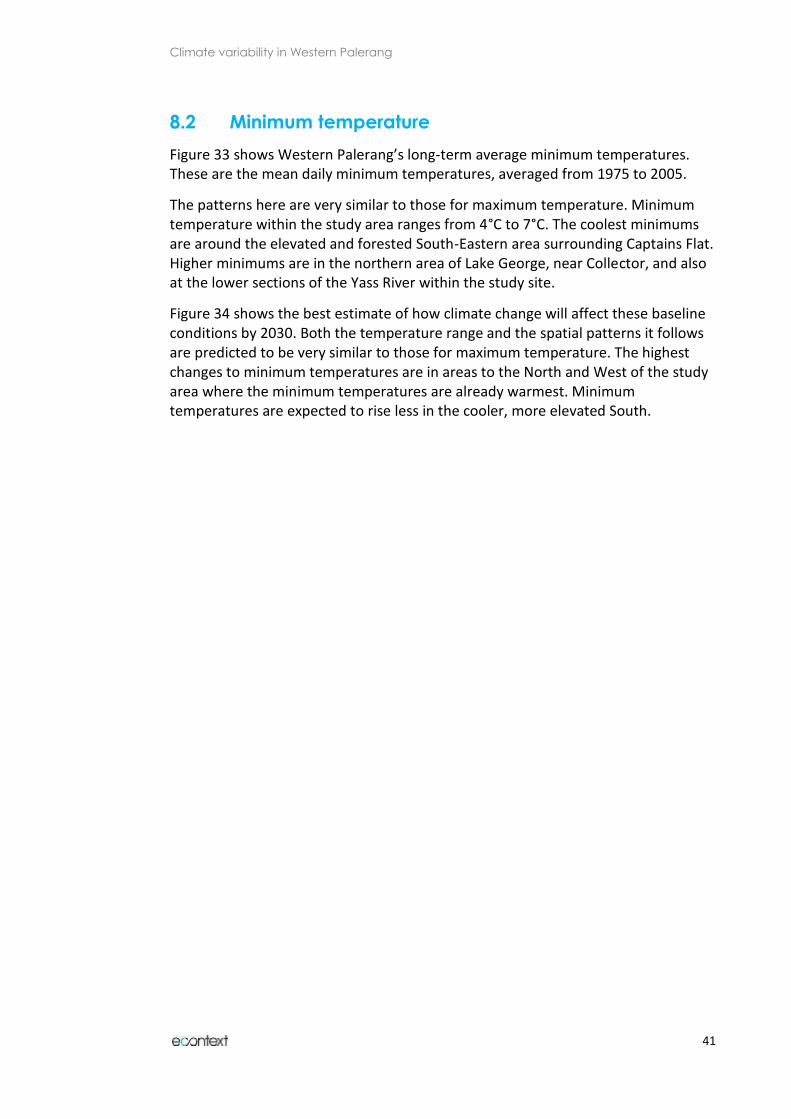
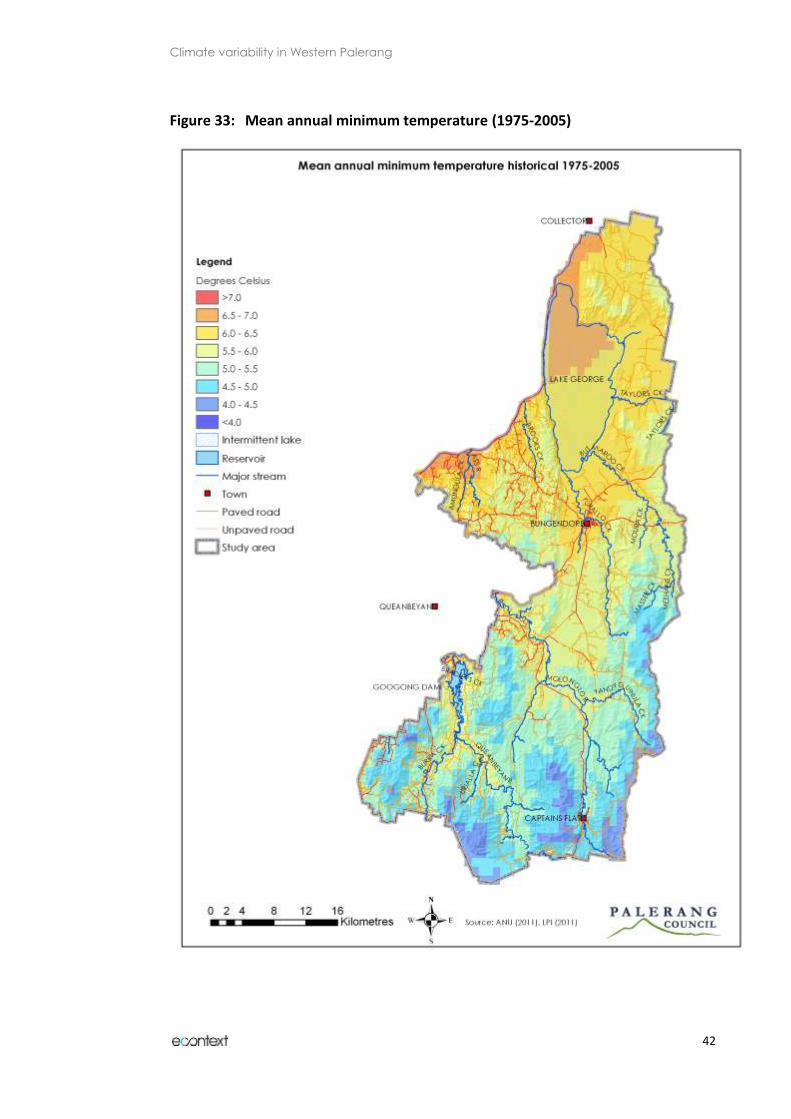
Figure 33 shows Western Palerang’s long-term average minimum temperatures. These are the mean daily minimum temperatures, averaged from 1975 to 2005.
The patterns here are very similar to those for maximum temperature. Minimum temperature within the study area ranges from 4°C to 7°C. The coolest minimums are around the elevated and forested South-Eastern area surrounding Captains Flat. Higher minimums are in the northern area of Lake George, near Collector, and also at the lower sections of the Yass River within the study site.
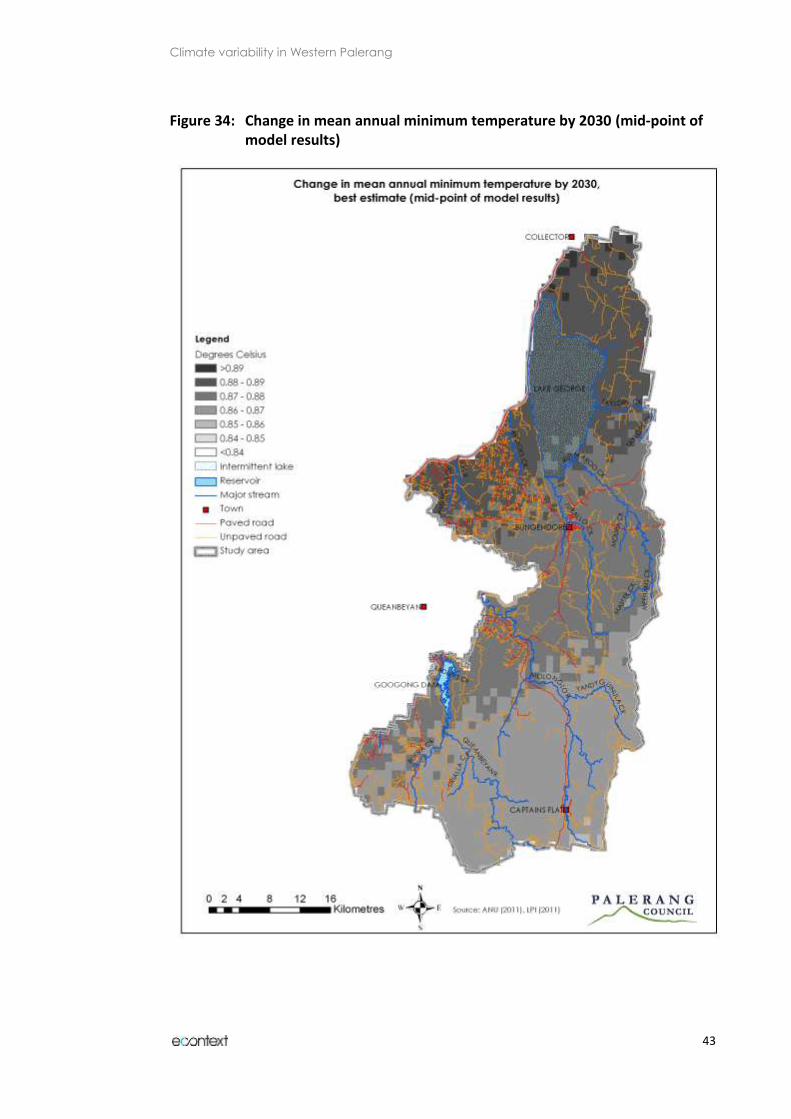
Figure 34 shows the best estimate of how climate change will affect these baseline conditions by 2030. Both the temperature range and the spatial patterns it follows are predicted to be very similar to those for maximum temperature. The highest changes to minimum temperatures are in areas to the North and West of the study area where the minimum temperatures are already warmest. Minimum temperatures are expected to rise less in the cooler, more elevated South.
Climate variability in Western Palerang
42
Figure 33: Mean annual minimum temperature (1975-2005)
Climate variability in Western Palerang
43
Figure 34: Change in mean annual minimum temperature by 2030 (mid-point of model results)
Climate variability in Western Palerang
44
8.3 Rainfall
Australia’s high rainfall variability was described in Section 4.1 as arguably the most notable feature of Australia’s climate. Rainfall variability in Palerang’s past and future is no exception.
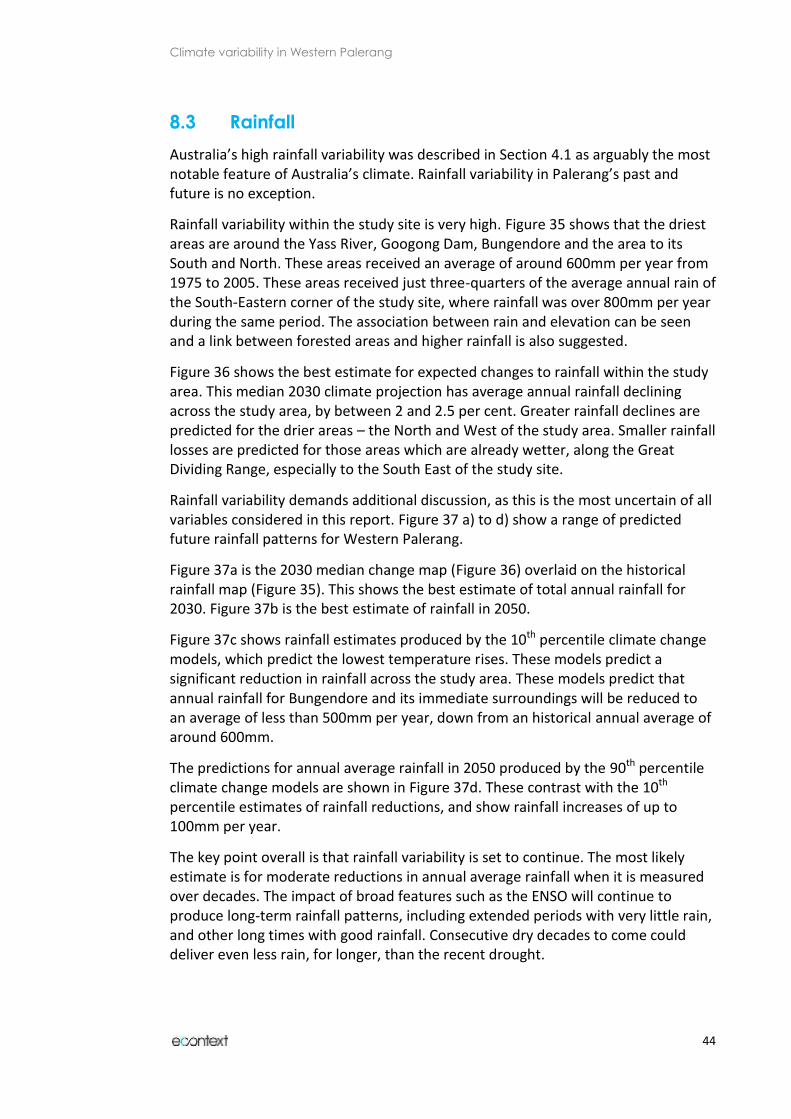
Rainfall variability within the study site is very high. Figure 35 shows that the driest areas are around the Yass River, Googong Dam, Bungendore and the area to its South and North. These areas received an average of around 600mm per year from 1975 to 2005. These areas received just three-quarters of the average annual rain of the South-Eastern corner of the study site, where rainfall was over 800mm per year during the same period. The association between rain and elevation can be seen and a link between forested areas and higher rainfall is also suggested.
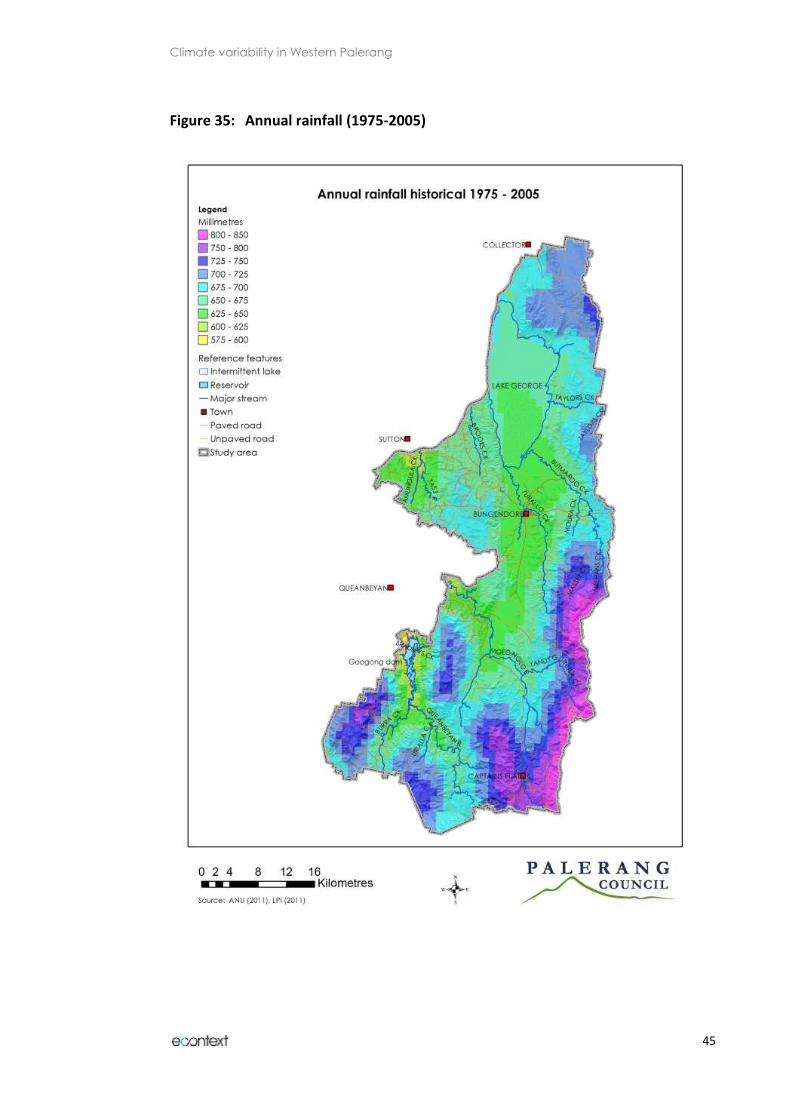
Figure 36 shows the best estimate for expected changes to rainfall within the study area. This median 2030 climate projection has average annual rainfall declining across the study area, by between 2 and 2.5 per cent. Greater rainfall declines are predicted for the drier areas – the North and West of the study area. Smaller rainfall losses are predicted for those areas which are already wetter, along the Great Dividing Range, especially to the South East of the study site.
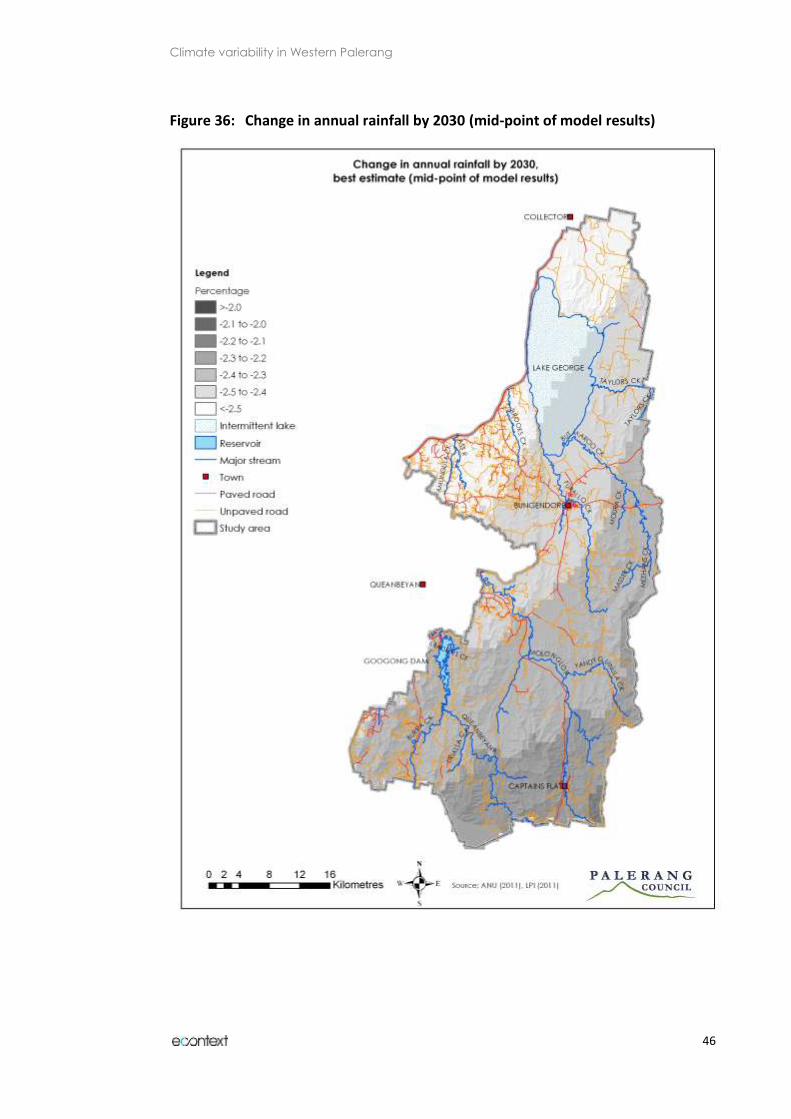
Rainfall variability demands additional discussion, as this is the most uncertain of all variables considered in this report. Figure 37 a) to d) show a range of predicted future rainfall patterns for Western Palerang.
Figure 37a is the 2030 median change map (Figure 36) overlaid on the historical rainfall map (Figure 35). This shows the best estimate of total annual rainfall for 2030. Figure 37b is the best estimate of rainfall in 2050.
Figure 37c shows rainfall estimates produced by the 10th percentile climate change models, which predict the lowest temperature rises. These models predict a significant reduction in rainfall across the study area. These models predict that annual rainfall for Bungendore and its immediate surroundings will be reduced to an average of less than 500mm per year, down from an historical annual average of around 600mm.
The predictions for annual average rainfall in 2050 produced by the 90th percentile climate change models are shown in Figure 37d. These contrast with the 10th percentile estimates of rainfall reductions, and show rainfall increases of up to 100mm per year.
The key point overall is that rainfall variability is set to continue. The most likely estimate is for moderate reductions in annual average rainfall when it is measured over decades. The impact of broad features such as the ENSO will continue to produce long-term rainfall patterns, including extended periods with very little rain, and other long times with good rainfall. Consecutive dry decades to come could deliver even less rain, for longer, than the recent drought.
Climate variability in Western Palerang
45
Figure 35: Annual rainfall (1975-2005)
Climate variability in Western Palerang
46
Figure 36: Change in annual rainfall by 2030 (mid-point of model results)
Climate variability in Western Palerang
47
Figure 37: Rainfall predictions – 2030 and 2050, 50th, 10th and 90th percentiles
a
b
c
d
Climate variability in Western Palerang
48
8.4 Evaporation
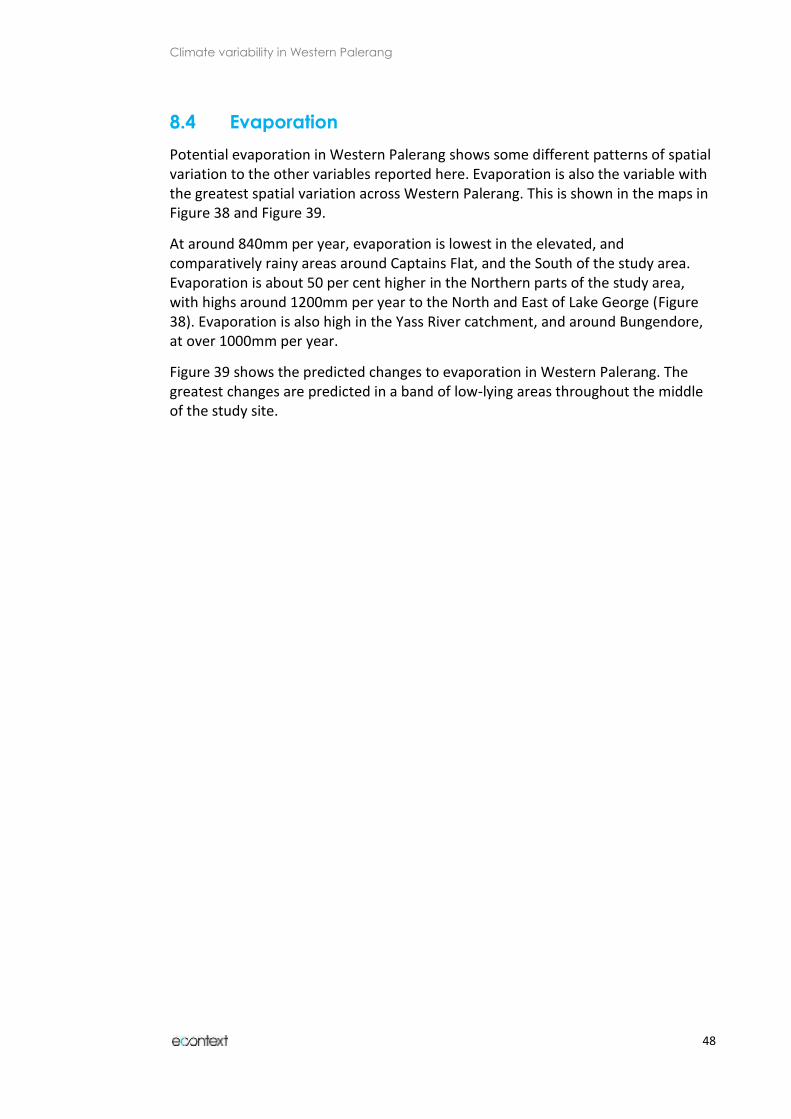
Potential evaporation in Western Palerang shows some different patterns of spatial variation to the other variables reported here. Evaporation is also the variable with the greatest spatial variation across Western Palerang. This is shown in the maps in Figure 38 and Figure 39.
At around 840mm per year, evaporation is lowest in the elevated, and comparatively rainy areas around Captains Flat, and the South of the study area. Evaporation is about 50 per cent higher in the Northern parts of the study area, with highs around 1200mm per year to the North and East of Lake George (Figure 38). Evaporation is also high in the Yass River catchment, and around Bungendore, at over 1000mm per year.
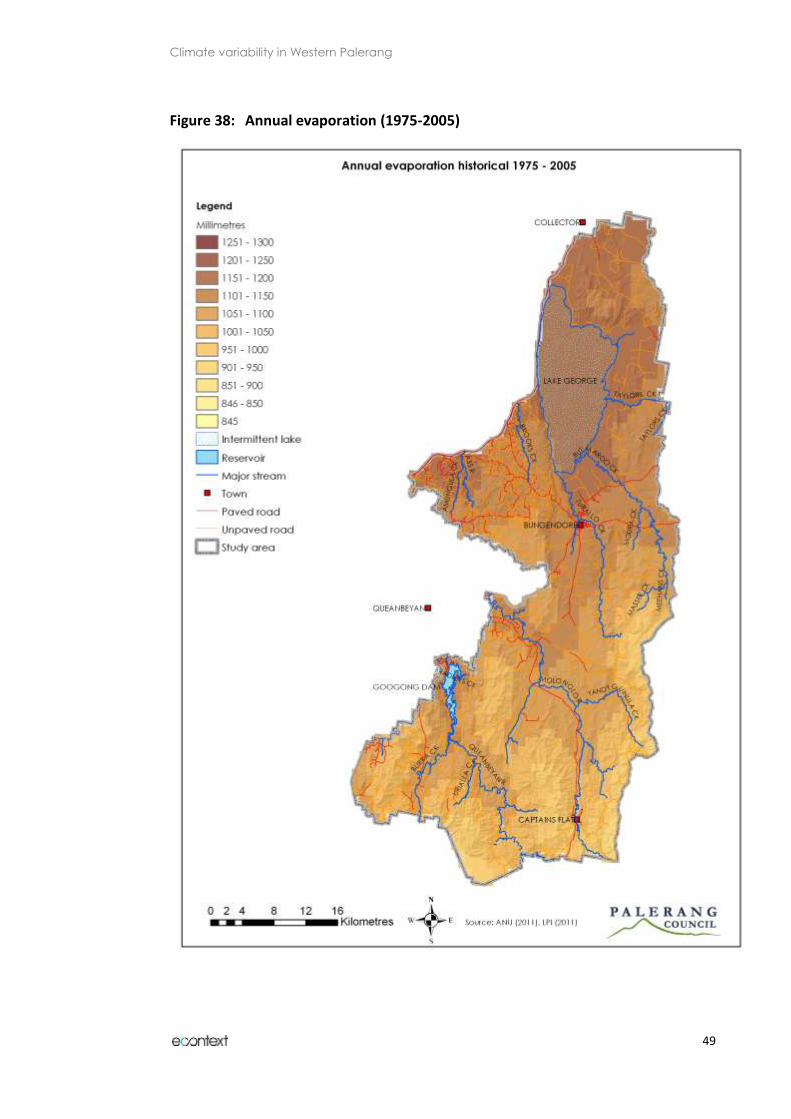
Figure 39 shows the predicted changes to evaporation in Western Palerang. The greatest changes are predicted in a band of low-lying areas throughout the middle of the study site.
Climate variability in Western Palerang
49
Figure 38: Annual evaporation (1975-2005)
Climate variability in Western Palerang
50
Figure 39: Change in annual evaporation by 2030 (mid-point of model results)
Climate variability in Western Palerang
51
9 Discussion
Climate variability and climate change are already present in Western Palerang. This study has discussed climate features and climate change from the international scale, right through to the local level, using fine-detailed 1km grid squares to analyse local climate features.
The results show very high levels of spatial variability in climatic conditions, even within just one half of a local government area. For instance, comparing Bungendore to Captains Flat, although only 37 km distant, Bungendore averages:
6 per cent higher annual mean maximum temperatures,
19 per cent higher annual mean minimum temperatures,
9 per cent lower annual rainfall, and
8 per cent higher evaporation (from Table 2).
The comparatively hot, dry conditions described here for Bungendore are also found in the flat lands to its South, Northwards to beyond Lake George, and in the Yass River Catchment. Western Palerang’s most elevated Southern and Eastern areas are comparatively wetter and cooler.
As with most of Australia, rainfall variability is the most distinctive climatic condition. Rainfall differs significantly between years and decades, with broad influences like the El Nino Southern Oscillation helping to drive long-cycles of wet and dry years. The recent drought was not atypical for this region, and the previous dry cycle lasted over 40 years, compared with the 7 years of the recent dry time.
The detailed local modelling of climate change undertaken for this project predicts hotter, drier, more evaporative conditions for all of Western Palerang in the future. Combining the detailed analysis here with broader knowledge we know that such conditions will interact with other features including other climatic conditions, infrastructure, social structures and biodiversity. As well as being hotter and drier, Palerang will be windier, more prone to bushfires, heatwaves and other extreme weather events. The best estimates for climate change suggest that all of the spatial differences within Western Palerang will also be exacerbated in the future. The areas which are already hottest and driest will become even hotter and drier compared with the comparatively cooler highlands.
9.1 Climate change adaptation for Western Palerang
The adaptation priorities that have been identified for surrounding areas like the Australian Capital Region clearly apply to Palerang. Key regional priorities applying to Palerang include:
prepare for hotter, drier times, with long periods of less rain,
anticipate more heat waves and bushfires and ensure capacity to deal with extreme weather events,
design new infrastructure to be water efficient, and able to cope with weather
Climate variability in Western Palerang
52
extremes,
encourage agricultural adaptation to maximise opportunities from higher local temperatures and atmospheric carbon dioxide, but with less water, and greater evaporation.
The high degree of spatial variation within Palerang suggests additional opportunities. Knowing which areas are hottest and driest provides the capacity to recognise climatic constraints and opportunities during strategic planning. Areas with less rain may not be able to sustain such large populations as those with more rain. Comparing this climate work with analysis of groundwater and surface water availability will further clarify these issues.

Climate variability in Western Palerang
53
References
ACT Government (2007). Weathering the Change: The ACT Climate Change Strategy 2007-2025. Publishing Services for Sustainability Policy and Programs, Department of Territory and Municipal Services. Canberra.
AECOM (2010). Human settlement vulnerability and adaptive capacity assessment: special plan evaluation. Prepared for ACT Planning and Land Authority. Canberra.
BoM (Bureau of Meteorology) (2011a). “Australian climate and variability maps.” URL: http://www.bom.gov.au/cgi-bin/climate/change/trendmaps.cgi. Accessed August 2011.
BoM (2011b). Australia – climate of our continent. URL: http://www.bom.gov.au/lam/climate/levelthree/ausclim/zones.htm Accessed August 2011.
BoM (2011c). “New South Wales in 2010: La Niña brings wettest year in half a century”. URL: http://www.bom.gov.au/climate/current/annual/nsw/summary.shtml Accessed August 2011.
Braganza, K. and Church, J.A. (2011) Climate Change: Science and Solutions for Australia. CSIRO. pp. 1-14.
Canadell, J.G., Le Quere, C., Raupach, M.R., Field, C.V., Buitenhuis, E.T., Ciais, P., Conway, T.J., Gillett, N., Houghton, R.A. and Marland, G. (2007) Contributions to accelerating atmospheric CO2 growth from economic activity, carbon intensity, and efficiency of natural sinks. Proceedings of the National Academy of Science, 104(24), pp. 10288-10293.
Cleugh, H. Stafford-Smith, M. Battaglia, M. and Graham, P. (2011) Climate Change: Science and Solutions for Australia. CSIRO. pp. 135-138.
Climate Commission Secretariat, (2011) The critical decade: climate science, risks and response. Department of Climate Change and Energy Efficiency. Commonwealth of Australia.
Commonwealth of Australia (2011). Securing a Clean Energy Future: The Australian Government’s Climate Change Plan. Commonwealth of Australia. Canberra.
CSIRO, Australian Bureau of Meteorology. (2007). Climate change in Australia: technical report 2007. CSIRO.
CSIRO (2008). Water availability in the Murray-Darling Basin. Summary of a report to the Australian Government from the CSIRO Murray-Darling Basin Sustainable Yields Project. CSIRO, Australia.
DECCW (NSW Department of Environment, Climate Change and Water) 2010. NSW Climate Impact Profile: The impacts of climate change on the biophysical environment of New South Wales. State of NSW and DECCW. Sydney.
Climate variability in Western Palerang
54
EPA (US Environmental Protection Authority) 2011. “Past Climate Change – Climate Change – Science” URL: http://www.epa.gov/climatechange/science/pastcc.html Accessed August 2011
Fowler, D. Haigh, J. Hilsum, C, Kelly, A. McWhirter, J., Pendry, J., Rudge, A., Steward, W., Watson, A., Wolfendale, A., and Wunsch, C. (2010) Climate change: a summary of the science. The Royal Society. London. September 2010.
Garnaut, R. 2011. The Garnaut review 2011: Australia in the global response to climate change. Cambridge University Press, Melbourne.
Gifford, R., G. Farquhar, M. Roderick, N. Nicholls (2005). “Pan evaporation: an example of the detection and attribution of trends in climate variables.” Proceedings of a workshop held at the Shine Dome, Australian Academy of Science, Canberra 22-23 November 2004.
Hennessy, K. 2011 “Climate change impacts” in Cleugh et al 2011. Climate Change: Science and Solutions for Australia. CSIRO. pp. 45-58.
Hosking, R. (2007)”Climate change in Braidwood: a single site case study”. Unpublished. PO Box 236, Braidwood, NSW 2622.
Hutchinson, M. Climate Change Notes - 22 June 2011
Hutchinson, M.F. 2004. ‘ANUSPLIN version 4.3’. Fenner School of Environment and Society, Australian National University, Canberra. http://fennerschool.anu.edu.au/publications/software/anusplin.php.
InterAcademy Council (2008) (Brazil, Canada, China, France, Germany, India, Italy, Japan, Mexico, Russia, South Africa, United Kingdom, United States of America). Joint Science Academies’ Statement: Climate Change Adaptation and the Transition to a Low Carbon Society. URL: www.interacademycouncil.net. Accessed August 2011.
International Confederation of Energy Regulators (2010). A description of current regulatory practices for the promotion of energy efficiency: a presentation of information gathered from the world’s energy markets on regulatory practices aimed at fostering energy efficiency. International Confederation of Energy Regulators.
IPCC (2001) ‘Projections of Future Climate Change’. In: Climate Change Synthesis Report. Cubasch, U., G.A. Meehl, G.J. Boer, R.J. Stouffer, M. Dix, A. Noda, C.A. Senior, S. Raper, K.S.Yap (Lead Authors) Cambridge: Cambridge University Press
IPCC (2005). Guidance Notes for Lead Authors of the IPCC Fourth Assessment Report on Addressing Uncertainties. URL: http://www.ipcc.ch/pdf/supporting-material/uncertainty-guidance-note.pdf. July 2005. Accessed August 2011.
IPCC (2007a) ‘Summary for Policymakers’. In: Climate Change 2007: The Physical Basis. Contribution of Working Group I to the Fourth Assessment Report of the Intergovernmental Panel on Climate Change, Solomon, S., D. Qin, M. Manning, Z.
Climate variability in Western Palerang
55
Chen, M. Marquis, K.B. Averyt, M.Tignor and H.L. Miller (eds.) Cambridge: Cambridge University Press.
IPCC (2007b) ‘Summary for Policymakers’. In: Climate Change 2007: Impacts, Adaptation and Vulnerability. Contribution of Working Group II to the Fourth Assessment Report of the Intergovernmental Panel on Climate Change, M.L. Parry, O.F. Canziani, J.P. Palutikof, P.J. van der Linden and C.E. Hanson, Eds., Cambridge: Cambridge University Press.
IPCC (2007c) ‘Summary for Policymakers’. In: Climate Change 2007: Synthesis Report. Bernstein, L. Bosch, P., Canziani, O., Chen, Z., Christ, R., Davidson, O., Hare, W., Huq, S., Karoly, D., Kattsov, V., Kundzewicz, Z., Liu, J., Lohmann, U., Manning, M., Matsuno, T., Menne, B., Metz, B., Mirza, M., Nicholls, N., Nurse,L., Pachauri,R., Jea Palutikof, J., , Parry, M., Qin, D., Ravindranath, N., Reisinger, A., Ren, J., Riahi, K., Rosenzweig, C., , Rusticucci, M., Schneider, S., Sokona, Y. Solomon, S., Stott, P., Stouffer, R., Sugiyama, T., Swart, R., Tirpak,D., Vogel, C., Yohe, G., Cambridge: Cambridge University Press.
IPCC (2007d). ‘Contribution of Working Group I to the Fourth Assessment Report of the Intergovernmental Panel on Climate Change’. IPCC Fourth Assessment Report. 2007 Solomon, S., D. Qin, M. Manning, Z. Chen, M. Marquis, K.B. Averyt, M. Tignor and H.L. Miller (eds.) Cambridge University Press, Cambridge, United Kingdom and New York, NY, USA.
LGSA (NSW Local Government and Shires Association). Website. Climate Change Action Pack. URL: http://www.lgsa-plus.net.au/www/html/3436-case-studies-by-topic.asp?intSiteID=2. Accessed August 2011.
Mackey, B. Watson J and Worboys GL of ANU Enterprises Pty Ltd 2010, Connectivity conservation and the Great Eastern Ranges corridor, an independent report to the Interstate Agency Working Group (Alps to Atherton Connectivity Conservation Working Group) convened under the Environment Heritage and Protection Council/Natural Resource Management Ministerial Council.
Manins, P. (2001). “Climate Themes Report” in Australia State of the Environment Report 2001. Commonwealth of Australia.
McKeon, G. (2006). “Living in a variable climate” Integrative Commentary in Australia State of the Environment Report 2006. Commonwealth of Australia.
MDB (Murray Darling Basin) Commission (2005). Annual Report 2004-5. MDB Commission. Canberra.
National Water Commission 2005. “Regional Water Resource Assessment: Australian Capital Territory”. URL: http://water.gov.au/regionalwaterresourcesassessments/specificgeographicregion/tabbedreports.aspx?pid=act_sw_410x&menu=level1_7. Accessed August 2011.
Rahmstorf, S. Cazenave, A., Church, J.A., Hansen, J.E., Keeling, R.F., Parker, D.E., Somerville, R.C.J. (2007) ‘Recent climate observations compared to projections’.

Climate variability in Western Palerang
56
Science 316(5825), p. 709.
Richardson, K., Steffen, W., Schellnhuber, H.-J., Alcamo, J., Barker, T., Kammen, D.M., Leemans, R., Liverman, D., Munasinghe, M., Osman-Elasha, B., Stern, N. and Waever, O. (2009). Synthesis Report. Climate Change: Global Risks, Challenges & Decisions. Summary of the Copenhagen Climate Change Congress, 10-12 March 2009. University of Copenhagen.
Richardson, K., Steffen, W., Liverman, D., Barker, T., Jotzo, F., Kammen, D., Leemans, R., Lenton, T., Munasinghe, M., Osman-Elasha, B., Schellnhuber, J., Stern, N., Vogel, C., and Waever, O. (2011). Climate Change: Global Risks, Challenges and Decisions. Cambridge: Cambridge University Press, 501 pp.
Risbey, J.S., Pook, M.J., McIntosh, P.C., Wheeler, M.C. and Hendon, H.H. (2009) “On the remote drivers of rainfall variability in Australia”. In American Meteorological Society. v137. pp.3323-3253.
Smith, I. and Chandler, E. (2009). Refining rainfall projections for the Murray Darling Basin of south-east Australia—the effect of sampling model results based on performance. Climatic Change DOI 0.1007/s10584-009-9757-1
Stafford Smith, M. and Ash A. 2011 “Adaptation: reducing risk, gaining opportunity” in Cleugh et al. 2011. Climate Change: Science and Solutions for Australia. CSIRO. pp. 59-72.
Stern, N. (2006). ‘What is the economics of climate change?’ in World Economics. 7:2:1-
Suppiah, R., Hennessy, K.J., Whetton, P.H., McInnes, K., Macadam, I., Bathols, J., Ricketts, J. and Page, C.M. (2007) Australian climate change projections derived from simulations performed for the IPCC 4th Assessment Report. Australian Meteorological Magazine 56:131–152.
Webb, B. (2010) “Climate Change, Biodiversity and the Australian Capital Region”. Presentation to the NCCARF Biodiversity Workshop, Canberra, 8 December 2010.
Whetton, P., M. Stafford Smith, M. Battaglia, p. Graham. (2011). “Future Australian climate scenarios” in Cleugh et al 2011. Climate Change: Science and Solutions for Australia. CSIRO. pp. 35-44.
Wild-River, S. 2006. “The role of local government in environment and heritage management” Integrative Commentary in Australia State of the Environment Report 2006. Commonwealth of Australia.
Wiles, P. 2007. “Climate Change and Variability: Observed trends for Australia, NSW and the Namoi”. Climate Change and Agriculture Conference, 21-22 March 2007. URL: http://www.dpi.nsw.gov.au/__data/assets/pdf_file/0017/127430/perry-wiles-bom-namoi-climate-change-forums.pdf. Accessed August 2011.
Wong, P. 2010. “Australia’s Submission to Copenhagen Accord” Press Release. 27 January 2010. URL:

Climate variability in Western Palerang
57
http://www.climatechange.gov.au/~/media/Files/minister/previous%20minister/wong/2010/media-releases/january/mr20100127.pdf. Accessed August 2011.
Xu, T. and Hutchinson, M.F. (2011). ‘ANUCLIM. version 6.1’. Fenner School of Environment and Society, Australian National University, Canberra. http://fennerschool.anu.edu.au/publications/software/anuclim.php
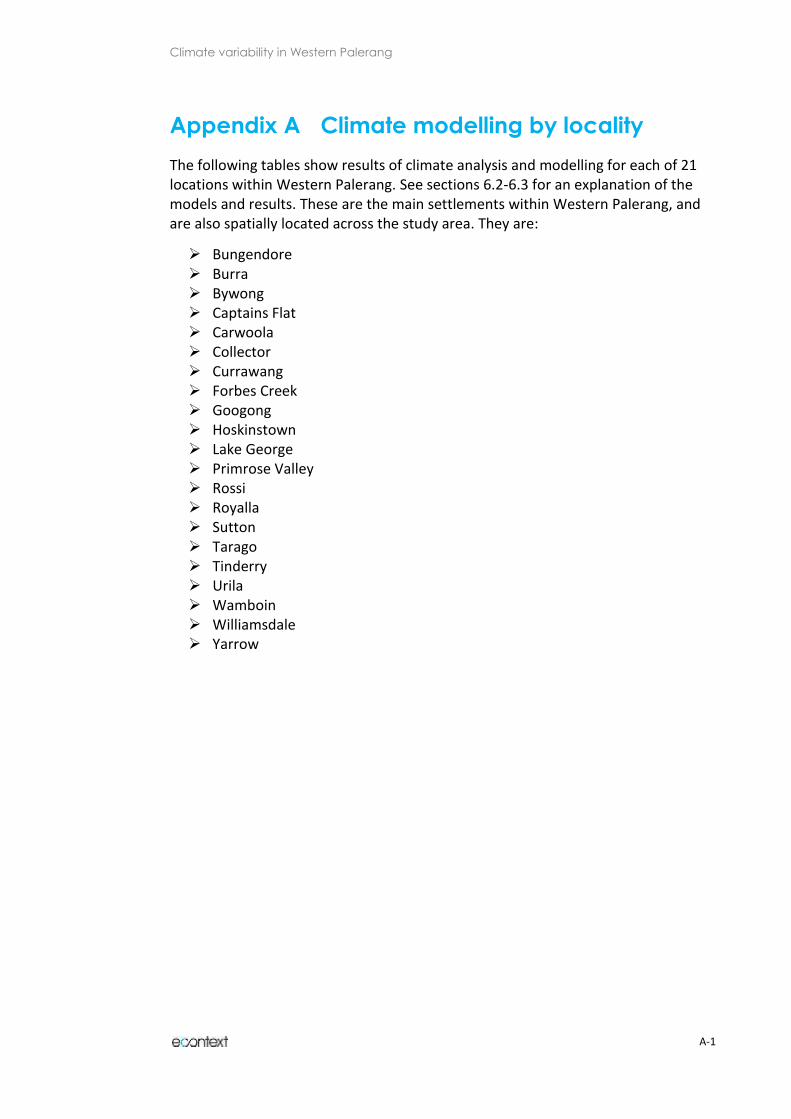
Climate variability in Western Palerang
A-1
Appendix A Climate modelling by locality
The following tables show results of climate analysis and modelling for each of 21 locations within Western Palerang. See sections 6.2-6.3 for an explanation of the models and results. These are the main settlements within Western Palerang, and are also spatially located across the study area. They are:
Bungendore Burra Bywong Captains Flat Carwoola Collector Currawang Forbes Creek Googong Hoskinstown Lake George Primrose Valley Rossi Royalla Sutton Tarago Tinderry Urila Wamboin Williamsdale Yarrow

Climate variability in Western Palerang
A-2
Table 3: Bungendore climate analysis and modelling
Min Temp Summer Autumn Winter Spring Annual
Reference period (oC) 11.3 6.2 0.1 5.2 5.7
2030 10th percentile (oC) 0.6 0.6 0.5 0.6 0.6
2030 50th percentile (oC) 0.9 0.9 0.7 0.9 0.9
2030 90th percentile (oC) 1.4 1.3 1.1 1.4 1.3
2050 10th percentile (oC) 1.3 1.2 1.0 1.3 1.2
2050 50th percentile (oC) 2.0 1.8 1.5 2.0 1.8
2050 90th percentile (oC) 2.9 2.6 2.2 2.8 2.6
Max Temp Summer Autumn Winter Spring Annual
Reference period (oC) 25.8 18.9 11.3 18.3 18.5
2030 10th percentile (oC) 0.6 0.6 0.5 0.6 0.6
2030 50th percentile (oC) 0.9 0.9 0.7 0.9 0.9
2030 90th percentile (oC) 1.4 1.3 1.1 1.4 1.3
2050 10th percentile (oC) 1.3 1.2 1.0 1.3 1.2
2050 50th percentile (oC) 2.0 1.8 1.5 2.0 1.8
2050 90th percentile (oC) 2.9 2.6 2.2 2.8 2.6
Rainfall Summer Autumn Winter Spring Annual
Reference period (mm) 171.5 155.5 157.2 195.1 679.3
2030 10th percentile (%) -6.4 -8.0 -11.7 -13.5 -10.0
2030 50th percentile (%) 1.0 -0.7 -4.4 -5.1 -2.4
2030 90th percentile (%) 9.9 7.6 3.4 2.9 5.9
2050 10th percentile (%) -13.3 -16.5 -24.1 -27.9 -20.8
2050 50th percentile (%) 2.1 -1.4 -9.2 -10.6 -4.9
2050 90th percentile (%) 20.5 15.8 7.1 5.9 12.1
Evaporation Summer Autumn Winter Spring Annual
Reference period (mm) 462.6 220.6 109.7 305.1 1097.9
2030 10th percentile (%) 1.1 1.9 1.5 0.2 1.0
2030 50th percentile (%) 2.7 3.9 5.4 2.0 3.0
2030 90th percentile (%) 4.7 6.4 10.2 4.2 5.4
2050 10th percentile (%) 2.2 3.9 3.2 0.5 2.1
2050 50th percentile (%) 5.6 8.0 11.2 4.2 6.2
2050 90th percentile (%) 9.7 13.3 21.0 8.7 11.3
Effective Rainfall Summer Autumn Winter Spring Annual
Reference period 37% 70% 143% 64% 62%
2030 10th percentile (%) 34% 64% 125% 55% 55%
2030 50th percentile (%) 36% 67% 130% 59% 59%
2030 90th percentile (%) 39% 71% 135% 63% 62%
2050 10th percentile (%) 31% 57% 105% 46% 48%
2050 50th percentile (%) 36% 64% 117% 55% 55%
2050 90th percentile (%) 41% 72% 127% 62% 62%
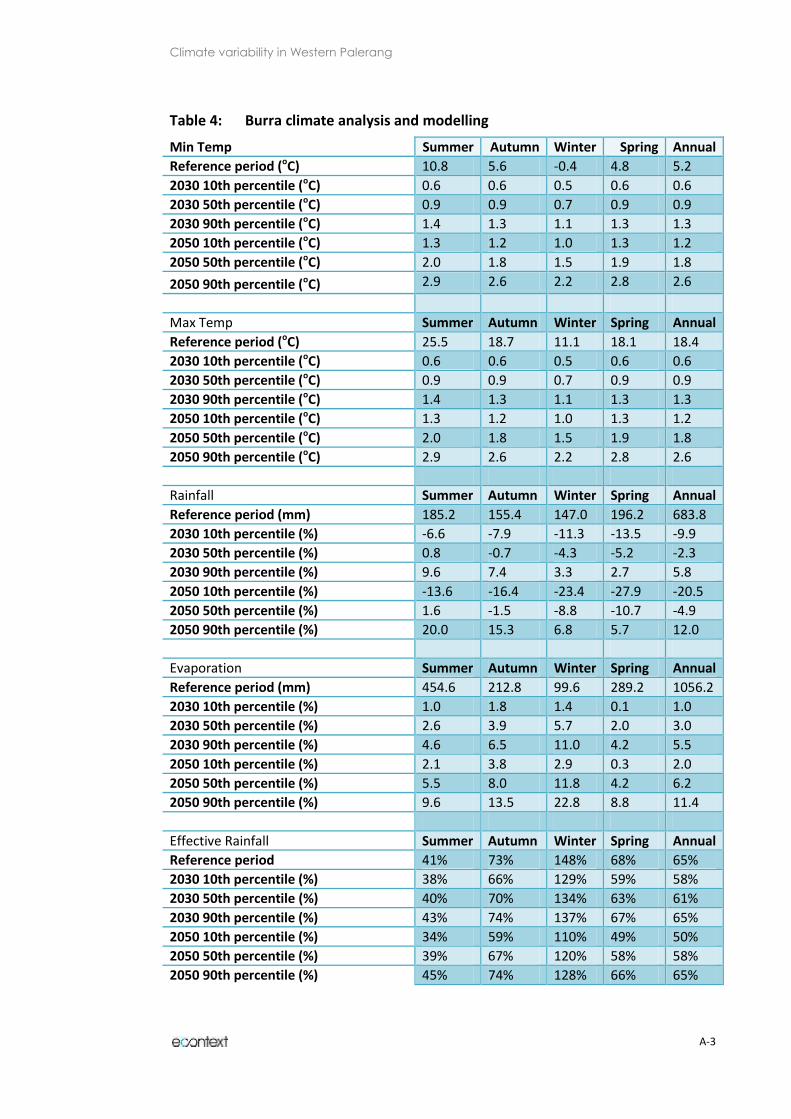
Climate variability in Western Palerang
A-3
Table 4: Burra climate analysis and modelling
Min Temp Summer Autumn Winter Spring Annual
Reference period (oC) 10.8 5.6 -0.4 4.8 5.2
2030 10th percentile (oC) 0.6 0.6 0.5 0.6 0.6
2030 50th percentile (oC) 0.9 0.9 0.7 0.9 0.9
2030 90th percentile (oC) 1.4 1.3 1.1 1.3 1.3
2050 10th percentile (oC) 1.3 1.2 1.0 1.3 1.2
2050 50th percentile (oC) 2.0 1.8 1.5 1.9 1.8
2050 90th percentile (oC) 2.9 2.6 2.2 2.8 2.6
Max Temp Summer Autumn Winter Spring Annual
Reference period (oC) 25.5 18.7 11.1 18.1 18.4
2030 10th percentile (oC) 0.6 0.6 0.5 0.6 0.6
2030 50th percentile (oC) 0.9 0.9 0.7 0.9 0.9
2030 90th percentile (oC) 1.4 1.3 1.1 1.3 1.3
2050 10th percentile (oC) 1.3 1.2 1.0 1.3 1.2
2050 50th percentile (oC) 2.0 1.8 1.5 1.9 1.8
2050 90th percentile (oC) 2.9 2.6 2.2 2.8 2.6
Rainfall Summer Autumn Winter Spring Annual
Reference period (mm) 185.2 155.4 147.0 196.2 683.8
2030 10th percentile (%) -6.6 -7.9 -11.3 -13.5 -9.9
2030 50th percentile (%) 0.8 -0.7 -4.3 -5.2 -2.3
2030 90th percentile (%) 9.6 7.4 3.3 2.7 5.8
2050 10th percentile (%) -13.6 -16.4 -23.4 -27.9 -20.5
2050 50th percentile (%) 1.6 -1.5 -8.8 -10.7 -4.9
2050 90th percentile (%) 20.0 15.3 6.8 5.7 12.0
Evaporation Summer Autumn Winter Spring Annual
Reference period (mm) 454.6 212.8 99.6 289.2 1056.2
2030 10th percentile (%) 1.0 1.8 1.4 0.1 1.0
2030 50th percentile (%) 2.6 3.9 5.7 2.0 3.0
2030 90th percentile (%) 4.6 6.5 11.0 4.2 5.5
2050 10th percentile (%) 2.1 3.8 2.9 0.3 2.0
2050 50th percentile (%) 5.5 8.0 11.8 4.2 6.2
2050 90th percentile (%) 9.6 13.5 22.8 8.8 11.4
Effective Rainfall Summer Autumn Winter Spring Annual
Reference period 41% 73% 148% 68% 65%
2030 10th percentile (%) 38% 66% 129% 59% 58%
2030 50th percentile (%) 40% 70% 134% 63% 61%
2030 90th percentile (%) 43% 74% 137% 67% 65%
2050 10th percentile (%) 34% 59% 110% 49% 50%
2050 50th percentile (%) 39% 67% 120% 58% 58%
2050 90th percentile (%) 45% 74% 128% 66% 65%

Climate variability in Western Palerang
A-4
Table 5: Bywong climate analysis and modelling
Min Temp Summer Autumn Winter Spring Annual
Reference period (oC) 11.8 6.5 0.4 5.6 6.1
2030 10th percentile (oC) 0.6 0.6 0.5 0.6 0.6
2030 50th percentile (oC) 1.0 0.9 0.7 1.0 0.9
2030 90th percentile (oC) 1.4 1.3 1.1 1.4 1.3
2050 10th percentile (oC) 1.3 1.2 1.0 1.3 1.2
2050 50th percentile (oC) 2.0 1.8 1.5 2.0 1.8
2050 90th percentile (oC) 2.9 2.6 2.2 2.8 2.6
Max Temp Summer Autumn Winter Spring Annual
Reference period (oC) 26.4 19.2 11.4 18.6 18.9
2030 10th percentile (oC) 0.6 0.6 0.5 0.6 0.6
2030 50th percentile (oC) 1.0 0.9 0.7 1.0 0.9
2030 90th percentile (oC) 1.4 1.3 1.1 1.4 1.3
2050 10th percentile (oC) 1.3 1.2 1.0 1.3 1.2
2050 50th percentile (oC) 2.0 1.8 1.5 2.0 1.8
2050 90th percentile (oC) 2.9 2.6 2.2 2.8 2.6
Rainfall Summer Autumn Winter Spring Annual
Reference period (mm) 163.1 146.1 159.2 192.8 661.2
2030 10th percentile (%) -6.6 -8.2 -11.8 -13.7 -10.3
2030 50th percentile (%) 1.0 -0.8 -4.5 -5.2 -2.5
2030 90th percentile (%) 10.0 7.7 3.4 2.9 5.8
2050 10th percentile (%) -13.6 -17.1 -24.3 -28.4 -21.3
2050 50th percentile (%) 2.1 -1.6 -9.3 -10.7 -5.2
2050 90th percentile (%) 20.6 15.9 7.1 6.0 12.1
Evaporation Summer Autumn Winter Spring Annual
Reference period (mm) 485.0 229.8 110.6 313.3 1138.8
2030 10th percentile (%) 1.0 1.9 1.4 0.1 1.0
2030 50th percentile (%) 2.7 3.9 5.6 2.0 3.0
2030 90th percentile (%) 4.7 6.5 10.7 4.2 5.5
2050 10th percentile (%) 2.1 3.8 3.0 0.2 2.0
2050 50th percentile (%) 5.5 8.0 11.6 4.1 6.2
2050 90th percentile (%) 9.6 13.4 22.2 8.7 11.4
Effective Rainfall Summer Autumn Winter Spring Annual
Reference period 34% 64% 144% 62% 58%
2030 10th percentile (%) 31% 57% 125% 53% 52%
2030 50th percentile (%) 33% 61% 130% 57% 55%
2030 90th percentile (%) 35% 64% 134% 61% 58%
2050 10th percentile (%) 28% 51% 106% 44% 45%
2050 50th percentile (%) 33% 58% 117% 53% 52%
2050 90th percentile (%) 37% 65% 126% 60% 58%

Climate variability in Western Palerang
A-5
Table 6: Captains Flat climate analysis and modelling
Min Temp Summer Autumn Winter Spring Annual
Reference period (oC) 10.2 5.3 -0.7 4.4 4.8
2030 10th percentile (oC) 0.6 0.6 0.5 0.6 0.6
2030 50th percentile (oC) 0.9 0.9 0.7 0.9 0.9
2030 90th percentile (oC) 1.4 1.2 1.1 1.3 1.2
2050 10th percentile (oC) 1.3 1.2 1.0 1.3 1.2
2050 50th percentile (oC) 1.9 1.8 1.5 1.9 1.8
2050 90th percentile (oC) 2.8 2.6 2.2 2.7 2.6
Max Temp Summer Autumn Winter Spring Annual
Reference period (oC) 24.4 17.8 10.4 17.2 17.5
2030 10th percentile (oC) 0.6 0.6 0.5 0.6 0.6
2030 50th percentile (oC) 0.9 0.9 0.7 0.9 0.9
2030 90th percentile (oC) 1.4 1.2 1.1 1.3 1.2
2050 10th percentile (oC) 1.3 1.2 1.0 1.3 1.2
2050 50th percentile (oC) 1.9 1.8 1.5 1.9 1.8
2050 90th percentile (oC) 2.8 2.6 2.2 2.7 2.6
Rainfall Summer Autumn Winter Spring Annual
Reference period (mm) 195.0 176.6 158.9 211.2 741.7
2030 10th percentile (%) -6.4 -7.7 -11.3 -13.3 -9.7
2030 50th percentile (%) 0.9 -0.6 -4.2 -5.0 -2.3
2030 90th percentile (%) 9.6 7.4 3.4 2.8 5.8
2050 10th percentile (%) -13.3 -16.0 -23.4 -27.5 -20.1
2050 50th percentile (%) 1.8 -1.3 -8.8 -10.4 -4.7
2050 90th percentile (%) 20.0 15.3 7.0 5.7 12.0
Evaporation Summer Autumn Winter Spring Annual
Reference period (mm) 427.8 200.8 96.9 278.1 1003.6
2030 10th percentile (%) 1.1 1.9 1.5 0.3 1.0
2030 50th percentile (%) 2.7 3.9 5.4 2.1 3.0
2030 90th percentile (%) 4.7 6.5 10.2 4.2 5.4
2050 10th percentile (%) 2.2 3.9 3.2 0.6 2.2
2050 50th percentile (%) 5.5 8.0 11.2 4.3 6.2
2050 90th percentile (%) 9.7 13.3 21.1 8.7 11.2
Effective Rainfall Summer Autumn Winter Spring Annual
Reference period 46% 88% 164% 76% 74%
2030 10th percentile (%) 42% 80% 143% 66% 66%
2030 50th percentile (%) 45% 84% 149% 71% 70%
2030 90th percentile (%) 48% 89% 154% 75% 74%
2050 10th percentile (%) 39% 71% 122% 55% 58%
2050 50th percentile (%) 44% 80% 135% 65% 66%
2050 90th percentile (%) 50% 89% 145% 74% 74%
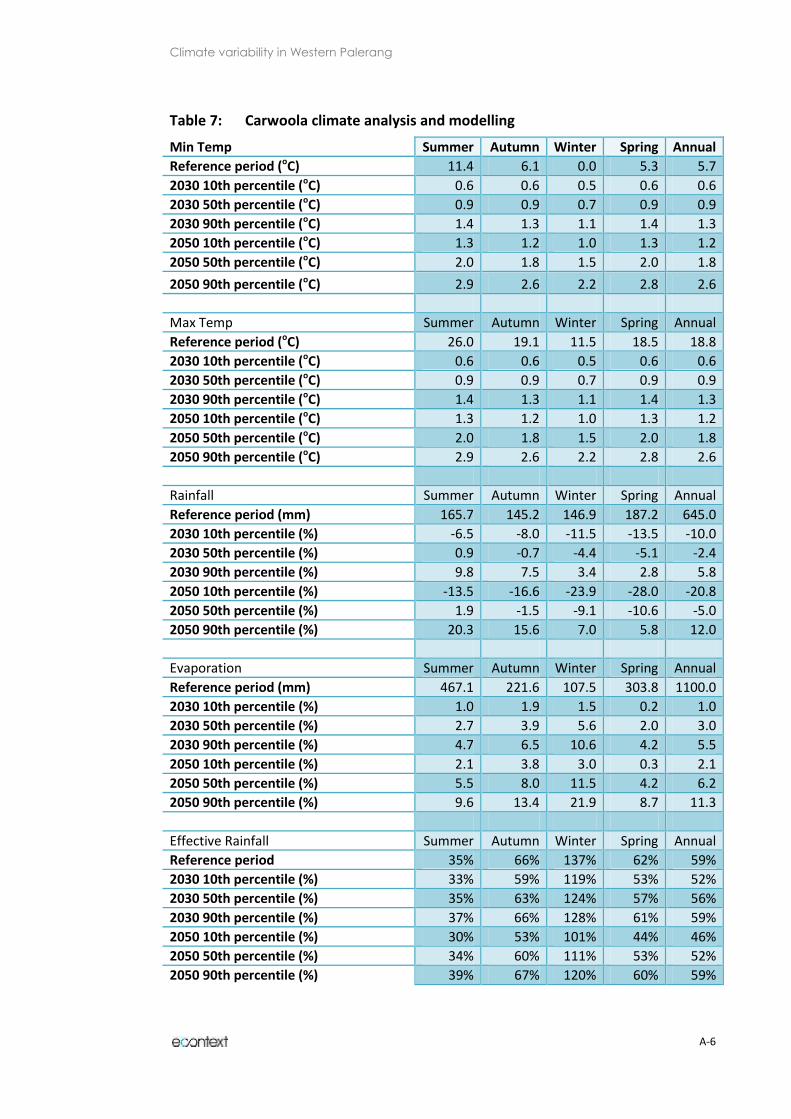
Climate variability in Western Palerang
A-6
Table 7: Carwoola climate analysis and modelling
Min Temp Summer Autumn Winter Spring Annual
Reference period (oC) 11.4 6.1 0.0 5.3 5.7
2030 10th percentile (oC) 0.6 0.6 0.5 0.6 0.6
2030 50th percentile (oC) 0.9 0.9 0.7 0.9 0.9
2030 90th percentile (oC) 1.4 1.3 1.1 1.4 1.3
2050 10th percentile (oC) 1.3 1.2 1.0 1.3 1.2
2050 50th percentile (oC) 2.0 1.8 1.5 2.0 1.8
2050 90th percentile (oC) 2.9 2.6 2.2 2.8 2.6
Max Temp Summer Autumn Winter Spring Annual
Reference period (oC) 26.0 19.1 11.5 18.5 18.8
2030 10th percentile (oC) 0.6 0.6 0.5 0.6 0.6
2030 50th percentile (oC) 0.9 0.9 0.7 0.9 0.9
2030 90th percentile (oC) 1.4 1.3 1.1 1.4 1.3
2050 10th percentile (oC) 1.3 1.2 1.0 1.3 1.2
2050 50th percentile (oC) 2.0 1.8 1.5 2.0 1.8
2050 90th percentile (oC) 2.9 2.6 2.2 2.8 2.6
Rainfall Summer Autumn Winter Spring Annual
Reference period (mm) 165.7 145.2 146.9 187.2 645.0
2030 10th percentile (%) -6.5 -8.0 -11.5 -13.5 -10.0
2030 50th percentile (%) 0.9 -0.7 -4.4 -5.1 -2.4
2030 90th percentile (%) 9.8 7.5 3.4 2.8 5.8
2050 10th percentile (%) -13.5 -16.6 -23.9 -28.0 -20.8
2050 50th percentile (%) 1.9 -1.5 -9.1 -10.6 -5.0
2050 90th percentile (%) 20.3 15.6 7.0 5.8 12.0
Evaporation Summer Autumn Winter Spring Annual
Reference period (mm) 467.1 221.6 107.5 303.8 1100.0
2030 10th percentile (%) 1.0 1.9 1.5 0.2 1.0
2030 50th percentile (%) 2.7 3.9 5.6 2.0 3.0
2030 90th percentile (%) 4.7 6.5 10.6 4.2 5.5
2050 10th percentile (%) 2.1 3.8 3.0 0.3 2.1
2050 50th percentile (%) 5.5 8.0 11.5 4.2 6.2
2050 90th percentile (%) 9.6 13.4 21.9 8.7 11.3
Effective Rainfall Summer Autumn Winter Spring Annual
Reference period 35% 66% 137% 62% 59%
2030 10th percentile (%) 33% 59% 119% 53% 52%
2030 50th percentile (%) 35% 63% 124% 57% 56%
2030 90th percentile (%) 37% 66% 128% 61% 59%
2050 10th percentile (%) 30% 53% 101% 44% 46%
2050 50th percentile (%) 34% 60% 111% 53% 52%
2050 90th percentile (%) 39% 67% 120% 60% 59%
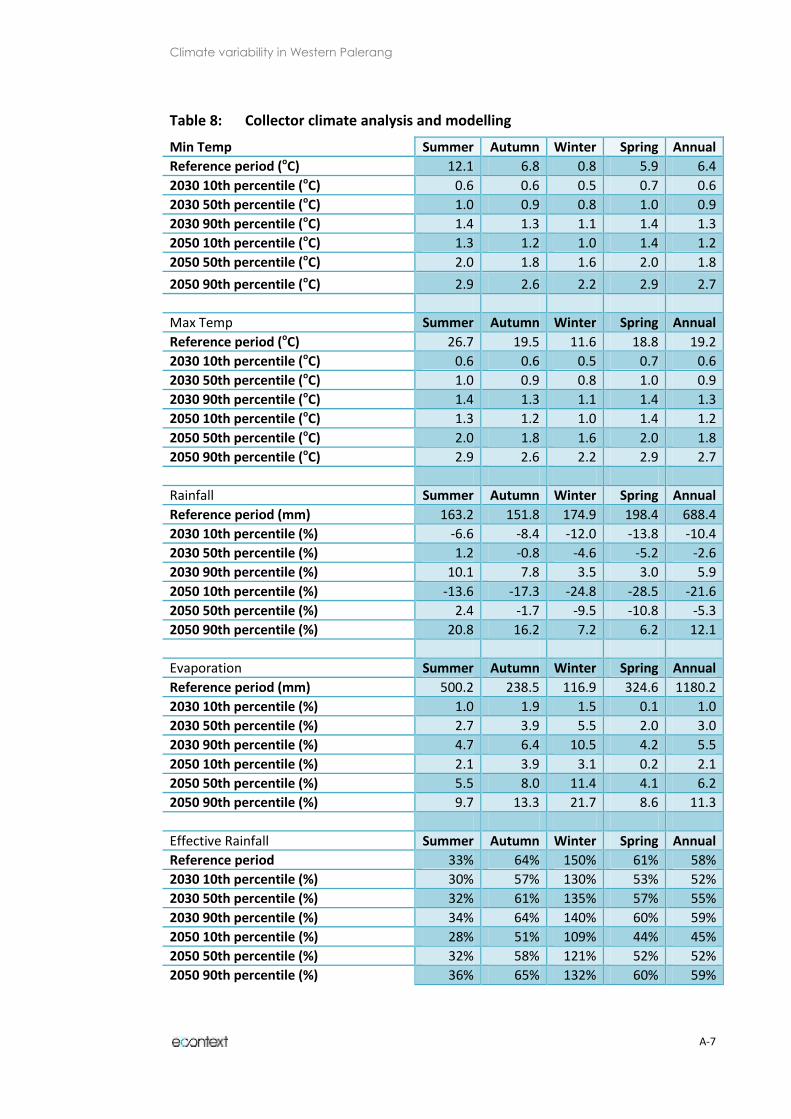
Climate variability in Western Palerang
A-7
Table 8: Collector climate analysis and modelling
Min Temp Summer Autumn Winter Spring Annual
Reference period (oC) 12.1 6.8 0.8 5.9 6.4
2030 10th percentile (oC) 0.6 0.6 0.5 0.7 0.6
2030 50th percentile (oC) 1.0 0.9 0.8 1.0 0.9
2030 90th percentile (oC) 1.4 1.3 1.1 1.4 1.3
2050 10th percentile (oC) 1.3 1.2 1.0 1.4 1.2
2050 50th percentile (oC) 2.0 1.8 1.6 2.0 1.8
2050 90th percentile (oC) 2.9 2.6 2.2 2.9 2.7
Max Temp Summer Autumn Winter Spring Annual
Reference period (oC) 26.7 19.5 11.6 18.8 19.2
2030 10th percentile (oC) 0.6 0.6 0.5 0.7 0.6
2030 50th percentile (oC) 1.0 0.9 0.8 1.0 0.9
2030 90th percentile (oC) 1.4 1.3 1.1 1.4 1.3
2050 10th percentile (oC) 1.3 1.2 1.0 1.4 1.2
2050 50th percentile (oC) 2.0 1.8 1.6 2.0 1.8
2050 90th percentile (oC) 2.9 2.6 2.2 2.9 2.7
Rainfall Summer Autumn Winter Spring Annual
Reference period (mm) 163.2 151.8 174.9 198.4 688.4
2030 10th percentile (%) -6.6 -8.4 -12.0 -13.8 -10.4
2030 50th percentile (%) 1.2 -0.8 -4.6 -5.2 -2.6
2030 90th percentile (%) 10.1 7.8 3.5 3.0 5.9
2050 10th percentile (%) -13.6 -17.3 -24.8 -28.5 -21.6
2050 50th percentile (%) 2.4 -1.7 -9.5 -10.8 -5.3
2050 90th percentile (%) 20.8 16.2 7.2 6.2 12.1
Evaporation Summer Autumn Winter Spring Annual
Reference period (mm) 500.2 238.5 116.9 324.6 1180.2
2030 10th percentile (%) 1.0 1.9 1.5 0.1 1.0
2030 50th percentile (%) 2.7 3.9 5.5 2.0 3.0
2030 90th percentile (%) 4.7 6.4 10.5 4.2 5.5
2050 10th percentile (%) 2.1 3.9 3.1 0.2 2.1
2050 50th percentile (%) 5.5 8.0 11.4 4.1 6.2
2050 90th percentile (%) 9.7 13.3 21.7 8.6 11.3
Effective Rainfall Summer Autumn Winter Spring Annual
Reference period 33% 64% 150% 61% 58%
2030 10th percentile (%) 30% 57% 130% 53% 52%
2030 50th percentile (%) 32% 61% 135% 57% 55%
2030 90th percentile (%) 34% 64% 140% 60% 59%
2050 10th percentile (%) 28% 51% 109% 44% 45%
2050 50th percentile (%) 32% 58% 121% 52% 52%
2050 90th percentile (%) 36% 65% 132% 60% 59%
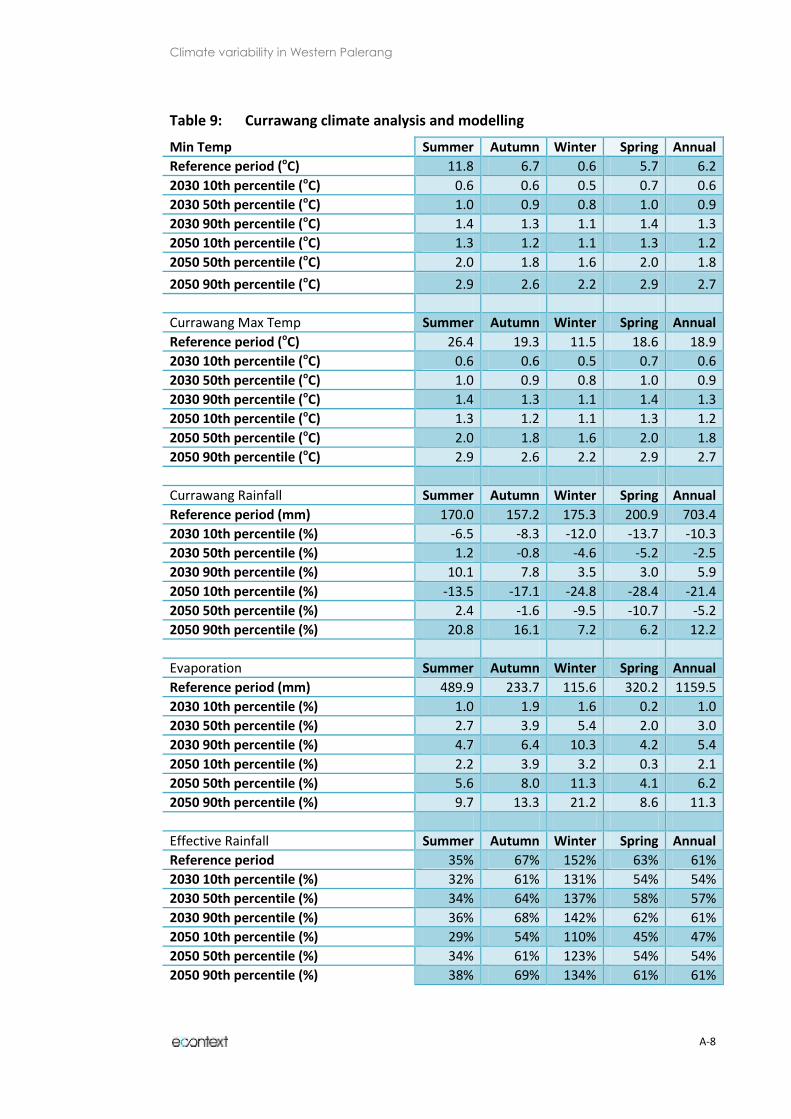
Climate variability in Western Palerang
A-8
Table 9: Currawang climate analysis and modelling
Min Temp Summer Autumn Winter Spring Annual
Reference period (oC) 11.8 6.7 0.6 5.7 6.2
2030 10th percentile (oC) 0.6 0.6 0.5 0.7 0.6
2030 50th percentile (oC) 1.0 0.9 0.8 1.0 0.9
2030 90th percentile (oC) 1.4 1.3 1.1 1.4 1.3
2050 10th percentile (oC) 1.3 1.2 1.1 1.3 1.2
2050 50th percentile (oC) 2.0 1.8 1.6 2.0 1.8
2050 90th percentile (oC) 2.9 2.6 2.2 2.9 2.7
Currawang Max Temp Summer Autumn Winter Spring Annual
Reference period (oC) 26.4 19.3 11.5 18.6 18.9
2030 10th percentile (oC) 0.6 0.6 0.5 0.7 0.6
2030 50th percentile (oC) 1.0 0.9 0.8 1.0 0.9
2030 90th percentile (oC) 1.4 1.3 1.1 1.4 1.3
2050 10th percentile (oC) 1.3 1.2 1.1 1.3 1.2
2050 50th percentile (oC) 2.0 1.8 1.6 2.0 1.8
2050 90th percentile (oC) 2.9 2.6 2.2 2.9 2.7
Currawang Rainfall Summer Autumn Winter Spring Annual
Reference period (mm) 170.0 157.2 175.3 200.9 703.4
2030 10th percentile (%) -6.5 -8.3 -12.0 -13.7 -10.3
2030 50th percentile (%) 1.2 -0.8 -4.6 -5.2 -2.5
2030 90th percentile (%) 10.1 7.8 3.5 3.0 5.9
2050 10th percentile (%) -13.5 -17.1 -24.8 -28.4 -21.4
2050 50th percentile (%) 2.4 -1.6 -9.5 -10.7 -5.2
2050 90th percentile (%) 20.8 16.1 7.2 6.2 12.2
Evaporation Summer Autumn Winter Spring Annual
Reference period (mm) 489.9 233.7 115.6 320.2 1159.5
2030 10th percentile (%) 1.0 1.9 1.6 0.2 1.0
2030 50th percentile (%) 2.7 3.9 5.4 2.0 3.0
2030 90th percentile (%) 4.7 6.4 10.3 4.2 5.4
2050 10th percentile (%) 2.2 3.9 3.2 0.3 2.1
2050 50th percentile (%) 5.6 8.0 11.3 4.1 6.2
2050 90th percentile (%) 9.7 13.3 21.2 8.6 11.3
Effective Rainfall Summer Autumn Winter Spring Annual
Reference period 35% 67% 152% 63% 61%
2030 10th percentile (%) 32% 61% 131% 54% 54%
2030 50th percentile (%) 34% 64% 137% 58% 57%
2030 90th percentile (%) 36% 68% 142% 62% 61%
2050 10th percentile (%) 29% 54% 110% 45% 47%
2050 50th percentile (%) 34% 61% 123% 54% 54%
2050 90th percentile (%) 38% 69% 134% 61% 61%

Climate variability in Western Palerang
A-9
Table 10: Forbes Creek climate analysis and modelling
Min Temp Summer Autumn Winter Spring Annual
Reference period (oC) 10.5 5.6 -0.4 4.6 5.1
2030 10th percentile (oC) 0.6 0.6 0.5 0.6 0.6
2030 50th percentile (oC) 0.9 0.9 0.7 0.9 0.9
2030 90th percentile (oC) 1.4 1.2 1.1 1.3 1.3
2050 10th percentile (oC) 1.3 1.2 1.0 1.3 1.2
2050 50th percentile (oC) 1.9 1.8 1.5 1.9 1.8
2050 90th percentile (oC) 2.9 2.6 2.2 2.8 2.6
Max Temp Summer Autumn Winter Spring Annual
Reference period (oC) 24.7 17.9 10.4 17.3 17.6
2030 10th percentile (oC) 0.6 0.6 0.5 0.6 0.6
2030 50th percentile (oC) 0.9 0.9 0.7 0.9 0.9
2030 90th percentile (oC) 1.4 1.2 1.1 1.3 1.3
2050 10th percentile (oC) 1.3 1.2 1.0 1.3 1.2
2050 50th percentile (oC) 1.9 1.8 1.5 1.9 1.8
2050 90th percentile (oC) 2.9 2.6 2.2 2.8 2.6
Rainfall Summer Autumn Winter Spring Annual
Reference period (mm) 188.6 179.9 172.2 209.7 750.5
2030 10th percentile (%) -6.4 -7.8 -11.5 -13.4 -9.9
2030 50th percentile (%) 1.0 -0.6 -4.4 -5.1 -2.3
2030 90th percentile (%) 9.8 7.5 3.4 2.8 5.8
2050 10th percentile (%) -13.2 -16.2 -23.8 -27.7 -20.4
2050 50th percentile (%) 2.0 -1.3 -9.0 -10.5 -4.8
2050 90th percentile (%) 20.3 15.6 7.0 5.8 12.1
Evaporation Summer Autumn Winter Spring Annual
Reference period (mm) 434.9 205.2 100.6 285.4 1026.1
2030 10th percentile (%) 1.1 1.9 1.6 0.3 1.1
2030 50th percentile (%) 2.7 3.9 5.3 2.1 3.0
2030 90th percentile (%) 4.7 6.4 10.0 4.2 5.4
2050 10th percentile (%) 2.2 3.9 3.2 0.5 2.2
2050 50th percentile (%) 5.6 8.0 11.1 4.3 6.2
2050 90th percentile (%) 9.7 13.3 20.7 8.7 11.2
Effective Rainfall Summer Autumn Winter Spring Annual
Reference period 43% 88% 171% 73% 73%
2030 10th percentile (%) 40% 79% 149% 63% 65%
2030 50th percentile (%) 43% 84% 156% 68% 69%
2030 90th percentile (%) 46% 89% 161% 73% 73%
2050 10th percentile (%) 37% 71% 126% 53% 57%
2050 50th percentile (%) 42% 80% 140% 63% 66%
2050 90th percentile (%) 48% 89% 152% 72% 74%

Climate variability in Western Palerang
A-10
Table 11: Googong climate analysis and modelling
Min Temp Summer Autumn Winter Spring Annual
Reference period (oC) 11.3 6.0 -0.1 5.2 5.6
2030 10th percentile (oC) 0.6 0.6 0.5 0.6 0.6
2030 50th percentile (oC) 0.9 0.9 0.7 0.9 0.9
2030 90th percentile (oC) 1.4 1.3 1.1 1.4 1.3
2050 10th percentile (oC) 1.3 1.2 1.0 1.3 1.2
2050 50th percentile (oC) 2.0 1.8 1.5 1.9 1.8
2050 90th percentile (oC) 2.9 2.6 2.2 2.8 2.6
Max Temp Summer Autumn Winter Spring Annual
Reference period (oC) 26.0 19.1 11.5 18.5 18.8
2030 10th percentile (oC) 0.6 0.6 0.5 0.6 0.6
2030 50th percentile (oC) 0.9 0.9 0.7 0.9 0.9
2030 90th percentile (oC) 1.4 1.3 1.1 1.4 1.3
2050 10th percentile (oC) 1.3 1.2 1.0 1.3 1.2
2050 50th percentile (oC) 2.0 1.8 1.5 1.9 1.8
2050 90th percentile (oC) 2.9 2.6 2.2 2.8 2.6
Rainfall Summer Autumn Winter Spring Annual
Reference period (mm) 171.0 142.9 138.6 183.7 636.2
2030 10th percentile (%) -6.6 -8.0 -11.4 -13.6 -10.0
2030 50th percentile (%) 0.8 -0.7 -4.3 -5.2 -2.4
2030 90th percentile (%) 9.7 7.5 3.3 2.8 5.8
2050 10th percentile (%) -13.6 -16.6 -23.6 -28.1 -20.6
2050 50th percentile (%) 1.7 -1.5 -9.0 -10.7 -4.9
2050 90th percentile (%) 20.1 15.5 6.9 5.7 12.1
Evaporation Summer Autumn Winter Spring Annual
Reference period (mm) 470.2 221.9 105.5 301.7 1099.3
2030 10th percentile (%) 1.0 1.8 1.4 0.1 1.0
2030 50th percentile (%) 2.6 3.9 5.7 2.0 3.0
2030 90th percentile (%) 4.6 6.5 11.0 4.2 5.5
2050 10th percentile (%) 2.1 3.8 2.9 0.3 2.0
2050 50th percentile (%) 5.5 8.0 11.8 4.2 6.2
2050 90th percentile (%) 9.6 13.5 22.7 8.8 11.4
Effective Rainfall Summer Autumn Winter Spring Annual
Reference period 36% 64% 131% 61% 58%
2030 10th percentile (%) 34% 58% 115% 53% 52%
2030 50th percentile (%) 36% 62% 119% 57% 55%
2030 90th percentile (%) 38% 65% 122% 60% 58%
2050 10th percentile (%) 31% 52% 98% 44% 45%
2050 50th percentile (%) 35% 59% 107% 52% 52%
2050 90th percentile (%) 40% 66% 114% 59% 58%
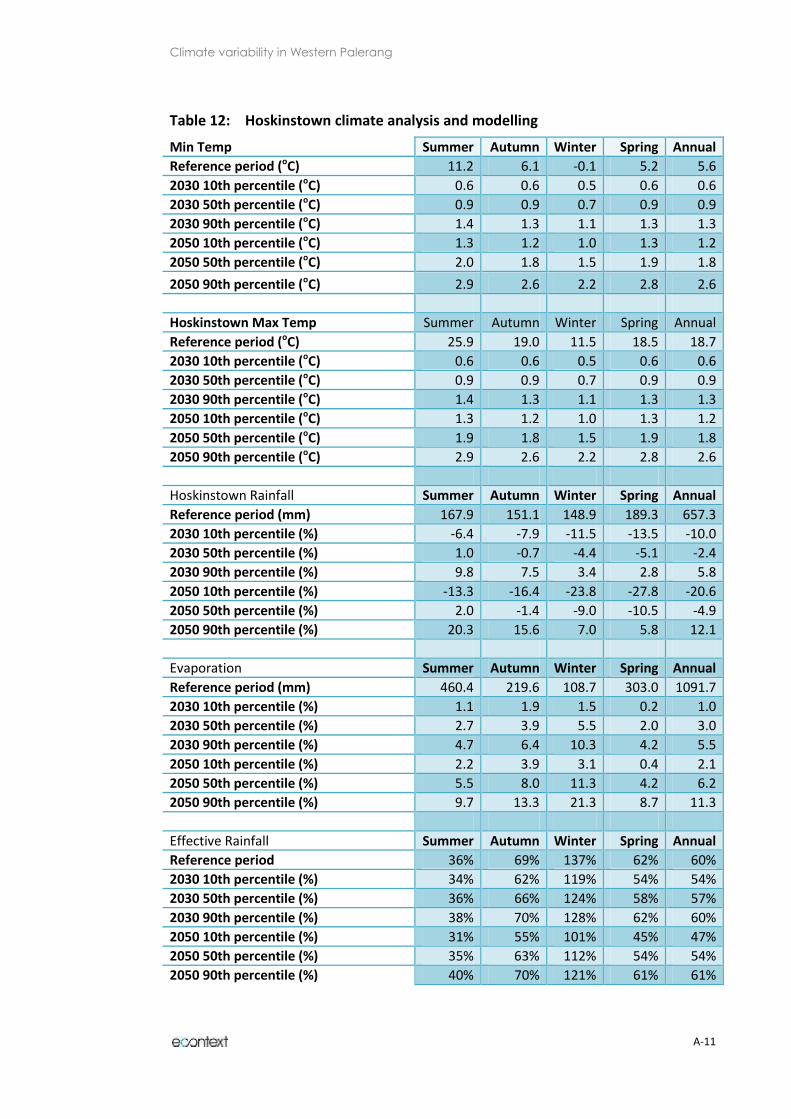
Climate variability in Western Palerang
A-11
Table 12: Hoskinstown climate analysis and modelling
Min Temp Summer Autumn Winter Spring Annual
Reference period (oC) 11.2 6.1 -0.1 5.2 5.6
2030 10th percentile (oC) 0.6 0.6 0.5 0.6 0.6
2030 50th percentile (oC) 0.9 0.9 0.7 0.9 0.9
2030 90th percentile (oC) 1.4 1.3 1.1 1.3 1.3
2050 10th percentile (oC) 1.3 1.2 1.0 1.3 1.2
2050 50th percentile (oC) 2.0 1.8 1.5 1.9 1.8
2050 90th percentile (oC) 2.9 2.6 2.2 2.8 2.6
Hoskinstown Max Temp Summer Autumn Winter Spring Annual
Reference period (oC) 25.9 19.0 11.5 18.5 18.7
2030 10th percentile (oC) 0.6 0.6 0.5 0.6 0.6
2030 50th percentile (oC) 0.9 0.9 0.7 0.9 0.9
2030 90th percentile (oC) 1.4 1.3 1.1 1.3 1.3
2050 10th percentile (oC) 1.3 1.2 1.0 1.3 1.2
2050 50th percentile (oC) 1.9 1.8 1.5 1.9 1.8
2050 90th percentile (oC) 2.9 2.6 2.2 2.8 2.6
Hoskinstown Rainfall Summer Autumn Winter Spring Annual
Reference period (mm) 167.9 151.1 148.9 189.3 657.3
2030 10th percentile (%) -6.4 -7.9 -11.5 -13.5 -10.0
2030 50th percentile (%) 1.0 -0.7 -4.4 -5.1 -2.4
2030 90th percentile (%) 9.8 7.5 3.4 2.8 5.8
2050 10th percentile (%) -13.3 -16.4 -23.8 -27.8 -20.6
2050 50th percentile (%) 2.0 -1.4 -9.0 -10.5 -4.9
2050 90th percentile (%) 20.3 15.6 7.0 5.8 12.1
Evaporation Summer Autumn Winter Spring Annual
Reference period (mm) 460.4 219.6 108.7 303.0 1091.7
2030 10th percentile (%) 1.1 1.9 1.5 0.2 1.0
2030 50th percentile (%) 2.7 3.9 5.5 2.0 3.0
2030 90th percentile (%) 4.7 6.4 10.3 4.2 5.5
2050 10th percentile (%) 2.2 3.9 3.1 0.4 2.1
2050 50th percentile (%) 5.5 8.0 11.3 4.2 6.2
2050 90th percentile (%) 9.7 13.3 21.3 8.7 11.3
Effective Rainfall Summer Autumn Winter Spring Annual
Reference period 36% 69% 137% 62% 60%
2030 10th percentile (%) 34% 62% 119% 54% 54%
2030 50th percentile (%) 36% 66% 124% 58% 57%
2030 90th percentile (%) 38% 70% 128% 62% 60%
2050 10th percentile (%) 31% 55% 101% 45% 47%
2050 50th percentile (%) 35% 63% 112% 54% 54%
2050 90th percentile (%) 40% 70% 121% 61% 61%
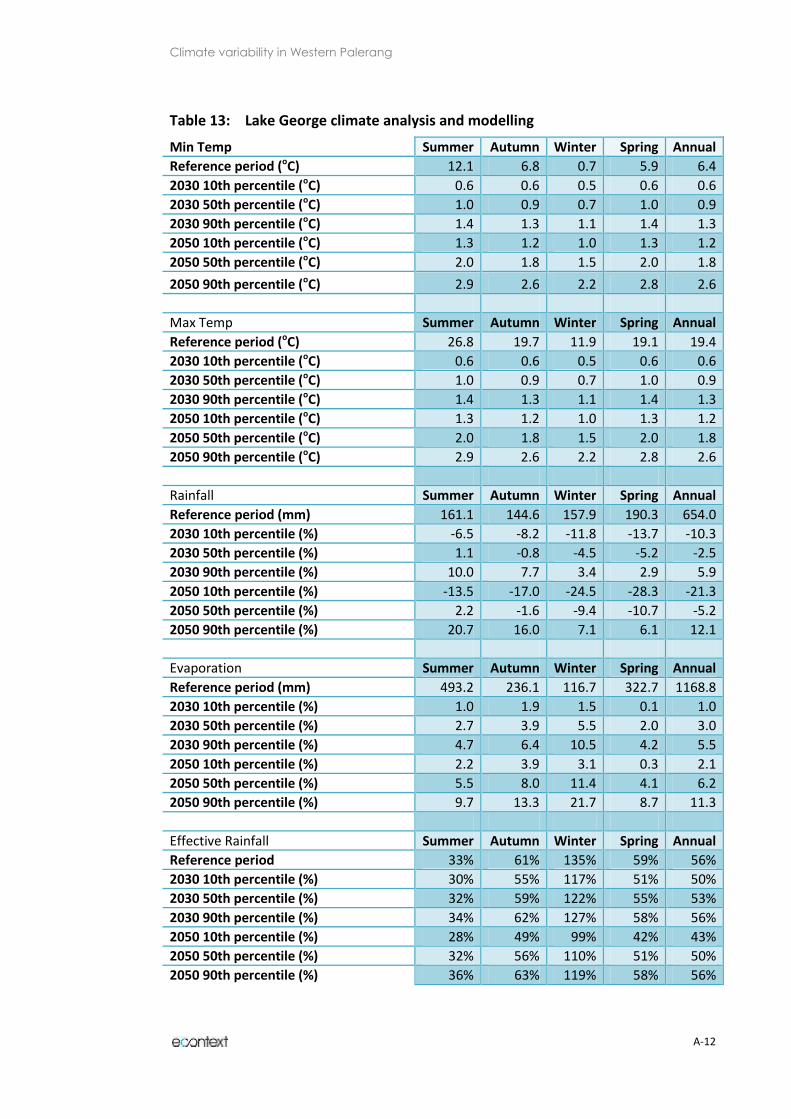
Climate variability in Western Palerang
A-12
Table 13: Lake George climate analysis and modelling
Min Temp Summer Autumn Winter Spring Annual
Reference period (oC) 12.1 6.8 0.7 5.9 6.4
2030 10th percentile (oC) 0.6 0.6 0.5 0.6 0.6
2030 50th percentile (oC) 1.0 0.9 0.7 1.0 0.9
2030 90th percentile (oC) 1.4 1.3 1.1 1.4 1.3
2050 10th percentile (oC) 1.3 1.2 1.0 1.3 1.2
2050 50th percentile (oC) 2.0 1.8 1.5 2.0 1.8
2050 90th percentile (oC) 2.9 2.6 2.2 2.8 2.6
Max Temp Summer Autumn Winter Spring Annual
Reference period (oC) 26.8 19.7 11.9 19.1 19.4
2030 10th percentile (oC) 0.6 0.6 0.5 0.6 0.6
2030 50th percentile (oC) 1.0 0.9 0.7 1.0 0.9
2030 90th percentile (oC) 1.4 1.3 1.1 1.4 1.3
2050 10th percentile (oC) 1.3 1.2 1.0 1.3 1.2
2050 50th percentile (oC) 2.0 1.8 1.5 2.0 1.8
2050 90th percentile (oC) 2.9 2.6 2.2 2.8 2.6
Rainfall Summer Autumn Winter Spring Annual
Reference period (mm) 161.1 144.6 157.9 190.3 654.0
2030 10th percentile (%) -6.5 -8.2 -11.8 -13.7 -10.3
2030 50th percentile (%) 1.1 -0.8 -4.5 -5.2 -2.5
2030 90th percentile (%) 10.0 7.7 3.4 2.9 5.9
2050 10th percentile (%) -13.5 -17.0 -24.5 -28.3 -21.3
2050 50th percentile (%) 2.2 -1.6 -9.4 -10.7 -5.2
2050 90th percentile (%) 20.7 16.0 7.1 6.1 12.1
Evaporation Summer Autumn Winter Spring Annual
Reference period (mm) 493.2 236.1 116.7 322.7 1168.8
2030 10th percentile (%) 1.0 1.9 1.5 0.1 1.0
2030 50th percentile (%) 2.7 3.9 5.5 2.0 3.0
2030 90th percentile (%) 4.7 6.4 10.5 4.2 5.5
2050 10th percentile (%) 2.2 3.9 3.1 0.3 2.1
2050 50th percentile (%) 5.5 8.0 11.4 4.1 6.2
2050 90th percentile (%) 9.7 13.3 21.7 8.7 11.3
Effective Rainfall Summer Autumn Winter Spring Annual
Reference period 33% 61% 135% 59% 56%
2030 10th percentile (%) 30% 55% 117% 51% 50%
2030 50th percentile (%) 32% 59% 122% 55% 53%
2030 90th percentile (%) 34% 62% 127% 58% 56%
2050 10th percentile (%) 28% 49% 99% 42% 43%
2050 50th percentile (%) 32% 56% 110% 51% 50%
2050 90th percentile (%) 36% 63% 119% 58% 56%
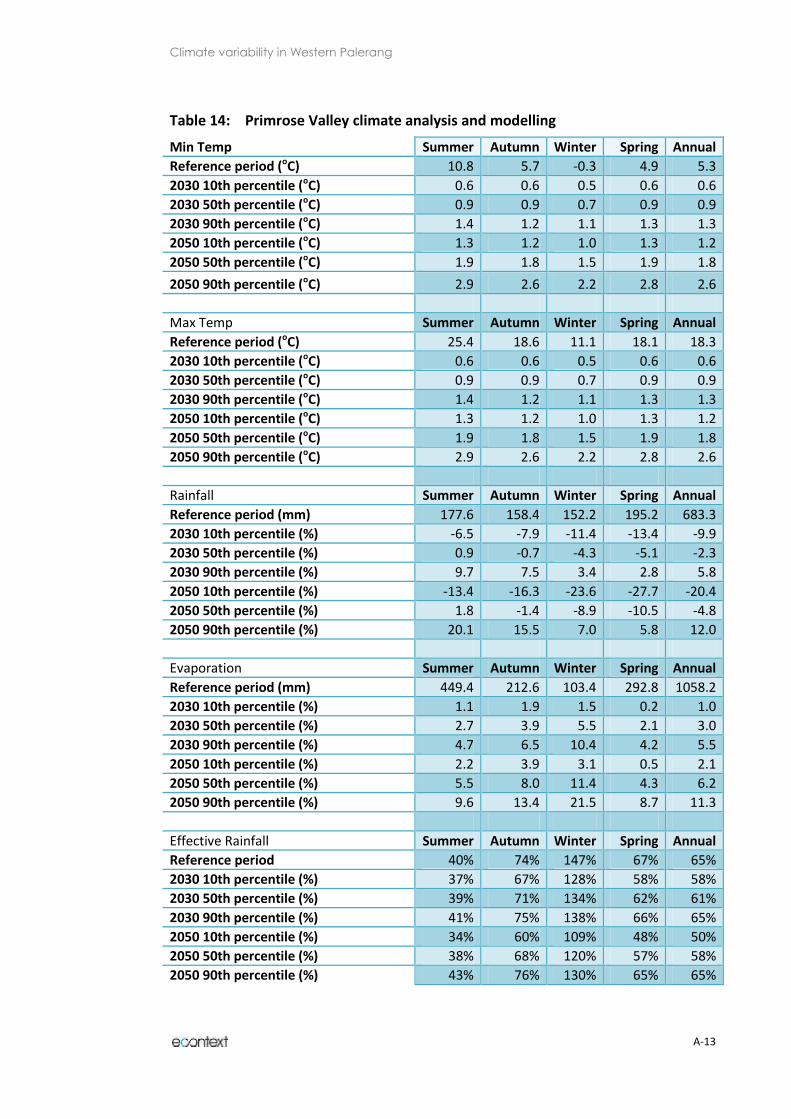
Climate variability in Western Palerang
A-13
Table 14: Primrose Valley climate analysis and modelling
Min Temp Summer Autumn Winter Spring Annual
Reference period (oC) 10.8 5.7 -0.3 4.9 5.3
2030 10th percentile (oC) 0.6 0.6 0.5 0.6 0.6
2030 50th percentile (oC) 0.9 0.9 0.7 0.9 0.9
2030 90th percentile (oC) 1.4 1.2 1.1 1.3 1.3
2050 10th percentile (oC) 1.3 1.2 1.0 1.3 1.2
2050 50th percentile (oC) 1.9 1.8 1.5 1.9 1.8
2050 90th percentile (oC) 2.9 2.6 2.2 2.8 2.6
Max Temp Summer Autumn Winter Spring Annual
Reference period (oC) 25.4 18.6 11.1 18.1 18.3
2030 10th percentile (oC) 0.6 0.6 0.5 0.6 0.6
2030 50th percentile (oC) 0.9 0.9 0.7 0.9 0.9
2030 90th percentile (oC) 1.4 1.2 1.1 1.3 1.3
2050 10th percentile (oC) 1.3 1.2 1.0 1.3 1.2
2050 50th percentile (oC) 1.9 1.8 1.5 1.9 1.8
2050 90th percentile (oC) 2.9 2.6 2.2 2.8 2.6
Rainfall Summer Autumn Winter Spring Annual
Reference period (mm) 177.6 158.4 152.2 195.2 683.3
2030 10th percentile (%) -6.5 -7.9 -11.4 -13.4 -9.9
2030 50th percentile (%) 0.9 -0.7 -4.3 -5.1 -2.3
2030 90th percentile (%) 9.7 7.5 3.4 2.8 5.8
2050 10th percentile (%) -13.4 -16.3 -23.6 -27.7 -20.4
2050 50th percentile (%) 1.8 -1.4 -8.9 -10.5 -4.8
2050 90th percentile (%) 20.1 15.5 7.0 5.8 12.0
Evaporation Summer Autumn Winter Spring Annual
Reference period (mm) 449.4 212.6 103.4 292.8 1058.2
2030 10th percentile (%) 1.1 1.9 1.5 0.2 1.0
2030 50th percentile (%) 2.7 3.9 5.5 2.1 3.0
2030 90th percentile (%) 4.7 6.5 10.4 4.2 5.5
2050 10th percentile (%) 2.2 3.9 3.1 0.5 2.1
2050 50th percentile (%) 5.5 8.0 11.4 4.3 6.2
2050 90th percentile (%) 9.6 13.4 21.5 8.7 11.3
Effective Rainfall Summer Autumn Winter Spring Annual
Reference period 40% 74% 147% 67% 65%
2030 10th percentile (%) 37% 67% 128% 58% 58%
2030 50th percentile (%) 39% 71% 134% 62% 61%
2030 90th percentile (%) 41% 75% 138% 66% 65%
2050 10th percentile (%) 34% 60% 109% 48% 50%
2050 50th percentile (%) 38% 68% 120% 57% 58%
2050 90th percentile (%) 43% 76% 130% 65% 65%

Climate variability in Western Palerang
A-14
Table 15: Rossi climate analysis and modelling
Min Temp Summer Autumn Winter Spring Annual
Reference period (oC) 10.5 5.6 -0.4 4.7 5.1
2030 10th percentile (oC) 0.6 0.6 0.5 0.6 0.6
2030 50th percentile (oC) 0.9 0.9 0.7 0.9 0.9
2030 90th percentile (oC) 1.4 1.2 1.1 1.3 1.3
2050 10th percentile (oC) 1.3 1.2 1.0 1.3 1.2
2050 50th percentile (oC) 1.9 1.8 1.5 1.9 1.8
2050 90th percentile (oC) 2.8 2.6 2.2 2.8 2.6
Max Temp Summer Autumn Winter Spring Annual
Reference period (oC) 24.8 18.1 10.7 17.5 17.8
2030 10th percentile (oC) 0.6 0.6 0.5 0.6 0.6
2030 50th percentile (oC) 0.9 0.9 0.7 0.9 0.9
2030 90th percentile (oC) 1.4 1.2 1.1 1.3 1.3
2050 10th percentile (oC) 1.3 1.2 1.0 1.3 1.2
2050 50th percentile (oC) 1.9 1.8 1.5 1.9 1.8
2050 90th percentile (oC) 2.8 2.6 2.2 2.8 2.6
Rainfall Summer Autumn Winter Spring Annual
Reference period (mm) 187.6 178.1 165.5 207.4 738.6
2030 10th percentile (%) -6.4 -7.8 -11.4 -13.3 -9.8
2030 50th percentile (%) 0.9 -0.6 -4.3 -5.0 -2.3
2030 90th percentile (%) 9.8 7.5 3.4 2.8 5.8
2050 10th percentile (%) -13.2 -16.1 -23.7 -27.6 -20.3
2050 50th percentile (%) 2.0 -1.3 -8.9 -10.4 -4.7
2050 90th percentile (%) 20.2 15.5 7.0 5.8 12.1
Evaporation Summer Autumn Winter Spring Annual
Reference period (mm) 435.3 206.1 101.7 286.6 1029.8
2030 10th percentile (%) 1.1 1.9 1.6 0.3 1.1
2030 50th percentile (%) 2.7 3.8 5.3 2.1 3.0
2030 90th percentile (%) 4.7 6.4 10.0 4.2 5.4
2050 10th percentile (%) 2.2 3.9 3.2 0.6 2.2
2050 50th percentile (%) 5.6 8.0 11.0 4.3 6.2
2050 90th percentile (%) 9.7 13.3 20.7 8.7 11.2
Effective Rainfall Summer Autumn Winter Spring Annual
Reference period 43% 86% 163% 72% 72%
2030 10th percentile (%) 40% 78% 142% 63% 64%
2030 50th percentile (%) 42% 83% 148% 67% 68%
2030 90th percentile (%) 45% 87% 153% 71% 72%
2050 10th percentile (%) 37% 70% 120% 52% 56%
2050 50th percentile (%) 42% 79% 133% 62% 64%
2050 90th percentile (%) 47% 88% 144% 70% 72%
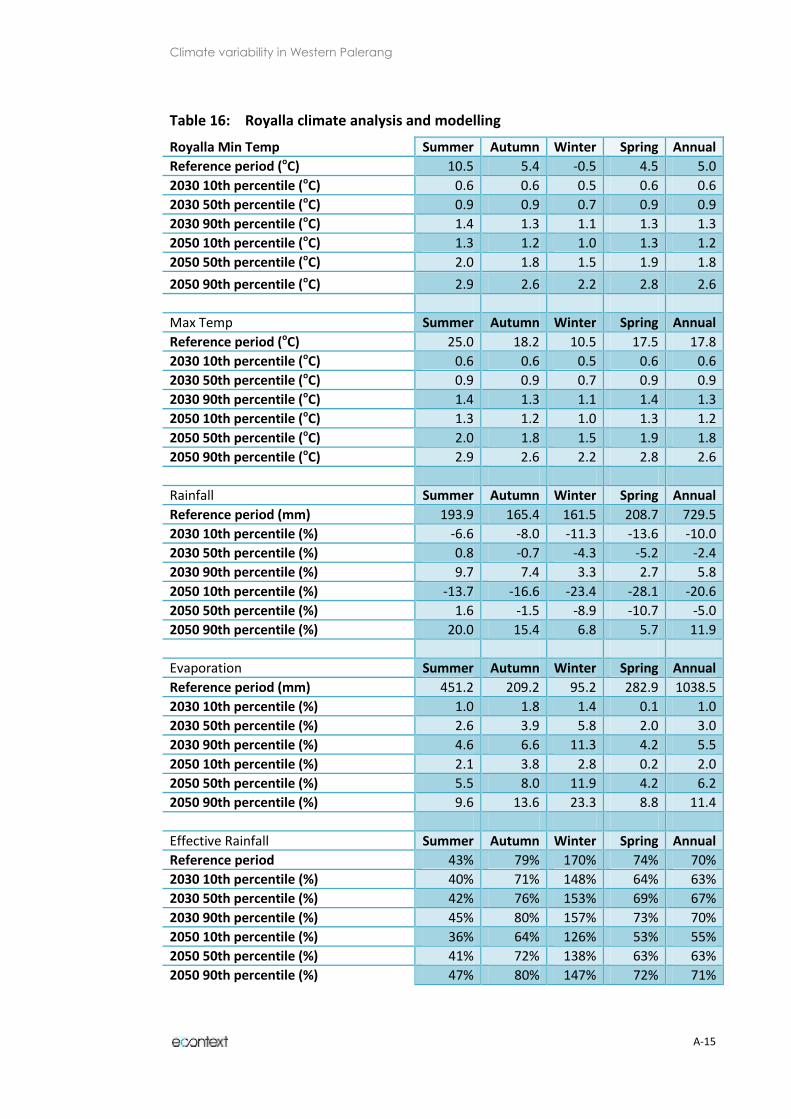
Climate variability in Western Palerang
A-15
Table 16: Royalla climate analysis and modelling
Royalla Min Temp Summer Autumn Winter Spring Annual
Reference period (oC) 10.5 5.4 -0.5 4.5 5.0
2030 10th percentile (oC) 0.6 0.6 0.5 0.6 0.6
2030 50th percentile (oC) 0.9 0.9 0.7 0.9 0.9
2030 90th percentile (oC) 1.4 1.3 1.1 1.3 1.3
2050 10th percentile (oC) 1.3 1.2 1.0 1.3 1.2
2050 50th percentile (oC) 2.0 1.8 1.5 1.9 1.8
2050 90th percentile (oC) 2.9 2.6 2.2 2.8 2.6
Max Temp Summer Autumn Winter Spring Annual
Reference period (oC) 25.0 18.2 10.5 17.5 17.8
2030 10th percentile (oC) 0.6 0.6 0.5 0.6 0.6
2030 50th percentile (oC) 0.9 0.9 0.7 0.9 0.9
2030 90th percentile (oC) 1.4 1.3 1.1 1.4 1.3
2050 10th percentile (oC) 1.3 1.2 1.0 1.3 1.2
2050 50th percentile (oC) 2.0 1.8 1.5 1.9 1.8
2050 90th percentile (oC) 2.9 2.6 2.2 2.8 2.6
Rainfall Summer Autumn Winter Spring Annual
Reference period (mm) 193.9 165.4 161.5 208.7 729.5
2030 10th percentile (%) -6.6 -8.0 -11.3 -13.6 -10.0
2030 50th percentile (%) 0.8 -0.7 -4.3 -5.2 -2.4
2030 90th percentile (%) 9.7 7.4 3.3 2.7 5.8
2050 10th percentile (%) -13.7 -16.6 -23.4 -28.1 -20.6
2050 50th percentile (%) 1.6 -1.5 -8.9 -10.7 -5.0
2050 90th percentile (%) 20.0 15.4 6.8 5.7 11.9
Evaporation Summer Autumn Winter Spring Annual
Reference period (mm) 451.2 209.2 95.2 282.9 1038.5
2030 10th percentile (%) 1.0 1.8 1.4 0.1 1.0
2030 50th percentile (%) 2.6 3.9 5.8 2.0 3.0
2030 90th percentile (%) 4.6 6.6 11.3 4.2 5.5
2050 10th percentile (%) 2.1 3.8 2.8 0.2 2.0
2050 50th percentile (%) 5.5 8.0 11.9 4.2 6.2
2050 90th percentile (%) 9.6 13.6 23.3 8.8 11.4
Effective Rainfall Summer Autumn Winter Spring Annual
Reference period 43% 79% 170% 74% 70%
2030 10th percentile (%) 40% 71% 148% 64% 63%
2030 50th percentile (%) 42% 76% 153% 69% 67%
2030 90th percentile (%) 45% 80% 157% 73% 70%
2050 10th percentile (%) 36% 64% 126% 53% 55%
2050 50th percentile (%) 41% 72% 138% 63% 63%
2050 90th percentile (%) 47% 80% 147% 72% 71%
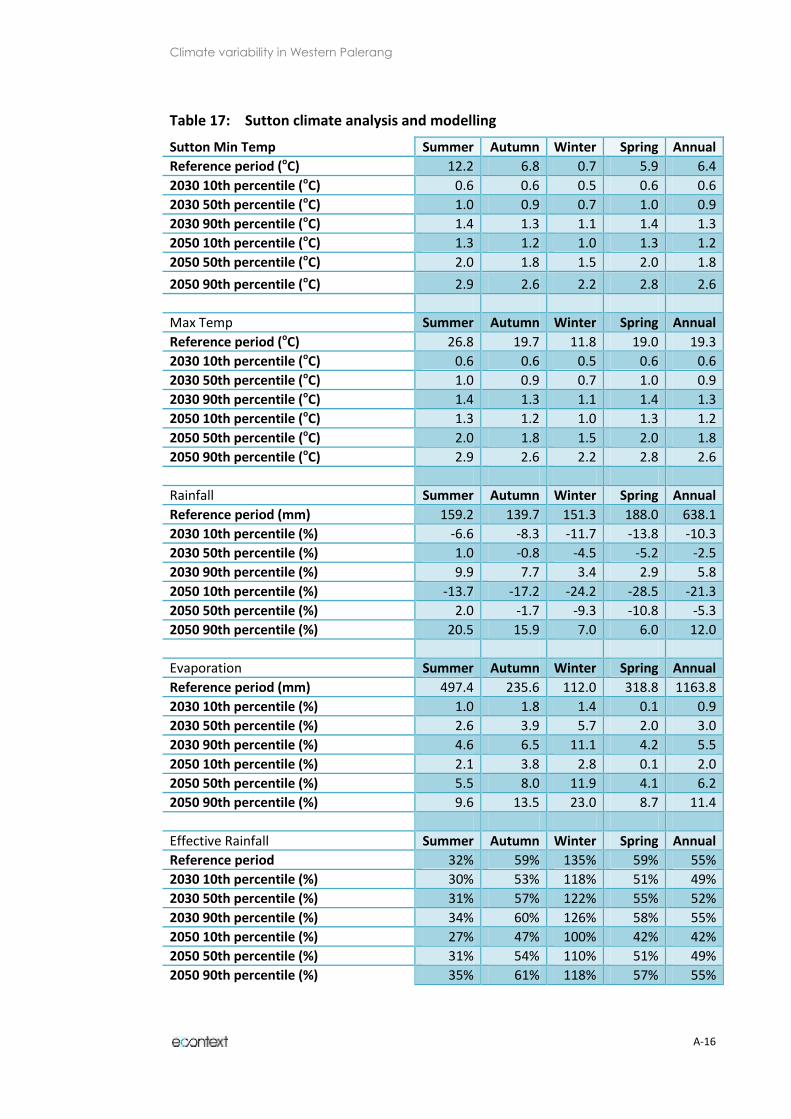
Climate variability in Western Palerang
A-16
Table 17: Sutton climate analysis and modelling
Sutton Min Temp Summer Autumn Winter Spring Annual
Reference period (oC) 12.2 6.8 0.7 5.9 6.4
2030 10th percentile (oC) 0.6 0.6 0.5 0.6 0.6
2030 50th percentile (oC) 1.0 0.9 0.7 1.0 0.9
2030 90th percentile (oC) 1.4 1.3 1.1 1.4 1.3
2050 10th percentile (oC) 1.3 1.2 1.0 1.3 1.2
2050 50th percentile (oC) 2.0 1.8 1.5 2.0 1.8
2050 90th percentile (oC) 2.9 2.6 2.2 2.8 2.6
Max Temp Summer Autumn Winter Spring Annual
Reference period (oC) 26.8 19.7 11.8 19.0 19.3
2030 10th percentile (oC) 0.6 0.6 0.5 0.6 0.6
2030 50th percentile (oC) 1.0 0.9 0.7 1.0 0.9
2030 90th percentile (oC) 1.4 1.3 1.1 1.4 1.3
2050 10th percentile (oC) 1.3 1.2 1.0 1.3 1.2
2050 50th percentile (oC) 2.0 1.8 1.5 2.0 1.8
2050 90th percentile (oC) 2.9 2.6 2.2 2.8 2.6
Rainfall Summer Autumn Winter Spring Annual
Reference period (mm) 159.2 139.7 151.3 188.0 638.1
2030 10th percentile (%) -6.6 -8.3 -11.7 -13.8 -10.3
2030 50th percentile (%) 1.0 -0.8 -4.5 -5.2 -2.5
2030 90th percentile (%) 9.9 7.7 3.4 2.9 5.8
2050 10th percentile (%) -13.7 -17.2 -24.2 -28.5 -21.3
2050 50th percentile (%) 2.0 -1.7 -9.3 -10.8 -5.3
2050 90th percentile (%) 20.5 15.9 7.0 6.0 12.0
Evaporation Summer Autumn Winter Spring Annual
Reference period (mm) 497.4 235.6 112.0 318.8 1163.8
2030 10th percentile (%) 1.0 1.8 1.4 0.1 0.9
2030 50th percentile (%) 2.6 3.9 5.7 2.0 3.0
2030 90th percentile (%) 4.6 6.5 11.1 4.2 5.5
2050 10th percentile (%) 2.1 3.8 2.8 0.1 2.0
2050 50th percentile (%) 5.5 8.0 11.9 4.1 6.2
2050 90th percentile (%) 9.6 13.5 23.0 8.7 11.4
Effective Rainfall Summer Autumn Winter Spring Annual
Reference period 32% 59% 135% 59% 55%
2030 10th percentile (%) 30% 53% 118% 51% 49%
2030 50th percentile (%) 31% 57% 122% 55% 52%
2030 90th percentile (%) 34% 60% 126% 58% 55%
2050 10th percentile (%) 27% 47% 100% 42% 42%
2050 50th percentile (%) 31% 54% 110% 51% 49%
2050 90th percentile (%) 35% 61% 118% 57% 55%
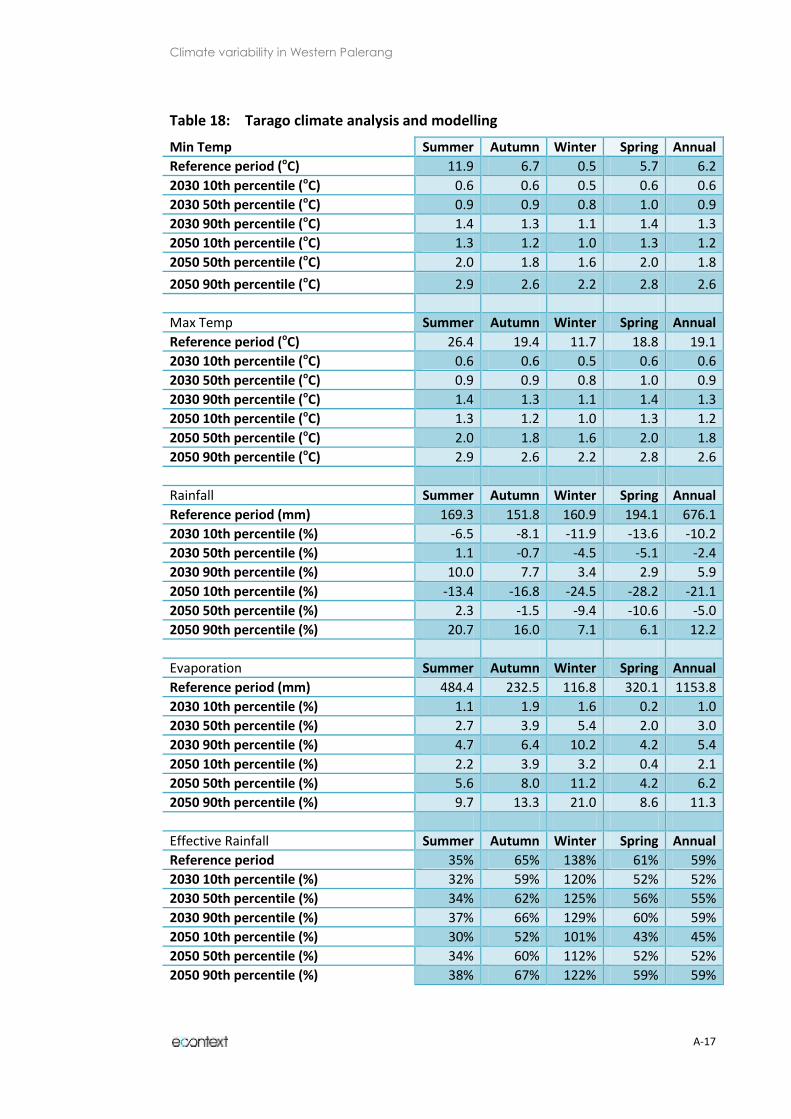
Climate variability in Western Palerang
A-17
Table 18: Tarago climate analysis and modelling
Min Temp Summer Autumn Winter Spring Annual
Reference period (oC) 11.9 6.7 0.5 5.7 6.2
2030 10th percentile (oC) 0.6 0.6 0.5 0.6 0.6
2030 50th percentile (oC) 0.9 0.9 0.8 1.0 0.9
2030 90th percentile (oC) 1.4 1.3 1.1 1.4 1.3
2050 10th percentile (oC) 1.3 1.2 1.0 1.3 1.2
2050 50th percentile (oC) 2.0 1.8 1.6 2.0 1.8
2050 90th percentile (oC) 2.9 2.6 2.2 2.8 2.6
Max Temp Summer Autumn Winter Spring Annual
Reference period (oC) 26.4 19.4 11.7 18.8 19.1
2030 10th percentile (oC) 0.6 0.6 0.5 0.6 0.6
2030 50th percentile (oC) 0.9 0.9 0.8 1.0 0.9
2030 90th percentile (oC) 1.4 1.3 1.1 1.4 1.3
2050 10th percentile (oC) 1.3 1.2 1.0 1.3 1.2
2050 50th percentile (oC) 2.0 1.8 1.6 2.0 1.8
2050 90th percentile (oC) 2.9 2.6 2.2 2.8 2.6
Rainfall Summer Autumn Winter Spring Annual
Reference period (mm) 169.3 151.8 160.9 194.1 676.1
2030 10th percentile (%) -6.5 -8.1 -11.9 -13.6 -10.2
2030 50th percentile (%) 1.1 -0.7 -4.5 -5.1 -2.4
2030 90th percentile (%) 10.0 7.7 3.4 2.9 5.9
2050 10th percentile (%) -13.4 -16.8 -24.5 -28.2 -21.1
2050 50th percentile (%) 2.3 -1.5 -9.4 -10.6 -5.0
2050 90th percentile (%) 20.7 16.0 7.1 6.1 12.2
Evaporation Summer Autumn Winter Spring Annual
Reference period (mm) 484.4 232.5 116.8 320.1 1153.8
2030 10th percentile (%) 1.1 1.9 1.6 0.2 1.0
2030 50th percentile (%) 2.7 3.9 5.4 2.0 3.0
2030 90th percentile (%) 4.7 6.4 10.2 4.2 5.4
2050 10th percentile (%) 2.2 3.9 3.2 0.4 2.1
2050 50th percentile (%) 5.6 8.0 11.2 4.2 6.2
2050 90th percentile (%) 9.7 13.3 21.0 8.6 11.3
Effective Rainfall Summer Autumn Winter Spring Annual
Reference period 35% 65% 138% 61% 59%
2030 10th percentile (%) 32% 59% 120% 52% 52%
2030 50th percentile (%) 34% 62% 125% 56% 55%
2030 90th percentile (%) 37% 66% 129% 60% 59%
2050 10th percentile (%) 30% 52% 101% 43% 45%
2050 50th percentile (%) 34% 60% 112% 52% 52%
2050 90th percentile (%) 38% 67% 122% 59% 59%

Climate variability in Western Palerang
A-18
Table 19: Tinderry climate analysis and modelling
Min Temp Summer Autumn Winter Spring Annual
Reference period (oC) 10.1 5.1 -0.8 4.3 4.7
2030 10th percentile (oC) 0.6 0.6 0.5 0.6 0.6
2030 50th percentile (oC) 0.9 0.9 0.7 0.9 0.9
2030 90th percentile (oC) 1.4 1.2 1.0 1.3 1.2
2050 10th percentile (oC) 1.3 1.2 1.0 1.3 1.2
2050 50th percentile (oC) 1.9 1.8 1.5 1.9 1.8
2050 90th percentile (oC) 2.8 2.6 2.2 2.8 2.6
Max Temp Summer Autumn Winter Spring Annual
Reference period (oC) 24.5 17.9 10.4 17.3 17.5
2030 10th percentile (oC) 0.6 0.6 0.5 0.6 0.6
2030 50th percentile (oC) 0.9 0.9 0.7 0.9 0.9
2030 90th percentile (oC) 1.4 1.2 1.0 1.3 1.2
2050 10th percentile (oC) 1.3 1.2 1.0 1.3 1.2
2050 50th percentile (oC) 1.9 1.8 1.5 1.9 1.8
2050 90th percentile (oC) 2.8 2.6 2.2 2.8 2.6
Rainfall Summer Autumn Winter Spring Annual
Reference period (mm) 193.5 162.4 147.3 201.1 704.3
2030 10th percentile (%) -6.5 -7.8 -11.2 -13.3 -9.7
2030 50th percentile (%) 0.8 -0.6 -4.2 -5.1 -2.3
2030 90th percentile (%) 9.6 7.4 3.3 2.7 5.8
2050 10th percentile (%) -13.4 -16.1 -23.2 -27.6 -20.1
2050 50th percentile (%) 1.6 -1.3 -8.7 -10.5 -4.7
2050 90th percentile (%) 19.8 15.2 6.9 5.6 12.0
Evaporation Summer Autumn Winter Spring Annual
Reference period (mm) 430.5 200.6 94.3 275.3 1000.8
2030 10th percentile (%) 1.0 1.9 1.5 0.2 1.0
2030 50th percentile (%) 2.7 3.9 5.5 2.1 3.0
2030 90th percentile (%) 4.7 6.5 10.6 4.2 5.5
2050 10th percentile (%) 2.2 3.8 3.1 0.5 2.1
2050 50th percentile (%) 5.5 8.0 11.5 4.3 6.2
2050 90th percentile (%) 9.6 13.5 22.0 8.8 11.3
Effective Rainfall Summer Autumn Winter Spring Annual
Reference period 45% 81% 156% 73% 70%
2030 10th percentile (%) 42% 73% 137% 63% 63%
2030 50th percentile (%) 44% 77% 142% 68% 67%
2030 90th percentile (%) 47% 82% 146% 72% 71%
2050 10th percentile (%) 38% 65% 116% 53% 55%
2050 50th percentile (%) 43% 74% 128% 63% 63%
2050 90th percentile (%) 49% 82% 137% 71% 71%
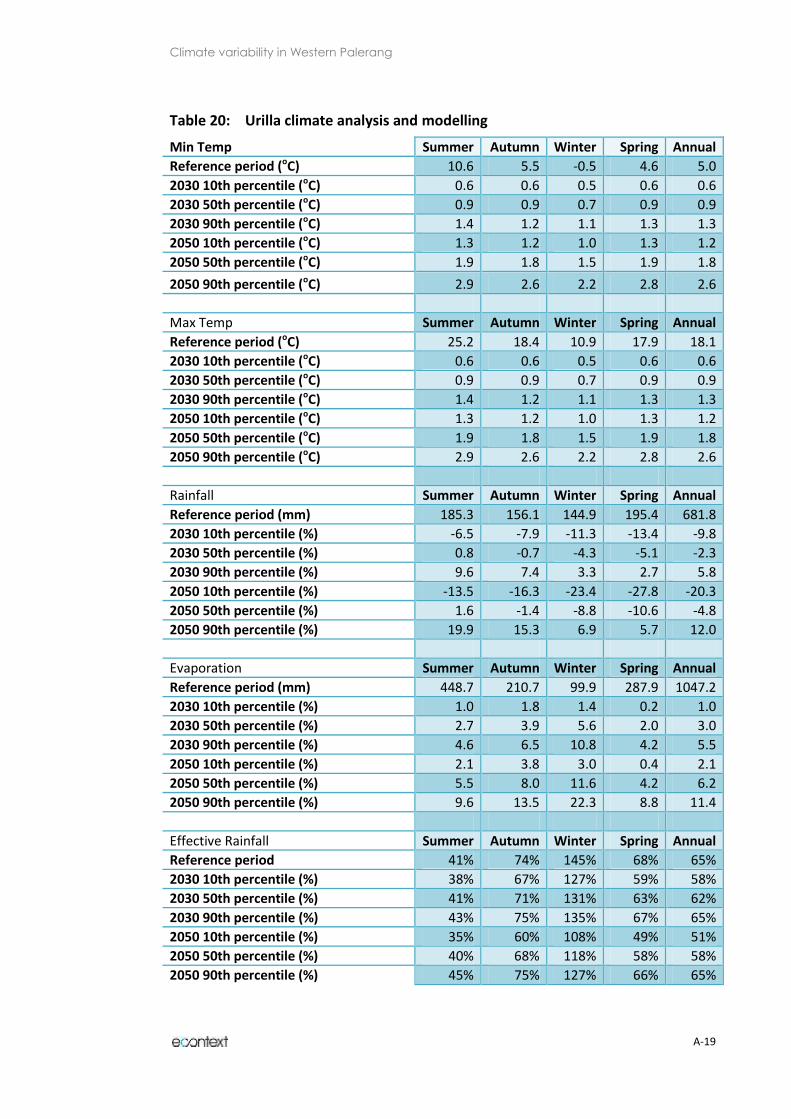
Climate variability in Western Palerang
A-19
Table 20: Urilla climate analysis and modelling
Min Temp Summer Autumn Winter Spring Annual
Reference period (oC) 10.6 5.5 -0.5 4.6 5.0
2030 10th percentile (oC) 0.6 0.6 0.5 0.6 0.6
2030 50th percentile (oC) 0.9 0.9 0.7 0.9 0.9
2030 90th percentile (oC) 1.4 1.2 1.1 1.3 1.3
2050 10th percentile (oC) 1.3 1.2 1.0 1.3 1.2
2050 50th percentile (oC) 1.9 1.8 1.5 1.9 1.8
2050 90th percentile (oC) 2.9 2.6 2.2 2.8 2.6
Max Temp Summer Autumn Winter Spring Annual
Reference period (oC) 25.2 18.4 10.9 17.9 18.1
2030 10th percentile (oC) 0.6 0.6 0.5 0.6 0.6
2030 50th percentile (oC) 0.9 0.9 0.7 0.9 0.9
2030 90th percentile (oC) 1.4 1.2 1.1 1.3 1.3
2050 10th percentile (oC) 1.3 1.2 1.0 1.3 1.2
2050 50th percentile (oC) 1.9 1.8 1.5 1.9 1.8
2050 90th percentile (oC) 2.9 2.6 2.2 2.8 2.6
Rainfall Summer Autumn Winter Spring Annual
Reference period (mm) 185.3 156.1 144.9 195.4 681.8
2030 10th percentile (%) -6.5 -7.9 -11.3 -13.4 -9.8
2030 50th percentile (%) 0.8 -0.7 -4.3 -5.1 -2.3
2030 90th percentile (%) 9.6 7.4 3.3 2.7 5.8
2050 10th percentile (%) -13.5 -16.3 -23.4 -27.8 -20.3
2050 50th percentile (%) 1.6 -1.4 -8.8 -10.6 -4.8
2050 90th percentile (%) 19.9 15.3 6.9 5.7 12.0
Evaporation Summer Autumn Winter Spring Annual
Reference period (mm) 448.7 210.7 99.9 287.9 1047.2
2030 10th percentile (%) 1.0 1.8 1.4 0.2 1.0
2030 50th percentile (%) 2.7 3.9 5.6 2.0 3.0
2030 90th percentile (%) 4.6 6.5 10.8 4.2 5.5
2050 10th percentile (%) 2.1 3.8 3.0 0.4 2.1
2050 50th percentile (%) 5.5 8.0 11.6 4.2 6.2
2050 90th percentile (%) 9.6 13.5 22.3 8.8 11.4
Effective Rainfall Summer Autumn Winter Spring Annual
Reference period 41% 74% 145% 68% 65%
2030 10th percentile (%) 38% 67% 127% 59% 58%
2030 50th percentile (%) 41% 71% 131% 63% 62%
2030 90th percentile (%) 43% 75% 135% 67% 65%
2050 10th percentile (%) 35% 60% 108% 49% 51%
2050 50th percentile (%) 40% 68% 118% 58% 58%
2050 90th percentile (%) 45% 75% 127% 66% 65%
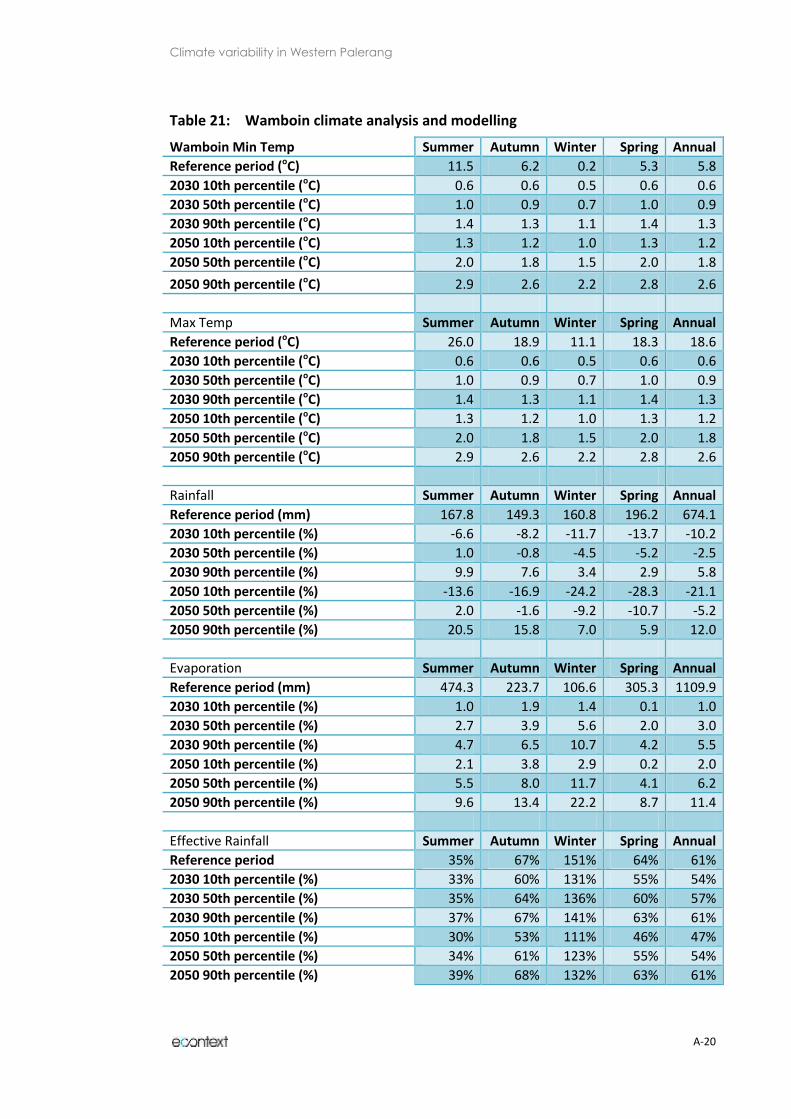
Climate variability in Western Palerang
A-20
Table 21: Wamboin climate analysis and modelling
Wamboin Min Temp Summer Autumn Winter Spring Annual
Reference period (oC) 11.5 6.2 0.2 5.3 5.8
2030 10th percentile (oC) 0.6 0.6 0.5 0.6 0.6
2030 50th percentile (oC) 1.0 0.9 0.7 1.0 0.9
2030 90th percentile (oC) 1.4 1.3 1.1 1.4 1.3
2050 10th percentile (oC) 1.3 1.2 1.0 1.3 1.2
2050 50th percentile (oC) 2.0 1.8 1.5 2.0 1.8
2050 90th percentile (oC) 2.9 2.6 2.2 2.8 2.6
Max Temp Summer Autumn Winter Spring Annual
Reference period (oC) 26.0 18.9 11.1 18.3 18.6
2030 10th percentile (oC) 0.6 0.6 0.5 0.6 0.6
2030 50th percentile (oC) 1.0 0.9 0.7 1.0 0.9
2030 90th percentile (oC) 1.4 1.3 1.1 1.4 1.3
2050 10th percentile (oC) 1.3 1.2 1.0 1.3 1.2
2050 50th percentile (oC) 2.0 1.8 1.5 2.0 1.8
2050 90th percentile (oC) 2.9 2.6 2.2 2.8 2.6
Rainfall Summer Autumn Winter Spring Annual
Reference period (mm) 167.8 149.3 160.8 196.2 674.1
2030 10th percentile (%) -6.6 -8.2 -11.7 -13.7 -10.2
2030 50th percentile (%) 1.0 -0.8 -4.5 -5.2 -2.5
2030 90th percentile (%) 9.9 7.6 3.4 2.9 5.8
2050 10th percentile (%) -13.6 -16.9 -24.2 -28.3 -21.1
2050 50th percentile (%) 2.0 -1.6 -9.2 -10.7 -5.2
2050 90th percentile (%) 20.5 15.8 7.0 5.9 12.0
Evaporation Summer Autumn Winter Spring Annual
Reference period (mm) 474.3 223.7 106.6 305.3 1109.9
2030 10th percentile (%) 1.0 1.9 1.4 0.1 1.0
2030 50th percentile (%) 2.7 3.9 5.6 2.0 3.0
2030 90th percentile (%) 4.7 6.5 10.7 4.2 5.5
2050 10th percentile (%) 2.1 3.8 2.9 0.2 2.0
2050 50th percentile (%) 5.5 8.0 11.7 4.1 6.2
2050 90th percentile (%) 9.6 13.4 22.2 8.7 11.4
Effective Rainfall Summer Autumn Winter Spring Annual
Reference period 35% 67% 151% 64% 61%
2030 10th percentile (%) 33% 60% 131% 55% 54%
2030 50th percentile (%) 35% 64% 136% 60% 57%
2030 90th percentile (%) 37% 67% 141% 63% 61%
2050 10th percentile (%) 30% 53% 111% 46% 47%
2050 50th percentile (%) 34% 61% 123% 55% 54%
2050 90th percentile (%) 39% 68% 132% 63% 61%
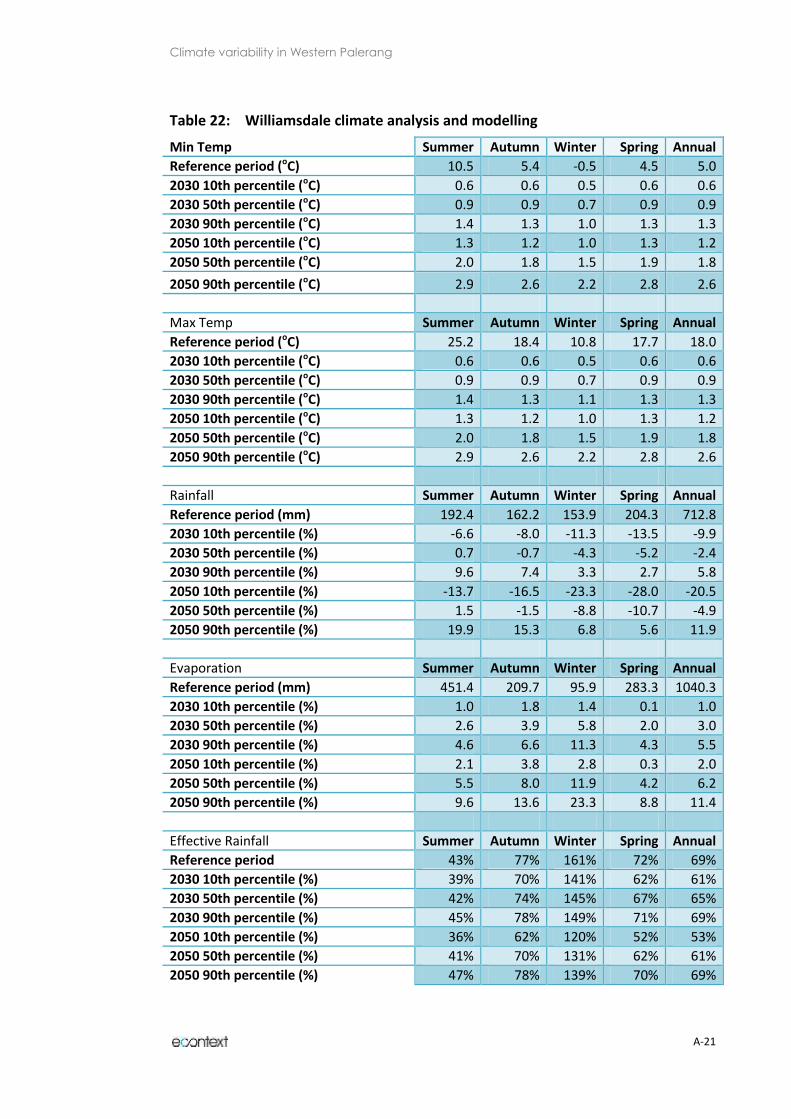
Climate variability in Western Palerang
A-21
Table 22: Williamsdale climate analysis and modelling
Min Temp Summer Autumn Winter Spring Annual
Reference period (oC) 10.5 5.4 -0.5 4.5 5.0
2030 10th percentile (oC) 0.6 0.6 0.5 0.6 0.6
2030 50th percentile (oC) 0.9 0.9 0.7 0.9 0.9
2030 90th percentile (oC) 1.4 1.3 1.0 1.3 1.3
2050 10th percentile (oC) 1.3 1.2 1.0 1.3 1.2
2050 50th percentile (oC) 2.0 1.8 1.5 1.9 1.8
2050 90th percentile (oC) 2.9 2.6 2.2 2.8 2.6
Max Temp Summer Autumn Winter Spring Annual
Reference period (oC) 25.2 18.4 10.8 17.7 18.0
2030 10th percentile (oC) 0.6 0.6 0.5 0.6 0.6
2030 50th percentile (oC) 0.9 0.9 0.7 0.9 0.9
2030 90th percentile (oC) 1.4 1.3 1.1 1.3 1.3
2050 10th percentile (oC) 1.3 1.2 1.0 1.3 1.2
2050 50th percentile (oC) 2.0 1.8 1.5 1.9 1.8
2050 90th percentile (oC) 2.9 2.6 2.2 2.8 2.6
Rainfall Summer Autumn Winter Spring Annual
Reference period (mm) 192.4 162.2 153.9 204.3 712.8
2030 10th percentile (%) -6.6 -8.0 -11.3 -13.5 -9.9
2030 50th percentile (%) 0.7 -0.7 -4.3 -5.2 -2.4
2030 90th percentile (%) 9.6 7.4 3.3 2.7 5.8
2050 10th percentile (%) -13.7 -16.5 -23.3 -28.0 -20.5
2050 50th percentile (%) 1.5 -1.5 -8.8 -10.7 -4.9
2050 90th percentile (%) 19.9 15.3 6.8 5.6 11.9
Evaporation Summer Autumn Winter Spring Annual
Reference period (mm) 451.4 209.7 95.9 283.3 1040.3
2030 10th percentile (%) 1.0 1.8 1.4 0.1 1.0
2030 50th percentile (%) 2.6 3.9 5.8 2.0 3.0
2030 90th percentile (%) 4.6 6.6 11.3 4.3 5.5
2050 10th percentile (%) 2.1 3.8 2.8 0.3 2.0
2050 50th percentile (%) 5.5 8.0 11.9 4.2 6.2
2050 90th percentile (%) 9.6 13.6 23.3 8.8 11.4
Effective Rainfall Summer Autumn Winter Spring Annual
Reference period 43% 77% 161% 72% 69%
2030 10th percentile (%) 39% 70% 141% 62% 61%
2030 50th percentile (%) 42% 74% 145% 67% 65%
2030 90th percentile (%) 45% 78% 149% 71% 69%
2050 10th percentile (%) 36% 62% 120% 52% 53%
2050 50th percentile (%) 41% 70% 131% 62% 61%
2050 90th percentile (%) 47% 78% 139% 70% 69%
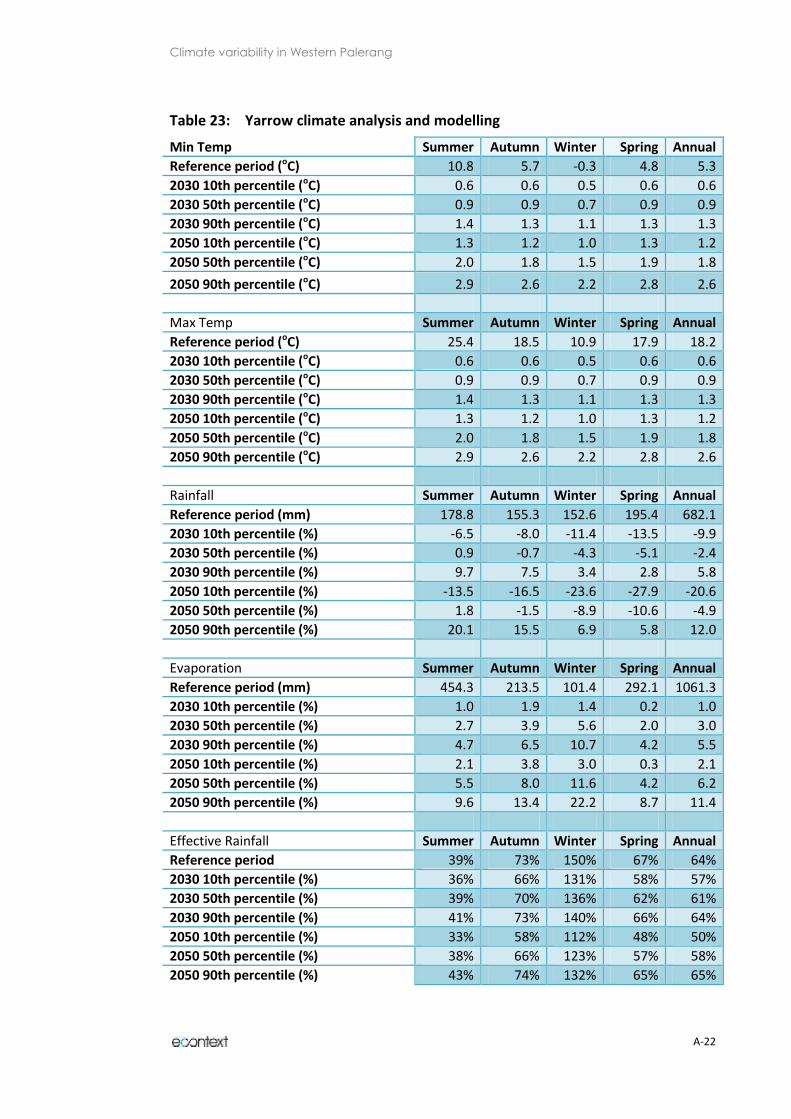
Climate variability in Western Palerang
A-22
Table 23: Yarrow climate analysis and modelling
Min Temp Summer Autumn Winter Spring Annual
Reference period (oC) 10.8 5.7 -0.3 4.8 5.3
2030 10th percentile (oC) 0.6 0.6 0.5 0.6 0.6
2030 50th percentile (oC) 0.9 0.9 0.7 0.9 0.9
2030 90th percentile (oC) 1.4 1.3 1.1 1.3 1.3
2050 10th percentile (oC) 1.3 1.2 1.0 1.3 1.2
2050 50th percentile (oC) 2.0 1.8 1.5 1.9 1.8
2050 90th percentile (oC) 2.9 2.6 2.2 2.8 2.6
Max Temp Summer Autumn Winter Spring Annual
Reference period (oC) 25.4 18.5 10.9 17.9 18.2
2030 10th percentile (oC) 0.6 0.6 0.5 0.6 0.6
2030 50th percentile (oC) 0.9 0.9 0.7 0.9 0.9
2030 90th percentile (oC) 1.4 1.3 1.1 1.3 1.3
2050 10th percentile (oC) 1.3 1.2 1.0 1.3 1.2
2050 50th percentile (oC) 2.0 1.8 1.5 1.9 1.8
2050 90th percentile (oC) 2.9 2.6 2.2 2.8 2.6
Rainfall Summer Autumn Winter Spring Annual
Reference period (mm) 178.8 155.3 152.6 195.4 682.1
2030 10th percentile (%) -6.5 -8.0 -11.4 -13.5 -9.9
2030 50th percentile (%) 0.9 -0.7 -4.3 -5.1 -2.4
2030 90th percentile (%) 9.7 7.5 3.4 2.8 5.8
2050 10th percentile (%) -13.5 -16.5 -23.6 -27.9 -20.6
2050 50th percentile (%) 1.8 -1.5 -8.9 -10.6 -4.9
2050 90th percentile (%) 20.1 15.5 6.9 5.8 12.0
Evaporation Summer Autumn Winter Spring Annual
Reference period (mm) 454.3 213.5 101.4 292.1 1061.3
2030 10th percentile (%) 1.0 1.9 1.4 0.2 1.0
2030 50th percentile (%) 2.7 3.9 5.6 2.0 3.0
2030 90th percentile (%) 4.7 6.5 10.7 4.2 5.5
2050 10th percentile (%) 2.1 3.8 3.0 0.3 2.1
2050 50th percentile (%) 5.5 8.0 11.6 4.2 6.2
2050 90th percentile (%) 9.6 13.4 22.2 8.7 11.4
Effective Rainfall Summer Autumn Winter Spring Annual
Reference period 39% 73% 150% 67% 64%
2030 10th percentile (%) 36% 66% 131% 58% 57%
2030 50th percentile (%) 39% 70% 136% 62% 61%
2030 90th percentile (%) 41% 73% 140% 66% 64%
2050 10th percentile (%) 33% 58% 112% 48% 50%
2050 50th percentile (%) 38% 66% 123% 57% 58%
2050 90th percentile (%) 43% 74% 132% 65% 65%
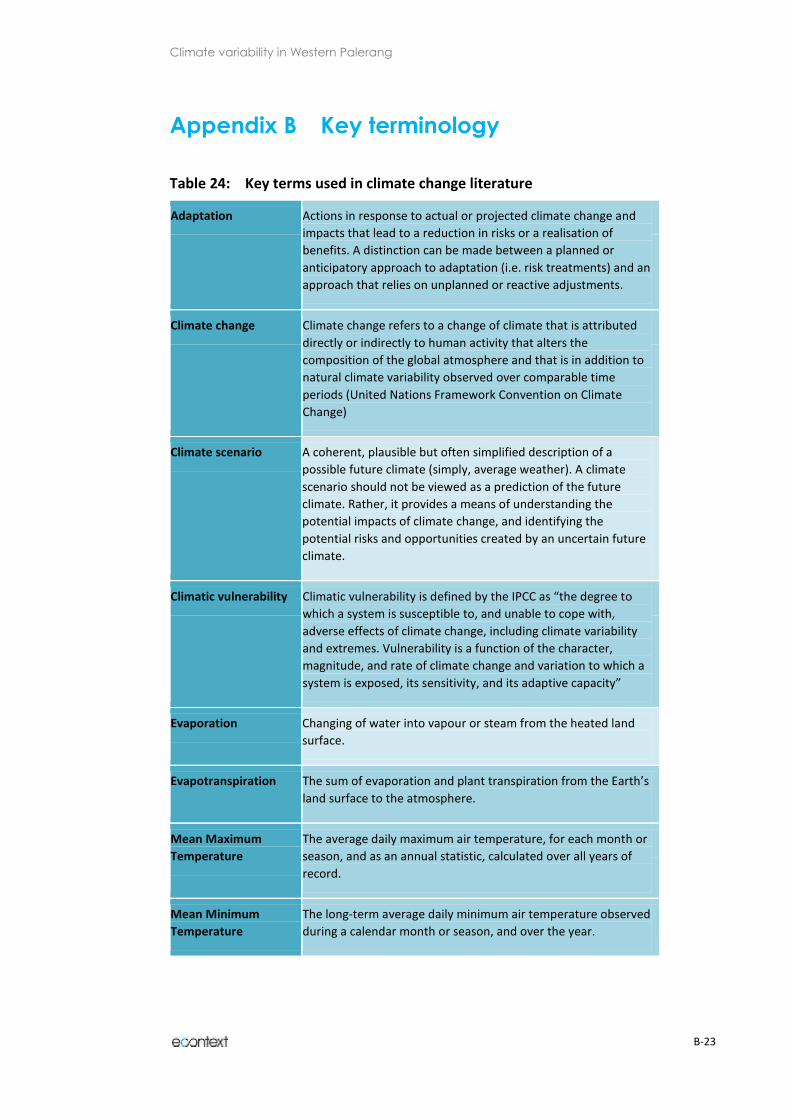
Climate variability in Western Palerang
B-23
Appendix B Key terminology
Table 24: Key terms used in climate change literature
Adaptation Actions in response to actual or projected climate change and
impacts that lead to a reduction in risks or a realisation of
benefits. A distinction can be made between a planned or
anticipatory approach to adaptation (i.e. risk treatments) and an
approach that relies on unplanned or reactive adjustments.
Climate change Climate change refers to a change of climate that is attributed
directly or indirectly to human activity that alters the
composition of the global atmosphere and that is in addition to
natural climate variability observed over comparable time
periods (United Nations Framework Convention on Climate
Change)
Climate scenario A coherent, plausible but often simplified description of a
possible future climate (simply, average weather). A climate
scenario should not be viewed as a prediction of the future
climate. Rather, it provides a means of understanding the
potential impacts of climate change, and identifying the
potential risks and opportunities created by an uncertain future
climate.
Climatic vulnerability Climatic vulnerability is defined by the IPCC as “the degree to
which a system is susceptible to, and unable to cope with,
adverse effects of climate change, including climate variability
and extremes. Vulnerability is a function of the character,
magnitude, and rate of climate change and variation to which a
system is exposed, its sensitivity, and its adaptive capacity”
Evaporation Changing of water into vapour or steam from the heated land
surface.
Evapotranspiration The sum of evaporation and plant transpiration from the Earth’s
land surface to the atmosphere.
Mean Maximum
Temperature
The average daily maximum air temperature, for each month or
season, and as an annual statistic, calculated over all years of
record.
Mean Minimum
Temperature
The long-term average daily minimum air temperature observed
during a calendar month or season, and over the year.
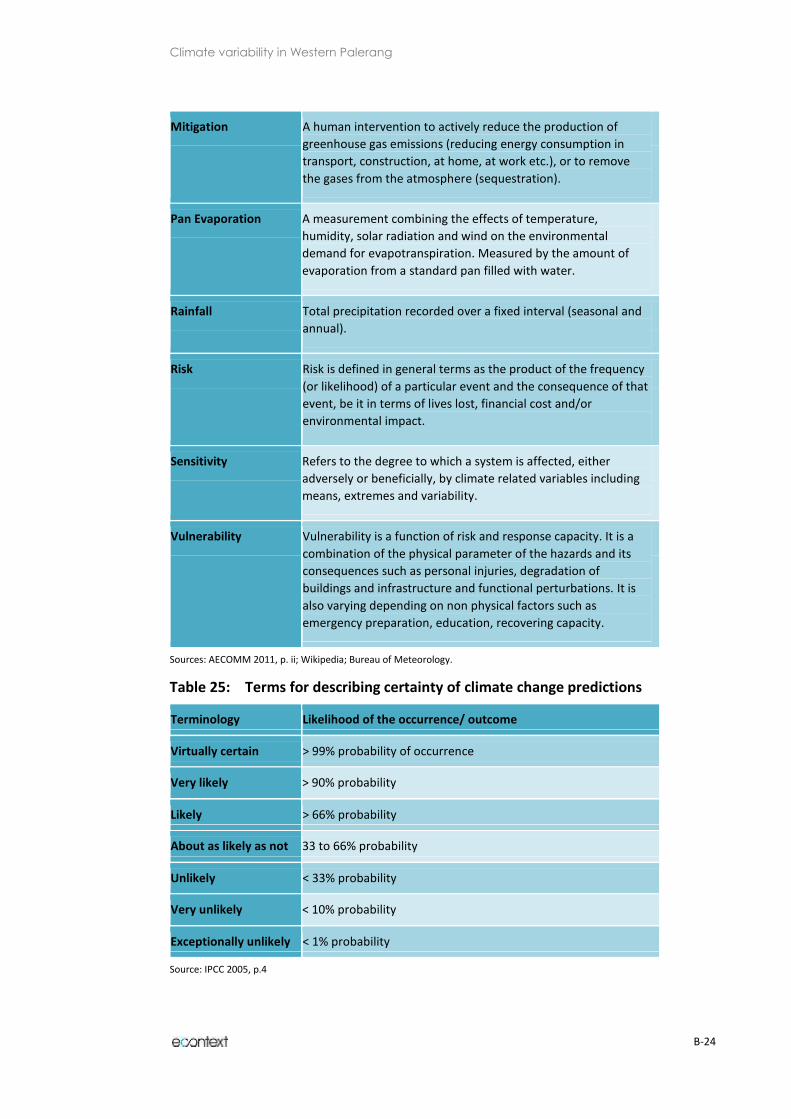
Climate variability in Western Palerang
B-24
Mitigation A human intervention to actively reduce the production of
greenhouse gas emissions (reducing energy consumption in
transport, construction, at home, at work etc.), or to remove
the gases from the atmosphere (sequestration).
Pan Evaporation A measurement combining the effects of temperature,
humidity, solar radiation and wind on the environmental
demand for evapotranspiration. Measured by the amount of
evaporation from a standard pan filled with water.
Rainfall Total precipitation recorded over a fixed interval (seasonal and
annual).
Risk Risk is defined in general terms as the product of the frequency
(or likelihood) of a particular event and the consequence of that
event, be it in terms of lives lost, financial cost and/or
environmental impact.
Sensitivity Refers to the degree to which a system is affected, either
adversely or beneficially, by climate related variables including
means, extremes and variability.
Vulnerability Vulnerability is a function of risk and response capacity. It is a
combination of the physical parameter of the hazards and its
consequences such as personal injuries, degradation of
buildings and infrastructure and functional perturbations. It is
also varying depending on non physical factors such as
emergency preparation, education, recovering capacity.
Sources: AECOMM 2011, p. ii; Wikipedia; Bureau of Meteorology.
Table 25: Terms for describing certainty of climate change predictions
Terminology Likelihood of the occurrence/ outcome
Virtually certain > 99% probability of occurrence
Very likely > 90% probability
Likely > 66% probability
About as likely as not 33 to 66% probability
Unlikely < 33% probability
Very unlikely < 10% probability
Exceptionally unlikely < 1% probability
Source: IPCC 2005, p.4
Copyright © 2022 FDOKUMEN