Climate variability and incidences on agricultural production in the municipalities of Dassa-Zoume...
10
Roméo et al. Page 141 RESEARCH PAPER OPEN ACCESS Climate variability and incidences on agricultural production in the municipalities of Dassa-Zoume and Glazoue in the center of Benin Kadjegbin Roméo 1* , Egbetowokpo Kokou 2 , Guedenon Patient 3,4 , Houssou Christophe 2 . 1 Urban and Regional Dynamics Studies Laboratory, University of Abomey-Calavi, Benin 2 Pierre Pagney ' Climate, Water, Ecosystem and Development ' Laboratory (LACEEDE), Benin 3 Environmental Health and Toxicology Laboratory, Interfaculty Centre of Training and Research in Environment for Sustainable Development (CIFRED), Benin 4 School of Health sciences, Houdegbe North American University of Benin, Benin Article published on July 26, 2014 Key words: Climate variabilities, incidences, agricultural production, Municipalities of Dassa-Zoumé and Glazoué. Abstract The present work studies climate variabilities and theirs incidences on the agricultural production in Municipalities of Dassa-Zoumé and Glazoué. It is based on the analysis of thermal pluviometric data of the insolation, and the climate balance assessment, in order to estimate the climate characteristics on the agricultural production in Municipalities of Dassa-Zoumé and Glazoué. The methodological approach consisted in the calculation of climate parameters. The results revealed a very large variability of the rainfall from one station to another and that this significant variation of the precipitation represented a disruptive factor for the agricultural activities. The monthly average values of the calculated temperatures showed a variation between 25 and 30.5°C with effects on respiration and photosynthesis of plants therefore triggering a regression of the activities of agricultural production. * Corresponding Author: Kadjegbin Roméo [email protected] International Journal of Agronomy and Agricultural Research (IJAAR) ISSN: 2223-7054 (Print) 2225-3610 (Online) http://www.innspub.net Vol. 5, No. 1, p. 141-150, 2014
-
Upload
independent -
Category
Documents
-
view
3 -
download
0
Transcript of Climate variability and incidences on agricultural production in the municipalities of Dassa-Zoume...
Roméo et al. Page 141
RESEARCH PAPER OPEN ACCESS
Climate variability and incidences on agricultural production in
the municipalities of Dassa-Zoume and Glazoue in the center of
Benin
Kadjegbin Roméo1*, Egbetowokpo Kokou2, Guedenon Patient3,4, Houssou Christophe2
.
1Urban and Regional Dynamics Studies Laboratory, University of Abomey-Calavi, Benin
2Pierre Pagney ' Climate, Water, Ecosystem and Development ' Laboratory (LACEEDE), Benin
3Environmental Health and Toxicology Laboratory, Interfaculty Centre of Training and Research in
Environment for Sustainable Development (CIFRED), Benin
4School of Health sciences, Houdegbe North American University of Benin, Benin
Article published on July 26, 2014 Key words: Climate variabilities, incidences, agricultural production, Municipalities of Dassa-Zoumé and
Glazoué.
Abstract The present work studies climate variabilities and theirs incidences on the agricultural production in
Municipalities of Dassa-Zoumé and Glazoué. It is based on the analysis of thermal pluviometric data of the
insolation, and the climate balance assessment, in order to estimate the climate characteristics on the agricultural
production in Municipalities of Dassa-Zoumé and Glazoué. The methodological approach consisted in the
calculation of climate parameters. The results revealed a very large variability of the rainfall from one station to
another and that this significant variation of the precipitation represented a disruptive factor for the agricultural
activities. The monthly average values of the calculated temperatures showed a variation between 25 and 30.5°C
with effects on respiration and photosynthesis of plants therefore triggering a regression of the activities of
agricultural production.
* Corresponding Author: Kadjegbin Roméo [email protected]
International Journal of Agronomy and Agricultural Research (IJAAR) ISSN: 2223-7054 (Print) 2225-3610 (Online)
http://www.innspub.net Vol. 5, No. 1, p. 141-150, 2014
Roméo et al. Page 142
Introduction
Agriculture represents the basis of the economy in
Benin (Puttevils, 1999). Therefore, it plays an
essential role in the process of economic and social
development (FAO, 2005). Still, with the climate
hazards which have been impacting the farming
sector since the 1970s (Vignigbé, 1992), there is a
good reason to be interested in their consequences on
Beninese economy and mainly on food supply for the
rural populations.
In Benin, the reduction in rainfalls coupled with the
thermal reheating, lead to a degradation of the
ecological environment and result in negative impacts
on agricultural production (Boko, 1988; Afouda,
1990; Houndénou, 1999).
Agbossou and Akponikpe (1999) join in this context
and assert that from 1960 till 1992, serious
pluviometric shortages were recorded and resulting in
harmful incidences on the agricultural yield of the
main crops. Thus, the access to food supplies becomes
one of the major concerns highlighted in the new
orientations of Beninese agriculture.
Municipalities of Dassa-Zoumé and Glazoué,
although being part of Collines Department
considered to be an agricultural center - because of its
available lands favourable to the culture of foodstuffs
and although it welcomes the largest number of
agricultural populations coming from overpopulated
regions or those from less fertile soils – is confronted
with problems of climate hazards which have
certainly impacts on agricultural production. The aim
of this research is to analyze the climate parameters
and to assess their incidences on the agricultural
production.
Materials and methods
Data collected
The data collected within the framework of the
present investigation are pluviometric data from
Dassa-Zoumé and Glazoué between 1950 and 2010 as
well as the thermal data (minimal, maximal and
average temperatures), of insolation and winds of
Savè between 1965 and 2010 in order to estimate the
climate characteristics on agricultural production in
the Municipalities of Dassa-Zoumé and Glazoué.
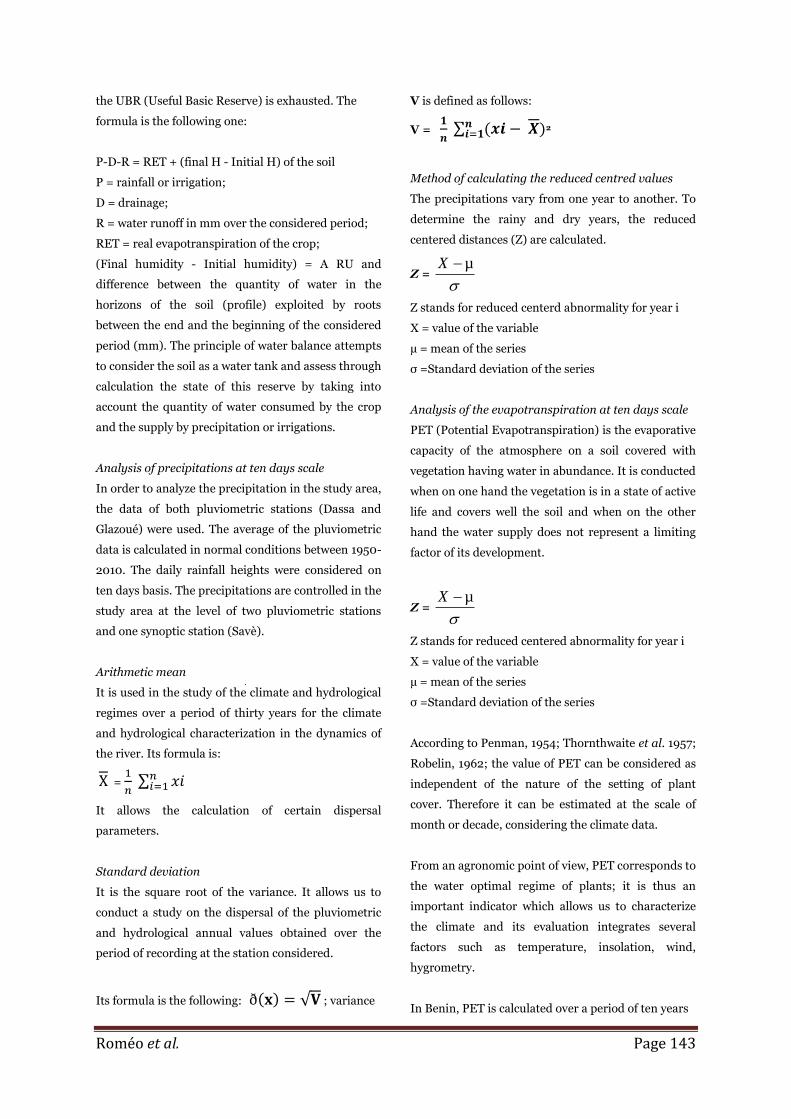
Fig. 1. Geographical location of the Municipalities of
Dassa-Zoumé and Glazoué.
Data processing methods
Soil Water balance
In a given region, a good knowledge of the climate,
soils and water required for crops allows us to
estimate the food supply issues which can arise in
certain periods. Assessing the water content balance
means comparing the quantity of water necessary for
the crops with the one that is available in the soil.
These two values vary constantly over time according
to the stage of the crop and the climate conditions
(rainfall and potential evapotranspiration) that allow
to figure out the inputs and outputs of the water
balance. There are two types of balance: the real
balance and the potential balance. Actually, thanks to
its root system, the plant can prospect the soil and
draw from the useful water reserve of the soil. The
water balance thus consists in estimating the store of
water in the soil and its changes during the cycle of
the crop. It is useful to better know the environment
and the relations climate-soil-plant which take place
during the cycle of the crop. They allow us to better
know the amount of water to be used, the right time
of the supply and thus to make the diagnosis of the
functioning of an irrigation system. During the
vegetative cycle of a plant, when the pluviometry is
lower than the maximal evapotranspiration, the plant
appeals for water contained in the useful store of the
soil to survive. If this period goes on, there is a
moment when the useful store is exhausted. This
results in reduction of its photosynthesis as soon as
Roméo et al. Page 143
the UBR (Useful Basic Reserve) is exhausted. The
formula is the following one:
P-D-R = RET + (final H - Initial H) of the soil
P = rainfall or irrigation;
D = drainage;
R = water runoff in mm over the considered period;
RET = real evapotranspiration of the crop;
(Final humidity - Initial humidity) = A RU and
difference between the quantity of water in the
horizons of the soil (profile) exploited by roots
between the end and the beginning of the considered
period (mm). The principle of water balance attempts
to consider the soil as a water tank and assess through
calculation the state of this reserve by taking into
account the quantity of water consumed by the crop
and the supply by precipitation or irrigations.
Analysis of precipitations at ten days scale
In order to analyze the precipitation in the study area,
the data of both pluviometric stations (Dassa and
Glazoué) were used. The average of the pluviometric
data is calculated in normal conditions between 1950-
2010. The daily rainfall heights were considered on
ten days basis. The precipitations are controlled in the
study area at the level of two pluviometric stations
and one synoptic station (Savè).
Arithmetic mean
It is used in the study of the climate and hydrological
regimes over a period of thirty years for the climate
and hydrological characterization in the dynamics of
the river. Its formula is:
=
It allows the calculation of certain dispersal
parameters.
Standard deviation
It is the square root of the variance. It allows us to
conduct a study on the dispersal of the pluviometric
and hydrological annual values obtained over the
period of recording at the station considered.
Its formula is the following: ; variance
V is defined as follows:
V =
2
Method of calculating the reduced centred values
The precipitations vary from one year to another. To
determine the rainy and dry years, the reduced
centered distances (Z) are calculated.
Z =
µX
Z stands for reduced centerd abnormality for year i
X = value of the variable
µ = mean of the series
σ =Standard deviation of the series
Analysis of the evapotranspiration at ten days scale
PET (Potential Evapotranspiration) is the evaporative
capacity of the atmosphere on a soil covered with
vegetation having water in abundance. It is conducted
when on one hand the vegetation is in a state of active
life and covers well the soil and when on the other
hand the water supply does not represent a limiting
factor of its development.
Z =
µX
Z stands for reduced centered abnormality for year i
X = value of the variable
µ = mean of the series
σ =Standard deviation of the series
According to Penman, 1954; Thornthwaite et al. 1957;
Robelin, 1962; the value of PET can be considered as
independent of the nature of the setting of plant
cover. Therefore it can be estimated at the scale of
month or decade, considering the climate data.
From an agronomic point of view, PET corresponds to
the water optimal regime of plants; it is thus an
important indicator which allows us to characterize
the climate and its evaluation integrates several
factors such as temperature, insolation, wind,
hygrometry.
In Benin, PET is calculated over a period of ten years
Roméo et al. Page 144
on six synoptic stations. The values of PET used
within the framework were averages calculated
between 1950-2010 on four synoptic stations.
Calculation of water balance
The calculated water balance is global; it takes into
account only the value of precipitations minus those
of PET over a decadal period. At Savè, the water
balance is positive starting from the 16th decade till
28th decade, and negative from the 29th decade of
year (x) until 11th decade of year (x+1). At Glazoué,
the analysis of the results of the calculation of the
water balance assessment shows that - contrary to
Savè station which is situated upstream, the balance
assessment is positive already starting from the 13th
decade and remained positie until the 28th decade.
From the 29th decade of the year (x) to the 12th
decade of the year (x+1), the balance assessment is
negative.
Climate balance
It presents the succession of surpluses and water
shortages. Thus the climate becomes dry when the
precipitations are lower than the potential
evapotranspiration, and when there is no reserve of
available water (Hufty, 1976, quoted by Vissin, 2007).
PET allows us to express the quantity of maximal
water susceptible to be evaporated by a plant cover
well spread over the soil, in active phase of growth
and watered in an optimal manner (Trochain et al.,
1980 quoted by Arouna, 2012).
Climate balance assessment represents in particular
the rhythm of the surpluses or water shortages. It
expresses the difference between the sum of the
pluviometry and that of the potential
evapotranspiration (PET) and when it is positive it
denotes the disposable surplus for the refill in
groundwater and for the flow (Sutcliffe and Piper,
1986 quoted by Vissin, 2001, Houndénou, 1999). It
also allowed us to highlight the evolution of the
climate through the rainy contributions and the losses
by evaporation. PET is defined as the climate
requirement in steam.
- If P -PET > 0, then the balance assessment is
surplus;
- If P – ETP < 0, then the balance assessment has a
deficit;
- If P - ETP = 0, then the balance assessment is at fair
value.
The climate balance assessment is often used, in
particular in a regional study of the hydroelectric
resources in West Africa (Thomson, 1985; Olivry,
1993; Le Barbé et al. 1993) or still in a study of the
hydrological balance assessment in Guinea, in Togo-
Benin (Sucliffe and Piper, 1986) and in Benin (Vissin,
2007). It is calculated from the average values of P
and PET of the whole dock between 1965 and 2010.
Geographical location of the study area
The study area comprising Municipalities of Dassa-
Zoumé and Glazoué (figure 1) is located between 1°41
' and 2°39 ' 38 " of east longitude and between 7°27 '
and 8°31 ' of north latitude. It is bordered in the
North by Municipality of Bassila in department of
Donga, in the South by Municipalities of Djidja, Covê
and Zagnanado in department of Zou, in the East by
Municipalities of Savè and Ouèssè, and in the West by
Municipalities of Bantè and Savalou, with a surface
area of 3461 km2 and a population of 197817
inhabitants (INSAE, 2002).
Results and discussion
Climate characteristics
Municipalities of Dassa-Zoumé and Glazoué present a
climate, transitional between the subequatorial in the
South and the Sudanese in the North. In order to
assess the evolution of the precipitation, the data of
Dassa-Zoumé and Savè stations were used. Besides,
in order to estimate better the climate balance, the
used data are the ones of the meteorological station of
Savè because it is the closest in latitude of Dassa-
Zoumé and Glazoué.
Precipitations
Precipitations vary from one year to another. To
determine the rainy years and the dry years, the
Roméo et al. Page 145
reduced cantered gaps (Z) were calculated. Figures 2
and 3 present the inter-annual variations of
precipitations in Dassa-Zoumè and Glazoué between
1950 and 2010.
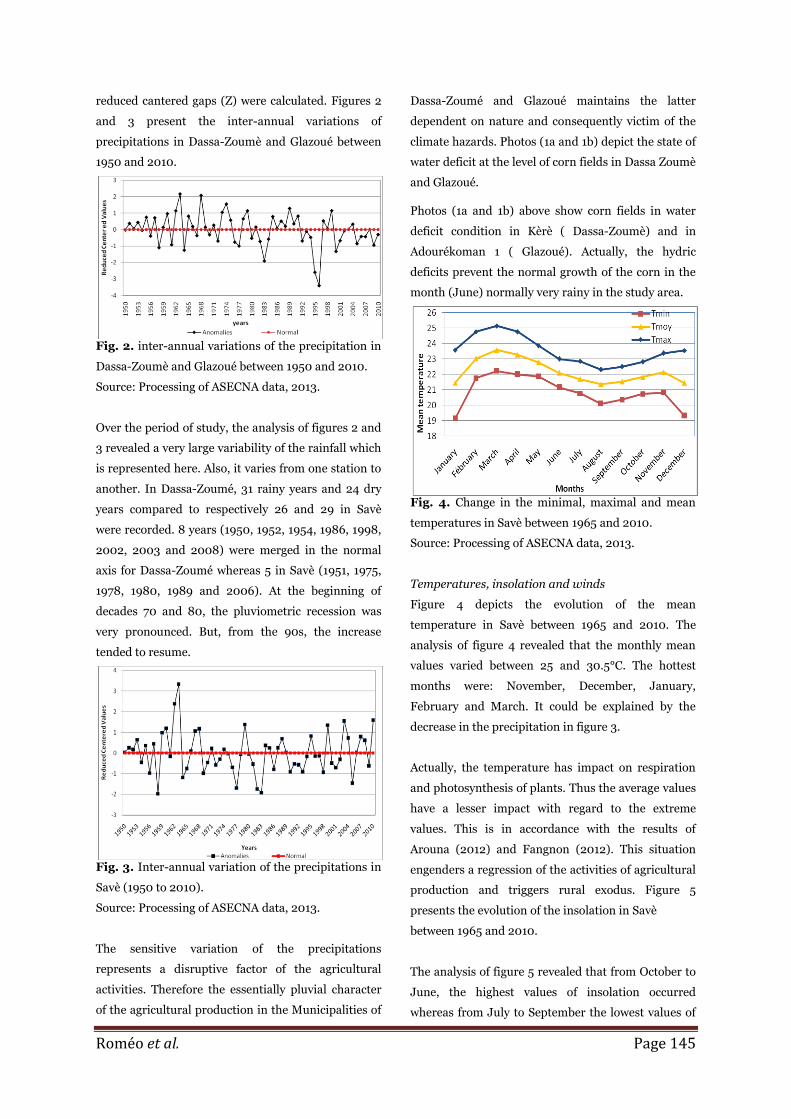
Fig. 2. inter-annual variations of the precipitation in
Dassa-Zoumè and Glazoué between 1950 and 2010.
Source: Processing of ASECNA data, 2013.
Over the period of study, the analysis of figures 2 and
3 revealed a very large variability of the rainfall which
is represented here. Also, it varies from one station to
another. In Dassa-Zoumé, 31 rainy years and 24 dry
years compared to respectively 26 and 29 in Savè
were recorded. 8 years (1950, 1952, 1954, 1986, 1998,
2002, 2003 and 2008) were merged in the normal
axis for Dassa-Zoumé whereas 5 in Savè (1951, 1975,
1978, 1980, 1989 and 2006). At the beginning of
decades 70 and 80, the pluviometric recession was
very pronounced. But, from the 90s, the increase
tended to resume.
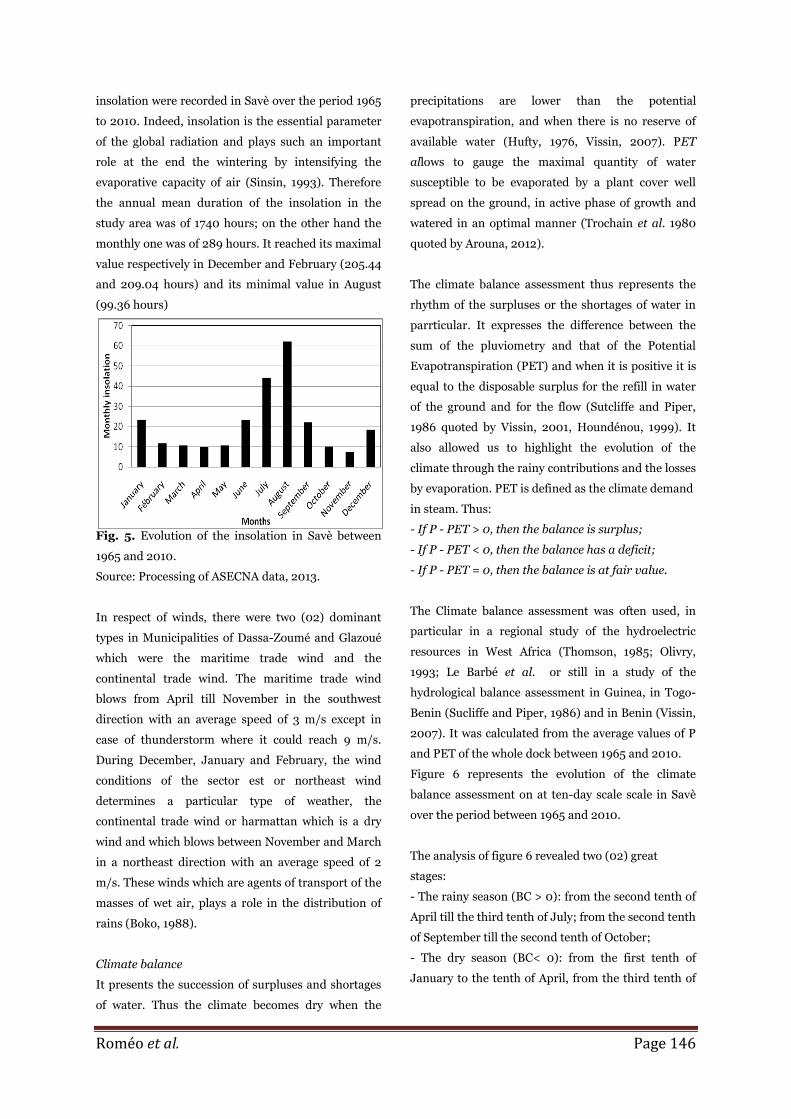
Fig. 3. Inter-annual variation of the precipitations in
Savè (1950 to 2010).
Source: Processing of ASECNA data, 2013.
The sensitive variation of the precipitations
represents a disruptive factor of the agricultural
activities. Therefore the essentially pluvial character
of the agricultural production in the Municipalities of
Dassa-Zoumé and Glazoué maintains the latter
dependent on nature and consequently victim of the
climate hazards. Photos (1a and 1b) depict the state of
water deficit at the level of corn fields in Dassa Zoumè
and Glazoué.
Photos (1a and 1b) above show corn fields in water
deficit condition in Kèrè ( Dassa-Zoumè) and in
Adourékoman 1 ( Glazoué). Actually, the hydric
deficits prevent the normal growth of the corn in the
month (June) normally very rainy in the study area.
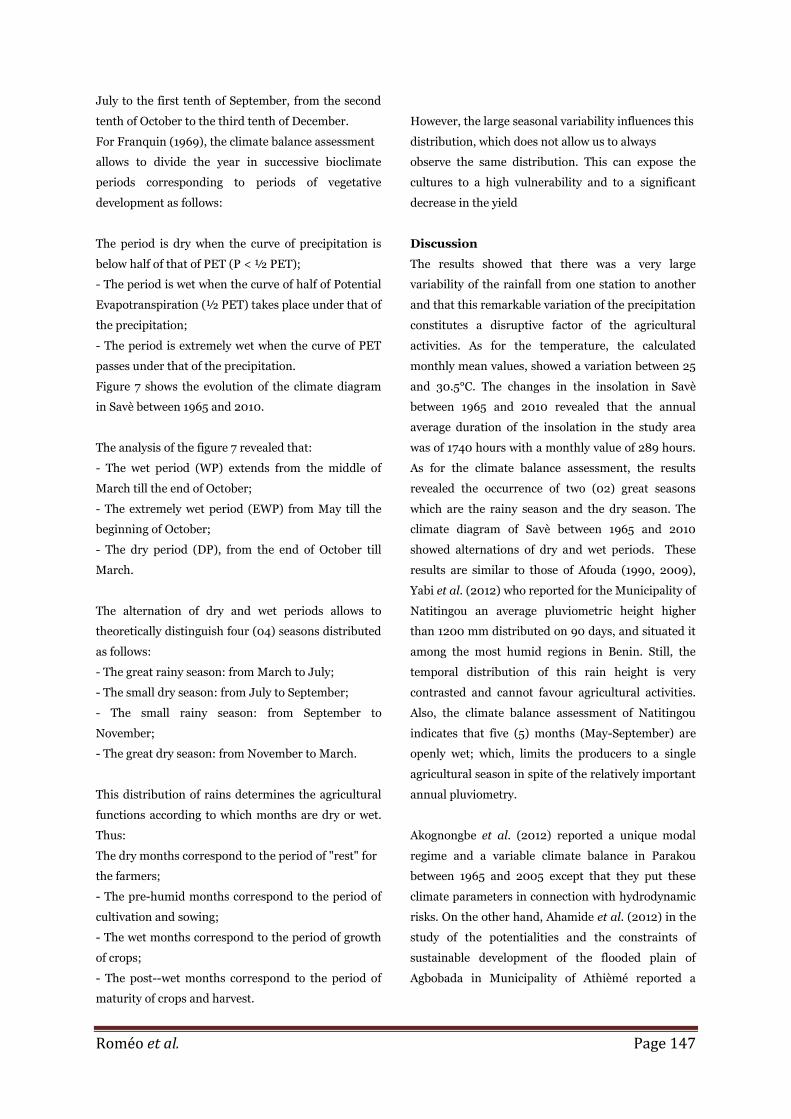
Fig. 4. Change in the minimal, maximal and mean
temperatures in Savè between 1965 and 2010.
Source: Processing of ASECNA data, 2013.
Temperatures, insolation and winds
Figure 4 depicts the evolution of the mean
temperature in Savè between 1965 and 2010. The
analysis of figure 4 revealed that the monthly mean
values varied between 25 and 30.5°C. The hottest
months were: November, December, January,
February and March. It could be explained by the
decrease in the precipitation in figure 3.
Actually, the temperature has impact on respiration
and photosynthesis of plants. Thus the average values
have a lesser impact with regard to the extreme
values. This is in accordance with the results of
Arouna (2012) and Fangnon (2012). This situation
engenders a regression of the activities of agricultural
production and triggers rural exodus. Figure 5
presents the evolution of the insolation in Savè
between 1965 and 2010.
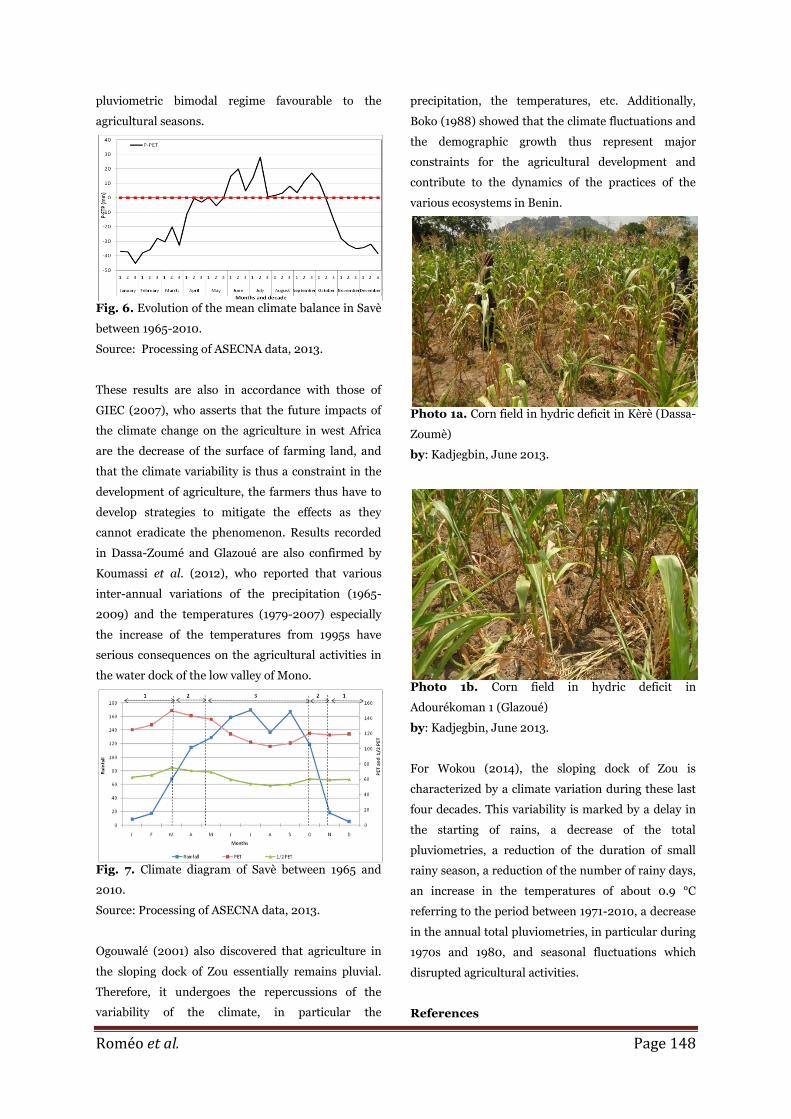
The analysis of figure 5 revealed that from October to
June, the highest values of insolation occurred
whereas from July to September the lowest values of
Roméo et al. Page 146
insolation were recorded in Savè over the period 1965
to 2010. Indeed, insolation is the essential parameter
of the global radiation and plays such an important
role at the end the wintering by intensifying the
evaporative capacity of air (Sinsin, 1993). Therefore
the annual mean duration of the insolation in the
study area was of 1740 hours; on the other hand the
monthly one was of 289 hours. It reached its maximal
value respectively in December and February (205.44
and 209.04 hours) and its minimal value in August
(99.36 hours)
Fig. 5. Evolution of the insolation in Savè between
1965 and 2010.
Source: Processing of ASECNA data, 2013.
In respect of winds, there were two (02) dominant
types in Municipalities of Dassa-Zoumé and Glazoué
which were the maritime trade wind and the
continental trade wind. The maritime trade wind
blows from April till November in the southwest
direction with an average speed of 3 m/s except in
case of thunderstorm where it could reach 9 m/s.
During December, January and February, the wind
conditions of the sector est or northeast wind
determines a particular type of weather, the
continental trade wind or harmattan which is a dry
wind and which blows between November and March
in a northeast direction with an average speed of 2
m/s. These winds which are agents of transport of the
masses of wet air, plays a role in the distribution of
rains (Boko, 1988).
Climate balance
It presents the succession of surpluses and shortages
of water. Thus the climate becomes dry when the
precipitations are lower than the potential
evapotranspiration, and when there is no reserve of
available water (Hufty, 1976, Vissin, 2007). PET
allows to gauge the maximal quantity of water
susceptible to be evaporated by a plant cover well
spread on the ground, in active phase of growth and
watered in an optimal manner (Trochain et al. 1980
quoted by Arouna, 2012).
The climate balance assessment thus represents the
rhythm of the surpluses or the shortages of water in
parrticular. It expresses the difference between the
sum of the pluviometry and that of the Potential
Evapotranspiration (PET) and when it is positive it is
equal to the disposable surplus for the refill in water
of the ground and for the flow (Sutcliffe and Piper,
1986 quoted by Vissin, 2001, Houndénou, 1999). It
also allowed us to highlight the evolution of the
climate through the rainy contributions and the losses
by evaporation. PET is defined as the climate demand
in steam. Thus:
- If P - PET > 0, then the balance is surplus;
- If P - PET < 0, then the balance has a deficit;
- If P - PET = 0, then the balance is at fair value.
The Climate balance assessment was often used, in
particular in a regional study of the hydroelectric
resources in West Africa (Thomson, 1985; Olivry,
1993; Le Barbé et al. or still in a study of the
hydrological balance assessment in Guinea, in Togo-
Benin (Sucliffe and Piper, 1986) and in Benin (Vissin,
2007). It was calculated from the average values of P
and PET of the whole dock between 1965 and 2010.
Figure 6 represents the evolution of the climate
balance assessment on at ten-day scale scale in Savè
over the period between 1965 and 2010.
The analysis of figure 6 revealed two (02) great
stages:
- The rainy season (BC > 0): from the second tenth of
April till the third tenth of July; from the second tenth
of September till the second tenth of October;
- The dry season (BC< 0): from the first tenth of
January to the tenth of April, from the third tenth of
Roméo et al. Page 147
July to the first tenth of September, from the second
tenth of October to the third tenth of December.
For Franquin (1969), the climate balance assessment
allows to divide the year in successive bioclimate
periods corresponding to periods of vegetative
development as follows:
The period is dry when the curve of precipitation is
below half of that of PET (P < ½ PET);
- The period is wet when the curve of half of Potential
Evapotranspiration (½ PET) takes place under that of
the precipitation;
- The period is extremely wet when the curve of PET
passes under that of the precipitation.
Figure 7 shows the evolution of the climate diagram
in Savè between 1965 and 2010.
The analysis of the figure 7 revealed that:
- The wet period (WP) extends from the middle of
March till the end of October;
- The extremely wet period (EWP) from May till the
beginning of October;
- The dry period (DP), from the end of October till
March.
The alternation of dry and wet periods allows to
theoretically distinguish four (04) seasons distributed
as follows:
- The great rainy season: from March to July;
- The small dry season: from July to September;
- The small rainy season: from September to
November;
- The great dry season: from November to March.
This distribution of rains determines the agricultural
functions according to which months are dry or wet.
Thus:
The dry months correspond to the period of "rest" for
the farmers;
- The pre-humid months correspond to the period of
cultivation and sowing;
- The wet months correspond to the period of growth
of crops;
- The post--wet months correspond to the period of
maturity of crops and harvest.
However, the large seasonal variability influences this
distribution, which does not allow us to always
observe the same distribution. This can expose the
cultures to a high vulnerability and to a significant
decrease in the yield
Discussion
The results showed that there was a very large
variability of the rainfall from one station to another
and that this remarkable variation of the precipitation
constitutes a disruptive factor of the agricultural
activities. As for the temperature, the calculated
monthly mean values, showed a variation between 25
and 30.5°C. The changes in the insolation in Savè
between 1965 and 2010 revealed that the annual
average duration of the insolation in the study area
was of 1740 hours with a monthly value of 289 hours.
As for the climate balance assessment, the results
revealed the occurrence of two (02) great seasons
which are the rainy season and the dry season. The
climate diagram of Savè between 1965 and 2010
showed alternations of dry and wet periods. These
results are similar to those of Afouda (1990, 2009),
Yabi et al. (2012) who reported for the Municipality of
Natitingou an average pluviometric height higher
than 1200 mm distributed on 90 days, and situated it
among the most humid regions in Benin. Still, the
temporal distribution of this rain height is very
contrasted and cannot favour agricultural activities.
Also, the climate balance assessment of Natitingou
indicates that five (5) months (May-September) are
openly wet; which, limits the producers to a single
agricultural season in spite of the relatively important
annual pluviometry.
Akognongbe et al. (2012) reported a unique modal
regime and a variable climate balance in Parakou
between 1965 and 2005 except that they put these
climate parameters in connection with hydrodynamic
risks. On the other hand, Ahamide et al. (2012) in the
study of the potentialities and the constraints of
sustainable development of the flooded plain of
Agbobada in Municipality of Athièmé reported a
Roméo et al. Page 148
pluviometric bimodal regime favourable to the
agricultural seasons.
Fig. 6. Evolution of the mean climate balance in Savè
between 1965-2010.
Source: Processing of ASECNA data, 2013.
These results are also in accordance with those of
GIEC (2007), who asserts that the future impacts of
the climate change on the agriculture in west Africa
are the decrease of the surface of farming land, and
that the climate variability is thus a constraint in the
development of agriculture, the farmers thus have to
develop strategies to mitigate the effects as they
cannot eradicate the phenomenon. Results recorded
in Dassa-Zoumé and Glazoué are also confirmed by
Koumassi et al. (2012), who reported that various
inter-annual variations of the precipitation (1965-
2009) and the temperatures (1979-2007) especially
the increase of the temperatures from 1995s have
serious consequences on the agricultural activities in
the water dock of the low valley of Mono.
Fig. 7. Climate diagram of Savè between 1965 and
2010.
Source: Processing of ASECNA data, 2013.
Ogouwalé (2001) also discovered that agriculture in
the sloping dock of Zou essentially remains pluvial.
Therefore, it undergoes the repercussions of the
variability of the climate, in particular the
precipitation, the temperatures, etc. Additionally,
Boko (1988) showed that the climate fluctuations and
the demographic growth thus represent major
constraints for the agricultural development and
contribute to the dynamics of the practices of the
various ecosystems in Benin.
Photo 1a. Corn field in hydric deficit in Kèrè (Dassa-
Zoumè)
by: Kadjegbin, June 2013.
Photo 1b. Corn field in hydric deficit in
Adourékoman 1 (Glazoué)
by: Kadjegbin, June 2013.
For Wokou (2014), the sloping dock of Zou is
characterized by a climate variation during these last
four decades. This variability is marked by a delay in
the starting of rains, a decrease of the total
pluviometries, a reduction of the duration of small
rainy season, a reduction of the number of rainy days,
an increase in the temperatures of about 0.9 °C
referring to the period between 1971-2010, a decrease
in the annual total pluviometries, in particular during
1970s and 1980, and seasonal fluctuations which
disrupted agricultural activities.
References
Roméo et al. Page 149
Boko M. 1988. Climats et communautés rurales du
Bénin : rythmes climatiques et rythmes de
développement. Thèse d'Etat. 2 tomes. Centre de
recherches en Climatologie. URA 909 CNRS.
Université de Bourgogne, Dijon, 601 p.
Fangnon B. 2012. Qualité des sols, systèmes de
production agricole et impacts environnementaux et
socio-économiques dans le Département du Couffo au
sud-ouest du Bénin. Thèse de Doctorat de
Géographie, EDP/FLASH/UAC, 308 p.
FAO. 2005. Evaluation des ressources forestières.
Rapport national du Bénin. Rome, 17 p.
Houndenou C. 1999. Variabilité climatique et
maïsiculture en milieu tropical humide : l’exemple du
Bénin,
diagnostic et modélisation. Thèse de doctorat de
climatologie. Centre de Recherches de Climatologie,
UMR 5080 CNRS, « Climatologie de l’Espace
Tropical », Université de Bourgogne, Dijon, 390 p.
GIEC. 2007. Climate Change 2007: The Physical
Science Basis. Summary for Policymakers.
Contribution of Working Group I to the Fourth
Assessment Report of the Intergovernmental Panel
on Climate Change. URL Genève, Suisse, 103 p.
Hufty A. 1976. Introduction à la climatologie. PUF,
Collection Magellan, Paris, 264 p.
INSAE. 2002. Atlas monographique des communes
du Bénin. Cotonou, Bénin, 310 p.
Koumassi DH, Houndenou C, Vissin WE.
2012. Variabilité hydroclimatique et productions
agricoles dans la basse vallée de Mono à Djanglanmé
(Commune de Grand-Popo), In revue spéciale
journées scientifiques de la FLASH, vol 2, N°3, pp7-
16.
Le Barbe L, Ale G, Millet B, Texier H, Borel Y.
1993. Monographie des ressources en eaux
superficielles de la République du Bénin. ORSTOM,
Paris, 540 p.
Ogouwale E. 2001. Vulnérabilité/Adaptation de
l'agriculture aux changements climatiques dans le
Département des Collines. Mémoire de maitrise de
Géographie.,UAC/FLASH.DGAT, 119 p.
Olivry JC. 1993. Evolution récente des régimes
hydrologiques en Afrique intertropicale. In l’eau, la
terre et les hommes, hommage à René Frécaut Ed.
Presses Universitaires de Nancy, 181-190 p.
Penman HL. 1954. Evaporation over parts of
Europe. A.I.H.S., A.G., tome 3, Rome, p. 168-176.
Puttevils F. 1999. Phytosociologie des groupements
messicoles et post culturaux du sud et du centre-
Bénin. Mémoire de fin d’études pour l’obtention du
grade d’Ingénieur Agronome, Université Libre de
Bruxelles, Belgique, 152 p.
Robelin M. 1962. Evapotranspiration réelle de
différents couverts végétaux bien alimentés ne eau et
évapotranspiration potentielle ; détermination
expérimentale. Ann, Agron. 13(6), 493-522 p.
Sinsin B. 1993.Phytosociologie, écologie pastorale,
production et capacité de charge des pâturages
naturels du périmètre Nikki-Kalalé au nord Bénin.
Thèse de Doctorat en sciences agronomiques,
Université Libre de Bruxelles, Belgique, 390 p.
Sutcliffe VJ, Piper BS. 1986. Bilan hydrologique
en Guinée et au Togo - Bénin. In hydrol. Continent,
I,n° 1, pp. 51 - 61.
Thomson HR. 1985.Hydroélectric resource studies
in Togo and Benin. Proc. Instn. Civ. Engrs. Part 1, 78.
1403-1420 p.
Thornthwaite CW, Matter JR. 1957. Instructions
and Tables for Computeing Potential Evaporation and
the Water Balance. Climatol. X(3), 311 p.
Roméo et al. Page 150
Trochain JL, Blasco F, Puig H. 1980. Ecologie
Végétale de la zone intertropicale non désertique.
Université Paul Sabatier, Toulouse. 468 p.
Vignigbe A. 1992. Influence climatique sur
l’agriculture et la sécurité alimentaire : étude de cas
de la zone de l’extrême nord Bénin. Mémoire de
maîtrise de Géographie, FLASH/UNB, 72 p.
Vissin EW. 2007. Impact de la variabilité climatique
et de la dynamique des états de surface sur les
écoulements du bassin béninois du fleuve Niger.
Thèse de Doctorat de l’Université de Bourgogne,
Centre de Recherches de Climatologie CNRS - UMR
5210, 286 p.
Vissin WE. 2001. Contribution à l’étude de la
variabilité des précipitations et des écoulements dans
le bassin béninois du fleuve Niger. Mémoire de DEA,
Université de Bourgogne, CNRS, 56 p.
Wokou G. 2014.Croissance démographique,
évolution climatique et mutations agricoles et
environnementales dans le bassin versant du zou au
Bénin, Thèse de Doctorat de Géographie,
EDP/FLASH/UAC, 244 p.