
Clean Hydrogen Production and Carbon dioxide Capture ...
264
Florida International University FIU Digital Commons FIU Electronic eses and Dissertations University Graduate School 10-1-2013 Clean Hydrogen Production and Carbon dioxide Capture Methods Sushant Kumar skuma002@fiu.edu DOI: 10.25148/etd.FI13120609 Follow this and additional works at: hps://digitalcommons.fiu.edu/etd Part of the Other Materials Science and Engineering Commons is work is brought to you for free and open access by the University Graduate School at FIU Digital Commons. It has been accepted for inclusion in FIU Electronic eses and Dissertations by an authorized administrator of FIU Digital Commons. For more information, please contact dcc@fiu.edu. Recommended Citation Kumar, Sushant, "Clean Hydrogen Production and Carbon dioxide Capture Methods" (2013). FIU Electronic eses and Dissertations. 1039. hps://digitalcommons.fiu.edu/etd/1039
-
Upload
khangminh22 -
Category
Documents
-
view
3 -
download
0
Transcript of Clean Hydrogen Production and Carbon dioxide Capture ...
Florida International UniversityFIU Digital Commons
FIU Electronic Theses and Dissertations University Graduate School
10-1-2013
Clean Hydrogen Production and Carbon dioxideCapture MethodsSushant [email protected]
DOI: 10.25148/etd.FI13120609Follow this and additional works at: https://digitalcommons.fiu.edu/etd
Part of the Other Materials Science and Engineering Commons
This work is brought to you for free and open access by the University Graduate School at FIU Digital Commons. It has been accepted for inclusion inFIU Electronic Theses and Dissertations by an authorized administrator of FIU Digital Commons. For more information, please contact [email protected].
Recommended CitationKumar, Sushant, "Clean Hydrogen Production and Carbon dioxide Capture Methods" (2013). FIU Electronic Theses and Dissertations.1039.https://digitalcommons.fiu.edu/etd/1039

FLORIDA INTERNATIONAL UNIVERSITY
Miami, Florida
CLEAN HYDROGEN PRODUCTION AND CARBON DIOXIDE CAPTURE
METHODS
A dissertation submitted in partial fulfillment of the
requirements for the degree of
DOCTOR OF PHILOSOPHY
in
MATERIALS SCIENCE AND ENGINEERING
by
Sushant Kumar
2013

ii
To: Dean Amir Mirmiran College of Engineering and Computing This dissertation, written by Sushant Kumar, and entitled Clean Hydrogen Production and Carbon dioxide Capture Methods, having been approved in respect to style and intellectual content, is referred to you for judgment. We have read this dissertation and recommend that it be approved. _______________________________________ Arvind Agarwal _______________________________________ Chunlei Wang _______________________________________ Jiuhua Chen _______________________________________ Krish Jayachandran _______________________________________ Surendra K. Saxena, Major Professor Date of Defense: October 1, 2013 The dissertation of Sushant Kumar is approved. _______________________________________
Dean Amir Mirmiran College of Engineering and Computing
_______________________________________ Dean Lakshmi N. Reddi
University Graduate School
Florida International University, 2013

iii
DEDICATION
In loving memory of my father
“I have a lot to learn and long way to go,
I may fall on the way,
But I won’t give up,
As I know, you are with me”

iv
ACKNOWLEDGMENTS
I sincerely thank my adviser, Professor Surendra K. Saxena, for his invaluable guidance,
encouragement and support, not only pertaining to research but to many other facets of
life. His constructive criticism and critical review were absolute blessings for my
research work. I greatly appreciate his long hours of discussion. Those experiences have
pushed my boundaries of thinking and ingrained confidence in me.
I wish to extend my gratitude to committee members, Dr. Arvind Agarwal, Dr. Jiuhua
Chen, Dr. Chunlei Wang and Dr. Krish Jayachandran for their continuous support and
encouragement. I acknowledge Dr. Jiuhua Chen for his useful discussions on my research
work. I wish to thank Dr. Wang and Dr. Jayachandran for always extending their help
when I needed them. I can’t forget my first meeting with Dr. Arvind Agarwal. I would
like to thank him for the words that he told me at that meeting. Those inspiring words
will always keep me moving.
I offer my heartfelt thanks to Dr. Vadym Drozd. Without his suggestions and help, this
work would not have resulted. Special thanks to Dr. Andriy Durygin for helping me in
learning the instruments. Dr. Durygin has always motivated me to do better at work. I
owe him big thanks.
I shall be grateful to University Graduate School, FIU for supporting me with through
Dissertation Evidence Acquisition (DEA) and Dissertation Year Fellowship (DYF)
awards. I highly appreciate Dr. Cesar Levy and Dr. Giri Narasimhan for their extensive
help during my doctoral study. I am also thankful to Department of Mechanical and
Materials Engineering for their substantial teaching assistantship.

v
It gives me an immense pleasure to acknowledge my wonderful friends for helping me
during challenging phases of my life. I would not have come so far without their
unconditional support and wishes. I wish them, a great life full of happiness and success.
I fell short of words to express my wholehearted gratitude to my family for being my
source of energy. Their blessings, selfless and unfeigned love and empathy always
motivated me to be happy. Lastly, I would like to thank my mother for her eternal love
and sacrifice for me. This dissertation is a gift for her.

vi
ABSTRACT OF THE DISSERTATION
CLEAN HYDROGEN PRODUCTION AND CARBON DIOXIDE CAPTURE
METHODS
by
Sushant Kumar
Florida International University, 2013
Miami, Florida
Professor Surendra K. Saxena, Major Professor
Fossil fuels constitute a significant fraction of the world’s energy demand. The burning of
fossil fuels emits huge amounts of carbon dioxide into the atmosphere. Therefore, the
limited availability of fossil fuel resources and the environmental impact of their use
require a change to alternative energy sources or carriers (such as hydrogen) in the
foreseeable future. The development of methods to mitigate carbon dioxide emission into
the atmosphere is equally important. Hence, extensive research has been carried out on
the development of cost-effective technologies for carbon dioxide capture and techniques
to establish hydrogen economy.
Hydrogen is a clean energy fuel with a very high specific energy content of about
120MJ/kg and an energy density of 10Wh/kg. However, its potential is limited by the
lack of environment-friendly production methods and a suitable storage medium.
Conventional hydrogen production methods such as Steam-methane-reformation and
Coal-gasification were modified by the inclusion of NaOH. The modified methods are
thermodynamically more favorable and can be regarded as near-zero emission production
routes. Further, suitable catalysts were employed to accelerate the proposed NaOH-

vii
assisted reactions and a relation between reaction yield and catalyst size has been
established. A 1:1:1 molar mixture of LiAlH4, NaNH2 and MgH2 were investigated as a
potential hydrogen storage medium. The hydrogen desorption mechanism was explored
using in-situ XRD and Raman Spectroscopy.
Mesoporous metal oxides were assessed for CO2 capture at both power and non-power
sectors. A 96.96% of mesoporous MgO (325 mesh size, surface area = 95.08 ± 1.5 m2/g)
was converted to MgCO3 at 350°C and 10 bars CO2. But the absorption capacity of 1h
ball milled zinc oxide was low, 0.198 gCO2 /gZnO at 75°C and 10 bars CO2.
Interestingly, 57% mass conversion of Fe and Fe3O4 mixture to FeCO3 was observed at
200°C and 10 bars CO2. MgO, ZnO and Fe3O4 could be completely regenerated at 550°C,
250°C and 350°C respectively. Furthermore, the possible retrofit of MgO and a mixture
of Fe and Fe3O4 to a 300 MWe coal-fired power plant and iron making industry were also
evaluated.

viii
TABLE OF CONTENTS
CHAPTER PAGE
1. INTRODUCTION 1 1.1 Overview and Challenges 2 1.2 Purpose of the dissertation 8 1.3 Structure of the dissertation 9 1.4 References 11
2. EXPERIMENTAL TECHNIQUES AND DETAILS
2.1 Powder X-ray Diffraction 13 2.2 Raman Spectroscopy 15 2.3 Experimental set-up for hydrogen producing reactions 17 2.4 Experimental set-up for CO2 capture reaction 19 2.5 Multi anvil Press technique 19 2.6 Brunauer–Emmett–Teller analysis 21 2.7 Thermo-gravimetric analysis 23 2.8 Fourier Transform Infra-red technique 23 2.9 PCT-Pro 2000 24 2.10 Differential Scanning Calorimetry 25 2.11 References 27
3. CLEAN PRODUCTION OF HYDROGEN 28
3.1 LITERATURE REVIEW 28 3.1.1 Overview of Sodium Hydroxide 30 3.1.2 Sodium Hydroxide assisted hydrogen production schemes 32
3.1.2.1 Modified Industrial hydrogen production routes 32 3.1.2.2 Biomass 36 3.1.2.3 Metals 37 3.1.2.4 Water-splitting thermochemical cycle 39 3.1.2.5 Organic Compounds 41
3.1.3 Conclusion 44 3.1.4 References 45
3.2 MODIFIED STEAM –METHANE-REFORMATION REACTION 50 3.2.1 Introduction 50 3.2.2 Experimental Section 52 3.2.3 Results and Discussion 53 3.2.4 Economic Analysis 64 3.2.5 References 67
3.3 A CATALYTIC STUDY OF THE MODIFIED COAL GASIFICATION PROCESS TO PRODUCE CLEAN HYDROGEN GAS 69 3.3.1 Introduction 69 3.3.2 Materials and Methods 70
3.3.2.1 Catalysts Preparation 70

ix
3.3.2.2 Catalysts Characterization 71 3.3.2.3 Reaction Study 71
3.3.3 Results and Discussion 72 3.3.3.1 Catalysts Crystallite Size 72 3.3.3.2 Morphology and Particle Size analysis 74 3.3.3.3 Reaction Results 76
3.3.4 References 82 3.4 A CATALYTIC STUDY OF SODIUM HYDROXIDE AND CARBON
MONOXIDE REACTION 84 3.4.1 Introduction 84 3.4.2 Experimental Section 86
3.4.2.1 Catalyst Preparation 86 3.4.2.2 Particle Characterization 86 3.4.2.3 Reaction Study 86
3.4.3 Results and Discussion 87 3.4.3.1 Characterization of catalysts 87 3.4.3.2 Morphology and Particle Size 90 3.4.3.3 Reaction Results 94
3.4.4 References 101
4. HYDROGEN STORAGE USING METAL HYDRIDES 101 4.1 LITERATURE REVIEW 101
4.1.1 Potential hydrogen storage materials 103 4.1.2 Metal Hydrides 104
4.1.2.1 Reversible Storage Capacity 106 4.1.2.2 Gravimetric Storage Capacity 106 4.1.2.3 Volumetric Storage Capacity 107
4.1.3 Complex Hydrides 107 4.1.4 Summary 109 4.1.5 References 111
4.2 In-Situ INVESTIGATION FOR THE DEHYDROGENATION MECHANISM OF THE LiAlH4 -MgH2-NaNH2 TERNARY SYSTEM 114 4.2.1 Introduction 114 4.2.2 Experimental Section 116 4.2.3 Results and Discussion 117
4.2.3.1 Temperature-programmed Decomposition 117 4.2.3.2 Differential Scanning Calorimetry 119 4.2.3.3 Room Temperature Raman Spectrum 121 4.2.3.4 Temperature dependent in-situ Raman Spectrum 122 4.2.3.5 Room Temperature X-ray diffraction analysis 123 4.2.3.6 Temperature dependent in-situ X-ray diffraction analysis 125
4.2.4 References 129

x
5. CARBON DIOXIDE CAPTURE USING METAL OXIDES 132 5.1 LITERATURE REVIEW 132
5.1.1 Selection criteria for metal oxides 134 5.1.2 Metal oxides 137
5.1.2.1 Alkali metal based oxides 137 5.1.2.2 Alkali earth metal oxides 140 5.1.2.3 Transition metal oxides 143 5.1.2.4 Miscellaneous 146
5.1.3 Summary 147 5.1.4 References 148
5.2 AN EXPERIMENTAL INVESTIGATION OF MESOPOROUS MgO AS A POTENTIAL PRE-COMBUSTION CO2 SORBENT 153 5.2.1 Introduction 153 5.2.2 Experimental Procedure 157 5.2.3 Results and Discussion 158 5.2.4 References 167
5.3 INTEGRATION OF MgO TO A 300 MWe COAL-FIRED POWER PLANT 170 5.3.1 Introduction 170 5.3.2 Post-combustion Process 170
5.3.2.1 Mass and Energy Analysis 173 5.3.2.2 Economic Analysis of the carbonation process 178
5.3.3 Pre-combustion Process 186 5.3.3.1 Mass Balance Calculation 187 5.3.3.2 Energy Balance Calculation 189
5.4 MITIGATING CO2 EMISSIONS IN THE IRON INDUSTRY USING MIXTURE OF MAGNETITE AND IRON 191 5.4.1 Introduction 191 5.4.2 Experimental Procedure 194 5.4.3 Results and Discussion 196 5.4.4 References 199
5.5 PROCESS DESIGN FOR THE PROPOSED CARBON DIOXIDE SORBENT FOR IRON MAKING INDUSTRY 200 5.5.1 Retrofit in a blast furnace 200 5.5.2 Mass balance calculation 203 5.5.3 Energy balance calculation 206 5.5.4 Advantages of the proposed scheme 208
5.6 THE EFFECT OF ELEVATED PRESSURE, TEMPERATURE AND PARTICLES MORPHOLOGY ON THE CARBON DIOXIDE CAPTURE USING ZINC OXIDE 211 5.6.1 Introduction 211 5.6.2 Experimental Procedure 212 5.6.3 Thermodynamics and Structural Properties 215 5.6.4 Reaction Results 220 5.6.5 Discussion 223
xi
5.6.6 References 228
6. MISCELLANEOUS 6.1 HIGH PRESSURE AND HIGH TEMPERATURE STUDY FOR THE
MIXTURE OF MgH2 AND Si USING MULTI ANVIL PRESS 232 6.1.1 Introduction 232 6.1.2 Experimental Section 234 6.1.3 Results and Discussions 234 6.1.4 References 238
7. SUMMARY 239
7.1 Conclusions 239 7.2 Recommendations of the Future Research 242
VITA 244
xii
LIST OF TABLES
TABLE PAGE
Table 1.1 Six basic hydrogen storage methods……………………………………..4
Table 1.2 Original and revised DOE targets for on-board hydrogen storage systems for light-duty vehicles……………………………………………………………………..5
Table 1.3 Materials for CO2 capture………………………………………………...7
Table 2.1 Classification of pores according to their width……………………….. 23
Table 3.1.1 Comparison of the commercially available production methods for sodium hydroxide………………………………………………………………………………...31
Table 3.2.1 Crystallite size for variously milled nickel catalysts………………….. 56
Table 3.4.1 Crystallite size of variously ball milled catalysts………………………89
Table 4.1.1 Summary of the complex hydrides…………………………………....109
Table 4.2.1 Hydrogen storage properties for the binary system composed of LiAlH4 -MgH2-NaNH2 ………………………………………………………………………………………………………………..116
Table 4.2.2 Phases present at different temperatures for LiAlH4+ MgH2+ NaNH2 mixture………………………………………………………………………………….127
Table 5.2.1 CO2 uptake capacity of MgO obtained from the literature…………...156
Table 5.2.2 Surface Properties of MgO particles before and after carbonation reaction at 350°C, 10 bars………………………………………………………………………..164
Table 5.3.1 Mass and molar flue gas composition………………………………….173
Table 5.3.2 Energy balance calculation for Post-combustion CO2 capture using MgO at a Coal-fired power plant……………………………………………………………..177
Table 5.3.3 Detailed economic analysis for Post-combustion CO2 capture using MgO…………………………………………………………………………………….180
Table 5.3.4 Levelized Cost for Post-combustion CO2 capture using MgO………...182
Table 5.3.5 Cost per carbon captured……………………………………………….183
Table 5.3.6 Transportation cost……………………………………………………..185
Table 5.3.7 Mass balance calculation for pre-combustion CO2 capture using MgO at a coal-fired power plant…………………………………………………………………..188

xiii
Table 5.4.1 Experimental result for reaction [5.4.1] at different set of temperature, pressure and time……………………………………………………………………….197
Table 5.5.1 Reactions involved in the proposed scheme for CO2 capture at iron making industry………………………………………………………………………...203
Table 5.5.2 Mass balance for the proposed scheme………………………………...205 Table 5.5.3 Energy consumed and released at different stages of the proposed scheme………………………………………………………………………………….207 Table 5.6.1 Effect of ball milling on sorbent (ZnO) properties…………………….218 Table 6.1 Literature survey for (de-) hydrogenation of MgH2/Si System………..233

xiv
LIST OF FIGURES
FIGURE PAGE
Figure 1.1.1 World leading energy resources demand in year 2010 and 2035………….. 2
Figure 1.2.1 Flowchart of the research plan……………………………………………..11
Figure 2.1 Schematic for Raman Spectroscopy………………………………………..15
Figure 2.2 Raman experimental arrangement at CeSMEC…………………………….16
Figure 2.3 Experimental set up for study of hydrogen producing reactions…………...18
Figure 2.4 Experimental arrangements for study of metal oxide-carbon dioxide reactions ……………………………………………………………………………………………19
Figure 2.5 14/8 “G2” Assembly………………………………………………………..20
Figure 2.6 Schematic for FTIR Spectroscopy………………………………………….24
Figure 3.1.1 Simplified schematic of hydrogen production using SMR technique…….. 29
Figure 3.1.2 Membrane cell process schematic for production of sodium hydroxide………………………………………………………………………………...32
Figure 3.1.3 (a) Equilibrium in the system 2NaOH+ C+ H2O (b) Equilibrium composition in the system 2NaOH+ CO (c) Equilibrium in the system 4NaOH+ C+CO2 (d) the gas-shift reaction CO + H2O …………………………………………………………………34
Figure 3.1.4 Schematic for Water Splitting Thermochemical Cycle (MO= metal oxide)…………………………………………………………………………………….40
Figure 3.1.5 Electricity generation using alkaline hydroxide (NaOH) for the electrolysis of HCOOH……………………………………………………………………………….42
Figure 3.2.1 (a) equilibrium in the system methane-water and (b) when modified by addition of sodium hydroxide……………………………………………………………51
Figure 3.2.2 Results relating the formation of sodium carbonate as a function of the methane flow. In 30 minutes, the reaction in an open system is completed at any temperature above 600°C. One data point at 700°C was not included in the fitting procedure…………………………………………………………………………………53

xv
Figure 3.2.3 The data on % conversion of NaOH to Na2CO3 as a function of temperature and time for 25ml/min methane flow rate. An estimate of error is provided by the repeated experiment at 500oC. The curves are smoothed spline fit to show the trends. No catalyst was used…………………………………………………………………………54
Figure 3.2.4 Nickel particle size distribution for (a) Raw (b) 2h ball milled (c) 3h ball milled (d) 4h ball milled…………………………………………………………………57
Figure 3.2.5 X-ray diffraction patterns for different time ball milled nickel catalysts…..58
Figure 3.2.6 Effect of using 2h ball milled nickel catalyst. The arrows show the significant change in the conversion amount for a given time…………………………..59
Figure 3.2.7 The experimental data on a sample with catalysis and without for 30 minutes between 300 to 600oC……………………………………………………………………60
Figure 3.2.8 The effect of variously ball-milled catalyst on the carbonation reaction at 300oC…………………………………………………………………………………….61
Figure 3.2.9 SEM images of nickel particles (a) without ball milling magnification 2000x (b) Ball milled for 2 hrs, magnification 2000x (c) Ball milled for 3 hrs, magnification 1000x; (d) Ball milled for 4 hrs, magnification 2000x………………….. 62
Figure 3.2.10 The effect of different alkali hydroxide on the Carbonation reaction at 400°C…………………………………………………………………………………… 63
Figure 3.2.11 The price difference in soda and sodium hydroxide determines the price of hydrogen. In this example the price of hydrogen is fixed at $1000/tonne. If the price of soda goes below the sodium hydroxide by $30/tonne, the method may not be profitable…………………………………………………………………………………64
Figure 3.3.1 X-ray diffraction pattern for variously ball milled Raney nickel…………..72
Figure 3.3.2 Back scattered SEM image of (i) without (ii) 1h (iii) 2h and (iv) 4h ball milled…………………………………………………………………………………….74
Figure 3.3.3 SEM images of (i) variously ball milled Raney nickel each at 2000x magnification (ii) 2h ball milled Raney nickel showing caves at 5000x magnification…………………………………………………………………………….75
Figure 3.3.4 X-ray diffraction pattern confirms the product formation in the presence of nickel catalyst for reaction (1) at 600°C…………………………………………………77
Figure 3.3.5 % Conversion of NaOH to Na2CO3 for different sized coal particles at different time at 600°C…………………………………………………………………..77
xvi
Figure 3.3.6 % Conversion of NaOH to Na2CO3 for (i) different catalysts at 600°C and (ii) different sized Raney nickel at 500°C……………………………………………….78
Figure 3.4.1 X-ray diffraction patterns for variously ball milled (a) alumina mixed nickel (b) magnetite (c) Raney nickel…………………………………………………………...88
Figure 3.4.2 SEM image of (a) alumina mixed nickel ball milled for (i) 1 hour (ii) 2 hours (iii) 4 hours at (b) magnetite ball milled for (i) 1 hour (ii) 2 hours (iii) without ball milling at 2000x each…………………………………………………………………………….91
Figure 3.4.3 SEM image of Raney nickel (i) without (ii) 2h (iii) 4h ball milling at 2000x each and (iv) 2h ball milled Raney nickel with pores (at 5000x)………………………..92
Figure 3.4.4 Change of average particle size of catalysts with milling time…………….93
Figure 3.4.5 % Conversion of NaOH to Na2CO3 for variously ball milled alumina mixed nickel (2:1) (wt. %) at 300°C…………………………………………………………….95
Figure 3.4.6 % Conversion of NaOH to Na2CO3 for variously ball milled magnetite at 300°C. 1 and 2 h ball milling time has exhibited a comparable result…………………96
Figure 3.4.7 % Conversion of NaOH to Na2CO3 for variously ball milled Raney nickel at 300°C. 2h ball milling time has exhibited the best result………………………………97
Figure 4.1.1 Primitive phase diagram of hydrogen……………………………………..101
Figure 4.1.2 Chart for the potential reversible hydrogen system……………………….103
Figure 4.1.3 Schematic of hydrogen interaction with metal. The solid solution α -phase and the hydride β –phase……………………………………………………………….104
Figure 4.2.1 Temperature programmed decomposition of the LiAlH4-MgH2-NaNH2 (1:1:1) mixture………………………………………………………………………….118
Figure 4.2.2 Differential scanning calorimetry (DSC) traces for LiAlH4–MgH2-NaNH2 samples, with a heating rate of 5°C/min………………………………………………..119
Figure 4.2.3 DSC traces of the LiAlH4–MgH2-NaNH2 at different heating rates. The inset plot is the Kissinger’s analysis for the hydrogen desorption reaction of the ternary hydrides ………………………………………………………………………………...120
Figure 4.2.4 Room Temperature Raman Spectra for unmillled and 0.5h mechanically milled LiAlH4–MgH2-NaNH2 mixture…………………………………………………122
Figure 4.2.5 Temperature dependent Raman Spectra for unmilled LiAlH4–MgH2-NaNH2…………………………………………………………………………………..123

xvii
Figure 4.2.6 Temperature dependent Raman Spectra for mechanically milled LiAlH4–MgH2-NaNH2 mixture……………………………………………………….................124
Figure 4.2.7 X-ray diffraction pattern for milled and unmilled LiAlH4–MgH2-NaNH2 mixture……………………………………………………….........................................125
Figure 4.2.8 Temperature dependent X-ray diffraction pattern for unmilled LiAlH4–MgH2-NaNH2 mixture……………………………………………………….................126
Figure 5.1.1 A Cyclic CO2 capture process for metal oxides (MO) and metal carbonates (MCO3)…………………………………………………………………………………134
Figure 5.1.2 Thermodynamic properties and CO2 wt. % for metal oxides MO(s) + CO2 (g) = MCO3(s) at 300K …………………………………………………………..135
Figure 5.2.1 X-ray diffraction patterns for MgCO3 formation after reaction at various temperatures and CO2 pressure of (a) 10 bars and (b) 50 bars…………………………159
Figure 5.2.2 Adsorption/absorption model for MgO-CO2-H2O reaction………………160
Figure 5.2.3 DTG plots for product at (a) 300°C and 10 bars and (b) 350°C and 10 bars……………………………………………………………………………………...161
Figure 5.3.1 Process design for post-combustion CO2 capture using MgO…………....174
Figure 5.3.2 Process design for pre-combustion CO2 capture using MgO……………..187
Figure 5.4.1 Equilibrium composition in the system Fe3O4+ Fe+ 4CO2 at 10 and 50 bars pressure………………………………………………………………………………... 193
Figure 5.4.2 (i) X-ray diffraction pattern confirm the siderite formation for reaction [5.4.1] performed at 100°C, 50 bars and 3 h (ii) X-ray diffraction pattern of the products for different molar composition of magnetite and iron mixture at 200°C, 10 bars and 1 h (iii) DTG plot for product obtained as a result of reaction [5.4.1] performed at 200°C, 10 bars, and 3h under air flow rate of 100mL/min………………………………………...196
Figure 5.5.1 Flow sheet for carbonation process integrated to a blast furnace…………200
Figure 5.5.2 Process scheme for post-combustion CO2 capture using magnetite and iron mixture at iron making industry………………………………………………………...202
Figure 5.6.1 Equilibrium temperature for ZnO+CO2→ ZnCO3 reaction at different PCO2 (0.1-100 bars) in the presence and absence of water…………………………………...215
Figure 5.6.2 SEM image of (i) as received ZnO (ii) 1h ball milled (iii) 2 h ball milled and (iv) AR (after reaction) ZnO at a magnification of 20, 000x each……………………..217

xviii
Figure 5.6.3 Particle size distribution plots for variously milled ZnO…………………219
Figure 5.6.4 X-ray Diffraction patterns confirm the (i) product formation (JCPDS # 11-0287) (ii) regeneration of ZnO (JCPDS #89-1397) (iii) FTIR –spectra of the product in the mid IR range (4000-400 cm-1)……………………………………………………...221
Figure 5.6.5 TG-DTG plot of thermal decomposition reaction of product; sample mass 10.0mg, heating rate 10ºC /min, and argon atmosphere………………………………. 222
Figure 5.6.6 (i) Plot for capture capacity of ZnO at various pressure and time keeping constant temperature of 75ºC…………………………………………………………...224
Figure 5.6.6 (ii) CO2 capture capacity variation with temperature at pressure of 10 bars……………………………………………………………………………………...225
Figure 5.6.6 (iii) Effect of particle size on capture capacity of ZnO…………………...226
Figure 6.1 (i) X-ray diffraction of the product after compression to 4GPa at 500°C for 2h and 150°C for 12h (ii) X-ray diffraction of MgH2 used and product obtained after the experiment and (iii) Raman Spectra of the product…………………………………….235
Figure 6.2 X-ray diffraction of the product after compression to 4GPa at 900°C for 2h and then quenched.……………………………………………………………………...236
Figure 6.3 shows the X-ray diffraction of the product obtained after ball milling under H2 atmosphere……………………………………………………………………………...237

1
1. INTRODUCTION
The aim of this study is to investigate the material and process that can deal with the
issues related to global warming and use of fossil fuels. In line with these objectives, this
study emphasizes: (1) clean hydrogen production methods, (2) storage of hydrogen using
solid metal hydrides, and (3) metal oxides for carbon dioxide capture at power and non-
power sectors.
The first section of the dissertation (Chapter 3) deals with the study of clean hydrogen
production method. In the past two decades, lot of attention has been focused on the
mitigation of carbon dioxide emissions during hydrogen production. This work examines
the inclusion of sodium hydroxide to the existing major hydrogen production
technologies. Using the proposed techniques, sodium hydroxide not only facilitates
hydrogen generation but also locks carbon dioxide in the form of sodium carbonate. The
work also identifies suitable catalysts to accelerate the reactions.
The second section of the dissertation (Chapter 4) is aimed to investigate materials that
can store hydrogen. This part of the dissertation examines the dehydrogenation kinetics
and mechanism of multinary complex metal hydrides. A part of this section (Chapter 6)
also describes the behavior of magnesium hydride and silicon under extreme pressure and
temperature condition.
The last section of the dissertation (Chapter 5) focuses on the capture of carbon dioxide
using metal oxides. The growing use of fossil fuels to meet the energy demands has led to
a rapid increase in carbon dioxide levels in the atmosphere. This part deals with the

2
investigation of potential use of metal oxide as a carbon dioxide sorbent. In the latter
part, an energy and economic analysis is performed to evaluate the integration of metal
oxides to the existing power and non-power sectors for the capture of carbon dioxide.
1.1 Overview and Challenges
Fossil fuels (coal, oil and natural gas) continue to be the primary energy source for
electricity, transportation and residential services. International Energy Agency (IEA)
reports the energy demand by fuel for 2010 and 2035 [Fig. 1.1.1]. The trend clearly
shows the continued significance of fossil fuel for energy demand [1].
Figure 1.1.1 World leading energy resources demand in year 2010 and 2035.
Fossil fuels are relatively less expensive than renewable sources (such as solar, wind,
geothermal and biomass) for large-scale applications. The vast depletion of fossil fuels,
the increase in carbon dioxide levels in the atmosphere, and the related environmental
hazards are growing concerns for mankind. Moreover, the energy demand is projected to
3
increase over 60% in 2030, developing an alternative energy source as well as mitigating
carbon dioxide emission is becoming ever more pressing.
Hydrogen is a clean energy fuel with a very high specific energy content of about 120
MJ/kg and an energy density of 10Wh/kg. Hydrogen is environmentally friendly and can
be used without concerns over the greenhouse gas emissions at the point of use.
Hydrogen is produced using both renewable and non-renewable resources. The available
technologies for hydrogen production are the reforming of natural gas; gasification of
coal and biomass; and the splitting of water by water-electrolysis, photo-electrolysis,
photo-biological production, water splitting thermochemical cycle and high temperature
decomposition [2].
Currently, Steam Methane Reformation (SMR) is the most common and least expensive
method to produce hydrogen [3]. It is a two-step process. At first step, methane reacts
with steam at temperature (700-1100) ºC to form Syn gas (mixture of carbon monoxide
and hydrogen) and then carbon monoxide reacts with steam to produce additional
hydrogen. A simple calculation shows that while producing 1 gram of hydrogen via SMR
technique, 10.5 grams of carbon dioxide is emitted. Such an undesired vast emission of
carbon dioxide downgrades the use of the conventional SMR technique to produce
hydrogen. Thus, it is essential to develop a method that can produce hydrogen without or
reduced carbon dioxide emissions. Several methods have been proposed to mitigate
carbon emission but most of them are either expensive compared to those using fossil
fuels, or are in the very early stages of development. Thus, the dependence on fossil fuel
for the production of hydrogen seems to be certain in the foreseeable future.
4
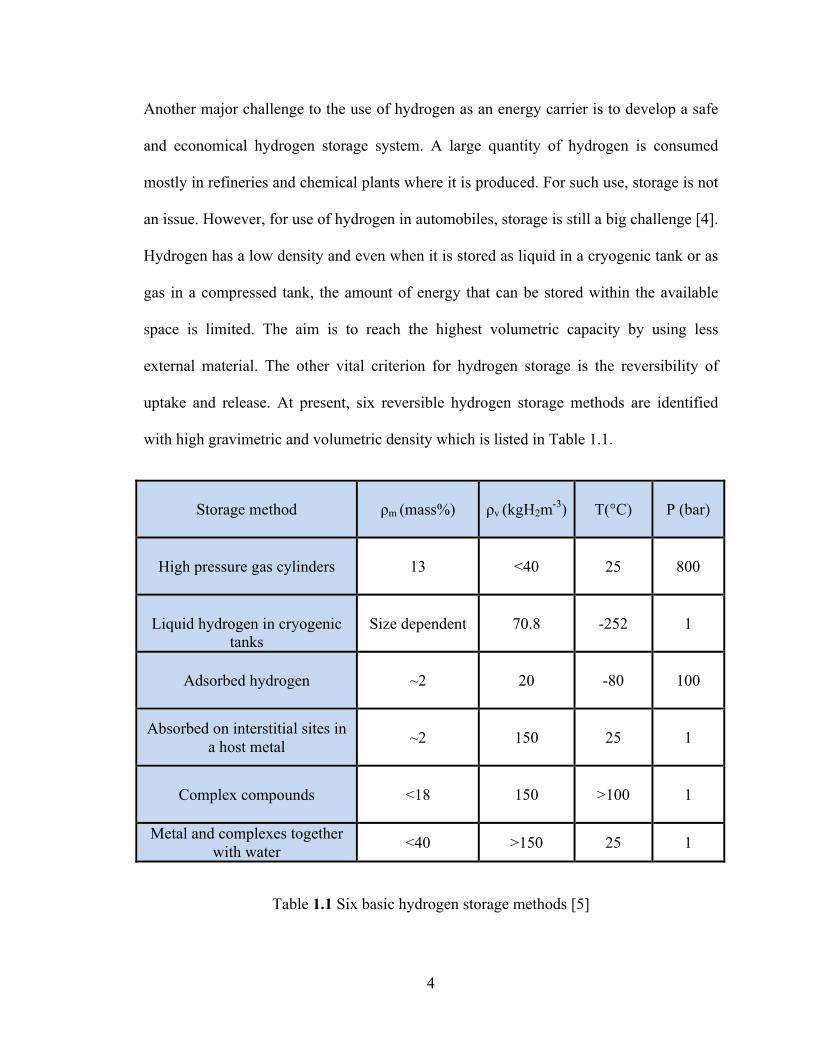
Another major challenge to the use of hydrogen as an energy carrier is to develop a safe
and economical hydrogen storage system. A large quantity of hydrogen is consumed
mostly in refineries and chemical plants where it is produced. For such use, storage is not
an issue. However, for use of hydrogen in automobiles, storage is still a big challenge [4].
Hydrogen has a low density and even when it is stored as liquid in a cryogenic tank or as
gas in a compressed tank, the amount of energy that can be stored within the available
space is limited. The aim is to reach the highest volumetric capacity by using less
external material. The other vital criterion for hydrogen storage is the reversibility of
uptake and release. At present, six reversible hydrogen storage methods are identified
with high gravimetric and volumetric density which is listed in Table 1.1.
Storage method ρm (mass%) ρv (kgH2m-3) T(°C)
P (bar)
High pressure gas cylinders 13 <40 25
800
Liquid hydrogen in cryogenic
tanks Size dependent 70.8 -252
1
Adsorbed hydrogen ~2 20 -80
100
Absorbed on interstitial sites in a host metal ~2 150 25
1
Complex compounds <18 150 >100 1
Metal and complexes together with water <40 >150 25 1
Table 1.1 Six basic hydrogen storage methods [5]

5
High pressure cylinders and liquid hydrogen storage methods are well-established for
laboratory and space applications, respectively. However, hydrogen stored in solid metal
hydrides is safer alternative to liquid or pressurized forms. Table 1.2 summarizes the
detailed requirements of metal hydrides for automobile applications.
Storage System Parameter Original 2010 target
New 2010 target
2017 target
Ultimate
target
Gravimetric Capacity
(kgH2/kg system) 6% 4.5% 5.5% 7.5%
Volumetric Capacity
(gH2/L system ) 45 28 40 70
Operational cycle life
1000 1000 1500 1500
Fill time (min., for 5kg)
3 4.2 3.3 2.5
Minimum full flow
rate(gH2/s/kW) 0.02 0.02 0.02 0.02
Min. delivery pressure @ 85°C PEMFC, (atm)
8 5 4 3
Fuel Purity
99.99% 99.97% 99.97% 99.97%
Table 1.2 Original and revised DOE targets for on-board hydrogen storage systems for light-duty vehicles [6]
Besides developing alternative energy resource, mitigation of carbon dioxide emission is
equally desired. Natural greenhouse gases (CO2, CH4, N2O, CFCs, HFCs, PFCs, SF6 and

6
H2O) are responsible for raising the temperature of the earth to 33°C, making it habitable
[7]. However, concentration of greenhouse gases in the atmosphere has increased
significantly since the Industrial Revolution. One major concern is over the increase in
the concentration of greenhouse gases, which may warm the planet.
The combustion of fossil fuels emits carbon dioxide into the atmosphere. Carbon dioxide
is the most significant greenhouse gas and largely responsible for the increase in
greenhouse effect. Therefore, it is essential to capture carbon dioxide from the industrial
flue gas stream, one of the leading contributors of the anthropogenic gases [8]. The
development of Carbon Capture and Sequestration (CCS) technology can be seen as a
viable solution to mitigate the vast carbon emission. CCS constitutes the process (1) of
separation of carbon dioxide from industrial flue gas stream; (2) liquefaction of pure
carbon dioxide; (3) transportation of liquefied carbon dioxide using pipelines to a
geological storage site; and (4) eventually underground storage of liquefied carbon
dioxide. CCS could be applied using available technologies, as many of the components
in these systems are already in use. However, there is a large scope for improvements in
energy efficiency and reduction in carbon capture cost for the existing carbon dioxide
mitigation technologies.
Currently, various carbon dioxide capture technologies exist including physical
absorption [9-10], chemical absorption [11-12], adsorption [13] and membranes [14].
Table 1.3 summarizes the materials used for CO2 capture in the context of Post-, Pre- and
Oxy- Combustion Processes [15]. However, they are still far from being considered as a
technologically viable solution. The obvious bottlenecks are the huge amount of flue gas,
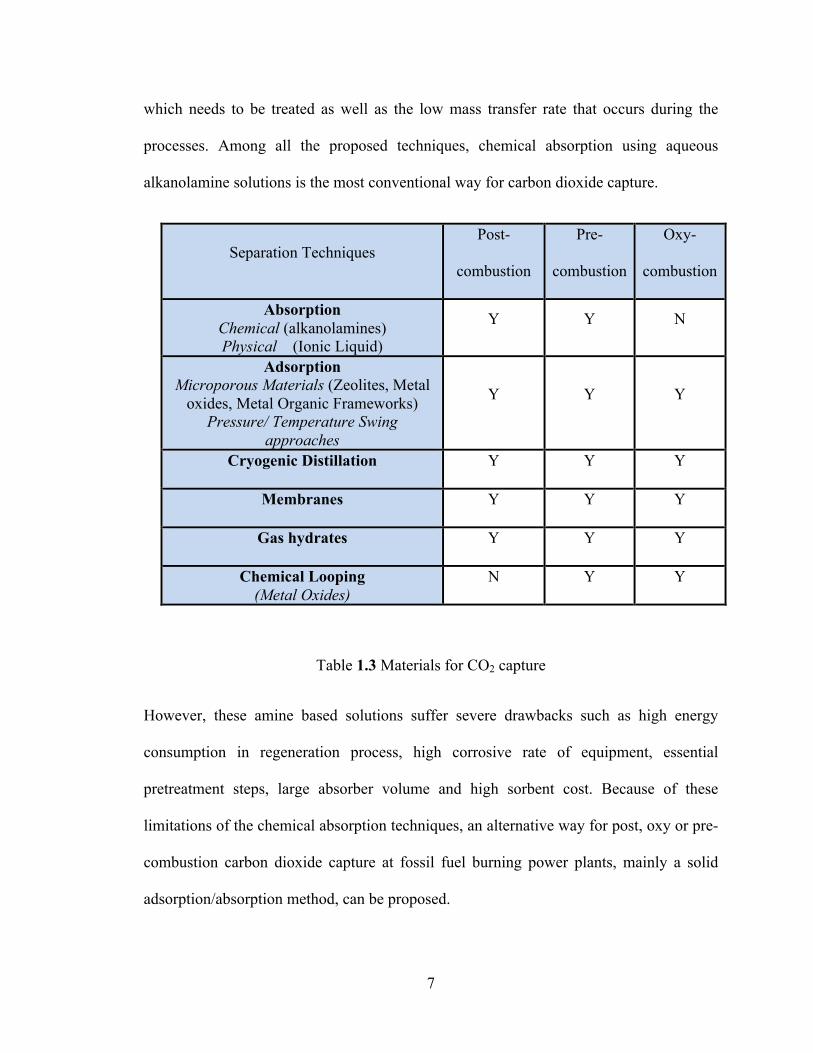
7
which needs to be treated as well as the low mass transfer rate that occurs during the
processes. Among all the proposed techniques, chemical absorption using aqueous
alkanolamine solutions is the most conventional way for carbon dioxide capture.
Separation Techniques Post-
combustion
Pre-
combustion
Oxy-
combustion
Absorption Chemical (alkanolamines) Physical (Ionic Liquid)
Y Y N
Adsorption Microporous Materials (Zeolites, Metal
oxides, Metal Organic Frameworks) Pressure/ Temperature Swing
approaches
Y Y Y
Cryogenic Distillation Y Y Y
Membranes Y Y Y
Gas hydrates Y Y Y
Chemical Looping (Metal Oxides)
N Y Y
Table 1.3 Materials for CO2 capture
However, these amine based solutions suffer severe drawbacks such as high energy
consumption in regeneration process, high corrosive rate of equipment, essential
pretreatment steps, large absorber volume and high sorbent cost. Because of these
limitations of the chemical absorption techniques, an alternative way for post, oxy or pre-
combustion carbon dioxide capture at fossil fuel burning power plants, mainly a solid
adsorption/absorption method, can be proposed.
8
1.2 Purpose of the Dissertation
The limitations to realize hydrogen-based economy need to be overcome in the near
future. Similarly, it is necessary to reduce carbon dioxide emissions at various industrial
sectors. Such challenges are the motivation for this dissertation.
The focus is to use fossil fuel (such as coal and methane) and toxic gas (carbon
monoxide) for the production of hydrogen in such a way that there is a relatively less
carbon dioxide gas emission at a point source as compared with the existing technologies.
Sodium hydroxide, a byproduct of the chlor-alkali process, can simultaneously be used to
produce hydrogen and capture carbon dioxide. Moreover, different catalysts such as
nickel, Raney nickel, magnetite, and alumina mixed nickel are chosen to accelerate such
sodium hydroxide assisted hydrogen producing reactions. The effects of ball milling on
catalysts are investigated and thus correlation between the reaction yield and catalysts
size has also been established.
Solid metal hydrides with high volumetric and gravimetric storage capacities are selected
for hydrogen storage. A part of this dissertation investigates the dehydrogenation kinetics
and mechanism for multinary complex metal hydride, Li-Mg-Na-Al-N-H. The
dehydrogenation rate is also examined for the variously milled samples. Another focus is
to examine the interaction between light metal hydrides, such as magnesium hydride and
silicon, under extreme pressure and temperature conditions. A large volume multi anvil
apparatus is employed to pressurize and heat the mixture of magnesium hydride and
silicon to a desired set of pressure and temperature for the specified duration.

9
The final section of this dissertation investigates magnesium oxide, iron based
compounds and zinc oxide as potential carbon dioxide sorbent for power and non-power
sectors. The criterion for the selection of the sorbents is mainly based on the
accessibility, thermodynamics, absorption capacity and economics. The role of water and
partial pressure of carbon dioxide is also examined for the sorbent absorption capacity.
Moreover, other structural parameters such as particle size, pore volume, pore size and
surface area of the sorbent are also explored. Based on the experimental findings, mass
and energy balance calculations are performed for the pre- and post-combustion capture
at a coal-fired power plant (300 MWe) and iron making industry.
1.3 Structure of the dissertation
The dissertation has been arranged in various chapters, sections and subsections to
describe: the current status of the issues and the state-of-the-art, the experimental
methods used in this study, analysis of the experimental outcomes and the future scope
and recommendations. Chapter 2 explains the employed characterization techniques and
experimental set-up for carrying out the proposed reactions. Chapter 3 describes the
proposed clean production routes of hydrogen. This chapter first provides the
comprehensive literature review, and then experimental results for modified hydrogen
producing routes are explained in the following subsections. Chapter 4 provides the
experimental findings for the storage of hydrogen using different metal hydrides.
Chapter 5 focuses on the capture of carbon dioxide using metal oxides. The beginning
section reviews the current state-of-the-art and further different metal oxides are tested

10
for CO2 capture at different sets of conditions. Chapter 6 presents summary of the
dissertation and recommendations for future research.

11
Figure 1.2.1 Flow chart of the research plan
Pre-
com
bust
ion
sorb
ent M
gO
Mix
ture
of F
e 3O4 +
Fe
ZnO
MO
DIF
IED
CO
AL
GA
SIFI
CA
TIO
N
NaO
H +
C+
H 2O
MO
DIF
IED
W
ATE
R-G
AS
SHIF
T
NaO
H +
CO
PRO
LON
G T
HE
USE
OF
FOSS
IL F
UEL
S
ESTA
BLI
SH A
LTER
NA
TIV
E C
LEA
N F
UEL
C
APT
UR
E O
F C
O2
H2 P
RO
DU
CTI
ON
H
2 STO
RA
GE
MO
DIF
IED
STE
AM
-M
ETH
AN
E R
EFO
RM
ATI
ON
NaO
H +
CH
4 +
H 2
O
%ca
rbon
ate
yiel
d at
var
ious
CH
4 fl
ow
Find
Sui
tabl
e C
atal
ysts
C
orre
late
Cat
alys
ts si
ze w
ith %
yie
ld
%ca
rbon
ate
yiel
d at
var
ious
coa
l par
ticle
siz
e fin
d Su
itabl
e C
atal
ysts
co
rrel
ate
Cat
alys
ts si
ze w
ith %
yie
ld
%ca
rbon
ate
yiel
d at
var
ious
CO
flow
Fi
nd S
uita
ble
Cat
alys
ts
Cor
rela
te C
atal
ysts
size
with
% y
ield
MgH
2 -S
i U
ND
ER H
T/H
P C
OM
PLEX
MU
LTIN
AR
Y
HY
DR
IDES
LiA
lH 4: N
aNH
2 :M
gH 2
1:1:
1 M
gH 2
:Si::
3:1
UN
DER
HT/
HP
Kin
etic
and
mec
hani
sm fo
r deh
drog
enat
ion
In-s
itu X
RD
and
Ram
an S
pect
rosc
opy
Tem
pera
ture
<40
0 C
Use
of M
ultia
nvil
pres
s B
ehav
ior o
f MgH
-Si a
t 4 G
Pa
Tem
pera
ture
<90
0 C
, tim
e <2
h
CO
2 abs
orpt
ion
capa
city
at
diff
eren
t P/T
K
inet
ics a
nd M
echa
nism
of
carb
onat
ion
reac
tion
Abs
orpt
ion
mod
el
Ret
rofit
to 3
00 M
We
Coa
l-fire
d pl
ant
Mas
s an
d En
ergy
ana
lysi
s Ec
onom
ic a
naly
sis
CO
2abso
rptio
n ca
paci
ty a
t diff
eren
t P/
T K
inet
ics o
f car
bona
tion
reac
tion
Mol
ar ra
tio o
f Fe
3 O
4 a
nd F
e
Ret
rofit
to a
bla
st fu
rnac
e
Mas
s an
d En
ergy
ana
lysi
s
CO
2 abs
orpt
ion
capa
city
at d
iffer
ent P
/T
CO
2 abs
orpt
ion
capa
city
of d
iffer
ent
ZnO
par
ticle
siz
e D
eter
min
atio
n of
dec
ompo
sitio
n T

12
1.4 References
[1]International energy agency,world energy outlook 2012. www.worldenergyoutlook.com
[2] S. Kumar, S. K. Saxena, Materials and processes for energy: communicating current research and technological developments, Ed. A. Mendez-Vilas, Formatex Research Center (Badajoz, Spain), 2013, In Press.
[3] R.F. Probstein, R.E. Hicks, Synthetic fuels, 3rd ed. New York, Dover Publications, 2006.
[4] D. P. Broom, Hydrogen storage materials: the characterization of their storage properties, London, Springer, 2011. DOI: 10.1007/978-0-85729-221-6_1
[5] A. Zuttel, Materials Today, 2003, 6, 24-33.
[6] L.E. Klebanoff, J.O. Keller, International Journal of Hydrogen Energy, 2013, 38, 4533–4576.
[7] M.V. Iyer, High Temperature Reactive Separation Process for Combined Carbon dioxide and sulfur dioxide from Flue gas and Enhanced Hydrogen Production with in-situ Carbon dioxide Capture using High Reactivity Calcium and Biomineral sorbents, Ohio State University, 2006.
[8] T.C. Merkel, H. Lin, X. Wei, R. Baker, Journal of Membrane Science, 2010, 359, 126–139.
[9] R.J. Littel, G.F. Versteeg, W.P.M. Van Swaaij, Chemical Engineering Science, 1991, 46, 3308–3313.
[10] P. Chiesa, S.P. Consonni, Journal of Engineering for Gas Turbines and Power, 1999, 121, 295–305.
[11] S. Bishnoi, G.T. Rochelle, Chemical Engineering Science, 2000, 55, 5531–5543.
[12] G.T. Rochelle, Science, 2009, 325, 1652–1654.
[13] P.J.E. Harlick, F.H. Tezel, Microporous and Mesoporous Materials, 2004, 76, 71–77.
[14] C.E. Powell, G.G. Qiao, Journal of Membrane Science, 2006, 279, 1–49.
[15] D.M. D. Alessandro, B. Smit, J. R. Long, Angewandte Chemie International Edition, 2010, 49, 6058-6082.

13
2. EXPERIMENTAL TECHNIQUES AND DETAILS
2.1 Powder X-ray diffraction
The X-ray powder diffraction method dates back to Debye and Scherrer who were first to
observe LiF powder diffraction pattern and thus solving its crystal structure. Powder X-
ray diffraction is a non-destructive technique which identifies the chemical composition
and determines the crystal structure of the material [1]. X-rays are generated using two
different methods. The first is a device, an X-ray tube, where electromagnetic waves are
produced from impact of high-energy electrons with a metal target. Another is advance
source of X-ray radiation- the synchrotron, where high energy electrons are confined in a
storage ring. These high energy electrons move in a circular orbit and emit
electromagnetic radiation. Conventional X-ray sources generally have a low-efficiency,
and their brightness is limited by the thermal properties of the target material. At
CeSMEC, Mo is used as the target; however others including Cu, Co, Fe and Cr can also
be employed. Conventional X-ray sources must be continuously cooled because almost
all the kinetic energy of the accelerated electrons is converted into heat. However,
synchrotron sources do not need to be cooled as they are extremely bright and their
brightness is only limited by the flux of electrons in the high energy beam.
Although powder diffraction lacks the three-dimensionality of a diffraction pattern, the
basic nature of the method is appreciated from the fact that each pattern represents one-
dimensional projection of the three-dimensional reciprocal lattice of the crystal.
However, the quality of powder diffraction pattern is limited by the factors such as the
physical and chemical compositions of the specimen, nature and energy of the available
14
radiation and the resolution of the instrument. The scattered intensity is measured as a
function of a single independent variable- the Bragg angle.
The powder diffraction experiment is powerful as the different structural features of a
material have different effects on various parameters of its diffraction pattern. A change
in the atomic parameters such as the coordinates of atoms in the unit cell or populations
of different sites in the lattice of the crystalline phases is reflected in the relative
intensities and/or positions of the Bragg peaks. The microscopic changes such as
deformation or reduction in grain size of the material affects the shapes, intensities and
positions of the Bragg peaks. Hence, a lot of the structural information about the material
is embedded into its powder-diffraction pattern.
In powder diffraction, it is crucial to have a plain surface. In general, to obtain better
diffraction pattern, samples are ground to micron sizes and placed inside a sample holder
such as quartz capillary. A large area of the Debye ring can be measured with 2D
diffraction detection in transmission geometry and can be evaluated for structural and
chemical properties of the material.
X-ray diffraction studies are conducted using Bruker-GADDS/D8 X-ray system with
MacSci rotating anode of Molybdenum (λ= 0.71073 Å) and Apex Smart CCD detector.
The dehydrogenation study of multinary complex hydrides are carried out using home-
made heater coupled with thermo controller to heat the sample for in situ XRD
experiments up to 500°C. The sample position is calibrated using the standard, LaB6
(Lanthanum Hexaboride).
15
ν0
(Laser)
ν0
(Rayleigh scattering)
ν0 ± ν m
(Raman scattering)
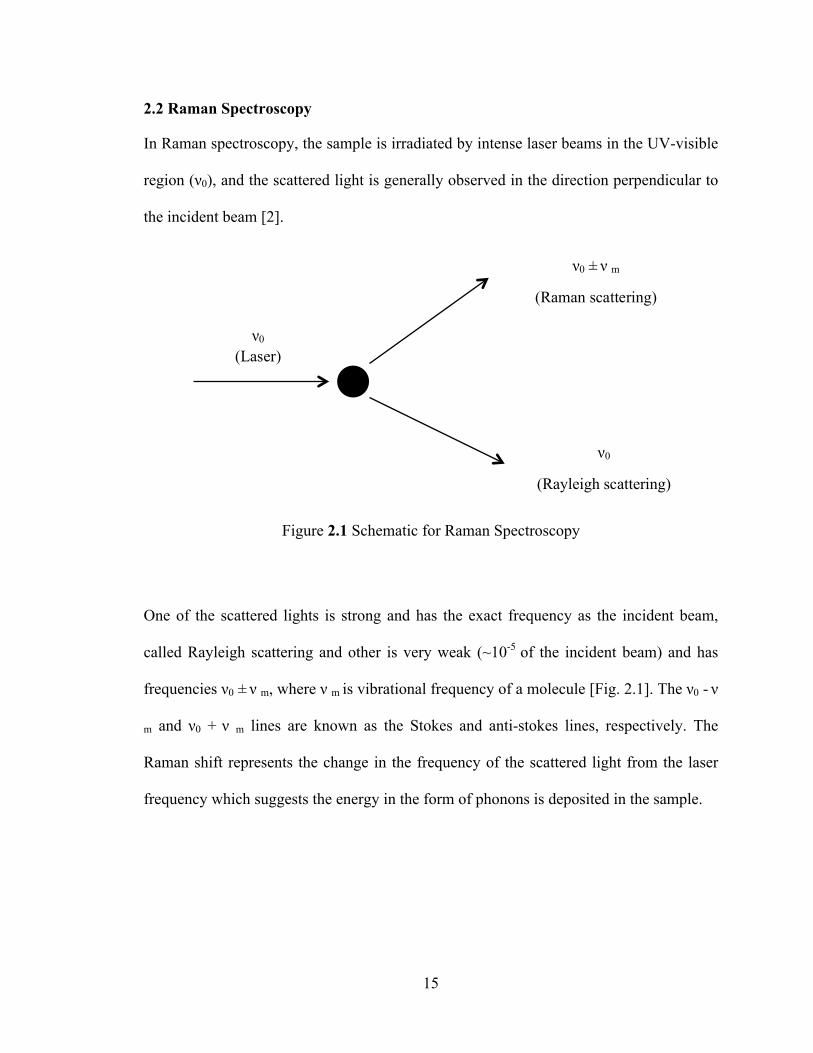
2.2 Raman Spectroscopy
In Raman spectroscopy, the sample is irradiated by intense laser beams in the UV-visible
region (ν0), and the scattered light is generally observed in the direction perpendicular to
the incident beam [2].
Figure 2.1 Schematic for Raman Spectroscopy
One of the scattered lights is strong and has the exact frequency as the incident beam,
called Rayleigh scattering and other is very weak (~10-5 of the incident beam) and has
frequencies ν0 ± ν m, where ν m is vibrational frequency of a molecule [Fig. 2.1]. The ν0 - ν
m and ν0 + ν m lines are known as the Stokes and anti-stokes lines, respectively. The
Raman shift represents the change in the frequency of the scattered light from the laser
frequency which suggests the energy in the form of phonons is deposited in the sample.

16
Figure 2.2 illustrates the Raman experimental arrangement at CeSMEC
The laser beam from the argon ion laser is filtered to achieve a monochromatic beam,
which is further directed by a system of mirrors to a focusing/collecting lens and focused
on the sample. The backscattered beam is then directed to the spectrometer through filters
and gratings. The holographic notch filters permit absorption of Raman scattered light
closer to the Rayleigh line with fewer ripples. The holographic transmission gratings
allow acquiring entire Raman spectrum. The system detector, a multichannel CCD array,
reads signal as a function of position. Computer equipped with Andor software converts
the wavelength-intensity information to frequency-shift versus intensity plots. The extent
to which the image may move along the face of the CCD array is determined by the slit-
width. The final slit-width should be smaller than peak width for the better resolution of a
Raman peak. The dark current of CCD array depends on the detector temperature and
thus needs to be cooled. Joule Thomson effect is used to cool CCD set up. The intensity

17
of Raman spectrum is dependent on the applied laser power, slit width and the sample
properties (intrinsic strength of the Raman modes, absorptive or reflective power of the
sample).
Raman spectroscopy experiments are performed using an argon ion (Ar+) laser system
(Spectra Physics, model 177G02) of λ = 514.5 nm. Backscattered Raman spectra are
captured by high throughput holographic imaging spectrograph (Kaiser Optical Systems,
model HoloSpec ƒ/1.8i) with volume transmission grating, holographic notch filter and
thermoelectrically cooled CCD detector (Andor Technology). The average spot size of
the laser beam used is approximately 5 µm. The Raman spectrometer system has a
spectral resolution of 4 cm-1 and the spectra are collected at an exposure of 600s.
2.3 Experimental set up for hydrogen producing reactions
Fig. 2.3 illustrates the experimental set up for hydrogen producing reactions. It is a home-
made furnace (1ftx1ftx1ft) which facilitates the study for effect of gases over a bed of
solid/liquid at various temperatures. Solid samples are put in an alumina boat and placed
at the hot spot position in an alumina tubular furnace (18.5" long and 0.7" in diameter).
Before reaction, nitrogen gas is used to create an inert atmosphere. Once the required
temperature is attained, the flow of nitrogen gas is ceased to zero and the desired gas
(CH4 or CO) is fed to the furnace. As required, steam is also delivered to the furnace as
shown in Fig. 2.3. However, steam flow rates are not controlled.

18
Figure 2.3 Experimental set up for study of hydrogen producing reactions
The extent of proposed hydrogen producing reaction is analyzed by calculating the
amount of sodium carbonate. The mixture of product (Na2CO3) and un-reacted reactant
(NaOH) is titrated against 0.1009 N volumetric standard solution of nitric acid (Aldrich).
The equivalent points are detected by using acid-base indicators (Phenolphthalein and
Methyl Orange). The equivalents can be detected by using acid-base indicators; here
phenolphthalein and methyl orange are the indicators. NaHCO3 does not form in the
reaction but it does during titration:
Na2CO3 + HNO3 → NaHCO3+ HNO3
and then
NaHCO3+ HNO3 → NaNO3+CO2+H2O
CH4/CO

19
2.4 Experimental set up for study of carbon dioxide capture reaction
Figure 2.4 Experimental arrangements for study of metal oxide-carbon dioxide reactions.
Few grams of oxide are put inside a closed cylindrical vessel (1.25” long and 0.35”
internal diameter) with specific amount of water is also sprinkled on the reactor walls as
shown in Fig. 2.4. Chemically pure and pressurized carbon dioxide gas (Airgas) is passed
into this system. Before experiments, carbon dioxide gas is flushed three times to ensure
a pure carbon dioxide atmosphere inside the reactor. The reactions are performed for
desired set of time, temperature and pressure conditions.
2.5 Multi anvil press
Multi anvil press is a two-stage type apparatus able to reach pressure maximum of 25GPa
and temperature maximum of 2400°C [3]. The first stage consists of six stainless steel
wedges which enclose the second stage in a cubic cavity. The force is applied to the
wedges by single ram. The second stage of anvils consists in eight tungsten carbide cubes

20
with truncated corners. These cubes are hold together using epoxy-impregnated fiberglass
laminate sheets which also insure electrical insulation with the wedges. The pressure cell
is a sintered MgO octahedron. The pressure cell is compressed in the octahedral cavity
formed by the truncated cubes.
Figure 2.5 14/8 “G2” Assembly
The sample loaded in the octahedron shown in Fig. 2.5 is heated by a Rhenium Furnace.
A LaCrO3 sleeve is inserted around the heater for thermal insulation. The sample is
encapsulated in a Rhenium capsule and placed in MgO sleeve to insure quasi-hydrostatic
conditions. The temperature is measured close to the sample using a thermocouple
(W5%Re-W26%Re) in an Al2O3 sleeve.

21
Tungsten carbide anvils are used to generate high pressure. Pyrophyllite gasket and
extruding pressure medium support the large stress gradients generated in the anvils. The
pressure is driven by a hydraulic system. The pressure generated in the cell depends on
the truncation edge- length (TEL) of the tungsten carbide cube and on the octahedral
edge-length (OEL) if the octahedron as well as on materials used and on the cross-
sectional dimensions of the gaskets. Different assemblies are named after the ratio of
these two lengths; OEL/TEL in mm. increasing the OEL/ TEL ratio results in a decrease
of the sample size and in an increase of the pressure range.
The press can be used to perform different types of experiments such as
(1) Synthesis and sintering under high temperature and/or high pressure
(2) Study of phase diagram
(3) Electrical conductivity
(4) Ultra-sonic measurements
2.6 Brunauer–Emmett–Teller analysis
When a solid is exposed in a closed environment to a gas or vapor at a definite pressure,
the solid begins to adsorb the gas [4]. As a consequence, increase in weight of the solid
and decrease in the pressure of the gas can be observed. However, after a time the
pressure becomes constant and correspondingly the weight ceases to increase any further.
The amount of the adsorbed gas can either be calculated from the drop in pressure by use
of gas laws or can be determined directly as the increase in weight of the solid. The
quantity of the gas adsorbed by a sample is proportional to the mass m of the sample.
Assuming n is the quantity of adsorbed gas in moles per gram of solid,
22
𝑛𝑛 = 𝑓𝑓(𝑝𝑝,𝑇𝑇,𝑔𝑔𝑔𝑔𝑔𝑔, 𝑠𝑠𝑠𝑠𝑠𝑠𝑠𝑠𝑠𝑠)
The adsorption of a gas by solid can yield valuable information about surface area and
pore structure of the solid. As the range of suitable adsorptives is quite narrow, by far the
most frequently used one being nitrogen at its boiling point, 77K. The concept of BET
theory is an extension of Langmuir theory with the hypothesis: (a) gas molecules adsorb
on solids in layers; (b) no chemical or physical interaction is assumed between two
adsorption layers; and (c) each layer abides the Langmuir theory.
The surface area of a solid is inversely proportional to the size of the constituent particles
(𝐴𝐴 ∝ 1 𝑙𝑙). However, in practice, constituent particles are of different sizes and irregular
shapes and thus the relationship is more complicated. The particles of fine powder
(primary particles) sticks together more or less firmly under the action of surface forces
to form secondary particles. A pore system constitutes the space between the primary
particles within a secondary particle, together with those between a secondary particle
and its neighbors. The size and shape of individual pores vary within a given solid.
Below is the classification of pores according to their average width originally proposed
by Dubinin and then officially accepted by International Union of Pure and Applied
Chemistry.
23
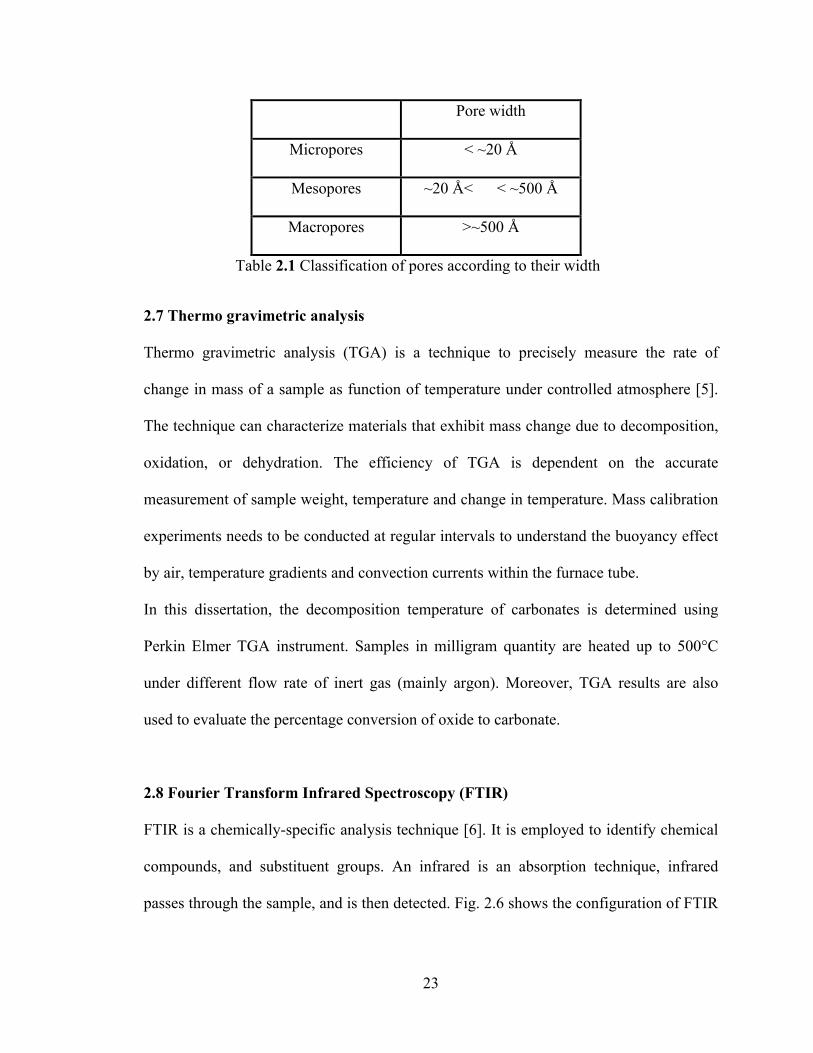
Pore width
Micropores < ~20 Å
Mesopores ~20 Å< < ~500 Å
Macropores >~500 Å
Table 2.1 Classification of pores according to their width
2.7 Thermo gravimetric analysis
Thermo gravimetric analysis (TGA) is a technique to precisely measure the rate of
change in mass of a sample as function of temperature under controlled atmosphere [5].
The technique can characterize materials that exhibit mass change due to decomposition,
oxidation, or dehydration. The efficiency of TGA is dependent on the accurate
measurement of sample weight, temperature and change in temperature. Mass calibration
experiments needs to be conducted at regular intervals to understand the buoyancy effect
by air, temperature gradients and convection currents within the furnace tube.
In this dissertation, the decomposition temperature of carbonates is determined using
Perkin Elmer TGA instrument. Samples in milligram quantity are heated up to 500°C
under different flow rate of inert gas (mainly argon). Moreover, TGA results are also
used to evaluate the percentage conversion of oxide to carbonate.
2.8 Fourier Transform Infrared Spectroscopy (FTIR)
FTIR is a chemically-specific analysis technique [6]. It is employed to identify chemical
compounds, and substituent groups. An infrared is an absorption technique, infrared
passes through the sample, and is then detected. Fig. 2.6 shows the configuration of FTIR

24
spectrometers based on Michelson Interferometer. At the interferometer, light strikes the
beam splitter and splits in half. First half is directed to moving mirror (to and fro
movement) and other half to the fixed mirror. After reflections from these mirrors, the
beam splitter recombines the light which is further guided towards the sample. This light
is absorbed by the sample and recorded by the detector.
Figure 2.6 Schematic for FTIR Spectroscopy
2.9 Sieverts-type apparatus HyEnergy PCTPro-2000
PCTPro-2000 is fully automated Sievert’s apparatus for measuring gas sorption
properties of the materials. It can precisely measure the PCT (Pressure Composition
Isotherms), Gas Sorption Kinetics, Heat-of-Formation, Volume Calibration and Packing
Density measurements. This instrument is designed for accurate measurements over

25
broad range of temperature, pressure and size. It can measure sample quantities down to
milligrams and the temperature can be raised up to 400°C.
The amount of gas absorbed or desorbed by the material is pressure and temperature
dependent and thus needs to be precisely evaluated. A large number of hydrides desorb
hydrogen via multi-step reactions and HyEnergy PCTPro-2000 can be used to obtain the
hydrogen desorption rate. Here, standard start-up procedures, namely, leak check, purge
gas and volume calibration at 50°C is used. The de-hydrogenation experiments for
multinary complex hydrides are performed in a static vacuum (~0.01-0.05 bar). The
temperature programmed desorption measurements are performed between 50-380°C
with a heating ratio of 5°C/min. After 7 h the vacuum is adjusted to the original level
because of pressure increase in the experimental set-up and reservoir caused by hydrogen
evolution from the sample and temperature change since temperature programmed
desorption is applied. The blank tests performed under temperature programmed
desorption conditions to estimate the approximate error of the whole measurement in the
vacuum and up to ~1 bar resulted in negligible wt.% changes (up to ~0.1 wt.%). The
error of the measured temperature can be estimated to be at ±2-3°C.
2.10 Differential Scanning Calorimetry (DSC)
DSC is a thermoanalytical technique used to determine the work done on a given sample
for phase transformation and decomposition [7]. The sample and reference materials are
maintained at nearly equal temperature. When sample undergoes an exothermic process
(such as crystallization), less heat is required to raise the sample temperature. The
difference of heat flow is accounted as a function of temperature. Therefore, DSC plot

26
determines the value of heat absorbed or released during any phase transition. DSC can
be used to observe fusion, crystallization, glass transition, oxidation and other chemical
reaction.

27
2.11 References
[1] V.K. Pecharsky, P.Y.Zavalij, Fundamentals of Powder Diffraction and Structural Characterization of Materials, Springer, New York, 2nd ed., 2009
[2] J.R. Ferraro, K. Nakamoto, Introductory Raman Spectroscopy, Academic Press, London, 1994.
[3] G.Y. Bussod, T. Katsura, D.C. Rubie, Pure and applied geophysics, 1993, 141, 579-599.
[4] S.J. Gregg, K.S.W. Sing, Adsorption, Surface Area and Porosity, Academic Press, London, 2nd ed., 1982.
[5] D. Clement, Inorganic Thermogravimetric Analysis, Elsevier, New York, 2nd ed., 1963.
[6] D.A. Burns, E.W. Ciurczak, Handbook of near Infra-red Analysis, CRC Press, Boca Raton, 3rd ed., 2008.
[7] G.W.H. Hohne, W.F. Hemminger, H.J. Flammersheim, Differential Scanning Calorimetry, Springer, New York, 2nd ed., 2003.
28
3. CLEAN PRODUCTION ROUTES OF HYDROGEN
3.1 LITERATURE REVIEW
Hydrogen is the lightest and most abundant element on the earth. However, unlike
oxygen, hydrogen is not found as free in the nature at any significant concentration.
Hydrogen is an important starting ingredient for chemical, metallurgical, pharmaceutical,
food and electronic industries. Ammonia synthesis and oil refineries together consumes
about three-fourth of the total hydrogen produced in United States.
The principal methods for the production of hydrogen include water-electrolysis and
natural gas reforming processes [1]. However, photo-electrolysis, photo-biological
production and high temperature decomposition are in the developing stage. Thus,
extensive research and development is needed to mature these technologies for any future
commercial applications.
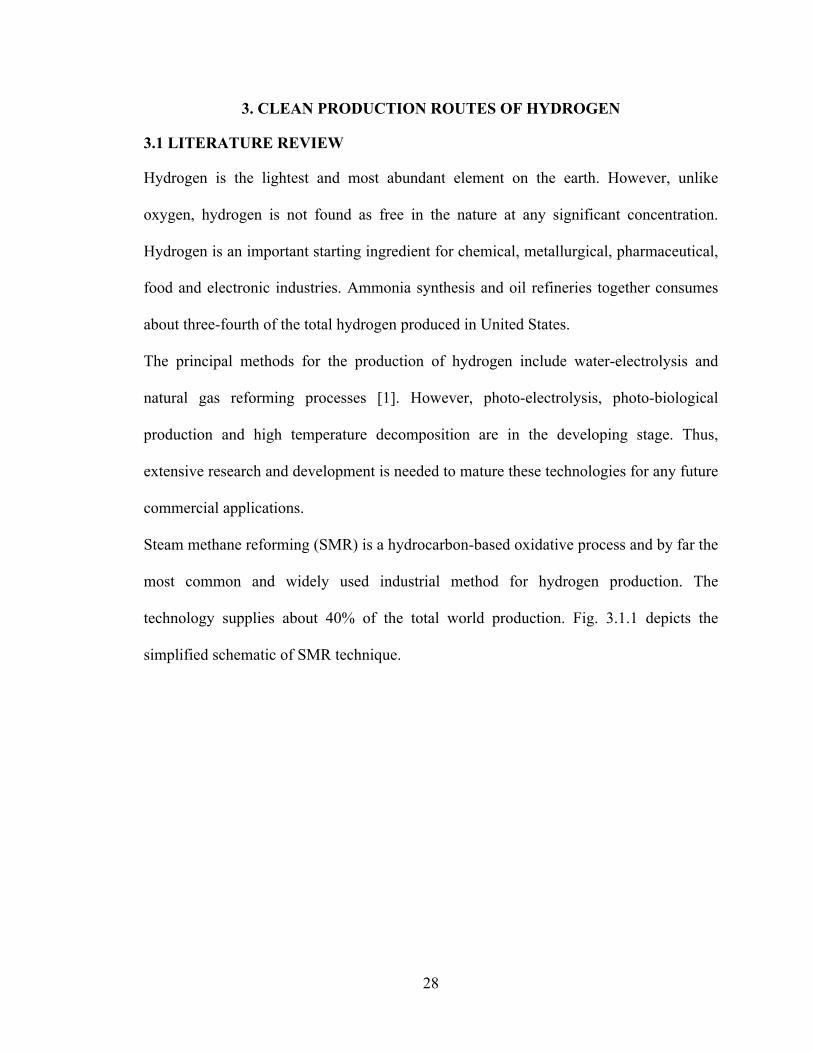
Steam methane reforming (SMR) is a hydrocarbon-based oxidative process and by far the
most common and widely used industrial method for hydrogen production. The
technology supplies about 40% of the total world production. Fig. 3.1.1 depicts the
simplified schematic of SMR technique.

29
Figure 3.1.1 Simplified schematic of hydrogen production using SMR technique
The operating units of an SMR plant consists of methane gas desulphurization unit, steam
reforming, water-gas shift reactors, hydrogen gas separation and carbon dioxide removal
unit. WGS catalysts are prone to sulfur poisoning and thus a high degree desulphurization
is required. Sulfur-organic compounds such as thiols are first transformed into hydrogen
sulfide by catalytic hydrogenation reaction (Co-Mo catalysts, 290-370°C). Hydrogen
sulfide is further scrubbed using ZnO (340-390°C) and forms ZnS. In the reforming
reactor, the preheated mixture of methane (500°C) and steam (2.6MPa, 500°C) is passed
through externally heated reformer tubes filled with nickel catalyst, where the following
reaction occurs:
CH4 (g) + H2O (g) → CO (g) + 3H2 (g) (3.1.1)
The gaseous mixture of carbon monoxide, steam and hydrogen leaves the reforming
reactor at around 800-900°C. The mixture is cooled instantaneously to 350 °C (steam
generation step) and is fed to WGS reactors. Carbon monoxide reacts with steam to form
carbon dioxide and generates additional hydrogen. The combination of high and low
temperature WGS reactors consumes 92% of the carbon monoxide in the reformate gas.
30
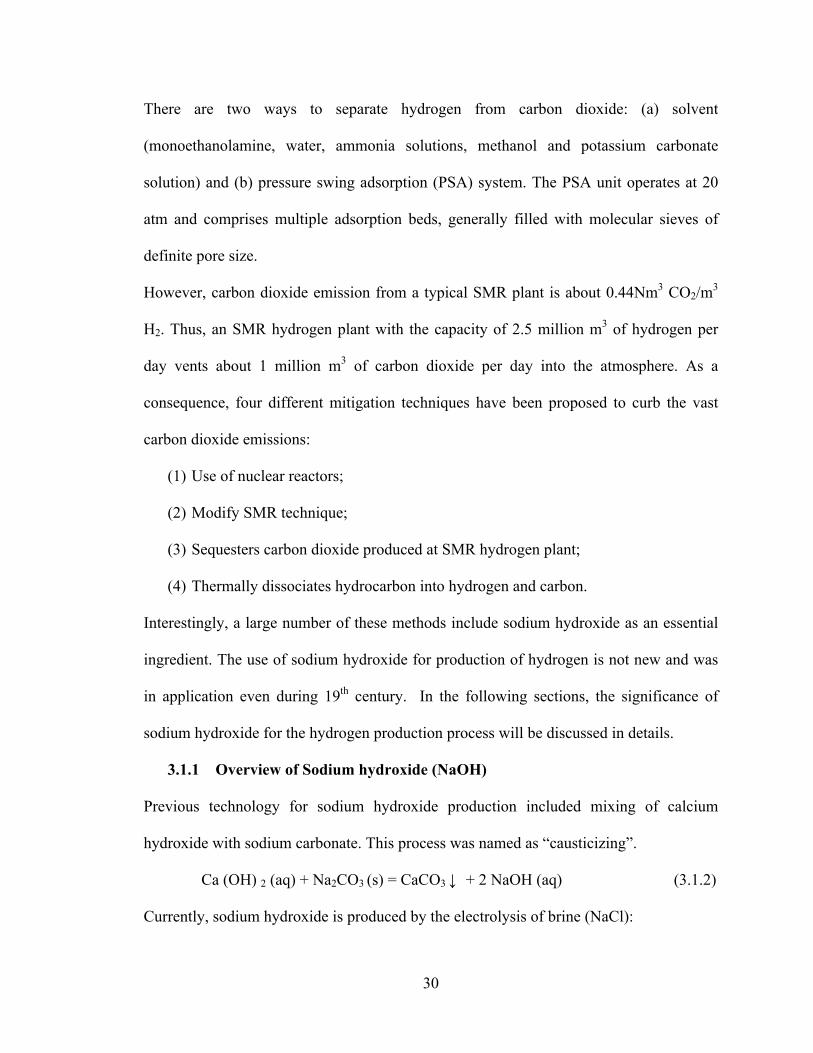
There are two ways to separate hydrogen from carbon dioxide: (a) solvent
(monoethanolamine, water, ammonia solutions, methanol and potassium carbonate
solution) and (b) pressure swing adsorption (PSA) system. The PSA unit operates at 20
atm and comprises multiple adsorption beds, generally filled with molecular sieves of
definite pore size.
However, carbon dioxide emission from a typical SMR plant is about 0.44Nm3 CO2/m3
H2. Thus, an SMR hydrogen plant with the capacity of 2.5 million m3 of hydrogen per
day vents about 1 million m3 of carbon dioxide per day into the atmosphere. As a
consequence, four different mitigation techniques have been proposed to curb the vast
carbon dioxide emissions:
(1) Use of nuclear reactors;
(2) Modify SMR technique;
(3) Sequesters carbon dioxide produced at SMR hydrogen plant;
(4) Thermally dissociates hydrocarbon into hydrogen and carbon.
Interestingly, a large number of these methods include sodium hydroxide as an essential
ingredient. The use of sodium hydroxide for production of hydrogen is not new and was
in application even during 19th century. In the following sections, the significance of
sodium hydroxide for the hydrogen production process will be discussed in details.
3.1.1 Overview of Sodium hydroxide (NaOH)
Previous technology for sodium hydroxide production included mixing of calcium
hydroxide with sodium carbonate. This process was named as “causticizing”.
Ca (OH) 2 (aq) + Na2CO3 (s) = CaCO3 ↓ + 2 NaOH (aq) (3.1.2)
Currently, sodium hydroxide is produced by the electrolysis of brine (NaCl):
31
2NaCl + 2H2O = 2NaOH + Cl2 ↑ + H2 ↑ (3.1.3)
Besides hydrogen evolution, reaction (3.1.3) produces chlorine (a toxic gas) and sodium
hydroxide. Moreover, the electrolysis of brine is also a high energy consuming process.
Thus, the combined effect of high energy requirement and emission of chlorine gas
makes the production of sodium hydroxide using electrolysis of brine, an
environmentally unsafe process.
Table 3.1.1 compares the three commercially available production methods for sodium
hydroxide. It can be observed that diaphragm cell process produces the lowest quality
electrochemical caustic soda solutions (only 12wt. %). Therefore, evaporation is required
to raise the concentration up to 50 wt. % solution as in mercury-cell process. Hence, the
amount of steam consumption varies according to the strength of the produced
electrochemical caustic soda solutions.
Factors Diaphragm Mercury Membrane
Use of mercury No Yes No
Cl2 as a byproduct Yes No Yes
Operating current density (kA/m2) 0.9-2.6 8-13 3-5
Cell voltage (V) 2.9-3.5 3.9-4.2 3.0-3.6
NaOH strength (wt. %) 12 50 33-35
Energy consumption (kWh/MTCl2 )
at a current density (kA/m2) 2720(1.7) 3360(10) 2650(5)
Steam consumption (kWh/MT Cl2 )
for concentration to 50% NaOH 610 0 180
% NaOH produced in USA 62 10 24
Table 3.1.1 Comparison of the commercially available production methods for sodium
hydroxide

32
Figure 3.1.2 illustrates the membrane cell used for the electrolysis of brine.
Figure 3.1.2 Membrane cell process schematic for production of sodium hydroxide.
3.1.2 NaOH assisted Hydrogen Production Schemes
3.1.2.1 Modified Industrial Hydrogen Production
Reaction between NaOH and CO yielding sodium formate (HCOONa) was described by
Berthelot in 1856. When heated above 250ºC, HCOONa transforms into oxalate with
release of hydrogen:
NaOH (s) + CO (g) = HCOONa (s) (3.1.4)
2HCOONa(s) = Na2C2O4(s) + H2 (g) (3.1.5)
In 1918 Boswell and Dickson demonstrated that when carbon monoxide is heated with
excess of sodium hydroxide at temperatures at which formate is transformed into oxalate,
oxidation almost quantitatively to carbon dioxide occurs with the evolution of an
equivalent amount of hydrogen [2]:
2 NaOH (s) + CO (g) = Na2CO3(s) + H2 (g) (3.1.6)

33
Large scale hydrogen producing methods such as coal-gasification and WGS reaction
needs to be modified. Coal-gasification process requires coal as a raw material and is a
very energy intensive process. However, the WGS method is an exothermic reaction and
operates at a high to low temperature. WGS reaction is an integral step for SMR
technique as it produces additional hydrogen. Therefore, any modifications to these
conventional techniques that can significantly reduce carbon dioxide emission are highly
desired.

34
Figure 3.1.3 (a) equilibrium in the system 2NaOH+ C+ H2O (b) equilibrium composition
in the system 2NaOH+ CO (c) equilibrium in the system 4NaOH+ C+ CO2 (d) the gas-
shift reaction CO + H2O
Saxena proposed reaction (3.1.7) and performed the thermodynamic calculation using the
software FACTSAGE and the databases therein [3]. Although reaction (3.1.7) is
endothermic, it can mitigate carbon dioxide emission by forming Na2CO3. Na2CO3 and
H2 are generated over a wide range of temperature (100-800°C).
2NaOH(s) + C(s) + H2O (g) → Na2CO3(s) + 2 H2 (g) ∆H = 645.8 kJ (600oC) (3.1.7)
(a) (b)
(c) (d)

35
Reaction (3.1.8) can be considered as a combination of the Boudouard reaction (C + CO2
→ CO) and Reaction 3.1.6 (2NaOH + CO→Na2CO3 + H2):
4NaOH(s) + C(s) + CO2 (g) → 2Na2CO3(s) + 2 H2 (g) ∆H = -662 kJ (600oC) (3.1.8)
Sodium in the above reactions may be replaced by potassium.
In the subsequent sections of this chapter, thermodynamic calculation shows that the
addition of sodium hydroxide to methane, coal and carbon monoxide lowers the
operating temperature and can significantly reduce the carbon dioxide emission.
A similar concept of including sodium hydroxide as a reactant for hydrogen production is
already in use at industrial scale. For instance, the black liquor gasification process
utilizes alkali hydroxide to serve the dual purpose of hydrogen production and carbon
sequestration. In a typical pulping process for paper production, approximately one-half
of the raw materials are converted to pulp and other half is dissolved in the black liquor.
The black liquor solution consists of well- dispersed carbonaceous material, steam and
alkali metal which are burned to provide part of energy for the plant. Due to the presence
of carbonaceous material and water in the liquor, following carbon-water reaction
predominates:
C (s) + H2O (g) = CO (g) + H2 (g) (3.1.9)
CO (g) + H2O (g) = CO2 (g) + H2 (g) (3.1.10)
However, due to the thermodynamic limitations, reaction (3.1.10) never proceeds towards
completion; therefore hydrogen concentration does not exceed a certain limit. However,
in the presence of sodium hydroxide, carbon dioxide capture medium, the equilibrium

36
can be shifted to drive reaction (3.1.10) towards completion and therefore maximize
hydrogen concentration. Consequently, carbon monoxide and carbon dioxide
concentration reduces significantly in the product gases.
3.1.2.2 Biomass
Biomass is a renewable energy resource obtained from solar energy, carbon dioxide and
water. Biomass does not increase carbon dioxide level in the atmosphere as it uptakes the
same amount of carbon while growing as releases when burnt as a fuel.
Biomass + heat + steam → H2 + CO + CO2 + CH4 + Light/ Heavy hydrocarbons + Char (3.1.11)
One of the major issues other than high carbon emission in biomass gasification is to deal
with tar formation that occurs during the gasification process. The undesirable tar may
cause the formation of tar aerosol and a more complex polymer structure, which are
unfavorable for hydrogen production through steam reforming. The existing methods to
minimize tar formation are: (a) proper designing of gasifier (b) proper control and
operation and (c) use of additives or catalysts.
Sodium hydroxide-promoted biomass gasification to generate hydrogen without carbon
monoxide and carbon dioxide formation generates hydrogen and capture carbon [4].
Cellulose [C6H10O5], D-glucose [C6H12O6] and sucrose [C12H22O11] reacts with water
vapor in the presence of sodium hydroxide to form sodium carbonate and hydrogen.
However, the product consists of hydrocarbons such as methane and thus lowers the %
hydrogen yield. Nickel catalysts supported on alumina can reduce the formation of
methane and increase the hydrogen yield to roughly 100% [5-9]. The mechanism of

37
alkali promoted steam gasification of biomass indicates that the dehydrogenation of
cellulose in presence of Na+ and OH- ions yields hydrogen. The concentration of Na+ and
OH- ions strongly influences the dehydrogenation of cellulose [10-11].
Despite that the sodium hydroxide-promoted reaction provides many advantages; the
alkali metal costs and their recycling are major concerns [12] Su et al used a new catalyst
derived from sodium aluminum oxide (Al2O3.Na2O), Al2O3.Na2O.xH2O/NaOH/Al(OH)3,
to increase the hydrogen content in the product after steam gasification of cellulose. The
gasification temperature was kept below 500ºC to prevent any tar formation [13-14].
Moreover, sodium hydroxide can also significantly decrease the pyrolysis temperature of
biomass species [15]. Sodium ion, being small, can penetrate into the biomass texture and
break the hydrogen bridges. Consequently, devolatilization occurs rapidly. Thus, it can be
seen that sodium hydroxide does play a significant role in biomass gasification.
3.1.2.3 Metals
Metals can react in the presence or absence of water and sodium hydroxide to produce
hydrogen. Transition metals form metal oxides and hydrogen during the reaction with
sodium hydroxide [16]. Moreover, ferrosilicon when reacts with sodium hydroxide
produces sodium silicate and hydrogen [17]. Here, we focus on the Al-NaOH-H2O
system.
Hydrogen gas is generated from the chemical reaction between Al and water (3.7wt% H2,
theoretical yield) [18].Al/H2O system is indeed a safe method to generate hydrogen. But
the system has kinetic limitations as the metal surface passivation in neutral water occurs

38
more easily and the metal activity with water is extremely low. Thus, improving the
aluminum activity in water is an important task. To solve the problem of surface
passivation of aluminum, various solutions have been suggested so far. The solutions
either include the addition of hydroxides [19-20] metal oxides [21-22] selected salts [23-
24] or alloying aluminum with low melting point metal [25-28]. Alkali-promoted Al/H2O
system is favored over other metal systems because of high hydrogen generation rate.
When the reaction between aluminum and water is assisted by alkali, OH- ions are able to
destroy the protective oxide layer on the aluminum surface forming aluminate ions, AlO2-
.
The reaction between aluminum and water with sodium hydroxide solution produces
hydrogen, which can be expressed as follows [3.1.12]
2Al + 6H2O + NaOH → 2 NaAl(OH)4↓ + 3H2 ↑ (3.1.12)
NaAl(OH)4 → NaOH + Al(OH)3↓ (3.1.13)
Sodium hydroxide consumed for the hydrogen generation in exothermic reaction (3.1.12)
will be regenerated through the decomposition of NaAl (OH)4 via reaction (3.1.13).
Reaction (3.1.13) also produces a crystalline precipitate of aluminum hydroxide. The
combination of above two reactions completes the cycle and shows that only water will
be consumed in the whole process if the process is properly monitored. Previous works
reported kinetics of the reaction between aluminum and water with sodium hydroxide
solution and calculated the activation energy in the range of 42.5-68.4 kJ/mol [29, 30].
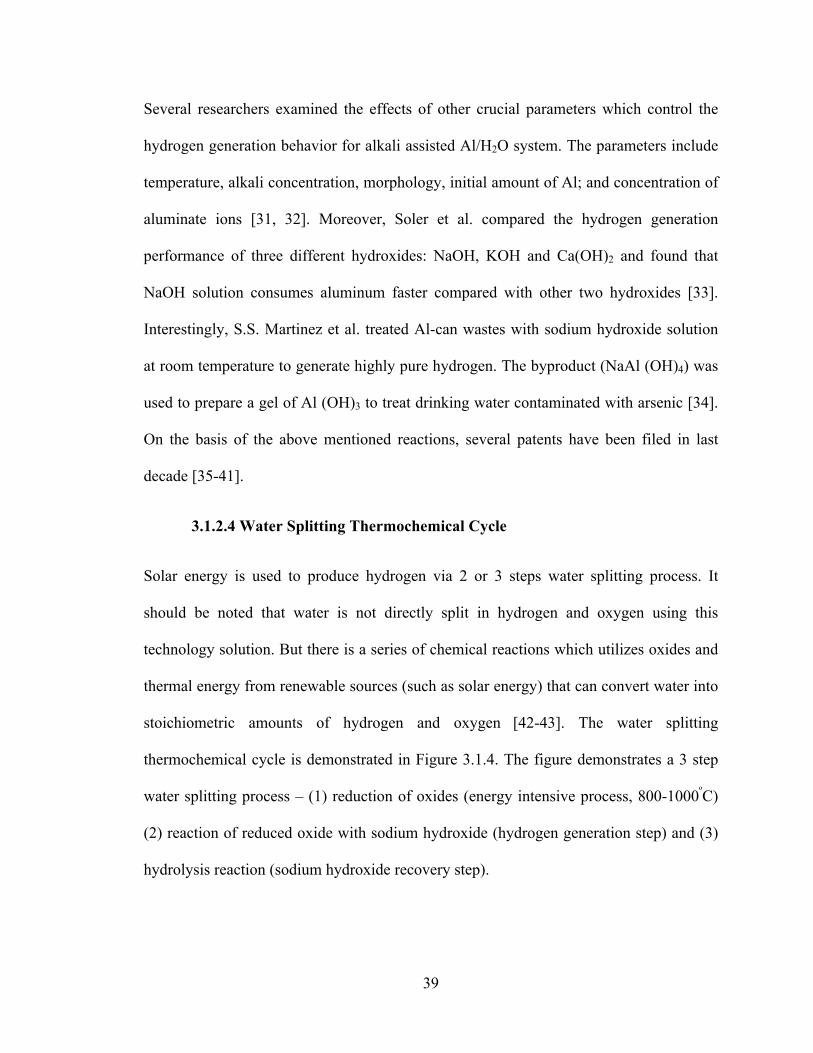
39
Several researchers examined the effects of other crucial parameters which control the
hydrogen generation behavior for alkali assisted Al/H2O system. The parameters include
temperature, alkali concentration, morphology, initial amount of Al; and concentration of
aluminate ions [31, 32]. Moreover, Soler et al. compared the hydrogen generation
performance of three different hydroxides: NaOH, KOH and Ca(OH)2 and found that
NaOH solution consumes aluminum faster compared with other two hydroxides [33].
Interestingly, S.S. Martinez et al. treated Al-can wastes with sodium hydroxide solution
at room temperature to generate highly pure hydrogen. The byproduct (NaAl (OH)4) was
used to prepare a gel of Al (OH)3 to treat drinking water contaminated with arsenic [34].
On the basis of the above mentioned reactions, several patents have been filed in last
decade [35-41].
3.1.2.4 Water Splitting Thermochemical Cycle
Solar energy is used to produce hydrogen via 2 or 3 steps water splitting process. It
should be noted that water is not directly split in hydrogen and oxygen using this
technology solution. But there is a series of chemical reactions which utilizes oxides and
thermal energy from renewable sources (such as solar energy) that can convert water into
stoichiometric amounts of hydrogen and oxygen [42-43]. The water splitting
thermochemical cycle is demonstrated in Figure 3.1.4. The figure demonstrates a 3 step
water splitting process – (1) reduction of oxides (energy intensive process, 800-1000ºC)
(2) reaction of reduced oxide with sodium hydroxide (hydrogen generation step) and (3)
hydrolysis reaction (sodium hydroxide recovery step).

40
Any thermodynamically favorable oxide can be selected and use to generate hydrogen.
Thus, so far, a large number of oxides have been considered. The water splitting
thermochemical cycle reactions can be mainly classified as (1) 2- step water splitting [44-
48] (2) iodine-sulfur process [49-51] and (3) calcium-bromine process [52-54].
Figure 3.1.4 Schematic for Water Splitting Thermochemical Cycle (MO= metal oxide)
Here, we focus only on alkali metal assisted water splitting thermochemical cycles and
summary of the previous experimental results can be found elsewhere [55]. The presence
of sodium hydroxide is able to reduce the hydrogen generation reaction temperature.
Recently, Miyoka et al considered sodium redox reaction and conducted several
experiments in a non-equilibrium condition but could not achieve a 100% conversion
[56]. It was attributed to the slow kinetics of both the hydrogen generation reaction and
sodium recovery. Moreover, sodium hydroxide facilitates oxidation in the water splitting
step. But the volatility of sodium hydroxide at temperature higher than 800ºC and
incomplete Na+ extraction by water to recover sodium hydroxide limits its application.

41
Several research groups concluded that even though sodium or sodium hydroxide assisted
reaction has major advantages; their recovery could be a big challenge. Interestingly,
Weimer et al recommends membrane separation to recover sodium hydroxide [57]. Few
researcher groups also pointed out the possibility of using sodium carbonate rather than
sodium hydroxide [58, 60].
Besides sodium hydroxide recovery, there are other limitations too. For instance, the
reduction of oxides requires a very high temperature. If such a high temperature will be
provided by the solar energy, a large scale solar heat plant is needed. Thus at present, the
construction of thermochemical hydrogen production plants is restricted by the location,
cost and safety issues. Therefore, the major challenge is to lower the operating
temperature of water splitting process. A low temperature water splitting process will
allow the utilization of small-scale solar heat systems or even exhaust heat from
industries. As sodium hydroxide can significantly reduce the operating temperature of the
water splitting process, hence sodium hydroxide has a major role to play.
3.1.2.5 Organic Compounds
(a) Formic acid (HCOOH)
Formic acid and its solution are industrial hazards. Any use of such chemical waste will
be of a great advantage. Formic acid is considered for both hydrogen production and
storage. Basically, formic acid can produce hydrogen using two methods: (1) Thermo
catalytic decomposition and (2) Electrolysis in presence of sodium hydroxide.

42
Formic acid thermally decomposes to produce hydrogen and carbon dioxide (ΔGº = -32.9
kJ/mol, ΔHº = 31.2 kJ/mol), which is actually the reversible reaction of carbon dioxide
hydrogenation [61-69]. Electrolysis of formic acid solutions in the presence of sodium
hydroxide requires theoretically much lower energy than water [70]. Hence, use of formic
acid solution to generate hydrogen will have double benefits of tackling pollution and
generating clean energy. The electrochemical reaction for the electrolysis of formic acid
solutions is as follows [71]:
Anode: HCOOH + OH- → CO2 + H2O + 2e-
Cathode: 2H2O + 2e- → H2 + 2OH-
Overall reaction: HCOOH → H2 + CO2 (3.1.14)
Figure 3.1.5 demonstrates the scheme of electricity generation via the combined use of
alkaline hydroxide (sodium hydroxide) for the electrolysis of formic acid (HCOOH) and
fuel cell. The separation of hydrogen and carbon dioxide is desired prior to injection in
the fuel cell.
Figure 3.1.5 Electricity generation using alkaline hydroxide (NaOH) for the
electrolysis of HCOOH

43
(b) Formaldehyde (HCHO)
An aqueous solution of formaldehyde when mixed with sodium hydroxide produces very
small amount of hydrogen [72]. Thus, it is obvious that hydrogen evolution competes
with the disproportionation of formaldehyde to corresponding alcohol and acid [73, 74].
Further, Ashby et al proposed a mechanistic explanation of hydrogen evolution from
formaldehyde in the presence of sodium hydroxide [75].The mechanism indicates that
one hydrogen atom originates from the water and the other from the organic moiety. The
experimental study exhibits that when a dilute solution of formaldehyde (4x10⁻⁴M) reacts
with concentrated sodium hydroxide (19M) at room temperature, hydrogen is produced in
a significant amount. However, concentrated solution of formaldehyde when interacts
with dilute sodium hydroxide solution produces only a trace amount of hydrogen.
When solution of hydrogen peroxide is mixed with formaldehyde in presence of sodium
hydroxide, hydrogen is generated [76]. Hydrogen peroxide oxidizes formaldehyde to
formic acid and sodium hydroxide further neutralizes the acid.
H2O2 + 2HCHO + 2NaOH = 2HCOONa + H2 + 2H2O (3.1.15)
However, no trace of hydrogen is observed in the absence of sodium hydroxide [77-79].
The reaction (3.1.15) is limited by slow kinetics and requires a large excess of alkali
hydroxide. When hydrogen peroxide is replaced by cuprous oxide, hydrogen is generated
in a quantitative amount.

44
3.1.3 Conclusion
The use of sodium hydroxide for hydrogen production is justified by the high reaction
rate, lower operating temperature and overall reduction in carbon dioxide emission.
Depending on the reaction and its conditions, sodium can produce or store hydrogen.
Moreover, several situations illustrate how sodium hydroxide binds with carbon dioxide
and forms valuable chemical compound, Na2CO3.
However, a major limitation for the inclusion of sodium hydroxide as one of the primary
ingredients for generating hydrogen is the production route of sodium hydroxide itself. At
present, energy intensive process (electrolysis of brine) is the prime method to produce
sodium hydroxide.
In the following sections, sodium hydroxide is included as a reactant in major fossil fuels
based hydrogen producing technologies is explained.

45
3.1.4 References
[1] R.F. Probstein, R.E. Hicks, Synthetic fuels, 3rd ed. New York: Dover Publications, 2006.
[2] M.C. Boswell, J.V. Dickson, Journal of the American Chemical Society, 1918, 40, 1779–1786.
[3] S. K. Saxena, V. Drozd, A. Durygin, International Journal of Hydrogen Energy, 2008, 33, 3625-3631.
[4] M. Ishida, S. Takenaka, I. Yamanaka, K. Otsuka, Energy & Fuels, 2006, 20, 748–753.
[5] T. Minowa, Z. Fang, Journal of Chemical Engineering of Japan, 1998, 31,488–491.
[6] T. Minowa, Z. Fang, T. Ogi, G. Varhegyi, Journal of Chemical Engineering of Japan, 1998, 31,131–134.
[7] R. Muangrat, J.A. Onwudili, P.T. Williams, International Journal of Hydrogen Energy, 2010, 35, 7405-7415.
[8] J.A. Onwudili, P.T. Williams, International Journal of Hydrogen Energy, 2009, 34, 5645-5656.
[9] S. Su, W. Li, Z. Bai, H. Xiang, J. Bai, International Journal of Hydrogen Energy, 2010, 35, 4459-4465.
[10] R. Muangrat, J.A. Onwudili, P.T. Williams, Applied Catalysis B: Environmental. 2010, 100, 440–449
[11] M. Ishida, K. Otsuka, S. Takenaka, I. Yamanaka, Journal of Chemical Technology and Biotechnology, 2005, 80, 281–284.
[12] S. Su, W. Li, Z. Bai, H. Xiang, International Journal of Hydrogen Energy, 2008, 33, 6947-6952.
[13] S. Su, W. Li, Z. Bai, H. Xiang, J. Bai, Journal of Fuel Chemistry & Technology, 2010, 38, 270-274.
[14] J. Wang, M. Zhang, M. Chen, F. Min, S. Zhang, Z. Ren , Y. Yan, Thermochimica Acta, 2006, 444, 110–114.
[15] D. D. Williams, J.A. Grand, R.R. Miller, Journal of the American Chemical Society, 1956, 78, 5150-5155.
[16] Annual Report National Advisory Committee for aeronautics.Washigton,DC:1934.

46
[17] H.Z. Wang, D.Y.C. Leung, M.K.H. Leung, M. Ni, Renewable and Sustainable Energy Reviews, 2009, 13, 845–853.
[18] D. Belitskus, Journal of the Electrochemical Society, 1970, 117, 1097–1099.
[19] C.R. Jung, A. Kundu, B. Ku, J.H. Gil, H.R. Lee, J.H. Jang, Journal of Power Sources, 2008, 175, 490-494.
[20] Z.Y. Deng, Y.B. Tang, L.L. Zhu, Y. Sakka, J. Ye, International Journal of Hydrogen Energy, 2010, 35, 9561-9568.
[21] P. Dupiano, D. Stamatis, E.L. Dreizin, International Journal of Hydrogen Energy, 2011, 36, 4781-4791.
[22] J. Skrovan, A. Alfantazi, T. Troczynski, Journal of Applied Electrochemistry, 2009, 39, 1695-1702.
[23] L. Soler, J. Macana´s, M. Mun˜oz, J. Casado, Proceedings of International Hydrogen Energy. Congress and Exhibition IHEC, Istanbul, Turkey, 2005
[24] W. Wang, D.M. Chen,K. Yang, International Journal of Hydrogen Energy, 2010, 35, 12011-12019.
[25] J.T. Ziebarth , J.M. Woodall, R.A. Kramer, G. Choi, International Journal of Hydrogen Energy, 2011, 36,5271-5279.
[26] M.Q. Fan, F. Xu, L.X. Sun, Energy & Fuels, 2007, 21, 2294-2298.
[27] A.V. Ilyukhina, O.V. Kravchenk, B.M. Bulychev, E.I. Shkolnikov, International Journal of Hydrogen Energy, 2010, 35,1905-1910.
[28] Y.A. Aleksandrov, E.I. Tsyganova, A.L. Pisarev Russian Journal of General Chemistry, 2003, 73, 689–694.
[29] A.Z. Zhuk, A.E. Sheindlin, B.V. Kleymenov, Journal of Power Sources, 2006, 157, 921–926.
[30] D. Stockburger, J.H. Stannard, B.M.L. Rao, W. Kobasz, C.D. Tuck, Proceedings & Symposium on the Hydrogen Storage Materials, Batteries & Electrochemistry, 1992, 92,431–444
[31] L. Soler, J. Macana´s, M. Mun˜oz, J. Casado, Journal of Power Sources, 2007, 169,144–149.
[32] , , A. Gallegosa, P.J. Sebastia´n, Solar Energy Materials & Solar Cells, 2005, 88, 237–243.

47
[33] G.F. Brindley, US Patent 909536, 1909.
[34] G.F. Brindley, M. Bennie, US Patent 934036, 1909.
[35] G.C. Gill, US Patent 2721789, 1955.
[36] J.H. Checketts, US Patent 5728464, 1998.
[37] J.H. Checkettes , US Patent 5817157, 1998.
[38] E.R. Andersen, E.J. Andersen, US Patent 6506360, 2003
[39] E.R. Andersen, E.J. Andersen, US Patent 2003/0118505 A1, 2003.
[40] E.R. Andersen, US Patent 2004/0115125 A1, 2004.
[41] S.A. Yalc, International Journal of Hydrogen Energy, 1989, 14, 551-561.
[42] S. Abanades, P. Charvin, G. Flamant, P. Neveu, Energy, 2006, 31, 2805-2822.
[43] J.D. Holladay, J. Hu, D.L. King, Y. Wang, Catalysis Today, 2009, 139,244-260.
[44] T. Nakamura, Solar Energy, 1977, 19, 467-475.
[45] F. Sibieude, M. Ducarroir, A. Tofighi, J. Ambriz, International Journal of Hydrogen Energy, 1982, 7, 79-88.
[46] J.J. Ambriz, M. Ducarroir, F. Sibieude, International Journal of Hydrogen Energy, 1982, 7,143-153
[47] A. Weidenkaff, A. Steinfeld, A. Wokaun, P.O. Auer , B. Eichler , A. Reller, Solar Energy, 1999, 65,59-69.
[48] M. Lundberg, International Journal of Hydrogen Energy, 1993, 18,369-376.
[49] D. O’Keefe, C. Allen, G. Besenbruch, L. Brown, J. Norman, R. Sharp, International Journal of Hydrogen Energy, 1982, 7,381-392
[50] M. Sakurai, H. Nakajima, R. Amir, K. Onuki, S. Shimizu, International Journal of Hydrogen Energy, 2000, 25,613-619.
[51] S. Kubo, H. Nakajima, S. Kasahara, S. Higashi, T. Masaki, H.A. Abe, Nuclear Engineering & Design, 2004, 233, 347-354.
[52] H. Kameyama, K. Yoshida, International Journal of Hydrogen Energy, 1981, 6, 567-575.
48
[53] H. Kameyama, Y. Tomino, T. Sato, R. Amir, A. Orihara, M. Aihara, International Journal of Hydrogen Energy, 1989, 14, 323-330
[54] M. Sakurai, E. Bilgen, A. Tsutsumi, K. Yoshida, International Journal of Hydrogen Energy, 1996, 21, 865-70.
[55] S. Kumar, S. K. Saxena, Materials and processes for energy: communicating current research and technological developments, Ed. A. Mendez-Vilas, Formatex Research Center (Badajoz, Spain), 2013, In Press.
[56] H. Miyoka, T. Ichikawa, N. Nakamura, Y. Kojima, International Journal of Hydrogen Energy, 2012, 37, 17709-17714.
[57] A. Weimer, H2A analysis for Manganese oxide based solar thermal water splitting cycle. University of Colorado, STCH, 2008.
[58] Y. Tamura, A. Steinfeld, P. Kuhn, K. Ehrensberger, Energy, 1995, 20,325–330.
[59] M. Sturzenegger, J. Ganz, P. Nüesch, T. Schelling, Journal de Physique archives, 1999, 09, Pr3–331–Pr3–335
[60] B. Xu, Y. Bhawe, M.E. Davis, Proceedings of the National Academy of Sciences, 2012, 109, 9260–9264.
[61] P.B. Kreider, H.H. Funke, K. Cuche, M. Schmidt, A. Steinfeld , A.W. Weimer, International Journal of Hydrogen Energy, 2011, 36, 7028-7037
[62] P. Charvin, S. Abanades, E. Beche, F. Lemont, G. Flamant, Solid State Ionics, 2009, 180, 1003–1010.
[63] W. Leitner, E. Dinjus, F. Gaßner, Journal of Organometallic Chemistry, 1994, 475, 257 –266.
[64] R.S. Coffey, Chemical Communications, 1967, 18: 923b–924.
[65] T. Yoshida, Y. Ueda, S. Otsuka, Journal of the American Chemical Society, 1978, 100, 3941 –3942.
[66] R.S. Paonessa, W.C. Trogler, Journal of the American Chemical Society, 1982, 104, 3529 –3530.
[67] I. Joszai, F. Joo, Journal of Molecular Catalysis A: Chemical, 2004, 224: 87–91.
[68] Y. Gao, J.K. Kuncheria, G.P.A. Yap, R.J. Puddephatt, Chemical Communications,1998, 21,2365 – 2366.

49
[69] J.H. Shin, D.G. Churchill, G. Parkin, Journal of Organometallic Chemistry, 2002, 642, 9–15.
[70] B. Loges, A. Boddien , F. Gartner, H. Junge, M. Beller, Topics in Catalysis, 2010, 53, 902–914.
[71] S. Fukuzumi, T. Suenobu, S. Ogo, US Patent application no US2010/ 0034733 A1
[72] W.L. Guo, L. Li, L.L. Li, S. Tian, S.L. Liu,Y.P. Wu, International Journal of Hydrogen Energy, 2011, 36, 9415-9419
[73] A. Majewski, D.J. Morris, K. Kendall, M.A. Wills, ChemSusChem, 2010, 3, 431-434.
[74] O. Loew, Berichte der deutschen chemischen Gesellscha, 1887, 20, 144-145.
[75] E.C. Ashby, F. Doctorovich, C.L. Liotta, H.M. Neumann, E.K. Barefield, A. Konda , K. Zhang, J. Hurley, D.D. Siemer, Journal of the American Chemical Society, 1993, 115, 1171-1173.
[76] M.F. Ansell, S. Coffey, E.H. Rodd, Rodd’s Chemistry of Carbon Compounds.2nd ed. Amesterdam, Elsiever, 1965.
[77] S. Kapoor, S. Naumov, Chemical Physics Letters, 2004, 387, 322–326.
[78] A. Harden, Journal of the Society of Chemical Indusry, 1899, 15, 158-159.
[79] C.N. Satterfield, R.E. Wilson, R.M. LeClair, R.C. Reid, Analytical Chemistry, 1954, 26, 1792 -1797.

50
3.2 MODIFIED STEAM-METHANE-REFORMATION (MSMR)
3.2.1 Introduction
A major problem in using hydrogen for transportation is the use of the SMR technique
[1] for hydrogen production. This technique causes a large carbon emission and requires
metal-based catalysis. There are several proposed methods being currently under study to
solve this problem [2-6]. In this chapter, steam-methane-reformation is modified using
sodium hydroxide, producing hydrogen with zero carbon emission. The purpose of this
chapter is to show that production of hydrogen with zero emission could be a very
profitable business. Once this problem is solved, the technology already exists which can
use hydrogen as a fuel-carrier in many applications.
The Steam-methane reformation
The cheapest and most common method of producing commercial bulk hydrogen as well
as the hydrogen used in the industrial synthesis of ammonia is considered to be the one
involving the reactions at high temperatures (700–1100°C) and in the presence of
a metal-based catalyst (nickel). Steam reacts with methane to yield carbon monoxide and
hydrogen:
CH4 + H2O → CO + 3 H2 (endothermic, requires heat) (3.2.1)
Additional hydrogen can be recovered by a lower-temperature gas-shift reaction with
the carbon monoxide produced. The reaction is:
CO + H2O → CO2 + H2 (exothermic, produces heat) (3.2.2)

51
The United States produces nine million tons of hydrogen per year, mostly with steam
reforming of natural gas.
The modified reaction
The modified reaction is as follows:
CH4 + 2 NaOH + H2O = Na2CO3 + 4H2 (3.2.3)
A comparison of the standard SMR reaction and the modified reaction is shown in
Fig.3.2.1a and 3.2.1b. These thermodynamic calculations as well as the experiments
conducted [7] show clearly that a) the modified reaction proceeds at lower temperatures
and b) the metal-based catalysis is not required. The total energy requirement for the
combined SMR and gas-shift reactions for the complete reaction (maximum hydrogen
production) is 430 kJ/mol of methane (at 1200 K) versus 244 kJ (at 700 K) for the
modified reaction.
Figure 3.2.1 (a) equilibrium in the system methane-water and (b) when modified by
addition of sodium hydroxide
(a) (b)

52
The result of modifying the SMR reaction by introducing sodium hydroxide is presented.
Further, the possibility of reducing the temperature by catalysis is checked. Variously
sized nickel powder is used to demonstrate the effect on temperature.
3.2.2 Experimental Section
The reaction:
2NaOH (s) + CH4 (g) + H2O (g) → Na2CO3(s) + 4H2 (g) (3.2.3)
was studied experimentally. Anhydrous Sodium hydroxide was supplied by Sigma-
Aldrich with a purity of 98%. About 0.1 gm of sodium hydroxide was dissolved using a
minimal amount of distilled water in an alumina boat and then this crucible was put in a
tubular furnace with an alumina tube. Once the required temperature was attained, the
flow rate of nitrogen gas was decreased from 50ml/min to zero and the methane gas was
fed at a few different rates.
Initially, the formation of carbonate was studied at 600, 700 and 800°C. At each
temperature the reaction was carried out for 30 minutes fixed time with the methane flow
varying between 10 to 25 ml/min. Further, the effect of catalysts was determined keeping
constant flow rate of methane (25ml/min). Nickel Powder (2-5 µm) with a purity of
99.99% was delivered by Aldrich and used as a catalyst for this reaction. This catalytic
behavior was also studied for different sizes of nickel powder produced by ball milling.
Nickel is of a low cost, high activity and widely employed catalyst for the industrial
application [8]. Various studies have been done so far which use nickel and support it as
a catalyst which resulted in a better performance of SMR reaction [9-12]. Methane

53
dissociates at nickel surface and enhances % efficiency. The nickel powder is
homogenously mixed with NaOH which is spread in a thin layer. On melting, the powder
will spread with nickel distributed evenly.
The determination of the amount of soda formed during the reaction was performed by
titrating the product against 0.1009 N volumetric standard solution of Nitric acid
(Aldrich). The products of reaction were analyzed by powder X-ray diffraction using
Bruker GADDS/D8 X-ray system with Apex Smart CCD Detector and Mo Kα-radiation.
Ball milling of a catalyst was performed using planetary Retsch PM100 ball mill.
3.2.3 Results and Discussion
Flow rate of methane m/l8 10 12 14 16 18 20 22 24 26 28
Perc
ent c
onve
rsio
n to
car
bona
te
65
70
75
80
85
90
95
100
600 C700 C800 CFitted curves
Figure 3.2.2 Results relating the formation of sodium carbonate as a function of the
methane flow. In 30 minutes, the reaction in an open system is completed at any
temperature above 600°C. One data point at 700°C was not included in the fitting
procedure.
54
The results are shown in Fig.3.2.2. There is one anomalous point at 700°C which was not
included in the regression analysis which gives us the following equation
% yield = 28.772 + 4.868 b -0.083 b2 (r ²=0.9997) (3.2.4)
The good fit shows the internal consistency of the results.
ball milled 400oCball milled 300oC
400oC
300oC
Time, minute0 20 40 60 80 100
%C
onve
rsio
n
30
40
50
60
70
80
90
100
110
500oC 500oC repeated600oC 800oC
Figure 3.2.3.The data on % conversion of NaOH to Na2CO3 as a function of temperature
and time for 25ml/min methane flow rate. An estimate of error is provided by the
repeated experiment at 500oC. The curves are smoothed spline fit to show the trends. No
catalyst was used.
Fig.3.2.3 shows the % amount of soda formed from the initial sodium hydroxide at
temperatures of 500, 600 and 800oC. The estimated error is around 5% as may be judged
from the repeated results at 500oC. In 30 minutes, the reaction is essentially complete at

55
600oC without using any metal catalyst. According to X-ray diffraction study, the product
of complete reaction is decahydrate of sodium carbonate, Na2CO3·10H2O.
In 1918, P. Sherrer explained that when parallel monochromatic radiation falls on a
random oriented mass of crystals, the diffracted beam is broadened when the particle size
is small. The two major informations that can be obtained from peak width analysis are
crystallite size and lattice strain. Here, crystallite size of the catalysts is determined.
Crystallite size represents the size of coherently diffracting domain. Due to the presence
of polycrystalline aggregates, crystallite size is generally not the same as of particle size.
The diffraction patterns from the different ball milled catalysts have been observed based
on Bragg’s law nλ= 2dsinθ, where n is an integer, λ is the wavelength of Mo Kα1
radiation, d is inter planar spacing and θ is the diffraction angle. The output from the X-
ray analysis of these catalysts yields various plots of intensity versus angle of diffraction.
The evaluation of XRD peak broadening inherently adds error due to the instrument
interference. Therefore, it is necessary to eliminate this problem. To do so, it is customary
to collect a diffraction pattern from the line broadening of a standard material such as
LaB6 to determine the instrumental broadening.
The Scherrer equation explains the relationship between mean crystallite size and
diffraction line breadth. The equation that was employed here is
𝐷𝐷 = 0.9𝜆𝜆(β− β0) Cosθ (3.2.5)
Where, λ= wavelength of X-ray (Mo Kα=0.71073Å)
56
β = breadth at half maximum intensity of a peak
β0 = breadth at half maximum intensity of highly crystalline material (LaB6)
θ = Bragg angle, half of the spectrometer angle
The calculated crystallite size of different catalysts is reported in Table 3.2.1.
Crystallite Size
Raw
2h
3h
4h
(Å)
304.8
265.7
239.9
184.7
Table 3.2.1 Crystallite size for variously milled nickel catalysts
The result shows that prolonged ball milling time has generated much lower crystallite
size and thus increased specific surface area for the catalysts. 4h ball milled nickel has the
minimum crystallite size and therefore maximum specific surface area. However, its
catalytic activity is the lowest. The reason could be the agglomeration of particles that
happened at prolonged ball milling. This causes the reduction in the effective surface area
exposed for gas adsorption onto the catalytic material.
Fig.3.2.4 shows the distribution of particle size for different catalysts. The Gaussian fitted
graph to the chart clarifies that the average particle size increases from 3-4 micron (for
raw nickel) to 33-38 micron (for 4h ball milled nickel). Referring to SEM image of the
catalysts (Fig.3.2.9), it clearly shows that the platelets at 2h ball milling time grew larger
as the ball milling time progressed.

57
Figure 3.2.4 Nickel particle size distribution for (a) Raw (b) 2h ball milled
(c) 3h ball milled (d) 4h ball milled
(a) (b)
(c) (d)

58
X-ray diffraction study of the different sized nickel revealed the absence of any oxide
peaks of nickel. Nickel was observed un-oxidized for any ball milling duration. In
Fig.3.2.5, the peak width broadened as time of milling was increased. So, the observation
of smaller crystallite size at higher ball milling time seemed to be in congruency with the
X-ray results.
Figure 3.2.5 X-ray diffraction patterns for different time ball milled nickel catalysts
While the result in Fig.3.2.6 shows substantial improvement over the unmodified SMR
reaction, we decided to study the effect of catalysis on the reaction using variously ball
milled nickel catalyst. Nickel was used as 3 wt. % of the initial amount of sodium
hydroxide. Different size of nickel was considered.
59
ball milled 400oCball milled 300oC
400oC
300oC
Time, minute0 20 40 60 80 100
%C
onve
rsio
n
0
20
40
60
80
100
120
300oC, no catalyst400oC, no catalyst 500oC, no catalyst 300oC, catalyst400oC, catalyst500oC, catalyst
Figure 3.2.6 Effect of using 2h ball milled nickel catalyst. The arrows show the
significant change in the conversion amount for a given time
Fig.3.2.6 shows a comparison of the ball milled results with the data when no catalyst
was used. As can be seen from the figure that there is a substantial effect of the ball
milled catalyst on the carbonation reaction. This effect is most pronounced at lower
temperature, where the conversion increases by close to 30% (Fig.3.2.7). But the effect
decreases with temperature such that the conversion in 30 minutes is 100% complete
between 500 to 550oC for the catalyzed sample whereas it takes only 600oC for the
sample without catalysis (Fig.3.2.7).

60
400oC
300oC
Temperature oC250 300 350 400 450 500 550 600 650
%C
onve
rsio
n
30
40
50
60
70
80
90
100
110
Ball-milled catalyst
No catalyst
Figure 3.2.7. The experimental data on a sample with catalysis and without for 30
minutes between 300 to 600oC
In the experiments as described above, ball milled nickel for 2h was used. The effect of
the duration of ball milling on the catalyst and resulting conversion is shown in Fig.
3.2.8. Four cases are compared, one with no catalyst, second with un-ball-milled catalyst,
third and fourth with the catalyst ball-milled for 2 and 4h respectively. It appears that
ball-milling beyond 2h leads to a decatalytic effect as may be noted from the data on the
sample with 4h ball milled nickel.

61
Time, minutes0 20 40 60 80 100
% C
onve
rsio
n
0
20
40
60
80
100
%conversion = a + b*t + c*t-2t = minute No cat Raw cat Ball milleda = 21.00 34.34 47.78b = 0.73 0.57 0.526c =-886.0 -3268.4 -2938.5
Ball milled Catalyst, 2hr
Raw catalyst
No catalystBall milled 4 hrs
Figure 3.2.8 The effect of variously ball-milled catalyst on the carbonation reaction at
300oC
To understand this phenomenon, we studied the ball milled samples with SEM. Fig. 3.2.9
shows the results.

62
Figure 3.2.9 SEM images of nickel particles (a) without ball milling magnification 2000x
(b) Ball milled for 2 hrs, magnification 2000x (c) Ball milled for 3 hrs, magnification
1000x; (d) Ball milled for 4 hrs, magnification 2000x.
The morphology of as-received nickel particles is uneven and particle sizes are ranging
from 2-5 µm. Ball milled for 2h nickel has a platelet like structure with small thickness
and therefore has the highest ratio of surface area to volume. However, this ratio
drastically decreases as prolonged ball milling was performed. The globular particles of
the catalyst (Fig.3.2.9a) become platelets after milling for 2h (Fig.3.2.9b). After a
continued grinding for 4h, the platelets instead of decreasing in size become larger
(a) (b)
(c) (d)

63
(Fig.3.2.9d). The increased size would cause a decrease in the surface area leading to the
reverse effect. Such decrease in a surface area of nickel powder with increasing ball
milling time might be related to the absence of any milling media or dispersant.
Figure 3.2.10 The effect of different alkali hydroxide on the Carbonation reaction at
400°C.
In Fig. 3.2.10 effect of alkali hydroxide on the methane transformation rate at 400oC is
shown for three alkali hydroxides. The carbonate formation rate becomes higher in the
following order: KOH ≈ NaOH > LiOH. The similar observation of hydroxide reactivity
is reported by Ishida et al. for the coal – alkali hydroxide – steam reaction [13] and by
Kamo et al. for PVC or activated carbon steam gasification reaction [14]. The authors [M.
Ishida] correlated such a change in hydroxide reactivity with their melting points. In our
case, the reaction occurs with high rate well below the melting point of the hydroxides.
Thus, change in reactivity of alkali hydroxides can be related with their alkalinity rather
than with melting point differences.
0 15 30 45 60 75 90 105 120 1350
20
40
60
80
100
C
onve
rsio
n (%
)
T ime (m in)
N aO H L iO H K O H

64
3.2.4 Economic Analysis
A method can be only useful to industry if it is economically viable. The economics of
this process is as follows. For 40 tonnes of NaOH per hour+ 8 tonnes of methane feed,
we produce 4 tonnes H2 and 53 tonnes of soda. The price variation of soda and of the
hydroxide [15] would determine the price of hydrogen. A simple calculation, not taking
account of the efficiency of the process, capital, operational and other costs, would show
that for a fixed price of hydrogen of $1000/tonne, the business would be profitable for a
variety of market situations. The method of calculations is illustrated in Fig. 3.2.11. It
shows if the price of the product soda and the reactant hydroxide is balanced, a plant
owner with access to the hydroxide would earn a substantial profit. Losses would result if
the demand for soda and hydrogen decreases and that of sodium hydroxide increases.
More likely, if the proposed method is adopted the price of soda may increase due to the
demand on hydrogen.
Cost calculations
Price difference -100 -50 0 50 100
Annu
al p
rofit
$m
illion
-40
-20
0
20
40
60
80
Upper: soda at $300/tonneLower: soda at $200/tonneDashed: Including cost of operation
Figure 3.2.11 The price difference in soda and sodium hydroxide determines the price of
hydrogen. In this example the price of hydrogen is fixed at $1000/tonne. If the price of
soda goes below the sodium hydroxide by $30/tonne, the method may not be profitable.
65
Note that sodium hydroxide is produced by the overall reaction for the electrolysis of
brine as:
2NaCl + 2H2O → Cl2 + H2 + 2NaOH (3.2.6)
The reaction produces chlorine and sodium hydroxide in approximately equal amounts.
Depending on which demand is dominant, either chlorine or NaOH can be regarded as a
by-product and the price varies accordingly. Price fluctuations can be extreme: in the spot
market in cases of oversupply, caustic soda prices can be as low as $ 20-30 per tonne
whereas, in short supply, prices can be $ 300 and higher per tonne [16]. One may offset
the vagary of the price fluctuation by converting the caustic soda to soda [17] because
caustic soda can be substituted for soda ash in many uses, particularly in the pulp and
paper, water treatment, and certain chemical sectors.
Unfortunately the chlor-alkali plants produce several more tons of carbon dioxide than
we can sequester but as long as these plants exist and even grow in number all over the
developing countries, we have no control on their carbon emission. This method reduces
that emission that these plants produce and it does so with great profit to the plant
owners. Furthermore, the use of hydrogen produced with zero carbon emission will add
to the health of the environment. The following calculations show the environmental
impact of this process:
There are close to 50 plants in the US which could use the modified SMR technique and
each of the plants would produce 35040 tons of hydrogen annually. If we now accept that
a hydrogen car using an internal combustion engine would run 300 miles on a full tank of
hydrogen (8 kilograms) [18], we can run (35040000x300/8) 1,314,000,000 miles with

66
hydrogen produced from one plant. If each car drives on the average 10,000 miles, we
can run 131,400 cars on hydrogen produced from one plant or about 7 million cars from
all the 50 plants. This number is close to about 10% cars in the US. The number will
double if fuel-cell powered engines are used.
In summary, there is a way to produce hydrogen with zero emission by using the sodium
hydroxide from existing chlor-alkali plants. This modified SMR process removes a major
impediment in the use of hydrogen for vehicular transportation in a commercially viable
way.

67
3.2.5 References
1. R.F. Probstein, R.E. Hicks. Synthetic fuels. New York, Dover, 2006.
2. H.Z. Wang, D.Y.C. Leung, M.K.H. Leung, M. Ni, Renewable & Sustainable Energy Reviews, 2009, 13, 845-53.
3. A. Shakeel, A. Abdullah, R. Faizur, A. Al-Dawood, A.M. Fahad, Appl. Catal. A: Gen., 2009, 359, 1-24.
4. M. Nazim, International Journal of Hydrogen Energy, 2001, 26, 1165-1175.
5. V. Drozd, S. Saxena, S.V. Garimella, A. Durygin, International Journal of Hydrogen Energy, 2007, 32, 3370-3375.
6. Y. Kalinci, A. Hepbasli, I. Dincer, International Journal of Hydrogen Energy, 2009, 34, 8799-8817.
7. S. K. Saxena, V. Drozd, A. Durygin, International Journal of Hydrogen Energy, 2008, 33, 3625-3631.
8. C. Pistonesi, A. Juan, B. Irigoyen, N. Amadeo, Applied Surface Science, 2007, 253, 4427-4437.
9. Y. Matsumura, T. Nakamori, Applied Catalysis A: Gen., 2004, 258, 107-114.
10. K. Hou, R. Hughes, Chemical Engineering Journal, 2001, 82, 311-328.
11. T. Numaguchi, K. Shoji, S. Yoshida, Applied Catalysis A: Gen., 1995, 133, 241-262.
12. T. Nozaki, N. Muto, S. Kado , K. Okazaki, Catalysis Today, 2004, 89, 57-65.
13. M. Ishida, M. Toida, T. Shimizu, S. Takenaka, K. Otsuka , Industrial & Engineering Chemistry Research, 2004, 43,7204-7206.
14. T. Kamo, K. Takaoka, J. Otomo , H. Takahashi, J. Mater, Cycles Waste Management, 2006, 8,109-115.
15. Eurochlor report 1997. http://www.eurochlor.org/
16. http://www.icis.com/Articles/2009/12/30/9321358/OUTLOOK-10-US-chlor-alkali-on-a-tightrope.html

68
17. S. Dennis, D. Kostick, Soda Ash. U.S. Geological Survey, Mineral Commodity Summaries, January 1998. http://minerals.usgs.gov/minerals/pubs/commodity/soda_ash/610398.pdf
18. The hydrogen tank in BMW Hydrogen 7 takes up approximately 8 kilos (about 170 litres or 45 Imp gals) of liquid hydrogen, the conventional gasoline tank has a volume of 74 litres or 16.3 Imp gals. http://www.worldcarfans.com/10611145727/bmw-hydrogen-7-in-depth
69
3.3 CATALYTIC STUDY OF THE MODIFIED COAL GASIFICATION
PROCESS TO PRODUCE CLEAN HYDROGEN GAS
3.3.1 Introduction
One of the major industrial methods of hydrogen production, coal-gasification, requires
emission of several tonnes of carbon dioxide for each tonne of hydrogen and therefore, is
not helpful to the environment. The solution to this problem is still under research. Here,
the inclusion of sodium hydroxide in the coal gasification reaction lowers the reaction
temperature and produces a carbonate [1, 2].
2NaOH(s) +C(s) + H2O (g) = Na2CO3 (s) +2H2 (g) ΔH= 64.58 kJ (600 K) (3.3.1)
C(s) + 2H2O (g) = CO2 (g) + 2H2 (g) ΔH= 95.73 kJ (600 K) (3.3.2)
Reaction (3.3.2) is a well-established coal gasification process. This process is operated
between 500 and 1200°C in gasifiers. Gasifiers use steam, oxygen and/or air and produce
a mixture of CO2, CO, H2, CH4 and H2O. Carbon monoxide gas is further processed by
the shift-gas reaction to produce hydrogen with evolution of carbon dioxide. However,
modified coal gasification reaction (here, reaction (3.3.1)) uses sodium hydroxide as a
reactant which not only reduces the amount of required heat but also sequesters carbon
dioxide gas.
Sodium hydroxide has been employed as a reactant to facilitate various reactions which
are involved in the hydrogen gas production. Reichman et al. [3] suggested a process
called Ovonic renewable hydrogen (ORH). This method involves sodium hydroxide for
the reformation of organic matter to produce hydrogen gas. While, William et al. [4] used
sodium hydroxide as a promoter to produce hydrogen gas via hydrothermal gasification

70
of glucose and other biomass sample. Kamo et al. [5] pyrolyzed dehydrochlorinated
polyvinyl chloride (PVC) and activated carbon with sodium hydroxide and steam to
generate hydrogen gas and sodium carbonate with methane, ethane and carbon dioxide as
byproducts.
Nickel and Raney nickel are highly active and widely employed as catalysts for various
industrial processes [6-10]. Numerous studies have confirmed the significant role of
catalysts geometric factor, electronic factor and surface imperfections in determining
their catalytic activity [11-17]. Therefore, it is always reasonable to explore the possible
relation between the catalyst grain size and the reaction rate.
Here, different sized coal and catalysts particles are obtained using mechanical milling.
Mechanical milling is regarded as one of the simple and common methods to obtain
uniform distribution of composition. During mechanical process, powder particles
undergo severe deformation which leads to various crystal defects such as lattice strains,
dislocations, vacancies and morphological changes [18-20]. In this work, our focus is to
study the catalytic behaviour of different sized and shaped catalysts and also to learn
about the effect of using variously ball milled coal with this reaction.
3.3.2 Materials and Methods:
3.3.2.1 Catalysts preparation
The catalysts used for reaction (3.3.1) are nickel and Raney nickel. Nickel Powder (-100
mesh), Raney nickel (-325 mesh) were delivered by Sigma Aldrich and Acros Organics
respectively. A planetary Retsch PM100 ball milling machine has been used to reduce
the particle sizes of these catalysts. The cylindrical ball milling container has an internal

71
diameter and length of 1.6” each. The powder to ball weight ratio was 1/54. Milling time
varied from 1 to 4 h but the revolution speed (250 rpm) remained the same.
3.3.2.2 Catalyst Characterization
X-ray diffraction patterns for different catalysts were obtained using Bruker GADDS/D8
X-ray system with Apex Smart CCD Detector and Mo direct-drive rotating anode (50
kV; 20mA). JSM-5910-LV and JSM-6330F scanning electron microscope were used to
study the surface morphology of the catalysts.
Image J software was used to determine the average particle sizes of both coal and Raney
nickel catalysts. A total of nearly 50 particles were taken into consideration from 3-4
different SEM images to ensure a precise estimation of the average particle sizes.
3.3.2.3 Reaction Study
About 0.1 gm of anhydrous sodium hydroxide (Sigma Aldrich (98% purity)) was
homogeneously mixed with a stoichiometric amount of anthracite coal in an alumina boat
(reaction 1). Once the required temperature was attained, steam was allowed to pass
through the alumina tube. The catalysts were added in an amount of 3 wt. % of initial
weight of sodium hydroxide.
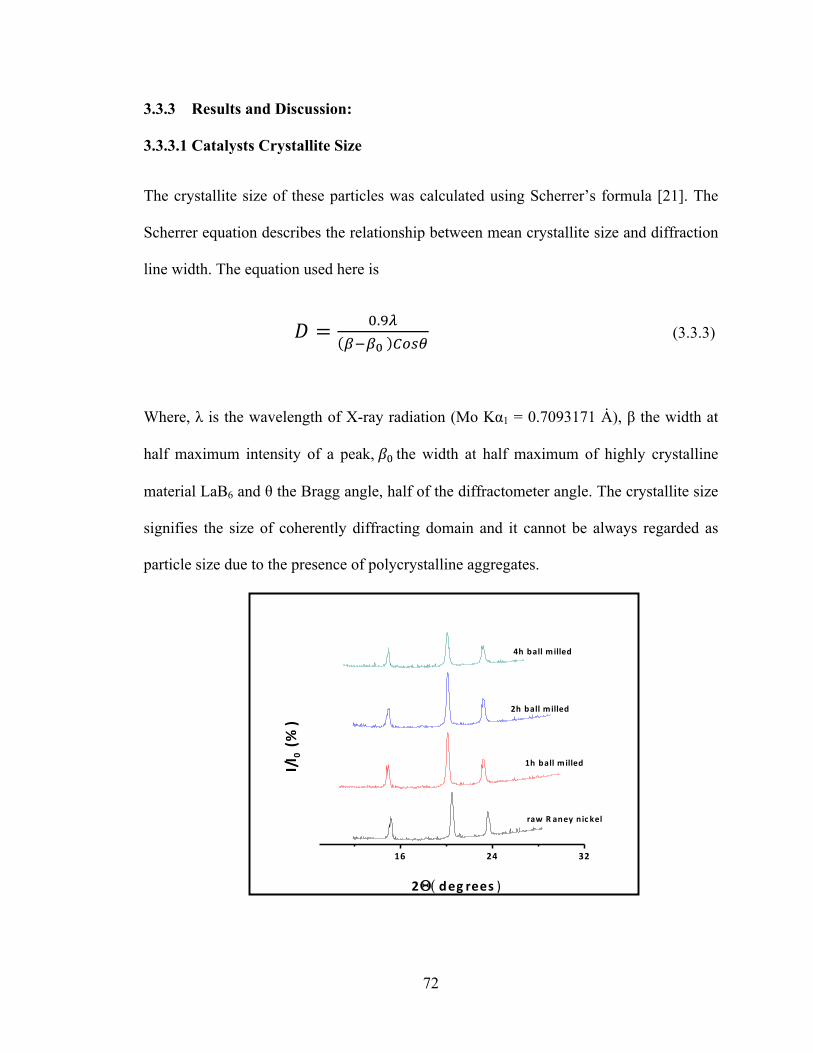
72
3.3.3 Results and Discussion:
3.3.3.1 Catalysts Crystallite Size
The crystallite size of these particles was calculated using Scherrer’s formula [21]. The
Scherrer equation describes the relationship between mean crystallite size and diffraction
line width. The equation used here is
𝐷𝐷 = .
(3.3.3)
Where, λ is the wavelength of X-ray radiation (Mo Kα1 = 0.7093171 Ȧ), β the width at
half maximum intensity of a peak, 𝛽𝛽 the width at half maximum of highly crystalline
material LaB6 and θ the Bragg angle, half of the diffractometer angle. The crystallite size
signifies the size of coherently diffracting domain and it cannot be always regarded as
particle size due to the presence of polycrystalline aggregates.
16 24 32
1h ball milled
4h ball milled
2h ball milled
raw R aney nic kel
I/I0 (%)
2ΘΘ( deg rees )

73
Figure 3.3.1 X-ray diffraction pattern for variously ball milled Raney nickel
Fig.3.3.1 illustrates the x-ray diffraction pattern for variously ball milled Raney nickel
catalysts. The crystallite sizes for raw, 1, 2 or 4h ball milled Raney nickel are 413, 347,
209 and 190 Å respectively. It can be seen that as the crystallite sizes decreased due to
ball milling, diffraction peaks shift towards the low angle direction and peak widths
increase. During the prolonged ball milling time, the energy produced by ball milling
drastically increases the strain rate and causes several modifications like vacancies,
atomic site interchanges and dislocations [12,22-23]. However, Raney nickel nullifies the
chance of any atomic site interchange but the possibility of formation and movement of
dislocations can not be denied. According to Fetch, the generation and movement of
dislocations could decrease grain size [24]. Here, it can be observed that for 2h ball
milled Raney nickel, there is relatively high % reduction in the crystallite sizes. This
suggests that the mechanical milling caused an intensive deformation for 2h ball milled
Raney nickel catalysts powders.
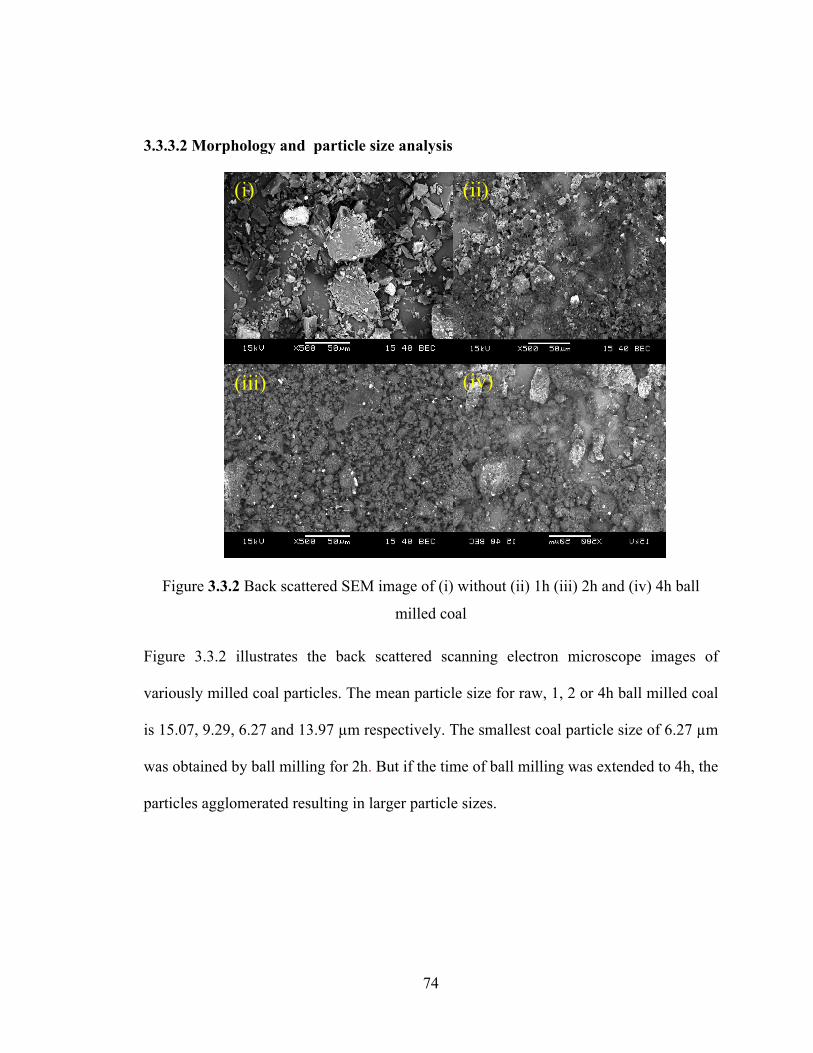
74
3.3.3.2 Morphology and particle size analysis
Figure 3.3.2 Back scattered SEM image of (i) without (ii) 1h (iii) 2h and (iv) 4h ball
milled coal
Figure 3.3.2 illustrates the back scattered scanning electron microscope images of
variously milled coal particles. The mean particle size for raw, 1, 2 or 4h ball milled coal
is 15.07, 9.29, 6.27 and 13.97 µm respectively. The smallest coal particle size of 6.27 µm
was obtained by ball milling for 2h. But if the time of ball milling was extended to 4h, the
particles agglomerated resulting in larger particle sizes.
(i) (ii)
(iii) (iv)

75
(i)
(ii)
Figure 3.3.3 SEM images of (i) variously ball milled Raney nickel each at 2000X magnification (ii) 2 h ball milled Raney nickel showing caves at 5000x magnification.
2h milled 4h milled
1h milled Raw
Caves
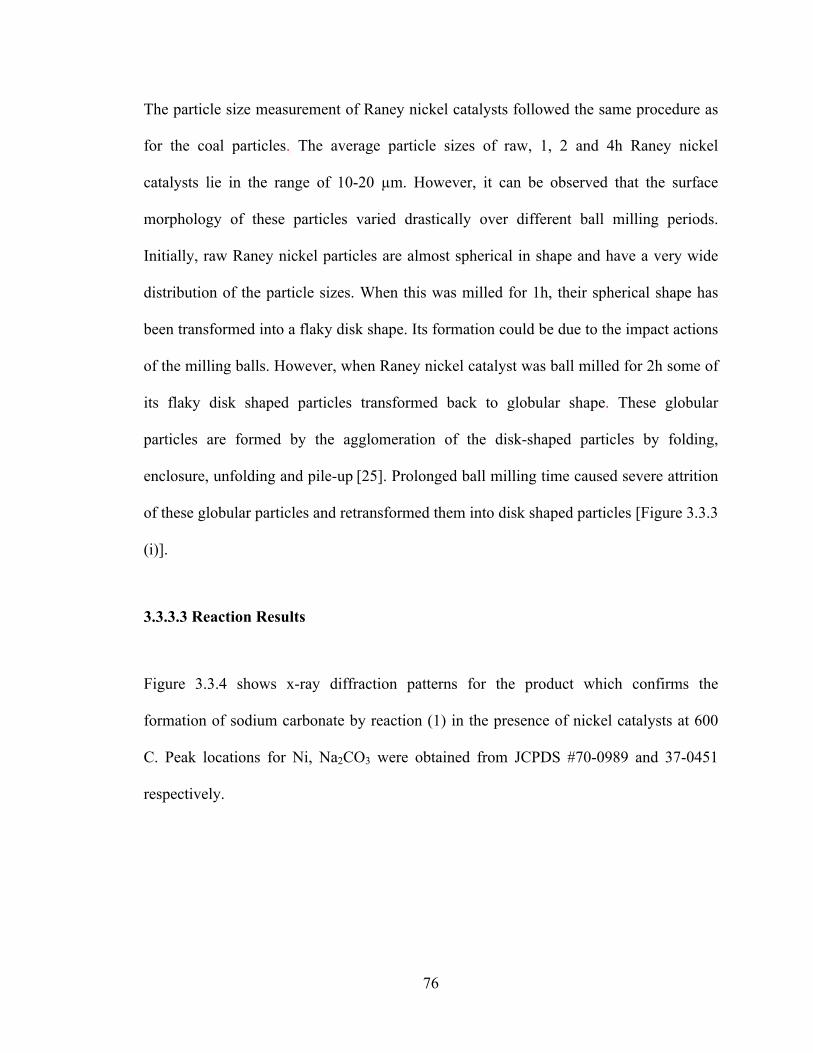
76
The particle size measurement of Raney nickel catalysts followed the same procedure as
for the coal particles. The average particle sizes of raw, 1, 2 and 4h Raney nickel
catalysts lie in the range of 10-20 µm. However, it can be observed that the surface
morphology of these particles varied drastically over different ball milling periods.
Initially, raw Raney nickel particles are almost spherical in shape and have a very wide
distribution of the particle sizes. When this was milled for 1h, their spherical shape has
been transformed into a flaky disk shape. Its formation could be due to the impact actions
of the milling balls. However, when Raney nickel catalyst was ball milled for 2h some of
its flaky disk shaped particles transformed back to globular shape. These globular
particles are formed by the agglomeration of the disk-shaped particles by folding,
enclosure, unfolding and pile-up [25]. Prolonged ball milling time caused severe attrition
of these globular particles and retransformed them into disk shaped particles [Figure 3.3.3
(i)].
3.3.3.3 Reaction Results
Figure 3.3.4 shows x-ray diffraction patterns for the product which confirms the
formation of sodium carbonate by reaction (1) in the presence of nickel catalysts at 600
C. Peak locations for Ni, Na2CO3 were obtained from JCPDS #70-0989 and 37-0451
respectively.
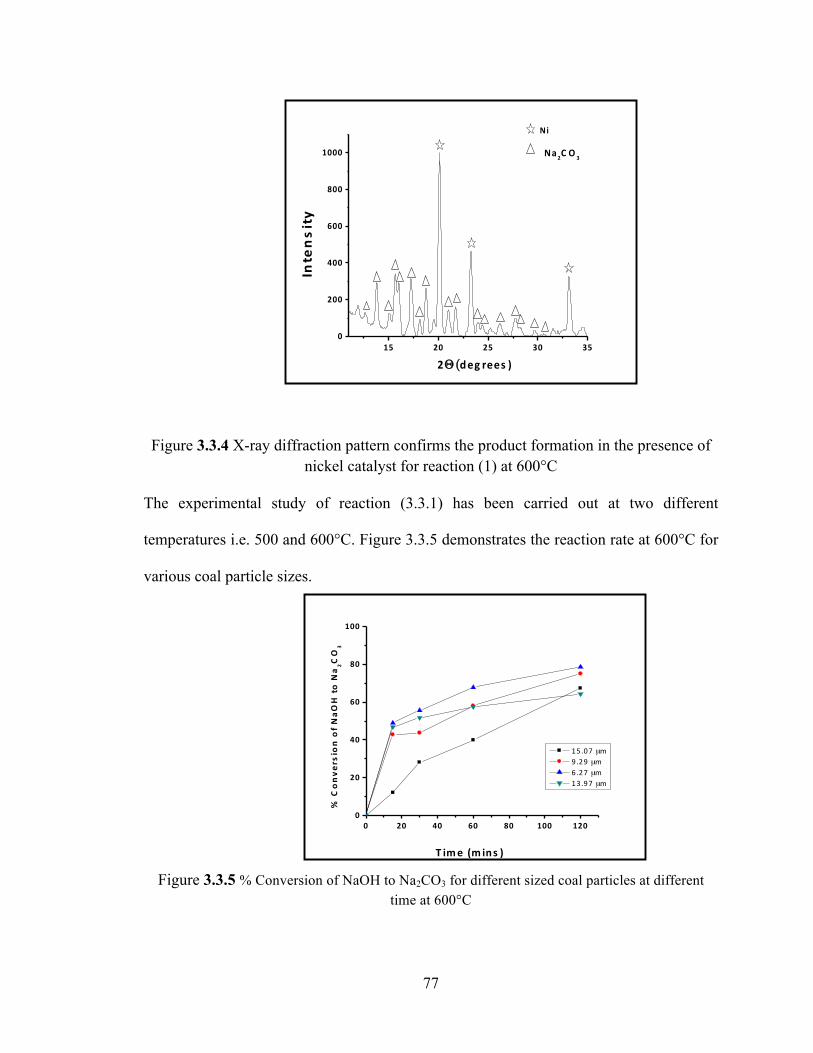
77
Figure 3.3.4 X-ray diffraction pattern confirms the product formation in the presence of nickel catalyst for reaction (1) at 600°C
The experimental study of reaction (3.3.1) has been carried out at two different
temperatures i.e. 500 and 600°C. Figure 3.3.5 demonstrates the reaction rate at 600°C for
various coal particle sizes.
Figure 3.3.5 % Conversion of NaOH to Na2CO3 for different sized coal particles at different time at 600°C
15 20 25 30 350
200
400
600
800
1000
Ni
Intensity
2ΘΘ ((deg rees )
Na2C O 3
0 20 40 60 80 100 1200
20
40
60
80
100
% C
onve
rsion of NaO
H to N
a2C
O3
T ime (m ins )
15.07 µm 9.29 µm 6.27 µm 13.97 µm
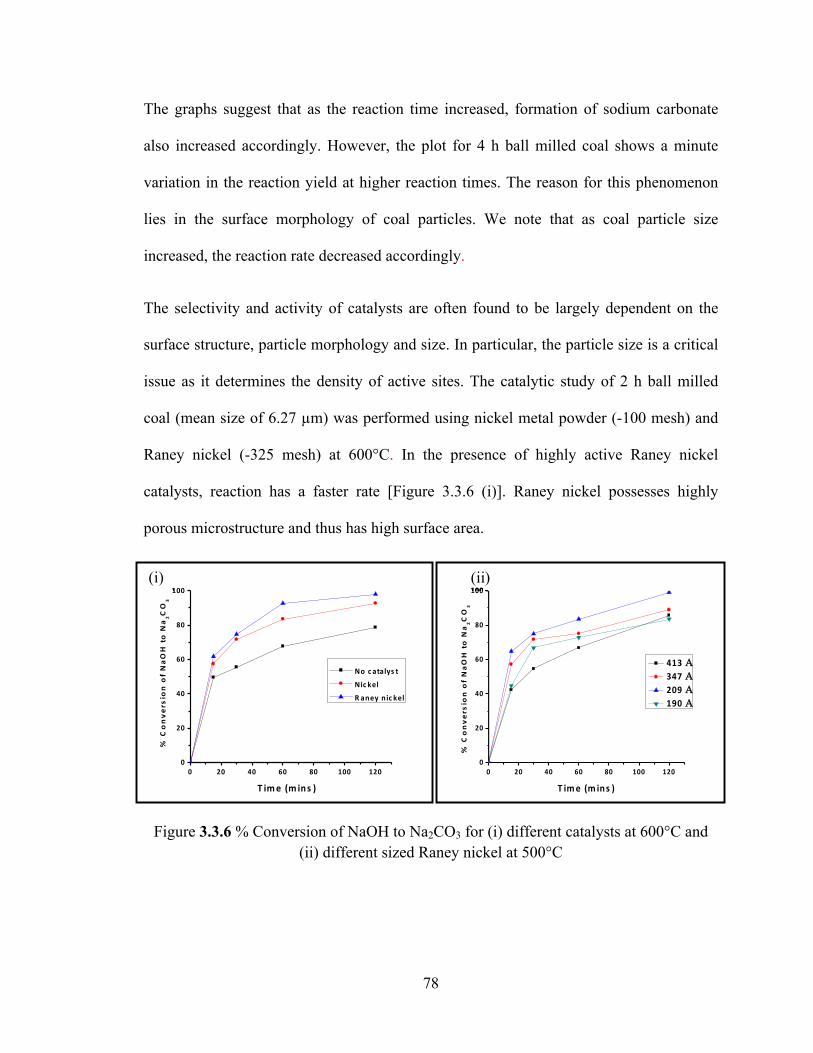
78
The graphs suggest that as the reaction time increased, formation of sodium carbonate
also increased accordingly. However, the plot for 4 h ball milled coal shows a minute
variation in the reaction yield at higher reaction times. The reason for this phenomenon
lies in the surface morphology of coal particles. We note that as coal particle size
increased, the reaction rate decreased accordingly.
The selectivity and activity of catalysts are often found to be largely dependent on the
surface structure, particle morphology and size. In particular, the particle size is a critical
issue as it determines the density of active sites. The catalytic study of 2 h ball milled
coal (mean size of 6.27 µm) was performed using nickel metal powder (-100 mesh) and
Raney nickel (-325 mesh) at 600°C. In the presence of highly active Raney nickel
catalysts, reaction has a faster rate [Figure 3.3.6 (i)]. Raney nickel possesses highly
porous microstructure and thus has high surface area.
Figure 3.3.6 % Conversion of NaOH to Na2CO3 for (i) different catalysts at 600°C and (ii) different sized Raney nickel at 500°C
0 20 40 60 80 100 1200
20
40
60
80
100
% C
onvers
ion o
f N
aO
H to N
a2C
O3
413 ΑΑ 347 ΑΑ 209 ΑΑ 190 ΑΑ
T ime (m ins )
0 20 40 60 80 100 1200
20
40
60
80
100
No c atalys t
Nic kel
R aney nic kel
% C
onvers
ion of NaOH to N
a2C
O3
T ime (m ins )
1(i)
100(ii)

79
However, nickel can also act as a catalyst for reaction (1) but its observed activity is
relatively lower than that of Raney nickel. Here, the purpose was to explore the effect of
different sized Raney nickel catalysts. Therefore, raw Raney nickel catalysts were ball
milled for different times.
Hydrogen generation curves for different sized Raney nickel at 500°C are plotted in
Figure 3.3.6(ii). Results show that 2h ball milled catalysts have the best effect compared
to others. The reason for high catalytic activity of 2h ball milled Raney nickel catalysts
lie in the morphological as well as geometrical factors. SEM images in figure 3.3.3 show
the surface morphology of variously ball milled Raney nickel. Fig.3.3.3 (ii) demonstrates
the presence of a large number of open caves for 2h ball milled Raney nickel which could
be the reason for its high efficiency. In summary, globular catalyst particles exhibit high
catalytic activity compared to that of flaky disk shaped catalyst. The deactivation of 4h
ball milled Raney nickel can be due to either a high mechanical abrasion of the catalysts
surface or thermally induced deactivation. Since high temperature existed during
prolonged milling, most likely it caused the loss of catalytic surface area because of the
growth of the crystallites of the catalytic phase. A poor catalytic activity of the disk
shaped 1 h ball milled Raney nickel can be explained in a similar fashion. Here, shape of
the catalysts has been transformed into globular to flaky disk. This could have led to
closing of the open caves. However, during 2h of ball milling, flaky disk shaped particles
agglomerate and leave a large number of open pores. In addition to the morphological
aspect of the catalysts, there is also a geometric factor which is contributing to the
catalytic activity. The maximum % reduction in the crystallite size was observed for 2h
80
milling time of Raney nickel catalysts. Thus, a large number of formations and
movement of dislocations or vacancies have occurred which led to an increased activity
for 2h ball milled Raney nickel catalysts.
All the kinetic curves show a rapid increase in the yield after 30 minutes of the reaction.
The obvious reason could be the formation of sodium carbonate as a product; which
when formed in a sufficient amount speed up this reaction. Thus, sodium carbonate too
possesses catalytic property and can be categorized as a catalyst for reaction (3.3.1).The
strong support to this observation lies in the fact that alkali metal salts of weak acids like
sodium carbonate, potassium carbonate, sodium sulphide and potassium sulphide are
used to catalyze steam gasification of coal. Kellogg molten salt process involves the
gasification of coal in a bath of molten sodium carbonate through which steam is passed
[26]. Here, the molten salt (sodium carbonate) functions as a strong catalyst, disperses
coal and transfers heat as well as eradicates the formation of tars or tar acids. The coal
gasification products can be separated either by liquefaction of carbon dioxide gas or
using sodium hydroxide as a carbon dioxide adsorbent.
Carbon monoxide has a high affinity for forming carbonyl compounds with the transition
metals [27]. These carbonyl compounds can be readily decomposed back to the transition
metals. Carbon monoxide passing over the catalysts surface may have been adsorbed and
formed carbonyl compounds. These nickels based formed carbonyl compounds have
increased the collision frequency of sodium hydroxide and carbon monoxide gas. As a
81
result, higher % conversion of NaOH to Na2CO3 was observed in the presence of nickel
or Raney nickel catalysts.
Nickel has the least corrosion rates for molten sodium hydroxide. Nickel is essentially
immune to caustic stress-corrosion cracking even in molten anhydrous sodium hydroxide
at high temperatures. As concentration of sodium hydroxide and temperature increase
during the evaporation process or during chemical- processing, the corrosivity enhances
considerably. Likewise, increasing the nickel content of nickel-based alloys produces
increasing resistance to general corrosion and stress-corrosion cracking in the caustic
soda. Thus, a number of nickel-base alloys can be used for handling sodium hydroxide,
depending on concentration and temperature [28]. Therefore, these properties of nickel
ensure the longevity and high recyclability of nickel based catalysts applied in reaction
(3.3.1).

82
3.3.4 References:
[1] S.K. Saxena, V. Drozd, A. Durygin, International Journal of Hydrogen Energy, 2008, 33, 3625-3631. [2] S.K. Saxena, International Journal of Hydrogen Energy, 2003, 28, 49-53. [3] B. Reichman, W. Mays, J. Strebe, M. Fetcenko, International Journal of Hydrogen Energy, 2010, 35, 4918-4924. [4] J.A. Onwudili, P.T. Williams, International Journal of Hydrogen Energy, 2009, 34, 5645-5656. [5] T. Kamo, K. Takaoka, J. Otomo, H. Takahashi, Fuel, 2006, 85, 1052-1059. [6] C. Pistonesi, A. Juan, B. Irigoyen, N. Amadeo, Applied Surface Science, 2007, 253, 4427-4437. [7] Y. Matsumura, T. Nakamori, Applied Catalysis A: Gen., 2004, 258,107-114. [8] K. Hou, R. Hughes, R. Chemical Engineering Journal, 2001, 82, 311-328. [9] T. Numaguchi, K. Shoji, S. Yoshida, Applied Catalysis A: Gen., 1995, 133,241-262. [10] T. Nozaki, N. Muto, S. Kado, K. Okazaki, Catalysis Today, 2004, 89, 57-65. [11] Beeck. Advances in Catalysis, 1950, 2, 151 [12] Trapnell. Quart. Rev., 1954, 8, 494 [13] Gregg. The surface chemistry of solids, Champan and Hall, 1961 [14] Beeck. Reviews of Modern Physics, 1945, 17, 61 [15] E. Couper, Discussions of the Faraday Society, 1950, 8, 174 [16] R. Dowden, Discussions of the Faraday Society, 1950, 8, 184 [17] E.M. Hofer, H.E. Hintermann, Transactions of the Faraday Society, 1964, 60, 1457-1465. [18] C. Suryanarayan, Progress in Materials Science, 2001, 46, 1-184. [19] C.C. Koch, Nanostructured Materials, 1997, 9, 13-22.

83
[20] J. Guerrero-Paz, D. Jaramillo-Vigueras, Nanostructured Materials, 1999, 11, 1123-1132. [21] U. Holzwarth, N. Gibson, Nature Nanotechnology, 2011, 6,534. [22] L.Z. Zhou, J.T. Guo, T.D. Jiang, S.H. Wang, Journal of Materials Science Letters, 1998, 17, 137-139. [23] G. Liang, J. Huot, R. Schulz, Journal of Alloys & Compounds, 2001, 320,133-139 [24] H.J. Fecht, Nanostructured Materials, 1995, 6, 33-42. [25] G.G. Lee, H. Hashimoto, R. Watanabe, Materials Transactions The Japan Institute of Metals, 1995, 36,548-554. [26] S. Lee, Handbook of Alternative Fuel Technologies CRC Press: Taylor & Francis, 1996. [27] J.J. Zuckerman, D.J. Atwood, Inorganic Reactions and Methods, Formation of Bonds to Transition and Inner-Transition Metals, New York: WILEY-VCH, 1998. [28] D.B. Craig, D.S. Anderson, Handbook of corrosion data, 2nd Edition, Ohio: ASM International, 2002.

84
3.4 CATALYTIC STUDIES OF SODIUM HYDROXIDE AND CARBON MONOXIDE REACTION
3.4.1 Introduction
Carbon monoxide is a toxic gas emitted by power plants and blast furnaces with a severe
impact on global warming. Generally, water-gas shift reaction uses steam to lock carbon
monoxide and produces carbon dioxide and hydrogen. A vast emission of anthropogenic
gas (carbon dioxide) is a major drawback of the water-gas shift reaction.
We propose to solve this problem of carbon emission using a hydroxide as a reactant with
carbon monoxide gas [1]. One should note that the present scheme serves the dual
purpose of carbon monoxide capture and hydrogen production.
2NaOH (s) + CO (g) → Na2CO3(s) +H2 (g) ΔH= −119 kJ (600 °C) (3.4.1)
However, if sodium hydroxide is to be produced for carbonation, the method proposed
here cannot be regarded as carbon-emission free because sodium hydroxide itself is
produced from electrolysis of brine, which is very energy intensive process. Instead, if we
use sodium hydroxide that is a byproduct from existing chlor-alkali plants, we can
produce sodium carbonate and hydrogen gas using reaction (3.4.1). Sodium carbonate is a
valuable byproduct and has many applications in chemical industries. Apart from the fact
that the production of sodium hydroxide is an energy intensive process, there is also an
imbalance between the global hydrogen demand and sodium hydroxide production; hence
reaction (3.4.1) cannot be seen as a global solution for hydrogen. However, reaction
(3.4.1) will be certainly helpful in mitigating the vast emission of greenhouse gases
during production of hydrogen. The purpose of present work is to study the effect of
catalysis on the carbonation of the hydroxide. It is highly desirable to lower the reaction
85
time or even the operating temperature of exothermic reaction (3.4.1). Thus, several
catalysts are tested to accelerate reaction (3.4.1).
Nickel is a low cost, highly active and widely employed catalyst for industrial application
[2–6]. Raney nickel catalysts possess high catalytic activity due to its highly porous
microstructure and high surface area. It is extensively used in various industrial processes
and also in organic synthesis process [7, 8]. Magnetite acts as a catalyst for water gas
shift reaction (CO (g) + H2O (g) → CO2 (g) +H2 (g), ΔH = −41.1kJ/mol) [9, 10].
Previous results [11–13] show strong effect of the catalyst’s geometric factor, electronic
factor and surface imperfections. Beeck [14] correlated the catalytic activity to the lattice
parameter of the contact surface. The electronic factors are dependent on the extent to
which d-band of the crystal filled up by the electrons [15, 16]. The effect of the
imperfections is due to the surface imperfections (e.g., kinks, screw dislocations) which
can also behave as catalytically active sites [17]. Therefore, it is important to investigate
the possible relation between the catalyst grain size and the reaction rate. In this work,
different sized catalysts were prepared by mechanical milling.
Mechanical milling is one of the common methods for milling powder materials to obtain
uniform distribution of composition [18]. It is quite often employed due to its simplicity,
low cost, and ability to form a large number of different materials [19]. During milling,
powder particles experience intensive deformation which leads to various crystal defects
such as lattice strains, dislocations, vacancies and morphological changes [18, 20]. Here,
we have studied the changes in catalysts powder morphology, average particle size and
crystallite size with milling time. We also examined the relation between kinetics of
reaction (3.4.1) and morphological and structural changes in the catalysts.

86
3.4.2 Experimental Section
3.4.2.1 Catalyst Preparation
The catalysts used in this work are alumina (Al2O3) mixed nickel, magnetite and Raney
nickel. Nickel Powder (-100 mesh), Raney nickel (-325 mesh) and alumina were
delivered by Sigma Aldrich, Acros Organics and Good Fellow respectively. The various
sizes of these catalysts were obtained using planetary Retsch PM100 ball mill. The
cylindrical ball milling container has internal diameter of 1.6" and internal length of 1.6".
The powder to ball weight ratio was 1/54. Magnetite was ball milled for 1 and 2 h. Al2O3
mixed nickel was prepared in 2:1 ratio by weight. Then, this mixture was ground for 1 or
2 or 4 h. For Raney nickel, milling time was 2 and 4h. The same revolution speed (250
rpm) was maintained for grinding all the catalyst particles.
3.4.2.2 Catalyst Characterization X-ray diffraction patterns for different catalysts were obtained using Bruker GADDS/D8
X-ray system with Apex Smart CCD Detector and Mo direct-drive rotating anode (50
kV; 20mA). The surface morphology of the catalyst was studied using JEOL JSM-5910-
LV and JEOL JSM-6330F scanning electron microscope. Image J software was used to
determine the average particle size of catalysts. A total of nearly 50 particles of each
catalyst were taken into consideration from 3–4 SEM images.
3.4.2.3 Reaction Study Anhydrous sodium hydroxide with a purity of 98% was supplied by Sigma Aldrich.
About 0.10 g of sodium hydroxide was dissolved using 1 mL of distilled water in an
alumina boat. Then, the catalyst (3 wt. % of sodium hydroxide) was mixed with the
solution. Nitrogen gas was allowed to flow at the rate of 50 mL/min until the required

87
temperature was achieved. After that, nitrogen flow was ceased and carbon monoxide
was passed through the reaction chamber at the rate of 20 mL/min. The reaction (3.4.1)
was studied at several temperatures using various sizes of the different catalysts.
3.4.3 Results and Discussion 3.4.3.1 Characterization of Catalysts Catalyst crystallite size was determined using Scherrer’s equation. The powder X-ray
diffraction pattern for alumina mixed nickel catalysts (2:1 wt. %) (Fig.3.4.1a) shows the
presence of alumina and nickel peaks. Few initial peaks of alumina disappeared as
prolonged ball milling was carried out leading to the amorphorization of alumina. No
oxidation of nickel was observed throughout the ball milling time. The calculated
crystallite sizes for alumina mixed nickel ball milled for 1, 2 and 4 h are 184, 158 and
150 Å respectively. X-ray diffraction pattern for magnetite catalyst ball milled for
different times are shown in Fig.3.4.1b. As the crystallite sizes decreased due to
prolonged ball milling, diffraction peaks shift towards the low angle direction and peak
widths increase. The crystallite size of coarser magnetite (in micron) decreased to 181
and 169 Å for 1 and 2 h ball milling time respectively.

88
Figure 3.4.1 X-ray diffraction patterns for variously ball milled (a) alumina mixed
nickel (b) magnetite (c) Raney nickel
Fig. 3.4.1c depicts the X-ray diffraction pattern for variously ball milled Raney nickel.
Peak width broadening can be observed for prolonged ball milling time. The crystallite
sizes for raw, 2 and 4h ball milled Raney nickel are 413, 209 and 190 Å respectively.
Table 3.4.1 summarizes the crystallite sizes of all the variously ball milled catalysts.
Ni Ni(a) (b)
(c)
Al2O3
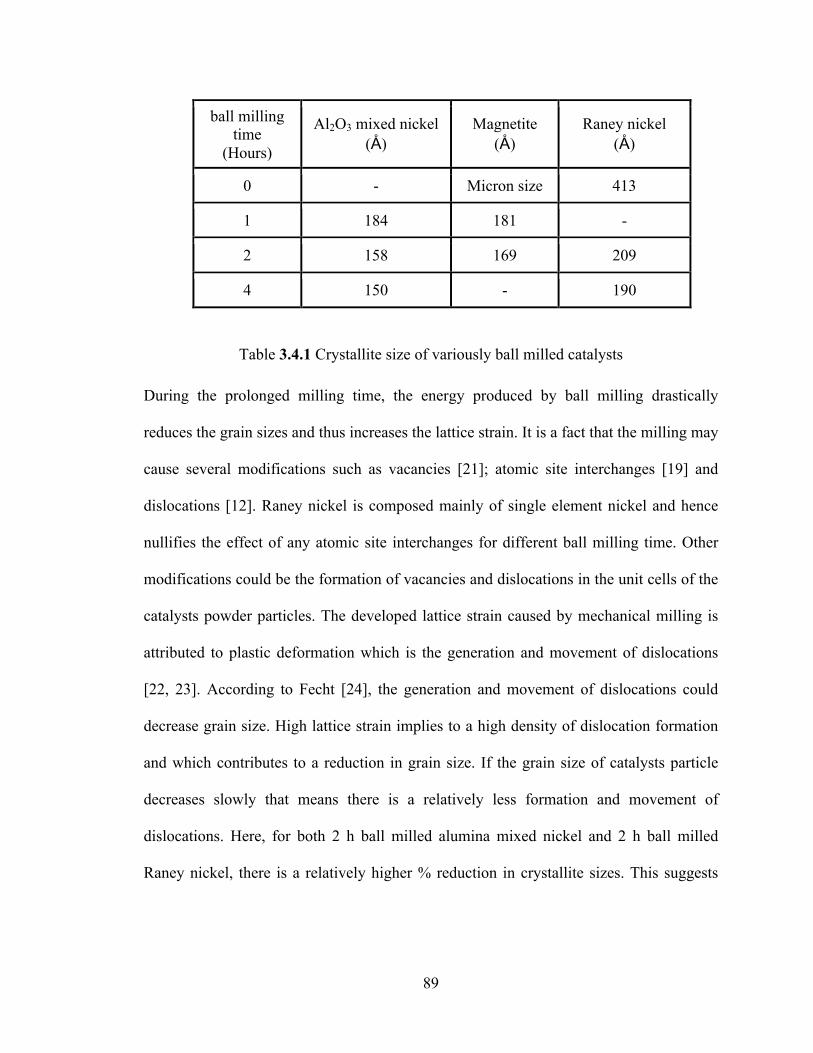
89
ball milling time
(Hours)
Al2O3 mixed nickel (Å)
Magnetite (Å)
Raney nickel (Å)
0 - Micron size 413
1 184 181 -
2 158 169 209
4 150 - 190
Table 3.4.1 Crystallite size of variously ball milled catalysts
During the prolonged milling time, the energy produced by ball milling drastically
reduces the grain sizes and thus increases the lattice strain. It is a fact that the milling may
cause several modifications such as vacancies [21]; atomic site interchanges [19] and
dislocations [12]. Raney nickel is composed mainly of single element nickel and hence
nullifies the effect of any atomic site interchanges for different ball milling time. Other
modifications could be the formation of vacancies and dislocations in the unit cells of the
catalysts powder particles. The developed lattice strain caused by mechanical milling is
attributed to plastic deformation which is the generation and movement of dislocations
[22, 23]. According to Fecht [24], the generation and movement of dislocations could
decrease grain size. High lattice strain implies to a high density of dislocation formation
and which contributes to a reduction in grain size. If the grain size of catalysts particle
decreases slowly that means there is a relatively less formation and movement of
dislocations. Here, for both 2 h ball milled alumina mixed nickel and 2 h ball milled
Raney nickel, there is a relatively higher % reduction in crystallite sizes. This suggests

90
that the mechanical milling caused a severe plastic deformation to these catalysts powder
particles.
3.4.3.2 Morphology and Particle Size Analysis Scanning electron microscope (SEM) was used to determine the surface morphology of
the catalysts. Alumina mixed nickel ball milled for 2h, shown in (Fig. 3.4.2a), exhibits
sponge- like morphology and consists of many small particles. The average particle sizes
are 3.24, 3.26 and 2.80 µm for the milling time of 1, 2 and 4h, respectively.
Fig.3.4.2b shows the surface morphology for variously ball milled magnetite catalyst
particles. Coarse magnetite has relatively larger average particle size. The average
particle sizes are 4.56, 3.09 and 2.62 µm for the milling time of 0, 1 and 2 h respectively.
One should note that average particle size of magnetite decreases with increase in ball
milling time.

91
(a)
(b)
Figure 3.4.2 SEM image of (a) alumina mixed nickel ball milled for (i) 1 hour (ii) 2 hours
(iii) 4 hours at (b) magnetite ball milled for (i) 1 hour (ii) 2 hours. (iii) Without ball
milling at 2000x each.
(i) (ii)
(iii)
(i) (ii)
(iii)

92
Figure 3.4.3 SEM image of Raney nickel (i) without (ii) 2h (iii) 4h ball milling at
2000x each and (iv) 2h ball milled Raney nickel with pores (at 5000x)
Figure 3.4.3 depicts the SEM images for variously ball milled Raney nickel. A relatively
high number of openings or caves are observed for 2h ball milled catalyst as shown in
Fig. 3.4.3iv. The globular particles of 2h ball milled catalyst can be assumed to be a
stacked layer of flaky disk particles (formed as an attrition product of raw Raney nickel).
However, further attrition of these globular particles changed them back to platelet
structure (Fig.3.4.3iii). Moreover, the sizes of Raney nickel particles varied significantly
over different ball milling periods. Initially, raw Raney nickel particles are almost
Caves
(i) (ii)
(iii) (iv)

93
spherical in shape and have a very wide distribution of the particle sizes. The average
particle size of raw, 2 and 4h ball milled Raney nickel are 11.74, 15.72, and 13.72 µm
respectively.
Figure 3.4.4 Change of average particle size of catalysts with milling time
It is well known that milling process is controlled by the two processes of cold welding
and fracture [25, 26]. Figure 3.4.4 illustrates the change in average particle size with
milling time for variously ball milled catalysts. It also demonstrates the dominant stages
of milling process with time for different catalysts. The particle size and morphology of
catalysts are determined by the competition between cold welding and fracture process.
The average particle sizes of Raney nickel increases until 2 h milling time which is
attributed to the dominant cold welding process. However, fracture process dominates
only after 2 h and causes a decrease in the average particle size for 4 h milling time.
Alumina mixed nickel catalyst also shows the similar trends. Alumina mixed nickel has
94
almost constant particle size for first 2 h and then decrease in the average particle size
was observed. It means that initially cold welding was dominant process and after 2 h
milling time, it was the fracture process which prevailed. However, magnetite showed a
different tendency for the milling process. The decrease in the magnetite average particle
size with milling time is due to the dominant fracture process. It should be noted that for
Al2O3 mixed nickel and Raney nickel, fracture process dominates only after 2 h milling
time.
3.4.3.3. Reaction Results The curves for % conversion of NaOH to Na2CO3 in the presence of variously ball milled
Al2O3 mixed nickel, magnetite and Raney nickel catalysts at 300°C are shown in Figures
3.4.5, 3.4.6 and 3.4.7 respectively. A substantial increase in the % conversion of NaOH to
Na2CO3 was observed due to addition of the catalyst. However, a clear distinction
between the catalytic activities for these catalysts becomes discernible only after a 30 min
run (Figures 3.4.5–3.4.7). The obvious reason could be due to the formation of product
Na2CO3, which once formed shows catalytic activity for the reaction [27].
A 2h ball milled alumina mixed nickel catalyst was catalytically most effective compared
to other alumina mixed catalysts. The purpose to add alumina with nickel was to avoid
the chance of agglomeration. In our previous work [28], we observed that nickel particles
tend to agglomerate when ball milled in the absence of dispersant (such as alumina) [28].
In this study, we have minimized the coalescence by mixing alumina with nickel. X-ray
diffraction study (Fig. 3.4.1a) confirms the amorphorization of alumina over prolonged
milling time. Smaller crystallite size for alumina mixed nickel was generated as ball
milling time was increased. Therefore, a better specific surface area and thus a better
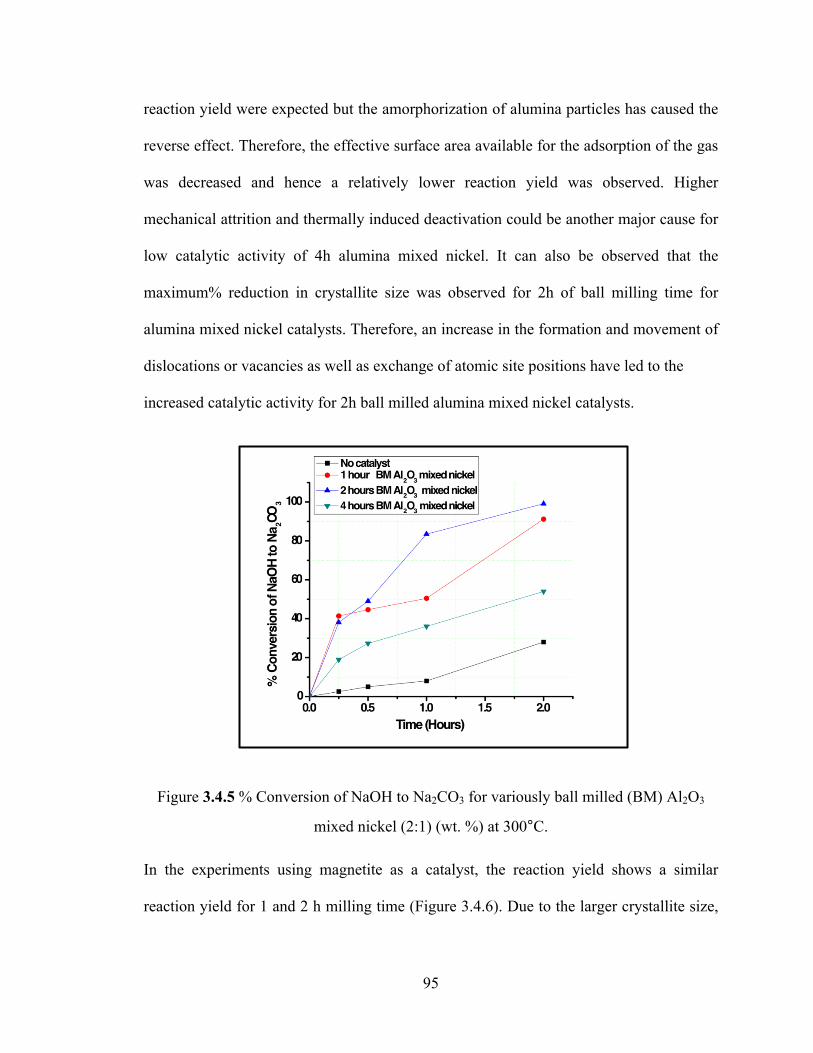
95
reaction yield were expected but the amorphorization of alumina particles has caused the
reverse effect. Therefore, the effective surface area available for the adsorption of the gas
was decreased and hence a relatively lower reaction yield was observed. Higher
mechanical attrition and thermally induced deactivation could be another major cause for
low catalytic activity of 4h alumina mixed nickel. It can also be observed that the
maximum% reduction in crystallite size was observed for 2h of ball milling time for
alumina mixed nickel catalysts. Therefore, an increase in the formation and movement of
dislocations or vacancies as well as exchange of atomic site positions have led to the
increased catalytic activity for 2h ball milled alumina mixed nickel catalysts.
Figure 3.4.5 % Conversion of NaOH to Na2CO3 for variously ball milled (BM) Al2O3
mixed nickel (2:1) (wt. %) at 300°C.
In the experiments using magnetite as a catalyst, the reaction yield shows a similar
reaction yield for 1 and 2 h milling time (Figure 3.4.6). Due to the larger crystallite size,

96
coarser magnetite has a low surface area to volume ratio. The poor reaction yield in the
presence of coarser magnetite was in consistent with its relative larger particle size. When
magnetite was milled for 1 h, crystallite size reduced from several microns to 181 Å and
that causes an increase in the catalytic activity. But for 2 h milling time, crystallite size
reduced by only 12 Å compared to 1 h ball milled magnetite. Therefore, there is a
relatively less plastic deformation for 2 h ball milled magnetite. Hence, 2 h ball milled
exhibited identical catalytic activity to that of 1 h. Thus, it can be stated that the reaction
yield goes hand in hand to the particle size of magnetite. 1 and 2 h ball milled magnetite
has comparable crystallite size and therefore their reaction yields are also similar.
Figure 3.4.6 % Conversion of NaOH to Na2CO3 for variously ball milled (BM)
magnetite at 300°C. 1 and 2 hours ball milling time has exhibited a comparable result

97
Figure 3.4.7 % Conversion of NaOH to Na2CO3 for variously ball milled (BM) Raney
nickel at 300°C. 2 hours ball milling time has exhibited the best result.
The effect for the use of Raney nickel catalyst on reaction (3.4.1) is illustrated in Figure
7. The curve shows that 2h ball milled Raney nickel catalysts have the best results. 4 h
ball milled Raney nickel catalysts have a low catalytic effect on reaction (3.4.1). The
deactivation of 4h ball milled Raney nickel can be due to either a high mechanical
abrasion of the catalysts surface or thermally induced deactivation. The cold welding
process dominates until 2h of mechanical milling time for Raney nickel catalysts. As well
as maximum % reduction in crystallite size was also observed for 2h milling time only.
Therefore, a large number of formations and movement of dislocations or vacancies have
led to an increased catalytic activity for 2h ball milled Raney nickel catalysts. However,
there is a relatively less reduction in the crystallite size for 4h milling time. Moreover, X-

98
ray diffraction pattern for 4h ball milling time clearly shows the amorphorization for the
catalyst. Hence, 4h milling time decreased the catalytic activity of Raney nickel.
Raw Raney nickel has a very wide distribution of particle sizes. Due to globular shape,
they possess higher surface area. The globular particles are formed by the agglomeration
of the disk-shaped particles by folding, enclosure, unfolding and pile-up [29]. Large
number of open pores or caves formation allowed 2h ball milled Raney nickel to show
the highest catalytic activity compared to others. In summary, globular particles for
Raney nickel has shown a better effect on reaction (3.4.1) compared to platelet like
structure.

99
3.4.4. References 1. S.K. Saxena, V. Drozd, A. Durygin, International Journal of Hydrogen Energy, 2008, 33, 3625–3631.
2. C. Pistonesi, A. Juan, B. Irigoyen, N. Amadeo, Applied Surface Science, 2007, 253, 4427–4437.
3. Y. Matsumura, T. Nakamori, T., Applied Catalysis, 2004, 258, 107–114.
4. K. Hou, R. Hughes, Chemical Engineering Journal, 2001, 82, 311–328.
5. T. Numaguchi, K. Shoji, S. Yoshida, Applied Catalysis A, 1995, 133, 241–262.
6. T. Nozaki, N. Muto, S. Kado, K. Okazaki, Catalysis Today, 2004, 89, 57–65.
7. H. Hauptmann, W.F. Walter, Chemical Reviews, 1962, 62, 347–404.
8. E. Gerhard, K. Helmut, Prep. Solid Catalysis, 1997, 1, 30–34.
9. C.R.F. Lund, J.E. Kubsh, J.A. Dumesic, ACS Symposium Series, 1985, 279, 313.
10. D.G. Rethwisch, J. Phillips, Y. Chen, T.F. Hayden, J.A. Dumesic, Journal of Catalysis, 1985, 91, 167–180.
11. O. Beeck, Advances in Catalysis, 1950, 2, 151–195.
12. B.M.W. Trapnell, Quart. Rev., 1954, 8, 404–421.
13. S.J. Gregg, The Surface Chemistry of Solids; Reinhold Pub. Corp.: New York, NY, USA, 1969, 233.
14. O. Beeck, Reviews of Modern Physics, 1945, 17, 61–71.
15. A. Couper, D.D. Eley, Discussion of the Faraday Society, 1950, 8, 172–184.
16. D.A. Dowden, P.W. Reynolds, Discussion of the Faraday Society, 1950, 8, 184–190.
17. E.M. Hofer, H.E. Hintermann, Transactions of the Faraday Society, 1964, 60, 1457–1465.
18. C. Suryanarayan, Progress in Materials Science, 2001, 46, 1–184.
19. C.C. Koch, Nanostructured Materials, 1997, 9, 13–22.
20. J. Guerrero-Paz, D. Jaramillo-Vigueras, Nanostructured Materials, 1999, 11, 1123–1132.
100
21. L.Z. Zhou, J.T. Guo, T.D. Jiang, S.H. Wang, Journal of Materials Science Letters, 1998, 17, 137–139.
22. G. Liang, J. Huot, R. Schulz, Journal of Alloys & Compounds, 2001, 320,133–139
23. F.A. Mohamed, Acta Materialia, 2003, 51, 4107–4119.
24. H.J. Fecht, Nanostructured Materials, 1995, 6, 33–42.
25. J.B. Zhou, K.P. Rao, Journal of Alloys & Compounds, 2004, 384, 125–130.
26. X. Zhao, Y. Ding, L. Ma, X. Shen, S. Xu, International Journal of Hydrogen Energy, 2008, 33, 6351–6356.
27. S. Lee, Alternative Fuels; Taylors& Francis: Washington, DC, USA, 1996,127.
28. S. Kumar, S. Saxena, V. Drozd, International Journal of Energy Research, 2012, 36, 1133–1138.
29. G.G. Lee, H. Hashimoto, R. Watanabe, Material Transactions The Japan Institute of Metals, 1995, 36, 548–554.

101
4. HYDROGEN STORAGE USING METAL HYDRIDES
4.1 LITERATURE REVIEW
At ambient condition, 1 kg of hydrogen occupies 11m3 of space. Therefore, to use
hydrogen for vehicular applications, hydrogen needs to be either compressed as much as
possible or increase the hydrogen density. Fig. 4.1.1 illustrates the phase diagram of
hydrogen. Hydrogen exists as solid with a density of 70.6 kg/m3 at very low temperatures
(~11.15 K or -262°C). However, at higher temperature (~-273.15 K or 0°C, 1bar),
hydrogen transform to a gas with low density of 0.089886 kg/m3.[1]
Figure 4.1.1 Primitive phase diagram of hydrogen [1]
A piston-type mechanical compressor can be used to compress hydrogen. The isothermal
compression of hydrogen from 1 to 800 bars consumes 2.21kWh/kg (∆𝐺𝐺 = 𝑅𝑅.𝑇𝑇. ln ( ))
[2]. However, in a real practice, the compressive work for hydrogen is significantly
higher. The most conventional medium to store hydrogen is to use high pressure gas

102
cylinders. The materials such as austenitic stainless steel which have very high tensile
strength, low density and are inert to hydrogen are selected for the manufacturing of gas
cylinder [3]. There are two major concerns for high pressure gas cylinders: (1) safety
issues; and (2) decrease in gravimetric density as pressure increases.
The hydrogen phase diagram illustrates that liquid hydrogen exists only between solidus
line and the line from triple point at 21.2 K and the critical point at 32 K. The
thermodynamic calculation states that the free enthalpy change between gaseous
hydrogen at 300 K and liquid hydrogen at 20 K is 11.64 MJ/kg [4]. Therefore, the
required theoretical work to liquefy hydrogen from room temperature is Wth =
3.23kWh/kg. However, the technical work is approximately 15.2kWh/kg, almost half of
the lower heating value of hydrogen combustion (33.32kWh/kg) [5]. Thus, it can be
easily observed that storage of hydrogen as a liquid is energetically unfavorable.
Hydrogen storage is also reported using chemical reaction with water. For instance, the
binary hydride (LiH) reacts spontaneously with water while the complex hydride
(NaBH4) reacts slowly unless catalyzed [6-9] However, for both hydrides, it is difficult to
achieve the stoichiometric amount of hydrogen. A brief overview for the sodium
hydroxide assisted hydrogen storage reactions can be found elsewhere [10].
This work focused on the storage of hydrogen in the form of metal hydrides. In the
following sections, a review is presented for the potential solid materials for hydrogen
storage.

103
4.1.1 Potential Hydrogen Storage Materials
Figure 4.1.2 illustrates the chart for potential reversible hydrogen system considered so
far [11].
HYDROGEN STORAGE MATERIALS
Figure 4.1.2 Chart for the potential reversible hydrogen system
Here, the attention is focused on the metal hydride and complex hydride systems because
of their reversible behavior and high density. In the following section, a brief
introduction of their (de-) hydrogenation of these hydride systems is presented.
Microporous Materials
erials Interestitial hydrides Complex hydrides s Miscellaneous
Intermetallic Compounds
Solid Solution Alloys
Modified Binary hydrides
Amorphous and
Nanostructured Alloys
Activated Carbon CNTs Templated Carbon
Alanates
Nitrides, Amides
Borohydrides
Complex transition
Metal hydrides
Clathrates
Ionic Liquids
Organic and
Inorganic
Nanotubes
Organic Polymers
Zeolites
MOFs
Carbon

104
H2 gas α- Phase β- Phase
4.1.2 Metal Hydrides
Recently, metal-hydride has been extensively explored as a potential hydrogen storage
system. The light metal such as Mg, Al, B, Na, Li, and Be forms a large number of
hydride compounds. These light metals are capable to store twice the number of
hydrogen atoms per metal atom. However, heavier metals (such as transition metals) may
also be included in the multi component system but mainly as an additive or a catalyst.
Metals and alloys react with hydrogen to form metal hydrides according to Reaction
4.1.1: Direct dissociative chemisorption (M + x/2 H2 ↔ MHx). Where, M denotes a
metal, a solid-solution or intermetallic compounds. Reaction (4.1.1) has a forward
exothermic and reverse endothermic reaction.
Figure 4.1.3 Schematic of hydrogen interaction with metal. The solid solution α -phase
and the hydride β -phase.
105
Metal hydrides consist of metal and hydrogen atoms. Metal hydrides hold hydrogen
through ionic, covalent, interstitial or complex bonds. On the criteria for extent of metal-
hydrogen interaction, two different kinds of metal hydrides exist: (1) α-phase
(hydrogen/metal < 0.1); and (2) β-phase (hydrogen/metal > 0.1) [1].
Hydrogen storage in metal hydrides is a complex process and includes several
mechanistic steps. Moreover, hydrogen dissociation steps of metal hydrides depend on
surface structure, morphology and purity. An optimum hydrogen-storage material is
required to meet the target set by DOE (Table 1.2). A suitable hydrogen-storage material
must have:
(1) High hydrogen capacity per unit mass or volume;
(2) Low dissociation temperature;
(3) Moderate dissociation pressure;
(4) Fast (de-) hydrogenation kinetics;
(5) High stability against moisture and O2;
(6) Low cost of recycling;
(7) Reversibility;
(8) Minimum heat loss during the exothermic hydride formation;
(9) Minimum heat loss during charging and discharging of hydrogen; and
(10) High safety
In the following subsections, practical storage properties such as the reversible storage
capacity, gravimetric storage capacity and volumetric storage capacity are discussed in
brief.

106
4.1.2.1 Reversible Storage Capacity
The reversible storage capacity is defined as the quantity of hydrogen sorbed and
desorbed between the lower and upper operating pressures of a hydrogen storage system.
The most important criteria for any metal hydrides are their operation as a reversible
system within required pressure and temperature condition. The thermodynamics of the
materials plays a vital role in such situation. Zuttel explained the thermodynamic aspect
of hydride formation using pressure-composition isotherm [1]. The study mentions that
the stability of hydride can be presented in the form of Van’t Hoff plots:
ln 𝑃𝑃𝑃𝑃 = ∆ . − ∆ 4.1.1
All the notations have their usual meaning.
The shape of pressure-composition isotherm determines the pressure range over which
the majority of the reversible uptake will occur. Moreover, rate of hydrogen uptake and
release can also affect the amount of reversible amount of hydrogen stored. As it is
possible that some of the stored hydrogen will not be released in a practical timeframe
due to kinetic limitations, which could also prevent full hydrogenation upon recharging.
4.1.2.2 Gravimetric Storage Capacity
The gravimetric storage capacity is described as the amount of hydrogen stored per unit
mass of material. Formula (4.1.2) illustrates the way to calculate the gravimetric storage
capacity:

107
𝐺𝐺 % = ×100 % 4.1.2
Where, H/M = hydrogen-to-metal atom ratio; MH = molar mass of hydrogen; MM = molar
mass of the metal.
4.1.2.3 Volumetric storage capacity
The volumetric storage capacity is the amount of hydrogen per unit volume of the
material. In principle, every absorbed hydrogen atom diffuses through the bulk of the
material and contained within the boundaries of the crystal lattice. It should be noted that
there is always a lattice expansion due to the hydrogen absorption and must be accounted
for in the calculation of the volumetric storage capacity.
4.1.3 Complex hydrides
In complex hydrides, atomic hydrogen is often bonded ionically or covalent into the bulk
of the storage material. The hydrogen in the complex hydrides is generally positioned in
the corners of tetrahedron with light elements (B, Al, Mg and Li) in the center. The
complex hydrides consist of alkali or alkaline earth metals and [AlH4]-, [BH4]-, [NH2] -
anionic hydrides. These complex hydrides are stable in nature and decompose only at
elevated temperature. Table 4.1.1 is the summary for the complex hydrides.
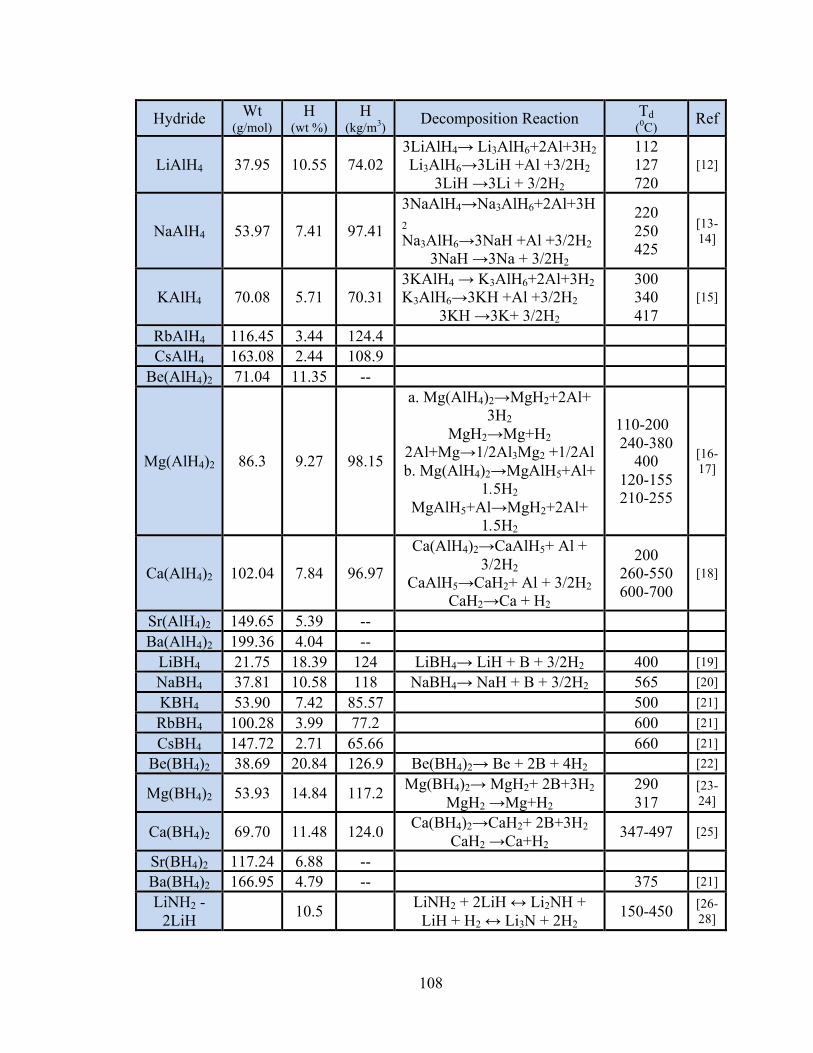
108
Hydride Wt (g/mol)
H (wt %)
H (kg/m3) Decomposition Reaction Td
(0C) Ref
LiAlH4 37.95 10.55 74.02 3LiAlH4→ Li3AlH6+2Al+3H2 Li3AlH6→3LiH +Al +3/2H2
3LiH →3Li + 3/2H2
112 127 720
[12]
NaAlH4 53.97 7.41 97.41
3NaAlH4→Na3AlH6+2Al+3H2 Na3AlH6→3NaH +Al +3/2H2
3NaH →3Na + 3/2H2
220 250 425
[13-14]
KAlH4 70.08 5.71 70.31 3KAlH4 → K3AlH6+2Al+3H2 K3AlH6→3KH +Al +3/2H2
3KH →3K+ 3/2H2
300 340 417
[15]
RbAlH4 116.45 3.44 124.4 CsAlH4 163.08 2.44 108.9
Be(AlH4)2 71.04 11.35 --
Mg(AlH4)2 86.3 9.27 98.15
a. Mg(AlH4)2→MgH2+2Al+ 3H2
MgH2→Mg+H2 2Al+Mg→1/2Al3Mg2 +1/2Al b. Mg(AlH4)2→MgAlH5+Al+
1.5H2 MgAlH5+Al→MgH2+2Al+
1.5H2
110-200 240-380
400 120-155 210-255
[16-17]
Ca(AlH4)2 102.04 7.84 96.97
Ca(AlH4)2→CaAlH5+ Al + 3/2H2
CaAlH5→CaH2+ Al + 3/2H2 CaH2→Ca + H2
200 260-550 600-700
[18]
Sr(AlH4)2 149.65 5.39 -- Ba(AlH4)2 199.36 4.04 --
LiBH4 21.75 18.39 124 LiBH4→ LiH + B + 3/2H2 400 [19] NaBH4 37.81 10.58 118 NaBH4→ NaH + B + 3/2H2 565 [20] KBH4 53.90 7.42 85.57 500 [21] RbBH4 100.28 3.99 77.2 600 [21] CsBH4 147.72 2.71 65.66 660 [21]
Be(BH4)2 38.69 20.84 126.9 Be(BH4)2→ Be + 2B + 4H2 [22]
Mg(BH4)2 53.93 14.84 117.2 Mg(BH4)2→ MgH2+ 2B+3H2 MgH2 →Mg+H2
290 317
[23-24]
Ca(BH4)2 69.70 11.48 124.0 Ca(BH4)2→CaH2+ 2B+3H2 CaH2 →Ca+H2
347-497 [25]
Sr(BH4)2 117.24 6.88 -- Ba(BH4)2 166.95 4.79 -- 375 [21] LiNH2 -
2LiH 10.5 LiNH2 + 2LiH ↔ Li2NH + LiH + H2 ↔ Li3N + 2H2
150-450 [26-28]

109
CaNH-CaH2
2.1 CaNH+CaH2↔Ca2NH+H2 350-650 [26]
Mg(NH2)2 - 2LiH 5.6 Mg(NH2)2 + 2LiH ↔
Li2Mg(NH)2 + 2H2 100-250 [29-
32]
6.9 3Mg(NH2)2 + 8LiH = 4Li2NH + Mg3N2 + 8H2
150-300 [33]
9.1 Mg(NH2)2 + 4LiH = Li3N + LiMgN + 4H2
150-300 [34]
LiNH2 - LiBH4
11.9 2LiNH2 + LiBH4 → Li3BN2H8→ Li3BN2 + 4H2
150-350 [35-36]
Mg(NH2)2 -MgH2
7.4 Mg(NH2)2 + 2MgH2 → Mg3N2 + 4H2
20** [37]
LiNH2 - LiAlH4
5.0 2LiNH2 + LiAlH4 → LiNH2 +
2LiH + AlN + 2H2 = Li3A +N2 + 4H2
20**-500 [38]
Mg(NH2)2 - LiAlH4
8.5 3Mg(NH2)2 + 3LiAlH4 →
Mg3N2 + Li3AlN2 + 2AlN+12H2
20**-350 [39]
Mg(NH2)2 - CaH2
4.1 Mg(NH2)2 + CaH2 → MgCa(NH)2 + 2H2
20**-500 [40]
NaNH2 - LiAlH4
5.2 NaNH2 + LiAlH4 → NaH + LiAl0.33NH +0.67Al+ 2H2
20** [41]
LiNH2- CaH2
4.5 2LiNH2 + CaH2 = Li2Ca(NH)2 + 2H2
100-330 [42]
LiNH2 - Li3AlH6
7.5 4LiNH2 + 2Li3AlH6 →
Li3AlN2 + Al +2Li2NH + 3LiH + 15/2H2
100-500 [43]
Li4BN3H10 - MgH2
9.2 2Li4BN3H10 + 3MgH2 →
2Li3BN2 + Mg3N2 + 2 LiH + 12H2
100-400 [44]
Table 4.1.1 Summary of the complex hydrides
4.1.4 Summary
As a result of extensive research during the past decade, a large number of potential
hydrogen storage systems are identified. Even though, the present situation is satisfactory
but still there are challenges (such as slow kinetics and unfavorable thermodynamics)

110
remain and needs to be resolved. Therefore, the current demand is to perform application-
focused research and understand in-depth mechanistic steps of the hydride system.

111
4.1.5 References
[1] A. Zuttel, Materials Today, 2003, 6, 24-33.
[2] E.L. Houston,A Liquid and Solid Storage of Hydorgen. In: Proceedings of the 5th World Hydrogen Energy Conference, Veziroqlu, T.N., and Taylor, J.B. (eds.), Pergamon Press, Oxford, 1984, 3.
[3] L. Schlapabch, In: Hydrogen in Intermetallic Compounds II, Schlapabch, L. (ed.), Springer, Heidelberg, 1988, 219.
[4] G. Chen, S. Anghaie based on NIST databases http://www.inspi.uf.edu/data/h_prop_package.html
[5] M.V. Ardenne, Effekte der Physik, Verlag Harri Deutsch, Frankfurt am Main, 1990, 712.
[6] C. Haertling, R.J. Hanrahan Jr., R. Smith, Journal of Nuclear Materials, 2006, 349, 195–233.
[7] A.W. McClaine, R.W. Breault, C. Larsen, R. Konduri, J. Rolfe, F. Becker, G. Miskolczy, Proceedings of 2000 US DOE H2 Program Review, 2000.
[8] A. Garron, D. S´wierczyn´ski, S. Bennici, A. Auroux, International Journal of Hydrogen Energy, 2009, 34, 1185 – 1199.
[9] H.I. Schlesinger, H.C. Brown, A.E. Finholt, J.R. Gilbreath, H.R. Hoekstra, E.K. Hyde, Journal of the American Chemical Society, 1953, 75, 215–219.
[10] S. Kumar, S.K. Saxena, In Materials and processes for energy: communicating current research and technological developments, A. Mendez-Vilas (ed.), Formatex Research Center (Badajoz, Spain), 2013.
[11] D. P. Broom, Hydrogen storage materials: the characterization of their storage properties, London, Springer, 2011. DOI: 10.1007/978-0-85729-221-6_1.
[12] B.Bogdanovic, M.Schwickardi, Journal of Alloys and Compounds, 1997, 253-254, 1
[13] B.Bogdanovic, R.A.Brand, A.Marjanovic, M.Schwickardi, J.Tolle, Journal of
Alloys and Compounds, 2000, 302, 36
[14] F.Schuth, B.Bogdanovic, M.Felderhoff, Chemical Communications, 2004, 2249.
[15] H.Morioka, K.Kakizaki, S.C.Chung, A.Yamada, Journal of Alloys and

112
Compounds, 2003, 353, 310
[16] M.Fichtner, O.Fuhr, O.Kircher, Journal of Alloys and Compounds, 2003, 356-357,418.
[17] A.Fossdal, H.W.Brinks, M.Fichtner, B.C.Hauback, Journal of Alloys and
Compounds, 2005, 387, 47
[18] O.M.Lovvik, Physical Review B, 2005, 71, 1144111.
[19] L. Mosegaard, B. Moller, J.E. Jorgensen, U. Bosenberg, M. Dornheim, J.C. Hanson, Y. Cerenius, G. Walker, H.J. Jakobsen, F. Besenbacher, T.R. Jensen, Journal of Alloys and Compounds, 2007, 446-447, 301.
[20] A.G. Ostroff, R.T. Sanderson, Journal of Inorganic and Nuclear Chemistry, 1957, 4, 230.
[21] W. Grochala, P.P. Edwards, Chemical Reviews, 2004, 104, 1283.
[22] M.J. van Setten, G.A.de Wijs, G. Brocks, Physical Review B, 2008, 77, 165115.
[23] J. Voss, J.S. Hummelshoj, Z. Lodziana, T. Vegge, Journal of Physics: Condensed
Matter, 2009, 21, 012203
[24] T. Matsunaga, F. Buchter, P. Mauron, M. Bielman, Y. Nakamori, S. Orimo, N. Ohba, K. Miwa, S. Towata, A. Zuttel, Journal of Alloys and Compounds, 2008, 459, 583.
[25] J. H. Kim, S.A. Jin, J.H. Shim, Y.W. Cho, Journal of Alloys and Compounds 2008,461, L20-L22.
[26] P. Chen, Z. Xiong, J. Luo, J. Lin, K.L. Tan, Nature, 2002, 420, 302-304
[27] S. Orimo, Y. Nakamori, J. R. Eliseo, A. Zuttel, C. M. Jensen, Chemical Reviews, 2007 107, 4111-4132.
[28] T. Ichikawa, S. Isobe, N. Hanada, H. Fujii, Journal of Alloys and Compounds, 2004, 365, 271-276.
[29] Z. T. Xiong, G. Wu, J. Hu, P. Chen, Advanced Materials, 2004, 16, 1522-1525.
[30] P. Chen, Oral presentation, MRS Fall Meeting, Boston, MA, 2003.
[31] W.F. Luo, Journal of Alloys and Compounds, 2004, 381, 284-287.
113
[32] J. Hu, Y. Liu, G. Wu, Z. Xiong, Y.S. Chua, P. Chen, Chemistry of Materials, 2008, 20, 4398-4402.
[33] H. Y. Leng, T. Ichikawa, S. Hino, N. Hanada, S. Isobe, H. Fujii, The Journal of Physical Chemistry B, 2004, 108, 8763
[34] Y. Nakamori, S. Orimo, Journal of Alloys and Compounds, 2004, 370, 271-275
[35] F.F. Pinkerton, G.P. Meisner, M.S. Meyer, M.P. Balogh, M.D. Kundrat , The Journal of Physical Chemistry B , 2005, 109, 6-8.
[36] M. Aoki, K. Miwa, T. Noritake, G. Kitahara, Y. Nakamori, S, Orimo, S. Towata, Applied Physics A: Material Science & Processing, 2005, 80, 1409-1412.
[37] J. Hu, G. Wu, Y. Liu, Z. Xiong, P. Chen, K. Murata, K. Sokata, G. Wolf, The Journal of Physical Chemistry B, 2006, 110, 14688-14692.
[38] Z. Xiong, G. Wu, J. Hu, Y. Liu, P. Chen, W. Luo, J. Wang, Advanced Functional Materials, 2007, 17, 1137-1142.
[39] Y. Liu, J. Hu, G. Wu, Z. Xiong, P. Chen , The Journal of Physical Chemistry C, 2007, 111, 19161-19164.
[40] Y. Liu, T. Liu, Z. Xiong, J. Hu, G. Wu, P. Chen, A.T.S. Wee, P. Yang, K. Murata, K. Sokata, European Journal of Inorganic Chemistry, 2006, 21, 4368-4373.
[41] Z. Xiong, J. Hu, G. Wu, Y. Liu, P. Chen, Catalysis Today, 2007, 120, 287-291
[42] G. Wu , Z. Xiong , T. Liu, Y. Liu , J. Hu, P. Chen, Y. Feng, A.T.S. Wee, Inorganic Chemistry, 2007, 46, 517-521.
[43] Y. Kojima, M. Matsumoto, Y. Kawai, T. Haga, N. Ohba, K. Miwa, S. Towata, Y. Nakamori, S. Orimo, The Journal of Physical Chemistry B, 2006, 110, 9632-9636.
[44] J. Yang, A. Sudik , D. J. Siegel, D. Halliday, A. Drews, R. O. Carter III, C. Wolverton, G. J. Lewis, J. W. A. Sachtler, J. J. Low, S. A. Faheem, D. A. Lesch, V. Ozolinš, Angewandte Chemie International Edition, 2008, 47, 882-887.

114
4.2 In-Situ INVESTIGATION FOR THE DEHYDROGENATION MECHANISM
OF THE LiAlH4 -MgH2-NaNH2 TERNARY SYSTEM
4.2.1 INTRODUCTION
An intensive research has been focused on MgH2[1-3], light-element complex hydrides
such as amides (NH2-) [4-7], alanates (AlH4
-) [8-11] and borohydrides (BH4-) [12-15] to
meet the DOE target for hydrogen storage. The theoretical hydrogen capacity of LiAlH4
is as high as 10.5 wt. %, highest among the alkali metals (M) AlH4 family. LiAlH4
dehydrogenates in following three steps:
3LiAlH4→Li3AlH6 + 2Al + 3H2 (4.2.1)
Li3AlH6→3LiH + Al + 3/2H2 (4.2.2)
LiH+ Al → LiAl + ½ H2 (4.2.3)
The hydrogen evolution from reaction (4.2.1) is thermodynamically favored at low
temperatures (ΔH= -27kJ/mol H2) [16] but the reaction is kinetically slow in transforming
AlH4- to AlH6
3- [17]. A lot of efforts have been performed to improve its hydrogen
storage properties such as doping with different catalysts and combining with other
metal/complex hydrides. However, the destabilization of LiAlH4 is still to be resolved.
The other two reactions (4.2.2 and 4.2.3) dehydrogenates at higher temperature.
The interest for sodium amide (NaNH2, 5.1 wt. % H2) is growing in the recent years. A
number of possible combinations such as NaNH2-MgH2 [18-19], NaNH2-NaBH4 [20-21],
NaNH2-NaAlH4 [22] and NaNH2-LiAlH4 [23-24] have been investigated. The earlier

115
reports suggest a relatively faster kinetics for hydrogen desorption after the inclusion of
sodium amide. On the other hand, MgH2 possesses a large gravimetric hydrogen storage
density (7.6 wt. %) and can successfully destabilize LiAlH4 and NaNH2. However, MgH2
suffers unfavorable thermodynamics (ΔH= -76kJ/mol H2) and slow
dehydrogenation/rehydrogenation kinetics. Table 4.2.1 illustrates the hydrogen
absorption and desorption for the binary combinations of LiAlH4 /MgH2/NaNH2. In the
present study, the ternary hydride system of LiAlH4 -MgH2-NaNH2 (1:1:1 molar mixture)
was prepared and investigated, in order to improve the hydrogen storage properties via
the mutual destabilization among the three hydrides. The gravimetric hydrogen storage
density of the ternary system is 7.75 wt. % and thus exceeds the target of DOE.
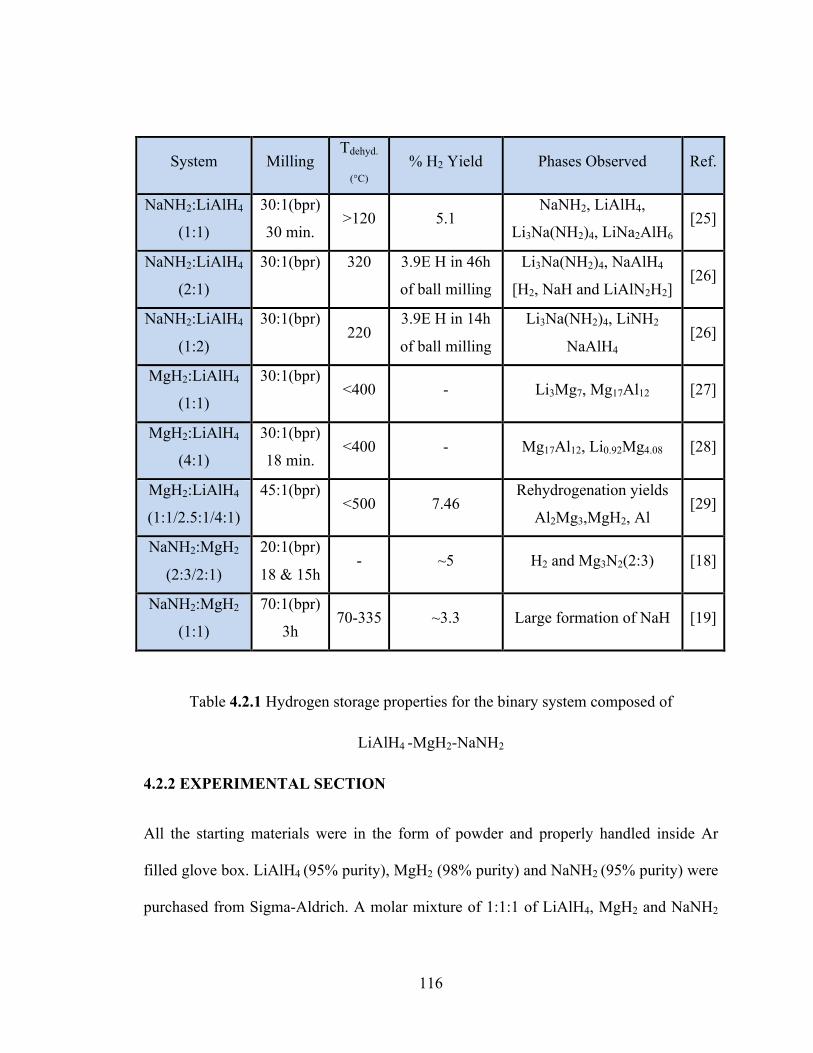
116
System Milling Tdehyd.
(°C) % H2 Yield Phases Observed Ref.
NaNH2:LiAlH4
(1:1)
30:1(bpr)
30 min. >120 5.1
NaNH2, LiAlH4,
Li3Na(NH2)4, LiNa2AlH6 [25]
NaNH2:LiAlH4
(2:1)
30:1(bpr)
320
3.9E H in 46h
of ball milling
Li3Na(NH2)4, NaAlH4
[H2, NaH and LiAlN2H2] [26]
NaNH2:LiAlH4
(1:2)
30:1(bpr)
220
3.9E H in 14h
of ball milling
Li3Na(NH2)4, LiNH2
NaAlH4 [26]
MgH2:LiAlH4
(1:1)
30:1(bpr)
<400 - Li3Mg7, Mg17Al12 [27]
MgH2:LiAlH4
(4:1)
30:1(bpr)
18 min. <400 - Mg17Al12, Li0.92Mg4.08 [28]
MgH2:LiAlH4
(1:1/2.5:1/4:1)
45:1(bpr)
<500 7.46
Rehydrogenation yields
Al2Mg3,MgH2, Al [29]
NaNH2:MgH2
(2:3/2:1)
20:1(bpr)
18 & 15h - ~5 H2 and Mg3N2(2:3) [18]
NaNH2:MgH2
(1:1)
70:1(bpr)
3h 70-335 ~3.3 Large formation of NaH [19]
Table 4.2.1 Hydrogen storage properties for the binary system composed of
LiAlH4 -MgH2-NaNH2
4.2.2 EXPERIMENTAL SECTION
All the starting materials were in the form of powder and properly handled inside Ar
filled glove box. LiAlH4 (95% purity), MgH2 (98% purity) and NaNH2 (95% purity) were
purchased from Sigma-Aldrich. A molar mixture of 1:1:1 of LiAlH4, MgH2 and NaNH2

117
were homogeneously ground using mortar and pestle and used for study. A planetary
Retsch Mill PM100 was employed to mechanically grind the hydrides at a revolution
speed of 300 rpm for 0.5h. The ball to powder ratio was 30:1.
PCTPro-2000 was employed to study the dehydrogenation kinetics of the ternary system.
The standard start-up procedures, namely, leak check, purge gas and volume calibration
at 50°C was used. The de-hydrogenation experiments for multinary complex hydrides
were performed in a static vacuum (~0.01-0.05 bar). The temperature programmed
desorption measurements were performed between 50-380°C with a heating ratio of
5°C/min. The differential scanning calorimetry was performed under argon atmosphere
(30 ml/min) at a heating rate of 5, 10 and 15°C/min to reach 500°C. The temperature was
kept constant at 500°C for 10 minutes.
In-Situ x-ray diffraction and Raman spectroscopy analysis were performed using a home-
made furnace. The hydride mixture was put inside the capillary under glove box and
hermetically sealed. The mixture was heated to a particular temperature and kept constant
for 0.5 h.
4.2.3 RESULTS AND DISCUSSION
4.2.3.1 Temperature-programmed decomposition
Fig. 4.2.1 shows the temperature programmed decomposition of the LiAlH4-MgH2-
NaNH2 (1:1:1) mixture during the heating from 50°C to 380°C with a heating rate of 5°C
/min. A clear difference in desorption profile can be observed for unmilled and 0.5h
milled mixture. The pressure data indicates that gas release, most likely hydrogen, begins

118
at 50°C. The desorption process appears to be composed of three steps. First step is the
gradual but continuous release of hydrogen. Large amount of gas evolves at
approximately 150°C and 115°C for unmilled and milled mixture respectively. This step
can be categorized as second-step desorption of hydrogen. The third step of hydrogen
release is relatively faster than the first step. The total amount of hydrogen desorbed from
the unmilled and milled mixture is 5.23 and 4.61 wt. % respectively. This is equivalent to
5.39 H and 4.75 H atoms per LiAlH4+MgH2+NaNH2.
The hydrogen desorption kinetics improves and dehydriding temperature reduces for ball
milled sample. It may be attributed to the reduced particle size of the mixed hydrides.
However, the weight loss for milled sample is relatively lower, due to evolution of
hydrogen during ball milling.
Figure 4.2.1 Temperature programmed decomposition of the LiAlH4-MgH2-NaNH2 (1:1:1) mixture
50 100 150 200 250 300 350 400-‐6
-‐5
-‐4
-‐3
-‐2
-‐1
0
H2 re
leas
e, w
t %
Temperature [°C ]
Unmilled 0.5h milled
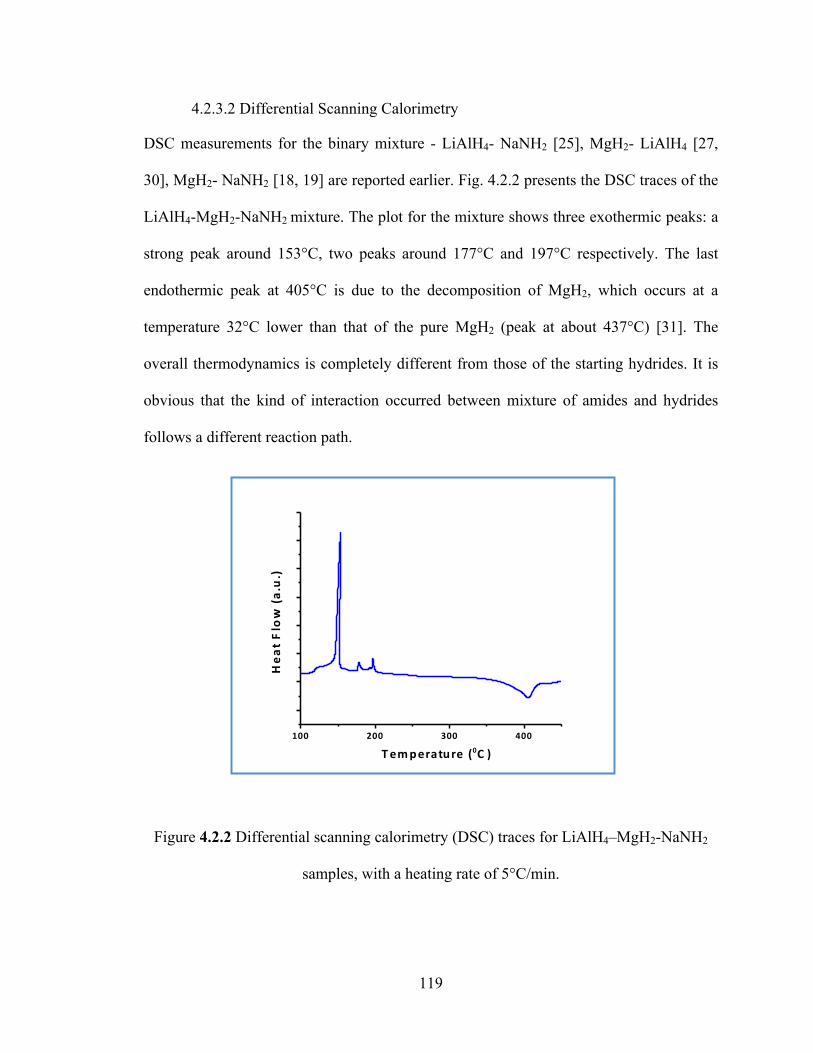
119
4.2.3.2 Differential Scanning Calorimetry
DSC measurements for the binary mixture - LiAlH4- NaNH2 [25], MgH2- LiAlH4 [27,
30], MgH2- NaNH2 [18, 19] are reported earlier. Fig. 4.2.2 presents the DSC traces of the
LiAlH4-MgH2-NaNH2 mixture. The plot for the mixture shows three exothermic peaks: a
strong peak around 153°C, two peaks around 177°C and 197°C respectively. The last
endothermic peak at 405°C is due to the decomposition of MgH2, which occurs at a
temperature 32°C lower than that of the pure MgH2 (peak at about 437°C) [31]. The
overall thermodynamics is completely different from those of the starting hydrides. It is
obvious that the kind of interaction occurred between mixture of amides and hydrides
follows a different reaction path.
Figure 4.2.2 Differential scanning calorimetry (DSC) traces for LiAlH4–MgH2-NaNH2
samples, with a heating rate of 5°C/min.
100 200 300 400
Hea
t Flow (a.u.)
T emperature (0C )

120
The Kissinger equation [32] is used to determine the activation energy required for the
MgH2-related decomposition, which is given below:
ln 𝛽𝛽𝑇𝑇 = −𝐸𝐸 𝑅𝑅𝑇𝑇 + 𝐴𝐴
Where, β is the heating rate, TP is the peak temperature in the DSC curve, R is the gas
constant, and A is a linear constant. Fig. 4.2.3 illustrates the DSC traces for the mixture at
a different heating rates (β = 5, 10, and 15°C min-1, respectively). The apparent activation
energy for the MgH2- related decomposition in the LiAlH4-MgH2-NaNH2 is found to be
(173.6 ± 6) kJ/mol. The activation energy for the dehydrogenation was lowered by
approximately 22kJ/mol compared to the bulk material (Ea =195.3 ± 10 kJ/mol) [33].
Figure 4.2.3 DSC traces of the LiAlH4–MgH2-NaNH2 at different heating rates. The inset
plot is the Kissinger’s analysis for the hydrogen desorption reaction of the ternary
hydrides.
4.2.3.3 Room Temperature Raman Spectrum
350 400 450
1.43 1.44 1.45 1.46 1.47-‐11.6
-‐11.4
-‐11.2
-‐11.0
-‐10.8
-‐10.6
-‐10.4y = 24.78-‐24.63xR 2 = 0.99817
1000/TP (K -‐1)
ln(ββ//T
2 P)
150C /min100C /minH
eat Flow(a.u.)
T emperature(0C )
50C /min
121
Fig illustrates the Raman spectra for 0.5h milled and unmilled LiAlH4–MgH2-NaNH2
mixture at ambient conditions. Two fundamental internal modes are observed for NH2- at
3210 and 3261 cm-1 in the Raman spectrum, corresponding to N-H symmetric stretching
(ν1(A1)) and asymmetric stretching mode (ν3(B2)) respectively. However, no bending
mode (ν2 (A1)) at 1536 cm-1 was observed [34]. Moreover, the Raman spectra in the low
frequency region (at 253, 464 and 535 cm-1) correspond to the lattice modes of solid
NaNH2 [34, 35]. However, the intensity of these peaks is especially weak and exhibits a
broad FWHM after ball milling for 0.5h.
Three distinct peaks at 688,778 and 873 cm-1 in the spectral region, 600 to 950 cm-1, and
are assigned to the bending of Al-H bonds [36-39]. Also, a shoulder peak is noticed at
816 cm-1. The high frequency spectral region (1500-2000 cm-1) has the Al-H symmetric
peak at 1829 cm-1 and a shouldered antisymmetric peak at 1754 cm-1( shoulder at 1720
cm-1). In the Al-H bending spectral region, the intensity of the peaks are significantly
reduced and becomes broad after mechanical milling. However, after milling for 0.5h, the
shouldered antisymmetric peak at 1754 cm-1 merged with the shoulder peak at 1720 cm-1.
The basic features of the Raman spectrum of α- MgH2 are in agreement with the earlier
reports [40, 41]. The corresponding weak but broad peaks are observed at ~945 and
~1270 cm-1. However, no discernible change is observed for MgH2 Raman peaks after
milling for 0.5h.
In comparison with the unmilled mixture, the milled sample exhibits markedly reduction
in the intensity of the peaks, and particularly, several weak peaks in the Raman active
modes are found to disappear after mechanical milling.
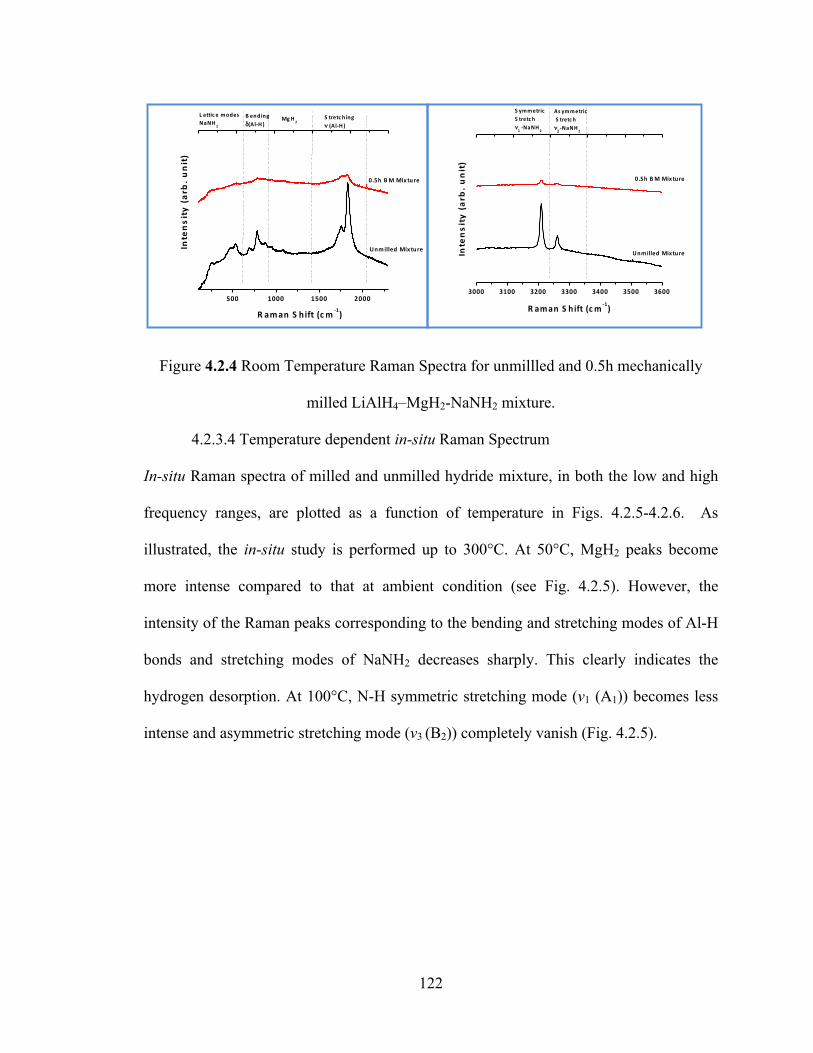
122
Figure 4.2.4 Room Temperature Raman Spectra for unmillled and 0.5h mechanically
milled LiAlH4–MgH2-NaNH2 mixture.
4.2.3.4 Temperature dependent in-situ Raman Spectrum
In-situ Raman spectra of milled and unmilled hydride mixture, in both the low and high
frequency ranges, are plotted as a function of temperature in Figs. 4.2.5-4.2.6. As
illustrated, the in-situ study is performed up to 300°C. At 50°C, MgH2 peaks become
more intense compared to that at ambient condition (see Fig. 4.2.5). However, the
intensity of the Raman peaks corresponding to the bending and stretching modes of Al-H
bonds and stretching modes of NaNH2 decreases sharply. This clearly indicates the
hydrogen desorption. At 100°C, N-H symmetric stretching mode (ν1 (A1)) becomes less
intense and asymmetric stretching mode (ν3 (B2)) completely vanish (Fig. 4.2.5).
3000 3100 3200 3300 3400 3500 3600
0.5h BM Mix ture
Intensity (arb
. unit)
R aman S hift (cm -‐1)
Unmilled Mix ture
As ymmetric S tretc h νν
22 -‐NaNH
2
S ymmetric S tretc h νν
11 -‐NaNH
2
500 1000 1500 2000
S tretc hing νν (Al-‐H )
Mg H2
0.5h B M Mix ture
Unmilled Mix tureInte
nsi
ty (
arb
. un
it)
R aman S hift (c m -‐1)
B ending δδ(Al-‐H )
L attic e modesNaNH
2

123
Figure 4.2.5 Temperature dependent Raman Spectra for unmilled LiAlH4–MgH2-NaNH2
In the temperature range, 100-200°C, the stretching modes of Al-H bonds becomes less
intense and broad. Moreover, there is also a tendency for downshifting of the spectral
lines of ν (Al-H) towards lower frequency in the same temperature region (100-200°C).
But in the temperature range, 175-200°C, the peak at ~1780 cm-1 becomes more intense.
This trend indicates that the Al-H bonded phase has more developed crystallinity and/ or
present in greater amounts in the Raman scattering volume than at 100-175°C. At a much
higher temperature (≥250°C), stretching modes (ν (Al-H)) completely disappears. MgH2
peak becomes more intense at 300°C and can be attributed to the remaining undesorbed
stable MgH2.
500 1000 1500 2000
Inte
nsi
ty (
arb
. un
it)
R aman S hift (c m -‐1)
3000C
2500C
2000C
1750C1500C
1000C
500C
250C
Mg H2
S tretc hing νν (Al-‐H )
Mg H2
B ending δδ(Al-‐H )
L attic e modesNaNH
2
3000 3100 3200 3300 3400
R aman S hift (cm -‐1)
3000C
2500C2000C
1750C
1500C
1000C
500C
Intensity (arb
. unit)
250C
As ymmetric S tretc h νν
22 -‐NaNH
2
S ymmetric S tretc h νν
11 -‐NaNH
2

124
Figure 4.2.6 Temperature dependent Raman Spectra for mechanically milled
LiAlH4–MgH2-NaNH2 mixture
In-situ Raman spectra of the milled mixture as a function of temperature are shown in
Fig. 4.2.6. The mechanically milled sample illustrates the same behavior of the Raman
spectrum on the thermal treatment as that for the unmilled mixture. However, the initial
peaks of the milled sample are less intense and have broader FWHM, which indicates
desorption of hydrogen during ball milling. The Raman spectrum strongly evidences the
release of hydrogen during milling, which is in congruence with the temperature
programmed desorption analysis of the mixture.
4.2.3.5 Room Temperature X-ray diffraction analysis
Figure 4.2.7 shows the x-ray diffraction patterns for unmilled and milled sample of
ternary hydrides. Clearly, LiAlH4, MgH2 and NaNH2 phases react with each other during
mechanical milling. The phase identification of the milled sample suggests that following
reactions could take place during 0.5h of milling time:
LiAlH4 → 1/3Li3AlH6 + 2/3Al + H2 (4.2.4)
MgH2 + 2NaNH2→ Mg (NH2)2 + 2NaH (4.2.5)
3000 3100 3200 3300 3400
3000C
2500C
2000C
1750C
1500C
1000C
500C
250C
R aman S h ift (c m -‐1)
Intensity (ar
b. u
nits)
As ymmetric S tretc h νν
22 -‐NaNH
2
S ymmetric S tretc h νν
11 -‐NaNH
2
500 1000 1500 2000
S tretc hing νν (Al-‐H )
Mg H2
B ending δδ(Al-‐H )
L attic e modesNaNH
2
3000C
2500C
2000C1750C
1500C
1000C
500C
250C
R aman S h ift (c m -‐1)
Inte
nsi
ty (
arb
. un
its)

125
LiAlH4 + NaNH2→ LiNH2 + NaAlH4 (4.2.6)
Li3AlH6 + NaNH2→ Na3AlH6 + LiNH2 (4.2.7)
Li3AlH6 + LiNH2→ Al+ Li2NH+ 9/2 H2 (4.2.8)
LiAlH4 + LiNH2→ Al+ Li2NH+ 5/2 H2 (4.2.9)
Figure 4.2.7 X-ray diffraction pattern for milled and unmilled LiAlH4–MgH2-NaNH2
mixture
The partial decomposition of LiAlH4 generates Li3AlH6 and Al. Moreover, LiAlH4 reacts
with NaNH2 via a metathesis reaction to form LiNH2 and NaAlH4. Further, Li2NH is
formed due to reactions between: (1) LiNH2+ Li3AlH6 and (2) LiNH2+ LiAlH4. One more
Li-Na exchange (metathesis reaction) is observed between Li3AlH6 and NaNH2. MgH2
and NaNH2 partially reacts to form Mg (NH2)2.
4.2.3.6 Temperature dependent in-situ X-ray diffraction analysis
In order to explore the hydrogen desorption mechanism, the in-situ X-ray diffraction
measurement were performed for the ternary hydride mixture. The mixture was heated
10 20 30
Unmilled mixture
2ΘΘ(deg rees )
Milled mixture

126
till 250°C. At each temperature, the mixture was held for 0.5h [shown in Fig. 4.2.8]. On
the basis of the phase identification, the mechanism of hydrogen desorption is predicted.
As can be seen from Fig. 4.2.8, the hydrogen desorption starts at 50°C and is in
congruence with the observation from the Raman Spectroscopy.
Figure 4.2.8 Temperature dependent X-ray diffraction pattern for unmilled
LiAlH4–MgH2-NaNH2 mixture
Table 4.2.2 illustrates the phases present at different temperatures for the ternary mixture.
The presence of Li3AlH6 at 50°C strongly evidences the faster desorption of LiAlH4
compared to the other two hydrides, MgH2 and NaNH2. The x-ray diffraction peaks of Al
overlap with those of LiH and some of the Li3AlH6 peaks and thus the presence or
absence of Al cannot be conclusively demonstrated using x-ray diffraction. Further,
heating of the mixture, leads to decrease of the amount of Li3AlH6. Li3AlH6 decomposes
to release more hydrogen and LiH at high temperature. However, MgH2 is a stable
10 20 30
2500C
2000C
2250C
1000C
1750C
1500C
500C
2ΘΘ((deg rees )
250C
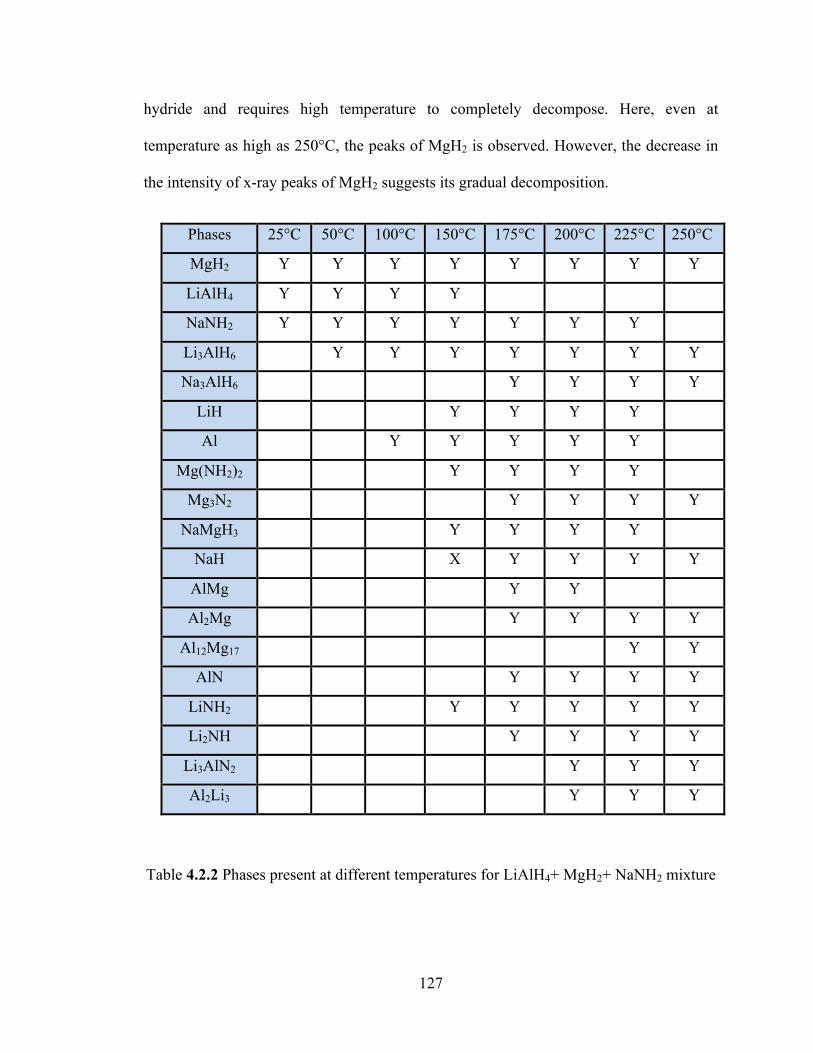
127
hydride and requires high temperature to completely decompose. Here, even at
temperature as high as 250°C, the peaks of MgH2 is observed. However, the decrease in
the intensity of x-ray peaks of MgH2 suggests its gradual decomposition.
Phases 25°C 50°C 100°C 150°C 175°C 200°C 225°C 250°C
MgH2 Y Y Y Y Y Y Y Y
LiAlH4 Y Y Y Y
NaNH2 Y Y Y Y Y Y Y
Li3AlH6 Y Y Y Y Y Y Y
Na3AlH6 Y Y Y Y
LiH Y Y Y Y
Al Y Y Y Y Y
Mg(NH2)2 Y Y Y Y
Mg3N2 Y Y Y Y
NaMgH3 Y Y Y Y
NaH X Y Y Y Y
AlMg Y Y
Al2Mg Y Y Y Y
Al12Mg17 Y Y
AlN Y Y Y Y
LiNH2 Y Y Y Y Y
Li2NH Y Y Y Y
Li3AlN2 Y Y Y
Al2Li3 Y Y Y
Table 4.2.2 Phases present at different temperatures for LiAlH4+ MgH2+ NaNH2 mixture

128
NaNH2 reacts with MgH2 to form Mg (NH2)2, which further releases hydrogen to form
Mg3N2 on heating. At high temperature (≥200°C), a large number of intermetallic
compounds formed such as Al2Mg, Al2Li3, Li3AlN2, AlN. Thus, the overall
dehydrogenation mechanism for the 1:1:1 molar mixture of LiAlH4, MgH2 and NaNH2
can be given as follows:
At 50-100°C, LiAlH4 → 1/3Li3AlH6 + 2/3Al + H2
At 150°C, MgH2 + NaNH2 → Mg (NH2)2 + NaH + NaMgH3
LiAlH4 + NaNH2 → LiNH2 + NaAlH4
At 175-200°C, Li3AlH6 → 3LiH + Al + 3/2H2
LiAlH4 + Mg (NH2)2 → 1/3Mg3N2 + 1/3Li3AlN2 + 2/3AlN + 4H2
8LiH + 3Mg (NH2)2 → 4Li2NH + Mg3N2 + 8H2
Li3AlH6 + NaNH2 → Na3AlH6 + LiNH2
At 225-250°C, 17MgH2 + 12Al → Al12Mg17 + 17H2
3LiH + 2Al → Al2Li3 + 3/2H2

129
4.2.4 REFERENCES
[1] G. Liang, J. Huot, S. Boily, A. Van Neste, R. Schulz, Journal of Alloys and Compounds, 1999, 292, 247-252.
[2] A. Zaluska, L. Zaluski, J.O. Stro¨m-Olsen, Journal of Alloys and Compounds, 1999, 288, 217-225.
[3] J. F. Mao, Z. Wu, T. J. Chen, B. C. Weng, N. X. Xu, T. S. Huang, Z. P. Guo, H. K. Liu, D. M. Grant, G. S. Walker, and X. B. Yu, The Journal of Physical Chemistry C, 2007, 111, 12495-12498.
[4] P. Chen, Z. Xiong, J. Luo, J. Lin, K. Tan, Nature, 2002, 420, 302-304.
[5] W. Luo, Journal of Alloys and Compounds, 2004, 381, 284-287.
[6] H.Y. Leng, T. Ichikawa, S. Hino, N. Hanada, S. Isobe, H. Fujii, The Journal of Physical Chemistry B, 2004, 108, 8763-8765.
[7] J. Yang, A. Sudik, J. S. Donald, D. Halliday, A. Drews, R.O. Carter, C. Wolverton, G.J. Lewis, J.W.A. Sachtler, J.J. Low, S.A. Faheem, D.A. Lesch, V.Ozolins, Angewandte Chemie International Edition, 2008, 47, 882–887.
[8] B. Bogdanovic´, M. Schwickardi, Journal of Alloys and Compounds, 1997, 253- 254, 1-9.
[9] D.L. Sun, S. Srinivasan, T. Kiyobayashi, N. Kuriyama, C.M. Jensen, Journal of Physical Chemistry B, 2003, 107, 10176–10179.
[10] J. Chen, N. Kuriyama, Q. Xu, H.T. Takeshita, T. Sakai, Journal of Physical Chemistry B, 2001, 105, 11214–11220.
[11] J.F. Mao, X.B. Yu, Z.P. Guo, C.K. Poh, H.K. Liu, Z. Wu, J. Ni, Journal of Physical Chemistry C, 2009, 113, 10813–10818.
[12] A. Zu¨ttel, P. Wenger, S. Rentsch, P. Sudan, Ph. Mauron, Ch. Emmenegger, Journal of Power Sources, 2003, 118, 1–7.
[13] M. Aoki, K. Miwa, T. Noritake, G. Kitahara, Y. Nakamori, S. Orimo, S. Towata, Applied Physics A: Materials Science & Processing, 2005, 80, 1409–1412.
[14] P. Mauron, F. Buchter, O. Friedrichs, A. Remhof, M. Bielmann, N.Z. Christoph, A. Zu¨ttel, Journal of Physical Chemistry B, 2008, 112, 906–910.
[15] A. Zu¨ttel, S. Rentsch, P. Fischer, P. Wenger, P. Sudan, Ph. Mauron, Ch. Emmenegger, Journal of Alloys and Compounds, 2003, 356-357, 515–520.
130
[16] J.W. Jang, J.H. Shim, Y.W. Cho, B.J. Lee, Journal of Alloys and Compounds, 2006, 420, 286-290.
[17] X.L. Zheng, Z.T. Xiong, S. Qin, Y.S. Chua, H. Chen, P. Chen, International Journal of Hydrogen Energy, 2008, 33, 3346-3350.
[18] N.K. Singh, T. Kobayashi, O. Dolotko, J.W. Wiench, M. Pruski, V.K. Pecharsky, Journal of Alloys and Compounds, 2012, 513, 324-327.
[19] D.A. Sheppard, M. Paskevicius, C.E. Buckley, The Journal of Physical Chemistry C, 2011, 115, 8407-8413.
[20] P.A. Chater, P.A. Anderson, J.W. Prendergast, A. Walton, V.S.J. Mann, D. Book, W.I.F. David, S.R. Johnson, P.P. Edwards, Journal of Alloys and Compounds, 2007, 446-447, 350–354.
[21] M. Somer, S. Acar, C. Koz, I. Kokal, P. Hohn, R. Cardoso-Gil, U. Aydemir, L. Akselrud, Journal of Alloys and Compounds, 2010, 491, 98–105.
[22] O. Dolotko, H. Zhang, O. Ugurlu, J.W. Wiench, M. Pruski, L. Scott Chumbley, V. Pecharsky, Acta Materialia, 2007, 55, 3121–3130.
[23] Z.T. Xiong, J. J. Hu, G.T. Wu, Y.F. Liu, P. Chen, Catalysis Today, 2007, 120, 287–291.
[24] Y.S. Chua, G. Wu, Z. Xiong, P. Chen, Journal of Solid State Chemistry, 2010, 183, 2040–2044.
[25] Z.T. Xiong, J.J. Hu, G.T. Wu, Y.F. Liu, P. Chen, Catalysis Today, 2007, 120, 287–291.
[26] Y.S. Chua, G. Wu, Z. Xiong, P. Chen, Journal of Solid State Chemistry, 2010, 183, 2040–2044.
[27] J. Mao, Z. Guo, X. Yu, M. Ismail, H. Liu, International Journal of Hydrogen Energy, 2011, 36, 5369–5374.
[28] M. Ismail, Y. Zhao, X. B. Yu and S. X. Dou, RSC Advances, 2011, 1, 408-414.
[29] R. Chen, X. Wang, L. Xu, L. Chen, S. Li, C. Chen, Materials Chemistry and Physics, 2010, 124, 83-87.
[30] Y. Zhang, Q.F. Tian, S.S. Liu, L.X. Sun, Journal of Power Sources, 2008, 185, 1514–1518.
[31] B. Zhao, F. Fang, D. Sun, Q. Zhang, S. Wei, F. Cao, H. Sun, L. Ouyang, M. Zhu, Journal of Solid Chemistry, 2012, 192, 210-214.

131
[32] H. E. Kissinger, Journal of Research of the National Bureau of Standards, 1956, 57, 217.
[33] Z.Z. Karger, J. Hu, A. Roth, D. Wang, C. Kübel, W. Lohstroh, M. Fichtner, Chemical Communications, 2010, 46, 8353-8355.
[34] A. Liu, Y. Song, The Journal of Physical Chemistry B, 2011, 115, 7-13.
[35] P.T. Cunningham, V.A. Maroni, The Journal of Chemical Physics, 1972, 57, 1415-1418.
[36] A.V. Talyzin, B. Sundquist, Physical Review B, 2004, 70, 180101-3.
[37] J.C. Bureau, B. Bonnetot, P. Claudy, H. Eddaoudi, Materials Research Bulletin, 1985, 20, 1147-1155.
[38] L. D’Or, J. Fuger, Bulletin de la Société Royale des Sciences de Liège, 1956, 25, 14
[39] A.E. Shirk, D.F. Shriver, Journal of the American Chemical Society, 1973, 95, 5904-5912.
[40] H.G. Schimmel, M.R. Johnson, G.J. Kearley, A.J. Ramirez-Cuesta, J. Huot, F.M. Mulder, Materials Science & Engineering B, 2004, 108, 38–41.
[41] M.A. Kuzovnikov, V.S. Efimchenko, E.V. Filatov, A.A. Maksimov, I.I. Tartakovskii, A.J. Ramirez-Cuesta, Solid State Communications, 2013,154, 77-80.

132
5. CARBON DIOXIDE CAPTURE USING METAL OXIDES
5.1 LITERATURE REVIEW
The problem of carbon dioxide emission from various fossil fuel burning plants (such as
power, steel, cement, gasifiers) has become an important issue that may tremendously
affect our future survival. Carbon dioxide, one of the greenhouse gases, contributes to the
global warming effect once release into the atmosphere [1-2]. Therefore, it is essential to
capture carbon dioxide from the industrial flue gas stream, one of the leading contributors
of the anthropogenic gases [3]. The development of Carbon Capture and Sequestration
(CCS) technologies can be seen as a viable solution to mitigate the vast carbon emission.
The separation of a pure carbon dioxide stream, combined with a well-managed
geological storage site, is being considered as a mitigation option for climate change. The
CCS technologies could be applied using available technologies as many of the
components in these systems are already in use. However, it is widely accepted that there
is a large scope for cost reduction and energy efficiency improvements in carbon dioxide
capture systems.
Currently, various carbon dioxide capture technologies exist including physical
absorption [4-5], chemical absorption [6-7], adsorption [8] and membranes [9]. However,
they are still far from being considered as a technologically viable solution. The obvious
bottlenecks are the huge amount of flue gas which needs to be treated as well as low mass
transfer rate during the processes. Among all the proposed techniques, chemical
absorption using aqueous alkanolamine solutions is the most conventional way for carbon
dioxide capture. But these amine based solutions suffer severe drawbacks such as high

133
energy consumption in regeneration process, high corrosive rate of equipment, essential
pretreatment steps, large absorber volume and high sorbent cost. Because of these
limitations of the chemical absorption techniques- an alternative way for post, oxy or pre-
combustion carbon dioxide capture at fossil fuel burning power plants, mainly a solid
adsorption/absorption method can be proposed.
A schematic diagram on Fig. 5.1.1 is depicted to demonstrate the concept of cyclic
carbon dioxide capture process by metal oxides. The metal oxides (MO), such as CaO
and MgO, combine with carbon dioxide to form thermodynamically stable carbonates.
Metal carbonates, when heated, liberate pure stream of carbon dioxide gas and
regenerates the oxides. The combined use of exothermic carbonation reaction and
endothermic regeneration reaction form a cyclic process. Eventually, the generated pure
carbon dioxide gas can either be sequestered underground or used for enhanced oil
recovery [10]. In general, any metal oxides which can qualify for carbon dioxide capture
application must be abundant in earth’s crust, react with carbon dioxide at low
temperature, require low regeneration energy, should have suitable reaction kinetics and
must form a carbonate that is stable in the environment at ambient conditions. Porous
oxides, namely alkali and alkaline-earth metals have been reported as promising
candidates for carbon dioxide capture. These metal oxides possess properties such as long
durability, good mechanical strength, wide availability, low cost since they are present as
natural minerals and high carbon dioxide absorption capacity at moderate working
temperatures [11-14]. In this study, we review the carbon dioxide capture capacity of
these different potential oxides.
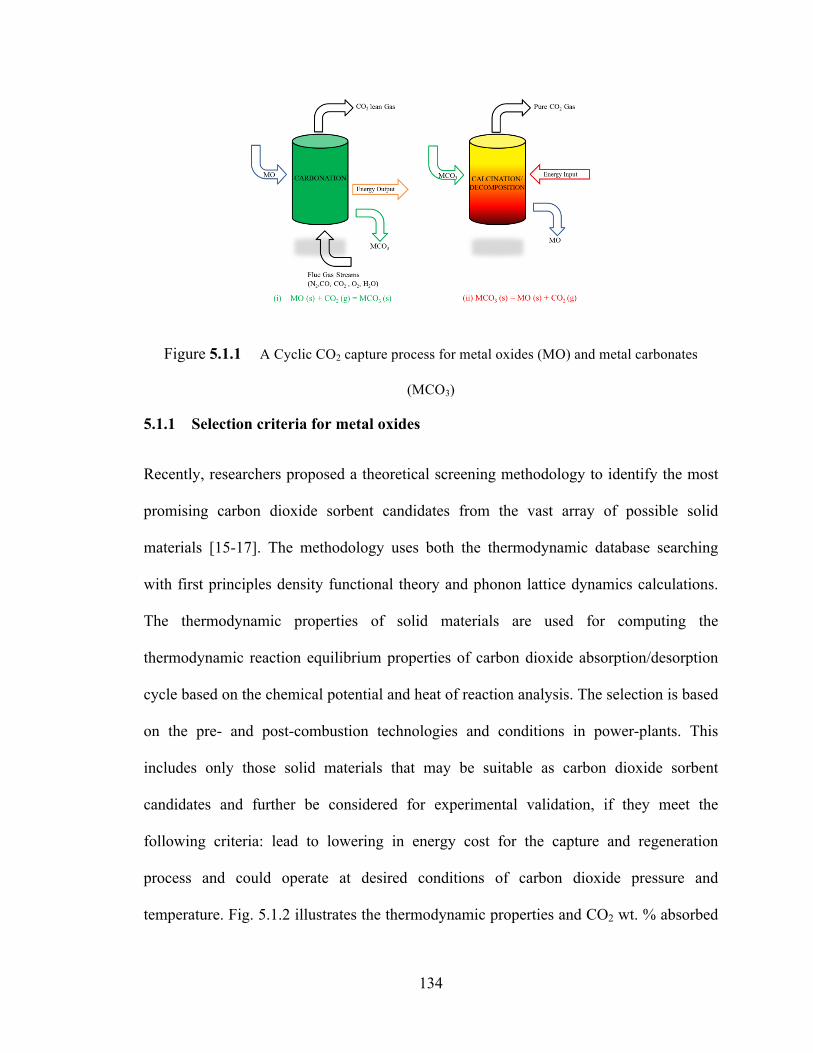
134
Figure 5.1.1 A Cyclic CO2 capture process for metal oxides (MO) and metal carbonates
(MCO3)
5.1.1 Selection criteria for metal oxides
Recently, researchers proposed a theoretical screening methodology to identify the most
promising carbon dioxide sorbent candidates from the vast array of possible solid
materials [15-17]. The methodology uses both the thermodynamic database searching
with first principles density functional theory and phonon lattice dynamics calculations.
The thermodynamic properties of solid materials are used for computing the
thermodynamic reaction equilibrium properties of carbon dioxide absorption/desorption
cycle based on the chemical potential and heat of reaction analysis. The selection is based
on the pre- and post-combustion technologies and conditions in power-plants. This
includes only those solid materials that may be suitable as carbon dioxide sorbent
candidates and further be considered for experimental validation, if they meet the
following criteria: lead to lowering in energy cost for the capture and regeneration
process and could operate at desired conditions of carbon dioxide pressure and
temperature. Fig. 5.1.2 illustrates the thermodynamic properties and CO2 wt. % absorbed

135
by different metal oxides. However, the thermodynamic properties and CO2 wt. %
absorbed by any sorbent could not be the only factors to select them for experimental
studies. Various other important parameters such as availability or cost, regeneration
temperature, kinetics, reversibility and durability must also be carefully considered before
selecting any metal oxides for a large scale application.
Figure 5.1.2 Thermodynamic properties and CO2 wt. % for metal oxides
MO(s) + CO2 (g) = MCO3(s) at 300 K
Based on the above figure it can deduced that BeO has a favorable thermodynamics, but
this system is not a viable candidate for carbon dioxide capture because of the health
issues related to beryllium powder or dust. It should be noted that a high exothermic
forward reaction (MO(s) + CO2 (g) = MCO3(s)) generally requires a large regeneration
temperature for the oxide (MCO3(s) = MO (s) + CO2 (g)). Also, a low CO2 wt. % (~40-
50) will require a large amount of the solid materials to deal with a huge volume of flue
B aO
Na2O
Na2O
NiOMnO
K2Z rO
3
Na2Z rO
3
L i2Z rO
3
L i4S iO
4
B aO
K2Z rO
3 C aO
Na2Z rO
3L i
4S iO
4
L i2Z rO
3
L i2O
L i2O
MgO
MnO
ZnO NiO
B eO
B eO
C dO
ZnO
-‐400 -‐350 -‐300 -‐250 -‐200 -‐150 -‐100 -‐50 0 50
20
40
60
80
100
120
140
160
K2O
S rO
S rO
K2O
C dOMgO
ΔΔG (kJ /mol)
CO
2(wt%
)
C O2 (wt% )
ΔH (kJ /mol)
-‐400
-‐350
-‐300
-‐250
-‐200
-‐150
-‐100
-‐50
0
C aO
ΔH(kJ/m
ol)

136
gas stream at any fossil fuel burning plants. Thus, a high regeneration temperature and
low CO2 wt. % can cause a vast energy or carbon emission penalty. Moreover, such
oxides can eventually increase the electricity cost by a significant factor and thus may not
be suitable for carbon dioxide capture at any plants.
The turnover temperature represents the value above which sorbents cannot absorb
carbon dioxide and the release of carbon dioxide begins. The flue gas conditions are
different for pre- and post- combustion carbon dioxide capture at power plants. Under
pre-combustion conditions, after water-gas shift reaction, the gas stream mainly contains
CO2, H2O, and H2. The partial carbon dioxide pressure in this case is around 20–25 bar
and the temperature is about 300–350°C. But for post-combustion conditions, the flue gas
stream mainly contains CO2 and N2. In this case, the partial pressure of CO2 is around
0.1–0.2 bar, while the temperature range can vary around 27-77 °C. The goal set up by
the US Department of Energy is to capture at least 90% CO2 with an increase in the
electricity cost of no more than 10% and 35% for pre- and post- combustion technologies
respectively [18]. In order to minimize the energy consumption, the ideal sorbents should
work in the above indicated pressure and temperature ranges to separate carbon dioxide
from hydrogen. A list of turnover temperatures for different oxides can be found
elsewhere [15-17].
Based on the above discussed limitations, exclusively few oxides seem to be promising
and thus chosen to study for the experimental validation. The two alkaline-earth metal
oxides (such as CaO and MgO) draw the tremendous attention because of accessibility
and favourable thermodynamics. Recently, Lithium, Sodium and Potassium based

137
silicates or zirconates also gained interest due to their high carbon dioxide absorption
capacity. Moreover, FeO can also be seen as a promising material for carbon dioxide
capture at both power and non-power sectors (Iron and steel industry). In the following
sections, we review the experimental studies for the most promising carbon dioxide
sorbent candidates.
5.1.2 Metal oxides
5.1.2.1 Alkali metal based oxides
(a) Lithium zirconate (Li2ZrO3)
The reaction between Lithium carbonate (Li2CO3) and Zirconium dioxide (ZrO2) is well
known to synthesize Lithium zirconate (Li2ZrO3). However, the reverse reaction was not
considered for carbon dioxide capture until 1998 [19].
Li2CO3 (s) + ZrO2(s) ↔ Li2ZrO3(s) + CO2 (g) (5.1.1)
The separation of carbon dioxide with aid of Li2ZrO3 works in a temperature range of
450-700°C. The main advantage of this new material with respect to calcium-based
absorbents is its unique thermal stability that allows achieving many
absorption/regeneration cycles (over 20) without loss of capacity. Previous reports
suggest that only 11-13 wt. % change after absorption of carbon dioxide using Li2ZrO3 at
500-700°C in more than an hour is possible. Thus, it is evident that Li2ZrO3 has
extremely slow absorption kinetics and hence, recently the addition of dopants was
proposed as a solution.
138
K2CO3 was used as a dopant of Li2ZrO3 causing an important increase of the absorption
kinetics. Li2CO3 and K2CO3 form a eutectic mixture already at 500°C, which presumably
increases the carbon dioxide diffusion towards the inner unreacted particles during the
absorption process [20]. In the case of the pure Li2ZrO3 (without K2CO3 additive),
formation of an impervious shell of Li2CO3 on the surface leads to residual unreactive
Li2ZrO3 core. This observation suggests that the diffusion resistance of carbon dioxide
through the solid Li2CO3 surface layer is the rate-limiting step. In contrast, the potassium
and lithium carbonate-containing Li2ZrO3 sample reacts with gaseous CO2 at 500ºC to
form a molten liquid outer layer and a solid interior ZrO2 core. Consequently, carbon
dioxide diffuses through the molten carbonate layer at a much faster rate. Therefore, the
difference in carbon dioxide sorption rate can be partially attributed to the molten
carbonate layer.
Y2O3 was also considered as a dopant of Li2ZrO3 under the principle that Y2O3 would
improve the O-2 ionic diffusion in the ZrO2 layer that is formed during the absorption.
However, the addition of Y2O3 did not contribute to increase the absorption kinetics of
the material, on the opposite; it did slow the kinetics [21]. In other findings, solid
solutions of lithium and potassium meta zirconates (Li2-xKxZrO3) gave about five times
faster kinetics compared to undoped Li2ZrO3 [22]. In the same line, solid solutions of
lithium and sodium zirconates were also explored [23]. It was concluded that the higher
the Na content in the samples the faster the absorption kinetics being produced. While,
regeneration results were exactly opposed to the absorption, as higher the Li content in
the mixture the faster the regeneration kinetics was produced.

139
(b) Lithium Orthosilicate (Li4SiO4)
Lithium silicate-based (Li4SiO4) sorbent material emerged as a promising candidate for
high temperature carbon dioxide removal in the recent times [24-25]. In a study, Wang et
al reported an interesting way to synthesize Li4SiO4 using rice husk, which were calcined
at 8000C in the presence of Li2CO3 [26]. This material is ideally suited for carbon dioxide
removal from synthesis gas (syngas) derived from gasification of carbonaceous fuels
(coal, coke, natural gas, biomass, etc.) and hence is considered as a pre-combustion
carbon dioxide sorbent.
Li4SiO4 (s) + CO2 (g) ↔ Li2SiO3 (s) + Li2CO3 (s) (5.1.2)
Li4SiO4 has shown the ability to remove more than 90% of the carbon dioxide from
simulated syngas in both fixed-bed and fluidized bed process configuration. The lithium
silicate-based sorbent is highly effective at temperatures of 250-550ºC, pressures of 0-20
atm, carbon dioxide concentrations of 2-20 %, and in the presence of contaminants such
as hydrogen sulfide. Yamachui et al reported a carbonation yield of 87.2% under 100
cm3/min flow rate of pure carbon dioxide [27]. The water vapor plays a major role in
increasing the carbon dioxide absorption rates of Li4SiO4. About 22−26 wt. % (capacities
of∼5−6 mmol/g) were obtained using a gas stream containing about 15% CO2 and 10%
H2O in N2 at 550°C [28].
Moreover, the sorbent has shown excellent regenerability and attrition resistance in
thermal cycling tests. Recent analysis has shown that the lithium silicate-based sorbent
has the capability not only to separate carbon dioxide from syngas, but also to promote
the water gas- shift reaction [29]. It is reported that dopant such as Al, Fe, Na, K and Cs

140
increases the carbon dioxide uptake of lithium orthosilicate [30-31]. On the basis of a
study on the particle size effects on Li4SiO4, the reactivity of Li4SiO4 was modeled as a
reaction of carbon dioxide at the solid surface followed by the rate limiting diffusion of
lithium [32]. Although, Li4SiO4-based absorbent demonstrates high capacity, calculations
based on the most optimistic assumptions revealed that the scale of a fixed bed
temperature swing process would be impractical for post-combustion at a 500 MW coal-
fired power plant [28].
5.1.2.2 Alkali earth metal oxides
(a) Magnesium oxide (MgO)
MgO combines with carbon dioxide to form MgCO3. MgCO3 is thermodynamically
stable at ambient conditions. A simple calculation shows that to capture 1 ton of CO2,
about 0.92 ton of MgO is required (assuming 100% conversion). Thus, it is certain that
to capture carbon dioxide using MgO at any power plant site, a large quantity of MgO
will be needed. Moreover, the kinetics and recycling efficiency of MgO-CO2 reaction are
also the major issues to use MgO as a sorbent for practical applications. MgO is an
attractive candidate for both pre- and post-combustion capture technologies due to its low
regenerating temperatures: T2=287ºC (post-combustion) and T1= 447ºC (pre-combustion)
[33]. One should note that MgO when recycled between naturally occurring magnesite or
dolomite can cause relatively lesser energy or carbon emission penalty [34].
Many researchers studied the heterogeneous reaction between magnesium species and
CO2 in the presence or absence of H2O [35-49]. Although, a majority of research was not
directly aimed at carbon capture but still the results are valuable additions to the mineral

141
carbonation research. Most of the experiments are restricted to low temperature and
ambient or low pressure conditions. Hence, the reported sorption capacities of carbon
dioxide on MgO are not very high. In contrast, recent work of Highfield et al reports a
conversion of about 70-80% MgO to MgCO3 in about 2h with steam pressure between 5-
10% of the total pressure 20-40 bar and temperature around 300-350ºC.
One of the key factors in gas-solid reaction is the presence of water. There have been
several observations when water catalyzed the reaction [50-51]. MgO-CO2 reaction has
been studied to some extent. The role of water vapor in increasing the activity of MgO is
now well-established. The direct relation of porosity, surface area and particle size with
the carbonation yield has been examined. However, several factors such as carbonation
kinetics, sorbent reversibility and durability are still not completely resolved and thus
needs to be investigated.
(b) Calcium oxide (CaO)
In 1995, Silaban and Harrison proposed the method which involves the separation of
carbon dioxide at high temperatures (>600ºC) using the reversible reaction of CaO [52]
CaO (s) + CO2 (g) ↔ CaCO3 (g) (5.1.3)
The low price (because of naturally occurring mineral, limestone) and favorable
thermodynamics of CaO has attracted a lot of interest in the past one decade and thus the
CaO-CO2 system has been extensively studied. A great advantage of calcium based
sorbents is that the absorption of carbon dioxide can occur at temperatures above 600°C
(possibility of heat recovery) [53].The efficiency of the carbon dioxide capture depends
on many parameters such as diffusion resistance, which depends on the size of sorbent
142
particles, volume and the pore structure, as well as surface size and reaction kinetics [54].
These parameters influence carbonation, but many of them also effect calcination. A
detailed list of recent methods used to enhance the carbon dioxide uptake by CaO based
sorbents can be found elsewhere [55].
Bulk CaO, as a CO2-sorbent, has three severe limitations: (i) Kinetics of the carbonation
reaction, despite being highly exothermic, become slow after the first layer of carbonate
formation because the reaction is limited by the diffusion of carbon dioxide through the
thin surface layer of CaCO3 formed on CaO [56-57]. The uptake kinetics of CaO-based
sorbents was improved by innovative synthesis methods or precursors [58-59] (ii)
Regeneration step is very energy-intensive (> 800ºCfor CaCO3 decomposition), so
excessive sintering and mechanical failure of the oxide occurs. This leads to a drastic loss
in adsorption activity after a few sorption and regeneration cycles [60] (iii) To be an
effective sorbent, CaO that is suitable for high surface area exposure, such as a powder.
However, powders can be used in fluidized beds but the pressure drop associated with
them is very large. Also, use of fine powders can be problematic due to entrainment in
the process flow and attrition of the material [61].
The improvement in the sorbent reversibility can be seen as a major challenge for
extended operation purpose. Decrease in absorption capacity is associated with sintering
of the sorbent surface because of the influence of temperature, and the reduction in
porosity and active surface [62-65]. Other factors that reduce the activity of sorbents are
the attrition of sorbent grains during the process and chemical inactivation [66]. It should
be noted that the reaction with sulfur oxide (SO2) is competitive to the carbonation

143
reaction. Sulfurization and carbonation reactions are similar because of being
heterogeneous and occurring in the porous structure of the sorbent. However,
sulfurization is irreversible in the temperature range 500-900°C, occurs in small pores
and covers the surface of the sorbent [67-70]. Decrease in the absorption capacity after 45
cycles was 60% for limestone, 40% for dolomite and less than 20% for huntite and can be
attributed to the differences in the sorbent structure [71].The decrease in absorption
capacity by CaO can be limited in several ways. The parameters which have impact are
dopant (NaCl, Na2CO3, KCl, KMnO4, MgCl2, CaCl2, Mg (NO3)2), sorbent grain size, raw
material for calcium-based sorbent, thermal pretreatment of the sorbent and steam
reactivation. The properties of CaO obtained from calcium acetate are better than the
properties of CaO obtained from natural limestone because it has a much better
conversion and greater durability [72].
5.1.2.3 Transition metal oxides
(a) Iron based oxides
Iron oxide based materials can be used for carbon dioxide capture purpose in both the
power and non-power sectors. The main advantages of this sorbent are: it’s readily
accessiblity, has favorable thermodynamics and can be utilized for a large number of
cycles.
Recently, Ohio State University has developed an iron oxide-based oxygen carrier for
particles suitable for operation in the Coal- Direct Chemical Looping (CDCL) process.
CDCL is an efficient power generation process. The process consists of a unique moving
144
bed reactor, namely the reducer, where pulverized coal is fully converted using iron
oxide.
Fe2O3(s) + C (s) = FeO (s) + Fe (s) + CO2 (g) (5.1.4)
2FeO (s) + 0.5O2 (g) = Fe2O3(s) (5.1.5)
Fe2O3, an oxygen carrier, reduced to FeO and Fe while the exhaust gas is a stream of pure
carbon dioxide that can be sequestered or used for enhanced oil recovery. The reduced
FeO and Fe mixture can then oxidized to Fe2O3 using air in the combustor reactor,
liberating heat to produce steam [73].
Another recent study presents the carbon dioxide capture technique for iron and steel
industries using iron-based raw materials easily available at the iron making sites [74].
Fe3O4 (s) + Fe (s) + 4 CO2 (g) → 4FeCO3(s) (5.1.6)
3FeCO3 (s) + 0.5O2 (g) → Fe3O4 (s) + 3CO2 (g) (5.1.7)
The global steel production is growing rapidly, from 1248 Mt in 2006 to 1490 Mt in
2011, an increase of about 16% in a short span of 5 years [75]. Steel production is an
energy intensive process and thus consumes huge amount of fossil fuels. Each ton of steel
production emits 2.2 ton of CO2 as a world average. Therefore, iron making industries is
one of the biggest targets next to power plants to curb vast emission of greenhouse gases.
A mixture of magnetite and iron combines with carbon dioxide and forms siderite. The
reaction generates heat and thus can be utilized to produce steam. Siderite, once formed
can further decompose back to magnetite in presence of oxygen at 350ºC. Once the

145
absorption capacity of magnetite degrades, it can be sent back to blast furnace for further
processing. For example, the sorbents can be processed in a blast furnace for the
production of iron or steel. Thus, the proposed method can advantageously reduce or
even eliminate the loss of raw materials. This system and method can be more
thermodynamically favorable and can save energy. The reversibility and suitable kinetics
can make the system highly favorable for carbon dioxide capture at any iron and steel
industries.
(b) Other transition metal oxides
It is predicted that MnO can be used for both post- and pre-combustion conditions. At
PCO2 =0.1 bar the driving force for MnO to convert in MnCO3 was high even at a low
temperature 77ºC. The carbon dioxide could be released at about 377ºCat partial PCO2=10
bar. For pre-combustion, MnO will capture carbon dioxide at a partial pressure of about
10 bar below 327ºC and then could be regenerated by heating above 377ºC to produce a
stream of pure carbon dioxide.
According to the thermodynamics, CdO can be used for both pre-and post -combustion
conditions. However, the toxicity of Cd system would be a big hurdle in its practical
applications.
ZnO can be used preferably for post-combustion but not for pre-combustion. As the
equilibrium temperature required for carbonate formation is 77ºC at PCO2 =0.1 bar and
around 167ºC for PCO2= 10 bars [16]. Therefore, it may be essential to cool post-
146
combustion gases prior to carbonation for high driving force and thus make the sorbent
unfit for post-combustion capture.
The NiO material could be considered for post-combustion capture, but not pre-
combustion. Post-combustion absorption will occur below 77ºC and could be regenerated
above 187ºC. However, NiO availability is a matter of big concern for the practical usage.
5.1.2.4 Miscellaneous
The adsorbent material which is promising for carbon dioxide capture from post-
combustion gas streams is aluminosilicate zeolite because of the selective carbon dioxide
adsorption and high capacities [76]. Numerous experiments have been conducted on this
material and exhibit enhanced uptake capacity compared to the pure-silica zeolites [77-
79]. In general, adsorption kinetics of carbon dioxide on zeolites is comparatively fast
and achieved equilibrium capacity within a few minutes. However, temperature and
pressure strongly governs the carbon dioxide adsorption on zeolites. As the temperature
increases, the adsorption of carbon dioxide decreases but as the gas-phase partial pressure
of carbon dioxide increases, carbon dioxide adsorption increases accordingly. The
presence of water vapor may limit the application of zeolite sorbents by decreasing its
capacity. It is therefore clear, that by optimizing different important factors, such as
basicity, pore size of zeolites, electric field strength caused by the presence of
exchangeable cations in their cavities may significantly influence the carbon dioxide
adsorption capacities of zeolites.

147
5.1.3 Summary
It is certain that an improved and cost efficient process for carbon dioxide capture
obtained from flue gas streams from power plants burning fossil fuels is needed to
mitigate the huge emission of greenhouse gases. Among several different proposed
processes, metal oxides are promising options for suitable sorbent and have a great
potential in the future. However, these sorbents also have limitations and challenges
which must be solved before these can be employed commercially for carbon dioxide
capture purpose. Based on the current scenario, following suggestions are proposed for
the future research on carbon dioxide capture using metal oxides:
(a) Improvement in the potential sorbent performance, in terms of capture capacity,
reversibility rate, carbonation kinetics, multi-cycle durability and sorbent
reversibility;
(b) In depth analysis of performance check of potential sorbent under actual flue gas
conditions;
(c) A detailed techno-economic assessment of the potential sorbents;

148
5.1.4 References
[1] D. Aaron, C. Tsouris, Separation Science & Technology, 2005, 40, 321-348.
[2] C.M. White, B.R. Strazisar, E.J. Granite, J.S. Hoffman, H.W. Pennline, Journal of the Air & Waste Management Association, 2003, 53, 645-715.
[3] T.C. Merkel, H. Lin, X. Wei, R. Baker, Journal of Membrane Science, 2010, 359, 126–139.
[4] R.J. Littel, G.F. Versteeg, W.P.M. Van Swaaij, Chemical Engineering Science, 1991, 46, 3308–3313.
[5] P. Chiesa, S.P. Consonni, Journal of Engineering for Gas Turbines and Power, 1999, 121, 295–305.
[6] S. Bishnoi, G.T. Rochelle, Chemical Engineering Science, 2000, 55, 5531–5543.
[7] G.T. Rochelle, Science, 2009, 325, 1652–1654.
[8] P.J.E. Harlick, F.H.Tezel, Microporous and Mesoporous Materials, 2004, 76, 71–77.
[9] C.E. Powell, G.G. Qiao, Journal of Membrane Science, 2006, 279, 1–49.
[10] S.M. Benson, D.R. Cole, Elements, 2008, 4, 325-331.
[11] H. Guoxin, H. Huang, Y.H. Li, International Journal of Hydrogen Energy, 2008, 33,5422-5429.
[12] R. Siriwardane, J. Poston, K. Chaudhari, A. Zinn, T. Simonyi, C. Robinson, Energy & Fuels, 2007, 21, 1582-1591.
[13] S.C. Lee, J.C. Kim, Catalysis Surveys from Asia, 2007, 11,171-185.
[14] J.C. Abanades, E.J. Anthony, J. Wang, J.E. Oakey, Environmental Science & Technology, 2005, 39, 2861-2866.
[15] Y. Duan, D.C. Sorescu, The Journal of Chemical Physics, 2010, 133, 074508
[16] B. Zhang, Y. Duan, K. Johnson, The Journal of Chemical Physics, 2012, 136, 064516
[17] Y. Duan, D. Luebke, H. Pennline, International Journal of Clean Coal and Energy, 2012, 1, 1-11.
[18] DOE-NETL, Cost and performance baseline for fossil energy plants, Volume 1: Bituminous Coal and Natural Gas to Electricity Final Report. August 2007

149
[19] K. Nakagawa, T.J. Ohashi, Journal of the Electrochemical Society, 1998, 145, 1344-1346.
[20] J. Ida, R. Xiong, Y.S. Lin, Separation and Purification Technology, 2004, 36, 41-51.
[21] G. Pannocchia, M. Puccini, M. Seggiani, S. Vitolo, Industrial & Engineering Chemistry Research, 2007, 46, 6696-6706.
[22] M. Veliz-Enriquez, G. González, H. Pfeiffer, Journal of Solid State Chemistry, 2007, 180, 2485-2492.
[23] L.O.G. Hernández, D.L. Gutiérrez, V.C. Martínez, A.L. Ortiz, Journal of New Materials for Electrochemical Systems, 2008, 11, 137-142.
[24] K. Essaki, K. Nakagawa, M. Kato, H. Uemoto, Journal of Chemical Engineering of Japan, 2004, 37,772–777.
[25] M. Kato, K. Nakagawa, K. Essaki, Y. Maezawa, S. Takeda , R. Kogo, Y. Hagiwara, International Journal of Applied Ceramic Technology, 2005, 2, 467–475.
[26] K. Wang, X. Guo, P. Zhao, F. Wang, C. Zheng, Journal of Hazardous Material, 2011, 189, 301-307.
[27] K. Yamauchi, N. Murayama, J. Shibata, Materials Transactions, 2007, 48, 2739 – 2742.
[28] R. Quinn, R.J. Kitzhoffer, J.R. Hufton, T.C. Golden, Industrial & Engineering Chemistry Research, 2012, 51, 9320−9327.
[29] J.D. Figueroa, T. Fout, S. Plasynski, H. McIlvried, R.D. Srivastava, International Journal of Greenhouse Gas Control, 2008, 2, 9-20.
[30] P. V. Korake, A. G. Gaikwad, Frontiers of Chemical Science & Engineering, 2011, 5, 215-226.
[31] C. Gauer, W. Heschel, Journal of Material Science, 2006, 41, 2405−2409
[32] R.R. Mosqueda, H. Pfeiffer, The Journal of Physical Chemistry A., 2010, 114, 4535−454.
[33] M. Bhagiyalakshmi, J.Y. Lee, H.T. Jang, International Journal of Greenhouse Gas Control, 2010, 4, 51-56.
[34] B. Feng, H. An, E. Tan, Energy & Fuels, 2007, 21, 426-434
[35] L. Li, X. Wen, X. Fu, F. Wang, N. Zhao, F. Xiao, W. Wei, Y. Sun, Energy & Fuels, 2010, 24, 5773-5780.
150
[36] S.C. Lee, H.J. Chae, S.J. Lee, B.Y. Choi, C.K. Yi, J.B. Lee, C.K. Ryu , J.C. Kim, Environmental Science & Technology, 2008, 42, 2736-2741.
[37] S.M. Ward, J. Braslaw, R.L. Gealer, Thermochimica Acta, 1983, 64, 107-114.
[38] S. Choi, J.H. Drese, C.W. Jones, Chemsuschem, 2009, 2, 796-854.
[39] X. Fu, N. Zhao, J. Li, F. Xiao, W. Wei, Y. Sun, Adsorption Science &Technology, 2009, 27, 593-601.
[40] S. Liu, X. Zhang, J. Li, N. Zhao, W. Wei, Y. Sun, Catalysis Communications, 2008, 9,1527-1532.
[41] B. Li, X. Wen, N. Zhao, X.Z. Wang, W. Wei, Y. Sun, Z.H. Ren, Z.J. Wang , Journal of Fuel Chemistry & Technology, 2010, 38, 473-477.
[42] Z. Yong, V. Mata, A.E. Rodrigues, Industrial & Engineering Chemistry Research, 2001, 40, 204-209.
[43] L. Li, Y. Li, X. Wen, F. Wang, N. Zhao, F. Xiao, W. Wei, Y. Sun, Energy &Fuels, 2011, 25, 3835-3842.
[44] S.C. Lee, B.Y. Choi, T.J. Lee, C.K. Ryu, Y.S. Soo, J.C. Kim, Catalysis Today, 2006, 111, 385-390.
[45] A.M. Ruminski, K.J. Jeon, J.J. Urban, Journal of Material Chemistry, 2011, 21, 11486-11491
[46] D. Beruto, R. Botter, A.W. Searcy, The Journal of Physical Chemistry, 1987, 91, 3578-3581
[47] W. Lu, D. Yuan, J. Sculley, D. Zhao, R. Krishna, H.C. Zhou, Journal of the American Chemical Society, 2011, 133, 18126-18129.
[48] J. Fagerlund, J. Highfield, R. Zevenhoven, RSC Advances, 2012, 2, 10380–10393
[49] J. Highfield, J. Bu, J. Fagerlund, R. Zevenhoven, ICCDU-XI, 2011
[50] D.P. Butt, S.P. Pile, Y. Park, R. Vaidya, K.S. Lackner, C.H. Wendt, K. Nomura, Report LA-UR-98-7631, 1998
[51] A. Hassanzadeh, J. Abbasian, Fuel, 2010, 89, 1287–1297.
[52] A. Silaban, D.P. Harrison, Chemical Engineering Communications, 1995, 137, 177-190

151
[53] C. Salvador, D. Lu, E. Anthony, J. Abanades, Chemical Engineering Journal, 2003, 96, 187–195.
[54] R. Hughes, D. Lu, E. Anthony, Y.Wu, Industrial Engineering& Chemistry Research, 2004, 43, 5529–5539.
[55] M. K. Moranska, G. Tomaszewicz, G. Labojko, Physicochemical Problems of Mineral Processing, 2012, 48, 77–90
[56] R. Barker, Journal of Applied Chemistry & Biotechnology, 1974, 24, 221–227.
[57] S.K. Bhatia, D.D. Perlmutter, American Institute of Chemical Engineers Journal, 1983, 29, 79–86.
[58] H. Lu, P.G. Smirniotis, F.O. Ernst, S.E. Pratsinis, Chemical Engineering Science, 2009, 64, 1936–1943.
[59] H. Lu, E.P. Reddy, P.G. Smirniotis, Industrial & Engineering Chemistry Research, 2006, 45, 3944–3949.
[60] J.C. Abanades, D. Alvarez, Energy & Fuels, 2003, 17, 308–315.
[61] P. Gruene, A.G. Belova, T.M. Yegulalp, R.J. Farrauto, M.J. Castaldi, Industrial & Engineering Chemistry Research, 2011, 50, 4042-4049
[62] J. Wang, V. Manovic, Y. Wu, E. Anthony, Applied Energy, 2010, 87, 1453–1458.
[63] E. Bouquet, G. Leyssens, C. Schönnenbeck, P. Gilot, Chemical Engineering Science , 2009, 64, 2136–2146.
[64] A. Lysikov, S. Trukhan, A. Okunev, International Journal of Hydrogen Energy, 2008, 33, 3061–3066.
[65] B. Stanmore, P. Gilot, Fuel Processing Technology, 2005, 86, 1707–1743.
[66] Y. Li, C. Zhao, H. Chen, C. Liang, L. Duan, W. Zhou , Fuel, 2009, 88, 697–704.
[67] J. Adanez, L. de Diego, F. Garcia-Labiano, Fuel, 1999, 78, 583–592
[68] W. Nimmo, A. Patsias, E. Hampartsoumian, B. Gibbs, M. Fairweather, P. Williams, Fuel, 2004, 83, 1143–1150.
[69] A. Patsias, W. Nimmo, B. Gibbs, P. Williams, Fuel, 2005, 84, 1864–1873.
[70] A. Silaban, M. Narcida, D. Harrision, Chemical Engineering Communications, 1996, 146, 149–162.

152
[71] A. Bandi, M. Specht, P. Sichler, N. Nicoloso, 5th International Symposium on Gas Cleaning at High Temperature, Morgantown, 2002.
[72] V. Manovic, E. Anthony, G. Grasa, J. Abanades, Energy & Fuels, 2008, 22, 3258–3264.
[73] H.R. Kim, Unit Document no. osu1352996758
[74] S. Kumar, V. Drozd, A. Durygin, S. K. Saxena, U.S. Provisional Patent Application No. 61/733,297, 2012.
[75] www.worldsteel.org
[76] O.M. Yaghi, M. Keeffe , N. Ockwig, C. Hee, M. Eddaoudi, J. Kim, Nature, 2003, 423, 705-714.
[77] M. Hudson, W. Queen, J. Mason, D. Fickel, R. Lobo, C. Brown, Journal of the American Chemical Society, 2012, 134, 1970-1973.
[78] J. Pires, M.B. de Carvalho, F.R. Ribeiro, E.G. Derouane, Journal of Molecular Catalysis, 1993, 85, 295-303
[79] A.K. Samanta, A. Zhao, G.K.H. Shimizu, P. Sarkar, R. Gupta Industrial & Engineering Chemistry Research, 2012, 51, 1438–1463

153
5.2 AN EXPERIMENTAL INVESTIGATION OF MESOPOROUS MgO AS A
POTENTIAL PRE-COMBUSTION CO2 SORBENT
5.2.1 INTRODUCTION
Currently, a large focus is devoted on capturing carbon dioxide from coal-fired power
plant flue streams, which continues to be the major carbon dioxide contributor [1].There
are three main technological approaches for carbon dioxide capture- post-, oxy- and pre-
combustion. Post-combustion systems capture carbon dioxide from nitrogen rich flue gas
stream, produced by burning fossil fuel in air. Oxy-combustion uses pure stream of
oxygen, instead of air, to combust coal and thus produces carbon dioxide rich gas stream.
While, pre-combustion systems are designed mainly to remove carbon dioxide from the
syngas prior to its combustion for power production [2].Under pre-combustion
conditions, after the Water gas-shift reactor, the gas stream mainly consists of CO2, H2O
and H2. The partial carbon dioxide pressure for pre-combustion capture conditions is
around 20-30 bar and the temperature is between 250 and 450°C [3].
Both the physical and chemical solvents can be used for pre-combustion carbon dioxide
capture. Unlike chemical solvent, physical solvent (such as Selexol and Rectisol)
selectively absorb carbon dioxide without forming any chemical bonds. Thus, the
physical solvent requires relatively less regeneration energy as compared to that of
chemical solvent [4]. However, these physical solvent-based processes suffer severe
disadvantages which include the loss of pressure during regeneration and requirement of
a low operating temperature. Due to the necessity of a lower operating temperature, the
syngas needs to be cooled prior to carbon dioxide absorption. After carbon dioxide

154
absorption, the remaining hydrogen gas stream requires to be reheated to the gas turbine
inlet temperature. However, chemical solvents have the advantage of high mass transfer
driving force into solution and increased acid gas selectivity. Also, chemical solvents can
be used in processes that utilize thermal swing regeneration and generate the carbon
dioxide at elevated pressure [5].But chemical solvents increase the energy and cost
penalty and thus downgraded as a future carbon dioxide sorbent [6].
Currently, the focus is to develop advanced physical and chemical solvent systems that
have the potential to provide significant improvements in both cost and performance as
compared to the Selexol and Rectisol for pre-combustion carbon dioxide capture. The
challenges are to modify regeneration conditions to recover the carbon dioxide at a higher
pressure; improve selectivity to reduce hydrogen losses; and develop a solvent that has a
high carbon dioxide loading at a higher temperature, which would increase Integrated
Gasification Combined Cycle (IGCC) efficiency. In the same line, another vital task is to
develop a new sorbent which could be highly efficient for pre-combustion capture
conditions. Consequently, the US Department of Energy (DOE) performed the
thermodynamic modeling activities included screening analyses for a number of different
metal oxides, zirconates, silicates and titanates under various operating conditions to
identify new solid sorbents for pre-combustion carbon dioxide capture. About 18 sorbents
were modeled and finally seven candidates are chosen – magnesium oxide (MgO),
calcium oxide (CaO), lithium zirconate (Li2ZrO3), calcium zirconate (CaZrO3), barium
zirconate (BaZrO3), barium titanate (BaTiO3) and barium silicate (BaSiO3) for further
investigations [7]. Among these solid sorbents, MgO and CaO are attractive because of
their easy accessibility and favorable thermodynamic properties.

155
The alkaline earth metal oxides (such as CaO and MgO) combine with carbon dioxide to
form thermodynamically stable carbonates. Metal carbonates, when heated, liberates pure
stream of carbon dioxide gas and regenerates the oxides. Eventually, the generated pure
carbon dioxide gas can either be sequestered underground or used for enhanced oil
recovery [8]. CaO are abundant and thus relatively easily accessible than MgO. However,
CaO as carbon dioxide -sorbent suffers severe major drawbacks and a detailed discussion
can be found elsewhere [9]. It is a fact that regeneration of oxides needs a lot of energy
[10]. MgO and Mg (OH) 2 are known to be better candidates than CaO for carbon dioxide
capture applications due to their low regeneration energy requirement and low operating
temperature [11]. Thus, MgO (periclase), although occurs only rarely as an oxide, we
choose it here for our study. One should note that MgO when recycled between naturally
occurring magnesite or dolomite can cause relatively lesser energy or carbon emission
penalty [12].
The carbon dioxide absorption capacity of MgO was studied as a function of particle size,
surface area, temperature, pressure, supports and concentration of water vapor. The
carbon dioxide uptake capacity on different MgO sorbents at different conditions is listed
in Table 5.2.1. Most of the experiments are restricted to low temperature and ambient or
low pressure condition. Hence, the reported sorption capacities of carbon dioxide on
MgO are not very high. However, the sorbents which can operate in the range of 300-
350°C would be ideal for the use in IGCC applications. Therefore, we study the carbon
dioxide capture capacity of MgO in the relatively high temperature and pressure
condition of 300-375°C and 10-50 bars respectively.
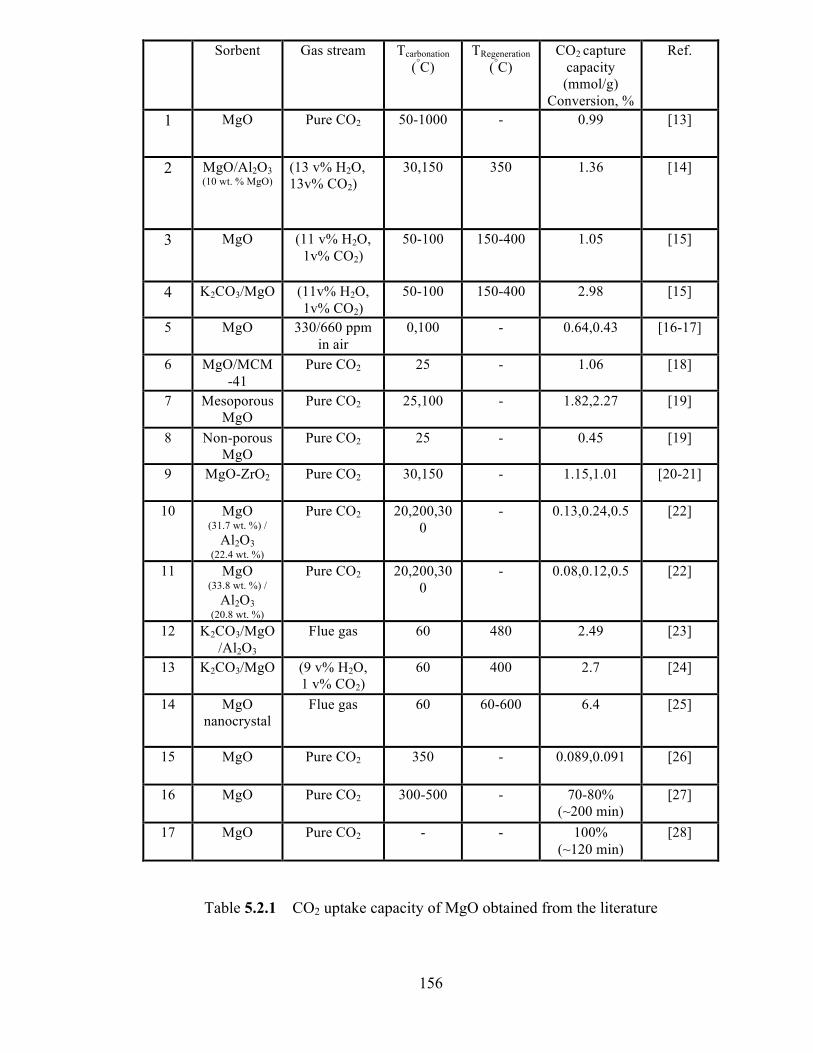
156
Table 5.2.1 CO2 uptake capacity of MgO obtained from the literature
Sorbent Gas stream Tcarbonation (°C)
TRegeneration (°C)
CO2 capture capacity (mmol/g)
Conversion, %
Ref.
1 MgO Pure CO2 50-1000 - 0.99 [13]
2 MgO/Al2O3 (10 wt. % MgO)
(13 v% H2O, 13v% CO2)
30,150 350 1.36 [14]
3 MgO (11 v% H2O, 1v% CO2)
50-100 150-400 1.05 [15]
4 K2CO3/MgO (11v% H2O, 1v% CO2)
50-100 150-400 2.98 [15]
5 MgO 330/660 ppm in air
0,100 - 0.64,0.43 [16-17]
6 MgO/MCM-41
Pure CO2 25 - 1.06 [18]
7 Mesoporous MgO
Pure CO2 25,100 - 1.82,2.27 [19]
8 Non-porous MgO
Pure CO2 25 - 0.45 [19]
9 MgO-ZrO2 Pure CO2 30,150 - 1.15,1.01 [20-21]
10 MgO (31.7 wt. %) /
Al2O3 (22.4 wt. %)
Pure CO2 20,200,300
- 0.13,0.24,0.5 [22]
11 MgO (33.8 wt. %) /
Al2O3 (20.8 wt. %)
Pure CO2 20,200,300
- 0.08,0.12,0.5 [22]
12 K2CO3/MgO/Al2O3
Flue gas 60 480 2.49 [23]
13 K2CO3/MgO
(9 v% H2O, 1 v% CO2)
60 400 2.7
[24]
14 MgO nanocrystal
Flue gas 60 60-600 6.4 [25]
15 MgO
Pure CO2 350 - 0.089,0.091 [26]
16 MgO Pure CO2 300-500 - 70-80% (~200 min)
[27]
17 MgO Pure CO2 - - 100% (~120 min)
[28]

157
5.2.2 EXPERIMENTAL PROCEDURE
The reaction
MgO(s) + CO2 (g) ↔ MgCO3(s) (5.2.1)
was studied experimentally. The carbonation reaction was performed in a closed system
which permits us to efficiently maintain high temperature and pressure for a long period
of time. The decomposition reaction of carbonate was examined using Thermo
gravimetric Analysis (TGA) technique.
About 0.2 g of 325 mesh sized magnesium oxide (delivered by Alfa Aesar) was put
inside a closed cylindrical vessel (1.25” long and 0.35” internal diameter). About 0.1 ml
of water was also introduced on the vessel walls. Chemically pure CO2 gas (Airgas) was
passed into this system. Before experiments, CO2 gas was flushed three times to ensure a
pure CO2 atmosphere inside the reactor. The reaction was performed for 30 minutes at a
desired temperature and pressure condition. Once the reaction completed, the system was
air-cooled. The product was then ground using mortar and pestle. The powder particle
was again put back for another reaction at the same experimental condition. This cycle
was repeated until no increment in weight of the product was observed.
Thermo gravimetric analysis (TGA) of the product was done by using TGA 2950 Thermo
gravimetric analyzer. The samples (10mg) were heated under argon purge, at a heating
rate of 10°C/ min to a final temperature of 800°C. The TGA provides continuous
measurements of the sample weight as a function of time and temperature. The amount of
158
formation of MgCO3 was analyzed by the percent loss in weight of the sample while
heating up to 800°C in an argon atmosphere.
The product characterization was performed using X-ray powder diffraction method.
Bruker GADDS/D8 is equipped with Apex Smart CCD Detector and direct-drive rotating
anode. The MacSci rotating anode (Molybdenum) operates with a 50 kV generator and
20 mA current. X-ray beam size can vary from 50 to 300 µm. The usual collection time is
1200 s.
An isothermal gas adsorption was employed to measure internal surface areas of the
powder particles. Micromeritics Tristar II 3020 (surface area and porosimetry analyzer
instrument) was used with N2 as adsorptive gas at 77 K (liquid nitrogen bath). The
samples were first degassed under 300oC with a N2 gas flow for 1 h in order to remove
the moisture and other adsorbed gases before analysis. The internal surface area was
calculated using the Brunauer- Emmett-Teller (BET) method. The pore volume was also
calculated from the adsorbed nitrogen after complete pore condensation (P/P0 = 0.9925)
using the ratio of the densities of liquid and gaseous nitrogen. The pore size was
calculated by using the Barrett–Joyner–Halenda (BJH) method.
5.2.3 RESULTS AND DISCUSSION
Fig.5.2.1 confirms the formation of MgCO3 at different temperatures and carbon dioxide
pressures. MgO, Mg(OH)2, MgO.2MgCO3 and MgCO3 were identified conventionally by
their corresponding Joint Committee Powder Diffraction Standard (JCPDS) card number
79-0612,82-2345,31-0804 and 86-2345 respectively.
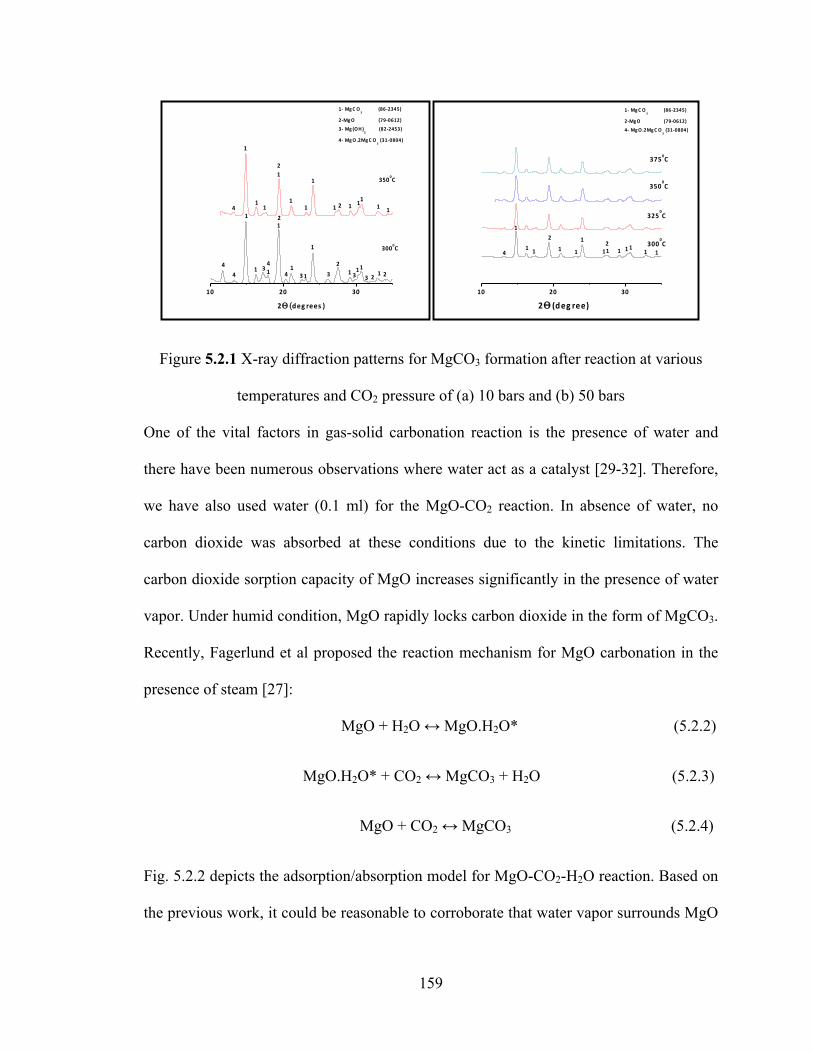
159
Figure 5.2.1 X-ray diffraction patterns for MgCO3 formation after reaction at various
temperatures and CO2 pressure of (a) 10 bars and (b) 50 bars
One of the vital factors in gas-solid carbonation reaction is the presence of water and
there have been numerous observations where water act as a catalyst [29-32]. Therefore,
we have also used water (0.1 ml) for the MgO-CO2 reaction. In absence of water, no
carbon dioxide was absorbed at these conditions due to the kinetic limitations. The
carbon dioxide sorption capacity of MgO increases significantly in the presence of water
vapor. Under humid condition, MgO rapidly locks carbon dioxide in the form of MgCO3.
Recently, Fagerlund et al proposed the reaction mechanism for MgO carbonation in the
presence of steam [27]:
MgO + H2O ↔ MgO.H2O* (5.2.2)
MgO.H2O* + CO2 ↔ MgCO3 + H2O (5.2.3)
MgO + CO2 ↔ MgCO3 (5.2.4)
Fig. 5.2.2 depicts the adsorption/absorption model for MgO-CO2-H2O reaction. Based on
the previous work, it could be reasonable to corroborate that water vapor surrounds MgO
10 20 30
1-‐ MgC O3 (86-‐2345)
2-‐MgO (79-‐0612)
3-‐ Mg (OH)2 (82-‐2453)
4-‐ MgO.2MgC O3 (31-‐0804)
11 14 2 1
1
1 111
1
1
1
1
1
1
11333 33
2
2
2
22 111
1
1
1
1
44
4
4
3500C
2ΘΘ ((deg rees )
3000C
10 20 30
1 11 1 14
1
1 11 1
1
11
22
1-‐ MgC O3 (86-‐2345)
2-‐MgO (79-‐0612)
4-‐ MgO.2MgC O3 (31-‐0804)
3750C
3500C
3250C
3000C
2ΘΘ (deg ree)
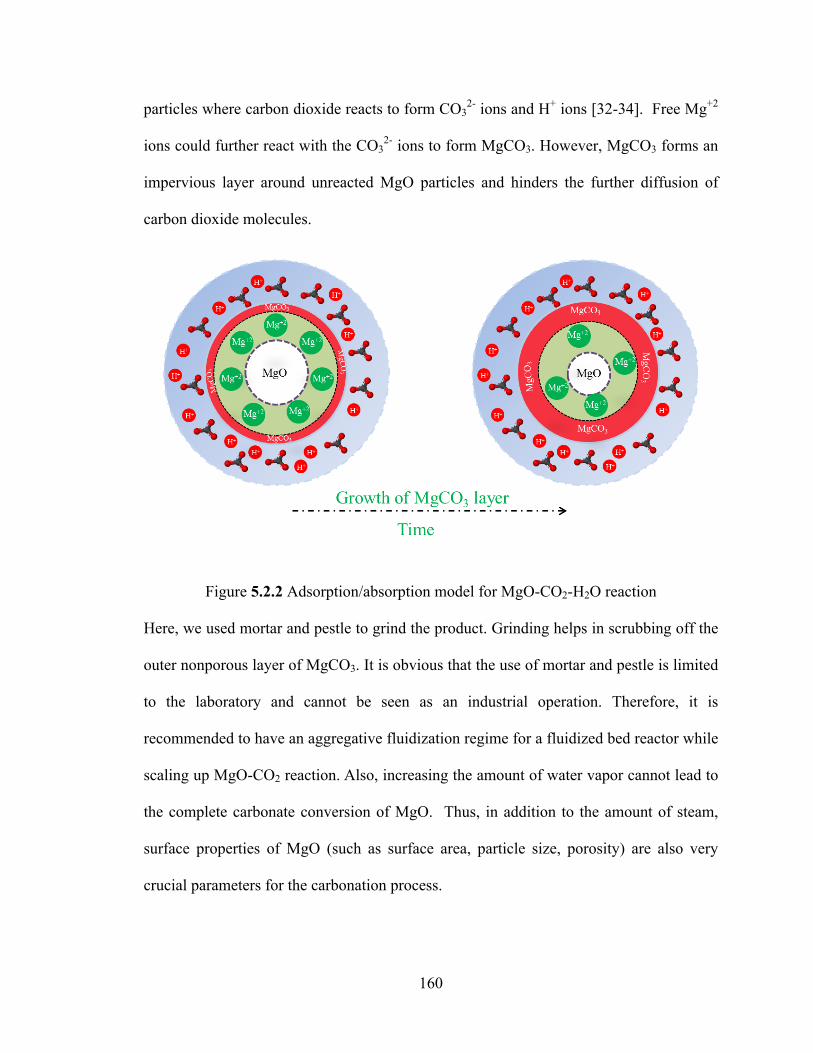
160
particles where carbon dioxide reacts to form CO32- ions and H+ ions [32-34]. Free Mg+2
ions could further react with the CO32- ions to form MgCO3. However, MgCO3 forms an
impervious layer around unreacted MgO particles and hinders the further diffusion of
carbon dioxide molecules.
Figure 5.2.2 Adsorption/absorption model for MgO-CO2-H2O reaction
Here, we used mortar and pestle to grind the product. Grinding helps in scrubbing off the
outer nonporous layer of MgCO3. It is obvious that the use of mortar and pestle is limited
to the laboratory and cannot be seen as an industrial operation. Therefore, it is
recommended to have an aggregative fluidization regime for a fluidized bed reactor while
scaling up MgO-CO2 reaction. Also, increasing the amount of water vapor cannot lead to
the complete carbonate conversion of MgO. Thus, in addition to the amount of steam,
surface properties of MgO (such as surface area, particle size, porosity) are also very
crucial parameters for the carbonation process.

161
Figure 5.2.3 DTG plots for product at (a) 300°C and 10 bars and (b) 350°C and 10 bars
The thermal analysis curve does not show any significant differences in amounts of
carbonate in the high pressure (50 bars) experiments. We obtained almost similar TGA
plots and XRD patterns for different temperatures 300-375°C and 50 bars carbon dioxide
pressure. However, the experiment performed at 300°C and 10 bars did indicate that the
100 200 300 400 500 600 70040
60
80
100
% W
eight
T emperature (C )
~345°°C~474°°C
~539°°C
(300°°C ,10 bars )
-‐2.5
-‐2.0
-‐1.5
-‐1.0
-‐0.5
0.0
0.5
1.0
1.5
25.01%
11.5%
6.5%
dm/dT
(a)
100 200 300 400 500 600 70040
60
80
100
-‐2.5
-‐2.0
-‐1.5
-‐1.0
-‐0.5
0.0
0.5
1.0
1.5
50.7 %
(350°°C ,10 bars )
~550°°C
dm/dT
% W
eight
T emperature (C )
(b)

162
product were not simply MgCO3. The X-ray diffraction pattern in Fig. 5.2.1a confirms
the presence of Mg (OH) 2 and relatively high amount of MgO.2MgCO3 at 300°C and 10
bars. DTG curve (Fig. 5.2.3a) also evidences the similar situation. The two peaks around
350°C and 475°C were attributed to the losses of water of crystallization and hydroxyl
water respectively. However, another peak at 550°C corresponds to the complete
decomposition of MgCO3. But at a temperature of 350°C and a pressure equals 10 bars,
only MgCO3 was formed. This is evidenced by both DTG analysis curve (Fig. 5.2.3b)
and XRD analysis (Fig.5.2.1a).
The steps to calculate % conversion of MgO to MgCO3 is explained in supplementary
section. A conversion of 30.54 % and 96.96 % for MgO to MgCO3 was observed at 300
and 350°C respectively. Here, we observed the formation of relatively high amount of
magnesium oxide carbonate (MgO.2MgCO3) at 300°C and 10 bars. It can be easily
calculated that the carbon dioxide capture capacity of MgO.2MgCO3 is about two-third
that of MgCO3. Hence, formation of MgO.2MgCO3 can significantly reduce the further
uptake of carbon dioxide by MgO particles. However, it can be observed from X-ray
patterns (Fig.5.2.1) that at higher temperature or pressure, the formation of
MgO.2MgCO3 is reduced.
The calculated MgO-Mg(OH) 2-MgCO3 phase diagram suggest that with increase in PH2O
the transition temperature for direct conversion of MgCO3 to Mg(OH)2 also increases
[11]. Here, with change in experimental temperature from 300 to 350°C, partial pressure
of water also increases and consequently transition temperature also increased. Therefore,
the low carbonation of MgO in the presence of water at 300°C might be due to the high

163
conversion of MgCO3 to Mg (OH) 2 at a lower transition temperature. Moreover, a
significant formation of MgO.2MgCO3 at 300°C and 10 bars also lead to a less direct
conversion of MgO to MgCO3. Thus, it can be deduced that a low partial pressure of
water can lead to a higher amount of MgO.2MgCO3 formation. Therefore, the reaction
mechanism is changed to:
MgO + CO2 ↔ MgCO3 (5.2.5)
MgO + 2MgCO3 ↔ MgO.2MgCO3 (5.2.6)
Moreover, at 50 bars of carbon dioxide pressure and a temperature of 300°C, MgO has
the highest yield of 98.54 %. At 50 bars and temperatures 300-375°C, we observe a slight
but continuous decrease in the absorption of CO2 with increase in temperature and thus
are in agreement with other reported results [28]. It is well known that at low
temperature, the physisorption process dominates but at elevated temperature carbon
dioxide chemisorbs on MgO and thus carbon dioxide uptake capacity gradually starts
decreasing.

164
Carbon dioxide uptake capacity of a metal oxide is primarily dominated by the factors
such as surface area, pore volume, pore functionality and pore size [26]. BET surface area
measurement, pore volume and average pore sizes presented in Table 5.2.2 do indicate
that carbonating with pure carbon dioxide does influence the particle structure.
Table 5.2.2 Surface Properties of MgO particles before and after carbonation reaction at
350°C, 10 bars
As received, 325 mesh size mesoporous MgO, have a pore size of 9.09 nm and a high
surface area (95.08± 1.5m2/g). The N2 adsorption- desorption isotherm curves for MgO
follows Type IV isotherms (as per IUPAC classification); typical for mesoporous
substances. Also, the hysteresis pattern is H3 (following IUPAC classification) indicating
the presence of slit-like pores. After capture of carbon dioxide at 350°C and 10 bars,
surface area dramatically decreased to (4.15 ± 0.05) m2/g. The ratio of surface area to
pore volume is also reduced by almost half and resulting in high diffusion paths. The
significant decrease in surface area attributes to the basicity of mesoporous MgO. The
mesoporous MgO is highly basic with well-ordered pores to hold high carbon dioxide at
both lower and higher temperatures. It is well known that porous materials allow
Sample Surface area (m2/g)
Pore volume (cm³/g)
Pore Size (nm)
SA/PV (106m-1)
As received MgO 95.08 ± 1.5 0.22 9.09
439.59
After Reaction at (350 °C,10 bars) 4.15 ± 0.05 0.01 16.25 246.15

165
molecules to pass through their pore aperture for storage, separation or conversion [33].
MgO with a fine particle size (<44µm) has a high content of mesopores, which leads to
good mass transfer properties during the absorption process. The mechanism for metal
oxide reaction with carbon dioxide gas has been discussed a lot [35-37]. Carbon dioxide
molecules diffuse through the pores of mesoporous MgO and the present large active
sites hold these carbon dioxide molecules [17]. The trapped carbon dioxide molecules
further react to form MgCO3.
It can be observed from Table 2 that at 350°C and 10 bars, 96.96% of MgO was
converted to MgCO3 and almost all the pores have been utilized after reaction with
carbon dioxide molecules. Henceforth, almost no carbon dioxide molecules could have
diffused further in the pores. Noticeably, pore size increased to 16.25 nm. Thus, it is
apparent that the porosity of MgO particles plays a very vital role for carbon dioxide
uptake.
Previously, Beruto et al has reported a very low carbon dioxide absorption capacity of
MgO in absence of water vapor [25]. An uptake capacity of 0.089 and 0.091 mmol CO2/g
MgO was observed at 350°C in 1.33 and 3.33 bars of carbon dioxide respectively. Thus,
it was concluded that there is a high activation energy barrier to MgO recarbonation. On
the contrary, Feng et al. [12] heated the sorbent (MgO) until 1000°C in pure carbon
dioxide and noted a low but almost constant (for 8 cycles) absorption capacity of 0.99
mmol CO2/g MgO. Thus, unlike CaO- based sorbents, MgO does not show a fast decline
in their carbon dioxide capture capacity over a large number of carbonation- calcination
cycles. Bhagiyalakshmi et al.[18] synthesized basic mesoporous MgO (surface area of
250 m2/g) using mesoporous carbon obtained from SBA-15 and obtained a maximum

166
CO2 adsorption of 2.27 mmol CO2/g at 100°C and nearly 1.81 mmol CO2/g at 25°C for a
feed flow rate of 30ml/min CO2 gas (99.9% purity). Therefore, it is evident that even for a
relatively lower surface area (95m2/g compared to 250 m2/g), MgO can have a better
carbon dioxide uptake at a higher temperature (here, 300-375°C) and higher carbon
dioxide pressure (10-50 bars). Recently, Fagerlund et al reported a very high %
conversion of MgO to MgCO3 under high temperature and pressure conditions [26].
However, MgO showed a slow conversion rate (50% for ~7 h) for the condition (PCO2
(~18-19 bar), PH2O (~1-2 bar) and 300-350°C) which can be suitable for pre-combustion
capture process. The reason could be the deposition of impervious carbonate layer on the
surface of MgO which does not allow carbon dioxide molecules to further diffuse in the
pores. Therefore, continuous removal of these nonporous layers of carbonates is needed.
Hence, it is recommended to have an aggregative fluidization regime for a fluidized bed
reactor while scaling up MgO-CO2 reaction.
In summary, we demonstrate the increase in uptake of carbon dioxide by mesoporous
MgO at high temperature and pressure in the humid environment. We observed the
significant role of temperature, pressure, water vapor and porosity of the sorbent on the
improvement of the carbon dioxide absorption capacity of mesoporous MgO.

167
5.2.4 REFERENCES
[1] T.C. Merkel, H. Lin, X. Wei, R. Baker, Journal of Membrane Science, 2010, 359, 126–139.
[2] J. Davison, Energy, 2007, 32, 1163–1176.
[3] B. P. Burton, N. Dupin, S. G. Fries, G. Grimvall, A. Fernández Guillermet, P. Miodownik, W. A. Oats, and V. Vinograd, Z. Metallkd, 2001, 92, 514.
[4] B. Miller, D. Tillman, Combustion engineering issues for solid fuel systems, Elsevier 2008, 449-451.
[5] DOE/NETL Carbon dioxide capture and storage RD&D roadmap, December 2010.
[6] C.H. Yu, C.H. Huang, C.S. Tan, Aerosol and Air Quality Research, 2012, 12, 745–769
[7] Evaluation of Dry Sorbent Technology; Presentation at the 2010 NETL CO2 Capture Technology Meeting, Pittsburgh, PA, September 13–17, 2010.
[8] S.M. Benson and D.R. Cole, Elements, 2008, 4, 325-331.
[9] P. Gruene, A.G. Belova, T.M. Yegulalp, R.J. Farrauto, M.J. Castaldi, Industrial & Engineering Chemistry Research, 2011, 50, 4042-9.
[10] S. Rackley, Carbon Capture and Storage, Elsevier, Burlington, 2010.
[11] Y. Duan, D.C. Sorescu, Journal of Chemical Physics, 2010, 133, 074508-11 [12] B. Feng, H. An, E. Tan, Energy & Fuels, 2007, 21,426-434 [13] L. Li , X. Wen , X. Fu , F. Wang , N. Zhao, F. Xiao , W. Wei , Y. Sun, Energy & Fuels, 2010, 24, 5773-5780. [14] S.C. Lee, H.J. Chae , S.J. Lee , B.Y. Choi, C.K. Yi , J.B. Lee , C.K. Ryu , J.C. Kim, Environmental Science & Technology, 2008, 42, 2436-2471 [15] S.M. Ward, J. Braslaw, R. L. Gealer, Thermochimica Acta, 1983, 64, 107-114 [16] S. Choi, J.H. Drese , C.W. Jones, Chemsuschem, 2009, 2, 796-854
168
[17] X. Fu , N. Zhao , J. Li , F. Xiao , W. Wei , Y. Sun, Adsorption Science & Technology, 2009, 27, 593-601. [18] M. Bhagiyalakshmi, J.Y. Lee, H. T. Jang, International Journal of Greenhouse Gas Control, 2010, 4, 51-56. [19] S. Liu, X. Zhang, J. Li, N. Zhao, W. Wei,Y. Sun, Catalysis Communications, 2008, 9, 1527-1532. [20] B. Li, X. Wen, N. Zhao, X.Z. Wang, W. Wei, Y. Sun, Z.H. Ren, Z. J. Wang, Journal of Fuel Chemistry & Technology, 2010, 38, 473-477. [21] Z. Yong, Vera, A.E. Rodrigues, Industrial & Engineering Chemistry Research, 2001, 40, 204-209. [22] L. Li, Y. Li, X. Wen, F. Wang, N. Zhao, F. Xiao, W. Wei, Y. Sun, Energy & Fuels 2011, 25,3835-3842. [23] S.C. Lee, B.Y. Choi, T.J. Lee, C.K. Ryu, Y.S. Soo, J.C. Kim, Catalysis Today, 2006, 111, 385-390. [24] A.M. Ruminski, K.J. Jeon, J.J. Urban, Journal of Materials Chemistry, 2011, 21, 11486-11491. [25] D. Beruto, R. Botter, A.W. Searcy, The Journal of Physical Chemistry, 1987, 91, 3578-3581. [26] W. Lu, D. Yuan, J. Sculley, D. Zhao, R. Krishna, H.C. Zhou, Journal of American Chemical Society, 2011, 133,18126-9 [27] J. Fagerlund, J. Highfield, R. Zevenhoven, RSC Advances, 2012, 2, 10380–10393. [28] J. Highfield, J. Bu, J. Fagerlund and R. Zevenhoven, ICCDU-XI, 2011 [29] D. P. Butt, S. P. Pile, Y. Park, R. Vaidya, K. S. Lackner, C. H. Wendt and K. Nomura, Report LA-UR-98-7631, 1998. [30] A. Hassanzadeh and J. Abbasian, Fuel, 2010, 89, 1287–1297.

169
[31] Y. Kato, N. Yamashita, K. Kobayashi and Y. Yoshizawa, Applied Thermal Engineering, 1996, 16, 853–862. [32] C. Liu and S. Shih, Industrial & Engineering Chemistry Research, 2009, 48, 8335 [33] R. Zevenhoven, S. Teir and S. Eloneva, Energy, 2008, 33, 362–370.
[34] R. Zevenhoven, S. Eloneva and S. Teir, International conference on Greenhouse Gas Technologies-8, 2006
[35] H. Deng,S. Grunder, K.E. Cordova, C. Valente, H. Furukawa , M. Hmadeh , F. Gándara , A.C. Whalley, Z. Liu , S. Asahina , H. Kazumori , M. O’Keeffe , O. Terasaki , F.J. Stoddart, O.M. Yaghi, Science, 2012, 336, 1018-1023. [36] S.K. Bhatia, D.D. Perlmutter, American Institute of Chemical Engineers Journal, 1983, 29, 79-86. [37] D.P. Butt, K.S. Lackner, C.H. Wendt, S.D. Conzone , H. Kung ,Y.C. Lu, J.K. Bremser, Journal of American Ceramic Society, 1996, 79, 1892-1898.

170
5.3 INTEGRATION OF MgO FOR CO2 CAPTURE AT A 300 MWe COAL-FIRED POWER PLANT
5.3.1 INTRODUCTION
Solid sorbents have the potential to reduce the energy cost as compared to the liquid
solvents. Liquid solvents need large quantities of water that must be continuously heated
and cooled to regenerate the solvent solution. Moreover, sorbent materials have also
lower heat capacity and thus require less regeneration energy to attain a desired
temperature. Despite many advantages, there are numerous challenges which hinder the
efficient integration of solid sorbent based technology for CO2 capture at a power plant.
Here, MgO is chosen for the mass and energy balance calculation for post-combustion
CO2 capture.
The typical coal-fired burning plant consists of coal fired burners for coal combustion,
equipped with staged heat transfer units to utilize the thermal energy in flue gas to
generate steam. An assembly of superheater, boiler banks, economizer and air pre-heater
constitutes a boiler. A coal-fired exhaust flue gas has a gross heating value of 11500
BTU/lb (26.74 MJ/kg) as it contains mostly N2 (~65%), H2O (~18%), CO2 (~15%) and
rest O2. Here, the calculation is performed for both the cases- (a) Post-combustion CO2
capture and (b) Pre-combustion CO2 capture process.
5.3.2 Post-combustion process
The retrofit of MgO for post-combustion CO2 capture at a coal-fired power plant is
shown in Fig. 5.3.1. The flue gas after desulphurization unit is subjected to a compressor
and then to the carbonation reactor. During the exothermic carbonation process, MgO
reacts with CO2 in the presence of N2 to form MgCO3. The reacted sorbent particles are

171
sent to a high temperature cyclone. Here, the gaseous mixture is sent to the combined gas
and vapor power cycle. The solid mixture of product (MgCO3) and unreacted MgO can
then be transferred to the calcination reactor. Calcination reactor is a coal-fired unit. After
the calcination, the pure stream of CO2 gas is passed through cyclone (to remove any fine
solid particles) and then to a compressor. At compressor, CO2 can be liquefied and can
then be transferred through pipelines to a storage site and can be injected underground.

172
172
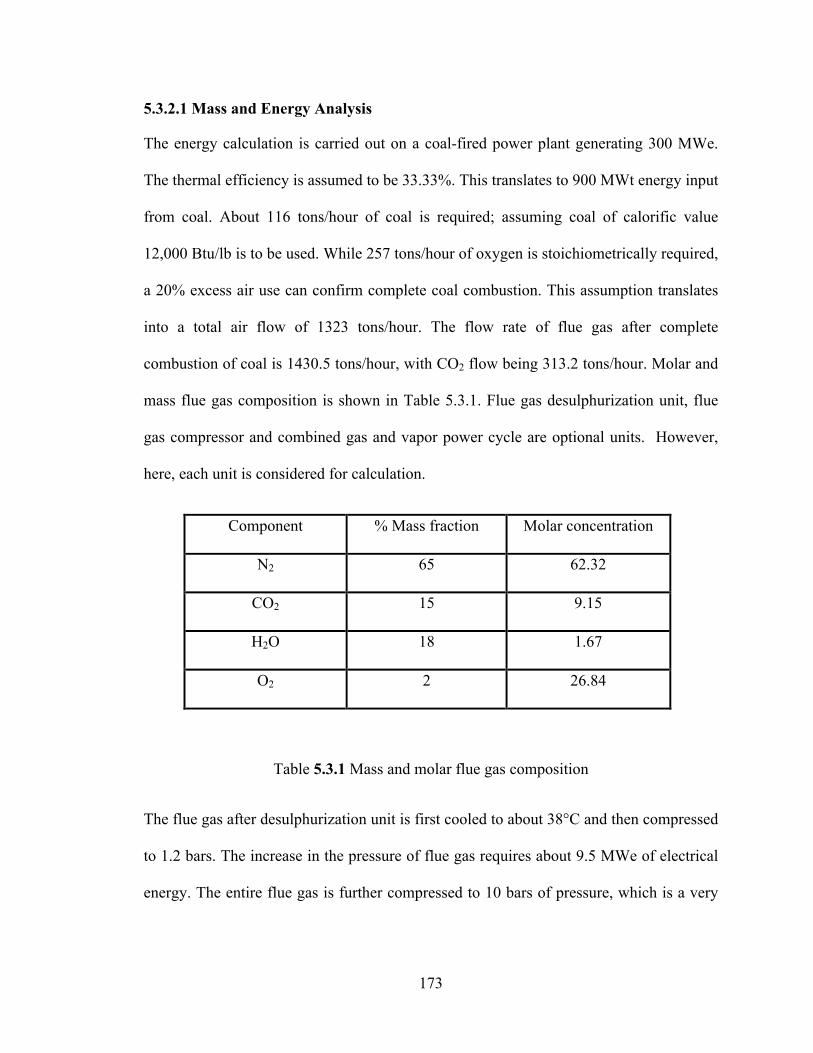
173
5.3.2.1 Mass and Energy Analysis
The energy calculation is carried out on a coal-fired power plant generating 300 MWe.
The thermal efficiency is assumed to be 33.33%. This translates to 900 MWt energy input
from coal. About 116 tons/hour of coal is required; assuming coal of calorific value
12,000 Btu/lb is to be used. While 257 tons/hour of oxygen is stoichiometrically required,
a 20% excess air use can confirm complete coal combustion. This assumption translates
into a total air flow of 1323 tons/hour. The flow rate of flue gas after complete
combustion of coal is 1430.5 tons/hour, with CO2 flow being 313.2 tons/hour. Molar and
mass flue gas composition is shown in Table 5.3.1. Flue gas desulphurization unit, flue
gas compressor and combined gas and vapor power cycle are optional units. However,
here, each unit is considered for calculation.
Component % Mass fraction Molar concentration
N2 65 62.32
CO2 15 9.15
H2O 18 1.67
O2 2 26.84
Table 5.3.1 Mass and molar flue gas composition
The flue gas after desulphurization unit is first cooled to about 38°C and then compressed
to 1.2 bars. The increase in the pressure of flue gas requires about 9.5 MWe of electrical
energy. The entire flue gas is further compressed to 10 bars of pressure, which is a very
174
energy intensive process and requires 208.83 MWe. The compressed flue gas is further
routed through a CO2 scrubber where the CO2 is removed by contacting the flue gas with
MgO. The experimental study indicates that MgO can attain an overall mass conversion
of 96.96% in 3-cycles each of 0.5h at 350°C and 10 bars CO2 pressure. If we target to
remove 80% of CO2 present in the flue gas, we require 286.89 tons/hour of MgO. The
reaction enthalpy of MgO-CO2 reaction at 350°C and 10 bars is ΔH= -85.62 kJ/mole.
The released heat from the carbonation reactor needs to be adequately removed to
maintain the high CO2 absorption capacity. Here, we consider only 20% of heat recovery
from the carbonation reactor (while, the maximum efficiency = (T2-T1)/T2 = (623-
300)/623 = 51.84%) and this translates to a heat recovery of 11.17 MWe.
Hot and compressed CO2 lean flue gas is then subjected through the combined gas and
vapor power cycle. The assumed temperature and pressure conditions are mentioned in
Figure 5.3.1. The calculation shows that even if 80% of CO2 lean flue gas stream is
utilized, about 307.49 MWe of electricity can be generated. MgCO3, formed as a result of
carbonation reaction is sent to the calciner. Make-up MgCO3 is also injected to the
calciner. Calciner uses thermal energy from the direct burning of coal. The calcination of
605.33 tons/hour of MgCO3 at 550°C and 1 bar (ΔH= + 164.69kJ/mol) requires 109.49
MWe. Thus, 36.14 tons/hour of coal needs to be burnt to produce the regeneration energy
(109.49 MWe). The burning of 36.14 tons/hour of coal produces 97.56 tons/hour of CO2.
The total consumption of coal is increased by (116+36.14)/116= 1.31. Also, the overall
CO2 capture reduces to only 48.8%.

175
CO2 rich gas stream exits the calciner and then sent to the compressor where the pure
CO2 is compressed to 136 bars via multistage compressors equipped with intercooling.
Several studies concur that the compression energy requirements of CO2 lie in the range
of 95-135 kWh/ ton of CO2. Here, we have chosen an energy requirement of 105
kWh/ton of CO2 as based on ASPEN simulations for multistage compression. Therefore,
the compression of 250.56 tons/hour of CO2 requires 26.31 MWe. Thus, the integration
of MgO based sorbent for CO2 capture at high temperature and high pressure reduces the
electric generation capacity from 300 MWe to 264.53 MWe.
The integration of heat recovery system in a coal-fired power plant can decrease energy
penalty and also control the electricity cost. The basic heat integration technology that
has been suggested in this process can be classified in three parts. At first, carbonation
reaction generates much more heat than is required to maintain the carbonation
temperature (H.E.1). Secondly, the hot MgO/MgCO3 flow exiting the carbonator cyclone
carries recyclable heat (H.E.2) and finally the CO2 rich gas stream exits as a very hot
gaseous flow (~400-500°C) can provide additional heat (H.E.3) for steam generation.
The compression of entire flue gas is energetically unfavorable process and can put
enormous parasitic burden on a coal-fired power plant. However, our experimental
results suggest that compressed gases do increase the CO2 capture capacity of MgO and
also hot and compressed CO2 lean flue gas when routed through a combined gas and
vapor power cycle generates electricity. Although, the proposed integration might have
high capital costs but it certainly has advantages such as high sorption capacity and
relatively less parasitic load for a power plant.

176
The integration of carbonation process requires electrical energy for various unit
operations and regarded as a “parasitic load” for any power plant. However, a
justification for the integration of any unit is needed. The calculation is based on the
account of MWe produced and spent. The efficiency by which the produced energy from
the carbonation reactor can be utilized will have a significant effect on the overall
efficiency of the power plant. If fully utilized, this energy can alleviate the energy burden
due to the compression of entire flue gas. Table 5.3.2 delineates the electrical energy
produced and consumed to operate various operations. The overall electric generation
capacity of plant is 264.53 MWe. Thus, this figure can be compared to that of the CCR
and MEA process.
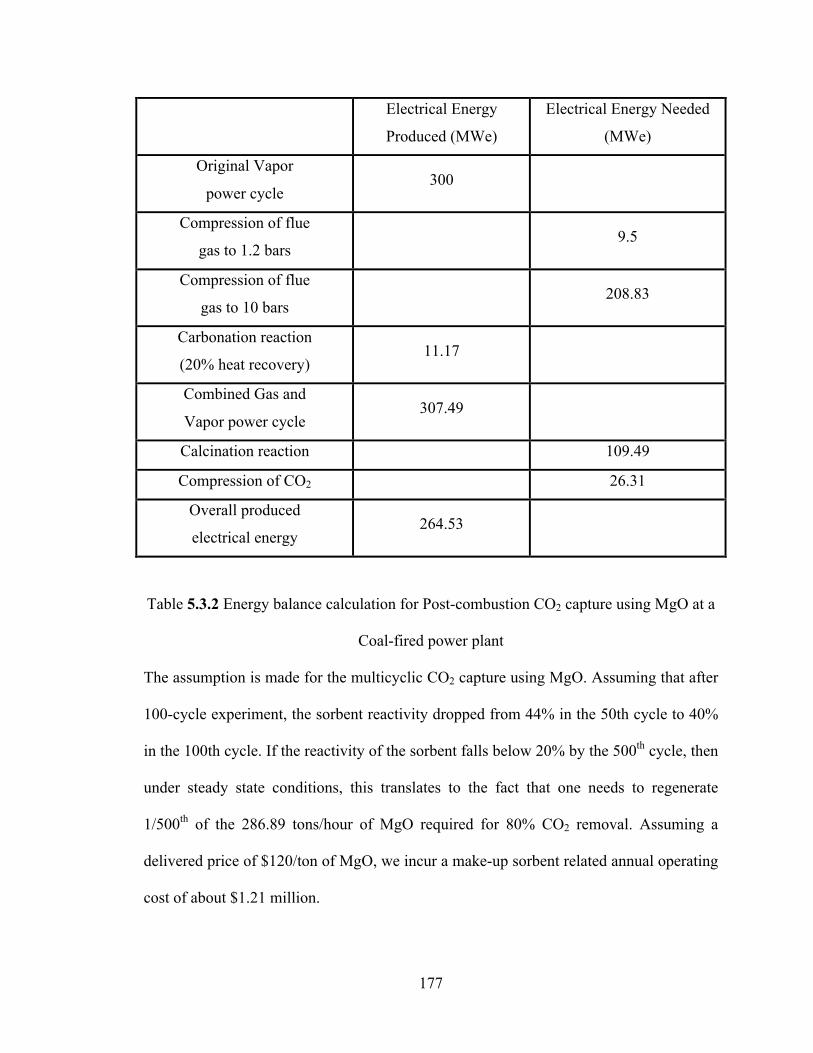
177
Table 5.3.2 Energy balance calculation for Post-combustion CO2 capture using MgO at a
Coal-fired power plant
The assumption is made for the multicyclic CO2 capture using MgO. Assuming that after
100-cycle experiment, the sorbent reactivity dropped from 44% in the 50th cycle to 40%
in the 100th cycle. If the reactivity of the sorbent falls below 20% by the 500th cycle, then
under steady state conditions, this translates to the fact that one needs to regenerate
1/500th of the 286.89 tons/hour of MgO required for 80% CO2 removal. Assuming a
delivered price of $120/ton of MgO, we incur a make-up sorbent related annual operating
cost of about $1.21 million.
Electrical Energy
Produced (MWe)
Electrical Energy Needed
(MWe)
Original Vapor
power cycle 300
Compression of flue
gas to 1.2 bars 9.5
Compression of flue
gas to 10 bars 208.83
Carbonation reaction
(20% heat recovery) 11.17
Combined Gas and
Vapor power cycle 307.49
Calcination reaction 109.49
Compression of CO2 26.31
Overall produced
electrical energy 264.53

178
5.3.2.2 ECONOMIC ANALYSIS OF THE CARBONATION PROCESS
The economic analysis is based on the estimated procurement cost. The total direct plant
cost (TDPC) accounts for both the procurement cost as well as installation cost of
equipment, piping, instrumentation and other accessories required to complete the plant
construction. The total capital investment (TCI) includes charges for general facilities,
contingencies, engineering, working land and miscellaneous. The calculation shows that
TCI is about 57 % of TDPC calculated. The total annual variable operating costs is
$120.4821 million; which corresponds to approximately 23% of TDPC. Based on the
various literatures, fixed operating and maintenance cost is taken as 5% of the capital
cost. The total cost is estimated by summing up the variable operating cost, fixed charges
and fixed operating cost. All the equipment costs are estimated from the web service
(www.matche.com). The detailed economic analysis is shown in Table 5.3.3. One should
note that the capital cost of combined gas and vapor power cycle is not included in this
calculation. Moreover, the equipment costs are based on 2007. However, if the natural
gas combined cycle is to be considered then the CO2 capture cost exceeds to almost
$191/ton CO2 captured. The costs for natural gas combined cycle are: capital cost
($917/kW), Fixed O & M ($13.17/kW) and Variable O & M ($3.60/kW). Thus, the
compression of entire flue gas seems to be economically and energetically unfavorable.
However, if a natural gas combined cycle can be integrated to the coal-fired burning
plant, cost of carbon capture may reduce without a high increase in the electricity cost.
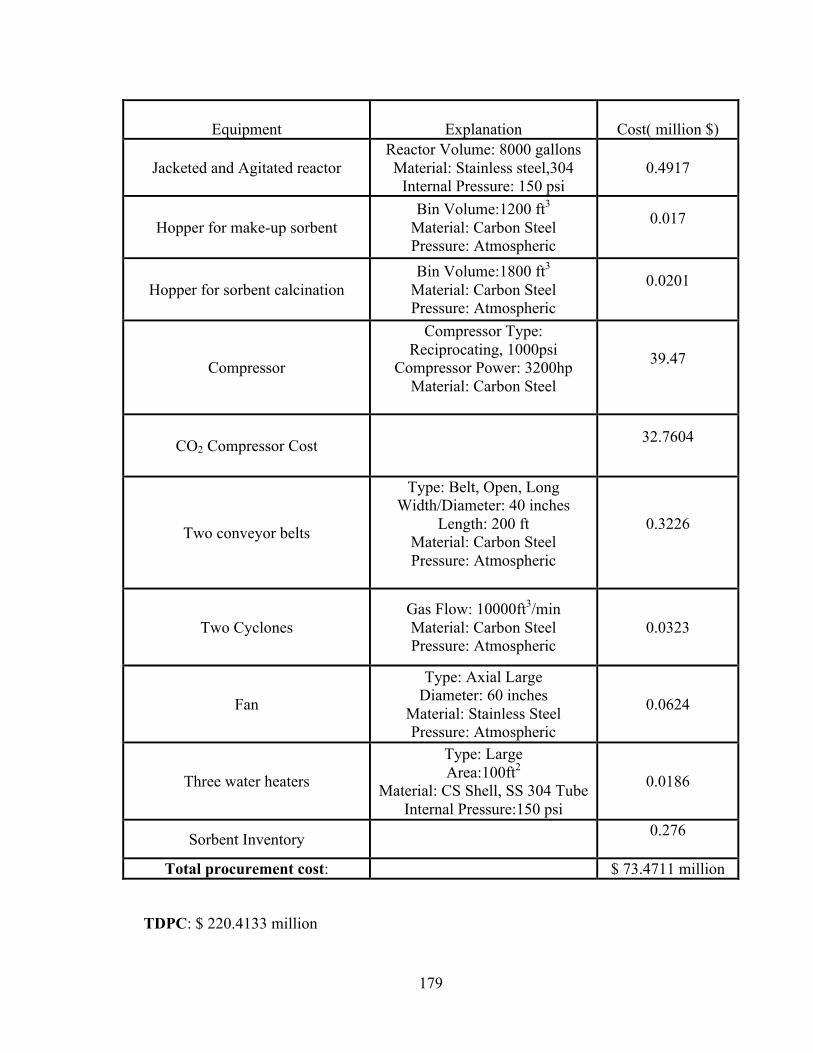
179
Equipment
Explanation
Cost( million $)
Jacketed and Agitated reactor Reactor Volume: 8000 gallons Material: Stainless steel,304
Internal Pressure: 150 psi 0.4917
Hopper for make-up sorbent Bin Volume:1200 ft3
Material: Carbon Steel Pressure: Atmospheric
0.017
Hopper for sorbent calcination Bin Volume:1800 ft3
Material: Carbon Steel Pressure: Atmospheric
0.0201
Compressor
Compressor Type: Reciprocating, 1000psi
Compressor Power: 3200hp Material: Carbon Steel
39.47
CO2 Compressor Cost 32.7604
Two conveyor belts
Type: Belt, Open, Long Width/Diameter: 40 inches
Length: 200 ft Material: Carbon Steel Pressure: Atmospheric
0.3226
Two Cyclones Gas Flow: 10000ft3/min Material: Carbon Steel Pressure: Atmospheric
0.0323
Fan
Type: Axial Large Diameter: 60 inches
Material: Stainless Steel Pressure: Atmospheric
0.0624
Three water heaters
Type: Large Area:100ft2
Material: CS Shell, SS 304 Tube Internal Pressure:150 psi
0.0186
Sorbent Inventory 0.276
Total procurement cost: $ 73.4711 million
TDPC: $ 220.4133 million

180
General facilities 30 % 66.124
Eng. Permitting and start up 10% 22.0411 contingencies 10% 22.0411
Working capital, land and miscellaneous 7% 15.42893
Total capital investment $ 346.0484
Variable operating costs
Variable Non-fuel operating cost(% capital) 1 % 2.2041
Calciner cost (Rotary Kiln)
47.868
Make up Sorbent cost 1.21 Total annual variable
operating cost $ 51.2821 million
Fixed operating and maintenance cost (5% capital cost) $17.30 million
Capital charges (15% capital cost) $51.90 million
Total annual cost $120.4821 million
CO2/coal (tons/tons) 2.69 Total coal consumed (tons/hr)
(electricity generation + calcination) 152.14
CO2 emitted (tons/hr) ( electricity generation + calcination) 410.76
CO2 emitted(tons/year) 3598257.6 Total CO2 captured (tons/hr) 250.56
Total CO2 captured (tons/year) 2194905.6 Original kgCO2/kWh 1.044
kgCO2/kWh 0.6056
Table 5.3.3 Detailed economic analysis for Post-combustion CO2 capture using MgO

181
The parasitic energy load due to various unit operations for the proposed scheme reduces
the electric generation capacity from 300 MWe to 264.53 MWe (Assuming the use of
combined vapor and power cycle). In the literature, two different approaches are
discussed to estimate CO2 capture costs. In first approach, all the costs, such as annual
variable operating costs and electrical energy requirement are considered as if they are
external resources. Here, the accessible electricity available for sale by the plant remains
the same despite any attempt to reduce CO2 emissions. In other approach, only expenses
that cannot be obtained within power plant operations are considered. In this case, all the
parasitic electricity requirements are obtained from power plant operations. Hence, the
final available electricity for sale is reduced.
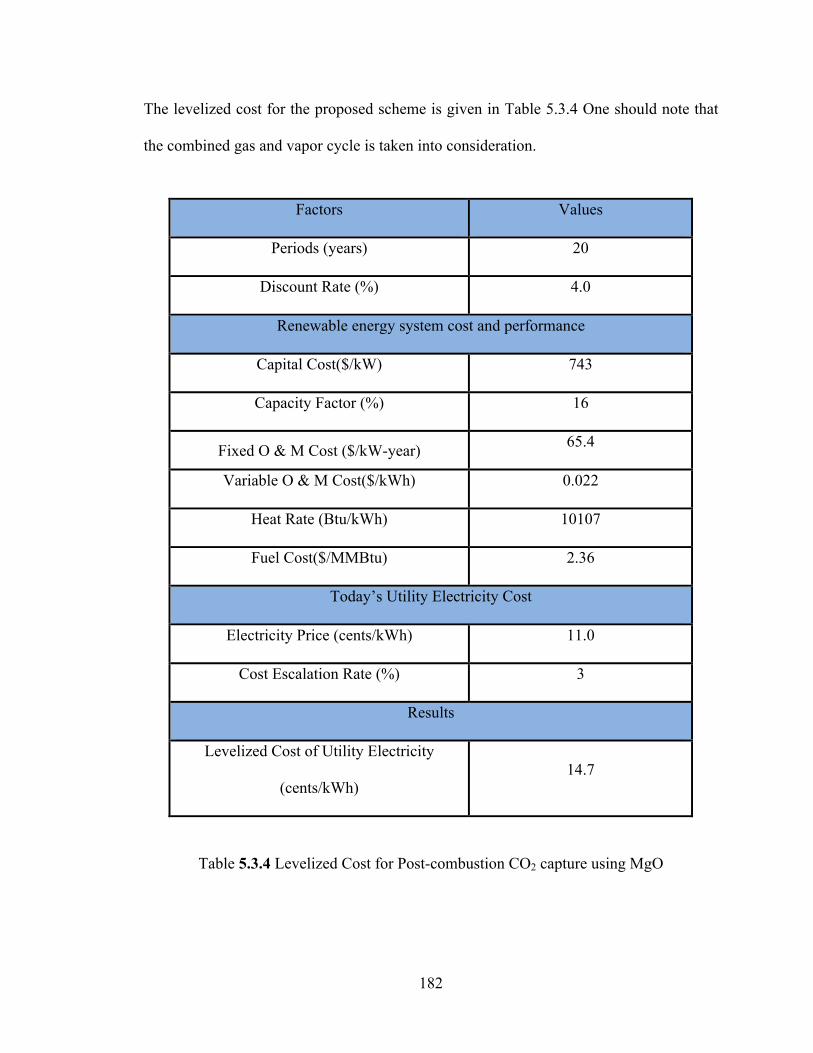
182
The levelized cost for the proposed scheme is given in Table 5.3.4 One should note that
the combined gas and vapor cycle is taken into consideration.
Table 5.3.4 Levelized Cost for Post-combustion CO2 capture using MgO
Factors Values
Periods (years) 20
Discount Rate (%) 4.0
Renewable energy system cost and performance
Capital Cost($/kW) 743
Capacity Factor (%) 16
Fixed O & M Cost ($/kW-year) 65.4
Variable O & M Cost($/kWh) 0.022
Heat Rate (Btu/kWh) 10107
Fuel Cost($/MMBtu) 2.36
Today’s Utility Electricity Cost
Electricity Price (cents/kWh) 11.0
Cost Escalation Rate (%) 3
Results
Levelized Cost of Utility Electricity
(cents/kWh) 14.7
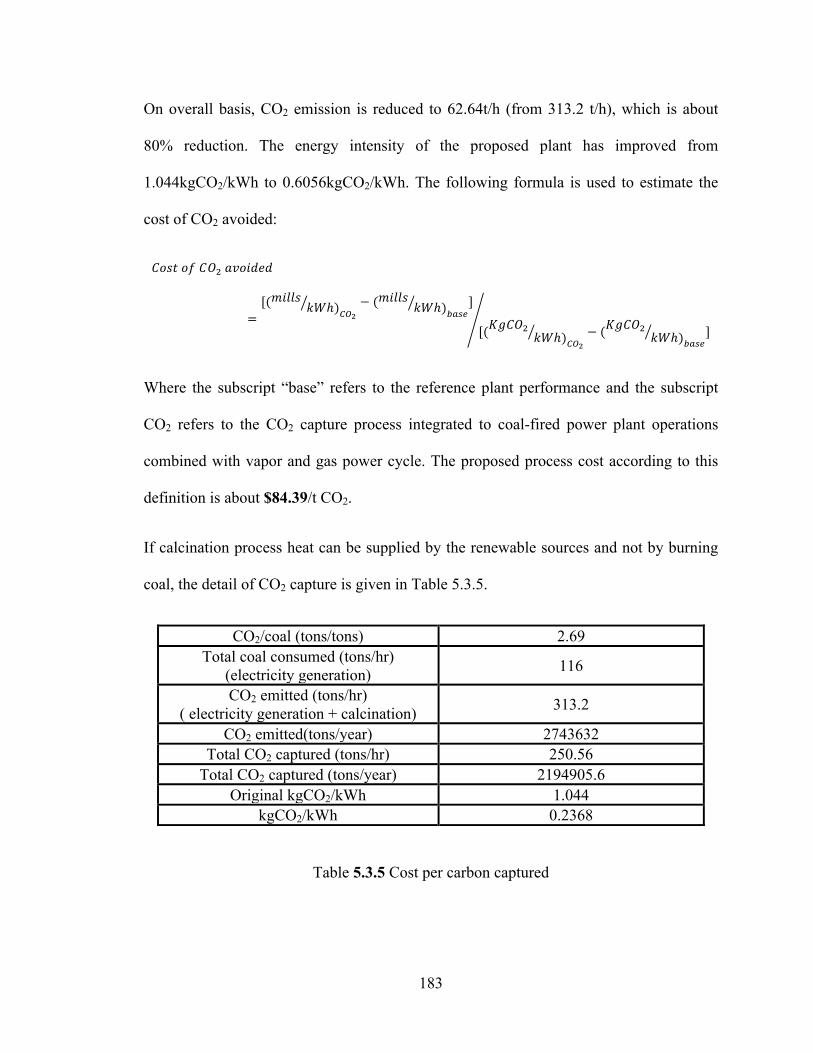
183
On overall basis, CO2 emission is reduced to 62.64t/h (from 313.2 t/h), which is about
80% reduction. The energy intensity of the proposed plant has improved from
1.044kgCO2/kWh to 0.6056kgCO2/kWh. The following formula is used to estimate the
cost of CO2 avoided:
𝐶𝐶𝐶𝐶𝐶𝐶𝐶𝐶 𝑜𝑜𝑜𝑜 𝐶𝐶𝑂𝑂 𝑎𝑎𝑎𝑎𝑎𝑎𝑖𝑖𝑖𝑖𝑖𝑖𝑖𝑖
=[(𝑚𝑚𝑚𝑚𝑚𝑚𝑚𝑚𝑚𝑚 𝑘𝑘𝑘𝑘ℎ) − (𝑚𝑚𝑚𝑚𝑚𝑚𝑚𝑚𝑚𝑚 𝑘𝑘𝑘𝑘ℎ) ]
[(𝐾𝐾𝐾𝐾𝐶𝐶𝐶𝐶 𝑘𝑘𝑘𝑘ℎ) − (𝐾𝐾𝐾𝐾𝐶𝐶𝐶𝐶 𝑘𝑘𝑘𝑘ℎ) ]
Where the subscript “base” refers to the reference plant performance and the subscript
CO2 refers to the CO2 capture process integrated to coal-fired power plant operations
combined with vapor and gas power cycle. The proposed process cost according to this
definition is about $84.39/t CO2.
If calcination process heat can be supplied by the renewable sources and not by burning
coal, the detail of CO2 capture is given in Table 5.3.5.
CO2/coal (tons/tons) 2.69 Total coal consumed (tons/hr)
(electricity generation) 116
CO2 emitted (tons/hr) ( electricity generation + calcination) 313.2
CO2 emitted(tons/year) 2743632 Total CO2 captured (tons/hr) 250.56
Total CO2 captured (tons/year) 2194905.6 Original kgCO2/kWh 1.044
kgCO2/kWh 0.2368
Table 5.3.5 Cost per carbon captured
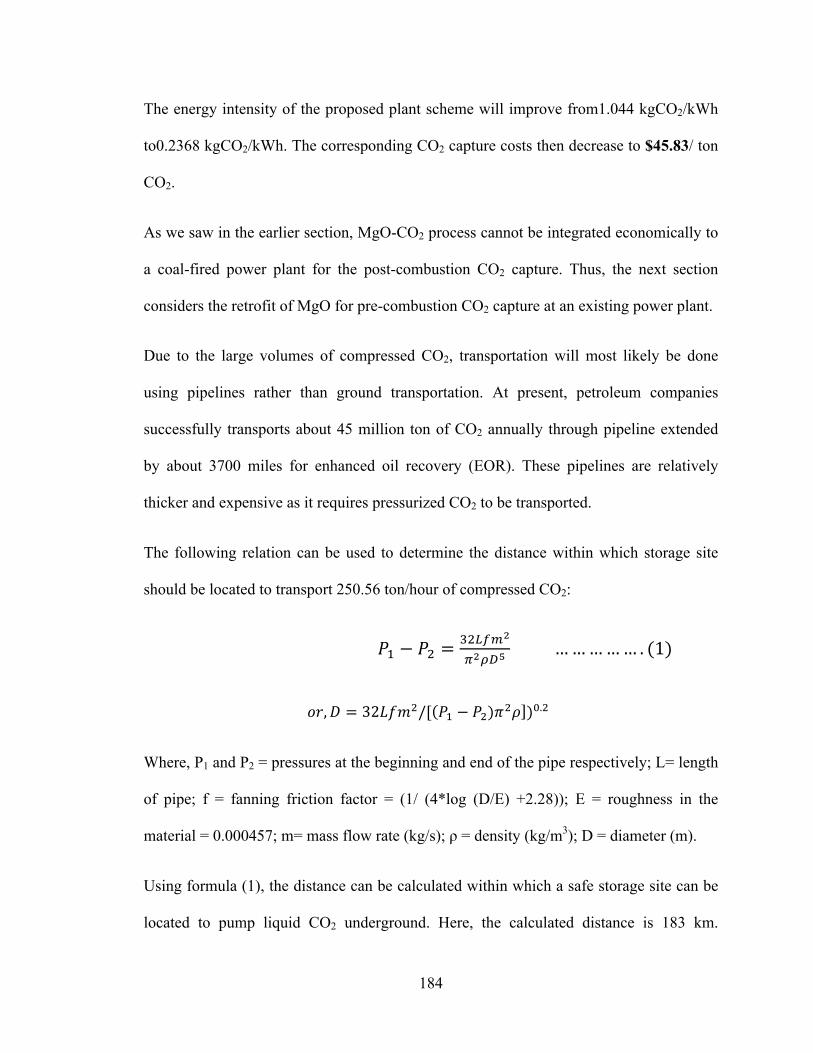
184
The energy intensity of the proposed plant scheme will improve from1.044 kgCO2/kWh
to0.2368 kgCO2/kWh. The corresponding CO2 capture costs then decrease to $45.83/ ton
CO2.
As we saw in the earlier section, MgO-CO2 process cannot be integrated economically to
a coal-fired power plant for the post-combustion CO2 capture. Thus, the next section
considers the retrofit of MgO for pre-combustion CO2 capture at an existing power plant.
Due to the large volumes of compressed CO2, transportation will most likely be done
using pipelines rather than ground transportation. At present, petroleum companies
successfully transports about 45 million ton of CO2 annually through pipeline extended
by about 3700 miles for enhanced oil recovery (EOR). These pipelines are relatively
thicker and expensive as it requires pressurized CO2 to be transported.
The following relation can be used to determine the distance within which storage site
should be located to transport 250.56 ton/hour of compressed CO2:
𝑃𝑃 − 𝑃𝑃 = …………… . (1)
𝑜𝑜𝑜𝑜,𝐷𝐷 = 32𝐿𝐿𝐿𝐿𝑚𝑚 /[ 𝑃𝑃 − 𝑃𝑃 )𝜋𝜋 𝜌𝜌 ) .
Where, P1 and P2 = pressures at the beginning and end of the pipe respectively; L= length
of pipe; f = fanning friction factor = (1/ (4*log (D/E) +2.28)); E = roughness in the
material = 0.000457; m= mass flow rate (kg/s); ρ = density (kg/m3); D = diameter (m).
Using formula (1), the distance can be calculated within which a safe storage site can be
located to pump liquid CO2 underground. Here, the calculated distance is 183 km.

185
National Energy Technology Laboratory (NETL) suggests the cost estimation procedure
for CO2 pipeline. Table 5.3.6 (a) shows the calculation. The cost incurred in $/in/mile is
86,370.97 by using pipeline of diameter of 8.82 inches and length of 62 miles.
Pipeline Capital Costs
(D= inches; L= miles)
$/in/mile $86,370.97
Table 5.3.6 Transportation Cost
5.3.3 Pre-combustion process
Pre-combustion capture process refers to mitigating CO2 from fossil fuels before they are
combusted. Fossil fuels are partially combusted in steam and oxygen/air under high
temperature and pressure to form synthesis or syn gas (CO+ H2). CO can then undergo
reaction with steam (water-gas shift reaction) to generate CO2 and H2-rich gas stream.

186
The concentration of CO2 in the mixture may increase to 15-50%. Further, the pressurized
mixture of CO2 and H2 can be separated using MgO. As mentioned earlier, MgO reacts
with CO2 to form carbonates, which when heated liberates pure CO2. The pure CO2 can
then be compressed, transported using pipeline and eventually sequestered underground.
In comparison to post-combustion process, the shifted syn gas rich in CO2 and at higher
pressure can be easily removed prior to hydrogen combustion. However, pre-combustion
capture technology is relatively less expensive but the capital costs are higher than
conventional coal-fired power plants.

187

188
5.3.3.1 Mass balance calculation
Table 5.3.3.1 illustrates the mass flow rates of solids and gases at different stages of the
process.
Table 5.3.7 Mass balance calculation for pre-combustion CO2 capture using MgO at a
coal-fired power plant
Assuming the same capacity of plant (330 MWe) and thus about 116t/h coal that is
required. A 20% stocihiometrically excess of O2 (154.67t/h) is assumed and water should
be sufficient enough to prepare coal slurry. A gasifier operates at a high temperature
(800-1000°C) and pressure of 55 bars. At the exit of gasifier, H2, CO and CO2 are present
in 30, 40, 10% molar concentration and that translates to 6.51t/h,110.43t/h and 108.46t/h
respectively. After the gasifier, synthesis gas (CO +H2) is sent to water-gas shift (WGS)
reactor. The input feed of steam is twice that of syn gas. After water-gas shift reaction,
the gas feed is sent for carbonation reactor in fluidized bed reactor. About 151.89t/h MgO
is required for 80% CO2 capture at the power plant. At the exit of carbonation reactor,
MgCO3 is about 254.16t/h and the detailed mass of each species is given in Table 5.3.7.

189
5.3.3.2 Energy balance calculation
As mentioned earlier, flue gas out of the gasifier comes out at a high pressure (~55 bars)
and high temperature (~800-1000°C). The raw syn gas out of the gasifier is at a slightly
lower pressure of 54.51 bars and temperature of 285°C. Conventionally, for other pre-
combustion sorbents such as slexol, the syn gas is cooled to room temperature while the
pressure is kept constant. For the purpose of using MgO as a sorbent, cooling of gases
exiting WGS reactor will not be energetically favorable. So, here, these gases are directly
sent to the carbonation reactor. Based on our experimental findings, at 300°C and 50
bars, we are getting about 96% conversion of MgO to MgCO3. Thus, for the combination
of 285°C and 50 bars pressure, 80% conversion can be accepted. 151.89t/h MgO is
required. This amount is too big and may not be practically easy to deal with such huge
amount. The reaction enthalpy of MgO-CO2 reaction at 300°C and 50 bars is ΔH= -107
kJ/mole. The released heat from the carbonation reactor needs to be adequately removed
to maintain the high CO2 absorption capacity. Here, we consider only 10% of heat
recovery from the carbonation reactor (while, the maximum efficiency = (T2-T1)/T2 = (-
300)/623 = 46.23%) and this translates to a heat recovery of 0.45 MWe.
Hot and compressed H2 can then be subjected to the combined gas and vapor power
cycle. A significant amount of electricity can be generated at this point. MgCO3, formed
as a result of carbonation reaction is sent to the calciner. Make-up MgCO3 is also injected
to the calciner. Calciner uses thermal energy from the direct burning of coal. The
calcination of 254.16 tons/hour of MgCO3 at 550°C and 1 bar (ΔH= + 164.69kJ/mol)
requires 11.62 MWe. Thus, 3.83 tons/hour of coal is required to regenerate MgO. The
190
burning of 3.83 tons/hour of coal produces about 10.31 tons/hour of CO2. The total
consumption of coal is increased by (116+3.83)/116= 1.033.
As discussed earlier, CO2 exiting the calciner needs to be compressed to 136 bars. Using
105 kWh/ton of CO2 energy required to compress CO2, compression energy for 132.65
tons/hour of CO2 requires 13.92 MWe. 151.89 tons/hour of MgO is regenerated in the
process and thus can be recycled for the next capture cycle. Thus, the total parasitic load
for pre-combustion capture using MgO is 25.54MWe. One should note that electricity
generated by the hydrogen used in the combined gas and vapor power cycle is not
included for the energy calculation.
191
5.4 MITIGATING CO2 EMISSIONS IN THE IRON INDUSTRY USING
MIXTURE OF MAGNETITE AND IRON
5.4.1 INTRODUCTION
The global steel production is growing rapidly, from 1248 Mt in 2006 to 1490 Mt in
2011, an increase of about 16% in a short span of 5 years [1]. Steel production is an
energy intensive process and thus consumes huge amount of fossil fuels. Each ton of steel
production emits 2.2 ton of CO2 as a world average. Therefore, iron making industries
can be seen as one of the biggest targets next to power plants to curb vast emission of
greenhouse gases.
It is known that a significant amount of the overall carbon input to the iron and steel plant
flows through the iron making process (Blast furnace and smelting reduction process). In
particular, blast furnace requires around 70% of the total carbon input [2]. Blast furnace
gas has a pressure of about 2-3 bar and contains CO (17-25%), N2 (50-55%), O2 (1-5%),
CO2 (17-25%) [3]. The CO2 capture approaches are mainly based on chemical
(Monoethanolamine (MEA), MEA/piperazine mix and sterically hindered primary
amines) or physical (pressure swing adsorption and vacuum pressure swing adsorption)
absorption [4-5]. Chemical absorption is appropriate for CO2 capture from gases with
low-CO2 partial pressures while physical absorption requires higher CO2 partial
pressures. Hence, the latter approach is suitable to separate CO2 from the process gas
only after water-gas shift reaction, which is operated at 20 bars [6]. A detail explanation
of the existing CO2 capture process for iron and steel sector can be found elsewhere [7-9].

192
We present here a novel add-on technology which can be employed for blast furnace gas
after conversion of CO to CO2 (using water gas shift reaction). The combined use of
following reactions for CO2 capture could be energetically and economically favorable at
any iron making industries. Reaction (5.4.1) suggests that a mixture of magnetite and iron
can selectively combine with CO2 from blast furnace gas and forms siderite.
Reaction 5.4.1: Fe3O4 (s) + Fe (s) + 4 CO2 (g) = 4FeCO3(s) ΔH (2000C, 10 bars) = -
288.55kJ/mol
Siderite, once formed can further decompose back to magnetite [Reaction (5.4.2)] in
presence of oxygen at 3500C. Reaction (5.4.2) liberates pure CO2 which can either be
sequestered underground or used for oil gas recovery.
Reaction 5.4.2: 3FeCO3 (s) +1/2O2 (g) = Fe3O4 (s) + 3CO2 (g) ΔH (3500C, 1 bar) = +
87.29kJ/mol
After regeneration, the magnetite can further be recycled back to reaction (5.4.1) and thus
completes the cycle. This carbonation-calcination cycle can be repeated for several times.
Once the CO2 capture capacity of magnetite degrades, it can be reused to manufacture
iron. In such a way, there would not be any loss of raw materials.
Magnetite is the one of the main ingredients for manufacturing iron and hence it is
readily accessible. But, at present, most of the iron and steel industries are not involved in
forming iron powders at their own site. However, iron powders can be manufactured
using conventional techniques such as sponge-iron or water atomizing process [10].

193
Nevertheless, any industrial waste containing iron in sufficient amount can also be used
instead of pure iron powders for reaction (5.4.1).
We performed thermodynamic equilibrium calculations using the software FACTSAGE
and the databases therein and conducted several experiments for verification. An
equilibrium calculation shows that at high pressure of carbonation reaction, the
decomposition temperature of siderite is also higher. For instance, at 10 bars CO2
pressure, siderite starts decomposing around (200-250)0C. However, at 50 bars, siderite
becomes unstable only after 3000C [Fig. 5.4.1]. A similar result was reported by Svoboda
et al. [11]. The calculation also shows no formation of siderite until 1000C for both 10 and
50 bars.
Figure 5.4.1 Equilibrium composition in the system Fe3O4+ Fe+ 4CO2 at 10 and 50 bars pressure
Here, we performed the experiments at a relatively high pressure. High pressure CO2
capture technologies require entire process gas compression and can significantly
increase the power consumption due to an additional feed gas compressor prior to the
carbonation reactor [12]. However, Lampert et al. [13], who indicated that the

194
compression energy penalty for add-on CO2 capture can be partially offset as the
exported gas is compressed anyway before combustion in power plant.
5.4.2. EXPERIMENTAL PROCEDURE
The carbonation reactions were performed in a closed system while the decomposition of
siderite was evaluated using thermo gravimetric analysis (TGA).
About 0.4 g mixture of Fe3O4 (Alfa Aesar, 98% purity) and Fe (Good Fellow, 99%
purity) was ground using mortar and pestle and then put inside a closed cylindrical vessel
of length 1.25” and internal diameter of 0.35”. About 0.10 mL water were added on the
vessel wall to create a slight humid environment for the carbonation reaction. Chemically
pure CO2 gas (Airgas) was then passed into the system. Before experiments, CO2 gas was
flushed three times to ensure a pure CO2 atmosphere inside the reactor. The reaction was
performed for several minutes at a desired temperature and pressure condition. Once the
reaction completed, the system was air-cooled. The degree of carbonation reaction was
determined by weight loss during calcination of the product.
TGA 2950 Thermo gravimetric analyzer was primarily used to identify the
decomposition temperature of the product. The sample was heated under air atmosphere
(flow rate =100 mL/min.), at a heating rate of 15oC/ min to a final temperature of 800oC.
The TGA provides continuous measurements of the sample weight as a function of time
and temperature. FeCO3 content in the product was analyzed by the percent loss in
weight of the sample while heating up to 800oC in an air atmosphere.

195
Powder X-ray diffraction method was used to characterize the product using Bruker
GADDS/D8 X-ray diffractometer equipped with Apex Smart CCD Detector and direct-
drive rotating anode. The MacSci rotating anode (Molybdenum) operates with a 50 kV
generator and 20 mA current. X-ray beam size can vary from 50 to 300 µm. The usual
collection time is 1200 s.
5.4.3. RESULTS AND DISCUSSION
Figure 5.4.2 (i) confirm the formation of FeCO3 at 2000C and 10 bars of CO2 pressure.
Fe3O4 and FeCO3 were identified by their XRD patterns (Joint Committee Powder
Diffraction Standard (JCPDS) card number 89-4319 and 83-1764). A mixture of Fe3O4
and Fe locks CO2 in the form of FeCO3. Several experiments at various set of
temperature, pressure and time have been performed. It is observed that the molar ratio of
Fe and Fe3O4 should be at least higher than 0.75 to form FeCO3 [Fig.5.4.2 (ii)]. All the
experiments have been performed in the presence of 0.1mL water. However, x-ray
diffraction pattern of the product does not show any formation of iron based hydroxides.
This could be attributed to the catalytic behavior of water molecules. Several other works
illustrate the significant role of water in increasing the CO2 uptake capacity of metal
oxides. Figure 5.4.2 (iii) shows the DTG plot for the product obtained as a result of
reaction (5.4.1) performed at 2000C, 10 bars and 3 hours under air flow rate of 100
mL/min. The peak around 1000C attributes to the loss of water while second peak around
3500C corresponds to the complete decomposition of FeCO3.

196
Figure 5.4.2 (i) X-ray diffraction pattern confirm the siderite formation for reaction [5.4.1]
performed at 1000C, 50 bars and 3 h (ii) X-ray diffraction pattern of the products for different
molar composition of magnetite and iron mixture at 2000C, 10 bars and 1 h (iii) DTG plot for
product obtained as a result of reaction [5.4.1] performed at 2000C, 10 bars, and 3 h under air
flow rate of 100mL/min.
10 15 20 25 300
200
400
600
800
1000
2ΘΘ (deg rees )
Intensity (arb
itary
unit)
(83-‐1764)
(89-‐4319)
F eC O3
F e3O
4
200 400 60080
85
90
95
100
-‐0.2
-‐0.1
0.0
0.1
0.2200C ,10bars ,3h
dm/dT
T emperature (C )
% W
eight ~13.0wt.%
~355C
~2.0wt.%
10 20 30
2ΘΘ (deg rees )
1 F e
0.75 F e
0.5 F e
0.25 F e
0 F e
(89-‐4319)
(83-‐1764)
F eC O3
F e3O
4
Intensity ( arb
itary
Unit)

197
Table 5.4.1 illustrates the % conversion for mixture of Fe and Fe3O4 to FeCO3 at various
conditions. Based on TGA results, % conversion for mixture of Fe and Fe3O4 to FeCO3 is
calculated. At 2000C, 10 bars and 3 hours, we observed a maximum mass conversion of
57%.
Table 5.4.1 Experimental result for reaction [5.4.1] at different set of temperature, pressure and time
Since the reaction between mixture of Fe and Fe3O4 is highly exothermic in nature, the
observed temperature dependence suggests that the sorption of CO2 is controlled by the
kinetic diffusion rather than the thermodynamic factor [14]. As the temperature is
increased, more CO2 diffuses to the pores of powder mixture and the present active sites
hold these CO2 molecules. Hence, these trapped CO2 molecules further react with the
mixture to form FeCO3. It can be observed that the capture capacity of Fe and Fe3O4
mixture increases with increase in pressure. At 1000C, the % mass conversion of Fe and
Fe3O4 mixture increases from 0.16 to 0.22 at 25 and 50 bars of CO2 pressure. As
expected, faster sorption kinetics was observed at a high pressure. One should note that as
the pressure increases, the gas flux increases, and the intermolecular collisions of CO2
Temperature (oC) Pressure(bars) Time(h) % Conversion
100 25 3 0.16
100 50 1 0.16
100 50 3 0.22
100 50 6 0.43
200 10 1 0.44
200 10 3 0.57

198
dominate and thus system is in Fickian regime. Hence, CO2 molecules intrude through
each available pores of Fe and Fe3O4 powder mixture. However, at low pressure
(Knudsen regime), collisions between the CO2 molecules and pore walls are dominant
and the free path is limited to the geometry of void space [15]. Thus, it is apparent that at
low pressure, there is relatively less CO2 capture by a mixture of Fe and Fe3O4.
199
5.4.4 REFERENCES:
[1] www.worldsteel.org
[2] J.C.M. Farla, C.A. Hendriks, K. Blok, Climatic Change, 1995, 29, 439-61
[3] IPPC, Reference Document on best available techniques on the production of iron and steel. Integrated Pollution Prevention and control Bureau, Seville, Spain 2001
[4] F.A. Tobiesen, H.F. Svendsen, T. Mejdell, Industrial & Engineering Chemistry Research, 2007, 46, 7811-9
[5] K. Wieder , C. Bohm , J. Wurn, The COREX and FINEX Processes - reliable, environmental friendly and economical Hot Metal Production, Kolkata, India 2005.
[6] D. Gielen, Energy Conversion and Management, 2003, 44, 1027–1037
[7] C. Xu, C.Da-qiang, Journal of Iron and Steel Research International, 2010, 17, 01-07
[8] T. Kuramochi, A. Ramirez, W. Turkenburg, A.Faaij, Progress in Energy and Combustion Science, 2012, 38, 87-112
[9] J.P. Birat, J.P. Vizioz, Y. de Lassat de Pressigny, M. Schneider, M. Jeanneau, CO2 emissions and the steel industry's available responses to the greenhouse effect, Revue de Metallurgie, Cahiers d'Informations Techniques, France 1999, 96,1203–15
[10] J.M. Capus, Metal Powders- A global survey of production, applications and markets to 2010, fourth ed., Elsevier, Oxford 2006
[11] K. Svoboda, G. Slowinski, J. Rogut, D. Baxter, Energy Conversion and Management, 2007, 48, 3063–73
[12] M.T. Ho, G.W. Allinson, D.E. Wiley, International Journal of Greenhouse Gas Control, 2010, 5, 49-60
[13] K. Lampert, A. Ziebik, W. Stanek, Energy, 2010, 35, 1188-95
[14] S.F. Wu, Industrial & Engineering Chemistry Research, 2007, 46, 7896-9
[15] R. Feres, G.S. Yablonsky, Chemical Engineering Science, 2006, 61, 7864 – 83

200
5.5 PROCESS DESIGN FOR THE PROPOSED CARBON DIOXIDE SORBENT FOR IRON MAKING INDUSTRY
5.5.1 RETROFIT IN A BLAST FURNACE
Fig.5.5.1 illustrates the idea for the integration of a mixture of magnetite and iron as a
potential CO2 sorbent at any iron making industry.
Figure 5.5.1 Flow sheet for carbonation process integrated to a blast furnace
Based on the experimental results for a mixture of iron and magnetite powder, a process
design is proposed for carbon dioxide capture at iron making industries. The retrofit of
the process to an existing iron making industry is shown in Fig.5.5.2. Blast furnace gas is
produced when iron ore is reduced to metallic iron using coke. Since blast furnace gas
contains mostly N2 (~50%), CO (~23%), CO2 (~25%) and rest O2, it has a very low
heating value of 93BTU/Cubic foot (0.037kJ/l), compared to CH4 (0.364kJ/l). The
presence of a high amount of CO in blast furnace gas requires a water-gas shift reactor.

201
Water gas shift reaction converts CO and stem to H2 and CO2 rich gas stream. Hydrogen
gas can be separated from the mixture of N2 and CO2 using diaphragm. Further, the gas
stream (N2+ CO2) can be compressed and heated prior to the injection into the
carbonation reactor. The reaction of a mixture of iron and magnetite (I + M) with CO2 in
the carbonation reactor is an exothermic reaction. The reacted sorbent particles are sent to
high temperature cyclone. Further, a magnetic separator is used to separate siderite
(product) and unreacted magnetite. A part of magnetite can be sent to the blast furnace or
carbonation reactor for the next capture cycle. Siderite particles are subsequently
decomposed to release pure carbon dioxide which can further be liquefied using carbon
dioxide compressor. The magnetite obtained after calcination process can then be re-
injected to either blast furnace or carbonation reactor.

202

203
The benefit of using mixture magnetite and iron mixture is that
(i) readily accessible at any iron making industry
(ii) raw materials can be used for a large number of cycles
(iii) Once the materials adsorption capacity degrades, it can be converted back into
iron
5.5.2 MASS BALANCE CALCULATION
A blast furnace of capacity 6000 tons/ day is considered as an example. A total of 0.4
million m3/h of blast furnace gas will be emitted. A detailed material flows is illustrated
in Table 5.5.1. The respective amount of N2, CO, CO2 and O2 out of blast furnace is
198.11t/h, 91.03t/h, 155.66t/h and 9.06t/h. The assumed conditions for carbonation
reaction are based on the experimental findings: 200°C, 10 bars, 1h and efficiency=0.44.
It is also assumed that only 10% of carbonation heat is recovered from a carbonation
reactor (Maximum efficiency = [(473-300)/300] = 0.57). The calcination of siderite
occurs at a temperature of 350°C. The pure CO2 is compressed to 136 bars and
transported to the storage site using pipeline.
The reaction involved in the proposed scheme is illustrated in Table 5.5.1
Efficiency Enthalpy
(kJ/mol) Reaction 1 CO + H2O = CO2 +H2 0.99 -41.1 Reaction 2 Fe3O4 +Fe +4CO2= 4FeCO3 0.44 -288.55 Reaction 3 3FeCO3+1/2O2 = Fe3O4 + 3CO2 0.99 44.78 Reaction 4 Fe3O4+3C = 3 Fe + 2 CO+ CO2 0.9 52.82 Reaction 5 2 H2 + O2 = 2 H2O 0.99 -572
Heat of Vaporization H2O 40.65 Heat Efficiency 2
Table 5.5.1 Reactions involved in the proposed scheme for CO2 capture at iron making
industry

204
Water gas shift reaction is a conventional way to generate hydrogen gas using the flow
streams of CO and steam. It is generally carried out in adiabatic fixed bed reactors. One,
two or even three series reactors have been suggested for water gas shift reaction. The
reaction is often used in two stages. The first reactor is of high temperature (350°C) and
another relatively lower temperature (~200°C).
Reaction 5.5.1: CO + H2O → CO2 + H2 ΔH = -41.1kJ/mol
A high ratio of steam and CO favors CO conversions. However, a high amount of energy
will be required for producing more steam. Therefore, trade-off exists between hydrogen
production and amount of used steam. Here, we considered this ration to be 4.4:1(Steam:
CO). High temperature catalyst (iron oxides) is readily available and thus can lower the
operating costs at iron making industry. 9.5t/h steam (produced via 10% heat recovery
from the exothermic carbonation reaction) can be fed to the water-gas shift reactor as a
complement to 248.26t/h steam.
After water-gas shift reaction, gases (N2, CO, CO2, H2 and O2 are 198.11t/h, 0.91t/h,
297.43t/h, 0.64t/h and 9.06t/h) are fed to a diaphragm, where H2 gas can be separated
out. 505.5t/h of the gaseous mixture should be compressed to 10 bars prior to injection
into the carbonation reactor.
Reaction 5.5.2: Fe3O4 +Fe +4CO2→ 4FeCO3 ΔH = -288.55 kJ/mol
A stoichiometric amount, Fe3O4 (391.28t/h) and Fe (94.37t/h), needs to be fed into the
carbonation reactor, which is assumed to be a fluidized bed reactor. After CO2
absorption, the exit gas contains N2 (198.11t/h), O2 (9.06t/h), CO (0.91t/h) and CO2
(166.56t/h). For complete CO2 absorption, about 890t/h Fe3O4 and 214.47t/h Fe is
required (as efficiency=0.44).
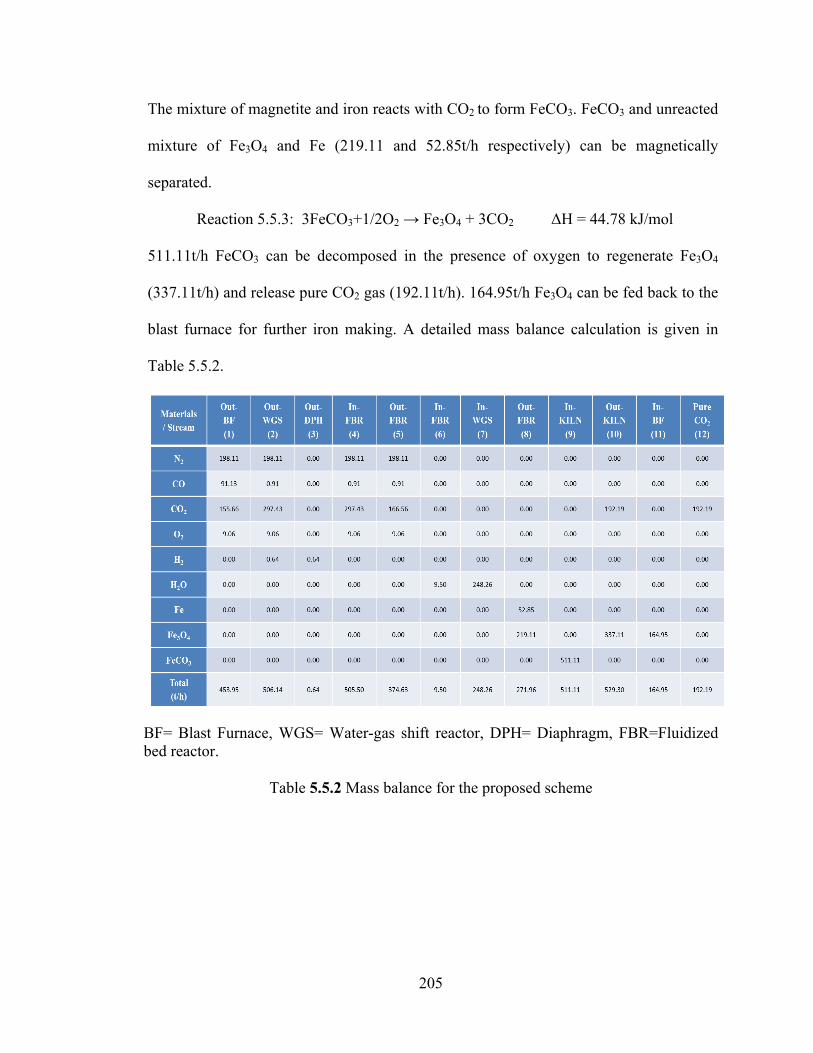
205
The mixture of magnetite and iron reacts with CO2 to form FeCO3. FeCO3 and unreacted
mixture of Fe3O4 and Fe (219.11 and 52.85t/h respectively) can be magnetically
separated.
Reaction 5.5.3: 3FeCO3+1/2O2 → Fe3O4 + 3CO2 ΔH = 44.78 kJ/mol
511.11t/h FeCO3 can be decomposed in the presence of oxygen to regenerate Fe3O4
(337.11t/h) and release pure CO2 gas (192.11t/h). 164.95t/h Fe3O4 can be fed back to the
blast furnace for further iron making. A detailed mass balance calculation is given in
Table 5.5.2.
BF= Blast Furnace, WGS= Water-gas shift reactor, DPH= Diaphragm, FBR=Fluidized bed reactor.
Table 5.5.2 Mass balance for the proposed scheme

206
5.5.3 ENERGY BALANCE CALCULATION
Table 5.5.3 illustrates the energy consumed and released at different stages of the
proposed CO2 capture scheme. The energy values are given against the materials flow
rate. Since the gases coming out of the fluidized bed reactor is compressed and hot, it is
proposed that a combined gas and vapor power cycle can be used. Natural gas can be
used as a feed input for the combined power cycle. For the water-gas shift reaction and
carbonation reaction, 30 % and 10% heat recovery is assumed respectively. If combined
gas and vapor power cycle is not employed, the whole process turns out to be an energy
intensive process. It can be observed that a large amount of energy is required to
generate steam for water-gas shift reaction (ΔHvap. =40.65kJ/mol). However, a part of
steam (9.50t/h) is planned to be generated using the heat from exothermic carbonation
reaction. Moreover, regeneration of iron from magnetite in the blast furnace is also taken
into consideration for energy estimation.
Reaction 5.5.4: Fe3O4+3C →3 Fe + 2 CO+ CO2 ΔH = 52.82 kJ/mol
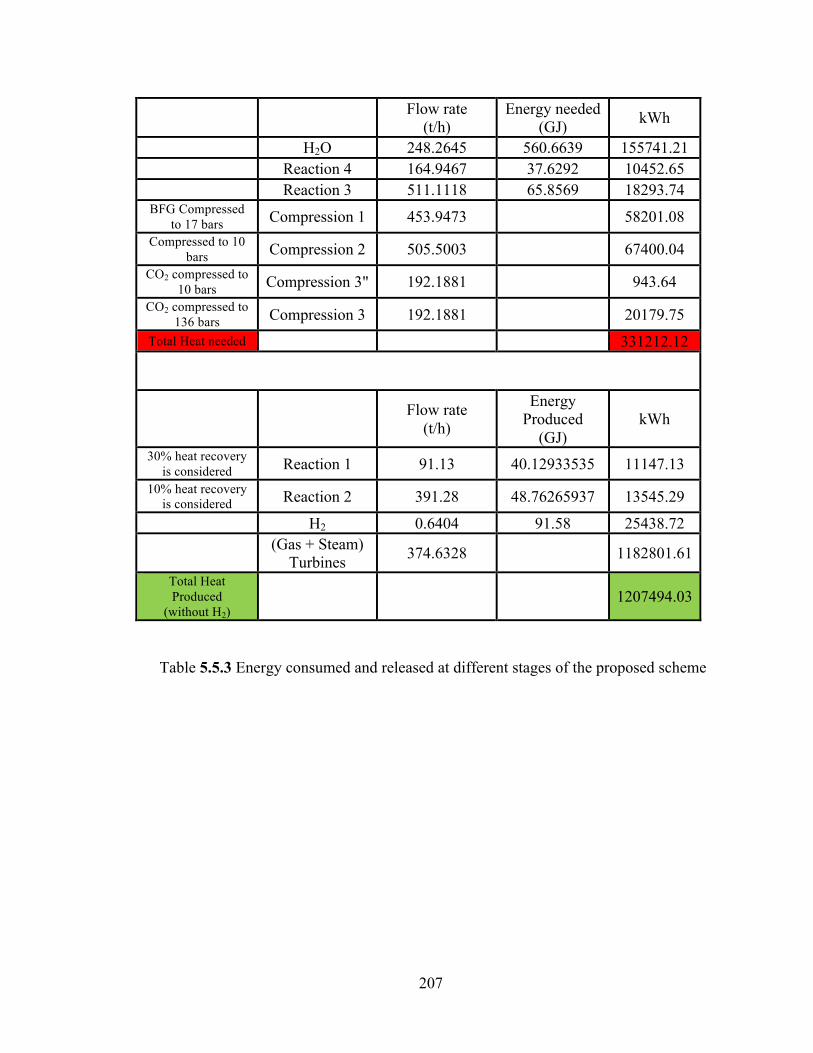
207
Table 5.5.3 Energy consumed and released at different stages of the proposed scheme
Flow rate
(t/h) Energy needed
(GJ) kWh
H2O 248.2645 560.6639 155741.21
Reaction 4 164.9467 37.6292 10452.65
Reaction 3 511.1118 65.8569 18293.74 BFG Compressed
to 17 bars Compression 1 453.9473 58201.08 Compressed to 10
bars Compression 2 505.5003 67400.04 CO2 compressed to
10 bars Compression 3" 192.1881 943.64 CO2 compressed to
136 bars Compression 3 192.1881 20179.75 Total Heat needed 331212.12
Flow rate
(t/h)
Energy Produced
(GJ) kWh
30% heat recovery is considered Reaction 1 91.13 40.12933535 11147.13
10% heat recovery is considered Reaction 2 391.28 48.76265937 13545.29
H2 0.6404 91.58 25438.72
(Gas + Steam)
Turbines 374.6328 1182801.61
Total Heat Produced
(without H2) 1207494.03
208
5.5.4 ADVANTAGES OF THE PROPOSED SCHEME
The use of the proposed scheme for CO2 capture at any iron making industry can have
one or more of the following advantageous features:
(1) Raw materials
The raw materials needed to capture CO2 gas are magnetite and iron. These materials are
readily accessible at a blast furnace site. They generally do not have harmful effects
unlike MEA solvents and can be easily handled. These raw materials too can be used for
a large number of cycles to absorb CO2 gas. Once the materials adsorption capacity
degrades, it can be converted back into iron. The raw materials can have a high
adsorption capacity, for example, of about 0.7624(tonCO2/tonFe3O4) compared to
0.4(tonCO2/ton MEA).
(2) Hydrogen gas production
Since blast furnace has almost equal proportion of CO and CO2 gas, it is desirable to have
a water gas shift reactor. Water gas shift reaction is a known process to produce pure
hydrogen gas. Moreover, the raw material, such as magnetite, can also work as a catalyst
for the water gas shift reaction. Pure hydrogen gas can be sold for $1600-1800/ton.
(3) Combined gas and vapor power cycle
The gases coming out of the carbonation reactor will be mainly heated and pressurized
gases. These gases can be fed in a combined gas and vapor power cycle. Thus, electricity
can be produced at the same site. The design also permits to route the produced hydrogen
gas into the combined gas and vapor power cycle and thus can lead to an enhanced
efficiency for the turbines.

209
(4) Exothermic carbonation reaction
The carbonation reaction is exothermic in nature. The produced heat can be utilized to
generate steam in various embodiments. The generated steam can be passed into the
water gas shift reactor to make hydrogen gas. This will partly supply the amount of steam
needed to run the water gas shift reaction. Thus, it can save energy.
(5) Less Transportation cost
Since raw materials for this proposed scheme are readily accessible at a blast furnace site,
it is possible to eliminate the need for extra transportation to deliver raw materials, which
can ultimately reduce prices. Conventional technologies need raw materials to be
transported at the site, which not only increase the cost but also emit significant amount
of CO2 gas during the transportation process.
(6) No external energy supply needed
The decomposition reaction requires energy. The energy requirement can be fulfilled by
either using non-fossil energy sources (nuclear, hydro, solar or wind) or electricity
produced by using combined gas and vapor power cycles. Thus, unlike other
conventional technologies, the methods of the disclosure can reduce or even eliminate the
need to purchase any electricity or source of electricity.
(7) No chemical pretreatment steps or no chemical waste
The proposed reaction uses solids (magnetite and iron) as an adsorbent for CO2 gas. They
do not require any chemical pretreatment process (unlike MEA) and can be used as
mined. After, several cycles of carbonation and calcination process, the raw materials can
be again fed back in the blast furnace to get fresh iron. Thus, the method can reduce or

210
eliminate the loss of raw materials. Moreover, unlike other chemical scrubbing
technologies, the proposed method will not produce any chemical wastes.

211
5.6 THE EFFECT OF ELEVATED PRESSURE, TEMPERATURE AND
PARTICLES MORPHOLOGY ON THE CARBON DIOXIDE CAPTURE USING
ZINC OXIDE
5.6.1 INTRODUCTION
Several oxides have been extensively studied such as calcium oxide (CaO) or magnesium
oxide (MgO) [1-6], lithium metal oxides (Li2ZrO3, Li4SO4) [7-9], hydrotalcites [10-17].
However, other oxides may also prove to be a good alternative such as, zinc oxide (ZnO)
that requires low regeneration energy and can have competitive CO2 capture capacity
[18,19]. Nevertheless, ZnO as a material to capture CO2 has been sparsely studied
probably due to its rare occurrence in nature.
5.6.1.1 Industrial production methods of ZnO
Due to the porous structured networks and high internal surface area, porous ZnO
nano/microstructures, have shown promising properties viable for potential applications
in gas sensing, lithium-ion battery, selective adsorption, photoluminescence,
photovoltaic, and photocatalytic properties [20]. This can be evidenced by a considerable
increase in the number of scientific publications and patents addressing significant and
interesting role of this material. At present, annual production of ZnO is about one and a
half million tons [21] and mainly produced using pyrometallurgical methods (the indirect
process [22], the direct process [23, 24], or spray pyrolysis [25, 26]) or by
hydrometallurgical methods [27]. Even though, it may be possible that the same amount
of ZnO can be repeatedly used for several times as CO2 sorbent, the annual production of
ZnO is not sufficient enough to capture global CO2 emission. However, it is expected that

212
production of ZnO may increase in coming years. Thus, it is worth to investigate the role
of ZnO as a CO2 capture material.
5.6.1.2 ZnO-CO2 reaction
Few researcher groups studied the heterogeneous reaction between ZnO and CO2 in the
presence or absence of H2O under mild conditions. Previous experiments were performed
under mild conditions, mainly room temperature and PCO2 varied from 0.01 atmospheres
to 1 atmosphere (atm) [28-30]. Basic zinc carbonate, with chemical formula Zn3CO3
(OH)4·2H2O was reported as a predominant phase at these conditions. However, a strong
evidence to support ZnO as an alternate CO2 capture material is inhibited by the lack of
experimental data in the range of elevated temperature (T≥25ºC) and pressure(> 1 bar).
Moreover, the correlation between ZnO particle size and CO2 capture capacity is still
unexplored.
Thus, here, several issues are investigated related to the carbonation process of ZnO
powders. The carbonation reaction is examined at different set of pressure, temperature
and time. The particle size of oxides plays a significant role for CO2 capture capacity [31-
34]. Thus, the effect of particle size, surface area and pore volume on CO2 capture
capacity of ZnO is also examined.
5.6.2 EXPERIMENTAL PROCEDURE
5.6.2.1 Reaction Study
Both the formation and decomposition reaction of carbonate was studied experimentally.
The carbonation reactions were performed in a closed system while the decomposition of
carbonates was evaluated using Thermo gravimetric analysis (TGA).

213
About 0.5 g of ZnO (delivered by Fluka) was put inside a sealed cylindrical vessel with
0.10 mL water sprinkled on the wall of vessel to create a slight humid environment for
the reaction. Chemically pure carbon dioxide gas (delivered by Airgas) was passed into
the system. Before experiments, CO2 gas was flushed three times to ensure a pure CO2
atmosphere inside the reactor. The reaction was performed for several minutes at a
desired temperature and pressure condition. Once the reaction completed, the system was
air-cooled. After that, the product was weighed. The gain in weight of carbonated
samples indicates about the reaction of CO2 with ZnO.
TGA 2950 Thermo gravimetric analyzer (delivered by TA instruments) was primarily
used to identify the decomposition temperature of the product. The sample was heated
under an inert atmosphere (argon flow rate =100 ml/min.), at a heating rate of 15ºC/ min
to a final temperature of 700ºC. The TGA provides continuous measurements of the
sample weight as a function of time and temperature. The regeneration temperature of
ZnCO3 was analyzed by heating the product sample to 700ºC in an argon atmosphere.
5.6.2.2 Mechanical milling
The effect of ZnO particle sizes on reaction yield has been studied. A planetary Retsch
PM100 ball milling machine was used to produce different particle sizes of ZnO. The
cylindrical ball milling container has an internal diameter and length of 1.6” each. The
powder to ball weight ratio was 2/27. ZnO powder particles were milled at a revolution
speed of 300 rpm for 1 and 2 h.
214
5.6.2.3 Particles characterization
X-ray powder diffraction method was used to characterize the product. Bruker
GADDS/D8 is equipped with Apex Smart CCD Detector and direct-drive rotating anode.
The MacSci rotating anode (Molybdenum) operates with a 50 kV generator and 20 mA
current. X-ray beam size can vary from 50 to 300 µm. The usual collection time is 1200
s.
The FTIR analyses were performed on powder sample using the IR spectrophotometer
(Perkin Elmer SpectrumTM 100). Samples were measured using attenuated total reflection
(ATR) on a single bounce diamond/ZnSe ATR crystal. The spectra were collected in the
mid-IR range of 4000-600 cm-1 (2.5-25µm).
An isothermal gas adsorption was used to quantify internal surface areas of the powder
particles. Micromeritics Tristar II 3020 (surface area and porosimetry analyzer
instrument) was used with N2 as adsorptive gas at 77 K (liquid nitrogen bath). The
samples were first degassed under 200ºC with a N2 gas flow for 2h in order to remove the
moisture and other adsorbed gases before analysis. The internal surface area was
calculated using the Brunauer- Emmett-Teller (BET) method. The pore volume was also
calculated from the adsorbed nitrogen after complete pore condensation (P/P0 = 0.9925)
using the ratio of the densities of liquid and gaseous nitrogen. The pore size was
calculated by using the Barrett–Joyner–Halenda (BJH) method.
Scanning electron microscope (SEM, JEOL JSM-6330F) was used to study the
morphology of powder particles. Energy Dispersive Spectrometer (EDS) was also
employed to provide chemical analysis of the powder particle.

215
5.6.3 Thermodynamics and Structural Properties
5.6.3.1 Thermodynamics of ZnO-CO2
The calculation of thermodynamic equilibrium temperature for ZnO carbonation process
at different PCO2 is performed using the software FACTSAGE and the databases therein.
Figure 4.6.1 illustrates the equilibrium temperature for ZnO-CO2 reaction at different
PCO2 (0.1-100 bars) in both the presence and absence of water. ZnCO3 decomposes back
to ZnO above these equilibrium temperatures. It can be observed that the stability of
ZnCO3 increases with PCO2. However, in the presence of water vapor, ZnCO3
decomposes back to ZnO at a relatively low temperature.
Figure 5.6.1 Equilibrium temperature for ZnO+CO2→ ZnCO3 reaction at different PCO2
(0.1-100 bars) in the presence and absence of water
0 20 40 60 80 100
40
80
120
160
200
240
Teq
b(0C)
Z n-‐C -‐O -‐H Z n-‐C -‐O
P C O2 (bar)
Teq
b(0C)
40
80
120
160
200
240

216
The main components of post-combustion flue gas stream are CO2, O2, H2O and N2 and
the partial pressure of CO2 is around 0.1–0.2 bar, while the temperature varies from 27-
77ºC. In Figure 5.6.1, at PCO2 = 0.1 bar, ZnCO3 becomes unstable and regenerates ZnO at
80 and 40ºC in the absence and presence of water respectively. Hence, a hot flue gas
stream (~40ºC) may decompose ZnCO3 at PCO2 = 0.1 bar and can regenerate ZnO. Thus, it
can be easily deduced that cooling down the post-combustion gases prior to the
carbonation process will be essential for high carbonation yield and thus may make ZnO
unfit for post-combustion capture [35].
5.6.3.2 Morphology and structural analysis
Figure 5.6.2(i-iii) illustrates the SEM images of variously ball milled ZnO particles.
Commercial ZnO particles are in tubular form and sizes are evenly distributed. The
mechanical milling of ZnO changes the particle morphology from tubular to cubical.
Interestingly, Figure 5.6.2(iv) shows the morphology of product after reaction at 75ºC and
10 bars and the product looks similar to elongated leaf platelets. The dimension of these
leaf platelets-like structures is about 0.074 micron wide and 0.35 micron long. The EDS
analysis suggests that the leaf platelet is composed of C, O and Zn. Mechanical milling
also changes the color of ZnO particles from white to deep yellow and it may be
attributed to the thermochromic property of ZnO [36].

217
Figure 5.6.2 SEM image of (i) as received ZnO (ii) 1h ball milled (iii) 2 h ball milled and
(iv) AR (after reaction) ZnO at a magnification of x20, 000 each
(i)As received ZnO (ii) 1 h ball milled ZnO
(iii) 2 h ball milled ZnO (iv) AR ZnO

218
CO2-uptake capacity of a metal oxide is primarily dominated by the factors, such as
surface area, pore volume, pore functionality and pore size [37]. The morphology
properties of milled and unmilled ZnO particles are given in Table 5.6.1. The N2
adsorption- desorption isotherm curves for variously milled ZnO obey Type IV isotherms
(as per IUPAC classification); typical for mesoporous substances. Also, the hysteresis
pattern is H3 (following IUPAC classification) indicating the presence of slit-like pores
[38].
Table 5.6.1 Effect of ball milling on sorbent (ZnO) properties
Mesoporous materials are defined to have pores with diameter between 2-50 nm and
generally have high surface area. Here, pore size of commercially available ZnO
resembles to that of mesoporous materials but has significantly low surface area (5.56 ±
0.06m2/g). Such a low surface area of mesoporous ZnO can be attributed to the high
density of ZnO powders and also suggests that the material has no significant open
porosity. However, mechanical milling slightly increased the surface area of ZnO
particles.
The surface area of 1h ball-milled ZnO particles is greater than that of 2h milled sample
followed by the as received ZnO particles [Table 5.6.1]. Here, the cubical ZnO particles
ZnO Surface area (m2/g)
Avg. Pore width (Å)
Pore volume (cm3/g)
Particle Size (µm)
As received 5.56 ± 0.06 114.4 0.016 0.42 ± 0.21 1 h ball milled 7.50 ± 0.04 137.6 0.029 0.34 ± 0.15 2 h ball milled 7.23 ± 0.04 133.8 0.027 0.40 ± 0.28

219
obtained after 1h of milling tend to agglomerate when further milled for 2h. All other
structural properties such as average pore width, pore volume and average particle size of
ZnO follow the same order (As received < 2h ball milled ZnO < 1h ball milled ZnO). 1 h
being the smallest and therefore has the highest surface area (7.50 ± 0.04 m2/g).
However, fine particles of 2h ball milled ZnO tend to agglomerate and, as a result,
surface area reduces to (7.23 ± 0.04) m2/g. Thus, it may be concluded that the fracture
process dominates the initial ball-milling time (1h) and later, cold welding process taking
place [39, 40].
Figure 5.6.3 Particle size distribution plots for variously milled ZnO
Fig.5.6.3 illustrates the particle size distribution of variously milled ZnO particles. Image
J software was used to determine the average particle sizes of variously ball milled ZnO
particles. A total of nearly 50 ZnO particles were selected from 3 different SEM images
to ensure a correct estimation of the average particle sizes. Commercially available ZnO
0.0 0.4 0.8 1.2 1.6 2.00
10
20
30
40
50
60
0.34µµm
0.40µµm
0.42µµm
P artic le S ize (µµm)
As rec eived Z nO 1 h milled Z nO 2 h milled Z nO
% of ZnO P
articles
220
has a broad particle size distribution whereas the particles of ZnO ball-milled for 1h and
2h have a narrow size distribution and most of the particles of the latter two lie in the
vicinity of 0.40 µm.
5.6.4 Reaction Results
5.6.4.1 Carbonation yield
The kinetic study of the ZnO carbonation process is a crucial factor in the evaluation of
the material for potential applications in CO2 capture. As mentioned earlier, the
carbonation yield of ZnO is examined here at different set of temperature, pressure and
time. First series of the experiments examined the effect of pressure (PCO2=10 bars) and
temperature (100ºC) over commercially available ZnO at different times (0.5-3h).
Further, the effect of the particle size was explored for variously milled ZnO at 100ºC
and PCO2=10 bars. All the CO2 uptake capacity results at different conditions are plotted
in Figure 6 and discussed in the following sections.
5.6.4.2 X-ray Diffraction and FT-IR analysis
Fig. 5.6.4(i) shows the formation of zinc carbonate hydroxide hydrate
(Zn4(CO3)(OH)6·H2O) as indicated by the X-ray powder diffraction data. The product
was identified conventionally by their corresponding Joint Committee Powder
Diffraction Standard (JCPDS) file (#11-0287). CO2 combines with ZnO in the presence
of water as basic zinc carbonate over a wide range of temperature and pressure. The
powder obtained after thermal analysis was examined using X-ray diffraction technique
and the study revealed that the regeneration of ZnO (JCPDS# 89-1397) [Figure 5.6.4 (ii)]
occurred. The regeneration of ZnO supports the possibility of using sorbent for a large
number of capture cycles.

221
Figure 5.6.4 X-ray Diffraction patterns confirm the (i) product formation (JCPDS # 11-
0287) (ii) regeneration of ZnO (JCPDS #89-1397) (iii) FTIR –spectra of the product in
the mid IR range (4000-400 cm-1)
The Fourier Transformed-Infrared (FT-IR) spectrum of the reaction product for
experiment performed at 100ºC, 10 bars CO2 pressure and 3h time is shown in Figure
5.6.4 (iii). The peaks near 707cm-1 is due to the in-plane bending mode (ν4) and is doubly
degenerate for undistorted CO32- groups. The out-of-plane bending mode (ν2) is observed
(i) (ii)
(iii)
4000 3500 3000 2500 2000 1500 1000 50086
88
90
92
94
96
98
100
832 cm-‐1
1385 cm -‐1
1505 cm-‐1
% T
c m -‐1
3359 cm -‐1
707 cm -‐1
5 10 15 20 25 30 350
200
400
600
800
1000
2ΘΘ (deg rees )
Intensity
Z nO #89-‐1397Z n
4(C O
3)(OH)
6.H
2O #11-‐0287
10 15 20 25 30 350
200
400
600
800
1000
ZnO #89-‐1397
2ΘΘ (deg rees )
Intensity

222
around 882cm-1 [41, 42].The bicarbonate species were assigned at 1384 cm-1(ν3, O-C-O)
and the stretching mode for bidentate carbonate species was found at 1606 cm-1(ν3, O-C-
O)[43]. The peaks at 3380-3600 cm-1 indicate the presence of hydroxyl group and basic
form of zinc carbonate [44].
5.6.4.3 Thermal analysis
Figure 5.6.5 TG-DTG plot of thermal decomposition reaction of product; sample mass 10.0mg, heating rate 10ºC /min, and argon atmosphere
The thermodynamic calculation shows a low regeneration temperature for ZnO. A low
regeneration temperature causes low carbon emission or less energy penalty at any coal-
fired power plants. Here, the regeneration temperature of ZnO is experimentally
determined using the thermogravimetry analysis method.TG-DTG plot for experiment
performed at 10 bars CO2 pressure, 0.5h and 75ºC is shown in Fig. 5.6.5. Only one peak
100 200 300 400 500 60080
90
100
dm/dT
% W
eight
T emperature(0C )
~2520C
-‐0.4
-‐0.3
-‐0.2
-‐0.1
0.0
0.1
0.2
~14.72%

223
is recorded at ~250ºC for the combined evolution of water vapor and CO2. A weight loss
of 14.72% is registered that translates to 0.068g CO2 capture using one gram of as
received ZnO.
5.6.5 Discussion
5.6.5.1 Regeneration temperature
Jianxun et al. synthesized the same compound, zinc carbonate hydroxide hydrate (JCPDS
#11-0287), using chemical precipitation method [41]. They too observed only one
endothermic peak for zinc carbonate hydroxide hydrate and suggested that the evolution
of both water vapor and CO2 occurs simultaneously. It was reported that heating rate of
the sample does have an effect on the decomposition temperature [41]. The
decomposition temperature was observed in the range of 197-257ºC for various heating
rate(5-20ºC/min). In the same line, a decomposition temperature of ~250ºC was found
when we heated our product sample at a rate of 15ºC/min under argon flow of
100mL/min.
Zn4(CO3)(OH)6·H2O (s) → 4ZnO (s) + CO2 (g) ↑ + 4H2O (g) ↑ (5.6.1)
Recent work of Chen et al. reports the decomposition kinetics of precipitated Zn4CO3
(OH) 6·H2O [45]. Based on the DTA results under different heating rates (4–20°C/min),
they too suggested a single-step decomposition process with an activation energy of
113 kJ/mol. Kanari et al. carried out experiments to study the thermal decomposition of
Zn4(CO3)(OH)6·H2O up to 400ºC. They observed simultaneous de-hydroxylation and de-
carboxylation of Zn4(CO3)(OH)6·H2O [46]. Thus, the present study is in well-agreement
with previous reports which suggests a single-step decomposition of Zn4(CO3)(OH)6·H2O
to ZnO.

224
5.6.5.2 Effect of Pressure
Figure 5.6.6 (i) Plot for capture capacity of ZnO at various pressure and time keeping
constant temperature of 75ºC
It can be observed that the capture capacity increases with increase in pressure. As
expected, faster sorption kinetics was observed for a high pressure condition. The noticed
CO2 capture capacity for 25 bars pressure, 100ºC and 3h is 0.1334 g CO2/g ZnO.
However, when the pressure is decreased to 5 bars, CO2 capture capacity is reduced to
0.086 g CO2/g ZnO.
A porous solid has interconnected pathways where gas molecules may collide with each
other or with the pore walls. When the gas pressure is high, intermolecular collisions of
CO2 dominate and hence CO2 molecules intrude through each available pores of ZnO.
However, at low pressure, collisions between the CO2 molecule and pore walls are
dominant and the free path is restricted with the geometry of void space [37]. Thus, it is
apparent that at low pressure, there is relatively less binding of CO2 over ZnO particles.
0 20 40 60 80 100 120 140 160 180 2000.00
0.02
0.04
0.06
0.08
0.10
0.12
0.14
T ime (min)
C
O2 ca
ptu
re c
apac
ity
(g
CO
2/g ZnO)
5 bars 10 bars 25 barsTemperature = 750C

225
5.6.5.3 Effect of Temperature
Figure 5.6.6 (ii) CO2 capture capacity variation with temperature at pressure of 10 bars
The CO2 uptake increases with temperature and attain a maximum at 75ºC for PCO2=
10bars. The exothermic sorption of CO2 over ZnO is highly controlled by the kinetic
diffusion rather than the thermodynamic factor. At high temperature, more CO2 diffuses
to the pores and the present large active sites hold these CO2 molecules. Hence, these
trapped CO2 molecules further react with ZnO particles to form ZnCO3. As evidenced by
the experimental results, increase in temperature favors CO2 capture capacity of ZnO.
However, a decrease in conversion of ZnO to carbonates at 100ºC reflects the increasing
dominance of reverse reaction at a pressure of 10 bars. Thus, the experimental results
validate the thermodynamic calculation using FACTSAGE software.
0 20 40 60 80 100 120 140 160 180 2000.00
0.02
0.04
0.06
0.08
0.10
0.12
0.14
0.16
0.18CO
2 ca
ptu
re cap
acity
(g C
O2/g ZnO)
P res s ure = 10 bars
250C 350C 500C 750C 1000C
T ime (min)

226
5.6.5.4 Effect of particle size
Figure 5.6.6 (iii) Effect of particle size on capture capacity of ZnO
The effect of particle size was studied at experimental condition of 75ºC and 10 bars CO2
pressure. The smallest average particle size for 1h ball milled ZnO (0.34µm)
demonstrates the highest CO2 capture capacity. However, prolonged milling time (2h)
has increased average particle size due to the agglomerated particles and as a result,
capture capacity of ZnO was also decreased. 1h ball milled ZnO exhibits highest capture
capacity of 0.198 CO2/g ZnO for 3h time. It is attributed to the relatively high surface
area or pore volume compared to that of as received and 2h ball milled ZnO. During
mechanical milling, intensive deformations of particle may occur which lead to various
crystal defects such as lattice strains, vacancies, dislocations and morphological changes
[47-50]. All these structural modifications expose more active sites of ZnO for CO2.
Hence, the absorption capacity of CO2 over ZnO correlates with the surface area or pore
volume of ZnO.
0 20 40 60 80 100 120 140 160 180 2000.00
0.02
0.04
0.06
0.08
0.10
0.12
0.14
0.16
0.18
0.20
0.22
T ime(min)
C
O2 c
aptu
re c
apac
ity
(g
CO
2/g ZnO
)
As rec eived 1h BM 2h BM
227
5.6.5.5 Effect of moisture
Moisture is present in the flue gas streams. The presence of moisture plays a vital role
because a slight humid environment plays a promoting effect on the sorption of CO2 and
thus affects the materials reactivity and capacity. Several reports evidence the significant
role of steam in increasing BET surface area and porosity of the sorbent [51-55]. It should
be noted that no formation of basic zinc carbonate was observed in the absence of
moisture due to kinetic limitations. However, it is observed that moisture have an effect
on the stability of ZnCO3 and thus control the uptake of CO2 by ZnO. This is also
because H2O tends to compete for the reaction sites with CO2 and thus causing decrease
in sorption capacity.
The key variables to understand the performance of ZnO as a CO2 absorber such as
surface area, particle size and pore volume were examined, as influenced by broad
temperature and pressure range. According to the aforementioned results, zinc carbonate
hydroxyl hydrate formed as a ZnO carbonation process product. The decomposition of
carbonation product to ZnO occurs in a single-step with simultaneous de-hydroxylation
and de-carboxylation at ~250ºC. Experiments have demonstrated that ZnO carbonation
can be effective at temperatures around 75ºC. Although ZnO has favorable
thermodynamics, the commercial use of ZnO as a CO2 absorber have severe limitations
such as high ZnO cost and slow carbonation kinetics.
228
5.6.6 REFERENCES:
1. M.K. Aroua, W.M.A.W. Daud, C.Y. Yin, D. Adinata, Separation and Purification Technology, 2008, 62, 609-614.
2. H. Gupta, L.S. Fan, Industrial & Engineering Chemistry Research, 2002, 41, 4035-4042.
3. M.B. Jensen, L.G.M. Petterson, O. Swang, U. Olsbye, The Journal of Physical Chemistry B, 2005, 109, 16774-16781.
4. F. Teng, W. Qu, G. Wen, Z. Wang, Z. Tian, X. Yang, P. Xu, Y. Zhu, G. Xiong, Microporous Mesoporous Materials , 2008, 111, 620-626.
5. S. Teir, R. Kuusik, C.J. Fogelholm, R. Zevenhoven, International Journal of Mineral Processing, 2007, 85, 1-15.
6. T. Kojima, A. Nagamine, N. Ueno, S. Uemiya, Energy and Conservation Management , 1997, 38 Suppl., S461-S466.
7. W. D. Gunter, E. H. Perkins, T. J. McCann, Energy Conversion and Management, 1993, 34, 941-948.
8. M. Kato, K. Nakagawa, K. Essaki, Y. Maezawa, S. Takeda, R. Kogo, Y. Hagiwara, International Journal of Applied Ceramic Technology, 2005, 2, 467-475.
9. E.O. Fernández, H.K. Rusten, H.A. Jakobsen, M. Rønning, A. Holmen, D. Chen, Catalysis Today, 2005, 106, 41-46.
10. M.J. Venegas, E.F. Israel, R. Escamilla, H. Pfeiffer, Industrial & Engineering Chemistry Research, 2007, 46, 2407-2412.
11. Y. Ding, E. Alpay, Transactions of Institute of Chemical Engineers, 2001, 79(B), 45-51.
12. Y. Ding, E. Alpay, Chemical Engineering Science, 2000, 55, 3461-3474.
13. X.P. Wang, J.J. Yu, J. Cheng, Z.P. Hao, Environmental Science & Technology, 2008, 42, 614-618.
14. M.R. Othman, Z. Helwani, W.J.N. Martunus, Fernando, Applied Organometallic Chemistry, 2009, 23, 335-346.
15. N.D. Huston, B.C. Attwood, Adsorption, 2008, 14, 781-789.
16. K.B. Lee, A. Verdooren, H.S. Caram, S. Sircar, Journal of Colloid and Interface Science, 2007, 308, 30-39.

229
17. E.L.G. Oliviera, C.A. Grande, A.E. Rodrigues, Separation and Purification Technology, 2008, 62, 137-147.
18. H.T. Reijers, S.E.A.Valster-Schiermeir, P.D. Cobden, R.W. van den Brink, Industrial & Engineering Chemistry Research, 2006, 45, 2522-2530.
19. B. Feng, H. An, E. Tan, Energy & Fuels, 2007, 21, 426-434.
20. X. Wang, W. Liu, J. Liu, F. Wang, J. Kong, S. Qiu, C. He,L. Luan, Applied Materials & Interfaces, 2012, 4, 817-825.
21. International Zinc Association-Zinc Oxide Information Center, [cited5/08/2011], Available from: http://www.znoxide.org/index.html
22. S. Mahmud, M.J. Abdullah, G. Putrus, J. Chong, A.K. Mohamad, Synth. React. Inorganic and Metal-Organic Chemistry, 2006, 36, 155–159.
23. S. Wetherill, U.S. Patent 0013806, 1855
24. S. Wetherill, U.S. Patent 0012418, 1855
25. S. Turner, S. Tavernier, G. Huyberechts, E. Biermans, S. Bals, K. Batenburg, G. Van Tendeloo, Journal of Nanoparticle Research, 2009, 12, 615–622.
26. X. Zhao, B. Zheng, C. Li, H. Gu, Powder Technology, 1998, 100, 20–23.
27. F. Habashi, Canadian Institute of Mining Bulletin, 2001, 94, 71–76.
28. N. Ohkuma, Y. Funayama, H. Ito, N. Mizutani, M. Kato , Nihon kagaku kaishi, 1987, 802.
29. J. Galvez, R. Arana, University of Murcia Science, 1979, 38, 153
30. N. Ohkuma, Y. Funayama, H. Ito, N. Mizutani, M. Kato, Hyomen kagaku, 1988, 5, 452.
31. Y. Swada, M. Murakami, T. Nishide, Thermochimica Acta, 1996, 273, 95-102.
32. G. Qi, Y. Wang, L. Estevez, X. Duan, N. Anako, A.H.A. Park, W. Li, C.W. Jones, E.P. Giannelis, Energy & Environmental Science, 2011, 4, 444–452.
33. F. Fang, Z.S. Li, N.S. Cai, Korean Journal of Chemical Engineering, 2009, 26, 1414-1421.
34. B. Zhang, Y. Duan, K. Johnson, Journal of Chemical Physics, 2012, 136, 064516.
35. E. Wiberg, A. F. Holleman, Inorganic Chemistry 2001, Elsevier
230
36. W. Lu, D. Yuan, J. Sculley, D. Zhao, R. Krishna, H.C. Zhou, Journal of American Chemical Society, 2011, 133, 18126–18129.
37. J. B. Condon, Surface area and porosity determinations by physisorption: measurements and theory, 2006, Elsevier.
38. J.B. Zhou, K.P. Rao, Journal of Alloys and Compounds, 2004, 384, 125-130.
39. X. Zhao, Y. Ding, L. Ma, X. Shen, S. Xu, International Journal of Hydrogen Energy, 2008, 33, 6351-6356.
40. J. Chen, R. Zhao, H. Jiang, Transactions of Nonferrous Metals Society, 1988, 8, 149-153.
41. C. Suryanarayan, Progress in Materials Science, 2001, 46, 1-184.
42. Z. Xianxi, W. Xiaojuan, Z. Guanjie, J. Jianzhuang, Chinese Journal of Inorganic Chemistry, 2002, 18, 1038–1040.
43. H. Yongning, S. Xiaoliang, M. Lidun, Chinese Journal of Applied Chemistry, 1996, 13, 92–94.
44. M. Shamsipur, S.M. Pourmortazavi, S.S. Hajimirsadeghi, M.M. Zahedi, M. Rahimi-Nasrabadi, Ceramics International In press.
45. J. Chen, R. Zhao, H. Jiang, Y. Li, G. Bao, Transactions of Nonferrous Metals Society, 1998, 8, 149
46. N. Kanari, D. Mishra, I. Gaballah, B. Dupré, Thermochimica Acta, 2004, 410, 93-100
47. D. Stoilova, V. Koleva, V. Vassileva, Spectrochimica Acta Part A, 2002, 58, 2051-2059.
48. C.C. Koch, Nanostructured Materials, 1997, 9, 13-22.
49. L.Z. Zhou, J.T. Guo, T.D. Jiang, S.H. Wang, Journal of Materials Science Letters, 1998, 17,137-139.
50. G. Liang, J. Huot, R. Schulz, Journal of Alloys and Compounds, 2001, 320, 133-139.
51. S. Dobner, L. Sterns, R.A. Gralf, A.M. Squires, Industrial & Engineering Chemistry, 1977, 16, 479–486.
52. R.W. Hughes, D. Lu, E.J. Anthony,Y. Wu, Industrial & Engineering Chemistry Research, 2004, 43, 5529–5539.

231
53. K. Laursen, W. Duo, J.R. Grace, C.J. Lim, Industrial & Engineering Chemistry Research, 2004, 43, 5715–5520
54. A. Hassanzadeh, J. Abbasian, Fuel, 2010, 89, 1287–1297.
55. V. Manovic, E.J. Anthony, Industrial & Engineering Chemistry Research, 2010, 49, 9105–9110.

232
6.1 HIGH PRESSURE AND HIGH TEMPERATURE STUDY FOR THE MIXTURE OF MgH2 AND Si USING MULTI ANVIL PRESS
6.1.1 INTRODUCTION
Magnesium, a light metal, gained lot of attention owing to its large gravimetric density,
7.68 wt. %. Magnesium and its alloys are potential materials for hydrogen storage. The
MgH2 system is limited by poor thermodynamics (ΔH desorption= 74.06 kJ/mol, ΔS desorption
= 133.4 kJ/mol H2/K) [1]. The high decomposition temperature (>325°C), slow
dehydrogenation kinetics and low diffusion rate in MgH2 have prevented pure Mg from
being a viable storage material. Hence, it is desired to identify the best additive for
destabilizing MgH2. The literature suggests that the equilibrium pressure of MgH2 at
275°C is about 1 bar, and the equilibrium pressure for a mixture of MgH2 and Si is about
100 bar at 150°C [2, 3].
MgH2 + Si→Mg2Si (6.1)
Moreover, the thermodynamics of MgH2/Si system is more improved than the pure
MgH2, where thermodynamic predictions show ΔH= 36.8 kJ/mol H2 and ΔS = 128.1
kJ/mol H2/K at 25°C [4]. Thus, the findings show that the mixture of MgH2 and Si
(hydrogen capacity of 5 wt. %) could be applicable for hydrogen storage at low
temperatures. Consequently, MgH2/Si system has been investigated several times.
However, some contradictory results such as Guintel et al. (Mg2Si reaches a hydrogen
absorption capacity of 2wt % after 10h at 300°C) and Janot et al. (no significant
hydrogen absorption detected for Mg2Si phases under hydrogen pressures up to 100 bars
and 300°C) were reported in recent times [5, 6]. Overall, it is widely accepted that the

233
MgH2/Si system is not readily reversible and the hydrogenation of the Mg2Si appears to
be kinetically hindered.
System Reaction studied
T (°C)
P (bar)
Time (h)
Crystallite size (nm)
Remarks Ref
Mg2Si absorption 250-290
1750-1800 H2
48 11.9±0.1
(i) No H2 absorption (ii) slow kinetics for
H2 desorption (significant only at
250°C)
[7]
MgH2+ Si - 600 0.5,3.8
GPa - -
(i) at 0.5 Gpa, formation of Mg2Si
alloy (ii) at 3.8 Gpa, MgH2
dissociates to Mg and H2
[8]
MgH2+ Si
desorption 250-
300 - 3 <50
activation energy : milled (163kJ/mol)˂
unmilled (213kJ/mol)
[9]
Mg2Si absorption 300 95 - - No H2 absorption [10] Mg2Si absorption - 20 48 - MgH2 + Si formation [6]
Pd/Mg/Mg2Si absorption 240-
70 200 ~142 Several nm films
severe limitations of kinetics for
hydrogenation [11]
Table 6.1 Literature survey for (de-) hydrogenation of MgH2/Si System
Table 6.1 illustrates the experimental findings to date for MgH2/Si system. An interesting
set of experiments have been performed on Mg and Mg2Si thin films. The hydrogenation
was attempted in presence and absence of Pd catalysts under 200 bars H2 from 240°C to
70°C. Kelly et al. observed that hydrogen migrated through Mg2Si and pure Mg
embedded within the Mg2Si layer readily formed MgH2 even at 165°C (contrary to
thermodynamics) [11]. Thus, the result shows that the hydrogen absorption into Mg2Si is

234
limited by the mass transport rate of both Mg and Si. The conclusion was made that the
hydrogen absorption into Mg2Si system would need particles in the range of few nm sizes
to allow for an adequate phase migration rate.
Given the kinetic and diffusion limitations with the MgH2/ Si system, this work aims to
study the high pressure and high temperature of the system using multi anvil apparatus.
Moreover, MgH2/ Si system was also ball milled under hydrogen pressure.
6.1.2 EXPERIMENTAL SECTION
A 3:1 molar ratio of MgH2 and Si was used and sealed in a brass capsule. The brass
capsule was put as in 14/8 G2 assembly and compressed to the desired pressure using
Multi anvil press. Once the pressure was attained, temperature was increased and set for
specific duration. For the next experiment, a planetary Retsch PM 100 ball was employed
to ball mill the MgH2/ Si mixture under hydrogen pressure for several hours at 300 rpm.
6.1.3 RESULTS AND DISCUSSION
The molar mixture of MgH2 and Si (3:1) was compressed to 4GPa. At 4GPa, the
temperature was first maintained to 500°C for 2h and then the temperature was lowered
to 150°C and kept constant for 12h. At this condition, a structural phase transition of
MgH2 was observed. α- MgH2 transformed to γ-MgH2. These two phases coexist in this
temperature and pressure range [12]. X-ray diffraction pattern and Raman Spectroscopy
were used to confirm the product formation (Fig. 6.1).

235
Figure 6.1 (i) X-ray diffraction of the product after compression to 4GPa at 500°C for 2h
and 150°C for 12h (ii) X-ray diffraction of MgH2 used and product obtained after the
experiment and (iii) Raman Spectra of the product
Figure 6.1 (i) show the X-ray diffraction of the product. It can be observed that apart
from phase transformation of MgH2, a small amount of MgH2 seems to react with Si to
form Mg2Si. However, no distinctive peaks of Mg2Si were observed. Raman spectra of
the product show the peaks characteristic for both phases. The peaks at 310cm-1, 945cm-1
10 15 20 25 30 350
200
400
600
800
1000
1
32
22 25
5
5
4 4
3
4
3
3
2
2
2
2
1-‐ MgH2(35-‐1184)
2-‐ MgH2(74-‐0934)
3-‐ S i (89-‐2749)4-‐ MgO (89-‐4248)5-‐ Mg
2S i (75-‐0445)
1 11
1
1
1
1
11
1
1
1
Intensity (ar
b. U
nit)
2ΘΘ(ΜΜΟΟ κκαα)
MAP_500(2)_150(12)
Without H2 S ourc e, MgH
2:S i ::3:1
10 20 30
Intensity (ar
b. Unit)
2ΘΘ (deg rees )
MgH 2 Us ed
0 500 1000 1500 2000
B2g
Eg
2Ag
2B3g
B1g
αα S iαα
S i
γγ
γγ
γγαα
R aman S h ift (cm -‐1)
1Ag
(i) (ii)
(iii)

236
and 1270 cm-1 corresponds to α- MgH2 [13]. The intense narrow peak at 660 cm-1 and
weak peak at 313 cm-1 resembles to γ-MgH2 [12, 14].
The next experiment was performed at a higher temperature and same pressure (4GPa).
The assembly was at 900°C for 2h and then the system was quenched instantly. At this
experimental parameter, following reaction occurs:
MgH2 → Mg + H2 (6.2)
Fig. 6.2 confirms the product formation. Corresponding JCPDS number of each
compound is mentioned in the bracket. It can be observed that pure Mg was formed at
this condition. The experimental findings suggest (i) the complete dissociation of MgH2
(reaction (6.2)) and (ii) less or no interaction between MgH2 and Si as major peaks
correspond to silicon. A small amount of MgO was observed too. The presence of MgO
may be because of initial impurity or exposure of the sample to air or oxygen during
experiment.
Figure 6.2 X-ray diffraction of the product after compression to 4GPa at 900°C for 2h
and then quenched.
10 15 20 25 30 350
200
400
600
800
1000
61
3'
6
6 6 1
1-‐ Mg H2
(35-‐1184)
3'-‐ S i (40-‐0932)4-‐ Mg O (89-‐4248)6-‐ Mg (01-‐1141)
4
4
3'6
3'
3'
3'
3'1
1
1
1
MAP_900(2)_Quench_4G Pa
Without H2 S ourc e, Mg H
2:S i ::3:1
Inte
nsi
ty (
arb
. Un
it)
2ΘΘ(ΜΜΟΟ κκαα)
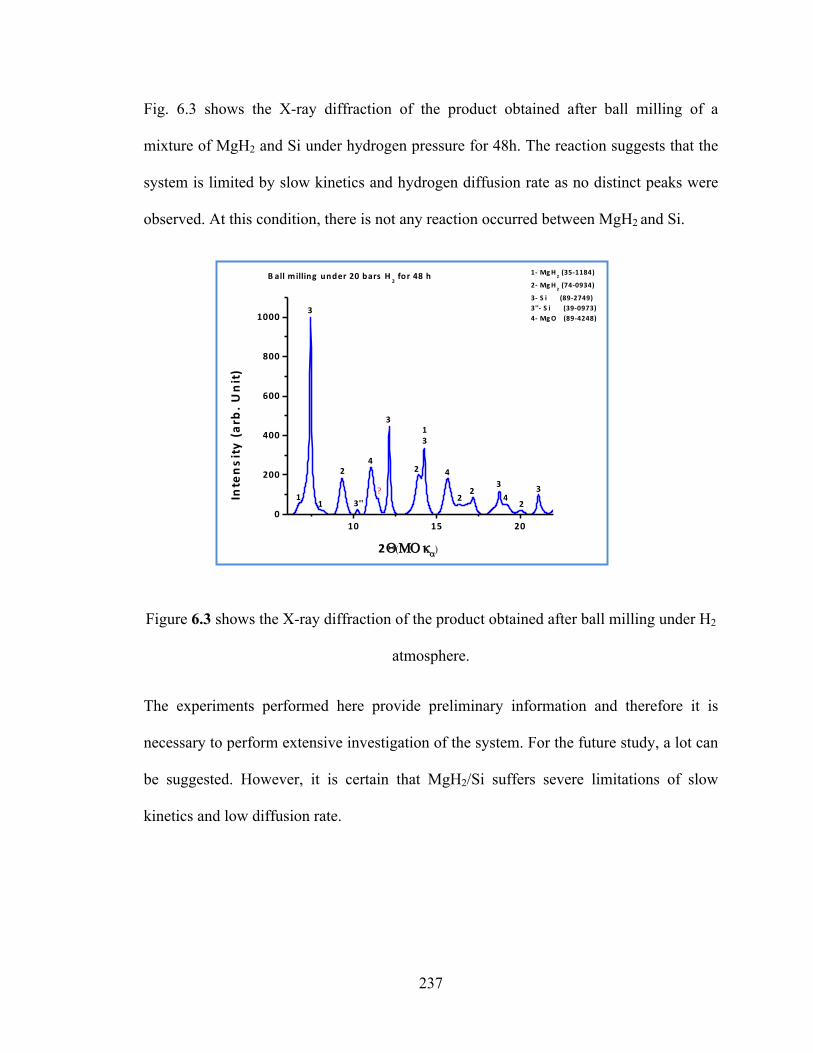
237
Fig. 6.3 shows the X-ray diffraction of the product obtained after ball milling of a
mixture of MgH2 and Si under hydrogen pressure for 48h. The reaction suggests that the
system is limited by slow kinetics and hydrogen diffusion rate as no distinct peaks were
observed. At this condition, there is not any reaction occurred between MgH2 and Si.
Figure 6.3 shows the X-ray diffraction of the product obtained after ball milling under H2
atmosphere.
The experiments performed here provide preliminary information and therefore it is
necessary to perform extensive investigation of the system. For the future study, a lot can
be suggested. However, it is certain that MgH2/Si suffers severe limitations of slow
kinetics and low diffusion rate.
10 15 200
200
400
600
800
1000
B all milling under 20 bars H2 for 48 h
21
3''1
1
33
3
3
4
4
4
3
22
2
1-‐ MgH2 (35-‐1184)
2-‐ MgH2 (74-‐0934)
3-‐ S i (89-‐2749)3''-‐ S i (39-‐0973)4-‐ MgO (89-‐4248)
2
2ΘΘ(ΜΜΟΟ κκαα)
Intensity (ar
b. U
nit)
?
238
6.1.4 REFERENCES
[1] M. Paskevicius, D.A. Sheppard, C.E. Buckley, Journal of the American Chemical Society, 2010,132, 5077-5083.
[2] J.J. Vajo, F. Mertens, C.C. Ahn, C. Robert, B. Fultz, The Journal of Physical
Chemistry B, 2004, 108, 13977
[3] T. Kelkar, S. Pal, D.G. Kanhere, Chemphyschem, 2008, 9, 928.
[4] Outukumpu, HSC Chemistry, Houston: Chemistry Software, 2006.
[5] P. Guinet, P. Perroud, J. Rebie`re, Hydrogen energy system, Veziroglu- Seifritz, 1978
[6] R. Janot, F. Cuevas, M. Latroche, A. Percheron-Guegan, Intermetallics, 2006, 14, 163-169.
[7] M. Paskevicius, D.A. Sheppard, A.L. Choudhary, C.J. Webb, E. MacA. Gray, H.Y. Tian, V.K.Peterson, C.E.Buckley, International Journal of hydrogen energy, 2011, 36, 10779-10786
[8] L. George, Structural Characterization of Metal Hydrides for Energy Applications, 2010, ProQuest ETD Collection for FIU. Paper AAI3431317.
[9] J. Bystrzycki, M. Polanski, T. Plocinski, Journal of Nanoscience and Nanotechnology, 2008, 8, 1–8.
[10] M. Polanski, J. Bystrzycki, International Journal of hydrogen energy, 2009, 34, 7692-7699
[11] S.T. Kelly, S.L.V. Atta, J.J. Vajo, G.L. Olson, B.M. Clemens, Nanotechnology, 2009, 20, 204017
[12] T. Moriwaki, Y. Akahama, H. Kawamura, S. Nakano, K. Takemura, Journal of the Physical Society of Japan, 2006, 75, 074603
[13] H.G. Schimmel, M.R. Johnson, G.J. Kearley, A.J. Ramirez-Cuesta, J. Huot, F.M. Mulder, Material Science Engineering B, 2004, 108, 38–41.
[14] M.A.Kuzovnikov, V.S.Efimchenko, E.V. Filatov, A.A. Maksimov, I.I. Tartakovskii, A.J. Ramirez-Cuesta, Solid State Communications, 2013, 154, 77-80.

239
7. SUMMARY
This dissertation presents a detailed study of various processes which could establish
hydrogen as an energy carrier and also control the increasing concentration of carbon
dioxide in the atmosphere due to the burning of fossil fuels. Investigations reveal
substantial improvement on the mitigation of carbon dioxide during hydrogen production
and carbon dioxide sorption at power and non-power sectors. Significant findings can be
derived from this dissertation and are presented below. The results are sectioned in three
different parts for better understanding.
7.1 Conclusions
(1) Clean hydrogen production methods
Sodium hydroxide serves the dual purpose of carbon capture and
hydrogen production for existing fossil-fuel based hydrogen producing
methods. The inclusion of sodium hydroxide also lowers the operating
temperature and thus decreases the energy penalty.
The catalytic activity of nickel based catalysts (such as nickel, Raney
nickel and alumina mixed nickel) increases with the ball milling time.
However, prolonged ball milling causes the particles to coalesce and grow
in size decreasing the catalytic activity. In other words, longer milling
causes a decatalyzation. Moreover, globular particles have better catalytic
effect than flaky disk shaped particles.
Mechanical milling is controlled by the two processes, cold welding and
fracture process. During milling, the time when fracture process
240
dominates, the catalytic activity of ductile materials (such as nickel) starts
decreasing. Moreover, amorphorization of the particles can also affect
their catalytic effect.
A nickel catalyzed modified steam-methane-reformation reaction takes
place at much lower temperatures (300-600°C) than the steam-methane-
reformation reaction (800-1200°C). Moreover, a Raney nickel assisted
modified coal-gasification reaction can lower the operating temperature
from 675°C to 500°C.
(2) Hydrogen Storage using multinary complex hydrides
A 1:1:1 molar mixture of LiAlH4, MgH2 and NaNH2 desorbs 5.23 wt. %
of hydrogen. While, 0.5h milled mixture of the ternary hydrides release
4.61 wt. %. The hydrogen desorption kinetics improves and dehydriding
temperature reduces for ball milled sample.
The apparent activation energy for the MgH2- related decomposition in the
LiAlH4-MgH2-NaNH2 is found to be (173.6 ± 6) kJ/mol. The activation
energy for the dehydrogenation was lowered by approximately 22kJ/mol
compared to the bulk material (Ea =195.3 ± 10 kJ/mol).
Hydrogen desorption starts at 50°C. Intermetallic compounds such as
Al2Mg, Al2Li3, Li3AlN2, AlN formed at higher temperature.
The three hydrides mutually destabilize and thus lowers the respective
hydrogen desorption temperature and improves the kinetics.

241
(3) Carbon dioxide capture using metal oxide
MgO can be used as a potential pre-combustion carbon dioxide sorbent for
a coal-fired power plant. The use of MgO can lead to a lesser energy
penalty.
The continuous removal of impervious layer (MgCO3) formed around the
periphery of MgO particles can allow higher carbon dioxide sorption.
Therefore, it is recommended to use an aggregative fluidized regime for
fluidized bed reactor while scaling up MgO- based carbonation reactor. A
lower partial pressure of water vapor can form high amount of
MgO.2MgCO3 that can cause a less direct conversion of MgO to MgCO3.
A mixture of magnetite and iron can drastically reduce the carbon capture
cost for any iron making industry. Moreover, the proposed scheme can
simultaneously generate electricity. The integration can eliminate the loss
of raw materials and avoid any chemical wastes for carbon capture
process.
Despite the fact that the thermodynamic favors ZnO as a carbon dioxide
sorbent, it suffers severe limitations such as high material cost and low
absorption carbon dioxide capacity.
The carbonation and decomposition temperature are given in parenthesis
for MgO (350°C, 550°C), ZnO (75°C, 250°C) and mixture of Fe3O4 /Fe
(200°C, 350°C).
Carbon dioxide uptake capacity of a metal oxide is primarily dominated
by the factors such as surface area, pore volume, pore functionality and

242
pore size. After carbon dioxide absorption, surface area and pore volume
decreases.
(4) Destabilization of MgH2 using Si as an additive
A structural phase transition of MgH2 (α→γ) occurs at 4GPa and
temperature of 500°C (for 2h) and then lowered to150°C (for 12h).
At 4GPa and 900°C (for 2h), MgH2 decomposes to Mg and H2.
Ball milling of 3:1 molar mixture of MgH2 and Si under H2 pressure for
48h showed no new phases.
The interaction of MgH2 and Si is kinetically hindered.
7.2 Recommendations for Future Research
§ Sodium hydroxide assisted hydrogen producing reactions need to be
scaled up in the near future. Moreover, the effect for different flow rate
of water vapor needs to be investigated for the modified steam-
methane-reformation reaction.
§ It will be of a great interest to invent or modify a method in which
sodium hydroxide can be produced using renewable resources such as
solar, water and wind.
§ Catalytic deactivation of nickel based catalysts at a higher ball milling
time needs to be completely prevented. Here, dispersant (alumina) is
successful in maintaining the catalytic activity but only to some extent.
243
§ The separation method of soda ash and sodium hydroxide that avoids
energy penalty, high costs and long operation time needs to be
investigated in the future.
§ Rehydrogenation of the ternary hydride mixture should be tested.
§ Moreover, catalysts can be explored to further improve the (de-
)hydrogenation of the ternary mixture.
§ Metal oxide based carbon dioxide capture methods need to be
performed for a larger volume of gas. The actual flue gas composition
should be taken while scaling up the reaction.
§ The reactions should be repeated for a large number of cycles, and also
the change in surface properties of sorbents should be investigated after
each cycle.
§ It is recommended to develop an efficient heat recovery system for
exothermic carbonation reaction.
§ The interaction of MgH2 and Si should be investigated in the presence
of hydrogen source (such as NaBH4 + Ca (OH) 2) at different set of
temperature and pressure conditions.
§ The reaction between MgH2 and Si particles in the nanometer range
could also be worth to examine.

244
VITA
SUSHANT KUMAR
EDUCATION
Aug. 2009- Dec. 2013 Doctor of Philosophy (Ph.D.) in Materials Engineering, Department of Mechanical and Materials Engineering, Florida International University, Miami, GPA 3.63/4.0
Aug. 2005-May 2009 Bachelor in Chemical Technology, Institute of Chemical Technology (erstwhile UDCT), Mumbai, India (First class)
PATENT
Sushant Kumar, Vadym Drozd, Andriy Durygin and Surendra K. Saxena, Method and System for Sequestering Carbon Dioxide and Producing Hydrogen Gas, U.S. Provisional Patent Application No. 61/733,297.
PUBLICATIONS
Surendra Saxena, Sushant Kumar and Vadym Drozd, “A Modified steam-methane-reformation reaction for hydrogen production”, Int J of Hydrogen energy, 36(2011) 4366-4369.
Sushant Kumar, Surendra K. Saxena and Vadym Drozd, “A modified method for production of hydrogen from methane”, Int. J. Energy Res. 36(2012) 1133–1138.
Sushant Kumar, Vadym Drozd and Surendra K. Saxena, “A catalytic study of the modified coal gasification process to produce clean hydrogen gas”, CheM, 1(2012), 20-26.
Sushant Kumar, Vadym Drozd and Surendra K. Saxena, “Catalytic studies of sodium hydroxide and carbon monoxide reaction”, Catalysts, 2(2012), 532-543.
Sushant Kumar, Surendra K. Saxena, Vadym Drozd and Andriy Durygin “An experimental investigation of mesoporous MgO as a potential pre-combustion CO2 sorbent”, Under Review
Sushant Kumar “The effect of elevated pressure, temperature and particles morphology on the carbon dioxide capture using zinc oxide”, Under Review.
Sushant Kumar, Vadym Drozd, Andriy Durygin and Surendra K. Saxena, “Mitigating CO2 emissions in the Iron Industry using mixture of magnetite and iron”, Under Review.
High pressure and temperature study on MgH2-Si system using Multi-anvil press technique, Under Preparation

245
Study of hydrogen absorption/desorption: kinetics and reversibility of multinary complex hydride system, Under Preparation
BOOK CHAPTER
Sushant Kumar, Suredra K. Saxena, Role of sodium hydroxide for hydrogen gas production and storage, In “Materials and processes for energy: communicating current research and technological developments” Ed. A. Mendez-Vilas, Formatex Research Center (Badajoz, Spain), ISBN: 9788493984373, Page no. 452-463.
CONFERENCE PAPER
Sushant Kumar, Integration of MgO Carbonation Process to Capture CO2 from a Coal-Fired Power Plant, in Materials Challenges in Alternative and Renewable Energy II: Ceramic Transactions (eds G. Wicks, J. Simon, R. Zidan, R. Brigmon, G. Fischman, S. Arepalli, A. Norris and M. McCluer), John Wiley & Sons, Inc., Hoboken, NJ, USA, 2012.