
CK 12 Algebra I Second Edition - Imus City Public Library
715
-
Upload
khangminh22 -
Category
Documents
-
view
0 -
download
0
Transcript of CK 12 Algebra I Second Edition - Imus City Public Library


CK-12 Algebra I - SecondEdition
Eve Rawley, (EveR)Anne Gloag, (AnneG)
Andrew Gloag, (AndrewG)
Say Thanks to the AuthorsClick http://www.ck12.org/saythanks
(No sign in required)

www.ck12.org
To access a customizable version of this book, as well as otherinteractive content, visit www.ck12.org
CK-12 Foundation is a non-profit organization with a mission toreduce the cost of textbook materials for the K-12 market bothin the U.S. and worldwide. Using an open-content, web-basedcollaborative model termed the FlexBook®, CK-12 intends topioneer the generation and distribution of high-quality educationalcontent that will serve both as core text as well as provide anadaptive environment for learning, powered through the FlexBookPlatform®.
Copyright © 2013 CK-12 Foundation, www.ck12.org
The names “CK-12” and “CK12” and associated logos and theterms “FlexBook®” and “FlexBook Platform®” (collectively“CK-12 Marks”) are trademarks and service marks of CK-12Foundation and are protected by federal, state, and internationallaws.
Any form of reproduction of this book in any format or medium,in whole or in sections must include the referral attribution linkhttp://www.ck12.org/saythanks (placed in a visible location) inaddition to the following terms.
Except as otherwise noted, all CK-12 Content (including CK-12Curriculum Material) is made available to Users in accordancewith the Creative Commons Attribution-Non-Commercial 3.0Unported (CC BY-NC 3.0) License (http://creativecommons.org/licenses/by-nc/3.0/), as amended and updated by Creative Com-mons from time to time (the “CC License”), which is incorporatedherein by this reference.
Complete terms can be found at http://www.ck12.org/terms.
Printed: September 27, 2013
AUTHORSEve Rawley, (EveR)Anne Gloag, (AnneG)Andrew Gloag, (AndrewG)
SOURCEAnne Gloag, (AnneG)
EDITORAnnamaria Farbizio,(AnnamariaF)
iii

Contents www.ck12.org
Contents
1 Equations and Functions 11.1 Variable Expressions . . . . . . . . . . . . . . . . . . . . . . . . . . . . . . . . . . . . . . . . 21.2 Order of Operations . . . . . . . . . . . . . . . . . . . . . . . . . . . . . . . . . . . . . . . . . 81.3 Patterns and Equations . . . . . . . . . . . . . . . . . . . . . . . . . . . . . . . . . . . . . . . 171.4 Equations and Inequalities . . . . . . . . . . . . . . . . . . . . . . . . . . . . . . . . . . . . . 261.5 Functions as Rules and Tables . . . . . . . . . . . . . . . . . . . . . . . . . . . . . . . . . . . . 341.6 Functions as Graphs . . . . . . . . . . . . . . . . . . . . . . . . . . . . . . . . . . . . . . . . . 421.7 Problem-Solving Plan . . . . . . . . . . . . . . . . . . . . . . . . . . . . . . . . . . . . . . . . 561.8 Problem-Solving Strategies: Make a Table and Look for a Pattern . . . . . . . . . . . . . . . . . 61
2 Real Numbers 722.1 Integers and Rational Numbers . . . . . . . . . . . . . . . . . . . . . . . . . . . . . . . . . . . 732.2 Adding and Subtracting Rational Numbers . . . . . . . . . . . . . . . . . . . . . . . . . . . . . 812.3 Multiplying and Dividing Rational Numbers . . . . . . . . . . . . . . . . . . . . . . . . . . . . 892.4 The Distributive Property . . . . . . . . . . . . . . . . . . . . . . . . . . . . . . . . . . . . . . 992.5 Square Roots and Real Numbers . . . . . . . . . . . . . . . . . . . . . . . . . . . . . . . . . . 1042.6 Problem-Solving Strategies: Guess and Check, Work Backward . . . . . . . . . . . . . . . . . . 110
3 Equations of Lines 1163.1 One-Step Equations . . . . . . . . . . . . . . . . . . . . . . . . . . . . . . . . . . . . . . . . . 1173.2 Two-Step Equations . . . . . . . . . . . . . . . . . . . . . . . . . . . . . . . . . . . . . . . . . 1233.3 Multi-Step Equations . . . . . . . . . . . . . . . . . . . . . . . . . . . . . . . . . . . . . . . . 1303.4 Equations with Variables on Both Sides . . . . . . . . . . . . . . . . . . . . . . . . . . . . . . 1363.5 Ratios and Proportions . . . . . . . . . . . . . . . . . . . . . . . . . . . . . . . . . . . . . . . 1413.6 Percent Problems . . . . . . . . . . . . . . . . . . . . . . . . . . . . . . . . . . . . . . . . . . 148
4 Graphs of Equations and Functions 1564.1 The Coordinate Plane . . . . . . . . . . . . . . . . . . . . . . . . . . . . . . . . . . . . . . . . 1574.2 Graphs of Linear Equations . . . . . . . . . . . . . . . . . . . . . . . . . . . . . . . . . . . . . 1684.3 Graphing Using Intercepts . . . . . . . . . . . . . . . . . . . . . . . . . . . . . . . . . . . . . 1764.4 Slope and Rate of Change . . . . . . . . . . . . . . . . . . . . . . . . . . . . . . . . . . . . . . 1864.5 Graphs Using Slope-Intercept Form . . . . . . . . . . . . . . . . . . . . . . . . . . . . . . . . . 1954.6 Direct Variation Models . . . . . . . . . . . . . . . . . . . . . . . . . . . . . . . . . . . . . . . 2034.7 Linear Function Graphs . . . . . . . . . . . . . . . . . . . . . . . . . . . . . . . . . . . . . . . 2104.8 Problem-Solving Strategies - Graphs . . . . . . . . . . . . . . . . . . . . . . . . . . . . . . . . 216
5 Writing Linear Equations 2235.1 Forms of Linear Equations . . . . . . . . . . . . . . . . . . . . . . . . . . . . . . . . . . . . . 2245.2 Equations of Parallel and Perpendicular Lines . . . . . . . . . . . . . . . . . . . . . . . . . . . 2385.3 Fitting a Line to Data . . . . . . . . . . . . . . . . . . . . . . . . . . . . . . . . . . . . . . . . 2475.4 Predicting with Linear Models . . . . . . . . . . . . . . . . . . . . . . . . . . . . . . . . . . . 257
iv

www.ck12.org Contents
6 Linear Inequalities 2666.1 Solving Inequalities . . . . . . . . . . . . . . . . . . . . . . . . . . . . . . . . . . . . . . . . . 2676.2 Using Inequalities . . . . . . . . . . . . . . . . . . . . . . . . . . . . . . . . . . . . . . . . . . 2756.3 Compound Inequalities . . . . . . . . . . . . . . . . . . . . . . . . . . . . . . . . . . . . . . . 2796.4 Absolute Value Equations and Inequalities . . . . . . . . . . . . . . . . . . . . . . . . . . . . . 2886.5 Linear Inequalities in Two Variables . . . . . . . . . . . . . . . . . . . . . . . . . . . . . . . . 300
7 Solving Systems of Equations and Inequalities 3097.1 Linear Systems by Graphing . . . . . . . . . . . . . . . . . . . . . . . . . . . . . . . . . . . . 3107.2 Solving Linear Systems by Substitution . . . . . . . . . . . . . . . . . . . . . . . . . . . . . . 3207.3 Solving Linear Systems by Elimination . . . . . . . . . . . . . . . . . . . . . . . . . . . . . . . 3287.4 Special Types of Linear Systems . . . . . . . . . . . . . . . . . . . . . . . . . . . . . . . . . . 3407.5 Systems of Linear Inequalities . . . . . . . . . . . . . . . . . . . . . . . . . . . . . . . . . . . 349
8 Exponential Functions 3648.1 Exponent Properties Involving Products . . . . . . . . . . . . . . . . . . . . . . . . . . . . . . 3658.2 Exponent Properties Involving Quotients . . . . . . . . . . . . . . . . . . . . . . . . . . . . . . 3718.3 Zero, Negative, and Fractional Exponents . . . . . . . . . . . . . . . . . . . . . . . . . . . . . 3768.4 Scientific Notation . . . . . . . . . . . . . . . . . . . . . . . . . . . . . . . . . . . . . . . . . . 3838.5 Geometric Sequences . . . . . . . . . . . . . . . . . . . . . . . . . . . . . . . . . . . . . . . . 3918.6 Exponential Functions . . . . . . . . . . . . . . . . . . . . . . . . . . . . . . . . . . . . . . . . 3978.7 Applications of Exponential Functions . . . . . . . . . . . . . . . . . . . . . . . . . . . . . . . 405
9 Polynomials 4159.1 Addition and Subtraction of Polynomials . . . . . . . . . . . . . . . . . . . . . . . . . . . . . . 4169.2 Multiplication of Polynomials . . . . . . . . . . . . . . . . . . . . . . . . . . . . . . . . . . . . 4259.3 Special Products of Polynomials . . . . . . . . . . . . . . . . . . . . . . . . . . . . . . . . . . 4339.4 Polynomial Equations in Factored Form . . . . . . . . . . . . . . . . . . . . . . . . . . . . . . 4399.5 Factoring Quadratic Expressions . . . . . . . . . . . . . . . . . . . . . . . . . . . . . . . . . . 4469.6 Factoring Special Products . . . . . . . . . . . . . . . . . . . . . . . . . . . . . . . . . . . . . 4549.7 Factoring Polynomials Completely . . . . . . . . . . . . . . . . . . . . . . . . . . . . . . . . . 463
10 Quadratic Equations and Quadratic Functions 47310.1 Graphs of Quadratic Functions . . . . . . . . . . . . . . . . . . . . . . . . . . . . . . . . . . . 47410.2 Quadratic Equations by Graphing . . . . . . . . . . . . . . . . . . . . . . . . . . . . . . . . . . 48810.3 Quadratic Equations by Square Roots . . . . . . . . . . . . . . . . . . . . . . . . . . . . . . . . 49710.4 Solving Quadratic Equations by Completing the Square . . . . . . . . . . . . . . . . . . . . . . 50510.5 Solving Quadratic Equations by the Quadratic Formula . . . . . . . . . . . . . . . . . . . . . . 51610.6 The Discriminant . . . . . . . . . . . . . . . . . . . . . . . . . . . . . . . . . . . . . . . . . . 52610.7 Linear, Exponential and Quadratic Models . . . . . . . . . . . . . . . . . . . . . . . . . . . . . 531
11 Algebra and Geometry Connections 54811.1 Graphs of Square Root Functions . . . . . . . . . . . . . . . . . . . . . . . . . . . . . . . . . . 54911.2 Radical Expressions . . . . . . . . . . . . . . . . . . . . . . . . . . . . . . . . . . . . . . . . . 56011.3 Radical Equations . . . . . . . . . . . . . . . . . . . . . . . . . . . . . . . . . . . . . . . . . . 57111.4 The Pythagorean Theorem and Its Converse . . . . . . . . . . . . . . . . . . . . . . . . . . . . 57811.5 Distance and Midpoint Formulas . . . . . . . . . . . . . . . . . . . . . . . . . . . . . . . . . . 588
12 Rational Equations and Functions 59612.1 Inverse Variation Models . . . . . . . . . . . . . . . . . . . . . . . . . . . . . . . . . . . . . . 59712.2 Graphs of Rational Functions . . . . . . . . . . . . . . . . . . . . . . . . . . . . . . . . . . . . 60312.3 Division of Polynomials . . . . . . . . . . . . . . . . . . . . . . . . . . . . . . . . . . . . . . . 615
v
Contents www.ck12.org
12.4 Rational Expressions . . . . . . . . . . . . . . . . . . . . . . . . . . . . . . . . . . . . . . . . 62112.5 Multiplying and Dividing Rational Expressions . . . . . . . . . . . . . . . . . . . . . . . . . . 62512.6 Adding and Subtracting Rational Expressions . . . . . . . . . . . . . . . . . . . . . . . . . . . 63012.7 Solutions of Rational Equations . . . . . . . . . . . . . . . . . . . . . . . . . . . . . . . . . . . 638
13 Probability and Statistics 64413.1 Theoretical and Experimental Probability . . . . . . . . . . . . . . . . . . . . . . . . . . . . . . 64513.2 Probability and Permutations . . . . . . . . . . . . . . . . . . . . . . . . . . . . . . . . . . . . 65213.3 Probability and Combinations . . . . . . . . . . . . . . . . . . . . . . . . . . . . . . . . . . . . 65813.4 Probability of Compound Events . . . . . . . . . . . . . . . . . . . . . . . . . . . . . . . . . . 66413.5 Measures of Central Tendency and Dispersion . . . . . . . . . . . . . . . . . . . . . . . . . . . 67013.6 Stem-and-Leaf Plots and Histograms . . . . . . . . . . . . . . . . . . . . . . . . . . . . . . . . 67813.7 Box-and-Whisker Plots . . . . . . . . . . . . . . . . . . . . . . . . . . . . . . . . . . . . . . . 68913.8 Surveys and Samples . . . . . . . . . . . . . . . . . . . . . . . . . . . . . . . . . . . . . . . . 696
vi

www.ck12.org Chapter 1. Equations and Functions
CHAPTER 1 Equations and FunctionsChapter Outline
1.1 VARIABLE EXPRESSIONS
1.2 ORDER OF OPERATIONS
1.3 PATTERNS AND EQUATIONS
1.4 EQUATIONS AND INEQUALITIES
1.5 FUNCTIONS AS RULES AND TABLES
1.6 FUNCTIONS AS GRAPHS
1.7 PROBLEM-SOLVING PLAN
1.8 PROBLEM-SOLVING STRATEGIES: MAKE A TABLE AND LOOK FOR A PATTERN
1

1.1. Variable Expressions www.ck12.org
1.1 Variable Expressions
Learning Objectives
• Evaluate algebraic expressions.• Evaluate algebraic expressions with exponents.
Introduction - The Language of Algebra
No one likes doing the same problem over and over again—that’s why mathematicians invented algebra. Algebratakes the basic principles of math and makes them more general, so we can solve a problem once and then use thatsolution to solve a group of similar problems.
In arithmetic, you’ve dealt with numbers and their arithmetical operations (such as +, −, ×, ÷). In algebra, we usesymbols called variables (which are usually letters, such as x, y, a, b, c, . . .) to represent numbers and sometimesprocesses.
For example, we might use the letter x to represent some number we don’t know yet, which we might need tofigure out in the course of a problem. Or we might use two letters, like x and y, to show a relationship betweentwo numbers without needing to know what the actual numbers are. The same letters can represent a wide rangeof possible numbers, and the same letter may represent completely different numbers when used in two differentproblems.
Using variables offers advantages over solving each problem “from scratch.” With variables, we can:
• Formulate arithmetical laws such as a+b = b+a for all real numbers a and b.• Refer to “unknown” numbers. For instance: find a number x such that 3x+1 = 10.• Write more compactly about functional relationships such as, “If you sell x tickets, then your profit will be
3x−10 dollars, or “ f (x) = 3x−10,” where “ f ” is the profit function, and x is the input (i.e. how many ticketsyou sell).
Example 1
Write an algebraic expression for the perimeter and area of the rectangle below.
To find the perimeter, we add the lengths of all 4 sides. We can still do this even if we don’t know the side lengthsin numbers, because we can use variables like l and w to represent the unknown length and width. If we start at thetop left and work clockwise, and if we use the letter P to represent the perimeter, then we can say:
2

www.ck12.org Chapter 1. Equations and Functions
P = l +w+ l +w
We are adding 2 l’s and 2 w’s, so we can say that:
P = 2 · l +2 ·w
It’s customary in algebra to omit multiplication symbols whenever possible. For example, 11x means the same thingas 11 · x or 11× x. We can therefore also write:
P = 2l +2w
Area is length multiplied by width. In algebraic terms we get:
A = l×w→ A = l ·w→ A = lw
Note: 2l+2w by itself is an example of a variable expression; P = 2l+2w is an example of an equation. The maindifference between expressions and equations is the presence of an equals sign (=).
In the above example, we found the simplest possible ways to express the perimeter and area of a rectangle when wedon’t yet know what its length and width actually are. Now, when we encounter a rectangle whose dimensions we doknow, we can simply substitute (or plug in) those values in the above equations. In this chapter, we will encountermany expressions that we can evaluate by plugging in values for the variables involved.
Evaluate Algebraic Expressions
When we are given an algebraic expression, one of the most common things we might have to do with it is evaluateit for some given value of the variable. The following example illustrates this process.
Example 2
Let x = 12. Find the value of 2x−7.
To find the solution, we substitute 12 for x in the given expression. Every time we see x, we replace it with 12.
2x−7 = 2(12)−7
= 24−7
= 17
Note: At this stage of the problem, we place the substituted value in parentheses. We do this to make the written-outproblem easier to follow, and to avoid mistakes. (If we didn’t use parentheses and also forgot to add a multiplicationsign, we would end up turning 2x into 212 instead of 2 times 12!)
Example 3
Let y =−2. Find the value of 7y −11y+2.
3

1.1. Variable Expressions www.ck12.org
Solution
7(−2)
−11(−2)+2 =−312+22+2
= 24−312
= 2012
Many expressions have more than one variable in them. For example, the formula for the perimeter of a rectangle inthe introduction has two variables: length (l) and width (w). In these cases, be careful to substitute the appropriatevalue in the appropriate place.
Example 4
The area of a trapezoid is given by the equation A = h2(a+ b). Find the area of a trapezoid with bases a = 10 cm
and b = 15 cm and height h = 8 cm.
To find the solution to this problem, we simply take the values given for the variables a, b, and h, and plug them into the expression for A:
A =h2(a+b) Substitute 10 for a, 15 for b, and 8 for h.
A =82(10+15) Evaluate piece by piece. 10+15 = 25;
82= 4.
A = 4(25) = 100
Solution: The area of the trapezoid is 100 square centimeters.
Evaluate Algebraic Expressions with Exponents
Many formulas and equations in mathematics contain exponents. Exponents are used as a short-hand notation forrepeated multiplication. For example:
2 ·2 = 22
2 ·2 ·2 = 23
4

www.ck12.org Chapter 1. Equations and Functions
The exponent stands for how many times the number is used as a factor (multiplied). When we deal with integers, itis usually easiest to simplify the expression. We simplify:
22 = 4
23 = 8
However, we need exponents when we work with variables, because it is much easier to write x8 than x · x · x · x · x ·x · x · x.
To evaluate expressions with exponents, substitute the values you are given for each variable and simplify. It isespecially important in this case to substitute using parentheses in order to make sure that the simplification is donecorrectly.
For a more detailed review of exponents and their properties, check out the video at http://www.mathvids.com/lesson/mathhelp/863-exponents—basics.
Example 5
The area of a circle is given by the formula A = πr2. Find the area of a circle with radius r = 17 inches.
Substitute values into the equation.
A = πr2 Substitute 17 for r.
A = π(17)2π ·17 ·17≈ 907.9202 . . . Round to 2 decimal places.
The area is approximately 907.92 square inches.
Example 6
Find the value of x2y3
x3+y2 , for x = 2 and y =−4.
Substitute the values of x and y in the following.
x2y3
x3 + y2 =(2)2(−4)3
(2)3 +(−4)2 Substitute 2 for x and −4 for y.
4(−64)8+16
=−256
24=−32
3Evaluate expressions: (2)2 = (2)(2) = 4 and
(2)3 = (2)(2)(2) = 8. (−4)2 = (−4)(−4) = 16 and
(−4)3 = (−4)(−4)(−4) =−64.
Example 7
5

1.1. Variable Expressions www.ck12.org
The height (h) of a ball in flight is given by the formula h =−32t2 +60t +20, where the height is given in feet andthe time (t) is given in seconds. Find the height of the ball at time t = 2 seconds.
Solution
h =−32t2 +60t +20
=−32(2)2 +60(2)+20 Substitute 2 for t.
=−32(4)+60(2)+20
= 12
The height of the ball is 12 feet.
Review Questions
1. Write the following in a more condensed form by leaving out a multiplication symbol.
a. 2×11xb. 1.35 · yc. 3× 1
4d. 1
4 · z2. Evaluate the following expressions for a =−3, b = 2, c = 5, and d =−4.
a. 2a+3bb. 4c+dc. 5ac−2bd. 2a
c−de. 3b
df. a−4b
3c+2dg. 1
a+bh. ab
cd
3. Evaluate the following expressions for x =−1, y = 2, z =−3, and w = 4.
a. 8x3
b. 5x2
6z3
c. 3z2−5w2
d. x2− y2
e. z3+w3
z3−w3
f. 2x3−3x2 +5x−4g. 4w3 +3w2−w+2h. 3+ 1
z2
4. The weekly cost C of manufacturing x remote controls is given by the formula C = 2000+3x, where the costis given in dollars.
a. What is the cost of producing 1000 remote controls?b. What is the cost of producing 2000 remote controls?c. What is the cost of producing 2500 remote controls?
5. The volume of a box without a lid is given by the formula V = 4x(10− x)2, where x is a length in inches andV is the volume in cubic inches.
6

www.ck12.org Chapter 1. Equations and Functions
a. What is the volume when x = 2?b. What is the volume when x = 3?
7

1.2. Order of Operations www.ck12.org
1.2 Order of Operations
Learning Objectives
• Evaluate algebraic expressions with grouping symbols.• Evaluate algebraic expressions with fraction bars.• Evaluate algebraic expressions using a graphing calculator.
Introduction
Look at and evaluate the following expression:
2+4×7−1 =?
How many different ways can we interpret this problem, and how many different answers could someone possiblyfind for it?
The simplest way to evaluate the expression is simply to start at the left and work your way across:
2+4×7−1
= 6×7−1
= 42−1
= 41
This is the answer you would get if you entered the expression into an ordinary calculator. But if you entered theexpression into a scientific calculator or a graphing calculator you would probably get 29 as the answer.
In mathematics, the order in which we perform the various operations (such as adding, multiplying, etc.) isimportant. In the expression above, the operation of multiplication takes precedence over addition, so we evaluateit first. Let’s re-write the expression, but put the multiplication in brackets to show that it is to be evaluated first.
2+(4×7)−1 =?
First evaluate the brackets: 4×7 = 28. Our expression becomes:
2+(28)−1 =?
When we have only addition and subtraction, we start at the left and work across:
8

www.ck12.org Chapter 1. Equations and Functions
2+28−1
= 30−1
= 29
Algebra students often use the word “PEMDAS” to help remember the order in which we evaluate the mathematicalexpressions: Parentheses, Exponents, Multiplication, Division, Addition and Subtraction.
Order of Operations
1. Evaluate expressions within Parentheses (also all brackets [ ] and braces ) first.2. Evaluate all Exponents (terms such as 32 or x3) next.3. Multiplication and Division is next - work from left to right completing both multiplication and division in
the order that they appear.4. Finally, evaluate Addition and Subtraction - work from left to right completing both addition and subtraction
in the order that they appear.
Evaluate Algebraic Expressions with Grouping Symbols
The first step in the order of operations is called parentheses, but we include all grouping symbols in this step—notjust parentheses (), but also square brackets [ ] and curly braces .
Example 1
Evaluate the following:
a) 4−7−11+2
b) 4− (7−11)+2
c) 4− [7− (11+2)]
Each of these expressions has the same numbers and the same mathematical operations, in the same order. Theplacement of the various grouping symbols means, however, that we must evaluate everything in a different ordereach time. Let’s look at how we evaluate each of these examples.
a) This expression doesn’t have parentheses, exponents, multiplication, or division. PEMDAS states that we treataddition and subtraction as they appear, starting at the left and working right (it’s NOT addition then subtraction).
4−7−11+2 =−3−11+2
=−14+2
=−12
b) This expression has parentheses, so we first evaluate 7−11 =−4. Remember that when we subtract a negative itis equivalent to adding a positive:
9

1.2. Order of Operations www.ck12.org
4− (7−11)+2 = 4− (−4)+2
= 8+2
= 10
c) An expression can contain any number of sets of parentheses. Sometimes expressions will have sets of parenthesesinside other sets of parentheses. When faced with nested parentheses, start at the innermost parentheses and workoutward.
Brackets may also be used to group expressions which already contain parentheses. This expression has bothbrackets and parentheses. We start with the innermost group: 11+ 2 = 13. Then we complete the operation inthe brackets.
4− [7− (11+2)] = 4− [7− (13)]
= 4− [−6]
= 10
Example 2
Evaluate the following:
a) 3×5−7÷2
b) 3× (5−7)÷2
c) (3×5)− (7÷2)
a) There are no grouping symbols. PEMDAS dictates that we multiply and divide first, working from left to right:3×5 = 15 and 7÷2 = 3.5. (NOTE: It’s not multiplication then division.) Next we subtract:
3×5−7÷2 = 15−3.5
= 11.5
b) First, we evaluate the expression inside the parentheses: 5−7 =−2. Then work from left to right:
3× (5−7)÷2 = 3× (−2)÷2
= (−6)÷2
=−3
c) First, we evaluate the expressions inside parentheses: 3×5 = 15 and 7÷2 = 3.5. Then work from left to right:
(3×5)− (7÷2) = 15−3.5
= 11.5
Note that adding parentheses didn’t change the expression in part c, but did make it easier to read. Parentheses canbe used to change the order of operations in an expression, but they can also be used simply to make it easier tounderstand.
10

www.ck12.org Chapter 1. Equations and Functions
We can also use the order of operations to simplify an expression that has variables in it, after we substitute specificvalues for those variables.
Example 3
Use the order of operations to evaluate the following:
a) 2− (3x+2) when x = 2
b) 3y2 +2y+1 when y =−3
c) 2− (t−7)2× (u3− v) when t = 19, u = 4, and v = 2
a) The first step is to substitute the value for x into the expression. We can put it in parentheses to clarify the resultingexpression.
2− (3(2)+2)
(Note: 3(2) is the same as 3×2.)
Follow PEMDAS - first parentheses. Inside parentheses follow PEMDAS again.
2− (3×2+2) = 2− (6+2) Inside the parentheses, we multiply first.
2−8 =−6 Next we add inside the parentheses, and finally we subtract.
b) The first step is to substitute the value for y into the expression.
3× (−3)2 +2× (−3)−1
Follow PEMDAS: we cannot simplify the expressions in parentheses, so exponents come next.
3× (−3)2 +2× (−3)−1 Evaluate exponents: (−3)2 = 9
= 3×9+2× (−3)−1 Evaluate multiplication: 3×9 = 27; 2×−3 =−6
= 27+(−6)−1 Add and subtract in order from left to right.
= 27−6−1
= 20
c) The first step is to substitute the values for t, u, and v into the expression.
2− (19−7)2× (43−2)
Follow PEMDAS:
2− (19−7)2× (43−2) Evaluate parentheses: (19−7) = 12; (43−2) = (64−2) = 62
= 2−122×62 Evaluate exponents: 122 = 144
= 2−144×62 Multiply: 144×62 = 8928
= 2−8928 Subtract.
=−8926
11

1.2. Order of Operations www.ck12.org
In parts (b) and (c) we left the parentheses around the negative numbers to clarify the problem. They did not affectthe order of operations, but they did help avoid confusion when we were multiplying negative numbers.
Part (c) in the last example shows another interesting point. When we have an expression inside the parentheses, weuse PEMDAS to determine the order in which we evaluate the contents.
Evaluate Algebraic Expressions with Fraction Bars
Fraction bars count as grouping symbols for PEMDAS, so we evaluate them in the first step of solving an expression.All numerators and all denominators can be treated as if they have invisible parentheses around them. When realparentheses are also present, remember that the innermost grouping symbols come first. If, for example, parenthesesappear on a numerator, they would take precedence over the fraction bar. If the parentheses appear outside of thefraction, then the fraction bar takes precedence.
Example 4
Use the order of operations to evaluate the following expressions:
a) z+34 −1 when z = 2
b)(a+2
b+4 −1)+b when a = 3 and b = 1
c) 2×(
w+(x−2z)(y+2)2 −1
)when w = 11,x = 3,y = 1, and z =−2
a) We substitute the value for z into the expression.
2+34−1
Although this expression has no parentheses, the fraction bar is also a grouping symbol—it has the same effect as aset of parentheses. We can write in the “invisible parentheses” for clarity:
(2+3)4−1
Using PEMDAS, we first evaluate the numerator:
54−1
We can convert 54 to a mixed number:
54= 1
14
Then evaluate the expression:
54−1 = 1
14−1 =
14
12

www.ck12.org Chapter 1. Equations and Functions
b) We substitute the values for a and b into the expression:
(3+21+4
−1)+1
This expression has nested parentheses (remember the effect of the fraction bar). The innermost grouping symbol isprovided by the fraction bar. We evaluate the numerator (3+2) and denominator (1+4) first.
(3+21+4
−1)+1 =
(55−1)+1 Next we evaluate the inside of the parentheses. First we divide.
= (1−1)+1 Next we subtract.
= 0+1 = 1
c) We substitute the values for w,x,y, and z into the expression:
2×(
11+(3−2(−2))(1+2)2 −1
)This complicated expression has several layers of nested parentheses. One method for ensuring that we start withthe innermost parentheses is to use more than one type of parentheses. Working from the outside, we can leave theoutermost brackets as parentheses (). Next will be the “invisible brackets” from the fraction bar; we will write theseas [ ]. The third level of nested parentheses will be the . We will leave negative numbers in round brackets.
2×
[11+3−2(−2)][1+22
] −1
Start with the innermost grouping sign: .
1+2= 3; 3−2(−2)= 3+4 = 7
= 2([11+7][32]
−1)
Next, evaluate the square brackets.
= 2(
189−1)
Next, evaluate the round brackets. Start with division.
= 2(2−1) Finally, do the addition and subtraction.
= 2(1) = 2
Evaluate Algebraic Expressions with a TI-83/84 Family Graphing Calculator
A graphing calculator is a very useful tool in evaluating algebraic expressions. Like a scientific calculator, a graphingcalculator follows PEMDAS. In this section we will explain two ways of evaluating expressions with the graphingcalculator.
Example 5
Evaluate[3(x2−1)2− x4 +12
]+5x3−1 when x =−3.
Method 1: Substitute for the variable first. Then evaluate the numerical expression with the calculator.
Substitute the value x =−3 into the expression.
[3((−3)2−1)2− (−3)4 +12
]+5(−3)3−1
13
1.2. Order of Operations www.ck12.org
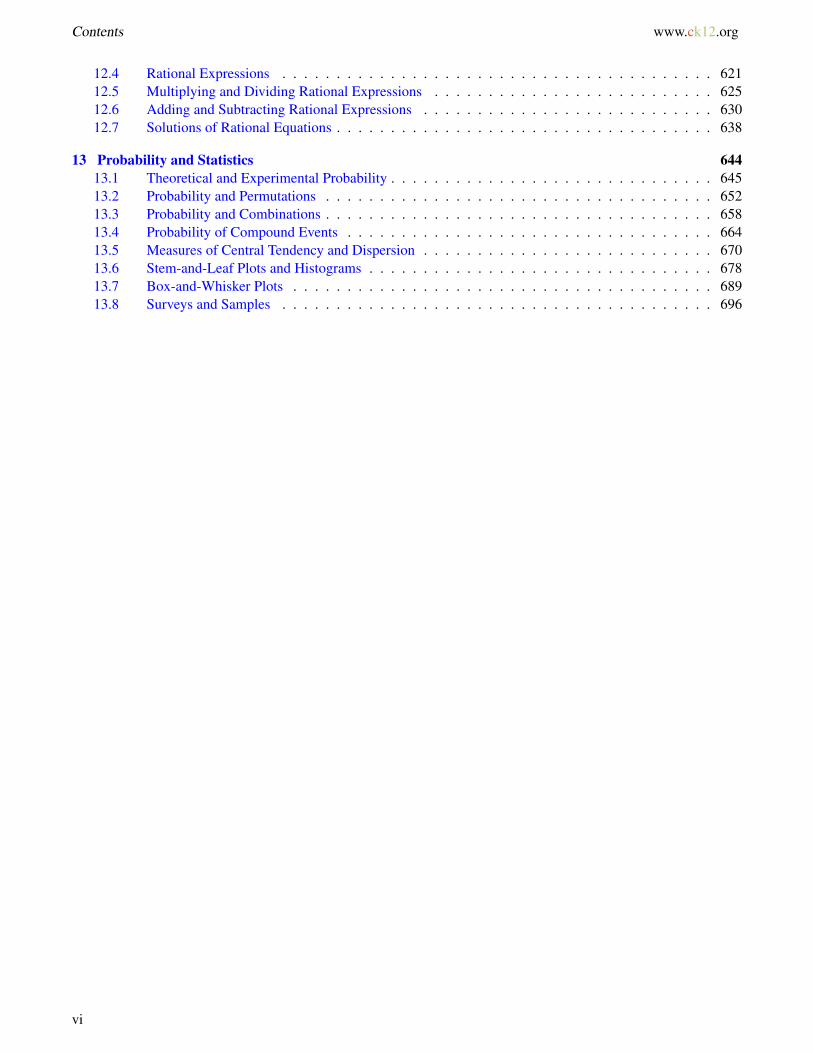
Input this in the calculator just as it is and press [ENTER]. (Note: use ∧ to enter exponents)
The answer is -13.
Method 2: Input the original expression in the calculator first and then evaluate.
First, store the value x = −3 in the calculator. Type -3 [STO] x (The letter x can be entered using the x−[VAR]button or [ALPHA] + [STO]). Then type the original expression in the calculator and press [ENTER].
The answer is -13.
The second method is better because you can easily evaluate the same expression for any value you want. Forexample, let’s evaluate the same expression using the values x = 2 and x = 2
3 .
For x= 2, store the value of x in the calculator: 2[STO] x. Press [2nd] [ENTER] twice to get the previous expressionyou typed in on the screen without having to enter it again. Press [ENTER] to evaluate the expression.
The answer is 62.
For x = 23 , store the value of x in the calculator: 2
3 [STO] x. Press [2nd] [ENTER] twice to get the expression on thescreen without having to enter it again. Press [ENTER] to evaluate.
The answer is 13.21, or 107081 in fraction form.
Note: On graphing calculators there is a difference between the minus sign and the negative sign. When we storedthe value negative three, we needed to use the negative sign which is to the left of the [ENTER] button on the
14

www.ck12.org Chapter 1. Equations and Functions
calculator. On the other hand, to perform the subtraction operation in the expression we used the minus sign. Theminus sign is right above the plus sign on the right.
You can also use a graphing calculator to evaluate expressions with more than one variable.
Example 7
Evaluate the expression 3x2−4y2+x4
(x+y)12
for x = 2, y =−1.
Solution
Store the values of x and y: 2 [STO] x, -1 [STO] y. (The letters x and y can be entered using [ALPHA] +[KEY].) Input the expression in the calculator. When an expression includes a fraction, be sure to use parentheses:(numerator)
(denominator) .
Press [ENTER] to obtain the answer 24.
Additional Resources
For more practice, you can play an algebra game involving order of operations online at http://www.funbrain.com/algebra/index.html.
Review Questions
1. Use the order of operations to evaluate the following expressions.
a. 8− (19− (2+5)−7)b. 2+7×11−12÷3c. (3+7)÷ (7−12)d. 2·(3+(2−1))
4−(6+2) − (3−5)
e. 4+7(3)9−4 + 12−3·2
2f. (4−1)2 +32 ·2g. (22+5)2
52−42 ÷ (2+1)
2. Evaluate the following expressions involving variables.
a. jkj+k when j = 6 and k = 12
b. 2y2 when x = 1 and y = 5c. 3x2 +2x+1 when x = 5d. (y2− x)2 when x = 2 and y = 1e. x+y2
y−x when x = 2 and y = 3
15

1.2. Order of Operations www.ck12.org
3. Evaluate the following expressions involving variables.
a. 4x9x2−3x+1 when x = 2
b. z2
x+y +x2
x−y when x = 1, y =−2, and z = 4
c. 4xyzy2−x2 when x = 3, y = 2, and z = 5
d. x2−z2
xz−2x(z−x) when x =−1 and z = 3
4. Insert parentheses in each expression to make a true equation.
a. 5−2×6−5+2 = 5b. 12÷4+10−3×3+7 = 11c. 22−32−5×3−6 = 30d. 12−8−4×5 =−8
5. Evaluate each expression using a graphing calculator.
a. x2 +2x− xy when x = 250 and y =−120b. (xy− y4)2 when x = 0.02 and y =−0.025c. x+y−z
xy+yz+xz when x = 12 , y = 3
2 , and z =−1
d. (x+y)2
4x2−y2 when x = 3 and y =−5
e. (x−y)3
x3−y + (x+y)2
x+y4 when x = 4 and y =−2
16

www.ck12.org Chapter 1. Equations and Functions
1.3 Patterns and Equations
Learning Objectives
• Write an equation.• Use a verbal model to write an equation.• Solve problems using equations.
Introduction
In mathematics, and especially in algebra, we look for patterns in the numbers we see. The tools of algebra helpus describe these patterns with words and with equations (formulas or functions). An equation is a mathematicalrecipe that gives the value of one variable in terms of another.
For example, if a theme park charges $12 admission, then the number of people who enter the park every day andthe amount of money taken in by the ticket office are related mathematically, and we can write a rule to find theamount of money taken in by the ticket office.
In words, we might say “The amount of money taken in is equal to twelve times the number of people who enter thepark.”
We could also make a table. The following table relates the number of people who visit the park and the total moneytaken in by the ticket office.
Number of visitors 1 2 3 4 5 6 7
Money taken in ($) 12 24 36 48 60 72 84
Clearly, we would need a big table to cope with a busy day in the middle of a school vacation!
A third way we might relate the two quantities (visitors and money) is with a graph. If we plot the money taken inon the vertical axis and the number of visitors on the horizontal axis, then we would have a graph that looks likethe one shown below. Note that this graph shows a smooth line that includes non-whole number values of x (e.g.x = 2.5). In real life this would not make sense, because fractions of people can’t visit a park. This is an issue ofdomain and range, something we will talk about later.
17

1.3. Patterns and Equations www.ck12.org
The method we will examine in detail in this lesson is closer to the first way we chose to describe the relationship.In words we said that “The amount of money taken in is twelve times the number of people who enter the park.” Inmathematical terms we can describe this sort of relationship with variables. A variable is a letter used to representan unknown quantity. We can see the beginning of a mathematical formula in the words:
The amount of money taken in is twelve times the number of people who enter the park.
This can be translated to:
the amount of money taken in = 12× (the number of people who enter the park)
We can now see which quantities can be assigned to letters. First we must state which letters (or variables) relateto which quantities. We call this defining the variables:
Let x = the number of people who enter the theme park.
Let y = the total amount of money taken in at the ticket office.
We now have a fourth way to describe the relationship: with an algebraic equation.
y = 12x
Writing a mathematical equation using variables is very convenient. You can perform all of the operations necessaryto solve this problem without having to write out the known and unknown quantities over and over again. At the endof the problem, you just need to remember which quantities x and y represent.
Write an Equation
An equation is a term used to describe a collection of numbers and variables related through mathematical oper-ators. An algebraic equation will contain letters that represent real quantities. For example, if we wanted to usethe algebraic equation in the example above to find the money taken in for a certain number of visitors, we wouldsubstitute that number for x and then solve the resulting equation for y.
Example 1
18

www.ck12.org Chapter 1. Equations and Functions
A theme park charges $12 entry to visitors. Find the money taken in if 1296 people visit the park.
Let’s break the solution to this problem down into steps. This will be a useful strategy for all the problems in thislesson.
Step 1: Extract the important information.
(number of dollars taken in) = 12× (number of visitors)
(number of visitors) = 1296
Step 2: Translate into a mathematical equation. To do this, we pick variables to stand for the numbers.
Let y = (number of dollars taken in).
Let x = (number of visitors).
(number of dollars taken in) = 12× (number of visitors)
y = 12× x
Step 3: Substitute in any known values for the variables.
y = 12× x
x = 1296
∴
y = 12×1296
Step 4: Solve the equation.
y = 12×1296 = 15552
The amount of money taken in is $15552.
Step 5: Check the result.
If $15552 is taken at the ticket office and tickets are $12, then we can divide the total amount of money collected bythe price per individual ticket.
(number of people) =15552
12= 1296
1296 is indeed the number of people who entered the park. The answer checks out.
Example 2
The following table shows the relationship between two quantities. First, write an equation that describes therelationship. Then, find out the value of b when a is 750.
19

1.3. Patterns and Equations www.ck12.org
a 0 10 20 30 40 50
b 20 40 60 80 100 120
Step 1: Extract the important information.
We can see from the table that every time a increases by 10, b increases by 20. However, b is not simply twice thevalue of a. We can see that when a = 0, b = 20, and this gives a clue as to what rule the pattern follows. The rulelinking a and b is:
“To find b, double the value of a and add 20.”
Step 2: Translate into a mathematical equation:
TABLE 1.1:
Text Translates to Mathematical Expression“To find b” → b =“double the value of a” → 2a“add 20” → + 20
Our equation is b = 2a+20.
Step 3: Solve the equation.
The original problem asks for the value of b when a is 750. When a is 750, b = 2a+20 becomes b = 2(750)+20.Following the order of operations, we get:
b = 2(750)+20
= 1500+20
= 1520
Step 4: Check the result.
In some cases you can check the result by plugging it back into the original equation. Other times you must simplydouble-check your math. In either case, checking your answer is always a good idea. In this case, we can plug ouranswer for b into the equation, along with the value for a, and see what comes out. 1520 = 2(750)+ 20 is TRUEbecause both sides of the equation are equal. A true statement means that the answer checks out.
Use a Verbal Model to Write an Equation
In the last example we developed a rule, written in words, as a way to develop an algebraic equation. We willdevelop this further in the next few examples.
Example 3
The following table shows the values of two related quantities. Write an equation that describes the relationshipmathematically.
20

www.ck12.org Chapter 1. Equations and Functions
TABLE 1.2:
x−value y−value-2 100 02 -104 -206 -30
Step 1: Extract the important information.
We can see from the table that y is five times bigger than x. The value for y is negative when x is positive, and it ispositive when x is negative. Here is the rule that links x and y:
“y is the negative of five times the value of x”
Step 2: Translate this statement into a mathematical equation.
TABLE 1.3:
Text Translates to Mathematical Expression“y is” → y =“negative 5 times the value of x” → −5x
Our equation is y =−5x.
Step 3: There is nothing in this problem to solve for. We can move to Step 4.
Step 4: Check the result.
In this case, the way we would check our answer is to use the equation to generate our own xy pairs. If they matchthe values in the table, then we know our equation is correct. We will plug in -2, 0, 2, 4, and 6 for x and solve for y:
TABLE 1.4:
x y-2 −5(−2) = 100 −5(0) = 02 −5(2) =−104 −5(4) =−206 −5(6) =−30
The y−values in this table match the ones in the earlier table. The answer checks out.
Example 4
Zarina has a $100 gift card, and she has been spending money on the card in small regular amounts. She checks thebalance on the card weekly and records it in the following table.
TABLE 1.5:
Week Number Balance ($)1 1002 783 564 34
21

1.3. Patterns and Equations www.ck12.org
Write an equation for the money remaining on the card in any given week.
Step 1: Extract the important information.
The balance remaining on the card is not just a constant multiple of the week number; 100 is 100 times 1, but 78 isnot 100 times 2. But there is still a pattern: the balance decreases by 22 whenever the week number increases by 1.This suggests that the balance is somehow related to the amount “-22 times the week number.”
In fact, the balance equals “-22 times the week number, plus something.” To determine what that something is, wecan look at the values in one row on the table—for example, the first row, where we have a balance of $100 for weeknumber 1.
Step 2: Translate into a mathematical equation.
First, we define our variables. Let n stand for the week number and b for the balance.
Then we can translate our verbal expression as follows:
TABLE 1.6:
Text Translates to Mathematical ExpressionBalance equals -22 times the weeknumber, plus something.
→ b =−22n+?
To find out what that ? represents, we can plug in the values from that first row of the table, where b = 100 andn = 1. This gives us 100 =−22(1)+?.
So what number gives 100 when you add -22 to it? The answer is 122, so that is the number the ? stands for. Nowour final equation is:
b =−22n+122
Step 3: All we were asked to find was the expression. We weren’t asked to solve it, so we can move to Step 4.
Step 4: Check the result.
To check that this equation is correct, we see if it really reproduces the data in the table. To do that we plug in valuesfor n:
n = 1→ b =−22(1)+122 = 122−22 = 100
n = 2→ b =−22(2)+122 = 122−44 = 78
n = 3→ b =−22(3)+122 = 122−66 = 56
n = 4→ b =−22(4)+122 = 122−88 = 34
The equation perfectly reproduces the data in the table. The answer checks out.
Solve Problems Using Equations
Let’s solve the following real-world problem by using the given information to write a mathematical equation thatcan be solved for a solution.
Example 5
22

www.ck12.org Chapter 1. Equations and Functions
A group of students are in a room. After 25 students leave, it is found that 23 of the original group is left in the room.
How many students were in the room at the start?
Step 1: Extract the important information
We know that 25 students leave the room.
We know that 23 of the original number of students are left in the room.
We need to find how many students were in the room at the start.
Step 2: Translate into a mathematical equation. Initially we have an unknown number of students in the room. Wecan refer to this as the original number.
Let’s define the variable x = the original number of students in the room. After 25 students leave the room, thenumber of students in the room is x−25. We also know that the number of students left is 2
3 of x. So we have twoexpressions for the number of students left, and those two expressions are equal because they represent the samenumber. That means our equation is:
23
x = x−25
Step 3: Solve the equation.
Add 25 to both sides.
x−25 =23
x
x−25+25 =23
x+25
x =23
x+25
Subtract 23 x from both sides.
x− 23
x =23
x− 23
x+25
13
x = 25
Multiply both sides by 3.
3 · 13
x = 3 ·25
x = 75
Remember that x represents the original number of students in the room. So, there were 75 students in the room tostart with.
Step 4: Check the answer:
If we start with 75 students in the room and 25 of them leave, then there are 75−25 = 50 students left in the room.23 of the original number is 2
3 ·75 = 50.
23

1.3. Patterns and Equations www.ck12.org
This means that the number of students who are left over equals 23 of the original number. The answer checks out.
The method of defining variables and writing a mathematical equation is the method you will use the most in analgebra course. This method is often used together with other techniques such as making a table of values, creatinga graph, drawing a diagram and looking for a pattern.
Review Questions
TABLE 1.7:
Day Profit1 202 403 604 805 100
1. The above table depicts the profit in dollars taken in by a store each day.
a. Write a mathematical equation that describes the relationship between the variables in the table.b. What is the profit on day 10?c. If the profit on a certain day is $200, what is the profit on the next day?
1. Write a mathematical equation that describes the situation: A full cookie jar has 24 cookies. How manycookies are left in the jar after you have eaten some?
2. How many cookies are in the jar after you have eaten 9 cookies?3. How many cookies are in the jar after you have eaten 9 cookies and then eaten 3 more?
2. Write a mathematical equation for the following situations and solve.
a. Seven times a number is 35. What is the number?b. Three times a number, plus 15, is 24. What is the number?c. Twice a number is three less than five times another number. Three times the second number is 15. What
are the numbers?d. One number is 25 more than 2 times another number. If each number were multiplied by five, their sum
would be 350. What are the numbers?e. The sum of two consecutive integers is 35. What are the numbers?f. Peter is three times as old as he was six years ago. How old is Peter?
3. How much water should be added to one liter of pure alcohol to make a mixture of 25% alcohol?4. A mixture of 50% alcohol and 50% water has 4 liters of water added to it. It is now 25% alcohol. What was
the total volume of the original mixture?5. In Crystal’s silverware drawer there are twice as many spoons as forks. If Crystal adds nine forks to the
drawer, there will be twice as many forks as spoons. How many forks and how many spoons are in the drawerright now?
1. Mia drove to Javier’s house at 40 miles per hour. Javier’s house is 20 miles away. Mia arrived at Javier’shouse at 2:00 pm. What time did she leave?
2. Mia left Javier’s house at 6:00 pm to drive home. This time she drove 25% faster. What time did shearrive home?
3. The next day, Mia took the expressway to Javier’s house. This route was 24 miles long, but she was ableto drive at 60 miles per hour. How long did the trip take?
4. When Mia took the same route back, traffic on the expressway was 20% slower. How long did the returntrip take?
24

www.ck12.org Chapter 1. Equations and Functions
6. The price of an mp3 player decreased by 20% from last year to this year. This year the price of the player is$120. What was the price last year?
7. SmartCo sells deluxe widgets for $60 each, which includes the cost of manufacture plus a 20% markup. Whatdoes it cost SmartCo to manufacture each widget?
8. Jae just took a math test with 20 questions, each worth an equal number of points. The test is worth 100 pointstotal.
a. Write an equation relating the number of questions Jae got right to the total score he will get on the test.b. If a score of 70 points earns a grade of C−, how many questions would Jae need to get right to get a C−
on the test?c. If a score of 83 points earns a grade of B, how many questions would Jae need to get right to get a B on
the test?d. Suppose Jae got a score of 60% and then was allowed to retake the test. On the retake, he got all the
questions right that he got right the first time, and also got half the questions right that he got wrong thefirst time. What is his new score?
25

1.4. Equations and Inequalities www.ck12.org
1.4 Equations and Inequalities
Learning Objectives
• Write equations and inequalities.• Check solutions to equations.• Check solutions to inequalities.• Solve real-world problems using an equation.
Introduction
In algebra, an equation is a mathematical expression that contains an equals sign. It tells us that two expressionsrepresent the same number. For example, y = 12x is an equation. An inequality is a mathematical expressionthat contains inequality signs. For example, y ≤ 12x is an inequality. Inequalities are used to tell us that anexpression is either larger or smaller than another expression. Equations and inequalities can contain both variablesand constants.
Variables are usually given a letter and they are used to represent unknown values. These quantities can changebecause they depend on other numbers in the problem.
Constants are quantities that remain unchanged. Ordinary numbers like 2, −3, 34 , and π are constants.
Equations and inequalities are used as a shorthand notation for situations that involve numerical data. They are veryuseful because most problems require several steps to arrive at a solution, and it becomes tedious to repeatedly writeout the situation in words.
Write Equations and Inequalities
Here are some examples of equations:
3x−2 = 5 x+9 = 2x+5x3= 15 x2 +1 = 10
To write an inequality, we use the following symbols:
>greater than
≥greater than or equal to
<less than
≤less than or equal to
6=not equal to
Here are some examples of inequalities:
26

www.ck12.org Chapter 1. Equations and Functions
3x < 5 4− x≤ 2x x2 +2x−1 > 03x4≥ x
2−3
The most important skill in algebra is the ability to translate a word problem into the correct equation or inequalityso you can find the solution easily. The first two steps are defining the variables and translating the word probleminto a mathematical equation.
Defining the variables means that we assign letters to any unknown quantities in the problem.
Translating means that we change the word expression into a mathematical expression containing variables andmathematical operations with an equal sign or an inequality sign.
Example 1
Define the variables and translate the following expressions into equations.
a) A number plus 12 is 20.
b) 9 less than twice a number is 33.
c) $20 was one quarter of the money spent on the pizza.
Solution
a) Define
Let n = the number we are seeking.
Translate
A number plus 12 is 20.
n+12 = 20
b) Define
Let n = the number we are seeking.
Translate
9 less than twice a number is 33.
This means that twice the number, minus 9, is 33.
2n−9 = 33
c) Define
Let m = the money spent on the pizza.
Translate
$20 was one quarter of the money spent on the pizza.
20 =14
m
Often word problems need to be reworded before you can write an equation.
27

1.4. Equations and Inequalities www.ck12.org
Example 2
Find the solution to the following problems.
a) Shyam worked for two hours and packed 24 boxes. How much time did he spend on packing one box?
b) After a 20% discount, a book costs $12. How much was the book before the discount?
Solution
a) Define
Let t = time it takes to pack one box.
Translate
Shyam worked for two hours and packed 24 boxes. This means that two hours is 24 times the time it takes to packone box.
2 = 24t
Solve
t =224
=1
12hours
112×60 minutes = 5 minutes
Answer
Shyam takes 5 minutes to pack a box.
b) Define
Let p = the price of the book before the discount.
Translate
After a 20% discount, the book costs $12. This means that the price minus 20% of the price is $12.
p−0.20p = 12
Solve
p−0.20p = 0.8p, so 0.8p = 12
p =120.8
= 15
Answer
The price of the book before the discount was $15.
Check
If the original price was $15, then the book was discounted by 20% of $15, or $3. $15− 3 = $12. The answerchecks out.
28

www.ck12.org Chapter 1. Equations and Functions
Example 3
Define the variables and translate the following expressions into inequalities.
a) The sum of 5 and a number is less than or equal to 2.
b) The distance from San Diego to Los Angeles is less than 150 miles.
c) Diego needs to earn more than an 82 on his test to receive a B in his algebra class.
d) A child needs to be 42 inches or more to go on the roller coaster.
Solution
a) Define
Let n = the unknown number.
Translate
5+n≤ 2
b) Define
Let d = the distance from San Diego to Los Angeles in miles.
Translate
d < 150
c) Define
Let x = Diego’s test grade.
Translate
x > 82
d) Define
Let h = the height of child in inches.
Translate:
h≥ 42
Check Solutions to Equations
You will often need to check solutions to equations in order to check your work. In a math class, checking that youarrived at the correct solution is very good practice. We check the solution to an equation by replacing the variablein an equation with the value of the solution. A solution should result in a true statement when plugged into theequation.
Example 4
29

1.4. Equations and Inequalities www.ck12.org
Check that the given number is a solution to the corresponding equation.
a) y =−1; 3y+5 =−2y
b) z = 3; z2 +2z = 8
c) x =−12 ; 3x+1 = x
Solution
Replace the variable in each equation with the given value.
a)
3(−1)+5 =−2(−1)
−3+5 = 2
2 = 2
This is a true statement. This means that y =−1 is a solution to 3y+5 =−2y.
b)
32 +2(3) = 8
9+6 = 8
15 = 8
This is not a true statement. This means that z = 3 is not a solution to z2 +2z = 8 .
c)
3(−1
2
)+1 =−1
2(−3
2
)+1 =−1
2
−12=−1
2
This is a true statement. This means that x =−12 is a solution to 3x+1 = x.
Check Solutions to Inequalities
To check the solution to an inequality, we replace the variable in the inequality with the value of the solution. Asolution to an inequality produces a true statement when substituted into the inequality.
Example 5
Check that the given number is a solution to the corresponding inequality.
a) a = 10; 20a≤ 250
b) b =−0.5; 3−bb >−4
c) x = 34 ; 4x+5≤ 8
Solution
Replace the variable in each inequality with the given value.
30

www.ck12.org Chapter 1. Equations and Functions
a)
20(10)≤ 250
200≤ 250
This statement is true. This means that a = 10 is a solution to the inequality 20a≤ 250.
Note that a = 10 is not the only solution to this inequality. If we divide both sides of the inequality by 20, we canwrite it as a≤ 12.5. This means that any number less than or equal to 12.5 is also a solution to the inequality.
b)
3− (−0.5)(−0.5)
>−4
3+0.5−0.5
>−4
−3.50.5
>−4
−7 >−4
This statement is false. This means that b =−0.5 is not a solution to the inequality 3−bb >−4 .
c)
4(
34
)+5≥ 8
3+5≥ 8
8≥ 8
This statement is true. It is true because this inequality includes an equals sign; since 8 is equal to itself, it is also“greater than or equal to” itself. This means that x = 3
4 is a solution to the inequality 4x+5≤ 8.
Solve Real-World Problems Using an Equation
Let’s use what we have learned about defining variables, writing equations and writing inequalities to solve somereal-world problems.
Example 6
Tomatoes cost $0.50 each and avocados cost $2.00 each. Anne buys six more tomatoes than avocados. Her total billis $8. How many tomatoes and how many avocados did Anne buy?
Solution
Define
Let a = the number of avocados Anne buys.
Translate
Anne buys six more tomatoes than avocados. This means that a+6 = the number of tomatoes.
Tomatoes cost $0.50 each and avocados cost $2.00 each. Her total bill is $8. This means that .50 times the numberof tomatoes plus 2 times the number of avocados equals 8.
31

1.4. Equations and Inequalities www.ck12.org
0.5(a+6)+2a = 8
0.5a+0.5 ·6+2a = 8
2.5a+3 = 8
2.5a = 5
a = 2
Remember that a= the number of avocados, so Anne buys two avocados. The number of tomatoes is a+6= 2+6=8.
Answer
Anne bought 2 avocados and 8 tomatoes.
Check
If Anne bought two avocados and eight tomatoes, the total cost is: (2× 2)+ (8× 0.5) = 4+ 4 = 8. The answerchecks out.
Example 7
To organize a picnic Peter needs at least two times as many hamburgers as hot dogs. He has 24 hot dogs. What isthe possible number of hamburgers Peter has?
Solution
Define
Let x = number of hamburgers
Translate
Peter needs at least two times as many hamburgers as hot dogs. He has 24 hot dogs.
This means that twice the number of hot dogs is less than or equal to the number of hamburgers.
2×24≤ x, or 48≤ x
Answer
Peter needs at least 48 hamburgers.
Check
48 hamburgers is twice the number of hot dogs. So more than 48 hamburgers is more than twice the number of hotdogs. The answer checks out.
Additional Resources
For more practice solving inequalities, check out http://www.aaastudy.com/equ725x7.htm.
Review Questions
1. Define the variables and translate the following expressions into equations.
32

www.ck12.org Chapter 1. Equations and Functions
a. Peter’s Lawn Mowing Service charges $10 per job and $0.20 per square yard. Peter earns $25 for a job.b. Renting the ice-skating rink for a birthday party costs $200 plus $4 per person. The rental costs $324 in
total.c. Renting a car costs $55 per day plus $0.45 per mile. The cost of the rental is $100.d. Nadia gave Peter 4 more blocks than he already had. He already had 7 blocks.
2. Define the variables and translate the following expressions into inequalities.
a. A bus can seat 65 passengers or fewer.b. The sum of two consecutive integers is less than 54.c. The product of a number and 3 is greater than 30.d. An amount of money is invested at 5% annual interest. The interest earned at the end of the year is
greater than or equal to $250.e. You buy hamburgers at a fast food restaurant. A hamburger costs $0.49. You have at most $3 to spend.
Write an inequality for the number of hamburgers you can buy.f. Mariel needs at least 7 extra credit points to improve her grade in English class. Additional book reports
are worth 2 extra credit points each. Write an inequality for the number of book reports Mariel needs todo.
3. Check whether the given number is a solution to the corresponding equation.
a. a =−3; 4a+3 =−9b. x = 4
3 ; 34 x+ 1
2 = 32
c. y = 2; 2.5y−10.0 =−5.0d. z =−5; 2(5−2z) = 20−2(z−1)
4. Check whether the given number is a solution to the corresponding inequality.
a. x = 12; 2(x+6)≤ 8xb. z =−9; 1.4z+5.2 > 0.4zc. y = 40; −5
2 y+ 12 <−18
d. t = 0.4; 80≥ 10(3t +2)
5. The cost of a Ford Focus is 27% of the price of a Lexus GS 450h. If the price of the Ford is $15000, what isthe price of the Lexus?
6. On your new job you can be paid in one of two ways. You can either be paid $1000 per month plus 6%commission of total sales or be paid $1200 per month plus 5% commission on sales over $2000. For whatamount of sales is the first option better than the second option? Assume there are always sales over $2000.
7. A phone company offers a choice of three text-messaging plans. Plan A gives you unlimited text messages for$10 a month; Plan B gives you 60 text messages for $5 a month and then charges you $0.05 for each additionalmessage; and Plan C has no monthly fee but charges you $0.10 per message.
a. If m is the number of messages you send per month, write an expression for the monthly cost of each ofthe three plans.
b. For what values of m is Plan A cheaper than Plan B?c. For what values of m is Plan A cheaper than Plan C?d. For what values of m is Plan B cheaper than Plan C?e. For what values of m is Plan A the cheapest of all? (Hint: for what values is A both cheaper than B and
cheaper than C?)f. For what values of m is Plan B the cheapest of all? (Careful—for what values is B cheaper than A?)g. For what values of m is Plan C the cheapest of all?h. If you send 30 messages per month, which plan is cheapest?i. What is the cost of each of the three plans if you send 30 messages per month?
33
1.5. Functions as Rules and Tables www.ck12.org
1.5 Functions as Rules and Tables
Learning Objectives
• Identify the domain and range of a function.• Make a table for a function.• Write a function rule.• Represent a real-world situation with a function.
Introduction
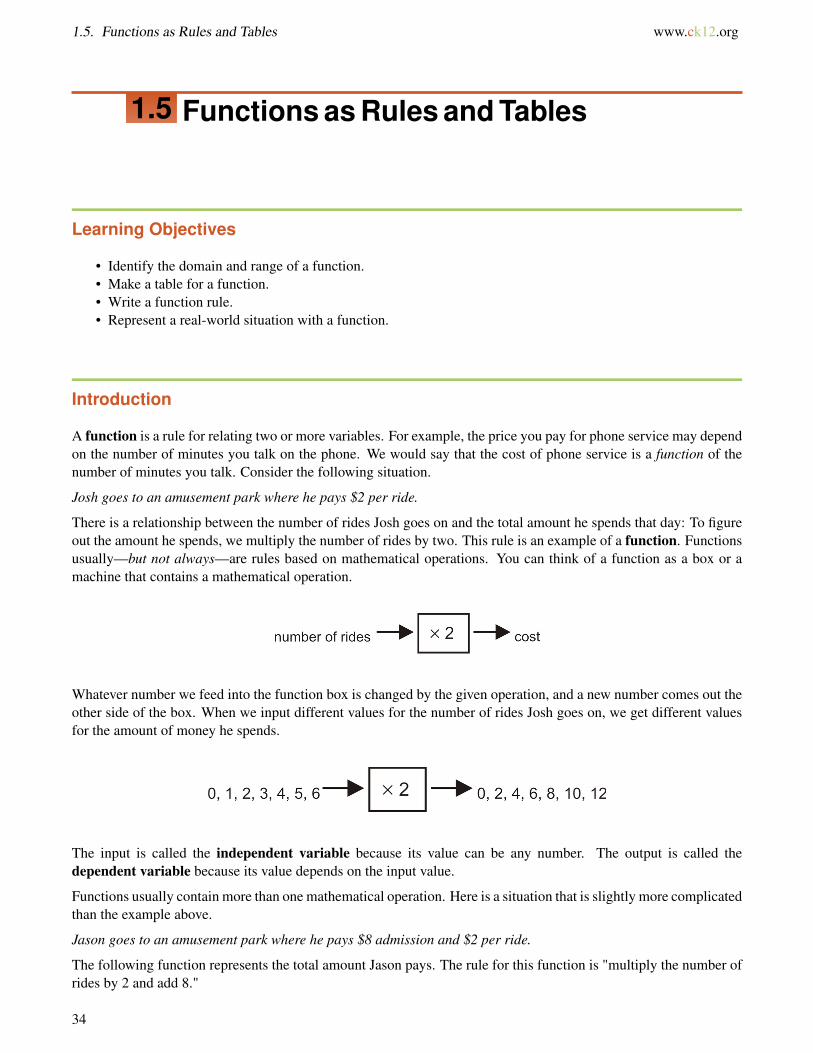
A function is a rule for relating two or more variables. For example, the price you pay for phone service may dependon the number of minutes you talk on the phone. We would say that the cost of phone service is a function of thenumber of minutes you talk. Consider the following situation.
Josh goes to an amusement park where he pays $2 per ride.
There is a relationship between the number of rides Josh goes on and the total amount he spends that day: To figureout the amount he spends, we multiply the number of rides by two. This rule is an example of a function. Functionsusually—but not always—are rules based on mathematical operations. You can think of a function as a box or amachine that contains a mathematical operation.
Whatever number we feed into the function box is changed by the given operation, and a new number comes out theother side of the box. When we input different values for the number of rides Josh goes on, we get different valuesfor the amount of money he spends.
The input is called the independent variable because its value can be any number. The output is called thedependent variable because its value depends on the input value.
Functions usually contain more than one mathematical operation. Here is a situation that is slightly more complicatedthan the example above.
Jason goes to an amusement park where he pays $8 admission and $2 per ride.
The following function represents the total amount Jason pays. The rule for this function is "multiply the number ofrides by 2 and add 8."
34

www.ck12.org Chapter 1. Equations and Functions
When we input different values for the number of rides, we arrive at different outputs (costs).
These flow diagrams are useful in visualizing what a function is. However, they are cumbersome to use in practice.In algebra, we use the following short-hand notation instead:
input
↓f (x)︸︷︷︸= y← out put
f unction
box
First, we define the variables:
x = the number of rides Jason goes on
y = the total amount of money Jason spends at the amusement park.
So, x represents the input and y represents the output. The notation f () represents the function or the mathematicaloperations we use on the input to get the output. In the last example, the cost is 2 times the number of rides plus 8.This can be written as a function:
f (x) = 2x+8
In algebra, the notations y and f (x) are typically used interchangeably. Technically, though, f (x) represents thefunction itself and y represents the output of the function.
Identify the Domain and Range of a Function
In the last example, we saw that we can input the number of rides into the function to give us the total cost for goingto the amusement park. The set of all values that we can use for the input is called the domain of the function, andthe set of all values that the output could turn out to be is called the range of the function. In many situations thedomain and range of a function are both simply the set of all real numbers, but this isn’t always the case. Let’s lookat our amusement park example.
Example 1
Find the domain and range of the function that describes the situation:
Jason goes to an amusement park where he pays $8 admission and $2 per ride.
Solution
Here is the function that describes this situation:
35

1.5. Functions as Rules and Tables www.ck12.org
f (x) = 2x+8 = y
In this function, x is the number of rides and y is the total cost. To find the domain of the function, we need todetermine which numbers make sense to use as the input (x).
• The values have to be zero or positive, because Jason can’t go on a negative number of rides.• The values have to be integers because, for example, Jason could not go on 2.25 rides.• Realistically, there must be a maximum number of rides that Jason can go on because the park closes, he runs
out of money, etc. However, since we aren’t given any information about what that maximum might be, wemust consider that all non-negative integers are possible values regardless of how big they are.
Answer For this function, the domain is the set of all non-negative integers.
To find the range of the function we must determine what the values of y will be when we apply the function to theinput values. The domain is the set of all non-negative integers: 0, 1, 2, 3, 4, 5, 6, .... Next we plug these valuesinto the function for x. If we plug in 0, we get 8; if we plug in 1, we get 10; if we plug in 2, we get 12, and so on,counting by 2s each time. Possible values of y are therefore 8, 10, 12, 14, 16, 18, 20... or in other words all evenintegers greater than or equal to 8.
Answer The range of this function is the set of all even integers greater than or equal to 8.
Example 2
Find the domain and range of the following functions.
a) A ball is dropped from a height and it bounces up to 75% of its original height.
b) y = x2
Solution
a) Let’s define the variables:
x = original height
y = bounce height
A function that describes the situation is y = f (x) = 0.75x. x can represent any real value greater than zero, sinceyou can drop a ball from any height greater than zero. A little thought tells us that y can also represent any real valuegreater than zero.
Answer
The domain is the set of all real numbers greater than zero. The range is also the set of all real numbers greater thanzero.
b) Since there is no word problem attached to this equation, we can assume that we can use any real number as avalue of x. When we square a real number, we always get a non-negative answer, so y can be any non-negative realnumber.
Answer
The domain of this function is all real numbers. The range of this function is all non-negative real numbers.
In the functions we’ve looked at so far, x is called the independent variable because it can be any of the values fromthe domain, and y is called the dependent variable because its value depends on x. However, any letters or symbolscan be used to represent the dependent and independent variables. Here are three different examples:
36

www.ck12.org Chapter 1. Equations and Functions
y = f (x) = 3x
R = f (w) = 3w
v = f (t) = 3t
These expressions all represent the same function: a function where the dependent variable is three times theindependent variable. Only the symbols are different. In practice, we usually pick symbols for the dependent andindependent variables based on what they represent in the real world—like t for time, d for distance, v for velocity,and so on. But when the variables don’t represent anything in the real world—or even sometimes when they do—wetraditionally use y for the dependent variable and x for the independent variable.
For another look at the domain of a function, see the following video, where the narrator solves a sample problemfrom the California Standards Test about finding the domain of an unusual function: http://www.youtube.com/watch?v=NRB6s77nx2gI.
Make a Table For a Function
A table is a very useful way of arranging the data represented by a function. We can match the input and outputvalues and arrange them as a table. For example, the values from Example 1 above can be arranged in a table asfollows:
x 0 1 2 3 4 5 6
y 8 10 12 14 16 18 20
A table lets us organize our data in a compact manner. It also provides an easy reference for looking up data, and itgives us a set of coordinate points that we can plot to create a graph of the function.
Example 3
Make a table of values for the function f (x) = 1x . Use the following numbers for input values: -1, -0.5, -0.2, -0.1,
-0.01, 0.01, 0.1, 0.2, 0.5, 1.
Solution
Make a table of values by filling the first row with the input values and the next row with the output values calculatedusing the given function.
x −1 −0.5 −0.2 −0.1 −0.01 0.01 0.1 0.2 0.5 1
f (x) =1x
1−1
1−0.5
1−0.2
1−0.1
1−0.01
10.01
10.1
10.2
10.5
11
y −1 −2 −5 −10 −100 100 10 5 2 1
When you’re given a function, you won’t usually be told what input values to use; you’ll need to decide for yourselfwhat values to pick based on what kind of function you’re dealing with. We will discuss how to pick input valuesthroughout this book.
37

1.5. Functions as Rules and Tables www.ck12.org
Write a Function Rule
In many situations, we collect data by conducting a survey or an experiment, and then organize the data in a table ofvalues. Most often, we want to find the function rule or formula that fits the set of values in the table, so we can usethe rule to predict what could happen for values that are not in the table.
Example 4
Write a function rule for the following table:
Number of CDs 2 4 6 8 10
Cost in $ 24 48 72 96 120
Solution
You pay $24 for 2 CDs, $48 for 4 CDs, $120 for 10 CDs. That means that each CD costs $12.
We can write a function rule:
Cost = $12 × (number of CDs) or f (x) = 12x
Example 5
Write a function rule for the following table:
x −3 −2 −1 0 1 2 3
y 3 2 1 0 1 2 3
Solution
You can see that a negative number turns into the same number, only positive, while a non-negative number staysthe same. This means that the function being used here is the absolute value function: f (x) =| x |.
Coming up with a function based on a set of values really is as tricky as it looks. There’s no rule that will tell youthe function every time, so you just have to think of all the types of functions you know and guess which one mightbe a good fit, and then check if your guess is right. In this book, though, we’ll stick to writing functions for linearrelationships, which are the simplest type of function.
Represent a Real-World Situation with a Function
Let’s look at a few real-world situations that can be represented by a function.
Example 5
Maya has an internet service that currently has a monthly access fee of $11.95 and a connection fee of $0.50 perhour. Represent her monthly cost as a function of connection time.
Solution
Define
Let x = the number of hours Maya spends on the internet in one month
Let y = Maya’s monthly cost
38
www.ck12.org Chapter 1. Equations and Functions
Translate
The cost has two parts: the one-time fee of $11.95 and the per-hour charge of $0.50. So the total cost is the flat fee+ the charge per hour × the number of hours.
Answer
The function is y = f (x) = 11.95+0.50x.
Example 6
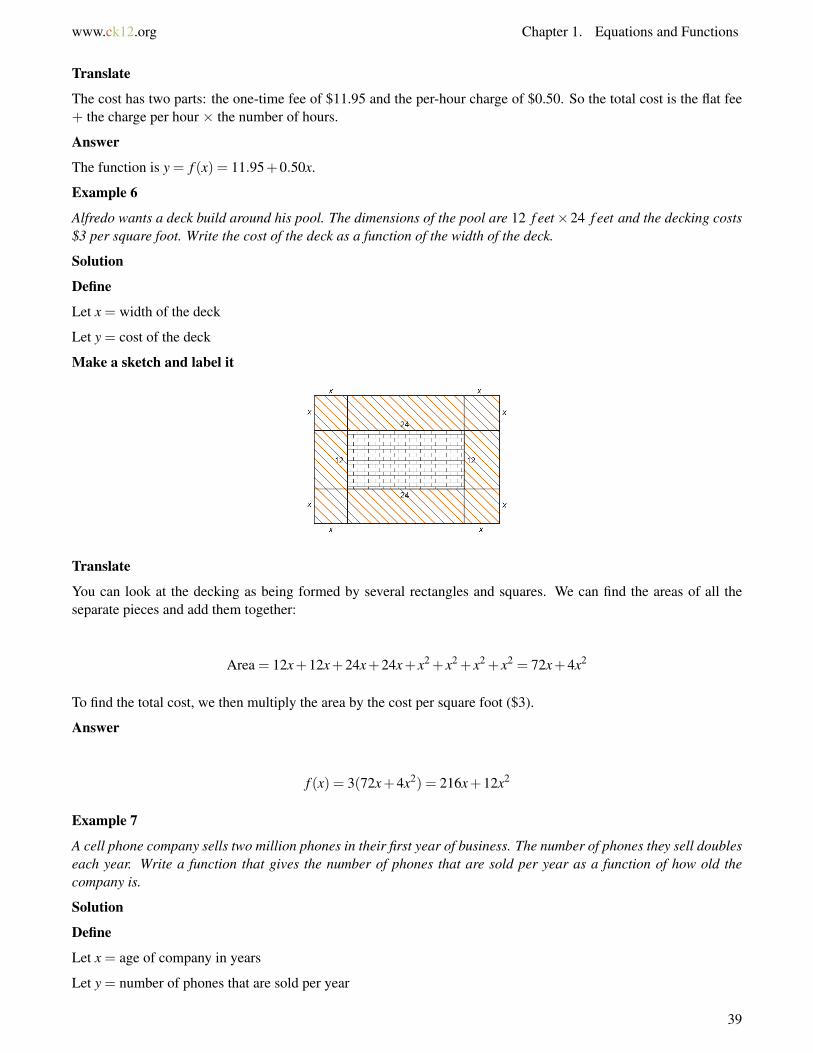
Alfredo wants a deck build around his pool. The dimensions of the pool are 12 f eet×24 f eet and the decking costs$3 per square foot. Write the cost of the deck as a function of the width of the deck.
Solution
Define
Let x = width of the deck
Let y = cost of the deck
Make a sketch and label it
Translate
You can look at the decking as being formed by several rectangles and squares. We can find the areas of all theseparate pieces and add them together:
Area = 12x+12x+24x+24x+ x2 + x2 + x2 + x2 = 72x+4x2
To find the total cost, we then multiply the area by the cost per square foot ($3).
Answer
f (x) = 3(72x+4x2) = 216x+12x2
Example 7
A cell phone company sells two million phones in their first year of business. The number of phones they sell doubleseach year. Write a function that gives the number of phones that are sold per year as a function of how old thecompany is.
Solution
Define
Let x = age of company in years
Let y = number of phones that are sold per year
39
1.5. Functions as Rules and Tables www.ck12.org
Make a table
Age (years) 1 2 3 4 5 6 7
Millions of phones 2 4 8 16 32 64 128
Write a function rule
The number of phones sold per year doubles every year, so the first year the company sells 2 million phones, thenext year it sells 2×2 million, the next year it sells 2×2×2 million, and so on. You might remember that when wemultiply a number by itself several times we can use exponential notation: 2 = 21, 2×2 = 22, 2×2×2 = 23, andso on. In this problem, the exponent just happens to match the company’s age in years, which makes our functioneasy to describe.
Answer
y = f (x) = 2x
Review Questions
1. Identify the domain and range of the following functions.
a. Dustin charges $10 per hour for mowing lawns.b. Maria charges $25 per hour for tutoring math, with a minimum charge of $15.c. f (x) = 15x−12d. f (x) = 2x2 +5e. f (x) = 1
xf. f (x) =
√x
2. What is the range of the function y = x2−5 when the domain is -2, -1, 0, 1, 2?3. What is the range of the function y = 2x− 3
4 when the domain is -2.5, -1.5, 5?4. What is the domain of the function y = 3x when the range is 9, 12, 15?5. What is the range of the function y = 3x when the domain is 9, 12, 15?6. Angie makes $6.50 per hour working as a cashier at the grocery store. Make a table that shows how much she
earns if she works 5, 10, 15, 20, 25, or 30 hours.7. The area of a triangle is given by the formula A = 1
2 bh. If the base of the triangle measures 8 centimeters,make a table that shows the area of the triangle for heights 1, 2, 3, 4, 5, and 6 centimeters.
8. Make a table of values for the function f (x) =√
2x+3 for input values -1, 0, 1, 2, 3, 4, 5.9. Write a function rule for the following table:
x 3 4 5 6
y 9 16 15 36
10. Write a function rule for the following table:
Hours 0 1 2 3
Cost 15 20 25 30
11. Write a function rule for the following table:
x 0 1 2 3
y 24 12 6 3
40

www.ck12.org Chapter 1. Equations and Functions
12. Write a function that represents the number of cuts you need to cut a ribbon into x pieces.13. Write a function that represents the number of cuts you need to divide a pizza into x slices.14. Solomon charges a $40 flat rate plus $25 per hour to repair a leaky pipe.
a. Write a function that represents the total fee charged as a function of hours worked.b. How much does Solomon earn for a 3-hour job?c. How much does he earn for three separate 1-hour jobs?
15. Rochelle has invested $2500 in a jewelry making kit. She makes bracelets that she can sell for $12.50 each.
a. Write a function that shows how much money Rochelle makes from selling b bracelets.b. Write a function that shows how much money Rochelle has after selling b bracelets, minus her investment
in the kit.c. How many bracelets does Rochelle need to make before she breaks even?d. If she buys a $50 display case for her bracelets, how many bracelets does she now need to sell to break
even?
41

1.6. Functions as Graphs www.ck12.org
1.6 Functions as Graphs
Learning Objectives
• Graph a function from a rule or table.• Write a function rule from a graph.• Analyze the graph of a real world situation.• Determine whether a relation is a function.
Introduction
We represent functions graphically by plotting points on a coordinate plane (also sometimes called the Cartesianplane). The coordinate plane is a grid formed by a horizontal number line and a vertical number line that cross at apoint called the origin. The origin has this name because it is the “starting” location; every other point on the grid isdescribed in terms of how far it is from the origin.
The horizontal number line is called the x−axis and the vertical line is called the y−axis. We can represent eachvalue of a function as a point on the plane by representing the x−value as a distance along the x−axis and they−value as a distance along the y−axis. For example, if the y−value of a function is 2 when the x−value is 4, wecan represent this pair of values with a point that is 4 units to the right of the origin (that is, 4 units along the x−axis)and 2 units up (2 units in the y−direction).
42

www.ck12.org Chapter 1. Equations and Functions
We write the location of this point as (4, 2).
Example 1
Plot the following coordinate points on the Cartesian plane.
a) (5, 3)
b) (-2, 6)
c) (3, -4)
d) (-5, -7)
Solution
Here are all the coordinate points on the same plot.
Notice that we move to the right for a positive x−value and to the left for a negative one, just as we would on a singlenumber line. Similarly, we move up for a positive y−value and down for a negative one.
The x− and y−axes divide the coordinate plane into four quadrants. The quadrants are numbered counter-clockwisestarting from the upper right, so the plotted point for (a) is in the first quadrant, (b) is in the second quadrant, (c) isin the fourth quadrant, and (d) is in the third quadrant.
Graph a Function From a Rule or Table
If we know a rule or have a table of values that describes a function, we can draw a graph of the function. A table ofvalues gives us coordinate points that we can plot on the Cartesian plane.
Example 2
Graph the function that has the following table of values.
x −2 −1 0 1 2
y 6 8 10 12 14
Solution
The table gives us five sets of coordinate points: (-2, 6), (-1, 8), (0, 10), (1, 12), and (2, 14).
To graph the function, we plot all the coordinate points. Since we are not told the domain of the function or given areal-world context, we can just assume that the domain is the set of all real numbers. To show that the function holds
43

1.6. Functions as Graphs www.ck12.org
for all values in the domain, we connect the points with a smooth line (which, we understand, continues infinitely inboth directions).
Example 3
Graph the function that has the following table of values.
Side of square 0 1 2 3 4
Area of square 0 1 4 9 16
The table gives us five sets of coordinate points: (0, 0), (1, 1), (2, 4), (3, 9), and (4, 16).
To graph the function, we plot all the coordinate points. Since we are not told the domain of the function, we canassume that the domain is the set of all non-negative real numbers. To show that the function holds for all values inthe domain, we connect the points with a smooth curve. The curve does not make sense for negative values of theindependent variable, so it stops at x = 0, but it continues infinitely in the positive direction.
Example 4
Graph the function that has the following table of values.
Number of balloons 12 13 14 15 16
Cost 41 44 47 50 53
This function represents the total cost of the balloons delivered to your house. Each balloon is $3 and the storedelivers if you buy a dozen balloons or more. The delivery charge is a $5 flat fee.
44

www.ck12.org Chapter 1. Equations and Functions
Solution
The table gives us five sets of coordinate points: (12, 41), (13, 44), (14, 47), (15, 50), and (16, 53).
To graph the function, we plot all the coordinate points. Since the x−values represent the number of balloons for 12balloons or more, the domain of this function is all integers greater than or equal to 12. In this problem, the pointsare not connected by a line or curve because it doesn’tmake sense to have non-integer values of balloons.
In order to draw a graph of a function given the function rule, we must first make a table of values to give us a setof points to plot. Choosing good values for the table is a skill you’ll develop throughout this course. When you pickvalues, here are some of the things you should keep in mind.
• Pick only values from the domain of the function.• If the domain is the set of real numbers or a subset of the real numbers, the graph will be a continuous curve.• If the domain is the set of integers of a subset of the integers, the graph will be a set of points not connected
by a curve.• Picking integer values is best because it makes calculations easier, but sometimes we need to pick other values
to capture all the details of the function.• Often we start with one set of values. Then after drawing the graph, we realize that we need to pick different
values and redraw the graph.
Example 5
Graph the following function: f (x) = |x−2|
Solution
Make a table of values. Pick a variety of negative and positive values for x. Use the function rule to find the value ofy for each value of x. Then, graph each of the coordinate points.
TABLE 1.8:
x y = f (x) =| x−2 |-4 | −4−2 |=| −6 |= 6-3 | −3−2 |=| −5 |= 5-2 | −2−2 |=| −4 |= 4-1 | −1−2 |=| −3 |= 30 | 0−2 |=| −2 |= 21 | 1−2 |=| −1 |= 12 | 2−2 |=| 0 |= 03 | 3−2 |=| 1 |= 14 | 4−2 |=| 2 |= 2
45

1.6. Functions as Graphs www.ck12.org
TABLE 1.8: (continued)
x y = f (x) =| x−2 |5 | 5−2 |=| 3 |= 36 | 6−2 |=| 4 |= 47 | 7−2 |=| 5 |= 58 | 8−2 |=| 6 |= 6
It is wise to work with a lot of values when you begin graphing. As you learn about different types of functions, youwill start to only need a few points in the table of values to create an accurate graph.
Example 6
Graph the following function: f (x) =√
x
Solution
Make a table of values. We know x can’t be negative because we can’t take the square root of a negative number.The domain is all positive real numbers, so we pick a variety of positive integer values for x. Use the function ruleto find the value of y for each value of x.
TABLE 1.9:
x y = f (x) =√
x0
√0 = 0
1√
1 = 12
√2≈ 1.41
3√
3≈ 1.734
√4 = 2
5√
5≈ 2.246
√6≈ 2.45
7√
7≈ 2.658
√8≈ 2.83
9√
9 = 3
46
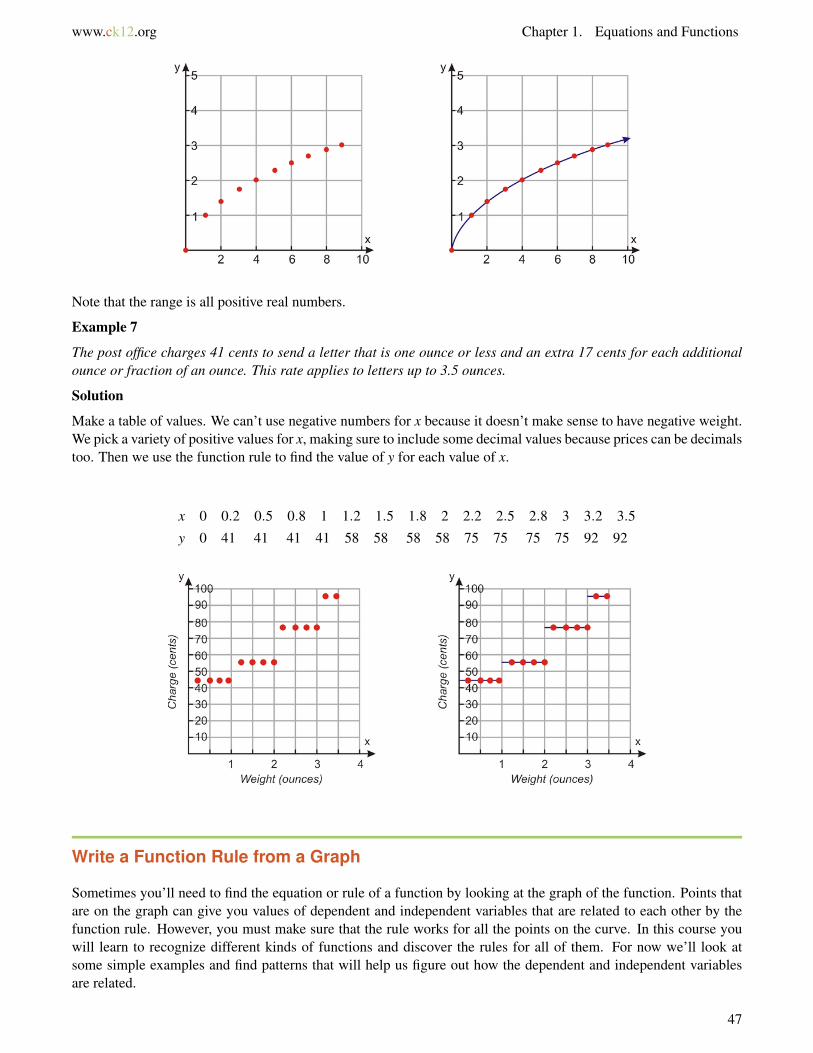
www.ck12.org Chapter 1. Equations and Functions
Note that the range is all positive real numbers.
Example 7
The post office charges 41 cents to send a letter that is one ounce or less and an extra 17 cents for each additionalounce or fraction of an ounce. This rate applies to letters up to 3.5 ounces.
Solution
Make a table of values. We can’t use negative numbers for x because it doesn’t make sense to have negative weight.We pick a variety of positive values for x, making sure to include some decimal values because prices can be decimalstoo. Then we use the function rule to find the value of y for each value of x.
x 0 0.2 0.5 0.8 1 1.2 1.5 1.8 2 2.2 2.5 2.8 3 3.2 3.5
y 0 41 41 41 41 58 58 58 58 75 75 75 75 92 92
Write a Function Rule from a Graph
Sometimes you’ll need to find the equation or rule of a function by looking at the graph of the function. Points thatare on the graph can give you values of dependent and independent variables that are related to each other by thefunction rule. However, you must make sure that the rule works for all the points on the curve. In this course youwill learn to recognize different kinds of functions and discover the rules for all of them. For now we’ll look atsome simple examples and find patterns that will help us figure out how the dependent and independent variablesare related.
47

1.6. Functions as Graphs www.ck12.org
Example 8
The graph to the right shows the distance that an ant covers over time. Find the function rule that shows howdistance and time are related to each other.
Solution
Let’s make a table of values of several coordinate points to see if we can spot how they are related to each other.
Time 0 1 2 3 4 5 6
Distance 0 1.5 3 4.5 6 7.5 9
We can see that for every second the distance increases by 1.5 feet. We can write the function rule as
Distance = 1.5× time
The equation of the function is f (x) = 1.5x.
Example 9
Find the function rule that describes the function shown in the graph.
Solution
Again, we can make a table of values of several coordinate points to identify how they are related to each other.
48

www.ck12.org Chapter 1. Equations and Functions
x −4 −3 −2 −1 0 1 2 3 4
y 8 4.5 2 .5 0 .5 5 4.5 8
Notice that the values of y are half of perfect squares: 8 is half of 16 (which is 4 squared), 4.5 is half of 9 (which is3 squared), and so on. So the equation of the function is f (x) = 1
2 x2.
Example 10
Find the function rule that shows the volume of a balloon at different times, based on the following graph:
(Notice that the graph shows negative time. The negative time can represent what happened on days before youstarted measuring the volume.)
Solution
Once again, we make a table to spot the pattern:
Time −1 0 1 2 3 4 5
Volume 10 5 2.5 1.2 0.6 0.3 0.15
We can see that every day, the volume of the balloon is half what it was the previous day. On day 0, the volume is 5;on day 1, the volume is 5× 1
2 ; on day 2, it is 5× 12 ×
12 , and in general, on day x it is 5×
(12
)x. The equation of thefunction is f (x) = 5×
(12
)x.
Determine Whether a Relation is a Function
A function is a special kind of relation. In a function, for each input there is exactly one output; in a relation, therecan be more than one output for a given input.
Consider the relation that shows the heights of all students in a class. The domain is the set of people in the class andthe range is the set of heights. This relation is a function because each person has exactly one height. If any personhad more than one height, the relation would not be a function.
49

1.6. Functions as Graphs www.ck12.org
Notice that even though the same person can’t have more than one height, it’s okay for more than one person to havethe same height. In a function, more than one input can have the same output, as long as more than one output nevercomes from the same input.
Example 11
Determine if the relation is a function.
a) (1, 3), (-1, -2), (3, 5), (2, 5), (3, 4)
b) (-3, 20), (-5, 25), (-1, 5), (7, 12), (9, 2)
c)
x 2 1 0 1 2
y 12 10 8 6 4
Solution
The easiest way to figure out if a relation is a function is to look at all the x−values in the list or the table. If a valueof x appears more than once, and it’s paired up with different y−values, then the relation is not a function.
a) You can see that in this relation there are two different y−values paired with the x−value of 3. This means thatthis relation is not a function.
b) Each value of x has exactly one y−value. The relation is a function.
c) In this relation there are two different y−values paired with the x−value of 2 and two y−values paired with thex−value of 1. The relation is not a function.
When a relation is represented graphically, we can determine if it is a function by using the vertical line test. If youcan draw a vertical line that crosses the graph in more than one place, then the relation is not a function. Here aresome examples.
50

www.ck12.org Chapter 1. Equations and Functions
Not a function. It fails the vertical line test.
A function. No vertical line will cross more than one point on the graph.
A function. No vertical line will cross more than one point on the graph.
51

1.6. Functions as Graphs www.ck12.org
Not a function. It fails the vertical line test.
Additional Resources
Once you’ve had some practice graphing functions by hand, you may want to use a graphing calculator to makegraphing easier. If you don’t have one, you can also use the applet at http://rechneronline.de/function-graphs/. Justtype a function in the blank and press Enter. You can use the options under Display Properties to zoom in or panaround to different parts of the graph.
Review Questions
1. Plot the coordinate points on the Cartesian plane.
a. (4, -4)b. (2, 7)c. (-3, -5)d. (6, 3)e. (-4, 3)
2. Give the coordinates for each point in this Cartesian plane.
3. Graph the function that has the following table of values. (a)
x −10 −5 0 5 10
y −3 −0.5 2 4.5 7
52

www.ck12.org Chapter 1. Equations and Functions
(b)
Side of cube (in.) 0 1 2 3
Volume (in3) 0 1 8 27
(c)
Time (hours) −2 −1 0 1 2
Distance from town center (miles) 50 25 0 25 50
4. Graph the following functions.
a. Brandon is a member of a movie club. He pays a $50 annual membership and $8 per movie.b. f (x) = (x−2)2
c. f (x) = 3.2x
5. Determine whether each relation is a function: (a) (1, 7), (2, 7), (3, 8), (4, 8), (5, 9) (b) (1, 1), (1, -1), (4, 2),(4, -2), (9, 3), (9, -3) (c)
x −4 −3 −2 −1 0
y 16 9 4 1 0
(d)
Age 20 25 25 30 35
Number of jobs by that age 3 4 7 4 2
6. Write the function rule for each graph.
a.
b.
7. The students at a local high school took The Youth Risk Behavior Survey. The graph below shows thepercentage of high school students who reported that they were current smokers. (A current smoker is anyonewho has smoked one or more cigarettes in the past 30 days.) What percentage of high-school students werecurrent smokers in the following years?
53
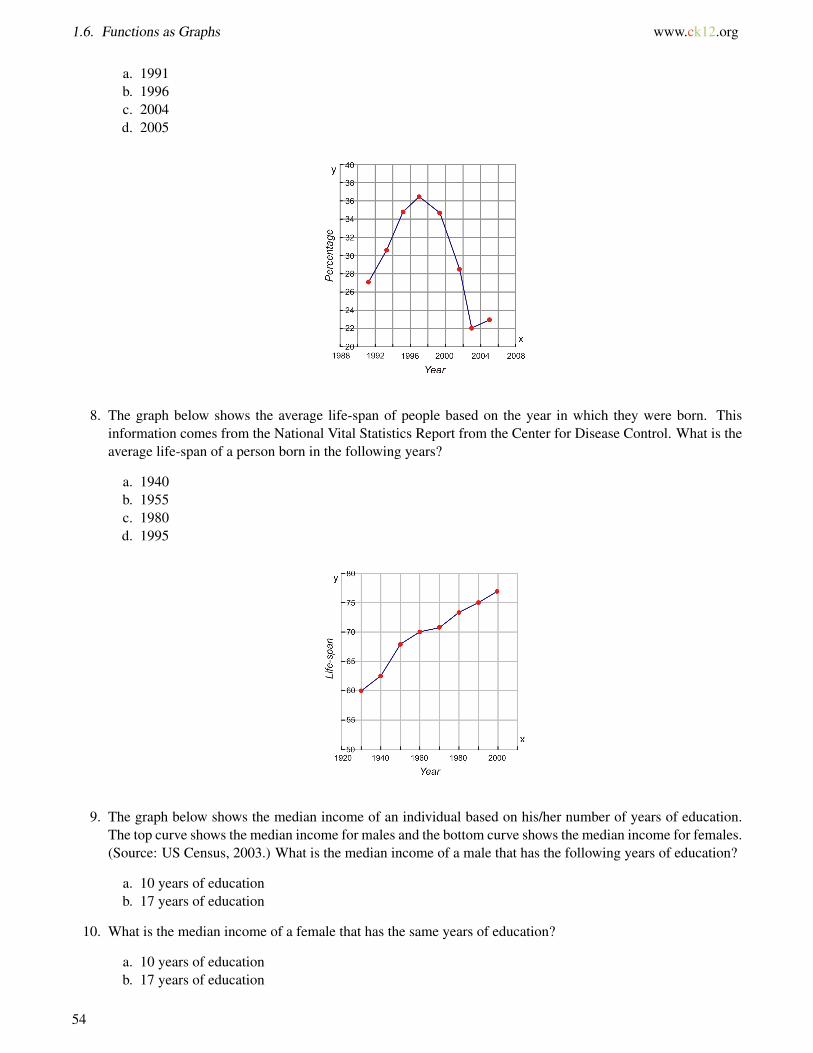
1.6. Functions as Graphs www.ck12.org
a. 1991b. 1996c. 2004d. 2005
8. The graph below shows the average life-span of people based on the year in which they were born. Thisinformation comes from the National Vital Statistics Report from the Center for Disease Control. What is theaverage life-span of a person born in the following years?
a. 1940b. 1955c. 1980d. 1995
9. The graph below shows the median income of an individual based on his/her number of years of education.The top curve shows the median income for males and the bottom curve shows the median income for females.(Source: US Census, 2003.) What is the median income of a male that has the following years of education?
a. 10 years of educationb. 17 years of education
10. What is the median income of a female that has the same years of education?
a. 10 years of educationb. 17 years of education
54

www.ck12.org Chapter 1. Equations and Functions
11. Use the vertical line test to determine whether each relation is a function.
a.
b.
55

1.7. Problem-Solving Plan www.ck12.org
1.7 Problem-Solving Plan
Learning Objectives
• Read and understand given problem situations.• Make a plan to solve the problem.• Solve the problem and check the results.• Compare alternative approaches to solving the problem.• Solve real-world problems using a plan.
Introduction
We always think of mathematics as the subject in school where we solve lots of problems. Problem solving isnecessary in all aspects of life. Buying a house, renting a car, or figuring out which is the better sale are just a fewexamples of situations where people use problem-solving techniques. In this book, you will learn different strategiesand approaches to solving problems. In this section, we will introduce a problem-solving plan that will be usefulthroughout this book.
Read and Understand a Given Problem Situation
The first step to solving a word problem is to read and understand the problem. Here are a few questions that youshould be asking yourself:
• What am I trying to find out?• What information have I been given?• Have I ever solved a similar problem?
This is also a good time to define any variables. When you identify your knowns and unknowns, it is often usefulto assign them a letter to make notation and calculations easier.
Make a Plan to Solve the Problem
The next step in the problem-solving plan is to develop a strategy. How can the information you know assist youin figuring out the unknowns?
Here are some common strategies that you will learn:
• Drawing a diagram.• Making a table.
56

www.ck12.org Chapter 1. Equations and Functions
• Looking for a pattern.• Using guess and check.• Working backwards.• Using a formula.• Reading and making graphs.• Writing equations.• Using linear models.• Using dimensional analysis.• Using the right type of function for the situation.
In most problems, you will use a combination of strategies. For example, looking for patterns is a good strategy formost problems, and making a table and drawing a graph are often used together. The “writing an equation” strategyis the one you will work with the most in your study of algebra.
Solve the Problem and Check the Results
Once you develop a plan, you can implement it and solve the problem, carrying out all operations to arrive at theanswer you are seeking.
The last step in solving any problem should always be to check and interpret the answer. Ask yourself:
• Does the answer make sense?• If you plug the answer back into the problem, do all the numbers work out?• Can you get the same answer through another method?
Compare Alternative Approaches to Solving the Problem
Sometimes one specific method is best for solving a problem. Most problems, however, can be solved by usingseveral different strategies. When you are familiar with all of the problem-solving strategies, it is up to you tochoose the methods that you are most comfortable with and that make sense to you. In this book, we will often usemore than one method to solve a problem, so we can demonstrate the strengths and weakness of different strategiesfor solving different types of problems.
Whichever strategy you are using, you should always implement the problem-solving plan when you are solvingword problems. Here is a summary of the problem-solving plan.
Step 1:
Understand the problem
Read the problem carefully. Once the problem is read, list all the components and data that are involved. This iswhere you will be assigning your variables.
Step 2:
Devise a plan - Translate
Come up with a way to solve the problem. Set up an equation, draw a diagram, make a chart or construct a table asa start to solve your problem solving plan.
Step 3:
Carry out the plan - Solve
57

1.7. Problem-Solving Plan www.ck12.org
This is where you solve the equation you developed in Step 2.
Step 4:
Look - Check and Interpret
Check to see if you used all your information. Then look to see if the answer makes sense.
Solve Real-World Problems Using a Plan
Let’s now apply this problem solving plan to a problem.
Example 1
A coffee maker is on sale at 50% off the regular ticket price. On the “Sunday Super Sale” the same coffee maker ison sale at an additional 40% off. If the final price is $21, what was the original price of the coffee maker?
Solution
Step 1: Understand
We know: A coffee maker is discounted 50% and then 40%. The final price is $21.
We want: The original price of the coffee maker.
Step 2: Strategy
Let’s look at the given information and try to find the relationship between the information we know and theinformation we are trying to find.
50% off the original price means that the sale price is half of the original or 0.5 × original price.
So, the first sale price = 0.5 × original price
A savings of 40% off the new price means you pay 60% of the new price, or 0.6 × new price.
0.6× (0.5×original price) = 0.3×original price is the price after the second discount.
We know that after two discounts, the final price is $21.
So 0.3×original price = $21.
Step 3: Solve
Since 0.3×original price = $21, we can find the original price by dividing $21 by 0.3.
Original price = $21÷0.3 = $70.
The original price of the coffee maker was $70.
Step 4: Check
We found that the original price of the coffee maker is $70.
To check that this is correct, let’s apply the discounts.
50% of $70 = .5×$70 = $35 savings. So the price after the first discount is original price− savings or $70−35 =$35.
Then 40% of that is .4×$35 = $14. So after the second discount, the price is $35−14 = $21.
The answer checks out.
58

www.ck12.org Chapter 1. Equations and Functions
Additional Resources
The problem-solving plan used here is based on the ideas of George Polya, who describes his useful problem-solving strategies in more detail in the book How to Solve It. Some of the techniques in the book can also be foundon Wikipedia, in the entry http://en.wikipedia.org/wiki/How_to_Solve_It.
Review Questions
1. A sweatshirt costs $35. Find the total cost if the sales tax is 7.75%.2. This year you got a 5% raise. If your new salary is $45,000, what was your salary before the raise?3. Mariana deposits $500 in a savings account that pays 3% simple interest per year. How much will be in her
account after three years?4. It costs $250 to carpet a room that is 14 ft by 18 ft. How much does it cost to carpet a room that is 9 ft by 10
ft?5. A department store has a 15% discount for employees. Suppose an employee has a coupon worth $10 off any
item and she wants to buy a $65 purse. What is the final cost of the purse if the employee discount is appliedbefore the coupon is subtracted?
6. To host a dance at a hotel you must pay $250 plus $20 per guest. How much money would you have to payfor 25 guests?
7. Yusef’s phone plan costs $10 a month plus $0.05 per minute. If his phone bill for last month was $25.80, howmany minutes did he spend on the phone?
8. It costs $12 to get into the San Diego County Fair and $1.50 per ride.
a. If Rena spent $24 in total, how many rides did she go on?b. How much would she have spent in total if she had gone on five more rides?
9. An ice cream shop sells a small cone for $2.95, a medium cone for $3.50, and a large cone for $4.25. LastSaturday, the shop sold 22 small cones, 26 medium cones and 15 large cones. How much money did the storeearn?
10. In Lise’s chemistry class, there are two midterm exams, each worth 30% of her total grade, and a final examworth 40%. If Lise scores 90% on both midterms and 80% on the final exam, what is her overall score in theclass?
11. The sum of the angles in a triangle is 180 degrees. If the second angle is twice the size of the first angle andthe third angle is three times the size of the first angle, what are the measures of the angles in the triangle?
12. A television that normally costs $120 goes on sale for 20% off. What is the new price?13. A cake recipe calls for 1 3
4 cup of flour. Jeremy wants to make four cakes. How many cups of flour will heneed?
14. Casey is twice as old as Marietta, who is two years younger than Jake. If Casey is 14, how old is Jake?15. Kylie is mowing lawns to earn money for a new bike. After mowing four lawns, she still needs $40 more to
pay for the bike. After mowing three more lawns, she has $5 more than she needs to pay for the bike.
a. How much does she earn per lawn?b. What is the cost of the bike?
16. Jared goes trick-or-treating with his brother and sister. At the first house they stop at, they collect three piecesof candy each; at the next three houses, they collect two pieces of candy each. Then they split up and go downdifferent blocks, where Jared collects 12 pieces of candy and his brother and sister collect 14 each.
a. How many pieces of candy does Jared end up with?b. How many pieces of candy do all three of them together end up with?
59
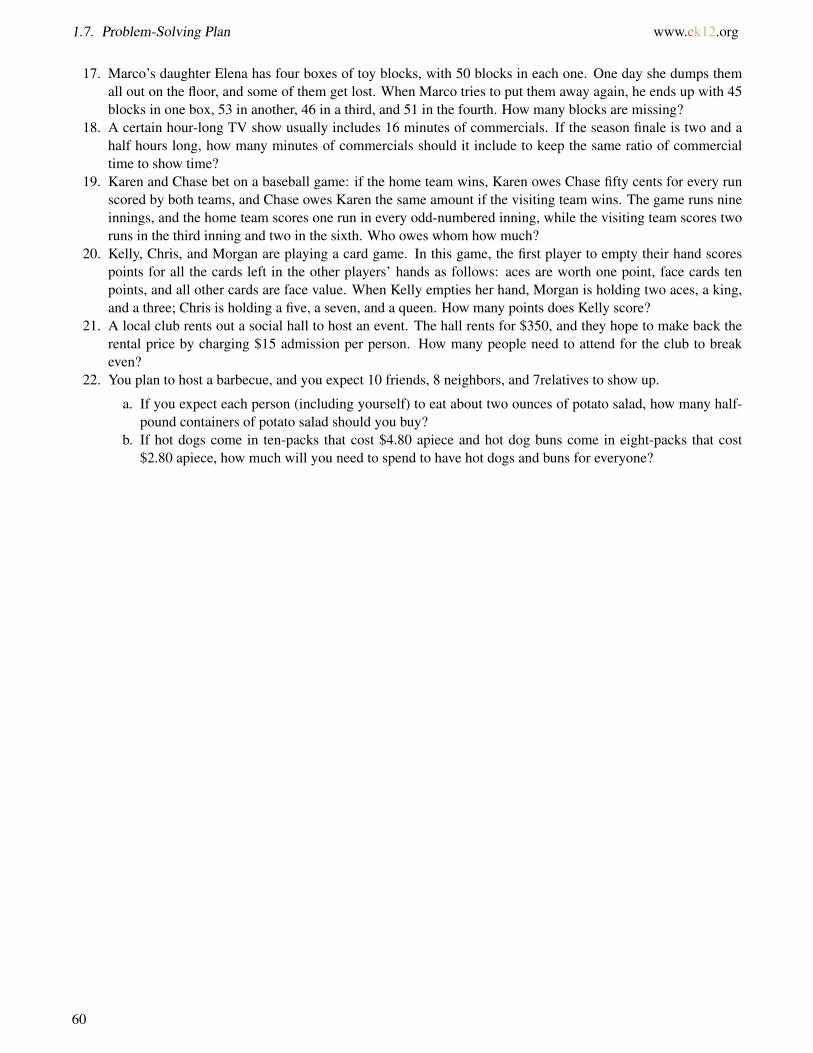
1.7. Problem-Solving Plan www.ck12.org
17. Marco’s daughter Elena has four boxes of toy blocks, with 50 blocks in each one. One day she dumps themall out on the floor, and some of them get lost. When Marco tries to put them away again, he ends up with 45blocks in one box, 53 in another, 46 in a third, and 51 in the fourth. How many blocks are missing?
18. A certain hour-long TV show usually includes 16 minutes of commercials. If the season finale is two and ahalf hours long, how many minutes of commercials should it include to keep the same ratio of commercialtime to show time?
19. Karen and Chase bet on a baseball game: if the home team wins, Karen owes Chase fifty cents for every runscored by both teams, and Chase owes Karen the same amount if the visiting team wins. The game runs nineinnings, and the home team scores one run in every odd-numbered inning, while the visiting team scores tworuns in the third inning and two in the sixth. Who owes whom how much?
20. Kelly, Chris, and Morgan are playing a card game. In this game, the first player to empty their hand scorespoints for all the cards left in the other players’ hands as follows: aces are worth one point, face cards tenpoints, and all other cards are face value. When Kelly empties her hand, Morgan is holding two aces, a king,and a three; Chris is holding a five, a seven, and a queen. How many points does Kelly score?
21. A local club rents out a social hall to host an event. The hall rents for $350, and they hope to make back therental price by charging $15 admission per person. How many people need to attend for the club to breakeven?
22. You plan to host a barbecue, and you expect 10 friends, 8 neighbors, and 7relatives to show up.
a. If you expect each person (including yourself) to eat about two ounces of potato salad, how many half-pound containers of potato salad should you buy?
b. If hot dogs come in ten-packs that cost $4.80 apiece and hot dog buns come in eight-packs that cost$2.80 apiece, how much will you need to spend to have hot dogs and buns for everyone?
60

www.ck12.org Chapter 1. Equations and Functions
1.8 Problem-Solving Strategies: Make a Tableand Look for a Pattern
Learning Objectives
• Read and understand given problem situations.• Develop and use the strategy “make a table.”• Develop and use the strategy “look for a pattern.”• Plan and compare alternative approaches to solving a problem.• Solve real-world problems using the above strategies as part of a plan.
Introduction
In this section, we will apply the problem-solving plan you learned about in the last section to solve several real-world problems. You will learn how to develop and use the methods make a table and look for a pattern.
Read and Understand Given Problem Situations
The most difficult parts of problem-solving are most often the first two steps in our problem-solving plan. You needto read the problem and make sure you understand what you are being asked. Once you understand the problem,you can devise a strategy to solve it.
Let’s apply the first two steps to the following problem.
Example 1:
Six friends are buying pizza together and they are planning to split the check equally. After the pizza was ordered,one of the friends had to leave suddenly, before the pizza arrived. Everyone left had to pay $1 extra as a result. Howmuch was the total bill?
Solution
Understand
We want to find how much the pizza cost.
We know that five people had to pay an extra $1 each when one of the original six friends had to leave.
Strategy
We can start by making a list of possible amounts for the total bill.
We divide the amount by six and then by five. The total divided by five should equal $1 more than the total dividedby six.
Look for any patterns in the numbers that might lead you to the correct answer.
In the rest of this section you will learn how to make a table or look for a pattern to figure out a solution for this typeof problem. After you finish reading the rest of the section, you can finish solving this problem for homework.
61

1.8. Problem-Solving Strategies: Make a Table and Look for a Pattern www.ck12.org
Develop and Use the Strategy: Make a Table
The method “Make a Table” is helpful when solving problems involving numerical relationships. When data isorganized in a table, it is easier to recognize patterns and relationships between numbers. Let’s apply this strategy tothe following example.
Example 2
Josie takes up jogging. On the first week she jogs for 10 minutes per day, on the second week she jogs for 12 minutesper day. Each week, she wants to increase her jogging time by 2 minutes per day. If she jogs six days each week,what will be her total jogging time on the sixth week?
Solution
Understand
We know in the first week Josie jogs 10 minutes per day for six days.
We know in the second week Josie jogs 12 minutes per day for six days.
Each week, she increases her jogging time by 2 minutes per day and she jogs 6 days per week.
We want to find her total jogging time in week six.
Strategy
A good strategy is to list the data we have been given in a table and use the information we have been given to findnew information.
We are told that Josie jogs 10 minutes per day for six days in the first week and 12 minutes per day for six days inthe second week. We can enter this information in a table:
TABLE 1.10:
Week Minutes per Day Minutes per Week1 10 602 12 72
You are told that each week Josie increases her jogging time by 2 minutes per day and jogs 6 times per week. Wecan use this information to continue filling in the table until we get to week six.
TABLE 1.11:
Week Minutes per Day Minutes per Week1 10 602 12 723 14 844 16 965 18 1086 20 120
Apply strategy/solve
To get the answer we read the entry for week six.
Answer: In week six Josie jogs a total of 120 minutes.
Check
62
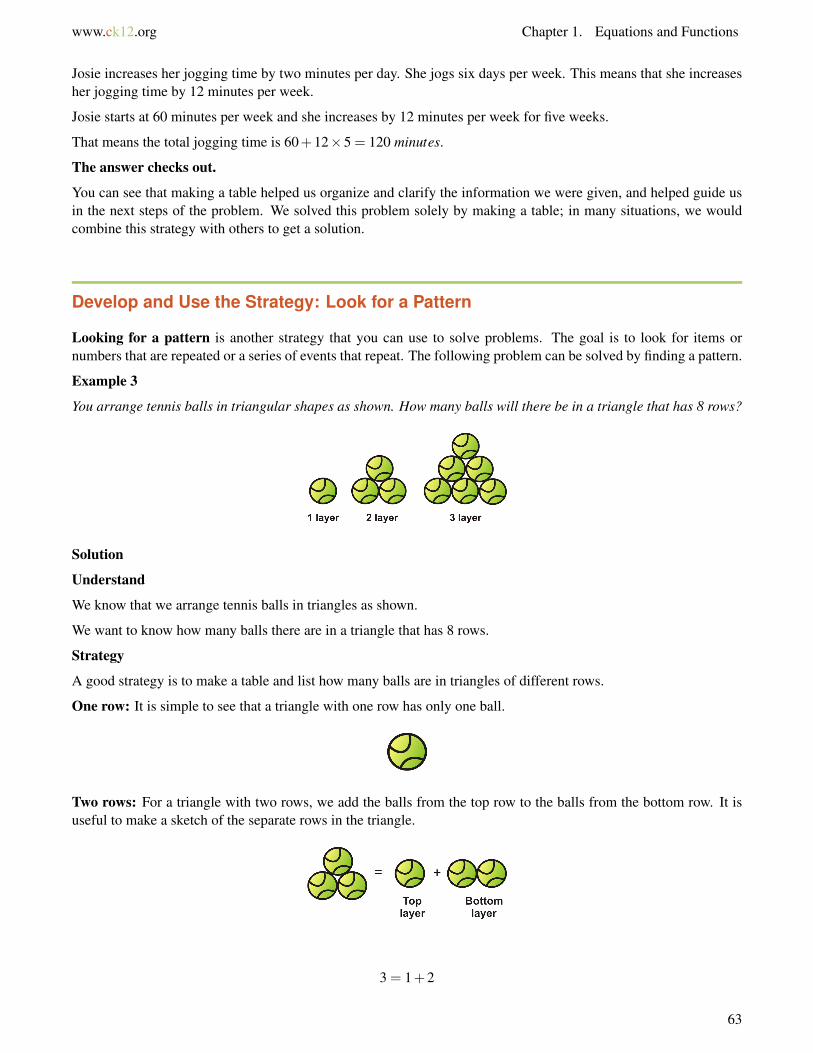
www.ck12.org Chapter 1. Equations and Functions
Josie increases her jogging time by two minutes per day. She jogs six days per week. This means that she increasesher jogging time by 12 minutes per week.
Josie starts at 60 minutes per week and she increases by 12 minutes per week for five weeks.
That means the total jogging time is 60+12×5 = 120 minutes.
The answer checks out.
You can see that making a table helped us organize and clarify the information we were given, and helped guide usin the next steps of the problem. We solved this problem solely by making a table; in many situations, we wouldcombine this strategy with others to get a solution.
Develop and Use the Strategy: Look for a Pattern
Looking for a pattern is another strategy that you can use to solve problems. The goal is to look for items ornumbers that are repeated or a series of events that repeat. The following problem can be solved by finding a pattern.
Example 3
You arrange tennis balls in triangular shapes as shown. How many balls will there be in a triangle that has 8 rows?
Solution
Understand
We know that we arrange tennis balls in triangles as shown.
We want to know how many balls there are in a triangle that has 8 rows.
Strategy
A good strategy is to make a table and list how many balls are in triangles of different rows.
One row: It is simple to see that a triangle with one row has only one ball.
Two rows: For a triangle with two rows, we add the balls from the top row to the balls from the bottom row. It isuseful to make a sketch of the separate rows in the triangle.
3 = 1+2
63

1.8. Problem-Solving Strategies: Make a Table and Look for a Pattern www.ck12.org
Three rows: We add the balls from the top triangle to the balls from the bottom row.
6 = 3+3
Now we can fill in the first three rows of a table.
TABLE 1.12:
Number of Rows Number of Balls1 12 33 6
We can see a pattern.
To create the next triangle, we add a new bottom row to the existing triangle.
The new bottom row has the same number of balls as there are rows. (For example, a triangle with 3 rows has 3balls in the bottom row.)
To get the total number of balls for the new triangle, we add the number of balls in the old triangle to the number ofballs in the new bottom row.
Apply strategy/solve:
We can complete the table by following the pattern we discovered.
Number of balls = number of balls in previous triangle + number of rows in the new triangle
TABLE 1.13:
Number of Rows Number of Balls1 12 33 64 6+4 = 105 10+5 = 156 15+6 = 217 21+7 = 288 28+8 = 36
Answer There are 36 balls in a triangle arrangement with 8 rows.
Check
Each row of the triangle has one more ball than the previous one. In a triangle with 8 rows,
row 1 has 1 ball, row 2 has 2 balls, row 3 has 3 balls, row 4 has 4 balls, row 5 has 5 balls, row 6 has 6 balls, row 7has 7 balls, row 8 has 8 balls.
64
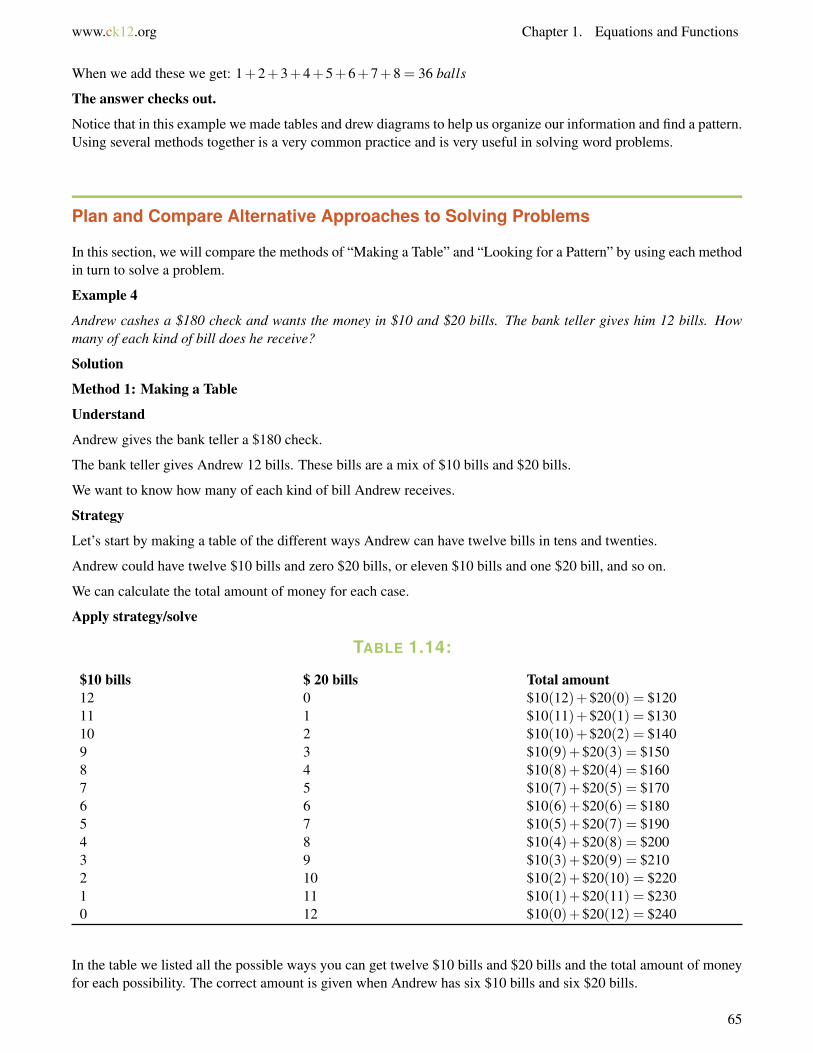
www.ck12.org Chapter 1. Equations and Functions
When we add these we get: 1+2+3+4+5+6+7+8 = 36 balls
The answer checks out.
Notice that in this example we made tables and drew diagrams to help us organize our information and find a pattern.Using several methods together is a very common practice and is very useful in solving word problems.
Plan and Compare Alternative Approaches to Solving Problems
In this section, we will compare the methods of “Making a Table” and “Looking for a Pattern” by using each methodin turn to solve a problem.
Example 4
Andrew cashes a $180 check and wants the money in $10 and $20 bills. The bank teller gives him 12 bills. Howmany of each kind of bill does he receive?
Solution
Method 1: Making a Table
Understand
Andrew gives the bank teller a $180 check.
The bank teller gives Andrew 12 bills. These bills are a mix of $10 bills and $20 bills.
We want to know how many of each kind of bill Andrew receives.
Strategy
Let’s start by making a table of the different ways Andrew can have twelve bills in tens and twenties.
Andrew could have twelve $10 bills and zero $20 bills, or eleven $10 bills and one $20 bill, and so on.
We can calculate the total amount of money for each case.
Apply strategy/solve
TABLE 1.14:
$10 bills $ 20 bills Total amount12 0 $10(12)+$20(0) = $12011 1 $10(11)+$20(1) = $13010 2 $10(10)+$20(2) = $1409 3 $10(9)+$20(3) = $1508 4 $10(8)+$20(4) = $1607 5 $10(7)+$20(5) = $1706 6 $10(6)+$20(6) = $1805 7 $10(5)+$20(7) = $1904 8 $10(4)+$20(8) = $2003 9 $10(3)+$20(9) = $2102 10 $10(2)+$20(10) = $2201 11 $10(1)+$20(11) = $2300 12 $10(0)+$20(12) = $240
In the table we listed all the possible ways you can get twelve $10 bills and $20 bills and the total amount of moneyfor each possibility. The correct amount is given when Andrew has six $10 bills and six $20 bills.
65

1.8. Problem-Solving Strategies: Make a Table and Look for a Pattern www.ck12.org
Answer: Andrew gets six $10 bills and six $20 bills.
Check
Six $10 bills and six $20 bills→ 6($10)+6($20) = $60+$120 = $180
The answer checks out.
Let’s solve the same problem using the method “Look for a Pattern.”
Method 2: Looking for a Pattern
Understand
Andrew gives the bank teller a $180 check.
The bank teller gives Andrew 12 bills. These bills are a mix of $10 bills and $20 bills.
We want to know how many of each kind of bill Andrew receives.
Strategy
Let’s start by making a table just as we did above. However, this time we will look for patterns in the table that canbe used to find the solution.
Apply strategy/solve
Let’s fill in the rows of the table until we see a pattern.
TABLE 1.15:
$10 bills $20 bills Total amount12 0 $10(12)+$20(0) = $12011 1 $10(11)+$20(1) = $13010 2 $10(10)+$20(2) = $140
We see that every time we reduce the number of $10 bills by one and increase the number of $20 bills by one, thetotal amount increases by $10. The last entry in the table gives a total amount of $140, so we have $40 to go untilwe reach our goal. This means that we should reduce the number of $10 bills by four and increase the number of$20 bills by four. That would give us six $10 bills and six $20 bills.
6($10)+6($20) = $60+120 = $180
Answer: Andrew gets six $10 bills and six $20 bills.
Check
Six $10 bills and six $20 bills→ 6($10)+6($20) = $60+120 = $180
The answer checks out.
You can see that the second method we used for solving the problem was less tedious. In the first method, welisted all the possible options and found the answer we were seeking. In the second method, we started by listingthe options, but we found a pattern that helped us find the solution faster. The methods of “Making a Table” and“Looking for a Pattern” are both more powerful if used alongside other problem-solving methods.
66

www.ck12.org Chapter 1. Equations and Functions
Solve Real-World Problems Using Selected Strategies as Part of a Plan
Example 5
Anne is making a box without a lid. She starts with a 20 in. square piece of cardboard and cuts out four equal squaresfrom each corner of the cardboard as shown. She then folds the sides of the box and glues the edges together. Howbig does she need to cut the corner squares in order to make the box with the biggest volume?
Solution
Step 1:
Understand
Anne makes a box out of a 20 in×20 in piece of cardboard.
She cuts out four equal squares from the corners of the cardboard.
She folds the sides and glues them to make a box.
How big should the cut out squares be to make the box with the biggest volume?
Step 2:
Strategy
We need to remember the formula for the volume of a box.
Volume = Area of base×height
Volume = width× length×height
Make a table of values by picking different values for the side of the squares that we are cutting out and calculatethe volume.
Step 3:
Apply strategy/solve
Let’s “make” a box by cutting out four corner squares with sides equal to 1 inch. The diagram will look like this:
67

1.8. Problem-Solving Strategies: Make a Table and Look for a Pattern www.ck12.org
You see that when we fold the sides over to make the box, the height becomes 1 inch, the width becomes 18 inchesand the length becomes 18 inches.
Volume = width× length×height
Volume = 18×18×1 = 324 in3
Let’s make a table that shows the value of the box for different square sizes:
TABLE 1.16:
Side of Square Box Height Box Width Box Length Volume1 1 18 18 18×18×1 = 3242 2 16 16 16×16×2 = 5123 3 14 14 14×14×3 = 5884 4 12 12 12×12×4 = 5765 5 10 10 10×10×5 = 5006 6 8 8 8×8×6 = 3847 7 6 6 6×6×7 = 2528 8 4 4 4×4×8 = 1289 9 2 2 2×2×9 = 3610 10 0 0 0×0×10 = 0
We stop at a square of 10 inches because at this point we have cut out all of the cardboard and we can’t make a boxany more. From the table we see that we can make the biggest box if we cut out squares with a side length of threeinches. This gives us a volume of 588 in3.
Answer The box of greatest volume is made if we cut out squares with a side length of three inches.
Step 4:
Check
We see that 588 in3 is the largest volume appearing in the table. We picked integer values for the sides of the squaresthat we are cut out. Is it possible to get a larger value for the volume if we pick non-integer values? Since we getthe largest volume for the side length equal to three inches, let’s make another table with values close to three inchesthat is split into smaller increments:
TABLE 1.17:
Side of Square Box Height Box Width Box Length Volume2.5 2.5 15 15 15 × 15 × 2.5 =
562.5
68

www.ck12.org Chapter 1. Equations and Functions
TABLE 1.17: (continued)
Side of Square Box Height Box Width Box Length Volume2.6 2.6 14.8 14.8 14.8× 14.8× 2.6 =
569.52.7 2.7 14.6 14.6 14.6× 14.6× 2.7 =
575.52.8 2.8 14.4 14.4 14.4× 14.4× 2.8 =
580.62.9 2.9 14.2 14.2 14.2× 14.2× 2.9 =
584.83 3 14 14 14×14×3 = 5883.1 3.1 13.8 13.8 13.8× 13.8× 3.1 =
590.43.2 3.2 13.6 13.6 13.6× 13.6× 3.2 =
591.93.3 3.3 13.4 13.4 13.4× 13.4× 3.3 =
592.53.4 3.4 13.2 13.2 13.2× 13.2× 3.4 =
592.43.5 3.5 13 13 13 × 13 × 3.5 =
591.5
Notice that the largest volume is not when the side of the square is three inches, but rather when the side of thesquare is 3.3 inches.
Our original answer was not incorrect, but it was not as accurate as it could be. We can get an even more accurateanswer if we take even smaller increments of the side length of the square. To do that, we would choose smallermeasurements that are in the neighborhood of 3.3 inches.
Meanwhile, our first answer checks out if we want it rounded to zero decimal places, but a more accurate answeris 3.3 inches.
Review Questions
1. Go back and find the solution to the problem in Example 1.2. Britt has $2.25 in nickels and dimes. If she has 40 coins in total, how many of each coin does she have?3. Jeremy divides a 160-square-foot garden into plots that are either 10 or 12 square feet each. If there are 14
plots in all, how many plots are there of each size?4. A pattern of squares is put together as shown. How many squares are in the 12th diagram?
5. In Harrisville, local housing laws specify how many people can live in a house or apartment: the maximumnumber of people allowed is twice the number of bedrooms, plus one. If Jan, Pat, and their four children wantto rent a house, how many bedrooms must it have?
69
1.8. Problem-Solving Strategies: Make a Table and Look for a Pattern www.ck12.org
6. A restaurant hosts children’s birthday parties for a cost of $120 for the first six children (including the birthdaychild) and $30 for each additional child. If Jaden’s parents have a budget of $200 to spend on his birthdayparty, how many guests can Jaden invite?
7. A movie theater with 200 seats charges $8 general admission and $5 for students. If the 5:00 showing is soldout and the theater took in $1468 for that showing, how many of the seats are occupied by students?
8. Oswald is trying to cut down on drinking coffee. His goal is to cut down to 6 cups per week. If he starts with24 cups the first week, then cuts down to 21 cups the second week and 18 cups the third week, how manyweeks will it take him to reach his goal?
9. Taylor checked out a book from the library and it is now 5 days late. The late fee is 10 cents per day. Howmuch is the fine?
10. Mikhail is filling a sack with oranges.
a. If each orange weighs 5 ounces and the sack will hold 2 pounds, how many oranges will the sack holdbefore it bursts?
b. Mikhail plans to use these oranges to make breakfast smoothies. If each smoothie requires 34 cup of
orange juice, and each orange will yield half a cup, how many smoothies can he make?
11. Jessamyn takes out a $150 loan from an agency that charges 12% of the original loan amount in interest eachweek. If she takes five weeks to pay off the loan, what is the total amount (loan plus interest) she will need topay back?
12. How many hours will a car traveling at 75 miles per hour take to catch up to a car traveling at 55 miles perhour if the slower car starts two hours before the faster car?
13. Grace starts biking at 12 miles per hour. One hour later, Dan starts biking at 15 miles per hour, following thesame route. How long will it take him to catch up with Grace?
14. A new theme park opens in Milford. On opening day, the park has 120 visitors; on each of the next three days,the park has 10 more visitors than the day before; and on each of the three days after that, the park has 20more visitors than the day before.
a. How many visitors does the park have on the seventh day?b. How many total visitors does the park have all week?
15. Lemuel wants to enclose a rectangular plot of land with a fence. He has 24 feet of fencing. What is the largestpossible area that he could enclose with the fence?
16. Quizzes in Keiko’s history class are worth 20 points each. Keiko scored 15 and 18 points on her last twoquizzes. What score does she need on her third quiz to get an average score of 17 on all three?
17. Tickets to an event go on sale for $20 six weeks before the event, and go up in price by $5 each week. Whatis the price of tickets one week before the event?
18. Mark is three years older than Janet, and the sum of their ages is 15. How old are Mark and Janet?19. In a one-on-one basketball game, Jane scored 1 1
2 times as many points as Russell. If the two of them togetherscored 10 points, how many points did Jane score?
20. Scientists are tracking two pods of whales during their migratory season. On the first day of June, one pod is120 miles north of a certain group of islands, and every day thereafter it gets 15 miles closer to the islands.The second pod starts out 160 miles east of the islands on June 3, and heads toward the islands at a rate of 20miles a day.
a. Which pod will arrive at the islands first, and on what day?b. How long after that will it take the other pod to reach the islands?c. Suppose the pod that reaches the islands first immediately heads south from the islands at a rate of 15
miles a day, and the pod that gets there second also heads south from there at a rate of 25 miles a day.On what day will the second pod catch up with the first?
d. How far will both pods be from the islands on that day?
70

www.ck12.org Chapter 1. Equations and Functions
Texas Instruments Resources
In the CK-12 Texas Instruments Algebra I FlexBook, there are graphing calculator activities designed to supple-ment the objectives for some of the lessons in this chapter. See http://www.ck12.org/flexr/chapter/9611.
71
www.ck12.org
CHAPTER 2 Real NumbersChapter Outline
2.1 INTEGERS AND RATIONAL NUMBERS
2.2 ADDING AND SUBTRACTING RATIONAL NUMBERS
2.3 MULTIPLYING AND DIVIDING RATIONAL NUMBERS
2.4 THE DISTRIBUTIVE PROPERTY
2.5 SQUARE ROOTS AND REAL NUMBERS
2.6 PROBLEM-SOLVING STRATEGIES: GUESS AND CHECK, WORK BACKWARD
72

www.ck12.org Chapter 2. Real Numbers
2.1 Integers and Rational Numbers
Learning Objectives
• Graph and compare integers.• Classify and order rational numbers.• Find opposites of numbers.• Find absolute values.• Compare fractions to determine which is bigger.
Introduction
One day, Jason leaves his house and starts walking to school. After three blocks, he stops to tie his shoe and leaveshis lunch bag sitting on the curb. Two blocks farther on, he realizes his lunch is missing and goes back to get it.After picking up his lunch, he walks six more blocks to arrive at school. How far is the school from Jason’s house?And how far did Jason actually walk to get there?
Graph and Compare Integers
Integers are the counting numbers (1, 2, 3...), the negative opposites of the counting numbers (-1, -2, -3...), and zero.There are an infinite number of integers and examples are 0, 3, 76, -2, -11, and 995.
Example 1
Compare the numbers 2 and -5.
When we plot numbers on a number line, the greatest number is farthest to the right, and the least is farthest to theleft.
In the diagram above, we can see that 2 is farther to the right on the number line than -5, so we say that 2 is greaterthan -5. We use the symbol “>” to mean “greater than”, so we can write 2 >−5.
73

2.1. Integers and Rational Numbers www.ck12.org
Classifying Rational Numbers
When we divide an integer a by another integer b (as long as b is not zero) we get a rational number. It’s calledthis because it is the ratio of one number to another, and we can write it in fraction form as a
b . (You may recall thatthe top number in a fraction is called the numerator and the bottom number is called the denominator.)
You can think of a rational number as a fraction of a cake. If you cut the cake into b slices, your share is a of thoseslices.
For example, when we see the rational number 12 , we can imagine cutting the cake into two parts. Our share is one
of those parts. Visually, the rational number 12 looks like this:
With the rational number 34 , we cut the cake into four parts and our share is three of those parts. Visually, the rational
number 34 looks like this:
The rational number 910 represents nine slices of a cake that has been cut into ten pieces. Visually, the rational
number 910 looks like this:
Proper fractions are rational numbers where the numerator is less than the denominator. A proper fraction repre-sents a number less than one.
Improper fractions are rational numbers where the numerator is greater than or equal to the denominator. Animproper fraction can be rewritten as a mixed number – an integer plus a proper fraction. For example, 9
4 can bewritten as 2 1
4 . An improper fraction represents a number greater than or equal to one.
Equivalent fractions are two fractions that represent the same amount. For example, look at a visual representationof the rational number 2
4 , and one of the number 12 .
74
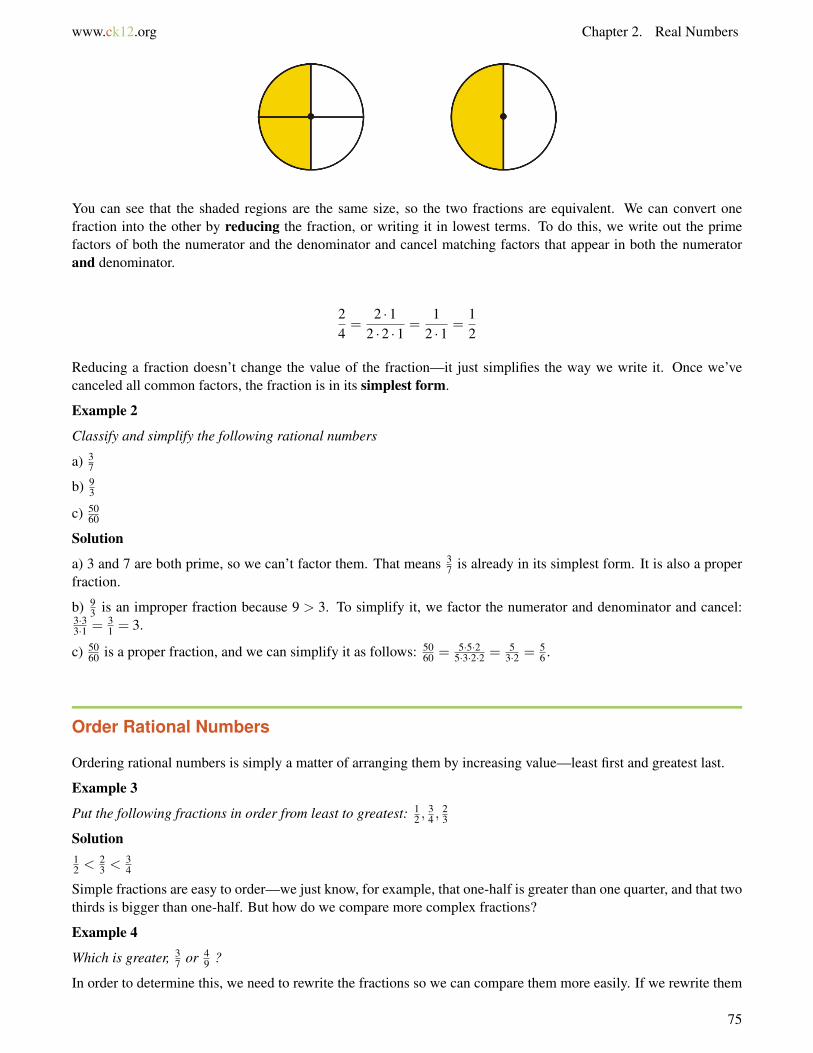
www.ck12.org Chapter 2. Real Numbers
You can see that the shaded regions are the same size, so the two fractions are equivalent. We can convert onefraction into the other by reducing the fraction, or writing it in lowest terms. To do this, we write out the primefactors of both the numerator and the denominator and cancel matching factors that appear in both the numeratorand denominator.
24=
2 ·12 ·2 ·1
=1
2 ·1=
12
Reducing a fraction doesn’t change the value of the fraction—it just simplifies the way we write it. Once we’vecanceled all common factors, the fraction is in its simplest form.
Example 2
Classify and simplify the following rational numbers
a) 37
b) 93
c) 5060
Solution
a) 3 and 7 are both prime, so we can’t factor them. That means 37 is already in its simplest form. It is also a proper
fraction.
b) 93 is an improper fraction because 9 > 3. To simplify it, we factor the numerator and denominator and cancel:
3·33·1 = 3
1 = 3.
c) 5060 is a proper fraction, and we can simplify it as follows: 50
60 = 5·5·25·3·2·2 = 5
3·2 = 56 .
Order Rational Numbers
Ordering rational numbers is simply a matter of arranging them by increasing value—least first and greatest last.
Example 3
Put the following fractions in order from least to greatest: 12 ,
34 ,
23
Solution12 < 2
3 < 34
Simple fractions are easy to order—we just know, for example, that one-half is greater than one quarter, and that twothirds is bigger than one-half. But how do we compare more complex fractions?
Example 4
Which is greater, 37 or 4
9 ?
In order to determine this, we need to rewrite the fractions so we can compare them more easily. If we rewrite them
75

2.1. Integers and Rational Numbers www.ck12.org
as equivalent fractions that have the same denominators, then we can compare them directly. To do this, we need tofind the lowest common denominator (LCD), or the least common multiple of the two denominators.
The lowest common multiple of 7 and 9 is 63. Our fraction will be represented by a shape divided into 63 sections.This time we will use a rectangle cut into 9 by 7 = 63 pieces.
7 divides into 63 nine times, so 37 = 9·3
9·7 = 2763 .
We can multiply the numerator and the denominator both by 9 because that’s really just the opposite of reducing thefraction—to get back from 27
63 to 37 , we’d just cancel out the 9’s. Or, to put that in more formal terms:
The fractions ab and c·a
c·b are equivalent as long as c 6= 0.
Therefore, 2763 is an equivalent fraction to 3
7 . Here it is shown visually:
9 divides into 63 seven times, so 49 = 7·4
7·9 = 2863 .
2863 is an equivalent fraction to 4
9 . Here it is shown visually:
By writing the fractions with a common denominator of 63, we can easily compare them. If we take the 28 shadedboxes out of 63 (from our image of 4
9 above) and arrange them in rows instead of columns, we can see that they takeup more space than the 27 boxes from our image of 3
7 :
Solution
Since 2863 is greater than 27
63 , 49 is greater than 3
7 .
Graph and Order Rational Numbers
To plot non-integer rational numbers (fractions) on the number line, we can convert them to mixed numbers (graph-ing is one of the few occasions in algebra when it’s better to use mixed numbers than improper fractions), or we canconvert them to decimal form.
76

www.ck12.org Chapter 2. Real Numbers
Example 5
Plot the following rational numbers on the number line.
a) 23
b) −37
c) 175
If we divide up the number line into sub-intervals based on the denominator of the fraction, we can look at thefraction’s numerator to determine how many of these sub-intervals we need to include.
a) 23 falls between 0 and 1. Because the denominator is 3, we divide the interval between 0 and 1 into three smaller
units. Because the numerator is 2, we count two units over from 0.
b)−37 falls between 0 and -1. We divide the interval into seven units, and move left from zero by three of those units.
c) 175 as a mixed number is 3 2
5 and falls between 3 and 4. We divide the interval into five units, and move over twounits.
Another way to graph this fraction would be as a decimal. 3 25 is equal to 3.4, so instead of dividing the interval
between 3 and 4 into 5 units, we could divide it into 10 units (each representing a distance of 0.1) and then countover 4 units. We would end up at the same place on the number line either way.
To make graphing rational numbers easier, try using the number line generator at http://themathworksheetsite.com/numline.html. You can use it to create a number line divided into whatever units you want, as long as you expressthe units in decimal form.
Find the Opposites of Numbers
Every number has an opposite. On the number line, a number and its opposite are, predictably, opposite each other.In other words, they are the same distance from zero, but on opposite sides of the number line.
77

2.1. Integers and Rational Numbers www.ck12.org
The opposite of zero is defined to be simply zero.
The sum of a number and its opposite is always zero—for example, 3+−3 = 0,4.2+−4.2 = 0, and so on. This isbecause adding 3 and -3 is like moving 3 steps to the right along the number line, and then 3 steps back to the left.The number and its opposite cancel each other out, leaving zero.
Another way to think of the opposite of a number is that it is simply the original number multiplied by -1. Theopposite of 4 is 4×−1 or -4, the opposite of -2.3 is −2.3×−1 or just 2.3, and so on. Another term for the oppositeof a number is the additive inverse.
Example 6
Find the opposite of each of the following:
a) 19.6
b) −49
c) x
d) xy2
e) (x−3)
Solution
Since we know that opposite numbers are on opposite sides of zero, we can simply multiply each expression by -1.This changes the sign of the number to its opposite—if it’s negative, it becomes positive, and vice versa.
a) The opposite of 19.6 is -19.6.
b) The opposite of is −49 is 4
9 .
c) The opposite of x is −x.
d) The opposite of xy2 is −xy2.
e) The opposite of (x−3) is −(x−3), or (3− x).
Note: With the last example you must multiply the entire expression by -1. A common mistake in this example isto assume that the opposite of (x−3) is (x+3). Avoid this mistake!
Find Absolute Values
When we talk about absolute value, we are talking about distances on the number line. For example, the number 7is 7 units away from zero—and so is the number -7. The absolute value of a number is the distance it is from zero,so the absolute value of 7 and the absolute value of -7 are both 7.
We write the absolute value of -7 as |−7|. We read the expression |x| as “the absolute value of x.”
• Treat absolute value expressions like parentheses. If there is an operation inside the absolute value symbols,evaluate that operation first.
78

www.ck12.org Chapter 2. Real Numbers
• The absolute value of a number or an expression is always positive or zero. It cannot be negative. Withabsolute value, we are only interested in how far a number is from zero, and not in which direction.
Example 7
Evaluate the following absolute value expressions.
a) |5+4|
b) 3−|4−9|
c) |−5−11|
d) −|7−22|
(Remember to treat any expressions inside the absolute value sign as if they were inside parentheses, and evaluatethem first.)
Solution
a) |5+4|= |9|= 9
b) 3−|4−9|= 3−|−5|= 3−5 =−2
c) |−5−11|= |−16|= 16
d) −|7−22|=−|−15|=−(15) =−15
Lesson Summary
• Integers (or whole numbers) are the counting numbers (1, 2, 3, ...), the negative counting numbers (-1, -2,-3, ...), and zero.
• A rational number is the ratio of one integer to another, like 35 or a
b . The top number is called the numeratorand the bottom number (which can’t be zero) is called the denominator.
• Proper fractions are rational numbers where the numerator is less than the denominator.• Improper fractions are rational numbers where the numerator is greater than the denominator.• Equivalent fractions are two fractions that equal the same numerical value. The fractions a
b and c·ac·b are
equivalent as long as c 6= 0.• To reduce a fraction (write it in simplest form), write out all prime factors of the numerator and denominator,
cancel common factors, then recombine.• To compare two fractions it helps to write them with a common denominator.• The absolute value of a number is the distance it is from zero on the number line. The absolute value of any
expression will always be positive or zero.• Two numbers are opposites if they are the same distance from zero on the number line and on opposite sides
of zero. The opposite of an expression can be found by multiplying the entire expression by -1.
Review Questions
1. Solve the problem posed in the Introduction.2. The tick-marks on the number line represent evenly spaced integers. Find the values of a,b,c,d and e.
79

2.1. Integers and Rational Numbers www.ck12.org
3. Determine what fraction of the whole each shaded region represents.
a.
b.
c.
4. Place the following sets of rational numbers in order, from least to greatest.
a. 12 ,
13 ,
14
b. 110 ,
12 ,
25 ,
14 ,
720
c. 3960 ,
4980 ,
59100
d. 711 ,
813 ,
1219
e. 95 ,
2215 ,
43
5. Find the simplest form of the following rational numbers.
a. 2244
b. 927
c. 1218
d. 315420
e. 244168
6. Find the opposite of each of the following.
a. 1.001b. (5−11)c. (x+ y)d. (x− y)e. (x+ y−4)f. (−x+2y)
7. Simplify the following absolute value expressions.
a. 11−|−4|b. |4−9|−|−5|c. |−5−11|d. 7−|22−15−19|e. −|−7|f. |−2−88|−|88+2|
80

www.ck12.org Chapter 2. Real Numbers
2.2 Adding and Subtracting Rational Numbers
Learning Objectives
• Add and subtract using a number line.• Add and subtract rational numbers.• Identify and apply properties of addition and subtraction.• Solve real-world problems using addition and subtraction of fractions.• Evaluate change using a variable expression.
Introduction
Ilana buys two identically sized cakes for a party. She cuts the chocolate cake into 24 pieces and the vanilla cakeinto 20 pieces, and lets the guests serve themselves. Martin takes three pieces of chocolate cake and one of vanilla,and Sheena takes one piece of chocolate and two of vanilla. Which of them gets more cake?
Add and Subtract Using a Number Line
In Lesson 1, we learned how to represent numbers on a number line. To add numbers on a number line, we start atthe position of the first number, and then move to the right by a number of units equal to the second number.
Example 1
Represent the sum −2+3 on a number line.
We start at the number -2, and then move 3 units to the right. We thus end at +1.
Solution
−2+3 = 1
Example 2
Represent the sum 2 - 3 on a number line.
Subtracting a number is basically just adding a negative number. Instead of moving to the right, we move to theleft. Starting at the number 2, and then moving 3 to the left, means we end at -1.
Solution
2−3 =−1
81

2.2. Adding and Subtracting Rational Numbers www.ck12.org
Adding and Subtracting Rational Numbers
When we add or subtract two fractions, the denominators must match before we can find the sum or difference. Wehave already seen how to find a common denominator for two rational numbers.
Example 3
Simplify 35 +
16 .
To combine these fractions, we need to rewrite them over a common denominator. We are looking for the lowestcommon denominator (LCD). We need to identify the lowest common multiple or least common multiple (LCM)of 5 and 6. That is the smallest number that both 5 and 6 divide into evenly (that is, without a remainder).
The lowest number that 5 and 6 both divide into evenly is 30. The LCM of 5 and 6 is 30, so the lowest commondenominator for our fractions is also 30.
We need to rewrite our fractions as new equivalent fractions so that the denominator in each case is 30.
If you think back to our idea of a cake cut into a number of slices, 35 means 3 slices of a cake that has been cut into
5 pieces. You can see that if we cut the same cake into 30 pieces (6 times as many) we would need 6 times as manyslices to make up an equivalent fraction of the cake—in other words, 18 slices instead of 3.
35 is equivalent to 18
30 .
By a similar argument, we can rewrite the fraction 16 as a share of a cake that has been cut into 30 pieces. If we cut
it into 5 times as many pieces, we need 5 times as many slices.
16 is equivalent to 5
30 .
Now that both fractions have the same denominator, we can add them. If we add 18 pieces of cake to 5 pieces, weget a total of 23 pieces. 23 pieces of a cake that has been cut into 30 pieces means that our answer is 23
30 .
82
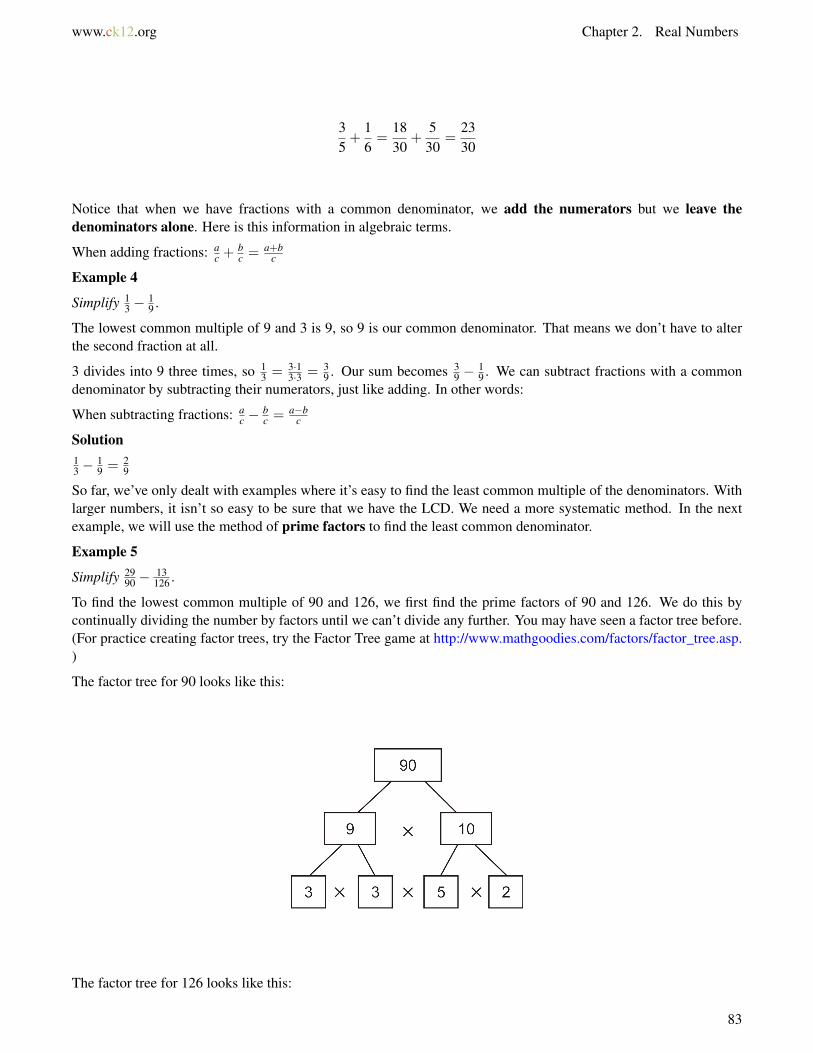
www.ck12.org Chapter 2. Real Numbers
35+
16=
1830
+5
30=
2330
Notice that when we have fractions with a common denominator, we add the numerators but we leave thedenominators alone. Here is this information in algebraic terms.
When adding fractions: ac +
bc = a+b
c
Example 4
Simplify 13 −
19 .
The lowest common multiple of 9 and 3 is 9, so 9 is our common denominator. That means we don’t have to alterthe second fraction at all.
3 divides into 9 three times, so 13 = 3·1
3·3 = 39 . Our sum becomes 3
9 −19 . We can subtract fractions with a common
denominator by subtracting their numerators, just like adding. In other words:
When subtracting fractions: ac −
bc = a−b
c
Solution13 −
19 = 2
9
So far, we’ve only dealt with examples where it’s easy to find the least common multiple of the denominators. Withlarger numbers, it isn’t so easy to be sure that we have the LCD. We need a more systematic method. In the nextexample, we will use the method of prime factors to find the least common denominator.
Example 5
Simplify 2990 −
13126 .
To find the lowest common multiple of 90 and 126, we first find the prime factors of 90 and 126. We do this bycontinually dividing the number by factors until we can’t divide any further. You may have seen a factor tree before.(For practice creating factor trees, try the Factor Tree game at http://www.mathgoodies.com/factors/factor_tree.asp.)
The factor tree for 90 looks like this:
The factor tree for 126 looks like this:
83

2.2. Adding and Subtracting Rational Numbers www.ck12.org
The LCM for 90 and 126 is made from the smallest possible collection of primes that enables us to construct eitherof the two numbers. We take only enough instances of each prime to make the number with the greater number ofinstances of that prime in its factor tree.
TABLE 2.1:
Prime Factors in 90 Factors in 126 We Need2 1 1 13 2 2 25 1 0 17 0 1 1
So we need one 2, two 3’s, one 5 and one 7. That gives us 2 ·3 ·3 ·5 ·7 = 630 as the lowest common multiple of 90and 126. So 630 is the LCD for our calculation.
90 divides into 630 seven times (notice that 7 is the only factor in 630 that is missing from 90), so 2990 = 7·29
7·90 = 203630 .
126 divides into 630 five times (notice that 5 is the only factor in 630 that is missing from 126), so 13126 = 5·13
5·126 = 65630 .
Now we complete the problem: 2990 −
13126 = 203
630 −65630 = 138
630 .
This fraction simplifies. To be sure of finding the simplest form for 138630 , we write out the prime factors of the
numerator and denominator. We already know the prime factors of 630. The prime factors of 138 are 2, 3 and 23.138630 = 2·3·23
2·3·3·5·7 ; one factor of 2 and one factor of 3 cancels out, leaving 233·5·7 or 23
105 as our answer.
Identify and Apply Properties of Addition
Three mathematical properties which involve addition are the commutative, associative, and the additive identityproperties.
Commutative property: When two numbers are added, the sum is the same even if the order of the items beingadded changes.
Example: 3+2 = 2+3
Associative Property: When three or more numbers are added, the sum is the same regardless of how they aregrouped.
Example: (2+3)+4 = 2+(3+4)
Additive Identity Property: The sum of any number and zero is the original number.
Example: 5+0 = 5
84

www.ck12.org Chapter 2. Real Numbers
Solve Real-World Problems Using Addition and Subtraction
Example 6
Peter is hoping to travel on a school trip to Europe. The ticket costs $2400. Peter has several relatives who havepledged to help him with the ticket cost. His parents have told him that they will cover half the cost. His grandmaZenoviea will pay one sixth, and his grandparents in Florida will send him one fourth of the cost. What fraction ofthe cost can Peter count on his relatives to provide?
The first thing we need to do is extract the relevant information. Peter’s parents will provide 12 the cost; his grandma
Zenoviea will provide 16 ; and his grandparents in Florida 1
4 . We need to find the sum of those numbers, or 12 +
16 +
14 .
To determine the sum, we first need to find the LCD. The LCM of 2, 6 and 4 is 12, so that’s our LCD. Now we canfind equivalent fractions:
12=
6 ·16 ·2
=612
16=
2 ·12 ·6
=212
14=
3 ·13 ·4
=312
Putting them all together: 612 +
212 +
312 = 11
12 .
Peter will get 1112 the cost of the trip, or $2200 out of $2400, from his family.
Example 7
A property management firm is buying parcels of land in order to build a small community of condominiums. It hasjust bought three adjacent plots of land. The first is four-fifths of an acre, the second is five-twelfths of an acre, andthe third is nineteen-twentieths of an acre. The firm knows that it must allow one-sixth of an acre for utilities and asmall access road. How much of the remaining land is available for development?
The first thing we need to do is extract the relevant information. The plots of land measure 45 ,
512 , and 19
20 acres,and the firm can use all of that land except for 1
6 of an acre. The total amount of land the firm can use is therefore45 +
512 +
1920 −
16 acres.
We can add and subtract multiple fractions at once just by finding a common denominator for all of them. Thefactors of 5, 9, 20, and 6 are as follows:
5 5
12 2 ·2 ·320 2 ·2 ·56 2 ·3
We need a 5, two 2’s, and a 3 in our LCD. 2 ·2 ·3 ·5 = 60, so that’s our common denominator. Now to convert thefractions:
85

2.2. Adding and Subtracting Rational Numbers www.ck12.org
45=
12 ·412 ·5
=4860
512
=5 ·55 ·12
=2560
1920
=3 ·193 ·20
=5760
16=
10 ·110 ·6
=1060
We can rewrite our sum as 4860 +
2560 +
5760 −
1060 = 48+25+57−10
60 = 12060 .
Next, we need to reduce this fraction. We can see immediately that the numerator is twice the denominator, so thisfraction reduces to 2
1 or simply 2. One is sometimes called the invisible denominator, because every whole numbercan be thought of as a rational number whose denominator is one.
Solution
The property firm has two acres available for development.
Evaluate Change Using a Variable Expression
When we write algebraic expressions to represent a real quantity, the difference between two values is the changein that quantity.
Example 8
The intensity of light hitting a detector when it is held a certain distance from a bulb is given by this equation:
Intensity =3d2
where d is the distance measured in meters, and intensity is measured in lumens. Calculate the change in intensitywhen the detector is moved from two meters to three meters away.
We first find the values of the intensity at distances of two and three meters.
Intensity (2) =3
(2)2 =34
Intensity (3) =3
(3)2 =39=
13
The difference in the two values will give the change in the intensity. We move from two meters to three metersaway.
Change = Intensity (3)− Intensity (2) = 13 −
34
86
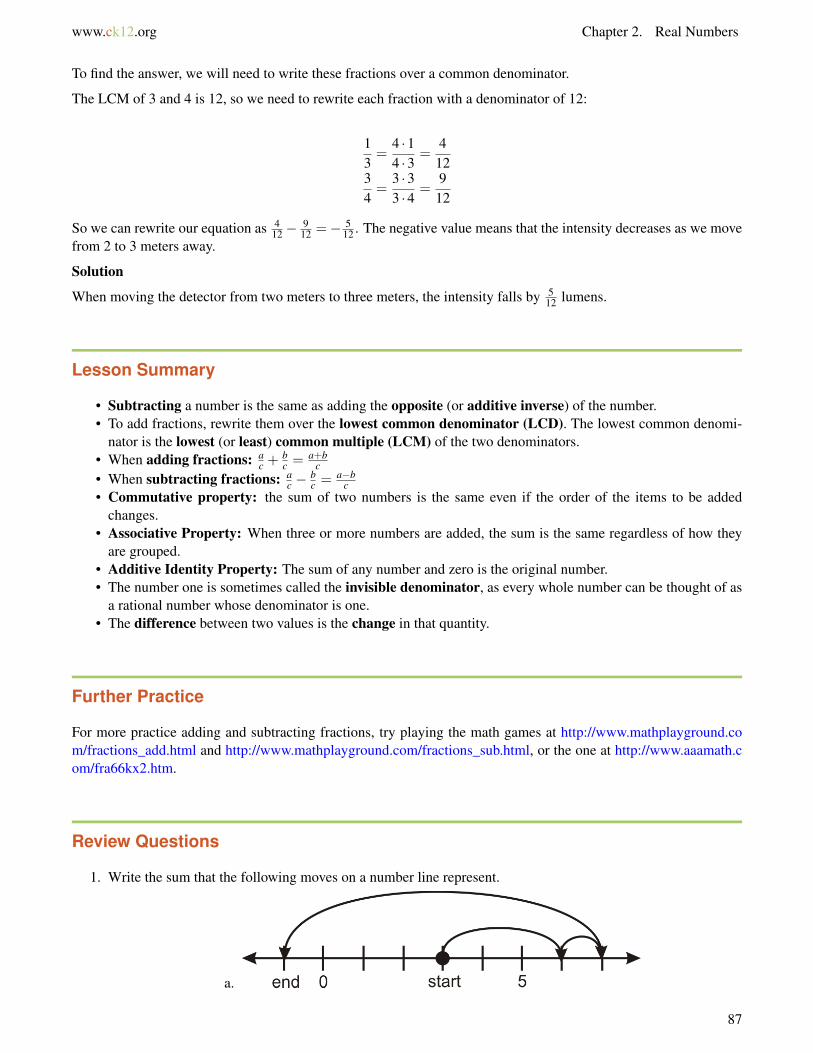
www.ck12.org Chapter 2. Real Numbers
To find the answer, we will need to write these fractions over a common denominator.
The LCM of 3 and 4 is 12, so we need to rewrite each fraction with a denominator of 12:
13=
4 ·14 ·3
=412
34=
3 ·33 ·4
=912
So we can rewrite our equation as 412 −
912 =− 5
12 . The negative value means that the intensity decreases as we movefrom 2 to 3 meters away.
Solution
When moving the detector from two meters to three meters, the intensity falls by 512 lumens.
Lesson Summary
• Subtracting a number is the same as adding the opposite (or additive inverse) of the number.• To add fractions, rewrite them over the lowest common denominator (LCD). The lowest common denomi-
nator is the lowest (or least) common multiple (LCM) of the two denominators.• When adding fractions: a
c +bc = a+b
c• When subtracting fractions: a
c −bc = a−b
c• Commutative property: the sum of two numbers is the same even if the order of the items to be added
changes.• Associative Property: When three or more numbers are added, the sum is the same regardless of how they
are grouped.• Additive Identity Property: The sum of any number and zero is the original number.• The number one is sometimes called the invisible denominator, as every whole number can be thought of as
a rational number whose denominator is one.• The difference between two values is the change in that quantity.
Further Practice
For more practice adding and subtracting fractions, try playing the math games at http://www.mathplayground.com/fractions_add.html and http://www.mathplayground.com/fractions_sub.html, or the one at http://www.aaamath.com/fra66kx2.htm.
Review Questions
1. Write the sum that the following moves on a number line represent.
a.
87

2.2. Adding and Subtracting Rational Numbers www.ck12.org
b.
2. Add the following rational numbers. Write each answer in its simplest form.
a. 37 +
27
b. 310 +
15
c. 516 +
512
d. 38 +
916
e. 825 +
710
f. 16 +
14
g. 715 +
29
h. 519 +
227
3. Which property of addition does each situation involve?
a. Whichever order your groceries are scanned at the store, the total will be the same.b. However many shovel-loads it takes to move 1 ton of gravel, the number of rocks moved is the same.c. If Julia has no money, then Mark and Julia together have just as much money as Mark by himself has.
4. Solve the problem posed in the Introduction to this lesson.5. Nadia, Peter and Ian are pooling their money to buy a gallon of ice cream. Nadia is the oldest and gets the
greatest allowance. She contributes half of the cost. Ian is next oldest and contributes one third of the cost.Peter, the youngest, gets the smallest allowance and contributes one fourth of the cost. They figure that thiswill be enough money. When they get to the check-out, they realize that they forgot about sales tax and worrythere will not be enough money. Amazingly, they have exactly the right amount of money. What fraction ofthe cost of the ice cream was added as tax?
6. Subtract the following rational numbers. Be sure that your answer is in the simplest form.
a. 512 −
918
b. 23 −
14
c. 34 −
13
d. 1511 −
97
e. 213 −
111
f. 727 −
939
g. 611 −
322
h. 1364 −
740
i. 1170 −
1130
7. Consider the equation y = 3x+2. Determine the change in y between x = 3 and x = 7.8. Consider the equation y = 2
3 x+ 12 . Determine the change in y between x = 1 and x = 2.
9. The time taken to commute from San Diego to Los Angeles is given by the equation time = 120speed where time
is measured in hours and speed is measured in miles per hour (mph). Calculate the change in time that arush hour commuter would see when switching from traveling by bus to traveling by train, if the bus averages40 mph and the train averages 90 mph.
88

www.ck12.org Chapter 2. Real Numbers
2.3 Multiplying and Dividing Rational Numbers
Learning Objectives
• Multiply by negative one.• Multiply rational numbers.• Identify and apply properties of multiplication.• Solve real-world problems using multiplication.• Find multiplicative inverses.• Divide rational numbers.• Solve real-world problems using division.
Multiplying Numbers by Negative One
Whenever we multiply a number by negative one, the sign of the number changes. In more mathematical terms,multiplying by negative one maps a number onto its opposite. The number line below shows two examples: 3 ·−1= 3and −1 ·−1 = 1.
When we multiply a number by negative one, the absolute value of the new number is the same as the absolute valueof the old number, since both numbers are the same distance from zero.
The product of a number “x” and negative one is −x. This does not mean that −x is necessarily less than zero! If xitself is negative, then −x will be positive because a negative times a negative (negative one) is a positive.
When you multiply an expression by negative one, remember to multiply the entire expression by negative one.
Example 1
Multiply the following by negative one.
a) 79.5
b) π
c) (x+1)
d) |x|
Solution
a) -79.5
b) −π
89

2.3. Multiplying and Dividing Rational Numbers www.ck12.org
c) −(x+1) or − x−1
d) −|x|
Note that in the last case the negative sign outside the absolute value symbol applies after the absolute value.Multiplying the argument of an absolute value equation (the term inside the absolute value symbol) does not changethe absolute value. |x| is always positive. |−x| is always positive. −|x| is always negative.
Whenever you are working with expressions, you can check your answers by substituting in numbers for thevariables. For example, you could check part d of Example 1 by letting x = −3. Then you’d see that |−3|6= −|3|,because |−3|= 3 and −|3|=−3.
Careful, though—plugging in numbers can tell you if your answer is wrong, but it won’t always tell you for sure ifyour answer is right!
Multiply Rational Numbers
Example 2
Simplify 13 ·
25 .
One way to solve this is to think of money. For example, we know that one third of sixty dollars is written as 13 ·$60.
We can read the above problem as one-third of two-fifths. Here is a visual picture of the fractions one-third andtwo-fifths.
If we divide our rectangle into thirds one way and fifths the other way, here’s what we get:
Here is the intersection of the two shaded regions. The whole has been divided into five pieces width-wise and threepieces height-wise. We get two pieces out of a total of fifteen pieces.
Solution13 ·
25 = 2
15
Notice that 1 · 2 = 2 and 3 · 5 = 15. This turns out to be true in general: when you multiply rational numbers, thenumerators multiply together and the denominators multiply together. Or, to put it more formally:
When multiplying fractions: ab ·
cd = ac
bd
This rule doesn’t just hold for the product of two fractions, but for any number of fractions.
Example 4
90

www.ck12.org Chapter 2. Real Numbers
Multiply the following rational numbers:
a) 25 ·
59
b) 13 ·
27 ·
25
c) 12 ·
23 ·
34 ·
45
Solution
a) With this problem, we can cancel the fives: 25 ·
59 = 2·5
5·9 = 29 .
b) With this problem, we multiply all the numerators and all the denominators:
13· 2
7· 2
5=
1 ·2 ·23 ·7 ·5
=4
105
c) With this problem, we multiply all the numerators and all the denominators, and then we can cancel most of them.The 2’s, 3’s, and 4’s all cancel out, leaving 1
5 .
With multiplication of fractions, we can simplify before or after we multiply. The next example uses factors to helpsimplify before we multiply.
Example 5
Evaluate and simplify 1225 ·
3542 .
Solution
We can see that 12 and 42 are both multiples of six, 25 and 35 are both multiples of five, and 35 and 42 are bothmultiples of 7. That means we can write the whole product as 6·2
5·5 ·5·76·7 = 6·2·5·7
5·5·6·7 . Then we can cancel out the 5, the 6,and the 7, leaving 2
5 .
Identify and Apply Properties of Multiplication
The four mathematical properties which involve multiplication are the Commutative, Associative, MultiplicativeIdentity and Distributive Properties.
Commutative property: When two numbers are multiplied together, the product is the same regardless of the orderin which they are written.
Example: 4 ·2 = 2 ·4
We can see a geometrical interpretation of The Commutative Property of Multiplication to the right. The Areaof the shape (length×width) is the same no matter which way we draw it.
Associative Property: When three or more numbers are multiplied, the product is the same regardless of theirgrouping.
Example: 2 · (3 ·4) = (2 ·3) ·4
91

2.3. Multiplying and Dividing Rational Numbers www.ck12.org
Multiplicative Identity Property: The product of one and any number is that number.
Example: 5 ·1 = 5
Distributive property: The multiplication of a number and the sum of two numbers is equal to the first numbertimes the second number plus the first number times the third number.
Example: 4(6+3) = 4 ·6+4 ·3
Example 6
A gardener is planting vegetables for the coming growing season. He wishes to plant potatoes and has a choice of asingle 8×7 meter plot, or two smaller plots of 3×7 and 5×7 meters. Which option gives him the largest area forhis potatoes?
Solution
In the first option, the gardener has a total area of (8×7) or 56 square meters.
In the second option, the gardener has (3×7) or 21 square meters, plus (5×7) or 35 square meters. 21+35 = 56,so the area is the same as in the first option.
Solve Real-World Problems Using Multiplication
Example 7
In the chemistry lab there is a bottle with two liters of a 15% solution of hydrogen peroxide (H2O2). John removesone-fifth of what is in the bottle, and puts it in a beaker. He measures the amount of H2O2 and adds twice thatamount of water to the beaker. Calculate the following measurements.
a) The amount of H2O2 left in the bottle.
b) The amount of diluted H2O2 in the beaker.
c) The concentration of the H2O2 in the beaker.
Solution
a) To determine the amount of H2O2 left in the bottle, we first determine the amount that was removed. That amountwas 1
5 of the amount in the bottle (2 liters). 15 of 2 is 2
5 .
The amount remaining is 2− 25 , or 10
5 −25 = 8
5 liter (or 1.6 liters).
There are 1.6 liters left in the bottle.
b) We determined that the amount of the 15% H2O2 solution removed was 25 liter. The amount of water added was
twice this amount, or 45 liter. So the total amount of solution in the beaker is now 2
5 +45 = 6
5 liter, or 1.2 liters.
There are 1.2 liters of diluted H2O2 in the beaker.
c) The new concentration of H2O2 can be calculated.
92

www.ck12.org Chapter 2. Real Numbers
John started with 25 liter of 15% H2O2 solution, so the amount of pure H2O2 is 15% of 2
5 liters, or 0.15×0.40 = 0.06liters.
After he adds the water, there is 1.2 liters of solution in the beaker, so the concentration of H2O2 is 0.061.2 = 1
20 or 0.05.To convert to a percent we multiply this number by 100, so the beaker’s contents are 5% H2O2.
Example 8
Anne has a bar of chocolate and she offers Bill a piece. Bill quickly breaks off 14 of the bar and eats it. Another
friend, Cindy, takes 13 of what was left. Anne splits the remaining candy bar into two equal pieces which she shares
with a third friend, Dora. How much of the candy bar does each person get?
First, let’s look at this problem visually.
Anne starts with a full candy bar.
Bill breaks off 14 of the bar.
Cindy takes 13 of what was left.
Dora gets half of the remaining candy bar.
We can see that the candy bar ends up being split four ways, with each person getting an equal amount.
Solution
Each person gets exactly 14 of the candy bar.
We can also examine this problem using rational numbers. We keep a running total of what fraction of the barremains. Remember, when we read a fraction followed by of in the problem, it means we multiply by that fraction.
We start with 1 bar. Then Bill takes 14 of it, so there is 1− 1
4 = 34 of a bar left.
Cindy takes 13 of what’s left, or 1
3 ·34 = 1
4 of a whole bar. That leaves 34 −
14 = 2
4 , or 12 of a bar.
That half bar gets split between Anne and Dora, so they each get half of a half bar: 12 ·
12 = 1
4 .
So each person gets exactly 14 of the candy bar.
Extension: If each person’s share is 3 oz, how much did the original candy bar weigh?
93

2.3. Multiplying and Dividing Rational Numbers www.ck12.org
Identity Elements
An identity element is a number which, when combined with a mathematical operation on a number, leaves thatnumber unchanged. For example, the identity element for addition and subtraction is zero, because adding orsubtracting zero to a number doesn’t change the number. And zero is also what you get when you add together anumber and its opposite, like 3 and -3.
The inverse operation of addition is subtraction—when you add a number and then subtract that same number,you end up back where you started. Also, adding a number’s opposite is the same as subtracting it—for example,4+(−3) is the same as 4−3.
Multiplication and division are also inverse operations to each other—when you multiply by a number and thendivide by the same number, you end up back where you started. Multiplication and division also have an identityelement: when you multiply or divide a number by one, the number doesn’t change.
Just as the opposite of a number is the number you can add to it to get zero, the reciprocal of a number is thenumber you can multiply it by to get one. And finally, just as adding a number’s opposite is the same as subtractingthe number, multiplying by a number’s reciprocal is the same as dividing by the number.
Find Multiplicative Inverses
The reciprocal of a number x is also called the multiplicative inverse. Any number times its own multiplicativeinverse equals one, and the multiplicative inverse of x is written as 1
x .
To find the multiplicative inverse of a rational number, we simply invert the fraction—that is, flip it over. In otherwords:
The multiplicative inverse of ab is b
a , as long as a 6= 0.
You’ll see why in the following exercise.
Example 9
Find the multiplicative inverse of each of the following.
a) 37
b) 49
c) 3 12
d) − xy
e) 111
Solution
a) When we invert the fraction 37 , we get 7
3 . Notice that if we multiply 37 ·
73 , the 3’s and the 7’s both cancel out and
we end up with 11 , or just 1.
b) Similarly, the inverse of 49 is 9
4 ; if we multiply those two fractions together, the 4’s and the 9’s cancel out andwe’re left with 1. That’s why the rule “invert the fraction to find the multiplicative inverse” works: the numeratorand the denominator always end up canceling out, leaving 1.
c) To find the multiplicative inverse of 3 12 we first need to convert it to an improper fraction. Three wholes is six
halves, so 3 12 = 6
2 +12 = 7
2 . That means the inverse is 27 .
d) Don’t let the negative sign confuse you. The multiplicative inverse of a negative number is also negative! Just
94

www.ck12.org Chapter 2. Real Numbers
ignore the negative sign and flip the fraction as usual.
The multiplicative inverse of − xy is − y
x .
e) The multiplicative inverse of 111 is 11
1 , or simply 11.
Look again at the last example. When we took the multiplicative inverse of 111 we got a whole number, 11. That’s
because we can treat that whole number like a fraction with a denominator of 1. Any number, even a non-rationalone, can be treated this way, so we can always find a number’s multiplicative inverse using the same method.
Divide Rational Numbers
Earlier, we mentioned that multiplying by a number’s reciprocal is the same as dividing by the number. That’s howwe can divide rational numbers; to divide by a rational number, just multiply by that number’s reciprocal. In moreformal terms:
ab÷ c
d=
ab× d
c.
Example 10
Divide the following rational numbers, giving your answer in the simplest form.
a) 12 ÷
14
b) 73 ÷
23
c) x2 ÷
14y
d) 112x ÷
(− x
y
)Solution
a) Replace 14 with 4
1 and multiply: 12 ×
41 = 4
2 = 2.
b) Replace 23 with 3
2 and multiply: 73 ×
32 = 7·3
3·2 = 72 .
c) x2 ÷
14y =
x2 ×
4y1 = 4xy
2 = 2xy1 = 2xy
d) 112x ÷
(− x
y
)= 11
2x ×(− y
x
)=−11y
2x2
Solve Real-World Problems Using Division
Speed, Distance and Time
An object moving at a certain speed will cover a fixed distance in a set time. The quantities speed, distance andtime are related through the equation Speed = Distance
Time .
Example 11
Andrew is driving down the freeway. He passes mile marker 27 at exactly mid-day. At 12:35 he passes mile marker69. At what speed, in miles per hour, is Andrew traveling?
Solution
95

2.3. Multiplying and Dividing Rational Numbers www.ck12.org
To find the speed, we need the distance traveled and the time taken. If we want our speed to come out in miles perhour, we’ll need distance in miles and time in hours.
The distance is 69−27 or 42 miles. The time is 35 minutes, or 3560 hours, which reduces to 7
12 . Now we can plug inthe values for distance and time into our equation for speed.
Speed =42712
= 42÷ 712
=421× 12
7=
6 ·7 ·121 ·7
=6 ·12
1= 72
Andrew is driving at 72 miles per hour.
Example 12
Anne runs a mile and a half in a quarter hour. What is her speed in miles per hour?
Solution
We already have the distance and time in the correct units (miles and hours), so we just need to write them asfractions and plug them into the equation.
Speed =1 1
214
=32÷ 1
4=
32× 4
1=
3 ·42 ·1
=122
= 6
Anne runs at 6 miles per hour.
Example 13 – Newton’s Second Law
Newton’s second law (F = ma) relates the force applied to a body in Newtons (F), the mass of the body in kilograms(m) and the acceleration in meters per second squared (a). Calculate the resulting acceleration if a Force of 7 1
3Newtons is applied to a mass of 1
5 kg.
Solution
First, we rearrange our equation to isolate the acceleration, a. If F = ma, dividing both sides by m gives us a = Fm .
Then we substitute in the known values for F and m:
a =7 1
315
=223÷ 1
5=
223× 5
1=
1103
The resultant acceleration is 36 23 m/s2.
Lesson Summary
When multiplying an expression by negative one, remember to multiply the entire expression by negative one.
To multiply fractions, multiply the numerators and multiply the denominators: ab ·
cd = ac
bd
The multiplicative properties are:
• Commutative Property: The product of two numbers is the same whichever order the items to be multipliedare written. Example: 2 ·3 = 3 ·2
• Associative Property: When three or more numbers are multiplied, the sum is the same regardless of howthey are grouped. Example: 2 · (3 ·4) = (2 ·3) ·4
96

www.ck12.org Chapter 2. Real Numbers
• Multiplicative Identity Property: The product of any number and one is the original number. Example:2 ·1 = 2
• Distributive property: The multiplication of a number and the sum of two numbers is equal to the firstnumber times the second number plus the first number times the third number. Example: 4(2+3) = 4(2)+4(3)
The multiplicative inverse of a number is the number which produces 1 when multiplied by the original number.The multiplicative inverse of x is the reciprocal 1
x . To find the multiplicative inverse of a fraction, simply invert thefraction: a
b inverts to ba .
To divide fractions, invert the divisor and multiply: ab ÷
cd = a
b ×dc .
Further Practice
For more practice multiplying fractions, try playing the fraction game at http://www.aaamath.com/fra66mx2.htm, orthe one at http://www.mathplayground.com/fractions_mult.html. For more practice dividing fractions, try the gameat http://www.aaamath.com/div66ox2.htm or the one at http://www.mathplayground.com/fractions_div.html.
Review Questions
1. Multiply the following expressions by negative one.
a. 25b. -105c. x2
d. (3+ x)e. (3− x)
2. Multiply the following rational numbers. Write your answer in the simplest form.
a. 512 ×
910
b. 23 ×
14
c. 34 ×
13
d. 1511 ×
97
e. 113 ×
111
f. 727 ×
914
g.(3
5
)2
h. 111 ×
2221 ×
710
i. 1215 ×
3513 ×
102 ×
2636
3. Find the multiplicative inverse of each of the following.
a. 100b. 2
8c. −19
21d. 7e. − z3
2xy2
4. Divide the following rational numbers. Write your answer in the simplest form.
a. 52 ÷
14
b. 12 ÷
79
97

2.3. Multiplying and Dividing Rational Numbers www.ck12.org
c. 511 ÷
67
d. 12 ÷
12
e. − x2 ÷
57
f. 12 ÷
x4y
g.(−1
3
)÷(−3
5
)h. 7
2 ÷74
i. 11÷ −x4
5. The label on a can of paint says that it will cover 50 square feet per pint. If I buy a 18 pint sample, it will cover
a square two feet long by three feet high. Is the coverage I get more, less or the same as that stated on thelabel?
6. The world’s largest trench digger, "Bagger 288", moves at 38 mph. How long will it take to dig a trench 2
3 milelong?
7. A 27 Newton force applied to a body of unknown mass produces an acceleration of 3
10 m/s2. Calculate themass of the body.
98

www.ck12.org Chapter 2. Real Numbers
2.4 The Distributive Property
Learning Objectives
• Apply the distributive property.• Identify parts of an expression.• Solve real-world problems using the distributive property.
Introduction
At the end of the school year, an elementary school teacher makes a little gift bag for each of his students. Each bagcontains one class photograph, two party favors and five pieces of candy. The teacher will distribute the bags amonghis 28 students. How many of each item does the teacher need?
Apply the Distributive Property
When we have a problem like the one posed in the introduction, The Distributive Property can help us solve it.First, we can write an expression for the contents of each bag: Items = (photo + 2 favors + 5 candies), or simplyI = (p+2 f +5c).
For all 28 students, the teacher will need 28 times that number of items, so I = 28(p+2 f +5c).
Next, the Distributive Property of Multiplication tells us that when we have a single term multiplied by a sum ofseveral terms, we can rewrite it by multiplying the single term by each of the other terms separately. In other words,28(p+ 2 f + 5c) = 28(p)+ 28(2 f )+ 28(5c), which simplifies to 28p+ 56 f + 140c. So the teacher needs 28 classphotos, 56 party favors and 140 pieces of candy.
You can see why the Distributive Property works by looking at a simple problem where we just have numbers insidethe parentheses, and considering the Order of Operations.
Example 1
Determine the value of 11(2 - 6) using both the Order of Operations and the Distributive Property.
Solution
Order of Operations tells us to evaluate the amount inside the parentheses first:
11(2−6) = 11(−4) =−44
Now let’s try it with the Distributive Property:
11(2−6) = 11(2)−11(6) = 22−66 =−44
99

2.4. The Distributive Property www.ck12.org
Note: When applying the Distributive Property you MUST take note of any negative signs!
Example 2
Use the Distributive Property to determine the following.
a) 11(2x+6)
b) 7(3x−5)
c) 27(3y2−11)
d) 2x7
(3y2− 11
xy
)Solution
a) 11(2x+6) = 11(2x)+11(6) = 22x+66
b) Note the negative sign on the second term.
7(3x−5) = 21x−35
c) 27(3y2−11) = 2
7(3y2)+ 27(−11) = 6y2
7 −227 , or 6y2−22
7
d) 2x7
(3y2− 11
xy
)= 2x
7 (3y2)+ 2x7
(−11
xy
)= 6xy2
7 −22x7xy
We can simplify this answer by canceling the x’s in the second fraction, so we end up with 6xy2
7 −227y .
Identify Expressions That Involve the Distributive Property
The Distributive Property can also appear in expressions that don’t include parentheses. In Lesson 1.2, we saw howthe fraction bar also acts as a grouping symbol. Now we’ll see how to use the Distributive Property with fractions.
Example 3
Simplify the following expressions.
a) 2x+84
b) 9y−23
c) z+62
Solution
Even though these expressions aren’t written in a form we usually associate with the Distributive Property, rememberthat we treat the numerator of a fraction as if it were in parentheses, and that means we can use the DistributiveProperty here too.
a) 2x+84 can be re-written as 1
4(2x+8). Then we can distribute the 14 :
14(2x+8) =
2x4+
84=
x2+2
b) 9y−23 can be re-written as 1
3(9y−2), and then we can distribute the 13 :
100
www.ck12.org Chapter 2. Real Numbers
13(9y−2) =
9y3− 2
3= 3y− 2
3
c) Rewrite z+62 as 1
2(z+6), and distribute the 12 :
12(z+6) =
z2+
62=
z2+3
Solve Real-World Problems Using the Distributive Property
The Distributive Property is one of the most common mathematical properties used in everyday life. Any time wehave two or more groups of objects, the Distributive Property can help us solve for an unknown.
Example 4
Each student on a field trip into a forest is to be given an emergency survival kit. The kit is to contain a flashlight,a first aid kit, and emergency food rations. Flashlights cost $12 each, first aid kits are $7 each and emergency foodrations cost $2 per day. There is $500 available for the kits and 17 students to provide for. How many days worth ofrations can be provided with each kit?
The unknown quantity in this problem is the number of days’ rations. This will be x in our expression.
Each kit will contain one $12 flashlight, one $7 first aid kit, and x times $2 worth of rations, for a total cost of(12+7+2x) dollars. With 17 kits, therefore, the total cost will be 17(12+7+2x) dollars.
We can use the Distributive Property on this expression:
17(12+7+2x) = 204+119+34x
Since the total cost can be at most $500, we set the expression equal to 500 and solve for x. (You’ll learn in moredetail how to solve equations like this in the next chapter.)
204+119+34x = 500
323+34x = 500
323+34x−323 = 500−323
34x = 17734x34
=17734
x≈ 5.206
Since this represents the number of days’ worth of rations that can be bought, we must round to the next lowestwhole number. We wouldn’t have enough money to buy a sixth day of supplies.
Solution
Five days worth of emergency rations can be purchased for each survival kit.
101

2.4. The Distributive Property www.ck12.org
Lesson Summary
• Distributive Property The product of a number and the sum of two numbers is equal to the first number timesthe second number plus the first number times the third number.
• When applying the Distributive Property you MUST take note of any negative signs!
Further Practice
For more practice using the Distributive Property, try playing the Battleship game at http://www.quia.com/ba/15357.html.
Review Questions
1. Use the Distributive Property to simplify the following expressions.
a. (x+4)−2(x+5)b. 1
2(4z+6)c. (4+5)− (5+2)d. x(x+7)e. y(x+7)f. 13x(3y+ z)g. x
(3x +5
)h. xy
(1x +
2y
)2. Use the Distributive Property to remove the parentheses from the following expressions.
a. 12(x− y)−4
b. 0.6(0.2x+0.7)c. 6+(x−5)+7d. 6− (x−5)+7e. 4(m+7)−6(4−m)f. −5(y−11)+2yg. −(x−3y)+ 1
2(z+4)h. a
b
(2a +
3b +
b5
)3. Use the Distributive Property to simplify the following fractions.
a. 8x+124
b. 9x+123
c. 11x+122
d. 3y+26
e. −6z−23
f. 7−6p3
g. 3d−46d
h. 12g+8h4gh
4. A bookcase has five shelves, and each shelf contains seven poetry books and eleven novels. How many ofeach type of book does the bookcase contain?
102

www.ck12.org Chapter 2. Real Numbers
5. Amar is making giant holiday cookies for his friends at school. He makes each cookie with 6 oz of cookiedough and decorates them with macadamia nuts. If Amar has 5 lbs of cookie dough (1 lb = 16 oz) and 60macadamia nuts, calculate the following.
a. How many (full) cookies he can make?b. How many macadamia nuts he can put on each cookie, if each is to be identical?c. If 4 cups of flour and 1 cup of sugar went into each pound of cookie dough, how much of each did Amar
use to make the 5 pounds of dough?
103
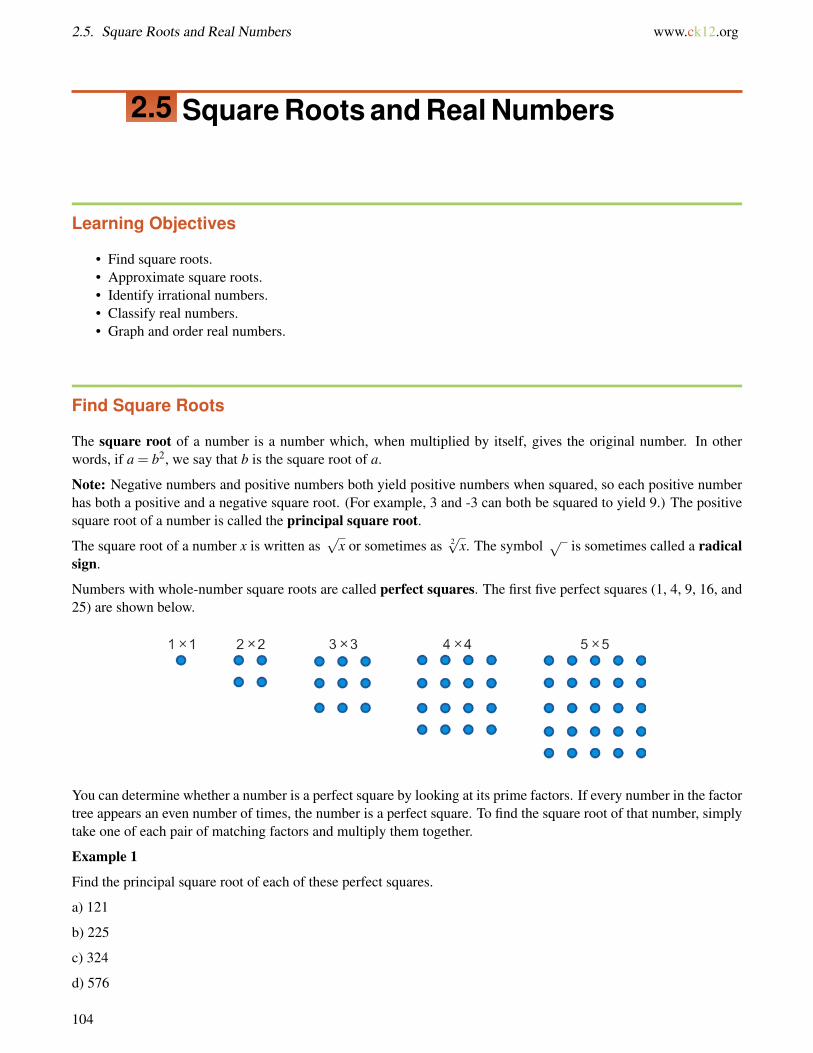
2.5. Square Roots and Real Numbers www.ck12.org
2.5 Square Roots and Real Numbers
Learning Objectives
• Find square roots.• Approximate square roots.• Identify irrational numbers.• Classify real numbers.• Graph and order real numbers.
Find Square Roots
The square root of a number is a number which, when multiplied by itself, gives the original number. In otherwords, if a = b2, we say that b is the square root of a.
Note: Negative numbers and positive numbers both yield positive numbers when squared, so each positive numberhas both a positive and a negative square root. (For example, 3 and -3 can both be squared to yield 9.) The positivesquare root of a number is called the principal square root.
The square root of a number x is written as√
x or sometimes as 2√x. The symbol √ is sometimes called a radicalsign.
Numbers with whole-number square roots are called perfect squares. The first five perfect squares (1, 4, 9, 16, and25) are shown below.
You can determine whether a number is a perfect square by looking at its prime factors. If every number in the factortree appears an even number of times, the number is a perfect square. To find the square root of that number, simplytake one of each pair of matching factors and multiply them together.
Example 1
Find the principal square root of each of these perfect squares.
a) 121
b) 225
c) 324
d) 576
104

www.ck12.org Chapter 2. Real Numbers
Solution
a) 121 = 11×11, so√
121 = 11.
b) 225 = (5×5)× (3×3), so√
225 = 5×3 = 15.
c) 324 = (2×2)× (3×3)× (3×3), so√
324 = 2×3×3 = 18.
d) 576 = (2×2)× (2×2)× (2×2)× (3×3), so√
576 = 2×2×2×3 = 24.
For more practice matching numbers with their square roots, try the Flash games at http://www.quia.com/jg/65631.html.
When the prime factors don’t pair up neatly, we “factor out” the ones that do pair up and leave the rest under aradical sign. We write the answer as a
√b, where a is the product of half the paired factors we pulled out and b is
the product of the leftover factors.
Example 2
Find the principal square root of the following numbers.
a) 8
b) 48
c) 75
d) 216
Solution
a) 8 = 2×2×2. This gives us one pair of 2’s and one leftover 2, so√
8 = 2√
2.
b) 48 = (2×2)× (2×2)×3, so√
48 = 2×2×√
3, or 4√
3.
c) 75 = (5×5)×3, so√
75 = 5√
3.
d) 216 = (2×2)×2× (3×3)×3, so√
216 = 2×3×√
2×3, or 6√
6.
Note that in the last example we collected the paired factors first, then we collected the unpaired ones under a singleradical symbol. Here are the four rules that govern how we treat square roots.
•√
a×√
b =√
ab• A√
a×B√
b = AB√
ab
•√
a√b=
√ab
• A√
aB√
b= A
B
√ab
Example 3
Simplify the following square root problems
a)√
8×√
2
b) 3√
4×4√
3
c)√
12 ÷√
3
d) 12√
10÷6√
5
Solution
a)√
8×√
2 =√
16 = 4
b) 3√
4×4√
3 = 12√
12 = 12√(2×2)×3 = 12×2
√3 = 24
√3
105

2.5. Square Roots and Real Numbers www.ck12.org
c)√
12 ÷√
3 =
√123
=√
4 = 2
d) 12√
10÷6√
5 = 126
√105
= 2√
2
Approximate Square Roots
Terms like√
2,√
3 and√
7 (square roots of prime numbers) cannot be written as rational numbers. That is to say,they cannot be expressed as the ratio of two integers. We call them irrational numbers. In decimal form, they havean unending, seemingly random, string of numbers after the decimal point.
To find approximate values for square roots, we use the √ or√
x button on a calculator. When the number weplug in is a perfect square, or the square of a rational number, we will get an exact answer. When the number is anon-perfect square, the answer will be irrational and will look like a random string of digits. Since the calculator canonly show some of the infinitely many digits that are actually in the answer, it is really showing us an approximateanswer—not exactly the right answer, but as close as it can get.
Example 4
Use a calculator to find the following square roots. Round your answer to three decimal places.
a)√
99
b)√
5
c)√
0.5
d)√
1.75
Solution
a) ≈ 9.950
b) ≈ 2.236
c) ≈ 0.707
d) ≈ 1.323
You can also work out square roots by hand using a method similar to long division. (See the web page at http://www.homeschoolmath.net/teaching/square-root-algorithm.php for an explanation of this method.)
Identify Irrational Numbers
Not all square roots are irrational, but any square root that can’t be reduced to a form with no radical signs in it isirrational. For example,
√49 is rational because it equals 7, but
√50 can’t be reduced farther than 5
√2. That factor
of√
2 is irrational, making the whole expression irrational.
Example 5
Identify which of the following are rational numbers and which are irrational numbers.
a) 23.7
b) 2.8956
c) π
106

www.ck12.org Chapter 2. Real Numbers
d)√
6
e) 3.27
Solution
a) 23.7 can be written as 23 710 , so it is rational.
b) 2.8956 can be written as 2 895610000 , so it is rational.
c) π = 3.141592654 . . . We know from the definition of π that the decimals do not terminate or repeat, so π isirrational.
d)√
6 =√
2 ×√
3. We can’t reduce it to a form without radicals in it, so it is irrational.
e) 3.27 = 3.272727272727 . . . This decimal goes on forever, but it’s not random; it repeats in a predictable pattern.Repeating decimals are always rational; this one can actually be expressed as 36
11 .
You can see from this example that any number whose decimal representation has a finite number of digits is rational,since each decimal place can be expressed as a fraction. For example, 0.439 can be expressed as 4
10 +3
100 +9
1000 , orjust 439
1000 . Also, any decimal that repeats is rational, and can be expressed as a fraction. For example, 0.2538 can beexpressed as 25
100 +38
9900 , which is equivalent to 25139900 .
Classify Real Numbers
We can now see how real numbers fall into one of several categories.
If a real number can be expressed as a rational number, it falls into one of two categories. If the denominator of itssimplest form is one, then it is an integer. If not, it is a fraction (this term also includes decimals, since they can bewritten as fractions.)
If the number cannot be expressed as the ratio of two integers (i.e. as a fraction), it is irrational.
Example 6
Classify the following real numbers.
a) 0
b) -1
c) π
3
d)√
23
e)√
369
107

2.5. Square Roots and Real Numbers www.ck12.org
Solution
a) Integer
b) Integer
c) Irrational (Although it’s written as a fraction, π is irrational, so any fraction with π in it is also irrational.)
d) Irrational
e) Rational (It simplifies to 69 , or 2
3 .)
Lesson Summary
• The square root of a number is a number which gives the original number when multiplied by itself. Inalgebraic terms, for two numbers a and b, if a = b2, then b =
√a.
• A square root can have two possible values: a positive value called the principal square root, and a negativevalue (the opposite of the positive value).
• A perfect square is a number whose square root is an integer.• Some mathematical properties of square roots are:
–√
a ×√
b =√
ab– A√
a ×B√
b = AB√
ab
–√
a√b=
√ab
– A√
aB√
b= A
B
√ab
• Square roots of numbers that are not perfect squares (or ratios of perfect squares) are irrational numbers.They cannot be written as rational numbers (the ratio of two integers). In decimal form, they have an unending,seemingly random, string of numbers after the decimal point.
• Computing a square root on a calculator will produce an approximate solution since the calculator onlyshows a finite number of digits after the decimal point.
Review Questions
1. Find the following square roots exactly without using a calculator, giving your answer in the simplest form.
a.√
25b.√
24c.√
20d.√
200e.√
2000
f.
√14
(Hint: The division rules you learned can be applied backwards!)
g.
√94
h.√
0.16i.√
0.1j.√
0.01
2. Use a calculator to find the following square roots. Round to two decimal places.
a.√
13
108
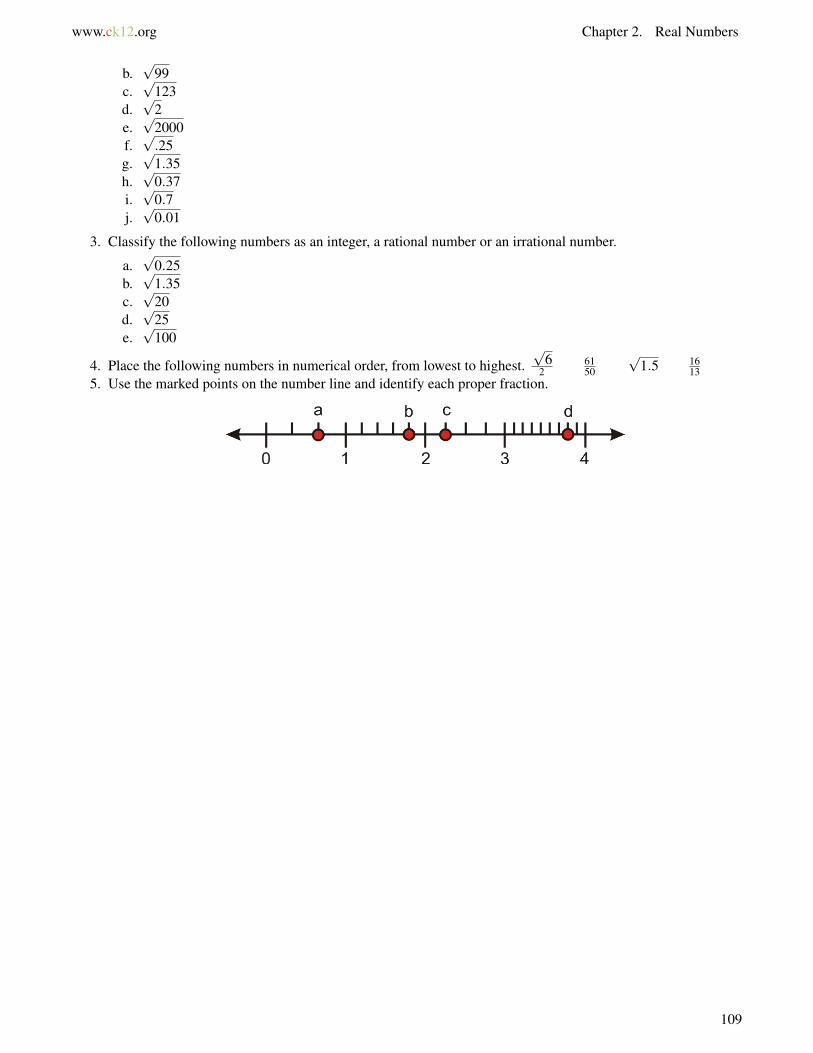
www.ck12.org Chapter 2. Real Numbers
b.√
99c.√
123d.√
2e.√
2000f.√.25
g.√
1.35h.√
0.37i.√
0.7j.√
0.01
3. Classify the following numbers as an integer, a rational number or an irrational number.
a.√
0.25b.√
1.35c.√
20d.√
25e.√
100
4. Place the following numbers in numerical order, from lowest to highest.√
62
6150
√1.5 16
135. Use the marked points on the number line and identify each proper fraction.
109

2.6. Problem-Solving Strategies: Guess and Check, Work Backward www.ck12.org
2.6 Problem-Solving Strategies: Guess andCheck, Work Backward
Learning Objectives
• Read and understand given problem situations.• Develop and use the strategy “Guess and Check.”• Develop and use the strategy “Work Backward.”• Plan and compare alternative approaches to solving problems.• Solve real-world problems using selected strategies as part of a plan.
Introduction
In this section, you will learn about the methods of Guess and Check and Working Backwards. These are verypowerful strategies in problem solving and probably the most commonly used in everyday life. Let’s review ourproblem-solving plan.
Step 1
Understand the problem.
Read the problem carefully. Then list all the components and data involved, and assign your variables.
Step 2
Devise a plan – Translate
Come up with a way to solve the problem. Set up an equation, draw a diagram, make a chart or construct a table.
Step 3
Carry out the plan – Solve
This is where you solve the equation you came up with in Step 2.
Step 4
Look – Check and Interpret
Check that the answer makes sense.
Let’s now look at some strategies we can use as part of this plan.
Develop and Use the Strategy “Guess and Check”
The strategy for the method “Guess and Check” is to guess a solution and then plug the guess back into the problemto see if you get the correct answer. If the answer is too big or too small, make another guess that will get you closerto the goal, and continue guessing until you arrive at the correct solution. The process might sound long, but oftenyou will find patterns that you can use to make better guesses along the way.
110

www.ck12.org Chapter 2. Real Numbers
Here is an example of how this strategy is used in practice.
Example 1
Nadia takes a ribbon that is 48 inches long and cuts it in two pieces. One piece is three times as long as the other.How long is each piece?
Solution
Step 1: Understand
We need to find two numbers that add up to 48. One number is three times the other number.
Step 2: Strategy
We guess two random numbers, one three times bigger than the other, and find the sum.
If the sum is too small we guess larger numbers, and if the sum is too large we guess smaller numbers.
Then, we see if any patterns develop from our guesses.
Step 3: Apply Strategy/Solve
Guess 5 and 15 5+15 = 20 sum is too small
Guess 6 and 18 6+18 = 24 sum is too small
Our second guess gives us a sum that is exactly half of 48. What if we double that guess?
12+36 = 48
There’s our answer. The pieces are 12 and 36 inches long.
Step 4: Check
12+36 = 48 The pieces add up to 48 inches.
36 = 3(12) One piece is three times as long as the other.
The answer checks out.
Develop and Use the Strategy “Work Backward”
The “Work Backward” method works well for problems where a series of operations is done on an unknown numberand you’re only given the result. To use this method, start with the result and apply the operations in reverse orderuntil you find the starting number.
Example 2
Anne has a certain amount of money in her bank account on Friday morning. During the day she writes a check for$24.50, makes an ATM withdrawal of $80 and deposits a check for $235. At the end of the day she sees that herbalance is $451.25. How much money did she have in the bank at the beginning of the day?
Step 1: Understand
We need to find the money in Anne’s bank account at the beginning of the day on Friday.
111
2.6. Problem-Solving Strategies: Guess and Check, Work Backward www.ck12.org
She took out $24.50 and $80 and put in $235.
She ended up with $451.25 at the end of the day.
Step 2: Strategy
We start with an unknown amount, do some operations, and end up with a known amount.
We need to start with the result and apply the operations in reverse.
Step 3: Apply Strategy/Solve
Start with $451.25. Subtract $235, add $80, and then add $24.50.
451.25−235+80+24.50 = 320.75
Anne had $320.75 in her account at the beginning of the day on Friday.
Step 4: Check
Anne starts with $320.75
She writes a check for $24.50. $320.75−24.50 = $296.25
She withdraws $80. $296.25−80 = $216.25
She deposits $235. $216.25+235 = $451.25
The answer checks out.
Plan and Compare Alternative Approaches to Solving Problems
Most word problems can be solved in more than one way. Often one method is more straightforward than others,but which method is best can depend on what kind of problem you are facing.
Example 3
Nadia’s father is 36. He is 16 years older than four times Nadia’s age. How old is Nadia?
Solution
This problem can be solved with either of the strategies you learned in this section. Let’s solve it using both strategies.
Guess and Check Method
Step 1: Understand
We need to find Nadia’s age.
We know that her father is 16 years older than four times her age, or 4× (Nadia’s age)+16.
We know her father is 36 years old.
Step 2: Strategy
We guess a random number for Nadia’s age.
We multiply the number by 4 and add 16 and check to see if the result equals 36.
If the answer is too small, we guess a larger number, and if the answer is too big, we guess a smaller number.
We keep guessing until we get the answer to be 36.
Step 3: Apply strategy/Solve
112

www.ck12.org Chapter 2. Real Numbers
Guess Nadia’s age 10 4(10)+16 = 56 too big for her father’s age
Guess a smaller number 9 4(9)+16 = 52 still too big
Guessing 9 for Nadia’s age gave us a number that is 16 years too great to be her father’s age. But notice that whenwe decreased Nadia’s age by one, her father’s age decreased by four. That suggests that we can decrease our finalanswer by 16 years if we decrease our guess by 4 years.
4 years less than 9 is 5. 4(5)+16 = 36, which is the right age.
Answer: Nadia is 5 years old.
Step 4: Check
Nadia is 5 years old. Her father’s age is 4(5)+16 = 36. This is correct. The answer checks out.
Work Backward Method
Step 1: Understand
We need to find Nadia’s age.
We know her father is 16 years older than four times her age, or 4× (Nadia’s age)+16.
We know her father is 36 years old.
Step 2: Strategy
To get from Nadia’s age to her father’s age, we multiply Nadia’s age by four and add 16.
Working backwards means we start with the father’s age, subtract 16 and divide by 4.
Step 3: Apply Strategy/Solve
Start with the father’s age 36
Subtract 16 36−16 = 20
Divide by 4 20÷4 = 5
Answer Nadia is 5 years old.
Step 4: Check
Nadia is 5 years old. Her father’s age is 4(5)+16 = 36. This is correct. The answer checks out.
You see that in this problem, the “Work Backward” strategy is more straightforward than the Guess and Checkmethod. The Work Backward method always works best when we know the result of a series of operations, but notthe starting number. In the next chapter, you will learn algebra methods based on the Work Backward method.
Lesson Summary
The four steps of the problem solving plan are:
• Understand the problem• Devise a plan – Translate• Carry out the plan – Solve• Look – Check and Interpret
113

2.6. Problem-Solving Strategies: Guess and Check, Work Backward www.ck12.org
Two common problem solving strategies are:
Guess and Check
Guess a solution and use the guess in the problem to see if you get the correct answer. If the answer is too big or toosmall, then make another guess that will get you closer to the goal.
Work Backward
This method works well for problems in which a series of operations is applied to an unknown quantity and you aregiven the resulting number. Start with the result and apply the operations in reverse order until you find the unknown.
Review Questions
1. Finish the problem we started in Example 1.2. Nadia is at home and Peter is at school which is 6 miles away from home. They start traveling towards each
other at the same time. Nadia is walking at 3.5 miles per hour and Peter is skateboarding at 6 miles per hour.When will they meet and how far from home is their meeting place?
3. Peter bought several notebooks at Staples for $2.25 each; then he bought a few more notebooks at Rite-Aidfor $2 each. He spent the same amount of money in both places and he bought 17 notebooks in all. How manynotebooks did Peter buy in each store?
4. Andrew took a handful of change out of his pocket and noticed that he was only holding dimes and quarters inhis hand. He counted and found that he had 22 coins that amounted to $4. How many quarters and how manydimes does Andrew have?
5. Anne wants to put a fence around her rose bed that is one and a half times as long as it is wide. She uses 50feet of fencing. What are the dimensions of the garden?
6. Peter is outside looking at the pigs and chickens in the yard. Nadia is indoors and cannot see the animals.Peter gives her a puzzle. He tells her that he can see 13 heads and 36 feet and asks her how many pigs andhow many chickens are in the yard. Help Nadia find the answer.
7. Andrew invests $8000 in two types of accounts: a savings account that pays 5.25% interest per year and amore risky account that pays 9% interest per year. At the end of the year he has $450 in interest from the twoaccounts. Find the amount of money invested in each account.
8. 450 tickets are sold for a concert: balcony seats for $35 each and orchestra seats for $25 each. If the total boxoffice take is $13,000, how many of each kind of ticket were sold?
9. There is a bowl of candy sitting on our kitchen table. One morning Nadia takes one-sixth of the candy. Laterthat morning Peter takes one-fourth of the candy that’s left. That afternoon, Andrew takes one-fifth of what’sleft in the bowl and finally Anne takes one-third of what is left in the bowl. If there are 16 candies left in thebowl at the end of the day, how much candy was there at the beginning of the day?
10. Nadia can completely mow the lawn by herself in 30 minutes. Peter can completely mow the lawn by himselfin 45 minutes. How long does it take both of them to mow the lawn together?
11. Three monkeys spend a day gathering coconuts together. When they have finished, they are very tired and fallasleep. The following morning, the first monkey wakes up. Not wishing to disturb his friends, he decides todivide the coconuts into three equal piles. There is one left over, so he throws this odd one away, helps himselfto his share, and goes home. A few minutes later, the second monkey awakes. Not realizing that the first hasalready gone, he too divides the coconuts into three equal heaps. He finds one left over, throws the odd oneaway, helps himself to his fair share, and goes home. In the morning, the third monkey wakes to find that he isalone. He spots the two discarded coconuts, and puts them with the pile, giving him a total of twelve coconuts.
a. How many coconuts did the first two monkeys take?b. How many coconuts did the monkeys gather in all?
12. Two prime numbers have a product of 51. What are the numbers?13. Two prime numbers have a product of 65. What are the numbers?
114

www.ck12.org Chapter 2. Real Numbers
14. The square of a certain positive number is eight more than twice the number. What is the number?15. Is 91 prime? (Hint: if it’s not prime, what are its prime factors?)16. Is 73 prime?17. Alison’s school day starts at 8:30, but today Alison wants to arrive ten minutes early to discuss an assignment
with her English teacher. If she is also giving her friend Sherice a ride to school, and it takes her 12 minutesto get to Sherice’s house and another 15 minutes to get to school from there, at what time does Alison need toleave her house?
18. At her retail job, Kelly gets a raise of 10% every six months. After her third raise, she now makes $13.31 perhour. How much did she make when she first started out?
19. Three years ago, Kevin’s little sister Becky had her fifth birthday. If Kevin was eight when Becky was born,how old is he now?
20. A warehouse is full of shipping crates; half of them are headed for Boston and the other half for Philadelphia.A truck arrives to pick up 20 of the Boston-bound crates, and then another truck carries away one third ofthe Philadelphia-bound crates. An hour later, half of the remaining crates are moved onto the loading dockoutside. If there are 40 crates left in the warehouse, how many were there originally?
21. Gerald is a bus driver who takes over from another bus driver one day in the middle of his route. He doesn’tpay attention to how many passengers are on the bus when he starts driving, but he does notice that threepassengers get off at the next stop, a total of eight more get on at the next three stops, two get on and four getoff at the next stop, and at the stop after that, a third of the passengers get off.
a. If there are now 14 passengers on the bus, how many were there when Gerald first took over the route?b. If half the passengers who got on while Gerald was driving paid the full adult fare of $1.50, and the other
half were students or seniors who paid a discounted fare of $1.00, how much cash was in the bus’s farebox at the beginning of Gerald’s shift if there is now $73.50 in it?
c. When Gerald took over the route, all the passengers currently on the bus had paid full fare. However,some of the passengers who had previously gotten on and off the bus were students or seniors who hadpaid the discounted fare. Based on the amount of money that was in the cash box, if 28 passengers hadgotten on the bus and gotten off before Gerald arrived (in addition to the passengers who had gotten onand were still there when he arrived), how many of those passengers paid the discounted fare?
d. How much money would currently be in the cash box if all the passengers throughout the day had paidthe full fare?
Texas Instruments Resources
In the CK-12 Texas Instruments Algebra I FlexBook, there are graphing calculator activities designed to supple-ment the objectives for some of the lessons in this chapter. See http://www.ck12.org/flexr/chapter/9612.
115
www.ck12.org
CHAPTER 3 Equations of LinesChapter Outline
3.1 ONE-STEP EQUATIONS
3.2 TWO-STEP EQUATIONS
3.3 MULTI-STEP EQUATIONS
3.4 EQUATIONS WITH VARIABLES ON BOTH SIDES
3.5 RATIOS AND PROPORTIONS
3.6 PERCENT PROBLEMS
116

www.ck12.org Chapter 3. Equations of Lines
3.1 One-Step Equations
Learning Objectives
• Solve an equation using addition.• Solve an equation using subtraction.• Solve an equation using multiplication.• Solve an equation using division.
Introduction
Nadia is buying a new mp3 player. Peter watches her pay for the player with a $100 bill. She receives $22.00 inchange, and from only this information, Peter works out how much the player cost. How much was the player?
In algebra, we can solve problems like this using an equation. An equation is an algebraic expression that involvesan equals sign. If we use the letter x to represent the cost of the mp3 player, we can write the equation x+22 = 100.This tells us that the value of the player plus the value of the change received is equal to the $100 that Nadia paid.
Another way we could write the equation would be x = 100−22. This tells us that the value of the player is equalto the total amount of money Nadia paid (100−22). This equation is mathematically equivalent to the first one, butit is easier to solve.
In this chapter, we will learn how to solve for the variable in a one-variable linear equation. Linear equations areequations in which each term is either a constant, or a constant times a single variable (raised to the first power). Theterm linear comes from the word line, because the graph of a linear equation is always a line.
We’ll start with simple problems like the one in the last example.
Solving Equations Using Addition and Subtraction
When we work with an algebraic equation, it’s important to remember that the two sides have to stay equal for theequation to stay true. We can change the equation around however we want, but whatever we do to one side of theequation, we have to do to the other side. In the introduction above, for example, we could get from the first equationto the second equation by subtracting 22 from both sides:
x+22 = 100
x+22−22 = 100−22
x = 100−22
Similarly, we can add numbers to each side of an equation to help solve for our unknown.
Example 1
117

3.1. One-Step Equations www.ck12.org
Solve x−3 = 9.
Solution
To solve an equation for x, we need to isolate x−that is, we need to get it by itself on one side of the equals sign.Right now our x has a 3 subtracted from it. To reverse this, we’ll add 3—but we must add 3 to both sides.
x−3 = 9
x−3+3 = 9+3
x+0 = 9+3
x = 12
Example 2
Solve z−9.7 =−1.026
Solution
It doesn’t matter what the variable is—the solving process is the same.
z−9.7 =−1.026
z−9.7+9.7 =−1.026+9.7
z = 8.674
Make sure you understand the addition of decimals in this example!
Example 3
Solve x+ 47 = 9
5 .
Solution
To isolate x, we need to subtract 47 from both sides.
x+47=
95
x+47− 4
7=
95− 4
7
x =95− 4
7
Now we have to subtract fractions, which means we need to find the LCD. Since 5 and 7 are both prime, their lowestcommon multiple is just their product, 35.
x =95− 4
7
x =7 ·97 ·5− 4 ·5
7 ·5
x =6335− 20
35
x =63−20
35
x =4335
118
www.ck12.org Chapter 3. Equations of Lines
Make sure you’re comfortable with decimals and fractions! To master algebra, you’ll need to work with themfrequently.
Solving Equations Using Multiplication and Division
Suppose you are selling pizza for $1.50 a slice and you can get eight slices out of a single pizza. How much moneydo you get for a single pizza? It shouldn’t take you long to figure out that you get 8×$1.50 = $12.00. You solvedthis problem by multiplying. Here’s how to do the same thing algebraically, using x to stand for the cost in dollarsof the whole pizza.
Example 4
Solve 18 · x = 1.5.
Our x is being multiplied by one-eighth. To cancel that out and get x by itself, we have to multiply by the reciprocal,8. Don’t forget to multiply both sides of the equation.
8(
18· x)= 8(1.5)
x = 12
Example 5
Solve 9x5 = 5.
9x5 is equivalent to 9
5 · x, so to cancel out that 95 , we multiply by the reciprocal, 5
9 .
59
(9x5
)=
59(5)
x =259
Example 6
Solve 0.25x = 5.25.
0.25 is the decimal equivalent of one fourth, so to cancel out the 0.25 factor we would multiply by 4.
4(0.25x) = 4(5.25)
x = 21
119

3.1. One-Step Equations www.ck12.org
Solving by division is another way to isolate x. Suppose you buy five identical candy bars, and you are charged$3.25. How much did each candy bar cost? You might just divide $3.25 by 5, but let’s see how this problem looksin algebra.
Example 7
Solve 5x = 3.25.
To cancel the 5, we divide both sides by 5.
5x5
=3.25
5x = 0.65
Example 8
Solve 7x = 511 .
Divide both sides by 7.
x =5
11.7
x =577
Example 9
Solve 1.375x = 1.2.
Divide by 1.375
x =1.2
1.375x = 0.872
Notice the bar above the final two decimals; it means that those digits recur, or repeat. The full answer is 0.872727272727272....
To see more examples of one - and two-step equation solving, watch the Khan Academy video series starting at http://www.youtube.com/watch?v=bAerID24QJ0.
Solve Real-World Problems Using Equations
Example 10
In the year 2017, Anne will be 45years old. In what year was Anne born?
The unknown here is the year Anne was born, so that’s our variable x. Here’s our equation:
x+45 = 2017
x+45−45 = 2017−45
x = 1972
120

www.ck12.org Chapter 3. Equations of Lines
Anne was born in 1972.
Example 11
A mail order electronics company stocks a new mini DVD player and is using a balance to determine the shippingweight. Using only one-pound weights, the shipping department found that the following arrangement balances:
How much does each DVD player weigh?
Solution
Since the system balances, the total weight on each side must be equal. To write our equation, we’ll use x for theweight of one DVD player, which is unknown. There are two DVD players, weighing a total of 2x pounds, on theleft side of the balance, and on the right side are 5 1-pound weights, weighing a total of 5 pounds. So our equationis 2x = 5. Dividing both sides by 2 gives us x = 2.5.
Each DVD player weighs 2.5 pounds.
Example 12
In 2004, Takeru Kobayashi of Nagano, Japan, ate 53.5 hot dogs in 12 minutes. This was 3 more hot dogs than hisown previous world record, set in 2002. Calculate:
a) How many minutes it took him to eat one hot dog.
b) How many hot dogs he ate per minute.
c) What his old record was.
Solution
a) We know that the total time for 53.5 hot dogs is 12 minutes. We want to know the time for one hot dog, so that’sx. Our equation is 53.5x = 12. Then we divide both sides by 53.5 to get x = 12
53.5 , or x = 0.224 minutes.
We can also multiply by 60 to get the time in seconds; 0.224 minutes is about 13.5 seconds. So that’s how long ittook Takeru to eat one hot dog.
b) Now we’re looking for hot dogs per minute instead of minutes per hot dog. We’ll use the variable y instead of xthis time so we don’t get the two confused. 12 minutes, times the number of hot dogs per minute, equals the totalnumber of hot dogs, so 12y = 53.5. Dividing both sides by 12 gives us y = 53.5
12 , or y = 4.458 hot dogs per minute.
c) We know that his new record is 53.5, and we know that’s three more than his old record. If we call his old recordz, we can write the following equation: z+3 = 53.5. Subtracting 3 from both sides gives us z = 50.5. So Takeru’sold record was 50.5 hot dogs in 12 minutes.
Lesson Summary
• An equation in which each term is either a constant or the product of a constant and a single variable is alinear equation.
• We can add, subtract, multiply, or divide both sides of an equation by the same value and still have anequivalent equation.
121

3.1. One-Step Equations www.ck12.org
• To solve an equation, isolate the unknown variable on one side of the equation by applying one or morearithmetic operations to both sides.
Review Questions
1. Solve the following equations for x.
a. x = 11 = 7b. x−1.1 = 3.2c. 7x = 21d. 4x = 1e. 5x
12 = 23
f. x+ 52 = 2
3g. x− 5
6 = 38
h. 0.01x = 11
2. Solve the following equations for the unknown variable.
a. q−13 =−13b. z+1.1 = 3.0001c. 21s = 3d. t + 1
2 = 13
e. 7 f11 = 7
11f. 3
4 =−12 − y
g. 6r = 38
h. 9b16 = 3
8
3. Peter is collecting tokens on breakfast cereal packets in order to get a model boat. In eight weeks he hascollected 10 tokens. He needs 25 tokens for the boat. Write an equation and determine the followinginformation.
a. How many more tokens he needs to collect, n.b. How many tokens he collects per week, w.c. How many more weeks remain until he can send off for his boat, r.
4. Juan has baked a cake and wants to sell it in his bakery. He is going to cut it into 12 slices and sell themindividually. He wants to sell it for three times the cost of making it. The ingredients cost him $8.50, and heallowed $1.25 to cover the cost of electricity to bake it. Write equations that describe the following statements
a. The amount of money that he sells the cake for (u).b. The amount of money he charges for each slice (c).c. The total profit he makes on the cake (w).
5. Jane is baking cookies for a large party. She has a recipe that will make one batch of two dozen cookies, andshe decides to make five batches. To make five batches, she finds that she will need 12.5 cups of flour and 15eggs.
a. How many cookies will she make in all?b. How many cups of flour go into one batch?c. How many eggs go into one batch?d. If Jane only has a dozen eggs on hand, how many more does she need to make five batches?e. If she doesn’t go out to get more eggs, how many batches can she make? How many cookies will that
be?
122
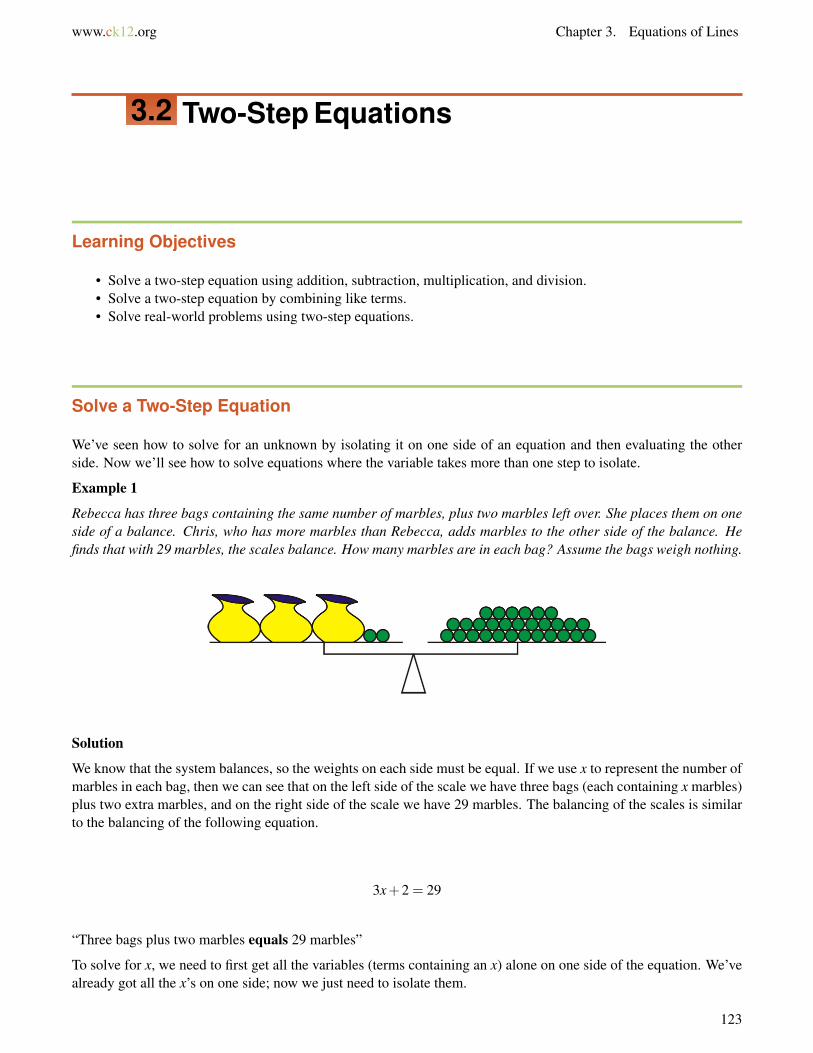
www.ck12.org Chapter 3. Equations of Lines
3.2 Two-Step Equations
Learning Objectives
• Solve a two-step equation using addition, subtraction, multiplication, and division.• Solve a two-step equation by combining like terms.• Solve real-world problems using two-step equations.
Solve a Two-Step Equation
We’ve seen how to solve for an unknown by isolating it on one side of an equation and then evaluating the otherside. Now we’ll see how to solve equations where the variable takes more than one step to isolate.
Example 1
Rebecca has three bags containing the same number of marbles, plus two marbles left over. She places them on oneside of a balance. Chris, who has more marbles than Rebecca, adds marbles to the other side of the balance. Hefinds that with 29 marbles, the scales balance. How many marbles are in each bag? Assume the bags weigh nothing.
Solution
We know that the system balances, so the weights on each side must be equal. If we use x to represent the number ofmarbles in each bag, then we can see that on the left side of the scale we have three bags (each containing x marbles)plus two extra marbles, and on the right side of the scale we have 29 marbles. The balancing of the scales is similarto the balancing of the following equation.
3x+2 = 29
“Three bags plus two marbles equals 29 marbles”
To solve for x, we need to first get all the variables (terms containing an x) alone on one side of the equation. We’vealready got all the x’s on one side; now we just need to isolate them.
123

3.2. Two-Step Equations www.ck12.org
3x+2 = 29
3x+2−2 = 29−2 Get rid of the 2 on the left by subtracting it from both sides.
3x = 273x3
=273
Divide both sides by 3.
x = 9
There are nine marbles in each bag.
We can do the same with the real objects as we did with the equation. Just as we subtracted 2 from both sides of theequals sign, we could remove two marbles from each side of the scale. Because we removed the same number ofmarbles from each side, we know the scales will still balance.
Then, because there are three bags of marbles on the left-hand side of the scale, we can divide the marbles on theright-hand side into three equal piles. You can see that there are nine marbles in each.
Three bags of marbles balances three piles of nine marbles.
So each bag of marbles balances nine marbles, meaning that each bag contains nine marbles.
Check out http://www.mste.uiuc.edu/pavel/java/balance/ for more interactive balance beam activities!
Example 2
Solve 6(x+4) = 12.
This equation has the x buried in parentheses. To dig it out, we can proceed in one of two ways: we can eitherdistribute the six on the left, or divide both sides by six to remove it from the left. Since the right-hand side of theequation is a multiple of six, it makes sense to divide. That gives us x+ 4 = 2. Then we can subtract 4 from bothsides to get x =−2.
Example 3
Solve x−35 = 7.
It’s always a good idea to get rid of fractions first. Multiplying both sides by 5 gives us x−3 = 35, and then we canadd 3 to both sides to get x = 38.
Example 4
Solve 59(x+1) = 2
7 .
124

www.ck12.org Chapter 3. Equations of Lines
First, we’ll cancel the fraction on the left by multiplying by the reciprocal (the multiplicative inverse).
95· 5
9(x+1) =
95· 2
7
(x+1) =1835
Then we subtract 1 from both sides. ( 3535 is equivalent to 1.)
x+1 =1835
x+1−1 =1835− 35
35
x =18−35
35
x =−1735
These examples are called two-step equations, because we need to perform two separate operations on the equationto isolate the variable.
Solve a Two-Step Equation by Combining Like Terms
When we look at a linear equation we see two kinds of terms: those that contain the unknown variable, and thosethat don’t. When we look at an equation that has an x on both sides, we know that in order to solve it, we need toget all the x−terms on one side of the equation. This is called combining like terms. The terms with an x in themare like terms because they contain the same variable (or, as you will see in later chapters, the same combination ofvariables).
TABLE 3.1:
Like Terms Unlike Terms4x,10x,−3.5x, and x
12 3x and 3y3y,0.000001y, and y 4xy and 4xxy,6xy, and 2.39xy 0.5x and 0.5
To add or subtract like terms, we can use the Distributive Property of Multiplication.
3x+4x = (3+4)x = 7x
0.03xy−0.01xy = (0.03−0.01)xy = 0.02xy
−y+16y+5y = (−1+16+5)y = 10y
5z+2z−7z = (5+2−7)z = 0z = 0
To solve an equation with two or more like terms, we need to combine the terms first.
Example 5
125

3.2. Two-Step Equations www.ck12.org
Solve (x+5)− (2x−3) = 6.
There are two like terms: the x and the −2x (don’t forget that the negative sign applies to everything in theparentheses). So we need to get those terms together. The associative and distributive properties let us rewritethe equation as x + 5− 2x + 3 = 6, and then the commutative property lets us switch around the terms to getx−2x+5+3 = 6, or (x−2x)+(5+3) = 6.
(x−2x) is the same as (1−2)x, or −x, so our equation becomes −x+8 = 6
Subtracting 8 from both sides gives us −x =−2.
And finally, multiplying both sides by -1 gives us x = 2.
Example 6
Solve x2 −
x3 = 6.
This problem requires us to deal with fractions. We need to write all the terms on the left over a common denominatorof six.
3x6− 2x
6= 6
Then we subtract the fractions to get x6 = 6.
Finally we multiply both sides by 6 to get x = 36.
Solve Real-World Problems Using Two-Step Equations
The hardest part of solving word problems is translating from words to an equation. First, you need to look to seewhat the equation is asking. What is the unknown for which you have to solve? That will be what your variablestands for. Then, follow what is going on with your variable all the way through the problem.
Example 7
An emergency plumber charges $65 as a call-out fee plus an additional $75 per hour. He arrives at a house at 9:30and works to repair a water tank. If the total repair bill is $196.25, at what time was the repair completed?
In order to solve this problem, we collect the information from the text and convert it to an equation.
Unknown: time taken in hours – this will be our x
The bill is made up of two parts: a call out fee and a per-hour fee. The call out is a flat fee, and independent ofx—it’s the same no matter how many hours the plumber works. The per-hour part depends on the number of hours(x). So the total fee is $65 (no matter what) plus $75x (where x is the number of hours), or 65+75x.
Looking at the problem again, we also can see that the total bill is $196.25. So our final equation is 196.25 =65+75x.
126

www.ck12.org Chapter 3. Equations of Lines
Solving for x:
196.25 = 65+75x Subtract 65 from both sides.
131.25 = 75x Divide both sides by 75.
1.75 = x The job took 1.75 hours.
Solution
The repair job was completed 1.75 hours after 9:30, so it was completed at 11:15AM.
Example 8
When Asia was young her Daddy marked her height on the door frame every month. Asia’s Daddy noticed thatbetween the ages of one and three, he could predict her height (in inches) by taking her age in months, adding 75inches and multiplying the result by one-third. Use this information to answer the following:
a) Write an equation linking her predicted height, h, with her age in months, m.
b) Determine her predicted height on her second birthday.
c) Determine at what age she is predicted to reach three feet tall.
Solution
a) To convert the text to an equation, first determine the type of equation we have. We are going to have an equationthat links two variables. Our unknown will change, depending on the information we are given. For example, wecould solve for height given age, or solve for age given height. However, the text gives us a way to determine height.Our equation will start with “h =”.
The text tells us that we can predict her height by taking her age in months, adding 75, and multiplying by 13 . So our
equation is h = (m+75) · 13 , or h = 1
3(m+75).
b) To predict Asia’s height on her second birthday, we substitute m = 24 into our equation (because 2 years is 24months) and solve for h.
h =13(24+75)
h =13(99)
h = 33
Asia’s height on her second birthday was predicted to be 33 inches.
c) To determine the predicted age when she reached three feet, substitute h = 36 into the equation and solve for m.
36 =13(m+75)
108 = m+75
33 = m
Asia was predicted to be 33 months old when her height was three feet.
Example 9
To convert temperatures in Fahrenheit to temperatures in Celsius, follow the following steps: Take the temperature indegrees Fahrenheit and subtract 32. Then divide the result by 1.8 and this gives the temperature in degrees Celsius.
127

3.2. Two-Step Equations www.ck12.org
a) Write an equation that shows the conversion process.
b) Convert 50 degrees Fahrenheit to degrees Celsius.
c) Convert 25 degrees Celsius to degrees Fahrenheit.
d) Convert -40 degrees Celsius to degrees Fahrenheit.
a) The text gives the process to convert Fahrenheit to Celsius. We can write an equation using two variables. Wewill use f for temperature in Fahrenheit, and c for temperature in Celsius.
First we take the temperature in Fahrenheit and subtract 32. f −32
Then divide by 1.8.f −32
1.8
This equals the temperature in Celsius. c =f −32
1.8
In order to convert from one temperature scale to another, simply substitute in for whichever temperature you know,and solve for the one you don’t know.
b) To convert 50 degrees Fahrenheit to degrees Celsius, substitute f = 50 into the equation.
c =50−32
1.8
c =181.8
c = 10
50 degrees Fahrenheit is equal to 10 degrees Celsius.
c) To convert 25 degrees Celsius to degrees Fahrenheit, substitute c = 25 into the equation:
25 =f −32
1.845 = f −32
77 = f
25 degrees Celsius is equal to 77 degrees Fahrenheit.
d) To convert -40 degrees Celsius to degrees Fahrenheit, substitute c =−40 into the equation.
−40 =f −32
1.8−72 = f −32
−40 = f
-40 degrees Celsius is equal to -40 degrees Fahrenheit. (No, that’s not a mistake! This is the one temperature wherethey are equal.)
128

www.ck12.org Chapter 3. Equations of Lines
Lesson Summary
• Some equations require more than one operation to solve. Generally it, is good to go from the outside in. Ifthere are parentheses around an expression with a variable in it, cancel what is outside the parentheses first.
• Terms with the same variable in them (or no variable in them) are like terms. Combine like terms (addingor subtracting them from each other) to simplify the expression and solve for the unknown.
Review Questions
1. Solve the following equations for the unknown variable.
a. 1.3x−0.7x = 12b. 6x−1.3 = 3.2c. 5x− (3x+2) = 1d. 4(x+3) = 1e. 5q−7 = 2
3f. 3
5 x+ 52 = 2
3g. s− 3s
8 = 56
h. 0.1y+11 = 0i. 5q−7
12 = 23
j. 5(q−7)12 = 2
3k. 33t−99 = 0l. 5p−2 = 32
m. 10y+5 = 10n. 10(y+5) = 10o. 10y+5y = 10p. 10(y+5y) = 10
2. Jade is stranded downtown with only $10 to get home. Taxis cost $0.75 per mile, but there is an additional$2.35 hire charge. Write a formula and use it to calculate how many miles she can travel with her money.
3. Jasmin’s Dad is planning a surprise birthday party for her. He will hire a bouncy castle, and will provide partyfood for all the guests. The bouncy castle costs $150 for the afternoon, and the food will cost $3 per person.Andrew, Jasmin’s Dad, has a budget of $300. Write an equation and use it to determine the maximum numberof guests he can invite.
4. The local amusement park sells summer memberships for $50 each. Normal admission to the park costs $25;admission for members costs $15.
a. If Darren wants to spend no more than $100 on trips to the amusement park this summer, how manyvisits can he make if he buys a membership with part of that money?
b. How many visits can he make if he does not?c. If he increases his budget to $160, how many visits can he make as a member?d. And how many as a non-member?
5. For an upcoming school field trip, there must be one adult supervisor for every five children.
a. If the bus seats 40 people, how many children can go on the trip?b. How many children can go if a second 40-person bus is added?c. Four of the adult chaperones decide to arrive separately by car. Now how many children can go in the
two buses?
129

3.3. Multi-Step Equations www.ck12.org
3.3 Multi-Step Equations
Learning Objectives
• Solve a multi-step equation by combining like terms.• Solve a multi-step equation using the distributive property.• Solve real-world problems using multi-step equations.
Solving Multi-Step Equations by Combining Like Terms
We’ve seen that when we solve for an unknown variable, it can take just one or two steps to get the terms in the rightplaces. Now we’ll look at solving equations that take several steps to isolate the unknown variable. Such equationsare referred to as multi-step equations.
In this section, we’ll simply be combining the steps we already know how to do. Our goal is to end up with all theconstants on one side of the equation and all the variables on the other side. We’ll do this by collecting like terms.Don’t forget, like terms have the same combination of variables in them.
Example 1
Solve 3x+43 −5x = 6.
Before we can combine the variable terms, we need to get rid of that fraction.
First let’s put all the terms on the left over a common denominator of three: 3x+43 −
15x3 = 6.
Combining the fractions then gives us 3x+4−15x3 = 6.
Combining like terms in the numerator gives us 4−12x3 = 6.
Multiplying both sides by 3 gives us 4−12x = 18.
Subtracting 4 from both sides gives us −12x = 14.
And finally, dividing both sides by -12 gives us x =−1412 , which reduces to x =−7
6 .
Solving Multi-Step Equations Using the Distributive Property
You may have noticed that when one side of the equation is multiplied by a constant term, we can either distributeit or just divide it out. If we can divide it out without getting awkward fractions as a result, then that’s usually thebetter choice, because it gives us smaller numbers to work with. But if dividing would result in messy fractions, thenit’s usually better to distribute the constant and go from there.
Example 2
Solve 7(2x−5) = 21.
The first thing we want to do here is get rid of the parentheses. We could use the Distributive Property, but it just
130
www.ck12.org Chapter 3. Equations of Lines
so happens that 7 divides evenly into 21. That suggests that dividing both sides by 7 is the easiest way to solve thisproblem.
If we do that, we get 2x−5 = 217 or just 2x−5 = 3. Then all we need to do is add 5 to both sides to get 2x = 8, and
then divide by 2 to get x = 4.
Example 3
Solve 17(3x+4) = 7.
Once again, we want to get rid of those parentheses. We could divide both sides by 17, but that would give us aninconvenient fraction on the right-hand side. In this case, distributing is the easier way to go.
Distributing the 17 gives us 51x+ 68 = 7. Then we subtract 68 from both sides to get 51x = −61, and then wedivide by 51 to get x = −61
51 . (Yes, that’s a messy fraction too, but since it’s our final answer and we don’t have to doanything else with it, we don’t really care how messy it is.)
Example 4
Solve 4(3x−4)−7(2x+3) = 3.
Before we can collect like terms, we need to get rid of the parentheses using the Distributive Property. That givesus 12x− 16− 14x− 21 = 3, which we can rewrite as (12x− 14x) + (−16− 21) = 3. This in turn simplifies to−2x−37 = 3.
Next we add 37 to both sides to get −2x = 40.
And finally, we divide both sides by -2 to get x =−20.
Example 5
Solve the following equation for x: 0.1(3.2+2x)+ 12
(3− x
5
)= 0
This function contains both fractions and decimals. We should convert all terms to one or the other. It’s often easierto convert decimals to fractions, but in this equation the fractions are easy to convert to decimals—and with decimalswe don’t need to find a common denominator!
In decimal form, our equation becomes 0.1(3.2+2x)+0.5(3−0.2x) = 0.
Distributing to get rid of the parentheses, we get 0.32+0.2x+1.5−0.1x = 0.
Collecting and combining like terms gives us 0.1x+1.82 = 0.
Then we can subtract 1.82 from both sides to get 0.1x =−1.82, and finally divide by 0.1 (or multiply by 10) to getx =−18.2.
Solving Real-World Problems Using Multi-Step Equations
Example 6
A growers’ cooperative has a farmer’s market in the town center every Saturday. They sell what they have grownand split the money into several categories. 8.5% of all the money taken in is set aside for sales tax. $150 goes topay the rent on the space they occupy. What remains is split evenly between the seven growers. How much totalmoney is taken in if each grower receives a $175 share?
Let’s translate the text above into an equation. The unknown is going to be the total money taken in dollars. We’llcall this x.
“8.5% of all the money taken in is set aside for sales tax." This means that 91.5% of the money remains. This is0.915x.
131

3.3. Multi-Step Equations www.ck12.org
“$150 goes to pay the rent on the space they occupy.” This means that what’s left is 0.915x−150.
“What remains is split evenly between the 7 growers.” That means each grower gets 0.915x−1507 .
If each grower’s share is $175, then our equation to find x is 0.915x−1507 = 175.
First we multiply both sides by 7 to get 0.915x−150 = 1225.
Then add 150 to both sides to get 0.915x = 1375.
Finally divide by 0.915 to get x ≈ 1502.7322. Since we want our answer in dollars and cents, we round to twodecimal places, or $1502.73.
The workers take in a total of $1502.73.
Example 7
A factory manager is packing engine components into wooden crates to be shipped on a small truck. The truck isdesigned to hold sixteen crates, and will safely carry a 1200 lb cargo. Each crate weighs 12 lbs empty. How muchweight should the manager instruct the workers to put in each crate in order to get the shipment weight as close aspossible to 1200 lbs?
The unknown quantity is the weight to put in each box, so we’ll call that x.
Each crate when full will weigh x+12 lbs, so all 16 crates together will weigh 16(x+12) lbs.
We also know that all 16 crates together should weigh 1200 lbs, so we can say that 16(x+12) = 1200.
To solve this equation, we can start by dividing both sides by 16: x+12 = 120016 = 75.
Then subtract 12 from both sides: x = 63.
The manager should tell the workers to put 63 lbs of components in each crate.
Ohm’s Law
The electrical current, I (amps), passing through an electronic component varies directly with the applied voltage, V(volts), according to the relationship V = I ·R where R is the resistance measured in Ohms (Ω).
Example 8
A scientist is trying to deduce the resistance of an unknown component. He labels the resistance of the unknowncomponent x Ω. The resistance of a circuit containing a number of these components is (5x + 20)Ω. If a 120volt potential difference across the circuit produces a current of 2.5 amps, calculate the resistance of the unknowncomponent.
Solution
To solve this, we need to start with the equation V = I ·R and substitute in V = 120, I = 2.5, and R = 5x+20. Thatgives us 120 = 2.5(5x+20).
Distribute the 2.5 to get 120 = 12.5x+50.
Subtract 50 from both sides to get 70 = 12.5x.
Finally, divide by 12.5 to get 5.6 = x.
The unknown components have a resistance of 5.6 Ω.
132

www.ck12.org Chapter 3. Equations of Lines
Distance, Speed and Time
The speed of a body is the distance it travels per unit of time. That means that we can also find out how far an objectmoves in a certain amount of time if we know its speed: we use the equation “distance = speed× time.”
Example 8
Shanice’s car is traveling 10 miles per hour slower than twice the speed of Brandon’s car. She covers 93 miles in 1hour 30 minutes. How fast is Brandon driving?
Solution
Here, we don’t know either Brandon’s speed or Shanice’s, but since the question asks for Brandon’s speed, that’swhat we’ll use as our variable x.
The distance Shanice covers in miles is 93, and the time in hours is 1.5. Her speed is 10 less than twice Brandon’sspeed, or 2x−10 miles per hour. Putting those numbers into the equation gives us 93 = 1.5(2x−10).
First we distribute, to get 93 = 3x−15.
Then we add 15 to both sides to get 108 = 3x.
Finally we divide by 3 to get 36 = x.
Brandon is driving at 36 miles per hour.
We can check this answer by considering the situation another way: we can solve for Shanice’s speed instead ofBrandon’s and then check that against Brandon’s speed. We’ll use y for Shanice’s speed since we already used x forBrandon’s.
The equation for Shanice’s speed is simply 93 = 1.5y. We can divide both sides by 1.5 to get 62 = y, so Shanice istraveling at 62 miles per hour.
The problem tells us that Shanice is traveling 10 mph slower than twice Brandon’s speed; that would mean that 62is equal to 2 times 36 minus 10. Is that true? Well, 2 times 36 is 72, minus 10 is 62. The answer checks out.
In algebra, there’s almost always more than one method of solving a problem. If time allows, it’s always a good ideato try to solve the problem using two different methods just to confirm that you’ve got the answer right.
Speed of Sound
The speed of sound in dry air, v, is given by the equation v = 331+0.6T , where T is the temperature in Celsius andv is the speed of sound in meters per second.
Example 9
Tashi hits a drainpipe with a hammer and 250 meters away Minh hears the sound and hits his own drainpipe.Unfortunately, there is a one second delay between him hearing the sound and hitting his own pipe. Tashi accuratelymeasures the time between her hitting the pipe and hearing Mihn’s pipe at 2.46 seconds. What is the temperature ofthe air?
This is a complex problem and we need to be careful in writing our equations. First of all, the distance the soundtravels is equal to the speed of sound multiplied by the time, and the speed is given by the equation above. Sothe distance equals (331+ 0.6T )× time, and the time is 2.46− 1 (because for 1 second out of the 2.46 secondsmeasured, there was no sound actually traveling). We also know that the distance is 250× 2 (because the soundtraveled from Tashi to Minh and back again), so our equation is 250×2 = (331+0.6T )(2.46−1), which simplifiesto 500 = 1.46(331+0.6T ).
133

3.3. Multi-Step Equations www.ck12.org
Distributing gives us 500= 483.26+0.876T , and subtracting 483.26 from both sides gives us 16.74= 0.876T . Thenwe divide by 0.876 to get T ≈ 19.1.
The temperature is about 19.1 degrees Celsius.
Lesson Summary
• Multi-step equations are slightly more complex than one - and two-step equations, but use the same basictechniques.
• If dividing a number outside of parentheses will produce fractions, it is often better to use the DistributiveProperty to expand the terms and then combine like terms to solve the equation.
Review Questions
1. Solve the following equations for the unknown variable.
a. 3(x−1)−2(x+3) = 0b. 3(x+3)−2(x−1) = 0c. 7(w+20)−w = 5d. 5(w+20)−10w = 5e. 9(x−2)−3x = 3f. 12(t−5)+5 = 0g. 2(2d +1) = 2
3h. 2
(5a− 1
3
)= 2
7i. 2
9
(i+ 2
3
)= 2
5j. 4
(v+ 1
4
)= 35
2k. g
10 = 63
l. s−411 = 2
5m. 2k
7 = 38
n. 7x+43 = 9
2o. 9y−3
6 = 52
p. r3 +
r2 = 7
q. p16 −
2p3 = 1
9r. m+3
2 −m4 = 1
3s. 5
( k3 +2
)= 32
3t. 3
z =25
u. 2r +2 = 10
3v. 12
5 = 3+zz
2. An engineer is building a suspended platform to raise bags of cement. The platform has a mass of 200 kg, andeach bag of cement is 40 kg. He is using two steel cables, each capable of holding 250 kg. Write an equationfor the number of bags he can put on the platform at once, and solve it.
3. A scientist is testing a number of identical components of unknown resistance which he labels xΩ. He connectsa circuit with resistance (3x+4)Ω to a steady 12 volt supply and finds that this produces a current of 1.2 amps.What is the value of the unknown resistance?
4. Lydia inherited a sum of money. She split it into five equal parts. She invested three parts of the money ina high-interest bank account which added 10% to the value. She placed the rest of her inheritance plus $500in the stock market but lost 20% on that money. If the two accounts end up with exactly the same amount of
134

www.ck12.org Chapter 3. Equations of Lines
money in them, how much did she inherit?5. Pang drove to his mother’s house to drop off her new TV. He drove at 50 miles per hour there and back, and
spent 10 minutes dropping off the TV. The entire journey took him 94 minutes. How far away does his motherlive?
135

3.4. Equations with Variables on Both Sides www.ck12.org
3.4 Equations with Variables on Both Sides
Learning Objectives
• Solve an equation with variables on both sides.• Solve an equation with grouping symbols.• Solve real-world problems using equations with variables on both sides.
Solve an Equation with Variables on Both Sides
When a variable appears on both sides of the equation, we need to manipulate the equation so that all variable termsappear on one side, and only constants are left on the other.
Example 1
Dwayne was told by his chemistry teacher to measure the weight of an empty beaker using a balance. Dwayne foundonly one lb weights, and so devised the following way of balancing the scales.
Knowing that each weight is one lb, calculate the weight of one beaker.
Solution
We know that the system balances, so the weights on each side must be equal. We can write an algebraic expressionbased on this fact. The unknown quantity, the weight of the beaker, will be our x. We can see that on the lefthand scale we have one beaker and four weights. On the right scale, we have four beakers and three weights. Thebalancing of the scales is analogous to the balancing of the following equation:
x+4 = 4x+3
“One beaker plus 4 lbs equals 4 beakers plus 3 lbs”
To solve for the weight of the beaker, we want all the constants (numbers) on one side and all the variables (termswith x in them) on the other side. Since there are more beakers on the right and more weights on the left, we’ll try tomove all the x terms (beakers) to the right, and the constants (weights) to the left.
First we subtract 3 from both sides to get x+1 = 4x.
Then we subtract x from both sides to get 1 = 3x.
136
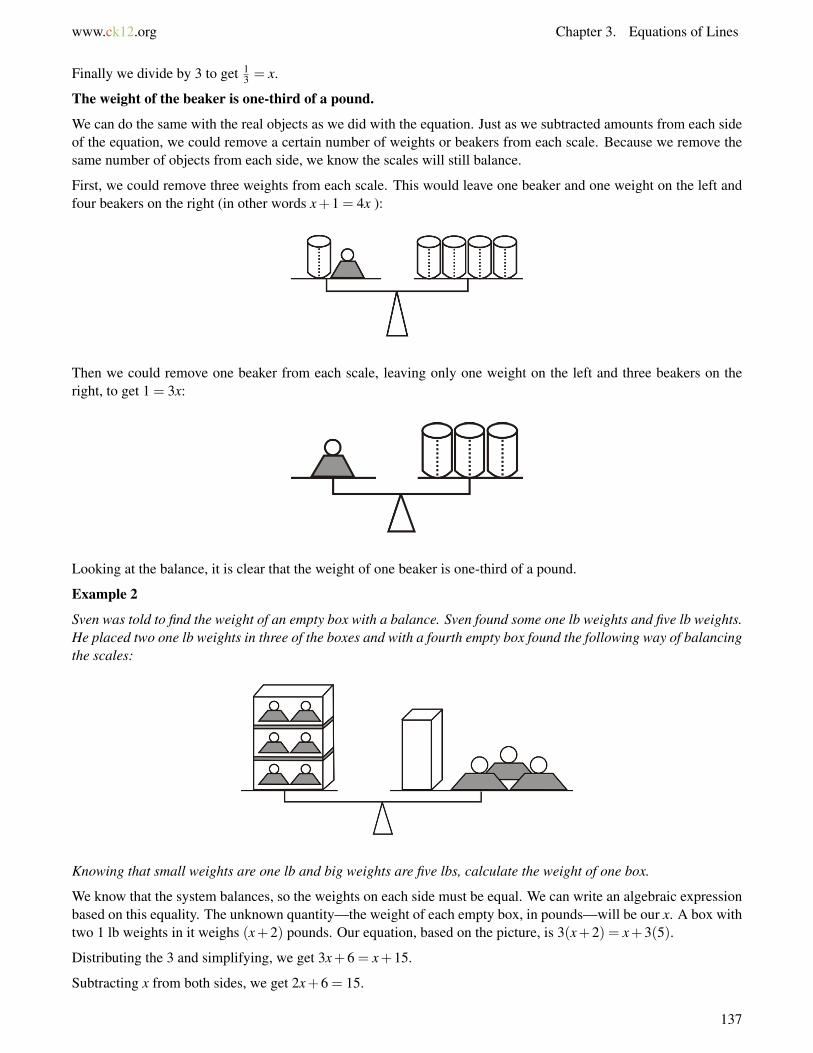
www.ck12.org Chapter 3. Equations of Lines
Finally we divide by 3 to get 13 = x.
The weight of the beaker is one-third of a pound.
We can do the same with the real objects as we did with the equation. Just as we subtracted amounts from each sideof the equation, we could remove a certain number of weights or beakers from each scale. Because we remove thesame number of objects from each side, we know the scales will still balance.
First, we could remove three weights from each scale. This would leave one beaker and one weight on the left andfour beakers on the right (in other words x+1 = 4x ):
Then we could remove one beaker from each scale, leaving only one weight on the left and three beakers on theright, to get 1 = 3x:
Looking at the balance, it is clear that the weight of one beaker is one-third of a pound.
Example 2
Sven was told to find the weight of an empty box with a balance. Sven found some one lb weights and five lb weights.He placed two one lb weights in three of the boxes and with a fourth empty box found the following way of balancingthe scales:
Knowing that small weights are one lb and big weights are five lbs, calculate the weight of one box.
We know that the system balances, so the weights on each side must be equal. We can write an algebraic expressionbased on this equality. The unknown quantity—the weight of each empty box, in pounds—will be our x. A box withtwo 1 lb weights in it weighs (x+2) pounds. Our equation, based on the picture, is 3(x+2) = x+3(5).
Distributing the 3 and simplifying, we get 3x+6 = x+15.
Subtracting x from both sides, we get 2x+6 = 15.
137

3.4. Equations with Variables on Both Sides www.ck12.org
Subtracting 6 from both sides, we get 2x = 9.
And finally we can divide by 2 to get x = 92 , or x = 4.5.
Each box weighs 4.5 lbs.
To see more examples of solving equations with variables on both sides of the equation, see the Khan Academyvideo at http://www.youtube.com/watch?v=Zn-GbH2S0Dk.
Solve an Equation with Grouping Symbols
As you’ve seen, we can solve equations with variables on both sides even when some of the variables are inparentheses; we just have to get rid of the parentheses, and then we can start combining like terms. We use thesame technique when dealing with fractions: first we multiply to get rid of the fractions, and then we can shuffle theterms around by adding and subtracting.
Example 3
Solve 3x+2 = 5x3 .
Solution
The first thing we’ll do is get rid of the fraction. We can do this by multiplying both sides by 3, leaving 3(3x+2)= 5x.
Then we distribute to get rid of the parentheses, leaving 9x+6 = 5x.
We’ve already got all the constants on the left side, so we’ll move the variables to the right side by subtracting 9xfrom both sides. That leaves us with 6 =−4x.
And finally, we divide by -4 to get −32 = x, or x =−1.5.
Example 4
Solve 7x+2 = 5x−36 .
Solution
Again we start by eliminating the fraction. Multiplying both sides by 6 gives us 6(7x+2) = 5x−3, and distributinggives us 42x+12 = 5x−3.
Subtracting 5x from both sides gives us 37x+12 =−3.
Subtracting 12 from both sides gives us 37x =−15.
Finally, dividing by 37 gives us x =−1537 .
Example 5
Solve the following equation for x: 14x(x+3) = 7
Solution
The form of the left hand side of this equation is known as a rational function because it is the ratio of two otherfunctions: 14x and (x+3). But we can solve it just like any other equation involving fractions.
First we multiply both sides by (x+3) to get rid of the fraction. Now our equation is 14x = 7(x+3).
Then we distribute: 14x = 7x+21.
Then subtract 7x from both sides: 7x = 21.
And divide by 7: x = 3.
138
www.ck12.org Chapter 3. Equations of Lines
Solve Real-World Problems Using Equations with Variables on Both Sides
Here’s another chance to practice translating problems from words to equations. What is the equation asking? Whatis the unknown variable? What quantity will we use for our variable?
The text explains what’s happening. Break it down into small, manageable chunks, and follow what’s going on withour variable all the way through the problem.
More on Ohm’s Law
Recall that the electrical current, I (amps), passing through an electronic component varies directly with the appliedvoltage, V (volts), according to the relationship V = I ·R where R is the resistance measured in Ohms (Ω).
The resistance R of a number of components wired in a series (one after the other) is simply the sum of all theresistances of the individual components.
Example 6
In an attempt to find the resistance of a new component, a scientist tests it in series with standard resistors. A fixedvoltage causes a 4.8 amp current in a circuit made up from the new component plus a 15Ω resistor in series. Whenthe component is placed in a series circuit with a 50Ω resistor, the same voltage causes a 2.0 amp current to flow.Calculate the resistance of the new component.
This is a complex problem to translate, but once we convert the information into equations it’s relatively straightfor-ward to solve. First, we are trying to find the resistance of the new component (in Ohms, Ω). This is our x. We don’tknow the voltage that is being used, but we can leave that as a variable, V . Our first situation has a total resistancethat equals the unknown resistance plus 15Ω. The current is 4.8 amps. Substituting into the formula V = I ·R, weget V = 4.8(x+15).
Our second situation has a total resistance that equals the unknown resistance plus 50Ω. The current is 2.0 amps.Substituting into the same equation, this time we get V = 2(x+50).
We know the voltage is fixed, so the V in the first equation must equal the V in the second. That means we can setthe right-hand sides of the two equations equal to each other: 4.8(x+15) = 2(x+50). Then we can solve for x.
Distribute the constants first: 4.8x+72 = 2x+100.
Subtract 2x from both sides: 2.8x+72 = 100.
Subtract 72 from both sides: 2.8x = 28.
Divide by 2.8: x = 10.
The resistance of the component is 10Ω.
Lesson Summary
If an unknown variable appears on both sides of an equation, distribute as necessary. Then simplify the equation tohave the unknown on only one side.
Review Questions
1. Solve the following equations for the unknown variable.
a. 3(x−1) = 2(x+3)
139

3.4. Equations with Variables on Both Sides www.ck12.org
b. 7(x+20) = x+5c. 9(x−2) = 3x+3d. 2
(a− 1
3
)= 2
5
(a+ 2
3
)e. 2
7
(t + 2
3
)= 1
5
(t− 2
3
)f. 1
7
(v+ 1
4
)= 2
(3v2 −
52
)g. y−4
11 = 25 ·
2y+13
h. z16 = 2(3z+1)
9
i. q16 +
q6 = (3q+1)
9 + 32
j. 3x = 2
x+1k. 5
2+p = 3p−8
2. Manoj and Tamar are arguing about a number trick they heard. Tamar tells Andrew to think of a number,multiply it by five and subtract three from the result. Then Manoj tells Andrew to think of a number, add fiveand multiply the result by three. Andrew says that whichever way he does the trick he gets the same answer.
a. What was the number Andrew started with?b. What was the result Andrew got both times?c. Name another set of steps that would have resulted in the same answer if Andrew started with the same
number.
3. Manoj and Tamar try to come up with a harder trick. Manoj tells Andrew to think of a number, double it, addsix, and then divide the result by two. Tamar tells Andrew to think of a number, add five, triple the result,subtract six, and then divide the result by three.
a. Andrew tries the trick both ways and gets an answer of 10 each time. What number did he start out with?b. He tries again and gets 2 both times. What number did he start out with?c. Is there a number Andrew can start with that will not give him the same answer both ways?d. Bonus: Name another set of steps that would give Andrew the same answer every time as he would get
from Manoj’s and Tamar’s steps.
4. I have enough money to buy five regular priced CDs and have $6 left over. However, all CDs are on sale today,for $4 less than usual. If I borrow $2, I can afford nine of them.
a. How much are CDs on sale for today?b. How much would I have to borrow to afford nine of them if they weren’t on sale?
5. Five identical electronics components were connected in series. A fixed but unknown voltage placed acrossthem caused a 2.3 amp current to flow. When two of the components were replaced with standard 10Ω
resistors, the current dropped to 1.9 amps. What is the resistance of each component?6. Solve the following resistance problems. Assume the same voltage is applied to all circuits.
a. Three unknown resistors plus 20Ω give the same current as one unknown resistor plus 70Ω.b. One unknown resistor gives a current of 1.5 amps and a 15Ω resistor gives a current of 3.0 amps.c. Seven unknown resistors plus 18Ω gives twice the current of two unknown resistors plus 150Ω.d. Three unknown resistors plus 1.5Ω gives a current of 3.6 amps and seven unknown resistors plus seven
12Ω resistors gives a current of 0.2 amps.
140

www.ck12.org Chapter 3. Equations of Lines
3.5 Ratios and Proportions
Learning Objectives
• Write and understand a ratio.• Write and solve a proportion.• Solve proportions using cross products.• Solve problems using scale drawings.
Introduction
Nadia is counting out money with her little brother. She gives her brother all the nickels and pennies. She keepsthe quarters and dimes for herself. Nadia has four quarters and six dimes. Her brother has fifteen nickels and fivepennies and is happy because he has more coins than his big sister. How would you explain to him that he is actuallygetting a bad deal?
Write a ratio
A ratio is a way to compare two numbers, measurements or quantities. When we write a ratio, we divide one numberby another and express the answer as a fraction. There are two distinct ratios in the problem above. For example,the ratio of the number of Nadia’s coins to her brother’s is 4+6
15+5 , or 1020 = 1
2 . (Ratios should always be simplified.)In other words, Nadia has half as many coins as her brother.
Another ratio we could look at is the value of the coins. The value of Nadia’s coins is (4×25)+(6×10)= 160 cents.The value of her brother’s coins is (15× 5)+ (5× 1) = 80 cents. The ratio of the value of Nadia’s coins to herbrother’s is 160
80 = 21 . So the value of Nadia’s money is twice the value of her brother’s.
Notice that even though the denominator is one, we still write it out and leave the ratio as a fraction instead of awhole number. A ratio with a denominator of one is called a unit rate.
Example 1
The price of a Harry Potter Book on Amazon.com is $10.00. The same book is also available used for $6.50. Findtwo ways to compare these prices.
Solution
We could compare the numbers by expressing the difference between them: $10.00−$6.50 = $3.50.
We can also use a ratio to compare them: 10.006.50 = 100
65 = 2013 (after multiplying by 10 to remove the decimals, and then
simplifying).
So we can say that the new book is $3.50 more than the used book, or we can say that the new book costs 2013 times
as much as the used book.
Example 2
141

3.5. Ratios and Proportions www.ck12.org
A tournament size shuffleboard table measures 30 inches wide by 14 feet long. Compare the length of the table to itswidth and express the answer as a ratio.
Solution
We could just write the ratio as 14 f eet30 inches . But since we’re comparing two lengths, it makes more sense to convert all
the measurements to the same units. 14 feet is 14×12 = 168 inches, so our new ratio is 16830 = 28
5 .
Example 3
A family car is being tested for fuel efficiency. It drives non-stop for 100 miles and uses 3.2 gallons of gasoline.Write the ratio of distance traveled to fuel used as a unit rate.
Solution
The ratio of distance to fuel is 100 miles3.2 gallons . But a unit rate has to have a denominator of one, so to make this ratio a unit
rate we need to divide both numerator and denominator by 3.2.1003.2 miles
3.23.2 gallons
= 31.25 miles1 gallon or 31.25 miles per gallon.
Write and Solve a Proportion
When two ratios are equal to each other, we call it a proportion. For example, the equation 105 = 6
9 is a proportion.We know it’s true because we can reduce both fractions to 2
3 .
(Check this yourself to make sure!)
We often use proportions in science and business—for example, when scaling up the size of something. We generallyuse them to solve for an unknown, so we use algebra and label the unknown variable x.
Example 4
A small fast food chain operates 60 stores and makes $1.2 million profit every year. How much profit would the chainmake if it operated 250 stores?
Solution
First, we need to write a ratio: the ratio of profit to number of stores. That would be $1,200,00060 .
Now we want to know how much profit 250 stores would make. If we label that profit x, then the ratio of profit tostores in that case is x
250 .
Since we’re assuming the profit is proportional to the number of stores, the ratios are equal and our proportion is1,200,000
60 = x250 .
(Note that we can drop the units – not because they are the same in the numerator and denominator, but because theyare the same on both sides of the equation.)
To solve this equation, first we simplify the left-hand fraction to get 20,000 = x250 . Then we multiply both sides by
250 to get 5,000,000 = x.
If the chain operated 250 stores, the annual profit would be 5 million dollars.
Example 5
A chemical company makes up batches of copper sulfate solution by adding 250 kg of copper sulfate powder to 1000liters of water. A laboratory chemist wants to make a solution of identical concentration, but only needs 350 mL(0.35 liters) of solution. How much copper sulfate powder should the chemist add to the water?
Solution
The ratio of powder to water in the first case, in kilograms per liter, is 2501000 , which reduces to 1
4 . In the second case,
142

www.ck12.org Chapter 3. Equations of Lines
the unknown amount is how much powder to add. If we label that amount x, the ratio is x0.35 . So our proportion is
14 = x
0.35 .
To solve for x, first we multiply both sides by 0.35 to get 0.354 = x, or x = 0.0875.
The mass of copper sulfate that the chemist should add is 0.0875 kg, or 87.5 grams.
Solve Proportions Using Cross Products
One neat way to simplify proportions is to cross multiply. Consider the following proportion:
164
=205
If we want to eliminate the fractions, we could multiply both sides by 4 and then multiply both sides by 5. Butsuppose we just do both at once?
4×5× 164
= 4×5× 205
5×16 = 4×20
Now comparing this to the proportion we started with, we see that the denominator from the left hand side ends upbeing multiplied by the numerator on the right hand side. You can also see that the denominator from the right handside ends up multiplying the numerator on the left hand side.
In effect the two denominators have multiplied across the equal sign:
becomes 5×16 = 4×20.
This movement of denominators is known as cross multiplying. It is extremely useful in solving proportions,especially when the unknown variable is in the denominator.
Example 6
Solve this proportion for x: 43 = 9
x
Solution
Cross multiply to get 4x = 9×3, or 4x = 27. Then divide both sides by 4 to get x = 274 , or x = 6.75.
Example 7
Solve the following proportion for x: 0.53 = 56
x
Solution
Cross multiply to get 0.5x = 56×3, or 0.5x = 168. Then divide both sides by 0.5 to get x = 336.
Solve Real-World Problems Using Proportions
Example 8
143

3.5. Ratios and Proportions www.ck12.org
A cross-country train travels at a steady speed. It covers 15 miles in 20 minutes. How far will it travel in 7 hoursassuming it continues at the same speed?
Solution
We’ve done speed problems before; remember that speed is just the ratio distancetime , so that ratio is the one we’ll use
for our proportion. We can see that the speed is 15 miles20 minutes , and that speed is also equal to x miles
7 hours .
To set up a proportion, we first have to get the units the same. 20 minutes is 13 of an hour, so our proportion will be
1513= x
7 . This is a very awkward looking ratio, but since we’ll be cross multiplying, we can leave it as it is.
Cross multiplying gives us 7×15 = 13 x. Multiplying both sides by 3 then gives us 3×7×15 = x, or x = 315.
The train will travel 315 miles in 7 hours.
Example 9
In the United Kingdom, Alzheimer’s disease is said to affect one in fifty people over 65 years of age. If approximately250000 people over 65 are affected in the UK, how many people over 65 are there in total?
Solution
The fixed ratio in this case is the 1 person in 50. The unknown quantity x is the total number of people over 65. Notethat in this case we don’t need to include the units, as they will cancel between the numerator and denominator.
Our proportion is 150 = 250000
x . Each ratio represents people with Alzheimer’stotal people .
Cross multiplying, we get 1 · x = 250000 ·50, or x = 12,500,000.
There are approximately 12.5 million people over the age of 65 in the UK.
For some more advanced ratio problems and applications, watch the Khan Academy video at http://www.youtube.com/watch?v=PASSD2OcU0c.
Scale and Indirect Measurement
One place where ratios are often used is in making maps. The scale of a map describes the relationship betweendistances on a map and the corresponding distances on the earth’s surface. These measurements are expressed as afraction or a ratio.
So far we have only written ratios as fractions, but outside of mathematics books, ratios are often written as twonumbers separated by a colon (:). For example, instead of 2
3 , we would write 2:3.
Ratios written this way are used to express the relationship between a map and the area it represents. For example, amap with a scale of 1:1000 would be a map where one unit of measurement (such as a centimeter) on the map wouldrepresent 1000 of the same unit (1000 centimeters, or 10 meters) in real life.
Example 10
Anne is visiting a friend in London, and is using a map to navigate from Fleet Street to Borough Road. She is usinga 1:100,000 scale map, where 1 cm on the map represents 1 km in real life. Using a ruler, she measures the distanceon the map from Fleet Street to Borough Road as 8.8 cm. How far is the real distance from the start of her journeyto the end?
Solution
The scale is the ratio of distance on the map to the corresponding distance in real life. Written as a fraction, it is1
100000 . We can also write an equivalent ratio for the distance Anne measures on the map and the distance in real lifethat she is trying to find: 8.8
x . Setting these two ratios equal gives us our proportion: 1100000 = 8.8
x . Then we can cross
144

www.ck12.org Chapter 3. Equations of Lines
multiply to get x = 880000.
That’s how many centimeters it is from Fleet Street to Borough Road; now we need to convert to kilometers. Thereare 100000 cm in a km, so we have to divide our answer by 100000.
880000100000
= 8.8.
The distance from Fleet Street to Borough Road is 8.8 km.
In this problem, we could have just used our intuition: the 1 cm = 1 km scale tells us that any number of cm on themap is equal to the same number of km in real life. But not all maps have a scale this simple. You’ll usually need torefer to the map scale to convert between measurements on the map and distances in real life!
Example 11
Antonio is drawing a map of his school for a project in math. He has drawn out the following map of the schoolbuildings and the surrounding area
He is trying to determine the scale of his figure. He knows that the distance from the point marked A on the baseballdiamond to the point marked B on the athletics track is 183 meters. Use the dimensions marked on the drawing todetermine the scale of his map.
Solution
We know that the real-life distance is 183 m, and the scale is the ratio distance on mapdistance in real life .
To find the distance on the map, we use Pythagoras’ Theorem: a2 + b2 = c2, where a and b are the horizontal andvertical lengths and c is the diagonal between points A and B.
82 +142 = c2
64+196 = c2
260 = c2
√260 = c
16.12≈ c
So the distance on the map is about 16.12 cm. The distance in real life is 183 m, which is 18300 cm. Now we candivide:
145

3.5. Ratios and Proportions www.ck12.org
Scale =16.1218300
≈ 11135.23
The scale of Antonio’s map is approximately 1:1100.
Another visual use of ratio and proportion is in scale drawings. Scale drawings (often called plans) are usedextensively by architects. The equations governing scale are the same as for maps; the scale of a drawing is the ratiodistance on diagramdistance in real life .
Example 12
Oscar is trying to make a scale drawing of the Titanic, which he knows was 883 ft long. He would like his drawingto be at a 1:500 scale. How many inches long does his sheet of paper need to be?
Solution
We can reason intuitively that since the scale is 1:500, the paper must be 883500 = 1.766 f eet long. Converting to inches
means the length is 12(1.766) = 21.192 inches.
Oscar’s paper should be at least 22 inches long.
Example 13
The Rose Bowl stadium in Pasadena, California measures 880 feet from north to south and 695 feet from east towest. A scale diagram of the stadium is to be made. If 1 inch represents 100 feet, what would be the dimensions ofthe stadium drawn on a sheet of paper? Will it fit on a standard 8.5×11 inch sheet of paper?
Solution
Instead of using a proportion, we can simply use the following equation: (distance on diagram) = (distance in real
life) × (scale). (We can derive this from the fact that scale = distance on diagramdistance in real life .)
Plugging in, we get
height on paper = 880 f eet× 1 inch100 f eet = 8.8 inches
width on paper = 695 f eet× 1 inch100 f eet = 6.95 inches
The scale diagram will be 8.8 in×6.95 in. It will fit on a standard sheet of paper.
Lesson Summary
• A ratio is a way to compare two numbers, measurements or quantities by dividing one number by the otherand expressing the answer as a fraction.
• A proportion is formed when two ratios are set equal to each other.• Cross multiplication is useful for solving equations in the form of proportions. To cross multiply, multiply
the bottom of each ratio by the top of the other ratio and set them equal. For instance, cross multiplying
results in 11×3 = 5x.• Scale is a proportion that relates map distance to real life distance.
146

www.ck12.org Chapter 3. Equations of Lines
Review Questions
1. Write the following comparisons as ratios. Simplify fractions where possible.
a. $150 to $3b. 150 boys to 175 girlsc. 200 minutes to 1 hourd. 10 days to 2 weeks
2. Write the following ratios as a unit rate.
a. 54 hotdogs to 12 minutesb. 5000 lbs to 250 square inchesc. 20 computers to 80 studentsd. 180 students to 6 teacherse. 12 meters to 4 floorsf. 18 minutes to 15 appointments
3. Solve the following proportions.
a. 136 = 5
xb. 1.25
7 = 3.6x
c. 619 = x
11d. 1
x = 0.015
e. 3004 = x
99f. 2.75
9 = x( 2
9)g. 1.3
4 = x1.3
h. 0.11.01 = 1.9
x
4. A restaurant serves 100 people per day and takes in $908. If the restaurant were to serve 250 people per day,how much money would it take in?
5. The highest mountain in Canada is Mount Yukon. It is 29867 the size of Ben Nevis, the highest peak in Scotland.
Mount Elbert in Colorado is the highest peak in the Rocky Mountains. Mount Elbert is 22067 the height of Ben
Nevis and 1112 the size of Mont Blanc in France. Mont Blanc is 4800 meters high. How high is Mount Yukon?
6. At a large high school it is estimated that two out of every three students have a cell phone, and one in fiveof all students have a cell phone that is one year old or less. Out of the students who own a cell phone, whatproportion owns a phone that is more than one year old?
7. Use the map in Example 10. Using the scale printed on the map, determine the distances (rounded to thenearest half km) between:
a. Points 1 and 4b. Points 22 and 25c. Points 18 and 13d. Tower Bridge and London Bridge
147

3.6. Percent Problems www.ck12.org
3.6 Percent Problems
Learning Objectives
• Find a percent of a number.• Use the percent equation.• Find the percent of change.
Introduction
A percent is simply a ratio with a base unit of 100. When we write a ratio as a fraction, the percentage we want torepresent is the numerator, and the denominator is 100. For example, 43% is another way of writing 43
100 . 431000 , on
the other hand, is equal to 4.3100 , so it would be equivalent to 4.3%. 2
5 is equal to 40100 , or 40%. To convert any fraction
to a percent, just convert it to an equivalent fraction with a denominator of 100, and then take the numerator as yourpercent value.
To convert a percent to a decimal, just move the decimal point two spaces to the right:
67% = 0.67
0.2% = 0.002
150% = 1.5
And to convert a decimal to a percent, just move the decimal point two spaces to the left:
2.3 = 230%
0.97 = 97%
0.00002 = 0.002%
Finding and Converting Percentages
Before we work with percentages, we need to know how to convert between percentages, decimals and fractions.
Converting percentages to fractions is the easiest. The word “percent” simply means “per 100”—so, for example,55% means 55 per 100, or 55
100 . This fraction can then be simplified to 1120 .
Example 1
Convert 32.5% to a fraction.
Solution
148
www.ck12.org Chapter 3. Equations of Lines
32.5% is equal to 32.5 per 100, or 32.5100 . To reduce this fraction, we first need to multiply it by 10
10 to get rid of thedecimal point. 325
1000 then reduces to 1340 .
Converting fractions to percentages can be a little harder. To convert a fraction directly to a percentage, you need toexpress it as an equivalent fraction with a denominator of 100.
Example 2
Convert 78 to a percent.
Solution
To get the denominator of this fraction equal to 100, we have to multiply it by 12.5. Multiplying the numerator by12.5 also, we get 87.5
100 , which is equivalent to 87.5%.
But what about a fraction like 16 , where there’s no convenient number to multiply the denominator by to get 100?
In a case like this, it’s easier to do the division problem suggested by the fraction in order to convert the fraction toa decimal, and then convert the decimal to a percent. 1 divided by 6 works out to 0.166666.... Moving the decimaltwo spaces to the right tells us that this is equivalent to about 16.7%.
Why can we convert from decimals to percents just by moving the decimal point? Because of what decimal placesrepresent. 0.1 is another way of representing one tenth, and 0.01 is equal to one hundredth—and one hundredth isone percent. By the same logic, 0.02 is 2 percent, 0.35 is 35 percent, and so on.
Example 3
Convert 2.64 to a percent.
Solution
To convert to a percent, simply move the decimal two places to the right. 2.64 = 264%.
Does a percentage greater than 100 even make sense? Sure it does—percentages greater than 100 come up in reallife all the time. For example, a business that made 10 million dollars last year and 13 million dollars this year wouldhave made 130% as much money this year as it did last year.
The only situation where a percentage greater than 100 doesn’t make sense is when you’re talking about dividingup something that you only have a fixed amount of—for example, if you took a survey and found that 56% of therespondents gave one answer and 72% gave another answer (for a total of 128%), you’d know something wentwrong with your math somewhere, because there’s no way you could have gotten answers from more than 100% ofthe people you surveyed.
Converting percentages to decimals is just as easy as converting decimals to percentages—simply move the decimalto the left instead of to the right.
Example 4
Convert 58% to a decimal.
Solution
The decimal point here is invisible—it’s right after the 8. So moving it to the left two places gives us 0.58.
It can be hard to remember which way to move the decimal point when converting from decimals to percents or viceversa. One way to check if you’re moving it the right way is to check whether your answer is a bigger or smallernumber than you started out with. If you’re converting from percents to decimals, you should end up with a smallernumber—just think of how a number like 50 percent, where 50 is greater than 1, represents a fraction like 1
2 (or 0.50in decimal form), where 1
2 is less than 1. Conversely, if you’re converting from decimals to percents, you should endup with a bigger number.
One way you might remember this is by remembering that a percent sign is bigger than a decimal point—so percentsshould be bigger numbers than decimals.
149

3.6. Percent Problems www.ck12.org
Example 5
Convert 3.4 to a percent.
Solution
If you move the decimal point to the left, you get 0.034%. That’s a smaller number than you started out with, butyou’re moving from decimals to percents, so you want the number to get bigger, not smaller. Move it to the rightinstead to get 340%.
Now let’s try another fraction.
Example 6
Convert 27 to a percent.
Solution27 doesn’t convert easily unless you change it to a decimal first. 2 divided by 7 is approximately 0.285714..., andmoving the decimal and rounding gives us 28.6%.
The following Khan Academy video shows several more examples of finding percents and might be useful for furtherpractice: http://www.youtube.com/watch?v=_SpE4hQ8D_o.
Use the Percent Equation
The percent equation is often used to solve problems. It goes like this:
Rate×Total = Part
or
R% of Total is Part
Rate is the ratio that the percent represents (R% in the second version).
Total is often called the base unit.
Part is the amount we are comparing with the base unit.
Example 7
Find 25% of $80.
Solution
We are looking for the part. The total is $80. ’of’ means multiply. R% is 25%, so we can use the second form of theequation: 25% of $80 is Part, or 0.25×80 = Part.
0.25×80 = 20, so the Part we are looking for is $20.
Example 8
Express $90 as a percentage of $160.
Solution
This time we are looking for the rate. We are given the part ($90) and the total ($160). Using the rate equation, weget Rate×160 = 90. Dividing both sides by 160 tells us that the rate is 0.5625, or 56.25%.
Example 9
$50 is 15% of what total sum?
150

www.ck12.org Chapter 3. Equations of Lines
This time we are looking for the total. We are given the part ($50) and the rate (15%, or 0.15). Using the rateequation, we get 0.15×Total = $50. Dividing both sides by 0.15, we get Total = 50
0.15 ≈ 333.33. So $50 is 15% of$333.33.
Find Percent of Change
A useful way to express changes in quantities is through percents. You’ve probably seen signs such as “20% extrafree,” or “save 35% today.” When we use percents to represent a change, we generally use the formula
Percent change =final amount - original amount
original amount×100%
or
percent change100
=actual change
original amount
This means that a positive percent change is an increase, while a negative change is a decrease.
Example 10
A school of 500 students is expecting a 20% increase in students next year. How many students will the school have?
Solution
First let’s solve this using the first formula. Since the 20% change is an increase, we represent it in the formula as20 (if it were a decrease, it would be -20.) Plugging in all the numbers, we get
20% =final amount−500
500×100%
Dividing both sides by 100%, we get 0.2 = final amount−500500 .
Multiplying both sides by 500 gives us 100 = final amount−500.
Then adding 500 to both sides gives us 600 as the final number of students.
How about if we use the second formula? Then we get 20100 =
actual change500 . (Reducing the first fraction to 1
5 will
make the problem easier, so let’s rewrite the equation as 15 =
actual change500
Cross multiplying is our next step; that gives us 500 = 5×(actual change). Dividing by 5 tells us the change is equalto 100. We were told this was an increase, so if we start out with 500 students, after an increase of 100 we knowthere will be a total of 600.
Markup
A markup is an increase from the price a store pays for an item from its supplier to the retail price it charges to thepublic. For example, a 100% mark-up (commonly known in business as keystone) means that the price is doubled.Half of the retail price covers the cost of the item from the supplier, half is profit.
Example 11
A furniture store places a 30% markup on everything it sells. It offers its employees a 20% discount from the salesprice. The employees are demanding a 25% discount, saying that the store would still make a profit. The managersays that at a 25% discount from the sales price would cause the store to lose money. Who is right?
151

3.6. Percent Problems www.ck12.org
Solution
We’ll consider this problem two ways. First, let’s consider an item that the store buys from its supplier for a certainprice, say $1000. The markup would be 30% of 1000, or $300, so the item would sell for $1300 and the store wouldmake a $300 profit.
And what if an employee buys the product? With a discount of 20%, the employee would pay 80% of the $1300retail price, or 0.8×$1300 = $1040.
But with a 25% discount, the employee would pay 75% of the retail price, or 0.75×$1300 = $975.
So with a 20% employee discount, the store still makes a $40 profit on the item they bought for $1000—but with a25% employee discount, the store loses $25 on the item.
Now let’s use algebra to see how this works for an item of any price. If x is the price of an item, then the store’smarkup is 30% of x, or 0.3x, and the retail price of the item is x+0.3x, or 1.3x. An employee buying the item at a20% discount would pay 0.8×1.3x= 1.04x, while an employee buying it at a 25% discount would pay 0.75×1.3x=0.975x.
So the manager is right: a 20% employee discount still allows the store to make a profit, while a 25% employeediscount would cause the store to lose money.
It may not seem to make sense that the store would lose money after applying a 30% markup and only a 25%discount. The reason it does work out that way is that the discount is bigger in absolute dollars after the markup isfactored in. That is, an employee getting 25% off an item is getting 25% off the original price plus 25% off the 30%markup, and those two numbers together add up to more than 30% of the original price.
Solve Real-World Problems Using Percents
Example 12
In 2004 the US Department of Agriculture had 112071 employees, of which 87846 were Caucasian. Of the remainingminorities, African-American and Hispanic employees had the two largest demographic groups, with 11754 and6899 employees respectively.∗
a) Calculate the total percentage of minority (non-Caucasian) employees at the USDA.
b) Calculate the percentage of African-American employees at the USDA.
c) Calculate the percentage of minority employees who were neither African-American nor Hispanic.
Solution
a) Use the percent equation Rate×Total = Part.
The total number of employees is 112071. We know that the number of Caucasian employees is 87846, which meansthat there must be 112071− 87646 = 24225 non-Caucasian employees. This is the part. Plugging in the total andthe part, we get Rate×112071 = 24225.
Divide both sides by 112071 to get Rate = 24225112071 ≈ 0.216. Multiply by 100 to get this as a percent: 21.6%.
21.6% of USDA employees in 2004 were from minority groups.
b) Here, the total is still 112071 and the part is 11754, so we have Rate× 112071 = 11754. Dividing, we getRate = 11754
112071 ≈ 0.105, or 10.5%.
10.5% of USDA employees in 2004 were African-American.
c) Here, our total is just the number of non-Caucasian employees, which we found out is 24225. Subtracting theAfrican-American and Hispanic employees leaves 24225− 11754− 6899 = 5572 employees in the group we’re
152

www.ck12.org Chapter 3. Equations of Lines
looking at.
So with 24225 for the whole and 5572 for the part, our equation is Rate×24225 = 5572, or Rate = 557224225 ≈ 0.230,
or 23%.
23% of USDA minority employees in 2004 were neither African-American nor Hispanic.
Example 13
In 1995 New York had 18136000 residents. There were 827025 reported crimes, of which 152683 were violent. By2005 the population was 19254630 and there were 85839 violent crimes out of a total of 491829 reported crimes.(Source: New York Law Enforcement Agency Uniform Crime Reports.) Calculate the percentage change from 1995to 2005 in:
a) Population of New York
b) Total reported crimes
c) violent crimes
Solution
This is a percentage change problem. Remember the formula for percentage change:
Percent change =final amount - original amount
original amount×100%
In these problems, the final amount is the 2005 statistic, and the initial amount is the 1995 statistic.
a) Population:
Percent change =19254630−18136000
18136000×100%
=111863018136000
×100%
≈ 0.0617×100%
= 6.17%
The population grew by 6.17%.
b) Total reported crimes:
Percent change =491829−827025
827025×100%
=−335196827025
×100%
≈−0.4053×100%
=−40.53%
The total number of reported crimes fell by 40.53%.
c) Violent crimes:
153

3.6. Percent Problems www.ck12.org
Percent change =85839−152683
152683×100%
=−66844152683
×100%
≈−0.4377×100%
=−43.77%
The total number of violent crimes fell by 43.77%.
Lesson Summary
• A percent is simply a ratio with a base unit of 100—for example, 13% = 13100 .
• The percent equation is Rate×Total = Part, or R% of Total is Part.• The percent change equation is Percent change = final amount - original amount
original amount ×100%. A positive percentchange means the value increased, while a negative percent change means the value decreased.
Review Questions
1. Express the following decimals as a percent.
a. 0.011b. 0.001c. 0.91d. 1.75e. 20
2. Express the following percentages in decimal form.
a. 15%b. 0.08%c. 222%d. 3.5%e. 341.9%
3. Express the following fractions as a percent (round to two decimal places when necessary).
a. 16
b. 524
c. 67
d. 117
e. 1397
4. Express the following percentages as a reduced fraction.
a. 11%b. 65%c. 16%d. 12.5%e. 87.5%
154

www.ck12.org Chapter 3. Equations of Lines
5. Find the following.
a. 30% of 90b. 16.7% of 199c. 11.5% of 10.01d. y% of 3x
6. A TV is advertised on sale. It is 35% off and now costs $195. What was the pre-sale price?7. An employee at a store is currently paid $9.50 per hour. If she works a full year she gets a 12% pay raise.
What will her new hourly rate be after the raise?8. Store A and Store B both sell bikes, and both buy bikes from the same supplier at the same prices. Store A
has a 40% mark-up for their prices, while store B has a 250% mark-up. Store B has a permanent sale and willalways sell at 60% off the marked-up prices. Which store offers the better deal?
Texas Instruments Resources
In the CK-12 Texas Instruments Algebra I FlexBook, there are graphing calculator activities designed to supple-ment the objectives for some of the lessons in this chapter. See http://www.ck12.org/flexr/chapter/9613.
155

www.ck12.org
CHAPTER 4 Graphs of Equations andFunctions
Chapter Outline4.1 THE COORDINATE PLANE
4.2 GRAPHS OF LINEAR EQUATIONS
4.3 GRAPHING USING INTERCEPTS
4.4 SLOPE AND RATE OF CHANGE
4.5 GRAPHS USING SLOPE-INTERCEPT FORM
4.6 DIRECT VARIATION MODELS
4.7 LINEAR FUNCTION GRAPHS
4.8 PROBLEM-SOLVING STRATEGIES - GRAPHS
156
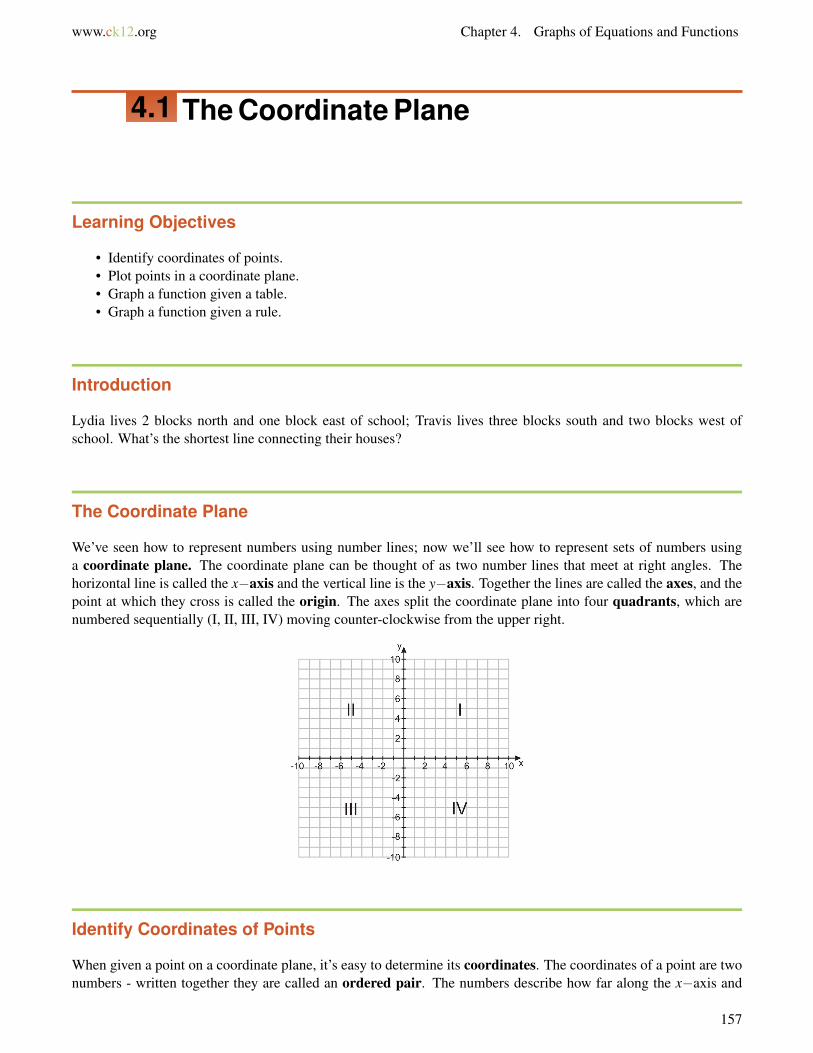
www.ck12.org Chapter 4. Graphs of Equations and Functions
4.1 The Coordinate Plane
Learning Objectives
• Identify coordinates of points.• Plot points in a coordinate plane.• Graph a function given a table.• Graph a function given a rule.
Introduction
Lydia lives 2 blocks north and one block east of school; Travis lives three blocks south and two blocks west ofschool. What’s the shortest line connecting their houses?
The Coordinate Plane
We’ve seen how to represent numbers using number lines; now we’ll see how to represent sets of numbers usinga coordinate plane. The coordinate plane can be thought of as two number lines that meet at right angles. Thehorizontal line is called the x−axis and the vertical line is the y−axis. Together the lines are called the axes, and thepoint at which they cross is called the origin. The axes split the coordinate plane into four quadrants, which arenumbered sequentially (I, II, III, IV) moving counter-clockwise from the upper right.
Identify Coordinates of Points
When given a point on a coordinate plane, it’s easy to determine its coordinates. The coordinates of a point are twonumbers - written together they are called an ordered pair. The numbers describe how far along the x−axis and
157

4.1. The Coordinate Plane www.ck12.org
y−axis the point is. The ordered pair is written in parentheses, with the x−coordinate (also called the abscissa) firstand the y−coordinate (or the ordinate) second.
(1,7) An ordered pair with an x−value of one and a y−value of seven
(0,5) An ordered pair with an x−value of zero and a y−value of five
(−2.5,4) An ordered pair with an x−value of -2.5 and a y−value of four
(−107.2,−.005) An ordered pair with an x−value of -107.2 and a y−value of − .005
Identifying coordinates is just like reading points on a number line, except that now the points do not actually lie onthe number line! Look at the following example.
Example 1
Find the coordinates of the point labeled P in the diagram above
Solution
Imagine you are standing at the origin (the point where the x−axis meets the y−axis). In order to move to a positionwhere P was directly above you, you would move 3 units to the right (we say this is in the positive x−direction).
The x−coordinate of P is +3.
Now if you were standing at the 3 marker on the x−axis, point P would be 7 units above you (above the axis meansit is in the positive y direction).
The y−coordinate of P is +7.
The coordinates of point P are (3, 7).
Example 2
158
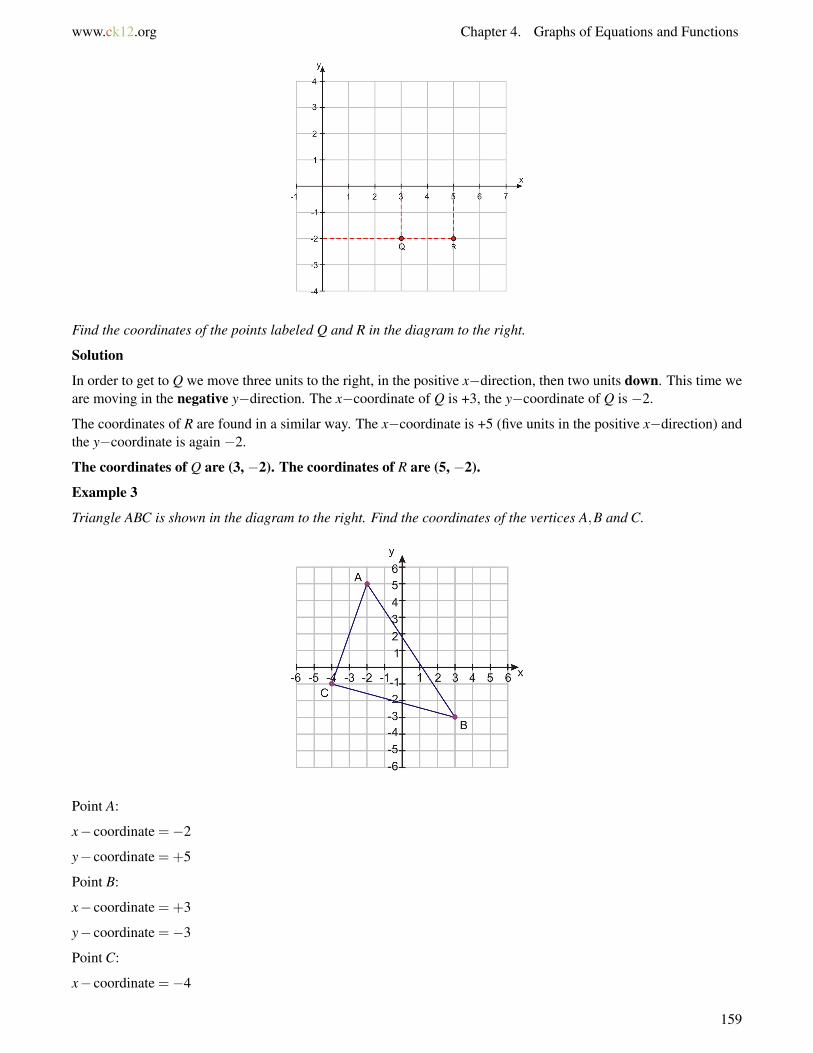
www.ck12.org Chapter 4. Graphs of Equations and Functions
Find the coordinates of the points labeled Q and R in the diagram to the right.
Solution
In order to get to Q we move three units to the right, in the positive x−direction, then two units down. This time weare moving in the negative y−direction. The x−coordinate of Q is +3, the y−coordinate of Q is −2.
The coordinates of R are found in a similar way. The x−coordinate is +5 (five units in the positive x−direction) andthe y−coordinate is again −2.
The coordinates of Q are (3, −2). The coordinates of R are (5, −2).
Example 3
Triangle ABC is shown in the diagram to the right. Find the coordinates of the vertices A,B and C.
Point A:
x− coordinate =−2
y− coordinate =+5
Point B:
x− coordinate =+3
y− coordinate =−3
Point C:
x− coordinate =−4
159
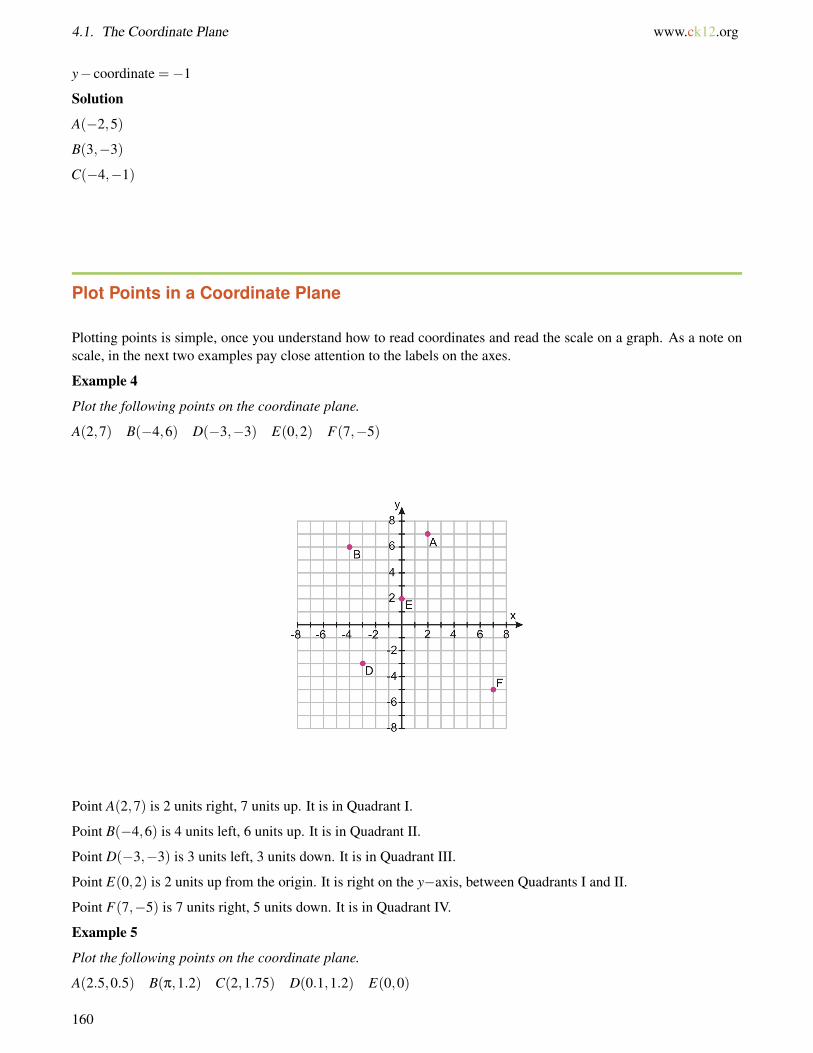
4.1. The Coordinate Plane www.ck12.org
y− coordinate =−1
Solution
A(−2,5)
B(3,−3)
C(−4,−1)
Plot Points in a Coordinate Plane
Plotting points is simple, once you understand how to read coordinates and read the scale on a graph. As a note onscale, in the next two examples pay close attention to the labels on the axes.
Example 4
Plot the following points on the coordinate plane.
A(2,7) B(−4,6) D(−3,−3) E(0,2) F(7,−5)
Point A(2,7) is 2 units right, 7 units up. It is in Quadrant I.
Point B(−4,6) is 4 units left, 6 units up. It is in Quadrant II.
Point D(−3,−3) is 3 units left, 3 units down. It is in Quadrant III.
Point E(0,2) is 2 units up from the origin. It is right on the y−axis, between Quadrants I and II.
Point F(7,−5) is 7 units right, 5 units down. It is in Quadrant IV.
Example 5
Plot the following points on the coordinate plane.
A(2.5,0.5) B(π,1.2) C(2,1.75) D(0.1,1.2) E(0,0)
160

www.ck12.org Chapter 4. Graphs of Equations and Functions
Here we see the importance of choosing the right scale and range for the graph. In Example 4, our points werescattered throughout the four quadrants. In this case, all the coordinates are positive, so we don’t need to show thenegative values of x or y. Also, there are no x−values bigger than about 3.14, and 1.75 is the largest value of y. Wecan therefore show just the part of the coordinate plane where 0≤ x≤ 3.5 and 0≤ y≤ 2.
Here are some other important things to notice about this graph:
• The tick marks on the axes don’t correspond to unit increments (i.e. the numbers do not go up by one eachtime). This is so that we can plot the points more precisely.
• The scale on the x−axis is different than the scale on the y−axis, so distances that look the same on both axesare actually greater in the x−direction. Stretching or shrinking the scale in one direction can be useful whenthe points we want to plot are farther apart in one direction than the other.
For more practice locating and naming points on the coordinate plane, try playing the Coordinate Plane Game at http://www.math-play.com/Coordinate%20Plane%20Game/Coordinate%20Plane%20Game.html.
Graph a Function Given a Table
Once we know how to plot points on a coordinate plane, we can think about how we’d go about plotting a relationshipbetween x−and y−values. So far we’ve just been plotting sets of ordered pairs. A set like that is a relation, and thereisn’t necessarily a relationship between the x−values and y−values. If there is a relationship between the x−andy−values, and each x−value corresponds to exactly one y−value, then the relation is called a function. Rememberthat a function is a particular way to relate one quantity to another.
If you’re reading a book and can read twenty pages an hour, there is a relationship between how many hours you readand how many pages you read. You may even know that you could write the formula as either n = 20h or h = n
20 ,where h is the number of hours you spend reading and n is the number of pages you read. To find out, for example,how many pages you could read in 3 1
2 hours, or how many hours it would take you to read 46 pages, you could useone of those formulas. Or, you could make a graph of the function:
161

4.1. The Coordinate Plane www.ck12.org
Once you know how to graph a function like this, you can simply read the relationship between the x−and y−valuesoff the graph. You can see in this case that you could read 70 pages in 3 1
2 hours, and it would take you about 2 13
hours to read 46 pages.
Generally, the graph of a function appears as a line or curve that goes through all points that have the relationshipthat the function describes. If the domain of the function (the set of x−values we can plug into the function) is allreal numbers, then we call it a continuous function. If the domain of the function is a particular set of values (suchas whole numbers only), then it is called a discrete function. The graph will be a series of dots, but they will stilloften fall along a line or curve.
In graphing equations, we assume the domain is all real numbers, unless otherwise stated. Often, though, whenwe look at data in a table, the domain will be whole numbers (number of presents, number of days, etc.) and thefunction will be discrete. But sometimes we’ll still draw the graph as a continuous line to make it easier to interpret.Be aware of the difference between discrete and continuous functions as you work through the examples.
Example 6
Sarah is thinking of the number of presents she receives as a function of the number of friends who come to herbirthday party. She knows she will get a present from her parents, one from her grandparents and one each fromher uncle and aunt. She wants to invite up to ten of her friends, who will each bring one present. She makes atable of how many presents she will get if one, two, three, four or five friends come to the party. Plot the points ona coordinate plane and graph the function that links the number of presents with the number of friends. Use yourgraph to determine how many presents she would get if eight friends show up.
TABLE 4.1:
Number of Friends Number of Presents0 41 52 63 74 85 9
The first thing we need to do is decide how our graph should appear. We need to decide what the independentvariable is, and what the dependant variable is. Clearly in this case, the number of friends can vary independently,but the number of presents must depend on the number of friends who show up.
So we’ll plot friends on the x−axis and presents on the y−axis. Let’s add another column to our table containing thecoordinates that each (friends, presents) ordered pair gives us.
162

www.ck12.org Chapter 4. Graphs of Equations and Functions
TABLE 4.2:
Friends (x) Presents (y) Coordinates (x,y)0 4 (0, 4)1 5 (1, 5)2 6 (2, 6)3 7 (3, 7)4 8 (4, 8)5 9 (5, 9)
Next we need to set up our axes. It is clear that the number of friends and number of presents both must be positive,so we only need to show points in Quadrant I. Now we need to choose a suitable scale for the x− and y−axes. Weonly need to consider eight friends (look again at the question to confirm this), but it always pays to allow a littleextra room on your graph. We also need the y−scale to accommodate the presents for eight people. We can see thatthis is still going to be under 20!
The scale of this graph has room for up to 12 friends and 15 presents. This will be fine, but there are many otherscales that would be equally good!
Now we proceed to plot the points. The first five points are the coordinates from our table. You can see they all lie ona straight line, so the function that describes the relationship between x and y will be linear. To graph the function,we simply draw a line that goes through all five points. This line represents the function.
This is a discrete problem since Sarah can only invite a positive whole number of friends. For instance, it would beimpossible for 2.4 or -3 friends to show up. So although the line helps us see where the other values of the functionare, the only points on the line that actually are values of the function are the ones with positive whole-numbercoordinates.
The graph easily lets us find other values for the function. For example, the question asks how many presents Sarahwould get if eight friends come to her party. Don’t forget that x represents the number of friends and y representsthe number of presents. If we look at the graph where x = 8, we can see that the function has a y−value of 12.
Solution
If 8 friends show up, Sarah will receive a total of 12 presents.
163

4.1. The Coordinate Plane www.ck12.org
Graph a Function Given a Rule
If we are given a rule instead of a table, we can proceed to graph the function in either of two ways. We will use thefollowing example to show each way.
Example 7
Ali is trying to work out a trick that his friend showed him. His friend started by asking him to think of a number,then double it, then add five to the result. Ali has written down a rule to describe the first part of the trick. He isusing the letter x to stand for the number he thought of and the letter y to represent the final result of applying therule. He wrote his rule in the form of an equation: y = 2x+5.
Help him visualize what is going on by graphing the function that this rule describes.
Method One - Construct a Table of Values
If we wish to plot a few points to see what is going on with this function, then the best way is to construct a tableand populate it with a few (x,y) pairs. We’ll use 0, 1, 2 and 3 for x−values.
TABLE 4.3:
x y0 51 72 93 11
Next, we plot the points and join them with a line.
This method is nice and simple—especially with linear relationships, where we don’t need to plot more than twoor three points to see the shape of the graph. In this case, the function is continuous because the domain is allreal numbers—that is, Ali could think of any real number, even though he may only be thinking of positive wholenumbers.
Method Two - Intercept and Slope
164

www.ck12.org Chapter 4. Graphs of Equations and Functions
Another way to graph this function (one that we’ll learn in more detail in a later lesson) is the slope-intercept method.To use this method, follow these steps:
1. Find the y value when y = 0.
y(0) = 2 ·0+5 = 5, so our y−intercept is (0, 5).
2. Look at the coefficient multiplying the x.
Every time we increase x by one, y increases by two, so our slope is +2.
3. Plot the line with the given slope that goes through the intercept. We start at the point (0, 5) and move overone in the x−direction, then up two in the y−direction. This gives the slope for our line, which we extend in bothdirections.
We will properly examine this last method later in this chapter!
Lesson Summary
• The coordinate plane is a two-dimensional space defined by a horizontal number line (the x−axis) anda vertical number line (the y−axis). The origin is the point where these two lines meet. Four areas, orquadrants, are formed as shown in the diagram above.
• Each point on the coordinate plane has a set of coordinates, two numbers written as an ordered pair whichdescribe how far along the x−axis and y−axis the point is. The x−coordinate is always written first, then they−coordinate, in the form (x,y).
165

4.1. The Coordinate Plane www.ck12.org
• Functions are a way that we can relate one quantity to another. Functions can be plotted on the coordinateplane.
Review Questions
1. Identify the coordinates of each point, A−F , on the graph below.
2. Draw a line on the above graph connecting point B with the origin. Where does that line intersect the lineconnecting points C and D?
3. Plot the following points on a graph and identify which quadrant each point lies in:
a. (4, 2)b. (-3, 5.5)c. (4, -4)d. (-2, -3)
4. Without graphing the following points, identify which quadrant each lies in:
a. (5, 3)b. (-3, -5)c. (-4, 2)d. (2, -4)
5. Consider the graph of the equation y = 3. Which quadrants does it pass through?6. Consider the graph of the equation y = x. Which quadrants does it pass through?7. Consider the graph of the equation y = x+3. Which quadrants does it pass through?8. The point (4, 0) is on the boundary between which two quadrants?9. The point (0, -5) is on the boundary between which two quadrants?
10. If you moved the point (3, 2) five units to the left, what quadrant would it be in?11. The following three points are three vertices of square ABCD. Plot them on a graph, then determine what the
coordinates of the fourth point, D, would be. Plot that point and label it.
A(−4,−4) B(3,−4) C(3,3)
12. In what quadrant is the center of the square from problem 10? (You can find the center by drawing the square’sdiagonals.)
13. What point is halfway between (1, 3) and (1, 5)?14. What point is halfway between (2, 8) and (6, 8)?15. What point is halfway between the origin and (10, 4)?16. What point is halfway between (3, -2) and (-3, 2)?
166

www.ck12.org Chapter 4. Graphs of Equations and Functions
17. Becky has a large bag of MMs that she knows she should share with Jaeyun. Jaeyun has a packet of Starburst.Becky tells Jaeyun that for every Starburst he gives her, she will give him three MMs in return. If x is thenumber of Starburst that Jaeyun gives Becky, and y is the number of MMs he gets in return, then completeeach of the following.
a. Write an algebraic rule for y in terms of x.b. Make a table of values for y with x-values of 0, 1, 2, 3, 4, 5.c. Plot the function linking x and y on the following scale: 0≤ x≤ 10, 0≤ y≤ 10.
167

4.2. Graphs of Linear Equations www.ck12.org
4.2 Graphs of Linear Equations
Learning Objectives
• Graph a linear function using an equation.• Write equations and graph horizontal and vertical lines.• Analyze graphs of linear functions and read conversion graphs.
Introduction
You’re stranded downtown late at night with only $8 in your pocket, and your home is 6 miles away. Two cabcompanies serve this area; one charges $1.20 per mile with an additional $1 fee, and the other charges $0.90 permile with an additional $2.50 fee. Which cab will be able to get you home?
Graph a Linear Equation
At the end of Lesson 4.1 we looked at ways to graph a function from a rule. A rule is a way of writing the relationshipbetween the two quantities we are graphing. In mathematics, we tend to use the words formula and equation todescribe the rules we get when we express relationships algebraically. Interpreting and graphing these equations isan important skill that you’ll use frequently in math.
Example 1
A taxi costs more the further you travel. Taxis usually charge a fee on top of the per-mile charge to cover hire of thevehicle. In this case, the taxi charges $3 as a set fee and $0.80 per mile traveled. Here is the equation linking thecost in dollars (y) to hire a taxi and the distance traveled in miles (x).
y = 0.8x+3
Graph the equation and use your graph to estimate the cost of a seven-mile taxi ride.
Solution
We’ll start by making a table of values. We will take a few values for x (0, 1, 2, 3, and 4), find the correspondingy−values, and then plot them. Since the question asks us to find the cost for a seven-mile journey, we need to choosea scale that can accommodate this.
First, here’s our table of values:
TABLE 4.4:
x y0 3
168

www.ck12.org Chapter 4. Graphs of Equations and Functions
TABLE 4.4: (continued)
x y1 3.82 4.63 5.44 6.2
And here’s our graph:
To find the cost of a seven-mile journey, first we find x = 7 on the horizontal axis and draw a line up to our graph.Next, we draw a horizontal line across to the y−axis and read where it hits. It appears to hit around half way betweeny = 8 and y = 9. Let’s call it 8.5.
A seven mile taxi ride would cost approximately $8.50 ($8.60 exactly).
Here are some things you should notice about this graph and the formula that generated it:
• The graph is a straight line (this means that the equation is linear), although the function is discrete and reallyjust consists of a series of points.
• The graph crosses the y−axis at y = 3 (notice that there’s a+ 3 in the equation—that’s not a coincidence!).This is the base cost of the taxi.
• Every time we move over by one square we move up by 0.8 squares (notice that that’s also the coefficient ofx in the equation). This is the rate of charge of the taxi (cost per mile).
• If we move over by three squares, we move up by 3×0.8 squares.
Example 2
A small business has a debt of $500,000 incurred from start-up costs. It predicts that it can pay off the debt at arate of $85,000 per year according to the following equation governing years in business (x) and debt measured inthousands of dollars (y).
y =−85x+500
Graph the above equation and use your graph to predict when the debt will be fully paid.
Solution
First, we start with our table of values:
169

4.2. Graphs of Linear Equations www.ck12.org
TABLE 4.5:
x y0 5001 4152 3303 2454 160
Then we plot our points and draw the line that goes through them:
Notice the scale we’ve chosen here. There’s no need to include any points above y = 500, but it’s still wise to allowa little extra.
Next we need to determine how many years it takes the debt to reach zero, or in other words, what x−value willmake the y−value equal 0. We know it’s greater than four (since at x = 4 the y−value is still positive), so we needan x−scale that goes well past x = 4. Here we’ve chosen to show the x−values from 0 to 12, though there are manyother places we could have chosen to stop.
To read the time that the debt is paid off, we simply read the point where the line hits y = 0 (the x−axis). It looks asif the line hits pretty close to x = 6. So the debt will definitely be paid off in six years.
To see more simple examples of graphing linear equations by hand, see the Khan Academy video on graphing lines athttp://www.youtube.com/watch?v=2UrcUfBizyw. The narrator shows how to graph several linear equations, usinga table of values to plot points and then connecting the points with a line.
Graphs and Equations of Horizontal and Vertical Lines
Example 3
“Mad-cabs” have an unusual offer going on. They are charging $7.50 for a taxi ride of any length within the citylimits. Graph the function that relates the cost of hiring the taxi (y) to the length of the journey in miles (x).
To proceed, the first thing we need is an equation. You can see from the problem that the cost of a journey doesn’tdepend on the length of the journey. It should come as no surprise that the equation then, does not have x in it. Sinceany value of x results in the same value of y(7.5), the value you choose for x doesn’t matter, so it isn’t included inthe equation. Here is the equation:
y = 7.5
170
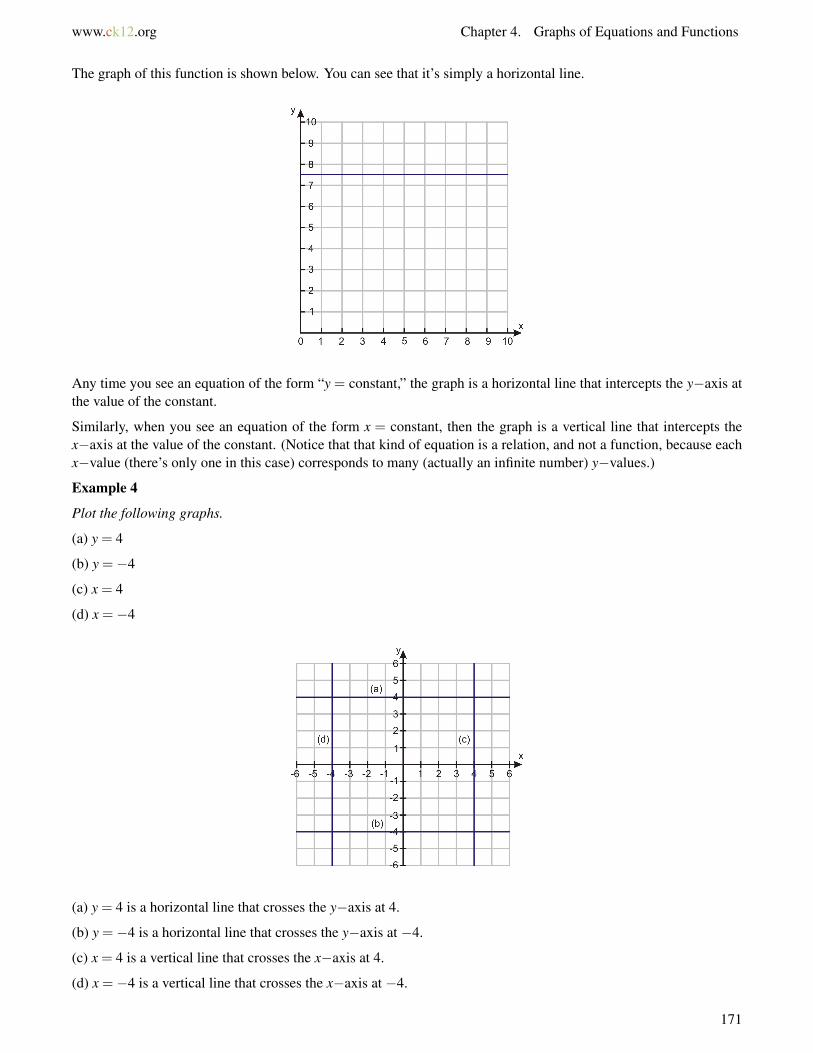
www.ck12.org Chapter 4. Graphs of Equations and Functions
The graph of this function is shown below. You can see that it’s simply a horizontal line.
Any time you see an equation of the form “y = constant,” the graph is a horizontal line that intercepts the y−axis atthe value of the constant.
Similarly, when you see an equation of the form x = constant, then the graph is a vertical line that intercepts thex−axis at the value of the constant. (Notice that that kind of equation is a relation, and not a function, because eachx−value (there’s only one in this case) corresponds to many (actually an infinite number) y−values.)
Example 4
Plot the following graphs.
(a) y = 4
(b) y =−4
(c) x = 4
(d) x =−4
(a) y = 4 is a horizontal line that crosses the y−axis at 4.
(b) y =−4 is a horizontal line that crosses the y−axis at −4.
(c) x = 4 is a vertical line that crosses the x−axis at 4.
(d) x =−4 is a vertical line that crosses the x−axis at −4.
171
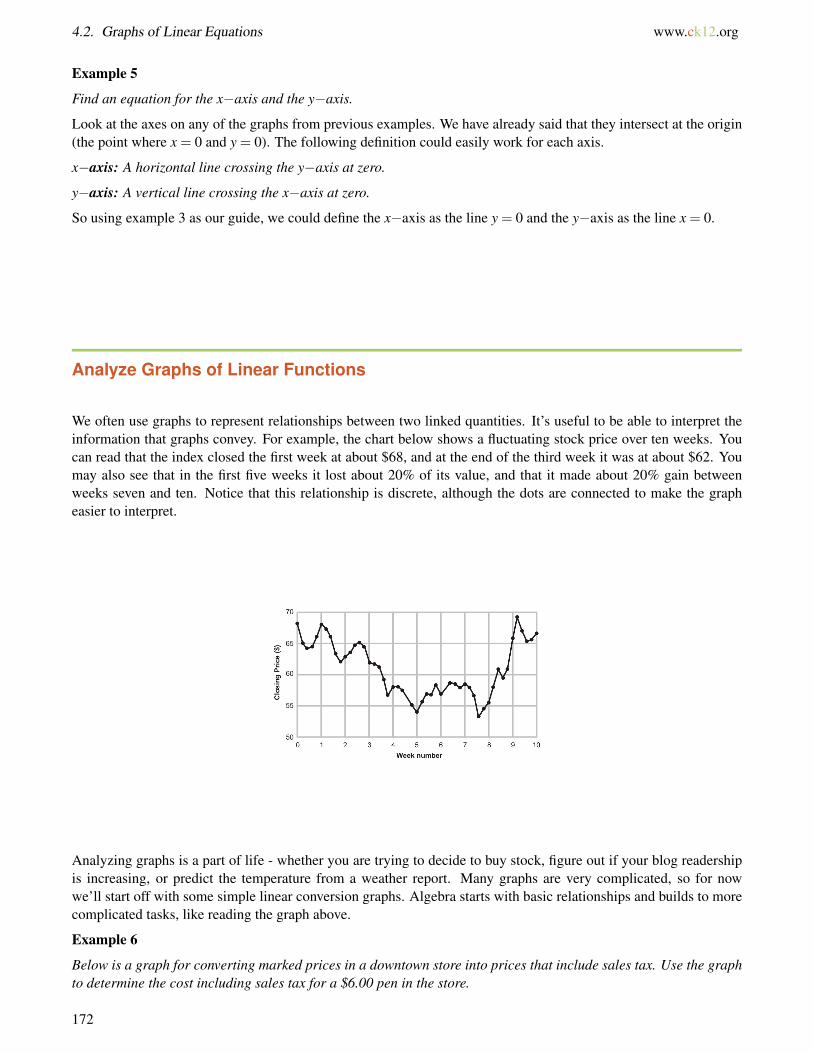
4.2. Graphs of Linear Equations www.ck12.org
Example 5
Find an equation for the x−axis and the y−axis.
Look at the axes on any of the graphs from previous examples. We have already said that they intersect at the origin(the point where x = 0 and y = 0). The following definition could easily work for each axis.
x−axis: A horizontal line crossing the y−axis at zero.
y−axis: A vertical line crossing the x−axis at zero.
So using example 3 as our guide, we could define the x−axis as the line y = 0 and the y−axis as the line x = 0.
Analyze Graphs of Linear Functions
We often use graphs to represent relationships between two linked quantities. It’s useful to be able to interpret theinformation that graphs convey. For example, the chart below shows a fluctuating stock price over ten weeks. Youcan read that the index closed the first week at about $68, and at the end of the third week it was at about $62. Youmay also see that in the first five weeks it lost about 20% of its value, and that it made about 20% gain betweenweeks seven and ten. Notice that this relationship is discrete, although the dots are connected to make the grapheasier to interpret.
Analyzing graphs is a part of life - whether you are trying to decide to buy stock, figure out if your blog readershipis increasing, or predict the temperature from a weather report. Many graphs are very complicated, so for nowwe’ll start off with some simple linear conversion graphs. Algebra starts with basic relationships and builds to morecomplicated tasks, like reading the graph above.
Example 6
Below is a graph for converting marked prices in a downtown store into prices that include sales tax. Use the graphto determine the cost including sales tax for a $6.00 pen in the store.
172

www.ck12.org Chapter 4. Graphs of Equations and Functions
To find the relevant price with tax, first find the correct pre-tax price on the x−axis. This is the point x = 6.
Draw the line x = 6 up until it meets the function, then draw a horizontal line to the y−axis. This line hits at y≈ 6.75(about three fourths of the way from y = 6 to y = 7).
The approximate cost including tax is $6.75.
Example 7
The chart for converting temperature from Fahrenheit to Celsius is shown to the right. Use the graph to convert thefollowing:
a) 70 Fahrenheit to Celsius
b) 0 Fahrenheit to Celsius
c) 30 Celsius to Fahrenheit
d) 0 Celsius to Fahrenheit
Solution
a) To find 70 Fahrenheit, we look along the Fahrenheit-axis (in other words the x−axis) and draw the line x = 70up to the function. Then we draw a horizontal line to the Celsius-axis (y−axis). The horizontal line hits the axis at alittle over 20 (21 or 22).
70 Fahrenheit is approximately equivalent to 21 Celsius.
b) To find 0 Fahrenheit, we just look at the y−axis. (Don’t forget that this axis is simply the line x = 0.) The linehits the y−axis just below the half way point between −15 and −20.
173

4.2. Graphs of Linear Equations www.ck12.org
0 Fahrenheit is approximately equivalent to −18 Celsius.
c) To find 30 Celsius, we look up the Celsius-axis and draw the line y = 30 along to the function. When thishorizontal line hits the function, we draw a line straight down to the Fahrenheit-axis. The line hits the axis atapproximately 85.
30 Celsius is approximately equivalent to 85 Fahrenheit.
d) To find 0 Celsius, we look at the Fahrenheit-axis (the line y = 0). The function hits the x−axis just right of 30.
0 Celsius is equivalent to 32 Fahrenheit.
Lesson Summary
• Equations with the variables y and x can be graphed by making a chart of values that fit the equation and thenplotting the values on a coordinate plane. This graph is simply another representation of the equation and canbe analyzed to solve problems.
• Horizontal lines are defined by the equation y = constant and vertical lines are defined by the equation x =constant.
• Be aware that although we graph the function as a line to make it easier to interpret, the function may actuallybe discrete.
Review Questions
1. Make a table of values for the following equations and then graph them.
a. y = 2x+7b. y = 0.7x−4c. y = 6−1.25x
2. “Think of a number. Multiply it by 20, divide the answer by 9, and then subtract seven from the result.”
a. Make a table of values and plot the function that represents this sentence.b. If you picked 0 as your starting number, what number would you end up with?c. To end up with 12, what number would you have to start out with?
3. Write the equations for the five lines (A through E) plotted in the graph below.
4. In the graph above, at what points do the following lines intersect?
174

www.ck12.org Chapter 4. Graphs of Equations and Functions
a. A and Eb. A and Dc. C and Dd. B and the y−axise. E and the x−axisf. C and the line y = xg. E and the line y = 1
2 xh. A and the line y = x+3
5. At the airport, you can change your money from dollars into euros. The service costs $5, and for everyadditional dollar you get 0.7 euros.
a. Make a table for this and plot the function on a graph.b. Use your graph to determine how many euros you would get if you give the office $50.c. To get 35 euros, how many dollars would you have to pay?d. The exchange rate drops so that you can only get 0.5 euros per additional dollar. Now how many dollars
do you have to pay for 35 euros?
6. The graph below shows a conversion chart for converting between weight in kilograms and weight in pounds.Use it to convert the following measurements.
a. 4 kilograms into weight in poundsb. 9 kilograms into weight in poundsc. 12 pounds into weight in kilogramsd. 17 pounds into weight in kilograms
7. Use the graph from problem 6 to answer the following questions.
a. An employee at a sporting goods store is packing 3-pound weights into a box that can hold 8 kilograms.How many weights can she place in the box?
b. After packing those weights, there is some extra space in the box that she wants to fill with one-poundweights. How many of those can she add?
c. After packing those, she realizes she misread the label and the box can actually hold 9 kilograms. Howmany more one-pound weights can she add?
175

4.3. Graphing Using Intercepts www.ck12.org
4.3 Graphing Using Intercepts
Learning Objectives
• Find intercepts of the graph of an equation.• Use intercepts to graph an equation.• Solve real-world problems using intercepts of a graph
Introduction
Sanjit’s office is 25 miles from home, and in traffic he expects the trip home to take him an hour if he starts at 5 PM.Today he hopes to stop at the post office along the way. If the post office is 6 miles from his office, when will Sanjitget there?
If you know just one of the points on a line, you’ll find that isn’t enough information to plot the line on a graph.As you can see in the graph above, there are many lines—in fact, infinitely many lines—that pass through a singlepoint. But what if you know two points that are both on the line? Then there’s only one way to graph that line; allyou need to do is plot the two points and use a ruler to draw the line that passes through both of them.
There are a lot of options for choosing which two points on the line you use to plot it. In this lesson, we’ll focuson two points that are rather convenient for graphing: the points where our line crosses the x−and y−axes, orintercepts. We’ll see how to find intercepts algebraically and use them to quickly plot graphs.
176

www.ck12.org Chapter 4. Graphs of Equations and Functions
Look at the graph above. The y−intercept occurs at the point where the graph crosses the y−axis. The y−value atthis point is 8, and the x−value is 0.
Similarly, the x−intercept occurs at the point where the graph crosses the x−axis. The x−value at this point is 6,and the y−value is 0.
So we know the coordinates of two points on the graph: (0, 8) and (6, 0). If we’d just been given those twocoordinates out of the blue, we could quickly plot those points and join them with a line to recreate the above graph.
Note: Not all lines will have both an x−and a y−intercept, but most do. However, horizontal lines never cross thex−axis and vertical lines never cross the y−axis.
For examples of these special cases, see the graph below.
Finding Intercepts by Substitution
Example 1
Find the intercepts of the line y = 13− x and use them to graph the function.
Solution
The first intercept is easy to find. The y−intercept occurs when x = 0. Substituting gives us y = 13−0 = 13, so they−intercept is (0, 13).
Similarly, the x−intercept occurs when y = 0. Plugging in 0 for y gives us 0 = 13− x, and adding x to both sidesgives us x = 13. So (13, 0) is the x−intercept.
177

4.3. Graphing Using Intercepts www.ck12.org
To draw the graph, simply plot these points and join them with a line.
Example 2
Graph the following functions by finding intercepts.
a) y = 2x+3
b) y = 7−2x
c) 4x−2y = 8
d) 2x+3y =−6
Solution
a) Find the y−intercept by plugging in x = 0 :
y = 2 ·0+3 = 3 − the y− intercept is (0,3)
Find the x−intercept by plugging in y = 0 :
0 = 2x+3 − subtract 3 f rom both sides :
−3 = 2x −divide by 2 :
−32= x − the x− intercept is (−1.5,0)
178
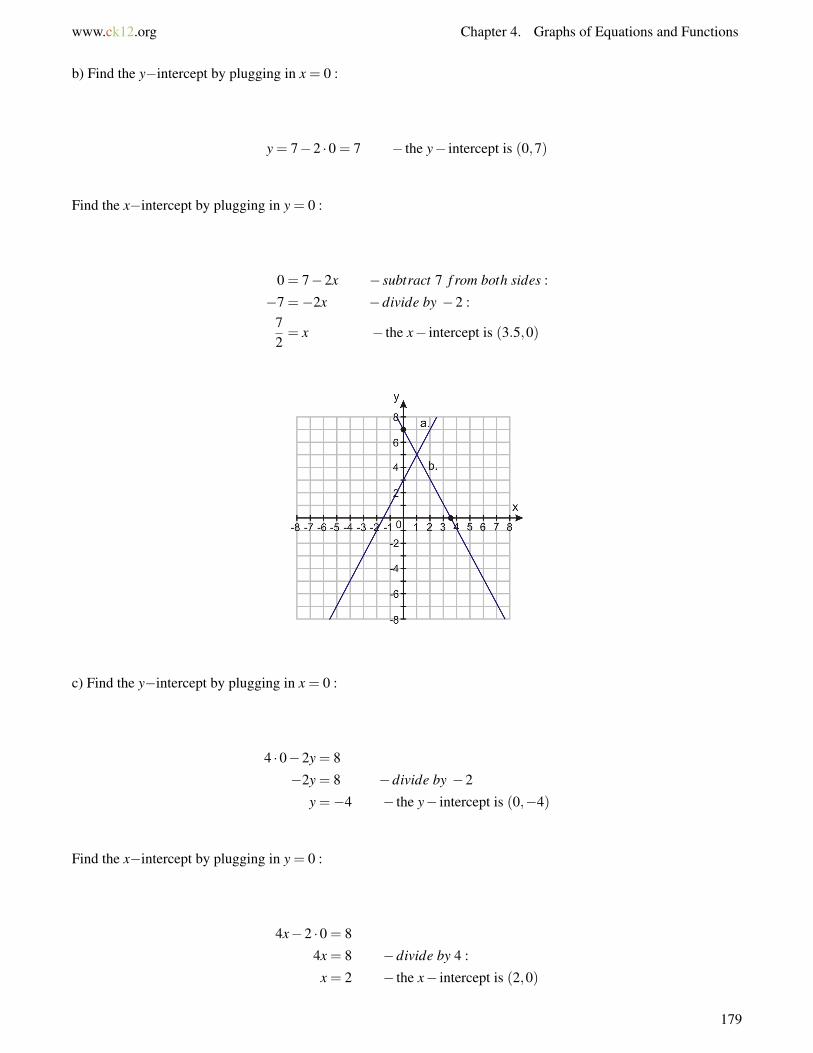
www.ck12.org Chapter 4. Graphs of Equations and Functions
b) Find the y−intercept by plugging in x = 0 :
y = 7−2 ·0 = 7 − the y− intercept is (0,7)
Find the x−intercept by plugging in y = 0 :
0 = 7−2x − subtract 7 f rom both sides :
−7 =−2x −divide by −2 :72= x − the x− intercept is (3.5,0)
c) Find the y−intercept by plugging in x = 0 :
4 ·0−2y = 8
−2y = 8 −divide by −2
y =−4 − the y− intercept is (0,−4)
Find the x−intercept by plugging in y = 0 :
4x−2 ·0 = 8
4x = 8 −divide by 4 :
x = 2 − the x− intercept is (2,0)
179

4.3. Graphing Using Intercepts www.ck12.org
d) Find the y−intercept by plugging in x = 0 :
2 ·0+3y =−6
3y =−6 −divide by 3 :
y =−2 − the y− intercept is (0,−2)
Find the x−intercept by plugging in y = 0 :
2x+3 ·0 =−6
2x =−6 −divide by 2 :
x =−3 − the x− intercept is (−3,0)
Finding Intercepts for Standard Form Equations Using the Cover-Up Method
Look at the last two equations in example 2. These equations are written in standard form. Standard form equationsare always written “coefficient times x plus (or minus) coefficient times y equals value”. In other words, they looklike this:
180

www.ck12.org Chapter 4. Graphs of Equations and Functions
ax+by = c
where a has to be positive, but b and c do not.
There is a neat method for finding intercepts in standard form, often referred to as the cover-up method.
Example 3
Find the intercepts of the following equations:
a) 7x−3y = 21
b) 12x−10y =−15
c) x+3y = 6
Solution
To solve for each intercept, we realize that at the intercepts the value of either xor y is zero, and so any terms thatcontain that variable effectively drop out of the equation. To make a term disappear, simply cover it (a finger is anexcellent way to cover up terms) and solve the resulting equation.
a) To solve for the y−intercept we set x = 0 and cover up the x−term:
−3y = 21y =−7 (0,−7) is the y− intercept.
Now we solve for the x−intercept:
7x = 21x = 3 (3,0) is the x− intercept.
b) To solve for the y−intercept (x = 0), cover up the x−term:
−10y =−15y = 1.5 (0,1.5) is the y− intercept.
Now solve for the x−intercept (y = 0):
181

4.3. Graphing Using Intercepts www.ck12.org
12x =−15x =−5
4 (−1.25,0) is the x− intercept.
c) To solve for the y−intercept (x = 0), cover up the x−term:
3y = 6y = 2 (0,2) is the y− intercept.
Solve for the y−intercept:
x = 6 (6,0) is the x− intercept.
The graph of these functions and the intercepts is below:
To learn more about equations in standard form, try the Java applet at http://www.analyzemath.com/line/line.htm(scroll down and click the “click here to start” button.) You can use the sliders to change the values of a,b, and c
and see how that affects the graph.
Solving Real-World Problems Using Intercepts of a Graph
Example 4
Jesus has $30 to spend on food for a class barbecue. Hot dogs cost $0.75 each (including the bun) and burgers cost$1.25 (including the bun). Plot a graph that shows all the combinations of hot dogs and burgers he could buy forthe barbecue, without spending more than $30.
This time we will find an equation first, and then we can think logically about finding the intercepts.
If the number of burgers that Jesus buys is x, then the money he spends on burgers is 1.25x
If the number of hot dogs he buys is y, then the money he spends on hot dogs is 0.75y
182
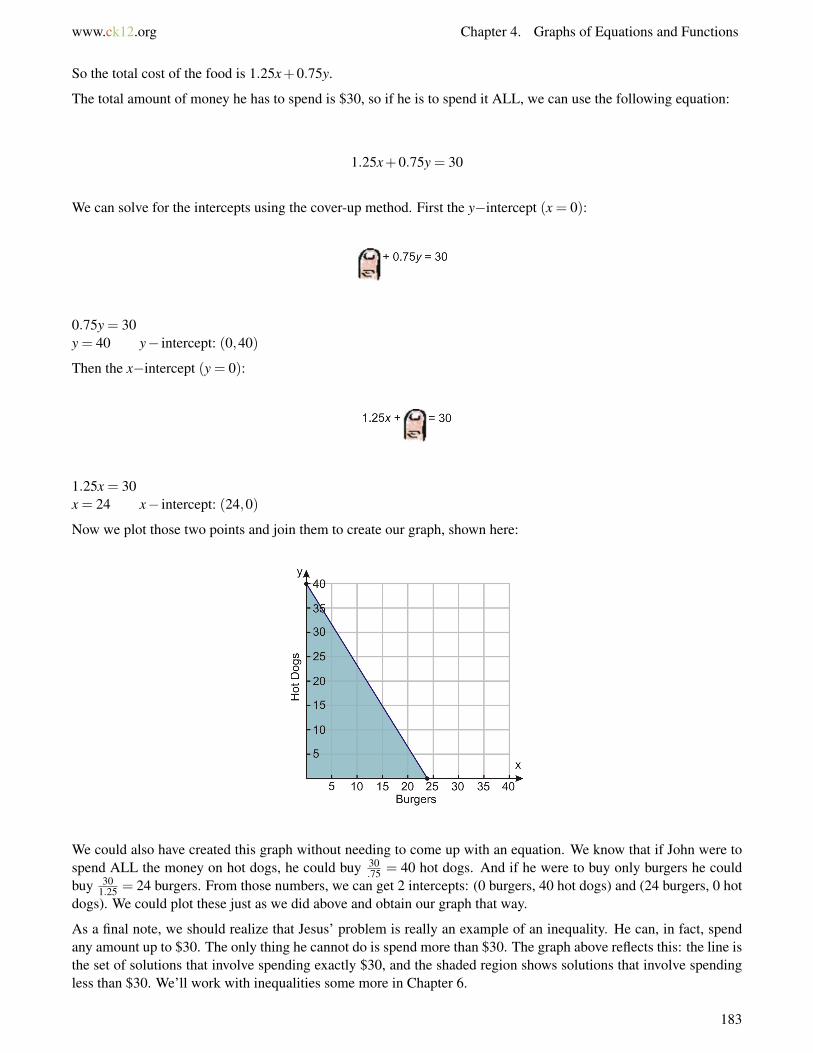
www.ck12.org Chapter 4. Graphs of Equations and Functions
So the total cost of the food is 1.25x+0.75y.
The total amount of money he has to spend is $30, so if he is to spend it ALL, we can use the following equation:
1.25x+0.75y = 30
We can solve for the intercepts using the cover-up method. First the y−intercept (x = 0):
0.75y = 30y = 40 y− intercept: (0,40)
Then the x−intercept (y = 0):
1.25x = 30x = 24 x− intercept: (24,0)
Now we plot those two points and join them to create our graph, shown here:
We could also have created this graph without needing to come up with an equation. We know that if John were tospend ALL the money on hot dogs, he could buy 30
.75 = 40 hot dogs. And if he were to buy only burgers he couldbuy 30
1.25 = 24 burgers. From those numbers, we can get 2 intercepts: (0 burgers, 40 hot dogs) and (24 burgers, 0 hotdogs). We could plot these just as we did above and obtain our graph that way.
As a final note, we should realize that Jesus’ problem is really an example of an inequality. He can, in fact, spendany amount up to $30. The only thing he cannot do is spend more than $30. The graph above reflects this: the line isthe set of solutions that involve spending exactly $30, and the shaded region shows solutions that involve spendingless than $30. We’ll work with inequalities some more in Chapter 6.
183

4.3. Graphing Using Intercepts www.ck12.org
Lesson Summary
• A y−intercept occurs at the point where a graph crosses the y−axis (where x = 0) and an x−intercept occursat the point where a graph crosses the x−axis (where y = 0).
• The y−intercept can be found by substituting x = 0 into the equation and solving for y. Likewise, thex−intercept can be found by substituting y = 0 into the equation and solving for x.
• A linear equation is in standard form if it is written as “positive coefficient times x plus coefficient times yequals value”. Equations in standard form can be solved for the intercepts by covering up the x (or y) term andsolving the equation that remains.
Review Questions
1. Find the intercepts for the following equations using substitution.
a. y = 3x−6b. y =−2x+4c. y = 14x−21d. y = 7−3xe. y = 2.5x−4f. y = 1.1x+2.2g. y = 3
8 x+7h. y = 5
9 −27 x
2. Find the intercepts of the following equations using the cover-up method.
a. 5x−6y = 15b. 3x−4y =−5c. 2x+7y =−11d. 5x+10y = 25e. 5x−1.3y = 12f. 1.4x−3.5y = 7g. 3
5 x+2y = 25
h. 34 x− 2
3 y = 15
3. Use any method to find the intercepts and then graph the following equations.
a. y = 2x+3b. 6(x−1) = 2(y+3)c. x− y = 5d. x+ y = 8
4. At the local grocery store strawberries cost $3.00 per pound and bananas cost $1.00 per pound.
a. If I have $10 to spend on strawberries and bananas, draw a graph to show what combinations of each Ican buy and spend exactly $10.
b. Plot the point representing 3 pounds of strawberries and 2 pounds of bananas. Will that cost more or lessthan $10?
c. Do the same for the point representing 1 pound of strawberries and 5 pounds of bananas.
5. A movie theater charges $7.50 for adult tickets and $4.50 for children. If the theater takes in $900 in ticketsales for a particular screening, draw a graph which depicts the possibilities for the number of adult ticketsand the number of child tickets sold.
6. Why can’t we use the intercept method to graph the following equation? 3(x+2) = 2(y+3)
184

www.ck12.org Chapter 4. Graphs of Equations and Functions
7. Name two more equations that we can’t use the intercept method to graph.
185

4.4. Slope and Rate of Change www.ck12.org
4.4 Slope and Rate of Change
Learning Objectives
• Find positive and negative slopes.• Recognize and find slopes for horizontal and vertical lines.• Understand rates of change.• Interpret graphs and compare rates of change.
Introduction
Wheelchair ramps at building entrances must have a slope between 116 and 1
20 . If the entrance to a new office buildingis 28 inches off the ground, how long does the wheelchair ramp need to be?
We come across many examples of slope in everyday life. For example, a slope is in the pitch of a roof, the grade orincline of a road, or the slant of a ladder leaning on a wall. In math, we use the word slope to define steepness in aparticular way.
Slope =distance moved vertically
distance moved horizontally
To make it easier to remember, we often word it like this:
Slope =riserun
In the picture above, the slope would be the ratio of the height of the hill to the horizontal length of the hill. In otherwords, it would be 3
4 , or 0.75.
If the car were driving to the right it would climb the hill - we say this is a positive slope. Any time you see thegraph of a line that goes up as you move to the right, the slope is positive.
If the car kept driving after it reached the top of the hill, it might go down the other side. If the car is driving to theright and descending, then we would say that the slope is negative.
186
www.ck12.org Chapter 4. Graphs of Equations and Functions
Here’s where it gets tricky: If the car turned around instead and drove back down the left side of the hill, the slopeof that side would still be positive. This is because the rise would be -3, but the run would be -4 (think of the x−axis- if you move from right to left you are moving in the negative x−direction). That means our slope ratio would be−3−4 , and the negatives cancel out to leave 0.75, the same slope as before. In other words, the slope of a line is thesame no matter which direction you travel along it.
Find the Slope of a Line
A simple way to find a value for the slope of a line is to draw a right triangle whose hypotenuse runs along the line.Then we just need to measure the distances on the triangle that correspond to the rise (the vertical dimension) andthe run (the horizontal dimension).
Example 1
Find the slopes for the three graphs shown.
Solution
There are already right triangles drawn for each of the lines - in future problems you’ll do this part yourself. Notethat it is easiest to make triangles whose vertices are lattice points (i.e. points whose coordinates are all integers).
a) The rise shown in this triangle is 4 units; the run is 2 units. The slope is 42 = 2.
b) The rise shown in this triangle is 4 units, and the run is also 4 units. The slope is 44 = 1.
c) The rise shown in this triangle is 2 units, and the run is 4 units. The slope is 24 = 1
2 .
Example 2
Find the slope of the line that passes through the points (1, 2) and (4, 7).
Solution
We already know how to graph a line if we’re given two points: we simply plot the points and connect them with aline. Here’s the graph:
187

4.4. Slope and Rate of Change www.ck12.org
Since we already have coordinates for the vertices of our right triangle, we can quickly work out that the rise is7−2 = 5 and the run is 4−1 = 3 (see diagram). So the slope is 7−2
4−1 = 53 .
If you look again at the calculations for the slope, you’ll notice that the 7 and 2 are the y−coordinates of the twopoints and the 4 and 1 are the x−coordinates. This suggests a pattern we can follow to get a general formula for theslope between two points (x1,y1) and (x2,y2):
Slope between (x1,y1) and (x2,y2) =y2−y1x2−x1
or m = ∆y∆x
In the second equation the letter m denotes the slope (this is a mathematical convention you’ll see often) and theGreek letter delta (∆) means change. So another way to express slope is change in y divided by change in x. In thenext section, you’ll see that it doesn’t matter which point you choose as point 1 and which you choose as point 2.
Example 3
Find the slopes of the lines on the graph below.
Solution
Look at the lines - they both slant down (or decrease) as we move from left to right. Both these lines have negativeslope.
The lines don’t pass through very many convenient lattice points, but by looking carefully you can see a few pointsthat look to have integer coordinates. These points have been circled on the graph, and we’ll use them to determinethe slope. We’ll also do our calculations twice, to show that we get the same slope whichever way we choose point1 and point 2.
188

www.ck12.org Chapter 4. Graphs of Equations and Functions
For Line A:
(x1,y1) = (−6,3) (x2,y2) = (5,−1) (x1,y1) = (5,−1) (x2,y2) = (−6,3)
m =y2− y1
x2− x1=
(−1)− (3)(5)− (−6)
=−411≈−0.364 m =
y2− y1
x2− x1=
(3)− (−1)(−6)− (5)
=4−11
≈−0.364
For Line B
(x1,y1) = (−4,6) (x2,y2) = (4,−5) (x1,y1) = (4,−5) (x2,y2) = (−4,6)
m =y2− y1
x2− x1=
(−5)− (6)(4)− (−4)
=−11
8=−1.375 m =
y2− y1
x2− x1=
(6)− (−5)(−4)− (4)
=11−8
=−1.375
You can see that whichever way round you pick the points, the answers are the same. Either way, Line A has slope-0.364, and Line B has slope -1.375.
Khan Academy has a series of videos on finding the slope of a line, starting at http://www.youtube.com/watch?v=hXP1Gv9IMBo.
Find the Slopes of Horizontal and Vertical lines
Example 4
Determine the slopes of the two lines on the graph below.
Solution
There are 2 lines on the graph: A(y = 3) and B(x = 5).
Let’s pick 2 points on line A—say, (x1,y1) = (−4,3) and (x2,y2) = (5,3)—and use our equation for slope:
m =y2− y1
x2− x1=
(3)− (3)(5)− (−4)
=09= 0.
If you think about it, this makes sense - if y doesn’t change as x increases then there is no slope, or rather, the slopeis zero. You can see that this must be true for all horizontal lines.
189

4.4. Slope and Rate of Change www.ck12.org
Horizontal lines (y = constant) all have a slope of 0.
Now let’s consider line B. If we pick the points (x1,y1) = (5,−3) and (x2,y2) = (5,4), our slope equation ism = y2−y1
x2−x1= (4)−(−3)
(5)−(5) = 70 . But dividing by zero isn’t allowed!
In math we often say that a term which involves division by zero is undefined. (Technically, the answer can also besaid to be infinitely large—or infinitely small, depending on the problem.)
Vertical lines (x = constant) all have an infinite (or undefined) slope.
Find a Rate of Change
The slope of a function that describes real, measurable quantities is often called a rate of change. In that case theslope refers to a change in one quantity (y)per unit change in another quantity (x). (This is where the equationm = ∆y
∆x comes in—remember that ∆y and ∆x represent the change in y and x respectively.)
Example 5
A candle has a starting length of 10 inches. 30 minutes after lighting it, the length is 7 inches. Determine the rate ofchange in length of the candle as it burns. Determine how long the candle takes to completely burn to nothing.
Solution
First we’ll graph the function to visualize what is happening. We have 2 points to start with: we know that at themoment the candle is lit (time = 0) the length of the candle is 10 inches, and after 30 minutes (time = 30) the lengthis 7 inches. Since the candle length depends on the time, we’ll plot time on the horizontal axis, and candle length onthe vertical axis.
The rate of change of the candle’s length is simply the slope of the line. Since we have our 2 points (x1,y1) = (0,10)and (x2,y2) = (30,7), we can use the familiar version of the slope formula:
Rate of change =y2− y1
x2− x1=
(7 inches)− (10 inches)(30 minutes)− (0 minutes)
=−3 inches30 minutes
=−0.1 inches per minute
Note that the slope is negative. A negative rate of change means that the quantity is decreasing with time—just aswe would expect the length of a burning candle to do.
To find the point when the candle reaches zero length, we can simply read the x−intercept off the graph (100minutes). We can use the rate equation to verify this algebraically:
190

www.ck12.org Chapter 4. Graphs of Equations and Functions
Length burned = rate× time
10 = 0.1×100
Since the candle length was originally 10 inches, our equation confirms that 100 minutes is the time taken.
Example 6
The population of fish in a certain lake increased from 370 to 420 over the months of March and April. At what rateis the population increasing?
Solution
Here we don’t have two points from which we can get x− and y−coordinates for the slope formula. Instead, we’llneed to use the alternate formula, m = ∆y
∆x .
The change in y−values, or ∆y, is the change in the number of fish, which is 420− 370 = 50. The change inx−values, ∆x, is the amount of time over which this change took place: two months. So ∆y
∆x = 50 fish2 months , or 25 fish
per month.
Interpret a Graph to Compare Rates of Change
Example 7
The graph below represents a trip made by a large delivery truck on a particular day. During the day the truck madetwo deliveries, one taking an hour and the other taking two hours. Identify what is happening at each stage of thetrip (stages A through E).
Solution
Here are the stages of the trip:
a) The truck sets off and travels 80 miles in 2 hours.
b) The truck covers no distance for 2 hours.
c) The truck covers (120−80) = 40 miles in 1 hour.
d) The truck covers no distance for 1 hour.
e) The truck covers -120 miles in 2 hours.
191

4.4. Slope and Rate of Change www.ck12.org
Let’s look at each section more closely.
A. Rate of change = ∆y∆x =
80 miles2 hours = 40 miles per hour
Notice that the rate of change is a speed—or rather, a velocity. (The difference between the two is that velocity hasa direction, and speed does not. In other words, velocity can be either positive or negative, with negative velocityrepresenting travel in the opposite direction. You’ll see the difference more clearly in part E.)
Since velocity equals distance divided by time, the slope (or rate of change) of a distance-time graph is always avelocity.
So during the first part of the trip, the truck travels at a constant speed of 40 mph for 2 hours, covering a distance of80 miles.
B. The slope here is 0, so the rate of change is 0 mph. The truck is stationary for one hour. This is the first deliverystop.
C. Rate of change = ∆y∆x =
(120−80) miles(4−3) hours = 40 miles per hour. The truck is traveling at 40 mph.
D. Once again the slope is 0, so the rate of change is 0 mph. The truck is stationary for two hours. This is the seconddelivery stop. At this point the truck is 120 miles from the start position.
E. Rate of change = ∆y∆x = (0−120) miles
(8−6) hours = −120 miles2 hours = −60 miles per hour. The truck is traveling at negative 60
mph.
Wait – a negative speed? Does that mean that the truck is reversing? Well, probably not. It’s actually the velocityand not the speed that is negative, and a negative velocity simply means that the distance from the starting positionis decreasing with time. The truck is driving in the opposite direction – back to where it started from. Since it nolonger has 2 heavy loads, it travels faster (60 mph instead of 40 mph), covering the 120 mile return trip in 2 hours.Its speed is 60 mph, and its velocity is -60 mph, because it is traveling in the opposite direction from when it startedout.
Lesson Summary
• Slope is a measure of change in the vertical direction for each step in the horizontal direction. Slope is oftenrepresented as “m”.
• Slope can be expressed as riserun , or ∆y
∆x .• The slope between two points (x1,y1) and (x2,y2) is equal to y2−y1
x2−x1.
• Horizontal lines (where y = a constant) all have a slope of 0.• Vertical lines (where x = a constant) all have an infinite (or undefined) slope.• The slope (or rate of change) of a distance-time graph is a velocity.
Review Questions
1. Use the slope formula to find the slope of the line that passes through each pair of points.
a. (-5, 7) and (0, 0)b. (-3, -5) and (3, 11)c. (3, -5) and (-2, 9)d. (-5, 7) and (-5, 11)e. (9, 9) and (-9, -9)f. (3, 5) and (-2, 7)
192

www.ck12.org Chapter 4. Graphs of Equations and Functions
g. (2.5, 3) and (8, 3.5)
2. For each line in the graphs below, use the points indicated to determine the slope.
3. For each line in the graphs above, imagine another line with the same slope that passes through the point (1,1), and name one more point on that line.
4. The graph below is a distance-time graph for Mark’s three and a half mile cycle ride to school. During thisride, he rode on cycle paths but the terrain was hilly. He rode slower up hills and faster down them. He stoppedonce at a traffic light and at one point he stopped to mend a punctured tire. The graph shows his distance fromhome at any given time. Identify each section of the graph accordingly.
193

www.ck12.org Chapter 4. Graphs of Equations and Functions
4.5 Graphs Using Slope-Intercept Form
Learning Objectives
• Identify the slope and y−intercept of equations and graphs.• Graph an equation in slope-intercept form.• Understand what happens when you change the slope or intercept of a line.• Identify parallel lines from their equations.
Introduction
The total profit of a business is described by the equation y = 15000x−80000, where x is the number of months thebusiness has been running. How much profit is the business making per month, and what were its start-up costs?How much profit will it have made in a year?
Identify Slope and
So far, we’ve been writing a lot of our equations in slope-intercept form—that is, we’ve been writing them in theform y = mx+b, where m and b are both constants. It just so happens that m is the slope and the point (0,b) is they−intercept of the graph of the equation, which gives us enough information to draw the graph quickly.
Example 1
Identify the slope and y−intercept of the following equations.
a) y = 3x+2
b) y = 0.5x−3
c) y =−7x
d) y =−4
Solution
a) Comparing
, we can see that m = 3 and b = 2. So y = 3x+2 has a slope of 3 and a y−intercept of (0, 2).
b)
195

4.5. Graphs Using Slope-Intercept Form www.ck12.org
has a slope of 0.5 and a y−intercept of (0, -3).
Notice that the intercept is negative. The b−term includes the sign of the operator (plus or minus) in front of thenumber—for example, y = 0.5x−3 is identical to y = 0.5x+(−3), and that means that b is -3, not just 3.
c) At first glance, this equation doesn’t look like it’s in slope-intercept form. But we can rewrite it as y = −7x+0,and that means it has a slope of -7 and a y−intercept of (0, 0). Notice that the slope is negative and the line passesthrough the origin.
d) We can rewrite this one as y = 0x− 4, giving us a slope of 0 and a y−intercept of (0, -4). This is a horizontalline.
Example 2
Identify the slope and y−intercept of the lines on the graph shown below.
The intercepts have been marked, as well as some convenient lattice points that the lines pass through.
Solution
a) The y−intercept is (0, 5). The line also passes through (2, 3), so the slope is ∆y∆x =
−22 =−1.
b) The y−intercept is (0, 2). The line also passes through (1, 5), so the slope is ∆y∆x =
31 = 3.
c) The y−intercept is (0, -1). The line also passes through (2, 3), so the slope is ∆y∆x =
42 = 2.
d) The y−intercept is (0, -3). The line also passes through (4, -4), so the slope is ∆y∆x =
−14 =−1
4 or -0.25.
Graph an Equation in Slope-Intercept Form
Once we know the slope and intercept of a line, it’s easy to graph it. Just remember what slope means. Let’s lookback at this example from Lesson 4.1.
Ali is trying to work out a trick that his friend showed him. His friend started by asking him to think of a number,then double it, then add five to the result. Ali has written down a rule to describe the first part of the trick. He is
196

www.ck12.org Chapter 4. Graphs of Equations and Functions
using the letter x to stand for the number he thought of and the letter y to represent the final result of applying therule. He wrote his rule in the form of an equation: y = 2x+5.
Help him visualize what is going on by graphing the function that this rule describes.
In that example, we constructed a table of values, and used that table to plot some points to create our graph.
We also saw another way to graph this equation. Just by looking at the equation, we could see that the y−interceptwas (0, 5), so we could start by plotting that point. Then we could also see that the slope was 2, so we could findanother point on the graph by going over 1 unit and up 2 units. The graph would then be the line between those twopoints.
Here’s another problem where we can use the same method.
Example 3
Graph the following function: y =−3x+5
Solution
To graph the function without making a table, follow these steps:
1. Identify the y−intercept: b = 52. Plot the intercept: (0, 5)3. Identify the slope: m =−3. (This is equal to −3
1 , so the rise is -3 and the run is 1.)4. Move over 1 unit and down 3 units to find another point on the line: (1, 2)5. Draw the line through the points (0, 5) and (1, 2).
197

4.5. Graphs Using Slope-Intercept Form www.ck12.org
Notice that to graph this equation based on its slope, we had to find the rise and run—and it was easiest to do thatwhen the slope was expressed as a fraction. That’s true in general: to graph a line with a particular slope, it’s easiestto first express the slope as a fraction in simplest form, and then read off the numerator and the denominator of thefraction to get the rise and run of the graph.
Example 4
Find integer values for the rise and run of the following slopes, then graph lines with corresponding slopes.
a) m = 3
b) m =−2
c) m = 0.75
d) m =−0.375
Solution
a)
b)
198
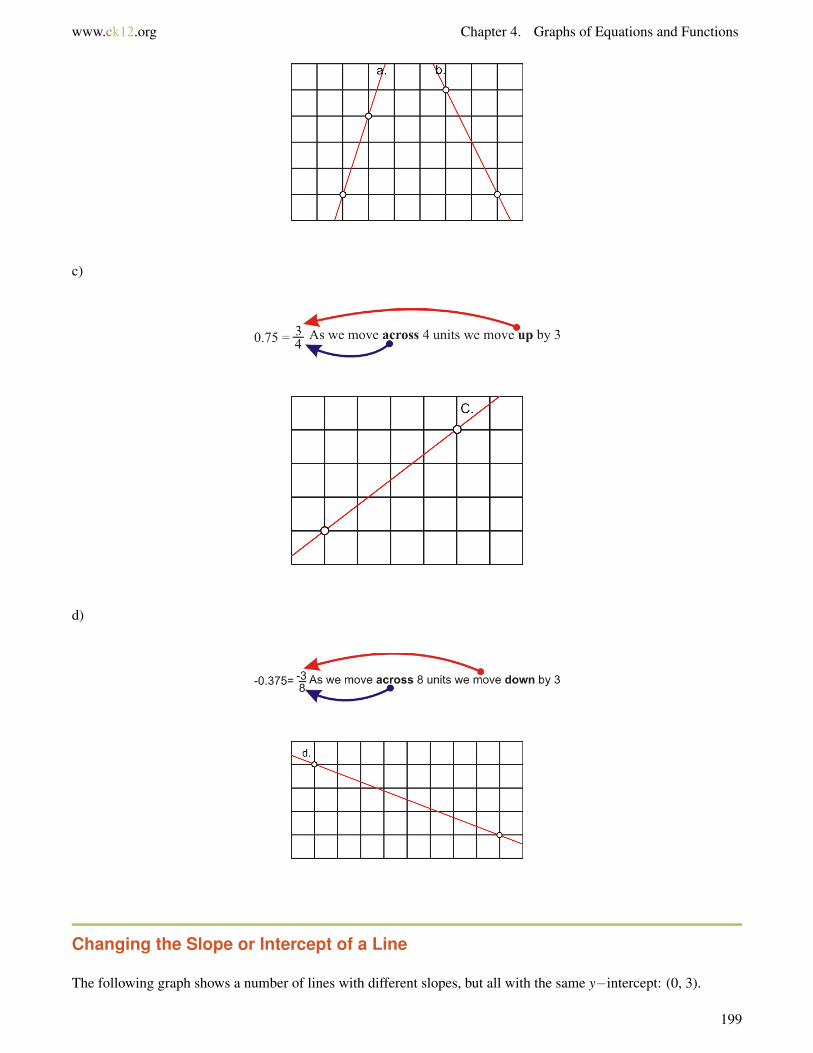
www.ck12.org Chapter 4. Graphs of Equations and Functions
c)
d)
Changing the Slope or Intercept of a Line
The following graph shows a number of lines with different slopes, but all with the same y−intercept: (0, 3).
199

4.5. Graphs Using Slope-Intercept Form www.ck12.org
You can see that all the functions with positive slopes increase as we move from left to right, while all functionswith negative slopes decrease as we move from left to right. Another thing to notice is that the greater the slope, thesteeper the graph.
This graph shows a number of lines with the same slope, but different y−intercepts.
Notice that changing the intercept simply translates (shifts) the graph up or down. Take a point on the graph ofy = 2x, such as (1, 2). The corresponding point on y = 2x+3 would be (1, 5). Adding 3 to the y−intercept meanswe also add 3 to every other y−value on the graph. Similarly, the corresponding point on the y = 2x−3 line wouldbe (1, -1); we would subtract 3 from the y−value and from every other y−value.
Notice also that these lines all appear to be parallel. Are they truly parallel?
To answer that question, we’ll use a technique that you’ll learn more about in a later chapter. We’ll take 2 of theequations—say, y = 2x and y = 2x+ 3—and solve for values of x and y that satisfy both equations. That will tellus at what point those two lines intersect, if any. (Remember that parallel lines, by definition, are lines that don’tintersect.)
So what values would satisfy both y = 2x and y = 2x+3? Well, if both of those equations were true, then y wouldbe equal to both 2x and 2x+3, which means those two expressions would also be equal to each other. So we can getour answer by solving the equation 2x = 2x+3.
But what happens when we try to solve that equation? If we subtract 2x from both sides, we end up with 0 = 3. Thatcan’t be true no matter what x equals. And that means that there just isn’t any value for x that will make both of theequations we started out with true. In other words, there isn’t any point where those two lines intersect. They areparallel, just as we thought.
200
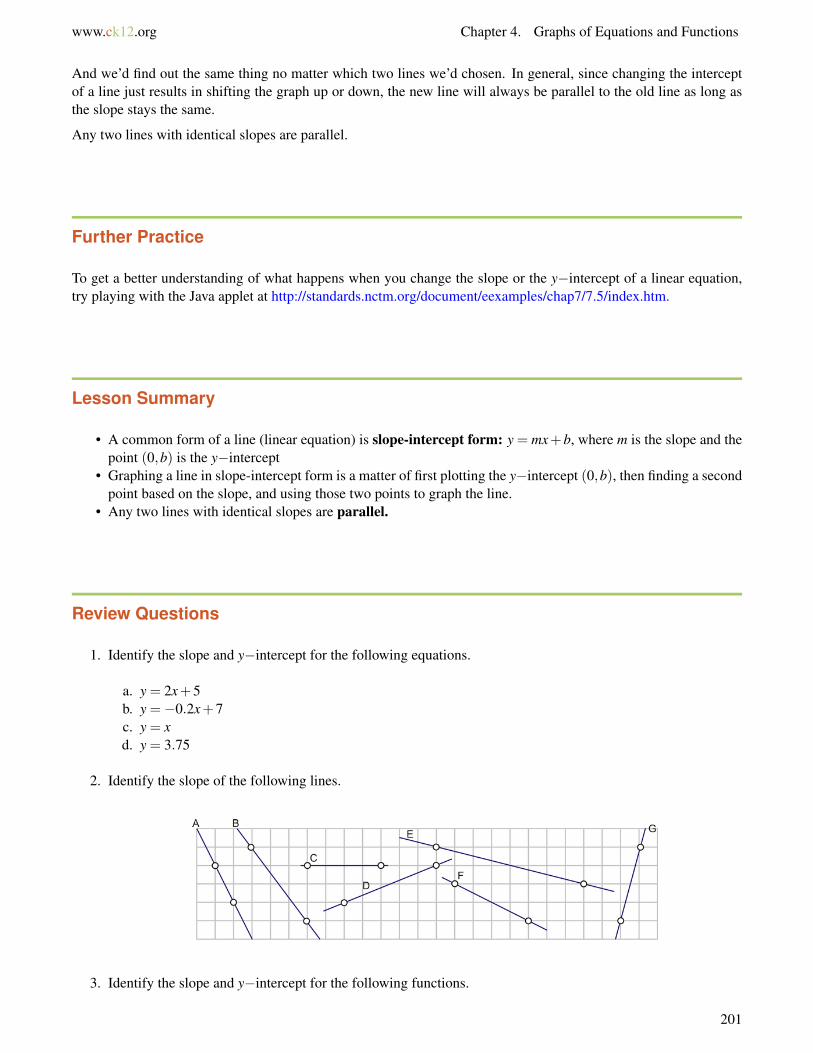
www.ck12.org Chapter 4. Graphs of Equations and Functions
And we’d find out the same thing no matter which two lines we’d chosen. In general, since changing the interceptof a line just results in shifting the graph up or down, the new line will always be parallel to the old line as long asthe slope stays the same.
Any two lines with identical slopes are parallel.
Further Practice
To get a better understanding of what happens when you change the slope or the y−intercept of a linear equation,try playing with the Java applet at http://standards.nctm.org/document/eexamples/chap7/7.5/index.htm.
Lesson Summary
• A common form of a line (linear equation) is slope-intercept form: y = mx+b, where m is the slope and thepoint (0,b) is the y−intercept
• Graphing a line in slope-intercept form is a matter of first plotting the y−intercept (0,b), then finding a secondpoint based on the slope, and using those two points to graph the line.
• Any two lines with identical slopes are parallel.
Review Questions
1. Identify the slope and y−intercept for the following equations.
a. y = 2x+5b. y =−0.2x+7c. y = xd. y = 3.75
2. Identify the slope of the following lines.
3. Identify the slope and y−intercept for the following functions.
201

4.5. Graphs Using Slope-Intercept Form www.ck12.org
4. Plot the following functions on a graph.
a. y = 2x+5b. y =−0.2x+7c. y = xd. y = 3.75
5. Which two of the following lines are parallel?
a. y = 2x+5b. y =−0.2x+7c. y = xd. y = 3.75e. y =−1
5 x−11f. y =−5x+5g. y =−3x+11h. y = 3x+3.5
6. What is the y−intercept of the line passing through (1, -4) and (3, 2)?7. What is the y−intercept of the line with slope -2 that passes through (3, 1)?8. Line A passes through the points (2, 6) and (-4, 3). Line B passes through the point (3, 2.5), and is parallel to
line A
a. Write an equation for line A in slope-intercept form.b. Write an equation for line B in slope-intercept form.
9. Line C passes through the points (2, 5) and (1, 3.5). Line D is parallel to line C, and passes through the point(2, 6). Name another point on line D. (Hint: you can do this without graphing or finding an equation for eitherline.)
202

www.ck12.org Chapter 4. Graphs of Equations and Functions
4.6 Direct Variation Models
Learning Objectives
• Identify direct variation.• Graph direct variation equations.• Solve real-world problems using direct variation models.
Introduction
Suppose you see someone buy five pounds of strawberries at the grocery store. The clerk weighs the strawberriesand charges $12.50 for them. Now suppose you wanted two pounds of strawberries for yourself. How much wouldyou expect to pay for them?
Identify Direct Variation
The preceding problem is an example of a direct variation. We would expect that the strawberries are priced on a“per pound” basis, and that if you buy two-fifths the amount of strawberries, you would pay two-fifths of $12.50 foryour strawberries, or $5.00.
Similarly, if you bought 10 pounds of strawberries (twice the amount) you would pay twice $12.50, and if you didnot buy any strawberries you would pay nothing.
If variable y varies directly with variable x, then we write the relationship as y = k · x. k is called the constant ofproportionality.
If we were to graph this function, you can see that it would pass through the origin, because y = 0 when x =0,whatever the value of k. So we know that a direct variation, when graphed, has a single intercept at (0, 0).
Example 1
If y varies directly with x according to the relationship y = k ·x, and y = 7.5 when x = 2.5, determine the constant ofproportionality, k.
Solution
We can solve for the constant of proportionality using substitution. Substitute x = 2.5 and y = 7.5 into the equationy = k · x to get 7.5 = k(2.5). Then divide both sides by 2.5 to get k = 7.5
2.5 = 3. The constant of proportionality, k,is 3.
We can graph the relationship quickly, using the intercept (0, 0) and the point (2.5, 7.5). The graph is shown below.It is a straight line with slope 3.
203

4.6. Direct Variation Models www.ck12.org
The graph of a direct variation always passes through the origin, and always has a slope that is equal to the constantof proportionality, k.
Example 2
The volume of water in a fish-tank, V , varies directly with depth, d. If there are 15 gallons in the tank when the depthis 8 inches, calculate how much water is in the tank when the depth is 20 inches.
Solution
This is a good example of a direct variation, but for this problem we’ll have to determine the equation of the variationourselves. Since the volume, V , depends on depth, d, we’ll use an equation of the form y = k · x, but in place of ywe’ll use V and in place of x we’ll use d:
V = k ·d
We know that when the depth is 8 inches the volume is 15 gallons, so to solve for k, we plug in 15 for V and 8 for dto get 15 = k(8). Dividing by 8 gives us k = 15
8 = 1.875.
Now to find the volume of water at the final depth, we use V = k · d again, but this time we can plug in our new dand the value we found for k:
V = 1.875×20
V = 37.5
At a depth of 20 inches, the volume of water in the tank is 37.5 gallons.
Example 3
The graph shown below is a conversion chart used to convert U.S. dollars (US$) to British pounds (GB£) in a bankon a particular day. Use the chart to determine:
a) the number of pounds you could buy for $600
b) the number of dollars it would cost to buy £200
c) the exchange rate in pounds per dollar
204

www.ck12.org Chapter 4. Graphs of Equations and Functions
Solution
We can read the answers to a) and b) right off the graph. It looks as if at x = 600 the graph is about one fifth of theway between £350 and £400. So $600 would buy £360.
Similarly, the line y = 200 appears to intersect the graph about a third of the way between $300 and $400. We canround this to $330, so it would cost approximately $330 to buy £200.
To solve for the exchange rate, we should note that as this is a direct variation - the graph is a straight line passingthrough the origin. The slope of the line gives the constant of proportionality (in this case the exchange rate) and itis equal to the ratio of the y−value to x−value at any point. Looking closely at the graph, we can see that the linepasses through one convenient lattice point: (500, 300). This will give us the most accurate value for the slope andso the exchange rate.
y = k · x⇒=yx
And so rate =300 pounds500 dollors
= 0.60 pounds per dollar
Graph Direct Variation Equations
We know that all direct variation graphs pass through the origin, and also that the slope of the line is equal to theconstant of proportionality, k. Graphing is a simple matter of using the point-slope or point-point methods discussedearlier in this chapter.
Example 4
Plot the following direct variations on the same graph.
a) y = 3x
b) y =−2x
c) y =−0.2x
d) y = 29 x
Solution
205

4.6. Direct Variation Models www.ck12.org
a) The line passes through (0, 0), as will all these functions. This function has a slope of 3. When we move acrossby one unit, the function increases by three units.
b) The line has a slope of -2. When we move across the graph by one unit, the function falls by two units.
c) The line has a slope of -0.2. As a fraction this is equal to −15 . When we move across by five units, the function
falls by one unit.
d) The line passes through (0, 0) and has a slope of 29 . When we move across the graph by 9 units, the function
increases by two units.
For more examples of how to plot and identify direct variation functions, see the video at http://neaportal.k12.ar.us/index.php/2010/06/slope-and-direct-variation/.
Solve Real-World Problems Using Direct Variation Models
Direct variations are seen everywhere in everyday life. Any time one quantity increases at the same rate anotherquantity increases (for example, doubling when it doubles and tripling when it triples), we say that they follow adirect variation.
Newton’s Second Law
In 1687 Sir Isaac Newton published the famous Principia Mathematica. It contained, among other things, his secondlaw of motion. This law is often written as F = m ·a, where a force of F Newtons applied to a mass of m kilogramsresults in acceleration of a meters per second2. Notice that if the mass stays constant, then this formula is basicallythe same as the direct variation equation, just with different variables—and m is the constant of proportionality.
Example 5
If a 175 Newton force causes a shopping cart to accelerate down the aisle with an acceleration of 2.5 m/s2, calculate:
a) The mass of the shopping cart.
b) The force needed to accelerate the same cart at 6 m/s2.
Solution
a) We can solve for m (the mass) by plugging in our given values for force and acceleration. F = m · a becomes175 = m(2.5), and then we divide both sides by 2.5 to get 70 = m.
So the mass of the shopping cart is 70 kg.
b) Once we have solved for the mass, we simply substitute that value, plus our required acceleration, back into theformula F = m ·a and solve for F . We get F = 70×6 = 420.
206

www.ck12.org Chapter 4. Graphs of Equations and Functions
So the force needed to accelerate the cart at 6 m/s2 is 420 Newtons.
Ohm’s Law
The electrical current, I (amps), passing through an electronic component varies directly with the applied voltage,V (volts), according to the relationship V = I ·R, where R is the resistance (measured in Ohms). The resistance isconsidered to be a constant for all values of V and I, so once again, this formula is a version of the direct variationformula, with R as the constant of proportionality.
Example 6
A certain electronics component was found to pass a current of 1.3 amps at a voltage of 2.6 volts. When the voltagewas increased to 12.0 volts the current was found to be 6.0 amps.
a) Does the component obey Ohm’s law?
b) What would the current be at 6 volts?
Solution
Ohm’s law is a simple direct proportionality law, with the resistance R as our constant of proportionality. To knowif this component obeys Ohm’s law, we need to know if it follows a direct proportionality rule. In other words, is Vdirectly proportional to I?
We can determine this in two different ways.
Graph It: If we plot our two points on a graph and join them with a line, does the line pass through (0, 0)?
Voltage is the independent variable and current is the dependent variable, so normally we would graph V on thehorizontal axis and I on the vertical axis. However, if we swap the variables around just this once, we’ll get a graphwhose slope conveniently happens to be equal to the resistance, R. So we’ll treat I as the independent variable, andour two points will be (1.3, 2.6) and (6, 12).
Plotting those points and joining them gives the following graph:
The graph does appear to pass through the origin, so yes, the component obeys Ohm’s law.
Solve for R: If this component does obey Ohm’s law, the constant of proportionality (R) should be the same whenwe plug in the second set of values as when we plug in the first set. Let’s see if it is. (We can quickly find the valueof R in each case; since V = I ·R, that means R = V
I .)
207

4.6. Direct Variation Models www.ck12.org
Case 1: R =VI=
2.61.3
= 2 Ohms
Case 2: R =VI=
126
= 2 Ohms
The values for R agree! This means that we are indeed looking at a direct variation. The component obeys Ohm’slaw.
b) Now to find the current at 6 volts, simply substitute the values for V and R into V = I ·R. We found that R = 2, sowe plug in 2 for R and 6 for V to get 6 = I(2), and divide both sides by 2 to get 3 = I.
So the current through the component at a voltage of 6 volts is 3 amps.
Lesson Summary
• If a variable y varies directly with variable x, then we write the relationship as y = k · x, where k is a constantcalled the constant of proportionality.
• Direct variation is very common in many areas of science.
Review Questions
1. Plot the following direct variations on the same graph.
a. y = 43 x
b. y =−23 x
c. y =−16 x
d. y = 1.75x
2. Dasan’s mom takes him to the video arcade for his birthday.
a. In the first 10 minutes, he spends $3.50 playing games. If his allowance for the day is $20, how long canhe keep playing games before his money is gone?
b. He spends the next 15 minutes playing Alien Invaders. In the first two minutes, he shoots 130 aliens. Ifhe keeps going at this rate, how many aliens will he shoot in fifteen minutes?
c. The high score on this machine is 120000 points. If each alien is worth 100 points, will Dasan beat thehigh score? What if he keeps playing for five more minutes?
3. The current standard for low-flow showerheads is 2.5 gallons per minute.
a. How long would it take to fill a 30-gallon bathtub using such a showerhead to supply the water?b. If the bathtub drain were not plugged all the way, so that every minute 0.5 gallons ran out as 2.5 gallons
ran in, how long would it take to fill the tub?c. After the tub was full and the showerhead was turned off, how long would it take the tub to empty
through the partly unplugged drain?d. If the drain were immediately unplugged all the way when the showerhead was turned off, so that it
drained at a rate of 1.5 gallons per minute, how long would it take to empty?
4. Amin is using a hose to fill his new swimming pool for the first time. He starts the hose at 10 PM and leavesit running all night.
a. At 6 AM he measures the depth and calculates that the pool is four sevenths full. At what time will hisnew pool be full?
208

www.ck12.org Chapter 4. Graphs of Equations and Functions
b. At 10 AM he measures again and realizes his earlier calculations were wrong. The pool is still only threequarters full. When will it actually be full?
c. After filling the pool, he needs to chlorinate it to a level of 2.0 ppm (parts per million). He adds twogallons of chlorine solution and finds that the chlorine level is now 0.7 ppm. How many more gallonsdoes he need to add?
d. If the chlorine level in the pool decreases by 0.05 ppm per day, how much solution will he need to addeach week?
5. Land in Wisconsin is for sale to property investors. A 232-acre lot is listed for sale for $200,500.
a. Assuming the same price per acre, how much would a 60-acre lot sell for?b. Again assuming the same price, what size lot could you purchase for $100,000?
6. The force (F) needed to stretch a spring by a distance x is given by the equation F = k ·x, where k is the springconstant (measured in Newtons per centimeter, or N/cm). If a 12 Newton force stretches a certain spring by10 cm, calculate:
a. The spring constant, kb. The force needed to stretch the spring by 7 cm.c. The distance the spring would stretch with a 23 Newton force.
7. Angela’s cell phone is completely out of power when she puts it on the charger at 3 PM. An hour later, it is30% charged. When will it be completely charged?
8. It costs $100 to rent a recreation hall for three hours and $150 to rent it for five hours.
a. Is this a direct variation?b. Based on the cost to rent the hall for three hours, what would it cost to rent it for six hours, assuming it
is a direct variation?c. Based on the cost to rent the hall for five hours, what would it cost to rent it for six hours, assuming it is
a direct variation?d. Plot the costs given for three and five hours and graph the line through those points. Based on that graph,
what would you expect the cost to be for a six-hour rental?
209

4.7. Linear Function Graphs www.ck12.org
4.7 Linear Function Graphs
Learning Objectives
• Recognize and use function notation.• Graph a linear function.• Analyze arithmetic progressions.
Introduction
The highly exclusive Fellowship of the Green Mantle allows in only a limited number of new members a year. In itsthird year of membership it has 28 members, in its fourth year it has 33, and in its fifth year it has 38. How manymembers are admitted a year, and how many founding members were there?
Functions
So far we’ve used the term function to describe many of the equations we’ve been graphing, but in mathematics it’simportant to remember that not all equations are functions. In order to be a function, a relationship between twovariables, x and y, must map each x−value to exactly one y−value.
Visually this means the graph of y versus x must pass the vertical line test, meaning that a vertical line drawn throughthe graph of the function must never intersect the graph in more than one place:
Use Function Notation
When we write functions we often use the notation “ f (x) =” in place of “y =”. f (x) is pronounced “ f of x”.
Example 1
Rewrite the following equations so that y is a function of x and is written f (x):
a) y = 2x+5
b) y =−0.2x+7
210
www.ck12.org Chapter 4. Graphs of Equations and Functions
c) x = 4y−5
d) 9x+3y = 6
Solution
a) Simply replace y with f (x) : f (x) = 2x+5
b) Again, replace y with f (x) : f (x) =−0.2x+7
c) First we need to solve for y. Starting with x = 4y−5, we add 5 to both sides to get x+5 = 4y, divide by 4 to getx+5
4 = y, and then replace y with f (x) : f (x) = x+54 .
d) Solve for y : take 9x+3y = 6, subtract 9x from both sides to get 3y = 6−9x, divide by 3 to get y = 6−9x3 = 2−3x,
and express as a function: f (x) = 2−3x.
Using the functional notation in an equation gives us more information. For instance, the expression f (x) = mx+bshows clearly that x is the independent variable because you plug in values of x into the function and perform aseries of operations on the value of x in order to calculate the values of the dependent variable, y.
We can also plug in expressions rather than just numbers. For example, if our function is f (x) = x+2, we can plugin the expression (x+5). We would express this as f (x+5) = (x+5)+2 = x+7.
Example 2
A function is defined as f (x) = 6x−36. Evaluate the following:
a) f (2)
b) f (0)
c) f (z)
d) f (x+3)
e) f (2r−1)
Solution
a) Substitute x = 2 into the function f (x) : f (2) = 6 ·2−36 = 12−36 =−24
b) Substitute x = 0 into the function f (x) : f (0) = 6 ·0−36 = 0−36 =−36
c) Substitute x = z into the function f (x) : f (z) = 6z+36
d) Substitute x = (x+3) into the function f (x) : f (x+3) = 6(x+3)+36 = 6x+18+36 = 6x+54
e) Substitute x = (2r+1) into the function f (x) : f (2r+1) = 6(2r+1)+36 = 12r+6+36 = 12r+42
Graph a Linear Function
Since the notations “ f (x) =” and “y =” are interchangeable, we can use all the concepts we have learned so far tograph functions.
Example 3
Graph the function f (x) = 3x+54 .
Solution
We can write this function in slope-intercept form:
211

4.7. Linear Function Graphs www.ck12.org
f (x) =34
x+54= 0.75x+1.25
So our graph will have a y−intercept of (0, 1.25) and a slope of 0.75.
Example 4
Graph the function f (x) = 7(5−x)5 .
Solution
This time we’ll solve for the x− and y−intercepts.
To solve for the y−intercept, plug in x = 0 : f (0) = 7(5−0)5 = 35
5 = 7, so the x−intercept is (0, 7).
To solve for the x−intercept, set f (x) = 0 : 0 = 7(5−x)5 , so 0 = 35−7x, therefore 7x = 35 and x = 5. The y−intercept
is (5, 0).
We can graph the function from those two points:
Arithmetic Progressions
You may have noticed that with linear functions, when you increase the x−value by 1 unit, the y−value increases bya fixed amount, equal to the slope. For example, if we were to make a table of values for the function f (x) = 2x+3,we might start at x = 0 and then add 1 to x for each row:
TABLE 4.6:
x f (x)0 31 52 73 94 11
212
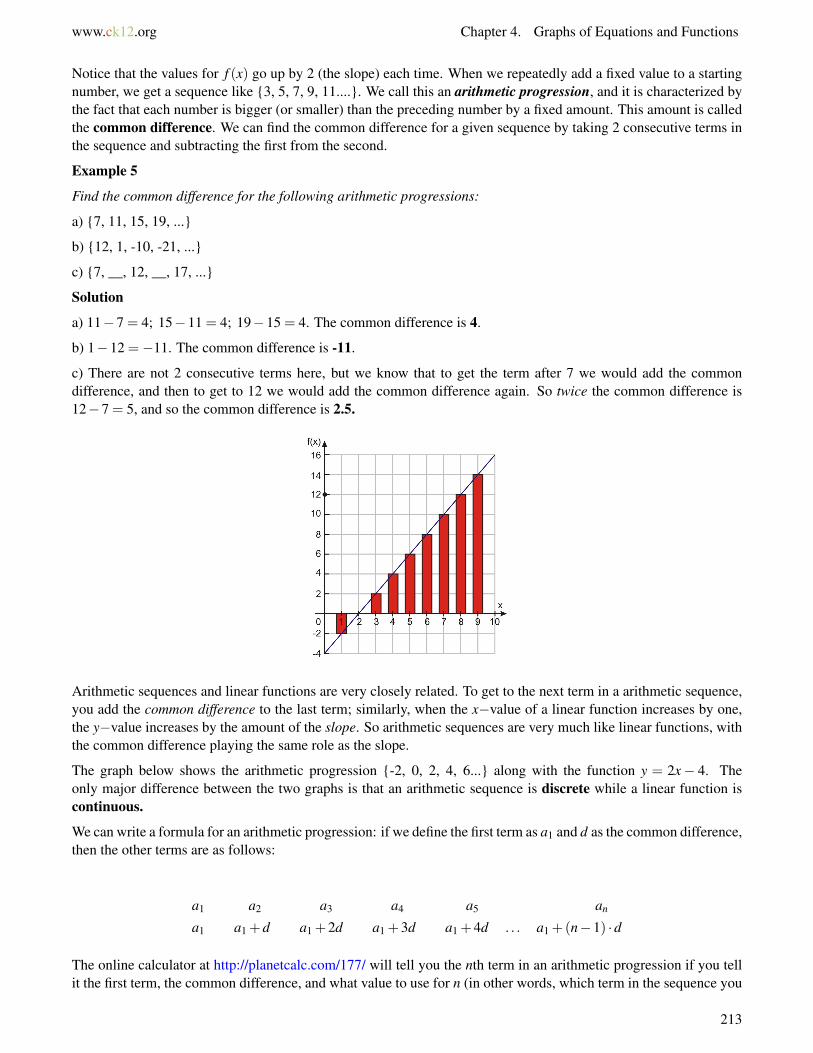
www.ck12.org Chapter 4. Graphs of Equations and Functions
Notice that the values for f (x) go up by 2 (the slope) each time. When we repeatedly add a fixed value to a startingnumber, we get a sequence like 3, 5, 7, 9, 11..... We call this an arithmetic progression, and it is characterized bythe fact that each number is bigger (or smaller) than the preceding number by a fixed amount. This amount is calledthe common difference. We can find the common difference for a given sequence by taking 2 consecutive terms inthe sequence and subtracting the first from the second.
Example 5
Find the common difference for the following arithmetic progressions:
a) 7, 11, 15, 19, ...
b) 12, 1, -10, -21, ...
c) 7, __, 12, __, 17, ...
Solution
a) 11−7 = 4; 15−11 = 4; 19−15 = 4. The common difference is 4.
b) 1−12 =−11. The common difference is -11.
c) There are not 2 consecutive terms here, but we know that to get the term after 7 we would add the commondifference, and then to get to 12 we would add the common difference again. So twice the common difference is12−7 = 5, and so the common difference is 2.5.
Arithmetic sequences and linear functions are very closely related. To get to the next term in a arithmetic sequence,you add the common difference to the last term; similarly, when the x−value of a linear function increases by one,the y−value increases by the amount of the slope. So arithmetic sequences are very much like linear functions, withthe common difference playing the same role as the slope.
The graph below shows the arithmetic progression -2, 0, 2, 4, 6... along with the function y = 2x− 4. Theonly major difference between the two graphs is that an arithmetic sequence is discrete while a linear function iscontinuous.
We can write a formula for an arithmetic progression: if we define the first term as a1 and d as the common difference,then the other terms are as follows:
a1 a2 a3 a4 a5 an
a1 a1 +d a1 +2d a1 +3d a1 +4d . . . a1 +(n−1) ·d
The online calculator at http://planetcalc.com/177/ will tell you the nth term in an arithmetic progression if you tellit the first term, the common difference, and what value to use for n (in other words, which term in the sequence you
213
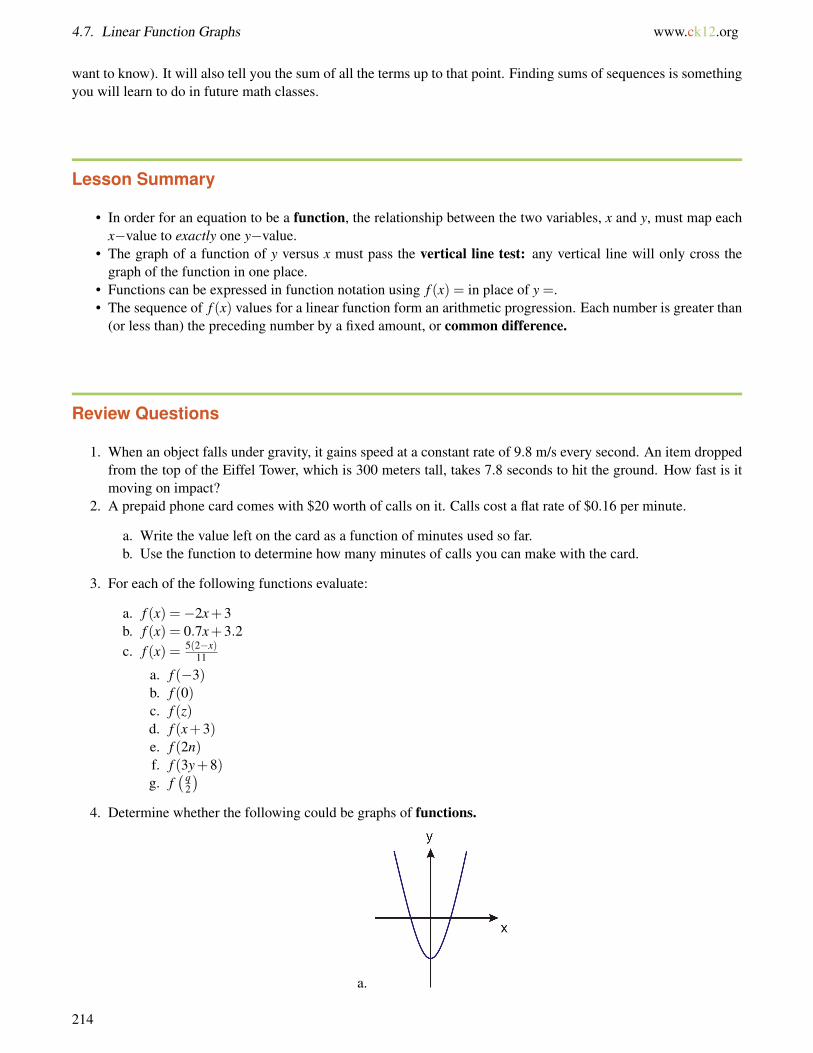
4.7. Linear Function Graphs www.ck12.org
want to know). It will also tell you the sum of all the terms up to that point. Finding sums of sequences is somethingyou will learn to do in future math classes.
Lesson Summary
• In order for an equation to be a function, the relationship between the two variables, x and y, must map eachx−value to exactly one y−value.
• The graph of a function of y versus x must pass the vertical line test: any vertical line will only cross thegraph of the function in one place.
• Functions can be expressed in function notation using f (x) = in place of y =.• The sequence of f (x) values for a linear function form an arithmetic progression. Each number is greater than
(or less than) the preceding number by a fixed amount, or common difference.
Review Questions
1. When an object falls under gravity, it gains speed at a constant rate of 9.8 m/s every second. An item droppedfrom the top of the Eiffel Tower, which is 300 meters tall, takes 7.8 seconds to hit the ground. How fast is itmoving on impact?
2. A prepaid phone card comes with $20 worth of calls on it. Calls cost a flat rate of $0.16 per minute.
a. Write the value left on the card as a function of minutes used so far.b. Use the function to determine how many minutes of calls you can make with the card.
3. For each of the following functions evaluate:
a. f (x) =−2x+3b. f (x) = 0.7x+3.2c. f (x) = 5(2−x)
11
a. f (−3)b. f (0)c. f (z)d. f (x+3)e. f (2n)f. f (3y+8)g. f
(q2
)4. Determine whether the following could be graphs of functions.
a.
214

www.ck12.org Chapter 4. Graphs of Equations and Functions
b.
c.
d.
5. The roasting guide for a turkey suggests cooking for 100 minutes plus an additional 8 minutes per pound.
a. Write a function for the roasting time the given the turkey weight in pounds (x).b. Determine the time needed to roast a 10 lb turkey.c. Determine the time needed to roast a 27 lb turkey.d. Determine the maximum size turkey you could roast in 4.5 hours.
6. Determine the missing terms in the following arithmetic progressions.
a. -11, 17, __, 73b. 2, __, -4c. 13, __, __, __, 0
215

4.8. Problem-Solving Strategies - Graphs www.ck12.org
4.8 Problem-Solving Strategies - Graphs
Learning Objectives
• Read and understand given problem situations.• Use the strategy “Read a Graph.”• Use the strategy “Make a Graph.”• Solve real-world problems using selected strategies as part of a plan.
Introduction
In this chapter, we’ve been solving problems where quantities are linearly related to each other. In this section, we’lllook at a few examples of linear relationships that occur in real-world problems, and see how we can solve themusing graphs. Remember back to our Problem Solving Plan:
1. Understand the Problem2. Devise a Plan—Translate3. Carry Out the Plan—Solve4. Look—Check and Interpret
Example 1
A cell phone company is offering its costumers the following deal: You can buy a new cell phone for $60 and pay amonthly flat rate of $40 per month for unlimited calls. How much money will this deal cost you after 9 months?
Solution
Let’s follow the problem solving plan.
Step 1: The phone costs $60; the calling plan costs $40 per month.
Let x = number of months.
Let y = total cost.
Step 2: We can solve this problem by making a graph that shows the number of months on the horizontal axis andthe cost on the vertical axis.
Since you pay $60 when you get the phone, the y−intercept is (0, 60).
You pay $40 for each month, so the cost rises by $40 for 1 month, so the slope is 40.
We can graph this line using the slope-intercept method.
216

www.ck12.org Chapter 4. Graphs of Equations and Functions
Step 3: The question was “How much will this deal cost after 9 months?” We can now read the answer from thegraph. We draw a vertical line from 9 months until it meets the graph, and then draw a horizontal line until it meetsthe vertical axis.
We see that after 9 months you pay approximately $420.
Step 4: To check if this is correct, let’s think of the deal again.
Originally, you pay $60 and then $40 a month for 9 months.
Phone = $60
Calling plan = $40×9 = $360
Total cost = $420.
The answer checks out.
Example 2
A stretched spring has a length of 12 inches when a weight of 2 lbs is attached to the spring. The same spring has alength of 18 inches when a weight of 5 lbs is attached to the spring. What is the length of the spring when no weightsare attached?
217

4.8. Problem-Solving Strategies - Graphs www.ck12.org
Solution
Step 1: We know: the length of the spring = 12 inches when weight = 2 lbs
the length of the spring = 18 inches when weight = 5 lbs
We want: the length of the spring when weight = 0 lbs
Let x = the weight attached to the spring.
Let y = the length of the spring.
Step 2: We can solve this problem by making a graph that shows the weight on the horizontal axis and the length ofthe spring on the vertical axis.
We have two points we can graph:
When the weight is 2 lbs, the length of the spring is 12 inches. This gives point (2, 12).
When the weight is 5 lbs, the length of the spring is 18 inches. This gives point (5, 18).
Graphing those two points and connecting them gives us our line.
Step 3: The question was: “What is the length of the spring when no weights are attached?
We can answer this question by reading the graph we just made. When there is no weight on the spring, the x−valueequals zero, so we are just looking for the y−intercept of the graph. On the graph, the y−intercept appears to beapproximately 8 inches.
Step 4: To check if this correct, let’s think of the problem again.
218

www.ck12.org Chapter 4. Graphs of Equations and Functions
You can see that the length of the spring goes up by 6 inches when the weight is increased by 3 lbs, so the slope ofthe line is 6 inches
3 lbs = 2 inches/lb.
To find the length of the spring when there is no weight attached, we can look at the spring when there are 2 lbsattached. For each pound we take off, the spring will shorten by 2 inches. If we take off 2 lbs, the spring will beshorter by 4 inches. So, the length of the spring with no weights is 12 inches - 4 inches = 8 inches.
The answer checks out.
Example 3
Christine took 1 hour to read 22 pages of Harry Potter. She has 100 pages left to read in order to finish the book.How much time should she expect to spend reading in order to finish the book?
Solution
Step 1: We know - Christine takes 1 hour to read 22 pages.
We want - How much time it takes to read 100 pages.
Let x = the time expressed in hours.
Let y = the number of pages.
Step 2: We can solve this problem by making a graph that shows the number of hours spent reading on the horizontalaxis and the number of pages on the vertical axis.
We have two points we can graph:
Christine takes 1 hour to read 22 pages. This gives point (1, 22).
A second point is not given, but we know that Christine would take 0 hours to read 0 pages. This gives point (0, 0).
Graphing those two points and connecting them gives us our line.
Step 3: The question was: “How much time should Christine expect to spend reading 100 pages?” We can find theanswer from reading the graph - we draw a horizontal line from 100 pages until it meets the graph and then we drawthe vertical until it meets the horizontal axis. We see that it takes approximately 4.5 hours to read the remaining100 pages.
Step 4: To check if this correct, let’s think of the problem again.
We know that Christine reads 22 pages per hour - this is the slope of the line or the rate at which she is reading.To find how many hours it takes her to read 100 pages, we divide the number of pages by the rate. In this case,
100 pages22 pages/hour = 4.54 hours. This is very close to the answer we got from reading the graph.
The answer checks out.
219

4.8. Problem-Solving Strategies - Graphs www.ck12.org
Example 4
Aatif wants to buy a surfboard that costs $249. He was given a birthday present of $50 and he has a summer jobthat pays him $6.50 per hour. To be able to buy the surfboard, how many hours does he need to work?
Solution
Step 1: We know - The surfboard costs $249.
Aatif has $50.
His job pays $6.50 per hour.
We want - How many hours Aatif needs to work to buy the surfboard.
Let x = the time expressed in hours
Let y = Aatif’s earnings
Step 2: We can solve this problem by making a graph that shows the number of hours spent working on the horizontalaxis and Aatif’s earnings on the vertical axis.
Aatif has $50 at the beginning. This is the y−intercept: (0, 50).
He earns $6.50 per hour. This is the slope of the line.
We can graph this line using the slope-intercept method. We graph the y−intercept of (0, 50), and we know that foreach unit in the horizontal direction, the line rises by 6.5 units in the vertical direction. Here is the line that describesthis situation.
Step 3: The question was: “How many hours does Aatif need to work to buy the surfboard?”
We find the answer from reading the graph - since the surfboard costs $249, we draw a horizontal line from $249on the vertical axis until it meets the graph and then we draw a vertical line downwards until it meets the horizontalaxis. We see that it takes approximately 31 hours to earn the money.
Step 4: To check if this correct, let’s think of the problem again.
We know that Aatif has $50 and needs $249 to buy the surfboard. So, he needs to earn $249−$50 = $199 from hisjob.
His job pays $6.50 per hour. To find how many hours he need to work we divide: $199$6.50/hour = 30.6 hours. This is
very close to the answer we got from reading the graph.
The answer checks out.
220

www.ck12.org Chapter 4. Graphs of Equations and Functions
Lesson Summary
The four steps of the problem solving plan when using graphs are:
1. Understand the Problem2. Devise a Plan—Translate: Make a graph.3. Carry Out the Plan—Solve: Use the graph to answer the question asked.4. Look—Check and Interpret
Review Questions
Solve the following problems by making a graph and reading it.
1. A gym is offering a deal to new members. Customers can sign up by paying a registration fee of $200 and amonthly fee of $39.
a. How much will this membership cost a member by the end of the year?b. The old membership rate was $49 a month with a registration fee of $100. How much more would a
year’s membership cost at that rate?c. Bonus: For what number of months would the two membership rates be the same?
2. A candle is burning at a linear rate. The candle measures five inches two minutes after it was lit. It measuresthree inches eight minutes after it was lit.
a. What was the original length of the candle?b. How long will it take to burn down to a half-inch stub?c. Six half-inch stubs of candle can be melted together to make a new candle measuring 2 5
6 inches (a littlewax gets lost in the process). How many stubs would it take to make three candles the size of the originalcandle?
3. A dipped candle is made by taking a wick and dipping it repeatedly in melted wax. The candle gets a little bitthicker with each added layer of wax. After it has been dipped three times, the candle is 6.5 mm thick. Afterit has been dipped six times, it is 11 mm thick.
a. How thick is the wick before the wax is added?b. How many times does the wick need to be dipped to create a candle 2 cm thick?
4. Tali is trying to find the thickness of a page of his telephone book. In order to do this, he takes a measurementand finds out that 55 pages measures 1
8 inch. What is the thickness of one page of the phone book?5. Bobby and Petra are running a lemonade stand and they charge 45 cents for each glass of lemonade. In order
to break even they must make $25.
a. How many glasses of lemonade must they sell to break even?b. When they’ve sold $18 worth of lemonade, they realize that they only have enough lemons left to make
10 more glasses. To break even now, they’ll need to sell those last 10 glasses at a higher price. Whatdoes the new price need to be?
6. Dale is making cookies using a recipe that calls for 2.5 cups of flour for two dozen cookies. How many cupsof flour does he need to make five dozen cookies?
7. To buy a car, Jason makes a down payment of $1500 and pays $350 per month in installments.
a. How much money has Jason paid at the end of one year?b. If the total cost of the car is $8500, how long will it take Jason to finish paying it off?
221
4.8. Problem-Solving Strategies - Graphs www.ck12.org
c. The resale value of the car decreases by $100 each month from the original purchase price. If Jason sellsthe car as soon as he finishes paying it off, how much will he get for it?
8. Anne transplants a rose seedling in her garden. She wants to track the growth of the rose so she measures itsheight every week. On the third week, she finds that the rose is 10 inches tall and on the eleventh week shefinds that the rose is 14 inches tall. Assuming the rose grows linearly with time, what was the height of therose when Anne planted it?
9. Ravi hangs from a giant spring whose length is 5 m. When his child Nimi hangs from the spring its length is 2m. Ravi weighs 160 lbs and Nimi weighs 40 lbs. Write the equation for this problem in slope-intercept form.What should we expect the length of the spring to be when his wife Amardeep, who weighs 140 lbs, hangsfrom it?
10. Nadia is placing different weights on a spring and measuring the length of the stretched spring. She finds thatfor a 100 gram weight the length of the stretched spring is 20 cm and for a 300 gram weight the length of thestretched spring is 25 cm.
a. What is the unstretched length of the spring?b. If the spring can only stretch to twice its unstretched length before it breaks, how much weight can it
hold?
11. Andrew is a submarine commander. He decides to surface his submarine to periscope depth. It takes him 20minutes to get from a depth of 400 feet to a depth of 50 feet.
a. What was the submarine’s depth five minutes after it started surfacing?b. How much longer would it take at that rate to get all the way to the surface?
12. Kiersta’s phone has completely run out of battery power when she puts it on the charger. Ten minutes later,when the phone is 40% recharged, Kiersta’s friend Danielle calls and Kiersta takes the phone off the chargerto talk to her. When she hangs up 45 minutes later, her phone has 10% of its charge left. Then she gets anothercall from her friend Kwan.
a. How long can she spend talking to Kwan before the battery runs out again?b. If she puts the phone back on the charger afterward, how long will it take to recharge completely?
13. Marji is painting a 75-foot fence. She starts applying the first coat of paint at 2 PM, and by 2:10 she haspainted 30 feet of the fence. At 2:15, her husband, who paints about 2
3 as fast as she does, comes to join her.
a. How much of the fence has Marji painted when her husband joins in?b. When will they have painted the whole fence?c. How long will it take them to apply the second coat of paint if they work together the whole time?
Texas Instruments Resources
In the CK-12 Texas Instruments Algebra I FlexBook, there are graphing calculator activities designed to supple-ment the objectives for some of the lessons in this chapter. See http://www.ck12.org/flexr/chapter/9614.
222
www.ck12.org Chapter 5. Writing Linear Equations
CHAPTER 5 Writing Linear EquationsChapter Outline
5.1 FORMS OF LINEAR EQUATIONS
5.2 EQUATIONS OF PARALLEL AND PERPENDICULAR LINES
5.3 FITTING A LINE TO DATA
5.4 PREDICTING WITH LINEAR MODELS
223

5.1. Forms of Linear Equations www.ck12.org
5.1 Forms of Linear Equations
Learning Objectives
• Write equations in slope-intercept form.• Write equations in point-slope form.• Write equations in standard form.• Solve real-world problems using linear models in all three forms.
Introduction
We saw in the last chapter that many real-world situations can be described with linear graphs and equations. In thischapter, we’ll see how to find those equations in a variety of situations.
Write an Equation Given Slope and
You’ve already learned how to write an equation in slope–intercept form: simply start with the general equation forthe slope-intercept form of a line, y = mx+ b, and then plug the given values of m and b into the equation. Forexample, a line with a slope of 4 and a y−intercept of -3 would have the equation y = 4x−3.
If you are given just the graph of a line, you can read off the slope and y−intercept from the graph and write theequation from there. For example, on the graph below you can see that the line rises by 1 unit as it moves 2 units tothe right, so its slope is 1
2 . Also, you can see that the y−intercept is -2, so the equation of the line is y = 12 x−2.
224

www.ck12.org Chapter 5. Writing Linear Equations
Write an Equation Given the Slope and a Point
Often, we don’t know the value of the y−intercept, but we know the value of y for a non-zero value of x. In this case,it’s often easier to write an equation of the line in point-slope form. An equation in point-slope form is written asy− y0 = m(x− x0), where m is the slope and (x0,y0) is a point on the line.
Example 1
A line has a slope of 35 , and the point (2, 6) is on the line. Write the equation of the line in point-slope form.
Solution
Start with the formula y− y0 = m(x− x0).
Plug in 35 for m, 2 for x0 and 6 for y0.
The equation in point-slope form is y−6 = 35(x−2).
Notice that the equation in point-slope form is not solved for y. If we did solve it for y, we’d have it in y−interceptform. To do that, we would just need to distribute the 3
5 and add 6 to both sides. That means that the equation of thisline in slope-intercept form is y = 3
5 x− 65 +6, or simply y = 3
5 x+ 245 .
Write an Equation Given Two Points
Point-slope form also comes in useful when we need to find an equation given just two points on a line.
For example, suppose we are told that the line passes through the points (-2, 3) and (5, 2). To find the equation ofthe line, we can start by finding the slope.
Starting with the slope formula, m= y2−y1x2−x1
, we plug in the x− and y−values of the two points to get m= 2−35−(−2) =
−17 .
We can plug that value of m into the point-slope formula to get y− y0 =−17(x− x0).
Now we just need to pick one of the two points to plug into the formula. Let’s use (5, 2); that gives us y− 2 =−1
7(x−5).
What if we’d picked the other point instead? Then we’d have ended up with the equation y−3 =−17(x+2), which
doesn’t look the same. That’s because there’s more than one way to write an equation for a given line in point-slopeform. But let’s see what happens if we solve each of those equations for y.
Starting with y− 2 = −17(x− 5), we distribute the −1
7 and add 2 to both sides. That gives us y = −17 x+ 5
7 + 2, ory =−1
7 x+ 197 .
On the other hand, if we start with y− 3 = −17(x+ 2), we need to distribute the −1
7 and add 3 to both sides. Thatgives us y =−1
7 x− 27 +3, which also simplifies to y =−1
7 x+ 197 .
So whichever point we choose to get an equation in point-slope form, the equation is still mathematically the same,and we can see this when we convert it to y−intercept form.
Example 2
A line contains the points (3, 2) and (-2, 4). Write an equation for the line in point-slope form; then write an equationin y−intercept form.
Solution
Find the slope of the line: m = y2−y1x2−x1
= 4−2−2−3 =−2
5
Plug in the value of the slope: y− y0 =−25(x− x0).
225

5.1. Forms of Linear Equations www.ck12.org
Plug point (3, 2) into the equation: y−2 =−25(x−3).
The equation in point-slope form is y−2 =−25(x−3).
To convert to y−intercept form, simply solve for y:
y−2 =−25(x−3)→ y−2 =−2
5x− 6
5→ y =−2
5x− 6
5+2 =−2
5x+
45.
The equation in y−intercept form is y =−25 x+ 4
5 .
Graph an Equation in Point-Slope Form
Another useful thing about point-slope form is that you can use it to graph an equation without having to convertit to slope-intercept form. From the equation y− y0 = m(x− x0), you can just read off the slope m and the point(x0,y0). To draw the graph, all you have to do is plot the point, and then use the slope to figure out how many unitsup and over you should move to find another point on the line.
Example 5
Make a graph of the line given by the equation y+2 = 23(x−2).
Solution
To read off the right values, we need to rewrite the equation slightly: y− (−2) = 23(x− 2). Now we see that point
(2, -2) is on the line and that the slope is 23 .
First plot point (2, -2) on the graph:
A slope of 23 tells you that from that point you should move 2 units up and 3 units to the right and draw another
point:
226

www.ck12.org Chapter 5. Writing Linear Equations
Now draw a line through the two points and extend it in both directions:
Linear Equations in Standard Form
You’ve already encountered another useful form for writing linear equations: standard form. An equation instandard form is written ax+ by = c, where a,b, and c are all integers and a is positive. (Note that the b in thestandard form is different than the b in the slope-intercept form.)
One useful thing about standard form is that it allows us to write equations for vertical lines, which we can’t do inslope-intercept form.
For example, let’s look at the line that passes through points (2, 6) and (2, 9). How would we find an equation forthat line in slope-intercept form?
First we’d need to find the slope: m = 9−60−0 = 3
0 . But that slope is undefined because we can’t divide by zero. And ifwe can’t find the slope, we can’t use point-slope form either.
If we just graph the line, we can see that x equals 2 no matter what y is. There’s no way to express that in slope-intercept or point-slope form, but in standard form we can just say that x+0y = 2, or simply x = 2.
227

5.1. Forms of Linear Equations www.ck12.org
Converting to Standard Form
To convert an equation from another form to standard form, all you need to do is rewrite the equation so that all thevariables are on one side of the equation and the coefficient of x is not negative.
Example 1
Rewrite the following equations in standard form:
a) y = 5x−7
b) y−2 =−3(x+3)
c) y = 23 x+ 1
2
Solution
We need to rewrite each equation so that all the variables are on one side and the coefficient of x is not negative.
a) y = 5x−7
Subtract y from both sides to get 0 = 5x− y−7.
Add 7 to both sides to get 7 = 5x− y.
Flip the equation around to put it in standard form: 5x− y = 7.
b) y−2 =−3(x+3)
Distribute the –3 on the right-hand-side to get y−2 =−3x−9.
Add 3x to both sides to get y+3x−2 =−9.
Add 2 to both sides to get y+3x =−7. Flip that around to get 3x+ y =−7.
c) y = 23 x+ 1
2
Find the common denominator for all terms in the equation – in this case that would be 6.
Multiply all terms in the equation by 6: 6(y = 2
3 x+ 12
)⇒ 6y = 4x+3
Subtract 6y from both sides: 0 = 4x−6y+3
Subtract 3 from both sides: −3 = 4x−6y
The equation in standard form is 4x−6y =−3.
Graphing Equations in Standard Form
When an equation is in slope-intercept form or point-slope form, you can tell right away what the slope is. How doyou find the slope when an equation is in standard form?
Well, you could rewrite the equation in slope-intercept form and read off the slope. But there’s an even easier way.Let’s look at what happens when we rewrite an equation in standard form.
Starting with the equation ax+by = c, we would subtract ax from both sides to get by = −ax+ c. Then we woulddivide all terms by b and end up with y =−a
b x+ cb .
That means that the slope is −ab and the y−intercept is c
b . So next time we look at an equation in standard form, wedon’t have to rewrite it to find the slope; we know the slope is just −a
b , where a and b are the coefficients of x and yin the equation.
Example 2
228

www.ck12.org Chapter 5. Writing Linear Equations
Find the slope and the y−intercept of the following equations written in standard form.
a) 3x+5y = 6
b) 2x−3y =−8
c) x−5y = 10
Solution
a) a = 3,b = 5, and c = 6, so the slope is −ab =−3
5 , and the y−intercept is cb = 6
5 .
b) a = 2,b =−3, and c =−8, so the slope is −ab = 2
3 , and the y−intercept is cb = 8
3 .
c) a = 1,b =−5, and c = 10, so the slope is −ab = 1
5 , and the y−intercept is cb = 10
−5 =−2.
Once we’ve found the slope and y−intercept of an equation in standard form, we can graph it easily. But if we startwith a graph, how do we find an equation of that line in standard form?
First, remember that we can also use the cover-up method to graph an equation in standard form, by finding theintercepts of the line. For example, let’s graph the line given by the equation 3x−2y = 6.
To find the x−intercept, cover up the y term (remember, the x−intercept is where y = 0):
3x = 6⇒ x = 2
The x− intercept is (2, 0).
To find the y−intercept, cover up the x term (remember, the y−intercept is where x = 0):
−2y = 6⇒ y =−3
The y−intercept is (0, -3).
We plot the intercepts and draw a line through them that extends in both directions:
229

5.1. Forms of Linear Equations www.ck12.org
Now we want to apply this process in reverse—to start with the graph of the line and write the equation of the linein standard form.
Example 3
Find the equation of each line and write it in standard form.
a)
b)
c)
230
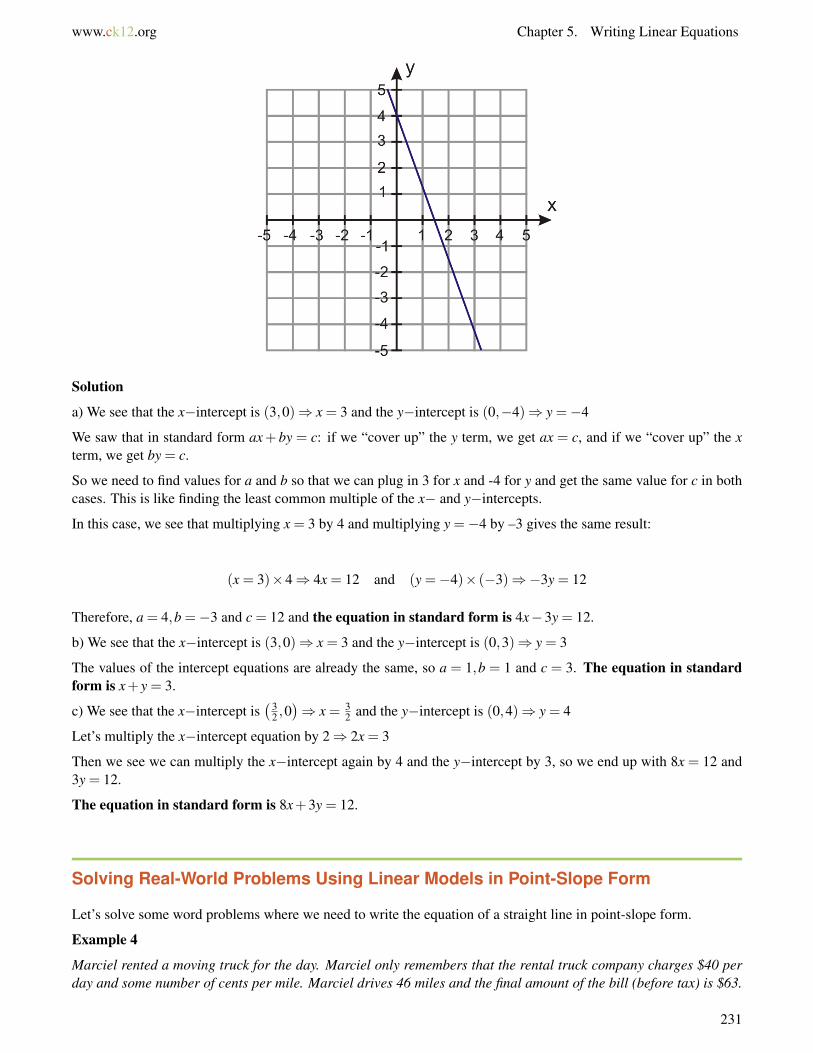
www.ck12.org Chapter 5. Writing Linear Equations
Solution
a) We see that the x−intercept is (3,0)⇒ x = 3 and the y−intercept is (0,−4)⇒ y =−4
We saw that in standard form ax+ by = c: if we “cover up” the y term, we get ax = c, and if we “cover up” the xterm, we get by = c.
So we need to find values for a and b so that we can plug in 3 for x and -4 for y and get the same value for c in bothcases. This is like finding the least common multiple of the x− and y−intercepts.
In this case, we see that multiplying x = 3 by 4 and multiplying y =−4 by –3 gives the same result:
(x = 3)×4⇒ 4x = 12 and (y =−4)× (−3)⇒−3y = 12
Therefore, a = 4,b =−3 and c = 12 and the equation in standard form is 4x−3y = 12.
b) We see that the x−intercept is (3,0)⇒ x = 3 and the y−intercept is (0,3)⇒ y = 3
The values of the intercept equations are already the same, so a = 1,b = 1 and c = 3. The equation in standardform is x+ y = 3.
c) We see that the x−intercept is(3
2 ,0)⇒ x = 3
2 and the y−intercept is (0,4)⇒ y = 4
Let’s multiply the x−intercept equation by 2⇒ 2x = 3
Then we see we can multiply the x−intercept again by 4 and the y−intercept by 3, so we end up with 8x = 12 and3y = 12.
The equation in standard form is 8x+3y = 12.
Solving Real-World Problems Using Linear Models in Point-Slope Form
Let’s solve some word problems where we need to write the equation of a straight line in point-slope form.
Example 4
Marciel rented a moving truck for the day. Marciel only remembers that the rental truck company charges $40 perday and some number of cents per mile. Marciel drives 46 miles and the final amount of the bill (before tax) is $63.
231

5.1. Forms of Linear Equations www.ck12.org
What is the amount per mile the truck rental company charges? Write an equation in point-slope form that describesthis situation. How much would it cost to rent this truck if Marciel drove 220 miles?
Solution
Let’s define our variables:
x = distance in milesy = cost of the rental truck
Peter pays a flat fee of $40 for the day; this is the y−intercept.
He pays $63 for 46 miles; this is the coordinate point (46,63).
Start with the point-slope form of the line: y− y0 = m(x− x0)
Plug in the coordinate point: 63− y0 = m(46− x0)
Plug in the point (0, 40): 63−40 = m(46−0)
Solve for the slope: 23 = 46m→ m = 2346 = 0.5
The slope is 0.5 dollars per mile, so the truck company charges 50 cents per mile ($0.5 = 50 cents). Plugging in theslope and the y−intercept, the equation of the line is y = 0.5x+40.
To find out the cost of driving the truck 220 miles, we plug in x = 220 to get y−40 = 0.5(220)⇒ y = $150.
Driving 220 miles would cost $150.
Example 5
Anne got a job selling window shades. She receives a monthly base salary and a $6 commission for each windowshade she sells. At the end of the month she adds up sales and she figures out that she sold 200 window shades andmade $2500. Write an equation in point-slope form that describes this situation. How much is Anne’s monthly basesalary?
Solution
Let’s define our variables:
x = number of window shades soldy = Anne’s earnings
We see that we are given the slope and a point on the line:
Nadia gets $6 for each shade, so the slope is 6.
She made $2500 when she sold 200 shades, so the point is (200, 2500).
Start with the point-slope form of the line: y− y0 = m(x− x0)
Plug in the slope: y− y0 = 6(x− x0)
Plug in the point (200, 2500): y−2500 = 6(x−200)
To find Anne’s base salary, we plug in x = 0 and get y−2500 =−1200⇒ y = $1300.
Anne’s monthly base salary is $1300.
Solving Real-World Problems Using Linear Models in Standard Form
Here are two examples of real-world problems where the standard form of an equation is useful.
Example 6
232
www.ck12.org Chapter 5. Writing Linear Equations
Nadia buys fruit at her local farmer’s market. This Saturday, oranges cost $2 per pound and cherries cost $3 perpound. She has $12 to spend on fruit. Write an equation in standard form that describes this situation. If she buys 4pounds of oranges, how many pounds of cherries can she buy?
Solution
Let’s define our variables:
x = pounds of orangesy = pounds of cherries
The equation that describes this situation is 2x+3y = 12.
If she buys 4 pounds of oranges, we can plug x = 4 into the equation and solve for y:
2(4)+3y = 12⇒ 3y = 12−8⇒ 3y = 4⇒ y =43
Nadia can buy 1 13 pounds of cherries.
Example 7
Peter skateboards part of the way to school and walks the rest of the way. He can skateboard at 7 miles per hour andhe can walk at 3 miles per hour. The distance to school is 6 miles. Write an equation in standard form that describesthis situation. If he skateboards for 1
2 an hour, how long does he need to walk to get to school?
Solution
Let’s define our variables:
x = time Peter skateboardsy = time Peter walks
The equation that describes this situation is: 7x+3y = 6
If Peter skateboards 12 an hour, we can plug x = 0.5 into the equation and solve for y:
7(0.5)+3y = 6⇒ 3y = 6−3.5⇒ 3y = 2.5⇒ y =56
Peter must walk 56 of an hour.
Further Practice
Now that you’ve worked with equations in all three basic forms, check out the Java applet at http://www.ronblond.com/M10/lineAP/index.html. You can use it to manipulate graphs of equations in all three forms, and see how thegraphs change when you vary the terms of the equations.
Another applet at http://www.cut-the-knot.org/Curriculum/Calculus/StraightLine.shtml lets you create multiple linesand see how they intersect. Each line is defined by two points; you can change the slope of a line by moving either ofthe points, or just drag the whole line around without changing its slope. To create another line, just click Duplicateand then drag one of the lines that are already there.
233

5.1. Forms of Linear Equations www.ck12.org
Review Questions
Find the equation of each line in slope–intercept form.
1. The line has a slope of 7 and a y−intercept of -2.2. The line has a slope of -5 and a y−intercept of 6.3. The line has a slope of −1
4 and contains the point (4, -1).4. The line has a slope of 2
3 and contains the point(1
2 ,1).
5. The line has a slope of -1 and contains the point(4
5 ,0).
6. The line contains points (2, 6) and (5, 0).7. The line contains points (5, -2) and (8, 4).8. The line contains points (3, 5) and (-3, 0).9. The line contains points (10, 15) and (12, 20).
Write the equation of each line in slope-intercept form.
10.
11.
Find the equation of each linear function in slope–intercept form.
12. m = 5, f (0) =−313. m =−7, f (2) =−1
234
www.ck12.org Chapter 5. Writing Linear Equations
14. m = 13 , f (−1) = 2
315. m = 4.2, f (−3) = 7.116. f
(14
)= 3
4 , f (0) = 54
17. f (1.5) =−3, f (−1) = 2
Write the equation of each line in point-slope form.
18. The line has slope − 110 and goes through the point (10, 2).
19. The line has slope -75 and goes through the point (0, 125).20. The line has slope 10 and goes through the point (8, -2).21. The line goes through the points (-2, 3) and (-1, -2).22. The line contains the points (10, 12) and (5, 25).23. The line goes through the points (2, 3) and (0, 3).24. The line has a slope of 3
5 and a y−intercept of -3.25. The line has a slope of -6 and a y−intercept of 0.5.
Write the equation of each linear function in point-slope form.
26. m =−15 and f (0) = 7
27. m =−12 and f (−2) = 528. f (−7) = 5 and f (3) =−429. f (6) = 0 and f (0) = 630. m = 3 and f (2) =−931. m =−9
5 and f (0) = 32
Rewrite the following equations in standard form.
32. y = 3x−833. y−7 =−5(x−12)34. 2y = 6x+935. y = 9
4 x+ 14
36. y+ 35 = 2
3(x−2)37. 3y+5 = 4(x−9)
Find the slope and y−intercept of the following lines.
38. 5x−2y = 1539. 3x+6y = 2540. x−8y = 1241. 3x−7y = 2042. 9x−9y = 443. 6x+ y = 3
Find the equation of each line and write it in standard form.
235

www.ck12.org Chapter 5. Writing Linear Equations
47.48. Andrew has two part time jobs. One pays $6 per hour and the other pays $10 per hour. He wants to make
$366 per week. Write an equation in standard form that describes this situation. If he is only allowed to work15 hours per week at the $10 per hour job, how many hours does he need to work per week in his $6 per hourjob in order to achieve his goal?
49. Anne invests money in two accounts. One account returns 5% annual interest and the other returns 7% annualinterest. In order not to incur a tax penalty, she can make no more than $400 in interest per year. Write anequation in standard form that describes this problem. If she invests $5000 in the 5% interest account, howmuch money does she need to invest in the other account?
237

5.2. Equations of Parallel and Perpendicular Lines www.ck12.org
5.2 Equations of Parallel and PerpendicularLines
Learning Objectives
• Determine whether lines are parallel or perpendicular• Write equations of perpendicular lines• Write equations of parallel lines• Investigate families of lines
Introduction
In this section you will learn how parallel lines and perpendicular lines are related to each other on the coordinateplane. Let’s start by looking at a graph of two parallel lines.
We can clearly see that the two lines have different y−intercepts: 6 and –4.
How about the slopes of the lines? The slope of line A is 6−20−(−2) =
42 = 2, and the slope of line B is 0−(−4)
2−0 = 42 = 2.
The slopes are the same.
Is that significant? Yes. By definition, parallel lines never meet. That means that when one of them slopes up by acertain amount, the other one has to slope up by the same amount so the lines will stay the same distance apart. Ifyou look at the graph above, you can see that for any x−value you pick, the y−values of lines A and B are the samevertical distance apart—which means that both lines go up by the same vertical distance every time they go acrossby the same horizontal distance. In order to stay parallel, their slopes must stay the same.
All parallel lines have the same slopes and different y−intercepts.
Now let’s look at a graph of two perpendicular lines.
238

www.ck12.org Chapter 5. Writing Linear Equations
We can’t really say anything about the y−intercepts. In this example, the y−intercepts are different, but if we movedthe lines four units to the right, they would both intercept the y−axis at (0, -2). So perpendicular lines can have thesame or different y−intercepts.
What about the relationship between the slopes of the two lines?
To find the slope of line A, we pick two points on the line and draw the blue (upper) right triangle. The legs of thetriangle represent the rise and the run. We can see that the slope is 8
4 , or 2.
To find the slope of line B, we pick two points on the line and draw the red (lower) right triangle. Notice that the twotriangles are identical, only rotated by 90. Where line A goes 8 units up and 4 units right, line B goes 8 units rightand 4 units down. Its slope is −4
8 , or −12 .
This is always true for perpendicular lines; where one line goes a units up and b units right, the other line will go aunits right and b units down, so the slope of one line will be a
b and the slope of the other line will be −ba .
The slopes of perpendicular lines are always negative reciprocals of each other.
The Java applet at http://members.shaw.ca/ron.blond/perp.APPLET/index.html lets you drag around a pair of per-pendicular lines to see how their slopes change. Click “Show Grid” to see the x− and y−axes, and click “Show
239
5.2. Equations of Parallel and Perpendicular Lines www.ck12.org
Constructors” to see the triangles that are being used to calculate the slopes of the lines (you can then drag the circleto make it bigger or smaller, and click on a triangle to see the slope calculations in detail.)
Determine When Lines are Parallel or Perpendicular
You can find whether lines are parallel or perpendicular by comparing the slopes of the lines. If you are given pointson the lines, you can find their slopes using the formula. If you are given the equations of the lines, re-write eachequation in a form that makes it easy to read the slope, such as the slope-intercept form.
Example 1
Determine whether the lines are parallel or perpendicular or neither.
a) One line passes through the points (2, 11) and (-1, 2); another line passes through the points (0, -4) and (-2, -10).
b) One line passes through the points (-2, -7) and (1, 5); another line passes through the points (4, 1) and (-8, 4).
c) One lines passes through the points (3, 1) and (-2, -2); another line passes through the points (5, 5) and (4, -6).
Solution
Find the slope of each line and compare them.
a) m1 =2−11−1−2 = −9
−3 = 3 and m2 =−10−(−4)−2−0 = −6
−2 = 3
The slopes are equal, so the lines are parallel.
b) m1 =5−(−7)1−(−2) =
123 = 4 and m2 =
4−1−8−4 = 3
−12 =−14
The slopes are negative reciprocals of each other, so the lines are perpendicular.
c) m1 =−2−1−2−3 = −3
−5 = 35 and m2 =
−6−54−5 = −13
−1 = 13
The slopes are not the same or negative reciprocals of each other, so the lines are neither parallel nor perpendic-ular.
Example 2
Determine whether the lines are parallel or perpendicular or neither:
a) 3x+4y = 2 and 8x−6y = 5
b) 2x = y−10 and y =−2x+5
c) 7y+1 = 7x and x+5 = y
Solution
Write each equation in slope-intercept form:
a) line 1: 3x+4y = 2⇒ 4y =−3x+2⇒ y =−34 x+ 1
2 ⇒ slope =−34
line 2: 8x−6y = 5⇒ 8x−5 = 6y⇒ y = 86 x− 5
6 ⇒ y = 43 x− 5
6 ⇒ slope = 43
The slopes are negative reciprocals of each other, so the lines are perpendicular.
b) line 1: 2x = y−10⇒ y = 2x+10⇒ slope = 2
line 2: y =−2x+5⇒ slope =−2
The slopes are not the same or negative reciprocals of each other, so the lines are neither parallel nor perpendic-ular.
c) line 1: 7y+1 = 7x⇒ 7y = 7x−1⇒ y = x− 17 ⇒ slope = 1
240

www.ck12.org Chapter 5. Writing Linear Equations
line 2: x+5 = y⇒ y = x+5⇒ slope = 1
The slopes are the same, so the lines are parallel.
Write Equations of Parallel and Perpendicular Lines
We can use the properties of parallel and perpendicular lines to write an equation of a line parallel or perpendicularto a given line. You might be given a line and a point, and asked to find the line that goes through the given pointand is parallel or perpendicular to the given line. Here’s how to do this:
1. Find the slope of the given line from its equation. (You might need to re-write the equation in a form such asthe slope-intercept form.)
2. Find the slope of the parallel or perpendicular line—which is either the same as the slope you found in step 1(if it’s parallel), or the negative reciprocal of the slope you found in step 1 (if it’s perpendicular).
3. Use the slope you found in step 2, along with the point you were given, to write an equation of the new line inslope-intercept form or point-slope form.
Example 3
Find an equation of the line perpendicular to the line y =−3x+5 that passes through the point (2, 6).
Solution
The slope of the given line is -3, so the perpendicular line will have a slope of 13 .
Now to find the equation of a line with slope 13 that passes through (2, 6):
Start with the slope-intercept form: y = mx+b.
Plug in the slope: y = 13 x+b.
Plug in the point (2, 6) to find b: 6 = 13(2)+b⇒ b = 6− 2
3 ⇒ b = 203 .
The equation of the line is y = 13 x+ 20
3 .
Example 4
Find the equation of the line perpendicular to x−5y = 15 that passes through the point (-2, 5).
Solution
Re-write the equation in slope-intercept form: x−5y = 15⇒−5y =−x+15⇒ y = 15 x−3.
The slope of the given line is 15 , so we’re looking for a line with slope -5.
Start with the slope-intercept form: y = mx+b.
Plug in the slope: y =−5x+b.
Plug in the point (-2, 5): 5 =−5(−2)+b⇒ b = 5−10⇒ b =−5
The equation of the line is y =−5x−5.
Example 5
Find the equation of the line parallel to 6x−5y = 12 that passes through the point (-5, -3).
Solution
Rewrite the equation in slope-intercept form: 6x−5y = 12⇒ 5y = 6x−12⇒ y = 65 x− 12
5 .
The slope of the given line is 65 , so we are looking for a line with slope 6
5 that passes through the point (-5, -3).
Start with the slope-intercept form: y = mx+b.
241

5.2. Equations of Parallel and Perpendicular Lines www.ck12.org
Plug in the slope: y = 65 x+b.
Plug in the point (-5, -3): n−3 = 65(−5)+b⇒−3 =−6+b⇒ b = 3
The equation of the line is y = 65 x+3.
Investigate Families of Lines
A family of lines is a set of lines that have something in common with each other. Straight lines can belong to twotypes of families: one where the slope is the same and one where the y−intercept is the same.
Family 1: Keep the slope unchanged and vary the y−intercept.
The figure below shows the family of lines with equations of the form y =−2x+b:
All the lines have a slope of –2, but the value of b is different for each line.
Notice that in such a family all the lines are parallel. All the lines look the same, except that they are shifted upand down the y−axis. As b gets larger the line rises on the y−axis, and as b gets smaller the line goes lower on they−axis. This behavior is often called a vertical shift.
Family 2: Keep the y−intercept unchanged and vary the slope.
The figure below shows the family of lines with equations of the form y = mx+2:
242

www.ck12.org Chapter 5. Writing Linear Equations
All the lines have a y−intercept of two, but the slope is different for each line. The steeper lines have higher valuesof m.
Example 6
Write the equation of the family of lines satisfying the given condition.
a) parallel to the x−axis
b) through the point (0, -1)
c) perpendicular to 2x+7y−9 = 0
d) parallel to x+4y−12 = 0
Solution
a) All lines parallel to the x−axis have a slope of zero; the y−intercept can be anything. So the family of lines isy = 0x+b or just y = b.
b) All lines passing through the point (0, -1) have the same y−intercept, b =−1. The family of lines is: y = mx−1.
243
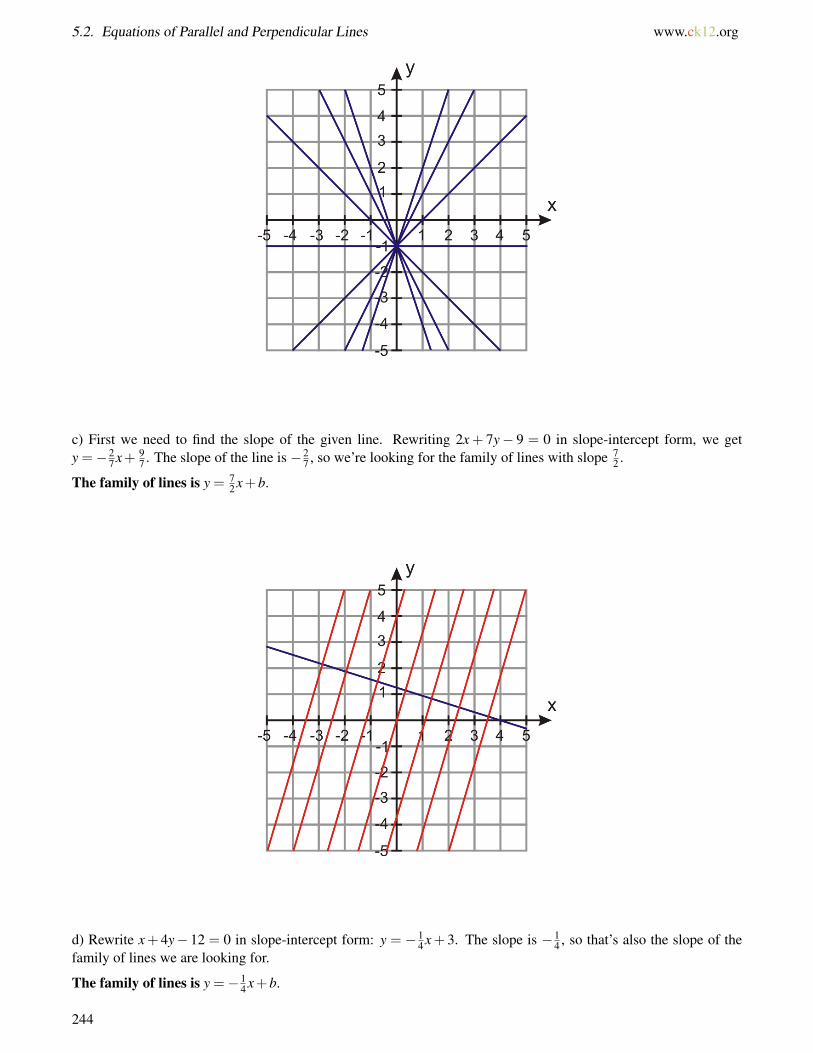
5.2. Equations of Parallel and Perpendicular Lines www.ck12.org
c) First we need to find the slope of the given line. Rewriting 2x + 7y− 9 = 0 in slope-intercept form, we gety =−2
7 x+ 97 . The slope of the line is −2
7 , so we’re looking for the family of lines with slope 72 .
The family of lines is y = 72 x+b.
d) Rewrite x+ 4y− 12 = 0 in slope-intercept form: y = −14 x+ 3. The slope is −1
4 , so that’s also the slope of thefamily of lines we are looking for.
The family of lines is y =−14 x+b.
244

www.ck12.org Chapter 5. Writing Linear Equations
Review Questions
For questions 1-10, determine whether the lines are parallel, perpendicular or neither.
1. One line passes through the points (-1, 4) and (2, 6); another line passes through the points (2, -3) and (8, 1).2. One line passes through the points (4, -3) and (-8, 0); another line passes through the points (-1, -1) and (-2,
6).3. One line passes through the points (-3, 14) and (1, -2); another line passes through the points (0, -3) and (-2,
5).4. One line passes through the points (3, 3) and (-6, -3); another line passes through the points (2, -8) and (-6, 4).5. One line passes through the points (2, 8) and (6, 0); another line has the equation x−2y = 5.6. One line passes through the points (-5, 3) and (2, -1); another line has the equation 2x+3y = 6.7. Both lines pass through the point (2, 8); one line also passes through (3, 5), and the other line has slope 3.8. Line 1: 4y+ x = 8 Line 2: 12y+3x = 19. Line 1: 5y+3x = 1 Line 2: 6y+10x =−3
10. Line 1: 2y−3x+5 = 0 Line 2: y+6x =−311. Lines A,B,C,D, and E all pass through the point (3, 6). Line A also passes through (7, 12); line B passes
through (8, 4); line C passes through (-1, -3); line D passes through (1, 1); and line E passes through (6, 12).
a. Are any of these lines perpendicular? If so, which ones? If not, why not?b. Are any of these lines parallel? If so, which ones? If not, why not?
12. Find the equation of the line parallel to 5x−2y = 2 that passes through point (3, -2).13. Find the equation of the line perpendicular to y =−2
5 x−3 that passes through point (2, 8).14. Find the equation of the line parallel to 7y+2x−10 = 0 that passes through the point (2, 2).15. Find the equation of the line perpendicular to y+5 = 3(x−2) that passes through the point (6, 2).16. Line S passes through the points (2, 3) and (4, 7). Line T passes through the point (2, 5). If Lines S and T are
parallel, name one more point on line T . (Hint: you don’t need to find the slope of either line.)17. Lines P and Q both pass through (-1, 5). Line P also passes through (-3, -1). If P and Q are perpendicular,
name one more point on line Q. (This time you will have to find the slopes of both lines.)18. Write the equation of the family of lines satisfying the given condition.
a. All lines that pass through point (0, 4).b. All lines that are perpendicular to 4x+3y−1 = 0.
245

5.2. Equations of Parallel and Perpendicular Lines www.ck12.org
c. All lines that are parallel to y−3 = 4x+2.d. All lines that pass through the point (0, -1).
19. Name two lines that pass through the point (3, -1) and are perpendicular to each other.20. Name two lines that are each perpendicular to y =−4x−2. What is the relationship of those two lines to each
other?21. Name two perpendicular lines that both pass through the point (3, -2). Then name a line parallel to one of
them that passes through the point (-2, 5).
246

www.ck12.org Chapter 5. Writing Linear Equations
5.3 Fitting a Line to Data
Learning Objectives
• Make a scatter plot.• Fit a line to data and write an equation for that line.• Perform linear regression with a graphing calculator.• Solve real-world problems using linear models of scattered data.
Introduction
Katja has noticed that sales are falling off at her store lately. She plots her sales figures for each week on a graph andsees that the points are trending downward, but they don’t quite make a straight line. How can she predict what hersales figures will be over the next few weeks?
In real-world problems, the relationship between our dependent and independent variables is linear, but not perfectlyso. We may have a number of data points that don’t quite fit on a straight line, but we may still want to find anequation representing those points. In this lesson, we’ll learn how to find linear equations to fit real-world data.
Make a Scatter Plot
A scatter plot is a plot of all the ordered pairs in a table. Even when we expect the relationship we’re analyzing tobe linear, we usually can’t expect that all the points will fit perfectly on a straight line. Instead, the points will be“scattered” about a straight line.
There are many reasons why the data might not fall perfectly on a line. Small errors in measurement are one reason;another reason is that the real world isn’t always as simple as a mathematical abstraction, and sometimes math canonly describe it approximately.
Example 1
Make a scatter plot of the following ordered pairs:
(0, 2); (1, 4.5); (2, 9); (3, 11); (4, 13); (5, 18); (6, 19.5)
Solution
We make a scatter plot by graphing all the ordered pairs on the coordinate axis:
247

5.3. Fitting a Line to Data www.ck12.org
Fit a Line to Data
Notice that the points look like they might be part of a straight line, although they wouldn’t fit perfectly on a straightline. If the points were perfectly lined up, we could just draw a line through any two of them, and that line would goright through all the other points as well. When the points aren’t lined up perfectly, we just have to find a line that isas close to all the points as possible.
Here you can see that we could draw many lines through the points in our data set. However, the red line A is theline that best fits the points. To prove this mathematically, we would measure all the distances from each data pointto line A: and then we would show that the sum of all those distances—or rather, the square root of the sum of thesquares of the distances—is less than it would be for any other line.
248

www.ck12.org Chapter 5. Writing Linear Equations
Actually proving this is a lesson for a much more advanced course, so we won’t do it here. And finding the bestfit line in the first place is even more complex; instead of doing it by hand, we’ll use a graphing calculator or just“eyeball” the line, as we did above—using our visual sense to guess what line fits best.
For more practice eyeballing lines of best fit, try the Java applet at http://mste.illinois.edu/activity/regression/. Clickon the green field to place up to 50 points on it, then use the slider to adjust the slope of the red line to try and makeit fit the points. (The thermometer shows how far away the line is from the points, so you want to try to make thethermometer reading as low as possible.) Then click “Show Best Fit” to show the actual best fit line in blue. Refreshthe page or click “Reset” if you want to try again. For more of a challenge, try scattering the points in a less obviouspattern.
Write an Equation For a Line of Best Fit
Once you draw the line of best fit, you can find its equation by using two points on the line. Finding the equation ofthe line of best fit is also called linear regression.
Caution: Make sure you don’t get caught making a common mistake. Sometimes the line of best fit won’t passstraight through any of the points in the original data set. This means that you can’t just use two points from the dataset – you need to use two points that are on the line, which might not be in the data set at all.
In Example 1, it happens that two of the data points are very close to the line of best fit, so we can just use thesepoints to find the equation of the line: (1, 4.5) and (3, 11).
Start with the slope-intercept form of a line: y = mx+b
249

5.3. Fitting a Line to Data www.ck12.org
Find the slope: m = 11−4.53−1 = 6.5
2 = 3.25.
So y = 3.25x+b.
Plug (3, 11) into the equation: 11 = 3.25(3)+b⇒ b = 1.25
So the equation for the line that fits the data best is y = 3.25x+1.25.
Perform Linear Regression With a Graphing Calculator
The problem with eyeballing a line of best fit, of course, is that you can’t be sure how accurate your guess is. To getthe most accurate equation for the line, we can use a graphing calculator instead. The calculator uses a mathematicalalgorithm to find the line that minimizes the sum of the squares.
Example 2
Use a graphing calculator to find the equation of the line of best fit for the following data:
(3, 12), (8, 20), (1, 7), (10, 23), (5, 18), (8, 24), (11, 30), (2, 10)
Solution
Step 1: Input the data in your calculator.
Press [STAT] and choose the [EDIT] option. Input the data into the table by entering the x−values in the firstcolumn and the y−values in the second column.
Step 2: Find the equation of the line of best fit.
Press [STAT] again use right arrow to select [CALC] at the top of the screen.
Chose option number 4, LinReg(ax+b), and press [ENTER]
The calculator will display LinReg(ax+b).
Press [ENTER] and you will be given the a− and b−values.
Here a represents the slope and b represents the y−intercept of the equation. The linear regression line is y =2.01x+5.94.
250
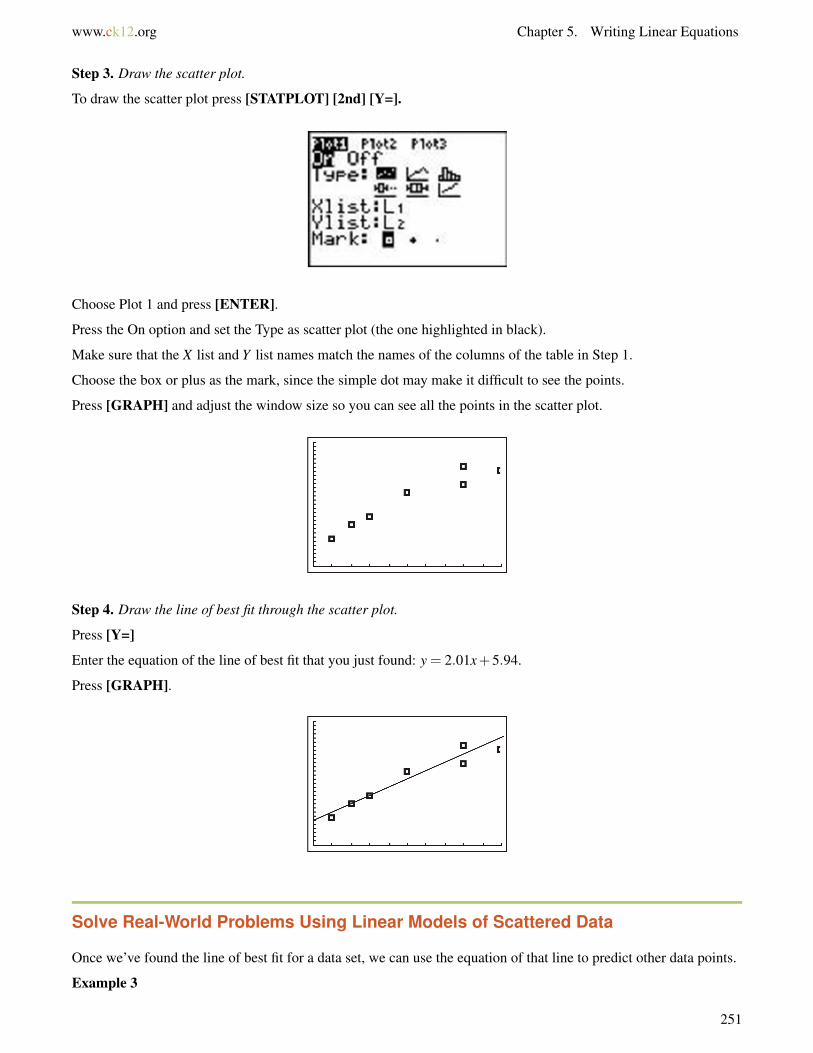
www.ck12.org Chapter 5. Writing Linear Equations
Step 3. Draw the scatter plot.
To draw the scatter plot press [STATPLOT] [2nd] [Y=].
Choose Plot 1 and press [ENTER].
Press the On option and set the Type as scatter plot (the one highlighted in black).
Make sure that the X list and Y list names match the names of the columns of the table in Step 1.
Choose the box or plus as the mark, since the simple dot may make it difficult to see the points.
Press [GRAPH] and adjust the window size so you can see all the points in the scatter plot.
Step 4. Draw the line of best fit through the scatter plot.
Press [Y=]
Enter the equation of the line of best fit that you just found: y = 2.01x+5.94.
Press [GRAPH].
Solve Real-World Problems Using Linear Models of Scattered Data
Once we’ve found the line of best fit for a data set, we can use the equation of that line to predict other data points.
Example 3
251
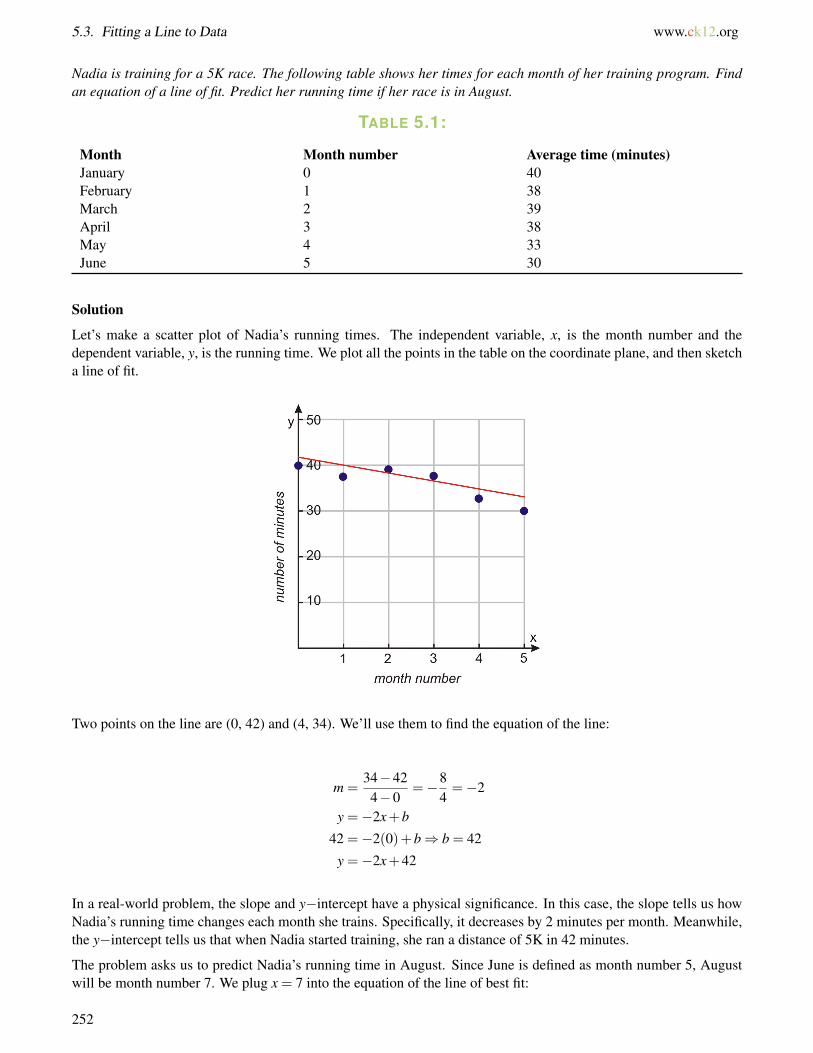
5.3. Fitting a Line to Data www.ck12.org
Nadia is training for a 5K race. The following table shows her times for each month of her training program. Findan equation of a line of fit. Predict her running time if her race is in August.
TABLE 5.1:
Month Month number Average time (minutes)January 0 40February 1 38March 2 39April 3 38May 4 33June 5 30
Solution
Let’s make a scatter plot of Nadia’s running times. The independent variable, x, is the month number and thedependent variable, y, is the running time. We plot all the points in the table on the coordinate plane, and then sketcha line of fit.
Two points on the line are (0, 42) and (4, 34). We’ll use them to find the equation of the line:
m =34−424−0
=−84=−2
y =−2x+b
42 =−2(0)+b⇒ b = 42
y =−2x+42
In a real-world problem, the slope and y−intercept have a physical significance. In this case, the slope tells us howNadia’s running time changes each month she trains. Specifically, it decreases by 2 minutes per month. Meanwhile,the y−intercept tells us that when Nadia started training, she ran a distance of 5K in 42 minutes.
The problem asks us to predict Nadia’s running time in August. Since June is defined as month number 5, Augustwill be month number 7. We plug x = 7 into the equation of the line of best fit:
252

www.ck12.org Chapter 5. Writing Linear Equations
y =−2(7)+42 =−14+42 = 28
The equation predicts that Nadia will run the 5K race in 28 minutes.
In this solution, we eyeballed a line of fit. Using a graphing calculator, we can find this equation for a line of fitinstead: y =−2.2x+43.7
If we plug x = 7 into this equation, we get y =−2.2(7)+43.7 = 28.3. This means that Nadia will run her race in28.3 minutes. You see that the graphing calculator gives a different equation and a different answer to the question.The graphing calculator result is more accurate, but the line we drew by hand still gives a good approximation to theresult. And of course, there’s no guarantee that Nadia will actually finish the race in that exact time; both answersare estimates, it’s just that the calculator’s estimate is slightly more likely to be right.
Example 4
Peter is testing the burning time of “BriteGlo” candles. The following table shows how long it takes to burn candlesof different weights. Assume it’s a linear relation, so we can use a line to fit the data. If a candle burns for 95 hours,what must be its weight in ounces?
TABLE 5.2:
Candle weight (oz) Time (hours)2 153 204 355 3610 8016 10022 12026 180
Solution
Let’s make a scatter plot of the data. The independent variable, x, is the candle weight and the dependent variable,y, is the time it takes the candle to burn. We plot all the points in the table on the coordinate plane, and draw a lineof fit.
253

5.3. Fitting a Line to Data www.ck12.org
Two convenient points on the line are (0,0) and (30, 200). Find the equation of the line:
m =20030
=203
y =203
x+b
0 =203(0)+b⇒ b = 0
y =203
x
A slope of 203 = 6 2
3 tells us that for each extra ounce of candle weight, the burning time increases by 6 23 hours. A
y−intercept of zero tells us that a candle of weight 0 oz will burn for 0 hours.
The problem asks for the weight of a candle that burns 95 hours; in other words, what’s the x−value that gives ay−value of 95? Plugging in y = 95:
y =203
x⇒ 95 =203
x⇒ x =28520
=574
= 1414
A candle that burns 95 hours weighs 14.25 oz.
A graphing calculator gives the linear regression equation as y = 6.1x+5.9 and a result of 14.6 oz.
Review Questions
For problems 1-4, draw the scatter plot and find an equation that fits the data set by hand.
1. (57, 45); (65, 61); (34, 30); (87, 78); (42, 41); (35, 36); (59, 35); (61, 57); (25, 23); (35, 34)2. (32, 43); (54, 61); (89, 94); (25, 34); (43, 56); (58, 67); (38, 46); (47, 56); (39, 48)3. (12, 18); (5, 24); (15, 16); (11, 19); (9, 12); (7, 13); (6, 17); (12, 14)
254
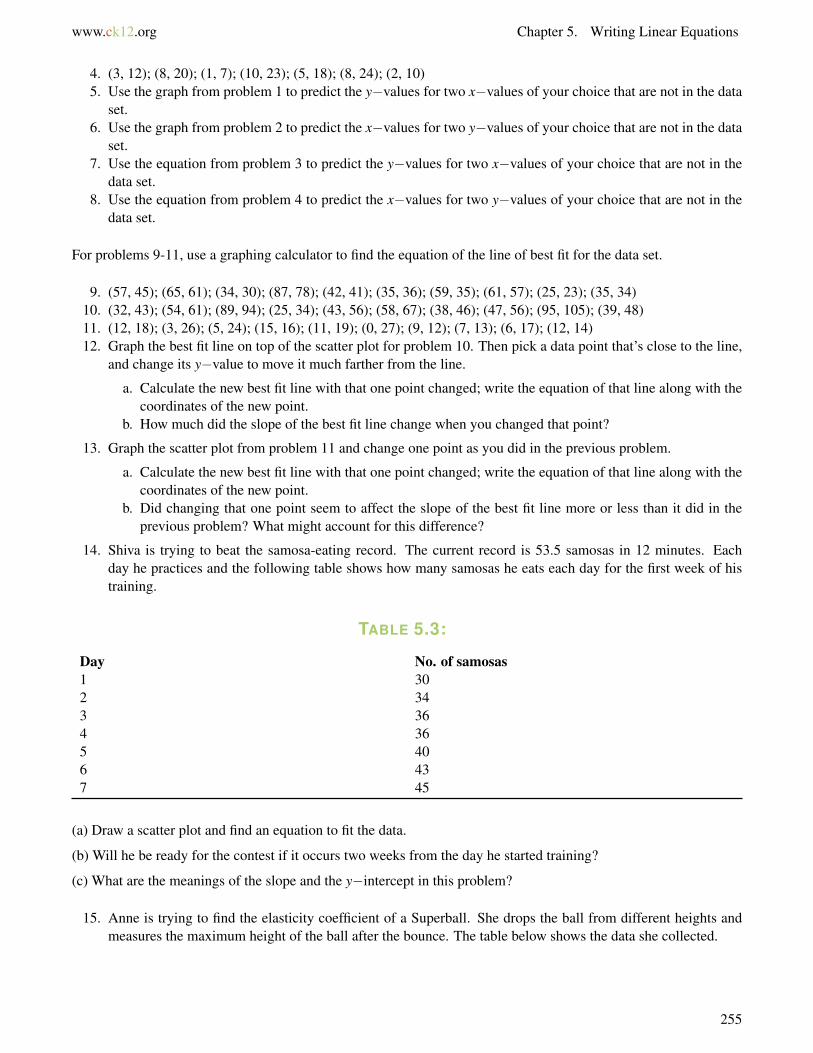
www.ck12.org Chapter 5. Writing Linear Equations
4. (3, 12); (8, 20); (1, 7); (10, 23); (5, 18); (8, 24); (2, 10)5. Use the graph from problem 1 to predict the y−values for two x−values of your choice that are not in the data
set.6. Use the graph from problem 2 to predict the x−values for two y−values of your choice that are not in the data
set.7. Use the equation from problem 3 to predict the y−values for two x−values of your choice that are not in the
data set.8. Use the equation from problem 4 to predict the x−values for two y−values of your choice that are not in the
data set.
For problems 9-11, use a graphing calculator to find the equation of the line of best fit for the data set.
9. (57, 45); (65, 61); (34, 30); (87, 78); (42, 41); (35, 36); (59, 35); (61, 57); (25, 23); (35, 34)10. (32, 43); (54, 61); (89, 94); (25, 34); (43, 56); (58, 67); (38, 46); (47, 56); (95, 105); (39, 48)11. (12, 18); (3, 26); (5, 24); (15, 16); (11, 19); (0, 27); (9, 12); (7, 13); (6, 17); (12, 14)12. Graph the best fit line on top of the scatter plot for problem 10. Then pick a data point that’s close to the line,
and change its y−value to move it much farther from the line.
a. Calculate the new best fit line with that one point changed; write the equation of that line along with thecoordinates of the new point.
b. How much did the slope of the best fit line change when you changed that point?
13. Graph the scatter plot from problem 11 and change one point as you did in the previous problem.
a. Calculate the new best fit line with that one point changed; write the equation of that line along with thecoordinates of the new point.
b. Did changing that one point seem to affect the slope of the best fit line more or less than it did in theprevious problem? What might account for this difference?
14. Shiva is trying to beat the samosa-eating record. The current record is 53.5 samosas in 12 minutes. Eachday he practices and the following table shows how many samosas he eats each day for the first week of histraining.
TABLE 5.3:
Day No. of samosas1 302 343 364 365 406 437 45
(a) Draw a scatter plot and find an equation to fit the data.
(b) Will he be ready for the contest if it occurs two weeks from the day he started training?
(c) What are the meanings of the slope and the y−intercept in this problem?
15. Anne is trying to find the elasticity coefficient of a Superball. She drops the ball from different heights andmeasures the maximum height of the ball after the bounce. The table below shows the data she collected.
255

5.3. Fitting a Line to Data www.ck12.org
TABLE 5.4:
Initial height (cm) Bounce height (cm)30 2235 2640 2945 3450 3855 4060 4565 5070 52
(a) Draw a scatter plot and find the equation.
(b) What height would she have to drop the ball from for it to bounce 65 cm?
(c) What are the meanings of the slope and the y−intercept in this problem?
(d) Does the y−intercept make sense? Why isn’t it (0, 0)?
16. The following table shows the median California family income from 1995 to 2002 as reported by the USCensus Bureau.
TABLE 5.5:
Year Income1995 53,8071996 55,2171997 55,2091998 55,4151999 63,1002000 63,2062001 63,7612002 65,766
(a) Draw a scatter plot and find the equation.
(b) What would you expect the median annual income of a Californian family to be in year 2010?
(c) What are the meanings of the slope and the y−intercept in this problem?
(d) Inflation in the U.S. is measured by the Consumer Price Index, which increased by 20% between 1995 and 2002.Did the median income of California families keep up with inflation over that time period? (In other words, did itincrease by at least 20%?)
256

www.ck12.org Chapter 5. Writing Linear Equations
5.4 Predicting with Linear Models
Learning Objectives
• Interpolate using an equation.• Extrapolate using an equation.• Predict using an equation.
Introduction
Katja’s sales figures were trending downward quickly at first, and she used a line of best fit to describe the numbers.But now they seem to be decreasing more slowly, and fitting the line less and less accurately. How can she make amore accurate prediction of what next week’s sales will be?
In the last lesson we saw how to find the equation of a line of best fit and how to use this equation to make predictions.The line of “best fit” is a good method if the relationship between the dependent and the independent variables islinear. In this section you will learn other methods that are useful even when the relationship isn’t linear.
Linear Interpolation
We use linear interpolation to fill in gaps in our data—that is, to estimate values that fall in between the values wealready know. To do this, we use a straight line to connect the known data points on either side of the unknownpoint, and use the equation of that line to estimate the value we are looking for.
Example 1
The following table shows the median ages of first marriage for men and women, as gathered by the U.S. CensusBureau.
TABLE 5.6:
Year Median age of males Median age of females1890 26.1 22.01900 25.9 21.91910 25.1 21.61920 24.6 21.21930 24.3 21.31940 24.3 21.51950 22.8 20.31960 22.8 20.31970 23.2 20.81980 24.7 22.01990 26.1 23.9
257

5.4. Predicting with Linear Models www.ck12.org
TABLE 5.6: (continued)
Year Median age of males Median age of females2000 26.8 25.1
Estimate the median age for the first marriage of a male in the year 1946.
Solution
We connect the two points on either side of 1946 with a straight line and find its equation. Here’s how that looks ona scatter plot:
We find the equation by plugging in the two data points:
m =22.8−24.31950−1940
=−1.5
10=−0.15
y =−0.15x+b
24.3 =−0.15(1940)+b
b = 315.3
Our equation is y =−0.15x+315.3.
To estimate the median age of marriage of males in the year 1946, we plug x = 1946 into the equation we just found:
y =−0.15(1946)+315.3 = 23.4years old
Example 2
The Center for Disease Control collects information about the health of the American people and behaviors thatmight lead to bad health. The following table shows the percent of women who smoke during pregnancy.
TABLE 5.7:
Year Percent of pregnant women smokers1990 18.41991 17.71992 16.91993 15.8
258
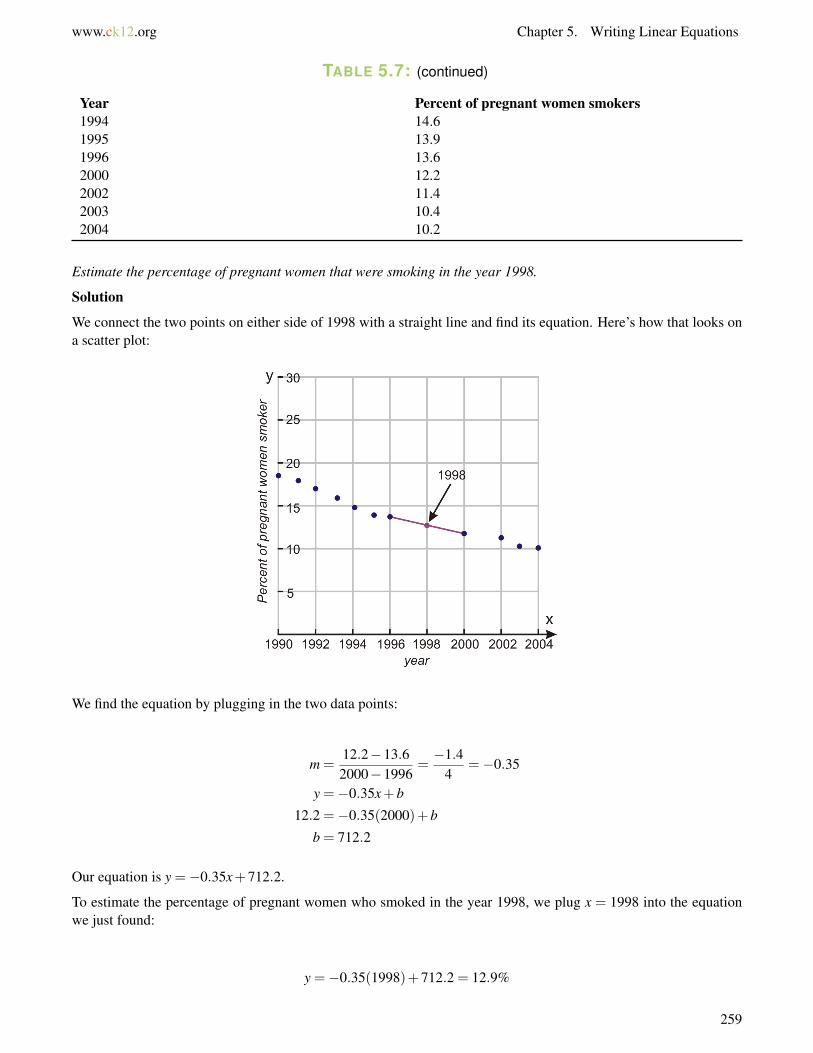
www.ck12.org Chapter 5. Writing Linear Equations
TABLE 5.7: (continued)
Year Percent of pregnant women smokers1994 14.61995 13.91996 13.62000 12.22002 11.42003 10.42004 10.2
Estimate the percentage of pregnant women that were smoking in the year 1998.
Solution
We connect the two points on either side of 1998 with a straight line and find its equation. Here’s how that looks ona scatter plot:
We find the equation by plugging in the two data points:
m =12.2−13.62000−1996
=−1.4
4=−0.35
y =−0.35x+b
12.2 =−0.35(2000)+b
b = 712.2
Our equation is y =−0.35x+712.2.
To estimate the percentage of pregnant women who smoked in the year 1998, we plug x = 1998 into the equationwe just found:
y =−0.35(1998)+712.2 = 12.9%
259

5.4. Predicting with Linear Models www.ck12.org
For non-linear data, linear interpolation is often not accurate enough for our purposes. If the points in the data setchange by a large amount in the interval you’re interested in, then linear interpolation may not give a good estimate.In that case, it can be replaced by polynomial interpolation, which uses a curve instead of a straight line to estimatevalues between points. But that’s beyond the scope of this lesson.
Linear Extrapolation
Linear extrapolation can help us estimate values that are outside the range of our data set. The strategy is similar tolinear interpolation: we pick the two data points that are closest to the one we’re looking for, find the equation of theline between them, and use that equation to estimate the coordinates of the missing point.
Example 3
The winning times for the women’s 100 meter race are given in the following table. Estimate the winning time in theyear 2010. Is this a good estimate?
TABLE 5.8:
Winner Country Year Time (seconds)Mary Lines UK 1922 12.8Leni Schmidt Germany 1925 12.4Gerturd Glasitsch Germany 1927 12.1Tollien Schuurman Netherlands 1930 12.0Helen Stephens USA 1935 11.8Lulu Mae Hymes USA 1939 11.5Fanny Blankers-Koen Netherlands 1943 11.5Marjorie Jackson Australia 1952 11.4Vera Krepkina Soviet Union 1958 11.3Wyomia Tyus USA 1964 11.2Barbara Ferrell USA 1968 11.1Ellen Strophal East Germany 1972 11.0Inge Helten West Germany 1976 11.0Marlies Gohr East Germany 1982 10.9Florence Griffith Joyner USA 1988 10.5
Solution
We start by making a scatter plot of the data; then we connect the last two points on the graph and find the equationof the line.
260
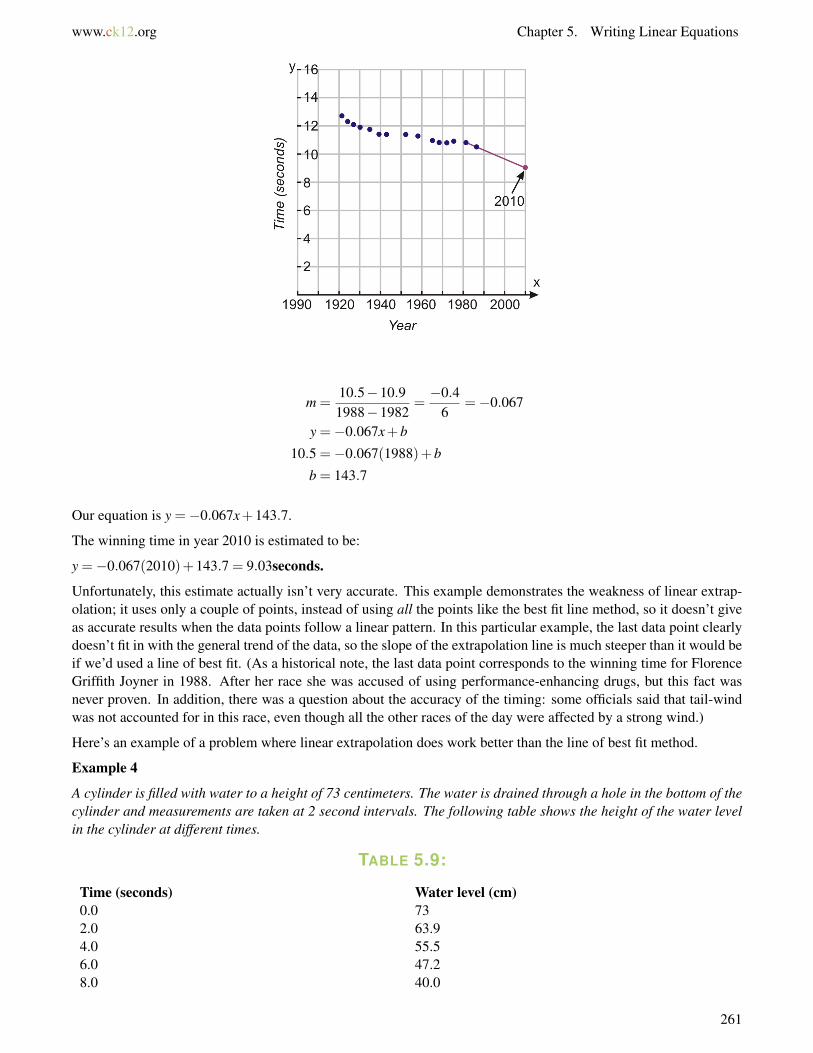
www.ck12.org Chapter 5. Writing Linear Equations
m =10.5−10.91988−1982
=−0.4
6=−0.067
y =−0.067x+b
10.5 =−0.067(1988)+b
b = 143.7
Our equation is y =−0.067x+143.7.
The winning time in year 2010 is estimated to be:
y =−0.067(2010)+143.7 = 9.03seconds.
Unfortunately, this estimate actually isn’t very accurate. This example demonstrates the weakness of linear extrap-olation; it uses only a couple of points, instead of using all the points like the best fit line method, so it doesn’t giveas accurate results when the data points follow a linear pattern. In this particular example, the last data point clearlydoesn’t fit in with the general trend of the data, so the slope of the extrapolation line is much steeper than it would beif we’d used a line of best fit. (As a historical note, the last data point corresponds to the winning time for FlorenceGriffith Joyner in 1988. After her race she was accused of using performance-enhancing drugs, but this fact wasnever proven. In addition, there was a question about the accuracy of the timing: some officials said that tail-windwas not accounted for in this race, even though all the other races of the day were affected by a strong wind.)
Here’s an example of a problem where linear extrapolation does work better than the line of best fit method.
Example 4
A cylinder is filled with water to a height of 73 centimeters. The water is drained through a hole in the bottom of thecylinder and measurements are taken at 2 second intervals. The following table shows the height of the water levelin the cylinder at different times.
TABLE 5.9:
Time (seconds) Water level (cm)0.0 732.0 63.94.0 55.56.0 47.28.0 40.0
261
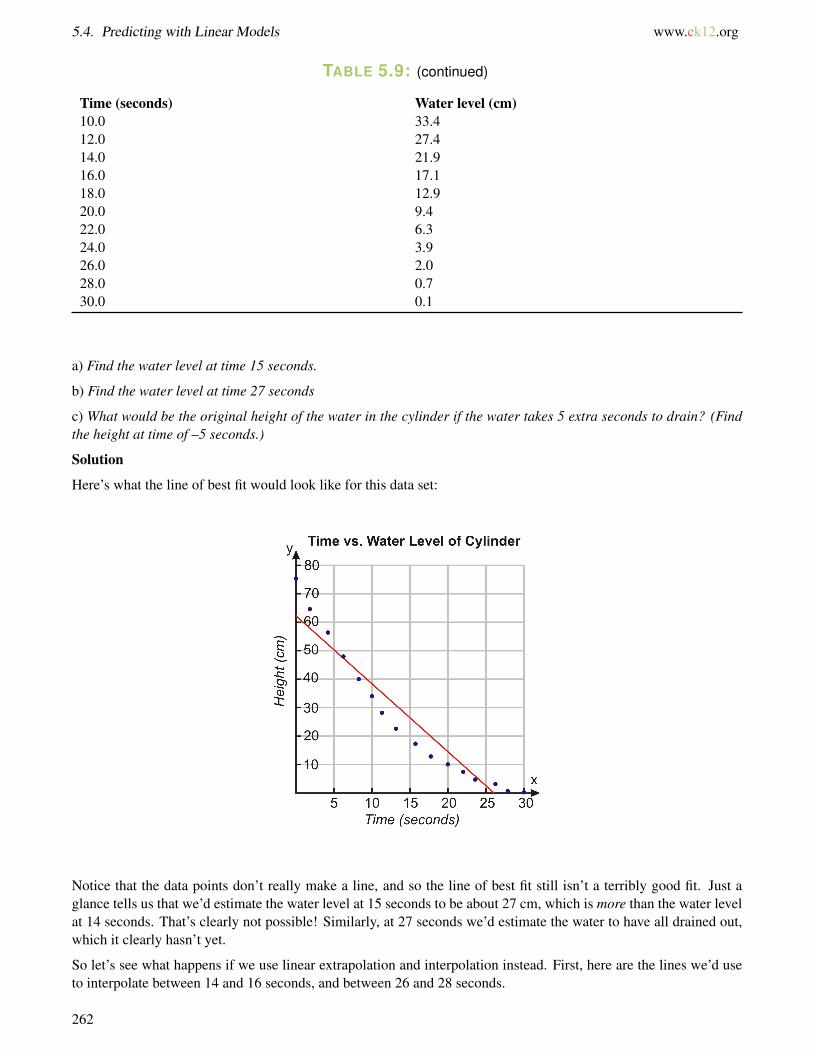
5.4. Predicting with Linear Models www.ck12.org
TABLE 5.9: (continued)
Time (seconds) Water level (cm)10.0 33.412.0 27.414.0 21.916.0 17.118.0 12.920.0 9.422.0 6.324.0 3.926.0 2.028.0 0.730.0 0.1
a) Find the water level at time 15 seconds.
b) Find the water level at time 27 seconds
c) What would be the original height of the water in the cylinder if the water takes 5 extra seconds to drain? (Findthe height at time of –5 seconds.)
Solution
Here’s what the line of best fit would look like for this data set:
Notice that the data points don’t really make a line, and so the line of best fit still isn’t a terribly good fit. Just aglance tells us that we’d estimate the water level at 15 seconds to be about 27 cm, which is more than the water levelat 14 seconds. That’s clearly not possible! Similarly, at 27 seconds we’d estimate the water to have all drained out,which it clearly hasn’t yet.
So let’s see what happens if we use linear extrapolation and interpolation instead. First, here are the lines we’d useto interpolate between 14 and 16 seconds, and between 26 and 28 seconds.
262

www.ck12.org Chapter 5. Writing Linear Equations
a) The slope of the line between points (14, 21.9) and (16, 17.1) is m = 17.1−21.916−14 = −4.8
2 =−2.4. So y =−2.4x+b⇒21.9 =−2.4(14)+b⇒ b = 55.5, and the equation is y =−2.4x+55.5.
Plugging in x = 15 gives us y =−2.4(15)+55.5 = 19.5 cm.
b) The slope of the line between points (26, 2) and (28, 0.7) is m = 0.7−228−26 = −1.3
2 =−.65, so y =−.65x+b⇒ 2 =−.65(26)+b⇒ b = 18.9, and the equation is y =−.65x+18.9.
Plugging in x = 27, we get y =−.65(27)+18.9 = 1.35 cm.
c) Finally, we can use extrapolation to estimate the height of the water at -5 seconds. The slope of the line betweenpoints (0, 73) and (2, 63.9) is m = 63.9−73
2−0 = −9.12 =−4.55, so the equation of the line is y =−4.55x+73.
Plugging in x =−5 gives us y =−4.55(−5)+73 = 95.75 cm.
To make linear interpolation easier in the future, you might want to use the calculator at http://www.ajdesigner.com/phpinterpolation/linear_interpolation_equation.php. Plug in the coordinates of the first known data point in theblanks labeled x1 and y1, and the coordinates of the second point in the blanks labeled x3 and y3; then enter thex−coordinate of the point in between in the blank labeled x2, and the y−coordinate will be displayed below whenyou click “Calculate.”
Review Questions
1. Use the data from Example 1 (Median age at first marriage) to estimate the age at marriage for females in1946. Fit a line, by hand, to the data before 1970.
2. Use the data from Example 1 (Median age at first marriage) to estimate the age at marriage for females in1984. Fit a line, by hand, to the data from 1970 on in order to estimate this accurately.
3. Use the data from Example 1 (Median age at first marriage) to estimate the age at marriage for males in 1995.Use linear interpolation between the 1990 and 2000 data points.
4. Use the data from Example 2 (Pregnant women and smoking) to estimate the percentage of pregnant smokersin 1997. Use linear interpolation between the 1996 and 2000 data points.
5. Use the data from Example 2 (Pregnant women and smoking) to estimate the percentage of pregnant smokersin 2006. Use linear extrapolation with the final two data points.
263

5.4. Predicting with Linear Models www.ck12.org
6. Use the data from Example 3 (Winning times) to estimate the winning time for the female 100-meter race in1920. Use linear extrapolation because the first two or three data points have a different slope than the rest ofthe data.
7. The table below shows the highest temperature vs. the hours of daylight for the 15th day of each month in theyear 2006 in San Diego, California.
TABLE 5.10:
Hours of daylight High temperature (F)10.25 6011.0 6212 6213 6613.8 6814.3 7314 8613.4 7512.4 7111.4 6610.5 7310 61
(a) What would be a better way to organize this table if you want to make the relationship between daylight hoursand temperature easier to see?
(b) Estimate the high temperature for a day with 13.2 hours of daylight using linear interpolation.
(c) Estimate the high temperature for a day with 9 hours of daylight using linear extrapolation. Is the predictionaccurate?
(d) Estimate the high temperature for a day with 9 hours of daylight using a line of best fit.
The table below lists expected life expectancies based on year of birth (US Census Bureau). Use it to answerquestions 8-15.
TABLE 5.11:
Birth year Life expectancy in years1930 59.71940 62.91950 68.21960 69.71970 70.81980 73.71990 75.42000 77
8. Make a scatter plot of the data.9. Use a line of best fit to estimate the life expectancy of a person born in 1955.
10. Use linear interpolation to estimate the life expectancy of a person born in 1955.11. Use a line of best fit to estimate the life expectancy of a person born in 1976.12. Use linear interpolation to estimate the life expectancy of a person born in 1976.13. Use a line of best fit to estimate the life expectancy of a person born in 2012.
264

www.ck12.org Chapter 5. Writing Linear Equations
14. Use linear extrapolation to estimate the life expectancy of a person born in 2012.15. Which method gives better estimates for this data set? Why?
The table below lists the high temperature for the fist day of the month for the year 2006 in San Diego, California(Weather Underground). Use it to answer questions 16-21.
TABLE 5.12:
Month number Temperature (F)1 632 663 614 645 716 787 888 789 8110 7511 6812 69
16. Draw a scatter plot of the data.17. Use a line of best fit to estimate the temperature in the middle of the 4th month (month 4.5).18. Use linear interpolation to estimate the temperature in the middle of the 4th month (month 4.5).19. Use a line of best fit to estimate the temperature for month 13 (January 2007).20. Use linear extrapolation to estimate the temperature for month 13 (January 2007).21. Which method gives better estimates for this data set? Why?22. Name a real-world situation where you might want to make predictions based on available data. Would linear
extrapolation/interpolation or the best fit method be better to use in that situation? Why?
Texas Instruments Resources
In the CK-12 Texas Instruments Algebra I FlexBook, there are graphing calculator activities designed to supple-ment the objectives for some of the lessons in this chapter. See http://www.ck12.org/flexr/chapter/9615.
265

www.ck12.org
CHAPTER 6 Linear InequalitiesChapter Outline
6.1 SOLVING INEQUALITIES
6.2 USING INEQUALITIES
6.3 COMPOUND INEQUALITIES
6.4 ABSOLUTE VALUE EQUATIONS AND INEQUALITIES
6.5 LINEAR INEQUALITIES IN TWO VARIABLES
266

www.ck12.org Chapter 6. Linear Inequalities
6.1 Solving Inequalities
Learning Objectives
• Write and graph inequalities in one variable on a number line.• Solve inequalities using addition and subtraction.• Solve inequalities using multiplication and division.• Solve multi-step inequalities.
Introduction
Dita has a budget of $350 to spend on a rental car for an upcoming trip, but she wants to spend as little of that moneyas possible. If the trip will last five days, what range of daily rental rates should she be willing to consider?
Like equations, inequalities show a relationship between two expressions. We solve and graph inequalities in asimilar way to equations—but when we solve an inequality, the answer is usually a set of values instead of just onevalue.
When writing inequalities we use the following symbols:
>is greater than
≥ is greater than or equal to
<is less than
≤ is less than or equal to
Write and Graph Inequalities in One Variable on a Number Line
Let’s start with the simple inequality x > 3.
We read this inequality as “x is greater than 3.” The solution is the set of all real numbers that are greater than three.We often represent the solution set of an inequality with a number line graph.
Consider another simple inequality: x≤ 4.
We read this inequality as “x is less than or equal to 4.” The solution is the set of all real numbers that are equal tofour or less than four. We can graph this solution set on the number line.
267
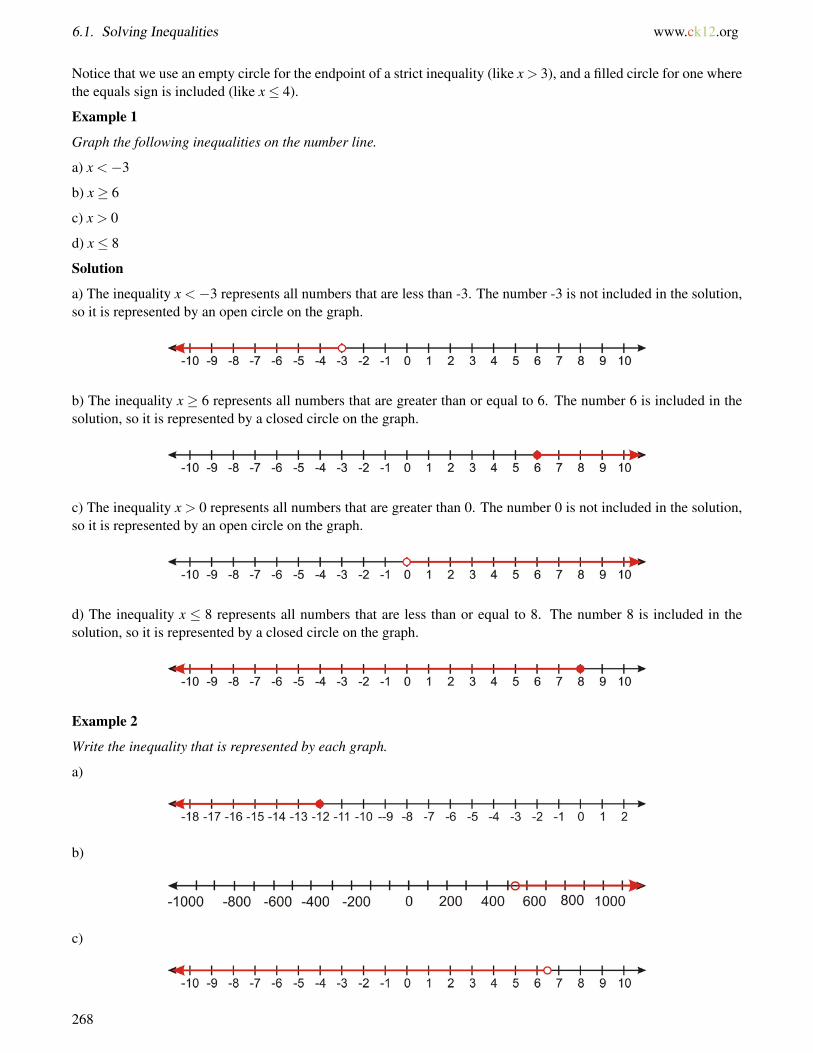
6.1. Solving Inequalities www.ck12.org
Notice that we use an empty circle for the endpoint of a strict inequality (like x > 3), and a filled circle for one wherethe equals sign is included (like x≤ 4).
Example 1
Graph the following inequalities on the number line.
a) x <−3
b) x≥ 6
c) x > 0
d) x≤ 8
Solution
a) The inequality x <−3 represents all numbers that are less than -3. The number -3 is not included in the solution,so it is represented by an open circle on the graph.
b) The inequality x ≥ 6 represents all numbers that are greater than or equal to 6. The number 6 is included in thesolution, so it is represented by a closed circle on the graph.
c) The inequality x > 0 represents all numbers that are greater than 0. The number 0 is not included in the solution,so it is represented by an open circle on the graph.
d) The inequality x ≤ 8 represents all numbers that are less than or equal to 8. The number 8 is included in thesolution, so it is represented by a closed circle on the graph.
Example 2
Write the inequality that is represented by each graph.
a)
b)
c)
268

www.ck12.org Chapter 6. Linear Inequalities
d)
Solution
a) x≤−12
b) x > 540
c) x < 6.5
d) x≥ 85
Inequalities appear everywhere in real life. Here are some simple examples of real-world applications.
Example 3
Write each statement as an inequality and graph it on the number line.
a) You must maintain a balance of at least $2500 in your checking account to get free checking.
b) You must be at least 48 inches tall to ride the “Thunderbolt” Rollercoaster.
c) You must be younger than 3 years old to get free admission at the San Diego Zoo.
d) The speed limit on the interstate is 65 miles per hour or less.
Solution
a) The words “at least” imply that the value of $2500 is included in the solution set, so the inequality is written asx≥ 2500.
b) The words “at least” imply that the value of 48 inches is included in the solution set, so the inequality is writtenas x≥ 48.
c) The inequality is written as x < 3.
d) Speed limit means the highest allowable speed, so the inequality is written as x≤ 65.
Solving Inequalities Using Addition and Subtraction
To solve an inequality we must isolate the variable on one side of the inequality sign. To isolate the variable, we usethe same basic techniques used in solving equations.
We can solve some inequalities by adding or subtracting a constant from one side of the inequality.
269

6.1. Solving Inequalities www.ck12.org
Example 4
Solve each inequality and graph the solution set.
a) x−3 < 10
b) x−20≥ 14
c) x+8≤−7
d) x+4 > 13
Solution
a) Starting inequality: x−3 < 10
Add 3 to both sides of the inequality: x−3+3 < 10+3
Simplify: x < 13
b) Starting inequality: x−20≤ 14
Add 20 to both sides of the inequality: x−20+20≤ 14+20
Simplify: x≤ 34
c) Starting inequality: x+8≤−7
Subtract 8 from both sides of the inequality: x+8−8≤−7−8
Simplify: x≤−15
d) Starting inequality: x+4 > 13
Subtract 4 from both sides of the inequality: x+4−4 > 13−4
Simplify: x > 9
Solving Inequalities Using Multiplication and Division
We can also solve inequalities by multiplying or dividing both sides by a constant. For example, to solve theinequality 5x < 3, we would divide both sides by 5 to get x < 3
5 .
However, something different happens when we multiply or divide by a negative number. We know, for example,that 5 is greater than 3. But if we multiply both sides of the inequality 5 > 3 by -2, we get −10 >−6. And we knowthat’s not true; -10 is less than -6.
270

www.ck12.org Chapter 6. Linear Inequalities
This happens whenever we multiply or divide an inequality by a negative number, and so we have to flip the signaround to make the inequality true. For example, to multiply 2 < 4 by -3, first we multiply the 2 and the 4 each by-3, and then we change the <sign to a >sign, so we end up with −6 >−12.
The same principle applies when the inequality contains variables.
Example 5
Solve each inequality.
a) 4x < 24
b) −5x≤ 21
c) x25 < 3
2
d) x−7 ≥ 9
Solution
a) Original problem: 4x < 24
Divide both sides by 4: 4x4 < 24
4
Simplify: x < 6
b) Original problem: −5x≤ 21
Divide both sides by -5 : −5x−5 ≥
21−5 Flip the inequality sign.
Simplify: x≥−215
c) Original problem: x25 < 3
2
Multiply both sides by 25: 25 · x25 < 3
2 ·25
Simplify: x < 752 or x < 37.5
d) Original problem: x−7 ≥ 9
Multiply both sides by -7: −7 · x−7 ≤ 9 · (−7)Flip the inequality sign.
Simplify: x≤−63
Solving Multi-Step Inequalities
In the last two sections, we considered very simple inequalities which required one step to obtain the solution.However, most inequalities require several steps to arrive at the solution. As with solving equations, we must usethe order of operations to find the correct solution. In addition, remember that when we multiply or divide theinequality by a negative number, the direction of the inequality changes.
The general procedure for solving multi-step inequalities is almost exactly like the procedure for solving multi-stepequations:
1. Clear parentheses on both sides of the inequality and collect like terms.2. Add or subtract terms so the variable is on one side and the constant is on the other side of the inequality sign.3. Multiply and divide by whatever constants are attached to the variable. Remember to change the direction of
the inequality if you multiply or divide by a negative number.
Example 6
Solve each of the following inequalities and graph the solution set.
271

6.1. Solving Inequalities www.ck12.org
a) 9x5 −7≥−3x+12
b) −25x+12≤−10x−12
Solution
a) Original problem: 9x5 −7≥−3x+12
Add 3x to both sides: 9x5 +3x−7≥−3x+3x+12
Simplify: 24x5 −7≥ 12
Add 7 to both sides: 24x5 −7+7≥ 12+7
Simplify: 24x5 ≥ 19
Multiply 5 to both sides: 5 · 24x5 ≥ 5 ·19
Simplify: 24x≥ 95
Divide both sides by 24: 24x24 ≥
9524
Simplify: x≥ 9524 Answer
Graph:
b) Original problem: −25x+12≤−10x−12
Add 10x to both sides: −25x+10x+12≤−10x+10x−12
Simplify: −15x+12≤−12
Subtract 12: −15x+12−12≤−12−12
Simplify: −15x≤−24
Divide both sides by -15: −15x−15 ≥
−24−15 flip the inequality sign
Simplify: x≥ 85 Answer
Graph:
Example 7
Solve the following inequalities.
a) 4x−2(3x−9)≤−4(2x−9)
b) 5x−14 >−2(x+5)
Solution
a) Original problem: 4x−2(3x−9)≤−4(2x−9)
Simplify parentheses: 4x−6x+18≤−8x+36
Collect like terms: −2x+18≤−8x+36
Add 8x to both sides: −2x+8x+18≤−8x+8x+36
Simplify: 6x+18≤ 36
Subtract 18: 6x+18−18≤ 36−18
272

www.ck12.org Chapter 6. Linear Inequalities
Simplify: 6x≤ 18
Divide both sides by 6: 6x6 ≤
186
Simplify: x≤ 3Answer
b) Original problem: 5x−14 >−2(x+5)
Simplify parenthesis: 5x−14 >−2x−10
Multiply both sides by 4: 4 · 5x−14 > 4(−2x−10)
Simplify: 5x−1 >−8x−40
Add 8x to both sides: 5x+8x−1 >−8x+8x−40
Simplify: 13x−1 >−40
Add 1 to both sides: 13x−1+1 >−40+1
Simplify: 13x >−39
Divide both sides by 13: 13x13 >−39
13
Simplify: x >−3Answer
Further Practice
For additional practice solving inequalities, try the online game at http://www.aaamath.com/equ725x7.htm#section2. If you’re having a hard time with multi-step inequalities, the video at http://www.schooltube.com/video/aa66df49e0af4f85a5e9/MultiStep-Inequalities will walk you through a few.
Lesson Summary
• The answer to an inequality is usually an interval of values.• Solving inequalities works just like solving an equation. To solve, we isolate the variable on one side of the
equation.• When multiplying or dividing both sides of an inequality by a negative number, you need to reverse the
inequality.
Review Questions
1. Write the inequality represented by the graph.
2. Write the inequality represented by the graph.
3. Write the inequality represented by the graph.
273

6.1. Solving Inequalities www.ck12.org
4. Write the inequality represented by the graph.
Graph each inequality on the number line.
5. x <−356. x >−177. x≥ 208. x≤ 3
Solve each inequality and graph the solution on the number line.
9. x−5 < 3510. x+15≥−6011. x−2≤ 112. x−8 >−2013. x+11 > 1314. x+65 < 10015. x−32≤ 016. x+68≥ 75
Solve each inequality. Write the solution as an inequality and graph it.
17. 3x≤ 618. x
5 >− 310
19. −10x > 25020. x
−7 ≥−5
Solve each multi-step inequality.
21. x−5 > 2x+322. 2(x−3)≤ 3x−223. x
3 < x+724. 3(x−4)
12 ≤ 2x3
25. 2( x
4 +3)> 6(x−1)
26. 9x+4≤−2(x+ 1
2
)
274

www.ck12.org Chapter 6. Linear Inequalities
6.2 Using Inequalities
Learning Objectives
• Express answers to inequalities in a variety of ways.• Identify the number of solutions of an inequality.• Solve real-world problems using inequalities.
Introduction
Ms. Jerome wants to buy identical boxes of art supplies for her 25 students. If she can spend no more than $375 onart supplies, what inequality describes the price can she afford for each individual box of supplies?
Expressing Solutions of an Inequality
The solution of an inequality can be expressed in four different ways:
1. Inequality notation The answer is simply expressed as x < 15.2. Set notation The answer is expressed as a set: x|x < 15. The brackets indicate a set and the vertical line
means “such that,” so we read this expression as “the set of all values of x such that x is a real number lessthan 15”.
3. Interval notation uses brackets to indicate the range of values in the solution. For example, the answer to ourproblem would be expressed as (−∞, 15), meaning “the interval containing all the numbers from −∞ to 15but not actually including −∞ or 15”.
a. Square or closed brackets “[” and “]” indicate that the number next to the bracket is included in thesolution set.
b. Round or open brackets “(” and “)” indicate that the number next to the bracket is not included inthe solution set. When using infinity and negative infinity (∞ and −∞), we always use open brackets,because infinity isn’t an actual number and so it can’t ever really be included in an interval.
4. Solution graph shows the solution on the real number line. A closed circle on a number indicates that thenumber is included in the solution set, while an open circle indicates that the number is not included in the set.For our example, the solution graph is:
Example 1
a) [-4, 6] means that the solutions is all numbers between -4 and 6 including -4 and 6.
b) (8, 24) means that the solution is all numbers between 8 and 24 not including the numbers 8 and 24.
c) [3, 12) means that the solution is all numbers between 3 and 12, including 3 but not including 12.
275

6.2. Using Inequalities www.ck12.org
d) (−10,∞) means that the solution is all numbers greater than -10, not including -10.
e) (−∞,∞) means that the solution is all real numbers.
Identify the Number of Solutions of an Inequality
Inequalities can have:
• A set that has an infinite number of solutions.• A set that has a discrete number of solutions.• No solutions.
The inequalities we have solved so far all have an infinite number of solutions, at least in theory. For example, theinequality 5x−1
4 >−2(x+5) has the solution x >−3. This solution says that all real numbers greater than -3 makethis inequality true, and there are infinitely many such numbers.
However, in real life, sometimes we are trying to solve a problem that can only have positive integer answers, becausethe answers describe numbers of discrete objects.
For example, suppose you are trying to figure out how many $8 CDs you can buy if you want to spend less than $50.An inequality to describe this situation would be 8x < 50, and if you solved that inequality you would get x < 50
8 , orx < 6.25.
But could you really buy any number of CDs as long as it’s less than 6.25? No; you couldn’t really buy 6.1 CDs, or-5 CDs, or any other fractional or negative number of CDs. So if we wanted to express our solution in set notation,we couldn’t express it as the set of all numbers less than 6.25, or x|x < 6.25. Instead, the solution is just the setcontaining all the nonnegative whole numbers less than 6.25, or 0, 1, 2, 3, 4, 5, 6. When we’re solving a real-worldproblem dealing with discrete objects like CDs, our solution set will often be a finite set of numbers instead of aninfinite interval.
An inequality can also have no solutions at all. For example, consider the inequality x−5 > x+6. When we subtractx from both sides, we end up with −5 > 6, which is not true for any value of x. We say that this inequality has nosolution.
The opposite can also be true. If we flip the inequality sign in the above inequality, we get x− 5 < x+ 6, whichsimplifies to −5 < 6. That’s always true no matter what x is, so the solution to that inequality would be all realnumbers, or (−∞,∞).
Solve Real-World Problems Using Inequalities
Solving real-world problems that involve inequalities is very much like solving problems that involve equations.
Example 2
In order to get a bonus this month, Leon must sell at least 120 newspaper subscriptions. He sold 85 subscriptions inthe first three weeks of the month. How many subscriptions must Leon sell in the last week of the month?
Solution
Let x = the number of subscriptions Leon sells in the last week of the month. The total number of subscriptions forthe month must be greater than 120, so we write 85+ x≥ 120. We solve the inequality by subtracting 85 from bothsides: x≥ 35.
Leon must sell 35 or more subscriptions in the last week to get his bonus.
276

www.ck12.org Chapter 6. Linear Inequalities
To check the answer, we see that 85+35= 120. If he sells 35 or more subscriptions, the total number of subscriptionshe sells that month will be 120 or more. The answer checks out.
Example 3
Virena’s Scout troop is trying to raise at least $650 this spring. How many boxes of cookies must they sell at $4.50per box in order to reach their goal?
Solution
Let x = number of boxes sold. Then the inequality describing this problem is 4.50x≥ 650.
We solve the inequality by dividing both sides by 4.50: x≥ 144.44.
We round up the answer to 145 since only whole boxes can be sold.
Virena’s troop must sell at least 145 boxes.
If we multiply 145 by $4.50 we obtain $652.50, so if Virena’s troop sells more than 145 boxes they will raise morethan $650. But if they sell 144 boxes, they will only raise $648, which is not enough. So they must indeed sell atleast 145 boxes. The answer checks out.
Example 4
The width of a rectangle is 20 inches. What must the length be if the perimeter is at least 180 inches?
Solution
Let x = length of the rectangle. The formula for perimeter is
Perimeter = 2× length+2×width
Since the perimeter must be at least 180 inches, we have 2x+2(20)≥ 180.
Simplify: 2x+40≥ 180
Subtract 40 from both sides: 2x≥ 140
Divide both sides by 2: x≥ 70
The length must be at least 70 inches.
If the length is at least 70 inches and the width is 20 inches, then the perimeter is at least 2(70)+2(20) = 180 inches.The answer checks out.
Further Practice
The videos at http://www.youtube.com/watch?v=k9JSbMfFZ9U&feature=related and http://www.youtube.com/watch?v=ArzPkaqym50 contain more examples of real-world problems using inequalities.
Lesson Summary
• Inequalities can have infinite solutions, no solutions, or discrete solutions.• There are four ways to represent an inequality: Equation notation, set notation, interval notation, and solution
graph.
277

6.2. Using Inequalities www.ck12.org
Review Questions
Solve each inequality. Give the solution in inequality notation and interval notation.
1. x+15 < 122. x−4≥ 133. 9x >−3
44. − x
15 ≤ 55. 620x > 24006. x
20 ≥−7
407. 3x
5 > 35
8. x+3 > x−2
Solve each inequality. Give the solution in inequality notation and set notation.
9. x+17 < 310. x−12≥ 8011. −0.5x≤ 7.512. 75x≥ 12513. x
−3 >−109
14. x−15 < 8
15. x4 > 5
416. 3x−7≥ 3(x−7)
Solve the following inequalities, give the solution in set notation, and show the solution graph.
17. 4x+3 <−118. 2x < 7x−3619. 5x > 8x+2720. 5− x < 9+ x21. 4−6x≤ 2(2x+3)22. 5(4x+3)≥ 9(x−2)− x23. 2(2x−1)+3 < 5(x+3)−2x24. 8x−5(4x+1)≥−1+2(4x−3)25. 9. 2(7x−2)−3(x+2)< 4x− (3x+4)26. 2
3 x− 12(4x−1)≥ x+2(x−3)
27. At the San Diego Zoo you can either pay $22.75 for the entrance fee or $71 for the yearly pass which entitlesyou to unlimited admission.
a. At most how many times can you enter the zoo for the $22.75 entrance fee before spending more thanthe cost of a yearly membership?
b. Are there infinitely many or finitely many solutions to this inequality?
28. Proteek’s scores for four tests were 82, 95, 86, and 88. What will he have to score on his fifth and last test toaverage at least 90 for the term?
278

www.ck12.org Chapter 6. Linear Inequalities
6.3 Compound Inequalities
Learning Objectives
• Write and graph compound inequalities on a number line.• Solve compound inequalities with “and.”• Solve compound inequalities with “or.”• Solve compound inequalities using a graphing calculator (TI family).• Solve real-world problems using compound inequalities.
Introduction
In this section, we’ll solve compound inequalities—inequalities with more than one constraint on the possible valuesthe solution can have.
There are two types of compound inequalities:
1. Inequalities joined by the word “and,” where the solution is a set of values greater than a number and lessthan another number. We can write these inequalities in the form “x > a and x < b,” but usually we just write“a < x < b.” Possible values for x are ones that will make both inequalities true.
2. Inequalities joined by the word “or,” where the solution is a set of values greater than a number or less thananother number. We write these inequalities in the form “x > a or x < b.” Possible values for x are ones thatwill make at least one of the inequalities true.
You might wonder why the variable x has to be greater than one number and/or less than the other number; whycan’t it be greater than both numbers, or less than both numbers? To see why, let’s take an example.
Consider the compound inequality “x > 5 and x > 3.” Are there any numbers greater than 5 that are not greater than3? No! Since 5 is greater than 3, everything greater than 5 is also greater than 3. If we say x is greater than both5 and 3, that doesn’t tell us any more than if we just said x is greater than 5. So this compound inequality isn’treally compound; it’s equivalent to the simple inequality x > 5. And that’s what would happen no matter which twonumbers we used; saying that x is greater than both numbers is just the same as saying that x is greater than thebigger number, and saying that x is less than both numbers is just the same as saying that x is less than the smallernumber.
Compound inequalities with “or” work much the same way. Every number that’s greater than 3 or greater than 5 isalso just plain greater than 3, and every number that’s greater than 3 is certainly greater than 3 or greater than 5—soif we say “x > 5 or x > 3,” that’s the same as saying just “x > 3.” Saying that x is greater than at least one of twonumbers is just the same as saying that x is greater than the smaller number, and saying that x is less than at least oneof two numbers is just the same as saying that x is less than the greater number.
279
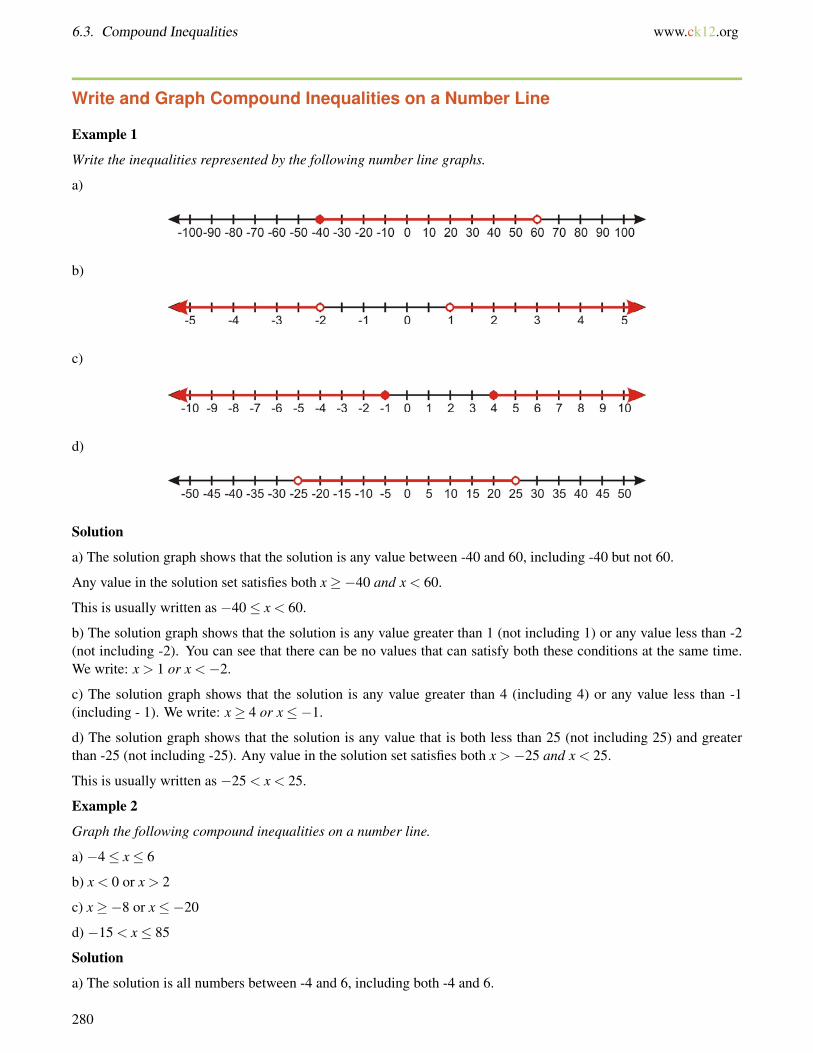
6.3. Compound Inequalities www.ck12.org
Write and Graph Compound Inequalities on a Number Line
Example 1
Write the inequalities represented by the following number line graphs.
a)
b)
c)
d)
Solution
a) The solution graph shows that the solution is any value between -40 and 60, including -40 but not 60.
Any value in the solution set satisfies both x≥−40 and x < 60.
This is usually written as −40≤ x < 60.
b) The solution graph shows that the solution is any value greater than 1 (not including 1) or any value less than -2(not including -2). You can see that there can be no values that can satisfy both these conditions at the same time.We write: x > 1 or x <−2.
c) The solution graph shows that the solution is any value greater than 4 (including 4) or any value less than -1(including - 1). We write: x≥ 4 or x≤−1.
d) The solution graph shows that the solution is any value that is both less than 25 (not including 25) and greaterthan -25 (not including -25). Any value in the solution set satisfies both x >−25 and x < 25.
This is usually written as −25 < x < 25.
Example 2
Graph the following compound inequalities on a number line.
a) −4≤ x≤ 6
b) x < 0 or x > 2
c) x≥−8 or x≤−20
d) −15 < x≤ 85
Solution
a) The solution is all numbers between -4 and 6, including both -4 and 6.
280

www.ck12.org Chapter 6. Linear Inequalities
b) The solution is all numbers less than 0 or greater than 2, not including 0 or 2.
c) The solution is all numbers greater than or equal to -8 or less than or equal to -20.
d) The solution is all numbers between -15 and 85, not including -15 but including 85.
Solve a Compound Inequality With “and” or “or”
When we solve compound inequalities, we separate the inequalities and solve each of them separately. Then, wecombine the solutions at the end.
Example 3
Solve the following compound inequalities and graph the solution set.
a) −2 < 4x−5≤ 11
b) 3x−5 < x+9≤ 5x+13
Solution
a) First we re-write the compound inequality as two separate inequalities with and. Then solve each inequalityseparately.
−2 < 4x−5 4x−5≤ 11
3 < 4x and 4x≤ 1634< x x≤ 4
Answer: 34 < x and x≤ 4. This can be written as 3
4 < x≤ 4.
b) Re-write the compound inequality as two separate inequalities with and. Then solve each inequality separately.
3x−5 < x+9 x+9≤ 5x+13
2x < 14 and −4≤ 4x
x < 7 −1≤ x
Answer: x < 7 and x≥−1. This can be written as: −1≤ x < 7.
281

6.3. Compound Inequalities www.ck12.org
Example 4
Solve the following compound inequalities and graph the solution set.
a) 9−2x≤ 3 or 3x+10≤ 6− x
b) x−26 ≤ 2x−4 or x−2
6 > x+5
Solution
a) Solve each inequality separately:
9−2x≤ 3 3x+10≤ 6− x
−2x≤−6 or 4x≤−4
x≥ 3 x≤−1
Answer: x≥ 3 or x≤−1
b) Solve each inequality separately:
x−26≤ 2x−4
x−26
> x+5
x−2≤ 6(2x−4) x−2 > 6(x+5)
x−2≤ 12x−24 or x−2 > 6x+30
22≤ 11x −32 > 5x
2≤ x −6.4 > x
Answer: x≥ 2 or x <−6.4
The video at http://www.math-videos-online.com/solve-compound-inequality.html shows the process of solving andgraphing compound inequalities in more detail. One thing you may notice in this video is that in the second problem,the two solutions joined with “or” overlap, and so the solution ends up being the set of all real numbers, or (−∞,∞).This happens sometimes with compound inequalities that involve “or”; for example, if the solution to an inequalityended up being “x < 5 or x > 1,” the solution set would be all real numbers. This makes sense if you think about it:all real numbers are either a) less than 5, or b) greater than or equal to 5, and the ones that are greater than or equalto 5 are also greater than 1—so all real numbers are either a) less than 5 or b) greater than 1.
Compound inequalities with “and,” meanwhile, can turn out to have no solutions. For example, the inequality “x < 3and x > 4” has no solutions: no number is both greater than 4 and less than 3. If we write it as 4 < x < 3 it’s evenmore obvious that it has no solutions; 4 < x < 3 implies that 4 < 3, which is false.
282

www.ck12.org Chapter 6. Linear Inequalities
Solve Compound Inequalities Using a Graphing Calculator (TI-83/84 family)
Graphing calculators can show you the solution to an inequality in the form of a graph. This can be especially usefulwhen dealing with compound inequalities.
Example 5
Solve the following inequalities using a graphing calculator.
a) 5x+2(x−3)≥ 2
b) 7x−2 < 10x+1 < 9x+5
c) 3x+2≤ 10 or 3x+2≥ 15
Solution
a) Press the [Y=] button and enter the inequality on the first line of the screen.
(To get the ≥ symbol, press [TEST] [2nd] [MATH] and choose option 4.)
Then press the [GRAPH] button.
Because the calculator uses the number 1 to mean “true” and 0 to mean “false,” you will see a step function with they−value jumping from 0 to 1.
The solution set is the values of x for which the graph shows y = 1—in other words, the set of x−values that makethe inequality true.
283
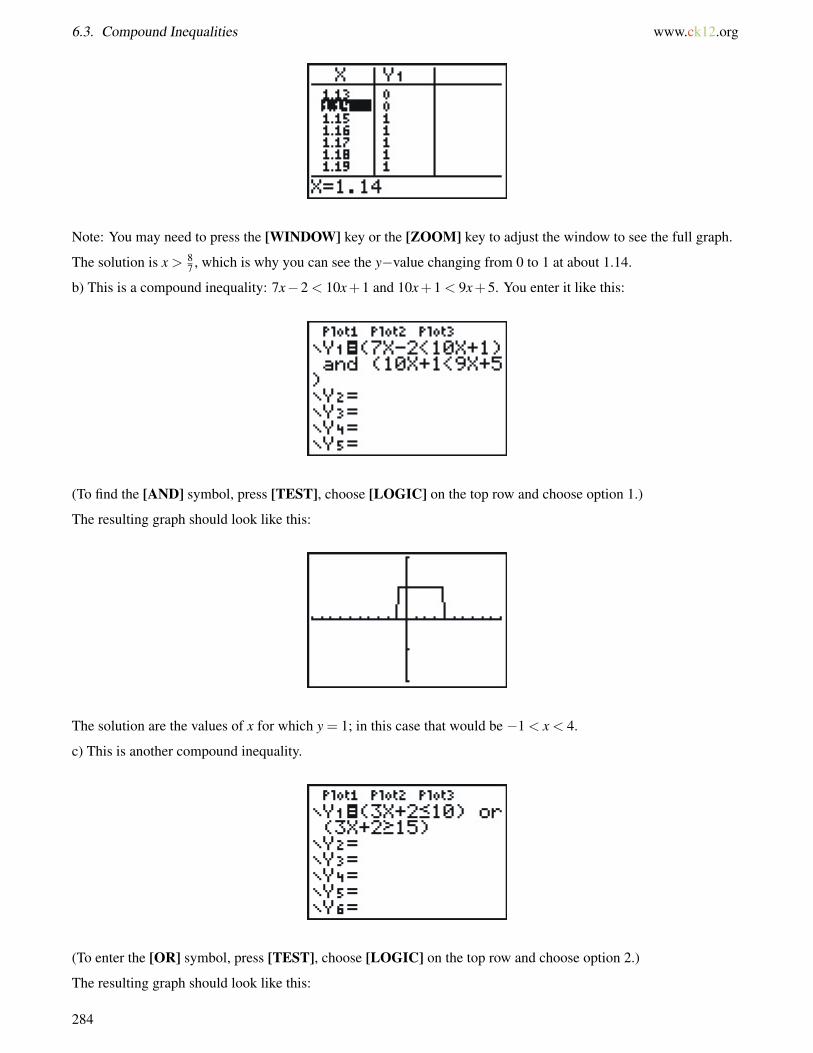
6.3. Compound Inequalities www.ck12.org
Note: You may need to press the [WINDOW] key or the [ZOOM] key to adjust the window to see the full graph.
The solution is x > 87 , which is why you can see the y−value changing from 0 to 1 at about 1.14.
b) This is a compound inequality: 7x−2 < 10x+1 and 10x+1 < 9x+5. You enter it like this:
(To find the [AND] symbol, press [TEST], choose [LOGIC] on the top row and choose option 1.)
The resulting graph should look like this:
The solution are the values of x for which y = 1; in this case that would be −1 < x < 4.
c) This is another compound inequality.
(To enter the [OR] symbol, press [TEST], choose [LOGIC] on the top row and choose option 2.)
The resulting graph should look like this:
284

www.ck12.org Chapter 6. Linear Inequalities
The solution are the values of x for which y = 1–in this case, x≤ 2.7 or x≥ 4.3.
Solve Real-World Problems Using Compound Inequalities
Many application problems require the use of compound inequalities to find the solution.
Example 6
The speed of a golf ball in the air is given by the formula v =−32t+80. When is the ball traveling between 20 ft/secand 30 ft/sec?
Solution
First we set up the inequality 20≤ v≤ 30, and then replace v with the formula v=−32t+80 to get 20≤−32t+80≤30.
Then we separate the compound inequality and solve each separate inequality:
20≤−32t +80 −32t +80≤ 30
32t ≤ 60 and 50≤ 32t
t ≤ 1.875 1.56≤ t
Answer: 1.56≤ t ≤ 1.875
To check the answer, we plug in the minimum and maximum values of t into the formula for the speed.
For t = 1.56, v =−32t +80 =−32(1.56)+80 = 30 f t/sec
For t = 1.875, v =−32t +80 =−32(1.875)+80 = 20 f t/sec
So the speed is between 20 and 30 ft/sec. The answer checks out.
Example 7
William’s pick-up truck gets between 18 to 22 miles per gallon of gasoline. His gas tank can hold 15 gallons ofgasoline. If he drives at an average speed of 40 miles per hour, how much driving time does he get on a full tank ofgas?
Solution
Let t = driving time. We can use dimensional analysis to get from time per tank to miles per gallon:
t hours1 tank
× 1 tank15 gallons
× 40 miles1 hour
× 40t15
milesgallon
Since the truck gets between 18 and 22 miles/gallon, we set up the compound inequality 18 ≤ 40t15 ≤ 22. Then we
separate the compound inequality and solve each inequality separately:
285

6.3. Compound Inequalities www.ck12.org
18≤ 40t15
40t15≤ 22
270≤ 40t and 40t ≤ 330
6.75≤ t t ≤ 8.25
Answer: 6.75≤ t ≤ 8.25.
Andrew can drive between 6.75 and 8.25 hours on a full tank of gas.
If we plug in t = 6.75 we get 40t15 = 40(6.75)
15 = 18 miles per gallon.
If we plug in t = 8.25 we get 40t15 = 40(8.25)
15 = 22 miles per gallon.
The answer checks out.
Lesson Summary
• Compound inequalities combine two or more inequalities with “and” or “or.”• “And” combinations mean that only solutions for both inequalities will be solutions to the compound inequal-
ity.• “Or” combinations mean solutions to either inequality will also be solutions to the compound inequality.
Review Questions
Write the compound inequalities represented by the following graphs.
1.
2.
3.
4.
Solve the following compound inequalities and graph the solution on a number line.
5. −5≤ x−4≤ 136. 1≤ 3x+5≤ 47. −12≤ 2−5x≤ 78. 3
4 ≤ 2x+9≤ 32
9. −2≤ 2x−13 <−1
10. 4x−1≥ 7 or 9x2 < 3
11. 3− x <−4 or 3− x > 1012. 2x+3
4 < 2 or − x5 +3 < 2
513. 2x−7≤−3 or 2x−3 > 1114. 4x+3 < 9 or −5x+4≤−1215. How would you express the answer to problem 5 as a set?16. How would you express the answer to problem 5 as an interval?
286
www.ck12.org Chapter 6. Linear Inequalities
17. How would you express the answer to problem 10 as a set?
1. Could you express the answer to problem 10 as a single interval? Why or why not?2. How would you express the first part of the solution in interval form?3. How would you express the second part of the solution in interval form?
18. Express the answers to problems 1 and 3 in interval notation.19. Express the answers to problems 6 through 9 in interval notation.20. Solve the inequality “x≥−3 or x < 1” and express the answer in interval notation.21. How many solutions does the inequality “x≥ 2 and x≤ 2” have?22. To get a grade of B in her Algebra class, Stacey must have an average grade greater than or equal to 80 and
less than 90. She received the grades of 92, 78, 85 on her first three tests.
a. Between which scores must her grade on the final test fall if she is to receive a grade of B for the class?(Assume all four tests are weighted the same.)
b. What range of scores on the final test would give her an overall grade of C, if a C grade requires anaverage score greater than or equal to 70 and less than 80?
c. If an A grade requires a score of at least 90, and the maximum score on a single test is 100, is it possiblefor her to get an A in this class? (Hint: look again at your answer to part a.)
287
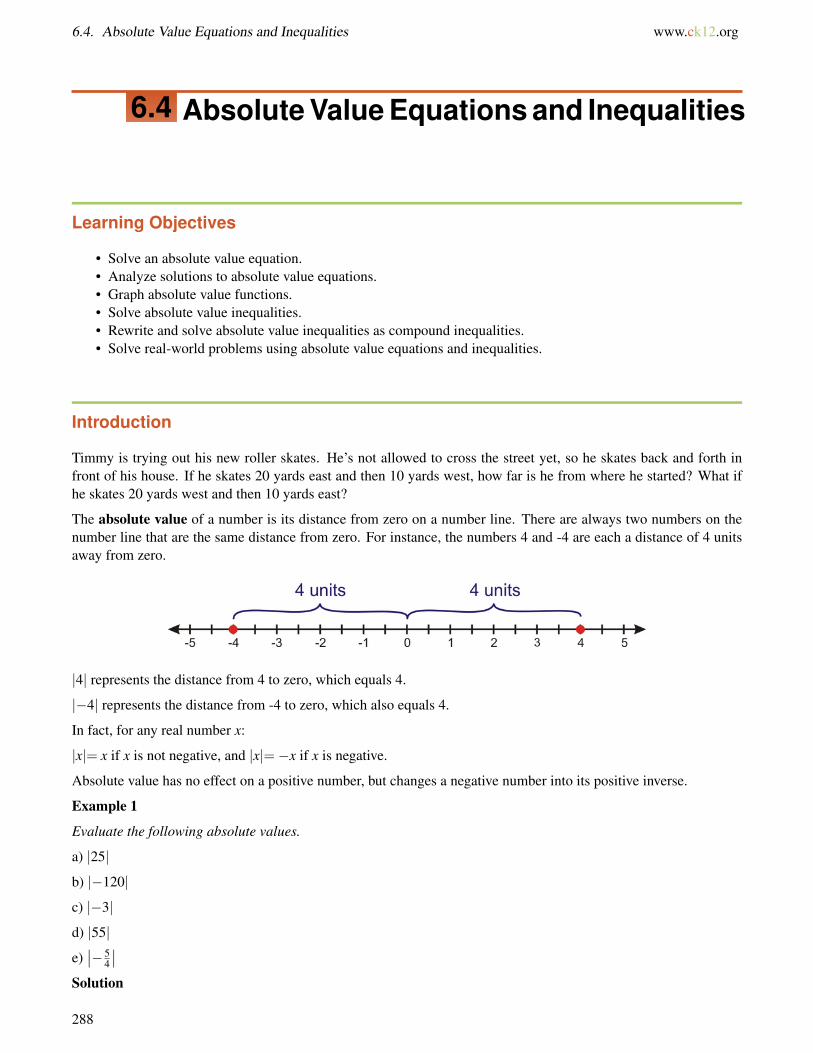
6.4. Absolute Value Equations and Inequalities www.ck12.org
6.4 Absolute Value Equations and Inequalities
Learning Objectives
• Solve an absolute value equation.• Analyze solutions to absolute value equations.• Graph absolute value functions.• Solve absolute value inequalities.• Rewrite and solve absolute value inequalities as compound inequalities.• Solve real-world problems using absolute value equations and inequalities.
Introduction
Timmy is trying out his new roller skates. He’s not allowed to cross the street yet, so he skates back and forth infront of his house. If he skates 20 yards east and then 10 yards west, how far is he from where he started? What ifhe skates 20 yards west and then 10 yards east?
The absolute value of a number is its distance from zero on a number line. There are always two numbers on thenumber line that are the same distance from zero. For instance, the numbers 4 and -4 are each a distance of 4 unitsaway from zero.
|4| represents the distance from 4 to zero, which equals 4.
|−4| represents the distance from -4 to zero, which also equals 4.
In fact, for any real number x:
|x|= x if x is not negative, and |x|=−x if x is negative.
Absolute value has no effect on a positive number, but changes a negative number into its positive inverse.
Example 1
Evaluate the following absolute values.
a) |25|
b) |−120|
c) |−3|
d) |55|
e)∣∣−5
4
∣∣Solution
288

www.ck12.org Chapter 6. Linear Inequalities
a) |25|= 25 Since 25 is a positive number, the absolute value does not change it.
b) |−120|= 120 Since -120 is a negative number, the absolute value makes it positive.
c) |−3|= 3 Since -3 is a negative number, the absolute value makes it positive.
d) |55|= 55 Since 55 is a positive number, the absolute value does not change it.
e)∣∣−5
4
∣∣= 54 Since −5
4 is a negative number, the absolute value makes it positive.
Absolute value is very useful in finding the distance between two points on the number line. The distance betweenany two points a and b on the number line is |a−b| or |b−a|.
For example, the distance from 3 to -1 on the number line is |3− (−1)|= |4|= 4.
We could have also found the distance by subtracting in the opposite order: |−1−3|= |−4|= 4. This makes sensebecause the distance is the same whether you are going from 3 to -1 or from -1 to 3.
Example 2
Find the distance between the following points on the number line.
a) 6 and 15
b) -5 and 8
c) -3 and -12
Solution
Distance is the absolute value of the difference between the two points.
a) distance = |6−15|= |−9|= 9
b) distance = |−5−8|= |−13|= 13
c) distance = |−3− (−12)|= |9|= 9
Remember: When we computed the change in x and the change in y as part of the slope computation, these valueswere positive or negative, depending on the direction of movement. In this discussion, “distance” means a positivedistance only.
Solve an Absolute Value Equation
We now want to solve equations involving absolute values. Consider the following equation:
|x|= 8
This means that the distance from the number x to zero is 8. There are two numbers that satisfy this condition: 8 and-8.
289

6.4. Absolute Value Equations and Inequalities www.ck12.org
When we solve absolute value equations we always consider two possibilities:
1. The expression inside the absolute value sign is not negative.2. The expression inside the absolute value sign is negative.
Then we solve each equation separately.
Example 3
Solve the following absolute value equations.
a) |x|= 3
b) |x|= 10
Solution
a) There are two possibilities: x = 3 and x =−3.
b) There are two possibilities: x = 10 and x =−10.
Analyze Solutions to Absolute Value Equations
Example 4
Solve the equation |x−4|= 5 and interpret the answers.
Solution
We consider two possibilities: the expression inside the absolute value sign is nonnegative or is negative. Then wesolve each equation separately.
x−4 = 5 and x−4 =−5
x = 9 x =−1
x = 9 and x =−1 are the solutions.
The equation |x−4|= 5 can be interpreted as “what numbers on the number line are 5 units away from the number4?” If we draw the number line we see that there are two possibilities: 9 and -1.
Example 5
Solve the equation |x+3|= 2 and interpret the answers.
Solution
Solve the two equations:
x+3 = 2 and x+3 =−2
x =−1 x =−5
290

www.ck12.org Chapter 6. Linear Inequalities
x =−5 and x =−1 are the answers.
The equation |x+3|= 2 can be re-written as: |x− (−3)|= 2. We can interpret this as “what numbers on the numberline are 2 units away from -3?” There are two possibilities: -5 and -1.
Example 6
Solve the equation |2x−7|= 6 and interpret the answers.
Solution
Solve the two equations:
2x−7 = 6 2x−7 =−6
2x = 13 and 2x = 1
x =132
x =12
Answer: x = 132 and x = 1
2 .
The interpretation of this problem is clearer if the equation |2x−7|= 6 is divided by 2 on both sides to get 12 |2x−7|=
3. Because 12 is nonnegative, we can distribute it over the absolute value sign to get
∣∣x− 72
∣∣ = 3. The question thenbecomes “What numbers on the number line are 3 units away from 7
2 ?” There are two answers: 132 and 1
2 .
Graph Absolute Value Functions
Now let’s look at how to graph absolute value functions.
Consider the function y = |x−1|. We can graph this function by making a table of values:
TABLE 6.1:
x y = |x−1|-2 y = |−2−1|= |−3|= 3-1 y = |−1−1|= |−2|= 20 y = |0−1|= |−1|= 11 y = |1−1|= |0|= 02 y = |2−1|= |1|= 13 y = |3−1|= |2|= 24 y = |4−1|= |3|= 3
291

6.4. Absolute Value Equations and Inequalities www.ck12.org
You can see that the graph of an absolute value function makes a big “V”. It consists of two line rays (or linesegments), one with positive slope and one with negative slope, joined at the vertex or cusp.
We’ve already seen that to solve an absolute value equation we need to consider two options:
1. The expression inside the absolute value is not negative.2. The expression inside the absolute value is negative.
Combining these two options gives us the two parts of the graph.
For instance, in the above example, the expression inside the absolute value sign is x− 1. By definition, thisexpression is nonnegative when x− 1 ≥ 0, which is to say when x ≥ 1. When the expression inside the absolutevalue sign is nonnegative, we can just drop the absolute value sign. So for all values of x greater than or equal to 1,the equation is just y = x−1.
On the other hand, when x− 1 < 0 — in other words, when x < 1 — the expression inside the absolute value signis negative. That means we have to drop the absolute value sign but also multiply the expression by -1. So for allvalues of x less than 1, the equation is y =−(x−1), or y =−x+1.
These are both graphs of straight lines, as shown above. They meet at the point where x−1 = 0 — that is, at x = 1.
We can graph absolute value functions by breaking them down algebraically as we just did, or we can graph themusing a table of values. However, when the absolute value equation is linear, the easiest way to graph it is to combinethose two techniques, as follows:
1. Find the vertex of the graph by setting the expression inside the absolute value equal to zero and solving for x.2. Make a table of values that includes the vertex, a value smaller than the vertex, and a value larger than the
vertex. Calculate the corresponding values of y using the equation of the function.3. Plot the points and connect them with two straight lines that meet at the vertex.
Example 7
Graph the absolute value function y = |x+5|.
Solution
Step 1: Find the vertex by solving x+5 = 0. The vertex is at x =−5.
Step 2: Make a table of values:
292

www.ck12.org Chapter 6. Linear Inequalities
TABLE 6.2:
x y = |x+5|-8 y = |−8+5|= |−3|= 3-5 y = |−5+5|= |0|= 0-2 y = |−2+5|= |3|= 3
Step 3: Plot the points and draw two straight lines that meet at the vertex:
Example 8
Graph the absolute value function: y = |3x−12|
Solution
Step 1: Find the vertex by solving 3x−12 = 0. The vertex is at x = 4.
Step 2: Make a table of values:
TABLE 6.3:
x y = |3x−12|0 y = |3(0)−12|= |−12|= 124 y = |3(4)−12|= |0|= 08 y = |3(8)−12|= |12|= 12
Step 3: Plot the points and draw two straight lines that meet at the vertex.
293

6.4. Absolute Value Equations and Inequalities www.ck12.org
Solve Real-World Problems Using Absolute Value Equations
Example 9
A company packs coffee beans in airtight bags. Each bag should weigh 16 ounces, but it is hard to fill each bag tothe exact weight. After being filled, each bag is weighed; if it is more than 0.25 ounces overweight or underweight,it is emptied and repacked. What are the lightest and heaviest acceptable bags?
Solution
The weight of each bag is allowed to be 0.25 ounces away from 16 ounces; in other words, the difference betweenthe bag’s weight and 16 ounces is allowed to be 0.25 ounces. So if x is the weight of a bag in ounces, then theequation that describes this problem is |x−16|= 0.25.
Now we must consider the positive and negative options and solve each equation separately:
x−16 = 0.25 and x−16 =−0.25
x = 16.25 x = 15.75
The lightest acceptable bag weighs 15.75 ounces and the heaviest weighs 16.25 ounces.
We see that 16.25− 16 = 0.25 ounces and 16− 15.75 = 0.25 ounces. The answers are 0.25 ounces bigger andsmaller than 16 ounces respectively.
The answer checks out.
The answer you just found describes the lightest and heaviest acceptable bags of coffee beans. But how do wedescribe the total possible range of acceptable weights? That’s where inequalities become useful once again.
Absolute Value Inequalities
Absolute value inequalities are solved in a similar way to absolute value equations. In both cases, you must considerthe same two options:
1. The expression inside the absolute value is not negative.2. The expression inside the absolute value is negative.
294

www.ck12.org Chapter 6. Linear Inequalities
Then you must solve each inequality separately.
Solve Absolute Value Inequalities
Consider the inequality |x|≤ 3. Since the absolute value of x represents the distance from zero, the solutions to thisinequality are those numbers whose distance from zero is less than or equal to 3. The following graph shows thissolution:
Notice that this is also the graph for the compound inequality −3≤ x≤ 3.
Now consider the inequality |x|> 2. Since the absolute value of x represents the distance from zero, the solutionsto this inequality are those numbers whose distance from zero are more than 2. The following graph shows thissolution.
Notice that this is also the graph for the compound inequality x <−2 or x > 2.
Example 1
Solve the following inequalities and show the solution graph.
a) |x|< 5
b) |x|≥ 2.5
Solution
a) |x|< 5 represents all numbers whose distance from zero is less than 5.
This answer can be written as “−5 < x < 5”.
b) |x|≥ 2.5 represents all numbers whose distance from zero is more than or equal to 2.5
This answer can be written as “x≤−2.5 or x≥ 2.5”.
Rewrite and Solve Absolute Value Inequalities as Compound Inequalities
In the last section you saw that absolute value inequalities are compound inequalities.
Inequalities of the type |x|< a can be rewritten as “−a < x < a”.
Inequalities of the type |x|> b can be rewritten as “x <−b or x > b.”
295

6.4. Absolute Value Equations and Inequalities www.ck12.org
To solve an absolute value inequality, we separate the expression into two inequalities and solve each of themindividually.
Example 2
Solve the inequality |x−3|< 7 and show the solution graph.
Solution
Re-write as a compound inequality: −7 < x−3 < 7
Write as two separate inequalities: x−3 < 7 and x−3 >−7
Solve each inequality: x < 10 and x >−4
Re-write solution: −4 < x < 10
The solution graph is
We can think of the question being asked here as “What numbers are within 7 units of 3?”; the answer can then beexpressed as “All the numbers between -4 and 10.”
Example 3
Solve the inequality |4x+5|≤ 13 and show the solution graph.
Solution
Re-write as a compound inequality: −13≤ 4x+5≤ 13
Write as two separate inequalities: 4x+5≤ 13 and 4x+5≥−13
Solve each inequality: 4x≤ 8 and 4x≥−18
x≤ 2 and x≥−92
Re-write solution: −92 ≤ x≤ 2
The solution graph is
Example 4
Solve the inequality |x+12|> 2 and show the solution graph.
Solution
Re-write as a compound inequality: x+12 <−2 or x+12 > 2
Solve each inequality: x <−14 or x >−10
The solution graph is
Example 5
Solve the inequality |8x−15|≥ 9 and show the solution graph.
Solution
Re-write as a compound inequality: 8x−15≤−9 or 8x−15≥ 9
296

www.ck12.org Chapter 6. Linear Inequalities
Solve each inequality: 8x≤ 6 or 8x≥ 24
x≤ 34 or x≥ 3
The solution graph is
Solve Real-World Problems Using Absolute Value Inequalities
Absolute value inequalities are useful in problems where we are dealing with a range of values.
Example 6
The velocity of an object is given by the formula v = 25t−80, where the time is expressed in seconds and the velocityis expressed in feet per second. Find the times for which the magnitude of the velocity is greater than or equal to 60feet per second.
Solution
The magnitude of the velocity is the absolute value of the velocity. If the velocity is 25t−80 feet per second, thenits magnitude is |25t−80| feet per second. We want to find out when that magnitude is greater than or equal to 60,so we need to solve |25t−80|≥ 60 for t.
First we have to split it up: 25t−80≥ 60 or 25t−80≤−60
Then solve: 25t ≥ 140 or 25t ≤ 20
t ≥ 5.6 or t ≤ 0.8
The magnitude of the velocity is greater than 60 ft/sec for times less than 0.8 seconds and for times greater than5.6 seconds.
When t = 0.8 seconds, v = 25(0.8)− 80 = −60 f t/sec. The magnitude of the velocity is 60 ft/sec. (The negativesign in the answer means that the object is moving backwards.)
When t = 5.6 seconds, v = 25(5.6)−80 = 60 f t/sec.
To find where the magnitude of the velocity is greater than 60 ft/sec, check some arbitrary values in each of thefollowing time intervals: t ≤ 0.8, 0.8≤ t ≤ 5.6 and t ≥ 5.6.
Check t = 0.5 : v = 25(0.5)−80 =−67.5 f t/sec
Check t = 2 : v = 25(2)−80 =−30 f t/sec
Check t = 6 : v = 25(6)−80 =−70 f t/sec
You can see that the magnitude of the velocity is greater than 60 ft/sec only when t ≥ 5.6 or when t ≤ 0.8.
The answer checks out.
Further Resources
For a multimedia presentation on absolute value equations and inequalities, see http://www.teachertube.com/viewVideo.php?video_id=124516.
297
6.4. Absolute Value Equations and Inequalities www.ck12.org
Lesson Summary
• The absolute value of a number is its distance from zero on a number line.• |x|= x if x is not negative, and |x|=−x if x is negative.• An equation or inequality with an absolute value in it splits into two equations, one where the expression
inside the absolute value sign is positive and one where it is negative. When the expression within the absolutevalue is positive, then the absolute value signs do nothing and can be omitted. When the expression withinthe absolute value is negative, then the expression within the absolute value signs must be negated beforeremoving the signs.
• Inequalities of the type |x|< a can be rewritten as “−a < x < a.”• Inequalities of the type |x|> b can be rewritten as “x <−b or x > b.”
Review Questions
Evaluate the absolute values.
1. |250|2. |−12|3.∣∣−2
5
∣∣4.∣∣ 1
10
∣∣Find the distance between the points.
5. 12 and -116. 5 and 227. -9 and -188. -2 and 3
Solve the absolute value equations and interpret the results by graphing the solutions on the number line.
9. |x−5|= 1010. |x+2|= 611. |5x−2|= 312. |x−4|=−3
Graph the absolute value functions.
13. y = |x+3|14. y = |x−6|15. y = |4x+2|16. y =
∣∣ x3 −4
∣∣Solve the following inequalities and show the solution graph.
13. |x|≤ 614. |x|> 3.515. |x|< 1216. |x|> 10
298

www.ck12.org Chapter 6. Linear Inequalities
17. |7x|≥ 2118. |x−5|> 819. |x+7|< 320.
∣∣x− 34
∣∣≤ 12
21. |2x−5|≥ 1322. |5x+3|< 723.
∣∣ x3 −4
∣∣≤ 224.
∣∣2x7 +9
∣∣> 57
1. How many solutions does the inequality |x|≤ 0 have?2. How about the inequality |x|≥ 0?
25. A company manufactures rulers. Their 12-inch rulers pass quality control if they are within 132 inches of the
ideal length. What is the longest and shortest ruler that can leave the factory?26. A three month old baby boy weighs an average of 13 pounds. He is considered healthy if he is at most 2.5
lbs. more or less than the average weight. Find the weight range that is considered healthy for three monthold boys.
299

6.5. Linear Inequalities in Two Variables www.ck12.org
6.5 Linear Inequalities in Two Variables
Learning Objectives
• Graph linear inequalities in one variable on the coordinate plane.• Graph linear inequalities in two variables.• Solve real-world problems using linear inequalities.
Introduction
Yasmeen is selling handmade bracelets for $5 each and necklaces for $7 each. How many of both does she need tosell to make at least $100?
A linear inequality in two variables takes the form y > mx+b or y < mx+b. Linear inequalities are closely relatedto graphs of straight lines; recall that a straight line has the equation y = mx+b.
When we graph a line in the coordinate plane, we can see that it divides the plane in half:
The solution to a linear inequality includes all the points in one half of the plane. We can tell which half by lookingat the inequality sign:
>The solution set is the half plane above the line.
≥ The solution set is the half plane above the line and also all the points on the line.
<The solution set is the half plane below the line.
≤ The solution set is the half plane below the line and also all the points on the line.
For a strict inequality, we draw a dashed line to show that the points in the line are not part of the solution. Foran inequality that includes the equals sign, we draw a solid line to show that the points on the line are part of thesolution.
300
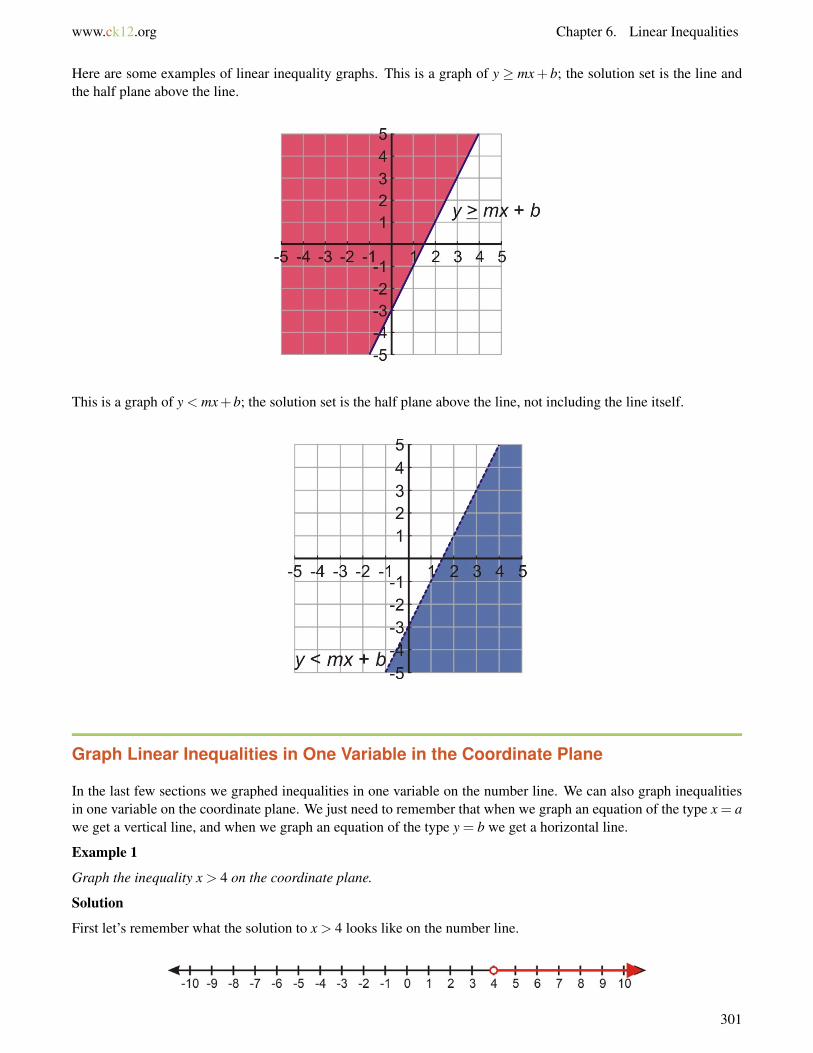
www.ck12.org Chapter 6. Linear Inequalities
Here are some examples of linear inequality graphs. This is a graph of y ≥ mx+ b; the solution set is the line andthe half plane above the line.
This is a graph of y < mx+b; the solution set is the half plane above the line, not including the line itself.
Graph Linear Inequalities in One Variable in the Coordinate Plane
In the last few sections we graphed inequalities in one variable on the number line. We can also graph inequalitiesin one variable on the coordinate plane. We just need to remember that when we graph an equation of the type x = awe get a vertical line, and when we graph an equation of the type y = b we get a horizontal line.
Example 1
Graph the inequality x > 4 on the coordinate plane.
Solution
First let’s remember what the solution to x > 4 looks like on the number line.
301

6.5. Linear Inequalities in Two Variables www.ck12.org
The solution to this inequality is the set of all real numbers x that are bigger than 4, not including 4. The solution isrepresented by a line.
In two dimensions, the solution still consists of all the points to the right of x = 4, but for all possible y−values aswell. This solution is represented by the half plane to the right of x = 4. (You can think of it as being like the solutiongraphed on the number line, only stretched out vertically.)
The line x = 4 is dashed because the equals sign is not included in the inequality, meaning that points on the line arenot included in the solution.
Example 2
Graph the inequality |x|≥ 2.
Solution
The absolute value inequality |x|≥ 2 can be re-written as a compound inequality:
x≤−2 or x≥ 2
In other words, the solution is all the coordinate points for which the value of x is smaller than or equal to -2 orgreater than or equal to 2. The solution is represented by the plane to the left of the vertical line x = −2 and theplane to the right of line x = 2.
302

www.ck12.org Chapter 6. Linear Inequalities
Both vertical lines are solid because points on the lines are included in the solution.
Example 3
Graph the inequality |y|< 5
Solution
The absolute value inequality |y|< 5 can be re-written as −5 < y < 5. This is a compound inequality which can beexpressed as
y >−5 and y < 5
In other words, the solution is all the coordinate points for which the value of y is larger than -5 and smaller than 5.The solution is represented by the plane between the horizontal lines y =−5 and y = 5.
Both horizontal lines are dashed because points on the lines are not included in the solution.
Graph Linear Inequalities in Two Variables
The general procedure for graphing inequalities in two variables is as follows:
1. Re-write the inequality in slope-intercept form: y = mx+b. Writing the inequality in this form lets you knowthe direction of the inequality.
2. Graph the line of the equation y = mx+ b using your favorite method (plotting two points, using slope andy−intercept, using y−intercept and another point, or whatever is easiest). Draw the line as a dashed line if theequals sign is not included and a solid line if the equals sign is included.
3. Shade the half plane above the line if the inequality is “greater than.” Shade the half plane under the line if theinequality is “less than.”
Example 4
Graph the inequality y≥ 2x−3.
Solution
The inequality is already written in slope-intercept form, so it’s easy to graph. First we graph the line y = 2x− 3;then we shade the half-plane above the line. The line is solid because the inequality includes the equals sign.
303

6.5. Linear Inequalities in Two Variables www.ck12.org
Example 5
Graph the inequality 5x−2y > 4.
Solution
First we need to rewrite the inequality in slope-intercept form:
−2y >−5x+4
y <52
x−2
Notice that the inequality sign changed direction because we divided by a negative number.
To graph the equation, we can make a table of values:
TABLE 6.4:
x y-2 5
2(−2)−2 =−70 5
2(0)−2 =−22 5
2(2)−2 = 3
After graphing the line, we shade the plane below the line because the inequality in slope-intercept form is less than.The line is dashed because the inequality does not include an equals sign.
304

www.ck12.org Chapter 6. Linear Inequalities
Solve Real-World Problems Using Linear Inequalities
In this section, we see how linear inequalities can be used to solve real-world applications.
Example 8
A retailer sells two types of coffee beans. One type costs $9 per pound and the other type costs $7 per pound. Findall the possible amounts of the two different coffee beans that can be mixed together to get a quantity of coffee beanscosting $8.50 or less.
Solution
Let x = weight of $9 per pound coffee beans in pounds.
Let y = weight of $7 per pound coffee beans in pounds.
The cost of a pound of coffee blend is given by 9x+7y.
We are looking for the mixtures that cost $8.50 or less. We write the inequality 9x+7y≤ 8.50.
Since this inequality is in standard form, it’s easiest to graph it by finding the x− and y−intercepts. When x = 0, wehave 7y = 8.50 or y = 8.50
7 ≈ 1.21. When y = 0, we have 9x = 8.50 or x = 8.509 ≈ 0.94. We can then graph the line
that includes those two points.
Now we have to figure out which side of the line to shade. In y−intercept form, we shade the area below the linewhen the inequality is “less than.” But in standard form that’s not always true. We could convert the inequality toy−intercept form to find out which side to shade, but there is another way that can be easier.
The other method, which works for any linear inequality in any form, is to plug a random point into the inequalityand see if it makes the inequality true. Any point that’s not on the line will do; the point (0, 0) is usually the mostconvenient.
In this case, plugging in 0 for x and y would give us 9(0)+7(0)≤ 8.50, which is true. That means we should shadethe half of the plane that includes (0, 0). If plugging in (0, 0) gave us a false inequality, that would mean that thesolution set is the part of the plane that does not contain (0, 0).
305

6.5. Linear Inequalities in Two Variables www.ck12.org
Notice also that in this graph we show only the first quadrant of the coordinate plane. That’s because weight valuesin the real world are always nonnegative, so points outside the first quadrant don’t represent real-world solutions tothis problem.
Example 9
Julius has a job as an appliance salesman. He earns a commission of $60 for each washing machine he sells and$130 for each refrigerator he sells. How many washing machines and refrigerators must Julius sell in order to make$1000 or more in commissions?
Solution
Let x = number of washing machines Julius sells.
Let y = number of refrigerators Julius sells.
The total commission is 60x+130y.
We’re looking for a total commission of $1000 or more, so we write the inequality 60x+130y≥ 1000.
Once again, we can do this most easily by finding the x− and y−intercepts. When x = 0, we have 130y = 1000, ory = 1000
30 ≈ 7.69. When y = 0, we have 60x = 1000, or x = 100060 ≈ 16.67.
We draw a solid line connecting those points, and shade above the line because the inequality is “greater than.” Wecan check this by plugging in the point (0, 0): selling 0 washing machines and 0 refrigerators would give Julius acommission of $0, which is not greater than or equal to $1000, so the point (0, 0) is not part of the solution; instead,we want to shade the side of the line that does not include it.
306

www.ck12.org Chapter 6. Linear Inequalities
Notice also that we show only the first quadrant of the coordinate plane, because Julius’s commission should benonnegative.
The video at http://www.youtube.com/watch?v=7629PsZLP1A&feature=related contains more examples of real-world problems using inequalities in two variables.
Review Questions
Graph the following inequalities on the coordinate plane.
1. x < 202. y≥−53. |x|> 104. |y|≤ 75. y≤ 4x+36. y >− x
2 −67. 3x−4y≥ 128. x+7y < 59. 6x+5y > 1
10. y+5≤−4x+1011. x− 1
2 y≥ 512. 6x+ y < 2013. 30x+5y < 10014. Remember what you learned in the last chapter about families of lines.
a. What do the graphs of y > x+2 and y < x+5 have in common?b. What do you think the graph of x+2 < y < x+5 would look like?
15. How would the answer to problem 6 change if you subtracted 2 from the right-hand side of the inequality?16. How would the answer to problem 7 change if you added 12 to the right-hand side?17. How would the answer to problem 8 change if you flipped the inequality sign?18. A phone company charges 50 cents per minute during the daytime and 10 cents per minute at night. How
many daytime minutes and nighttime minutes could you use in one week if you wanted to pay less than $20?19. Suppose you are graphing the inequality y > 5x.
a. Why can’t you plug in the point (0, 0) to tell you which side of the line to shade?b. What happens if you do plug it in?c. Try plugging in the point (0, 1) instead. Now which side of the line should you shade?
20. A theater wants to take in at least $2000 for a certain matinee. Children’s tickets cost $5 each and adult ticketscost $10 each.
a. If x represents the number of adult tickets sold and y represents the number of children’s tickets, writean inequality describing the number of tickets that will allow the theater to meet their minimum take.
b. If 100 children’s tickets and 100 adult tickets have already been sold, what inequality describes howmany more tickets of both types the theater needs to sell?
c. If the theater has only 300 seats (so only 100 are still available), what inequality describes the maximumnumber of additional tickets of both types the theater can sell?
307

6.5. Linear Inequalities in Two Variables www.ck12.org
Texas Instruments Resources
In the CK-12 Texas Instruments Algebra I FlexBook, there are graphing calculator activities designed to supple-ment the objectives for some of the lessons in this chapter. See http://www.ck12.org/flexr/chapter/9616.
308

www.ck12.org Chapter 7. Solving Systems of Equations and Inequalities
CHAPTER 7 Solving Systems ofEquations and Inequalities
Chapter Outline7.1 LINEAR SYSTEMS BY GRAPHING
7.2 SOLVING LINEAR SYSTEMS BY SUBSTITUTION
7.3 SOLVING LINEAR SYSTEMS BY ELIMINATION
7.4 SPECIAL TYPES OF LINEAR SYSTEMS
7.5 SYSTEMS OF LINEAR INEQUALITIES
309

7.1. Linear Systems by Graphing www.ck12.org
7.1 Linear Systems by Graphing
Learning Objectives
• Determine whether an ordered pair is a solution to a system of equations.• Solve a system of equations graphically.• Solve a system of equations graphically with a graphing calculator.• Solve word problems using systems of equations.
Introduction
In this lesson, we’ll discover methods to determine if an ordered pair is a solution to a system of two equations.Then we’ll learn to solve the two equations graphically and confirm that the solution is the point where the two linesintersect. Finally, we’ll look at real-world problems that can be solved using the methods described in this chapter.
Determine Whether an Ordered Pair is a Solution to a System of Equations
A linear system of equations is a set of equations that must be solved together to find the one solution that fits themboth.
Consider this system of equations:
y = x+2
y =−2x+1
Since the two lines are in a system, we deal with them together by graphing them on the same coordinate axes. Wecan use any method to graph them; let’s do it by making a table of values for each line.
Line 1: y = x+2
TABLE 7.1:
x y0 21 3
Line 2: y =−2x+1
310

www.ck12.org Chapter 7. Solving Systems of Equations and Inequalities
TABLE 7.2:
x y0 11 -1
We already know that any point that lies on a line is a solution to the equation for that line. That means that anypoint that lies on both lines in a system is a solution to both equations.
So in this system:
• Point A is not a solution to the system because it does not lie on either of the lines.• Point B is not a solution to the system because it lies only on the blue line but not on the red line.• Point C is a solution to the system because it lies on both lines at the same time.
In fact, point C is the only solution to the system, because it is the only point that lies on both lines. For a systemof equations, the geometrical solution is the intersection of the two lines in the system. The algebraic solution is theordered pair that solves both equations—in other words, the coordinates of that intersection point.
You can confirm the solution by plugging it into the system of equations, and checking that the solution works ineach equation.
Example 1
Determine which of the points (1, 3), (0, 2), or (2, 7) is a solution to the following system of equations:
y = 4x−1
y = 2x+3
Solution
To check if a coordinate point is a solution to the system of equations, we plug each of the x and y values into theequations to see if they work.
Point (1, 3):
311

7.1. Linear Systems by Graphing www.ck12.org
y = 4x−1
3 ? = ? 4(1)−1
3 = 3 solution checks
y = 2x+3
3 ? = ? 2(1)+3
3 6= 5 solution does not check
Point (1, 3) is on the line y = 4x−1, but it is not on the line y = 2x+3, so it is not a solution to the system.
Point (0, 2):
y = 4x−1
2 ? = ? 4(0)−1
2 6=−1 solution does not check
Point (0, 2) is not on the line y = 4x−1, so it is not a solution to the system. Note that it is not necessary to checkthe second equation because the point needs to be on both lines for it to be a solution to the system.
Point (2, 7):
y = 4x−1
7 ? = ? 4(2)−1
7 = 7 solution checks
y = 2x+3
7 ? = ? 2(2)+3
7 = 7 solution checks
Point (2, 7) is a solution to the system since it lies on both lines.
The solution to the system is the point (2, 7).
Determine the Solution to a Linear System by Graphing
The solution to a linear system of equations is the point, (if there is one) that lies on both lines. In other words, thesolution is the point where the two lines intersect.
We can solve a system of equations by graphing the lines on the same coordinate plane and reading the intersectionpoint from the graph.
This method most often offers only approximate solutions, so it’s not sufficient when you need an exact answer.However, graphing the system of equations can be a good way to get a sense of what’s really going on in theproblem you’re trying to solve, especially when it’s a real-world problem.
312

www.ck12.org Chapter 7. Solving Systems of Equations and Inequalities
Example 2
Solve the following system of equations by graphing:
y = 3x−5
y =−2x+5
Solution
Graph both lines on the same coordinate axis using any method you like.
In this case, let’s make a table of values for each line.
Line 1: y = 3x−5
TABLE 7.3:
x y1 -22 1
Line 2: y =−2x+5
TABLE 7.4:
x y1 32 1
The solution to the system is given by the intersection point of the two lines. The graph shows that the lines intersectat point (2, 1). So the solution is x = 2,y = 1or (2, 1).
Example 3
Solve the following system of equations by graphing:
2x+3y = 6
4x− y =−2
313
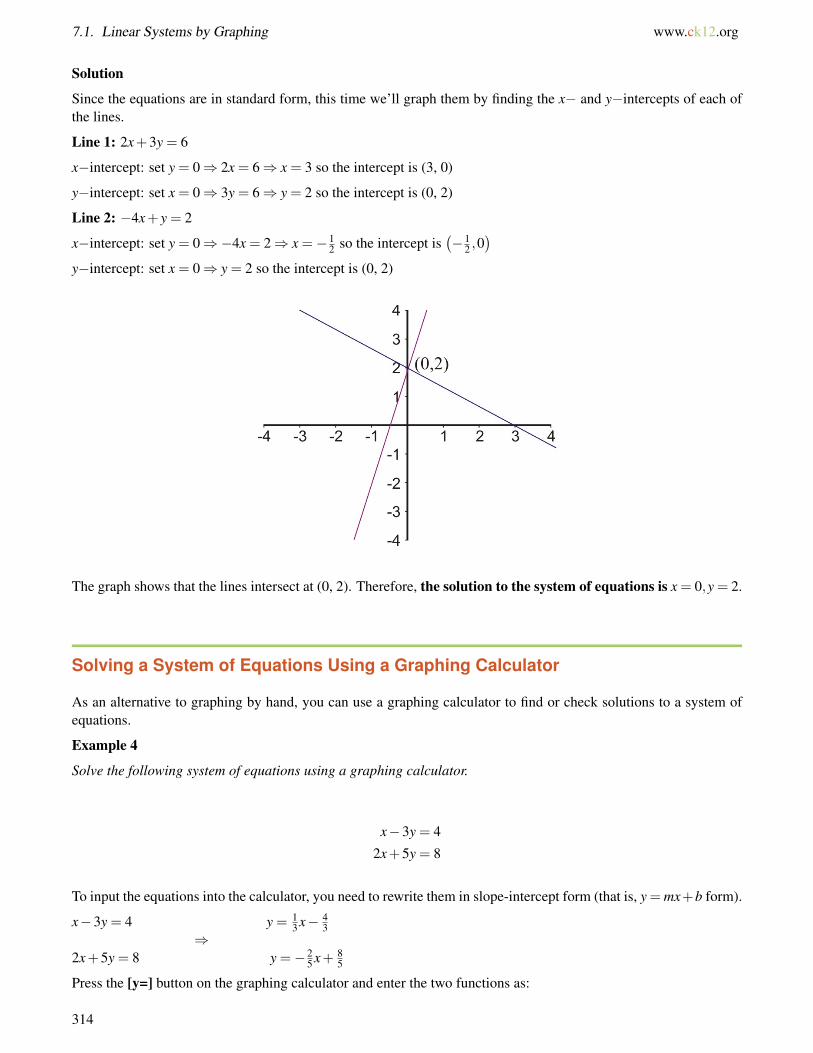
7.1. Linear Systems by Graphing www.ck12.org
Solution
Since the equations are in standard form, this time we’ll graph them by finding the x− and y−intercepts of each ofthe lines.
Line 1: 2x+3y = 6
x−intercept: set y = 0⇒ 2x = 6⇒ x = 3 so the intercept is (3, 0)
y−intercept: set x = 0⇒ 3y = 6⇒ y = 2 so the intercept is (0, 2)
Line 2: −4x+ y = 2
x−intercept: set y = 0⇒−4x = 2⇒ x =−12 so the intercept is
(−1
2 ,0)
y−intercept: set x = 0⇒ y = 2 so the intercept is (0, 2)
The graph shows that the lines intersect at (0, 2). Therefore, the solution to the system of equations is x = 0,y = 2.
Solving a System of Equations Using a Graphing Calculator
As an alternative to graphing by hand, you can use a graphing calculator to find or check solutions to a system ofequations.
Example 4
Solve the following system of equations using a graphing calculator.
x−3y = 4
2x+5y = 8
To input the equations into the calculator, you need to rewrite them in slope-intercept form (that is, y = mx+b form).
x−3y = 4 y = 13 x− 4
3⇒
2x+5y = 8 y =−25 x+ 8
5
Press the [y=] button on the graphing calculator and enter the two functions as:
314
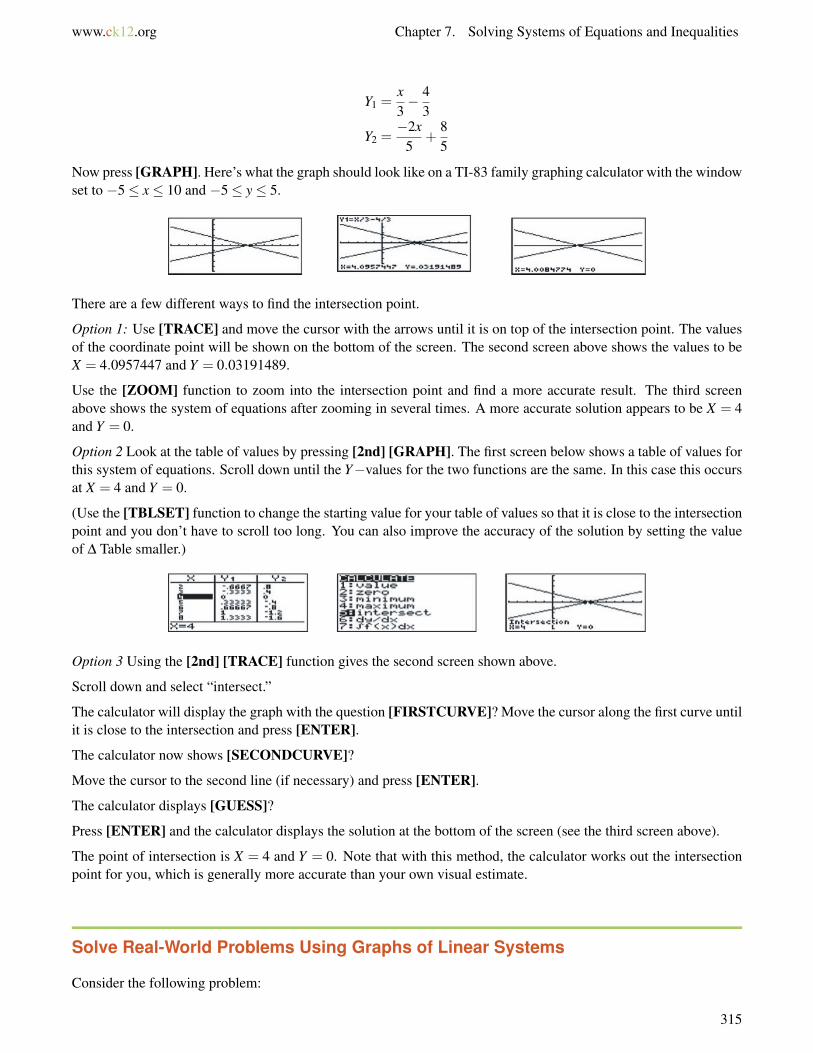
www.ck12.org Chapter 7. Solving Systems of Equations and Inequalities
Y1 =x3− 4
3
Y2 =−2x
5+
85
Now press [GRAPH]. Here’s what the graph should look like on a TI-83 family graphing calculator with the windowset to −5≤ x≤ 10 and −5≤ y≤ 5.
There are a few different ways to find the intersection point.
Option 1: Use [TRACE] and move the cursor with the arrows until it is on top of the intersection point. The valuesof the coordinate point will be shown on the bottom of the screen. The second screen above shows the values to beX = 4.0957447 and Y = 0.03191489.
Use the [ZOOM] function to zoom into the intersection point and find a more accurate result. The third screenabove shows the system of equations after zooming in several times. A more accurate solution appears to be X = 4and Y = 0.
Option 2 Look at the table of values by pressing [2nd] [GRAPH]. The first screen below shows a table of values forthis system of equations. Scroll down until the Y−values for the two functions are the same. In this case this occursat X = 4 and Y = 0.
(Use the [TBLSET] function to change the starting value for your table of values so that it is close to the intersectionpoint and you don’t have to scroll too long. You can also improve the accuracy of the solution by setting the valueof ∆ Table smaller.)
Option 3 Using the [2nd] [TRACE] function gives the second screen shown above.
Scroll down and select “intersect.”
The calculator will display the graph with the question [FIRSTCURVE]? Move the cursor along the first curve untilit is close to the intersection and press [ENTER].
The calculator now shows [SECONDCURVE]?
Move the cursor to the second line (if necessary) and press [ENTER].
The calculator displays [GUESS]?
Press [ENTER] and the calculator displays the solution at the bottom of the screen (see the third screen above).
The point of intersection is X = 4 and Y = 0. Note that with this method, the calculator works out the intersectionpoint for you, which is generally more accurate than your own visual estimate.
Solve Real-World Problems Using Graphs of Linear Systems
Consider the following problem:
315
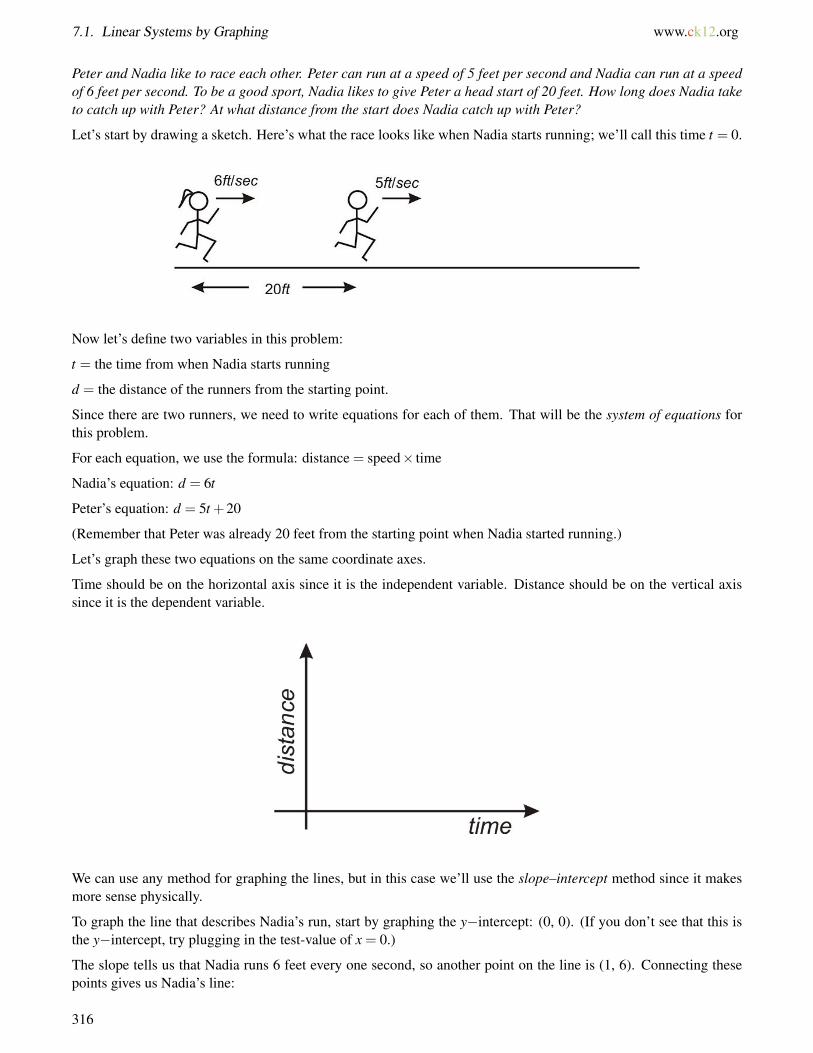
7.1. Linear Systems by Graphing www.ck12.org
Peter and Nadia like to race each other. Peter can run at a speed of 5 feet per second and Nadia can run at a speedof 6 feet per second. To be a good sport, Nadia likes to give Peter a head start of 20 feet. How long does Nadia taketo catch up with Peter? At what distance from the start does Nadia catch up with Peter?
Let’s start by drawing a sketch. Here’s what the race looks like when Nadia starts running; we’ll call this time t = 0.
Now let’s define two variables in this problem:
t = the time from when Nadia starts running
d = the distance of the runners from the starting point.
Since there are two runners, we need to write equations for each of them. That will be the system of equations forthis problem.
For each equation, we use the formula: distance = speed× time
Nadia’s equation: d = 6t
Peter’s equation: d = 5t +20
(Remember that Peter was already 20 feet from the starting point when Nadia started running.)
Let’s graph these two equations on the same coordinate axes.
Time should be on the horizontal axis since it is the independent variable. Distance should be on the vertical axissince it is the dependent variable.
We can use any method for graphing the lines, but in this case we’ll use the slope–intercept method since it makesmore sense physically.
To graph the line that describes Nadia’s run, start by graphing the y−intercept: (0, 0). (If you don’t see that this isthe y−intercept, try plugging in the test-value of x = 0.)
The slope tells us that Nadia runs 6 feet every one second, so another point on the line is (1, 6). Connecting thesepoints gives us Nadia’s line:
316
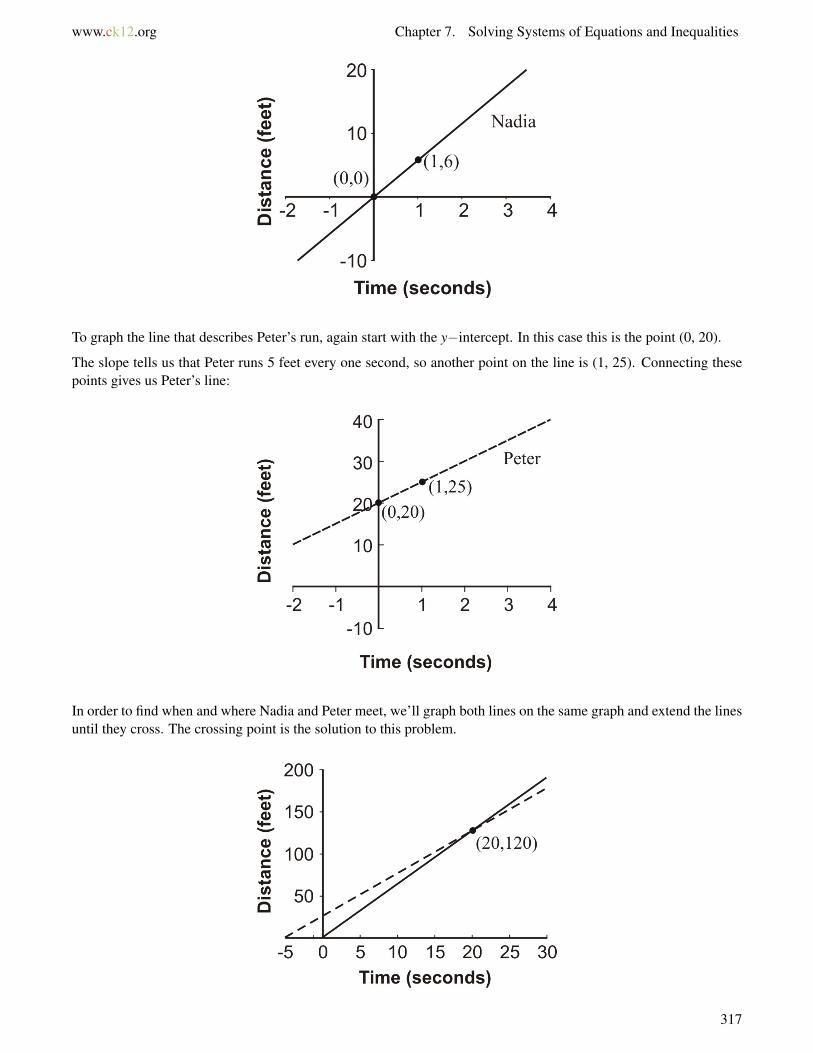
www.ck12.org Chapter 7. Solving Systems of Equations and Inequalities
To graph the line that describes Peter’s run, again start with the y−intercept. In this case this is the point (0, 20).
The slope tells us that Peter runs 5 feet every one second, so another point on the line is (1, 25). Connecting thesepoints gives us Peter’s line:
In order to find when and where Nadia and Peter meet, we’ll graph both lines on the same graph and extend the linesuntil they cross. The crossing point is the solution to this problem.
317

7.1. Linear Systems by Graphing www.ck12.org
The graph shows that Nadia and Peter meet 20 seconds after Nadia starts running, and 120 feet from the startingpoint.
These examples are great at demonstrating that the solution to a system of linear equations means the point at whichthe lines intersect. This is, in fact, the greatest strength of the graphing method because it offers a very visualrepresentation of system of equations and its solution. You can also see, though, that finding the solution from agraph requires very careful graphing of the lines, and is really only practical when you’re sure that the solution givesinteger values for x and y. Usually, this method can only offer approximate solutions to systems of equations, so weneed to use other methods to get an exact solution.
Review Questions
Determine which ordered pair satisfies the system of linear equations.
1. y = 3x−2y =−x
a. (1, 4)b. (2, 9)c.(1
2 ,−12
)2. y = 2x−3
y = x+5
a. (8, 13)b. (-7, 6)c. (0, 4)
3. 2x+ y = 85x+2y = 10
a. (-9, 1)b. (-6, 20)c. (14, 2)
4. 3x+2y = 6y = 1
2 x−3
a.(3, −3
2
)b. (-4, 3)c.(1
2 ,4)
5. 2x− y = 103x+ y =−5
a. (4, -2)b. (1, -8)c. (-2, 5)
Solve the following systems using the graphing method.
6. y = x+3y =−x+3
7. y = 3x−6y =−x+6
318

www.ck12.org Chapter 7. Solving Systems of Equations and Inequalities
8. 2x = 4y =−3
9. y =−x+5− x+ y = 1
10. x+2y = 85x+2y = 0
11. 3x+2y = 124x− y = 5
12. 5x+2y =−4x− y = 2
13. 2x+4 = 3yx−2y+4 = 0
14. y = 12 x−3
2x−5y = 515. y = 4
x = 8−3y16. Try to solve the following system using the graphing method: y = 3
5 x+5y =−2x− 1
2 .
a. What does it look like the x−coordinate of the solution should be?b. Does that coordinate really give the same y−value when you plug it into both equations?c. Why is it difficult to find the real solution to this system?
17. Try to solve the following system using the graphing method: y = 4x+8y = 5x+1. Use a grid with x−values and y−values ranging from -10 to 10.
a. Do these lines appear to intersect?b. Based on their equations, are they parallel?c. What would we have to do to find their intersection point?
18. Try to solve the following system using the graphing method: y = 12 x+4
y = 49 x+ 9
2 . Use the same grid as before.
a. Can you tell exactly where the lines cross?b. What would we have to do to make it clearer?
Solve the following problems by using the graphing method.
19. Mary’s car has broken down and it will cost her $1200 to get it fixed—or, for $4500, she can buy a new, moreefficient car instead. Her present car uses about $2000 worth of gas per year, while gas for the new car wouldcost about $1500 per year. After how many years would the total cost of fixing the car equal the total cost ofreplacing it?
20. Juan is considering two cell phone plans. The first company charges $120 for the phone and $30 per monthfor the calling plan that Juan wants. The second company charges $40 for the same phone but charges $45 permonth for the calling plan that Juan wants. After how many months would the total cost of the two plans bethe same?
21. A tortoise and hare decide to race 30 feet. The hare, being much faster, decides to give the tortoise a 20 foothead start. The tortoise runs at 0.5 feet/sec and the hare runs at 5.5 feet per second. How long until the harecatches the tortoise?
319

7.2. Solving Linear Systems by Substitution www.ck12.org
7.2 Solving Linear Systems by Substitution
Learning Objectives
• Solve systems of equations with two variables by substituting for either variable.• Manipulate standard form equations to isolate a single variable.• Solve real-world problems using systems of equations.• Solve mixture problems using systems of equations.
Introduction
In this lesson, we’ll learn to solve a system of two equations using the method of substitution.
Solving Linear Systems Using Substitution of Variable Expressions
Let’s look again at the problem about Peter and Nadia racing.
Peter and Nadia like to race each other. Peter can run at a speed of 5 feet per second and Nadia can run at a speedof 6 feet per second. To be a good sport, Nadia likes to give Peter a head start of 20 feet. How long does Nadia taketo catch up with Peter? At what distance from the start does Nadia catch up with Peter?
In that example we came up with two equations:
Nadia’s equation: d = 6t
Peter’s equation: d = 5t +20
Each equation produced its own line on a graph, and to solve the system we found the point at which the linesintersected—the point where the values for d and t satisfied both relationships. When the values for d and t areequal, that means that Peter and Nadia are at the same place at the same time.
But there’s a faster way than graphing to solve this system of equations. Since we want the value of d to be thesame in both equations, we could just set the two right-hand sides of the equations equal to each other to solve fort. That is, if d = 6t and d = 5t +20, and the two d’s are equal to each other, then by the transitive property we have6t = 5t +20. We can solve this for t:
6t = 5t +20 subtract 5t f rom both sides :
t = 20 substitute this value f or t into Nadia′s equation :
d = 6 ·20 = 120
Even if the equations weren’t so obvious, we could use simple algebraic manipulation to find an expression for onevariable in terms of the other. If we rearrange Peter’s equation to isolate t:
320
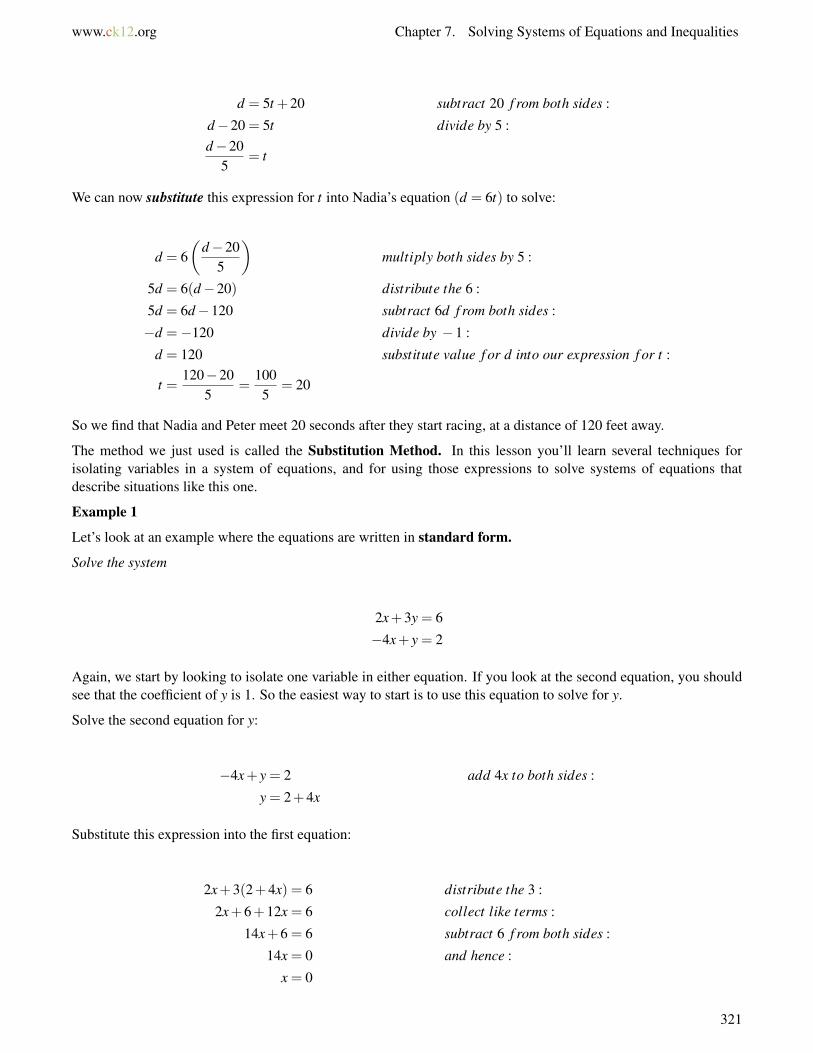
www.ck12.org Chapter 7. Solving Systems of Equations and Inequalities
d = 5t +20 subtract 20 f rom both sides :
d−20 = 5t divide by 5 :d−20
5= t
We can now substitute this expression for t into Nadia’s equation (d = 6t) to solve:
d = 6(
d−205
)multiply both sides by 5 :
5d = 6(d−20) distribute the 6 :
5d = 6d−120 subtract 6d f rom both sides :
−d =−120 divide by −1 :
d = 120 substitute value f or d into our expression f or t :
t =120−20
5=
1005
= 20
So we find that Nadia and Peter meet 20 seconds after they start racing, at a distance of 120 feet away.
The method we just used is called the Substitution Method. In this lesson you’ll learn several techniques forisolating variables in a system of equations, and for using those expressions to solve systems of equations thatdescribe situations like this one.
Example 1
Let’s look at an example where the equations are written in standard form.
Solve the system
2x+3y = 6
−4x+ y = 2
Again, we start by looking to isolate one variable in either equation. If you look at the second equation, you shouldsee that the coefficient of y is 1. So the easiest way to start is to use this equation to solve for y.
Solve the second equation for y:
−4x+ y = 2 add 4x to both sides :
y = 2+4x
Substitute this expression into the first equation:
2x+3(2+4x) = 6 distribute the 3 :
2x+6+12x = 6 collect like terms :
14x+6 = 6 subtract 6 f rom both sides :
14x = 0 and hence :
x = 0
321

7.2. Solving Linear Systems by Substitution www.ck12.org
Substitute back into our expression for y:
y = 2+4 ·0 = 2
As you can see, we end up with the same solution (x = 0,y = 2) that we found when we graphed these functionsback in Lesson 7.1. So long as you are careful with the algebra, the substitution method can be a very efficient wayto solve systems.
Next, let’s look at a more complicated example. Here, the values of x and y we end up with aren’t whole numbers,so they would be difficult to read off a graph!
Example 2
Solve the system
2x+3y = 3
2x−3y =−1
Again, we start by looking to isolate one variable in either equation. In this case it doesn’t matter which equation weuse—all the variables look about equally easy to solve for.
So let’s solve the first equation for x:
2x+3y = 3 subtract 3y f rom both sides :
2x = 3−3y divide both sides by 2 :
x =12(3−3y)
Substitute this expression into the second equation:
2 ·12(3−3y)−3y =−1 cancel the f raction and re−write terms :
3−3y−3y =−1 collect like terms :
3−6y =−1 subtract 3 f rom both sides :
−6y =−4 divide by −6 :
y =23
Substitute into the expression we got for x:
x =12
(3− 3
(23
))x =
12
So our solution is x = 12 ,y = 2
3 . You can see how the graphical solution(1
2 ,23
)might have been difficult to read
accurately off a graph!
322
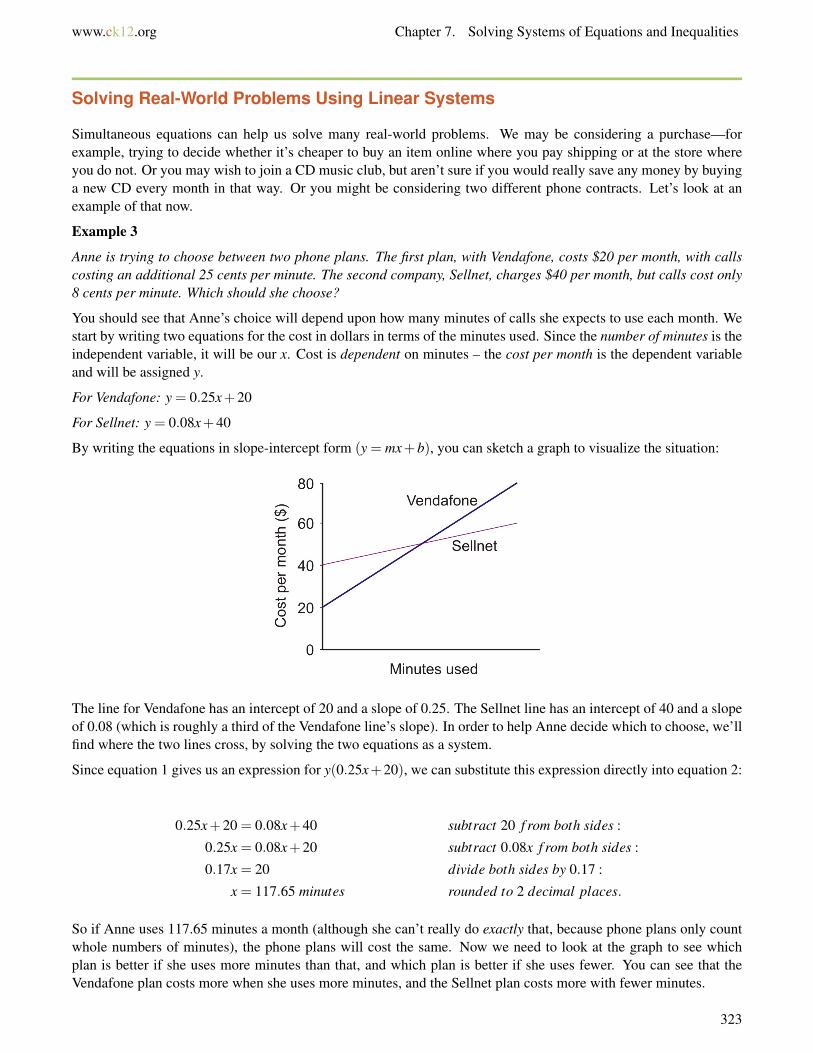
www.ck12.org Chapter 7. Solving Systems of Equations and Inequalities
Solving Real-World Problems Using Linear Systems
Simultaneous equations can help us solve many real-world problems. We may be considering a purchase—forexample, trying to decide whether it’s cheaper to buy an item online where you pay shipping or at the store whereyou do not. Or you may wish to join a CD music club, but aren’t sure if you would really save any money by buyinga new CD every month in that way. Or you might be considering two different phone contracts. Let’s look at anexample of that now.
Example 3
Anne is trying to choose between two phone plans. The first plan, with Vendafone, costs $20 per month, with callscosting an additional 25 cents per minute. The second company, Sellnet, charges $40 per month, but calls cost only8 cents per minute. Which should she choose?
You should see that Anne’s choice will depend upon how many minutes of calls she expects to use each month. Westart by writing two equations for the cost in dollars in terms of the minutes used. Since the number of minutes is theindependent variable, it will be our x. Cost is dependent on minutes – the cost per month is the dependent variableand will be assigned y.
For Vendafone: y = 0.25x+20
For Sellnet: y = 0.08x+40
By writing the equations in slope-intercept form (y = mx+b), you can sketch a graph to visualize the situation:
The line for Vendafone has an intercept of 20 and a slope of 0.25. The Sellnet line has an intercept of 40 and a slopeof 0.08 (which is roughly a third of the Vendafone line’s slope). In order to help Anne decide which to choose, we’llfind where the two lines cross, by solving the two equations as a system.
Since equation 1 gives us an expression for y(0.25x+20), we can substitute this expression directly into equation 2:
0.25x+20 = 0.08x+40 subtract 20 f rom both sides :
0.25x = 0.08x+20 subtract 0.08x f rom both sides :
0.17x = 20 divide both sides by 0.17 :
x = 117.65 minutes rounded to 2 decimal places.
So if Anne uses 117.65 minutes a month (although she can’t really do exactly that, because phone plans only countwhole numbers of minutes), the phone plans will cost the same. Now we need to look at the graph to see whichplan is better if she uses more minutes than that, and which plan is better if she uses fewer. You can see that theVendafone plan costs more when she uses more minutes, and the Sellnet plan costs more with fewer minutes.
323

7.2. Solving Linear Systems by Substitution www.ck12.org
So, if Anne will use 117 minutes or less every month she should choose Vendafone. If she plans on using 118or more minutes she should choose Sellnet.
Mixture Problems
Systems of equations crop up frequently in problems that deal with mixtures of two things—chemicals in a solution,nuts and raisins, or even the change in your pocket! Let’s look at some examples of these.
Example 4
Janine empties her purse and finds that it contains only nickels (worth 5 cents each) and dimes (worth 10 centseach). If she has a total of 7 coins and they have a combined value of 45 cents, how many of each coin does shehave?
Since we have 2 types of coins, let’s call the number of nickels x and the number of dimes y. We are given two keypieces of information to make our equations: the number of coins and their value.
of coins equation: x+ y = 7 (number o f nickels)+(number o f dimes)
value equation: 5x+10y = 55 (since nickels are worth 5c and dimes 10c)
We can quickly rearrange the first equation to isolate x:
x = 7− y now substitute into equation 2 :
5(7− y)+10y = 55 distribute the 5 :
35−5y+10y = 55 collect like terms :
35+5y = 55 subtract 35 f rom both sides :
5y = 20 divide by 5 :
y = 4 substitute back into equation 1 :
x+4 = 7 subtract 4 f rom both sides :
x = 3
Janine has 3 nickels and 4 dimes.
Sometimes a question asks you to determine (from concentrations) how much of a particular substance to use. Thesubstance in question could be something like coins as above, or it could be a chemical in solution, or even heat.In such a case, you need to know the amount of whatever substance is in each part. There are several commonsituations where to get one equation you simply add two given quantities, but to get the second equation you needto use a product. Three examples are below.
TABLE 7.5:
Type of mixture First equation Second equationCoins (items with $ value) total number of items (n1 +n2) total value (item value × no. of
items)Chemical solutions total solution volume (V1 +V2) amount of solute (vol × concentra-
tion)Density of two substances total amount or volume of mix total mass (volume × density)
324

www.ck12.org Chapter 7. Solving Systems of Equations and Inequalities
For example, when considering mixing chemical solutions, we will most likely need to consider the total amountof solute in the individual parts and in the final mixture. (A solute is the chemical that is dissolved in a solution.An example of a solute is salt when added to water to make a brine.) To find the total amount, simply multiply theamount of the mixture by the fractional concentration. To illustrate, let’s look at an example where you are givenamounts relative to the whole.
Example 5
A chemist needs to prepare 500 ml of copper-sulfate solution with a 15% concentration. She wishes to use a highconcentration solution (60%) and dilute it with a low concentration solution (5%) in order to do this. How much ofeach solution should she use?
Solution
To set this problem up, we first need to define our variables. Our unknowns are the amount of concentrated solution(x) and the amount of dilute solution (y). We will also convert the percentages (60%, 15% and 5%) into decimals(0.6, 0.15 and 0.05). The two pieces of critical information are the final volume (500 ml) and the final amount ofsolute (15% of 500 ml = 75 ml). Our equations will look like this:
Volume equation: x+ y = 500
Solute equation: 0.6x+0.05y = 75
To isolate a variable for substitution, we can see it’s easier to start with equation 1:
x+ y = 500 subtract y f rom both sides :
x = 500− y now substitute into equation 2 :
0.6(500− y)+0.05y = 75 distribute the 0.6 :
300−0.6y+0.05y = 75 collect like terms :
300−0.55y = 75 subtract 300 f rom both sides :
−0.55y =−225 divide both sides by −0.55 :
y = 409 ml substitute back into equation f or x :
x = 500−409 = 91 ml
So the chemist should mix 91 ml of the 60% solution with 409 ml of the 5% solution.
Further Practice
For lots more practice solving linear systems, check out this web page: http://www.algebra.com/algebra/homework/coordinate/practice-linear-system.epl
After clicking to see the solution to a problem, you can click the back button and then click Try Another PracticeLinear System to see another problem.
Review Questions
1. Solve the system: x+2y = 93x+5y = 20
325
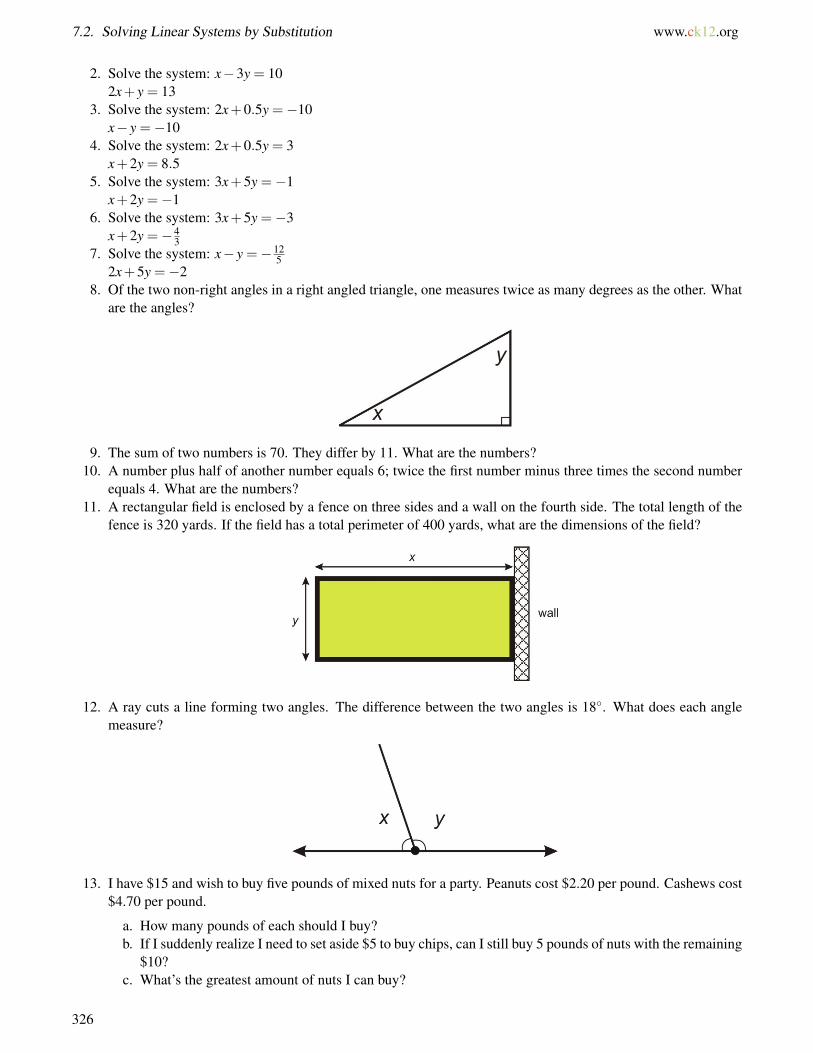
7.2. Solving Linear Systems by Substitution www.ck12.org
2. Solve the system: x−3y = 102x+ y = 13
3. Solve the system: 2x+0.5y =−10x− y =−10
4. Solve the system: 2x+0.5y = 3x+2y = 8.5
5. Solve the system: 3x+5y =−1x+2y =−1
6. Solve the system: 3x+5y =−3x+2y =−4
37. Solve the system: x− y =−12
52x+5y =−2
8. Of the two non-right angles in a right angled triangle, one measures twice as many degrees as the other. Whatare the angles?
9. The sum of two numbers is 70. They differ by 11. What are the numbers?10. A number plus half of another number equals 6; twice the first number minus three times the second number
equals 4. What are the numbers?11. A rectangular field is enclosed by a fence on three sides and a wall on the fourth side. The total length of the
fence is 320 yards. If the field has a total perimeter of 400 yards, what are the dimensions of the field?
12. A ray cuts a line forming two angles. The difference between the two angles is 18. What does each anglemeasure?
13. I have $15 and wish to buy five pounds of mixed nuts for a party. Peanuts cost $2.20 per pound. Cashews cost$4.70 per pound.
a. How many pounds of each should I buy?b. If I suddenly realize I need to set aside $5 to buy chips, can I still buy 5 pounds of nuts with the remaining
$10?c. What’s the greatest amount of nuts I can buy?
326

www.ck12.org Chapter 7. Solving Systems of Equations and Inequalities
14. A chemistry experiment calls for one liter of sulfuric acid at a 15% concentration, but the supply room onlystocks sulfuric acid in concentrations of 10% and 35%.
a. How many liters of each should be mixed to give the acid needed for the experiment?b. How many liters should be mixed to give two liters at a 15% concentration?
15. Bachelle wants to know the density of her bracelet, which is a mix of gold and silver. Density is total massdivided by total volume. The density of gold is 19.3 g/cc and the density of silver is 10.5 g/cc. The jeweler toldher that the volume of silver in the bracelet was 10 cc and the volume of gold was 20 cc. Find the combineddensity of her bracelet.
16. Jason is five years older than Becky, and the sum of their ages is 23. What are their ages?17. Tickets to a show cost $10 in advance and $15 at the door. If 120 tickets are sold for a total of $1390, how
many of the tickets were bought in advance?18. The multiple-choice questions on a test are worth 2 points each, and the short-answer questions are worth 5
points each.
a. If the whole test is worth 100 points and has 35 questions, how many of the questions are multiple-choiceand how many are short-answer?
b. If Kwan gets 31 questions right and ends up with a score of 86 on the test, how many questions of eachtype did she get right? (Assume there is no partial credit.)
c. If Ashok gets 5 questions wrong and ends up with a score of 87 on the test, how many questions of eachtype did he get wrong? (Careful!)
d. What are two ways you could have set up the equations for part c?e. How could you have set up part b differently?
327

7.3. Solving Linear Systems by Elimination www.ck12.org
7.3 Solving Linear Systems by Elimination
Learning Objectives
• Solve a linear system of equations using elimination by addition.• Solve a linear system of equations using elimination by subtraction.• Solve a linear system of equations by multiplication and then addition or subtraction.• Compare methods for solving linear systems.• Solve real-world problems using linear systems by any method.
Introduction
In this lesson, we’ll see how to use simple addition and subtraction to simplify our system of equations to a singleequation involving a single variable. Because we go from two unknowns (x and y) to a single unknown (either xor y), this method is often referred to by solving by elimination. We eliminate one variable in order to make ourequations solvable! To illustrate this idea, let’s look at the simple example of buying apples and bananas.
Example 1
If one apple plus one banana costs $1.25 and one apple plus 2 bananas costs $2.00, how much does one bananacost? One apple?
It shouldn’t take too long to discover that each banana costs $0.75. After all, the second purchase just contains 1more banana than the first, and costs $0.75 more, so that one banana must cost $0.75.
Here’s what we get when we describe this situation with algebra:
a+b = 1.25
a+2b = 2.00
Now we can subtract the number of apples and bananas in the first equation from the number in the second equation,and also subtract the cost in the first equation from the cost in the second equation, to get the difference in cost thatcorresponds to the difference in items purchased.
(a+2b)− (a+b) = 2.00−1.25→ b = 0.75
That gives us the cost of one banana. To find out how much one apple costs, we subtract $0.75 from the total cost ofone apple and one banana.
a+0.75 = 1.25→ a = 1.25−0.75→ a = 0.50
So an apple costs 50 cents.
328

www.ck12.org Chapter 7. Solving Systems of Equations and Inequalities
To solve systems using addition and subtraction, we’ll be using exactly this idea – by looking at the sum or differenceof the two equations we can determine a value for one of the unknowns.
Solving Linear Systems Using Addition of Equations
Often considered the easiest and most powerful method of solving systems of equations, the addition (or elimination)method lets us combine two equations in such a way that the resulting equation has only one variable. We can thenuse simple algebra to solve for that variable. Then, if we need to, we can substitute the value we get for that variableback into either one of the original equations to solve for the other variable.
Example 2
Solve this system by addition:
3x+2y = 11
5x−2y = 13
Solution
We will add everything on the left of the equals sign from both equations, and this will be equal to the sum ofeverything on the right:
(3x+2y)+(5x−2y) = 11+13→ 8x = 24→ x = 3
A simpler way to visualize this is to keep the equations as they appear above, and to add them together vertically,going down the columns. However, just like when you add units, tens and hundreds, you MUST be sure to keep thex′s and y′s in their own columns. You may also wish to use terms like “0y′′ as a placeholder!
3x+2y = 11
+ (5x−2y) = 13
8x+0y = 24
Again we get 8x = 24, or x = 3. To find a value for y, we simply substitute our value for x back in.
Substitute x = 3 into the second equation:
5 ·3−2y = 13 since 5×3 = 15, we subtract 15 f rom both sides :
−2y =−2 divide by −2 to get :
y = 1
The reason this method worked is that the y−coefficients of the two equations were opposites of each other: 2 and-2. Because they were opposites, they canceled each other out when we added the two equations together, so ourfinal equation had no y−term in it and we could just solve it for x.
In a little while we’ll see how to use the addition method when the coefficients are not opposites, but for now let’slook at another example where they are.
329

7.3. Solving Linear Systems by Elimination www.ck12.org
Example 3
Andrew is paddling his canoe down a fast-moving river. Paddling downstream he travels at 7 miles per hour, relativeto the river bank. Paddling upstream, he moves slower, traveling at 1.5 miles per hour. If he paddles equally hard inboth directions, how fast is the current? How fast would Andrew travel in calm water?
Solution
First we convert our problem into equations. We have two unknowns to solve for, so we’ll call the speed that Andrewpaddles at x, and the speed of the river y. When traveling downstream, Andrew speed is boosted by the river current,so his total speed is his paddling speed plus the speed of the river (x+ y). Traveling upstream, the river is workingagainst him, so his total speed is his paddling speed minus the speed of the river (x− y).
Downstream Equation: x+ y = 7
Upstream Equation: x− y = 1.5
Next we’ll eliminate one of the variables. If you look at the two equations, you can see that the coefficient of y is +1in the first equation and -1 in the second. Clearly (+1)+ (−1) = 0, so this is the variable we will eliminate. To dothis we simply add equation 1 to equation 2. We must be careful to collect like terms, and make sure that everythingon the left of the equals sign stays on the left, and everything on the right stays on the right:
(x+ y)+(x− y) = 7+1.5⇒ 2x = 8.5⇒ x = 4.25
Or, using the column method we used in example 2:
x+ y = 7
+ x− y = 1.5
2x+0y = 8.5
Again we get 2x = 8.5, or x = 4.25. To find a corresponding value for y, we plug our value for x into either equationand isolate our unknown. In this example, we’ll plug it into the first equation:
4.25+ y = 7 subtract 4.25 f rom both sides :
y = 2.75
Andrew paddles at 4.25 miles per hour. The river moves at 2.75 miles per hour.
Solving Linear Systems Using Subtraction of Equations
Another, very similar method for solving systems is subtraction. When the x− or y−coefficients in both equationsare the same (including the sign) instead of being opposites, you can subtract one equation from the other.
If you look again at Example 3, you can see that the coefficient for x in both equations is +1. Instead of adding thetwo equations together to get rid of the y′s, you could have subtracted to get rid of the x′s:
330
www.ck12.org Chapter 7. Solving Systems of Equations and Inequalities
(x+ y)− (x− y) = 7−1.5⇒ 2y = 5.5⇒ y = 2.75
or...
x+ y = 7
− (x− y) =−1.5
0x+2y = 5.5
So again we get y = 2.75, and we can plug that back in to determine x.
The method of subtraction is just as straightforward as addition, so long as you remember the following:
• Always put the equation you are subtracting in parentheses, and distribute the negative.• Don’t forget to subtract the numbers on the right-hand side.• Always remember that subtracting a negative is the same as adding a positive.
Example 4
Peter examines the coins in the fountain at the mall. He counts 107 coins, all of which are either pennies or nickels.The total value of the coins is $3.47. How many of each coin did he see?
Solution
We have 2 types of coins, so let’s call the number of pennies x and the number of nickels y. The total value of all thepennies is just x, since they are worth 1c each. The total value of the nickels is 5y. We are given two key pieces ofinformation to make our equations: the number of coins and their value in cents.
of coins equation : x+ y = 107 (number o f pennies)+(number o f nickels)
value equation : x+5y = 347 pennies are worth 1c, nickels are worth 5c.
We’ll jump straight to subtracting the two equations:
x+ y = 107
− (x+5y) =−347
−4y =−240
y = 60
Substituting this value back into the first equation:
x+60 = 107 subtract 60 f rom both sides :
x = 47
So Peter saw 47 pennies (worth 47 cents) and 60 nickels (worth $3.00) making a total of $3.47.
Solving Linear Systems Using Multiplication
So far, we’ve seen that the elimination method works well when the coefficient of one variable happens to be thesame (or opposite) in the two equations. But what if the two equations don’t have any coefficients the same?
331

7.3. Solving Linear Systems by Elimination www.ck12.org
It turns out that we can still use the elimination method; we just have to make one of the coefficients match. We canaccomplish this by multiplying one or both of the equations by a constant.
Here’s a quick review of how to do that. Consider the following questions:
1. If 10 apples cost $5, how much would 30 apples cost?2. If 3 bananas plus 2 carrots cost $4, how mush would 6 bananas plus 4 carrots cost?
If you look at the first equation, it should be obvious that each apple costs $0.50. So 30 apples should cost $15.00.
The second equation is trickier; it isn’t obvious what the individual price for either bananas or carrots is. Yet weknow that the answer to question 2 is $8.00. How?
If we look again at question 1, we see that we can write an equation: 10a = 5 (a being the cost of 1 apple). So tofind the cost of 30 apples, we could solve for a and then multiply by 30—but we could also just multiply both sidesof the equation by 3. We would get 30a = 15, and that tells us that 30 apples cost $15.
And we can do the same thing with the second question. The equation for this situation is 3b+ 2c = 4, and wecan see that we need to solve for (6b+ 4c), which is simply 2 times (3b+ 2c)! So algebraically, we are simplymultiplying the entire equation by 2:
2(3b+2c) = 2 ·4 distribute and multiply :
6b+4c = 8
So when we multiply an equation, all we are doing is multiplying every term in the equation by a fixed amount.
Solving a Linear System by Multiplying One Equation
If we can multiply every term in an equation by a fixed number (a scalar), that means we can use the addition methodon a whole new set of linear systems. We can manipulate the equations in a system to ensure that the coefficients ofone of the variables match.
This is easiest to do when the coefficient as a variable in one equation is a multiple of the coefficient in the otherequation.
Example 5
Solve the system:
7x+4y = 17
5x−2y = 11
Solution
You can easily see that if we multiply the second equation by 2, the coefficients of y will be +4 and -4, allowing usto solve the system by addition:
2 times equation 2:
332

www.ck12.org Chapter 7. Solving Systems of Equations and Inequalities
10x−4y = 22 now add to equation one :
+ (7x+4y) = 17
17x = 34
divide by 17 to get : x = 2
Now simply substitute this value for x back into equation 1:
7 ·2+4y = 17 since 7×2 = 14, subtract 14 f rom both sides :
4y = 3 divide by 4 :
y = 0.75
Example 6
Anne is rowing her boat along a river. Rowing downstream, it takes her 2 minutes to cover 400 yards. Rowingupstream, it takes her 8 minutes to travel the same 400 yards. If she was rowing equally hard in both directions,calculate, in yards per minute, the speed of the river and the speed Anne would travel in calm water.
Solution
Step one: first we convert our problem into equations. We know that distance traveled is equal to speed × time.We have two unknowns, so we’ll call the speed of the river x, and the speed that Anne rows at y. When travelingdownstream, her total speed is her rowing speed plus the speed of the river, or (x+ y). Going upstream, her speed ishindered by the speed of the river, so her speed upstream is (x− y).
Downstream Equation: 2(x+ y) = 400
Upstream Equation: 8(x− y) = 400
Distributing gives us the following system:
2x+2y = 400
8x−8y = 400
Right now, we can’t use the method of elimination because none of the coefficients match. But if we multiplied thetop equation by 4, the coefficients of y would be +8 and -8. Let’s do that:
8x+8y = 1,600
+ (8x−8y) = 400
16x = 2,000
Now we divide by 16 to obtain x = 125.
Substitute this value back into the first equation:
2(125+ y) = 400 divide both sides by 2 :
125+ y = 200 subtract 125 f rom both sides :
y = 75
333

7.3. Solving Linear Systems by Elimination www.ck12.org
Anne rows at 125 yards per minute, and the river flows at 75 yards per minute.
Solving a Linear System by Multiplying Both Equations
So what do we do if none of the coefficients match and none of them are simple multiples of each other? We do thesame thing we do when we’re adding fractions whose denominators aren’t simple multiples of each other. Rememberthat when we add fractions, we have to find a lowest common denominator—that is, the lowest common multipleof the two denominators—and sometimes we have to rewrite not just one, but both fractions to get them to have acommon denominator. Similarly, sometimes we have to multiply both equations by different constants in order toget one of the coefficients to match.
Example 7
Andrew and Anne both use the I-Haul truck rental company to move their belongings from home to the dorm roomson the University of Chicago campus. I-Haul has a charge per day and an additional charge per mile. Andrewtravels from San Diego, California, a distance of 2060 miles in five days. Anne travels 880 miles from Norfolk,Virginia, and it takes her three days. If Anne pays $840 and Andrew pays $1845, what does I-Haul charge
a) per day?
b) per mile traveled?
Solution
First, we’ll set up our equations. Again we have 2 unknowns: the daily rate (we’ll call this x), and the per-mile rate(we’ll call this y).
Anne’s equation: 3x+880y = 840
Andrew’s Equation: 5x+2060y = 1845
We can’t just multiply a single equation by an integer number in order to arrive at matching coefficients. But if welook at the coefficients of x (as they are easier to deal with than the coefficients of y), we see that they both have acommon multiple of 15 (in fact 15 is the lowest common multiple). So we can multiply both equations.
Multiply the top equation by 5:
15x+4400y = 4200
Multiply the lower equation by 3:
15x+6180y = 5535
Subtract:
15x+4400y = 4200
− (15x+6180y) = 5535
−1780y =−1335
Divide by −1780 : y = 0.75
334

www.ck12.org Chapter 7. Solving Systems of Equations and Inequalities
Substitute this back into the top equation:
3x+880(0.75) = 840 since 880×0.75 = 660, subtract 660 f rom both sides :
3x = 180 divide both sides by 3
x = 60
I-Haul charges $60 per day plus $0.75 per mile.
Comparing Methods for Solving Linear Systems
Now that we’ve covered the major methods for solving linear equations, let’s review them. For simplicity, we’ll lookat them in table form. This should help you decide which method would be best for a given situation.
TABLE 7.6:
Method: Best used when you... Advantages: Comment:Graphing ...don’t need an accurate
answer.Often easier to see num-ber and quality of inter-sections on a graph. Witha graphing calculator, itcan be the fastest methodsince you don’t have to doany computation.
Can lead to imprecise an-swers with non-integer so-lutions.
Substitution ...have an explicit equa-tion for one variable (e.g.y = 14x+2)
Works on all systems. Re-duces the system to onevariable, making it easierto solve.
You are not often givenexplicit functions in sys-tems problems, so youmay have to do extra workto get one of the equationsinto that form.
Elimination by Additionor Subtraction
...have matching coeffi-cients for one variable inboth equations.
Easy to combine equa-tions to eliminate onevariable. Quick to solve.
It is not very likely thata given system will havematching coefficients.
Elimination by Multipli-cation and then Additionand Subtraction
...do not have any vari-ables defined explicitly orany matching coefficients.
Works on all systems.Makes it possible to com-bine equations to elimi-nate one variable.
Often more algebraic ma-nipulation is needed toprepare the equations.
The table above is only a guide. You might prefer to use the graphical method for every system in order to betterunderstand what is happening, or you might prefer to use the multiplication method even when a substitution wouldwork just as well.
Example 8
Two angles are complementary when the sum of their angles is 90. Angles A and B are complementary angles, andtwice the measure of angle A is 9 more than three times the measure of angle B. Find the measure of each angle.
Solution
First we write out our 2 equations. We will use x to be the measure of angle A and y to be the measure of angle B.We get the following system:
335

7.3. Solving Linear Systems by Elimination www.ck12.org
x+ y = 90
2x = 3y+9
First, we’ll solve this system with the graphical method. For this, we need to convert the two equations to y = mx+bform:
x+ y = 90 ⇒ y =−x+90
2x = 3y+9 ⇒ y =23
x−3
The first line has a slope of -1 and a y−intercept of 90, and the second line has a slope of 23 and a y−intercept of -3.
The graph looks like this:
In the graph, it appears that the lines cross at around x = 55,y = 35, but it is difficult to tell exactly! Graphing byhand is not the best method in this case!
Next, we’ll try solving by substitution. Let’s look again at the system:
x+ y = 90
2x = 3y+9
We’ve already seen that we can start by solving either equation for y, so let’s start with the first one:
y = 90− x
Substitute into the second equation:
2x = 3(90− x)+9 distribute the 3 :
2x = 270−3x+9 add 3x to both sides :
5x = 270+9 = 279 divide by 5 :
x = 55.8
336

www.ck12.org Chapter 7. Solving Systems of Equations and Inequalities
Substitute back into our expression for y:
y = 90−55.8 = 34.2
Angle Ameasures 55.8; angle Bmeasures 34.2.
Finally, we’ll try solving by elimination (with multiplication):
Rearrange equation one to standard form:
x+ y = 90 ⇒ 2x+2y = 180
Multiply equation two by 2:
2x = 3y+9 ⇒ 2x−3y = 9
Subtract:
2x+2y = 180
− (2x−3y) =−9
5y = 171
Divide by 5 to obtain y = 34.2
Substitute this value into the very first equation:
x+34.2 = 90 subtract 34.2 f rom both sides :
x = 55.8
Angle A measures 55.8; angle B measures 34.2.
Even though this system looked ideal for substitution, the method of multiplication worked well too. Once theequations were rearranged properly, the solution was quick to find. You’ll need to decide yourself which methodto use in each case you see from now on. Try to master all the techniques, and recognize which one will be mostefficient for each system you are asked to solve.
The following Khan Academy video contains three examples of solving systems of equations using addition andsubtraction as well as multiplication (which is the next topic): http://www.youtube.com/watch?v=nok99JOhcjo(9:57). (Note that the narrator is not always careful about showing his work, and you should try to be neater in
your mathematical writing.)
For even more practice, we have this video. One common type of problem involving systems of equations (especiallyon standardized tests) is “age problems." In the following video the narrator shows two examples of age problems,one involving a single person and one involving two people. Khan Academy Age Problems (7:13)
337

7.3. Solving Linear Systems by Elimination www.ck12.org
Review Questions
1. Solve the system: 3x+4y = 2.55x−4y = 25.5
2. Solve the system: 5x+7y =−315x−9y = 17
3. Solve the system: 3y−4x =−335x−3y = 40.5
4. Nadia and Peter visit the candy store. Nadia buys three candy bars and four fruit roll-ups for $2.84. Peter alsobuys three candy bars, but can only afford one additional fruit roll-up. His purchase costs $1.79. What is thecost of a candy bar and a fruit roll-up individually?
5. A small plane flies from Los Angeles to Denver with a tail wind (the wind blows in the same direction as theplane) and an air-traffic controller reads its ground-speed (speed measured relative to the ground) at 275 milesper hour. Another, identical plane, moving in the opposite direction has a ground-speed of 227 miles per hour.Assuming both planes are flying with identical air-speeds, calculate the speed of the wind.
6. An airport taxi firm charges a pick-up fee, plus an additional per-mile fee for any rides taken. If a 12-milejourney costs $14.29 and a 17-mile journey costs $19.91, calculate:
a. the pick-up feeb. the per-mile ratec. the cost of a seven mile trip
7. Calls from a call-box are charged per minute at one rate for the first five minutes, then a different rate for eachadditional minute. If a 7-minute call costs $4.25 and a 12-minute call costs $5.50, find each rate.
8. A plumber and a builder were employed to fit a new bath, each working a different number of hours. Theplumber earns $35 per hour, and the builder earns $28 per hour. Together they were paid $330.75, but theplumber earned $106.75 more than the builder. How many hours did each work?
9. Paul has a part time job selling computers at a local electronics store. He earns a fixed hourly wage, but canearn a bonus by selling warranties for the computers he sells. He works 20 hours per week. In his first week,he sold eight warranties and earned $220. In his second week, he managed to sell 13 warranties and earned$280. What is Paul’s hourly rate, and how much extra does he get for selling each warranty?
Solve the following systems using multiplication.
10. 5x−10y = 153x−2y = 3
11. 5x− y = 103x−2y =−1
12. 5x+7y = 157x−3y = 5
13. 9x+5y = 912x+8y = 12.8
14. 4x−3y = 13x−4y = 4
15. 7x−3y =−36x+4y = 3
Solve the following systems using any method.
16. x = 3yx−2y =−3
338

www.ck12.org Chapter 7. Solving Systems of Equations and Inequalities
17. y = 3x+2y =−2x+7
18. 5x−5y = 55x+5y = 35
19. y =−3x−33x−2y+12 = 0
20. 3x−4y = 34y+5x = 10
21. 9x−2y =−42x−6y = 1
22. Supplementary angles are two angles whose sum is 180. Angles A and B are supplementary angles. Themeasure of Angle A is 18 less than twice the measure of Angle B. Find the measure of each angle.
23. A farmer has fertilizer in 5% and 15% solutions. How much of each type should he mix to obtain 100 litersof fertilizer in a 12% solution?
24. A 150-yard pipe is cut to provide drainage for two fields. If the length of one piece is three yards less thattwice the length of the second piece, what are the lengths of the two pieces?
25. Mr. Stein invested a total of $100,000 in two companies for a year. Company A’s stock showed a 13% annualgain, while Company B showed a 3% loss for the year. Mr. Stein made an 8% return on his investment overthe year. How much money did he invest in each company?
26. A baker sells plain cakes for $7 and decorated cakes for $11. On a busy Saturday the baker started with 120cakes, and sold all but three. His takings for the day were $991. How many plain cakes did he sell that day,and how many were decorated before they were sold?
27. Twice John’s age plus five times Claire’s age is 204. Nine times John’s age minus three times Claire’s age isalso 204. How old are John and Claire?
339

7.4. Special Types of Linear Systems www.ck12.org
7.4 Special Types of Linear Systems
Learning Objectives
• Identify and understand what is meant by an inconsistent linear system.• Identify and understand what is meant by a consistent linear system.• Identify and understand what is meant by a dependent linear system.
Introduction
As we saw in Section 7.1, a system of linear equations is a set of linear equations which must be solved together.The lines in the system can be graphed together on the same coordinate graph and the solution to the system is thepoint at which the two lines intersect.
Or at least that’s what usually happens. But what if the lines turn out to be parallel when we graph them?
If the lines are parallel, they won’t ever intersect. That means that the system of equations they represent has nosolution. A system with no solutions is called an inconsistent system.
And what if the lines turn out to be identical?
340

www.ck12.org Chapter 7. Solving Systems of Equations and Inequalities
If the two lines are the same, then every point on one line is also on the other line, so every point on the line isa solution to the system. The system has an infinite number of solutions, and the two equations are really justdifferent forms of the same equation. Such a system is called a dependent system.
But usually, two lines cross at exactly one point and the system has exactly one solution:
A system with exactly one solution is called a consistent system.
To identify a system as consistent, inconsistent, or dependent, we can graph the two lines on the same graph andsee if they intersect, are parallel, or are the same line. But sometimes it is hard to tell whether two lines are paralleljust by looking at a roughly sketched graph.
Another option is to write each line in slope-intercept form and compare the slopes and y− intercepts of the twolines. To do this we must remember that:
• Lines with different slopes always intersect.• Lines with the same slope but different y−intercepts are parallel.• Lines with the same slope and the same y−intercepts are identical.
Example 1
Determine whether the following system has exactly one solution, no solutions, or an infinite number of solutions.
2x−5y = 2
4x+ y = 5
Solution
We must rewrite the equations so they are in slope-intercept form
2x−5y = 2 −5y =−2x+2 y = 25 x− 2
5⇒ ⇒
x+ y = 5 y =−4x+5 y =−4x+5
The slopes of the two equations are different; therefore the lines must cross at a single point and the system hasexactly one solution. This is a consistent system.
Example 2
Determine whether the following system has exactly one solution, no solutions, or an infinite number of solutions.
3x = 5−4y
6x+8y = 7
341

7.4. Special Types of Linear Systems www.ck12.org
Solution
We must rewrite the equations so they are in slope-intercept form
3x = 5−4y 4y =−3x+5 y =−34 x+ 5
4⇒ ⇒
6x+8y = 7 8y =−6x+7 y =−34 x+ 7
8
The slopes of the two equations are the same but the y−intercepts are different; therefore the lines are parallel andthe system has no solutions. This is an inconsistent system.
Example 3
Determine whether the following system has exactly one solution, no solutions, or an infinite number of solutions.
x+ y = 3
3x+3y = 9
Solution
We must rewrite the equations so they are in slope-intercept form
x+ y = 3 y =−x+3 y =−x+3⇒ ⇒
x+3y = 9 3y =−3x+9 y =−x+3
The lines are identical; therefore the system has an infinite number of solutions. It is a dependent system.
Determining the Type of System Algebraically
A third option for identifying systems as consistent, inconsistent or dependent is to just solve the system and use theresult as a guide.
Example 4
Solve the following system of equations. Identify the system as consistent, inconsistent or dependent.
10x−3y = 3
2x+ y = 9
Solution
Let’s solve this system using the substitution method.
Solve the second equation for y:
2x+ y = 9⇒ y =−2x+9
Substitute that expression for y in the first equation:
342
www.ck12.org Chapter 7. Solving Systems of Equations and Inequalities
10x−3y = 3
10x−3(−2x+9) = 3
10x+6x−27 = 3
16x = 30
x =158
Substitute the value of x back into the second equation and solve for y:
2x+ y = 9⇒ y =−2x+9⇒ y =−2 · 158+9⇒ y =
214
The solution to the system is(15
8 ,214
). The system is consistent since it has only one solution.
Example 5
Solve the following system of equations. Identify the system as consistent, inconsistent or dependent.
3x−2y = 4
9x−6y = 1
Solution
Let’s solve this system by the method of multiplication.
Multiply the first equation by 3:
3(3x−2y = 4) 9x−6y = 12⇒
9x−6y = 1 9x−6y = 1
Add the two equations:
9x−6y = 4
9x−6y = 1
0 = 13 This statement is not true.
If our solution to a system turns out to be a statement that is not true, then the system doesn’t really have a solution;it is inconsistent.
Example 6
Solve the following system of equations. Identify the system as consistent, inconsistent or dependent.
4x+ y = 3
12x+3y = 9
Solution
343
7.4. Special Types of Linear Systems www.ck12.org
Let’s solve this system by substitution.
Solve the first equation for y:
4x+ y = 3⇒ y =−4x+3
Substitute this expression for y in the second equation:
12x+3y = 9
12x+3(−4x+3) = 9
12x−12x+9 = 9
9 = 9
This statement is always true.
If our solution to a system turns out to be a statement that is always true, then the system is dependent.
A second glance at the system in this example reveals that the second equation is three times the first equation, sothe two lines are identical. The system has an infinite number of solutions because they are really the same equationand trace out the same line.
Let’s clarify this statement. An infinite number of solutions does not mean that any ordered pair (x,y) satisfies thesystem of equations. Only ordered pairs that solve the equation in the system (either one of the equations) are alsosolutions to the system. There are infinitely many of these solutions to the system because there are infinitely manypoints on any one line.
For example, (1, -1) is a solution to the system in this example, and so is (-1, 7). Each of them fits both the equationsbecause both equations are really the same equation. But (3, 5) doesn’t fit either equation and is not a solution to thesystem.
In fact, for every x−value there is just one y−value that fits both equations, and for every y−value there is exactlyone x−value—just as there is for a single line.
Let’s summarize how to determine the type of system we are dealing with algebraically.
• A consistent system will always give exactly one solution.• An inconsistent system will yield a statement that is always false (like 0 = 13).• A dependent system will yield a statement that is always true (like 9 = 9).
Applications
In this section, we’ll see how consistent, inconsistent and dependent systems might arise in real life.
Example 7
The movie rental store CineStar offers customers two choices. Customers can pay a yearly membership of $45 andthen rent each movie for $2 or they can choose not to pay the membership fee and rent each movie for $3.50. Howmany movies would you have to rent before the membership becomes the cheaper option?
Solution
Let’s translate this problem into algebra. Since there are two different options to consider, we can write two differentequations and form a system.
344

www.ck12.org Chapter 7. Solving Systems of Equations and Inequalities
The choices are “membership” and “no membership.” We’ll call the number of movies you rent x and the total costof renting movies for a year y.
TABLE 7.7:
flat fee rental fee totalmembership $45 2x y = 45+2xno membership $0 3.50x y = 3.5x
The flat fee is the dollar amount you pay per year and the rental fee is the dollar amount you pay when you rent amovie. For the membership option the rental fee is 2x, since you would pay $2 for each movie you rented; for theno membership option the rental fee is 3.50x, since you would pay $3.50 for each movie you rented.
Our system of equations is:
y = 45+2xy = 3.50x
Here’s a graph of the system:
Now we need to find the exact intersection point. Since each equation is already solved for y, we can easily solvethe system with substitution. Substitute the second equation into the first one:
y = 45+2x⇒ 3.50x = 45+2x⇒ 1.50x = 45⇒ x = 30 movies
y = 3.50x
You would have to rent 30 movies per year before the membership becomes the better option.
This example shows a real situation where a consistent system of equations is useful in finding a solution. Rememberthat for a consistent system, the lines that make up the system intersect at single point. In other words, the lines arenot parallel or the slopes are different.
In this case, the slopes of the lines represent the price of a rental per movie. The lines cross because the price ofrental per movie is different for the two options in the problem
Now let’s look at a situation where the system is inconsistent. From the previous explanation, we can conclude thatthe lines will not intersect if the slopes are the same (and the y−intercept is different). Let’s change the previousproblem so that this is the case.
Example 8
345

7.4. Special Types of Linear Systems www.ck12.org
Two movie rental stores are in competition. Movie House charges an annual membership of $30 and charges $3 permovie rental. Flicks for Cheap charges an annual membership of $15 and charges $3 per movie rental. After howmany movie rentals would Movie House become the better option?
Solution
It should already be clear to see that Movie House will never become the better option, since its membership is moreexpensive and it charges the same amount per movie as Flicks for Cheap.
The lines on a graph that describe each option have different y−intercepts—namely 30 for Movie House and 15 forFlicks for Cheap—but the same slope: 3 dollars per movie. This means that the lines are parallel and so the systemis inconsistent.
Now let’s see how this works algebraically. Once again, we’ll call the number of movies you rent x and the total costof renting movies for a year y.
TABLE 7.8:
flat fee rental fee totalMovie House $30 3x y = 30+3xFlicks for Cheap $15 3x y = 15+3x
The system of equations that describes this problem is:
y = 30+3xy = 15+3x
Let’s solve this system by substituting the second equation into the first equation:
y = 30+3x⇒ 15+3x = 30+3x⇒ 15 = 30 This statement is always false.
y = 15+3x
This means that the system is inconsistent.
Example 9
Peter buys two apples and three bananas for $4. Nadia buys four apples and six bananas for $8 from the same store.How much does one banana and one apple costs?
Solution
We must write two equations: one for Peter’s purchase and one for Nadia’s purchase.
Let’s say a is the cost of one apple and b is the cost of one banana.
TABLE 7.9:
cost of apples cost of bananas total costPeter 2a 3b 2a+3b = 4Nadia 4a 6b 4a+6b = 8
The system of equations that describes this problem is:
2a+3b = 44a+6b = 8
Let’s solve this system by multiplying the first equation by -2 and adding the two equations:
−2(2a+3b = 4) −4a−6b =−8⇒
346
www.ck12.org Chapter 7. Solving Systems of Equations and Inequalities
4a+6b = 8 4a+6b = 80+0 = 0
This statement is always true. This means that the system is dependent.
Looking at the problem again, we can see that we were given exactly the same information in both statements. IfPeter buys two apples and three bananas for $4, it makes sense that if Nadia buys twice as many apples (four apples)and twice as many bananas (six bananas) she will pay twice the price ($8). Since the second equation doesn’t giveus any new information, it doesn’t make it possible to find out the price of each fruit.
Review Questions
Express each equation in slope-intercept form. Without graphing, state whether the system of equations is consistent,inconsistent or dependent.
1. 3x−4y = 13y =−3x−7
2. 35 x+ y = 31.2x+2y = 6
3. 3x−4y = 13y =−3x−7
4. 3x−3y = 3x− y = 1
5. 0.5x− y = 300.5x− y =−30
6. 4x−2y =−23x+2y =−12
7. 3x+ y = 4y = 5−3x
8. x−2y = 74y−2x = 14
Find the solution of each system of equations using the method of your choice. State if the system is inconsistent ordependent.
9. 3x+2y = 4−2x+2y = 24
10. 5x−2y = 32x−3y = 10
11. 3x−4y = 13y =−3x−7
12. 5x−4y = 1−10x+8y =−30
13. 4x+5y = 03x = 6y+4.5
14. −2y+4x = 8y−2x =−4
15. x− 12 y = 3
23x+ y = 6
16. 0.05x+0.25y = 6x+ y = 24
347
7.4. Special Types of Linear Systems www.ck12.org
17. x+ 23 y = 6
3x+2y = 218. A movie theater charges $4.50 for children and $8.00 for adults.
a. On a certain day, 1200 people enter the theater and $8375 is collected. How many children and howmany adults attended?
b. The next day, the manager announces that she wants to see them take in $10000 in tickets. If there are240 seats in the house and only five movie showings planned that day, is it possible to meet that goal?
c. At the same theater, a 16-ounce soda costs $3 and a 32-ounce soda costs $5. If the theater sells 12,480ounces of soda for $2100, how many people bought soda? (Note: Be careful in setting up this problem!)
19. Jamal placed two orders with an internet clothing store. The first order was for 13 ties and 4 pairs ofsuspenders, and totaled $487. The second order was for 6 ties and 2 pairs of suspenders, and totaled $232.The bill does not list the per-item price, but all ties have the same price and all suspenders have the same price.What is the cost of one tie and of one pair of suspenders?
20. An airplane took four hours to fly 2400 miles in the direction of the jet-stream. The return trip against thejet-stream took five hours. What were the airplane’s speed in still air and the jet-stream’s speed?
21. Nadia told Peter that she went to the farmer’s market and bought two apples and one banana, and that it costher $2.50. She thought that Peter might like some fruit, so she went back to the seller and bought four moreapples and two more bananas. Peter thanked Nadia, but told her that he did not like bananas, so he would onlypay her for four apples. Nadia told him that the second time she paid $6.00 for the fruit.
a. What did Peter find when he tried to figure out the price of four apples?b. Nadia then told Peter she had made a mistake, and she actually paid $5.00 on her second trip. Now what
answer did Peter get when he tried to figure out how much to pay her?c. Alicia then showed up and told them she had just bought 3 apples and 2 bananas from the same seller
for $4.25. Now how much should Peter pay Nadia for four apples?
348
www.ck12.org Chapter 7. Solving Systems of Equations and Inequalities
7.5 Systems of Linear Inequalities
Learning Objectives
• Graph linear inequalities in two variables.• Solve systems of linear inequalities.• Solve optimization problems.
Introduction
In the last chapter you learned how to graph a linear inequality in two variables. To do that, you graphed the equationof the straight line on the coordinate plane. The line was solid for ≤ or ≥ signs (where the equals sign is included),and the line was dashed for <or >signs (where the equals sign is not included). Then you shaded above the line (ifthe inequality began with y > or y≥) or below the line (if it began with y < or y≤).
In this section, we’ll see how to graph two or more linear inequalities on the same coordinate plane. The inequalitiesare graphed separately on the same graph, and the solution for the system is the common shaded region betweenall the inequalities in the system. One linear inequality in two variables divides the plane into two half-planes. Asystem of two or more linear inequalities can divide the plane into more complex shapes.
Let’s start by solving a system of two inequalities.
Graph a System of Two Linear Inequalities
Example 1
Solve the following system:
2x+3y≤ 18
x−4y≤ 12
Solution
Solving systems of linear inequalities means graphing and finding the intersections. So we graph each inequality,and then find the intersection regions of the solution.
First, let’s rewrite each equation in slope-intercept form. (Remember that this form makes it easier to tell whichregion of the coordinate plane to shade.) Our system becomes
3y≤−2x+18 y≤−23 x+6
⇒−4y≤−x+12 y≥ x
4 −3
Notice that the inequality sign in the second equation changed because we divided by a negative number!
349
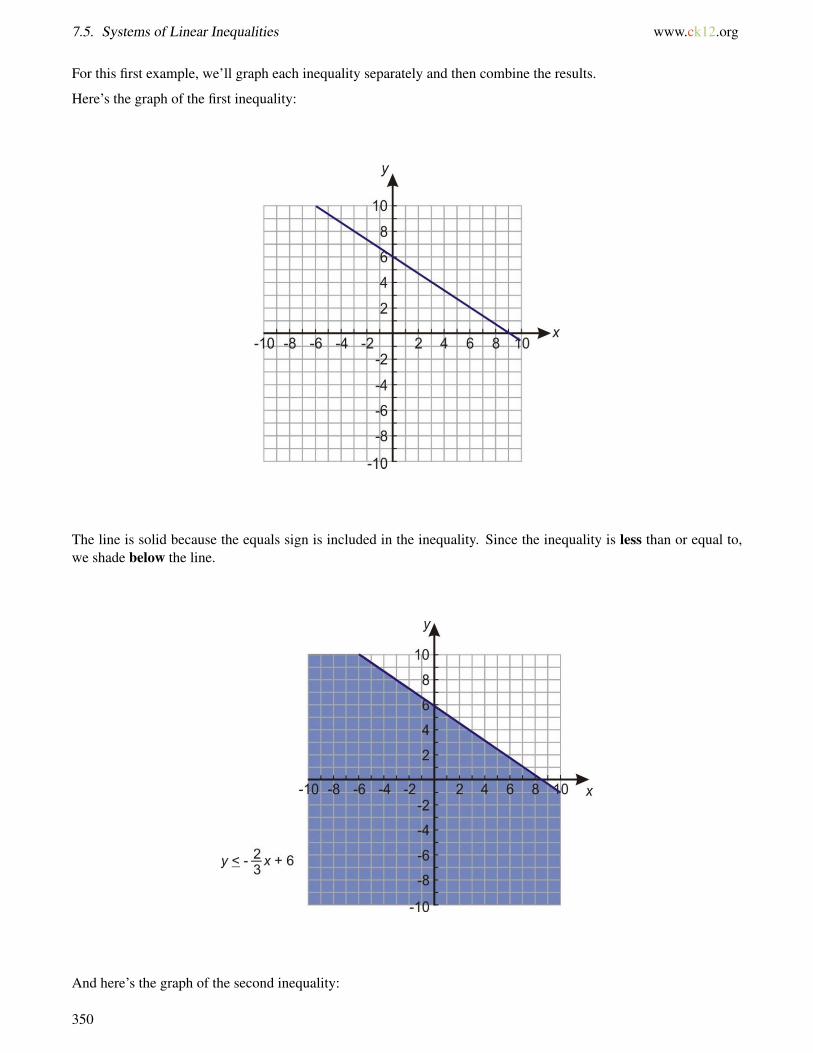
7.5. Systems of Linear Inequalities www.ck12.org
For this first example, we’ll graph each inequality separately and then combine the results.
Here’s the graph of the first inequality:
The line is solid because the equals sign is included in the inequality. Since the inequality is less than or equal to,we shade below the line.
And here’s the graph of the second inequality:
350

www.ck12.org Chapter 7. Solving Systems of Equations and Inequalities
The line is solid again because the equals sign is included in the inequality. We now shade above the line because yis greater than or equal to.
When we combine the graphs, we see that the blue and red shaded regions overlap. The area where they overlap isthe area where both inequalities are true. Thus that area (shown below in purple) is the solution of the system.
351

7.5. Systems of Linear Inequalities www.ck12.org
The kind of solution displayed in this example is called unbounded, because it continues forever in at least onedirection (in this case, forever upward and to the left).
Example 2
There are also situations where a system of inequalities has no solution. For example, let’s solve this system.
y≤ 2x−4
y > 2x+6
Solution
We start by graphing the first line. The line will be solid because the equals sign is included in the inequality. Wemust shade downwards because y is less than.
352

www.ck12.org Chapter 7. Solving Systems of Equations and Inequalities
Next we graph the second line on the same coordinate axis. This line will be dashed because the equals sign is notincluded in the inequality. We must shade upward because y is greater than.
It doesn’t look like the two shaded regions overlap at all. The two lines have the same slope, so we know they areparallel; that means that the regions indeed won’t ever overlap since the lines won’t ever cross. So this system ofinequalities has no solution.
But a system of inequalities can sometimes have a solution even if the lines are parallel. For example, what happensif we swap the directions of the inequality signs in the system we just graphed?
To graph the system
y≥ 2x−4y < 2x+6,
we draw the same lines we drew for the previous system, but we shade upward for the first inequality and downwardfor the second inequality. Here is the result:
353

7.5. Systems of Linear Inequalities www.ck12.org
You can see that this time the shaded regions overlap. The area between the two lines is the solution to the system.
Graph a System of More Than Two Linear Inequalities
When we solve a system of just two linear inequalities, the solution is always an unbounded region—one thatcontinues infinitely in at least one direction. But if we put together a system of more than two inequalities, sometimeswe can get a solution that is bounded—a finite region with three or more sides.
Let’s look at a simple example.
Example 3
Find the solution to the following system of inequalities.
3x− y < 4
4y+9x < 8
x≥ 0
y≥ 0
Solution
Let’s start by writing our inequalities in slope-intercept form.
y > 3x−4
y <−94
x+2
x≥ 0
y≥ 0
Now we can graph each line and shade appropriately. First we graph y > 3x−4 :
354

www.ck12.org Chapter 7. Solving Systems of Equations and Inequalities
Next we graph y <−94 x+2 :
Finally we graph x≥ 0 and y≥ 0, and we’re left with the region below; this is where all four inequalities overlap.
355

7.5. Systems of Linear Inequalities www.ck12.org
The solution is bounded because there are lines on all sides of the solution region. In other words, the solutionregion is a bounded geometric figure, in this case a triangle.
Notice, too, that only three of the lines we graphed actually form the boundaries of the region. Sometimes when wegraph multiple inequalities, it turns out that some of them don’t affect the overall solution; in this case, the solutionwould be the same even if we’d left out the inequality y > 3x−4. That’s because the solution region of the systemformed by the other three inequalities is completely contained within the solution region of that fourth inequality;in other words, any solution to the other three inequalities is automatically a solution to that one too, so adding thatinequality doesn’t narrow down the solution set at all.
But that wasn’t obvious until we actually drew the graph!
Solve Real-World Problems Using Systems of Linear Inequalities
A lot of interesting real-world problems can be solved with systems of linear inequalities.
For example, you go to your favorite restaurant and you want to be served by your best friend who happens to workthere. However, your friend only waits tables in a certain region of the restaurant. The restaurant is also known forits great views, so you want to sit in a certain area of the restaurant that offers a good view. Solving a system of linearinequalities will allow you to find the area in the restaurant where you can sit to get the best view and be served byyour friend.
Often, systems of linear inequalities deal with problems where you are trying to find the best possible situation givena set of constraints. Most of these application problems fall in a category called linear programming problems.
Linear programming is the process of taking various linear inequalities relating to some situation, and finding thebest possible value under those conditions. A typical example would be taking the limitations of materials and laborat a factory, then determining the best production levels for maximal profits under those conditions. These kinds ofproblems are used every day in the organization and allocation of resources. These real-life systems can have dozensor hundreds of variables, or more. In this section, we’ll only work with the simple two-variable linear case.
The general process is to:
• Graph the inequalities (called constraints) to form a bounded area on the coordinate plane (called the feasi-bility region).
356

www.ck12.org Chapter 7. Solving Systems of Equations and Inequalities
• Figure out the coordinates of the corners (or vertices) of this feasibility region by solving the system ofequations that applies to each of the intersection points.
• Test these corner points in the formula (called the optimization equation) for which you’re trying to find themaximum or minimum value.
Example 4
If z = 2x+5y, find the maximum and minimum values of z given these constraints:
2x− y≤ 12
4x+3y≥ 0
x− y≤ 6
Solution
First, we need to find the solution to this system of linear inequalities by graphing and shading appropriately. Tograph the inequalities, we rewrite them in slope-intercept form:
y≥ 2x−12
y≥−43
x
y≥ x−6
These three linear inequalities are called the constraints, and here is their graph:
The shaded region in the graph is called the feasibility region. All possible solutions to the system occur in thatregion; now we must try to find the maximum and minimum values of the variable z within that region. In otherwords, which values of x and y within the feasibility region will give us the greatest and smallest overall values forthe expression 2x+5y?
357
7.5. Systems of Linear Inequalities www.ck12.org
Fortunately, we don’t have to test every point in the region to find that out. It just so happens that the minimum ormaximum value of the optimization equation in a linear system like this will always be found at one of the vertices(the corners) of the feasibility region; we just have to figure out which vertices. So for each vertex—each pointwhere two of the lines on the graph cross—we need to solve the system of just those two equations, and then findthe value of z at that point.
The first system consists of the equations y = 2x−12 and y =−43 x. We can solve this system by substitution:
−43
x = 2x−12⇒−4x = 6x−36⇒−10x =−36⇒ x = 3.6
y = 2x−12⇒ y = 2(3.6)−12⇒ y =−4.8
The lines intersect at the point (3.6, -4.8).
The second system consists of the equations y = 2x−12 and y = x−6. Solving this system by substitution:
x−6 = 2x−12⇒ 6 = x⇒ x = 6
y = x−6⇒ y = 6−6⇒ y = 6
The lines intersect at the point (6, 6).
The third system consists of the equations y =−43 x and y = x−6. Solving this system by substitution:
x−6 =−43
x⇒ 3x−18 =−4x⇒ 7x = 18⇒ x = 2.57
y = x−6⇒ y = 2.57−6⇒ y =−3.43
The lines intersect at the point (2.57, -3.43).
So now we have three different points that might give us the maximum and minimum values for z. To find out whichones actually do give the maximum and minimum values, we can plug the points into the optimization equationz = 2x+5y.
When we plug in (3.6, -4.8), we get z = 2(3.6)+5(−4.8) =−16.8.
When we plug in (6, 0), we get z = 2(6)+5(0) = 12.
When we plug in (2.57, -3.43), we get z = 2(2.57)+5(−3.43) =−12.01.
So we can see that the point (6, 0) gives us the maximum possible value for z and the point (3.6, –4.8) gives usthe minimum value.
In the previous example, we learned how to apply the method of linear programming in the abstract. In the nextexample, we’ll look at a real-life application.
Example 5
You have $10,000 to invest, and three different funds to choose from. The municipal bond fund has a 5% return, thelocal bank’s CDs have a 7% return, and a high-risk account has an expected 10% return. To minimize risk, youdecide not to invest any more than $1,000 in the high-risk account. For tax reasons, you need to invest at least threetimes as much in the municipal bonds as in the bank CDs. What’s the best way to distribute your money given theseconstraints?
Solution
Let’s define our variables:
358

www.ck12.org Chapter 7. Solving Systems of Equations and Inequalities
x is the amount of money invested in the municipal bond at 5% return
y is the amount of money invested in the bank’s CD at 7% return
10000− x− y is the amount of money invested in the high-risk account at 10% return
z is the total interest returned from all the investments, so z = .05x+ .07y+ .1(10000−x−y) or z = 1000−0.05x−0.03y. This is the amount that we are trying to maximize. Our goal is to find the values of x and y that maximizesthe value of z.
Now, let’s write inequalities for the constraints:
You decide not to invest more than $1000 in the high-risk account—that means:
10000− x− y≤ 1000
You need to invest at least three times as much in the municipal bonds as in the bank CDs—that means:
3y≤ x
Also, you can’t invest less than zero dollars in each account, so:
x≥ 0
y≥ 0
10000− x− y≥ 0
To summarize, we must maximize the expression z = 1000− .05x− .03y using the constraints:
10000− x− y≤ 1000 y≥ 9000− x
3y≤ x y≤ x3
x≥ 0 Or in slope-intercept form: x≥ 0
y≥ 0 y≥ 0
10000− x− y≥ 0 y≤ 10000− x
Step 1: Find the solution region to the set of inequalities by graphing each line and shading appropriately. Thefollowing figure shows the overlapping region:
359

7.5. Systems of Linear Inequalities www.ck12.org
The purple region is the feasibility region where all the possible solutions can occur.
Step 2: Next we need to find the corner points of the feasibility region. Notice that there are four corners. To findtheir coordinates, we must pair up the relevant equations and solve each resulting system.
System 1:
y = x3
y = 10000− x
Substitute the first equation into the second equation:
x3= 10000− x⇒ x = 30000−3x⇒ 4x = 30000⇒ x = 7500
y =x3⇒ y =
75003⇒ y = 2500
The intersection point is (7500, 2500).
System 2:
y = x3
y = 9000− x
Substitute the first equation into the second equation:
x3= 9000− x⇒ x = 27000−3x⇒ 4x = 27000⇒ x = 6750
y =x3⇒ y =
67503⇒ y = 2250
The intersection point is (6750, 2250).
System 3:
y = 0y = 10000− x.
The intersection point is (10000, 0).
360
www.ck12.org Chapter 7. Solving Systems of Equations and Inequalities
System 4:
y = 0y = 9000− x.
The intersection point is (9000, 0).
Step 3: In order to find the maximum value for z, we need to plug all the intersection points into the equation for zand find which one yields the largest number.
(7500, 2500): z = 1000−0.05(7500)−0.03(2500) = 550
(6750, 2250): z = 1000−0.05(6750)−0.03(2250) = 595
(10000, 0): z = 1000−0.05(10000)−0.03(0) = 500
(9000, 0): z = 1000−0.05(9000)−0.03(0) = 550
The maximum return on the investment of $595 occurs at the point (6750, 2250). This means that:
$6,750 is invested in the municipal bonds.
$2,250 is invested in the bank CDs.
$1,000 is invested in the high-risk account.
Graphing calculators can be very useful for problems that involve this many inequalities. The video at http://www.youtube.com/watch?v=__wAxkYmhvY shows a real-world linear programming problem worked through in detail ona graphing calculator, although the methods used there can also be used for pencil-and paper solving.
Review Questions
1. Consider the system y < 3x−5y > 3x−5. Is it consistent or inconsistent? Why?
2. Consider the system y≤ 2x+3y≥ 2x+3. Is it consistent or inconsistent? Why?
3. Consider the system y≤−x+1y >−x+1. Is it consistent or inconsistent? Why?
4. In example 3 in this lesson, we solved a system of four inequalities and saw that one of the inequalities,y > 3x−4, didn’t affect the solution set of the system.
a. What would happen if we changed that inequality to y < 3x−4?b. What’s another inequality that we could add to the original system without changing it? Show how by
sketching a graph of that inequality along with the rest of the system.c. What’s another inequality that we could add to the original system to make it inconsistent? Show how
by sketching a graph of that inequality along with the rest of the system.
5. Recall the compound inequalities in one variable that we worked with back in chapter 6. Compound inequal-ities with “and” are simply systems like the ones we are working with here, except with one variable insteadof two.
a. Graph the inequality x > 3 in two dimensions. What’s another inequality that could be combined with itto make an inconsistent system?
b. Graph the inequality x ≤ 4 on a number line. What two-dimensional system would have a graph thatlooks just like this one?
Find the solution region of the following systems of inequalities.
361
7.5. Systems of Linear Inequalities www.ck12.org
6. x− y <−62y≥ 3x+17
7. 4y−5x < 8−5x≥ 16−8y
8. 5x− y≥ 52y− x≥−10
9. 5x+2y≥−253x−2y≤ 17x−6y≥ 27
10. 2x−3y≤ 21x+4y≤ 63x+ y≥−4
11. 12x−7y < 1207x−8y≥ 365x+ y≥ 12
Solve the following linear programming problems.
12. Given the following constraints, find the maximum and minimum values of z =−x+5y: x+3y≤ 0x− y≥ 03x−7y≤ 16
13. Santa Claus is assigning elves to work an eight-hour shift making toy trucks. Apprentice elves draw a wageof five candy canes per hour worked, but can only make four trucks an hour. Senior elves can make six trucksan hour and are paid eight candy canes per hour. There’s only room for nine elves in the truck shop, and dueto a candy-makers’ strike, Santa Claus can only pay out 480 candy canes for the whole 8-hour shift.
a. How many senior elves and how many apprentice elves should work this shift to maximize the numberof trucks that get made?
b. How many trucks will be made?c. Just before the shift begins, the apprentice elves demand a wage increase; they insist on being paid seven
candy canes an hour. Now how many apprentice elves and how many senior elves should Santa assignto this shift?
d. How many trucks will now get made, and how many candy canes will Santa have left over?
14. In Adrian’s Furniture Shop, Adrian assembles both bookcases and TV cabinets. Each type of furniture takesher about the same time to assemble. She figures she has time to make at most 18 pieces of furniture by thisSaturday. The materials for each bookcase cost her $20 and the materials for each TV stand costs her $45.She has $600 to spend on materials. Adrian makes a profit of $60 on each bookcase and a profit of $100 oneach TV stand.
a. Set up a system of inequalities. What x− and y−values do you get for the point where Adrian’s profit ismaximized? Does this solution make sense in the real world?
b. What two possible real-world x−values and what two possible real-world y−values would be closest tothe values in that solution?
c. With two choices each for x and y, there are four possible combinations of x− and y−values. Of thosefour combinations, which ones actually fall within the feasibility region of the problem?
d. Which one of those feasible combinations seems like it would generate the most profit? Test out eachone to confirm your guess. How much profit will Adrian make with that combination?
e. Based on Adrian’s previous sales figures, she doesn’t think she can sell more than 8 TV stands. Nowhow many of each piece of furniture should she make, and what will her profit be?
f. Suppose Adrian is confident she can sell all the furniture she can make, but she doesn’t have room todisplay more than 7 bookcases in her shop. Now how many of each piece of furniture should she make,and what will her profit be?
362

www.ck12.org Chapter 7. Solving Systems of Equations and Inequalities
15. Here’s a “linear programming” problem on a line instead of a plane: Given the constraints x≤ 5 and x≥−2,maximize the value of y where y = x+3.
Texas Instruments Resources
In the CK-12 Texas Instruments Algebra I FlexBook, there are graphing calculator activities designed to supple-ment the objectives for some of the lessons in this chapter. See http://www.ck12.org/flexr/chapter/9617.
363

www.ck12.org
CHAPTER 8 Exponential FunctionsChapter Outline
8.1 EXPONENT PROPERTIES INVOLVING PRODUCTS
8.2 EXPONENT PROPERTIES INVOLVING QUOTIENTS
8.3 ZERO, NEGATIVE, AND FRACTIONAL EXPONENTS
8.4 SCIENTIFIC NOTATION
8.5 GEOMETRIC SEQUENCES
8.6 EXPONENTIAL FUNCTIONS
8.7 APPLICATIONS OF EXPONENTIAL FUNCTIONS
364
www.ck12.org Chapter 8. Exponential Functions
8.1 Exponent Properties Involving Products
Learning Objectives
• Use the product of a power property.• Use the power of a product property.• Simplify expressions involving product properties of exponents.
Introduction
Back in chapter 1, we briefly covered expressions involving exponents, like 35 or x3. In these expressions, thenumber on the bottom is called the base and the number on top is the power or exponent. The whole expression isequal to the base multiplied by itself a number of times equal to the exponent; in other words, the exponent tells ushow many copies of the base number to multiply together.
Example 1
Write in exponential form.
a) 2 ·2
b) (−3)(−3)(−3)
c) y · y · y · y · y
d) (3a)(3a)(3a)(3a)
Solution
a) 2 ·2 = 22 because we have 2 factors of 2
b) (−3)(−3)(−3) = (−3)3 because we have 3 factors of (-3)
c) y · y · y · y · y = y5 because we have 5 factors of y
d) (3a)(3a)(3a)(3a) = (3a)4 because we have 4 factors of 3a
When the base is a variable, it’s convenient to leave the expression in exponential form; if we didn’t write x7, we’dhave to write x · x · x · x · x · x · x instead. But when the base is a number, we can simplify the expression further thanthat; for example, 27 equals 2 ·2 ·2 ·2 ·2 ·2 ·2, but we can multiply all those 2’s to get 128.
Let’s simplify the expressions from Example 1.
Example 2
Simplify.
a) 22
b) (−3)3
c) y5
d) (3a)4
365

8.1. Exponent Properties Involving Products www.ck12.org
Solution
a) 22 = 2 ·2 = 4
b) (−3)3 = (−3)(−3)(−3) =−27
c) y5 is already simplified
d) (3a)4 = (3a)(3a)(3a)(3a) = 3 ·3 ·3 ·3 ·a ·a ·a ·a = 81a4
Be careful when taking powers of negative numbers. Remember these rules:
(negative number) · (positive number) = negative number(negative number) · (negative number) = positive number
So even powers of negative numbers are always positive. Since there are an even number of factors, we pair up thenegative numbers and all the negatives cancel out.
(−2)6 = (−2)(−2)(−2)(−2)(−2)(−2) = (−2)(−2)︸ ︷︷ ︸+4
·(−2)(−2)︸ ︷︷ ︸+4
·(−2)(−2)︸ ︷︷ ︸+4
=+64
And odd powers of negative numbers are always negative. Since there are an odd number of factors, we can stillpair up negative numbers to get positive numbers, but there will always be one negative factor left over, so the answeris negative:
(−2)5 = (−2)(−2)(−2)(−2)(−2) = (−2)(−2)︸ ︷︷ ︸+4
·(−2)(−2)︸ ︷︷ ︸+4
·(−2)︸ ︷︷ ︸−2
=−32
Use the Product of Powers Property
So what happens when we multiply one power of x by another? Let’s see what happens when we multiply x to thepower of 5 by x cubed. To illustrate better, we’ll use the full factored form for each:
(x · x · x · x · x)︸ ︷︷ ︸x5
·(x · x · x)︸ ︷︷ ︸x3
= (x · x · x · x · x · x · x · x)︸ ︷︷ ︸x8
So x5× x3 = x8. You may already see the pattern to multiplying powers, but let’s confirm it with another example.We’ll multiply x squared by x to the power of 4:
(x · x)︸ ︷︷ ︸x2
·(x · x · x · x)︸ ︷︷ ︸x4
= (x · x · x · x · x · x)︸ ︷︷ ︸x6
So x2× x4 = x6. Look carefully at the powers and how many factors there are in each calculation. 5 x’s times 3 x’sequals (5+3) = 8 x’s. 2 x’s times 4 x’s equals (2+4) = 6 x’s.
You should see that when we take the product of two powers of x, the number of x’s in the answer is the total numberof x’s in all the terms you are multiplying. In other words, the exponent in the answer is the sum of the exponents inthe product.
366
www.ck12.org Chapter 8. Exponential Functions
Product Rule for Exponents: xn · xm = x(n+m)
There are some easy mistakes you can make with this rule, however. Let’s see how to avoid them.
Example 3
Multiply 22 ·23.
Solution
22 ·23 = 25 = 32
Note that when you use the product rule you don’t multiply the bases. In other words, you must avoid the commonerror of writing 22 ·23 = 45. You can see this is true if you multiply out each expression: 4 times 8 is definitely 32,not 1024.
Example 4
Multiply 22 ·33.
Solution
22 ·33 = 4 ·27 = 108
In this case, we can’t actually use the product rule at all, because it only applies to terms that have the same base. Ina case like this, where the bases are different, we just have to multiply out the numbers by hand—the answer is not25 or 35 or 65 or anything simple like that.
Use the Power of a Product Property
What happens when we raise a whole expression to a power? Let’s take x to the power of 4 and cube it. Again we’lluse the full factored form for each expression:
(x4)3 = x4× x4× x4 3 f actors o f x to the power 4(x · x · x · x) · (x · x · x · x) · (x · x · x · x) = x · x · x · x · x · x · x · x · x · x · x · x = x12
So (x4)3 = x12. You can see that when we raise a power of x to a new power, the powers multiply.
Power Rule for Exponents: (xn)m = x(n·m)
If we have a product of more than one term inside the parentheses, then we have to distribute the exponent over allthe factors, like distributing multiplication over addition. For example:
(x2y)4 = (x2)4 · (y)4 = x8y4.
Or, writing it out the long way:
(x2y)4 = (x2y)(x2y)(x2y)(x2y) = (x · x · y)(x · x · y)(x · x · y)(x · x · y)= x · x · x · x · x · x · x · x · y · y · y · y = x8y4
Note that this does NOT work if you have a sum or difference inside the parentheses! For example, (x+y)2 6= x2+y2.This is an easy mistake to make, but you can avoid it if you remember what an exponent means: if you multiply out
367

8.1. Exponent Properties Involving Products www.ck12.org
(x+y)2 it becomes (x+y)(x+y), and that’s not the same as x2+y2. We’ll learn how we can simplify this expressionin a later chapter.
The following video from YourTeacher.com may make it clearer how the power rule works for a variety of exponen-tial expressions:
http://www.youtube.com/watch?v=Mm4y_I8-hoU
Example 5
Simplify the following expressions.
a) 35 ·37
b) 26 ·2
c) (42)3
Solution
When we’re just working with numbers instead of variables, we can use the product rule and the power rule, or wecan just do the multiplication and then simplify.
a) We can use the product rule first and then evaluate the result: 35 ·37 = 312 = 531441.
OR we can evaluate each part separately and then multiply them: 35 ·37 = 243 ·2187 = 531441.
b) We can use the product rule first and then evaluate the result: 26 ·2 = 27 = 128.
OR we can evaluate each part separately and then multiply them: 26 ·2 = 64 ·2 = 128.
c) We can use the power rule first and then evaluate the result: (42)3 = 46 = 4096.
OR we can evaluate the expression inside the parentheses first, and then apply the exponent outside the parentheses:(42)3 = (16)3 = 4096.
Example 6
Simplify the following expressions.
a) x2 · x7
b) (y3)5
Solution
When we’re just working with variables, all we can do is simplify as much as possible using the product and powerrules.
a) x2 · x7 = x2+7 = x9
b) (y3)5 = y3×5 = y15
Example 7
Simplify the following expressions.
a) (3x2y3) · (4xy2)
b) (4xyz) · (x2y3) · (2yz4)
c) (2a3b3)2
Solution
When we have a mix of numbers and variables, we apply the rules to each number and variable separately.
a) First we group like terms together: (3x2y3) · (4xy2) = (3 ·4) · (x2 · x) · (y3 · y2)
Then we multiply the numbers or apply the product rule on each grouping: = 12x3y5
368

www.ck12.org Chapter 8. Exponential Functions
b) Group like terms together: (4xyz) · (x2y3) · (2yz4) = (4 ·2) · (x · x2) · (y · y3 · y) · (z · z4)
Multiply the numbers or apply the product rule on each grouping: = 8x3y5z5
c) Apply the power rule for each separate term in the parentheses: (2a3b3)2 = 22 · (a3)2 · (b3)2
Multiply the numbers or apply the power rule for each term = 4a6b6
Example 8
Simplify the following expressions.
a) (x2)2 · x3
b) (2x2y) · (3xy2)3
c) (4a2b3)2 · (2ab4)3
Solution
In problems where we need to apply the product and power rules together, we must keep in mind the order ofoperations. Exponent operations take precedence over multiplication.
a) We apply the power rule first: (x2)2 · x3 = x4 · x3
Then apply the product rule to combine the two terms: x4 · x3 = x7
b) Apply the power rule first: (2x2y) · (3xy2)3 = (2x2y) · (27x3y6)
Then apply the product rule to combine the two terms: (2x2y) · (27x3y6) = 54x5y7
c) Apply the power rule on each of the terms separately: (4a2b3)2 · (2ab4)3 = (16a4b6) · (8a3b12)
Then apply the product rule to combine the two terms: (16a4b6) · (8a3b12) = 128a7b18
Review Questions
Write in exponential notation:
1. 4 ·4 ·4 ·4 ·42. 3x ·3x ·3x3. (−2a)(−2a)(−2a)(−2a)4. 6 ·6 ·6 · x · x · y · y · y · y5. 2 · x · y ·2 ·2 · y · x
Find each number.
6. 54
7. (−2)6
8. (0.1)5
9. (−0.6)3
10. (1.2)2 +53
11. 32 · (0.2)3
Multiply and simplify:
12. 63 ·66
13. 22 ·24 ·26
14. 32 ·43
369

8.1. Exponent Properties Involving Products www.ck12.org
15. x2 · x4
16. (−2y4)(−3y)17. (4a2)(−3a)(−5a4)
Simplify:
18. (a3)4
19. (xy)2
20. (3a2b3)4
21. (−2xy4z2)5
22. (−8x)3(5x)2
23. (4a2)(−2a3)4
24. (12xy)(12xy)2
25. (2xy2)(−x2y)2(3x2y2)
370

www.ck12.org Chapter 8. Exponential Functions
8.2 Exponent Properties Involving Quotients
Learning Objectives
• Use the quotient of powers property.• Use the power of a quotient property.• Simplify expressions involving quotient properties of exponents.
Use the Quotient of Powers Property
The rules for simplifying quotients of exponents are a lot like the rules for simplifying products. Let’s look at whathappens when we divide x7 by x4:
x7
x4 = x ·x ·x ·x · x · x · xx ·x ·x ·x
=x · x · x
1= x3
You can see that when we divide two powers of x, the number of x’s in the solution is the number of x’s in the top ofthe fraction minus the number of x’s in the bottom. In other words, when dividing expressions with the same base,we keep the same base and simply subtract the exponent in the denominator from the exponent in the numerator.
Quotient Rule for Exponents: xn
xm = x(n−m)
When we have expressions with more than one base, we apply the quotient rule separately for each base:
x5y3
x3y2 = x ·x ·x · x · xx ·x ·x
· y ·y · yy ·y
=x · x1· y
1= x2y OR
x5y3
x3y2 = x5−3 · y3−2 = x2y
Example 1
Simplify each of the following expressions using the quotient rule.
a) x10
x5
b) a6
a
c) a5b4
a3b2
Solution
a) x10
x5 = x10−5 = x5
b) a6
a = a6−1 = a5
c) a5b4
a3b2 = a5−3 ·b4−2 = a2b2
Now let’s see what happens if the exponent in the denominator is bigger than the exponent in the numerator. Forexample, what happens when we apply the quotient rule to x4
x7 ?
371

8.2. Exponent Properties Involving Quotients www.ck12.org
The quotient rule tells us to subtract the exponents. 4 minus 7 is -3, so our answer is x−3. A negative exponent!What does that mean?
Well, let’s look at what we get when we do the division longhand by writing each term in factored form:
x4
x7 = x ·x ·x ·xx ·x ·x ·x · x · x · x
=1
x · x · x=
1x3
Even when the exponent in the denominator is bigger than the exponent in the numerator, we can still subtract thepowers. The x’s that are left over after the others have been canceled out just end up in the denominator instead ofthe numerator. Just as x7
x4 would be equal to x3
1 (or simply x3), x4
x7 is equal to 1x3 . And you can also see that 1
x3 is equalto x−3. We’ll learn more about negative exponents shortly.
Example 2
Simplify the following expressions, leaving all exponents positive.
a) x2
x6
b) a2b6
a5b
Solution
a) Subtract the exponent in the numerator from the exponent in the denominator and leave the x’s in the denominator:x2
x6 =1
x6−2 =1x4
b) Apply the rule to each variable separately: a2b6
a5b = 1a5−2 · b6−1
1 = b5
a3
The Power of a Quotient Property
When we raise a whole quotient to a power, another special rule applies. Here is an example:
(x3
y2
)4
=
(x3
y2
)·(
x3
y2
)·(
x3
y2
)·(
x3
y2
)=
(x · x · x) · (x · x · x) · (x · x · x) · (x · x · x)(y · y) · (y · y) · (y · y) · (y · y)
=x12
y8
Notice that the exponent outside the parentheses is multiplied by the exponent in the numerator and the exponent inthe denominator, separately. This is called the power of a quotient rule:
Power Rule for Quotients:(
xn
ym
)p= xn·p
ym·p
Let’s apply these new rules to a few examples.
Example 3
Simplify the following expressions.
a) 45
42
b) 53
57
c)(
34
52
)2
Solution
Since there are just numbers and no variables, we can evaluate the expressions and get rid of the exponents com-pletely.
372

www.ck12.org Chapter 8. Exponential Functions
a) We can use the quotient rule first and then evaluate the result: 45
42 = 45−2 = 43 = 64
OR we can evaluate each part separately and then divide: 45
42 =102416 = 64
b) Use the quotient rule first and hen evaluate the result: 53
57 =154 =
1625
OR evaluate each part separately and then reduce: 53
57 =125
78125 = 1625
Notice that it makes more sense to apply the quotient rule first for examples (a) and (b). Applying the exponent rulesto simplify the expression before plugging in actual numbers means that we end up with smaller, easier numbers towork with.
c) Use the power rule for quotients first and then evaluate the result:(
34
52
)2= 38
54 =6561625
OR evaluate inside the parentheses first and then apply the exponent:(
34
52
)2=(81
25
)2= 6561
625
Example 4
Simplify the following expressions:
a) x12
x5
b)(
x4
x
)5
Solution
a) Use the quotient rule: x12
x5 = x12−5 = x7
b) Use the power rule for quotients and then the quotient rule:(
x4
x
)5= x20
x5 = x15
OR use the quotient rule inside the parentheses first, then apply the power rule:(
x4
x
)5= (x3)5 = x15
Example 5
Simplify the following expressions.
a) 6x2y3
2xy2
b)(
2a3b3
8a7b
)2
Solution
When we have a mix of numbers and variables, we apply the rules to each number or each variable separately.
a) Group like terms together: 6x2y3
2xy2 = 62 ·
x2
x ·y3
y2
Then reduce the numbers and apply the quotient rule on each fraction to get 3xy.
b) Apply the quotient rule inside the parentheses first:(
2a3b3
8a7b
)2=(
b2
4a4
)2
Then apply the power rule for quotients:(
b2
4a4
)2= b4
16a8
Example 6
Simplify the following expressions.
a) (x2)2 · x6
x4
b)(
16a2
4b5
)3· b2
a16
Solution
373

8.2. Exponent Properties Involving Quotients www.ck12.org
In problems where we need to apply several rules together, we must keep the order of operations in mind.
a) We apply the power rule first on the first term:
(x2)2 · x6
x4 = x4 · x6
x4
Then apply the quotient rule to simplify the fraction:
x4 · x6
x4 = x4 · x2
And finally simplify with the product rule:
x4 · x2 = x6
b)(
16a2
4b5
)3· b2
a16
Simplify inside the parentheses by reducing the numbers:
(4a2
b5
)3
· b2
a16
Then apply the power rule to the first fraction:
(4a2
b5
)3
· b2
a16 =64a6
b15 ·b2
a16
Group like terms together:
64a6
b15 ·b2
a16 = 64 · a6
a16 ·b2
b15
And apply the quotient rule to each fraction:
64 · a6
a16 ·b2
b15 =64
a10b13
Review Questions
Evaluate the following expressions.
1. 56
52
374

www.ck12.org Chapter 8. Exponential Functions
2. 67
63
3. 34
310
4.(3
8
)2
5.(
22
33
)3
6. 22·32
52
7. 33·52
37
8.(
23·42
24
)2
Simplify the following expressions.
9. a3
a2
10. x5
x9
11.(
a3b4
a2b
)3
12. x6y2
x2y5
13. 6a3
2a2
14. 15x5
5x
15.(
18a4
15a10
)4
16. 25yx6
20y5x2
17.(
x6y2
x4y4
)3
18.(
6a2
4b4
)2· 5b
3a
19. (3ab)2(4a3b4)3
(6a2b)4
20. (2a2bc2)(6abc3)4ab2c
21. (2a2bc2)(6abc3)4ab2c for a = 2,b = 1, and c = 3
22.(
3x2y2z
)3· z2
x for x = 1,y = 2, and z =−1
23. 2x3
xy2 ·(
x2y
)2for x = 2,y =−3
24. 2x3
xy2 ·(
x2y
)2for x = 0,y = 6
25. If a = 2 and b = 3, simplify (a2b)(bc)3
a3c2 as much as possible.
375
8.3. Zero, Negative, and Fractional Exponents www.ck12.org
8.3 Zero, Negative, and Fractional Exponents
Learning Objectives
• Simplify expressions with negative exponents.• Simplify expressions with zero exponents.• Simplify expression with fractional exponents.• Evaluate exponential expressions.
Introduction
The product and quotient rules for exponents lead to many interesting concepts. For example, so far we’ve mostlyjust considered positive, whole numbers as exponents, but you might be wondering what happens when the exponentisn’t a positive whole number. What does it mean to raise something to the power of zero, or -1, or 1
2 ? In this lesson,we’ll find out.
Simplify Expressions With Negative Exponents
When we learned the quotient rule for exponents( xn
xm = x(n−m)), we saw that it applies even when the exponent in
the denominator is bigger than the one in the numerator. Canceling out the factors in the numerator and denominatorleaves the leftover factors in the denominator, and subtracting the exponents leaves a negative number. So negativeexponents simply represent fractions with exponents in the denominator. This can be summarized in a rule:
Negative Power Rule for Exponents: x−n = 1xn , where x 6= 0
Negative exponents can be applied to products and quotients also. Here’s an example of a negative exponent beingapplied to a product:
(x3y)−2 = x−6y−2 using the power rule
x−6y−2 =1x6 ·
1y2 =
1x6y2 using the negative power rule separately on each variable
And here’s one applied to a quotient:
376

www.ck12.org Chapter 8. Exponential Functions
(ab
)−3=
a−3
b−3 using the power rule for quotients
a−3
b−3 =a−3
1· 1
b−3 =1a3 ·
b3
1using the negative power rule on each variable separately
1a3 ·
b3
1=
b3
a3 simplifying the division of fractions
b3
a3 =
(ba
)3
using the power rule for quotients in reverse.
That last step wasn’t really necessary, but putting the answer in that form shows us something useful:(a
b
)−3 is equal
to(b
a
)3. This is an example of a rule we can apply more generally:
Negative Power Rule for Fractions:(
xy
)−n=( y
x
)n, where x 6= 0,y 6= 0
This rule can be useful when you want to write out an expression without using fractions.
Example 1
Write the following expressions without fractions.
a) 1x
b) 2x2
c) x2
y3
d) 3xy
Solution
a) 1x = x−1
b) 2x2 = 2x−2
c) x2
y3 = x2y−3
d) 3xy = 3x−1y−1
Example 2
Simplify the following expressions and write them without fractions.
a) 4a2b3
2a5b
b)(
x3y2
)3· x2y
4
Solution
a) Reduce the numbers and apply the quotient rule to each variable separately:
4a2b3
2a5b= 2 ·a2−5 ·b3−1 = 2a−3b2
b) Apply the power rule for quotients first:
(2xy2
)3
· x2y4
=8x3
y6 ·x2y4
377

8.3. Zero, Negative, and Fractional Exponents www.ck12.org
Then simplify the numbers, and use the product rule on the x’s and the quotient rule on the y’s:
8x3
y6 ·x2y4
= 2 · x3+2 · y1−6 = 2x5y−5
You can also use the negative power rule the other way around if you want to write an expression without negativeexponents.
Example 3
Write the following expressions without negative exponents.
a) 3x−3
b) a2b−3c−1
c) 4x−1y3
d) 2x−2
y−3
Solution
a) 3x−3 = 3x3
b) a2b−3c−1 = a2
b3c
c) 4x−1y3 = 4y3
x
d) 2x−2
y−3 = 2y3
x2
Example 4
Simplify the following expressions and write the answers without negative powers.
a)(
ab−2
b3
)2
b) x−3y2
x2y−2
Solution
a) Apply the quotient rule inside the parentheses:(
ab−2
b3
)2= (ab−5)2
Then apply the power rule: (ab−5)2 = a2b−10 = a2
b10
b) Apply the quotient rule to each variable separately: x−3y2
x2y−2 = x−3−2y2−(−2) = x−5y4 = y4
x5
Simplify Expressions with Exponents of Zero
Let’s look again at the quotient rule for exponents( xn
xm = x(n−m))
and consider what happens when n = m. Forexample, what happens when we divide x4 by x4? Applying the quotient rule tells us that x4
x4 = x(4−4) = x0—so whatdoes that zero mean?
Well, we first discovered the quotient rule by considering how the factors of x cancel in such a fraction. Let’s do thatagain with our example of x4 divided by x4:
x4
x4 = x ·x ·x ·xx ·x ·x ·x
= 1
378

www.ck12.org Chapter 8. Exponential Functions
So x0 = 1! You can see that this works for any value of the exponent, not just 4:
xn
xn = x(n−n) = x0
Since there is the same number of x’s in the numerator as in the denominator, they cancel each other out and we getx0 = 1. This rule applies for all expressions:
Zero Rule for Exponents: x0 = 1, where x 6= 0
For more on zero and negative exponents, watch the following video at squidoo.com: http://www.google.com/url?sa=t&source=video&cd=4&ved=0CFMQtwIwAw&url=http%3A%2F%2Fwww.youtube.com%2Fwatch%3Fv%3D9svqGWwyN8Q&rct=j&q=negative%20exponents%20applet&ei=1fH6TP2IGoX4sAOnlbT3DQ&usg=AFQjCNHzLF4_-2aeo0dMWsa2wJ_CwzckXNA&cad=rja.
Simplify Expressions With Fractional Exponents
So far we’ve only looked at expressions where the exponents are positive and negative integers. The rules we’velearned work exactly the same if the powers are fractions or irrational numbers—but what does a fractional exponenteven mean? Let’s see if we can figure that out by using the rules we already know.
Suppose we have an expression like 912 —how can we relate this expression to one that we already know how to work
with? For example, how could we turn it into an expression that doesn’t have any fractional exponents?
Well, the power rule tells us that if we raise an exponential expression to a power, we can multiply the exponents.
For example, if we raise 912 to the power of 2, we get
(9
12
)2= 92· 12 = 91 = 9.
So if 912 squared equals 9, what does 9
12 itself equal? Well, 3 is the number whose square is 9 (that is, it’s the square
root of 9), so 912 must equal 3. And that’s true for all numbers and variables: a number raised to the power of 1
2 isjust the square root of the number. We can write that as
√x = x
12 , and then we can see that’s true because
(√x)2
= x
just as(
x12
)2= x.
Similarly, a number to the power of 13 is just the cube root of the number, and so on. In general, x
1n = n√x. And
when we raise a number to a power and then take the root of it, we still get a fractional exponent; for example,3√
x4 =(x4) 1
3 = x43 . In general, the rule is as follows:
Rule for Fractional Exponents: m√an = anm and
(m√a)n
= anm
We’ll examine roots and radicals in detail in a later chapter. In this section, we’ll focus on how exponent rules applyto fractional exponents.
Example 5
Simplify the following expressions.
a) a12 ·a 1
3
b)(
a13
)2
c) a52
a12
d)(
x2
y3
) 13
Solution
379

8.3. Zero, Negative, and Fractional Exponents www.ck12.org
a) Apply the product rule: a12 ·a 1
3 = a12+
13 = a
56
b) Apply the power rule:(
a13
)2= a
23
c) Apply the quotient rule: a52
a12= a
52−
12 = a
42 = a2
d) Apply the power rule for quotients:(
x2
y3
) 13= x
23
y
Evaluate Exponential Expressions
When evaluating expressions we must keep in mind the order of operations. You must remember PEMDAS:
1. Evaluate inside the Parentheses.2. Evaluate Exponents.3. Perform Multiplication and Division operations from left to right.4. Perform Addition and Subtraction operations from left to right.
Example 6
Evaluate the following expressions.
a) 50
b)(2
3
)3
c) 1612
d) 8−13
Solution
a) 50 = 1 A number raised to the power 0 is always 1.
b)(2
3
)3= 23
33 =8
27
c) 1612 =√
16 = 4 Remember that an exponent of 12 means taking the square root.
d) 8−13 = 1
813= 1
3√8= 1
2 Remember that an exponent of 13 means taking the cube root.
Example 7
Evaluate the following expressions.
a) 3 ·52−10 ·5+1
b) 2·42−3·52
32−22
c)(
33
22
)−2· 3
4
Solution
a) Evaluate the exponent: 3 ·52−10 ·5+1 = 3 ·25−10 ·5+1
Perform multiplications from left to right: 3 ·25−10 ·5+1 = 75−50+1
Perform additions and subtractions from left to right: 75−50+1 = 26
b) Treat the expressions in the numerator and denominator of the fraction like they are in parentheses: (2·42−3·52)(32−22)
=(2·16−3·25)
(9−4) = (32−75)5 = −43
5
380
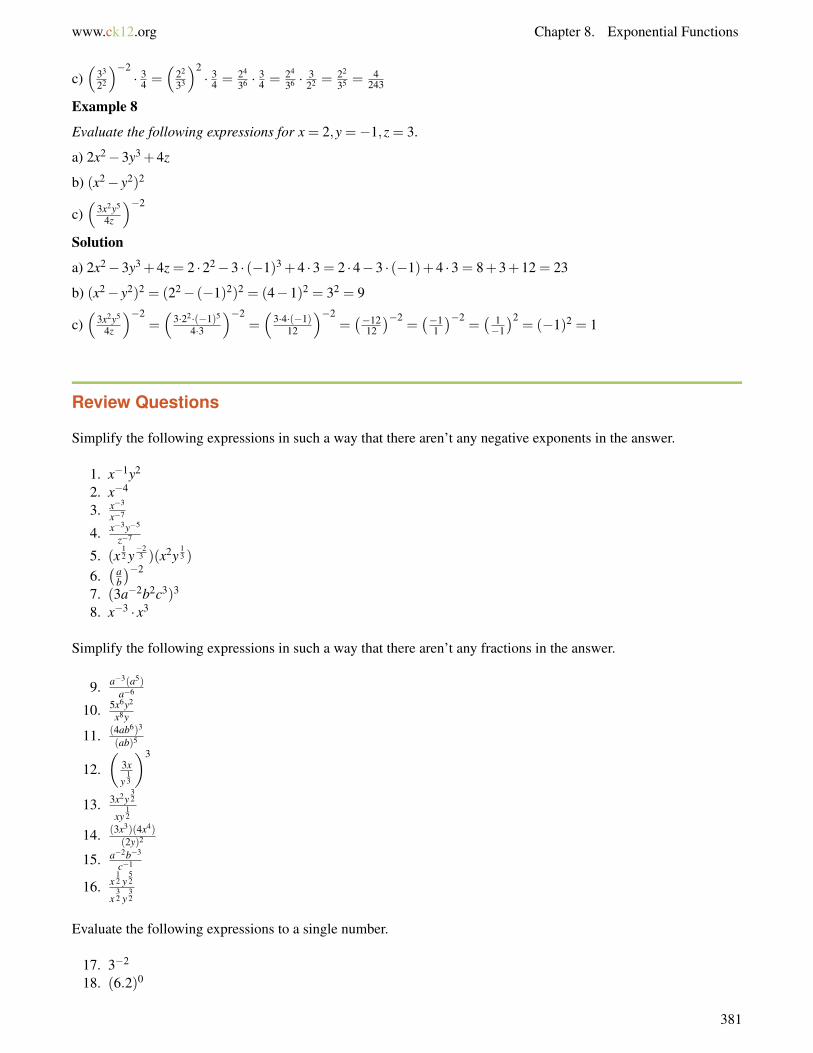
www.ck12.org Chapter 8. Exponential Functions
c)(
33
22
)−2· 3
4 =(
22
33
)2· 3
4 = 24
36 · 34 = 24
36 · 322 =
22
35 =4
243
Example 8
Evaluate the following expressions for x = 2,y =−1,z = 3.
a) 2x2−3y3 +4z
b) (x2− y2)2
c)(
3x2y5
4z
)−2
Solution
a) 2x2−3y3 +4z = 2 ·22−3 · (−1)3 +4 ·3 = 2 ·4−3 · (−1)+4 ·3 = 8+3+12 = 23
b) (x2− y2)2 = (22− (−1)2)2 = (4−1)2 = 32 = 9
c)(
3x2y5
4z
)−2=(
3·22·(−1)5
4·3
)−2=(
3·4·(−1)12
)−2=(−12
12
)−2=(−1
1
)−2=( 1−1
)2= (−1)2 = 1
Review Questions
Simplify the following expressions in such a way that there aren’t any negative exponents in the answer.
1. x−1y2
2. x−4
3. x−3
x−7
4. x−3y−5
z−7
5. (x12 y−23 )(x2y
13 )
6.(a
b
)−2
7. (3a−2b2c3)3
8. x−3 · x3
Simplify the following expressions in such a way that there aren’t any fractions in the answer.
9. a−3(a5)a−6
10. 5x6y2
x8y
11. (4ab6)3
(ab)5
12.(
3x
y13
)3
13. 3x2y32
xy12
14. (3x3)(4x4)(2y)2
15. a−2b−3
c−1
16. x12 y
52
x32 y
32
Evaluate the following expressions to a single number.
17. 3−2
18. (6.2)0
381

8.3. Zero, Negative, and Fractional Exponents www.ck12.org
19. 8−4 ·86
20.(
1612
)3
21. x2 ·4x3 · y4 ·4y2, if x = 2 and y =−122. a4(b2)3 +2ab, if a =−2 and b = 123. 5x2−2y3 +3z, if x = 3,y = 2, and z = 4
24.(
a2
b3
)−2, if a = 5 and b = 3
25.(
x−2
y4
) 12, if x =−3 and y = 2
382
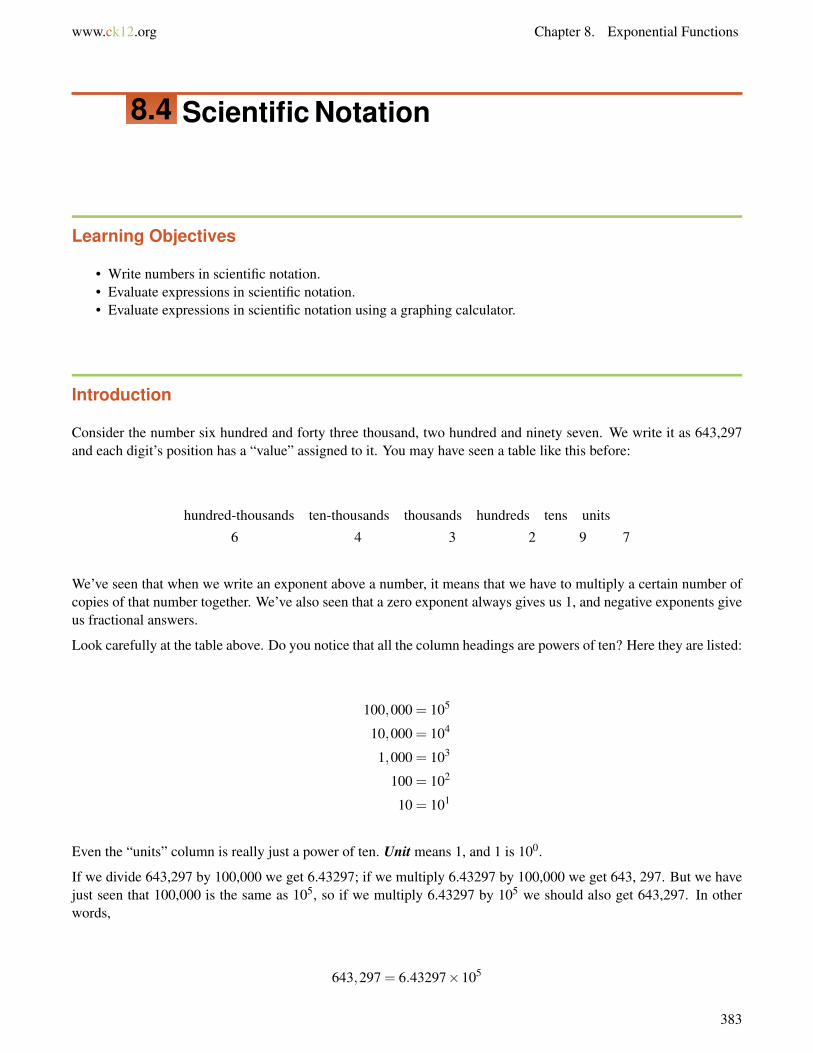
www.ck12.org Chapter 8. Exponential Functions
8.4 Scientific Notation
Learning Objectives
• Write numbers in scientific notation.• Evaluate expressions in scientific notation.• Evaluate expressions in scientific notation using a graphing calculator.
Introduction
Consider the number six hundred and forty three thousand, two hundred and ninety seven. We write it as 643,297and each digit’s position has a “value” assigned to it. You may have seen a table like this before:
hundred-thousands ten-thousands thousands hundreds tens units
6 4 3 2 9 7
We’ve seen that when we write an exponent above a number, it means that we have to multiply a certain number ofcopies of that number together. We’ve also seen that a zero exponent always gives us 1, and negative exponents giveus fractional answers.
Look carefully at the table above. Do you notice that all the column headings are powers of ten? Here they are listed:
100,000 = 105
10,000 = 104
1,000 = 103
100 = 102
10 = 101
Even the “units” column is really just a power of ten. Unit means 1, and 1 is 100.
If we divide 643,297 by 100,000 we get 6.43297; if we multiply 6.43297 by 100,000 we get 643, 297. But we havejust seen that 100,000 is the same as 105, so if we multiply 6.43297 by 105 we should also get 643,297. In otherwords,
643,297 = 6.43297×10⁵
383

8.4. Scientific Notation www.ck12.org
Writing Numbers in Scientific Notation
In scientific notation, numbers are always written in the form a×10b , where b is an integer and a is between 1 and10 (that is, it has exactly 1 nonzero digit before the decimal). This notation is especially useful for numbers that areeither very small or very large.
Here’s a set of examples:
1.07×104 = 10,700
1.07×103 = 1,070
1.07×102 = 107
1.07×101 = 10.7
1.07×100 = 1.07
1.07×10−1 = 0.107
1.07×10−2 = 0.0107
1.07×10−3 = 0.00107
1.07×10−4 = 0.000107
Look at the first example and notice where the decimal point is in both expressions.
So the exponent on the ten acts to move the decimal point over to the right. An exponent of 4 moves it 4 places andan exponent of 3 would move it 3 places.
This makes sense because each time you multiply by 10, you move the decimal point one place to the right. 1.07times 10 is 10.7, times 10 again is 107.0, and so on.
Similarly, if you look at the later examples in the table, you can see that a negative exponent on the 10 means thedecimal point moves that many places to the left. This is because multiplying by 10−1 is the same as multiplying by110 , which is like dividing by 10. So instead of moving the decimal point one place to the right for every multiple of10, we move it one place to the left for every multiple of 1
10 .
That’s how to convert numbers from scientific notation to standard form. When we’re converting numbers toscientific notation, however, we have to apply the whole process backwards. First we move the decimal point
384

www.ck12.org Chapter 8. Exponential Functions
until it’s immediately after the first nonzero digit; then we count how many places we moved it. If we moved it tothe left, the exponent on the 10 is positive; if we moved it to the right, it’s negative.
So, for example, to write 0.000032 in scientific notation, we’d first move the decimal five places to the right to get3.2; then, since we moved it right, the exponent on the 10 should be negative five, so the number in scientific notationis 3.2×10⁻⁵.
You can double-check whether you’ve got the right direction by comparing the number in scientific notation with thenumber in standard form, and thinking “Does this represent a big number or a small number?” A positive exponenton the 10 represents a number bigger than 10 and a negative exponent represents a number smaller than 10, and youcan easily tell if the number in standard form is bigger or smaller than 10 just by looking at it.
For more practice, try the online tool at http://hotmath.com/util/hm_flash_movie.html?movie=/learning_activities/interactivities/sciNotation.swf. Click the arrow buttons to move the decimal point until the number in the middle iswritten in proper scientific notation, and see how the exponent changes as you move the decimal point.
Example 1
Write the following numbers in scientific notation.
a) 63
b) 9,654
c) 653,937,000
d) 0.003
e) 0.000056
f) 0.00005007
Solution
a) 63 = 6.3×10 = 6.3×101
b) 9,654 = 9.654×1,000 = 9.654×10³
c) 653,937,000 = 6.53937000×100,000,000 = 6.53937×10⁸
d) 0.003 = 3× 11000 = 3×10⁻³
e) 0.000056 = 5.6× 1100,000 = 5.6×10⁻⁵
f) 0.00005007 = 5.007× 1100,000 = 5.007×10⁻⁵
Evaluating Expressions in Scientific Notation
When we are faced with products and quotients involving scientific notation, we need to remember the rules forexponents that we learned earlier. It’s relatively straightforward to work with scientific notation problems if youremember to combine all the powers of 10 together. The following examples illustrate this.
Example 2
Evaluate the following expressions and write your answer in scientific notation.
a) (3.2×106) · (8.7×1011)
b) (5.2×10−4) · (3.8×10−19)
c) (1.7×106) · (2.7×10−11)
Solution
385

8.4. Scientific Notation www.ck12.org
The key to evaluating expressions involving scientific notation is to group the powers of 10 together and deal withthem separately.
a) (3.2× 10⁶)(8.7× 10¹¹) = 3.2×8.7︸ ︷︷ ︸27.84
×106×1011︸ ︷︷ ︸1017
= 27.84× 10¹⁷. But 27.84× 10¹⁷ isn’t in proper scientific
notation, because it has more than one digit before the decimal point. We need to move the decimal point onemore place to the left and add 1 to the exponent, which gives us 2.784×10¹⁸.
b) (5.2×10⁻⁴)(3.8×10⁻¹⁹) = 5.2×3.8︸ ︷︷ ︸19.76
×10−4×10−19︸ ︷︷ ︸10−23
= 19.76×10−23 = 1.976×10⁻²²
c) (1.7×10⁶)(2.7×10⁻¹¹) = 1.7×2.7︸ ︷︷ ︸4.59
×106×10−11︸ ︷︷ ︸10−5
= 4.59×10⁻⁵
When we use scientific notation in the real world, we often round off our calculations. Since we’re often dealingwith very big or very small numbers, it can be easier to round off so that we don’t have to keep track of as manydigits—and scientific notation helps us with that by saving us from writing out all the extra zeros. For example, ifwe round off 4,227, 457,903 to 4,200,000,000, we can then write it in scientific notation as simply 4.2×10⁹.
When rounding, we often talk of significant figures or significant digits. Significant figures include
• all nonzero digits• all zeros that come before a nonzero digit and after either a decimal point or another nonzero digit
For example, the number 4000 has one significant digit; the zeros don’t count because there’s no nonzero digit afterthem. But the number 4000.5 has five significant digits: the 4, the 5, and all the zeros in between. And the number0.003 has three significant digits: the 3 and the two zeros that come between the 3 and the decimal point.
Example 3
Evaluate the following expressions. Round to 3 significant figures and write your answer in scientific notation.
a) (3.2×10⁶)÷ (8.7×10¹¹)
b) (5.2×10⁻⁴)÷ (3.8×10⁻¹⁹)
c) (1.7×10⁶)÷ (2.7×10⁻¹¹)
Solution
It’s easier if we convert to fractions and THEN separate out the powers of 10.
a)
(3.2×10⁶)÷ (8.7×10¹¹) =3.2×10⁶
8.7×10¹¹ − separate out the powers o f 10 :
=3.28.7× 106
1011 − evaluate each f raction (round to 3 s. f .) :
= 0.368×10(6−11)
= 0.368×10⁻⁵ − remember how to write scienti f ic notation!
= 3.68×10⁻⁶
386

www.ck12.org Chapter 8. Exponential Functions
b)
(5.2×10⁻⁴)÷ (3.8×10⁻¹⁹) =5.2×10⁻⁴
3.8×10⁻¹⁹ − separate the powers o f 10 :
=5.23.8× 10−4
10−19 − evaluate each f raction (round to 3 s. f .)
= 1.37×10((−4)−(−19))
= 1.37×10¹⁵
c)
(1.7×10⁶)÷ (2.7×10⁻¹¹) =1.7×10⁶
2.7×10⁻¹¹ −next we separate the powers o f 10 :
=1.72.7× 106
10−11 − evaluate each f raction (round to 3 s. f .)
= 0.630×10(6−(−11))
= 0.630×1017
= 6.30×10¹⁶
Note that we have to leave in the final zero to indicate that the result has been rounded.
Evaluate Expressions in Scientific Notation Using a Graphing Calculator
All scientific and graphing calculators can use scientific notation, and it’s very useful to know how.
To insert a number in scientific notation, use the [EE] button. This is [2nd] [,] on some TI models.
For example, to enter 2.6×10⁵, enter 2.6 [EE] 5. When you hit [ENTER] the calculator displays 2.6E5 if it’s set inScientific mode, or 260000 if it’s set in Normal mode.
(To change the mode, press the ’Mode’ key.)
Example 4
Evaluate (2.3×106)× (4.9×10−10) using a graphing calculator.
Solution
Enter 2.3 [EE] 6×4.9[EE] - 10 and press [ENTER].
387

8.4. Scientific Notation www.ck12.org
The calculator displays 6.296296296E16 whether it’s in Normal mode or Scientific mode. That’s because the numberis so big that even in Normal mode it won’t fit on the screen. The answer displayed instead isn’t the precisely correctanswer; it’s rounded off to 10 significant figures.
Since it’s a repeating decimal, though, we can write it more efficiently and more precisely as 6.296×10¹⁶.
Example 5
Evaluate (4.5×10¹⁴)3 using a graphing calculator.
Solution
Enter (4.5 [EE] 14)∧3 and press [ENTER].
The calculator displays 9.1125E43. The answer is 9.1125×1043.
Solve Real-World Problems Using Scientific Notation
Example 6
The mass of a single lithium atom is approximately one percent of one millionth of one billionth of one billionth ofone kilogram. Express this mass in scientific notation.
Solution
We know that a percent is 1100 , and so our calculation for the mass (in kg) is:
1100× 1
1,000,000× 1
1,000,000,000× 1
1,000,000,000= 10−2×10−6×10−9×10⁻⁹
Next we use the product of powers rule we learned earlier:
10−2×10−6×10−9×10−9 = 10((−2)+(−6)+(−9)+(−9)) = 10−26 kg.
388

www.ck12.org Chapter 8. Exponential Functions
The mass of one lithium atom is approximately 1×10⁻²⁶ kg.
Example 7
You could fit about 3 million E. coli bacteria on the head of a pin. If the size of the pin head in question is1.2×10−5 m2, calculate the area taken up by one E. coli bacterium. Express your answer in scientific notation
Solution
Since we need our answer in scientific notation, it makes sense to convert 3 million to that format first:
3,000,000 = 3×10⁶
Next we need an expression involving our unknown, the area taken up by one bacterium. Call this A.
3×10⁶ ·A = 1.2×10⁻⁵ − since 3 million o f them make up the area o f the pin−head
Isolate A:
A =1
3×106 ·1.2×10−5 − rearranging the terms gives :
A =1.23· 1
106 ×10−5 − then using the de f inition o f a negative exponent :
A =1.23·10−6×10⁻⁵ − evaluate & combine exponents using the product rule :
A = 0.4×10⁻¹¹ −but we can′t leave our answer like this, so . . .
The area of one bacterium is 4.0×10⁻¹² m2.
(Notice that we had to move the decimal point over one place to the right, subtracting 1 from the exponent on the10.)
Review Questions
Write the numerical value of the following.
1. 3.102×10²
2. 7.4×10⁴
3. 1.75×10⁻³
4. 2.9×10⁻⁵
5. 9.99×10⁻⁹
Write the following numbers in scientific notation.
6. 120,0007. 1,765,2448. 129. 0.00281
389

8.4. Scientific Notation www.ck12.org
10. 0.000000027
How many significant digits are in each of the following?
11. 3855300012. 2754000.2313. 0.000022214. 0.0002000079
Round each of the following to two significant digits.
15. 3.013216. 82.9913
Perform the following operations and write your answer in scientific notation.
17. (3.5×104) · (2.2×107)
18. 2.1×10⁹
3×10²
19. (3.1×10−3) · (1.2×10−5)
20. 7.4×10⁻⁵
3.7×10⁻²
21. 12,000,000×400,00022. 3,000,000×0.0000000002223. 17,000
680,000,000
24. 25,000,0000.000000005
25. 0.00000000000420.00014
26. The moon is approximately a sphere with radius r = 1.08×10³ miles. Use the formula Surface Area = 4πr2
to determine the surface area of the moon, in square miles. Express your answer in scientific notation, roundedto two significant figures.
27. The charge on one electron is approximately 1.60×10¹⁹ coulombs. One Faraday is equal to the total chargeon 6.02×10²³ electrons. What, in coulombs, is the charge on one Faraday?
28. Proxima Centauri, the next closest star to our Sun, is approximately 2.5× 10¹³ miles away. If light fromProxima Centauri takes 3.7×10⁴ hours to reach us from there, calculate the speed of light in miles per hour.Express your answer in scientific notation, rounded to 2 significant figures.
390
www.ck12.org Chapter 8. Exponential Functions
8.5 Geometric Sequences
Learning Objectives
• Identify a geometric sequence• Graph a geometric sequence.• Solve real-world problems involving geometric sequences.
Introduction
Consider the following question:
Which would you prefer, being given one million dollars, or one penny the first day, double that penny the next day,and then double the previous day’s pennies and so on for a month?
At first glance it’s easy to say "Give me the million!" But why don’t we do a few calculations to see how the otherchoice stacks up?
You start with a penny the first day and keep doubling each day. Doubling means that we keep multiplying by 2 eachday for one month (30 days).
On the first day, you get 1 penny, or 20 pennies.
On the second day, you get 2 pennies, or 21 pennies.
On the third day, you get 4 pennies, or 22 pennies. Do you see the pattern yet?
On the fourth day, you get 8 pennies, or 23 pennies. Each day, the exponent is one less than the number of that day.
So on the thirtieth day, you get 229 pennies, which is 536,870,912 pennies, or $5,368,709.12. That’s a lot more thana million dollars, even just counting the amount you get on that one day!
This problem is an example of a geometric sequence. In this section, we’ll find out what a geometric sequence isand how to solve problems involving geometric sequences.
Identify a Geometric Sequence
A geometric sequence is a sequence of numbers in which each number in the sequence is found by multiplyingthe previous number by a fixed amount called the common ratio. In other words, the ratio between any term andthe term before it is always the same. In the previous example the common ratio was 2, as the number of penniesdoubled each day.
The common ratio, r, in any geometric sequence can be found by dividing any term by the preceding term.
Here are some examples of geometric sequences and their common ratios.
391

8.5. Geometric Sequences www.ck12.org
4,16,64,256, . . . r = 4 (divide 16 by 4 to get 4)
15,30,60,120, . . . r = 2 (divide 30 by 15 to get 2)
11,112,114,118,1116
, . . . r =12
(divide
112
by 11 to get12
)25,−5,1,−1
5,
125
, . . . r =−15
(divide 1 by -5 to get− 1
5
)If we know the common ratio r, we can find the next term in the sequence just by multiplying the last term by r.Also, if there are any terms missing in the sequence, we can find them by multiplying the term before each missingterm by the common ratio.
Example 1
Fill is the missing terms in each geometric sequence.
a) 1, ___, 25, 125, ___
b) 20, ___, 5, ___, 1.25
Solution
a) First we can find the common ratio by dividing 125 by 25 to obtain r = 5.
To find the first missing term, we multiply 1 by the common ratio: 1 ·5 = 5
To find the second missing term, we multiply 125 by the common ratio: 125 ·5 = 625
Sequence (a) becomes: 1, 5, 25, 125, 625,...
b) We need to find the common ratio first, but how do we do that when we have no terms next to each other that wecan divide?
Well, we know that to get from 20 to 5 in the sequence we must multiply 20 by the common ratio twice: once to getto the second term in the sequence, and again to get to five. So we can say 20 · r · r = 5, or 20 · r2 = 5.
Dividing both sides by 20, we get r2 = 520 = 1
4 , or r = 12 (because 1
2 ·12 = 1
4 ).
To get the first missing term, we multiply 20 by 12 and get 10.
To get the second missing term, we multiply 5 by 12 and get 2.5.
Sequence (b) becomes: 20, 10, 5, 2.5, 1.25,...
You can see that if we keep multiplying by the common ratio, we can find any term in the sequence that we want—thetenth term, the fiftieth term, the thousandth term.... However, it would be awfully tedious to keep multiplying overand over again in order to find a term that is a long way from the start. What could we do instead of just multiplyingrepeatedly?
Let’s look at a geometric sequence that starts with the number 7 and has common ratio of 2.
The 1st term is: 7 or 7 ·20
We obtain the 2nd term by multiplying by 2 : 7 ·2 or 7 ·21
We obtain the 3rd term by multiplying by 2 again: 7 ·2 ·2 or 7 ·22
We obtain the 4th term by multiplying by 2 again: 7 ·2 ·2 ·2 or 7 ·23
We obtain the 5th term by multiplying by 2 again: 7 ·2 ·2 ·2 ·2 or 7 ·24
The nth term would be: 7 ·2n−1
392

www.ck12.org Chapter 8. Exponential Functions
The nth term is 7 ·2n−1 because the 7 is multiplied by 2 once for the 2nd term, twice for the third term, and so on—foreach term, one less time than the term’s place in the sequence. In general, we write a geometric sequence with nterms like this:
a,ar,ar2,ar3, . . . ,arn−1
The formula for finding a specific term in a geometric sequence is:
nth term in a geometric sequence: an = a1rn−1
(a1 = first term, r = common ratio)
Example 2
For each of these geometric sequences, find the eighth term in the sequence.
a) 1, 2, 4,...
b) 16, -8, 4, -2, 1,...
Solution
a) First we need to find the common ratio: r = 21 = 2.
The eighth term is given by the formula a8 = a1r7 = 1 ·27 = 128
In other words, to get the eighth term we start with the first term, which is 1, and then multiply by 2 seven times.
b) The common ratio is r = −816 = −1
2
The eighth term in the sequence is a8 = a1r7 = 16 ·(−1
2
)7= 16 · (−1)7
27 = 16 · −127 = −16
128 =−18
Let’s take another look at the terms in that second sequence. Notice that they alternate positive, negative, positive,negative all the way down the list. When you see this pattern, you know the common ratio is negative; multiplyingby a negative number each time means that the sign of each term is opposite the sign of the previous term.
Solve Real-World Problems Involving Geometric Sequences
Let’s solve two application problems involving geometric sequences.
Example 3
A courtier presented the Indian king with a beautiful, hand-made chessboard. The king asked what he would like inreturn for his gift and the courtier surprised the king by asking for one grain of rice on the first square, two grainson the second, four grains on the third, etc. The king readily agreed and asked for the rice to be brought. (FromMeadows et al. 1972, via Porritt 2005) How many grains of rice does the king have to put on the last square?
Solution
A chessboard is an 8×8 square grid, so it contains a total of 64 squares.
The courtier asked for one grain of rice on the first square, 2 grains of rice on the second square, 4 grains of rice onthe third square and so on. We can write this as a geometric sequence:
1, 2, 4,...
The numbers double each time, so the common ratio is r = 2.
The problem asks how many grains of rice the king needs to put on the last square, so we need to find the 64th termin the sequence. Let’s use our formula:
393
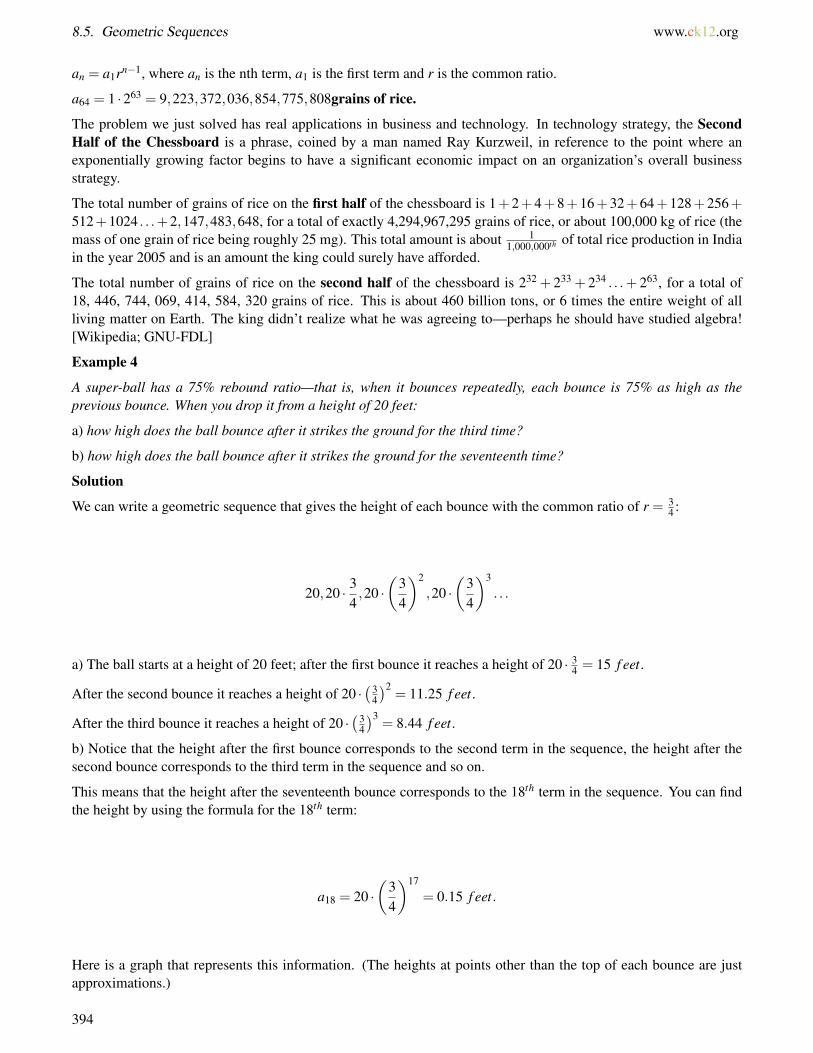
8.5. Geometric Sequences www.ck12.org
an = a1rn−1, where an is the nth term, a1 is the first term and r is the common ratio.
a64 = 1 ·263 = 9,223,372,036,854,775,808grains of rice.
The problem we just solved has real applications in business and technology. In technology strategy, the SecondHalf of the Chessboard is a phrase, coined by a man named Ray Kurzweil, in reference to the point where anexponentially growing factor begins to have a significant economic impact on an organization’s overall businessstrategy.
The total number of grains of rice on the first half of the chessboard is 1+2+4+8+16+32+64+128+256+512+1024 . . .+2,147,483,648, for a total of exactly 4,294,967,295 grains of rice, or about 100,000 kg of rice (themass of one grain of rice being roughly 25 mg). This total amount is about 1
1,000,000th of total rice production in Indiain the year 2005 and is an amount the king could surely have afforded.
The total number of grains of rice on the second half of the chessboard is 232 + 233 + 234 . . .+ 263, for a total of18, 446, 744, 069, 414, 584, 320 grains of rice. This is about 460 billion tons, or 6 times the entire weight of allliving matter on Earth. The king didn’t realize what he was agreeing to—perhaps he should have studied algebra![Wikipedia; GNU-FDL]
Example 4
A super-ball has a 75% rebound ratio—that is, when it bounces repeatedly, each bounce is 75% as high as theprevious bounce. When you drop it from a height of 20 feet:
a) how high does the ball bounce after it strikes the ground for the third time?
b) how high does the ball bounce after it strikes the ground for the seventeenth time?
Solution
We can write a geometric sequence that gives the height of each bounce with the common ratio of r = 34 :
20,20 · 34,20 ·
(34
)2
,20 ·(
34
)3
. . .
a) The ball starts at a height of 20 feet; after the first bounce it reaches a height of 20 · 34 = 15 f eet.
After the second bounce it reaches a height of 20 ·(3
4
)2= 11.25 f eet.
After the third bounce it reaches a height of 20 ·(3
4
)3= 8.44 f eet.
b) Notice that the height after the first bounce corresponds to the second term in the sequence, the height after thesecond bounce corresponds to the third term in the sequence and so on.
This means that the height after the seventeenth bounce corresponds to the 18th term in the sequence. You can findthe height by using the formula for the 18th term:
a18 = 20 ·(
34
)17
= 0.15 f eet.
Here is a graph that represents this information. (The heights at points other than the top of each bounce are justapproximations.)
394

www.ck12.org Chapter 8. Exponential Functions
For more practice finding the terms in geometric sequences, try the browser game at http://www.ies.co.jp/math/java/misc/sum/sum.html.
Review Questions
Determine the first five terms of each geometric sequence.
1. a1 = 2,r = 32. a1 = 90,r =−1
33. a1 = 6,r =−24. a1 = 1,r = 55. a1 = 5,r = 56. a1 = 25,r = 57. What do you notice about the last three sequences?
Find the missing terms in each geometric sequence.
8. 3, __ , 48, 192, __9. 81, __ , __ , __ , 1
10. 94 , , , 2
3 ,11. 2, __ , __ , -54, 162
Find the indicated term of each geometric sequence.
12. a1 = 4,r = 2; find a613. a1 =−7,r =−3
4 ; find a414. a1 =−10,r =−3; find a1015. In a geometric sequence, a3 = 28 and a5 = 112; find r and a1.16. In a geometric sequence, a2 = 28 and a5 = 112; find r and a1.17. As you can see from the previous two questions, the same terms can show up in sequences with different
ratios.
a. Write a geometric sequence that has 1 and 9 as two of the terms (not necessarily the first two).b. Write a different geometric sequence that also has 1 and 9 as two of the terms.c. Write a geometric sequence that has 6 and 24 as two of the terms.d. Write a different geometric sequence that also has 6 and 24 as two of the terms.e. What is the common ratio of the sequence whose first three terms are 2, 6, 18?
395

8.5. Geometric Sequences www.ck12.org
f. What is the common ratio of the sequence whose first three terms are 18, 6, 2?g. What is the relationship between those ratios?
18. Anne goes bungee jumping off a bridge above water. On the initial jump, the bungee cord stretches by 120feet. On the next bounce the stretch is 60% of the original jump and each additional bounce the rope stretchesby 60% of the previous stretch.
a. What will the rope stretch be on the third bounce?b. What will be the rope stretch be on the 12th bounce?
396

www.ck12.org Chapter 8. Exponential Functions
8.6 Exponential Functions
Learning Objectives
• Graph an exponential function.• Compare graphs of exponential functions.• Analyze the properties of exponential functions.
Introduction
A colony of bacteria has a population of three thousand at noon on Monday. During the next week, the colony’spopulation doubles every day. What is the population of the bacteria colony just before midnight on Saturday?
At first glance, this seems like a problem you could solve using a geometric sequence. And you could, if the bacteriapopulation doubled all at once every day; since it doubled every day for five days, the final population would be3000 times 25.
But bacteria don’t reproduce all at once; their population grows slowly over the course of an entire day. So how dowe figure out the population after five and a half days?
Exponential Functions
Exponential functions are a lot like geometrical sequences. The main difference between them is that a geometricsequence is discrete while an exponential function is continuous.
Discrete means that the sequence has values only at distinct points (the 1st term, 2nd term, etc.)
Continuous means that the function has values for all possible values of x. The integers are included, but also allthe numbers in between.
The problem with the bacteria is an example of a continuous function. Here’s an example of a discrete function:
An ant walks past several stacks of Lego blocks. There is one block in the first stack, 3 blocks in the 2nd stack and9 blocks in the 3rd stack. In fact, in each successive stack there are triple the number of blocks than in the previousstack.
In this example, each stack has a distinct number of blocks and the next stack is made by adding a certain number ofwhole pieces all at once. More importantly, however, there are no values of the sequence between the stacks. Youcan’t ask how high the stack is between the 2nd and 3rd stack, as no stack exists at that position!
As a result of this difference, we use a geometric series to describe quantities that have values at discrete points, andwe use exponential functions to describe quantities that have values that change continuously.
When we graph an exponential function, we draw the graph with a solid curve to show that the function has valuesat any time during the day. On the other hand, when we graph a geometric sequence, we draw discrete points tosignify that the sequence only has value at those points but not in between.
397

8.6. Exponential Functions www.ck12.org
Here are graphs for the two examples above:
The formula for an exponential function is similar to the formula for finding the terms in a geometric sequence. Anexponential function takes the form
y = A ·bx
where A is the starting amount and b is the amount by which the total is multiplied every time. For example, thebacteria problem above would have the equation y = 3000 ·2x.
Compare Graphs of Exponential Functions
Let’s graph a few exponential functions and see what happens as we change the constants in the formula. The basicshape of the exponential function should stay the same—but it may become steeper or shallower depending on theconstants we are using.
First, let’s see what happens when we change the value of A.
Example 1
Compare the graphs of y = 2x and y = 3 ·2x.
Solution
Let’s make a table of values for both functions.
TABLE 8.1:
x y = 2x y = 3 ·2x
-3 18 y = 3 ·2−3 = 3 · 1
23 =38
-2 14 y = 3 ·2−2 = 3 · 1
22 =34
-1 12 y = 3 ·2−1 = 3 · 1
21 =32
0 1 y = 3 ·20 = 31 2 y = 3 ·21 = 62 4 y = 3 ·22 = 3 ·4 = 123 8 y = 3 ·23 = 3 ·8 = 24
398

www.ck12.org Chapter 8. Exponential Functions
Now let’s use this table to graph the functions.
We can see that the function y = 3 · 2x is bigger than the function y = 2x. In both functions, the value of y doublesevery time x increases by one. However, y = 3 ·2x “starts” with a value of 3, while y = 2x “starts” with a value of 1,so it makes sense that y = 3 ·2x would be bigger as its values of y keep getting doubled.
Similarly, if the starting value of A is smaller, the values of the entire function will be smaller.
Example 2
Compare the graphs of y = 2x and y = 13 ·2
x.
Solution
Let’s make a table of values for both functions.
TABLE 8.2:
x y = 2x y = 13 ·2
x
-3 18 y = 1
3 ·2−3 = 1
3 ·123 =
124
-2 14 y = 1
3 ·2−2 = 1
3 ·122 =
112
-1 12 y = 1
3 ·2−1 = 1
3 ·121 =
16
0 1 y = 13 ·2
0 = 13
1 2 y = 13 ·2
1 = 23
2 4 y = 13 ·2
2 = 13 ·4 = 4
33 8 y = 1
3 ·23 = 1
3 ·8 = 83
Now let’s use this table to graph the functions.
399

8.6. Exponential Functions www.ck12.org
As we expected, the exponential function y = 13 ·2
x is smaller than the exponential function y = 2x.
So what happens if the starting value of A is negative? Let’s find out.
Example 3
Graph the exponential function y =−5 ·2x.
Solution
Let’s make a table of values:
TABLE 8.3:
x y =−5 ·2x
-2 −54
-1 −52
0 -51 -102 -203 -40
Now let’s graph the function:
400

www.ck12.org Chapter 8. Exponential Functions
This result shouldn’t be unexpected. Since the starting value is negative and keeps doubling over time, it makessense that the value of y gets farther from zero, but in a negative direction. The graph is basically just like the graphof y = 5 ·2x, only mirror-reversed about the x−axis.
Now, let’s compare exponential functions whose bases (b) are different.
Example 4
Graph the following exponential functions on the same graph: y = 2x,y = 3x,y = 5x,y = 10x.
Solution
First we’ll make a table of values for all four functions.
TABLE 8.4:
x y = 2x y = 3x y = 5x y = 10x
-2 14
19
125
1100
-1 12
13
15
110
0 1 1 1 11 2 3 5 102 4 9 25 1003 8 27 125 1000
Now let’s graph the functions.
Notice that for x = 0, all four functions equal 1. They all “start out” at the same point, but the ones with highervalues for b grow faster when x is positive—and also shrink faster when x is negative.
Finally, let’s explore what happens for values of b that are less than 1.
Example 5
Graph the exponential function y = 5 ·(1
2
)x.
Solution
Let’s start by making a table of values. (Remember that a fraction to a negative power is equivalent to its reciprocalto the same positive power.)
401

8.6. Exponential Functions www.ck12.org
TABLE 8.5:
x y = 5 ·(1
2
)x
-3 y = 5 ·(1
2
)−3= 5 ·23 = 40
-2 y = 5 ·(1
2
)−2= 5 ·22 = 20
-1 y = 5 ·(1
2
)−1= 5 ·21 = 10
0 y = 5 ·(1
2
)0= 5 ·1 = 5
1 y = 5 ·(1
2
)1= 5
2
2 y = 5 ·(1
2
)2= 5
4
Now let’s graph the function.
This graph looks very different than the graphs from the previous example! What’s going on here?
When we raise a number greater than 1 to the power of x, it gets bigger as x gets bigger. But when we raise a numbersmaller than 1 to the power of x, it gets smaller as x gets bigger—as you can see from the table of values above. Thismakes sense because multiplying any number by a quantity less than 1 always makes it smaller.
So, when the base b of an exponential function is between 0 and 1, the graph is like an ordinary exponential graph,only decreasing instead of increasing. Graphs like this represent exponential decay instead of exponential growth.Exponential decay functions are used to describe quantities that decrease over a period of time.
When b can be written as a fraction, we can use the Property of Negative Exponents to write the function in adifferent form. For instance, y = 5 ·
(12
)x is equivalent to 5 ·2−x. These two forms are both commonly used, so it’simportant to know that they are equivalent.
Example 6
Graph the exponential function y = 8 ·3−x.
Solution
Here is our table of values and the graph of the function.
402
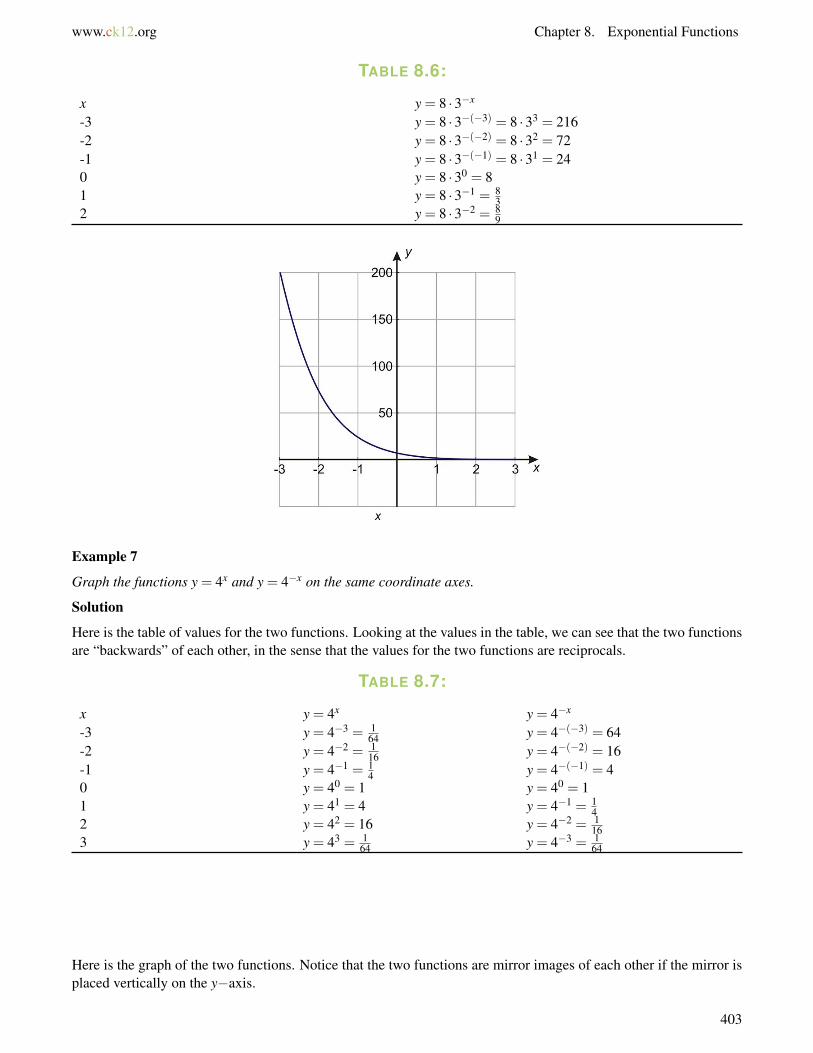
www.ck12.org Chapter 8. Exponential Functions
TABLE 8.6:
x y = 8 ·3−x
-3 y = 8 ·3−(−3) = 8 ·33 = 216-2 y = 8 ·3−(−2) = 8 ·32 = 72-1 y = 8 ·3−(−1) = 8 ·31 = 240 y = 8 ·30 = 81 y = 8 ·3−1 = 8
32 y = 8 ·3−2 = 8
9
Example 7
Graph the functions y = 4x and y = 4−x on the same coordinate axes.
Solution
Here is the table of values for the two functions. Looking at the values in the table, we can see that the two functionsare “backwards” of each other, in the sense that the values for the two functions are reciprocals.
TABLE 8.7:
x y = 4x y = 4−x
-3 y = 4−3 = 164 y = 4−(−3) = 64
-2 y = 4−2 = 116 y = 4−(−2) = 16
-1 y = 4−1 = 14 y = 4−(−1) = 4
0 y = 40 = 1 y = 40 = 11 y = 41 = 4 y = 4−1 = 1
42 y = 42 = 16 y = 4−2 = 1
163 y = 43 = 1
64 y = 4−3 = 164
Here is the graph of the two functions. Notice that the two functions are mirror images of each other if the mirror isplaced vertically on the y−axis.
403

8.6. Exponential Functions www.ck12.org
In the next lesson, you’ll see how exponential growth and decay functions can be used to represent situations in thereal world.
Review Questions
Graph the following exponential functions by making a table of values.
1. y = 3x
2. y = 5 ·3x
3. y = 40 ·4x
4. y = 3 ·10x
Graph the following exponential functions.
5. y =(1
5
)x
6. y = 4 ·(2
3
)x
7. y = 3−x
8. y = 34 ·6
−x
9. Which two of the eight graphs above are mirror images of each other?10. What function would produce a graph that is the mirror image of the one in problem 4?11. How else might you write the exponential function in problem 5?12. How else might you write the function in problem 6?
Solve the following problems.
13. A chain letter is sent out to 10 people telling everyone to make 10 copies of the letter and send each one to anew person.
a. Assume that everyone who receives the letter sends it to ten new people and that each cycle takes a week.How many people receive the letter on the sixth week?
b. What if everyone only sends the letter to 9 new people? How many people will then get letters on thesixth week?
14. Nadia received $200 for her 10th birthday. If she saves it in a bank account with 7.5% interest compoundedyearly, how much money will she have in the bank by her 21st birthday?
404

www.ck12.org Chapter 8. Exponential Functions
8.7 Applications of Exponential Functions
Learning Objectives
• Apply the problem-solving plan to problems involving exponential functions.• Solve real-world problems involving exponential growth.• Solve real-world problems involving exponential decay.
Introduction
For her eighth birthday, Shelley’s grandmother gave her a full bag of candy. Shelley counted her candy and foundout that there were 160 pieces in the bag. As you might suspect, Shelley loves candy, so she ate half the candy on thefirst day. Then her mother told her that if she eats it at that rate, the candy will only last one more day—so Shelleydevised a clever plan. She will always eat half of the candy that is left in the bag each day. She thinks that this wayshe can eat candy every day and never run out.
How much candy does Shelley have at the end of the week? Will the candy really last forever?
Let’s make a table of values for this problem.
Day 0 1 2 3 4 5 6 7
of candies 160 80 40 20 10 5 2.5 1.25
You can see that if Shelley eats half the candies each day, then by the end of the week she only has 1.25 candies leftin her bag.
Let’s write an equation for this exponential function. Using the formula y = A · bx, we can see that A is 160 (thenumber of candies she starts out with and b is 1
2 , so our equation is y = 160 ·(1
2
)x.)
Now let’s graph this function. The resulting graph is shown below.
405

8.7. Applications of Exponential Functions www.ck12.org
So, will Shelley’s candy last forever? We saw that by the end of the week she has 1.25 candies left, so there doesn’tseem to be much hope for that. But if you look at the graph, you’ll see that the graph never really gets to zero.Theoretically there will always be some candy left, but Shelley will be eating very tiny fractions of a candy everyday after the first week!
This is a fundamental feature of an exponential decay function. Its values get smaller and smaller but never quitereach zero. In mathematics, we say that the function has an asymptote at y = 0; in other words, it gets closer andcloser to the line y = 0 but never quite meets it.
Problem-Solving Strategies
Remember our problem-solving plan from earlier?
1. Understand the problem.2. Devise a plan – Translate.3. Carry out the plan – Solve.4. Look – Check and Interpret.
We can use this plan to solve application problems involving exponential functions. Compound interest, loudness ofsound, population increase, population decrease or radioactive decay are all applications of exponential functions.In these problems, we’ll use the methods of constructing a table and identifying a pattern to help us devise a plan forsolving the problems.
Example 1
Suppose $4000 is invested at 6% interest compounded annually. How much money will there be in the bank at theend of 5 years? At the end of 20 years?
Solution
Step 1: Read the problem and summarize the information.
$4000 is invested at 6% interest compounded annually; we want to know how much money we have in five years.
Assign variables:
Let x = time in years
406
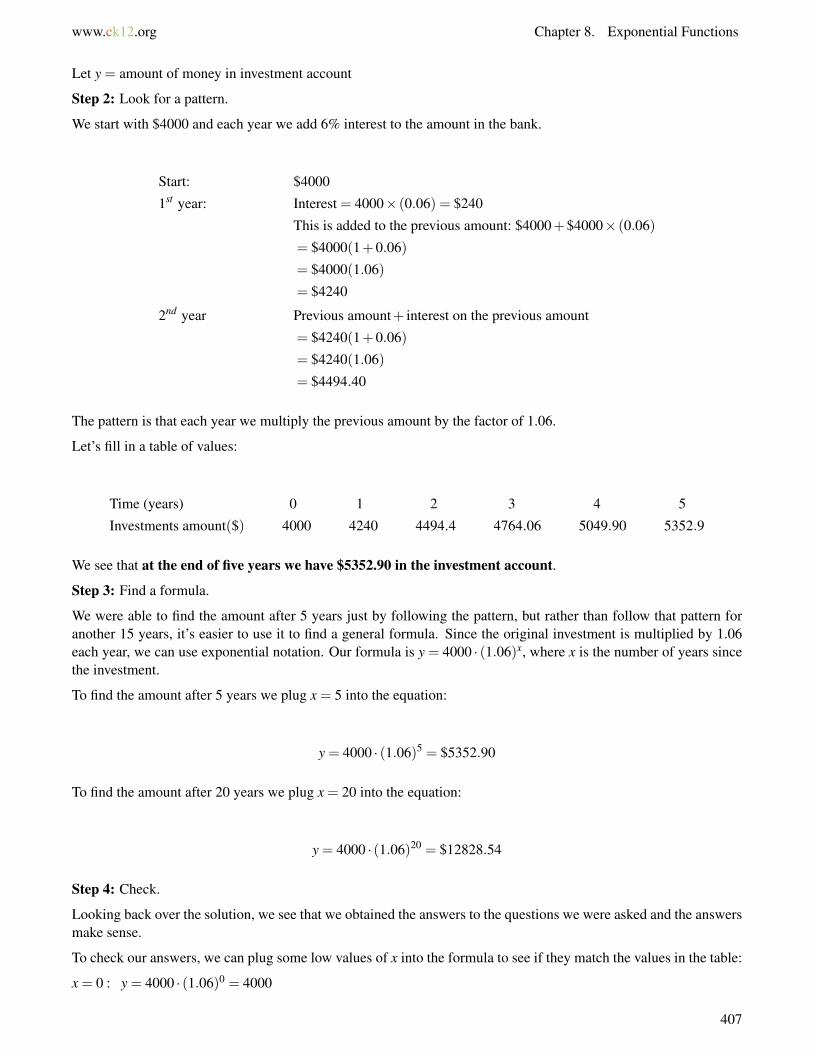
www.ck12.org Chapter 8. Exponential Functions
Let y = amount of money in investment account
Step 2: Look for a pattern.
We start with $4000 and each year we add 6% interest to the amount in the bank.
Start: $4000
1st year: Interest = 4000× (0.06) = $240
This is added to the previous amount: $4000+$4000× (0.06)
= $4000(1+0.06)
= $4000(1.06)
= $4240
2nd year Previous amount+ interest on the previous amount
= $4240(1+0.06)
= $4240(1.06)
= $4494.40
The pattern is that each year we multiply the previous amount by the factor of 1.06.
Let’s fill in a table of values:
Time (years) 0 1 2 3 4 5
Investments amount($) 4000 4240 4494.4 4764.06 5049.90 5352.9
We see that at the end of five years we have $5352.90 in the investment account.
Step 3: Find a formula.
We were able to find the amount after 5 years just by following the pattern, but rather than follow that pattern foranother 15 years, it’s easier to use it to find a general formula. Since the original investment is multiplied by 1.06each year, we can use exponential notation. Our formula is y = 4000 · (1.06)x, where x is the number of years sincethe investment.
To find the amount after 5 years we plug x = 5 into the equation:
y = 4000 · (1.06)5 = $5352.90
To find the amount after 20 years we plug x = 20 into the equation:
y = 4000 · (1.06)20 = $12828.54
Step 4: Check.
Looking back over the solution, we see that we obtained the answers to the questions we were asked and the answersmake sense.
To check our answers, we can plug some low values of x into the formula to see if they match the values in the table:
x = 0 : y = 4000 · (1.06)0 = 4000
407

8.7. Applications of Exponential Functions www.ck12.org
x = 1 : y = 4000 · (1.06)1 = 4240
x = 2 : y = 4000 · (1.06)2 = 4494.4
The answers match the values we found earlier. The amount of increase gets larger each year, and that makes sensebecause the interest is 6% of an amount that is larger every year.
Example 2
In 2002 the population of schoolchildren in a city was 90,000. This population decreases at a rate of 5% each year.What will be the population of school children in year 2010?
Solution
Step 1: Read the problem and summarize the information.
The population is 90,000; the rate of decrease is 5% each year; we want the population after 8 years.
Assign variables:
Let x = time since 2002 (in years)
Let y = population of school children
Step 2: Look for a pattern.
Let’s start in 2002, when the population is 90,000.
The rate of decrease is 5% each year, so the amount in 2003 is 90,000 minus 5% of 90,000, or 95% of 90,000.
In 2003 : Population = 90,000×0.95
In 2004 : Population = 90,000×0.95×0.95
The pattern is that for each year we multiply by a factor of 0.95
Let’s fill in a table of values:
Year 2002 2003 2004 2005 2006 2007
Population 90,000 85,500 81,225 77,164 73,306 69,640
Step 3: Find a formula.
Since we multiply by 0.95 every year, our exponential formula is y = 90000 · (0.95)x, where x is the number of yearssince 2002. To find the population in 2010 (8 years after 2002), we plug in x = 8:
y = 90000 · (0.95)8 = 59,708 schoolchildren.
Step 4: Check.
Looking back over the solution, we see that we answered the question we were asked and that it makes sense. Theanswer makes sense because the numbers decrease each year as we expected. We can check that the formula iscorrect by plugging in the values of x from the table to see if the values match those given by the formula.
Year 2002,x = 0 : Population = y = 90000 · (0.95)0 = 90,000
Year 2003,x = 1 : Population = y = 90000 · (0.95)1 = 85,500
Year 2004,x = 2 : Population = y = 90000 · (0.95)2 = 81,225
408

www.ck12.org Chapter 8. Exponential Functions
Solve Real-World Problems Involving Exponential Growth
Now we’ll look at some more real-world problems involving exponential functions. We’ll start with situationsinvolving exponential growth.
Example 3
The population of a town is estimated to increase by 15% per year. The population today is 20 thousand. Make agraph of the population function and find out what the population will be ten years from now.
Solution
First, we need to write a function that describes the population of the town.
The general form of an exponential function is y = A ·bx.
Define y as the population of the town.
Define x as the number of years from now.
A is the initial population, so A = 20 (thousand).
Finally we must find what b is. We are told that the population increases by 15% each year. To calculate percentswe have to change them into decimals: 15% is equivalent to 0.15. So each year, the population increases by 15% ofA, or 0.15A.
To find the total population for the following year, we must add the current population to the increase in population.In other words, A+0.15A = 1.15A. So the population must be multiplied by a factor of 1.15 each year. This meansthat the base of the exponential is b = 1.15.
The formula that describes this problem is y = 20 · (1.15)x.
Now let’s make a table of values.
TABLE 8.8:
x y = 20 · (1.15)x
-10 4.9-5 9.90 205 40.210 80.9
Now we can graph the function.
409

8.7. Applications of Exponential Functions www.ck12.org
Notice that we used negative values of x in our table of values. Does it make sense to think of negative time? Yes;negative time can represent time in the past. For example, x = −5 in this problem represents the population fromfive years ago.
The question asked in the problem was: what will be the population of the town ten years from now? To find thatnumber, we plug x = 10 into the equation we found: y = 20 · (1.15)10 = 80,911.
The town will have 80,911 people ten years from now.
Example 4
Peter earned $1500 last summer. If he deposited the money in a bank account that earns 5% interest compoundedyearly, how much money will he have after five years?
Solution
This problem deals with interest which is compounded yearly. This means that each year the interest is calculated onthe amount of money you have in the bank. That interest is added to the original amount and next year the interest iscalculated on this new amount, so you get paid interest on the interest.
Let’s write a function that describes the amount of money in the bank.
The general form of an exponential function is y = A ·bx.
Define y as the amount of money in the bank.
Define x as the number of years from now.
A is the initial amount, so A = 1500.
Now we have to find what b is.
We’re told that the interest is 5% each year, which is 0.05 in decimal form. When we add 0.05A to A, we get 1.05A,so that is the factor we multiply by each year. The base of the exponential is b = 1.05.
The formula that describes this problem is y = 1500 ·1.05x. To find the total amount of money in the bank at the endof five years, we simply plug in x = 5.
y = 1500 · (1.05)5 = $1914.42
410

www.ck12.org Chapter 8. Exponential Functions
Solve Real-World Problems Involving Exponential Decay
Exponential decay problems appear in several application problems. Some examples of these are half-life problemsand depreciation problems. Let’s solve an example of each of these problems.
Example 5
A radioactive substance has a half-life of one week. In other words, at the end of every week the level of radioactivityis half of its value at the beginning of the week. The initial level of radioactivity is 20 counts per second.
Draw the graph of the amount of radioactivity against time in weeks.
Find the formula that gives the radioactivity in terms of time.
Find the radioactivity left after three weeks.
Solution
Let’s start by making a table of values and then draw the graph.
TABLE 8.9:
Time Radioactivity0 201 102 53 2.54 1.255 0.625
Exponential decay fits the general formula y = A ·bx. In this case:
y is the amount of radioactivity
x is the time in weeks
A = 20 is the starting amount
b = 12 since the substance losses half its value each week
411
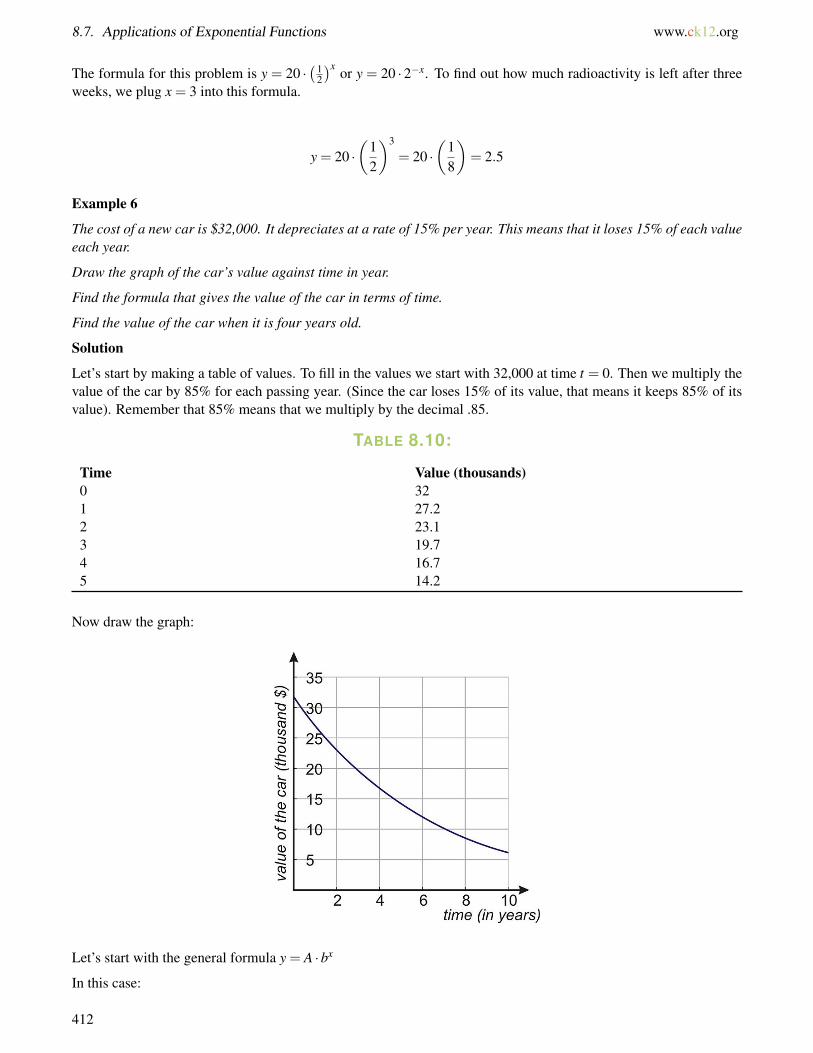
8.7. Applications of Exponential Functions www.ck12.org
The formula for this problem is y = 20 ·(1
2
)x or y = 20 · 2−x. To find out how much radioactivity is left after threeweeks, we plug x = 3 into this formula.
y = 20 ·(
12
)3
= 20 ·(
18
)= 2.5
Example 6
The cost of a new car is $32,000. It depreciates at a rate of 15% per year. This means that it loses 15% of each valueeach year.
Draw the graph of the car’s value against time in year.
Find the formula that gives the value of the car in terms of time.
Find the value of the car when it is four years old.
Solution
Let’s start by making a table of values. To fill in the values we start with 32,000 at time t = 0. Then we multiply thevalue of the car by 85% for each passing year. (Since the car loses 15% of its value, that means it keeps 85% of itsvalue). Remember that 85% means that we multiply by the decimal .85.
TABLE 8.10:
Time Value (thousands)0 321 27.22 23.13 19.74 16.75 14.2
Now draw the graph:
Let’s start with the general formula y = A ·bx
In this case:
412
www.ck12.org Chapter 8. Exponential Functions
y is the value of the car,
x is the time in years,
A = 32 is the starting amount in thousands,
b = 0.85 since we multiply the amount by this factor to get the value of the car next year
The formula for this problem is y = 32 · (0.85)x.
Finally, to find the value of the car when it is four years old, we plug x = 4 into that formula: y = 32 · (0.85)4 = 16.7thousand dollars, or $16,704 if we don’t round.
Review Questions
Solve the following application problems.
1. Half-life: Suppose a radioactive substance decays at a rate of 3.5% per hour.
a. What percent of the substance is left after 6 hours?b. What percent is left after 12 hours?c. The substance is safe to handle when at least 50% of it has decayed. Make a guess as to how many hours
this will take.d. Test your guess. How close were you?
2. Population decrease: In 1990 a rural area has 1200 bird species.
a. If species of birds are becoming extinct at the rate of 1.5% per decade (ten years), how many bird specieswill be left in the year 2020?
b. At that same rate, how many were there in 1980?
3. Growth: Janine owns a chain of fast food restaurants that operated 200 stores in 1999. If the rate of increaseis 8% annually, how many stores does the restaurant operate in 2007?
4. Investment: Paul invests $360 in an account that pays 7.25% compounded annually.
a. What is the total amount in the account after 12 years?b. If Paul invests an equal amount in an account that pays 5% compounded quarterly (four times a year),
what will be the amount in that account after 12 years?c. Which is the better investment?
5. The cost of a new ATV (all-terrain vehicle) is $7200. It depreciates at 18% per year.
a. Draw the graph of the vehicle’s value against time in years.b. Find the formula that gives the value of the ATV in terms of time.c. Find the value of the ATV when it is ten years old.
6. A person is infected by a certain bacterial infection. When he goes to the doctor the population of bacteria is2 million. The doctor prescribes an antibiotic that reduces the bacteria population to 1
4 of its size each day.
a. Draw the graph of the size of the bacteria population against time in days.b. Find the formula that gives the size of the bacteria population in terms of time.c. Find the size of the bacteria population ten days after the drug was first taken.d. Find the size of the bacteria population after 2 weeks (14 days).
413

8.7. Applications of Exponential Functions www.ck12.org
Texas Instruments Resources
In the CK-12 Texas Instruments Algebra I FlexBook, there are graphing calculator activities designed to supple-ment the objectives for some of the lessons in this chapter. See http://www.ck12.org/flexr/chapter/9618.
414

www.ck12.org Chapter 9. Polynomials
CHAPTER 9 PolynomialsChapter Outline
9.1 ADDITION AND SUBTRACTION OF POLYNOMIALS
9.2 MULTIPLICATION OF POLYNOMIALS
9.3 SPECIAL PRODUCTS OF POLYNOMIALS
9.4 POLYNOMIAL EQUATIONS IN FACTORED FORM
9.5 FACTORING QUADRATIC EXPRESSIONS
9.6 FACTORING SPECIAL PRODUCTS
9.7 FACTORING POLYNOMIALS COMPLETELY
415
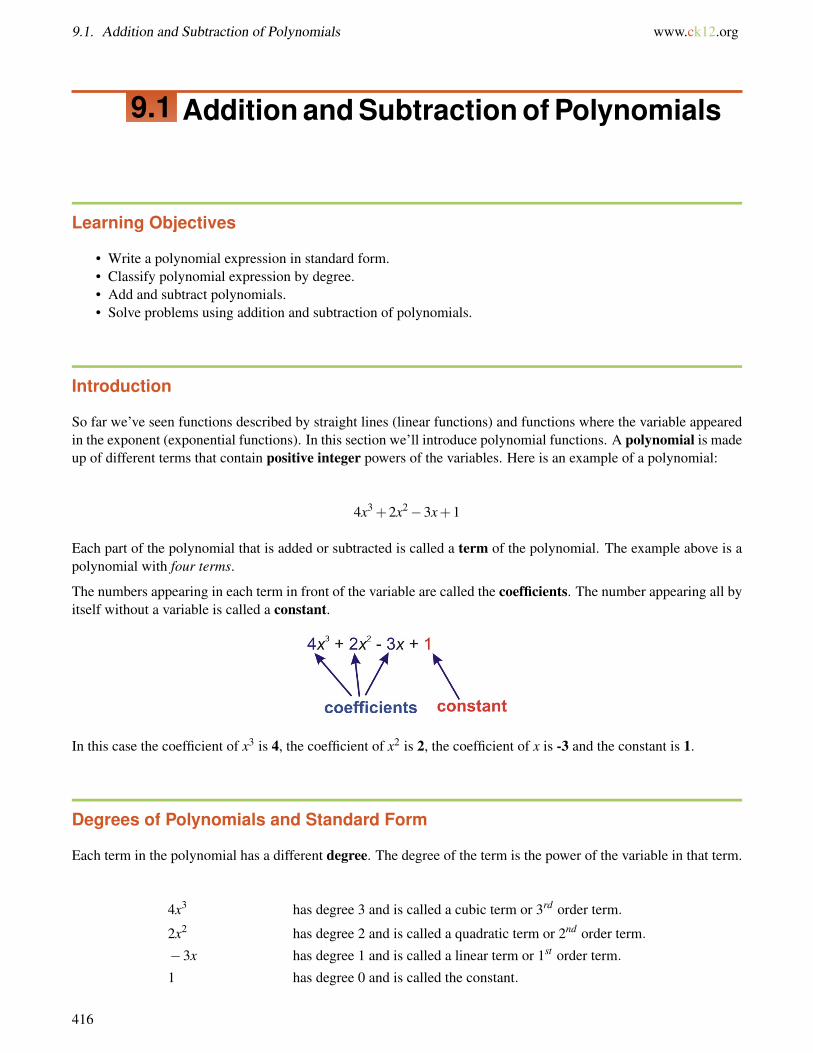
9.1. Addition and Subtraction of Polynomials www.ck12.org
9.1 Addition and Subtraction of Polynomials
Learning Objectives
• Write a polynomial expression in standard form.• Classify polynomial expression by degree.• Add and subtract polynomials.• Solve problems using addition and subtraction of polynomials.
Introduction
So far we’ve seen functions described by straight lines (linear functions) and functions where the variable appearedin the exponent (exponential functions). In this section we’ll introduce polynomial functions. A polynomial is madeup of different terms that contain positive integer powers of the variables. Here is an example of a polynomial:
4x3 +2x2−3x+1
Each part of the polynomial that is added or subtracted is called a term of the polynomial. The example above is apolynomial with four terms.
The numbers appearing in each term in front of the variable are called the coefficients. The number appearing all byitself without a variable is called a constant.
In this case the coefficient of x3 is 4, the coefficient of x2 is 2, the coefficient of x is -3 and the constant is 1.
Degrees of Polynomials and Standard Form
Each term in the polynomial has a different degree. The degree of the term is the power of the variable in that term.
4x3 has degree 3 and is called a cubic term or 3rd order term.
2x2 has degree 2 and is called a quadratic term or 2nd order term.
−3x has degree 1 and is called a linear term or 1st order term.
1 has degree 0 and is called the constant.
416

www.ck12.org Chapter 9. Polynomials
By definition, the degree of the polynomial is the same as the degree of the term with the highest degree. Thisexample is a polynomial of degree 3, which is also called a “cubic” polynomial. (Why do you think it is called acubic?).
Polynomials can have more than one variable. Here is another example of a polynomial:
t4−6s3t2−12st +4s4−5
This is a polynomial because all the exponents on the variables are positive integers. This polynomial has five terms.Let’s look at each term more closely.
Note: The degree of a term is the sum of the powers on each variable in the term. In other words, the degree ofeach term is the number of variables that are multiplied together in that term, whether those variables are the sameor different.
t4 has a degree of 4, so it’s a 4th order term
−6s3t2 has a degree of 5, so it’s a 5th order term.
−12st has a degree of 2, so it’s a 2nd order term.
4s4 has a degree of 4, so it’s a 4th order term.
−5 is a constant, so its degree is 0.
Since the highest degree of a term in this polynomial is 5, then this is polynomial of degree 5th or a 5th orderpolynomial.
A polynomial that has only one term has a special name. It is called a monomial (mono means one). A monomialcan be a constant, a variable, or a product of a constant and one or more variables. You can see that each term ina polynomial is a monomial, so a polynomial is just the sum of several monomials. Here are some examples ofmonomials:
b2 −2ab2 814
x4 −29xy
Example 1
For the following polynomials, identify the coefficient of each term, the constant, the degree of each term and thedegree of the polynomial.
a) x5−3x3 +4x2−5x+7
b) x4−3x3y2 +8x−12
Solution
a) x5−3x3 +4x2−5x+7
The coefficients of each term in order are 1, -3, 4, and -5 and the constant is 7.
The degrees of each term are 5, 3, 2, 1, and 0. Therefore the degree of the polynomial is 5.
b) x4−3x3y2 +8x−12
The coefficients of each term in order are 1, -3, and 8 and the constant is -12.
The degrees of each term are 4, 5, 1, and 0. Therefore the degree of the polynomial is 5.
417

9.1. Addition and Subtraction of Polynomials www.ck12.org
Example 2
Identify the following expressions as polynomials or non-polynomials.
a) 5x5−2x
b) 3x2−2x−2
c) x√
x−1
d) 5x3+1
e) 4x13
f) 4xy2−2x2y−3+ y3−3x3
Solution
a) This is a polynomial.
b) This is not a polynomial because it has a negative exponent.
c) This is not a polynomial because it has a radical.
d) This is not a polynomial because the power of x appears in the denominator of a fraction (and there is no way torewrite it so that it does not).
e) This is not a polynomial because it has a fractional exponent.
f) This is a polynomial.
Often, we arrange the terms in a polynomial in order of decreasing power. This is called standard form.
The following polynomials are in standard form:
4x4−3x3 +2x2− x+1
a4b3−2a3b3 +3a4b−5ab2 +2
The first term of a polynomial in standard form is called the leading term, and the coefficient of the leading term iscalled the leading coefficient.
The first polynomial above has the leading term 4x4, and the leading coefficient is 4.
The second polynomial above has the leading term a4b3, and the leading coefficient is 1.
Example 3
Rearrange the terms in the following polynomials so that they are in standard form. Indicate the leading term andleading coefficient of each polynomial.
a) 7−3x3 +4x
b) ab−a3 +2b
c) −4b+4+b2
Solution
a) 7−3x3 +4x becomes −3x3 +4x+7. Leading term is −3x3; leading coefficient is -3.
b) ab−a3 +2b becomes −a3 +ab+2b. Leading term is −a3; leading coefficient is -1.
c) −4b+4+b2 becomes b2−4b+4. Leading term is b2; leading coefficient is 1.
418

www.ck12.org Chapter 9. Polynomials
Simplifying Polynomials
A polynomial is simplified if it has no terms that are alike. Like terms are terms in the polynomial that have thesame variable(s) with the same exponents, whether they have the same or different coefficients.
For example, 2x2y and 5x2y are like terms, but 6x2y and 6xy2 are not like terms.
When a polynomial has like terms, we can simplify it by combining those terms.
x2 +6xy−4xy+ y2
Like terms
We can simplify this polynomial by combining the like terms 6xy and −4xy into (6− 4)xy, or 2xy. The newpolynomial is x2 +2xy+ y2.
Example 4
Simplify the following polynomials by collecting like terms and combining them.
a) 2x−4x2 +6+ x2−4+4x
b) a3b3−5ab4 +2a3b−a3b3 +3ab4−a2b
Solution
a) Rearrange the terms so that like terms are grouped together: (−4x2 + x2)+(2x+4x)+(6−4)
Combine each set of like terms: −3x2 +6x+2
b) Rearrange the terms so that like terms are grouped together: (a3b3−a3b3)+(−5ab4 +3ab4)+2a3b−a2b
Combine each set of like terms: 0−2ab4 +2a3b−a2b =−2ab4 +2a3b−a2b
Adding and Subtracting Polynomials
To add two or more polynomials, write their sum and then simplify by combining like terms.
Example 5
Add and simplify the resulting polynomials.
a) Add 3x2−4x+7 and 2x3−4x2−6x+5
b) Add x2−2xy+ y2 and 2y2−3x2 and 10xy+ y3
Solution
a)
(3x2−4x+7)+(2x3−4x2−6x+5)
Group like terms: = 2x3 +(3x2−4x2)+(−4x−6x)+(7+5)
Simplify: = 2x3− x2−10x+12
419

9.1. Addition and Subtraction of Polynomials www.ck12.org
b)
(x2−2xy+ y2)+(2y2−3x2)+(10xy+ y3)
Group like terms: = (x2−3x2)+(y2 +2y2)+(−2xy+10xy)+ y3
Simplify: =−2x2 +3y2 +8xy+ y3
To subtract one polynomial from another, add the opposite of each term of the polynomial you are subtracting.
Example 6
a) Subtract x3−3x2 +8x+12 from 4x2 +5x−9
b) Subtract 5b2−2a2 from 4a2−8ab−9b2
Solution
a)
(4x2 +5x−9)− (x3−3x2 +8x+12) = (4x2 +5x−9)+(−x3 +3x2−8x−12)
Group like terms: =−x3 +(4x2 +3x2)+(5x−8x)+(−9−12)
Simplify: =−x3 +7x2−3x−21
b)
(4a2−8ab−9b2)− (5b2−2a2) = (4a2−8ab−9b2)+(−5b2 +2a2)
Group like terms: = (4a2 +2a2)+(−9b2−5b2)−8ab
Simplify: = 6a2−14b2−8ab
Note: An easy way to check your work after adding or subtracting polynomials is to substitute a convenient valuein for the variable, and check that your answer and the problem both give the same value. For example, in part (b)above, if we let a = 2 and b = 3, then we can check as follows:
Given Solution
(4a2−8ab−9b2)− (5b2−2a2) 6a2−14b2−8ab
(4(2)2−8(2)(3)−9(3)2)− (5(3)2−2(2)2) 6(2)2−14(3)2−8(2)(3)
(4(4)−8(2)(3)−9(9))− (5(9)−2(4)) 6(4)−14(9)−8(2)(3)
(−113)−37 24−126−48
−150 −150
Since both expressions evaluate to the same number when we substitute in arbitrary values for the variables, we canbe reasonably sure that our answer is correct.
Note: When you use this method, do not choose 0 or 1 for checking since these can lead to common problems.
Problem Solving Using Addition or Subtraction of Polynomials
One way we can use polynomials is to find the area of a geometric figure.
Example 7
420

www.ck12.org Chapter 9. Polynomials
Write a polynomial that represents the area of each figure shown.
a)
b)
c)
d)
Solution
a) This shape is formed by two squares and two rectangles.
The blue square has area y× y = y2.
The yellow square has area x× x = x2.
The pink rectangles each have area x× y = xy.
421

9.1. Addition and Subtraction of Polynomials www.ck12.org
To find the total area of the figure we add all the separate areas:
Total area = y2 + x2 + xy+ xy
= y2 + x2 +2xy
b) This shape is formed by two squares and one rectangle.
The yellow squares each have area a×a = a2.
The orange rectangle has area 2a×b = 2ab.
To find the total area of the figure we add all the separate areas:
Total area = a2 +a2 +2ab
= 2a2 +2ab
c) To find the area of the green region we find the area of the big square and subtract the area of the little square.
The big square has area : y× y = y2.
The little square has area : x× x = x2.
Area o f the green region = y2− x2
d) To find the area of the figure we can find the area of the big rectangle and add the areas of the pink squares.
The pink squares each have area a×a = a2.
The blue rectangle has area 3a×a = 3a2.
To find the total area of the figure we add all the separate areas:
Total area = a2 +a2 +a2 +3a2 = 6a2
Another way to find this area is to find the area of the big square and subtract the areas of the three yellow squares:
422

www.ck12.org Chapter 9. Polynomials
The big square has area 3a×3a = 9a2.
The yellow squares each have area a×a = a2.
To find the total area of the figure we subtract:
Area = 9a2− (a2 +a2 +a2)
= 9a2−3a2
= 6a2
Further Practice
For more practice adding and subtracting polynomials, try playing the Battleship game at http://www.quia.com/ba/28820.html. (The problems get harder as you play; watch out for trick questions!)
Review Questions
Indicate whether each expression is a polynomial.
1. x2 +3x12
2. 13 x2y−9y2
3. 3x−3
4. 23 t2− 1
t2
5.√
x−2x
6.(
x32
)2
Express each polynomial in standard form. Give the degree of each polynomial.
7. 3−2x8. 8−4x+3x3
9. −5+2x−5x2 +8x3
10. x2−9x4 +1211. 5x+2x2−3x
Add and simplify.
12. (x+8)+(−3x−5)13. (−2x2 +4x−12)+(7x+ x2)14. (2a2b−2a+9)+(5a2b−4b+5)15. (6.9a2−2.3b2 +2ab)+(3.1a−2.5b2 +b)16.
(35 x2− 1
4 x+4)+( 1
10 x2 + 12 x−2 1
5
)Subtract and simplify.
423

9.1. Addition and Subtraction of Polynomials www.ck12.org
17. (−t +5t2)− (5t2 +2t−9)18. (−y2 +4y−5)− (5y2 +2y+7)19. (−5m2−m)− (3m2 +4m−5)20. (2a2b−3ab2 +5a2b2)− (2a2b2 +4a2b−5b2)21. (3.5x2y−6xy+4x)− (1.2x2y− xy+2y−3)
Find the area of the following figures.
22.
23.
24.
25.
424

www.ck12.org Chapter 9. Polynomials
9.2 Multiplication of Polynomials
Learning Objectives
• Multiply a polynomial by a monomial.• Multiply a polynomial by a binomial.• Solve problems using multiplication of polynomials.
Introduction
Just as we can add and subtract polynomials, we can also multiply them. The Distributive Property and the techniquesyou’ve learned for dealing with exponents will be useful here.
Multiplying a Polynomial by a Monomial
When multiplying polynomials, we must remember the exponent rules that we learned in the last chapter. Especiallyimportant is the product rule: xn · xm = xn+m.
If the expressions we are multiplying have coefficients and more than one variable, we multiply the coefficients justas we would any number and we apply the product rule on each variable separately.
Example 1
Multiply the following monomials.
a) (2x2)(5x3)
b) (−3y4)(2y2)
c) (3xy5)(−6x4y2)
d) (−12a2b3c4)(−3a2b2)
Solution
a) (2x2)(5x3) = (2 ·5) · (x2 · x3) = 10x2+3 = 10x5
b) (−3y4)(2y2) = (−3 ·2) · (y4 · y2) =−6y4+2 =−6y6
c) (3xy5)(−6x4y2) =−18x1+4y5+2 =−18x5y7
d) (−12a2b3c4)(−3a2b2) = 36a2+2b3+2c4 = 36a4b5c4
To multiply a polynomial by a monomial, we have to use the Distributive Property. Remember, that property saysthat a(b+ c) = ab+ac.
Example 2
Multiply:
425

9.2. Multiplication of Polynomials www.ck12.org
a) 3(x2 +3x−5)
b) 4x(3x2−7)
c) −7y(4y2−2y+1)
Solution
a) 3(x2 +3x−5) = 3(x2)+3(3x)−3(5) = 3x2 +9x−15
b) 4x(3x2−7) = (4x)(3x2)+(4x)(−7) = 12x3−28x
c) −7y(4y2−2y+1) = (−7y)(4y2)+(−7y)(−2y)+(−7y)(1) =−28y3 +14y2−7y
Notice that when we use the Distributive Property, the problem becomes a matter of just multiplying monomials bymonomials and adding all the separate parts together.
Example 3
Multiply:
a) 2x3(−3x4 +2x3−10x2 +7x+9)
b) −7a2bc3(5a2−3b2−9c2)
Solution
a)
2x3(−3x4 +2x3−10x2 +7x+9) = (2x3)(−3x4)+(2x3)(2x3)+(2x3)(−10x2)+(2x3)(7x)+(2x3)(9)
=−6x7 +4x6−20x5 +14x4 +18x3
b)
−7a2bc3(5a2−3b2−9c2) = (−7a2bc3)(5a2)+(−7a2bc3)(−3b2)+(−7a2bc3)(−9c2)
=−35a4bc3 +21a2b3c3 +63a2bc5
Multiplying Two Polynomials
Let’s start by multiplying two binomials together. A binomial is a polynomial with two terms, so a product of twobinomials will take the form (a+b)(c+d).
We can still use the Distributive Property here if we do it cleverly. First, let’s think of the first set of parentheses asone term. The Distributive Property says that we can multiply that term by c, multiply it by d, and then add thosetwo products together: (a+b)(c+d) = (a+b) · c+(a+b) ·d.
We can rewrite this expression as c(a+ b)+ d(a+ b). Now let’s look at each half separately. We can apply thedistributive property again to each set of parentheses in turn, and that gives us c(a+b)+d(a+b)= ca+cb+da+db.
What you should notice is that when multiplying any two polynomials, every term in one polynomial is multipliedby every term in the other polynomial.
Example 4
Multiply and simplify: (2x+1)(x+3)
Solution
We must multiply each term in the first polynomial by each term in the second polynomial. Let’s try to be systematicto make sure that we get all the products.
First, multiply the first term in the first set of parentheses by all the terms in the second set of parentheses.
426

www.ck12.org Chapter 9. Polynomials
Now we’re done with the first term. Next we multiply the second term in the first parenthesis by all terms in thesecond parenthesis and add them to the previous terms.
Now we’re done with the multiplication and we can simplify:
(2x)(x)+(2x)(3)+(1)(x)+(1)(3) = 2x2 +6x+ x+3 = 2x2 +7x+3
This way of multiplying polynomials is called in-line multiplication or horizontal multiplication. Another methodfor multiplying polynomials is to use vertical multiplication, similar to the vertical multiplication you learned withregular numbers.
Example 5
Multiply and simplify:
a) (4x−5)(x−20)
b) (3x−2)(3x+2)
c) (3x2 +2x−5)(2x−3)
d) (x2−9)(4x4 +5x2−2)
Solution
a) With horizontal multiplication this would be
(4x−5)(x−20) = (4x)(x)+(4x)(−20)+(−5)(x)+(−5)(−20) = 4x2−80x−5x+100 = 4x2−85x+100
To do vertical multiplication instead, we arrange the polynomials on top of each other with like terms in the samecolumns:
4x−5
x−20
−80x+100
4x2−5x
4x2−85x+100
Both techniques result in the same answer: 4x2−85x+100. We’ll use vertical multiplication for the other problems.
b)
3x−2
3x+2
6x−4
9x2−6x
9x2 +0x−4
427
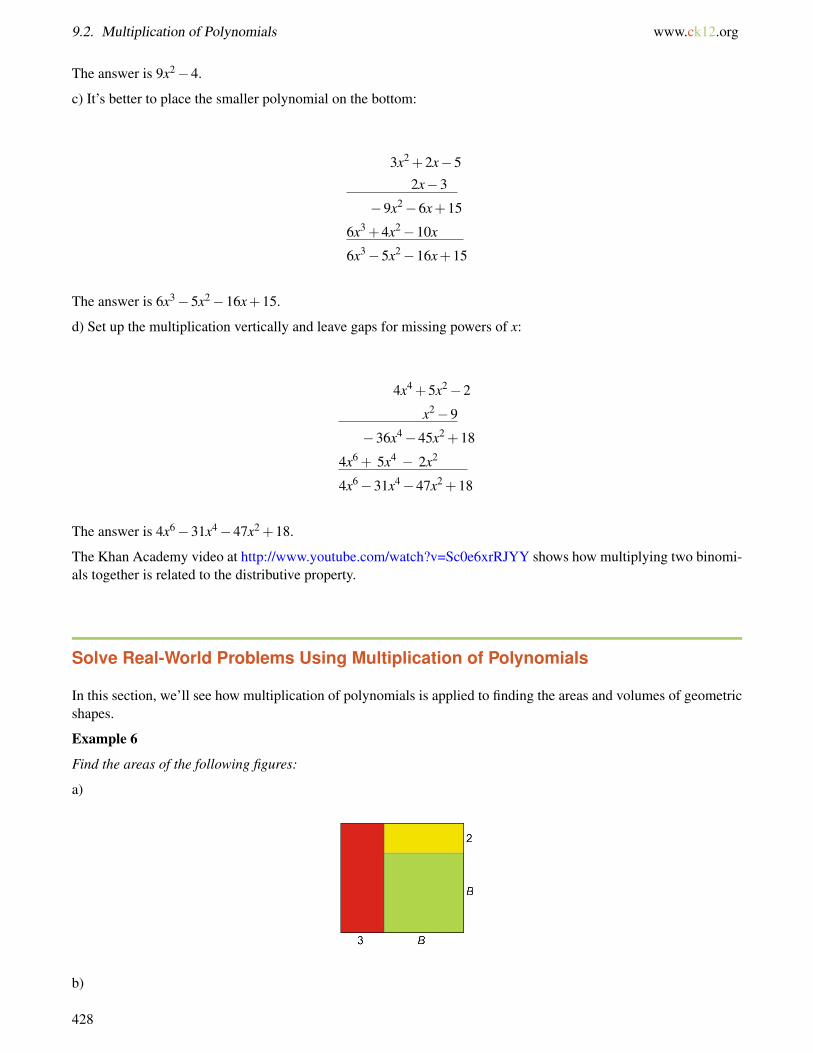
9.2. Multiplication of Polynomials www.ck12.org
The answer is 9x2−4.
c) It’s better to place the smaller polynomial on the bottom:
3x2 +2x−5
2x−3
−9x2−6x+15
6x3 +4x2−10x
6x3−5x2−16x+15
The answer is 6x3−5x2−16x+15.
d) Set up the multiplication vertically and leave gaps for missing powers of x:
4x4 +5x2−2
x2−9
−36x4−45x2 +18
4x6 + 5x4 − 2x2
4x6−31x4−47x2 +18
The answer is 4x6−31x4−47x2 +18.
The Khan Academy video at http://www.youtube.com/watch?v=Sc0e6xrRJYY shows how multiplying two binomi-als together is related to the distributive property.
Solve Real-World Problems Using Multiplication of Polynomials
In this section, we’ll see how multiplication of polynomials is applied to finding the areas and volumes of geometricshapes.
Example 6
Find the areas of the following figures:
a)
b)
428

www.ck12.org Chapter 9. Polynomials
Find the volumes of the following figures:
c)
d)
Solution
a) We use the formula for the area of a rectangle: Area = length×width.
For the big rectangle:
Length = b+3, Width = b+2
Area = (b+3)(b+2)
= b2 +2b+3b+6
= b2 +5b+6
b) We could add up the areas of the blue and orange rectangles, but it’s easier to just find the area of the whole bigrectangle and subtract the area of the yellow rectangle.
429

9.2. Multiplication of Polynomials www.ck12.org
Area of big rectangle = 20(12) = 240
Area of yellow rectangle = (12− x)(20−2x)
= 240−24x−20x+2x2
= 240−44x+2x2
= 2x2−44x+240
The desired area is the difference between the two:
Area = 240− (2x2−44x+240)
= 240+(−2x2 +44x−240)
= 240−2x2 +44x−240
=−2x2 +44x
c) The volume of this shape = (area of the base)(height).
Area of the base = x(x+2)
= x2 +2x
Height = 2x+1
Volume = (x2 +2x)(2x+1)
= 2x3 + x2 +4x2 +2x
= 2x3 +5x2 +2x
d) The volume of this shape = (area of the base)(height).
Area of the base = (4a−3)(2a+1)
= 8a2 +4a−6a−3
= 8a2−2a−3
Height = a+4
Volume = (8a2−2a−3)(a+4)
Let’s multiply using the vertical method:
8a2−2a−3
a+4
32a2−8a−12
8a3 − 2a2 −3a
8a3 + 30a2−11a−12
The volume is 8a3 +30a2−11a−12.
430

www.ck12.org Chapter 9. Polynomials
Review Questions
Multiply the following monomials.
1. (2x)(−7x)2. (10x)(3xy)3. (4mn)(0.5nm2)4. (−5a2b)(−12a3b3)5. (3xy2z2)(15x2yz3)
Multiply and simplify.
6. 17(8x−10)7. 2x(4x−5)8. 9x3(3x2−2x+7)9. 3x(2y2 + y−5)
10. 10q(3q2r+5r)11. −3a2b(9a2−4b2)12. (x−3)(x+2)13. (a+b)(a−5)14. (x+2)(x2−3)15. (a2 +2)(3a2−4)16. (7x−2)(9x−5)17. (2x−1)(2x2− x+3)18. (3x+2)(9x2−6x+4)19. (a2 +2a−3)(a2−3a+4)20. 3(x−5)(2x+7)21. 5x(x+4)(2x−3)
Find the areas of the following figures.
22.
23.
Find the volumes of the following figures.
24.
431

www.ck12.org Chapter 9. Polynomials
9.3 Special Products of Polynomials
Learning Objectives
• Find the square of a binomial• Find the product of binomials using sum and difference formula• Solve problems using special products of polynomials
Introduction
We saw that when we multiply two binomials we need to make sure to multiply each term in the first binomial witheach term in the second binomial. Let’s look at another example.
Multiply two linear binomials (binomials whose degree is 1):
(2x+3)(x+4)
When we multiply, we obtain a quadratic polynomial (one with degree 2) with four terms:
2x2 +8x+3x+12
The middle terms are like terms and we can combine them. We simplify and get 2x2 +11x+12. This is a quadratic,or second-degree, trinomial (polynomial with three terms).
You can see that every time we multiply two linear binomials with one variable, we will obtain a quadratic polyno-mial. In this section we’ll talk about some special products of binomials.
Find the Square of a Binomial
One special binomial product is the square of a binomial. Consider the product (x+4)(x+4).
Since we are multiplying the same expression by itself, that means we are squaring the expression. (x+4)(x+4) isthe same as (x+4)2.
When we multiply it out, we get x2 +4x+4x+16, which simplifies to x2 +8x+16.
Notice that the two middle terms—the ones we added together to get 8x—were the same. Is this a coincidence? Inorder to find that out, let’s square a general linear binomial.
(a+b)2 = (a+b)(a+b) = a2 +ab+ab+b2
= a2 +2ab+b2
433

9.3. Special Products of Polynomials www.ck12.org
Sure enough, the middle terms are the same. How about if the expression we square is a difference instead of a sum?
(a−b)2 = (a−b)(a−b) = a2−ab−ab+b2
= a2−2ab+b2
It looks like the middle two terms are the same in general whenever we square a binomial. The general pattern is: tosquare a binomial, take the square of the first term, add or subtract twice the product of the terms, and add the squareof the second term. You should remember these formulas:
(a+b)2 = a2 +2ab+b2
and
(a−b)2 = a2−2ab+b2
Remember! Raising a polynomial to a power means that we multiply the polynomial by itself however many timesthe exponent indicates. For instance, (a+b)2 = (a+b)(a+b). Don’t make the common mistake of thinking that(a+b)2 = a2 +b2! To see why that’s not true, try substituting numbers for a and b into the equation (for example,a = 4 and b = 3), and you will see that it is not a true statement. The middle term, 2ab, is needed to make theequation work.
We can apply the formulas for squaring binomials to any number of problems.
Example 1
Square each binomial and simplify.
a) (x+10)2
b) (2x−3)2
c) (x2 +4)2
d) (5x−2y)2
Solution
Let’s use the square of a binomial formula to multiply each expression.
a) (x+10)2
If we let a = x and b = 10, then our formula (a+ b)2 = a2 + 2ab+ b2 becomes (x+ 10)2 = x2 + 2(x)(10)+ 102,which simplifies to x2 +20x+100.
b) (2x−3)2
If we let a = 2x and b = 3, then our formula (a−b)2 = a2−2ab+b2 becomes (2x−3)2 = (2x2)−2(2x)(3)+(3)2,which simplifies to 4x2−12x+9.
c) (x2 +4)2
If we let a = x2 and b = 4, then
(x2 +4)2 = (x2)2 +2(x2)(4)+(4)2
= x4 +8x2 +16
d) (5x−2y)2
434

www.ck12.org Chapter 9. Polynomials
If we let a = 5x and b = 2y, then
(5x−2y)2 = (5x)2−2(5x)(2y)+(2y)2
= 25x2−20xy+4y2
Find the Product of Binomials Using Sum and Difference Patterns
Another special binomial product is the product of a sum and a difference of terms. For example, let’s multiply thefollowing binomials.
(x+4)(x−4) = x2−4x+4x−16
= x2−16
Notice that the middle terms are opposites of each other, so they cancel out when we collect like terms. This is nota coincidence. This always happens when we multiply a sum and difference of the same terms. In general,
(a+b)(a−b) = a2−ab+ab−b2
= a2−b2
When multiplying a sum and difference of the same two terms, the middle terms cancel out. We get the square ofthe first term minus the square of the second term. You should remember this formula.
Sum and Difference Formula: (a+b)(a−b) = a2−b2
Let’s apply this formula to a few examples.
Example 2
Multiply the following binomials and simplify.
a) (x+3)(x−3)
b) (5x+9)(5x−9)
c) (2x3 +7)(2x3−7)
d) (4x+5y)(4x−5y)
Solution
a) Let a = x and b = 3, then:
(a+b)(a−b) = a2−b2
(x+3)(x−3) = x2−32
= x2−9
b) Let a = 5x and b = 9, then:
435
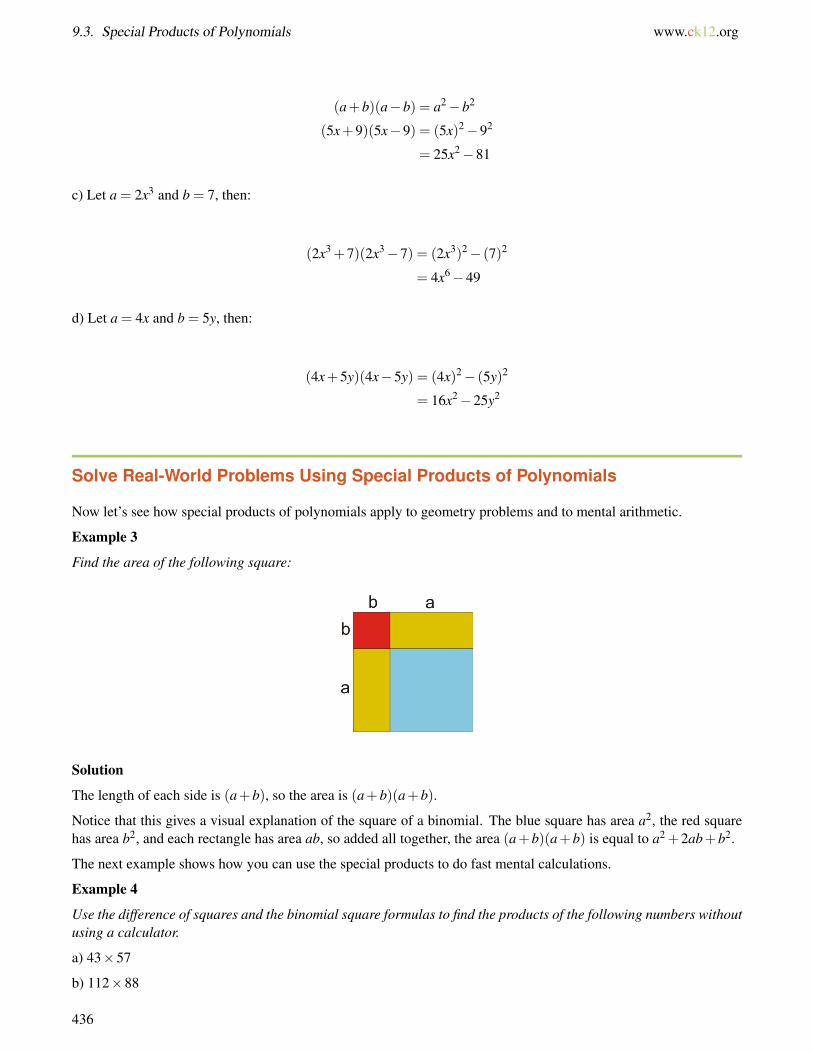
9.3. Special Products of Polynomials www.ck12.org
(a+b)(a−b) = a2−b2
(5x+9)(5x−9) = (5x)2−92
= 25x2−81
c) Let a = 2x3 and b = 7, then:
(2x3 +7)(2x3−7) = (2x3)2− (7)2
= 4x6−49
d) Let a = 4x and b = 5y, then:
(4x+5y)(4x−5y) = (4x)2− (5y)2
= 16x2−25y2
Solve Real-World Problems Using Special Products of Polynomials
Now let’s see how special products of polynomials apply to geometry problems and to mental arithmetic.
Example 3
Find the area of the following square:
Solution
The length of each side is (a+b), so the area is (a+b)(a+b).
Notice that this gives a visual explanation of the square of a binomial. The blue square has area a2, the red squarehas area b2, and each rectangle has area ab, so added all together, the area (a+b)(a+b) is equal to a2 +2ab+b2.
The next example shows how you can use the special products to do fast mental calculations.
Example 4
Use the difference of squares and the binomial square formulas to find the products of the following numbers withoutusing a calculator.
a) 43×57
b) 112×88
436
www.ck12.org Chapter 9. Polynomials
c) 452
d) 481×319
Solution
The key to these mental “tricks” is to rewrite each number as a sum or difference of numbers you know how tosquare easily.
a) Rewrite 43 as (50−7) and 57 as (50+7).
Then 43×57 = (50−7)(50+7) = (50)2− (7)2 = 2500−49 = 2451
b) Rewrite 112 as (100+12) and 88 as (100−12).
Then 112×88 = (100+12)(100−12) = (100)2− (12)2 = 10000−144 = 9856
c) 452 = (40+5)2 = (40)2 +2(40)(5)+(5)2 = 1600+400+25 = 2025
d) Rewrite 481 as (400+81) and 319 as (400−81).
Then 481×319 = (400+81)(400−81) = (400)2− (81)2
(400)2 is easy - it equals 160000.
(81)2 is not easy to do mentally, so let’s rewrite 81 as 80+1.
(81)2 = (80+1)2 = (80)2 +2(80)(1)+(1)2 = 6400+160+1 = 6561
Then 481×319 = (400)2− (81)2 = 160000−6561 = 153439
Review Questions
Use the special product rule for squaring binomials to multiply these expressions.
1. (x+9)2
2. (3x−7)2
3. (5x− y)2
4. (2x3−3)2
5. (4x2 + y2)2
6. (8x−3)2
7. (2x+5)(5+2x)8. (xy− y)2
Use the special product of a sum and difference to multiply these expressions.
9. (2x−1)(2x+1)10. (x−12)(x+12)11. (5a−2b)(5a+2b)12. (ab−1)(ab+1)13. (z2 + y)(z2− y)14. (2q3 + r2)(2q3− r2)15. (7s− t)(t +7s)16. (x2y+ xy2)(x2y− xy2)
Find the area of the lower right square in the following figure.
437

9.3. Special Products of Polynomials www.ck12.org
17.
Multiply the following numbers using special products.
18. 45×5519. 562
20. 1002×99821. 36×4422. 10.5×9.523. 100.2×9.824. −95×−10525. 2×−2
438
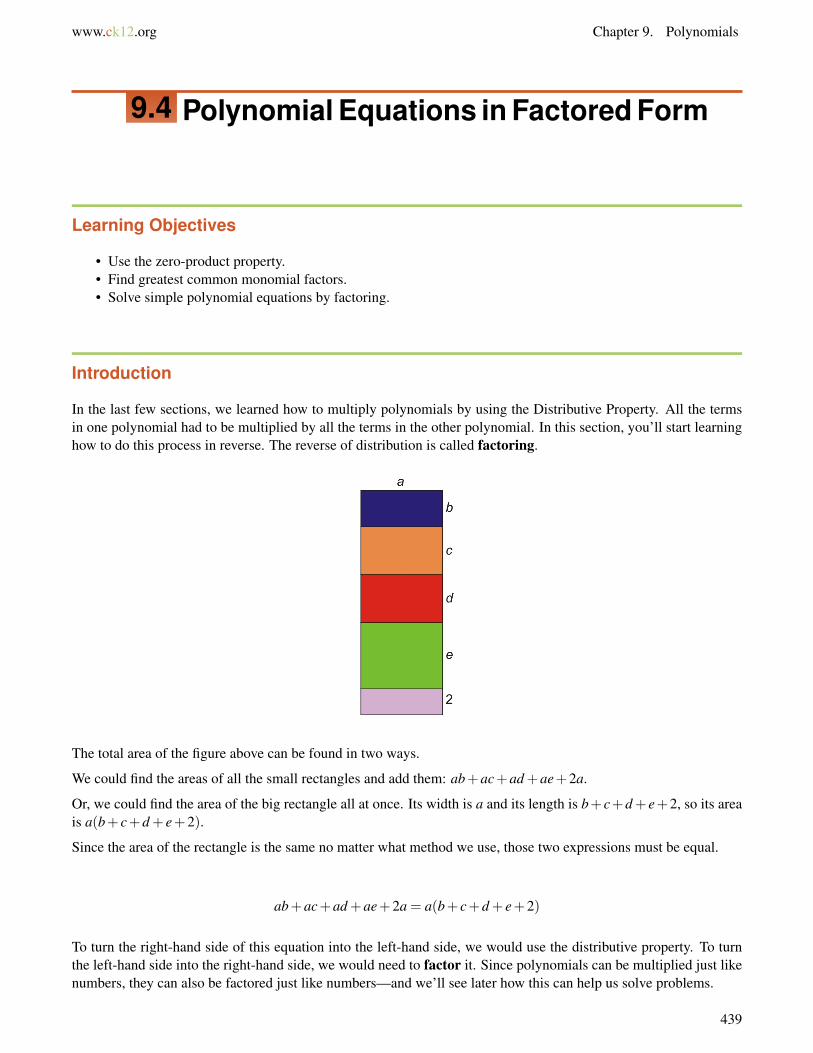
www.ck12.org Chapter 9. Polynomials
9.4 Polynomial Equations in Factored Form
Learning Objectives
• Use the zero-product property.• Find greatest common monomial factors.• Solve simple polynomial equations by factoring.
Introduction
In the last few sections, we learned how to multiply polynomials by using the Distributive Property. All the termsin one polynomial had to be multiplied by all the terms in the other polynomial. In this section, you’ll start learninghow to do this process in reverse. The reverse of distribution is called factoring.
The total area of the figure above can be found in two ways.
We could find the areas of all the small rectangles and add them: ab+ac+ad +ae+2a.
Or, we could find the area of the big rectangle all at once. Its width is a and its length is b+c+d+e+2, so its areais a(b+ c+d + e+2).
Since the area of the rectangle is the same no matter what method we use, those two expressions must be equal.
ab+ac+ad +ae+2a = a(b+ c+d + e+2)
To turn the right-hand side of this equation into the left-hand side, we would use the distributive property. To turnthe left-hand side into the right-hand side, we would need to factor it. Since polynomials can be multiplied just likenumbers, they can also be factored just like numbers—and we’ll see later how this can help us solve problems.
439

9.4. Polynomial Equations in Factored Form www.ck12.org
Find the Greatest Common Monomial Factor
You will be learning several factoring methods in the next few sections. In most cases, factoring takes several stepsto complete because we want to factor completely. That means that we factor until we can’t factor any more.
Let’s start with the simplest step: finding the greatest monomial factor. When we want to factor, we always look forcommon monomials first. Consider the following polynomial, written in expanded form:
ax+bx+ cx+dx
A common factor is any factor that appears in all terms of the polynomial; it can be a number, a variable or acombination of numbers and variables. Notice that in our example, the factor x appears in all terms, so it is acommon factor.
To factor out the x, we write it outside a set of parentheses. Inside the parentheses, we write what’s left when wedivide each term by x:
x(a+b+ c+d)
Let’s look at more examples.
Example 1
Factor:
a) 2x+8
b) 15x−25
c) 3a+9b+6
Solution
a) We see that the factor 2 divides evenly into both terms: 2x+8 = 2(x)+2(4)
We factor out the 2 by writing it in front of a parenthesis: 2( )
Inside the parenthesis we write what is left of each term when we divide by 2: 2(x+4)
b) We see that the factor of 5 divides evenly into all terms: 15x−25 = 5(3x)−5(5)
Factor out the 5 to get: 5(3x−5)
c) We see that the factor of 3 divides evenly into all terms: 3a+9b+6 = 3(a)+3(3b)+3(2)
Factor 3 to get: 3(a+3b+2)
Example 2
Find the greatest common factor:
a) a3−3a2 +4a
b) 12a4−5a3 +7a2
Solution
a) Notice that the factor a appears in all terms of a3−3a2 +4a, but each term has a raised to a different power. Thegreatest common factor of all the terms is simply a.
So first we rewrite a3−3a2 +4a as a(a2)+a(−3a)+a(4).
440

www.ck12.org Chapter 9. Polynomials
Then we factor out the a to get a(a2−3a+4).
b) The factor a appears in all the terms, and it’s always raised to at least the second power. So the greatest commonfactor of all the terms is a2.
We rewrite the expression 12a4−5a3 +7a2 as (12a2 ·a2)− (5a ·a2)+(7 ·a2)
Factor out the a2 to get a2(12a2−5a+7).
Example 3
Factor completely:
a) 3ax+9a
b) x3y+ xy
c) 5x3y−15x2y2 +25xy3
Solution
a) Both terms have a common factor of 3, but they also have a common factor of a. It’s simplest to factor these bothout at once, which gives us 3a(x+3).
b) Both x and y are common factors. When we factor them both out at once, we get xy(x2 +1).
c) The common factors are 5, x, and y. Factoring out 5xy gives us 5xy(x2−3xy+5xy2).
Use the Zero-Product Property
The most useful thing about factoring is that we can use it to help solve polynomial equations.
For example, consider an equation like 2x2 + 5x− 42 = 0. There’s no good way to isolate x in this equation, sowe can’t solve it using any of the techniques we’ve already learned. But the left-hand side of the equation can befactored, making the equation (x+6)(2x−7) = 0.
How is this helpful? The answer lies in a useful property of multiplication: if two numbers multiply to zero, then atleast one of those numbers must be zero. This is called the Zero-Product Property.
What does this mean for our polynomial equation? Since the product equals 0, then at least one of the factors onthe left-hand side must equal zero. So we can find the two solutions by setting each factor equal to zero and solvingeach equation separately.
Setting the factors equal to zero gives us:
(x+6) = 0 OR (2x−7) = 0
Solving both of those equations gives us:
x+6 = 0 2x−7 = 0
x =−6 OR 2x = 7
x =72
Notice that the solution is x =−6OR x = 72 . The OR means that either of these values of x would make the product
of the two factors equal to zero. Let’s plug the solutions back into the equation and check that this is correct.
441

9.4. Polynomial Equations in Factored Form www.ck12.org
Check : x =−6; Check : x =72
(x+6)(2x−7) = (x+6)(2x−7) =
(−6+6)(2(−6)−7) =(
72+6)(
2 · 72−7)=
(0)(−19) = 0(
192
)(7−7) =(
192
)(0) = 0
Both solutions check out.
Factoring a polynomial is very useful because the Zero-Product Property allows us to break up the problem intosimpler separate steps. When we can’t factor a polynomial, the problem becomes harder and we must use othermethods that you will learn later.
As a last note in this section, keep in mind that the Zero-Product Property only works when a product equals zero.For example, if you multiplied two numbers and the answer was nine, that wouldn’t mean that one or both of thenumbers must be nine. In order to use the property, the factored polynomial must be equal to zero.
Example 4
Solve each equation:
a) (x−9)(3x+4) = 0
b) x(5x−4) = 0
c) 4x(x+6)(4x−9) = 0
Solution
Since all the polynomials are in factored form, we can just set each factor equal to zero and solve the simplerequations separately
a) (x−9)(3x+4) = 0 can be split up into two linear equations:
x−9 = 0 3x+4 = 0
x = 9 or 3x =−4
x =−43
b) x(5x−4) = 0 can be split up into two linear equations:
5x−4 = 0
x = 0 or 5x = 4
x =45
c) 4x(x+6)(4x−9) = 0 can be split up into three linear equations:
442

www.ck12.org Chapter 9. Polynomials
4x = 0 x+6 = 0 4x−9 = 0
x =04
or x =−6 or 4x = 9
x = 0 x =94
Solve Simple Polynomial Equations by Factoring
Now that we know the basics of factoring, we can solve some simple polynomial equations. We already saw how wecan use the Zero-Product Property to solve polynomials in factored form—now we can use that knowledge to solvepolynomials by factoring them first. Here are the steps:
a) If necessary, rewrite the equation in standard form so that the right-hand side equals zero.
b) Factor the polynomial completely.
c) Use the zero-product rule to set each factor equal to zero.
d) Solve each equation from step 3.
e) Check your answers by substituting your solutions into the original equation
Example 5
Solve the following polynomial equations.
a) x2−2x = 0
b) 2x2 = 5x
c) 9x2y−6xy = 0
Solution
a) x2−2x = 0
Rewrite: this is not necessary since the equation is in the correct form.
Factor: The common factor is x, so this factors as x(x−2) = 0.
Set each factor equal to zero:
x = 0 or x−2 = 0
Solve:
x = 0 or x = 2
Check: Substitute each solution back into the original equation.
x = 0⇒ (0)2−2(0) = 0 works out
x = 2⇒ (2)2−2(2) = 4−4 = 0 works out
443
9.4. Polynomial Equations in Factored Form www.ck12.org
Answer: x = 0,x = 2
b) 2x2 = 5x
Rewrite: 2x2 = 5x⇒ 2x2−5x = 0
Factor: The common factor is x, so this factors as x(2x−5) = 0.
Set each factor equal to zero:
x = 0 or 2x−5 = 0
Solve:
x = 0 or 2x = 5
x =52
Check: Substitute each solution back into the original equation.
x = 0⇒ 2(0)2 = 5(0)⇒ 0 = 0 works out
x =52⇒ 2
(52
)2
= 5 · 52⇒ 2 · 25
4=
252⇒ 25
2=
252
works out
Answer: x = 0,x = 52
c) 9x2y−6xy = 0
Rewrite: not necessary
Factor: The common factor is 3xy, so this factors as 3xy(3x−2) = 0.
Set each factor equal to zero:
3 = 0 is never true, so this part does not give a solution. The factors we have left give us:
x = 0 or y = 0 or 3x−2 = 0
Solve:
x = 0 or y = 0 or 3x = 2
x =23
Check: Substitute each solution back into the original equation.
x = 0⇒ 9(0)y−6(0)y = 0−0 = 0 works out
y = 0⇒ 9x2(0)−6x(0) = 0−0 = 0 works out
x =23⇒ 9 ·
(23
)2
y−6 · 23
y = 9 · 49
y−4y = 4y−4y = 0 works out
Answer: x = 0,y = 0,x = 23
444

www.ck12.org Chapter 9. Polynomials
Review Questions
Factor out the greatest common factor in the following polynomials.
1. 2x2−5x2. 3x3−21x3. 5x6 +15x4
4. 4x3 +10x2−2x5. −10x6 +12x5−4x4
6. 12xy+24xy2 +36xy3
7. 5a3−7a8. 3y+6z9. 10a3−4ab
10. 45y12 +30y10
11. 16xy2z+4x3y12. 2a−4a2 +613. 5xy2−10xy+5y2
Solve the following polynomial equations.
14. x(x+12) = 015. (2x+1)(2x−1) = 016. (x−5)(2x+7)(3x−4) = 017. 2x(x+9)(7x−20) = 018. x(3+ y) = 019. x(x−2y) = 020. 18y−3y2 = 021. 9x2 = 27x22. 4a2 +a = 023. b2− 5
3 b = 024. 4x2 = 3625. x3−5x2 = 0
445

9.5. Factoring Quadratic Expressions www.ck12.org
9.5 Factoring Quadratic Expressions
Learning Objectives
• Write quadratic equations in standard form.• Factor quadratic expressions for different coefficient values.
Write Quadratic Expressions in Standard Form
Quadratic polynomials are polynomials of the 2nd degree. The standard form of a quadratic polynomial is writtenas
ax2 +bx+ c
where a,b, and c stand for constant numbers. Factoring these polynomials depends on the values of these constants.In this section we’ll learn how to factor quadratic polynomials for different values of a,b, and c. (When none of thecoefficients are zero, these expressions are also called quadratic trinomials, since they are polynomials with threeterms.)
You’ve already learned how to factor quadratic polynomials where c = 0. For example, for the quadratic ax2 + bx,the common factor is x and this expression is factored as x(ax+b). Now we’ll see how to factor quadratics where cis nonzero.
Factor when a = 1, b is Positive, and c is Positive
First, let’s consider the case where a = 1,b is positive and c is positive. The quadratic trinomials will take the form
x2 +bx+ c
You know from multiplying binomials that when you multiply two factors (x + m)(x + n), you get a quadraticpolynomial. Let’s look at this process in more detail. First we use distribution:
(x+m)(x+n) = x2 +nx+mx+mn
Then we simplify by combining the like terms in the middle. We get:
(x+m)(x+n) = x2 +(n+m)x+mn
446
www.ck12.org Chapter 9. Polynomials
So to factor a quadratic, we just need to do this process in reverse.
We see that x2 +(n+m)x+mn
is the same form as x2 +bx+ c
This means that we need to find two numbers m and n where
n+m = b and mn = c
The factors of x2 +bx+ c are always two binomials
(x+m)(x+n)
such that n+m = b and mn = c.
Example 1
Factor x2 +5x+6.
Solution
We are looking for an answer that is a product of two binomials in parentheses:
(x )(x )
We want two numbers m and n that multiply to 6 and add up to 5. A good strategy is to list the possible ways we canmultiply two numbers to get 6 and then see which of these numbers add up to 5:
6 = 1 ·6 and 1+6 = 7
6 = 2 ·3 and 2+3 = 5 T his is the correct choice.
So the answer is (x+2)(x+3).
We can check to see if this is correct by multiplying (x+2)(x+3):
x+2
x+3
3x+6
x2 +2x
x2 +5x+6
The answer checks out.
Example 2
Factor x2 +7x+12.
447

9.5. Factoring Quadratic Expressions www.ck12.org
Solution
We are looking for an answer that is a product of two binomials in parentheses: (x )(x )
The number 12 can be written as the product of the following numbers:
12 = 1 ·12 and 1+12 = 13
12 = 2 ·6 and 2+6 = 8
12 = 3 ·4 and 3+4 = 7 T his is the correct choice.
The answer is (x+3)(x+4).
Example 3
Factor x2 +8x+12.
Solution
We are looking for an answer that is a product of two binomials in parentheses: (x )(x )
The number 12 can be written as the product of the following numbers:
12 = 1 ·12 and 1+12 = 13
12 = 2 ·6 and 2+6 = 8 T his is the correct choice.
12 = 3 ·4 and 3+4 = 7
The answer is (x+2)(x+6).
Example 4
Factor x2 +12x+36.
Solution
We are looking for an answer that is a product of two binomials in parentheses: (x )(x )
The number 36 can be written as the product of the following numbers:
36 = 1 ·36 and 1+36 = 37
36 = 2 ·18 and 2+18 = 20
36 = 3 ·12 and 3+12 = 15
36 = 4 ·9 and 4+9 = 13
36 = 6 ·6 and 6+6 = 12 T his is the correct choice.
The answer is (x+6)(x+6).
Factor when a = 1, b is Negative and c is Positive
Now let’s see how this method works if the middle coefficient is negative.
Example 5
448
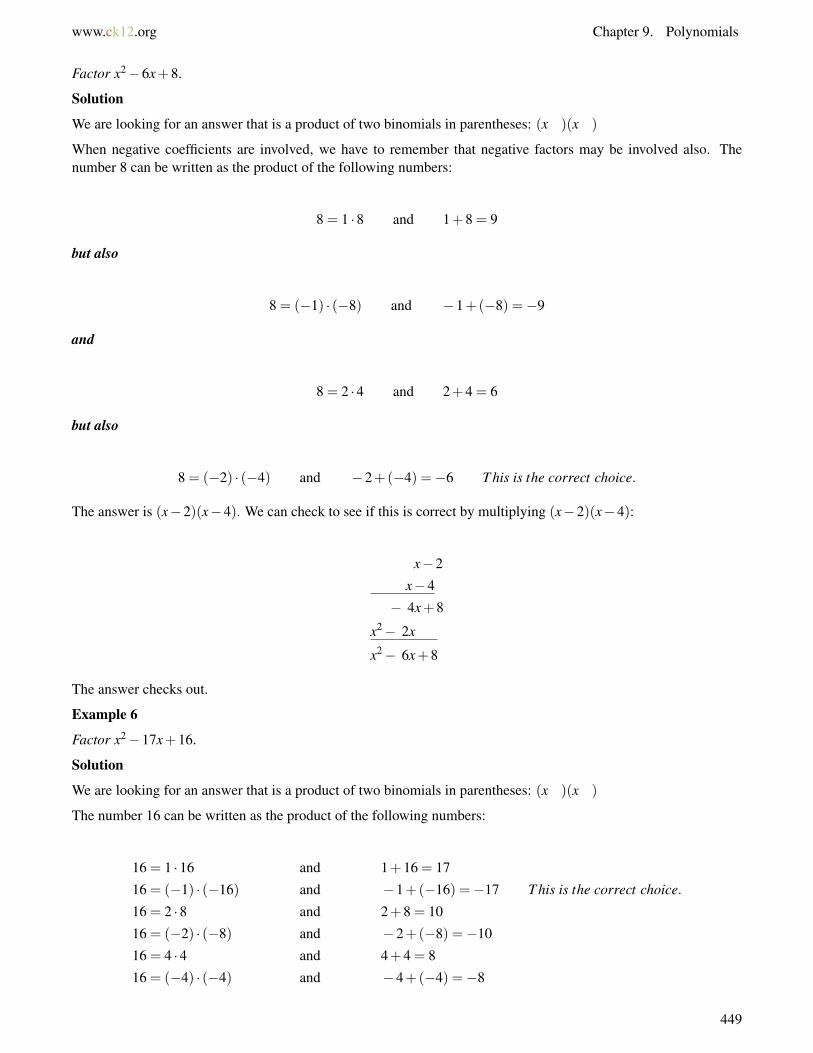
www.ck12.org Chapter 9. Polynomials
Factor x2−6x+8.
Solution
We are looking for an answer that is a product of two binomials in parentheses: (x )(x )
When negative coefficients are involved, we have to remember that negative factors may be involved also. Thenumber 8 can be written as the product of the following numbers:
8 = 1 ·8 and 1+8 = 9
but also
8 = (−1) · (−8) and −1+(−8) =−9
and
8 = 2 ·4 and 2+4 = 6
but also
8 = (−2) · (−4) and −2+(−4) =−6 T his is the correct choice.
The answer is (x−2)(x−4). We can check to see if this is correct by multiplying (x−2)(x−4):
x−2
x−4
− 4x+8
x2− 2x
x2− 6x+8
The answer checks out.
Example 6
Factor x2−17x+16.
Solution
We are looking for an answer that is a product of two binomials in parentheses: (x )(x )
The number 16 can be written as the product of the following numbers:
16 = 1 ·16 and 1+16 = 17
16 = (−1) · (−16) and −1+(−16) =−17 T his is the correct choice.
16 = 2 ·8 and 2+8 = 10
16 = (−2) · (−8) and −2+(−8) =−10
16 = 4 ·4 and 4+4 = 8
16 = (−4) · (−4) and −4+(−4) =−8
449
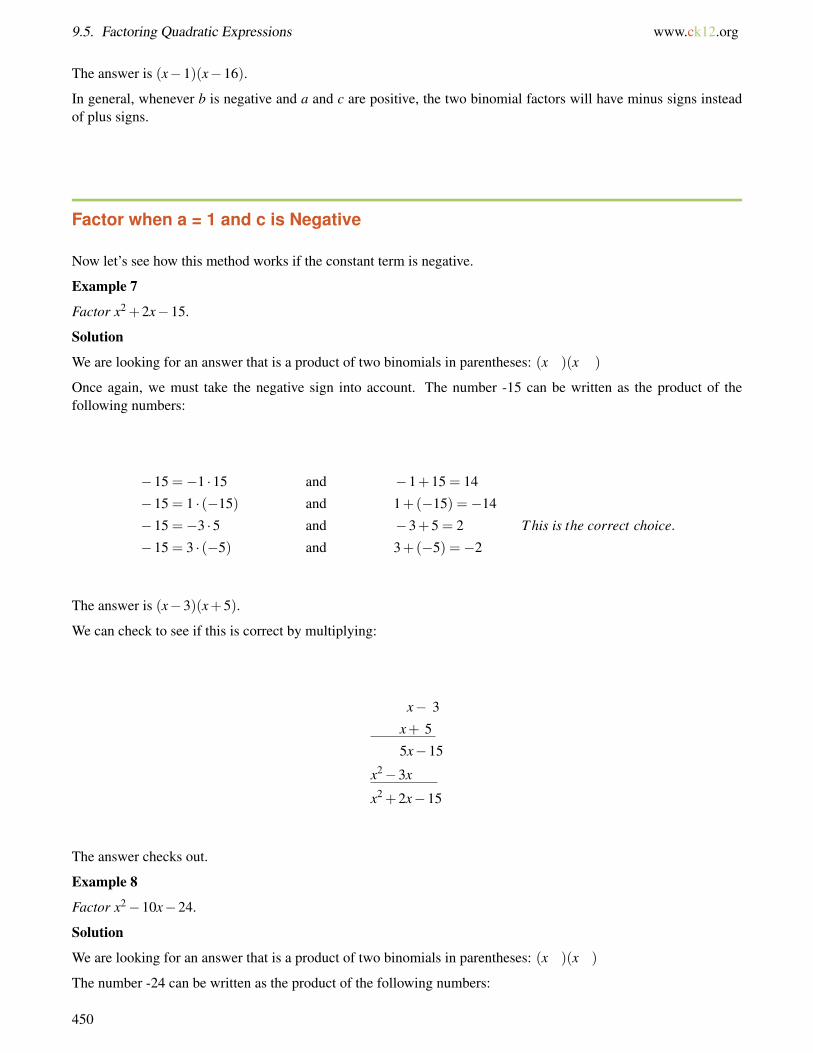
9.5. Factoring Quadratic Expressions www.ck12.org
The answer is (x−1)(x−16).
In general, whenever b is negative and a and c are positive, the two binomial factors will have minus signs insteadof plus signs.
Factor when a = 1 and c is Negative
Now let’s see how this method works if the constant term is negative.
Example 7
Factor x2 +2x−15.
Solution
We are looking for an answer that is a product of two binomials in parentheses: (x )(x )
Once again, we must take the negative sign into account. The number -15 can be written as the product of thefollowing numbers:
−15 =−1 ·15 and −1+15 = 14
−15 = 1 · (−15) and 1+(−15) =−14
−15 =−3 ·5 and −3+5 = 2 T his is the correct choice.
−15 = 3 · (−5) and 3+(−5) =−2
The answer is (x−3)(x+5).
We can check to see if this is correct by multiplying:
x− 3
x+ 5
5x−15
x2−3x
x2 +2x−15
The answer checks out.
Example 8
Factor x2−10x−24.
Solution
We are looking for an answer that is a product of two binomials in parentheses: (x )(x )
The number -24 can be written as the product of the following numbers:
450

www.ck12.org Chapter 9. Polynomials
−24 =−1 ·24 and −1+24 = 23
−24 = 1 · (−24) and 1+(−24) =−23
−24 =−2 ·12 and −2+12 = 10
−24 = 2 · (−12) and 2+(−12) =−10 T his is the correct choice.
−24 =−3 ·8 and −3+8 = 5
−24 = 3 · (−8) and 3+(−8) =−5
−24 =−4 ·6 and −4+6 = 2
−24 = 4 · (−6) and 4+(−6) =−2
The answer is (x−12)(x+2).
Example 9
Factor x2 +34x−35.
Solution
We are looking for an answer that is a product of two binomials in parentheses: (x )(x )
The number -35 can be written as the product of the following numbers:
−35 =−1 ·35 and −1+35 = 34 T his is the correct choice.
−35 = 1 · (−35) and 1+(−35) =−34
−35 =−5 ·7 and −5+7 = 2
−35 = 5 · (−7) and 5+(−7) =−2
The answer is (x−1)(x+35).
Factor when a = - 1
When a =−1, the best strategy is to factor the common factor of -1 from all the terms in the quadratic polynomialand then apply the methods you learned so far in this section
Example 10
Factor −x2 + x+6.
Solution
First factor the common factor of -1 from each term in the trinomial. Factoring -1 just changes the signs of eachterm in the expression:
−x2 + x+6 =−(x2− x−6)
We’re looking for a product of two binomials in parentheses: −(x )(x )
Now our job is to factor x2− x−6.
The number -6 can be written as the product of the following numbers:
451

9.5. Factoring Quadratic Expressions www.ck12.org
−6 =−1 ·6 and −1+6 = 5
−6 = 1 · (−6) and 1+(−6) =−5
−6 =−2 ·3 and −2+3 = 1
−6 = 2 · (−3) and 2+(−3) =−1 T his is the correct choice.
The answer is −(x−3)(x+2).
Lesson Summary
• A quadratic of the form x2 +bx+ c factors as a product of two binomials in parentheses: (x+m)(x+n)• If b and c are positive, then both m and n are positive.
Example: x2 +8x+12 factors as (x+6)(x+2).
• If b is negative and c is positive, then both m and n are negative.
Example: x2−6x+8 factors as (x−2)(x−4).
• If c is negative, then either m is positive and n is negative or vice-versa.
Example: x2 +2x−15 factors as (x+5)(x−3).
Example: x2 +34x−35 factors as (x+35)(x−1).
• If a = −1, factor out -1 from each term in the trinomial and then factor as usual. The answer will have theform: −(x+m)(x+n)
Example: −x2 + x+6 factors as −(x−3)(x+2).
Review Questions
Factor the following quadratic polynomials.
1. x2 +10x+92. x2 +15x+503. x2 +10x+214. x2 +16x+485. x2−11x+246. x2−13x+427. x2−14x+338. x2−9x+209. x2 +5x−14
10. x2 +6x−2711. x2 +7x−78
452

www.ck12.org Chapter 9. Polynomials
12. x2 +4x−3213. x2−12x−4514. x2−5x−5015. x2−3x−4016. x2− x−5617. −x2−2x−118. −x2−5x+2419. −x2 +18x−7220. −x2 +25x−15021. x2 +21x+10822. −x2 +11x−3023. x2 +12x−6424. x2−17x−6025. x2 +5x−36
453

9.6. Factoring Special Products www.ck12.org
9.6 Factoring Special Products
Learning Objectives
• Factor the difference of two squares.• Factor perfect square trinomials.• Solve quadratic polynomial equation by factoring.
Introduction
When you learned how to multiply binomials we talked about two special products.
The sum and difference formula: (a+b)(a−b) = a2−b2
The square of a binomial formulas: (a+b)2 = a2 +2ab+b2
(a−b)2 = a2−2ab+b2
In this section we’ll learn how to recognize and factor these special products.
Factor the Difference of Two Squares
We use the sum and difference formula to factor a difference of two squares. A difference of two squares is anyquadratic polynomial in the form a2−b2, where a and b can be variables, constants, or just about anything else. Thefactors of a2−b2 are always (a+b)(a−b); the key is figuring out what the a and b terms are.
Example 1
Factor the difference of squares:
a) x2−9
b) x2−100
c) x2−1
Solution
a) Rewrite x2−9 as x2−32. Now it is obvious that it is a difference of squares.
The difference of squares formula is: a2−b2 = (a+b)(a−b)
Let’s see how our problem matches with the formula: x2−32 = (x+3)(x−3)
The answer is: x2−9 = (x+3)(x−3)
454
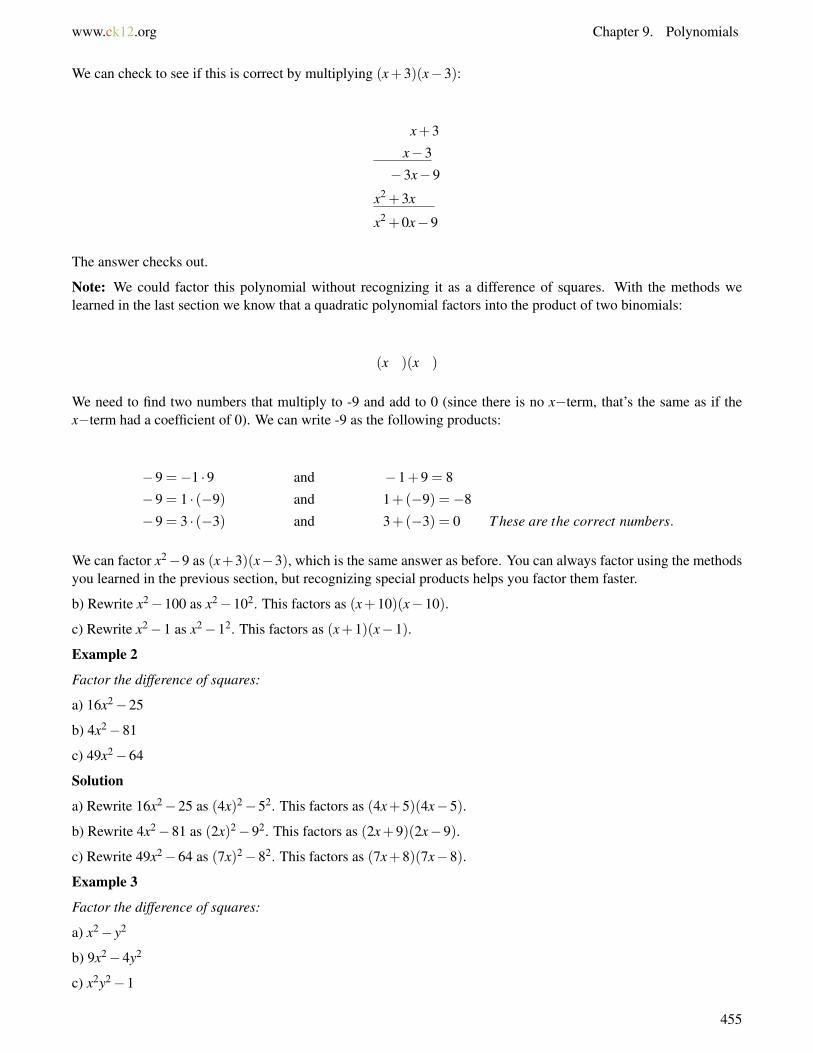
www.ck12.org Chapter 9. Polynomials
We can check to see if this is correct by multiplying (x+3)(x−3):
x+3
x−3
−3x−9
x2 +3x
x2 +0x−9
The answer checks out.
Note: We could factor this polynomial without recognizing it as a difference of squares. With the methods welearned in the last section we know that a quadratic polynomial factors into the product of two binomials:
(x )(x )
We need to find two numbers that multiply to -9 and add to 0 (since there is no x−term, that’s the same as if thex−term had a coefficient of 0). We can write -9 as the following products:
−9 =−1 ·9 and −1+9 = 8
−9 = 1 · (−9) and 1+(−9) =−8
−9 = 3 · (−3) and 3+(−3) = 0 T hese are the correct numbers.
We can factor x2−9 as (x+3)(x−3), which is the same answer as before. You can always factor using the methodsyou learned in the previous section, but recognizing special products helps you factor them faster.
b) Rewrite x2−100 as x2−102. This factors as (x+10)(x−10).
c) Rewrite x2−1 as x2−12. This factors as (x+1)(x−1).
Example 2
Factor the difference of squares:
a) 16x2−25
b) 4x2−81
c) 49x2−64
Solution
a) Rewrite 16x2−25 as (4x)2−52. This factors as (4x+5)(4x−5).
b) Rewrite 4x2−81 as (2x)2−92. This factors as (2x+9)(2x−9).
c) Rewrite 49x2−64 as (7x)2−82. This factors as (7x+8)(7x−8).
Example 3
Factor the difference of squares:
a) x2− y2
b) 9x2−4y2
c) x2y2−1
455

9.6. Factoring Special Products www.ck12.org
Solution
a) x2− y2 factors as (x+ y)(x− y).
b) Rewrite 9x2−4y2 as (3x)2− (2y)2. This factors as (3x+2y)(3x−2y).
c) Rewrite x2y2−1 as (xy)2−12. This factors as (xy+1)(xy−1).
Example 4
Factor the difference of squares:
a) x4−25
b) 16x4− y2
c) x2y8−64z2
Solution
a) Rewrite x4−25 as (x2)2−52. This factors as (x2 +5)(x2−5).
b) Rewrite 16x4− y2 as (4x2)2− y2. This factors as (4x2 + y)(4x2− y).
c) Rewrite x2y4−64z2 as (xy2)2− (8z)2. This factors as (xy2 +8z)(xy2−8z).
Factor Perfect Square Trinomials
We use the square of a binomial formula to factor perfect square trinomials. A perfect square trinomial has the forma2 +2ab+b2 or a2−2ab+b2.
In these special kinds of trinomials, the first and last terms are perfect squares and the middle term is twice theproduct of the square roots of the first and last terms. In a case like this, the polynomial factors into perfect squares:
a2 +2ab+b2 = (a+b)2
a2−2ab+b2 = (a−b)2
Once again, the key is figuring out what the a and b terms are.
Example 5
Factor the following perfect square trinomials:
a) x2 +8x+16
b) x2−4x+4
c) x2 +14x+49
Solution
a) The first step is to recognize that this expression is a perfect square trinomial.
First, we can see that the first term and the last term are perfect squares. We can rewrite x2 +8x+16 as x2 +8x+42.
Next, we check that the middle term is twice the product of the square roots of the first and the last terms. This istrue also since we can rewrite x2 +8x+16 as x2 +2 ·4 · x+42.
This means we can factor x2 +8x+16 as (x+4)2. We can check to see if this is correct by multiplying (x+4)2 =(x+4)(x+4) :
456

www.ck12.org Chapter 9. Polynomials
x+4
x+4
4x+16
x2 +4x
x2 +8x+16
The answer checks out.
Note: We could factor this trinomial without recognizing it as a perfect square. We know that a trinomial factors asa product of two binomials:
(x )(x )
We need to find two numbers that multiply to 16 and add to 8. We can write 16 as the following products:
16 = 1 ·16 and 1+16 = 17
16 = 2 ·8 and 2+8 = 10
16 = 4 ·4 and 4+4 = 8 T hese are the correct numbers
So we can factor x2 +8x+16 as (x+4)(x+4), which is the same as (x+4)2.
Once again, you can factor perfect square trinomials the normal way, but recognizing them as perfect squares givesyou a useful shortcut.
b) Rewrite x2 +4x+4 as x2 +2 · (−2) · x+(−2)2.
We notice that this is a perfect square trinomial, so we can factor it as (x−2)2.
c) Rewrite x2 +14x+49 as x2 +2 ·7 · x+72.
We notice that this is a perfect square trinomial, so we can factor it as (x+7)2.
Example 6
Factor the following perfect square trinomials:
a) 4x2 +20x+25
b) 9x2−24x+16
c) x2 +2xy+ y2
Solution
a) Rewrite 4x2 +20x+25 as (2x)2 +2 ·5 · (2x)+52.
We notice that this is a perfect square trinomial and we can factor it as (2x+5)2.
b) Rewrite 9x2−24x+16 as (3x)2 +2 · (−4) · (3x)+(−4)2.
We notice that this is a perfect square trinomial and we can factor it as (3x−4)2.
We can check to see if this is correct by multiplying (3x−4)2 = (3x−4)(3x−4):
457

9.6. Factoring Special Products www.ck12.org
3x−4
3x−4
−12x+16
9x2−12x
9x2−24x+16
The answer checks out.
c) x2 +2xy+ y2
We notice that this is a perfect square trinomial and we can factor it as (x+ y)2.
For more examples of factoring perfect square trinomials, watch the videos at http://www.onlinemathlearning.com/perfect-square-trinomial.html.
Solve Quadratic Polynomial Equations by Factoring
With the methods we’ve learned in the last two sections, we can factor many kinds of quadratic polynomials. Thisis very helpful when we want to solve them. Remember the process we learned earlier:
1. If necessary, rewrite the equation in standard form so that the right-hand side equals zero.2. Factor the polynomial completely.3. Use the zero-product rule to set each factor equal to zero.4. Solve each equation from step 3.5. Check your answers by substituting your solutions into the original equation
We can use this process to solve quadratic polynomials using the factoring methods we just learned.
Example 7
Solve the following polynomial equations.
a) x2 +7x+6 = 0
b) x2−8x =−12
c) x2 = 2x+15
Solution
a) Rewrite: We can skip this since the equation is in the correct form already.
Factor: We can write 6 as a product of the following numbers:
6 = 1 ·6 and 1+6 = 7 T his is the correct choice.
6 = 2 ·3 and 2+3 = 5
x2 +7x+6 = 0 factors as (x+1)(x+6) = 0.
Set each factor equal to zero:
x+1 = 0 or x+6 = 0
458

www.ck12.org Chapter 9. Polynomials
Solve:
x =−1 or x =−6
Check: Substitute each solution back into the original equation.
x =−1 (−1)2 +7(−1)+6 = 1−7+6 = 0 checks out
x =−6 (−6)2 +7(−6)+6 = 36−42+6 = 0 checks out
b) Rewrite: x2−8x =−12 is rewritten as x2−8x+12 = 0
Factor: We can write 12 as a product of the following numbers:
12 = 1 ·12 and 1+12 = 13
12 =−1 · (−12) and −1+(−12) =−13
12 = 2 ·6 and 2+6 = 8
12 =−2 · (−6) and −2+(−6) =−8 T his is the correct choice.
12 = 3 ·4 and 3+4 = 7
12 =−3 · (−4) and −3+(−4) =−7
x2 +8x+12 = 0 factors as (x−2)(x−6) = 0.
Set each factor equal to zero:
x−2 = 0 or x−6 = 0
Solve:
x = 2 or x = 6
Check: Substitute each solution back into the original equation.
x = 2 (2)2−8(2) = 4−16 =−12 checks out
x = 6 (6)2−8(6) = 36−48 =−12 checks out
c) Rewrite: x2 = 2x+15 is rewritten as x2−2x−15 = 0
Factor: We can write -15 as a product of the following numbers:
−15 = 1 · (−15) and 1+(−15) =−14
−15 =−1 · (15) and −1+(15) = 14
−15 =−3 ·5 and −3+5 = 2
−15 = 3 · (−5) and 3+(−5) =−2 T his is the correct choice.
459

9.6. Factoring Special Products www.ck12.org
x2−2x−15 = 0 factors as (x+3)(x−5) = 0
Set each factor equal to zero:
x+3 = 0 or x−5 = 0
Solve:
x =−3 or x = 5
Check: Substitute each solution back into the original equation.
x =−3 (−3)2 = 2(−3)+15⇒ 9 = 9 checks out
x = 5 (5)2 = 2(5)+15⇒ 25 = 25 checks out
Example 8
Solve the following polynomial equations:
a) x2−12x+36 = 0
b) x2−81 = 0
c) x2 +20x+100 = 0
Solution
a) x2−12x+36 = 0
Rewrite: The equation is in the correct form already.
Factor: Rewrite x2−12x+36 = 0 as x2−2 · (−6)x+(−6)2.
We recognize this as a perfect square. This factors as (x−6)2 = 0 or (x−6)(x−6) = 0
Set each factor equal to zero:
x−6 = 0 or x−6 = 0
Solve:
x = 6 or x = 6
Notice that for a perfect square the two solutions are the same. This is called a double root.
Check: Substitute each solution back into the original equation.
x = 6 62−12(6)+36 = 36−72+36 = 0 checks out
b) x2−81 = 0
460

www.ck12.org Chapter 9. Polynomials
Rewrite: this is not necessary since the equation is in the correct form already
Factor: Rewrite x2−81 as x2−92.
We recognize this as a difference of squares. This factors as (x−9)(x+9) = 0.
Set each factor equal to zero:
x−9 = 0 or x+9 = 0
Solve:
x = 9 or x =−9
Check: Substitute each solution back into the original equation.
x = 9 92−81 = 81−81 = 0 checks out
x =−9 (−9)2−81 = 81−81 = 0 checks out
c) x2 +20x+100 = 0
Rewrite: this is not necessary since the equation is in the correct form already
Factor: Rewrite x2 +20x+100 as x2 +2 ·10 · x+102.
We recognize this as a perfect square. This factors as (x+10)2 = 0 or (x+10)(x+10) = 0
Set each factor equal to zero:
x+10 = 0 or x+10 = 0
Solve:
x =−10 or x =−10 This is a double root.
Check: Substitute each solution back into the original equation.
x = 10 (−10)2 +20(−10)+100 = 100−200+100 = 0 checks out
Review Questions
Factor the following perfect square trinomials.
1. x2 +8x+162. x2−18x+81
461

9.6. Factoring Special Products www.ck12.org
3. −x2 +24x−1444. x2 +14x+495. 4x2−4x+16. 25x2 +60x+367. 4x2−12xy+9y2
8. x4 +22x2 +121
Factor the following differences of squares.
9. x2−410. x2−3611. −x2 +10012. x2−40013. 9x2−414. 25x2−4915. −36x2 +2516. 4x2− y2
17. 16x2−81y2
Solve the following quadratic equations using factoring.
18. x2−11x+30 = 019. x2 +4x = 2120. x2 +49 = 14x21. x2−64 = 022. x2−24x+144 = 023. 4x2−25 = 024. x2 +26x =−16925. −x2−16x−60 = 0
462

www.ck12.org Chapter 9. Polynomials
9.7 Factoring Polynomials Completely
Learning Objectives
• Factor out a common binomial.• Factor by grouping.• Factor a quadratic trinomial where a 6= 1.• Solve real world problems using polynomial equations.
Introduction
We say that a polynomial is factored completely when we can’t factor it any more. Here are some suggestions thatyou should follow to make sure that you factor completely:
• Factor all common monomials first.• Identify special products such as difference of squares or the square of a binomial. Factor according to their
formulas.• If there are no special products, factor using the methods we learned in the previous sections.• Look at each factor and see if any of these can be factored further.
Example 1
Factor the following polynomials completely.
a) 6x2−30x+24
b) 2x2−8
c) x3 +6x2 +9x
Solution
a) Factor out the common monomial. In this case 6 can be divided from each term:
6(x2−5x−6)
There are no special products. We factor x2−5x+6 as a product of two binomials: (x )(x )
The two numbers that multiply to 6 and add to -5 are -2 and -3, so:
6(x2−5x+6) = 6(x−2)(x−3)
If we look at each factor we see that we can factor no more.
The answer is 6(x−2)(x−3).
463

9.7. Factoring Polynomials Completely www.ck12.org
b) Factor out common monomials: 2x2−8 = 2(x2−4)
We recognize x2−4 as a difference of squares. We factor it as (x+2)(x−2).
If we look at each factor we see that we can factor no more.
The answer is 2(x+2)(x−2).
c) Factor out common monomials: x3 +6x2 +9x = x(x2 +6x+9)
We recognize x2 +6x+9 as a perfect square and factor it as (x+3)2.
If we look at each factor we see that we can factor no more.
The answer is x(x+3)2.
Example 2
Factor the following polynomials completely:
a) −2x4 +162
b) x5−8x3 +16x
Solution
a) Factor out the common monomial. In this case, factor out -2 rather than 2. (It’s always easier to factor out thenegative number so that the highest degree term is positive.)
−2x4 +162 =−2(x4−81)
We recognize expression in parenthesis as a difference of squares. We factor and get:
−2(x2−9)(x2 +9)
If we look at each factor we see that the first parenthesis is a difference of squares. We factor and get:
−2(x+3)(x−3)(x2 +9)
If we look at each factor now we see that we can factor no more.
The answer is −2(x+3)(x−3)(x2 +9).
b) Factor out the common monomial: x5−8x3 +14x = x(x4−8x2 +16)
We recognize x4−8x2 +16 as a perfect square and we factor it as x(x2−4)2.
We look at each term and recognize that the term in parentheses is a difference of squares.
We factor it and get ((x+2)(x−2))2, which we can rewrite as (x+2)2(x−2)2.
If we look at each factor now we see that we can factor no more.
The final answer is x(x+2)2(x−2)2.
Factor out a Common Binomial
The first step in the factoring process is often factoring out the common monomials from a polynomial. Butsometimes polynomials have common terms that are binomials. For example, consider the following expression:
464

www.ck12.org Chapter 9. Polynomials
x(3x+2)−5(3x+2)
Since the term (3x+2) appears in both terms of the polynomial, we can factor it out. We write that term in front ofa set of parentheses containing the terms that are left over:
(3x+2)(x−5)
This expression is now completely factored.
Let’s look at some more examples.
Example 3
Factor out the common binomials.
a) 3x(x−1)+4(x−1)
b) x(4x+5)+(4x+5)
Solution
a) 3x(x−1)+4(x−1) has a common binomial of (x−1).
When we factor out the common binomial we get (x−1)(3x+4).
b) x(4x+5)+(4x+5) has a common binomial of (4x+5).
When we factor out the common binomial we get (4x+5)(x+1).
Factor by Grouping
Sometimes, we can factor a polynomial containing four or more terms by factoring common monomials from groupsof terms. This method is called factor by grouping.
The next example illustrates how this process works.
Example 4
Factor 2x+2y+ax+ay.
Solution
There is no factor common to all the terms. However, the first two terms have a common factor of 2 and the last twoterms have a common factor of a. Factor 2 from the first two terms and factor a from the last two terms:
2x+2y+ax+ay = 2(x+ y)+a(x+ y)
Now we notice that the binomial (x+ y) is common to both terms. We factor the common binomial and get:
(x+ y)(2+a)
Example 5
465
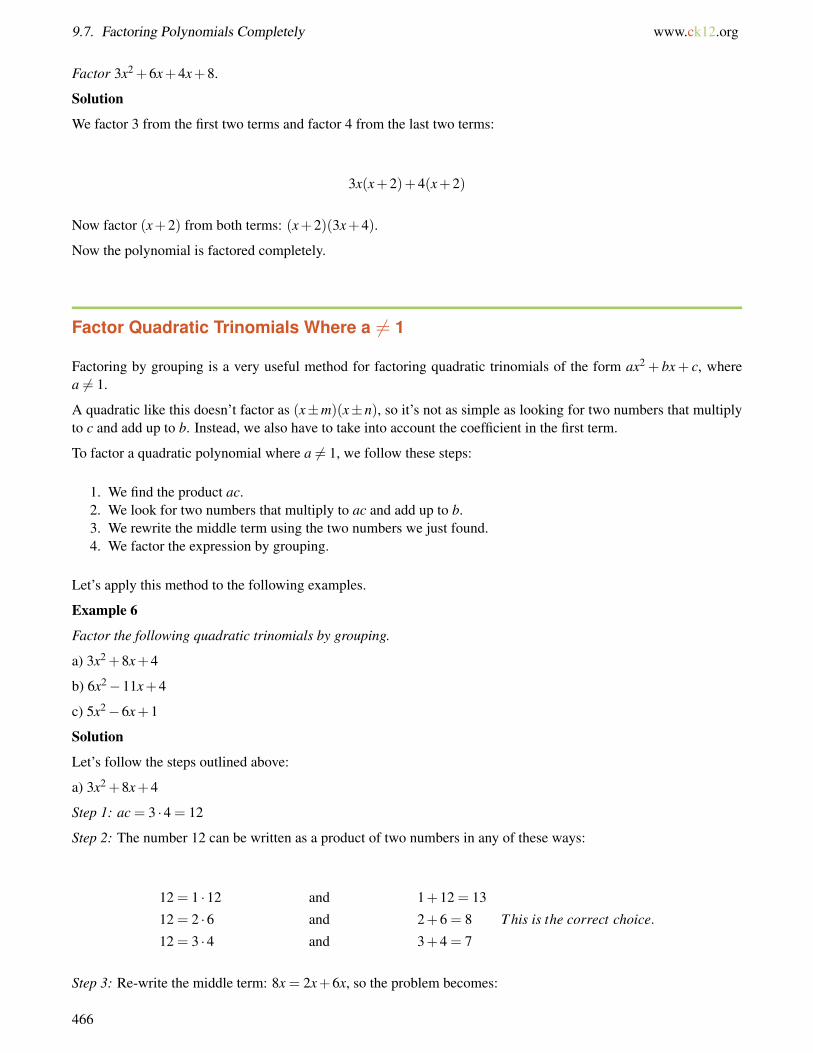
9.7. Factoring Polynomials Completely www.ck12.org
Factor 3x2 +6x+4x+8.
Solution
We factor 3 from the first two terms and factor 4 from the last two terms:
3x(x+2)+4(x+2)
Now factor (x+2) from both terms: (x+2)(3x+4).
Now the polynomial is factored completely.
Factor Quadratic Trinomials Where a 6= 1
Factoring by grouping is a very useful method for factoring quadratic trinomials of the form ax2 + bx+ c, wherea 6= 1.
A quadratic like this doesn’t factor as (x±m)(x±n), so it’s not as simple as looking for two numbers that multiplyto c and add up to b. Instead, we also have to take into account the coefficient in the first term.
To factor a quadratic polynomial where a 6= 1, we follow these steps:
1. We find the product ac.2. We look for two numbers that multiply to ac and add up to b.3. We rewrite the middle term using the two numbers we just found.4. We factor the expression by grouping.
Let’s apply this method to the following examples.
Example 6
Factor the following quadratic trinomials by grouping.
a) 3x2 +8x+4
b) 6x2−11x+4
c) 5x2−6x+1
Solution
Let’s follow the steps outlined above:
a) 3x2 +8x+4
Step 1: ac = 3 ·4 = 12
Step 2: The number 12 can be written as a product of two numbers in any of these ways:
12 = 1 ·12 and 1+12 = 13
12 = 2 ·6 and 2+6 = 8 T his is the correct choice.
12 = 3 ·4 and 3+4 = 7
Step 3: Re-write the middle term: 8x = 2x+6x, so the problem becomes:
466

www.ck12.org Chapter 9. Polynomials
3x2 +8x+4 = 3x2 +2x+6x+4
Step 4: Factor an x from the first two terms and a 2 from the last two terms:
x(3x+2)+2(3x+2)
Now factor the common binomial (3x+2):
(3x+2)(x+2) T his is the answer.
To check if this is correct we multiply (3x+2)(x+2):
3x+2
x+2
6x+4
3x2 +2x
3x2 +8x+4
The solution checks out.
b) 6x2−11x+4
Step 1: ac = 6 ·4 = 24
Step 2: The number 24 can be written as a product of two numbers in any of these ways:
24 = 1 ·24 and 1+24 = 25
24 =−1 · (−24) and −1+(−24) =−25
24 = 2 ·12 and 2+12 = 14
24 =−2 · (−12) and −2+(−12) =−14
24 = 3 ·8 and 3+8 = 11
24 =−3 · (−8) and −3+(−8) =−11 T his is the correct choice.
24 = 4 ·6 and 4+6 = 10
24 =−4 · (−6) and −4+(−6) =−10
Step 3: Re-write the middle term: −11x =−3x−8x, so the problem becomes:
6x2−11x+4 = 6x2−3x−8x+4
Step 4: Factor by grouping: factor a 3x from the first two terms and a -4 from the last two terms:
3x(2x−1)−4(2x−1)
467
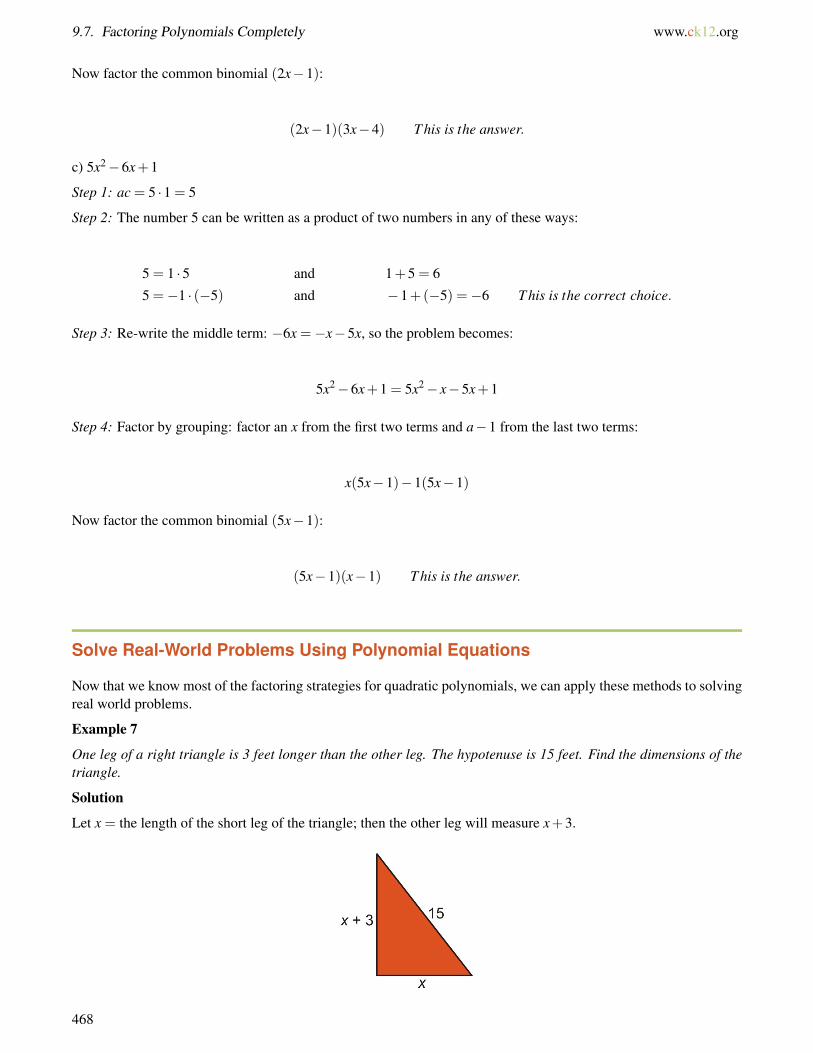
9.7. Factoring Polynomials Completely www.ck12.org
Now factor the common binomial (2x−1):
(2x−1)(3x−4) T his is the answer.
c) 5x2−6x+1
Step 1: ac = 5 ·1 = 5
Step 2: The number 5 can be written as a product of two numbers in any of these ways:
5 = 1 ·5 and 1+5 = 6
5 =−1 · (−5) and −1+(−5) =−6 T his is the correct choice.
Step 3: Re-write the middle term: −6x =−x−5x, so the problem becomes:
5x2−6x+1 = 5x2− x−5x+1
Step 4: Factor by grouping: factor an x from the first two terms and a−1 from the last two terms:
x(5x−1)−1(5x−1)
Now factor the common binomial (5x−1):
(5x−1)(x−1) T his is the answer.
Solve Real-World Problems Using Polynomial Equations
Now that we know most of the factoring strategies for quadratic polynomials, we can apply these methods to solvingreal world problems.
Example 7
One leg of a right triangle is 3 feet longer than the other leg. The hypotenuse is 15 feet. Find the dimensions of thetriangle.
Solution
Let x = the length of the short leg of the triangle; then the other leg will measure x+3.
468

www.ck12.org Chapter 9. Polynomials
Use the Pythagorean Theorem: a2 + b2 = c2, where a and b are the lengths of the legs and c is the length of thehypotenuse. When we substitute the values from the diagram, we get x2 +(x+3)2 = 152.
In order to solve this equation, we need to get the polynomial in standard form. We must first distribute, collect liketerms and rewrite in the form “polynomial = 0.”
x2 + x2 +6x+9 = 225
2x2 +6x+9 = 225
2x2 +6x−216 = 0
Factor out the common monomial: 2(x2 +3x−108) = 0
To factor the trinomial inside the parentheses, we need two numbers that multiply to -108 and add to 3. It wouldtake a long time to go through all the options, so let’s start by trying some of the bigger factors:
−108 =−12 ·9 and −12+9 =−3
−108 = 12 · (−9) and 12+(−9) = 3 T his is the correct choice.
We factor the expression as 2(x−9)(x+12) = 0.
Set each term equal to zero and solve:
x−9 = 0 x+12 = 0
or
x = 9 x =−12
It makes no sense to have a negative answer for the length of a side of the triangle, so the answer must be x = 9. Thatmeans the short leg is 9 feet and the long leg is 12 feet.
Check: 92 +122 = 81+144 = 225 = 152, so the answer checks.
Example 8
The product of two positive numbers is 60. Find the two numbers if one numbers is 4 more than the other.
Solution
Let x = one of the numbers; then x+4 is the other number.
The product of these two numbers is 60, so we can write the equation x(x+4) = 60.
In order to solve we must write the polynomial in standard form. Distribute, collect like terms and rewrite:
x2 +4x = 60
x2 +4x−60 = 0
Factor by finding two numbers that multiply to -60 and add to 4. List some numbers that multiply to -60:
469

9.7. Factoring Polynomials Completely www.ck12.org
−60 =−4 ·15 and −4+15 = 11
−60 = 4 · (−15) and 4+(−15) =−11
−60 =−5 ·12 and −5+12 = 7
−60 = 5 · (−12) and 5+(−12) =−7
−60 =−6 ·10 and −6+10 = 4 T his is the correct choice.
−60 = 6 · (−10) and 6+(−10) =−4
The expression factors as (x+10)(x−6) = 0.
Set each term equal to zero and solve:
x+10 = 0 x−6 = 0
or
x =−10 x = 6
Since we are looking for positive numbers, the answer must be x = 6. One number is 6, and the other number is10.
Check: 6 ·10 = 60, so the answer checks.
Example 9
A rectangle has sides of length x+5 and x−3. What is x if the area of the rectangle is 48?
Solution
Make a sketch of this situation:
Using the formula Area = length × width, we have (x+5)(x−3) = 48.
In order to solve, we must write the polynomial in standard form. Distribute, collect like terms and rewrite:
x2 +2x−15 = 48
x2 +2x−63 = 0
Factor by finding two numbers that multiply to -63 and add to 2. List some numbers that multiply to -63:
−63 =−7 ·9 and −7+9 = 2 T his is the correct choice.
−63 = 7 · (−9) and 7+(−9) =−2
470

www.ck12.org Chapter 9. Polynomials
The expression factors as (x+9)(x−7) = 0.
Set each term equal to zero and solve:
x+9 = 0 x−7 = 0
or
x =−9 x = 7
Since we are looking for positive numbers the answer must be x = 7. So the width is x− 3 = 4and the length isx+5 = 12.
Check: 4 ·12 = 48, so the answer checks.
Resources
The WTAMU Virtual Math Lab has a detailed page on factoring polynomials here: http://www.wtamu.edu/academic/anns/mps/math/mathlab/col_algebra/col_alg_tut7_factor.htm. This page contains many videos showing exampleproblems being solved.
Review Questions
Factor completely.
1. 2x2 +16x+302. 5x2−70x+2453. −x3 +17x2−70x4. 2x4−5125. 25x4−20x3 +4x2
6. 12x3 +12x2 +3x
Factor by grouping.
7. 6x2−9x+10x−158. 5x2−35x+ x−79. 9x2−9x− x+1
10. 4x2 +32x−5x−4011. 2a2−6ab+3ab−9b2
12. 5x2 +15x−2xy−6y
Factor the following quadratic trinomials by grouping.
13. 4x2 +25x−2114. 6x2 +7x+115. 4x2 +8x−516. 3x2 +16x+2117. 6x2−2x−4
471

9.7. Factoring Polynomials Completely www.ck12.org
18. 8x2−14x−15
Solve the following application problems:
19. One leg of a right triangle is 7 feet longer than the other leg. The hypotenuse is 13. Find the dimensions ofthe right triangle.
20. A rectangle has sides of x+2 and x−1. What value of x gives an area of 108?21. The product of two positive numbers is 120. Find the two numbers if one numbers is 7 more than the other.22. A rectangle has a 50-foot diagonal. What are the dimensions of the rectangle if it is 34 feet longer than it is
wide?23. Two positive numbers have a sum of 8, and their product is equal to the larger number plus 10. What are the
numbers?24. Two positive numbers have a sum of 8, and their product is equal to the smaller number plus 10. What are the
numbers?25. Framing Warehouse offers a picture framing service. The cost for framing a picture is made up of two parts:
glass costs $1 per square foot and the frame costs $2 per foot. If the frame has to be a square, what size picturecan you get framed for $20?
472

www.ck12.org Chapter 10. Quadratic Equations and Quadratic Functions
CHAPTER 10 Quadratic Equations andQuadratic Functions
Chapter Outline10.1 GRAPHS OF QUADRATIC FUNCTIONS
10.2 QUADRATIC EQUATIONS BY GRAPHING
10.3 QUADRATIC EQUATIONS BY SQUARE ROOTS
10.4 SOLVING QUADRATIC EQUATIONS BY COMPLETING THE SQUARE
10.5 SOLVING QUADRATIC EQUATIONS BY THE QUADRATIC FORMULA
10.6 THE DISCRIMINANT
10.7 LINEAR, EXPONENTIAL AND QUADRATIC MODELS
473

10.1. Graphs of Quadratic Functions www.ck12.org
10.1 Graphs of Quadratic Functions
Learning Objectives
• Graph quadratic functions.• Compare graphs of quadratic functions.• Graph quadratic functions in intercept form.• Analyze graphs of real-world quadratic functions.
Introduction
The graphs of quadratic functions are curved lines called parabolas. You don’t have to look hard to find parabolicshapes around you. Here are a few examples:
• The path that a ball or a rocket takes through the air.• Water flowing out of a drinking fountain.• The shape of a satellite dish.• The shape of the mirror in car headlights or a flashlight.• The cables in a suspension bridge.
Graph Quadratic Functions
Let’s see what a parabola looks like by graphing the simplest quadratic function, y = x2.
We’ll graph this function by making a table of values. Since the graph will be curved, we need to plot a fair numberof points to make it accurate.
TABLE 10.1:
x y = x2
−3 (−3)2 = 9–2 (−2)2 = 4–1 (−1)2 = 10 (0)2 = 01 (1)2 = 12 (2)2 = 43 (3)2 = 9
Here are the points plotted on a coordinate graph:
474

www.ck12.org Chapter 10. Quadratic Equations and Quadratic Functions
To draw the parabola, draw a smooth curve through all the points. (Do not connect the points with straight lines).
Let’s graph a few more examples.
Example 1
Graph the following parabolas.
a) y = 2x2 +4x+1
b) y =−x2 +3
c) y = x2−8x+3
Solution
a) y = 2x2 +4x+1
Make a table of values:
TABLE 10.2:
x y = 2x2 +4x+1−3 2(−3)2 +4(−3)+1 = 7–2 2(−2)2 +4(−2)+1 = 1–1 2(−1)2 +4(−1)+1 =−10 2(0)2 +4(0)+1 = 11 2(1)2 +4(1)+1 = 72 2(2)2 +4(2)+1 = 173 2(3)2 +4(3)+1 = 31
475
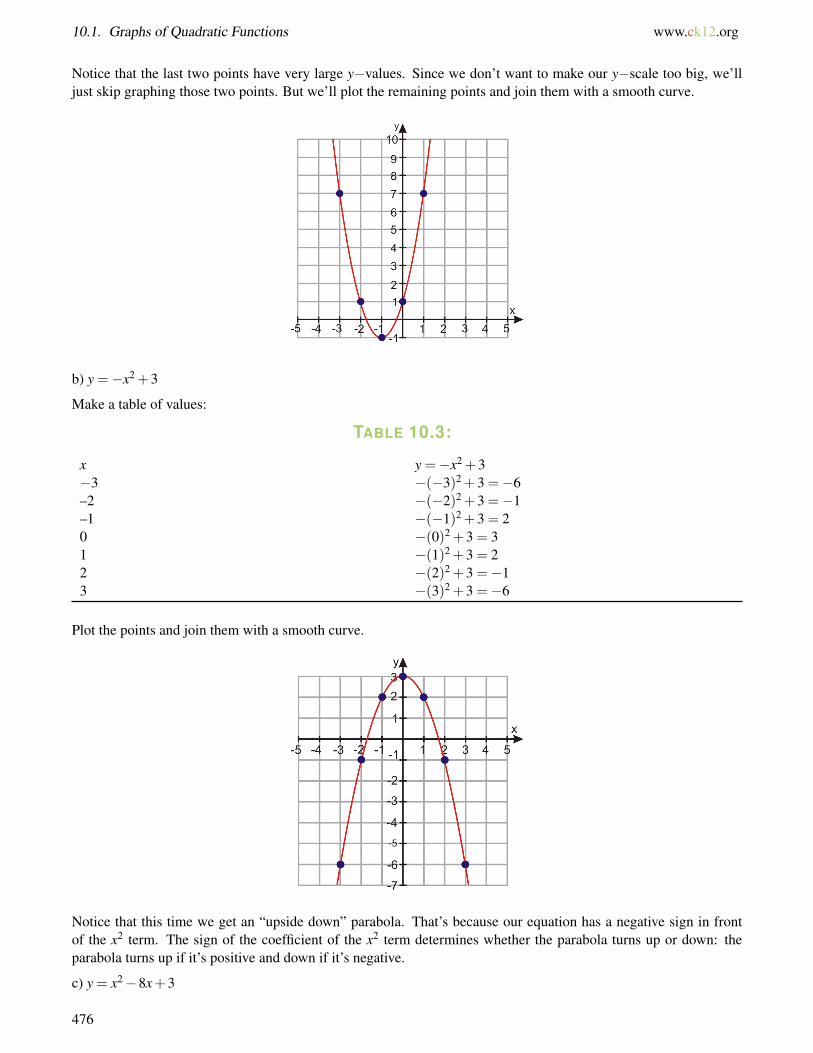
10.1. Graphs of Quadratic Functions www.ck12.org
Notice that the last two points have very large y−values. Since we don’t want to make our y−scale too big, we’lljust skip graphing those two points. But we’ll plot the remaining points and join them with a smooth curve.
b) y =−x2 +3
Make a table of values:
TABLE 10.3:
x y =−x2 +3−3 −(−3)2 +3 =−6–2 −(−2)2 +3 =−1–1 −(−1)2 +3 = 20 −(0)2 +3 = 31 −(1)2 +3 = 22 −(2)2 +3 =−13 −(3)2 +3 =−6
Plot the points and join them with a smooth curve.
Notice that this time we get an “upside down” parabola. That’s because our equation has a negative sign in frontof the x2 term. The sign of the coefficient of the x2 term determines whether the parabola turns up or down: theparabola turns up if it’s positive and down if it’s negative.
c) y = x2−8x+3
476

www.ck12.org Chapter 10. Quadratic Equations and Quadratic Functions
Make a table of values:
TABLE 10.4:
x y = x2−8x+3−3 (−3)2−8(−3)+3 = 36–2 (−2)2−8(−2)+3 = 23–1 (−1)2−8(−1)+3 = 120 (0)2−8(0)+3 = 31 (1)2−8(1)+3 =−42 (2)2−8(2)+3 =−93 (3)2−8(3)+3 =−12
Let’s not graph the first two points in the table since the values are so big. Plot the remaining points and join themwith a smooth curve.
Wait—this doesn’t look like a parabola. What’s going on here?
Maybe if we graph more points, the curve will look more familiar. For negative values of x it looks like the valuesof y are just getting bigger and bigger, so let’s pick more positive values of x beyond x = 3.
TABLE 10.5:
x y = x2−8x+3−1 (−1)2−8(−1)+3 = 120 (0)2−8(0)+3 = 31 (1)2−8(1)+3 =−42 (2)2−8(2)+3 =−93 (3)2−8(3)+3 =−124 (4)2−8(4)+3 =−135 (5)2−8(5)+3 =−126 (6)2−8(6)+3 =−97 (7)2−8(7)+3 =−48 (8)2−8(8)+3 = 3
Plot the points again and join them with a smooth curve.
477
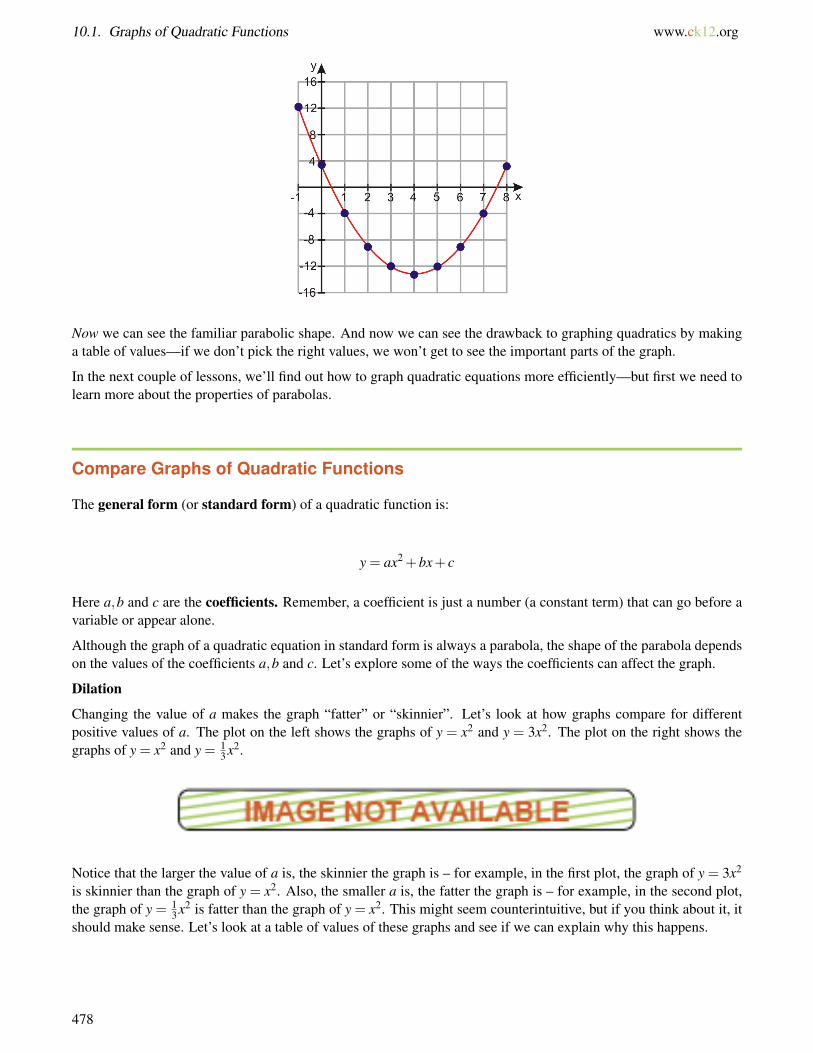
10.1. Graphs of Quadratic Functions www.ck12.org
Now we can see the familiar parabolic shape. And now we can see the drawback to graphing quadratics by makinga table of values—if we don’t pick the right values, we won’t get to see the important parts of the graph.
In the next couple of lessons, we’ll find out how to graph quadratic equations more efficiently—but first we need tolearn more about the properties of parabolas.
Compare Graphs of Quadratic Functions
The general form (or standard form) of a quadratic function is:
y = ax2 +bx+ c
Here a,b and c are the coefficients. Remember, a coefficient is just a number (a constant term) that can go before avariable or appear alone.
Although the graph of a quadratic equation in standard form is always a parabola, the shape of the parabola dependson the values of the coefficients a,b and c. Let’s explore some of the ways the coefficients can affect the graph.
Dilation
Changing the value of a makes the graph “fatter” or “skinnier”. Let’s look at how graphs compare for differentpositive values of a. The plot on the left shows the graphs of y = x2 and y = 3x2. The plot on the right shows thegraphs of y = x2 and y = 1
3 x2.
Notice that the larger the value of a is, the skinnier the graph is – for example, in the first plot, the graph of y = 3x2
is skinnier than the graph of y = x2. Also, the smaller a is, the fatter the graph is – for example, in the second plot,the graph of y = 1
3 x2 is fatter than the graph of y = x2. This might seem counterintuitive, but if you think about it, itshould make sense. Let’s look at a table of values of these graphs and see if we can explain why this happens.
478
www.ck12.org Chapter 10. Quadratic Equations and Quadratic Functions
TABLE 10.6:
x y = x2 y = 3x2 y = 13 x2
−3 (−3)2 = 9 3(−3)2 = 27 (−3)2
3 = 3–2 (−2)2 = 4 3(−2)2 = 12 (−2)2
3 = 43
–1 (−1)2 = 1 3(−1)2 = 3 (−1)2
3 = 13
0 (0)2 = 0 3(0)2 = 0 (0)2
3 = 01 (1)2 = 1 3(1)2 = 3 (1)2
3 = 13
2 (2)2 = 4 3(2)2 = 12 (2)2
3 = 43
3 (3)2 = 9 3(3)2 = 27 (3)2
3 = 3
From the table, you can see that the values of y = 3x2 are bigger than the values of y = x2. This is because each valueof y gets multiplied by 3. As a result the parabola will be skinnier because it grows three times faster than y = x2.On the other hand, you can see that the values of y = 1
3 x2 are smaller than the values of y = x2, because each valueof y gets divided by 3. As a result the parabola will be fatter because it grows at one third the rate of y = x2.
Orientation
As the value of a gets smaller and smaller, then, the parabola gets wider and flatter. What happens when a gets allthe way down to zero? What happens when it’s negative?
Well, when a = 0, the x2 term drops out of the equation entirely, so the equation becomes linear and the graph isjust a straight line. For example, we just saw what happens to y = ax2 when we change the value of a; if we tried tograph y = 0x2, we would just be graphing y = 0, which would be a horizontal line.
So as a gets smaller and smaller, the graph of y = ax2 gets flattened all the way out into a horizontal line. Then,when a becomes negative, the graph of y = ax2 starts to curve again, only it curves downward instead of upward.This fits with what you’ve already learned: the graph opens upward if a is positive and downward if a is negative.
For example, here are the graphs of y = x2 and y = −x2. You can see that the parabola has the same shape in bothgraphs, but the graph of y = x2 is right-side-up and the graph of y =−x2 is upside-down.
Vertical Shift
Changing the constant c just shifts the parabola up or down. The following plot shows the graphs of y = x2,y =x2 +1,y = x2−1,y = x2 +2, and y = x2−2.
479

10.1. Graphs of Quadratic Functions www.ck12.org
You can see that when c is positive, the graph shifts up, and when c is negative the graph shifts down; in either case,it shifts by |c| units. In one of the later sections we’ll learn about horizontal shift (i.e. moving to the right or to theleft). Before we can do that, though, we need to learn how to rewrite quadratic equations in different forms.
Meanwhile, if you want to explore further what happens when you change the coefficients of a quadratic equation,the page at http://www.analyzemath.com/quadraticg/quadraticg.htm has an applet you can use. Click on the “Clickhere to start” button in section A, and then use the sliders to change the values of a,b, and c.
Graph Quadratic Functions in Intercept Form
Now it’s time to learn how to graph a parabola without having to use a table with a large number of points.
Let’s look at the graph of y = x2−6x+8.
There are several things we can notice:
• The parabola crosses the x−axis at two points: x = 2 and x = 4. These points are called the x−intercepts ofthe parabola.
480

www.ck12.org Chapter 10. Quadratic Equations and Quadratic Functions
• The lowest point of the parabola occurs at (3, -1).
– This point is called the vertex of the parabola.– The vertex is the lowest point in any parabola that turns upward, or the highest point in any parabola that
turns downward.– The vertex is exactly halfway between the two x−intercepts. This will always be the case, and you can
find the vertex using that property.
• The parabola is symmetric. If you draw a vertical line through the vertex, you see that the two halves of theparabola are mirror images of each other. This vertical line is called the line of symmetry.
We said that the general form of a quadratic function is y = ax2+bx+c. When we can factor a quadratic expression,we can rewrite the function in intercept form:
y = a(x−m)(x−n)
This form is very useful because it makes it easy for us to find the x−intercepts and the vertex of the parabola. Thex−intercepts are the values of x where the graph crosses the x−axis; in other words, they are the values of x wheny = 0. To find the x−intercepts from the quadratic function, we set y = 0 and solve:
0 = a(x−m)(x−n)
Since the equation is already factored, we use the zero-product property to set each factor equal to zero and solvethe individual linear equations:
x−m = 0 x−n = 0
or
x = m x = n
So the x−intercepts are at points (m,0) and (n,0).
Once we find the x−intercepts, it’s simple to find the vertex. The x−value of the vertex is halfway between the twox−intercepts, so we can find it by taking the average of the two values: m+n
2 . Then we can find the y−value byplugging the value of x back into the equation of the function.
Example 2
Find the x−intercepts and the vertex of the following quadratic functions:
a) y = x2−8x+15
b) y = 3x2 +6x−24
Solution
a) y = x2−8x+15
Write the quadratic function in intercept form by factoring the right hand side of the equation. Remember, to factorwe need two numbers whose product is 15 and whose sum is –8. These numbers are –5 and –3.
The function in intercept form is y = (x−5)(x−3)
We find the x−intercepts by setting y = 0.
We have:
481

10.1. Graphs of Quadratic Functions www.ck12.org
0 = (x−5)(x−3)
x−5 = 0 x−3 = 0
or
x = 5 x = 3
So the x−intercepts are (5, 0) and (3, 0).
The vertex is halfway between the two x−intercepts. We find the x−value by taking the average of the twox−intercepts: x = 5+3
2 = 4
We find the y−value by plugging the x−value we just found into the original equation:
y = x2−8x+15⇒ y = 42−8(4)+15 = 16−32+15 =−1
So the vertex is (4, -1).
b) y = 3x2 +6x−24
Re-write the function in intercept form.
Factor the common term of 3 first: y = 3(x2 +2x−8)
Then factor completely: y = 3(x+4)(x−2)
Set y = 0 and solve:
x+4 = 0 x−2 = 0
0 = 3(x+4)(x−2)⇒ or
x =−4 x = 2
The x−intercepts are (-4, 0) and (2, 0).
For the vertex,
x = −4+22 =−1 and y = 3(−1)2 +6(−1)−24 = 3−6−24 =−27
The vertex is: (-1, -27)
Knowing the vertex and x−intercepts is a useful first step toward being able to graph quadratic functions more easily.Knowing the vertex tells us where the middle of the parabola is. When making a table of values, we can make sureto pick the vertex as a point in the table. Then we choose just a few smaller and larger values of x. In this way, weget an accurate graph of the quadratic function without having to have too many points in our table.
Example 3
Find the x− intercepts and vertex. Use these points to create a table of values and graph each function.
a) y = x2−4
b) y =−x2 +14x−48
Solution
a) y = x2−4
Let’s find the x−intercepts and the vertex:
482

www.ck12.org Chapter 10. Quadratic Equations and Quadratic Functions
Factor the right-hand side of the function to put the equation in intercept form:
y = (x−2)(x+2)
Set y = 0 and solve:
0 = (x−2)(x+2)
x−2 = 0 x+2 = 0
or
x = 2 x =−2
The x−intercepts are (2, 0) and (-2, 0).
Find the vertex:
x =2−2
2= 0 y = (0)2−4 =−4
The vertex is (0, -4).
Make a table of values using the vertex as the middle point. Pick a few values of x smaller and larger than x = 0.Include the x−intercepts in the table.
TABLE 10.7:
x y = x2−4−3 y = (−3)2−4 = 5–2 y = (−2)2−4 = 0 x−intercept–1 y = (−1)2−4 =−30 y = (0)2−4 =−4 vertex1 y = (1)2−4 =−32 y = (2)2−4 = 0 x−intercept3 y = (3)2−4 = 5
Then plot the graph:
483

10.1. Graphs of Quadratic Functions www.ck12.org
b) y =−x2 +14x−48
Let’s find the x−intercepts and the vertex:
Factor the right-hand-side of the function to put the equation in intercept form:
y =−(x2−14x+48) =−(x−6)(x−8)
Set y = 0 and solve:
0 =−(x−6)(x−8)
x−6 = 0 x−8 = 0
or
x = 6 x = 8
The x−intercepts are (6, 0) and (8, 0).
Find the vertex:
x =6+8
2= 7 y =−(7)2 +14(7)−48 = 1
The vertex is (7, 1).
Make a table of values using the vertex as the middle point. Pick a few values of x smaller and larger than x = 7.Include the x−intercepts in the table.
TABLE 10.8:
x y =−x2 +14x−484 y =−(4)2 +14(4)−48 =−85 y =−(5)2 +14(5)−48 =−36 y =−(6)2 +14(6)−48 = 07 y =−(7)2 +14(7)−48 = 18 y =−(8)2 +14(8)−48 = 09 y =−(9)2 +14(9)−48 =−310 y =−(10)2 +14(10)−48 =−8
Then plot the graph:
484

www.ck12.org Chapter 10. Quadratic Equations and Quadratic Functions
Analyze Graphs of Real-World Quadratic Functions.
As we mentioned at the beginning of this section, parabolic curves are common in real-world applications. Here wewill look at a few graphs that represent some examples of real-life application of quadratic functions.
Example 4
Andrew has 100 feet of fence to enclose a rectangular tomato patch. What should the dimensions of the rectangle bein order for the rectangle to have the greatest possible area?
Solution
Drawing a picture will help us find an equation to describe this situation:
If the length of the rectangle is x, then the width is 50− x. (The length and the width add up to 50, not 100, becausetwo lengths and two widths together add up to 100.)
If we let y be the area of the triangle, then we know that the area is length × width, so y = x(50− x) = 50x− x2.
Here’s the graph of that function, so we can see how the area of the rectangle depends on the length of the rectangle:
485

10.1. Graphs of Quadratic Functions www.ck12.org
We can see from the graph that the highest value of the area occurs when the length of the rectangle is 25. The areaof the rectangle for this side length equals 625. (Notice that the width is also 25, which makes the shape a squarewith side length 25.)
This is an example of an optimization problem. These problems show up often in the real world, and if you everstudy calculus, you’ll learn how to solve them without graphs.
Example 5
Anne is playing golf. On the 4th tee, she hits a slow shot down the level fairway. The ball follows a parabolic pathdescribed by the equation y = x− 0.04x2, where y is the ball’s height in the air and x is the horizontal distance ithas traveled from the tee. The distances are measured in feet. How far from the tee does the ball hit the ground? Atwhat distance from the tee does the ball attain its maximum height? What is the maximum height?
Solution
Let’s graph the equation of the path of the ball:
x(1−0.04x) = 0 has solutions x = 0 and x = 25.
From the graph, we see that the ball hits the ground 25 feet from the tee. (The other x−intercept, x = 0, tells us thatthe ball was also on the ground when it was on the tee!)
We can also see that the ball reaches its maximum height of about 6.25 feet when it is 12.5 feet from the tee.
486
www.ck12.org Chapter 10. Quadratic Equations and Quadratic Functions
Review Questions
Rewrite the following functions in intercept form. Find the x−intercepts and the vertex.
1. y = x2−2x−82. y =−x2 +10x−213. y = 2x2 +6x+44. y = 3(x+5)(x−2)
Does the graph of the parabola turn up or down?
5. y =−2x2−2x−36. y = 3x2
7. y = 16−4x2
8. y = 3x2−2x−4x2 +3
The vertex of which parabola is higher?
9. y = x2 +4 or y = x2 +110. y =−2x2 or y =−2x2−211. y = 3x2−3 or y = 3x2−612. y = 5−2x2 or y = 8−2x2
Which parabola is wider?
13. y = x2 or y = 4x2
14. y = 2x2 +4 or y = 12 x2 +4
15. y =−2x2−2 or y =−x2−216. y = x2 +3x2 or y = x2 +3
Graph the following functions by making a table of values. Use the vertex and x−intercepts to help you pick valuesfor the table.
17. y = 4x2−418. y =−x2 + x+1219. y = 2x2 +10x+820. y = 1
2 x2−2x21. y = x−2x2
22. y = 4x2−8x+423. Nadia is throwing a ball to Peter. Peter does not catch the ball and it hits the ground. The graph shows the path
of the ball as it flies through the air. The equation that describes the path of the ball is y = 4+ 2x− 0.16x2.Here y is the height of the ball and x is the horizontal distance from Nadia. Both distances are measured infeet.
a. How far from Nadia does the ball hit the ground?b. At what distance x from Nadia, does the ball attain its maximum height?c. What is the maximum height?
24. Jasreel wants to enclose a vegetable patch with 120 feet of fencing. He wants to put the vegetable against anexisting wall, so he only needs fence for three of the sides. The equation for the area is given by A = 120x−x2.From the graph, find what dimensions of the rectangle would give him the greatest area.
487

10.2. Quadratic Equations by Graphing www.ck12.org
10.2 Quadratic Equations by Graphing
Learning Objectives
• Identify the number of solutions of a quadratic equation.• Solve quadratic equations by graphing.• Analyze quadratic functions using a graphing calculator.• Solve real-world problems by graphing quadratic functions.
Introduction
Solving a quadratic equation means finding the x−values that will make the quadratic function equal zero; in otherwords, it means finding the points where the graph of the function crosses the x−axis. The solutions to a quadraticequation are also called the roots or zeros of the function, and in this section we’ll learn how to find them bygraphing the function.
Identify the Number of Solutions of a Quadratic Equation
Three different situations can occur when graphing a quadratic function:
Case 1: The parabola crosses the x−axis at two points. An example of this is y = x2 + x−6:
Looking at the graph, we see that the parabola crosses the x−axis at x =−3 and x = 2.
We can also find the solutions to the equation x2 + x−6 = 0 by setting y = 0. We solve the equation by factoring:
(x+3)(x−2) = 0, so x =−3 or x = 2.
When the graph of a quadratic function crosses the x−axis at two points, we get two distinct solutions to thequadratic equation.
488

www.ck12.org Chapter 10. Quadratic Equations and Quadratic Functions
Case 2: The parabola touches the x−axis at one point. An example of this is y = x2−2x+1:
We can see that the graph touches the x−axis at x = 1.
We can also solve this equation by factoring. If we set y = 0 and factor, we obtain (x−1)2 = 0, so x = 1. Since thequadratic function is a perfect square, we get only one solution for the equation—it’s just the same solution repeatedtwice over.
When the graph of a quadratic function touches the x−axis at one point, the quadratic equation has one solution andthe solution is called a double root.
Case 3: The parabola does not cross or touch the x−axis. An example of this is y = x2 +4:
If we set y = 0 we get x2 +4 = 0. This quadratic polynomial does not factor.
When the graph of a quadratic function does not cross or touch the x−axis, the quadratic equation has no realsolutions.
Solve Quadratic Equations by Graphing
So far we’ve found the solutions to quadratic equations using factoring. However, in real life very few functionsfactor easily. As you just saw, graphing a function gives a lot of information about the solutions. We can find exactor approximate solutions to a quadratic equation by graphing the function associated with it.
489

10.2. Quadratic Equations by Graphing www.ck12.org
Example 1
Find the solutions to the following quadratic equations by graphing.
a) −x2 +3 = 0
b) 2x2 +5x−7 = 0
c) −x2 + x−3 = 0
d) y =−x2 +4x−4
Solution
Since we can’t factor any of these equations, we won’t be able to graph them using intercept form (if we could, wewouldn’t need to use the graphs to find the intercepts!) We’ll just have to make a table of arbitrary values to grapheach one.
a)
TABLE 10.9:
x y =−x2 +3−3 y =−(−3)2 +3 =−6–2 y =−(−2)2 +3 =−1–1 y =−(−1)2 +3 = 20 y =−(0)2 +3 = 31 y =−(1)2 +3 = 22 y =−(2)2 +3 =−13 y =−(3)2 +3 =−6
We plot the points and get the following graph:
From the graph we can read that the x−intercepts are approximately x = 1.7and x =−1.7. These are the solutionsto the equation.
b)
TABLE 10.10:
x y = 2x2 +5x−7−5 y = 2(−5)2 +5(−5)−7 = 18–4 y = 2(−4)2 +5(−4)−7 = 5
490

www.ck12.org Chapter 10. Quadratic Equations and Quadratic Functions
TABLE 10.10: (continued)
x y = 2x2 +5x−7–3 y = 2(−3)2 +5(−3)−7 =−4–2 y = 2(−2)2 +5(−2)−7 =−9–1 y = 2(−1)2 +5(−1)−7 =−100 y = 2(0)2 +5(0)−7 =−71 y = 2(1)2 +5(1)−7 = 02 y = 2(2)2 +5(2)−7 = 113 y = 2(3)2 +5(3)−7 = 26
We plot the points and get the following graph:
From the graph we can read that the x−intercepts are x = 1and x =−3.5. These are the solutions to the equation.
c)
TABLE 10.11:
x y =−x2 + x−3−3 y =−(−3)2 +(−3)−3 =−15–2 y =−(−2)2 +(−2)−3 =−9–1 y =−(−1)2 +(−1)−3 =−50 y =−(0)2 +(0)−3 =−31 y =−(1)2 +(1)−3 =−32 y =−(2)2 +(2)−3 =−53 y =−(3)2 +(3)−3 =−9
We plot the points and get the following graph:
491
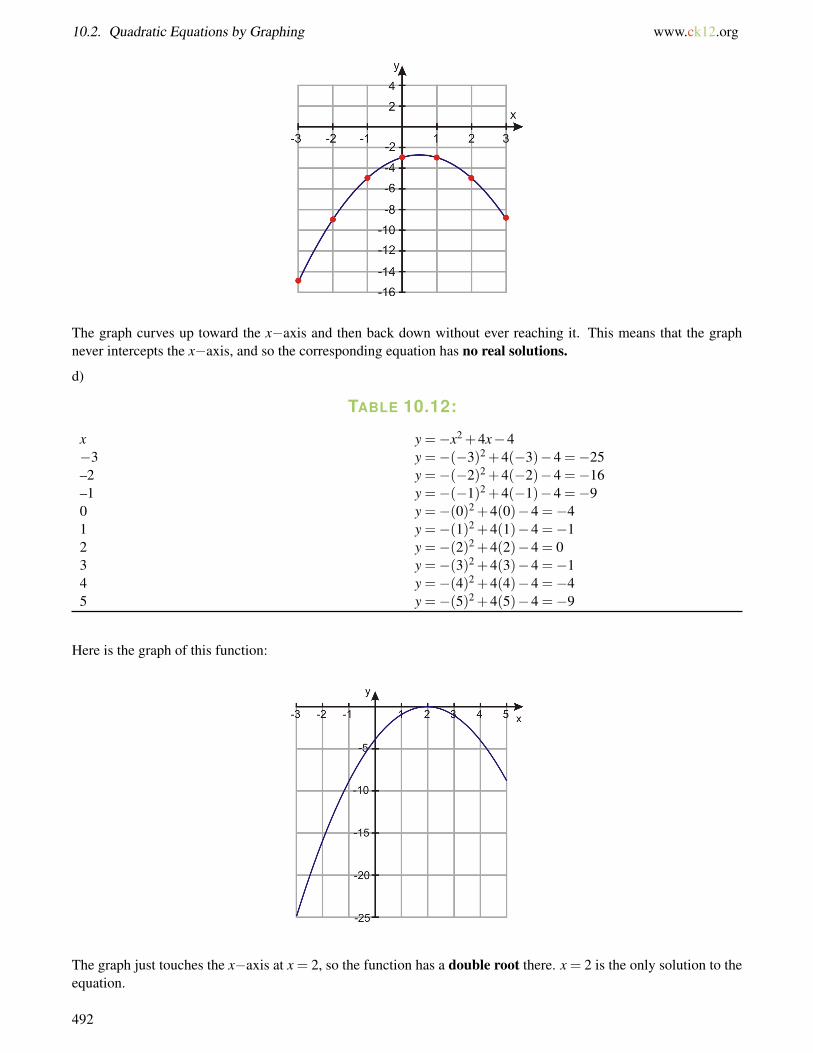
10.2. Quadratic Equations by Graphing www.ck12.org
The graph curves up toward the x−axis and then back down without ever reaching it. This means that the graphnever intercepts the x−axis, and so the corresponding equation has no real solutions.
d)
TABLE 10.12:
x y =−x2 +4x−4−3 y =−(−3)2 +4(−3)−4 =−25–2 y =−(−2)2 +4(−2)−4 =−16–1 y =−(−1)2 +4(−1)−4 =−90 y =−(0)2 +4(0)−4 =−41 y =−(1)2 +4(1)−4 =−12 y =−(2)2 +4(2)−4 = 03 y =−(3)2 +4(3)−4 =−14 y =−(4)2 +4(4)−4 =−45 y =−(5)2 +4(5)−4 =−9
Here is the graph of this function:
The graph just touches the x−axis at x = 2, so the function has a double root there. x = 2 is the only solution to theequation.
492

www.ck12.org Chapter 10. Quadratic Equations and Quadratic Functions
Analyze Quadratic Functions Using a Graphing Calculator
A graphing calculator is very useful for graphing quadratic functions. Once the function is graphed, we can use thecalculator to find important information such as the roots or the vertex of the function.
Example 2
Use a graphing calculator to analyze the graph of y = x2−20x+35.
Solution
1. Graph the function.
Press the [Y=] button and enter “x2− 20x+ 35” next to [Y1 =]. Press the [GRAPH] button. This is the plot youshould see:
If this is not what you see, press the [WINDOW] button to change the window size. For the graph shown here, thex−values should range from -10 to 30 and the y−values from -80 to 50.
2. Find the roots.
There are at least three ways to find the roots:
Use [TRACE] to scroll over the x−intercepts. The approximate value of the roots will be shown on the screen. Youcan improve your estimate by zooming in.
OR
Use [TABLE] and scroll through the values until you find values of y equal to zero. You can change the accuracy ofthe solution by setting the step size with the [TBLSET] function.
OR
Use [2nd] [TRACE] (i.e. ’calc’ button) and use option ’zero’.
Move the cursor to the left of one of the roots and press [ENTER].
Move the cursor to the right of the same root and press [ENTER].
Move the cursor close to the root and press [ENTER].
The screen will show the value of the root. Repeat the procedure for the other root.
Whichever technique you use, you should get about x = 1.9and x = 18 for the two roots.
3. Find the vertex.
493
10.2. Quadratic Equations by Graphing www.ck12.org
There are three ways to find the vertex:
Use [TRACE] to scroll over the highest or lowest point on the graph. The approximate value of the roots will beshown on the screen.
OR
Use [TABLE] and scroll through the values until you find values the lowest or highest value of y. You can changethe accuracy of the solution by setting the step size with the [TBLSET] function.
OR
Use [2nd] [TRACE] and use the option ’maximum’ if the vertex is a maximum or ’minimum’ if the vertex is aminimum.
Move the cursor to the left of the vertex and press [ENTER].
Move the cursor to the right of the vertex and press [ENTER].
Move the cursor close to the vertex and press [ENTER].
The screen will show the x− and y−values of the vertex.
Whichever method you use, you should find that the vertex is at (10, -65).
Solve Real-World Problems by Graphing Quadratic Functions
Here’s a real-world problem we can solve using the graphing methods we’ve learned.
Example 3
Andrew is an avid archer. He launches an arrow that takes a parabolic path. The equation of the height of the ballwith respect to time is y = −4.9t2 + 48t, where y is the height of the arrow in meters and t is the time in secondssince Andrew shot the arrow. Find how long it takes the arrow to come back to the ground.
Solution
Let’s graph the equation by making a table of values.
TABLE 10.13:
t y =−4.9t2 +48t0 y =−4.9(0)2 +48(0) = 01 y =−4.9(1)2 +48(1) = 43.12 y =−4.9(2)2 +48(2) = 76.43 y =−4.9(3)2 +48(3) = 99.94 y =−4.9(4)2 +48(4) = 113.65 y =−4.9(5)2 +48(5) = 117.66 y =−4.9(6)2 +48(6) = 111.67 y =−4.9(7)2 +48(7) = 95.98 y =−4.9(8)2 +48(8) = 70.49 y =−4.9(9)2 +48(9) = 35.110 y =−4.9(10)2 +48(10) =−10
Here’s the graph of the function:
494

www.ck12.org Chapter 10. Quadratic Equations and Quadratic Functions
The roots of the function are approximately x = 0 sec and x = 9.8 sec. The first root tells us that the height of thearrow was 0 meters when Andrew first shot it. The second root says that it takes approximately 9.8 seconds for thearrow to return to the ground.
Further Practice
Now that you’ve learned how to solve quadratic equations by graphing them, you can sharpen your skills even moreby learning how to find an equation from the graph alone. Go to the page linked in the previous section, http://www.analyzemath.com/quadraticg/quadraticg.htm, and scroll down to section E. Read the example there to learn howto find the equation of a quadratic function by reading off a few key values from the graph; then click the “Click hereto start” button to try a problem yourself. The “New graph” button will give you a new problem when you finish thefirst one.
Review Questions
Find the solutions of the following equations by graphing.
1. x2 +3x+6 = 02. −2x2 + x+4 = 03. x2−9 = 04. x2 +6x+9 = 05. 10x−3x2 = 06. 1
2 x2−2x+3 = 0
Find the roots of the following quadratic functions by graphing.
7. y =−3x2 +4x−18. y = 9−4x2
9. y = x2 +7x+210. y =−x2−10x−2511. y = 2x2−3x12. y = x2−2x+5
495

10.2. Quadratic Equations by Graphing www.ck12.org
Using your graphing calculator, find the roots and the vertex of each polynomial.
13. y = x2 +12x+514. y = x2 +3x+615. y =−x2−3x+916. y =−x2 +4x−1217. y = 2x2−4x+818. y =−5x2−3x+219. Graph the equations y = 2x2−4x+8 and y = x2−2x+4 on the same screen. Find their roots and vertices.
a. What is the same about the graphs? What is different?b. How are the two equations related to each other? (Hint: factor them.)c. What might be another equation with the same roots? Graph it and see.
20. Graph the equations y = x2−2x+2 and y = x2−2x+4 on the same screen. Find their roots and vertices.
a. What is the same about the graphs? What is different?b. How are the two equations related to each other?
21. Phillip throws a ball and it takes a parabolic path. The equation of the height of the ball with respect to timeis y =−16t2 +60t, where y is the height in feet and t is the time in seconds. Find how long it takes the ball tocome back to the ground.
22. Use your graphing calculator to solve Ex. 3. You should get the same answers as we did graphing by hand,but a lot quicker!
496
www.ck12.org Chapter 10. Quadratic Equations and Quadratic Functions
10.3 Quadratic Equations by Square Roots
Learning Objectives
• Solve quadratic equations involving perfect squares.• Approximate solutions of quadratic equations.• Solve real-world problems using quadratic functions and square roots.
Introduction
So far you know how to solve quadratic equations by factoring. However, this method works only if a quadraticpolynomial can be factored. In the real world, most quadratics can’t be factored, so now we’ll start to learn othermethods we can use to solve them. In this lesson, we’ll examine equations in which we can take the square root ofboth sides of the equation in order to arrive at the result.
Solve Quadratic Equations Involving Perfect Squares
Let’s first examine quadratic equations of the type
x2− c = 0
We can solve this equation by isolating the x2 term: x2 = c
Once the x2 term is isolated we can take the square root of both sides of the equation. Remember that when we takethe square root we get two answers: the positive square root and the negative square root:
x =√
c and x =−√
c
Often this is written as x =±√
c.
Example 1
Solve the following quadratic equations:
a) x2−4 = 0
b) x2−25 = 0
Solution
a) x2−4 = 0
Isolate the x2: x2 = 4
497

10.3. Quadratic Equations by Square Roots www.ck12.org
Take the square root of both sides: x =√
4 and x =−√
4
The solutions are x = 2and x =−2.
b) x2−25 = 0
Isolate the x2: x2 = 25
Take the square root of both sides: x =√
25 and x =−√
25
The solutions are x = 5and x =−5.
We can also find the solution using the square root when the x2 term is multiplied by a constant—in other words,when the equation takes the form
ax2− c = 0
We just have to isolate the x2:
ax2 = b
x2 =ba
Then we can take the square root of both sides of the equation:
x =
√ba
and x =−√
ba
Often this is written as: x =±√
ba
.
Example 2
Solve the following quadratic equations.
a) 9x2−16 = 0
b) 81x2−1 = 0
Solution
a) 9x2−16 = 0
Isolate the x2:
9x2 = 16
x2 =169
Take the square root of both sides: x =
√169
and x =−√
169
Answer: x = 43 and x =−4
3
b) 81x2−1 = 0
498

www.ck12.org Chapter 10. Quadratic Equations and Quadratic Functions
Isolate the x2:
81x2 = 1
x2 =181
Take the square root of both sides: x =
√181
and x =−√
181
Answer: x = 19 and x =−1
9
As you’ve seen previously, some quadratic equations have no real solutions.
Example 3
Solve the following quadratic equations.
a) x2 +1 = 0
b) 4x2 +9 = 0
Solution
a) x2 +1 = 0
Isolate the x2: x2 =−1
Take the square root of both sides: x =√−1 and x =−
√−1
Square roots of negative numbers do not give real number results, so there are no real solutions to this equation.
b) 4x2 +9 = 0
Isolate the x2:
4x2 =−9
x2 =−94
Take the square root of both sides: x =
√−9
4and x =−
√−9
4There are no real solutions.
We can also use the square root function in some quadratic equations where one side of the equation is a perfectsquare. This is true if an equation is of this form:
(x−2)2 = 9
Both sides of the equation are perfect squares. We take the square root of both sides and end up with two equations:x−2 = 3 and x−2 =−3.
Solving both equations gives us x = 5 and x =−1.
Example 4
Solve the following quadratic equations.
a) (x−1)2 = 4
499

10.3. Quadratic Equations by Square Roots www.ck12.org
b) (x+3)2 = 1
Solution
a) (x−1)2 = 4
Take the square root of both sides : x−1 = 2 and x−1 =−2
Solve each equation : x = 3 and x =−1
Answer: x = 3 and x =−1
b) (x+3)2 = 1
Take the square root of both sides : x+3 = 1 and x+3 =−1
Solve each equation : x =−2 and x =−4
Answer: x =−2 and x =−4
It might be necessary to factor the right-hand side of the equation as a perfect square before applying the methodoutlined above.
Example 5
Solve the following quadratic equations.
a) x2 +8x+16 = 25
b) 4x2−40x+25 = 9
Solution
a) x2 +8x+16 = 25
Factor the right-hand-side : x2 +8x+16 = (x+4)2 so (x+4)2 = 25
Take the square root of both sides : x+4 = 5 and x+4 =−5
Solve each equation : x = 1 and x =−9
Answer: x = 1 and x =−9
b) 4x2−20x+25 = 9
Factor the right-hand-side : 4x2−20x+25 = (2x−5)2 so (2x−5)2 = 9
Take the square root of both sides : 2x−5 = 3 and 2x−5 =−3
Solve each equation : 2x = 8 and 2x = 2
Answer: x = 4 and x = 1
Approximate Solutions of Quadratic Equations
We can use the methods we’ve learned so far in this section to find approximate solutions to quadratic equations,when taking the square root doesn’t give an exact answer.
500

www.ck12.org Chapter 10. Quadratic Equations and Quadratic Functions
Example 6
Solve the following quadratic equations.
a) x2−3 = 0
b) 2x2−9 = 0
Solution
a) Isolate the x2 : x2 = 3Take the square root of both sides : x =
√3 and x =−
√3
Answer: x≈ 1.73 and x≈−1.73
b) Isolate the x2 : 2x2 = 9 so x2 = 92
Take the square root of both sides : x =
√92
and x =−√
92
Answer: x≈ 2.12 and x≈−2.12
Example 7
Solve the following quadratic equations.
a) (2x+5)2 = 10
b) x2−2x+1 = 5
Solution
a)
Take the square root of both sides : 2x+5 =√
10 and 2x+5 =−√
10
Solve both equations : x =−5+
√10
2and x =
−5−√
102
Answer: x≈−0.92 and x≈−4.08
b)
Factor the right-hand-side : (x−1)2 = 5
Take the square root of both sides : x−1 =√
5 and x−1 =−√
5
Solve each equation : x = 1+√
5 and x = 1−√
5
Answer: x≈ 3.24 and x≈−1.24
Solve Real-World Problems Using Quadratic Functions and Square Roots
Quadratic equations are needed to solve many real-world problems. In this section, we’ll examine problems aboutobjects falling under the influence of gravity. When objects are dropped from a height, they have no initial velocity;the force that makes them move towards the ground is due to gravity. The acceleration of gravity on earth is givenby the equation
g =−9.8 m/s2 or g =−32 f t/s2
501

10.3. Quadratic Equations by Square Roots www.ck12.org
The negative sign indicates a downward direction. We can assume that gravity is constant for the problems we’ll beexamining, because we will be staying close to the surface of the earth. The acceleration of gravity decreases as anobject moves very far from the earth. It is also different on other celestial bodies such as the moon.
The equation that shows the height of an object in free fall is
y =12
gt2 + y0
The term y0 represents the initial height of the object, t is time, and g is the constant representing the force of gravity.You then plug in one of the two values for g above, depending on whether you want the answer in feet or meters.Thus the equation works out to y =−4.9t2 + y0 if you want the height in meters, and y =−16t2 + y0 if you want itin feet.
Example 8
How long does it take a ball to fall from a roof to the ground 25 feet below?
Solution
Since we are given the height in feet, use equation : y =−16t2 + y0
The initial height is y0 = 25 f eet, so : y =−16t2 +25
The height when the ball hits the ground is y = 0, so : 0 =−16t2 +25
Solve for t : 16t2 = 25
t2 =2516
t =54
or t =−54
Since only positive time makes sense in this case, it takes the ball 1.25 seconds to fall to the ground.
Example 9
A rock is dropped from the top of a cliff and strikes the ground 7.2 seconds later. How high is the cliff in meters?
Solution
Since we want the height in meters, use equation : y =−4.9t2 + y0
The time of flight is t = 7.2 seconds : y =−4.9(7.2)2 + y0
The height when the ball hits the ground is y = 0, so : 0 =−4.9(7.2)2 + y0
Simplify : 0 =−254+ y0 so y0 = 254
The cliff is 254 meters high.
Example 10
Victor throws an apple out of a window on the 10th floor which is 120 feet above ground. One second later Juanthrows an orange out of a 6th floor window which is 72 feet above the ground. Which fruit reaches the ground first,and how much faster does it get there?
Solution
Let’s find the time of flight for each piece of fruit.
502
www.ck12.org Chapter 10. Quadratic Equations and Quadratic Functions
Apple:
Since we have the height in feet, use this equation : y =−16t2 + y0
The initial height is y0 = 120 f eet : y =−16t2 +120
The height when the ball hits the ground is y = 0, so : 0 =−16t2 +120
Solve for t : 16t2 = 120
t2 =12016
= 7.5
t = 2.74 or t =−2.74 seconds
Orange:
The initial height is y0 = 72 f eet : 0 =−16t2 +72
Solve for t : 16t2 = 72
t2 =7216
= 4.5
t = 2.12 or t =−2.12 seconds
The orange was thrown one second later, so add 1 second to the time of the orange: t = 3.12 seconds
The apple hits the ground first. It gets there 0.38 seconds faster than the orange.
Review Questions
Solve the following quadratic equations.
1. x2−1 = 02. x2−100 = 03. x2 +16 = 04. 9x2−1 = 05. 4x2−49 = 06. 64x2−9 = 07. x2−81 = 08. 25x2−36 = 09. x2 +9 = 0
10. x2−16 = 011. x2−36 = 012. 16x2−49 = 013. (x−2)2 = 114. (x+5)2 = 1615. (2x−1)2−4 = 016. (3x+4)2 = 917. (x−3)2 +25 = 018. x2−6 = 019. x2−20 = 0
503

10.3. Quadratic Equations by Square Roots www.ck12.org
20. 3x2 +14 = 021. (x−6)2 = 522. (4x+1)2−8 = 023. x2−10x+25 = 924. x2 +18x+81 = 125. 4x2−12x+9 = 1626. (x+10)2 = 227. x2 +14x+49 = 328. 2(x+3)2 = 829. Susan drops her camera in the river from a bridge that is 400 feet high. How long is it before she hears the
splash?30. It takes a rock 5.3 seconds to splash in the water when it is dropped from the top of a cliff. How high is the
cliff in meters?31. Nisha drops a rock from the roof of a building 50 feet high. Ashaan drops a quarter from the top story window,
40 feet high, exactly half a second after Nisha drops the rock. Which hits the ground first?
504
www.ck12.org Chapter 10. Quadratic Equations and Quadratic Functions
10.4 Solving Quadratic Equations by Complet-ing the Square
Learning Objectives
• Complete the square of a quadratic expression.• Solve quadratic equations by completing the square.• Solve quadratic equations in standard form.• Graph quadratic equations in vertex form.• Solve real-world problems using functions by completing the square.
Introduction
You saw in the last section that if you have a quadratic equation of the form (x−2)2 = 5, you can easily solve it bytaking the square root of each side:
x−2 =√
5 and x−2 =−√
5
Simplify to get:
x = 2+√
5≈ 4.24 and x = 2−√
5≈−0.24
So what do you do with an equation that isn’t written in this nice form? In this section, you’ll learn how to rewriteany quadratic equation in this form by completing the square.
Complete the Square of a Quadratic Expression
Completing the square lets you rewrite a quadratic expression so that it contains a perfect square trinomial that youcan factor as the square of a binomial.
Remember that the square of a binomial takes one of the following forms:
(x+a)2 = x2 +2ax+a2
(x−a)2 = x2−2ax+a2
So in order to have a perfect square trinomial, we need two terms that are perfect squares and one term that is twicethe product of the square roots of the other terms.
Example 1
505

10.4. Solving Quadratic Equations by Completing the Square www.ck12.org
Complete the square for the quadratic expression x2 +4x.
Solution
To complete the square we need a constant term that turns the expression into a perfect square trinomial. Since themiddle term in a perfect square trinomial is always 2 times the product of the square roots of the other two terms,we re-write our expression as:
x2 +2(2)(x)
We see that the constant we are seeking must be 22:
x2 +2(2)(x)+22
Answer: By adding 4 to both sides, this can be factored as: (x+2)2
Notice, though, that we just changed the value of the whole expression by adding 4 to it. If it had been an equation,we would have needed to add 4 to the other side as well to make up for this.
Also, this was a relatively easy example because a, the coefficient of the x2 term, was 1. When that coefficientdoesn’t equal 1, we have to factor it out from the whole expression before completing the square.
Example 2
Complete the square for the quadratic expression 4x2 +32x.
Solution
Factor the coefficient of the x2 term : 4(x2 +8x)
Now complete the square of the expression in parentheses.
Re-write the expression : 4(x2 +2(4)(x))
We complete the square by adding the constant 42 : 4(x2 +2(4)(x)+42)
Factor the perfect square trinomial inside the parenthesis : 4(x+4)2 Answer
The expression “completing the square” comes from a geometric interpretation of this situation. Let’s revisit thequadratic expression in Example 1: x2 +4x.
We can think of this expression as the sum of three areas. The first term represents the area of a square of side x.The second expression represents the areas of two rectangles with a length of 2 and a width of x:
We can combine these shapes as follows:
506

www.ck12.org Chapter 10. Quadratic Equations and Quadratic Functions
We obtain a square that is not quite complete. To complete the square, we need to add a smaller square of side length2.
We end up with a square of side length (x+2); its area is therefore (x+2)2.
Solve Quadratic Equations by Completing the Square
Let’s demonstrate the method of completing the square with an example.
Example 3
Solve the following quadratic equation: 3x2−10x =−1
Solution
Divide all terms by the coefficient of the x2 term:
x2− 103
x =−13
Rewrite: x2−2(5
3
)(x) =−1
3
In order to have a perfect square trinomial on the right-hand-side we need to add the constant(5
3
)2. Add this constant
to both sides of the equation:
x2−2(
53
)(x)+
(53
)2
=−13+
(53
)2
Factor the perfect square trinomial and simplify:
507

10.4. Solving Quadratic Equations by Completing the Square www.ck12.org
(x− 5
3
)2
=−13+
259(
x− 53
)2
=229
Take the square root of both sides:
x− 53=
√229
and x− 53=−
√229
x =53+
√229≈ 3.23 and x =
53−√
229≈ 0.1
Answer: x = 3.23 and x = 0.1
If an equation is in standard form (ax2 +bx+ c = 0), we can still solve it by the method of completing the square.All we have to do is start by moving the constant term to the right-hand-side of the equation.
Example 4
Solve the following quadratic equation: x2 +15x+12 = 0
Solution
Move the constant to the other side of the equation:
x2 +15x =−12
Rewrite: x2 +2(15
2
)(x) =−12
Add the constant(15
2
)2to both sides of the equation:
x2 +2(
152
)(x)+
(152
)2
=−12+(
152
)2
Factor the perfect square trinomial and simplify:
(x+
152
)2
=−12+225
4(x+
152
)2
=1774
Take the square root of both sides:
x+152
=
√1774
and x+152
=−√
1774
x =−152+
√1774≈−0.85 and x =−15
2−√
1774≈−14.15
Answer: x =−0.85 and x =−14.15
508

www.ck12.org Chapter 10. Quadratic Equations and Quadratic Functions
Graph Quadratic Functions in Vertex Form
Probably one of the best applications of the method of completing the square is using it to rewrite a quadratic functionin vertex form. The vertex form of a quadratic function is
y− k = a(x−h)2
This form is very useful for graphing because it gives the vertex of the parabola explicitly. The vertex is at the point(h,k).
It is also simple to find the x−intercepts from the vertex form: just set y = 0 and take the square root of both sidesof the resulting equation.
To find the y−intercept, set x = 0 and simplify.
Example 5
Find the vertex, the x− intercepts and the y− intercept of the following parabolas:
a) y−2 = (x−1)2
b) y+8 = 2(x−3)2
Solution
a) y−2 = (x−1)2
Vertex: (1, 2)
To find the x−intercepts,
Set y = 0 : −2 = (x−1)2
Take the square root of both sides :√−2 = x−1 and −
√−2 = x−1
The solutions are not real so there are no x−intercepts.
To find the y−intercept,
Set x = 0 : y−2 = (−1)2
Simplify : y−2 = 1⇒ y = 3
b) y+8 = 2(x−3)2
Rewrite : y− (−8) = 2(x−3)2
Vertex : (3,−8)
To find the x−intercepts,
509

10.4. Solving Quadratic Equations by Completing the Square www.ck12.org
Set y = 0 : 8 = 2(x−3)2
Divide both sides by 2 : 4 = (x−3)2
Take the square root of both sides : 4 = x−3 and −4 = x−3
Simplify : x = 7 and x =−1
To find the y−intercept,
Set x = 0 : y+8 = 2(−3)2
Simplify : y+8 = 18⇒ y = 10
To graph a parabola, we only need to know the following information:
• the vertex• the x−intercepts• the y−intercept• whether the parabola turns up or down (remember that it turns up if a > 0 and down if a < 0)
Example 6
Graph the parabola given by the function y+1 = (x+3)2.
Solution
Rewrite : y− (−1) = (x− (−3))2
Vertex : (−3,−1) vertex : (−3,−1)
To find the x−intercepts,
Set y = 0 : 1 = (x+3)2
Take the square root of both sides : 1 = x+3 and −1 = x+3
Simplify : x =−2 and x =−4
x− intercepts : (−2,0) and (−4,0)
To find the y−intercept,
Set x = 0 : y+1 = (3)2
Simplify: y = 8 y− intercept : (0,8)
And since a > 0, the parabola turns up.
Graph all the points and connect them with a smooth curve:
510

www.ck12.org Chapter 10. Quadratic Equations and Quadratic Functions
Example 7
Graph the parabola given by the function y =−12(x−2)2.
Solution:
Rewrite y− (0) =−12(x−2)2
Vertex: (2,0) vertex:(2,0)
To find the x−intercepts,
Set y = 0 : 0 =−12(x−2)2
Multiply both sides by −2 : 0 = (x−2)2
Take the square root of both sides : 0 = x−2
Simplify : x = 2 x− intercept:(2,0)
Note: there is only one x−intercept, indicating that the vertex is located at this point, (2, 0).
To find the y−intercept,
Set x = 0 : y =−12(−2)2
Simplify: y =−12(4)⇒ y =−2 y− intercept:(0,−2)
Since a < 0, the parabola turns down.
Graph all the points and connect them with a smooth curve:
511

10.4. Solving Quadratic Equations by Completing the Square www.ck12.org
Solve Real-World Problems Using Quadratic Functions by Completing the Square
In the last section you learned that an object that is dropped falls under the influence of gravity. The equation for itsheight with respect to time is given by y = 1
2 gt2 + y0, where y0 represents the initial height of the object and g is thecoefficient of gravity on earth, which equals −9.8 m/s2 or −32 f t/s2.
On the other hand, if an object is thrown straight up or straight down in the air, it has an initial vertical velocity.This term is usually represented by the notation v0y. Its value is positive if the object is thrown up in the air and isnegative if the object is thrown down. The equation for the height of the object in this case is
y =12
gt2 + v0yt + y0
Plugging in the appropriate value for g turns this equation into
y =−4.9t2 + v0yt + y0 if you wish to have the height in meters
y =−16t2 + v0yt + y0 if you wish to have the height in feet
Example 8
An arrow is shot straight up from a height of 2 meters with a velocity of 50 m/s.
a) How high will the arrow be 4 seconds after being shot? After 8 seconds?
b) At what time will the arrow hit the ground again?
c) What is the maximum height that the arrow will reach and at what time will that happen?
Solution
Since we are given the velocity in m/s, use: y =−4.9t2 + v0yt + y0
We know v0y = 50 m/s and y0 = 2 meters so: y =−4.9t2 +50t +2
a) To find how high the arrow will be 4 seconds after being shot we plug in t = 4:
512

www.ck12.org Chapter 10. Quadratic Equations and Quadratic Functions
y =−4.9(4)2 +50(4)+2
=−4.9(16)+200+2 = 123.6 f eet
we plug in t = 8:
y =−4.9(8)2 +50(8)+2
=−4.9(64)+400+2 = 88.4 f eet
b) The height of the ball arrow on the ground is y = 0, so: 0 =−4.9t2 +50t +2
Solve for t by completing the square:
−4.9t2 +50t =−2
−4.9(t2−10.2t) =−2
t2−10.2t = 0.41
t2−2(5.1)t +(5.1)2 = 0.41+(5.1)2
(t−5.1)2 = 26.43
t−5.1 = 5.14 and t−5.1 =−5.14
t = 10.2 sec and t =−0.04 sec
The arrow will hit the ground about 10.2 seconds after it is shot.
c) If we graph the height of the arrow with respect to time we would get an upside down parabola (a < 0). Themaximum height and the time when this occurs is really the vertex of this parabola: (t,h).
We re-write the equation in vertex form: y =−4.9t2 +50t +2
y−2 =−4.9t2 +50t
y−2 =−4.9(t2−10.2t)
Complete the square: y−2−4.9(5.1)2 =−4.9(t2−10.2t +(5.1)2)
y−129.45 =−4.9(t−5.1)2
The vertex is at (5.1, 129.45). In other words, when t = 5.1 seconds, the height is y = 129 meters.
Another type of application problem that can be solved using quadratic equations is one where two objects aremoving away from each other in perpendicular directions. Here is an example of this type of problem.
Example 9
Two cars leave an intersection. One car travels north; the other travels east. When the car traveling north had gone30 miles, the distance between the cars was 10 miles more than twice the distance traveled by the car heading east.Find the distance between the cars at that time.
Solution
Let x = the distance traveled by the car heading east
Then 2x+10 = the distance between the two cars
Let’s make a sketch:
513
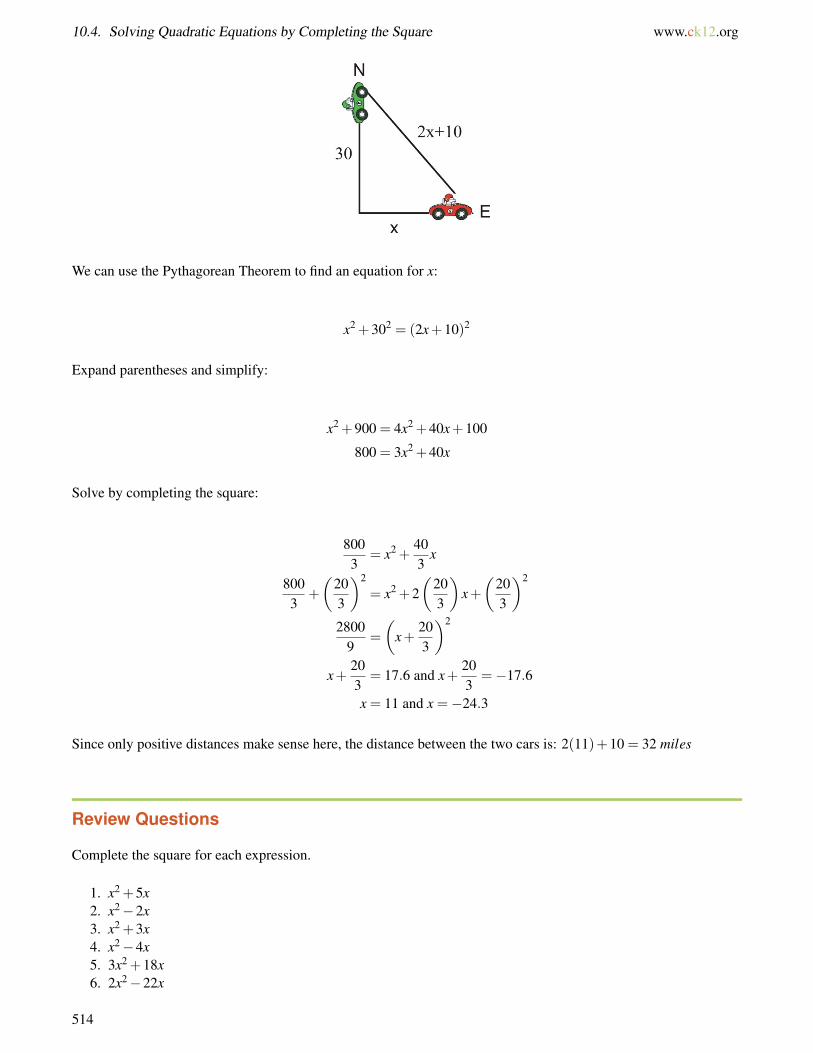
10.4. Solving Quadratic Equations by Completing the Square www.ck12.org
We can use the Pythagorean Theorem to find an equation for x:
x2 +302 = (2x+10)2
Expand parentheses and simplify:
x2 +900 = 4x2 +40x+100
800 = 3x2 +40x
Solve by completing the square:
8003
= x2 +403
x
8003
+
(203
)2
= x2 +2(
203
)x+(
203
)2
28009
=
(x+
203
)2
x+203
= 17.6 and x+203
=−17.6
x = 11 and x =−24.3
Since only positive distances make sense here, the distance between the two cars is: 2(11)+10 = 32 miles
Review Questions
Complete the square for each expression.
1. x2 +5x2. x2−2x3. x2 +3x4. x2−4x5. 3x2 +18x6. 2x2−22x
514

www.ck12.org Chapter 10. Quadratic Equations and Quadratic Functions
7. 8x2−10x8. 5x2 +12x
Solve each quadratic equation by completing the square.
9. x2−4x = 510. x2−5x = 1011. x2 +10x+15 = 012. x2 +15x+20 = 013. 2x2−18x = 314. 4x2 +5x =−115. 10x2−30x−8 = 016. 5x2 +15x−40 = 0
Rewrite each quadratic function in vertex form.
17. y = x2−6x18. y+1 =−2x2− x19. y = 9x2 +3x−1020. y =−32x2 +60x+10
For each parabola, find the vertex; the x− and y−intercepts; and if it turns up or down. Then graph the parabola.
21. y−4 = x2 +8x22. y =−4x2 +20x−2423. y = 3x2 +15x24. y+6 =−x2 + x25. Sam throws an egg straight down from a height of 25 feet. The initial velocity of the egg is 16 ft/sec. How
long does it take the egg to reach the ground?26. Amanda and Dolvin leave their house at the same time. Amanda walks south and Dolvin bikes east. Half an
hour later they are 5.5 miles away from each other and Dolvin has covered three miles more than the distancethat Amanda covered. How far did Amanda walk and how far did Dolvin bike?
515

10.5. Solving Quadratic Equations by the Quadratic Formula www.ck12.org
10.5 Solving Quadratic Equations by theQuadratic Formula
Learning Objectives
• Solve quadratic equations using the quadratic formula.• Identify and choose methods for solving quadratic equations.• Solve real-world problems using functions by completing the square.
Introduction
The Quadratic Formula is probably the most used method for solving quadratic equations. For a quadratic equationin standard form, ax2 +bx+ c = 0, the quadratic formula looks like this:
x =−b±
√b2−4ac
2a
This formula is derived by solving a general quadratic equation using the method of completing the square that youlearned in the previous section.
We start with a general quadratic equation: ax2 +bx+ c = 0
Subtract the constant term from both sides: ax2 +bx =−c
Divide by the coefficient of the x2 term: x2 +ba
x =− ca
Rewrite: x2 +2(
b2a
)x =− c
a
Add the constant(
b2a
)2
to both sides: x2 +2(
b2a
)x+(
b2a
)2
=− ca+
b2
4a2
Factor the perfect square trinomial:(
x+b2a
)2
=−4ac4a2 +
b2
4a2
Simplify:(
x+b2a
)2
=b2−4ac
4a2
Take the square root of both sides: x+b
2a=
√b2−4ac
4a2 and x+b2a
=−√
b2−4ac4a2
Simplify: x+b
2a=
√b2−4ac
2aand x+
b2a
=−√
b2−4ac2a
x =− b2a
+
√b2−4ac
2aand x =− b
2a−√
b2−4ac2a
x =−b+
√b2−4ac
2aand x =
−b−√
b2−4ac2a
516
www.ck12.org Chapter 10. Quadratic Equations and Quadratic Functions
This can be written more compactly as x = −b±√
b2−4ac2a .
You can see that the familiar formula comes directly from applying the method of completing the square. Applyingthe method of completing the square to solve quadratic equations can be tedious, so the quadratic formula is a morestraightforward way of finding the solutions.
Solve Quadratic Equations Using the Quadratic Formula
To use the quadratic formula, just plug in the values of a,b, and c.
Example 1
Solve the following quadratic equations using the quadratic formula.
a) 2x2 +3x+1 = 0
b) x2−6x+5 = 0
c) −4x2 + x+1 = 0
Solution
Start with the quadratic formula and plug in the values of a,b and c.
a)
Quadratic formula: x =−b±
√b2−4ac
2a
Plug in the values a = 2, b = 3, c = 1 x =−3±
√(3)2−4(2)(1)2(2)
Simplify: x =−3±
√9−8
4=−3±
√1
4
Separate the two options: x =−3+1
4and x =
−3−14
Solve: x =−24
=−12
and x =−44
=−1
Answer: x =−12 and x =−1
b)
Quadratic formula: x =−b±
√b2−4ac
2a
Plug in the values a = 1, b =−6, c = 5 x =−(−6)±
√(−6)2−4(1)(5)2(1)
Simplify: x =6±√
36−202
=6±√
162
Separate the two options: x =6+4
2and x =
6−42
Solve: x =102
= 5 and x =22= 1
Answer: x = 5 and x = 1
517

10.5. Solving Quadratic Equations by the Quadratic Formula www.ck12.org
c)
Quadratic formula: x =−b±
√b2−4ac
2a
Plug in the values a =−4, b = 1, c = 1 x =−1±
√(1)2−4(−4)(1)2(−4)
Simplify: x =−1±
√1+16
−8=−1±
√17
−8
Separate the two options: x =−1+
√17
−8and x =
−1−√
17−8
Solve: x =−.39 and x = .64
Answer: x =−.39 and x = .64
Often when we plug the values of the coefficients into the quadratic formula, we end up with a negative numberinside the square root. Since the square root of a negative number does not give real answers, we say that the equationhas no real solutions. In more advanced math classes, you’ll learn how to work with “complex” (or “imaginary”)solutions to quadratic equations.
Example 2
Use the quadratic formula to solve the equation x2 +2x+7 = 0.
Solution
Quadratic formula: x =−b±
√b2−4ac
2a
Plug in the values a = 1, b = 2, c = 7 x =−2±
√(2)2−4(1)(7)2(1)
Simplify: x =−2±
√4−28
2=−2±
√−24
2
Answer: There are no real solutions.
To apply the quadratic formula, we must make sure that the equation is written in standard form. For some problems,that means we have to start by rewriting the equation.
Example 3
Solve the following equations using the quadratic formula.
a) x2−6x = 10
b) −8x2 = 5x+6
Solution
518

www.ck12.org Chapter 10. Quadratic Equations and Quadratic Functions
a)
Re-write the equation in standard form: x2−6x−10 = 0
Quadratic formula: x =−b±
√b2−4ac
2a
Plug in the values a = 1, b =−6, c =−10 x =−(−6)±
√(−6)2−4(1)(−10)
2(1)
Simplify: x =6±√
36+402
=6±√
762
Separate the two options: x =6+√
762
and x =6−√
762
Solve: x = 7.36 and x =−1.36
Answer: x = 7.36 and x =−1.36
b)
Re-write the equation in standard form: 8x2 +5x+6 = 0
Quadratic formula: x =−b±
√b2−4ac
2a
Plug in the values a = 8, b = 5, c = 6 x =−5±
√(5)2−4(8)(6)2(8)
Simplify: x =−5±
√25−192
16=−5±
√−167
16
Answer: no real solutions
For more examples of solving quadratic equations using the quadratic formula, see the Khan Academy video at
MEDIAClick image to the left for more content.
. This video isn’t necessarily different from the examples above, but it does help reinforce the procedure of usingthe quadratic formula to solve equations.
Finding the Vertex of a Parabola with the Quadratic Formula
Sometimes a formula gives you even more information than you were looking for. For example, the quadraticformula also gives us an easy way to locate the vertex of a parabola.
Remember that the quadratic formula tells us the roots or solutions of the equation ax2 + bx+ c = 0. Those roots
are x = −b±√
b2−4ac2a , and we can rewrite that as x = −b
2a ±√
b2−4ac2a
Recall that the roots are symmetric about the vertex. In the form above, we can see that the roots of a quadratic
equation are symmetric around the x−coordinate −b2a , because they are
√b2−4ac
2a units to the left and right (recall
519

10.5. Solving Quadratic Equations by the Quadratic Formula www.ck12.org
the ± sign) from the vertical line x = −b2a . For example, in the equation x2−2x−3 = 0, the roots -1 and 3 are both 2
units from the vertical line x = 1, as you can see in the graph below:
Identify and Choose Methods for Solving Quadratic Equations.
In mathematics, you’ll need to solve quadratic equations that describe application problems or that are part of morecomplicated problems. You’ve learned four ways of solving a quadratic equation:
• Factoring• Taking the square root• Completing the square• Quadratic formula
Usually you’ll have to decide for yourself which method to use. However, here are some guidelines as to whichmethods are better in different situations.
Factoring is always best if the quadratic expression is easily factorable. It is always worthwhile to check if you canfactor because this is the fastest method. Many expressions are not factorable so this method is not used very oftenin practice.
Taking the square root is best used when there is no x−term in the equation.
Completing the square can be used to solve any quadratic equation. This is usually not any better than using thequadratic formula (in terms of difficult computations), but it is very useful if you need to rewrite a quadratic functionin vertex form. It’s also used to rewrite the equations of circles, ellipses and hyperbolas in standard form (somethingyou’ll do in algebra II, trigonometry, physics, calculus, and beyond).
Quadratic formula is the method that is used most often for solving a quadratic equation. When solving directlyby taking square root and factoring does not work, this is the method that most people prefer to use.
If you are using factoring or the quadratic formula, make sure that the equation is in standard form.
Example 4
Solve each quadratic equation.
a) x2−4x−5 = 0
b) x2 = 8
520
www.ck12.org Chapter 10. Quadratic Equations and Quadratic Functions
c) −4x2 + x = 2
d) 25x2−9 = 0
e) 3x2 = 8x
Solution
a) This expression if easily factorable so we can factor and apply the zero-product property:
Factor: (x−5)(x+1) = 0
Apply zero-product property: x−5 = 0 and x+1 = 0
Solve: x = 5 and x =−1
Answer: x = 5 and x =−1
b) Since the expression is missing the x term we can take the square root:
Take the square root of both sides: x =√
8 and x =−√
8
Answer: x = 2.83 and x =−2.83
c) Re-write the equation in standard form: −4x2 + x−2 = 0
It is not apparent right away if the expression is factorable so we will use the quadratic formula:
Quadratic formula: x =−b±
√b2−4ac
2a
Plug in the values a =−4, b = 1, c =−2 : x =−1±
√12−4(−4)(−2)2(−4)
Simplify: x =−1±
√1−32
−8=−1±
√−31
−8
Answer: no real solution
d) This problem can be solved easily either with factoring or taking the square root. Let’s take the square root in thiscase:
Add 9 to both sides of the equation: 25x2 = 9
Divide both sides by 25 : x2 =925
Take the square root of both sides: x =
√925
and x =−√
925
Simplify: x =35
and x =−35
Answer: x = 35 and x =−3
5
e)
Re-write the equation in standard form: 3x2−8x = 0
Factor out common x term: x(3x−8) = 0
Set both terms to zero: x = 0 and 3x = 8
Solve: x = 0 and x =83= 2.67
521
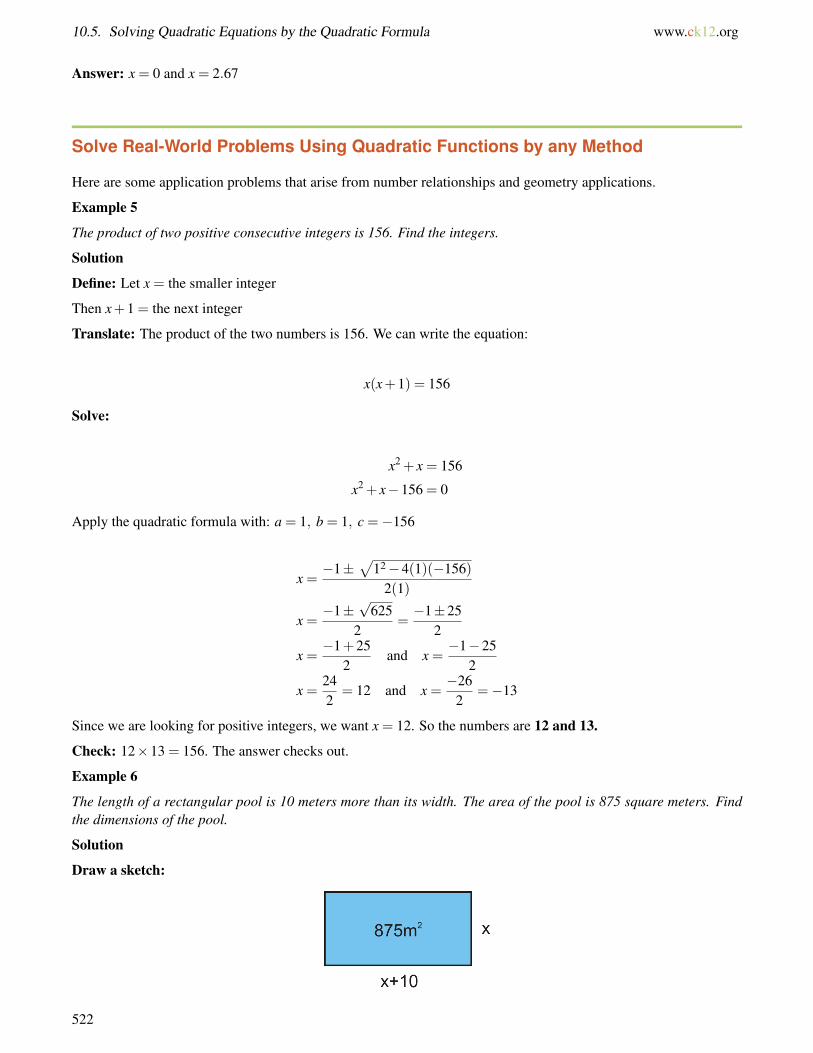
10.5. Solving Quadratic Equations by the Quadratic Formula www.ck12.org
Answer: x = 0 and x = 2.67
Solve Real-World Problems Using Quadratic Functions by any Method
Here are some application problems that arise from number relationships and geometry applications.
Example 5
The product of two positive consecutive integers is 156. Find the integers.
Solution
Define: Let x = the smaller integer
Then x+1 = the next integer
Translate: The product of the two numbers is 156. We can write the equation:
x(x+1) = 156
Solve:
x2 + x = 156
x2 + x−156 = 0
Apply the quadratic formula with: a = 1, b = 1, c =−156
x =−1±
√12−4(1)(−156)
2(1)
x =−1±
√625
2=−1±25
2
x =−1+25
2and x =
−1−252
x =242
= 12 and x =−26
2=−13
Since we are looking for positive integers, we want x = 12. So the numbers are 12 and 13.
Check: 12×13 = 156. The answer checks out.
Example 6
The length of a rectangular pool is 10 meters more than its width. The area of the pool is 875 square meters. Findthe dimensions of the pool.
Solution
Draw a sketch:
522

www.ck12.org Chapter 10. Quadratic Equations and Quadratic Functions
Define: Let x = the width of the pool
Then x+10 = the length of the pool
Translate: The area of a rectangle is A = length×width, so we have x(x+10) = 875.
Solve:
x2 +10x = 875
x2 +10x−875 = 0
Apply the quadratic formula with a = 1, b = 10 and c =−875
x =−10±
√(10)2−4(1)(−875)
2(1)
x =−10±
√100+35002
x =−10±
√3600
2=−10±60
2
x =−10+60
2and x =
−10−602
x =502
= 25 and x =−70
2=−35
Since the dimensions of the pool should be positive, we want x = 25 meters. So the pool is 25 meters×35 meters.
Check: 25×35 = 875 m2. The answer checks out.
Example 7
Suzie wants to build a garden that has three separate rectangular sections. She wants to fence around the wholegarden and between each section as shown. The plot is twice as long as it is wide and the total area is 200 f t2. Howmuch fencing does Suzie need?
Solution
Define: Let x = the width of the plot
Then 2x = the length of the plot
Translate: area of a rectangle is A = length×width, so
x(2x) = 200
Solve: 2x2 = 200
Solve by taking the square root:
x2 = 100
x =√
100 and x =−√
100
x = 10 and x =−10
523
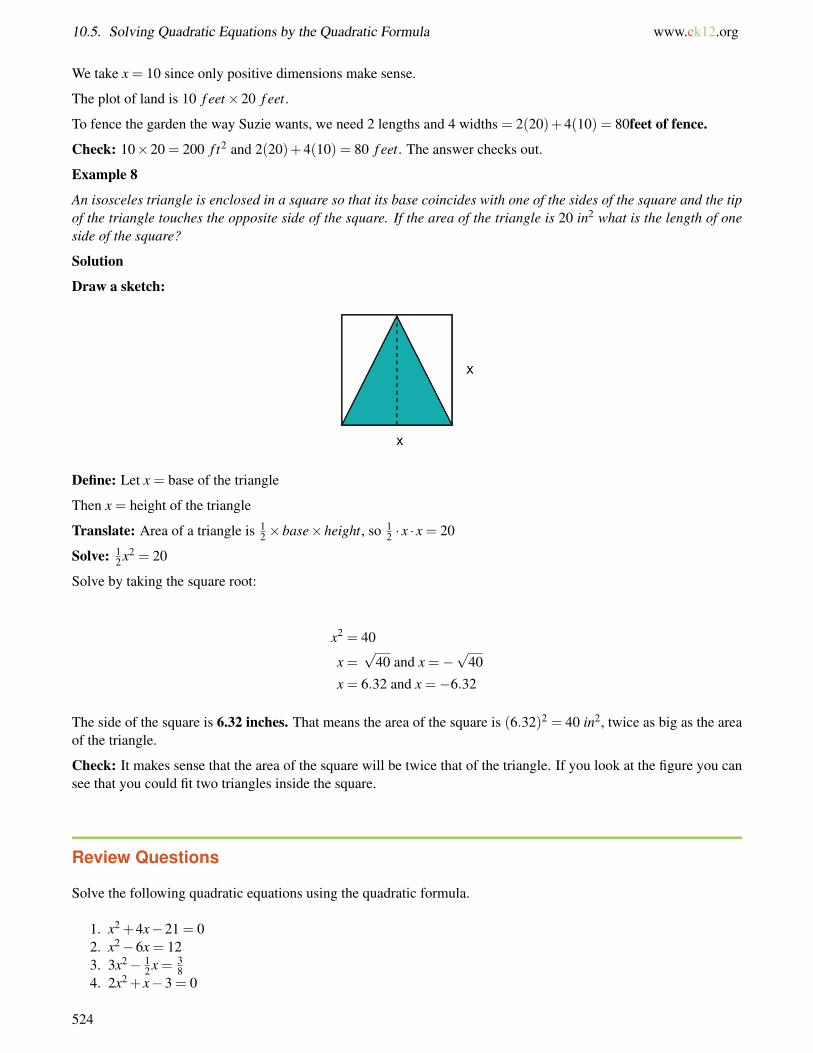
10.5. Solving Quadratic Equations by the Quadratic Formula www.ck12.org
We take x = 10 since only positive dimensions make sense.
The plot of land is 10 f eet×20 f eet.
To fence the garden the way Suzie wants, we need 2 lengths and 4 widths = 2(20)+4(10) = 80feet of fence.
Check: 10×20 = 200 f t2 and 2(20)+4(10) = 80 f eet. The answer checks out.
Example 8
An isosceles triangle is enclosed in a square so that its base coincides with one of the sides of the square and the tipof the triangle touches the opposite side of the square. If the area of the triangle is 20 in2 what is the length of oneside of the square?
Solution
Draw a sketch:
Define: Let x = base of the triangle
Then x = height of the triangle
Translate: Area of a triangle is 12 ×base×height, so 1
2 · x · x = 20
Solve: 12 x2 = 20
Solve by taking the square root:
x2 = 40
x =√
40 and x =−√
40
x = 6.32 and x =−6.32
The side of the square is 6.32 inches. That means the area of the square is (6.32)2 = 40 in2, twice as big as the areaof the triangle.
Check: It makes sense that the area of the square will be twice that of the triangle. If you look at the figure you cansee that you could fit two triangles inside the square.
Review Questions
Solve the following quadratic equations using the quadratic formula.
1. x2 +4x−21 = 02. x2−6x = 123. 3x2− 1
2 x = 38
4. 2x2 + x−3 = 0
524

www.ck12.org Chapter 10. Quadratic Equations and Quadratic Functions
5. −x2−7x+12 = 06. −3x2 +5x = 27. 4x2 = x8. x2 +2x+6 = 0
Solve the following quadratic equations using the method of your choice.
9. x2− x = 610. x2−12 = 011. −2x2 +5x−3 = 012. x2 +7x−18 = 013. 3x2 +6x =−1014. −4x2 +4000x = 015. −3x2 +12x+1 = 016. x2 +6x+9 = 017. 81x2 +1 = 018. −4x2 +4x = 919. 36x2−21 = 020. x2−2x−3 = 021. The product of two consecutive integers is 72. Find the two numbers.22. The product of two consecutive odd integers is 1 less than 3 times their sum. Find the integers.23. The length of a rectangle exceeds its width by 3 inches. The area of the rectangle is 70 square inches, find its
dimensions.24. Angel wants to cut off a square piece from the corner of a rectangular piece of plywood. The larger piece of
wood is 4 f eet×8 f eet and the cut off part is 13 of the total area of the plywood sheet. What is the length of
the side of the square?25. Mike wants to fence three sides of a rectangular patio that is adjacent the back of his house. The area of the
patio is 192 f t2 and the length is 4 feet longer than the width.
Find how much fencing Mike will need.
525

10.6. The Discriminant www.ck12.org
10.6 The Discriminant
Learning Objectives
• Find the discriminant of a quadratic equation.• Interpret the discriminant of a quadratic equation.• Solve real-world problems using quadratic functions and interpreting the discriminant.
Introduction
In the quadratic formula, x = −b±√
b2−4ac2a , the expression inside the square root is called the discriminant. The
discriminant can be used to analyze the types of solutions to a quadratic equation without actually solving theequation. Here’s how:
• If b2−4ac > 0, the equation has two separate real solutions.• If b2−4ac < 0, the equation has only non-real solutions.• If b2−4ac = 0, the equation has one real solution, a double root.
Find the Discriminant of a Quadratic Equation
To find the discriminant of a quadratic equation we calculate D = b2−4ac.
Example 1
Find the discriminant of each quadratic equation. Then tell how many solutions there will be to the quadraticequation without solving.
a) x2−5x+3 = 0
b) 4x2−4x+1 = 0
c) −2x2 + x = 4
Solution
a) Plug a = 1, b = −5 and c = 3 into the discriminant formula: D = (−5)2−4(1)(3) = 13D > 0, so there are tworeal solutions.
b) Plug a = 4, b =−4 and c = 1 into the discriminant formula: D = (−4)2−4(4)(1) = 0D = 0, so there is one realsolution.
c) Rewrite the equation in standard form: −2x2 + x−4 = 0
Plug a =−2, b = 1 and c =−4 into the discriminant formula: D = (1)2−4(−2)(−4) =−31D < 0, so there are noreal solutions.
526

www.ck12.org Chapter 10. Quadratic Equations and Quadratic Functions
Interpret the Discriminant of a Quadratic Equation
The sign of the discriminant tells us the nature of the solutions (or roots) of a quadratic equation. We can obtain twodistinct real solutions if D > 0, two non-real solutions if D < 0 or one solution (called a double root) if D = 0. Recallthat the number of solutions of a quadratic equation tells us how many times its graph crosses the x−axis. If D > 0,the graph crosses the x−axis in two places; if D = 0 it crosses in one place; if D < 0 it doesn’t cross at all:
Example 2
Determine the nature of the solutions of each quadratic equation.
a) 4x2−1 = 0
b) 10x2−3x =−4
c) x2−10x+25 = 0
Solution
Use the value of the discriminant to determine the nature of the solutions to the quadratic equation.
a) Plug a = 4, b = 0 and c =−1 into the discriminant formula: D = (0)2−4(4)(−1) = 16
The discriminant is positive, so the equation has two distinct real solutions.
The solutions to the equation are: 0±√
168 =±4
8 =±12
b) Re-write the equation in standard form: 10x2−3x+4 = 0
Plug a = 10, b =−3 and c = 4 into the discriminant formula: D = (−3)2−4(10)(4) =−151
The discriminant is negative, so the equation has two non-real solutions.
c) Plug a = 1, b =−10 and c = 25 into the discriminant formula: D = (−10)2−4(1)(25) = 0
The discriminant is 0, so the equation has a double root.
The solution to the equation is: 10±√
02 = 10
2 = 5
If the discriminant is a perfect square, then the solutions to the equation are not only real, but also rational. If thediscriminant is positive but not a perfect square, then the solutions to the equation are real but irrational.
Example 3
Determine the nature of the solutions to each quadratic equation.
a) 2x2 + x−3 = 0
b) 5x2− x−1 = 0
Solution
Use the discriminant to determine the nature of the solutions.
527

10.6. The Discriminant www.ck12.org
a) Plug a = 2, b = 1 and c =−3 into the discriminant formula: D = (1)2−4(2)(−3) = 25
The discriminant is a positive perfect square, so the solutions are two real rational numbers.
The solutions to the equation are: −1±√
254 = −1±5
4 , so x = 1 and x =−32 .
b) Plug a = 5, b =−1 and c =−1 into the discriminant formula: D = (−1)2−4(5)(−1) = 21
The discriminant is positive but not a perfect square, so the solutions are two real irrational numbers.
The solutions to the equation are: 1±√
2110 , so x≈ 0.56 and x≈−0.36.
Solve Real-World Problems Using Quadratic Functions and Interpreting the Dis-criminant
You’ve seen that calculating the discriminant shows what types of solutions a quadratic equation possesses. Knowingthe types of solutions is very useful in applied problems. Consider the following situation.
Example 4
Marcus kicks a football in order to score a field goal. The height of the ball is given by the equation y =− 326400 x2+x.
If the goalpost is 10 feet high, can Marcus kick the ball high enough to go over the goalpost? What is the farthestdistance that Marcus can kick the ball from and still make it over the goalpost?
Solution
Define: Let y = height of the ball in feet.
Let x = distance from the ball to the goalpost.
Translate: We want to know if it is possible for the height of the ball to equal 10 feet at some real distance from thegoalpost.
Solve:
Write the equation in standard form: − 326400
x2 + x−10 = 0
Simplify: −0.005x2 + x−10 = 0
Find the discriminant: D = (1)2−4(−0.005)(−10) = 0.8
Since the discriminant is positive, we know that it is possible for the ball to go over the goal post, if Marcus kicks itfrom an acceptable distance x from the goalpost.
To find the value of x that will work, we need to use the quadratic formula:
x =−1±
√0.8
−0.01= 189.4 f eet or 10.56 f eet
What does this answer mean? It means that if Marcus is exactly 189.4 feet or exactly 10.56 feet from the goalposts,the ball will just barely go over them. Are these the only distances that will work? No; those are just the distances atwhich the ball will be exactly 10 feet high, but between those two distances, the ball will go even higher than that.(It travels in a downward-opening parabola from the place where it is kicked to the spot where it hits the ground.)This means that Marcus will make the goal if he is anywhere between 10.56 and 189.4 feet from the goalposts.
Example 5
528

www.ck12.org Chapter 10. Quadratic Equations and Quadratic Functions
Emma and Bradon own a factory that produces bike helmets. Their accountant says that their profit per year is givenby the function P = −0.003x2 + 12x+ 27760, where x is the number of helmets produced. Their goal is to make aprofit of $40,000 this year. Is this possible?
Solution
We want to know if it is possible for the profit to equal $40,000.
40000 =−0.003x2 +12x+27760
Write the equation in standard form: −0.003x2 +12x−12240 = 0
Find the discriminant: D = (12)2−4(−0.003)(−12240) =−2.88
Since the discriminant is negative, we know that it is not possible for Emma and Bradon to make a profit of $40,000this year no matter how many helmets they make.
Review Questions
Find the discriminant of each quadratic equation.
1. 2x2−4x+5 = 02. x2−5x = 83. 4x2−12x+9 = 04. x2 +3x+2 = 05. x2−16x = 326. −5x2 +5x−6 = 07. x2 +4x = 28. −3x2 +2x+5 = 0
Determine the nature of the solutions of each quadratic equation.
9. −x2 +3x−6 = 010. 5x2 = 6x11. 41x2−31x−52 = 012. x2−8x+16 = 013. −x2 +3x−10 = 014. x2−64 = 015. 3x2 = 716. x2 +30+225 = 0
Without solving the equation, determine whether the solutions will be rational or irrational.
17. x2 =−4x+2018. x2 +2x−3 = 019. 3x2−11x = 1020. 1
2 x2 +2x+ 23 = 0
21. x2−10x+25 = 022. x2 = 5x23. 2x2−5x = 12
529

10.6. The Discriminant www.ck12.org
24. Marty is outside his apartment building. He needs to give his roommate Yolanda her cell phone but he doesnot have time to run upstairs to the third floor to give it to her. He throws it straight up with a verticalvelocity of 55 feet/second. Will the phone reach her if she is 36 feet up? (Hint: the equation for the height isy =−32t2 +55t +4.)
25. Bryson owns a business that manufactures and sells tires. The revenue from selling the tires in the month ofJuly is given by the function R = x(200− 0.4x) where x is the number of tires sold. Can Bryson’s businessgenerate revenue of $20,000 in the month of July?
530

www.ck12.org Chapter 10. Quadratic Equations and Quadratic Functions
10.7 Linear, Exponential and Quadratic Models
Learning Objectives
• Identify functions using differences and ratios.• Write equations for functions.• Perform exponential and quadratic regressions with a graphing calculator.• Solve real-world problems by comparing function models.
Introduction
In this course we’ve learned about three types of functions, linear, quadratic and exponential.
• Linear functions take the form y = mx+b.• Quadratic functions take the form y = ax2 +bx+ c.• Exponential functions take the form y = a ·bx.
In real-world applications, the function that describes some physical situation is not given; it has to be found beforethe problem can be solved. For example, scientific data such as observations of planetary motion are often collectedas a set of measurements given in a table. Part of the scientist’s job is to figure out which function best fits the data.In this section, you’ll learn some methods that are used to identify which function describes the relationship betweenthe variables in a problem.
Identify Functions Using Differences or Ratios
One method for identifying functions is to look at the difference or the ratio of different values of the dependentvariable. For example, if the difference between values of the dependent variable is the same each time wechange the independent variable by the same amount, then the function is linear.
Example 1
Determine if the function represented by the following table of values is linear.
TABLE 10.14:
x y−2 –4–1 –10 21 52 8
531

10.7. Linear, Exponential and Quadratic Models www.ck12.org
If we take the difference between consecutive y−values, we see that each time the x−value increases by one, they−value always increases by 3.
Since the difference is always the same, the function is linear.
When we look at the difference of the y−values, we have to make sure that we examine entries for which thex−values increase by the same amount.
For example, examine the values in this table:
TABLE 10.15:
x y0 51 103 204 256 35
At first glance this function might not look linear, because the difference in the y−values is not always the same. Butif we look closer, we can see that when the y−value increases by 10 instead of 5, it’s because the x−value increasedby 2 instead of 1. Whenever the x−value increases by the same amount, the y−value does too, so the function islinear.
Another way to think of this is in mathematical notation. We can say that a function is linear if y2−y1x2−x1
is always thesame for any two pairs of x− and y−values. Notice that the expression we used here is simply the definition of theslope of a line.
Differences can also be used to identify quadratic functions. For a quadratic function, when we increase thex−values by the same amount, the difference between y−values will not be the same. However, the differenceof the differences of the y−values will be the same.
Here are some examples of quadratic relationships represented by tables of values:
In this quadratic function, y = x2, when we increase the x−value by one, the value of y increases by different values.However, it increases at a constant rate, so the difference of the difference is always 2.
532

www.ck12.org Chapter 10. Quadratic Equations and Quadratic Functions
In this quadratic function, y = 2x2− 3x+ 1, when we increase the x−value by one, the value of y increases bydifferent values. However, the increase is constant: the difference of the difference is always 4.
To identify exponential functions, we use ratios instead of differences. If the ratio between values of the dependentvariable is the same each time we change the independent variable by the same amount, then the function isexponential.
Example 2
Determine if the function represented by each table of values is exponential.
a)
b)
533

10.7. Linear, Exponential and Quadratic Models www.ck12.org
a) If we take the ratio of consecutive y−values, we see that each time the x−value increases by one, the y−value ismultiplied by 3. Since the ratio is always the same, the function is exponential.
b) If we take the ratio of consecutive y−values, we see that each time the x−value increases by one, the y−value ismultiplied by 1
2 . Since the ratio is always the same, the function is exponential.
Write Equations for Functions
Once we identify which type of function fits the given values, we can write an equation for the function by startingwith the general form for that type of function.
Example 3
Determine what type of function represents the values in the following table.
TABLE 10.16:
x y0 51 12 -33 -74 -11
Solution
Let’s first check the difference of consecutive values of y.
534

www.ck12.org Chapter 10. Quadratic Equations and Quadratic Functions
If we take the difference between consecutive y−values, we see that each time the x−value increases by one, they−value always decreases by 4. Since the difference is always the same, the function is linear.
To find the equation for the function, we start with the general form of a linear function: y = mx+b. Since m is theslope of the line, it’s also the quantity by which y increases every time the value of x increases by one. The constantb is the value of the function when x = 0. Therefore, the function is y =−4x+5.
Example 4
Determine what type of function represents the values in the following table.
TABLE 10.17:
x y0 01 52 203 454 805 1256 180
Solution
Here, the difference between consecutive y−values isn’t constant, so the function is not linear. Let’s look at thosedifferences more closely.
TABLE 10.18:
x y0 01 5 5−0 = 52 20 20−5 = 153 45 45−20 = 254 80 80−45 = 355 125 125−80 = 456 180 180−125 = 55
535

10.7. Linear, Exponential and Quadratic Models www.ck12.org
When the x−value increases by one, the difference between the y−values increases by 10 every time. Since thedifference of the differences is constant, the function describing this set of values is quadratic.
To find the equation for the function that represents these values, we start with the general form of a quadraticfunction: y = ax2 +bx+ c.
We need to use the values in the table to find the values of the constants: a,b and c.
The value of c represents the value of the function when x = 0, so c = 0.
Plug in the point (1,5) : 5 = a+b
Plug in the point (2,20) : 20 = 4a+2b⇒ 10 = 2a+b
To find a and b,we solve the system of equations: 5 = a+b
10 = 2a+b
Solve the first equation for b : 5 = a+b⇒ b = 5−a
Plug the first equation into the second: 10 = 2a+5−a
Solve for a and b a = 5 and b = 0
Therefore the equation of the quadratic function is y = 5x2.
Example 5
Determine what type of function represents the values in the following table.
TABLE 10.19:
x y0 4001 5002 253 6.254 1.5625
Solution
The differences between consecutive y−values aren’t the same, and the differences between those differences aren’tthe same either. So let’s check the ratios instead.
536

www.ck12.org Chapter 10. Quadratic Equations and Quadratic Functions
Each time the x−value increases by one, the y−value is multiplied by 14 . Since the ratio is always the same, the
function is exponential.
To find the equation for the function that represents these values, we start with the general form of an exponentialfunction, y = a ·bx.
Here b is the ratio between the values of y each time x is increased by one. The constant a is the value of the functionwhen x = 0. Therefore, the function is y = 400
(14
)x.
Perform Exponential and Quadratic Regressions with a Graphing Calculator
Earlier, you learned how to perform linear regression with a graphing calculator to find the equation of a straight linethat fits a linear data set. In this section, you’ll learn how to perform exponential and quadratic regression to findequations for curves that fit non-linear data sets.
Example 6
The following table shows how many miles per gallon a car gets at different speeds.
TABLE 10.20:
Speed (mph) Miles per gallon30 1835 2040 2345 2550 2855 3060 2965 2570 25
Using a graphing calculator:
a) Draw the scatterplot of the data.
b) Find the quadratic function of best fit.
c) Draw the quadratic function of best fit on the scatterplot.
d) Find the speed that maximizes the miles per gallon.
e) Predict the miles per gallon of the car if you drive at a speed of 48 mph.
Solution
Step 1: Input the data.
Press [STAT] and choose the [EDIT] option.
Input the values of x in the first column (L1) and the values of y in the second column (L2). (Note: in order to cleara list, move the cursor to the top so that L1 or L2 is highlighted. Then press [CLEAR] and then [ENTER].)
Step 2: Draw the scatterplot.
First press [Y=] and clear any function on the screen by pressing [CLEAR] when the old function is highlighted.
Press [STATPLOT] [STAT] and [Y=] and choose option 1.
537

10.7. Linear, Exponential and Quadratic Models www.ck12.org
Choose the ON option; after TYPE, choose the first graph type (scatterplot) and make sure that the Xlist and Ylistnames match the names on top of the columns in the input table.
Press [GRAPH] and make sure that the window is set so you see all the points in the scatterplot. In this case, thesettings should be 30≤ x≤ 80 and 0≤ y≤ 40. You can set the window size by pressing the [WINDOW] key at thetop.
Step 3: Perform quadratic regression.
Press [STAT] and use the right arrow to choose [CALC].
Choose Option 5 (QuadReg) and press [ENTER]. You will see “QuadReg” on the screen.
Type in L1,L2 after ’QuadReg’ and press [ENTER]. The calculator shows the quadratic function: y = −0.017x2 +1.9x−25
Step 4: Graph the function.
Press [Y=] and input the function you just found.
Press [GRAPH] and you will see the curve fit drawn over the data points.
To find the speed that maximizes the miles per gallon, use [TRACE] and move the cursor to the top of the parabola.You can also use [CALC] [2nd] [TRACE] and option 4:Maximum, for a more accurate answer. The speed thatmaximizes miles per gallon is 56 mph.
Finally, plug x = 48 into the equation you found: y =−0.017(48)2 +1.9(48)−25 = 27.032 miles per gallon.
Note: The image above shows our function plotted on the same graph as the data points from the table. One thingthat is clear from this graph is that predictions made with this function won’t make sense for all values of x. Forexample, if x < 15, this graph predicts that we will get negative mileage, which is impossible. Part of the skill ofusing regression on your calculator is being aware of the strengths and limitations of this method of fitting functionsto data.
Example 7
The following table shows the amount of money an investor has in an account each year for 10 years.
538

www.ck12.org Chapter 10. Quadratic Equations and Quadratic Functions
TABLE 10.21:
Year Value of account1996 $50001997 $54001998 $58001999 $63002000 $68002001 $73002002 $79002003 $86002004 $93002005 $100002006 $11000
Using a graphing calculator:
a) Draw a scatterplot of the value of the account as the dependent variable, and the number of years since 1996 asthe independent variable.
b) Find the exponential function that fits the data.
c) Draw the exponential function on the scatterplot.
d) What will be the value of the account in 2020?
Solution
Step 1: Input the data.
Press [STAT] and choose the [EDIT] option.
Input the values of x in the first column (L1) and the values of y in the second column (L2).
Step 2: Draw the scatterplot.
First press [Y=] and clear any function on the screen.
Press [GRAPH] and choose Option 1.
Choose the ON option and make sure that the Xlist and Ylist names match the names on top of the columns in theinput table.
Press [GRAPH] make sure that the window is set so you see all the points in the scatterplot. In this case the settingsshould be 0≤ x≤ 10 and 0≤ y≤ 11000.
Step 3: Perform exponential regression.
Press [STAT] and use the right arrow to choose [CALC].
Choose Option 0 and press [ENTER]. You will see “ExpReg” on the screen.
Press [ENTER]. The calculator shows the exponential function: y = 4975.7(1.08)x
Step 4: Graph the function.
Press [Y=] and input the function you just found. Press [GRAPH].
Finally, plug x = 2020−1996 = 24 into the function: y = 4975.7(1.08)24 = $31551.81
In 2020, the account will have a value of $31551.81.
Note: The function above is the curve that comes closest to all the data points. It won’t return y−values that areexactly the same as in the data table, but they will be close. It is actually more accurate to use the curve fit values
539

10.7. Linear, Exponential and Quadratic Models www.ck12.org
than the data points.
If you don’t have a graphing calculator, there are resources available on the Internet for finding lines and curvesof best fit. For example, the applet at http://science.kennesaw.edu/ plaval/applets/LRegression.html does linearregression on a set of data points; the one at http://science.kennesaw.edu/ plaval/applets/QRegression.html doesquadratic regression; and the one at http://science.kennesaw.edu/ plaval/applets/ERegression.html does exponentialregression. Also, programs like Microsoft Office or OpenOffice have the ability to create graphs and charts thatinclude lines and curves of best fit.
Solve Real-World Problems by Comparing Function Models
Example 8
The following table shows the number of students enrolled in public elementary schools in the US (source: USCensus Bureau). Make a scatterplot with the number of students as the dependent variable, and the number of yearssince 1990 as the independent variable. Find which curve fits this data the best and predict the school enrollment inthe year 2007.
TABLE 10.22:
Year Number of students (millions)1990 26.61991 26.61992 27.11993 27.71994 28.11995 28.41996 28.11997 29.11998 29.32003 32.5
Solution
We need to perform linear, quadratic and exponential regression on this data set to see which function represents thevalues in the table the best.
Step 1: Input the data.
Input the values of x in the first column (L1) and the values of y in the second column (L2).
Step 2: Draw the scatterplot.
Set the window size: 0≤ x≤ 10 and 20≤ y≤ 40.
Here is the scatterplot:
540

www.ck12.org Chapter 10. Quadratic Equations and Quadratic Functions
Step 3: Perform Regression.
Linear Regression
The function of the line of best fit is y = 0.51x+26.1. Here is the graph of the function on the scatterplot:
Quadratic Regression
The quadratic function of best fit is y = 0.064x2− .067x+26.84. Here is the graph of the function on the scatterplot:
541

10.7. Linear, Exponential and Quadratic Models www.ck12.org
Exponential Regression
The exponential function of best fit is y = 26.2(1.018)x. Here is the graph of the function on the scatterplot:
From the graphs, it looks like the quadratic function is the best fit for this data set. We’ll use this function to predictschool enrollment in 2007.
Plug in x = 2007−1990 = 17 : y = 0.064(17)2− .067(17)+26.84 = 44.2 million students.
542
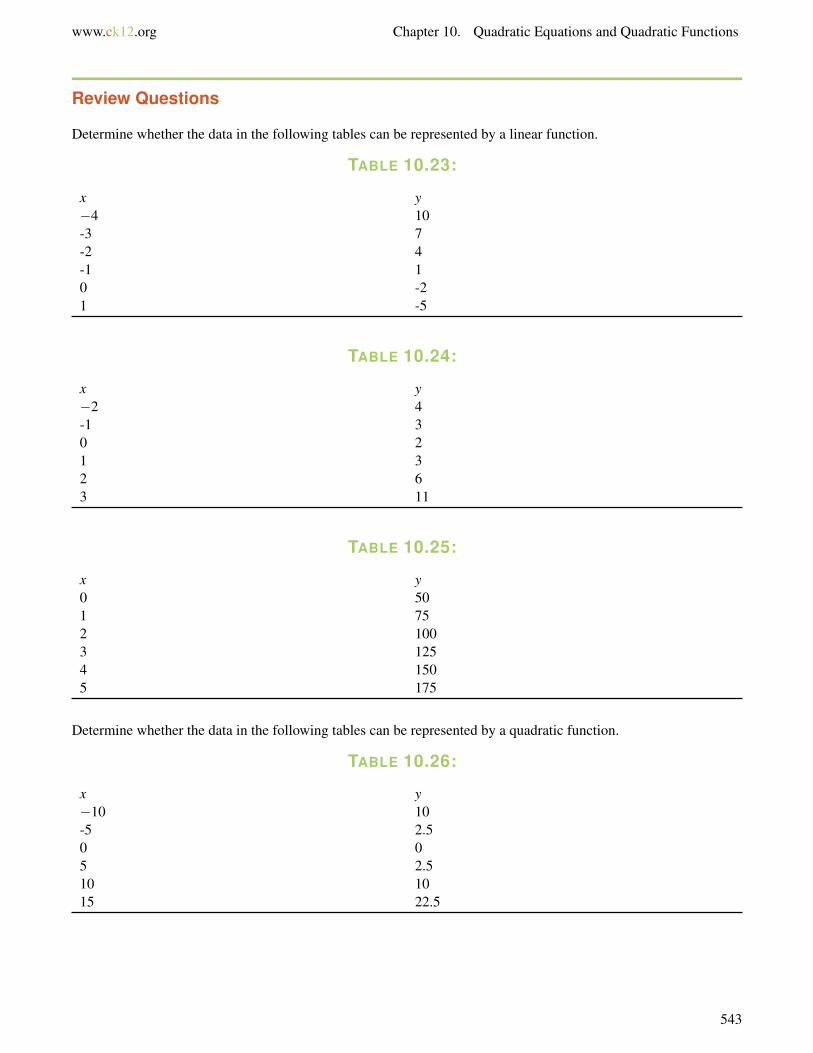
www.ck12.org Chapter 10. Quadratic Equations and Quadratic Functions
Review Questions
Determine whether the data in the following tables can be represented by a linear function.
TABLE 10.23:
x y−4 10-3 7-2 4-1 10 -21 -5
TABLE 10.24:
x y−2 4-1 30 21 32 63 11
TABLE 10.25:
x y0 501 752 1003 1254 1505 175
Determine whether the data in the following tables can be represented by a quadratic function.
TABLE 10.26:
x y−10 10-5 2.50 05 2.510 1015 22.5
543

10.7. Linear, Exponential and Quadratic Models www.ck12.org
TABLE 10.27:
x y1 42 63 64 45 06 -6
TABLE 10.28:
x y−3 -27-2 -8-1 -10 01 12 83 27
Determine whether the data in the following tables can be represented by an exponential function.
TABLE 10.29:
x y0 2001 3002 18003 83004 258005 62700
TABLE 10.30:
x y0 1201 1802 2703 4054 607.55 911.25
TABLE 10.31:
x y0 40001 24002 14403 864
544

www.ck12.org Chapter 10. Quadratic Equations and Quadratic Functions
TABLE 10.31: (continued)
x y4 518.45 311.04
Determine what type of function represents the values in the following tables and find the equation of each function.
TABLE 10.32:
x y0 4001 5002 6253 781.254 976.5625
TABLE 10.33:
x y−9 -3-7 -2-5 -1-3 0-1 11 2
TABLE 10.34:
x y−3 14-2 4-1 -20 -41 -22 43 14
13. As a ball bounces up and down, the maximum height that the ball reaches continually decreases from onebounce to the next. For a given bounce, this table shows the height of the ball with respect to time:
TABLE 10.35:
Time (seconds) Height (inches)2 22.2 162.4 242.6 332.8 383.0 42
545

10.7. Linear, Exponential and Quadratic Models www.ck12.org
TABLE 10.35: (continued)
Time (seconds) Height (inches)3.2 363.4 303.6 283.8 144.0 6
Using a graphing calculator:
a) Draw the scatterplot of the data
b) Find the quadratic function of best fit
c) Draw the quadratic function of best fit on the scatterplot
d) Find the maximum height the ball reaches on the bounce
e) Predict how high the ball is at time t = 2.5 seconds
14. A chemist has a 250 gram sample of a radioactive material. She records the amount of radioactive materialremaining in the sample every day for a week and obtains the data in the following table:
TABLE 10.36:
Day Weight (grams)0 2501 2082 1583 1304 1025 806 657 50
Using a graphing calculator:
a) Draw a scatterplot of the data
b) Find the exponential function of best fit
c) Draw the exponential function of best fit on the scatterplot
d) Predict the amount of material after 10 days.
15. The following table shows the rate of pregnancies (per 1000) for US women aged 15 to 19. (source: USCensus Bureau).
a. Make a scatterplot with the rate of pregnancies as the dependent variable and the number of years since1990 as the independent variable.
b. Find which type of curve fits this data best.c. Predict the rate of teen pregnancies in the year 2010.
546

www.ck12.org Chapter 10. Quadratic Equations and Quadratic Functions
TABLE 10.37:
Year Rate of pregnancy (per 1000)1990 116.91991 115.31992 111.01993 108.01994 104.61995 99.61996 95.61997 91.41998 88.71999 85.72000 83.62001 79.52002 75.4
547

www.ck12.org
CHAPTER 11 Algebra and GeometryConnections
Chapter Outline11.1 GRAPHS OF SQUARE ROOT FUNCTIONS
11.2 RADICAL EXPRESSIONS
11.3 RADICAL EQUATIONS
11.4 THE PYTHAGOREAN THEOREM AND ITS CONVERSE
11.5 DISTANCE AND MIDPOINT FORMULAS
548

www.ck12.org Chapter 11. Algebra and Geometry Connections
11.1 Graphs of Square Root Functions
Learning Objectives
• Graph and compare square root functions.• Shift graphs of square root functions.• Graph square root functions using a graphing calculator.• Solve real-world problems using square root functions.
Introduction
In this chapter you’ll learn about a different kind of function called the square root function. You’ve seen that takingthe square root is very useful in solving quadratic equations. For example, to solve the equation x2 = 25 we take thesquare root of both sides:
√x2 =±
√25, so x =±5.
A square root function is any function with the form: y = a√
f (x)+ c —in other words, any function where anexpression in terms of x is found inside a square root sign (also called a “radical” sign), although other terms maybe included as well.
Graph and Compare Square Root Functions
When working with square root functions, you’ll have to consider the domain of the function before graphing.The domain is very important because the function is undefined when the expression inside the square root sign isnegative, and as a result there will be no graph in whatever region of x−values makes that true.
To discover how the graphs of square root functions behave, let’s make a table of values and plot the points.
Example 1
Graph the function y =√
x.
Solution
Before we make a table of values, we need to find the domain of this square root function. The domain is found byrealizing that the function is only defined when the expression inside the square root is greater than or equal to zero.Since the expression inside the square root is just x, that means the domain is all values of x such that x≥ 0.
This means that when we make our table of values, we should pick values of x that are greater than or equal to zero.It is very useful to include zero itself as the first value in the table and also include many values greater than zero.This will help us in determining what the shape of the curve will be.
TABLE 11.1:
x y =√
x0 y =
√0 = 0
549

11.1. Graphs of Square Root Functions www.ck12.org
TABLE 11.1: (continued)
x y =√
x1 y =
√1 = 1
2 y =√
2 = 1.43 y =
√3 = 1.7
4 y =√
4 = 25 y =
√5 = 2.2
6 y =√
6 = 2.47 y =
√7 = 2.6
8 y =√
8 = 2.89 y =
√9 = 3
Here is what the graph of this table looks like:
The graphs of square root functions are always curved. The curve above looks like half of a parabola lying on itsside, and in fact it is. It’s half of the parabola that you would get if you graphed the expression y2 = x. And the graphof y =−
√x is the other half of that parabola:
Notice that if we graph the two separate functions on the same coordinate axes, the combined graph is a parabolalying on its side.
550
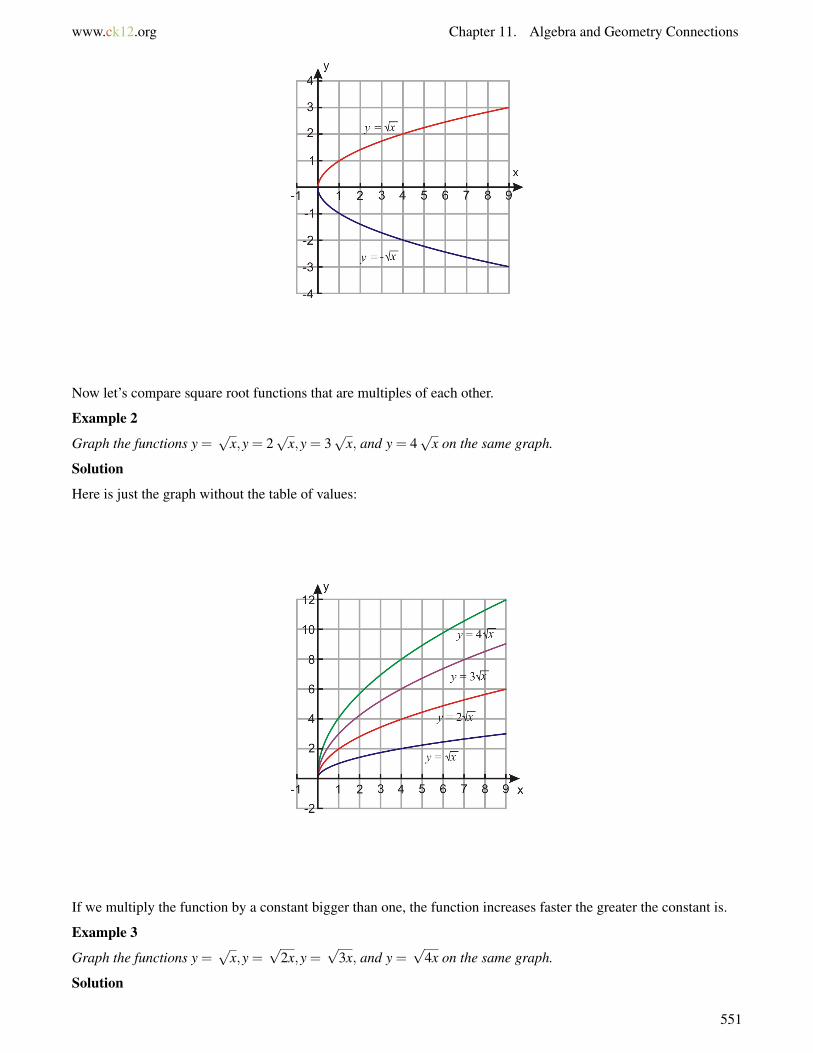
www.ck12.org Chapter 11. Algebra and Geometry Connections
Now let’s compare square root functions that are multiples of each other.
Example 2
Graph the functions y =√
x,y = 2√
x,y = 3√
x, and y = 4√
x on the same graph.
Solution
Here is just the graph without the table of values:
If we multiply the function by a constant bigger than one, the function increases faster the greater the constant is.
Example 3
Graph the functions y =√
x,y =√
2x,y =√
3x, and y =√
4x on the same graph.
Solution
551

11.1. Graphs of Square Root Functions www.ck12.org
Notice that multiplying the expression inside the square root by a constant has the same effect as multiplying by aconstant outside the square root; the function just increases at a slower rate because the entire function is effectivelymultiplied by the square root of the constant.
Also note that the graph of√
4x is the same as the graph of 2√
x. This makes sense algebraically since√
4 = 2.
Example 4
Graph the functions y =√
x,y = 12
√x,y = 1
3
√x, and y = 1
4
√x on the same graph.
Solution
If we multiply the function by a constant between 0 and 1, the function increases more slowly the smaller the constantis.
Example 5
Graph the functions y = 2√
x and y =−2√
x on the same graph.
Solution
If we multiply the whole function by -1, the graph is reflected about the x−axis.
552

www.ck12.org Chapter 11. Algebra and Geometry Connections
Example 6
Graph the functions y =√
x and y =√−x on the same graph.
Solution
On the other hand, when just the x is multiplied by -1, the graph is reflected about the y−axis. Notice that thefunction y =
√−x has only negative x−values in its domain, because when x is negative, the expression under the
radical sign is positive.
Example 7
Graph the functions y =√
x,y =√
x+2 and y =√
x−2.
Solution
553
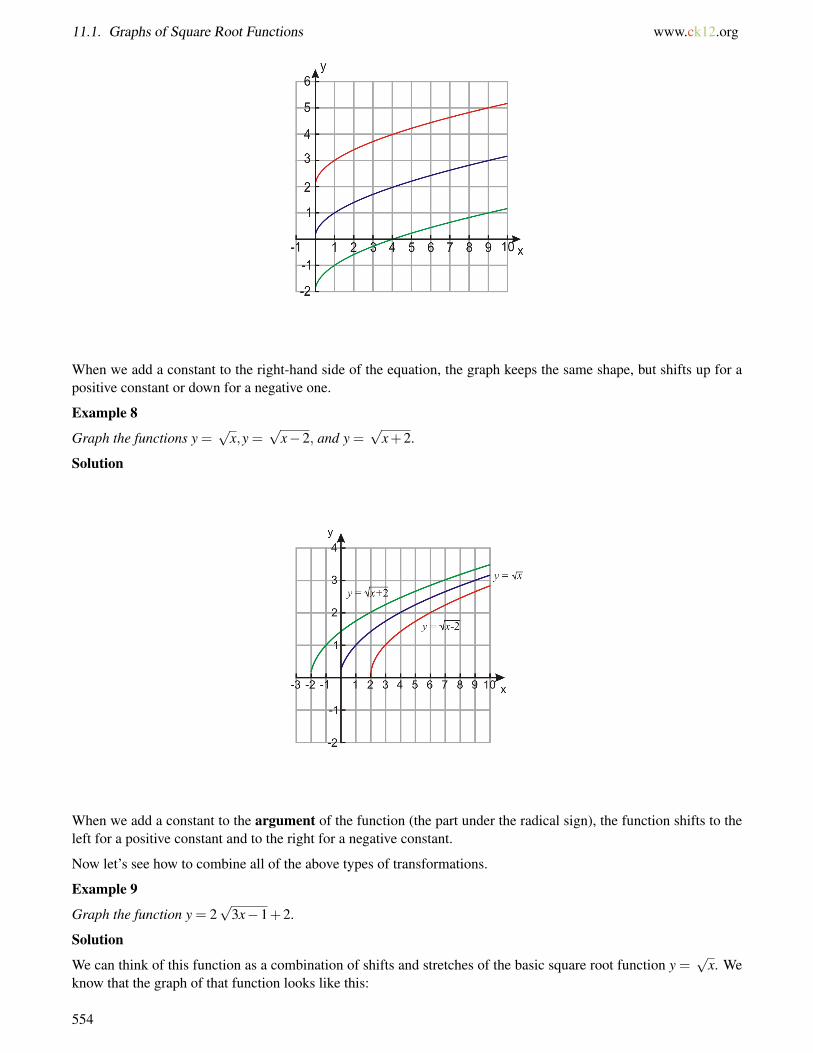
11.1. Graphs of Square Root Functions www.ck12.org
When we add a constant to the right-hand side of the equation, the graph keeps the same shape, but shifts up for apositive constant or down for a negative one.
Example 8
Graph the functions y =√
x,y =√
x−2, and y =√
x+2.
Solution
When we add a constant to the argument of the function (the part under the radical sign), the function shifts to theleft for a positive constant and to the right for a negative constant.
Now let’s see how to combine all of the above types of transformations.
Example 9
Graph the function y = 2√
3x−1+2.
Solution
We can think of this function as a combination of shifts and stretches of the basic square root function y =√
x. Weknow that the graph of that function looks like this:
554
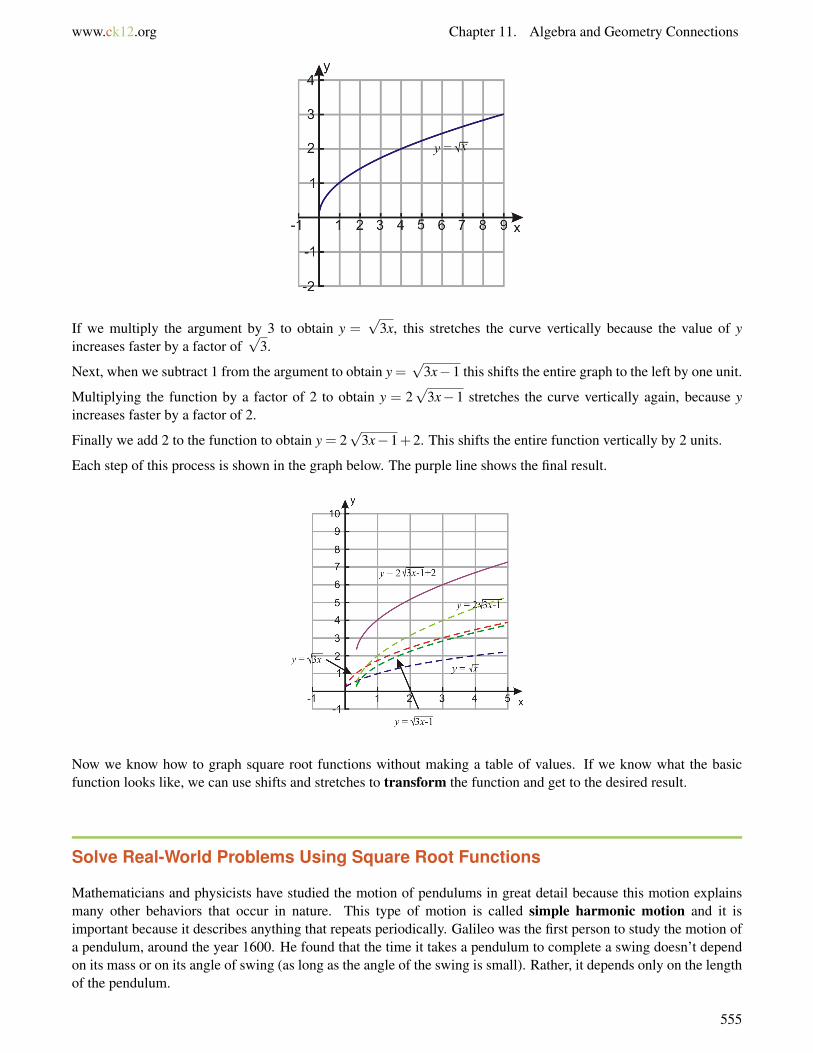
www.ck12.org Chapter 11. Algebra and Geometry Connections
If we multiply the argument by 3 to obtain y =√
3x, this stretches the curve vertically because the value of yincreases faster by a factor of
√3.
Next, when we subtract 1 from the argument to obtain y =√
3x−1 this shifts the entire graph to the left by one unit.
Multiplying the function by a factor of 2 to obtain y = 2√
3x−1 stretches the curve vertically again, because yincreases faster by a factor of 2.
Finally we add 2 to the function to obtain y = 2√
3x−1+2. This shifts the entire function vertically by 2 units.
Each step of this process is shown in the graph below. The purple line shows the final result.
Now we know how to graph square root functions without making a table of values. If we know what the basicfunction looks like, we can use shifts and stretches to transform the function and get to the desired result.
Solve Real-World Problems Using Square Root Functions
Mathematicians and physicists have studied the motion of pendulums in great detail because this motion explainsmany other behaviors that occur in nature. This type of motion is called simple harmonic motion and it isimportant because it describes anything that repeats periodically. Galileo was the first person to study the motion ofa pendulum, around the year 1600. He found that the time it takes a pendulum to complete a swing doesn’t dependon its mass or on its angle of swing (as long as the angle of the swing is small). Rather, it depends only on the lengthof the pendulum.
555
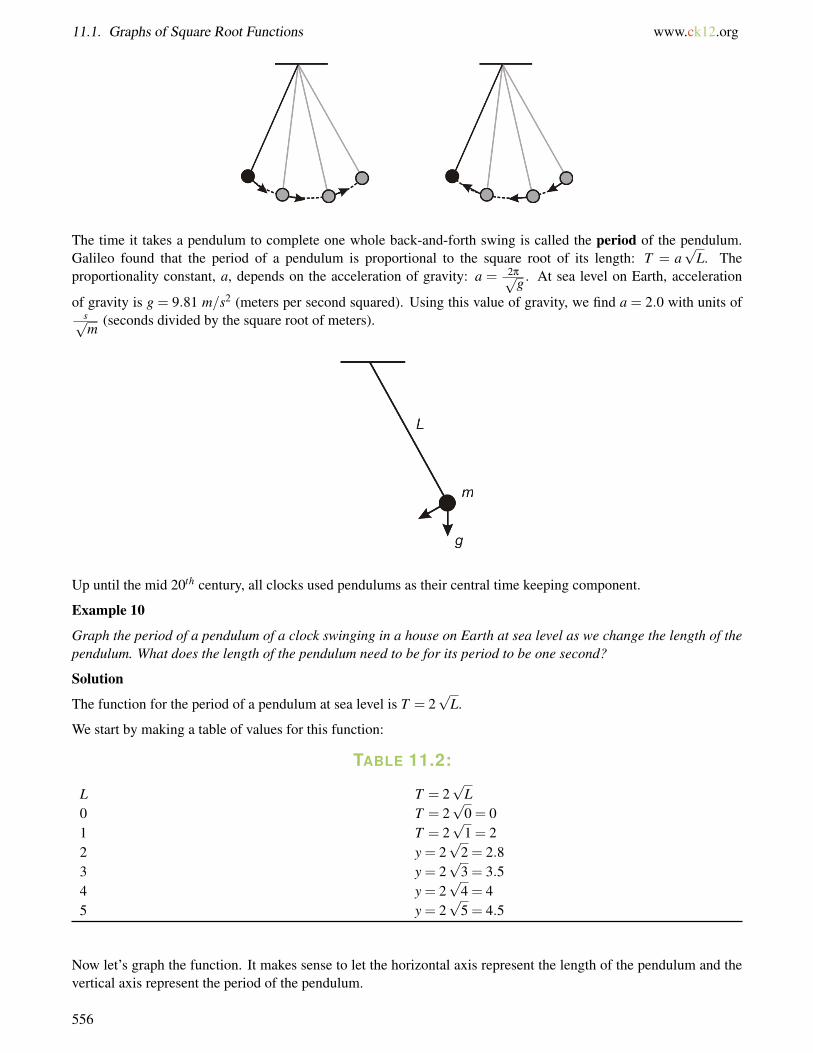
11.1. Graphs of Square Root Functions www.ck12.org
The time it takes a pendulum to complete one whole back-and-forth swing is called the period of the pendulum.Galileo found that the period of a pendulum is proportional to the square root of its length: T = a
√L. The
proportionality constant, a, depends on the acceleration of gravity: a = 2π√g . At sea level on Earth, acceleration
of gravity is g = 9.81 m/s2 (meters per second squared). Using this value of gravity, we find a = 2.0 with units ofs√m
(seconds divided by the square root of meters).
Up until the mid 20th century, all clocks used pendulums as their central time keeping component.
Example 10
Graph the period of a pendulum of a clock swinging in a house on Earth at sea level as we change the length of thependulum. What does the length of the pendulum need to be for its period to be one second?
Solution
The function for the period of a pendulum at sea level is T = 2√
L.
We start by making a table of values for this function:
TABLE 11.2:
L T = 2√
L0 T = 2
√0 = 0
1 T = 2√
1 = 22 y = 2
√2 = 2.8
3 y = 2√
3 = 3.54 y = 2
√4 = 4
5 y = 2√
5 = 4.5
Now let’s graph the function. It makes sense to let the horizontal axis represent the length of the pendulum and thevertical axis represent the period of the pendulum.
556

www.ck12.org Chapter 11. Algebra and Geometry Connections
We can see from the graph that a length of approximately 14 meters gives a period of 1 second. We can confirm this
answer by using our function for the period and plugging in T = 1 second:
T = 2√
L⇒ 1 = 2√
L
Square both sides of the equation: 1 = 4L
Solve for L : L =14
meters
For more equations that describe pendulum motion, check out http://hyperphysics.phy-astr.gsu.edu/hbase/pend.html, where you can also find a tool for calculating the period of a pendulum in different gravities than Earth’s.
Example 11
“Square” TV screens have an aspect ratio of 4:3; in other words, the width of the screen is 43 the height. TV “sizes”
are traditionally represented as the length of the diagonal of the television screen. Graph the length of the diagonalof a screen as a function of the area of the screen. What is the diagonal of a screen with an area of 180 in2?
Solution
Let d = length of the diagonal, x = width
Then 4 × height = 3 × width
Or, height = 34 x.
557

11.1. Graphs of Square Root Functions www.ck12.org
The area of the screen is: A = length × width or A = 34 x2
Find how the diagonal length relates to the width by using the Pythagorean theorem:
x2 +
(34
x)2
= d2
x2 +916
x2 = d2
2516
x2 = d2⇒ x2 =1625
d2⇒ x =45
d
Therefore, the diagonal length relates to the area as follows: A = 34
(45 d)2
= 34 ·
1625 d2 = 12
25 d2.
We can also flip that around to find the diagonal length as a function of the area: d2 = 2512 A or d = 5
2√
3
√A.
Now we can make a graph where the horizontal axis represents the area of the television screen and the vertical axisis the length of the diagonal. First let’s make a table of values:
TABLE 11.3:
A d = 5
2√
3
√A
0 025 7.250 10.275 12.5100 14.4125 16.1150 17.6175 19200 20.4
From the graph we can estimate that when the area of a TV screen is 180 in2 the length of the diagonal is approx-imately 19.5 inches. We can confirm this by plugging in A = 180 into the formula that relates the diagonal to thearea: d = 5
2√
3
√A = 5
2√
3
√180 = 19.4 inches.
558

www.ck12.org Chapter 11. Algebra and Geometry Connections
Review Questions
Graph the following functions on the same coordinate axes.
1. y =√
x,y = 2.5√
x and y =−2.5√
x2. y =
√x,y = 0.3
√x and y = 0.6
√x
3. y =√
x,y =√
x−5 and y =√
x+54. y =
√x,y =
√x+8 and y =
√x−8
Graph the following functions.
5. y =√
2x−16. y =
√4x+4
7. y =√
5− x8. y = 2
√x+5
9. y = 3−√
x10. y = 4+2
√x
11. y = 2√
2x+3+112. y = 4+
√2− x
13. y =√
x+1−√
4x−514. The acceleration of gravity can also given in feet per second squared. It is g = 32 f t/s2 at sea level.
a. Graph the period of a pendulum with respect to its length in feet.b. For what length in feet will the period of a pendulum be 2 seconds?
15. The acceleration of gravity on the Moon is 1.6 m/s2.
a. Graph the period of a pendulum on the Moon with respect to its length in meters.b. For what length, in meters, will the period of a pendulum be 10 seconds?
16. The acceleration of gravity on Mars is 3.69 m/s2.
a. Graph the period of a pendulum on the Mars with respect to its length in meters.b. For what length, in meters, will the period of a pendulum be 3 seconds?
17. The acceleration of gravity on the Earth depends on the latitude and altitude of a place. The value of g isslightly smaller for places closer to the Equator than places closer to the poles and the value of g is slightlysmaller for places at higher altitudes that it is for places at lower altitudes. In Helsinki the value of g =9.819 m/s2, in Los Angeles the value of g = 9.796 m/s2 and in Mexico City the value of g = 9.779 m/s2.
a. Graph the period of a pendulum with respect to its length for all three cities on the same graph.b. Use the formula to find for what length, in meters, will the period of a pendulum be 8 seconds in each of
these cities?
18. The aspect ratio of a wide-screen TV is 2.39:1.
a. Graph the length of the diagonal of a screen as a function of the area of the screen.b. What is the diagonal of a screen with area 150 in2?
Graph the following functions using a graphing calculator.
19. y =√
3x−220. y = 4+
√2− x
21. y =√
x2−922. y =
√x−√
x+2
559

11.2. Radical Expressions www.ck12.org
11.2 Radical Expressions
Learning Objectives
• Use the product and quotient properties of radicals.• Rationalize the denominator.• Add and subtract radical expressions.• Multiply radical expressions.• Solve real-world problems using square root functions.
Introduction
A radical reverses the operation of raising a number to a power. For example, the square of 4 is 42 = 4 ·4 = 16, andso the square root of 16 is 4. The symbol for a square root is √ . This symbol is also called the radical sign.
In addition to square roots, we can also take cube roots, fourth roots, and so on. For example, since 64 is the cube of4, 4 is the cube root of 64.
3√64 = 4 since 43 = 4 ·4 ·4 = 64
We put an index number in the top left corner of the radical sign to show which root of the number we are seeking.Square roots have an index of 2, but we usually don’t bother to write that out.
2√36 =
√36 = 6
The cube root of a number gives a number which when raised to the power three gives the number under the radicalsign. The fourth root of number gives a number which when raised to the power four gives the number under theradical sign:
4√81 = 3 since 34 = 3 ·3 ·3 ·3 = 81
And so on for any power we can name.
Even and Odd Roots
Radical expressions that have even indices are called even roots and radical expressions that have odd indices arecalled odd roots. There is a very important difference between even and odd roots, because they give drasticallydifferent results when the number inside the radical sign is negative.
560

www.ck12.org Chapter 11. Algebra and Geometry Connections
Any real number raised to an even power results in a positive answer. Therefore, when the index of a radical is even,the number inside the radical sign must be non-negative in order to get a real answer.
On the other hand, a positive number raised to an odd power is positive and a negative number raised to an odd poweris negative. Thus, a negative number inside the radical sign is not a problem. It just results in a negative answer.
Example 1
Evaluate each radical expression.
a)√
121
b)3√
125
c) 4√−625
d) 5√−32
Solution
a)√
121 = 11
b)3√
125 = 5
c) 3√−625 is not a real number
d) 5√−32 =−2
Use the Product and Quotient Properties of Radicals
Radicals can be re-written as rational powers. The radical: m√an is defined as anm .
Example 2
Write each expression as an exponent with a rational value for the exponent.
a)√
5
b) 4√a
c) 3√
4xy
d)6√
x5
Solution
a)√
5 = 512
b) 4√a = a14
c) 3√
4xy = (4xy)13
d)6√
x5 = x56
As a result of this property, for any non-negative number a we know that n√an = ann = a.
Since roots of numbers can be treated as powers, we can use exponent rules to simplify and evaluate radicalexpressions. Let’s review the product and quotient rule of exponents.
Raising a product to a power: (x · y)n = xn · yn
Raising a quotient to a power:(
xy
)n
=xn
yn
561

11.2. Radical Expressions www.ck12.org
In radical notation, these properties are written as
Raising a product to a power: m√
x · y = m√x · m√
y
Raising a quotient to a power: m
√xy=
m√
xm√
y
A very important application of these rules is reducing a radical expression to its simplest form. This means that weapply the root on all the factors of the number that are perfect roots and leave all factors that are not perfect rootsinside the radical sign.
For example, in the expression√
16, the number 16 is a perfect square because 16 = 42. This means that we cansimplify it as follows:
√16 =
√42 = 4
Thus, the square root disappears completely.
On the other hand, in the expression√
32, the number 32 is not a perfect square, so we can’t just remove the squareroot. However, we notice that 32 = 16 ·2, so we can write 32 as the product of a perfect square and another number.Thus,
√32 =
√16 ·2
If we apply the “raising a product to a power” rule we get:
√32 =
√16 ·2 =
√16 ·√
2
Since√
16 = 4, we get:√
32 = 4 ·√
2 = 4√
2
Example 3
Write the following expressions in the simplest radical form.
a)√
8
b)√
50
c)
√12572
Solution
The strategy is to write the number under the square root as the product of a perfect square and another number. Thegoal is to find the highest perfect square possible; if we don’t find it right away, we just repeat the procedure untilwe can’t simplify any longer.
a)
We can write 8 = 4 ·2, so√
8 =√
4 ·2.With the “Raising a product to a power” rule, that becomes
√4 ·√
2.
Evaluate√
4 and we’re left with 2√
2.
562
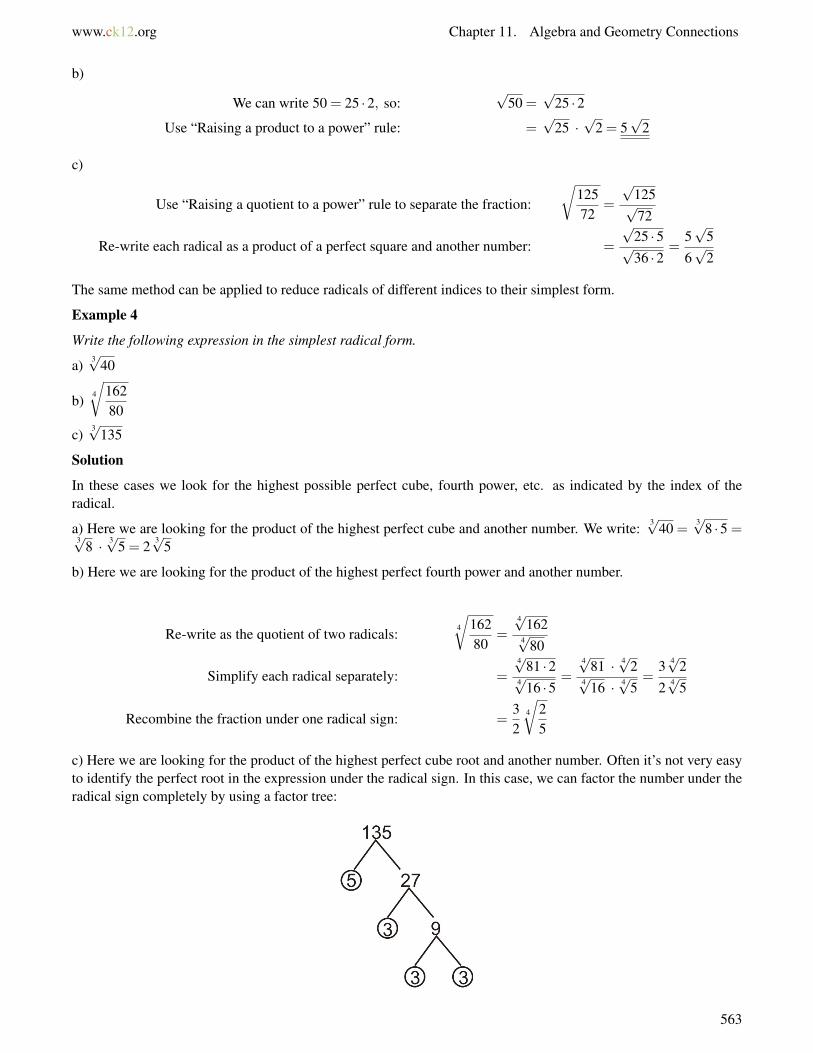
www.ck12.org Chapter 11. Algebra and Geometry Connections
b)
We can write 50 = 25 ·2, so:√
50 =√
25 ·2Use “Raising a product to a power” rule: =
√25 ·√
2 = 5√
2
c)
Use “Raising a quotient to a power” rule to separate the fraction:
√12572
=
√125√72
Re-write each radical as a product of a perfect square and another number: =
√25 ·5√36 ·2
=5√
56√
2
The same method can be applied to reduce radicals of different indices to their simplest form.
Example 4
Write the following expression in the simplest radical form.
a) 3√40
b) 4
√16280
c)3√
135
Solution
In these cases we look for the highest possible perfect cube, fourth power, etc. as indicated by the index of theradical.
a) Here we are looking for the product of the highest perfect cube and another number. We write: 3√40 =3√
8 ·5 =3√8 · 3√
5 = 23√
5
b) Here we are looking for the product of the highest perfect fourth power and another number.
Re-write as the quotient of two radicals:4
√16280
=4√1624√80
Simplify each radical separately: =4√81 ·24√16 ·5
=4√81 · 4√24√16 · 4√5
=3 4√22 4√5
Recombine the fraction under one radical sign: =32
4
√25
c) Here we are looking for the product of the highest perfect cube root and another number. Often it’s not very easyto identify the perfect root in the expression under the radical sign. In this case, we can factor the number under theradical sign completely by using a factor tree:
563

11.2. Radical Expressions www.ck12.org
We see that 135 = 3 ·3 ·3 ·5 = 33 ·5. Therefore3√
135 =3√
33 ·5 =3√
33 · 3√5 = 3
3√5.
(You can find a useful tool for creating factor trees at http://www.softschools.com/math/factors/factor_tree/. Clickon “User Number” to type in your own number to factor, or just click “New Number” for a random number if youwant more practice factoring.)
Now let’s see some examples involving variables.
Example 5
Write the following expression in the simplest radical form.
a)√
12x3y5
b) 4
√1250x7
405y9
Solution
Treat constants and each variable separately and write each expression as the products of a perfect power as indicatedby the index of the radical and another number.
a)
Re-write as a product of radicals:√
12x3y5 =√
12 ·√
x3 ·√
y5
Simplify each radical separately:(√
4 ·3)·(√
x2 · x)·(√
y4 · y)=(
2√
3)·(x√
x)·(y2√y
)Combine all terms outside and inside the radical sign: = 2xy2
√3xy
b)
Re-write as a quotient of radicals: 4
√1250x7
405y9 =
4√1250x7
4√
405y9
Simplify each radical separately: =4√625 ·2 · 4√
x4 · x3
4√81 ·5 · 4√
y4 · y4 · y=
5 4√2 · x · 4√x3
3 4√5 · y · y · 4√
y=
5x4√
2x3
3y2 4√
5y
Recombine fraction under one radical sign: =5x3y2
4
√2x3
5y
Add and Subtract Radical Expressions
When we add and subtract radical expressions, we can combine radical terms only when they have the sameexpression under the radical sign. This is a lot like combining like terms in variable expressions. For example,
4√
2+5√
2 = 9√
2
or
2√
3−√
2+5√
3+10√
2 = 7√
3+9√
2
It’s important to reduce all radicals to their simplest form in order to make sure that we’re combining all possiblelike terms in the expression. For example, the expression
√8− 2
√50 looks like it can’t be simplified any more
because it has no like terms. However, when we write each radical in its simplest form we get 2√
2− 10√
2, andwe can combine those terms to get −8
√2.
564
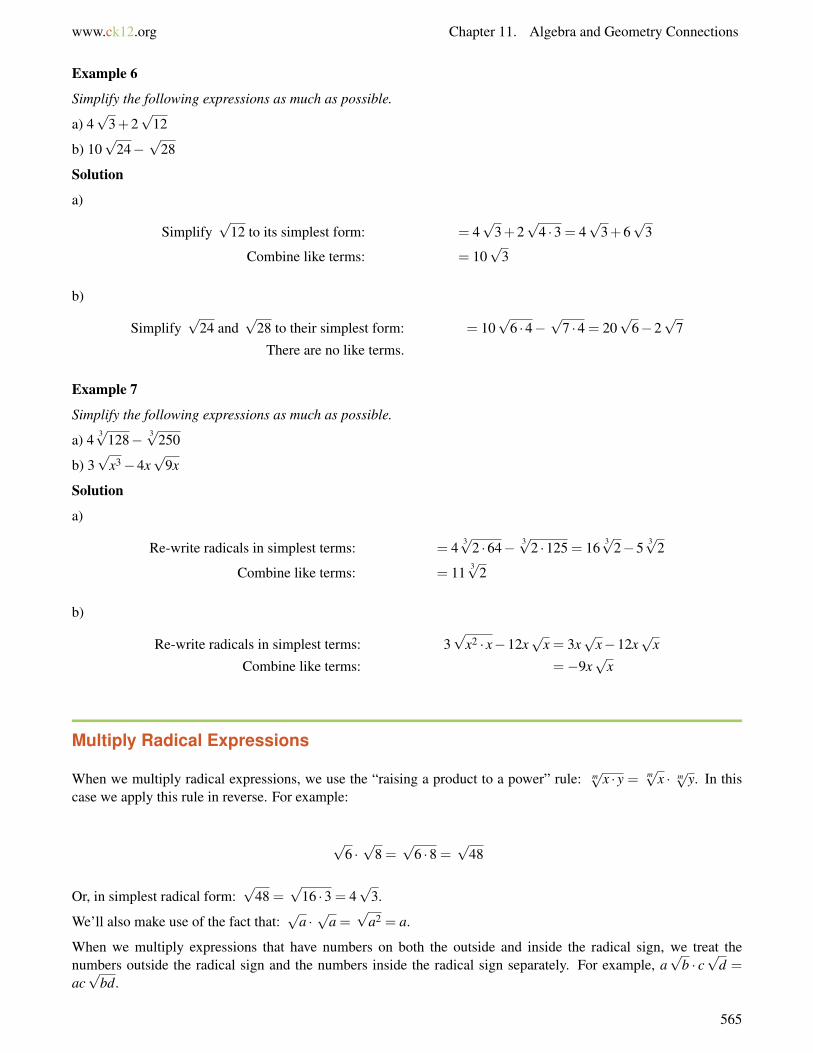
www.ck12.org Chapter 11. Algebra and Geometry Connections
Example 6
Simplify the following expressions as much as possible.
a) 4√
3+2√
12
b) 10√
24−√
28
Solution
a)
Simplify√
12 to its simplest form: = 4√
3+2√
4 ·3 = 4√
3+6√
3
Combine like terms: = 10√
3
b)
Simplify√
24 and√
28 to their simplest form: = 10√
6 ·4−√
7 ·4 = 20√
6−2√
7
There are no like terms.
Example 7
Simplify the following expressions as much as possible.
a) 4 3√128− 3√250
b) 3√
x3−4x√
9x
Solution
a)
Re-write radicals in simplest terms: = 43√
2 ·64− 3√2 ·125 = 16
3√2−5
3√2
Combine like terms: = 113√
2
b)
Re-write radicals in simplest terms: 3√
x2 · x−12x√
x = 3x√
x−12x√
x
Combine like terms: =−9x√
x
Multiply Radical Expressions
When we multiply radical expressions, we use the “raising a product to a power” rule: m√
x · y = m√x · m√
y. In thiscase we apply this rule in reverse. For example:
√6 ·√
8 =√
6 ·8 =√
48
Or, in simplest radical form:√
48 =√
16 ·3 = 4√
3.
We’ll also make use of the fact that:√
a ·√
a =√
a2 = a.
When we multiply expressions that have numbers on both the outside and inside the radical sign, we treat thenumbers outside the radical sign and the numbers inside the radical sign separately. For example, a
√b · c√
d =ac√
bd.
565
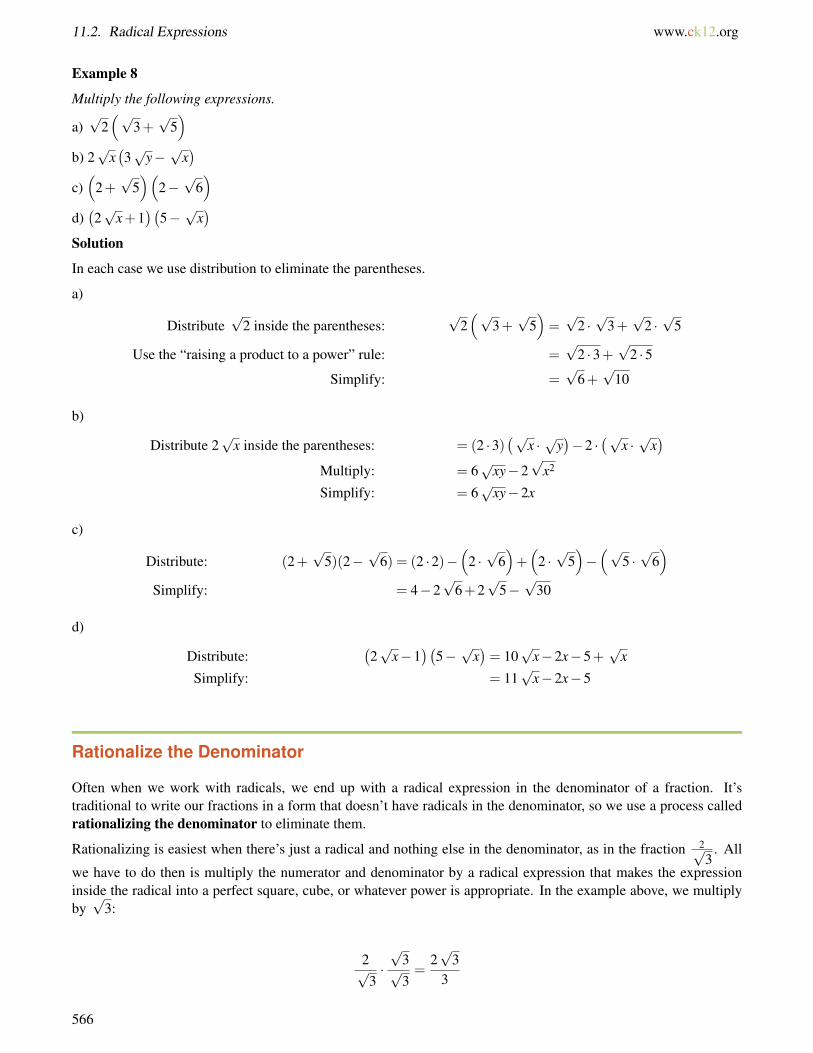
11.2. Radical Expressions www.ck12.org
Example 8
Multiply the following expressions.
a)√
2(√
3+√
5)
b) 2√
x(3√
y−√
x)
c)(
2+√
5)(
2−√
6)
d)(2√
x+1)(
5−√
x)
Solution
In each case we use distribution to eliminate the parentheses.
a)
Distribute√
2 inside the parentheses:√
2(√
3+√
5)=√
2 ·√
3+√
2 ·√
5
Use the “raising a product to a power” rule: =√
2 ·3+√
2 ·5Simplify: =
√6+√
10
b)
Distribute 2√
x inside the parentheses: = (2 ·3)(√
x · √y)−2 ·
(√x ·√
x)
Multiply: = 6√
xy−2√
x2
Simplify: = 6√
xy−2x
c)
Distribute: (2+√
5)(2−√
6) = (2 ·2)−(
2 ·√
6)+(
2 ·√
5)−(√
5 ·√
6)
Simplify: = 4−2√
6+2√
5−√
30
d)
Distribute:(2√
x−1)(
5−√
x)= 10
√x−2x−5+
√x
Simplify: = 11√
x−2x−5
Rationalize the Denominator
Often when we work with radicals, we end up with a radical expression in the denominator of a fraction. It’straditional to write our fractions in a form that doesn’t have radicals in the denominator, so we use a process calledrationalizing the denominator to eliminate them.
Rationalizing is easiest when there’s just a radical and nothing else in the denominator, as in the fraction 2√3
. All
we have to do then is multiply the numerator and denominator by a radical expression that makes the expressioninside the radical into a perfect square, cube, or whatever power is appropriate. In the example above, we multiplyby√
3:
2√3·√
3√3=
2√
33
566

www.ck12.org Chapter 11. Algebra and Geometry Connections
Cube roots and higher are a little trickier than square roots. For example, how would we rationalize 73√5
? We can’t
just multiply by3√
5, because then the denominator would be3√
52. To make the denominator a whole number, weneed to multiply the numerator and the denominator by
3√52:
73√5·
3√52
3√52
=7 3√25
3√53
=7 3√25
5
Trickier still is when the expression in the denominator contains more than one term. For example, consider theexpression 2
2+√
3. We can’t just multiply by
√3, because we’d have to distribute that term and then the denominator
would be 2√
3+3.
Instead, we multiply by 2−√
3. This is a good choice because the product(
2+√
3)(
2−√
3)
is a product of asum and a difference, which means it’s a difference of squares. The radicals cancel each other out when we multiply
out, and the denominator works out to(
2+√
3)(
2−√
3)= 22−
(√3)2
= 4−3 = 1.
When we multiply both the numerator and denominator by 2−√
3, we get:
22+√
3· 2−
√3
2−√
3=
2(2−√
3)
4−3=
4−2√
31
= 4−2√
3
Now consider the expression√
x−1√x−2√
y.
In order to eliminate the radical expressions in the denominator we must multiply by√
x+2√
y.
We get:√
x−1√x−2√
y·√
x+2√
y√x+2√
y=
(√x−1
)(√x+2√
y)
(√x−2√
y)(√
x+2√
y) = x−2
√y−√
x+2√
xyx−4y
Solve Real-World Problems Using Radical Expressions
Radicals often arise in problems involving areas and volumes of geometrical figures.
Example 9
A pool is twice as long as it is wide and is surrounded by a walkway of uniform width of 1 foot. The combined areaof the pool and the walkway is 400 square feet. Find the dimensions of the pool and the area of the pool.
Solution
Make a sketch:
567

11.2. Radical Expressions www.ck12.org
Let x = the width of the pool. Then:
Area = length × width
Combined length of pool and walkway = 2x+2
Combined width of pool and walkway = x+2
Area = (2x+2)(x+2)
Since the combined area of pool and walkway is 400 f t2 we can write the equation
(2x+2)(x+2) = 400
Multiply in order to eliminate the parentheses: 2x2 +4x+2x+4 = 400
Collect like terms: 2x2 +6x+4 = 400
Move all terms to one side of the equation: 2x2 +6x−396 = 0
Divide all terms by 2: x2 +3x−198 = 0
Use the quadratic formula: x =−b±
√b2−4ac
2a
x =−3±
√32−4(1)(−198)
2(1)
x =−3±
√801
2=−3±28.3
2x = 12.65 f eet
(The other answer is negative, so we can throw it out because only a positive number makes sense for the width of aswimming pool.)
Check by plugging the result in the area formula:
Area = (2(12.65)+2)(12.65+2) = 27.3 ·14.65 = 400 f t2.
The answer checks out.
Example 10
The volume of a soda can is 355 cm3. The height of the can is four times the radius of the base. Find the radius ofthe base of the cylinder.
Solution
Make a sketch:
Let x = the radius of the cylinder base. Then the height of the cylinder is 4x.
568

www.ck12.org Chapter 11. Algebra and Geometry Connections
The volume of a cylinder is given by V = πR2 ·h; in this case, R is x and h is 4x, and we know the volume is 355.
Solve the equation:
355 = πx2 · (4x)
355 = 4πx3
x3 =3554π
x =3
√3554π
= 3.046 cm
Check by substituting the result back into the formula:
V = πR2 ·h = π(3.046)2 · (4 ·3.046) = 355 cm3
So the volume is 355 cm3. The answer checks out.
Review Questions
Evaluate each radical expression.
1.√
1692. 4√−813. 3√−1254. 5√1024
Write each expression as a rational exponent.
5.3√
146. 4√
zw7.√
a8. 9√
y3
Write the following expressions in simplest radical form.
9.√
2410.√
30011.
5√96
12.
√240567
13.3√
50014.
6√64x8
15.3√
48a3b7
16. 3
√16x5
135y4
Simplify the following expressions as much as possible.
569
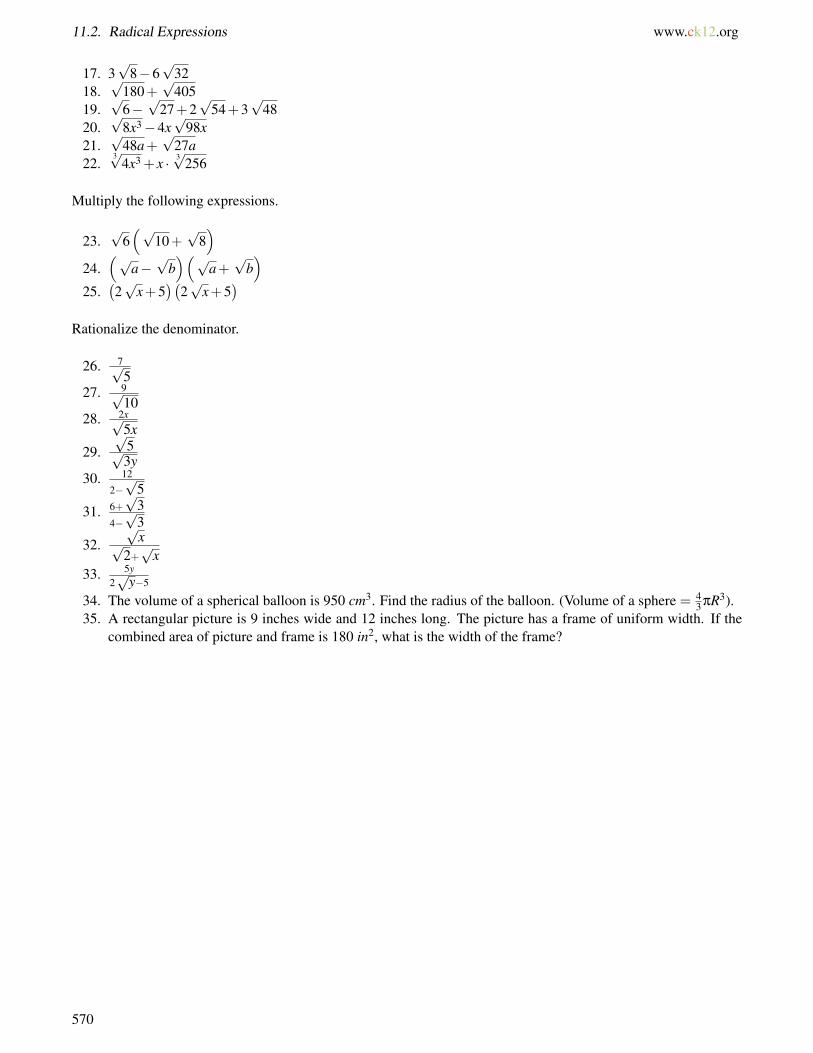
11.2. Radical Expressions www.ck12.org
17. 3√
8−6√
3218.√
180+√
40519.√
6−√
27+2√
54+3√
4820.√
8x3−4x√
98x21.√
48a+√
27a22.
3√4x3 + x · 3√
256
Multiply the following expressions.
23.√
6(√
10+√
8)
24.(√
a−√
b)(√
a+√
b)
25.(2√
x+5)(
2√
x+5)
Rationalize the denominator.
26. 7√5
27. 9√10
28. 2x√5x
29.√
5√3y
30. 12
2−√
5
31. 6+√
34−√
3
32.√
x√2+√
x33. 5y
2√
y−5
34. The volume of a spherical balloon is 950 cm3. Find the radius of the balloon. (Volume of a sphere = 43 πR3).
35. A rectangular picture is 9 inches wide and 12 inches long. The picture has a frame of uniform width. If thecombined area of picture and frame is 180 in2, what is the width of the frame?
570

www.ck12.org Chapter 11. Algebra and Geometry Connections
11.3 Radical Equations
Learning Objectives
• Solve a radical equation.• Solve radical equations with radicals on both sides.• Identify extraneous solutions.• Solve real-world problems using square root functions.
Introduction
When the variable in an equation appears inside a radical sign, the equation is called a radical equation. To solve aradical equation, we need to eliminate the radical and change the equation into a polynomial equation.
A common method for solving radical equations is to isolate the most complicated radical on one side of the equationand raise both sides of the equation to the power that will eliminate the radical sign. If there are any radicals leftin the equation after simplifying, we can repeat this procedure until all radical signs are gone. Once the equation ischanged into a polynomial equation, we can solve it with the methods we already know.
We must be careful when we use this method, because whenever we raise an equation to a power, we could introducefalse solutions that are not in fact solutions to the original problem. These are called extraneous solutions. In orderto make sure we get the correct solutions, we must always check all solutions in the original radical equation.
Solve a Radical Equation
Let’s consider a few simple examples of radical equations where only one radical appears in the equation.
Example 1
Find the real solutions of the equation√
2x−1 = 5.
Solution
Since the radical expression is already isolated, we can just square both sides of the equation in order to eliminatethe radical sign:
(√2x−1
)2= 52
Remember that√
a2 = a so the equation simplifies to: 2x−1 = 25
Add one to both sides: 2x = 26
Divide both sides by 2: x = 13
571

11.3. Radical Equations www.ck12.org
Finally we need to plug the solution in the original equation to see if it is a valid solution.√
2x−1 =√
2(13)−1 =√
26−1 =√
25 = 5The solution checks out.
Example 2
Find the real solutions of 3√3−7x−3 = 0.
Solution
We isolate the radical on one side of the equation: 3√3−7x = 3
Raise each side of the equation to the third power:(
3√3−7x)3
= 33
Simplify: 3−7x = 27
Subtract 3 from each side: −7x = 24
Divide both sides by -7: x =−247
Check: 3√3−7x−3 = 3
√3−7
(−24
7
)−3 =
3√3+24−3 =3√
27−3 = 3−3 = 0. The solution checks out.
Example 3
Find the real solutions of√
10− x2− x = 2.
Solution
We isolate the radical on one side of the equation:√
10− x2 = 2+ x
Square each side of the equation:(√
10− x2)2
= (2+ x)2
Simplify: 10− x2 = 4+4x+ x2
Move all terms to one side of the equation: 0 = 2x2 +4x−6
Solve using the quadratic formula: x =−4±
√42−4(2)(−6)
4
Simplify: x =−4±
√64
4
Re-write√
24 in simplest form: x =−4±8
4Reduce all terms by a factor of 2: x = 1 or x =−3
Check:√
10−12−1 =√
9−1 = 3−1 = 2 This solution checks out.√10− (−3)2− (−3) =
√1+3 = 1+3 = 4 This solution does not check out.
The equation has only one solution, x = 1; the solution x =−3 is extraneous.
Solve Radical Equations with Radicals on Both Sides
Often equations have more than one radical expression. The strategy in this case is to start by isolating the mostcomplicated radical expression and raise the equation to the appropriate power. We then repeat the process until all
572
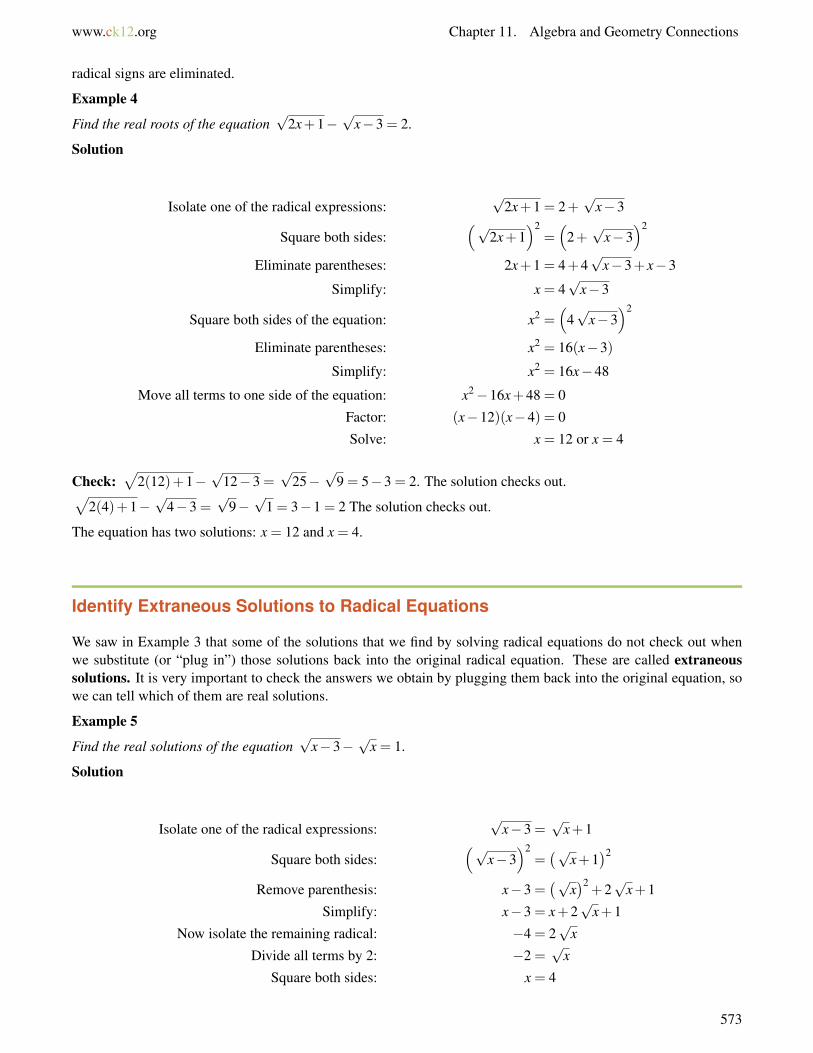
www.ck12.org Chapter 11. Algebra and Geometry Connections
radical signs are eliminated.
Example 4
Find the real roots of the equation√
2x+1−√
x−3 = 2.
Solution
Isolate one of the radical expressions:√
2x+1 = 2+√
x−3
Square both sides:(√
2x+1)2
=(
2+√
x−3)2
Eliminate parentheses: 2x+1 = 4+4√
x−3+ x−3
Simplify: x = 4√
x−3
Square both sides of the equation: x2 =(
4√
x−3)2
Eliminate parentheses: x2 = 16(x−3)
Simplify: x2 = 16x−48
Move all terms to one side of the equation: x2−16x+48 = 0
Factor: (x−12)(x−4) = 0
Solve: x = 12 or x = 4
Check:√
2(12)+1−√
12−3 =√
25−√
9 = 5−3 = 2. The solution checks out.√2(4)+1−
√4−3 =
√9−√
1 = 3−1 = 2 The solution checks out.
The equation has two solutions: x = 12 and x = 4.
Identify Extraneous Solutions to Radical Equations
We saw in Example 3 that some of the solutions that we find by solving radical equations do not check out whenwe substitute (or “plug in”) those solutions back into the original radical equation. These are called extraneoussolutions. It is very important to check the answers we obtain by plugging them back into the original equation, sowe can tell which of them are real solutions.
Example 5
Find the real solutions of the equation√
x−3−√
x = 1.
Solution
Isolate one of the radical expressions:√
x−3 =√
x+1
Square both sides:(√
x−3)2
=(√
x+1)2
Remove parenthesis: x−3 =(√
x)2
+2√
x+1
Simplify: x−3 = x+2√
x+1
Now isolate the remaining radical: −4 = 2√
x
Divide all terms by 2: −2 =√
x
Square both sides: x = 4
573

11.3. Radical Equations www.ck12.org
Check:√
4−3−√
4 =√
1−2 = 1−2 =−1 The solution does not check out.
The equation has no real solutions. x = 4 is an extraneous solution.
Solve Real-World Problems using Radical Equations
Radical equations often appear in problems involving areas and volumes of objects.
Example 6
Anita’s square vegetable garden is 21 square feet larger than Fred’s square vegetable garden. Anita and Fred decideto pool their money together and buy the same kind of fencing for their gardens. If they need 84 feet of fencing, whatis the size of each garden?
Solution
Make a sketch:
Define variables: Let Fred’s area be x; then Anita’s area is x+21.
Find an equation:
Side length of Fred’s garden is√
x
Side length of Anita’s garden is√
x+21
The amount of fencing is equal to the combined perimeters of the two squares:
4√
x+4√
x+21 = 84
Solve the equation:
Divide all terms by 4:√
x+√
x+21 = 21
Isolate one of the radical expressions:√
x+21 = 21−√
x
Square both sides:(√
x+21)2
=(21−
√x)2
Eliminate parentheses: x+21 = 441−42√
x+ x
Isolate the radical expression: 42√
x = 420
Divide both sides by 42:√
x = 10
Square both sides: x = 100 f t2
Check: 4√
100+4√
100+21 = 40+44 = 84. The solution checks out.
Fred’s garden is 10 f t×10 f t = 100 f t2 and Anita’s garden is 11 f t×11 f t = 121 f t2.
574

www.ck12.org Chapter 11. Algebra and Geometry Connections
Example 7
A sphere has a volume of 456 cm3. If the radius of the sphere is increased by 2 cm, what is the new volume of thesphere?
Solution
Make a sketch:
Define variables: Let R = the radius of the sphere.
Find an equation: The volume of a sphere is given by the formula V = 43 πR3.
Solve the equation:
Plug in the value of the volume: 456 =43
πR3
Multiply by 3: 1368 = 4πR3
Divide by 4π : 108.92 = R3
Take the cube root of each side: R =3√108.92⇒ R = 4.776 cm
The new radius is 2 centimeters more: R = 6.776 cm
The new volume is: V =43
π(6.776)3 = 1302.5 cm3
Check: Let’s plug in the values of the radius into the volume formula:
V = 43 πR3 = 4
3 π(4.776)3 = 456 cm3. The solution checks out.
Example 8
The kinetic energy of an object of mass m and velocity v is given by the formula: KE = 12 mv2. A baseball has a mass
of 145 kg and its kinetic energy is measured to be 654 Joules (kg ·m2/s2) when it hits the catcher’s glove. What isthe velocity of the ball when it hits the catcher’s glove?
Solution
Start with the formula: KE =12
mv2
Plug in the values for the mass and the kinetic energy: 654kg ·m2
s2 =12(145 kg)v2
Multiply both sides by 2: 1308kg ·m2
s2 = 145 kg · v2
Divide both sides by 145 kg : 9.02m2
s2 = v2
Take the square root of both sides: v =√
9.02
√m2
s2 = 3.003 m/s
575

11.3. Radical Equations www.ck12.org
Check: Plug the values for the mass and the velocity into the energy formula:
KE =12
mv2 =12(145 kg)(3.003 m/s)2 = 654 kg ·m2/s2
(To learn more about kinetic energy, watch the video at
MEDIAClick image to the left for more content.
.)
Review Questions
Find the solution to each of the following radical equations. Identify extraneous solutions.
1.√
x+2−2 = 02.√
3x−1 = 53. 2√
4−3x+3 = 04. 3√x−3 = 15.
4√
x2−9 = 26. 3√−2−5x+3 = 07.√
x2−3 = x−18.√
x = x−69.√
x2−5x−6 = 010.
√(x+1)(x−3) = x
11.√
x+6 = x+412.√
x =√
x−9+113.√
x+2 =√
3x−214.√
3x+4 =−615. 5
√x =√
x+12+616.√
10−5x+√
1− x = 717.√
2x−2−2√
x+2 = 018.√
2x+5−3√
2x−3 =√
2− x19. 3
√x−9 =
√2x−14
20.√
x+7 =√
x+4+121. The area of a triangle is 24 in2 and the height of the triangle is twice as long as the base. What are the base
and the height of the triangle?22. The length of a rectangle is 7 meters less than twice its width, and its area is 660 m2. What are the length and
width of the rectangle?23. The area of a circular disk is 124 in2. What is the circumference of the disk? (Area = πR2,Circumference =
2πR).24. The volume of a cylinder is 245 cm3 and the height of the cylinder is one third of the diameter of the base
of the cylinder. The diameter of the cylinder is kept the same but the height of the cylinder is increased by 2centimeters. What is the volume of the new cylinder? (Volume = πR2 ·h)
576

www.ck12.org Chapter 11. Algebra and Geometry Connections
25. The height of a golf ball as it travels through the air is given by the equation h =−16t2 +256. Find the timewhen the ball is at a height of 120 feet.
577

11.4. The Pythagorean Theorem and Its Converse www.ck12.org
11.4 The Pythagorean Theorem and Its Con-verse
Learning Objectives
• Use the Pythagorean Theorem.• Use the converse of the Pythagorean Theorem.• Solve real-world problems using the Pythagorean Theorem and its converse.
Introduction
Teresa wants to string a clothesline across her backyard, from one corner to the opposite corner. If the yard measures22 feet by 34 feet, how many feet of clothesline does she need?
The Pythagorean Theorem is a statement of how the lengths of the sides of a right triangle are related to each other.A right triangle is one that contains a 90 degree angle. The side of the triangle opposite the 90 degree angle is calledthe hypotenuse and the sides of the triangle adjacent to the 90 degree angle are called the legs.
If we let a and b represent the legs of the right triangle and c represent the hypotenuse then the Pythagorean Theoremcan be stated as:
In a right triangle, the square of the length of the hypotenuse is equal to the sum of the squares of the lengths of thelegs. That is: a2 +b2 = c2.
This theorem is very useful because if we know the lengths of the legs of a right triangle, we can find the length ofthe hypotenuse. Also, if we know the length of the hypotenuse and the length of a leg, we can calculate the lengthof the missing leg of the triangle. When you use the Pythagorean Theorem, it does not matter which leg you call aand which leg you call b, but the hypotenuse is always called c.
Although nowadays we use the Pythagorean Theorem as a statement about the relationship between distances andlengths, originally the theorem made a statement about areas. If we build squares on each side of a right triangle, thePythagorean Theorem says that the area of the square whose side is the hypotenuse is equal to the sum of the areasof the squares formed by the legs of the triangle.
578

www.ck12.org Chapter 11. Algebra and Geometry Connections
Use the Pythagorean Theorem and Its Converse
The Pythagorean Theorem can be used to verify that a triangle is a right triangle. If you can show that the three sidesof a triangle make the equation a2 + b2 = c2 true, then you know that the triangle is a right triangle. This is calledthe Converse of the Pythagorean Theorem.
Note: When you use the Converse of the Pythagorean Theorem, you must make sure that you substitute the correctvalues for the legs and the hypotenuse. The hypotenuse must be the longest side. The other two sides are the legs,and the order in which you use them is not important.
Example 1
Determine if a triangle with sides 5, 12 and 13 is a right triangle.
Solution
The triangle is right if its sides satisfy the Pythagorean Theorem.
If it is a right triangle, the longest side has to be the hypotenuse, so we let c = 13.
We then designate the shorter sides as a = 5 and b = 12.
We plug these values into the Pythagorean Theorem:
a2 +b2 = c2⇒ 52 +122 = c2
25+144 = 169 = c2⇒ c = 13
The sides of the triangle satisfy the Pythagorean Theorem, thus the triangle is a right triangle.
Example 2
Determine if a triangle with sides,√
10,√
15 and 5 is a right triangle.
Solution
The longest side has to be the hypotenuse, so c = 5.
We designate the shorter sides as a =√
10 and b =√
15.
We plug these values into the Pythagorean Theorem:
a2 +b2 = c2⇒(√
10)2
+(√
15)2
= c2
10+15 = 25 = c2⇒ c = 5
579

11.4. The Pythagorean Theorem and Its Converse www.ck12.org
The sides of the triangle satisfy the Pythagorean Theorem, thus the triangle is a right triangle.
The Pythagorean Theorem can also be used to find the missing hypotenuse of a right triangle if we know the legs ofthe triangle. (For a demonstration of this, see
MEDIAClick image to the left for more content.
.)
Example 3
In a right triangle one leg has length 4 and the other has length 3. Find the length of the hypotenuse.
Solution
Start with the Pythagorean Theorem: a2 +b2 = c2
Plug in the known values of the legs: 32 +42 = c2
Simplify: 9+16 = c2
25 = c2
Take the square root of both sides: c = 5
Use the Pythagorean Theorem with Variables
Example 4
Determine the values of the missing sides. You may assume that each triangle is a right triangle.
a)
580

www.ck12.org Chapter 11. Algebra and Geometry Connections
b)
c)
Solution
Apply the Pythagorean Theorem.
a)
a2 +b2 = c2
x2 +152 = 212
x2 +225 = 441
x2 = 216⇒x =√
216 = 6√
6
b)
a2 +b2 = c2
y2 +32 = 72
y2 +9 = 49
y2 = 40⇒y =√
40 = 2√
10
c)
a2 +b2 = c2
182 +152 = z2
324+225 = z
z2 = 549⇒z =√
549 = 3√
61
581

11.4. The Pythagorean Theorem and Its Converse www.ck12.org
Example 5
One leg of a right triangle is 5 units longer than the other leg. The hypotenuse is one unit longer than twice the sizeof the short leg. Find the dimensions of the triangle.
Solution
Let x = length of the short leg.
Then x+5 = length of the long leg
And 2x+1 = length of the hypotenuse.
The sides of the triangle must satisfy the Pythagorean Theorem.
Therefore: x2 +(x+5)2 = (2x+1)2
Eliminate the parentheses: x2 + x2 +10x+25 = 4x2 +4x+1
Move all terms to the right hand side of the equation: 0 = 2x2−6x−24
Divide all terms by 2 : 0 = x2−3x−12
Solve using the quadratic formula: x =3±√
9+482
=3±√
572
x = 5.27 or x =−2.27
The negative solution doesn’t make sense when we are looking for a physical distance, so we can discard it. Usingthe positive solution, we get: short leg = 5.27, long leg = 10.27 and hypotenuse = 11.54.
Solve Real-World Problems Using the Pythagorean Theorem and Its Converse
The Pythagorean Theorem and its converse have many applications for finding lengths and distances.
Example 6
Maria has a rectangular cookie sheet that measures 10 inches× 14 inches. Find the length of the diagonal of thecookie sheet.
Solution
Draw a sketch:
Define variables: Let c = length of the diagonal.
Write a formula: Use the Pythagorean Theorem: a2 +b2 = c2
Solve the equation:
582

www.ck12.org Chapter 11. Algebra and Geometry Connections
102 +142 = c2
100+196 = c2
c2 = 296⇒ c =√
296⇒ c = 2√
74 or c = 17.2 inches
Check: 102 +142 = 100+196 = 296 and c2 = 17.22 = 296. The solution checks out.
Example 7
Find the area of the shaded region in the following diagram:
Solution
Draw the diagonal of the square in the figure:
Notice that the diagonal of the square is also the diameter of the circle.
Define variables: Let c = diameter of the circle.
Write the formula: Use the Pythagorean Theorem: a2 +b2 = c2.
Solve the equation:
22 +22 = c2
4+4 = c2
c2 = 8⇒ c =√
8⇒ c = 2√
2
The diameter of the circle is 2√
2, therefore the radius R =√
2.
Area of a circle formula: A = π ·R2 = π
(√2)2
= 2π.
The area of the shaded region is therefore 2π−4 = 2.28.
583

11.4. The Pythagorean Theorem and Its Converse www.ck12.org
Example 8
In a right triangle, one leg is twice as long as the other and the perimeter is 28. What are the measures of the sidesof the triangle?
Solution
Make a sketch and define variables:
Let: a = length of the short leg
2a = length of the long leg
c = length of the hypotenuse
Write formulas:
The sides of the triangle are related in two different ways.
The perimeter is 28, so a+2a+ c = 28⇒ 3a+ c = 28
The triangle is a right triangle, so the measures of the sides must satisfy the Pythagorean Theorem:
a2 +(2a)2 = c2⇒ a2 +4a2 = c2⇒ 5a2 = c2
or c = a√
5 = 2.236a
Solve the equation:
Plug the value of c we just obtained into the perimeter equation: 3a+ c = 28
3a+2.236a = 28⇒ 5.236a = 28⇒ a = 5.35
The short leg is: a = 5.35
The long leg is: 2a = 10.70
The hypotenuse is: c = 11.95
Check: The legs of the triangle should satisfy the Pythagorean Theorem:
a2 +b2 = 5.352 +10.702 = 143.1,c2 = 11.952 = 142.80. The results are approximately the same.
The perimeter of the triangle should be 28:
a+b+ c = 5.35+10.70+11.95 = 28The answer checks out.
Example 9
Mike is loading a moving van by walking up a ramp. The ramp is 10 feet long and the bed of the van is 2.5 feetabove the ground. How far does the ramp extend past the back of the van?
Solution
584

www.ck12.org Chapter 11. Algebra and Geometry Connections
Make a sketch:
Define variables: Let x = how far the ramp extends past the back of the van.
Write a formula: Use the Pythagorean Theorem: x2 +2.52 = 102
Solve the equation:
x2 +6.25 = 100
x2 = 93.5
x =√
93.5 = 9.7 f t
Check by plugging the result in the Pythagorean Theorem:
9.72 +2.52 = 94.09+6.25 = 100.34≈ 100. So the ramp is 10 feet long. The answer checks out.
Review Questions
Verify that each triangle is a right triangle.
1. a = 12,b = 9,c = 152. a = 6,b = 6,c = 6
√2
3. a = 8,b = 8√
3,c = 164. a = 2
√14,b = 5,c = 9
Find the missing length of each right triangle.
5. a = 12,b = 16,c =?6. a =? ,b = 20,c = 307. a = 4,b =? ,c = 11
8.
585

11.4. The Pythagorean Theorem and Its Converse www.ck12.org
9.
10.11. One leg of a right triangle is 4 feet less than the hypotenuse. The other leg is 12 feet. Find the lengths of the
three sides of the triangle.12. One leg of a right triangle is 3 more than twice the length of the other. The hypotenuse is 3 times the length
of the short leg. Find the lengths of the three legs of the triangle.13. Two sides of a right triangle are 5 units and 8 units respectively. Those sides could be the legs, or they could
be one leg and the hypotenuse. What are the possible lengths of the third side?14. A regulation baseball diamond is a square with 90 feet between bases. How far is second base from home
plate?15. Emanuel has a cardboard box that measures 20 cm long × 10 cm wide × 8 cm deep.
a. What is the length of the diagonal across the bottom of the box?b. What is the length of the diagonal from a bottom corner to the opposite top corner?
16. Samuel places a ladder against his house. The base of the ladder is 6 feet from the house and the ladder is 10feet long.
a. How high above the ground does the ladder touch the wall of the house?b. If the edge of the roof is 10 feet off the ground and sticks out 1.5 feet beyond the wall, how far is it from
the edge of the roof to the top of the ladder?
17. Find the area of the triangle below if the area of a triangle is defined as A = 12 base×height:
18. Instead of walking along the two sides of a rectangular field, Mario decided to cut across the diagonal. Hethus saves a distance that is half of the long side of the field.
a. Find the length of the long side of the field given that the short side is 123 feet.b. Find the length of the diagonal.
19. Marcus sails due north and Sandra sails due east from the same starting point. In two hours Marcus’ boat is35 miles from the starting point and Sandra’s boat is 28 miles from the starting point.
a. How far are the boats from each other?b. Sandra then sails 21 miles due north while Marcus stays put. How far is Sandra from the original starting
point?c. How far is Sandra from Marcus now?
586

www.ck12.org Chapter 11. Algebra and Geometry Connections
20. Determine the area of the circle below. (Hint: the hypotenuse of the triangle is the diameter of the circle.)
587

11.5. Distance and Midpoint Formulas www.ck12.org
11.5 Distance and Midpoint Formulas
Learning Objectives
• Find the distance between two points in the coordinate plane.• Find the missing coordinate of a point given the distance from another known point.• Find the midpoint of a line segment.• Solve real-world problems using distance and midpoint formulas.
Introduction
In the last section, we saw how to use the Pythagorean Theorem to find lengths. In this section, you’ll learn how touse the Pythagorean Theorem to find the distance between two coordinate points.
Example 1
Find the distance between points A = (1,4) and B = (5,2).
Solution
Plot the two points on the coordinate plane.
In order to get from point A = (1,4) to point B = (5,2), we need to move 4 units to the right and 2 units down. Theselines make the legs of a right triangle.
To find the distance between A and B we find the value of the hypotenuse, d, using the Pythagorean Theorem.
d2 = 22 +42 = 20
d =√
20 = 2√
5 = 4.47
Example 2
588

www.ck12.org Chapter 11. Algebra and Geometry Connections
Find the distance between points C = (2,−1) and D = (−3,−4).
Solution
We plot the two points on the graph above.
In order to get from point C to point D, we need to move 3 units down and 5 units to the left.
We find the distance from C to D by finding the length of d with the Pythagorean Theorem.
d2 = 32 +52 = 34
d =√
34 = 5.83
The Distance Formula
The procedure we just used can be generalized by using the Pythagorean Theorem to derive a formula for the distancebetween any two points on the coordinate plane.
Let’s find the distance between two general points A = (x1,y1) and B = (x2,y2).
Start by plotting the points on the coordinate plane:
In order to move from point A to point B in the coordinate plane, we move x2−x1 units to the right and y2−y1 unitsup.
We can find the length d by using the Pythagorean Theorem:
d2 = (x1− x2)2 +(y1− y2)
2
Therefore, d =√
(x1− x2)2 +(y1− y2)2. This is called the Distance Formula. More formally:
Given any two points (x1,y1) and (x2,y2), the distance between them is d =√
(x1− x2)2 +(y1− y2)2.
We can use this formula to find the distance between any two points on the coordinate plane. Notice that the distanceis the same whether you are going from point A to point B or from point B to point A, so it does not matter whichorder you plug the points into the distance formula.
589

11.5. Distance and Midpoint Formulas www.ck12.org
Let’s now apply the distance formula to the following examples.
Example 2
Find the distance between the following points.
a) (-3, 5) and (4, -2)
b) (12, 16) and (19, 21)
c) (11.5, 2.3) and (-4.2, -3.9)
Solution
Plug the values of the two points into the distance formula. Be sure to simplify if possible.
a) d =√(−3−4)2 +(5− (−2))2 =
√(−7)2 +(7)2 =
√49+49 =
√98 = 7
√2
b) d =√(12−19)2 +(16−21)2 =
√(−7)2 +(−5)2 =
√49+25 =
√74
c) d =√(11.5+4.2)2 +(2.3+3.9)2 =
√(15.7)2 +(6.2)2 =
√284.93 = 16.88
We can also use the Pythagorean Theorem
Example 3
Find all points on the line y = 2 that are exactly 8 units away from the point (-3, 7).
Solution
Let’s make a sketch of the given situation.
Draw line segments from the point (-3, 7) to the line y = 2.
Let k be the missing value of x we are seeking.
Let’s use the distance formula: 8 =√
(−3− k)2 +(7−2)2
Square both sides of the equation: 64 = (−3− k)2 +25
Therefore: 0 = 9+6k+ k2−39 or 0 = k2 +6k−30
Use the quadratic formula: k =−6±
√36+1202
=−6±
√156
2Therefore: k = 3.24 or k =−9.24
The points are (-9.24, 2) and (3.24, 2).
590

www.ck12.org Chapter 11. Algebra and Geometry Connections
Find the Midpoint of a Line Segment
Example 4
Find the coordinates of the point that is in the middle of the line segment connecting the points A = (−7,−2) andB = (3,−8).
Solution
Let’s start by graphing the two points:
We see that to get from point A to point B we move 6 units down and 10 units to the right.
In order to get to the point that is halfway between the two points, it makes sense that we should move half thevertical distance and half the horizontal distance—that is, 3 units down and 5 units to the right from point A.
The midpoint is M = (−7+5,−2−3) = (−2,−5).
The Midpoint Formula
We now want to generalize this method in order to find a formula for the midpoint of a line segment.
Let’s take two general points A = (x1,y1) and B = (x2,y2) and mark them on the coordinate plane:
We see that to get from A to B, we move x2− x1 units to the right and y2− y1 units up.
In order to get to the half-way point, we need to move x2−x12 units to the right and y2−y1
2 up from point A. Thus themidpoint M is at
(x1 +
x2−x12 ,y1 +
y2−y12
).
591

11.5. Distance and Midpoint Formulas www.ck12.org
This simplifies to M =( x1+x2
2 , y1+y22
). This is the Midpoint Formula:
The midpoint of the line segment connecting the points (x1,y1) and (x2,y2) is( x1+x2
2 , y1+y22
).
It should hopefully make sense that the midpoint of a line is found by taking the average values of the x and y−valuesof the endpoints.
For a graphic demonstration of the midpoint formula, watch this video:
MEDIAClick image to the left for more content.
.
Example 5
Find the midpoint between the following points.
a) (-10, 2) and (3, 5)
b) (3, 6) and (7, 6)
c) (4, -5) and (-4, 5)
Solution
Let’s apply the Midpoint Formula:( x1+x2
2 , y1+y22
)a) the midpoint of (-10, 2) and (3, 5) is
(−10+32 , 2+5
2
)=(−7
2 , 72
)= (−3.5,3.5)
b) the midpoint of (3, 6) and (7, 6) is(3+7
2 , 6+62
)=(10
2 ,122
)= (5,6)
c) the midpoint of (4, -5) and (-4, 5) is(4−4
2 , −5+52
)=(0
2 ,02
)= (0,0)
Example 6
A line segment whose midpoint is (2, -6) has an endpoint of (9, -2). What is the other endpoint?
Solution
In this problem we know the midpoint and we are looking for the missing endpoint.
The midpoint is (2, -6).
One endpoint is (x1,x2) = (9,−2).
Let’s call the missing point (x,y).
We know that the x−coordinate of the midpoint is 2, so: 2 = 9+x22 ⇒ 4 = 9+ x2⇒ x2 =−5
We know that the y−coordinate of the midpoint is -6, so:
−6 =−2+ y2
2⇒−12 =−2+ y2⇒ y2 =−10
The missing endpoint is (-5, -10).
Here’s another way to look at this problem: To get from the endpoint (9, -2) to the midpoint (2, [U+2011]6), wehad to go 7 units left and 4 units down. To get from the midpoint to the other endpoint, then, we would need to go 7more units left and 4 more units down, which takes us to (-5, -10).
592

www.ck12.org Chapter 11. Algebra and Geometry Connections
Solve Real-World Problems Using Distance and Midpoint Formulas
The distance and midpoint formula are useful in geometry situations where we want to find the distance betweentwo points or the point halfway between two points.
Example 7
Plot the points A = (4,−2),B = (5,5), and C = (−1,3) and connect them to make a triangle. Show that the triangleis isosceles.
Solution
Let’s start by plotting the three points on the coordinate plane and making a triangle:
We use the distance formula three times to find the lengths of the three sides of the triangle.
AB =√(4−5)2 +(−2−5)2 =
√(−1)2 +(−7)2 =
√1+49 =
√50 = 5
√2
BC =√(5+1)2 +(5−3)2 =
√(6)2 +(2)2 =
√36+4 =
√40 = 2
√10
AC =√
(4+1)2 +(−2−3)2 =√(5)2 +(−5)2 =
√25+25 =
√50 = 5
√2
Notice that AB = AC, therefore triangle ABC is isosceles.
Example 8
At 8 AM one day, Amir decides to walk in a straight line on the beach. After two hours of making no turns andtraveling at a steady rate, Amir is two miles east and four miles north of his starting point. How far did Amir walkand what was his walking speed?
Solution
Let’s start by plotting Amir’s route on a coordinate graph. We can place his starting point at the origin: A = (0,0).Then his ending point will be at B = (2,4).
593

11.5. Distance and Midpoint Formulas www.ck12.org
The distance can be found with the distance formula:
d =√(2−0)2 +(4−0)2 =
√(2)2 +(4)2 =
√4+16 =
√20
d = 4.47 miles
Since Amir walked 4.47 miles in 2 hours, his speed is s = 4.47 miles2 hours = 2.24 mi/h.
Review Questions
Find the distance between the two points.
1. (3, -4) and (6, 0)2. (-1, 0) and (4, 2)3. (-3, 2) and (6, 2)4. (0.5, -2.5) and (4, -4)5. (12, -10) and (0, -6)6. (-5, -3) and (-2, 11)7. (2.3, 4.5) and (-3.4, -5.2)8. Find all points having an x−coordinate of -4 whose distance from the point (4, 2) is 10.9. Find all points having a y−coordinate of 3 whose distance from the point (-2, 5) is 8.
10. Find three points that are each 13 units away from the point (3, 2) but do not have an x−coordinate of 3 or ay−coordinate of 2.
Find the midpoint of the line segment joining the two points.
11. (3, -4) and (6, 1)12. (2, -3) and (2, 4)13. (4, -5) and (8, 2)14. (1.8, -3.4) and (-0.4, 1.4)15. (5, -1) and (-4, 0)16. (10, 2) and (2, -4)17. (3, -3) and (2, 5)18. An endpoint of a line segment is (4, 5) and the midpoint of the line segment is (3, -2). Find the other endpoint.
594

www.ck12.org Chapter 11. Algebra and Geometry Connections
19. An endpoint of a line segment is (-10, -2) and the midpoint of the line segment is (0, 4). Find the otherendpoint.
20. Find a point that is the same distance from (4, 5) as it is from (-2, -1), but is not the midpoint of the linesegment connecting them.
21. Plot the points A = (1,0),B = (6,4),C = (9,−2) and D = (−6,−4),E = (−1,0),F = (2,−6). Prove thattriangles ABC and DEF are congruent.
22. Plot the points A = (4,−3),B = (3,4),C = (−2,−1),D = (−1,−8). Show that ABCD is a rhombus (all sidesare equal)
23. Plot points A = (−5,3),B = (6,0),C = (5,5). Find the length of each side. Show that ABC is a right triangle.Find its area.
24. Find the area of the circle with center (-5, 4) and the point on the circle (3, 2).25. Michelle decides to ride her bike one day. First she rides her bike due south for 12 miles and then the direction
of the bike trail changes and she rides in the new direction for a while longer. When she stops Michelle is 2miles south and 10 miles west from her starting point. Find the total distance that Michelle covered from herstarting point.
595

www.ck12.org
CHAPTER 12 Rational Equations andFunctions
Chapter Outline12.1 INVERSE VARIATION MODELS
12.2 GRAPHS OF RATIONAL FUNCTIONS
12.3 DIVISION OF POLYNOMIALS
12.4 RATIONAL EXPRESSIONS
12.5 MULTIPLYING AND DIVIDING RATIONAL EXPRESSIONS
12.6 ADDING AND SUBTRACTING RATIONAL EXPRESSIONS
12.7 SOLUTIONS OF RATIONAL EQUATIONS
596

www.ck12.org Chapter 12. Rational Equations and Functions
12.1 Inverse Variation Models
Learning Objectives
• Distinguish direct and inverse variation.• Graph inverse variation equations.• Write inverse variation equations.• Solve real-world problems using inverse variation equations.
Introduction
Many variables in real-world problems are related to each other by variations. A variation is an equation that relatesa variable to one or more other variables by the operations of multiplication and division. There are three differentkinds of variation: direct variation, inverse variation and joint variation.
Distinguish Direct and Inverse Variation
In direct variation relationships, the related variables will either increase together or decrease together at a steadyrate. For instance, consider a person walking at three miles per hour. As time increases, the distance covered by theperson walking also increases, at the rate of three miles each hour. The distance and time are related to each otherby a direct variation:
distance = speed× time
Since the speed is a constant 3 miles per hour, we can write: d = 3t.
The general equation for a direct variation is y = kx, where k is called the constant of proportionality.
You can see from the equation that a direct variation is a linear equation with a y−intercept of zero. The graphof a direct variation relationship is a straight line passing through the origin whose slope is k, the constant ofproportionality.
597

12.1. Inverse Variation Models www.ck12.org
A second type of variation is inverse variation. When two quantities are related to each other inversely, one quantityincreases as the other one decreases, and vice versa.
For instance, if we look at the formula distance = speed× time again and solve for time, we obtain:
time =distance
speed
If we keep the distance constant, we see that as the speed of an object increases, then the time it takes to cover thatdistance decreases. Consider a car traveling a distance of 90 miles, then the formula relating time and speed is:t = 90
s .
The general equation for inverse variation is y = kx , where k is the constant of proportionality.
In this chapter, we’ll investigate how the graphs of these relationships behave.
Another type of variation is a joint variation. In this type of relationship, one variable may vary as a product of twoor more variables.
For example, the volume of a cylinder is given by:
V = πR2 ·h
In this example the volume varies directly as the product of the square of the radius of the base and the height of thecylinder. The constant of proportionality here is the number π.
In many application problems, the relationship between the variables is a combination of variations. For instanceNewton’s Law of Gravitation states that the force of attraction between two spherical bodies varies jointly as themasses of the objects and inversely as the square of the distance between them:
F = Gm1m2
d2
In this example the constant of proportionality is called the gravitational constant, and its value is given by G =6.673×10⁻¹¹ N ·m2/kg2.
598

www.ck12.org Chapter 12. Rational Equations and Functions
Graph Inverse Variation Equations
We saw that the general equation for inverse variation is given by the formula y = kx , where k is a constant of
proportionality. We will now show how the graphs of such relationships behave. We start by making a table ofvalues. In most applications, x and y are positive, so in our table we’ll choose only positive values of x.
Example 1
Graph an inverse variation relationship with the proportionality constant k = 1.
Solution
TABLE 12.1:
x y = 1x
0 y = 10 = undefined
14 y = 1
14= 4
12 y = 1
12= 2
34 y = 1
34= 1.33
1 y = 11 = 1
32 y = 1
32= 0.67
2 y = 12 = 0.5
3 y = 13 = 0.33
4 y = 14 = 0.25
5 y = 15 = 0.2
10 y = 110 = 0.1
Here is a graph showing these points connected with a smooth curve.
Both the table and the graph demonstrate the relationship between variables in an inverse variation. As one variableincreases, the other variable decreases and vice versa.
Notice that when x = 0, the value of y is undefined. The graph shows that when the value of x is very small, thevalue of y is very big—so it approaches infinity as x gets closer and closer to zero.
Similarly, as the value of x gets very large, the value of y gets smaller and smaller but never reaches zero. We willinvestigate this behavior in detail throughout this chapter.
599

12.1. Inverse Variation Models www.ck12.org
Write Inverse Variation Equations
As we saw, an inverse variation fulfills the equation y = kx . In general, we need to know the value of y at a particular
value of x in order to find the proportionality constant. Once we know the proportionality constant, we can then findthe value of y for any given value of x.
Example 2
If y is inversely proportional to x, and if y = 10 when x = 5, find y when x = 2.
Solution
Since y is inversely proportional to x, then: y = kx
Plug in the values y = 10 and x = 5 : 10 = k5
Solve for k by multiplying both sides of the equation by 5 : k = 50
The inverse relationship is given by: y = 50x
When x = 2 : y = 502 or y = 25
Example 3
If p is inversely proportional to the square of q, and p = 64 when q = 3, find p when q = 5.
Solution
Since p is inversely proportional to q2, then: p = kq2
Plug in the values p = 64 and q = 3 : 64 = k32 or 64 = k
9
Solve for k by multiplying both sides of the equation by 9 : k = 576
The inverse relationship is given by: p = 576q2
When q = 5 : p = 57625 or y = 23.04
To see some more variation problems worked out, including problems involving joint variation, watch the video at
MEDIAClick image to the left for more content.
.
600

www.ck12.org Chapter 12. Rational Equations and Functions
Solve Real-World Problems Using Inverse Variation Equations
Many formulas in physics are described by variations. In this section we’ll investigate some problems that aredescribed by inverse variations.
Example 4
The frequency, f , of sound varies inversely with wavelength, λ. A sound signal that has a wavelength of 34 metershas a frequency of 10 hertz. What frequency does a sound signal of 120 meters have?
Solution
The inverse variation relationship is: f = kλ
Plug in the values: λ = 34 and f = 10 : 10 = k34
Multiply both sides by 34 : k = 340
Thus, the relationship is given by: f = 340λ
Plug in λ = 120 meters: f = 340120 ⇒ f = 2.83 Hertz
Example 5
Electrostatic force is the force of attraction or repulsion between two charges. The electrostatic force is given bythe formula F = Kq1q2
d2 , where q1 and q2 are the charges of the charged particles, d is the distance between thecharges and k is a proportionality constant. The charges do not change, so they too are constants; that means wecan combine them with the other constant k to form a new constant K, so we can rewrite the equation as F = K
d2 .
If the electrostatic force is F = 740 Newtons when the distance between charges is 5.3× 10⁻¹¹ meters, what is Fwhen d = 2.0×10⁻¹⁰ meters?
Solution
The inverse variation relationship is: F = Kd2
Plug in the values F = 740 and d = 5.3×10⁻¹¹ : 740 = K(5.3 × 10⁻¹¹)
2
Multiply both sides by (5.3×10⁻¹¹)2 : K = 740(5.3×10⁻¹¹
)2
K = 2.08×10⁻¹⁸
The electrostatic force is given by: F = 2.08 × 10⁻¹⁸
d2
When d = 2.0×10⁻¹⁰ : F = 2.08 × 10⁻¹⁸
(2.0 × 10⁻¹⁰)2
Use scientific notation to simplify: F = 52 Newtons
Review Questions
Graph the following inverse variation relationships.
1. y = 3x
601

12.1. Inverse Variation Models www.ck12.org
2. y = 10x
3. y = 14x
4. y = 56x
5. If z is inversely proportional to w and z = 81 when w = 9, find w when z = 24.6. If y is inversely proportional to x and y = 2 when x = 8, find y when x = 12.7. If a is inversely proportional to the square root of b, and a = 32 when b = 9, find b when a = 6.8. If w is inversely proportional to the square of u and w = 4 when u = 2, find w when u = 8.9. If a is proportional to both b and c and a = 7 when b = 2 and c = 6, find a when b = 4 and c = 3.
10. If x is proportional to y and inversely proportional to z, and x = 2 when y = 10 and z = 25, find x when y = 8and z = 35.
11. If a varies directly with b and inversely with the square of c, and a = 10 when b = 5 and c = 2, find the valueof a when b = 3 and c = 6.
12. If x varies directly with y and z varies inversely with x, and z = 3 when y = 5, find z when y = 10.13. The intensity of light is inversely proportional to the square of the distance between the light source and the
object being illuminated.
a. A light meter that is 10 meters from a light source registers 35 lux. What intensity would it register 25meters from the light source?
b. A light meter that is registering 40 lux is moved twice as far away from the light source illuminating it.What intensity does it now register? (Hint: let x be the original distance from the light source.)
c. The same light meter is moved twice as far away again (so it is now four times as far from the lightsource as it started out). What intensity does it register now?
14. Ohm’s Law states that current flowing in a wire is inversely proportional to the resistance of the wire. If thecurrent is 2.5 Amperes when the resistance is 20 ohms, find the resistance when the current is 5 Amperes.
15. The volume of a gas varies directly with its temperature and inversely with its pressure. At 273 degrees Kelvinand pressure of 2 atmospheres, the volume of a certain gas is 24 liters.
a. Find the volume of the gas when the temperature is 220 Kelvin and the pressure is 1.2 atmospheres.b. Find the temperature when the volume is 24 liters and the pressure is 3 atmospheres.
16. The volume of a square pyramid varies jointly with the height and the square of the side length of the base. Apyramid whose height is 4 inches and whose base has a side length of 3 inches has a volume of 12 in3.
a. Find the volume of a square pyramid that has a height of 9 inches and whose base has a side length of 5inches.
b. Find the height of a square pyramid that has a volume of 49 in3 and whose base has a side length of 7inches.
c. A square pyramid has a volume of 72 in3 and its base has a side length equal to its height. Find the heightof the pyramid.
602

www.ck12.org Chapter 12. Rational Equations and Functions
12.2 Graphs of Rational Functions
Learning Objectives
• Compare graphs of inverse variation equations.• Graph rational functions.• Solve real-world problems using rational functions.
Introduction
In this section, you’ll learn how to graph rational functions. Graphs of rational functions are very distinctive, becausethey get closer and closer to certain values but never reach those values. This behavior is called asymptotic behavior,and we will see that rational functions can have horizontal asymptotes, vertical asymptotes or oblique (or slant)asymptotes.
Compare Graphs of Inverse Variation Equations
Inverse variation problems are the simplest example of rational functions. We saw that an inverse variation has thegeneral equation: y = k
x . In most real-world problems, x and y take only positive values. Below, we will show graphsof three inverse variation functions.
Example 1
On the same coordinate grid, graph inverse variation relationships with the proportionality constants k = 1,k = 2,and k = 1
2 .
Solution
We’ll skip the table of values for this problem, and just show the graphs of the three functions on the same coordinateaxes. Notice that for larger constants of proportionality, the curve decreases at a slower rate than for smaller constantsof proportionality. This makes sense because the value of y is related directly to the proportionality constants, so weshould expect larger values of y for larger values of k.
603

12.2. Graphs of Rational Functions www.ck12.org
Graph Rational Functions
Now we’ll extend the domain and range of rational equations to include negative values of x and y. First we’ll plota few rational functions by using a table of values, and then we’ll talk about the distinguishing characteristics ofrational functions that can help us make better graphs.
As we graph rational functions, we need to always pay attention to values of x that will cause us to divide by 0.Remember that dividing by 0 doesn’t give us an actual number as a result.
Example 2
Graph the function y = 1x .
Solution
Before we make a table of values, we should notice that the function is not defined for x = 0. This means that thegraph of the function won’t have a value at that point. Since the value of x = 0 is special, we should make sure topick enough values close to x = 0 in order to get a good idea how the graph behaves.
Let’s make two tables: one for x−values smaller than zero and one for x−values larger than zero.
TABLE 12.2:
x y = 1x x y = 1
x−5 y = 1
−5 =−0.2 0.1 y = 10.1 = 10
-4 y = 1−4 =−0.25 0.2 y = 1
0.2 = 5-3 y = 1
−3 =−0.33 0.3 y = 10.3 = 3.3
-2 y = 1−2 =−0.5 0.4 y = 1
0.4 = 2.5-1 y = 1
−1 =−1 0.5 y = 10.5 = 2
-0.5 y = 1−0.5 =−2 1 y = 1
1 = 1-0.4 y = 1
−0.4 =−2.5 2 y = 12 = 0.5
-0.3 y = 1−0.3 =−3.3 3 y = 1
3 = 0.33-0.2 y = 1
−0.2 =−5 4 y = 14 = 0.25
-0.1 y = 1−0.1 =−10 5 y = 1
5 = 0.2
We can see that as we pick positive values of x closer and closer to zero, y gets larger, and as we pick negative valuesof x closer and closer to zero, y gets smaller (or more and more negative).
604

www.ck12.org Chapter 12. Rational Equations and Functions
Notice on the graph that for values of x near 0, the points on the graph get closer and closer to the vertical line x = 0.The line x = 0 is called a vertical asymptote of the function y = 1
x .
We also notice that as the absolute values of x get larger in the positive direction or in the negative direction, thevalue of y gets closer and closer to y = 0 but will never gain that value. Since y = 1
x , we can see that there are novalues of x that will give us the value y = 0. The horizontal line y = 0 is called a horizontal asymptote of thefunction y = 1
x
Asymptotes are usually denoted as dashed lines on a graph. They are not part of the function; instead, they showvalues that the function approaches, but never gets to. A horizontal asymptote shows the value of y that the functionapproaches (but never reaches) as the absolute value of x gets larger and larger. A vertical asymptote shows that theabsolute value of y gets larger and larger as x gets closer to a certain value which it can never actually reach.
Now we’ll show the graph of a rational function that has a vertical asymptote at a non-zero value of x.
Example 3
Graph the function y = 1(x−2)2 .
Solution
We can see that the function is not defined for x = 2, because that would make the denominator of the fraction equalzero. This tells us that there should be a vertical asymptote at x = 2, so we can start graphing the function by drawingthe vertical asymptote.
605

12.2. Graphs of Rational Functions www.ck12.org
Now let’s make a table of values.
TABLE 12.3:
x y = 1(x−2)2
0 y = 1(0−2)2 =
14
1 y = 1(1−2)2 = 1
1.5 y = 1(1.5−2)2 = 4
2 undefined2.5 y = 1
(2.5−2)2 = 43 y = 1
(3−2)2 = 14 y = 1
(4−2)2 =14
Here’s the resulting graph:
Notice that we didn’t pick as many values for our table this time, because by now we have a pretty good idea whathappens near the vertical asymptote.
We also know that for large values of |x|, the value of y could approach a constant value. In this case that value isy = 0: this is the horizontal asymptote.
A rational function doesn’t have to have a vertical or horizontal asymptote. The next example shows a rationalfunction with no vertical asymptotes.
606

www.ck12.org Chapter 12. Rational Equations and Functions
Example 4
Graph the function y = x2
x2+1 .
Solution
We can see that this function will have no vertical asymptotes because the denominator of the fraction will never bezero. Let’s make a table of values to see if the value of y approaches a particular value for large values of x, bothpositive and negative.
TABLE 12.4:
x y = x2
x2+1
−3 y = (−3)2
(−3)2+1 = 910 = 0.9
-2 y = (−2)2
(−2)2+1 = 45 = 0.8
-1 y = (−1)2
(−1)2+1 = 12 = 0.5
0 y = (0)2
(0)2+1 = 01 = 0
1 y = (1)2
(1)2+1 = 12 = 0.5
2 y = (2)2
(2)2+1 = 45 = 0.8
3 y = (3)2
(3)2+1 = 910 = 0.9
Below is the graph of this function.
The function has no vertical asymptote. However, we can see that as the values of |x| get larger, the value of y getscloser and closer to 1, so the function has a horizontal asymptote at y = 1.
Finding Horizontal Asymptotes
We said that a horizontal asymptote is the value of y that the function approaches for large values of |x|. When weplug in large values of x in our function, higher powers of x get larger much quickly than lower powers of x. Forexample, consider:
y =2x2 + x−13x2−4x+3
607

12.2. Graphs of Rational Functions www.ck12.org
If we plug in a large value of x, say x = 100, we get:
y =2(100)2 +(100)−13(100)2−4(100)+3
=20000+100−130000−400+2
We can see that the beginning terms in the numerator and denominator are much bigger than the other terms in eachexpression. One way to find the horizontal asymptote of a rational function is to ignore all terms in the numeratorand denominator except for the highest powers.
In this example the horizontal asymptote is y = 2x2
3x2 , which simplifies to y = 23 .
In the function above, the highest power of x was the same in the numerator as in the denominator. Now consider afunction where the power in the numerator is less than the power in the denominator:
y =x
x2 +3
As before, we ignore all the terms except the highest power of x in the numerator and the denominator. That givesus y = x
x2 , which simplifies to y = 1x .
For large values of x, the value of y gets closer and closer to zero. Therefore the horizontal asymptote is y = 0.
To summarize:
• Find vertical asymptotes by setting the denominator equal to zero and solving for x.• For horizontal asymptotes, we must consider several cases:
– If the highest power of x in the numerator is less than the highest power of x in the denominator, then thehorizontal asymptote is at y = 0.
– If the highest power of x in the numerator is the same as the highest power of x in the denominator, thenthe horizontal asymptote is at y = coe f f icient o f highest power o f x
coe f f icient o f highest power o f x .– If the highest power of x in the numerator is greater than the highest power of x in the denominator, then
we don’t have a horizontal asymptote; we could have what is called an oblique (slant) asymptote, or noasymptote at all.
Example 5
Find the vertical and horizontal asymptotes for the following functions.
a) y = 1x−1
b) y = 3x4x+2
c) y = x2−22x2+3
d) y = x3
x2−3x+2
Solution
a) Vertical asymptotes:
Set the denominator equal to zero. x−1 = 0⇒ x = 1 is the vertical asymptote.
Horizontal asymptote:
Keep only the highest powers of x. y = 1x ⇒ y = 0 is the horizontal asymptote.
b) Vertical asymptotes:
Set the denominator equal to zero. 4x+2 = 0⇒ x =−12 is the vertical asymptote.
608

www.ck12.org Chapter 12. Rational Equations and Functions
Horizontal asymptote:
Keep only the highest powers of x. y = 3x4x ⇒ y = 3
4 is the horizontal asymptote.
c) Vertical asymptotes:
Set the denominator equal to zero: 2x2+3= 0⇒ 2x2 =−3⇒ x2 =−32 . Since there are no solutions to this equation,
there is no vertical asymptote.
Horizontal asymptote:
Keep only the highest powers of x. y = x2
2x2 ⇒ y = 12 is the horizontal asymptote.
d) Vertical asymptotes:
Set the denominator equal to zero: x2−3x+2 = 0
Factor: (x−2)(x−1) = 0
Solve: x = 2 and x = 1 are the vertical asymptotes.
Horizontal asymptote. There is no horizontal asymptote because the power of the numerator is larger than thepower of the denominator.
Notice the function in part d had more than one vertical asymptote. Here’s another function with two verticalasymptotes.
Example 6
Graph the function y = −x2
x2−4 .
Solution
Let’s set the denominator equal to zero: x2−4 = 0
Factor: (x−2)(x+2) = 0
Solve: x = 2,x =−2
We find that the function is undefined for x = 2and x = −2, so we know that there are vertical asymptotes at thesevalues of x.
We can also find the horizontal asymptote by the method we outlined above. It’s at y = −x2
x2 , or y =−1.
So, we start plotting the function by drawing the vertical and horizontal asymptotes on the graph.
Now, let’s make a table of values. Because our function has a lot of detail we must make sure that we pick enoughvalues for our table to determine the behavior of the function accurately. We must make sure especially that we pick
609

12.2. Graphs of Rational Functions www.ck12.org
values close to the vertical asymptotes.
TABLE 12.5:
x y = −x2
x2−4
−5 y = −(−5)2
(−5)2−4 = −2521 =−1.19
-4 y = −(−4)2
(−4)2−4 = −1612 =−1.33
-3 y = −(−3)2
(−3)2−4 = −95 =−1.8
-2.5 y = −(−2.5)2
(−2.5)2−4 = −6.252.25 =−2.8
-1.5 y = −(−1.5)2
(−1.5)2−4 = −2.25−1.75 = 1.3
-1 y = −(−1)2
(−1)2−4 = −1−3 = 0.33
0 y = −02
(0)2−4 = 0−4 = 0
1 y = −12
(1)2−4 = −1−3 = 0.33
1.5 y = −1.52
(1.5)2−4 = −2.25−1.75 = 1.3
2.5 y = −2.52
(2.5)2−4 = −6.252.25 =−2.8
3 y = −32
(3)2−4 = −95 =−1.8
4 y = −42
(4)2−4 = −1612 =−1.33
5 y = −52
(5)2−4 = −2521 =−1.19
Here is the resulting graph.
To explore more graphs of rational functions, try the applets available at http://www.analyzemath.com/rational/rational1.html.
Solve Real-World Problems Using Rational Functions
Electrical circuits are commonplace is everyday life—for example, they’re in all the electrical appliances in yourhome. The figure below shows an example of a simple electrical circuit. It consists of a battery which provides avoltage (V , measured in Volts, V ), a resistor (R, measured in ohms, Ω) which resists the flow of electricity and anammeter that measures the current (I, measured in amperes, A) in the circuit.
610

www.ck12.org Chapter 12. Rational Equations and Functions
Ohm’s Law gives a relationship between current, voltage and resistance. It states that
I =VR
Your light bulbs, toaster and hairdryer are all basically simple resistors. In addition, resistors are used in an electricalcircuit to control the amount of current flowing through a circuit and to regulate voltage levels. One important reasonto do this is to prevent sensitive electrical components from burning out due to too much current or too high a voltagelevel. Resistors can be arranged in series or in parallel.
For resistors placed in a series:
the total resistance is just the sum of the resistances of the individual resistors:
Rtot = R1 +R2
For resistors placed in parallel:
the reciprocal of the total resistance is the sum of the reciprocals of the resistances of the individual resistors:
1Rc
=1
R1+
1R2
Example 7
Find the quantity labeled x in the following circuit.
611

12.2. Graphs of Rational Functions www.ck12.org
Solution
We use the formula I = VR .
Plug in the known values:I = 2 A,V = 12 V : 2 = 12R
Multiply both sides by R : 2R = 12
Divide both sides by 2 : R = 6Ω Answer
Example 8
Find the quantity labeled x in the following circuit.
Solution
Ohm’s Law also tells us that Itotal =VtotalRtotal
Plug in the values we know, I = 2.5 A and E = 9 V : 2.5 = 9Rtot
Multiply both sides by R : 2.5Rtot = 9
Divide both sides by 2.5 : Rtot = 3.6Ω
Since the resistors are placed in parallel, the total resistance is given by: 1Rtot
= 1X + 1
20
⇒ 136 = 1
X + 120
Multiply all terms by 72X : 13.6(72X) = 1
X (72X)+ 120(72X)
Cancel common factors: 20X = 72+3.6X
Solve: 16.4X = 72
Divide both sides by 16.4 : X = 4.39Ω Answer
612

www.ck12.org Chapter 12. Rational Equations and Functions
Review Questions
Find all the vertical and horizontal asymptotes of the following rational functions.
1. y = 4x+2
2. y = 5x−12x−6
3. y = 10x
4. y = x+1x2
5. y = 4x2
4x2+16. y = 2x
x2−9
7. y = 3x2
x2−48. y = 1
x2+4x+39. y = 2x+5
x2−2x−8
Graph the following rational functions. Draw dashed vertical and horizontal lines on the graph to denote asymptotes.
10. y = 2x−3
11. y = 3x2
12. y = xx−1
13. y = 2xx+1
14. y = −1x2+2
15. y = xx2+9
16. y = x2
x2+117. y = 1
x2−118. y = 2x
x2−9
19. y = x2
x2−1620. y = 3
x2−4x+421. y = x
x2−x−6
Find the quantity labeled x in each of the following circuits.
22.
23.
613

www.ck12.org Chapter 12. Rational Equations and Functions
12.3 Division of Polynomials
Learning Objectives
• Divide a polynomial by a monomial.• Divide a polynomial by a binomial.• Rewrite and graph rational functions.
Introduction
A rational expression is formed by taking the quotient of two polynomials.
Some examples of rational expressions are
2xx2−1
4x2−3x+42x
9x2 +4x−5x2 +5x−1
2x3
2x+3
Just as with rational numbers, the expression on the top is called the numerator and the expression on the bottomis called the denominator. In special cases we can simplify a rational expression by dividing the numerator by thedenominator.
Divide a Polynomial by a Monomial
We’ll start by dividing a polynomial by a monomial. To do this, we divide each term of the polynomial by themonomial. When the numerator has more than one term, the monomial on the bottom of the fraction serves as thecommon denominator to all the terms in the numerator.
Example 1
Divide.
a) 8x2−4x+162
b) 3x2+6x−1x
c) −3x2−18x+69x
Solution
a) 8x2−4x+162 = 8x2
2 −4x2 + 16
2 = 4x2−2x+8
b) 3x3+6x−1x = 3x3
x + 6xx −
1x = 3x2 +6− 1
x
c) −3x2−18x+69x =−3x2
9x −18x9x + 6
9x =−x3 −2+ 2
3x
A common error is to cancel the denominator with just one term in the numerator.
615

12.3. Division of Polynomials www.ck12.org
Consider the quotient 3x+44 .
Remember that the denominator of 4 is common to both the terms in the numerator. In other words we are dividingboth of the terms in the numerator by the number 4.
The correct way to simplify is:
3x+44
=3x4+
44=
3x4+1
A common mistake is to cross out the number 4 from the numerator and the denominator, leaving just 3x. This isincorrect, because the entire numerator needs to be divided by 4.
Example 2
Divide 5x3−10x2+x−25−5x2 .
Solution
5x3−10x2 + x−25−5x2 =
5x3
−5x2 −10x2
−5x2 +x−5x2 −
25−5x2
The negative sign in the denominator changes all the signs of the fractions:
−5x3
5x2 +10x2
5x2 −x
5x2 +255x2 =−x+2− 1
5x+
5x2
Divide a Polynomial by a Binomial
We divide polynomials using a method that’s a lot like long division with numbers. We’ll explain the method bydoing an example.
Example 3
Divide x2+4x+5x+3 .
Solution
When we perform division, the expression in the numerator is called the dividend and the expression in thedenominator is called the divisor.
To start the division we rewrite the problem in the following form:
x+3)x2 +4x+5
We start by dividing the first term in the dividend by the first term in the divisor: x2
x = x.
We place the answer on the line above the x term:
x
x+3)x2+4x+5
616

www.ck12.org Chapter 12. Rational Equations and Functions
Next, we multiply the x term in the answer by the divisor, x+ 3, and place the result under the dividend, matchinglike terms. x times (x+3) is x2 +3x, so we put that under the divisor:
x
x+3)x2+4x+5
x2 +3x
Now we subtract x2 + 3x from x2 + 4x+ 5. It is useful to change the signs of the terms of x2 + 3x to −x2− 3x andadd like terms vertically:
x
x+3)x2+4x+5
−x2−3x
x
Now, we bring down the 5, the next term in the dividend.
x
x+3)x2+4x+5
−x2−3x
x+5
And now we go through that procedure once more. First we divide the first term of x+ 5 by the first term of thedivisor. x divided by x is 1, so we place this answer on the line above the constant term of the dividend:
x + 1
x+3)x2+4x+5
−x2−3x
x+5
Multiply 1 by the divisor, x+3, and write the answer below x+5, matching like terms.
x + 1
x+3)x2+4x+5
−x2−3x
x+5
x+3
Subtract x+3 from x+5 by changing the signs of x+3 to −x−3 and adding like terms:
x + 1
x+3)x2+4x+5
−x2−3x
x+5
−x−3
2
617

12.3. Division of Polynomials www.ck12.org
Since there are no more terms from the dividend to bring down, we are done. The quotient is x+1 and the remainderis 2.
Remember that for a division with a remainder the answer is quotient+ remainderdivisor . So the answer to this division
problem is x2+4x+5x+3 = x+1+ 2
x+3 .
Check
To check the answer to a long division problem we use the fact that
(divisor×quotient)+ remainder = dividend
For the problem above, here’s how we apply that fact to check our solution:
(x+3)(x+1)+2 = x2 +4x+3+2
= x2 +4x+5
The answer checks out.
To check your answers to long division problems involving polynomials, try the solver at http://calc101.com/webMathematica/long-divide.jsp. It shows the long division steps so you can tell where you may have made a mistake.
Rewrite and Graph Rational Functions
In the last section we saw how to find vertical and horizontal asymptotes. Remember, the horizontal asymptoteshows the value of y that the function approaches for large values of x. Let’s review the method for finding horizontalasymptotes and see how it’s related to polynomial division.
When it comes to finding asymptotes, there are basically four different types of rational functions.
Case 1: The polynomial in the numerator has a lower degree than the polynomial in the denominator.
Take, for example, y = 2x−1 . We can’t reduce this fraction, and as x gets larger the denominator of the fraction gets
much bigger than the numerator, so the whole fraction approaches zero.
The horizontal asymptote is y = 0.
Case 2: The polynomial in the numerator has the same degree as the polynomial in the denominator.
Take, for example, y = 3x+2x−1 . In this case we can divide the two polynomials:
3
x−1)3x+2
−3x+3
5
So the expression can be written as y = 3+ 5x−1 .
Because the denominator of the remainder is bigger than the numerator of the remainder, the remainder will approachzero for large values of x. Adding the 3 to that 0 means the whole expression will approach 3.
The horizontal asymptote is y = 3.
618

www.ck12.org Chapter 12. Rational Equations and Functions
Case 3: The polynomial in the numerator has a degree that is one more than the polynomial in the denominator.
Take, for example, y = 4x2+3x+2x−1 . We can do long division once again and rewrite the expression as y = 4x+7+ 9
x−1 .The fraction here approaches zero for large values of x, so the whole expression approaches 4x+7.
When the rational function approaches a straight line for large values of x, we say that the rational function has anoblique asymptote. In this case, then, the oblique asymptote is y = 4x+7.
Case 4: The polynomial in the numerator has a degree that in two or more than the degree in the denominator. Forexample: y = x3
x−1 .
This is actually the simplest case of all: the polynomial has no horizontal or oblique asymptotes.
Example 5
Find the horizontal or oblique asymptotes of the following rational functions.
a) y = 3x2
x2+4
b) y = x−13x2−6
c) y = x4+1x−5
d) y = x3−3x2+4x−1x2−2
Solution
a) When we simplify the function, we get y = 3− 12x2+4 . There is a horizontal asymptote at y = 3.
b) We cannot divide the two polynomials. There is a horizontal asymptote at y = 0.
c) The power of the numerator is 3 more than the power of the denominator. There are no horizontal or obliqueasymptotes.
d) When we simplify the function, we get y = x−3+ 6x−7x2−2 . There is an oblique asymptote at y = x−3.
Notice that a rational function will either have a horizontal asymptote, an oblique asymptote or neither kind. In otherwords, a function can’t have both; in fact, it can’t have more than one of either kind. On the other hand, a rationalfunction can have any number of vertical asymptotes at the same time that it has horizontal or oblique asymptotes.
Review Questions
Divide the following polynomials:
1. 2x+42
2. x−4x
3. 5x−355x
4. x2+2x−5x
5. 4x2+12x−36−4x
6. 2x2+10x+72x2
7. x3−x−2x2
8. 5x4−93x
9. x3−12x2+3x−412x2
10. 3−6x+x3
−9x3
11. x2+3x+6x+1
12. x2−9x+6x−1
619

12.3. Division of Polynomials www.ck12.org
13. x2+5x+4x+4
14. x2−10x+25x−5
15. x2−20x+12x−3
16. 3x2−x+5x−2
17. 9x2+2x−8x+4
18. 3x2−43x+1
19. 5x2+2x−92x−1
20. x2−6x−125x4
Find all asymptotes of the following rational functions:
21. x2
x−222. 1
x+4
23. x2−1x2+1
24. x−4x2−9
25. x2+2x+14x−1
26. x3+14x−1
27. x−x3
x2−6x−7
28. x4−2x8x+24
Graph the following rational functions. Indicate all asymptotes on the graph:
29. x2
x+2
30. x3−1x2−4
31. x2+12x−4
32. x−x2
3x+2
620

www.ck12.org Chapter 12. Rational Equations and Functions
12.4 Rational Expressions
Learning Objectives
• Simplify rational expressions.• Find excluded values of rational expressions.
Introduction
A simplified rational expression is one where the numerator and denominator have no common factors. In order tosimplify an expression to lowest terms, we factor the numerator and denominator as much as we can and cancelcommon factors from the numerator and the denominator.
Simplify Rational Expressions
Example 1
Reduce each rational expression to simplest terms.
a) 4x−22x2+x−1
b) x2−2x+18x−8
c) x2−4x2−5x+6
Solution
a) Factor the numerator and denominator completely: 2(2x−1)(2x−1)(x+1)
Cancel the common factor (2x−1) : 2x+1
b) Factor the numerator and denominator completely: (x−1)(x−1)8(x−1)
Cancel the common factor (x−1) : x−18
c) Factor the numerator and denominator completely: (x−2)(x+2)(x−2)(x−3)
Cancel the common factor(x−2) : x+2x−3
When reducing fractions, you are only allowed to cancel common factors from the denominator but NOT commonterms. For example, in the expression (x+1)·(x−3)
(x+2)·(x−3) , we can cross out the (x−3) factor because (x−3)(x−3) = 1. But in the
expression x2+1x2−5 we can’t just cross out the x2 terms.
Why can’t we do that? When we cross out terms that are part of a sum or a difference, we’re violating the orderof operations (PEMDAS). Remember, the fraction bar means division. When we perform the operation x2+1
x2−5 , we’re
621

12.4. Rational Expressions www.ck12.org
really performing the division (x2 + 1)÷ (x2− 5) — and the order of operations says that we must perform theoperations inside the parentheses before we can perform the division.
Using numbers instead of variables makes it more obvious that canceling individual terms doesn’t work. You cansee that 9+1
9−5 = 104 = 2.5 — but if we canceled out the 9’s first, we’d get 1
−5 , or -0.2, instead.
For more examples of how to simplify rational expressions, watch the video at
MEDIAClick image to the left for more content.
.
Find Excluded Values of Rational Expressions
Whenever there’s a variable expression in the denominator of a fraction, we must remember that the denominatorcould be zero when the independent variable takes on certain values. Those values, corresponding to the verticalasymptotes of the function, are called excluded values. To find the excluded values, we simply set the denominatorequal to zero and solve the resulting equation.
Example 2
Find the excluded values of the following expressions.
a) xx+4
b) 2x+1x2−x−6
c) 4x2−5x
Solution
a) When we set the denominator equal to zero we obtain: x+4 = 0⇒ x =−4
So −4 is the excluded value.
b) When we set the denominator equal to zero we obtain: x2− x−6 = 0
Solve by factoring: (x−3)(x+2) = 0
⇒ x = 3 and x =−2
So 3 and −2 are the excluded values.
c) When we set the denominator equal to zero we obtain: x2−5x = 0
Solve by factoring: x(x−5) = 0
⇒ x = 0 and x = 5
So 0 and 5 are the excluded values.
622

www.ck12.org Chapter 12. Rational Equations and Functions
Removable Zeros
Notice that in the expressions in Example 1, we removed a division by zero when we simplified the problem. Forinstance, we rewrote 4x−2
2x2+x−1 as 2(2x−1)(2x−1)(x+1) . The denominator of this expression is zero when x = 1
2 or when x =−1.
However, when we cancel common factors, we simplify the expression to 2x+1 . This reduced form allows the value
x = 12 , so x =−1 is its only excluded value.
Technically the original expression and the simplified expression are not the same. When we reduce a radicalexpression to its simplest form, we should specify the removed excluded value. In other words, we should write ourfinal answer as 4x−2
2x2+x−1 = 2x+1 ,x 6=
12 .
Similarly, we should write the answer from Example 1, part b as x2−2x+18x−8 = x−1
8 ,x 6= 1 and the answer from Example
1, part c as x2−4x2−5x+6 = x+2
x−3 ,x 6= 2.
Review Questions
Reduce each fraction to lowest terms.
1. 42x−8
2. x2+2xx
3. 9x+312x+4
4. 6x2+2x4x
5. x−2x2−4x+4
6. x2−95x+15
7. x2+6x+8x2+4x
8. 2x2+10xx2+10x+25
9. x2+6x+5x2−x−2
10. x2−16x2+2x−8
11. 3x2+3x−182x2+5x−3
12. x3+x2−20x6x2+6x−120
Find the excluded values for each rational expression.
13. 2x
14. 4x+2
15. 2x−1(x−1)2
16. 3x+1x2−4
17. x2
x2+9
18. 2x2+3x−1x2−3x−28
19. 5x3−4x2+3x
20. 9x3+11x2+30x
21. 4x−1x2+3x−5
22. 5x+113x2−2x−4
23. x2−12x2+x+3
623

12.4. Rational Expressions www.ck12.org
24. 12x2+6x+1
25. In an electrical circuit with resistors placed in parallel, the reciprocal of the total resistance is equal to the sumof the reciprocals of each resistance. 1
Rc= 1
R1+ 1
R2. If R1 = 25 Ω and the total resistance is Rc = 10 Ω, what is
the resistance R2?26. Suppose that two objects attract each other with a gravitational force of 20 Newtons. If the distance between
the two objects is doubled, what is the new force of attraction between the two objects?27. Suppose that two objects attract each other with a gravitational force of 36 Newtons. If the mass of both
objects was doubled, and if the distance between the objects was doubled, then what would be the new forceof attraction between the two objects?
28. A sphere with radius R has a volume of 43 πR3 and a surface area of 4πR2. Find the ratio the surface area to the
volume of a sphere.29. The side of a cube is increased by a factor of 2. Find the ratio of the old volume to the new volume.30. The radius of a sphere is decreased by 4 units. Find the ratio of the old volume to the new volume.
624
www.ck12.org Chapter 12. Rational Equations and Functions
12.5 Multiplying and Dividing Rational Expres-sions
Learning Objectives
• Multiply rational expressions involving monomials.• Multiply rational expressions involving polynomials.• Multiply a rational expression by a polynomial.• Divide rational expressions involving polynomials.• Divide a rational expression by a polynomial.• Solve real-world problems involving multiplication and division of rational expressions.
Introduction
The rules for multiplying and dividing rational expressions are the same as the rules for multiplying and dividingrational numbers, so let’s start by reviewing multiplication and division of fractions. When we multiply two fractionswe multiply the numerators and denominators separately:
ab· c
d=
a · cb ·d
When we divide two fractions, we replace the second fraction with its reciprocal and multiply, since that’s mathe-matically the same operation:
ab÷ c
d=
ab· d
c=
a ·db · c
Multiply Rational Expressions Involving Monomials
Example 1
Multiply the following: a16b8 · 4b3
5a2 .
Solution
Cancel common factors from the numerator and denominator. The common factors are 4, a, and b3. Canceling themout leaves 1
4b5 · 15a = 1
20ab5 .
Example 2
Multiply 9x2 · 4y2
21x4 .
Solution
625

12.5. Multiplying and Dividing Rational Expressions www.ck12.org
Rewrite the problem as a product of two fractions: 9x2
1 ·4y2
21x4 Then cancel common factors from the numerator anddenominator.
The common factors are 3 and x2. Canceling them out leaves 31 ·
4y2
7x2 =12y2
7x2 .
Multiply Rational Expressions Involving Polynomials
When multiplying rational expressions involving polynomials, first we need to factor all polynomial expressions asmuch as we can. Then we follow the same procedure as before.
Example 3
Multiply 4x+123x2 · x
x2−9 .
Solution
Factor all polynomial expressions as much as possible: 4(x+3)3x2 · x
(x+3)(x−3)
The common factors are x and (x+3). Canceling them leaves 43x ·
1(x−3) =
43x(x−3) =
43x2−9x .
Example 4
Multiply 12x2−x−6x2−1 · x2+7x+6
4x2−27x+18 .
Solution
Factor polynomials: (3x+2)(4x−3)(x+1)(x−1) ·
(x+1)(x+6)(4x−3)(x−6) .
The common factors are (x+1) and (4x−3). Canceling them leaves (3x+2)(x−1) ·
(x+6)(x−6) =
(3x+2)(x+6)(x−1)(x−6) = 3x2+20x+12
x2−7x+6
Multiply a Rational Expression by a Polynomial
When we multiply a rational expression by a whole number or a polynomial, we can write the whole number (orpolynomial) as a fraction with denominator equal to one. We then proceed the same way as in the previous examples.
Example 5
Multiply 3x+184x2+19x−5 · (x
2 +3x−10).
Solution
Rewrite the expression as a product of fractions: 3x+184x2+19x−5 ·
x2+3x−101
Factor polynomials: 3(x+6)(x+5)(4x−1) ·
(x−2)(x+5)1
The common factor is (x+5). Canceling it leaves 3(x+6)(4x−1) ·
(x−2)1 = 3(x+6)(x−2)
(4x−1) = 3x2+12x−364x−1
Divide Rational Expressions Involving Polynomials
Just as with ordinary fractions, we first rewrite the division problem as a multiplication problem and then proceedwith the multiplication as outlined in the previous example.
Note: Remember that ab ÷
cd = a
b ·dc . The first fraction remains the same and you take the reciprocal of the second
fraction. Do not fall into the common trap of flipping the first fraction.
626
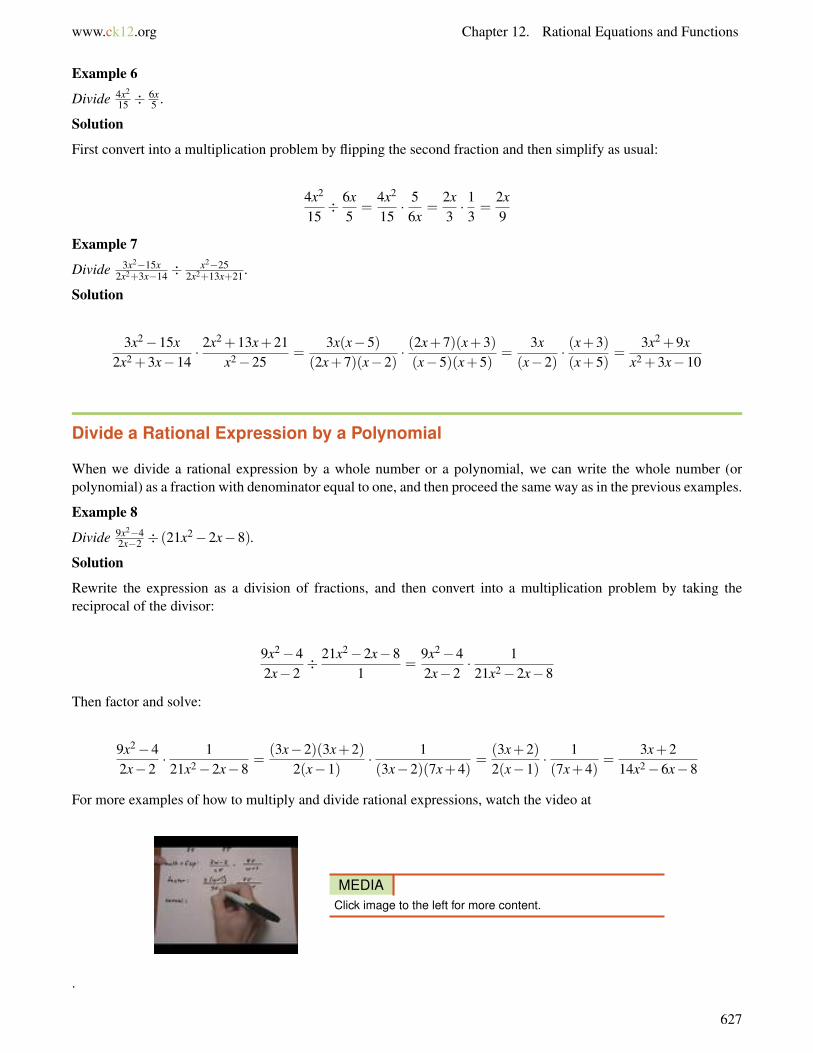
www.ck12.org Chapter 12. Rational Equations and Functions
Example 6
Divide 4x2
15 ÷6x5 .
Solution
First convert into a multiplication problem by flipping the second fraction and then simplify as usual:
4x2
15÷ 6x
5=
4x2
15· 5
6x=
2x3· 1
3=
2x9
Example 7
Divide 3x2−15x2x2+3x−14 ÷
x2−252x2+13x+21 .
Solution
3x2−15x2x2 +3x−14
· 2x2 +13x+21x2−25
=3x(x−5)
(2x+7)(x−2)· (2x+7)(x+3)(x−5)(x+5)
=3x
(x−2)· (x+3)(x+5)
=3x2 +9x
x2 +3x−10
Divide a Rational Expression by a Polynomial
When we divide a rational expression by a whole number or a polynomial, we can write the whole number (orpolynomial) as a fraction with denominator equal to one, and then proceed the same way as in the previous examples.
Example 8
Divide 9x2−42x−2 ÷ (21x2−2x−8).
Solution
Rewrite the expression as a division of fractions, and then convert into a multiplication problem by taking thereciprocal of the divisor:
9x2−42x−2
÷ 21x2−2x−81
=9x2−42x−2
· 121x2−2x−8
Then factor and solve:
9x2−42x−2
· 121x2−2x−8
=(3x−2)(3x+2)
2(x−1)· 1(3x−2)(7x+4)
=(3x+2)2(x−1)
· 1(7x+4)
=3x+2
14x2−6x−8
For more examples of how to multiply and divide rational expressions, watch the video at
MEDIAClick image to the left for more content.
.
627

12.5. Multiplying and Dividing Rational Expressions www.ck12.org
Solve Real-World Problems Involving Multiplication and Division of Rational Ex-pressions
Example 9
Suppose Marciel is training for a running race. Marciel’s speed (in miles per hour) of his training run each morningis given by the function x3− 9x, where x is the number of bowls of cereal he had for breakfast. Marciel’s trainingdistance (in miles), if he eats x bowls of cereal, is 3x2− 9x. What is the function for Marciel’s time, and how longdoes it take Marciel to do his training run if he eats five bowls of cereal on Tuesday morning?
Solution
time = distancespeed
time = 3x2−9xx3−9x = 3x(x−3)
x(x2−9) =3x(x−3)
x(x+3)(x−3)
time = 3x+3
If x = 5, then
time = 35+3 = 3
8
Marciel will run for 38 of an hour.
Review Questions
Perform the indicated operation and reduce the answer to lowest terms.
1. x3
2y3 · 2y2
x
2. 2xy÷ 2x2
y
3. 2xy2 · 4y
5x
4. 2x3
y ÷3x2
5. 2xy · 2y2
x3
6. 3x+6y−4 ÷
3y+9x−1
7. 4y2−1y2−9 ·
y−32y−1
8. 6aba2 · a3b
3b2
9. x2
x−1 ÷x
x2+x−2
10. 33a2
−5 ·20
11a3
11. a2+2ab+b2
ab2−a2b ÷ (a+b)
12. 2x2+2x−24x2+3x · x2+x−6
x+4
13. 3−x3x−5 ÷
x2−92x2−8x−10
14. x2−25x+3 ÷ (x−5)
15. 2x+12x−1 ÷
4x2−11−2x
16. xx−5 ·
x2−8x+15x2−3x
17. 3x2+5x−12x2−9 ÷ 3x−4
3x+4
628

www.ck12.org Chapter 12. Rational Equations and Functions
18. 5x2+16x+336x2−25 · (6x2 +5x)
19. x2+7x+10x2−9 · x2−3x
3x2+4x−4
20. x2+x−12x2+4x+4 ÷
x−3x+2
21. x4−16x2−9 ÷
x2+4x2+6x+9
22. x2+8x+167x2+9x+2 ·
7x+2x2+4x
23. Maria’s recipe asks for 2 12 times more flour than sugar. How many cups of flour should she mix in if she uses
3 13 cups of sugar?
24. George drives from San Diego to Los Angeles. On the return trip he increases his driving speed by 15 milesper hour. In terms of his initial speed, by what factor is the driving time decreased on the return trip?
25. Ohm’s Law states that in an electrical circuit I = VRc
. The total resistance for resistors placed in parallel isgiven by: 1
Rtot= 1
R1+ 1
R2. Write the formula for the electric current in term of the component resistances: R1
and R2.
629
12.6. Adding and Subtracting Rational Expressions www.ck12.org
12.6 Adding and Subtracting Rational Expres-sions
Learning Objectives
• Add and subtract rational expressions with the same denominator.• Find the least common denominator of rational expressions.• Add and subtract rational expressions with different denominators.• Solve real-world problems involving addition and subtraction of rational expressions.
Introduction
Like fractions, rational expressions represent a portion of a quantity. Remember that when we add or subtract frac-tions we must first make sure that they have the same denominator. Once the fractions have the same denominator,we combine the different portions by adding or subtracting the numerators and writing that answer over the commondenominator.
Add and Subtract Rational Expressions with the Same Denominator
Fractions with common denominators combine in the following manner:
ac+
bc=
a+bc
andac− b
c=
a−bc
Example 1
Simplify.
a) 87 −
27 +
47
b) 4x2−3x+5 + 2x2−1
x+5
c) x2−2x+12x+3 −
3x2−3x+52x+3
Solution
a) Since the denominators are the same we combine the numerators:
87− 2
7+
47=
8−2+47
=107
b) Since the denominators are the same we combine the numerators: 4x2−3+2x2−1x+5
Simplify by collecting like terms: 6x2−4x+5
630

www.ck12.org Chapter 12. Rational Equations and Functions
c) Since the denominators are the same we combine the numerators. Make sure the subtraction sign is distributed toall terms in the second expression:
x2−2x+1− (3x2−3x+5)2x+3
=x2−2x+1−3x2 +3x−5
2x+3=−2x2 + x−4
2x+3
Find the Least Common Denominator of Rational Expressions
To add and subtract fractions with different denominators, we must first rewrite all fractions so that they havethe same denominator. In general, we want to find the least common denominator. To find the least commondenominator, we find the least common multiple (LCM) of the expressions in the denominators of the differentfractions. Remember that the least common multiple of two or more integers is the least positive integer that has allof those integers as factors.
The procedure for finding the lowest common multiple of polynomials is similar. We rewrite each polynomial infactored form and we form the LCM by taking each factor to the highest power it appears in any of the separateexpressions.
Example 2
Find the LCM of 48x2y and 60xy3z.
Solution
First rewrite the integers in their prime factorization.
48 = 24 ·360 = 22 ·3 ·5
The two expressions can be written as:
48x2y = 24 ·3 · x2 · y60xy3z = 22 ·3 ·5 · x · y3 · z
To find the LCM, take the highest power of each factor that appears in either expression.
LCM = 24 ·3 ·5 · x2 · y3 · z = 240x2y3z
Example 3
Find the LCM of 2x2 +8x+8 and x3−4x2−12x
Solution
Factor the polynomials completely:
2x2 +8x+8 = 2(x2 +4x+4)
= 2(x+2)2
631
12.6. Adding and Subtracting Rational Expressions www.ck12.org
x3−4x2−12x = x(x2−4x−12)
= x(x+2)(x−6)
To find the LCM, take the highest power of each factor that appears in either expression.
LCM = 2x(x+2)2(x−6)
It’s customary to leave the LCM in factored form, because this form is useful in simplifying rational expressions andfinding any excluded values.
Example 4
Find the LCM of x2−25 and x2 +3x+2
Solution
Factor the polynomials completely:
x2−25 = (x−5)(x+5)
x2 +3x+2 = (x+1)(x+2)
Since the two expressions have no common factors, the LCM is just the product of the two expressions.
LCM = (x−5)(x+5)(x+1)(x+2)
Add and Subtract Rational Expressions with Different Denominators
Now we’re ready to add and subtract rational expressions. We use the following procedure.
1. Find the least common denominator (LCD) of the fractions.2. Express each fraction as an equivalent fraction with the LCD as the denominator.3. Add or subtract and simplify the result.
Example 5
Perform the following operation and simplify: 2x+2 −
32x−5
Solution
The denominators can’t be factored any further, so the LCD is just the product of the separate denominators: (x+2)(2x−5). That means the first fraction needs to be multiplied by the factor (2x−5) and the second fraction needsto be multiplied by the factor (x+2):
2x+2
· (2x−5)(2x−5)
− 32x−5
· (x+2)(x+2)
632

www.ck12.org Chapter 12. Rational Equations and Functions
Combine the numerators and simplify: 2(2x−5)−3(x+2)(x+2)(2x−5) = 4x−10−3x−6
(x+2)(2x−5)
Combine like terms in the numerator: x−16(x+2)(2x−5) Answer
Example 6
Perform the following operation and simplify: 4xx−5 −
3x5−x .
Solution
Notice that the denominators are almost the same; they just differ by a factor of -1.
Factor out -1 from the second denominator: 4xx−5 −
3x−(x−5)
The two negative signs in the second fraction cancel: 4xx−5 +
3x(x−5)
Since the denominators are the same we combine the numerators: 7xx−5 Answer
Example 7
Perform the following operation and simplify: 2x−1x2−6x+9 −
3x+4x2−9 .
Solution
We factor the denominators: 2x−1(x−3)2 − 3x+4
(x+3)(x−3)
The LCD is the product of all the different factors, each taken to the highest power they have in either denominator:(x−3)2(x+3).
The first fraction needs to be multiplied by a factor of (x+ 3) and the second fraction needs to be multiplied by afactor of (x−3):
2x−1(x−3)2 ·
(x+3)(x+3)
− 3x+4(x+3)(x−3)
· (x−3)(x−3)
Combine the numerators by subtracting: (2x−1)(x+3)−(3x+4)(x−3)(x−3)2(x+3)
Eliminate parentheses in the numerator: 2x2+5x−3−(3x2−5x−12)(x−3)2(x+3)
Distribute the negative sign: 2x2+5x−3−3x2+5x+12(x−3)2(x+3)
Combine like terms in the numerator: −x2+10x+9(x−3)2(x+3) Answer
For more examples of how to add and subtract rational expressions, watch the video at
MEDIAClick image to the left for more content.
.
633

12.6. Adding and Subtracting Rational Expressions www.ck12.org
Solve Real-World Problems by Adding and Subtracting Rational Expressions
Example 8
In an electrical circuit with two resistors placed in parallel, the reciprocal of the total resistance is equal to the sumof the reciprocals of each resistance: 1
Rtot= 1
R1+ 1
R2. Find an expression for the total resistance, Rtot .
Solution
Let’s simplify the expression 1R1
+ 1R2.
The lowest common denominator is R1R2, so we multiply the first fraction by R2R2
and the
second fraction by R1R1
: R2R2· 1
R1+ R1
R1· 1
R2
Simplify: R2+R1R1R2
The total resistance is the reciprocal of this expression: Rtot =R1R2
R1+R2Answer
Example 9
The sum of a number and its reciprocal is 5314 . Find the numbers.
Solution
Define variables:
Let x be the number; then its reciprocal is 1x .
Set up an equation:
The equation that describes the relationship between the numbers is x+ 1x = 53
14
Solve the equation:
Find the lowest common denominator: LCM = 14x
Multiply all terms by 14x : 14x · x+14x · 1x = 14x · 53
14
(Notice that we’re multiplying the terms by 14x instead of by 14x14x . We can do this because we’re multiplying both
sides of the equation by the same thing, so we don’t have to keep the actual values of the terms the same. We couldalso multiply by 14x
14x , but then the denominators would just cancel out a couple of steps later.)
Cancel common factors in each term: 14x · x+14x · 1x = 14x · 53
14
Simplify: 14x2 +14 = 53x
Write all terms on one side of the equation: 14x2−53x+14 = 0
Factor: (7x−2)(2x−7) = 0
x = 27 and x = 7
2
Notice there are two answers for x, but they are really parts of the same solution. One answer represents the numberand the other answer represents its reciprocal.
Check:27 +
72 = 4+49
14 = 5314 . The answer checks out.
634

www.ck12.org Chapter 12. Rational Equations and Functions
Work problems are problems where two people or two machines work together to complete a job. Work problemsoften contain rational expressions. Typically we set up such problems by looking at the part of the task completedby each person or machine. The completed task is the sum of the parts of the tasks completed by each individual oreach machine.
To determine the part of the task completed by each person or machine we use the following fact:
Part of the task completed = rate of work× time spent on the task
It’s usually useful to set up a table where we can list all the known and unknown variables for each person or machineand then combine the parts of the task completed by each person or machine at the end.
Example 10
Mary can paint a house by herself in 12 hours. John can paint a house by himself in 16 hours. How long would ittake them to paint the house if they worked together?
Solution
Define variables:
Let t = the time it takes Mary and John to paint the house together.
Construct a table:
Since Mary takes 12 hours to paint the house by herself, in one hour she paints 112 of the house.
Since John takes 16 hours to pain the house by himself, in one hour he paints 116 of the house.
Mary and John work together for t hours to paint the house together. Using
Part o f the task completed = rate o f work · time spent on the task
we can write that Mary completed t12 of the house and John completed t
16 of the house in this time.
This information is nicely summarized in the table below:
TABLE 12.6:
Painter Rate of work (per hour) Time worked Part of taskMary 1
12 t t12
John 116 t t
16
Set up an equation:
In t hours, Mary painted t12 of the house and John painted t
16 of the house, and together they painted 1 whole house.So our equation is t
12 +t
16 = 1.
Solve the equation:
Find the lowest common denominator: LCM = 48
Multiply all terms in the equation by the LCM: 48 · t12 +48 · t
16 = 48 ·1
Cancel common factors in each term: 4 · t1 +3 · t
1 = 48 ·1
Simplify: 4t +3t = 48
635

12.6. Adding and Subtracting Rational Expressions www.ck12.org
7t = 48⇒ t = 487 = 6.86 hours
Check: The answer is reasonable. We’d expect the job to take more than half the time Mary would take by herselfbut less than half the time John would take, since Mary works faster than John.
Example 11
Suzie and Mike take two hours to mow a lawn when they work together. It takes Suzie 3.5 hours to mow the samelawn if she works by herself. How long would it take Mike to mow the same lawn if he worked alone?
Solution
Define variables:
Let t = the time it takes Mike to mow the lawn by himself.
Construct a table:
TABLE 12.7:
Painter Rate of work (per hour) Time worked Part of TaskSuzie 1
3.5 = 27 2 4
7Mike 1
t 2 2t
Set up an equation:
Since Suzie completed 47 of the lawn and Mike completed 2
t of the lawn and together they mowed the lawn in 2hours, we can write the equation: 4
7 +2t = 1
Solve the equation:
Find the lowest common denominator: LCM = 7t
Multiply all terms in the equation by the LCM: 7t · 47 +7t · 2
t = 7t ·1
Cancel common factors in each term: t · 41 +7 · 2
1 = 7t ·1
Simplify: 4t +14 = 7t
3t = 14⇒ t = 143 = 4 2
3 hours
Check: The answer is reasonable. We’d expect Mike to work slower than Suzie, because working by herself it takesher less than twice the time it takes them to work together.
Review Questions
Perform the indicated operation and simplify. Leave the denominator in factored form.
1. 524 −
724
2. 1021 +
935
3. 52x+3 +
32x+3
4. 3x−1x+9 −
4x+3x+9
5. 4x+72x2 − 3x−4
2x2
6. x2
x+5 −25
x+57. 2x
x−4 +x
4−x
636

www.ck12.org Chapter 12. Rational Equations and Functions
8. 103x−1 −
71−3x
9. 52x+3 −3
10. 5x+1x+4 +2
11. 1x +
23x
12. 45x2 − 2
7x3
13. 4xx+1 −
22(x+1)
14. 10x+5 +
2x+2
15. 2xx−3 −
3xx+4
16. 4x−32x+1 +
x+2x−9
17. x2
x+4 −3x2
4x−118. 2
5x+2 −x+1x2
19. x+42x + 2
9x20. 5x+3
x2+x +2x+1
x21. 4
(x+1)(x−1) −5
(x+1)(x+2)
22. 2x(x+2)(3x−4) +
7x(3x−4)2
23. 3x+5x(x−1) −
9x−1(x−1)2
24. 1(x−2)(x−3) +
4(2x+5)(x−6)
25. 3x−2x−2 + 1
x2−4x+4
26. −x3
x2−7x+6 + x−427. 2x
x2+10x+25 −3x
2x2+7x−1528. 1
x2−9 +2
x2+5x+629. −x+4
2x2−x−15 +x
4x2+8x−530. 4
9x2−49 −1
3x2+5x−2831. One number is 5 less than another. The sum of their reciprocals is 13
36 . Find the two numbers.32. One number is 8 times more than another. The difference in their reciprocals is 21
20 . Find the two numbers.33. A pipe can fill a tank full of Kool-Aid in 4 hours and another pipe can empty the tank in 8 hours. If the valves
to both pipes are open, how long will it take to fill the tank?34. Stefan and Misha have a lot full of cars to wash. Stefan could wash the cars by himself in 6 hours and Misha
could wash the cars by himself in 5 hours. Stefan starts washing the cars by himself, but he has to leave after2.5 hours. Misha continues the task by himself. How long does it take Misha to finish washing the cars?
35. Amanda and her sister Chyna are shoveling snow to clear their driveway. Amanda can clear the snow byherself in 3 hours and Chyna can clear the snow by herself in 4 hours. After Amanda has been working byherself for one hour, Chyna joins her and they finish the job together. How long does it take to clear the snowfrom the driveway?
36. At a soda bottling plant one bottling machine can fulfill the daily quota in 10 hours and a second machinecan fill the daily quota in 14 hours. The two machines start working together, but after four hours the slowermachine breaks and the faster machine has to complete the job by itself. How many more hours does the fastmachine take to finish the job?
637

12.7. Solutions of Rational Equations www.ck12.org
12.7 Solutions of Rational Equations
Learning Objectives
• Solve rational equations using cross products.• Solve rational equations using lowest common denominators.• Solve real-world problems with rational equations.
Introduction
A rational equation is one that contains rational expressions. It can be an equation that contains rational coefficientsor an equation that contains rational terms where the variable appears in the denominator.
An example of the first kind of equation is: 35 x+ 1
2 = 4.
An example of the second kind of equation is: xx−1 +1 = 4
2x+3 .
The first aim in solving a rational equation is to eliminate all denominators. That way, we can change a rationalequation to a polynomial equation which we can solve with the methods we have learned this far.
Solve Rational Equations Using Cross Products
A rational equation that contains just one term on each side is easy to solve by cross multiplication. Consider thefollowing equation:
x5=
x+12
Our first goal is to eliminate the denominators of both rational expressions. In order to remove the 5 from thedenominator of the first fraction, we multiply both sides of the equation by 5:
5 · x5= 5 · x+1
2
x =5(x+1)
2
Now, we remove the 2 from the denominator of the second fraction by multiplying both sides of the equation by 2:
2 · x = 2 · 5(x+1)2
2x = 5(x+1)
Then we can solve this equation for x.
638

www.ck12.org Chapter 12. Rational Equations and Functions
Notice that this equation is what we would get if we simply multiplied each numerator in the original equation bythe denominator from the opposite side of the equation. It turns out that we can always simplify a rational equationwith just two terms by multiplying each numerator by the opposite denominator; this is called cross multiplication.
Example 1
Solve the equation 2xx+4 = 5
x .
Solution
Cross-multiply. The equation simplifies to: 2x2 = 5(x+4)
Simplify: 2x2 = 5x+20
Move all terms to one side of the equation: 2x2−5x−20 = 0
Solve using the quadratic formula: x = 5±√
1854 ⇒ x =−2.15 or x = 4.65
It’s important to plug the answer back into the original equation when the variable appears in any denominator of theequation, because the answer might be an excluded value of one of the rational expressions. If the answer obtainedmakes any denominator equal to zero, that value is not really a solution to the equation.
Check: 2xx+4 = 5
x ⇒2(−2.15)−2.15+4
?= 5−2.15 ⇒
−4.301.85
?=−2.3⇒−2.3 =−2.3. The answer checks out.
2xx+4 = 5
x ⇒2(4.65)4.65+4
?= 5
4.65 ⇒9.3
8.65?=1.08⇒ 1.08 = 1.08. The answer checks out.
Solve Rational Equations Using Lowest Common Denominators
Another way of eliminating the denominators in a rational equation is to multiply all the terms in the equation by thelowest common denominator. You can use this method even when there are more than two terms in the equation.
Example 2
Solve 3x+2 −
4x−5 = 2
x2−3x−10 .
Solution
Factor all denominators: 3x+2 −
4x−5 = 2
(x+2)(x−5)
Find the lowest common denominator: LCD = (x+2)(x−5)
Multiply all terms in the equation by the LCD:
(x+2)(x−5) · 3x+2
− (x+2)(x−5) · 4x−5
= (x+2)(x−5) · 2(x+2)(x−5)
The equation simplifies to: 3(x−5)−4(x+2) = 2
Simplify: 3x−15−4x−8 = 2
x =−25
Check: 3x+2 −
4x−5 = 2
x2−3x−10 ⇒3
−25+2 −4
−25−5?= 2
(−25)2−3(−25)−10 ⇒ .003 = .003. The answer checks out.
Example 3
639

12.7. Solutions of Rational Equations www.ck12.org
Solve 2x2x+1 +
xx+4 = 1.
Solution
Find the lowest common denominator: LCD = (2x+1)(x+4)
Multiply all terms in the equation by the LCD:
(2x+1)(x+4) · 2x2x+1
+(2x+1)(x+4) · xx+4
= (2x+1)(x+4)
Cancel all common terms. 2x(x+4)+ x(2x+1) = (2x+1)(x+4)The simplified equation is:
Eliminate parentheses: 2x2 +8x+2x2 + x = 2x2 +9x+4
Collect like terms: 2x2 = 4
x2 = 2⇒ x =±√
2
Check: 2x2x+1 +
xx+4 = 2
√2
2√
2+1+
√2√
2+4= 0.739+0.261 = 1. The answer checks out.
2x2x+1 +
xx+4 =
2(−√
2)
2(−√
2)+1
+ −√
2−√
2+4= 1.547−0.547 = 1. The answer checks out.
Solve Real-World Problems Using Rational Equations
A motion problem with no acceleration is described by the formula distance = speed× time. These problems caninvolve the addition and subtraction of rational expressions.
Example 4
Last weekend Nadia went canoeing on the Snake River. The current of the river is three miles per hour. It took Nadiathe same amount of time to travel 12 miles downstream as it did to travel 3 miles upstream. Determine how fastNadia’s canoe would travel in still water.
Solution
Define variables:
Let s = speed of the canoe in still water
Then, s+3 = the speed of the canoe traveling downstream
s−3 = the speed of the canoe traveling upstream
Construct a table:
TABLE 12.8:
Direction Distance (miles) Rate TimeDownstream 12 s+3 tUpstream 3 s−3 t
640

www.ck12.org Chapter 12. Rational Equations and Functions
Write an equation:
Since distance = rate× time, we can say that time = distancerate .
The time to go downstream is: t = 12s+3
The time to go upstream is: t = 3s−3
Since the time it takes to go upstream and downstream are the same, we have: 3s−3 = 12
s+3
Solve the equation:
Cross-multiply: 3(s+3) = 12(s−3)
Simplify: 3s+9 = 12s−36
Solve: s = 5 mi/h
Check: Upstream: t = 128 = 1 1
2 hour; downstream: t = 32 = 1 1
2 hour. The answer checks out.
Example 5
Peter rides his bicycle. When he pedals uphill he averages a speed of eight miles per hour, when he pedals downhillhe averages 14 miles per hour. If the total distance he travels is 40 miles and the total time he rides is four hours,how long did he ride at each speed?
Solution
Define variables:
Let t = time Peter bikes at 8 miles per hour.
Construct a table:
TABLE 12.9:
Direction Distance (miles) Rate (mph) Time (hours)Uphill d 8 t1Downhill 40−d 14 t2
Write an equation:
We know that time = distancerate .
The time to go uphill is: t1 = d8
The time to go downhill is: t2 = 40−d14
We also know that the total time is 4 hours: d8 +
40−d14 = 4
Solve the equation:
Find the lowest common denominator: LCD = 56
Multiply all terms by the common denominator: 7d +160−4d = 224
Solve: d = 21.3 mi
Check: Uphill: t = 21.38 = 2.67 hours; downhill: t = 40−21.3
14 = 1.33 hours. The answer checks out.
Example 6
641

12.7. Solutions of Rational Equations www.ck12.org
A group of friends decided to pool together and buy a birthday gift that cost $200. Later 12 of the friends decidednot to participate any more. This meant that each person paid $15 more than their original share. How many peoplewere in the group to begin with?
Solution
Define variables:
Let x = the number of friends in the original group.
Make a table:
TABLE 12.10:
Number of people Gift price Share amountOriginal group x 200 200
xLater group x−12 200 200
x−12
Write an equation:
Since each person’s share went up by $15 after 2 people refused to pay, we write the equation 200x−12 = 200
x +15
Solve the equation:
Find the lowest common denominator: LCD = x(x−12)
Multiply all terms by the LCD: x(x−12) · 200x−12 = x(x−12) · 200
x + x(x−12) ·15
Cancel common factors and simplify: 200x = 200(x−12)+15x(x−12)
Eliminate parentheses: 200x = 200x−2400+15x2−180x
Get all terms on one side of the equation: 0 = 15x2 = 180x−2400
Divide all terms by 15 : 0 = x2−12x−160
Factor: 0 = (x−20)(x+8)
Solve: x = 20,x =−8
The answer that makes sense is x = 20people.
Check: Originally $200 shared among 20 people is $10 each. After 12 people leave, $200 shared among 8 peopleis $25 each. So each person pays $15 more. The answer checks out.
Review Questions
Solve the following equations.
1. 2x+14 = x−3
102. 4x
x+2 = 59
3. 53x−4 = 2
x+14. 7
x+3 = x+12x−3
5. 7xx−5 = x+3
x
642

www.ck12.org Chapter 12. Rational Equations and Functions
6. 2x+3 −
1x+4 = 0
7. 3x2+2x−1x2−1 =−2
8. x+ 1x = 2
9. −3+ 1x+1 = 2
x10. 1
x −x
x−2 = 211. 3
2x−1 +2
x+4 = 212. 2x
x−1 −x
3x+4 = 313. x+1
x−1 +x−4x+4 = 3
14. xx−2 +
xx+3 = 1
x2+x−615. 2
x2+4x+3 = 2+ x−2x+3
16. 1x+5 −
1x−5 = 1−x
x+517. x
x2−36 +1
x−6 = 1x+6
18. 2x3x+3 −
14x+4 = 2
x+119. −x
x−2 +3x−1x+4 = 1
x2+2x−820. Juan jogs a certain distance and then walks a certain distance. When he jogs he averages 7 miles/hour and
when he walks he averages 3.5 miles per hour. If he walks and jogs a total of 6 miles in a total of 1.2 hours,how far does he jog and how far does he walk?
21. A boat travels 60 miles downstream in the same time as it takes it to travel 40 miles upstream. The boat’sspeed in still water is 20 miles per hour. Find the speed of the current.
22. Paul leaves San Diego driving at 50 miles per hour. Two hours later, his mother realizes that he forgotsomething and drives in the same direction at 70 miles per hour. How long does it take her to catch up toPaul?
23. On a trip, an airplane flies at a steady speed against the wind and on the return trip the airplane flies with thewind. The airplane takes the same amount of time to fly 300 miles against the wind as it takes to fly 420 mileswith the wind. The wind is blowing at 30 miles per hour. What is the speed of the airplane when there is nowind?
24. A debt of $420 is shared equally by a group of friends. When five of the friends decide not to pay, the shareof the other friends goes up by $25. How many friends were in the group originally?
25. A non-profit organization collected $2250 in equal donations from their members to share the cost of im-proving a park. If there were thirty more members, then each member could contribute $20 less. How manymembers does this organization have?
643

www.ck12.org
CHAPTER 13 Probability and StatisticsChapter Outline
13.1 THEORETICAL AND EXPERIMENTAL PROBABILITY
13.2 PROBABILITY AND PERMUTATIONS
13.3 PROBABILITY AND COMBINATIONS
13.4 PROBABILITY OF COMPOUND EVENTS
13.5 MEASURES OF CENTRAL TENDENCY AND DISPERSION
13.6 STEM-AND-LEAF PLOTS AND HISTOGRAMS
13.7 BOX-AND-WHISKER PLOTS
13.8 SURVEYS AND SAMPLES
644

www.ck12.org Chapter 13. Probability and Statistics
13.1 Theoretical and Experimental Probability
Learning Objectives
• Find a sample space.• Find theoretical probability of an event.• Perform a probability simulation.• Find experimental probability of an event.• Find odds for and against an event.
Find a Sample Space
A sample space is the set of all possible outcomes for an event. In tossing a coin, the sample space consists of 2outcomes – getting heads, and getting tails. Each of these outcomes (heads and tails) could be considered an event.Each event has 1 matching element in the sample space.
For example, the roll of a single die has 6 possible outcomes: the die can show any number from 1 to 6. We can saythat the sample space for rolling a single die contains 6 outcomes: 1, 2, 3, 4, 5, 6. If we say we are interested inrolling a six, then rolling a six is our event and this event has 1 matching element in the sample space: 6. If, onthe other hand, we are interested in rolling an even number, then rolling an even number is our event, and this eventhas 3 matching elements in the sample space: 2, 4, 6.
Example 1
A pair of standard, 6-sided dice are rolled, and the total of the numbers that come up determines a player’s score.Find the sample space of possible outcomes, and determine how many outcomes result in a score of 5.
Solution
The scores a player can get are those in the following set: 2, 3, 4, 5, 6, 7, 8, 9, 10, 11, 12. But the sample spaceisn’t just this set of 11 events. For example, there’s only one way to score 12: the player has to roll a six on each ofthe dice. But to score 5, the player can roll a 1 and a 4, or a 2 and a 3. Furthermore, there are 2 possibilities for eachof these combinations (imagine one die is red, and 1 die is green: we could roll 1 on the red die and 4 on the greenor we could roll 4 on the red die and 1 on the green). Even though the dice we actually use may appear identical,they’re still separate entities, and it does make a difference which one rolls which number. So there are 4 ways aplayer can score 5:
(1&4) (2&3) (3&2) (4&1)
To find the full sample space, we must consider all possible outcomes. The best way to do this is with a table (theoutcomes that give a score of 5 are highlighted):
645
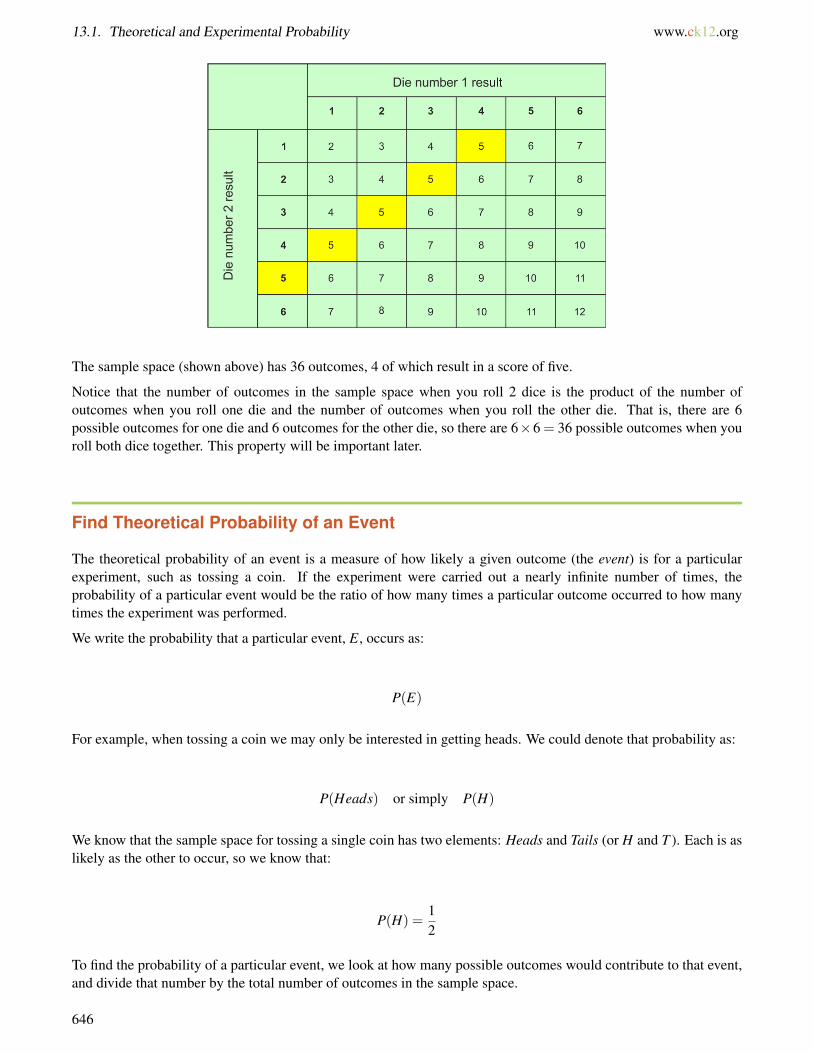
13.1. Theoretical and Experimental Probability www.ck12.org
The sample space (shown above) has 36 outcomes, 4 of which result in a score of five.
Notice that the number of outcomes in the sample space when you roll 2 dice is the product of the number ofoutcomes when you roll one die and the number of outcomes when you roll the other die. That is, there are 6possible outcomes for one die and 6 outcomes for the other die, so there are 6×6 = 36 possible outcomes when youroll both dice together. This property will be important later.
Find Theoretical Probability of an Event
The theoretical probability of an event is a measure of how likely a given outcome (the event) is for a particularexperiment, such as tossing a coin. If the experiment were carried out a nearly infinite number of times, theprobability of a particular event would be the ratio of how many times a particular outcome occurred to how manytimes the experiment was performed.
We write the probability that a particular event, E, occurs as:
P(E)
For example, when tossing a coin we may only be interested in getting heads. We could denote that probability as:
P(Heads) or simply P(H)
We know that the sample space for tossing a single coin has two elements: Heads and Tails (or H and T ). Each is aslikely as the other to occur, so we know that:
P(H) =12
To find the probability of a particular event, we look at how many possible outcomes would contribute to that event,and divide that number by the total number of outcomes in the sample space.
646

www.ck12.org Chapter 13. Probability and Statistics
P(E) =EventSpace
SampleSpace
When we roll a single 6-sided die, we know that the chances of rolling a 3 are 1 in 6. This is, in effect, the probabilityof rolling 3:
P(3) =16
Example 2
Determine the probability of scoring 5 as the combined score of a roll of 2 dice.
Solution
We have just seen (in example 2) that there are 4 ways we can score 5 if we roll 2 dice: (1 & 4), (2 & 3), (3 &2), (4 & 1). The sample space consists of 6× 6 = 36 elements, so the probability of rolling a 5 with 2 dice isP(5) = 4
36 = 19
Example 3
Four coins are tossed simultaneously. What is the probability of getting three or more heads?
Solution
We’ll start by listing all the possible outcomes in a table. But how many elements will the table have?
Remember that when we rolled 2 dice together, we found the number of outcomes by multiplying the number ofoutcomes for one die by the number of outcomes for the other die. So if we’re flipping four coins, it makes sense tomultiply the number of outcomes for each of the four coins together. There are 2 outcomes for each coin, so whenall four coins are flipped there should be 2×2×2×2 = 16 outcomes. Let’s organize them as follows:
Once we fill out the table, we see that there are indeed 16 possible outcomes, and 5 of those outcomes match ourevent. So the probability of getting three or more heads is P(3 or more heads) = 5
16 .
Perform a Probability Simulation
A probability simulation is an experiment designed to determine a probability from many trials. By looking at thenumber of favorable outcomes and dividing by the number of trials, we can get an estimate of the true probability.The more trials we can do, the better our estimate of the true probability will be, but given that we can’t do infinitelymany trials, the result we get will always be just an estimate of the true probability. Often we perform probabilitysimulations because we can’t determine theoretical probability from looking at the sample space.
647
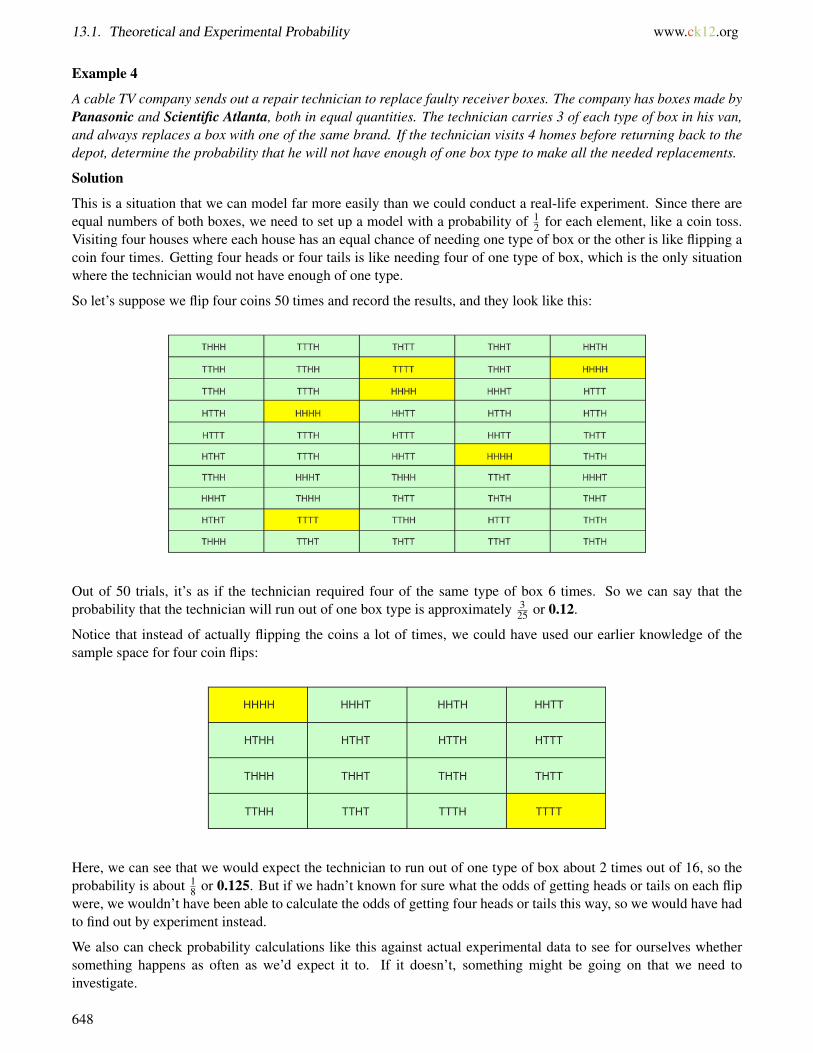
13.1. Theoretical and Experimental Probability www.ck12.org
Example 4
A cable TV company sends out a repair technician to replace faulty receiver boxes. The company has boxes made byPanasonic and Scientific Atlanta, both in equal quantities. The technician carries 3 of each type of box in his van,and always replaces a box with one of the same brand. If the technician visits 4 homes before returning back to thedepot, determine the probability that he will not have enough of one box type to make all the needed replacements.
Solution
This is a situation that we can model far more easily than we could conduct a real-life experiment. Since there areequal numbers of both boxes, we need to set up a model with a probability of 1
2 for each element, like a coin toss.Visiting four houses where each house has an equal chance of needing one type of box or the other is like flipping acoin four times. Getting four heads or four tails is like needing four of one type of box, which is the only situationwhere the technician would not have enough of one type.
So let’s suppose we flip four coins 50 times and record the results, and they look like this:
Out of 50 trials, it’s as if the technician required four of the same type of box 6 times. So we can say that theprobability that the technician will run out of one box type is approximately 3
25 or 0.12.
Notice that instead of actually flipping the coins a lot of times, we could have used our earlier knowledge of thesample space for four coin flips:
Here, we can see that we would expect the technician to run out of one type of box about 2 times out of 16, so theprobability is about 1
8 or 0.125. But if we hadn’t known for sure what the odds of getting heads or tails on each flipwere, we wouldn’t have been able to calculate the odds of getting four heads or tails this way, so we would have hadto find out by experiment instead.
We also can check probability calculations like this against actual experimental data to see for ourselves whethersomething happens as often as we’d expect it to. If it doesn’t, something might be going on that we need toinvestigate.
648
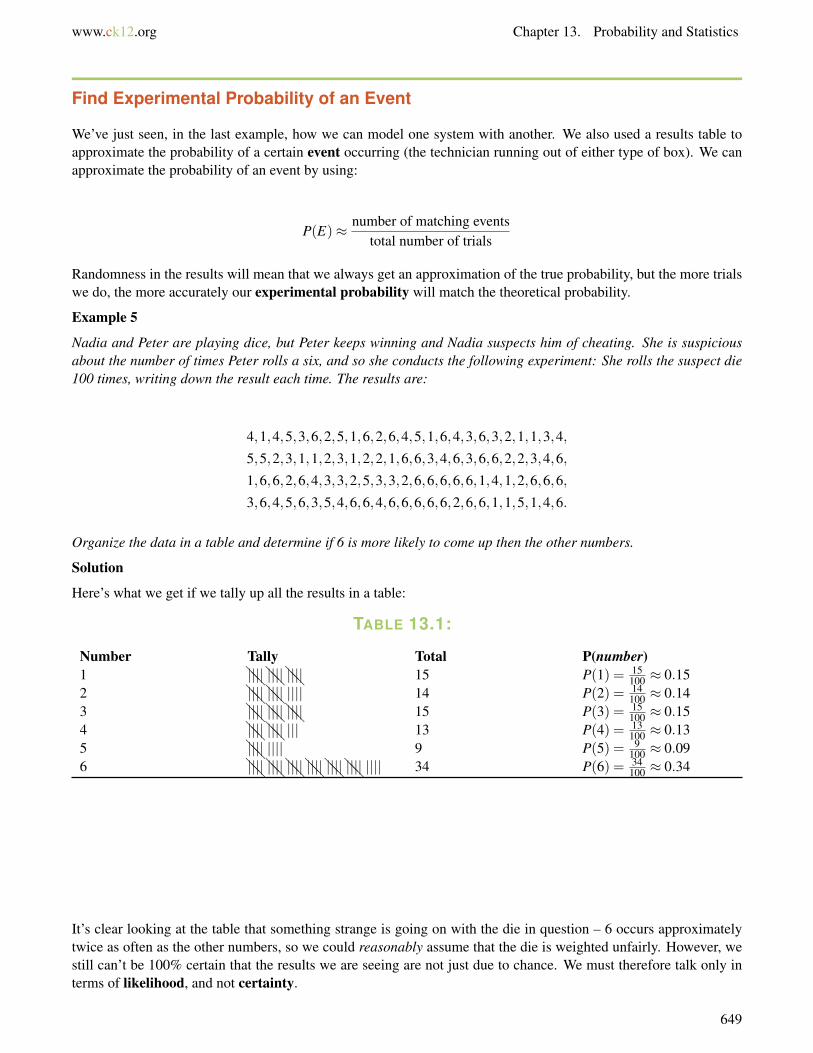
www.ck12.org Chapter 13. Probability and Statistics
Find Experimental Probability of an Event
We’ve just seen, in the last example, how we can model one system with another. We also used a results table toapproximate the probability of a certain event occurring (the technician running out of either type of box). We canapproximate the probability of an event by using:
P(E)≈ number of matching eventstotal number of trials
Randomness in the results will mean that we always get an approximation of the true probability, but the more trialswe do, the more accurately our experimental probability will match the theoretical probability.
Example 5
Nadia and Peter are playing dice, but Peter keeps winning and Nadia suspects him of cheating. She is suspiciousabout the number of times Peter rolls a six, and so she conducts the following experiment: She rolls the suspect die100 times, writing down the result each time. The results are:
4,1,4,5,3,6,2,5,1,6,2,6,4,5,1,6,4,3,6,3,2,1,1,3,4,
5,5,2,3,1,1,2,3,1,2,2,1,6,6,3,4,6,3,6,6,2,2,3,4,6,
1,6,6,2,6,4,3,3,2,5,3,3,2,6,6,6,6,6,1,4,1,2,6,6,6,
3,6,4,5,6,3,5,4,6,6,4,6,6,6,6,6,2,6,6,1,1,5,1,4,6.
Organize the data in a table and determine if 6 is more likely to come up then the other numbers.
Solution
Here’s what we get if we tally up all the results in a table:
TABLE 13.1:
Number Tally Total P(number)1 @@||||@@||||@@|||| 15 P(1) = 15
100 ≈ 0.152 @@||||@@|||| |||| 14 P(2) = 14
100 ≈ 0.143 @@||||@@||||@@|||| 15 P(3) = 15
100 ≈ 0.154 @@||||@@|||| ||| 13 P(4) = 13
100 ≈ 0.135 @@|||| |||| 9 P(5) = 9
100 ≈ 0.096 @@||||@@||||@@||||@@||||@@||||@@|||| |||| 34 P(6) = 34
100 ≈ 0.34
It’s clear looking at the table that something strange is going on with the die in question – 6 occurs approximatelytwice as often as the other numbers, so we could reasonably assume that the die is weighted unfairly. However, westill can’t be 100% certain that the results we are seeing are not just due to chance. We must therefore talk only interms of likelihood, and not certainty.
649
13.1. Theoretical and Experimental Probability www.ck12.org
Find Odds For and Against an Event
When we talk of probability, we generally think (as we’ve seen in this lesson) of the ratio of the number of timesour event occurs to the number of times the experiment was carried out.
Another way to talk about the chances of an event occurring is with odds. You may have heard of the phrases“fifty-fifty” or “even odds” to describe an unpredictable situation like the chances of getting heads when you tossa coin. The phrase means that the coin is as likely to come up tails as it is heads (each event occurring 50% of thetime). The odds of an event are given by the ratio of the number of times the event occurs to the number of timesthe event does not occur. In sample space terms it means:
Odds =number of matching events in sample place
number of non-matching events in sample place
whereas we would describe probability as
Probability =number of matching events in sample place
number of total events in sample place
To avoid confusion with probability, odds are usually left as a ratio such as 1:5, which would be read as “one tofive”. When probability is read as a ratio, it’s usually written as a fraction like 1
5 , which would usually be read as“one in five.”
Example 6
Find the odds of the following events:
a) Tossing a coin and getting heads.
b) Rolling a die and getting a 3.
c) Tossing 4 coins and getting exactly 3 tails.
Solution
The key to finding odds is looking at how many outcomes result in the event and how many do not:
a) The sample space consists of 2 outcomes: 1 heads, 1 not-heads. The odds of getting heads are 1 : 1 (one to one,or even).
b) The sample space consists of 6 outcomes: 1 three and 5 not-three. The odds of getting three are 1 : 5 (one tofive).
c) Look back at example 4, where we found the sample space for tossing 4 coins. The sample space consists of 4outcomes where exactly 3 tails came up and 12 outcomes when they did not. So the odds of getting 3 tails are 3 : 12= 1 : 4 (one to four).
Look carefully at part b above. This illustrates the need to avoid confusion between odds and probability. We knowthat the probability of getting a 3 is P(3) = 1
6 or “one in six,” but the odds describes the same event with the ratio 1: 5 or “one to five”.
Review Questions
1. Find the number of outcomes in the sample space of:
650

www.ck12.org Chapter 13. Probability and Statistics
a. Tossing 3 coins simultaneously.b. Rolling 3 dice and summing the score.c. Rolling 3 dice and interpreting the result as a 3 digit number.d. Pulling a card from a standard 52-card deck.
2. Find the theoretical probability of
a. Tossing 3 coins simultaneously and getting 2 or more heads.b. Rolling 3 dice, summing the score and getting 17.c. Rolling 3 dice and interpreting the result as a 3 digit number, and getting 333.d. Pulling a club from a standard 52-card deck.
3. Find the odds of
a. Tossing 3 coins simultaneously and getting 2 or more heads.b. Rolling 3 dice, summing the score and getting 12.c. Rolling 3 dice and interpreting the result as a 3 digit number, and not getting 333.d. Pulling a club from a standard 52-card deck.
4. Peter and Andrew each visit the hardware store in the high street every week. The store is open 6 days a week(it is closed on Sundays) and Peter and Andrew visit the store on random days when it is open.
a. Use a pair of dice to simulate what day Andrew and Peter each visit the store, and determine experimen-tally the probability that they both visit the store on the same day.
b. What would you expect the theoretical probability to be?
5. Find experimentally both the probability and odds for the next car passing a stoplight being red if the previous25 car colors were: red, blue, white, blue, silver, red, black, black, white, red, green, red, black, blue, white,red, silver, white, red, black, white, blue, silver, red, black.
6. In each of the following situations, determine whether you could calculate the theoretical probability of thegiven event based on your knowledge of the possible outcomes, or whether you would have to do a test (or getmore real-world information some other way) to find the experimental probability:
a. Flipping a coin three times in a row and getting three heads.b. Pulling a nickel from your pocket when you know you have three nickels and five dimes in your pocket.c. Pulling a nickel from your pocket when you know you have ten coins in your pocket but can’t remember
what they are.d. Guessing the right answer on a multiple-choice question.e. Guessing the right answer on a free-response question.f. Getting a perfect score on a twenty-question multiple-choice test.g. Getting a perfect score on a test that has ten multiple-choice questions and ten free-response questions.h. Guessing a randomly chosen high school student’s age correctly.i. Sharing a birthday with one of your three best friends.j. Getting a flat tire while driving home.k. Having your left front tire be the one that goes flat, whenever you do get your next flat tire.
651

13.2. Probability and Permutations www.ck12.org
13.2 Probability and Permutations
Learning Objectives
• Identify, list and count permutations.• Recognize factorial notation and use factorials to count permutations• Find permutations using a formula.• Find probability in simple cases using permutations.
Introduction
In this lesson we’ll be looking at ways of arranging things. To illustrate what we mean by this, let’s look at a simpleexample. Think about choosing your favorite color from the following list of choices; red, blue, green, yellow, pink,purple, orange, brown, black. Clearly there are nine different colors, so there are nine possible choices you couldmake.
Now think about choosing your top three colors in order of preference. There are many different ways you canchoose the top three. You might choose red as your favorite, followed by black, then green. Someone else mightchoose the same three colors as you, but in a different order! When you are choosing items from a list and theorder in which you choose them is important, the arrangement is called a permutation. How many differentpermutations do you think there are in this situation?
In this lesson, we’ll use counting methods to determine how many permutations a given situation has. We’ll alsodiscover a formula to calculate permutations when counting alone is impractical.
Counting Permutations
In simple cases, sometimes it’s easiest to calculate permutations by just listing all the possibilities and countingthem. Let’s examine a situation where it is relatively straightforward to do that.
Example 1
Nadia and Peter are going to watch two movies on a rainy Saturday. Nadia will choose the first movie, and Petergets to choose the second. The four movies they have to choose from are The Lion King, Aladdin, Toy Story andPinocchio. Given that Peter will choose a different movie than Nadia, how many permutations are there for themovies they watch?
Solution
Since the order in which they watch the movies is important, and they don’t plan to choose the same movie twice,we can list all the different possibilities in a table:
652

www.ck12.org Chapter 13. Probability and Statistics
TABLE 13.2:
First Movie Second MovieLion King AladdinLion King Toy StoryLion King PinocchioAladdin Lion KingAladdin Toy StoryAladdin PinocchioToy Story Lion KingToy Story AladdinToy Story PinocchioPinocchio Lion KingPinocchio AladdinPinocchio Toy Story
You can see that this table contains all the possibilities for the situation. There are four movies for Nadia to choosefrom. For every movie that Nadia chooses first, Peter has three choices left for his movie. By simply counting therows in the table you can see that there are 12 permutations in this situation.
Example 2
I have 5 cards with the numbers 1 through 5 on them. I take three cards and arrange them to form a 3-digit number.How many 3-digit numbers can I make?
Since the numbers we can make fit a numerical ordering pattern, we can list the possibilities in increasing order:
123 124 125 132 134 135 142 143 145 152 153 154
213 214 215 231 234 235 241 243 245 251 253 254
312 314 315 321 324 325 341 342 345 351 352 354
412 413 415 421 423 425 431 432 435 451 452 453
512 513 514 521 523 524 531 532 534 541 542 543
By arranging the table this way, you can see how the number of remaining choices decreases as we choose numbers.There are five choices for the first number, four choices for the second number and three choices for the thirdnumber. Counting the table entries gives a total of 60 permutations.
If we look closely at the last two examples we can see a pattern start to appear. Mathematicians love patterns—theytend to lead to formulas, which make life much easier! After all, why spend hours counting possibilities when aformula can calculate them in seconds?
In example 1, Nadia had four choices and Peter had three. The number of permutations was 4×3 = 12.
In example 2 there were 5 choices for the first digit, followed by 4 for the second digit, and then 3 for the third digit.The total number of permutations was 5×4×3 = 60.
In the introduction, we thought about picking our top three choices from a list of nine colors. You should now beable to do that. Even without listing all the possibilities, you can see that you have 9 choices for your favorite, 8choices for your second favorite, and 7 choices for your third. The number of permutations is thus 9×8×7 = 504.
653

13.2. Probability and Permutations www.ck12.org
Factorial Notation
Look again at the color list in the introduction, and think this time about writing down every color in order ofpreference. You would have 9 choices for your favorite, followed by 8 choices for your second favorite, then 7, then6, then 5, and so on. To determine the number of permutations for any possible list, we would perform the followingcalculation:
Color Permutations = 9×8×7×6×5×4×3×2×1
This sort of pattern crops up a great deal in statistics, probability and number theory. It’s so common that it has itsown notation: 4×3×2×1 is written as 4! and is called four factorial. So the number of color permutations aboveis nine factorial = 9! = 362,880.
So what happens when we only want the first few terms in a factorial? For example, the number of permutations forarranging ALL the colors is 362,880, but the number of permutation for the top three is 504.
One way to get this result is to divide one factorial by another. Look at nine factorial divided by six factorial:
9!6!
=9×8×7× 6× 5× 4× 3× 2× 1
6× 5× 4× 3× 2× 1= 9×8×7 = 504
The terms in six factorial cancel out all but the first three terms in nine factorial. You should see that if we wantedthe first four terms we would divide by 5!, or for only the first two terms we would divide by 7!. In general, howevermany terms we want to keep, we divide by the factorial of the quantity:
(number o f items in list)− (number o f items we are choosing)
So to get the first five terms in twelve factorial we would use the formula 12!(12−5)! =
12!7! .
Formulas like this are useful if you have a calculator that can handle factorials: you can just type in 12!7! instead of
12× 11× 10× 9× 8. However, some factorials are too big for some calculators to handle, so in those cases youwould need to simplify the fraction and do the multiplication by hand.
Example 3
How many ways can Dale choose his favorite 5 songs from the current Billboard Hot 100T M?
Solution
To find the answer, consider how many choices he has at each stage. For his first choice he has 100 songs to choosefrom, then 99, then 98 and so on. We need the first 5 terms only, so our calculation is:
Permutations =100!
(100−5)!=
100!95!
= 100×99×98×97×96 = 9,034,502,400
Notice that that’s a pretty big number – far too large to count in a table! This is why we need formulas to help uscount permutations.
Finding Permutations Using a Formula
We’ve just seen that a formula for determining the number of permutations for choosing 3 objects from a list of 9objects is:
654

www.ck12.org Chapter 13. Probability and Statistics
9!6!
=9×8×7× 6× 5× 4× 3× 2× 1
6× 5× 4× 3× 2× 1= 9×8×7 = 504 permutations
Now we’re ready to come up with a general formula for determining permutations. When we are choosing r ordereditems from a group of n items, the number of permutations is given by the first r terms in n! We use the notation nPr
for this, and the general form for calculating permutations is:
nPr =n!
(n− r)!
Example 4
How many ways are there to choose a 5-song mix from a CD containing 12 tracks?
Solution
Choosing 5 from 12: 12P5 =12!
(12−5)! =12!7! = 12×11×10×9×8 = 95,040 ways
Example 5
How many 3-letter “words” can be made from the letters in “computer”? (The words do NOT need to be real, oreven pronounceable – for example “rtp” would count as a word)
Solution
Choosing 3 from 8: 8P3 =8!
(8−3)! =8!5! = 8×7×6 = 336 words
Find Probability Using Permutations
When we talk about probability, we are talking about chance. We may use words like ’possible’ to indicate somethinghas a low to medium chance of happening, or ’probable’ to indicate something has a high chance of happening.
When we perform calculations in probability we are generally looking at a situation to find the number of favorableoutcomes in relation to the total number of all possible outcomes. In mathematics, a favorable outcome simplymeans the outcome we are looking to solve for. Over the course of 100 days a child may get ice-cream on 25 of thosedays. A mathematician would look at that data and conclude that the fraction of days when the child gets ice-creamis one-fourth. He may also conclude that on any day the child has a “one in four chance” of receiving ice-cream.This is one way to think about probability: the number of times something favorable happens divided by the totalnumber of outcomes. We have no way of knowing for sure if the child is going to get ice-cream today, but we canestimate the chance that he will by looking at the number of times he did get ice-cream and the number of times hedid not.
Example 6
If Nadia and Peter have chosen their movies as in example 1, what is the probability that Aladdin is the second moviethey will watch?
Solution
If we look back at example 1, we see that there are a total of 12 possible outcomes. Out of those 12, Aladdin wasthe second movie 3 times. So the probability is as follows:
P(Aladdin being second) = 312 = 1
4 =one in four or 25%
Example 7
655

13.2. Probability and Permutations www.ck12.org
The card game “21 hearts” consists of dealing two cards to a player and counting the points as follows: face cards(King, Queen, Jack) are worth 10 points, and number cards are worth their face value except for aces, which areworth 11. The maximum score is 21. If the game is played only with the 13 cards in the hearts suit, what is theprobability that a player will score 21?
Solution
To find the answer, we need to know two pieces of information: 1) the total number of permutations it’s possible toget in the game and 2) the number of permutations that will score 21.
To find the total number of permutations for the game, use the formula nPr with n = 13 and r = 2:
13P2 =13!
(13−2)!=
13!11!
= 13×12 = 132 permutations
Now we need to determine how many of those permutations score 21. We can do that by simply listing all ways toscore 21. Remember, of course, that as we are talking about permutations, the combinations (ace, king) and (king,ace) each count as separate hands! The winning permutations are:
(ace, king) (king, ace) (ace, queen) (queen, ace)
(ace, jack) (jack, ace) (ace,10) (10,ace)
There are 8 winning hands, so the probability of scoring 21 is given by:
P(21) = 8132 = 2
33 =two in thirty-three or approximately 6%.
Sometimes when looking at probability (especially in games of chance), there are too many wining permutations tocalculate directly. In such circumstances it can be useful to remember that a player must either win or lose – it’simpossible to do both! In these circumstances remember that:
P(winning)+P(losing) = 1
Since it’s certain that you’ll either win or lose, the probability that you’ll win and the probability that you’ll lose addup to 1.
So to calculate the probability of losing we can use:
P(winning) = 1−P(losing)
Example 8
A funfair game consists of throwing three darts at a board with 16 numbered squares in a 4× 4 grid. The squaresare numbered 1 through 16 and no number is repeated or omitted. In order to win a player needs to score 9 or more.If a dart hits a square that has already been taken or if a dart misses the board the player must throw the dart again.What are the chances of winning the game?
There are too many winning permutations to list easily, but there are only a few losing permutations. If you need ascore of 9 or more to win, then you’ll lose with a score of 8 or less. There are only four combinations of numbersthat add up to 8 or less (remember that you can’t repeat a number), and they can occur in any of the following orders:
656
www.ck12.org Chapter 13. Probability and Statistics
1,2,3(= 6) 1,3,2 2,1,3 2,3,1 3,1,2 3,2,1
1,2,4(= 7) 1,4,2 2,1,4 2,4,1 4,1,2 4,2,1
1,2,5(= 8) 1,5,2 2,1,5 2,5,1 5,1,2 5,2,1
1,3,4(= 8) 1,4,3 3,1,4 3,4,1 4,1,3 4,3,1
So there are 24 permutations totaling less than 9.
The total number of ways to choose 3 numbers out of 16 is
16P3 =16!
16−3!=
20!13!
= 16×15×14 = 3360 permutations
So the probability of losing the game is 243360 , or 1
140 . That means the probability of winning is:
P(winning) = 1−P(losing) = 1− 243360 = 1− 1
140 = 139140 or approximately 99.3%.
Review Questions
1. In how many ways can the letters a,b,c,d,e be arranged?2. In how many ways can the digits 1, 2, 3, 4, 5, 6, 7, 8, 9 be arranged?3. From a collection of 12 books, 5 are to be selected and placed in a particular order on a shelf. How many
arrangements are possible?4. 3 cards are taken at random from a deck of 52 cards and laid in a row. How many possible outcomes are there
for the card arrangements?5. How many distinct 3-letter permutations can you make from the letters in the word HEXAGON?6. How many distinct 2-letter permutations can you make from the letters in the word GEESE?7. A jukebox has 50 songs on it. If $1.00 pays for three songs, how many permutations are there for choosing 3
different songs?8. Evaluate the following:
a. 3P1b. 7P1c. 6P2d. 8P8e. 9P3f. 7P3g. 19P7h. 99P3i. 3P0
9. What is the probability that a randomly generated 3-letter arrangement of the letters in the word SPIN endswith the letter N?
10. A bag contains eight chips numbered 1 through 8. Two chips are drawn randomly from the bag and laid downin the order they were drawn. What is the probability that the 2-digit number formed is divisible by 3?
11. A prepaid telephone calling card comes with a randomly selected 4-digit PIN, using the digits 1 through 9without repeating any digits. What is the probability that the PIN for a card chosen at random does not containthe number 7?
657

13.3. Probability and Combinations www.ck12.org
13.3 Probability and Combinations
Learning Objectives
• Identify, list and count combinations.• Use permutations to help calculate combinations• Find combinations using a formula.• Find probability in simple cases using combinations.
Introduction
In the previous lesson we looked at situations where the order of an arrangement is important. For example, whenlooking at 3-digit numbers, the number 123 is very different from the number 312, even though it contains thesame 3 digits. But in some situations, the order is not important – for example, when looking at cards in a hand ofpoker, or choosing toppings to put on a pizza. In these situations, when order is not important, we are lookingat combinations of items. For example, if you are a poker player you might want to know the probability of beingdealt four aces in a hand of five cards. You don’t care in which order you receive the ace cards – only the fact thatyou have four of them is important.
Counting Combinations
Just as with permutations, it’s sometimes easiest to calculate combinations by listing all the possibilities available,and counting them. The only difference is, when we list one combination, we automatically exclude a larger numberof permutations. For example a poker hand that is (ace, ace, ace, ace, king♣) is identical to (ace, ace, ace, king♣,ace), (ace, ace, king♣, ace, ace), (ace, king♣, ace, ace, ace) and (king♣, ace, ace, ace, ace). So we must be carefulto use a listing method that includes all combinations without repeating ones that are really the same. Let’s examinea situation where it’s relatively straightforward to do that.
Example 1
Anne wishes to knit herself a striped sweater. She has 4 colors of yarn available; red, blue, green and yellow. Howmany different combinations of two colors does she have to choose from?
Solution
When we just choose color pairs, there will be fewer combinations than we would have if we were countingpermutations as in the previous lesson. For example red and blue is equivalent to blue and red, and we shouldonly count one as a unique pairing. We start by listing the color pairs but we will also write down equivalent pairingsat the same time. This will help prevent us from repeating combinations:
TABLE 13.3:
Pairing Equivalent pairings (do not count)Red & blue blue & red
658

www.ck12.org Chapter 13. Probability and Statistics
TABLE 13.3: (continued)
Pairing Equivalent pairings (do not count)Red & green green & redRed & yellow yellow & redGreen & blue blue & greenGreen & yellow yellow & greenYellow & blue blue & yellow
So there are 6 distinct combinations. There are also 6 “repeat” pairings – for every pair of colors we choose there is1 combination but 2 permutations. Anne can choose from six distinct color pairs for her sweater.
Example 2
Triominoes Pizza Company specializes in 3-topping pizzas. If the available toppings are cheese, pepperoni, mush-room, pineapple and olives, how many different 3-topping combinations can customers choose from?
Solution
We’ll start by making a table and list first choice, second choice and third choice:
TABLE 13.4:
1st topping 2nd topping 3rd toppingcheese pepperoni mushroomcheese pepperoni pineapplecheese pepperoni olivescheese mushroom pineapplecheese mushroom olivescheese pineapple olivespepperoni mushroom pineapplepepperoni mushroom olivespepperoni pineapple olivesmushroom pineapple olives
Note that as we progress through the choices for first topping, the number of combinations we have for the secondand third toppings get fewer. This is because some combinations have already been used, in a different order.
By counting the table entries we see that there are 10 possibilities for a 3-topping pizza.
Determining Combinations by Looking at Permutations
You can see that there are always fewer combinations than permutations in a given situation – but you should alsosee that knowing which combinations have already been used is important to avoid counting combinations twice.One combination can give rise to several permutations of the same objects.
Another way to calculate combinations is this: If we know how many permutations there are in a system andhow many permutations there are for each combination, then we can divide the number of permutations by thenumber of permutations for each combination to get the number of combinations.
To illustrate this, look again at the Triominoes Pizza menu. If we were to look at permutations of toppings, wecould quickly calculate that there are 5×4×3 = 60 permutations. But for every 3-topping choice there are severalpermutations which are all equivalent. For example, the following all give identical pizzas:
659

13.3. Probability and Combinations www.ck12.org
Cheese, pepperoni & mushroom Cheese, mushroom & pepperoni
Pepperoni, cheese & mushroom Pepperoni, mushroom & cheese
Mushroom, cheese & pepperoni Mushroom, pepperoni & cheese
So for every different combination there are 6 distinct permutations. Since we have a formula for counting permuta-tions, we can use it to find out how many total permutations there are and simply divide that number by 6:
Combinations =16·5 P3 =
16· 5!
2!=
16· 5×4×3× 2× 1
2× 1=
606
= 10
Find Combinations Using a Formula
If you look back at examples 1 and 2 you can see that the number of permutations is a simple multiple of the numberof combinations. In example 1 there are two times as many permutations as combinations. In example 2 there aresix times as many permutations as combinations. One question you might be asking is: “How do I know how thenumber of combinations is related to the number of permutations?”
A more important question might be “where did the numbers two and six come from?” If you think carefully youshould realize that any time you’ve chosen 2 objects, there are only 2 ways of ordering them, while if you’ve chosen3 objects there are 3! ways of ordering them (6 ways). Similarly, if you choose 7 objects, there will be 7! ways ofarranging them. We can make use of this fact when calculating combinations. The number of combinations is thenumber of permutations divided by the number of ways of arranging the items you choose. If you choose r objectsfrom a collection of n objects there are r! ways of arranging what you choose. In equation form, the number ofcombinations is therefore:
nCr =n!
(n− r)!r!
In other words, the number of combinations is equal to the number of permutations divided by r! (because r! isthe number of permutations for each combination). We can use this new formula to quickly calculate combinationswithout listing them all.
Example 3
Andrew is packing for a vacation. He owns twelve shirts and wants to pack five of them. How many combinations ofshirts does he have to choose from?
Solution
Since the order he packs his shirts in is not important, we are looking at a combination. He is choosing five shirtsfrom a total of twelve:
Choosing 5 from 12: 12C5 =12!
(12−5)!5! =12!7!5! =
12×11×10×9×85×4×3×2×1 = 792 combinations.
Find Probability Using Combinations
Just as with permutations, combinations crop up frequently in probability. In many card games the objective is toacquire a winning hand. In order to do that, it’s useful for players to know how likely a given hand is to arise, and
660

www.ck12.org Chapter 13. Probability and Statistics
also the probability that another player has a better hand. Mathematicians have been studying such games of chancefor centuries.
Example 4
A word game requires players to select 4 tiles from a bag containing 26 tiles, each with one of the letters A throughZ written on it. If each letter appears once and only once, what is the probability that a player will be able to spellCATS with his tiles?
Solution
Since a player needs a C, an A, a T and an S in any order, we are looking at a combination calculation. We firstneed to determine how many combinations there are, choosing 5 letters from a total of 26:
Choosing 4 from 26: 26C4 =26!
(26−4)!4! =26!
22!4! =26×25×24×23
4×3×2×1 = 59,800 combinations.
Since only one combination allows a player to spell CATS, the probability of getting that combination is 159,800 .
Example 5
A funfair game consists of pulling numbered chips from a bag. The game starts with nine chips numbered 1 through9, and players are allowed to pull out three chips. A player wins by drawing the number 7 chip. What is theprobability that a player will win?
Solution
To find the probability for winning this game we need to know two pieces of information: 1) the total number ofcombinations for the game and 2) the number of combinations that contain a 7.
To find the total number of combinations for the game, use the formula nCr with n = 9 and r = 3:
9C2 =9!
(9−3)!3!=
9!6!3!
=9×8×73×2×1
= 84 combinations
Now we need to determine how many combinations contain a 7. We can figure this out by reasoning as follows:given that there MUST be a 7 in the list, the number of combinations that contain a seven is the same as the numberof combinations of choosing any two numbers out of the eight chips that don’t include the 7. In other words, if weimagine that we got to pick the 7 chip on purpose, how many ways would there be of picking the other two chips?
To find that number, we use the formula nCr with n = 8 and r = 2:
8C2 =8!
(8−2)!2!=
8!6!2!
=8×72×1
= 28 combinations
So the probability is given by:
P(getting a 7) =8428
=13= or one in three.
Example 6
Calculate the probability of being dealt four aces in a five card poker hand.
Solution
The first thing we need to know to solve this problem is the total number of unique hands. Since players can arrangetheir cards however they wish, the order of the cards is unimportant. So we will calculate, using the formula, thenumber of combinations for choosing 5 cards from a 52 card deck.
661

13.3. Probability and Combinations www.ck12.org
Choosing 5 from 52: 52C5 =52!
(52−5)!5! =52!
47!5! =52×51×50×49×48
5×4×3×2×1 = 2,598,960 unique hands
Next we need to calculate how many hands there are that contain four aces. This sounds difficult, but we can thinkabout it like this:
• If a hand contains four aces, it must also contain exactly ONE other card.• Since the four aces are accounted for, there are 48 (that’s 52 – 4) cards left in the deck.
Since a unique hand is independent of the order in which the cards are dealt, there must be 48 unique hands thatcontain four aces (one unique hand for every non-ace card in the deck).
There are 48 possible hands that contain four aces. So the probability of being dealt four aces in poker is:
P(four aces) =48
2,598,690=
154,145
Review Questions
1. How many combinations are possible in the following situations?
a. Buying a hot-dog with two of the following toppings: ketchup, mustard, chili, cheese, picklesb. Choosing 5 CDs from a selection of 8.c. Selecting 3 games from a box containing Scrabble, Twister, Connect-4, Snap Mousetrap.d. What do you notice about the answers to parts a and c? How might this be explained by the formula for
finding numbers of combinations?
2. Evaluate the following:
a. 3C1b. 7C1c. 6C2d. 8C8e. 9C3f. 9C6g. 7C3h. 17C4i. 30C11j. 10C0
3. A bag contains 13 dominoes. Each domino has a different number of dots on it, and the numbers of dots are 0,1, 2, 3, 4, 5, 6, 7, 8, 9, 10, 11, and 12. Peter selects 2 dominos at random from the bag. What is the probabilitythat the total number of dots on the two dominoes he selects is 7?
4. A town lottery requires players to choose three different numbers from the numbers 1 through 36.
a. How many different combinations are there?b. What is the probability that a player’s numbers match all three numbers chosen by the computer?c. What is the probability that two of a player’s numbers match the numbers chosen by the computer?d. What is the probability that one of a player’s numbers matches the numbers chosen by the computer?e. What is the probability that none of a player’s numbers match the numbers chosen by the computer?
5. Looking at the odds that you came up with in question 4, devise a sensible payout plan for the lottery—inother words, how big should the prizes be for players who match 1, 2, or all 3 numbers? Assume that ticketscost $1. Don’t forget to take into account the following:
662

www.ck12.org Chapter 13. Probability and Statistics
a. The town uses the lottery to raise money for schools and sports clubs.b. Selling tickets costs the town a certain amount of money.c. If payouts are too low, nobody will play!
663

13.4. Probability of Compound Events www.ck12.org
13.4 Probability of Compound Events
Learning Objectives
• Find the probability of mutually exclusive events.• Find the probability of overlapping events.• Find the probability of independent events.• Find the probability of dependent events.
Introduction
Imagine you are going to see a movie. Your friend has just bought the tickets, and you are not sure which movie youare seeing. There are 4 movies playing. Harry Potter (which you have already seen, but your friend has not) is oneof them.
• What are the chances you will be seeing Harry Potter?• What are the chances you will NOT be seeing Harry Potter?
This is an easy example of a mutually exclusive event: you will either see Harry Potter, or you will not. You cannotdo both!
Finding the probability of mutually exclusive events is easy; what’s not as easy is finding the probability of eventsthat can overlap depend on each other. In this lesson, you’ll learn how to find the probability of any two events thatcan be related to each other.
Find the Probability of Mutually Exclusive Events
In probability, when two events are mutually exclusive, the probability of both happening together is zero.
Examples of mutually exclusive events in probability include:
• Flipping a coin and:
– getting heads– getting tails
• Picking a single card from a deck and:
– getting an ace– getting a 7– getting a queen– etc...
• Picking a single colored marble from a bag and:
664

www.ck12.org Chapter 13. Probability and Statistics
– getting a red marble– getting a blue marble– getting a green marble– etc..
What this means mathematically is two-fold. If our two mutually exclusive events are A and B:
• P(A and B) = 0 There is no possibility of both events happening.• P(A or B) = P(A)+P(B) To find the probability of either event happening, sum the individual probabilities.
Example 1
There are 7 marbles in a bag: 4 green, 2 blue and 1 red. Peter reaches into the bag and blindly picks a single marble.The following letters refer to these events:
• A – the marble is red• B – the marble is blue• C – the marble is green
Find the following:
a. P(A)
b. P(B)
c. P(C)
d. P(B or A)
e. P(C or A)
f. P(C or B or A)
g. P(A and C)
Solution
Look at the 3 events A,B and C. They must be mutually exclusive: if we pick a single marble from the bag then itmust be either red or blue or green. There is no possibility of it being both blue and green!
a) There are 7 marbles and only one is red, so P(A) = 17 .
b) There are 7 marbles and 2 are blue, so P(B) = 27 .
c) There are 7 marbles and 4 are green, so P(C) = 47 .
d) The events are mutually exclusive, therefore P(B or A) = P(B)+P(A) = 27 +
17 = 3
7 .
e) The events are mutually exclusive, therefore P(C or A) = P(C)+P(A) = 47 +
17 = 5
7 .
f) The events are mutually exclusive, therefore P(C or B or A) = P(C)+P(B)+P(A) = 47 +
27 +
17 = 7
7 = 1.
g) The events are mutually exclusive, so P(A and C) = 0.
The last two results make sense: P(C or B or A) means the probability of the marble being green blue or red. Itmust be one of these. And P(A and C) is the probability of the marble being both red and green. There are no suchmarbles in the bag!
Earlier we learned about permutations and combinations. We often have to use these calculations when determiningthe probability of mutually exclusive events.
Example 2
There are 7 marbles in a bag: 4 green, 2 blue and 1 red. Peter reaches into the bag and blindly picks out 4 marbles.Find the probability that he removes at least 3 green marbles.
665

13.4. Probability of Compound Events www.ck12.org
Solution
There are 2 distinct ways this could occur:
a) Peter picks 3 green marbles and 1 other.
b) Peter picks 4 green marbles.
These events are mutually exclusive – he cannot remove (three green and one other) and (four green) at once. If wefind P(A) and P(B) we know that the total probability P(A or B) = P(A)+P(B).
We are choosing 4 marbles from a bag containing 7 marbles. The total number of marble combinations there are is7C4 =
7!4!3! = 35 possible combinations.
a) The number of combinations that contain 3 green marbles +1 other:
First, the 3 greens. We are choosing 3 green marbles out of a total of 4: 4C3 =4!
3!1! = 4
Now to choose 1 other – we’re picking 1 marble out of the 3 non-green ones: 3C1 =3!
2!1! = 3
The total number of combinations of 3 greens and 1 other = 4C3×3 C1 = 4×3 = 12
So P(A) = 1235 .
b) The number of combinations that contain 4 green balls:
We are choosing 4 from 4 possible green balls: 4C4 = 1 possible combination
So P(B) = 135
P(A or B) = P(A)+P(B), so the probability of getting at least 3 green balls is 1235 +
135 = 13
35 or slightly better than1 in 3.
Find the Probability of Overlapping Events
Sometimes we wish to look at overlapping events. In essence, this means two events that are NOT mutuallyexclusive. For instance, if you pick a card at random from a standard deck, what is the probability that you’llget a card which is either a seven or a diamond? Let’s use this as our next example:
Example 3
If you pick a card at random from a standard 52-card deck, what is the probability that you get a card which is eithera seven or a diamond?
Solution
One thing we can say for certain is that these two events are not mutually exclusive (it is possible to get a card whichboth a seven and a diamond). First of all, let’s look at the information we have:
• There are 52 cards – the chances of picking any particular one is 152 .
• There are 4 sevens (diamond, heart, club, spade) – the chances of picking a seven is 452 = 1
13 .• There are 13 diamonds (ace through king) – the chances of picking a diamond is 13
52 = 14 .
• The chances of picking the seven of diamonds is 152 .
So there are 4 sevens, 13 diamonds and 1 card that is both (the seven of diamonds). That means we can’t just add upthe number of sevens and the number of diamonds, because if we did that, we’d be counting the seven of diamondstwice. Instead, we have to add up the number of sevens and the number of diamonds, and then subtract the numberof cards that fit in both categories. That means there are (4+ 13− 1) = 16 cards that are seven or diamond. Theprobability of getting a seven or a diamond is therefore 16
52 = 413 .
We can check this by listing all the cards in the deck and highlighting those that are sevens or diamonds:
666

www.ck12.org Chapter 13. Probability and Statistics
You can see that there are 16 cards that fit, not the 17 we’d get if we just added up the sevens and the diamonds.
Look again at the numbers: the number of cards that are seven or diamond is (number of sevens) plus (number ofdiamonds) minus (number of seven and diamond). In probability terms we can write this as:
P(seven or diamonds) = P(seven)+P(diamonds)−P(seven and diamonds)
This leads to a general formula:
For overlapping events : P(A or B) = P(A)+P(B)−P(A and B)
Find the Probability of Independent Events
If the result of one event has no bearing on the probability of the second event, we call them independent events.For example, if you flip a coin 3 times and get heads 3 times, what is the probability that the next flip will result intails? Many people think that the previous run of heads somehow influences the flip to make tails more likely, but inreality the previous flips have no bearing on the outcome of the new flip – how could they? The coin doesn’t have abrain or a memory.
(The idea that tails is more likely after a run of heads is called the Gambler’s Fallacy, and it probably arises frompeople getting confused about something called prior probability. Now that you’ve learned a little about probability,you know that getting three heads and one tail is a little more likely than getting four heads on four coin flips, sobefore you flip the coin, you’d expect that it’s more likely you’ll get three heads than four heads. But after you’vealready flipped the coin three times, the chances of getting heads on the first three flips don’t matter any more,because you already got those three heads; the probability of getting those first three heads has gone from 12.5% to100%! So the only probability that still matters is the probability of getting heads on the one flip remaining, whichis just the same as it always is on a single coin flip: 50%.)
Because one flip of the coin has no effect on the outcome of any other flips, each flip of the coin counts as anindependent event.
To find the probability of multiple independent events happening together, we multiply the individual probabilities:
For independent events : P(A and B) = P(A) ·P(B)
Example 4
Find the probability of rolling a 5 on a 6-sided die and getting heads if you flip a coin at the same time.
Solution
Clearly the outcome of rolling a die has no effect on flipping a coin, so the two events are independent. SoP(5 and heads) = P(5) ·P(heads) = 1
6 ×12 = 1
12 .
667

13.4. Probability of Compound Events www.ck12.org
Example 5
Out of the 480 students in a school, 40 have art first period; also, 96 students have math first period. Find theprobability that a student picked at random will either have math or art in first period.
Solution
A student cannot take both math and art during the same period, so the events are not overlapping. If event A ishaving art first period and event B is having math first period, P(A and B) = 0. We want to find P(A or B).
P(A or B) = P(A)+P(B)−P(A and B)
P(A or B) = 40480 +
96480 −0
P(A or B) = 96480
P(A or B) = 15 = 20%
Find the Probability of Dependent Events
If the result of one event influences the probability of the second, we call them dependent events. For example, ifyou pick two cards from a deck, the chances of getting an ace on the first pick is 4
52 = 113 . If you keep that ace and
draw again, the chance of getting another ace on your second pick is less: there are now only 3 aces left in the deck(of 51 cards), so the chance of getting an ace is 3
51 = 117 . To find the probability of getting two aces we multiply the
two individual probabilities: 113 ×
117 = 1
221 .
Example 6
Three cards are picked from a standard 52 card deck. The cards are not replaced. Find the probability of picking 3queens.
Solution
There are 52 cards and 4 of them are queens, so the chance of getting a queen on the first pick is 452 = 1
13 .
Assuming you get a queen on the first pick, there are 51 cards remaining of which 3 are queens, so the chance ofgetting a queen on the second pick is 3
51 = 117 .
If you were successful on the second pick, there will be 50 cards remaining of which 2 are queens, so the chance ofgetting a queen on the third pick is 2
50 = 125 .
The probability of picking 3 queens in a row is 113 ×
117 ×
125 = 1
5525 or 1 in 5,525.
Example 7
100 raffle tickets were sold and Peter bought 4 of them. There are 3 prizes, and winners are selected randomly froma hat containing all the numbers. Find the probability that Peter wins all 3 prizes.
Solution
For the first draw, Peter’s numbers account for 4 tickets out of 100: 4100 = 1
25
For the second draw, Peter’s remaining numbers (assuming he won the first draw) account for 3 tickets out of 99:399 = 1
33
For the first draw, Peter’s remaining numbers (assuming he won the first two draws) account for 2 tickets out of 98:298 = 1
49
The probability that Peter wins all 3 prizes is 125 ×
133 ×
149 = 1
40425 or 1 in 40, 425.
668

www.ck12.org Chapter 13. Probability and Statistics
Review Questions
1. Determine whether the following pairs of events are mutually exclusive or overlapping:
a. The next car you see being red; the next car you see being a Ford.b. A train being on time; the train being full.c. Flipping a coin and getting heads; flipping a coin and getting tails.d. Selecting 3 cards and getting an ace; selecting 3 cards and getting a king.e. Selecting 3 cards and getting 2 aces; selecting 3 cards and getting 2 kings.f. A person’s age is an even number; a person’s age is a prime number.
2. Determine whether the events are dependent or independent.
a. Driving at night and falling asleep at the wheel.b. Visiting the zoo and seeing a giraffe.c. The next 2 cars you see are both red.d. A coin tossed twice comes up heads both times.e. Being dealt 4 aces in a hand of poker.f. It is your birthday and it is a windy day.
3. A cooler contains 6 cans of Sprite, 9 cans of Coke, 4 cans of Dr Pepper and 7 cans of Pepsi. If a can is selectedat random, calculate the probability that it is either Pepsi or Coke.
4. A bag contains 10 colored marbles – 4 red, 4 blue and 2 green. Calculate the probability of:
a. Removing 2 green marbles in a row if you replace the marble each time.b. Removing 2 green marbles in a row if you do not replace the marble each time.c. Removing 3 marbles without replacing and getting all blue.d. Removing 4 marbles without replacing and getting exactly 3 blue.
5. A card is selected at random from a standard 52 card deck. Calculate the probability that:
a. The card is either a red card or an even number (2, 4, 6, 8 or 10).b. The card is both a red card and an even number.c. The card is red or even but not both.
669
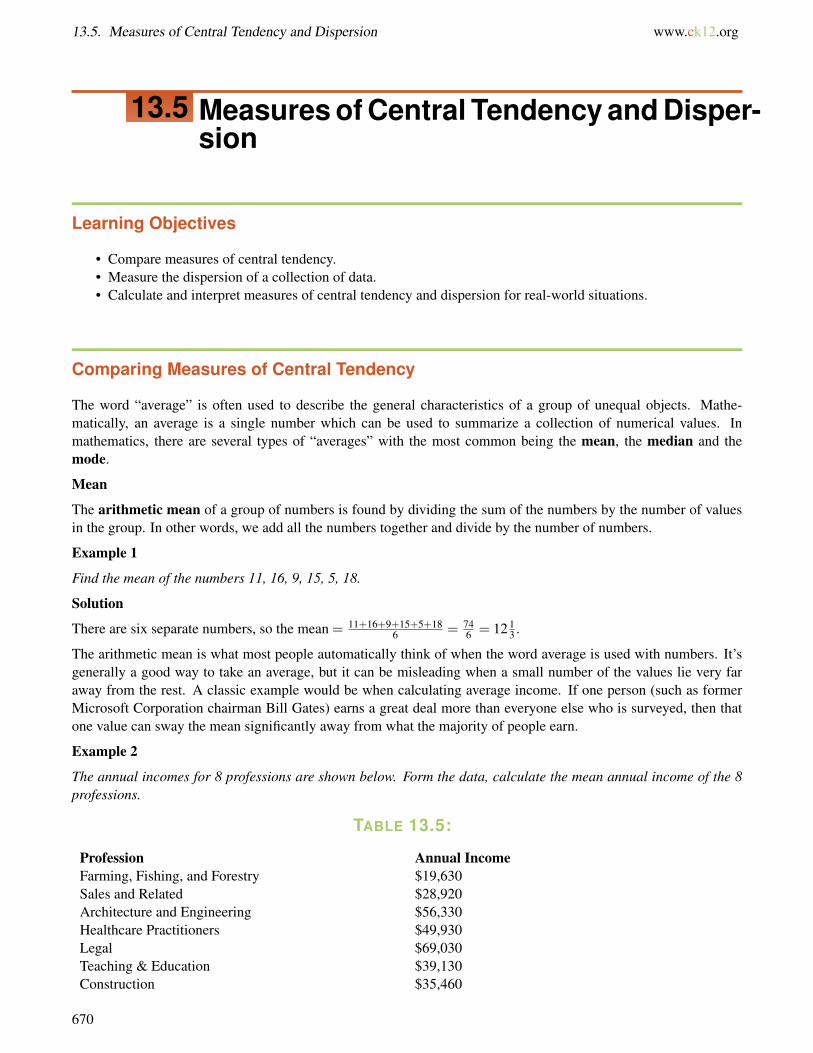
13.5. Measures of Central Tendency and Dispersion www.ck12.org
13.5 Measures of Central Tendency and Disper-sion
Learning Objectives
• Compare measures of central tendency.• Measure the dispersion of a collection of data.• Calculate and interpret measures of central tendency and dispersion for real-world situations.
Comparing Measures of Central Tendency
The word “average” is often used to describe the general characteristics of a group of unequal objects. Mathe-matically, an average is a single number which can be used to summarize a collection of numerical values. Inmathematics, there are several types of “averages” with the most common being the mean, the median and themode.
Mean
The arithmetic mean of a group of numbers is found by dividing the sum of the numbers by the number of valuesin the group. In other words, we add all the numbers together and divide by the number of numbers.
Example 1
Find the mean of the numbers 11, 16, 9, 15, 5, 18.
Solution
There are six separate numbers, so the mean = 11+16+9+15+5+186 = 74
6 = 12 13 .
The arithmetic mean is what most people automatically think of when the word average is used with numbers. It’sgenerally a good way to take an average, but it can be misleading when a small number of the values lie very faraway from the rest. A classic example would be when calculating average income. If one person (such as formerMicrosoft Corporation chairman Bill Gates) earns a great deal more than everyone else who is surveyed, then thatone value can sway the mean significantly away from what the majority of people earn.
Example 2
The annual incomes for 8 professions are shown below. Form the data, calculate the mean annual income of the 8professions.
TABLE 13.5:
Profession Annual IncomeFarming, Fishing, and Forestry $19,630Sales and Related $28,920Architecture and Engineering $56,330Healthcare Practitioners $49,930Legal $69,030Teaching & Education $39,130Construction $35,460
670
www.ck12.org Chapter 13. Probability and Statistics
TABLE 13.5: (continued)
Profession Annual IncomeProfessional Baseball Player* $2,476,590
(Source: Bureau of Labor Statistics, except (*)-The Baseball Players’ Association (playbpa.com)).
Solution
There are 8 values listed, so the mean is19630+28920+56330+49930+69030+39130+35460+2476590
8 = $346,877.50
As you can see, the mean annual income is substantially larger than the income of 7 out of the 8 professions. Theeffect of the single outlier (the baseball player) has a dramatic effect on the mean, so the mean is not a good methodfor representing the ’average’ salary in this case.
Median
The median is another type of average. It is defined as the value in the middle of a group of numbers. To find themedian, we must first list all the numbers in order from least to greatest.
Example 3
Find the median of the numbers 11, 21, 6, 17, 9.
Solution
We first list the numbers in ascending order: 6, 9, 11, 17, 21.
The median is the value in the middle of the set (in bold).
The median is 11. There are two values higher than 11 and two values lower than 11.
If there is an even number of values, then the median is the arithmetic mean of the two numbers in the middle (inother words, the number halfway between them).
Example 4
Find the median of the numbers 2, 17, 1, -3, 12, 8, 12, 16.
Solution
We first list the numbers in ascending order: -3, 1, 2, 8, 12, 12, 16, 17.
The median is the value in the middle of the set, so the median lies between 8 and 12. Halfway between 8 and 12 is10, so 10 is the median.
A useful formula for finding the middle value is as follows: if there are n values in the data set, the median is then+1
2th value.
The median is a useful measure of average when the data set is highly skewed by a small number of points that areextremely large or extremely small. Such outliers will have a large effect on the mean, but will leave the medianrelatively unchanged.
Mode
The mode can be a useful measure of data when that data falls into a small number of categories. It is simply ameasure of the most common number, or sometimes the most popular choice. The mode is an especially usefulconcept for data sets that contains non-numerical information, such as surveys of eye color or favorite ice-creamflavor.
Of course, a data set can contain more than one mode; when it does, it is called multimodal. In fact, every value ina data set could be a mode, if every value appears an equal number of times. However, this situation is quite rare.You might encounter data sets with two or even three modes, but more than that would be unlikely unless you are
671

13.5. Measures of Central Tendency and Dispersion www.ck12.org
working with very small sample sets.
Example 5
Jim is helping to raise money at his church bake sale by doing face painting for children. He collects the ages of hiscustomers, and displays the data in the graph below. Find the mean, median and mode for the ages represented.
Solution
By reading the graph we can see that there was one 2-year-old, three 3-year-olds, four 4-year-olds, etc. In total, therewere 1+3+4+5+6+7+3+1 = 30 customers.
The mean age is found by adding up all the ages multiplied by the number of times each age appears, and thendividing by 30:
2(1)+3(3)+4(4)+5(5)+6(6)+7(7)+8(3)+9(1)30
=17030
= 523
Since there are 30 children, the median is half way between the 15th and 16th oldest (that way there will be 15younger and 15 older than the median age). Both the 15th and 16th oldest fall in the 6-year-old range, therefore themedian is 6.
The mode is given by the age group with the highest frequency. Reading directly from the graph, we see that themode is 7; there are more 7-year-olds than any other age.
The following video is an introduction to the mean, median, and mode: http://www.youtube.com/watch?v=uhxtUt_-GyM.
The narrator models finding the mean, median, and mode of a set of numbers. While this is similar to the contentabove, you may find it to be a helpful comparison of what the three measures of central tendency show.
Measures of Dispersion
Look at the graphs below. Each represents a collection of many data points and shows how the individual values(solid line) compare to the mean of the data set (dashed line). You can see that even though all three graphs have
672
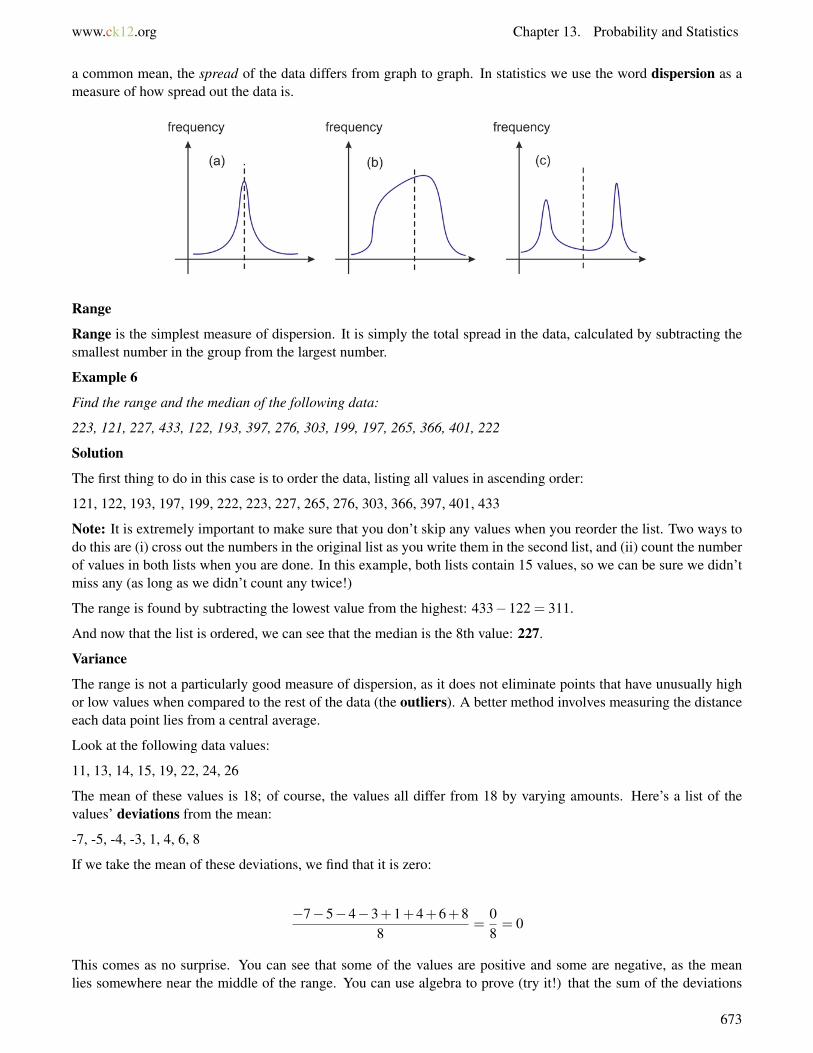
www.ck12.org Chapter 13. Probability and Statistics
a common mean, the spread of the data differs from graph to graph. In statistics we use the word dispersion as ameasure of how spread out the data is.
Range
Range is the simplest measure of dispersion. It is simply the total spread in the data, calculated by subtracting thesmallest number in the group from the largest number.
Example 6
Find the range and the median of the following data:
223, 121, 227, 433, 122, 193, 397, 276, 303, 199, 197, 265, 366, 401, 222
Solution
The first thing to do in this case is to order the data, listing all values in ascending order:
121, 122, 193, 197, 199, 222, 223, 227, 265, 276, 303, 366, 397, 401, 433
Note: It is extremely important to make sure that you don’t skip any values when you reorder the list. Two ways todo this are (i) cross out the numbers in the original list as you write them in the second list, and (ii) count the numberof values in both lists when you are done. In this example, both lists contain 15 values, so we can be sure we didn’tmiss any (as long as we didn’t count any twice!)
The range is found by subtracting the lowest value from the highest: 433−122 = 311.
And now that the list is ordered, we can see that the median is the 8th value: 227.
Variance
The range is not a particularly good measure of dispersion, as it does not eliminate points that have unusually highor low values when compared to the rest of the data (the outliers). A better method involves measuring the distanceeach data point lies from a central average.
Look at the following data values:
11, 13, 14, 15, 19, 22, 24, 26
The mean of these values is 18; of course, the values all differ from 18 by varying amounts. Here’s a list of thevalues’ deviations from the mean:
-7, -5, -4, -3, 1, 4, 6, 8
If we take the mean of these deviations, we find that it is zero:
−7−5−4−3+1+4+6+88
=08= 0
This comes as no surprise. You can see that some of the values are positive and some are negative, as the meanlies somewhere near the middle of the range. You can use algebra to prove (try it!) that the sum of the deviations
673

13.5. Measures of Central Tendency and Dispersion www.ck12.org
will always be zero, no matter what numbers are in the list. So, the sum of the deviations is not a useful tool formeasuring variance.
But if we square the differences, all the negative differences become positive, and then we can tell how great theaverage deviation is. If we do that for this data set, we get the following list:
49, 25, 16, 9, 1, 16, 36, 64
The sum of those squares is 216, so their average is 2168 = 27.
We call this averaging of the square of the differences from the mean (the mean squared deviation) the variance.The variance is a measure of the dispersion, and its value is lower for tightly grouped data than for widely spreaddata. In the example above, the variance is 27.
What does it mean to say that tightly grouped data will have a low variance? You can probably already imaginethat the size of the variance also depends on the size of the data itself. Mathematicians have tried to standardize thedefinition of variance in various ways; the standard deviation is one of the most commonly used.
Standard Deviation
You can see from the previous example that using variance gives us a measure of the spread of the data (you shouldhopefully see that tightly grouped data would have a smaller mean squared deviation and so a smaller variance) but itis not immediately clear what a number like 27 actually refers to. Since it is the mean of the squares of the deviation,however, it seems logical that taking its square root would be a better way to make sense of it. The root mean square(i.e. square root of the variance) is called the standard deviation, and is given the symbol s.
Example 7
Find the mean, the variance and the standard deviation of the following values.
121, 122, 193, 197, 199, 222, 223, 227, 265, 276, 303, 366, 397, 401, 433
Solution
The mean will be needed to find the variance, and from the variance we can determine the standard deviation. Thesum of all fifteen values is 3945, so their mean is 3945
15 = 263.
The variance and standard deviation are often best calculated by constructing a table. Using this method, we enterthe deviation and the square of the deviation for each separate data point.
TABLE 13.6:
Value Deviation Deviation2
121 –142 20,164122 –141 19,881193 –70 4,900197 –66 4,356199 –64 4,096222 –41 1,681223 –40 1,600227 –36 1,296265 2 4276 13 169303 40 1,600366 103 10,609397 134 17,956401 138 19,044433 170 28,900sum: 0 136,256
674
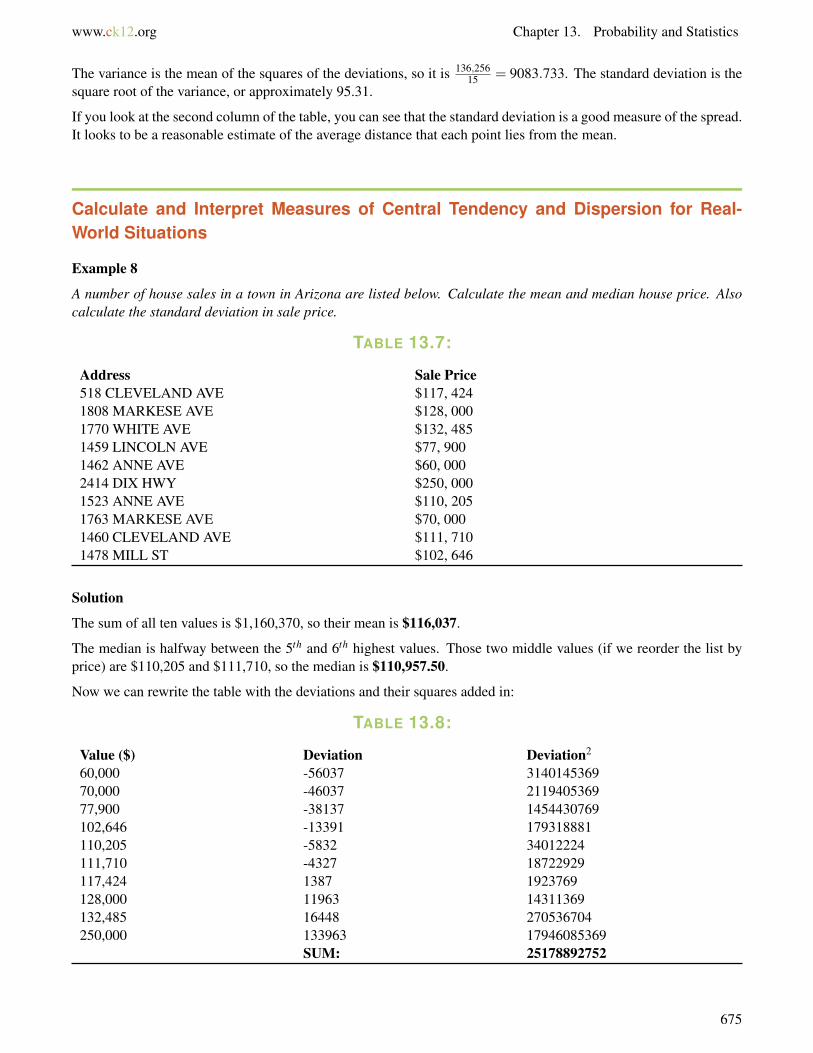
www.ck12.org Chapter 13. Probability and Statistics
The variance is the mean of the squares of the deviations, so it is 136,25615 = 9083.733. The standard deviation is the
square root of the variance, or approximately 95.31.
If you look at the second column of the table, you can see that the standard deviation is a good measure of the spread.It looks to be a reasonable estimate of the average distance that each point lies from the mean.
Calculate and Interpret Measures of Central Tendency and Dispersion for Real-World Situations
Example 8
A number of house sales in a town in Arizona are listed below. Calculate the mean and median house price. Alsocalculate the standard deviation in sale price.
TABLE 13.7:
Address Sale Price518 CLEVELAND AVE $117, 4241808 MARKESE AVE $128, 0001770 WHITE AVE $132, 4851459 LINCOLN AVE $77, 9001462 ANNE AVE $60, 0002414 DIX HWY $250, 0001523 ANNE AVE $110, 2051763 MARKESE AVE $70, 0001460 CLEVELAND AVE $111, 7101478 MILL ST $102, 646
Solution
The sum of all ten values is $1,160,370, so their mean is $116,037.
The median is halfway between the 5th and 6th highest values. Those two middle values (if we reorder the list byprice) are $110,205 and $111,710, so the median is $110,957.50.
Now we can rewrite the table with the deviations and their squares added in:
TABLE 13.8:
Value ($) Deviation Deviation2
60,000 -56037 314014536970,000 -46037 211940536977,900 -38137 1454430769102,646 -13391 179318881110,205 -5832 34012224111,710 -4327 18722929117,424 1387 1923769128,000 11963 14311369132,485 16448 270536704250,000 133963 17946085369
SUM: 25178892752
675

13.5. Measures of Central Tendency and Dispersion www.ck12.org
The variation is 2517889275210 = 2517889275.2, and the square root of that is about 50179. So the standard deviation is
$50,179.
In this case, the mean and the median are close to each other, indicating that the house prices in this area of Mesa arespread fairly symmetrically about the mean. Although there is one house that is significantly more expensive thanthe others, there are also a number that are cheaper to balance out the spread.
Example 9
James and John both own fields in which they plant cabbages. James plants cabbages by hand, while John usesa machine to carefully control the distance between the cabbages. The diameters of each grower’s cabbages aremeasured. James’s cabbages have an average (mean) diameter of 7.10 inches with a standard deviation of 2.75inches; John’s have a mean diameter of 6.85 inches with a standard deviation of 0.60 inches.
John claims his method of machine planting is better. James insists it is better to plant by hand. Use the data toprovide a reason to justify both sides of the argument.
Solution
• James’s cabbages have a larger mean diameter, so on average they are larger than John’s. The larger standarddeviation also means that there will be a number of cabbages which are significantly bigger than most ofJohn’s.
• John’s cabbages are smaller on average, but only by a little bit (one quarter inch). Meanwhile, the smallerstandard deviation means that the sizes of his cabbages are much more predictable. The spread of sizes ismuch less, so they all end up being closer to the mean. While he may not have many extra large cabbages,he will not have any that are excessively small either, which may be better for any stores to which he sells hiscabbages.
Review Questions
1. Find the median of the salaries given in Example 2.2. Find the mean, median and standard deviation of the following numbers. Which, of the mean and median,
will give the best average? 15, 19, 15, 16, 11, 11, 18, 21, 165, 9, 11, 20, 16, 8, 17, 10, 12, 11, 16, 143. Ten house sales in Encinitas, California are shown in the table below. Find the mean, median and standard
deviation for the sale prices. Explain, using the data, why the median house price is most often used as ameasure of the house prices in an area.
TABLE 13.9:
Address Sale Price Date Of Sale643 3RD ST $1,137,000 6/5/2007911 CORNISH DR $879,000 6/5/2007911 ARDEN DR $950,000 6/13/2007715 S VULCAN AVE $875,000 4/30/2007510 4TH ST $1,499,000 4/26/2007415 ARDEN DR $875,000 5/11/2007226 5TH ST $4,000,000 5/3/2007710 3RD ST $975,000 3/13/200768 LA VETA AVE $796,793 2/8/2007207 WEST D ST $2,100,000 3/15/2007
676

www.ck12.org Chapter 13. Probability and Statistics
4. Determine which average (mean, median or mode) would be most appropriate for the following.
a. The life expectancy of store-bought goldfish.b. The age in years of audience for a kids TV program.c. The weight of potato sacks that a store labels as “5 pound bag.”
5. Two bus companies run services between Los Angeles and San Francisco. Inter-Cal Express takes a meantime of 9.5 hours to make the trip, with a standard deviation of 0.25 hours. Fast-Dog Travel takes 8.75 hourson average, with a standard deviation of 2.5 hours. If Samantha needs to travel between the cities, whichcompany should she choose if:
a. She needs to be on time for a meeting in San Francisco.b. She travels weekly to visit friends who live in San Francisco and wishes to minimize the time she spends
on a bus over the entire year.
6. Suppose you have a collection of data points for which you have already found the mean, median, mode,range, variance, and standard deviation. Then, you collect two new data points—one that is higher than anyof the values in the original set, and one that is lower than any of the values in the original set.
a. Based on just this information, can you tell what will happen to the mean value of the data set whenthese new points are added? (In other words, can you say anything at all about whether the mean willor won’t increase, decrease, or stay the same, or do you not have enough information to tell—and if not,what additional information would you need?)
b. Can you tell what will happen to the median value?c. Can you tell what will happen to the mode? (Assume the original data set has only one mode.)d. Can you tell what will happen to the range?e. Can you tell what will happen to the variance and standard deviation?
7. Now suppose that instead of collecting two new values for your data set above, you have only collected onenew value—one that is higher than all the values in the original set.
a. Now can you tell what will happen to the mean value?b. Can you tell what will happen to the median value?c. Can you tell what will happen to the mode?d. Can you tell what will happen to the range?e. Can you tell what will happen to the variance and standard deviation?
8. Finally, suppose that instead of being higher than all the values in the original data set, your new value issomewhere in the middle of the original data set. Specifically, suppose it is higher than the mean, lower thanthe median, and equal to the mode.
a. Now can you tell what will happen to the mean?b. Can you tell what will happen to the median?c. Can you tell what will happen to the mode?d. Can you tell what will happen to the range?e. Can you tell what will happen to the variance and standard deviation?
677

13.6. Stem-and-Leaf Plots and Histograms www.ck12.org
13.6 Stem-and-Leaf Plots and Histograms
Learning Objectives
• Make and interpret stem-and-leaf plots.• Make and interpret histograms.• Make histograms using a graphing calculator.
Introduction-Grouping and Visualizing Data
Imagine asking a class of 20 algebra students how many brothers and sisters they had. You would probably get arange of answers from zero on up. Some students would have no siblings, but most would have at least one. Theresults might look like this:
1, 4, 2, 1, 0, 2, 1, 0, 1, 2, 1, 0, 0, 2, 2, 3, 1, 1, 3, 6
We could organize this information in many ways. The first way might just be to create an ordered list, relisting allthe numbers in order, starting with the smallest:
0, 0, 0, 0, 1, 1, 1, 1, 1, 1, 1, 2, 2, 2, 2, 2, 3, 3, 4, 6
Another way to list the results is in a table:
TABLE 13.10:
Number of siblings Number of matching students0 41 72 53 24 15 06 1
We could also make a visual representation of the data by making categories for the number of siblings on thex−axis, and stacking representations of each student above the category marker. We could use crosses, stick-men oreven photographs of the students to show how many students are in each category.
678

www.ck12.org Chapter 13. Probability and Statistics
Make and Interpret Stem-and-Leaf Plots
Another useful way to display data is with a stem-and-leaf plot. Stem-and-leaf plots are especially useful becausethey give a visual representation of how the data is clustered, but preserve all of the numerical information. A stem-and-leaf plot consists of a vertical “stem” containing the first digit of each number, with the rest of each numberwritten to the right of the stem like a “leaf.” In the stem and leaf plot below, the first number represented is 21. Itis the only number with a stem of 2, so that makes it the only number in the 20’s. The next two numbers have acommon stem of 3. They are 33 and 36. The next numbers are 40, 46 and 47.
Stem-and-leaf plots have a number of advantages over simply listing the data in a single line.
• They show how data is distributed, and whether it is symmetric around the center.• They can be used as the data is being collected.• They make it easy to determine the median and mode.
Stem-and-leaf plots are not ideal for all situations; in particular they are not practical when the data is too tightlyclustered. For example, with the data above about students’ siblings, all the data points would occupy the same stem(zero). In that case, no additional information could be gained from a stem-and-leaf plot.
Example 1
While traveling on a long train journey, Rowena collected the ages of all the passengers traveling in her carriage.The ages for the passengers are shown below. Arrange the data into a stem-and-leaf plot, and use the plot to findthe median and mode ages.
35, 42, 38, 57, 2, 24, 27, 36, 45, 60, 38, 40, 40, 44, 1, 44, 48, 84, 38, 20, 4, 2, 48, 58, 3, 20, 6, 40, 22, 26, 17, 18, 40,51, 62, 31, 27, 48, 35, 27, 37, 58, 21
Solution
679

13.6. Stem-and-Leaf Plots and Histograms www.ck12.org
The first step is to determine a sensible stem. Since all the values fall between 1 and 84, the stem should representthe tens column, and run from 0 to 8 so that the numbers represented can range from 00 (which we would representby placing a leaf of 0 next to the 0 on the stem) to 89 (a leaf of 9 next to the 8 on the stem). We then go through thedata and fill out our plot:
You can see immediately that the interval with the most number of passengers is the 40-49 group. In order tocorrectly determine the median and the mode, it is helpful to construct a second, ordered stem and leaf plot,placing the leaves on each branch in ascending order
The mode is now apparent—there are 4 zeros in a row on the 4-branch, so the mode is 40. The median is the middlevalue; since there are 43 data points, the median is the 22nd value. (Using our formula from earlier, 43+1
2 = 22.) Sothe median is 37.
Make and Interpret Histograms
Look again at the example of the algebra students and their siblings. The data was collected in the following list.
1, 4, 2, 1, 0, 2, 1, 0, 1, 2, 1, 0, 0, 2, 2, 3, 1, 1, 3, 6
We were able to organize the data into a table. Here is the table again, but this time we will use the word frequencyas a header to indicate the number of times each value occurs in the list.
680

www.ck12.org Chapter 13. Probability and Statistics
TABLE 13.11:
Number of siblings Frequency0 41 72 53 24 15 06 1
Now we could use this table as an (x,y) coordinate list to plot a line diagram like this one:
While this diagram does indeed show the data, it is somewhat misleading. For example, the continuous line joiningthe number of students with one and two siblings makes it look like we know something about how many studentshave 1.5 siblings (which of course, is impossible). In this case, where the data points are all integers, it’s wrong tosuggest that the function is continuous between the points!
When the data we are representing falls into well defined categories (such as the integers 1, 2, 3, 4, 5 & 6) it is moreappropriate to use a histogram to display that data. A histogram for this data is shown below.
681

13.6. Stem-and-Leaf Plots and Histograms www.ck12.org
Each number on the x−axis has an associated column, whose height shows how many students have that number ofsiblings. For example, the column at x = 2 is 5 units high, indicating that there are 5 students with 2 siblings.
The categories on the x−axis are called bins. Histograms differ from bar charts in that they don’t necessarily havefixed widths for the bins. They are also useful for displaying continuous data (data that varies continuously ratherthan in integer amounts). To illustrate this, here are some examples.
Example 2
Rowena made a survey of the ages of passengers in a train carriage, and collected the results in a table. Display theresults as a histogram.
TABLE 13.12:
Age range Frequency0 – 9 610 – 19 220 – 29 930 – 39 840 – 49 1150 – 59 460 – 69 270 – 79 080 – 89 1
Solution
Since the data is already collected into intervals we will use these as our bins for the histogram. Even though the topend of the first interval is 9, the bin on our histogram will extend to 10. This is because, as we move to continuousdata, we have a range of numbers that goes right up to the lower end of the following bin, even if it doesn’t includethat number. The range of values for the first bin would therefore be 0 ≤ x < 10, and all the other bins would havesimilarly described ranges.
682

www.ck12.org Chapter 13. Probability and Statistics
Example 3
Monthly rainfall (in millimeters) for Beaver Creek Oregon was collected over a five year period, and the data isshown below. Display the data in a histogram.
41.1, 254.7, 91.6, 60.9, 75.6, 36.0, 16.5, 10.6, 62.2, 89.4, 124.9, 176.7, 121.6, 135.6, 141.6, 77.0, 82.8, 28.9, 6.7,22.1, 29.9, 110.0, 179.3, 97.6, 176.8, 143.5, 129.8, 94.9, 77.0, 60.8, 60.0, 32.5, 61.7, 117.2, 194.5, 208.6, 176.8,143.5, 129.8, 94.9, 77.0, 60.8, 20.0, 32.5, 61.7, 117.2, 194.5, 208.6, 133.1, 105.2, 92.0, 60.7, 52.8, 37.8, 14.8, 23.1,41.3, 75.7, 134.6, 148.8
Solution
Notice the similarity between histograms and stem-and-leaf plots. A stem-and-leaf plot resembles a histogram onits side. We could start by making a stem-and-leaf plot of our data.
For our data above our stem would be the tens, and run from 1 to 25. Instead of rounding the decimals in the data,we truncate them, meaning we simply remove the decimal. For example, 165.7 would have a stem of 16 and a leafof 5, and we would just leave out the seven tenths.
683

13.6. Stem-and-Leaf Plots and Histograms www.ck12.org
By outlining the numbers on the stem and leaf plot, we can see what a histogram with a bin-width of 10 would looklike. You can see that with so many bins, the histogram looks random, with no clear pattern visible. In a situationlike this we need to reduce the number of bins. We will increase the bin width to 25 and collect the data in a table:
TABLE 13.13:
Rainfall (mm) Frequency0≤ x < 25 725≤ x < 50 850≤ x < 75 975≤ x < 100 12100≤ x < 125 6125≤ x < 150 9150≤ x < 175 0175≤ x < 200 6
684
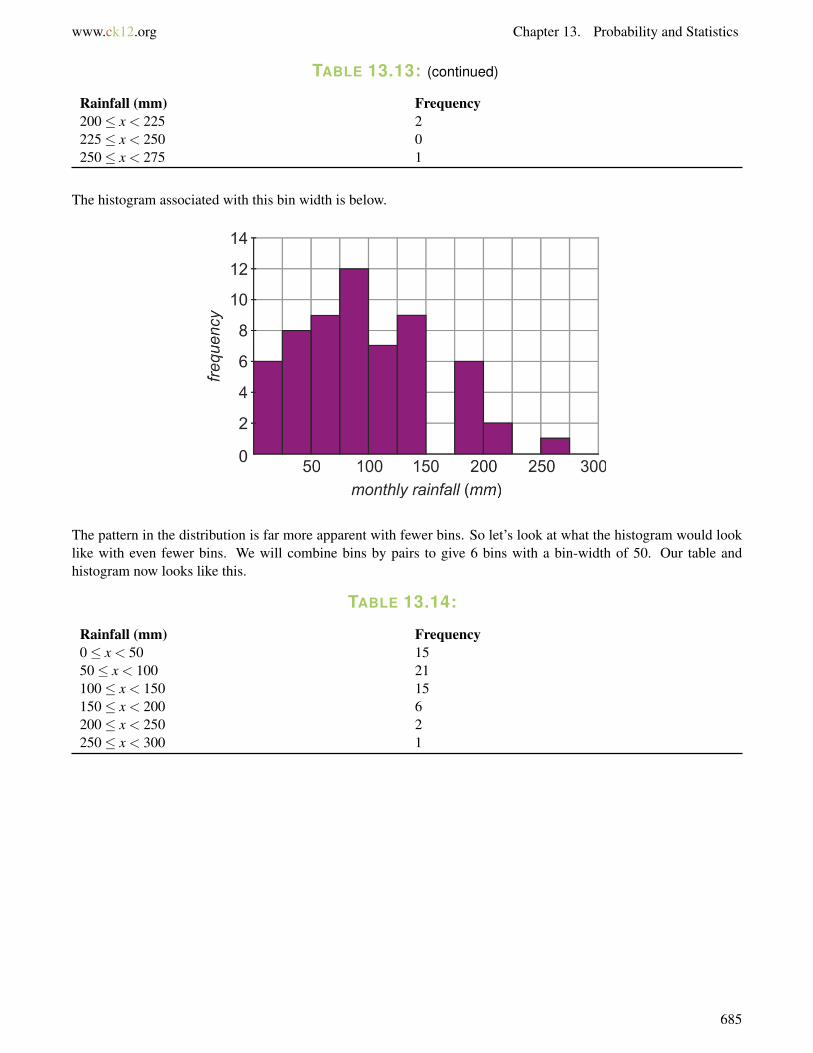
www.ck12.org Chapter 13. Probability and Statistics
TABLE 13.13: (continued)
Rainfall (mm) Frequency200≤ x < 225 2225≤ x < 250 0250≤ x < 275 1
The histogram associated with this bin width is below.
The pattern in the distribution is far more apparent with fewer bins. So let’s look at what the histogram would looklike with even fewer bins. We will combine bins by pairs to give 6 bins with a bin-width of 50. Our table andhistogram now looks like this.
TABLE 13.14:
Rainfall (mm) Frequency0≤ x < 50 1550≤ x < 100 21100≤ x < 150 15150≤ x < 200 6200≤ x < 250 2250≤ x < 300 1
685

13.6. Stem-and-Leaf Plots and Histograms www.ck12.org
The pattern is much clearer now. The normal monthly rainfall is around 75 mm, but sometimes it will be a very wetmonth and be higher (even much higher).
You can see that although it may be counter-intuitive, sometimes you can see more information by reducing thenumber of intervals (or bins) in a histogram. It’s a bit like zooming out on a picture; you can’t see as many of thedetails, but the overall shape of what you are looking at may become clearer.
Make Histograms Using a Graphing Calculator
Look again at the data from Example 1. We’ve seen how to manipulate raw data to give a stem-and-leaf plot anda histogram. Now let’s take some of the tedious sorting work out of the process by using a graphing calculator toautomatically sort our data into bins.
Example 4
The following unordered data represents the ages of passengers on a train carriage.
35, 42, 38, 57, 2, 24, 27, 36, 45, 60, 38, 40, 40, 44, 1, 44, 48, 84, 38, 20, 4, 2, 48, 58, 3, 20, 6, 40, 22, 26, 17, 18, 40,51, 62, 31, 27, 48, 35, 27, 37, 58, 21.
Use a graphing calculator to display the data as a histogram with bin-widths of 10, 5 and 20.
686

www.ck12.org Chapter 13. Probability and Statistics
Solution
Input the data in your calculator:
Press [START] and choose the [EDIT] option.
Input all 43 data points into the table in column L1.
Select plot type:
Bring up the [STATPLOT] option by pressing [2nd], [Y=].
Highlight 1:Plot1 and press [ENTER]. This will bring up the plot options screen. Highlight the histogram and press[ENTER]. Make sure the Xlist is the list that contains your data.
Select bin widths and plot:
Press [WINDOW] and ensure that Xmin and Xmax allow for all data points to be shown. The Xscl value determinesthe bin width.
Press [GRAPH] to display the histogram.
You can change bin widths and see how the histogram changes, by varying Xscl. Below are histograms with binwidths of 10, 5 and 20. (In this example Xmin = 0 and Xmax = 100 will work whatever bin width we choose, butnotice that to display the histogram correctly we need to use a different Ymax value for each.)
687

13.6. Stem-and-Leaf Plots and Histograms www.ck12.org
Review Questions
1. Create a stem-and-leaf plot for the following data. Use the first digit (hundreds) as the stem, and the second(tens) as the leaf. Truncate any units and decimals. Order the plot to find the median and the mode. data:607.4, 886.0, 822.2, 755.7, 900.6, 770.9, 780.8, 760.1, 936.9, 962.9, 859.9, 848.3, 898.7, 670.9, 946.7, 817.8,868.1, 887.1, 881.3, 744.6, 984.9, 941.5, 851.8, 905.4, 810.6, 765.3, 881.9, 851.6, 815.7, 989.7, 723.4, 869.3,951.0, 794.7, 807.6, 841.3, 741.5, 822.2, 966.2, 950.1.
2. Make a frequency table for the data in Question 1. Use a bin width of 50.3. Plot the data from Question 1 as a histogram with a bin width of
a. 50b. 100
4. The following stem-and-leaf plot shows data collected for the speed of 40 cars in a 35 mph limit zone inCulver City, California.
a. Find the mean, median and mode speed.b. Complete the frequency table, starting at 25 mph with a bin width of 5 mph.c. Use the table to construct a histogram with the intervals from your frequency table.
5. The histogram shown below displays the results of a larger scale survey of the subjects’ number of siblings.Use it to find:
a. The median of the data.b. The mean of the data.c. The mode of the data.d. The number of people who have an odd number of siblings.e. The percentage of the people surveyed who have 4 or more siblings.
688

www.ck12.org Chapter 13. Probability and Statistics
13.7 Box-and-Whisker Plots
Learning Objectives
• Make and interpret box-and-whisker plots.• Analyze effects of outliers.• Make box-and-whisker plots using a graphing calculator.
Making and Interpreting Box-and-Whisker Plots
Consider the following list of numbers: 1, 2, 3, 4, 5, 6, 7, 8, 9, 10.
The median is the(n+1
2
)th value. There are 10 values, so the median lies halfway between the 5th and the 6th value.
The median is therefore 5.5. This splits the list cleanly into two halves.
The lower list is: 1, 2, 3, 4, 5
And the upper list is: 6, 7, 8, 9, 10
The median of the lower half is 3. The median of the upper half is 8. These numbers, together with the median,cut the list into four quarters. We call the division between the lower two quarters the first quartile. The divisionbetween the upper two quarters is the third quartile (the second quartile is, of course, the median).
A box-and-whisker plot is formed by placing vertical lines at five positions, corresponding to the smallest value,the first quartile, the median, the third quartile and the greatest value. (These five numbers are often referred to asthe five number summary.) A box is drawn between the position of the first and third quartiles, and horizontal linesegments (the whiskers) connect the box with the two extreme values.
The box-and-whisker plot for the integers 1 through 10 is shown below.
689

13.7. Box-and-Whisker Plots www.ck12.org
With a box-and-whisker plot, a simple measure of dispersion can be gained from the distance from the first quartileto the third quartile. This inter-quartile range is a measure of the spread of the middle half of the data.
Example 1
Forty students took a college algebra entrance test and the results are summarized in the box-and-whisker plot below.How many students would be allowed to enroll in the class if the pass mark was set at
a) 65%
b) 60%
Solution
From the plot, we can see the following information:
Lowest score = 52%
First quartile = 60%
Median score = 65%
Third quartile = 77%
Highest score = 97%
Since the pass marks given in the question correspond with the median and the first quartile, the question is reallyasking how many students there are in: a) the upper half and b) the upper 3 quartiles.
a) Since there are 40 students, there are 20 in the upper half; that is, 20 students scored above 65%.
b) Similarly, there are 30 students in the upper 3 quartiles, so 30 students scored above 60%.
Example 2
Harika is rolling 3 dice and adding the numbers together. She records the total score for each of 50 rolls, andthe scores she gets are shown below. Display the data in a box-and-whisker plot, and find both the range and theinter-quartile range.
9, 10, 12, 13, 10, 14, 8, 10, 12, 6, 8, 11, 12, 12, 9, 11, 10, 15, 10, 8, 8, 12, 10, 14, 10, 9, 7, 5, 11, 15, 8, 9, 17, 12, 12,13, 7, 14, 6, 17, 11, 15, 10, 13, 9, 7, 12, 13, 10, 12
Solution
First we’ll put the list in order. Since there are 50 data points,(n+1
2
)= 26.5, so the median will be the mean of the
25th and 26th values. The median will split the data into two lists of 25 values; we can write them as two distinctlists.
5,6,6,7,7,7,8,8,8,8,8,9, 9 ,9,9,9,10,10,10,10,10,10,10,10, 10 , 11 ,11,
11,11,12,12,12,12,12,12,12,12,12, 13 ,13,13,13,14,14,14,15,15,15,17,17
Since each sub-list has 25 values, the first and third quartiles of the entire data set can be found from the medianof each smaller list. For 25 values,
(n+12
)= 13, and so the quartiles are given by the 13th value from each smaller
sub-list.
From the ordered list we can see the five number summary:
690

www.ck12.org Chapter 13. Probability and Statistics
• The lowest value is 5• The first quartile is 9• The median is 10.5• The third quartile is 13• The highest value is 17.
The box-and-whisker plot therefore looks like this:
The range is given by subtracting the smallest value from the largest value: 17−5 = 12.
The inter-quartile range is given by subtracting the first quartile from the third quartile: 13−9 = 4.
Example 3
The box-and-whisker plots below represent the times taken by a school class to complete an obstacle course. Thetimes have been separated into boys and girls. The boys and the girls each think that they did best. Determine thefive number summary for both the boys and the girls and give a convincing argument for each of them.
Solution
Comparing two sets of data with a box-and-whisker plot is relatively straightforward. For example, you can see thatthe data for the boys is more spread out, both in terms of the range and the inter-quartile range.
The five number summary for each is shown in the table below.
TABLE 13.15:
Boys GirlsLowest value 1:30 1:40First Quartile 2:00 2:30Median 2:30 2:55Third Quartile 3:30 3:20Highest value 5:10 4:10
Here are some points each side could use in their argument:
Boys:
• The boys had the fastest time (1 minute 30 seconds), so the fastest individual was a boy.• The boys also had the smaller median (2 minutes 30 seconds), meaning half of the boys were finished when
only one fourth of the girls were finished (since the girls’ first quartile is also 2:30). In other words, the boys’
691

13.7. Box-and-Whisker Plots www.ck12.org
average time was faster.
Girls:
• The boys had the slowest time (5 minutes 10 seconds), so by the time all the girls were finished there was stillat least one boy completing the course.
• The girls had the smaller third quartile (3 min 20 seconds), meaning that even without taking the slowestfourth of each group into account, the girls were still quickest.
Representing Outliers in a Box-and-Whisker Plot
Box-and-whisker plots can be misleading if we don’t take outliers into account. An outlier is a data point that doesnot fit well with the other data in the list. For box-and-whisker plots, we can define which points are outliers byhow far they are from the box part of the diagram. Defining which data are outliers is somewhat arbitrary, but manybooks use the norm that follows. Our basic measure of distance will be the inter-quartile range (IQR).
• A mild outlier is a point that falls more than 1.5 times the IQR outside of the box.• An extreme outlier is a point that falls more than 3 times the IQR outside of the box.
When we draw a box-and-whisker plot, we don’t include the outliers in the “whisker” part of the plot; instead, wedraw them as separate points.
Example 3
Draw a box-and-whisker plot for the following ordered list of data:
1,2,5, 9 ,10,10, 11, 12 ,13,13, 14 ,19,25,30
Solution
From the ordered list we see:
• The lowest value is 1.• The first quartile (Q1) is 9.• The median is 11.5.• The third quartile (Q3) is 14.• The highest value is 30.
Before we start to draw our box-and-whisker plot, we can determine the IQR:
IQR = Q3−Q1 = 14−9 = 5
Outliers are points that fall more than 1.5 times the IQR outside of the box—in other words, values that are morethan 7.5 units less than 9 or greater than 14. So any values less than 1.5 or greater than 21.5 are outliers.
Looking back at the data we see:
• The value of 1 is less than 1.5, so it is a mild outlier.• The value 2 is the lowest value that falls within the included range.
692

www.ck12.org Chapter 13. Probability and Statistics
• The value 30 is greater than 21.5. In fact, it’s not just more than 7.5 units outside the box, it’s more than twicethat far outside the box. Since it falls more than 3 times the IQR above the third quartile, it’s an extremeoutlier.
• The value 25 is also greater than 21.5, so it is a mild outlier.• The value 19 is the highest value that falls within the included range.
So when we draw our box-and-whisker plot, the whiskers will only go out as far as 2 and 19 respectively. The pointsoutside of that range are all outliers. Here is the plot:
Making Box-and-Whisker Plots Using a Graphing Calculator
Graphing calculators make analyzing large lists of data easy. They have built-in algorithms for finding the medianand the quartiles, and can be used to display box-and-whisker plots.
Example 4
The ages of all the passengers traveling in a train carriage are shown below.
35, 42, 38, 57, 2, 24, 27, 36, 45, 60, 38, 40, 40, 44, 1, 44, 48, 84, 38, 20, 4, 2, 48, 58, 3, 20, 6, 40, 22, 26, 17, 18, 40,51, 62, 31, 27, 48, 35, 27, 37, 58, 21
Use a graphing calculator to:
a) obtain the 5 number summary for the data.
b) create a box-and-whisker plot.
c) determine if any of the points are outliers.
Solution
Enter the data in your calculator:
Press [START] then choose [EDIT].
Enter all 43 data points in list L1.
Find the 5 number summary:
693

13.7. Box-and-Whisker Plots www.ck12.org
Press [START] again. Use the right arrow to choose [CALU].
Highlight the 1-Var Stats option. Press [EDIT].
The single variable statistics summary appears.
Note the mean (x) is the first item given.
Use the down arrow to bring up the data for the five number summary. n is the number of data points, and the finalfie numbers in the screen are the numbers we require.
TABLE 13.16:
Symbol ValueLowest Value minX 1First Quartile Q2 21Median Med 37Third Quartile Q3 45Highest Value maxX 84
Display the box-and-whisker plot:
Bring up the [STARTPLOT] option by pressing [2nd]. [Y=].
Highlight 1:Plot1 and press [ENTER].
There are two types of box-and-whisker plots available. The first automatically identifies outliers. Highlight it andpress [ENTER].
Press [WINDOW] and ensure that Xmin and Xmax allow for all data points to be shown. In this example, Xmin= 0and Xmax = 100.
Press [GRAPH] and the box-and-whisker plot should appear.
The calculator will automatically identify outliers and plot them as such. You can use the [TRACE] function alongwith the arrows to identify outlier values. In this case there is one outlier: 84.
694

www.ck12.org Chapter 13. Probability and Statistics
Review Questions
1. Draw a box-and-whisker plot for the following unordered data: 49, 57, 53, 54, 57, 49, 67, 51, 57, 56, 59, 57,50, 49, 52, 53, 50, 58
2. A simulation of a large number of runs of rolling 3 dice and adding the numbers results in the following 5-number summary: 3, 8, 10.5, 13, 18. Make a box-and-whisker plot for the data and comment on the differencesbetween it and the plot in example 2.
3. The box-and-whisker plots below represent the percentage of people living below the poverty line by countyin both Texas and California. Determine the 5-number summary for each state, and comment on the spread ofeach distribution.
4. The 5-number summary for the average daily temperature in Atlantic City, NJ1 (given in F) is: 31, 39, 52,68, 76. Draw the box-and-whisker plot for this data and use it to determine which of the following, if any,would be considered outliers if they were included in the data:
a. January’s record high temperature of 78
b. January’s record low temperature of −8
c. April’s record high temperature of 94
d. The all time record high of 106
5. In 1887 Albert Michelson and Edward Morley conducted an experiment to determine the speed of light. Thedata for the first 10 runs (5 results in each run) is given below. Each value represents how many kilometersper second over 299,000 km/s was measured. Create a box-and-whisker plot of the data. Be sure to identifyoutliers and plot them as such. 850, 740, 900, 1070, 930, 850, 950, 980, 980, 880, 960, 940, 960, 940, 880,800, 850, 880, 900, 840, 880, 880, 800, 860, 720, 720, 620, 860, 970, 950, 890, 810, 810, 820, 800, 770, 760,740, 750, 760, 890, 840, 780, 810, 760, 810, 790, 810, 820, 850
6. Is it possible to have outliers on both ends of a data set? Explain.7. Is it possible for more than half the values in a data set to be outliers? Explain.8. Is it possible for more than a quarter of the values in a data set to be outliers? Explain.9. Is it possible for either of the whiskers in a box-and-whisker plot to be of zero length? Explain.
10. Is it possible for either of the whiskers in a box-and-whisker plot to be longer than the box? Explain.11. Is it possible for either of the whiskers in a box-and-whisker plot to be twice as long as the box? Explain.
1Information taken from data published by Rutgers University Climate Lab (http://climate.rutgers.edu)
695
13.8. Surveys and Samples www.ck12.org
13.8 Surveys and Samples
Learning Objectives
• Classify sampling methods.• Identify biased samples.• Identify biased questions.• Design and conduct a survey.• Display, analyze, and interpret statistical survey data.
Introduction
One of the most important applications of statistics is collecting information. Statistical studies are done for manypurposes: A government agency may want to collect data on weather patterns. An advertising firm might seekinformation about what people buy. A consumer group could conduct a statistical study on gas consumption of cars,or a biologist might study primates to find out more about animal behaviors. All of these applications and manymore rely on the collection and analysis of information.
One method to collect information is to conduct a census. In a census, information is collected on all the membersof the population of interest. For example, when voting for a class president at school every person in the classvotes, so this is an example of a census. With this method, the whole population is polled.
It’s sensible to include everyone’s opinion when the population is small, like that of a high school. But conductinga census on a very large population can be very time-consuming and expensive. An alternate method for collectinginformation is by using a sampling method. This means that information is collected from a small sample thatrepresents the population with which the study is concerned. The information from the sample is then extrapolatedto the population—that is, we assume the results for the whole population would be about the same as the results forthe sample.
Sampling Methods
The word population in statistics means the group of people we wish to study, as opposed to the population at large.When we use sampling to conduct a statistical study, first we need to decide how to choose the sample population.It is essential that the sample is a representative sample of the population we are studying. For example, if we aretrying to determine the effect of a drug on teenage girls, it would make no sense to include males or older women inour sample population.
There are several ways to choose a population sample from a larger group. The two main types of sampling arerandom sampling and stratified sampling.
Random Sampling
This method simply involves picking people at random from the population we wish to poll. However, this doesn’tmean we can simply ask the first fifty people who walk by in the street. For instance, if you were conducting a
696
www.ck12.org Chapter 13. Probability and Statistics
survey on people’s eating habits, you’d get different results if you were standing in front of a fast-food restaurantthan if you were standing in front of a health food store. In a true random sample, everyone in the population musthave the same chance of being chosen. Calling people on the phone, for example, might be a better way of getting arandom sample for a survey about eating habits.
Stratified Sampling
This method of sampling actively seeks to poll people from many different backgrounds. The population is firstdivided into different categories (or strata) and the number of members in each category is determined. Gender andage groups are commonly used strata, but others could include salary, education level or even hair color. Then, asample is made up by picking members from each category in the same proportion as they are in the population. Forexample, imagine you are conducting a survey that calls for a sample size of 100 people. If you know that 10% ofthe population you’re studying are males between the ages of 10 and 25, then you would seek 10 males in that agegroup to be part of your sample. Once those 10 have responded, no more males between 10 and 25 may take part inthe survey.
Sample Size
In order for sampling to work well, the sample size must be large enough to lessen the effect of a biased sample. Forexample, if you randomly sample 6 children, there is a fairly good chance that most or all of them will be boys. Ifyou randomly sample 6000 children, it’s far more likely that they will be approximately equally spread between boysand girls. Even in stratified sampling (when we would likely poll equal numbers of boys and girls) it’s important tohave a large enough sample to include other kinds of different viewpoints.
The sample size is determined by the precision desired for the population. The larger the sample size is, the moreprecise the estimate is. However, the larger the sample size, the more expensive and time consuming the statisticalstudy becomes. In more advanced statistics classes you’ll learn how to use statistical methods to determine the bestsample size for a given survey.
Example 1
For a class assignment you have been asked to find if students in your school are planning to attend universityafter graduating high-school. Students can respond with “yes”, “no” or “undecided”. How will you choose whichstudents to interview if you want your results to be reliable?
Solution
The best method for obtaining a representative sample would be stratified sampling. Students in the upper gradesmight be more sure of their post-graduation plans than students in the lower grades, so it makes sense to divide yoursample by grade level. You’ll need to find out what proportion of the total student population is included in eachgrade, then interview the same proportion of students from each grade when conducting the survey.
Identify Biased Samples
Once we have identified our population, it is important that the sample we choose accurately reflect the spread ofpeople present in the population. If the sample we choose ends up with one or more sub-groups that are eitherover-represented or under-represented, then the sample is biased. The results of a biased sample might not reallyrepresent the entire population, so we want to avoid selecting one. Stratified sampling helps, but it doesn’t alwayseliminate bias in a sample. Even with a large sample size, we may be consistently picking one group over another.
Some samples may deliberately seek a biased sample in order to bolster a particular viewpoint. For example, if agroup of students were trying to petition the school to allow eating candy in the classroom, they might try to show
697

13.8. Surveys and Samples www.ck12.org
that a lot of students support this idea by surveying students immediately before lunchtime when they are all hungry.The practice of polling only those who you believe will support your cause is sometimes referred to as cherrypicking.
Many surveys may have a non-response bias. For example, if researchers simply hand out questionnaires on a streetcorner and ask people to fill them out and then mail them in, most people will just throw the questionnaires away.Only people who are really interested in the subject will bother to send them in, and those might also be the peoplewho are more likely to answer the questions a certain way. (Imagine if the questionnaire asked “Do you care a lotabout surveys?” People who cared about surveys would answer it, people who didn’t care wouldn’t bother, and aresearcher just looking at the surveys that got sent in would conclude that everybody cares about surveys, becauseeverybody who actually answered the survey said yes!)
Non-response bias may be reduced by conducting face-to-face interviews. When you talk to people in person, youcan get them to agree to answer a question before you tell them what it is, and then the people you get answers fromwon’t just be the people who care a lot about the question.
Self-selected respondents tend to have stronger opinions on subjects than others and are more motivated to respond.For this reason, phone-in and online polls also tend to be poor representations of the overall population. Even if itlooks like both sides are responding, the poll may disproportionately represent extreme viewpoints from both sides,while ignoring more moderate opinions which may, in fact, be the majority view. Self-selected polls are generallyregarded as unscientific.
A classic example of a biased sample occurred in the 1948 Presidential Election. On Election night, the ChicagoTribune printed the headline DEWEY DEFEATS TRUMAN, which turned out to be mistaken. The reason the paperwas mistaken is that their editor trusted the results of a phone survey. Telephones were still relatively new at the time,so the people who had them tended to be wealthier than average; therefore, a sample of people who had telephoneswas not a representative sample of the population at large.
(The above text is adapted from Wikipedia http://www.wikipedia.org/wiki/Biased_sample.)
Example 2
Identify each sample as biased or unbiased. If the sample is biased explain how you would improve your samplingmethod.
a) Asking people shopping at a farmer’s market if they think locally grown fruit and vegetables are healthier thansupermarket fruits and vegetables.
b) You want to find out public opinion on whether teachers get paid a sufficient salary by interviewing the teachersin your school.
c) You want to find out if your school needs to improve its communications with parents by sending home a surveywritten in English.
Solution
a) This would be a biased sample because people who shop at farmer’s markets are more likely than the averageperson to think that locally grown produce is better. The study could be improved by interviewing an equal numberof people coming out of a supermarket, or by interviewing people in a more neutral environment such as the postoffice.
b) This is a biased sample because teachers probably would think they should get a higher salary, but that doesn’tmean everybody else would agree. A better sample could be obtained by constructing a stratified sample with peoplein different income categories.
c) This is a biased sample because only English-speaking parents would understand the survey, and parents whodon’t speak English would be more likely to find that the school doesn’t communicate with them well. The studycould be improved by sending different versions of the survey written in languages spoken at the students’ homes.
698

www.ck12.org Chapter 13. Probability and Statistics
Identify Biased Questions
When you are creating a survey, you must think very carefully about the questions you should ask, how manyquestions are appropriate and even the order in which the questions should be asked. A biased question is aquestion that is worded in such a way (whether intentional or not) that it causes a swing in the way people answerit. Biased questions can lead even a representative, non-biased population sample to answer in a way that does notaccurately reflect the larger population.
While biased questions are a bad way to judge the overall mood of a population, they are sometimes used bypoliticians or advertising companies to falsely suggest that a product or policy is more or less popular than it reallyis.
There are several ways to spot biased questions:
• They may use polarizing language, words and phrases that people associate with emotions:
– Is it right that farmers murder animals to feed people?– How much of your time do you waste on TV every week?– Should we be able to remove a person’s freedom of choice over cigarette smoking?
• They may refer to a majority or to a supposed authority:
– Would you agree with the American Heart and Lung Association that smoking is bad for your health?– The president believes that criminals should serve longer prison sentences. Do you agree?– Do you agree with 90% of the public that the car on the right looks better?
• The question may be phrased so as to suggest the person asking the question already knows the answer:
– It’s OK to smoke so long as you do it on your own, right?– You shouldn’t be forced to give your money to the government, should you?– You wouldn’t want criminals free to roam the streets, would you?
• The question may be phrased in ambiguous way (often with double negatives) which may confusepeople:
– Do you reject the possibility that the moon landings never took place?– Do you disagree with people who oppose the ban on smoking in public places?
In addition to biased questions, the overall design of a survey can be biased in other ways. In particular, questionorder can play a role. For example, a survey may contain several questions on people’s attitudes to cigarettesmoking. Then, if the question “What, in your opinion, are the three biggest threats to public health today?” isasked at the end of the survey, people will be more likely to give “smoking” as one of their answers than they wouldbe if that question had been asked as part of a different survey, or if it had been placed at the beginning of this surveyinstead of at the end.
Design and Conduct a Survey
A survey is a way to ask a lot of people a few well-constructed questions. The survey is a series of unbiased questionsthat the subject must answer. Some advantages of surveys are that they are efficient ways of collecting informationfrom a large number of people, they are relatively easy to administer, a wide variety of information can be collectedand they can be focused (researchers can stick to just the questions that interest them.) Some disadvantages ofsurveys arise from the fact that they depend on the subjects’ motivation, honesty, memory and ability to respond.Moreover, answer choices to survey questions could lead to vague data. For example, the choice “moderately agree”may mean different things to different people or to whoever ends up interpreting the data.
699

13.8. Surveys and Samples www.ck12.org
Conducting a Survey
There are various methods for administering a survey. It can be done as a face-to face interview or a phone interviewwhere the researcher is questioning the subject. A different option is to have a self-administered survey where thesubject can complete a survey on paper and mail it back, or complete the survey online. There are advantages anddisadvantages to each of these methods.
The advantages of face-to-face interviews include fewer misunderstood questions, fewer incomplete responses,higher response rates, and greater control over the environment in which the survey is administered; also, theresearcher can collect additional information if any of the respondents’ answers need clarifying. The disadvantagesof face-to-face interviews are that they can be expensive and time-consuming and may require a large staff of trainedinterviewers. In addition, the response can be biased by the appearance or attitude of the interviewer.
The advantages of self-administered surveys are that they are less expensive than interviews, do not require a largestaff of experienced interviewers and can be administered in large numbers. In addition, anonymity and privacyencourage more candid and honest responses, and there is less pressure on respondents. The disadvantages ofself-administered surveys are that responders are more likely to stop participating mid-way through the survey andrespondents cannot ask them to clarify their answers. In addition, there are lower response rates than in personalinterviews, and often the respondents who bother to return surveys represent extremes of the population – thosepeople who care about the issue strongly, whichever way their opinion leans.
Designing a Survey
Surveys can take different forms. They can be used to ask only one question or they can ask a series of questions.We can use surveys to test out people’s opinions or to test a hypothesis.
When designing a survey, the following steps are useful:
1. Determine the goal of your survey: What question do you want to answer?2. Identify the sample population: Whom will you interview?3. Choose an interviewing method: face-to-face interview, phone interview, self-administered paper survey, or
internet survey.4. Decide what questions you will ask in what order, and how to phrase them. (This is important if there is more
than one piece of information you are looking for.)5. Conduct the interview and collect the information.6. Analyze the results by making graphs and drawing conclusions.
Example 3
Martha wants to construct a survey that shows which sports students at her school like to play the most.
a) List the goal of the survey.
b) What population sample should she interview?
c) How should she administer the survey?
d) Create a data collection sheet that she can use to record her results.
Solution
a) The goal of the survey is to find the answer to the question: “Which sports do students at Martha’s school like toplay the most?”
b) A sample of the population would include a random sample of the student population in Martha’s school. Agood strategy would be to randomly select students (using dice or a random number generator) as they walk into anall-school assembly.
c) Face-to-face interviews are a good choice in this case. Interviews will be easy to conduct since the survey consistsof only one question which can be quickly answered and recorded, and asking the question face to face will helpeliminate non-response bias.
700

www.ck12.org Chapter 13. Probability and Statistics
d) In order to collect the data to this simple survey Martha can design a data collection sheet such as the one below:
TABLE 13.17:
Sport Tallybaseballbasketballfootballsoccervolleyballswimming
This is a good, simple data collection sheet because:
• Plenty of space is left for the tally marks.• Only one question is being asked.• Many possibilities are included, but space is left at the bottom in case students give answers that Martha didn’t
think of.• The answer from each interviewee can be quickly collected and then the data collector can move on to the
next person.
Once the data has been collected, suitable graphs can be made to display the results.
Example 4
Raoul wants to construct a survey that shows how many hours per week the average student at his school works.
a) List the goal of the survey.
b) What population sample will he interview?
c) How would he administer the survey?
d) Create a data collection sheet that Raoul can use to record his results.
Solution
a) The goal of the survey is to find the answer to the question “How many hours per week do you work?”
b) Raoul suspects that older students might work more hours per week than younger students. He decides that astratified sample of the student population would be appropriate in this case. The strata are grade levels 9th through12th. He would need to find out what proportion of the students in his school are in each grade level, and then includethe same proportions in his sample.
c) Face-to-face interviews are a good choice in this case since the survey consists of two short questions which canbe quickly answered and recorded.
d) In order to collect the data for this survey Raoul designed the data collection sheet shown below:
TABLE 13.18:
Grade Level Number of Hours Worked Total number of students9th grade10th grade11th grade12th grade
This data collection sheet allows Raoul to write down the actual numbers of hours worked per week by students as
701

13.8. Surveys and Samples www.ck12.org
opposed to just collecting tally marks for several categories.
Display, Analyze, and Interpret Statistical Survey Data
In the previous section we considered two examples of surveys you might conduct in your school. The first one wasdesigned to find the sport that students like to play the most. The second survey was designed to find out how manyhours per week students worked.
For the first survey, students’ choices fit neatly into separate categories. Appropriate ways to display the data mightbe a pie chart or a bar graph. Let’s revisit this example.
Example 5
In Example 3 Martha interviewed 112 students and obtained the following results.
TABLE 13.19:
Sport Tallybaseball @@||||@@||||@@||||@@||||@@||||@@|||| | 31basketball @@||||@@||||@@|||| || 17football @@||||@@|||| |||| 14soccer @@||||@@||||@@||||@@||||@@|||| ||| 28volleyball @@|||| |||| 9swimming @@|||| ||| 8gymnastics ||| 3fencing || 2
Total: 112
a) Make a bar graph of the results showing the percentage of students in each category.
b) Make a pie chart of the collected information, showing the percentage of students in each category.
Solution
a) To make a bar graph, we list the sport categories on the x−axis and let the percentage of students be representedby the y−axis.
To find the percentage of students in each category, we divide the number of students in each category by the totalnumber of students surveyed:
TABLE 13.20:
Sport Percentagebaseball 31
112 = .28 = 28%basketball 17
112 = .15 = 15%football 14
112 = .125 = 12.5%soccer 28
112 = .25 = 25%volleyball 9
112 = .08 = 8%swimming 8
112 = .07 = 7%gymnastic 3
112 = .025 = 2.5%fencing 2
112 = .02 = 2%
Now we can make a graph where the height of each bar represents the percentage of students in each category:
702

www.ck12.org Chapter 13. Probability and Statistics
b. To make a pie chart, we find the percentage of the students in each category by dividing the number of studentsin each category as in part a. The central angle of each slice of the pie is found by multiplying the percentage ofstudents in each category by 360 degrees (the total number of degrees in a circle). To draw a pie-chart by hand, youcan use a protractor to measure the central angles that you find for each category.
TABLE 13.21:
Sport Percentage Central anglebaseball 31
112 = .28 = 28% .28×360 = 101
basketball 17112 = .15 = 15% .15×360 = 54
football 14112 = .125 = 12.5% .125×360 = 45
soccer 28112 = .25 = 25% .25×360 = 90
volleyball 9112 = .08 = 8% .08×360 = 29
swimming 8112 = .07 = 7% .07×360 = 25
gymnastics 3112 = .025 = 2.5% .025×360 = 9
fencing 2112 = .02 = 2% .02×360 = 7
Here is the pie-chart that represents the percentage of students in each category:
703

13.8. Surveys and Samples www.ck12.org
For the second survey, actual numerical data can be collected from each student. In this case we can display the datausing a stem-and-leaf plot, a frequency table, a histogram, or a box-and-whisker plot.
Example 6
In Example 4 Raoul found that that 30% of the students at his school are in 9th grade, 26% of the students are in the10th grade, 24% of the students are in 11th grade and 20% of the students are in the 12th grade. He surveyed a totalof 60 students using these proportions as a guide for the number of students he interviewed from each grade. Raoulrecorded the following data:
TABLE 13.22:
Grade Level Number of hours worked Total number of students9th grade 0, 5, 4, 0, 0, 10, 5, 6, 0,
0, 2, 4, 0, 8, 0, 5, 7, 018
10th grade 6, 10, 12, 0, 10, 15, 0, 0,8, 5, 0, 7, 10, 12, 0, 0
16
11th grade 0, 12, 15, 18, 10, 0, 0,20, 8, 15, 10, 15, 0, 5
14
12th grade 22, 15, 12, 15, 10, 0,18, 20, 10, 0, 12, 16
12
a) Construct a stem-and-leaf plot of the collected data.
b) Construct a frequency table with bin size of 5.
c) Draw a histogram of the data.
d) Find the five number summary of the data and draw a box-and-whisker plot.
Solution
a) The ordered stem-and-leaf plot looks as follows:
704

www.ck12.org Chapter 13. Probability and Statistics
0 0 0 0 0 0 0 0 0 0 0 0 0 0 0 0 0 0 0 0 0 2 4 4 5 5 5 5 5 6 6 7 7 8 8 8
1 0 0 0 0 0 0 0 0 2 2 2 2 2 5 5 5 5 5 5 6 8 8
2 0 0 2
We can easily see from the stem-and-leaf plot that the mode of the data is 0. This makes sense because many studentsdo not work in high school.
b) We construct the frequency table by counting how many students fit in each category.
TABLE 13.23:
Hours worked Frequency0≤ x < 5 235≤ x < 10 1210≤ x < 15 1315≤ x < 20 920≤ x < 25 3
c) The histogram associated with this frequency table is shown below.
d) The five number summary is as follows:
smallest number = 0
largest number = 22
Since there are 60 data points,(n+1
2
)= 30.5. The median is the mean of the 30th and the 31st values:
median = 6.5
Since each half of the list has 30 values in it, then the first and third quartiles are the medians of each of the smallerlists. The first quartile is the mean of the 15th and 16th values:
first quartile = 0
705

13.8. Surveys and Samples www.ck12.org
The third quartile is the mean of the 45th and 46th values:
third quartile = 12
The associated box-and-whisker plot is shown below.
Review Questions
1. For a class assignment, you have been asked to find out how students get to school. Do they take publictransportation, drive themselves, get a ride from their parents, carpool, walk, or bike? You decide to interviewa sample of students. How will you choose those you wish to interview if you want your results to be reliable?
2. Comment on the way the following samples have been chosen. For the unsatisfactory cases, suggest a way toimprove the sample choice.
a. You want to find whether wealthier people have more nutritious diets by interviewing people coming outof a five-star restaurant.
b. You want to find if there is there a pedestrian crossing needed at a certain intersection by interviewingpeople walking by that intersection.
c. You want to find out if women talk more than men by interviewing an equal number of men and women.d. You want to find whether students in your school get too much homework by interviewing a stratified
sample of students from each grade level.e. You want to find out whether there should be more public busses running during rush hour by interview-
ing people getting off the bus.f. You want to find out whether children should be allowed to listen to music while doing their homework
by interviewing a stratified sample of male and female students in your school.
3. Melissa conducted a survey to answer the question “What sport do high school students like to watch on TVthe most?” She collected the following information on her data collection sheet.
TABLE 13.24:
Sport Tallybaseball @@||||@@||||@@||||@@||||@@||||@@|||| || 32basketball @@||||@@||||@@||||@@||||@@|||| ||| 28football @@||||@@||||@@||||@@|||| |||| 24soccer @@||||@@||||@@|||| ||| 18gymnastics @@||||@@||||@@|||| |||| 19figure skating @@|||| ||| 8hockey @@||||@@||||@@|||| ||| 18
Total: 147
a) Make a pie-chart of the results showing the percentage of people in each category.
b) Make a bar-graph of the results.
4. Samuel conducted a survey to answer the following question: “What is the favorite kind of pie of the people
706

www.ck12.org Chapter 13. Probability and Statistics
living in my town?” By standing in front of his grocery store, he collected the following information on hisdata collection sheet:
TABLE 13.25:
Type of pie Tallyapple @@||||@@||||@@||||@@||||@@||||@@||||@@|||| || 37pumpkin @@||||@@|||| ||| 13lemon meringue @@|||| || 7chocolate mousse @@||||@@||||@@||||@@|||| ||| 23cherry |||| 4chicken pot pie @@||||@@||||@@||||@@||||@@||||@@|||| | 31other @@|||| || 7
Total: 122
a) Make a pie chart of the results showing the percentage of people in each category.
b) Make a bar graph of the results.
5. Myra conducted a survey of people at her school to see “In which month does a person’s birthday fall?” Shecollected the following information in her data collection sheet:
TABLE 13.26:
Month TallyJanuary @@||||@@||||@@|||| | 16February @@||||@@|||| ||| 13March @@||||@@|||| || 12April @@||||@@|||| | 11May @@||||@@|||| ||| 13June @@||||@@|||| || 12July @@|||| |||| 9August @@|||| || 7September @@|||| |||| 9October @@|||| ||| 8November @@||||@@|||| ||| 13December @@||||@@|||| ||| 13
Total: 136
a) Make a pie chart of the results showing the percentage of people whose birthday falls in each month.
b) Make a bar graph of the results.
6. Nam-Ling conducted a survey that answers the question “Which student would you vote for in your school’selections?” She collected the following information:
TABLE 13.27:
Candidate 9th graders 10th graders 11th graders 12th graders TotalSusan Cho @@||||@@|||| || | @@|||| | 19Margarita Mar-tinez
@@|||| || @@||||@@||||@@||||@@|||| |||| 31
707

13.8. Surveys and Samples www.ck12.org
TABLE 13.27: (continued)
Candidate 9th graders 10th graders 11th graders 12th graders TotalSteve Coogan @@|||| |||| || @@|||| 16SolomonDuning
@@|||| | | @@||||@@||||@@|||| ||| | 26
Juan Rios @@|||| ||| ||| @@|||| @@||||@@|||| || 28Total 36 30 30 24 120
a) Make a pie chart of the results showing the percentage of people planning to vote for each candidate.
b) Make a bar graph of the results.
7. Graham conducted a survey to find how many hours of TV teenagers watch each week in the United States.He collaborated with three friends that lived in different parts of the US and found the following information:
TABLE 13.28:
Part of the country Number of hours of TV watchedper week
Total number of teens
West Coast 10, 12, 8, 20, 6, 0, 15, 18, 12, 22, 9,5, 16, 12, 10, 18, 10, 20, 24, 8
20
Mid West 20, 12, 24, 10, 8, 26, 34, 15, 18, 6,22, 16, 10, 20, 15, 25, 32, 12, 18, 22
20
New England 16, 9, 12, 0, 6, 10, 15, 24, 20, 30,15, 10, 12, 8, 28, 32, 24, 12, 10, 10
20
South 24, 22, 12, 32, 30, 20, 25, 15, 10,14, 10, 12, 24, 28, 32, 38, 20, 25,15, 12
20
a) Make a stem-and-leaf plot of the data.
b) Decide on an appropriate bin size and construct a frequency table.
c) Make a histogram of the results.
d) Find the five-number summary of the data and construct a box-and-whisker plot.
In exercises 8-11, consider the following survey questions.
8. “What do students in your high-school like to spend their money on?”
a. Which categories would you include on your data collection sheet?b. Design the data collection sheet that can be used to collect this information.c. Conduct the survey. This activity is best done as a group with each person contributing at least 20 results.d. Make a pie chart of the results showing the percentage of people in each category.e. Make a bar graph of the results.
9. “What is the height of students in your class?”
a. Design the data collection sheet that can be used to collect this information.b. Conduct the survey. This activity is best done as a group with each person contributing at least 20 results.c. Make a stem-and-leaf plot of the data.d. Decide on an appropriate bin size and construct a frequency table.e. Make a histogram of the results.f. Find the five-number summary of the data and construct a box-and-whisker plot.
708

www.ck12.org Chapter 13. Probability and Statistics
10. “How much allowance money do students in your school get per week?”
a. Design the data collection sheet that can be used to collect this information,b. Conduct the survey. This activity is best done as a group with each person contributing at least 20 results.c. Make a stem-and-leaf plot of the data.d. Decide on an appropriate bin size and construct a frequency table.e. Make a histogram of the results.f. Find the five-number summary of the data and construct a box-and-whisker plot.
11. “What time do students in your school get up in the morning during the school week?”
a. Design the data collection sheet that can be used to collect this information.b. Conduct the survey. This activity is best done as a group with each person contributing at least 20 results.c. Make a stem-and-leaf plot of the data.d. Decide on an appropriate bin size and construct a frequency table.e. Make a histogram of the results.f. Find the five-number summary of the data and construct a box-and-whisker plot.
709