Civil Society Assessment - CODE-NGO
276
-
Upload
khangminh22 -
Category
Documents
-
view
3 -
download
0
Transcript of Civil Society Assessment - CODE-NGO


Civil Society Assessmentof the Medium-Term Philippine Development Plan(MTPDP)2004-2010
May 2010
Assessment Report

Civil Society Assessment of the 2004-2010Medium Term Philippine Development Plan (MTPDP)Copyright © 2010 CODE-NGO
Some rights reserved.
The Caucus of Development NGO Networks (CODE-NGO) encourages the use, translation, adaptation and copying of this material for noncommercial use, with appropriate credit given to CODE-NGO.
ISBN No.: 978-971-93700-6-2
Printed and bound in Manila, Philippines
Published by
Caucus of Development NGO Networks (CODE-NGO)
69 Esteban Abada Street, Loyola Heights, Quezon City, 1108Tel. / Fax No.: (02) 9202595 or (02) 4356616Email: [email protected]: www.code-ngo.org
Conveners of the Civil Society Assessment of the 2004-2007 MTPDP:Alyansa Tigil Mina (ATM), Asia Pacific Projects (APP), Association of Foundations (AF), Ateneo School of Government (ASoG), Caucus of Development NGO Networks, (CODE-NGO), Civil Society Resource Institute (CSRI), Coalition for a Citizens’ Constitution (C4CC), Foundation for Media Alternatives (FMA), Foundation for Philippine Environment (FPE), Gaston Z. Ortigas Peace Institute (GZO-PI), Initiatives for Dialogue and Empowerment through Alternative Legal Services, Inc. (IDEALS), Katutubong Samahan ng Pilipinas (KASAPI), Mindanao Coalition of Development NGO Networks (MINCODE), National Confederation of Cooperatives (NATCCO), National Council of Social Development (NCSD), National Institute for Policy Studies (NIPS), NGOs for Fisheries Reform (NFR), Pambansang Kilusan ng mga Samahang Magsasaka (PAKISAMA), Partnership of Philippine Support Service Agencies (PHILSSA), People’s Campaign for Agrarian Reform Network, Inc (AR Now!), Philippine Agrarian Reform Foundation for National Development (PARFUND), Philippine Business for Social Progress (PBSP), Philippine Legislators’ Committee on Population and Development Foundation, Inc (PLCPD), Philippine Partnership for Development of Human Resources in Rural Areas (PhilDHRRA), Transparency and Accountability Network (TAN), Trade Advocacy Group (TAG), Urban Poor Alliance (UP ALL)
Production Team
Editor: Margarita A. Lopa-Perez and Sixto Donato C. MacasaetSupport Staff: Patrick Lim and Sandino SolimanDesign and Lay-out: Ignacio Chiong Jr.

Table of Contents
Foreword
1) Summary of the CSO Assessment of the 2004-2010 MTPDP ...........................9
2) Thematic Assessments
2.1) Macro-Economy .......................................................................................... 272.2) Trade and Investment ............................................................................... 392.3) Agriculture .................................................................................................... 512.4) Fisheries ......................................................................................................... 832.5) Housing .......................................................................................................... 972.6) Micro, Small and Medium Enterprises (MSMEs) ............................1132.7) Tourism .........................................................................................................1252.8) Information and Communication Technology (ICT) ....................1392.9) Labor .............................................................................................................1512.10) Health ...........................................................................................................1692.11) Education ....................................................................................................1852.12) Agrarian Reform ........................................................................................2072.13) Mining ..........................................................................................................2192.14) Election Modernization ..........................................................................2312.15) Peace .............................................................................................................2352.16) Anti-Corruption ........................................................................................2492.17) Constitutional Reform ............................................................................257
3) Convenors and Advisers of the Assessment ......................................................267

Acknowledgements
The civil society organizations - convenors of this assessment would like to acknowledge with gratitude the support of our advisers, Prof. Leonor M. Briones, Dr. Cielito Habito, Archbishop Antonio J. Ledesma, SJ, Mr. Alberto Lim, Atty. Christian S. Monsod and Dr. Mary Racelis.
We also wish to thank the Foundation for the Philippine Environment (FPE), ICCO-IDEALS and Oxfam – Great Britain for their financial and other support for this assessment. We also thank the Freedom from Debt Coalition (FDC) for allowing us to use in our assessment summary their assessment paper on the fiscal performance of the Macapagal-Arroyo Administration.
We are grateful for the assistance of Director Dennis Arroyo of the National Economic and Development Authority (NEDA) in providing information on the MTPDP accomplishment reports of government and for the openness of NEDA Director General Augusto Santos, Deputy Director General Margarita Songco, Director Erlinda Capones and other NEDA staff in discussing and providing comments on the draft assessment summary.
Finally, we wish to thank the regional NGO networks that helped us organize the regional focus group discussions on the draft summary and on selected draft thematic assessments in late 2009 – Mindanao Coalition of Development NGO Networks (MINCODE), Kaabag sa Sugbu and Central Visayas Network of Development NGOs (CENVISNET), Western Visayas Network of Social Development NGOs (WEVNET), Coalition for Bicol Development (CBD) and Cordillera Network of NGOs and POs (CORDNET).

As this report was going to press, the May 2010 national and local elections were just days away. This much awaited democratic exercise was expected to install a new President and a new Administration by June 30, 2010. This new government is expected to craft, in its first months in office, the new Medium Term Philippine Development Plan (MTPDP) for 2011 to 2016.
The MTPDP is the government’s economic and development blueprint. It sets the over-all goals of the administration and presents strategies and plans for achieving the said goals. While many quarters have noted that the MTPDP is not always followed by many government agencies and by the local government units, it cannot be denied that it still plays an important role in defining the development strategies, programs and projects of the government.
In April 2009, various civil society organizations (CSOs) came together to start a process of assessing the performance of the Macapagal-Arroyo administration in implementing the MTPDP of 2004 to 2010. These CSOs and CSO networks, which eventually numbered twenty seven, acted as convenors of this CSO Assessment of the 2004-2010 MTPDP.
The convenors agreed on the following objectives of the assessment:
1) assess the government’s performance viz. its commitments/targets in the 2004-2010 MTPDP,
2) examine the appropriateness and responsiveness of the MTPDP framework and targets to the development agenda of the basic sectors and of CSOs,
3) build consensus among the convenors/advisers and other CSOs on key policy recommendations for the MTPDP for 2011-16, and
4) advocate for these recommendations viz. national candidates in the 2010 elections and the new President/ Cabinet starting July 2010.
In order to meet these objectives, the convenors undertook seventeen ‘thematic assessments’ of the MTPDP. The convenors agreed to follow an assessment framework based on the first two objectives, and in conclusion make an over-all assessment of the theme and identify key recommendations. The over-all assessment is based on the three basic development pillars agreed upon by the convenors, namely: (a) Reducing poverty and inequality, (b) Promoting a sustainable economy, and (c) Ensuring empowerment and democratization.
As the convenors completed their assessment drafts, the drafts were presented in the meetings of the convenors and in thematic focus group discussions (FGDs) where government agencies, NGOs, and concerned stakeholders were invited to attend to give their feedback. A summary of the overall assessment was also drafted and, with
MTPDP Assessment ReportFo
rew
ord

selected thematic assessments, was presented in seven regional FGDs. As a result, a revised summary of the assessments and recommendations was put together. This draft summary, with the recommendations, was presented to and discussed with National Economic and Development Authority (NEDA) officials in January 2010. Copies of the semi-final draft assessments and summary were also provided to NEDA in April 2010 for their comments.
Valuable contribution was also made to this CSO assessment by the team of advisers who are highly respected experts in their field and come from or have close links with CSOs. These advisers are: Prof. Leonor Briones of the University of the Philippines - National College of Public Administration and former National Treasurer, Dr. Cielito Habito of the Department of Economics of the Ateneo de Manila University and former NEDA Director-General, Archbishop Antonio Ledesma, SJ, Archbishop of Cagayan de Oro, Mr. Alberto Lim, Executive Director of the Makati Business Club (MBC), Atty. Christian Monsod, Chairperson of the Philippine Agrarian Reform Foundation (PARFUND) and former Chairman of the Commission on Elections and Dr. Mary Racelis of the Department of Socio-Anthropology of the Ateneo de Manila University.
We have undertaken this CSO assessment of the MTPDP as an effort to hold government accountable for its promises, plans and programs. We also hope that this assessment will facilitate CSO and citizens’ participation in the process of planning and implementing a new medium term development plan which is responsive to the needs of the Filipino people, attainable and is focused on ensuring good governance and people empowerment, reducing poverty and inequality and promoting a sustainable economy.
Anna Marie A. KaraosChairperson
Caucus of Development NGO Networks (CODE-NGO)April 28, 2010

Ass
essm
ent R
epor
t
9
INTRODUCTIONThe Medium-Term Philippine Development Plan (MTPDP) for 2004-2010 is the basic planning document of the Macapagal-Arroyo administration. In the foreword of the Updated MTPDP for 2004-2010 approved in late 2009, President Gloria Macapagal-Arroyo (GMA) wrote “This Plan translated into explicit actions the 10-point agenda that I intended as my development legacy to my countrymen”. The MTPDP has 25 chapters and is divided into five parts – (a) Economic Growth and Job Creation, (b) Energy, (c) Social Justice and Basic Needs, (d) Education and Youth Opportunity, and (e) Anti-Corruption and Good Governance.
In April 2009, various civil society organizations (CSOs) and networks started this assessment of the MTPDP, with these objectives:
a) assess the government’s performance viz. its commitments/targets in the 2004-10 MTPDP;b) examine the appropriateness and responsiveness of the MTPDP framework and targets to the development
agenda of the basic sectors and of CSOs;c) build consensus among the convenors/advisers and other CSOs on key policy recommendations for the
MTPDP for 2010-16; and d) advocate for these recommendations viz. national candidates in the 2010 elections and the new president/
cabinet starting July 2010.
The MTPDP Assessment convenors included 27 CSOs and networks, including development NGOs, peasant, indigenous peoples and urban poor organizations, and coalitions. (See Box 1 for the list of convenors.)
Box 1: List of Convenors of the CSO Assessment of the 2004-2010 MTPDP
CSO Assessment of the 2004-2010 MTPDP: Summary
1) Alyansa Tigil Mina (ATM)2) Asia-Pacific Projects, Inc3) Association of Foundations (AF)4) Ateneo School of Government (ASOG)5) Caucus of Development NGO Networks (CODE-
NGO)6) Civil Society Resource Institute (CSRI)7) Coalition for a Citizens’ Constitution (C4CC)8) Foundation for Media Alternatives (FMA)9) Foundation for the Philippine Environment (FPE)10) Gaston Z. Ortigas Peace Institute (GZO-PI)11) Initiatives for Dialogue and Empowerment through
Alternative Legal Services, Inc. (IDEALS)12) Katutubong Samahan ng Pilipinas (KASAPI)13) Mindanao Coalition of Development NGO
Networks (MINCODE) 14) National Confederation of Cooperatives (NATCCO) 15) National Council of Social Development (NCSD)
16) National Institute of Policy Studies (NIPS)17) NGOs for Fisheries Reform (NFR)18) Pambansang Kilusan ng mga Samahang
Magsasaka (PAKISAMA)19) Partnership of Philippine Support Service Agencies
(PHILSSA)20) People’s Campaign for Agrarian Reform Network
(AR Now!)21) Philippine Agrarian Reform Foundation for National
Development (PARFUND)22) Philippine Business for Social Progress (PBSP)23) Philippine Legislators’ Committee on Population
and Development (PLCPD)24) Philippine Partnership for the Development of
Human Resources in Rural Areas (PhilDHRRA)25) Trade Advocacy Group (TAG)26) Transparency and Accountability Network (TAN)27) Urban Poor Alliance (UP ALL)
The convenors also identified and worked with six advisers with various fields of expertise - Prof. Leonor Briones of the University of the Philippines’ National College of Public Administration and Governance (NCPAG) and former National Treasurer, Dr. Cielito Habito, Ateneo de Manila University. Economics Department and former Socio-Economic Planning Secretary, Archbishop Antonio Ledesma, SJ of the Archdiocese of Cagayan de Oro, and former Executive Director of the South East Asia Rural Social Leadership Institute (SEARSOLIN), Mr. Alberto Lim, Executive Director of the Makati Business Club (MBC), Atty. Christian Monsod, Chairperson of the Philippine Agrarian Reform Foundation (PARFUND) and former Chairman of the Commission on Elections, and Dr. Mary Racelis, Department of Socio-Anthropology of the Ateneo de Manila University and former Director of the Institute of Philippine Culture (IPC).
CSO Assessment of the 2004-2010 MTPDP: Summary

Civi
l Soc
iety
Ass
essm
ent o
f the
200
4 -2
010
MTP
DP
10
1) Macro-Economy2) Trade3) Agriculture4) Fisheries5) Housing6) Micro, Small and Medium Enterprises7) Tourism8) Information and Communication
Technology
9) Labor10) Health11) Agrarian Reform12) Mining13) Automated Elections14) Peace15) Education16) Anti-Corruption17) Constitutional Reform
CSO Assessment of the 2004-2010 MTPDP: Summary
The convenors and advisers identified the assessment themes (see box 2 for the list) and, from April 2009 to February 2010, undertook research and consultations, drafted and refined the thematic assessment reports, conducted sectoral focus group discussions (FGDs) and seven regional FGDs involving CSOs, government agencies and academe (in Davao City, Cagayan de Oro, Cebu City, Iloilo City, Naga City, Quezon City and Baguio City), held six meetings of the convenors and advisers, including two that focused on the assessment report drafts and one on the draft summary.
Box 2. List of Assessment Themes
The thematic assessments used a common assessment framework. First, the government's performance was measured viz. the targets in the MTPDP (sometimes supplemented by government targets in the president’s annual State of the Nation Address and other official documents). Then, the appropriateness and responsiveness of the MTPDP targets and strategies were evaluated.
The convenors also agreed on three strategic development goals against which, as an over-all assessment, to measure the MTPDP/SONA targets and accomplishments - (a) reducing poverty and inequality, (b) promoting a sustainable economy (both in the environmental and economic sense of sustainability), and (c) ensuring people empowerment and democratization.
Finally, the thematic assessment reports were asked to identify and briefly explain a few key recommendations for the next MTPDP.
This assessment has several important limitations. First, the planned thematic assessment on environment was delayed due to the lack of resources and could not be included here. The organizations involved in this thematic assessment still plan to pursue this in the next months. It must be noted though that there is a thematic assessment report on mining and the assessment framework for all themes includes environmental sustainability.
Second, while we recognize that differences across regions are important, not all the thematic assessments were able to look into this and there is no particular assessment focusing on the historically neglected regions in Mindanao.
Finally, there was no thematic assessment on the fiscal program of the MTPDP. However, for this summary, we have included a look at the accomplishments of the government viz. its fiscal targets based on a paper presented by the Freedom from Debt Coalition (FDC) to the convenors in July 2009.
SUMMARY OF THE ASSESSMENTThe thematic assessment reports show that while the GMA Administration can point to some accomplishments, more of the MTPDP targets have been missed. Many significant key targets were attained only in macro-economy and micro, small and medium enterprises (MSMEs) development – just 2 of the 17 assessment themes. Also, even in macro-economy, a key target – reducing poverty incidence – has not been attained.

Ass
essm
ent R
epor
t
11
CSO Assessment of the 2004-2010 MTPDP: Summary
Even with the crisis, the country eked out a 0.9 percent growth in 2009
The administration performed better in the legislative arena with the passage of significant laws related to MTPDP targets. However, it seems that these were as much due to opposition legislators as the efforts of the administration.
MTPDP AccomplishmentsWhat were the important MTPDP accomplishments in 2004 to 2009?
Executive
In the executive arena, the GMA Administration has these to show -
1) Economic Growth - The Philippines returned to its moderate expansion trend of around 5 percent growth per year. Even with the global financial crisis, the country eked out a 0.9 percent growth in 2009.
2) Resettlement of the Urban Poor - Dubbed as the government’s “biggest and most successful resettlement program ever”, the Rail Relocation and Resettlement Program has moved 69,752 families (71 percent of target for 2004-10). Thirty four resettlement sites in Metro Manila and surrounding provinces and 84,111 housing units have been developed and constructed to accommodate these families.
3) Aquaculture – The Bureau of Fisheries and Aquatic Resources (BFAR) has been meeting its aquaculture targets, including, as of April 30, 2009, around 56 mariculture parks; of this number 40 have been established and 16 others are set to be launched.
4) MSMEs - From 2004 to April 2009, government financial institutions (GFIs) of the SME (Small and Medium Enterprises) Unified Lending Opportunities for National Growth (SULONG) program released Php 165.5 billion in loans to SMEs. The funds released under the program supported 143,105 enterprises. The accomplishment is already around 70 percent of the 2004-10 target.
5) Tourist Receipts - The Department of Tourism (DOT) estimates that as early as 2007, the Philippines had already exceeded the 2010 target for visitor receipts. The figure dropped (from US$ 4.89 billion to 4.4 billion) slightly in 2008, though it still proved to be higher than the 2009 target. Assuming a continuation of the zero-growth scenario, the Philippines will fall just slightly short of its original visitor receipts target for 2010. Nevertheless, all things considered, these are good results.
6) Peace Processes
6.1) Peace processes between the government and the various armed groups [ Communist Party of the Philippines – New People’s Army – National Democratic Front (CPP-NPA-NDF), Moro Islamic Liberation Front (MILF), and Rebolusyonaryong Partido ng Manggagawa Mindanao (RPMM) ] have been marked by on and off negotiations and have made uneven progress. With the collapse of the Memorandum of Agreement on Ancestral Domain (MOA-AD), the main accomplishments of the Government of the Republic of the Philippines (GRP)-MILF talks have been ceasefire and security agreements and related monitoring mechanisms (JCCCH, International Monitoring Team, AHJAG) that have helped lower the levels of violence, and the interim agreement on relief and rehabilitation, that has led to building capacities of the MILF–led Bangsamoro Development Agency for current rehabilitation and development work in conflict areas.
6.2) The GRP-NDF talks had little substantive progress but was finally able to convene the Joint Monitoring Committee (JMC) of the CARHRIHL (Comprehensive Agreement on Respect for Human Rights and International Humanitarian Law) on April 2004 and open offices of the “Joint Secretariat” in June 2004, even though the NDF Monitoring Committee (NDF MC) and the GRP MC are operating entirely separately.

Civi
l Soc
iety
Ass
essm
ent o
f the
200
4 -2
010
MTP
DP
12
CSO Assessment of the 2004-2010 MTPDP: Summary
6.3) A different and perhaps more effective model of peace process has been implemented for the GRP-RPMM , where local barangay level consultations and resulting projects in about 100 barangays are an integral part of the peace negotiations.
7) Health
7.1) Reduce the Cost of Medicines – The MTPDP targeted the reduction of the cost of medicines commonly bought by the poor to half of their 2004 prices and make these available nationwide. The enactment into law of Republic Act (RA) No. 9502 entitled “Universally Accessible Cheaper and Quality Medicines Act of 2008” in June 2008 and the issuance of EO 821 or the Maximum Drug Retail Price (MDRP) Executive Order, a direct offshoot of RA 9502, slashed the prices of 22 selected drugs by half.
7.2) Botika ng Barangay (BnB) – The BnBs have been shown to increase access to medicines. To date, more than 11,000 BnBs have been created or more than 60% of the target of 1 BnB in every 3 barangays or around 16,600 BnBs.
8) Anti-Corruption
Lifestyle Checks - Since 2004, the Presidential Anti-Graft Commission (PAGC) has resolved 95 lifestyle check cases, 56 of which have already been acted upon by President Arroyo. As of September 2009, there were 98 lifestyle check cases that are in various stages of investigation and adjudication.
9) Election Automation
The Commission on Elections (COMELEC) conducted a pilot-test of the Automated Election System (AES) in the 2008 Autonomous Region of Muslim Mindanao (ARMM) elections. Following the reported success of the 2008 ARMM elections, the AES is now being rolled out nationwide for the May 2010 elections.
10} Information and Communication Technology (ICT)
Phone and Internet Access - There were 1.4 million broadband subscribers in 2008 and a reported broadband penetration of 0.56 percent. Generally, phone and internet access rates have gone up as expected from 2000 to 2009. For example, mobile phone subscribers increased from 6.4 million to more than 70 million. Internet use also grew steadily from 1.9 percent of the population to 24 percent.
Globe cell sites increased from 3,736 (2004) to 6,446 (2008) with increased number of mobile subscribers, 12.5 million (2004) to 24.7 million (2008) while Smart has 8,700 cell sites at present and 38.5 million subscribers in its GSM-network as of end-June 2009.
11) Fiscal
Of the three fiscal objectives in the MTPDP, the government attained one - the reduction of the ratio of public sector debt-to-GDP from 136 percent in 2004 to 90 percent. As of the end of the 3rd quarter 2008, public sector debt-to-GDP was already at 68.4 percent.
Legislation
A number of important laws related to MTPDP targets were approved by Congress since 2004. These include:
1) Republic Act (RA) No. 9700 or the Comprehensive Agrarian Reform Program Extension with Reforms (CARPER), which provides five more years to complete the land acquisition and distribution component of the agrarian reform program, an additional P150 billion of funding and a number of reform provisions in the Comprehensive Agrarian Reform Program.

Ass
essm
ent R
epor
t
13
CSO Assessment of the 2004-2010 MTPDP: Summary
The benefits accrued more to the top 40 percent of the population.
2) RA 9501, enacted on May 23, 2008, which further amended RA 6977 or the Magna Carta for Small Enterprises. The law laid down the legal basis for a comprehensive approach to promote, develop, and assist small and medium-sized enterprises in the Philippines. Recognizing the potential of micro-enterprises, RA 9501 also expanded its coverage to include them.
3) RA 9593, also known as the Tourism Act, which was signed into law on May 12, 2009.
4) Three laws that impact on the labor sector and pertain to employment generation and preservation
4.1) Republic Act (RA) No. 9481 – An Act strengthening the workers’ constitutional right to self-organization, amending for the purpose the Labor Code of the Philippines. The Act simplifies the creation, registration, and legal support for various labor organizations – from local chapters , through federations, and national centers;
4.2) RA 9422 – An Act to strengthen the regulatory functions of the Philippine Overseas Employment Administration (POEA), amending for this purpose RA No. 8042 (otherwise known as the Migrant Workers and Overseas Filipinos Act of 1995); and
4.3) RA 9347 – An Act rationalizing the composition and functions of the National Labor Relations Commission, increasing the number of Commissioners so that they also represent geographical areas (i.e., Luzon, Visayas, and Mindanao) aside from representatives of the different labor centers and federations.
5) Two laws related to health
5.1) RA 9502 – the “Universally Accessible Cheaper and Quality Medicines Act of 2008”, approved in June 2008, and
5.2) RA 9711 - the Food and Drugs Administration (FDA) Act of 2009, enacted in August 2009, which renames the Bureau of Food and Drugs (BFAD) to the FDA and strengthens its regulatory powers, resources and capabilities.
6) RA 9369, passed into law on January 23, 2007, which amended the law (RA 8436) that authorizes the Commission on Elections to use an Automated Election System (AES) for the May 2010 elections.
7) Two laws on peace and human rights
7.1) RA 9745 - The Anti -Torture Act of 2009
7.2) RA 9851 - “Philippine Act on Crimes against International Humanitarian Law, Genocide, and Other Crimes against Humanity”, an important breakthrough for the Philippines on international criminal, humanitarian and human rights law, and applicable to individual perpetrators, both state and non-state.
8) RA 9485 or the Anti Red Tape Law – June 2, 2007 and ratified the United Nations Convention against Corruption in 2006.
Gaps: MTPDP Targets MissedMost of the MTPDP targets related to the 17 assessment themes have not been attained by the GMA Administration.
1) Macro-economy
1.1) The government targeted to reduce poverty incidence to 20 percent or lower by 2010. However, despite the moderate economic growth rates experienced by the Philippines in recent years, poverty incidence

Civi
l Soc
iety
Ass
essm
ent o
f the
200
4 -2
010
MTP
DP
14
CSO Assessment of the 2004-2010 MTPDP: Summary
increased from 30.0 percent of the population in 2003 to 32.9 percent in 2006 and the number of poor people from 23.8 million in 2003 to 27.6 million in 2006. The next official poverty data will be for 2009 and is expected to come out after the May 2010 elections. However, with the rice and oil price increases, global financial crisis and the disastrous typhoons (Frank, Ondoy, Pepeng, and Santi) in 2008 and 2009, many believe the poverty incidence would have further increased last year.
1.2) High levels of inequality were recorded for the past 20-25 years. While there was economic growth from 2003 to 2006, the benefits accrued more to the top 40 percent of the population.
2) Trade and Investment
2.1) Investment rate, targeted to increase to 28 percent of GDP by 2010, has instead gone down from 17 percent in 2004 to 14-15 percent in 2005 to 2008.
2.2) Savings-to-GDP is also far below the target of 30 percent, averaging at 18.5 percent in the past five years.
3) Agriculture
One of the main MTPDP targets is to develop 2 million hectares of new land for agribusiness in order to create 2 million jobs. As of the end of 2008, the government reported only 800,000 hectares developed for agri-business1. Data on employment in the agriculture sector from the National Statistics Office (NSO) show that from January 2004 to January 2009, the employment in the agriculture sector grew by only 679,268 jobs.
4) Fisheries
4.1) The MTPDP declares that the national government will complete the delineation of municipal waters. As of March 25, 2009, the National Mapping and Resource Information Authority (NAMRIA) reported that it has completed mapping and delineating 918 municipalities in 66 coastal provinces. However, only 31 of the local government units (LGUs) have passed the required ordinances stipulating its municipal territorial boundaries.
4.2) Also, only the guideline for municipal water delineation of municipalities without offshore islands (Department Administrative Order or DAO No. 01, series of 2004) has been issued. The guideline on municipal water delineation of 483 municipalities with offshore islands and overlapping waters has not yet been finalized and issued.
5) Housing
5.1) Against the original MTPDP targets, the Community Mortgage Program (CMP) and Presidential Proclamations (covering government land to be distributed to the urban poor) did poorly, attaining only 54 percent (52,689 households) and 44 percent (93,233 households) of their targets by June 2009, respectively.
5.2) Certificates of Lot Allotments (CELAs), the legal instrument ensuring land tenure security, was given to only 63,400 beneficiaries or only 25 percent of the total number of families covered by the proclamations issued since 2001.
6) Tourism
Although the tourist receipts target was met, visitor arrival fell short of the MTPDP target, roughly 1.3 million arrivals short of the DOT’s target of 5 million for 2009.

Ass
essm
ent R
epor
t
15
In its Updated MTPDP, the government reported a total of 1,222,983 hectares of agribusiness (including agroforestry) lands developed from 2005 to the 3rd quarter of 2008 (pp. 38-39)
CSO Assessment of the 2004-2010 MTPDP: Summary
… primary education showed a declining trend from 2000 to 2006.
7) ICT
7.1) Looking at how telecommunications services have expanded in the country from 2004 to the present, the infrastructure targets of the MTPDP may have been met, but only largely through the efforts of the private sector and only in aggregate terms. The private telecommunications sector claims to cover almost the entire archipelago; but the stark realities were recently exposed with the recent COMELEC report that around 30 percent of the provinces, including the poor provinces (e.g., Abra, Benguet, Samar, Leyte, Maguindanao, Tawi-tawi), are still without a reliable cellular phone signal.
7.2) Some draft policies were consulted with the aim of regulating the industry that had - amidst some genuine competition among the top 3 players - seemed to always be criticized on anti-trust and anti-competitive grounds. But rarely did progressive frameworks, such as an envisioned “Significant Market Power” competition policy for telecommunications, become actual policy.
8) Labor
8.1) The MTPDP target is to create 10 million jobs by 2010. As of January 2009, the Bureau of Labor Statistics reported a net increase of just 3.5 million jobs from 2004. Thus, despite the Filipino diaspora, unemployment rates remain high by East Asian standards. Indonesia is the only other country whose unemployment equals the Philippines.
8.2) A correlation analysis shows that economic growth has a weak link to employment particularly for the GMA Administration. This however has been equally true for past administrations, calling attention once again to the structural weaknesses of the Philippine economy.
9) Health
9.1) The availability of low cost medicine in government facilities and outlets continues to be a concern. The latest figures available show that in 2006, drugstore sales vastly outweighed hospital sales (89 percent vs. 11 percent), and of the hospital sales, only 10 percent were sold to government hospitals. Also very few importers have shown interest in parallel importation; even the drug importations of the Philippine International Trading Corporation (PITC) are in relatively small quantities that are not enough to make a dent in the drug market.
9.2) Last July 2009, President Macapagal-Arroyo claimed 86 percent nationwide PhilHealth coverage, effectively achieving universal coverage as the government defines it (85 percent), but PhilHealth coverage is most likely overestimated. The 2008 Annual Poverty Indicator Survey showed that only 37 percent of households were headed by PhilHealth members. It can be inferred that the true coverage is probably only 40-45 percent. Also, the support value (the amount that PhilHealth shoulders from the total bill of the patient) remains way below the 70 percent target at 25-40 percent for hospital ward rates.
9.3) The MTPDP target is to achieve and maintain fully immunized children coverage at 95 percent. But according to the 2008 Philippine National Demographic and Health Survey (PNDHS) Preliminary Report, the percentage of immunized children stands at only 78.4 percent for females and 80.5 percent for males. Malaria morbidity rate was also targeted to be reduced by 50 percent from 48 cases per 100,000 population in 2002 to 24 cases by the year 2010, but the National Statistics Coordination Board reports that the current malaria morbidity rate has remained quite high at 41 per 100,000 population.
9.4) Another target was to widen the choice and reach of family planning services and increase the prevalence rate of men and women/couples practicing responsible parenthood using either modern, natural or

Civi
l Soc
iety
Ass
essm
ent o
f the
200
4 -2
010
MTP
DP
16
CSO Assessment of the 2004-2010 MTPDP: Summary
artificial methods to 60 percent by 2010. This has not been attained, with only 50.7 percent of women practicing responsible parenthood per the 2008 PNDHS.
9.5) The 2006 Family Planning Survey shows that 162 mothers for every 100,000 live births die due to pregnancy and pregnancy-related complications. This reflects a slight improvement compared to 172 maternal deaths in 1998, but is very far from the MDG target of ¾ reduction in the maternal mortality ratio.
10) Education
10.1) The key to change in basic education is not to plug the leaks, but to build a new boat, to come up with long-term solutions. One can deal with shortages every year but a fast-growing population will only mean more spinning of wheels while staying in place. In January 2001, the Arroyo Administration had a nine-year window of opportunity to take a poorly-performing education system and radically restructure it. Sadly, today, we have the same overcrowded structure, the same processes, and the same low education standards but with millions more children to attend to. In summary, an opportunity wasted.
10.2) In terms of the Millennium Development Goal (MDG) indicators (elementary participation rate, cohort survival rate, completion rate and literacy rate), performance indicators for primary education showed a declining trend from 2000 to 2006. In 2007, the Philippine Midterm Progress Report on the MDGs noted that there is a "low probability” that the Philippines will achieve its goal on primary education by 2015.
10.3) In the MTPDP for 2004-2010, indicators on classrooms, teachers, textbooks, and computers show that while the Arroyo administration met some of its targets: number of classrooms to be built per school year; classroom-pupil ratio; teacher-pupil/student ratio; textbook-pupil/student ratio in some subjects; and the provision of computers in high schools, the manner of measuring success (for example, the use of double-shifting as a way of decreasing the number of classrooms needed) has been questioned. Thus, some targets were missed particularly classroom-student ratio.
11) Agrarian Reform
11.1) There are 7 MTPDP/SONA commitments related to agrarian reform. Of these, the government delivered only on the commitments to pass the law extending CARP and to provide development support to agrarian reform beneficiaries (ARBs), with the latter being done only at a very limited scale.
11.2) The administration missed its target of distributing 100,000 hectares of private agricultural lands (PALs) per year and failed to complete the land acquisition and distribution (LAD) component of CARP by June 2008. At that time, there was still a balance of 1.1 million has. of PALs to be distributed.
12) Mining
12.1) The MTPDP targeted 18 to 23 large scale mining projects. As of 2008, Environment Secretary Lito Atienza reported that there are only nine mining projects currently operating. Apart from this, eight are in construction and development stage, eight in feasibility and financing stage, and another nine are in advance exploration stage.
12.2) The government targeted US$ 4-6 billion worth of investment in mining, but the estimated worth of investment in mining from 2004 to September 2009 is just US$ 2.1 billion or only 35 percent of the total target investment.

Ass
essm
ent R
epor
t
17
CSO Assessment of the 2004-2010 MTPDP: Summary
The appointment of Merceditas Gutierrez as the Ombudsman in 2005 has resulted in loss of confidence...
12.3) The MTPDP targeted the generation of 239,000 jobs in indirect and direct employment. From 2004 to 2008, the government reported that the total employment generated is 13,462 or only 5.63 percent of the target.
12.4) The government also expected to collect P 336 billion in excise taxes, fees, and royalties from mining from 2004-2010, but from 2004-2007, the government just collected P 26 billion or an 8 percent accomplishment.
13) Election Modernization
13.1) Following the 2004 SONA announcement, there was no budgetary commitment for election modernization until three years later in 2007. In September 2008, the Comelec requested a supplemental budget of P21 billion for the automation project. It took Congress six months (until March 2009) to approve the budget at half the proposed amount (P11.3 billion). This left the Comelec just a little over one year to implement the automation project from procurement to testing, roll-out, and execution.
13.2) The Special Bids and Award Committee (SBAC) was constituted late. It was created when the Automated Election System design was already being finalized by the Comelec Advisory Council (CAC). The request for proposal (RFP) or call for bids was based on that design. However, as bidding transpired, some requirements in the RFP were found to be impossible, which therefore required revisions of the RFP by the SBAC. The SBAC issued 25 bid bulletins to clarify and/or modify the RFP requirements. This caused the long debates and deliberations between and among the bidders, the SBAC members, and the observers, to resolve issues.
13.3) Further, because of the over-extended opening and evaluation of bids, some parts of the bidding process were rushed, which may have compromised the integrity of the automation project. The post-qualification of TIM-SMARTMATIC was done in haste. There was no investigation conducted to verify the 60-40 percent ownership requirement of the joint venture TIM-SMARTMATIC. Also, the cursory verification done by Comelec on the other qualifications of TIM-SMARTMATIC now presents problems in terms of its capability to deliver. As of February 2010, it had been incurring delays in meeting key deliverables according to contract schedules.
13.4) No law has been passed to strengthen the party system as committed in the MTPDP. Three bills are pending at the House of Representatives. Another three are pending at the Senate.
14) Peace
14.1) The main target of completing the peace agreements (GRP-NDF, GRP-MILF and GRP-RPMM) has not been met and government has failed to build the constituency for peace processes among major stakeholders, including local government officials and legislators, as well as the broader public (as shown in the MOA-AD failure). The armed conflict has led periodically to massive internal displacements, e.g. more than 600,000 persons in 2008.
14.2) While the previously signed peace agreements (GRP-MNLF, GRP-CPLA, GRP-RPMP) have in general led to cessation of hostilities, the non-state parties continue to cite major lack of implementation of these agreements. Some segments or “renegade” factions of these non-state armed groups have been involved in armed attacks, kidnappings, or other criminality. The current ARMM falls short as a mechanism for good or autonomous governance. Instead, patronage, electoral fraud, and continuing underdevelopment (lowest in human development indicators) are manifest. The massacre in Ampatuan, Maguindanao on November 23, 2009 revealed the worst aspects of this situation

Civi
l Soc
iety
Ass
essm
ent o
f the
200
4 -2
010
MTP
DP
18
CSO Assessment of the 2004-2010 MTPDP: Summary
15) Anti-Corruption
15.1) The record of the Ombudsman on lifestyle checks is unclear; and the lifestyle check efforts were dealt a serious blow when the Office of the Ombudsman recently restricted public access to the statement of assets, liabilities and net worth (SALN) that it has in its possession thru its Memorandum Circular 01 dated June 16, 2009 and entitled, Revised Guidelines Governing Access to SALNs Filed with the Ombudsman.
15.2) The Administration presented in the MTPDP an action plan to enhance the capability of the Ombudsman. It identified legislative measures aimed at providing the Ombudsman with additional funds from forfeited assets in
corruption cases and to allow the use of private prosecutors. However, it failed to follow up on this plan, even as the legislature attempted to take up the bills.
15.3) The appointment by President Arroyo of Merceditas Gutierrez as the Ombudsman in 2005 has resulted in loss of confidence and a growing public perception that the Ombudsman is not serious about doing its job. The 2008-2009 Human Development Philippine Report, entitled Institutions, Politics and Human Development, pointed out that despite an initial spike in its conviction rate, the Office of the Ombudsman’s performance has declined because of over-centralization and poor management.
15.4) Also, high profile procurement controversies still abound. The most visible of these was the attempted procurement of a US$ 329 million national broadband network. During the Senate hearing on the NBN-ZTE deal, the Arroyo administration sent a very clear message about its lack of commitment to transparency in the procurement process. It allowed Secretary Romulo Neri, then NEDA Director General, to invoke executive privilege to refuse to answer questions regarding how the President reacted when he told her that then Comelec chairman, Benjamin Abalos, Jr. offered him (Neri) a bribe to approve the project.
16) Constitutional Reforms
16.1) The administration promised Charter Change through a Constitutional Convention (ConCon). Instead, the GMA Administration pushed for a Constituent Assembly (Con-Ass) and People’s Initiative, abandoning the ConCon that it earlier promised.
16.2) The declared agenda on political dynasty (defining political dynasties and making the Constitutional prohibition against political dynasties self-executory) was altogether abandoned and was in fact deleted from the Declaration of State Principles and Policies in the proposed revised Constitution of the Constitutional Commission appointed by the President.
17) Fiscal
17.1) The MTPDP targeted a balanced national government budget in six years and planned a balanced budget in 2008 (P1.23 trillion). It was almost able to achieve this ending 2008 with a small deficit of P68 billion. The GMA administration used an aggressive taxation measure, the expanded value added tax which was approved by Congress in 2005, in order to beef-up revenues. It also undertook aggressive privatization measures, including the 20-hectare Food Terminal Inc. in Taguig City (estimated at P15 billion), Philippine Telecommunications Investment Corporation (P25.2 billion), the 20% in Philippine National Oil Company (PNOC)-EDC (P16.6 billion), the remaining stake in PNOC-EDC (P32 to P36 billion), and the shares in San Miguel Corporation (P50 billion) and Manila Electric Co. (P10 billion). However, as a result of its efforts to boost the economy amidst the global financial crisis, the budget deficit again went up in 2009 to P298 billion.
17.2) Relying on privatization is essentially an attempt of the Arroyo government to mask its failure to reach its tax targets. It has had the lowest tax effort since 1988, a mere 11.53 percent of GDP in 2004.

Ass
essm
ent R
epor
t
19
Good governance is crucial in maximizing public resources...
CSO Assessment of the 2004-2010 MTPDP: Summary
Revenue effort was also low that year, pegged at 13.47%. This has since risen to 15.00 percent as projected in 2008, but is nowhere near the revenue effort in 1994 (19.86%). Our neighbors, Thailand, Malaysia and Indonesia, had average revenue efforts from 2001 to 2005 ranging from 17.1% to 22.8%
17.3) The MTPDP target is 1 percent Consolidated Public Sector Deficit to GDP. The program for 2009 was higher at P221.6 billion, equivalent to 2.8 percent of GDP, following the readjusted budget gap of P250 billion for 2009 to accommodate more spending.
17.4) Between debt and social investments, debt servicing remains the top priority. In 2009, education got merely a fourth of debt servicing (P 158.2 billion compared to P 631.4 billion) and health got only 4% (P 27.9 billion). Even if the total proposed spending in 2009 on education, health, agriculture are added, these would still be less than interest payments alone by as much as P 62.8 billion.
17.5) The Bangko Sentral ng Pilipinas reports that as of end-September 2008, the external debt level is pegged at $53.48 billion, $1.58 billion dollars more than in end-2001 when external debt was pegged at $51.9 billion.
Critique of the MTPDPIn addition to the non-attainment of most of the key MTPDP targets, the CSO assessment has found the plan wanting, particularly in its lack of emphasis on asset reforms despite the historical problem of income and resource inequality, its lack of consideration for environmental sustainability and its narrow view of certain concerns, particularly tourism and ICT.
1) Asset reforms were not emphasized.
The plan seems to be blind to a major underlying and long-standing cause of poverty in the country – the marked inequality in income, wealth and access to productive resources such as land and capital.
The targets of the plan for major asset reform programs were set too low to make any significant impact.It set very low yearly targets for land acquisition and distribution (LAD) under CARP at 100,000 hectares of private agricultural lands (PALs) and another 100,000 hectares of public lands when the LAD balance called for at least 200,000 hectares of PALs per year. Thus, President Arroyo’s MTPDP did not reflect from the start in 2004 her pronouncement that her administration will complete the implementation of LAD by 2008.
Also, the housing target of 1,145,668 units barely covers the housing backlog estimated as of the beginning of the planning period (2005) at 1,170,800 units. Both the overall housing target and the socialized housing targets have been set too low compared to the projected housing need which is more than three times the total target. Furthermore, the estimate of the housing backlog also appears unrealistically low.
Furthermore, since the best performing housing program of the government, in terms of numbers, is resettlement, it means that it is the major housing approach being pursued as far as informal settlers are concerned. However, many problems attendant to resettlement, especially the loss of income and livelihood are not being addressed. The programs which have the highest potential for effecting asset/land redistribution, such as the Community Mortgage Program (CMP) and presidential proclamations, did not perform well and were not considered a priority in the past years.
The MTPDP also focuses on big agri-business rather than supporting small agricultural producers and fisherfolk, who are more numerous and in need of support. This seems to be based on the desire for high profile projects and the traditional – and questionable – notion that economies of scale can only be attained through large agri-business firms.

Civi
l Soc
iety
Ass
essm
ent o
f the
200
4 -2
010
MTP
DP
20
CSO Assessment of the 2004-2010 MTPDP: Summary
2) Unsustainable Development – The plan has also been criticized for its strategies and targets that undermine environmental sustainability.
The emphasis on the revitalization of mining is a misplaced economic policy. This damages bio-diversity and works against environmental protection and conservation. The MTPDP goal of developing 2 million hectares of new land for agribusiness, which has involved chemical intensive agriculture, as well as the focus on aquaculture do not take into account their environmental costs.
The Plan also failed to highlight climate change mitigation and adaptation and disaster risk reduction, which have been proven critical with the onslaught of El Nino and destructive typhoons in recent years (Milenyo in 2006, Frank in 2008 and Ondoy, Pepeng and Santi in 2009).
3) Narrow View of Tourism and ICT
The MTPDP’s implied approach to poverty reduction from tourism appears to follow the hubs-and-spokes structure for building the priority tourism destinations. By generating international tourism growth at the main international gateways and urban population centers, the strategy seeks to disperse economic impact down to the secondary destinations that are accessible from the primary hubs. This tends to limit the scope and breadth of tourism’s poverty reduction effect to the priority tourism destinations and their vicinity. The plan for tourism does not integrate the concerns for environmental sustainability and community involvement and empowerment. Forms of tourism such as ecotourism, agritourism and cultural tourism end up being treated by both DOT and the other government agencies as niche activities that are peripheral to their main activities.
The MTPDP has also taken a narrow view of ICT, seeing ICT more as a “sector” or an industry. The more expansive view of ICT as an “enabler” of growth, good governance and social inclusion is eschewed. As a consequence, government's vision of harnessing ICT as a tool for national development is limited to developing the ICT infrastructure through market friendly policies and developing the ICT industry to generate jobs. Government policy is lacking in ensuring the widespread adoption and use of ICT, with a clear development agenda that should necessarily underpin such a strategy.
Over-all Assessment of the MTPDP In general, the thematic assessments would lead us to state that, after 5 years of implementation (2004-2009), the MTPDP has not resulted to (a) reduced inequality and poverty, (b) a sustainable economy and (c) people empowerment and democratization.
Poverty incidence has increased even as economic growth benefited the richer 40% of Filipinos, and the poor still have limited access to productive resources (farm land, fishing waters, etc) and basic social services such as health.
Economic growth has not produced enough jobs and savings and investment rates remain low, which are all fundamental requirements for sustainable economic growth. Bio-diversity and environmental sustainability are damaged by MTPDP strategies such as the promotion of mining and large-scale agri-business.
Also, the transparency of government transactions in various agencies has become more of a problem in the past years, affecting the capability of the people to effectively participate in democratic governance.
Thus, the MTPDP for 2004-2010 must be marked as having failed on these three development goals.

Ass
essm
ent R
epor
t
21
CSO Assessment of the 2004-2010 MTPDP: Summary
The next MTPDP… should stress asset reform, job generation, support for small producers and effective social protection...
Recommendations for the MTPDP for 2010-16General Framework
The general framework for the next MTPDP should be based on good governance and people empowerment, which would unleash the energies of the people and lead to the proper use of resources for development. Good governance, starting with judicious appointments, would also result in the effective implementation of government policies and programs – for poverty reduction and economic and environmental sustainability.
The next MTPDP should also directly address the problem of poverty and inequality by emphasizing asset reform, employment generation and support for small producers, and by enhancing the access of the poor to health, education, and other basic social services.
Reducing poverty and inequality would also help spur economic productivity, broaden the domestic market, and improve the competitiveness of Philippine producers and enterprises.
While establishing good governance and promoting people empowerment, reducing poverty and inequality, and enhancing the competitiveness of our producers, the MTPDP should also ensure environmental sustainability, especially in this age of climate change.
The new MTPDP for 2010-2016 should be mindful that we have committed to achieve the Millennium Development Goals (MDGs) by 2015. Thus, the plan should also focus on the 8 MDGs – eradicating extreme poverty and hunger, achieving universal primary education, promoting gender equality and empowering women, reducing child mortality, improving maternal health, combating HIV/AIDS, malaria and other diseases, ensuring environmental sustainability, and developing a global partnership for development.
1) Establish Good Governance and Promote People Empowerment
Good governance has been shown to be crucial in maximizing public resources for development and poverty reduction, and the delivery of social services. It is also important for the country to improve its competitiveness and attract domestic and foreign investments. In the World Trade Indicators Survey 2009, the Philippines performed badly in trade outcomes (rank 157 out of 161 countries) and institutional environment (rank 140 out of 181 countries). This showed that upholding the rule of law, ensuring the credibility of contract agreements, reducing red tape, and most of all reigning in corruption are all important measures that must be undertaken to boost the country’s competitiveness.
The MTPDP must promote transparency, accountability and people’s participation at all levels of government, starting with the president, the cabinet members and other top government officials.
The MTPDP should also promote subsidiarity in government, which means that decisions should be made at the lowest level possible, closest to the situation. In this way, government programs can be made more appropriate to the local conditions and can be more responsive.
The key actions related to ensuring good governance, subsidiarity and people empowerment would include:
1.1) Creating a structure similar to the Judicial and Bar Council (JBC) to recommend appointments to constitutional bodies and sub-cabinet positions in government financial institutions (GFIs) and government-owned and controlled corporations (GOCCs) as well as other critical agencies,
1.2) Enhancing freedom of information (FOI) by fast-tracking the approval of the FOI bill or, if the FOI bill is ratified by the House of Representatives on May 31, 2010 and is enacted before July 2010, by vigorously implementing its provisions,

Civi
l Soc
iety
Ass
essm
ent o
f the
200
4 -2
010
MTP
DP
22
CSO Assessment of the 2004-2010 MTPDP: Summary
1.3) Strengthening the Office of the Ombudsman by, among others, appointing a credible, competent and independent Ombudsman to lead a genuine and vigorous fight against corruption,
1.4) Strengthening the lifestyle checks and other monitoring mechanisms on government officials and the prosecution of erring government officials,
1.5) Recognizing the role of and respecting the autonomy of the NGO/PO sectors in government bodies such as the National Anti-Poverty Commission (NAPC) and the local development councils, including having at least 40 percent women representation as provided by law, and strengthening these bodies as venues for meaningful people’s participation in governance,
1.6) Reforming institutions that coordinate poverty policy and implement anti poverty programs to enhance coordination, improve efficiency and monitoring, and reduce corruption by
• renewingthememorandumofagreementbetweentheNAPCandNEDAtoclarifythecoordinationroles of each agency; the new poverty strategy and plan of action should incorporate the specific roles of agencies and key stakeholders at various levels of intervention,
• accessingmoreNGOsandcivilsocietysectorstomonitorthedeliveryofpovertyprogramsandsocialservices,
1.7) Enhancing local government resources and capacity for fighting poverty including improvements in national agency–local government coordination. This would include (i) establishing an incentive system on allocations to better motivate LGUs in the fight against poverty, (ii) promoting inter-LGU cooperation in implementing antipoverty programs and projects including reforms in health, education, and population management, (iii) continuing advocacy for more democratic and people-centered processes at the local levels, (iv) reviewing the 14 core poverty indicators, reviewing available local poverty indicators, and simplifying local data collection systems, and (v) making provinces focal points for coordinating poverty-related programs and projects for local implementation,
1.8) Strengthening government decentralization, including regional governance. This means that, among others, national government agencies such as the Department of Agriculture should work through and pass budgets to the local governments. The delivery of housing services should also be decentralized by strengthening the role and capacities of local governments in social housing provision. The Department of Tourism and other national government agencies should also provide increased support for LGU and community-based tourism destination development initiatives.
2) Prioritize Asset Reform Programs, Employment Generation, Social Protection and Support for Small Producers
The next MTPDP, recognizing the vital need to address inequality in our society in order to successfully fight against poverty and lay the foundation for sustainable economic growth and development, should stress asset reform, job generation, and support for small producers while providing effective social protection especially for the poorest.
2.1) Future MTPDP housing targets should aim to cover at least 70 percent of the housing need (or double the existing targets). Also, the urban development framework must proceed from the principle that the poor are the work force of cities and have the right to remain in or near the cities. The CMP lending policies must be reviewed and reformed to make them more effective. The unreleased CISFA funds of P 12 billion must be released and fully utilized within 3 years by urging Congress to appropriate P 4 billion per year from 2011 to 2013. The distribution of CELAs in the proclaimed sites must be expedited and new presidential land proclamations for the government-owned lands recommended by HUDCC must be issued. A CISFA 2 needs to be enacted to ensure funds for socialized housing.

Ass
essm
ent R
epor
t
23
2.2) The CARPER law, with its reforms, needs to be fully implemented and provided with an adequate budget, to ensure the completion of the land acquisition and distribution of the remaining 1 million hectares of private agricultural lands and the provision of appropriate support for the agrarian reform beneficiaries.
2.3) The delineation of municipal waters should be completed and the national government should provide technical and logistical support to LGUs in securing assets for municipal fisherfolk.
2.4) A fisherfolk settlement program based on Section 108 of Republic Act 8550 or the Philippine Fisheries Code of 1998 should be implemented.
2.5) The processing of Certificates of Ancestral Domain Title (CADTs) and Land Title (CALTs) needs to be fast-tracked.
2.6) Small farmers/ fishers/ rural women and MSMEs need to be effectively supported.
2.7) The promotion of and support for job and livelihood generation thru labor-intensive government projects and other measures must be ensured.
2.8) The dignity of labor must always be stressed; they may be inputs to production and there will always be pressure to cut production costs, but they are also people who work in order to live. Attention must be given to the growing practice of contractualization, which minimizes costs to employers as workers are not regularized. Non-regularization also allows employers to avoid even paying the minimum wage applicable in their areas of operation. While the intention of the exemptions to minimum wage legislation was to help start-up businesses, particularly MSMEs, these are open to abuse.
2.9) Develop a comprehensive framework for the strategic use of ICT for development. This includes: (a) ICT and Economic Growth, (b) E-Government, (c) ICT in Education, (d) Digital inclusion, (e) Content creation, and (f ) Sustainable ICT use.
3) Enhance Access to Basic Health and Education Services
3.1) Health
Establish a Universal Health Care system to uphold the rights of all people to quality health care. Expand PhilHealth coverage to include all Filipinos. This system will ensure that every Filipino, when he or she gets sick, has access to needed health care, with minimal or no copayment. It will be government led as reflected in health financing and regulation based on health needs rather than market forces. The system will be characterized by integration rather than fragmentation with true people’s participation in the definition and management of priority health services. Universal Health Care may start with a defined set of health benefits with no or minimal copayments that are gradually expanded as the Health Benefit Fund increases.
The next MTPDP must also ensure the effective implementation of the Cheaper and Quality Medications Law, the Maximum Drug Retail Price Executive Order, the Food and Drug Authority
Law and the Generics Act of 1988. The next government must even go beyond this to ensure affordable and quality medicines by, among others, increasing and sustaining awareness and support for the use of generic medications not only among consumers but also among physicians, nurses, pharmacists and health professionals as well.
There should be increased advocacy for and information/education/communication activities targeted at mothers to encourage them to get prenatal, natal and postnatal care and available, accessible and competent health professionals
CSO Assessment of the 2004-2010 MTPDP: Summary

Civi
l Soc
iety
Ass
essm
ent o
f the
200
4 -2
010
MTP
DP
24
CSO Assessment of the 2004-2010 MTPDP: Summary
who could attend to the prenatal, natal and postnatal needs of mothers nationwide and institutions/mechanisms for the referral of women with complicated pregnancies and for those with complications arising during and after pregnancy should be ensured.
3.2) Education
The next MTPDP should target that by School Year (SY) 2015-16, every child passing pre-school must be a reader by Grade 1. To support this, the Department of Education must build a library infrastructure in all school districts (if not in all schools), procure reading books from the Philippine publishing industry to support local authors, and train elementary teachers on how to teach reading.
A strong science and math curriculum that starts as early as Grade 1 with instructional materials and properly trained teachers must also be put in place by SY 2012-13. To build a culture for science and math in our schools, the science/math clubs and elementary, high school science/math fairs must be revived, expanded and strengthened.
By SY 2015-16, two years must be added to the basic education cycle to catch up with the rest of the world. Total investment over the next six years (up through Budget Year 2017) will be close to P100.0 Billion or P20.0 Billion a year for 5 years to build the additional schools and classrooms, hire more teachers, procure more textbooks, supplies and equipment, and provide more maintenance and other operating expenses for the two additional years.
Also by SY 2015-16, a universal pre-school sub-system should be set up in all public and private schools nationwide. The required investment for additional infrastructure, new teachers and workbooks is in the vicinity of P41.4 Billion. If done incrementally over the next four years, this will cost from P9.6 to 11.1 Billion a year.
4) Improve the competitiveness of local producers and enterprises for both the domestic and the export markets
The global financial crisis showed that we need to promote a vibrant domestic economy even as we strive to widen our export market. This will ensure sustainable jobs and businesses for Filipino industries and workers. Given our natural resources and labor force, we especially need to focus on developing agricultural/fishery production, agri/fishery processing industries and their domestic and export markets.
We also need to promote sustainable and culturally-sensitive forms of tourism as alternative/supplementary livelihood and heritage conservation strategy in protected areas, ancestral lands, agricultural and fishing communities.
Enhancing our competitiveness would include improving the infrastructure for transportation (land, water and air) and communication and strengthening our human resource development/ skills training systems. Infrastructure deficiency remains a top impediment to business environment and investment climate. High-quality infrastructure supports businesses well and reduces transaction costs, and when transaction costs are low, location becomes a less crucial factor in investment decisions. Moreover, MSMEs stand to benefit more when it comes to good infrastructure as they are unable to self-provide enabling infrastructure unlike larger companies. Good road networks, efficient power and water provision, and communication and technology channels, and reducing other logistics bottlenecks improve the country’s investment climate. Enhanced investment programming and prioritization and political coordination can facilitate the process of improving public infrastructure.
5) Ensure Environmental Sustainability and Integrate Climate Change Mitigation/Adaptation and Disaster Risk Reduction

Ass
essm
ent R
epor
t
25
The development targets and strategies of the next MTPDP should be mindful of the environmental costs of development. It should even prioritize the enhancement of environmental sustainability.
The next MTPDP should promote organic and sustainable agriculture and fishery, and increase investment in research on environmentally and socially appropriate technology.
The current mining revitalization policy should be abandoned and a new national mining policy should be adopted. In finalizing this new policy, several measures must first be put in place. These include: (a) a National Industrialization Plan that will indicate the actual minerals and metal needs of the country, (b) an accurate and realistic inventory of the actual mineral reserves, pin-pointing the specific locations, types and values of the minerals, which can be potentially extracted, (c) a mineral extraction plan that will respond to the actual needs specified in the National Industrialization Plan, while considering the other alternative (and more beneficial) uses of the targeted mineral lands.
The MTPDP should also make climate change mitigation/adaptation (CCMA) and disaster risk reduction (DRR) an integral component. Climate change impacts, among them destructive natural calamities that result in the loss of lives and property, are bound to worsen in the coming years (especially with no substantial deal on carbon emission reduction targets reached in the UN Climate Change Conference at Copenhagen).
Community and LGU plans for CCMA and DRR should be prepared and supported by the national government. An important action for government is to provide funds for reforestation projects and community-based adaptation and DRR projects, which would also create alternative jobs and livelihood opportunities for the poor.
6) Continue the integration of a peace and development framework
The Philippine Human Development Report of 2005, focusing on Peace, Human Security and Development tracked economic losses of P5 billion to 10 billion annually from 1975 to 2002 resulting just from the Mindanao conflict. The report also showed how socio-economic investments and a human development approach helped reduce the probability of armed conflict.
The next MTPDP should also set the goals and strategies for ending human insecurity, particularly the ideology based armed conflicts, keeping in mind current lessons such as the need for cohesive government response, for constituency building, and for related governance reforms.
7) Maintain fiscal discipline and reduce the debt service burden
Finally, the recommendations above indicate that, especially in this time of crises, the government should allocate more resources to building our socio-economic infrastructure. This should be undertaken while keeping within sound fiscal limits. Ensuring good governance will plug important resource leakages, ensuring higher tax collections and more effective use of government funds. In addition, the government would need to reduce the debt service burden by, among others:
a) ensuring a Congressional Debt Audit which will identify illegitimate debts and then negotiating for the cancellation of these debts
b) discontinuing the practice of shouldering private sector debts through sovereign guarantees, and
c) putting debt-creating activities such as bilateral loan agreements with export credit agencies under full public scrutiny and participation.
In sum, the next MTPDP should clearly be founded on these development pillars – (a) people empowerment and democratization, (b) poverty reduction and equitable access to resources, social services, opportunities and benefits and (c) economic and environmental sustainability.
-0-
CSO Assessment of the 2004-2010 MTPDP: Summary

Civi
l Soc
iety
Ass
essm
ent o
f the
200
4 -2
010
MTP
DP
26

Ass
essm
ent R
epor
t
27
Moderate economic growth during GMA’s watch
While the Philippine economy was expanding during the 1960s through the 1970s at around 5-6 percent growth rate, it slumped in the 1980s and mid 90’s when average real Gross Domestic Product (GDP) growth rate was registered only at around 2 percent. The 1980s saw the rapid growth of East Asian developing countries while the Philippines suffered from external debt crisis and political turmoil. During the GMA administration, the Philippines has returned to its moderate expansion trend of around 5 percent rate. However, its average rate from 2001-1007 is still among the lowest in ASEAN.
Table 1 Average GDP Growth Rates: 1960-2007Average
61-70Average
71-80Average
81-90Average
91-95Average 96-2000
Average2001-07
Cambodia NA NA 7.77 7.34 9.68Indonesia 4.18 7.87 6.41 7.87 0.98 5.07Lao PDR NA NA 4.54 6.42 6.17 6.56Malaysia 6.49 7.87 6.03 9.47 4.99 4.79Philippines 4.93 5.92 1.80 2.19 3.96 5.02Singapore 9.88 8.83 7.49 8.87 6.40 5.34Thailand 8.17 6.89 7.89 8.62 0.64 5.05Vietnam NA NA 4.63 8.21 6.96 7.74Source: WB Development Indicators; author’s computations
Despite growth, poverty has increased in recent years
Despite the moderate economic growth rates experienced by the Philippines in recent years, poverty incidence has remained relatively high. Poverty incidence among households increased from 24.4 percent in 2003 to 26.9 percent in 2006 and the number of poor families increased from 4.02 million in 2003 to 4.68 million in 2006. The headcount index increased from 30.0 percent in 2003 to 32.9 percent in 2006 and the number of poor people from 23.8 million in 2003 to 27.6 million in 2006.
The table below shows that the country has done relatively poorly in the fight against poverty in the last 25 years. Its slow rate of .47 percent per year is even surpassed by Indonesia, Cambodia, Lao PDR, Thailand, and Vietnam. Note also that Thailand and Malaysia, the country’s co-founders of ASEAN has almost nil poverty incidence today. It is only in the Philippines where the absolute number of poor people increased from 1990 to 2005. This might be an indication that a segment of the household population has been chronically poor and underscores the fact that quality and inclusiveness of growth is vital for poverty reduction.
An Assessment of the GMA Administration’s Macroeconomic Performance1
1By Fernando T. Aldaba, President, Civil Society Resource Institute and Professor, Economics Department, Ateneo de Manila University. This assessment borrows heavily from Chapter 4 in Aldaba , “Poverty in the Philippines: Causes, Constraints and Opportunities”, paper submitted to the Southeast Asia Department, Asian Development Bank, May 2009.

Civi
l Soc
iety
Ass
essm
ent o
f the
200
4 -2
010
MTP
DP
28
2This has averaged 20 percent, which compares unfavorably with those of our neighbors—over 30 percent for Thailand and 40 percent plus for Singapore. 3in terms of security of tenure and higher wages & benefits
Table 2 Comparative Headcount Index and Number of Poor in ASEAN (US$ 1.25 at 2005 PPP)
Country
Headcount Index percent
Average Reduction Per Year (percent)
Number of Poor (mil) Average Reduction Per Year
(mil)1990 2005 1990 2005
Cambodia 77.3 40.2 2.47 7.5 5.6 0.13Indonesia 51.3 21.4 1.99 96.7 47.3 3.29Lao PDR 65.9 35.7 1.99 2.7 2.0 0.05Malaysia 1.9 0.5 0.09 0.3 0.1 0.01Philippines 29.7 22.6 0.47 18.2 19.1 (0.06)Thailand 9.4 0.4 0.6 5.1 0.3 0.32Vietnam 34.2 22.8 0.76 22.6 19.0 0.24
Source: ADB
Table 3 below shows the Philippines’ performance in earlier years where it started to fall behind Thailand, Malaysia and Indonesia. These were the years when these countries had sustained relatively high levels of economic growth. The poverty reduction rate in the 70s to the 90s at .7 percent per year was higher than the more recent rate of .5 percent for the Philippines.
Table 3 Changes in Poverty Incidence for Selected Countries, 1960-90
Country Years Annual Reduc-tion
First Year Last Year
Philippines 1971-91 0.7% 52% 39%Indonesia 1970-90 2.0% 58% 19%Korea 1970-90 0.9% 23% 5%Malaysia 1973-87 1.6% 37% 14%Thailand 1962-88 1.4% 59% 22%
Note: Poverty incidence is based on the official head count index calculated from family income in the respective countries (no common poverty line among them)Source: World Bank (1995); Balisacan (1994)
Recent economic growth has been limited to a few sectors and areas and has been described by Ciel Habito as “narrow, shallow, and hollow”. Investments, both domestic and foreign also continue to slide during Arroyo’s
administration basically because of low savings rate2. Very few sectors provide the stimulus to growth e.g. export-oriented semi-conductor industry, telecommunications, business process outsourcing, real estate and housing and retail trade. Most of these are in the services sectors, which have expanded mainly due to remittances of overseas Filipino workers (OFWs). Remittances totaling US$16.43 billion in 2008 comprise almost 12 percent of the country’s GDP. This has been a major reason why not enough “quality”3 jobs are created and that poverty incidence and inequality have not improved much in recent years. Sectors that would provide more jobs have not performed relatively well in recent years – agriculture, manufacturing and industry. The economy needs to diversify its sources of economic growth to obtain higher levels of expansion and quality job creation.
An indicator of the positive impact of macroeconomic growth is the “growth elasticity of poverty reduction”. Using panel data for the Philippines from the 1980 to 1990s, Balisacan and Pernia (2002) noted that the average growth elasticity of poverty is 0.5 indicating that income growth does not correspond one-for-one to changes in the welfare of the poor. More recently,
An Assessment of the GMA Administration’s Macroeconomic Performance

Ass
essm
ent R
epor
t
29
Balisacan and Hill (2007) present various estimates of the growth elasticity of poverty reduction of the Philippines compared to other developing countries - from a low of 1.1 to a high of 2.2.
Table 4 Growth Elasticity of Poverty Reduction
Country Growth Elasticity of Poverty Reduction Source and Year
Philippines 1.1 Balisacan and Hill (2007)Philippines 1.6 Balisacan and Hill (2003)47 Developing Countries 2.5 Ravallion (2001) - Philippines 1.3 Balisacan (2001)China 2.9 Cline (2004)Indonesia 3.0 Cline (2004)Thailand 3.5 Cline (2004)Philippines 2.2 Cline (2004)Thailand 2.2 Deolalikar (2002)Source: Balisacan and Hill (2007)
An ADB (2008) study projects the headcount index in 2020 for various countries in Asia using the US$1.25 per day, 2005 PS PPP poverty lines. For the Philippines, given the main assumption of GDP growth rates of 1.6 percent and considering three scenarios, the poverty incidence for the Philippines will still be in the range of 21.1 to 28.7 percent by 2020. Unless the Philippine economy is able to shift to a higher growth trajectory, it might be stuck in a poverty trap.
Table 5 ADB Projections for poverty incidence by 2020
CountryYear
Headcount Index (percent)
Latest Year 2005
Projected Annualized
Growth Rates or GDP Per Capita
2020
Pro-Poor Distribution
Neutral Distribution
Pro-rich Distribution
(1) (2) (3) (4) (5) (6) (7)Bangladesh 2005 42.9 42.9 3.0 17.5 21.3 27.0Bhutan 2003 31.8 31.5 4.9 7.0 8.2 13.7Cambodia 2004 36.9 31.4 5.7 4.2 4.9 9.5Fiji Islands 2002 28.9 30.1 1.6 23.9 25.4 30.1India 2005 24.1 24.1 2.2 9.0 11.2 19.7Lao PDR 2002 53.6 44.4 4.0 16.6 19.2 25.4Malaysia 2005 0.0 0.0 3.2 0.0 0.0 0.0Maldives 2003 12.6 10.7 5.2 0.0 0.0 0.0Mongolia 2002 40.4 32.0 1.8 18.2 20.5 24.6Nepal 2004 55.8 55.6 2.0 44.7 46.1 48.6Pakistan 2005 24.9 24.9 1.5 11.5 14.0 19.9Philippines 2006 29.5 30.6 1.6 21.1 22.9 28.7Sri Lanka 2002 9.9 5.9 3.7 0.0 0.0 1.3Thailand 2002 0.0 0.0 2.8 0.0 0.0 0.0Viet Nam 2004 16.0 13.5 5.8 0.0 0.0 0.0
Source: ADB Key Indicators 2008
An Assessment of the GMA Administration’s Macroeconomic Performance

Civi
l Soc
iety
Ass
essm
ent o
f the
200
4 -2
010
MTP
DP
30
The current financial crisis may well impede the government’s effort to reduce poverty. While the domestic economy grew a record high of 7.2 percent in 2007, it started sliding to 4.6 percent last year. As the crisis deepens this year (2009), the country’s exports will be greatly affected, as most of the country’s major export partners are in recession e.g. U.S., Japan, and the E.U. Remittances, the lifeline of the economy will have zero growth in a best case scenario this year while foreign and domestic investments will also decrease with a cautious business sentiment amidst uncertainty. Recent consensus forecast for the GDP growth rate is around 0.5-1.5 percent, way below government’s target.
Weaknesses in employment generation and the quality of jobs generated
The inability to sustain a high level of economic growth also accounts for the non-availability of jobs in the country. Without jobs, Filipinos will not be able to earn incomes and will be vulnerable to poverty. The working age population in the Philippines grew by 2.6 percent annually from 1997-2008. This is approximately equal to an average of 1 million new entrants and reentrants into the labor force in each year. The labor force, which numbered 23.9 million in 1997, had increased by more than 50 percent to 37.1 million by October 2008. The rapid increase in the size of the labor force has been attributed not only to high population growth but also to the steady increase in the participation of women in the workforce. The total labor force participation rate rose from only 49 percent in 1970 to almost 65 percent in 2008. Because of the boom and bust cycles of the Philippine economy in the last three decades and only moderate economic growth performance in recent years, employment opportunities have failed to keep up with this growth in the labor force. Despite the Filipino diaspora, unemployment rates remain high by East Asian standards. Indonesia is the only other country with unemployment rates as high as the Philippines. The independent Social Weather Stations’ estimates, based on its latest quarterly survey in December 2008, that there are 11 million unemployed, corresponding to an unemployment rate of 27.9 percent.
Table 6 Unemployment Rates in East Asia, 2003-2007Country 2003 2004 2005 2006 2007China 4.3 4.2 4.2 4.1 4.0Hong Kong 7.9 6.8 5.6 4.8 4.0Indonesia 9.5 9.9 11.2 10.3 9.1Malaysia 3.6 3.5 3.5 3.4 3.1Philippines* 11.3 11.8 11.5 8.0 7.3Singapore 4.0 3.4 3.1 2.7 2.1South Korea 3.6 3.7 3.7 3.5 3.2Taiwan 5.0 4.4 4.1 3.9 3.9Thailand 2.2 2.1 1.8 1.5 1.4
* The official definition of unemployment was changed in 2006 resulting in lower rates (see footnote 38)Source: ADB Outlook 2008
The share of industrial and manufacturing employment, where relatively stable and higher quality jobs can be found has decreased over the years. The agricultural sector’s share in employment also declined significantly from 61.2 percent in 1960 to 51.4 percent in 1980 and down to 36.1 percent in 2007. In contrast, the services sector, which is mostly urban based and composed of informal workers, absorbed much of the labor force during the last two decades (see Table 7).
Table 7 Sectoral Employment Shares (percent)
Sector 1960 1965 1970 1975 1980 1985 1990 1995 2000 2005 2007Agriculture 61.2 56.7 53.7 53.5 51.4 49.0 45.2 43.4 37.1 35.9 36.1Industry 12.6 11.3 12.6 12.1 11.6 10.7 10.7 5.9 6.2 10.0 9.5Manufacturing 12.1 10.9 11.9 11.4 10.6 9.7 9.7 10.2 10.0 9.7 9.1Services 26.2 31.5 32.1 34.1 36.5 40.2 44.0 40.5 46.7 53.9 54.4
Source: 2002 Philippine Statistical Yearbook, 2008 ADB Key Indicators
An Assessment of the GMA Administration’s Macroeconomic Performance

Ass
essm
ent R
epor
t
31
Agriculture has been neglected in the past years by various administrations. Habito and Briones (2005) note that the bad performance of the Philippine agriculture sector is due to the unconducive policy environment, the inadequate resources given by government and the inequitable and inefficient allocation of such funds including resources lost to corruption. These have hampered investments in the sector, both at the small and commercial farm level. Lack of certain policies, inadequate infrastructure and institutional weaknesses decreased investor interest to improve agricultural productivity.
Underemployment rates, which mirror the existence of low quality jobs, have remained relatively high for the past fifteen years. The figure below shows that the rates ranged from 16-22 percent. This seems consistent with the results of the 2008 Informal Sector Survey which showed that there were about 10.5 million informal sector operators in the country with almost 90 percent as self employed workers. Hasan and Jandoc (2009) examines the trends in the labor market and revealed findings that deviate from the familiar pattern of successful development - the share of employment in manufacturing, the sector where most quality permanent jobs are generated has been stagnant and it is the services sector that has “absorbed” the shift of employment from agriculture. They also found that the fastest-growing job type is not permanent wage employment but casual wage jobs and that there is weak growth in wages and earnings for workers in general.
employed workers. Hasan and Jandoc (2009) examines the trends in the labor market and revealed findings that deviate from the familiar pattern of successful development - the share of employment in manufacturing, the sector where most quality permanent jobs are generated has been stagnant and it is the services sector that has “absorbed” the shift of employment from agriculture. They also found that the fastest-growing job type is not permanent wage employment but casual wage jobs and that there is weak growth in wages and earnings for workers in general.
Figure 1. Trend in Underemployment Rate, January 95-09
Underemployment Rates
0
5
10
15
20
25
95 96 97 98 99 00 01 02 03 04 05 06 07 08 09
January 95-09
Achieved moderate inflation but episodes of food inflation dampen the benefits of macroeconomic growth
Another factor that dampens the positive impact of macroeconomic growth is high inflation. GMA’s administration can boast of the lowest inflation rates but mostly because of the BSP’s management of the money supply of the country. The inflation rate shot up to an average 14.3 percent during the martial law years, but fell down to 9.8 percent during Aquino’s term, gradually declined to 9.15 percent under Ramos and 6.4 percent under Estrada, until it reached 6.16 percent during Arroyo (2001-2008).
Table 8 Inflation rates 1990 - 2008 Year Average Inflation Rate Year Average Inflation Rate1990 12.2 2000 4.01991 19.3 2001 6.81992 8.7 2002 3.01993 6.7 2003 3.51994 10.4 2004 6.01995 6.8 2005 7.71996 7.5 2006 6.21997 5.6 2007 2.81998 9.21 2008 9.31999 5.99Source: NSO
Son (2008a), using household surveys and detailed price data, estimates the price elasticity of poverty by commodity in the Philippines and finds that a 10 percent increase in food prices will create 2.3 million more poor people, while a 10 percent increase in non-food prices will drive an additional 1.7 million people into poverty. A 10 percent increase in the price of rice will force an additional 0.66 million people into poverty, while a 10 percent increase in fuel prices will cause an additional 0.16
5
Achieved moderate inflation but episodes of food inflation dampen the benefits of macroeconomic growth
Another factor that dampens the positive impact of macroeconomic growth is high inflation. GMA’s administration can boast of the lowest inflation rates but mostly because of the BSP’s management of the money supply of the country. The inflation rate shot up to an average 14.3 percent during the martial law years, but fell down to 9.8 percent during Aquino’s term, gradually declined to 9.15 percent under Ramos and 6.4 percent under Estrada, until it reached 6.16 percent during Arroyo (2001-2008).
Table 8 Inflation rates 1990 - 2008
Year Average Inflation Rate Year Average Inflation Rate1990 12.2 2000 4.01991 19.3 2001 6.81992 8.7 2002 3.01993 6.7 2003 3.51994 10.4 2004 6.01995 6.8 2005 7.71996 7.5 2006 6.21997 5.6 2007 2.81998 9.21 2008 9.31999 5.99
Source: NSO
An Assessment of the GMA Administration’s Macroeconomic Performance
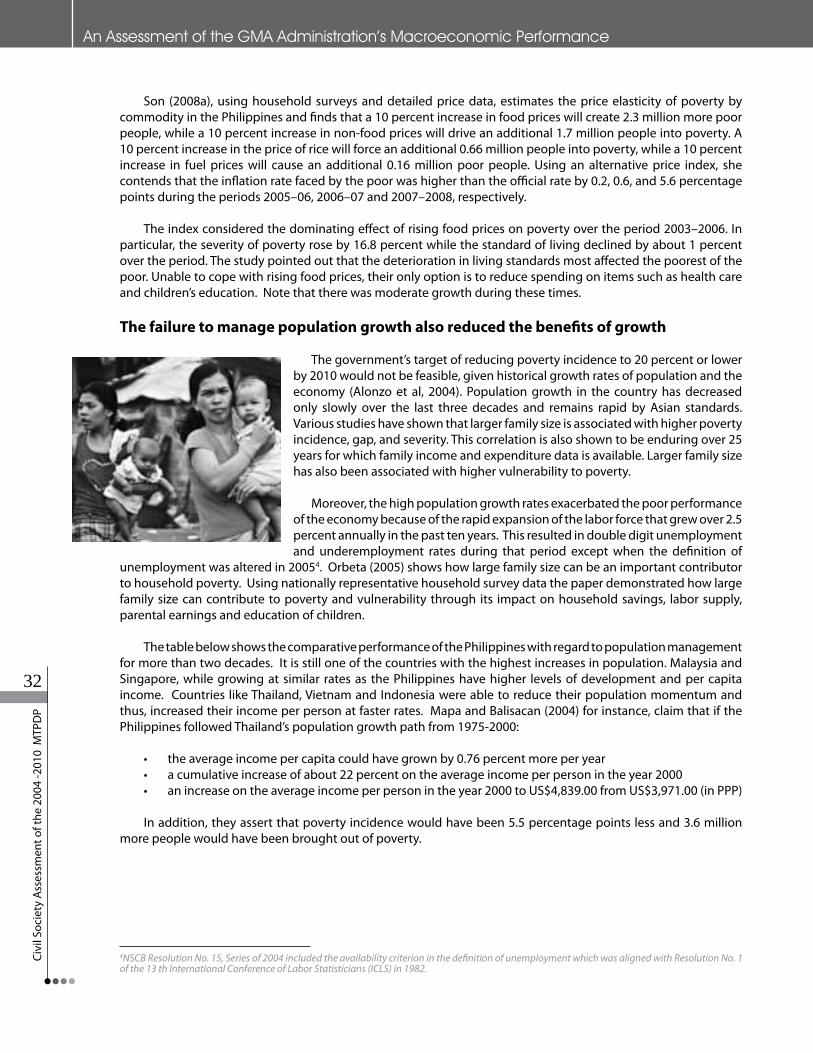
Civi
l Soc
iety
Ass
essm
ent o
f the
200
4 -2
010
MTP
DP
32
4NSCB Resolution No. 15, Series of 2004 included the availability criterion in the definition of unemployment which was aligned with Resolution No. 1 of the 13 th International Conference of Labor Statisticians (ICLS) in 1982.
Son (2008a), using household surveys and detailed price data, estimates the price elasticity of poverty by commodity in the Philippines and finds that a 10 percent increase in food prices will create 2.3 million more poor people, while a 10 percent increase in non-food prices will drive an additional 1.7 million people into poverty. A 10 percent increase in the price of rice will force an additional 0.66 million people into poverty, while a 10 percent increase in fuel prices will cause an additional 0.16 million poor people. Using an alternative price index, she contends that the inflation rate faced by the poor was higher than the official rate by 0.2, 0.6, and 5.6 percentage points during the periods 2005–06, 2006–07 and 2007–2008, respectively.
The index considered the dominating effect of rising food prices on poverty over the period 2003–2006. In particular, the severity of poverty rose by 16.8 percent while the standard of living declined by about 1 percent over the period. The study pointed out that the deterioration in living standards most affected the poorest of the poor. Unable to cope with rising food prices, their only option is to reduce spending on items such as health care and children’s education. Note that there was moderate growth during these times.
The failure to manage population growth also reduced the benefits of growth
The government’s target of reducing poverty incidence to 20 percent or lower by 2010 would not be feasible, given historical growth rates of population and the economy (Alonzo et al, 2004). Population growth in the country has decreased only slowly over the last three decades and remains rapid by Asian standards. Various studies have shown that larger family size is associated with higher poverty incidence, gap, and severity. This correlation is also shown to be enduring over 25 years for which family income and expenditure data is available. Larger family size has also been associated with higher vulnerability to poverty.
Moreover, the high population growth rates exacerbated the poor performance of the economy because of the rapid expansion of the labor force that grew over 2.5 percent annually in the past ten years. This resulted in double digit unemployment and underemployment rates during that period except when the definition of
unemployment was altered in 20054. Orbeta (2005) shows how large family size can be an important contributor to household poverty. Using nationally representative household survey data the paper demonstrated how large family size can contribute to poverty and vulnerability through its impact on household savings, labor supply, parental earnings and education of children.
The table below shows the comparative performance of the Philippines with regard to population management for more than two decades. It is still one of the countries with the highest increases in population. Malaysia and Singapore, while growing at similar rates as the Philippines have higher levels of development and per capita income. Countries like Thailand, Vietnam and Indonesia were able to reduce their population momentum and thus, increased their income per person at faster rates. Mapa and Balisacan (2004) for instance, claim that if the Philippines followed Thailand’s population growth path from 1975-2000:
• theaverageincomepercapitacouldhavegrownby0.76percentmoreperyear• acumulativeincreaseofabout22percentontheaverageincomeperpersonintheyear2000• anincreaseontheaverageincomeperpersonintheyear2000toUS$4,839.00fromUS$3,971.00(inPPP)
In addition, they assert that poverty incidence would have been 5.5 percentage points less and 3.6 million more people would have been brought out of poverty.
An Assessment of the GMA Administration’s Macroeconomic Performance

Ass
essm
ent R
epor
t
33
An Assessment of the GMA Administration’s Macroeconomic Performance
Table 9 Population Growth Rates in ASEAN percent
Country 1990 1995 2000 2005 2007 Average(1990-07)
Average(2000-07)
Brunei Darussalam 3.1 2.9 2.5 2.9 1.8 2.4 2.6Cambodia 3.6 5.2 1.8 2.1 1.9 2.9 1.9Indonesia 2.0 1.7 0.9 1.3 1.3 1.3 1.2Lao PDR 2.1 -0.3 2.1 1.8 2.1 1.9 2.1Malaysia 2.5 2.8 2.5 2.2 2.0 2.4 2.2Myanmar 1.9 1.9 2.0 2.0 2.0 2.1 2.0Philippines 1.4 2.3 2.5 2.0 2.0 2.1 2.1Singapore 4.0 3.1 1.7 2.4 4.3 2.4 1.9Thailand 1.1 1.2 0.7 0.9 0.8 0.9 0.8Viet Nam 1.9 1.7 1.4 1.3 1.2 1.5 1.3
Source: ADB Key Indicators 2008 and NSCB
High and persistent levels of inequality mitigates the beneficial impact of growth
Income inequality
The impact of economic growth on poverty reduction is either mitigated or enhanced by initial distribution of income and its consequent improvement or deterioration. High levels of inequality were recorded for the past 20-25 years, which in turn have weakened the already moderate growth experienced by the economy. Inequality, if examined through the contribution of each decile to total income remained severe in 2006, as the richest 20 percent of Filipino families (3.5 million) accounted for 52.8 percent of total family income, while the poorest 80 percent (13.9 million) had to share the remaining 47.3 percent. The income of the richest 10 percent of Filipino households was equivalent to 19 times that of the poorest 10 percent (see Table 10 below derived from Virola, 2007). Thus while there was economic growth from 2003 to 2006, the benefits accrued more to the top four deciles as shown in the table below. There was improvement in distribution but poverty still became worse. Thus, the impact of growth was even more limited on the rich although the middle classes were hardly hit.
Table 10 Percentage Point Change in Income Sharea/, 2003-2006b/
Income Decile 2006 2003 Percentage Point Change2003-2006
First to Fourth 13.2687 13.1309 +0.1378First 1.8717 1.8055 +0.0662Second 2.9412 2.8724 +0.0688Third 3.7767 3.7751 +0.0016Fourth 4.6791 4.6779 +0.0013
Fifth to Seventh 22.0588 22.1584 -0.0996Fifth 5.7821 5.8268 -0.0448Sixth 7.1858 7.2220 -0.0362Seventh 9.0909 9.1096 -0.0187
Eight to Tenth 64.6767 64.7066 -0.0299Eight 11.8984 11.8588 +0.0396Ninth 16.8783 16.5778 +0.3006Tenth 35.9000 36.2700 -0.3700
Ratio of Top 30percent over Bottom 30percent
7.5300 7.6600 -0.1300
Ratio of Top 30percent over Bottom 10percent
19.1800 20.0900 -0.9100
Source of basic data: National Statistics Office (NSO) in Virola (2007) a/ - Based on the computations made by the NSCB Technical staff.b/ - All computations made were in nominal terms as the public use file (PUF) of the 2006 FIES, which is needed to compute for each household’s income in real terms, is not yet available.

Civi
l Soc
iety
Ass
essm
ent o
f the
200
4 -2
010
MTP
DP
34
5This problem has been inherited from the Spanish colonial times and the resulting political economy has rendered inadequate reforms
An Assessment of the GMA Administration’s Macroeconomic Performance
Balisacan (2003) decomposes the growth and distribution components of poverty reduction during the episodes of relatively high economic expansion in the country i.e. 1985-88 and 1994-1997. He found that in the second growth episode (1994-97), the increase in inequality blunted the impact of growth by three percentage points while an improvement in distribution in the first episode (1985-88) augmented the growth effect on poverty reduction. Reyes (2002) share a similar finding after decomposing the growth and distribution components i.e. the dominance of the growth over the redistribution component during the sub-periods 1985-1991, 1991-1997 and 1997-2000. Her results also show that for the entire period 1985 to 2000, growth could have led to a reduction in poverty incidence of 16.5 percentage points but the actual decrease was only 9.40 because of an increase in inequality of 4.66.
In terms of comparison with the ASEAN neighbors, the Philippines has the highest level of inequality in terms of the gini-coefficient and the gap between the richest 20 percent to the poorest 20 percent. This is one reason why poverty reduction has been slow relative to these countries (See Annex 11 for details)
Inequitable Distribution of Land
In addition, the Philippines has a very skewed distribution of landholdings. However, Balisacan (1991) noted that the poorest in rural areas tend to be landless farmers indicating a link between access to land resources and poverty alleviation. Balisacan and Pernia (2002) also found that agrarian reform is a significant variable exerting direct impact on the welfare of the poor. But despite years of implementation, the agrarian reform program of the country has made little dent on the inequitable distribution of land, which many analysts say is a path dependency problem5.
Various studies also assert that a country’s initial land distribution influences its subsequent economic growth and human development performance e.g. Deininger and Squire (1998). A typical developing country with initially high land inequality is expected to have a lower long-term income growth rate and slower pace of poverty reduction than a country with a more favourable land distribution. Thus, aside from its direct effects on poverty, high land inequality also affects the poor indirectly through its negative impact on long run economic growth. Land inequity has spawned a continuing rural insurgency, which adds to investment uncertainties in rural areas. Table 11 shows that land inequality has been persistent over the 40 years.
Table 11 Gini Ratio of Land Holdings
Year Ave. Farm Size (ha)
Land-labor ratio
Percent of Farms Percent of AreaGini RatioAbove
10 haAbove 25 ha
Above 10 ha
Above 25 ha
1960 3.6 1.34 5.5 0.5 38.3 15.4 0.531971 3.5 1.16 4.8 0.6 33.8 17.1 0.541980 2.8 1.08 3.5 … 26 … 0.541991 2.2 0.88 2.3 0.3 23.5 10.6 0.572002 2.0 0.69 1.8 0.23 19.4 8.1 0.57
Source (Balisacan 2007b) citing Philippine Census of Agriculture, various years
Perennial if not almost regular dose of shocks and exposure to risks like man made conflicts, natural disasters and environmental poverty cancel positive effects of growth and increase poverty
Long Running Conflicts
Social conflicts prevent people from pursuing their livelihood and economic activities as they are displaced from their homes and places of work. The Philippines is home to two of the longest-running armed conflicts in the

Ass
essm
ent R
epor
t
35
6Bauer (2008)
An Assessment of the GMA Administration’s Macroeconomic Performance
world: against the communist insurgency (CPP-NPA-NDF) and against the Bangsa Moro rebellion (MNLF and MILF); both have run for almost four decades. The PHDR 2005 also estimates that during the periods of acute conflict, 1970-1982 and 1997-2001, the Moro insurgency resulted in lost annual output valued at $150 million, with a total loss of $2-3 billion over the entire period. The World Bank estimates a total of 120,000 deaths (civilians and combatants) from the Mindanao conflict from the 1970s to the present. The total number of people displaced by armed conflict in the Philippines during the period 2000-2007 is estimated at 2.1 million. With more than 600,000 people displaced between January and October 2008, it is estimated that the total IDP (internally displaced people) "flow" since 2000 could be at around 2.6 million people (www.internal-displacement.org).
Natural Disasters and Environmental Poverty
According to the International Red Cross and Red Crescent Societies, the Philippines is the fourth most accident-prone country in the world. 5,809,986 Filipinos were killed or injured as a result of disasters or man-made calamities over a ten-year period (1992-2001). The Philippines also ranks fourth in the Global Climate Risk Index (CRI), which identifies countries affected by extreme weather events in specific time periods according to the following indicators: total number of deaths, deaths per 100,000 inhabitants, absolute losses in US$ million purchasing power parities and losses per unit GDP. The geographical location of the Philippines in the path of tropical cyclones and what geologists call the Pacific Ring of Fire makes it susceptible to all kinds of natural hazards such as:
• Earthquakes. On average, the Philippines experiences a significantly damaging earthquake about every 18 months.
• Volcanic eruptions. Out of 220 volcanoes in the archipelago, 22 are classified as active.
• Environmental degradation. Demographic growth and poor land use planning have led to massive depletion of natural resources and destruction of the environment e.g. declining forest cover contributes to more frequent flash flooding, landslides and droughts.
• Tropical cyclones. On average, about 20 typhoons occur annually. In 2006, more than 11 million persons were affected and damage amounted to almost P20 billion.
• Flooding. Little information is available on flooding and a detailed mapping of flood prone areas in the country has yet to be done.
Using a full panel data, Balisacan and Fuwa (2001) noted that spatial isolation, landlocked areas or high transport cost, and the average frequency of typhoons or disasters hitting the province are found to be positively related to poverty. Balisacan and Pernia (2002) likewise found the occurrence of typhoons a significant variable affecting the poor man’s standard of living. Thus, areas frequently hit by natural disasters may lead to ‘poverty traps’ as people and communities are not able to recover easily from such shocks.
The poor suffer more losses, illnesses, injuries, and deaths than the rest of the population because they are the ones most likely to be dependent on natural systems for their livelihood and health6. In rural areas, soil erosion, coastal and marine-system degradation, deforestation, and biodiversity are causing a decline in agricultural productivity that threatens the livelihood of the poor. In cities, the poor are exposed to congestion and polluted air and water. In the Asia-Pacific region in 2005, about 53 percent of the extreme poor and 85 percent of the moderate poor (based on $1 and $2 poverty lines) live in areas where the environment is the primary cause of poverty7. It is likely that a similar pattern will also apply to the Philippines.

Civi
l Soc
iety
Ass
essm
ent o
f the
200
4 -2
010
MTP
DP
36
7Ibid.8Bocchi, 20089Alba, 200710Pritchett, 200311Nelson, 2007
An Assessment of the GMA Administration’s Macroeconomic Performance
Economic growth cannot attain high levels and be sustained with persistent poverty
The failure of the Philippine economy to transition to a higher and sustained level of growth has been explained as the result of a sustained decline in domestic investments8, weaknesses in institutions and social infrastructure9, institutional uncertainty10 and a history and culture that has impacted negatively on current growth11. However, it is also possible that poverty itself is constraining economic expansion. The channels through which poverty may impact on economic growth include:
• Investmentcapacity constraints (lackof access to credit aggravatedby theunderdevelopmentof thefinancial markets);
• Humancapitalconstraints(lackofaccesstoqualityeducation,healthandnutrition);• Regulardoseofrisksandshockscausingpovertytraps;and• Conflictsanddisorderresultingfromhighinequalityhamperinvestmentsanddestroysocialcapital.
As long as a large segment of our population is mired in chronic poverty, our chances for attaining sustained high levels of growth will be jeopardized. Unless the country is able to tackle poverty, macroeconomic growth will always be low to moderate in the future.
RECOMMENDATIONSHereunder are our most important recommendations for the next MTPDP -1) Government should continue to pursue the following key economic reforms for sustained and inclusive growth:
• increase available resources for social services, poverty reduction, and infrastructure through fiscalreforms;
• maintainpricestabilitytoprotectthepoorfromthenegativeimpactofincreasingfoodprices;• improvetheinvestmentenvironment(throughdevelopingmajorinfrastructure,anddecreasingredtape
and corruption);• promotehighergrowthandproductivityoftheagriculturesector;• continuetostrengthentourism,asthisisanimportantsectorforruralemployment;• closelyexamineproposedmacroeconomicpoliciesandlargeinvestmentprojectsintermsoftheirimpact
on poverty (NEDA); and• scrutinizeproposedbudgetsintermsoftheirpro-poorbias(NAPCcanleadthiseffort).
2) A comprehensive poverty framework that includes a social protection strategy to address vulnerability must be formulated. The framework and strategy should also tackle chronic poverty (and pathways out of a poverty trap) and give serious attention to population management.
3) Interventions and programs to fight poverty should incorporate both growth and distribution factors to maximize impact:
• Continued and improved implementation of the ComprehensiveAgrarian Reform Program should remain a government priority.
• TheCommunityMortgageProgramshouldbegivenmoreresourcesand implemented more widely in key cities and major urban areas.
The government should further expand its efforts in dealing with the informal sector; its initiatives in microfinance can further be strengthened.
4) Institutions that coordinate poverty policy and implement poverty programs must be reformed to enhance coordination, improve efficiency and monitoring, and reduce corruption by

Ass
essm
ent R
epor
t
37
An Assessment of the GMA Administration’s Macroeconomic Performance
• renewingthememorandumofagreementbetweentheNAPCandNEDAtoclarifythecoordinationrolesof each agency; the new poverty strategy and plan of action should incorporate the specific roles of agencies and key stakeholders at various levels of intervention;
• continuingtoreformtheeducationalsystem(throughtheBasicEducationSectorReformAgenda),thehealth system through (FOURmula One), and the social welfare system;
• accessingmoreNGOsandcivilsocietysectorstomonitorthedeliveryofpovertyprogramsandsocialservices;
• mappingkeystakeholdersandtheirrolesinpovertyalleviationatalllevelsofgovernance;• examiningthepoliticaleconomyofpovertyprogramsbeforeimplementation;and• strengtheningsafeguardmechanisms (e.g.,civil societywatchdogssuchas thetextbookwatchof the
DepEd) against leakages and corruption in large poverty programs.
5) Local government resources and capacity for fighting poverty should be enhanced, including improvements in national agency–local government coordination. Such activities may include
• establishinganincentivesystemonallocationtobettermotivateLGUsinthefightagainstpoverty;• promotinginter-LGUcooperationinimplementingantipovertyprogramsandprojectsincludingreforms
in health, education, and population management;• learninghowselectlocalgovernmentssuccessfullyimplementpovertyreductionprograms(e.g.,Galing
Pook awardees Bohol, Concepcion, Iloilo, and Naga City);• continuingadvocacyformoredemocraticandpeople-centeredprocessesatthelocallevels;• reviewingthe14corepoverty indicators, reviewingavailable localpoverty indicators,andsimplifying
local data collection systems; and• making provinces focal points for coordinating poverty-related programs and projects for local
implementation (Panadero 2009).
REFERENCES
Alba, Michael M. “Why has the Philippines Remained a Poor Country?” UPSE Discussion Paper 2007-1, January 2007.
Aldaba, Fernando. “Poverty in the Philippines: Causes, Constraints and Opportunities.” Paper submitted to the Asian Development Bank Southeast Asia Department, May 2009.
Alonzo, Ruperto P. et al. “Population and Poverty: the Real Score.” UPSE Discussion Paper 2004-15, December 2004.
Asian Development Bank, Key Indicators, 2008.
Balisacan, Arsenio M. Poverty, Urbanization, and Development Policy: A Philippine Perspective. Quezon City: University of the Philippines Press, 1994.
Balisacan, Arsenio M. “Poverty and Inequality” in The Philippine Economy: Development, Policies and Challenges. ed. A. Balisacan and H. Hill. Quezon City: Ateneo de Manila University Press, 2003.
Balisacan, Arsenio M. and Nobuhiko Fuwa. “Growth, Inequality and Poverty Reduction in the Philippines.” UPSE Discussion Paper, 1-9, 2001.
Balisacan, Arsenio M. and Nobuhiko Fuwa. “Growth, Inequality and Politics Revisited: A Developing Country Case.” Economic Letters, 79, 53-8, 2003.
Balisacan, Arsenio M. and Nobuhiko Fuwa. “Going Beyond Cross Country Averages: Growth, Inequality and Poverty Reduction in the Philippines.” World Development, 32, 891-907, 2004.
Balisacan, Arsenio M. and Hal Hill (eds). The Philippine Economy: Development, Policies, and Challenges. Quezon City: Ateneo de Manila University Press, 2003.

Civi
l Soc
iety
Ass
essm
ent o
f the
200
4 -2
010
MTP
DP
38
An Assessment of the GMA Administration’s Macroeconomic Performance
Balisacan, Arsenio M. and Hal Hill. The Dynamics of Regional Development: The Philippines in East Asia. Quezon City: Ateneo de Manila University Press, 2007.
Balisacan, Arsenio M. “Agrarian Reform and Poverty Reduction in the Philippines.” Paper presented during a Policy Dialogue on Agrarian Reform Issues in Rural Development and Poverty in Manila, May 30, 2007.
Balisacan, Arsenio M. “Making Good on the MDG Poverty Challenge.” Paper presented to the National Academy of Science and Technology, February 26, 2009.
Bauer, Armin. “The Environments of the Poor: New Perspectives on Development Programs.” A power point presentation in the 13th Poverty and Environment Meeting, Manila, Philippines, June 2008.
Bocchi, Alessandro M. “Rising Growth, Declining Investment, The Puzzle of the Philippines.” World Bank Policy Research Working Paper 4472, 2008.
Deolalikar, Anil B. “Poverty, Growth and Inequality in Thailand.” ERD Working Paper No. 8, March 2002.
Habito, Cielito F. “RP Growth-Poverty Link: An Asian Anomaly.” Philippine Daily Inquirer, April 6, 2009.
Habito, Cielito F. and Roehlano M. Briones. Philippine Agriculture Over The Years: Performance, Policies and Pitfalls, 2005 manuscript, unpublished.
Llanto, Gilberto M. “Infrastructure and Regional Growth.” in Balisacan, A. and H. Hill, The Dynamics of Regional Development. Quezon City: Ateneo de Manila University Press, 2007.
Mangahas, Mahar. Social Weather Stations Monitoring of Self Rated Deprivation. Philippine Institute for Development Studies, 2008.
Mapa, Dennis S. and Arsenio M. Balisacan. “Quantifying the Impact of Population on Economic Growth and Poverty: The Philippines in an East Asian Context.” in Sevilla, L.A. (ed.), Population and Development in the Philippines: The Ties That Bind. Makati: AIM Policy Center, 2004.
Nelson, Robert H. “The Philippine Economic Mystery.” UPSE Discussion paper 2007-09, July, 2007.
Orbeta, Aniceto Jr. C. “Poverty, Vulnerability and Family Size: Evidence from the Philippines”, DP 2005-19. Philippine Institute for Development Studies, 2005.
Ravallion, Martin. “Growth, Inequality and Poverty: Looking Beyond Averages.” World Development, 29: 1, 803-15, 2001.
Reyes, Celia M. “The Poverty Fight: Have We Made an Impact?” PIDS Discussion paper 2002-20. Philippine Institute for Development Studies, 2002.
Reyes, Celia M. “Movements In and Out of Poverty in the Philippines.” MIMAP Research Paper no. 53, 2004.
Social Weather Stations. “Fourth Quarter 2008 Social Weather Report.” December 2008.
Son, Hyun H. “Has Inflation Hurt the Poor? Regional Analysis in the Philippines.” ERD Working Paper No. 112. Asian development Bank, May 2008.
Son Hyun H. and Florentino, Jaedon. “Ex-Ante Evaluation of CCT on School Attendance and Poverty: The Case of the Philippines.” ADB Economics Working Paper Series 142, December 2008.
Virola, Romulo A. “Anti-Poverty? How about Pro-Middle Class?” Statistically Speaking in www.nscb.gov.ph, 2007.
Warr, Peter G. “Poverty and Growth in Southeast Asia.” ASEAN Economic Bulletin, volume 23, number 3. 2006.

Ass
essm
ent R
epor
t
39
Civil Society Assessment of the 2004-2010 Medium Term Philippine Development Plan for Trade and Investment1
I Introduction and Background
The first chapter of the Medium Term Philippine Development Plan (MTPDP) 2004-2010 begins with a recognition of the necessity of investment and trade in job creation and an enumeration of the reasons why the country has remained relatively uncompetitive vis-à-vis other countries in the region. It then outlines a series of policy goals, macroeconomic targets, and program initiatives the government hopes to achieve within the six years of President Gloria Macapagal-Arroyo’s term. It specifies among others, a targeted increase in investment rate from 19 to 28 percent of Gross Domestic Product (GDP), with focus on priority areas such as information and communications technology (ICT), automotive, electronics, mining, health care, tourism, and a rationalization of the investment incentive scheme. It also targets increased spending on public infrastructure by Php100 billion, citing the country’s poor infrastructure as adversely affecting the country’s competitiveness. Goals for the export sector include a minimum growth rate of 10 percent, streamlining of government procedures for registering business, and closely linking export products with priority markets. The plan also highlights the role of small and medium enterprises (SMEs) in spurring economic growth and providing livelihood and outlines multiple government initiatives that would channel credit, provide assistance, and increase participation in these enterprises.
Though not lacking in detail, what is patently absent is a comprehensive agenda that would substantiate and consolidate all the specific goals and targets articulated in the plan. The tendency to design and implement trade policies that are de-linked from Philippine domestic realities and development objectives cannot be ignored, especially when we are assessing the government’s performance of its trade and investment plan2. One can easily be impressed by the number of initiatives the government wishes to undertake in MTPDP 2004-2010, but the plan remains a bullet-point list of goals and targets which, although concrete, is still very limited. Nevertheless, the importance of assessing the administration’s performance remains vital in our efforts to hold it accountable to the goals it has publicly stated to meet.
The paper’s assessment is structured as follows. Part II reviews major aspects of the Philippine economy’s performance, emphasizing key trade and investment indicators. The second section assesses and analyzes these numbers in light of the trade targets and strategies contained in the most recent MTPDP 2004-2010. The final section summarizes key findings and policy recommendations.
II. ECONOMIC HIGHLIGHTS IN 2004-2010
A review of the country’s economic performance the past five years reveals the following facts: • Theverystrongperformanceoftheservicessectorontheproductionside,andthehighinflowofOverseas
Filipino Worker (OFW) remittances on the consumption side, have kept the economy afloat the past five years in spite of the global financial and economic downturn in 2008.
• Theagricultureandmanufacturingsectorregisteredmodest–ifnotdecelerating–growth,offsettingthestrong performance of the services sector.
• Robustexportgrowthin2006wasnotsustainedthesucceedingyearsduetotheweakeningdemandoftrading partners and the appreciation of the peso.
1Prepared by Marian Angelica Panganiban, Tanya Lat J.D., LL.M. and Veronica Arreza, Initiatives for Dialogue and Empowerment through Alternative Legal Services (IDEALS)2Trade Advocacy’s Group, “A National Agenda.”

Civi
l Soc
iety
Ass
essm
ent o
f the
200
4 -2
010
MTP
DP
40
OFW remittances and the Services Sector
Driven by increased household spending and the strong performance of merchandise exports, gross domestic product (GDP) grew an average of 4.4 percent the past 5 years. A robust services sector also sustained the growth in GDP. Services, with a share of 48.0 percent of total GDP, contributed the most to GDP growth with 3.3 percentage points. Leading the sector’s growth were trade, transportation, communication and storage and private services. In terms of growth rates, the services sector registered a 7.0 percent growth rate from 6.4 percent in 2005, counteracting the slowdown in industry and agriculture, which grew by 3.3 percent from 4.9 and by 1.9 percent from 3.7 percent respectively.
Gross Domestic Product Growth Rates2004-2009
The sustained growth in the stock of OFWs particularly in the last quarter of 2006 also resulted in the growth of 14.2 percent in compensation inflow from 6.0 percent in 2005. The hike in OFW remittances also fueled the expansion by 5.6 percent in 2006 from 5.0 percent in 2005 of consumer spending. Expenditures on food and miscellaneous items increased while expenditures on transportation/communication and household operations decreased.
Gross Domestic Product by Industrial Origin2004-2009
at constant 1985 prices, in millions of pesos
By 2007, GDP expanded by 7.1 percent. The services sector once again, was the star performer, growing by an impressive 8.7 percent. The banking sector also contributed to this expansion, recording double-digit growth despite the sub-prime-induced volatility in the second half.
Accounting for the GDP expansion on the demand side was private consumption, supported in part by rising remittances (the appreciation of the peso notwithstanding). High remittance inflow (US$14.4 billion) in 2007 far outweighed the slowdown in exports, turning a large trade deficit into a healthy current account surplus of 4.4 percent of GDP. Stimulated by higher public investment, private investment picked up too but the growth came mostly from construction; durable equipment growth remained lackluster. Net capital inflow was positive, aided by stronger portfolio investment (US$3.1 billion) and other investment (US$1.6 billion) inflows. As a result, reserves climbed by 50 percent, and reached US$36 billion by February 2008 (6.1 months of imports).
A surge in inflation and weaker demand for exports due to the lingering global financial and economic crisis saw the Philippines’ GDP sharply slow down to 3.8 percent in 2008. Again, inflows of remittances by OFWs helped keep the current account in surplus as these transfers grew by 13.8 percent to US$ 16.4 billion in 2008 or 10 percent of GDP. The surplus in the capital account however was pulled down by portfolio investment outflows, and as inflows of foreign direct investment fell to US$ 1.5 billion from US$ 2.9 billion in 2007. The overall balance-of-payments surplus was US$ 89 million, down from a record US$ 8.6 billion in 2007.
By 2009, sources of growth on the demand side were investments in construction, government consumption expenditure, and household spending. The continued inflow of remittances from overseas workers buttressed the Net Factor Income Abroad, which went up by 29.7 percent from 15.8 percent last year, and pushed GNP to grow by 4.4 percent from 5.3 percent in 2008. On the production side, services continue to buoy the economy even with a modest 3.1 percent growth.
Export performance
The Philippine economy enjoyed a relatively good year in 2006. Exports grew robustly as it grew 16.6 percent from January to October despite peso appreciation and the weakening of the dollar. Exports increased at a record 20.6 percent in June, its highest in six years. Total Merchandise Exports expanded to 8.7 percent from a growth of 5.1 percent in the same quarter in 2005. The robust growth was accounted for by the acceleration in the growth of garments, gold from copper, semiconductors and other electronic
3
By 2007, GDP expanded by 7.1 percent. The services sector once again, was the star performer, growing by an impressive 8.7 percent. The banking sector also contributed to this expansion, recording double-digit growth despite the sub-prime-induced volatility in the second half.
Accounting for the GDP expansion on the demand side was private consumption, supported in part by rising remittances (the appreciation of the peso notwithstanding). High remittance inflow (US$14.4 billion) in 2007 far
Civil Society Assessment of the 2004-2010 Medium Term Philippine Development Plan for Trade and Investment

Ass
essm
ent R
epor
t
41
outweighed the slowdown in exports, turning a large trade deficit into a healthy current account surplus of 4.4 percent of GDP. Stimulated by higher public investment, private investment picked up too but the growth came mostly from construction; durable equipment growth remained lackluster. Net capital inflow was positive, aided by stronger portfolio investment (US$3.1 billion) and other investment (US$1.6 billion) inflows. As a result, reserves climbed by 50 percent, and reached US$36 billion by February 2008 (6.1 months of imports).
A surge in inflation and weaker demand for exports due to the lingering global financial and economic crisis saw the Philippines’ GDP sharply slow down to 3.8 percent in 2008. Again, inflows of remittances by OFWs helped keep the current account in surplus as these transfers grew by 13.8 percent to US$ 16.4 billion in 2008 or 10 percent of GDP. The surplus in the capital account however was pulled down by portfolio investment outflows, and as inflows of foreign direct investment fell to US$ 1.5 billion from US$ 2.9 billion in 2007. The overall balance-of-payments surplus was US$ 89 million, down from a record US$ 8.6 billion in 2007.
By 2009, sources of growth on the demand side were investments in construction, government consumption expenditure, and household spending. The continued inflow of remittances from overseas workers buttressed the Net Factor Income Abroad, which went up by 29.7 percent from 15.8 percent last year, and pushed GNP to grow by 4.4 percent from 5.3 percent in 2008. On the production side, services continue to buoy the economy even with a modest 3.1 percent growth.
Export performance
The Philippine economy enjoyed a relatively good year in 2006. Exports grew robustly as it grew 16.6 percent from January to October despite peso appreciation and the weakening of the dollar. Exports increased at a record 20.6 percent in June, its highest in six years. Total Merchandise Exports expanded to 8.7 percent from a growth of 5.1 percent in the same quarter in 2005. The robust growth was accounted for by the acceleration in the growth of garments, gold from copper, semiconductors and other electronic products. This was however offset by the dips in the growth rates of crude coconut oil, banana and plantains, shrimp and prawns, and basket and basket wares. Exports of non-factor services also suffered a slowdown, slipping to 1.0 percent from 2005’s growth of 12.9 percent. This was due to the decline in growth of travel services, transportation services, and government and miscellaneous services3.
Export growth declined sharply over the four quarters of 2007 reflecting slower demand from key trading partners (except China). The peso’s sharp appreciation was also a factor although high infrastructure cost remains a key bottleneck to improving competitiveness. Negative real import growth was a surprise given the strength of domestic demand and the appreciation of the peso.
By 2008, Philippine earnings from external trade contracted by a tenth of a percentage point to US$ 105.824 billion in 2008 from US$ 105.979 billion the previous year. About 54 percent of the earnings, or US$56.746 billion, came from the importation of goods, while export receipts, at US$49.078 billion, accounted for the balance. As a result, the Philippines’ trade gap widened to US$7.669 billion from 2007’s US$5 billion. By 2009, total trade considerably declined in part because of the global economic downturn. The Philippine’s balance of trade remains negative at US$ 4,674 billion dollars (See Table 2).
Civil Society Assessment of the 2004-2010 Medium Term Philippine Development Plan for Trade and Investment
3National Statistical Coordination Board (NSCB) records that travel services slipped by 7.8 percent from positive 6.5 percent; transportation services, dipped further to a negative 8.8 percent from negative 5.4 percent in 2005; government and miscellaneous services decelerated from 62.2 percent to 37.5 percent and 11.1 percent to 9.0 percent, respectively

Civi
l Soc
iety
Ass
essm
ent o
f the
200
4 -2
010
MTP
DP
42
Table 2: Total External Trade 2004-2009
Values in million dollarsYear Total
TradeImports Exports Balance of
Trade2004 83,720 44,039 39,681 -4,3592005 88,673 47,418 41,255 -6,1642006 99,184 51,774 47,410 -4,364 2007 105,979 55,514 50,466 -5,048 2008 105,824 56,746 49,078 -7,669 2009 66,796 31,311 35,985 -4,674Source: National Statistics Office
The electronics segment continued to support the exports industry, churning in a total of US$28.501 billion last year, though a bit lower than the US$31.085 billion recorded in 2007. China is the country’s major market for electronics, becoming the Philippines’ third largest trading partner in 2008 with export receipts from outbound shipments of electronic products amounting to US$4.594 billion. The US availed of US$3.937 billion worth of electronic products last year while Japan bought US$3.455 billion worth of electronic products. Singapore came in fourth and purchased electronic materials amounting to US$1.588 billion. As in previous years, garments, cathodes and sections of cathodes of refined copper, woodcrafts and furniture helped sustain export growth.
In sum, the exports industry in 2008 saw profits picking up in the first half of last year, with the month of June recording the highest exports receipts of US$4.527 billion plunging US$2.675 billion in December as the global economic crisis deepened. Merchandise exports also fell by 2.8 percent in 2008, the first contraction since 2001.
The country’s trade balance was negative for the entire 2008, save for November, where US$28 million surplus was recorded. Gross receipts from the country’s top 10 imports in 2008 amounted to US$45.685 billion, according to NSO data. The country’s top imports include electronic products; mineral fuels, lubricants and related materials; transport equipment; cereals and cereal preparations; industrial machinery and equipment; and iron and steel. US sources accounted for 12.7 percent of imports; others were sourced from Japan (11.6 percent) and Singapore (10.5 percent).
Civil Society Assessment of the 2004-2010 Medium Term Philippine Development Plan for Trade and Investment

Ass
essm
ent R
epor
t
43
III. PERFORMANCE AND ACCOMPLISHMENT VIS-À-VIS THE MTPDP
We now synthesize the key targets summarized in the introduction and the figures presented in the second section.
Table 3: MTPDP Targets and Progress, 2004-2010
Targets ProgressInvestments
1. Increase in investment rate from 19% to 28% of GDP
Prioritize the following sectors: information technology and IT-enabled services sector, automotive, electronics, mining, health care, and tourism.
2. Increase spending on public infrastructure by Php 100 billion.
3. Rationalize the investment incentives scheme.
4. Achieve a minimum export growth rate of 10 percent.
5. Simplify and streamline the export and import procedures
The investment-to-GDP ratio exhibited minimal changes in the last five years, averaging at 15.28%, and remains far below the target.
Increase in capital outlays from 2003-2009 amounted to approximately Php110 billion. Note, however, that this figure also includes corporate equity and capital transfers to local government units. The actual increase in infrastructure outlay may be smaller4.
As of January 2010, Senate Bill No. 1640, An Act Ordaining a Consolidated Investment and Incentives Code of the Philippines, is pending second reading. The bill was originally filed in 2007
Export growth rate from 2004-2009 averaged at a negative 0.82. Indeed, Exports registered positive growth rates from 2004-2007, reaching its peak in 2007. Growth in exports began to slacken by 2008 and fell sharply in 2009. The Philippines scores a low 49.3 in Business Freedom and 78.6 in Trade Freedom (out of a possible 100) in the 2009 Index of Freedom5. The report cites a number of factors that contribute to this problem: weak regulatory process, lack of transparency and cumbersome application processes.
Exports4. Achieve a minimum export growth rate of
10 percent.
5. Simplify and streamline the export and import procedures
Export growth rate from 2004-2009 averaged at a negative 0.82. Indeed, Exports registered positive growth rates from 2004-2007, reaching its peak in 2007. Growth in exports began to slacken by 2008 and fell sharply in 2009. The Philippines scores a low 49.3 in Business Freedom and 78.6 in Trade Freedom (out of a possible 100) in the 2009 Index of Freedom. The report cites a number of factors that contribute to this problem: weak regulatory process, lack of transparency and cumbersome application processes.
Civil Society Assessment of the 2004-2010 Medium Term Philippine Development Plan for Trade and Investment
4See Department of Budget and Management, “Summary of Appropriations and Obligations by the National Government by Expense Class 2003-2009”Figures from Rolando Andaya, “The Philippines: Defying Gravity. Rising Steadily. Philippine Economic Briefing,” ; available from http://www.iro.ph/downloads/Presentations/Feb percent202008 percent20YEB/DBM percent20FINAL.pdf; INTERNET.5The Index of Economic Freedom is a series of 10 economic measurements created by the Heritage Foundation and Wall Street Journal. See http://www.heritage.org/index/Country/Philippines

Civi
l Soc
iety
Ass
essm
ent o
f the
200
4 -2
010
MTP
DP
44
Assessment and Analysis
1. Increase in investment rate from 19 to 28% of GDP, prioritizing following sectors: information technology and IT-enabled services sector, automotive, electronics, mining, health care, and tourism.
4. Achieve a minimum export growth rate of 10 percent.
5. Simplify and streamline the export and import procedures
Export growth rate from 2004-2009 averaged at a negative 0.82. Indeed, Exports registered positive growth rates from 2004-2007, reaching its peak in 2007. Growth in exports began to slacken by 2008 and fell sharply in 2009. The Philippines scores a low 49.3 in Business Freedom and 78.6 in Trade Freedom (out of a possible 100) in the 2009 Index of Freedom.5
The report cites a number of factors that contribute to this problem: weak regulatory process, lack of transparency and cumbersome application processes.
Assessment and Analysis
1. Increase in investment rate from 19 to 28% of GDP, prioritizing following sectors: information technology and IT-enabled services sector, automotive, electronics, mining, health care, and tourism.
Source: NSCB
5 The Index of Economic Freedom is a series of 10 economic measurements created by the Heritage Foundation and Wall Street Journal. See http://www.heritage.org/index/Country/Philippines
6
Source: NSCB
Source: NSCB
The investment-to-GDP ratio exhibited minimal changes in the last five years, averaging at 15.28 percent, and remains far below the target. The official target requires foreign direct investment (FDI) to reach US$3 billion annually. Savings-to-GDP is also far below the target of 30 percent, averaging at 18.48 the past five years.
The country attracted US$2.93 billion worth of net foreign direct investments in 2007, higher than the US$2.92 billion in 2006. The manufacturing sector attracted fresh FDI inflows into electronics, health and chemical products, food, automotive sensor and safety products, decorative crafts and molded plastic products, and cleaning products. The services sub-sectors receiving investments were those in international courier, information technology development, and multimedia.
In the electronics industry, exports are mostly concentrated in semiconductors. However, the country’s participation in the global production network has hardly progressed beyond the lowest level of the production chain, given the limited role of Philippine electronics in the labor-intensive assembly and testing segment of the production process. Our electronics exports have become import dependent and hence, domestic value added is minimal. Backward linkages are few due to limited local suppliers and costly raw materials. The same problems plague the auto parts industry and the ICT manufacturing sector.
On a more positive note, the ICT-supported business process outsourcing (BPO) sub-sector is expected to continue to post double-digit growth but is hindered by human resource shortages, particularly high-level professionals. Apart from the availability of further training to address BPO’s human resource needs, passage of data privacy and cyber crime bills which are articulated in the MTPDP would also assist in the creation of a more enabling environment for BPOs. 6
6 Alexander Villafania, “BPO growth in 2009 similar to 2008,” available from http://newsinfo.inquirer.net/breakingnews/infotech/view/20090108-182183/BPO-growth-in-2009-similar-to-2008;INTERNET.
7
Source: NSCB
The investment-to-GDP ratio exhibited minimal changes in the last five years, averaging at 15.28 percent, and remains far below the target. The official target requires foreign direct investment (FDI) to reach US$3 billion annually. Savings-to-GDP is also far below the target of 30 percent, averaging at 18.48 the past five years.
The country attracted US$2.93 billion worth of net foreign direct investments in 2007, higher than the US$2.92 billion in 2006. The manufacturing sector attracted fresh FDI inflows into electronics, health and chemical products, food, automotive sensor and safety products, decorative crafts and molded plastic products, and cleaning products. The services sub-sectors receiving investments were those in international courier, information technology development, and multimedia.
In the electronics industry, exports are mostly concentrated in semiconductors. However, the country’s participation in the global production network has hardly progressed beyond the lowest level of the production chain, given the limited role of Philippine electronics in the labor-intensive assembly and testing segment of the production process. Our electronics exports have become import dependent and hence, domestic value added is minimal. Backward linkages are few due to limited local suppliers and costly raw materials. The same problems plague the auto parts industry and the ICT manufacturing sector.
Civil Society Assessment of the 2004-2010 Medium Term Philippine Development Plan for Trade and Investment

Ass
essm
ent R
epor
t
45
On a more positive note, the ICT-supported business process outsourcing (BPO) sub-sector is expected to continue to post double-digit growth but is hindered by human resource shortages, particularly high-level professionals. Apart from the availability of further training to address BPO’s human resource needs, passage of data privacy and cyber crime bills which are articulated in the MTPDP would also assist in the creation of a more enabling environment for BPOs.6 The global economic slowdown, however, poses additional challenges that constrain the country’s growth in the services and electronics sector. Durano and Hung7 (2009) say that labor-intensive, export-oriented industries across the region have lost, and will continue to lose their jobs or experience lower working conditions as Asian countries feel the effects of the slowdown. Women, in particular, are vulnerable. Women employees outnumber men by about five to two in affected sectors such as the garment, textiles, and electronic industries (Dejardin and Owens, ILO 2009a)8. Although men may dominate other labor-intensive export industries such as furniture and auto-parts, women may be employed in lower skill roles compared with men and hence, are at risk of being considered more dispensable.
For example, Durano and Hung’s study also find that the Philippines electronics sector permanently let go of 5,408 workers from October 2008; 9,621 workers were temporarily displaced and another 35,325 workers were put on flexible work arrangements. The country field study found that 23 percent of BPO workers had been laid off, compared with 97 percent of electronics sector workers (Lopez 2009)9. Analysis across both Philippine sectors found that 65 percent of women were laid off compared with 50 percent of men. 18 percent of women workers had their production quota increased compared with only 5 percent of men. In addition, a few women reported salary delays and reduced benefits, whereas no men had those experiences. But more men reported a reduction in their average weekly hours and monthly earnings. Socio-demographic profiles of these industries show that the majority is young with an average age of 27.8 years, and 59 percent are single.
While promoting growth in identified sectors, e.g. electronics, BPO services sector can fuel the engine of economic growth. Addressing the labor conditions and vulnerabilities present in these industries can help translate growth into real welfare gains for workers.
2. Increase spending on public infrastructure by Php 100 billion.
Current spending on infrastructure remains far below target, although the nominal target of an increase in public infrastructure outlay by PhP100 billion appears to have been reached. An ADB report10 finds that the unmet investment requirements for highways alone amounted to $135 million, equivalent to 213 kilometers. These projects include Tuguegarao City Bypass, Santiago City Bypass, San Jose City Bypass, Tiaong Bypass, Candelaria Bypass, Sariaya Bypass, Daraga Diversion Road, Sipocot-Putiao Diversion Road, Palo Bypass, Cebu North Coastal Road, Tagum City Bypass, Panabo City Bypass, Davao City Coastal Road, Koronadal City Bypass, Digos City Bypass, Koronadal City Bypass, and General Santos City Bypass.
Beyond the spending target, it is also vital to assess whether current spending has translated into enhanced competitiveness for the country. Infrastructure deficiency remains a big obstacle in the country’s business environment and investment climate. The Philippines is one of the economies threatened by the serious
Civil Society Assessment of the 2004-2010 Medium Term Philippine Development Plan for Trade and Investment
6Alexander Villafania, “BPO growth in 2009 similar to 2008,” available from http://newsinfo.inquirer.net/breakingnews/infotech/view/20090108-182183/BPO-growth-in-2009-similar-to-2008; INTERNET.7Hung and Durano, “Lessons Not Learned? Gender, Employment And Social Protection In Asia’s Crisis-Affected Export Sectors”, available from http://www.adb.org/documents/events/2009/Poverty-Social-Development/gender-impact-in-asia-Hung-paper.pdf; INTERNET. 8Dejardin and Owens, “Asia in the global economic crisis: impacts and responses from a gender perspective,” Technical Note, Responding to the Economic Crisis: Coherent Policies for Growth, Employment and Decent Work in Asia and Pacific, 18-20 February 2009, Manila, Philippines, ILO Regional Office for Asia Pacific, Bangkok, and Policy Integration and Statistics Department, Geneva.9Malou Lopez, “The Economic Impact of the Global Economic Slowdown on Gender and Value Chain Markets in Asia: Philippine Country Study,” (August 2009, Draft).10See “Lack of infrastructure hurting Philippines – ADB”, [cited 29 September 2009], available from http://www.manilatimes.net/index.php/news/nation/2929-lack-of-infrastructure-hurting-philippines--adb. C. Ordinario, “Study: RP to gain $224.1B if infra gaps addressed”, [cited 29 Sep 2009]; available from http://businessmirror.com.ph/home/economy/16649-study-rp-to-gain-2241b-if-infra-gaps-addressed.html; INTERNET.

Civi
l Soc
iety
Ass
essm
ent o
f the
200
4 -2
010
MTP
DP
46
implications of not addressing infrastructure gaps. The country’s below-average score relative to other Southeast Asian countries in infrastructure quality in the World Competitiveness Report is worth noting here.11
Beyond the spending target, it is also vital to assess whether current spending has translated into enhanced competitiveness for the country. Infrastructure deficiency remains a big obstacle in the country’s business environment and investment climate. The Philippines is one of the economies threatened by the serious implications of not addressing infrastructure gaps. The country’s below-average score relative to other Southeast Asian countries in infrastructure quality in the World Competitiveness Report is worth noting here. 11
Infrastructure Quality: Quality ranking World Competitiveness Report 2006-2007
0 1 2 3 4 5 6 7
JapanTaiwanKorea
Hong KongSingapore
PhilippinesVietnam
IndonesiaChina
ThailandMalaysia
Note: Rankings are shown for developing East Asian economies (darker bars), and advanced East Asian economies (lighter bars). Vertical line is the average for all 125 surveyed countries, both within and outside of East Asia.
3. Rationalize the investment incentive scheme
Congress has found it difficult to pass the bills targeted to rationalize the investment incentive scheme, despite these already being previously identified as priority bills in 2007. This is reflective of the overall productivity of the legislative body. The need to rationalize the investment incentive scheme is premised on the observation that revenue leakages may arise from offering highly redundant and unnecessary fiscal incentives. The bill seeks to create a sound investment policy that shifts the focus from offering fiscal incentives to improving factors that fundamentally affect investment decisions such as political stability, market size, economic growth, agglomeration factors, and legal and regulatory risk. 12 According to the
11 Joachim von Amsberg, “Philippines: Ready for the Future? The Quantity and Quality of Infrastructure Investment,” (The World Bank, 25 January 2007), available from siteresources.worldbank.org/INTPHILIPPINES/.../InfraSpendingSpecialfocusPhilippines.ppt, INTERNET.
12 Renato Reside, Jr., 2006. Towards Rational Fiscal Incentives (Good Investments or wasted gifts?). (Manila: UP School of Economics, 2006).
9
Note: Rankings are shown for developing East Asian economies (darker bars), and advanced East Asian economies (lighter bars). Vertical line is the average for all 125 surveyed countries, both within and outside of East Asia.
3. Rationalize the investment incentive scheme
Congress has found it difficult to pass the bills targeted to rationalize the investment incentive scheme, despite these already being previously identified as priority bills in 2007. This is reflective of the overall productivity of the legislative body. The need to rationalize the investment incentive scheme is premised on the observation that revenue leakages may arise from offering highly redundant and unnecessary fiscal incentives. The bill seeks to create a sound investment policy that shifts the focus from offering fiscal incentives to improving factors that fundamentally affect investment decisions such as political stability, market size, economic growth, agglomeration factors, and legal and regulatory risk.12 According to the Foreign Direct Investment Survey,13 fiscal incentives are not key factors influencing a firm’s decision to invest. More critical were factors such as access to customers, a stable social and political environment, reliability of quality infrastructure, and the ability to hire management and technical staff. Beyond offering fiscal and tax incentives, addressing the country’s weakness in these factors can be more fruitful in efforts to attract investment to the country.
4. Achieve a minimum export growth rate of 10%
Since exports performance has been uneven from 2004-2009, it is still probably optimistic to assume that it will create any substantial positive dent on the country’s economy given the weakening demand of our major trading partner, the US. Exports are expected to bear the brunt of the global economic crisis. Moreover, the points articulated in (1) of our analysis are also relevant here.
5. Simplify and streamline the export and import procedures
Again, we ask the question whether efforts exerted to streamline procedures have made the country more competitive. The Philippines scores a low 49.3 in Business Freedom and 78.6 in Trade Freedom (out of a possible 100) in the 2009 Index of Freedom. The country ranks 20 out of 41 countries surveyed in the region. The report cites
Civil Society Assessment of the 2004-2010 Medium Term Philippine Development Plan for Trade and Investment
11Joachim von Amsberg, “Philippines: Ready for the Future? The Quantity and Quality of Infrastructure Investment,” (The World Bank, 25 January 2007), available from siteresources.worldbank.org/INTPHILIPPINES/.../InfraSpendingSpecialfocusPhilippines.ppt, INTERNET.12Renato Reside, Jr., 2006. Towards Rational Fiscal Incentives (Good Investments or wasted gifts?). (Manila: UP School of Economics, 2006).13Multilateral Investment Guarantee Agency, Foreign Direct Investment Survey 2002.

Ass
essm
ent R
epor
t
47
a number of factors that contribute to this problem: weak regulatory process, lack of transparency, and cumbersome application processes.
The report further notes that overall freedom to conduct a business is limited by the Philippines' regulatory environment. Starting a business takes an average of 58 days, compared to the world average of 38 days. Obtaining a business license takes less than the world average of 225 days. Closing a business can be a difficult and lengthy process. Dispute resolution can be cumbersome and complex, and the enforcement of contracts remains weak. Residents and non-residents may hold foreign exchange accounts subject to some restrictions. Payments, capital transactions, and transfers are subject to some restrictions, controls, quantitative limits, and authorizations. Fast-tracking the processing of documents (e.g. via Citizen’s Charter) and ensuring transparency in transactions can help address this problem.
IV. OVERALL ASSESSMENT
This section tackles the appropriateness and responsiveness of the MTPDP framework and targets to the development agenda.
1. Accuracy of Assessment
Crucial to any government (or any institution for that matter) is an accurate and truthful assessment to guide its vision. In essence, the MTPDP is the government’s vision for its people. Before the goals, strategies and action plan is laid out in every chapter of the MTPDP, there is first a situationer. This provides a scan of the environment and, moreover, an assessment of its previous performance. This, then, is what government uses as a basis for coming up with a plan.
The trade and investment chapter discusses the reasons behind not being able generate significant investment. These include the: (1) pull of investments towards China, (2) concerns over the country’s fiscal sustainability, (3) unfavorable peace situation, and (4) inadequate infrastructure and logistics system. It makes no mention of the problem of corruption and lack of transparency – issues which are central to either attracting or maintaining investors’ confidence. What is needed is an acceptance of the existence of certain realities. Had these issues been included – the strategies would have been more appropriate and supportive of the targets (and ultimately the vision) that the government has in mind. Identifying corruption as a social ill that cuts across different aspects of the economy does not make it redundant – it emphasizes the need to step-up efforts to address it.
Aside from the problem of corruption, there was also no mention of smuggling. For instance, the automotives sector is gravely affected by the smuggling of second-hand cars. For obvious reasons, there are no data on smuggled goods, but the magnitude of the problem is significantly felt by the sector.
2. Long-term perspective: towards sustainable development 14
Medium Term Plans run the risk of being short-sighted; there is a lack of continuity / long-term perspective. There is no mention of how the current targets would benefit the people in the long-run. For instance, the trade chapter makes mention of high power rates, an unfavorable circumstance for businesses. Subscribing to the principle of sustainable development, the solution to this would be to invest on renewable sources of energy. In the short-run it would be easy to drive-down power rates by encouraging power generation regardless of its nature: i.e. coal-fired power plants, which are neither renewable nor ecologically sound, in other words, unsustainable. In the long-run this would translate to higher cost of business having to contend with costs for cleaning the environment and overhauling infrastructure to make room for plants which process renewable resources.
The MTPDP does not include policy programs to address stakeholders clamor for the reversal of trade Liberazation measures.
Civil Society Assessment of the 2004-2010 Medium Term Philippine Development Plan for Trade and Investment
14In accordance with the United Nations’s Department of Economic and Social Affairs, Division for Sustainable Development (DSD). One of the goals set by the DSD is the integration of the social, economic and environmental dimensions of sustainable development in policy-making at interna-tional, regional and national levels. So far, in Southest Asia, Myanmar, Singapore and Brunei have come up with a long-term sustainability plan in place of / to guide their respective medium-term national development plans.
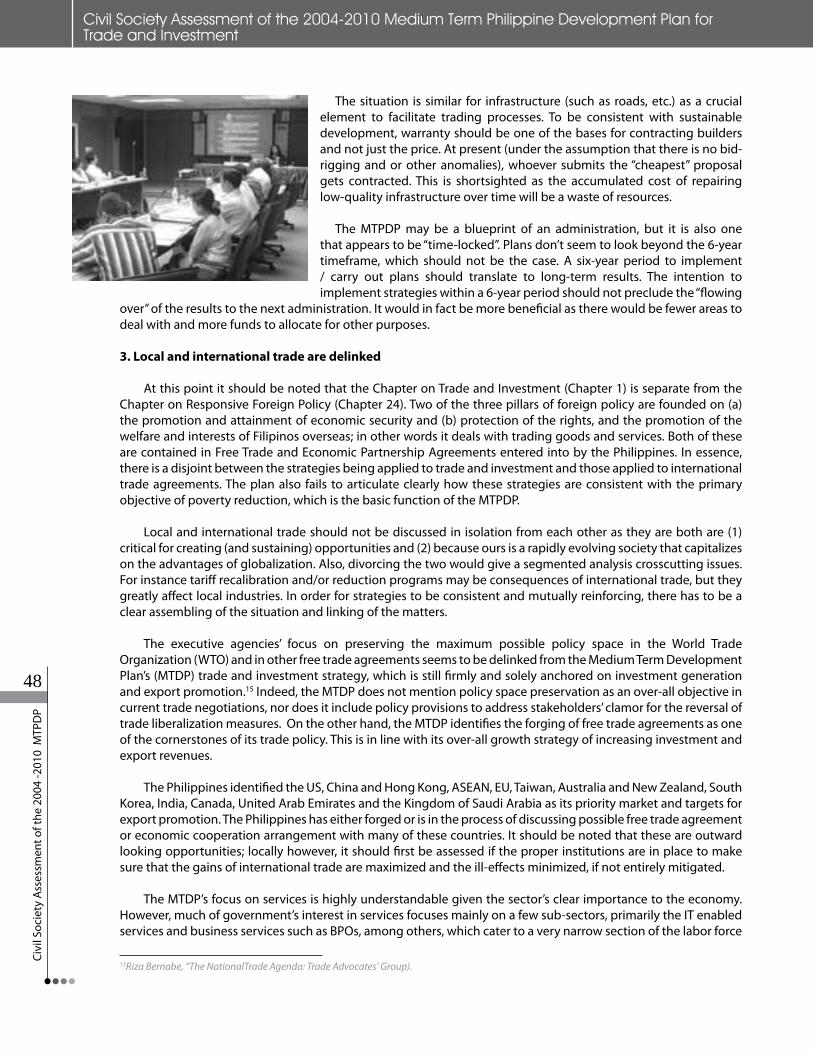
Civi
l Soc
iety
Ass
essm
ent o
f the
200
4 -2
010
MTP
DP
48
The situation is similar for infrastructure (such as roads, etc.) as a crucial element to facilitate trading processes. To be consistent with sustainable development, warranty should be one of the bases for contracting builders and not just the price. At present (under the assumption that there is no bid-rigging and or other anomalies), whoever submits the “cheapest” proposal gets contracted. This is shortsighted as the accumulated cost of repairing low-quality infrastructure over time will be a waste of resources.
The MTPDP may be a blueprint of an administration, but it is also one that appears to be “time-locked”. Plans don’t seem to look beyond the 6-year timeframe, which should not be the case. A six-year period to implement / carry out plans should translate to long-term results. The intention to implement strategies within a 6-year period should not preclude the “flowing
over” of the results to the next administration. It would in fact be more beneficial as there would be fewer areas to deal with and more funds to allocate for other purposes.
3. Local and international trade are delinked
At this point it should be noted that the Chapter on Trade and Investment (Chapter 1) is separate from the Chapter on Responsive Foreign Policy (Chapter 24). Two of the three pillars of foreign policy are founded on (a) the promotion and attainment of economic security and (b) protection of the rights, and the promotion of the welfare and interests of Filipinos overseas; in other words it deals with trading goods and services. Both of these are contained in Free Trade and Economic Partnership Agreements entered into by the Philippines. In essence, there is a disjoint between the strategies being applied to trade and investment and those applied to international trade agreements. The plan also fails to articulate clearly how these strategies are consistent with the primary objective of poverty reduction, which is the basic function of the MTPDP.
Local and international trade should not be discussed in isolation from each other as they are both are (1) critical for creating (and sustaining) opportunities and (2) because ours is a rapidly evolving society that capitalizes on the advantages of globalization. Also, divorcing the two would give a segmented analysis crosscutting issues. For instance tariff recalibration and/or reduction programs may be consequences of international trade, but they greatly affect local industries. In order for strategies to be consistent and mutually reinforcing, there has to be a clear assembling of the situation and linking of the matters.
The executive agencies’ focus on preserving the maximum possible policy space in the World Trade Organization (WTO) and in other free trade agreements seems to be delinked from the Medium Term Development Plan’s (MTDP) trade and investment strategy, which is still firmly and solely anchored on investment generation and export promotion.15 Indeed, the MTDP does not mention policy space preservation as an over-all objective in current trade negotiations, nor does it include policy provisions to address stakeholders’ clamor for the reversal of trade liberalization measures. On the other hand, the MTDP identifies the forging of free trade agreements as one of the cornerstones of its trade policy. This is in line with its over-all growth strategy of increasing investment and export revenues.
The Philippines identified the US, China and Hong Kong, ASEAN, EU, Taiwan, Australia and New Zealand, South Korea, India, Canada, United Arab Emirates and the Kingdom of Saudi Arabia as its priority market and targets for export promotion. The Philippines has either forged or is in the process of discussing possible free trade agreement or economic cooperation arrangement with many of these countries. It should be noted that these are outward looking opportunities; locally however, it should first be assessed if the proper institutions are in place to make sure that the gains of international trade are maximized and the ill-effects minimized, if not entirely mitigated.
The MTDP’s focus on services is highly understandable given the sector’s clear importance to the economy. However, much of government’s interest in services focuses mainly on a few sub-sectors, primarily the IT enabled services and business services such as BPOs, among others, which cater to a very narrow section of the labor force
Civil Society Assessment of the 2004-2010 Medium Term Philippine Development Plan for Trade and Investment
15Riza Bernabe, “The NationalTrade Agenda: Trade Advocates’ Group).

Ass
essm
ent R
epor
t
49
in the sector. For instance, it does not articulate a strategy for the retail and wholesale sub-sector, which, by virtue of its significant share in total services employment, is an important area for intervention.
For agriculture, the MTDP trade and investment strategy is limited to agribusiness. As mentioned earlier, it is practically silent about the growing clamor among agricultural producers to address the negative impact of trade liberalization (an issue consequent only of international and not domestic trade) on their respective industries. The fact that the MTDP has identified the forging of free trade agreements as a strategic trade strategy, despite stakeholders’ calls for a reversal of trade liberalization policies shows the degree to which the plan is removed and disconnected from Philippine reality.
V. Conclusion and Recommendations
The MTPDP 2004-2010 makes a crucial recognition in its situationer of how the country’s performance in trade and investment must be assessed vis-à-vis the performance of other countries. In a global environment, decisions to invest in or trade with other countries are largely driven by comparisons of costs and benefits dependent on location, and this makes the need to benchmark performance with other countries even more critical.
1) Develop a comprehensive national trade agenda
Before undertaking misplaced comparisons that lead to unwarranted adoption of other country’s strategies, it would be prudent to acknowledge domestic realities and anchor trade and investment strategies within this context. In this light, a comprehensive trade agenda is called for, one that is strongly integrated with the government’s overall development objectives. Instead of a collection of various initiatives that individually respond to specific sectoral problems, a comprehensive agenda should be guided by a clear set of objectives and principles that can serve as a framework when designing programs and making important policy decisions. The focus then shifts from inputs (e.g. increased spending etc.) to outcomes (e.g. higher standards of living, increase in employment). This will also help avoid the apparent problem of agencies performing overlapping functions to execute numerous projects amidst various financial and resource constraints.
A comprehensive national trade agenda should provide the country with a blueprint to help guide government in developing appropriate trade policies across sectors, using a clear, transparent, and rational set of criteria, which would take into account issues presented by both domestic and international trade. The absence of a comprehensive national trade agenda becomes particularly problematic in the arena of international trade where multilateral, bilateral, and regional trade agreements are rapidly emerging as the common norm of engagement. These agreements are generally wide in scope, covering almost all aspects of trade. These are generally governed by the principle of single undertaking, which binds countries to the whole agreement, as opposed to giving them the flexibility to choose specific sub-agreements to sign according to their domestic sensitivities. This approach inextricably links trade negotiations on areas affecting one sector to another, making the process a dynamic interplay of domestic trade-offs and concessions. Without a comprehensive national trade agenda, there is no rational and commonly agreed upon framework to decide which sectors should be given priority in terms of concessions and flexibilities in international trade agreements. It should be guided by a clear set of objectives and principles that are crucial to sustainable development. These include (1) economic viability, (2) environmental sustainability, (3) poverty alleviation, (4) gender equality, and (5) respect for human rights, including (5.a) labor rights, among others.
2) Promote high quality infrastructure (to reduce transaction cost)
Besides inadequate policies, there are definitely key weaknesses that should be addressed as soon and as effectively as possible. Infrastructure deficiency remains a top impediment to business environment and investment climate. High-quality infrastructure supports businesses well and reduces transaction costs, and when transaction costs are low, location becomes a less crucial factor in investment decisions; this is strategic for both boosting local and international trade. Moreover, MSMEs stand to benefit more when it comes to good infrastructure as they are unable to self-provide enabling infrastructure unlike larger companies. Good road networks, efficient power and water provision, and communication and technology channels, and reducing other logistics bottlenecks improve
Civil Society Assessment of the 2004-2010 Medium Term Philippine Development Plan for Trade and Investment

Civi
l Soc
iety
Ass
essm
ent o
f the
200
4 -2
010
MTP
DP
50
the country’s investment climate. Enhanced investment programming and prioritization and political coordination can facilitate the process of improving public infrastructure.
3) Strengthen the institutional environment
A weak institutional environment also explains the country’s poor trade outcomes. In the World Trade Indicators Survey 200916, the Philippines performed badly in trade outcomes (ranking 157 out of 161 countries) and institutional environment (ranking 140 out of 181 countries). Upholding the rule of law, ensuring the credibility of contract agreements, reducing red tape, and most of all reigning in corruption are all important measures that must be undertaken to boost the country’s competitiveness. The automation of government procedures to reduce transaction costs while the improvement of information availability through the creation of online registry and databases can enhance the decision-making process of government and individual firms. The passage of bills (e.g. investment-incentives rationalization, freedom of information bill, antitrust / competition policy) is also crucial. Delineating government offices and assigning well-defined roles and oversight areas in implementing and coordinating policies should also be pursued.
Government must also promote the development of outsourcing arrangements and industries clustering to strengthen forward and backward linkages in industries identified as growth areas for export.
4. Invest in human capital (training and education) though immediate results may not be observable
Investments in human capital through the provision of additional skills training (e.g. via TESDA) and an increase in government spending in the education sector not only upgrades existing technology and industry but is also pivotal in enhancing the country’s competitiveness.
5. Institutionalize a consultative mechanism as a means of promoting peoples' participation
Finally, as in any other endeavor, the importance of promoting stakeholder participation should be emphasized. The institutionalization and establishment of a consultative mechanism for stakeholders is critical to ensure that there is ownership of development and that it is pro-people. Trade policies, strategies, and positions will only resonate with the need of the local industries and stakeholders if it comes from them. Consult with the sectors and those directly involved. MTPDPs are fashioned for the people; as such it should include input from stakeholders. This would also be in consonance with empowerment and democratization.
16http://www.worldbank.org/wti2008
Civil Society Assessment of the 2004-2010 Medium Term Philippine Development Plan for Trade and Investment

Ass
essm
ent R
epor
t
51
I. INTRODUCTION
In President Arroyo’s 2004-2010 Medium-Term Philippine Development Plan (MTPDP), a whole chapter is devoted to the agriculture sector. As stated in the chapter’s situationer, agriculture is the bedrock of the rural economy.2 In the past MTPDP (2001-2003), agriculture and fisheries production targets were exceeded in spite of the challenges posed by the El Niño and La Niña phenomena during the period. There was, however, not much improvement in overall labor productivity in the sector. Comparative yield, production cost, and price data on various agricultural commodities show that the gains posted by the country were surpassed by its neighboring countries. Thus, the comparative advantage of Philippine agriculture continued to wane resulting in its increasingly becoming a net importer of agricultural products since 1994.
With this scenario in mind, the MTPDP 2004-2010 outlined strategies and action plans to address the need of the sector not only in gaining back its comparative advantage but as well as improving the economic situation of its sector members—the rural poor. This paper will attempt to do a quantitative assessment of the outputs and results of implementing the medium-term plan. The main methodology of assessment is through comparison of targets cited in the plan and the actual outputs or results gained. Data to be utilized is consolidated from various government agencies.
II. POLICY FRAMEWORK: MTPDP TARGETS
As mentioned in the plan, there is a need for a more holistic approach in reducing rural poverty that will not only address the production bottlenecks in agriculture but also its inherent vulnerabilities. Therefore, the flagship strategy adopted is the promotion of agribusiness. This will not only address agricultural production constraints, but also post-production handling, value-adding, and distribution concerns, all of which are the major and inter-connected determinants of job creation and income stability in the countryside. The targets outlined in the MTPDP 2004-2010 and its accompanying Strategy Planning Matrices (SPM) which this paper attempts to assess are enumerated below:
Goal 1: Develop at least two million hectares of new land for agribusiness in order to contribute two out of the 10 million jobs targeted as a legacy by 2010
• Designandestablishtheframeworkandmechanisms,includingpublic-privatepartnershiparrangements,that will facilitate the transformation of farmlands into agribusiness enterprises, by the end of 2005;
• Organize a large-scale, community-based, and environment-friendly program of crop and fisheryproduction, intensification, and diversification, especially high-value and non-traditional commodities in existing crop, livestock, and fish farms;
• Transform idle agricultural lands, offshore and inland bodies ofwater, aswell asmarginal lands intoproductive agribusiness enterprises;
Civil Society Assessment of the 2004-2010 Medium Term Philippine Development Plan for Agriculture
1Prepared by Jennifer Javier, Research Coordinator, Philippine Partnership for the Development of Human Resources in Rural Areas (PhilDHRRA)
2Sections I and II are mostly culled from the MTPDP 2004-2010, Chapter 2. Agribusiness

Civi
l Soc
iety
Ass
essm
ent o
f the
200
4 -2
010
MTP
DP
52
• Promoteoff-andnon-farmenterprises(includingagri-processing)intheagribusinesslandstoincreaseand stabilize rural income; and
• MakeMindanaothecountry’smainagro-fisheryexportzone,
Goal 2: Make food plentiful at competitive prices where the cost of priority “wage goods” such as rice, sugar, vegetables, poultry, pork, fish, and other important non-wage goods like corn must be reduced. This also means that government will continue to fight for self-sufficiency in rice production by increasing price and production efficiency and competitiveness.
• Raisefactor(land,laborandcapital)productivitytoapproachtheregionalaveragewithinsixyears;• Increasetheeffectiveness,adequacy,andefficiencyoftheagriculturalsector’stransportandlogistical
support system for both farm inputs and produce to approach regional standards especially for agricultural and fishery food products; and
• Implementcriticalgovernancereformstoestablishabureaucracythatwillrespondtothedemandsofaproductive and enterprising agricultural sector.
Annual targets per commodity for areas for agribusiness development, productivity improvement, and job generation are also outlined in the MTPDP (Table 1). In terms of productivity, the target increase in yield is from 3 to 5 percent for palay and 9 to 15 percent for corn (Table 2). In addition, annual production target for selected cereals, fruits, plantation crops, root crops, vegetables, livestock and poultry, and fishery commodities were also cited (Table 3). In terms of support infrastructure constructed, the annual targets were also cited (Table 4) including the percentage increase in volume of agricultural commodities/products ferried by roll-on-roll-off (RORO) nautical highway in the western and eastern seaboard.
III. PERFORMANCE AND ACCOMPLISHMENT IN 2004-2010
Because of the comprehensive scope of the MTPDP, an assessment will be conducted in the following categories: 1) production and productivity, 2) prices, 3) employment and wage, 4) agribusiness lands development and land acquisition and development (LAD), 5) gross value added (GVA) in agriculture, and 6) agricultural support services. Some of the indicators outlined in the MTPDP and the SPM were not assessed because of a lack of data. In addition, the National Statistics and Coordination Board’s (NSCB) own monitoring indicators of the MTPDP will be presented. The accomplishments (for 2004 to 2008) cited in the Updated MTPDP will also be utilized.
A. Production and Productivity
Accomplishment based on target production per commodity is shown in Table 5. Results showed that actual production of some commodities falls below target. These commodities include palay, corn, mango, coffee, tobacco, and the majority of livestock and poultry products. On the other hand, some commodity production exceeded targets. These included banana, pineapple, calamansi, rubber, cassava, eggplant, tomato, and chicken eggs. No data has been consolidated for other crops.
In terms of productivity for palay and corn, accomplishment decreased over time, from 95 percent in 2005 to 89 percent in 2008 for palay, and from 88 percent to 78 percent for corn (Table 6). Though the area planted for these crops increased, production decreased.
B. Prices
Table 7 shows the annual retail prices of agricultural commodities. Although the MTPDP aims to reduce the cost of priority wage goods and other important non-wage goods, a comparison of retail prices of some commodities shows that prices are actually increasing, more than the rate of core inflation (7 percent in 2005; 5.5 percent in 2006; 2.8 percent in 2007;and 6.2 percent in 2008). Significant increases in the prices of cereals (rice and corn) are observed from 2007 to 2008.
Civil Society Assessment of the 2004-2010 Medium Term Philippine Development Plan for Agriculture
Note: Tables are at pp. 66-81

Ass
essm
ent R
epor
t
53
In addition, the consumer price index (CPI) is a measure of the average change in price of a fixed basket of goods and services usually purchased by a household for its consumption. It is considered as an important measure of inflation. Table 8 shows that prices of agricultural products have risen significantly (29 percent at most) from 2007 to 2008, for all income households.
The producer price index (PPI) shows the change over time (relative to a base period) on the prices received by farmers for the sale of their agricultural products. Table 9 shows that some commodities brought about significant income increase to farmers (e.g., onion, ginger) while some farmers faced declining prices for their products (e.g., mangosteen, garlic).
The increase in the retail prices of agricultural commodities may be attributed to the increase in the cost of production, such as fertilizers. Figure 1 below shows that prices of fertilizers are relatively constant from 2005 to 2006. However, prices rose sharply from 2007 to 2008. This may also explain the sudden decrease in production, therefore, yield, in this period.
Data source: Bureau of Agricultural Statistics
C. Employment and Wage
One of the main goals stated in the MTPDP is to develop two million hectares of new land for agribusiness in order to create two million jobs. The president’s State of the Nation Address (SONA) in the past 4 years has never failed to mention government’s accomplishments in agribusiness development and job creation. The table 10 summarizes these accomplishments. The assumption underlying these reports is that one hectare of land developed generates one job. For some commodities, one hectare bears the equivalent of as high as 27 jobs. However, these assumptions did not expound on the number of jobs generated based on commodity. Moreover, the reports cited that the developed areas were either planted to crops, grown with forage for pasture, stocked with animals, seeded with fingerlings, or are established seaweed plants.
If the targets were broken down into annual targets, 400,000 hectares of land should have been developed and 400,000 jobs created per year (for 2005-2010). Looking at the reported SONA accomplishments (Table 10), the figures fell short of the target. For instance, if only 800,000 has. of land were developed and only two years are left to fulfill the targets, then the projected additional 800,000 has. (that is, 400,000 has. average per year) would only add up to 1.6 million hectares.
Data from the National Convergence Initiative Secretariat showed that over 1.8 million jobs were generated from 2005 up to the third quarter of 2008, which included 256,048 new jobs for agrarian reform beneficiaries (ARBs) (Table 11). According to the data, one job is equivalent to 90 man-days in crop production. For swine production, one job is generated by raising 25 heads of swine. However, data on employment in the agriculture sector from the National Statistics Office (NSO) shows different figures. Table 12 shows that from January 2004 to January 2009, the
Philippine Partnership for the Development of Human Resources in Rural Areas (PhilDHRRA)
2
Annual targets per commodity for areas for agribusiness development, productivity improvement, and job generation are also outlined in the MTPDP (Table 1). In terms of productivity, the target increase in yield is from 3 to 5 percent for palay and 9 to 15 percent for corn (Table 2). In addition, annual production target for selected cereals, fruits, plantation crops, root crops,vegetables, livestock and poultry, and fishery commodities were also cited (Table 3). In terms of support infrastructure constructed, the annual targets were also cited (Table 4) including the percentage increase in volume of agricultural commodities/products ferried by roll-on-roll-off (RORO) nautical highway in the western and eastern seaboard.
III. PERFORMANCE AND ACCOMPLISHMENT IN 2004-2010
Because of the comprehensive scope of the MTPDP, an assessment will be conducted in the following categories: 1) production and productivity, 2) prices, 3) employment and wage, 4) agribusiness lands development and land acquisition and development (LAD), 5) gross value added (GVA) in agriculture, and 6) agricultural support services. Some of the indicators outlined in the MTPDP and the SPM were not assessed because of a lack of data. In addition, the National Statistics and Coordination Board’s (NSCB) own monitoring indicators of the MTPDP will be presented. The accomplishments (for 2004 to 2008) cited in the Updated MTPDP will also be utilized.
A. Production and Productivity
Accomplishment based on target production per commodity is shown in Table 5. Results showed that actual production of some commodities falls below target. These commodities include palay, corn, mango, coffee, tobacco, and the majority of livestock and poultry products. On the other hand, some commodity production exceeded targets. These included banana, pineapple, calamansi, rubber, cassava, eggplant, tomato, and chicken eggs. No data has been consolidated for other crops.
In terms of productivity for palay and corn, accomplishment decreased over time, from 95 percent in 2005 to 89 percent in 2008 for palay, and from 88 percent to 78 percent for corn (Table 6). Though the area planted for these crops increased, production decreased.
B. Prices
Table 7 shows the annual retail prices of agricultural commodities. Although the MTPDP aims to reduce the cost of priority wage goods and other important non-wage goods, a comparison of retail prices of some commodities shows that prices are actually increasing, more than the rate of core inflation (7 percent in 2005; 5.5 percent in 2006; 2.8 percent in 2007;and 6.2 percent in 2008). Significant increases in the prices of cereals (rice and corn) are observed from 2007 to 2008.
In addition, the consumer price index (CPI) is a measure of the average change in price of a fixed basket of goods and servicesusually purchased by a household for its consumption. It is considered as an important measure of inflation. Table 8 shows thatprices of agricultural products have risen significantly (29 percent at most) from 2007 to 2008, for all income households.
The producer price index (PPI) shows the change over time (relative to a base period) on the prices received by farmers for thesale of their agricultural products. Table 9 shows that some commodities brought about significant income increase to farmers (e.g., onion, ginger) while some farmers faced declining prices for their products (e.g., mangosteen, garlic).
Figure 1. The increase in the retail prices of agricultural commodities may be attributed to the increase in the cost of production, such as fertilizers. Figure 1 on the left shows that prices of fertilizers are relatively constant from 2005 to 2006. However, prices rose sharply from 2007 to 2008. This may also explain the sudden decrease in production, therefore, yield, in this period.
Data source: Bureau of Agricultural Statistics
Civil Society Assessment of the 2004-2010 Medium Term Philippine Development Plan for Agriculture

Civi
l Soc
iety
Ass
essm
ent o
f the
200
4 -2
010
MTP
DP
54
agriculture sector grew by only 679,268 jobs or only 34 percent of the target. Also, in the Updated MTPDP, it is cited that high underemployment rate (48.8 percent of 17.5 percent country’s rate) is still prevalent in the agriculture sector. This is attributed to the seasonal nature of agriculture work coupled with very low levels of diversification and cropping intensity.
The real wage rate for all farm workers decreased from 2005 to 2006 (Table 13). On the other hand, palay workers’ real wage rate increased by 4.2 percent in 2007. Based on the data collected, sugarcane workers receive higher wage rates (at an average of PhP133 per day) compared with palay, corn, and coconut workers. The minimal increase in the real wage rate of farm workers indicate that majority of them have not benefited from the government programs that aim to improve their economic status.
D. Agribusiness Lands Development and Land Acquisition and Distribution (LAD)
In the 2009 SONA, the president reported that more than 1 million hectares of land or roughly 60 percent of the target had already been developed for agribusiness (Table 10) from 2005 up to the 1st quarter of 2009. In the Updated MTPDP, covering accomplishments up to the third quarter of 2008, more than 1.2 million hectares were already developed (a discrepancy of 174, 983 has.). Region 10 registered the highest accomplishment followed by Region 8 and 12 (Table 14). For the remaining period, 713,293 hectares of land needed to be developed, that is, more than 400,000 hectares for 2009 and the rest for the remaining months in 2010. Given the annual average accomplishment of 350,000 hectares, it may be improbable that the targets will be met.
In terms of LAD, the reasons identified for underperformance are as follow: 1) budget shortfalls, 2) slow delivery of agrarian justice (i.e. few government lawyers to handle agrarian reform cases), 3) erroneous and defective land titles, 4) problems in identifying landowners, 5) resistance of landowners, and 6) problems in appropriate land valuation of acquired land. The Department of Agrarian Reform (DAR) originally projected the completion of its LAD program by 2008, thereby contributing to the opening up of new lands for agribusiness development. From 2004 to 2007, however, the total budget appropriated by Congress to DAR’s LAD activity only covered 390,000 hectares. This led DAR to downscale and peg its annual targets to 130,000 hectares starting 2005 until 2008, explaining the above-average LAD performance for 2005. Thus, from 2004 to September 2008, DAR was able to distribute a total of 570,360 hectares, 91 percent of the total funded target. It may be observed that the abovementioned problems were already identified or concluded in numerous studies in the past. Yet, there were no concrete efforts undertaken or plans developed to address them.
E. Gross Value Added in Agriculture
The agriculture sector contributes about 20 percent of total gross domestic product (GDP). This may be attributed to the minimal growth in the gross value added (GVA) of the sector. GVA refers to total payment to factors of production namely: wages, interest, profit, and rent. It also includes capital consumption allowance and indirect taxes. It is estimated by deducting from the gross value of output the sum of non-factor cost such as raw materials, fuel, advertising, and other non-industrial overhead cost. The growth rate of GVA may reflect how the agriculture sector grows in terms of technological improvement, efficiency, and productivity. Table 15 shows that the growth rate of GVA has been minimal in the past years (at 3.2 percent in 2008), with the rate actually decreasing by 1.6 percentage points from 2007 to 2008. According to the Updated MTPDP, the dip in the growth rate is due to severe weather disturbances that adversely affected production levels. Also, the slowing down of the sector in 2008 is attributed to the contraction of the livestock subsector (as cited, because of the decline in hog fattener stocks and occurrence of swine diseases in a number of Central and Southern Luzon provinces) and decreased growth in the fisheries subsector (due to bad weather conditions and lesser occurrence of frigate tuna, big-eyed scad, Indian mackerel, and other tuna species).
A comparison of the GVA growth rate of the agriculture, fishery, and forestry sectors with the other sectors is shown in Table 16, using constant 1985 prices. The agriculture sector’s growth lags behind the industry and service sectors, in particular during the periods of 2006 to 2007. As a matter of fact, from 2005 to 2008, the agriculture
Civil Society Assessment of the 2004-2010 Medium Term Philippine Development Plan for Agriculture

Ass
essm
ent R
epor
t
55
sector exhibited the lowest growth rate among the three sectors. A decline in the growth rate for all sectors is observed from 2007 to 2008, brought about by the Asian financial crisis.
F. Agricultural Support Services
Provision of support services is necessary to enhance the productivity of farmers. One type of support service is the construction of irrigation systems. The government agency primarily responsible for irrigation development in the Philippines is the National Irrigation Administration (NIA). In the SPM 2004-2010, the target for new irrigation systems is 73,939 hectares and the rehabilitated systems are targeted to cover 218,278 hectares. Table 17 shows the estimated potential irrigable area in the country and the areas with irrigation systems. Less than two-thirds of the estimated potential irrigable area had been serviced by NIA in the past years. The increase in irrigation systems is noticeably in private irrigation systems. Computing for the annual increase in service areas for national and communal irrigation systems yields only 63,577 Hectares or 86 percent of target (Table 18). No data for rehabilitated areas is available.
One of the programs cited in the SPM is the expansion of the agricultural credit guarantee and insurance system. The target is that outstanding agricultural loans to microenterprises, small to medium enterprises (SMEs), small farmers, and fisherfolk doubled by 2010, with a total estimated amount of PhP 62.8 billion. Data from the Bureau of Agricultural Statistics (BAS) shows that production loans increased by 65 percent in 2007 but falls in 2008 to only 26 percent compared to its 2007 level. As of 2008, total agricultural loans amount to PhP 85.4 billion, above the target set (Table 19).
Though the total amount of loans released exceeded the targets, the more important question is who availed of the loans? According to the Philippine Asset Reform Report Card, a study conducted by PhilDHRRA, less than half of small farmers (44.3percent) have access to credit, of which only 7.4 percent was extended by government. The study also found out that small farmers prefer to borrow from non-government sources, such as cooperatives, non-government organizations (NGOs), rural banks, and even informal lenders. The low level of borrowing is attributed to the tedious requirements imposed by government financing institutions (GFIs) such as the Land Bank of the Philippines (LBP) and the Development Bank of the Philippines (DBP).
The SPM also stated the establishment and operationalization of the Agriculture and Fisheries Market Information System (AFMIS), designed to aid in the transition of the Department of Agriculture (DA) into a market service-oriented agency. Under the AFMIS website, users would be able to explore alternative markets for their products and widen their knowledge on market services, outlets/trading centers, and investment opportunities. The website has already been developed (afmis.da.gov.ph), but is not, as yet, fully utilized and operational. The price bulletin data is not interactive and files that should have been uploaded cannot be accessed.
G. The NSCB StatDev
The Statistical Indicators on Philippine Development (StatDev) is an instrument formulated and maintained by the National Statistics and Coordination Board (NSCB) to strengthen the planning system by providing the means by which economic progress and social change can be monitored and measured more effectively. Specifically, the StatDev is a statistical indicator system to monitor the achievements of the economic and social development goals set forth in the MTPDP. Thus, the StatDev framework is congruent with the current MTPDP, and is revised each time a new plan is formulated. The StatDev, which is an annual undertaking of the NSCB, provides graphical presentation of the actual trends versus the respective targets indicated in the MTPDP for easier appreciation by planners, evaluators and researchers. It replaced the former Economic and Social Indicators (ESI) publication of the NSCB, starting with the StatDev 2004 released in July 2005.
The strategies/targets indicated in the MTPDP are mostly for 2010, which is the end of the plan period. However, there are some strategies with annual targets while others do not have targets. The methods used to track the performance of the sectors given the indicators are as follows:
... Less than half of small farmers have access to credit...
Civil Society Assessment of the 2004-2010 Medium Term Philippine Development Plan for Agriculture

Civi
l Soc
iety
Ass
essm
ent o
f the
200
4 -2
010
MTP
DP
56
For indicators with targets, some targets have already been attained even before the end of plan period, which implies “good performance.” For the other indicators, the tracking method used for monitoring the Millennium Development Goals (MDGs) was adopted, as follows: pace of performance = _ actual annual growth rate__ required annual growth ratewhere:actual annual growth rate = (latest data / baseline data) - 1 number of years elapsed required annual growth rate = target rate______ number of years coveredIf the pace of performance is: more than 0.9 – good performance between 0.5 and 0.9 – average performanceless than 0.5 – poor performance For indicators without targets, the slope of the latest and baseline data was the basis for the performance of the sector. The slope was computed as follows: slope = latest data - baseline data number of years elapsedIf the value of slope is:
more than 1 (upward) – good performance between 1 and –1 (horizontal) – average performanceless than –1 (downward) – poor performance The following icons are used:
Philippine Partnership for the Development of Human Resources in Rural Areas (PhilDHRRA)
5
For indicators with targets, some targets have already been attained even before the end of plan period, which implies “good performance.” For the other indicators, the tracking method used for monitoring the Millennium Development Goals (MDGs) was adopted, as follows: pace of performance = _ actual annual growth rate__ required annual growth rate where: actual annual growth rate = (latest data / baseline data) - 1 number of years elapsed required annual growth rate = target rate______ number of years covered If the pace of performance is: more than 0.9 – good performance between 0.5 and 0.9 – average performance less than 0.5 – poor performance
For indicators without targets, the slope of the latest and baseline data was the basis for the performance of the sector. Theslope was computed as follows:
slope = latest data - baseline data number of years elapsed If the value of slope is:
more than 1 (upward) – good performance between 1 and –1 (horizontal) – average performance less than –1 (downward) – poor performance
The following icons are used: Good
performance means that the target has already been reached or the probability of attaining the target is high and thus, the target is likely to be attained
average performance
means that the probability of attaining the target is medium and thus, the target may or may not be attained
poor performance
means that the probability of attaining the target is low and thus, the target is not likely to be attained
StatDev findings for the agribusiness sector are shown in Table 20. The most recent data is for 2008. The NSCB findings affirm that the accomplishment of the MTPDP (as of 2008) ranges from poor to average performance.
H. Governance Reforms
The Updated MTPDP outlines priority bills to modernize agriculture, fisheries and agroindustry and increase rural welfare. Five years have passed since the inception of the MTPDP but only two priority bills have been passed into law (The Comprehensive Agrarian Reform Program Extension with Reforms or CARPER and the Archipelagic Baselines Bill) while most of the reforms were partially or never implemented.
Policy reforms Status Comprehensive Agrarian Reform Program (CARP) extension RA 9700 or the CARPER Law was signed in July 27, 2009 National Land Use Act (NLUA) which will guide the optimum allocation of land among competing uses within the framework of sustainable development (target is enactment into law by 2006)
Adopted National Land Use Committee (NLUC) version of NLUA bill; Regional Land Use Committees meetings and House and Senate hearings; NLUA bill is part of the priority Common Legislative Executive Development Advisory Council
Defining the Archipelagic Baseline of the Philippines to conform to the provisions of the United Nations Convention on the Law of the Sea (UNCLOS)
The President signed RA 9522 or the Archipelagic Baselines Bill in March 10, 2009 treating the Kalayaan Island and Scarborough Shoal (Bajo de Masinloc or Panatag Shoal) as part of a “regime of island” instead of being included within the country’s baselines
Agri-Agra Law amendment to ensure that agri-agra funds are Substitute Bill sponsored by Cong. Mitra, ongoing
StatDev findings for the agribusiness sector are shown in Table 20. The most recent data is for 2008. The NSCB findings affirm that the accomplishment of the MTPDP (as of 2008) ranges from poor to average performance.
H. Governance Reforms
Policy reforms Status
Comprehensive Agrarian Reform Program (CARP) extension
RA 9700 or the CARPER Law was signed in July 27, 2009
National Land Use Act (NLUA) which will guide the optimum allocation of land among competing uses within the framework of sustainable development (target is enactment into law by 2006)
Adopted National Land Use Committee (NLUC) version of NLUA bill; Regional Land Use Committees meetings and House and Senate hearings; NLUA bill is part of the priority Common Legislative Executive Development Advisory Council
Defining the Archipelagic Baseline of the Philippines to conform to the provisions of the United Nations Convention on the Law of the Sea (UNCLOS)
The President signed RA 9522 or the Archipelagic Baselines Bill in March 10, 2009 treating the Kalayaan Island and Scarborough Shoal (Bajo de Masinloc or Panatag Shoal) as part of a “regime of island” instead of being included within the country’s baselines
Civil Society Assessment of the 2004-2010 Medium Term Philippine Development Plan for Agriculture

Ass
essm
ent R
epor
t
57
Agri-Agra Law amendment to ensure that agri-agra funds are used for rural credit
Substitute Bill sponsored by Cong. Mitra, ongoing deliberations at the House Committee TWG level
Rationalize the agriculture bureaucracy through the efficient and effective, convergence and complementation of the Agriculture, Agrarian Reform and Natural Resources (AARNR) service agencies and related offices by enforcing measures to address institutional overlaps
Creation of the National Convergence Initiative composed of the DA, DAR, and DENR
Reorient and restructure the Department of Agriculture-National Irrigation Authority (DA-NIA)’s management strategy along with streamlining of its plantilla to address NIA’s financial problems and improve system operation
The NIA Rationalization Plan has been approved last April 2008, for implementation.
Pursue volumetric pricing for irrigation No available update on this reform
Use the coconut levy fund for social services for coconut farmers and their communities, and for the development of coconut-based agribusinesses
No available update on this reform
Establish public-private sector mechanisms for finance mobilization in support of the provisions under the Philippine Fisheries Code (RA 8550) – Municipal Fishery Grant, Fishing Vessels Development Fund, Special Fisheries Science and Approfishtech Fund, and Aquaculture Investment Fund
No available update on this reform
Rationalize the rental fee of public lands for agricultural production such as in pasture and fishpond lease agreements to reflect the commensurate value of the resource being used
Consultation with concerned agencies (DAR, DA, DENR, DILG, NCIP) conducted to discuss technical issues (DA); No other updates available
Review of the Internal Revenue Allotment (IRA) system to make it performance- based and serve as an incentive system for the full and effective delivery of extension services by LGUs
Consultation with concerned agencies (DAR, DA, DENR, DILG, NCIP) conducted to discuss technical issues (DA); No other updates available
Sector agencies to adopt standard and transparent prioritization criteria and process for infrastructure and other support services in agriculture and fisheries, primarily considering cost effectiveness, efficiency parameters.
Consultation with concerned agencies (DAR, DA, DENR, DILG, NCIP) conducted to discuss technical issues (DA); No other updates available
IV. OVERALL ASSESSMENT
There are other areas of assessment that can be explored that are not bound to the MTPDP targets. These will be explored in this section and will include a rough assessment of the programs and strategies of the Department of Agriculture (DA), in general, and the Ginintuang Masaganang Ani (GMA Program) and the FIELDS approach, in particular. A comparison of the performance of the Philippine agriculture sector and our Asian neighbors will also be carried out. The last part will assess how appropriate and responsive the MTPDP has been in addressing the issues of agricultural development and cites some recommendations for future planning and targeting.
A. Government Programs for Agricultural Development
Republic Act 8435, otherwise known as the Agriculture and Fisheries Modernization Act (AFMA), enacted in 1997, aims to strengthen the agriculture and fishery sectors through modernization, greater participation of small-holders (or small stakeholders), food security and food self-sufficiency, private sector participation and people empowerment.
Civil Society Assessment of the 2004-2010 Medium Term Philippine Development Plan for Agriculture

Civi
l Soc
iety
Ass
essm
ent o
f the
200
4 -2
010
MTP
DP
58
Ginintuang Masaganang Ani (GMA) (Makapagpabagong Programa Tungo sa Masagana at Maunlad na Agrikultura at Pangisdaan) is the DA’s banner program for agricultural development, a transitional blueprint for putting AFMA to work. As such, it focused on achieving food security and poverty alleviation, with the LGUs (local government units) and other stakeholders developing plans and programs suitable to their own localities. Such plans and programs should be able to ensure food security by increasing productivity in irrigated areas, while addressing poverty alleviation by providing support to marginal areas to empower those who have the least.
The program envisions a modernized and productive agriculture and fishery sector which will, in turn, a) provide food at prices affordable to all, especially the marginalized sectors, and b) empower these same sectors through the provision of responsive support services. To attain security and competitive self-sufficiency in rice, the agriculture sector should modernize productivity in corn and other feed crops, promote diversification in resource-poor, lowland and upland ecosystems without access to irrigation, promote livestock enterprise development, and foster the recovery and eventual growth of the fisheries sector through stratified targeting; this way, interventions that will be introduced will be more responsive to farmer' needs.
The GMA programs focused on the following commodities: 1) rice, 2) corn, 3) fisheries, 4) livestock, 5) high value commercial crops like coconut and sugar. For 2009, the priorities for each GMA program are shown in Table 21.
In 2007, the Commission on Audit (COA) conducted an audit of the government’s rice program as part of its Government-wide Sectoral Performance Audit. The GMA rice program is one of the components under the Agriculture and Fisheries Modernization Act (AFMA). The audit was conducted to assess whether the implementation of the rice program was effectively undertaken to attain the desired level of rice sufficiency taking into consideration fund allocation and government interventions.
The audit concluded that the implementation of the government’s rice program was not effectively undertaken. The benefits to be derived from the funds appropriated for the program were not maximized, resulting in the failure of the implementing agencies to meet the desired/targeted palay production despite releases of funds to the DA in excess of the allocation for the program in CY 2006. This was compounded by increasing losses of the NFA due to, among others, setting of selling prices of rice insufficient to recover landed importation costs and deficiencies in stock management resulting in increasing capital deficiency, which amounted to PhP 42.7 billion as of December CY 2006. Despite substantial releases in CYs 2005 and 2006, the targeted palay production of 15.12 million metric tons (MT) and 15.88 million MT were not realized as the reported palay production during the period were only about 14.60 million MT and 15.33 million MT, respectively. The failure of the implementing agencies to meet their targets despite availability of funds is due to the following:• fundallocationswerenotbasedonneedsanddidnotprioritizeitemsthatwouldincreaseproduction(e.g.,funds
obligated to incidental expenses and procurement of office supplies instead of agricultural supplies, release of lump sum funds to regional offices without identifying the projects being funded)
• fundsprovidedbyDAandNIAwereput towaste (e.g., seedsubsidies releasedtoseedgrowerseven intheabsence of either the required quality test or master list of farmer-beneficiaries, insecticides and fertilizers remained undistributed or were stored in unprotected and unsuitable places causing them to expire, farm-to-market roads constructed within town/barangay proper and residential areas defeating the road’s purpose, irrigation projects either not operated or not fully operated due to high operation costs)
• NFA’smanner of handling its operations was not supportive of the principles of rice production and foodsufficiency (e.g., the accuracy of the quantity of rice for importation could not be assessed, because of the mandate to NFA to maintain sufficient rice reserves, extended period of storage resulted in the deterioration of the quality of rice and additional losses due to infestation and maintenance costs)
In addition, the annual DA audit (for 2007 and 2008), which includes a value-for-money audit, reveals various inefficiencies in program implementation that led to a waste of resources depriving benefits from farmers. Some of these inefficiencies include:• ineffectiveandinefficientconstructionoffarm-to-marketroads;• subsidyforfarminputssuchashybridandcertifiedseedswashigherthantheprevailingmarketprice;
Civil Society Assessment of the 2004-2010 Medium Term Philippine Development Plan for Agriculture

Ass
essm
ent R
epor
t
59
• authenticityoffarmerbeneficiaries’masterlistremaindoubtful;• useofprogramfundsforutilitiesandadministrativeexpensesinsteadofprogramcomponents;and• variousdeficienciesintheprocurementoffarminputs,inviolationoftheProcurementLaw(RA9184).
During the Food Summit in April 2008, President Arroyo expressed her government’s priority thrust to attain self-sufficiency in rice by 2013 and in corn by 2010. In addition, she cited the FIELDS as the main program to be utilized by the DA. Table 22 shows what FIELDS stands for and the main priorities for each program.
Annexed in the 2008 Commission on Audit (COA) report of the DA are the various accomplishments of the FIELDS program as of March 2009. The list includes quantitative data, such as the amount of fertilizers distributed, number of irrigation systems rehabilitated, number of trainings conducted, and amount of loans released, among others. However, no in-depth assessment has been conducted, showing the long-term impact of the program on the lives of the farmers, such as number of farmers with increased incomes or alleviated out of poverty.
B. Comparison with Asian Neighbors
This section will assess how the Philippine agricultural sector fared relative to other Asian countries. In particular, it will look into share of GVA in the country’s GDP, labor force, and rice production—as it is one of the most produced commodities in the region.
Table 23 shows the GVA as percentage of GDP. In the Philippines, the agriculture sector has contributed to less than 20 percent to total GDP. The level is relatively similar to that of Indonesia and Thailand, while in Cambodia, Laos, and Vietnam, the agriculture sector comprises a significant share of their GDP.
In terms of employment, the Philippines has a relatively greater number of persons employed in the agriculture sector compared to that of Cambodia and Malaysia (Table 24). In the region, Indonesia has the highest number of employed persons in the agriculture sector.
Rice is the top commodity produced by a majority of the Asian countries, as seen in Table 25 (based on 2007 data). Livestock and poultry products are also among the top producing commodities.
Cost of production for rice in the Philippines is of the same level as that of Thailand (Table 26), at an average of US$150/mt. Data for other countries is not available. Cost of production for rice is highest in Malaysia because of high labor costs.
One measure of land productivity is yield. Table 27 shows annual yield, in kilograms (kg) per hectare, for selected Asian countries. The Philippines is only third to Vietnam and Indonesia in terms of yield, at an average of 3,650 kg per hectare. The country’s land productivity level is relatively similar to that of Laos and Malaysia.
The farm gate price is the price that the farmer receives for selling his/her product at the farm. If a farmer sells his/her product in the market, transportation cost is deducted. The price may or may not include subsidies. Table 28 shows the annual farm gate prices of rice, in US$/ton, for selected Asian countries. The farm gate price of rice in the Philippines (US$317.71/ton in 2008) is slightly higher than that of Thailand (US$257.61/ton in 2008). However, the Philippines remains a net importer of rice, along with Indonesia and Malaysia. According to data from the BAS, rice is the leading import item in 2008. The major suppliers of rice were Vietnam and Thailand.
C. Responsiveness and Appropriateness of the MTPDP
There has been a debate regarding the responsiveness and appropriateness of the MTPDP in addressing issues related to agricultural development. Some of these issues will be discussed in the section below.
Civil Society Assessment of the 2004-2010 Medium Term Philippine Development Plan for Agriculture

Civi
l Soc
iety
Ass
essm
ent o
f the
200
4 -2
010
MTP
DP
60
For whom?
To reiterate, the banner program of the MTPDP for agricultural development is the promotion of agribusiness in order to create 2 million jobs. This includes transforming farmer-cultivators into entrepreneurs. In addition, venturing into agribusiness means engaging not only in production, but in processing and distribution of agricultural products as well. To do this, the first assumption is that farmers have achieved stability in terms of production and are thus, capable of venturing into agribusiness. However, this is not the case for small-scale farmers. In a survey of ARBs in 2007, access to support services by small-scale farmers has been low, at only 28 percent(Table 29).
If the capacity to sustain production is still a problem for most small-scale farmers, engaging in processing would be a far more difficult task. The ones with the capacity to venture into processing are the middle and upper class farmers or landowners who have the resources to invest in processing machines and equipments.
In addition, access to market has always been a problem for small-scale farmers. Some have relied on local traders or middlemen to purchase their commodities, with farmers at the losing end of the bargaining table. Table 30 shows the variance between farm gate (FG) and wholesale (WS) selling prices of selected commodities. It is observed that commodity prices more than double from its farm gate price. This simply means that local traders or middlemen reap most of the profits from the sale.
Support services provision, credit in particular, has always been biased against small-scale farmers. As mentioned in the earlier part of this paper, lending institutions such as the LBP implement stringent requirements, which small farmers find difficult to meet.
Thus, government programs should be “small-farmer centered”. That is, they should target those who are most in need - the small-farmers. A bottom-up approach in planning for agriculture-related programs will make certain that the programs are appropriate and responsive to small farmers’ concerns. For instance, a number of studies confirm that farmers who are organized tend to benefit more and are better able to access support services compared to those who do not belong to any group or association. Therefore, farmers’ organizations, particularly commodity-based organizations, should be promoted. The end results of organization include strengthened bargaining power for prices of commodities they produce, technology transfer, and expansion of market network, among others.
How?
It is clearly observed that one of the main thrusts in the MTPDP for the agriculture sector is crop intensification. The plan even outlined the annual production targets for selected agricultural commodities. It may be assumed that the plan equates agricultural development with an increase in production or crop intensification only, without considering the environmental repercussions. However, what is more important is the sustainability of the programs and its contribution to rural development.
The Food and Agriculture Organization (FAO) defines sustainable agriculture and rural development (SARD) as a process which meets the following criteria:• Ensures that the basic nutritional requirements of present and future generations, qualitatively and
quantitatively, are met while providing a number of other agricultural products.• Provides durable employment, sufficient income, and decent living andworking conditions for all those
engaged in agricultural production.• Maintainsand,wherepossible,enhancestheproductivecapacityofthenaturalresourcebaseasawhole,and
the regenerative capacity of renewable resources, without disrupting the functioning of basic ecological cycles
Civil Society Assessment of the 2004-2010 Medium Term Philippine Development Plan for Agriculture

Ass
essm
ent R
epor
t
61
and natural balances, destroying the socio-cultural attributes of rural communities, or causing contamination of the environment.
• Reducesthevulnerabilityoftheagriculturalsectortoadversenaturalandsocio-economicfactorsandotherrisks, and strengthens self-reliance.
One practice that will address sustainability and promote rural development is the adoption of organic agriculture. The International Federation of Organic Agriculture Movements (2005) defines organic agriculture as a holistic production management system which promotes and enhances agroecosystem health, including biodiversity, biological cycles, and soil biological activity. It emphasizes the use of management practices in preference to the use of off-farm inputs, taking into account that regional conditions require locally adapted systems. It is important to note that the MTPDP has not mentioned the promotion or support to organic agriculture in any of its programs. Instead, the plan espouses sustainable agribusiness and rural enterprise development.
Organic agriculture in the Philippines has been described to be in its emergent, incipient, or infancy stage in terms of awareness and understanding, production and marketing, and policies and institutional support. In addition, while the policy environment for organic agriculture has shown some improvements, much still remains to be done. The challenge is sustaining policies and programs, given constant turnovers in administrative regimes and bureaucracies. The DA, through the Bureau of Agriculture and Fisheries Product Standards, adopted the Philippine National Standards Specification for Organic Agriculture (2003). The DA also issued the Guidelines in the Accreditation of Certifying Bodies for Standards on Organic Agriculture (AO No. 13, Series of 2003). However, these initiatives were issued prior to the MTPDP. The most recent legislation is EO 481 or the Promotion and Development of Organic Agriculture in the Philippines, signed in 2005. The said EO established the National Organic Agriculture Board. The more important task of raising awareness and mainstreaming organic agriculture remains a challenge for the government.
Impact?
With all the programs and projects outlined in the MTPDP, one important question remains: how have these impacted the lives of small farmers? According to the NSCB, 44 percent (or roughly 2 million) of all farmers in the Philippines live below the poverty threshold. In addition, most poor farmers live in the ARMM. Comparing the 2003 and 2006 poverty estimates, it is observed that the poverty incidence rose by 1.6 percent over that period (involving 67,957 additional poor farmers) (Table 31). The increase in the number of poor farmers is highest in Region VIII.
Figure 2. Across the basic sectors, farmers rank second among the poorest sectors, with fisherfolk topping the list (Figure 2). It is also worth noting that all sectors posted increases in poverty incidence between the periods 2003 and 2006.
Data source: National Statistical Coordination Board (NSCB)
As also cited in the Updated MTPDP, growth in the agriculture sector did not translate to economic gains for the rural population. The average income of the poor in the agriculture sector was about 84.5 percent of the poverty line and inequality was highest among families who relied on agriculture and fisheries as their source of livelihood. It can be concluded that the MTPDP has not addressed the more important goal of alleviating poverty conditions among farmers. Though positive outcomes have been achieved and success stories of farmers,
Philippine Partnership for the Development of Human Resources in Rural Areas (PhilDHRRA)
9
How?
It is clearly observed that one of the main thrusts in the MTPDP for the agriculture sector is crop intensification. The plan even outlined the annual production targets for selected agricultural commodities. It may be assumed that the plan equates agricultural development with an increase in production or crop intensification only, without considering the environmental repercussions. However, what is more important is the sustainability of the programs and its contribution to rural development.
The Food and Agriculture Organization (FAO) defines sustainable agriculture and rural development (SARD) as a process which meets the following criteria:
• Ensures that the basic nutritional requirements of present and future generations, qualitatively and quantitatively, are met while providing a number of other agricultural products.
• Provides durable employment, sufficient income, and decent living and working conditions for all those engaged in agricultural production.
• Maintains and, where possible, enhances the productive capacity of the natural resource base as a whole, and the regenerative capacity of renewable resources, without disrupting the functioning of basic ecological cycles and natural balances, destroying the socio-cultural attributes of rural communities, or causing contamination of the environment.
• Reduces the vulnerability of the agricultural sector to adverse natural and socio-economic factors and other risks, and strengthens self-reliance.
One practice that will address sustainability and promote rural development is the adoption of organic agriculture. The International Federation of Organic Agriculture Movements (2005) defines organic agriculture as a holistic production management system which promotes and enhances agroecosystem health, including biodiversity, biological cycles, and soil biological activity. It emphasizes the use of management practices in preference to the use of off-farm inputs, taking into account that regional conditions require locally adapted systems. It is important to note that the MTPDP has not mentioned the promotion or support to organic agriculture in any of its programs. Instead, the plan espouses sustainable agribusiness and rural enterprise development.
Organic agriculture in the Philippines has been described to be in its emergent, incipient, or infancy stage in terms of awareness and understanding, production and marketing, and policies and institutional support. In addition, while the policy environment for organic agriculture has shown some improvements, much still remains to be done. The challenge is sustaining policies and programs, given constant turnovers in administrative regimes and bureaucracies. The DA, through the Bureau of Agriculture and Fisheries Product Standards, adopted the Philippine National Standards Specification for Organic Agriculture (2003). The DA also issued the Guidelines in the Accreditation of Certifying Bodies for Standards on Organic Agriculture (AO No. 13, Series of 2003). However, these initiatives were issued prior to the MTPDP. The most recent legislation is EO 481 or the Promotion and Development of Organic Agriculture in the Philippines, signed in 2005. The said EO established the National Organic Agriculture Board. The more important task of raising awareness and mainstreaming organic agriculture remains a challenge for the government.
Impact?
With all the programs and projects outlined in the MTPDP, one important question remains: how have these impacted the lives of small farmers? According to the NSCB, 44 percent (or roughly 2 million) of all farmers in the Philippines live below the poverty threshold. In addition, most poor farmers live in the ARMM. Comparing the 2003 and 2006 poverty estimates, it is observed that the poverty incidence rose by 1.6 percent over that period (involving 67,957 additional poor farmers) (Table 31).The increase in the number of poor farmers is highest in Region VIII.
Figure 2.
Across the basic sectors, farmers rank second among the poorest sectors, with fisherfolk topping the list (Figure 2). It is also worth noting that all sectors posted increases in poverty incidence between the periods 2003 and 2006.
Data source: National Statistical Coordination Board (NSCB)
Civil Society Assessment of the 2004-2010 Medium Term Philippine Development Plan for Agriculture

Civi
l Soc
iety
Ass
essm
ent o
f the
200
4 -2
010
MTP
DP
62
particularly beneficiaries of foreign-assisted projects, have been documented, it has not significantly reduced poverty on a nationwide scale.
Of greater significance has been the agriculture sector’s performance in terms of meeting the Millennium Development Goals (MDGs)—the reduction of hunger and poverty, the improvement of rural livelihoods and human health, and facilitating equitable, socially, environmentally and economically sustainable development. The challenge is to simultaneously meet development and sustainability goals while increasing agricultural production.
The MTPDP has also failed to concretely address gender concerns, particularly ensuring that women farmers are given tenurial security, equal access to support services, and maternal and childcare support services. In the plan, sector agencies are instructed to adopt a standard and transparent prioritization criteria and process for infrastructure and other support services in agriculture and fisheries, considering, where appropriate, gender responsiveness. In addition, gender-responsive market assistance and facilitation through the provision of timely and accurate business information and appropriate trading services is also mentioned. However, there are no concrete plans as to how the capacity of women farmers will be enhanced. Table 32 shows the distribution of workers in the agriculture sector based on gender and type of worker. It is observed that there are more wage and salary men workers compared with women. In addition, the daily real wage rate of women, at PhP120, falls below the threshold for agricultural workers.
V. CONCLUSIONS AND RECOMMENDATIONS
This paper presented a quantitative assessment of the targets outlined in the MTPDP and the reported accomplishments based on related government agencies’ data. In sum, the plan aims to: 1) reduce rural poverty, and 2) increase economic competitiveness. These will be achieved through the creation of 2 million jobs from the promotion of agribusiness, making food plentiful at competitive prices, and increasing production efficiency.
The findings of the assessment can be summed up below.
Indicators Assessment
Production and productivity
• Productionforthefollowingcommoditiesfallsbelowtheannualtargets:palay,corn, mango, coffee, tobacco, livestock and poultry products. On the other hand, production for the following commodities exceeded annual targets: banana, pine-apple, calamansi, rubber, cassava, eggplant, and tomato.
• Landproductivityforpalayandcornisdecreasingovertime(atmost,11%and22%of their targets in 2008, respectively).
Prices • Substantialincreaseinthepriceofriceandcornareobserved,particularlyin2008.• Consumerpriceindex(ameasureofinflation)ofagriculturalproductshasrisen
significantly (29% at most) from 2007 to 2008, for all income households.• Producerpriceindex(changeonthepricesreceivedbyfarmers)showsdecreasing
farm gate prices for certain vegetables and fruits. On the other hand, PPI for cereals and fishery products have been increasing.
• Theincreaseintheretailpricesofagriculturalcommoditiesmaybeattributedtothe increase in the cost of production, such as fertilizer, which rose sharply in 2008.
Employment and wage
• SONAaccomplishmentreportsdonotcoincidewiththeemploymentdatafromthe National Statistics Office. According to the SONA reports, 1.5 million jobs had already been generated from agribusiness promotion. However, data from the NSO showed that the agriculture sector grew by 679,268 jobs from 2004 to January 2009.
• Realwagerateforallfarmworkersdecreasedfrom2005to2006.Ontheotherhand, palay workers’ real wage rate increased by 4.2% in 2007.
Civil Society Assessment of the 2004-2010 Medium Term Philippine Development Plan for Agriculture

Ass
essm
ent R
epor
t
63
Agribusiness lands development and LAD
• AccordingtotheUpdatedMTPDP,morethan1.2millionhectareshadalreadybeen developed for agribusiness (2005 to 2008). For the remaining period, 713,293 hectares of land is needed to be developed, that is, more than 400,000 hectares for 2009 and the rest for the remaining months in 2010. Given the annual average accomplishment at 300,000 hectares, it may be improbable that the targets will be met.
• VariousproblemswereidentifiedtojustifytheunderperformanceinLAD(e.g.,budget shortfalls, erroneous and defective land titles, etc.). These problems have already been identified or concluded in numerous studies in the past. Yet, there are no concrete efforts or plans on how to address them.
GVA in agriculture • ThegrowthrateofGVAhasbeenminimalinthepastyears(rangingfrom3.2%to 4.8%), with the rate actually decreasing by 1.6 percentage points from 2007 to 2008.
• Theagriculturesector’sgrowthlagsbehindtheindustryandservicesectors,inpar-ticular during the periods of 2006 to 2007. As a matter of fact, from 2005 to 2008, the agri sector exhibits the lowest growth rate among the three sectors.
Agricultural support services
• Lessthantwo-thirdsoftheestimatedpotentialirrigableareahadbeenservicedby NIA in the past years. The increase in irrigation systems is noticeably in private irrigation systems.
• Productionloansincreasedby65%in2007butfallsin2008toonly26%comparedto its 2007 level. As of 2008, total agricultural loans amount to PhP 85.4 billion, above the target set. However, there are a number of studies showing that a ma-jority of those who benefited from agricultural loans are not small-scale farmers, citing their hesitance to borrow from government financial institutions due to strin-gent requirements.
• TheAFMISisnotfullyoperational.
NSCB StaDev • TheNSCBStatDevfindingsaffirmthattheaccomplishmentoftheMTPDP,asof2008, ranges from poor to average performance, using the following as indicators: GVA in agriculture, employment, irrigated areas served by NIA, and productivity.
Governance Reforms • FiveyearshavepassedsincetheinceptionoftheMTPDPbutonlytwoprioritybillshave been passed into law (CARPER and Archipelagic Baselines Bill) while most of the reforms were partially or never implemented.
Government pro-grams
• GinintuangMasaganangAni(GMA)isthebannerprogramoftheDepartmentofAgriculture for agricultural development, a transitional blueprint for putting AFMA to work. The program focused on the following commodities: 1) rice, 2) corn, 3) fisheries, 4) livestock, 5) high value commercial crops, coconut, and sugar.
• ACOAreportin2007concludedthattheimplementationoftheGovernment’sRiceProgram may not be considered effectively undertaken.
• ThecurrentprogramoftheDAistheFIELDSprogram.
Comparison with Asian neighbors
• InthePhilippines,theagriculturesectorhascontributedtolessthan20%tototalGDP, the level relatively similar to that of Indonesia and Thailand.
• ThePhilippinesisonlythirdtoVietnamandIndonesiaintermsofyield.Thecoun-try’s land productivity level is relatively similar to that of Laos and Malaysia.
• ThePhilippinesremainsanetimporterofrice,alongwithIndonesiaandMalaysia.
Civil Society Assessment of the 2004-2010 Medium Term Philippine Development Plan for Agriculture

Civi
l Soc
iety
Ass
essm
ent o
f the
200
4 -2
010
MTP
DP
64
Responsiveness and appropriateness
• Agribusinesspromotionassumesthatfarmershaveachievedstabilityintermsofproduction given access to support services. However, this is not the case for small-scale farmers for whom access to support services is only at 28%. If the capacity to sustain production is still a problem for most small-scale farmers, engaging in processing would be a far more difficult task. The ones with the capacity to venture into processing are the middle and upper class farmers or landowners who have the resources to invest in processing machines and equipments.
• Commoditypricesmorethandoublefromitsfarmgatetoitswholesaleprice,which means that local traders or middlemen reap most of the profits from the sale.
• Supportservicesprovision,creditinparticular,hasbeenbiasedagainstsmall-scalefarmers due to stringent requirements of government financial institutions.
• PovertyincidenceoffarmersinthePhilippinesisat44%,orequivalenttomorethan 2 million farmers. The most number of poor farmers live in the ARMM. Com-paring the 2003 to 2006 poverty estimates, it is observed that the poverty inci-dence rose by 1.6%; there are now67,957 more poor farmers. The MTPDP has not addressed the more important goal of alleviating farmers out of poverty.
For a more appropriate and responsive planning for the agriculture sector, the following are recommended:
1. Government programs should be “small-farmer centered”. Examples include promotion of commodity-based organizing and making credit more accessible to small farmers.
As earlier mentioned, promotion of agribusiness is the banner program of the GMA administration to develop the agriculture sector. However, this strategy is deemed inappropriate and not responsive to the needs of small farmers, who comprise a majority of the sector. What would be more beneficial for small farmers is to organize them into people’s organizations. Benefits of promoting commodity-based organizing include strengthened bargaining power for prices of commodities they produce, technology transfer, and expansion of market network, among others.
2. Focus should not be on crop intensification. Rather it should be on ensuring agricultural sustainability by lessening environmental repercussions.
The Department of Agriculture sets targets on production of specific commodities and productivity. The 2010 Book of Outputs of the DA where the performance measures and targets for next year are outlined, reveals that targets are in terms of number of outputs produced (such as hectares of land planted by specific crops, number of fertilizers, seeds and other farm implements distributed, etc). However, the data does not show the geographical areas in which these outputs will be distributed as well as the criteria used in determining which regions or provinces will benefit from these outputs. It can also be observed that the main goal of the DA, reflecting from their targets, is to intensify crop production, with less consideration on how it will impact on the environment. One recommendation to achieve sustainability and lessen environmental repercussions is to promote organic agriculture. Another measure is to increase investment in research and appropriate technology, particularly now that the country is faced with environmental challenges brought about by climate change. One of the findings in the International Assessment of Agricultural Science and Technology for Development (IAASTD)3 (2009) showed that an increase and strengthening of agricultural knowledge, science and technology (AKST) towards agroecological sciences will contribute to addressing environmental issues while maintaining increasing productivity.
3The IAASTD is a unique multistakeholder effort composed of international agencies (FAO, World Bank, UNEP, UNESCO, WHO, UNDP, GEF), CSOs (farmer groups, NGOs, consumers group), business sector (agrochemical companies), and governments (10 OECD governments and the EC).
Civil Society Assessment of the 2004-2010 Medium Term Philippine Development Plan for Agriculture

Ass
essm
ent R
epor
t
65
3. Promotion of organic agriculture by providing policies and institutional support.
As earlier mentioned, EO 481 or the Promotion and Development of Organic Agriculture in the Philippines, signed in 2005, is the most recent legislation on organic agriculture . A salient provision of the law is the adoption of the Philippine National Standards (PNS) for organic agriculture. However, some producers and exporters of organic products are pushing for a review of the PNS to make it at par with international standards. There are also some sectors calling for more financing support, citing the high cost of securing a certification from third party international certification bodies since no local body is certified to do this as of now. Some recommendations include waging an information campaign on the organic agriculture processes that can be gradually adopted by small farmers. Another measure is to partner with the LGUs in the adoption of organic agriculture and support already existing indigenous agricultural practices.
4. Peg the plans in terms of achieving the MDGs for the rural sector.
The MDGs to be achieved in 2015 are as follow:Goal 1: Eradicate extreme poverty and hunger Goal 5: Improve maternal healthGoal 2: Achieve universal primary education Goal 6: Combat HIV.AIDS, malaria and other diseasesGoal 3: Promote gender equality and empower women Goal 7: Ensure environmental sustainabilityGoal 4: Reduce child mortality Goal 8: Develop a global partnership for development
More significant is to ensure that the programs or projects for farmers contribute to the achievement of the MDG in the agriculture sector. As shown in the poverty data from the NSCB, farmers are among the second poorest sector across all sectors. Improvement in the quality of life does not only entail an increase in income of farmers but a more holistic perspective embodied in the MDGs.
5. Provide concrete plans to enhance the situation of women farmers.
These include programs specifically designed for women farmers, such as ensuring fair access to support services and credit, maternal health-related programs, capacity building activities, and proper utilization of the GAD budget.
TABLES
List of Tables
Table 1. Annual targets for agribusiness development, productivity improvement, and job generationTable 2. Annual targets for palay and corn productivityTable 3. Annual production targets of selected commoditiesTable 4. Annual targets of support infrastructure constructionTable 5. Percent accomplished from annual production targets of selected commoditiesTable 6. Percent accomplished from annual productivity targets for rice and cornTable 7. Annual retail prices of selected commodities and percent changeTable 8. Annual CPI of selected commodities and percent changeTable 9. Percent change in annual PPI for selected commoditiesTable 10. Compilation of SONA reports for jobs generation and lands developed for agribusinessTable 11. Jobs generated in the agriculture sector, by region (2005 to 3rd Q 2008)Table 12. Employed persons in agricultureTable 13. Real wage rate of farm workersTable 14. Agribusiness lands (including agroforestry) developed, by region (2005 to 3rd Q 2008)Table 15. Annual GVA in agriculture and growth rate
Civil Society Assessment of the 2004-2010 Medium Term Philippine Development Plan for Agriculture

Civi
l Soc
iety
Ass
essm
ent o
f the
200
4 -2
010
MTP
DP
66
Table 16. Comparison of GVA growth rate across sectorsTable 17. Irrigated areaTable 18. Irrigation service areas added per yearTable 19. Agricultural loans extended and growth rateTable 20. StatDev Indicators, 2008Table 21. GMA programs and prioritiesTable 22. FIELDS program and thrustsTable 23. GVA as percent of GDP in selected Asian countriesTable 24. Employment in the agriculture sector in selected Asian countriesTable 25. Top producing commodities in selected Asian countriesTable 26. Cost of production for rice in selected Asian countriesTable 27. Annual yield for rice in selected Asian countriesTable 28. Farmgate price of rice in selected Asian countriesTable 29. Access to and government provision of support servicesTable 30. Variance between farmgate and wholesale prices of selected commoditiesTable 31. Poverty incidence of farmersTable 32. Employment in the agriculture sector based on gender and type of worker
Table 1. Annual targets for agribusiness development, productivity improvement, and job generation
Commodity New areas for agribusiness
devt (has)
Number of jobs to be generated
Existing areas for productivity enhancement
(has)
Number of jobs to be generated
Rice - - 875,130 80,860Corn 280,250 280,250 - -Livestock 45,200 45,200 - -Fisheries 17,210 743,540 - - Bangus (culture) 3,190 86,260 - - Tilapia (culture) 8,200 221,450 - - Seaweeds 5,820 201,360 - - Others (mariculture, etc) - 234,470 - -High value crops (Food) 292,690 329,670 214,780 214,780 Pineapple 1,520 1,900 - - Pili 850 1,120 - - Sugar 20,410 20,410 - - Coffee 9,440 9,440 56,420 56,420 Mango 130,170 130,170 - - Durian 8,510 8,510 22,090 22,090 Banana 72,840 72,840 - - Onion - - 2,680 2,680 Cassava 15,590 15,590 48,420 48,420 Citrus 390 390 11,680 11,680 Vegetables 26,730 63,060 73,490 73,490
Civil Society Assessment of the 2004-2010 Medium Term Philippine Development Plan for Agriculture

Ass
essm
ent R
epor
t
67
Garlic 6,240 6,240 - -High value crops (Non-food) 1,412,050 1,412,050 170,340 170,340 Abaca 50,390 50,390 29,940 29,940 Rubber 11,660 11,660 83,900 83,900 Coconut 1,350,000 1,350,000 - - Tobacco - - 56,500 56,500Grand total 2,047,400 2,810,710 1,260,250 465,980
Table 2. Annual targets for palay and corn productivity
Commodity 2005 2006 2007 2008Palay Yield (mt/ha) 3.76 3.94 4.11 4.23 Area (million ha) 4.02 4.02 4.02 4.02Corn Yield (mt/ha) 2.45 2.81 3.07 3.35 Area (million ha) 2.42 2.33 2.29 2.21
Table 3. Annual production targets of selected commodities
Commodity/Crop 2005 2006 2007 2008CerealsPalay 15,110 15,850 16,510 17,020Corn 5,927 6,544 7,038 7,389FruitsMango 1,024 1,045 1,066 1,087Banana 5,476 5,586 5,698 5,812Durian 41 41 42 43
Papaya 133 136 139 142
Pineapple 1,730 1,765 1,800 1,836
Calamansi 185 188 192 196
Plantation cropsCoffee 109 111 113 115
Rubber 279 285 291 297
Palm oil 363 370 378 385
Abaca 71 71 72 73
Cotton 5 8 14 21
Tobacco 55 102 118 135
RootcropsCassava 1,655 1,688 1,721 1,756
Sweet potato 559 571 582 694
VegetablesAmpalaya 49 50 50 51
Brocolli 2 2 2 2
Cabbage 92 93 94 95
Cauliflower 12 13 13 13
Civil Society Assessment of the 2004-2010 Medium Term Philippine Development Plan for Agriculture

Civi
l Soc
iety
Ass
essm
ent o
f the
200
4 -2
010
MTP
DP
68
Carrot 35 35 36 36
Eggplant 181 183 185 187
Gourd 34 35 35 35
Habitchuelas 12 12 12 12
Lettuce 2 2 2 2
Mongo 28 28 28 28
Pechay 39 39 39 40
Radish 10 10 10 10
Squash fruit 117 118 119 121
Stringbeans 28 29 29 29
Tomato 151 152 154 155
Livestock and poultryCarabao 139 146 153 161
Cattle 260 261 263 266
Hog 1,858 1,913 1,990 2,050
Goat 74 75 77 78
Dairy 14 17 20 23
Chicken 1,261 1,299 1,338 1,378
Duck 55 56 56 57
Chicken eggs 293 304 315 327
Duck eggs 54 55 55 55
FisheriesBangus 297 322 347 372
Tilapia 212 266 332 415
Seaweeds 1,289 1,439 1,589 1,739
Table 4. Annual targets of support infrastructure construction
Infrastructure (unit: number constructed) 2005 2006 2007 2008 2009 2010 Total
New service area of multi-crop irrigation systems 15,878 23,525 10,207 12,195 5,384 6,750 73,939
Rehabilitated service area of multi-crop irrigation systems (in has.) 78,186 26,679 34,999 30,493 25,483 22,438 218,278
Farm-to-market roads (in kms.) 198 198 198 198 198 198 1,188
Tramline system 2 2 2 2 2 2 12
Post-harvest facilities construction/establishment facilitated warehouses/seed storage
141 273 243 255 255 185 1,352
Cold storage/cold chains/ice plants 1 2 2 2 2 2 11
Marketing-related infrastructure establishment facilitated Bagsakan center/trading post/food terminal
4 4 4 4 4 4 24
Fish ports construction/rehabilitation facilitated:
Regional 7 7 7 7 7 7 42
Municipal 3 3 3 3 3 3 18
Increase in volume of agricultural commodities/products fer-ried by roll-on-roll-off (RORO) nautical highway (%):
Western Sea Board
Batangas-Calapan 10 10 10 10 10 10
Civil Society Assessment of the 2004-2010 Medium Term Philippine Development Plan for Agriculture

Ass
essm
ent R
epor
t
69
Roxas, Oriental Mindoro-Caticlan 7 7 7 7 10 10
Iloilo-Bacolod 10 10 10 10 10 10
Dumaguete-Dipolog 10 10 10 10 10 10
Eastern Sea Board
Matnog-Allen, Samar 5 5 5 7 7 7
Liloan, Maasin-Surigao City 5 5 5 7 7 7
Naval, Biliran-Cataingan, Masbate 5 5 5 7 7 7
Agriculture and Fisheries Market Information System (AFMIS) established and operationalized
1
Percent of farmers in 4 focus areas accessing the AFMIS (CAR, Regions VI, VII, and X)
10 30 50 60 75 80
Table 5. Percent accomplished from annual production targets of selected commodities
Commodity/Crop 2005 2006 2007 2008% Accomplished % Accomplished % Accomplished % Accomplished
CerealsPalay 97% 97% 98% 99%Corn 89% 93% 96% 94%FruitsMango 96% 88% 96% 81%Banana 115% 122% 131% 149%Pineapple 103% 104% 112% 120%Calamansi 109% 104% 105% 102%Plantation cropsCoffee 98% 94% 87% 84%Rubber 113% 123% 139% 139%Abaca 104% 98% 92% 94%Tobacco 82% 38% 29% 24%RootcropsCassava 101% 104% 109% 111%Sweet potato 103% 99% 99% 82%VegetablesCabbage 99% 98% 131% 135%Eggplant 104% 105% 114% 107%Mongo 97% 93% 103% 102%Tomato 115% 115% 123% 126%Livestock and poultryCarabao 96% 89% 89% 87%Cattle 95% 91% 90% 90%Hog 95% 96% 95% 91%Goat 104% 100% 101% 100%Dairy 87% 77% 66% 60%Chicken 96% 93% 91% 93%
Civil Society Assessment of the 2004-2010 Medium Term Philippine Development Plan for Agriculture

Civi
l Soc
iety
Ass
essm
ent o
f the
200
4 -2
010
MTP
DP
70
Duck 89% 83% 75% 69%Chicken eggs 109% 109% 106% 107%Duck eggs 97% 92% 86% 76%
Table 6. Percent accomplished from annual productivity targets for rice and corn
Commodity2005 2006 2007 2008
Target Actual % Target Actual % Target Actual % Target Actual %Palay Area (M ha) 4.02 4.07 101% 4.02 4.15 103% 4.02 4.27 106% 4.02 4.45 111% Yield (mt/ha) 3.76 3.59 95% 3.94 3.68 93% 4.11 3.80 92% 4.23 3.77 89%
Corn Area (M ha) 2.42 2.44 101% 2.33 2.57 110% 2.29 2.64 115% 2.21 2.66 120% Yield (mt/ha) 2.45 2.15 88% 2.81 2.37 84% 3.07 2.54 83% 3.35 2.60 78%
Data source: Bureau of Agricultural Statistics (BAS)
Table 7. Annual retail prices of selected commodities and percent change
Commodities 2005 2006 2007 2008% increase
2005-2006
2006-2007
2007-2008
Cereals Rice Fancy 28.82 29.59 30.76 39.04 3% 4% 27% Rice Premium 25.09 25.81 26.93 35.83 3% 4% 33% Well Milled Rice (WMR) 22.88 23.56 24.72 32.71 3% 5% 32% Regular Milled Rice (RMR) 20.73 21.28 22.39 29.38 3% 5% 31% Corngrain Yellow 14.3 14.65 15.79 18.18 2% 8% 15% Corngrain White 15.25 15.72 15.31 17.19 3% -3% 12% Corngrits Yellow 16.55 17.98 18.81 20.78 9% 5% 10% Corngrits White 17.12 18.37 18.83 25.52 7% 3% 36%Commercial Crop Coconut matured* 10.49 10.57 11.52 14 1% 9% 22%Beans and Legumes Habitchuelas [Snap beans] 36.91 42.69 42.4 47.73 16% -1% 13% Mongo [Mungbean], green 42.74 47.81 51.26 52.64 12% 7% 3% Peanut with shell, dry 35.74 37.11 40.87 44.25 4% 10% 8% Peanut without shell, dry 52.19 53 58.15 64.21 2% 10% 10% Stringbeans 31.28 34.57 34.87 36.87 11% 1% 6%Condiments Garlic 128.03 172.16 163.6 149.57 34% -5% -9% Ginger Hawaiian 32.11 28.61 39.89 83.15 -11% 39% 108% Onion Red Creole (Bermuda red) 59.74 67.94 52.12 85.66 14% -23% 64% Onion White (Yellow granex) 44.62 51.88 52.15 69.82 16% 1% 34%Fruit Vegetables Ampalaya [Bitter gourd] 36.1 41.86 42.15 50.41 16% 1% 20%
Civil Society Assessment of the 2004-2010 Medium Term Philippine Development Plan for Agriculture

Ass
essm
ent R
epor
t
71
Chayote 13.8 16.87 16.77 18.02 22% -1% 7% Eggplant long, purple 24.24 30.75 27.88 34.99 27% -9% 26% Squash 15.64 17.63 17.37 20.33 13% -1% 17% Tomato 30.18 31.01 31.89 35.49 3% 3% 11% Upo [Bottle gourd] 14.1 15.8 15.97 18.74 12% 1% 17%Leafy Vegetables Cabbage 30.2 34.59 33.27 36.49 15% -4% 10% Camote tops [Sweet potato tops] 17.45 18.15 18.89 19.89 4% 4% 5% Kangkong [Morning glory] 17.98 18.4 18.74 19.8 2% 2% 6% Pechay native 29.7 31.41 32.33 36.61 6% 3% 13%Rootcrops Carrots 45.42 47.99 49.84 54.73 6% 4% 10% Gabi Cebu, for ginataan [Taro (cocoyam)]
19.12 19.34 20.26 21.01 1% 5% 4%
Sweet Potato 14.54 16.87 18 19.77 16% 7% 10% White/Irish Potato 34.25 41.06 43.81 51.25 20% 7% 17%Fruits Banana Lakatan, ripe* 2.3 2.4 2.69 2.87 4% 12% 7% Banana Latundan, ripe* 1.54 1.59 1.74 1.81 3% 9% 4% Banana Saba, ripe* 1.32 1.35 1.66 1.69 2% 23% 2% Calamansi 30.74 33.29 31.57 37.44 8% -5% 19% Mandarin Szinkom 25.87 26.24 28.09 30.98 1% 7% 10% Mango Carabao, ripe 46.72 50.88 50.42 61.72 9% -1% 22% Mango Piko, ripe 36.46 39.31 35.59 41.34 8% -9% 16% Papaya Hawaiian* 28.93 27.82 29.08 29.82 -4% 5% 3% Pineapple Hawaiian* 26.45 27.7 29.3 30.7 5% 6% 5%Meat Beef Lean Meat 174.27 178.44 185.92 199.88 2% 4% 8% Beef Meat with bones 137.06 139.79 144.33 155.85 2% 3% 8% Pork Lean Meat 139.28 138.44 139.32 156.19 -1% 1% 12% Pork Meat with bones 124.09 123.35 124.96 141.57 -1% 1% 13% Pork Pata (front) 101.85 102.32 103.58 117.81 0% 1% 14%Poultry Chicken Fully Dressed (broiler) 103.76 106.75 112.55 121.64 3% 5% 8% Chicken Broiler (live) 88.13 90.19 91.95 99.9 2% 2% 9% Chicken egg (other breed)* 3.64 3.9 4.36 4.47 7% 12% 3% Duck egg* 4.58 4.84 5.25 5.7 6% 8% 9%
Color code: yellow – decrease in priceblue – price increase of 10% or moreData source: Bureau of Agricultural Statistics (BAS), National Statistics Office (NSO)
Civil Society Assessment of the 2004-2010 Medium Term Philippine Development Plan for Agriculture

Civi
l Soc
iety
Ass
essm
ent o
f the
200
4 -2
010
MTP
DP
72
Table 8. Annual CPI of selected commodities and percent change
Commodity 2005 2006 2007 2008 2005-2006 2006-2007 2007-2008Cereals and Cereal Preparation
119.9 125.1 129.6 162.4 4% 4% 25%
Cereals 115.9 120.4 124.5 160.2 4% 3% 29%Rice 115.2 119.5 123.6 159.7 4% 3% 29%Corn 123.3 129.1 134.8 166.1 5% 4% 23%Cereal Preparation 133.3 141.2 146.6 169.6 6% 4% 16%Dairy Products 143.1 151.7 160 180.5 6% 5% 13%Eggs 119 125.7 134.2 143.4 6% 7% 7%Fish 126.9 133.5 137.9 150.4 5% 3% 9%Fruits and Vegetables 116.6 126.9 130.6 145.9 9% 3% 12%Meat 128.9 132 135.4 147.5 2% 3% 9%
Data source: Bureau of Agricultural Statistics (BAS)
Table 9. Percent change in annual PPI for selected commodities
Commodity 2005-2006 2006-2007 2007-2008Cereals 4% 8% 22%Vegetables and Legumes 18% -8% 44% Rootcrops & Tubers 25% -4% 11%Fruits 3% -2% 15%Commercial Crops 2% 19% 23%Livestock -2% 2% 13%Poultry 5% 6% 5%All Items 8% 5% 17%
Color code: yellow – decrease in priceblue – price increase of 10% or moreData source: Bureau of Agricultural Statistics (BAS)
Table 10. Compilation of SONA reports for jobs generation and lands developed for agribusiness
2005 SONA
2006 SONA
2007 SONA 2008 SONA
2009 SONA
Period reported Jan to Jun 2005
Jan to Dec 2005
2005 to 2006
Jan to May 2007
2005-2007 (Total)
2004 to Jun 2008
2005 to 1stQ 2009
Jobs generated from agribusiness development
135,314 313,291 890,654 142,629 1,033,283 1,513,965 2,019,000
Lands developed for agribusiness (in has.)
73,925 202,668 519,996 249,169 769,165 800,000 1,048,000
Table 11. Jobs generated in the agriculture sector, by region (2005 to 3rd Q 2008)
Region 2005 2006 2007 2008 (1st Q-3rd Q) TotalCAR 6,119 5,359 6,075 2,079 19,632I 8,296 9,008 4,549 7,486 29,339II 28,811 18,894 18,468 6,329 72,502III 17,774 15,521 8,737 11,842 53,874
Civil Society Assessment of the 2004-2010 Medium Term Philippine Development Plan for Agriculture

Ass
essm
ent R
epor
t
73
1V-A 25,218 38,039 29,844 7,844 100,9451V-B 34,102 69,651 50,949 30,943 185,645V 11,004 17,643 9,366 10,085 48,098VI 14,797 18,587 23,605 9,157 66,146VII 26,931 30,532 29,869 18,605 105,937VIII 71,358 49,687 43,248 15,402 179,695IX 35,361 84,932 42,245 43,033 205,571X 36,717 10,3036 30,849 37,235 207,837XI 59,122 36,877 34,566 20,229 150,794XII 56,774 71,361 30,047 40,790 198,972CARAGA 34,103 26,008 28,053 19,358 107,522ARMM 35,906 50,327 42,500 25,575 154,308Total 502,393 645,462 432,969 305,992 1,888,816
Data source: National Convergence Initiative Secretariat
Table 12. Employed persons in agriculture
Year No. of employed persons in Agriculture sector Net increaseJanuary 2004 11,174,000January 2005 11,359,000 185,000January 2006 11,834,000 475,000
January 2007 11,640,462 -193,538January 2008 11,793,250 152,788January 2009 11,853,268 60,018
Total increase 679,268Data source: National Statistics Office (NSO)
Table 13. Real wage rate of farm workers
Type 2005 2006 2007 2005-2006 2006-2007All Farm Workers 122.2 119.86 121.15 -1.9% 1.1%Palay Workers 125.2 124.63 129.81 -0.5% 4.2%Corn Workers 110.15 107.75 108.5 -2.2% 0.7%Coconut Workers 124.57 120.49 118.5 -3.3% -1.7%Sugarcane Workers 135.25 133.54 130.26 -1.3% -2.5%
Data source: Bureau of Agricultural Statistics (BAS)
Table 14. Agribusiness lands (including agroforestry) developed, by region (2005 to 3rd Q 2008)
Region 2005 2006 2007 2008 (1st Q-3rd Q) TotalCAR 4,551 4,895 5,288 1,253 15,987I 7,963 6,221 8,787 4,265 27,236II 18,819 12,432 13,908 2,098 47,257III 13,294 11,244 6,505 7,102 38,1451V-A 18,738 34,323 25,096 7,309 85,4661V-B 10,503 10,692 11,460 7,139 39,794V 9,952 13,032 9,069 4,137 36,190VI 11,076 14,728 19,609 8,429 53,842
Civil Society Assessment of the 2004-2010 Medium Term Philippine Development Plan for Agriculture

Civi
l Soc
iety
Ass
essm
ent o
f the
200
4 -2
010
MTP
DP
74
VII 26,158 27,791 24,347 13,300 91,596VIII 59,791 34,206 31,458 8,933 134,388IX 12,963 37,483 16,959 14,066 81,471X 32,394 93,504 31,624 23,426 180,948XI 48,901 26,476 23,308 12,923 111,608XII 39,728 46,151 20,676 13,605 120,160CARAGA 26,470 14,023 23,853 14,278 78,624ARMM 22,676 22,608 22,614 12,375 80,273Total 363,977 409,809 294,561 154,638 1,222,985
Data source: National Convergence Initiative Secretariat
Table 15. Annual GVA in agriculture and growth rate
2005 2006 2007 2008 2005-2006 2006-2007 2007-20081. AGRICULTURE INDUSTRY 229,573 238,040 249,989 258,062 3.7% 5.0% 3.2% a. AGRICULTURE 177,791 183,215 191,405 196,270 3.1% 4.5% 2.5% Palay 39,051 40,987 43,429 44,968 5.0% 6.0% 3.5% Corn 12,518 14,494 16,054 16,510 15.8% 10.8% 2.8% Coconut 8,226 8,302 8,249 8,501 0.9% -0.6% 3.1% Sugarcane 5,691 6,138 5,460 6,499 7.9% -11.0% 19.0% Banana 5,740 6,192 6,821 7,918 7.9% 10.2% 16.1% Other crops 43,510 43,114 46,165 45,450 -0.9% 7.1% -1.5% Livestock 27,742 28,397 29,083 28,774 2.4% 2.4% -1.1% Poultry 25,107 25,016 25,069 26,251 -0.4% 0.2% 4.7% Agricultural activities & services 10,204 10,575 11,075 11,399 3.6% 4.7% 2.9%
b. FISHERY 51,782 54,825 58,584 61,792 5.9% 6.9% 5.5%2. FORESTRY 1,381 1,736 1,322 1,344 25.7% -23.8% 1.7%GVA IN AGRI, FISHERY AND FORESTRY
230,954 239,777 251,311 259,406 3.8% 4.8% 3.2%
Data source: Bureau of Agricultural Statistics (BAS)
Table 16. Comparison of GVA growth rate across sectors
Sector/Subsectors 2005-2006 2006-2007 2007-2008Agriculture, Fishery, Forestry 3.8 4.8 3.2 Agriculture 3.3 4.5 2.5 Fishery 5.9 6.9 5.5 Forestry -4.0 -10.5 1.7Industry Sector 4.5 7.1 5.0 Mining and Quarrying -6.1 25.9 1.9 Manufacturing 4.6 3.4 4.3 Construction 7.3 23.1 7.8 Electricity, Gas, and Water 6.4 6.7 7.3Service Sector 6.7 8.1 3.3 Transport, Communications, and Storage 6.3 8.3 4.2 Trade 6.1 8.2 1.2
Civil Society Assessment of the 2004-2010 Medium Term Philippine Development Plan for Agriculture

Ass
essm
ent R
epor
t
75
Finance 11.4 13.1 2.5 Ownership of Dwellings and Real Estate 5.7 5.9 5.7 Private Services 6.9 8.4 4.9 Government Services 4.7 2.6 5.5
Table 17. Irrigated area
2005 2006 2007 2008 2005-2006 2006-2007 2007-2008Estimated Potential Irrigable Area
3,126,340 3,126,340 3,126,340 3,126,340
National Irrigation System 695,774 704,746 706,377 748,593 1.3% 0.2% 6.0%Communal Irrigation System 543,262 548,978 554,020 554,020 1.1% 0.9% 0.0%Private Irrigation System 174,200 174,200 174,200 217,329 0.0% 0.0% 24.8%Total 1,413,236 1,427,924 1,434,597 1,519,942 1.0% 0.5% 5.9%Remaining Area to be developed 1,713,661 1,698,973 1,692,300 1,607,073 54.8% 54.3% 54.1%
Data source: Bureau of Agricultural Statistics (BAS)
Table 18. Irrigation service areas added per year
Year Additional service areas2005 14,6882006 6,6732007 42,216Total 63,577
Table 19. Agricultural loans extended and growth rate
Year Amount (in PhP million) Net increase (decrease) Growth rate2005 108,9362006 93,228 (15,708) -14%2007 153,832 60,604 65%2008 194,380 40,548 26%
Total 85,444Data source: Agricultural Credit Policy Council
Civil Society Assessment of the 2004-2010 Medium Term Philippine Development Plan for Agriculture
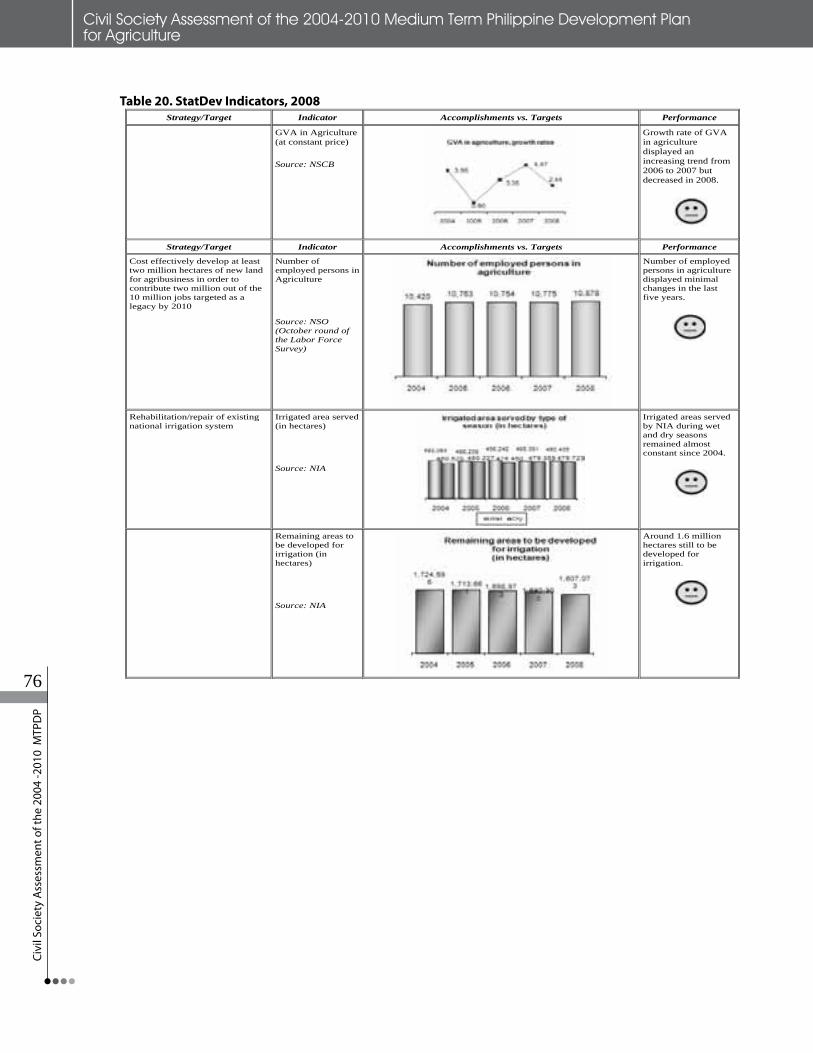
Civi
l Soc
iety
Ass
essm
ent o
f the
200
4 -2
010
MTP
DP
76
Table 20. StatDev Indicators, 2008
Philippine Partnership for the Development of Human Resources in Rural Areas (PhilDHRRA)
20
Sector/Subsectors 2005-2006 2006-2007 2007-2008 Ownership of Dwellings and Real Estate 5.7 5.9 5.7 Private Services 6.9 8.4 4.9 Government Services 4.7 2.6 5.5
Table 17. Irrigated area 2005 2006 2007 2008 2005-2006 2006-2007 2007-2008
Estimated Potential Irrigable Area 3,126,340 3,126,340 3,126,340 3,126,340 National Irrigation System 695,774 704,746 706,377 748,593 1.3% 0.2% 6.0% Communal Irrigation System 543,262 548,978 554,020 554,020 1.1% 0.9% 0.0% Private Irrigation System 174,200 174,200 174,200 217,329 0.0% 0.0% 24.8% Total 1,413,236 1,427,924 1,434,597 1,519,942 1.0% 0.5% 5.9% Remaining Area to be developed 1,713,661 1,698,973 1,692,300 1,607,073 54.8% 54.3% 54.1%
Data source: Bureau of Agricultural Statistics (BAS)
Table 18. Irrigation service areas added per year Year Additional service areas
886,41 5002 376,6 6002 612,24 7002 775,36 latoT
Table 19. Agricultural loans extended and growth rate Year Amount (in PhP million) Net increase (decrease) Growth rate
639,801 5002 %41- )807,51( 822,39 6002 %56 406,06 238,351 7002 %62 845,04 083,491 8002
Total 85,444 Data source: Agricultural Credit Policy Council
Table 20. StatDev Indicators, 2008 Strategy/Target Indicator Accomplishments vs. Targets Performance
GVA in Agriculture (at constant price)
Source: NSCB
Growth rate of GVA in agriculture displayed an increasing trend from 2006 to 2007 but decreased in 2008.
Philippine Partnership for the Development of Human Resources in Rural Areas (PhilDHRRA)
21
Strategy/Target Indicator Accomplishments vs. Targets Performance
Cost effectively develop at least two million hectares of new land for agribusiness in order to contribute two million out of the 10 million jobs targeted as a legacy by 2010
Number of employed persons in Agriculture
Source: NSO (October round of the Labor Force Survey)
Number of employed persons in agriculture displayed minimal changes in the last five years.
Rehabilitation/repair of existing national irrigation system
Irrigated area served (in hectares)
Source: NIA
Irrigated areas served by NIA during wet and dry seasons remained almost constant since 2004.
Remaining areas to be developed for irrigation (in hectares)
Source: NIA
Around 1.6 million hectares still to be developed for irrigation.
Raise factor productivity to approach the regional average within six years
Metric ton per hectare of Palay (MT/ha)
Source: BAS
Average corn yield inching up since 2004 but is still way below the target of 3.87 metric tons per hectare.
Civil Society Assessment of the 2004-2010 Medium Term Philippine Development Plan for Agriculture

Ass
essm
ent R
epor
t
77
Philippine Partnership for the Development of Human Resources in Rural Areas (PhilDHRRA)
22
Strategy/Target Indicator Accomplishments vs. Targets Performance
Metric ton per hectare of Corn (MT/ha)
Source: BAS
Average corn yield inching up since 2004 but is still way below the target of 3.87 metric tons per hectare.
Promote off-and-non-farm enterprises including agri-processing in the agribusiness lands to increase and stabilize rural income
Aquaculture production (in metric ton)
Source: BAS
Aquaculture production on an increasing trend from 2004 to 2008.
Inland Municipal Fisheries Production (in metric ton)
Source: BAS
Inland municipal fisheries production moving up in the last five years.
Table 21. GMA programs and priorities No. Commodity Priorities
1 Rice
• Expansion of areas planted with hybrid/certified seeds coupled with location-specific interventions (LSI)
• Restoration of Irrigation Facilities • Provision of Post-harvest Facilities • Integrated Crop Management
2 Corn
• Provision of high quality seeds (OPV, hybrid) to improve production • Provision of Recirculating Dryers and Shellers to farm clusters to reduce post-harvest losses from 15%
to 5% • Establishment of Post-harvest Processing and Trading Centers
3 HVCC • Provision of quality seeds, nurseries, greenhouses, and farm equipments • Market Development assistance
Philippine Partnership for the Development of Human Resources in Rural Areas (PhilDHRRA)
21
Strategy/Target Indicator Accomplishments vs. Targets Performance
Cost effectively develop at least two million hectares of new land for agribusiness in order to contribute two million out of the 10 million jobs targeted as a legacy by 2010
Number of employed persons in Agriculture
Source: NSO (October round of the Labor Force Survey)
Number of employed persons in agriculture displayed minimal changes in the last five years.
Rehabilitation/repair of existing national irrigation system
Irrigated area served (in hectares)
Source: NIA
Irrigated areas served by NIA during wet and dry seasons remained almost constant since 2004.
Remaining areas to be developed for irrigation (in hectares)
Source: NIA
Around 1.6 million hectares still to be developed for irrigation.
Raise factor productivity to approach the regional average within six years
Metric ton per hectare of Palay (MT/ha)
Source: BAS
Average corn yield inching up since 2004 but is still way below the target of 3.87 metric tons per hectare.
Civil Society Assessment of the 2004-2010 Medium Term Philippine Development Plan for Agriculture

Civi
l Soc
iety
Ass
essm
ent o
f the
200
4 -2
010
MTP
DP
78
Table 21. GMA programs and priorities
No. Commodity Priorities1 Rice • Expansion of areas planted with hybrid/certified seeds coupled with location-
specific interventions (LSI)• Restoration of Irrigation Facilities• Provision of Post-harvest Facilities• Integrated Crop Management
2 Corn • Provision of high quality seeds (OPV, hybrid) to improve production• Provision of Recirculating Dryers and Shellers to farm clusters to reduce post-
harvest losses from 15% to 5%• Establishment of Post-harvest Processing and Trading Centers
3 HVCC • Provision of quality seeds, nurseries, greenhouses, and farm equipments• Market Development assistance• Post-harvest assistance (e.g. cold storage, etc.)
4 Livestock • Control/prevent and eradicate animal diseases: Avian Flu, Foot and Mouth Disease, Hog Cholera, etc.
• Step-up genetic improvement program through nucleus multiplier, artificial breeding and biotechnology
• Strengthen regulatory services: certification, registration, licensing and ac-creditation
5 Fisheries • Distribute quality genetic materials for freshwater, brackish water and marine aquaculture
• Establishment of seaweed nurseries and hatcheries• Enforce stricter inspection procedures and higher product standards• Establishment of mariculture highways to link new and existing mariculture
parks
Table 22. FIELDS program and thrusts
Program ThrustFertilizer Tamang Abono Program
• Main thrust is to capacitate farmers to produce their own fertilizer to shield them from price spikes especially urea
• Interventions include establishment of community-based composting facilities, upgrading of trichoderma production laboratories and non-operational Bio-N mixing plants
Irrigation and other Infrastructure
• Priority shall be given to rehabilitation and restoration of existing national and communal irrigation systems
• New areas will be generated through the construction of small scale irrigation systems
• Continue to construct/rehabilitate farm-to-market roads, establish mariculture parks and seaweed nurseries
• Plans are underway to develop the eastern seaboardExtension, R&D, and Capacity Building
• Conduct season-long trainings for an estimated 500,000 rice farmers• Accreditation of private extension service providers to facilitate the provision
of extension servicesLoans • Make available low-cost credit to farmers through innovative financing
schemes• Intensify crop insurance system
Civil Society Assessment of the 2004-2010 Medium Term Philippine Development Plan for Agriculture

Ass
essm
ent R
epor
t
79
Dryers and other Postharvest/Post Production Facilities
• Establish appropriate integrated drying, processing and trading centers in collaboration with the private sector e.g., flatbed dryers, village-type corn cob and grain dryer, packing houses, mobile ice makers and bagsakan centers
Seeds and other Genetic Materials
• Encourage more farmers to migrate to higher yielding varieties• Support the infrastructure requirements of seed growers• Infusion of superior breeds of dairy animals to boost production of ready-to-
drink milk
Table 23. GVA as percent of GDP in selected Asian countries
Year Philippines Cambodia Indonesia Laos Malaysia Thailand Vietnam2004 15.00 29.50 14.34 46.64 8.19 10.32 21.752005 14.22 30.80 13.13 44.54 7.98 10.18 --2006 14.06 30.10 12.97 -- 7.95 10.74 --2007 14.03 29.70 13.83 -- 7.64 11.42 --2008 14.80 32.40 -- -- 7.53 -- --
Data source: ASEAN Food Security Information System
Table 24. Employment in the agriculture sector in selected Asian countries
Year Philippines Cambodia Indonesia Malaysia Thailand2004 11,359,000 9,301,000 44,838,000 1,476,000 13,634,0002005 11,834,000 9,466,000 46,594,000 1,470,000 13,617,0002006 11,640,000 9,807,000 -- 1,504,000 14,170,0002007 11,793,000 -- -- 1,558,000 14,306,0002008 11,853,000 -- -- -- 14,699,000
Data source: ASEAN Food Security Information System
Table 25. Top producing commodities in selected Asian countries
Rank Philippines Cambodia Indonesia Laos Malaysia Thailand Vietnam1 Rice Rice Rice Rice Palm oil Rice Rice2 Pig meat Cassava Palm oil Vegetable Chicken meat Cassava Pig meat3 Coconut Pig meat Coconut Tobacco Rubber Rubber Vegetable4 Banana Cattle meat Chicken meat Cattle meat Palm kernels Sugarcane Cashew nuts5 Vegetable Vegetable Rubber Pig meat Rice Chicken meat Coffee
Data source: FAO Stat
Table 26. Cost of production for rice in selected Asian countries
Year Philippines (in US$/mt) Cambodia (in US$/mt) Malaysia (in US$/mt) Thailand (in US$/mt)2004 128.29 -- 729.50 123.292005 141.28 127.80 -- 139.052006 151.41 -- 1,028.05 155.692007 174.33 -- -- 172.132008 221.62 -- -- --
Data source: ASEAN Food Security Information System
Civil Society Assessment of the 2004-2010 Medium Term Philippine Development Plan for Agriculture

Civi
l Soc
iety
Ass
essm
ent o
f the
200
4 -2
010
MTP
DP
80
Table 27. Annual yield for rice in selected Asian countries
Year Philippines Cambodia Indonesia Laos Malaysia Thailand Vietnam2004 3,513 1,977 4,531 3,283 3,235 2,970 4,8602005 3,588 2,479 4,575 3,489 3,467 2,940 4,8852006 3,684 2,489 4,620 3,348 3,236 2,988 4,8942007 3,801 2,621 4,705 3,468 3,514 2,916 4,9812008 3,770 2,746 4,834 3,550 3,584 3,009 --
Data source: ASEAN Food Security Information System
Table 28. Farmgate price of rice in selected Asian countries
Year Philippines Cambodia Indonesia Malaysia Thailand Vietnam2004 168.45 315.00 168.00 550.00 139.75 --2005 189.35 118.00 207.00 550.00 163.98 --2006 203.84 115.50 -- 650.00 172.23 --2007 243.13 136.62 -- 650.00 190.83 --2008 317.71 153.90 -- 750.00 257.61 --Trade Net importer Net exporter Net importer Net importer Net exporter Net exporter
Data source: ASEAN Food Security Information System
Table 29. Access to and government provision of support services
Support service Access Government provisionFrequency Percent (n=1,851) Frequency Percent*
Credit 820 44.3% 138 7.4%Post-harvest facilities 883 47.7% 335 37.9%
Infrastructure 1,397 75.5% 1,344 96.2%Extension services 1,127 60.9% 943 83.7%Production inputs 1,085 58.6% 579 53.4%
Post harvest facilities, infra-structures, extension services,
and production inputs
517 27.9% 184 35.6%
Data source: Philippine Asset Reform Report Card (PARRC), 2008
Table 30. Variance between farmgate and wholesale prices of selected commodities
Commodity/Crop
2005 2006 2007 2008FG WS % FG WS % FG WS % FG WS %
CerealsPalay/Rice (fancy)
11.08 25.61 131% 11.05 26.07 136% 12.39 27.37 121% 15.02 35.26 135%
Palay/Rice (other variety)
10.43 23.31 123% 10.46 24.04 130% 11.22 24.98 123% 14.13 32.92 133%
FruitsPapaya (hawaiian)
7.75 18.77 142% 6.44 21.42 233% 5.54 21.19 282% 4.78 17.30 262%
Pineapple (hawaiian)
5.24 16.55 216% 4.30 16.07 274% 4.89 17.01 248% 5.02 18.42 267%
Civil Society Assessment of the 2004-2010 Medium Term Philippine Development Plan for Agriculture

Ass
essm
ent R
epor
t
81
VegetablesCauliflower 10.65 36.68 244% 16.20 41.43 156% 16.24 41.38 155% 18.55 46.01 148%Carrot 16.75 28.12 68% 18.18 30.11 66% 15.87 30.86 94% 19.51 34.97 79%Tomato 11.66 19.43 67% 11.77 19.56 66% 11.50 19.74 72% 12.66 22.80 80%
Data source: Bureau of Agricultural Statistics (BAS)
Table 31. Poverty incidence of farmers
Region2006 2003-2006 (increase/decrease)
Poverty incidence (%)
Magnitude of poor
Poverty incidence (%)
Magnitude of poor
Philippines 44.0 2,095,646 1.6 67,957Region I 32.2 105,019 (1.2) (4,816)Region II 16.9 47,118 (2.4) (7,198)Region III 20.2 61,857 4.5 9,259Region IV-A 40.9 151,775 8.1 38,602Region IV-B 47.3 113,381 (2.6) 2,929Region V 47.4 178,374 (2.0) 3,767Region VI 39.8 156,350 (2.0) 6,415Region VII 51.4 194,811 7.3 6,722Region VIII 54.0 178,332 11.7 47,876Region IX 54.7 147,953 (11.0) (32,830)Region X 54.3 149,796 0.4 (23,842)Region XI 46.1 118,750 2.3 (5,230)Region XII 41.0 123,503 1.3 12,969CAR 46.1 74,834 4.9 9,262ARMM 62.3 212,188 4.5 25,694CARAGA 53.7 78,804 (5.9) (23,448)
Data source: National Statistical Coordination Board (NSCB)
Table 32. Employment in the agriculture sector based on gender and type of worker
Type2005 2006 2007
Women Men Women Men Women MenWage and salary 578 2,016 539 2,005 524 2,333Own account worker 881 4,384 854 4,366 891 5,238Unpaid family worker 1,585 1,320 1,636 1,354 1,663 1,511
Civil Society Assessment of the 2004-2010 Medium Term Philippine Development Plan for Agriculture

Civi
l Soc
iety
Ass
essm
ent o
f the
200
4 -2
010
MTP
DP
82

Ass
essm
ent R
epor
t
83
I. INTRODUCTION
The Philippines is naturally endowed with rich coastal resources. It has a coastline of 17,460 kilometers. Its territorial waters including its Exclusive Economic Zone (EEZ) total 2.2 million square kilometers; of this, 226,000 square kilometers are coastal while the rest are oceanic (CNFIDP, 2007:19). The country’s coral reef areas are considered to be the most extensive, second only to neighboring Indonesia. It has large tracts of mangrove forests and sizable sea grass areas scattered around its coasts. In fact, the country is considered to be the apex of the Coral Triangle, which is recognized as the world’s center of marine biodiversity (National Plan of Action for the Coral Triangle Initiative on Coral Reefs, Fisheries and Food Security, 2009:1).
To date, over 70 percent of coral reefs in the country are in poor condition; less than 5 percent are in excellent condition (Licuanan and Gomez, 2002). Only half of the 978 square kilometers of sea grass beds in 96 surveyed sites have remained; the rest have been lost or severely degraded over the past 56 years (as cited in Fortes and Santos, 2004:90). Equally alarming is the fact that out of the estimated 450,000 hectares of mangroves recorded in 1918, less than 140,000 hectares exist today (White and de Leon, 1996:84). Notably, the degradation of these critical ecosystems is largely attributed to anthropogenic factors. For example, the destruction of coral reefs is mostly attributed to cyanide squirting and dynamite blasting. Scientific evidence like the government initiated National Stock Assessment Program (NSAP) of the Department of Agriculture-Bureau of Fisheries and Aquatic Resources (DA-BFAR) substantiate the declining health of coastal resources. Out of the 12 major fishing grounds included in the study, more than two thirds have reached their sustainable limits.
On the other hand, the increase in human population in areas close to inland waters, shallow bays, lagoons and islands bordered by sea grass beds has resulted in coastal eutrophication or nutrient loading2. Increase in coastal construction and economic activities near bays and gulfs have significantly contributed to pollution and contamination of nearshore waters. The rapid decline of mangrove resources, on one hand, was attributed to government policies of expanding aquaculture in the 1960s and 1970s, which led to the clearing of mangrove areas for fishponds. The cutting of mangrove trees for fuel wood, charcoal production and house materials, on the other hand, have aggravated these conditions.
II. POLICY FRAMEWORK: THE MEDIUM TERM PHILIPPINE DEVELOPMENT PLAN
The updated Medium Term Philippine Development Plan (MTPDP) 2004-2010 ‘focuses on economic growth and job creation: energy, education and youth opportunity. It highlights the need for agriculture sector (including fisheries) modernization to raise farmers’ (and fishers’) incomes and to upgrade rural welfare... The MTPDP emphasizes the need to sustainably manage natural resources because a significant number of Filipinos
Civil Society Assessment of the 2004-2010 Medium Term Philippine Development Plan for the Fisheries Sector: The Troubled Waters of Philippine Fisheries1
1Prepared by Dennis Calvan, NGOs for Fisheries Reform (NFR)2According to Fortes and Santos (2004), coastal eutrophication or nutrient loading results from wastewaters which reach the coasts from industrial, commercial and domestic facilities, inadequate septic systems, boat discharge of human and fish wastes, and storm drain runoff carrying organic wastes and fertilizers. The direct impact of this is the enhancement of growth in many plant forms resulting in reduction of light. Fortes and Santos ultimately blame the increasing population density as the primary cause of coastal nutrient loading.

Civi
l Soc
iety
Ass
essm
ent o
f the
200
4 -2
010
MTP
DP
84
depend on these resources for income and food sustenance. The MTPDP cited that ‘The underutilization and mismanagement of the country’s abundant natural resources is a major cause of poverty, particularly in the countryside.’
However, non-recognition on the part of the national government on the real status of coastal resources makes the MTPDP miss its targets. The MTPDP cited that ‘Its (natural resources) potential to sustain poverty alleviation programs has not been fully explored.’ However, the fact that most major Philippine fishing grounds have reached their maximum potential indicates that these resources are already fully exploited. The
government’s policy to intensify resource exploitation to shore up revenues has meant an increase in resource extractive activities relating to offshore mining explorations and establishment of marine culture parks, which showed more adverse effects to the environment and to people who depend on it than benefits in terms of employment generation and livelihood opportunities for fisherfolk. Several government interventions were initiated to support government’s policies on coastal resources. The Agriculture and Fisheries Modernization Act (AFMA) provides mechanisms to improve infrastructures and technologies (i.e. sea to market roads, post harvest facilities and improved technological capabilities of fisherfolk) to enhance productivity. On the other hand, the Philippine Fisheries Code provided regulatory measures to reduce fishing efforts and addresses the de facto ‘open access’ of Philippine waters. The recent government initiative includes the Comprehensive National Fisheries Industry Development Plan (CNFIDP), a 25-year development plan by the Department of Agriculture-Bureau of Fisheries and Aquatic Resources (BFAR) for the fisheries industry. The Coral Triangle Initiative, on the other hand, is a regional agreement that seeks to preserve and conserve marine biodiversity.
All of them, however, fell short in arresting the declining health of coastal resources. They also failed to improve the lives of fishing families dependent on these resources. This paper is an attempt to show how government’s policies and programs failed to meet up to their expectations by using secondary data produced by the government and civil society organizations.
III. OVERALL ASSESSMENT: PERFORMANCE AND ACCOMPLISHMENT VIS-À-VIS MTPDP TARGETS IN 2004-2010
For the purpose of this paper, three pillars are used to assess the MTPDP in the fisheries sector, namely: (1) Reducing Poverty and Inequality; (2) Promoting a Sustainable Economy; and (3) Ensuring empowerment and democratization.
Poverty Alleviation Program in the Fisheries Sector
Poverty in the Philippines continues to be a grave and immediate concern. The government claimed that the country has made significant progress to improve its poverty situation by pointing out that ‘the proportion of the population living below US$1.25-a-day declined from 34.9 percent in 1985 to 22.6 percent in 2006, or a reduction of about 2 percent per year over the two decades’ (KALAHI-CIDSS, 2009). However, Balisacan (2009) showed that despite reported improvements in economic performance as reflected in the historic increase in Gross Domestic Product (GDP) from 2000 to 2006, poverty remains widespread. Notably, poverty predominates in rural areas, where populations face declining agricultural productivity and resource degradation.
The Millennium Development Goal (MDG), the overall framework of the MTPDP, envisions to reduce the population living in poverty by half in 2015. Based on government reports, this first MDG target is attainable. Notably, despite government claims of in combating poverty, poverty conditions across sectors are disturbing. Based on the National Statistical Coordination Board (NSCB, 2006), all sectors posted increases in poverty incidence between the period 2003 and 2006. The fisherfolk, children and farmers are the three poorest sectors in the country. The poorest fisherfolk are found in the CARAGA Region, the Autonomous Region of Muslim Mindanao (ARMM) and the Bicol Region (See Table 1).
Civil Society Assessment of the 2004-2010 Medium Term Philippine Development Plan for the Fisheries Sector: The Troubled Waters of Philippine Fisheries

Ass
essm
ent R
epor
t
85
Table 1. Poverty Incidence and Poorest Regions in the Philippines, 2006
Sector Poverty Incidence RegionHighest Lowest Poorest Least Poor
Fisherfolk 66.9 23.9 1. CARAGA2. ARMM3. REGION V
1. REGION III 2. REGION II3. NCR
Children 66.3 15.2 1. ARMM 2. REGION IVB 3. REGION VIII
1. NCR 2. REGION III3. REGION IVA
Farmers 62.3 16.9 1. ARMM 2. REGION IX 3. REGION X
1. REGION II2. REGION III 3. REGION I
Women 58.9 9.7 1. ARMM 2. REGION IVB 3. CARAGA
1. NCR 2. REGION III3. REGION IVA
Source: NSCB, 2006 Poverty Statistics for the Basic Sectors.
Table 2 indicates that if we take the three poorest regions in the country, several coastal municipalities need to be considered in the poverty alleviation programs of the national government. The CARAGA is the poorest region in the country. This means that in the region, which is composed of the provinces of Agusan del Sur, Agusan del Norte, Surigao del Sur, Surigao del Norte and Butuan City, around 49 coastal municipalities fall under extreme poverty conditions. On one hand, the ARMM provinces, which include Maguindanao, Shariff Kabunsuan, Lanao del Sur, Basilan, Sulu, and Tawi-Tawi, have 62 coastal municipalities living in poverty. The Bicol Region, on the other hand, which is comprised of Albay, Camarines Sur, Camarines Norte, Catanduanes, Masbate and Sorsogon, have 89 impoverished coastal municipalities.
Table 2. Number of Coastal Provinces and Municipalities in the Poorest Regions
Regions Provinces Coastal MunicipalitiesCARAGA Agusan del Sur NAD
Agusan del Norte 8Surigao del Sur 25
Surigao del Norte 16Butuan City NAD
ARMM Maguindanao 6Shariff Kabunsuan NAD
Lanao del Sur 22Basilan 7
Sulu 17Tawi-Tawi 10
Bicol Region Albay 13Camarines Sur 22
Camarines Norte 9Catanduanes 10
Masbate 21Sorsogon 14
Source: National Mapping Resources and Information Authority, 2008.
Civil Society Assessment of the 2004-2010 Medium Term Philippine Development Plan for the Fisheries Sector: The Troubled Waters of Philippine Fisheries

Civi
l Soc
iety
Ass
essm
ent o
f the
200
4 -2
010
MTP
DP
86
It is of particular interest to know how government programs effectively reach these coastal municipalities in the three poorest regions in the country. More particularly, it may be helpful to take a closer look at the Kapit Bisig Laban sa Kahirapan (KALAHI), the country’s over-all poverty alleviation strategy, and how it has fared in addressing poverty in coastal communities. According to the Department of Social Welfare and Development (DSWD), as of 2008 the KALAHI-Comprehensive and Integrated Delivery of Social Services (KALAHI-CIDSS) has been implemented in 12 regions, 42 provinces, 184 municipalities and 4,229 barangays. They covered the three poorest regions and the 17 provinces that comprised them. Unfortunately, there is no data on whether KALAHI-CIDSS reached all the coastal municipalities within these provinces.
Job Creation in the Fisheries Sector
Aside from improving access to basic social services, another poverty reduction strategy is to create employment opportunities to improve the income of fisherfolk. Based on BFAR data, the number of fisherfolk in 2003 is estimated to be around 990,872. Municipal fisherfolk comprised 675,677 (69.18 percent) followed by aquaculture workers and commercial fisherfolk (See Table 3).
Table 3. Number of Fisherfolks by Type (2003)
Types Number PercentageMunicipal Fisherfolk 675,677 68.19
Fishfarmers (Aquaculture Workers)
258,480 26.09
Commercial Fisheries 56,715 5.72Total 990,872 100.00
Source: BFAR
It is interesting to note that for the past several years the government has claimed to undertake measures towards creating employment in the fisheries sector. Based on government’s report, ‘the farm and fisheries sector created additional 412,000 jobs for the first quarter of 2009’ (claimed by Albay Governor Joey Salceda as cited in Manila Times, July 22, 2009). Governor Salceda, citing data from the Bureau of Labor and Employment Statistics, reported that employment in the farm and fisheries sector as of April 2009 was estimated to reach 12.318 million. He claimed that this is higher by 3.14 percent compared to 11.905 million for the same period last year.
However, figures from the Bureau of Labor and Employment Statistics on employment in the fishery sector between 2007-2009 is erratic. Improvement in employment numbers can be observed instead in the agriculture, hunting and forestry sector. For instance, in 2009, there are 12.31million persons employed for the agriculture, fishery and forestry. Of this, 10.84 million is attributed to agriculture, hunting and forestry. On the other hand, only 1.47 million employment is attributed to the fisheries sector. The year on year growth rate for the latter is 1.3 percent only compared to the agriculture, hunting and forestry which is 3.7 percent (See Table 4). Unfortunately, the information on employment generation in the fisheries sector is unavailable because most of the countries do not report the number of fishworkers and farmworkers. Thus, comparison on employment generated across countries cannot be made in this paper.
Table 4. Summary Statistics on Employment: 2007, 2008 and 2009
Sector 2009 2008 2007 Increment (2007-2009)
Year on Year Growth Rate (%)
Agriculture, Fishery and Forestry 12,313 11,905 11,853 408 3.4Agriculture, Hunting and Forestry 10,840 10,450 10,287 390 3.7
Fishing 1,473 1,454 1,566 19 1.3
Civil Society Assessment of the 2004-2010 Medium Term Philippine Development Plan for the Fisheries Sector: The Troubled Waters of Philippine Fisheries

Ass
essm
ent R
epor
t
87
Claims of employment generation failed to show what types of jobs and where these jobs were created. Were these claims accurate, however, additional jobs in the fisheries would not come from municipal fisheries because of declining fish catch. It would come from marine culture parks that are heavily promoted by the DA-BFAR. As of April 30, 2009, BFAR recorded around 56 mariculture parks, of which 40 have already been established; the other 16 have yet to be launched3. If we go back to the three poorest regions, there are around 4 mariculture parks in the CARAGA Region, 2 in ARMM and 5 in the Bicol Region (See Figure 1).
Figure 1.
Table 4. Summary Statistics on Employment: 2007, 2008 and 2009 Sector 2009 2008 2007 Increment
(2007-2009) Year on Year Growth Rate
(%)Agriculture,Fishery and
Forestry
12,313 11,905 11,853 408 3.4
Agriculture,Hunting and
Forestry
10,840 10,450 10,287 390 3.7
Fishing 1,473 1,454 1,566 19 1.3
Claims of employment generation failed to show what types of jobs and where these jobs were created. Were these claims accurate, however, additional jobs in the fisheries would not come from municipal fisheries because of declining fish catch. It would come from marine culture parks that are heavily promoted by the DA-BFAR. As of April 30, 2009, BFAR recorded around 56 mariculture parks, of which 40 have already been established; the other 16 have yet to be launched3. If we go back to the three poorest regions, there are around 4 mariculture parks in the CARAGA Region, 2 in ARMM and 5 in the Bicol Region (See Figure 1).
Figure 1.
Source: Presentation of Dir. Gil Adora of BFAR during the 2nd Conference of Coastal Municipalities in the Philippines held last June 28-30, 2009.
5
3 A marine culture park or zone is a marine-based industrial estate not less than 200 hectares; subdivided into farm plots for mariculture activities. It has communal storm resistant mooring system and boundary markers.
Source: Presentation of Dir. Gil Adora of BFAR during the 2nd Conference of Coastal Municipalities in the Philippines held last June 28-30, 2009.
The establishment of marine culture parks is one of the major programs included in the CNFIDP. The program is one of the crown jewels of a bigger government program called GMA Makamasa Program and BFAR’s Aquaculture for Rural Development Program (ARD). The latter is instrumental in the increase in aquaculture production over the past years. In 2006, total fisheries production was estimated to reach 4.4 million metric tons, of which aquaculture contributed 2.09 million metric tons or 47 percent. The municipal fisheries contributed 1.23 million metric tons or 28 percent and commercial fisheries contributed 1.08 million metric tons or 24 percent (Kilusang Mangingisda, 2008).
Suppose it is assumed that new jobs were actually created in aquaculture, the effectiveness of ARD is still doubtful because of several reasons. Primarily, the establishment of marine culture parks requires high capitalization. It is estimated that around Php500,000 to over a million pesos is needed to operate one marine culture park depending on its size. Undoubtedly, municipal fisherfolk, who comprise the majority of the fisheries sector will not gain anything from these programs. Moreover, the social and environmental costs of aquaculture are not taken into account. It is feared that mangrove conversions, reduced fishing grounds, salinization of drinking water, and marine pollution are among the expected effects of coastal construction.
Population Increase and Access to Health Services in Fishing Communities
It is widely acknowledged that uncontrolled population growth is inextricably linked with poverty. It is believed that ‘at any level of development, increase in population will lead to the increase in energy use, resource consumption, and environmental stress’ (UNFPA, 1992:14). This is the cycle of poverty in the fisheries sector, where too many fisherfolk compete over limited resources. To date, there are more than 80 million Filipinos. Population continues to grow with an average population growth rate of 2.03 percent per annum. The total population residing in coastal areas was estimated at around 43 million in 2005. By 2020, the coastal population is estimated to reach
3A marine culture park or zone is a marine-based industrial estate not less than 200 hectares; subdivided into farm plots for mariculture activities. It has communal storm resistant mooring system and boundary markers.
Civil Society Assessment of the 2004-2010 Medium Term Philippine Development Plan for the Fisheries Sector: The Troubled Waters of Philippine Fisheries

Civi
l Soc
iety
Ass
essm
ent o
f the
200
4 -2
010
MTP
DP
88
up to 55 million. The annual population growth rate in coastal areas is 2.26 percent. In 2000, the population density is 286 persons per square kilometres (See Table 4).
Table 4. Population Density in Coastal Areas
Parameter 2000 2005 2010 2015 2020Population NationalCoastal AreasNon-Coastal Areas
76,498,73539,007,90537,490,830
84,299,00042,992,49041,306,510
92,736,00047,295,36045,440,640
100,571,00051,291,21049,279,790
108,210,00055,187,10053,022,900
Land Area (square kilometers)NationalCoastal AreasNon-Coastal Areas
300,000136,400163,600
300,000136,400163,600
300,000136,400163,600
300,000136,400163,600
300,000136,400163,600
Population Density (Person per square kilometersNationalCoastal AreasNon-Coastal Areas
255286229
281315252
309347278
335376301
361405324
Source: ArcDev, 2003.
The continuing population increase in fishing communities and its role as a contributing factor in resource degradation in the Philippines is heavily documented. McNally, et al. (2002) used census data, survey and ethnographic information to understand the impact of rapid in-migration and growth of population on the ‘ability of the environment to adapt and accommodate growth’ in Palawan. The study revealed that 80 percent of its 200 respondents from Puerto Princesa City, Ulugan Bay and St. Lourdes were migrants. According to the study, around 70 percent of the migrants had established strong kin networks in Palawan, while ‘breaking of ties with the place of origin’. In other words, ‘the move to Palawan was a permanent one for most migrants’ (McNally et. al., 2002:19). As migration became ‘permanent’ and as population increased with the birth of the second and third generation of migrants, the coastal resources of Palawan became depleted. The environment was not able to adapt with the sudden increase in population through migration. The study also noted that the migrants brought with them ‘new resource extraction techniques’, which were more efficient and more destructive than those previously employed by local residents. This promoted conflicts between the migrants and the local residents. Campos (as cited from SEARCA: 2004) noted that in the coastal municipalities of Real, Infanta, and Polillo in the Quezon Province, increase in population, the number of sustenance fishermen, the number of boats in operation and unregulated fishing also contributed to the decline in fishing outputs (SEARCA: 2004). Furthermore, the increase in population also brought about a corresponding increase in the demand for decent human settlement along the coasts. This, in turn, threatened the mangrove areas near the emerging coastal communities.
The Mangrove Inventory and Valuation Study conducted by the Institute of Social Order (ISO) and the Integrated Fisheries and Aquatic Resources and Management Council in Northern Lamon Bay (IFAMC-NLB) in Quezon also indicated that the utilization of mangrove trees for charcoal production and house construction, as well as the conversion of mangrove forests for other uses resulted in the disturbance of mangrove ecosystems in the eight municipalities of Northern Lamon Bay in Quezon (ISO-IFAMC-NLB, 2006). In many cases, these led to the loss of some endemic mangrove species. Furthermore, the use of mangrove forests as public latrines caused the spread of communicable diseases particularly among children.
Unfortunately, efforts to integrate environmental management with population management are lacking. This could be attributed to the lack of an integrated policy framework that consciously links the two at the national or even at the local level. At present, national policies on environmental management and protection at least provide the local government units (LGUs) with basis for law enforcement and program implementation. The same cannot be said about population management, however. Based on the study, the lack of a unified stand on
Civil Society Assessment of the 2004-2010 Medium Term Philippine Development Plan for the Fisheries Sector: The Troubled Waters of Philippine Fisheries

Ass
essm
ent R
epor
t
89
population management at the national level makes them indifferent to the issue. Consequently, this translates to minimum information dissemination on the matter. Furthermore, information on family planning methods relatively acceptable to all stakeholders such as the natural family planning method is not made available to the people. This is further aggravated by the lack of medical and health structures and personnel who can actually provide information and services to the local people. As a result, people turn to rural health workers with less training for these services. Some, especially the poor fishing families, opt not to avail of such services at all.
The lack of a national policy framework is aggravated by the lack of databases on both population/reproductive health, as well as the conditions of natural resources at the local level. Existing data are outdated, incomplete, and inconsistent. These make it difficult for the LGUs to come up with responsive local policies and programs addressing population management and natural resource protection.
Environmental Sustainability
Several human-induced stresses led to a decline in the health of coastal ecosystems. The practice of dynamite fishing and cyanide squirting destroyed coral reefs. Cutting of mangrove trees for house construction materials and conversion to fishponds in the past resulted in poor mangrove stand. Population increase and massive coastal construction changed the bio-physical features of coastal communities. This is further compounded by the effects of sea level rise and increase in sea temperature due to climate change.
Scientific evidence like the government-initiated National Stock Assessment Program (NSAP) of the Department of Agriculture-Bureau of Fisheries and Aquatic Resources (DA-BFAR) substantiate the declining health of coastal resources. Out of the 12 major fishing grounds included in the study, more than two thirds had reached their sustainable limits. Of these, only the waters near Camiguin Island and Macajalar Bay are in sustainable conditions (See Figure 2). Despite constant prodding by the NGOs for Fisheries Reform (NFR), the DA-BFAR has yet to release the NSAP results due to fisheries trade implications. They argue that trade partners like the European countries will not import fisheries products from the Philippines if the country announces that its fishing grounds are already overfished.
Several human-induced stresses led to a decline in the health of coastal ecosystems. The practice of dynamite �shing and cyanide squirting destroyed coral reefs. Cutting of mangrove trees for house construction materials and conversion to �shponds in the past resulted in poor mangrove stand. Population increase and massive coastal construction changed the bio-physical features of coastal communities. This is further compounded by the e�ects of sea level rise and increase in sea temperature due to climate change. Scienti�c evidence like the government-initiated National Stock Assessment Program (NSAP) of the Department of Agriculture-Bureau of Fisheries and Aquatic Resources (DA-BFAR) substantiate the declining health of coastal resources. Out of the 12 major �shing grounds included in the study, more than two thirds had reached their sustainable limits. Of these, only the waters near Camiguin Island and Macajalar Bay are in sustainable conditions (See Figure 2). Despite constant prodding by the NGOs for Fisheries Reform (NFR), the DA-BFAR has yet to release the NSAP results due to �sheries trade implications. They argue that trade partners like the European countries will not import �sheries products from the Philippines if the country announces that its �shing grounds are already over�shed.
Figure 2.
Source: BFAR NFRDI, 2009.
8
This is supported by the data from the Bureau of Agricultural Statistics, which showed that the aquaculture subsector registered the highest production in terms of quantity but not so much of value. In 2008, for instance,
Civil Society Assessment of the 2004-2010 Medium Term Philippine Development Plan for the Fisheries Sector: The Troubled Waters of Philippine Fisheries

Civi
l Soc
iety
Ass
essm
ent o
f the
200
4 -2
010
MTP
DP
90
the aquaculture sector produced 2,407.7 million metric tons compared to 1,332.9 and 1,225.2 metric tons in municipal and commercial sub-sector, respectively (See Table 5).
Table 5. QUANTITY AND VALUE OF FISH PRODUCTION, by Type of Fishing Operation(1998-2008)
Year Total Commercial Fishing Municipal Fishing AquacultureQuantity Value Quantity Value Quantity Value Quantity Value
1998 2,829.5 85,133.1 940.5 29,737.1 891.1 28,966.5 997.8 26,429.5 1999 2,923.8 92,322.3 948.8 32,242.1 926.3 31,034.1 1,048.7 29,046.1 2000 2,993.3 98,622.1 946.5 33,878.7 945.9 32,595.6 1,100.9 32,147.9 2001 3,166.5 107,193.8 976.5 36,088.7 969.5 34,221.7 1,220.5 36,883.4 2002 3,369.5 113,258.2 1,042.2 39,681.2 988.9 38,158.9 1,338.2 35,418.22003 3,619.3 119,866.3 1,109.6 42,002.9 1,055.1 40,664.3 1,454.5 37,199.12004 3,926.1 138,846.5 1,128.4 48,349.3 1,080.7 45,674.9 1,717.0 44,822.3 2005 4,161.8 146,392.9 1,134.0 47,272.7 1,132.0 49,950.4 1,895.8 49,169.8 2006 4,408.5 163,374.4 1,080.7 48,555.9 1,235.5 59,146.6 2,092.3 55,671.9 2007 4,711.3 180,545.2 1,192.1 54,737.5 1,304.4 64,210.4 2,214.8 61,597.3 2008 4,965.8 215,511.1 1,225.2 63,025.7 1,332.9 70,967.0 2,407.7 81,518.4Source: Bureau of Agricultural Statistics, 2008.
It will not be a surprise that government policy focusing on aquaculture will guide fisheries industry development for years to come. It is because aquaculture is one of the emerging dollar generating industries that the Philippines is believed to have a comparative advantage. In fact, the Philippines is reported to be one of the top ten producing countries in terms of quantity for 2004-2006 (World Review of Fisheries and Aquaculture, 2008:19). It registered an annual average growth rate of 10.32 (See Table 6).
Table 6. Top Ten Aquaculture Producers of Food Fish Supply, in terms of Quantity
Countries Top Ten Producers in terms of Quantity
2004 2006Average Annual
Percentage Growth Rate
China 30,614,968 34,429,122 6.05India 2,794,636 3,123,135 5.71
Vietnam 1,198,617 1,657,727 17.60Thailand 1,259,983 1,385,801 4.87Indonesia 1,045,051 1,292,899 11.23
Bangladesh 914,752 892,049 -1.25Chile 665,421 804,410 9.81Japan 776,421 733,891 -2.78
Norway 636,802 708,780 5.50Philippines 512,220 623,369 10.32
Unfortunately, issues on aquaculture are numerous and complex. For one, the establishment of mariculture parks require high capitalization, which the municipal fisherfolk cannot afford. In addition, the environmental costs
Civil Society Assessment of the 2004-2010 Medium Term Philippine Development Plan for the Fisheries Sector: The Troubled Waters of Philippine Fisheries

Ass
essm
ent R
epor
t
91
(marine pollution) and social costs (displacement of municipal fisherfolk from their traditional fishing grounds) need to be considered in aquaculture. Again, the municipal fisherfolk are left out in the development process.
Better resource management practices have been proposed through a number of programs initiated by the academe, non-government organizations and the peoples’ organizations. For one, the no-take zone marine reserve concept of Dr. Angel Alcala is acclaimed for the protection and management of remaining coral reefs in Apo Island in Negros. The establishment of marine reserves has led to an observed increase in fish stocks within the Apo Island fishing grounds. It is believed that catch-per-unit-effort more than tripled after more than 10 years of establishing the marine reserves. There are also significant gains from the implementation of Community-Based Coastal Resource Management (CB-CRM), which adheres to a bottom-up approach in resource management. These gains can be observed in the experiences of different NGOs namely: the Institute of Social Order (ISO) in the Municipality of Mercedes in Camarines Norte and Municipality of Panukulan in Quezon; the Center for Empowerment and Research Development (CERD) in the Municipality of Mondragon in Western Samar and Municipality of Hinatuan in Surigao del Sur; the Sentro sa Ikauunlad ng Agham at Teknolohiya (SIKAT) in the Municipality of Romblon in Romblon and the Municipality of Candelaria in Zambales; and the Tambuyog Development Center in Tañon Strait and in the Province of Quezon. These are but a few of the organizations that have implemented CB-CRM and effected change in the income and livelihoods of fishing families.
Minimal Budget Allocation for Fisheries
The sincerity of the government to respond to the declining health of coastal resources is further questioned in view of the miniscule budget allocated for BFAR’s fishery management activities. The NFR study notes that from the period 2005-2009, BFAR’s regular budget was next to nil. BFAR’s budget comprised 13.7 percent of the total budget of DA in 2008. The following year, BFAR’s budget was 13 percent of the total budget of DA. In terms of budget allocation for fisheries modernization, this decreased from 5.13 percent of the total AFMA budget in 2008 to 4.26 percent of the total AFMA budget in 2009 (See Table 7).
Table 7. DA and BFAR Regular Budget in Pesos (2005-2009)REGULAR BUDGET
AGENCY and ITEM 2005
2006 (reenacted) 2007 2008 2009
TOTAL DA 2,916,015,000 2,916,015,000 3,111,308,000 3,198,643,000 3,615,228,000 Department of
Agriculture (OSEC) 2,056,783,000 2,056,783,000 2,228,408,000 2,305,085,000 2,520,201,000
Bureau of Fisheries and
Aquatic Resources
418,896,000 (14.36%)
418,896,000 (14.36%)
440,903,000 (14.17%)
438,338,000 (13.7%)
469,998,000 (13%)
AFMA
AGENCY and ITEM 2005
2006 (reenacted) 2007 2008 2009
Total AFMA 10,261,068,000 10,261,068,000 19,600,358,000 23,343,840,000 44,474,644,000 TOTAL DA 11,029,225,000 11,029,225,000 14,190,734,000 21,608,404,000 37,606,066,000
Department of Agriculture
(OSEC) 10,030,878,000 10,030,878,000 13,065,616,000 20,200,292,000 33,893,456,000 Bureau of
Fisheries and Aquatic
Resources 829,268,000
(8%) 829,268,000
(8%) 914,388,000
(4.6%) 1,199,180,000
(5.13%) 1,897,608,000
(4.26%) Source: Department of Budget and Management
Civil Society Assessment of the 2004-2010 Medium Term Philippine Development Plan for the Fisheries Sector: The Troubled Waters of Philippine Fisheries

Civi
l Soc
iety
Ass
essm
ent o
f the
200
4 -2
010
MTP
DP
92
Figure 3 shows that despite a significant increase in budget allocation for DA, a minimal increase is observed in the BFAR budget. The NFR study also notes that BFAR spend less than its approved budget. This makes it difficult for BFAR to demand budget allocation increases.
11
AGENCY and ITEM 2005
2006 (reenacted) 2007 2008 2009
Total AFMA 10,261,068,000 10,261,068,000 19,600,358,000 23,343,840,000 44,474,644,000 TOTAL DA 11,029,225,000 11,029,225,000 14,190,734,000 21,608,404,000 37,606,066,000
Department of Agriculture
(OSEC) 10,030,878,000 10,030,878,000 13,065,616,000 20,200,292,000 33,893,456,000 Bureau of
Fisheries and Aquatic
Resources 829,268,000
(8%) 829,268,000
(8%) 914,388,000
(4.6%) 1,199,180,000
(5.13%) 1,897,608,000
(4.26%) Source: Department of Budget and Management Figure 3 shows that despite a signi�cant increase in budget allocation for DA, a minimal increase is observed in the BFAR budget. The NFR study also notes that BFAR spend less than its approved budget. This makes it di�cult for BFAR to demand budget allocation increases.
Figure 3
Source: Department of Budget and Management It is a surprise that the budget allocation for �sheries is so small given the �nancial support needed for �sheries management e�orts. Fishery law enforcement activities involve, and necessarilly require funds for, patrolling and surveillance. Management of marine protected areas also need �nancial support for monitoring and assessment. Fisherfolk are demanding the immediate implementation of livelihood projects that will help them deal with declining �sh catch and the decrease in their income from �shing. The LGUs are in dire need of help from the national government, a fact pointed out by former Secretary Emilia Boncodin during the 2nd Conference of Coastal Municipalities. She pointed out that based on her 2008 preliminary data, a measly 0.2 percent budget allocation of LGU is observed. She also admitted that getting foreign assistance for �sheries has become problematic; only one project was approved in 2009.
It is a surprise that the budget allocation for fisheries is so small given the financial support needed for fisheries management efforts. Fishery law enforcement activities involve, and necessarilly require funds for, patrolling and surveillance. Management of marine protected areas also need financial support for monitoring and assessment. Fisherfolk are demanding the immediate implementation of livelihood projects that will help them deal with declining fish catch and the decrease in their income from fishing. The LGUs are in dire need of help from the national government, a fact pointed out by former Secretary Emilia Boncodin during the 2nd Conference of Coastal Municipalities. She pointed out that based on her 2008 preliminary data, a measly 0.2 percent budget allocation of LGU is observed. She also admitted that getting foreign assistance for fisheries has become problematic; only one project was approved in 2009.
The remaining reliable source of available funds then is from the regular budget of DA. The problem now is how to utilize these limited resources to improve fisheries conditions in the country.
Minimal Improvement in Asset Reform
Asset reform for fisherfolks is key to any poverty alleviation strategy. However, it is considered more as a fisheries management strategy because of the unique nature of fisheries. People who depend solely on coastal resources need to sustainably manage these resources to maintain productivity. It is difficult to separate access to assets like municipal waters from issues relating to fisheries management.
The MTPDP clearly stipulates that the national government will complete the municipal water delineation. This policy mandate emanates from the Local Government Code of 1991 and the Philippine Fisheries Code of 1998. Unfortunately, the delineation of municipal waters has yet to be completed. As of March 25, 2009, the NAMRIA reported that it had completed mapping and delineating 918 municipalities in 66 coastal provinces in the Philippines. Of the 918 municipalities, 435 are without offshore islands, 182 are with overlapping waters and 301 are with offshore islands. It facilitated around revisions on mapping of 275 municipal and city governments. However, in order to complete the delineation process, LGUs need to pass ordinances stipulating its municipal territorial boundaries. Unfortunately, only 31 municipalities have done this based on NAMRIA data.
Civil Society Assessment of the 2004-2010 Medium Term Philippine Development Plan for the Fisheries Sector: The Troubled Waters of Philippine Fisheries

Ass
essm
ent R
epor
t
93
The Philippine government signed Republic Act (RA) 9522 or the Archipelagic Baseline Law, which adopts the archipelagic principle in delineating the country’s territorial boundaries. The passage of the Baseline Law should have been complemented by a policy guideline on municipal water delineation of municipalities with offshore islands. The same archipelagic principle should have been applied to the delineation of municipal water boundaries.
On the other hand, the Philippine Asset Reform Report Card (PARRC) in 2008, in which the NGOs for Fisheries Reform (NFR) had participated as part of the research team, showed that 66 municipalities or 71.7 percent of the 92 target municipalities of the study were mapped by the National Mapping and Resource Information Authority (NAMRIA). However, only 44 municipalities or 66.7 percent of those mapped were able to pass an ordinance thus completing the process of delineation. The study only included 10 percent of the 915 coastal cities and municipalities in the Philippines, which indicates that complete delineation of municipal waters is yet to be achieved in the country. Moreover, the results of local consultations on the delineation of municipal waters conducted by the NFR in 2008 showed that out of the 366 coastal municipalities in the 19 major fishing grounds in the Philippines, only 17 municipalities or a dismal 4.64 percent had completed the delineation process.
The same dismal situation can be observed in terms of fisherfolk settlement. Section 108 of the Philippine Fisheries Code of 1998 mandates the DA-BFAR to provide safe and secure fisherfolk settlement. Unfortunately, BFAR has not done anything tangible in this area despite the fact that an overwhelming number of fisherfolk are affected by tenurial insecurity. Based on the PARRC report, out of the 92 respondents, 80 respondents or 87 percent said that there are fisherfolk in their community who are informal settlers. Around 64 or 69.6 percent are in danger of eviction. Minimal improvement in asset reform in the fisheries sector is attributed to several factors. The absence of clear guidelines on the municipal water delineation of municipalities with offshore islands is the primary contributing factor. This is due to the revocation of Department Order (DAO) 17 issued by the Department of Environment and Natural Resources (DENR) in 2001 because of a technicality. DAO 17 clearly stipulated that the reckoning point in the delineation of municipal waters in municipalities with offshore islands starts from the farthest island. However, pressure applied by the commercial fisheries sub-sector led to the revocation of the order. They claimed that implementing DAO-17 will reduce their fishing grounds. At present, only guidelines for municipal water delineation (DAO-01 series of 2004) of municipalities without offshore islands have been released. Of the 915 coastal municipalities and cities, 432 are without offshore islands and thus covered by DAO-01. Guidelines on municipal water delineation of the other 483 municipalities with offshore islands and overlapping waters have yet to be released.
The failure to secure fisherfolk settlements is rooted in the BFAR’s lack of appreciation of the issue. In fact, fisherfolk settlement is not included in the CNFIDP, which is supposed to be the 25 year development plan for the fisheries industry. The fisherfolk remain ambivalent about CNFIDP because of its notable weaknesses. Moreover, BFAR reports that more than 80 percent of coastal dwellers live in low lying fishing areas, making them vulnerable to the negative impact of sea-level rise and extreme weather conditions. The importance of fisherfolk settlement is thus underscored.
Little Room for Women Fisherfolk Participation
The CNFIDP lacks provisions to improve the plight of women fisherfolk and to reclaim their management roles in fishing communities. Contrary to popular belief, women in coastal zones are directly and indirectly engaged in fishing activities. Aside from fishing, they are also tasked with household chores and child rearing. Government response to the plight of women fisherfolk is dismal. This is surprising since the MTPDP targets profess to promote gender equality and women empowerment as envisioned in the MDG.
... Only 17 municipalities or 4.64 percent had completed the delineation process.
Civil Society Assessment of the 2004-2010 Medium Term Philippine Development Plan for the Fisheries Sector: The Troubled Waters of Philippine Fisheries

Civi
l Soc
iety
Ass
essm
ent o
f the
200
4 -2
010
MTP
DP
94
This dismal showing can be traced to a number of fishery-related laws like AFMA and the Fisheries Code, which are notably silent in improving women fisherfolk’s plights. For AFMA, several aspects have been noted. For one, the law does not provide how men and women fisherfolk will fit in the different management structures being proposed. Thus, their participation is relegated to consultations and dialogues. This has had lasting effects on AFMA-related programs, which have failed miserably in responding to the needs of the sector. Salazar and Dasig (2005:13) wrote that ‘Provisions regarding women were made only in four sections of the law... however, no concrete and specific initiatives or proposals were made in terms of women fisherfolk participation. In terms of the Fisheries Code, token mention of women fisherfolk in FARMCs belittled the gender-sensitiveness of the law. Salazar and Dasig (2005:13) noted that women representation in NFARMC and IFARMC is not given importance. They also pointed out that most of the times women involvement in FARMC-related activities is nil and unappreciated. In terms of the MTPDP, they also noted that ‘Part II of Chapters 7 and 9, specifically the Agriculture and Fisheries sections, did not attach importance to women fisherfolk’s roles, even in areas where they supposedly play major roles like credit and pre-harvest and post-harvest activities’ (2005:17).
It goes to say that government programs and policies for women fisherfolk are not in tune with the MDG targets. The gender perspective in planning targets and strategies that are fishery-related, particularly the agriculture and fisheries sections of the MTPDP, is explicitly lacking. This undermines the women fisherfolk’s roles in fisheries management and fisheries modernization.
IV. CONCLUSIONS
In terms of poverty alleviation in coastal communities, the MTPDP misses its target as shown by government claims stating that the fisheries sector is the poorest of all sectors in Philippine society in 2006. Although there are poverty alleviation programs being implemented by the current administration, no data can illustrate how these programs reached far-flung island communities. Data on job creation in coastal communities are equally unreliable. Most likely, jobs that have been created in the fisheries sector are located in aquaculture. However, the social and environmental costs of aquaculture activities must be considered. On hindsight, the costs of marine pollution and coastal construction may be greater than the values created by these new jobs. Population increase is a contributing factor in the poverty situation in coastal communities. The lack of access to health information and services in far-flung island communities is of primary consideration. On the other hand, access and utilization of assets like land and municipal waters by municipal fisherfolks remain out of reach.
In terms of environmental sustainability, the Philippine fisheries is overfished and overexploited. Government’s formula to resolve these problems do not include fisheries management. The DA-BFAR is in a state of denial on the current poor conditions of our fisheries. Budget allocation for fisheries management, both at the national and local levels, remains insufficient. Equally important, much remains to be desired in grassroots participation, by men and women fisherfolks, in the planning, implementation and monitoring of government programs for fisheries.
V. RECOMMENDATIONS
The NFR has consistently emphasized the need to incorporate the principles of fisheries management in fisheries-related programs and policies. Given the state of Philippine coastal resources, reduction of fishing efforts and strictly implementing fishery laws should be taken into considerations. There are a number of good laws. For one, the Philippine Fisheries Code is considered to be a landmark legislation as it addresses the de facto ‘open access’ of the nation’s fishing grounds. The problem lies in the implementation of these good laws. The NFR emphasizes the need for the government to focus on certain issues articulated in this paper and proposes the following recommended actions:
1. Shift policy framework from resource extraction to sustainable development. Sustainable development should be the guiding principle of the government’s policies and programs in fisheries modernization. The Philippine Agenda (PA) 21 offers a variety of strategies that can prove useful in determining sustainable use of finite resources like the fisheries. All fisheries-related government programs and policies should adhere to PA 21.
Civil Society Assessment of the 2004-2010 Medium Term Philippine Development Plan for the Fisheries Sector: The Troubled Waters of Philippine Fisheries

Ass
essm
ent R
epor
t
95
2. Complete Municipal Water Delineation. This study traces the root of the problem on municipal water delineation to the deficiency in policy guidelines particularly for municipalities with offshore islands. This paper suggests to adopt the archipelagic principle in municipal water delineation as it is being adopted by the national government in marking its national territorial boundaries. There are 918 municipalities in the Philippines, of which 435 are without offshore islands, 182 are with overlapping waters and 301 are with offshore islands. The 617 municipalities without offshore islands and with overlapping waters can proceed with the delineation using DAO-01 series of 2004. One concrete step for the achievement of this objective is to formulate and implement policy guidelines on municipal water delineation of municipalities with offshore islands. The need to complete municipal water delineation is articulated in various government programs such as the MTPDP, the CNFIDP and the Coral Triangle Initiative. It is a wonder why it has yet to be realized.
3. Implement Fisherfolk Settlement Programs. Section 108 of Republic Act 8550 or the Philippine Fisheries Code of 1998 should be the policy guideline in implementing fisherfolk settlement programs. The national government should release a Joint Administrative Order on Fisherfolk Settlement, mandating the Department of Environment and Natural Resources (DENR), the Bureau of Fisheries and Aquatic Resources (BFAR), and other concerned agencies to work out programs for secure settlement of fishing families. In addition, BFAR reports reveal that more than 80 percent of coastal dwellers live in low lying fishing areas. These make them vulnerable to the negative impact of sea-level rise and extreme weather conditions.
4. Implement Poverty Eliminating Programs for Fisherfolks. The government should come up with effective poverty eliminating programs for the fisheries sector, being among the poorest in the Philippines. Targeting the poorest regions, coastal provinces and municipalities can significantly improve the living conditions of impoverished fishing communities. The government should see to it that its economic stimulus fund and cash conditional transfers should reach the fishing families in coastal communities as they too bear the brunt of global economic slowdown. The national government should provide technical and logistical support to LGUs in securing assets for municipal fisherfolks. The delineation of municipal waters should be completed. Full implementation of Section 108 on fisherfolk settlement should be achieved.
5. Provide adequate and appropriate population and health-related programs for fishing families. Population increases in coastal communities should be considered carefully as more and more people compete for limited resources. Access to health-related information and services should be extended to far flung island communities. Moreover, population management should be incorporated in fisheries management as the two are intricately connected.
REFERENCES
Adora, Gil. “Philippine Mariculture Parks/Zones: A Response to Poverty and Food Security.” Paper presented at the 2nd Conference of Coastal Municipalities, Cebu City, 28-30 June, 2009.
Boncodin, Emilia. “Sustainable Financing for LGUs Coastal and Fisheries Management Program.” Paper presented at the 2nd Conference of Coastal Municipalities, Cebu City, 28-30 June, 2009.
Department of Agriculture-Bureau of Fisheries and Aquatic Resources (DA-BFAR). Comprehensive National Fisheries
Industry Development Plan (2006-2025).
Curran, Sara. “Migration, Social Capital and the Environment. Considering Migrant Selectivity and Networks in Relation to Coastal Ecosystems.” n.d.
Dasig-Salazar, Amiella and Sheila Marie M. Dasig. “Looking for Women in Fisheries Policies and Programs”. Palihan Journal 1, No.1. (2006).
Institute of Social Order and IFARMC-NLB. “Understanding the Impact of Population Increase to Mangrove Productivity”. Ateneo de Manila University, Loyola Heights, Quezon City, 2009. unpublished.
Civil Society Assessment of the 2004-2010 Medium Term Philippine Development Plan for the Fisheries Sector: The Troubled Waters of Philippine Fisheries

Civi
l Soc
iety
Ass
essm
ent o
f the
200
4 -2
010
MTP
DP
96
Kilusang Mangingisda. “Aquaculture Policy Paper.” Quezon City , 2009. unpublished.
“The KALAHI-CIDSS Experience.” Paper presented at the National Forum on Community-Driven Development, SEAMEO-Innotech, Commonwealth Avenue, Quezon City, 16 June 2009.
Philippine Partnership for the Development of Human Resources in Rural Areas. “Philippine Asset Reform Report Card.” PHILDHRRA, Quezon City, 2008.
Russ, G. R., and A. C. Alcala. “Marine reserves: Long-term Protection is Required for Full Recovery of Predatory Fish Populations.” Oecologia 138 (2004): 622-627.
Santos-Dulay, Maria Corazon Abigail. “Budgetary Dynamics in Philippine Fisheries.” NGOs for Fisheries Reform, Quezon City, 2006.
White A., E. Deguit, W. Jatulan, L. Eisma-Osorio. “Integrated Coastal Management in Philippine Local Governance: Evolution and Benefits.” Coastal Management 34 (2006): 287–302.
Civil Society Assessment of the 2004-2010 Medium Term Philippine Development Plan for the Fisheries Sector: The Troubled Waters of Philippine Fisheries

Ass
essm
ent R
epor
t
97
I. INTRODUCTION
Within the development framework of the Medium Term Philippine Development Plan (MTPDP), government support for the provision of housing is primarily seen as a strategy for “jumpstarting the housing construction sector” for purposes of spurring economic growth and alleviating poverty (Chapter 4). This assessment is limited to determining the extent to which the performance of the housing sector has contributed to the goal of poverty alleviation.
In the context of government’s policies and programs on housing, poverty alleviation is to be attained with the provision of secure tenure and/or decent housing for the bottom 40 percent of the population. This target population consists mostly of urban and rural poor informal settlers. Thus the National Shelter Program’s housing targets and accomplishments are measured in “shelter security units (SSUs).” For the period 2005-2010, the government targeted the delivery of 1,145,688 SSUs, 68 percent of which fall under the category of socialized housing which is supposed to cater to the bottom 40 percent.
Table 1. Housing Targets, 2005-2010Housing Package Number of Units Percentage ShareSocialized (below PhP 225,000) 780,191 68.1%Low Cost (PhP 225,000-PhP2M) 365,282 31.8%Medium (PhP 2M – PhP 4M) 195 0.01%Total 1,145,668 100.0%
Source: HUDCC
The key programs expected to deliver housing assistance to this target group and the agencies responsible for them are:
1) Resettlement, implemented by the National Housing Authority (NHA); 2) Community mortgage program (CMP), administered by the Social Housing Finance Corporation (SHFC); 3) Presidential land proclamations, supervised by the Housing and Urban Development Coordinating
Council; and 4) Housing loans to formal sector employees, provided by Home Development Mutual Fund (HDMF) or Pag-
ibig.
These four programs alone account for 577,536 SSUs, or 74 percent of the socialized housing target of 780,191 SSUs.
Some limitations of the assessment
Data presented in this assessment refer to the performance of the national government, represented by the key shelter agencies under the umbrella of the Housing and Urban Development Coordinating Council (HUDCC), namely the NHA, National Home Mortgage and Finance Corporation (NHMFC), the SHFC, and the HDMF. Not reflected by data is the performance of local government units, some of which also implement socialized housing or land acquisition programs. HUDCC does not monitor, nor does it have a database of local government housing programs. Thus, the assessment is limited to the performance of the national government.
Civil Society Assessment of the Medium Term Philippine Development Plan Performance in Housing1
1Prepared by Anna Marie A. Karaos and Gerald M. Nicolas, John J. Carroll Institute on Church and Social Issues (JJCICSI) and Partnership of Philippine Support Service Agencies (PHILSSA)

Civi
l Soc
iety
Ass
essm
ent o
f the
200
4 -2
010
MTP
DP
98
The national government’s housing targets assume that a major part of the housing need would be addressed by the private sector. However, this assessment does not cover the housing provided by the private sector, including those by non-profit organizations like Gawad Kalinga and Habitat for Humanity. Some of these organizations tie up with local governments in implementing housing programs.
II. POLICY FRAMEWORK: THE MTPDP
The appropriateness of the MTPDP targets can be assessed by comparing them with the projected housing need as estimated by the MTPDP itself.
The projected housing need for 2005-2010 is about 3.7 million units. Of this number, around 1.2 million, or 31 percent, comprise the housing backlog. The backlog consists of doubled-up households, housing units in need of replacement due to relocation from danger zones, government infrastructure project sites and private lands subject to court-ordered clearance, homeless families to be provided shelter, and makeshift units in need of upgrading. The rest, or almost 2.6 million units, represents the projected increase in the household population which has to be provided new housing.
Table 2. Housing Need, 2005-2010 Category Units
Housing Backlog 1,170,800 Doubled-Up Housing 387,315 Replacement/Informal Settlers 588,853 Homeless 8,298 Substandard (needs Upgrading) 186,334New Households 2,585,272Total 3,756,072
Source: HUDCC
The shortage of housing is considered to be more acute in cities and urban centers where the rate of population growth tends to be higher because in-migration adds to the natural growth rate. As of 2007, the national population growth rate is 2.16 percent. Some cities have higher growth rates compared to the national growth rate, among them Quezon City (2.53 percent), Baguio City (2.43 percent), Davao City (2.57 percent), General Santos City (4.12 percent), Zamboanga City (3.55 percent), and Lapu-lapu City (4.47 percent). But there are cities like Iloilo, Bacolod and Cebu with lower growth rates (1.9, 1.83, and 1.58 percent respectively). The National Capital Region (NCR) has a growth rate of 1.7 percent, significantly lower than the national growth rate.
The above figures would show that the housing target of 1,145,668 units barely covers the housing backlog estimated at 1,170,800 units. The government’s housing targets meet only a third of the projected housing need; it practically covers only the backlog and not the projected number of new households. This assumes that the rest will be fulfilled by the private sector. This assumption is unrealistic because the majority of units (comprising both the backlog and new households) belong to the lowest income groups and the cost of housing for these groups will need to be subsidized. This present assessment is not able to present data on housing provided by the private sector.
Looking at the composition of the backlog, it is reasonable to assume that the three categories-- 1) replacement units for informal settlers, 2) homeless and 3) substandard units -- constitute the targets of the government’s socialized housing programs. These three categories alone (excluding doubled-up households) add up to 783,485 which is almost the same number as the socialized housing target for the 6-year period of the MTPDP. In other words the target, even if achieved, would not even cover the backlog of the socialized housing program’s target population considering that a big proportion of doubled-up households are informal settlers.
Civil Society Assessment of the Medium Term Philippine Development Plan Performance in Housing

Ass
essm
ent R
epor
t
99
Taking into account the doubled-up and the new households, let us assume that informal settlers account for at least two-thirds of doubled-up households and a third of new households. Adding these numbers to 783,485 would result in an additional socialized housing need of 1,119,967 or a total estimated socialized housing need of 1,903,452. The MTPDP socialized housing target of 780,191 units is merely 41percent of the housing need.
The estimated number of households for the different categories comprising the housing backlog also appears to be grossly underestimated. Data released by the National Housing Authority (NHA) of the number of informal settler households in 2007 residing in danger zones, private lands and sites of government infrastructure projects (which correspond to the category of “replacement of informal settler units” in the backlog) placed the estimate at over 544,000 in Metro Manila alone (Table 3). Even assuming that a few thousands families had been relocated between 2001 and 2004 (at a yearly average of 15,000 a year which did not actually happen), the estimate of 588,853 units needing replacement nationwide in 2005 would still appear unrealistically low.
Table 3. Magnitude of Informal Settlers in Metro Manila by Category
Classification Number of households
Percentage
Danger areas 107,997 19.83%Areas earmarked for government infrastructure 35,198 6.46%Government owned lands 179,653 32.99%Privately owned lands 219,457 40.30%Areas for priority development (APDs) 2,304 0.42%Total 544,609 100%
Source: NHA, as of September 2007
In summary, if we were to assess the appropriateness and responsiveness of the targets, both the overall housing target and the socialized housing targets have been set too low compared to the housing need as estimated by the MTPDP. The targets barely cover the backlog. Even if the targets were reached, the backlog would continue to grow over time. Furthermore, the estimate of the housing backlog, particularly in terms of the number of informal settler families nationwide, also appears unrealistically low.
III. PERFORMANCE AND ACCOMPLISHMENT IN 2004-2010
Of the housing target of 1,145,668 units, 61 percent or 780,191 units are socialized housing, intended to benefit poor households. The socialized housing targets of each of the key shelter agencies and these agencies’ performance as of June 2009 vis-à-vis these targets are summarized in Table 4. Note that in 2008, the key shelter agencies adjusted their targets which resulted in reduced targets particularly for CMP and Presidential Proclamations. The reason given by HUDCC for the adjusted targets is the reduced budget set by the DBM for these programs. This assessment does not find the lowering of the targets justifiable for reasons that will be explained later.
In terms of meeting the numerical (adjusted) targets, it appears that the better-performing programs are resettlement of NHA, the CMP, and presidential land proclamations overseen by the HUDCC. Given that the recorded accomplishment covers 4.5 years of the 6-year period of the MTPDP, the benchmark rate of accomplishment should be 75 percent. CMP and presidential proclamations have an accomplishment rate of 70 and 77 percent respectively but these are based on the adjusted/reduced targets. Based on the original targets, the comparable rates of accomplishment would be only 54 percent for CMP and 44 percent for presidential proclamations (See Table 5). No accomplishment figures were reported on the community-based housing program of NHA, which consists of technical assistance provided to communities, some of who may be beneficiaries also of projects financed by SHFC, Pag-ibig/HDMF, and NHMFC.
Civil Society Assessment of the Medium Term Philippine Development Plan Performance in Housing

Civi
l Soc
iety
Ass
essm
ent o
f the
200
4 -2
010
MTP
DP
100
Four major socialized housing programs are expected to deliver 74 percent of the total socialized housing target, which cater mostly to urban informal settlers. The regularization of housing tenure is the primary goal of these programs which are directed at four distinct subgroups. The resettlement program assists families displaced by large infrastructure projects, mostly in and near Metro Manila. The CMP is directed at small and medium-sized informal settler communities inhabiting privately owned lands whose owners are willing to sell their property. Presidential proclamations cover informal settlers occupying government-owned lands which have not been used for the purpose for which they were acquired or allocated. Finally, the housing loans provided by Pag-ibig/HDMF, GSIS and DBP are availed of by government and private sector employees who want to buy land and/or construct or improve a house.
Table 4. MTPDP Socialized Housing Targets vs. AccomplishmentsTable 4. MTPDP Socialized Housing Targets vs. Accomplishments
Key Shelter Agency Programs
MTPDPTarget
(number of units)
HUDCC- AdjustedMTPDPTarget
(number of units)
Accomplishment(Per HUDCC
report, number of households
assisted as of June 2009)
Accomplishment Rate(%)
NHA Resettlement 117,100 184,564 107,079 58.02% Slum Upgradinga
29,800 59,995 16,184 26.98%
Sites and Servicesb
47,000 28,450 9,417 33.10%
Core Housingc 33,500 36,000 2,932 8.14% Temporary Housing/Community-Based Housingd
66,800 76,500 -
Other Housing Assistance
7,625
NHMFC/SHFC Community MortgageProgram (CMP)
98,025 75,111 52,689 70.15%
HUDCC PresidentialProclamation
210,000 120,000 93,233 77.69%
HDMF Housing Loans 152,411 No data 61,463 40.33%
GSIS Housing Loans 5,555 No data No data
DBP Housing Loans 20,000 No data No data
TOTAL 780,191 580,620
Source: MTPDP, HUDCC
a Slum upgrading refers to subdivided lots mostly in the proclaimed sites being administered by the NHA which have been surveyed and are ready to be awarded to individual families. b Sites and services are serviced lots in housing projects mostly for formal government and private sector employees c Core housing refers to house and lot packages in joint venture projects with government agencies for their employees d Community-based housing refers to technical assistance provided by NHA to community associations such as on surveying, bookkeeping, negotiating with landowners, processing documents, and other activities related to housing.
5
Source: MTPDP, HUDCC
a Slum upgrading refers to subdivided lots mostly in the proclaimed sites being administered by the NHA which have been surveyed and are ready to be awarded to individual families.b Sites and services are serviced lots in housing projects mostly for formal government and private sector employeesc Core housing refers to house and lot packages in joint venture projects with government agencies for their employeesd Community-based housing refers to technical assistance provided by NHA to community associations such as on surveying, bookkeeping, negotiating with landowners, processing documents, and other activities related to housing.
The annual performance of the three key socialized housing programs catering specifically to urban informal settlers is presented in Table 5. These three programs account for 54 percent of the total socialized housing target
Civil Society Assessment of the Medium Term Philippine Development Plan Performance in Housing

Ass
essm
ent R
epor
t
101
for 2005-2010. Against the original MTPDP targets, the CMP and presidential proclamations did poorly while resettlement performed very well. But against the adjusted targets, the situation is reversed.
This assessment maintains that the original MTPDP targets should remain the basis for assessing the government’s performance for 2005-2010 because the lowering of the targets for CMP and presidential proclamation on the grounds of a reduced budget is not justifiable. The CMP has reflows from loan repayments which supplements the budgetary appropriation for lending. In the years 2003-2005, the program was able to provide loans to more than 14,000 households with the same yearly budget allocation of 500 million pesos from the national government. Given this record, the lowering of the target to 9,422 beneficiaries is not justified. For presidential proclamations, the target refers to the number of households to be benefited by the issuance of a given proclamation. The issuance of a proclamation entails no cost. Thus the reduction of the target to 5,000 a year cannot be justified on the grounds of a reduced budget.
Table 5. Annual Performance of Major Social Housing Programs
The annual performance of the three key socialized housing programs catering speci�cally to urban informal settlers is presented in Table 5. These three programs account for 54 percent of the total socialized housing target for 2005-2010. Against the original MTPDP targets, the CMP and presidential proclamations did poorly while resettlement performed very well. But against the adjusted targets, the situation is reversed.
This assessment maintains that the original MTPDP targets should remain the basis for assessing the government’s performance for 2005-2010 because the lowering of the targets for CMP and presidential proclamation on the grounds of a reduced budget is not justi�able. The CMP has re�ows from loan repayments which supplements the budgetary appropriation for lending. In the years 2003-2005, the program was able to provide loans to more than 14,000 households with the same yearly budget allocation of 500 million pesos from the national government. Given this record, the lowering of the target to 9,422 bene�ciaries is not justi�ed. For presidential proclamations, the target refers to the number of households to be bene�ted by the issuance of a given proclamation. The issuance of a proclamation entails no cost. Thus the reduction of the target to 5,000 a year cannot be justi�ed on the grounds of a reduced budget. Table 5. Annual Performance of Major Social Housing Programs
Year
Number of shelter security units provided/ households assisted by each socialized housing program
Resettlement Community Mortgage Program Presidential Proclamation HDMF Housing Loans
Original MTPDP Targets
HUDCC Adjusted Targets
Actual Original MTPDP Targets
HUDCC Adjusted Targets
Actual Original MTPDP Targets
HUDCC Adjusted Targets
Actual Original MTPDP Targets
HUDCC Adjusted Targets
Actual
2005 22,900 22,900 16,960 15,360 15,360 14,199 35,000 35,000 11,784 18,313 11,938
2006 21,100 21,100 15,390 15,860 15,860 13,783 35,000 35,000 21,782 20,694 8,878
2007 19,900 19,900 28,655 15,625 15,625 11,822 35,000 35,000 51,668 23,384 14,622
2008 19,000 29,256 36,830 16,510 9,422 9,169 35,000 5,000 6,504 26,423 16,028
2009 17,700 45,268 9,244a 16,750 9,422 3,716a 35,000 5,000 1,495a 29,858 9,997a
2010 16,500 46,140 - 17,920 9,422 35,000 5,000 - 33,739
TOTAL 117,100 184,564 107,079 98,025 75,111 52,689 210,000 120,000 93,233 152,411 61,463 vs orig target 91.4% 53.8% 44.4% 40.3% vs new target 58.0% 70.1% 77.7%
Source: HUDCC (as of June 2009) a Figures for 2009 are for January – June 2009 Note: The number of families assisted by each program is determined as follows: 1) for resettlement, by the number of families awarded resettlement lots and/or housing units; 2) for CMP, by the number of bene�ciary families of loans taken-out; 3) for presidential proclamations, by the number of families awarded CELAs.
The poorest performance is registered by the presidential proclamations and HDMF social housing loans. A total of 111 presidential issuances (i.e. Proclamations, Executive Orders, Memorandum Orders) declaring unused government lands as open for disposition to identi�ed
6
Source: HUDCC (as of June 2009)a Figures for 2009 are for January – June 2009 Note: The number of families assisted by each program is determined as follows: 1) for resettlement, by the number of families awarded resettlement lots and/or housing units; 2) for CMP, by the number of beneficiary families of loans taken-out; 3) for presidential proclamations, by the number of families awarded CELAs.
The poorest performance is registered by the presidential proclamations and HDMF social housing loans. A total of 111 presidential issuances (i.e. Proclamations, Executive Orders, Memorandum Orders) declaring unused government lands as open for disposition to identified informal settler families have been issued since President Arroyo assumed the presidency in 2001. Of this number, 83 were issued in 2001-2004 compared to only 28 that were issued in 2005-2009. As for Pag-ibig, the social housing loans extended by HDMF as of June 2009 were only 40 percent of the target.
The government claims that the more than 27,300 hectares of proclaimed sites would benefit nearly 255,600 families.2 One should note, however, that beneficiaries in proclaimed sites do not enjoy full security of tenure until they receive their CELAs. A few land proclamations reportedly do not yet have implementing rules and regulations (IRR). To date, the Arroyo administration reported having awarded CELAs to 63,400 beneficiaries, or only 25 percent of the total number of families covered by the proclamations issued since 2001. A huge majority of families living in proclaimed sites can therefore be considered potentially displaceable.
The big drop in the number of issuances as well as the number of households served is due to several factors. Among them are the waning political will of the president to distribute lands to informal settlers, the fact that the remaining unproclaimed government lands are being considered for alternative uses by their owners (government agencies or GOCCs), and technical problems delaying the fulfillment of requirements for the properties to be
2Accomplishments on Housing (2009)
Civil Society Assessment of the Medium Term Philippine Development Plan Performance in Housing

Civi
l Soc
iety
Ass
essm
ent o
f the
200
4 -2
010
MTP
DP
102
proclaimed. The NEDA, on the other hand, reasoned that the implementation of the North Rail and South Rail projects caused HUDCC to shift its focus and priority from proclamations to resettlement efforts.3
Another worrisome trend is the declining yearly deliveries of the CMP. Despite its being widely recognized by the urban poor as one of the most effective and affordable means of gaining secure tenure, the number of program beneficiaries has been declining since 2005. The SHFC attributes the deteriorating performance to several reasons, foremost of which are the inability of community associations to complete the requirements, internal problems among CAs, limited personnel to oversee the program, and the insufficient budget allocation from the national government. Cognizant of these problems, the SHFC has reduced its annual target to 9,422 beneficiaries for 2008-2011. According to SHFC, the new annual target was based on the 500 million peso budget appropriation the agency receives from the national government.
Given that reflows from loan repayments should be going up over the years, the reduction in the target is not justified. While the annual appropriation has remained constant at 500 million pesos for many years, reflows from interest and principal payments which should form part of the loan fund are quite substantial and would allow SHFC to provide loans to more families. Furthermore, NGOs and urban poor groups allege that the declining performance is due to new policies that have made access to the program more difficult.
Of the 108,358 families targeted for resettlement, almost 75 percent are from communities affected by the North and South Rails Linkage Project. Dubbed as the government’s “biggest and most successful resettlement program ever” and “one of the major legacies” of President Arroyo, the Rail Relocation and Resettlement Program has moved about 71 percent of families targeted for resettlement, or 69,752 families.4 A total of 34 resettlement sites in Metro Manila and surrounding provinces and 84,111 housing units have been developed and constructed to accommodate these families.
Although the NHA’s accomplishment rate for its resettlement program is better than the other programs in the first three years of the current MTPDP, reports of insufficient basic and social services in many resettlement sites are common and remain largely unresolved. From a broader policy standpoint, if the best performing housing program of the government, in terms of numbers, is resettlement, it means that it is the major housing approach being pursued as far as informal settlers are concerned. Given the many problems attendant to resettlement, especially the loss of income and livelihood which studies have shown is rarely restored in the short to medium term, emphasizing resettlement blunts the government housing programs’ impact on poverty alleviation.
Performance in Housing Expenditures
Another indicator of performance is the actual size of the government’s expenditure on housing. Compared with other Asian countries, the Philippines has the lowest government expenditure on housing (see Table 6). From 2000 to 2007, the government has been spending an average of 0.1 percent of its Gross Domestic Production (GDP) annually for housing, a far cry from Thailand’s 0.5 percent and Singapore’s 2.1 percent, and even Malaysia’s 0.4 percent. The Philippines seems to be spending even less than Indonesia on housing.
Table 6. Government Expenditure on Housing and Community Amenities of Select Asian Countries
71 percent of families targeted for resettlement, or 69,752 families. 4 A total of 34 resettlement sites in Metro Manila and surrounding provinces and 84,111 housing units have been developed and constructed to accommodate these families.
Although the NHA’s accomplishment rate for its resettlement program is better than the
other programs in the �rst three years of the current MTPDP, reports of insu�cient basic and social services in many resettlement sites are common and remain largely unresolved. From a broader policy standpoint, if the best performing housing program of the government, in terms of numbers, is resettlement, it means that it is the major housing approach being pursued as far as informal settlers are concerned. Given the many problems attendant to resettlement, especially the loss of income and livelihood which studies have shown is rarely restored in the short to medium term, emphasizing resettlement blunts the government housing programs’ impact on poverty alleviation. Performance in Housing Expenditures Another indicator of performance is the actual size of the government’s expenditure on housing. Compared with other Asian countries, the Philippines has the lowest government expenditure on housing (see Table 6). From 2000 to 2007, the government has been spending an average of 0.1 percent of its Gross Domestic Production (GDP) annually for housing, a far cry from Thailand’s 0.5 percent and Singapore’s 2.1 percent, and even Malaysia’s 0.4 percent. The Philippines seems to be spending even less than Indonesia on housing. Table 6. Government Expenditure on Housing and Community Amenities of Select Asian Countries
Country 2000 2001 2002 2003 2004 2005 2006 2007 Ave
(2000-2007)
Brunei 2.12 1.90 0.99 1.17 0.56 0.67 … … Cambodia … … … … … … … … Indonesia … 0.28 0.25 0.25 0.16 … … … Lao PDR … … … … … … … … Malaysia 0.36 0.47 0.51 0.50 0.52 0.26 0.29 0.61 0.44 Myanmar … … … … … … … … Philippines 0.25 0.05 0.02 0.07 0.03 0.06 0.10 0.12 0.09 Singapore 2.02 2.31 2.02 2.67 2.22 1.84 1.63 1.79 2.06 Thailand 0.81 0.98 1.00 0.38 0.15 0.38 0.45 0.12 0.53 Vietnam … … … … … … … … Hong Kong 4.63 3.86 3.32 3.48 2.72 2.31 2.14 2.03 India 1.28 1.20 1.07 1.33 1.34 1.25 1.24 1.10 Bangladesh 0.28 0.70 0.36 0.34 0.29 0.27 0.32 0.21
SOURCE: Asian Development Bank 2009
4 Accomplishments on Housing (2009)
8
SOURCE: Asian Development Bank 2009
3NEDA Socioeconomic Report 20054Accomplishments on Housing (2009)
Civil Society Assessment of the Medium Term Philippine Development Plan Performance in Housing

Ass
essm
ent R
epor
t
103
Taking the 780,191 units targeted for socialized housing, the government estimated a total cost of 36.3 billion pesos or an average of 46,527 pesos per household served.
Table 7 below shows the projected annual financial requirement of the government’s socialized housing programs per MTPDP projections and actual expenditures until February 2008.
Table 7. Financial Requirement and Expenditure Performance, 2005 -2008
Taking the 780,191 units targeted for socialized housing, the government estimated a total cost of 36.3 billion pesos or an average of 46,527 pesos per household served.
Table 7 below shows the projected annual �nancial requirement of the government’s socialized housing programs per MTPDP projections and actual expenditures until February 2008. Table 7. Financial Requirement and Expenditure Performance, 2005 -2008
Socialized Housing Program
Amount in millions 2005 2006 2007
Required Actual Required Actual Required Actual
(until Feb 08)
Resettlement
2,035.0 1,791.3 1,930.0 2,697.1 1,893.0 2,284.4
CMP
705.5 722.1 761.2 740.6 781.2 626.0
Direct Housing
49,551,7
21,904.5
56,247.8
16,870.9
62,959.9
27,946.5
Indirect Housing
12,670.0
21,799.0
13,937.1
5,243.0
15,330.8
12,045.6
Total 64,962.2 56,216.9 72,876.1 25,551.6 80,964.9 42,902.5 Source: MTPDP, HUDCC
Available data on the budget allocations disbursed through the General Appropriations Act are not aggregated by sector. To examine the annual budget for housing, one would need to sort the project-speci�c budgets of the key shelter agencies, namely HUDCC, NHA and NHMFC. The table in Annex 1 presents a summary of the budget for speci�c housing programs.5 Figure 1. Percentage Share of Housing Expenditures (NG and GOCCs) to Total Public Expenditures, 2005-2009
5 The DBM website does not contain data for 2006.
9
Source: MTPDP, HUDCC
Available data on the budget allocations disbursed through the General Appropriations Act are not aggregated by sector. To examine the annual budget for housing, one would need to sort the project-specific budgets of the key shelter agencies, namely HUDCC, NHA and NHMFC. The table in Annex 1 presents a summary of the budget for specific housing programs.5
Figure 1. Percentage Share of Housing Expenditures (NG and GOCCs) to Total Public Expenditures, 2005-2009
Source: Department of Budget and Management
Figure 2. Public sector expenditure for housing (NG and GOCCs), 2005-2009
Source: Department of Budget and Management
10
Source: Department of Budget and Management
5The DBM website does not contain data for 2006.
Civil Society Assessment of the Medium Term Philippine Development Plan Performance in Housing

Civi
l Soc
iety
Ass
essm
ent o
f the
200
4 -2
010
MTP
DP
104
Figure 2. Public sector expenditure for housing (NG and GOCCs), 2005-2009
Source: Department of Budget and Management
Figure 2. Public sector expenditure for housing (NG and GOCCs), 2005-2009
Source: Department of Budget and Management
10
Source: Department of Budget and Management
Aside from budgetary appropriation, the housing sector receives financial resources from Government Owned and Controlled Corporations or GOCCs (NHMFC, HDMF, NHA, GSIS and SSS). On the average, funding from government corporations comprise 90 percent of the total expenditure for housing. Against the total annual national budget (GAA), the housing sector is given a measly 0.03 percent. Socialized housing programs, however, remain largely dependent on the very small national government appropriation.
The question can be, and is often, asked whether the low performance in socialized housing deliveries is due to insufficient funds. This question could be answered in the affirmative in the case of the Resettlement Program where the inability of the NHA to assist many more communities in need of resettlement can be traced to the absence of a budget for projects other than the priority resettlement projects. The lack of funds could also account for the slow progress in the distribution of proclaimed lands to their intended beneficiaries since funds would be needed for surveys and community organizing activities. But it cannot explain the big drop in the number of new proclamations.
Inadequate funds also cannot explain the poor performance of the CMP which receives a yearly appropriation of P500 million and is not able to fully lend out all its loanable funds. It would appear that in the case of the CMP and the slowdown in the issuance of new land proclamations, the reason for the poor performance lies elsewhere.
Program Policies’ Impact on Demand
Given that the magnitude of the housing need is more than three times bigger than the government’s housing targets, which are partly constrained by resources and institutional absorptive capacities, government programs have had to establish priorities in terms of their target beneficiaries. This means that certain households find it harder than others to access these government programs. The following table shows the target beneficiaries of the socialized housing programs and the priorities established by program policies and guidelines that have engendered exclusions in practice.
Civil Society Assessment of the Medium Term Philippine Development Plan Performance in Housing

Ass
essm
ent R
epor
t
105
Table 6. Socialized Housing Programs: Target and Priority BeneficiariesSocialized Housing Program
Scope of Target Beneficiaries
Prioritized Beneficiaries Limitations/ Exclusions in Practice
Resettlement Program
Informal settler families displaced by:• Government
infrastructure projects• Clearanceofeasements,
danger zones• Court-orderedeviction
Informal settler families displaced by:• Largeandpriority
infrastructure projects• Dangerzonesprioritized
for clearing (e.g. Pasig riverbanks)
Informal settler families displaced by:• Non-priority
infrastructure projects• Non-prioritydanger
zones• Court-orderedeviction
Community Mortgage Program
Informal settler families occupying privately-owned lands
Informal settler families occupying private lands whose owners are willing to sell their land at an affordable price (on-site)
Informal settler families who want to acquire land off-site either because the owner does not want to sell the occupied property or the selling price is too high
Presidential Proclamations
Informal settler families occupying government-owned lands
Informal settler families occupying the 102 sites already proclaimed by President Arroyo since 2001
Informal settler families on non-proclaimed government-owned properties, and portions of already proclaimed sites where there are other competing uses being considered by the government (e.g. Baseco, Welfareville)
HDMF/Pag-ibig Housing Loans
Pag-ibig members, i.e. employees in the government and private sectors, regular income earners
Applicants who meet eligibility criteria and capacity to pay
Big risk of leakage, i.e. better-off families can access Pag-ibig loans at subsidized interest of 6 percent if loan value is within socialized housing category (less than P300,000, recently increased to P400,000)
It bears noting that government defines the two home financing programs, CMP and Pag-ibig loans, as “demand-driven,” that is, the service is made available by the government upon demand from eligible beneficiaries. In contrast to resettlement or presidential proclamations which are government-initiated, the initiative to apply for a loan originates from the target communities or households. Nevertheless, these programs can either expand or restrict demand through policies that would make the lending terms more or less attractive to borrowers and access to loans more or less difficult. For instance, in the case of Pag-ibig, the decision to lower interest rates for loans within the socialized housing category to 6 percent, which is comparable to the subsidized CMP interest rate, undoubtedly had a positive effect in increasing the number of Pag-ibig socialized housing loans. The intensified information campaign through media advertisements on Pag-ibig loans very likely increased public awareness about the program and increased the demand. The question however is whether the increase in Pag-ibig loan borrowers availing of the subsidized 6 percent interest rate actually came from the lowest income groups. The risk of subsidy leakage in the case of Pag-ibig loans is quite high.
In the case of CMP, there is little risk of leakage because of the very stringent documentary and procedural requirements. The danger however has gone to the other extreme of making the lending window inaccessible to many prospective intended beneficiaries because of the difficult and, in the opinion of potential borrowers, unreasonable requirements. Communities and NGOs assisting community associations applying for CMP have complained of a number of such policies, particularly those that relate to project size or the minimum number of
Civil Society Assessment of the Medium Term Philippine Development Plan Performance in Housing

Civi
l Soc
iety
Ass
essm
ent o
f the
200
4 -2
010
MTP
DP
106
project beneficiaries, occupancy and residency requirements, and the collection efficiency rate (CER) requirement imposed on originators. In contrast to the Pag-ibig housing loan program, CMP’s policies have tended to restrict demand.
Local governments’ participation in housing
A number of local governments implement local housing programs for urban poor families. Some of them tap into existing national housing programs such as the CMP while others are purely local government-initiated and locally funded. Some local governments, such as Davao City, make specific budgetary allocations for its housing programs. Overall, however, local governments’ participation in housing has been greatly constrained by the large investment needed to be able to significantly address the problem of housing in their respective localities. Local governments typically have difficulty producing affordable housing units and some of them even add to the cost of the housing units the cost of basic services.
A positive development has been the increase in the number of local governments that have established local housing boards (LHB) even in the absence of a national law mandating this. However, some LHBs created by local legislation are not yet fully functional or have not been convened.
The 2005-2010 MTPDP Housing Commitments and President Arroyo’s SONAs
Pronouncements pertaining to housing made by President Arroyo in her yearly State of the Nation Addresses (SONAs) give a clue to the strategies and programs given emphasis by her government in its effort to achieve its MTPDP commitments.
Certain strategic policy directions were announced, which if operationalized would have significantly boosted the performance of the housing sector. For instance in 2004, shortly after her election to a full six-year term as president, she made a point to reiterate her government’s commitment to urban and land reform (see Table 3) and recognized the need to reform the system of urban land titling, presumably to make it more efficient, transparent, and accessible. Yet, many lands that have been proclaimed by President Arroyo since 2001 for the benefit of informal settler families remain undistributed and the prospective beneficiaries are still without any tenure instrument to guarantee their legal right to a home plot.
Her 2005 SONA reiterated the government’s commitment to providing tenure security to the urban poor. But in 2005, the number of new presidential proclamations began to drop drastically and government lands already proclaimed for distribution hardly made any progress in providing titles or formal tenure rights. There has been no directive from the Executive to speed up the titling process in the proclaimed sites.
In 2006, the president’s SONA lauded Vice President De Castro’s Railway Resettlement Program, setting it up as a model for subsequent resettlement programs. But while the vice president’s resettlement projects were prioritized for funding, the same standard of compensation and resettlement benefits could not be offered to other areas because the entire resettlement budget went to the North and South Rail affected communities. By 2007, interest rates of Pag-ibig socialized housing loans had been lowered to the subsidized CMP level of 6 percent. The president would again take the opportunity during her SONA to congratulate Vice President De Castro for this “unprecedented” initiative. The president took note of the dramatic increase in Pag-ibig loan take-outs. What she failed to mention is that the lowering of the socialized housing interest rate effectively halted the flow of housing finance from the private sector to socialized housing. Lowering the socialized housing interest rate to a subsidized level created a market that few private financing institutions would be able to compete in. Consequently, government, that is Pag-ibig, became the only supplier of housing loans to this rather large
Civil Society Assessment of the Medium Term Philippine Development Plan Performance in Housing

Ass
essm
ent R
epor
t
107
segment of the market and was forced to shoulder the immense cost of the subsidies involved. In 2008, the president asked GSIS and SSS to follow suit by increasing the volume of their socialized housing loans. The two financing institutions will hardly be eager to do the president’s bidding.
As pointed out earlier, the risk of leakage of subsidies to well-off households is also quite high. The risk rises with HUDCC’s recent decision to increase the socialized housing ceiling to 400,000 pesos. At this high loan ceiling, more middle income households are likely to take advantage of the subsidized interest rates.
Table 7. SONA Pronouncements Pertaining to HousingYear SONA pronouncements2004 “Kaya ang aking agenda para sa maralita ay hanapbuhay; reporma sa lupa; tubig, gamot at kury-
ente; pagtatanggol at kapangyarihan para sa mahina”.
“Land reform covers agrarian land, urban land, and ancestral domain land. I ask congress to qualify farmland as bank collateral and reform the system of urban land title.”
2005 “As a country on the verge of take off, our storyline would surprise many at home and abroad.”
“The story includes marked improvements in tax collections, infrastructure housing construction, shelter, security for the urban poor and indigenous peoples, and rice productivity.”
2006 “Maayos na ang kapaligiran sa riles ng tren sa South Superhighway. Masaya ang mga pamilyang hinatid namin ni Vice President Noli de Castro sa kanilang bago at permanenteng relokasyon. Teddy Boy Locsin said it hadn't been done before, and couldn't be done at all. Well, Teddy?”
“Ngayon gagawin ito sa Maynila, si Lito Atienza ang bahala.”“We thank China for agreeing to fund these housing needs. Huwaran ng ating programang pabahay para sa mahihirap ang mga proyekto ng Iglesia ni Kristo at Gawad Kalinga.”
2007 “The next three years will see record levels of well thought out and generous funding for the follow-ing priorities…investments in a stronger and wider social safety net - gamot, abot-kayang pabahay”
“Si Noli de Castro na isa pang kampeon ng senior citizens ay namumuno ng ating programa sa pabahay.Congratulations,Noli.Thelowinterestratesforhousingareunprecedented.Naglaan ang Pag-IBIG ng 25 billion pesos na pautang, six times the amount when we started it in 2001. Fifty bil-lion pesos pa ang ilalaan hanggang 2010.”
2008 “Pag-Ibig housing loans increased from 3.82 billion pesos in 2001 to 22.6 billion pesos in 2007. This yearitexperiencedan84percentincreaseinthefirstfourmonthsalone.Super heating na. Dapat dagdagan ng GSIS at buksan muli ng SSS ang pautang sa pabahay. I ask Congress to pass a bill al-lowing SSS to do housing loans beyond the present 10 percent limitation.”
Source: Office of the President, http://www.op.gov.ph/
The low Pag-ibig interest rates are no doubt pulling up the overall housing performance of the administration. But the negative impact it has had on the housing finance market and the high risk of leakages make this policy counter-productive and regressive.
IV. OVERALL ASSESSMENT
Impact on Reduction of Poverty and Inequality
The present emphasis of the government’s social housing program on resettlement as the main strategy for dealing with urban homelessness and absence of secure tenure has tended to exacerbate rather than reduce
Civil Society Assessment of the Medium Term Philippine Development Plan Performance in Housing

Civi
l Soc
iety
Ass
essm
ent o
f the
200
4 -2
010
MTP
DP
108
poverty. This is because poor families’ access to jobs and sources of livelihood is severely disrupted when they are resettled to distant sites. Moreover, the provision of essential services such as water, electricity, schools, cheap transport, and health clinics is also generally poor in resettlement sites. Often, the newly relocated communities have to wait four to six years before these services are provided at an acceptable level and quality. In the meantime the people have to suffer losses to human capital in the form of disruptions in schooling and health problems. They also incur additional financial costs for transport and medical/health expenses.
In contrast, slum upgrading and in-city relocation through CMP and land proclamations contribute positively to poverty reduction because they preserve the poor people’s access to jobs and basic services. Yet these two programs have performed poorly compared to resettlement.
HUDCC’s decision to increase the ceiling for housing to be considered socialized housing to the present level of 400,000 pesos could work against poorer households. HUDCC increased the social housing ceiling to accommodate private developers that want to avail of the benefits given to social housing developers, claiming that they cannot produce social housing at less than 400,000 pesos. This policy has made it possible for developers and better-off families to benefit from social housing incentives meant for poor families who could actually afford only a loan of up to 80,000 pesos, which is the ceiling for a CMP lot acquisition loan.
The present pattern of availment of Pag-ibig socialized housing loans needs to be examined for possible subsidy leakages. If the loans tend to cluster at the upper limit, there is a high probability that many borrowers are non-poor or are not actually in need of subsidy but are availing of the low interest rate being offered by Pag-ibig to social housing borrowers. In fact, it is possible that a big number of the low-salaried members of Pag-ibig do not avail themselves of a housing loan because they cannot find housing packages that they can afford. By raising the social housing ceiling to 400,000 pesos, HUDCC has in fact made it harder for poorer families to find affordable developer-built housing. It has also made housing for the average income earner more expensive.
Impact on the Economy
Housing can be one of the most effective ways of stimulating consumption and production activity in the other sectors of the economy.6 Housing is believed to have a strong multiplier effect on the economy for at least three reasons. “First, low-cost housing is labor-intensive, requiring large numbers of construction workers and thereby creating many jobs. Second, low-cost housing would have much lower import content than alternative government expenditures thus keeping the money circulating within the domestic economy. Third, housing construction has many allied domestic economic activities, ensuring that the money spent on housing will permeate widely in the economy and create broader benefits for the people” (Habito, 2009). But because government is spending so little on housing compared to other Asian countries, the country is actually missing out on an opportunity for supporting broad-based economic growth.
Impact on People Empowerment and Democratization
Of the various programs and measures undertaken by the Arroyo administration, the issuance of presidential land proclamations has had the biggest impact in terms of democratizing access to urban land. However, the empowerment of informal settler communities through the distribution of land has not happened. This failure stems from the slow disposition of the proclaimed lands and the absence of institutionalized mechanisms for people’s participation in planning and implementing community development and housing projects in the proclaimed sites. Some communities have initiated “people’s plans” and other community-led processes but these are hardly given official recognition by local and national authorities.
Resettlement projects also often do not involve the affected families in the planning stage. Relocation sites are determined by the housing agencies with
6The analysis in this section is based on Cielito Habito, “No Free Lunch” Philippine Daily Inquirer Business section, September 7, 2009
Civil Society Assessment of the Medium Term Philippine Development Plan Performance in Housing
Ass
essm
ent R
epor
t
109
little regard for the preferences of the families to be relocated. One exception is the North Rail project wherein the affected families were given the choice of in-city relocation sites in various municipalities in Bulacan. But most infrastructure-related relocation sites are pre-determined by the government. Considering that resettlement has emerged as the dominant social housing approach, the absence of people’s participation in planning resettlement projects is indicative of the lack of empowerment in the implementation of government-sponsored housing programs.
People empowerment is perhaps most visible in the CMP. Because the CMP is a demand-driven housing finance scheme, intensive community organizing precedes loan application and capacity building continues up to the time of loan repayment. The process itself is quite empowering as poor people learn the intricacies of taking out a loan, examining land titles, and fulfilling documentary requirements. But all these empowering processes are mostly due to the efforts of NGOs and the communities themselves, rather than the result of deliberate effort on government’s part.
V. RECOMMENDATIONS
In view of the above analysis and observations, this assessment offers the following recommendations:
1. Shift the emphasis of the social housing program away from resettlement in favor of slum upgrading through CMP and presidential land proclamations. Toward this end,
a) review and reform CMP lending policies and ensure the full release and utilization of the unreleased Comprehensive and Integrated Shelter Financing Act (CISFA) funds by 2010 and
b) expedite the distribution of Certificates of Entitlement to Lot Allocation (CELAs) in the proclaimed sites and issue new presidential land proclamations for the government-owned lands recommended by HUDCC.
2. Increase the housing budget from the present 0.5 percent of the total budget to 2 percent, allocating the needed funds to speed up the distribution of proclaimed lands and to provide the legally mandated resettlement assistance to all families affected by infrastructure projects, danger areas, and court-ordered evictions.
3. Review the interest rate structure of Pag-ibig with a view to minimizing the risk of subsidy leakages (i.e. to non-poor borrowers availing of the subsidized 6 percent rate for socialized housing) and maximizing private sector participation in social housing finance.
4. Future MTPDP housing targets should aim to cover at least 70 percent of the housing need (or double the existing targets) and provide appropriate incentives to the private sector, so as to progressively reduce the housing backlog over time. Government must improve the methodology for estimating the housing need and determining the populations in need of housing assistance by involving local government units (LGUs).
5. The development framework for housing in the next MTPDP should emphasize that addressing the housing issue goes beyond physical housing and involves establishing decent and livable settlements. This will require investment in the poor’s capacity to engage in settlements planning, management, as well as livelihood enhancement. Furthermore, the development framework must proceed from the principle that the poor are the workforce of cities and that they have the right to remain in the cities. Fighting poverty in cities therefore means protecting the poor’s access to jobs and livelihood in the cities.
6. Localize and decentralize the housing delivery system by empowering LGUs to assume the primary responsibility of addressing the housing needs of the poor. Mandate through legislation the establishment of local housing boards, ensure their institutionalization and operationalization, and create programs that would provide support and incentives to LGUs to take the lead in addressing the housing needs of their constituents.
Civil Society Assessment of the Medium Term Philippine Development Plan Performance in Housing
Relocation sites are determined by the housing agencies with little regard for the preferences of the family to be relocated...
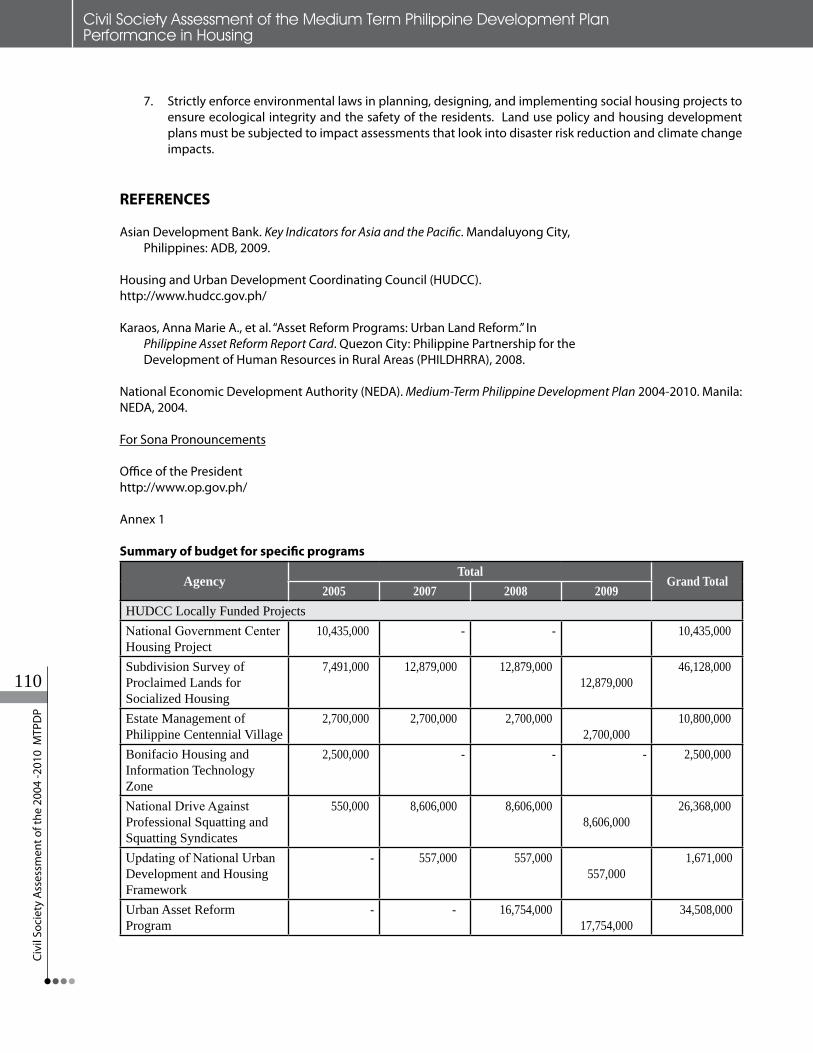
Civi
l Soc
iety
Ass
essm
ent o
f the
200
4 -2
010
MTP
DP
110
7. Strictly enforce environmental laws in planning, designing, and implementing social housing projects to ensure ecological integrity and the safety of the residents. Land use policy and housing development plans must be subjected to impact assessments that look into disaster risk reduction and climate change impacts.
REFERENCES
Asian Development Bank. Key Indicators for Asia and the Pacific. Mandaluyong City, Philippines: ADB, 2009.
Housing and Urban Development Coordinating Council (HUDCC). http://www.hudcc.gov.ph/
Karaos, Anna Marie A., et al. “Asset Reform Programs: Urban Land Reform.” In Philippine Asset Reform Report Card. Quezon City: Philippine Partnership for the Development of Human Resources in Rural Areas (PHILDHRRA), 2008.
National Economic Development Authority (NEDA). Medium-Term Philippine Development Plan 2004-2010. Manila: NEDA, 2004.
For Sona Pronouncements
Office of the Presidenthttp://www.op.gov.ph/
Annex 1
Summary of budget for specific programs
AgencyTotal
Grand Total2005 2007 2008 2009
HUDCC Locally Funded Projects NationalGovernmentCenterHousing Project
10,435,000 - - 10,435,000
Subdivision Survey of Proclaimed Lands for Socialized Housing
7,491,000 12,879,000 12,879,000 12,879,000
46,128,000
Estate Management of Philippine Centennial Village
2,700,000 2,700,000 2,700,000 2,700,000
10,800,000
Bonifacio Housing and Information Technology Zone
2,500,000 - - - 2,500,000
NationalDriveAgainstProfessional Squatting and Squatting Syndicates
550,000 8,606,000 8,606,000 8,606,000
26,368,000
UpdatingofNationalUrbanDevelopment and Housing Framework
- 557,000 557,000 557,000
1,671,000
Urban Asset Reform Program
- - 16,754,000 17,754,000
34,508,000
Civil Society Assessment of the Medium Term Philippine Development Plan Performance in Housing

Ass
essm
ent R
epor
t
111
Development of Shelter Monitoring Information System
- - 8,152,000 8,152,000
16,304,000
TOTAL 23,676,000 24,742,000 49,648,000 50,648,000 148,714,000 NHA Developmental Programs Resettlement Program 940,000,000 256,775,000 3,500,000,000
3,200,000,000 7,896,775,000
Local Housing Program - - - 300,000,000 300,000,000 Medium Rise Public and Private Housing Program
60,000,000 - - - 60,000,000
TOTAL 1,000,000,000 256,775,000 3,500,000,000 3,500,000,000 8,256,775,000 NHMFC Developmental Programs Purchase of Mortgages for Securitization
- - 500,000,000 400,000,000
900,000,000
Community Mortgage Program
500,000,000 500,000,000 500,000,000 500,000,000
2,000,000,000
TOTAL 500,000,000 500,000,000 1,000,000,000 900,000,000 2,900,000,000Source: Department of Budget and Management
Civil Society Assessment of the Medium Term Philippine Development Plan Performance in Housing

Civi
l Soc
iety
Ass
essm
ent o
f the
200
4 -2
010
MTP
DP
112
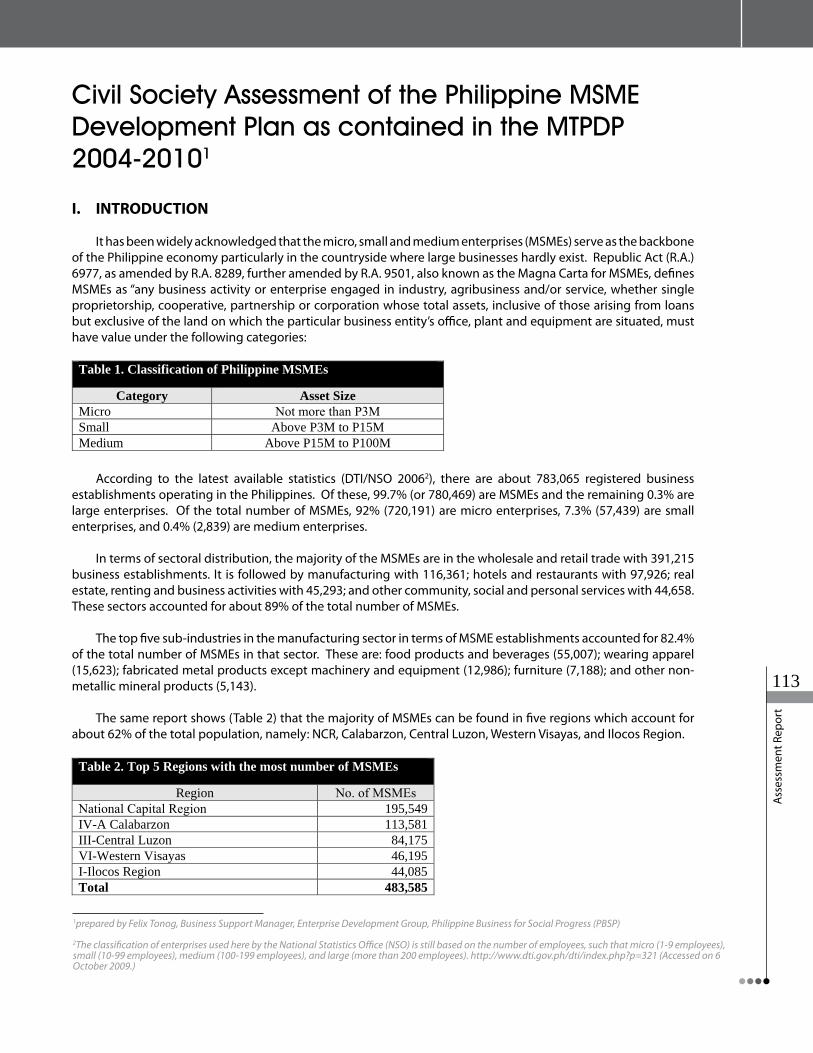
Ass
essm
ent R
epor
t
113
Civil Society Assessment of the Philippine MSME Development Plan as contained in the MTPDP 2004-20101
I. INTRODUCTION
It has been widely acknowledged that the micro, small and medium enterprises (MSMEs) serve as the backbone of the Philippine economy particularly in the countryside where large businesses hardly exist. Republic Act (R.A.) 6977, as amended by R.A. 8289, further amended by R.A. 9501, also known as the Magna Carta for MSMEs, defines MSMEs as “any business activity or enterprise engaged in industry, agribusiness and/or service, whether single proprietorship, cooperative, partnership or corporation whose total assets, inclusive of those arising from loans but exclusive of the land on which the particular business entity’s office, plant and equipment are situated, must have value under the following categories:
Table 1. Classification of Philippine MSMEs
Category Asset Size Micro NotmorethanP3MSmall Above P3M to P15M Medium Above P15M to P100M
Accordingtothelatestavailablestatistics(DTI/NSO20062), there are about 783,065 registered business establishments operating in the Philippines.Ofthese,99.7%(or780,469)areMSMEsandtheremaining0.3%arelargeenterprises.Of the total number of MSMEs, 92% (720,191) are micro enterprises, 7.3% (57,439) are small enterprises, and 0.4% (2,839) are medium enterprises.
In terms of sectoral distribution, the majority of the MSMEs are in the wholesale and retail trade with 391,215 business establishments. It is followed by manufacturing with 116,361; hotels and restaurants with 97,926; real estate, renting and business activities with 45,293; and other community, social and personal services with 44,658. These sectors accounted for about 89% of the total number of MSMEs.
The top five sub-industries in the manufacturing sector in terms of MSME establishments accounted for 82.4% of the total number of MSMEs in that sector. These are: food products and beverages (55,007); wearing apparel (15,623); fabricated metal products except machinery and equipment (12,986); furniture (7,188); and other non-metallic mineral products (5,143).
The same report shows (Table 2) that the majority of MSMEs can be found in five regions which account for about 62% of the total population,namely:NCR,Calabarzon,CentralLuzon,Western Visayas, and Ilocos Region.
1 prepared by Felix Tonog, Business Support Manager, Enterprise Development Group,Philippine Business for Social Progress (PBSP)
2 The classification of enterprises used here by theNationalStatisticsOffice(NSO)isstillbasedon the number of employees, such that micro (1-9 employees), small (10-99 employees), medium (100-199 employees), and large (more than 200 employees). http://www.dti.gov.ph/dti/index.php?p=321(Accessedon6October 2009.)
Page 1 of 13
According to the latest available statistics (DTI/NSO 20062), there are about 783,065 registered business establishments operating in the Philippines. Of these, 99.7% (or 780,469) are MSMEs and the remaining 0.3% are large enterprises. Of the total number of MSMEs, 92% (720,191) are micro enterprises, 7.3% (57,439) are small enterprises, and 0.4% (2,839) are medium enterprises.
In terms of sectoral distribution, the majority of the MSMEs are in the wholesale and retail trade with 391,215 business establishments. It is followed by manufacturing with 116,361; hotels and restaurants with 97,926; real estate, renting and business activities with 45,293; and other community, social and personal services with 44,658. These sectors accounted for about 89% of the total number of MSMEs.
The top five sub-industries in the manufacturing sector in terms of MSME establishments accounted for 82.4% of the total number of MSMEs in that sector. These are: food products and beverages (55,007); wearing apparel (15,623); fabricated metal products except machinery and equipment (12,986); furniture (7,188); and other non-metallic mineral products (5,143).
The same report shows (Table 2) that the majority of MSMEs can be found in five regions which account for about 62% of the total population, namely: NCR, Calabarzon, Central Luzon, Western Visayas, and Ilocos Region.
Table 2. Top 5 Regions with the most number of MSMEs
Region No.ofMSMEsNationalCapitalRegion 195,549 IV-A Calabarzon 113,581 III-Central Luzon 84,175VI-Western Visayas 46,195I-Ilocos Region 44,085Total 483,585
MSMEs play a major role in fostering economic development, especially in the countryside, as their labor-intensive operations bring about a more balanced economic growth and more equitable income distribution in the localities where they are situated. MSMEs also develop rural technology and promote Philippine culture through the exportation of goods featuring indigenous designs and materials.
“The growth of the MSME sector is, however, threatened by stiffer competition resulting from a more liberal and globalized business environment open to the influx of cheaper imports and substitutes into the country. Demand for goods and services produced by local MSMEs are also being driven-down by a global economic slow-down caused by increased macroeconomic and geopolitical uncertainties.” (MSMED Council, June 2009.)
According to the MSMED Council Report (June 2009), the implementation of the MSMED Plan 2004-2010 has helped:
• Generate 2.9 million direct and indirect jobs; • Encourage the registration and formalization of MSMEs by helping improve the business
and investment enabling environment of MSMEs; • Provide PhP 165.5 billion to support more than 143 thousand MSMEs around the
country; • Generate PhP11.6 billion worth of domestic MSME sales and U.S. $1.1 billion of total
MSME exports; • Provide productivity and efficiency enhancing training and other capacity building
programs to enhance the level of MSMEs’ local and international competitiveness; • Empower and build the capacity of provincial MSME development stakeholders to
develop and manage provincial MSME development plans that are harmonized with the national MSME development agenda.
ASSESSMENT METHODOLOGY
The study utilized secondary data coming from the official records and reports of various government agencies. In addition, research studies of independent international organizations were used.
The principal documents on national policies that were used as basis for the study are the Medium Term Philippine Development Plan (MTPDP) 2004-2010, the SME Development Plan 2004-2010, and Republic Act 9501.
Page 2 of 13
1prepared by Felix Tonog, Business Support Manager, Enterprise Development Group, Philippine Business for Social Progress (PBSP)
2The classification of enterprises used here by the National Statistics Office (NSO) is still based on the number of employees, such that micro (1-9 employees), small (10-99 employees), medium (100-199 employees), and large (more than 200 employees). http://www.dti.gov.ph/dti/index.php?p=321 (Accessed on 6 October 2009.)

Civi
l Soc
iety
Ass
essm
ent o
f the
200
4 -2
010
MTP
DP
114
MSMEs play a major role in fostering economic development, especially in the countryside, as their labor-intensive operations bring about a more balanced economic growth and more equitable income distribution in the localities where they are situated. MSMEs also develop rural technology and promote Philippine culture through the exportation of goods featuring indigenous designs and materials.
“The growth of the MSME sector is, however, threatened by stiffer competition resulting from a more liberal and globalized business environment open to the influx of cheaper imports and substitutes into the country. Demand for goods and services produced by local MSMEs are also being driven-down by a global economic slow-down caused by increased macroeconomic and geopolitical uncertainties.” (MSMED Council, June 2009.)
According to the MSMED Council Report (June 2009), the implementation of the MSMED Plan 2004-2010 has helped:
• Generate2.9milliondirectandindirectjobs;• EncouragetheregistrationandformalizationofMSMEsbyhelpingimprovethebusinessandinvestment
enabling environment of MSMEs;• ProvidePhP165.5billiontosupportmorethan143thousandMSMEsaroundthecountry;• GeneratePhP11.6billionworthofdomesticMSMEsalesandU.S.$1.1billionoftotalMSMEexports;• Provideproductivityandefficiencyenhancingtrainingandothercapacitybuildingprogramstoenhance
the level of MSMEs’ local and international competitiveness; • EmpowerandbuildthecapacityofprovincialMSMEdevelopmentstakeholderstodevelopandmanage
provincial MSME development plans that are harmonized with the national MSME development agenda.
ASSESSMENT METHODOLOGY
The study utilized secondary data coming from the official records and reports of various government agencies. In addition, research studies of independent international organizations were used.
The principal documents on national policies that were used as basis for the study are the Medium Term Philippine Development Plan (MTPDP) 2004-2010, the SME Development Plan 2004-2010, and Republic Act 9501.
The present assessment deals only with the MSME plans and targets as contained in the MTPDP and SMED Plan. Further, the assessment is limited by the following factors: lack of baseline data for the SMED Plan; the SMED Plan Accomplishment Report is dependent on the reports submitted by other government and private agencies involved in implementing the plan and were taken as is; the statistical data from NSO/NSCB are not current due to the lag in data gathering and analysis; and the lack of statistical measures for some indicators identified in the SMED Plan.
II. PERFORMANCE AND ACCOMPLISHMENT IN 2004-2010
Launched in July 2004, the SME Development Plan 2004-2010 (SMED Plan) “was meant to help in graduating MSMEs to higher levels of business undertakings and upgrading their productivity and value-added capabilities, and is expected to help improve the gross value added by the MSME sector from 32 percent to 40 percent and create 3.4 million jobs by 2010.” Based on the MSMED Council report, the MSME sector contributed in generating 2.9 million jobs—about 85 percent of the target. The SMED Plan is divided into four outcome portfolios, namely: (a) business and industry enabling environment; (b) access to finance; (c) access to market; (d) productivity and efficiency.
Civil Society Assessment of the Philippine MSME Development Plan as contained in the MTPDP 2004-2010

Ass
essm
ent R
epor
t
115
a) Business and Industry Enabling Environment
The business and industry enabling environment (BIEE) portfolio has three identified outcome measures as shown in Table 3.
The present assessment deals only with the MSME plans and targets as contained in the MTPDP and SMED Plan. Further, the assessment is limited by the following factors: lack of baseline data for the SMED Plan; the SMED Plan Accomplishment Report is dependent on the reports submitted by other government and private agencies involved in implementing the plan and were takenasis;thestatisticaldatafromNSO/NSCBarenot current due to the lag in data gathering and analysis; and the lack of statistical measures for some indicators identified in the SMED Plan.
II. PERFORMANCE AND ACCOMPLISHMENT IN 2004-2010
Launched in July 2004, the SME Development Plan 2004-2010 (SMED Plan) “was meant to help in graduating MSMEs to higher levels of business undertakings and upgrading their productivity and value-added capabilities, and is expected to help improve the gross value added by the MSME sector from 32 percent to 40 percent and create 3.4 million jobs by 2010.” Based on the MSMED Council report, the MSME sector contributed in generating 2.9 million jobs—about 85 percent of the target.
The SMED Plan is divided into four outcome portfolios, namely: (a) business and industry enabling environment; (b) access to finance; (c) access to market; (d) productivity and efficiency.
a) Business and Industry Enabling Environment
The business and industry enabling environment (BIEE) portfolio has three identified outcome measures as shown in Table 3.
Table 3: Business and Industry Enabling Environment
Results Indicators 2010 (Target)
Accomplishment (as of June 2009)
A total of 700,000 MSMEs have been created or have formalized their business in the Philippines from 2004 to 2010
700,000 277,000 MSMEs were (40% of target)
The Philippines ranks among the top 33 of the countries surveyed by the WBG-DBR in terms of “ease of starting a business” by 2010
Top 33 The Philippines is ranked 22nd out of 24 East Asia & Pacific economies, and 155th overall (181 total)
By 2010, 50% of the cities and 50% of municipalities have alignedtoISOstandards,theirquality management systems related to business registration
50% Data not available.
The MSMED Council (June 2009) reports that the implementation of the plan helped the government promote 277,000 MSMEs. It is not clear however, whether these are new businesses created. Even then, the accomplishment is only about 40 percent of the target.
Page 3 of 13
The MSMED Council (June 2009) reports that the implementation of the plan helped the government promote 277,000 MSMEs. It is not clear however, whether these are new businesses created. Even then, the accomplishment is only about 40 percent of the target.
Table 4: Philippines’ Ranking in Doing Business 2009Table 4: Philippines’ Ranking in Doing Business 2009
Based on the World Bank and International Finance Corporation “Doing Business 2009”, the Philippines is ranked 22nd out of 24 East Asia & the Pacific economies, and 155th out of the 181 total economies surveyed on the “ease of starting a business” indicator (see Table 4). Overall, the Philippines ranked 140th out of 181, from 136th in 2008. Singapore is the top ranked economy in the “ease of doing business”. Thailand, Malaysia and Indonesia fared far better than the Philippines (see Figure 1).
Fig. 1: Pilippines compared to global good practice economy as well as selected economies
Page 4 of 13
Based on the World Bank and International Finance Corporation “Doing Business 2009”, the Philippines is ranked 22nd out of 24 East Asia & the Pacific economies, and 155th out of the 181 total economies surveyed on the “ease of starting a business” indicator (see Table 4). Overall, the Philippines ranked 140th out of 181, from 136th in 2008. Singapore is the top ranked economy in the “ease of doing business”. Thailand, Malaysia and Indonesia fared far better than the Philippines (see Figure 1).
Civil Society Assessment of the Philippine MSME Development Plan as contained in the MTPDP 2004-2010

Civi
l Soc
iety
Ass
essm
ent o
f the
200
4 -2
010
MTP
DP
116
Table 4: Philippines’ Ranking in Doing Business 2009
Based on the World Bank and International Finance Corporation “Doing Business 2009”, the Philippines is ranked 22nd out of 24 East Asia & the Pacific economies, and 155th out of the 181 total economies surveyed on the “ease of starting a business” indicator (see Table 4). Overall, the Philippines ranked 140th out of 181, from 136th in 2008. Singapore is the top ranked economy in the “ease of doing business”. Thailand, Malaysia and Indonesia fared far better than the Philippines (see Figure 1).
Fig. 1: Pilippines compared to global good practice economy as well as selected economies
Page 4 of 13
Fig. 1: Pilippines compared to global good practice economy as well as selected economies
Republic Act (RA) 6977 or the Magna Carta for Small Enterprises, as amended by RA 8289, was further amended by RA 9501 on May 23, 2008. The law laid down the legal basis for a comprehensive approach to promote, develop, and assist small and medium-sized enterprises in the Philippines. Recognizing the potential of micro-enterprises to foster economic growth and employment generation, the new law expanded its coverage to include the promotion, development, and assistance of micro-enterprises in the Philippines.
The law’s salient points are as follows:
• MandatoryallocationofcreditresourcesofalllendinginstitutionsforMSMEsfor10years;• Banks’allocationoftheirloanportfoliotoMSMEsofatleast10percent;• Administrativesanctionsandotherpenaltiestobeimposedonlendinginstitutionsfornon-compliance
with the mandatory credit allocation provision;• RevisionoftheMSMEdefinition,raisingtheassetceilingformicro-enterprisesfromPhp1.5millionto
Php 3 million; small enterprises, from total assets of Php 3 million to not more than Php 15 million; and medium enterprises, from Php 15 million to not more than Php 100 million, from the previous threshold of Php 60 million;
• IncreaseinthecapitalstockoftheSmallBusiness(SB)Corporation,thegovernment’sfinancialinstitutionfocused on assisting MSMEs, from Php 5 billion to Php 10 billion;
• CreationofaVentureCapitalMicrofinanceTrustFundtopromotebusinessopportunitiesasavailabletoMSMEs; and
• StrengtheningoftheMSMEDevelopment(MSMED)Council,whichisassignedtoformulateanMSMEDPlan and integrate various government and private sector initiatives.
However, since the law is only a year old, most of the reforms needed are still in their infancy stage, and the effects of these reforms to the MSMEs have yet to be seen.
RA 9178 or the Barangay Micro Business Enterprises (BMBEs) Act of 2002 has not been fully implemented due to lack of coordination and disagreements among government agencies that are supposed to implement them, the apparent unwillingness of the local government units to issue BMBE registration because of its effect on their revenue, and lack of information dissemination among the target beneficiaries of the law. The BMBE Act encourages the formation and growth of micro business enterprises and integrates them into the formal mainstream economy by granting them incentives and other benefits such as (i) income tax exemption; (ii) exemption from the coverage of the minimum wage law; (iii) priority to a special credit window; and (iv) technology transfer, production and management training, marketing assistance program. Unfortunately, these did not happen.
Civil Society Assessment of the Philippine MSME Development Plan as contained in the MTPDP 2004-2010

Ass
essm
ent R
epor
t
117
Efforts have been initiated to streamline the business name registration at the DTI and issuance of business licenses at the municipal level through computerization and simplification of procedures.
b) Access to Finance
Table 5 shows the outcome targets for the access to finance portfolio. From 2004 to April 2009, government financial institutions (GFIs) of the SME Unified Lending Opportunities for National Growth (SULONG) program released about Php 165.5 billion loans to SMEs. The funds released under the program supported 143,105 enterprises all over the country. The accomplishment is about 77.8 percent of the target.
Another initiative to increase MSMEs access to credit is the adaption of risk-based lending, a lending technology based on the client’s cash flow instead of the traditional collateral. Being spearheaded by the SB Corp., the project is now on its roll-out phase in collaboration with participating GFI and rural banks. Whether this project will actually result in more MSMEs accessing credit remains to be seen.
under the program supported 143,105 enterprises all over the country. The accomplishment is about 77.8 percent of the target.
Another initiative to increase MSMEs access to credit is the adaption of risk-based lending, a lending technology based on the client’s cash flow instead of the traditional collateral. Being spearheaded by the SB Corp., the project is now on its roll-out phase in collaboration with participating GFI and rural banks. Whether this project will actually result in more MSMEs accessing credit remains to be seen.
Table 5: Access to Finance
Results Indicators 2010 (Target) Accomplishment
GFIs have increased their total funds for MSME financing by Php 212 billion cumulatively from 2004 to 2010
Php 212 billionAs of April 2009, released Php 165.5 billion in loans (77.8 percent of target) to 143,105 MSMEs, supporting 2.5 million jobs
GFIs have increased their MSME portfolio from Php 24 billion in 2004 to Php 38 billion in 2010
Php 38 billion Php 35.6 billion as of 2008 (93.6 percent of target)
Table 6: Loans Released by Government Financial Institutions to SMEs (in Million Pesos)
GFI 2004 2005 2006 2007 2008 Apr-09 CumulativeTotal
DBP 9,872 10,488
11,051 8,515 11,63
0 2,438 53,995
LBP 12,560
17,431
16,214
16,353
20,001 6,754 89,313
NLDC 115 25 60 47 36 1 284PhilEXIM 404 154 202 328 257 78 1,422QUEDANCOR 831 560 1,133 548 184 8 3,266SB Corp* 3,268 2,939 3,443 2,690 3,005 609 15,953SSS** 166 129 304 97 455 66 1,216Total for the Year***
27,216
31,727
32,407
28,576
35,570 9,954 165,449
According to the “Doing Business 2009”, the Philippines is ranked 123rd overall for “getting credit”. Malaysia is ranked 1st. Firms consistently rate access to credit as among the greatest barrier to their operation and growth. Despite the availability of funds from GFIs and the liquidity of the banking sector, the MSMEs are still having difficulty in availing of credit for various reasons. The global economic crisis also slowed down production in the small manufacturing sector, which is about 15 percent of all industries.
c) Access to Market
Page 6 of 13
Table 6: Loans Released by Government Financial Institutions to SMEs (in Million Pesos)
GFI 2004 2005 2006 2007 2008 Apr-09Cumulative
Total
DBP 9,872 10,488 11,051 8,515 11,630 2,438 53,995LBP 12,560 17,431 16,214 16,353 20,001 6,754 89,313NLDC 115 25 60 47 36 1 284PhilEXIM 404 154 202 328 257 78 1,422QUEDANCOR 831 560 1,133 548 184 8 3,266SB Corp* 3,268 2,939 3,443 2,690 3,005 609 15,953SSS** 166 129 304 97 455 66 1,216Total for the Year***
27,216 31,727 32,407 28,576 35,570 9,954 165,449
According to the “Doing Business 2009”, the Philippines is ranked 123rd overall for “getting credit”. Malaysia is ranked 1st. Firms consistently rate access to credit as among the greatest barrier to their operation and growth. Despite the availability of funds from GFIs and the liquidity of the banking sector, the MSMEs are still having difficulty in availing of credit for various reasons. The global economic crisis also slowed down production in the small manufacturing sector, which is about 15 percent of all industries.
Civil Society Assessment of the Philippine MSME Development Plan as contained in the MTPDP 2004-2010

Civi
l Soc
iety
Ass
essm
ent o
f the
200
4 -2
010
MTP
DP
118
c) Access to MarketTable 7 shows the targets and accomplishment for the access to market portfolio.
Table 7: Access to Market
Results Indicators 2010 (Target)
Accomplishment (as of June 2009)
The total sales of the MSME sector has increased by 90 percent
90 percentPhP 11.6 billion of domestic MSME sales and US$ 1.1 billion of total MSME exports
The total exports of the MSME sector has increased by 16 percent annually from Php 24 billion in 2004.
16 percent annually
The One Town, One Product program generated export sales of US$ 417 million and domestic sales of Php 10 billion during the period. The program also created 312,118 jobs and assisted 29,639 SMEs. The Center for International Trade Expositions and Missions (CITEM) organized national and international trade fair, assisted 4,357 companies and generated export sales worth US$ 651.5 million and domestic sales of Php 1.1 billion. Direct buyer-supplier matching assistance were provided to 6,032 SMEs generating Php 531.7 million in domestic sales and US$ 9.4 million worth of exports. (MSMED Council, June 2009.)
Table 8: OTOP Performance (2004 – 1st Quarter 2009)
Performance Indicator 2004 2005 2006 2007 2008 1Q 2009 TotalInvestments (PhP M) 565.0 814.1 1,891.3 2,330.5 2,618.1 212.1 8,431.0 Employment 1,431.0 70,439.0 70,609.0 70,733.0 85,419.0 13,887.0 312,118.0 Exports (US $ M) 0.2 85.2 92.2 105.4 106.9 27.2 417.0 Domestic Sales (PhP M) 1,302.4 1,808.3 2,773.8 3,565.2 544.8 9,995.0 MSMEs Assisted 4,396.0 5,968.0 6,785.0 10,175.0 2,315.0 29,639.0
The Philippines is ranked 58th overall for “trading across borders” based on the Doing Business 2009. In contrast, Thailand is ranked 10th, Malaysia 29th, and Indonesia 37th. “The Philippines upgraded the risk management and electronic data interchange system for customs, reducing the time to import by a day.”
d) Productivity and Efficiency
Table 9 shows the SMED Plan targets for productivity and efficiency of MSMEs. No data on accomplishments is available from the DTI report. Two international indices show that the Philippines has been lagging behind its neighbors and comparator economies in terms of competitiveness of its industries.
Table 9: Productivity and Efficiency
Results Indicators 2010 (Target)
Accomplishment (as of June 2009)
The level of productivity of the MSME sector has increased by 60 percent from 2004 to 2010
60 percent Not available
Page 7 of 13
The One Town, One Product program generated export sales of US$ 417 million and domestic sales of Php 10 billion during the period. The program also created 312,118 jobs and assisted 29,639 SMEs. The Center for International Trade Expositions and Missions (CITEM) organized national and international trade fair, assisted 4,357 companies and generated export sales worth US$ 651.5 million and domestic sales of Php 1.1 billion. Direct buyer-supplier matching assistance were provided to 6,032 SMEs generating Php 531.7 million in domestic sales and US$ 9.4 million worth of exports. (MSMED Council, June 2009.)
Table 7 shows the targets and accomplishment for the access to market portfolio.
Table 7: Access to Market
Results Indicators 2010 (Target)
Accomplishment (as of June 2009)
The total sales of the MSME sector has increased by 90 percent
90 percentPhP 11.6 billion of domestic MSME sales and US$ 1.1 billion of total MSME exports
The total exports of the MSME sector has increased by 16 percent annually from Php 24 billion in 2004.
16 percent annually
The One Town, One Product program generated export sales of US$ 417 million and domestic sales of Php 10 billion during the period. The program also created 312,118 jobs and assisted 29,639 SMEs. The Center for International Trade Expositions and Missions (CITEM) organized national and international trade fair, assisted 4,357 companies and generated export sales worth US$ 651.5 million and domestic sales of Php 1.1 billion. Direct buyer-supplier matching assistance were provided to 6,032 SMEs generating Php 531.7 million in domestic sales and US$ 9.4 million worth of exports. (MSMED Council, June 2009.)
Table 8: OTOP Performance (2004 – 1st Quarter 2009)
Performance Indicator 2004 2005 2006 2007 2008 1Q 2009 TotalInvestments (PhP M) 565.0 814.1 1,891.3 2,330.5 2,618.1 212.1 8,431.0 Employment 1,431.0 70,439.0 70,609.0 70,733.0 85,419.0 13,887.0 312,118.0 Exports (US $ M) 0.2 85.2 92.2 105.4 106.9 27.2 417.0 Domestic Sales (PhP M) 1,302.4 1,808.3 2,773.8 3,565.2 544.8 9,995.0 MSMEs Assisted 4,396.0 5,968.0 6,785.0 10,175.0 2,315.0 29,639.0
The Philippines is ranked 58th overall for “trading across borders” based on the Doing Business 2009. In contrast, Thailand is ranked 10th, Malaysia 29th, and Indonesia 37th. “The Philippines upgraded the risk management and electronic data interchange system for customs, reducing the time to import by a day.”
d) Productivity and Efficiency
Table 9 shows the SMED Plan targets for productivity and efficiency of MSMEs. No data on accomplishments is available from the DTI report. Two international indices show that the Philippines has been lagging behind its neighbors and comparator economies in terms of competitiveness of its industries.
Table 9: Productivity and Efficiency
Results Indicators 2010 (Target)
Accomplishment (as of June 2009)
The level of productivity of the MSME sector has increased by 60 percent from 2004 to 2010
60 percent Not available
Page 7 of 13
The Philippines is ranked 58th overall for “trading across borders” based on the Doing Business 2009. In contrast, Thailand is ranked 10th, Malaysia 29th, and Indonesia 37th. “The Philippines upgraded the risk management and electronic data interchange system for customs, reducing the time to import by a day.”
d) Productivity and Efficiency
Table 9 shows the SMED Plan targets for productivity and efficiency of MSMEs. No data on accomplishments is available from the DTI report. Two international indices show that the Philippines has been lagging behind its neighbors and comparator economies in terms of competitiveness of its industries.
Table9:ProductivityandEfficiency
Results Indicators 2010 (Target) Accomplishment(as of June 2009)
The level of productivity of the MSME sector has increased by 60 percent from 2004 to 2010
60 percent Notavailable
ThelevelofefficiencyofMSMEshasdoubledfrom2004to2010
100 percent Notavailable
According to the “2009 World Competitiveness Scoreboard” prepared by the International Institute of Management Development (IMD) in Switzerland, the Philippines ranked 43rd out of 57 economies, sliding from 40th in 2008.
The World Economic Forum’s “Global Competitiveness Report (GCR) 2008-2009”, ranked the Philippines 71st out of 134 countries, the same rank since 2006. (See Figure 2 for the summary of Philippines’ GCI.)
Civil Society Assessment of the Philippine MSME Development Plan as contained in the MTPDP 2004-2010

Ass
essm
ent R
epor
t
119
Compared to its Asian neighbors, the Philippines performed poorly in improving its competitiveness, only faring better than Cambodia (see Table 7). Singapore is the most competitive (ranked 5), followed by Japan and Hong Kong (ranked 9 and 11, respectively).
The level of efficiency of MSMEs has doubled from 2004 to 2010
100 percent Not available
According to the “2009 World Competitiveness Scoreboard” prepared by the International Institute of Management Development (IMD) in Switzerland, the Philippines ranked 43rd out of 57 economies, sliding from 40th in 2008.
The World Economic Forum’s “Global Competitiveness Report (GCR) 2008-2009”, ranked the Philippines 71st out of 134 countries, the same rank since 2006. (See Figure 2 for the summary of Philippines’ GCI.)
Compared to its Asian neighbors, the Philippines performed poorly in improving its competitiveness, only faring better than Cambodia (see Table 7). Singapore is the most competitive (ranked 5), followed by Japan and Hong Kong (ranked 9 and 11, respectively).
Fig. 2: Philippines GCI Summary
Table 10: Comparative GCI Rankings of Asian Economies
Country CGI2005 Rank
GCI2006 Rank
GCI2007-2008 Rank
GCI2008-2009 Rank
Cambodia 111 103 110 109China 48 54 34 30Hong Kong 14 11 12 11India 45 43 48 50Indonesia 69 50 54 55Japan 10 7 8 9Korea 19 24 11 13
Page 8 of 13
Fig. 2: Philippines GCI Summary
Table 10: Comparative GCI Rankings of Asian EconomiesCountry CGI
2005 RankGCI
2006 RankGCI
2007-2008 RankGCI
2008-2009 RankCambodia 111 103 110 109China 48 54 34 30Hong Kong 14 11 12 11India 45 43 48 50Indonesia 69 50 54 55Japan 10 7 8 9Korea 19 24 11 13Malaysia 25 26 21 21Philippines 73 71 71 71Singapore 5 5 7 5Thailand 33 35 28 34Vietnam 74 77 68 70
A nation’s level of competitiveness reflects the extent to which it is able to provide rising prosperity to its citizens. The GCR examines the many factors enabling national economies to achieve sustained economic growth and long-term prosperity. Global Competitiveness Index (GCI) is a highly comprehensive index for measuring national competitiveness, which captures the microeconomic and macroeconomic foundations of national competitiveness.
Competitiveness is defined as the “set of institutions, policies, and factors that determine the level of productivity of a country. The 12 pillars of competitiveness are: institutions, infrastructure, macroeconomic
Civil Society Assessment of the Philippine MSME Development Plan as contained in the MTPDP 2004-2010

Civi
l Soc
iety
Ass
essm
ent o
f the
200
4 -2
010
MTP
DP
120
stability, health and primary education, higher education and training, goods market efficiency, labor market efficiency, financial market sophistication, technological readiness, market size, business sophistication, and innovation. The first four pillars are the basic requirements, which are key for first stage, factor-driven economies, i.e., countries that compete based on their factor endowments, primarily unskilled labor and natural resources.”
Malaysia 25 26 21 21Philippines 73 71 71 71Singapore 5 5 7 5Thailand 33 35 28 34Vietnam 74 77 68 70
“A nation’s level of competitiveness reflects the extent to which it is able to provide rising prosperity to its citizens. The GCR examines the many factors enabling national economies to achieve sustained economic growth and long-term prosperity. Global Competitiveness Index (GCI) is a highly comprehensive index for measuring national competitiveness, which captures the microeconomic and macroeconomic foundations of national competitiveness.
Competitiveness is defined as the “set of institutions, policies, and factors that determine the level of productivity of a country. The 12 pillars of competitiveness are: institutions, infrastructure, macroeconomic stability, health and primary education, higher education and training, goods market efficiency, labor market efficiency, financial market sophistication, technological readiness, market size, business sophistication, and innovation. The first four pillars are the basic requirements, which are key for first stage, factor-driven economies, i.e., countries that compete based on their factor endowments, primarily unskilled labor and natural resources.”
Source: GCR 2008-2009
Fig. 3 Philippines – Most problematic factors for doing business
“The Philippines, at 71st place, benefits from its relatively large market size (ranked 34th). In addition, the country has seen an improvement in its macroeconomic stability since last year, with a shrinking government budget deficit and lower public debt. On the other hand, the main
Page 9 of 13
Source: GCR 2008-2009
Fig. 3 Philippines – Most problematic factors for doing business
“The Philippines, at 71st place, benefits from its relatively large market size (ranked 34th). In addition, the country has seen an improvement in its macroeconomic stability since last year, with a shrinking government budget deficit and lower public debt. On the other hand, the main obstacles to greater competitiveness are related to the quality of the country’s public institutions and lack of efficiency in its labor market (see Figure 3). The institutional environment is characterized by the perception that government spending is highly wasteful (ranked 120th), a lack of evenhandedness in the government’s dealing with the private sector (117th), and general concerns about corruption in the public sphere. In addition, the threat of terrorism imposes significant costs on business in the country (ranked 125th). With regard to labor market inefficiencies, wages are not flexibly determined by companies (108th), regulation impedes firms from freely hiring and firing workers (101st), and firing costs are excessive (ranked 108th), all of which hinder job creation.” (GCR 2008-2009, p.29)
5) Livelihood and Microfinance
The MTPDP targets “three million (micro) entrepreneurs shall be supported through microfinance. Loans for the poor shall be tripled (p.156).”
One of the government's strategies to alleviate poverty is to provide poor households engaged in livelihood and micro-enterprise activities access to production and consumption-smoothing credit through various microfinance programs. The People’s Credit and Finance Corporation (PCFC) was established by virtue of Memorandum Order 261 & Administrative Order No. 148. Republic Act 8425 of 1998 or the Social Reform and Poverty Alleviation Act further strengthened the role of PCFC as the lead government entity specifically tasked to mobilize resources for microfinance services for the exclusive use of the poor (www.pcfc.gov.ph).
Civil Society Assessment of the Philippine MSME Development Plan as contained in the MTPDP 2004-2010

Ass
essm
ent R
epor
t
121
As of June 2004, the GFIs/GOCCs (NLSF, TLRC, SBGFC, BSP, with PCFC as the main lending arm) have released a cumulative amount of PhP6.882 billion of microfinance loans to 1,536,697 poor clients through the various IFIs. PCFC alone reported an outstanding loan portfolio of about Php2.5 billion, lent through 191 private institutional conduits reaching 1,575,439 million micro-borrowers. (MTPDP, p.154.)
Table 11: PCFC Financial and Operational Highlights, As of June 2009Financial Highlights: (Million Pesos)
Total assets 3,545.23Total Liabilities 2,364.49Total Equity 1,180.74Loan Portfolio (net) 3,124.92Investments (net) 2.00Gross Income: 184.24Financial Cost: 96.95OperatingExpenses: 43.72NetIncome(aftertax) 28.29
Operational HighlightsGeographical CoverageProvinces 80 out of 80Cities 115 out of 115Municipalities 1,378of 1,497 (92%)Active Partner-(MFIs) 163 ActiveClientsbeingservedthruMicrofinanceInstitu-tion Partners (MFIs)
2,709,773
LoanOutstanding(Mn) Php3,390.03Source: http://www.pcfc.gov.ph/OperationalHighlights/tabid/66/Default.aspx (Accessed 12 October 2009.)
However, whether these microfinance programs are reaching their intended beneficiaries and actually alleviating poverty is the question.
According to an ADB study (Kondo, 2007) on the impact of microfinance in the Philippines, “while microfinance has spread considerably in the past 10 years to help fill the unmet need for financial services, a majority of poor families in the poorer regions still do not have access to microfinance services. Poor infrastructure combined with spatial dispersion and seasonality of agriculture production makes lending to small-scale farmers and fishers costly and risky. Moreover, providers of microfinance cater largely to non-farm enterprises and poor agricultural households generally do not have access to microfinance services.”
The study shows the profile of respondent microfinance clients, thus: On the average, 9 percent of existing MFI clients are problem clients; only about 2 percent graduate. About 95 percent of the clients surveyed are female. Only 10 percent are poor (the national threshold for rural areas is estimated to be Php 13,659, NSCB); only 4 percent are subsistence poor (defined as those below the food threshold of Php 9,445 as of March 2006). This is quite revealing considering that the program was designed to reach poor households. In spite of the means-testing instrument used to identify the intended clients, all relevant stakeholders of the program in the field are not pointing to the intended clients—the poor. This may convey the message that those considered as officially poor may not be the desired clients of microfinance programs.
The study reveals that there is mildly statistically significant (significance level 10 percent) positive impact on per capita income. Based on estimates, availing of a loan enables one to increase one’s income by about Php 5,222; for every Php 100 loan availed, income increase by P47. Per capita expenditure is also positively affected by access to program loans estimated at about P4,136 or P38 increase in per capita consumption per every P100
Civil Society Assessment of the Philippine MSME Development Plan as contained in the MTPDP 2004-2010

Civi
l Soc
iety
Ass
essm
ent o
f the
200
4 -2
010
MTP
DP
122
loan availed. Per capita expenditure on food is positively affected, estimated at about P1,333 higher compared to those who did not avail of the program loans or about P12 per every P100 loan availed.
There is positive and highly statistically significant both in terms of having a personal savings account as well as on the amount of savings, i.e., 86 percent of existing clients and 66 percent of new clients, compared to 54 percent of non-clients.
The impact of the program on both the number of enterprises as well as the number of employed people in these enterprises is very significantly positive. 93 percent of existing clients and 87 percent of new clients have household enterprises compared to 78 percent of non-clients; existing clients have 2.1 enterprises employing about 3 people, new clients have about 1.8 enterprises employing 2.4 people, compared to non-clients having 1.6 enterprises employing 2.4 people.
III. CONCLUSIONS AND RECOMMENDATIONS
While these accomplishments are notable amidst the backdrop of a global economic crisis, much more still needs to be done. The SMED Plan 2004-2010 for example, needs to be updated to incorporate the demands of the growing number of micro-enterprises and to encourage the formalization of informal enterprises. Furthermore, the availability of a national MSME Development Statistical Framework, the development of which is currently being guided by the DTI-BMSMED and the National Statistical Coordination Board (NSCB), needs to be ensured to help improve the level of information that stakeholders can use to design, develop and manage MSME development efforts in the years to come.
The Philippines has a long way to go in improving its competitiveness. Critical to this is the curbing of corruption at all levels and streamlining of the bureaucracy to stimulate enterprise creation and harness economic activities.
The majority of existing microfinance clients is not poor according to the official definition. Given this finding, there is a need to re-examine the targeting approach of microfinance implementers in the Philippines. Another factor that needs to be looked at is whether there is enough motivation for the implementers to seek poor clients.
The impact of the availability of program loans on per capita income is shown to be positive and mildly significant. This is true for per capita total expenditure and per capita food expenditure. But it was also found that this impact is regressive, that is negative or insignificant for poorer households and becomes only positive and increasing with richer households. This is disturbing as this indicates that among poorer borrowers the cost of and availability of program loans appears not to be sufficient to prod them into selecting more productive activities that will not only pay for the cost of borrowing but also earn them some profit.
For microfinance to be an effective poverty-alleviation tool there is a need to review targeting procedures to know whether these are correctly identifying the intended beneficiaries. There is also a need to regularly assess the economic status of clients to avoid drifting away from the focus on the poor and low-income households. Considering the regressive impact on income, there is a need to help the poor in selecting projects so that these do not only ensure the payment of loans but also generate enough profit as well. @
Civil Society Assessment of the Philippine MSME Development Plan as contained in the MTPDP 2004-2010

Ass
essm
ent R
epor
t
123
REFERENCES
Asian Development Bank. Key Indicators for Asia and the Pacific. Mandaluyong City: ADB, 2008.
Asian Development Bank. Country Diagnostics Studies, Philippines: Critical Development Constraints. Mandaluyong City: ADB, 2008.
Asian Institute of Management Policy Center. “Getting to C: Competencies, Clusters, Communities, Convergence, Competitiveness”. State of Philippine Competitiveness National Conference 2007. Makati City: July 2007.
International Bank for Reconstruction and Development/World Bank. “Doing Business 2009.” Washington, D.C.: World Bank, 2008.
Kondo, Toshio. “Impact of Microfinance on Rural Households in the Philippines: A Case Study from the Special Evaluation Study on the Effects of Microfinance Operations on Poor Rural Households and the Status of Women.” Mandaluyong City: Asian Development Bank, 2007.
Micro, Small and Medium Enterprise Development Council. “MSME Development Plan Accomplishment Report July 2004 – June 2009.” Bureau of Micro, Small and Medium Enterprise Development, Department of Trade and Industry.
National Statistical Coordination Board. “2006 Official Poverty Statistics.” Makati City: NSCB, 2006.
National Statistical Coordination Board. “Statistical Indicators on Philippine Development.” Makati City: NSCB, 2008.
World Economic Forum. “The Global Competitiveness Report 2008-2009.” Geneva: WEF, 2008.
Civil Society Assessment of the Philippine MSME Development Plan as contained in the MTPDP 2004-2010

Civi
l Soc
iety
Ass
essm
ent o
f the
200
4 -2
010
MTP
DP
124

Ass
essm
ent R
epor
t
125
Civil Society Assessment of the 2004-2010 Medium Term Philippine Development Plan for the Tourism Sector*SUSTAINABILITY AND EQUITY, NOT JUST GROWTH1
I. INTRODUCTION
On May 12, 2009, President Gloria Macapagal-Arroyo (PGMA) signed into law Republic Act (RA) 9593, also known as the Tourism Act of 2009. In its general provisions, the new law declared the policy of the state to harness the tourism industry “as an engine of socio-economic growth and cultural affirmation to generate investment, foreign exchange and employment, and to continue to mold an enhanced sense of national pride for all Filipinos.”
This policy statement reflects a national government perspective on tourism that has remained largely unchanged since the creation of the Department of Tourism (DOT) in 1973. The message has been consistent for almost 40 years: tourism is a powerful economic growth engine for the country with great potential for generating direct and indirect jobs, large levels of investment, and huge foreign exchange movements. Thus, it should not be surprising that the policy framework of the 2004-2010 Medium-Term Philippine Development Plan (MTPDP) remains “geared towards attracting more visitors, extending their length of stay, and increasing the attractiveness of tourist products to encourage travelers to spend more.”
As the Philippines prepares for the 2010 national elections, tourism is likely to continue to be viewed as an important economic platform in the post-PGMA scenarios. It is timely, therefore, to assess the tourism sector’s performance in the context of the 2004-2010 MTPDP. To what extent have we met our growth targets for tourism? How competitive is the Philippines in the international tourism marketplace?
However, tourism cannot be assessed solely on the basis of its contributions to economic growth. Over the past few years, tourism’s role beyond being a platform for economic growth and serving as a mechanism for creating jobs, generating foreign exchange, and stimulating foreign investment, has drawn the attention of both national governments and international development partners worldwide. This assessment has thus been expanded to look into Philippine tourism’s contributions to achieving such overarching goals as poverty reduction, sustainable development, gender equality, etc.
II. POLICY FRAMEWORK: THE 2004-2010 STRATEGIC FRAMEWORK FOR TOURISM
The National Tourism Strategy presented in the 2004-2010 MTPDP is, for all intents and purposes, a national strategy for international tourism. The critical elements of the tourism chapter are focused on international, or inbound, tourism. For example:
• Thekeymeasuresofnationaltourismperformanceareexpressedintermsofinternationalarrivalsandtourist receipts in US dollars.
• Prioritymarketsaredescribedaslongorshorthaul,withprimaryfocusgiventoChina,Korea,andJapan.
1Prepared by Ramon Benedicto A. Alampay of Asia Pacific Projects, Inc.

Civi
l Soc
iety
Ass
essm
ent o
f the
200
4 -2
010
MTP
DP
126
Although domestic tourism is mentioned briefly – as one of the ten most attractive tourist segments going into 2010 – most of the strategic priorities are geared towards achieving growth through inbound tourism, particularly through mass tourism. These include:
• aproductfocusondevelopingpackagetours,beachattractions,and“world-class”hotelandconventionfacilities for international target markets;
• aggressive promotions targeted at short-haul beachgoer and sightseeing/shopper segments (anddomestic market segments) as well as specialized niche promotions to short-haul recreation travelers and ecotourists;
• prioritydestinationsselectedonthebasisofcurrentvolumeoftouristactivity,“Wow”factor,andreadinessfor international visitor traffic;
• infrastructureprioritiesbasedon:o facilitating international air access to the Philippines; o improving internal air, sea, and land access to the priority destinations from the country’s main air
gateways;o providing infrastructure to make destinations more attractive for big-ticket investments in tourism
economic zones (TEZs); ando sustainable development and environmental protection infrastructure to manage the impacts of
mass tourism on the priority destinations.• aninvestment-promotionprogramforbuildingTEZsintheprioritydestinationsasvehiclesforintegrated
development of hotels, resorts, and other high-volume tourist facilities; and• an institutional re-structuring agenda to recast the DOT and its attached agencies asmore effective
international tourism marketing offices and administrators of priority destinations and their TEZ’s.
The tourism chapter of the 2004-2010 Medium-Term Public Investment Program (MTPIP) reflects this strong international tourism slant. Over 90 percent of the total required investments were intended for marketing and promotional activities targetting strategic markets identified under the MTPDP (China, Japan, Korea, and North America).
III. PERFORMANCE AND ACCOMPLISHMENT IN 2004 TO 2010
GROWTH AND COMPETITIVENESS
According to the DOT, there were 3.14 million international arrivals to the Philippines in 2008. Thus, from 2.29 million arrivals in 2004, the Philippine tourism industry achieved an average annual growth rate (AAGR) of 8.21%, despite the dampening effects of 2008’s global financial crisis. As shown in Table 1, Philippine tourism grew at an above-average rate for the Asia-Pacific region from 2004 to 2008. This was faster than Thailand, Singapore, and Indonesia, and roughly comparable to Malaysia’s rate over that period.
However, these results fall far short of the original visitor arrival targets of the 2004-2010 MTPDP. In the updated MTPDP, the department considered the effects of the 2008 global financial crisis and significantly downgraded its forecasts for the last three years of the plan. Based on DOT’s most recent forecasts, international tourism to the Philippines in 2010 will be short by more than a third, or about 1.86 million international arrivals, from its original target of five million (see Table 2).
TABLE 1. INTERNATIONAL VISITOR ARRIVALS TO PHILIPPINES (IN MILLIONS). REGIONAL BENCHMARKS.
2004 2005 2006 2007 2008 AAGR 04-08
Malaysia 15.70 16.43 17.55 20.97 22.10 8.92%Thailand 11.74 11.57 13.82 14.46 14.60 5.61%Singapore 6.55 7.08 7.59 7.96 7.80 4.45%Indonesia 5.32 5.00 4.87 5.51 6.20 3.90%Vietnam 2.93 3.47 3.58 4.17 4.20 9.44%Philippines 2.29 2.62 2.84 3.09 3.14 8.21%Asia and the Pacific 144.20 154.70 167.10 185.40 188.30 6.90%
Source of data: National Tourism Organizations and UNWTO
Civil Society Assessment of the 2004-2010 Medium Term Philippine Development Plan for the Tourism Sector*

Ass
essm
ent R
epor
t
127
In fact, the year-to-year gaps between the MTPDP targets and the actual visitor arrival figures had been growing even before 2008. It is worth noting that the “5 million by 2010” target was already reduced from the 6.3 million originally projected by DOT and the UNWTO in the 2000 Strategic Marketing Plan for the Philippines.
TABLE 2. ACTUAL AND PROJECTED ARRIVALS (IN MILLIONS) VS 2004-2010 MTPDP TARGETS.
Year 2004 2005 2006 2007 2008 2009* 2010*MTPDP Targets 2.30 2.67 3.07 3.53 4.02 4.50 5.00Adjusted Post 2008 Targets 3.20 3.24 3.27Actual Arrivals 2.29 2.62 2.84 3.09 3.14 3.14 3.14% difference -0.38% -1.68% -7.33% -12.37% -21.95% -30.31% -37.22%
* Official visitor arrival numbers for 2009 are not available from DOT. But recent public pronouncements by DOT suggest a zero growth scenario for 2009 and 2010, as a result of the 2008 global financial crisis.
In addition to increasing visitor arrivals to the country, there were two other growth measures specifically mentioned in the 2004-2010 MTPDP: tourism receipts and tourist employment. The MTPDP targets for these variables are shown in Table 3.
TABLE 3. 2004-2010 TARGETS FOR TOURISM JOBS CREATION AND INTERNATIONAL VISITOR RECEIPTS
2004 2005 2006 2007 2008 2009 2010Jobs
(in Millions) 2.81 3.25 3.74 4.30 4.91 5.50 6.10
Visitor Receipts(US$ Billion) 2.24 2.59 2.98 3.43 3.91 4.38 4.86
Source: 2004-2010 MTPDP
The DOT estimates2 that as early as 2007, the Philippines had already exceeded the 2010 target for visitor receipts. The figure dropped (from US$4.89 billion to 4.4 billion) slightly in 2008, though still proved to be higher than the 2009 target. Assuming a continuation of the zero-growth scenario, the Philippines will fall just slightly short of its original visitor receipts target for 2010. Nevertheless, all things considered, the DOT is quite pleased with these results. They suggest that the country’s marketing efforts are bringing in higher-quality, higher-spending international tourists. As shown in Table 4, the Philippines earned more than twice the amount of visitor receipts per international arrival in 2008 than Malaysia did from its visitors.
TABLE 4. INTERNATIONAL TOURIST RECEIPTS (US$ BILLION) COMPARED TO SEA RIVALS AND MTPDP TARGETS
Visitor Receipts (US$ Billion) 2008 Yield per VARR2004 2005 2006 2007 2008
Indonesia 5.00 4.50 4.40 5.30 7.40 1,193.55Malaysia 8.20 8.80 10.40 14.00 15.30 692.31Singapore 5.20 6.20 7.50 9.20 10.60 1,358.97Thailand 10.00 9.60 13.40 16.70 17.70 1,212.33Vietnam 1.70 1.90 3.20 n/a n/a n/aPhilippines 1.99 2.24 3.47 4.89 4.40 1,401.53
Source: UNWTO
With regard to tourism employment, DOT estimates this as a function of international visitor arrivals. Thus, it follows that the Philippines will also fall short of its tourism jobs targets over the course of the 2004-2010 MTPDP.
2Visitor receipts are calculated using survey-based estimates of length of stay and average daily spending by international tourists during their stay in the Philippines.
Civil Society Assessment of the 2004-2010 Medium Term Philippine Development Plan for the Tourism Sector*

Civi
l Soc
iety
Ass
essm
ent o
f the
200
4 -2
010
MTP
DP
128
Using the standard DOT multiplier3, it is estimated that the Philippine tourism industry would generate around 1 to 1.8 million jobs less per year, than the MTPDP targets for 2008-2010. This means that, despite the greater value received by the country from international tourism, fewer Filipinos experienced these earnings (in the form of direct employment), than the MTPDP had expected in 2004.
Were these targets unrealistic? In other words, was it unreasonable to expect the Philippines to bring in five million visitors (generating some six million jobs, in the process) by 2010?
As shown in Figure 1, the Southeast Asian region encountered a series of natural, political, and socio-economic events that significantly affected the tourism sector’s growth from 2000 to the present. Though the number of visitors increased every year (except for a slight dip in 2003) from 2001, they increased at an average rate of only 5.85% per year – well below the 12% average projected by DOT and UNWTO. Nevertheless, external events are not enough to explain the extent to which the Philippine tourism sector has failed to meet MTPDP targets. Facing the same external factors, Vietnam’s tourism sector still managed to achieve an annual average growth rate of 8.73% from 2000 to 2008, or more than 3 percentage points higher than the Philippines.
FIGURE 1. INTERNATIONAL VISITOR ARRIVALS TO THE PHILIPPINES, 1994-2008 (IN MILLIONS)
Civil Society Assessment of the 2004-2008 MTPDP: Tourism
Page 5
growth rate of 8.73% from 2000 to 2008, or more than 3 percentage points higher than the Philippines.
FIGURE 1. INTERNATIONAL VISITOR ARRIVALS TO THE PHILIPPINES, 1994-2008 (IN MILLIONS)
Source: Asia Pacific Projects, Inc., based on DOT data
Table 5 shows the latest Travel & Tourism Competitiveness Index (TTCI) ratings of the Philippines according to the World Economic Forum (WEF). The TTCI aims to measure4 the factors and policies that make it attractive to develop tourism in each country. The Index covers 73 different variables that make up 14 pillars of competitiveness. These 14 pillars are, in turn, summarized into three broad categories or sub-indices: 1) travel and tourism regulatory framework; 2) business environment and infrastructure; and 3) human, cultural, and natural resources for travel and tourism.
In 2009, the Philippines received an overall score of 3.73 (with 7 as the highest possible score), ranking 86th out of 133 countries in the study. Out of 25 countries in Asia and the Pacific, the Philippines ranked 16th overall. Compared to its Southeast Asian rivals, the Philippines received a relatively low ranking (59th overall) on the Prioritization of Travel and Tourism scale, with only Vietnam ranked below it. All the other neighboring countries ranked among the top 25 countries in this pillar. On the specific variables included in this scale, the Philippines rated the poorest within the comparison group on “government prioritization of tourism” and “effectiveness of marketing and branding”.
4 Developed in collaboration with agencies such as the International Air Transport Association (IATA), the International Union
for Conservation of Nature (IUCN), and UNWTO, the TTCI uses a combination of data from publicly available sources, international travel and tourism institutions and experts, as well as the results of the Executive Opinion Survey, a comprehensive annual survey conducted by WEF.
Table 5 shows the latest Travel & Tourism Competitiveness Index (TTCI) ratings of the Philippines according to the World Economic Forum (WEF). The TTCI aims to measure4 the factors and policies that make it attractive to develop tourism in each country. The Index covers 73 different variables that make up 14 pillars of competitiveness. These 14 pillars are, in turn, summarized into three broad categories or sub-indices: 1) travel and tourism regulatory framework; 2) business environment and infrastructure; and 3) human, cultural, and natural resources for travel and tourism.
In 2009, the Philippines received an overall score of 3.73 (with 7 as the highest possible score), ranking 86th out of 133 countries in the study. Out of 25 countries in Asia and the Pacific, the Philippines ranked 16th overall. Compared to its Southeast Asian rivals, the Philippines received a relatively low ranking (59th overall) on the
31.22 tourism jobs for every 1 international arrival4Developed in collaboration with agencies such as the International Air Transport Association (IATA), the International Union for Conservation of Nature (IUCN), and UNWTO, the TTCI uses a combination of data from publicly available sources, international travel and tourism institutions and experts, as well as the results of the Executive Opinion Survey, a comprehensive annual survey conducted by WEF.
Civil Society Assessment of the 2004-2010 Medium Term Philippine Development Plan for the Tourism Sector*

Ass
essm
ent R
epor
t
129
Prioritization of Travel and Tourism scale, with only Vietnam ranked below it. All the other neighboring countries ranked among the top 25 countries in this pillar. On the specific variables included in this scale, the Philippines rated the poorest within the comparison group on “government prioritization of tourism” and “effectiveness of marketing and branding”.
However, the Philippines’ biggest area of weakness is related to the business environment and infrastructure for travel and tourism. The Philippines was ranked lower than Indonesia, Malaysia, Singapore, Thailand, and even Vietnam, on this sub-index. An examination of the specific business environment and infrastructure pillars shows that the Philippines rated poorly in ground (3.0 out of 7.0) and air (2.9) transportation infrastructure, and especially on tourism infrastructure (1.9). Table 5 breaks down the variables for these particular pillars5.
TABLE 5. COMPARATIVE TRAVEL & TOURISM COMPETITIVENESS RATING OF THE PHILIPPINES
Civil Society Assessment of the 2004-2008 MTPDP: Tourism
Page 6
However, the Philippines’ biggest area of weakness is related to the business environment and infrastructure for travel and tourism. The Philippines was ranked lower than Indonesia, Malaysia, Singapore, Thailand, and even Vietnam, on this sub-index. An examination of the specific business environment and infrastructure pillars shows that the Philippines rated poorly in ground (3.0 out of 7.0) and air (2.9) transportation infrastructure, and especially on tourism infrastructure (1.9). Table 5 breaks down the variables for these particular pillars 5.
TABLE 5. COMPARATIVE TRAVEL & TOURISM COMPETITIVENESS RATING OF THE PHILIPPINES
Pillars of Travel & Tourism Competitiveness
Rating* (Global Rank out of 133 Countries)
Philippines Indonesia Malaysia Singapore Thailand Vietnam
T&T Regulatory Framework 4.3 (85) 3.8 (113) 5.0 (42) 5.8 (6) 4.5 (70) 4.2 (92) Policy Rules & Regulations 4.3 (72) 3.3 (123) 5.4 (9) 6.2 (1) 4.5 (62) 3.9 (96) Environmental Sustainability 4.4 (73) 3.4 (130) 4.7 (54) 4.9 (42) 4.1 (99) 4.1 (100) Safety & Security 4.1 (113) 3.9 (119) 5.3 (59) 6.3 (10) 3.9 (118) 4.5 (100) Health & Hygiene 4.0 (87) 2.6 (110) 4.5 (69) 5.2 (53) 4.4 (71) 3.8 (95) Prioritization of Trav. & Tour. 4.5 (59) 5.7 (10) 5.3 (23) 6.3 (2) 5.3 (22) 4.4 (61)
T&T Business Envi & Infra 3.1 (89) 3.2 (79) 4.2 (38) 5.2 (5) 4.1 (40) 3.1 (85) Air Transport Infrastructure 2.9 (73) 3.2 (60) 4.2 (35) 5.0 (15) 4.5 (25) 2.7 (84) Ground Transport Infra 3.0 (90) 3.0 (89) 4.8 (28) 6.5 (4) 3.8 (56) 3.2 (80) Tourism Infrastructure 1.9 (96) 2.1 (88) 2.7 (77) 4.4 (37) 4.3 (39) 1.6 (109) ICT Infrastructure 2.2 (92) 2.1 (102) 3.6 (46) 5.1 (17) 2.7 (71) 2.6 (79) Price Competitiveness 5.4 (16) 5.9 (3) 5.8 (4) 5.2 (27) 5.4 (19) 5.5 (11)
T&T Resources 3.9 (70) 4.4 (40) 4.9 (14) 4.7 (23) 4.7 (19) 3.8 (76) Human Resources 5.0 (69) 5.3 (42) 5.5 (30) 6.3 (1) 5.2 (57) 4.9 (82) Affinity for Travel & Tourism 4.9 (53) 4.6 (78) 5.4 (21) 5.7 (10) 5.4 (22) 4.6 (81) Natural Resources 3.1 (65) 4.4 (28) 4.6 (21) 2.7 (94) 4.5 (24) 3.6 (52) Cultural Resources 2.4 (63) 3.1 (37) 3.9 (32) 4.1 (29) 3.8 (23) 2.2 (68)
Overall Average (Rank) 3.73 (86) 3.79 (81) 4.71 (32) 5.24 (10) 4.45 (39) 3.70 (89) 2008 Average (Rank) 3.70 (81) 3.70 (80) 4.63 (32) 5.06 (16) 4.37 (42) 3.57 (96)
* - variable scores are standardized on 1- to 7-point scales. Higher scores are better. Source: The Travel and Tourism Competitiveness Report 2009 (World Economic Forum)
Table 6 hints at the factors that have constrained the Philippine travel and tourism sector from achieving its medium term targets for international tourism. The Philippine scores for “government prioritization of tourism”, as well as the perceived “effectiveness of its tourism marketing campaigns”, are quite respectable (5.8/7.0 and 4.9/7.0, respectively). However, these were still the lowest scores in its competitive group.
The most significant constraints or competitive disadvantages appear to be supply-related. The Philippines scored the lowest in terms of hotel room supply. In addition, the quality of its air transport infrastructure is only slightly better than Vietnam’s. More importantly, it has the fewest number of operating airlines among the six countries and also scored relatively low on its 5 Unless noted, the ratings are based on the 1-7 scales from the WEF’s Executive Opinion survey. Explanatory notes on the
measures for which actual data were used are provided in the table.
Table 6 hints at the factors that have constrained the Philippine travel and tourism sector from achieving its medium term targets for international tourism. The Philippine scores for “government prioritization of tourism,” as well as the perceived “effectiveness of its tourism marketing campaigns,” are quite respectable (5.8/7.0 and 4.9/7.0, respectively). However, these were still the lowest scores in its competitive group.
The most significant constraints or competitive disadvantages appear to be supply-related. The Philippines scored the lowest in terms of hotel room supply. In addition, the quality of its air transport infrastructure is only slightly better than Vietnam’s. More importantly, it has the fewest number of operating airlines among the six countries and also scored relatively low on its international air transport network (a measure of the perceived accessibility, by air, to key destinations around the world). These are critical issues for the Philippines because 98% of its arrivals come by air.
5Unless noted, the ratings are based on the 1-7 scales from the WEF’s Executive Opinion survey. Explanatory notes on the measures for which actual data were used are provided in the table.
Civil Society Assessment of the 2004-2010 Medium Term Philippine Development Plan for the Tourism Sector*
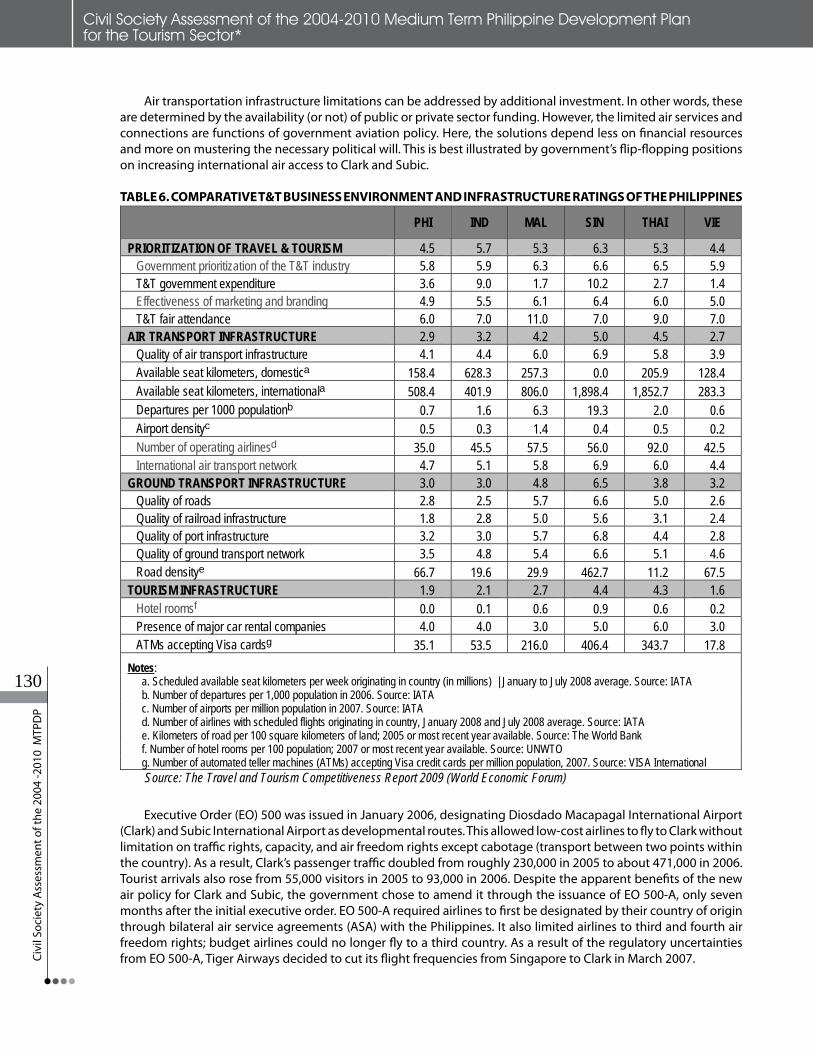
Civi
l Soc
iety
Ass
essm
ent o
f the
200
4 -2
010
MTP
DP
130
Air transportation infrastructure limitations can be addressed by additional investment. In other words, these are determined by the availability (or not) of public or private sector funding. However, the limited air services and connections are functions of government aviation policy. Here, the solutions depend less on financial resources and more on mustering the necessary political will. This is best illustrated by government’s flip-flopping positions on increasing international air access to Clark and Subic.
TABLE 6. COMPARATIVE T&T BUSINESS ENVIRONMENT AND INFRASTRUCTURE RATINGS OF THE PHILIPPINES
Civil Society Assessment of the 2004-2008 MTPDP: Tourism
Page 7
international air transport network (a measure of the perceived accessibility, by air, to key destinations around the world). These are critical issues for the Philippines because 98% of its arrivals come by air.
Air transportation infrastructure limitations can be addressed by additional investment. In other words, these are determined by the availability (or not) of public or private sector funding. However, the limited air services and connections are functions of government aviation policy. Here, the solutions depend less on financial resources and more on mustering the necessary political will. This is best illustrated by government’s flip-flopping positions on increasing international air access to Clark and Subic.
TABLE 6. COMPARATIVE T&T BUSINESS ENVIRONMENT AND INFRASTRUCTURE RATINGS OF THE PHILIPPINES
PHI IND MAL SIN THAI VIE
PRIORITIZATION OF TRAVEL & TOURISM 4.5 5.7 5.3 6.3 5.3 4.4Government prioritization of the T&T industry 5.8 5.9 6.3 6.6 6.5 5.9 T&T government expenditure 3.6 9.0 1.7 10.2 2.7 1.4 Effectiveness of marketing and branding 4.9 5.5 6.1 6.4 6.0 5.0 T&T fair attendance 6.0 7.0 11.0 7.0 9.0 7.0
AIR TRANSPORT INFRASTRUCTURE 2.9 3.2 4.2 5.0 4.5 2.7Quality of air transport infrastructure 4.1 4.4 6.0 6.9 5.8 3.9 Available seat kilometers, domestica 158.4 628.3 257.3 0.0 205.9 128.4 Available seat kilometers, internationala 508.4 401.9 806.0 1,898.4 1,852.7 283.3 Departures per 1000 populationb 0.7 1.6 6.3 19.3 2.0 0.6 Airport densityc 0.5 0.3 1.4 0.4 0.5 0.2 Number of operating airlinesd 35.0 45.5 57.5 56.0 92.0 42.5 International air transport network 4.7 5.1 5.8 6.9 6.0 4.4
GROUND TRANSPORT INFRASTRUCTURE 3.0 3.0 4.8 6.5 3.8 3.2Quality of roads 2.8 2.5 5.7 6.6 5.0 2.6 Quality of railroad infrastructure 1.8 2.8 5.0 5.6 3.1 2.4 Quality of port infrastructure 3.2 3.0 5.7 6.8 4.4 2.8 Quality of ground transport network 3.5 4.8 5.4 6.6 5.1 4.6 Road densitye 66.7 19.6 29.9 462.7 11.2 67.5
TOURISM INFRASTRUCTURE 1.9 2.1 2.7 4.4 4.3 1.6Hotel roomsf 0.0 0.1 0.6 0.9 0.6 0.2 Presence of major car rental companies 4.0 4.0 3.0 5.0 6.0 3.0 ATMs accepting Visa cardsg 35.1 53.5 216.0 406.4 343.7 17.8
Notes:a. Scheduled available seat kilometers per week originating in country (in millions) | January to July 2008 average. Source: IATAb. Number of departures per 1,000 population in 2006. Source: IATAc. Number of airports per million population in 2007. Source: IATAd. Number of airlines with scheduled flights originating in country, January 2008 and July 2008 average. Source: IATA e. Kilometers of road per 100 square kilometers of land; 2005 or most recent year available. Source: The World Bank f. Number of hotel rooms per 100 population; 2007 or most recent year available. Source: UNWTOg. Number of automated teller machines (ATMs) accepting Visa credit cards per million population, 2007. Source: VISA InternationalSource: The Travel and Tourism Competitiveness Report 2009 (World Economic Forum)
Executive Order (EO) 500 was issued in January 2006, designating Diosdado Macapagal International Airport (Clark) and Subic International Airport as developmental routes. This Executive Order (EO) 500 was issued in January 2006, designating Diosdado Macapagal International Airport (Clark) and Subic International Airport as developmental routes. This allowed low-cost airlines to fly to Clark without limitation on traffic rights, capacity, and air freedom rights except cabotage (transport between two points within the country). As a result, Clark’s passenger traffic doubled from roughly 230,000 in 2005 to about 471,000 in 2006. Tourist arrivals also rose from 55,000 visitors in 2005 to 93,000 in 2006. Despite the apparent benefits of the new air policy for Clark and Subic, the government chose to amend it through the issuance of EO 500-A, only seven months after the initial executive order. EO 500-A required airlines to first be designated by their country of origin through bilateral air service agreements (ASA) with the Philippines. It also limited airlines to third and fourth air freedom rights; budget airlines could no longer fly to a third country. As a result of the regulatory uncertainties from EO 500-A, Tiger Airways decided to cut its flight frequencies from Singapore to Clark in March 2007.
Civil Society Assessment of the 2004-2010 Medium Term Philippine Development Plan for the Tourism Sector*

Ass
essm
ent R
epor
t
131
IV. OVERALL ASSESSMENT: SUSTAINABILITY, EQUITY AND THE PHILIPPINE TOURISM SECTOR 2004-2010
Considering the tourism sector goals of the 2004-2010 MTPDP, the Philippines has significantly underperformed in terms of its targets for visitor arrivals and tourism employment. On the other hand, it appears to have gone well beyond its targets for tourism receipts, surpassing the 2010 targets two years early. What is less clear, however, is the extent to which this economic yield from international tourism makes a significant contribution to the goals of poverty reduction, sustainable economy, and empowerment and democratization in the Philippines.
Reduction of Poverty and Inequality
The MTPDP’s implied approach to poverty reduction from tourism appears to follow the hubs-and-spokes structure for building the priority tourism destinations. By generating international tourism growth at the main international gateways and urban population centers, the strategy seeks to disperse the economic impacts down to the secondary destinations that are accessible from the primary hubs. This tends to limit the scope and breadth of tourism’s poverty reduction effect to the priority tourism destinations and their vicinity.
As shown in Figure 2, the 40 poorest provinces account for only 22.6% of all international travel to local destinations. If the provinces of Aklan, Bohol, and Palawan are excluded, the proportion going to the poorest provinces drops to only 11%. Including visits from domestic travelers, about eight out of 10 overnight visits (83.08%) are to destinations in the National Capital Region and Regions 4 to 8 (Southern Tagalog, Bicol, and the Visayas).
FIGURE 2. DISTRIBUTION OF INTERNATIONAL* TRAVELLERS IN THE PHILIPPINES (2007)
Civil Society Assessment of the 2004-2008 MTPDP: Tourism
Page 9
FIGURE 2. DISTRIBUTION OF INTERNATIONAL* TRAVELLERS IN THE PHILIPPINES (2007)
* Includes Overseas Filipinos Source: DOT, from accommodation establishment reports submitted to DOT Regional Offices; no data for ARMM
Map 1 shows the eight priority tourism destinations identified in the 2004-2010 MTPDP: four major priority destinations (Manila plus Tagaytay; Cebu, including Bohol and Camiguin; Davao; and Palawan); two minor priority destinations (Subic/Clark, and Vigan/Laoag); and two priority special interest destinations (Boracay and Baguio/Banaue). The map shows these priority areas in relation to the 40 poorest provinces of the Philippines as of 2006. The map also indicates the location of lands with ancestral domain titles or pending ancestral domain claims.
Map 1 shows the eight priority tourism destinations identified in the 2004-2010 MTPDP: four major priority destinations (Manila plus Tagaytay; Cebu, including Bohol and Camiguin; Davao; and Palawan); two minor priority destinations (Subic/Clark, and Vigan/Laoag); and two priority special interest destinations (Boracay and Baguio/Banaue). The map shows these priority areas in relation to the 40 poorest provinces of the Philippines as of 2006. The map also indicates the location of lands with ancestral domain titles or pending ancestral domain claims.
Civil Society Assessment of the 2004-2010 Medium Term Philippine Development Plan for the Tourism Sector*

Civi
l Soc
iety
Ass
essm
ent o
f the
200
4 -2
010
MTP
DP
132
MAP 1. PRIORITY TOURISM DESTINATIONS* & THE PHILIPPINES’ POOREST PROVINCES**
Civil Society Assessment of the 2004-2008 MTPDP: Tourism
Page 10
MAP 1. PRIORITY TOURISM DESTINATIONS* &THE PHILIPPINES’ POOREST PROVINCES**
* Anchor destinations as identified in the 2004-2010 MTPDP **Based on poverty incidence in 2006 (NSCB) Note: The representations of the destinations, ancestral domains and protected areas on the map are merely
indicative of relative location. No claims are made as to the precision and accuracy of these locations.
With the adoption of the Super Region Development Strategy in 2006, tourism was identified as a key development strategy for Central Philippines6. However, the priority strategic destination areas (SDA) identified in the Sustainable Tourism Management Plan for Central Philippines (2007) hardly differ from those in the 2004 MTPDP. Five priority SDAs were identified based on criteria such as market potential, private sector interest, environmental risk posed by further development, and potential for direct international air access. In order of importance, these five were: (1) Metro Cebu, with Sogod; (2) Boracay with Carabao Island; (3) Bohol; and (4) Northern Palawan, with (5) Metro Iloilo-Guimaras and Negros Occidental as the only new priority development area.
6 Central Philippines is composed of the 3 Central Visayas Regions (6-Western Visayas, 7-Central Visayas, 8 – Eastern Visayas),
with the addition of Region 5 (the Bicol Region), the provinces of Palawan and Romblon from Region 4, and Dapitan City (Zamboanga del Norte), Camiguin, and Siargao (Surigao del Norte) in Mindanao
With the adoption of the Super Region Development Strategy in 2006, tourism was identified as a key development strategy for Central Philippines6. However, the priority strategic destination areas (SDA) identified in the Sustainable Tourism Management Plan for Central Philippines (2007) hardly differ from those in the 2004 MTPDP. Five priority SDAs were identified based on criteria such as market potential, private sector interest, environmental risk posed by further development, and potential for direct international air access. In order of importance, these five were: (1) Metro Cebu, with Sogod; (2) Boracay with Carabao Island; (3) Bohol; and (4) Northern Palawan, with (5) Metro Iloilo-Guimaras and Negros Occidental as the only new priority development area.
Of the priority destinations, only Bohol, Palawan, and Camiguin are among the 40 poorest provinces, with all three belonging to the second group of provinces from 21st to 40th rank. However, there has been little tourism development or growth in Camiguin since 2004. Furthermore, tourism development in Bohol has tended to be concentrated in the Tagbilaran-Panglao island cluster. In Palawan, tourism development continues to be primarily concentrated in Northern Palawan and Puerto Princesa City.
As Map 1 shows, most of the poorer provinces are not priority destinations. With the exception of Banaue and parts of Northern Palawan, none of the ancestral lands are identified as priority destinations. Their distance to major tourism gateways as well as the difficulty in providing last-mile access to the potential attractions in
6Central Philippines is composed of the 3 Central Visayas Regions (6-Western Visayas, 7-Central Visayas, 8 – Eastern Visayas), with the addition of Re-gion 5 (the Bicol Region), the provinces of Palawan and Romblon from Region 4, and Dapitan City (Zamboanga del Norte), Camiguin, and Siargao (Surigao del Norte) in Mindanao.
Civil Society Assessment of the 2004-2010 Medium Term Philippine Development Plan for the Tourism Sector*

Ass
essm
ent R
epor
t
133
the poorer provinces almost automatically exclude them from the mainstream tourism sector towards which the MTPDP is directed. Even in the case of Boracay Island, tourism development is centered on the island with little impact on Aklan province beyond Caticlan and Kalibo, or on the adjacent province of Antique.
The orientation towards mass-based, international tourism development is likely to continue for the foreseeable future. By putting a premium on tourism’s contributions to foreign-exchange generation, there will continue to be a bias towards the development of international and domestic gateways, urban destinations, and large beach areas that have potential for development as integrated resorts for mass tourism. Table 7 shows the list of approved tourism enterprise zones. The list illustrates the scale and character of TEZs as incubators of “world-class” tourist facilities such as integrated resorts, upscale hotels, casinos, and other mass tourism infrastructure.
Civil Society Assessment of the 2004-2008 MTPDP: Tourism
Page 11
Of theprioritydestinations,onlyBohol,Palawan, and Camiguin are among the 40 poorest provinces, with all three belonging to the second group of provinces from 21st to 40th rank. However, there has been little tourism development or growth in Camiguin since 2004. Furthermore, tourism development in Bohol has tended to be concentrated in the Tagbilaran-Panglao island cluster. In Palawan, tourism development continues to be primarily concentrated inNorthernPalawanandPuertoPrincesaCity.
As Map 1 shows, most of the poorer provinces are not priority destinations. With the exceptionofBanaueandpartsofNorthernPalawan, none of the ancestral lands are identified as priority destinations. Their distance to major tourism gateways as well as the difficulty in providing last-mile access to the potential attractions in the poorer provinces almost automatically exclude them from the mainstream tourism sector towards which the MTPDP is directed. Even in the case of Boracay Island, tourism development is centered on the island with little impact on Aklan province beyond Caticlan and Kalibo, or on the adjacent province of Antique.
The orientation towards mass-based, international tourism development is likely to continue for the foreseeable future. By putting a premium on tourism’s contributions to foreign-exchange generation, there will continue to be a bias towards the development of international and domestic gateways, urban destinations, and large beach areas that have potential for development as integrated resorts for mass tourism. Table 7 shows the list of approved tourism enterprise zones. The list illustrates the scale and character of TEZs as incubators of “world-class” tourist facilities such as integrated resorts, upscale hotels, casinos, and other mass tourism infrastructure.
TABLE 7. APPROVED TOURISM ENTERPRISE ZONES
NAME OF APPROVED TOURISM ENTERPRISE ZONE LOCATION SIZE (HA.)
Boracay Eco-Village Resort Tourism Economic Zone (includes the Shangri-la Boracay) Boracay Island 79.21
Eastbay Arts, Recreational and Tourism Zone (Thunderbird Fiesta Resort & Casino)
San Roque, Angono, Binangonan, Rizal 26.68
Fort Ilocandia Tourism Economic Zone Laoag, Ilocos Norte 77.47 John Hay Special Tourism Economic Zone Baguio City 301.86Misibis Resorts and Estates Bacacay, Albay 19.67Newport City CyberTourism Zone (Megaworld development in Villamor Airbase) Pasay City 25.34
Pamalican Island Tourism Ecozone (Joint venture of Aboitiz and Andres Soriano groups) Cuyo, Palawan 89.75
Phil. BXT Corp. Tourism Economic Zone (Imperial Palace Waterpark & Spa ) Lapu-Lapu City 7.50
San Lazaro Tourism and Business Park (Manila Jockey Club) Sta. Cruz, Manila 7.42
Development of a Sustainable Economy
The Tourism chapter of the MTPDP starts with this statement: “The tourism industry is among the sectors that has the potential to boost the Philippine economy. It can be a powerful economic growth engine for the country, if developed in a sustainable manner.” This paragraph also happens to be the last mention of sustainability in connection with tourism in the MTPDP.
In July 2002, the DOT in partnership with the Department of Environment and Natural Resources (DENR) completed the National Ecotourism Strategy (NES) with a vision of tourism “characterized by a balanced ecosystem and a well-preserved culture and indigenous knowledge systems and practices for the benefit of present and future generations (National Ecotourism Strategy, 2002).” The corresponding National Ecotourism Program7 (NEP) tasked DOT with developing ecotourism standards, regulation, and accreditation systems, as well as the promotion and advocacy for the key sites. DENR would then be responsible for the development of visitor management services, implementation of livelihood programs, provision of extension services, conduct of training and monitoring of impacts in the key sites. It is telling that – as with sustainability – there is no mention of the NES neither in the tourism chapter of the 2004-2010 MTPDP nor in any of the president’s State of the Nation Addresses (SONA) during the period. The only reference to the NES in the MTPDP is as a minor bullet entry in the chapter on environment and natural resources, related to a program for managing protected areas.
A 2008 review by New Zealand’s Agency for International Aid & Development (NZAID) concluded that the start of implementation and work plan activities of the NES had been delayed. As a result, project impacts have just begun to emerge. Phase 1 (2001-2004) of the NEP focused on three sites: Pamilacan Island in Bohol, Sapang
7he formulation of the NES and the implementation of the NEP was funded by New Zealand’s International Aid & Development Agency (NZAID)
Civil Society Assessment of the 2004-2010 Medium Term Philippine Development Plan for the Tourism Sector*

Civi
l Soc
iety
Ass
essm
ent o
f the
200
4 -2
010
MTP
DP
134
Bato-Mt. Pinatubo in Pampanga, and the Banaue Rice Terraces in Ifugao Province. Phase 2 (2004-2008) covered 4 sites: Hundred Islands National Park (HINP) in Pangasinan, Mayon Volcano Natural Park in Albay, Rajah Sikatuna Protected Landscape in Bohol, and Lake Sebu Protected Landscape in South Cotabato.
The projects were intended to serve as banner sites that would develop and demonstrate the potentials of community-based ecotourism for contributing to poverty reduction and sustainable development in natural and cultural heritage sites of the Philippines. Table 7 summarizes the generally, positive impacts of the NEP projects in the banner sites, according to a review conducted by NZAID. In general, tangible economic and social benefits have been observed in those areas where community-based ecotourism businesses have been established.
However, the NZAID review noted that there remains significant room for improving employment generation by sustaining and improving the projects. In addition, the economic sustainability of the enterprises must be strengthened by educating the community members about reinvesting profits into improvements for the business. In three out of the five community enterprises established so far, business proceeds have been tapped as credit lines for members or other community residents.
Civil Society Assessment of the 2004-2008 MTPDP: Tourism
Page 13
TABLE 7. IMPACTS OF THE NEP PROJECTS AT THE BANNER SITES
Economic Impacts Environmental Impacts Social Impacts • Visitor numbers have increased at
all the banner sites. • Employment generated for target
beneficiaries in most sites: o 12 kayak operators in HINP; 39
Aeta tour guides in Sapang Bato; o 98 Pamilacan Island Dolphin and
Whale Watchers Organization (PIDWWO) members in Pamilacan;
o 435 Kenhulung members and 29 local tour guides in Lake Sebu;
o Ifugao tour guides in Banaue • Incomes of most project
beneficiaries increased. Those who were formerly employed part-time are working more and longer hours due to project interventions
• No or minimal negative environmental impact in all banner sites.
• Environmental improvement occurred partly or in large part due to the introduction of ecotourism in four banner sites:
o Reduction in timber poaching in Lake Sebu, due to the increased demand for abaca – which needs shade from tall trees – for tinalak production..
o Decrease in solid waste disposal into the sea at Hundred Islands National Park
o Decreased incidences of timber poaching and slash-and-burn farming in Sapang Bato.
o Less destructive fishing, manta ray hunting, and decreased use of destructive resource extraction methods in Pamilacan.
• All participants of the training programs claimed improved social status, mostly due to the new-found levels of confidence from improved skills, membership in organizations, and exposure to people outside their community
• In sites where indigenous people groups were present, impacts on these groups were highly positive, given the direct targeting of indigenous people groups as project beneficiaries.
• Positive impacts on targeting women beneficiaries for most sites.
Source: NZAID (2008). NZAID Development Practice Themes Key Learning from 2007 Evaluation and Review Reports. June 2008.
In terms of environmental impacts, the banner site projects have demonstrated that tourism can be introduced in natural environments with minimal negative impacts. In some cases, enhancement or improvement of the natural resources has even been achieved. Nevertheless,potential risks remain as the expansion of economic activities may put greater stress on the natural resources of an area. For example, continued expansion of the indigenous weaving business in Lake Sebu may result in increased, and potentially unhealthy, demand for the endemic plants needed for the traditional dyes used in the production of tinalak.
Empowerment & Democratization through TourismMap 1 showed that the impacts and benefits of tourism tended to converge in priority
destinations, rather than spread more widely to the poorer areas of the Philippines. However, as the map also shows, the poorer provinces have natural and cultural resources (e.g. nature parks, protected areas, and cultural communities) that could become potential assets for tourism. In fact, anumberofkeysitesidentifiedintheNES are located in the poorer provinces.
The emergence, in recent years, of destinations such as Donsol (Sorsogon), Siargao (Surigao delNorte),andCamarinesSurshowthattourism can be nurtured even beyond the priority areas identifiedbyDOT.Perhapsmoresignificantly,there have been notable case studies of tourism being used as a vehicle for the empowerment of traditionally disadvantaged sectors of Philippine society, i.e. women and indigenous cultural communities.
NZAID’s reviewof theNationalEcotourismProgram concluded that for those sites where indigenous communities were involved, the introduced projects had highly positive impacts on
In terms of environmental impacts, the banner site projects have demonstrated that tourism can be introduced in natural environments with minimal negative impacts. In some cases, enhancement or improvement of the natural resources has even been achieved. Nevertheless, potential risks remain as the expansion of economic activities may put greater stress on the natural resources of an area. For example, continued expansion of the indigenous weaving business in Lake Sebu may result in increased, and potentially unhealthy, demand for the endemic plants needed for the traditional dyes used in the production of tinalak.
Empowerment & Democratization through Tourism
Map 1 showed that the impacts and benefits of tourism tended to converge in priority destinations, rather than spread more widely to the poorer areas of the Philippines. However, as the map also shows, the poorer provinces
Civil Society Assessment of the 2004-2010 Medium Term Philippine Development Plan for the Tourism Sector*

Ass
essm
ent R
epor
t
135
have natural and cultural resources (e.g. nature parks, protected areas, and cultural communities) that could become potential assets for tourism. In fact, a number of key sites identified in the NES are located in the poorer provinces.
The emergence, in recent years, of destinations such as Donsol (Sorsogon), Siargao (Surigao del Norte), and Camarines Sur show that tourism can be nurtured even beyond the priority areas identified by DOT. Perhaps more significantly, there have been notable case studies of tourism being used as a vehicle for the empowerment of traditionally disadvantaged sectors of Philippine society, i.e. women and indigenous cultural communities.
NZAID’s review of the National Ecotourism Program concluded that for those sites where indigenous communities were involved, the introduced projects had highly positive impacts on the indigenous groups. NZAID also noted the NEP’s positive impacts on women beneficiaries at most of the project sites, including improved economic and social status, and a corresponding rise in their confidence to fight for their rights as women, in general, and as wives, in particular (NZAID, 2008). Case study research by the World Wide Fund for Nature (WWF) has also provided evidence of tourism’s viability as a strategy for managing community-based natural resources in destinations like Anilao (Batangas) and El Nido (Palawan), as well as marine protected areas like Tubbataha Reef and the Turtle Islands.
In 2007, the DOT, with the Philippine Convention & Visitors Corporation (PCVC), launched the Grassroots Entrepreneurs for Ecotourism (GREET) livelihood program “to promote and safeguard the country’s ecotourism sites by empowering the community through its involvement in provision of essential services for tourists.” Under the GREET program, grants worth Php 50,000 were awarded to groups or individuals with feasible entrepreneurial/business proposals in ecotourism sites around the country – with preference being given to “young” entrepreneurs. According to the GREET Secretariat, some 432 applications were received for the first phase of the program, with a total of 117 business proposals being approved for a combined Php 18.8 million in grants. Applications for the second phase8 re-opened in December 2009 and will continue to March 2010.
While the principle of supporting community-based enterprises is laudable, it is unclear why GREET has a built-in preference for young proponents. There is little in DOT’s marketing literature for GREET which explicitly relates the program’s youth-oriented strategy to broader national or regional programs for poverty reduction, sustainable resource management, and responsible destination management. If these small enterprises cannot be placed within the framework of an integrated and comprehensive destination strategy, it will be that much harder to sustain the individual ventures as well as the GREET program as a whole.
Tourism enterprises outside the main tourism hubs, whether initiated by local government units, community members, or young entrepreneurs, will still require significant support and technical assistance to ensure their sustainability – as well as that of the destinations in which they are located. Project reviews by international donor agencies as well as NGOs have highlighted key areas of institutional and human resource capacity-building requiring expertise that are not yet available at the local levels.
In the overall context of tourism development planning, LGUs are encouraged, under the Tourism Act of 2009, to formulate and implement sustainable tourism development plans for their own areas. Many LGUs do not have the capabilities to undertake these exercises on their own. Unfortunately, the DOT’s current structure and strategic framework limit its ability to service the technical planning needs of many emerging destinations. Its technical expertise is concentrated in DOT’s main planning unit. Regional offices are understaffed and already burdened with other duties related to the administration and enforcement of national tourism rules, regulations, and policies.
The DOT’s relative lack of emphasis on sustainability, poverty reduction, and empowerment as departmental concerns has also stunted the development of broader, inter-agency partnerships with resource- and culture-oriented units such as the Departments of Agriculture, Agrarian Reform, Environment and Natural Resources, etc.
8Phase 2 of GREET is now restricted to applications from organizations. Applications from individual entrepreneurs are no longer accepted.
Civil Society Assessment of the 2004-2010 Medium Term Philippine Development Plan for the Tourism Sector*
... there have been notable case studies of tourism being used as a vehicle for empowerment...

Civi
l Soc
iety
Ass
essm
ent o
f the
200
4 -2
010
MTP
DP
136
Forms of tourism such as ecotourism, agritourism, and cultural tourism end up being treated by both DOT and the other government agencies as niche activities that are peripheral to the main activities of the departments. As a result, the tourism-related expertise in these partner agencies, which could also greatly benefit the community-based initiatives, has been left largely undeveloped.
V. CONCLUSIONS AND RECOMMENDATIONS
There have been significant achievements in Philippine tourism from 2004-2010. The Philippines has registered a very respectable annual growth rate, despite the various disruptions experienced by Southeast Asia over the term of the MTPDP. The DOT has also been able to generate international tourism receipts above the MTPDP targets by drawing in a longer-staying, higher-spending mix of tourists. Nevertheless, these results are disappointing when viewed in the context of the country’s failure to live up to its full potential.
Overall, the performance of the Philippine tourism sector from 2004-2010 has been mediocre. The Department of Tourism has fallen short of its official targets for international visitor arrivals every year, by increasingly larger deficits. For the remainder of the MTPDP period, the Philippines is likely to fall 20 to 30 percent below its international visitor goals.
The Philippines still lags behind its regional tourism rivals because of its own actions and inactions. The policy and infrastructure constraints that have held back Philippine tourism have long been known. To a large extent, the successive 2001-
2004 and 2004-2010 medium-term plans for tourism have tried to address these through aggressive but focused marketing strategies, public investments in international and internal transportation infrastructure, promotion of private sector investment in facilities to upgrade the tourism supply, and policy initiatives to facilitate the flow of visitors into the Philippines.
While the international marketing efforts of DOT/PCVC will still focus on the most tourist-ready destinations, the strategy for expanding tourism supply needs to be broadened. More than just channeling tourism investments in large-scale tourism infrastructure to the priority destinations, the next MTPDP for tourism should also support the medium- to long-term development of emerging and potential destinations outside Metro Manila. The ability to offer a diverse yet high quality basket of tourist destinations will be key to the Philippines’ regional and global competitiveness.
For 2010 onwards, focused marketing programs, facilitation of visitor access (through infrastructure and policy initiatives), and expansion of tourism supply should still be the priorities as far as the tourism growth objectives are concerned. Nevertheless, a key lesson from 2004-2010 is that well-crafted policies and plans will be ineffective if there is little political will to fully implement these policies and programs.
From the perspective of civil society, the more meaningful story of Philippine tourism from 2004-2010 has been about the missed opportunities for harnessing tourism (especially domestic tourism) to develop pro-poor and sustainable economies and to empower disadvantaged groups of society. By overemphasizing the tourism-as-growth-engine model, the MTPDP failed to consider programs that would be able to use tourism as a vehicle for promoting poverty reduction and sustainable resource use. The tourism strategy for 2010 onwards should not just focus on maximizing the benefits from tourism growth but also on promoting social equity through tourism.
Tourism is a potentially viable strategy for poverty reduction because many of the poorest areas of the country already have natural and cultural resources (protected areas, scenic coastal and highland areas, indigenous communities) that could become tourism assets if properly developed. Tourism is labor-intensive and could provide employment for residents, especially women and ethnic minorities, of poor communities. Micro- and small- business enterprises in tourism can be started with little capital, thus providing residents with additional income to supplement the seasonal revenues from farming or fishing. Finally, tourism shares a common interest with other resource-based sectors, e.g. agriculture, fisheries, forestry, etc., in pushing for the development of a sustainable economy.
Civil Society Assessment of the 2004-2010 Medium Term Philippine Development Plan for the Tourism Sector*

Ass
essm
ent R
epor
t
137
Recommendations
As stated earlier, the general growth agenda for tourism beyond 2010 has already been defined. However, from the perspective of civil society, the impacts of a purely growth-oriented tourism program will be limited as far as contributing to the deeper development goals of the nation. In addition, there is also a need to highlight the potential dangers that large-scale tourism developments could bring in terms of the disruption and dislocation of rural/coastal communities, potential increases in prostitution, drug use and other illegal activities, as well as significant long-term damage to sensitive natural ecosystems.
Thus, the recommendations given here seek to introduce a broader agenda for Philippine tourism based not only on tourism growth, but also on equity and sustainability. From a single-minded focus on expanding the Philippine tourism industry, a multi-pronged program is recommended to also promote tourism as a complementary or alternative (where appropriate) development strategy for reducing poverty, promoting sustainable resource management, and empowering disadvantaged groups around the country.
In addition to the continued programs for enhancing market access and overall tourism competitiveness of the Philippines, three main policy recommendations for broadening and deepening the 2010-2016 tourism agenda are given below. Some specific action items are also listed with each policy recommendation.
1. Official recognition in the 2010-2016 MTPDP of poverty reduction, sustainable resource use, and empowerment of disadvantaged groups as primary goals for the tourism sector.a. Promote sustainable and culturally-sensitive forms of tourism as alternative/supplementary
livelihood and heritage conservation strategy in protected areas, ancestral lands, agricultural and fishing communities,
b. Provide investment support and incentives for small and medium enterprises (SMEs), including advocacies for micro-financing in the tourism industry.
c. Harness tourism as a vehicle for promoting peace in the countryside through economic empowerment and improvement of social services and infrastructure in destination communities.
d. Institutionalize mechanisms for working with civil society organizations (CSO) not just on the National Ecotourism Programme (NEP), but particularly on tourism infrastructure projects and tourism estate developments that pose significant risks to communities and sensitive environments.
e. Develop monitoring frameworks and generate data on local and household-level indicators of tourism impacts – both positive and negative.
2. Restructure the DOT in line with the new poverty reduction and sustainable development roles.a. Take advantage of the opportunities from the Tourism Act of 2009 (RA 9593) to shift human resource
capital from the central to the regional offices.b. Strengthen technical support functions of regional offices for local tourism planning and development
initiativesc. Build capacity of regional offices to provide technical and marketing support to LGUs and
communities, particularly in the areas of responsible and sustainable tourism developmentd. Reduce the accreditation burden of regional offices by encouraging private-sector/civil society-
led accreditation and classification systems that emphasize elements of sustainability and social responsibility
3. Increased support for LGU and community-based destination development initiatives.a. The DOT as the champion for integrating infrastructure (DPWH), natural resource management
(DENR), agricultural development (DA/DAR) and other national government programs in support of sustainable destination development at the local levels.
Civil Society Assessment of the 2004-2010 Medium Term Philippine Development Plan for the Tourism Sector*

Civi
l Soc
iety
Ass
essm
ent o
f the
200
4 -2
010
MTP
DP
138
b. Domestic tourism as strategy for equity and wealth redistribution, by promoting destinations beyond the priority (international) destinations.
c. Domestic tourism development as a strategy for global competitiveness by supporting local efforts to raise tourism product quality and service standards to national and, eventually international, standards.
d. Use last mile tourism access and connectivity infrastructure to link community-based projects to mainstream tourist activities in the gateways, and stimulate other forms of local livelihood through related improvements in market access.
e. Promote volunteer tourism as strategy for providing technical support to community-based tourism initiatives.
Civil Society Assessment of the 2004-2010 Medium Term Philippine Development Plan for the Tourism Sector*

Ass
essm
ent R
epor
t
139
Civil Society Assessment of Medium Term Philippine Development Plan 2004-2010: ICT Section1
I. INTRODUCTION: ICT in the Philippines
It is not easy to judge the country's ICT performance compared to the rest of world.
The Philippines ranked in the lower half among the 10 Association of Southeast Asian Nations (ASEAN) countries in terms of fixed/land line, mobile, Internet and broadband subscription. (See Table 1 below.) Mobile telephony is the most ubiquitous communications device in the country, seen as well in the country's stature as being the world's highest in terms of SMS (“texts”) sent daily over mobile networks (about 2 billion messages exchanged by Filipinos2).
1
Civil Society Assessment of Medium Term Philippine Development Plan 2004-2010: ICT Section1
I. INTRODUCTION: ICT in the Philippines
It is not easy to judge the country's ICT performance compared to the rest of world.
The Philippines ranked in the lower half among the 10AssociationofSoutheastAsianNations(ASEAN)countries in terms of fixed/land line, mobile, Internet and broadband subscription. (See Table 1 below.)Mobile telephony is the most ubiquitous communications device in the country, seen as well in the country's stature as being the world's highest in terms of SMS (“texts”) sent daily over mobile networks (about 2 billion messages exchanged by Filipinos2).
Table 1. Comparative ICT Indicators, ASEAN
Country Subscribers per 100 Inhabitants
Fixed Line Mobile Internet Broadband Brunei 19.53 95.85 4.66 2.91
Cambodia 0.31 29.1 0.12 0.06 Indonesia 3.36 61.83 1.39 0.13 Lao PDR 1.57 29.36 0.09 0.06 Malaysia 15.89 100.41 19.33 4.82 Myanmar 1.67 0.76 0.01
Philippines 4.32 75.38 2.82 0.56 Singapore 40.24 138.15 23.91 21.74 Thailand 10.42 92.01 1.36 Vietnam 33.98 80.37 6.09 2.35
Source: ITU (2008)
The figure of 2.8 percent of Internet subscribers (Table 1) definitely underestimates the number of Internet users in the Philippines, as a lot of Filipinos have intermittent access, whether at work, in school orviaInternetcafes.TheNationalTelecommunicationsCommission(NTC),usingInternetpenetration(instead of subscription) as the yardstick, reports the Philippines’ Internet penetration increased from 2.03 per 100 (2000) to 5.56 (2005) to14.16per100in2007.ArecentNielsenstudyestimatesthat28percent of the total Philippine population has access to the Internet. But regardless of yardstick – subscription or access, Internet penetration in the Philippines still ranks among the lowest in the region.
But it has been rising. It was barely 2 percent of the population in 2000, and has steadily grown to 28.3 percent by some estimates towards the end of 2008. The growth — noted both in Internet access from home computers and from Internet cafes — was observed not just in Metro Manila but also in all major
all economic classes and age groups as well.cities around the country, and in
3
1 Prepared by the Foundation for Media Alternatives (FMA) withe, Philip Arnold Tuano, Cherry Pie Felisse Maraya)
ideacorp (Emmanuel Lallana PhD, Alan Alegr 2
http://www.straitstimes.com/Breaking%2BNews/SE%2BAsia/Story/STIStory_430939.html3 Digital infra helps boost RP economy, says PGMA, http://www.pia.gov.ph/default.asp?m=12&r=&y=&mo=&fi=p100203.htm&no=70. Also Philippines: Media in a State of Flux, http://www.theasiamediaforum.org/node/3058)
The figure of 2.8 percent of Internet subscribers (Table 1) definitely underestimates the number of Internet users in the Philippines, as a lot of Filipinos have intermittent access, whether at work, in school or via Internet cafes. The National Telecommunications Commission (NTC), using Internet penetration (instead of subscription) as the yardstick, reports the Philippines’ Internet penetration increased from 2.03 per 100 (2000) to 5.56 (2005) to 14.16 per 100 in 2007. A recent Nielsen study estimates that 28 percent of the total Philippine population has access to the Internet. But regardless of yardstick – subscription or access, Internet penetration in the Philippines still ranks among the lowest in the region.
But it has been rising. It was barely 2 percent of the population in 2000, and has steadily grown to 28.3 percent by some estimates towards the end of 2008. The growth — noted both in Internet access from home computers and from Internet cafes — was observed not just in Metro Manila but also in all major cities around the country, and in all economic classes and age groups as well.3
But relatively low Internet penetration figures hide the fact that the Philippines ranks among the highest percentage of Internet users participating in social networks.4 This means that the small portion of Filipinos who
1Prepared by the Foundation for Media Alternatives (FMA) with ideacorp (Emmanuel Lallana PhD, Alan Alegre, Philip Arnold Tuano, Cherry Pie Felisse Maraya)2http://www.straitstimes.com/Breaking%2BNews/SE%2BAsia/Story/STIStory_430939.html 3Digital infra helps boost RP economy, says PGMA, http://www.pia.gov.ph/default.asp?m=12&r=&y=&mo=&fi=p100203.htm&no=70. Also Philip-pines: Media in a State of Flux, http://www.theasiamediaforum.org/node/3058)4RP has highest percentage of social network users -- study http://newsinfo.inquirer.net/breakingnews/infotech/view/20080508-135336/RP-has-highest-percentage-of-social-network-users----study

Civi
l Soc
iety
Ass
essm
ent o
f the
200
4 -2
010
MTP
DP
140
use the Internet, do so in a fairly sophisticated manner. They do not just consume information, they produce information/content via social networks (Facebook and Twitter), blogs and photo sites (Flicker and Photobucket). The beneficial uses of these social network sites were demonstrated most recently during the typhoons that hit the country in the last quarter of 2009.
Plus, it is in telephony—specifically mobile telephony—where the Philippines has grown by leaps and bounds. The number of mobile phone subscribers in the Philippines reached 75 million in 2009, from just 6.4 million in 2000. Government never really had to do much as the liberalized environment brought forth the needed competition envisioned in the mid-1990s with the Telecommunications Act of 1995.
The role of the Internet and ICT in the country's economic growth has regularly been trumpeted, and is often cited as one of the legacies of the Arroyo administration. Some indication of this is already evident, particularly in the offshoring and outsourcing (O&O) industries. In a recent presentation of the Business Processing Association of the Philippines (BPAP) to the Commission on Information and Communications Technology (CICT)5, it reported that the IT-BPO industry earnings are growing: from USD$1.5 billion in 2004, to USD$5 billion in export revenues in 2007, it now earns USD$7.3 billion in 2009; it now provides full-time employment as well to almost 500,000 individuals in contact centers, back office operations, transcription, animation, IT outsourcing, engineering services outsourcing and digital content/game development.6 It must be noted, however, that almost 80 percent of IT-BPO activity is in the National Capital Region (NCR) despite the presence of the industry in 10 regions, with Region 3 (Central Luzon) as the next fast-growing region.
ICT has an important role to play in good governance. The use of ICT in government can simultaneously lower costs and improve the delivery of public service. Implemented properly, it can also enhance transparency and accountability. Unfortunately, the Philippines has yet to be competitive in terms of its achievements in e-government specifically in ensuring access and empowering citizens. Table 2 shows where the Philippines ranks globally, with its rank moving down from 2006 to 2009.
2
But relatively low Internet penetration figures hide the fact that the Philippines ranks among the highest percentage of Internet users participating in social networks.4 This means that the small portion of Filipinos who use the Internet, do so in a fairly sophisticated manner. They do not just consume information, they produce information/content via social networks (Facebook and Twitter), blogs and photo sites (Flicker and Photobucket). The beneficial uses of these social network sites were demonstrated most recently during the typhoons that hit the country in the last quarter of 2009.
Plus, it is in telephony—specifically mobile telephony—where the Philippines has grown by leaps and bounds. The number of mobile phone subscribers in the Philippines reached 75 million in 2009, from just 6.4 million in 2000. Government never really had to do much as the liberalized environment brought forth the needed competition envisioned in the mid-1990s with the Telecommunications Act of 1995.
The role of the Internet and ICT in the country's economic growth has regularly been trumpeted, and is often cited as one of the legacies of the Arroyo administration. Some indication of this is already evident, particularlyintheoffshoringandoutsourcing(O&O)industries.InarecentpresentationoftheBusinessProcessing Association of the Philippines (BPAP) to the Commission on Information and Communications Technology (CICT)5,itreportedthattheIT-BPOindustryearningsaregrowing:fromUSD$1.5 billion in 2004, to USD$5 billion in export revenues in 2007, it now earns USD$7.3 billion in 2009; it now provides full-time employment as well to almost 500,000 individuals in contact centers, back office operations, transcription, animation, IT outsourcing, engineering services outsourcing and digital content/game development.6Itmustbenoted,however,thatalmost80percentofIT-BPOactivityisintheNationalCapitalRegion(NCR)despitethepresence of the industry in 10 regions, with Region 3 (Central Luzon) as the next fast-growing region.
ICT has an important role to play in good governance. The use of ICT in government can simultaneously lower costs and improve the delivery of public service. Implemented properly, it can also enhance transparency and accountability. Unfortunately, the Philippines has yet to be competitive in terms of its achievements in e-government specifically in ensuring access and empowering citizens. Table 2 showswhere the Philippines ranks globally, with its rank moving down from 2006 to 2009.
Table 2. International Ranking on e-Government (Waseda University)7
2009 2008 2007 2006 2005 1 Singapore 1 USA 1 USA 1 USA 1 USA 2 USA 2 Singapore 2 Singapore 2 Canada 2 Canada 3 Sweden 3 Canada 3 Canada 3 Singapore 3 Singapore 4 UK 4 Korea 4 Japan 4 Japan 4 Finland 5 Japan 5 Japan 4 Korea 5 Korea 5 Sweden 5 Korea 6 Hong Kong 6 Australia 6 Germany 6 Australia 7 Canada 7 Australia 7 Finland 7 Taiwan 7 Japan 8 Taiwan 8 Finland 8 Taiwan 8 Australia 8 Hong Kong 9 Finland 9 Sweden 9 UK 9 UK 9 Malaysia
4
RP has highest percentage of social network users -- study http://newsinfo.inquirer.net/breakingnews/infotech/view/20080508-135336/RP-h -highest-percentage-of-social-network-users----studyas5
Copy provided by CICT to Research Team in September 2009 6 500,000 ICT jobs - A PGMA Legacy, http://www.pia.gov.ph/?m=12&r=&y=&mo=&fi=p100203.htm&no=73. 7 Indicatorsusedwere“Networkpreparedness,RequiredInterface-Functionalapplications,ManagementOptimization,NationalPortal,CIO
in Government, e-Government Promotion”
3
10 Germany 9 Taiwan 10 Sweden 10 Finland 10 UK 10 Italy
27Philippines
24Philippines
23Philippines
23Philippines
Given the potential role of ICT as a tool in national development, it is not surprising that the Philippine government has sought to harness it for national development. How it has fared in deploying ICT in the country and utilizing it for good governance will be seen through this review of the ICT section of the Medium Term Philippine Development Plan (MTPDP).
II. PERFORMANCE AND ACCOMPLISHMENT IN 2004-2010
“The basic task of the Medium Term Philippine Development Plan (MTPDP) 2004-2010 is to fight poverty by building prosperity for the greatest number of the Filipino people. The country must open up economic opportunities, maintain sociopolitical stability, and promote good stewardship --- all to ensure better quality of life of its citizens.”8
The MTPDP presents the thrusts of the Arroyo Administration in five (5) major sections: economic growth and job creation; energy; social justice and basic needs; education and youth opportunity; and, anti-corruption and good governance.
In these five major sections, information and communications technology (ICT) is recognized both as a tool and as a potential growth sector that will push the administration’s goals forward. Specifically, the following provisions on ICT are included within the MTPDP in two chapters: “The network of transport and digital infrastructure on which the Arroyo government embarked in 2002 shall have linked the entire country.”9; and, “(i) Elections will no longer raise a doubt about their integrity. The electoral process will have been completely computerized.”10
The MTPDP also recognizes ICT as an engine for growth in new areas as “telecommunicationcompanies expand outside Metro Manila. New investments in the call/contact center, business process outsourcing (BPOs) and software development…” It also enumerates a “to do” list given the economic potential from ICT. To wit:
1. Focus on job creation in high-skill industries and services,namely,software,BPO,contactcenterand medical services, etc.
2. Draw up incentives packages with focus on IT and IT-enabled services sector as priority area. Existing or new investment packages with focus on ICT will be rationalized.
3. Establish an HRD Program in the five (5) top priority areas in ICT services --- contact centers, animation and software development, medical transcription,BPO,engineeringanddesignservices.Given this, action steps have been identified as focusing as well in basic and higher education.
4. Undertake legal and regulatory reforms, such as: 4.1 Creation of the Departme
nt of ICT
8
MTPDP, page 1 9
MTPDP Chapter 6, Infrastructure 10
MTPDP Chapter 13, Automated Elections. This paper will not assess this area and concentrate on the Digital Infrastructure section.
Given the potential role of ICT as a tool in national development, it is not surprising that the Philippine government has sought to harness it for national development. How it has fared in deploying ICT in the country
5Copy provided by CICT to Research Team in September 20096500,000 ICT jobs - A PGMA Legacy, http://www.pia.gov.ph/?m=12&r=&y=&mo=&fi=p100203.htm&no=73.7Indicators used were “Network preparedness, Required Interface-Functional applications, Management Optimization, National Portal, CIO in Government, e-Government Promotion”
Civil Society Assessment of Medium Term Philippine Development Plan 2004-2010: ICT Section

Ass
essm
ent R
epor
t
141
and utilizing it for good governance will be seen through this review of the ICT section of the Medium Term Philippine Development Plan (MTPDP).
II. PERFORMANCE AND ACCOMPLISHMENT IN 2004-2010
“The basic task of the Medium Term Philippine Development Plan (MTPDP) 2004-2010 is to fight poverty by building prosperity for the greatest number of the Filipino people. The country must open up economic opportunities, maintain sociopolitical stability, and promote good stewardship --- all to ensure better quality of life of its citizens.”8
The MTPDP presents the thrusts of the Arroyo Administration in five (5) major sections: economic growth and job creation; energy; social justice and basic needs; education and youth opportunity; and, anti-corruption and good governance.
In these five major sections, information and communications technology (ICT) is recognized both as a tool and as a potential growth sector that will push the administration’s goals forward. Specifically, the following provisions on ICT are included within the MTPDP in two chapters: “The network of transport and digital infrastructure on which the Arroyo government embarked in 2002 shall have linked the entire country.”9; and, “(i) Elections will no longer raise a doubt about their integrity. The electoral process will have been completely computerized.”10
The MTPDP also recognizes ICT as an engine for growth in new areas as “telecommunication companies expand outside Metro Manila. New investments in the call/contact center, business process outsourcing (BPOs) and software development…” It also enumerates a “to do” list given the economic potential from ICT. To wit:
1. Focus on job creation in high-skill industries and services, namely, software, BPO, contact center and medical services, etc.
2. Draw up incentives packages with focus on IT and IT-enabled services sector as priority area. Existing or new investment packages with focus on ICT will be rationalized.
3. Establish an HRD Program in the five (5) top priority areas in ICT services --- contact centers, animation and software development, medical transcription, BPO, engineering and design services. Given this, action steps have been identified as focusing as well in basic and higher education.
4. Undertake legal and regulatory reforms, such as:4.1 Creation of the Department of ICT4.2 Reorganization of NTC4.3 Institutionalization of the e-Government Fund4.4 Establishment of a National Information Security Plan (NISP)4.5 Passage of Cybercrime and Cyberfraud Prevention Law4.6 Passage of Freedom of Information Law
The core of the ICT Plan is placed under the Infrastructure chapter of the MTPDP, under the section “Digital Infrastructure”, found in pages 86 to 90. Most of the above targets are enumerated here as well, and these targets are what this section will address.
A matrix of the relevant MTPDP targets and accomplishments is attached. (See Table 3 designated as Annex A.).
8MTPDP, page 19MTPDP Chapter 6, Infrastructure 10MTPDP Chapter 13, Automated Elections. This paper will not assess this area and concentrate on the Digital Infrastructure section.
Civil Society Assessment of Medium Term Philippine Development Plan 2004-2010: ICT Section
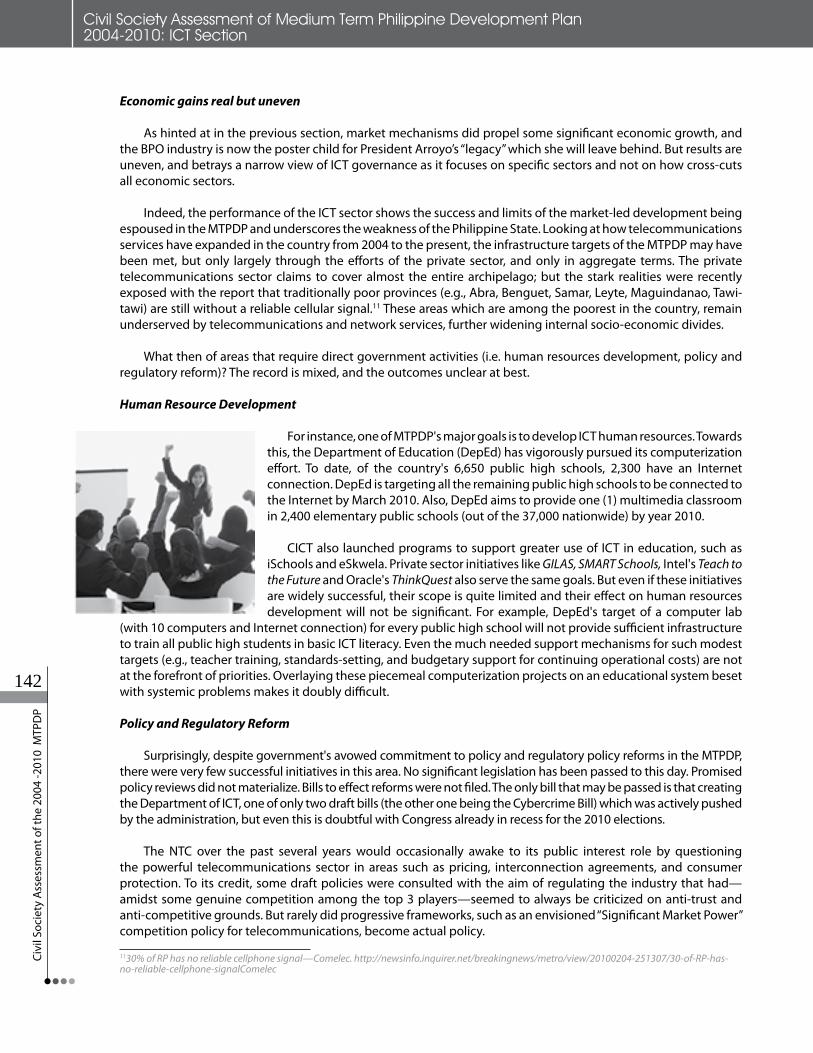
Civi
l Soc
iety
Ass
essm
ent o
f the
200
4 -2
010
MTP
DP
142
Economic gains real but uneven
As hinted at in the previous section, market mechanisms did propel some significant economic growth, and the BPO industry is now the poster child for President Arroyo’s “legacy” which she will leave behind. But results are uneven, and betrays a narrow view of ICT governance as it focuses on specific sectors and not on how cross-cuts all economic sectors.
Indeed, the performance of the ICT sector shows the success and limits of the market-led development being espoused in the MTPDP and underscores the weakness of the Philippine State. Looking at how telecommunications services have expanded in the country from 2004 to the present, the infrastructure targets of the MTPDP may have been met, but only largely through the efforts of the private sector, and only in aggregate terms. The private telecommunications sector claims to cover almost the entire archipelago; but the stark realities were recently exposed with the report that traditionally poor provinces (e.g., Abra, Benguet, Samar, Leyte, Maguindanao, Tawi-tawi) are still without a reliable cellular signal.11 These areas which are among the poorest in the country, remain underserved by telecommunications and network services, further widening internal socio-economic divides.
What then of areas that require direct government activities (i.e. human resources development, policy and regulatory reform)? The record is mixed, and the outcomes unclear at best.
Human Resource Development
For instance, one of MTPDP's major goals is to develop ICT human resources. Towards this, the Department of Education (DepEd) has vigorously pursued its computerization effort. To date, of the country's 6,650 public high schools, 2,300 have an Internet connection. DepEd is targeting all the remaining public high schools to be connected to the Internet by March 2010. Also, DepEd aims to provide one (1) multimedia classroom in 2,400 elementary public schools (out of the 37,000 nationwide) by year 2010.
CICT also launched programs to support greater use of ICT in education, such as iSchools and eSkwela. Private sector initiatives like GILAS, SMART Schools, Intel's Teach to the Future and Oracle's ThinkQuest also serve the same goals. But even if these initiatives are widely successful, their scope is quite limited and their effect on human resources development will not be significant. For example, DepEd's target of a computer lab
(with 10 computers and Internet connection) for every public high school will not provide sufficient infrastructure to train all public high students in basic ICT literacy. Even the much needed support mechanisms for such modest targets (e.g., teacher training, standards-setting, and budgetary support for continuing operational costs) are not at the forefront of priorities. Overlaying these piecemeal computerization projects on an educational system beset with systemic problems makes it doubly difficult. Policy and Regulatory Reform
Surprisingly, despite government's avowed commitment to policy and regulatory policy reforms in the MTPDP, there were very few successful initiatives in this area. No significant legislation has been passed to this day. Promised policy reviews did not materialize. Bills to effect reforms were not filed. The only bill that may be passed is that creating the Department of ICT, one of only two draft bills (the other one being the Cybercrime Bill) which was actively pushed by the administration, but even this is doubtful with Congress already in recess for the 2010 elections.
The NTC over the past several years would occasionally awake to its public interest role by questioning the powerful telecommunications sector in areas such as pricing, interconnection agreements, and consumer protection. To its credit, some draft policies were consulted with the aim of regulating the industry that had—amidst some genuine competition among the top 3 players—seemed to always be criticized on anti-trust and anti-competitive grounds. But rarely did progressive frameworks, such as an envisioned “Significant Market Power” competition policy for telecommunications, become actual policy.
1130% of RP has no reliable cellphone signal—Comelec. http://newsinfo.inquirer.net/breakingnews/metro/view/20100204-251307/30-of-RP-has-no-reliable-cellphone-signalComelec
Civil Society Assessment of Medium Term Philippine Development Plan 2004-2010: ICT Section

Ass
essm
ent R
epor
t
143
ICT in the MTPDP
A major shortcoming of the ICT component of the MTPDP is that it has taken a narrow view of ICT. ICT is seen more as a “sector” or an industry. The more expansive view of ICT as an “enabler” of growth, good governance and social inclusion is eschewed. As a consequence, government's vision of harnessing ICT as a tool for national development is limited to developing the ICT infrastructure through market friendly policies and developing the ICT industry to generate jobs. Government policy is lacking in ensuring the widespread adoption and use of ICT, with a clear development agenda that should necessarily underpin such a strategy.
III. POLICY AND INSTITUTIONAL GAPS There are several policy and institutional gaps in the 2004-2010 MTPDP. This section will outline perceived gaps in the plan itself.
A. Lack of harmonization of Government’s ICT Directions with International Commitments (e.g. WSIS, MDGs, APEC).
One of the limitations of the government’s ICT plan is their lack of congruence with the international agreements that the Philippines has signed.
As a party to the World Summit for Information Society (WSIS), the two-step global conference supported by the United Nations undertaken in 2003 and 2005, the Philippines agreed to, among others: a) develop enabling policies that would promote investment and entrepreneurship, especially among micro, small, and medium scale businesses; b) develop ICT capacities, especially of women and marginalized sectors, integrate the use of ICTs in education and training programs and develop assistive technologies, especially for persons with disabilities; c) improve access to knowledge in health and agricultural services; and, d) strengthen freedom of information and plurality and diversity in media. The WSIS final document also contends that, “multi-stakeholder participation is essential to the successful building of a people-centred, inclusive and development-oriented Information Society.”
Government has not seriously incorporated WSIS goals into its national ICT policy, and civil society organizations had pointed this out in the consultations on the 2006-2010 Philippine Strategic ICT Roadmap.12 For instance, instead of promoting ICT usage among small-scale entrepreneurs, government’s infrastructure strategy in the MTPDP seems to be targeted towards large-scale entrepreneurs and multinationals in the business process outsourcing industry. Further, despite the commitment to an inclusive process of developing an Information Society Plan, in which different sectors of society have a stake, the formulation of the ICT plan did not solicit comments from a wider set of stakeholders beyond the national government agencies. The table below compares WSIS Goals with our government's responses (see Table 4).
WSIS Goals Assessment of Government Response
Develop enabling policies that would promote investment and entrepreneurship, especially among micro, small and medium scale businesses;
Policy seems to be targeted towards large-scale entrepreneurs and multinationals in the business process outsourcing industry, hardly any SME-centered initiatives.
Develop ICT capacities, especially of women and marginalized sectors, integrate the use of ICTs in education and training programs and develop assistive technologies, especially for persons with disabilities;
No gender specific targets in any ICT plans, no gender specific projects implemented.Some initial partnerships with NGOs for PWDs in very limited pilot areas.Numerous partnerships with private sector in education and training programmes. (See Table 3.)
12“Civil Society Comments on the 2006-2010 Philippine Strategic Roadmap”, Preliminary Draft Submitted to the CICT 23 October 2006. (Typescript, Foundation for Media Alternatives).
Civil Society Assessment of Medium Term Philippine Development Plan 2004-2010: ICT Section
... poor provinces are still without a reliable cellular signal.

Civi
l Soc
iety
Ass
essm
ent o
f the
200
4 -2
010
MTP
DP
144
Improve access to knowledge in health and agricultural services
Limited, and dependent on budgets and political will of NGA. Existence of agriculture-related ICT projects (e.g. FITS) but no major health related ICT projects, though civil society lobbying for effective telehealth policy.
Strengthen freedom of information and plurality and diversity in media.
Freedom of Information bills filed in House and Senate in advanced stages due to strong civil society lobby, but Executive Department did not certify as urgent, and is seemingly lukewarm, with recent track record favoring expansion of government secrecy (e.g., executive privilege cases).
Media is unregulated but recent policies strengthen the role of incumbent telco providers in telecommunications and Internet services (e.g. VOIP, wifi guidelines).
Multi-stakeholder participation in policymaking and creation of information society
Very uneven; though the incumbent telcos are always consulted, and the dream to make the Philippines the regional “cyberservices” hub drives public-private collaboration. Civil society consultation has waned since WSIS, due in part to the high turnover of CICT officials since 2006.
Other key WSIS themes and action lines that are absent in the MTPDP include:- Public domain and “intellectual property rights issues”: Access to information and knowledge- Local content development: Cultural diversity/identity; linguistic diversity and local content- International and regional cooperation- Financial mechanisms for meeting the challenges of ICT for development- Other Internet governance issues
Similar dissonance of the MTPDP with various other international agreements were also noted by civil society groups—such as the United Nations Millennium Development Goals (MDGs), and commitments within the Association of Southeast Asian Nations (ASEAN) and the Asia Pacific Economic Cooperation (APEC) community—but will not be detailed here.13
B. Gaps in the ICT Governance Framework
As noted earlier, the MTPDP section dealing with ICTs (i.e., mainly “Digital Infrastructure”) reveals a narrow conceptual view of the role of ICTs in and for governance. This is a major flaw of the planning document. “E-governance”, to include ICT and Internet Governance, is a crucial emergent domain in the so-called “global information society”, but is overlooked.
1. Lack of an e-Governance framework. Today, governance is understood as combining the resources and expertise of government, civil society, and the market in order to steer society. Governance is not government's responsibility alone. Unfortunately, there is a lack of appreciation of this understanding and practice of governance. For instance, there is no strategy on how to use ICT to harness both the business sector and civil society in steering Philippine development. There is no recognition and effort to use ICT to empower citizens and groups and to strengthen democratic institutions. (This despite the fact that the Philippines is seen as a global leader in the use of mobile phones for social mobilization and political change.) Furthermore, the framework for eGovernment (government's use of ICT) is wanting. The following trends are clear:
13Ibid.
Civil Society Assessment of Medium Term Philippine Development Plan 2004-2010: ICT Section

Ass
essm
ent R
epor
t
145
a. There exists no e-Government framework like a government-as-a-whole “enterprise architecture” that would allow seamless, government-wide integration of systems and content. The 2006 Strategic ICT Roadmap developed by the CICT could be the basis of the framework; however, the document focuses on very limited areas of government administrative services (procurement and accounting systems).
An e-government fund has been set up to finance selected government ICT projects, but in the absence of a comprehensive strategy, the fund becomes less strategic in pushing for government-wide projects pro-actively, and remains a funding window for disparate computerization projects of national agencies.
b. There is no government interoperability framework to ensure that different IT systems or components of various government agencies share data/information meaningfully and seamlessly. This is important given that many government electronic systems are not able to exchange information with one another, reducing the availability to reap potential time and resource efficiencies in the delivery of services. There is also a lack of policy on open standards and on the use of open source software in public administration—a global trend.
Government, through CICT should begin the process of defining and mandating standards to enable interoperability through an open and inclusive process. Among the standards that should be defined are data standards, communications standards, content management, and user-interface standards (including accessibility standards).
2. Lack of a comprehensive digital inclusion strategy. Despite the recognition of low PC and Internet penetration, there is no national program at increasing ownership of personal computers. Even the community e-center (CeC) strategy though laudable, is misguided, as most government CeCs are in urban areas competing with private Internet cafes.
a. Even more worrisome is the lack of Universal Access Policy. This is a particular concern since the country has signed an APEC agreement calling for Universal Internet Access by 2010. Furthermore, government has not gleaned the lessons from the lapsed Service Area Scheme or SAS – which was implemented in the mid-90s to ensure equitable distribution of telecommunications services. There are also no metrics to establish baselines and track progress of using ICTs for social inclusion. Several issues related to these are the following:
• Strategiesforaccess of particular disadvantaged sectors (including rural communities, women and persons with disabilities) or thematic areas (such as health informatics or disaster management) have to be undertaken.
• Thegovernmentshouldreviewitsspectrum management policy in order to promote developmental use, especially in the areas of education, scientific (research and development) and medicine. The areas for review include the legal distinction between community radio and commercial radio, socialized fees structure for payment of fees and royalties, and the provision of financial incentives for the promotion of rural based broadcasting and access to information.
• Aparticularstrategy for mobile telephony (i.e., an“m-government” strategy as it were)—with the cellphone the most ubiquitous access tool in the hands of citizens—should also be pro-actively developed.
Civil Society Assessment of Medium Term Philippine Development Plan 2004-2010: ICT Section

Civi
l Soc
iety
Ass
essm
ent o
f the
200
4 -2
010
MTP
DP
146
3. Lack of a broadband development policy. Broadband is said to be the oxygen of the information society. The more there is, the better society flourishes. The Philippines needs a broadband strategy. While broadband deployment should continue to be a private sector concern, government should influence the pace, direction, and deployment of broadband through its role as a consumer. For instance, government policy that mandates that all public high schools should have broadband connection or that public health centers should have Internet connection will help the private sector better anticipate demand and design their networks accordingly. Leaving infrastructure deployment to the private sector would also allow government to focus on demand creation through content development.
4. Absence of a digital content development strategy. The digital content industry is a new area of economic activity that has been brought about by the convergence of traditional content, media and entertainment, software and multimedia, and electronic hardware and telecommunications. The digital content industry comprises the creation, design, management, and distribution of digital products and services and the technologies that underpin them. Specific sectors include visual effects and animation (including virtual reality and 3D products), interactive multimedia (e.g. websites, CD-ROMS), computer and online games, educational multimedia (e-learning), and digital film and TV production, and film and TV post-production.14
There is the need for the Philippine government to push for and strengthen content creation and ensure its sustainability. In the cases of Korea and Ireland for example, their governments directed efforts to develop their digital content industry. This began with robust government support providing incentives (e.g. subsidies and access to funding), skills development, and training especially in areas where there would have been a shortfall of capability, and a conducive business environment that is "pro-digital content.”15 Of course this should be part of an overall strategy that utilizes the various media channels at government’s disposal.
To reiterate the main point: the MTPDP targets and whatever accomplishments cited betray a lack of imagination in the full potential of ICTs as enabler, equalizer and driver of popular participation. Even market-driven policies and a "hands-off" approach -- while effective for sections of the ICT sector (particularly indicated by the continuing growth in mobile services), point to the State's inability to correct market failure and protect citizens from abuses of the private sector.
C. Institutional Weakness
Another exacerbating factor that could be identified as a manifestation of a “weak state” within the context of ICT is the weak policy and regulatory agencies.
1. The CICT and NTC, as Government’s policy and regulatory bodies have limited internal capabilities (and have a limited vision) to establish standards, policies, and guidelines for ICT use in the country. It has also been difficult for both institutions to adapt to the dynamics of the technological and policy terrain. The current institutional infrastructure is ill-equipped to respond to the challenges of a fast-changing techno-political and social ecosystem.
There is also a seeming lack of capacity-building goals by CICT to enable its own workforce to effectively deliver their mandate (not to mention the lack of vision for the government workplace to be as effective in ICT for governance). Thus, there is need for CICT to create a more relevant vision for itself as well.
14Lallana, 2009, from http://www.unapcict.org/academy/module2/Academy-Module2-web.pdf/view, p. 46 accessed on 13 September 2009 15Ibid, pp 47-50
Civil Society Assessment of Medium Term Philippine Development Plan 2004-2010: ICT Section

Ass
essm
ent R
epor
t
147
2. The CICT’s current organizational structure is based on the old “pillars” of its precursor, the Information Technology and E-Commerce Coordinating Council (ITECC). These ITECC pillars have become unresponsive to current realities and insufficient to respond to new challenges, as many information society issues do not fall neatly into the previously conceived areas. Compounding this is that it appears that CICT’s leadership has succumbed to the discourse of CICT being a "transition" to an envisioned department. This perpetual “transition mode” hinders their ability to make bold decisions, and sees everything falling into place with a new DICT, even as the planned department has not yet materialized.
3. There is a constant instability within the CICT and NTC, due to constant turnover and transition. The attrition rate of commissioners over the past six years has been unusually high (e.g. the resignation of 2 CICT chairmen and 6 commissioners since CICT’s creation; resignation of three NTC commissioners). The hodge-podge nature of its components (e.g. TELOF from DOTC; NCC) has resulted in budgetary constraints that impede CICT programs/projects.
4. NTC’s lack of fiscal autonomy hampers its ability to be an effective regulator. A pending bill was filed which sought to reorganize the NTC and make it more responsive. The said bill would grant it fiscal autonomy—where the commission could retain some of the earnings from franchise fees—in order to upgrade its staff and salary scale. The bill however was not strongly pushed and remains in legislative limbo. The lack of fiscal autonomy compromises its capability-building and autonomy; NTC then becomes prone to rent-seeking activities and undue influence from vested interests.
5. There is also the detrimental impact of patrimonial politics and regulatory capture on these institutions. Political decisions (e.g. the decision to detach NTC and TELOF from CICT then recently returned; “questionable” political appointments) and lobbying by private interests (e.g. COMELEC-Mega Pacific deal; ZTE-NBN, CyberEd program fiascos) have compromised the autonomy of the State. This has led to questionable deals, which serve to underline how much the State is susceptible to regulatory capture. In the end, ICT and governance has been reduced to another lucrative milking cow for rent-seekers both within and outside government.
D. Other Policy Gaps
Several other key issues that should also be addressed by the general policy framework are the following:16
3. There is a need for regular and coordinated collection of ICT-related data, statistics, measures, particularly aspects of the so-called “digital divide.” The government should strategize the collection and dissemination of indicators, following the standards suggested by the International Telecommunications Union (ITU), help define and further improve the ICT section of the Philippine Statistical Development Plan (e.g., further allowing for disaggregation--by sex, geographic area, and sub-industry, including location and manner of ICT use, increase frequency of surveys; etc.), and improve coordination with the National Statistics Office and the National Statistics Coordination Board (NSCB) and other data producers, including the academe. Initial work has been done by the NSCB last year with the release of core ICT indicators, but much more is needed.
4. There is a need to develop Open Standards policy for government interoperability, including the development of policies to strengthening and institutionalize initiatives for public schools and other training institutions, and government systems and procurement standards. Government should also adopt a preferential option for Free/Open Source Software, encourage the development of indigenous open source operating systems and applications; initiatives such as the development of the Bayanihan, a Linux-based system by the Advanced Science and Technology Institute (ASTI)-DOST should be strengthened.
5. Consumer rights in telecommunications must be strengthened, including the development of a sound and no-nonsense competition policy in the telecommunications
16All of these were mentioned by CSOs in their ICT Strategic Roadmap Review.
Civil Society Assessment of Medium Term Philippine Development Plan 2004-2010: ICT Section
Government should begin the process of taking and mandating standards...

Civi
l Soc
iety
Ass
essm
ent o
f the
200
4 -2
010
MTP
DP
148
sector. The National Telecommunications Commission and the Department of Trade and Industry, for example, could develop a charter on consumer rights. This initiative is tied to increasing the institutional capacities of government agencies to monitor and police the industry. Our legislature should formulate appropriate competition policy frame to ensure that low prices of and wider access to ICTs, including broadband, can be met.
6. Long-standing reforms should be undertaken reforms in .ph ccTLD administration. As the Internet forms the basis and the springboard for new and emerging ICTs, CICT, with regard to the governance and infrastructure of the Internet, the government should develop policies that promote an even, level playing field in order to further encourage the development of a home-grown Internet naming system. There should be transparency and accountability in the administration
of basic Internet infrastructure and services, that include stakeholders and civil society in the formulation of policy and guidelines regarding local Internet governance, and government should decouple Internet administrative roles from commercial functions in order to encourage open competition and development. It may be important to urge CICT to implement guidelines on the redelegation of the .ph country code top-level domain at the soonest possible time.
7. Data security and protection should be ensured and individual/consumer privacy rights should be strictly observed. Individual Filipinos should have control over the use of personal electronic data even if these are possessed and stored by governments, firms or other individuals. They should be informed if data is gathered about them, what will be done with the data (including how the data will be used and exchanged), how the data will be stored and how long this will be in the possession by others. A balanced regime therefore which also addresses the growing threats in digital environments (i.e., cybercrime) and communication rights should be crafted.
8. Civil rights in digital environments should be respected. Legislation could be developed to strengthen anti-censorship and anti-surveillance laws. Data and communication privacy issues are multiplying in a fast-changing Internet environment and government must commit to keeping the Internet as an open space for discussion and debate. Efforts to regulate any aspect of digital expression should be discussed extensively and “anti-terrorism” discourses should always adhere to universal human rights protection and promotion.
9. Government programs should be in place to protect the environment from electronic waste. This would include disposal of electronic waste in landfills, recycling, exchange and donation of electronic equipment, and, consumer awareness raising efforts. These programs should be consistent with existing laws such as the Toxic Substances and Hazardous and Nuclear Wastes Control Act (RA 6969) and Philippine Clean Air Act (RA 8749).
10. Gender mainstreaming in ICT programs should be strengthened. These could include the creation of relevant content for women (including those related to reproductive health and employment), capacity-building programs designed for women ICT managers and users, extending operations of access centers for mothers and women, and ensuring that the centers are located in a safe and accessible place, and, strengthening networking and collaboration of different women’s groups to enhance their ICT capability building efforts and others. The E-procurement fund guidelines could mainstream the Gender and Development (GAD) Framework of the National Commission on the Role of Filipino Women, in terms of increasing employment for women-run enterprises.
IV. Recommendations
In the spirit of the previous section’s comments, the following recommendations are submitted for any strategic planning process on ICTs and governance:
Civil Society Assessment of Medium Term Philippine Development Plan 2004-2010: ICT Section

Ass
essm
ent R
epor
t
149
1. Harmonization of ICT plans with international commitments, particularly the MDGs and the World Summit on the Information Society (WSIS) framework and targets.
2. Develop a comprehensive ICT framework for strategic use of ICT for development. This includes:
a. ICT and economic growth;b. E-government;c. ICT in education;d. digital inclusion; e. content creation; and,f. sustainable ICT use
3. Address aforementioned policy gaps in succeeding ICT-enabled development plans with regards to the following:
a. Regular and coordinated collection of ICT-related data, statistics, measures;b. Adopting a clear Open Standards policy for government interoperability, including the preferential use of
Free/Open Source Software in public administrations.c. Strengthen consumer rights in telecommunications;d. Undertaking reforms in .PH ccTLD administration;e. The promotion of data protection and individual/consumer privacy rights, balancing growing concerns
with cybercrime;f. The protection of civil rights in digital environments;g. The promotion of sustainable ICT use, including efforts to mitigate electronic waste;h. Strengthen gender mainstreaming in ICT policies, programs, and institutions.
4. Strengthen ICT policymaking and regulatory agencies through (but not limited to) the following measures (whether or not a DICT is created eventually):
a. Institutionalization of multi-stakeholder policy development in CICT (or its successor institution);b. Propose fixed term for NTC Commissioners after a transparent, broad-based and participative vetting and
selection process for NTC and CICT officials;c. Fiscal autonomy for NTC; and, d. Extensive capability-building efforts for both institutions.
Lastly, the national development planning process must become more inclusive, for what good are plans in a situation where those that are tasked to implement the plan are not consulted. Various quarters have admitted that the NEDA MTPDP process is delinked from their own institutional planning and evaluation systems. Efforts must be made to make the MTPDP process more organic to the various planning/implementation/monitoring/evaluation systems currently in place in the different national government agencies.
Civil Society Assessment of Medium Term Philippine Development Plan 2004-2010: ICT Section

Civi
l Soc
iety
Ass
essm
ent o
f the
200
4 -2
010
MTP
DP
150

Ass
essm
ent R
epor
t
151
Civil Society Assessment of the 2004-2010 Medium Term Philippine Development Plan - Labor Commitments1
I. INTRODUCTION
The Medium-Term Philippine Development Plan (MTPDP) is basically a compilation of broad macro-economic and social targets of an incoming or current administration. In addition to stating and defining those targets, the MTPDP also identifies the means by which government intends to attain, and the system of measurements appropriate to gauge milestones and achievements for, each one. It first was used during the Aquino administration and has been used by each successive administration since then. It has become one of the barometers – though certainly not the only one – by which an administration is viewed as a success or failure.
Framework for analysis
The framework we have adopted here is a simple targets-versus-actuals comparison and the appropriate analysis – quantitative or qualitative, or a combination of both – of the variance. We take each commitment and subject them to this comparative analysis, recalling events and developments of the applicable period that could explain the variance or the meeting of the target.
With respect to its commitments to the labor sector, the MTPDP has four (4) areas that impact directly on the sector. The corresponding actual achievements are also discussed here at length. These areas are: 1) introduction; 2) financial sector (Chapter 8); 3) labor (the main section dealing with the labor sector itself, Chapter 9); and 4) employment preservation.
A brief description of each commitment area and its relation to the labor sector is in order here. The introduction is the overarching framework of the MTPDP 2004-2010 and discusses in broad strokes the general macroeconomic goals and targets of the Arroyo administration. Obviously, therefore, it would include here the standard overall job creation targets – especially as they relate to poverty reduction targets (jobs and employment being the fastest and most effective method of combating poverty) – throughout the period. The financial sector is critical to the labor sector because they are symbiotic: the formal labor sector receives its wage and salary earnings through the financial sector, channels its remittances through the financial sector’s powerful electronic networks, and invests in investment products created by the financial sector. In turn, the financial sector earns through commissions and fees charged for the delivery of these products and services. The labor chapter itself is self-explanatory; quantities and qualities of jobs are identified, how and what economic sectors intend to be generated, what measures will be taken to safeguard the working Filipino and his or her right to work, and finally programs and policies to ensure the maintenance of the Filipino worker’s competitive edge at home and abroad.
II. PERFORMANCE AND ACCOMPLISHMENT IN 2004-2010
Here, we now apply the framework as described above to each commitment. Every main section below therefore discusses each commitment area. The main target for each commitment area shall be emphasized in italics.
1Prepared by Reuel Hermoso and Fr. Noel D. Vasquez, SJ, Ateneo School of Government (ASoG)

Civi
l Soc
iety
Ass
essm
ent o
f the
200
4 -2
010
MTP
DP
152
A. INTRODUCTION
By 2010, this will be the 10-point legacy of the Arroyo administration: Ten million jobs shall have been created.
By 2010, this will be the 10-point legacy of the Arroyo administration: Ten million jobs shall have been created.
Table 1. MTPDP 2004-2010 Government job creation efforts: targets vs. actuals, 2004-2010
Year Gov’t job targets* Actual results** Variance Net jobs created
2004 400,000 2005 1,600,000 700,000
(900,000)2006 1,600,000 648,000
(952,000)2007 1,600,000 599,000
(1,001,000)2008 1,600,000 529,000
(1,071,000)2009 1,600,000 169,000
(1,431,000)2010 1,600,000 -
10,000,000 2,645,000 (3,924,000)
6,076,000
Source of basic data: MTPDP 2004-2010; Bureau of Labor & Employment Statistics, Department of Labor & Employment; and compilation of Dr. Rene Ofreneo, “RP’s deepening job crisis,” a paper delivered at the Trade Union Preparatory Meeting on “Responding to the Economic Crisis – Coherent Policies for Growth, Employment and Decent Work in the Asia-Pacific Region,” 2009 (see References).
Actuals:
Fewer than 35 million people are employed as of January 2009, according to the key statistics page of the Bureau of Labor Statistics website 2. On the other hand, data for the same period in 2004 registered a little more than 31.5 million employed – or a net increase of just 3.5 million from the initial period topresent period in a simple targets-vs.-actuals analysis.
the
A more detailed analysis using year-on-year comparisons would show even worse results (see Table 1 in “Variance” column on the right). Consistently underperforming yearly by less than half (43 percent) in the first year covered by this study, the government’s performance in the area of job creation deteriorated even further. Overall, there is a net growth in jobs created of some 5.7 million from 2005 to 2009. It will be very well impossible for the Arroyo administration to generate the balance of some 4.3 million by the end of its term.
It will also be observed that the target number of jobs created for each year during the period is 1.6 million. This figure in and of itself as a constant appears to be remiss as it fails to take into account estimated annual entrants into the labor force, which is normally a function of the population. Table 2 below shows the country’s household population that is 15 years and older (which is by definition the
2 http://www.bles.dole.gov.ph/HTML%20FILES/keylabor.html
2
Actuals:
Fewer than 35 million people are employed as of January 2009, according to the key statistics page of the Bureau of Labor Statistics website2. On the other hand, data for the same period in 2004 registered a little more than 31.5 million employed – or a net increase of just 3.5 million from the initial period to the present period in a simple targets-vs.-actuals analysis.
A more detailed analysis using year-on-year comparisons would show even worse results (see Table 1 in “Variance” column on the right). Consistently underperforming yearly by less than half (43 percent) in the first year covered by this study, the government’s performance in the area of job creation deteriorated even further. Overall, there is a net growth in jobs created of some 5.7 million from 2005 to 2009. It will be very well impossible for the Arroyo administration to generate the balance of some 4.3 million by the end of its term.
It will also be observed that the target number of jobs created for each year during the period is 1.6 million. This figure in and of itself as a constant appears to be remiss as it fails to take into account estimated annual entrants into the labor force, which is normally a function of the population. Table 2 below shows the country’s household population that is 15 years and older (which is by definition the employable population) and their employment status. It will be noted that the actual labor force comprises, on average, 63.63 percent of the employable population, and that the actual year-on-year changes for both the employable population and the actual labor force are, on average, barely over 1 million and less than half a million, respectively. The Arroyo government appears, therefore, to have made overly optimistic projections. Actual growth is way below these expectations. In this case, we would have to give the administration a failing grade because it failed to meet its targets. If this were a classroom setting, the administration would also have to be taken to task for using what appears to be a sophomoric and non-scientific approach of conjuring up targets from out of nowhere and that are not based on reality. Had the government looked at the data, it would have been able to set more realistic, and
2http://www.bles.dole.gov.ph/HTML%20FILES/keylabor.html
Civil Society Assessment of the 2004-2010 Medium Term Philippine Development Plan Labor Commitments

Ass
essm
ent R
epor
t
153
hence more easily achievable targets.Though modest, achievable targets would at least have given the Arroyo administration a passing grade for which it could not be faulted. Had the economic and labor policy planners felt at some point that the economy would have had more upside, the targets could then have been adjusted upward. They chose, however, to make impractical targets, set in stone. Sadly for the Arroyo government, this means being given the appropriate red mark.
B. EMPLOYMENT & POVERTY
With the domestic economy growing by at least 7 percent by 2010, total job generation for 2004-2010 will reach 9.7-11.5 million, averaging 1.4-1.6 million new jobs each year.
Specific targets. These are identified as follows:
1) Services are expected to create the most jobs at 5.8-7.0 million, which will account for about 60 percent of total job creation. Next is agriculture, which will create 2.0-2.3 million net jobs with the development of 2 million hectares of agribusiness lands. Industry will create 1.9 million to 2.2 million jobs. Based on agency programs and estimates, by key employment generating industry, tourism is expected to create 3.0 million; agribusiness, 2.8 million; housing, 1.0 million; information and communications technology, 0.8 million; exports, 0.7 million; and mining, 0.2 million.
Actuals:
1. Based on the preliminary results of the January 2009 Labor Force Survey (LFS) of the National Statistics Office (NSO), the country’s labor force expanded by 2.0 percent (+745,000) from 36.368 million in January 2008 to 37.113 million the following year. On the other hand, the labor force participation rate (LFPR) diminished by a mere 0.1 percent from its rate of 63.4 percent a year ago.
2. Employed persons reached 34.258 million in January 2009, rising by 1.7 percent (565,000) from 33.693 million a year ago.
3. The number of part-time workers or those who worked less than 40 hours a week increased by 4.8 percent (574,000) from 11.876 million in January 2008 to 12.450 million in January 2009 while those who worked 40 hours or more or full-time workers declined by 0.8 percent (-174,000). We are unsure how the increase in part-time employment fits into the government’s overall employment targets but the fact that full-time employment fell is definitely a cause for concern.
4. Meanwhile, the number of employers went up by 10.2 percent (131,000) followed by wage and salaried workers (2.8 percent or 488,000) and unpaid family workers (2.5 percent or 104,000). On the other hand, self-employed workers fell by 1.4 percent (-156,000).
5. Employment in the service and agriculture sectors increased by 3.8 percent and 0.4 percent, respectively (+638,000 and 49,000). The bulk of the increase in employment came from the wholesale and retail trade (300,000) and real estate, renting and business activities (140,000). Employment in the industry sector went down by 2.4 percent (-121,000), the majority of which came from the manufacturing industry (-112,000).
6. National unemployment grew by 0.3 percent from 7.4 percent in January 2008 to 7.7 percent in January 2009. Likewise, the unemployment rate among females increased by 0.5 percent in the same period. By region, NCR recorded the highest unemployment rate of 14.0 percent followed by Region IV-A at 10.9 percent and Region III at 9.7 percent.
7. The number of underemployed persons declined by 130,000 (-2.0 percent), from 6.368 million in January 2008 to 6.238 million in January 2009.
Civil Society Assessment of the 2004-2010 Medium Term Philippine Development Plan Labor Commitments

Civi
l Soc
iety
Ass
essm
ent o
f the
200
4 -2
010
MTP
DP
154
4
wholesale and retail trade (300,000) and real estate, renting and business activities (140,000). Employment in the industry sector went down by 2.4 percent (-121,000), the majority of which came from the manufacturing industry (-112,000).
6. National unemployment grew by 0.3 percent from 7.4 percent in January 2008 to 7.7 percent in January 2009. Likewise, the unemployment rate among females increased by 0.5 percent in the same period. By region, NCR recorded the highest unemployment rate of 14.0 percent followed by Region IV-A at 10.9 percent and Region III at 9.7 percent.
7. The number of underemployed persons declined by 130,000 (-2.0 percent), from 6.368 million in January 2008 to 6.238 million in January 2009.
Table 3-A. Employment by major industry group, Philippines, 2001-2005 BY MAJOR INDUSTRY GROUP 2001 2002 2003 2004 2005
PHILIPPINES 29,156 30,062 30,635 31,613 32,313Agriculture, Hunting and Forestry 9,716 9,963 9,956 10,013 10,234Fishing 1,134 1,159 1,264 1,368 1,394Mining and Quarrying 103 113 104 118 123Manufacturing 2,906 2,869 2,941 3,061 3,077Electricity, Gas and Water Supply 119 117 112 120 117Construction 1,585 1,596 1,683 1,700 1,708Wholesale and Retail Trade, Repair of Motor
Vehicles,
Motorcycles and Personal and Household Goods
5,255 5,613 5,601 5,872 6,147
Hotels and Restaurants 668 693 750 806 861Transport, Storage and Communications 2,118 2,162 2,310 2,427 2,451Financial Intermediation 292 312 303 328 341Real Estate, Renting and Business Activities 516 544 639 690 734Public Administration & Defense, Compulsory
Social Security 1,382 1,442 1,415 1,491 1,481
Education 920 935 926 938 978Health and Social Work 314 348 371 361 375Other Community, Social and Personal Service
Activities 906 881 861 835 775
Private Households with Employed Persons 1,218 1,313 1,399 1,487 1,517Extra-Territorial Organizations and Bodies 4 3 2 2 1
Source: BLES, DOLE. Table 3-B. Employment by major industry group, Philippines, 2004~2009, with percentages of total and Y-O-Y changes
BY MAJOR INDUSTRY GROUP
2004 %of
total
%change Y-O-Y
2005 %of
total
%change Y-O-Y
2006 %of
total
%change Y-O-Y
2007 %oftotal
%change Y-O-Y
2008 %oftotal
%change Y-O-Y
2009 %oftotal
%change Y-O-Y
PHILIPPINES 31,613
32,313
32,313
33,561
34,090
34,995
Agriculture, Hunting and Forestry
10,013
33% 1% 10,234
34% 2% 10,395
35% 2% 10,342
34%
-1% 10,604
35%
3% 10,840
36%
2%
Fishing 1,368 5% 8% 1,394
5% 2% 1,418 5% 2% 1,444 5% 2% 1,426 5% -1% 1,473 5% 3%
Mining and Quarrying 118 0% 13% 123 0% 4% 141 0% 15% 149 0% 6% 158 1% 6% 166 1% 5% Manufacturing 3,061 10% 4% 3,07
710% 1% 3,058 10% -1% 3,059 10
%0% 2,926 10
%-4% 2,840 9% -3%
Electricity, Gas and Water Supply
120 0% 7% 117 0% -3% 129 0% 10% 135 0% 5% 130 0% -4% 130 0% 0%
Construction 1,700 6% 1% 1,708
6% 0% 1,678 6% -2% 1,778 6% 6% 1,834 6% 3% 1,951 6% 6%
Wholesale and Retail Trade, Repair of Motor Vehicles,
Motorcycles and Personal and Household Goods
5,872 20% 5% 6,147
20% 5% 6,283 21% 2% 6,354 21%
1% 6,446 21%
1% 6,680 22%
4%
Hotels and Restaurants 806 3% 7% 861 3% 7% 893 3% 4% 907 3% 2% 953 3% 5% 977 3% 3% Transport, Storage and
Communications 2,427 8% 5% 2,45
18% 1% 2,492 8% 2% 2,599 9% 4% 2,590 9% 0% 2,628 9% 1%
FinancialIntermediation
328 1% 8% 341 1% 4% 350 1% 3% 359 1% 3% 368 1% 3% 389 1% 6%
Real Estate, Renting and Business Activities
690 2% 8% 734 2% 6% 798 3% 9% 885 3% 11% 953 3% 8% 1023 3% 7%
Public Administration & Defense, Compulsory Social Security
1,491 5% 5% 1,481
5% -1% 1,510 5% 2% 1,551 5% 3% 1,676 6% 8% 1,794 6% 7%
Education 938 3% 1% 978 3% 4% 3% 4% 1035 3% 2% 1071 4% 3% 1068 4% 0%
5
6
1,013 Health and Social
Work 361 1% -3% 375 1% 4% 366 1% -2% 373 1% 2% 392 1% 5% 408 1% 4%
Other Community, Social and Personal Service Activities
835 3% -3% 775 3% -7% 813 3% 5% 849 3% 4% 833 3% -2% 907 3% 9%
Private Households with Employed Persons
1,487 5% 6% 1,517
5% 2% 1,625 5% 7% 1,740 6% 7% 1,729 6% -1% 1,718 6% -1%
Extra-Territorial Organizations and Bodies
2 0% 0% 1 0% -50% 2 0% 100%
2 0% 0% 1 0% -50% 3 0% 200%
Source:BLES-DOLE.
Civil Society Assessment of the 2004-2010 Medium Term Philippine Development Plan Labor Commitments

Ass
essm
ent R
epor
t
155
Tables 3-A and 3-B show the distribution of employment by economic sector, with 3-A showing the raw data from the Bureau of Labor and Employment Statistics (BLES) and 3-B our summary of computations exhibiting each sector’s employment figure as a percentage of the national total as well as the changes year-on-year. The results of the quantitative analysis are revealing.
First, the agriculture, hunting, and forestry sector is still the single biggest employer among all economic sectors. This tells us that the rural sector still absorbs the bulk of employment in the Philippines. Within the program period, employment in this sector actually increased from 33 percent in 2004 to 35 percent in 2008 – and is even projected to rise to 36 percent in 2009. The year on-year changes have in fact been minimal – the biggest was at 2 percent in 2006 and projected to reach the same percentage change in 2009. This suggests that the agriculture sector will continue to play aprominent role in the economy in the near future.
Combined, however, the service sector is undoubtedly the biggest economic sector. Spanning such activities as repair, wholesale and retail trade of motor vehicles, financial intermediation, hotels and restaurants, education, public administration, household-based employment, and social work, among others, this sector easily makes up more than half of total employment. What is instructive in the analysis, however, is that the quality of employment is suspect. It will be noted that the largest subsector here is “wholesale and retail trade, repair of motor vehicles” which accounts for 20 percent of aggregate employment and nearly 40 percent of the entire service sector. This subsector includes the neighborhood repair shops for cars, TVs, refrigerators, and other consumer durables. These establishments are likely to be paying their workers below minimum wage and are unlikely to be giving them standard benefits such as paid leaves, social security, and the like to which they are entitled under the law. The same goes for the transport, storage, and communications subsector. For while the large logistics companies such as the Aboitiz Group’s 2Go unit as well as the multinationals DHL and UPS would fall under this category, there are a large number of small bus and trucking companies that have little or no depreciation costs but have high direct costs because of poorly maintained, dilapidated vehicles, and are manned by drivers and conductors with little or no training. Compensation for such individuals in this subsector is also below standard for the most part.
Analysis of the variance:
1. As with the overall employment target of 10 million jobs to be created by the time the Arroyo administration exits in 2010, the specific economic sectors’ contributions to the growth in employment have not been within the ranges that the MTPDP identified for each sector.
2. The MTPDP 2004-2010 identifies the services sector as the one economic area that will generate the most jobs; the services sector is targeted to generate up to 7 million new jobs. In terms of gross new jobs created, actual results are way below targets at only 2.3 million for the period until 2008. On the other hand, in terms of percentages, the data (Table 4) show general improvements over the 5-year period from April 2004 to April 2008. So this goes back to the point made earlier that the Arroyo administration could have achieved success rather than failure had they reviewed the labor and employment data over the last ten (10) years or so and targeted a more realistic employment level per year.
Table 4. Selected labor sector indicators Y-O-Y, 2004~2008 Philippines April 2008 1/ April 2007 April 2006 April 2005 April 2004
Total 15 years old and over (in '000)
57,700 56,411 54,976 54,195 52,971
Labor Force Participation Rate (%)
63.2 64.5 64.8 64.5 68.9
Employment Rate (%) 92.0 92.6 91.8 91.7 86.3
Unemployment Rate (%) 8.0 7.4 8.2 8.3 13.7
Underemployment Rate (%) 19.8 18.9 25.4 26.1 18.5
Source: BLES-DOLE.
C. FINANCIAL SECTOR (Chapter 8)
Rationalize government pension and retirement schemes. This will be done with the achievement of the following targets.
Specific targets:
1. Allow increase of members’ contributions to pension funds to narrow the funding gap. This will require the updating of actuarial studies that shall be the basis for determining the increase in members’ contributions to ensure that the financial condition of pension funds is actuarially sound.
2. Introduce a clear set of credentials or qualifications that will become the basis for the appointments to the boards of main pension fund providers, namely the SSS and the GSIS.
3. Designate an appropriate agency as the regulator to supervise the activities of pension funds and ensure their viability.
Actuals:
A review of SSS board rulings and decisions archived on the SSS website (http://www.sss.gov.ph) failed to show any rulings or decisions of the SSS board in this regard. This would mean that employee contributions stay at the current minimum level of P250/month for rank-and-file minimum-wage earners3.In view of the fact that take-home pay or disposable income ranks high in importance among Filipino employees, an increase in SSS contributions would be a deduction from that disposable income, and may be resisted. Employers would also not agree with this policy as it increases their operating expenses because employers are required by law to at least match their employees’ contributions. 3 Compulsory coverage applies to all employees of privately-owned and operated institutions – whether permanent, temporary, or provisional – not over 60 years old. It also covers household employees as well as seafaring Filipinos. At present, while the SSS’s present mandate does not state its coverage of land-based OFWs, they are required to report their monthly standard credits (MSCs) based on their current compensation as stipulated in their overseas contracts – implying therefore that they are covered under the SSS. OFWs’ minimum MSC was, in fact, increased to PhP5,000 from PhP3,000 in January 2004.
8
Source: BLES-DOLE.
Civil Society Assessment of the 2004-2010 Medium Term Philippine Development Plan Labor Commitments

Civi
l Soc
iety
Ass
essm
ent o
f the
200
4 -2
010
MTP
DP
156
C. FINANCIAL SECTOR (Chapter 8)
Rationalize government pension and retirement schemes. This will be done with the achievement of the following targets.
Specific targets:
1. Allow increase of members’ contributions to pension funds to narrow the funding gap. This will require the updating of actuarial studies that shall be the basis for determining the increase in members’ contributions to ensure that the financial condition of pension funds is actuarially sound.
2. Introduce a clear set of credentials or qualifications that will become the basis for the appointments to the boards of main pension fund providers, namely the SSS and the GSIS.
3. Designate an appropriate agency as the regulator to supervise the activities of pension funds and ensure their viability.
Actuals:
A review of SSS board rulings and decisions archived on the SSS website (http://www.sss.gov.ph) failed to show any rulings or decisions of the SSS board in this regard. This would mean that employee contributions stay at the current minimum level of P250/month for rank-and-file minimum-wage earners3. In view of the fact that take-home pay or disposable income ranks high in importance among Filipino employees, an increase in SSS contributions would be a deduction from that disposable income, and may be resisted. Employers would also not agree with this policy as it increases their operating expenses because employers are required by law to at least match their employees’ contributions.
As regards policy target no. 2 above, there are no board rulings and decisions posted on the SSS website to show that this was met. This is unfortunate because of the growing need for greater accountability of boards and managements in pension fund operations4. Experiences in the United States, the United Kingdom, and other jurisdictions point to the need for more experienced and capable hands to run pension funds for both public and private sector retirees5. These problems still have to be adequately addressed6.
As regards policy target no. 3, the issue of a regulator to supervise the pension funds has not yet been addressed, much less resolved, to date. The issue affects
3Compulsory coverage applies to all employees of privately-owned and operated institutions – whether permanent, temporary, or provisional – not over 60 years old. It also covers household employees as well as seafaring Filipinos. At present, while the SSS’s present mandate does not state its coverage of land-based OFWs, they are required to report their monthly standard credits (MSCs) based on their current compensation as stipulated in their overseas contracts – implying therefore that they are covered under the SSS. OFWs’ minimum MSC was, in fact, increased to PhP5,000 from PhP3,000 in January 2004.4The appointment of the current president, Romulo Neri, was the subject of intense criticism within the business community as he is known to be a generalist and has a laid-back style of management that would make him hard-pressed at being able to scrutinize the fund’s financial statements and drilldowns into the fund’s databases with the same level of detail as his predecessor, Corazon de la Paz – a CPA. The more politically-oriented critics voiced out not too subtly that Mr. Neri is a foot soldier and might have been placed by the president in the SSS to see how the fund might be used to bankroll the president’s electoral war chest (assuming she is able to find some legal way to get around the constitutional limit of one term) – a charge which is entertaining and amusing but may be far from reality as fund use is specifically mandated in its Charter; any deviations from it would be vigorously opposed by the other board members. And even if they do allow it, COA audits will reflect the misuse. There will be much that Mr. Neri would have to answer for in that case.5A recently uncovered problem involving the US government-operated Pension Benefit Guarantee Corporation (PBGC) that dates back to last year when the Bush administration was still in power shows how kickbacks may have been involved in selecting fund managers to shepherd the PBGC’s US$2.5 billion fund. Charles Millard, director of the PBGC, was recently subpoenaed regarding his having made inappropriate contacts with fund managers J.P. Morgan Chase, Goldman Sachs, and Black Rock to manage the corporation’s fund, in return , allegedly, for receiving commissions. The PBGC takes over pension funds of private sector corporations that may have problems meeting their obligations to their retirees. This may be found in “US insurer of pensions sees flood of red ink,” by Eric Lipton, in The New York Times, 21 May 2009 (http://www.nytimes.com/2009/05/21/business/economy/21pension.html?ref=todayspaper ). 6The man appointed by US President Obama to solve the problems plaguing the US auto industry, Steve Rattner, was formerly connected with a management group called the Quadrangle, Inc. There are reports that Quadrangle is now using this connection to corner pension fund manage-ment contracts for huge state pensions like those of New York, New Mexico, California, and Pennsylvania. This, in Marcus Baram’s blog in The Huffington Post (“Pension Fund Scandal Expands: Rattner’s Ties to Bill Richardson” in http://www.huffingtonpost.com/2009/04/22/pension-fund-scandal-expa_n_190347.html)
Civil Society Assessment of the 2004-2010 Medium Term Philippine Development Plan Labor Commitments

Ass
essm
ent R
epor
t
157
not just the pension funds but the entire financial system as well, since the BSP, the SEC, and the Insurance Commission have kept the resolution of supervisory issues at the level of an inter-agency committee – similar to the UK’s Financial Services Authority or the proposed “superbody” in the US – but without any clear power given by legislation or executive mandate to levy sanctions on erring parties, which are left to the respective agencies.
D. Labor (Chapter 9)
This chapter is devoted entirely to addressing the issues of employment generation, employment preservation, employment enhancement, and employment facilitation. The actuals that immediately follow describe what work and achievements, if any, have been done to achieve each target.
Specific targets:
1. Employment generation7
“To support the efforts in job creation, the government shall issue administrative guidelines and propose legislative amendments to the Labor Code to recognize flexible work arrangements (e.g., subcontracting, flexi-work, flexi-wage) especially in business process outsourcing and cooperatives.”
Actuals:
With respect to no. 1 (employment generation), labor sector professionals and trade unionists have worked closely with members of Congress to draft amendments to the Labor Code to incorporate changes that will keep it up to speed with current workplace trends such as flexible work arrangements (flexibilization). According to Mr. Danny Edralin, president of the federated National Union of Workers in Hotels, Restaurants and Allied Industries (NUWHRAIN) and chairman of the broader Alliance of Progressive Labor (APL), they have been working closely with Senator Jinggoy Estrada to draft measures that will allow workers to enjoy the same social support and benefits (i.e., SSS, Pag-IBIG, paid leaves and other establishment-specific benefits provided by employers such as arrangements with health insurance and health care providers) as regular employees although limited to the period that they are actually working. Unfortunately, no bill has yet been filed in the Senate addressing this concern.
On the other hand, non-administration – in fact ardently opposition – legislators such as Sen. Estrada have done more for the labor sector. For instance, he filed Senate Bill (SB) No. 152 proposing amendments to the Labor Code, specifically amending Article 287 of the Code (“Financial Assistance and Benefits”) providing for financial assistance for employees reaching the mandatory age of retirement (65 years old) but who are not entitled under their employer’s human resource and administrative rules to receive retirement or some other kind of separation pay. This is still presently pending at the Committee level. These are issues that pertain to no. 3 (employment enhancement), and will be referred to in the discussion below.
There are three (3) pieces of legislation, again by Sen. Estrada, that have been passed into law that impact on the labor sector and pertain to no. 1 (employment generation). These are:
• Republic Act (RA) No. 9481 – An Act strengthening the workers’ constitutional right to self-organization, amending for the purpose Presidential Decree (PD) No. 442, as amended (otherwise known as the Labor Code of the Philippines). The Act simplifies the creation, registration, and legal support for various labor organizations – from local chapters , through federations, and national centers. There is a lower percentage of employees requiring consent (25 percent, in writing) for the holding of a certification election in an organized establishment. For unorganized establishments (i.e., where there is no union or collective bargaining unit), the filing of a petition by a legitimate labor organization, including a national union or
7This involves creating, directly or indirectly, new employment opportunities in the domestic labor market.
as far as measures passed into law are concerned, no targets have been achieved...
Civil Society Assessment of the 2004-2010 Medium Term Philippine Development Plan Labor Commitments

Civi
l Soc
iety
Ass
essm
ent o
f the
200
4 -2
010
MTP
DP
158
federation, will be sufficient. Moreover, in such cases, it shall not be required to disclose the names of the local chapter’s officers and members.
• RA No. 9422 – An Act to strengthen the regulatory functions of the Philippine Overseas Employment Administration (POEA), amending for this purpose RA No. 8042 (otherwise known as the Migrant Workers and Overseas Filipinos Act of 1995). The Act mandates the POEA to regulate private sector participation in the recruitment and overseas placement of workers by setting up a licensing and registration system. When necessary, it shall formulate and implement, in coordination with appropriate entities concerned, a system for promoting and monitoring the overseas employment of Filipino workers, taking into consideration their welfare and the domestic manpower requirements. It mandates the POEA to inform migrant workers not only of their rights as workers but also of their rights as human beings, giving them instructions on how to assert their rights and provide available mechanisms to redress violations of such rights. The only limitation of the law is that the POEA may enforce this law only in countries with which the Philippines has concluded bilateral labor agreements or arrangements, with the proviso that such countries shall guarantee to protect the rights of Filipino migrant workers and that such countries observe and/or comply with international laws and standards for migrant workers.
• RA No. 9347 – An Act rationalizing the composition and functions of the National Labor Relations Commission, amending for this purpose Articles 213, 214, 215, and 216 of PD No. 442, as amended (otherwise known as the Labor Code of the Philippines). Essentially, the changes here include increasing the number of commissioners so that they also represent geographical areas (i.e., Luzon, Visayas, and Mindanao) aside from representatives of the different labor centers and federations.
However, these are the individual efforts of Sen. Estrada, with the prodding of the labor sector. Certainly, these are not the result of the administration’s efforts as things stand. Estrada is in the opposition, and would not be so cooperative with the administration, which should be pushing this legislative agenda in the first place.
To have a balanced view of legislative action on labor issues, we look at the bills filed in the House of Representatives and note that 40 bills are presently pending before the House Committee on Labor and Employment. The more prominent among these that apply to no. 1 (employment generation) are:
• HBNo.185 (IntroducedbyCong. JuanEdgardoAngara, lonedistrict,Aurora)–AnActexpanding theexceptions from the night work prohibition for women, thereby amending Article 131 of PD No. 442, as amended (otherwise known as the Labor Code of the Philippines).
• HBNo.197 (IntroducedbyCong. JuanEdgardoAngara, lonedistrict,Aurora)–AnActexpanding theprohibited acts against the discrimination of women on account of sex, amending for this purpose Articles 135 and 137 of PD No. 442, as amended (otherwise known as the Labor Code of the Philippines).
• HBNo.1718 (IntroducedbyAKBAYANRep.AnaTheresiaHontiveros–Baraquel) –AnAct toenhancethe Philippine industrial and labor dispute settlement system and for that purpose, amending certain provisions of PD No. 442, as amended (otherwise known as the Labor Code of the Philippines), specifically encouraging the use of alternative dispute resolution (ADR) methods and embed it at the core of the State mechanism designed to address industrial and labor disputes.
• HBNo.1722(IntroducedbyAnakpawisRep.CrispinB.Beltran;GABRIELAWomen’s Party Reps. Liza Largoza-Maza and Luz Ilagan; and Bayan Muna Reps. Satur C. Ocampo and Teodoro A. Casino) – An Act providing for a PhP125.00 daily across-the-board increase in the salary rates of employees and workers in the private sector and for other purposes.
• HBNo.1723(IntroducedbyAnakpawisRep.CrispinB.Beltran;GABRIELAWomen’s Party Reps. Liza Largoza-Maza and Luz Ilagan; and Bayan Muna Reps. Satur C. Ocampo and Teodoro A. Casino) – An Act repealing RA No. 6727, otherwise known as an Act to rationalize wage policy determination
Civil Society Assessment of the 2004-2010 Medium Term Philippine Development Plan Labor Commitments

Ass
essm
ent R
epor
t
159
by establishing the mechanism and proper standards for it, amending for the this purpose Article 99 of, and incorporating Articles 120, 121, 122, 123, 124, 126, and 127 into PD No. 442, as amended (otherwise known as the Labor Code of the Philippines), fixing new wage rates, providing wage incentives for industrial dispersal to the countryside, and for other purposes.
However, the best proof of successful work done in the legislative arena would be how many of these bills actually make it to third and final reading, and approval by the President to become part of the law of the land. In the last session of Congress, the 14th Congress, there were 183 laws passed which originated from the House. Of these, only one law – RA 9509 (An Act establishing livelihood and skills training centers in fourth, fifth, and sixth class municipalities, and for other purposes) – may actually be connected with the concerns of the labor sector8.
2. Employment preservation9
“ xxx government shall ensure 24 hours/7 days-a-week action on labor cases, promote alternative dispute settlement mechanisms at the workplace for both unionized and non-unionized establishments, and continuously educate labor and management on workers’ rights, dispute prevention and settlement. To address work contingencies arising from unemployment or loss of livelihood, it shall promote efficiency-enhancing measures, including arrangements or human resource strategies that minimize employment losses, pursue the establishment of Tripartite Assistance and Supervising Committees, and administer an ‘Industrial Peace & Stability Fund’ to assist displaced workers on a tripartite basis. An electronic labor case tracking and management system shall be installed to support the overall efforts on improving case resolution. Finally, it shall sustain social dialogue as a central element of labor policies, and a means to secure sustainable decent work outcomes.”
Actuals:
On the Malacañang and DOLE front, there have been no efforts exerted to meet these targets. The last administrative order issued in line with the targets set above was passed in 2002 – way before the present applicable MTPDP10.
On the legislative front, only the following House bills are relevant:
• HBNo.203(IntroducedbyCong.EdgarM.Chatto,1stDistrict,Bohol11) – An Act to further strengthen and broaden the Special Program for the Employment of Students (SPES), amending for this purpose certain provisions of RA No. 7323.
• HBNo.510(IntroducedbyCong.MauricioG.Domogan)–AnActestablishingtheWorkersCompensationProgram, the Work Contingency Insurance Fund, the Philippine Workers’ Compensation Authority, and defining their powers and functions and amending for this purpose Articles 166 through 208-A of PD No. 442, as amended (otherwise known as the Labor Code of the Philippines) and appropriating funds for this purpose.
Again, as was the case with no. 1, these are bills still pending with the House Committee on Labor and Employment. Their proponents, whether with the administration or the opposition, cannot claim success until the
8Most of the laws passed by the 14th Congress were to create new high schools throughout the country, apparently passed by congressmen to show their constituents that they are undertaking projects for the benefit of their respective communities.9“This involves enhancing harmonious worker-employer relationship and maintaining existing jobs with remunerative terms and conditions. Industrial peace, which significantly contributes to the preservation of employment, shall be achieved through freedom of association and free col-lective bargaining, continuing social dialogue, mediation and voluntary arbitration of conflict and shared decision-making mechanisms at the firm, industry, sector, and national levels. By developing mutual trust and confidence among parties, the industrial relations paradigm will shift from one based on confrontation to one based on cooperation resulting to [sic] productivity and competitiveness.” (Medium-Term Philippine Development Plan. Pasig City: Government of the Republic of the Philippines-National Economic Development Authority, 2004, p. 113)10Department Order No. 27-02: Working Procedures of the Sugar Tripartite Council, District Tripartite Councils and the STC Executive Committee, 30 August 2002.11Cong. Chatto is a member of the ruling party Lakas-CMD (Christian-Muslim Democrats).
Civil Society Assessment of the 2004-2010 Medium Term Philippine Development Plan Labor Commitments

Civi
l Soc
iety
Ass
essm
ent o
f the
200
4 -2
010
MTP
DP
160
measure has been passed into law. The administration itself cannot claim to have achieved the goals it set out for itself under this MTPDP. So with respect to no. 2, as far as measures passed into law are concerned, no targets have been achieved.
3. Employment enhancement12
“To enhance labor productivity and competitiveness, government shall showcase productivity improvement programs in micro, small and medium enterprises (MSMEs), including barangay micro business enterprises (BMBEs). It shall promote a culture of self-regulation and voluntary compliance to (sic) labor standards through the full implementation of the new labor standards framework, and continuously review its wage policy framework vis-a-vis emerging labor and industry requirements.
Actuals:
In July 2004, within days after being sworn into office with a fresh mandate, President Arroyo issued Executive Order No. 325, creating the Presidential Task Force on Illegal Recruitment. A retired military man, Reynaldo Jaylo, was appointed to head the task force. Professionals and advocates long active in the protection of OFWs’ rights and welfare contend, however, that the task force has not been effective in combating illegal recruitment and the proliferation of so-called mail-order brides.
On the legislative front, once again, Sen. Estrada’s RA No. 9422, which provides more regulatory powers to the POEA, qualifies as a step in the right direction. Again, however, it must be stressed that this is a measure passed through the efforts of an opposition legislator. It can be argued that President Arroyo signed the bill into law, which makes it, technically, part of her legislative agenda. But it would be more to her administration’s credit if an administration senator had been the originator of the bill. Alternatively, she could have told her staunch allies in the House that she is certifying as urgent a legislative agenda that would help her achieve the MTPDP targets. Perhaps she did; she can and should be given the benefit of the doubt. But as we have frequently stated here, the only proof of success is whether or not a bill has been passed into law. Again, the Arroyo administration would have to be given a corresponding red mark in this area of employment enhancement as well.
We should also refer to the following bills applicable in this area:
• HouseBill(HB)No.97(IntroducedbyCong.JuanEdgardoAngara)–AnActprovidingforaMagnaCartafor workers in the informal sector, institutionalizing mechanisms for its implementation, and for other purposes.
• HBNo.1025(IntroducedbyCong.MauricioG.Domogan)–AnActmaintainingthepresentprovisiononprobationary employment increasing at the same time the government’s protection to (sic) probationary employees, amending for this purpose Article 281 of PD No. 442, as amended (otherwise known as the Labor Code of the Philippines).
• HBNo.1131(IntroducedbyGABRIELAWomen’sPartyListRep.LizaLargoza-Maza)–AnActamendingTitle 4 of Book 4 of PD No. 442, as amended (otherwise known as the Labor Code of the Philippines), providing for women and gender education in the workplace.
It will be clear that two of the above-mentioned bills were filed by congressmen affiliated with Mrs. Arroyo’s ruling coalition13. The third bill, however, was filed by a representative of a militant party with sympathies to the 12“This involves improving workers’ competency, productivity and work values, work conditions and occupational safety and health, remuneration, and welfare. There is a need for coherent strategies that will ensure basic security and employment while enabling adaptation to rapidly chang-ing circumstances in a highly competitive global market because decent work is not just concerned with the creation of employment, but also employment of acceptable quality.” (Medium-Term Philippine Development Plan. Pasig City: Government of the Republic of the Philippines-National Economic Development Authority, 2004, p. 113)13Cong. Juan Edgardo Angara represents the lone district of Aurora under the Laban ng Demokratikong Pilipino (LDP), which is part of the ruling coalition of Mrs. Arroyo. As for Cong. Domogan who represents the City of Baguio, his website does not show which party he belongs to. But reading his speech during the House deliberations on the last impeachment complaint filed against Mrs. Arroyo in 2008, Cong. Domogan called for the trashing of the impeachment complaint, which makes likely him a supporter of Mrs. Arroyo.
Civil Society Assessment of the 2004-2010 Medium Term Philippine Development Plan Labor Commitments

Ass
essm
ent R
epor
t
161
extreme Left, which has no love lost for Mrs. Arroyo. Thus, the bills filed by administration allies account for less than half of all labor-related bills filed, including those filed by Cong. Chatto.
The question that needs to be answered, therefore, is whether the bills filed by House members allied with the administration were actually filed because of their commitment to the administration. There is no way aside from an interview with these persons to determine whether they did so to help the administration meet its commitments. And even then, there is just a chance that they may make a post facto claim that they did this to help the administration meet its commitments. The next best way in this case would be to examine each piece of legislation at face value and see if it is consistent with the promises of the Arroyo administration under this MTPDP. Table 5 below helps us identify each administration member and the bills he or she has filed.
Table 5. Administration-affiliated (or identified with the administration) House member & labor-related bills filed
House Member Bills filed Relevant MTPDP provisions
Juan Edgardo Angara HB No. 185 – An Act expanding the exceptions from the night work prohibition for women, thereby amending Article 131 of PD No. 442, as amended (otherwise known as the Labor Code of the Philippines).HB No. 197 – An Act expanding the prohibited acts against the discrimination of women on account of sex, amending for this purpose Articles 135 and 137 of PD No. 442, as amend-ed (otherwise known as the Labor Code of the Philippines).HB No. 97 – An Act providing for a Magna Carta for workers in the informal sector, institutionalizing mechanisms for its implementation, and for other purposes.
Mauricio G.Domogan HB No. 1025 – An Act maintaining the present provision on probationary employment increasing at the same time the gov-ernment’s protection to (sic) probationary employees, amend-ing for this purpose Article 281 of PD No. 442, as amended (otherwise known as the Labor Code of the Philippines). HB No. 510 – An Act establishing the Workers Compensation Program, the Work Contingency Insurance Fund, the Philip-pine Workers’ Compensation Authority, and defining their powers and functions and amending for this purpose Articles 166 through 208-A of PD No. 442, as amended (otherwise known as the Labor Code of the Philippines) and appropriat-ing funds for this purpose.
Edgar M. Chatto HB No. 203 – An Act to further strengthen and broaden the Special Program for the Employment of Students (SPES), amending for this purpose certain provisions of RA No. 7323.
4. Employment facilitation14
To address the apparent mismatches in jobs and skills, the major Public Employment Service Offices (PESOs) shall be interconnected to strengthen the labor market information system. Alternative job search modes, such as the use of SMS technology shall also be set
14Employment facilitation involves facilitating access of Filipino workers to employment opportunities and alternatives, whether locally or abroad. Overseas employment remains to be a legitimate option for the country’s workforce. As such, government shall fully respect labor mobility, includ-ing the preference of workers for overseas employment. Protection shall be provided to Filipinos who choose to work abroad and programs for an effective reintegration into the domestic economy upon their return shall be put up.
Civil Society Assessment of the 2004-2010 Medium Term Philippine Development Plan Labor Commitments

Civi
l Soc
iety
Ass
essm
ent o
f the
200
4 -2
010
MTP
DP
162
up to increase workers’ access to information on job vacancies. Policies and procedures on overseas employment shall continue to be streamlined. By electronically linking the 12 government agencies involved in OFW documentation, the documentation process cycle time, requirements, and cost shall be reduced by 50 percent.
Actuals:
With respect to no. 4 (employment facilitation), Table 6 provides information on the number of job placements facilitated. Here, we see a slight dip from 2006 to 2007 in the number of job vacancies reported. The number rose again in 2008, surpassing the 2006 figure. The same trend follows for the number of applicants registered and the number of applicants successfully placed. As a percentage of the number of applicants registered, the number of applicants successfully placed was estimated at 66 percent in 2006, increasing to 70 percent the following year, and maintaining that number in 2008. On the other hand, as a percentage of total job vacancies reported, the successfully placed applicants was estimated at 49 percent, under 48 percent, and more than 52 percent for the same years, respectively. On average, about half of those jobs reported as needing to be filled up were actually filled up, which therefore accounts for a 50 percent success or passing rate.
With respect to Executive Branch action, DOLE issued two (2) department orders stating guidelines in the placement of cadets and apprentices under the Job Corps Program and in the conduct of jobs fairs by private entities, non-government organizations (NGOs), and educational institutions15. It should be noted that these two department orders were issued in 2001 and 2002 – again, as in the case of the sugar industry tripartite council, way before the period covered by the present MTPDP.
III. OVERALL ASSESSMENT
On a general level, we regret to have to state that, on a scale of 1 through 10 (10 being the highest), the Arroyo administration would have to be given an overall grade of 4 (i.e., below average). For sure, there are some significant gains in favour of the labor sector, particularly in the area of socio-economic benefits, which have been achieved under this administration. However, these cannot be attributed primarily to the efforts of the administration and its allies in Congress. In fact, many of these gains, as we have noted, were due more to non-administration members of Congress who have little or no sympathy for Mrs. Arroyo. The president could have marshalled the tremendous resources at her disposal and moved her congressional allies to ensure that her commitments to the labor sector under this MTPDP were achieved. Instead, it is the opposition that has come to be associated with these legislative measures to improve the overall condition of the labor sector. In sum, while it cannot be denied that there have been improvements for sure – these are no thanks to the Arroyo administration.
The following observations need to be considered to back up our assertion. These are:
1. The period is viewed as having growth without employment. The Arroyo administration always likes to trot out the gains it has made in moving the economy forward – even under difficult circumstances that forced many of the world’s major economies to grind to a halt. The terror attacks of 9/11 in the US in 2001 and the resulting War on Terror that continues to this day, the Avian flu and SARS epidemics of 2003 and 2004, and today’s Global Financial Crisis that began with the collapse of the secondary mortgage market in the US in 2007 – all these events caused serious setbacks to the global economy, adversely affecting the Philippines’ most important trading partners.
15Department Order No. 22-02: Guidelines in the Placement of Cadets/Apprentices under the Job Corps Program, 22 April 2002; and Department Order No. 02-01: Guidelines for the conduct of jobs fairs by private entities, non-governmental organizations, and educational institutions, 22 March 2001.
Civil Society Assessment of the 2004-2010 Medium Term Philippine Development Plan Labor Commitments

Ass
essm
ent R
epor
t
163
Table 6
18
Table 7. Household population 15 years old & older, and employment status, 2001~2007Table 7. Household population 15 years old & older, and employment status, 2001~2007
2001 2002 2003 2004 2005 2006 2007 Householdpop’n >15 y.o. (‘000s)
49,424 50,841 52,305 53,569 54,799 55,988 56,845
Percent in labor force (LFPR)
67.50 66.20 67.10 66.50 64.80 64.00 63.20
Percent of labor force (Emp. Rate)
90.20 89.80 89.80 89.10 92.60 92.10 93.70
Unemploymentrate 10.10 10.20 10.10 10.90 7.40 7.90 6.30
Source: 2008 Philippine Statistical Yearbook, National Statistics Office, 2008.
Table 7 shows erratic performance in the overall employment picture. While household populations with members at least 15 years old are increasing, the same cannot be said of other employment indicators. The highest percentage of the population participating in the labor force was highest at the start of Mrs. Arroyo’s years of service in 2001, and has slid since 2007. What could account for this might be the dropping-out from the labor force of a significant number of employable people (i.e., due to self-employment, own business, return to studies, etc.). The employment rate is also problematic, for while it is highest in 2007 since 2001, there is a clear downward trend from 2001 to 2004, picking up only in 2005. It drops again in 2006 and then moves on to its all-time high in 2007. Conversely, the unemployment rate, from a high in 2001, has dropped to its lowest in 2007 but not before peaking in 2004.
19
Table 7 shows erratic performance in the overall employment picture. While household populations with members at least 15 years old are increasing, the same cannot be said of other employment indicators. The highest percentage of the population participating in the labor force was highest at the start of Mrs. Arroyo’s years of service in 2001, and has slid since 2007. What could account for this might be the dropping-out from the labor force of a significant number of employable people (i.e., due to self-employment, own business, return to studies, etc.). The employment rate is also problematic, for while it is highest in 2007 since 2001, there is a clear downward
Civil Society Assessment of the 2004-2010 Medium Term Philippine Development Plan Labor Commitments
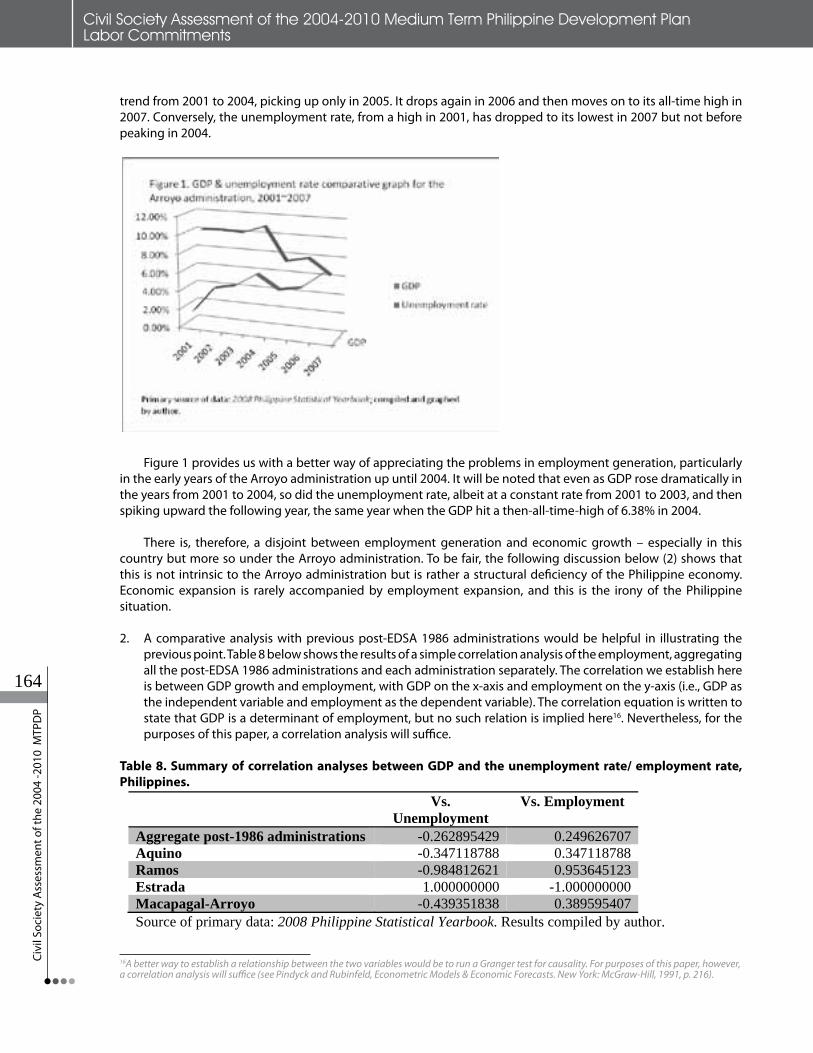
Civi
l Soc
iety
Ass
essm
ent o
f the
200
4 -2
010
MTP
DP
164
trend from 2001 to 2004, picking up only in 2005. It drops again in 2006 and then moves on to its all-time high in 2007. Conversely, the unemployment rate, from a high in 2001, has dropped to its lowest in 2007 but not before peaking in 2004.
Table 7. Household population 15 years old & older, and employment status, 2001~2007
2001 2002 2003 2004 2005 2006 2007 Householdpop’n >15 y.o. (‘000s)
49,424 50,841 52,305 53,569 54,799 55,988 56,845
Percent in labor force (LFPR)
67.50 66.20 67.10 66.50 64.80 64.00 63.20
Percent of labor force (Emp. Rate)
90.20 89.80 89.80 89.10 92.60 92.10 93.70
Unemploymentrate 10.10 10.20 10.10 10.90 7.40 7.90 6.30
Source: 2008 Philippine Statistical Yearbook, National Statistics Office, 2008.
Table 7 shows erratic performance in the overall employment picture. While household populations with members at least 15 years old are increasing, the same cannot be said of other employment indicators. The highest percentage of the population participating in the labor force was highest at the start of Mrs. Arroyo’s years of service in 2001, and has slid since 2007. What could account for this might be the dropping-out from the labor force of a significant number of employable people (i.e., due to self-employment, own business, return to studies, etc.). The employment rate is also problematic, for while it is highest in 2007 since 2001, there is a clear downward trend from 2001 to 2004, picking up only in 2005. It drops again in 2006 and then moves on to its all-time high in 2007. Conversely, the unemployment rate, from a high in 2001, has dropped to its lowest in 2007 but not before peaking in 2004.
19
Figure 1 provides us with a better way of appreciating the problems in employment generation, particularly in the early years of the Arroyo administration up until 2004. It will be noted that even as GDP rose dramatically in the years from 2001 to 2004, so did the unemployment rate, albeit at a constant rate from 2001 to 2003, and then spiking upward the following year, the same year when the GDP hit a then-all-time-high of 6.38% in 2004.
There is, therefore, a disjoint between employment generation and economic growth – especially in this country but more so under the Arroyo administration. To be fair, the following discussion below (2) shows that this is not intrinsic to the Arroyo administration but is rather a structural deficiency of the Philippine economy. Economic expansion is rarely accompanied by employment expansion, and this is the irony of the Philippine situation.
2. A comparative analysis with previous post-EDSA 1986 administrations would be helpful in illustrating the previous point. Table 8 below shows the results of a simple correlation analysis of the employment, aggregating all the post-EDSA 1986 administrations and each administration separately. The correlation we establish here is between GDP growth and employment, with GDP on the x-axis and employment on the y-axis (i.e., GDP as the independent variable and employment as the dependent variable). The correlation equation is written to state that GDP is a determinant of employment, but no such relation is implied here16. Nevertheless, for the purposes of this paper, a correlation analysis will suffice.
Table 8. Summary of correlation analyses between GDP and the unemployment rate/ employment rate, Philippines.
Figure 1 provides us with a better way of appreciating the problems in employment generation, particularly in the early years of the Arroyo administration up until 2004. It will be noted that even as GDP rose dramatically in the years from 2001 to 2004, so did the unemployment rate, albeit at a constant rate from 2001 to 2003, and then spiking upward the following year, the same year when the GDP hit a then-all-time-high of 6.38% in 2004.
There is, therefore, a disjoint between employment generation and economic growth – especially in this country but more so under the Arroyo administration. To be fair, the following discussion below (2) shows that this is not intrinsic to the Arroyo administration but is rather a structural deficiency of the Philippine economy. Economic expansion is rarely accompanied by employment expansion, and this is the irony of the Philippine situation.
2. A comparative analysis with previous post-EDSA 1986 administrations would be helpful in illustrating the previous point. Table 8 below shows the results of a simple correlation analysis of the employment, aggregating all the post-EDSA 1986 administrations and each administration separately. The correlation we establish here is between GDP growth and employment, with GDP on the x-axis and employment on the y-axis (i.e., GDP as the independent variable and employment as the dependent variable). The correlation equation is written to state that GDP is a determinant of employment, but no such relation is implied here16.Nevertheless,forthepurposesofthispaper,acorrelation analysis will suffice.
Table 8. Summary of correlation analyses between GDP and the unemployment rate/ employment rate, Philippines.
Vs.Unemployment
Vs. Employment
Aggregate post-1986 administrations -0.262895429 0.249626707 Aquino -0.347118788 0.347118788 Ramos -0.984812621 0.953645123 Estrada 1.000000000 -1.000000000 Macapagal-Arroyo -0.439351838 0.389595407 Source of primary data: 2008 Philippine Statistical Yearbook. Results compiled by author.
It will be seen here that there is a negative correlation between GDP and unemployment, and a positive correlation between GDP and employment, as expected. However, the results are tentative at best. The correlation was strongest only during the Ramos administration, implying that economic growth was a strong determinant of employment during that time. For all other administrations, the results are weak. The results for the Estrada administration, implying a solid correlation, may not be reliable given that there is very little data to work with, as this administration was in office only for a little more than two years.17. The results for the Arroyo administration are among the weakest when measured against unemployment and employment, thus lending credence to the argument that whatever growth is occurring means little to those millions seeking employment or are presently employed but may be in danger of losing their jobs.
16 A better way to establish a relationship between the two variables would be to run a Granger test for causality. For purposes of this paper, however, a correlation analysis will suffice (see Pindyck and Rubinfeld, Econometric Models & Economic Forecasts.NewYork:McGraw-Hill,1991,p.216).17 In any kind of statistical analysis, more reliable results can be achieved if there are more observations, i.e., the results are statistically significant (Fisher, R.A. Statistical Methods for Research Workers.Edinburgh:Oliver&Boyd, 1925, p. 43).
20
16A better way to establish a relationship between the two variables would be to run a Granger test for causality. For purposes of this paper, however, a correlation analysis will suffice (see Pindyck and Rubinfeld, Econometric Models & Economic Forecasts. New York: McGraw-Hill, 1991, p. 216).
Civil Society Assessment of the 2004-2010 Medium Term Philippine Development Plan Labor Commitments

Ass
essm
ent R
epor
t
165
It will be seen here that there is a negative correlation between GDP and unemployment, and a positive correlation between GDP and employment, as expected. However, the results are tentative at best. The correlation was strongest only during the Ramos administration, implying that economic growth was a strong determinant of employment during that time. For all other administrations, the results are weak. The results for the Estrada administration, implying a solid correlation, may not be reliable given that there is very little data to work with, as this administration was in office only for a little more than two years.17 The results for the Arroyo administration are among the weakest when measured against unemployment and employment, thus lending credence to the argument that whatever growth is occurring means little to those millions seeking employment or are presently employed but may be in danger of losing their jobs.
3. We conclude, however, by calling attention once again to the structural weaknesses of the Philippine economy as evidenced by the data. It matters little whatever administration is in power; the growth they manage to crank out for the economy does not benefit the majority of our people. This is a nagging problem that the incoming administration in 2010 will have to contend with. It will have to ensure that it can generate growth that will be meaningful to our working people.18
IV. RECOMMENDATIONS
Finally, we put forward our recommendations for the next MTPDP, applicable to the period from 2011 to 2016. We put this forward in the hope that subsequent administrations would be more attuned to the people’s sentiments for more and better jobs, and therefore draw up policies that continuously reflect that sensitivity.
From the assessments above, some initial recommendations can already be formulated, as follows:
• On employment generation – The new administration must make employment generation a major objective of its policy platform. Encouraging businesses to locate in the Philippines would, in our view, be of little consequence if they do not generate jobs for the majority of our people.
• Improving employment quality – Having stated the above, we must also insist that the new administration strive to foster business creation that in turn creates quality jobs. By quality jobs, we refer to the International Labor Organization’s (ILO) Decent Work agenda19. We appreciate the government’s efforts, particularly during the early part of the Global Crisis in late 2008 to mid-2009, to move laid-off domestic workers and OFWs to take on work that had skill and knowledge requirements below theirs, i.e., the problem of overqualification. Rather than face the prospect of being unable to meet their families’ more immediate requirements of food, clothing, and shelter (setting aside the important objectives of health and education), many of these workers understandably took on those jobs. Others took on entirely new fields of endeavor such as entrepreneurship and setting up small businesses even if they had absolutely no experience or did not possess the proper mindset, acumen, and attitude of an entrepreneur. In other words, many working Filipinos were forced by circumstance to seek work or livelihood in areas outside that which they had been trained for or had been accustomed to. Inevitably, the quality of the work suffered, and both the new employer and his/her new employee may have experienced frustration or disappointment with the new arrangement. Thus, the new administration must determine what local industries many of our working people have been trained and developed for, and try and encourage new investors to get into those industries, or encourage existing businesses in those industries to expand.
17In any kind of statistical analysis, more reliable results can be achieved if there are more observations, i.e., the results are statistically significant (Fisher, R.A. Statistical Methods for Research Workers. Edinburgh: Oliver & Boyd, 1925, p. 43).18An interesting assessment of the structural deficiencies of the Philippine economy was discussed by Cielito Habito in a working draft submitted to the Caucus of Development NGOs (CODE-NGO) for its assessment of the Arroyo administration’s Medium-Term Philippine Development Plan. 19Decent work is defined as work that promotes the decency of the human person and his/her productivity, “under conditions of freedom, equity, security, and human dignity.”
... the appropriate manpower development strategy can be done.
Civil Society Assessment of the 2004-2010 Medium Term Philippine Development Plan Labor Commitments

Civi
l Soc
iety
Ass
essm
ent o
f the
200
4 -2
010
MTP
DP
166
• Determine sunrise industries & train/develop appropriate manpower – Over the first six (6) months of the next administration’s term, the economic management team should help the president identify sunrise industries that have the potential to substantially contribute to employment over the next six years. They can also identify already functioning and running industries that still have the potential to contribute even further growth to the economy. From these assessments, an estimate of the gross manpower complement can be made, and the appropriate manpower development strategy (identifying number, skill level, and applicable training programs) can be done. Alternatively, the next administration should also consider encouraging entrepreneurship among the labor force that may be laid-off or subjected to downtime or idle time as a result of the crisis – and dovetail such efforts with the identification of sunrise or fast-growing industries. In vertically integrated industries, upstream manufacturing points can be the entry points of involvement and participation for entrepreneurs and small- to medium enterprises. Capital costs are usually lower at upstream points and can be more quickly recovered than in downstream assembly or marketing-and-distribution points.
• Standardized statistics – We have also learned about statistical indicators being redefined to capture the reality of underemployment as a substitute for full employment. Given the situation of declining economic activity and the resulting decline as well of employment numbers, we would like to believe that the government undertook this redefinition or reclassification in order to reflect the changing reality of underemployment as “alternative” full employment. However, this obscures the reality that underemployment is second-best to regular, full employment, and therefore the government must strive to attain full employment for the majority of the country’s working force.
• Social dialogue – One of the so-called pillars of the Decent Work paradigm is the emphasis on social dialogue in the tripartite structure of labor, government, and business. This is a new, refreshing commitment on the part of labor groups to engage government and business as the former continue to push for improvements in wages, benefits, and the protection of the freedom to organize and of association within a new framework that is different from the traditional, confrontational structure that has framed labor-management or labor-government relations in the past. There will continue to be tensions and misunderstandings between the three parties, but all can agree to disagree on certain principles but agree to arrive at minimum, mutually acceptable positions.
• Social protection – Over the last twenty (20) years, the imperative of driving costs down has become one of the most pressing concerns of markets. This has benefitted consumers in many obvious ways. It has also benefitted shareholders, who stand to gain from larger bottomlines. Labor will always be seen as a cost and will always be reflected as such in financial statements, and therefore it comes as no surprise that efforts to minimize labor costs – in terms of wages and benefits – will always be popular among management. With this in mind, the dignity of labor must always be stressed; they may be inputs to production but they are also people who work in order to live. Therefore, attention must be given by the next administration to the growing practice of contractualization, which minimizes benefits costs to employers as workers are not regularized. Non-regularization also allows employers to avoid even paying the minimum wage applicable in their areas of operation. We realize the intention of the exemptions to minimum wage legislation was to help start-up businesses, particularly SMEs and the so-called BAMBIs (barangay micro-business industries or enterprises) achieve break-even point more quickly. However, some large conglomerates have taken advantage of these laws and other legal loopholes. In other words, if a business can afford to pay its employees under a regularized scheme, then it should do so.
Civil Society Assessment of the 2004-2010 Medium Term Philippine Development Plan Labor Commitments

Ass
essm
ent R
epor
t
167
• Socially protective legislation – In line with the foregoing point, certain amendments to existing laws have been identified by various trade union groups, working closely with the ILO20, have called for the following amendments that would align the Labor Code to ratified International Labour Standards of the International Labour Organizations, specifically on two of the eight Core International Labour Standards: Freedom of Association (Convention 87) and the Right to Organize and Collective Bargaining (Convention 97); reforming pertinent chapters of the Labor Code on Labor Organizations, for the private and EO 180 and its IRR for the public sector, so as to ease the formation of unions for the purpose of collective bargaining and to speed up the resolution of labor disputes related to forming unions and to prevent delay in the resolution of labor disputes, in this manner removing the obstacles to unionism by frustrating its exercise; promoting collective bargaining, in both the private and public sectors, by amending provisions of the Labor Code and the IRR if EO 180 that facilitate anti-union discrimination and that overly regulate the right to strike; reforming the statutes and rules of non-standard or non-regular employment relations, in both private and public sectors, the existing provisions of which have resulted in union avoidance and/or union busting by employers, aside from enabling employers to run-around labor laws in order to mitigate or evade their basic obligations under established labor standards.
• Labor migration – The latter half of the 20th century in the Philippines was characterized by the unprecedented migration of Filipinos to various parts of the world. Although Filipinos have been going abroad to work since the early 20th century as farm workers in Hawaii, the level of outbound Filipinos reached unparalleled levels beginning in the 1960s, when doctors and nurses migrated to the United States, and then in subsequent decades when construction workers and engineers went to the Middle East and Northern Africa as contract workers. Clearly, therefore, the Philippines has been exporting its labor force for quite some time – a de facto situation since it has never been a declared policy of the present or even past administrations to identify migration as a development strategy. The next administration must make a specific stance on migration. As a nation, we cannot allow ourselves, more especially our leaders, to go on pretending that labor migration does not exist, even as we eagerly await – in our own homes and in meetings of our government’s economic managers – the bounty that remittances bring. The next administration must initiate the social dialogue on migration, and it must ask the difficult questions: is it something we want to continue doing? Is the social cost of having dysfunctional and broken families brought about by the absence at home of one or both parents as a result of overseas work worth bearing if it will result in financial gain and economic advancement for our respective OFW families and our country as a whole? If yes, how do our institutions go about mitigating that cost? And if no, what policy pronouncements and programs should the next administration initiate towards the “gradual yet irreversible disengagement” from labor migration – a process that will surely last beyond its term of office.
20From 17 to 19 December 2009, ILO-Philippines, in cooperation with the Alliance for Progressive Labor (APL), the Federation of Free Workers (FFW), and the Trade Union Congress of the Philippines (TUCP) convened a “writeshop” seminar to draft bills on these specific issues that they hope shall be addressed by the incoming 15th Congress in July 2010. The objective of the writeshop is to align Philippine legislation with the country’s commit-ments to particular ILO conventions as discussed above.
Civil Society Assessment of the 2004-2010 Medium Term Philippine Development Plan Labor Commitments

Civi
l Soc
iety
Ass
essm
ent o
f the
200
4 -2
010
MTP
DP
168

Ass
essm
ent R
epor
t
169
Civil Society Assessment of the 2004-2010Medium Term Philippine Development Plan on Health1
I. INTRODUCTION
In 2004, the Arroyo administration drafted the Medium Term Philippine Development Plan (MTPDP) for 2004-2010 to provide the framework within which the nation would operate over a six-year period to ensure a better quality of life for its citizens. Its basic task was defined as that of fighting poverty by building prosperity for the greatest number of the Filipino people. The health targets of the MTPDP are enumerated in the chapter “Responding to the Basic Needs of the Poor”. As the year 2010 nears, it is timely and appropriate to evaluate the attainment of the health targets of the MTPDP.
This paper assesses the attainment of its health targets within the following paradigms: Health as a Right and the Social Determinants to Health approach. The WHO Constitution of 1946, the Universal Declaration of Human Rights of 1948 and the 1987 Philippine Constitution all affirm that health is a basic human right. Therefore, it is primarily government’s responsibility to ensure the right of the Filipino people to health and health care. The Social Determinants to Health Approach maintains that the way to truly improve health is through comprehensive socioeconomic development. It also espouses that improvements in the health sector alone account for only 20 to 30 percent of the improvement in the health status of the population, while improvements in people’s living conditions: food, shelter, clothing, employment, education, participation in the political process, etc. account for the remaining 70 to 80 percent. This paper also evaluates the attainment of health targets within the overall assessment of the MTPDP in terms of:
a. reducing poverty and inequality, b. promoting economic sustainability, and c. ensuring people empowerment and democratization.
Objectives
The main objective of this paper is to assess the attainment of the health targets of the Medium Term Philippine Development Plan within the context of health as a right framework, social determinants to health paradigm and the overall parameters of: reduction of poverty and inequality, promotion of a sustainable economy and ensuring people empowerment and democratization.
The specific objectives of the paper are as follows: First, the paper evaluates the performance of the Philippine government in the achievement of the health targets of the MTPDP using the parameters mentioned above based on the latest available data. It also determines the appropriateness and responsiveness of the MTPDP health targets in improving the overall health status of the Philippine population. Lastly, the paper provides key recommendations on the health targets of the MTPDP based on the Health as a Right framework and the Social Determinants to Health approach.
1Prepared by Dr. Ramon Pedro P. Paterno, MD, MPH and Dr. Paolo Victor N. Medina, MD, both of the University of the Philippines – Manila - National Institutes of Health, and Ernesto M. Almocera, Jr., Philippine Legislators Committee on Population and Development (PLCPD)

Civi
l Soc
iety
Ass
essm
ent o
f the
200
4 -2
010
MTP
DP
170
Health Situationer
When it was created in 2004, the MTPDP stated that “the health care delivery system, adopting the rights-based and life-cycle approach shall be responsive to the needs of the population, especially the poor.”1 Targets were identified and programs were created to improve health care in the country and ultimately the overall health status of the population.
Generally speaking, the health status of the Philippines has improved in the last decades as evidenced by longer life expectancy at birth, lower maternal mortality ratio, lower child and infant mortality rates and better health outcomes in the management of many important diseases. However, progress has been slow.2 In terms of health outcomes the Philippines is lagging behind its neighbors in Southeast Asia and Western Pacific regions. The following table shows the common health indicators of the Philippines compared to those of selected countries in the region which illustrate the abovementioned observation. Table 1: Common health indicators of selected countries in the WHO Western Pacific and Southeast Asian Regions
IMR MMR Under 5 mortality rate
Underweight children under 5 (%)
Percentage of women in reproductive age group using modern contraceptive methods
Average life expectancy at birth (LEB)
Philippines 25a 162a 34b 26.2a 50.7b 67 (total)cThailand 16.3d 14d 20.4d 8.6d 77.8d 71.45 (total)d
Vietnam 16c 75.1c 26c 26c 67.1c 72 (total)c
Malaysia 6.3c 30c 8.1c 10.1c 4.3c 74.05 (total)c
South Korea 5.3c 15c 5.7c 3c 79.9c 79.18 (total)c
Japan 2.6c 4.9c 3.6c --- 43.9c 82.4 (total)c
Indonesia 32d 307d 46d 28d 74d 69 (total)d
China 17.20c 41.10c 20.60c 7.8c 84.6c 71.4 (total)c
Singapore 2.1c 7.6c 3.0c 14c 72.5c 80.60 (total)c
a - Statistical Indicators on Philippine Development – Health Services Chapter 2008 (Philippine National Statistics Coordination Board)b - Philippine National Demographic and Health Survey 2008 Preliminary Report (March 2009)c - Statistical Tables 2008 WHO Western Pacific Regiond - WHO Regional Office for Southeast Asia WebsiteMMR – per 100,000 live births IMR – per 1,000 live births
An even more disturbing feature of the country’s health situation is the increasing disparities in health status among population groups based on income and geographic origin. Residents of rich urban communities in Metro Manila, Cebu and Davao have health outcomes akin to those of developed countries (e.g. LEB over 80 years, IMR less than 10, MMR less than 15).3 Poor rural communities in Bicol, Samar and ARMM on the other hand have health outcomes that approximate those of the least developed countries (LEB under 60, IMR over 90, MMR over 150).3
Poor urban communities do not fare as bad as their rural counterparts but still show indicators that are from two to five times worse than their urban rich counterparts.3 The blatant inequity of the Philippine health care system becomes more pronounced when coupled with the results of a global health survey showing that Filipinos in the D and E socioeconomic classes did not purchase medications in the 4 week survey period compared to those in class A. The strongest indictment about the state of the Philippine health service delivery is the fact that six out of ten Filipinos who die, die without any health professional attendance.3
Civil Society Assessment of the 2004-2010 Medium Term Philippine Development Plan on Health

Ass
essm
ent R
epor
t
171
In 1999, the DOH implemented a comprehensive plan for reforming the Philippine health care system called the Health Sector Reform Agenda Philippines, 1999 – 2004 (HRSA). The HSRA presented sector wide reforms in health as a single package. Since then, the HSRA has evolved into the FOURmula ONE for Health (F1) program of the DOH, designed to implement critical health interventions as one package, backed by effective management infrastructure and financing arrangements. Overall, the program is directed towards achieving better health outcomes, a more responsive health system and more equitable healthcare financing attuned with the goals identified by the World Health Organization (WHO), the Millennium Development Goals (MDG), and the MTPDP.4 In spite of the abovementioned national health policy program in place, the persistent fragmentation of the country’s health system has perpetuated the disparities and inequities observed in the people’s access to basic health care. Too much of the basic health resources are privately provided, privately funded and used mainly for the benefit of those who can pay for such services. The public sector in health, which is the sector most amenable to equitable re-distribution of services, has remained too small and very much underfunded to make a difference that is felt by the people.3 What makes it worse is that it has been further cut up into smaller portions by the faulty design of the devolution of these services to local governments.
In terms of health financing, the Philippine government is just not spending enough for health. Through the years, the annual expenditure for health has remained at a little over 3 percent of the Philippines’ Gross Domestic Product (GDP)3,5, a figure way below the WHO recommendation of at least 5 percent. This figure puts government spending for health at only PhP 0.25 per Filipino per day. According to the latest data from the National Statistics Coordination Board (NSCB), 59.1 percent of national health expenditures are from private and out of pocket sources.6 Government and social insurance account for only 28.7 and 11.0 percent respectively.6 The inability of government and the existing social health insurance system to adequately fund the health needs of the Filipino people result in inefficient and excessive out of pocket spending for health.
II. PERFORMANCE AND ACCOMPLISHMENT IN 2004-2010
A. MTPDP Chapter 12: Responding to Basic Needs of the Poor under Goals, Strategies and Action Plan on Essential Services
The MTPDP health targets came about from the recognition that the Philippine health care delivery system, adopting the rights-based and life-cycle approach, must be responsive to the health needs of the population, especially the poor.1 The MTPDP emphasized that collaboration among national government, LGUs, and the private sector including NGOs should be strengthened to ensure access to and provision of quality health, nutrition, and population and development services for Filipinos.1 Health outcomes may have improved but as shown in the following table, the numbers seem to indicate that the gains of the past 4 to 5 years might not be significant enough.
Civil Society Assessment of the 2004-2010 Medium Term Philippine Development Plan on Health

Civi
l Soc
iety
Ass
essm
ent o
f the
200
4 -2
010
MTP
DP
172
Table 2: Trends in Essential Health Services: Latest Data compared to 2010 and 2015 MDG targetsINDICATORS 2004 DATA LATEST DATA
(2009)2010
TARGETMDG
TARGET 2015Eradicate extreme poverty and hungerProportion of families below subsistence threshold
Prevalence of underweight preschool children aged 0-5 years old (in %)
13.1a
27.6a
11e
26.2d
8.98a
21.6a
10.2a
17.25a
Provide basic amenitiesAccess to Safe Water Supply (in %) 80a
Nodataavailabled 92-96a 86.8a
Reduce child mortalityInfant Mortality Rate (per 1000 live births)
Under-fiveMortalityRate(per1000livebirths)
29a
40a
25b,d
34b
17a
32.24a
19a
26.7a
Improve Maternal HealthMaternal Mortality Ratio (per 100,000 live births)
Prevalence of men/women/couples practicing responsibleparenthood(naturalorartificialmethods; in %)
172a
48.9a
162c,d
50.7b
90a
60a
52.2a
100a
Combat Major DiseasesTB case detection rate and Cure rate (in %)
61a
78a83d
83d70a
85a------
Malaria morbidity rate (per 100,000 population) 48a 41d 24a ---HIV prevalence ≤1%a ≤1%f ≤1%a ---
Based on table 12-10 Essential Services and the Millennium Development Goals Medium Term Philippine Development Plan 2004-2010Sources:a - Table 12-10 Essential Services and the Millennium Development Goals Medium Term Philippine Development Plan 2004-2010 (2004)b - Philippine National Demographic and Health Survey 2008 Preliminary Report (March 2009)c - Philippine Family Planning Survey 2006d – Statistical Indicators on Philippine Development – Health Services Chapter 2008 (Philippine National Statistics Coordination Board) e – Report of the Philippine Government on the Millennium Development Goals f - http://www.aidsdatahub.org/countries/profile/philippines (2008 data: accessed September 7, 2009)
1. Reduce the cost of medicines commonly bought by the poor to half of their 2004 prices and make these available nationwide through a distribution network as determined by DOH, in coordination with the PITC.
a. Making low cost medicine available in facilities and outlets of the public sector nationwide including the 72 DOH hospitals, 530 LGU hospitals and health centers. These low cost medicines can either be imported (from India or other countries) or locally sourced.
b. Encouraging government partnership with the local pharmaceutical industry and encourage their meaningful participation towards provision of low cost medicines for government procurement or direct sale to the public.
c. Creating a regulatory environment that ensures a level playing field and fair competition among various players in the pharmaceutical industry. This includes increasing the effectiveness of the Intellectual Property Office and the Bureau of Food and Drugs in resolving patent issues.
d. Encouraging the use of generic products. This will include social advocacy on the demand side and, local sourcing and local production of generic medicine on the supply side.
e. Supporting community-based initiatives such as Botika sa Barangay and similar undertakings that increase the availability of over the counter medicine and home remedies.
Civil Society Assessment of the 2004-2010 Medium Term Philippine Development Plan on Health

Ass
essm
ent R
epor
t
173
Achievements
Several laws have been passed to address the issue of making medicines affordable to the poor. The enactment into law of Republic Act No. 9502 entitled “Universally Accessible Cheaper and Quality Medicines Act of 2008” in June 2008 was a major accomplishment of the Arroyo administration. EO 821 or the Maximum Drug Retail Price (MDRP) Executive Order, which was a direct offshoot of RA 9502, slashed the prices of 22 selected drugs by 50 percent. Parallel importation, which was envisioned as an important means of procuring drugs at a lower cost, was also liberalized by the said law.
The signing into law of Republic Act 9711 or the Food and Drugs Administration (FDA) Act of 2009 on August 18, 2009 was the primary achievement toward the creation of a regulatory environment for the Philippine Pharmaceutical Industry. The FDA Act complements RA 9502 and is presently just a prospective achievement since its impact has yet to be manifested. The law basically renames the Bureau of Food and Drugs (BFAD) to the Food and Drug Administration (FDA) and aims to strengthen its regulatory powers, resources, and capabilities to efficiently and expeditiously perform its mandate.7
Gaps
Even with the Generics Act of 1988 in place for more than two decades now, the cost of medicines in the Philippines is still the second highest in Asia.8,9,10 Generic drugs accounted for only 4 percent of total drug sales of the country as recently as 2006.8 This is mainly due to the prevailing belief among many consumers and physicians that generic drugs are of lower quality than branded ones, a consequence of the high profitability of branded marketing8 as well as the weakness of the BFAD to assure the public and health professionals alike of the equivalent quality and potency of generic drugs. The larger drugstores, despite being required by law to provide consumers with the information on the different brands available for each medicine, more often than not carry the more expensive ones, and in many cases offer no generic alternatives.11 The rampant prescription and use of supplements, herbal concoctions and chemical formulations with no proven benefit and potentially harmful effects also entails high costs for the Filipino consumer. Aggressive and misleading marketing strategies for these supplements are the norm rather than the exception and further complicate the situation of medicines in the country. Another factor that contributes to the high costs of drugs in the country is the lack of a genuinely innovative Philippine pharmaceutical industry.10
Offhand, the implementation of the Cheaper and Quality Medicines Law and the issuance of the MDRP Executive Order constitute a major victory in the battle to reduce the prohibitive prices of medicines in the Philippines. What is commonly glossed over is the glaring truth that these endeavors have had a truly rough start.11 Opposition coming from drug companies, private hospitals and drug stores has been strong with threats of hospital holidays and instances of hiking up hospital rates. The number of drugs identified for price reduction is woefully small.11 The reasons behind the selection of these particular drugs also hint that the lobbying and negotiations done by the pharmaceutical companies still affect policy in a very uncomfortable way.12 The fact that it was necessary for the MDRP to be issued also affirms the non-existence of a meaningful partnership between the government and the local pharmaceutical industry. Out of pocket expenditures still outweigh government expenditure for healthcare in general and medications in particular.6 According to the WHO World Health Survey 2002, the two lowest quintiles of society had no medication purchases in the four week survey period compared to the highest quintiles. To the poor who have no capability of buying medications however low the price, essential drugs remain inaccessible. RA 9502 may have liberalized parallel importation, but according to a source within the Pharmaceutical and Healthcare Association of the Philippines (PHAP), very few importers have shown interest in it.13 The drug importations of the Philippine International Trading Corporation (PITC) are in relatively small quantities, most likely attributable to financial constraints.13 It has been estimated that to make a dent in the drug market competition and for the drugs to reach majority of Filipinos, PhP5 billion should be allocated for parallel importation14, a far cry to the PhP400 million allocated by the PITC in 2007.15
Civil Society Assessment of the 2004-2010 Medium Term Philippine Development Plan on Health

Civi
l Soc
iety
Ass
essm
ent o
f the
200
4 -2
010
MTP
DP
174
More than being an achievement, the passing of the FDA Law may also be perceived as a gap since it is an affirmation of the regulatory weakness of the old BFAD, necessitating its transformation into the FDA.
2. Expand health insurance particularly for indigents through premium subsidy
a. Sustain the enrollment of five million indigent families to enable them to have access to essential health packages through the following:
b. Enhance the access of PhilHealth members and dependents particularly indigent members and their dependents to their PhilHealth benefits through the following:
c. Increase the coverage to 85 percent of the population by 2007 and sustain such coverage to 2010
Achievements
For health insurance, the main achievements in line with the MTPDP targets are as follows: First is the nationwide/national scope of the National Health Insurance Program (otherwise known as PhilHealth). Second, as of July 2009, the PhilHealth fund has already amounted to PhP91 billion, potentially translating to more Filipinos benefitting from claims and thus better health care. Lastly, during the 2009 SONA, the President claimed 86 percent nationwide PhilHealth coverage, effectively achieving universal coverage as PhilHealth defines it (85 percent coverage).
Gaps
Despite claims to the contrary, actual PhilHealth coverage is most likely overestimated. The 86 percent nationwide coverage alleged during the 2009 SONA is not supported by the 2008 Annual Poverty Indicator Survey, which showed that only 37 percent of households were headed by PhilHealth members. It can thus be inferred that the true coverage is probably only 40 to 50 percent. Moreover, PhilHealth has not been able to sustain the enrollment of five million indigent families from 2004 – 2008. To date, LGUs are not mandated to enroll their indigent population into the Sponsored Program and must be “courted” by the local PhilHealth office every year to do so. The enrollment of indigent families is dependent on both the subsidy from the national government (NG) and the counterpart from the local government. The NG subsidy for the Sponsored Program has fluctuated from 2004 to 2006, (Plan 5 million in 2004 and only Plan 2.5 million in 2005) making the sustained enrolment of 5 million families difficult.
Even with measures to increase the public’s familiarity with the NHIP, knowledge about PhilHealth, its benefits and how to avail of them remains low among the general population. The Community Based Health Services Association (CBHSA) based in Mindanao and the Community Health Development (CHD) in coordination with Mindanao-based community based health programs (CBHPs) conducted a community health survey in 2007, covering 43 communities with CBHPs from the provinces of Davao del Norte, Bukidnon, and Davao City. Only 51.7 percent of respondents were familiar with PhilHealth and only 26.8 percent were members of or had family members covered by PhilHealth. The DOH National Objectives for Health 2005 to 2010 also noted the same low awareness of PhilHealth members of their rights and responsibilities and how they can access benefits from the program as contributing to the low utilization rates, especially that of sponsored members.
The accreditation of hospitals also remains to be improved. There may be a general increasing trend of accredited health service providers especially hospitals, rural health units, and health professionals. However, most of the PhilHealth accredited hospitals are private hospitals, with government hospitals making up only 39 percent of all PHIC accredited institutions16 once again marginalizing the poor, who mostly rely on government facilities and services for their health care.
Practically all PhilHealth benefits are hospital-based ones. Moreover, the PhilHealth benefit design is flawed in that it basically covers hospitalization up to a ceiling, beyond which the beneficiary is charged by the hospital. Since support value or the percent of a
Civil Society Assessment of the 2004-2010 Medium Term Philippine Development Plan on Health

Ass
essm
ent R
epor
t
175
beneficiary’s hospitalization expense reimbursed by PhilHealth remains low (see below), the financial risk of a catastrophic illness remains with the beneficiary. This deters sponsored members from availing of their PhilHealth benefits. This benefit design must be reformed to a “last peso” coverage with zero or minimal co-payment for sponsored members.17
PhilHealth’s support value remains lower than the targeted 70 percent of ward rates and is further eroded by out-of-hospital purchases by as much as 30 percent.18 PhilHealth provides very limited financial protection for patients with serious illness, failing to break the link between illness and poverty. More unsettling is the fact that the sponsored members, mostly indigents, who theoretically should stand to benefit the most from having health insurance have consistently much lower claims rates when compared to paying/employed members averaging at only 2.04 percent yearly.16
3. Strengthen national and local health systems through the implementation of the Health Sector Reform Agenda (HSRA)
a. Institute health regulation reforms. b. Pursue public health reforms c. Continue health financing reforms d. Implement local health systems development
Achievements
Heath regulation is effected by the Philippine government mainly through the Department of Health (DOH) and its agencies, the Philippine Health Insurance Corporation (PHIC/PhilHealth) and the Professional Regulations Commission (PRC). Recently, two landmark achievements in health care regulation are being cited.12 These are the Cheaper and Quality Medicines Act of 2008, within which the MDRP executive order was implemented, and the BFAD Strengthening Act (FDA Act).12 The latter is technically only a prospective achievement, given that it has yet to be fully implemented.
Notable achievements in public health are: tuberculosis (TB) detection rate is at 85 percent (target: 70 percent) and TB cure rate is at 83 percent (target: 85 percent).19 HIV/AIDS prevalence rate has been maintained at ≤1 percent.20 Many basic food commodities such as rice, cooking oil, flour, and salt have also been fortified with micronutrients.12
In health financing the major accomplishment is the alleged achievement of universal health coverage based on the 2009 State of the Nation Address (SONA) at 86 percent of Filipinos covered by PhilHealth. While in the development of local health systems, functional Interlocal Health Zones (ILHZs) have been set up and at the same time, efforts are underway for the upgrading of health facilities.12
Gaps
Regulation remains weak, partly because of the limitations imposed by scarce resources and limited technical support.21 There is no venue for technical and operations training and very limited experts to handle the regulation of quality standards for healthcare, certification/conformity testing and monitoring of regulated products.21 Moreover the devolution of healthcare delivery restricted the expansion of the regulation and enforcement functions of the regulatory bureaus.21
On the issue of regulating the quality and cost of medications, the current status quo is one characterized by inefficient regulation compounded by difficulty in registering products with the BFAD.22 The quality and safety of drugs has yet to be assured for the general public, especially that of generics. Presently, the BFAD is also unable to regulate the rampant advertisement of nutritiuticals and food supplements with brazen therapeutic claims followed by the extremely brief disclosure “No approved therapeutic claims”. Despite technically being an achievement towards addressing these issues, the establishment of the new Food and Drug Authority (FDA) can also be considered a gap since the law stemmed from the perceived weakness of the BFAD in that it is mainly a reactive agency as evidenced by its handling of the melamine scare in 2008.
…only 37 percent of households were headed by PhilHealth Members…
Civil Society Assessment of the 2004-2010 Medium Term Philippine Development Plan on Health

Civi
l Soc
iety
Ass
essm
ent o
f the
200
4 -2
010
MTP
DP
176
Whatever gains made in public health are offset by what can only be described as slackening improvements in MDG health indicators. The percentage of fully-immunized children remains low at 78 to 80 percent (target: 95 percent).23 Malaria morbidity rate remains high at 41 percent (target: 24 percent) and has been assessed as one of the millennium development goals that are least likely to be achieved.19 Adolescent health services including sexuality education and counseling are lacking.12 Reproductive health remains to be a low priority for the DOH and the government.12 Even if there is a need for it with only 50.7 percent of women surveyed practicing responsible parenthood, the Reproductive Health Bill has yet to be enacted into law.12
The main critique to the MTPDP health targets aiming to strengthen national and local health systems through the HSRA is that these focused too much on very specific targets, which unfortunately gives an impression of incoherence. Reforms have primarily been geared towards the delivery of health services, which in this country work within a system that is not about health outcomes or service but about profit. The health care delivery system whether within the government or the private sector remains fragmented with inefficient and virtually non-existent referral systems.
4. Improve the Health Care Management System
a) Develop and operationalize a sectoral Human Resource Development and Management Plan to include the following:
• Improve quality of health professionals bymaking health professional education (curriculumandskills) at par with international standards
• Implementdeploymentprogramstocomplementhealthhumanresourceneedsofunderservedareas. Achievements
The MTPDP targets regarding the country’s health care management system focused mainly on Human Resources for Health (HRH). The achievements are as follows:
In accordance with RA 7722, the main agency in charge of the regulation of heath professional education is the Commission on Higher Education (CHED). CHED sets minimum standards for programs and institutions of higher learning, whether public or private, as well as degree-granting programs in all public and private post-secondary educational institutions. The Professional Regulation Commission (PRC) on the other hand, is in charge of the health professions. It consists of the different professional regulatory boards that administer, implement, and enforce the policies of the national government in terms of the regulation, licensing, and maintenance of the standards of the various health professions under its jurisdiction.
One measure to complement the health human resource needs of the underserved areas of the country was the creation of the Doctors to the Barrios (DTTB) Program in 1993. Since then, the program has had 26 batches with the 27th batch deployed around the time of this writing. A notable addition to the program was begun in 2006 when the First Gentleman Foundation of First Gentleman Mike Arroyo sponsored the DTTB program as a priority medical project. This was in addition to the Bagong Doktor Para Sa Bayan program, which aims to have a total of 100 doctors by 2010 with scholarships to poor but deserving medical scholars and the Bagong Espesyalista Para Sa Bayan endeavor, aiming to have 30 specialists by 2010 by supporting barrio doctors as they pursue further specialization.24 Another program that was instituted to augment the number of doctors who will serve the country is the Pinoy MD program. It is a joint effort by the DOH, Philippine Charity Sweepstakes Office (PCSO), various state universities, and Philippine medical schools to provide medical scholarship grants.4
Presently, the Philippines does not lack health professionals. In fact, the country’s HRH is actually characterized by high production. According to a lecture given by Dr. F. Marilyn E. Lorenzo RN, DrPH during the 5th UP Global Health Course conducted in the University of the Philippines (UP)- Manila last April 2009, the Philippines produced an estimated 45,000 nurses, 2,000 doctors, 1,500 midwives, 2,000 dentists, 1,500 pharmacists, 1,000 physical therapists, and 200 occupational therapists in the year 2008.25
Civil Society Assessment of the 2004-2010 Medium Term Philippine Development Plan on Health

Ass
essm
ent R
epor
t
177
Gaps
It appears that Philippine Human Resources for Health ironically contribute to rather than alleviate the gross inequities and injustices in health care access in the country. The main problem with HRH in the Philippines is that it has been left largely to market forces. Health worker training is profit-driven rather than service oriented. The high production of HRH in the Philippines is offset by the high out-migration, low return migration, nil in-migration and maldistribution of the country’s health professionals. A big portion of the country’s health professionals leave for better opportunities abroad yearly. The few that remain in the country are concentrated in urban areas leaving the rural, and often poor and undeveloped, areas of the country underserved. 70 percent of the HRH who stay in the country are concentrated in urban centers, work in the market-oriented private sector, and cater to only 30 percent of the population, who can afford to pay for health care.3 It does not help that government positions providing basic public health services are generally low-paying and often considered less prestigious.
5. Improve health and productivity through R and D
a. Promote, implement and monitor the activities of the Philippine National Health Research System (research, research ethics, research management, research utilization, capacity building, system governance, and resource generation)
b. Conduct health R and D in priority areas in support of HSRA such as natural products development for priority health problems, development of vaccines and pharmaceutical products, development of other technologies, processes for priority health problems, development of telehealth/bioinformatics
c. Conduct periodic national health and nutrition demographic surveys and surveillance activitiesd. Institutionalize health, nutrition, and population information systemse. Monitor and evaluate health, nutrition, and population development programs
Achievements
Sources assert that there is health research happening in the country.10 A landmark achievement for Philippine health R and D was the establishment of the Philippine National Health Research System (PNHRS) in March 2003 to create a vibrant, dynamic and responsible health research community for the attainment of national and global health goals.26 A Health Research Priority Agenda was thus defined. Broad research topics and areas were enumerated and efforts to do productive research and development to address them have been started.26
To further the health research interests of the country, pending bills have been filed in both the house (House Bill Nos. 1241, 2597, 3271) and the senate (Senate Bill No. 1708) that collectively constitute the Philippine National Health Research System (PNHRS) Act.26 If implemented, the PNHRS Act will institutionalize the Philippine National Health Research System, establish the Philippine National Health Research Fund, and provide for its administration and other purposes.26
Periodic national health, nutrition, and demographic surveys and surveillance activities are essential for effective and relevant health R and D work. The Philippine National Demographic and Health Survey, National Statistics Coordination Board Statistics, National Nutrition Surveys and the Field Health Service Information System are just some examples of such systems that have been in existence even before the MTPDP targets were formulated.
Gaps
If sources are to be believed, health R and D is happening in the country. However, such work remains at the academic level and is not translated to commercial and industrial development.10 Local health industries such
Civil Society Assessment of the 2004-2010 Medium Term Philippine Development Plan on Health

Civi
l Soc
iety
Ass
essm
ent o
f the
200
4 -2
010
MTP
DP
178
as pharmaceuticals hardly innovate in terms of basic research to provide impetuses for further development.10 Research-based companies do not have research facilities in the country.13 The little health R and D that reach the Filipino people often do not benefit the poor and the disenfranchised, who stand to benefit the most from them.
Research and development in general, and health research in particular, are not a priority of the Philippine government with only 0.1 to 0.3 percent of the health budget devoted to health R and D. The PNHRS itself stated in its 2008 National Assessment Report that the work of researchers has been limited by the availability of funds.27 Research projects funded by the PNHRS were also found to be too small and too isolated to make a difference.27 What little Health R and D in existence is mainly foreign funded.12 This is true of the DOH-led/DOH-“initiated” researches as well.12 The PNHRS Act has yet to be passed into law. Without it, the current efforts of the PNHRS to create a robust and empowered health research community will remain to be greatly hampered and whatever gains made would remain small. The nation’s health R and D endeavors would be limited to separate efforts by different agencies.
6. Establish drug treatment and rehabilitation centers and expand existing ones. The Comprehensive Dangerous Drugs Act (CDDA) transfers the supervision of all drug treatment and rehabilitation centers to DOH. This is in recognition that drug abuse is not just a social ill; it is a medical and health problem that must be met.
a. Operationalize a standard system for drug testing centers through dissemination and enforcement of
operating manuals for treatment and rehabilitation of drug users and offer tests at lower rate
b. Intensify primary prevention on drug addiction through advocacy and IEC activities and strictly enforce the CDDA
c. Establish secondary (treatment) and tertiary (rehabilitation) care services for persons with drug abuse problems in all regions
Achievements
RA 9165 or “The Comprehensive Dangerous Drugs Act of 2002” (CDDA) was enacted into law to intensify the campaign against the trafficking and use of illegal drugs. Under this law, the DOH was given greater responsibility and involvement in addressing the drug problem in the Philippines since drug abuse was acknowledged as a medical/health problem to be addressed as such and not just as a social ill or legal concern. The DOH was made responsible for the coordination and supervision of all drug rehabilitation, intervention, aftercare and follow-up programs.28 It was also given charge of the regulation, licensing, accreditation, establishment, and maintenance of drug testing networks and laboratories.28 All such facilities are required by law to comply with the standards set in the operations manual for drug testing, treatment and rehabilitation centers/facilities that was issued by the DOH.29
The CDDA also mandated the roles of the DOH in implementing and regulating treatment, rehabilitation, and aftercare programs including rehabilitative surveillance.28 As of October 20, 2008, there were already 40 accredited Drug Abuse Treatment and Rehabilitation Centers (DATRCs) spread across the regions.28
The DOH, under its Office for Special Concerns, also created the Dangerous Drugs Abuse, Prevention and Treatment Program (DDAPTP) to facilitate the department’s efforts in addressing the drug problem.29 Since 2003, several board regulations have been made by the said program to strengthen, regulate, and standardize the testing, treatment, and rehabilitation facilities in the country, whether government owned or privately-run.29
In terms of advocacy, campaigns for increasing the coverage of mandatory/random drug testing to cover students, workers, etc. comprise the main efforts at present.29 The DOH is also beginning to promote the importance of aftercare/reintegration into society and shift the attention from treatment/rehabilitation programs and facilities.29
Civil Society Assessment of the 2004-2010 Medium Term Philippine Development Plan on Health

Ass
essm
ent R
epor
t
179
Gaps
The CDDA may have brought about the creation of the DDAPTP within the DOH. However, a weakness of the body is that the DDAPTP is still operating on an “ad hoc” basis meaning that it is basically composed of personnel “borrowed/detailed” from other offices of the department.30 This setup creates difficulties and imposes limitations on the activities of the DDAPTP since the program has yet to be institutionalized to at least unit status for it to be fully effective.29 Even with 40 DATRCs accredited by the DDAPTP as of October 2008, full regional coverage has yet to be achieved. Regions such as Ilocos, Cagayan Valley, Bicol, Eastern Visayas, Central Mindanao, and ARMM have no DATRCs28 but work is allegedly underway for the establishment of at least one institution each in Bicol and Cagayan Valley.29 Of the 40 DATRCs accredited by the DDAPTP, the privately run centers vastly outnumber the government owned/run facilities 32 to 8.28 The present thrust is to promote the establishment of drug testing, treatment, and rehabilitation facilities that do not necessarily mean residential facilities.29 An outpatient system can give much benefit in terms of addressing drug treatment, rehabilitation, and aftercare issues and is being pushed by the DDAPTP to bridge the gaps in regions with no DATRCs.29
Drug testing is another area that can still be improved as the current drug test kits available only screen for two illegal drugs namely marijuana and methamphetamine (Shabu).29 The DDAPTP is aiming for the development of a testing kit which could screen for at least 5 prohibited substances.29 Presently, DDAPTP intends to focus on aftercare, which it considers a most pressing concern. It considers reintegration of rehabilitated drug abusers and dependents into society, which present programs and facilities don’t provide, equally important or potentially more so than mere treatment and rehabilitation.29 B. Health component targets of the Section on “Women in especially difficult circumstances” under the Goals,
Strategies and Action Plan for the Protection of the Vulnerable
The targets for women’s and maternal health were not part of the health targets of the MTPDP. They were enumerated in several separate sections of the document and have been collected here to be discussed in the following section:
1) Emphasize maternal health, women’s health and nutrition, responsible parenthood
Achievements
Under this MTPDP and the previous years of President Arroyo’s administration, the government implemented AO 50-A, s 2001 (National Family Planning policy), and AO 125, s 2002 (National NFP-Only Strategic Plan). It created the DOH NFP Program and its management through AO 132, s 2004 and implemented AO 125 s 2002 which is the National Natural Family Planning Strategic Plan for 2002 to 2006.31 The national government passed on the implementation of population management and RH policies to local governments. Since 2005, five provinces, 20 municipalities and three cities have already passed their own Reproductive Health Ordinances.32
To intensify its campaign for responsible parenthood, the national government, through the leadership of the Population Commission, launched the Responsible Parenthood Movement (RPM) in 2006. The RPM, which is mostly composed of different groups affiliated with the Catholic Bishops Conference of the Philippines, has been conducting various advocacy activities at the grassroots level to promote the natural method of family planning (NFP). The DOH allotted PhP50 million for the promotion of natural family planning to these church-based organizations.33
Civil Society Assessment of the 2004-2010 Medium Term Philippine Development Plan on Health
…the MTPDP doesn’t offer specific methods on how to prevent abortion...

Civi
l Soc
iety
Ass
essm
ent o
f the
200
4 -2
010
MTP
DP
180
Gaps
The policy issuances mentioned above nullify the significant post-Cairo policies initiated by former presidents Fidel Ramos and Joseph Estrada such as the creation of an Integrated Reproductive Health Program and elaboration of the RH approach; administrative orders such as AO 1-A, s. 1998 and AO 43, s 1999 spelling out the RH policy and identifying the ten elements of RH; AO 34-A, s 2000, policy on adolescent and youth health; AO 45, s 2000 on the prevention and management of abortion and its complications; and AO 79 s, 2000 on safe motherhood.34
The NGO alternative report on the International Committee on Population and Development Report (ICPD) at 15 states that the national government’s NFP-only policy disenfranchises the Filipino people, especially the poor women who mostly rely on government programs. The policy limits their access to the much needed and relevant effective modern contraceptive methods. Out of the 6.3 million married women of reproductive age (15-49) using any method of family planning, 4.6 million use modern methods while only 50,000 use the natural family planning methods.23,35
2) Broaden the availability of preventive and curative care services for mothers and women to support their enhanced quality of life and decrease the occurrence of preventable illness and death. These services include among others:
a. Care of pregnant women before, during, and after delivery of the child (safe motherhood).b. Responsible parenthood counseling, family planning services and breastfeeding counseling to include
the mother-baby friendly hospital initiative. c. Prevention of abortion and management of its complications. d. Prevention and treatment of all types of infections, including those which are sexually transmitted
(e.g. HIV/AIDS).
Achievements
Results of the 2008 NDHS showed slight improvement in maternal care. About 91 percent of pregnant women received prenatal care from a doctor, nurse or midwife compared to 87.6 percent in the 2003 NDHS. During actual deliveries, 61.8 percent of pregnant women were assisted by health professionals. This is an improvement from 59.8 percent based on the 2003 NDHS. There was also a significant increase from 37.9 percent in 2003 to 43.8 percent in 2008 in the number of pregnancies delivered in government or private health facilities.
In accordance with the National Family Planning Policy, National NFP-Only Strategic Plan and other AOs and EOs promoting natural family planning only policy, the government positioned family planning services under the context of the Responsible Parenthood Program. The program is centered on concepts promoting responsible parenting including family relationships and home management, birth spacing, fertility awareness, and natural family planning including breastfeeding.36 As previously discussed in the assessment of the HSRA targets, the HIV/AIDS prevalence rate has been on target and maintained at ≤1%.12,20
Gaps
Based on the latest data, the maternal mortality ratio remains high at 16219 which translates to approximately 4,600 deaths a year, hardly a number which gives an assurance of safe motherhood. This may have been an improvement from the 172 MMR back in 2004 but it is a relatively insignificant achievement especially when analyzed against the MTPDP target of 901 by 2010 and the Millennium Development Goal of 52.2 by 2015.
Despite stating it as a target, the MTPDP doesn’t offer specific methods on how to prevent abortion. It remains to be a
Civil Society Assessment of the 2004-2010 Medium Term Philippine Development Plan on Health

Ass
essm
ent R
epor
t
181
big problem threatening women in the country with 1 out of 3 of unplanned pregnancies ending in abortion. This is said to be a conservative estimate given that not all the induced abortions can be documented because abortion is considered a crime and thus underreported.37 Since having an abortion is a crime in this country, most women tend to obtain abortion services by going through unsafe and illegal abortions that often lead to complications. Due to the social stigma and legal implications, these women are hesitant to seek medical attention, which often leads to needless deaths.
The HIV/AIDS issue was touched on in earlier sections of this document. While the target of maintaining ≤1% prevalence has been met, the Philippine government and health authorities cannot afford to be complacent. The latest data seem to indicate that HIV/AIDS is a hidden and growing problem.12 HIV/AIDS cases have actually spread and are increasing in number albeit at a very subtle and insidious rate. It is predicted to keep doing so without prompt intervention and strong national policies regarding sexual education, adolescent health, and reproductive health.12
III. CONCLUSIONS AND RECOMMENDATIONS
Health is a fundamental right of all people. However, one only has to look at the significant differences in health status between the country’s rich minority and poor majority to see that this right is violated gravely and daily for most Filipinos. Under the Health is a Right Framework the greatest indictment against the health targets of the MTPDP are the pervasive and persistent inequities in health care as reflected in the health outcomes of the country’s rich and poor. The MTPDP health targets are fragmented, incoherent, and fail to address the ills of the nation’s health care system.
No matter what among or how many of the MTPDP health targets have been achieved since 2004, the country’s health situation remains dismal. Too much emphasis was placed on the improvement of the delivery of health services with token, if any, effort towards addressing the Social Determinants to Health. As such, poverty and inequality reduction through meeting the health targets have been minimal at best. Health improvements from the people’s (demand) side have been neglected. People empowerment, democratization, and economic sustainability are glaringly absent. We have yet to elect national leaders who recognize the impact of addressing the Social Determinants to Health as a means to really improve the country’s health status.
In order to fully deal with the problems of the Philippine health care system, a universal health care system must be instituted to effectively eliminate the inequities in health that the nation continues to struggle with. This system will ensure that every Filipino, when he or she gets sick, has access to needed health care, with minimal or no copayment. It will be government-led as reflected in health financing and regulation based on health needs rather than market forces. The system will be characterized by integration rather than fragmentation with true people’s participation in the definition and management of priority health services. To provide the integral framework for this, the next MTPDP health targets must focus on achieving Universal Health Care with the integrated and interconnected elements of: Health Financing, Health Service Delivery (Hospitals and Public Health), Good Governance and Health Regulation. Universal Health Care may start with a defined set of health benefits with no or minimal copayments that are gradually expanded as the Health Benefit Fund increases.
The next MTPDP must ensure the effective implementation of the Cheaper and Quality Medications Law, the Maximum Drug Retail Price Executive Order, the Food and Drug Authority Law and the Generics Act of 1988. The next government must even go beyond this to ensure affordable and quality medicines by, among others, increasing and sustaining awareness and support for the use of generic medications not only among consumers but also among physicians, nurses, pharmacists and health professionals as well.
The next Administration should also re-orient the training of public health professionals towards the “Health for All” paradigm under primary health care and encourage the return migration of health professionals by ensuring adequate compensation and increasing availability of career opportunities in the country.
Civil Society Assessment of the 2004-2010 Medium Term Philippine Development Plan on Health

Civi
l Soc
iety
Ass
essm
ent o
f the
200
4 -2
010
MTP
DP
182
There should be increased advocacy for and information/education/communication activities targeted at mothers to encourage them to get prenatal, natal, and postnatal care and available, accessible and competent health professionals who could attend to the prenatal, natal, and postnatal needs of mothers nationwide and institutions/mechanisms for the referral of women with complicated pregnancies and for those with complications arising during and after pregnancy should be ensured.
Simultaneously, the MTPDP must be within the framework of a long term Philippine Development Plan that lays the blueprint for genuine comprehensive socioeconomic development.
REFERENCES
1 Medium Term Philippine Development Plan 2004 – 2010. National Economic and Development Authority. 2004.2 National Objectives for Health Philippines 2005 – 2010.3 Romualdez, A. “State of the Nation’s Health”. UP Centennial Lecture. August 29 2008.4 Department of Health Website. http://www.doh.gov.ph. Accessed September – October, 2009.5 Statistical Tables 2008 WHO Western Pacific Region.6 Philippine National Health Accounts 2005. National Statistics Coordination Board. 2005. 7 Republic Act 9711 “Food and Drugs (FDA) Administration Act of 2009”. August 18, 2009.8 Nisperos G. ”Pharmaceuticals and Access to Essential Medicine”. 5th UP Global Health Course. August 13, 2008.9 Monsod, S. “The Business of Drugs". Transcription of the Segment “Analysis by Winnie Monsod”, News on Q
Channel 11. August 14, 2009. 10 Hartigan-Go K. “Why the RP Pharma Industry is not Competitive”. Congressional Commission on Science and
Technology and Engineering Article. Inquirer.net blogs. November 3, 2008.11 Tan A “Bitter Pills”. Pinoy Kasi Column. Philippine Daily Inquirer. September 19, 2009.12 Transcript: Interview with DOH Official Involved in Health Sector Reform. September 10, 2009. 13 Interview with Karen Alparce-Villanueva, External Affairs Director, Merck Sharp and Dohme representing PHAP.
October 2009.14 Lesaca R. “An Assessment of Pharma 50, A GMA SONA Promise”. http://www.bulatlat.com/news/2-23/2-23-rey.
html. Accessed October 25, 2009.15 “Government Triples Generic Drug Imports”. http://www.pitc.gov.ph/archives/triple.html. Accessed October 25,
2009.16 PhilHealth Stats and Charts 2008.17 Jowett M, Banzon E, Basa RJ. “The Impact of Social Health Insurance in the Philippines 1972-2007”. Presentation.
July 9, 2007.18 Duque III F. “Challenges Ahead for PhilHealth: Highlights from the Quality Improvement Demonstration Studies
Baseline Survey 2004”. Presentation. Manila. May 3, 2005.19 Statistical Indicators on Philippine Development – Health Services Chapter 2008. Philippine National Statistics
Coordination Board. 2008.20 Philippines HIV AIDS data spreadsheets, overview, charts, tables, graphs, maps, country review – 2008 data.
http://www.aidsdatahub.org/countries/profile/philippines. Accessed September 7, 2009.21 Romualdez A, Paterno RP, et al. Health Systems In Transition Project 2009 (unpublished). 2009.22 “Bringing Cheaper Medicines to Filipinos”. Universally Accessible Cheaper and Quality Medicines Act of 2008
NEDA Development Advocacy Factsheet. June 30, 2008. 23 Philippine National Demographic and Health Survey 2008 Preliminary Report. National Statistics Office. 2008.24 “FG Foundation ‘Adopts‘ Doctors to the Barrios Program”. http://www.philstar.com/Article.aspx?articleid=411352.
October 30, 2008. Accessed October 5, 2009.25 Lorenzo, FM. “Health Human Resource Development and Migration Lecture”. 5th UP Global Health Course. April
2009. 26 Montoya J. “The State of Health in the Philippines: The Role of Research and the Philippine National Health
Research System”. Presentation for the Health Summit. April 28, 2008. 27 “Regional Health Research and Development Councils: At the Helm of the PNHRS” Microsoft Powerpoint
Presentation. PNHRS National Assessment Report 2008.
Civil Society Assessment of the 2004-2010 Medium Term Philippine Development Plan on Health

Ass
essm
ent R
epor
t
183
Civil Society Assessment of the 2004-2010 Medium Term Philippine Development Plan on Health
28 “Del Mundo J. “Implementing the Comprehensive Dangerous Drugs Act in the Health Sector”. DOH Office for Special Concerns. 2006.
29 Interview with Ivan C. Escartin MD. Chairperson. Dangerous Drugs Abuse Prevention and Treatment Program, Office for Special Concerns, DOH. October 2009.
30 Escartin I. MD. “Community Based Approach to Management of Drug Abuse and Drug Dependency (Addiction)”. Dangerous Drugs Abuse, Prevention and Treatment Program. DOH. Policy Notes. HPDPB. 2008.
31 Department of Health Administrative Orders 2008. http://www.doh.gov.ph/health_policies_laws/administrative_order. Accessed November 18, 2009.
32 Population and Reproductive Health Policy Initiatives of LGUs with continuing assistance/intervention from PLCPD and/or initiated by the members of the Local legislators League on Population, Health, Environment & Development. PLCPD Annual Report 2008.
33 PLCPD, Briefing Paper on 2007 DOH Budget Hearing. 200734 Deparment of Health Administrative Orders 2000. http://www.doh.gov.ph/health_policies/admin_order/2000.
Accessed November 18, 2009.35 NSO, Family Planning Survey 2006.36 “People and Development: Upholding Rights, Enabling Choices”. ICPD at 15 Philippines Country Report. 2009.37 Guttmacher A. “Unintended Pregnancy and Induced Abortion in the Philippines”. Alan Guttmacher and UP
Population Institute. 2006.

Civi
l Soc
iety
Ass
essm
ent o
f the
200
4 -2
010
MTP
DP
184

Ass
essm
ent R
epor
t
185
BASIC EDUCATION UNDER THE ARROYO ADMINISTRATION: OPPORTUNITY WASTED1
PART IAN ASSESSMENT OF THE ARROYO ADMINISTRATION
LEADERSHIP IN BASIC EDUCATION
Basic education (elementary and secondary schooling) is the backbone of the entire education system in the country. It provides the primary building blocks for tertiary and vocational education and will determine whether or not a country’s labor force will have adequate knowledge, skills and the right attitudes to be productive workers and law-abiding citizens in the future.
A System in Crisis2
Philippine education is in crisis.3 This is manifest in performance indicators that reveal high rates of drop-outs across the system, poor performance in national and international achievement tests, poor reading abilities and functional literacy of older students, lack of student preparedness for study in high school and university as revealed in diagnostic tests and entrance exams4, and the recognition by the business community of declining abilities of Filipino workers in language proficiency, technical skill and ability to think and solve problems.5
Numerous studies of the problems in Philippine education lead to predictable and oft-repeated conclusions: the school system has gotten too large, too unwieldy and too difficult to manage; shortages in classrooms, teachers, textbooks and material resources are at the heart of the problem; teachers are poorly trained despite having passed a licensure examination; there is little or no in-service training to improve teachers once hired; oversized classroom sections, multiple shifting or both undermine student learning to occur. The list goes on and on.
The continuing situation begs the question: Is Philippine education being governed properly or is the system so structured that regardless of reform it cannot change for the better? Further, can proper governance and leadership improve performance of the system overall as measured by indicators? Or is the opposite true: That the poor performance of Philippine education, as a whole, is a reflection of poor governance (at worst) or of a governance structure (i.e. institutional arrangements) that cannot perform as mandated (at the very least)?
For the president, in her nine years in office, the problem of basic education is directly related to shortages in the system. Hence, the focus is on inputs rather than outcomes; to address shortages in the system rather than work for structural change in basic education. The principal concern of the Arroyo leadership (and the way success is measured) has been to build more classrooms (more built and at a faster rate than any administration), hire more teachers (more hired than any other administration), procure more textbooks (more procured and delivered than any other administration). This quantity-driven indicator has pushed aside quality outcomes. As a result, the Department of Education is forced to be look at incremental change rather than put in place structural reforms though it had the opportunity to do this having had a nine-year period of continuous leadership.
1Prepared by Juan Miguel Luz and Sharon Baquiran, National Institute for Policy Studies (NIPS)2This section draws heavily from J. M. Luz, Governance of the Education Sector, Philippine Human Development Network Report, 2009.3Abad, Florencio B., Keynote Address, Educators Congress, Bacolod City, 2004.4De Jesus, Edilberto C., The Bridge Program, Department of Education, Manila, Philippines, 2004.5Development Academy of the Philippines, 1999

Civi
l Soc
iety
Ass
essm
ent o
f the
200
4 -2
010
MTP
DP
186
The Arroyo Administration’s nine year experience with basic education can be summarized in one phrase: Opportunity wasted.
Presidential Commitments
In her 2004 inaugural address, President Arroyo promised that by 2010, “everyone of school age will be in school in an uncrowded classroom, in surroundings conducive to learning… at may computer sa bawat paaralan (with a computer in every school).”
In terms of the Millennium Development Goal (MDG) indicators (elementary participation rate, cohort survival rate, completion rate and literacy rate), performance indicators for primary education showed a declining trend from 2000 to 2006. In 2007, the Philippine Midterm Progress Report on the MDGs noted that there is a "low probability” that the Philippines will achieve its goal on primary education by 2015.
In the Medium Term Philippine Development Plan (MTPDP) for 2004-2010, indicators on classrooms, teachers, textbooks, and computers show that while the Arroyo administration met some of its targets: number of classrooms to be built per school year; classroom-pupil ratio; teacher-pupil/student ratio; textbook-pupil/student ratio in some subjects; and the provision of computers in high schools, the manner of measuring success (for example, the use of double-shifting as a way of decreasing the number of classrooms needed) has been questioned. Thus, some targets were missed particularly classroom-student ratio.
Framing the analysis6
The analysis can be framed in three statements.
First, if you have a leaking boat and a short period of time to get from where you are to where you need to be, all you can do if plug the leaks to keep afloat and moving. In the long run, however, the decision must be to build a new, better, sturdier boat. This way of thinking is the difference between a manager and a leader.
Second, in a globally-competitive world, if the country does not keep up with its neighbors (even if it reports economic growth of whatever rate), the country is actually falling further behind.
Third, if you get poor output from the current input, using more of the same input in the same way will only generate more poor output. To change, we need to restructure or reengineer what we are doing to get better output.
How do we measure success in the management of the basic education system? Three bottom-line indicators: government spending, structure of the system, and desired outcomes.
Education spending
Government spending in basic education is an indicator of its investment in the future (e.g. young children). The eight years of the Arroyo Administration7 can be broken down into
6 The balance of Part I draws heavily from J. M. Luz, Education: Plugging leaks, shortages (Nine Years of the Arroyo Administration). Philippine Daily Inquirer, 26 July 2009. Page A1, A8
Page 3 of 29
Framing the analysis6
The analysis can be framed in three statements.
First, if you have a leaking boat and a short period of time to get from where you are to where you need to be, all you can do if plug the leaks to keep afloat and moving. In the long run, however, the decision must be to build a new, better, sturdier boat. This way of thinking is the difference between a manager and a leader.
Second, in a globally-competitive world, if the country does not keep up with its neighbors (even if it reports economic growth of whatever rate), the country is actually falling further behind.
Third, if you get poor output from the current input, using more of the same input in the same way will only 6The balance of Part I draws heavily from J. M. Luz, Education: Plugging leaks, shortages (Nine Years of the Arroyo Administration). Philippine Daily Inquirer, 26 July 2009. Page A1, A8
Basic Education Under the Arroyo Administration:Opportunity Wasted

Ass
essm
ent R
epor
t
187
generate more poor output. To change, we need to restructure or reengineer what we are doing to get better output.
How do we measure success in the management of the basic education system? Three bottom-line indicators: government spending, structure of the system, and desired outcomes.
Education spending
Government spending in basic education is an indicator of its investment in the future (e.g. young children). The eight years of the Arroyo Administration7 can be broken down into two periods: The first four years of benign neglect (education spending barely keeping up with enrolment), followed by four years of frantic catch-up spending.
From 2002 to 2005, basic education spending by the Arroyo Administration grew slower (2.6% average annual growth) than the entire national budget (7.6% annual growth). This was reversed in 2006 to 2009 when basic education spending grew faster (11.2% per year average growth) than the total budget (10.6% annual growth). This is misleading, however, because growth in education spending outpaced national budget growth only in 2007. In the three other years, the national budget still grew faster than the basic education budget. Overall, the last eight years of the Arroyo Administration has seen the basic education budget grow at an average of 6.9% per year versus 9.1% annual growth for the national budget.
Contrast this with the Aquino and Ramos years when growth in basic education spending outpaced growth in the national budget (18.6% versus 16.1% and 18.8% versus 12.8% respectively). On the other hand, the growth rate in basic education spending fell drastically in the Estrada years to half that of the national budget (4.9% versus 9.7%).
In 1986, President Aquino took a budget that allocated only 10.8% for basic education in the last Marcos year and grew this to 12.9% by the time she left office. During President Ramos’ term, this was grown further to a high of 16.1% in 1998 before falling during the Estrada years. In 2009, basic education spending was at 11.9% of the national budget.
7Not including the budget for 2010 which is still to be released.
Basic Education Under the Arroyo Administration:Opportunity Wasted

Civi
l Soc
iety
Ass
essm
ent o
f the
200
4 -2
010
MTP
DP
188
DepEd Budget Breakdown and National Government (NG) Expenditures, 1986-2009(in million pesos)
DepEd Budget Breakdown and National Government (NG) Expenditures, 1986-2009 (in million pesos)
Year Reg. DepEd Budget 2/
SPF - School BuildingProgram
(SBP)
Total DepEd Budget
Total NG Expenditures
Total NG Expenditures,
net of IP
1986 11,699 - 11,699 108,138 86,526 1987 13,610 - 13,610 121,622 84,717 1988 18,131 - 18,131 142,462 96,597 1989 22,546 - 22,546 173,634 118,920 1990 28,091 - 28,091 223,473 152,359 1991 27,331 - 27,331 248,679 173,757 1992 31,701 - 31,701 262,042 182,471 1993 32,067 - 32,067 276,859 200,368 1994 36,821 - 36,821 330,203 251,080 1995 46,674 5,048 51,722 371,888 299,230 1996 55,618 5,131 60,749 416,139 339,617 1997 73,137 4,522 77,659 491,783 413,812 1998 83,590 2,702 86,292 537,433 437,641 1999 86,629 2,447 89,076 580,385 474,095
2000** 92,918 2,000 94,918 682,460 541,566 2001** 97,471 2,000 99,471 707,093 532,259 2002** 104,052 2,000 106,052 742,022 556,161 2003** 106,709 2,000 108,709 825,113 598,705 2004** 105,970 2,000 107,970 867,010 606,109 2005** 108,225 2,000 110,225 947,554 647,747 2006** 119,335 2,000 121,335 1,044,831 734,723 2007** 139,929 2,000 141,929 1,155,509 887,709
2008 (Adjusted) 147,247 * 2,000 149,247 1,226,700 956,853
2009 (Proposed) 165,942 *1/ 2,000 167,942 1,415,000 1,112,350 Source: Department of Budget and Management, B.11 BESF (Budget Expenditures and Sources of Funds)
* Includes additional appropriation for school building under DepEd regular budget of P5.8 Billion (2008) and P6.5 Billion (2009). This is on top of the P2.0 Billion SBP fund in the DPWH budget.
** Starting 2000, the P2.0 Billion SBP fund was added to the DPWH budget even though it was intended for DepED. That amount is included as part of DepED's share of budget
1/ Does not include the P3.344M for the Good-for-School Program which was placed under the DOH budget.
2/ Total DepED budget is comprised of two parts: (a) New Expenditure Program (NEP) including recurring expenses (e.g. salaries) and (b) statutory benefits (GSIS, PhilHealth, PagIBIG premiums which are managed by DBM under a separate budget item for all government workers.
Comparative Analysis of the growth of the DepED Budget versusgrowth of the National Budget, 1986-2009
Page 5 of 29
* Includes additional appropriation for school building under DepEd regular budget of P5.8 Billion (2008) and P6.5 Billion (2009). This is on top of the P2.0 Billion SBP fund in the DPWH budget. ** Starting 2000, the P2.0 Billion SBP fund was added to the DPWH budget even though it was intended for DepED. That amount is included as part of DepED's share of budget
1/ Does not include the P3.344M for the Good-for-School Program which was placed under the DOH budget.
2/ Total DepED budget is comprised of two parts: (a) New Expenditure Program (NEP) including recurring expenses (e.g. salaries) and (b) statutory benefits (GSIS, PhilHealth, PagIBIG premiums which are managed by DBM under a separate budget item for all government workers.
Basic Education Under the Arroyo Administration:Opportunity Wasted

Ass
essm
ent R
epor
t
189
Comparative Analysis of the growth of the DepED Budget versus growth of the National Budget, 1986-2009
DepED AnnualGrowth Annual Growth DepED NG
as % of in DepED in Total NG Ave growth Ave growth Total NG Budget Budget Budget per period per period
10.82% Aquino Aquino 11.19% 16.33% 12.47% 18.63% 16.14%
12.73% 33.22% 17.14%12.98% 24.35% 21.88%12.57% 24.59% 28.70%10.99% -2.71% 11.28%12.10% 15.99% 5.37%11.58% 1.15% 5.65% Ramos Ramos 11.15% 14.83% 19.27% 18.81% 12.82%
13.91% 40.47% 12.62%14.60% 17.45% 11.90%15.79% 27.84% 18.18%16.06% 11.12% 9.28%15.35% 3.23% 7.99% Estrada Estrada 13.91% 6.56% 17.59% 4.86% 9.73%
14.07% 4.80% 3.61%14.29% 6.62% 4.94% Arroyo Arroyo 2002-06 13.18% 2.51% 11.20% 6.91% 9.11% 2.63% 7.63%
12.45% -0.68% 5.08%11.63% 2.09% 9.29%11.61% 10.08% 10.27%12.28% 16.97% 10.59% 2007-09 12.17% 5.16% 6.16% 11.18% 10.59%
11.87% 12.53% 15.35%
Page 6 of 29
Education structure
In 2003, recognizing the inadequacy of a short 10-year basic education cycle, the Department of Education under then Secretary Edilberto de Jesus put in place a High School Bridge program as a first step towards building an expanded high school. At the same time, work began on building incrementally a universal pre-school program. The combination of both would have added two years to the basic education cycle, enough to catch up with the rest of the world. Instead, in 2004, the Administration scuttled the Bridge program for political reasons and announced that the day-care centers would be the de facto pre-schools needed by the system.
Why the need to restructure? By adding two years to basic education, the same curriculum could be redistributed over more years of schooling. Children would have time to learn things more deeply. With pre-schooling, children would be able to read at an earlier age. And graduation from high school would be at 18 years of age rather than 16 years on average, an age more fitting for college or for the world of work in terms of maturity.
Short Education Cycle. The Philippines has the shortest pre-college basic education cycle in the world – 10 years. The global norm is 12 years (with some high performing countries, i.e. Singapore, now requiring 13 years before entry to college/university.) The ten-year Philippine education cycle is divided into the following levels:
• Elementaryschooling(Grades1–6) • Secondaryschooling(HSI–IV). • Pre-schoolisnotcompulsory.88In the definition of basic education, pre-school is not considered a part of the cycle. It is, as termed, pre-elementary schooling.
Basic Education Under the Arroyo Administration:Opportunity Wasted

Civi
l Soc
iety
Ass
essm
ent o
f the
200
4 -2
010
MTP
DP
190
The Philippines is the only country in ASEAN and East Asia that is still at 10 years of basic education (# of years of elementary and secondary schooling before eligible for university).9
Country Elementary (Yrs) High School (Yrs) Total (Years)
In ASEAN:Cambodia 6 6 12Laos 6 6 12Indonesia 6 6 12Malaysia 7 6 13Myanmar 6 6 12PHILIPPINES 6 4 10Singapore 6 6 12Thailand 6 6 12Vietnam 6 6 12Brunei Darussalam 6 6 12
East AsiaChina 6 6 12Hong Kong 6 6 12Korea 6 6 12Japan 7 6 13
9Prior to 1950, the Philippines had an 11-year basic education cycle which was considered advanced for this region. Soon after World War II, a Department of Education policy decision restructured basic education into a 6-year elementary cycle, a 2-year junior high school level (now called middle school in many countries) and a 4-year senior high school. Grade 7 was taken out but the 2-year junior high was never implemented. The rest of the world has since moved ahead and expanded their basic education cycle adding additional years or grades (up to Grades 12 or 13). The Philippines went in the opposite direction and reduced the basic education cycle by one year.10For HSRT results, see Part III.
Basic Education Under the Arroyo Administration:Opportunity Wasted
The Proposed High School Bridge Program (SY 2004-05)
In 2004, the Department moved to begin conditioning the general public to the idea of adding an additional year (HS V) to high school. The first step in this direction was to set up the Bridge program as a remedial year before HS I to prepare students for the regular high school program.
The Bridge program was to take in the bottom 50% in the National High School Readiness Test (HSRT) and to drill them extensively and intensively in English, science and math.10
Simultaneously, the Department would require that every child be a reader by Grade 3. Once achieved, there would be no need to run a Bridge program after four years and that year could be converted into the first year of a 5-year high school program.

Ass
essm
ent R
epor
t
191
Education outcomes
In basic education, four indicators matter most: participation (enrollment in schools), retention (leading to graduation), and achievement (learning with competence). In between elementary and high school, there is transition. Focus on getting these indicators right and we solve the majority of problems in the system.
Education indicators follow a building blocks approach. There is no way to shortcut this approach. You cannot speak of achievement unless you measure it at the time of graduation. You cannot improve graduation unless you improve on participation (enrollment). High school performance cannot be improved if elementary school outputs are poor or weak. The key is to build quality from the onset/start.
If the quality of inputs is poor, remediation is an expensive process and will compound the problem because new material in the curriculum cannot be covered. Hence, the succeeding years will be a constant process of “playing catch-up”.
This, however, is not just about throwing money at the shortages. Rather, it has to be about creating a quality learning environment for all. Because the administration is focused on shortages, the annual State-of-the-Nation Address (SONA) have been replete with figures about new classrooms built, new teachers hired, new textbooks procured, new computers provided. If this is the measure of success, then this Administration passes as the most successful provider of education in Philippine history. But input is not matching outcomes.
Basic Education Under the Arroyo Administration:Opportunity Wasted
During the protracted post-election canvassing period in June-July 2004, Malacanang feared that the Bridge program would be unpopular and lead to anti-Administration sentiments. The Department was initially instructed to scrap the Bridge Program. Later, when the Department objected, the instruction was to make it optional. In SY 2004-2005, around 28% of all incoming HS I students enrolled voluntarily in the Bridge program. By SY 2005-2006, the Bridge was not offered.
Ironically, the Presidential Task Force on Education (PTFE) recommended adding an additional year to college as its own version of the Bridge program (Pre-Baccalaureate Program) because of the number of students who are deemed unprepared for college work.
NOTE: At the high school level, the Bridge program would have no cost implications as far as parents are concerned except for an additional year of incidental expenses. At the college level, the National Government has to provide scholarship funds to cover the tuition that must be paid universities to run their version of the Bridge program or households bear the cost of the additional year. With limited government funding, households would have to bear the additional cost.
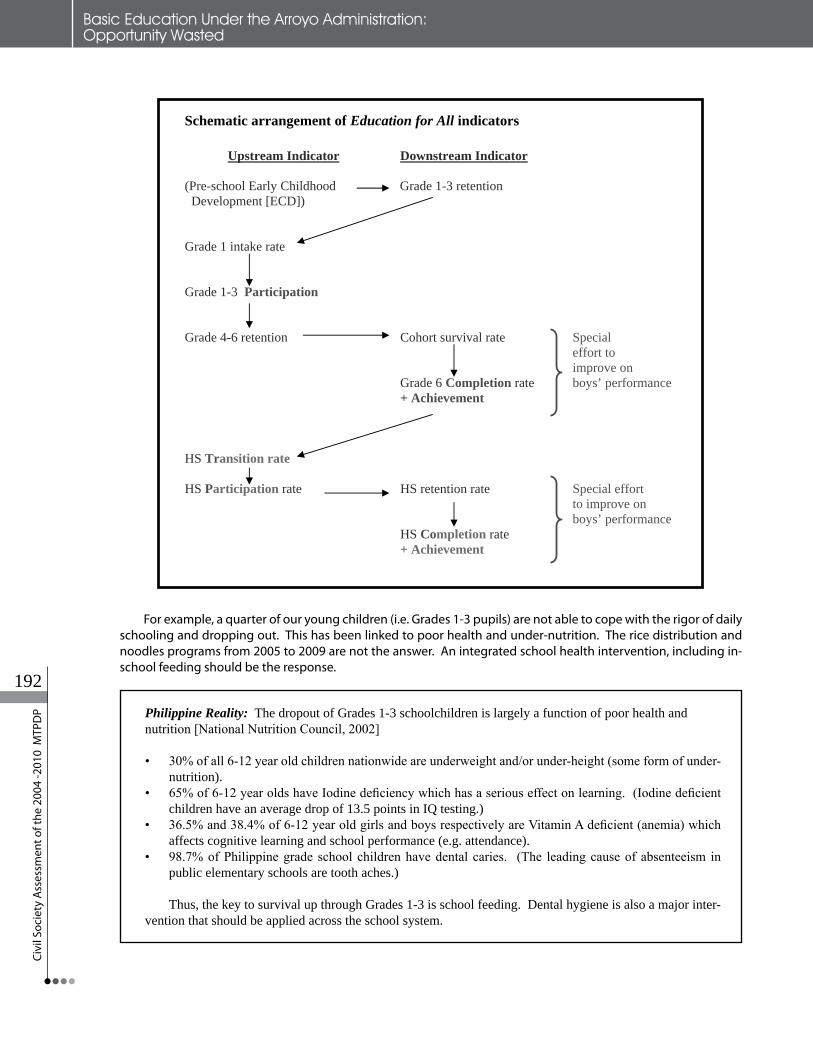
Civi
l Soc
iety
Ass
essm
ent o
f the
200
4 -2
010
MTP
DP
192
Schematic arrangement of Education for All indicators
Upstream Indicator Downstream Indicator
(Pre-school Early Childhood Grade 1-3 retention Development [ECD])
Grade 1 intake rate
Grade 1-3 Participation
Grade 4-6 retention Cohort survival rate Specialeffort to improve on
Grade 6 Completion rate boys’ performance + Achievement
HS Transition rate
HS Participation rate HS retention rate Special effortto improve on boys’ performance
HS Completion rate + Achievement
For example, a quarter of our young children (i.e. Grades 1-3 pupils) are not able to cope with the rigor of daily schooling and dropping out. This has been linked to poor health and under-nutrition. The rice distribution and noodles programs from 2005 to 2009 are not the answer. An integrated school health intervention, including in-school feeding should be the response.
Philippine Reality: The dropout of Grades 1-3 schoolchildren is largely a function of poor health and nutrition [National Nutrition Council, 2002]
Page 10 of 29
For example, a quarter of our young children (i.e. Grades 1-3 pupils) are not able to cope with the rigor of daily schooling and dropping out. This has been linked to poor health and under-nutrition. The rice distribution and noodles programs from 2005 to 2009 are not the answer. An integrated school health intervention, including in-school feeding should be the response.
Philippine Reality: The dropout of Grades 1-3 schoolchildren is largely a function of poor health and nutrition[NationalNutritionCouncil,2002] • 30%ofall6-12yearoldchildrennationwideareunderweightand/orunder-height(someformofunder-
nutrition). • 65%of6-12yearoldshaveIodinedeficiencywhichhasaseriouseffectonlearning.(Iodinedeficient
children have an average drop of 13.5 points in IQ testing.)• 36.5%and38.4%of6-12yearoldgirlsandboysrespectivelyareVitaminAdeficient(anemia)which
affects cognitive learning and school performance (e.g. attendance).• 98.7%ofPhilippinegrade schoolchildrenhavedentalcaries. (The leadingcauseofabsenteeism in
public elementary schools are tooth aches.)
Thus, the key to survival up through Grades 1-3 is school feeding. Dental hygiene is also a major inter-vention that should be applied across the school system.
Basic Education Under the Arroyo Administration:Opportunity Wasted

Ass
essm
ent R
epor
t
193
Why are boys dropping out faster than girls in late elementary and high school? More boys are dropping out than girls at the higher grade/year levels. By the higher grade/year levels, there are from over twice as many boys dropping out than girls and this is not solely about work as the surveys reveal.11 Rather, it is because of poor reading and arithmetic skills at the end of Grade 3. Reading and math programs are needed to develop these critical life-long learning skills.
At the end of high school, those kids left standing are only half inclined to go on to college. The other half (again, more boys than girls) do not feel they can cope with college. Unfortunately, most have no idea what they want to do. The education response should be technical-vocational education returned back to the high school level as an alternative course. Again, structural reform.
Dropout rates per year (National averages in %) SY 2004-2005, excluding ARMM
Boys Girls Both Parity (B/G)12
Grade 1 2.34 1.60 1.99 1.46 Grade 2 1.47 0.83 1.17 1.77 Grade 3 1.50 0.79 1.16 1.90 Grade 4 1.50 0.78 1.15 1.92 Grade 5 1.68 0.81 1.25 2.07 Grade 6 1.41 0.71 1.06 1.99 Elementary (all) 1.69 0.94 1.33 1.80
HS I 11.26 4.85 8.14 2.32 HS II 9.92 4.64 7.26 2.14 HS III 7.81 4.18 5.90 1.87 HS IV 4.66 2.93 3.73 1.59 Secondary (all) 8.89 4.24 6.52 2.10
Source: BEIS, DepED
DepED Survey of Graduating Seniors
More girls than boys have the ambition to go to college. In a survey undertaken by the Department in February/March 2005 (40% of all public high schools and students nationwide responded):
Boys Girls Both Interested in college 52.5 58.9 56.0 Want to work 20.0 17.4 18.6 Don’t know 27.5 23.7 25.4
Survey findings were fairly consistent across all regions: This means that at the tertiary level, there are almost 20% more girls entering the freshman year than boys. At the end of the tertiary level, there are also more girls graduating than boys. This will have implications on the long-term job market.
11Three major surveys are reported in Part III of this paper.12Parity: How many boys drop out for every 1 girl that drops out of school.
Basic Education Under the Arroyo Administration:Opportunity Wasted

Civi
l Soc
iety
Ass
essm
ent o
f the
200
4 -2
010
MTP
DP
194
Conclusion: Low Pass Grade
The key to change in basic education is not to plug the leaks, but to build a new boat. One can deal with shortages every year but a fast-growing population will only mean more spinning of wheels while staying in place. When the facts change, we have to change strategy.13
In January 2001, the Arroyo Administration had a nine-year window of opportunity to take a poorly-performing education system and radically restructure it. Sadly, today, we have the same overcrowded structure, the same processes, and the same low education standards but with millions more children to attend to.
In summary, an opportunity wasted.
PART II
UNDERSTANDING THE EDUCATION CYCLE
The basic education system is a centrally-controlled yet highly dispersed system. As such, change comes slowly in this monolithic structure. An education system need not be governed by one set of rules and formats since every school and every school district has a unique context and operating environment. Yet, the prevalent thinking within the Department of Education is that of “one-size-fits all”. Hence, the difficulty in achieving reform over a short period of time. Reform is entirely possible if the different parts can be coordinated. This section tries to describe the key parts of the system that need to be worked on if reform is to transform education in the country.14
General picture
The Education system is divided into public schools (operated and managed by the national Department of Education) and private schools (owned and operated by private individuals or corporations, religious orders, foundations and other entities not connected or under the control of government).
SY 2008-2009
A. Elementary enrolment Percentage Number of schools Percentage Teachers Percentage
B. Secondary enrolment Percentage
Number of schools Percentage Teachers Percentage C. Total enrolment D. Total number of teachers
Public
12,574,50691.87 %
37,60784.15 %
353,28087.10%
5,421,56280.15 %
5,35953.24 %
138,05871.45%
17,996,068 491,338
Private
1,112,1378.13 %
7,08415.85 %
52,30812.90%
1,342,29619.85 %
4,70746.76 %
55,16628.55%
2,454,433107,474
Total
13,686,643
44,691
405,588
6,763,858
10,066
193,224
20,450,501 598,812
13Paraphrased from Mark Twain: “When the facts change, I change my mind.”14The title of a major paper on the Department of Education and the impact of multilateral aid on the system (i.e. Third Elementary Education Project [TEEP] financed by the World Bank) was “When Reform does not Transform” by Cynthia Bautista, Alan Bernardo and Dina Ocampo.
Basic Education Under the Arroyo Administration:Opportunity Wasted

Ass
essm
ent R
epor
t
195
Teachers
Teachers in the public school system are required by DepED policy to be licensed by the Professional Regulatory Commission (PRC; Licensure Exam for Teachers or LET). Private schools can hire teachers who are not LET passers, though most now require the LET as well. All public and private school teachers, however, must be graduates of full undergraduate degree programs.
From 2004-2006, an average of 130,668 graduates took the LET every year. Only around 34,833 a year pass the LET (27% passing rate). The number of licensed teachers available to teach are not clear at this time, but there is a pool of tens of thousands of LET passers in the country who are not in the teaching profession today. Hence, there is no problem with the supply of licensed teachers. There are a limited number of teaching slots funded, however. Hence supply is much greater than vacancies for teachers.
Supply of teachers = PRC licensed individuals less total number of public school teachers less private school teachers less teachers who have gone abroad or to other jobs
By age, 40% of elementary grade teachers are older than 50 years of age. This proportion is much lower for secondary school teachers.15
Public school principals
In the public school system, not all schools have full-fledged principals:
SY 2008-2009 # of Public Schools % of all Public Schools
Elementary schools Principals 13,983 36.83 % Principals plus Head Teachers 22,537 59.36 %
Secondary Schools Principals 3,911 74.33 %
Not all public schools, however, require full-fledged principals. By budget, only schools with at least 10 full-time teachers are eligible for a principal position. Schools with less than 10 full-time teachers are headed by a Teacher-in-Charge or a Head Teacher. Both positions are designations rather than positions.
Two-Class Schooling System
There is in fact a two-class schooling system in the country: Elite (Public science high schools + private schools with tuition fees of P35,000 or more per year) and Non-elite (Regular public schools + private schools charging less than P35,000 A year)16
Students in elite schools take as many as 12-14 years of basic education from pre-school to fourth-year high school before entering college, including Grade 7. Most students in public school and non-elite private schools
15OECD/UNESCO, Teachers for Tomorrow’s Schools, An Analysis of the World Education Indicators. 2001 Edition16The P35,000 figure is determined by using a benchmark of 10% of household disposable income as the affordable share for education. At P35,000, this translates into a monthly tuition of P3,500 per child. At a 10% disposable income level, the household income must be at least P35,000 per month net or P45-50,000 per month gross. This is the upper limit for a middle income household per the FIES.
Basic Education Under the Arroyo Administration:Opportunity Wasted

Civi
l Soc
iety
Ass
essm
ent o
f the
200
4 -2
010
MTP
DP
196
take only 10-11 years of basic education (including pre-school for around 18% of this group) before college. This is further reflected in elite (first-tier schools) versus second-tier and other non-elite universities and colleges. Leading companies tend to limit their recruitment to first-tier universities.
Pre-School
Pre-school is not a requirement for Grade 1 nor is it compulsory. Only 18.3% of Grade I pupils in the public schools attended a proper pre-school (SY 2004-2005). In SY 2008-2009, DepED reported that 62.77% of Grade 1 pupils have attended pre-school classes and day care centers (ECD programs).17
Research findings reveal that children that attend pre-school tend to (a) stay in school (because of parents’ interest in early schooling) and (b) have higher achievement (starting with earlier reading rates). Therefore, pre-schooling is a critical start to the schooling cycle: it provides socialization and preparation for learning which is critical to the success of childhood schooling.
Stages of Learning
The basic education cycle can be divided into the following stages with specific learning objectives.
Level Age Objectives
Pre-school 5 Socialization, preparation for learning
Grades 1 – 3 6-8 3Rs, Every child a reader (lifelong survival skills)
Grades 4 – 6 (7) 9-12(13) Intermediate order thinking skills, preparation for secondary learning
HS I – II 13-14 Higher order thinking skills, deeper Learning of subjects as disciplines
HS III - IV 15-16 Higher order thinking skills, preparation for the world of work and/or college
PART III.
EDUCATION PERFORMANCE INDICATORS
The general pattern of poor performance cannot be attributed to the Arroyo Administration alone. Rather, it is, in fact, a build-up of neglect and complacency over the past four decades that has led us to where we are today: a system that underperforms relative to the immediate past and viz other national education systems in the region.
17NOTE: There is significant difference in the purpose, objectives and coverage of pre-schools and day care centers. Educators do not equate day-care centers with pre-schools.
Basic Education Under the Arroyo Administration:Opportunity Wasted
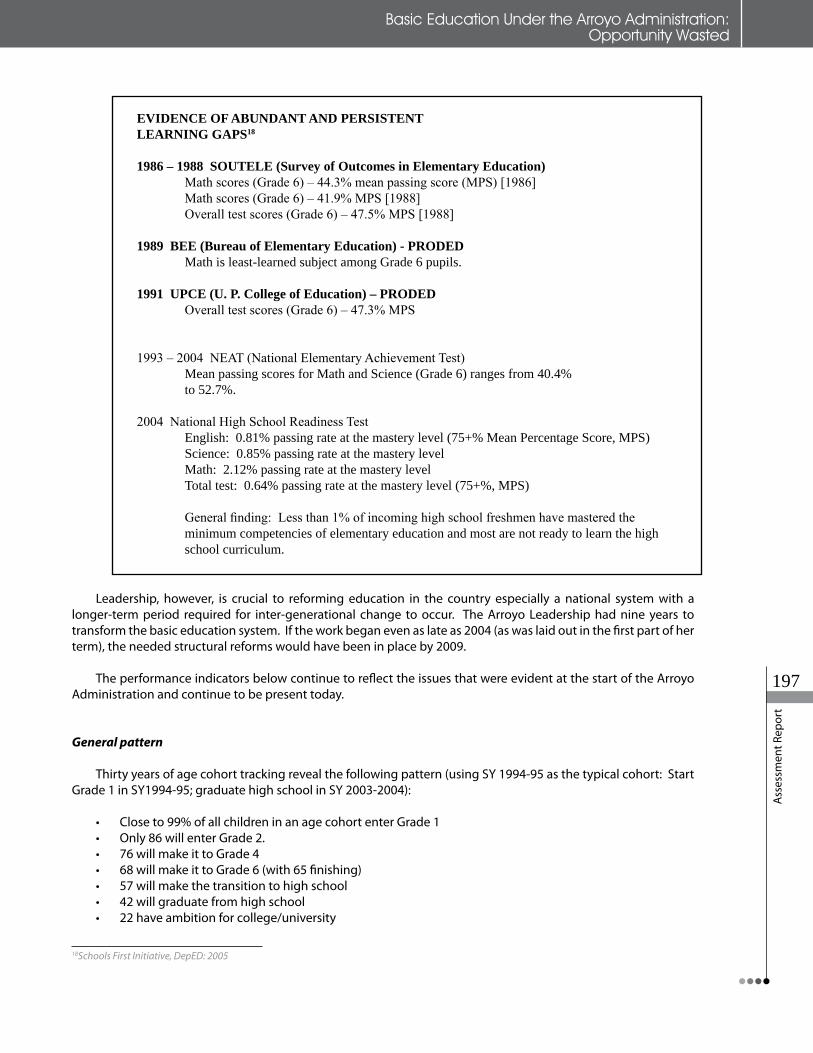
Ass
essm
ent R
epor
t
197
EVIDENCE OF ABUNDANT AND PERSISTENT LEARNING GAPS18
1986 – 1988 SOUTELE (Survey of Outcomes in Elementary Education) Mathscores(Grade6)–44.3%meanpassingscore(MPS)[1986] Mathscores(Grade6)–41.9%MPS[1988] Overalltestscores(Grade6)–47.5%MPS[1988] 1989 BEE (Bureau of Elementary Education) - PRODED Math is least-learned subject among Grade 6 pupils.
1991 UPCE (U. P. College of Education) – PRODED Overalltestscores(Grade6)–47.3%MPS
1993–2004NEAT(NationalElementaryAchievementTest) Mean passing scores for Math and Science (Grade 6) ranges from 40.4% to 52.7%.
2004NationalHighSchoolReadinessTest English: 0.81% passing rate at the mastery level (75+% Mean Percentage Score, MPS) Science: 0.85% passing rate at the mastery level Math: 2.12% passing rate at the mastery level Total test: 0.64% passing rate at the mastery level (75+%, MPS)
Generalfinding:Lessthan1%ofincominghighschoolfreshmenhavemasteredthe minimum competencies of elementary education and most are not ready to learn the high school curriculum.
18Schools First Initiative, DepED: 2005
Basic Education Under the Arroyo Administration:Opportunity Wasted
Leadership, however, is crucial to reforming education in the country especially a national system with a longer-term period required for inter-generational change to occur. The Arroyo Leadership had nine years to transform the basic education system. If the work began even as late as 2004 (as was laid out in the first part of her term), the needed structural reforms would have been in place by 2009.
The performance indicators below continue to reflect the issues that were evident at the start of the Arroyo Administration and continue to be present today.
General pattern
Thirty years of age cohort tracking reveal the following pattern (using SY 1994-95 as the typical cohort: Start Grade 1 in SY1994-95; graduate high school in SY 2003-2004):
• Closeto99%ofallchildreninanagecohortenterGrade1 • Only86willenterGrade2. • 76willmakeittoGrade4 • 68willmakeittoGrade6(with65finishing) • 57willmakethetransitiontohighschool • 42willgraduatefromhighschool • 22haveambitionforcollege/university

Civi
l Soc
iety
Ass
essm
ent o
f the
200
4 -2
010
MTP
DP
198
• 14willcompleteafulluniversitydegree • Only2willbeinthepuresciences
Entry age
Despite the DepED policy that lowered the entry age of children in formal schooling in 1995 to 6 years old (for Grade 1), the majority of children entering Grade 1 are still older than 6 years of age. SY 2008-2009 data reveal that 38.06% of Grade 1 pupils are 6 years old, 37.98% are 7 years old, 0.83% are 5 years old and the remaining 23.13% are 8 years old and older.
Tracking pupils by age group reveals that, on average, for Grades 1-3, more “at-age” kids drop out of school than overage kids. Starting Grade 5, however, the trend reverses. It is the over-age children who drop out of school (particularly in high school), not the right-age children.
Therefore, while the drop-off of right-age kids is greatest at the lowest grade levels, once they survive past Grade 3 their chances of surviving the entire schooling cycle is greater than overage children.
Grade 4-6 dropouts
The dropout of Grades 4-6 schoolchildren is largely a function of poor achievement (particularly reading). But once children make it to Grade 4, their chances of completing elementary improves significantly. NOTE: The inability to survive past Grade 3 has serious impact on functional literacy levels in the country.19
Philippine Reality: Elementary school pupils are not learning to read (in English or Filipino) at the appropriatelevels.TheoralreadingtestadministeredinSY2004-2005byDepEDnationwiderevealthat a small percentage of pupils are reading at the “right-age’ level (i.e. are “independent” readers for their age and grade level)
Grade 1 - 26.98 % Grade 4 – 40.47 %Grade 2 - 40.01 % Grade 5 – 32.99 %Grade 3 - 33.95 % Grade 6 – 40.60 %
Inability to read at the Grade 6 level largely explains the poor performance and retention in high school.
Simple dropout rate
The simple dropout rate (the percentage of students leaving school during the school year) in high school in SY 2007-2008 is 6.38%. This rate is higher than the elementary school dropout rate during the same school year
Elementary dropout rate – 1.02% Secondary dropout rate – 6.38%
On the other hand, the school leaver rate (the proportion of pupils/students who leave the school during the school year as well as those who complete the grade/year level but fail to enroll in the next grade/year level the following school year divided by the total number of pupils/students enrolled during the previous school year) shows almost equal levels between elementary and secondary levels.
Elementary - 6.02% Secondary - 7.45%
19Functional literacy is defined as the ability to read and write complete paragraphs, to do the four operations of arithmetic, and to follow a given (written) set of instructions. Functional literacy is the most important survival skill for factory-level workers in any economy.
Basic Education Under the Arroyo Administration:Opportunity Wasted

Ass
essm
ent R
epor
t
199
The highest dropout rate in high school is HS I and is related to the rapid change in the material covered. The inability to read and do simple arithmetic operations is the major culprit.
NatlAve. High Low
1. HS I dropout rate 8.14 % 10.94 % 5.93 % 2. HS II dropout rate 7.26 % 8.84 % 5.22 % 3. HS III dropout rate 5.90 % 7.73 % 4.31 % 4. HS IV dropout rate 3.73 % 5.36 % 2.46 %
The principal reasons for dropping out vary from survey to survey. Among the major surveys undertaken over the past five years are the following:
(1) FLEMMS 2003 (Functional Literacy, Education and Mass Media Survey): Reasons for dropping out of school (all schooling age groups)
• Lookingforwork - 30% • Lackinterest - 22% • Highcostofeducation - 20% • Housekeepingchoice - 11.8% • Illness/disability - 2.57% • Cannotcopew/schoolwork - 2.2% • Schoolisveryfar - 1.5% • Other - 9.1%
(2) UNICEF-DepED Dropout Study (2007) – Reasons for dropping out.
A. Student/Family-related reasons
• Poverty–nomoneyfortransportationtoandfromschool,forschoolexpensesandallowance• Hadtoworktoaugmentfamilyincome• Distanceofschoolfromhome–toofartowalk,therearenotransportationatall• Housework–takingcareofsiblingsorsickparents• Parents’lackofinterestandsupportforchildren’sschooling• Familyproblems–brokenhome• Earlymarriage• Studentsdonotseethevalueofearningadiploma• Prolongedabsenceduetoillness• Poor or low comprehension, partly due to malnourishment and poorpreparation for school
(B) Teacher-related reasons
• Studentsfearteacher,disliketeacher,teacherdoesnottreatstudentsfairly• Teachershavelesscontacthours• Teachersseemlessdedicatedtoteachingandlessconcernedwithstudents• Teachers have poor teaching methods, make attending classes
uninteresting and unmotivated, do not come prepared• Teachersalsohavepoorcomprehension
(C) School and community-related reasons
• Notenoughbooks• Notenoughdesks
Basic Education Under the Arroyo Administration:Opportunity Wasted
… a build-up of neglect and complacency over the past four decades…
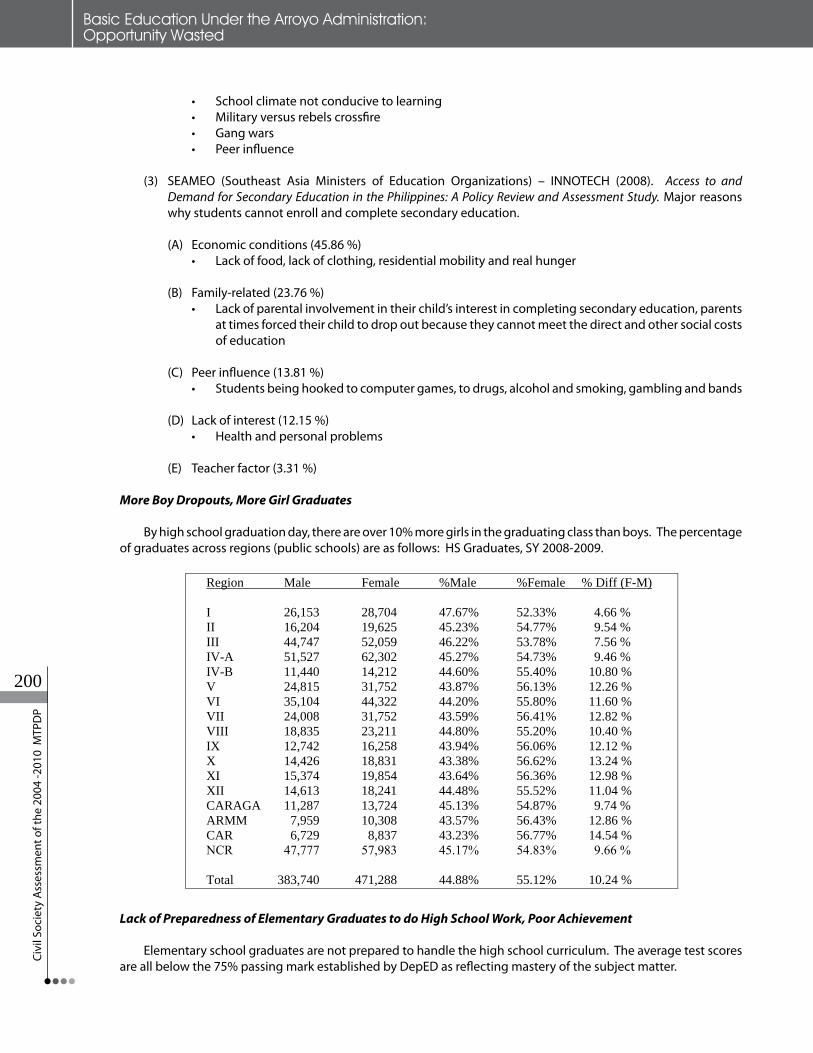
Civi
l Soc
iety
Ass
essm
ent o
f the
200
4 -2
010
MTP
DP
200
• Schoolclimatenotconducivetolearning• Militaryversusrebelscrossfire• Gangwars• Peerinfluence
(3) SEAMEO (Southeast Asia Ministers of Education Organizations) – INNOTECH (2008). Access to and
Demand for Secondary Education in the Philippines: A Policy Review and Assessment Study. Major reasons why students cannot enroll and complete secondary education.
(A) Economic conditions (45.86 %) • Lackoffood,lackofclothing,residentialmobilityandrealhunger
(B) Family-related (23.76 %) • Lackofparentalinvolvementintheirchild’sinterestincompletingsecondaryeducation,parents
at times forced their child to drop out because they cannot meet the direct and other social costs of education
(C) Peer influence (13.81 %) • Studentsbeinghookedtocomputergames,todrugs,alcoholandsmoking,gamblingandbands
(D) Lack of interest (12.15 %) • Healthandpersonalproblems
(E) Teacher factor (3.31 %)
More Boy Dropouts, More Girl Graduates
By high school graduation day, there are over 10% more girls in the graduating class than boys. The percentage of graduates across regions (public schools) are as follows: HS Graduates, SY 2008-2009.
More Boy Dropouts, More Girl Graduates
By high school graduation day, there are over 10% more girls in the graduating class than boys. The percentage of graduates across regions (public schools) are as follows: HS Graduates,SY2008-2009.
Region Male Female %Male %Female % Diff (F-M)
I 26,153 28,704 47.67% 52.33% 4.66 % II 16,204 19,625 45.23% 54.77% 9.54 % III 44,747 52,059 46.22% 53.78% 7.56 % IV-A 51,527 62,302 45.27% 54.73% 9.46 % IV-B 11,440 14,212 44.60% 55.40% 10.80 % V 24,815 31,752 43.87% 56.13% 12.26 % VI 35,104 44,322 44.20% 55.80% 11.60 % VII 24,008 31,752 43.59% 56.41% 12.82 % VIII 18,835 23,211 44.80% 55.20% 10.40 % IX 12,742 16,258 43.94% 56.06% 12.12 % X 14,426 18,831 43.38% 56.62% 13.24 % XI 15,374 19,854 43.64% 56.36% 12.98 % XII 14,613 18,241 44.48% 55.52% 11.04 % CARAGA 11,287 13,724 45.13% 54.87% 9.74 % ARMM 7,959 10,308 43.57% 56.43% 12.86 % CAR 6,729 8,837 43.23% 56.77% 14.54 % NCR 47,777 57,983 45.17% 54.83% 9.66%
Total 383,740 471,288 44.88% 55.12% 10.24 %
Lack of Preparedness of Elementary Graduates to do High School Work, Poor Achievement
Elementary school graduates are not prepared to handle the high school curriculum. The average test scores are all below the 75% passing mark established by DepED as reflecting mastery of the subject matter.
NationalAchievementTestResults(MeanPercentageScore)
Grade VI 2004 2005 2006 2007
Total 58.73 54.66 59.94 64.81 Mathematics 59.10 53.66 60.29 63.89 Science 54.12 46.77 51.58 57.90 English 59.15 54.05 60.78 61.62 Hekasi 59.55 58.12 61.05 67.44
Page 23 of 29
Filipino 61.75 60.68 66.02 73.18
Lack of Preparedness of Elementary Graduates to do High School Work, Poor Achievement
Elementary school graduates are not prepared to handle the high school curriculum. The average test scores are all below the 75% passing mark established by DepED as reflecting mastery of the subject matter.
Basic Education Under the Arroyo Administration:Opportunity Wasted

Ass
essm
ent R
epor
t
201
More Boy Dropouts, More Girl Graduates
By high school graduation day, there are over 10% more girls in the graduating class than boys. The percentage of graduates across regions (public schools) are as follows: HS Graduates,SY2008-2009.
Region Male Female %Male %Female % Diff (F-M)
I 26,153 28,704 47.67% 52.33% 4.66 % II 16,204 19,625 45.23% 54.77% 9.54 % III 44,747 52,059 46.22% 53.78% 7.56 % IV-A 51,527 62,302 45.27% 54.73% 9.46 % IV-B 11,440 14,212 44.60% 55.40% 10.80 % V 24,815 31,752 43.87% 56.13% 12.26 % VI 35,104 44,322 44.20% 55.80% 11.60 % VII 24,008 31,752 43.59% 56.41% 12.82 % VIII 18,835 23,211 44.80% 55.20% 10.40 % IX 12,742 16,258 43.94% 56.06% 12.12 % X 14,426 18,831 43.38% 56.62% 13.24 % XI 15,374 19,854 43.64% 56.36% 12.98 % XII 14,613 18,241 44.48% 55.52% 11.04 % CARAGA 11,287 13,724 45.13% 54.87% 9.74 % ARMM 7,959 10,308 43.57% 56.43% 12.86 % CAR 6,729 8,837 43.23% 56.77% 14.54 % NCR 47,777 57,983 45.17% 54.83% 9.66%
Total 383,740 471,288 44.88% 55.12% 10.24 %
Lack of Preparedness of Elementary Graduates to do High School Work, Poor Achievement
Elementary school graduates are not prepared to handle the high school curriculum. The average test scores are all below the 75% passing mark established by DepED as reflecting mastery of the subject matter.
NationalAchievementTestResults(MeanPercentageScore)
Grade VI 2004 2005 2006 2007
Total 58.73 54.66 59.94 64.81 Mathematics 59.10 53.66 60.29 63.89 Science 54.12 46.77 51.58 57.90 English 59.15 54.05 60.78 61.62 Hekasi 59.55 58.12 61.05 67.44
Page 23 of 29
Filipino 61.75 60.68 66.02 73.18
At the secondary level, DepED changed the NAT test from an end-of-cycle test (e.g. HS IV) to a mid-cycle assessment test (e.g. HS II). This makes time series comparisons not possible at this time.20
Atthesecondarylevel,DepEDchangedtheNAT test from an end-of-cycle test (e.g. HS IV) to a mid-cycle assessment test (e.g. HS II). This makes time series comparisons not possible at this time.20
2004 2005 2006 2007
YearLevelTested YearIV YearIV YearII YearII
Total 46.80 44.33 46.64 49.26 Mathematics 50.70 47.82 39.05 42.85 Science 39.49 37.98 41.99 46.71 English 51.33 47.73 51.78 53.46 Filipino 42.48 40.51 48.89 47.64
Araling Panlipunan 50.01 47.62 51.48 55.63
What is disturbing is that, with the exception of mathematics, HS II students score higher than HS IV students. Is there a decline in learning as students get to higher grades? Oneexplanation: Higher grade classes are focusing more and more on remediation which means new material is not being covered. Hence, tests are given for material that may not be covered at all or covered poorly.
High school seniors are graduating with little achievement reflecting a general lack of preparation for university or the world of work.
20Author’snote:ItwouldbebettertohavetheNATasanend-of-cycletestsothatlearningcanbemeasuredattheend of the secondary cycle. What would be ideal would be to have an aptitude or diagnostic test administered in HS II with the findings used to inform educators of what needs to be done as corrective measures at the secondary level before it is too late in the cycle.
Page 24 of 29
What is disturbing is that, with the exception of mathematics, HS II students score higher than HS IV students. Is there a decline in learning as students get to higher grades? One explanation: Higher grade classes are focusing more and more on remediation which means new material is not being covered. Hence, tests are given for material that may not be covered at all or covered poorly. High school seniors are graduating with little achievement reflecting a general lack of preparation for university or the world of work.
2003 2004 2005 21 NAT NATNAT
Percentage passing (at 75%) English 6.59 Science 1.75 Math 16.41 Total test * 0.48 * including Araling Panlipunan & Filipino
Percentage scoring > 50% 40.77 (total test) Median score
In the Trends in International Math and Science Survey (TIMMS), the Philippines scores at the bottom of the survey for both age groups tested.
1999 2003 TIMMS TIMMS Math Science Math Science
Highest score 604 569 605 578 World Average 487 488 467 474 Philippine score 345 345 378 377
Difference from: World Average 142 143 89 97 Highest score 259 224 227 201
Philippine test improvement -- -- +33 +32
21NationalAchievementTest(NAT)administeredtoallhigh school seniors at the close of the school year. The NATisasystemtestandmeasureshowwellthehighschoolcurriculumandteachingpreparesstudents.Itisnotapass-fail test for graduation.
Page 25 of 29
In the Trends in International Math and Science Survey (TIMMS), the Philippines scores at the bottom of the survey for both age groups tested.
20Author’s note: It would be better to have the NAT as an end-of-cycle test so that learning can be measured at the end of the secondary cycle. What would be ideal would be to have an aptitude or diagnostic test administered in HS II with the findings used to inform educators of what needs to be done as corrective measures at the secondary level before it is too late in the cycle.21National Achievement Test (NAT) administered to all high school seniors at the close of the school year. The NAT is a system test and measures how well the high school curriculum and teaching prepares students. It is not a pass-fail test for graduation.
Basic Education Under the Arroyo Administration:Opportunity Wasted

Civi
l Soc
iety
Ass
essm
ent o
f the
200
4 -2
010
MTP
DP
202
2003 2004 2005 21 NAT NATNAT
Percentage passing (at 75%) English 6.59 Science 1.75 Math 16.41 Total test * 0.48 * including Araling Panlipunan & Filipino
Percentage scoring > 50% 40.77 (total test) Median score
In the Trends in International Math and Science Survey (TIMMS), the Philippines scores at the bottom of the survey for both age groups tested.
1999 2003 TIMMS TIMMS Math Science Math Science
Highest score 604 569 605 578 World Average 487 488 467 474 Philippine score 345 345 378 377
Difference from: World Average 142 143 89 97 Highest score 259 224 227 201
Philippine test improvement -- -- +33 +32
21NationalAchievementTest(NAT)administeredtoallhigh school seniors at the close of the school year. The NATisasystemtestandmeasureshowwellthehighschoolcurriculumandteachingpreparesstudents.Itisnotapass-fail test for graduation.
Page 25 of 29
PART IVMAJOR RECOMMENDATIONS FOR THE
MEDIUM TERM DEVELOPMENT PLAN (BASIC EDUCATION)
1. 12-Year Basic Education Cycle
By SY 2015-16, add two years to the basic education cycle to catch up with the rest of the world. Total investment over the next six years (up through Budget Year 2017) will be close to P100.0 Billion or P20.0 Billion a year for 5 years to build the additional schools and classrooms, hire more teachers, procure more textbooks, supplies and equipment, and provide more maintenance and other operating expenses for the two additional years.22
2. Universal pre-schooling for all
By SY 2015-16, a universal pre-school sub-system should be set up in all public and private schools nationwide. The required investment for additional infrastructure, new teachers and workbooks is in the vicinity of P41.4 Billion. If done incrementally over the next four years, this will cost from P9.6 to 11.1 Billion a year.23
3. Bring back technical vocational education to high school.
The technical-vocational track should be returned to high school as an alternative to the university-preparatory track. High schools all over the country should be equipped to offer technical-vocational electives that are consistent with local development plans. The investment costs for this will have to be determined and estimated based on local development plans.
4. “Every Child a Reader” by Grade 1
By SY 2015-16, every child passing pre-school must be a reader by Grade 1. To support this, the Department of Education must build a library infrastructure in all school districts (if not in all schools), procure reading books from the Philippine publishing industry to support local authors, and train elementary teachers on how to teach reading.
22NOTE: A worksheet – “The cost of an additional year of High School” can be made available for discussion with NEDA.23NOTE: A worksheet – “What is the cost of an additional year of elementary school and pre-school” can be made available for discussion with NEDA.
Basic Education Under the Arroyo Administration:Opportunity Wasted

Ass
essm
ent R
epor
t
203
5. Science and Math proficiency
A strong science and math curriculum that starts as early as Grade 1 with instructional materials and properly trained teachers must be put in place by SY 2012-13. To build a culture for science and math in our schools, the science/math clubs and elementary, high school science/math fairs must be revived, expanded and strengthened.
6. Covenant with Local Governments to build more schools
To deal with the continuing classroom shortage, the program should be to establish more schools with smaller populations (particularly high schools) so that teachers, students, and parents can form a real learning community. The Special Education Fund of the local school boards should be tapped for this school expansion (classroom-building) strategy.
Basic Education Under the Arroyo Administration:Opportunity Wasted

Civi
l Soc
iety
Ass
essm
ent o
f the
200
4 -2
010
MTP
DP
204
ANNEX A
A NOTE ON THE PUBLIC SCHOOL CLASSROOM SHORTAGE24
Computing what that shortage might be
NYTIMES:
The Arroyo Administration has been surpassing its yearly target of building 6,000 classrooms a year. Do you think the government is on track when it comes to addressing classroom shortage? Why or why not?
JML:
1. In June 2006, at the start of the school year, PGMA berated Acting Secretary Fe Hidalgo about “misreporting” the classroom shortage situation. I wrote about that event and my analysis of the situation. At that time, the PGMA solution was to double-shift overcrowded schools at 50 students/pupils per class. At that ratio, the classroom shortage was reported by Sec. Hidalgo at 6,832 classrooms.
2. That picture, however, is an artificial one because if we are serious about education, we shouldn’t be double-shifting schools and depriving children of much-needed classroom time.
3. For planning purposes in 2006 (and perhaps, still valid today), we used 45 students/pupils per class to determine how many classrooms we needed (or were short). In 2006, that translated into a classroom shortage of 74,115 on a single shift basis (the norm).
4. Despite the large number of new classrooms built, you can see that we still have a long way to go. If we go by the 2009 SONA technical report, then the current shortage (based on that number in 2006 [which must have grown since]) would be 27,124 (2009).
Projected shortage (2006) = 74,115
Less new classroom construction:
2006 - 14,887 2007 - 15,215 2008 - 9,835 2009 - 7,054 (Target for year: 10,533)
5. By SY 2008-09, the enrolments in public schools grew further:
5.1 Elementary school enrolment = 12,829,381 5.2 High school enrolment = 5,282,574
That meant a growth of 745,720 elementary students + 255,751 high school students or a total of 1,001,471 over the three school years.
6. At a ratio of 50 students or pupils per class (not yet the ideal but a reasonable target in the short term), that would translate into an additional requirement of a little over 20,000 classrooms to the current backlog. That would mean the total shortage would be around 47,124 classrooms even with the 50,000 or so built since 2006.
Basic Education Under the Arroyo Administration:Opportunity Wasted
24A note prepared by J. M. Luz for discussion with the New York Times (7 August 2009)

Ass
essm
ent R
epor
t
205
Basic Education Under the Arroyo Administration:Opportunity Wasted
7. Why are we still behind? Population growth is still relatively high (> 2.0% per annum). This means higher enrolments every year. But, public schools are also being swelled by transferees from private schools. These are families that are having difficulty meeting the tuition fee requirements are shifting to public schools where there are no tuition fees.
8. Note: There are some private donations of school buildings from such groups as:
• FederationofFilipinoChineseChambersofCommerce,Inc.(FFCCCI) • Coca-ColaFoundation(LittleRedSchoolhouseprogram) • SMFoundation(BlueSchoolhouseprogram) • TanYanKeeFoundation • Variousprivatefoundations • GawadKalinga
9. There are also local governments that provide school-building construction. Most major cities fund school building construction from the Special Education Fund.
10. How many additional classrooms are funded by NGOs and local governments? The numbers are not readily available but my guess is that they can answer for about 2,000 classrooms a year. Since 2006, this would be around 8,000 classrooms. This could bring the total computed shortage of 47,124 down by this number.
11. Conclusion. It is easy to manipulate numbers and make them as large or as small as possible by changing the assumptions or definitions. At this point in time, it doesn’t make a lot of difference if the number is off by a few thousands when the final tally is as large as it is. Suffice it to say that the figure is at least 27,000 but more likely closer to 47,000 as of the start of 2010. Take your pick.

Civi
l Soc
iety
Ass
essm
ent o
f the
200
4 -2
010
MTP
DP
206
Basic Education Under the Arroyo Administration:Opportunity Wasted

Ass
essm
ent R
epor
t
207
Civil Society Assessment of the 2004-2010 Medium Term Philippine Development Plan on Agrarian Reform1
I. INTRODUCTION
Last August 7, 2009, President Gloria Macapagal-Arroyo (PGMA) signed into law Republic Act No. 9700 otherwise known as the Comprehensive Agrarian Reform Program Extension with Reforms (CARPER) Law. President Gloria Macapagal-Arroyo has projected the enactment of the CARPER law as a milestone achievement by her administration.
However, President Arroyo’s signing into law of RA No. 9700 should be considered more of a remedial measure for her administration’s failure, in the first place, to complete the land acquisition and distribution (LAD) component of the Comprehensive Agrarian Reform Program (CARP) by June 2008 or within her term. In fact, it was during her term that agrarian reform implementation, once considered the centerpiece program of the Philippine government, took the back seat in the nation’s development agenda.
In previous Medium Term Philippine Development Plans (MTPDPs), one whole chapter was usually devoted to agrarian reform. However, in the latest MTPDP of the Arroyo administration, agrarian reform was lumped with other asset reform programs of government, namely “urban land and asset reform” and “ancestral domain reform,” under the Asset Reform section of the chapter on “Responding to Basic Needs of the Poor” of the MTPDP.
It was also President Arroyo, in her 2002 State of the Nation Address (SONA), who set the very low yearly targets for LAD at 100,000 hectares of private agricultural lands (PALs) and another 100,000 hectares of public lands when the situation and standing LAD balance at that time called for the fast tracking of LAD and the targeting of at least 200,000 hectares of PALs per year. These low targets were also made in spite of pronouncements to the effect that her administration would complete the implementation of CARP by 2008. Not surprisingly, CARP’s LAD component was not completed by June 2008, which necessitated the passing of the CARP extension law.
Admittedly, Arroyo must be given credit for, at least, not vetoing the reforms that civil society groups drafted and lobbied for inclusion into RA 9700, and for not “killing CARP.”
RA 9700 has, in effect, provided five more years for the completion of the land acquisition and distribution component of CARP, an additional 150 billion pesos of additional funding, and a number of reform provisions in the CARP law.
This paper shall assess the performance of the Arroyo administration in the area of CARP implementation in the last five years vis-à-vis commitments she had made in her SONAs and the targets set by her administration under the Medium Term Philippine Development Plan (MTPDP).
This paper shall also put forward recommendations both for the government and civil society groups on how to ensure the effective and meaningful implementation of CARPER in the next five years.
1Prepared by Ernesto G. Lim Jr., Coordinator of the People’s Campaign for Agrarian Reform Network (AR Now!)

Civi
l Soc
iety
Ass
essm
ent o
f the
200
4 -2
010
MTP
DP
208
II. POLICY FRAMEWORK: MTPDP/SONA Targets/Commitments & Accomplishments on Agrarian Reform
There have been mainly seven MTPDP and SONA commitments made by President Arroyo on agrarian reform implementation. These are the following:
1. distribute 100,000 hectares of private agricultural lands and 100,000 hectares of public lands every year;2. complete the land acquisition & distribution (LAD) component of CARP by the year 2008;3. complete leasehold implementation by 2008;4. provide development interventions to transform landless farmers and farm workers into viable
small landowner-cultivators and agri-based entrepreneurs who contribute significantly to national development and economic growth;
5. follow-up on the passage of Farmland as Collateral Bill in close coordination with the concerned POs, NGOs, and civil society;
6. advocate for the passage of the National Land Use Act; and7. extend CARP with reforms.
The matrix below (see Table No. 1) summarizes the major MTPDP-SONA targets/commitments of the Arroyo administration on agrarian reform and the accomplishments in each area.
Table No. 1: 2004-2010 MTPDP Targets/SONA Commitments vis-à-vis
Accomplishments for Agrarian Reform
MTPDP/SONA Targets Accomplishments1. Distribute 100,000 hectares of private
agricultural lands every year2
Distribute 100,000 hectares of public lands every year
- 76,384 hectares of PALs for 2004- 85,239 hectares of PALs for 2005- 85,835 hectares of PALs for 2006- 90,082 hectares of PALs for 2007 - 85,632 hectares of PALs for 2008
- As of June 2008, the DENR has distributed a total of 3,114,878 hectares of Public A&D/ISF/CBFM lands or 83percent of its total scope of 3,771,411 hectares
- From 2004 to June 2008, the DENR had distributed a total of 705,833 hectares or an average of 141,166.6 hectares per year
2. Complete land acquisition & distribution component of CARP by 2008
- As of Dec. 2008, the LAD balance for DAR is at 1,057,223 hectares or 20 percent of the DAR’s total scope of 5,163,751 hectares
3. Complete leasehold implementation by 2008 - A total of 1,686,045 hectares involving 1,190,913 farmer beneficiaries have been covered under leasehold.
4. Provide development interventions to transform landless farmers and farm workers into viable small landowner-cultivators and agri-based entrepreneurs contributing significantly to national development and economic growth
- DAR has launched a total of 2,100 agrarian reform communities (ARCs)/special agrarian reform communities (SARCs) covering 1,262 municipalities and 9,131 barangays
- A total of 1,578 projects equivalent to 2.74 billion pesos have been funded through various CARP credit facilities, benefiting 221,848 agrarian reform beneficiaries (ARBs)
2Commitment made by President Arroyo during her 2001 SONA.
Civil Society Assessment of the 2004-2010 Medium Term Philippine Development Plan on Agrarian Reform
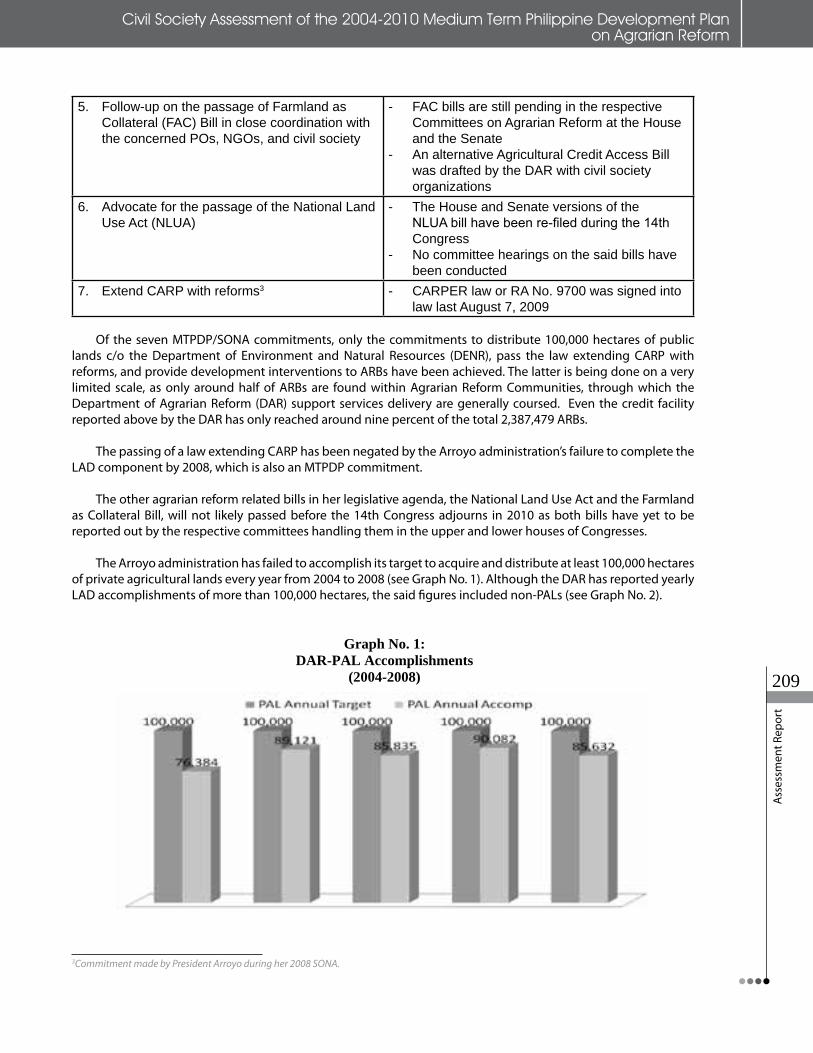
Ass
essm
ent R
epor
t
209
5. Follow-up on the passage of Farmland as Collateral (FAC) Bill in close coordination with the concerned POs, NGOs, and civil society
- FAC bills are still pending in the respective Committees on Agrarian Reform at the House and the Senate
- An alternative Agricultural Credit Access Bill was drafted by the DAR with civil society organizations
6. Advocate for the passage of the National Land Use Act (NLUA)
- The House and Senate versions of the NLUA bill have been re-filed during the 14th Congress
- No committee hearings on the said bills have been conducted
7. Extend CARP with reforms3 - CARPER law or RA No. 9700 was signed into law last August 7, 2009
Of the seven MTPDP/SONA commitments, only the commitments to distribute 100,000 hectares of public lands c/o the Department of Environment and Natural Resources (DENR), pass the law extending CARP with reforms, and provide development interventions to ARBs have been achieved. The latter is being done on a very limited scale, as only around half of ARBs are found within Agrarian Reform Communities, through which the Department of Agrarian Reform (DAR) support services delivery are generally coursed. Even the credit facility reported above by the DAR has only reached around nine percent of the total 2,387,479 ARBs.
The passing of a law extending CARP has been negated by the Arroyo administration’s failure to complete the LAD component by 2008, which is also an MTPDP commitment.
The other agrarian reform related bills in her legislative agenda, the National Land Use Act and the Farmland as Collateral Bill, will not likely passed before the 14th Congress adjourns in 2010 as both bills have yet to be reported out by the respective committees handling them in the upper and lower houses of Congresses.
The Arroyo administration has failed to accomplish its target to acquire and distribute at least 100,000 hectares of private agricultural lands every year from 2004 to 2008 (see Graph No. 1). Although the DAR has reported yearly LAD accomplishments of more than 100,000 hectares, the said figures included non-PALs (see Graph No. 2).
3
MTPDP/SONA Targets Accomplishmentsbeneficiaries (ARBs)
5. Follow-up on the passage of Farmland as Collateral (FAC) Bill in close coordination with the concerned POs, NGOs, and civil society
- FAC bills are still pending in the respective Committees on Agrarian Reform at the House and the Senate
- An alternative Agricultural Credit Access Bill was drafted by the DAR with civil society organizations
6. Advocate for the passage of the National Land Use Act (NLUA)
- The House and Senate versions of the NLUA bill have been re-filed during the 14th Congress
- No committee hearings on the said bills have been conducted
7. Extend CARP with reforms3 - CARPER law or RA No. 9700 was signed into law last August 7, 2009
Of the seven MTPDP/SONA commitments, only the commitments to distribute 100,000 hectares of public lands c/o the Department of Environment and Natural Resources (DENR), pass the law extending CARP with reforms, and provide development interventions to ARBs have been achieved. The latter is being done on a very limited scale, as only around half of ARBs are found within Agrarian Reform Communities, through which the Department of Agrarian Reform (DAR) support services delivery are generally coursed. Even the credit facility reported above by the DAR has only reached around nine percent of the total 2,387,479 ARBs.
The passing of a law extending CARP has been negated by the Arroyo administration’s failure to complete the LAD component by 2008, which is also an MTPDP commitment.
The other agrarian reform related bills in her legislative agenda, the National Land Use Act and the Farmland as Collateral Bill, will not likely passed before the 14th Congress adjourns in 2010 as both bills have yet to be reported out by the respective committees handling them in the upper and lower houses of Congresses.
The Arroyo administration has failed to accomplish its target to acquire and distribute at least 100,000 hectares of private agricultural lands every year from 2004 to 2008 (see Graph No. 1). Although the DAR has reported yearly LAD accomplishments of more than 100,000 hectares, the said figures included non-PALs (see Graph No. 2).
Graph No. 1:DAR-PAL Accomplishments
(2004-2008)
3 Commitment made by President Arroyo during her 2008 SONA.
3Commitment made by President Arroyo during her 2008 SONA.
Civil Society Assessment of the 2004-2010 Medium Term Philippine Development Plan on Agrarian Reform

Civi
l Soc
iety
Ass
essm
ent o
f the
200
4 -2
010
MTP
DP
210
Graph No. 2:DAR-LAD Annual Targets vis-à-vis Annual Total LAD Accomplishments
& Annual -PAL Accomplishments (2004-2008)
On the commitment to complete leasehold implementation by 2008, the DAR reports a total of 1,686,045 hectares involving 1,190,913 FBs covered under leasehold arrangements. The problem with the leasehold program is that there seems to be no definitive scope for it. The DAR, in public forums, has given the figure of 2 million hectares as the estimated scope for leasehold coverage. Even with the said figure, the DAR still has failed to meet the said commitment to complete leasehold implementation by 2008.
III. OVERALL ASSESSMENT
1. LAD targets have been mainly quantitative and insufficient.
From the onset of CARP’s implementation, one of the main sources of problems for CARP’s implementation has been the DAR’s focus on quantitative targets. That is, the DAR’s and CARP’s effectiveness and success have mainly been measured in terms of the number of hectares it has distributed in a year. Improvements on the poverty situation and productivity of ARBs have not been measured and are not used as basis for assessing the effectiveness of the program.
4
On the commitment to complete leasehold implementation by 2008, the DAR reports a total of 1,686,045 hectares involving 1,190,913 FBs covered under leasehold arrangements. The problem with the leasehold program is that there seems to be no definitive scope for it. The DAR, in public forums, has given the figure of 2 million hectares as the estimated scope for leasehold coverage. Even with the said figure, the DAR still has failed to meet the said commitment to complete leasehold implementation by 2008.
III. OVERALL ASSESSMENT
1. LAD targets have been mainly quantitative and insufficient.
From the onset of CARP’s implementation, one of the main sources of problems for CARP’s implementation has been the DAR’s focus on quantitative targets. That is, the DAR’s and CARP’s effectiveness and success have mainly been measured in terms of the number of hectares it has distributed in a year. Improvements on the poverty situation and productivity of ARBs have not been measured and are not used as basis for assessing the effectiveness of the program.
Also, the DAR’s numbers have fallen below its targets in the past years especially in the run up to the “expiration” of CARP in 2008. In 2001, seven years prior to CARP’s expiration, the balance for LAD at that time was at 1,190,041 hectares for private agricultural lands. Mathematically, the LAD target and accomplishment for the DAR should have been around 170,000 hectares per year starting 2001 if the objective was to complete LAD by June 2008.
However, President Arroyo, in her 2001 SONA, pegged the DAR’s and DENR’s LAD targets to only 100,000 hectares per year for each agency. These were clearly way below the necessary targets if CARP were to be completed by 2008.
2. Use of CARP funds for non-ARBs exposes it to fund diversion.
The 2004-2005 Commission on Audit reports on the DAR budget indicated that funds were used to procure farm inputs such as hybrid rice seeds and liquid fertilizers but were distributed to non-ARBs.
Civil Society Assessment of the 2004-2010 Medium Term Philippine Development Plan on Agrarian Reform

Ass
essm
ent R
epor
t
211
In its 2008 Annual Report, the DAR stated that the “ARC Connectivity/Cluster Development (ARC-CD) program would benefit 640,284 ARBs and 870,276 non-ARBs.” Ironically, the said CARP/DAR program benefitted more non-ARBs than ARBs, the intended primary recipient of such programs.
Such practice of using DAR funds/Agrarian Reform Funds for non-ARBs and non-CARP related activities/expenses exposes the said funds to diversion, malversation, graft and corruption.
3. Proliferation of reports of ghost beneficiaries
A number of reports by the Commission on Audit on the DAR budget and independent studies by civil society organizations (i.e. Centro Saka, Inc.’s CARP Validation Study, and the Philippine Partnership for the Development of Human Resources in Rural Areas’ study on the DAR’s 2007 budget) have indicated the proliferation of ghost beneficiaries. The designation of ghost beneficiaries is apparently being carried out by local DAR officials to pad accomplishment reports and in order to collect just compensation payments from government. 4. Alarming use of VLT as primary mode of acquisition for PALs
As of December 2008, the Voluntary Land Transfer (VLT) scheme has become the primary mode by which private agricultural lands have been acquired and distributed under CARP. Of the DAR’s total LAD accomplishment, 17% or 707,312 hectares were acquired through the VLT scheme, while lands acquired through Compulsory Acquisition (CA) covered only 284,791 hectares or just 7% of DAR’s total LAD accomplishment of 4,106,528 hectares (see Graph No. 3).
Graph No. 3: Total DAR-LAD Accomplishment by Mode of Acquisition
(In %, as of December 2008)
Under the VLT scheme, farmer beneficiaries (FBs) directly buy the land under CARP coverage from the landowner with the DAR merely overseeing the negotiations to ensure that the contract does not place the FBs in the short end of the deal.
In terms of percentage of total PALs distributed by DAR, the share of lands acquired through the VLT scheme have been increasing in the last five years from 36 percent in 2004 to 66 percent in 2008 (see Graph No. 4).
Graph No. 4:DAR-PAL Annual Accomplishments in % by Mode of Acquisition
(2004-2008)
6
Under the VLT scheme, farmer beneficiaries (FBs) directly buy the land under CARP coverage from the landowner with the DAR merely overseeing the negotiations to ensure that the contract does not place the FBs in the short end of the deal.
In terms of percentage of total PALs distributed by DAR, the share of lands acquired through the VLT scheme have been increasing in the last five years from 36 percent in 2004 to 66 percent in 2008 (see Graph No. 4).
Civil Society Assessment of the 2004-2010 Medium Term Philippine Development Plan on Agrarian Reform
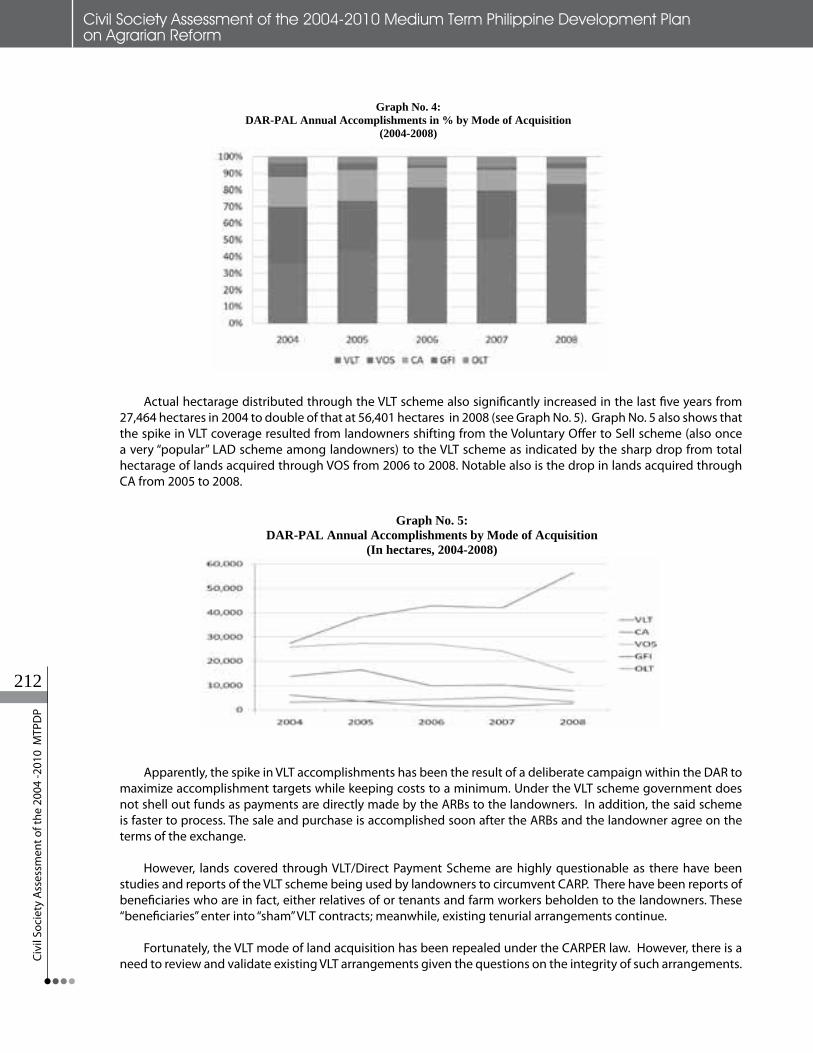
Civi
l Soc
iety
Ass
essm
ent o
f the
200
4 -2
010
MTP
DP
212
Graph No. 3: Total DAR-LAD Accomplishment by Mode of Acquisition
(In %, as of December 2008)
Under the VLT scheme, farmer beneficiaries (FBs) directly buy the land under CARP coverage from the landowner with the DAR merely overseeing the negotiations to ensure that the contract does not place the FBs in the short end of the deal.
In terms of percentage of total PALs distributed by DAR, the share of lands acquired through the VLT scheme have been increasing in the last five years from 36 percent in 2004 to 66 percent in 2008 (see Graph No. 4).
Graph No. 4:DAR-PAL Annual Accomplishments in % by Mode of Acquisition
(2004-2008)
6 Actual hectarage distributed through the VLT scheme also significantly increased in the last five years from 27,464 hectares in 2004 to double of that at 56,401 hectares in 2008 (see Graph No. 5). Graph No. 5 also shows that the spike in VLT coverage resulted from landowners shifting from the Voluntary Offer to Sell scheme (also once a very “popular” LAD scheme among landowners) to the VLT scheme as indicated by the sharp drop from total hectarage of lands acquired through VOS from 2006 to 2008. Notable also is the drop in lands acquired through CA from 2005 to 2008.
Actual hectarage distributed through the VLT scheme also significantly increased in the last five years from 27,464 hectares in 2004 to double of that at 56,401 hectares in 2008 (see Graph No. 5). Graph No. 5 also shows that the spike in VLT coverage resulted from landowners shifting from the Voluntary Offer to Sell scheme (also once a very “popular” LAD scheme among landowners) to the VLT scheme as indicated by the sharp drop from total hectarage of lands acquired through VOS from 2006 to 2008. Notable also is the drop in lands acquired through CA from 2005 to 2008.
Graph No. 5: DAR-PAL Annual Accomplishments by Mode of Acquisition
(In hectares, 2004-2008)
Apparently, the spike in VLT accomplishments has been the result of a deliberate campaign within the DAR to maximize accomplishment targets while keeping costs to a minimum. Under the VLT scheme government does not shell out funds as payments are directly made by the ARBs to the landowners. In addition, the said scheme is faster to process. The sale and purchase is accomplished soon after the ARBs and the landowner agree on the terms of the exchange.
However, lands covered through VLT/Direct Payment Scheme are highly questionable as there have been studies and reports of the VLT scheme being used by landowners to circumvent CARP.There have been reports of beneficiaries who are in fact, either relatives of or tenants and farm workers beholden to the landowners. These “beneficiaries” enter into “sham” VLT contracts; meanwhile, existing tenurial arrangements continue.
Fortunately, the VLT mode of land acquisition has been repealed under the CARPER law.However, there is a need to review and validate existing VLT arrangements given the questions on the integrity of such arrangements.
7
5. Suspicious spike in acquisition and distribution of KKK lands
Another alarming trend in the last five years in CARP implementation has been the sharp spike in the acquisition and distribution of Kilusan Kabuhayan at Kaunlaran (KKK) lands from 11,851 hectares in 2004 to 45,553 hectares in 2008, almost quadruple of the 2004 KKK accomplishment (see Graph No. 6).
Apparently, the spike in VLT accomplishments has been the result of a deliberate campaign within the DAR to maximize accomplishment targets while keeping costs to a minimum. Under the VLT scheme government does not shell out funds as payments are directly made by the ARBs to the landowners. In addition, the said scheme is faster to process. The sale and purchase is accomplished soon after the ARBs and the landowner agree on the terms of the exchange.
However, lands covered through VLT/Direct Payment Scheme are highly questionable as there have been studies and reports of the VLT scheme being used by landowners to circumvent CARP. There have been reports of beneficiaries who are in fact, either relatives of or tenants and farm workers beholden to the landowners. These “beneficiaries” enter into “sham” VLT contracts; meanwhile, existing tenurial arrangements continue.
Fortunately, the VLT mode of land acquisition has been repealed under the CARPER law. However, there is a need to review and validate existing VLT arrangements given the questions on the integrity of such arrangements.
Civil Society Assessment of the 2004-2010 Medium Term Philippine Development Plan on Agrarian Reform

Ass
essm
ent R
epor
t
213
5. Suspicious spike in acquisition and distribution of KKK lands
Another alarming trend in the last five years in CARP implementation has been the sharp spike in the acquisition and distribution of Kilusan Kabuhayan at Kaunlaran (KKK) lands from 11,851 hectares in 2004 to 45,553 hectares in 2008, almost quadruple of the 2004 KKK accomplishment (see Graph No. 6).
Graph No. 6: DAR-Non-PAL Annual Accomplishments by Mode of Acquisition
(In hectares, 2004-2008)
The spike is quite alarming as DAR data indicates that as early as December 2003, the DAR had already surpassed its original working scope of 657,843 hectares for KKK lands by 142,010 hectares. It had likewise surpassed its total/combined non-PAL scope of 1,294,348 hectares by 247,047 hectares. Despite these figures, the DAR continued to attain substantial accomplishments for this land type prompting one to ask whether the DAR has an inexhaustible supply of non-PAL lands (i.e. Settlements, Landed Estates and GOL/KKK lands).
As a result, Settlements and KKK lands comprised most of the lands acquired under CARP with KKK lands and Settlements covering 23 and 18 percent, respectively (see Graph No. 3).
As of December 2008, accomplishments for non-PAL lands (i.e. KKK lands, Settlements and Landed Estates) have already been significantly surpassed (see Graph No. 7).
Graph No. 7: Total DAR-LAD Accomplishment by Mode of Acquisition vis-à-vis Scope
(In hectares, as of December 2008)
8
The spike is quite alarming as DAR data indicates that as early as December 2003, the DAR had already surpassed its original working scope of 657,843 hectares for KKK lands by 142,010 hectares. It had likewise surpassed its total/combined non-PAL scope of 1,294,348 hectares by 247,047 hectares. Despite these figures, the DAR continued to attain substantial accomplishments for this land type prompting one to ask whether the DAR has an inexhaustible supply of non-PAL lands (i.e. Settlements, Landed Estates and GOL/KKK lands).
As a result, Settlements and KKK lands comprised most of the lands acquired under CARP with KKK lands and Settlements covering 23 and 18 percent, respectively (see Graph No. 3).
As of December 2008, accomplishments for non-PAL lands (i.e. KKK lands, Settlements and Landed Estates) have already been significantly surpassed (see Graph No. 7).
Graph No. 6: DAR-Non-PAL Annual Accomplishments by Mode of Acquisition
(In hectares, 2004-2008)
The spike is quite alarming as DAR data indicates that as early as December 2003, the DAR had already surpassed its original working scope of 657,843 hectares for KKK lands by 142,010 hectares. It had likewise surpassed its total/combined non-PAL scope of 1,294,348 hectares by 247,047 hectares. Despite these figures, the DAR continued to attain substantial accomplishments for this land type prompting one to ask whether the DAR has an inexhaustible supply of non-PAL lands (i.e. Settlements, Landed Estates and GOL/KKK lands).
As a result, Settlements and KKK lands comprised most of the lands acquired under CARP with KKK lands and Settlements covering 23 and 18 percent, respectively (see Graph No. 3).
As of December 2008, accomplishments for non-PAL lands (i.e. KKK lands, Settlements and Landed Estates) have already been significantly surpassed (see Graph No. 7).
Graph No. 7: Total DAR-LAD Accomplishment by Mode of Acquisition vis-à-vis Scope
(In hectares, as of December 2008)
8
Civil Society Assessment of the 2004-2010 Medium Term Philippine Development Plan on Agrarian Reform

Civi
l Soc
iety
Ass
essm
ent o
f the
200
4 -2
010
MTP
DP
214
There is great concern over the DAR’s excessive enthusiasm in covering KKK lands because it involves the inclusion of ancestral domain lands, even those with existing titles and claims and that have been subjected to earlier proclamations (e.g. Presidential Proclamation No. 2282).
Despite being a social justice legislation/program, the CARP is in effect being used to undermine the rights of the indigenous peoples to their ancestral domain for the sake of meeting “quantitative targets.” The said practice has, moreover, been a source of tension and violence between the ARB and IP sectors. The said scheme is also being suspected as a means of titling upland areas to be leased later on to foreign and/or local agribusiness investors.
6. Impact of CARP on poverty and productivity
Several studies provide strong evidence that CARP, when properly and completely implemented (i.e. land acquisition and distribution is accompanied with quality support services delivery), results in positive impacts for ARBs in terms of reduced incidence of poverty among ARBs, increase in income and productivity, and higher investments on social capital (i.e. children’s education) and land improvements. These include the CARP-Impact Assessment Study (Phase I) conducted in 2000, a re-validation of the said study under CARP-Impact Assessment Study (Phase II), the DAR-German Technical Cooperation (GTZ) Study on Post-LAD Scenarios in 2006, the Asset Reform CARD Study by Dr. Cielito Habito in 2008, and the CIRDAP study on Access to Land and Rural Development in the Philippines,
CARP Impact Assessment (Phase I)
To serve as a basis for reviewing and strengthening agrarian reform as a policy and strategy for reducing poverty and attaining equitable rural growth, the DAR commissioned seven studies in 2001 and 2002. Three studies examined the impact of CARP on investment, productivity and land market; on poverty; and on social capital and civic entrepreneurship. Two other studies determined the impact of CARP at the household (micro) and community (meso) levels. The final two studies assessed the fiscal (government expenditure) and institutional/organizational aspect of CARP implementation.
Among the major impacts of CARP identified by the said studies (published in 2003 as an eight -volume collection under the title CARP Impact Assessment Studies) were the following:
1. ARBs and LAD-compliant landowners invest more on farm assets compared to non-ARBs and LAD-pending landowners;
2. Children of ARBs have higher educational attainment (translating to higher human capital investments);3. ARBs have better perception of their economic and social conditions, and have more optimism about
their future compared to non-ARBs;4. Being an ARB (including the length of time as an ARB) and being in an ARC reduces one’s chances of being
poor compared to a non-ARBs;5. ARCs, if properly implemented, improve the economic conditions, social capital, civic entrepreneurship,
and democratic participation of the communities; and6. CARP contributed to the reduction of social conflicts and increased peace and order in the area.
CARP Impact Assessment (Phase II)
The CARP Impact Assessment Phase II study, conducted by the University of the Philippines in Los Banos (UPLB) and the Asia-Pacific Policy Center (APPC), is a revalidation of the CARP Impact Assessment Study conducted in 2000.
Civil Society Assessment of the 2004-2010 Medium Term Philippine Development Plan on Agrarian Reform

Ass
essm
ent R
epor
t
215
The CARP Impact Assessment Study Phase II had the following findings:
1. Average yields for rice and corn are much higher in ARCs than the national averages. However, the opposite is the case for sugar and coconut areas. This, the study surmised, was because it is in these areas where land distribution through compulsory acquisition had lagged and that sugar and coconut lands that have been distributed may have been less fertile.
2. ARBs use more four-wheeled tractors, chemical fertilizers, chemical pest controls, certified seeds and crop rotation. This is an indication of higher investments by ARBs on their farm production.
3. ARBs have higher real income per capita (based on 2000 prices) than non-ARBs.4. Real per capita income and real per capita family expenditure were highest when a household owns land,
is an ARB, and belongs to an ARC.5. There is a higher percentage of non-poor (lower percentage of poor) among the ARBs compared to the
non-ARBs in 2000 and in 2006. Furthermore, the percentage of ARBs who are non-ARBs who are non-poor remained basically the same.
6. The combination of possessing land, being an ARB, and being located in an ARC increases a farmer household’s income and expenditure per capita and makes them less likely to be poor.
7. There was improvement in the graduate ratio of ARB’s children in the elementary and college levels, especially in 2006.
8. A slightly smaller share of ARBs, perceived themselves as poor compared to non-ARBs in 1990, and, over the years, this perception gap between them increased. ARBs are more optimistic than non-ARBs of their chances of becoming non-poor by 2010.
DAR-GTZ Study on Post-LAD Scenarios
The study commissioned by the DAR and the GTZ entitled, “Study on Post-LAD Scenarios” (April 2006), also stated that “as of December 2004, people’s organizations (POs) in foreign assisted projects (FAPs) ARCs have been able to raise PhP146,903,495 in capital build-up (CBU) and PhP17,176,847 in savings; ARBs’ real income increased by 20.2 percent from 3,832 pesos to 16,627 pesos, higher than the 2003 national poverty threshold of 12,267 pesos (DAR-FAPsO, 2004); and poverty incidence among ARBs decreased by 2.4 percent from 47.6 percent in 1990 to 45.2 percent in 2000 despite the nationwide 3 percent increase in rural poverty (from 44.4 to 47.4%) (DAR, 2004).”
Dr. Habito’s Asset Reform CARD Study
Two conclusions emerge from the Habito Asset Reform CARD study:
1. First, asset reform results have been positive and deserve to be intensified and implemented more efficiently. The best evidence of this is that the bulk of beneficiaries positively indicated attaining better lives with asset reform (81 percent for farmer beneficiaries in AR)
2. Second, effective asset reform ultimately hinges on good governance and political will.
JBIC Assessment of CARP Projects
An assessment of CARP areas supported by the Japan Bank for International Cooperation (JBIC) under their Agrarian Reform Infrastructure Support Project (ARISP) has also indicated that there has been a 20 percent increase in the income of ARBs covered by the said projects.
CIRDAP Study on “Access to Land and Rural Development in the Philippines”
The 2008 study by the Asia Pacific Policy Center, commissioned by the Centre on Integrated Rural Development (CIRDAP) and funded
Civil Society Assessment of the 2004-2010 Medium Term Philippine Development Plan on Agrarian Reform

Civi
l Soc
iety
Ass
essm
ent o
f the
200
4 -2
010
MTP
DP
216
by the International Fund for Agricultural Development (IFAD), indicated “it is the re-distribution of privately-owned land but not of non-privately-owned land that has significant positive effects on poverty reduction.” It further added that “among the redistribution programs of privately-owned land, increased accomplishments in the GFI, CA and VLT components are significantly associated with poverty reduction but the size of the effects appear to be the largest with the CA component.
7. Gender mainstreaming in CARP
The DAR has made some progress in integrating gender mainstreaming in the implementation of CARP.
A series of policies on gender have been passed by the DAR, namely:
1. Memorandum Circular (MC) 04 series of 1992 - Building Mechanisms to Integrate Women and Pursue a Non-Biased Gender Consciousness Implementation of CARP
2. MC 18 series 1996 - Manner of Generating and Issuing Emancipation Patents and Certificates of Land Ownership Award to qualified ARBs and their Spouses
3. MC 05 series of 2001 - Guidelines in the Establishment of DAR’s Women’s Desk 4. Administrative Order (AO) 1 series of 2001 - Guidelines Governing the Non-Gender Biased Implementation
of Agrarian Laws5. MC 02 series of 2008 – Reconstitution and strengthening of the gender and development (GAD) focal
points6. MC 05 series of 2001 – Establishment of the DAR Women’s Desk
The latter memorandum circular is already being operationalized in collaboration with the Philippine National Police (PNP) through a memorandum of agreement (MOA) between the two agencies. However, during the bi-cameral conference committee meeting for the CARPER law, it was revealed that the said desk had only been established at the DAR-National Office.
Data from the DAR has indicated the following:
1. There are 298,394 women ARBs comprising 25.61 percent of all ARBs;2. Of the total ARBs who are members of organizations organized by the DAR in ARCs 496,756 ARBs or 55.24
percent are women; and 3. Of the 496,756 women ARBs who are members of organizations in ARCs, 73,632 are officers in these
organizations.
IV. RECOMMENDATIONS
To address the issues raised above, the following proposals are put forward for the government’s consideration:
1. DAR must develop & institutionalize a monitoring/evaluation system that measures ARB productivity, income & poverty indicators. The main performance indicator used by the DAR has been “hectares distributed” and yet the said indicator has failed to truly reveal the effectiveness or weakness of CARP implementation. Although legislators have indicated that RA 9700 may be the last “extension” for CARP, the estimates by the Land Bank of the Philippines (LBP) for landowners compensation alone vis-à-vis the PhP150 billion budget allocated under RA 9700 for CARP will surely require another extension for the program. In order to achieve a third extension more convincing arguments and data on why CARP must be continued are required. This will entail better data on CARP’s impact on ARB productivity, income and poverty.
2. CARP funding for support services delivery should focus on irrigation & credit. One of the main weaknesses of CARP has been the lack of credit support for ARBs. With RA 9700 addressing such weakness through the provisions on Initial Capitalization and Socialized Credit, funding support for such credit programs
Civil Society Assessment of the 2004-2010 Medium Term Philippine Development Plan on Agrarian Reform

Ass
essm
ent R
epor
t
217
should be ensured. Guidelines for such credit windows/programs should also ensure access by ARBs to said credit funds, safe guards from access by “rent seekers” to said funds, and sustainability of said funds. Also, irrigation development has also proven to be one of the most effective interventions to improve agricultural productivity and, thus, must be substantially funded.
3. Audit & validation of VLT contracts, KKK & LE accomplishments. As discussed earlier, land distribution accomplishments in the last few years under the VLT, KKK and LE schemes are highly questionable. These schemes need to be evaluated and assessed in terms of their role in undermining CARP implementation and encroaching on the tenurial rights of other sectors such as the indigenous peoples and their right to their ancestral domains. Unless these questionable land transfers are verified then the “completion” of CARP will always be suspect.
4. Fully implement LAD targets and reforms in the CARPER law (including full funding). For the DAR, it should hold its end of the deal in the passage of RA 9700 by ensuring that the phasing for land acquisition and distribution under RA 9700 is carefully followed to cover all remaining lands for CARP coverage within the next five years. At the same time, Congress should also make sure that full funding support for CARPER or RA 9700 is provided. Otherwise, the deadlines and targets set under RA 9700 will surely not be accomplished.
5. Having passed CARPER, passage of the National Land Use Act (NLUA) should now be prioritized. Without compromising the need to monitor and follow-through on the gains made under CARPER, the long-delayed, yet very important, National Land Use Act should be the next priority of both the incoming administration and Congress. NLUA has remained on the list of priority legislations of government since the Aquino administration and yet has remained un-enacted. With the recent impact of climate change on the country, through Typhoon Ondoy and other recent natural/climate related calamities, intensifying inter-sectoral land claim conflicts (i.e. IP/IPRA versus peasants/CARP, etc.), concerns over conflicts and tensions over land use (i.e. food security vis-à-vis urban development, etc.), and geo-hazard concerns, the need for a National Land Use Act have become more evident.
REFERENCES
Abad Santos, Carlos, “Access to land and rural development in the Philippines,” 2007
Arlanza, Ricardo S, Gordoncillo, Prudenciano U, Meliczek, Hans, Palafox, Juan Amor and Panalba, Linda. The Comprehensive Agrarian Reform Program: Scenarios and Options for Future Development. Quezon City, April 2006
Balisacan, Arsenio M. and & Dr. Prudenciano U. Gordoncillo, Prudenciano U., Study Team Leaders. An Assessment of the Comprehensive Agrarian Reform Program and Its Impacts on Rural Communities II, Quezon City, September 2007
Ballesteros, Marife and Felino Cortez. “CARP Institutional Assessment in a Post-2008 Transition Scenario: Implications for Land Administration and Management.” Discussion Paper Series No. 2008-07.Philippine Institute for Development Studies, February 2008.
Department of Agrarian Reform. Accomplishment Reports for 2004, 2005, 2006, 2007 & 2008.
Department of Agrarian Reform. “Mainstreaming Gender in Agrarian Reform Communities.” No date. Power point presentation.
DAR must develop and institutionalize a monitoring/evaluation system…
Civil Society Assessment of the 2004-2010 Medium Term Philippine Development Plan on Agrarian Reform

Civi
l Soc
iety
Ass
essm
ent o
f the
200
4 -2
010
MTP
DP
218
Gordoncillo, Prudenciano U. “The Comprehensive Agrarian Reform Program After 20 Years: Focus on Land Tenure Improvement.” Agricultural & Applied Economics Research Bulletin, 2008.
Gordoncillo, Prudenciano, Reyes, Celia, Habito, Cielito, et al. The Comprehensive Agrarian Reform Program Impact Assessment Studies, Department of Agrarian Reform, Quezon City, 2003
Habito, Cielito. “Asset Reform CARD Study.” Philippine Partnership for the Development of Human Resources in Rural Areas, Quezon City, 2008.
Lim, Ernesto Jr. “An Assessment of the Implementation of the Comprehensive Agrarian Reform Program: Year 2001.” Caucus of Development NGO Networks (CODE-NGO), Quezon City, June 2002.
Lim, Ernesto Jr. “Agrarian Reform Takes a Back Seat, Civil Society Monitoring of the MTPDP: Assessment of the 1st two years (2004-2005).” Caucus of Development NGO Networks (CODE-NGO), Quezon City, 2006.
Presidential Agrarian Reform Committee. Annual Report, 2005.
Civil Society Assessment of the 2004-2010 Medium Term Philippine Development Plan on Agrarian Reform

Ass
essm
ent R
epor
t
219
Civil Society Assessment of the 2004-2010 Medium Term Philippine Development Plan for Mining1
I. INTRODUCTION
The Philippines, an archipelago of 7,109 islands, is rich in minerals, gold, copper, chromate, nickel, coal, limestone, iron, ore, silver, platinum, palladium, and uranium. Many of these deposits, however, are located either a) in areas rich in biodiversity, containing the country’s few remaining forests, b) in geohazard zones prone to typhoons, earthquakes, landslides and volcanoes, or c) within the ancestral domain of indigenous peoples.2
Large-scale mining in the Philippines typically consists of open-pit mining, especially for copper and gold ores, and strip-mining for nickel. To extract the ores, thousands of tons of earth and rocks have to be removed, forests cleared, and drainage systems diverted. Strip-mining for nickel is especially problematic, as nickel-rich earth is stockpiled, causing massive damage to the land in the process. The industry also requires large volumes of water for mining, milling, and waste disposal, directly competing with water requirements for agricultural production and human needs.3
In the Philippines, most mining and exploration concessions are located in watershed areas where demand for water exceeds the available supply. According to the United States Environmental Protection Agency, water contamination from mining poses one of the top three ecological security threats in the world.4
Last but not the least, according to Starke (2003), mining’s most obvious impact on biodiversity is the removal of vegetation, which in turn alters the availability of food and shelter for wildlife. On a broader scale mining may impact biodiversity by changing species composition and structure.5
Clearly, mining has repercussions on the environment, affecting areas and communities, as well as water and all other natural resources, within and near the mining operations. Despite this fact, there appears to be a disjunction between the Department of Environment and Natural Resources’ (DENR) assessment of the situation and their recommendations on mining, illustrated in the provisions of the Medium Term Philippine Development Plan for 2004-2010.
II. POLICY FRAMEWORK : THE MTPDP PROVISIONS ON MINING
Chapter 3, Environment and Natural Resources, of the MTPDP 2004-2010 proposes to “promote responsible mining that adheres to the principles of sustainable development: economic growth, environmental protection and social equity.”6
1Prepared by Anthony Marza, Jaybee Garganera, Roslyn Arayata and Rodne Galicha, Alyansa Tigil Mina (ATM)2Robert Goodland and Clive Wicks. Philippines: Mining or Food? (London: Working Group on Mining in the Philippines, 2009). 3Ibid.4“Submarine Tailings Disposal Toolkit Introduction: Mining’s problem with waste” p1 ; available from miningwatch.ca/index.php?/crew/STD_toolkit; INTERNET. See also recent reports from Earthwatch highlighting the impact of mining on water pollution and necessity for independent monitoring; available from www.mine-aid.org/predictions; INTERNET. 5Linda Starke, ed. Breaking New Ground: Mining, Minerals, and Sustainable Development (Earthscan Publications, Ltd, February 2003). 6Medium Term Development Plan 2004-2010, Chapter 3 Environment and Natural Resources

Civi
l Soc
iety
Ass
essm
ent o
f the
200
4 -2
010
MTP
DP
220
It seeks to do this by means of three strategies: a) Launch a major program to revive the mining industry; b) Resolve the issues involving mining accidents in abandoned and idle mine areas; and c) Develop incentive schemes to attract international and local investors in Mt. Diwalwal.
It is largely seen to push, in effect, for the intensification and revitalization of the mining industry in the Philippines, despite its hazardous impacts on the environment and food security of the country.
III. OVERALL ASSESSMENT: PERFORMANCE AND ACCOMPLISHMENT VIS-À-VIS MTPDP TARGETS IN 2004-2010
A closer look is warranted when assessing the government’s accomplishments vis-à-vis their targets 15 months prior to the supposed completion of the MTPDP.
A. Under-Mining accomplishments
Republic Act (RA) 9742 or the Philippine Mining Act of 1995 is an attempt to revitalize the Philippine mining industry and embodies a major shift in the national government’s thrust from regulation to aggressive promotion of large-scale mining. In 2004, government pursues the revival of the mining industry even further by setting milestone targets in its Medium Term Development Plan. Ironically these targets are included in chapter 3, the chapter on Environment and Natural Resources.
Medium Term Philippine Development Plan 2004-2010
Promote responsible mining that adheres to the principles of sustainable development: economic growth, environmental protection and socialEquity.
Government Target Actual Output
Strategy 1Launch a major program to revive the mining industry
• 18-23Largescaleminingprojects developed
• $5-7billioninforeignexchange generated
• $5-7billioninexcisetaxesarecollected
• 239,000inindirectanddirectemployment generated
• $4-6billionworthofinvestments
• 9miningpriorityprojectsalready in operation
• Ofthe24first-tierprioritymineral development projects, 8 are in the construction and development stage, 8 in the feasibility and financing stage, and 9 in the advance exploration stage.
• $1.616billionworthofinvestments as of 2008
• 13,642jobscreatedinmining• Php26billionintaxes,fees
and royalties are collected (2004-2007)
• Php2.6Billiontotalpaid-upinvestment in mining
Civil Society Assessment of the 2004-2010 Medium Term Philippine Development Plan for Mining

Ass
essm
ent R
epor
t
221
Strategy 2Resolve the issues involving mining accidents in abandoned and idle mine areas.
• Marcopperminestailingsspillfully addressed
• FinalMabatasTailingsdamcovering some 38 hectares constructed in 2010
• Assessmentof7abandonedmines conducted and stop-gap measures/rehabilitation of 3 abandoned mines implemented
• Noupdatedpublicdocumenton the Marcopper mines tailings spill but the communities affected testified that the government and the mining companies not yet fully address the problems.
• Nopublicinformationordocument on the status of the Mabatas Tailings Dam.
• Oneabandoned/inactivemine on going rehabilitation.
Strategy 3Develop incentive schemes to attract international and local investors in Mt. Diwalwal
• Enterintoagreementswithinvestors for exploration and development of Mt. Diwalwal within the plan period
• CoredrillinginMt.Diwalwalcompleted by 2007
• Investorsforumconductedand investors mobilized
• Regularinvestorsforumconducted
• Incentiveschemesdeveloped• Thereis/arependingcase
questions mining Mt. Diwalwal
What Economic Growth?
To boost economic growth, the MTPDP targeted 18 to 23 large-scale mining projects8. But as of 2008, according to the Country Report of the Philippines to the Coordinating Committee for Geoscience Programmes in East and Southeast Asia, only 11 mining priority projects are in operation. Of the 24 first tier priority mineral development projects, seven (7) are in construction and development stage, 9 in the feasibility and financing stage and 8 in the advance exploration stage.9
DENR Secretary Lito Atienza reports that there are only nine (9) mining projects currently operating, eight (8) are in construction and development stage, eight (8) in feasibility and financing stage and nine (9) are in advance exploration stage.10
As of June 2008, 455 mining tenements have already been approved throughout the country with 2,499 applications under process. A large portion of these lies within the ancestral domains of the indigenous people. This figure increases every day, despite the negative effects on the lives and lands of the people in the mining communities. But what is more disturbing is that mining tenements granted through the program have eaten into 17 important biodiversity areas, 35 national conservation priority areas, and 32 national integrated protected areas.
The government targeted $4-6 billion worth of investment in mining. DENR further increase the government target by $15 billion by 201511 but the estimated worth of investment from mining from 2004 to September 2009 is just $2.1 billion12 or only 35 percent of the total target investment.
Ms. Nelia Halcon, the Executive Director of Chamber of Mines of the Philippines (CMP) said that the mining industry posted high growth13 but if you will compare it to the MTPDP targets, the government failed to achieve even a substantial portion of the targets.
8Ibid.9“Member Country Report of the Philippines” (country report presented at the 45th Coordinating Committee for Geoscience Programmes in East and Southeast Asia (CCOP) Annual Session, Khon Kaen Thailand, 23-38 November 2008). 10“Championing Responsible Mining”, Report of accomplishment on Mining and Geosciences under the watch of DENR Sec. Lito Atienza. 11Riza T. Olchondra, “Mining Targets Stay,” Philippine Daily Inquirer, 22 September 2009.12Ibid.13“COMP scores threat of Anti-Mining lobby group”, 4 September 2009.
Civil Society Assessment of the 2004-2010 Medium Term Philippine Development Plan for Mining

Civi
l Soc
iety
Ass
essm
ent o
f the
200
4 -2
010
MTP
DP
222
Reported Investment on Mining
MTPDP target
actual investment 2004-2008
0
1,000,000,000
2,000,000,000
3,000,000,000
4,000,000,000
5,000,000,000
6,000,000,000
7,000,000,000
8,000,000,000
1
MTPDP target actual investment 2004-2008
In terms of job creation, the government targeted the generation of 239,000 in indirect and direct employment. In a study by Hubo and Padojinog (2009), 158,000 employment in mining and quarrying were created in 200814 or .46% of the total Philippine work force. But from 2004 to 2008, the government reported that the total employment generated is 13,46215
or 5.63 percent of the total target employment in the MTPDP. And granting that it is 158,000 jobs, it is just 66.10 percent accomplishment.
14 Department of Labor and Employment (DOLE). 15 “Member Country Report of the Philippines” (country report presented at the 45th CCOP Annual Session, Thailand, 23-38 November 2008).
5
In terms of job creation, the government targeted the generation of 239,000 in indirect and direct employment. In a study by Hubo and Padojinog (2009), 158,000 employment in mining and quarrying were created in 200814 or .46% of the total Philippine work force. But from 2004 to 2008, the government reported that the total employment generated is 13,46215 or 5.63 percent of the total target employment in the MTPDP. And granting that it is 158,000 jobs, it is just 66.10 percent accomplishment.
Employment in Mining
0 50,000 100,000 150,000 200,000 250,000 300,000
1
2
3
Actual output CCOP and DENRDOLE dataMTPDP target
The possible explanation on the disparity on the Department of Labor and Employment (DOLE) data and Philippine Report to CCOP regarding employment generated on mining is that majority of jobs generated on the DOLE data are on quarrying operations and not on mining.
The government is also expected to collect $5-7 billion or Php336 billion in excise taxes, fees and royalties from mining from 2004-2010. But from 2004-2007, the government just collected Php26 billion of excise taxes, fees and royalties or eight percent accomplishment.
Taxes, Fees and Royalties from Mining (units are in million) Taxes 2004 2005 2006 2007
Fees, charges and royalties collected by DENR-MGB 120.1 210.2 192.1 774.0
Excise tax collected by BIR 232.5 251.4 489.6 942.1Taxes collected by the National
Government Agencies 2,769.1 4,733.6 5,313.2 8,349.7
Taxes and fees collected by LGUs 385.5 453.5 395.0 357.9Total 3,480.2 5,648.7 6,389.9 10,423.7
Mines and Geosciences Bureau (MGB), January 2009
6
14Department of Labor and Employment (DOLE). 15“Member Country Report of the Philippines” (country report presented at the 45th CCOP Annual Session, Thailand, 23-38 November 2008).
Civil Society Assessment of the 2004-2010 Medium Term Philippine Development Plan for Mining

Ass
essm
ent R
epor
t
223
The possible explanation on the disparity on the Department of Labor and Employment (DOLE) data and Philippine Report to CCOP regarding employment generated on mining is that majority of jobs generated on the DOLE data are on quarrying operations and not on mining.
The government is also expected to collect $5-7 billion or Php336 billion in excise taxes, fees and royalties from mining from 2004-2010. But from 2004-2007, the government just collected Php26 billion of excise taxes, fees and royalties or eight percent accomplishment.
Taxes, Fees and Royalties from Mining (units are in million)
Taxes 2004 2005 2006 2007Fees, charges and royalties
collected by DENR-MGB120.1 210.2 192.1 774.0
Excise tax collected by BIR 232.5 251.4 489.6 942.1Taxes collected by the National
Government Agencies2,769.1 4,733.6 5,313.2 8,349.7
Taxes and fees collected by LGUs
385.5 453.5 395.0 357.9
Total 3,480.2 5,648.7 6,389.9 10,423.7Mines and Geosciences Bureau (MGB), January 2009
Taxes, Fees and Royalties from Mining (units in million $)
MTPDP target
actual collection
0
1,000,000
2,000,000
3,000,000
4,000,000
5,000,000
6,000,000
7,000,000
8,000,000
1
MTPDP targetactual collection
The Securities and Exchange Commission (SEC) also recorded Php 2.5 billion in paid-up investment in mining. Mining’s contribution to the country’s Gross National Product (GNP) is one percent or Php 75 billion in three years.
On the macro-level, mining contribution to the Gross Domestic Product (GDP) of the Philippines in 2007 is 1.4 percent or Php90 billion compared to agriculture, fisheries, and forestry, which accounted for 16.5 percent of total GDP in the 2nd quarter of 200916.
Agriculture, fisheries, and forestry are the sectors that will be greatly affected by the continuing aggressive mining promotion by the government.
One study undertaken by the University of Asia and the Pacific, reveals that one of the primary obstacles facing investors in the mining industry is the presence of strong anti-mining lobby groups17. According to Alyansa Tigil Mina (ATM), the strong resistance to mining is rooted in the fact that mining is a misplaced economic policy, is destructive of the environment and poses serious threats to asset reform gains. Also, most of the Free Prior and Informed Consents (FPICs) used by the mining companies were fabricated with the help of pro-mining LGU officials and other government officials working on the revitalization of the mining industry.
With all the myths and promises of prosperity mining brings, areas that host mining explorations and operations are still among the poorest areas in the country. Examples of this are mining communities in the CARAGA, Bicol and Cordillera.
16 National Statistical Coordination Board (NSCB) 17 Corporate Social Responsibility: Mining and the Development of Local Economies and Governance. COMP 13th Lecture Series by Colin Hubo and Stan Padojinog, University of Asia & the Pacific CRC, 2009.
7
The Securities and Exchange Commission (SEC) also recorded Php 2.5 billion in paid-up investment in mining. Mining’s contribution to the country’s Gross National Product (GNP) is one percent or Php 75 billion in three years.
On the macro-level, mining contribution to the Gross Domestic Product (GDP) of the Philippines in 2007 is 1.4 percent or Php90 billion compared to agriculture, fisheries, and forestry, which accounted for 16.5 percent of total GDP in the 2nd quarter of 200916.
Agriculture, fisheries, and forestry are the sectors that will be greatly affected by the continuing aggressive mining promotion by the government.
16National Statistical Coordination Board (NSCB)
Civil Society Assessment of the 2004-2010 Medium Term Philippine Development Plan for Mining

Civi
l Soc
iety
Ass
essm
ent o
f the
200
4 -2
010
MTP
DP
224
One study undertaken by the University of Asia and the Pacific, reveals that one of the primary obstacles facing investors in the mining industry is the presence of strong anti-mining lobby groups17. According to Alyansa Tigil Mina (ATM), the strong resistance to mining is rooted in the fact that mining is a misplaced economic policy, is destructive of the environment and poses serious threats to asset reform gains. Also, most of the Free Prior and Informed Consents (FPICs) used by the mining companies were fabricated with the help of pro-mining LGU officials and other government officials working on the revitalization of the mining industry.
With all the myths and promises of prosperity mining brings, areas that host mining explorations and operations are still among the poorest areas in the country. Examples of this are mining communities in the CARAGA, Bicol and Cordillera.
Un-Sustainable Development
The guiding principles for sustainable development are economic development, environmental protection and social equity. In operational terms, sustainable development is defined as meeting the needs of the present without compromising the ability of future generations to meet their own needs. Over four decades of large-scale mining operations, the industry has failed miserably in living by any of the principles of sustainable development.
According to ATM, mining has had minimal contribution to economic development. Mining displaced indigenous peoples and farmers and fosters social division among mining affected communities. And mining will definitely cause major damages to our environment no matter how advanced the technology they are using. There is no way that agricultural land after it has been mined can be used again for agricultural purposes.
Representatives of CMP claim that they have abided by its policy of responsible mining and promoting the practice of sustainable development18.
To verify these counter-claims and to find out the real situation, let us now assess the second thrust of the MTPDP on the rehabilitation of inactive and abandoned mines and how the government and the mining companies handles crisis related to mining.
The government targeted to rehabilitate and address several unresolved mining issues but it seems that they are just paying lip service to its commitment to address the serious issues and problems raised against mining.
Unresolved mining issues
Another major thrust of the MTPDP is the resolution of issues involving mining accidents in abandoned and idle mines. The MTPDP targets are the following:
1. To fully address the Marcopper mines tailings spills. 2. Final Mabatas Tailings dam covering some 38 hectares constructed in 2010.3. Assessment of seven abandoned mines conducted and stopgap measures/rehabilitation of three
abandoned mines implemented.
Marcopper Mines Tailings Spill
The Marcopper mine was operated from 1967 to 1996 by Marcopper Mining Corporation, which was owned by Philippine President Ferdinand Marcos and Placer Development Limited until 1987. After the EDSA uprising, ownership of Marcopper was transferred to the Placer Dome. The mining operation was closed in 1996 after a devastating mining disaster causing over three million tons of tailings to flood a 30-kilometer area around the Boac River and out to sea.
17Corporate Social Responsibility: Mining and the Development of Local Economies and Governance. COMP 13th Lecture Series by Colin Hubo and Stan Padojinog, University of Asia & the Pacific CRC, 2009. 18Chamber of Mines of the Philippines, Inc, “COMP Scores Threats of Anti-Mining Lobby Group,” COMP, 4 September 2009.
Civil Society Assessment of the 2004-2010 Medium Term Philippine Development Plan for Mining

Ass
essm
ent R
epor
t
225
In 2005, the Mining Ombudsman Case Report on the Marcopper mines tailings spill revealed that approximately 200 million tones of mine tailings (waste) had been pumped at sea surface level into Calancan Bay-waters from the years 1975 to 1991.
Over 20,000 people relied on these waters for their livelihood and food through fishing.19 The communities complained of a loss of livelihood, damages to health, and environment impacts with little or no rehabilitation of their environment or compensation for damages. Heavy metal poisoning is blamed for the deaths of at least three children; many others have undergone traumatic lead detoxification. Fishermen have lost limbs allegedly as the result of arsenic contamination from the mine waste. Stomach complaints, dementia and cancer are common.20
In 2004, the Oxfam Australia Mining Ombudsman funded a scientific team to asses the water quality along Mogpoc River. The study showed that pollution levels in the river is at an extremely high level, sufficient to kill most aquatic animals.
To fully address Marcopper mines tailings spill, the Mining Ombudsman has specific recommendations based on the demands of the communities of Marinduque. In summary, these are21:
1. Compensation for the deaths of their children, lost livelihoods and homes, poor health and polluted environment.
2. Access to immediate treatment for their health problems.3. The full rehabilitation of their polluted rivers, lands and oceans.4. Immediate action to stop ongoing pollution from the Marcopper waste dumps and Calancan Bay tailings
causeway and to address the dangerous state of repair of the Maguila-Guila tailings dam and 310 tunnels.5. Transparency and information disclosure by the companies and full participation in all decision-making.6. The permanent closure of the Marinduque mine.
On August 2004, the first year of the MTPDP implementation, the fulfillment of these recommendations faced an impediment when the Placer Dome refused to take any responsibility given that they are no longer owners of Marcopper mine and pointed to Marcopper Mining Corporation as the company responsible for these problems. It is now also difficult to hold Placer Dome, having already divested from the country in 1997, accountable and legally liable.
No public documents or reports are available to present government’s response and detailed accomplishments relating to the Marcopper mines tailings spill.
Mabatas Tailings Dam
The Phase I Mabatas Interim Tailings Disposal Facility of the Diwalwal Direct State Development Project (DDSDP) will cover three hectares of the Mabatas Creek drainage area within public forest land that, according to the Mines and Geosciences Bureau (MGB) of the DENR, is not part of the protected forest in a logged over area of PICOP Resources, Inc.. The portion upstream of the dam will be used as an impoundment area for tailings coming from the processing of the ores from the Diwalwal mines. The Phase II Mabatas Final Tailings Disposal Facility will cover 35 hectares in the same area. It shall cover 3 hectares of the interim facility. The larger dam axis of the final facility will be constructed downstream of the interim tailings dam axis, about 1 kilometer from the confluence of the Mabatas Creek and the Naboc River.
The 8,100 hectares of the Diwalwal Mineral Reservation and Environmentally Critical Area was part of the 1.9 million hectare Agusan-Davao-Surigao Forest Reserve established in 1931 under Proclamation 369. There is no updated report on the status of the Mabatas Dam construction.
19Mining Ombudsman Case Report: Marinduque Island by Ingrid Macdonald and Cathy Southhall, Oxfam Australia20ibid21Mining Ombudsman Case Report: Marinduque Island by Ingrid Macdonald and Cathy Southall, Oxfam Australia
Civil Society Assessment of the 2004-2010 Medium Term Philippine Development Plan for Mining
…the industry has failed miserable in living by any of the principles of sustainable development…

Civi
l Soc
iety
Ass
essm
ent o
f the
200
4 -2
010
MTP
DP
226
Abandoned Mines
For more than three decades, several large-scale mining projects in the country have shut down because of economic loss, labor disputes, or a rejected mining application. But none of these mining projects were rehabilitated after the closure. Sadly, government regulations lacked the provision to enforce remediation until those regulations came in 1996, when guidelines on mine rehabilitation and decommissioning were set in the implementing rules and regulations of the Mining Act of 1995.
The government included the rehabilitation of abandoned mines in the priorities articulated in the MTPDP of 2004-2010. This was the result of consultations made in connection with the Mineral Action Plan. The MGB is carrying out this program parallel to the Revitalization Program22.
The program has two major components, the rehabilitation /re-development of identified abandoned mines and the activities relating to the Bagacay Mine Rehabilitation Project.
The MTPDP targeted assessment of seven (7) abandoned/inactive mines and implemented the rehabilitation of at least three (3) abandoned mines . According to the Philippine Center for Investigative Journalism (PCIJ) report23 by Karol Anne Ilagan, in 2001, MGB had tapped Tetra Tech to help it draw up a list of mines that needed the most attention. The project covered assessment of 20 mining sites. Previously, MGB had conducted a similar study, which assessed 44 abandoned mines.
The 2001 report by Tetra Tech EM Inc. on 20 abandoned mines across the country had observed that all pose risks at varying degrees. Noted the U.S based environmental consultancy firm: “Land and water media are impacted with chemical contaminants, which may harm human health and the aquatic, terrestrial and wild lives. Unless proper mitigation and corrective actions are undertaken, the surrounding population and receiving environment will be continuously exposed to both chemical and physical risks.”24
MGB identified six (6) priority abandoned/inactive mines from the Tetra Tech report for rehabilitation. These had been operated by the following companies: Philippine Pyrite Corp. in Bagacay, Western Samar; Basay Mining Corp. in Negros Oriental; Palawan Quicksilver Mines in Puerto Princesa City; Thanksgiving Mine/Benguet Exploration Inc.; Black Mountain Inc. in Benguet; and Consolidated Mines Inc. in Marinduque. From the earlier study, it selected the mine operated by Western Minolco Corp. in Benguet for the last slot in its priority list. Among other things, the MGB said that the mine had caused the destruction of aquifers, while toxins were found in surrounding bodies of water25.
22Championing Responsible Mining: A report of accomplishment on mining and geosciences under the watch of Sec. Lito Atienza23Karol Anne Ilagan, “Minding Mining: A Mess of Mines” in the Philippine Center for Investigative Journalism IReport; available from http://www.pcij.org/i-report/2009/mine-rehabilitation.html. INTERNET. 24 Ibid. 25Ibid.
Civil Society Assessment of the 2004-2010 Medium Term Philippine Development Plan for Mining

Ass
essm
ent R
epor
t
227
Mines and Geosciences Bureau’s First List of Priority Abandoned Mines Site26
PROJECT/COMPANY
COMMODITY LOCATION PERIOD OF OPERATION
RATE OF RISK
(%)
PHYSICAL HAZARD
Philippine Pyrite Corporation
Pyrite, Copper Bagacay, Hinabangan,
Western Samar
1956–1992 82.53 • Dilapidatedmillandlaboratoryfacilities may collapse and cause harm.
• SteepslopesinMinePit#1areunstable and may cause erosion.
• Thewallsoftailingsponds1,6,7 and 8 may collapse and cause spillage of its contents.
• Theremainingwallsoftailingsponds 2,3,4 and 5 may give way and cause landslides, flash floods and mudslides.
• Thecontinuingdischargeoftailings is causing siltation of the drainage systems.
Palawan Quicksilver Mines
Mercury Tagburos, Puerto
Princesa, Palawan
1953–1976 80.23 • Noobservedphysicalhazards
Basay Mining Corporation
Copper Bgy. Maglinao,
Basay, Negros Oriental
1978–1994 79.79 • Thetailingspondsareunstable.
• Unstableslopesarepronetoerosion and landslides.
• Potentialaccidentsmayhappen in the abandoned mine and mill facilities due to unstable structures.
Consolidated Mines Inc.
Copper Ino and Capayang, Mogpog,
Marinduque
1977–1979 61.93 • Theopenminepitiswater-filled.
• Metalandironscraps,spent/unused chemicals, corroded drums, roofing and wall panels, including equipment and machinery were left scattered in the mill plant area.
Black Mountain Inc.
Gold Tuba, Benguet
n.a. 59.86 • Noobservedphysicalhazards
Thanksgiving Mine, Benguet Exploration, Inc.
Gold Camp 6, Kennon
Road, Tuba, Benguet
n.a. 59.86 • Noobservedphysicalhazards
Western Minolco Corp.
Copper Atok, Benguet
1974–1982 n.a. • n.a.
26Ibid.
Civil Society Assessment of the 2004-2010 Medium Term Philippine Development Plan for Mining

Civi
l Soc
iety
Ass
essm
ent o
f the
200
4 -2
010
MTP
DP
228
Presently, only the Philippine Pyrite mine in Bagacay in Western Samar is undergoing rehabilitation. According to the PCIJ report, though the MGB says it will still use the Tetra Tech study as a reference point, the MGB has started re-evaluating and revising its priority list of abandoned mines for rehabilitation, based on an entirely new set of criteria and processes27.
Insensitive schemes
The government offers a wide variety of tax regime and incentives to attract mining investors. The incentives include repatriation of investment, remittance of earnings, foreign loans and contract, freedom from expropriation, requisition of investment, and confidentiality. There are also fiscal incentives like a six-year tax holiday for commercial mining operations.
Despite these incentives, as well as regular mining conferences and exhibitions held to showcase possible mining sites and opportunities in the Philippines, government has still failed to attract mining companies to invest in the country.
Mt. Diwalwal
The government showcases Mt. Diwalwal as one of the areas with a huge volume of mineral deposits, particularly gold. Mt. Diwalwal, a project being spearheaded by the state-run Philippine Mining Development Corporation (PMDC), is aggressively promoted in government’s regular mining conference and exhibitions. But in 2008, the Supreme Court (SC) ordered the PMDC to explain why they should not be cited in contempt for initiating the bidding process for the exploration and mining operations of the 8,100-hectare Diwalwal Gold Rush Area in Compostela Valley. The bidding was allegedly undertaken by the PMDC, an attached agency of the DENR, despite the pending legal dispute over the mining area before the high court.28
IV. RECOMMENDATIONS
The revitalization of mining is a misplaced economic policy. Statistics and economic history both reveal that mining has only contributed 1.4 percent of the GDP, has never employed more than 250,000 workers, translating to no more than 0.4 percent of the labor force. There is evidence that the claimed investments in mining for the period 2004-2008 has never achieved more than 40 percent of its target amount for investments.
Large-scale mining poses a serious threat to asset reform gains. It has displaced and continues to displace indigenous peoples from their ancestral domains under the Indigenous Peoples’ Rights Act (IPRA) and small farmers under the Comprehensive Agrarian Reform Program (CARP). In fact, the displacement of indigenous peoples and farmers is heightened. The Philippine Partnership for the Development of Human Resources in Rural Areas (PhilDHRRA) reported in 2008 that mining and logging applications or operations directly impact more than half of ancestral domains of indigenous peoples. Moreover, the study revealed that 72 percent of these extractive activities (mining and logging) located within ancestral domains operate without securing free, prior, and informed consent (FPIC) from indigenous peoples.
It poses risks to protected areas and critical watersheds covered by the National Integrated Protected Areas System (NIPAS). It also has a direct impact on irrigation and agricultural lands of farmers and leads to the contamination of municipal waters and coastal areas covered by the Fisheries Code.
Civil Society Assessment of the 2004-2010 Medium Term Philippine Development Plan for Mining
27Ibid.28“PMDC Made to Explain Start of Diwalwal Exploration,” in Sun Star Manila; Sunday, 23 November 2008; available from http://www.sunstar.com.ph/manila/pmdc-made-explain-start-diwalwal-exploration; INTERNET.

Ass
essm
ent R
epor
t
229
Concerns have been raised about the Philippines’ compatibility with large-mining operations. These concerns relate to the country’s geography and topography, its poor regulatory regime, its tendency to mining disasters and other environmental problems. Tailings waste pollution has contaminated at least 14 major river systems in the country; abandoned mines have shown signs of acid mine drainage. We have already experienced environmentally devastating mining disasters such as the 1996 Marcopper tragedy in Marinduque, which killed marine life in the 26-kilometer waterway, flooded farmlands and villages along its banks, and in the process, leaving a clean-up cost of US$80 million.
Social conflicts in mining-hosted communities have escalated. Human rights violations have been documented; one case has even been elevated to and discussed at the United Nations Commission on the Elimination of Racial Discrimination (UNCERD). In many instances, mining companies tap government enforcement agencies such as the Philippine National Police (PNP) and the Armed Forces of the Philippines (AFP) as security forces. In these cases, harassment and the denial of access to ancestral domains and livelihoods have increased.
The lack of transparency in many of these mining contracts remains to be a genuine concern. In many instances, communities and their support groups do not have or are denied access to relevant and pertinent documents regarding the mining applications and project details. This is because the government, as part of its strategy to attract investors, tolerates the lack of transparency in the mining industry. In some cases, the actual revenues generated by these mining companies are padded, or subjected to overly generous incentives. This, in the process, denies the communities and even LGUs of their just share in the benefits of mining.
In view of this situation, our recommendations for the next MTPDP would include:
1. Drop the prioritized revitalization of the mining industry. EO 270-A must be revoked immediately. Given the findings in the report, mining has not contributed significantly to economic growth in terms of tax revenues, substantial investments, or employment. In its stead, a shift to policy in rural development – agrarian reform, agriculture development, and fishery development – must be given priority.
2. The government must adopt a policy of “the whole Philippines is not open to mining, unless certain conditions (e.g., asset reform, social justice, cost-benefit analysis, etc.) reveal that extracting the mineral is the best use and most economically beneficial option.
3. The current Philippine Mining Act of 1996 (RA 7962) is flawed, given that it is clearly inconsistent with other laws. A new mining law that harmonizes mining policies with other laws such as the IPRA, NIPAS, the Local Government Code (LGC), Agriculture and Fisheries Modernization Act (AFMA), Environmental Impact Assessment (EIA)/Environmental Impact Statement (EIS), and the Climate Change Act, among others, must be enacted.
4. As the findings of the assessment reveal, too many risks are taken and negative impacts introduced by the current policy of aggressively promoting large-scale mining. Given these, a moratorium on large-scale mining operations must be imposed. Permits for pending applications must not be issued, and all large-scale mining operations that have questionable circumstances (resistance from communities, opposition of local government units or LGUs, flawed procedures, etc.), must be immediately suspended and reviewed.
5. The principles of local autonomy must be respected. Local ordinances banning or moratoriums issued against mining must be respected and upheld. The Department of Interior and Local Government (DILG) and the Department of Justice (DOJ) must review and revise their position that “2-out-of-3” is equivalent to “consent” or endorsement by the LGU. Instead, Sec. 26 and 27 of the LGC stating that ALL LGUs to be affected by national development projects (including mining) must first give their consent, must be absolutely respected.
Civil Society Assessment of the 2004-2010 Medium Term Philippine Development Plan for Mining
…a shift to policy in rural development must be given priority…

Civi
l Soc
iety
Ass
essm
ent o
f the
200
4 -2
010
MTP
DP
230
Civil Society Assessment of the 2004-2010 Medium Term Philippine Development Plan for Mining
6. As part of finalizing the national mining policy, several things must be put in place. These include the:
a) Finalization of a National Industrialization Plan that will indicate the actual minerals and metal needs of the country, and which will contribute to the realization of this industrialization plan.
b) Conduct of a complete, accurate, and realistic inventory of the country’s mineral reserves. This should pinpoint specific locations, types, and values of the minerals that can potentially be extracted.
c) Production of a mineral extraction plan that will respond to the actual needs specified in the National Industrialization Plan, while considering other alternative (and more beneficial) uses of the targeted mineral lands.
7. The government must sign the Extractive Industry Transparency Initiative (EITI), in order to ensure transparency and accountability among mining companies operating in the Philippines.

Ass
essm
ent R
epor
t
231
Civil Society Assessment of the 2004-2010 Medium Term Philippine Development Plan on Automated Elections
I. INTRODUCTION
The Medium Term Philippine Development Plan (MTPDP) 2004-2010 lays out the Arroyo government’s ten-point legacy to the Filipino people. Under the overarching objective of national harmony, the government commits to deliver credible elections through the modernization of electoral systems. Modernization under this plan centers on the computerization of elections. It is believed that through automated elections, electoral fraud issues will be addressed. To support this, the Omnibus Election Code will also have to be amended and updated according to the needs of the times. Other reform measures identified under this plan include the passage of laws that will strengthen the party system and regulate political party activities, specifically those related to campaign finance. On the other hand, voters need to be educated so that they can move away from personality-based towards platform-based politics. This is to be achieved through an improved voters education program.
Critique of the government’s reform efforts under this chapter will focus on the centerpiece of the reform agenda – automated elections. Automated elections predicate the amendments made to the election code, actions taken (or non-action) to improve the voters education program specifically on revised election procedures, and initiatives affecting election regulations including those related to campaign finance.
The Transparency and Accountability Network (TAN), along with other organizations and public interest groups such as Procurement Watch and the National Citizens’ Movement for Free Elections (NAMFREL), has monitored the procurement of the automated election systems since March 2009. TAN’s procurement monitoring experience has uncovered procedural problems, which now affect the execution of the grand automation project. While the automation process of the May 2010 elections is still unfolding, news reports already reveal operational problems rooted in earlier mistakes. At the homestretch, the realization is that electoral reform is only as good as government’s political will to undertake self-reform. Commitment to the reform effort is unveiled by real actuations vis-à-vis proclamations.
II. PERFORMANCE AND ACCOMPLISHMENT IN 2004-2010
Modernization of the Electoral System through Computerization
The call for modernization is premised on the idea that the current system is no longer responsive to current needs.
Oftentimes, modernization of electoral systems is equated with the introduction of new technologies. The experience of other countries has shown, however that the most effective election innovations can sometimes involve the simplification of, rather than the adoption of new technologies in, electoral processes. (Erben, 2008; Schmidt 2008)
1Prepared by Vincent Lazatin, Transparency and Accountability Network (TAN)

Civi
l Soc
iety
Ass
essm
ent o
f the
200
4 -2
010
MTP
DP
232
Historically, the Philippines’ framework for election modernization has been anchored on a ‘computerization’ agenda set as early as 1992. Computerization of the electoral process was then thought to be the appropriate response to electoral fraud. The Commission on Elections (COMELEC) attributed errors (whether deliberate or not) in the tallying of votes, preparation of election returns, manufacturing results in election returns, appreciation of ballots and unreadable handwriting to faulty procedures and systems that could be corrected through computerization. Efforts to computerize the electoral process began in 1992. However, the efforts did not move beyond the pilot-test stages for various reasons.
(www.COMELEC.gov.ph) The common thread underlying these reasons is the lack of political will on the part of government to create an enabling environment for the success of the modernization project. Foremost among these reasons was the absence of a sufficient budget and supportive laws and policies.
In 2004, President Gloria Macapagal-Arroyo identified election automation as a government priority in her State of the Nation Address (SONA). Shortly after that, the president was dragged into a scandal involving charges of election rigging during her 2004 presidential bid. The scandal led to investigations and finally a controversial public apology by the president. As a backdrop, this paints a grim picture for genuine electoral reform under the Arroyo administration. High levels of public distrust2 brought about by this and other events explains the general attitude of resistance and apprehension towards many government initiatives, not the least of which is electoral reform.
In January 23, 2007, Republic Act (RA) 9369 was passed into law, amending RA 8436, which authorizes the COMELEC to use an Automated Election System (AES) for the May 2010 elections. Pursuant to RA 9369, the COMELEC conducted a pilot-test, and subsequently reported the success, of the AES in the 2008 ARMM elections. The AES was now to be rolled out nationwide. The process of automating the May 2010 elections was begun at this point. In September 2008, the COMELEC requested a supplemental budget of 21 billion pesos from the Department of Budget and Management (DBM) for the automation project. It took Congress six months (until March 2009) to approve half of the proposed amount (11.3 billion pesos). This left the COMELEC with just a little over one year to implement the automation project from procurement to testing, roll-out, and execution. (TAN, 2009) The one-year timeframe for the implementation of a project with such magnitude invites doubts from different sectors of society. It set a fertile ground for political speculations and scenario building, such as the possibility of no or failure of elections. Again, issues of public trust and confidence continue to surface. This is further compounded by the persistent problem of the absence of political will. Congress’ belated passage of the budget left COMELEC with a tightrope to walk on. Further, following the 2004 SONA announcement, there was no budgetary commitment for election modernization until three years later in 2007. (GWatch, 2009)
COMELEC’s procurement of the AES also contributed to the delay in the implementation of the automation project. According to TAN, the delay was largely due to the complex institutional setup and procurement process of the COMELEC. Procurement of the AES was governed by the automation and procurement laws, which made the task doubly difficult to execute. It required the creation of a COMELEC Advisory Council (CAC), composed of civil society and private sector representatives among others, tasked to formulate the AES design. On the other hand, the COMELEC Special Bids and Awards Committee (SBAC) tasked with the conduct of procurement likewise had powers to define the AES design. This overlap in function contributed to the difficulties encountered by the SBAC in the conduct of the procurement.
To begin with, the SBAC was constituted late. It was created when the AES design was already being finalized by the CAC. The request for proposal (RFP) or call for bids was based on this design. The SBAC was expected to execute bidding strictly based on the RFP. However, as bidding transpired, some problems arose with the RFP requirements, which therefore required revisions by the SBAC. As it turned out, the SBAC issued 25 bid bulletins to clarify and/or modify the RFP requirements. This contributed to the difficulties encountered by bidders to
Civil Society Assessment of the 2004-2010 Medium Term Philippine Development Plan on Automated Elections
2At around the time when the “Hello Garci” scandal broke out, 57 to 62% of Filipinos wanted GMA out. This is according to the surveys conducted by CNN/Time, Social Weather Stations, and Pulse Asia. (http://edition.cnn.com/2005/WORLD/asiapcf/07/10/arroyo.poll/index.html; http://www.sws.org.ph/; http://en.wikipedia.org/wiki/Hello_Garci_scandal)

Ass
essm
ent R
epor
t
233
comply with bidding procedures and requirements. It resulted in long debates and deliberations between and among the bidders, the SBAC members, and the observers. Moreover, this likewise led to numerous motions for reconsideration filed by the bidders before the COMELEC en banc to appeal for unfavorable decisions rendered by the SBAC.
Further, because of the over-extended opening and evaluation of bids, some parts of the bidding process were rushed, which may have compromised the integrity of the automation project. The post-qualification of TIM-SMARTMATIC was done in haste. The 60-40 ownership requirement of the joint venture TIM-SMARTMATIC was never investigated. TAN’s apprehension is that there may have been misrepresentation on the part of the contractor to fulfill this ownership requirement, thus paving the way for its participation in the bidding process. Also, the cursory verification done by COMELEC on these and other qualifications now presents problems in terms of TIM-SMARTMATIC’s capability to deliver. Thus far, TIM-SMARTMATIC has been incurring delays in meeting key deliverables according to contract schedules. (TAN, 2009)
Voters Education
In October 2009, COMELEC launched the website www.ibanangayon.ph, which serves as its main channel to disseminate information on the new system for voting under automated elections. In December, it began its nationwide road show demonstration of the precinct count optical scan machines (PCOS) machines. The recent survey conducted by Pulse Asia, however, shows the low level of acceptance of the new system. Only four out of 10 Filipinos are optimistic about it; 16 percent think it will result in cheats; and 43 percent remain undecided about the outcome of elections in May 2010. At the homestretch, these figures depict a problematic scenario for COMELEC in the coming elections. Public confidence in the new system does not only encourage voters to exercise their right to vote and directly participate in the democratic process of elections, but also means that the public will accept the results that will be generated by the new system.
Measures to strengthen the party system and regulate the activities of the political parties.
At present, there are still no laws strengthening the party system. Three bills are pending at the House of Representatives (authored by Congressmen Juan Angara, Rufus Rodriguez, and Narciso Santiago III). At the Senate, three bills authored by Senators Ejercito-Estrada, Legarda, and Angara, remain pending. It is likely however that these bills will fade into the archives, as members of Congress get busy with early election-related activities.
Incidentally, the Supreme Court has issued a decision effectively weakening the COMELEC’s regulation power over campaign activities, specifically with regard to premature campaigning. Associate Justice Antonio Carpio’s decision on the Penera vs. COMELEC case resulted in the decriminalization of premature campaigning.
III. RECOMMENDATIONS
In the light of the above assessment, the following are being presented as recommendations:
• Enactmentofacampaignfinanceandpoliticalpartyreformlawthatwould,amongotherthings:o Strengthen genuine political parties and discourage and penalize political turncoats; ando Enhance the capacity and capabilities of the COMELEC to credibly enforce the political campaign
laws
• Modernization of the Commission on Elections. Modernization of elections goes beyond electionautomation and includes upgrading the capacities of COMELEC employees and officials, modernization if its information technology systems, etc.
Civil Society Assessment of the 2004-2010 Medium Term Philippine Development Plan on Automated Elections

Civi
l Soc
iety
Ass
essm
ent o
f the
200
4 -2
010
MTP
DP
234
REFERENCES:
Bauzon, Bernice Camille V. “Poll automation timetable threatened anew.” 2010. [Retrieved January 13, 2010]. Available from http://www.manilatimes.net/index.php/news/nation/9278-poll-automation-timetable-threatened-anew; INTERNET.
Commission on Elections. “Modernization of the Electoral Process.” [Retrieved March 27, 2009]. Available from http://www.COMELEC.gov.ph/modernization/history.html; INTERNET.
Crisostomo, Sheila. “COMELEC to start voters education drive.” 2009. [Retrieved January 13, 2010]. Available from http://www.philstar.com/Article.aspx?articleId=523477&publicationSubCategoryId=63; INTERNET.
Crisostomo, Sheila. “Melo worries about delay.” 2009. [Retrieved January 13, 2010]. Available from http://www.philstar.com/Article.aspx?articleId=522049; INTERNET.
Erben, Peter. “Principles and Standards for Introducing Electoral Technology.” Presented at the Election Technology Conference and Vendor Exhibition, Manila, Philippines, November 17, 2008.
GMANews.TV. “COMELEC voters’ info drive ‘weak’ – VP de Castro.” 2010. [Retrieved January 13, 2010]. Available from http://ph.news.yahoo.com/gma/20100111/tph-COMELECs-voters-info-drive-weak-vp-d-d6cd5cf.html; INTERNET.
Government Watch. “COMELEC BudgetWatch: G-Watch Report on the Tracking and Documentation of COMELEC Budget Process.” Paper presented at Baby Steps to Good Governance in COMELEC forum, Astoria Plaza, Pasig City, Philippines, April 1, 2009.
Ho, Abigail L. “COMELEC uses internet for voter education.” 2009. [Retrieved January 13, 2010]. Available from http://newsinfo.inquirer.net/breakingnews/infotech/view/20091029-232940/COMELEC-uses-Internet-for-voter-education; INTERNET.
Maragay, By Fel V. “Delay in election automation feared.” 2009. [Retrieved January 13 2010]. Available from http://www.manilastandardtoday.com/insideNation.htm?f=2009/october/31/nation1.isx&d=/2009/october/31; INTERNET.
Reformina, Ina. “Smartmatic-TIM says COMELEC also delayed.” 2009. [Retrieved January 13, 2010]. Available from http://www.abs-cbnnews.com/nation/12/16/09/smartmatic-tim-says-COMELEC-also-delayed; INTERNET.
Rufo, Aries. “SC decriminalizes premature campaigning.” 2009. [Retrieved January 13, 2010]. Available from http://www.abs-cbnnews.com/nation/11/24/09/sc-decriminalizes-premature-campaigning; INTERNET.
Schmidt, A. “Application of Election Technology: Considerations for Election Administrators, Practitioners and Policy Makers”. 2008.
Sun Star. “COMELEC urged to improve voter’s education.” 2010. [Retrieved January 13, 2010]. Available from http://www.sunstar.com.ph/manila/COMELEC-urged-improve-voters-education; INTERNET.
Transparency and Accountability Network. “Election Modernization in the Philippines: Prospects for Election Observers.” Unpublished manuscript. August 2009.
Civil Society Assessment of the 2004-2010 Medium Term Philippine Development Plan on Automated Elections

Ass
essm
ent R
epor
t
235
Civil Society Assessment of the 2004-2010 Medium Term Philippine Development Plan on the Implementation of the National Peace Plan1
I. INTRODUCTION
For almost four decades now, the Philippines has suffered armed conflict on two major fronts: the communist insurgency of the Communist Party of the Philippines - New People’s Army – National Democratic Front (CPP-NPA-NDF); and the Bangsamoro liberation front of the Moro Islamic Liberation Front (MILF) and Moro National Liberation Front (MNLF). The peace processes undertaken to address these intractable ideology-based armed conflicts have been likewise protracted.
Chapter 14 of the Medium Term Philippine Development Plan (2004-2010), entitled National Harmony: the Peace Process is considered to be the National Peace Plan. It states the five main goals of the GMA administration for the peace process:
• Completion of the comprehensive peace agreements with rebel groups resulting in the permanentcessation of armed hostilities by 2010;
• Completionoftheimplementationofallfinalpeaceagreementssignedsince1986;• Mainstreamingtherebelgroupsthroughanenhancedamnesty,reintegrationandreconciliationprogram;• Rehabilitation,development,andhealingofconflict-affectedareas;and• Strengtheningthepeaceconstituencyandcitizens’participationinthepeaceprocessontheground.
Towards these goals, the government will pursue a peace plan with two main components:
• Peacemakingandpeacekeeping;(focusingonthefirstthreegoalsabove)and • Peacebuildingandconflictprevention(withthegoals4and5)
The National Peace Plan, while new as the first peace policy and plan that is part of the MTPDP, is an elaboration based on Executive Order No. 3 issued by President Gloria Macapagal – Arroyo as a priority policy for her administration.
President Arroyo’s EO No.3 is in turn a reprise of Executive Order No. 125 issued by President Fidel V. Ramos in September 2003. These policies adopt the “Six Paths to Peace” which were recommended based on the National Unification Commission 1993 consultation findings. The six paths are the following: economic and political reforms, consensus building and empowerment, peace negotiations, reconciliation and reconstruction, conflict reduction and transformation, and building a climate of peace thru peace education.
The new aspect of the National Peace Plan is the strong emphasis and detail with regard to enhanced Mindanao initiatives (Mindanao NATIN) on rehabilitation and development in conflict areas and on “catch-up development for ARMM and affirmative action agenda for Muslims”. Therefore, the peace policy and plan of government is quite comprehensive and holistic, seeking to address the socio-economic and structural roots of conflict while undertaking political negotiations with the ideology -based non-state armed groups. The inclusion of this Chapter 14 on “ National Harmony: the Peace Process” in the MTPDP is significant because it affirms that peace processes leading to the end of major armed conflicts has a significant contribution to reaching development goals. The Philippine Human Development Report of 2005, focusing on Human Security, aptly highlighted the interconnections between human security and development, including the economic and non-economic costs of conflict.
1Prepared by Karen Tanada (Executive Director), Nikki Alben Delfin and Beverly Orozco of the Gaston Z. Ortigas Peace Institute (GZO-PI)

Civi
l Soc
iety
Ass
essm
ent o
f the
200
4 -2
010
MTP
DP
236
This assessment will discuss the progress or accomplishments in meeting the main goals set in the plan, and offer some analysis and recommendations. However, the major limitation is that this paper will not include an assessment of the Mindanao Natin implementation, which would require more information and analysis beyond the available government reports.
II. PERFORMANCE AND ACCOMPLISHMENT IN 2004-2010
Goal 1: Completion of Final Peace Agreements
The National Peace Plan boldly targets the conclusion of peace agreements through peace negotiations with three main armed groups/ideological fronts:
• TheMoroIslamicLiberationFront(MILF) • TheCommunistPartyofthePhilippines/NewPeoples’Army/NationalDemocraticFront(NDF) • TheRebolusyonaryongPartidongManggagawangMindanao
The following section tracks the peace negotiation efforts and their results, and also looks at the results with regard to “complementary measures to lower the levels of violence”. The latter is considered to be an important aspect - that there should not be just continuing peace talks but that their impact should be seen through decreased armed encounters and less number of casualties of conflict.
The GRP-MILF Peace Negotiations
At the onset, the Arroyo administration responded to the armed conflict with the Moro Islamic Liberation Front (MILF) by proclaiming a vigorous peace negotiations policy. This reversed the more militaristic approach of the previous administration that launched intensified military campaigns against the MILF in 2000. Aside from the issuance of Executive Order No. 3, the goal of “termination of peace processes”, with a just end to the armed conflicts was among the ten priority agenda of the government.
The September 11, 2001 attacks in the United States had global implications that included the Philippines, which had joined the global coalition against terror. The Philippine government however, opposed proposals to name the MILF as a terrorist organization, and instead continued to negotiate with
them for a peaceful settlement. It also distinguished the MILF from its breakaway or “rogue elements” and from the notorious Abu Sayyaf Group. Despite some negative implications for other peace processes and perspectives on human security, for the GRP-MILF talks, the 9-11 event had the effect of encouraging the armed parties, and supporting governments and entities, to pursue the peace talks and avoid a slide to terrorism in the Southeast Asia region.
An early achievement in the peace negotiations was the signing on the Agreement on General Framework for the Resumption of Peace Talks between the GRP and the MILF in 2001 identifying 4 aspects of coverage: security, rehabilitation, ancestral domain and activation of committees.
By May of 2002, the 4th round of the GRP-MILF formal peace talks also yielded the Implementing Guidelines on the Humanitarian Rehabilitation and Development aspect of the GRP-MILF Tripoli Agreement of Peace of 2001. This enabled capacity-building, and rehabilitation support through the Bangsamoro Development Authority of the MILF, towards their management of future development assistance.
However in February 2003, in the midst of progress in the peace processes, the Philippine military attacked the main MILF camp in the Buliok area, supposedly in pursuit of certain criminal elements. The attack also was done during the very holy religious feast of Eidl Adha. This triggered massive evacuations in the Central Mindanao
Civil Society Assessment of the 2004-2010 Medium Term Philippine Development Plan on the Implementation of the National Peace Plan

Ass
essm
ent R
epor
t
237
area - up to 452,000 persons, agricultural loss, infrastructure damage, and huge economic losses, including investments foregone. Fortunately, after various interventions including by religious leaders, peace elements in government and civil society advocates, the parties returned to a full ceasefire a few months later in July 2003.
Peace talks resumed and the 5th Exploratory Talks in Kuala Lumpur ended with the following results: 1) agreement on gradual pull-out of the troops in Buliok; 2) deployment of the Third Party Monitoring Team to Mindanao; 3) formation of the Ad Hoc Joint Action Group (AHJAG); and 4) ancestral domain set as next agenda for the peace talks .
After the difficult lessons from the Buliok attacks, the parties more seriously persisted with the peace negotiations, resulting in more substantive agreements. The mechanisms for ceasefire were also set up, in particular the GRP-MILF Tripoli Agreement on Peace which consolidated the Terms of Reference for the International Monitoring Team and formalized the Agreement for the Joint GRP-MILF Coordinating Committee on the Cessation of Hostilities (CCCH).
In April 2005, the seventh round of exploratory talks in Malaysia concluded the discussion on concept, territory, and resources on ancestral domain. Silvestre Afable, then the head of the peace panel said that “the most difficult hurdle in the ancestral domain agenda” was successfully finished. Exploratory talks on ancestral domain continued through December 2005.
By this time however, the Arroyo administration was rocked by political crises, and even had to declare a state of emergency in February 2006. Talks in September 2006 were not productive due to the contentions of both parties on the areas to be placed under the Bangsamoro Judicial Entity (BJE).
Despite a major event with the killing and beheading of 10 marines in Basilan in July 2007, where the MILF were initially accused, a joint investigation by the AFP and MILF found that elements other than the MILF were involved in the beheading. Eventually peace negotiations were resumed and sustained from October 2007, during which an agreement was reached on the scope and boundaries on ancestral domain affirming “all previous points of consensus on the core items of the territory issue”.
Then in December 2007, talks again stalled on “constitutional issues”. In the meantime, the International Monitoring Team was due to pull out by the 2nd Quarter of 2008, putting the ceasefire at risk.
It was therefore a surprise to the general public when a determined push in July 2008 by the peace negotiating panels, produced a consensus document (preliminary to a final contract) between the two parties: the Memorandum of Agreement on Ancestral Domain (MOA-AD). The MOA-AD schedule for signing was slightly delayed by a final legal vetting by Palace officials. This document cited in a Joint Communiqué on July 27, 2008 was said to be a product of intensive negotiations and also of creative approaches on the part of the peace panels, including proposals beyond the current Philippine constitution, that would entail charter amendments.
However, the MOA-AD was struck down by a temporary restraining order (TRO) of the Supreme Court just before it was due to be signed in a grand ceremony on August 5, 2008 with civil society and diplomatic community observers. Weeks later, the Supreme Court by a vote of 8-7 declared the MOA-AD unconstitutional.
The non-signing of the MOA-AD became the trigger for renewed hostilities. Furious, some MILF commanders started offensives, in particular with 102nd Base Commander Bravo attacking civilian areas in Lanao del Norte. Umbra Kato, the 105th MILF BIAF Base commander, had earlier in July already taken over 26 barangays in five municipalities in North Cotabato and some clashes had begun. Fighting escalated starting August 2008, with the AFP operations going after these MILF commanders in Maguindanao, Sultan Kudarat, and North Cotabato.
The hostilities resulted in massive evacuation of more than 600,000 persons, cited to be the biggest displacement of persons globally for the year 2008. After the non-signing of the MOA-AD and the renewed
Civil Society Assessment of the 2004-2010 Medium Term Philippine Development Plan on the Implementation of the National Peace Plan

Civi
l Soc
iety
Ass
essm
ent o
f the
200
4 -2
010
MTP
DP
238
hostilities of the ‘renegade’ MILF commanders, the government shifted its policy from that of negotiating with armed groups to “authentic dialogues with peoples and communities” and furthermore, to DDR (disarmament, demobilization and reintegration).
This post-MOA-AD conflict finally ended one year later in July 2009 with a SOMO (suspension of military operations) declared by the military, followed by declaration of a SOMA (suspension of military actions) by the MILF.
The MOA-AD debacle and effects
There have since been widespread and intensive debates on the MOA-AD, and a resurfacing of some ethnic and religious divides. These are often concerned with the process of the negotiations, the lack of consultation and transparency, as well as the content of the MOA. Although the government as well as the MILF did hold numerous consultations while keeping the details confidential, they failed to convince major stakeholders, including local government officials allied with the administration, on key elements of the agreement.
The MOA basically provides for a referendum to be held in about 700 villages in Mindanao (in contiguous areas beyond the current ARMM) within 12 months after the MOA signing on whether they want to join the Muslim homeland under a Bangsamoro Juridical Entity (BJE). The powers to be given the BJE are quite extensive, with levels of autonomy requiring constitutional amendment. While the MOA was softened by the requirement of a plebiscite for application, it still raised extreme fears and opposition especially among local chief executives in the target territories. Ironically, public opposition to the MOA further built up when disappointed MILF commanders attacked some communities upon the MOA-AD failure.
Another major reason for the MOA-AD problem has been the political context of the politics of survival of the current Administration. The strange timing and flip-flop handling of the MOA-AD stoked suspicions that the agreement may be related to charter change machinations.
As experienced peace advocate Fr. Eliseo Mercado, Jr. has pointed out, it is very difficult for a government, lacking political will and legitimacy, to negotiate and implement a peace agreement. Considering that controversial issues such as Bangsamoro self-determination as well as control over territory are concerned, the ability to build a constituency of support for the peace deal is crucial.
A sad result of the MOA-AD debacle was another round of evacuations for people who had been periodically refugees but had learned to hope that peace would soon be negotiated. As late as July 2009, there were between 259,000 (National Disaster Coordinating Council or NDCC data) and 430,000 (Department of Social Welfare and Development data) internally displaced persons in Mindanao. A total of 435 barangays, 51 municipalities and three cities in 11 provinces had been affected by the renewed hostilities since August 2008 (NDCC, 2009).
The NDCC (2009) stated that there were 380 civilian casualties from August 2008 to July 2009. Most of the civilian deaths were due to poor living conditions and sanitation at the evacuation centers. Out of the 380 civilian casualties, 268 died due to illnesses and not due to actual encounters. Moreover, 80 of the illness-related deaths of civilians were children younger than 5 years old, with diarrhea and respiratory illnesses as the primary reasons (IRIN, 2009).
IRIN (2009) also underlined that the figures for deaths may be underreported and/or unrecorded due to travel restrictions because of the conflict, the remoteness of several evacuation areas, the preference for traditional healing methods as well as the accustomed Islamic ritual of burial within 24 hours.
Civil Society Assessment of the 2004-2010 Medium Term Philippine Development Plan on the Implementation of the National Peace Plan

Ass
essm
ent R
epor
t
239
Casualty figures from the military and the MILF are difficult to access because the propaganda muddles the data coming from both sides. As an example, from August 2008 to July 2009, the MILF reported that AFP casualties reached 500 but the military claimed that there were only 80 deaths in their current military campaign. The military also stated that the MILF had 278 deaths since August 2008, and that this figure excludes MILF forces that were wounded, captured and had surrendered (Sunstar, 2009).
It must also be noted that while military operations increased against the renegades of the MILF since the non-signing of the MOA-AD, the agreement on ceasefire still held for 19 MILF commands (OPAPP, September 2009) and that the government attempted to distinguish the ‘lost commands’ or Lost MILF Groups (LMG) from the other commands. Despite such selective military attacks, the use of aerial bombardment drove many families in fear from their home communities.
Human Rights and IHL Violations
Findings indicate that both the government’s security forces and the MILF fighters had committed human rights and international humanitarian law violations (Amnesty International, 2008). The Amnesty International report outlined MILF attacks on civilians, hostage taking, and the destruction of private property. On the other hand, the military forces also attacked civilians and ill-treated detainees during their operations. There were records of torture, mutilation, pillage, and destruction of property. The Philippine Alliance of Human Rights Advocates (PAHRA) also noted MILF violations through civilian attacks, abduction, looting and mutilation and AFP attacks, torture, and illegal detention in its fact-finding mission in Lanao del Norte (2008). While cases from different fact-finding missions were available, official data on actual number of human rights violations is lacking.
In July 2009, the United Nations canceled its aid missions to the internally displaced persons (IDPs) in Mindanao and several reports of food blockades came in after a series of bombings took place (Reliefweb, 2009). On the other hand, the NDCC and the military denied the blockade along the General Santos-Palimbang highway as claimed by NGOs and the MILF. The military stopped aid workers from entering areas in Lanao del Norte for security reasons but the World Food Programme denied that this was a food blockade, stating that these were isolated incidents and not military policy/ (Inquirer and Mindanews reports).
Current Status of the Peace Process
There have been recent improvements and a revival of peace processes, beginning with the declaration of a SOMO by the GRP and SOMA by the MILF in July 2009 that ended a year of conflict. Informal talks resumed in Kuala Lumpur led to signing on September 15, 2009 of a Framework Agreement on the Formation of an International Contact Group. This ICG will be composed of representatives of countries from the OIC and the EU with an International NGO (INGO) with the mandate of supporting, giving advice, seeking expert assistance, and helping resolve substantive issues in the peace negotiations in coordination with the parties and the facilitator.
On October 27, 2009, another round of informal talks resulted in the signing of an Agreement on the Civilian Protection Component of the International Monitoring Team. An intervening event has been the kidnapping of an elderly Columban priest, Fr. Sinott, from his religious house in Pagadian. The MILF offered to help in the rescue of the priest, but the DILG Secretary Ronaldo Puno has directly accused elements of the 113th command of the MILF of the kidnapping.
Despite this, the GRP and MILF Peace Panels seem determined to continue the peace negotiations in the days to come. Meantime, a new Acting Presidential Adviser of the Peace Process, Annabelle Ababa, was appointed on October 2009, the seventh to hold the position since the drafting of the MTPDP. In preparation for a possible interim peace agreement, the OPAPP has held a series of 12 peace consultations called Dialogue Mindanaw –Reflective Dialogues , involving an average of 300 participants each, mostly in Mindanao but also in Luzon and Visayas. These reflective dialogues have provided participants information on the specific GRP and MILF positions
Civil Society Assessment of the 2004-2010 Medium Term Philippine Development Plan on the Implementation of the National Peace Plan

Civi
l Soc
iety
Ass
essm
ent o
f the
200
4 -2
010
MTP
DP
240
for the peace agreement, and given them the opportunity to give feedback and recommendations on these positions.
Summary of accomplishments on the GRP-MILF peace processes: Despite its problems as a controversial agreement publicly, the MOA-AD reflects a consensus reached between two parties that will be recognized in the coming/future peace negotiations. Much progress was made on
substantive agreements with regard to Ancestral Domain, including concept, resources and territory based on more creative approaches and thinking.
The ceasefire agreements and the related monitoring mechanisms (JCCCH, IMT, and AHJAG) have been effective in lowering the levels of violence. Prior to 2008, the GRP-MILF talks have implemented ceasefire mechanisms and joint monitoring setups. The International Monitoring Team also provided a third party ceasefire monitoring scheme while local civil society monitoring mechanisms, such as the Bantay Ceasefire, have been set up.
The security measures agreed upon by the GRP and the MILF proved to be effective in minimizing the level of violence in the conflict zones. Before the International Monitoring Team (IMT) was in place, over 1000 monitoring violations were noted by civil society groups, while during the IMT’s presence the numbers dropped to less than 10 violations of the ceasefire agreement. (Bantay Ceasefire, April 2008).
The Arroyo administration’s alliance on “global war on terror” has not resulted in the labeling of the MILF as terrorists; instead the threat of Islamic radicalization in the region has been a push to come up with a final peace agreement. The MILF has consistently denounced terror and sometimes claims to support the government in the interdiction of some criminal elements.
The interim agreements on relief and rehabilitation have supported the capacity building of the Bangsamoro Development Authority led and managed by the MILF, through which assistance can begin to reach conflict-affected areas.
One facilitating aspect to the peace negotiations was the basic decision made by the MILF to pursue and sustain the path of diplomacy or negotiations, as a major track in its struggle for Bangsamoro peoples’ rights to self-determination. This determined stance of the MILF since it began negotiations during the Ramos administration has also kept the level of fighting low and made it willing to enter ceasefire agreements. The role of third parties like Malaysia and the OIC in helping to facilitate the talks, and of other countries as well as multilateral agencies to provide post-conflict dividends have helped to build a supportive environment for the peace negotiations.
Gaps in the peace processes
A major gap and hindrance for the peace process has been government’s continuing shift among three competing policy position, which according to the UNDP-Philippines policy assessments on peace and development in southern Philippines are the “pacification position”, “military victory position” and “institutional peace building positions”.
This can be seen in the numerous highs and lows of the peace talks. Some concrete examples are: 1) the Buliok military offensive taking place a day before the Ceasefire Committee’s meeting in 2001; 2) the Tripoli Agreement on Peace in 2001 followed by convoluted Basilan military offensives linking the MILF and the Abu Sayyaf; 3) the PAPP’s 2003 presentation of the draft Final Peace Agreement (FPA) to the Senate President and House Speaker, followed by military attacks in Buliok Complex the day after; and more recently, 4) the security forces and MILF skirmishes that took place 3 days before the signing of the MOA-AD, with the failure fueling the intensification of the conflict and humanitarian crisis from August 2008 to July 2009.
Civil Society Assessment of the 2004-2010 Medium Term Philippine Development Plan on the Implementation of the National Peace Plan

Ass
essm
ent R
epor
t
241
The government has also failed to build a constituency for its peace policy, even among legislators, the judiciary, as well as the general public. This is partly because of the inability to build unities among diverse peoples, where the majority is often unconscious of its dominance and discrimination of the minority, the marginalized, the other. It is also because the government, and particularly the president, has extremely low trust ratings, as a result of continuing corruption scandals and governance crises.
A major stakeholder that should have been given more information and consulted in the negotiations were indigenous peoples of Mindanao whose own ancestral domain claims would be affected by the agreement. Efforts have been taken by the government to include a representative of IPs in the peace panel, but without much concern for credibility and leadership of the person among IPs, and with no support for accountability of the person to the IP constituency. Indigenous peoples tend to be more disadvantaged in socio-economic and political terms, and because they are not armed, so their rights to self-determination and other human rights must be especially protected.
A further issue for the GRP-MILF peace processes is the lack of due consideration for implications of the GRP-MNLF Final Peace Agreement (FPA), and the continuing issues including outbreaks of armed conflict.
On the level of the Organization of Islamic Conference (OIC), the MNLF remains as the sole legitimate representative of the Muslim peoples in Southern Philippines. The ARMM, the territory covered by the FPA, is also the core area to be covered by the MOA-AD between the GRP and MILF. Therefore, some coherence is needed and unity among the different Bangsamoro forces (factions within the MNLF and with the MILF) should be encouraged.
The GRP- NDF Peace Processes
Initial progress was made in the negotiations between GRP and the CPP-NPA-NDF in April 2001, considering that groups associated with the NDF had been among those who helped bring President Arroyo to power through EDSA II. Hopes were high that sustained peace talks could be held, following the basic framework set in The Hague Agreement which set four agenda on which agreement should be reached sequentially: Human Rights and International Humanitarian Law, Social and Economic Reforms, Political and Constitutional Reforms, and End of Hostilities/Disposition of Forces. Peace negotiations were held in Oslo, Norway, and were hosted by the Royal Norwegian Government.
However, the GRP panel suspended talks in June 2001 on the issue of the congratulatory statement of the NDF on the assassination of Governor Rodolfo Aguinaldo. Further talks were stymied by the issue of the terrorist listing of the CPP and NPA and Prof. Jose Ma. Sison by the US and later the European Union, with the NDF demand that the Philippine government achieve their removal from the terrorist list.
Despite these issues, formal talks were finally resumed in February 2004. The two parties agreed on 1) framework of the negotiations; 2) role of the third party facilitator; 3) effective measures regarding the “Terrorist” listing; 4) NDFP Proposal for accelerated work/GRP proposal of an enhanced process; 5) formation of the Joint Monitoring Committee (JMC) for the Comprehensive Agreement on Respect for Human Rights and International Humanitarian Law (CARHRIHL) of 1998; 6) indemnification of the victims of humans rights violations under the Marcos regime; 7) work of the Reciprocal Working Committee on Social and Economic Reforms (RWC-SER); 8) confidence building measures; and 9) exchange of information and complaints.
The Joint Monitoring Committee (JMC) of the CARHRIHL was formally convened on April 15, 2004 and the offices of the Joint Secretariat were formally opened on June 4, 2009 in Cubao, Quezon City. The JMC has not since been convened because the GRP view is that it cannot be convened without the formal peace panel talks, The GRP and NDF Monitoring Committees have been in operation but acting entirely as separate entities. Nevertheless, the operationalization of CARHRIHL through the above agreements may be considered the main achievement of the GRP-NDF peace negotiations since the start of the Arroyo administration.
Civil Society Assessment of the 2004-2010 Medium Term Philippine Development Plan on the Implementation of the National Peace Plan
As late as July 2009, there were between 259,000 and 430,00 internally displaced persons in Mindanao.

Civi
l Soc
iety
Ass
essm
ent o
f the
200
4 -2
010
MTP
DP
242
Otherwise, the negotiations have been characterized more by harsh accusations and preconditions set before talks can proceed. While the NDF has demanded the lifting of the terrorist tag on Jose Ma. Sison and the CPP and NPA, the government also tried to obtain the NDF’s agreement to a sustained ceasefire as a precondition to peace negotiations. The GRP intent was to see a lowering of levels of violence, but the NDF views such a permanent or prolonged ceasefire as surrender before political settlement is reached.
The GRP suspended the Joint Agreement on Safety and Immunity Guarantees (JASIG) in August 2005, arguing that since talks were suspended after the NDF unilaterally withdrew from the negotiating table, the JASIG
need not be in force. This had the effect of lifting the safe conduct passes of 97 NDF peace negotiators, putting them at risk of arrest.
In September 2008, the Arroyo administration called for the immediate implementation of a new paradigm that calls for the refocusing of peace negotiations with rebels, to one of authentic dialogues with the communities and stakeholders. Any negotiation with armed groups by the government should be within the context of disarmament, demobilization, and reintegration (DDR).
Nevertheless, two rounds of informal talks between the GRP and NDF were held in Norway in 2008, hosted by the Norwegian Government, as Third Party Facilitator. The November meeting was a continuation of the exchange of views between the parties on the issues and concerns affecting the peace process that commenced in May 2008. However, there was again failure to come to an agreement on modality for a ceasefire between the two parties.
After a prolonged hiatus and impasse, the JASIG was resumed on July 17, 2009 the GRP-NDF peace negotiations were scheduled to re-start in August 2009. However, NDF Political Consultant Jose Ma. Sison issued a statement on August 22, 2009 stating that because of the GRP’s non-compliance to the JASIG, the talks would not push through and would need a preparatory meeting in September to iron out these issues.
One group that has served as an informal third party aside from the Norwegian Government is the Philippine Ecumenical Peace Platform, composed of Christian religious leaders like several Catholic and evangelical bishops, convened in these past three years to support the resumption of formal peace talks. They are still trying to encourage some level of peace negotiations, even in these last few months of the Arroyo government.
If and when the GRP- NDF talks do resume, they will again take up the discussion towards a Comprehensive Agreement on Social and Economic Reforms (CASER). The earlier and only major substantive agreement has been the Comprehensive Agreement on Respect for Human Rights and International Humanitarian Law (CARHRIHL), which was signed in 1998. Ironically, when the peace negotiations were restarted on a high note during the first months of the new Arroyo administration, the topic of discussion was also the CASER.
Gains and gaps in the GRP- NDF peace processes
As previously mentioned, the only progress in the peace talks between the GRP and NDF was the activation of the Joint Monitoring Committee of the CARHRIHL, which was already long overdue. While the JMC has not formally convened since its setting up, the presence of offices on the GRP-Monitoring Committee and NDF Monitoring Committee in the Philippines, makes CARHRIHL an agreement to be taken more seriously. A broad, autonomous and non-partisan civil society network called Sulong CARHRIHL has also been active in promoting CARHRIHL implementation.
The GRP considers as a parallel track to the negotiations its actions to strengthen the GRP-MC through sustained monitoring of HR cases, and the conduct of fact-finding activities on alleged human rights violations. It supported the establishment of local monitoring bodies (LMB) in Bohol, Sorsogon, Bondoc Peninsula, and Tarlac on local human rights situation.
Civil Society Assessment of the 2004-2010 Medium Term Philippine Development Plan on the Implementation of the National Peace Plan

Ass
essm
ent R
epor
t
243
On the other hand, the GRP continues to have a dismal record on human rights. In fact, extra judicial killings during the Arroyo administration have reached numbers high enough to alarm the international community. UN Special Rapporteur on Extra Judicial Killings Philip Alston visited the Philippines in February 2007, and noted in his preliminary report that the alarming spate of extrajudicial killings was related to the government’s counter-insurgency policy. In his follow-up report to the UN Human Rights Council done in April 2009, Alston noted the drop in documented cases of executions of leftist activists, from 220 in 2006 to 94 in 2007 and 64 in 2008. But Alston says: “While an important informal message was clearly sent to the military, most of government’s formal actions in response to the Special Rapporteur’s recommendations have been symbolic, and lack the substantive and preventive dimensions necessary to end the culture of impunity.”
Alston also concluded that “no improvement has been made by the Communist Party of the Philippines and the New Peoples’ Army to reduce the extrajudicial executions for which they bear responsibility.”
There is also failure on one major commitment of government as a confidence building measure that is also part of the CARHRIHL, which is the just compensation for victims of the Martial Law human rights violations. Although the executive certified as a priority administration bill the Human Rights Compensation Act of 2005, it has not further helped to ensure the passage of this into law.
One further alarming development has been the increasing tendency of both the military and the NPA to recruit indigenous peoples, who are often in the areas of conflict and know the terrain well. These indigenous communities are very marginalized and vulnerable, and get caught in the warfare between the armed groups. They join the armies for their protection but often end up the victims, in the warfare as combatants, and as victims of assassinations or extrajudicial killings by either side.
The GRP has also recently retooled its rehabilitation, reintegration, and amnesty program. The National Committee on Social Integration was created within the OPAPP by virtue of AO 172 in March 2007 and Proclamation No. 1377 was signed in September 2007 to implement the Social Integration Program for former combatants. This program is directed to former rebels who have chosen to leave organizations that are continuing the armed struggle (as distinguished from former rebels with armed groups that have already signed peace agreements). Local Social Integration Committees (LSICs), consisting of local agencies and peace partners, were created in the following provinces and cities: Negros Occidental, Occidental Mindoro, Aurora, Quezon, Tacloban City, Butuan City, and Davao City, among others.
The OPAPP says that exactly 12,044 former rebels have availed of the government emergency and livelihood assistance from 2001 to the second quarter of 2009. OPAPP also reports that during the period, the government released P88,538,490 to these rebel returnees from the New People’s Army (NPA) and Moro Islamic Liberation Front (MILF). However the SIP program has to be well monitored and assessed, especially with larger funds recently made available and some allegations of misuse and corruption.
Other efforts cited by government among its “complementary measures to reduce violence “ are its support for the Peace Executive Council in the Mountain province, for the implementation of projects in line with their proposed expansion of peace zones. The GRP has provided mediation services and/or funding through NGOs to help prevent, mediate, or resolve local conflict, as well as to enhance the capability of communities for conflict management and declaration as peace zones including municipalities and barangays such in the Cordillera, Tarlac, Negros province, and in Mindanao.
Another track of government has been to implement the KALAHI-CIDSS model of community-driven development projects in identified conflict affected areas. In 2007, more than 80 percent of the 501 infrastructure projects under the program were reported to have been completed. PhP1 billion was allocated for the Kalayaan Barangays Program Projects for CY 2008, to support the projects for 200 sites. While these KALAHI-Kalayaan have yet to be assessed, the effort to bring development benefits to such communities would generally be positive.
Civil Society Assessment of the 2004-2010 Medium Term Philippine Development Plan on the Implementation of the National Peace Plan

Civi
l Soc
iety
Ass
essm
ent o
f the
200
4 -2
010
MTP
DP
244
The GRP-RPMM Peace Processes
Peace negotiations between the GRP and the Rebolusyonaryong Partido ng mga Manggagawa sa Mindanao (RPMM), a breakaway faction of the Rebolusyonaryong Partido ng mga Manggagawa ng Pilipinas (RPMP) have been so low key that they have been dubbed “The Other Peace Process”.
Since 2003, peace was pursued with the RPMM, and four major documents have since been signed: (1) Joint Commitment to Pursue Peace and Development, (2) Rules on the Conduct of Local Consultations as an Integral Component of the Peace Process, (3) Ceasefire Agreement, and (4) the Implementing Guidelines of the Ceasefire Agreement.
This peace process has been unique because the secretariat/facilitator for the peace negotiations for some time was the Cagayan de Oro- based NGO, the Balay Mindanao Development Foundation. They focused on participatory barangay-level consultations leading to implementation of local peace and development agenda and projects. By 2007, some 50 projects had being implemented from 89 barangay consultations; in 2008 some 100 barangay projects were targeted. In the past year, internal problems were said to have affected the RPMM, and the Balay Mindanaw Foundation also relinquished its role as secretariat. Despite such setbacks, the local peace and development approach is essentially being pursued, with significant participation of local government officials.
Goal 2: Implementation of Signed Peace Agreements
GRP-MNLF Peace Agreement Implementation Review
The government officially claims that it has successfully implemented the GRP-MNLF Peace Agreement signed on September 2, 1996. On the other hand, the MNLF has long disputed the government’s claim.
The MNLF in its 2005 Progress report argued on the unsatisfactory performance of the GRP in the implementation of the 1996 Agreement (MNLF, 2005):
“As an evidence of this fact is the continued marginalization of the Moros politically, economically, socially and physically, the ever-increasing incidence of poverty, the deterioration of peace and order brought about by the relentless and dubious anti-terrorism campaign of GRP in Morolands, and still, the more unequivocal evidence is the massacre of the innocent Moro civilians in Sulu that led to the resumption of Moro-Filipino war in February 1, 2005, wherein Philippine colonial forces suffered a heavy casualties.”
According to Kashim (2008) there are specific reasons for the MNLF’s dissatisfaction with the 1996 Peace Agreement implementation, such as in the right and representation and participation of the Bangsamoro people, in the lack of MNLF members’ reintegration for the special regional security force, the ill-prepared devolution of DepEd in ARMM, as well as unilateral implementation of the national government in the economic and financial systems.
Amina Rasul cites Nur Misuari’s arrest in 2001, the government’s war on terrorism and Balikatan military exercises and the MNLF fighters’ dissatisfaction as evidence of shortcomings in the 1996 FPA’s implementation.
A Tripartite GRP-MNLF-OIC review on the implementation of the agreement has been mandated in the FPA itself. Among its recent tracks has been to work towards a joint submission by both panels on legislative proposals to amend Republic Act 9054 or the Organic Act in the Autonomous Region of Muslim Mindanao (ARMM). Another is the creation of a mechanism providing funds for development projects in conflict affected areas.
Civil Society Assessment of the 2004-2010 Medium Term Philippine Development Plan on the Implementation of the National Peace Plan

Ass
essm
ent R
epor
t
245
These long-due developments would be very welcome especially considering that there are still occasional armed encounters between certain segments of the MNLF and the military. But these tracks would also have to consider the developments on the GRP-MILF peace processes, and should learn from the reality of the failure of the ARMM as a mechanism for real autonomy, good governance or peaceful political competition.
GRP- Cordillera People’s Liberation Army (CPLA) Peace Agreement of 1986
Twenty four years after its signing, the implementation of the GRP-CPLA agreement is still being pursued, based on demands of CPLA members. Administrative Order No. 18 of 2001 provides for the integration of CPLA members into the AFP and the PNP. The Philippine government and the CPLA signed in December 2006 a Joint Declaration on the Continuing Implementation of the 1986 Peace Accord to further integrate CPLA members and three companies of CAFGU Active Auxiliaries into the AFP regular force.
In 2008, the reunited CPLA presented three-point concerns to then Presidential Adviser on Peace Processes Hermogenes Esperon: the activation of (provision of budget to) the Cordillera Regional Assembly and Cordillera Executive Board; the pursuit of CPLA integration with the AFP in the context of a Regional Security Force envisioned in the governing policy, Executive Order No. 220; and another effort for a plebiscite for regional autonomy with funds for an effective campaign provided the CPLA and the CBA.
According to the OPAPP report, as of June 2009, there were 1,152 CPLA members integrated into the AFP and Civilian Armed Forces Geographical Units (CAFGUs), 110 of which benefitted from the AFP’s Paaral Program for CPLA. Seven CPLA cooperatives were provided with livelihood assistance amounting to PhP2 million. Basic infrastructure projects are either completed or ongoing in ten (10) CPLA-identified areas under the Kalayaan Barangay Program as of June 2009. Twenty-seven (27) more areas were also included in the program for 2009. The government implemented the KALAHI para SA Kalayaan in CPLA areas: Nambaran, Tabuk, Kalinga and Paracellis, Mt. Province; and Guinaang and Balatoc Pasil, Kalinga.
Unfortunately, the CPLA has been beset by factionalism, and many leaders have gained unsavory reputations, being accused on corruption, criminality, acting as goons for political warlords, and even drug dealing.
GRP-RPMP/RPA/ABB Peace Agreement of December 2000
The Revolutionary Proletarian Army-Alex Boncayao Brigade (RPA-ABB) and Rebolusyonaryong Partido ng Manggagawa - Pilipinas [Revolutionary Workers Party of the Philippines] (RPM-P) broke away from the mainstream rebel movement led by the Communist Party of the Philippines in the early 1990s and signed a peace agreement with then President Joseph Estrada in 2000. A ceasefire has generally been observed between the GRP and RPM-P from 2001 to the present through the Joint Enforcement and Monitoring Committee and Local Monitoring Team.
One aspect of the agreement is the release of Alleged Political Offenders (APOs) from among RPM-P members. 252 out of 312 APOs/ Political Prisoners (PPs) were released. Sixty remain in detention and the Administration is currently working on the executive clemency and release of other qualified political prisoners. A total of 147 APOs have also benefited from the reintegration assistance of the government.
On peace dividends, as of April 2009, PhP179.2 million worth of local projects were implemented in 69 peace agreement areas. This represents 35 percent of the government’s commitment of PhP500 million worth of impact projects under the agreement.
Unfortunately, there are also serious accusations against the RPA, including those leveled by peace advocates in the areas where they operate. The RPA forces are alleged to be involved as guns for hire-murders solicited by landlords and politicians, and are implicated in killings of some peasant leaders and agrarian reform advocates
Civil Society Assessment of the 2004-2010 Medium Term Philippine Development Plan on the Implementation of the National Peace Plan
Despite such setbacks, the local peace and development approach is essentially being pursued…

Civi
l Soc
iety
Ass
essm
ent o
f the
200
4 -2
010
MTP
DP
246
and in election harassment and other offenses. They have also split into two major factions and are involved also in armed clashes with the CPP-NPA-NDF.
Other gains/ accomplishments related to peace goals
Despite the failure to reach peace agreements, and the spotty implementation of signed peace agreements, there have been some recent gains, a number of which were not set among the MTPDP Chapter 14 goals. These include:
1. Targeted development support to conflict affected areas, particularly barangays through Kalayaan Barangay program, using KALAHI-CIDSS approaches;
2. Issuance of EO 570 Institutionalizing Peace Education in Basic Education and Teacher Education, to mainstream peace education in the basic formal and non-formal education curriculum;
3. Recognition and institutionalization of major Muslim holidays as official public non-working holidays; 4. Initiation of and support for national and global inter-faith dialogue programs;5. Passage of the Anti-Torture Law (RA 9745, signed on November 10, 2009), in compliance with the
International Convention Against Torture, although the law applies only to offenses by state actors;6. Enactment of RA 9851 - Defining and penalizing crimes against International Humanitarian Law, Genocide
and other Crimes against Humanity, signed on December 11, 2009, a landmark law that mandates observance by both state and non-state actors; and
7. The joint development by government and civil society of a National Action Plan on UN Security Council Resolution 1325/ 1820 (on Women, Peace and Security) and issuance of Executive Order 865 (March 1, 2010) creating a National Steering Committee on Women Peace and Security to Implement the UNSCR 1325/1820.
III. RECOMMENDATIONS
1. The government should consistently institutionalize and implement a national peace policy, consistent with the human security framework, and integrating strategies for national security. One strategy would be to enact such a policy into law, which would also institutionalize the mechanism for its oversight and implementation. The integration of peace policy into national economic and development policy should be sustained.
2. Pursue peace negotiations, but find ways to draw more citizen’s participation as well as technical and creative contributions.
As the Philippine Human Development Report of 2005 recommends: 3 tracks are important for the Moro conflict:- “Address gaps in and learn from implementation of the peace agreement with the MNLF - Give the highest priority to negotiations with the MILF - Delineate terrorism clearly and deal with it firmly without prejudicing the larger peace process “
On the communist insurgency, resume negotiations and institute social, economic and political reforms in parallel.
The recommendations of the “Policy Paper for the Next Administration: Reframing the Peace Negotiations on Mindanao” of the University Network on the Mindanao Question (January 2010) should be seriously considered. These include the following:
- The Mindanao peace process must assume the nature of a national dialogue ( in other words, involving all sectors and peoples)
Civil Society Assessment of the 2004-2010 Medium Term Philippine Development Plan on the Implementation of the National Peace Plan

Ass
essm
ent R
epor
t
247
- There must only be a single peace negotiation process that will resolve the main issue of Bangsamoro autonomous governance (bring in the MNLF as well as MILF)
- The just settlement of ancestral domain and other land claims through a set of cohesive measures, including effective land conflict settlement mechanisms.
3. Ensure protection and promotion of human rights and international humanitarian law, that should
help to build more confidence in the peace processes as well as help to lower the levels of violence. Implementation of the CARHRIHL through convening of the Joint Monitoring Committee should be a priority. The Commission on Human Rights should also be empowered and supported towards a stronger presence at regional levels. Impunity on extrajudicial killings must end.
4. After the Arroyo administration has fully ended without possibility of a comeback, seriously consider constitutional reforms such as on political structural changes that will be needed to resolve the armed conflicts.
5. Pursue security sector reform, focusing on democratic and civilian control of the armed forces, and addressing particularly concerns that hinder peace processes, including the need to disband private armies , CAFGUs and CVOs, and to stop the proliferation of illegal firearms
6. Ensure protection of indigenous peoples and their rights especially in conflict areas, and enable mechanisms for their participation in peace processes
Civil Society Assessment of the 2004-2010 Medium Term Philippine Development Plan on the Implementation of the National Peace Plan

Civi
l Soc
iety
Ass
essm
ent o
f the
200
4 -2
010
MTP
DP
248

Ass
essm
ent R
epor
t
249
Civil Society Assessment of the 2004-2010 Medium Term Philippine Development Plan on Anti-Corruption1
I. INTRODUCTION
Recent reports on development in the Philippines point to poor governance and corruption as among the key constraints to poverty reduction and development. In its report, Philippines: Critical Development Constraints, the Asian Development Bank (ADB) concludes that the worsening perception of corruption partly explains the low level of investments in the Philippines and that corruption is largely to blame for weak tax administration. Poor governance, it said, was found to translate into higher lending rates, making it more expensive to do business in the Philippines. In the end it concluded that one of the steps necessary to improve development is for the Philippine government to prioritize good governance.
The recently released Philippine Human Development Report 2008-2009, Institutions, Politics, and Human Development in the Philippines, says that institutions, broadly defined, are “the incentive systems that structure human interaction. They are the humanly devised ‘rules of the game’ in a society – the formal rules, informal constraints, and their enforcement characteristics, which reduce uncertainty, generate regularity in behavior and allow people to get on with everyday business.” Since the incentive systems are what structure human behavior, then there must be sufficient incentive for individuals to “follow the rules”. Non-compliance must therefore have some consequence, and in our system of government the ones that provide that consequence for non-compliance are the oversight and judicial/quasi-judicial bodies such as the Commission on Audit (COA), the Civil Service Commission (CSC), the Supreme Court (SC), and the Office of the Ombudsman, to name a few. So these institutions (which are themselves defined by a set of formal rules) must function properly in order to maintain the correct distribution of power and provide a check on abuses.
II. LEGAL AND POLICY FRAMEWORK
The Medium Term Philippine Development Plan (MTPDP) 2004-2010 recognizes the deleterious effects of corruption saying it, “distorts access to services for the poor, results in government’s poor performance and, consequently, low public confidence in government. The culture of corruption in the country breeds the vicious cycles of poverty and underdevelopment.”
It cites several efforts by the government to address corruption, including enhancing transparency and accountability, and increasing the effectiveness of sanctions against corrupt acts. Specifically, it cites a drive to investigate “the morality, lifestyle and nightlife of government officials” through the formation of the Lifestyle Check Coalition, composed of the Office of the Ombudsman, the Presidential Anti-Graft Commission (PAGC), the Department of Finance (DOF) and the Transparency Group (under the Office of the President). Additionally, lifestyle check and anti-graft units were established in six agencies: the Departments of Finance (DOF), Health (DOH), Public Works and Highways (DPWH), Environment and Natural Resources (DENR), and Education (DepED).
To better accomplish these efforts, several initiatives were undertaken to strengthen capabilities of institutions and enhance coordination among concerned agencies.
1Prepared by Vincent Lazatin, Transparency and Accountability Network (TAN)

Civi
l Soc
iety
Ass
essm
ent o
f the
200
4 -2
010
MTP
DP
250
The Office of the Ombudsman, the CSC and the PAGC worked together to handle the administrative and criminal sanctions aspects of the lifestyle check program. On the other hand, the Solana Covenant, an agreement among the CSC, the COA, and the Ombudsman, identified various areas of common interest to ensure better coordination. These areas include a) the establishment of a database for the statement of assets and liabilities, and net worth of public officials and b) the strict implementation of the rules regarding liquidation of cash advances.
The Government Procurement Reform Act, and the related Government Electronic Procurement System, and the new government accounting system (NGAS) were cited as accomplishments of government in addressing problems in procurement and financial accountability, respectively.
Identified as key issues that need to be addressed are: 1) weak enforcement of anti-corruption laws; 2 lack of coordination among anti-corruption bodies; 3) high tolerance for corruption; 4) need for greater and institutionalized collaboration between government, civil society, and business; 5) lack of integrity and accountability in government-business transactions.
The action plan centers around four main areas:
1. Continuing, strengthening and broadening the Lifestyle Check Program, where the Bureaus of Internal Revenue (BIR) and Customs will be “showcases” in the fight against corruption;
2. Strengthening the office of the Ombudsman and other anti-corruption agencies; enhancement of the legal framework for anti-corruption;
3. Ensuring transparency and accountability in governance processes such as in procurement; and 4. Values formation to reduce tolerance for corruption.
III. THE MTPDP TARGETS, PERFORMANCE AND ACCOMPLISHMENT IN 2004-2010
1. Continuing, strengthening, and broadening the Lifestyle Check Program
The Lifestyle Check Program (LCP) of the Arroyo administration is central to its strategy to fight corruption, as contained in the MTPDP, and involves a number of inter-agency bodies. The Transparency Group, created under the Office of the President (OP) in 2003, is mandated “to conduct intensive investigation and evidence gathering against suspected corrupt officials and those having property manifestly out of proportion to their legitimate income.” In addition to the formation of the Transparency Group, the Lifestyle Check Coalition was formed in 2003, composed of representatives from the Inter-Agency Anti-Graft Commission, the Office of the Ombudsman, the COA, the DOJ, the NBI, the National Youth Commission, the Philippine National Police (PNP)-Intelligence, Intelligence Service of the Armed Forces of the Philippines (ISAFP), and the Presidential Anti-Organized Crime Commission (PAOCC). Representing the private sector and non-government organizations in the Lifestyle Check Coalition were the National Secretariat for Social Action (NASSA) of the Catholic Bishops Conference of the Philippines (CBCP), the Transparency and Accountability Network (TAN), Citizens National Network Against Poverty and Corruption (CNNAPAC), United People Against Crime (UPAC), Citizens Battle Against Corruption (CIBAC), Philippine Government Employees Association (PGEA) and the National Association of Corruption Prevention Units (NACPU).
In 2004, President Arroyo transferred the responsibility of handling the LCP to the PAGC, and the Transparency Group was dissolved. Since PAGC’s takeover, the PAGC has resolved 95 cases, 56 of which have already been acted upon by President Arroyo2. There are currently 98 lifestyle check cases that are in various stages of investigation and adjudication.
In 2006 the Philippines was given a grant of 21 million dollars by the Millennium Challenge Corporation (MCC) to undertake an “anti-corruption initiative” under its Threshold Program. The MCC noted that the Philippine Threshold Proposal was in line with the MTPDP. Billeted as an anti-corruption initiative, a majority (or about 60 percent) of the money went to fund two programs under the Department of Finance (DOF) aimed squarely at the Bureaus
Civil Society Assessment of the 2004-2010 Medium Term Philippine Development Plan on Anti-Corruption
2PAGC, as of September 23, 2009

Ass
essm
ent R
epor
t
251
of Internal Revenue (BIR) and Customs (BOC), the Run After Tax Evaders (RATE) and the Run After the Smugglers (RATS) programs. Both programs are primarily outward looking and focus on bringing in tax evaders and smugglers into the tax net and/or running after them for prosecution. Touted as anti-corruption initiatives, the programs’ most glaring weakness is that it does not look at internal leakages and corruption at those two bureaus, widely believed to be the primary source of corruption in tax administration and collection. Only approximately seven percent of the grant was put into the Revenue Integrity Protection System, the only one of the three DOF programs aimed squarely at addressing corruption in the revenue collecting agencies.
The Office of the Ombudsman also has the power to conduct lifestyle checks on government officials. However, its powers are much broader and have a constitutional foundation. Unlike the PAGC, the Office of the Ombudsman is not limited to presidential appointees, but can investigate all government officials, including impeachable officials, such as the president and the commissioners and chairmen of the constitutional commissions. The Ombudsman’s record on lifestyle checks is unclear. According to the annual reports of the Ombudsman, the following has been reported:
2004 Training on lifestyle checks with the Lifestyle Check (LSC) Coalition (participants from PAGC, DOF, Office of the President (OP) , Office of the Ombudsman, Transparency International-Philippines); various other trainings on LSC with other NGOs/CSOs;
2005 Conducted various LSC trainings, seminars and fora
2006 50 government officials charged with violating various anti-graft and corrupt practices laws as a result of the conduct of the LSC program
2007 25 officials charged with violating various anti-graft and corrupt practices laws under the Revenue Integrity Protection System of the DOF.
2008 152 LSC investigations completed (Note: the report did not indicate the number of cases that were filed as a result of the 152 investigations.)
The lifestyle check efforts were dealt a serious blow when the Office of the Ombudsman recently restricted public access to the statement of assets, liabilities and net worth that it has in its possession. Memorandum Circular (MC) 01 dated June 16, 2009 and entitled, Revised Guidelines Governing Access to SALNs Filed with the Ombudsman, gravely impedes public access to the documents that form the basis of a lifestyle check.
2. Strengthening the Office of the Ombudsman and other anti-corruption agencies; Enhancement of the legal framework for anti-corruption
The MTPDP identifies the need to strengthen the investigative capabilities of the Ombudsman and the capabilities of the other anti-corruption agencies such as the PAGC, the NBI, and the DOJ.
The Ombudsman will be strengthened by recasting it as a new agency patterned after Hong Kong’s Independent Commission Against Corruption (ICAC). This would be achieved through one of two methods: amending the current Ombudsman Law (RA6770) or the creation of an entirely new agency that would focus only on case build-up, prevention, and education. The existing Ombudsman would be responsible for the preliminary investigation and prosecution. Additionally, an amendment to the Ombudsman law allowing the hiring of private prosecutors to litigate cases at the Sandiganbayan would also be considered.
To enhance the legal framework for anti-corruption, the MTPDP identified as key legislation the Whistleblowers Protection Act and the ratification of the UN Convention against Corruption (UNCAC). Whistleblower protection is seen as a necessary step in encouraging potential whistleblowers to come out in the open and speak up about anomalous dealings in government, while the ratification of the UNCAC would enable the Philippines to more easily seek mutual legal assistance and international cooperation for things like extradition and joint investigations.
Civil Society Assessment of the 2004-2010 Medium Term Philippine Development Plan on Anti-Corruption
…there are currently 98 lifestyle check cases that are in various stages of investigation and adjudication…

Civi
l Soc
iety
Ass
essm
ent o
f the
200
4 -2
010
MTP
DP
252
In the 13th Congress (2004-2007), House Resolution 00827, sponsored by Rep. Roilo Golez, sought to direct the House Committee on Good Government “To Conduct An Inquiry, In Aid Of Legislation, To Determine What Strategies The Independent Commission Against Corruption Employed In Effectively Deterring Graft And Corruption In Hong Kong, And How These Strategies Can Be Made Applicable In The Philippines”. The committee report was adopted as House Committee Report 01070, and has been pending with the Committee on Good Government since October 2005. However, from the records on the House of Representatives website, no action was taken on this report in the 13th Congress. As of October 2009, no bills were filed in either house of Congress in either the 13th Congress (2004-2007) or the 14th Congress (2007-2010) to create a new ICAC-like agency.
There are two sets of pending bills in both houses of Congress that seek to help the Office of the Ombudsman be more effective. The first set of bills3 seeks to provide additional funding to the Office of the Ombudsman by allocating a percentage of the forfeited assets in corruption cases for the Ombudsman to augment their regular budget. The second set of bills4 seeks to amend the Ombudsman Act (RA 6770) to allow the Ombudsman to use private prosecutors to assist in the investigation and prosecution of corruption cases. However, the Ombudsman has shown little interest in these bills. In a hearing of the Senate committee on Justice and Human Rights on August 29, 2007, the Ombudsman’s lack of interest was evident when it sent representatives that were not adequately prepared to present the position of their office on the proposed legislation. Senator Aquilino Pimentel, Jr. declared that if the Office of the Ombudsman, as the primary beneficiary of the bills, showed little interest in the process, then neither should the Senate. He moved that the bills be shelved5. As a result, according to the Senate website, no action has been taken on either of these bills since 2007.
The administration presented in the MTPDP a concrete action plan to enhance the capability of the Ombudsman, the country’s lead anti-corruption government agency. It identified legislative measures aimed at providing the Ombudsman with additional funds from forfeited assets in corruption cases and another measure to allow the use of private prosecutors. However, it failed to follow up on this plan, even as the legislature attempted to take up the bills. No presidential certification of urgency or priority has been issued on any of these bills. The administration, in effect, has not acted on the MTPDP commitment to strengthen the Ombudsman.
The Office of the Ombudsman has been seriously hampered in its ability to perform its duties to prevent, investigate, and prosecute cases of corruption. The appointment by President Arroyo of Merceditas Gutierrez as the Ombudsman in 2005 has resulted in loss of confidence and a growing public perception that the Ombudsman is not serious about doing its job. According to the Social Weather Stations (SWS) Annual Survey of Enterprises, the public perception of the sincerity of the Office of the Ombudsman to fight corruption declined significantly in the years since Gutierrez was appointed (see Table 1).
Year Net Sincerity Rating (Very/ Somewhat Sincere –
Somewhat/ Very Insincere)
Ombudsman
2000 -5 Desierto2001 +72002 n.a. Marcelo2003 +212004 +282005 +222006 +6 Gutierrez2007 +92008 +4
Source: Social Weather Stations Annual Survey of Enterprises
Civil Society Assessment of the 2004-2010 Medium Term Philippine Development Plan on Anti-Corruption
3Senate: SB1966, SB256; Congress: HB00781, HB01315, HB02664, HB062214Senate: SB257, SB263; Congress: HB0279, HB00881, HB01694, HB032645The author was present as a resource person at the hearing of the Senate Justice Committee on August 29, 2007 where it took up the two measures on asset forfeiture and the use of private prosecutors. Senator Aquilino Pimentel, Jr., in obvious disgust at the lack of interest by the Office of the Ombudsman, moved to shelve the two measures. The committee then proceeded to take up other matters.

Ass
essm
ent R
epor
t
253
The Philippine Human Development Report 2008-2009 also points out that despite an initial spike in its conviction rate, the Office of the Ombudsman’s performance has declined because of over-centralization and poor management. This has resulted in the disposition of some high profile cases, including the Commission on Elections (COMELEC)-Mega Pacific automated counting machine procurement (where the Ombudsman found no probable cause to charge any of the respondents in the face of a SC ruling that the procurement was attended with fraud), and the bribery case involving former Justice Secretary Hernando Perez.
As for whistleblower protection, a few bills were filed in both the 13th and 14th Congresses, but none of them made it past the committee level. Like legislation to amend the Ombudsman Act, whistleblower protection was never given priority by the Arroyo administration despite being identified as a key piece of anti-corruption legislation in the MTPDP. As such, whistleblower protection failed to make any headway in the legislative process. None of the bills in the Senate (SB2129, SB2040, SB1972) or the Congress (HB03809, HB01715, HB01891) were certified as urgent. Once again, the administration failed to prioritize and shepherd these pieces of legislation through Congress.
With the support of many civil society organizations, the Philippine Senate ratified the UN Convention against Corruption (UNCAC) in November 2006. By ratifying the Convention before the mid-November 2006 deadline, the Philippines became eligible to participate in the discussions regarding the implementation of the convention.
The ratification of the UNCAC is one bright spot in the government’s anti-corruption commitment under the MTPDP. Much of the legal framework put forth in the convention is already in place in the Philippines such as codes of conduct for public officials, criminalization of bribery, transparent, objective and competitive public procurement, among others. However, the problem lies in the full and proper implementation of these laws and regulations. Protection of reporting persons or whistleblowers has yet to be realized, as mentioned previously.
3. Ensuring transparency and accountability in governance processes such as in procurement
In the MTPDP, the Philippine government made a commitment “to ensure transparency, accountability, and participation in government processes, [and implement] preventive anti-corruption measures.” To do this, the government committed to streamline agency processes, especially for the delivery of frontline services. It would also strengthen procurement reforms, building upon the existing reforms that began with the Government Procurement Reform Act (RA 9184). Lastly, it would try to involve citizens in monitoring projects that are made purposefully transparent.
The passage of the Anti-Red Tape Act of 2007 (RA 9485) and the consequent promulgation of its implementing rules and regulations in September 2008, was a positive step in addressing bureaucratic red tape and streamlining government processes. RA 9485 and its IRRs aim to reduce bureaucratic red tape, thereby reducing opportunities for corruption. It requires government agencies providing front line services to reduce transaction times to a maximum of five working days for simple transactions and 10 working days for complex transactions. It also reduces to five the maximum number of signatures required for each document. For the sake of transparency, RA 9485 requires agencies providing front line services to publish a citizen’s charter to outline the services they provide, the service standards of the agency, the time for each step in the process, the relevant fees, if any, and the procedure for filing complaints, among others. RA 9485 has the potential for reducing bureaucratic corruption, but whether this can be realized remains to be seen.
In 2003, the Government Procurement Reform Act (GPRA) was signed into law. The law was designed to reduce opportunities for corruption, increase transparency, streamline and simplify the process, increase competition, ensure accountability, and allow for public monitoring of government procurement. The GPRA is viewed by many as being among the most advanced government procurement laws in the world. Since the passage of the GPRA, much has been done to strengthen and further the reform. The Government Procurement Policy Board (GPPB) was created to oversee the implementation of the law and make policy decisions with regard to procurement issues. In 2007 the GPPB began a series of roundtable discussions to “harmonize” the implementing rules and regulations (IRR) covering foreign assisted projects and the existing so-called IRR-A, covering locally funded projects. The result of the effort has been the revision of the existing IRR-A to create a single, harmonized IRR that covers both locally funded and foreign funded government procurements. This went beyond the original expectation of the
Civil Society Assessment of the 2004-2010 Medium Term Philippine Development Plan on Anti-Corruption

Civi
l Soc
iety
Ass
essm
ent o
f the
200
4 -2
010
MTP
DP
254
establishment of an IRR-B (covering foreign assisted projects) harmonized with the IRR-A.
Part of the effort to improve government procurement is the Philippine Electronic Procurement System (PhilGEPS). The PhilGEPS had its beginnings in 2000 when the procurement service of the Department of Budget and Management (DBM) pilot-tested an internet-based electronic procurement system. The passage of the GPRA in 2003, which mandated the use of an electronic procurement system, provided the impetus for the PhilGEPS. While it is envisioned that the PhilGEPS would be the electronic portal for government procurement, it has thus far failed in that vision. According to the Technical Assistance Report of the Asian Development Bank dated March 2009 and entitled, Republic of the Philippines: Strengthening the Philippine
Government Electronic Procurement System, the PhilGEPS is used by many government agencies merely to fulfill the requirements of RA9184, rather than to use it as a real procurement portal. Thus, much more work needs to be done to make PhilGEPS a real and operational electronic procurement system.
However, despite the law and much attention surrounding procurement reform, and commitments by the Arroyo administration to build upon the GPRA to make procurement more transparent and participatory, high profile procurement controversies still abound. The most visible of these was the attempted procurement of a 329 million dollar national broadband network. According to Committee Report 743 of the Senate Committee on Accountability of Public Officers and Investigations, the controversy, or the “stink” as the report puts it, reached high places, including the office of President Arroyo. During the Senate hearing on the NBN-ZTE deal, as the deal eventually became known, the Arroyo administration sent a very clear message about its commitment to transparency in the procurement process. It allowed Secretary Romulo Neri, then National Economic Development Authority (NEDA) director general, to invoke the executive privilege to refrain from answering questions regarding the president’s reactions upon learning that then COMELEC Chairman, Benjamin Abalos, Jr. had offered Neri a bribe to approve the project.
Another recent example is the issue of collusion in public bidding at the Department of Public Works and Highways (DPWH). In January 2009 the World Bank announced that it had debarred seven construction firms and one individual from participating in World Bank funded road projects. In its announcement the Bank said that it debarred the firms for having engaged in collusive practices related to road projects for the National Road Improvement and Management Project. The government’s inaction on the announcement was most telling of its commitment to address problems in procurement. The DPWH conducted its own investigation, the results of which have not been made public. Nor has it announced any action taken in light of the World Bank announcement.
This and other actions by the Arroyo administration speak much louder about its commitment to transparency in procurement than speeches and verbal commitments.
IV. OVERALL ASSESSMENT
There have been some bright spots in the Arroyo administration’s fulfillment of its commitments on anti-corruption in the MTPDP. Among these are the passage of the Anti-Red Tape Act of 2007 (RA 9485) and the ratification of the UNCAC. However, to merely pass laws or ratify international conventions is not enough. What will determine success is how these laws and conventions are implemented and if they are backed by a serious commitment to enforce them. As the implementing rules and regulations of RA 9485 are only a year old, it is still too early to tell if a solid commitment to implement has followed the enactment of the law. However, it is recognized as a positive first step.
Another bright spot includes reform in the area of procurement. The passage of RA 9184 in 2003 was a good step towards a simplified, transparent, more competitive, and streamlined procurement process. This has been followed up by many efforts to ensure its proper implementation. However, large gaps remain, and government’s
Civil Society Assessment of the 2004-2010 Medium Term Philippine Development Plan on Anti-Corruption

Ass
essm
ent R
epor
t
255
political will to address these large gaps remains weak. Large procurement scandals continue to surface and government’s response has been tepid, at best.
Attempts to showcase the Bureaus of Internal Revenue and Customs in the fight against corruption using the lifestyle check program of government have failed miserably. The lifestyle check program has been reduced to tokenism and failed to yield “big fish” at either of these agencies. Accordingly, they continue to be perceived as among the most corrupt government agencies.
None of the other pieces of legislation that were committed to under the MTPDP - such as laws to enhance the powers of the Ombudsman or make it more like Hong Kong’s ICAC, as well as the whistleblower protection legislation – have been passed. And while legislation does not fall within the control of the executive, no efforts, either to prioritize or shepherd, have been exhibited towards the passage of these laws. The commitment to enact such measures remained squarely on paper.
As a last word on the government’s efforts on anti-corruption, despite the many opportunities to show political will and fight corruption, government’s response has almost always left the public wanting. The question remains whether or not this government is truly committed to combating corruption. Its history, most unfortunately, is littered with failed litmus tests.
IV. RECOMMENDATIONS
Based on the above assessment, the following are proposed for government’s consideration in relation to anti-corruption measures:
• Enactmentor implementationofRight to InformationLegislation6. Prioritize and certify as urgent the passage of Right to Information legislation. If the legislation is not passed in the 14th Congress, prioritize its passage in the 15th Congress, using as basis the Bicameral Conference Committee Report of the 14th Congress. While waiting for the legislation, the three branches of government can issue public disclosure policies outlining how it will respond to information requests. If by some chance the legislation is enacted in the 14th Congress, then the implementing rules and regulations should be prioritized so that the law can be given full effect.
• EnactmentofaCareerExecutiveServicesAct. This would, among other things o limit the appointing power of the president in the bureaucracy; o further professionalize the bureaucracy; and o strengthen the system of merit and fitness-based promotions and appointments.
• EnactmentofaCampaignFinanceandPoliticalPartyReformlaw. This would, among other things:o strengthen genuine political parties and discourage and penalize political turncoats; and o enhance the capacity and capabilities of the Commission on Elections to credibly enforce the political
campaign laws.
• StrengtheningoftheOfficeoftheOmbudsmanby:o appointing a credible, competent, and independent Ombudsman to lead a genuine and vigorous
fight against corruption;o prioritizing legislation that would allow the use by the Office of the Ombudsman of private lawyers
in case build up; and o prioritizing legislation that would forfeit, in favor of the Office of the Ombudsman, a percentage of
the assets recovered in corruption cases.
Civil Society Assessment of the 2004-2010 Medium Term Philippine Development Plan on Anti-Corruption
6As of this writing, the Right to Information legislation has a slim chance of become a law in the 14th Congress.
Attempts to showcase the Bureaus of Internal Revenue and Customs using the lifestyle check program have failed…

Civi
l Soc
iety
Ass
essm
ent o
f the
200
4 -2
010
MTP
DP
256
Civil Society Assessment of the 2004-2010 Medium Term Philippine Development Plan on Anti-Corruption
• Havingaclearlystated,transparent,inclusive,andopensearchandnominationprocessformembersofindependentcommissionsandoversightbodiessuchasCommissiononAudit,CivilServiceCommission,Commission on Human Rights, Commission on Elections, etc. A multi-sectoral, secular, and credible search committee should be formed to accept nominations and applications for these positions. The criteria for selection, the names of the candidates and those endorsing them should be publicly known.
• Insulationofsensitivedepartmentsandagencies,liketheBIR,BOCandDPWHfrompoliticalappointments.

Ass
essm
ent R
epor
t
257
Civil Society Assessment of the 2004-2010 Medium Term Philippine Development PlanProvisions for Constitutional Reformz
I. INTRODUCTION
The 1987 Constitution was ratified by an overwhelming majority of Filipino voters on February 20, 1987, in the period following the 1986 People Power revolution. Drafted by 46 well-respected leaders from various sectors over a period of six months, the new Constitution promised to respond to a range of issues, including social justice, human rights, people’s participation, and sovereignty, deemed to have been inadequately tackled by previous Constitutions of 1898, 1935, and 1973.
Since then, all moves to revise the 1987 Constitution have been met with intense opposition, in large part because of the perceived self-serving nature of the initiators and their proposed methods and proposals.
II. POLICY FRAMEWORK: THE MTPDP PROVISIONS ON CHARTER CHANGE
Emerging victorious over a highly contested and controversial May 2004 presidential elections, President Gloria Macapagal-Arroyo (PGMA) approved the Medium Term Philippine Development Plan (MTPDP) for 2004-2010. Chapter 25 of the MTPDP was entitled “Constitutional Reform”, the rationale for which reads as follows:
The EDSA Revolution of 1986 allowed the country to restore its democratic institutions and restart its economic recovery. However, the country’s seriously weakened economy, political instability, and unabated corruption have continued to retard efforts to achieve progress.
Applying the solutions to these problems depends crucially on the presence of effective political institutions, effective and accountable political parties, and more liberal economic policies.
The Substantive Constitutional Reform Agenda
The MTPDP states that “The reassessment may include:
(a) Shift from the current presidential form of government, with its separation of powers between the executive and legislative, to a unicameral parliamentary form of government that would unify and coordinate those two functions in the parliament2;
(b) Change from the present centralized unitary system to a decentralized federal system3;
1Prepared by Raul Socrates C. Banzuela, Coalition for a Citizens’ Constitution (C4CC)
2“The country’s political institutions have become less effective to address problems under the present presidential setup. The separation of powers, meant to establish a system of checks and balances, between the executive and legislative branches often results in delays in legislation and poli-cymaking. The executive has to resort to compromise and concession to pass major initiatives including the annual appropriations bill. When good legislation is passed, it may suffer from execution problems because of the lack of legislative support to impose or raise taxes that are needed for its implementation. National policymaking has come to depend on the lowest common- denominator of agreement among executive and legislative branches of the government.”3The national government remains highly centralized making it slow and unresponsive to the needs of the people in the rural areas and cultural communities. Although local governments are supposed to enjoy local autonomy under the 1987 Constitution and the Local Government Code, they are in fact controlled in many ways by and habitually dependent for guidance and resources on the national government. This inhibits local initiative and resourcefulness to effect progress and development within their territories and communities.

Civi
l Soc
iety
Ass
essm
ent o
f the
200
4 -2
010
MTP
DP
258
(c) The restrictive constitutional provisions on national economy and patrimony to bring in investment that will create jobs and opportunities and eventually reduce poverty. Specifically, the constitutional preference to Filipinos in the granting of rights, privileges, and concessions on national economy and patrimony, and in certain economic activities shall be reviewed. A categorical definition and scope of the national patrimony shall also be provided4.
(d) Structural and functional reforms affecting the electoral and political party systems5;
(e) Defining political dynasties and making the constitutional prohibition against political dynasties self-executory"
Mode of Charter Change
The MTPDP declares “The reassessment of the Constitution through a constitutional convention to implement the needed structural and systemic reforms in political institutions and in the electoral and political party systems is imperative”.
Reform through a constitutional convention (ConCon) was the mode of choice expressed by President Arroyo during the 2004 presidential campaign period. She made several public pronouncements to this effect, claiming this to be a less divisive route that would, moreover, make her intentions less suspect.6
According to a survey conducted by the Social Weather Stations (SWS), while most Filipino adults did not see the need for Charter change (Cha-Cha),
the minority who believed that it should be pursued likewise thought that it should be achieved by means of a constitutional convention.
Many civil society organizations led by C4CC7 or the Coalition for a Citizen’s Constitution, churches including the Roman Catholic church, El Shaddai, and the Iglesia ni Kristo, business represented by the Makati Business Club,
Civil Society Assessment of the 2004-2010 Medium Term Philippine Development Plan (MTPDP) Provisions for Constitutional Reform
4“Along with these political challenges, the paucity of investment and domestic capital resources remain to be one of the fundamental problems of the economy. Though various structural reforms in banking, power and retail trade sectors helped sustain the moderate growth of the Philippine economy, such legislative and administrative reforms fell short of delivering the expected investments that would create jobs and spur economic growth. It is observed that the problem is systemic, rooted in the protectionist policies in the Constitution. These policies prevent the flow of foreign capital, technology and production skills into our economy.
The Constitutional provision providing for a self-reliant and independent economy effectively controlled by Filipinos, limiting the practice of all professions to Filipino citizens, reserving certain areas of investments, and giving preference in the grant of rights, privileges, and concessions cover-ing national economy and patrimony to Filipino individuals and corporations, stifled economic innovations and reforms that would open up the economy to foreign capital and investment. The question on what constitutes national patrimony also remains a problem in determining areas of investments wherein foreign equity may be allowed.
Moreover, the limitations set by the Constitution on the ownership, transfer, and conveyance of private lands have barred foreign individuals (save in case of hereditary succession) and foreign corporations to own land. These discouraged foreign investor’s confidence for longterm ventures. The limitations of foreign equity in domestic public utilities to 40 percent, advertising industry to 30 percent, educational institutions to 40 percent, and no equity participation at all in mass media prevents access of both international and domestic capital and the transfer of new technologies. These would have delivered the vital facilities and services in an economical and financially prudent manner.
The difference between the ownership requirement in media (100 percent Filipino) and in telecommunications (40 percent) likewise hinders the convergence of media, information technology and telecommunications industries. On the other hand, limiting foreign equity participation (40 percent) in companies engaged in developing natural resources and confining involvement of foreign corporations to technical and financial as-sistance in the large-scale exploration, development and utilization of minerals, petroleum, and other mineral oils, are major stumbling blocks in the entry of capital and more efficient technology needed in the exploration of natural resources.”
5This agendum would like to address the personalistic, less-accountable, political and electoral system. “The 1987 Constitution provides for a free and open party system that would afford free choice to the people and encourage citizens’ participation in governance. Seventeen years into the implementation of the charter, personalistic politics and the lack of effective, cohesive and functional political parties that focus on issues and policies still dominate the political system of the country. The current party system offers no meaningful policy choices since political parties form around well known personalities and families, instead of well-defined programs of government. This has made popularity, and not intelligence, competence, or experience, the winning qualification for public office. Though elections enable the country to change its leaders from time to time, these have not made much difference to improve leadership and governance. Elections cannot make political leaders accountable to the people without effective and responsible political parties that offer meaningful policy alternatives.”
6January 15, 2003, in a round table discussion with Japanese media people.
7The Coalition for a Citizen’s Constitution (C4CC), a civil society group composed of national NGO networks, NGO political institutes, and people’s or-ganizations with nationwide presence, counts among its members the Caucus of Development NGO Networks (CODE-NGO), Philippine Community Organizers Society (PhilCOS), Institute for Political and Economic Reform (IPER), Gaston Z. Ortigas Peace Institute (GZO-PI), Pilipina, Local Gover-nance and Citizens Network (LGC-Net), People’s Alternative Study Center for Research and Education in Social Development (PASCRES), Institute for Popular Democracy (IPD), and the Pambansang Kilusan ng mga Samahang Magsasaka (PAKISAMA).
Ass
essm
ent R
epor
t
259
and personalities including former president Corazon C. Aquino and Jaime Cardinal Sin, were likewise advocating for a constitutional convention, early on in the Arroyo administration. These groups were of the thought that a constitutional convention, while more expensive than a constituent assembly, was more fair, objective, and participatory.
Given the nature of the proposed substantive changes covering the structures, systems, and economic orientation of government full-time attention by elected delegates was seen by these groups to be far more desirable over a constituent assembly controlled by congressmen and senators with vested interests to protect.8
In the end, despite a hotly contested process in the upper and lower chambers of Philippine Congress that resulted in both houses eventually agreeing to the establishment of a constitutional convention, the proposal had run out of time. The Philippine Senate decided that there was not enough time before the 2004 elections and instead opted to attend to the 2004 budget.
In the end, the Arroyo administration failed to hold fast to its promise of a constitutional convention mode and the election of ConCon delegates during the scheduled barangay elections in October of 2004, thereby altering the course of history forever.9
Appropriateness and Responsiveness of MTPDP/SONA Targets Serious questions have been raised as to the appropriateness of constitutional revisions as a means of addressing concerns over the five constitutional reform agenda items in the MTPDP. The question remains whether constitutional revision is even necessary to address such concerns. Is good governance or the implementation of existing and introduction of new legislation the better route for responding to these concerns?
1. Shift from a presidential to a parliamentary system. Is the gridlock between the Senate and the House and between the executive and the legislative branches the real problem? Or it is the leadership of a particular president? Why was this not a problem during the Ramos administration, for example? Studies do not indicate a direct correlation between economic development and the parliamentary systems. Unicameral parliamentary governments exist in both highly developed as well as in least developed countries. Some authors liken the shift to a jump from the frying pan into the fire. Moreover, they add that the unicameral parliamentary system, as proposed, will simply further consolidate the hold of the local elite in national government.
2. Transition to a decentralized, federalist system. While many concur with the importance of building up a federal system, questions have been raised as to whether a constitutional revision is necessary to make this happen. If the government is serious about its intent to devolve power to the regions, why has it not pursued this in other ways? For instance, why has it failed to prioritize legislation expanding local government’s share in national wealth? Moreover why has national government failed to start devolving more power to the regions
The MTPDP states that “The reassessment may include…change from the present centralized unitary system to a decentralized federal system…
8This position was clearly manifested during the 2003 Senate hearings on Constitutional amendments when most of the C4CC members staged a rally in front of the Senate building and jointly fought the constituent assembly being proposed by the chairperson of the Senate Committee on Constitutional Amendments, Senator Edgardo Angara. Most of the senators led by Senate President Franklin Drilon had earlier signed a resolution for a Constitutional convention to counter the offensive by the House of Representatives led by Speaker Jose de Venecia for a constituent assembly mode. The Senate finally passed a resolution for a ConCon and by December of 2003, Speaker de Venecia had changed his position and expressed his approval of a constitutional convention.
9Not only did the Arroyo administration renege on its earlier expressed promise of ConCon elections, it used deceptive, elitist, and most contemptu-ous methods such as a people’s initiative and constituent assembly, which destroyed the essence of these Constitutionally-mandated institutions. People’s initiative, a process institutionalizing people power or direct democracy, has since been tainted negatively as a result of its application. What was meant as a mechanism for people’s participation in the governance process, was used by government through the Department of Interior and Local Government (DILG) to initiate a referendum in which more than 9 million people responded in the affirmative to a multi-topic and legally-crafted question, phrased moreover in English. The Supreme Court would eventually strike it down and judge the process as a grand deception.
The Constituent Assembly process, on the other hand, as one of the three legitimate means to change the Constitution has been attempted twice by the Lower House, perceived as the puppet of the President, which resorted to highly questionable means to ram its dominance over an equal chamber such as the Senate. Thus, in their first attempt, they voted to change the House Rule, in effect pushing out of the process the need for the Senate to give its equal voice to the Lower House as it deliberates the content of its charter change agenda. In the second attempt, they just voted via viva voce to transform the House into a Constituent Assembly. Both attempts were done and votes were conducted among the Congresspeople at around midnight while most of the Filipino people are asleep. The Senate, in reaction to both attempts, came out with resolutions rejecting the Con Ass initiative of the Lower House.
Civil Society Assessment of the 2004-2010 Medium Term Philippine Development Plan (MTPDP) Provisions for Constitutional Reform

Civi
l Soc
iety
Ass
essm
ent o
f the
200
4 -2
010
MTP
DP
260
through the regional development councils (RDCs)? Legislation or executive issuances might be sufficient to establish what a constitutional revision is being proposed to do.
3. Revisiting of national economy and patrimony provisions. Members of the business community have questioned Cha-Cha proponents’ preoccupation with opening up the economy to foreign investors. They argue that 99 percent of local enterprises are small to medium scale - including the 12 million jobs in Philippine agriculture. One wonders who these provision changes are then meant to benefit? Foreign investors have, moreover, explicitly listed infrastructure development, skills
levels (human capital), quality of general regulatory framework, clear rules of the game, fiscal determination, corruption, and peace and order as the critical factors to foreign direct investment.10
4. Reform of political party systems. Despite the MTPDP provisions on political party reform, questions have likewise been raised as to the importance of constitutional revisions to the reform of the political party systems. Congress has not undertaken any specific moves to help build strong and program-based political parties.
5. Dismantling of political dynasties. Proponents have proposed the deletion of the section curbing political dynasties in the Declaration of Principles and State Policy, in direct opposition to the provisions of the MTPDP. It is a recognized fact that the proliferation and continued expansion of local political dynasties undermines the implementation of current social reform laws. Political dynasties, however, can be dismantled through meaningful citizens participation in the electoral contest, aggressive implementation of asset reforms, and building countervailing progressive and citizen-led political parties. All of these are leadership and citizens’ initiatives and not necessarily related to constitutional reform.
III. PERFORMANCE AND ACCOMPLISHMENT IN 2004-2010: The Arroyo administration and its Fulfillment of Constitutional Reform Commitments and Targets
Constitutional Convention and the Two-Step Cha-Cha
Administration promises of a Charter change through a constitutional convention have fallen through the cracks in the past five years. The election of constitutional convention delegates is even less likely to happen now that the May 2010 presidential elections are almost upon us. While the election of constitutional convention delegates could still be held simultaneously with the barangay elections in October 2010, this initiative from the lower house of Congress is now less likely to find support from the Senate given the current nation-wide preoccupation with the national elections. Many of the current senators are running for re-election or higher office and few if any of the country’s lawmakers will want to draw the public’s ire as a result of any proposed Cha-Cha initiatives.
From reports and documents of the Constitutional Commission (ConCom) and the House of Representatives’ Committee on Constitutional Amendment and the resolution of the so-called people’s initiative, Malacanang it seems, has pursued a two-step Charter change strategy over the past five years. The first step was aimed at installing a unicameral parliament (originally by mid-June of 2006) through a combination of constituent assembly (Con-Ass) and people’s initiative. The second attempt involved the establishment of a Con-Ass towards the end of 2006 and before Arroyo’s term is to end in 2010, pushing the Supreme Court to issue a decision on whether the Senate and the lower house of Congress should vote jointly in a constituent assembly.
The Arroyo administration has committed to three modes of Charter change over the past four years abandoning in the process the MTPDP and prior presidential campaign commitments, and causing in the process widespread political turmoil and uncertainty. Prior to the “Garci tapes” scandal in June 2005, government was intent on pursuing a constitutional convention. After the revelation and the large and loud rallies that erupted
Civil Society Assessment of the 2004-2010 Medium Term Philippine Development Plan (MTPDP) Provisions for Constitutional Reform
10 One Voice Statement. NO TO CHA-CHA NOW. YES TO REAL CHANGE. A Peaceful Transfer of Power in 2010 Through Elections. June 9, 2009

Ass
essm
ent R
epor
t
261
in its wake, government began to pursue a people’s initiative”11 from March to October and a constituent assembly12 in December 2006 substantiated by a Malacanang-created Constitutional Commission13 convened a year earlier. Both the people’s initiative and the constituent assembly measures were met with intense and widespread non-violent resistance by various civil society and political formations across the country14. The Supreme Court struck down the people’s initiative while the constituent assembly was eventually abandoned amidst serious threats of people power.
After the 2007 elections there was a hiatus on the Cha-Cha front. Then in August 2008, war broke out in Central Mindanao after the failed signing of a Memorandum of Agreement on Ancestral Domain (MOA-AD) between the Philippine government and the MILF. Included in the MOA-AD was the Philippine government’s commitment to change the Charter within a year to pave the way for a federal system of government.
In early 2009, the lower house of Congress would again provide the backdrop for an attempt to change the Constitution by means of a constituent assembly. House Speaker Prospero Nograles (Lakas) and Congressman Luis Villafuerte (Kampi), an Arroyo ally, would fight it out in the lower house, with Speaker Nograles pushing for House Resolution (HR) 737 allowing foreigners to own land and Congressman Villafuerte seeking to push for HR 1180 transforming Congress into a constituent assembly.
In June of 2009, the Arroyo administration would attempt what was perhaps the most serious and potentially explosive push for Charter change through a constituent assembly composed solely of representatives of the lower house of Congress. Various groups from all over the country banded together to demonstrate against a government-initiated Charter change through a Con-Ass sans the Senate. The Con-Ass was perceived by many as a means for PGMA to perpetuate herself in power. Just as Congress was about to enter into recess on June 2, 2009, the lower house unilaterally passed via viva voce HR 1109 transforming Congress into a constituent assembly. The Senate, in turn, passed a unanimous resolution against the lower house’s attempt at midnight legislation. Heated deliberation was expected to happen during or immediately after the president’s State of the Nation Address (SONA) on July 27, 2009. But two key events would intervene before this could happen. First of all, the United States Central Intelligence Agency (CIA) Director Leon Panetta would meet with President Arroyo in Malacanang Palace. Secondly, former president Corazon Cojuangco Aquino died on August 5, 2009. Hundreds of thousands of Filipinos joined the wake and the funeral march. Suddenly, the Charter change debate was put on the back burner, with the lower house attempting a compromise, working hurriedly, and hoping against hope that the Senate would join them to pass a bill calling for a constitutional convention to be held simultaneous with the barangay elections in October 2010.
The possibility for this was earlier given hope by a possible compromise agreement between the lower and upper houses as they fought intensely over HR 1109, which sought the transformation of Congress into a constituent assembly. Senator Mar Roxas, for one, had a bill for Con-Con elections to be held simultaneously with the May 10 Elections.
Included in the MOA-AD was the Philippine government’s commitment to change the Charter within a year…
11Government succeeded in consolidating its own constituencies. Nine million signatures, more than the required 5 million signatures, were said to have been collected in two months since March 2006 by Sigaw ng Bayan movement led by Raul Lambino, a member of the Constitutional Commis-sion. Although the process of signature gathering and the authenticity of many of the signatures were questioned by many groups and later was struck down by the Supreme Court, this exercise in people’s initiative mobilized the vast networks of the local governments under the Union of Local Authorities of the Philippines (ULAP) and the DILG.
12Amidst the calls for her resignation and ouster following the “Garci tapes” scandal, Ms. Macapagal-Arroyo declared in her July 2005 State of the Nation Address that “The mode of Charter Change is the exclusive prerogative of Congress. But a Constituent Assembly may well give our people the quickest reforms.”
13In August-December 2005, the ConCom drafted amendments to the Constitution and submitted a report to Ms. Arroyo on December 15, 2005. The report was immediately sent to the Lower House as the administration seemed to assume that a Constituent Assembly would then be formed. In that same month, the House passed a resolution calling for a Constituent Assembly. In March 2006, a “People’s Initiative” signature campaign was launched through nationwide Citizens Assemblies, orchestrated by the Department of Interior and Local Government (DILG).
14Charter change (Cha-Cha) attempts angered the people. Pastoral letters by the Catholic Bishops Conference of the Philippines (CBCP), public statements by coalitions such as STOP ChaCha and One Voice and mobilizations in the streets against GMA’s Charter Change, and a Supreme Court Ruling all combined to kill this people’s initiative and the earlier attempt to establish a Senate-less Constituent Assembly. The same configuration of forces is mobilizing against the latest (2009) attempt at ConAss.
Civil Society Assessment of the 2004-2010 Medium Term Philippine Development Plan (MTPDP) Provisions for Constitutional Reform

Civi
l Soc
iety
Ass
essm
ent o
f the
200
4 -2
010
MTP
DP
262
But none of the Senators is expected to push for that bill to become a law. Given the tremendously negative attitude of voters on Charter change, many Senators, especially those intending to run in the forthcoming elections, must be very cautious in risking the ire of the public if they push Cha-Cha and even ConCon elections in October 2010.
The civil society aggrupation, C4CC, has issued a public statement calling for ConCon elections early on in the next administration. It believes that Charter change is of fundamental importance and thus, the constitutional reform process, including the election of ConCon delegates should be secured.
Other influential civil society formations including business organizations such as One Voice, the Catholic Bishops Conference of the Philippines, and the Makati Business Club, are likewise amenable and open to constitutional convention elections but only after the Arroyo administration has stepped down in June 30, 2010.
Another option, articulated by the group One Voice, is the holding of a referendum to accompany the upcoming elections asking voters whether or not they would want constitutional convention elections held in the early years of the new administration. This only needs a simple majority in both houses of Congress. Another option, likewise articulated by one of the leaders of One Voice, is a disaggregation of constitutional reform options. For instance, one does not need a constitutional convention, for example, to establish run-off elections. A constituent assembly may be good enough, in that situation.
It seems that the most generous scenario is for constitutional convention elections to be held in the early years of the new administration, on October 2010 or May 2013 with the latter finding more adherents than the former. It is not unlikely that given the political upheavals that accompanied the constitutional reform processes, support for a proposal being forwarded by former COMELEC chairperson Christian Monsod for a gradual, piecemeal, highly educational, and cautious constitutional reform process may snowball to find a greater number of adherents.
Content of Cha-Cha
With the failure of the people’s intiative and constituent assembly, no changes in the Constitution have yet been passed. But over the past year, the Arroyo administration has succeeded in fleshing out the details of four of five major items of its constitutional agenda as stated in MTPDP. These four items were elaborated quite extensively by the Constitutional Commission and by HR1230. The one remaining item pertaining to political dynasties was abandoned altogether; it was, in fact, deleted from the Declaration of State Principles and Policies in the proposed revised Constitution.
The Constitutional Commission Draft of December 15, 2005, the Petition on People’s Initiative, HR 1230, HR 737, and HR 1109 complemented each other in pushing the government’s Charter change agenda in accordance with the MTPDP.
1. Shift to parliamentary form of government. The documents propose the establishment of a unicameral parliament composed of as many members as may be provided by law, elected from single member districts, with at least 250,000 to 300,000 population, for a term of five years; the automatic membership of current cabinet members and congresspersons in the interim parliament; the election of a prime minister from among the members of the parliament; the designation of the president as head of state; and the retention of the incumbent president’s powers during the transition till 2010, save those that will be delegated to the prime minister, who shall serve as the government’s chief operating officer (COO).
2. Shift to federal system. More elaborate and intensely debated in the Constitutional Commission, members agreed not to rush the shift from unitary to federal system. Joel Rocamora of the Institute for Popular Democracy
Civil Society Assessment of the 2004-2010 Medium Term Philippine Development Plan (MTPDP) Provisions for Constitutional Reform

Ass
essm
ent R
epor
t
263
(IPD) described the ConCom’s proposal as sophisticated from the vantage point of institutional design15. The body suggested a process allowing sufficient implementation time, one that is not predetermined, and is paced by local initiatives, to start with strengthening local autonomy and getting local people to take the initiative in determining the boundaries of federal states.
3. Liberalization of national economy and patrimony. The ConCom Report and HR1230 both proposed the deletion of nationality provisions in the 1987 Constitution to expand foreigners’ participation in vital areas of the economy. In particular, this covered the use and ownership of land, natural resources, media, advertising, education, and public utilities.16 HR 737 allows foreigners to own 100 percent of agricultural land.
4. Electoral and political party reforms. The ConCom draft has provisions on securing the secrecy and sanctity of the ballot as well as a system for absentee voting by qualified Filipinos abroad17; 30 per centum party list and measures against turncoatism.18
5. Definition of political dynasties and making the constitutional prohibition against political dynasties self-executory. The ConCom draft deleted the section on political dynasty (Sec 26, Art 2), while the House Resolution retained the previous provision that did not make it self-executory.
15. Art. XII, Sec.3 says that “Parliament shall strengthen the existing Local Government Code to provide for a more responsive and accountable local government structure instituted through a system of decentralization and devolution with effective mechanisms of recall, initiative, and referen-dum, allocate among the different local government units their powers, responsibilities, and resources.”
Art. XII, Sec. 12 says: “An autonomous territory may be created in any part of the country upon a petition addressed to Parliament by a majority of contiguous, compact and adjacent provinces, highly urbanized and component cities, and cities and municipalities in metropolitan areas through a resolution of their respective legislative bodies.” Parliament will then pass “...an organic act which shall define the basic structure of government for the autonomous territory, consisting of a unicameral territorial assembly whose members shall be elective and representative of the constituent political units. The organic acts shall provide for courts consistent with the provisions of their constitution and national laws.”
Section 16 delineates the powers of the federal state. The new federal state will be formed after it is approved in a plebiscite within the territory. “Within one year and after at least sixty percent of the provinces, highly urbanized cities and component cities of the country shall have joined in the creation of different autonomous territories, upon petition of majority of such autonomous territories through their respective regional assemblies, the Parliament shall enact the basic law for the establishment of a Federal Republic of the Philippines, wherebyThe autonomous territories shall become federal states.” (Art. XX, SEC. 15, Transitory Provisions)
To assist the process, “...a constitutional Preparatory Commission shall be created that shall study and determine all constitutional, legal, financial, organizational, administrative, and other requirements necessary or appropriate... “. (Sec.16)
The House Resolution, however, only gave one paragraph in the entire document to the envisioned shift to a federal system, as follows:Sec. 24. A federal system of government consistent with the unicameral parliamentary system provided for herein shall be installed within ten (10) years from the approval of these amendments. The parliament shall provide by law the division of the country into as many “independent states”, allocating uniform powers thereto, and reserving to the federal government powers on national defense, foreign relations, monetary policies, and such other powers it may deem imperative.
16The Con Com drafts eliminated the following provisions: “...the State shall protect Filipino enterprises against unfair foreign competition and trade practices.” (Art. XIV, Sec.1, A. National Economy). “Parliament shall, upon recommendation of the economic and planning agency, provide forLimitations on foreign ownership in certain areas of investments when the national or public interest dictates.”
The ConCom, however, limited the acquisition of alienable lands of the public domain to Filipino citizens. “Save in cases of hereditary succession, no private agricultural lands shall be transferred or conveyed except to individuals, corporations, or associations qualified to acquire or hold lands of the public domain. Lands classified in accordance with law as industrial, commercial or residential may be transferred or conveyed to foreign individuals orcorporations with foreign ownership. Parliament shall define the conditions for ownership of allowable lands by foreign individuals and by corpora-tions with foreign ownership”. (Art. XIV, Sec. 6, “National Patrimony”).
In the House Resolution, however, one section that seemed to be a catch-all was added: “Sec.12. Notwithstanding the provisions of sections 2 and 11 hereof, citizenship restrictions are hereby lifted relative to the ownership and lease of alienable lands of the public domain which include agricul-tural, residential, commercial and reclaimed lands, development of natural resources, ownership of franchises and of public utilities, mass media, education, insurance and advertising, unless otherwise provided by law. Parliament shall provide forlimited foreign ownership in regard to franchises granted to corporations involving public utilities of large scale.”
17. It shall also design a procedure for the disabled and the illiterates to vote without the assistance of other persons. Until then, they shall be allowed to vote under existing laws and such rules as the Commission on Elections may promulgate to protect the secrecy of the ballot
18Of the total number of members including those elected by Parliament. In the choice of such members, the political parties shall ensure that the labor, peasant, urban poor, veterans, indigenous peoples, women, youth, differently-abled, and such other sectors as may be provided by law, except the religious sector, are properly represented. The House Resolution on the other hand has the following:“Sec. 6. Political parties must be strength-ened and must receive equitable subsidy from government. Incumbent elective officials shall forfeit their seats if they change parties within one year before the next elections.”
Civil Society Assessment of the 2004-2010 Medium Term Philippine Development Plan (MTPDP) Provisions for Constitutional Reform

Civi
l Soc
iety
Ass
essm
ent o
f the
200
4 -2
010
MTP
DP
264
IV. OVERALL ASSESSMENT
While substantive discussions were conducted and proposals drafted by the ConCom on the issues of federalism, parliamentarism, and economic provisions, one wonders whether they are indeed meant to further the reforms initiated in the 1987 Constitution or whether they are simply designed to ensure the political survival of the president, and in some views, transport the country back to the dark years of Martial Law. The findings of various civil society groups are quite disturbing.
The proposed revisions will change the direction and development strategy of the country and make it retrogressive. The development strategy bias will shift from self-sufficiency and equity-led sustainable development to import-dependent growth-without- equity, a strategy previously pursued by the Marcos administration. In the proposed Preamble, for example, the significance of social justice is de-emphasized. The Constitutional Commission has proposed the deletion of words such as “independence”, “the rule of law”, “truth”, “freedom”, and “love”. Article 2, on the National Patrimony, Section 2, which declares as national policy and principle that “national development and industrialization will be based on sound agricultural modernization and agrarian reform” will be deleted. The section that provides for the exclusive use to Filipinos of the country’s fishing grounds is also proposed for deletion. The indigenous peoples and small farmers will also be forced to deal with the influx of investors hunting for land to lease either as plantation area or for mining, logging, or real estate purposes. The section establishing a 40-60 ownership in favor of Filipinos and the land lease terms and ceilings will also be deleted in favor of 100 percent foreign ownership, as further provided in Nograles’ HR 737. Land prices can be expected to rise, as more foreigners will look for land to buy or lease. It will then be more difficult for both the rural and urban poor to acquire land.
The proposals will make government more repressive. Civil liberties may be curtailed with the introduction of modifiers such as “responsible” in the exercise of freedom of expression; the “defanging” of the judiciary by the removal of “expanded” judicial review as well as the deletion of the entire paragraph establishing the duty of the court to settle controversies, etc.; and most dangerously, making it easy for the government to impose martial law with the deletion of the requirements to report to Congress/ National Assembly and be subject to review by the Supreme Court.
They will undermine the country’s independence and make it more vulnerable to foreign military interests. The word “ independence” is to be deleted in the preamble, the national policies on freedom from nuclear weapons (Art 2, sec 8), and foreign military bases (Art 18, sec 25).
Finally, the proposed article on transitory provisions (Art 18) will enable Arroyo to rule both as head of government and state, a virtual dictator, until 2010 and beyond. The proposal cancels the elections scheduled in 2007, gives to the interim parliament the power to decide on when to hold elections, and ensures the overwhelming majority of loyalists in the interim parliament, which is composed of all existing congresspersons, senators, and existing cabinet members.
In sum, the gains made as a result of the 1986 People Power Revolution would be reversed; Arroyo and her allies’ power would be expanded, while significantly diminishing those of the citizens and civil society.
V. CONCLUSION AND RECOMMENDATIONS
The Arroyo administration has failed miserably, in both process and content, to live up to its promises to uphold the MTPDP provisions for constitutional reform. Arroyo reneged on her campaign promise to hold a constitutional convention to pave the way for constitutional reform, instead favoring a combination of people’s initiative and two attempts to establish a constituent assembly. The first attempt was thwarted by the threat of a people power uprising in December 2006. The second, introduced through HR 1109 in the lower house, was rejected by at least 70 percent of the voting population. Both attempts were viewed suspiciously as desperate means to extend the term and perpetuate the president and her allies’
Civil Society Assessment of the 2004-2010 Medium Term Philippine Development Plan (MTPDP) Provisions for Constitutional Reform

Ass
essm
ent R
epor
t
265
hold on political power. Both proposals have pushed the country towards the verge of great political turmoil and upheaval.
In terms of content, the proposals generated by the House of Representatives and the Constitutional Commission formed by the President in 2006, except for some new ideas such as a constituency-pushed federal system and subsidy to political parties, have been met with great suspicion. In general, far from expanding social justice and human rights, and strengthening democratic institutions, these proposals seem to set the country back many years in time.
Recommendations
Constitutional reform remains a necessary step towards substantially expanding political, economic, and cultural democracy in the Philippines. In this light, the C4CC network has researched on and come out with proposals to improve the 1987 Constitution. Among its recommendations is a shift to a federal system through an asymmetric and performance-based process providing greater powers and autonomy to regions that have achieved a certain level of accomplishment in the areas of asset reform and governance.
Moreover, it has established a number of specific recommendations towards genuine constitutional reform.
1. Ensure a thorough and objective public awareness campaign on constitutional reform issues, proposals, and processes.
2. Explore a piecemeal constitutional reform process, identifying which constitutional reform agenda should be pursued by what means. Not all items on a constitutional reform agenda may need a ConCon. Some may be better off pursued through a people’s initiative or a constituent assembly.
3. Initiate the holding of a constitutional convention in May 2013, simultaneously with local elections to tackle important issues such as the shift to a federal and/or parliamentary government system, the dismantling of the armed forces of the Philippines in favor of education, asset reforms, and health. Resulting proposals can then be implemented in 2016, at the onset of the next administration.
4. Pass laws that will pave the way for a smooth transition and set up the foundation for major constitutional reform proposals. These might include a political party reform law and strengthening the Local Government Code to include regional governance for a federal system.
5. Implement the 1987 Constitution with earnest by pursuing the implementation of existing laws that enflesh its social justice and human rights provisions. These include the Comprehensive Agrarian Reform Program Extension with Reforms, the Indigenous Peoples Rights Act, the Fisheries Code, and the Urban Development and Housing Act, among others. Legislation is likewise needed to follow through on the constitutional provision to end political dynasties and dismantle private armies.
REFERENCES
AKBAYAN Citizens’ Action Party. “Gloria’s Cha-Cha: A Dance of Desperation”, 2006.
Citizens’ Council for Human Rights/Philippine Alliance for Human Rights Advocates (CHR/PAHRA). “Mga Lihim sa Cha Cha ni Gloria: Mga Dapat Malaman Hinggil sa Charter
Change.” Coalition for a Citizens’ Constitution, 2006.
Coalition for a Citizens’ Constitution. Primer on Cha Cha ni Gloria: A Guide for Civil Society, 2006.
Institute of Popular Democracy. “Political Brief: Constitutional Change in the Philippines.”Reprinted by Citizens for Constitutional Convention (C4CC), 2006
Civil Society Assessment of the 2004-2010 Medium Term Philippine Development Plan (MTPDP) Provisions for Constitutional Reform
Civi
l Soc
iety
Ass
essm
ent o
f the
200
4 -2
010
MTP
DP
266
Casiple, Ramon. “Constitutional Change Proposals: A Critique. ” A PowerPoint presentation,2006.
Republic of the Philippines CONGRESS OF THE PHILIPPINES Thirteenth Congress, Second Regular Session: Resolution No. 1230: Resolution Proposing the Revision of the 1 987 Constitution. April 2006; HR 737; HR 1109
One Voice paid ad. What People Don’t Know About the Proposed Cha-Cha. 2006
One Voice Statement. NO TO CHA-CHA NOW. YES TO REAL CHANGE. A Peaceful Transfer of Power in 2010 Through Elections. June 9, 2009
www.neda.gov.ph NEDA web site. Medium Term Philippine Development Plan 2004-2010
www.pcij.org. Philippine Center for Investigative Journalism website, Consultative Commission, December 2005. Proposed Revision of the 1987 Constitution
Civil Society Assessment of the 2004-2010 Medium Term Philippine Development Plan (MTPDP) Provisions for Constitutional Reform

Ass
essm
ent R
epor
t
267
Convenors of the Assessment
ATM was born out of the collective concern of NGOs/POs and other civil society groups against the impending threat of the revitalization of the mining industry in the Philippines. Now, this is composed of 80 community organizations and support groups.
The term “tigil-mina” (stop mining) does not reflect a stand of totally going against mining and minerals extraction. What this refers to is to block the Arroyo administration and the DENR from aggressively promoting mining and using this strategy to allegedly address the fiscal problems and poverty situation of the country. ATM is convened by LRC-KSK, HARIBON, and PhilDHRRA.
The alliance is calling for the:• scrapping of the Philippine Mining Act of 1995 and the Passage of an
Alternative People’s Mining Act,• revocation EO 270-A and the rejection of the National Minerals Action
Plan,• a nationwide moratorium on large-scale mining operations, and
passage of HB 6324 (Alternative Mining Bill).
Established in November 1972, AF is the country’s first heterogeneous network of foundations and non-government organizations (NGOs). In its more than three decades of service, the AF has made achievements in information management activities, database gathering on foundation profiles and best practices, trends in development work, and institution and capacity building opportunities. With local and global partner institutions, AF works to improve the enabling environment for Philippine philanthropy and foundation development. AF is actively pursuing the establishment of community foundations and the formation of strategic alliances in efforts to promote a program of partnership or collaboration among stakeholders.
Among its advocacies are:• Good governance and PCNC certification• Enabling regulatory environment for NGOs• NGO Benchmarks for organizational excellence
APPI is based in the Philippines and was incorporated in 1992 but its principals and associates have over 50 years of combined expertise in the tourism and hospitality industry. Projects successfully completed have taken our experts all over the Asia-Pacific region: to the glaciers of the Himalayas; the stone forests of Yunnan; the mysterious Mekong River region; and the Tiger forests of Far East Russia and Uttarakhand in India.
APPI’s range of experiences works hand-in-hand with a specific mission: to promote tourism development that is environmentally, socially, and culturally sustainable. The firm’s experts make sure the components of any big Master Plan or small stand-alone development contributes to poverty reduction and the creation of social wealth, in that the poorest fishermen, farmers, or village women are able to benefit from tourist improvement and developments, either from the social infrastructures built; direct and indirect employment created; or through livelihood projects.
Alyansa Tigil-Mina
Jaybee GarganeraNational [email protected]
Associations of Foundations
Norman JiaoExecutive [email protected]
Asia-Pacific Projects, Inc.
Ramon Benedicto AlampayDirector

Civi
l Soc
iety
Ass
essm
ent o
f the
200
4 -2
010
MTP
DP
268
Convenors of the Assessment
The Ateneo School of Government is the Graduate School of Leadership and Public Service of the Ateneo de Manila University. Its mission is to work with ethical and effective national and local leaders to build prosperous and just communities all over the Philippines. As a leadership school, the priority of the school is making a difference on the ground by enabling and supporting local and community leaders and help create conditions for improved governance, wealth creation, efficient delivery of basic services, and open democratic access to opportunities and justice. The School carries out this mission through its Academic Program, its Jaime V. Ongpin Executive Education Program, and its Knowledge and Practice Clusters consisting of ASoG centers, institutes, networks, and project teams.
The School’s overarching vision is “transforming communities, building a nation.” It has prioritized the following knowledge and practice areas for its academic, research and training interventions:
(1) Enabling leadership (2) Strengthening local governance; (3) Providing solutions to poverty; (4) Implementing sustainable development; (4) Promoting social entrepreneurship; (5) Mainstreaming social accountability; and (6) Transforming politics.
The School is a forum for dialogue and partnership between government and citizen groups on a range of issues, including mining, climate change, biodiversity, agrarian reform, labor rights, health, education, constitutional change, elections, and other critical issues the country faces.
The need to scale up NGO impact on national development became the root motive that led to the formation of the Caucus of Development NGO Networks (CODE-NGO).
Today, CODE-NGO has 6 national and 6 regional member networks, representing 2,000 development NGOs, people’s organizations and cooperatives nationwide.
CODE-NGO maximizes its scale and synergy to influence public policy, provide leadership in civil society and increase the effectiveness of social development work in the country.
It focuses on policy advocacy and partnership building in the public arena as well as on developing the capacity and accountability of its member networks and affiliated organizations.
Among its advocacies are:• social accountability and participatory governance (including budget
reform and ODA reform),• asset reform,• constitutional reform (federalism and constitutional convention), and• enabling regulatory environment for NGOs
CSRI envisions a dynamic and effective civil society sector, a sector believed by this institute as “an essential foundation of a democratic and progressive Philippine society”.
Its mission is to engage in various activities that will contribute or build on the capacity, effectiveness and good governance of civil society organizations in Southeast Asia.
Ateneo School of Government
Antonio G. M. La ViñaDean
Caucus of Development NGO Networks
Sixto Donato C. MacasaetExecutive [email protected]
Civil Society Resource Institute
Fernando [email protected]

Ass
essm
ent R
epor
t
269
Convenors of the Assessment
C4CC is a coalition of eight national NGOs/NGO networks which aims at mobilizing civil society to help influence public opinion and put significant pressure on government, specifically the House of Representatives, the Senate, and the President to agree on a more credible and participatory constitutional reform process in order to safeguard the most progressive social justice and human rights provisions of the 1987 Constitution and to put in place a new system of representation that is more democratic.
Since its founding in 1986, FMA has sought to enhance the popularization and social marketing of development-oriented issues and campaigns through media-related interventions, social communication projects, and cultural work.
Also, FMA has helped produce a public affairs television show, video documentaries, songwriting festivals, advocacy campaigns and various publications.
FMA develops programs and projects to address access to and equity of disadvantaged sectors in information and communications technology.
A grant-making institution, FPE was incorporated on January 15, 1992. FPE was organized to help reverse the rapid destruction of the Philippine natural resource base through a strategic and integrated conservation program.
The final form of FPE emerged after a process of nationwide consultations with 334 Philippine NGOs and POs and 24 academic institutions. These took the lead in conceptualizing and organizing this foundation’s subsequent program directions. They are, in essence, the owners.
This envisions itself as a dynamic, relevant, proactive and growing organization enabling civil society and other stakeholders towards effective biodiversity conservation and sustainable development. Also, FPE envisions communities caring responsibly and living fully in harmony with their environment.
As for its mission, FPE seeks to be a catalyst for biodiversity conversation and sustainable development of communities in critical sites.
The Gaston Z. Ortigas Peace Institute (GZO), established in 1991, seeks to build a just peace in the Philippines through the active participation of citizens in peace processes.
It supports the building of civil society peace movements, and currently serves as the secretariat of peace networks such as the Waging Peace Philippines, the Generation Peace (Youth Peace Network), and the Indigenous Women Council for Peace and Development. GZO assists these networks in their peace agenda advocacy, engagement with stakeholders, and capability-building and consolidation.
Coalition For a Citizens’ Constitution
Cezar BelangelProgram Manager
Foundation for Media Alternatives
Alan AlegreExecutive [email protected]
Foundation for the Philippine Environment
Ma. Christine F. ReyesExecutive Director
Gaston Z. Ortigas Peace Institute
Karen TañadaExecutive [email protected]

Civi
l Soc
iety
Ass
essm
ent o
f the
200
4 -2
010
MTP
DP
270
Convenors of the Assessment
• to promote and utilize the law as a potent tool for the enforcement of the rights of and the creation and advancement of opportunities for the disadvantaged and marginalized sectors,
• to advocate the development of a policy and legal environment oriented towards enhanced accountability to the disadvantaged and marginalized sectors’ need,
• to assist disadvantaged and marginalized sectors gain improved access to justice and achieve more effective participation in governance, and
• to develop and/or facilitate partners’ initiatives for rural empowerment and sustainability
KASAPI is a national federation of different indigenous people (IP) organizations representing 64 ethno-linguistic groups from 127 different indigenous cultural communities in the Philippines. This is also a network of 16 regional and sub-regional federations comprise of about 250 community-based indigenous peoples’ organization.
KASAPI was formally established on October 23, 1997 at St. Michael’s Retreat House, Antipolo as a result of a national conference of Indigenous Peoples in the Philippines. This is governed by a Consultative Body of 34 members each representing member organizations or communities within the federation.
Organized in 1991, MINCODE is a coalition of twelve networks of NGOs based in Mindanao.
MINCODE envisions a Mindanao society where its peoples live with equity and peace respectful of cultural diversities, caring of its rich natural resources and in harmony with their Creator.
Its mission is composed of one: to take the lead in the advocacy and action of tripeople peace and development and other key issues affecting Mindanao by mobilizing network members and communities and two: to provide a forum/venue for genuine and meaningful dialogue among groups in Mindanao.
NATCCO was formed by the credit union pioneers who believed that the task of co-op development had lain primarily in the hands of the private sector. The co-op sector leaders were aware that in order to succeed they could not rely on government alone. Instead, co-ops have to be driven and patronized by their members and it is only through co-op education that this level of member patronage and responsibility can be established.
Today, NATCCO is the biggest and strongest federation of co-ops in the Philippines in terms of geographical reach, membership, financial capacity and array of services. It has around 1.2 million individual members coming from several co-op federations and some 308 rural and urban-based co-ops.
Initiatives for Dialogue and Empowerment through Alternative Legal Services
Edgardo LigonExecutive Director
Katutubong Samahan ng Pilipinas
Giovanni ReyesExecutive Director
Mindanao Coalition of Development NGO Networks
Rolando AbandoOfficer-In-Charge
National Confederation of Cooperatives
Sylvia ParaguyaExecutive Director

Ass
essm
ent R
epor
t
271
Convenors of the Assessment
Formerly known as the Council of Welfare Agencies in the Philippines, Inc. (CWAPI), NCSD was formally organized in 1952 when a group of Filipino leaders of various welfare and civic organizations bonded together to respond to the aftermath of World War II. Its formation can probably be considered as the beginning of NGO network in the Philippines.
In its more than 50 years of existence, this organization has built and expanded its network with both private, government and people’s organizations, locally and internationally to address varied issues confronting the deprived sectors of our society.
NCSD continues to be a network of social service and social development agencies and organizations, demonstrating the capacity to undertake capability building, advocacy and social mobilization activities towards influencing change in national policies and development programs.
A national coalition of 13 non-government organizations that promotes sustainable fisheries through the conduct of policy research and advocacy, NFR’s mission is to work as a catalyst for the creation of a policy environment that is conducive to fisherfolk empowerment as well as sustainable and equitable fisheries utilization, management and development. Also, this seeks mainstream sustainable development in fisheries through building and strengthening partnerships and ensuring the institutionalization of reforms at the national and local levels.
NFR seeks to:• contribute to fisheries development that ensures the conservation of
marine biodiversity,• promote policies and institutional arrangements that ensure effective
management of fisheries resources at appropriate scales, and• improve policy advocacy work by strengthening links of local resource
management initiatives to national level for effective policy reforms.
Since its inception in 1989, NIPS remains the principal political institute
that undertakes programs for the promotion of liberalism and democracy in the Philippines.
NIPS provides opportunities, facilities, and services for the systematic study, development and promotion of liberal politics in the Philippines through public advocacy and political education programs for liberal leaders and their supporters.
National Council of Social Development
Marian OpeñaExecutive [email protected]
NGOs for Fisheries Reform
Dennis CalvanNational [email protected]
National Institute for Policy Studies
Lambert RamirezExecutive Director
Civi
l Soc
iety
Ass
essm
ent o
f the
200
4 -2
010
MTP
DP
272
Convenors of the Assessment
This is a national confederation of 28 peasant organizations located in 30 provinces in the Philippines and two national sectoral federations of women and fisher folks. These organizations have a combined membership strength of about 20,000 small farmers, marginal fisher folks and rural women.
Dedicated to the empowerment of the Filipino small farmers, fishers, rural women, youth, and indigenous peoples leading in the advocacy and implementation of sustainable agrarian and aquatic reform and rural development and equality of men and women, and responding to our present and historical problem of poverty and injustice, PAKISAMA envisions the realization of humane, gender-sensitive and environmentally sound rural societies where peoples control and own the basic means of production and exchange, critically and actively participate in governance, protect and care for the environment, and live the values of authentic humanism in a Philippine society characterized by justice, freedom, democracy and national sovereignty.
Established on May 31, 1988 and registered on February 14, 1990, PHILSSA has embarked on a mission of prototyping innovative paradigms of sustainable development for the effective empowerment of urban sectors, namely, the slumdwellers, the formal and informal labor force, the youth, women, children, and the development workers themselves. In 2009, this already comprised 52 partner NGOs.
PHILSSA envisions itself as a partnership network and resource center of social development experts and practitioners committed to advocate and work towards a gender sensitive, transformative and sustainable urbanization with preference for marginalized individuals and communities.
Founded in 1997 as a response to the need to distribute private agricultural lands under the government’s Comprehensive Agrarian Reform Program (CARP) of 1988, AR Now! is a national coalition of 15 civil society organizations involved in agrarian reform advocacy in the country.
Many agrarian reform advocates looked at the poor performance of land distribution and saw the imperative of pursuing agrarian reform beyond the first 10 years of CARP implementation. Consensus formed around the urgency for a national campaign that would seek to revive agrarian reform and rural development in the national agenda.
The Philippine Agrarian Reform Foundation for National Development, Inc. (PARFUND) is a non-stock, non-profit organization that supports the programs and projects of small non-government and people’s organizations (NGOs and POs) that are engaged in promoting agrarian reform and rural development (ARRD) in the Philippines.
PARFUND was established in 1993 by leading personalities in the Philippine agrarian reform movement who wanted to address the lack of funding for grassroots initiatives in agrarian reform and rural development. Among PARFUND’s founding members are Bishop Antonio Ledesma, Mahar Mangahas, Romana delos Reyes, Sixto Roxas and Victor Tan.
Pambansang Kilusan ng mga Samahang Magsasaka
Raul Socrates BanzuelaExecutive Director
Partnership of Philippine Support Service Agencies
Benedict BalderramaExecutive [email protected]
People’s Campaingn for Agrarian Reform Network
Ernesto LimNational [email protected]
Philippine Agrarian Reform Foundation for National Development
Jose Noel OlanoExecutive Director

Ass
essm
ent R
epor
t
273
Convenors of the Assessment
PARFUND mobilizes resources to ensure that ARRD projects will have a source of support. PARFUND helps sustain the efforts of landless farmers and farm workers to acquire land through the Philippine Government’s Comprehensive Agrarian Reform Program (CARP). PARFUND also provides follow-on support to farmer beneficiaries of CARP to help them become efficient managers of their land. At the same time, PARFUND looks after the welfare of the families of CARP beneficiaries by supporting the education of their children, among others.
At the forefront in the fight against poverty through trailblazing corporate citizenship programs developed and implemented with the strategic commitment of more than 240 member-companies, PBSP is the largest corporate-led, non-profit social development foundation in the Philippines.
This enjoins businesses, large or small, to commit resources wisely to programs that assist communities towards their self-reliance and improved quality of life.
With four million Filipinos it has assisted for the past 38 years, PBSP envisions to be the leader in promoting business sector commitment to social development.
In addition, PBSP is committed to the empowerment of the poor by promoting business sector leadership in, and commitment to, poverty reduction programs that lead to self-reliance.
PBSP works with strategic partners such as donor agencies, civil society organizations, communities, government and the academe in implementing programs in education, enterprise development, health and water, and area resource management.
Established in September 1989, PLCPD envisions of an improved quality of life for all Filipinos through population and human development legislation.
Engaging a wide and diverse range of individuals, groups and organizations, this has, through the years, become an empowering and building institution, harnessing the people’s active participation in policymaking.
PLCPD endeavors to equip civil society on policy advocacy and serve as a conduit for them to actively engage the legislature—consolidating their differing viewpoints into legislative expressions that favor population and sustainable human development.
Committed to working with and among legislative bodies from the national down to the local level, PLCPD primarily works within the halls of Congress, devoted to developing policy champions and generating viable, responsive, and people-centered public policies on population and human development. These policy issues include: population and development, reproductive health, public health, governance and fiscal reforms, gender equality and equity, environment, education, agrarian reform and rural development, trade and investments, labor, housing and urban development, child rights, and human rights.
Philippine Business for Social Progress
Gil T. SalazarExecutive Director
Philippine Legislators’ Committee on Population and Development Foundation, Incorporated
Ramon San PascualExecutive Director
Civi
l Soc
iety
Ass
essm
ent o
f the
200
4 -2
010
MTP
DP
274
Convenors of the Assessment
This is a network organization that traces its roots to a three-week regional workshop held in Thailand in 1974 where 120 rural development practitioners from 12 Asian and Pacific countries discussed prevailing issues and formulated an action agenda for the development of the rural areas. In addition, this began as a loose coalition and was legalized in 1984.
Today, PhilDHRRA is a network of sixty-seven non-government organizations involved in various development activities in rural communities all over the country.
PHILDHRRA caters to social development initiatives to promote greater involvement of farmers, fishers, indigenous people, women, and children in issues of development, sustainability, governance, and democracy.
TAN is a growing coalition of multi-sectoral organizations which seeks to contribute significantly to the reduction of corruption in the Philippines.
TAN catalyzes and advances a comprehensive and multi-sectoral transparency and accountability strategy founded on the prevention and the promotion of a corruption-intolerant society.
Ang Urban Poor Alliance ay binubuo ng mga peoples organisation, non-government organisation at mga indbidwal mula sa sector ng mga maralitang tagalunsod. Ito ay isang kolektiba na naninindigan sa karapatan sa maayos at ligtas pabahay at mga batayang serbisyo.
ADVISERS
The advisers include Archbishop Antonio Ledesma, SJ, archbishop of Cagayan de Oro who is also an expert on agrarian reform, rural development and peace building, and is also the current Chairperson of the Peace and Equity Foundation (PEF), Dr. Cielito Habito, former NEDA Director-General and Secretary for Socio-Economic Planning and now a professor at the Ateneo de Manila University, Atty. Christian Monsod, former member of the 1986 Constitutional Commission and Chairperson of the Commission on Elections (COMELEC,) and current Chairperson of the Philippine Agrarian Reform Foundation (PARFUND), Dr. Mary Racelis, recognized socio-anthropologist who has taught at the Ateneo de Manila University and the University of the Philippines and has been active in many NGOs, including INCITEGOV and CO Multiversity, both of which she now chairs, former National Treasurer Prof. Leonor Briones of the UP National College of Public Administration and Mr. Alberto Lim, Executive Director of the Makati Business Club (MBC).
Philippine Partnership for the Development of Human Resources in Rural Areas
Divina Luz LopezNational [email protected]
Transparency and Accountability Network
Vincent LazatinExecutive [email protected]
Urban Poor Alliance
Nicasio de RosasCoordinator

Ass
essm
ent R
epor
t
275
Convenors of the Assessment

Civi
l Soc
iety
Ass
essm
ent o
f the
200
4 -2
010
MTP
DP
276
As this report was going to press, the May 2010 national and local elections were just days away. This much awaited democratic exercise was expected to install a new President and a new Administration by June 30, 2010. This new government is expected to craft, in its first months in office, the new Medium Term Philippine Development Plan (MTPDP) for 2011 to 2016.
The MTPDP is the government’s economic and development blueprint. It sets the over-all goals of the administration and presents strategies and plans for achieving the said goals. While many quarters have noted that the MTPDP is not always followed by many government agencies and by the local government units, it cannot be denied that it still plays an important role in defining the development strategies, programs and projects of the government.
In April 2009, various civil society organizations (CSOs) came together to start a process of assessing the performance of the Macapagal-Arroyo administration in implementing the MTPDP of 2004 to 2010 . These CSOs and CSO networks, which eventually numbered twenty seven, acted as convenors of this CSO Assessment of the 2004-2010 MTPDP.
The convenors agreed on the following objectives of the assessment:
1) assess the government’s performance viz. its commitments/targets in the 2004-2010 MTPDP,
2) examine the appropriateness and responsiveness of the MTPDP framework and targets to the development agenda of the basic sectors and of CSOs,
3) build consensus among the convenors/advisers and other CSOs on key policy recommendations for the MTPDP for 2011-16, and
4) advocate for these recommendations viz. national candidates in the 2010 elections and the new President/ Cabinet starting July 2010.
About the Assessment
This Assessment Report has likewise been published and may be viewed at and downloaded from www.code-ngo.org.
For any inquiry regarding this assessment report, you may contact:
Caucus of Development NGO Networks(CODE-NGO)69 Esteban Abada St., Loyola Heights, Quezon City
Tel/Fax No: (02) 9202595 or (02) 4356616Email: [email protected]: www.code-ngo.org