CITY OF SPRINGFIELD BUDGET COMMITTEE MEETING
497
CITY OF SPRINGFIELD BUDGET COMMITTEE MEETING Tuesday, April 30, 2013, 5:30 p.m. Library Meeting Room, Springfield City Hall 225 Fifth Street Springfield, Oregon AGENDA A.) COMMITTEE OPENING REMARKS 10 minutes 1. Welcome from the Chair Chair Terry Buck 2. Roll Call Staff 3. Election of Chairperson Chair Terry Buck 4. Election of Vice Chairperson Chair Terry Buck B.) STAFF OPENING REMARKS Gino Grimaldi 20 minutes 1. Welcome from the City Manager 2. Delivery of Budget Message C.) INTRODUCTION OF BUDGET Bob Duey 30 minutes 1. Budget Process 2. Budget Overview D.) PUBLIC HEARING STATE SHARED REVENUE Chairman 05 minutes BREAK 15 minutes E.) NEW BUSINESS Department presentations 1. Library Rob Everett 20 minutes 2. Fire & Life Safety Chief Roves 40 minutes F.) BUSINESS FROM THE AUDIENCE 10 minutes G.) ANNOUNCE NEXT BUDGET COMMITTEE MEETING Chair 1. Tuesday, May 07, 2013 – 5:30 PM, Springfield City Hall – Library Meeting Room Note: The Budget Committee for the Springfield Urban Renewal Agency (SEDA) will convene at 5:30 PM at the same location. The legal advertisement for this meeting will be published separately. Dinner will be provided and the City of Springfield Budget Committee will convene at the conclusion of the SEDA meeting. H.) ADJOURN Citizens’ comments are normally scheduled under the agenda item “Business from the Audience” and are limited to three (3) minutes each. All subsequent meetings will have time scheduled for citizen input and anyone wishing to make a longer presentation should contact the City Manager’s Office at 726-3700, so that the presentation can be included separately on the agenda. ATTACHMENTS 1) April 30, 2012 Agenda Memo 2) Budget Overview Memo 3) City of Springfield Total Operating Expenditures– Total All Funds 4) Operating Expenditures by Department’s – Total All Funds
-
Upload
khangminh22 -
Category
Documents
-
view
0 -
download
0
Transcript of CITY OF SPRINGFIELD BUDGET COMMITTEE MEETING

CITY OF SPRINGFIELD BUDGET COMMITTEE MEETING
Tuesday, April 30, 2013, 5:30 p.m. Library Meeting Room, Springfield City Hall
225 Fifth Street Springfield, Oregon
AGENDA
A.) COMMITTEE OPENING REMARKS 10 minutes 1. Welcome from the Chair Chair Terry Buck 2. Roll Call Staff 3. Election of Chairperson Chair Terry Buck 4. Election of Vice Chairperson Chair Terry Buck B.) STAFF OPENING REMARKS Gino Grimaldi 20 minutes 1. Welcome from the City Manager 2. Delivery of Budget Message C.) INTRODUCTION OF BUDGET Bob Duey 30 minutes 1. Budget Process 2. Budget Overview D.) PUBLIC HEARING STATE SHARED REVENUE Chairman 05 minutes BREAK 15 minutes E.) NEW BUSINESS Department presentations 1. Library Rob Everett 20 minutes 2. Fire & Life Safety Chief Roves 40 minutes F.) BUSINESS FROM THE AUDIENCE 10 minutes G.) ANNOUNCE NEXT BUDGET COMMITTEE MEETING Chair 1. Tuesday, May 07, 2013 – 5:30 PM, Springfield City Hall – Library Meeting Room
Note: The Budget Committee for the Springfield Urban Renewal Agency (SEDA) will convene at 5:30 PM at the same location. The legal advertisement for this meeting will be published separately. Dinner will be provided and the City of Springfield Budget Committee will convene at the conclusion of the SEDA meeting.
H.) ADJOURN Citizens’ comments are normally scheduled under the agenda item “Business from the Audience” and are limited to three (3) minutes each. All subsequent meetings will have time scheduled for citizen input and anyone wishing to make a longer presentation should contact the City Manager’s Office at 726-3700, so that the presentation can be included separately on the agenda. ATTACHMENTS
1) April 30, 2012 Agenda Memo 2) Budget Overview Memo 3) City of Springfield Total Operating Expenditures– Total All Funds 4) Operating Expenditures by Department’s – Total All Funds
April 30th 5) Library Budget Summary Memo 6) Library Presentation 7) Fire & Life Safety Budget Summary Memo 8) Fire & Life Safety Presentation
May 7th
9) Human Resources Budget Summary Memo 10) Human Resources Presentation 11) Finance Budget Summary Memo 12) Finance Presentation 13) Legal/Judicial Services Budget Summary Memo 14) Legal/Judicial Services Presentation 15) Police Budget Summary Memo 16) Police Crimes Statistics 17) Police Presentation
May 14th
18) Information Technology Budget Summary Memo 19) Information Technology Presentation 20) City Manager’s Office Budget Summary Memo 21) City Manager’s Office Presentation 22) League of Oregon Cities Budget Request 23) LCOG Budget Request 24) LRAPA Budget Request 25) NEDCO Main Street Program Budget Request 26) NEDCO Team Springfield Budget Request
May 21st
27) Development & Public Works Budget Summary Memo 28) Development & Public Works Presentation 29) Capital Budget Presentation 30) Priority Based Budgeting
FY14 Proposed
31) City of Springfield Proposed Budget Fiscal Year 2013/2014
CITY OF SPRINGFIELD BUDGET COMMITTEE MEETING
Tuesday, April 30, 2013, 5:30 p.m. Library Meeting Room, Springfield City Hall
225 Fifth Street Springfield, Oregon
AGENDA
A.) COMMITTEE OPENING REMARKS 10 minutes 1. Welcome from the Chair Chair Terry Buck 2. Roll Call Staff 3. Election of Chairperson Chair Terry Buck 4. Election of Vice Chairperson Chair Terry Buck B.) STAFF OPENING REMARKS Gino Grimaldi 20 minutes 1. Welcome from the City Manager 2. Delivery of Budget Message C.) INTRODUCTION OF BUDGET Bob Duey 30 minutes 1. Budget Process 2. Budget Overview D.) PUBLIC HEARING STATE SHARED REVENUE Chairman 05 minutes BREAK 15 minutes E.) NEW BUSINESS Department presentations 1. Library Rob Everett 20 minutes 2. Fire & Life Safety Chief Roves 40 minutes F.) BUSINESS FROM THE AUDIENCE 10 minutes G.) ANNOUNCE NEXT BUDGET COMMITTEE MEETING Chair 1. Tuesday, May 07, 2013 – 5:30 PM, Springfield City Hall – Library Meeting Room
Note: The Budget Committee for the Springfield Urban Renewal Agency (SEDA) will convene at 5:30 PM at the same location. The legal advertisement for this meeting will be published separately. Dinner will be provided and the City of Springfield Budget Committee will convene at the conclusion of the SEDA meeting.
H.) ADJOURN Citizens’ comments are normally scheduled under the agenda item “Business from the Audience” and are limited to three (3) minutes each. All subsequent meetings will have time scheduled for citizen input and anyone wishing to make a longer presentation should contact the City Manager’s Office at 726-3700, so that the presentation can be included separately on the agenda. ATTACHMENTS
1) April 30, 2012 Agenda Memo 2) Budget Overview Memo 3) City of Springfield Total Operating Expenditures– Total All Funds 4) Operating Expenditures by Department’s – Total All Funds

April 30th 5) Library Budget Summary Memo 6) Library Presentation 7) Fire & Life Safety Budget Summary Memo 8) Fire & Life Safety Presentation
May 7th
9) Human Resources Budget Summary Memo 10) Human Resources Presentation 11) Finance Budget Summary Memo 12) Finance Presentation 13) Legal/Judicial Services Budget Summary Memo 14) Legal/Judicial Services Presentation 15) Police Budget Summary Memo 16) Police Crimes Statistics 17) Police Presentation
May 14th
18) Information Technology Budget Summary Memo 19) Information Technology Presentation 20) City Manager’s Office Budget Summary Memo 21) City Manager’s Office Presentation 22) League of Oregon Cities Budget Request 23) LCOG Budget Request 24) LRAPA Budget Request 25) NEDCO Main Street Program Budget Request 26) NEDCO Team Springfield Budget Request
May 21st
27) Development & Public Works Budget Summary Memo 28) Development & Public Works Presentation 29) Capital Budget Presentation 30) Priority Based Budgeting
FY14 Proposed
31) City of Springfield Proposed Budget Fiscal Year 2013/2014

CITY OF SPRINGFIELD/FINANCE DEPARTMENT MEMORANDUM Date: April 25, 2013 To: Members of the Budget Committee From: Bob Duey, Finance Director Subject: First Budget Meeting Scheduled for April 30, 2013 I would like to thank each of you in advance for again volunteering your time to help review the Proposed Budget for the City. The first meeting is scheduled for 5:30 p.m. next Tuesday April 30, in the Library Meeting Room of Springfield City Hall. Dinner will be served. Committee Roster and Officers In the front of your FY14 Proposed Budget, Attachment 31, document there is a listing of the members for this year’s committee. We are going to see just one new Springfield citizen joining the returning members this year. In Ward 5 Diana Alldredge has been appointed by the Council to fill the current vacancy in that ward. Diana also serves on the Police Planning Task force. In Ward 6, Paul Selby has been re-appointed to another 3year term. Other returning veterans are Chris Stole in Ward 1, Terry Buck in Ward 2 and Pat Mahoney in Ward 3. Ward 4 is vacant at this time due to the very recent resignation of Garold Rupp (moved just outside the city boundaries). Your committee’s current Chair is Terry Buck and the current vice-chair is Paul Selby. One of the first official actions at your April 30th meeting will be to elect officers for 2013. You are being asked again to serve on the Budget Committee for the Springfield Economic Development Agency (SEDA). SEDA is required to follow Oregon budget law in a manner similar to your role on the City’s Budget Committee for the City’s two urban renewal districts. The SEDA Board is comprised of the six City Councilors, the City’s Mayor and one County Commissioner. To ensure equal representation between elected officials and appointed members, their Budget Committee is comprised of those eight individuals plus the six of you from the City’s Budget Committee plus two additional citizens representing the urban renewal districts. This is planned as a one meeting process. It will take place on Tuesday, May 7th and we are scheduled to provide dinner that night so that we can start at 5:30 pm with the SEDA Budget Committee meeting. Agenda for April 30th & Meeting Schedule The schedule is tentatively set to allow committee members to proceed at whatever pace works for you. We have developed a tentative agenda schedule for staff presentations that can accommodate the entire process in four meetings or be used to a similar outline in either three or five meetings. A four meeting schedule is being considered due to the cancellation of the mid-year meeting in December and the possible need to introduce some of the material at this time that was scheduled for December. A suggestion would be to conduct the first meeting on the staff’s schedule and then prior to the close of the first meeting determine as a committee if you want to make any adjustments or changes to the tentative agenda. As has happened in previous years, the tentative fourth meeting date May 21th falls on the same day as Oregon’s May election. There is often interest by some members in either not meeting that evening or wrapping up at an earlier hour but as this is an off-year election for most major issues it likely will not be an issue this year. At your first meeting it would be helpful for the Committee to discuss this issue as the calendar for the remainder of the meetings is set.
April 30th Agenda Memo Attachment 1 Page 1 of 2

As per Oregon budget law, City Manager Gino Grimaldi will be presenting his budget message at the first meeting. Due to the state and national economy staff has been working on the Proposed FY14 Budget since last fall and will be prepared to discuss with you actions taken during the current fiscal year as well as actions proposed for next year to help stabilize resources and services at the City. If you have any questions about the information or the process prior to next Tuesday’s meeting, please do not hesitate to contact either myself by phone at 726-3740 or e-mail at [email protected] or contact our Budget Analyst, Paula Davis, by phone at 726-3698 or e-mail at [email protected]. Either of us would be more than willing to meet with you prior to that time.
April 30th Agenda Memo Attachment 1 Page 2 of 2

CITY OF SPRINGFIELD/FINANCE DEPARTMENT MEMORANDUM Date: April 25, 2013 To: Members of the Budget Committee From: Bob Duey, Finance Director Subject: First Budget Meeting Scheduled for April 30, 2013 I would like to thank each of you in advance for again volunteering your time to help review the Proposed Budget for the City. The first meeting is scheduled for 5:30 p.m. next Tuesday April 30, in the Library Meeting Room of Springfield City Hall. Dinner will be served. Committee Roster and Officers In the front of your FY14 Proposed Budget, Attachment 31, document there is a listing of the members for this year’s committee. We are going to see just one new Springfield citizen joining the returning members this year. In Ward 5 Diana Alldredge has been appointed by the Council to fill the current vacancy in that ward. Diana also serves on the Police Planning Task force. In Ward 6, Paul Selby has been re-appointed to another 3year term. Other returning veterans are Chris Stole in Ward 1, Terry Buck in Ward 2 and Pat Mahoney in Ward 3. Ward 4 is vacant at this time due to the very recent resignation of Garold Rupp (moved just outside the city boundaries). Your committee’s current Chair is Terry Buck and the current vice-chair is Paul Selby. One of the first official actions at your April 30th meeting will be to elect officers for 2013. You are being asked again to serve on the Budget Committee for the Springfield Economic Development Agency (SEDA). SEDA is required to follow Oregon budget law in a manner similar to your role on the City’s Budget Committee for the City’s two urban renewal districts. The SEDA Board is comprised of the six City Councilors, the City’s Mayor and one County Commissioner. To ensure equal representation between elected officials and appointed members, their Budget Committee is comprised of those eight individuals plus the six of you from the City’s Budget Committee plus two additional citizens representing the urban renewal districts. This is planned as a one meeting process. It will take place on Tuesday, May 7th and we are scheduled to provide dinner that night so that we can start at 5:30 pm with the SEDA Budget Committee meeting. Agenda for April 30th & Meeting Schedule The schedule is tentatively set to allow committee members to proceed at whatever pace works for you. We have developed a tentative agenda schedule for staff presentations that can accommodate the entire process in four meetings or be used to a similar outline in either three or five meetings. A four meeting schedule is being considered due to the cancellation of the mid-year meeting in December and the possible need to introduce some of the material at this time that was scheduled for December. A suggestion would be to conduct the first meeting on the staff’s schedule and then prior to the close of the first meeting determine as a committee if you want to make any adjustments or changes to the tentative agenda. As has happened in previous years, the tentative fourth meeting date May 21th falls on the same day as Oregon’s May election. There is often interest by some members in either not meeting that evening or wrapping up at an earlier hour but as this is an off-year election for most major issues it likely will not be an issue this year. At your first meeting it would be helpful for the Committee to discuss this issue as the calendar for the remainder of the meetings is set.
April 30th Agenda Memo Attachment 1 Page 1 of 2
As per Oregon budget law, City Manager Gino Grimaldi will be presenting his budget message at the first meeting. Due to the state and national economy staff has been working on the Proposed FY14 Budget since last fall and will be prepared to discuss with you actions taken during the current fiscal year as well as actions proposed for next year to help stabilize resources and services at the City. If you have any questions about the information or the process prior to next Tuesday’s meeting, please do not hesitate to contact either myself by phone at 726-3740 or e-mail at [email protected] or contact our Budget Analyst, Paula Davis, by phone at 726-3698 or e-mail at [email protected]. Either of us would be more than willing to meet with you prior to that time.
April 30th Agenda Memo Attachment 1 Page 2 of 2
Hu
ma
n R
eso
urc
es
De
pa
rtm
en
tFY
201
4
Human
Resou
rces:
We supp
ort the
en
gine
that pow
ers
the City—ou
r em
ployees.
Human Resources Presentation Attachment 10 Page 1 of 16

Hu
ma
n R
eso
urc
es
De
pa
rtm
en
tFY
201
4
Program Area: Recruitm
ent, Selection, & Reten
tion
oga
eaec
ut
et,Se
ecto
,&ete
to
•C
on
tin
ue
d t
o p
art
ne
r w
ith
th
e C
ity
of
Eu
ge
ne
in F
ire
fig
hte
r a
nd
De
pu
ty
Fir
e M
ars
ha
ll re
cru
itm
en
t p
roc
ess
es
as
pa
rt o
f F
ire
De
pa
rtm
en
t m
erg
er
fft
eff
ort
.
•C
on
tin
ue
d s
po
nso
rsh
ip o
f “O
pti
on
s U
nlim
ite
d”
an
nu
al c
are
er
exp
o t
o
en
co
ura
ge
hig
h-s
cho
ol a
nd
mid
dle
-sch
oo
l ag
ed
gir
ls t
o c
on
sid
er
no
n-
tra
dit
ion
al c
are
ers
wit
h h
an
ds-
on
wo
rksh
op
s to
fu
rth
er
div
ers
ify
ou
r fu
ture
wo
rkfo
rce
fu
ture
wo
rkfo
rce.
Human Resources Presentation Attachment 10 Page 2 of 16

De
pa
rtm
en
tFY
201
4
Program Area: Recruitm
ent, Selection, & Reten
tion
g,
,
•D
eve
lop
ed
an
d d
eliv
ere
d t
rain
ing
on
ne
w p
roc
ess
es
an
d p
roc
ed
ure
s fo
r re
cru
itin
g a
nd
se
lec
tin
g n
ew
em
plo
yee
s w
ith
wo
rkfo
rce
d
ive
rsif
icat
ion
as
go
al.
•C
olla
bo
rati
ng
wit
h I
T D
ep
art
me
nt’
s w
ork
in im
ple
me
nti
ng
ne
w “
e-
rec
ruit
” a
pp
licat
ion
sys
tem
th
at w
ill m
od
ern
ize
ou
r in
terf
ac
e w
ith
p
ote
nti
al j
ob
ca
nd
idat
es.
Human Resources Presentation Attachment 10 Page 3 of 16

Hu
ma
n R
eso
urc
es
De
pa
rtm
en
tFY
201
4
il
i&
iProgram Area: Recruitm
ent, Selection, & Reten
tion
•W
ill b
e m
ajo
r su
pp
ort
de
pa
rtm
en
t fo
r n
ew
Po
lice
Ch
ief
sea
rch
an
d s
ele
cti
on
pro
ce
ssse
arc
h a
nd
se
lec
tio
n p
roc
ess
.
•A
re w
ork
ing
wit
h P
olic
e D
ep
art
me
nt
to in
no
vate
te
stin
g a
nd
ev
alu
atio
n p
roc
ess
es
for
ne
w r
ec
ruit
s.ev
alu
atio
n p
roc
ess
es
for
ne
w r
ec
ruit
s.
Human Resources Presentation Attachment 10 Page 4 of 16

Hu
ma
n R
eso
urc
es
De
pa
rtm
en
tFY
201
4
Program
Area:Employee
&Labo
rRelations
Program Area: Employee
& Lab
or Relations
PO
LIC
IES
& P
RO
CE
DU
RE
S:
•C
on
tin
ue
wo
rk w
ith
all
Cit
y d
ep
art
me
nts
on
re
org
an
izin
g, u
pd
atin
g, a
nd
re
wri
tin
g a
ll C
ity-
wid
e p
olic
ies
an
d p
roc
ed
ure
s; a
nd
are
p
p;
dev
elo
pin
g n
ew
po
licie
s to
re
du
ce
Cit
y’s
risk
e
xpo
sure
an
d d
ec
rea
se li
ab
ility
insu
ran
ce
p
rem
ium
co
sts.
•C
on
tin
ue
to
wo
rk w
ith
Cit
y o
f E
ug
en
e’s
HR
, R
isk,
& B
en
efi
ts s
erv
ice
s to
alig
n p
olic
ies
an
d
pro
ce
du
res
imp
ac
tin
g t
he
tw
o F
ire
De
pa
rtm
en
ts
an
d r
esp
ec
tive
co
llec
tive
ba
rga
inin
g u
nit
s.
Human Resources Presentation Attachment 10 Page 5 of 16
Hu
ma
n R
eso
urc
es
De
pa
rtm
en
tFY
201
4
Program Area: Employee
& Lab
or Relations
CO
NT
RA
CT
N
EG
OT
IAT
ION
S:
•B
arg
ain
ed
ne
w t
hre
e -
yea
r c
on
tra
ct
wit
h
Sp
rin
gfi
eld
’s In
tern
atio
na
l Ass
oc
iati
on
of
Fir
e F
igh
ters
(I
AF
F)
Lo
ca
l 13
95
an
d r
ep
rese
nte
d C
ity
of
Sp
rin
gfi
eld
o
n m
an
ag
em
en
t s
ide
of
tab
le f
or
ba
rga
inin
g c
on
tra
ct
wit
h E
ug
en
e’s
IAF
F 8
51
. E
ffo
rt r
esu
lte
d in
ph
ase
d
ap
pro
ach
to
bri
ng
ing
bo
th u
nit
s in
alig
nm
en
t w
ith
re
ga
rd t
o c
om
pe
nsa
tio
n a
nd
wo
rkin
g c
on
dit
ion
s b
y re
ga
rd t
o c
om
pe
nsa
tio
n a
nd
wo
rkin
g c
on
dit
ion
s b
y Ju
ly 2
01
4.
Human Resources Presentation Attachment 10 Page 6 of 16

Hu
ma
n R
eso
urc
es
De
pa
rtm
en
tFY
201
4
Program Area: Employee
& Lab
or Relations
CO
NT
RA
CT
NE
GO
TIA
TIO
NS
(C
on
tin
ue
d):
•B
arg
ain
ed
ne
w t
hre
e-y
ea
r c
on
tra
ct
wit
h A
me
ric
an
Fe
de
rati
on
of
Sta
te,
Co
un
ty &
Mu
nic
ipa
l Em
plo
yee
s (A
FS
CM
E)
.
•In
pro
ce
ss (
as
of
Ap
ril 2
01
3)
of
ba
rga
inin
g n
ew
ag
ree
me
nt
wit
h
Se
rvic
e E
mp
loye
es
Inte
rnat
ion
al U
nio
n (
SE
IU).
Human Resources Presentation Attachment 10 Page 7 of 16

Hu
ma
n R
eso
urc
es
De
pa
rtm
en
tFY
201
4
Program Area: Coo
rdinated
Training
Co
nti
nu
e t
o c
olla
bo
rate
wit
h o
the
r p
ub
lic e
nti
tie
s to
pro
vid
e h
igh
pp
gle
vel t
rain
ing
at
low
est
po
ssib
le c
ost
s:
•Em
oti
on
alI
nte
llig
en
ce
& B
eh
avio
ralE
ven
t In
terv
iew
ing
•Wo
rkin
g B
ett
er
Tog
eth
er:
Re
spe
ctf
ul W
ork
pla
ce
•Su
pe
rvis
ory
tra
inin
g :
Re
cru
itm
en
ta
nd
Se
lec
tio
n P
roc
ed
ure
s
Human Resources Presentation Attachment 10 Page 8 of 16

Hu
ma
n R
eso
urc
es
De
pa
rtm
en
tFY
201
4
PA
RikM
tProgram Area: R
isk Man
agem
ent
SA
FE
TY
& L
OS
S C
ON
TR
OL
•C
on
tin
ue
to
wo
rk w
ith
fou
r sa
fety
co
mm
itte
es
on
in
cid
en
t ro
ot-
ca
use
an
aly
sis
an
d p
reve
nti
on
. (P
olic
e,
Fir
e, C
ity
Ha
ll a
nd
Dev
elo
pm
en
t &
Pu
blic
Wo
rks
Op
era
tio
ns)
•C
on
tin
ue
to
wo
rk w
ith
Eu
ge
ne
Fir
e o
n s
tre
am
linin
g
of
cla
im t
rack
ing
, an
d r
ep
ort
ing
pro
ce
du
res
&
pro
ce
sse
s.•
Co
nti
nu
ed
to
eva
luat
e n
ew
em
plo
yee
& v
olu
nte
er
dri
ver
qu
alif
icat
ion
s•
Co
nti
nu
ed
to
ad
min
iste
r th
e P
W O
ps
Su
bst
an
ce
p
ab
use
te
stin
g p
rog
ram
.
Human Resources Presentation Attachment 10 Page 9 of 16

Hu
ma
n R
eso
urc
es
De
pa
rtm
en
tFY
201
4
PA
RikM
tProgram Area: R
isk Man
agem
ent
PR
OP
ER
TY
& L
IAB
ILIT
Y:
Cit
y o
f S
pri
ng
fie
ld C
om
pa
rati
ve C
laim
s D
ata
, b
en
chm
ark
ed
a
ga
inst
18
oth
er
cit
ies
for
pa
st 4
Ye
ars
.•G
en
era
l & A
uto
Lia
bili
ty c
ost
pe
r re
sid
en
t =
$1
.79
ve
rsu
s av
era
ge
$
2.5
6.
Human Resources Presentation Attachment 10 Page 10 of 16

Hu
ma
n R
eso
urc
es
De
pa
rtm
en
tFY
201
4
PA
RikM
tProgram Area: R
isk Man
agem
ent
WO
RK
ER
S C
OM
PE
NS
AT
ION
: C
ity
of
Sp
rin
gfi
eld
be
nch
ma
rke
d w
/ 14
oth
er
cit
iec
itie
s.•O
ver
the
last
fou
r ye
ars
, th
e
ave
rag
e c
ost
pe
r F
TE
wa
s $
30
2.5
0; T
he
Cit
y is
ab
ove
av
era
ge
wit
h a
co
st o
f $
32
4.3
1 p
er
FT
E e
mp
loye
e.
•Ove
r th
e la
st fo
ur
yea
rs, a
n
f
85
l
i
av
era
ge
of
.85
cla
ims
wa
s su
bm
itte
d fo
r ev
ery
10
fu
ll ti
me
em
plo
yee
s. T
he
Cit
y is
a
bo
ve a
vera
ge
wit
h .9
5 c
laim
s g
file
d.
Human Resources Presentation Attachment 10 Page 11 of 16
Hu
ma
n R
eso
urc
es
De
pa
rtm
en
tFY
201
4
PA
RikM
tProgram Area: R
isk Man
agem
ent
WO
RK
ER
S C
OM
PE
NS
AT
ION
W
OR
KE
RS
CO
MP
EN
SA
TIO
N
CO
NT
INU
ED
:
•R
evie
win
g d
iffe
ren
t o
pti
on
s fo
r W
C
gp
pro
ce
sse
s th
at p
rovi
de
s e
asi
er
tra
ckin
g
an
d t
ime
loss
pa
yme
nt
reim
bu
rse
me
nt;
Se
ttin
g u
p h
igh
ly f
lexi
ble
mo
dif
ied
du
ty
•S
ett
ing
up
hig
hly
fle
xib
le m
od
ifie
d d
uty
st
atio
n in
Co
urt
; will
en
ab
le in
jure
d
wo
rke
rs t
o r
etu
rn t
o w
ork
mo
re q
uic
kly.
Human Resources Presentation Attachment 10 Page 12 of 16

Hu
ma
n R
eso
urc
es
De
pa
rtm
en
tFY
201
4
PA
El
Bfit
Program Area: Employee
Ben
efits
•C
on
tin
ue
d im
pro
vem
en
t in
uti
lizat
ion
of
he
alt
h in
sura
nc
e b
en
efi
ts,
Cit
’ f
it
d
th
l
Wll
Cli
i h
lt
d
Cit
y’s
fitn
ess
pro
gra
m, a
nd
th
e e
mp
loye
e W
elln
ess
Clin
ic h
ave
re
sult
ed
in
leve
l me
dic
al p
rem
ium
s (
i.e.
no
inc
rea
se)
for
4th
stra
igh
t ye
ar.
•A
s p
art
of
Fir
e M
erg
er
serv
ice
a
na
lysi
s, p
ote
nti
al f
or
lon
ge
r te
rm
co
st s
tab
ility
de
spit
e t
ren
ds
(6-8
%
co
st s
tab
ility
de
spit
e t
ren
ds
(6-8
%
inc
rea
se in
me
dic
al c
ost
s p
er
yea
r)
evid
en
t in
mo
vin
g f
rom
fu
lly in
sure
d
to s
elf
insu
red
sta
tus.
Human Resources Presentation Attachment 10 Page 13 of 16

Hu
ma
n R
eso
urc
es
De
pa
rtm
en
tFY
201
4
PA
El
Bfit
Program Area: Employee
Ben
efits
Cit
y’s
We
llne
ss P
rog
ram
co
nti
nu
es
to g
row
in p
op
ula
rity
:y
gg
pp
y
•A
nn
ua
l nu
trit
ion
an
d d
iet
cla
sse
s at
tra
ct
mo
re e
ach
ye
ar.
•F
itn
ess
be
ne
fit
thro
ug
h c
on
tra
ct
wit
h
Fit
ne
ss b
en
efi
t th
rou
gh
co
ntr
ac
t w
ith
W
illa
ma
lan
eva
lue
d b
y e
mp
loye
es
an
d
fam
ilie
s.
•W
elln
ess
Ce
nte
r C
linic
an
d N
urs
e
An
n’s
tip
s a
nd
cla
sse
s a
re e
xtre
me
ly
we
ll re
ce
ive
d a
nd
gro
win
g n
um
be
r o
f e
mp
loye
es
use
th
e c
linic
inst
ea
d o
f m
aki
ng
mo
re e
xpe
nsi
ve v
isit
s to
m
aki
ng
mo
re e
xpe
nsi
ve v
isit
s to
p
hys
icia
n.
Human Resources Presentation Attachment 10 Page 14 of 16
Hu
ma
n R
eso
urc
es
De
pa
rtm
en
tFY
201
4
PA
El
Bfit
•C
ha
ng
e t
o S
elf
-Fu
nd
ing
ha
s h
ad
c
ide
ab
le i
ac
t H
R a
d
Program Area: Employee
Ben
efits
co
nsi
de
rab
le im
pa
ct
on
HR
an
d
fin
an
ce
; sti
ll u
nsu
re o
f p
erm
an
en
t re
sou
rce
imp
ac
ts.
An
tic
ipat
ing
sa
vin
gs
of
$2
K -
4K
an
nu
ally
.g
$y
•S
ho
rt t
erm
dis
ab
ility
insu
ran
ce
p
rog
ram
(e
mp
loye
e p
aid
) m
ay
ne
ed
to
b
e c
ha
ng
ed
, wh
ich
will
hav
e w
ork
loa
d
it
imp
ac
ts.
•N
ext
are
a o
f re
vie
w f
or
lon
g-t
erm
c
ost
co
nta
inm
en
t in
volv
es
an
aly
sis
of
sick
leav
e u
sag
e a
nd
va
cat
ion
ac
cru
al
sick
leav
e u
sag
e a
nd
va
cat
ion
ac
cru
al
rate
s.
Human Resources Presentation Attachment 10 Page 15 of 16

Hu
ma
n R
eso
urc
es
De
pa
rtm
en
tFY
201
4
PA
“Oth
Dti
Ai
d”
•H
ave
ta
ken
lea
d r
ole
in E
qu
ity
& C
om
mu
nit
y C
on
sort
ium
in
ord
er
to e
nh
an
ce
Cit
y’s
incl
usi
on
& d
ive
rsit
y e
ffo
rts
Program Area: “Other Duties a
s Assigned
”
in o
rde
r to
en
ha
nc
e C
ity
s in
clu
sio
n &
div
ers
ity
eff
ort
s.
•H
ave
ha
d m
ajo
r st
aff
ing
ch
an
ge
an
d t
ran
sfe
r o
f p
rog
ram
are
as,
esp
ec
ially
re
cru
itm
en
t &
se
lec
tio
n a
nd
b
en
efi
ts.
•N
ew
Dev
elo
pm
en
t &
Pu
blic
Wo
rks
de
pa
rtm
en
t st
ruc
ture
re
sult
ed
in m
ajo
r w
ork
re
ass
ign
me
nts
in D
PW
an
d p
osi
tio
n
cha
ng
e a
nd
re
allo
cat
ion
re
qu
est
s fo
r H
R.
•F
ire
Me
rge
r a
nd
ne
w IA
FF
co
ntr
ac
t im
ple
me
nta
tio
n h
as
ha
d m
ajo
r im
pa
ct
on
ce
ntr
al s
erv
ice
s.
•P
rovi
de
fac
ilita
tio
n, a
na
lyti
c s
up
po
rt fo
r C
ity’
s In
clu
sio
n
& D
iit
it
t
& D
ive
rsit
y c
om
mit
tee
Human Resources Presentation Attachment 10 Page 16 of 16

DEPARTMENT BUDGET SUMMARY City of Springfield, Oregon
To: Gino Grimaldi, City Manager
From: Bob Duey, Finance Director
Date: February 28, 2013
SUMMARY OF SIGNIFICANT ISSUE(S) IN THE DEPARTMENT PROPOSAL (Revenues/Expenditures)
Issue FTE Cost Increase Cost of Personal Services N/A +$64,915 or 7.3% increase (No change in 9.5 FTE) (All funds) Personal Services Reduction Target $18,727 Material & Services General Fund Flat except for escalator clauses
Issue Paper 1.0 FTE Centralized AP
No Issue Papers Priority Base Budgeting Analyzing Fiscal Health 1.0 FTE Staffing Level Requirement EXPLANATION OF SIGNIFICANT ISSUE(S) As it has been in other years, Finance’s primary cost of operation is attributed to cost the cost of personnel (82% of the General Fund) and large Material and Services contracts. These contracts are often long-term contracts with escalator clauses that continue to increase in subsequent years. A following is a summary of these two areas. Personal Services – The department is going to again budget for 9.5 FTE which include 1 director’s position, 1 supervisory Accounting Manager, 4 professional positions, 3 technician positions and 1 .5 FTE administrative support. This is down from the peak FTE of 12.35 in FY02 (23% reduction). Since the recession hit in 2008, Finance has seen a reduction of 1.8 FTE or 16%. During this time, the department has continued to increase its responsibilities in certain key areas to encourage city-wide efficiencies and provide better over-sight for City policy and regulatory compliance. Some example of increased responsibilities are 1) accounts payable for a key efficiency area; 2) purchasing as a key area for compliance; and 3) accounting functions for increased workload from health insurance self-funding and the shear increase in volume the number of transactions generated by all city departments. The Finance Department has need to an increase in FTE by 2.0 with all of this support being at the technician level. Only 1 FTE is being requested at this time. These two positions are:
Finance Department Attachment 11 Page 1 of 2

1.0 Accounting Tech I or II. This is actually the Director’s highest priority but is not being requested at this time. This is the replacement for position lost about 2 years ago that would be utilized in variety of areas to address current workload. It would particularly in accounting and purchasing relieve professional level staff of certain responsibilities so that the much needed analysis and review work could be conducted in a timely manner. Professional staff is currently under-utilized with the current arrangement or in some cases the work is not completed. 1.0 FTE Accounting Tech 1 or II. This is the position connected with the issue paper to help with
the centralization of accounts payable. Two keys points here is that Finance’s does not have the ability to proceed with the centralization concept without the additional staff as it would be dependent upon the support to expand past the current arrangements. And secondly, our hope is to accomplish this task without adding of an FTE to the City by utilizing existing city staff but this will only be accomplished with a large measure of support from other departments. For more information on this topic, please see the issue paper.
To meet the department’s target for personnel services a reduction of $18,727 was required. An employee resignation resulting in lower entry step and a less expensive health insurance coverage was utilized to meet this reduction. An additional reduction of $1,987 in M&S was required to meet the target. Material & Services – The City’s material & services budget in the General Fund for FY13 is $163,536. Of this total the primary drivers that have pre-determined fixed costs are 1) contract for audit services $38,000; 2) software license agreements for $56,115; 3) arbitrage compliance and investment custodial services $18,229; 4) participation in State purchasing consortium $4000;and 5) internal charges of $15,673. This total of $132,107 leaves the department with a semi-discretionary budget of $31,429. The decision by the Budget Team to allow for increases in contracts with escalator clauses allow the department to increase in M&S by$3,943 and an increase of $436 for internal charges.
Major Initiatives – Staff Projects for Next year Priority Based Budgeting is a strategic alternative to a traditional budgeting. The philosophy of priority-driven budgeting is that resources should be allocated according to how effectively a program or service achieves the goals and objectives that are of greatest value to the community. It is a flexible step-by-step process to budget scarce resources. Priority-driven budgeting demands accountability for results that were the basis for a service’s budget allocation. Priority Based Budgeting represents a fundamental change in the way resources are allocated. The governing body and the chief executives must understand and support the process and communicate that support throughout the organizations. Analyzing Fiscal Health will be an abbreviated process for what was defined in the GFOA program under this same concept. The department’s will not have the resources to complete both Priority Based Budgeting and Analyzing Fiscal Health in the same year so we will be choosing a “fiscal health light” version to key in on the major funds and establishing some additional policy guidelines.
CONCLUSION COUNCIL GOALS/POLICIES/DEPARTMENT PERFORMANCE MEASURES AFFECTED
Financially Responsible and Stable Government Services
Finance Department Attachment 11 Page 2 of 2

Fin
an
ce D
ep
art
me
nt
FY 2
014 Significant Issues
Implem
entatio
n of cen
tralize
d and pape
rless accou
nts p
ayable process
Completion of IT/Finance project to
upgrade
Peo
pleSoft financials to latest
version
Introd
uctio
n of Prio
rity Ba
sed Bu
dgeting as a strategic alternative to tradition
al
budgeting
budgeting
Completion of an analysis of financial health
for key ope
ratin
g fund
sCo
ntinue
upd
ating Ad
min and
Dep
artm
ent R
egulations to
better d
ocum
ent
processes
Addressin
g increase costs of m
aintaining
current and
expanding
use of
techno
logy
Finance Department Presentation Attachment 12 Page 1 of 11
Fin
an
ce D
ep
art
me
nt
FY 2
014
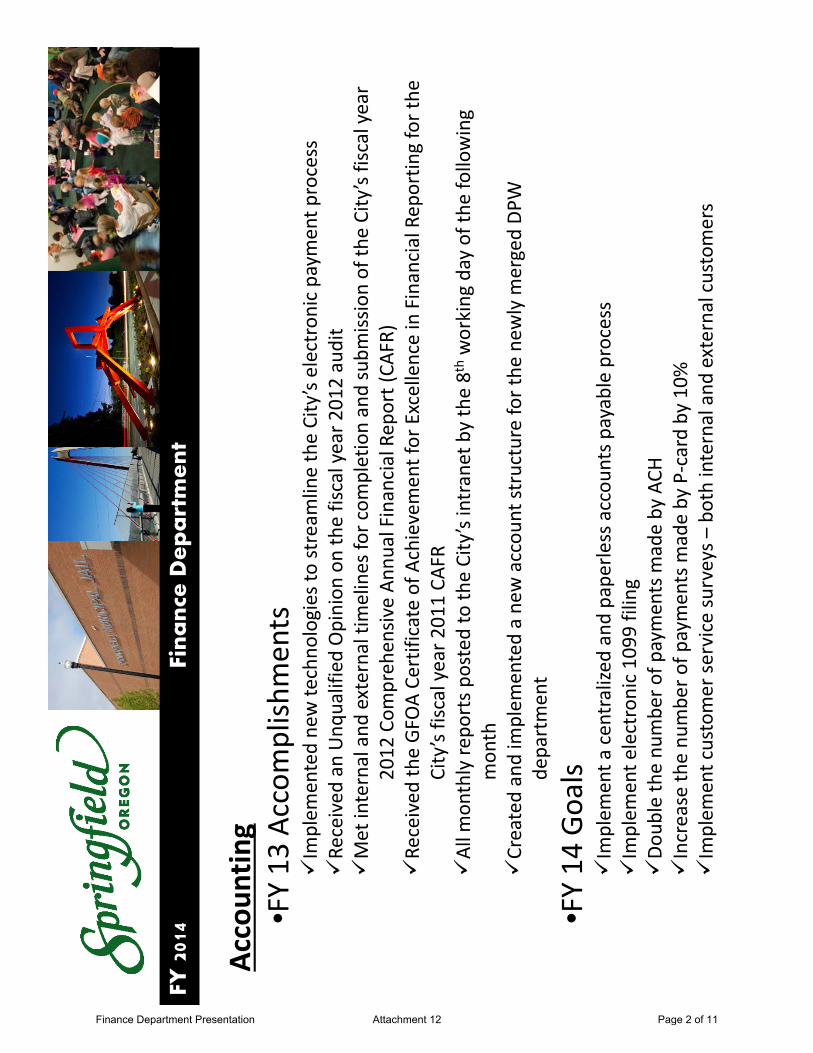
Accoun
tingg
•FY 13
Accom
plish
ments
Implem
ented ne
w te
chno
logies to
stream
line the City’s electron
ic payment p
rocess
Received
an Unq
ualified Opinion
on the fiscal year 2
012 audit
Mti
tl
dt
lti
lif
lti
db
ii
fth
Cit’fi
lMet internal and
external tim
elines fo
r com
pletion and subm
ission of th
e City’s fiscal year
2012
Com
preh
ensiv
e An
nual Financial Rep
ort (CA
FR)
Received
the GFO
A Ce
rtificate of A
chievement for Excellence in Financial Rep
ortin
g for the
City’s fiscal year 2
011 CA
FRAll
thl
ttdt
thCit’it
tbth
8th
kid
fth
fll
iAll m
onthly re
ports po
sted
to th
e City’s intranet by the 8t
hworking
day of the
following
mon
thCreated and im
plem
ented a ne
w accou
nt structure for the
new
ly m
erged DP
W
department
l•FY 14
Goals
Implem
ent a
centralize
d and pape
rless accou
nts p
ayable process
Implem
ent e
lectronic 1099
filing
Doub
le th
e nu
mbe
r of p
ayments m
ade by ACH
py
yIncrease th
e nu
mbe
r of p
ayments m
ade by P‐card by 10%
Implem
ent customer se
rvice surveys –
both internal and
external customers
Finance Department Presentation Attachment 12 Page 2 of 11
Fin
an
ce D
ep
art
me
nt
FY 2
014
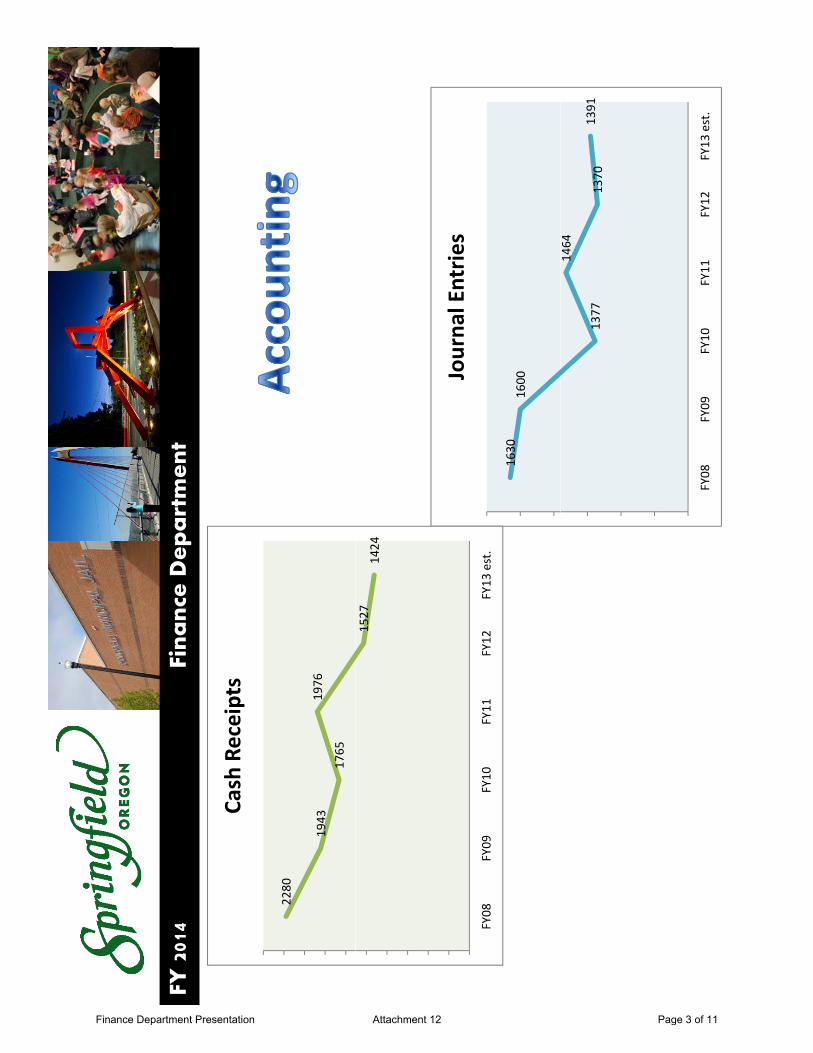
Cash Receipts
2280
1943
1765
1976
Journa
lEntrie
s
1527
1424
1630
1600Jo
urna
l Entrie
sFY08
FY09
FY10
FY11
FY12
FY13
est.
1377
1464
1370
1391
FY08
FY09
FY10
FY11
FY12
FY13
est.
Finance Department Presentation Attachment 12 Page 3 of 11

Fin
an
ce D
ep
art
me
nt
FY 2
014
Purcha
seCa
rds
$800
,000
$1,000
,000
$1,200
,000
Purcha
se Cards
TotalChe
ckCo
unt
$0
$200
,000
$400
,000
$600
,000
8500
9000
9500
1000
0
Total Che
ck Cou
nt$0
FY08
FY09
FY10
FY11
FY12
FY13
est.
5500
6000
6500
7000
7500
8000
ACH
Express C
hecks
Checks
FY08
FY09
FY10
FY11
FY12
FY13
est.
Finance Department Presentation Attachment 12 Page 4 of 11
Fin
an
ce D
ep
art
me
nt
FY 2
014
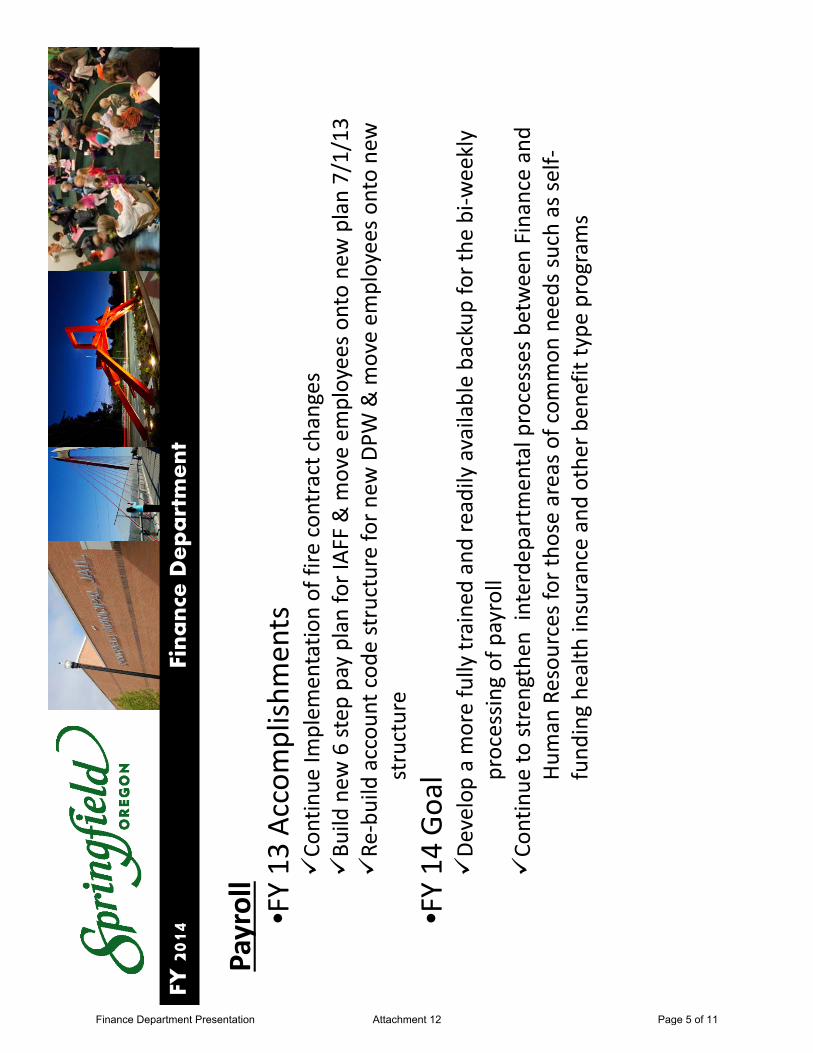
Payroll
y •FY 13
Accom
plish
ments
Continue
Implem
entatio
n of fire con
tract changes
Build
new
6 step
pay plan for IAF
F & m
ove em
ployees on
to new
plan 7/1/13
Re‐build accou
nt cod
e structure for n
ew DPW
& m
ove em
ployees on
to new
structure
•FY 14
Goal
Dl
fll
id
ddil
ilbl
bk
fh
bikl
Develop a more fully traine
d and readily available backup
for the
bi‐w
eekly
processin
g of payroll
Continue
to strengthen
interde
partmen
tal processes between Finance and
Human
Resou
rces fo
r tho
se areas of com
mon
needs such as se
lf‐fund
ing he
alth insurance and othe
r ben
efit type
program
s
Finance Department Presentation Attachment 12 Page 5 of 11

Fin
an
ce D
ep
art
me
nt
FY 2
014
Purcha
singg
•FY 13
Accom
plish
ments
Purchasin
g Mun
icipal Cod
e Ch
anges
Respon
se to
Statutory Req
uirements
Process Improvem
ent
Increased the pu
rchasin
g threshold for intermed
iate bids
Provided
provisio
ns fo
r electronic sig
natures
Fire m
erger fou
nd so
lutio
ns to
barrie
rs and
process im
provem
ent
Collabo
rated and partne
red with
other pub
lic agencies on
coop
erative and joint solicita
tions
•FY 14
Goals
Process Improvem
ent
Interm
ediate Bid Process
Contract and
Bidding
Templates
Upd
ateAd
ministrativeRe
gulatio
nsforP
urchasingandTravel
Upd
ate Ad
ministrative Re
gulatio
ns fo
r Purchasing and Travel
Increase P Card Program Reb
ate
Increase On Call Co
ntracts for Small $ Services
Finance Department Presentation Attachment 12 Page 6 of 11

Fin
an
ce D
ep
art
me
nt
FY 2
014
Budgeting
gg
•FY 13
Accom
plish
ments
IAFF con
tract implem
entatio
nBu
ild new
accou
nt structure for D
evelo p
men
t & Pub
lic W
orks
p•FY 14
Goals
Process Improvem
ent
Supp
lemental Bud
get Forms
Implem
entatio
n of Prio
rity Ba
sed Bu
dgeting
Finance Department Presentation Attachment 12 Page 7 of 11

Fin
an
ce D
ep
art
me
nt
FY 2
014
Priority Ba
sed Bu
dgeting
yg
g•Traditio
nal
Curren
t year’s bud
get is b
asis for n
ext year
Focus is d
etermining ways to meet targets
gy
gAccoun
tability for staying
with
in sp
ending
limits
•Prio
rity Ba
sed
yRe
sources shou
ld be allocated based on
goals and ob
jectives
Flexible step
‐by‐step
process to
bud
get scarce resources
Demands accou
ntability fo
r results
Finance Department Presentation Attachment 12 Page 8 of 11

Fin
an
ce D
ep
art
me
nt
FY 2
014
Across th
e Bo
ard Cu
ts Add
ress $14.5 Billion
Shortfall
From
2007
Shortfall
California Governo
r’s Office: “A
cross‐the‐bo
ard ap
proa
ch
spread
s redu
ctions as e
venly as possible so no single
py
pg
program gets singled ou
t.”
Reactio
n:“the
governo
r’s app
roach wou
ld be like a family
deciding
tocutsits
mon
thlymortgagepaym
entdining
out
deciding
to cuts its m
onthly m
ortgage paym
ent, dining
‐out
tab an
d Netflix subscriptio
n each by 10
%, rathe
r tha
n elim
inating the restau
rant and
DVD
spen
ding
in order to
keep
uptheho
usepaym
ents.”
keep
up the ho
use paym
ents.
Finance Department Presentation Attachment 12 Page 9 of 11

Fin
an
ce D
ep
art
me
nt
FY 2
014
According to M
oody
’s:g
yAcross‐the
‐Board versus T
argeted Bu
dget Cuts
“Across‐the‐bo
ard cuts can
be a way to
avoid to
ugh de
cisio
ns”
yg
“Targeted cuts re
quire
a se
rious discussion of com
mun
ity
values, relative be
nefits of differen
t services, and
long
‐term
implications”
implications”
Moo
dy's wants to
see ho
w local governm
ents plan for
andrespon
dto
financialchallenges
over
thelong
term
and respon
d to financial challenges over the
long
term
“Making targeted
cuts c
an dem
onstrate a m
ore strategic
approa
ch to
man
aging the fiscal crisis”
ppg
gf
Finance Department Presentation Attachment 12 Page 10 of 11

Fin
an
ce D
ep
art
me
nt
FY 2
014
Prioritiz
ation A
rray: C
ombin
ed City
‐wide
Progra
msCit
fBld
Cl
d$85
,915,772
$51,726
,155
1 2
Rankingst Rated Programs;t Rated Programs)
City of B
oulder, Colorad
o
$21,505
,297
$7,498
,842
3 4
Quartile (Quartile 1: HighesQuartile 4: Lowest
$‐$10
,000,000
$20
,000,000
$30
,000,000
$40
,000,000
$50
,000,000
$60
,000,000
$70
,000,000
$80
,000,000
$90
,000,000
$100
,000,000
Finance Department Presentation Attachment 12 Page 11 of 11

DEPARTMENT BUDGET SUMMARY City of Springfield, Oregon
To: Gino Grimaldi, City Manager
From: Robert Duey, Finance Director
Date: February 13, 2013
SUMMARY OF SIGNIFICANT ISSUE(S) IN THE DEPARTMENT PROPOSAL (Revenues/Expenditures)
Issue FTE Cost -- EXPLANATION OF SIGNIFICANT ISSUE(S) The Springfield Municipal Jail opened on January 29, 2010. The pace of trial settings required for custody cases has resulted in less than optimal docket management adversely impacting Prosecutors, Jail and defense bar. With changes in the Court schedule (effective in April, 2013) coupled with early settlement offers from the City Prosecutor’s office, it is anticipated that impacts will decrease and improvements will be made towards meeting the National Court Performance Standards (certainty of case resolution at first trial setting (currently at 67%). Matrix releases continue to occur for female inmates. While the Jail has provided the Court with tools to enforce compliance and hold defendants accountable for criminal behavior, it still remains a significant challenge to continually adjust practices to meet statutorily required time constraints and to accommodate constraints of other stakeholders as changes are made.
The” Tyler” court computer system (Tyler Technologies InCode) project began in February of 2012 and went live on October 29, 2012. While the new system offers enhanced functionalities over the AIRS system, system performance in the hosted environment and functionality provided has not been without problems. System performance is considerably slower than the previous system (up to 40 seconds recorded to complete one receipting transaction). System performance has occasionally slowed sufficiently to cause Judges to apologize for delays in courtroom processing. Tyler moved the Court to a new server on February 11; it is uncertain if this will resolve performance issues. One solution, not researched for solution or feasibility, is to host the system locally. Non-compliance processes: suspension, warrants and collections processes were not working correctly and those processes have been on hold since go-live. There was a version upgrade in late January to correct the bug and staff is working to complete changes and begin implementation of non-compliance processes. “E-forms” Approximately two weeks before go-live, Court received new information about forms functionality; insufficient time was available to re-work all the forms that had been developed. Tyler currently has a very cumbersome visual basic forms creation tool. The new forms tool was originally expected in December 2012, but is now expected mid-February, 2013. The new tool is expected to be user-friendly, allows fingerprint signature capability for Judges and movement towards greater e-forms that the court will begin using. This is significant for the Court’s goal to move to a
Legal Judicial Services Attachment 13 Page1 of 4

“paper-lite” system and also significant in terms of working around the document imaging system limitations. “TCM” – Tyler Content Manager is the module that provides integrated document image capture. TCM is superbly designed to rapidly capture electronic documents and save images to the appropriate case file. As an example, Guilty by Default automated processing does – mass updates to the case files, creates documents and saves images back to the appropriate case in approximately 5 minutes daily. Scanning of paper, however, is considerably slower – it takes approximately 35 seconds per document to scan paper which must be scan through single feeds rather than batch submissions. Because of the limitations of TCM paper scanning performance, the Court has delayed electronic document processing in the courtroom. It is expected that City Prosecutor’s office will be able to file electronic complaints within the next couple of months and Police will have e-citations in place by late 2014. These two document types alone represent a significant amount of paper documents that Court handles. Court will continue towards developing more electronic documents and work with stakeholders and service providers to move towards electronic document filing. If tentative plans to open another scan station materializes, individuals on light duty can be assigned to do scanning tasks. (Funding for this has not been identified yet, but will include a scanner, a Tyler license and as well as specialized furniture if needed). Financial processes and reports are considerably different than AIRS processes. Court and Finance staff with IT support has been working to bridge the differences in reporting methods. To accommodate some of the challenges posed, the Court now closes at 4:30 pm daily to allow closing of the cash drawers at day’s end (the AIRS system allowed closing by a date/time stamp parameter and allowed for closing on demand; Tyler does not). Tyler statistical reports – while Tyler provides on demand ability to query the database for certain criteria, the scope of reports that are provided are not sufficient. Reports such as final dockets are not deemed adequate; court will review statutory requirements and work with Tyler for fixes as needed. Court staff will also rely heavily on IT support until expertise can be developed to write specialized reports. An option would be to pay Tyler for specialized report development.
Enhanced Customer Services - On-line web services: Defendants now have the ability to resolve violations on line and make payments going through a web-based service. This feature was implemented on February 1, 2013. The ability for defendants to do so is dependent on citations being entered into the system. Because data propagation is no longer available, Court staff must enter cases into Tyler. Until late January, citation entry was backlogged to the extent that cases were being entered just days ahead of court appearance. Eugene Municipal Court has an import from AIRS to Tyler that appeared to be problematic until recently. Springfield will need to ensure that the import process does not cause issues and even if implemented, will still require Court staff to complete data entry to add required information. Enhanced document process: “E-abstracts”. Previously, court staff would manually note citation abstracts for every conviction and mail them to DMV. The process is now automated and generally takes approximately five minutes daily to generate and print documents and save images in Tyler. This process, however, does require that Court staff enter required information that is currently not captured through Police entry of citations. This issue should be resolved in late 2014 when e-citations are implemented by Police. (Our ODOT liaison is working on garnering support for a central print location in Salem and or an electronic transmission of data to update the DMV files).
Legal Judicial Services Attachment 13 Page2 of 4

Enhanced work-flows: Tyler provides the ability to perform actions in mass which greatly enhances the ability of staff to process large quantity of work with limited use of resources (similar to the guilty by default or e-abstract process). There is, however, still a great deal of work that must be done to accommodate some of the data conversion glitches and or to accommodate new mandates. Conversion glitches, pending warrants and pre-Tyler payment agreements all required manual fixes at conversion (warrants are nearly complete; payment agreements are being completed as staff encounters agreements in effect prior to Tyler go-live). The ability to suspend driver licenses for non-payment is now hampered by an appellate ruling (Richardson vs. ODOT addressed later) and while automated processes are available to suspend licenses, court will most likely need to do a manual review of each case before suspension can occur. Enhanced features: Jury, phone notifications, officer notifications, PeopleSoft interface and PCS import/export interface are pending implementation. These features are either awaiting Court staff implementation or Tyler development. These features are enhancements and while of great benefit in saving staff resources, are not critical for court operations. City Prosecutor: Tyler’s City Prosecutor’s module is not developed sufficiently to provide operational benefits. The Court has given the City Prosecutor office access to the Court module as an interim solution (read only access other than document generation). Forms have been developed for them which will allow the complaints to be electronically signed and e-filed by saving the image to the case. Other forms previously filed on paper by the Prosecutors’ office will also be developed for them as time permits and will help movement towards the Courts’ goal of “paper-lite” processes. Once security is tightened in Tyler, there may be a possibility of using the one module for both departments.
Tyler conclusion: In most cases staff has been able to accommodate deficiencies with temporary fit-gap solutions while awaiting new version fixes. Considering the scope of changes required with the new system, the actual go-live implementation of the system was non-eventful– staff were well trained and mentally prepared for go-live and were able to provide all critical services from day one. Staff remains focused on fixes to come rather than dwelling on the challenges of working in a system “under construction”. AIRS: Court cases will be purged out of the AIRS system in May of 2013. Court will be requesting to keep read-only access of AIRS until the Police SunGard system is implemented. AIRS is currently used in uniquely identifying individuals and ID numbers such as AIRS, Social Security, FBI and SID numbers are manually entered into Tyler to maintain the data integrity between the Court, Police and Jail systems.
New Court hours of operation starting on February 1, 2013. Court will be closing to the public at 4:30 pm daily to accommodate some of the financial constraints of the new Tyler court computer system. The 4:30 closing allows the Court staff to close cash drawers at the end of each day and decrease some of the processing challenges and additional work for both Court and Finance staff to accommodate the new system capabilities.
A new Court schedule will be in effect on April 1, 2013. The schedule has been reviewed by Judges, Police, Jail and City Prosecutors. This schedule is significantly different and seeks to alleviate issues identified with the previous schedule for court stakeholders. The trial schedule is heavily dependent on early disposition offers to attorneys. While not yet set, a “meet and greet” has been tentatively planned for the Judiciary, City Prosecutors and Jail to introduce the defense bar to the new scheduling, and to clearly define operational expectations that are designed to be respectful of
Legal Judicial Services Attachment 13 Page3 of 4

time constraints of all parties. This will also provide the opportunity to introduce expectations for billing practices and offer enhanced services with the introductions of electronic payment rather than checks.
Indigent Representation: A statutorily mandated service, the Court does not have any option but to provide this service short of treating misdemeanor cases as violations thus eliminating the need for appointment of counsel. As the new City Prosecutors’ office come up to speed and is successful in implementing some planned changes, it is anticipated that costs for indigent representation may decrease. Richardson vs. ODOT. Pursuant to an appellate court ruling, the Court can no longer use re-suspension of driving privileges as a means to compel payment of past due fines. The Court will have only one opportunity to suspend an individual’s driving privilege as DMV will no longer permit multiple suspension orders per case for failure to pay fines. This is significant as the re-suspension process has been a highly successful collection tool. It is our understanding that there will be some attempts towards legislative changes to offset the appellate ruling. If a Judge lifts a suspension order prior to payment of fines and fees in full, the only option Court will have to collect is through the Collection Agency and or the Department of Revenue collections program. The Court will be reviewing collections practices to decrease the ruling’s impact.
Department of Revenue “DOR” collections program was delayed in FY13 and is still on hold. This program is supported by .5 FTE not yet hired. Implementation is anticipated, pending FTE support and development of Tyler processes to accommodate this program.
CONCLUSION The opening of the Springfield Jail and implementation of a new computer system has placed significant challenges for the Court staff, but it has also placed the Court in a unique position to begin restoring public confidence in the ability of Springfield legal judicial system to compel compliance with laws that protect the safety and quality of life in the community in a cost effective manner respectful of funding required to do so. FY14 will prove to be challenging and have significant impact for the Court staff and Judges to bring the Tyler system fully functional and implement the immense scope of cultural changes brought about with the “paper-lite” processes. The entire City Prosecutor’s staff is a new to the office and it will take some time and adjustments to accommodate issues as they become familiar with Court operational needs. As the new Police SunGard system and Jail EIS system are implemented, these changes will most likely also impact court operations. These challenges and changes are an opportunity to implement many cultural and operational changes to make the legal judicial processes more efficient and effective; the Court is well positioned to make those changes. Changes, without additional support however, will be prioritized and implemented as staff is able to develop and implement new processes. COUNCIL GOALS/POLICIES/DEPARTMENT PERFORMANCE MEASURES AFFECTED The Court is charged with maintaining public confidence in the ability of the legal judicial system to uphold the rule of law, impartially resolve legal contests fairly, efficiently and effectively and to compel compliance with laws that protect the safety and quality of life in the community. The Court strives to meet council goals: 1) to enhance public safety and thereby help to 2) to preserve the hometown feel, livability and by holding offenders financially accountable for costs incurred, strive to participate positively towards goal 3) to offer financially responsible and stable government services.
Legal Judicial Services Attachment 13 Page4 of 4

MU
NIC
IPA
L C
OU
RT
FY 2
014
CourtJud
iciary
andStaff
Court Jud
iciary and
Staff
Represen
ting 168 years o
f service to
the City of Springfield
Legal Judicial Services Presentation Attachment 14 Page 1 of 11
Mu
nic
ipa
l C
ou
rtFY
201
4
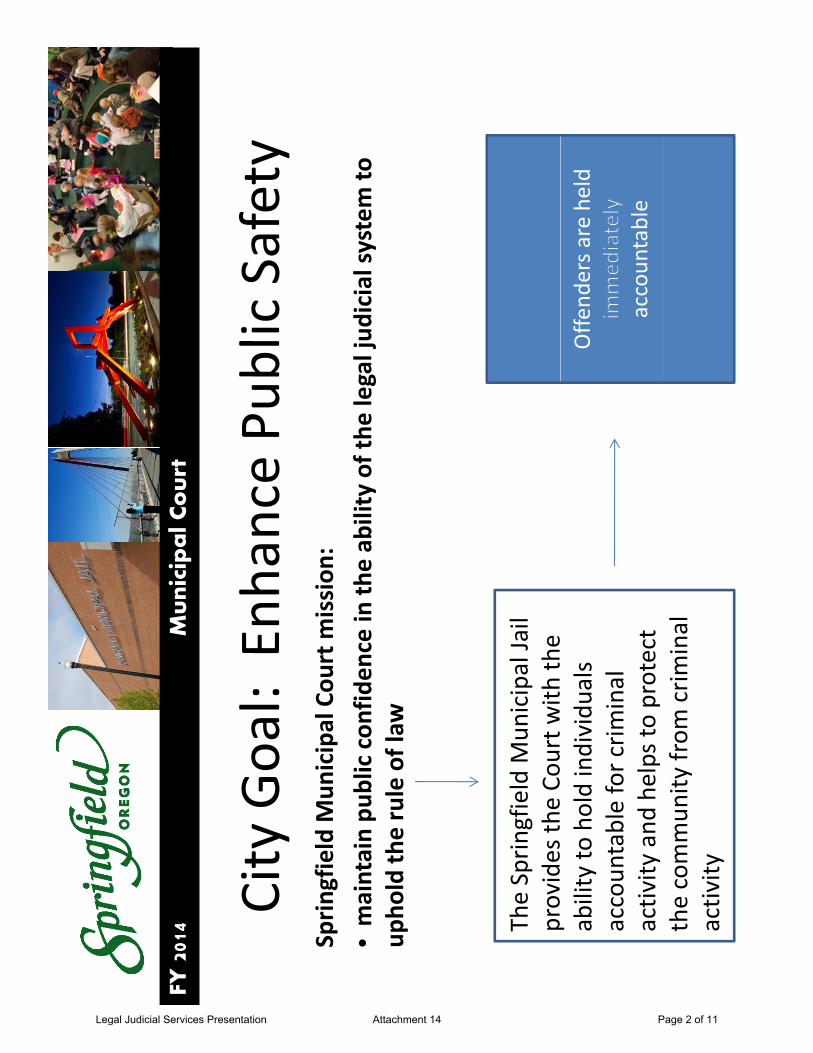
City
Goal:EnhancePu
blicSafety
City Goal: Enh
ance Pub
lic Safety
Sprin
gfield M
unicipal Cou
rt m
ission
:i
ibli
fidi
hbili
fh
llj
diil
•maintain pu
blic con
fiden
ce in
the ab
ility of the
legal jud
icial system to
upho
ld th
e rule of law
The Sprin
gfield M
unicipal Ja
il provides th
e Co
urt w
ith th
e p ability to
hold individu
als
accoun
table for crim
inal
activ
ity and
helps to
protect
Offe
nders a
re held
accoun
table
the commun
ity from
crim
inal
activ
ity
Legal Judicial Services Presentation Attachment 14 Page 2 of 11

Mu
nic
ipa
l C
ou
rtFY
201
4
Hldi
Df
dtA
tbl
Holding De
fend
ants Accou
ntable
13,552
14,000
13,033
12,915
12,573
13,356
13,290
13,000
13,500
12,140
12,142
11,829
,
12,046
12,000
12,500
Cases F
iled
Adjudicated
11,000
11,500
10,500
2008
2009
2010
2011
2012
Legal Judicial Services Presentation Attachment 14 Page 3 of 11

Mu
nic
ipa
l C
ou
rtFY
201
4 CityGoal:Financially
Respon
sibleand
City Goal: Financially Respo
nsible and
Stable Governm
ent S
ervices
Sprin
gfield M
unicipal Cou
rt m
ission
: •
To com
pel com
pliance with
the orde
rs of the
Cou
rt
Holdoffend
ersa
ccou
ntableforreimbu
rsem
ento
fcoststo
thecommun
ityfor
Hold offe
nders a
ccou
ntable fo
r reimbu
rsem
ent o
f costs to
the commun
ity fo
r crim
inal activity
Legal Judicial Services Presentation Attachment 14 Page 4 of 11

Mu
nic
ipa
l C
ou
rtFY
201
4
FinancialA
ccou
ntability
Financial A
ccou
ntability
$2,165
,086
$2,241
,072
$2,143
,927
$2,500
,000
$1,581
,213
$1,850
,275
$1,412
,092
$1,628
,817
$1,947
,756
$1,798
,015
$1,500
,000
$2,000
,000
$1,202
,475
$1,000
,000
Total Collected
City Reven
ue
$0
$500
,000
2008
2009
2010
2011
2012
Legal Judicial Services Presentation Attachment 14 Page 5 of 11

De
pa
rtm
en
tFY
201
4
City Goal: Preserve ou
r Hom
etow
n Feel, Livability
y,
yand Environm
ental Q
uality
•Sprin
gfieldMun
icipalCo
urt
Byorde
rsfor
Sprin
gfield M
unicipal Cou
rt
mission: strive to com
pel
compliance with
the laws that
protect the
safety and
quality of
lifith
it
By orders for
defend
ants to
appe
ar in
cou
rt to
show
cause why
Byissuing
life in th
e commun
itythey are in
non
‐compliance with
orde
rs of the
cou
rt
By issuing
warrants for
failure to
appe
ar in
court
Through the Sprin
gfield M
unicipal Ja
il, th
e commun
ity has th
e means to
en
forcethechoice
ofno
toleranceforcrim
inalactiv
ityandismakingstrid
esen
force the choice of n
o tolerance for crim
inal activity
and
is m
aking strid
es
towards preserving the ho
metow
n feel and
livability for the
children and
families in
the commun
ity
Legal Judicial Services Presentation Attachment 14 Page 6 of 11
De
pa
rtm
en
tFY
201
4
•By
passingop
erating
Police
Jail
•By
passin
g op
erating
levies and
bon
ds fo
r bu
ilding the Jail, th
e Jail
Prosecution
g,
commun
ity of
Sprin
gfield has fixed
Court
one of th
e dysfun
ctional
tfth
compo
nents o
f the
Crim
inal Ju
stice
System
System
Legal Judicial Services Presentation Attachment 14 Page 7 of 11

Mu
nic
ipa
l C
ou
rtFY
201
4
40 year o
ld com
puter system re
placed
: Tyler Techn
ologies InCo
de sy
stem
implem
ented
on Octob
er 29, 2013, with
supp
ort o
f IT, Finance and
com
pany con
sulta
nts
,,
pp,
py
Legal Judicial Services Presentation Attachment 14 Page 8 of 11

De
pa
rtm
en
tFY
201
4 Tyler Techn
ologies InCo
de System
Eh
dC
tS
i•Enhanced
Customer Services:
–Individu
als m
ay re
solve violations on line and
ktth
hbb
di
make paym
ents th
rough a web
‐based
service
–Sets th
e foun
datio
n for future pu
blic on line
recordssearch
records search
Legal Judicial Services Presentation Attachment 14 Page 9 of 11

Mu
nic
ipa
l C
ou
rtFY
201
4
Tl
Th
li
IC
dS
tTyler Techn
ologies InC
ode System
•Provides
thefoun
datio
nfortransition
ingto
Provides th
e foun
datio
n for transition
ing to
electron
ic and
“pape
r‐lite”processes:
Fingerprintsignature
forJud
ges
–Fingerprint signature fo
r Jud
ges
–Electron
ic signature for d
efen
dants
“Autom
ated
onde
mand”
documentcreationfrom
–“Autom
ated
, on‐de
mand” docum
ent creation from
system
inform
ation
Abilityto
send
documentsby
–Ab
ility to
send
docum
ents by e‐mail
Legal Judicial Services Presentation Attachment 14 Page 10 of 11

Mu
nic
ipa
l C
ou
rtFY
201
4
Challenges
Challenges …
‐Co
mpu
ter system: transition from
a 40 year old
legacy
mainframesystem
toclou
dbasedsystem
;legacy m
ainframe system
to cloud
based
system
; ‐Tyler Techn
ologies –
integrating the ne
w sy
stem
andim
plem
entin
gop
erationalchanges
and im
plem
entin
g op
erational changes
‐Janu
ary 1, 201
3, new
Prosecutors con
tracted
July20
13im
plem
entatio
nof
ane
wJailsystem
‐July 201
3 im
plem
entatio
n of a new
Jail system
‐Nov 201
3 im
plem
entatio
n of a new
Police system
fff
… and
con
tinue
d op
portun
ities fo
r efficiencies
across m
ultip
le sy
stem
s
Legal Judicial Services Presentation Attachment 14 Page 11 of 11

DEPARTMENT BUDGET SUMMARY City of Springfield, Oregon
To: Gino Grimaldi, City Manager
From: Rick Lewis, AIC Chief of Police
Date: April 5, 2013
SUMMARY OF SIGNIFICANT ISSUE(S) IN THE DEPARTMENT PROPOSAL (Revenues/Expenditures)
Issue FTE Salary Benefits Total 1.) General Fund Staffing 3.25 vacancies $205,800 $136,600 $342,400
2.) Jail Operations
3.) Public Safety Operating Levy
4.) Training
EXPLANATION OF SIGNIFICANT ISSUE(S)
1.) The proposed budget as submitted includes 3.25 FTE of planned vacancies. Two police officer
positions and one dispatcher position will be carried for the entire fiscal year, and a records/call-taking position will be carried until just before go-live of the new Public Safety Software systems. These vacancies will generate approximately $348,400 in General Fund Savings. In addition, reserve funds from the Operating Levy will be used to offset some General Fund contributions to the Jail Fund in order to reach the Department’s GF reduction target of $496,000. The Department has submitted an issue paper discussing and recommending the permanent elimination of one police officer position, #382, that was cut for FY12 for which no grant funds were awarded. The staffing reductions will temporarily limit the number of call-takers available to answer incoming calls for service and to staff the public front counter. Especially during evening hours, the Records division frequently works with only one or two employees on duty, which slows the ability of citizens to make their initial request for services. The Department intends to carry the call taking position until shortly before the new Public Safety Software Systems go live. Filling the position at that time will allow the new staff person to train only on the new system, and will restore desired service levels to the public. The losses of officer positions, whether permanent or temporary, create more shifts operating at ‘minimums’. Historical analysis has shown that response times increase significantly for patrol shifts operating at minimums compared to those with even one additional officer available.
2.) The Jail Fund continues to operate within expected budget parameters. There is an increase to the expected medical costs in the FY14 proposed budget because of a request by the medical services provider to increase staffing hours. Other operating costs in the jail have remained steady.
Police Department Attachment 15 Page 1 of 2

3.) FY14 will be the first year of the new Public Safety Operations Levy. Overall staffing levels and budgets have remained fairly stable in this fund, although General Fund reductions have made the success of the operating levy even more critical to Department operations.
4.) In November of 2013, the Department anticipates going live on a new suite of public safety software systems from the SunGard vendor. The new software will entirely replace the current Dispatch, Records Management, and Mobile Computer Terminal Systems, and will also add new functionality such as Field Based Reporting, Automatic Vehicle Location, E-Citation and Bar Coding for property and evidence. In order to train staff on these systems in a short period of time just before go-live, the Department will rely on federal forfeiture funds to pay overtime costs for staff attending training outside their normal work schedules. Costs for training all staff could approach $100,000 depending on scheduling issues.
CONCLUSION The Department has submitted a budged which complies with the direction received from the Finance Department. This budget continues to be extremely frugal and relies upon staffing vacancies to meet financial targets. The Department believes that it will be able to meet the goals and objectives of the City Council within the available resources.
COUNCIL GOALS/POLICIES/DEPARTMENT PERFORMANCE MEASURES AFFECTED
The Department fully expects to meet the goals and policies of the City Council, and the performance goal objectives of the Department, in the coming fiscal year.
Police Department Attachment 15 Page 2 of 2
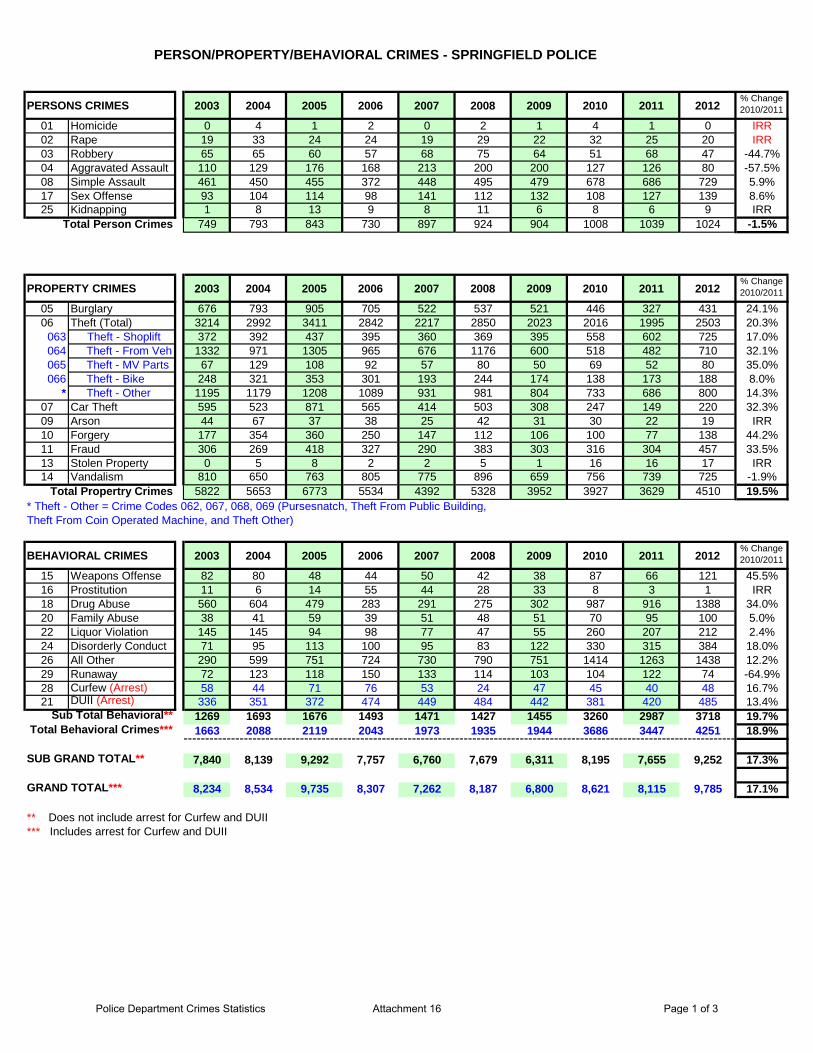
PERSON/PROPERTY/BEHAVIORAL CRIMES - SPRINGFIELD POLICE
PERSONS CRIMES 2003 2004 2005 2006 2007 2008 2009 2010 2011 2012% Change 2010/2011
01 Homicide 0 4 1 2 0 2 1 4 1 0 IRR02 Rape 19 33 24 24 19 29 22 32 25 20 IRR03 Robbery 65 65 60 57 68 75 64 51 68 47 -44.7%04 Aggravated Assault 110 129 176 168 213 200 200 127 126 80 -57.5%08 Simple Assault 461 450 455 372 448 495 479 678 686 729 5.9%17 Sex Offense 93 104 114 98 141 112 132 108 127 139 8.6%25 Kidnapping 1 8 13 9 8 11 6 8 6 9 IRR
Total Person Crimes 749 793 843 730 897 924 904 1008 1039 1024 -1.5%
PROPERTY CRIMES 2003 2004 2005 2006 2007 2008 2009 2010 2011 2012% Change 2010/2011
05 Burglary 676 793 905 705 522 537 521 446 327 431 24.1%06 Theft (Total) 3214 2992 3411 2842 2217 2850 2023 2016 1995 2503 20.3%
063 Theft - Shoplift 372 392 437 395 360 369 395 558 602 725 17.0%064 Theft - From Veh 1332 971 1305 965 676 1176 600 518 482 710 32.1%065 Theft - MV Parts 67 129 108 92 57 80 50 69 52 80 35.0%066 Theft - Bike 248 321 353 301 193 244 174 138 173 188 8.0%
* Theft - Other 1195 1179 1208 1089 931 981 804 733 686 800 14.3%07 Car Theft 595 523 871 565 414 503 308 247 149 220 32.3%09 Arson 44 67 37 38 25 42 31 30 22 19 IRR10 Forgery 177 354 360 250 147 112 106 100 77 138 44.2%11 Fraud 306 269 418 327 290 383 303 316 304 457 33.5%13 Stolen Property 0 5 8 2 2 5 1 16 16 17 IRR14 Vandalism 810 650 763 805 775 896 659 756 739 725 -1.9%
Total Propertry Crimes 5822 5653 6773 5534 4392 5328 3952 3927 3629 4510 19.5%* Theft - Other = Crime Codes 062, 067, 068, 069 (Pursesnatch, Theft From Public Building, Theft From Coin Operated Machine, and Theft Other)
BEHAVIORAL CRIMES 2003 2004 2005 2006 2007 2008 2009 2010 2011 2012% Change 2010/2011
15 Weapons Offense 82 80 48 44 50 42 38 87 66 121 45.5%16 Prostitution 11 6 14 55 44 28 33 8 3 1 IRR18 Drug Abuse 560 604 479 283 291 275 302 987 916 1388 34.0%20 Family Abuse 38 41 59 39 51 48 51 70 95 100 5.0%22 Liquor Violation 145 145 94 98 77 47 55 260 207 212 2.4%24 Disorderly Conduct 71 95 113 100 95 83 122 330 315 384 18.0%26 All Other 290 599 751 724 730 790 751 1414 1263 1438 12.2%29 Runaway 72 123 118 150 133 114 103 104 122 74 -64.9%28 Curfew (Arrest) 58 44 71 76 53 24 47 45 40 48 16.7%21 DUII (Arrest) 336 351 372 474 449 484 442 381 420 485 13.4%
Sub Total Behavioral** 1269 1693 1676 1493 1471 1427 1455 3260 2987 3718 19.7%Total Behavioral Crimes*** 1663 2088 2119 2043 1973 1935 1944 3686 3447 4251 18.9%
SUB GRAND TOTAL** 7,840 8,139 9,292 7,757 6,760 7,679 6,311 8,195 7,655 9,252 17.3%
GRAND TOTAL*** 8,234 8,534 9,735 8,307 7,262 8,187 6,800 8,621 8,115 9,785 17.1%
** Does not include arrest for Curfew and DUII*** Includes arrest for Curfew and DUII
Police Department Crimes Statistics Attachment 16 Page 1 of 3
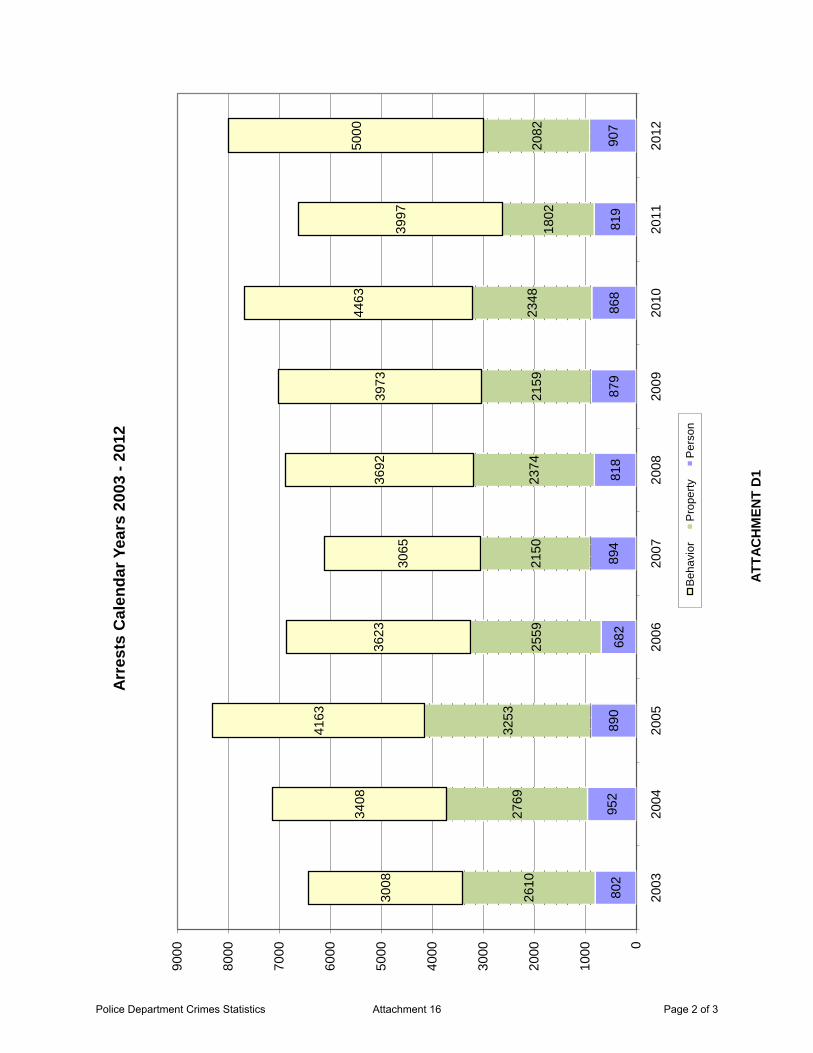
ATTA
CH
MEN
T D
1
802
952
890
682
894
818
879
868
819
907
2610
2769
3253
2559
2150
2374
2159
2348
1802
2082
3008
3408
4163
3623
3065
3692
3973
4463
3997
5000
0
1000
2000
3000
4000
5000
6000
7000
8000
9000
2003
2004
2005
2006
2007
2008
2009
2010
2011
2012
Arre
sts
Cal
enda
r Yea
rs 2
003
-201
2
Beh
avio
rP
rope
rtyP
erso
n
Police Department Crimes Statistics Attachment 16 Page 2 of 3

ATTA
CH
MEN
T D
1
770
789
841
733
897
911
904
1008
1039
1024
5296
5209
6776
5544
4392
5284
3956
3960
3639
4530
1640
1692
2115
2042
1973
1925
1944
3686
3447
4251
0
2000
4000
6000
8000
1000
0
1200
0
2003
2004
2005
2006
2007
2008
2009
2010
2011
2012
Rep
orte
d C
rimes
Cal
enda
r Yea
rs 2
003-
2012
Beh
avio
rP
rope
rtyP
erso
n
Police Department Crimes Statistics Attachment 16 Page 3 of 3

Po
lice
FY 2
014
FY20
14 B
udge
t Com
mitt
ee M
eetin
g
Police Department Presentation Attachment 17 Pages 1 of 26

Po
lice
FY 2
014
FY20
14 B
udge
t Com
mitt
ee M
eetin
g
Police Department Presentation Attachment 17 Pages 2 of 26
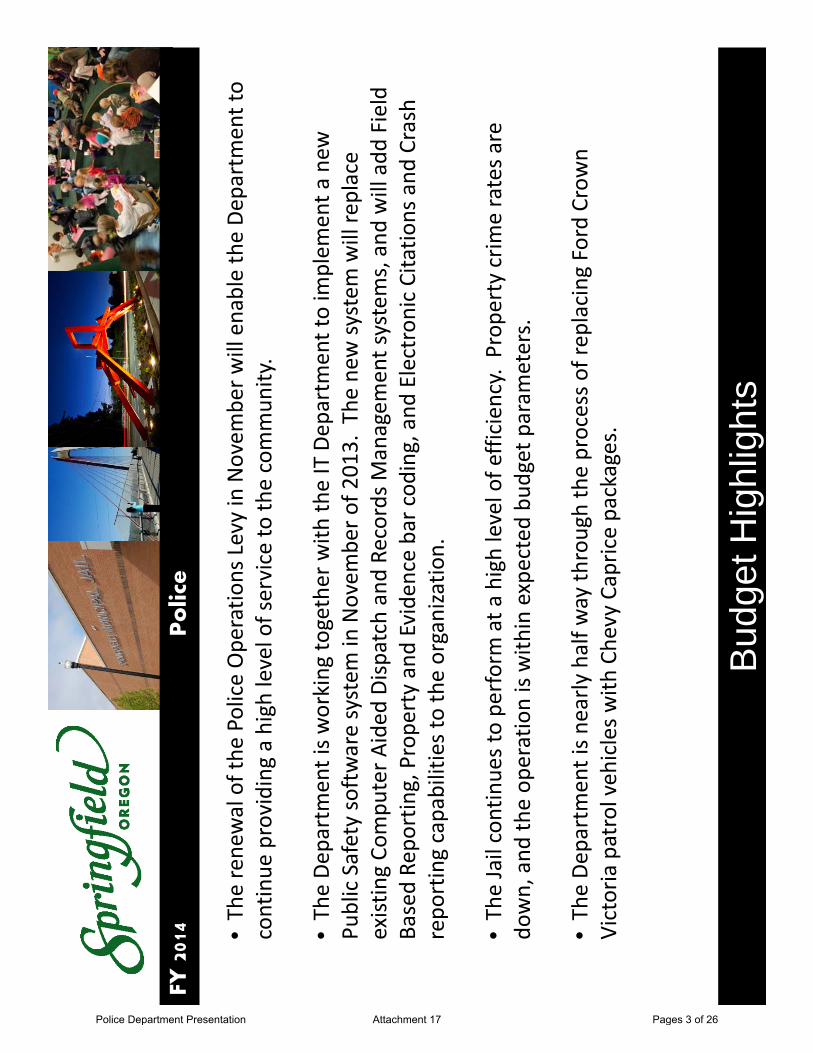
Po
lice
FY 2
014 •The rene
wal of the
Police Ope
ratio
ns Levy in Novem
ber w
ill enable the De
partmen
t to
continue
providing
a high level of service to
the commun
ity.
•The De
partmen
t is w
orking
together with
the IT Dep
artm
ent to im
plem
ent a
new
Pu
blicSafety
softwaresystem
inNovem
bero
f2013.
Thene
wsystem
willreplace
Public Safety software system
in Novem
ber o
f 2013. The
new
system
will re
place
existing Co
mpu
ter A
ided
Disp
atch and
Records M
anagem
ent systems, and
will add
Field
Based Re
porting, Prope
rty and Eviden
ce bar cod
ing, and
Electronic Citatio
ns and
Crash
repo
rting capabilities to the organizatio
n.
•The Jail continue
s to perform
at a
high level of e
fficien
cy. Prop
erty crim
e rates a
re
down, and
the op
eration is with
in expected bu
dget param
eters.
•The De
partmen
t is n
early
half w
ay th
rough the process o
f rep
lacing
Ford Crow
n Victoria patrol veh
icles w
ith Che
vy Caprice packages.
Bud
get H
ighl
ight
s
Police Department Presentation Attachment 17 Pages 3 of 26

Po
lice
FY 2
014
The Po
lice De
partmen
t is n
ot su
bmitting issue
papers for FY14
To m
eet b
udget targets:
•TheDe
partmen
twillmanageGen
eralFund
vacanciestogene
rate
approxim
ately
The De
partmen
t will m
anage Gen
eral Fun
d vacancies to gene
rate app
roximately
$340
,000
in sa
vings d
uring FY14
.
•Many of th
e sig
nificant g
rant opp
ortunitie
s from
previou
s years have dried up
or h
ave
bfll
dd
ThD
illi
fdi
hbe
en fu
lly expen
ded. The
Dep
artm
ent w
ill con
tinue
to pursue fund
ing sources w
herever
possible and
practical.
•This year’s prop
osed
bud
get restores som
e of th
e fund
ing ne
eded
to su
pport the
y
pp
gg
ppeventual re
placem
ent o
f critical te
chno
logy infrastructure. Fund
ing those replacem
ents
will re
main a bu
dget prio
rity.
Sig
nific
ant C
hang
es fo
r FY
14
Police Department Presentation Attachment 17 Pages 4 of 26

Po
lice
FY 2
014
•The De
partmen
t has a new
con
tract for with
Green
hill Hu
mane Society to provide
shelter
py
pand adop
tion services fo
r lost o
r aband
oned
dogs. The
Animal Con
trol program
has been
very su
ccessful in
returning foun
d do
gs to
their o
wne
rs, and
the result has b
een a savings in
the contractual costs fo
r she
lter services.
•The volunteer p
rogram
con
tinue
s to grow, and
provide
s sup
port fo
r ope
ratio
ns and
op
portun
ities fo
r our citizens to
actively participate in th
e work of th
e De
partmen
t.
Volunteers are currently involved
in Animal Con
trol su
pport, Fleet m
ainten
ance, G
raffiti
removal, Crim
e Preven
tion events, and
the Lock Out Crim
e project.
Sig
nific
ant C
hang
es fo
r FY
14
Police Department Presentation Attachment 17 Pages 5 of 26
Po
lice
FY 2
014
Citizen
Satisfaction
TheDe
partmen
tcon
tinue
sto
receivehigh
marks
from
citizen
sfrom
theannu
alThe De
partmen
t con
tinue
s to re
ceive high
marks from
citizens from
the annu
al
survey. 93% of this y
ear’s re
spon
dents indicated they are sa
tisfie
d with
services provide
d by th
e De
partmen
t.
Police Plan
ning
Task Force
The citizen
adviso
ry group
is a critical re
source fo
r the
Dep
artm
ent. W
e continue
to m
eet w
ith th
em on a mon
thly basis to re
view
policies a
nd plans.
Partne
rships and
Fun
ding
The De
partmen
t con
tinue
s to re
ly upo
n partne
rships whe
rever p
ossib
le to
increase
resources, im
prove efficiency and be
nefit th
e commun
ity. Exam
ples includ
e:Re
gion
al Radio System
Justice Assistance Grants
Scho
ol Resou
rce Officer P
rogram
How
are
we
doin
g?
Police Department Presentation Attachment 17 Pages 6 of 26
Po
lice
FY 2
014 Pat
rol
Pro
fess
ion
al S
tan
da
rds
Inve
stig
atio
ns
Ca
nin
e
Tra
ffic
Te
am
Bic
ycle
Pat
rol
Ma
jor
Ac
cid
en
t In
vest
igat
ion
s Te
am
Co
mm
un
icat
ion
s
SW
AT
Dru
g In
vest
igat
ion
sg
g
Cri
me
Pre
ven
tio
nA
nim
al C
on
tro
l
Vo
lun
tee
r P
rog
ram
Re
co
rds
& C
all
Taki
ng
Vo
lun
tee
r P
rog
ram
Re
co
rds
& C
all
Taki
ng
Sch
oo
l Re
sou
rce
Off
ice
r P
rog
ram
Mu
nic
ipa
l Ja
il
Our
Ser
vice
s
Police Department Presentation Attachment 17 Pages 7 of 26
Po
lice
FY 2
014
Our
Sta
ff
Police Department Presentation Attachment 17 Pages 8 of 26

Po
lice
FY 2
014
Our
Sta
ff
Police Department Presentation Attachment 17 Pages 9 of 26

Po
lice
FY 2
014
57,212
Calls for S
ervice in
2012
10,809
Traffic Citatio
ns. The four m
ost frequ
ent o
ffenses, including
Driv
ing Uninsured
, Driving While Suspe
nded
, Driv
ing While Usin
g a Ce
ll ph
one, and
Spe
eding accoun
ted for
more than
half o
f all tickets written.
7,98
9 Arrests
490Drun
kDrivingArrests
490 Drun
k Driving Arrests
4,53
0 Re
ported
Prope
rty Crim
es
2,24
5 Mun
icipal Ja
il bo
okings, w
hich includ
e an
average of 9
prison
ers p
er day hou
sed by
the City of E
ugen
e.
3,31
8Do
gLicenses
issue
dor
rene
wed
.
Act
ivity
Mea
sure
s
3,31
8 Do
g Licenses issued
or ren
ewed
.
Police Department Presentation Attachment 17 Pages 10 of 26

Po
lice
FY 2
014
Rep
orte
d C
rimes
Cal
enda
r Yea
rs 2
003-
2012
1000
0
1200
0
2115
2042
1925
4251
8000
1000
0
6776
1640
1692
1973
1925
1944
3686
3447
4000
6000
5296
5209
6776
5544
4392
5284
3956
3960
3639
4530
2000
4000
770
789
841
733
897
911
904
1008
1039
1024
020
0320
0420
0520
0620
0720
0820
0920
1020
1120
12
Beha
vior
Pro
perty
Per
son
Police Department Presentation Attachment 17 Pages 11 of 26

Po
lice
FY 2
014
Arr
ests
Cal
enda
r Yea
rs 2
003
-201
2
8000
9000
3408
4163
3623
3692
3973
4463
5000
5000
6000
7000
3008
3623
3065
3692
3973
3997
3000
4000
5000
952
90
2610
2769
3253
2559
2150
2374
2159
2348
1802
2082
1000
2000
802
952
890
682
894
818
879
868
819
907
020
0320
0420
0520
0620
0720
0820
0920
1020
1120
12
Beha
vior
Pro
perty
Per
son
Police Department Presentation Attachment 17 Pages 12 of 26

Po
lice
FY 2
014
Ch
rist
ma
s a
nd
Ve
tera
ns
Pa
rad
es
An
nu
al C
an
ine
Co
mp
eti
tio
n
Cit
ize
ns
Po
lice
Ac
ad
em
yC
itiz
en
s P
olic
e A
ca
de
my
Ne
igh
bo
rho
od
Wat
ch
4th
of
July
Fir
ew
ork
s
Sa
fety
Fa
ir E
ven
ts
Ro
ad
Ru
ns
Ca
r C
ruis
e
Pol
ice
are
Invo
lved
in P
ublic
Eve
nts
Police Department Presentation Attachment 17 Pages 13 of 26
Po
lice
FY 2
014
Pol
ice
in th
e C
omm
unity
Police Department Presentation Attachment 17 Pages 14 of 26

Po
lice
FY 2
014
Pol
ice
in th
e C
omm
unity
Police Department Presentation Attachment 17 Pages 15 of 26

Po
lice
FY 2
014
Pol
ice
in th
e C
omm
unity
Police Department Presentation Attachment 17 Pages 16 of 26

Po
lice
FY 2
014
Volu
ntee
r Pro
gram
Police Department Presentation Attachment 17 Pages 17 of 26
Po
lice
FY 2
014
Mun
icip
al J
ail
Police Department Presentation Attachment 17 Pages 18 of 26
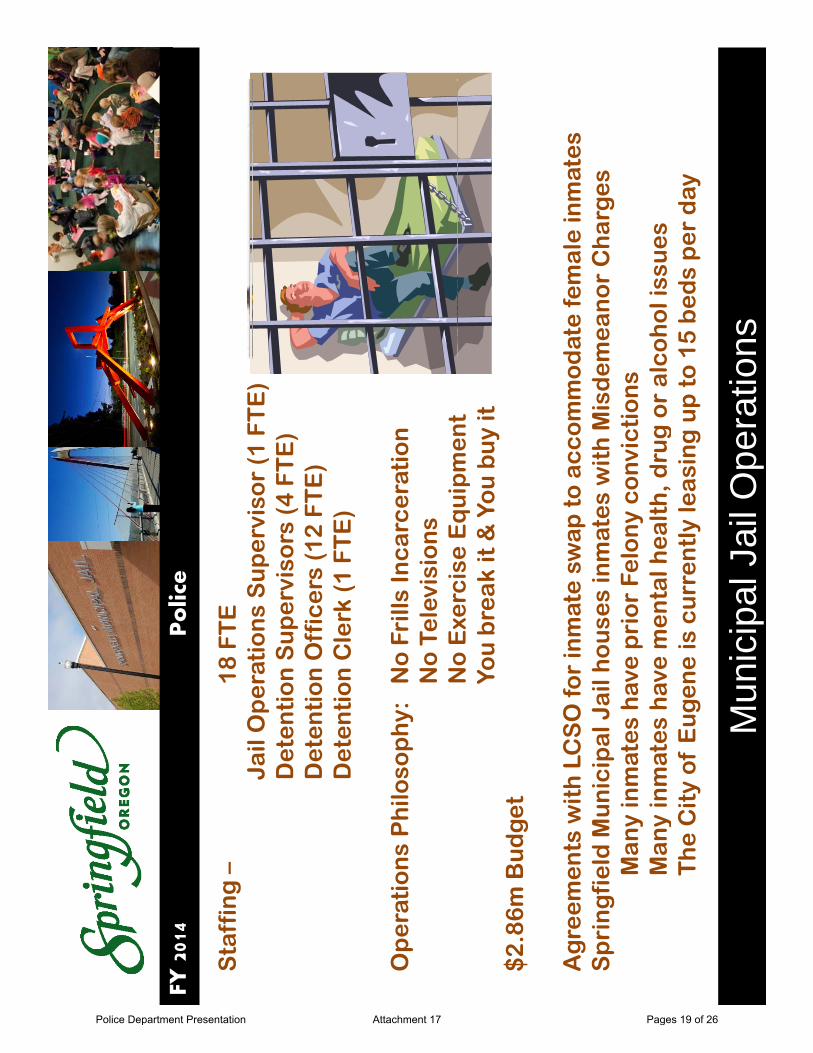
Po
lice
FY 2
014
Sta
ffin
g –
18
FT
EJa
il O
pe
rati
on
s S
up
erv
iso
r (1
FT
E)
Jail
Op
era
tio
ns
Su
pe
rvis
or
(1 F
TE
)D
ete
nti
on
Su
pe
rvis
ors
(4
FT
E)
De
ten
tio
n O
ffic
ers
(1
2 F
TE
)D
ete
nti
on
Cle
rk (
1 F
TE
)(
)
Op
era
tio
ns
Ph
iloso
ph
y:
No
Fri
lls In
ca
rce
rati
on
No
Te
levi
sio
ns
No
Exe
rcis
e E
qu
ipm
en
tN
o E
xerc
ise
Eq
uip
me
nt
You
bre
ak
it &
Yo
u b
uy
it$
2.8
6m
Bu
dg
et
Ag
ree
me
nts
wit
h L
CS
O fo
r in
mat
e s
wa
p t
o a
cc
om
mo
dat
e f
em
ale
inm
ate
sS
pri
ng
fie
ld M
un
icip
al J
ail
ho
use
s in
mat
es
wit
h M
isd
em
ea
no
r C
ha
rge
sM
an
y in
mat
es
hav
e p
rio
r Fe
lon
y c
on
vic
tio
ns
Ma
ny
inm
ate
s h
ave
me
nta
l he
alt
h d
rug
or
alc
oh
ol i
ssu
es
Ma
ny
inm
ate
s h
ave
me
nta
l he
alt
h, d
rug
or
alc
oh
ol i
ssu
es
Th
e C
ity
of
Eu
ge
ne
is c
urr
en
tly
lea
sin
g u
p t
o 1
5 b
ed
s p
er
da
y
Mun
icip
al J
ail O
pera
tions
Police Department Presentation Attachment 17 Pages 19 of 26

Po
lice
FY 2
014
Ho
ld o
ffe
nd
ers
ac
co
un
tab
le f
or
cri
min
al b
eh
avio
r: 2
082
Pro
per
ty C
rim
e A
rres
ts in
201
2A
rres
ts in
201
2
Inc
rea
se M
un
icip
al C
ou
rt R
eve
nu
e:
$1.5
mill
ion
in F
Y12
rev
enue
p
Re
du
ce
bo
oki
ng
tim
e fo
r p
olic
e o
ffic
ers
: A
vera
ge b
ooki
ng ti
me
is 1
0 m
inut
esm
inut
es
Re
du
ce
cri
me
in S
pri
ng
fie
ld:
Rep
orte
d P
rop
erty
Cri
mes
are
dow
n 17
%
com
par
ed to
200
8
Goa
ls a
nd O
utco
mes
of t
he M
unic
ipal
Jai
l
Police Department Presentation Attachment 17 Pages 20 of 26

Po
lice
FY 2
014
Am
en
de
dP
rop
ose
dE
xpe
nd
itu
res
by
Cat
eg
ory
:F
Y 1
3F
Y 1
4•
Pe
rso
na
l Se
rvic
es
$1
5,3
12
,98
9$
16
,04
3,5
44
•Mat
eri
als
an
d S
erv
ice
s$
3,3
61
,03
6$
3,1
13
,85
9•C
ap
ita
l Ou
tla
y$
6
55
,47
6$
4
43
,00
0C
ap
ita
l Ou
tla
y$
6
55
,47
6$
4
43
,00
0$
19
,32
9,5
01
$1
9,6
00
,40
3
Exp
en
dit
ure
s b
y F
un
dG
l Fd
$1
29
47
94
8$
13
45
42
81
•Ge
ne
ral F
un
d$
12
,94
7,9
48
$1
3,4
54
,28
1•J
ail
Op
era
tio
ns
$ 2
,74
3,9
76
$ 2
,86
0,2
51
•Po
lice
Lo
ca
l Op
tio
n L
evy
$ 2
,34
7,2
84
$ 2
,52
9,0
75
•Sp
ec
ial R
eve
nu
e$
8
01
,59
3$
5
23
,79
6p
$,
$,
•Ve
hic
le a
nd
Eq
uip
me
nt
$
48
8,7
00
$
23
3,0
00
$1
9,3
29
,50
1$
19
,60
0,4
03
FY 1
4 Fi
nanc
ial S
umm
ary
Police Department Presentation Attachment 17 Pages 21 of 26

Po
lice
FY 2
014
$FY1
4P
liB
dtb
Fd
3%1%$FY1
4 Po
lice Bu
dget by Fund
13%
100 Gen
eral Fun
d202JailFund
s14%
202 Jail Fund
s236 Ope
ratio
ns Levy
204 Special Reven
ue713R
lF
d69%
713 Re
placem
ent F
und
Fund
ing
–Le
vy Im
pact
Police Department Presentation Attachment 17 Pages 22 of 26

Po
lice
FY 2
014
Implem
ent n
ew Pub
lic Safety Software System
sp
yy
Supp
ort the
organiza
tion’s transition
during the Ch
ief’s hiring
process
Provideadeq
uate
training
insupp
orto
forganiza
tionalneeds
andtheLong
RangePlan
Provide adeq
uate training
in su
pport o
f organiza
tional needs and
the Long
Range Plan
Iden
tify fund
ing and im
plem
entatio
n strategies fo
r techn
ology projects su
ch as in‐car
cameras
Increase Ja
il revenu
es th
rough additio
nal bed
leases and
greater efficien
cies in
collecting fin
es owed Im
med
iate
Issu
es (1
to 2
yea
rs)
Police Department Presentation Attachment 17 Pages 23 of 26
Po
lice
FY 2
014
Redu
ce re
liance on
Levy fund
ing for P
olice and Jail op
erations
Iden
tify fund
ing and im
plem
entatio
n strategies fo
r techn
ology projects su
ch as in‐car
cameras, electronic repo
rting and digital evide
nce storage
Iden
tify ne
w sou
rces fo
r grants a
nd partnership opp
ortunitie
s to leverage available
resources
Inte
rmed
iate
Issu
es (3
to 5
yea
rs)
Police Department Presentation Attachment 17 Pages 24 of 26

Po
lice
FY 2
014
Transition from
Levy to permanen
t fun
ding
yp
g
Develop strategies to
maintain service levels as th
e City grows in po
pulatio
n and
geograph
ic area
Develop ne
w expertise to add
ress changes in
crim
e patterns, i.e. com
puter crim
es
and othe
r spe
cial sk
ills
Successio
n planning
to identify and de
velop future leadership
Long
Ter
m Is
sues
(bey
ond
5 ye
ars)
Police Department Presentation Attachment 17 Pages 25 of 26
Po
lice
FY 2
014
Que
stions?
Than
k Yo
u fo
r You
r Ser
vice
!Co
mmitted
to Excellence
Police Department Presentation Attachment 17 Pages 26 of 26

DEPARTMENT BUDGET SUMMARY City of Springfield, Oregon
To: Gino Grimaldi, City Manager
From: Rod Lathrop, IT
Date: February 27, 2013
SUMMARY OF SIGNIFICANT ISSUE(S) IN THE DEPARTMENT PROPOSAL (Revenues/Expenditures)
Issue FTE Cost
Fund 713 Reserves @ zero NA > $100,000 annually
EXPLANATION OF SIGNIFICANT ISSUE(S) Fund 713 reserves for equipment replacement contributions have been reduced due to budget reductions; from > $100,000 historically down to $45,000 annually. The remaining $165,000 is being utilized FY14. IT equipment replacements including servers, PCs, switches, printers, etc. starting in FY15 will be presented as budget issue papers unless this issue is resolved. The IT Department is taking on new support, implementation and development duties for Courts, Fire, and Police (new systems in Jail, Records, Patrol and Dispatch). All services previously provided by AIRS will be handled by Springfield IT. One FTE of work will be required for a this additional work and is being re-allocated from within the department from existing IT Network resources. The retirement of a long-term employee during FY14 will result in a planned vacancy control action to generate enough savings to cover the transition but the position will be filled at some point during the year. Three FTE will be available to implement new services plus provide all the operational support historically provided by Five FTE. Significant projects that will be undertaken will include CJIS requirements to segment the City network and apply encryption to Police data, new encryption requirements for Police hard drives, a new encrypted data route to the Regional Communications Center, new AVL technology for all Police and Fire vehicles, new client software in all Police and Fire vehicles, new Jail software and ancillary equipment, new Courts hardware, etc. New technology projects such as Firewall/VPN envisioned for the e-Recruit project and Public Safety System support, NetMotion in support of DPW field workers, and a large number of FY14 F713 core infrastructure replacements will be impacted. CONCLUSION IT reserves for equipment replacement will be diminished in the current year. The multiple year plan adopted by the City Manager for this service is to begin a program in FY15 to switch from a reserve based funding plan for IT equipment to one that will include an annual $100,000 per year for allocation for IT equipment needs.
COUNCIL GOALS/POLICIES/DEPARTMENT PERFORMANCE MEASURES AFFECTED
Help Desk and support metrics will decline. Infrastructure projects that are funded will face significant delays due to lack of staff resource. Council Goal of financially responsible and innovative government services will be negatively impacted by these reductions.
Information Technology Attachment 18 Page 1 of 1
Info
rma
tio
n T
ech
no
log
yFY
201
4
Information Technology Presentation Attachment 19 Page 1 of 7

Info
rma
tio
n T
ech
no
log
yFY
201
4
An In
ternal Service Dep
artm
ent
IT helps you
r Staff bu
ild and
run your City
by bu
ilding, m
aintaining,
and de
livering automated
techno
logy used to provide
real‐tim
e access to
ope
ratio
nal and
strategic inform
ation.
Four
Core
ServiceAreas:
Four Core Service Areas:
Telecommun
ications
Centralized
Hybrid
PBX
Pho
ne Systems providing digital
and Vo
ice Over IP (VOIP) p
hone
service
Network and work station supp
ort
Supp
ort o
ver 5
00 desktop
and
mob
ile PCs and
50+
file,
print, application, and
database servers
Networkinfrastructure
(pub
licandprivate)
conn
ectin
gNetwork infrastructure (p
ublic and
priv
ate) con
necting
Public Safety, Ope
ratio
ns and
Regional Partners
Application De
velopm
ent, An
alysis, and
Integration
Efficient app
lications m
ake for a
produ
ctive workforce
ppp
Multip
le City
Web
Site
sMore Efficient, A
ccessib
le, Transparent Governm
ent
Information Technology Presentation Attachment 19 Page 2 of 7

Info
rma
tio
n T
ech
no
log
yFY
201
4
Significant
Chan
ges
All Pub
lic Safety programs c
ommon
ly re
ferred
to as the
“AIRS”
applications are being
replaced
with
Com
mercial Off The Shelf solutions:
PoliceRe
cordsM
anagem
enta
ndFieldBa
sedRe
porting
Significant Cha
nges
Police Re
cords M
anagem
ent a
nd Field Based
Rep
ortin
gPo
lice Jail Managem
ent S
ystem
Fire Records M
anagem
ent
Police Electron
ic Cita
tions –data provide
d to State in
supp
ort o
f H
ldS
itHo
meland Security
Benefits:
More im
med
iate features and
functio
nality
Annu
al upgrade
s and
enh
ancemen
ts provide
d by Ven
dor
pgp
yLower long
‐term costs
Strategy:
Complete the work with
existing IT re
sources
Information Technology Presentation Attachment 19 Page 3 of 7
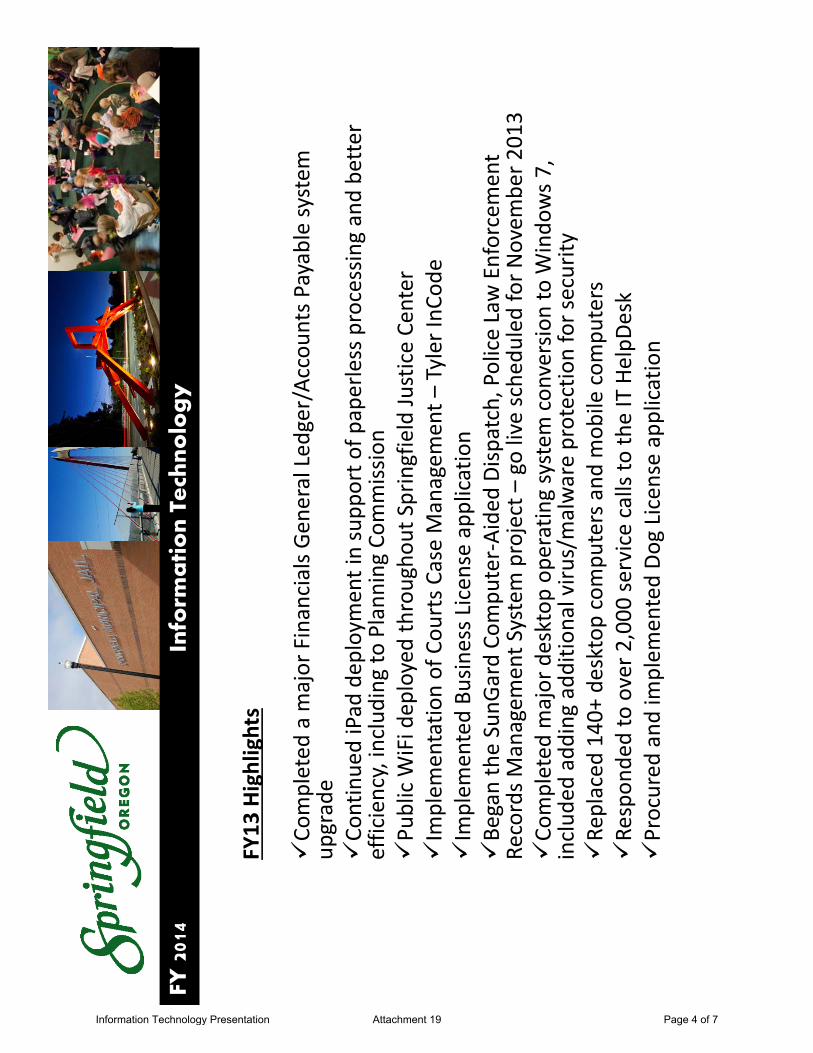
Info
rma
tio
n T
ech
no
log
yFY
201
4
FY13
Highlights
Completed
a m
ajor Financials G
eneral Led
ger/Accoun
ts Payable sy
stem
up
grade
Continue
diPad
deploymen
tinsupp
orto
fpaperless
processin
gandbe
tter
FY13
Highlights
Continue
d iPad
deploymen
t in supp
ort o
f paperless processing and be
tter
efficiency, includ
ing to Plann
ing Co
mmission
Public W
iFidep
loyed througho
ut Springfield Ju
stice Ce
nter
Implem
entatio
n of Cou
rts C
ase Managem
ent –
Tyler InC
ode
Il
tdB
iLi
liti
Implem
ented Bu
siness L
icen
se app
lication
Began the SunG
ard Co
mpu
ter‐Aide
d Dispatch, Police Law Enforcement
Records M
anagem
ent S
ystem project –go
live sc
hedu
led for N
ovem
ber 2
013
Completed
major desktop
ope
ratin
g system
con
version to W
indo
ws 7
, i
ld
ddd
idd
itili
/l
tti
fit
includ
ed add
ing additio
nal viru
s/malware protectio
n for security
Replaced
140+ de
sktop compu
ters and
mob
ile com
puters
Respon
ded to over 2
,000
service calls to
the IT HelpD
esk
Procured
and
implem
ented Do
g License application
pg
pp
Information Technology Presentation Attachment 19 Page 4 of 7

Info
rma
tio
n T
ech
no
log
yFY
201
4
FY14
Major
Initiatives
Public Safety application suite
go‐live (CAD
, Records M
anagem
ent
System
(RMS), Field‐based
Rep
ortin
g, electronic citatio
ns)
JailAp
plicationSuite
deploymen
t
FY14
Major In
itiatives
Jail Ap
plication Suite
dep
loym
ent
Public W
orks Asset M
anagem
ent/GIS Systems –
NetMotionsoftware
installatio
n to allow access to private ne
twork from
the fie
ld units
Centralized
Accou
nts P
ayable –de
velop and im
plem
ent w
ith Finance
Elt
iR
itit
ithH
Rt
dl
Electron
ic Recruiting
–partne
r with
Hum
an Resou
rces to
dep
loy a
more efficient hiring
system
integrated
with
Peo
pleSoft
Finance System
app
lication up
grade
Secure W
iFi–
deploymen
t to allow access to private ne
twork from
h
ithiCit
Hll
tiff
titi
anyw
here with
in City
Hall creating more effective meetin
gs.
Continue
LaserFichedo
cumen
t imaging de
ploymen
ts –projects
includ
e convertin
g em
ployee
med
ical files p
roviding
enh
anced security
Virtual Priv
ate Network –extend
ing the ne
twork for rem
ote access
Network Firewall –
in su
pport o
f FBI se
curity requ
irements, network
segm
entatio
n and en
cryptio
n will be de
ployed
Complete Office 2010 Upgrade
Information Technology Presentation Attachment 19 Page 5 of 7

Info
rma
tio
n T
ech
no
log
yFY
201
4
Pressing
Issues
Equipm
ent R
eplacement R
eserves D
windling
Result of ongoing
difficult b
udgets
Pressing
Issues
gg
gFuture Bud
get C
ommittees m
ay se
e specific
equipm
ent rep
lacement req
uests in Issue Pape
rsITStaffFullyExtend
edwith
CurrentP
rojects
IT Staff Fully Exten
ded with
Current Projects
Few IT re
sources a
vailable for n
ew and
inno
vative projects or u
nforeseen ne
eds
Information Technology Presentation Attachment 19 Page 6 of 7

Info
rma
tio
n T
ech
no
log
yFY
201
4
Information Technology Presentation Attachment 19 Page 7 of 7

CITY OF SPRINGFIELD/FINANCE DEPARTMENT MEMORANDUM Date: April 21, 2013 To: Members of the Budget Committee From: Bob Duey, Finance Director Subject: FY14 Budget Overview Each year at the first meeting the staff likes to present a more comprehensive overview of the budget process, the decision-making that went into the proposed budget and a view of the financial health of the organization. The graphs or charts that are included in the budget presentation packet, Exhibits 1 through 22, are not meant to be all inclusive or nor are they meant for each to be reviewed in detail. They are intended to assist in explaining to Committee members how management is currently viewing the important elements in determining the City’s overall financial health and allowing Committee members the opportunity to ask questions of areas they are a particular concern about or just want to know more about. The review tries to look at the current, the proposed and the future. It reviews both revenue and expenditures and it considers both those services that are primarily funded with tax dollars and those that are primarily self-supporting. The review does stay more with the City’s Operating Budget which is the budget for the current services being provided by the departments. The other areas of the budget that are covered later in the Budget Committee review are the Capital Projects budget and the budget for Fiscal Transactions. Operating Budget The City’s total Proposed Budget for FY14 is $307,136,848 while the Operating Budget share of the total is $90,263.864 (Proposed Budget FY14 Attachment 31 Pages 15-23). The Operating Budget includes the necessary resources for each of the 9 department within the City and is appropriated across 29 different accounting funds in recognition of the various revenues received that are accounted for separately. Included in the total operating budget is over $15M that is the City of Eugene’s cost of operating the regional sanitary sewer treatment plant that is appropriated within the City of Springfield’s budget because of the role Springfield has as the administrator of the Metro Wastewater Management Commission. The General Fund is by far the single largest accounting fund used by the City for accounting purposes and contains the largest percentage of every department’s operating budget except for the Department of Development and Public Works (DPW). The largest percentage of the DPW operating budget is located in the Street, Sanitary Sewer and Storm Water funds. The annual budget process for management historically begins in November when the executive team spends a day off-site to review the final closing numbers for the previous fiscal year (in this case FY12), receives an update on current fiscal year that was adopted by the Council in June of this year (FY13) and looks at trended projections for subsequent fiscal years (FY14 & FY15). For the General Fund, the Ending Cash on Hand for FY12 (Beginning Cash on Hand for FY13) did not meet the projections that were made at this time last year during the budget preparation process for FY13. Several key revenue resources underperformed expectations during the final few months of the year and left the General Fund about $375,000 below its projected revenues for the year. For expenses, all departments were below their adopted budgets for the year but were still slightly over the expense targets identified during the spring budget process by approximately $150,000 (less than 1/2 of 1%). After additional adjustments for accruals and re-appropriation projects the final FY12 ending cash on hand number for the General Fund is about $450, 000 (5%) below the amount management would prefer. To address this, the Executive Team worked on process to identify how adjustment would be made in the FY13 revenue/expenditure projections will bring these resources back into the General Fund reserve balance.
Budget Overview Memo Attachment 2 Page 1 of 26

For the General Fund only, the following chart compares the numbers that the Executive Team reviews in November with those that are currently included in the City Manager’s Proposed Budget for FY14.
FY12 FY13 FY13 FY14 FY14 Actuals Est Nov Est April Est Nov Proposed GENERAL FUND Revenue Less Beginning Cash $32.2M $32.6M $32.5M $32.2M $33.1M Less Operating Expenses ($31.1) ($32.17M) ($31.3M) ($33.0M) ($32.7M) Less Revenues Transferred Out ($0.8M) ($.08M) ($.8M) ($.9M) ($.7M) Net Difference ($0.20M) ($0.30M) $0.40M ($1.7M) ($.3M) Add Beginning Cash $7.55M $7.75M $7.75M $7.55M $8.14M Ending Cash $7.75M $7.55M $8.14M $5.85M $7.84M
Top 10 General Fund Revenues – The top 10 revenues make up 79% of the total General Fund operating revenues (excluding Beginning Cash). Additional information on the current collections and projections are noted below. Current Taxes – The first collection of current year property taxes occur in November. The County’s Assessor’s Office has released an updated forecast on 2013 property tax collections. The City’s overall assessed valuation will increase by 3.0% for the current fiscal year although when adjusted by the City’s two urban renewal districts for property tax revenue purposes the growth will be 2.3% SUB In-Lieu-of-Tax – This is a monthly payment made by the Springfield Utility Board in lieu of property taxes as authorized by Oregon statue and in an amount negotiated by the two agencies. Municipal Court Revenues – FY13 adopted budget has been adjusted downward from FY12 and the annual projections were also revised downward. Court revenues are increasing but not at the pace as originally projected at the time the jail opened. Rainbow Fire Protection – The first payment of 50% of contract is due on December 31st. Liquor Apportionment – Liquor revenues are paid monthly. Collections are on track to meet budget. Comcast Franchise – Franchise fees are paid quarterly, typically in the month following the quarter-end. 1st quarter collections are down significantly. State Revenue Sharing – State revenue sharing payments are received quarterly, typically in the month following the quarter-end. Collections are on track to meet budget. EWEB In-Lieu-of-Tax – This is a monthly payment made by the Eugene Water and Electric Board in lieu of property taxes as authorized by Oregon statue and in an amount negotiated by the two agencies. SaniPac Franchise Fee – Franchise fees are paid quarterly, typically in the month following the quarter end. FY13 projections are projecting a changing trend with a slight increase in activity. NW Natural Franchise Fee – Franchise fees are paid quarterly, typically in the month following the quarter end. FY13 projections were revised upward to reflect an increasing trend in fee revenue over the previous two years. The next chart summarizes the key revenues for the City’s General Fund for this fiscal year by its original budget, the estimated revenue for the year and the % of collection to budget. The percentages for the top 10 range from a high of 105% of budget to a low of 87%. A couple of areas this chart doesn’t address is the YTD Estimates compared to pre-recession projections for FY`13 and what revenues might have been on this chart as a top 10 revenue in the past but are not longer. The most obvious is Planning Fees which would have been as high as the 5th largest revenue in the General Fund. The FY13 revenue numbers are as follows:
Budget Overview Memo Attachment 2 Page 2 of 26

Top 10 Revenues Budget FY13 Estimate % of Budget Current Taxes 17,612,000 17,612,000 100% SUB In-Lieu-of-Tax 1,782,260 1,790,000 100% Municipal Court Revenues 1,821,159 1,786,040 98% Rainbow Fire Protection 1,105,402 1,083,309 98% Liquor Apportionment 720,000 720,000 100% Comcast Franchise 676,000 590,000 87% State Revenue Sharing 512,000 540,000 105% EWEB In-Lieu-Of-Tax 520,000 516,000 99% SaniPac Franchise Fee 383,000 382,476 100% NW Natural Franchise Fee 390,000 400,000 102% Total Top 10 Revenues 25,521,821 25,419,825 99.6% Total All General Fund Revenues 40,429,177 40,294,958 99.7%
Other Funds Beginning Cash and Operating Balances Although the General Fund has the largest impact across the most departments, the financial health of the City’s other operating and capital funds and the services that are funded through these resources are as critical to the City’s ability to provide stable and accessible services. Without going into written details in this briefing memo, charts reviewing the cash balances and the relation between annual revenue and annual expenses for several of these funds have been included as attachments. There will be opportunity during the first night to review these charts and request further information about their status. The funds included in chart form are:
Street Fund Building Code Fund Ambulance Fund Sanitary Sewer Operations Fund Storm Drainage Operations Fund SDC Transportation Improvement and Reimbursement Funds SDC Sanitary Sewer Improvement and Reimbursement Funds SDC Storm Drainage Improvement and Reimbursement Funds SDC Administration Fund
Summary As discussed in the Budget Message by our City Manager, the financial and service implications of a slow recovery to the economy has presented challenges the past several years for presenting a budget to the Budget Committee that is able to address Council goals, respond to citizen expectations and maintain the financial integrity necessary for the long term financial wellness of the City. During this period the City has reduced its staffing level by 60.9 FTE or a reduction of 13%. Not taken in consideration in these numbers is the addition of 18 new positions created with the opening of the municipal jail. The budget message identifies investments that the City is making is key areas to enhance efficiencies, it addresses needed items that are left out of the proposed budget due to limited resources and it also addresses likely items that would be included in the budget if additional resources would become available. The direction that was taken by management in the preparation of this year’s budget was to not seek a single or significant new resource in an attempt to close the budget deficit gap but rather to attempt to close the gap for at least one more year with a more modest revenue approach and careful expenditure planning. As a result, the projection trend for the General Fund for years beyond the currently proposed FY14show a trend that is remarkably similar to the trend in November of 2012.The current trended projections for the General Fund is as follows:
Budget Overview Memo Attachment 2 Page 3 of 26

General Fund FY 12 FY 13 FY 13 FY 14 FY 15 Actuals Adopted Est Actuals Proposed Trended
Total Revenue Less Beginning Cash $ 32,148,512 $ 32,570,501 $ 32,540,206 $ 33,093,177 $ 33,082,650 Operating Expenditures (30,866,349) (31,815,125) (31,092,683) (32,422,596) (33,621,383) Less Operating Transfers to: Jail Operating Fund (450,000) (448,309) (448,309) (373,685) (444,525) Ambulance Fund 0 0 0 0 0 Street Fund (357,673) (378,000) (378,000) (373,685) (384,764) Special Revenue Transfers (38,499) (2,947) (730) Operating Budget Over (Under) $ 435,991 $ (70,933) $ 618,267 $ (77,519) $ (1,368,022) Add Beginning Cash 7,551,136 8,095,025 7,754,752 8,143,851 7,835,617 Less Station #16 Debt Service (232,375) (229,168) (229,168) (230,715) (230,715) Ending Cash on Hand $ 7,754,752 $ 7,794,924 $ 8,143,851 $ 7,835,617 $ 6,236,880
The General Fund financial trend shown above again shows a projected deficit of approximately $1.6M for the FY15 budget without factoring into next year’s budget any of the items that were identified in the budget message as outstanding departmental needs to address current services. Introduced in the budget message is a strategic alternative budget process to the more traditional approach that is current used at Springfield as well as most other municipalities. Performance Base Budgeting is not a new budgeting concept as it is an outgrowth of public agencies efforts for a number of years to better align their budgeting processes with Council goals and the implementation of strategic plans. Attachment 30 in this week’s budget packet identifies the significant information that the City will be using during this process to arrive at a deliverable where the goal is to identify city programs in a tiered manner as far as how well they are able to advance goals as established by the City Council. On June 10, the Council is scheduled for work session with the consultants who have been chosen to facilitate this process to clarify existing Council goals and help identify for staff how to interpret successful goal outcomes. On June 11, approximately 30 City staff members will spend all day off-site developing a scoring matrix for which to evaluate city programs. As with many processes of this type, this modeling of city programs does not make decisions around how the changes in services may occur for next year or make the decisions around service changes any easier. The full intent of this type of exercise is to provide more objective data from which to base future decisions. This process is also not a one-year exercise as it is meant to be built upon in future years for a more complete review such as a stronger community involvement process than is likely to be seen in Year 1. If you have any questions about the information or the process prior to next Tuesday’s meeting, please do not hesitate to contact either myself by phone at 726-3740 or e-mail at [email protected] or contact our Budget Analyst, Paula Davis, by phone at 726-3698 or e-mail at [email protected]. Either of us would be more than willing to meet with you prior to that time.
Budget Overview Memo Attachment 2 Page 4 of 26
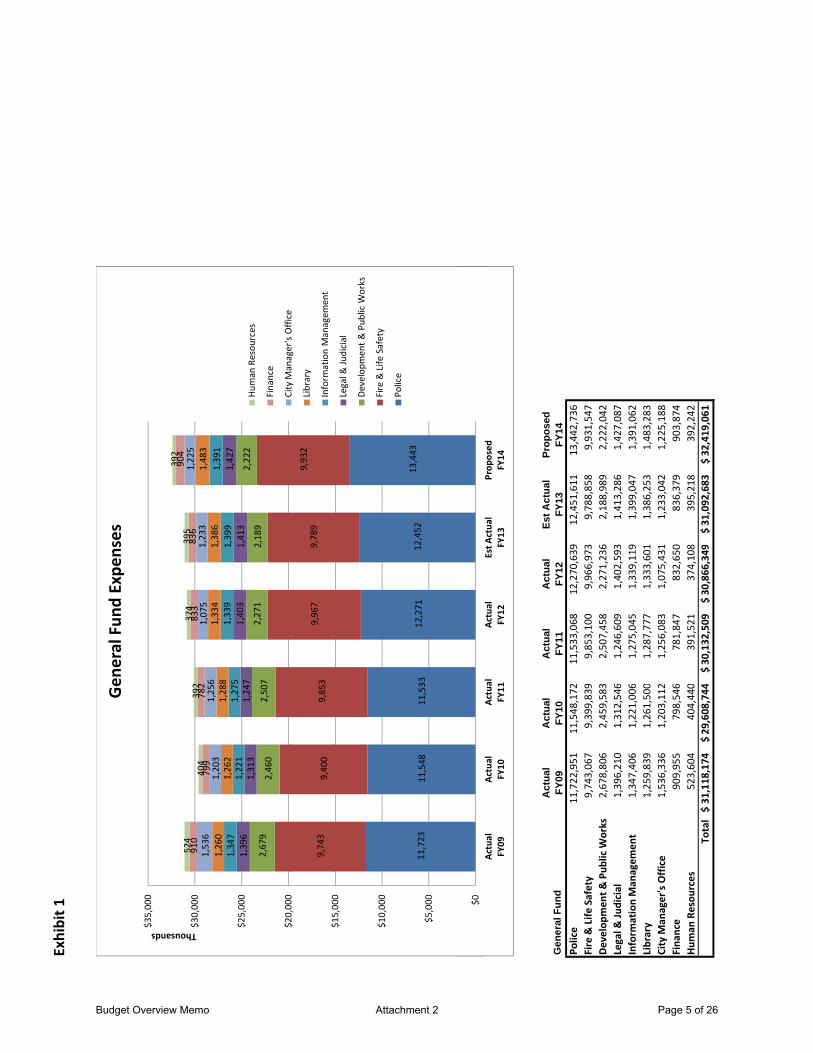
Exhibit 1
11,723
11
,548
11
,533
12
,271
12
,452
13
,443
9,74
3 9,40
0 9,85
3 9,96
7 9,78
9 9,93
2
2,67
9 2,46
0 2,50
7 2,27
1 2,18
9 2,22
2 1,39
6 1,31
3 1,24
7 1,40
3 1,41
3 1,42
7 1,34
7 1,22
1 1,27
5 1,33
9 1,39
9 1,39
1 1,26
0 1,26
2 1,28
8 1,33
4 1,38
6 1,48
3 1,53
6 1,20
3 1,25
6 1,07
5 1,23
3 1,22
5 91
0 79
9 78
2 83
3 83
6 90
4 52
4 40
4 39
2 37
4 39
5 39
2
$0
$5,000
$10,00
0
$15,00
0
$20,00
0
$25,00
0
$30,00
0
$35,00
0
ThousandsGen
eral Fun
d Expe
nses
Human
Resou
rces
Finance
City M
anager's Office
Library
Inform
ation Managem
ent
Legal &
Judicial
Developm
ent &
Pub
lic W
orks
Fire & Life
Safety
Police
Gen
eral
Fun
dA
ctua
lFY
09A
ctua
lFY
10A
ctua
lFY
11A
ctua
lFY
12Es
t Act
ual
FY13
Prop
osed
FY14
Police
11,722
,951
11,548
,172
11,533
,068
12
,270
,639
12
,451
,611
13
,442
,736
Fire & Life
Safety
9,74
3,067
9,39
9,839
9,85
3,100
9,96
6,973
9,78
8,858
9,93
1,547
Develop
men
t & Pub
lic W
orks
2,67
8,806
2,45
9,583
2,50
7,458
2,27
1,236
2,18
8,989
2,22
2,042
Legal &
Judicial
1,39
6,210
1,31
2,546
1,24
6,609
1,40
2,593
1,41
3,286
1,42
7,087
Inform
ation Man
agem
ent
1,34
7,406
1,22
1,006
1,27
5,045
1,33
9,119
1,39
9,047
1,39
1,062
Library
1,25
9,839
1,26
1,500
1,28
7,777
1,33
3,601
1,38
6,253
1,48
3,283
City M
anager's Office
1,53
6,336
1,20
3,112
1,25
6,083
1,07
5,431
1,23
3,042
1,22
5,188
Fina
nce
909,95
5
798,546
781,847
832,650
836,37
9
903,874
Hum
an Resou
rces
523,604
404,440
391,52
1
374,108
395,218
392,24
2
Total
31,118
,17 4
$
29,608
,744
$
30,132
,509
$ 30
,866
,349
$ 31
,092
,683
$ 32
,419
,061
$
$0Ac
tual
FY09
Actual
FY10
Actual
FY11
Actual
FY12
Est A
ctua
lFY13
Prop
osed
FY14
Budget Overview Memo Attachment 2 Page 5 of 26

Exhibit 2
37.7%
39.0%
38.3%
39.8%
40.0%
41.5%
31.3%
31.7%
32.7%
32.3%
31.5%
30.6%
8.6%
8.3%
8.3%
7.4%
7.0%
6.9%
4.5%
4.4%
4.1%
4.5%
4.5%
4.4%
4.3%
4.1%
4.2%
4.3%
4.5%
4.3%
4.0%
4.3%
4.3%
4.3%
4.5%
4.6%
4.9%
4.1%
4.2%
3.5%
4.0%
3.8%
2.9%
2.7%
2.6%
2.7%
2.7%
2.8%
1.7%
1.4%
1.3%
1.2%
1.3%
1.2%
10%
20%
30%
40%
50%
60%
70%
80%
90%
100%
Gen
eral Fun
d Expe
nses
Hum
an Resou
rces
Finance
City M
anager's Office
Library
Inform
ation Managem
ent
Legal &
Judicial
Developm
ent &
Pub
lic W
orks
Fire & Life
Safety
Police
Gen
eral
Fun
dA
ctua
lFY
09A
ctua
lFY
10A
ctua
lFY
11A
ctua
lFY
12Es
t Act
ual
FY13
Prop
osed
FY14
Police
37.7
%39
.0%
38.3
%39
.8%
40.0
%41
.5%
Fire & Life
Safety
31.3
%31
.7%
32.7
%32
.3%
31.5
%30
.6%
Develop
men
t & Pub
lic W
orks
8.6%
8.3%
8.3%
7.4%
7.0%
6.9%
Legal &
Judicial
4.5%
4.4%
4.1%
4.5%
4.5%
4.4%
Inform
ation Man
agem
ent
4.3%
4.1%
4.2%
4.3%
4.5%
4.3%
Library
4.0%
4.3%
4.3%
4.3%
4.5%
4.6%
City M
anager's Office
4.9%
4.1%
4.2%
3.5%
4.0%
3.8%
Fina
nce
2.9%
2.7%
2.6%
2.7%
2.7%
2.8%
Hum
an Resou
rces
1.7%
1.4%
1.3%
1.2%
1.3%
1.2%
0%10%
Actual
FY09
Actual
FY10
Actual
FY11
Actual
FY12
Est A
ctual
FY13
Prop
osed
FY14
Budget Overview Memo Attachment 2 Page 6 of 26

Exhibit 3
13,657
15
,385
15
,955
16
,870
17
,324
18
,847
10,876
10
,608
11
,293
11
,494
11
,343
11
,490
2,67
9 2,46
0 2,50
7 2,27
1 2,18
9
2,22
2
1,56
8 1,46
0 1,57
9 1,76
7 1,81
2
1,83
4
1,34
7 1,22
1 1,27
5 1,33
9 1,39
9
1,26
0 1,26
2 1,28
8 1,33
4 1,38
6
1,53
6 1,20
3 1,25
6 91
0 79
9 52
4 40
4
$0
$5,000
$10,00
0
$15,00
0
$20,00
0
$25,00
0
$30,00
0
$35,00
0
ThousandsTax Fund
s Expe
nses
Human
Resou
rces
Finance
City M
anager's Office
Library
Inform
ation Managem
ent
Legal &
Judicial
Developm
ent &
Pub
lic W
orks
Fire & Life
Safety
Police
Gen
eral
Fun
dA
ctua
lFY
09A
ctua
lFY
10A
ctua
lFY
11A
ctua
lFY
12Es
t Act
ual
FY13
Prop
osed
FY14
Police
13,656
,899
15,385
,092
15,955
,196
16
,870
,376
17
,324
,076
18
,846
,877
Fire & Life
Safety
10,876
,422
10,608
,067
11,292
,918
11
,493
,812
11
,342
,569
11
,490
,140
Develop
men
t & Pub
lic W
orks
2,67
8,806
2,45
9,583
2,50
7,458
2,27
1,236
2,18
8,989
2,22
2,042
Legal &
Judicial
1,56
7,864
1,46
0,064
1,57
9,381
1,76
7,219
1,81
2,041
1,83
4,475
Inform
ation Man
agem
ent
1,34
7,406
1,22
1,006
1,27
5,045
1,33
9,119
1,39
9,047
1,39
1,062
Library
1,25
9,839
1,26
1,500
1,28
7,777
1,33
3,601
1,38
6,253
1,48
3,283
City M
anager's Office
1,53
6,336
1,20
3,112
1,25
6,083
1,07
5,431
1,23
3,042
1,22
5,188
Fina
nce
909,95
5
798,546
781,847
832,650
836,37
9
903,874
Hum
an Resou
rces
523,604
404,440
391,52
1
374,108
395,218
392,24
2
Total
34,357
,13 2
$
34,801
,410
$
36,327
,227
$ 37
,357
,552
$ 37
,917
,614
$ 39
,789
,183
$
$0Ac
tual
FY09
Actual
FY10
Actual
FY11
Actual
FY12
Est A
ctua
lFY13
Prop
osed
FY14
Budget Overview Memo Attachment 2 Page 7 of 26

Exhibit 4
39.7%
44.2%
43.9%
45.2%
45.7%
47.4%
31.7%
30.5%
31.1%
30.8%
29.9%
28.9%
7.8%
7.1%
6.9%
6.1%
5.8%
5.6%
4.6%
4.2%
4.3%
4.7%
4.8%
4.6%
3.9%
3.5%
3.5%
3.6%
3.7%
3.5%
3.7%
3.6%
3.5%
3.6%
3.7%
3.7%
4.5%
3.5%
3.5%
2.9%
3.3%
3.1%
2.6%
2.3%
2.2%
2.2%
2.2%
2.3%
1.5%
1.2%
1.1%
1.0%
1.0%
1.0%
10%
20%
30%
40%
50%
60%
70%
80%
90%
100%
Tax Fund
s Expen
ses
Hum
an Resou
rces
Finance
City M
anager's Office
Library
Inform
ation Managem
ent
Legal &
Judicial
Developm
ent &
Pub
lic W
orks
Fire & Life
Safety
Police
Gen
eral
Fun
dA
ctua
lFY
09A
ctua
lFY
10A
ctua
lFY
11A
ctua
lFY
12Es
t Act
ual
FY13
Prop
osed
FY14
Police
39.7
%44
.2%
43.9
%45
.2%
45.7
%47
.4%
Fire & Life
Safety
31.7
%30
.5%
31.1
%30
.8%
29.9
%28
.9%
Develop
men
t & Pub
lic W
orks
7.8%
7.1%
6.9%
6.1%
5.8%
5.6%
Legal &
Judicial
4.6%
4.2%
4.3%
4.7%
4.8%
4.6%
Inform
ation Man
agem
ent
3.9%
3.5%
3.5%
3.6%
3.7%
3.5%
Library
3.7%
3.6%
3.5%
3.6%
3.7%
3.7%
City M
anager's Office
4.5%
3.5%
3.5%
2.9%
3.3%
3.1%
Fina
nce
2.6%
2.3%
2.2%
2.2%
2.2%
2.3%
Hum
an Resou
rces
1.5%
1.2%
1.1%
1.0%
1.0%
1.0%
0%10%
Actual
FY09
Actual
FY10
Actual
FY11
Actual
FY12
Est A
ctual
FY13
Prop
osed
FY14
Budget Overview Memo Attachment 2 Page 8 of 26

Exhibit 5
$‐$1,000
$2,000
$3,000
$4,000
$5,000
$6,000
$7,000
$8,000
$9,000
$10,000
$‐
$5,000
$10,000
$15,000
$20,000
$25,000
$30,000
$35,000
$40,000
Actual
Actual
Actual
Actual
Actual
Actual
Actual
Actual
Actual
EstA
ctua
lProp
osed
Beginning Cash Thousands
Resources & Requiremetns ThousandsGen
eral Fun
d
Tota
l Fun
dA
ctua
lFY
04A
ctua
lFY
05A
ctua
lFY
06A
ctua
lFY
07A
ctua
lFY
08A
ctua
lFY
09A
ctua
lFY
10A
ctua
lFY
11A
ctua
lFY
12Es
t Act
ual
FY13
Prop
osed
FY14
Resources
25,057
,050
$
25,765
,916
$
26,597
,756
$
28,735
,949
$
30,751
,840
$
30,8
64,5
71$
30
,955
,030
$
30,7
04,9
51$
32
,148
,512
$
32,5
40,2
06$
33
,093
,177
$
Requ
iremen
ts23
,986
,989
25,011
,420
25,955
,098
27,904
,198
29,709
,561
32,7
35,2
63
30
,364
,073
30,9
62,4
88
31
,944
,896
32,1
51,1
07
33
,401
,411
Beginn
ing Ca
sh4,89
0,64
2
5,96
0,70
3
6,71
5,25
0
7,35
7,90
7
8,18
9,65
8
9,23
1,93
8
7,
361,
246
7,80
8,67
2
7,
551,
136
7,75
4,75
2
8,
143,
851
$‐$‐
Actual
FY04
Actual
FY05
Actual
FY06
Actual
FY07
Actual
FY08
Actual
FY09
Actual
FY10
Actual
FY11
Actual
FY12
Est A
ctua
lFY13
Prop
osed
FY14
Beginn
ing Ca
shRe
sources
Requ
iremen
ts
Budget Overview Memo Attachment 2 Page 9 of 26
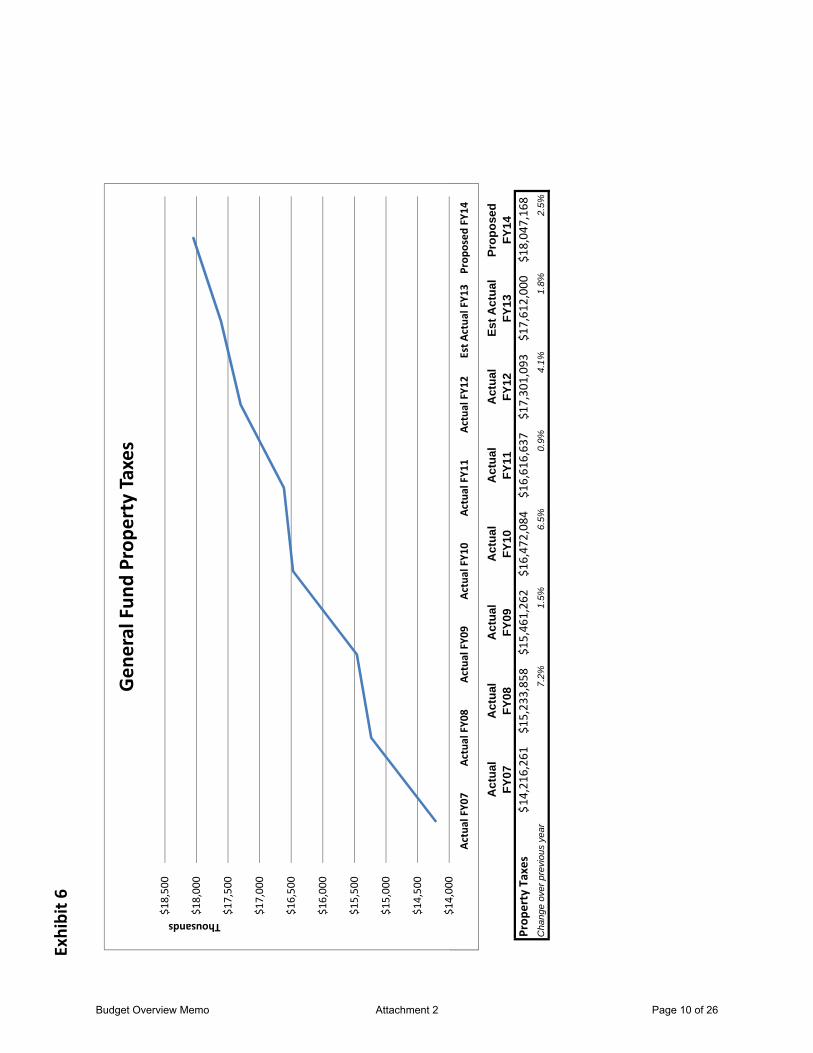
Exhibit 6 $14,000
$14,500
$15,000
$15,500
$16,000
$16,500
$17,000
$17,500
$18,000
$18,500
Actual FY0
7Ac
tual FY0
8Ac
tual FY0
9Ac
tual FY1
0Ac
tual FY1
1Ac
tual FY1
2Est A
ctua
l FY1
3Prop
osed
FY1
4
ThousandsGen
eral Fun
d Prop
erty Taxes
Curren
t Prope
rty Taxes
Act
ual
FY07
Act
ual
FY08
Act
ual
FY09
Act
ual
FY10
Act
ual
FY11
Act
ual
FY12
Est A
ctua
l FY
13Pr
opos
ed
FY14
AProp
erty Taxes
14,216
,261
$ 15
,233
,858
$ 15
,461
,262
$16
,472
,084
$16
,616
,637
$17
,301
,093
$ 17
,612
,000
$18
,047
,168
$A
Cha
nge
over
pre
viou
s ye
ar7.
2%1.
5%6.
5%0.
9%4.
1%1.
8%2.
5%A A A A E P
$14,00
0 Ac
tual FY0
7Ac
tual FY0
8Ac
tual FY0
9Ac
tual FY1
0Ac
tual FY1
1Ac
tual FY1
2Est A
ctua
l FY1
3Prop
osed
FY1
4
Budget Overview Memo Attachment 2 Page 10 of 26
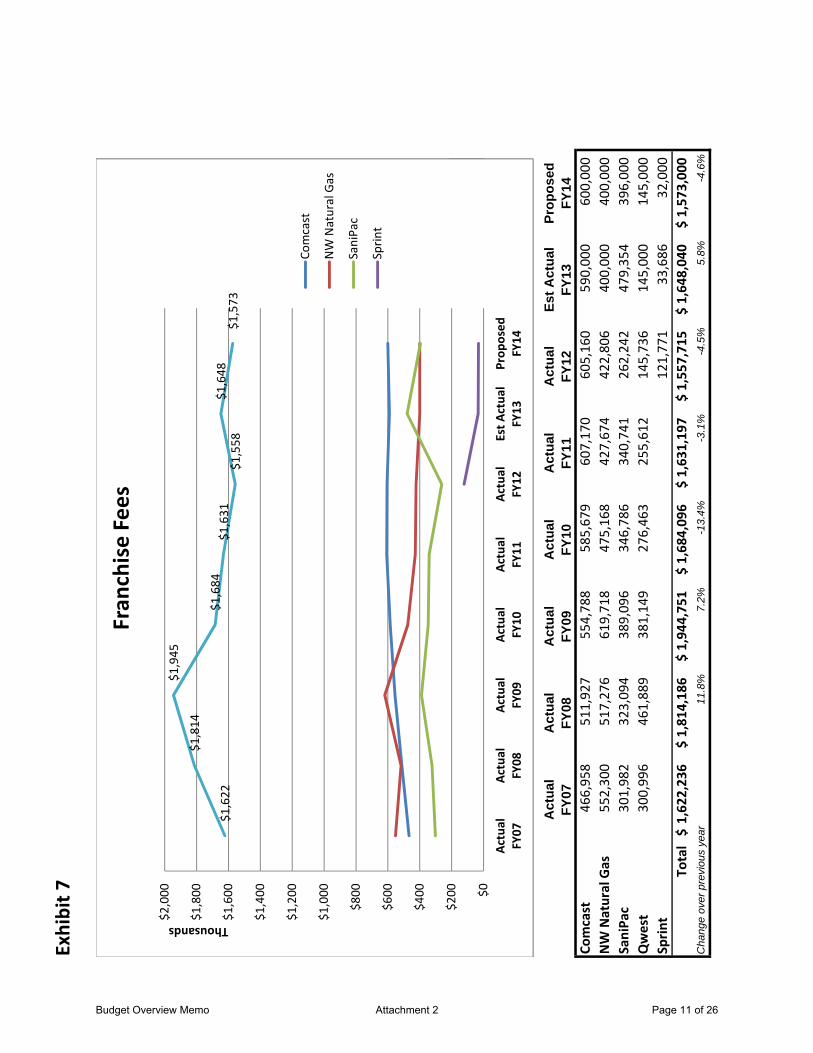
Exhibit 7
$1,622
$1,814
$1,945
$1,684
$1
,631
$1
,558
$1
,648
$1
,573
$0
$200
$400
$600
$800
$1,000
$1,200
$1,400
$1,600
$1,800
$2,000
ThousandsFran
chise Fees
Comcast
NW Natural Gas
SaniPac
Sprin
t
Act
ual
FY07
Act
ual
FY08
Act
ual
FY09
Act
ual
FY10
Act
ual
FY11
Act
ual
FY12
Est A
ctua
l FY
13Pr
opos
ed
FY14
Comcast
466,95
8
511,92
7
554,78
8
585,67
9
607,17
0
605,16
0
590,00
0
600,00
0
NW Natural Gas
552,30
0
517,27
6
619,71
8
475,16
8
427,67
4
422,80
6
400,00
0
400,00
0
SaniPa
c30
1,98
2
323,09
4
389,09
6
346,78
6
340,74
1
262,24
2
479,35
4
396,00
0
Qwest
300,99
6
461,88
9
381,14
9
276,46
3
255,61
2
145,73
6
145,00
0
145,00
0
Sprin
t12
1,77
1
33,686
32,000
Total
1,62
2,23
6$
1,81
4,18
6$
1,94
4,75
1$
1,68
4,09
6$
1,63
1,19
7$
1,55
7,71
5$
1,64
8,04
0$
1,57
3,00
0$
Cha
nge
over
pre
viou
s ye
ar11
.8%
7.2%
-13.
4%-3
.1%
-4.5
%5.
8%-4
.6%
$0
$200
Actual
FY07
Actual
FY08
Actual
FY09
Actual
FY10
Actual
FY11
Actual
FY12
Est A
ctua
l FY13
Prop
osed
FY14
Budget Overview Memo Attachment 2 Page 11 of 26
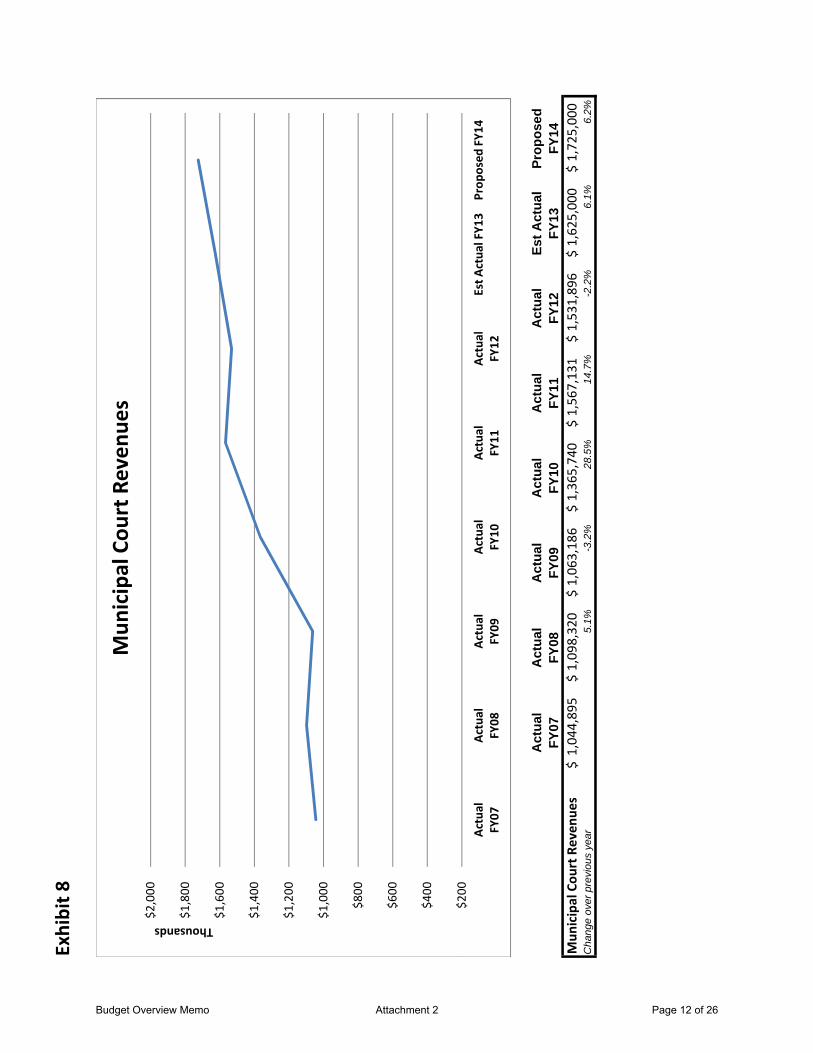
Exhibit 8 $200
$400
$600
$800
$1,000
$1,200
$1,400
$1,600
$1,800
$2,000
Actual
FY07
Actual
FY08
Actual
FY09
Actual
FY10
Actual
FY11
Actual
FY12
Est A
ctua
l FY1
3Prop
osed
FY1
4
ThousandsMun
icipal Cou
rt Reven
ues
Act
ual
FY07
Act
ual
FY08
Act
ual
FY09
Act
ual
FY10
Act
ual
FY11
Act
ual
FY12
Est A
ctua
l FY
13Pr
opos
ed
FY14
Mun
icipal Cou
rt Reven
ues
1,04
4,89
5$
1,09
8,32
0$
1,06
3,18
6$
1,36
5,74
0$
1,56
7,13
1$
1,53
1,89
6$
1,62
5,00
0$
1,72
5,00
0$
Cha
nge
over
pre
viou
s ye
ar5.
1%-3
.2%
28.5
%14
.7%
-2.2
%6.
1%6.
2%
$200
Ac
tual
FY07
Actual
FY08
Actual
FY09
Actual
FY10
Actual
FY11
Actual
FY12
Est A
ctua
l FY1
3Prop
osed
FY1
4
Budget Overview Memo Attachment 2 Page 12 of 26

Exhibit 9 $0
$100
$200
$300
$400
$500
$600
$700
$800
ThousandsState Shared
Reven
ue
Liqu
or App
ortio
nmen
t
Cigarette Ap
portionm
ent
State Shared
Reven
ue
Act
ual
FY07
Act
ual
FY08
Act
ual
FY09
Act
ual
FY10
Act
ual
FY11
Act
ual
FY12
Est A
ctua
l FY
13Pr
opos
ed
FY14
Liqu
or App
ortio
nmen
t65
3,59
1
546,26
8
801,29
0
655,03
6
683,32
3
761,00
8
720,00
0
750,00
0
Cigarette Ap
portionm
e n11
1,69
5
86,875
97,986
84,931
89,441
87,106
87,000
87,000
State Shared
Reven
ue42
8,57
1
505,74
9
485,64
5
507,57
8
494,99
0
535,43
1
540,00
0
540,00
0
Total
1,19
3,85
7$
1,13
8,89
2$
1,38
4,92
1$
1,24
7,54
5$
1,26
7,75
4$
1,38
3,54
5$
1,34
7,00
0$
1,37
7,00
0$
Cha
nge
over
pre
viou
s ye
ar-4
.6%
21.6
%-9
.9%
1.6%
9.1%
-2.6
%2.
2%
$0Ac
tual
FY07
Actual
FY08
Actual
FY09
Actual
FY10
Actual
FY11
Actual
FY12
Est A
ctua
l FY13
Prop
osed
FY14
Budget Overview Memo Attachment 2 Page 13 of 26
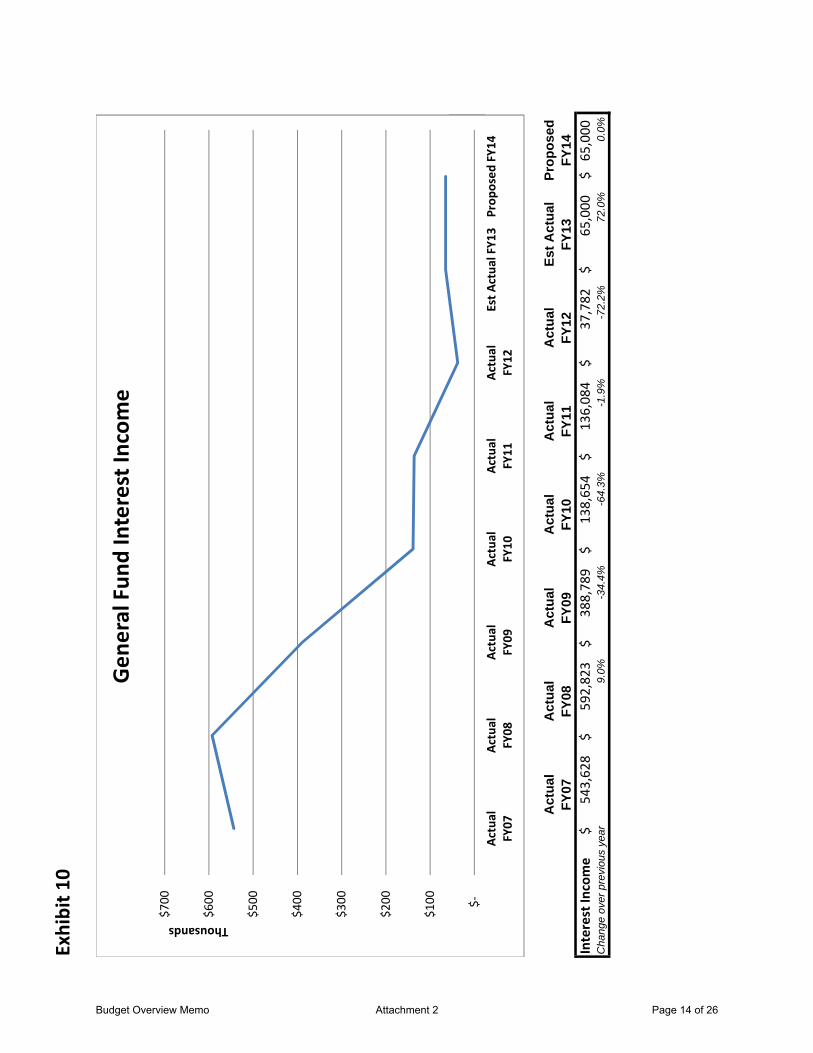
Exhibit 1
0
$‐
$100
$200
$300
$400
$500
$600
$700
ThousandsGen
eral Fun
d Interest In
come
Act
ual
FY07
Act
ual
FY08
Act
ual
FY09
Act
ual
FY10
Act
ual
FY11
Act
ual
FY12
Est A
ctua
l FY
13Pr
opos
ed
FY14
Interest In
come
543,62
8$
592,82
3$
388,78
9$
138,65
4$
136,08
4$
37,782
$
65,000
$
65,000
$
Cha
nge
over
pre
viou
s ye
ar9.
0%-3
4.4%
-64.
3%-1
.9%
-72.
2%72
.0%
0.0%
$‐Ac
tual
FY07
Actual
FY08
Actual
FY09
Actual
FY10
Actual
FY11
Actual
FY12
Est A
ctua
l FY1
3Prop
osed
FY1
4
Budget Overview Memo Attachment 2 Page 14 of 26

Exhibit 1
1
$100
$300
$500
$700
$900
$1,100
$1,300
$1,500
ThousandsPlan
ning
Fees
Act
ual
FY07
Act
ual
FY08
Act
ual
FY09
Act
ual
FY10
Act
ual
FY11
Act
ual
FY12
Est A
ctua
l FY
13Pr
opos
ed
FY14
Plan
ning
Fees
1,24
5,40
3$
1,56
0,71
5$
451,42
9$
425,56
8$
180,16
2$
147,15
6$
194,50
0$
178,00
0$
Cha
nge
over
pre
viou
s ye
ar25
.3%
-71.
1%-5
.7%
-57.
7%-1
8.3%
32.2
%-8
.5%
$100
Ac
tual
FY07
Actual
FY08
Actual
FY09
Actual
FY10
Actual
FY11
Actual
FY12
Est A
ctua
l FY13
Prop
osed
FY14
Budget Overview Memo Attachment 2 Page 15 of 26

Exhibit 1
2
$‐$500
$1,000
$1,500
$2,000
$2,500
$3,000
$‐
$1,000
$2,000
$3,000
$4,000
$5,000
$6,000
Actual
FY04
Actual
FY05
Actual
FY06
Actual
FY07
Actual
FY08
Actual
FY09
Actual
FY10
Actual
FY11
Actual
FY12
Est A
ctua
lFY13
Prop
osed
FY14
Beginning Cash Thousands
Resources & Requirements ThousandsStreet Fun
d
Beginn
ingCash
Resources
Requ
iremen
ts
Tota
l Fun
dA
ctua
lFY
04A
ctua
lFY
05A
ctua
lFY
06A
ctua
lFY
07A
ctua
lFY
08A
ctua
lFY
09A
ctua
lFY
10A
ctua
lFY
11A
ctua
lFY
12Es
t Act
ual
FY13
Prop
osed
FY14
Resources
4,36
3,85
2$
4,
944,
845
$
4,88
1,46
7$
5,
264,
520
$
4,40
7,78
9$
4,
694,
343
$
4,76
7,26
1$
4,
785,
646
$
5,26
8,08
3$
5,
353,
279
$
5,30
4,16
0$
Re
quire
men
ts3,
374,
778
5,11
7,06
9
5,
201,
679
5,53
3,85
3
5,
267,
565
5,30
7,61
3
4,
633,
059
4,79
7,32
3
4,
949,
626
5,18
4,30
6
5,
497,
917
Beginn
ing Ca
sh1,
471,
041
2,46
0,11
5
2,
287,
891
1,96
7,67
9
1,
698,
346
838,
570
22
5,29
9
359,
501
34
7,82
5
666,
281
83
5,25
4
FY04
FY05
FY06
FY07
FY08
FY09
FY10
FY11
FY12
FY13
FY14
Beginn
ing Cash
Resources
Requ
iremen
ts
Budget Overview Memo Attachment 2 Page 16 of 26

Exhibit 1
3
$0
$500
$1,000
$1,500
$2,000
$2,500
$3,000
$3,500
$4,000
$4,500
$5,000
ThousandsFuel Usage Tax Trend
State Hwy Ap
portionm
ent
Local Fue
l Tax
Act
ual
FY07
Act
ual
FY08
Act
ual
FY09
Act
ual
FY10
Act
ual
FY11
Act
ual
FY12
Est A
ctua
l FY
13Pr
opos
ed
FY14
Local Fue
l Tax
1,08
2,67
4
1,06
7,03
7
1,07
3,69
6
1,00
2,85
8
981,20
8
991,53
5
1,09
5,84
8
1,15
0,64
0
State Hwy Ap
portionm
ent
2,62
5,90
9
2,48
2,45
8
2,22
1,19
8
2,41
0,23
6
2,83
8,09
7
3,21
1,60
4
3,27
6,00
0
3,30
0,00
0
Total
3,70
8,58
3$
3,54
9,49
5$
3,29
4,89
4$
3,41
3,09
4$
3,81
9,30
5$
4,20
3,13
9$
4,37
1,84
8$
4,45
0,64
0$
Cha
nge
over
pre
viou
s ye
ar-4
.3%
-7.2
%3.
6%11
.9%
10.0
%4.
0%1.
8%
$0
$
Actual
FY07
Actual
FY08
Actual
FY09
Actual
FY10
Actual
FY11
Actual
FY12
Est A
ctua
l FY13
Prop
osed
FY14
Budget Overview Memo Attachment 2 Page 17 of 26

Exhibit 1
4
$‐$500
$1,000
$1,500
$2,000
$2,500
$‐
$500
$1,000
$1,500
$2,000
$2,500
$3,000
$3,500
Actual
FY04
Actual
FY05
Actual
FY06
Actual
FY07
Actual
FY08
Actual
FY09
Actual
FY10
Actual
FY11
Actual
FY12
Est A
ctua
lFY13
Prop
osed
FY14
Beginning Cash Thousands
Resources & Requirements ThousandsBu
ilding Co
de Fun
d
Beginn
ingCash
Resources
Requ
iremen
ts
Tota
l Fun
dA
ctua
lFY
04A
ctua
lFY
05A
ctua
lFY
06A
ctua
lFY
07A
ctua
lFY
08A
ctua
lFY
09A
ctua
lFY
10A
ctua
lFY
11A
ctua
lFY
12Es
t Act
ual
FY13
Prop
osed
FY14
Resources
2,18
2,92
9$
3,
121,
264
$
2,00
3,04
4$
2,
494,
333
$
975,
662
$
83
1,98
6$
782,
992
$
72
0,94
2$
699,
278
$
77
0,30
0$
Requ
iremen
ts1,
414,
259
1,87
5,34
5
2,
211,
592
2,28
2,68
8
1,
521,
374
1,28
7,71
7
1,
227,
016
1,03
5,92
4
87
3,06
9
829,
647
Beginn
ing Ca
sh-
768,
669
2,
014,
588
1,80
6,04
0
2,
017,
685
1,47
1,97
2
1,
016,
241
572,
216
25
7,23
4
83,4
43
FY04
FY05
FY06
FY07
FY08
FY09
FY10
FY11
FY12
FY13
FY14
Beginn
ing Cash
Resources
Requ
iremen
ts
Budget Overview Memo Attachment 2 Page 18 of 26

Exhibit 1
5
$(200)
$‐$200
$400
$600
$800
$1,000
$1,200
$1,400
$1,600
$‐
$1,000
$2,000
$3,000
$4,000
$5,000
$6,000
Actual
FY04
Actual
FY05
Actual
FY06
Actual
FY07
Actual
FY08
Actual
FY09
Actual
FY10
Actual
FY11
Actual
FY12
Est A
ctua
lFY13
Prop
osed
FY14
Beginning Cash Thousands
Resources & Requirements ThousandsAm
bulance
Beginn
ingCa
shRe
sources
Requ
iremen
ts
Tota
l Fun
dA
ctua
lFY
04A
ctua
lFY
05A
ctua
lFY
06A
ctua
lFY
07A
ctua
lFY
08A
ctua
lFY
09A
ctua
lFY
10A
ctua
lFY
11A
ctua
lFY
12Es
t Act
ual
FY13
Prop
osed
FY14
Resources
4,17
7,98
8$
3,
784,
154
$
3,51
9,52
9$
3,
921,
079
$
4,30
6,70
4$
4,
885,
228
$
4,94
2,82
1$
5,
338,
648
$
4,82
1,84
4$
5,18
2,17
5$
5,
026,
625
$
Requ
iremen
ts4,
199,
065
4,17
2,69
6
4,
000,
110
4,27
3,80
5
4,
508,
008
4,84
7,24
0
4,
942,
827
5,08
7,04
2
5,
005,
353
4,
984,
180
5,18
9,38
1
Beginn
ing Ca
sh1,
406,
248
1,38
5,17
1
99
6,62
9
516,
048
16
3,32
1
(37,
982)
5
25
1,60
6
68
,097
26
6,09
2
FY04
FY05
FY06
FY07
FY08
FY09
FY10
FY11
FY12
FY13
FY14
Beginn
ing Ca
shRe
sources
Requ
iremen
ts
Budget Overview Memo Attachment 2 Page 19 of 26
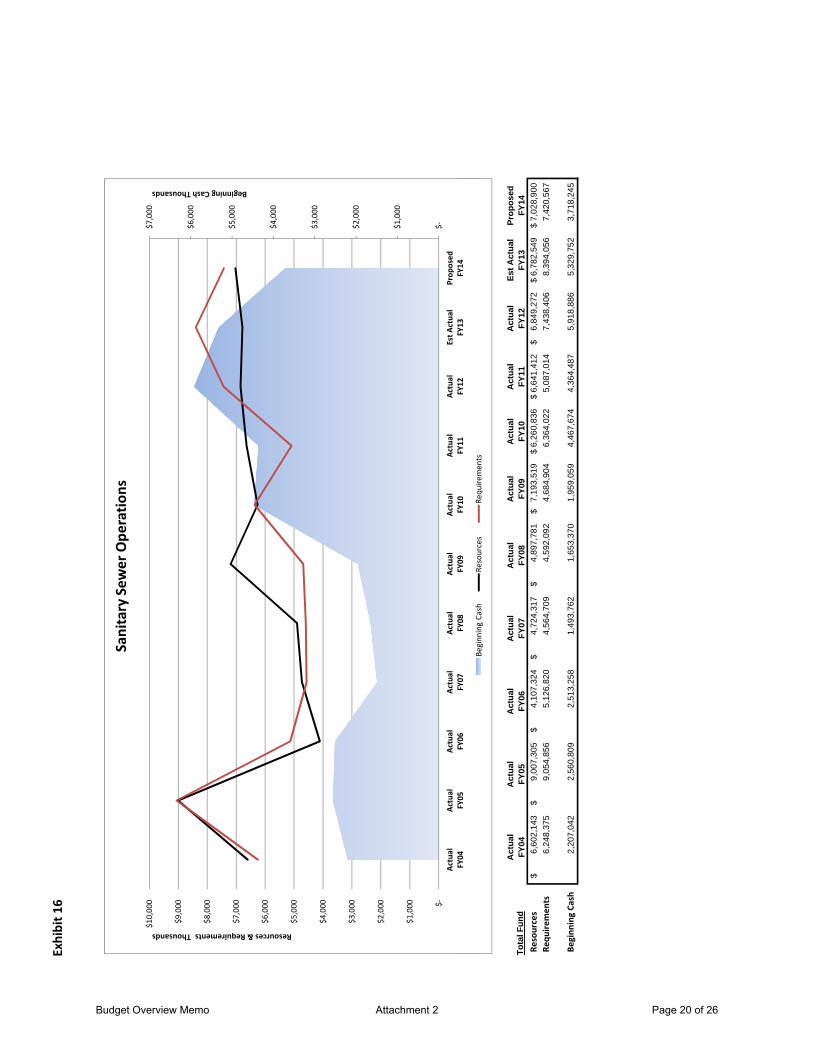
Exhibit 1
6
$‐$1,000
$2,000
$3,000
$4,000
$5,000
$6,000
$7,000
$‐
$1,000
$2,000
$3,000
$4,000
$5,000
$6,000
$7,000
$8,000
$9,000
$10,000
Actual
FY04
Actual
FY05
Actual
FY06
Actual
FY07
Actual
FY08
Actual
FY09
Actual
FY10
Actual
FY11
Actual
FY12
Est A
ctua
lFY13
Prop
osed
FY14
Beginning Cash Thousands
Resources & Requirements ThousandsSanitary Sew
er Ope
ratio
ns
Beginn
ingCa
shRe
sources
Requ
iremen
ts
Tota
l Fun
dA
ctua
lFY
04A
ctua
lFY
05A
ctua
lFY
06A
ctua
lFY
07A
ctua
lFY
08A
ctua
lFY
09A
ctua
lFY
10A
ctua
lFY
11A
ctua
lFY
12Es
t Act
ual
FY13
Prop
osed
FY14
Resources
6,60
2,14
3$
9,
007,
305
$
4,10
7,32
4$
4,
724,
317
$
4,89
7,78
1$
7,
193,
519
$
6,26
0,83
6$
6,
641,
412
$
6,84
9,27
2$
6,78
2,54
9$
7,
028,
900
$
Requ
iremen
ts6,
248,
375
9,05
4,85
6
5,
126,
820
4,56
4,70
9
4,
592,
092
4,68
4,90
4
6,
364,
022
5,08
7,01
4
7,
438,
406
8,
394,
056
7,42
0,56
7
Beginn
ing Ca
sh2,
207,
042
2,56
0,80
9
2,
513,
258
1,49
3,76
2
1,
653,
370
1,95
9,05
9
4,
467,
674
4,36
4,48
7
5,
918,
886
5,
329,
752
3,71
8,24
5
FY04
FY05
FY06
FY07
FY08
FY09
FY10
FY11
FY12
FY13
FY14
Beginn
ing Ca
shRe
sources
Requ
iremen
ts
Budget Overview Memo Attachment 2 Page 20 of 26

Exhibit 1
7
$500
$1,000
$1,500
$2,000
$2,500
$3,000
$3,500
$4,000
$4,500
$1,000
$2,000
$3,000
$4,000
$5,000
$6,000
$7,000
$8,000
Beginning Cash Thousands
Resources & Requirements ThousandsStorm Drainage Ope
ratio
ns
Tota
l Fun
dA
ctua
lFY
06A
ctua
lFY
07A
ctua
lFY
08A
ctua
lFY
09A
ctua
lFY
10A
ctua
lFY
11A
ctua
lFY
12Es
t Act
ual
FY13
Prop
osed
FY14
Resources
4,88
4,44
5$
4,
253,
679
$
4,31
6,83
5$
4,
362,
618
$
5,18
1,52
9$
5,
636,
751
$
5,69
6,01
4$
5,83
2,96
8$
5,
928,
000
$
Requ
iremen
ts3,
916,
905
4,06
5,98
6
3,
975,
607
4,00
4,86
9
3,
796,
635
4,64
5,67
5
6,
454,
943
6,
152,
514
7,09
5,67
8
Beginn
ing Ca
sh-
967,
540
1,
155,
234
1,49
6,46
1
1,
854,
210
3,23
9,10
3
4,
230,
179
3,
471,
249
3,15
1,70
3
$‐$500
$‐
$1,000
Actual
FY06
Actual
FY07
Actual
FY08
Actual
FY09
Actual
FY10
Actual
FY11
Actual
FY12
Est A
ctua
lFY13
Prop
osed
FY14
Beginn
ing Ca
shRe
sources
Requ
iremen
ts
Budget Overview Memo Attachment 2 Page 21 of 26

Exhibit 1
8
$‐$1,000
$2,000
$3,000
$4,000
$5,000
$6,000
$‐
$500
$1,000
$1,500
$2,000
$2,500
$3,000
$3,500
$4,000
$4,500
Actual
FY04
Actual
FY05
Actual
FY06
Actual
FY07
Actual
FY08
Actual
FY09
Actual
FY10
Actual
FY11
Actual
FY12
Est A
ctua
lFY13
Prop
osed
FY14
Beginning Cash Thousands
Resources & Requirements ThousandsSD
C Tran
sportatio
n
Beginn
ingCash
Resources
Requ
iremen
ts
Tota
l Fun
dA
ctua
lFY
04A
ctua
lFY
05A
ctua
lFY
06A
ctua
lFY
07A
ctua
lFY
08A
ctua
lFY
09A
ctua
lFY
10A
ctua
lFY
11A
ctua
lFY
12Es
t Act
ual
FY13
Prop
osed
FY14
Resources
644,
249
$
66
7,39
1$
4,12
4,95
4$
2,
748,
122
$
1,00
3,28
6$
64
1,33
1$
387,
077
$
36
3,57
1$
481,
179
$
20
3,10
0$
202,
500
$
Re
quire
men
ts52
4,42
7
1,00
3,87
5
3,
117,
143
1,44
9,43
9
1,
925,
303
1,11
4,27
4
65
0,29
2
1,99
9,93
9
27
5,93
7
841,
513
62
1,59
4
Beginn
ing Ca
sh2,
778,
062
2,89
7,88
4
2,
561,
400
3,56
9,21
2
4,
867,
895
3,94
5,87
7
3,
472,
935
3,20
9,72
0
1,
573,
352
1,77
8,59
4
1,
140,
181
FY04
FY05
FY06
FY07
FY08
FY09
FY10
FY11
FY12
FY13
FY14
Beginn
ing Cash
Resources
Requ
iremen
ts
Budget Overview Memo Attachment 2 Page 22 of 26

Exhibit 1
9
$‐$1,000
$2,000
$3,000
$4,000
$5,000
$6,000
$‐
$500
$1,000
$1,500
$2,000
$2,500
$3,000
$3,500
$4,000
$4,500
$5,000
Actual
FY04
Actual
FY05
Actual
FY06
Actual
FY07
Actual
FY08
Actual
FY09
Actual
FY10
Actual
FY11
Actual
FY12
Est A
ctua
lFY13
Prop
osed
FY14
Beginning Cash Thousands
Resources & Requirements ThousandsSanitary Sew
er SDC
Beginn
ingCash
Resources
Requ
iremen
ts
Tota
l Fun
dA
ctua
lFY
04A
ctua
lFY
05A
ctua
lFY
06A
ctua
lFY
07A
ctua
lFY
08A
ctua
lFY
09A
ctua
lFY
10A
ctua
lFY
11A
ctua
lFY
12Es
t Act
ual
FY13
Prop
osed
FY14
Resources
855,
234
$
1,
041,
874
$
2,42
2,71
5$
75
1,17
6$
431,
592
$
30
4,37
4$
271,
094
$
37
8,61
2$
447,
141
$
28
3,55
7$
282,
400
$
Re
quire
men
ts76
7,73
5
1,90
1,97
0
4,
694,
098
392,
086
1,
544,
053
354,
843
18
1,66
2
179,
827
32
6,34
0
299,
426
46
3,74
5
Beginn
ing Ca
sh4,
909,
918
4,99
7,41
7
4,
137,
322
1,86
5,93
8
2,
225,
029
1,11
2,56
8
1,
062,
098
1,15
1,53
0
1,
350,
315
1,47
1,11
5
1,
455,
246
FY04
FY05
FY06
FY07
FY08
FY09
FY10
FY11
FY12
FY13
FY14
Beginn
ing Cash
Resources
Requ
iremen
ts
Budget Overview Memo Attachment 2 Page 23 of 26
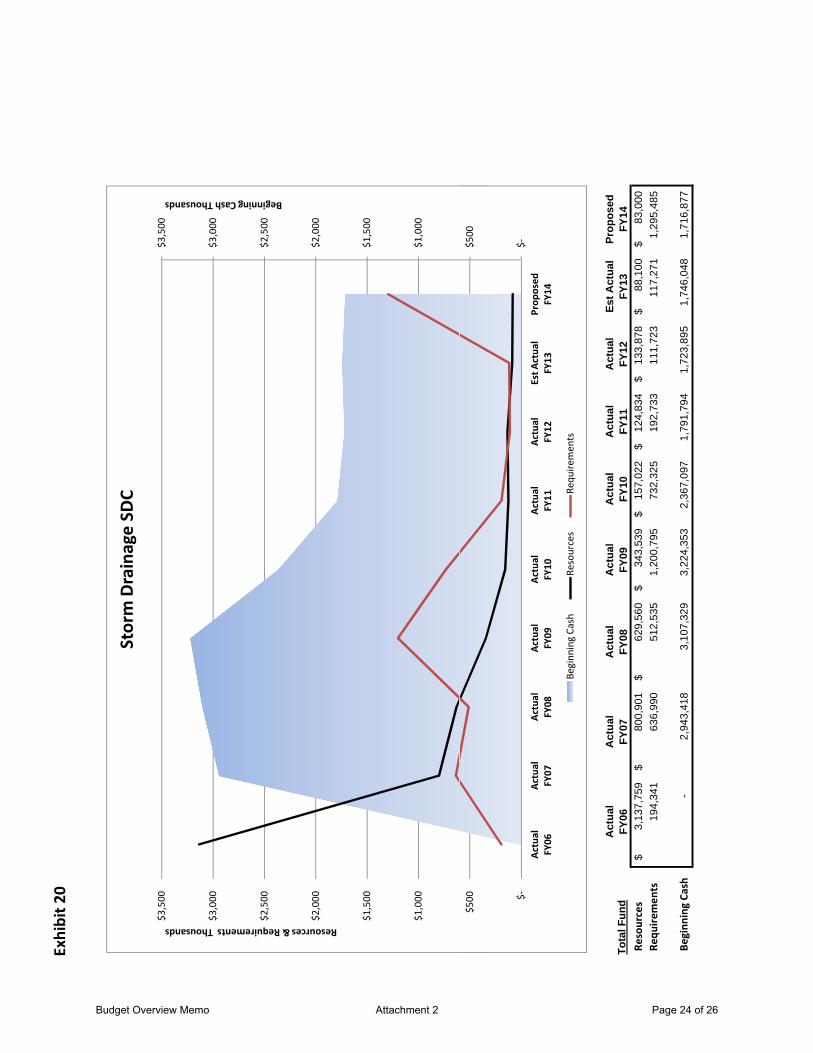
Exhibit 2
0
$500
$1,000
$1,500
$2,000
$2,500
$3,000
$3,500
$500
$1,000
$1,500
$2,000
$2,500
$3,000
$3,500
Beginning Cash Thousands
Resources & Requirements ThousandsStorm Drainage SD
C
Tota
l Fun
dA
ctua
lFY
06A
ctua
lFY
07A
ctua
lFY
08A
ctua
lFY
09A
ctua
lFY
10A
ctua
lFY
11A
ctua
lFY
12Es
t Act
ual
FY13
Prop
osed
FY14
Resources
3,13
7,75
9$
80
0,90
1$
629,
560
$
34
3,53
9$
157,
022
$
12
4,83
4$
133,
878
$
88
,100
$
83
,000
$
Re
quire
men
ts19
4,34
1
636,
990
51
2,53
5
1,20
0,79
5
73
2,32
5
192,
733
11
1,72
3
117,
271
1,
295,
485
Beginn
ing Ca
sh-
2,94
3,41
8
3,
107,
329
3,22
4,35
3
2,
367,
097
1,79
1,79
4
1,
723,
895
1,74
6,04
8
1,
716,
877
$‐$500
$‐
$500
Actual
FY06
Actual
FY07
Actual
FY08
Actual
FY09
Actual
FY10
Actual
FY11
Actual
FY12
Est A
ctua
lFY13
Prop
osed
FY14
Beginn
ing Ca
shRe
sources
Requ
iremen
ts
Budget Overview Memo Attachment 2 Page 24 of 26

Exhibit 2
1
$‐$50
$100
$150
$200
$250
$300
$350
$400
$‐
$100
$200
$300
$400
$500
$600
$700
$800
Actual
FY04
Actual
FY05
Actual
FY06
Actual
FY07
Actual
FY08
Actual
FY09
Actual
FY10
Actual
FY11
Actual
FY12
Est A
ctua
lFY13
Prop
osed
FY14
Beginning Cash Thousands
Resources & Requirements ThousandsSD
C Ad
ministration
Beginn
ing Ca
shRe
sources
Requ
iremen
ts
Tota
l Fun
dA
ctua
lFY
04A
ctua
lFY
05A
ctua
lFY
06A
ctua
lFY
07A
ctua
lFY
08A
ctua
lFY
09A
ctua
lFY
10A
ctua
lFY
11A
ctua
lFY
12Es
t Act
ual
FY13
Prop
osed
FY14
Resources
-$
-
$
423,
499
$
69
3,56
2$
573,
730
$
55
3,03
2$
472,
213
$
52
9,21
3$
501,
490
$
46
7,28
0$
525,
000
$
Re
quire
men
ts-
-
38
1,77
4
397,
320
55
6,73
7
588,
993
58
7,54
4
502,
766
50
9,57
0
566,
120
57
0,42
4
Beginn
ing Ca
sh-
-
-
41,7
25
33
7,96
7
354,
960
31
9,00
0
203,
669
23
0,11
6
222,
035
12
3,19
5
FY04
FY05
FY06
FY07
FY08
FY09
FY10
FY11
FY12
FY13
FY14
Beginn
ing Ca
shRe
sources
Requ
iremen
ts
Budget Overview Memo Attachment 2 Page 25 of 26

Exhibit 2
2
FTE
by
Fund
A
dopt
edFY
09
Ado
pted
FY10
A
dopt
edFY
11
Ado
pted
FY12
A
dopt
edFY
13
Bas
elin
eFY
14
5 Y
ear
Cha
nge
Tax
Rev
enue
Fun
ds26
2.1
251.
5
25
1.2
243.
5
24
0.4
239.
7
Stre
et F
und
37.6
36
.8
33.1
30
.6
29.8
30
.1
B
uild
ing
Fund
13.6
11
.9
11.0
10
.2
6.9
5.9
Was
tew
ater
Fun
ds77
.6
72.2
70
.6
67.6
66
.5
67.3
Am
bula
nce
Fund
37.8
35
.1
34.1
33
.1
32.1
32
.1
A
ll O
ther
Fun
ds20
.8
17.3
19
.4
18.9
14
.7
13.6
FTE
Tot
al e
xclu
ding
Jai
l44
9.5
424.
8
41
9.4
403.
9
39
0.4
388.
6
Yea
r ove
r Yea
r Cha
nge
(24.
7)
(5
.4)
(1
5.5)
(13.
5)
(1
.8)
(60.
9)
Jail
Ope
ratio
ns F
und
-
18
.0
18.1
18
.1
18.1
18
.1
To
tal A
ll Fu
nds
449.
5
44
2.8
437.
5
42
2.0
408.
5
40
6.7
Y
ear o
ver Y
ear C
hang
e(6
.7)
(5
.3)
(1
5.5)
(13.
5)
(1
.8)
(42.
8)
Budget Overview Memo Attachment 2 Page 26 of 26

DEPARTMENT BUDGET SUMMARY City of Springfield, Oregon
To: Gino Grimaldi, City Manager Jeff Towery, Assistant City Manager
From: Julie Wilson, Administrative Coordinator
Date: April 8, 2013
SUMMARY OF SIGNIFICANT ISSUE(S) IN THE DEPARTMENT PROPOSAL (Revenues/Expenditures) Issue FTE Cost Staffing: Since June 30, 2011, the City Manager’s Office has operated with one less FTE, the Administrative Specialist (CMO receptionist). Service delivery has continued for the basic function of the position. The additionl work on existing employees has been a bit of a challenge at times, although, manageable. Current City Manager’s Office FTE is 7.0. GENERAL OVERVIEW Contractual Development and Public Works Department (DPW) has been asked to again contribute $31,000 toward funding for Smith and Dawson (S&D) annual contract (approximately $25,956) as well as contributions toward the United Front trip ($6,000) for two people. DPW will confirm/identify available funding once they complete the budget preparation process. If funding is not available, CMO needs to evaluate the S&D contract as well as determine if the United Front trip will be eliminated, scaled back or identify other funding source. Economic Development • SEDA is working with local development firms to encourage potential development and
redevelopment projects and investments in Glenwood. Several local developers have indicated an interest in developing projects in the area and are working to secure sites and investment clients for projects that would fit and enhance the updated Glenwood Refinement Plan.
• Updating the 20-year old Glenwood Refinement Plan began in 2009 with meetings of the Citizen Advisory Committee and funding from SEDA and brought to a close, with adoption by Council and Lane County in 2012. Phase I encompasses the Franklin and McVay Boulevard corridors and riverfront areas. The three-year planning effort provides future land uses, development and environmental improvements not only along the major transportation corridors in Phase I but remaining Glenwood areas in a future phase.
• SEDA’s purchase of several parcels in Glenwood provided the first links for a public storm water system near the new Interstate-5 Bridge over the Willamette River and property for expanding Franklin Boulevard. SEDA is in early discussions to sell two lots to a local hotel developer. Other possible property acquisitions would help improve the intersection with a planned roundabout where Franklin and McVay Boulevards intersect.
• SEDA’s urban renewal area Downtown continues to implement the Downtown District Urban Design Plan and Implementation Strategy approved by City Council in September
City Manager's office Attachment 20 Page 1 of 5

2010. Implementation is underway on the first twelve items, including Systems Development Charge incentives for development and redevelopment consistent with the Plan; studying the timing, costs and options for possible two-way Main Street configuration and short-term demonstration projects; promoting High Speed Rail and station plan; re-signing parking; and securing properties that would form the proposed Mill plaza site.
• In smaller Downtown projects, SEDA continued to provide matching funds for some additional ‘Open’ Banner standards and now has over 60 businesses with standards along Downtown streets. SEDA Staff also worked in collaboration with NEDCO and Downtown firms and businesses through the Downtown Main Street Program. This effort promotes revitalization and partnerships in the Downtown using a Downtown façade improvement program and survey to prioritize possible projects like lighting.
• Among several public sponsors, the City also committed $100,000 in Transient Room Tax funds to assist the Track Town 2012 event for the 2012 US Olympic Track & Field Trials in late June/early July 2012. About 25,000 participants, coaches and visitors took part in the 10-day activity at Hayward Field and stayed in many Springfield area hotels substantially increasing Transient Room Tax Revenue.
• The City, with many area public and private participants, partnered with the University of Oregon Sustainable City Year Program (SCYP) to continue student work on Springfield projects during the 2012-13 Sustainable City Year. Springfield’s partnership between City staff and University of Oregon student body and faculty provides students opportunities to work on real-life projects and yields potential work-products worthy of City implementation. Examples include Brownfield redevelopment and planning of the Downtown Nicolai/9Wood Industrial site, design of city-wide and Downtown Wayfinding signage and continued legal research of Systems Development Methodologies. The City has received many of the final reports for the fourteen projects from the 2011-12 partnering year and has used this information to form the 2012-13 projects.
• The City of Springfield has entered into a partnership with the Lane Livability Consortium which includes the City of Eugene and Lane County. Staff is also working jointly with the partners to complete environmental assessments through a major EPA grant that identifies and analyzes properties with potential brownfield issues or conditions that stymie their redevelopment and that contribute to the Regional Prosperity Economic Development Plan.
• The Mohawk area’s banner program continues to grow. Currently boasting eighteen banners in place, with a total of 13 participating businesses, staff anticipates the programs’ continued growth. A council briefing of both banner programs is anticipated for late spring/early summer of this year. At this time, City-wide expansion is not contemplated, yet it is open for assessment should businesses express significant interest.
• In the greater Springfield areas, the existing web-based graffiti reporting system continues to operate in cooperation with several City departments and other local agencies. The system allows for citizens and agencies to report new instances of graffiti quickly and provides speedier responses for removal by citizens (using paint or graffiti removal kits and City staff guidance and property waiver obtainment), by the City, other public agency staff and Youth Day of Caring. Additionally, staff have partnered with the Police Department volunteer officers and the Springfield Utility Board (SUB) to abate graffiti tags on SUB property. Within the first week of the abatement work, over 60 tags
City Manager's office Attachment 20 Page 2 of 5

were removed from SUB power poles by Police volunteers. They continue to abate tags as they are identified.
• Staff has been working with potential firms to relocate and/or expand their operations in existing vacant buildings and to develop fully serviced lots in Gateway and Downtown areas.
• Staff provided information to owners about the necessary infrastructure for potential sites suitable for the siting of a 13-acre, 130,000-square-foot, $60-$80 million Veterans Administration Clinic long proposed for this area and currently awaiting the VA’s decision.
Emergency Management. DPW will take lead for the Emergency Management program and budget. Historic District Continued funding. The City pays the State of Oregon a flat $750 from Transient Room Tax revenues for signage on the freeway that directs travelers to the Washburne Historic District. Indirects Indirects have been charged to all CMO funds as outlined in the budget guidelines. Room Tax Revenue (July-August-Sept as of November 1 report) • FY12/13 $940,000 forecasted • FY12/13 Estimated Actual $986,943 (report total is 922,377 x 7% projected increase =
986,943) • FY13/14 $1,036,290 forecasted (986,943 x 5% projected increase = 1,036,290) Special Projects/Opportunity Fund (420) Fund 420 01110 860010 Special Projects proposed FY 13/14 budget is $30,000. The funding source for this may be Bancroft fund. Fund 420 Development Projects Fund is a funding source for special projects, such as property options and other related opportunities. FY12/13 the budget was $50,000. Specialty (Urban Renewal) Funds 229 (SEDA Glenwood) and 230 (SEDA Downtown) Internal Contractual Services 680020. The city invoices Urban Renewal for two CMO positions. This reimbursement is receipted into the citywide General Fund. Billing percentages are as follows: • Tamulonis – 40 percent billed to Fund 229 Glenwood(FY13 - 40%) • Griesel – 45 percent billed to Fund 229 Glenwood (FY13 - 35%) • Griesel – 50 percent billed to Fund 230 Downtown (Fy 13 – 60%) Telephone, Cell – internet CMO: Employee cell phone allowance included in the SBFS (Personal Services) • Three employees at $45 per month/$540 annual, for smart phone. Total $1620/annual • One employee at $30 per month/$360/annual Council: Cell phone, internet reimbursements • No councilors have city issued cell phones
City Manager's office Attachment 20 Page 3 of 5

• 6 councilors receive personal cell phone reimbursement ($45 per month). Total annual $3,240
• 1 councilor does not request personal cell phone reimbursement • 5 councilors receive internet reimbursement ($40 per month). Total annual $2400. • 1 councilor has laptop but still using paper. Not yet reimbursing. • 1 councilor has laptop but does not request reimbursement Intergovernmental Agency (IGA) Funding Summary: IGA proposed funding has been entered into the BRASS system as follows: Chamber of Commerce (Room Tax) • Current FY 12-13 Budget: $35,000 • Proposed FY 13-14 Budget: $35,000 Human Services Commission • Current FY 12-13 Budget: $128,394 • Proposed FY 13-14 Budget: $128,394 Human Services - Sobering Services $29,060 • Current FY 12-13 Budget: $0 • Currently contributed $29,060 (one time funding - through budget transfer) • Proposed FY 13-14 Budget: $0 Lane Council of Governments (LCOG) • Current FY 12-13 Budget: $23,417 • Proposed FY 13-14 Budget: $23,417
Lane Metro Partnership • Current FY 12-13 Budget: $50,000 • Proposed FY 13-14 Budget: $25,000 (see errata sheet)
Printed budget will reflect proposed at $0. LRAPA • Current FY 12-13 Budget: $21,224 • Proposed FY 13-14 Budget: $0
1/29/13 letter requesting continued funding of $21,224
League of Oregon Cities • Proposed FY 13-14 Budget: $38,117 • Current FY 12-13 Billed Amount: $38,122.66 (was not fully funded) • LOC Requesting $38,626. Increase $509
Museum – contract (Room Tax) • Current FY 12-13 Budget: $45,000 • Proposed FY 13-14 Budget: $45,000.
City Manager's office Attachment 20 Page 4 of 5

TEAM Springfield • Current FY 12-13 Budget: $20,000 • Proposed FY 13-14 Budget: $20,000 CONCLUSION The proposed budget submitted meets the guidelines set forth by the Finance Department. COUNCIL GOALS/POLICIES/DEPARTMENT PERFORMANCE MEASURES AFFECTED Based upon the proposed budget, the CMO is able to support council goals set forth. CMO should consider the proposed increases to the M&S budget, in order to fund the actual expenses/commitment during the fiscal year. If the increases are not approved, CMO may wish to evaluate reducing/eliminating funding of any non-mandatory expenditures/reimbursements as well as consider level of funding for IGAs.
City Manager's office Attachment 20 Page 5 of 5

Cit
y M
an
ag
er’
s O
ffic
eFY
201
4 1.City Cou
ncil Supp
ort
2Co
mmun
ityCo
ntacts
2.Co
mmun
ity Con
tacts
3.Partne
rships
4E
iD
lt
4.Econ
omic Develop
ment
5.Co
mmun
ity Relations/M
edia /IGR
City Manager's Office Presentation Attachment 21 Page 1 of 7

Cit
y M
an
ag
er’
s O
ffic
eFY
201
4
1.City
Coun
cilSup
port
1.City Cou
ncil Supp
ort
City Manager's Office Presentation Attachment 21 Page 2 of 7

Cit
y M
an
ag
er’
s O
ffic
eFY
201
4
Commun
ity Con
tacts
lC
ibi
Metro Partnership
Curren
t fun
ding: $5
0,00
0Prop
osed
fund
ing: $0
Intergovernm
ental A
gency Co
ntrib
utions
Lane
Regiona
l Air Po
llutio
n Au
thority
(LRA
PA)
Curren
t fun
ding: $2
1,22
4Prop
osed
fund
ing: $0
Buckley Hou
seCu
rren
t fun
ding: $0
/ $2
9,06
0Prop
osed
fund
ing: $0
FY13
$0fund
ing.
Processedsupp
lementalbud
gettransferinordertofund
inFY13
FY13
$0 fund
ing. Processed
supp
lemental bud
get transfer in order to fund
in FY13
NED
CO M
ain Street / Dow
ntow
n Man
ager Position
Curren
t fun
ding: $4
5,00
0Prop
osed
fund
ing: $0
Fund
ing: O
pportunity fu
nd $25
,000
;Dow
ntow
n Urban
Renew
al$1
5,00
0;TEAM
Spfld
$5,000
City Manager's Office Presentation Attachment 21 Page 3 of 7

Cit
y M
an
ag
er’
s O
ffic
eFY
201
4
Partne
rshipsp
One
Year:
1. Explore incentives to
encou
rage
annexatio
n2Iden
tifytw
olargeprop
ertie
sfor
Multicultural Event
Prom
ise Neighbo
rhoo
d, building on
recent
successes.
Idid
2. Iden
tify tw
o large prop
ertie
s for
near‐term job de
velopm
ent.
Two Year:
3. Hold a city‐w
ide cleanu
p event twice
Integrated
index
Youth workforce
Marketin
g Sprin
gfield ‐‐
Short Term
Mill Race ‐‐Multi‐year goal, vario
us phases.
a year.
4. Explore a local voter’s guide
Three Year:
5Co
mpleteasig
nature
mileston
ein
yg
,p
First step –visio
nStrategy
5. Com
plete a sig
nature m
ileston
e in
Glenw
ood
6. Develop
long
‐term plan to phase out
mob
ile hom
e parks in Glenw
ood
City Manager's Office Presentation Attachment 21 Page 4 of 7

Cit
y M
an
ag
er’
s O
ffic
eFY
201
4
Econ
omicDe
velopm
ent
Econ
omic Develop
ment
City staff p
artnered
with
the University
of
Oregon to progress 1
4 existing City projects
with
the inno
vative ideas o
f over 4
00
stud
entsin30
coursesa
cross1
0disciplines
stud
ents in
30 courses a
cross 1
0 disciplines.
Staff con
tinue
to
Downtow
ncontinue
stogrow
adding
new
work with
prop
erty
owne
rs
and de
velope
rs to
advance the visio
n Do
wntow
n continue
s togrow
, add
ing ne
w
partne
rships with
desire
d bu
siness, prope
rty
owne
rs and
com
mun
ity non
‐profits.
for G
lenw
ood
revitalization.
City Manager's Office Presentation Attachment 21 Page 5 of 7
Cit
y M
an
ag
er’
s O
ffic
eFY
201
4
Commun
ity Relations/M
edia /IGR
y/
/Med
ia –Events –Social M
edia
City Manager's Office Presentation Attachment 21 Page 6 of 7
Cit
y M
an
ag
er’
s O
ffic
eFY
201
4
Que
stions?
City Manager's Office Presentation Attachment 21 Page 7 of 7

League of Oregon Cities Attachment 22 Page 1 of 4

League of Oregon Cities Attachment 22 Page 2 of 4

League of Oregon Cities Attachment 22 Page 3 of 4

League of Oregon Cities Attachment 22 Page 4 of 4

LCOG Attachment 23 Page 1 of 2

LCOG Attachment 23 Page 2 of 2

LRAPA Attachment 24 Page 1 of 5

LRAPA Attachment 24 Page 2 of 5

LRAPA Attachment 24 Page 3 of 5

LRAPA Attachment 24 Page 4 of 5

LRAPA Attachment 24 Page 5 of 5

NEDCO Main Street Program Attachment 25 Page 1 of 2

NEDCO Main Street Program Attachment 25 Page 2 of 2

NEDCO Springfield Business Assistance Program Attachment 26 Page 1 of 2

NEDCO Springfield Business Assistance Program Attachment 26 Page 2 of 2

DEPARTMENT BUDGET SUMMARY City of Springfield, Oregon
To: Gino Grimaldi, City Manager
From: Len Goodwin, Development and Public Works Director Rhonda Rice, Senior Management Analyst
Date: April 1, 2013
SUMMARY OF SIGNIFICANT ISSUE(S) IN THE DEPARTMENT PROPOSAL The Development and Public Works Department presents the FY14 department budget.
The FY14 budget is the first for the merged department formed from the Development Services and Public Works Departments into a single department budget. The FY13 Amended budget remained separate for each department while implementation of the effective merger on July 1, 2012, took place. In order to fully evaluate budgetary impacts between the two fiscal years these funds must be viewed at the department level. Comparison of the FY13 and FY14 at the program level tells a confusing story as funding and staffing have shifted to accommodate the structure of the merged department. In addition, to simplify the accounting structure a completely new chart of accounts for the department was adopted, further complicating year to year comparison.
Expenditures
This budget submittal memo presents the current department budget proposal. On an all funds basis, FY14 operating expenditures decreased 6.6% or $2,634,891 compared to FY13. This large decrease is something of an anomaly since much of it can be attributed to declines in Regional Wastewater Capital Outlay, CDBG grant funds awards, Vehicles and Equipment purchases, and other one-time grants reflected in FY13. With those anomalies removed, the FY14 operating budget is essentially a flat budget over FY13.
The new department’s FY14 General Fund budget has increased 1.5%, or $32.5k and also has a reduction of 1.5 FTE in planning staff and .80 FTE Management Analyst. The new budget responds to the anticipated level of development activities, based on recent events with an increase of $30 k, or 20 percent, in planning revenues compared to FY13. Even this proportionately large increase leaves planning revenues well below that of pre-recession levels.
There are no major impacts for FY14 Materials and Services other than the revisit of the cost of utilities. After analysis, the Utilities budget was reestablished at the FY12 levels and increased by Finance’s recommended percentage, which incorporates the increases anticipated by the Springfield Utility Board in calendar year 2013 and 2014 for electricity and water and is an overall increase of 4.9% over FY12.
As always the Utility funds expenditures remain on constant watch. One focus has been and will be to keep the Wastewater and Stormwater expenditures well within the limits of the long term forecast for user rates, in the hope of meeting the Council’s goal of constraining those increases to the rate of change in the cost of living. In addition, it remains essential to improve the revenue capacity of the Street fund, so that the City can reinstitute a program of preservation. With the limitations of the Building Code Fund and the General Fund, the Utility funds have been turned to, to absorb more of the Personal Services increases for staff that are multi-funded.
Major Object FY09 Actuals FY10 Actuals FY11 Actuals FY12 Actuals FY13 Amended FY14 ProposedPercent ChangeFY14 to FY13
FY14 to FY13 Change
Personal Services 12,886,175 12,501,051 12,763,689 11,814,690 12,846,638 13,244,144 3.1% 397,506 Materials and Services 20,059,843 19,880,256 19,179,569 18,698,212 23,955,724 22,451,561 ‐6.3% (1,504,163) Capital Outlay 4,048,964 863,170 379,353 1,217,885 2,901,909 1,373,675 ‐52.7% (1,528,234) Grand Total 36,994,982 33,244,478 32,322,611 31,730,787 39,704,271 37,069,380 ‐6.6% (2,634,891)
Development & Public Works Attachment 27 Page 1 of 7

Personal Services for FY14 will increase 3.1%, or $397,506, reflective of the ability to maintain the majority of staff at current FY13 levels in addition to the increases in PERS, Medical-Dental Insurance, and other Fringe and Internal charges expenses.
Revenues
The revenue forecast for the Utility funds has increased 2% from FY13 Amended to Proposed FY14. For the Building Code fund the revenue is slowly increasing after a significant dip during the 2009-2011 years, and is projected to increase in FY14 to a more comparable FY12 level of revenue. While recent economic news on the national and state fronts continues the positive trend noted last year, at the local level the signs continue to remain mixed. Compounding the situation is that the government sector tends to lag the rest of the economy by 18 to 24 months, reflecting the time that it takes for the private economy to grow sufficiently to lead to new development activity or increased valuations for property taxes.
The Booth Kelly Fund revenue is rebounding with an increase in lease income of $63k from FY13 Budget.
The System Development Charges funds have been, and will continue to be, impacted by the Council’s decision to reduce System Development Charge fees throughout FY13. This decision impacted the revenue anticipated for FY13 to the extent that certain capital projects in FY14 will not be funded. Council is due to revisit that decision by the end of the Fiscal Year. A further extension of the reduced fees will impact how the System Development Charge funds will be able to staff and fund capital projects.
Now that the Street fund is stabilized a minimal capital transfer to the Street Capital fund will continue for Proposed FY14. This stabilization was brought about by Right of Way fee charges to the Stormwater and Wastewater funds for the use of the right of way. This fee revenue will continue to help fund Street operations and maintenance at its reduced level, but will not permit expansion of a preservation program. The Stormwater and Wastewater Funds are projecting rate increases and this will generate additional revenue from this source. Fuel tax remains relatively flat for FY14.
Issue Papers
None.
EXPLANATION OF SIGNIFICANT ISSUE(S)
As might be expected in a merger, understanding the new structure is a significant budgetary issue. In this case, most of the budgetary changes affect the Office of the Director, the Current Development Division and the Community Development Division, each of which are newly created out of amalgamations of other work groups in the former two departments.
In the Director’s office, a number of staff formerly in a variety of divisions were consolidated into one work unit to improve efficiency. In addition, a distinct emergency management program was created within the office, reflecting a decision to move responsibility for emergency management to the department following the fire service merger. The new Emergency Management program will be budgeted at $57,500 to support a more effective program, including a regional comprehensive Emergency Management Plan.
The new Current Development Division was formed by moving the Land Development Engineering program moved out of the old Engineering and Transportation Division to join the Current Planning program, the Code Enforcement program and the Building Code program to form the new division.
The Comprehensive Planning function in the old Development Services Department became part of the new Community Development Division, joining the Capital Project program and the former Transportation Planning and Operations program which was split into a Transportation Planning program and a new Traffic Engineering program.
Development & Public Works Attachment 27 Page 2 of 7

FY14 BUDGET HIGHLIGHTS
Personal Services
The most significant change for FY14 is the elimination of one vacant senior planner position and a half time planner 1 position, 1.5 FTE assigned to Development Review in the Current Development division, and the elimination of one Management Analyst, .80 FTE, from the Current Development Division. This is a total of 2.30 FTE.
Service Impacts from FTE Reductions:
A vacant Current Development Senior Planner position will be eliminated in FY14. As a result, it is expected that one of these comprehensive planning positions will also assist the Current Development Division with development review on an as needed basis. The City will have two full time planner positions to cover comprehensive planning activities such as the Springfield 2030 Plan, Downtown and Glenwood planning, and any other planning activities including the Main Street Corridor Visioning project funded by the State of Oregon. Depending on the pace of current development this could mean that the City’s existing comprehensive planning work projects will take longer to develop, produce and deliver. The department recommends reinstatement of the Current Development staffing if development activity increases significantly.
The Current Development Division also will eliminate a temporary one half planning positions for a total reduction of 1.5 FTE. This will cause service impacts to the Development Review process and general customer service activities. Although development figures have tapered off from the record numbers experienced between 1998 and 2008, the program still responds to an average of 30 service requests daily. The current staff level continues to meet performance benchmarks for customer service response time adopted by Council for FY13. Reduction in the work force to 1.75 FTE will result in accompanying increases in response time for applications; or in the possible temporary suspension of performance benchmarks in the event of an unanticipated development application that requires specialized attention. This reduction is also worrisome in light of what appears to be the beginning of an expansion of development activity. Once again, the department requests that staffing be restored as demand for services grows. Other staffing needs: The Council’s approval of an increase in building permit fees, which increases the Building Code fund’s FY14 revenue projections by $50 k, and by the FY14 projected increase in Planning fees revenue predicted by the upturn in the economy has prevented some potential reductions in staffing. Achieving compliance for water quality facilities (WQF) that serve multiple properties, such as a detention pond in a subdivision, has been challenging. The City has an interest in ensuring facilities that accept public water are functioning properly. The Stormwater program proposes to increase the Stormwater Facilities Seasonal Personnel by $40 k to provide resources to ensure that the vegetative component of Springfield’s public storm water system including water quality facilities located on private property and the Mill Race riparian corridor receive regular maintenance. It is anticipated that a comprehensive Industrial Pretreatment program audit conducted by Oregon DEQ will occur during FY14. Additional staff work will be associated with this process. Also, for the Industrial Pretreatment program, there will be additional sampling projects in the sanitary sewer system designed to obtain background data necessary for the development of local discharge limitations. These limitations are in place to regulate significant industrial users of the wastewater system. This project will require additional staff work and possible overtime during FY14. Materials and Services Contractual Services (All Funds) Contractual Services allocation for Long Range Planning in FY14 is budgeted at $4,000 from the General Fund. This funding is not sufficient to undertake any stand alone activity but will be a resource of last resort items like room rentals for public meetings or bulk mailings.
Development & Public Works Attachment 27 Page 3 of 7

Utilities Traffic Signal Electricity costs have decreased by about 35%. The FY13 Street Fund budget of $55,200 has been reduced to a conservative proposed FY14 budget of $35,000. This cost reduction is possible due to the energy efficient lighting technology installed in a portion of the City’s traffic signals using federal stimulus grant funds. Overall, utilities will see a predicted increase from Electricity of 4% in 2013, 3% in 2014 and from Water of 9.5% in 2013 and 9% in 2014. These increases plus the reevaluation of utilities, SUB Electricity, SUB Water, and SUB Sewer and Drainage budget has led staff to increase the FY14 budget by 4.9%, $9,282 over FY12 Actual expenditures. Property and Liability Insurance There potentially will be a significant increase of 10% in Internal Insurance Charges before the Proposed FY14 budget is adopted. The major cause of this increase is the response from the insurance industry to the Cascadia Subduction Zone predicted earthquake in the next 50 years. Already the Environmental Services Division projected property and liability insurance rates reflect a significant budget increase based on premium changes within the insurance industry related to properties and particularly public agencies located within the Cascadia Subduction Zone (between British Columbia and Northern California). The premium increases are projected based on: (1) Increased knowledge and awareness of exposures to risk from an earth movement event as published in comprehensive analyses of the Cascadia Subduction Zone; (2) Discussions and input from insurance brokers; (3) Proposals received in FY13 from several insurance providers reflecting an overall increase in public agency property insurance pricing, and; (4) Notification of non-renewal from current insurance provider effective July 1, 2013.
Software Licensing
The Technical Services Division has expanded program system administration support for the Accela application (software used to support Planning, Code Enforcement and Building Permits previously supported by the Information Technology Department). As part of this effort, a number of changes have been implemented in the Accela system, removing much of the customization that was built in when the application was implemented. This has produced significant efficiencies which have proven essential in maintaining customer service levels.
Internal Computer Contributions In both FY12 and FY13, funds normally devoted to maintaining reserves for computer replacement were used for other purposes. In FY12 contributions were not made to meet General Fund reduction targets and in FY13 they were used to support a staff position in the Information Technology Department. For the two years the decrease to Fund 713 was a total of $49,325. For FY14 the contributions have increased by 56% to not only contribute for current machines but to make up the lost two years of contributions.
Capital Outlay
Vehicles and Equipment (Fund 713)
The Transportation Quicknet Server will be replaced with $14,500 from equipment replacement reserves. The Quicknet Server controls a portion of the City’s traffic signals from a central location in City Hall.
As a first step toward the Team Springfield goal of reduce agency reliance on fossil fuels, the City will replace one of its pool cars with a lease of either a hybrid gasoline electric vehicle or a plug in electric vehicle.
Other Budgetary Needs
The Mill Race Restoration Project was completed this year with approximately 72 acres of riparian and native vegetation along the Mill Race banks and the millpond area. The Army Corp of Engineers
Development & Public Works Attachment 27 Page 4 of 7

agreement outlines that the City has an obligation to maintain this vegetation. To properly maintain the new vegetation staff has identified the need to develop a comprehensive vegetation management plan. This plan would need to identify the needs of SUB, Willamalane and the City, as some of the property is in joint ownership. The plan would also direct staff, including summer seasonal and volunteers, to properly identify desirable species and what horticulture practices would be allowed.
Regulatory uncertainty remains high for determining how the regional Water Pollution Control Facility will meet the Willamette Basin Total Maximum Daily Load for temperature, due to recent legal action challenging Oregon’s temperature standard. The uncertainty surrounding the temperature Total Maximum Daily Load litigation is challenging the capital planning process and implementation schedule of the recycle water plan as the temperature standard remains in flux. The Recycled Water Program Implementation Planning, Phase 2, continues to move forward in spite of this uncertainty. A Phase 2 final alternatives evaluation report will present the MWMC with detailed options for expanding recycled water use to meet future permit requirements.
The wet weather flow management efforts continue as the Regional Wastewater Policy Team is developing a regional guidance document to address the elements of a Capacity Management Operations and Maintenance program. . The regional Capacity Management Operations and Maintenance program approach replaces the need to update the 2001 Wet Weather Flow Management Plan, as the program will address the ongoing effort to reduce inflow and infiltration in both the public and private sewer systems. The local programs will meet the general requirements as outlined in the Environmental Protection Agency’s Guide for Evaluating Capacity, Management, Operation and Maintenance for sanitary sewer collection systems and address any specific requirements of the Department of Environmental Quality. The local programs will also be a guide for making business decisions required to manage the conveyance system in the most cost effective manner and maintain up-to-date asset inventory, condition assessment, and risk analysis information to assist in capital improvement planning.
Demands of a growing community for transportation infrastructure, accompanied by adoption of a TSP update will require an update to the Transportation Systems Development Charge (SDC) methodology and project list. The methodology must be updated to reflect changed project categories and new projects. This update will also be an opportunity to take advantage of the work done as part of Sustainable City Year work by the University of Oregon law School in analyzing SDC alternatives to incentivize multimodal transportation alternatives .It will be essential to update the Transportation SDC once the Transportation System Plan update is adopted in fall of 2013.
Work on Franklin Boulevard Redevelopment NEPA documentation will continue to produce a valid environmental document to support design and construction. The NEPA process is underway, funded by MPO discretionary funds, SDCs and urban renewal dollars. As we engage the public process there are likely to be issues with design, right of way impacts, and business displacements. Funding for a first phase of construction looks positive for the 2016 STIP and some form of City borrowing.
Over the last six years the demand for maintaining the City’s landscape areas, public trees and open spaces, i.e., Martin Luther King and Bob Straub parkways, LTD/EmX corridors, roundabouts, City entrances, public trees, Mill Race corridor, water quality facilities, cross county canals and other public assets has increased. These assets if not maintained properly are displeasing, invite public criticism and discourage economic development. Currently the condition of the assets is fair. Resources are not available to expand the program and are not keeping pace with expansion. Staff is forced to be reactive responding to complaints rather than proactive and scheduling needed work. Tree care has been especially reactive as street trees planted during the housing expansion are becoming mature and have had little work to ensure healthy and shapely trees. The demand for landscape services is expected to increase as the downtown area and Glenwood develop.
Long term planning and funding for facilities preservation remains inadequate to properly maintain City’s building assets. A consistent funding source(s) needs to be identified to maintain the City’s investments. The City has dedicated resources over the last several budget cycles to address our
Development & Public Works Attachment 27 Page 5 of 7
facilities maintenance and preservation needs as identified in the Buildings and Facilities Five Year Work Plan. While a portion of the needed improvements have been funded through an internal fee and the Capital Improvement Program, maintenance and preservation needs continue to grow. Together our aging facilities, new structures (i.e., Justice Center/Jail, FS16), facility purchases (Depot, Carter Building) and possible new construction (future Library) create an ever increasing maintenance and preservation demand that continues to go unfunded. We currently can identify over $1M in annual needs with a current funding level of under $200K. If this trend continues the building assets will deteriorate at an increasing pace and further increase the unfunded backlog.
Council approved funding for the FY13 Asset Management System Replacement Project to address hardware and software that had began to fail. Both new hardware and applications have been installed. The City relies on these systems to comply with regulations and mandates, plan for public improvements, maintain accurate records on the construction, operation and maintenance of City facilities, and feed regional public safety systems. To date, the project has been extremely successful. In fact, the first two phases will probably be implemented sufficiently under budget to permit existing resources to advance the third phase, which had been planned for FY14, without requiring additional budgetary resources. There remains a need to continue to fund the replacement of the system. The system is projected for renewal every five to eight years and will need an annual contribution from participating city departments. This contribution has not been established at this time.
Integrating street information will support informed decisions and cost containment on street planning such as the Transportation System Plan (TSP) and design, construction, preservation, and restoration projects. It also will support public safety dispatching and general addressing functions in all departments. Upon completion of the Asset Management System Replacement Project mentioned above (which is a targeted replacement of currently integrated systems) cost savings and capital reserves will be used to pursue advancing street system integration.
At the same time, support for General fund activities provided by the Technical Services Division has continued to grow well beyond the 6 percent level of General Fund resources devoted to those programs. This will continue to be a budgetary need.
The Team Springfield agencies and the Regional Fuel Facility (RFF) partners desire to reduce agency reliance on fossil fuels and seek clean energy opportunities through project collaboration. A common area of interest is to move our fleets and facilities to alternative fuels that promote the use of renewable and clean energy sources. Priority first-phased projects initiatives include;
o Fleet conversion to mixed use of electric vehicle (EV); o Hybrid, or other alternative fuels, i.e., bio-diesel, propane or compressed natural gas (CNG); o Facility upgrades to tap solar technology such as, installation of photovoltaic (PV) panels on
the Regional Fuel Facility and Springfield School District sites.
CONCLUSION
The Department budget proposal responds to a number of difficult challenges. It meets those challenges, but does so by not eliminating services. Rather, the budget attempts to fine tune resource needs to meet the minimum current level of services demands. In doing so it creates risk – there is little or no capacity to respond to either unexpected events, or to even a modest expansion of development activity as the economy recovers. From all accounts, it appears the City is in the dangerous and exposed position where the private sector is poised for an expansionary rebound, however modest, that will not be matched for a year or more by revenue generation which will permit expansion of the public sector. This department is on the front line of that risk, since the first hallmark of a significant expansion will likely be increased development activity. The Department merger that took effect at the beginning of the Fiscal Year has provided the department with additional flexibility in developing efficiencies in our use of human resources. Hopefully this will provide the nimbleness to respond in the short term, while we begin to develop plans to expand resources.
Development & Public Works Attachment 27 Page 6 of 7

COUNCIL GOALS/POLICIES/DEPARTMENT PERFORMANCE MEASURES AFFECTED
• Provide Financially Responsible and Innovative Government Services • Encourage Economic Development and Revitalization through Community Partnerships • Strengthen Public Safety by Leveraging Partnerships and Resources • Foster an Environment that Values Diversity and Inclusion • Maintain and Improve Infrastructure and Facilities • Promote and Enhance our Hometown Feel while Focusing on Livability and Environmental
Quality
Development & Public Works Attachment 27 Page 7 of 7
De
ve
lop
me
nt
an
d P
ub
lic
Wo
rks
De
pa
rtm
en
tFY
201
4
Mi
HB
kMorning
Has Broken
Photos co
urtesy of V
ern Ro
gers
Development & Public Works Presentation Attachment 28 Page 1 of 33

Development and Public Works DepartmentFY 2014
h i h iWeathering Tough Times
Photo courtesy of Vern Rogers
Development & Public Works Presentation Attachment 28 Page 2 of 33

Development and Public Works DepartmentFY 2014
Weathering Tough Times: The Merger of Two Departments
Public WorksDevelopment Services+ =Development and Public WorksPublic Works
l ff f h h lCommunity Development
Current Development
Environmental Services
Office of the Director
Operations Technical Services
Development & Public Works Presentation Attachment 28 Page 3 of 33

Development and Public Works DepartmentFY 2014
Weathering Tough Times: A Look at Service Levels
• 39 FTE eliminated since FY09• Service reductions since FY09:
FY09: *168.75 FTE
• Service reductions since FY09:• Building and Facilities• Capital Projects• Building Safety & Planning Programs• CDBG & HOME Program• GIS
FY14: *129.75 FTE
• Street Program*Includes Regional Wastewater Program staff
Development & Public Works Presentation Attachment 28 Page 4 of 33
Development and Public Works DepartmentFY 2014
Weathering Tough Times: Operating Efficiencies
• Building Safety Program‐ opportunity to train front counter staff helped reduce workload on building staffp g
• Holding more joint staff meetings to facilitate discussions, cohesive approaches, and creative problem solving
• Building & Land Development• Long Range Planning & Capital Projects• Building/Code & Planner on DutyL d hi T• Leadership Team
• Downtown staff and Operations Division staff working collaboratively on stormwater and traffic issues
• Roles and responsibilities for Booth Kelly clearly defined and centralized
Development & Public Works Presentation Attachment 28 Page 5 of 33

Development and Public Works DepartmentFY 2014
Weathering Tough Times: A Look at Budget
Local Operating Expenditures11
,275,744
10,802,696
11,195,803
0,380,106
11,295,365
11,650,593
56
05 $12,000,000
$14,000,000
FY09‐FY1410
8,904,15
8,207,129
118,798
1,010 8,
982,80
7,809,521
$8 000 000
$10,000,000 Does not include the regional wastewater program
7,1
6,60
$6,000,000
$8,000,000Personal Services
Materials and Services
Capital Outlay
3,119
7,453
94
360
1,007
,143
$2,000,000
$4,000,000
543
517
47,39
168,3
491
334,
$0FY09 Actuals
FY10 Actuals
FY11 Actuals
FY12 Actuals
FY13 Amended
FY14 Proposed
Development & Public Works Presentation Attachment 28 Page 6 of 33
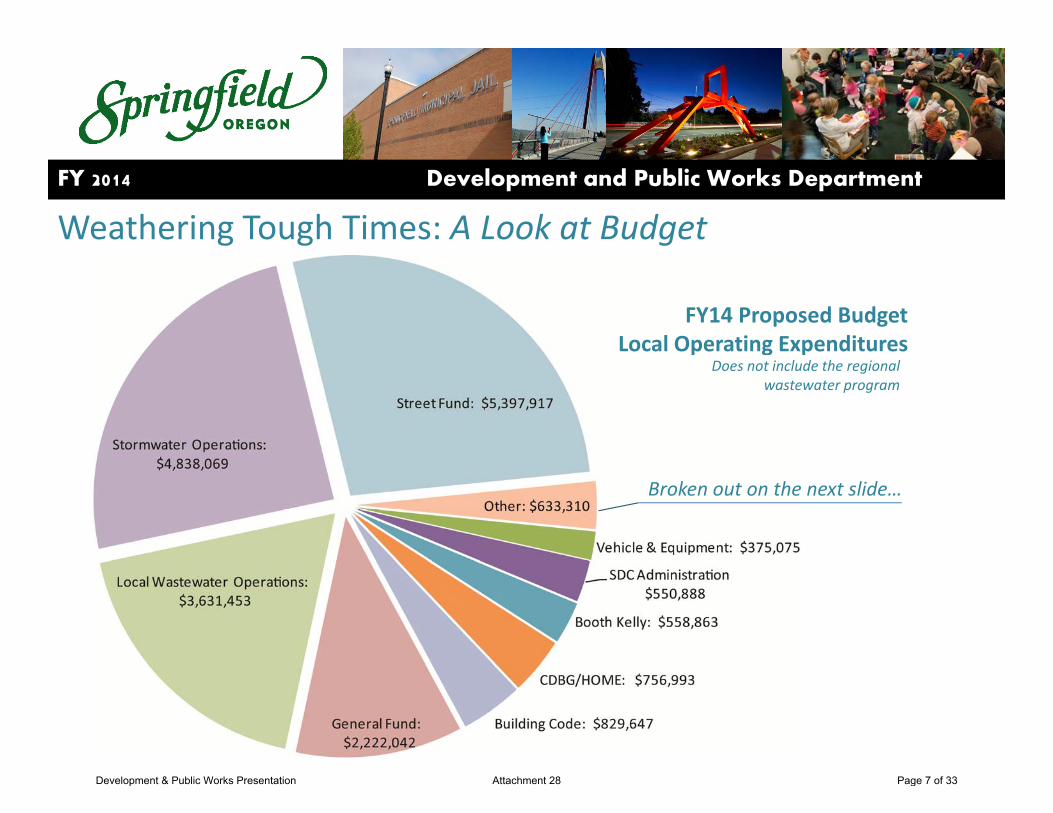
Development and Public Works DepartmentFY 2014
Weathering Tough Times: A Look at Budget
FY14 Proposed BudgetLocal Operating Expenditures
Does not include the regional wastewater program
Broken out on the next slide…
Development & Public Works Presentation Attachment 28 Page 7 of 33

Development and Public Works DepartmentFY 2014
Weathering Tough Times: A Changing Budget FY14 Proposed BudgetLocal Operating ExpendituresDoes not include the regional wastewater programwastewater program
Development & Public Works Presentation Attachment 28 Page 8 of 33

Development and Public Works DepartmentFY 2014
Weathering Tough Times: A Look at Budget
FY14 Proposed BudgetLocal Operating Revenue
Does not include the regional gwastewater program
Broken out on the next slide…
Development & Public Works Presentation Attachment 28 Page 9 of 33

Development and Public Works DepartmentFY 2014
Weathering Tough Times: A Look at Budget FY14 Proposed BudgetLocal Operating RevenueDoes not include the regional wastewater programwastewater program
Development & Public Works Presentation Attachment 28 Page 10 of 33

Development and Public Works DepartmentFY 2014
Weathering Tough Times: A Look at Budget
Regional Wastewater Operations:
FY14 Proposed BudgetRegional Wastewater Revenue
Operations: $16,230,591
SDC Regional Wastewater
SDC Regional Wastewater
SDC Regional WW
Regional Wastewater
SDC Regional WW
Improvement: $3 000
Reimbursement: $56,000
Improvement: $606,000
Reimbursement: $2,000
Capital: $1,039,532
$3,000
FY14 Proposed BudgetRegional Wastewater
Regional Wastewater O ti Regional Wastewater
Operating and SDC ExpendituresOperations: $30,022,920
Development & Public Works Presentation Attachment 28 Page 11 of 33

Development and Public Works DepartmentFY 2014
Weathering Tough Times: A Look at Development Activity
$914,347
$824,756$773 113 $770 000 500
550
600
$900,000
$1,000,000Planning and Building Revenues/
Permits and Applications Actual FY08‐Projected FY13 N
um$773,113
$713,750 $700,000
$770,000
404
413
374 368
350
400
450
500
$600,000
$700,000
$800,000
enue
mber of P
$452,343$425,598
333
241263
194
345 279
200
250
300
$300 000
$400,000
$500,000Reve
ermits/Ap
$180,162$146,566
$175,000 $178,00050
100
150
$100,000
$200,000
$300,000
pplications
0$0FY09 FY10 FY11 FY12 FY13 Budget FY14 Proposed
Planning Revenue Building Revenue Planning Activity Building Activity
s
Development & Public Works Presentation Attachment 28 Page 12 of 33

Development and Public Works DepartmentFY 2014
Weathering Tough Times: Signs of Improvement
January 2013, Tim Duy, Director Economic Forum, U of O
Development & Public Works Presentation Attachment 28 Page 13 of 33
Development and Public Works DepartmentFY 2014
Looking to the Future
Photo courtesy of Vern Rogers
Development & Public Works Presentation Attachment 28 Page 14 of 33

Development and Public Works DepartmentFY 2014
Looking to the Future: Improving CommunicationDPW e‐newsletter & updates
Development & Public Works Presentation Attachment 28 Page 15 of 33

Development and Public Works DepartmentFY 2014
Looking to the Future: Emergency Management
• DPW now responsible for City’s emergency management
• City Engineer oversees programCity Engineer oversees program
Development & Public Works Presentation Attachment 28 Page 16 of 33

Development and Public Works DepartmentFY 2014
Looking to the Future: Sprout! Regional Food Hub
• CDBG is assisting NEDCO• Year round indoor farmer’s market• High capacity commercial g p ygrade kitchen
Development & Public Works Presentation Attachment 28 Page 17 of 33

Development and Public Works DepartmentFY 2014
Looking to the Future: Traffic Engineering and Operations
• Signal technologies
• Rectangular Rapid Flash Beacon Pedestrian Crossings
•ADA ImprovementsDevelopment & Public Works Presentation Attachment 28 Page 18 of 33

Development and Public Works DepartmentFY 2014
Looking to the Future: Capital Projects
Springfield Mill Race
10th & N Sewer Upgrade
Development & Public Works Presentation Attachment 28 Page 19 of 33
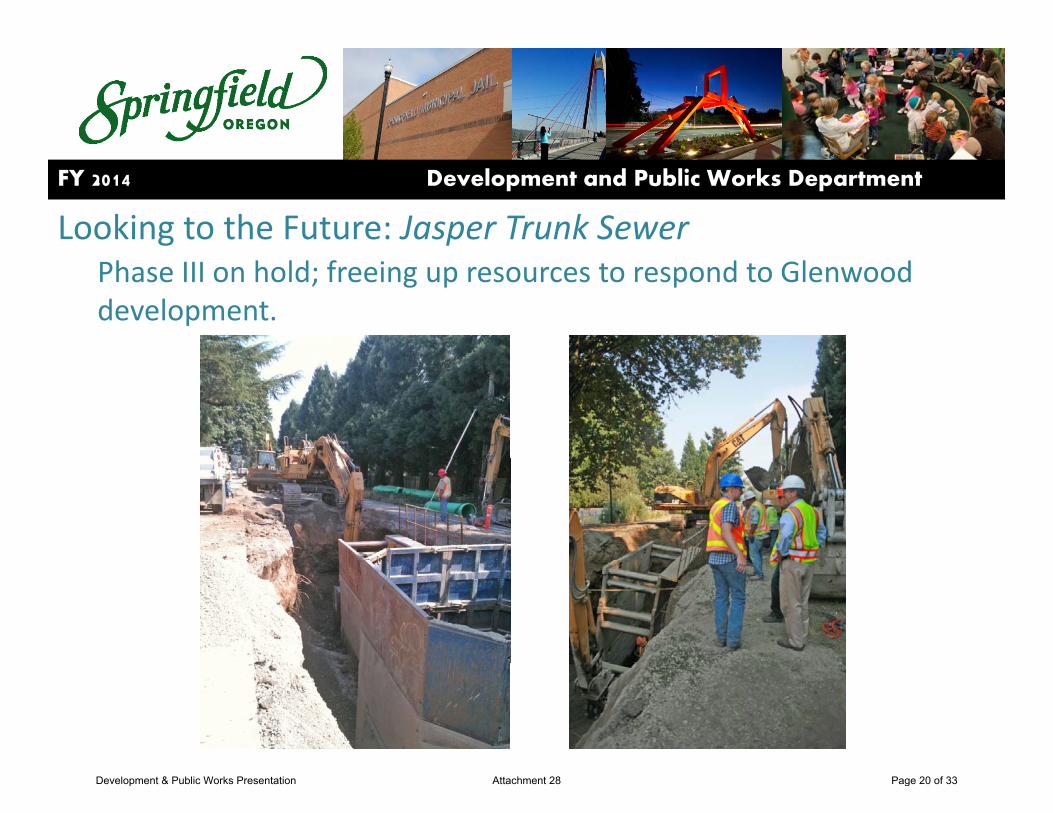
Development and Public Works DepartmentFY 2014
Looking to the Future: Jasper Trunk SewerPhase III on hold; freeing up resources to respond to Glenwood development.
Development & Public Works Presentation Attachment 28 Page 20 of 33
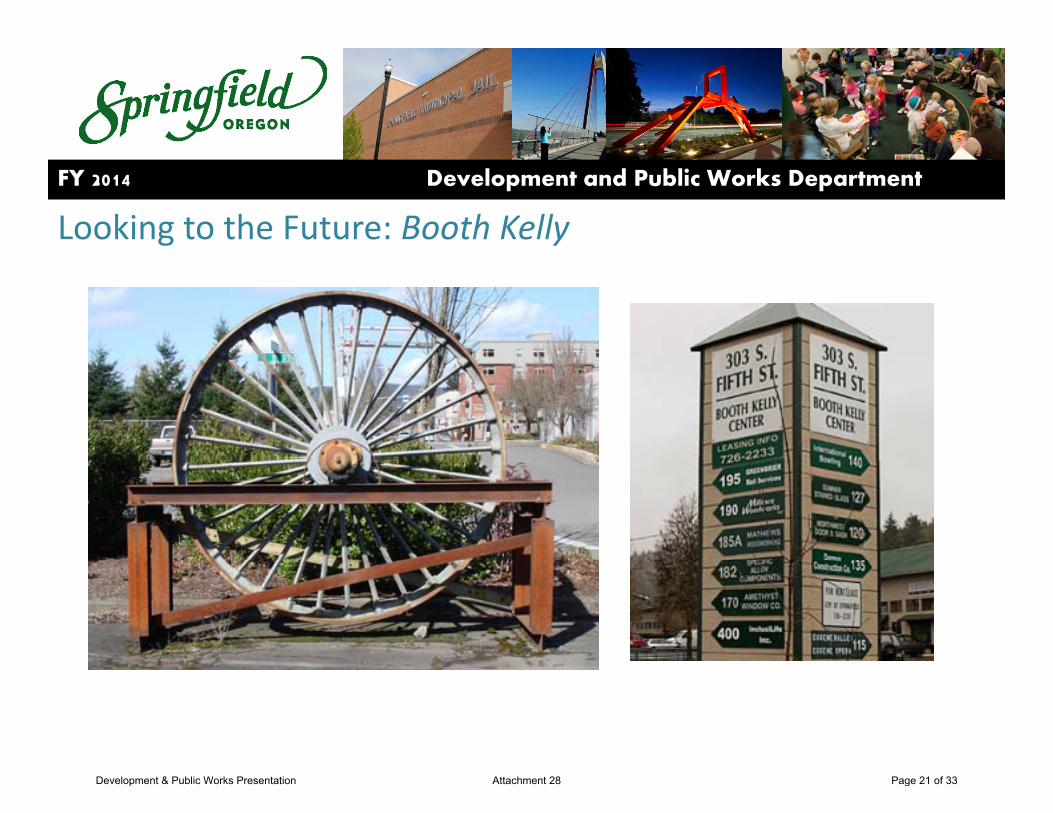
Development and Public Works DepartmentFY 2014
Looking to the Future: Booth Kelly
Development & Public Works Presentation Attachment 28 Page 21 of 33

Development and Public Works DepartmentFY 2014
Looking to the Future: Asset Management System
• Asset Management System ReplacementR & D
FY12‐13 • Mobile Solutions
• Street Integration• Sensor Technologies
R & D
FY14‐15• Sensor Technologies
• Planning Operations Support• Financial Operations Support
R & D
FY15‐16p pp
FY16 17
• Emergency Operations Support• Regional, State and Federal Integration
R & D
FY16‐17 Integration
R & DR & D‐ Research and Development
Development & Public Works Presentation Attachment 28 Page 22 of 33

Development and Public Works DepartmentFY 2014
Looking to the Future: Asset Management SystemServers and Software Decades of Data
Development & Public Works Presentation Attachment 28 Page 23 of 33

Development and Public Works DepartmentFY 2014
Looking to the Future: Asset Management System
• Infor‐Hansen
• Oracle Spatial
OGC Asset
FY12‐13OLC QL1 LiDAR
Compliance Management
Interactive 3D S t
Design I t ti
• World Wind• Map 3D Enterprise
SupportIntegration
R & D
Development & Public Works Presentation Attachment 28 Page 24 of 33

Development and Public Works DepartmentFY 2014
Looking to the Future: 2030 Refinement Plan
Development & Public Works Presentation Attachment 28 Page 25 of 33

Development and Public Works DepartmentFY 2014
Looking to the Future: Transportation System Plan
Development & Public Works Presentation Attachment 28 Page 26 of 33

Development and Public Works DepartmentFY 2014
Looking to the Future: Development Advisory Committee
• Trying to streamline the process
• Open Springfield for development
Development & Public Works Presentation Attachment 28 Page 27 of 33
Development and Public Works DepartmentFY 2014
Positioning Springfield for a recovered economy
Photo courtesy of Vern Rogers
Development & Public Works Presentation Attachment 28 Page 28 of 33

Development and Public Works DepartmentFY 2014
Positioning Springfield for a recovered economy: Downtown
•Demonstration block•Demonstration block
• Exploring Main Street & McVey Highway improvementsg y p
•Downtown Implementation Plan
Development & Public Works Presentation Attachment 28 Page 29 of 33
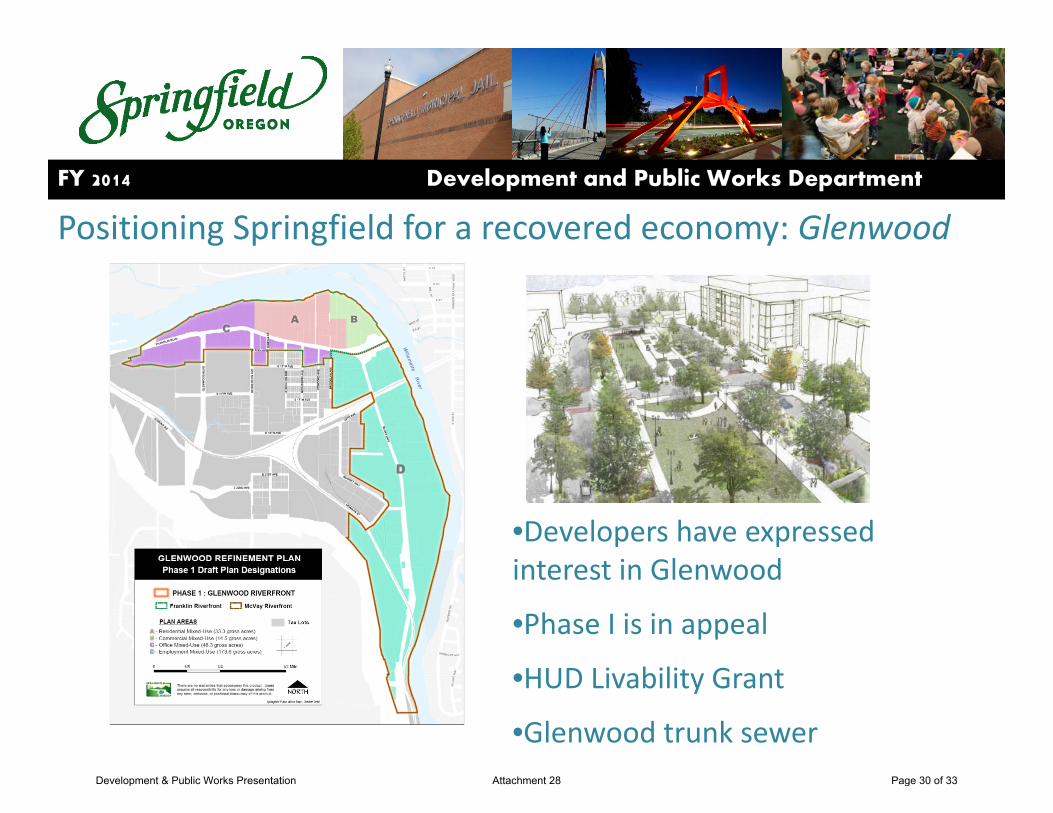
Development and Public Works DepartmentFY 2014
Positioning Springfield for a recovered economy: Glenwood
•Developers have expressed i i Gl dinterest in Glenwood
•Phase I is in appeal
•HUD Livability Grant
•Glenwood trunk sewerDevelopment & Public Works Presentation Attachment 28 Page 30 of 33

Development and Public Works DepartmentFY 2014
Positioning Springfield for a recovered economy: GlenwoodGlenwood Place, 150 unit workforce housing complex.
Development & Public Works Presentation Attachment 28 Page 31 of 33
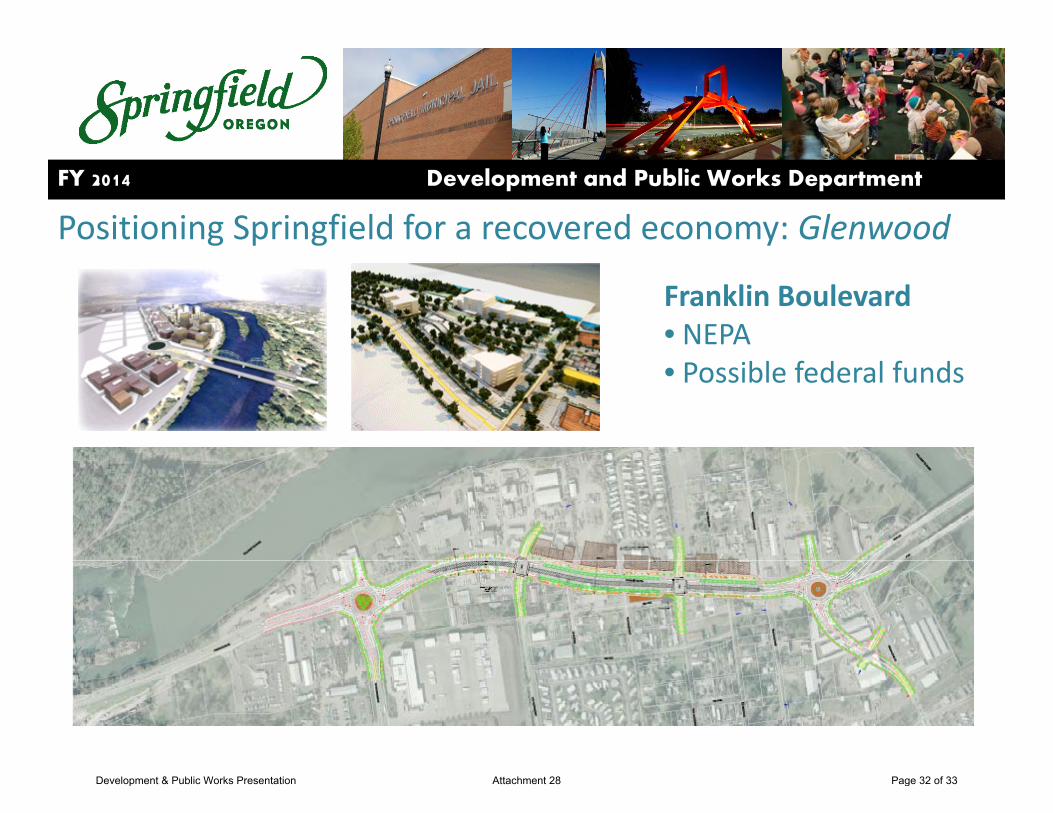
Development and Public Works DepartmentFY 2014
Positioning Springfield for a recovered economy: Glenwood
Franklin Boulevard• NEPA• Possible federal funds
Development & Public Works Presentation Attachment 28 Page 32 of 33
Development and Public Works DepartmentFY 2014
Development & Public Works Presentation Attachment 28 Page 33 of 33

De
ve
lop
me
nt
an
d P
ub
lic
Wo
rks
De
pa
rtm
en
tFY
201
4
CapitalB
udget:
Maintain an
d Im
prove Infrastructure and
Facilitie
sCa
pital B
udget:
Capital Budget Presentation Attachment 29 Page 1 of 14

De
ve
lop
me
nt
an
d P
ub
lic
Wo
rks
De
pa
rtm
en
tFY
201
4
Capital Bud
get: Maintain an
d Im
prove Infrastructure and
Facilitie
s
Capital B
udget T
hrou
gh th
e Years
All Fun
ds (M
illions)
35.3
100.0
120.0
140.0
951
39.0
60.0
80.0
100.0
95.1
65.0
32.4
25.9
21.6
13.5
25.0
27.6
27.9
23.0
00
20.0
40.0 0.0
FY 09
FY 10
FY 11
FY 12
FY 13
FY 14
Region
al (M
WMC)
Local (Sprin
gfield)
Capital Budget Presentation Attachment 29 Page 2 of 14

De
ve
lop
me
nt
an
d P
ub
lic
Wo
rks
De
pa
rtm
en
tFY
201
4
Capital Bud
get: Maintain an
d Im
prove Infrastructure and
Facilitie
s
FY 14 Ca
pital Projects By
Category (All Fund
s)
Stormwater Capita
l Improvem
ents
$6,23
4,65
0
Wastewater Capita
l Improvem
ents
$ 7,399
,000
Transportatio
n and Street Capita
l Improvem
ents
$ 51
9,47
7
BuildingandFacilitiesC
apita
lImprovem
ents
$624585
Building and Facilities C
apita
l Improvem
ents
$624,585
Misc
ellane
ous C
apita
l Improvem
ents
$ 42
4,00
0
Region
al W
astewater Capita
l Improvem
ents
$ 13
,456
,982
Dedicated Re
serves
$ 7,837
,072
Subtotal
$ 36,495,766
$SEDA
$ 0
Total
$ 36,495,766
Capital Budget Presentation Attachment 29 Page 3 of 14

De
ve
lop
me
nt
an
d P
ub
lic
Wo
rks
De
pa
rtm
en
tFY
201
4
Capital Bud
get: Maintain an
d Im
prove Infrastructure and
Facilitie
s
Projects
•Ca
sh Flow M
anagem
ent
•Investmen
t Poten
tial
Projects
Island
Park
$1,40
0,00
0Gray Creek Flow
Enh
ancemen
ts$ 14
9,17
6MillRa
ceStormwater
Facility
$1,25
4,50
0Mill Race Stormwater Facility
$ 1,25
4,50
0Jasper‐Natron
$50
0,00
0Ce
dar C
reek (Intake Re
constructio
n)$ 50
0,00
0Lower M
ill Race
$ 900,000
$,
Franklin Bou
levard Sew
er Exten
sion
$ 2,373
,000
Gatew
ay Area Traffic Im
provem
ents
$ 38
4,50
0Be
ltline/Gatew
ay Intersectio
n $ 205,000
/y
,S. 42n
dStreet Reserve
$ 170
,896
Total
$ 7,837,072
Capital Budget Presentation Attachment 29 Page 4 of 14

De
ve
lop
me
nt
an
d P
ub
lic
Wo
rks
De
pa
rtm
en
tFY
201
4
Capital Bud
get: Maintain an
d Im
prove Infrastructure and
Facilitie
s
JT
kPh
1C
i
$22.4 Million in Recen
tly Com
pleted
/Active City
Con
struction Projects
•Jaspe
r Trunk
Phase 1 Con
struction
•Mill Race
•22,300 Feet of Sanita
ry Sew
er
,y
Pipe
Reh
abilitatio
n in Basin 22
•10t
h& “N” Street Sanita
ry Sew
er
•58t
hStreet Sew
er Bypass
•Springfield M
useu
m Brick and
Mortar R
epair
Capital Budget Presentation Attachment 29 Page 5 of 14
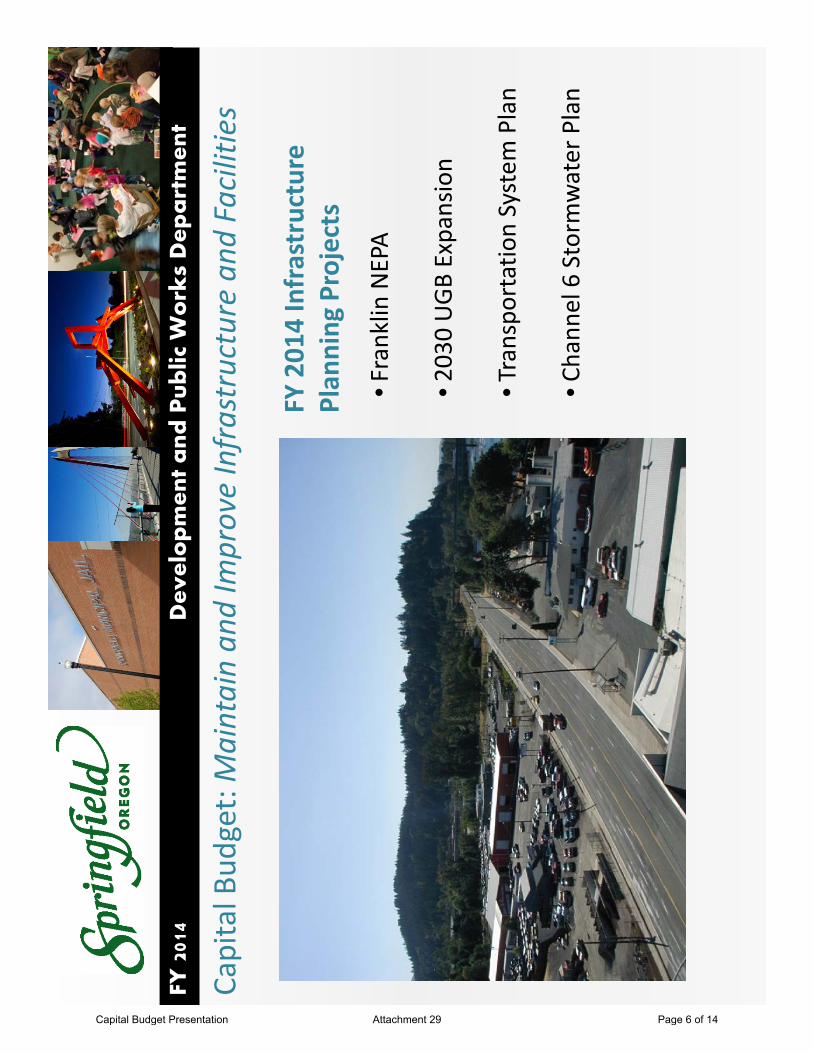
De
ve
lop
me
nt
an
d P
ub
lic
Wo
rks
De
pa
rtm
en
tFY
201
4
Capital Bud
get: Maintain an
d Im
prove Infrastructure and
Facilitie
s
FY 201
4 Infrastructure
Plan
ning
Projects
•Franklin
NEPA
•203
0 UGB Expansion
•Transpo
rtation System
Plan
•Chann
el 6 Storm
water Plan
Capital Budget Presentation Attachment 29 Page 6 of 14

De
ve
lop
me
nt
an
d P
ub
lic
Wo
rks
De
pa
rtm
en
tFY
201
4
Capital Bud
get: Maintain an
d Im
prove Infrastructure and
Facilitie
s
FY 201
4 Design Projects
•Franklin
Sewer
Expansion
Franklin Sew
er Expansio
n
•Mill Race Stormwater Facility
•S. 2
ndStreet Sew
er
•E. 17t
hAve. Sew
er
•Pum
p Stations
•Over/Und
erCh
anne
l•O
ver/Und
er Chann
el
Capital Budget Presentation Attachment 29 Page 7 of 14

De
ve
lop
me
nt
an
d P
ub
lic
Wo
rks
De
pa
rtm
en
tFY
201
4
Capital Bud
get: Maintain an
d Im
prove Infrastructure and
Facilitie
s
FY 201
4 Co
nstructio
n Projects
h•1
0th& N Street S
ewer Phase 2
•“A” St. Overla
y
•Thu
rston Rd
. Overla
y
• 59t
h&Aster
59& Aster
•Isla
nd Park
Capital Budget Presentation Attachment 29 Page 8 of 14

De
ve
lop
me
nt
an
d P
ub
lic
Wo
rks
De
pa
rtm
en
tFY
201
4
Capital Bud
get: Maintain an
d Im
prove Infrastructure and
Facilitie
s
•Partial Facilitie
s Plan
Upd
ate
Completed
Projects
•Odo
rous Air Treatm
ent
Phases 1 & 2
•Peak Flow M
anagem
ent
Improvem
ents
Capital Budget Presentation Attachment 29 Page 9 of 14

De
ve
lop
me
nt
an
d P
ub
lic
Wo
rks
De
pa
rtm
en
tFY
201
4
Capital Bud
get: Maintain an
d Im
prove Infrastructure and
Facilitie
sActive Planning
Projects C
arrie
d Over to FY 201
4
MWMC Plan
ning
•Wet W
eather Plann
ing (wastewater):
Capacity M
anagem
ent a
nd Ope
ratio
ns M
ainten
ance
(CMOM) P
rogram
•Facilities Plan
Engineerin
g Services
•ThermalLoad
Mitigatio
n:Thermal Load Mitigatio
n:
Pre‐Im
plem
entatio
n
Capital Budget Presentation Attachment 29 Page 10 of 14

De
ve
lop
me
nt
an
d P
ub
lic
Wo
rks
De
pa
rtm
en
tFY
201
4
Capital Bud
get: Maintain an
d Im
prove Infrastructure and
Facilitie
s
d(h
)
Design Projects Carrie
d Over to FY
201
4
•Line
BiosoidsL
agoo
n (Phase 4)
•Re
pair/Re
placem
ent o
f Biosolids
ForceMain
Force Main
Line
Biosolids L
agoo
n at Biocycle Man
agem
ent F
acility
Capital Budget Presentation Attachment 29 Page 11 of 14
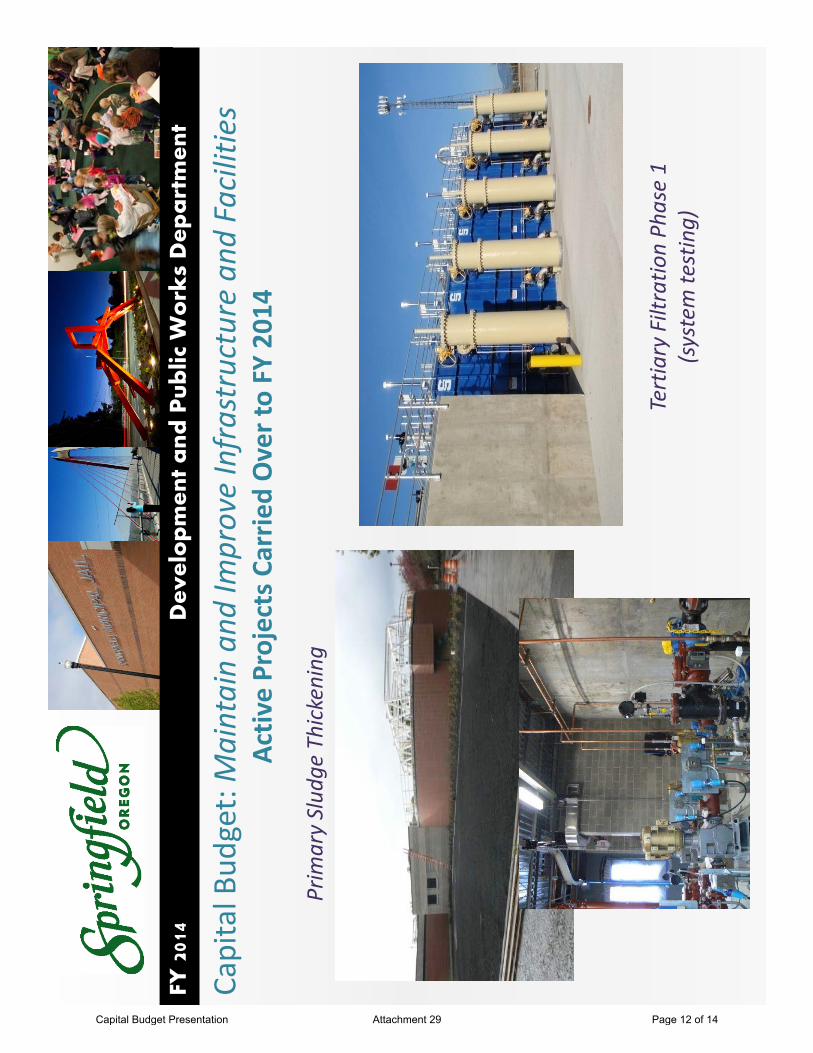
De
ve
lop
me
nt
an
d P
ub
lic
Wo
rks
De
pa
rtm
en
tFY
201
4
ij
CidO
201
Capital Bud
get: Maintain an
d Im
prove Infrastructure and
Facilitie
s
Prim
ary Slud
ge Thickening
Activ
e Projects Carrie
d Over to FY
2014
Tertiary
FiltrationPh
ase1
Tertiary Filtratio
n Ph
ase 1
(system te
sting)
Capital Budget Presentation Attachment 29 Page 12 of 14
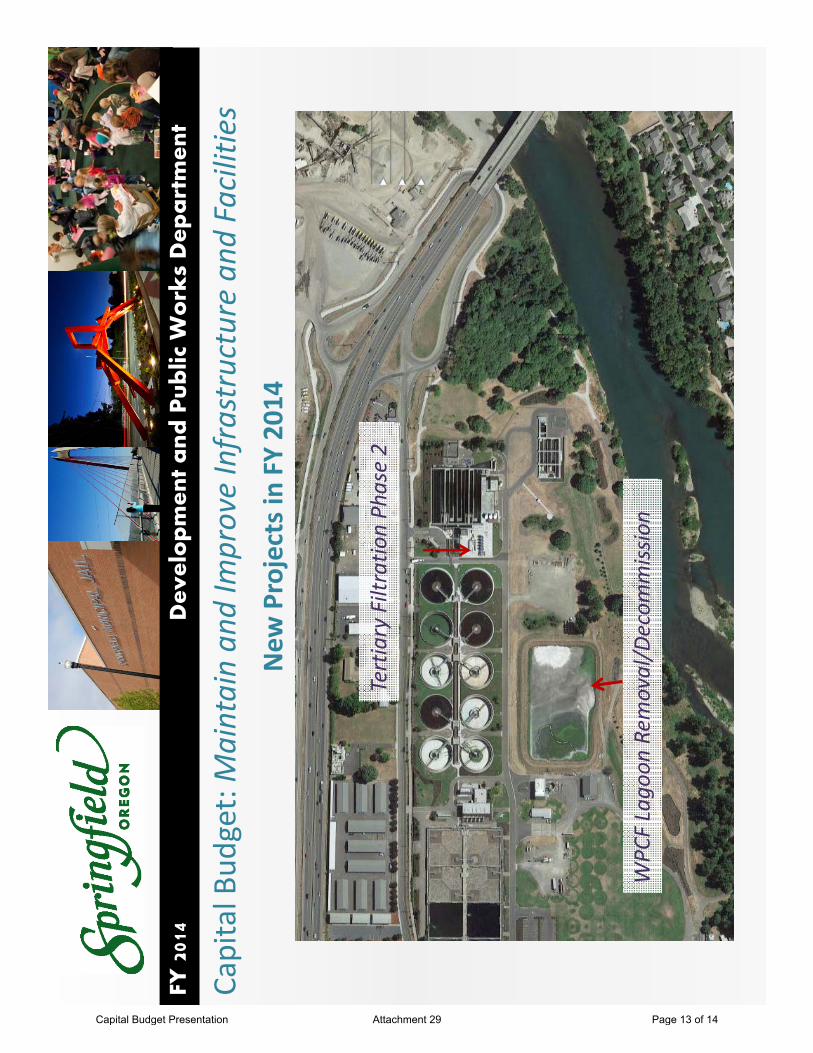
De
ve
lop
me
nt
an
d P
ub
lic
Wo
rks
De
pa
rtm
en
tFY
201
4
Capital Bud
get: Maintain an
d Im
prove Infrastructure and
Facilitie
sNew
Projects in FY 20
14
Tertiary Filtratio
n Ph
ase 2
WPC
F Lago
on Rem
oval/Decom
mission
Capital Budget Presentation Attachment 29 Page 13 of 14
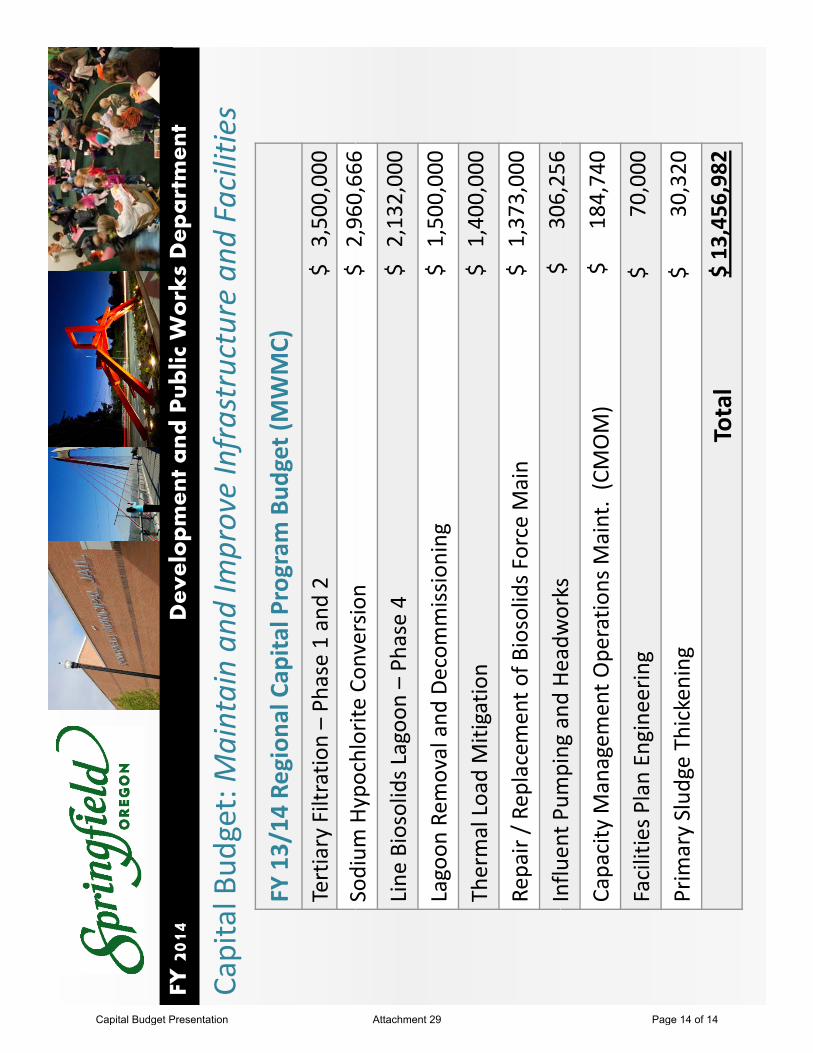
De
ve
lop
me
nt
an
d P
ub
lic
Wo
rks
De
pa
rtm
en
tFY
201
4
Capital Bud
get: Maintain an
d Im
prove Infrastructure and
Facilitie
s
FY 13/14
Regiona
l Cap
italProgram
Bud
get (MWMC)
Tertiary Filtratio
n –Ph
ase1 and 2
$ 3,500
,000
Sodium
Hypo
chloriteCo
nversio
n$
2960666
Sodium
Hypochlorite
Conversio
n$ 2,960,666
Line
Biosolids L
agoo
n –Ph
ase 4
$ 2,132
,000
Lagoon
Removal and
Decom
missioning
$ 1,500
,000
Thermal Load Mitigatio
n$ 1,400
,000
Repair / R
eplacemen
t of B
iosolids F
orce M
ain
$ 1,373
,000
Influ
entP
umping
andHe
adworks
$306256
Influ
ent P
umping
and
Headw
orks
$
306,256
Capacity M
anagem
ent O
peratio
nsMaint. (CMOM)
$ 184
,740
Facilities P
lan Engine
ering
$70
,000
Prim
ary Slud
geThickening
$
30,320
Total
$ 13,456,982
Capital Budget Presentation Attachment 29 Page 14 of 14

City
of S
prin
gfie
ldTo
tal O
pera
ting
Expe
nditu
res
Dec
reas
e bu
dget
>5%
5%A
ll Fu
nds
0%In
crea
se b
udge
t >5%
-5%
-25%
Acc
ount
FY1
1 A
ctua
l F
Y12
Act
ual
FY1
3 Es
t Act
ual
FY1
3 A
men
ded
Bud
get
Pro
pose
d FY
14
Bud
get
%
Cha
nge
Ove
r A
men d
FY11
-FY
13
Avg
%
Cha
ng eS
alar
ies
27,3
92,7
96
26
,527
,382
27,2
63,1
36
27,9
63,3
59
28,2
29,2
85
-1%
-4%
Sea
son/
Inte
rn/T
mp
Wag
es88
,524
65,9
01
146,
286
13
5,28
6
173,
486
-2
8%-7
3%O
verti
me
1,78
6,08
2
1,
980,
974
1,
801,
895
1,58
2,90
8
1,
539,
180
3%17
%Fr
inge
Ben
efits
3,86
5,11
3
3,
185,
956
3,
173,
335
3,13
0,17
1
3,
189,
060
-2%
6%M
edic
al/D
enta
l Ins
uran
ce7,
007,
141
7,10
2,71
2
7,43
9,53
0
7,
751,
193
7,83
8,33
4
-1
%-9
%C
ity R
etire
men
t Pla
n1,
197,
389
573,
129
580,
624
55
8,23
8
669,
361
-2
0%15
%P
ER
S/O
PS
RP
2,93
2,35
7
3,
715,
216
3,
792,
618
3,89
6,31
4
4,
978,
083
-28%
-43%
Sea
son/
Inte
rn/T
mp
Frin
ge-
-
9,26
0
9,26
0
12
,700
-3
7%-3
11%
CR
P In
tere
st G
uara
ntee
-
1,
215,
555
1,
215,
000
1,21
5,00
0
1,
352,
000
-11%
-67%
Car
Allo
wan
ce15
,258
13,2
89
16,5
51
12
,816
13
,848
-8
%8%
Pag
er A
llow
ance
30,0
30
15
,753
16
,304
13,4
76
17,0
04
-26%
18%
Uni
form
Allo
wan
ce15
1,00
1
152,
684
159,
466
15
8,44
8
154,
524
2%
0%C
ell P
hone
Allo
wan
ce33
,618
30,2
81
32,6
86
32
,940
35
,136
-7
%-9
%P
erso
nnel
Svs
Adj
ustm
ents
-
-
18
3,00
0
450,
174
5,
100
99%
92%
Par
t-tim
e/Te
mpo
rary
-
-
3,
166
3,
166
-
100%
100%
Pers
onne
l Ser
vice
s44
,499
,308
44,5
78,8
31
45
,832
,857
46
,912
,749
48
,207
,101
-3%
-7%
Inte
rpre
ter F
ees
5,77
2
5,65
3
6,
000
6,
000
5,00
0
17
%14
%D
ispa
tch
Con
tract
544,
333
55
2,73
9
62
3,29
0
623,
290
66
0,68
7
-6%
-15%
Bill
ing
& C
oll E
xp79
5,47
4
782,
129
838,
857
87
9,85
7
878,
100
0%
-9%
Con
tract
ual S
ervi
ces
2,20
5,07
9
2,
101,
849
2,
866,
110
3,15
2,98
6
2,
781,
564
12%
-16%
Litig
atio
n E
xpen
se47
,193
59,8
84
135,
000
22
3,50
0
240,
500
-8
%-1
98%
Pris
oner
Exp
Med
ical
186,
901
21
9,63
5
22
0,00
0
180,
000
23
3,00
0
-29%
-12%
Indi
gent
Rep
rese
ntat
ion
199,
279
21
9,73
2
20
1,10
8
176,
000
18
1,83
4
-3%
12%
Env
ironm
enta
l Ed
3,90
4
8,13
6
8,
200
10
,250
18
,750
-8
3%-1
78%
Dru
g P
reve
ntio
n/E
d24
,378
15,5
05
29,0
00
35
,000
25
,000
29
%-9
%A
ttorn
ey F
ees
43,8
14
52
,347
50
,000
75,0
00
75,0
00
0%-5
4%C
ontra
ctua
l Tem
pora
ry H
elp
15,0
20
-
-
-
-
100%
100%
Mer
chan
t fee
s60
,877
65,8
37
92,9
94
69
,264
73
,764
-6
%-1
%P
lann
ing
Com
mis
sion
Exp
ense
s1,
367
1,
083
500
1,50
0
1,
500
0%-5
3%Fu
el T
ax A
dmin
istra
tion
3,96
0
5,64
6
10
,000
10,0
00
7,50
0
25
%-1
5%Te
mp
Eng
/Pla
nnin
g26
-
-
-
-
10
0%10
0%E
mer
genc
y M
anag
emen
t Pro
gram
3,45
9
2,51
4
2,
000
2,
000
2,00
0
0%
25%
Men
tal H
ealth
Eva
l1,
950
7,
900
3,00
0
2,29
2
3,
000
-31%
30%
Total Operating Expenditures - All Funds Attachment 3 Page 1 of 7

Acc
ount
FY1
1 A
ctua
l F
Y12
Act
ual
FY1
3 Es
t Act
ual
FY1
3 A
men
ded
Bud
get
Pro
pose
d FY
14
Bud
get
%
Cha
nge
Ove
r A
men d
FY11
-FY
13
Avg
%
Cha
ng eS
peci
al P
rose
cuto
r Ser
vice
s-
-
3,00
0
3,00
0
3,
000
0%-2
00%
NE
SC
Com
plia
nce
-
-
5,
000
5,
000
5,00
0
0%
-200
%P
erso
nnel
Ser
vice
s R
eim
burs
emt
6,80
0,55
0
6,
920,
157
7,
446,
700
7,73
2,89
4
7,
864,
894
-2%
-11%
Cle
anin
g S
ervi
ces
7,05
7
3,98
6
9,
965
7,
540
8,11
5
-8
%-1
6%E
quip
men
t Ren
tal
3,49
3
7,01
2
4,
900
4,
450
10,9
91
-147
%-1
14%
Spa
ce R
enta
l16
,687
16,4
90
3,00
0
5,47
4
3,
624
34%
70%
Pro
perty
& L
iabi
lity
Ins
242,
869
24
2,96
8
28
6,12
4
300,
750
35
1,50
0
-17%
-37%
Tele
phon
e, C
ellu
lar,P
ager
91,5
01
82
,144
93
,397
97,8
63
100,
265
-2
%-1
3%R
is/A
irs/G
eo C
harg
es54
7,35
0
584,
913
504,
194
57
0,45
2
344,
127
40
%37
%A
udio
Vis
ual C
omm
unic
atio
ns10
,731
5,38
4
10
,760
10,7
60
10,7
60
0%-2
0%C
ompu
ter E
quip
men
t48
,248
194,
585
302,
446
34
3,20
8
176,
131
49
%3%
Adv
ertis
ing
317,
633
24
1,73
2
11
3,96
3
121,
113
12
0,37
1
1%46
%D
uplic
atin
g S
uppl
ies
39,3
36
36
,997
39
,428
50,8
80
38,2
50
25%
1%P
ublis
h P
rom
o M
trls
162
-
-
-
-
10
0%10
0%Li
brar
y X
erox
2,31
7
-
2,60
9
2,60
9
2,
609
0%-5
9%P
rintin
g19
,351
24,0
95
36,6
56
26
,150
23
,500
10
%12
%A
dver
tisin
g-
-
200
200
-
10
0%10
0%Tr
avel
& M
eetin
g E
xpen
ses
87,5
68
72
,047
97
,933
117,
203
11
2,74
0
4%-3
1%In
tern
al M
eetin
g6,
772
4,
741
4,59
1
3,76
1
3,
661
3%32
%M
anda
ted
Doc
umen
t/Mee
ting
Exp
83
-
-
-
-
100%
100%
Mile
age
Rei
mbu
rsem
ent
31
-
-
-
-
100%
100%
Cou
ncil
Rei
mbu
rsem
ent
4,86
6
10,6
58
10,9
22
10
,922
13
,422
-2
3%-5
2%S
oftw
are
Lice
nse
Fee
182,
546
21
3,32
8
29
5,88
1
301,
330
38
9,25
1
-29%
-69%
Rec
ordi
ng F
ees
189
55
825
825
82
5
0%-1
32%
Sub
poen
a &
Jur
y Fe
es99
6
1,
174
2,00
0
3,00
0
2,
000
33%
-44%
Witn
ess
Fees
325
2,23
6
35
0
3,
850
2,40
0
38
%-1
47%
Pro
perty
Tax
es61
,993
60,6
70
79,3
01
80
,000
77
,900
3%
-16%
NP
DE
S P
erm
its99
,862
101,
723
102,
850
12
9,60
0
128,
000
1%
-26%
Gov
ernm
ent e
thic
s C
omm
cha
rge s
794
1,02
8
2,
009
2,
066
2,07
6
0%
-63%
RO
W F
ee-
357,
673
374,
500
37
8,00
0
380,
220
-1
%-5
6%Fi
re S
tatio
n Li
nens
146
-
-
-
-
10
0%10
0%A
udio
Vis
ual S
uppl
ies
2,50
6
4,12
4
2,
694
2,
694
2,69
4
0%
13%
Eng
/Sur
vey
Sup
plie
s83
1,18
1
5,
050
5,
050
5,15
0
-2
%-1
45%
Cod
e E
nfor
ce S
uppl
y63
3
56
1
800
800
-
10
0%10
0%M
edic
al S
uppl
ies
155,
643
15
0,23
1
14
4,00
0
140,
500
14
6,00
0
-4%
3%P
retre
atm
ent S
uppl
ies
1,60
7
2,76
2
3,
100
4,
000
4,00
0
0%
-61%
Saf
ety
Clo
thin
g/E
q51
,865
91,4
12
67,0
89
78
,139
81
,339
-4
%-1
6%C
lean
ing
Sup
plie
s14
,141
14,4
94
10,2
00
9,
900
9,90
0
0%
24%
Pol
ice
Wea
pons
19,7
42
56
,667
90
,000
50,0
00
-
100%
100%
Uni
form
s12
,696
23,1
18
13,0
00
13
,000
13
,000
0%
20%
Total Operating Expenditures - All Funds Attachment 3 Page 2 of 7

Acc
ount
FY1
1 A
ctua
l F
Y12
Act
ual
FY1
3 Es
t Act
ual
FY1
3 A
men
ded
Bud
get
Pro
pose
d FY
14
Bud
get
%
Cha
nge
Ove
r A
men d
FY11
-FY
13
Avg
%
Cha
ng eP
erso
nnel
Pro
tect
ive
Equ
ipm
ent
28,1
30
-
-
-
-
100%
100%
Inm
ate
Sup
plie
s15
,419
14,6
31
10,0
00
25
,000
17
,000
32
%-2
7%P
rison
er M
eal E
xpen
se11
0,69
3
131,
352
115,
000
12
8,00
0
128,
000
0%
-8%
Gas
olin
e &
Oil
416,
606
48
1,76
8
51
0,60
1
489,
885
51
2,29
7
-5%
-9%
Util
ities
385,
091
15
7,99
4
31
5,66
1
357,
349
32
5,25
5
9%-1
4%E
lect
ricity
-
-
-
-
100
-1
00%
-100
%S
treet
Lig
htin
g E
lect
ricity
152,
441
15
6,15
1
15
0,50
0
150,
500
15
5,00
0
-3%
-1%
Traf
fic S
igna
l Ele
ctric
ity31
,553
28,8
97
35,0
00
55
,200
35
,000
37
%-1
0%S
UB
Wat
er-
36,0
30
24,3
93
23
,344
35
,693
-5
3%-7
7%S
UB
Sew
er &
Dra
inag
e-
25,0
45
5,32
0
4,78
0
10
,590
-1
22%
-5%
SU
B E
lect
ricity
-
20
5,31
3
52
,744
46,8
19
89,7
79
-92%
-4%
Per
iodi
cals
4,83
6
5,71
5
3,
095
3,
095
3,09
5
0%
32%
Mem
bers
hips
, Boo
ks, S
ubsc
rips
59,5
78
59
,613
66
,396
72,5
49
74,4
69
-3%
-20%
Dire
ct M
ail
115,
244
58
,541
18
4,45
0
184,
450
18
4,45
0
0%-5
4%P
osta
ge &
Shi
ppin
g C
harg
es67
,060
68,7
64
63,8
08
74
,318
69
,518
6%
-4%
Offi
ce S
uppl
ies
49,5
34
65
,318
72
,717
89,5
05
116,
754
-3
0%-8
7%C
ompu
ter S
uppl
ies
15,1
70
7,
295
10,7
50
10
,750
10
,750
0%
3%C
ompu
ter S
oftw
are
136,
065
73
,631
10
8,74
5
130,
727
11
2,16
7
14%
-6%
Sm
all F
urni
ture
& a
pplia
nces
15,5
92
4,
782
5,54
8
5,97
5
5,
575
7%35
%S
torm
wat
er S
ampl
ing
Sup
plie
s3,
301
2,
139
3,00
0
5,00
0
4,
500
10%
-60%
Clo
thin
g A
llow
ance
49,1
29
41
,316
54
,285
55,4
85
57,4
00
-3%
-19%
Com
mut
er T
rip R
educ
tion
1,26
6
2,05
5
3,
070
3,
050
3,84
0
-2
6%-8
0%P
arts
& M
ater
ials
7,75
2
6,75
6
10
,000
10,0
00
10,0
00
0%-2
2%S
treet
Mai
nt M
ater
ials
32,9
56
38
,236
70
,000
70,0
00
70,0
00
0%-4
9%S
wee
per S
uppl
ies
5,12
2
7,07
5
13
,500
15,2
50
14,5
00
5%-6
9%D
rain
age
Mai
nt M
ater
ials
48,5
08
44
,447
52
,000
55,7
35
55,8
35
0%-1
6%S
ewer
Mai
nt M
ater
ials
20,7
46
23
,722
33
,000
38,0
00
38,0
00
0%-4
7%C
lean
g/M
aint
Mat
eria
ls46
,058
44,0
58
42,5
00
36
,000
42
,000
-1
7%5%
Pro
gram
Exp
ense
294,
842
32
8,26
6
35
8,35
2
335,
469
34
6,57
5
-3%
-6%
Traf
f Mai
nt M
ater
ials
103,
841
11
0,54
0
11
8,47
9
119,
000
12
1,00
0
-2%
-9%
Land
Mai
nt M
ater
ials
14,7
50
17
,253
21
,000
21,0
00
21,0
00
0%-1
9%D
amag
e C
laim
s45
,869
61,2
08
60,0
00
60
,000
60
,000
0%
-8%
Can
ine
Don
atio
ns E
xpen
ditu
res
9,51
6
19,1
33
23,5
01
21
,000
30
,000
-4
3%-7
3%S
treet
Tre
e R
epla
cem
ent
1,97
6
2,46
7
12
,000
12,0
00
12,0
00
0%-1
19%
GIS
Pro
gram
Exp
ense
-
27
3
1,50
0
1,50
0
1,
500
0%-1
54%
Art
Alle
y R
epai
r94
5
-
4,
412
4,
412
4,41
2
0%
-147
%A
rts C
omm
Ope
ratio
ns5,
217
6,
799
7,95
5
10,9
00
8,19
0
25
%-2
3%R
ural
Life
Sup
port
Exp
9,40
0
10,0
00
10,0
00
9,
400
10,0
00
-6%
-2%
Per
mit
Pro
ject
Exp
684
-
34,3
67
35
,000
35
,000
0%
-200
%C
itize
n S
urve
y90
9
51
8
1,50
0
1,50
0
1,
500
0%-5
4%
Total Operating Expenditures - All Funds Attachment 3 Page 3 of 7

Acc
ount
FY1
1 A
ctua
l F
Y12
Act
ual
FY1
3 Es
t Act
ual
FY1
3 A
men
ded
Bud
get
Pro
pose
d FY
14
Bud
get
%
Cha
nge
Ove
r A
men d
FY11
-FY
13
Avg
%
Cha
ng eM
etro
Par
tner
ship
Inc
50,0
00
50
,000
50
,000
50,0
00
-
100%
100%
1st T
ime
Hom
ebuy
ers
333,
860
10
1,98
4
10
0,00
0
100,
000
-
10
0%10
0%Le
ague
Of O
rego
n C
ities
37,2
71
37
,503
38
,117
38,1
17
38,1
17
0%-1
%In
terg
vt H
uman
Srv
cs14
8,39
4
150,
395
128,
394
15
6,89
4
173,
646
-1
1%-2
2%M
etro
Pla
nnin
g/M
pc10
,000
-
-
-
-
10
0%10
0%R
egio
n Tr
aini
ng P
lan
5,00
0
5,00
0
5,
000
5,
000
5,00
0
0%
0%L-
CO
G27
,300
31,5
54
23,4
17
23
,417
23
,417
0%
15%
LCO
G/C
able
Reg
319
-
1,00
0
3,50
0
3,
500
0%-6
96%
Cha
mbe
r Of C
omm
erce
35,0
00
35
,000
35
,000
35,0
00
35,0
00
0%0%
His
t Dis
t Sig
nage
-
-
75
0
75
0
750
0%
-200
%R
oom
Tax
Col
lect
5,26
4
5,32
4
6,
000
6,
000
6,00
0
0%
-9%
Air
Pol
lutio
n-LR
AP
A56
,760
-
21,2
24
21
,224
-
10
0%10
0%E
ugen
e O
pera
tions
2,90
9,60
5
3,
030,
191
3,
151,
400
3,54
1,13
3
3,
661,
309
-3%
-21%
Eug
ene
Indi
rect
Cos
ts98
4,20
1
801,
147
829,
300
1,
187,
902
1,13
7,50
0
4%
-31%
Bic
ycle
Pro
gram
Sup
plie
s93
5
2,
013
800
2,00
0
2,
000
0%-6
0%H
azm
at67
1
93
3
500
-
-
100%
100%
Eug
ene
Cap
ital O
utla
y(1
,911
)
2,
603
47,8
00
47
,828
52
,328
-9
%-2
24%
Em
erge
ncy
Ren
tal A
ssis
tanc
e5,
058
31
4
-
-
-
10
0%10
0%S
prin
g C
lean
Up
-
1,
000
500
500
1,
000
-100
%-1
00%
Team
Spr
ingf
ield
17,9
82
10
,769
20
,000
20,0
00
20,0
00
0%-2
3%S
prin
gfie
ld M
useu
m55
,000
45,0
00
45,0
00
45
,000
45
,000
0%
7%C
atho
lic C
omm
unity
Ser
vice
s30
,329
30,3
31
15,3
17
15
,317
-
10
0%10
0%Fo
od fo
r Lan
e C
ount
y36
,081
18,4
99
18,5
01
18
,501
-
10
0%10
0%R
elie
f Nur
sery
14,2
47
14
,247
14
,247
14,2
47
-
100%
100%
St.
Vin
cent
de
Pau
l10
,802
11,7
84
11,7
84
11
,784
-
10
0%10
0%W
hite
Bird
8,02
9
8,02
9
8,
029
8,
029
-
100%
100%
Oly
mpi
c Tr
ials
-
50
,000
50
,000
50,0
00
50,0
00
0%-5
0%E
mer
ald
Em
pire
Art
Ass
ocia
tion
19,8
97
-
-
-
-
100%
100%
Art
Alle
y S
peci
al P
roje
ct-
-
1,26
5
1,26
5
1,
265
0%-2
00%
SD
C P
rior Y
ear R
efun
ds-
25,7
53
7
53,5
54
8
10
0%10
0%S
DC
Cre
dits
Pai
d13
,557
14,2
18
7
8
8
0%
100%
EE
EE
CB
G -
City
of S
prin
gfie
ld18
2,46
6
2,09
8
-
-
-
100%
100%
EE
CB
G -
Will
amal
ane
135,
371
-
-
-
-
100%
100%
EE
CB
G -
SS
D#1
918
8,64
5
-
-
-
-
10
0%10
0%M
ohaw
k O
pen
Ban
ners
-
-
-
-
730
-1
00%
-100
%FI
MB
A E
vent
2,91
9
-
-
-
-
10
0%10
0%M
illra
ce S
pons
orsh
ip-
-
-
20
0,00
0
-
100%
100%
Ced
ar C
reek
Spo
nsor
ship
-
-
-
250,
000
-
10
0%10
0%S
usta
inab
le C
ities
-
17
1,72
5
43
,450
43,4
90
-
100%
100%
CH
OR
E1,
575
25
0
985
985
-
10
0%10
0%
Total Operating Expenditures - All Funds Attachment 3 Page 4 of 7
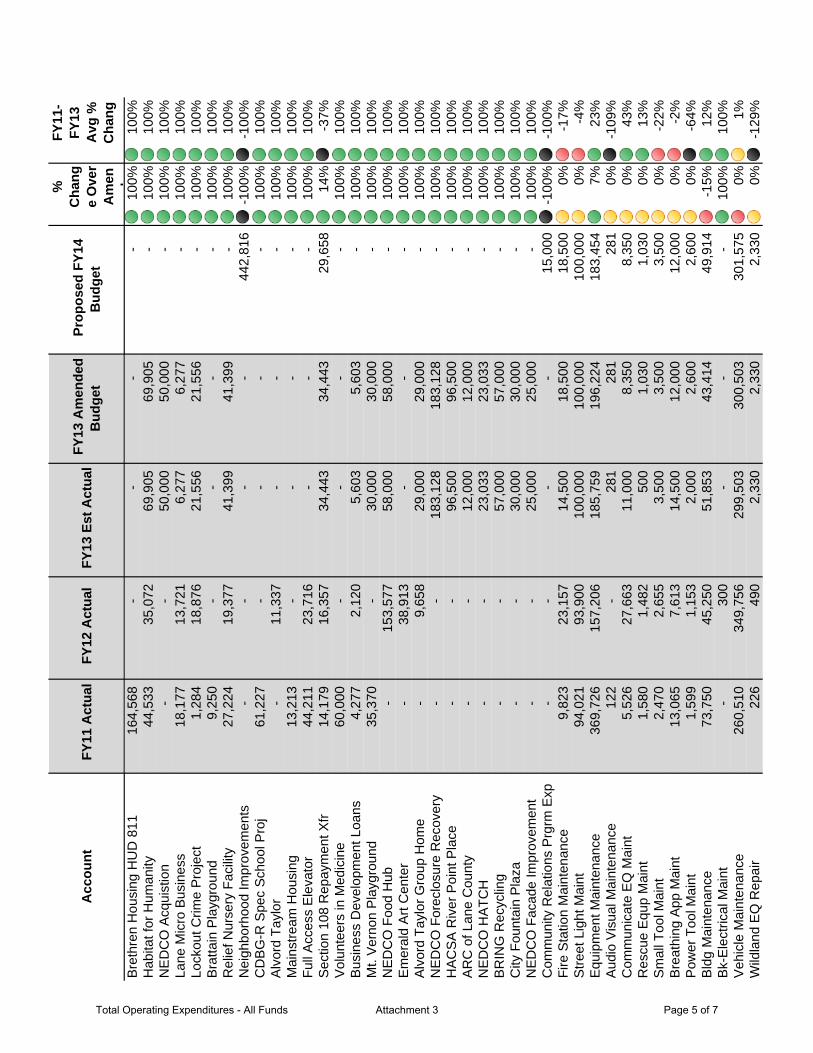
Acc
ount
FY1
1 A
ctua
l F
Y12
Act
ual
FY1
3 Es
t Act
ual
FY1
3 A
men
ded
Bud
get
Pro
pose
d FY
14
Bud
get
%
Cha
nge
Ove
r A
men d
FY11
-FY
13
Avg
%
Cha
ng eB
reth
ren
Hou
sing
HU
D 8
1116
4,56
8
-
-
-
-
10
0%10
0%H
abita
t for
Hum
anity
44,5
33
35
,072
69
,905
69,9
05
-
100%
100%
NE
DC
O A
cqui
stio
n-
-
50,0
00
50
,000
-
10
0%10
0%La
ne M
icro
Bus
ines
s18
,177
13,7
21
6,27
7
6,27
7
-
10
0%10
0%Lo
ckou
t Crim
e P
roje
ct1,
284
18
,876
21
,556
21,5
56
-
100%
100%
Bra
ttain
Pla
ygro
und
9,25
0
-
-
-
-
10
0%10
0%R
elie
f Nur
sery
Fac
ility
27,2
24
19
,377
41
,399
41,3
99
-
100%
100%
Nei
ghbo
rhoo
d Im
prov
emen
ts-
-
-
-
44
2,81
6
-100
%-1
00%
CD
BG
-R S
pec
Sch
ool P
roj
61,2
27
-
-
-
-
100%
100%
Alv
ord
Tayl
or-
11,3
37
-
-
-
10
0%10
0%M
ains
tream
Hou
sing
13,2
13
-
-
-
-
100%
100%
Full
Acc
ess
Ele
vato
r44
,211
23,7
16
-
-
-
10
0%10
0%S
ectio
n 10
8 R
epay
men
t Xfr
14,1
79
16
,357
34
,443
34,4
43
29,6
58
14%
-37%
Vol
unte
ers
in M
edic
ine
60,0
00
-
-
-
-
100%
100%
Bus
ines
s D
evel
opm
ent L
oans
4,27
7
2,12
0
5,
603
5,
603
-
100%
100%
Mt.
Ver
non
Pla
ygro
und
35,3
70
-
30
,000
30,0
00
-
100%
100%
NE
DC
O F
ood
Hub
-
15
3,57
7
58
,000
58,0
00
-
100%
100%
Em
eral
d A
rt C
ente
r-
38,9
13
-
-
-
10
0%10
0%A
lvor
d Ta
ylor
Gro
up H
ome
-
9,
658
29,0
00
29
,000
-
10
0%10
0%N
ED
CO
For
eclo
sure
Rec
over
y-
-
183,
128
18
3,12
8
-
100%
100%
HA
CS
A R
iver
Poi
nt P
lace
-
-
96
,500
96,5
00
-
100%
100%
AR
C o
f Lan
e C
ount
y-
-
12,0
00
12
,000
-
10
0%10
0%N
ED
CO
HA
TCH
-
-
23
,033
23,0
33
-
100%
100%
BR
ING
Rec
yclin
g-
-
57,0
00
57
,000
-
10
0%10
0%C
ity F
ount
ain
Pla
za-
-
30,0
00
30
,000
-
10
0%10
0%N
ED
CO
Fac
ade
Impr
ovem
ent
-
-
25
,000
25,0
00
-
100%
100%
Com
mun
ity R
elat
ions
Prg
rm E
xp-
-
-
-
15
,000
-1
00%
-100
%Fi
re S
tatio
n M
aint
enan
ce9,
823
23
,157
14
,500
18,5
00
18,5
00
0%-1
7%S
treet
Lig
ht M
aint
94,0
21
93
,900
10
0,00
0
100,
000
10
0,00
0
0%-4
%E
quip
men
t Mai
nten
ance
369,
726
15
7,20
6
18
5,75
9
196,
224
18
3,45
4
7%23
%A
udio
Vis
ual M
aint
enan
ce12
2
-
28
1
28
1
281
0%
-109
%C
omm
unic
ate
EQ
Mai
nt5,
526
27
,663
11
,000
8,35
0
8,
350
0%43
%R
escu
e E
qup
Mai
nt1,
580
1,
482
500
1,03
0
1,
030
0%13
%S
mal
l Too
l Mai
nt2,
470
2,
655
3,50
0
3,50
0
3,
500
0%-2
2%B
reat
hing
App
Mai
nt13
,065
7,61
3
14
,500
12,0
00
12,0
00
0%-2
%P
ower
Too
l Mai
nt1,
599
1,
153
2,00
0
2,60
0
2,
600
0%-6
4%B
ldg
Mai
nten
ance
73,7
50
45
,250
51
,853
43,4
14
49,9
14
-15%
12%
Bk-
Ele
ctric
al M
aint
-
30
0
-
-
-
10
0%10
0%V
ehic
le M
aint
enan
ce26
0,51
0
349,
756
299,
503
30
0,50
3
301,
575
0%
1%W
ildla
nd E
Q R
epai
r22
6
49
0
2,33
0
2,33
0
2,
330
0%-1
29%
Total Operating Expenditures - All Funds Attachment 3 Page 5 of 7

Acc
ount
FY1
1 A
ctua
l F
Y12
Act
ual
FY1
3 Es
t Act
ual
FY1
3 A
men
ded
Bud
get
Pro
pose
d FY
14
Bud
get
%
Cha
nge
Ove
r A
men d
FY11
-FY
13
Avg
%
Cha
ng eW
ater
Res
EQ
Rep
air
3,56
7
2,79
4
7,
000
3,
000
3,00
0
0%
33%
Cop
ier M
aint
enan
ce93
0
79
7
-
-
-
10
0%10
0%Te
chni
cal R
escu
e E
quip
. Rep
air
2,20
4
705
2,
000
2,
500
2,00
0
20
%-2
2%S
igna
l Det
ecto
r Rep
air
16,0
09
35
,581
45
,000
47,5
00
47,5
00
0%-4
8%S
idew
alk
Rep
air
10,1
80
17
,845
17
,500
17,5
00
17,5
00
0%-1
5%G
uard
Rai
l Rep
air
-
1,
221
2,50
0
2,50
0
2,
500
0%-1
02%
Wire
The
ft R
emed
iatio
n36
,193
7,65
6
20
,000
40,0
00
40,0
00
0%-8
8%Tr
aini
ng A
ids
308
-
200
200
80
0
-300
%-3
73%
City
EE
Rec
ogni
tion
13,2
29
6,
741
6,10
0
8,31
0
8,
810
-6%
-1%
Em
ploy
ee D
evel
opm
ent
124,
978
87
,871
14
9,03
8
198,
385
29
5,11
0
-49%
-145
%O
rgan
izat
ion
Dev
elop
men
t2,
366
1,
040
1,16
0
1,38
0
1,
730
-25%
-14%
Tuiti
on R
eim
burs
emen
t45
,262
27,9
68
40,0
00
32
,500
37
,500
-1
5%1%
City
Ee
Rec
ogni
tion
- Tax
able
-
25
-
-
-
100%
100%
Wel
lnes
s C
ente
r98
,196
73,6
61
88,0
00
88
,000
88
,000
0%
-2%
Sel
f Fun
ded
Ins
Pro
gram
-
-
26
5,00
0
265,
000
-
10
0%10
0%U
nem
ploy
men
t Rei
mbu
rse
89,3
92
85
,283
10
0,00
0
100,
000
10
0,00
0
0%-9
%R
etire
e M
edic
al P
rem
ium
49,5
60
53
,884
65
,000
65,0
00
65,0
00
0%-1
6%E
mpl
oyee
Ben
efit
Adj
ustm
ent
6,23
3
(2,6
72)
-
-
-
100%
100%
Mis
c B
enef
it E
xpen
se-
3,09
3
-
-
-
100%
100%
SF
Med
ical
Adm
in F
ee-
-
213,
005
21
3,00
5
181,
963
15
%-1
56%
SF
Med
Sto
p Lo
ss P
rem
-
-
19
,031
19,0
31
592,
719
##
###
-924
3%S
F M
ed A
ggre
gate
SL
Pre
m-
-
260,
050
26
0,05
0
39,7
88
85%
54%
SF
Med
Opt
iona
ls-
-
-
-
5,
261
-100
%-1
00%
SF
Den
tal A
dmin
Fee
-
-
16
,728
16,0
00
35,0
06
-119
%-5
28%
2013
Den
tal C
laim
s-
-
253,
513
25
3,51
3
644,
065
-1
54%
-662
%20
13 M
edic
al C
laim
s-
-
2,11
5,21
3
2,
415,
213
6,18
6,23
6
-1
56%
-777
%R
ecru
itmen
t Exp
ense
22,7
90
12
,177
13
,100
21,1
00
20,9
50
1%-3
1%H
iring
& P
rom
otio
n E
xpen
se2,
225
22
,922
2,
100
2,
100
21,0
00
-900
%-1
31%
Reh
ab L
oans
5,18
7
5,59
4
50
,000
50,0
00
-
100%
100%
Pro
ject
Inve
stm
ents
-
-
12
1,80
9
121,
809
-
10
0%10
0%H
ome
Rev
olvi
ng L
oan
-
91
,552
42
7,79
2
427,
792
-
10
0%10
0%La
te C
harg
es19
-
-
-
-
10
0%10
0%M
ater
ial &
Ser
vice
22,4
84,3
43
22
,224
,781
28,3
51,8
48
30,9
20,2
78
33,3
21,6
82
-8
%-3
7%
Inte
rnal
Insu
ranc
e C
hgs
674,
465
61
6,80
4
74
1,61
7
741,
863
74
1,85
9
0%-9
%In
tern
al V
eh M
t Chg
s15
1,32
7
175,
567
164,
769
16
4,76
9
189,
787
-1
5%-1
6%In
tern
al F
ac R
ent
-
15
4,23
3
22
7,14
6
237,
570
24
0,57
8
-1%
-89%
Int C
ompu
ter E
quip
Chg
s97
,290
163,
123
169,
704
16
9,70
4
239,
580
-4
1%-6
7%In
tern
al B
ldg
Mai
nt C
hgs
303,
449
28
1,85
5
30
2,13
5
302,
418
28
9,24
3
4%2%
Inte
rnal
Veh
& E
quip
Ren
t95
8,95
4
915,
684
992,
508
99
2,50
8
922,
404
7%
3%
Total Operating Expenditures - All Funds Attachment 3 Page 6 of 7
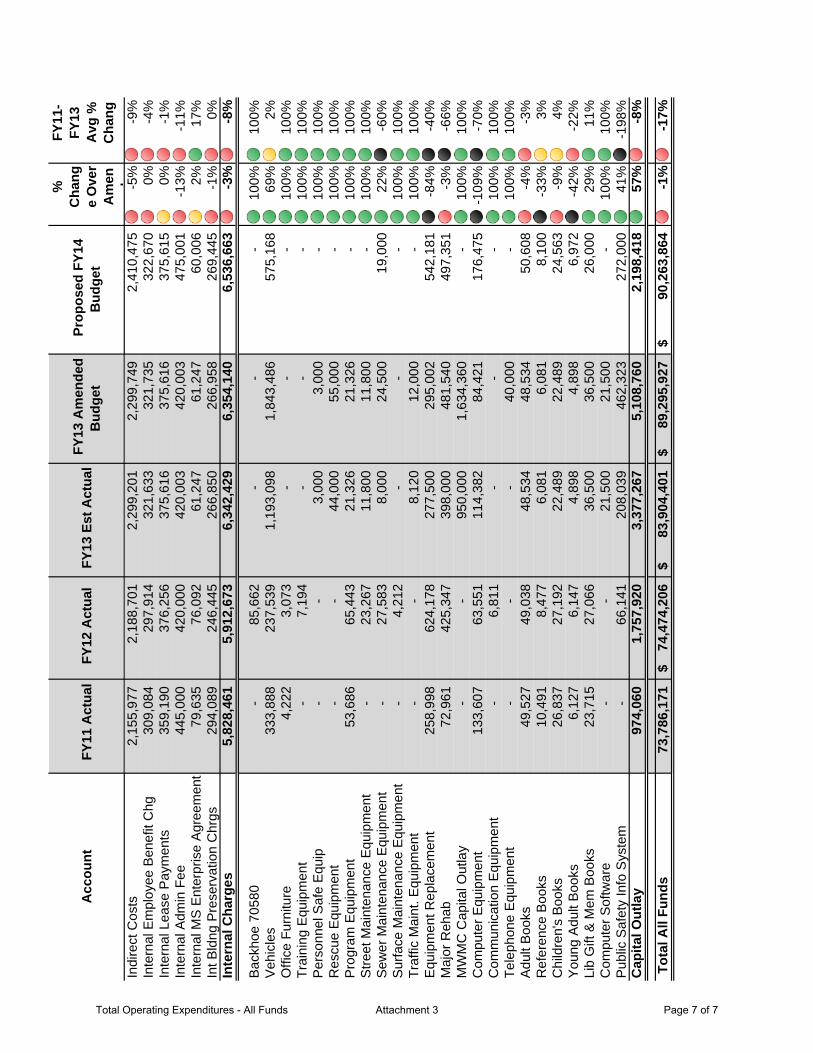
Acc
ount
FY1
1 A
ctua
l F
Y12
Act
ual
FY1
3 Es
t Act
ual
FY1
3 A
men
ded
Bud
get
Pro
pose
d FY
14
Bud
get
%
Cha
nge
Ove
r A
men d
FY11
-FY
13
Avg
%
Cha
ng eIn
dire
ct C
osts
2,15
5,97
7
2,
188,
701
2,
299,
201
2,29
9,74
9
2,
410,
475
-5%
-9%
Inte
rnal
Em
ploy
ee B
enef
it C
hg30
9,08
4
297,
914
321,
633
32
1,73
5
322,
670
0%
-4%
Inte
rnal
Lea
se P
aym
ents
359,
190
37
6,25
6
37
5,61
6
375,
616
37
5,61
5
0%-1
%In
tern
al A
dmin
Fee
445,
000
42
0,00
0
42
0,00
3
420,
003
47
5,00
1
-13%
-11%
Inte
rnal
MS
Ent
erpr
ise
Agr
eem
ent
79,6
35
76
,092
61
,247
61,2
47
60,0
06
2%17
%In
t Bld
ng P
rese
rvat
ion
Chr
gs29
4,08
9
246,
445
266,
850
26
6,95
8
269,
445
-1
%0%
Inte
rnal
Cha
rges
5,82
8,46
1
5,
912,
673
6,34
2,42
9
6,35
4,14
0
6,53
6,66
3
-3%
-8%
Bac
khoe
705
80-
85,6
62
-
-
-
10
0%10
0%V
ehic
les
333,
888
23
7,53
9
1,
193,
098
1,84
3,48
6
57
5,16
8
69%
2%O
ffice
Fur
nitu
re4,
222
3,
073
-
-
-
10
0%10
0%Tr
aini
ng E
quip
men
t-
7,19
4
-
-
-
100%
100%
Per
sonn
el S
afe
Equ
ip-
-
3,00
0
3,00
0
-
10
0%10
0%R
escu
e E
quip
men
t-
-
44,0
00
55
,000
-
10
0%10
0%P
rogr
am E
quip
men
t53
,686
65,4
43
21,3
26
21
,326
-
10
0%10
0%S
treet
Mai
nten
ance
Equ
ipm
ent
-
23
,267
11
,800
11,8
00
-
100%
100%
Sew
er M
aint
enan
ce E
quip
men
t-
27,5
83
8,00
0
24,5
00
19,0
00
22%
-60%
Sur
face
Mai
nten
ance
Equ
ipm
ent
-
4,
212
-
-
-
10
0%10
0%Tr
affic
Mai
nt. E
quip
men
t-
-
8,12
0
12,0
00
-
100%
100%
Equ
ipm
ent R
epla
cem
ent
258,
998
62
4,17
8
27
7,50
0
295,
002
54
2,18
1
-84%
-40%
Maj
or R
ehab
72,9
61
42
5,34
7
39
8,00
0
481,
540
49
7,35
1
-3%
-66%
MW
MC
Cap
ital O
utla
y-
-
950,
000
1,
634,
360
-
100%
100%
Com
pute
r Equ
ipm
ent
133,
607
63
,551
11
4,38
2
84,4
21
176,
475
-1
09%
-70%
Com
mun
icat
ion
Equ
ipm
ent
-
6,
811
-
-
-
10
0%10
0%Te
leph
one
Equ
ipm
ent
-
-
-
40,0
00
-
100%
100%
Adu
lt B
ooks
49,5
27
49
,038
48
,534
48,5
34
50,6
08
-4%
-3%
Ref
eren
ce B
ooks
10,4
91
8,
477
6,08
1
6,08
1
8,
100
-33%
3%C
hild
ren'
s B
ooks
26,8
37
27
,192
22
,489
22,4
89
24,5
63
-9%
4%Y
oung
Adu
lt B
ooks
6,12
7
6,14
7
4,
898
4,
898
6,97
2
-4
2%-2
2%Li
b G
ift &
Mem
Boo
ks23
,715
27,0
66
36,5
00
36
,500
26
,000
29
%11
%C
ompu
ter S
oftw
are
-
-
21
,500
21,5
00
-
100%
100%
Pub
lic S
afet
y In
fo S
yste
m-
66,1
41
208,
039
46
2,32
3
272,
000
41
%-1
98%
Cap
ital O
utla
y97
4,06
0
1,75
7,92
0
3,
377,
267
5,
108,
760
2,
198,
418
57
%-8
%
Tota
l All
Fund
s73
,786
,171
74,4
74,2
06$
83
,904
,401
$
89
,295
,927
$
90
,263
,864
$
-1
%-1
7%
Total Operating Expenditures - All Funds Attachment 3 Page 7 of 7

Pri
ori
ty B
ase
d B
ud
ge
tin
gFY
201
4
City Cou
ncil Goa
lsy
Provide Financially Respo
nsible and
Inno
vative Governm
ent
Services
EncourageEcon
omicDe
velopm
enta
ndRe
vitalizationthrough
Encourage Econ
omic Develop
ment a
nd Revita
lization through
Commun
ity Partnerships
Strengthen
Pub
lic Safety by Leveraging Partne
rships and
Re
sources
Foster an Environm
ent that V
alue
s Diversity and Inclusion
Maintain and Im
prove Infrastructure and
Facilitie
s p
Prom
ote and Enhance Our Hom
etow
n Feel W
hile Focusing on
Livability and Environm
ental Q
uality
Priority Based Budgeting Attachment 30 Page 1 of 10

Priority Based BudgetingFY 2014
One, Two & Three Year GoalsOOne Year:
Explore incentives to encourage annexation of improved area developments just beyond the city boundary.
Identify two large (50 acres minimum) properties for near‐term job development. y g ( ) p p j p
Two Year:Hold a city‐wide cleanup event twice a year. E plore the iabilit of a local oter’s g ide for SpringfieldExplore the viability of a local voter’s guide for Springfield.
Three Year:Complete a signature milestone in Glenwood such as NEPA process completion,
engineering of Franklin Boulevard, or acquisition of right of way for Franklin realignment, etc.
Develop long‐term plan to phase out mobile home parks in Glenwood by offering replacement housing counseling and other optionsreplacement housing, counseling, and other options.
Priority Based Budgeting Attachment 30 Page 2 of 10

Priority Based BudgetingFY 2014
Priority Based Budgetingy g g•Traditional
Current year’s budget is basis for next yearFocus is determining ways to meet targetsg y gAccountability for staying within spending limits
•Priority BasedyResources should be allocated based on goals and objectivesFlexible step‐by‐step process to budget scarce resourcesDemands accountability for results
Priority Based Budgeting Attachment 30 Page 3 of 10

FY 2014 Priority Based Budgeting
Across the Board Cuts Address $14.5 Billion Shortfall
From 2007
ShortfallCalifornia Governor’s Office: “Across‐the‐board approach spreads reductions as evenly as possible so no single p y p g
program gets singled out.”
Reaction: “the governor’s approach would be like a family deciding to cuts its monthly mortgage payment dining outdeciding to cuts its monthly mortgage payment, dining‐out
tab and Netflix subscription each by 10%, rather than eliminating the restaurant and DVD spending in order to
keep up the house payments.”keep up the house payments.
Priority Based Budgeting Attachment 30 Page 4 of 10
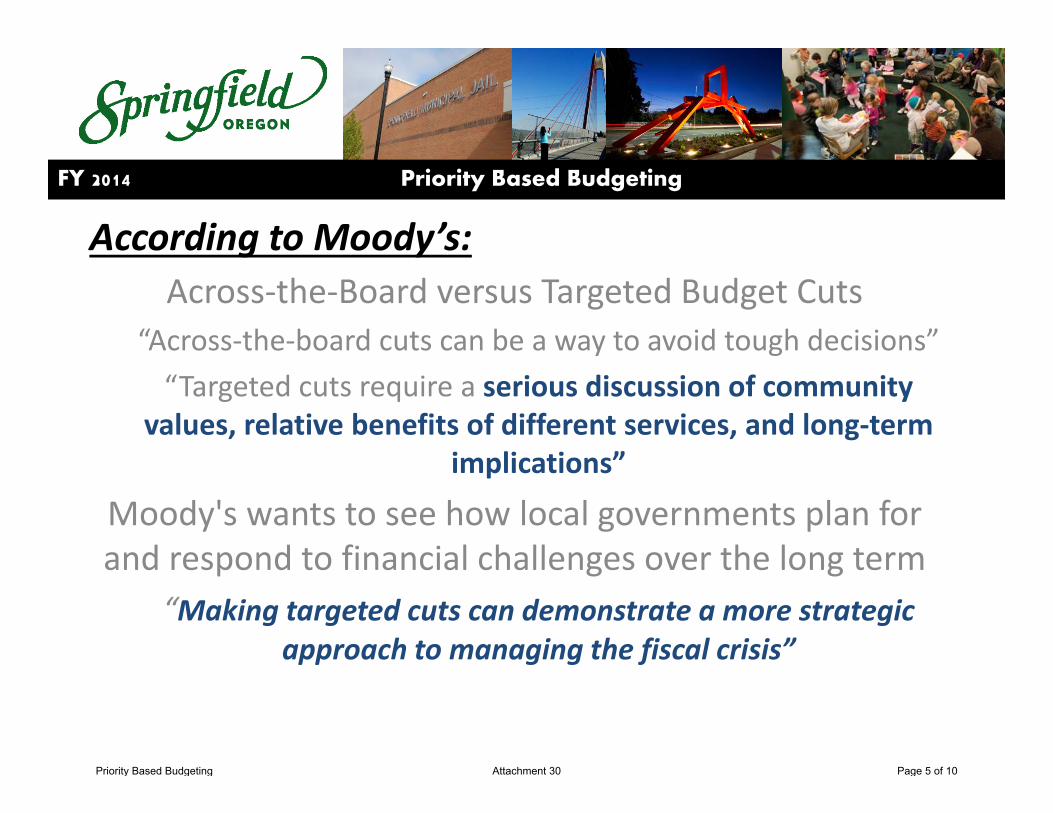
FY 2014
According to Moody’s:Priority Based Budgeting
g yAcross‐the‐Board versus Targeted Budget Cuts
“Across‐the‐board cuts can be a way to avoid tough decisions”y g“Targeted cuts require a serious discussion of community
values, relative benefits of different services, and long‐term implications”implications”
Moody's wants to see how local governments plan for and respond to financial challenges over the long termand respond to financial challenges over the long term
“Making targeted cuts can demonstrate a more strategic approach to managing the fiscal crisis”pp g g f
Priority Based Budgeting Attachment 30 Page 5 of 10

Priority Based BudgetingFY 2014
Step by Step Processp y p1. Determine Results
• Leveraging Council goals identifies City’s priorities • Community, Quality Service and Governance Results
2. Clarify Results Definitions• Defines the City’s results through Strategy Maps• “Why we exists”
3 Identify Programs & Services3. Identify Programs & Services• Departments develop program inventories • Programs are defined by their objectives
4. Score Programs against Results and Attributesg g• Scoring of each program in a way that indicates its relevance to Council goals
5. Allocate Resources Based on Prioritization• Tool that will be used in preparation of FY2015 Proposed Budget
Priority Based Budgeting Attachment 30 Page 6 of 10

FY 2014 Priority Based Budgeting
Step 1: Council Goalsp
Priority Based Budgeting Attachment 30 Page 7 of 10

FY 2014 Priority Based Budgeting
Step 2: Strategy Mapping
Priority Based Budgeting Attachment 30 Page 8 of 10

FY 2014 Priority Based Budgeting
Step 3: Program Inventory
Step 4: Program Scoring
Priority Based Budgeting Attachment 30 Page 9 of 10

FY 2014
Prioritization Array: Combined City‐wide Programs
Priority Based Budgeting
$85,915,772
$51,726,155
1
2
Ranking
st Rated Programs;
t Rated Programs) Step 5: Prioritization Array
$21,505,297
$7,498,842
3
4
Quartile
(Quartile 1: Highes
Quartile 4: Lowest
City of Boulder Colorado
$‐ $10,000,000 $20,000,000 $30,000,000 $40,000,000 $50,000,000 $60,000,000 $70,000,000 $80,000,000 $90,000,000 $100,000,000
City of Boulder, Colorado
Priority Based Budgeting Attachment 30 Page 10 of 10

Fiscal Year 2011/12www.springfield-or.gov
FY 14 Proposed BudgetCity of Springfield, Oregon

Council Members: Ward Public Members:
Sean Van Gordon 1 Chris StoleHillary Wylie 2 Terry BuckSheri Moore 3 Pat Mahoney
Dave Ralston 4 OpenMarilee Woodrow 5 Diana Alldredge
Bob Brew 6 Paul Selby
Gino Grimaldi Jeff ToweryCity Manager Assistant City Manager
Bob Duey -Robert Everett -
Len Goodwin -Rod Lathrop -Niel Laudati - Community Relations Manager
Randy Groves -Rick Lewis - Interim Chief of Police
Greta Utecht - Human Resources Director
City Executive Team
CITY OF SPRINGFIELDProposed Budget – FY14
Christine L. LundbergMayor
Members of the Budget Committee
Finance DirectorLibrary Director
Information Technology Director
Fire Chief
Development & Public Works Director


Budget Review Team: Gino Grimaldi, City ManagerJeff Towery, Asst. City ManagerBob Duey, Finance DirectorPaula Davis, Budget Analyst
Kathy Cunningham, Legal & Judicial ServicesMike Harman, Police DepartmentRod Lathrop, Information Technology DepartmentRhonda Rice, Development & Public Works DepartmentJana Sorenson, Fire and Life Safety DepartmentDebbie Steinman, Library DepartmentJulie Wilson, City Manager's OfficeGreta Utecht, Human Resources Director
Meg Allocco, AccountantNathan Bell, Accountant & Audit SupervisorAndrew Bemiller, Accounting TechDavid Held, Clerk 2Jayne McMahan, Procurement AnalystSally McKay, AccountantAllison Rich, Payroll TechnicianVahana Nekebit, Accounting Tech
Budget SystemSupport: Kerrie Miller, Programmer Analyst 3
Finance Department Staff:
Preparation of the Budget Document:
Acknowledgments
Additional appreciation goes to support staff, who have assisted the department budget coordinators.
Department Budget Coordinators:
Special thanks go to the following individuals for their assistance with the compilation of the FY13 Adopted Budget Document.
Paula Davis, Budget Analyst


Passion * Integrity *
Results
Passion for our community
We are dedicated to providing exceptional service. We listen carefully and respond to the needs and expectations of our customers and our community. Each of us plays an important role in serving the community and making our city a great place to live and work. We encourage creativity and innovation as we constantly seek to improve our services and to enhance the quality of life in our community. At Springfield, each individual makes a difference.
Integrity in our work
We are professional and honest in our working relationships. We strive for equity and fairness in our decision making and in our treatment of one another. We honor our commitments. We hold ourselves accountable to the highest ethical and performance standards.
Results through collaboration
As City of Springfield employees we are committed to working together with citizens, elected officials and each other. We get the job done. We value our culture of participation, building strong partnerships across our organization and within our community. We respect individual differences, recognizing they are part of our strength as a team. We share ideas to inspire and learn from one another.
Our Organizational Values Statement


City Government RosterAcknowledgementsCity of Springfield Values Statement
Readers GuideReaders Guide 1
Budget MessageBudget Message 3
City OverviewCity Overview 11Total Budget Summary; Resources and Requirements – FY11 through FY14 16Total Budget Summary; Requirements Only – FY11 through FY14 18
Operating BudgetOperating Budget Summary; by Department, Fund & Category FY11 through FY14 21Operating Budget Summary Chart 23City of Springfield Organization Chart 24
City Manager’s Office Department Description and Mission 25 Financial Summary Chart 26 Financial Summary by Category, Fund & Sub-Program – FY11 through FY14 27 Department Organization Chart 28 Full Time Equivalent; by Fund – FY11 through FY14 29 Position Summary – FY11 through FY14 29 Program Pages 31
Development & Public Works Department Department Description and Mission 35 Financial Summary Chart 37 Financial Summary by Category, Fund & Sub-Program – FY11 through FY14 38 Department Organization Chart 39 Full Time Equivalent; by Fund – FY11 through FY14 40 Position Summary – FY11 through FY14 40 Program Pages 43
Table of Contents
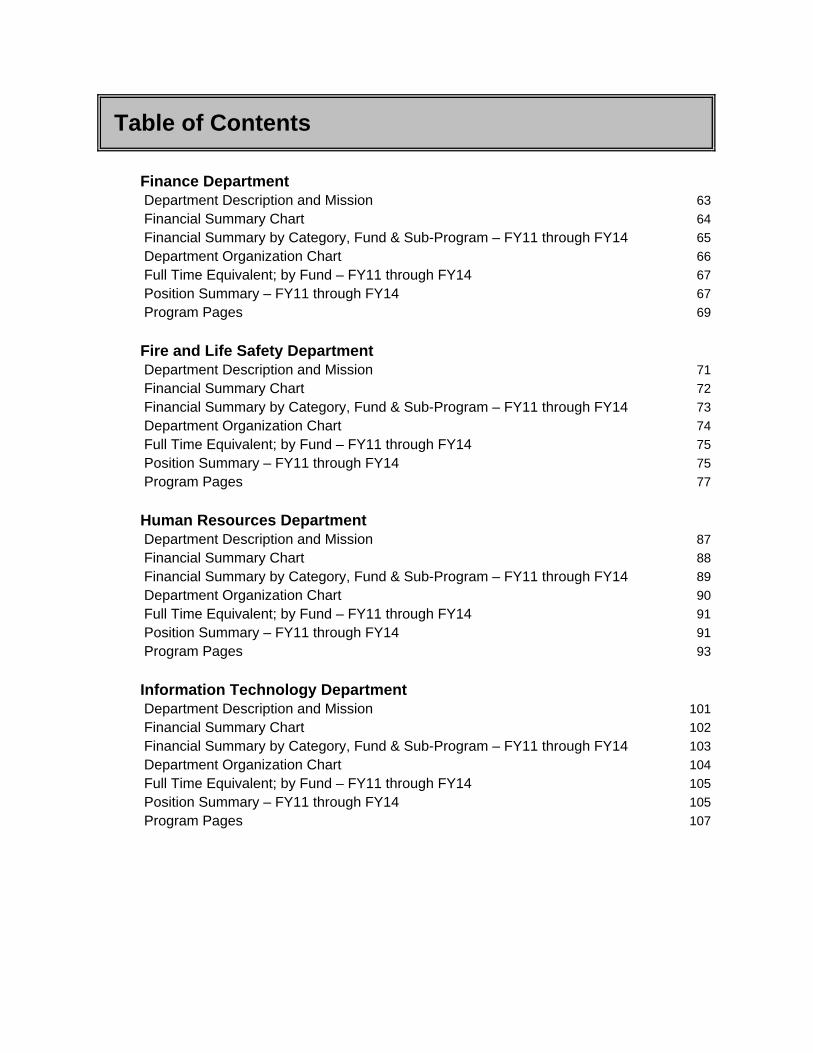
Table of Contents
Finance Department Department Description and Mission 63 Financial Summary Chart 64 Financial Summary by Category, Fund & Sub-Program – FY11 through FY14 65 Department Organization Chart 66 Full Time Equivalent; by Fund – FY11 through FY14 67 Position Summary – FY11 through FY14 67 Program Pages 69
Fire and Life Safety Department Department Description and Mission 71 Financial Summary Chart 72 Financial Summary by Category, Fund & Sub-Program – FY11 through FY14 73 Department Organization Chart 74 Full Time Equivalent; by Fund – FY11 through FY14 75 Position Summary – FY11 through FY14 75 Program Pages 77
Human Resources Department Department Description and Mission 87 Financial Summary Chart 88 Financial Summary by Category, Fund & Sub-Program – FY11 through FY14 89 Department Organization Chart 90 Full Time Equivalent; by Fund – FY11 through FY14 91 Position Summary – FY11 through FY14 91 Program Pages 93
Information Technology Department Department Description and Mission 101 Financial Summary Chart 102 Financial Summary by Category, Fund & Sub-Program – FY11 through FY14 103 Department Organization Chart 104 Full Time Equivalent; by Fund – FY11 through FY14 105 Position Summary – FY11 through FY14 105 Program Pages 107

Table of Contents
Legal and Judicial Services Department Description and Mission 111 Financial Summary Chart 112 Financial Summary by Category, Fund & Sub-Program – FY11 through FY14 113 Department Organization Chart 114 Full Time Equivalent; by Fund – FY11 through FY14 115 Position Summary – FY11 through FY14 115 Program Pages 117
Library Department Department Description and Mission 121 Financial Summary Chart 122 Financial Summary by Category, Fund & Sub-Program – FY11 through FY14 123 Department Organization Chart 124 Full Time Equivalent; by Fund – FY11 through FY14 125 Position Summary – FY11 through FY14 125 Program Pages 127
Police Department Department Description and Mission 133 Financial Summary Chart 134 Financial Summary by Category, Fund & Sub-Program – FY11 through FY14 135 Department Organization Chart 136 Full Time Equivalent; by Fund – FY11 through FY14 137 Position Summary – FY11 through FY14 137 Program Pages 139
Capital BudgetOverview 145Capital Budget Detail 151
Non-Departmental BudgetTotal Non-Departmental Budget 161Contingency 162Debt Activities 163Interfund Transfers and Loans 164Miscellaneous Fiscal Transactions 166Reserves; Non-Dedicated and Dedicated 167Statutory Payments 172Unappropriated Balances 173

Table of Contents
Financial Summaries and Statistical TablesResources and Requirements Summary by Fund 175Total Requirements Summary Chart 176Full Time Equivalent (FTE); Comparison by Fund 177Full Time Equivalent (FTE); by Department: FY11 through FY14 178Total Budget Summary; Resources Only – FY11 through FY14 179General Fund Revenue Detail – FY11 through FY14 180Assessed Valuation; Levy and Tax Revenue Information Summary 183Assessed Valuation; Levy and Tax Revenue Information Detail 184Tax and Assessed Valuation History; by Fiscal Year – FY04 through FY14 188
GlossaryCity Fund Types 189Description of Funds 194Descriptions of Budget Terms 198Budget Acronyms and Abbreviations 207

READERS GUIDE
The Budget Document The budget document represents the entire City budget. The City of Springfield budget is arranged in separate sections to provide an easier understanding of the budget document. They are:
• Budget Message • City Overview • Operating Budget • Capital Budget • Non-Departmental Budget • Financial Summaries and Statistical Tables • Glossary
The Budget Message is a letter to the Mayor and City Council of Springfield, from the Springfield City Manager. The budget message from the City Manager outlines the overall direction and key goals used in developing the budget. The message highlights major service changes, organization changes or budgetary changes that are part of the adopted budget. The City Overview provides the reader with a view of how the City is organized, information on how to contact the City and a list of scheduled meetings for the Budget Committee. This is also a description of the City’s Budget Process and Annual Budget Process and Timeline. The Operating Budget by Department presents the City’s operating budget (personnel services, materials and services, and capital outlay) from the department view. There are eight City departments and one service area: City Manager’s Office; Development & Public Works; Finance; Fire and Life Safety; Human Resources; Information Technology; Legal and Judicial (a service area); Library, and Police. Each of the nine Departmental areas includes a description of the Department, its mission, community outcomes, organization chart, financial summary, and information about the personnel services of the Department. The Department view answers such questions as “How is the department organized to provide services to Springfield citizens? What budget authority is established for each major category of expenditures? What is the total budget for the Department and where is the funding coming from?” The Operating Budget of $90,262,904 makes up 29.4% of the total City budget. The Capital Budget section provides a summary page of the total City capital budget and detail descriptions of the projects and project categories are included. The Capital Budget of $28,658,694 makes up 9.3% of the total City budget. This section represents
FY14 Proposed Budget Attachment 31 Page 1 of 202
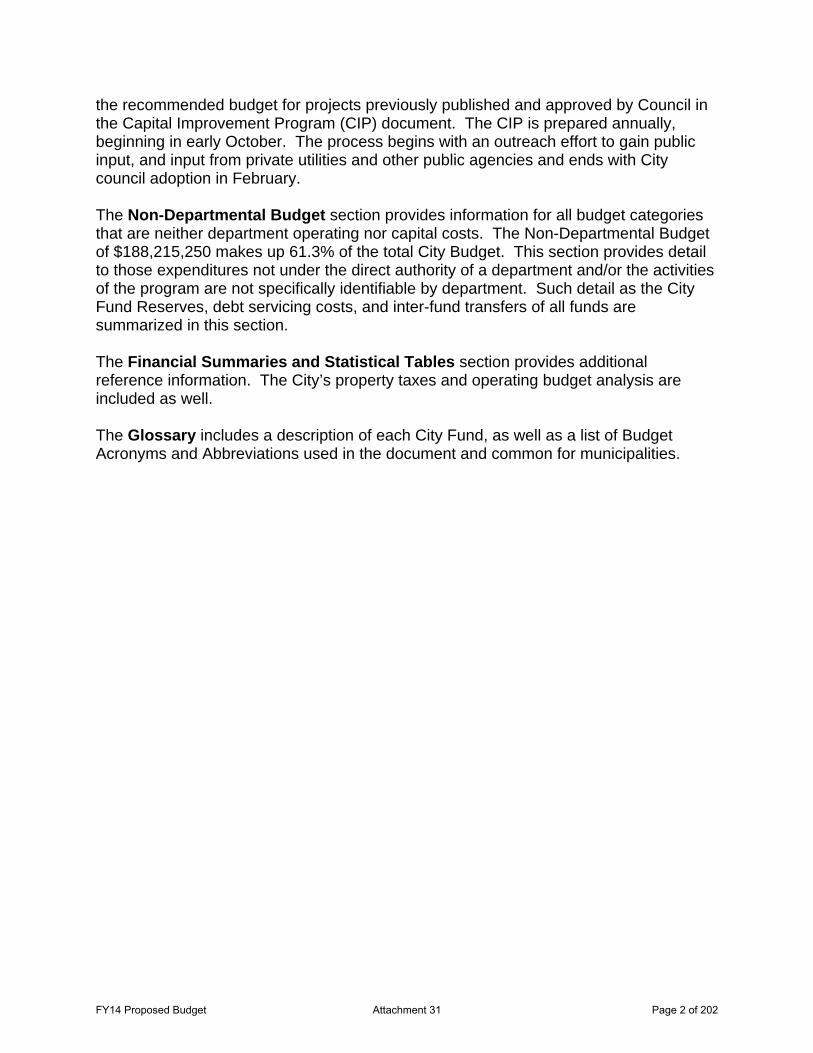
the recommended budget for projects previously published and approved by Council in the Capital Improvement Program (CIP) document. The CIP is prepared annually, beginning in early October. The process begins with an outreach effort to gain public input, and input from private utilities and other public agencies and ends with City council adoption in February. The Non-Departmental Budget section provides information for all budget categories that are neither department operating nor capital costs. The Non-Departmental Budget of $188,215,250 makes up 61.3% of the total City Budget. This section provides detail to those expenditures not under the direct authority of a department and/or the activities of the program are not specifically identifiable by department. Such detail as the City Fund Reserves, debt servicing costs, and inter-fund transfers of all funds are summarized in this section. The Financial Summaries and Statistical Tables section provides additional reference information. The City’s property taxes and operating budget analysis are included as well. The Glossary includes a description of each City Fund, as well as a list of Budget Acronyms and Abbreviations used in the document and common for municipalities.
FY14 Proposed Budget Attachment 31 Page 2 of 202

FY14 Proposed Budget Attachment 31 Page 3 of 202

FY14 Proposed Budget Attachment 31 Page 4 of 202

FY14 Proposed Budget Attachment 31 Page 5 of 202

FY14 Proposed Budget Attachment 31 Page 6 of 202

FY14 Proposed Budget Attachment 31 Page 7 of 202

FY14 Proposed Budget Attachment 31 Page 8 of 202

FY14 Proposed Budget Attachment 31 Page 9 of 202

FY14 Proposed Budget Attachment 31 Page 10 of 202

CITY OVERVIEW
City Government Organization The City of Springfield, incorporated in 1885, is a home rule charter city. This charter is the basic law under which the City operates. Amendments to the charter can only be made by a vote of the people and can be placed on the ballot by the Council or by the voters through an initiative process. The City of Springfield has a Council-Manager form of government. The Mayor is the formal representative of the City of Springfield and is elected to a four-year term by the voters at large on a non-partisan ballot. The Mayor presides over Council meetings and does not vote, except in the case of a tie. The Mayor can veto any Council decision, but a two-thirds vote of the Council can override the veto. As the chief elected officer, the Mayor is responsible for providing political and policy leadership for the community. The six-member City Council sets overall City policy and goals. The City Council also makes laws or ordinances, which govern the City of Springfield. Councilors are nominated from one of six wards and are elected at large for four-year staggered terms. Councilors are elected to represent citizens’ interests on the Council. The Council takes official action at regular Council meetings which are open to the public. The Council supervises, and is responsible for selecting, the City Manager. The City Manager supervises the operations of all City departments. City departments include the City Manager’s Office, Development Services, Finance, Fire and Life Safety, Human Resources, Information Technology, Legal and Judicial Services, Library, Police and Public Works Departments. As chief administrator, the City Manager has no vote in the Council, but may take part in discussions of matters coming before the legislative body. Citizen Involvement Our citizens are the most important part of the City organization. City services are directed to meet the needs of the citizens. Public hearings are held so that citizens can contribute to the planning and budgeting process of the City. Citizens may express their concerns and requests to their representatives on the City Council, City Budget Committee and other City committees. Citizens are also encouraged to attend the various public hearings held regarding City actions. Notices of all City public hearings are published in the Public Notices section of the Register Guard. Upcoming meeting agenda items are listed in the City Region section of the local newspapers.
Date Time and Place Agenda ItemsTuesday 5:30 p.m. Election of OfficersApril 30, 2013 Library Meeting Room Welcome from the City Manager Presentation of FY14 Proposed Budget Tuesday May 7, 2013 5:30 p.m. Presentation of SEDA Budget
6:00 p.m. Department Presentations Library Meeting Room Business from the Audience
FY14 Proposed Budget Attachment 31 Page 11 of 202
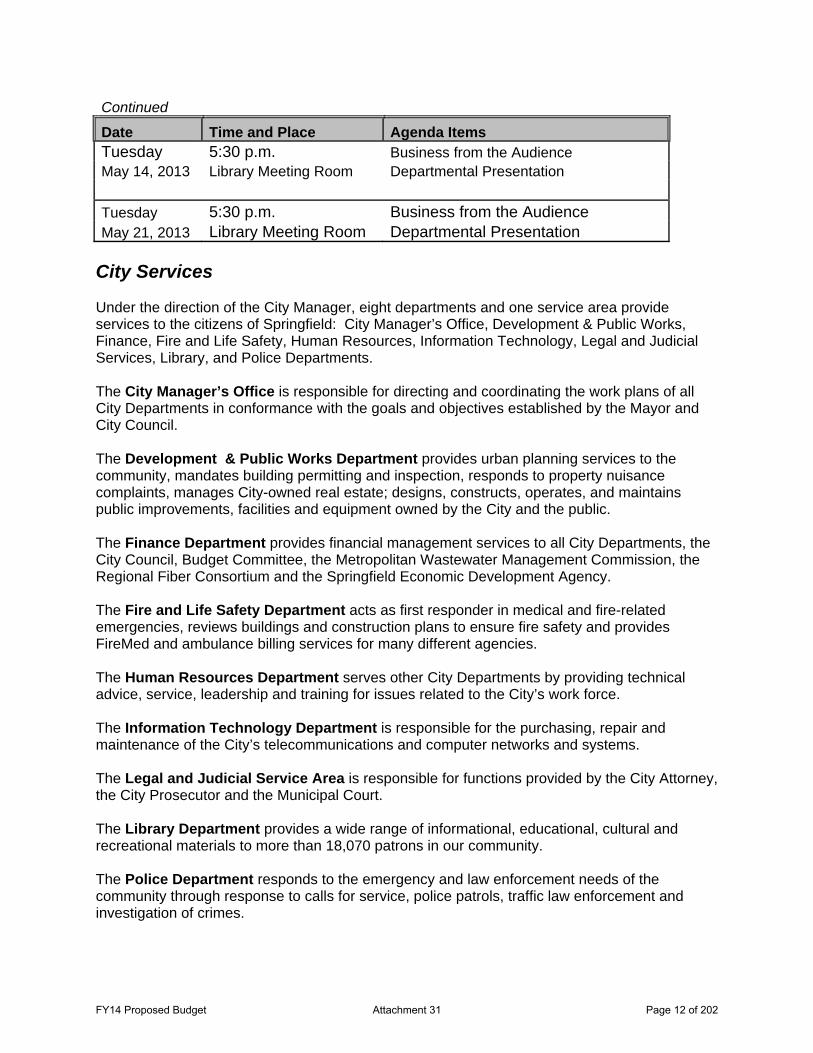
Continued Date Time and Place Agenda ItemsTuesday 5:30 p.m. Business from the Audience May 14, 2013 Library Meeting Room Departmental Presentation Tuesday 5:30 p.m. Business from the Audience May 21, 2013 Library Meeting Room Departmental Presentation
City Services Under the direction of the City Manager, eight departments and one service area provide services to the citizens of Springfield: City Manager’s Office, Development & Public Works, Finance, Fire and Life Safety, Human Resources, Information Technology, Legal and Judicial Services, Library, and Police Departments. The City Manager’s Office is responsible for directing and coordinating the work plans of all City Departments in conformance with the goals and objectives established by the Mayor and City Council. The Development & Public Works Department provides urban planning services to the community, mandates building permitting and inspection, responds to property nuisance complaints, manages City-owned real estate; designs, constructs, operates, and maintains public improvements, facilities and equipment owned by the City and the public. The Finance Department provides financial management services to all City Departments, the City Council, Budget Committee, the Metropolitan Wastewater Management Commission, the Regional Fiber Consortium and the Springfield Economic Development Agency. The Fire and Life Safety Department acts as first responder in medical and fire-related emergencies, reviews buildings and construction plans to ensure fire safety and provides FireMed and ambulance billing services for many different agencies. The Human Resources Department serves other City Departments by providing technical advice, service, leadership and training for issues related to the City’s work force. The Information Technology Department is responsible for the purchasing, repair and maintenance of the City’s telecommunications and computer networks and systems. The Legal and Judicial Service Area is responsible for functions provided by the City Attorney, the City Prosecutor and the Municipal Court. The Library Department provides a wide range of informational, educational, cultural and recreational materials to more than 18,070 patrons in our community. The Police Department responds to the emergency and law enforcement needs of the community through response to calls for service, police patrols, traffic law enforcement and investigation of crimes.
FY14 Proposed Budget Attachment 31 Page 12 of 202
Please refer to the Operating Budget section of this document for more detailed information about the departments and service area listed above. City Services Purpose of an Annual Budget – The budget represents the financial plan of the City. It is a policy tool for the Mayor and City Council to express the targets and priorities for the next fiscal year and an implementation tool that translates the targets into action plans which are reflected in each program’s goals, objectives and performance measures. The budget serves other functions as well. It is a financial tool which enables the City to allocate its resources. As a public document, it is a tool for elected officials and administrators to communicate decisions to the citizens and staff. As a decision-making document, staff uses the budget both as an accounting tool to ensure financial integrity and a management auditing tool to measure performance. Budget Process Overview – Oregon’s local budget law, as set forth in Chapter 294 of the Oregon Revised Statutes, requires local governments to prepare and adopt an annual budget. The law establishes standard procedures for preparing, presenting, and administering the budget. The law requires citizen involvement in the preparation of the budget and public disclosure of the budget before final adoption. Preparation – The City of Springfield operates on a fiscal year calendar (July 1 to June 30 of the following year). Preparation of the City budget usually begins in January by projecting annual resources and requirements for the coming fiscal year. Resources include revenues received in the current fiscal year, such as property tax receipts, user fees, grants and inter-governmental revenues, as well as reserves and working capital carried forward from the previous fiscal year. Requirements include wages, materials and services and other known costs. This comparison of resources and requirements establishes the context in which the Budget Committee provides policy direction for the preparation of the budget. Before City staff begins preparing the budget for the upcoming fiscal year, the Budget Committee or City Council are asked to establish general guidelines that will govern the preparation process. After the guidelines are established, staff prepares a proposed budget which the City manager presents to the Budget Committee, usually in April. The Budget Committee, consisting of the City Council and an equal number of citizens, reviews and revises the budget during a series of meetings in April and May. After the Budget Committee approves the budget, it is forwarded to the City Council for final adoption, usually in late June. A summary of the budget is published in the local newspaper prior to a City Council public hearing. The City Council has final authority to adopt or change the budget. If a change occurs during the review and adoption of the budget (after the public notice of the budget) that increases the property tax levy or increases expenditures in any fund by more than 10%, the budget must be referred back to the Budget Committee.
FY14 Proposed Budget Attachment 31 Page 13 of 202

City of Springfield Annual Budget Process and Timeline
A summary of the City’s annual budget process timeline is as follows: December 2012
The citizen members of the City of Springfield Budget Committee are appointed by Council.
Springfield City Council adopts goals for the next fiscal year.
January – March 2013 The City Council adopts the Five Year Capital Improvement Program. The City Council reviews the Community Development Block Grant projects for
budget preparation. The Budget Committee or City Council provides guidance to City Manager. The City Manager prepares the recommended FY14 Proposed Budget for
consideration by the Budget Committee.
April – May 2013 The City Manager’s budget message and the Proposed Budget are presented to the
Budget Committee. The Budget Committee meets and deliberates on the Proposed Budget.
May 2013
The Budget Committee recommends its FY14 Approved Budget to the City Council.
June 2013
The City Council holds hearings and adopts the FY14 Annual Budget. July 2014
The FY14 Adopted Budget is implemented and Tax Levy certified.
Adjusting the Adopted Budget The budget may be amended during the fiscal year. Amending a budget means that the original resolution adopted by Council will be changed based on updated information and/or unanticipated revenues or expenditures occurring after the adoption. Changes to the original resolution that alter legal spending levels must be approved by the City Council before any action can occur. Changes to the resolution are processed through supplemental budget action. A supplemental budget must be prepared and adopted before any expenditures are made in excess of a department’s legal budget appropriation. Regardless of the magnitude of the budget change, the City of Springfield holds a public hearing before adopting any supplemental budget changes. Notices of all budget hearings are published in the Springfield Times using guidelines in the Oregon Budget Law manual.
FY14 Proposed Budget Attachment 31 Page 14 of 202

Total Operating Budget and Debt Service - Last Four Fiscal YearsFY11 FY12 FY13* FY14
Actual Actual Amended Proposed
73,785,060$ 74,470,316$ 89,295,927$ 90,263,864$ 1,241.65 1,244.49 1,480.40 1,484.57
0.2% 19.0% 0.3%
3,296,511$ 3,292,676$ 3,295,157$ 3,287,968$ 55.47 55.02 54.63 54.08
-0.8% -0.7% -1.0%
59,425 59,840 60,319 60,801
Total Operating Revenue by Source - Last Four Fiscal YearsFY11 FY12 FY13* FY14
Actual Actual Amended Proposed
27,716,200$ 28,379,525$ 29,077,921$ 30,336,066$ 3,488,137 3,189,451 3,380,768 3,263,600 9,600,505 9,016,491 9,565,162 8,280,699
53,602,910 55,276,692 58,634,137 63,555,557 1,809,533 1,737,151 1,751,198 1,752,200 2,951,252 2,793,940 2,257,908 2,607,296 1,200,625 48,934 27,290 26,000 1,248,267 1,060,350 965,582 978,540
51,621,896 46,438,285 42,091,343 34,383,083 145,570,507 161,484,828 165,975,173 161,953,807 298 809 832$ 309 425 647$ 313 726 482$ 307 136 848$
% Change (cost per capita)
CITY OVERVIEW - ContinuedFY14 Proposed Budget
Budget Data
Operating Budget - All FundsCost per Capita
Use of Money and Property
Debt Service *Cost per Capita% Change (cost per capita)
Population
Source
TaxesLicenses and PermitsIntergovernmentalCharges for ServiceFines and Forfeitures
Special AssessmentsMiscellaneous ReceiptsOther Financing SourcesCash Carry-Over
Total 298,809,832$ 309,425,647$ 313,726,482$ 307,136,848$
Staffing Summaries Citywide Full-Time Authorized Positions - Last Four YearsFY11 FY12 FY13* FY14
Adopted Adopted Adopted Proposed437.50 421.96 408.49 406.69
7.36 7.05 6.77 6.69 -4.22% -3.96% -1.23%
* Amended as of Feb 4, 2013
Total Personnel (FTE)Employees/1,000 Population% Change in Emp/1,000 Population
Total
Source
FY14 Proposed Budget Attachment 31 Page 15 of 202

FY11 FY12 FY13* FY14Source Actual Actual Amended Proposed
Resources: (Summary Level)Taxes (Current and Delinquent) 27,716,200$ 28,379,525$ 29,077,921$ 30,336,066$ Licenses, Permits and Fees 3,488,137 3,189,451 3,380,768 3,263,600 Intergovernmental 9,600,505 9,016,491 9,565,162 8,280,699 Charges for Service 53,602,910 55,276,692 58,634,137 63,555,557 Fines and Forfeitures 1,809,533 1,737,151 1,751,198 1,752,200 Use of Money and Property 2,951,252 2,793,940 2,257,908 2,607,296 Special Assessments 1,200,625 48,934 27,290 26,000 Miscellaneous Receipts 1,248,267 1,060,350 965,582 978,540 Other Financing Sources 51,621,896 46,438,285 42,091,343 34,383,083 Total Current Revenues 153,239,325$ 147,940,819$ 147,751,309$ 145,183,041$ Cash Carryover 145,570,507 161,484,828 165,975,173 161,953,807 Total Resources 298,809,832$ 309,425,647$ 313,726,482$ 307,136,848$
- - - - Requirements:
Operating BudgetCity Manager's Office 1,451,174$ 1,412,294$ 1,544,588$ 1,477,085$ Development & Public Works 37,069,380$ Development Services 4,649,329 3,855,586 4,788,676 - Finance 1,012,624 1,066,336 1,156,549 1,215,670 Fire and Life Safety 16,636,547 16,557,474 17,908,776 16,777,521 Human Resources 1,083,985 1,080,258 4,666,727 8,905,685 Information Technology 1,414,843 1,408,940 1,535,217 1,658,627 Legal and Judicial Services 1,581,145 1,768,193 1,904,290 1,834,475 Library 1,372,206 1,440,910 1,546,008 1,621,748 Police 16,909,925 18,008,216 19,329,501 19,703,673 Public Works 27,673,283 27,872,108 34,915,595 -
Total Operating Budget 73,785,060$ 74,470,316$ 89,295,927$ 90,263,864$ Total Capital Budget 11,471,702 13,006,636 47,888,039 28,658,694 Total Non-Departmental Budget 51,763,226 56,012,406 176,542,516 188,214,290
Total Requirements 137,019,988$ 143,489,358$ 313,726,482$ 307,136,848$ - - - -
* Amended as of Feb 4, 2013
TOTAL BUDGET SUMMARY - FY11 through FY14Resources and Requirements: All Funds
FY14 Proposed Budget Attachment 31 Page 16 of 202

FY11 FY11 FY13* FY14Source Actual Actual Amended Proposed
Resources: (Summary Level)Taxes (Current and Delinquent) 17,139,200$ 17,648,630$ 18,137,044$ 18,522,168$ Licenses, Permits and Fees 2,259,845 2,044,417 2,258,868 2,130,800 Intergovernmental 3,778,249 3,857,269 3,753,260 3,926,900 Charges for Service 2,286,697 2,843,890 2,902,448 3,112,570 Fines and Forfeitures 1,608,031 1,573,505 1,749,998 1,752,000 Use of Money and Property 108,648 73,085 140,000 152,500 Miscellaneous Receipts 227,098 430,597 193,236 201,040 Other Financing Sources 3,297,183 3,677,118 3,539,571 3,295,199 Total Current Revenues 30,704,951$ 32,148,512$ 32,674,425$ 33,093,177$ Cash Carryover 7,808,672 7,551,136 7,754,752 8,143,851
Total Resources 38,513,623$ 39,699,648$ 40,429,177$ 41,237,028$
Requirements:Operating Budget
City Manager's Office 1,256,083$ 1,075,431$ 1,262,889$ 1,225,188$ Development & Public Works 2,222,042$ Development Services 1,523,935 1,283,833 1,156,913 - Finance 781,847 832,650 853,351 903,874 Fire and Life Safety 9,853,100 9,966,973 10,085,017 9,931,547 Human Resources 391,502 374,108 401,064 392,242 Information Technology 1,275,045 1,339,119 1,400,217 1,391,062 Legal and Judicial Services 1,246,609 1,402,593 1,486,661 1,427,087 Library 1,287,777 1,333,601 1,386,253 1,483,283 Police 11,532,906 12,270,639 12,947,948 13,442,736 Public Works 983,523 987,402 1,032,685 -
Total Operating Budget 30,132,328$ 30,866,349$ 32,012,998$ 32,419,061$ Total Capital Budget - - - - Total Non-Departmental Budget 829,979 1,078,547 8,416,179 8,817,967
Total Requirements 30,962,307$ 31,944,896$ 40,429,177$ 41,237,028$
* Amended as of Feb 4, 2013
TOTAL BUDGET SUMMARY - FY11 through FY14Resources and Requirements: General Fund
FY14 Proposed Budget Attachment 31 Page 17 of 202
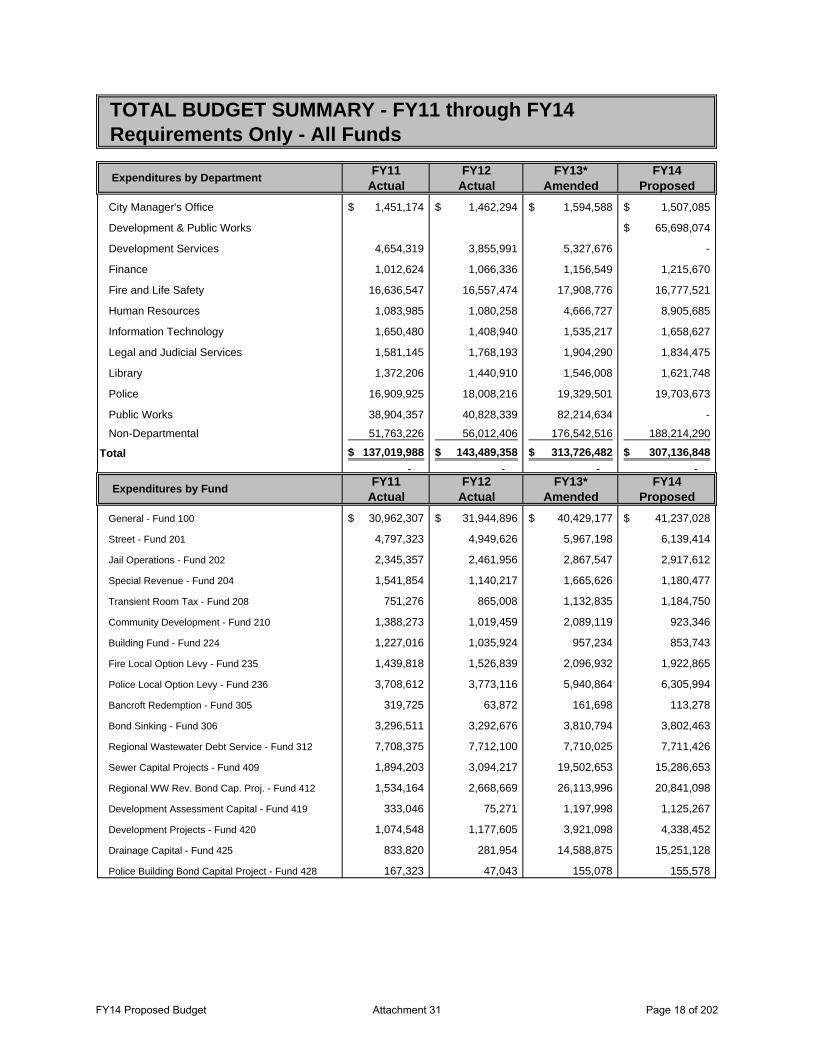
FY11 FY12 FY13* FY14Actual Actual Amended Proposed
City Manager's Office 1,451,174$ 1,462,294$ 1,594,588$ 1,507,085$
Development & Public Works 65,698,074$
Development Services 4,654,319 3,855,991 5,327,676 -
Finance 1,012,624 1,066,336 1,156,549 1,215,670
Fire and Life Safety 16,636,547 16,557,474 17,908,776 16,777,521
Human Resources 1,083,985 1,080,258 4,666,727 8,905,685
Information Technology 1,650,480 1,408,940 1,535,217 1,658,627
Legal and Judicial Services 1,581,145 1,768,193 1,904,290 1,834,475
Library 1,372,206 1,440,910 1,546,008 1,621,748
Police 16,909,925 18,008,216 19,329,501 19,703,673
Public Works 38,904,357 40,828,339 82,214,634 -
Non-Departmental 51,763,226 56,012,406 176,542,516 188,214,290
Total 137,019,988$ 143,489,358$ 313,726,482$ 307,136,848$ - - - -
FY11 FY12 FY13* FY14Actual Actual Amended Proposed
General - Fund 100 30,962,307$ 31,944,896$ 40,429,177$ 41,237,028$
Street - Fund 201 4,797,323 4,949,626 5,967,198 6,139,414
Jail Operations - Fund 202 2,345,357 2,461,956 2,867,547 2,917,612
Special Revenue - Fund 204 1,541,854 1,140,217 1,665,626 1,180,477
Transient Room Tax - Fund 208 751,276 865,008 1,132,835 1,184,750
Community Development - Fund 210 1,388,273 1,019,459 2,089,119 923,346
Building Fund - Fund 224 1,227,016 1,035,924 957,234 853,743
Fire Local Option Levy - Fund 235 1,439,818 1,526,839 2,096,932 1,922,865
Police Local Option Levy - Fund 236 3,708,612 3,773,116 5,940,864 6,305,994
Bancroft Redemption - Fund 305 319,725 63,872 161,698 113,278
Bond Sinking - Fund 306 3,296,511 3,292,676 3,810,794 3,802,463
Regional Wastewater Debt Service - Fund 312 7,708,375 7,712,100 7,710,025 7,711,426
Sewer Capital Projects - Fund 409 1,894,203 3,094,217 19,502,653 15,286,653
Regional WW Rev. Bond Cap. Proj. - Fund 412 1,534,164 2,668,669 26,113,996 20,841,098
Development Assessment Capital - Fund 419 333,046 75,271 1,197,998 1,125,267
Development Projects - Fund 420 1,074,548 1,177,605 3,921,098 4,338,452
Drainage Capital - Fund 425 833,820 281,954 14,588,875 15,251,128
Police Building Bond Capital Project - Fund 428 167,323 47,043 155,078 155,578
TOTAL BUDGET SUMMARY - FY11 through FY14Requirements Only - All Funds
Expenditures by Department
Expenditures by Fund
FY14 Proposed Budget Attachment 31 Page 18 of 202

FY11 FY12 FY13* FY14Actual Actual Amended Proposed
Regional Wastewater Capital - Fund 433 4,853,968 7,204,797 60,907,301 65,187,790
Street Capital - Fund 434 - 7,703 685,883 621,570
SDC Storm Improvement - Fund 440 165,297 90,550 1,781,540 1,699,613
SDC Storm Drainage Reimb Fund - Fund 441 27,436 21,173 102,583 100,264
SDC Sanitary Reimbursement - Fund 442 97,230 189,087 1,358,298 1,287,015
SDC Sanitary Improvement - Fund 443 82,597 137,254 513,717 450,631
SDC Regional Wastewater Reimb. - Fund 444 51,177 16,971 215,592 253,068
SDC Regional Wastewater Improv. - Fund 445 2,501,132 2,000,957 2,812,552 2,215,352
SDC Transportation Reimbursement - Fund 446 83,418 83,045 499,876 72,414
SDC Transportation Improvement - Fund 447 1,916,521 192,892 1,756,218 1,270,267
Sewer Operations - Fund 611 5,087,014 7,436,859 12,218,892 10,747,145
Regional Wastewater - Fund 612 30,107,685 27,846,001 42,658,109 42,392,676
Ambulance - Fund 615 5,087,042 5,005,353 5,045,597 5,292,717
Drainage Operating - Fund 617 4,645,675 6,453,396 9,182,217 9,079,703
Booth-Kelly - Fund 618 1,205,018 1,268,523 2,559,062 2,361,735
Regional Fiber Consortium - Fund 629 54,440 40,937 113,025 203,348
Insurance - Fund 707 14,378,486 16,754,581 20,712,941 22,780,751 Vehicle and Equipment - Fund 713 849,534 1,099,262 9,546,797 9,182,022 SDC Administration - Fund 719 502,766 509,570 747,535 648,195
Total 137,019,988$ 143,489,358$ 313,726,482$ 307,136,848$ - - - -
FY11 FY12 FY13* FY14Actual Actual Amended Proposed
Personal Services 44,499,308$ 44,578,831$ 46,912,749$ 48,207,101$
Materials and Services 28,311,692 28,133,565 37,274,418 39,858,345
Capital Outlay 974,060 1,757,920 5,108,760 2,198,418
Capital Projects 11,471,702 13,006,636 47,888,039 28,658,694 Non-Departmental 51,763,226 56,012,406 176,542,516 188,214,290
Total 137,019,988$ 143,489,358$ 313,726,482$ 307,136,848$
FY11 FY12 FY13* FY14Actual Actual Amended Proposed
Operating 73,785,060$ 74,470,316$ 89,295,927$ 90,263,864$
Capital Projects 11,471,702 13,006,636 47,888,039 28,658,694
Non Departmental 51,763,226 56,012,406 176,542,516 188,214,290
Total 137,019,988$ 143,489,358$ 313,726,482$ 307,136,848$
* Amended as of Feb 4, 2013Note: Department totals include Capital Projects and Capital Outlay
Expenditure Summary
Expenditures by Category
Expenditures by Fund - Continued
FY14 Proposed Budget Attachment 31 Page 19 of 202

FY14 Proposed Budget Attachment 31 Page 20 of 202

FY11 FY12 FY13* FY14Actual Actual Amended Proposed
City Manager's Office 1,451,174$ 1,412,294$ 1,544,588$ 1,477,085$ Development & Public Works 37,069,380 Development Services 4,649,329 3,855,586 4,788,676 - Finance 1,012,624 1,066,336 1,156,549 1,215,670 Fire and Life Safety 16,636,547 16,557,474 17,908,776 16,777,521 Human Resources 1,083,985 1,080,258 4,666,727 8,905,685 Information Technology 1,414,843 1,408,940 1,535,217 1,658,627 Legal and Judicial Services 1,581,145 1,768,193 1,904,290 1,834,475 Library 1,372,206 1,440,910 1,546,008 1,621,748 Police 16,909,925 18,008,216 19,329,501 19,703,673 Public Works 27,673,283 27,872,108 34,915,595 -
Total 73,785,060$ 74,470,316$ 89,295,927$ 90,263,864$
FY11 FY12 FY13* FY14Actual Actual Amended Proposed
General - Fund 100 30,132,328$ 30,866,349$ 32,012,998$ 32,419,061$
Street - Fund 201 4,797,323 4,599,626 5,216,967 5,397,917
Jail Operations - Fund 202 2,345,357 2,461,956 2,743,976 2,855,191
Special Revenue - Fund 204 1,541,854 1,097,230 1,066,745 712,354
Transient Room Tax - Fund 208 324,185 378,814 419,941 410,102
Community Development - Fund 210 1,388,273 1,019,459 1,946,533 780,746
Building Code - Fund 224 1,172,917 1,008,874 915,058 829,647
Fire Local Option Levy - Fund 235 1,439,818 1,526,839 1,556,762 1,558,593
Police Local Option Levy - Fund 236 2,408,612 2,501,611 2,764,913 2,956,338
Bancroft Redemption - Fund 305 13,582 13,872 15,885 17,479
Development Assessment Capital - Fund 419 69,110 61,399 104,692 105,758
Regional Wastewater Capital - Fund 433 331,959 1,049,525 2,860,902 1,039,532
SDC Storm Improvement - Fund 440 49,551 49,791 23,778 37,968
SDC Sanitary Reimbursement - Fund 442 73,870 181,632 110,315 161,148
SDC Storm Drainage Reimb Fund - Fund 441 27,436 21,173 16,344 31,218
SDC Sanitary Improvement - Fund 443 36,935 91,592 74,208 75,935
SDC Regional Wastewater Reimb. - Fund 444 1,177 87 4,000 2,000
SDC Regional Wastewater Improve. - Fund 445 1,132 957 3,500 3,000
SDC Transportation Reimb. - Fund 446 39,605 45,683 53,583 37,968
SDC Transportation Improvement - Fund 447 229,620 83,873 195,332 130,775
Sewer Operations - Fund 611 2,771,816 3,000,549 3,475,433 3,643,687
Regional Wastewater - Fund 612 13,706,172 13,617,734 16,180,746 16,347,793
OPERATING BUDGET SUMMARY - FY11 through FY14Requirements Only - All Funds
Expenditures by Department
Expenditures by Fund
FY14 Proposed Budget Attachment 31 Page 21 of 202
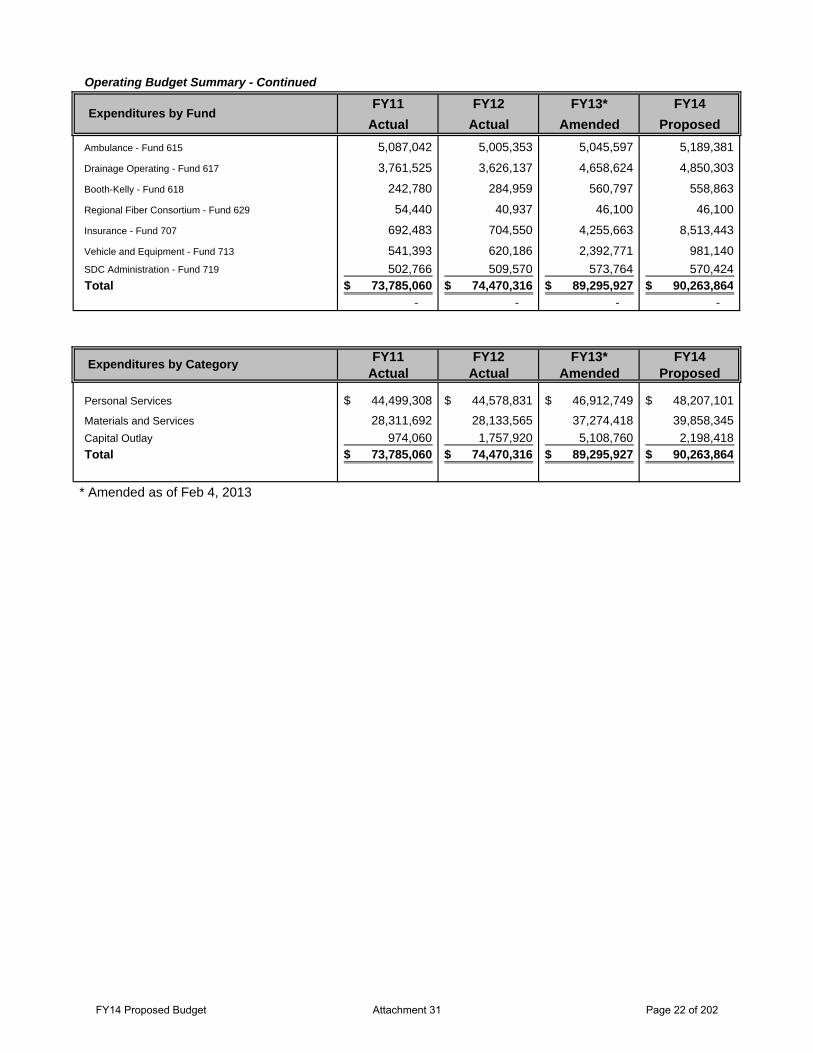
FY11 FY12 FY13* FY14Actual Actual Amended Proposed
Ambulance - Fund 615 5,087,042 5,005,353 5,045,597 5,189,381
Drainage Operating - Fund 617 3,761,525 3,626,137 4,658,624 4,850,303
Booth-Kelly - Fund 618 242,780 284,959 560,797 558,863
Regional Fiber Consortium - Fund 629 54,440 40,937 46,100 46,100
Insurance - Fund 707 692,483 704,550 4,255,663 8,513,443
Vehicle and Equipment - Fund 713 541,393 620,186 2,392,771 981,140 SDC Administration - Fund 719 502,766 509,570 573,764 570,424 Total 73,785,060$ 74,470,316$ 89,295,927$ 90,263,864$
- - - -
FY11 FY12 FY13* FY14Actual Actual Amended Proposed
Personal Services 44,499,308$ 44,578,831$ 46,912,749$ 48,207,101$ Materials and Services 28,311,692 28,133,565 37,274,418 39,858,345 Capital Outlay 974,060 1,757,920 5,108,760 2,198,418 Total 73,785,060$ 74,470,316$ 89,295,927$ 90,263,864$
* Amended as of Feb 4, 2013
Expenditures by Category
Operating Budget Summary - Continued
Expenditures by Fund
FY14 Proposed Budget Attachment 31 Page 22 of 202
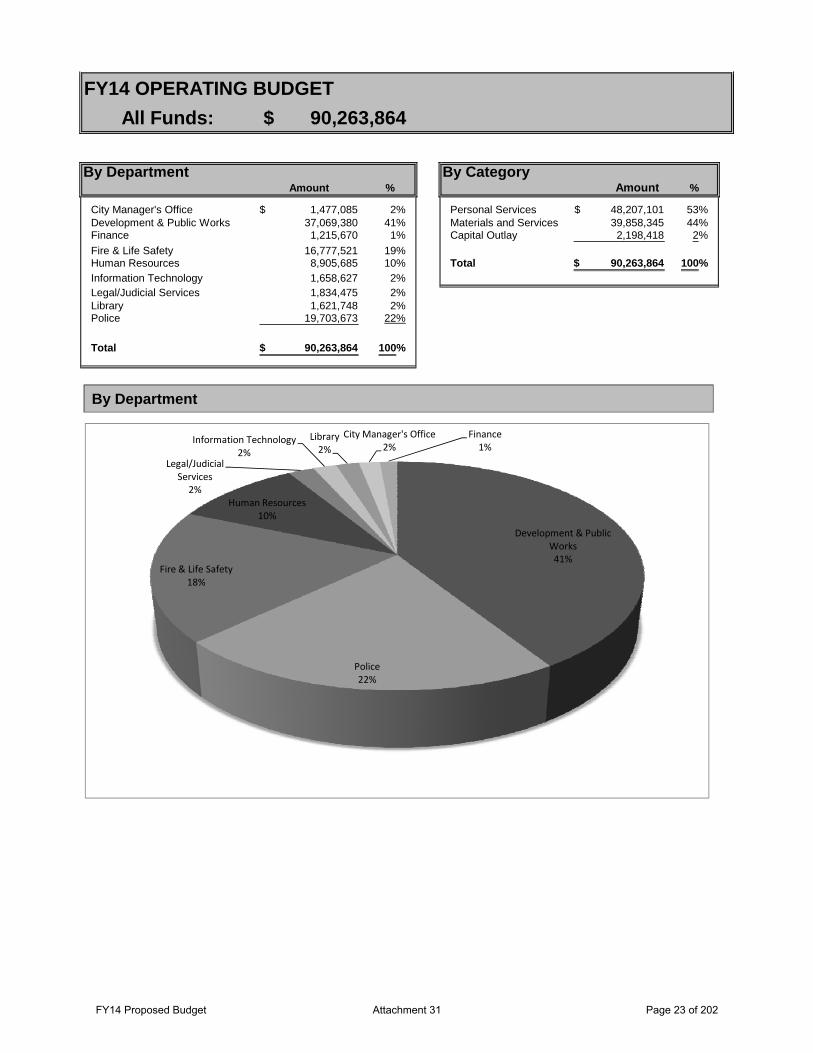
All Funds:
Amount % Amount %
City Manager's Office 1,477,085$ 2% Personal Services 48,207,101$ 53%Development & Public Works 37,069,380 41% Materials and Services 39,858,345 44%Finance 1,215,670 1% Capital Outlay 2,198,418 2%Fire & Life Safety 16,777,521 19%Human Resources 8,905,685 10% Total 90,263,864$ 100%Information Technology 1,658,627 2%Legal/Judicial Services 1,834,475 2%Library 1,621,748 2%Police 19,703,673 22%
Total 90,263,864$ 100%
90,263,864$
By Department By Category
FY14 OPERATING BUDGET
By Department
Development & Public Works41%
Human Resources10%
Legal/Judicial Services
2%
Information Technology2%
Library2%
City Manager's Office2%
Finance1%
Police22%
Fire & Life Safety18%
FY14 Proposed Budget Attachment 31 Page 23 of 202

CIT
Y O
F SP
RIN
GFI
ELD
CIT
Y C
OU
NC
IL
CIT
Y M
AN
AG
ER
LEG
AL
& J
UD
ICIA
L S
ER
VIC
ES
CIT
IZEN
S of
SPR
ING
FIEL
D
CIT
Y M
AN
AG
ER
’S
OFF
ICE
FI
NA
NC
E
DE
PA
RTM
EN
T
HU
MA
N
RE
SO
UR
CE
S
DE
PA
RTM
EN
T
DE
VE
LOP
ME
NT
PU
BLI
C W
OR
KS
D
EP
AR
TME
NT
INFO
RM
ATI
ON
TE
CH
NO
LOG
Y
DE
PA
RTM
EN
T
FIR
E L
IFE
AN
D
SA
FETY
D
EP
AR
TME
NT
PO
LIC
E
DE
PA
RTM
EN
T LI
BR
AR
Y
DE
PA
RTM
EN
T
City
Atto
rney
City
Pro
secu
tor
Mun
icip
al J
udge
s
FY14 Proposed Budget Attachment 31 Page 24 of 202
City Manager's Office
Departmental Programs
• Administration • Economic Development
Department Description The City Manager’s Office directs and coordinates the work plans of all City departments in conformance with the goals and objectives established by the Mayor and City Council. The City Manager is the chief administrative officer for the City and is responsible for informing and advising the City Council regarding services the City provides to the community and ensures that appropriate administrative processes are in place to facilitate effective and efficient provision of City services. The City Manager oversees the administration of all City departments and functions and appoints the department directors. Staff in the City Manager’s Office support the Mayor and City Council and are responsible for city recorder functions, city elections, management of boards, commissions and committees as well as media relations, public information, responding to citizen concerns, intergovernmental relations, website maintenance, administration of the City budget, oversight of the City Emergency Management Program, managing the city’s community and economic development program, including staffing of the Springfield Economic Development Agency.
Mission The City Manager’s Office mission is to ensure that a common vision exists throughout the City’s service delivery systems and that the citizens of Springfield are encouraged to participate in City government. Supporting multi-jurisdictional partnerships and maintaining excellent working relationships with other governments is a focus of the City Manager’s Office. The City Manager’s Office creates and facilitates systems, processes and policies necessary to provide quality and consistent services to our community. The City Manager’s Office ensures that the city’s Community and Economic Development Program offers businesses, community organizations and citizens the appropriate support for economic development and growth, promotes awareness and understanding of city services, policies, projects and issues through communication with the citizens, employees, news media, special interest groups, community groups, neighborhoods and businesses. The City Manager’s Office also staffs and implements the Springfield Economic Development Agency to develop and redevelop both the Glenwood and Downtown areas through their respective Urban Renewal plans.
FY14 Proposed Budget Attachment 31 Page 25 of 202

City Manager's Office:
City Manager's Office:
FY14 OPERATING BUDGET - General Fund 32,419,061$
FY14 OPERATING BUDGET - All Funds 90,263,864$
1,225,188$
1,477,085$
City Manager's Office
4%
All Others$31,193,873
96%
City Manager's Office
2%
All Others$88,786,779
98%
FY14 Proposed Budget Attachment 31 Page 26 of 202

FY11 FY12 FY13* FY14Actual Actual Amended Proposed
Expenditures by Category:Personal Services 886,041$ 792,850$ 948,083$ 1,013,397$ Materials and Services 565,133 619,444 596,505 463,688
Total 1,451,174$ 1,412,294$ 1,544,588$ 1,477,085$
Expenditures by Fund:General 1,256,083$ 1,075,431$ 1,262,889$ 1,225,188$ Special Revenue - 110,964 39,000 15,730 Street 1,881 - - - Transient Room Tax 193,210 225,899 242,699 233,767 Vehicle and Equipment - - - 2,400
Total 1,451,174$ 1,412,294$ 1,544,588$ 1,477,085$
Expenditures by Sub-Program:Administration 726,756$ 628,119$ 756,228$ 822,750$ City Council 54,158 33,757 34,628 34,430 Communications 9,542 6,265 17,853 13,933 Economic Development 223,012 387,956 346,227 316,044 Intergovernmental 437,707 356,197 389,652 289,928
Total 1,451,174$ 1,412,294$ 1,544,588$ 1,477,085$
City Manager's OfficeFinancial Summary
* Amended as of Feb 4, 2013
FY14 Proposed Budget Attachment 31 Page 27 of 202

City M
anager (1.0
)
CO
MM
UN
IC
AT
IO
NS
EC
ON
OM
IC
D
EV
ELO
PM
EN
T
Assis
tant C
ity M
anager (1.0
)
AD
MIN
ISTR
AT
IO
N
Managem
ent A
nalyst
(2.0
)
Manager/Pro
gram
Manager (1.0
)
Manager/Pro
gram
Manager (1.0
)
Managem
ent A
nalyst
(1.0
)
FY14 Proposed Budget Attachment 31 Page 28 of 202

Adopted Adopted Adopted ProposedFY11 FY12 FY13 FY14
General 7.40 6.40 6.40 6.40Transient Room Tax 0.60 0.60 0.60 0.60Total Full-Time Equivalents 8.00 7.00 7.00 7.00
Adopted Adopted Adopted ProposedFY11 FY12 FY13 FY14
Administrative Aide/City Recorder 1.00 1.00 1.00 1.00Administrative Coordinator 1.00 1.00 1.00 1.00Assistant City Manager 1.00 1.00 1.00 1.00City Manager 1.00 1.00 1.00 1.00Clerk 3 1.00 0.00 0.00 0.00Community Development Manager 1.00 1.00 1.00 1.00Community Relations Manager 1.00 1.00 1.00 1.00Management Analyst 1.00 1.00 1.00 1.00Total Full-Time Equivalents 8.00 7.00 7.00 7.00
City Manager's Office
Position Summary
Number of Full-Time Equivalents
Job Title/Classification:
FTE Summary by Fund
FY14 Proposed Budget Attachment 31 Page 29 of 202

FY14 Proposed Budget Attachment 31 Page 30 of 202

City Manager's Office
Program: Administration Program Description: The City Manager's Office is responsible for directing and coordinating the work plans of all City departments in conformance with the goals and objectives established by the Mayor and City Council. The City Manager is responsible for informing and advising the City Council about changes in service levels and delivery mechanisms, implementing administrative processes which facilitate the effective and efficient provision of City services, analyzing policy issues pertaining to organizational goals and objectives and appointing department directors. Staff in the City Manager's Office is responsible for media relations, public information, employee communication, responding to citizen concerns, special events, intergovernmental relations, website maintenance, general administration, budget administration, city recorder functions, city elections, management of boards, commissions and committees, support to the Mayor and City Council, oversight of the City's Emergency Management Program, managing the city's community and economic development program and staffing the City's urban renewal agency.
Budget Highlights: The budget includes continued funding to support City participation in TEAM Springfield. The proposed budget currently includes continued funding for regional Intergovernmental Agencies and local outside agencies (Chamber of Commerce, Human Services, L-COG, League of Oregon Cities, Springfield Museum and Metro Partnership). Funding for the referenced agencies is reflected within the City Manager's Office budget program area titled Intergovernmental Agencies. Based upon policy direction, funding for these outside agencies could continue to be funded, reduced and/or eliminated.
Service Level Changes: Material & Services targets for FY 2014 limits expenditures to the required activities and may limit any non-mandatory cost such as memberships, travel/meeting, subscriptions, donations and/or advertising.
FY14 Proposed Budget Attachment 31 Page 31 of 202

Program Performance Indicator:
Council Goals Key Processes Measurement
Methods FY13
Target FY13
Actual FY14
Target
To O
ffer F
inan
cial
ly S
ound
and
Sta
ble
Gov
ernm
ent S
ervi
ces
Departments manage resources to maintain staffing levels for key services, through proposed FTE,
each budget year.
Number of City Employees per 1000 Population
8.00 6.8 8.00
Retain community support by informing the community
regarding services provided on a monthly basis through media
advisories, print and news stories.
Update Council/Budget Committee regarding financial forecast related to annual FTE
by reporting annually, at the mid-year budget meeting.
FY14 Proposed Budget Attachment 31 Page 32 of 202

City Manager's Office
Program: Economic Development Program Description:
• Economic Development staff work to increase the number, diversity and stability of private sector jobs in the community, by assisting local businesses with site development and infrastructure, overseeing the Enterprise Zone program and accessing other incentive programs. The staff provides services designed to facilitate economic growth, redevelopment and neighborhood stability.
• The Transient Room Tax program supports tourist-related activities in Springfield.
• The Economic Development staff implements the Springfield Economic Development Agency to develop and redevelop both the Glenwood and Downtown areas through their respective Urban Renewal plans and development plans emerging for each area.
• Staff coordinated the FY 12 Sustainable City Year projects and potential follow-up actions and projects.
Budget Highlights: • Assist with marketing of vacant industrial properties and overcome redevelopment
problems for potential mixed-use sites in Glenwood and Downtown.
• 156 new hotel rooms were completed in Gateway. Room tax revenue increased 18% year-to-date, above an expected 5% increase.
• Provide staff support for the Springfield Economic Development Agency in redeveloping Glenwood and the Downtown areas with revisions to land-use plans and redevelopment regulations. Through SEDA funding, the first phase of the Glenwood Refinement Plan update is winding to completion. A strategic planning process completed for Downtown, includes an extensive parking management plan and implementation underway of key projects.
• Discussions continue with developers and owners regarding redevelopment of Glenwood's Riverfront and begin discussions regarding Glenwood's Refinement Plan update and complete plans for the Downtown redevelopment strategy area, through the City's Urban Renewal Agency (SEDA).
• Room Tax revenue increases have not stabilized enough to offer RFPs for community projects funded by Room Tax sources. Issues identified in the Visitors Readiness Report to improve the local area’s attractiveness to visitors are being addressed by Sustainable Cities Year projects and many help increase Room Tax revenue and improve the visitor’s experience.
Service Level Changes: None
FY14 Proposed Budget Attachment 31 Page 33 of 202

Program Performance Indicator: Council Goals Key Processes Measurement
Methods FY13
Target FY13
Actual FY14
Target To
Enc
oura
ge C
omm
unity
and
Eco
nom
ic D
evel
opm
ent a
nd R
evita
lizat
ion
Compare growth of property values in Glenwood Urban
Renewal area, versus growth in citywide property values,
through a review and comparison of assessed values,
from the Lane County Tax Assessor.
Growth in Level of Downtown
Urban Renewal Investments (as a % above City
assessed value/AV)
2.0% 1.2% 2.0% Compare growth of property values in Downtown Urban
Renewal area, versus growth in citywide property values,
through a review and comparison of assessed values,
from the Lane County Tax Assessor.
Monitor number of public/private investments enabled through the Glenwood Urban Renewal for planning and infrastructure.
Growth in Level of Glenwood Urban Renewal Investments (as a % above City assessed value/AV)
2.5% 2.4% 2.5% Monitor number of public/private
investments enabled through the Downtown Urban Renewal for planning and infrastructure.
Review Room Tax recipient contract, evaluate and confirm funds were used for intended
purpose. % of Outcome Measures Met by Room Tax
Recipients
100.0% 0.0% 100.0%Identify agency goal, confirm it was met and project funding resulted in effective use of
funds. Note: No annual funding distribution FY11/12.
FY14 Proposed Budget Attachment 31 Page 34 of 202
Development and Public Works Department Departmental Programs
Administration Building Safety and Inspection
Services Community Development Block
Grant (CDBG) and HOME Investment Partnerships (HOME)
Comprehensive Planning Development Review and
Enforcement
Drainage/Stormwater Emergency Management Facilities & Equipment Preservation Regional/Local Wastewater Special Events Streets Technical Services Transportation
Department Description The Development and Public Works Department plans, designs, constructs, operates, and maintains public improvements, facilities and equipment owned by the City and the public, processes development applications and building permits, and develops and manages the City’s comprehensive land use plans. The Department provides professional and technical support to other City departments. In addition to the Administration section of the Department, services are provided through five divisions: Current Development, Community Development, Environmental Services, Operations, and Technical Services. The Administration program provides overall direction and management of the Department, and coordinates interdepartmental activities and City Council support. The administration program is responsible for the City’s Emergency Management program, an assignment that was transferred from the Fire and Life Safety Department at the time of the merger of the Springfield and Eugene Fire Departments. The Administration program also manages long-term access to the City’s public ways and monitors the revenue sources that are critical to the fulfillment of the Department’s mission. The Community Development Division is responsible for the planning, design and construction of public improvements, establishing and operating an efficient and safe multi-modal transportation system, and developing and delivering comprehensive land use plans and associated refinement plans.
The Current Development Division actively works to increase Springfield’s housing, business and industry development opportunities and to improve the community’s health, safety, welfare and livability through the efficient implementation of the Division’s development assistance responsibilities, and the equitable enforcement of the City’s Development Code, Municipal Code and each of the Building Safety Codes. The Environmental Services Division provides administration, management and capital improvements planning and construction services for the Metropolitan Wastewater Management Commission; manages the Industrial Pretreatment Program, local wastewater and drainage rates, and customer service; and coordinates Development and Public Works efforts to manage and regulate activities affecting surface waters to protect water quality and comply with Federal clean water regulations. The Operations Division is responsible for maintaining the City’s infrastructure, including streets, sewers, drainageways, public properties, vehicles, equipment, and buildings. The Technical Services Division provides land surveying and develops and maintains geospatial information and automated mapping and facilities management systems.
FY14 Proposed Budget Attachment 31 Page 35 of 202

Mission The City of Springfield Development and Public Works Department facilitates the creation of the City. The Department offers comprehensive development assistance with primary emphasis on customer service to assist applicants with project navigation, facilitation and development with collaborative efforts from other departments and partners to guide applicants through the development process. The Department provides long-range land use planning and zoning; plan and design, construct, operate and maintain infrastructure to promote economic vitality and public safety using the design standards, building codes and the City’s municipal code to sustain Springfield’s livability.
FY14 Proposed Budget Attachment 31 Page 36 of 202

Development & Public Works:
Development & Public Works:
FY14 OPERATING BUDGET - General Fund 32,419,061$
FY14 OPERATING BUDGET - All Funds 90,263,864$
2,222,042$
37,069,380$
DPW7%
All Others$30,197,019
93%
DPW41%41%
All Others$53,194,484
59%
FY14 Proposed Budget Attachment 31 Page 37 of 202
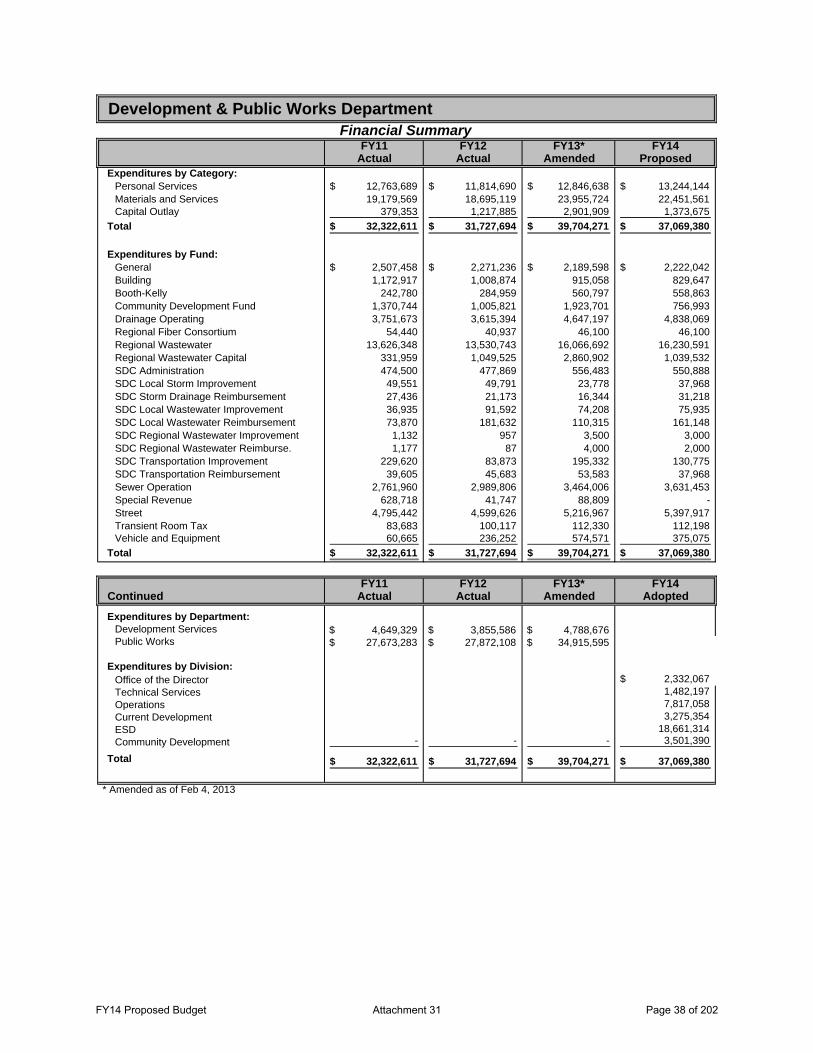
FY11 FY12 FY13* FY14Actual Actual Amended Proposed
Expenditures by Category:Personal Services 12,763,689$ 11,814,690$ 12,846,638$ 13,244,144$ Materials and Services 19,179,569 18,695,119 23,955,724 22,451,561 Capital Outlay 379,353 1,217,885 2,901,909 1,373,675
Total 32,322,611$ 31,727,694$ 39,704,271$ 37,069,380$
Expenditures by Fund:General 2,507,458$ 2,271,236$ 2,189,598$ 2,222,042$ Building 1,172,917 1,008,874 915,058 829,647 Booth-Kelly 242,780 284,959 560,797 558,863 Community Development Fund 1,370,744 1,005,821 1,923,701 756,993 Drainage Operating 3,751,673 3,615,394 4,647,197 4,838,069 Regional Fiber Consortium 54,440 40,937 46,100 46,100 Regional Wastewater 13,626,348 13,530,743 16,066,692 16,230,591 Regional Wastewater Capital 331,959 1,049,525 2,860,902 1,039,532 SDC Administration 474,500 477,869 556,483 550,888 SDC Local Storm Improvement 49,551 49,791 23,778 37,968 SDC Storm Drainage Reimbursement 27,436 21,173 16,344 31,218 SDC Local Wastewater Improvement 36,935 91,592 74,208 75,935 SDC Local Wastewater Reimbursement 73,870 181,632 110,315 161,148 SDC Regional Wastewater Improvement 1,132 957 3,500 3,000 SDC Regional Wastewater Reimburse. 1,177 87 4,000 2,000 SDC Transportation Improvement 229,620 83,873 195,332 130,775 SDC Transportation Reimbursement 39,605 45,683 53,583 37,968 Sewer Operation 2,761,960 2,989,806 3,464,006 3,631,453 Special Revenue 628,718 41,747 88,809 - Street 4,795,442 4,599,626 5,216,967 5,397,917 Transient Room Tax 83,683 100,117 112,330 112,198 Vehicle and Equipment 60,665 236,252 574,571 375,075
Total 32,322,611$ 31,727,694$ 39,704,271$ 37,069,380$
FY11 FY12 FY13* FY14Continued Actual Actual Amended Adopted
Expenditures by Department:Development Services $ 4,649,329 $ 3,855,586 $ 4,788,676 Public Works $ 27,673,283 $ 27,872,108 $ 34,915,595
Expenditures by Division:Office of the Director 2,332,067$ Technical Services 1,482,197 Operations 7,817,058 Current Development 3,275,354 ESD 18,661,314 Community Development - - - 3,501,390
Total 32,322,611$ 31,727,694$ 39,704,271$ 37,069,380$
Development & Public Works DepartmentFinancial Summary
* Amended as of Feb 4, 2013
FY14 Proposed Budget Attachment 31 Page 38 of 202

Sr. T
ranspo
rtatio
n
Pla
nner (1.0
)
Civ
il Engin
eer (2.0
)
Traffic
T
ech 4 (1.0
)
Traffic
/T
ranspo
rtatio
n
City T
raffic
Engin
eer
(1.0
)
OFFIC
E O
F T
HE D
IR
EC
TO
R
Develo
pm
ent and Public W
orks D
irecto
r (1.0)
Deputy D
irecto
r (1.0
)
Cle
rk 3 (2.0
)
Offic
e Supervis
or (1.0
)
Operatio
ns Supervis
or (4.0
)
OPER
ATIO
NS D
IV
ISIO
N
Operatio
ns M
anager (1.0
)
Asso
cia
te Pro
ject M
gr (1.0
)
EN
VIR
ON
MEN
TA
L SER
VIC
ES D
IV
ISIO
N
Envir
onm
ental Servic
es M
anager (1.0
)
Adm
inis
trativ
e Sp
ecia
list(1.0
)
Envir
onm
ental
Managem
ent A
naly
st (1.0
)
Water Q
uality Pro
gram
ESD
W
ater R
eso
urces and Pretreatm
ent Pro
gram
s
Envir
onm
ental Servic
es Pro
gram
M
anager (1.0
)
Envir
onm
ental Svs
Tech 2 (1.0
)
Pretreatm
ent Pro
gram
Co
ordin
ato
r (1.0
)
Sto
rm
water Pro
gram
Co
ordin
ato
r (1.0
)
Envir
onm
ental Svs
Tech 1 (0
.5)
Adm
inis
trativ
e Sp
ecia
list (1.0
)
Po
licy Suppo
rt and C
IP
Pla
nnin
g/D
evelo
pm
ent
Managin
g C
ivil Eng. (1.0)
Engin
eerin
g A
sst. (1.0
)
Engin
eerin
g A
sst. (1.0
)
CIP Pro
ject D
elivery
Managin
g C
ivil Eng. (1.0
)
Desig
n/C
onstructio
n
Co
ordin
ato
r (2.0
)
Co
nstructio
n Insp 2 (1.0
)
GIS D
atabase
Adm
inis
trato
r (2.0
)
GIS A
naly
st (2.0
)
Technic
al Servic
es D
ivisio
n
Technic
al Servic
es M
anager (1.0
)
CO
MM
UN
ITY
D
EV
ELO
PM
EN
T D
IV
ISIO
N
Co
mm
unity D
evelo
pm
ent M
anager (1.0
)
Prin
cip
al Engin
eer (1.0
)
Engin
eerin
g A
sst. (1.0
)
Surveyo
r (1.0
)
Survey Party C
hie
f
(1.0
)
City Surveyo
r (1.0
)
Pla
nnin
g, Pro
ject D
evelo
pm
ent
& D
elivery
Managin
g C
ivil Eng. (1.0
)
Engin
eerin
g T
ech 4 (1.0
)
Co
nstructio
n Insp. 2 (2.0
)
Civ
il Engin
eer (2.0
)
City Engin
eer (1.0
)
Custo
dia
n 2 (1.0
)
Custo
dia
n 1 (1.0
)
Bld
g M
ain
tenance W
orker
(2.0
)
Mechanic
2 (1.0
)
Mechanic
Jo
urney (1.0
)
Cle
rk 3(2.0
)
Main
tenance T
echnic
ian
Jo
urney (22.0
)
Traffic
M
ain
tenance T
ech
(2.0
)
Traffic
Sig
nal Ele
ctric
ian (1.0
)
Data M
anagem
ent T
ech
(1.0
)
Main
tenance T
echnic
ian
Apprentic
e (4.0
)
Main
tenance C
rew
C
hie
fs
(3.0
)
Civ
il Engin
eer (1.0
)
Infrastructure System
s
Spec. (1.0
)
Sr. M
anagem
ent A
naly
st (1.0
)
17.5
FT
E
20.0
FT
E
8.0
FT
E
50 F
TE
14.0
FT
E
Senio
r Fin
ance A
naly
st (1.0
)
Security A
ttendant (1.0
)
Land D
evelo
pm
ent &
Buildin
g C
ode Sectio
n
Supervis
ing C
ivil Eng. (1.0
)
Civ
il Engin
eer (2.0
)
Co
nstructio
n Insp. 1 (1.0
)
Engin
eerin
g T
ech 4 (1.0
)
Engin
eerin
g T
ech 3 (1.0
)
Public Info
rm
atio
n &
Educatio
n Specia
list (2.0
)
Pro
gram
Suppo
rt
Specia
list (1.0
)
Managem
ent Suppo
rt
Specia
list-A
nnexatio
ns (1.0
)
Adm
inis
trativ
e Sp
ecia
list (2.0
)
Scannin
g C
lerk (1.0
)
CU
RR
EN
T D
EV
ELO
PM
EN
T D
IV
ISIO
N
Current D
evelo
pm
ent M
anager (1.0
)
Managem
ent A
naly
st
(0
.5)
Sr. Infrastructure Pla
nner
(1.0
)
Prin
cip
al Pla
nner (1.0
)
Develo
pm
ent R
eview
/
CD
BG
Pro
gram
/C
ode Enfo
rcem
ent
Pla
nnin
g Sup
ervis
or (1.0
)
20.2
5 F
TE
Managem
ent A
naly
st (0
.5)
Buildin
g Perm
it
Review
T
ech (1.0
)
Pla
ns Exam
iner (1.0
)
Buildin
g Inspecto
r 3
(3.0
)
Co
de Enfo
rcem
ent
Offic
er (2.0
)
Ho
usin
g Pro
gram
Specia
list (1.0
)
Senio
r Pla
nner (2.0
)
Ho
usin
g Pro
gram
Asst. (1.0
)
Pla
nner (0
.75)
Envir
onm
ental Svs
Tech 2 (2.0
)
Envir
onm
ental Svs
Tech 1 (0
.5)
Infrastructure System
Tech(1.0
)
Senio
r Pla
nner (1.0
)
FY14 Proposed Budget Attachment 31 Page 39 of 202
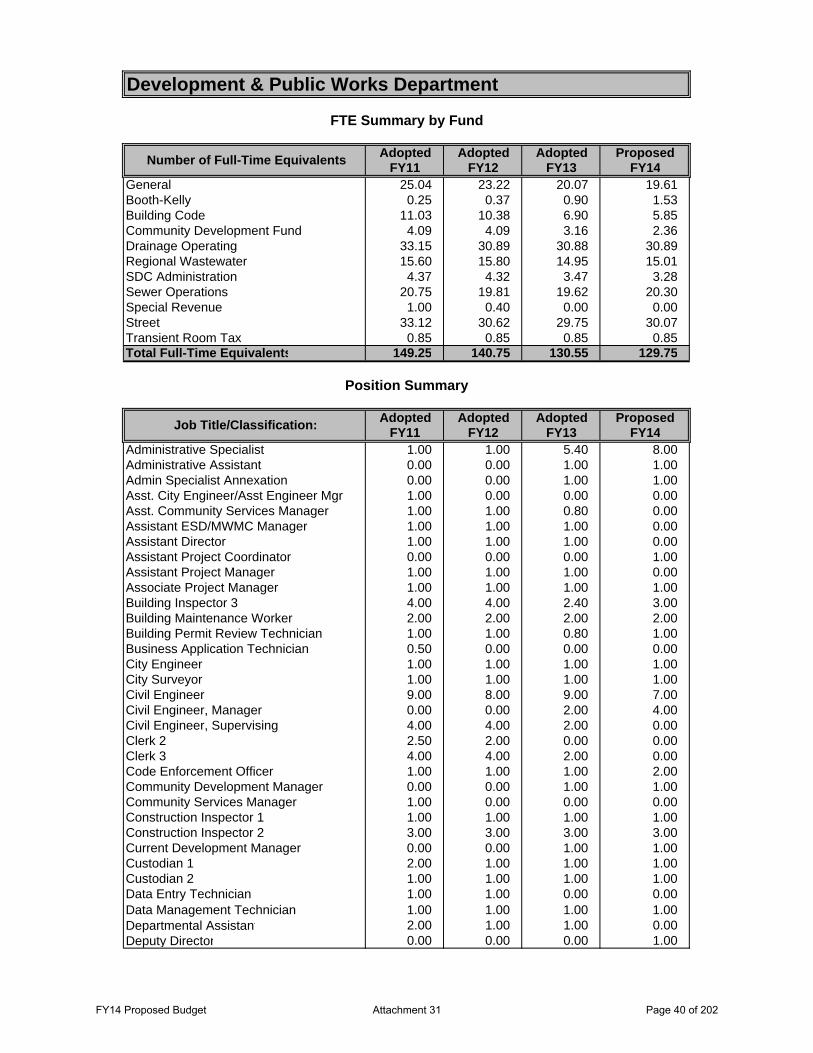
Adopted Adopted Adopted ProposedFY11 FY12 FY13 FY14
General 25.04 23.22 20.07 19.61Booth-Kelly 0.25 0.37 0.90 1.53Building Code 11.03 10.38 6.90 5.85Community Development Fund 4.09 4.09 3.16 2.36Drainage Operating 33.15 30.89 30.88 30.89Regional Wastewater 15.60 15.80 14.95 15.01SDC Administration 4.37 4.32 3.47 3.28Sewer Operations 20.75 19.81 19.62 20.30Special Revenue 1.00 0.40 0.00 0.00Street 33.12 30.62 29.75 30.07Transient Room Tax 0.85 0.85 0.85 0.85Total Full-Time Equivalents 149.25 140.75 130.55 129.75
Adopted Adopted Adopted ProposedFY11 FY12 FY13 FY14
Administrative Specialist 1.00 1.00 5.40 8.00Administrative Assistant 0.00 0.00 1.00 1.00Admin Specialist Annexation 0.00 0.00 1.00 1.00Asst. City Engineer/Asst Engineer Mgr 1.00 0.00 0.00 0.00Asst. Community Services Manager 1.00 1.00 0.80 0.00Assistant ESD/MWMC Manager 1.00 1.00 1.00 0.00Assistant Director 1.00 1.00 1.00 0.00Assistant Project Coordinator 0.00 0.00 0.00 1.00Assistant Project Manager 1.00 1.00 1.00 0.00Associate Project Manager 1.00 1.00 1.00 1.00Building Inspector 3 4.00 4.00 2.40 3.00Building Maintenance Worker 2.00 2.00 2.00 2.00Building Permit Review Technician 1.00 1.00 0.80 1.00Business Application Technician 0.50 0.00 0.00 0.00City Engineer 1.00 1.00 1.00 1.00City Surveyor 1.00 1.00 1.00 1.00Civil Engineer 9.00 8.00 9.00 7.00Civil Engineer, Manager 0.00 0.00 2.00 4.00Civil Engineer, Supervising 4.00 4.00 2.00 0.00Clerk 2 2.50 2.00 0.00 0.00Clerk 3 4.00 4.00 2.00 0.00Code Enforcement Officer 1.00 1.00 1.00 2.00Community Development Manager 0.00 0.00 1.00 1.00Community Services Manager 1.00 0.00 0.00 0.00Construction Inspector 1 1.00 1.00 1.00 1.00Construction Inspector 2 3.00 3.00 3.00 3.00Current Development Manager 0.00 0.00 1.00 1.00Custodian 1 2.00 1.00 1.00 1.00Custodian 2 1.00 1.00 1.00 1.00Data Entry Technician 1.00 1.00 0.00 0.00Data Management Technician 1.00 1.00 1.00 1.00Departmental Assistant 2.00 1.00 1.00 0.00Deputy Director 0.00 0.00 0.00 1.00
Development & Public Works Department
FTE Summary by Fund
Number of Full-Time Equivalents
Position Summary
Job Title/Classification:
FY14 Proposed Budget Attachment 31 Page 40 of 202
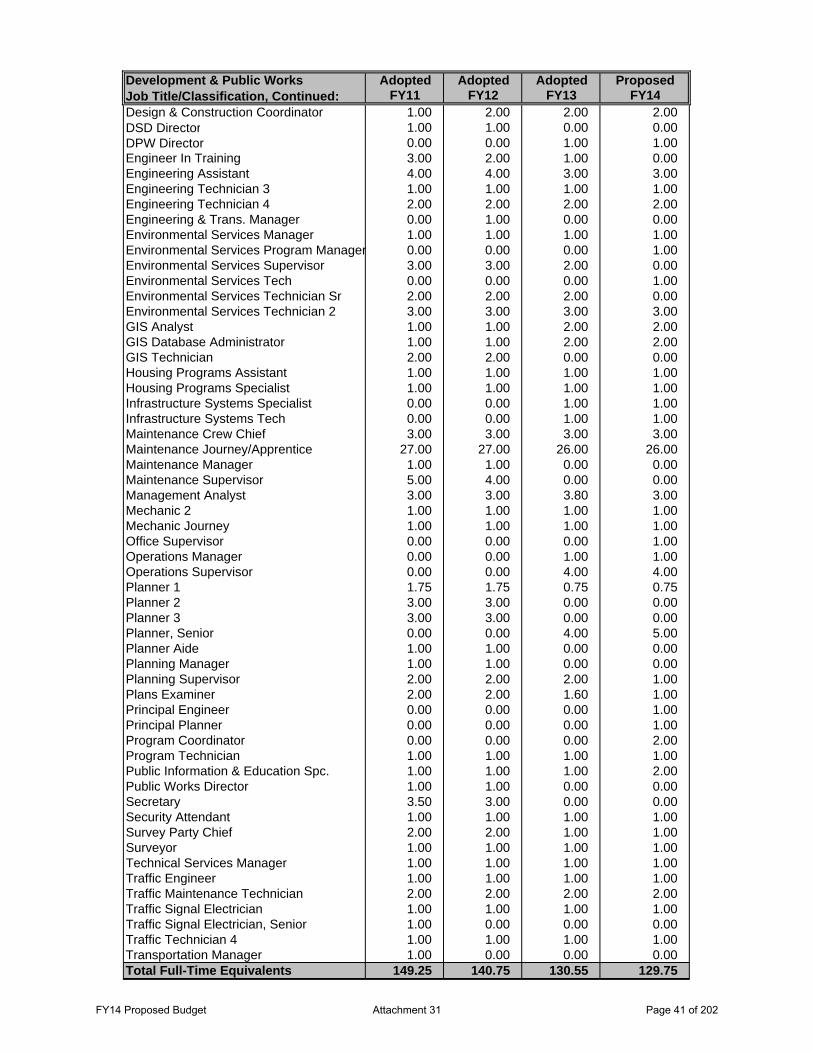
Adopted Adopted Adopted ProposedFY11 FY12 FY13 FY14
Design & Construction Coordinator 1.00 2.00 2.00 2.00DSD Director 1.00 1.00 0.00 0.00DPW Director 0.00 0.00 1.00 1.00Engineer In Training 3.00 2.00 1.00 0.00Engineering Assistant 4.00 4.00 3.00 3.00Engineering Technician 3 1.00 1.00 1.00 1.00Engineering Technician 4 2.00 2.00 2.00 2.00Engineering & Trans. Manager 0.00 1.00 0.00 0.00Environmental Services Manager 1.00 1.00 1.00 1.00Environmental Services Program Manager 0.00 0.00 0.00 1.00Environmental Services Supervisor 3.00 3.00 2.00 0.00Environmental Services Tech 0.00 0.00 0.00 1.00Environmental Services Technician Sr 2.00 2.00 2.00 0.00Environmental Services Technician 2 3.00 3.00 3.00 3.00GIS Analyst 1.00 1.00 2.00 2.00GIS Database Administrator 1.00 1.00 2.00 2.00GIS Technician 2.00 2.00 0.00 0.00Housing Programs Assistant 1.00 1.00 1.00 1.00Housing Programs Specialist 1.00 1.00 1.00 1.00Infrastructure Systems Specialist 0.00 0.00 1.00 1.00Infrastructure Systems Tech 0.00 0.00 1.00 1.00Maintenance Crew Chief 3.00 3.00 3.00 3.00Maintenance Journey/Apprentice 27.00 27.00 26.00 26.00Maintenance Manager 1.00 1.00 0.00 0.00Maintenance Supervisor 5.00 4.00 0.00 0.00Management Analyst 3.00 3.00 3.80 3.00Mechanic 2 1.00 1.00 1.00 1.00Mechanic Journey 1.00 1.00 1.00 1.00Office Supervisor 0.00 0.00 0.00 1.00Operations Manager 0.00 0.00 1.00 1.00Operations Supervisor 0.00 0.00 4.00 4.00Planner 1 1.75 1.75 0.75 0.75Planner 2 3.00 3.00 0.00 0.00Planner 3 3.00 3.00 0.00 0.00Planner, Senior 0.00 0.00 4.00 5.00Planner Aide 1.00 1.00 0.00 0.00Planning Manager 1.00 1.00 0.00 0.00Planning Supervisor 2.00 2.00 2.00 1.00Plans Examiner 2.00 2.00 1.60 1.00Principal Engineer 0.00 0.00 0.00 1.00Principal Planner 0.00 0.00 0.00 1.00Program Coordinator 0.00 0.00 0.00 2.00Program Technician 1.00 1.00 1.00 1.00Public Information & Education Spc. 1.00 1.00 1.00 2.00Public Works Director 1.00 1.00 0.00 0.00Secretary 3.50 3.00 0.00 0.00Security Attendant 1.00 1.00 1.00 1.00Survey Party Chief 2.00 2.00 1.00 1.00Surveyor 1.00 1.00 1.00 1.00Technical Services Manager 1.00 1.00 1.00 1.00Traffic Engineer 1.00 1.00 1.00 1.00Traffic Maintenance Technician 2.00 2.00 2.00 2.00Traffic Signal Electrician 1.00 1.00 1.00 1.00Traffic Signal Electrician, Senior 1.00 0.00 0.00 0.00Traffic Technician 4 1.00 1.00 1.00 1.00Transportation Manager 1.00 0.00 0.00 0.00Total Full-Time Equivalents 149.25 140.75 130.55 129.75
Development & Public WorksJob Title/Classification, Continued:
FY14 Proposed Budget Attachment 31 Page 41 of 202

FY14 Proposed Budget Attachment 31 Page 42 of 202

Development and Public Works Department
Program: Administration Program Description: The Office of the Director provides overall direction and management of the Development and Public Works Department administering and coordinating interdepartmental activities and providing policy support for the City Council. The program also works with Finance to streamline the budget process and monitors the revenue sources that are critical to the department while directing and evaluating resources. The Administration program directs the coordination of special projects with broader activities with City-wide impact such as implementation of special charges and assessments, the Development and Public Works legislative agenda, agreements for long-term uses of public rights-of-way, as well as the acquisition of public rights of way.
Staff direct departmental programs such as the management of the Booth-Kelly facility and administer the City’s Management Agreement with the Springfield Museum Board. Staff manage the Business License and Property Management programs for the City of Springfield. The Office of the Director manages a wide variety of revenue sources, and monitors and coordinates Department work plans to assure integrations with the City’s Strategic Plan and success in efforts to accomplish City Council objectives. This program also manages the critical communication components to inform the public and development community about our current projects and updates as they arise.
Budget Highlights: The Administration program budget has been increased due to the reorganization and implementation of the new department. The Administration budget now includes the Office Supervisor and Administrative Support staff for the whole department. The Administration budget also includes the City Engineer’s budget, another reorganization outcome, and includes the budget for the Public Outreach staff. The program has increased from 4.0 FTE to 14.0 FTE. These additions have increased the FY14 budget compared to FY13. Most of the increase is due to a decision to conform the budgeting practices of the two former departments. This resulted in additional activities being included in the administration program. Service Level Changes: The Administration program will continue the same service levels and incorporate the newly added functions at the same service levels.
Program Performance Indicator:
Council Goals Key Processes Measurement Methods FY12 Actual
FY13 Target
FY14 Target
Financially Sound and
Stable Government
Plan, budget, and manage enterprise funds that
support infrastructure and overhead: obtain funding
Infrastructure Enterprise Funds Meet Operating &
Capital Requirements 101% 92% 92%
Foster an Environment that Values
Diversity and Inclusion
Proactively solicit goods and services from a
diverse group of vendors
Percent of proposers on Development and Public
Works solicitation that Self-identify as MWESB.
Percent of awards to firms on State MWESB list
10.6% 14.9% 15% 15%
FY14 Proposed Budget Attachment 31 Page 43 of 202

Development and Public Works Department Program: Building Safety and Inspection Services Program Description: Staff in the Building Safety and Inspection Services Program 1) provide services that promote and facilitate economic growth and neighborhood stability, 2) provide reasonable safeguards to life, health, property and the public welfare through building permit administration, inspection and enforcement, 3) support the effective coordination of Federal, State and City requirements relative to the built environment and welfare of the community, 4) deliver permits and inspection services efficiently, cost effectively and in a professional manner, and 5) provide prompt, courteous and effective responses to Building Safety Code citizen requests.
Budget Highlights: In FY14, the Building Safety and Inspection Services program will continue to face a number of challenges with respect to revenues and expenditures. Building permit volume has continued to increase in the last several years, and is expected to remain steady through FY14. Though permit volumes are up, revenues are still projected to decline since much of the building activity is focused on low value additions, alterations, and other small scale construction projects which produce little revenue in comparison to larger projects. The FY14 proposed budget assumes this trend will continue for at least one more year and relies in part on an increase in building fees to maintain existing service levels. The performance standards of the program have been and will be maintained by funding core essential services while reducing expenditures in overhead, supervision, clerical assistance and materials and services. In FY14, overall expenditures in the building program will be reduced by 9.3% from FY13. Service Level Changes: In response to the shortfall in revenues and reserves in the Building Code Specialty Fund, administrative positions that provided services to the program have been reallocated to other funds and .55 FTE in budget management has been eliminated. The program will continue to have these services but they will be subsidized by the General Fund and the Utility funds.
The Building Safety and Inspection Services program has maintained the City’s “same day” response time with respect to inspection services and continues to meet the State’s mandated maximum 10 day plan review turnaround time for residential plans. Citizen/customer accessibility is a continued focus with staff work on digital imaging of construction documents in order to make this information accessible on-line to the public. Additional effort has been dedicated to expand and make more user-friendly the Building Safety and Inspection Services program website, a task that will be ongoing in FY14.
Program Performance Indicator:
Effectiveness Areas Key Processes Measurement Methods FY12
Actual FY13
Target FY14
Target Encourage Economic
Development and Revitalization
through Community Partnerships
Improve Customer Service through
Expeditious review of permitting and inspections.
Building permit applications processed in
a timely manner 89%
This target is being
reassessedTBD
FY14 Proposed Budget Attachment 31 Page 44 of 202

Development and Public Works Department Program: Community Development Block Grant (CDBG) and HOME Investment Partnerships (HOME) Programs Program Description: Administer the CDBG and HOME funded programs and projects to comply with federal regulations. Prepare and implement neighborhood refinement plans and functional plans that address community needs for housing, employment opportunities, public safety, affordable health services, social services, and parks and open space. Assist low-income Springfield residents with housing rehabilitation loans, grants, neighborhood improvements, social services, and access to housing. Provide assistance to downtown and Glenwood redevelopment. Provide financial assistance to non-profit and for-profit housing developers that create affordable housing for low-income Springfield residents. Provide assistance to low and moderate-income homebuyers purchasing homes in Springfield with Housing and Urban Development (HUD) grant funds made available through the Eugene-Springfield Consortium.
Budget Highlights: Based on anticipated HUD funding it is estimated that the City will receive allocations of approximately $430k in CDBG funds and $280k in HOME funding, a total of $710k in Federal FY14, compared to $748k in FY13. The programs will assist approximately 14,000 low-income persons with social services in part by providing approximately $70,000 to the Intergovernmental Human Services Commission (HSC). The HSC redistributes the funds to five service agencies; Food For Lane County, the Relief Nursery, Whitebird Medical, Catholic Community Services and St. Vincent de Paul. Funds will also be used to provide down payment assistance for low-income homebuyers, emergency repair assistance to low-income homeowners and project development assistance to affordable housing and community based non-profit organizations. Among the projects currently being assisted with FY13 funds are the commercial kitchen at the SPROUT! Regional Food Hub, predevelopment work for the Glenwood River Point Place housing development, improving the BRING Recycling facility, and instituting a Downtown Façade Improvement Program and a Downtown Food Cart Program through collaboration with NEDCO. Service Level Changes: In FY13 the staff assigned to Community Development Block Grant was reduced by .58 FTE. With no expected funding increases for FY14, staffing and service levels are expected to remain at the current levels.
Program Performance Indicator:
Council Goal Key Processes Measurement Methods FY12 Actual
FY13 Target
FY14 Target
Encourage Community
and Economic
Development and
Revitalization
Increase the Supply of
Affordable Housing
Opportunities for affordable and decent housing are increased through partnerships with Non-
Profit Housing Developers and by Providing Assistance to Low and
Very-Low Income Citizens throughout the community.
86% 90% 90%
Increase opportunities for low & moderate
income households to become and
remain homeowners
Opportunities for home ownership are increased
12 homes are
purchased
15 homes are
purchased
10 homes are
purchased
FY14 Proposed Budget Attachment 31 Page 45 of 202

Development and Public Works Department Program: Comprehensive Planning Program Description: The Comprehensive Planning Program prepares updates and provides assistance in the implementation of the Metro Plan, comprehensive plans, refinement plans, special projects, and federal and state mandates; coordinates regional and metropolitan-wide comprehensive planning with Eugene, Lane County and other governments and service providers; prepares reports and option scenarios as directed by Council; and assists other divisions and departments in evaluating and implementing state and federal laws applicable to buildable lands, housing, natural resources and hazards, TransPlan and the Public Facilities and Services Plan.
Budget Highlights: The Comprehensive Planning Program will continue to make progress toward completing the Springfield 2030 Refinement Plan while working with Metro planning partners to revise the Metro Plan to address the existence of two UGBs and greater jurisdictional planning autonomy. In FY13 staff completed the Springfield 2030 Refinement Plan Economic Development Element and made substantial progress on the Urbanization Element. In FY14 decision packages will be forwarded to the elected officials for adoption. These Council decisions are highly significant to Springfield’s future growth and vitality, as they will identify and locate a sufficient land base to accommodate economic and community development for the planning period 2010-2030. In addition, work will continue on a parcel-specific Springfield 2030 Refinement Plan Diagram resulting in specific land use designations for all lands within Springfield’s Urban Growth Boundary. In FY14, the City will be underway with a Main Street Corridor Visioning effort funded by the Oregon Department of Transportation. This work will be closely coordinated with efforts in the Transportation Program studying transit feasibility in the Main/McVey corridor and the Pedestrian Safety crossing improvements on Main Street. The Comprehensive Planning program has also provided the coordination for Downtown Revitalization through planning and plan implementation projects that build partnerships and community momentum for Downtown Revitalization. The Downtown Citizen Advisory Committee will continue to meet to maintain and build support for Downtown redevelopment, with a focus in FY14 on the preparation and adoption of amendments to implement the Downtown District Urban Design and Parking Management Plans. Staff will also continue to provide liaison support for the Neighborhood Economic Development Organization (NEDCO) initiated Main Street Program committees. Service Level Changes: In FY13 Comprehensive Planning staff were reduced to 2.0 FTE. In FY14 staff will remain at 2.0 FTE, although some portion of one position will continue to support development review activities due to cuts in that program. Comprehensive planning project timelines may need to be extended, and some priorities may not be advanced during the fiscal year due to limits on staff levels and funds for contractual services dollars.
Program Performance Indicator:
Council Goals Key Processes Measurement Methods FY12 Actual
FY13 Target
FY14 Target
Encourage Economic Development and
Revitalization through Community
Partnerships
Adopt 2030 Refinement Plan with 20 year land
supply for jobs and housing (mandate)
Project milestones are on schedule N/A 75% 75%
FY14 Proposed Budget Attachment 31 Page 46 of 202

Development and Public Works Department
Program: Development Review and Enforcement Program Description: Development Review Staff: 1) strive to fulfill the Council goals for a safe community, excellent customer service, increased assessed value through quality development, and protection of Springfield's hometown character; 2) implement the Springfield Development Code, and State and Federal law related to land use and development within Springfield's urban growth boundary; 3) amend and update the Springfield Development Code in response to legislation, rule-making, court decisions, and Council policies; 4) process administrative and quasi-judicial land use applications, and site-specific comprehensive plan amendments; 5) provide front-counter customer service on issues related to land use and development; 6) serve the City Council and Planning Commission on matters pertaining to the division's programs; 7) collaborate with other public agencies, property owners and land developers to protect the public interest; and 8) assure that development review will be fast, fair, friendly, flexible and consistent with adopted laws, goals, standards, policies and aspirations of the community. At the beginning of FY13 the Development Services Current Planning section was joined by what was formerly the Public Works Development Review Section to form the Development Review Section of the Current Development Division. These two work groups are responsible for the review and approval of all land development proposals.
Budget Highlights: Development Review staff will respond to over 6,000 front counter service requests in FY14 and staff approximately 300 development review applications to assist owners, consultants and lenders in identifying and developing new projects in the recovering market. This compares to 5,500 services requests and 275 applications estimated for FY13. For FY14, staff intends to achieve the Strategic Plan Goal of meeting or exceeding the number of applications completed within the Council target of 75 days with reduced staff; and 90% of land use decisions will be issued within the Council target of 75 days with the remaining 10% completed between 75 days and 120 days. Achieving this goal will require continued attention to efficiency improvements, perhaps including electronic review of plans submitted. Staff continues to cultivate new development and major projects that provide a community benefit and generate new jobs by coordinating with major economic development initiatives such as the VA Clinic and providing robust opportunities for community and developer input such as the newly created Developer Advisory Committee to the City Council. Development Review also assumed management of the Code Enforcement program previously administered by the former Community Services Division. The Code Enforcement program strives to meet its Council directed benchmark of 100% voluntary compliance, but annually averages about 15% of the case work being adjudicated in Municipal Court. Service Level Changes: In FY13 Development Review working staff were reduced by 1.5 FTE, which included a 1.0 FTE Senior planner position that was held vacant and 1.0 FTE planner reduced to temporary contracted .5 FTE. These reductions were an outcome of the economic downturn manifestation in slow development and its impact on the General Fund. In FY14 this reduction in planning staff levels continues with the elimination of the 1.0 FTE Senior Planner vacancy and the discontinuation of the .5 FTE contracted planner. These reduced staffing levels will challenge service level benchmarks even if the number of applications remains unchanged for FY14, and require exploration of additional efficiencies. If the level of planning applications and land use activity increases in response to market conditions and recent stimulus techniques, there may be a need to review staffing levels and work processes in order to avoid a reduction in response times for standard building and planning applications and the processing of major development applications.
FY14 Proposed Budget Attachment 31 Page 47 of 202

Code enforcement staffing will remain at 2.0 FTE for FY14 and benchmarks should remain constant if the number of infractions falls between the norm of 2,500 and 3,500. If the 4,300 infractions investigated in FY13 becomes the new norm, then benchmarks will have to be adjusted in FY15 to reflect the lengthened initial response times for site visits and notice of violation or warning citations.
Program Performance Indicator:
Council Goals Key Processes Measurement Methods FY12 Actual
FY13 Target
FY14 Target
Promote and Enhance Our
Hometown Feel while Focusing
on Livability and
Environmental Quality
Continuously advance customer service
satisfaction
Citizen request/Inquiries are given timely attention 99% 90% 80%
Recognize and prioritize time value of private
investment
Development Applications processed in a timely manner 97% 87% 85%
Promote Community values through collaborative public
engagement
Development Code and Municipal Code standards
enforced without the Necessity of a Warning Citation or Municipal Court Action
99% 100% 100%
FY14 Proposed Budget Attachment 31 Page 48 of 202
Development and Public Works Department
Program: Drainage/Stormwater
Program Description: The Drainage/Stormwater program consists of subprograms that maintain, enhance and improve surface and subsurface drainage, implement State and Federal water quality standards and regulations for urban stormwater runoff, and provide management of stream and waterway restoration projects, such as restoration of the Mill Race. Drainage management and planning activities optimize the stormwater drainage system capacity, minimize the occurrences and extent of local flooding, and protect the functions of open waterways. Drainage management services also provide public information and education, and program administration functions such as providing customer service, setting rates and charges, maintaining financial plans, and building and tracking budgets. Drainage maintenance activities provide for leaf and debris removal, vegetation control, management of the Mill Race, and functional maintenance of water quality facilities and bioswales. Drainage engineering activities include design and construction of new and existing drainage facilities to City standards, and oversight for private construction of public facilities.
Budget Highlights: In FY14, the drainage program operating budget continues to show signs of stress, as operations reductions are continued to minimize rate increases driven by the need to support capital spending.
The City’s Capital program to implement the Stormwater Facilities Master Plan will be a major focus of the program’s FY14 activity. Budget constraints have delayed implementation of high priority projects, and a backlog is developing. The sale of $10 million in revenue bonds in early FY11 has permitted the program to focus attention on immediately needed projects. Two projects of note are the planned completion of the Mill Race Ecosystem Restoration project by the end of FY13 and the design of the Over-Under Channel Pipe Replacement in FY14. The program has not been able to staff all of the funded CIP projects, including the Jasper/Natron storm drainage plan needed to address existing problems and prepare for future development.
In FY14 the City will continue to implement the City's Stormwater Management Plan to meet requirements of the National Pollutant Discharge Elimination System (NPDES) stormwater discharge permit, as well as the Total Maximum Daily Load (TMDL) Implementation Plan to meet the Willamette River TMDL requirements. In FY14 the storm drainage program will continue benefitting from the renewal of the intergovernmental agreement and partnership with Lane County, which provides payment for stormwater permit activities in the urbanizable area outside the City limits. City staff and the Oregon Chapter of the Association of Clean Water Agencies have been in negotiations with DEQ regarding issues and concerns with our draft Phase II NPDES MS4 permit. As a result, the DEQ has agreed to revise their approach from individual permits to a general permit for all phase II cities in Oregon. This new approach will rely heavily on individual Stormwater Management Plans for tailoring to a specific discharger. Given this development we do not anticipate receiving a new permit in the near future. We do, however, anticipate significant pressure on staff time throughout FY14 associated with our role as a regional ACWA and DEQ partner in the development of the general permit template. In addition, the U.S. Environmental Protection Agency is considering establishing water quality-based effluent limitations and waste load allocations in NPDES permits. These requirements would also add to Springfield’s resource burden as it applies to NPDES Permit mandates and performance requirements.
The Operations Division provides regular maintenance of the City's storm drainage system, including inspection and cleaning of 206 miles of stormwater pipe and 6,250 catch basins; maintenance and vegetation control in 29 public water quality facilities including both mechanical and natural facilities.
FY14 Proposed Budget Attachment 31 Page 49 of 202

Additionally, street sweeping is a surface stormwater quality activity that addresses compliance of the NPDES Permit. This year with an increase in funding for seasonal temporary employees the Division will begin to address the functionality of private bioswales, maintenance of the riparian vegetation along the Mill Race corridor and along the City system of cross country canals. Facilities in subdivisions accept public (i.e. street) runoff, thus the City has a responsibility to ensure these facilities function long term, regardless of who owns the land. The City also needs to meet its MS4 permit requirements, which regulates runoff from municipal properties (like streets).
Service Level Changes: Regulatory drivers and capital projects will place significant demands on existing staffing, which was reduced in FY11 as cost savings measures to minimize increases in the stormwater user fees and to reduce street fund expenditures. Even with the additional FY14 seasonal staff to work on stormwater maintenance projects the service level effects of the FY11 staff reduction will continue to challenge staff to meet work load requirements, particularly if development activity begins to increase, and will continue to result in some capital projects being deferred.
Program Performance Indicator:
Effectiveness Areas Key Processes Measurement Methods FY12
Actual FY13
Target FY14
Target Encourage Economic
Development and Revitalization
through Community Partnerships
Plan and design for community growth
Infrastructure Needed for Growth is Identified &
Planned (Streets, Wastewater and Drainage
Systems)(Plans completed)
100% 95% 95%
Maintain and Improve
Infrastructure and Facilities
Perform Budgeted Maintenance Activities
Planned Infrastructure Maintenance is Performed (Stormwater, Wastewater,
Streets)
77% 100% 100%
Preserve physical assets, streets, sewers, storm
drainage and building facilities
Preservation Projects are completed on schedule. 80% 85% 85%
Build new physical assets (buildings and
infrastructure)
Capital Projects are Constructed to Meet
Expanding Needs 85% 85% 85%
Promote and Enhance Our
Hometown Feel while Focusing on
Livability and Environmental
Quality
Manage the City’s stormwater system in compliance with MS4 permit requirements.
Percent of current year Stormwater Management
Plan activities in compliance with the six minimum
measures.
100% 100% 100%
FY14 Proposed Budget Attachment 31 Page 50 of 202

Development and Public Works Department Program: Emergency Management Program Description: The Emergency Management Program coordinates the Cities efforts for the mitigation, preparedness, response, and recovery of the community, and city government and services to disasters. The City Council established the Program via Chapter 2.8 of the Municipal Code. In FY13, the City Manager delegated to the Department the responsibility to deliver the Program and lead the City’s Emergency Management Committee (EMC). In response to this delegation, the Director designated the City Engineer as the Chair of the EMC and the City’s Interim Emergency Management Program Manager.
Budget Highlights: The Emergency Management Program is new to the Department budget in FY14. Previously, the Program was included in the budget for the City Manager’s Office and included only enough funding in FY13 to cover the City’s subscription payment to the Lane County Community Emergency Notification System. Any other Program expenditures, estimated at about $104,000 for FY13, were absorbed into the Operating Budgets of the various departments. For FY14, the Department will significantly increase the designated budget for the Program without increasing its overall budget. This will be accomplished by reallocating appropriations from other programs to this Program, including Personal Services expenditures. It is important for the City to be able to demonstrate that there is funding for a staff position in the Program because some of the federal grant opportunities available for Emergency Management require that the City has a funded Emergency Manager. The FY14 budget includes shifting 0.5 FTE funding for the City Engineer from engineering activities in the General Fund, Street Fund, Wastewater Fund, and Drainage Fund into the Emergency Management Program. The budget also includes shifting the Program’s FY13 Materials & Services appropriation from the City Manager’s Office to the Department and increasing this appropriation to $5,044 by shifting the funds from other accounts. While the Department’s FY14 budget includes expenditures for the Interim Emergency Manager and some Materials and Services, other Program expenditures, both within the Department and in other departments, will continue to be absorbed in their Operating Budgets. Service Level Changes: In response to several opportunities and initiatives, such as preparing a new Comprehensive Emergency Management Plan in coordination with the City of Eugene, the Department decided to dedicate 0.5 FTE of the City Engineer to the Program for the second half of FY13 and for FY14. This change will result in shifting some of the City Engineer’s duties to the Managing Civil Engineers and the City Traffic Engineer. The Department expects that distributing some of the City Engineer’s duties to others will not have an adverse service level impact on the Engineering activities, while creating the opportunity for dedicated staff resources for the Emergency Management Program. Program Performance Indicator:
Council Goals Key Processes Measurement Methods FY12 Actual
FY13 Target
FY14 Target
Strengthen Public Safety by
Leveraging Partnerships and
Resources
Implement the Whole Community Approach
to Emergency Management
The Springfield Emergency Management Program is compliant with
the National Incident Management System
(NIMS)
Baseline
TBD TBD
FY14 Proposed Budget Attachment 31 Page 51 of 202
Development and Public Works Department
Program: Facilities & Equipment Preservation
Program Description: The Facilities and Equipment Preservation program plans and oversees the maintenance of the City's physical assets, including real property, buildings, vehicles and equipment. Vehicle maintenance activities include purchasing and maintenance of the City's inventory of vehicles and operation of the Regional Fuel Facility. Facilities Preservation activities ensure all City buildings are sanitary, safe, adequately maintained, and operated efficiently and effectively.
Budget Highlights: The Council’s goal is to dedicate $500,000 in annual preservation maintenance and building systems reserves. The FY13 and the proposed FY14 budgets dedicated approximately $289k, which is not sufficient to attend to the growing list of backlog building maintenance and preservation projects. This fiscal trend is a concern. Additionally, approximately $90k of the $289k continues to fund a 1.0 FTE Building Maintenance Worker, thus only $199K is available for the actual preservation projects. This further restricts the ability to deliver the priority projects based on the Building and Facilities Preservation 5-year Work Plan. As a result, the 5-year Work Plan is used by Building Maintenance staff to triage among the numerous high priority preventive maintenance and preservation needs across all City facilities. Projects proposed for completion in FY14 could include HVAC replacements, overhead door replacements, ADA/access improvements, and energy conservation projects. In conjunction with Team Springfield, the City continues to seek opportunities to move its fleet and facilities to alternative fuels that promote the use of renewable and clean energy sources. Interoperable radio communications with other local jurisdictions continues to be an unfunded priority. Radio communications is critical for both day-to-day and emergency operations. Currently the Operations Division operates two systems; an antiquated VHF system and the Springfield Police Department’s old system. It has become apparent during recent emergency events that interagency interoperability is an important factor in coordinating response activities that keep our community and City staff safe. Funding to upgrade to the regional trunked radio system will continue to be researched. Service Level Changes: On the capital side, there are many preservation projects that have been deferred due to limited funding. For example, several fire stations are due for major rehabilitation of station access/egress and apparatus bays, and the dedicated major systems replacement reserve has also been eliminated. This will not change under the proposed budget. As the City continues to grow, it continues to add properties to the facilities inventory. Each new acquisition offers the potential for additional maintenance and preservation needs.
Program Performance Indicator: Effectiveness
Areas Key Processes Measurement Methods FY12
Actual FY13
TargetFY14
Target
Maintain and Improve
Infrastructure and Facilities
Preserve physical assets, streets, sewers, storm drainage
and building facilities
Preservation Projects are completed on
schedule. 80% 85% 85%
FY14 Proposed Budget Attachment 31 Page 52 of 202
Development and Public Works Department
Program: Regional/Local Wastewater
Program Description: The Regional/Local Wastewater program consists of sub-programs that design, construct, maintain, operate, and administer the local and regional wastewater (sanitary sewer) systems. Sewer maintenance activities preserve the local wastewater collection and conveyance system capacity, minimize infiltration and inflow into the system, and ensure minimal disruptions in service. Sewer engineering services design and construct new and expanded publicly developed wastewater facilities and oversee development of privately constructed public wastewater facilities to City's standards. Local wastewater services also provide administrative functions, such as customer service, and setting rates and charges, maintaining financial plans, and building and tracking budgets. Industrial Pretreatment activities manage industrial wastewater discharges to the system and implement pollution management programs necessary to comply with State and Federal regulations. Regional Wastewater Program administration supports the Metropolitan Wastewater Management Commission (MWMC) in carrying out its purpose to protect public health and safety and the environment by providing high quality wastewater management services to the Eugene-Springfield metropolitan area. The Regional Wastewater program provides: 1) interagency coordination in support of the regional partners; 2) financial management activities including budgeting, rate setting, and financial planning; 3) planning, design, and construction of new capital assets; and, 4) regulatory and permit programs to meet State and Federal wastewater quality requirements. The regional sewer operations and maintenance activities, staffed by the City of Eugene Wastewater Division, ensure the safe and efficient operation of the regional sewer operations conveyance and treatment facilities to meet the intended outcomes of the MWMC Regional Wastewater Program.
Budget Highlights: Regional Wastewater On an all funds basis, the program’s proposed budget for FY14 represents a 1.9% increase over FY13. This figure includes the regional wastewater program, which incorporates the entire regional water pollution control facility budget. In FY14, the Regional Wastewater Program activities will continue to emphasize obligations for constructing and financing MWMC facility upgrades as identified in the 2004 Facilities Plan. Fortunately, due to the successful project management and a favorable bidding climate, a new borrowing of $20 million, originally anticipated for FY11, will continue to be deferred. Wet Weather Flow Management The wet weather flow management efforts continue as the Regional Wastewater Policy Team is developing a regional guidance document to address the elements of a Capacity Management Operations and Maintenance program. Both Eugene and Springfield will use the guidance document to develop their specific local collection system programs. The regional Capacity Management Operations and Maintenance program approach replaces the need to update the 2001 Wet Weather Flow Management Plan, as the program will address the ongoing effort to reduce inflow and infiltration in both the public and private sewer systems. The guidance document will be written to protect the regional Water Pollution Control Facility against flows in excess of its design peak flow capacity. The local programs will meet the general requirements as outlined in Environmental Protection Agency’s Guide for Evaluating Capacity, Management, Operation and Maintenance for sanitary sewer collection systems and address any specific requirements of the Department of Environmental Quality. The local programs will also be a guide for making business decisions required to manage the conveyance system in the most cost effective manner and maintain up-to-date asset inventory, condition assessment, and risk analysis information to assist in capital improvement planning.
FY14 Proposed Budget Attachment 31 Page 53 of 202
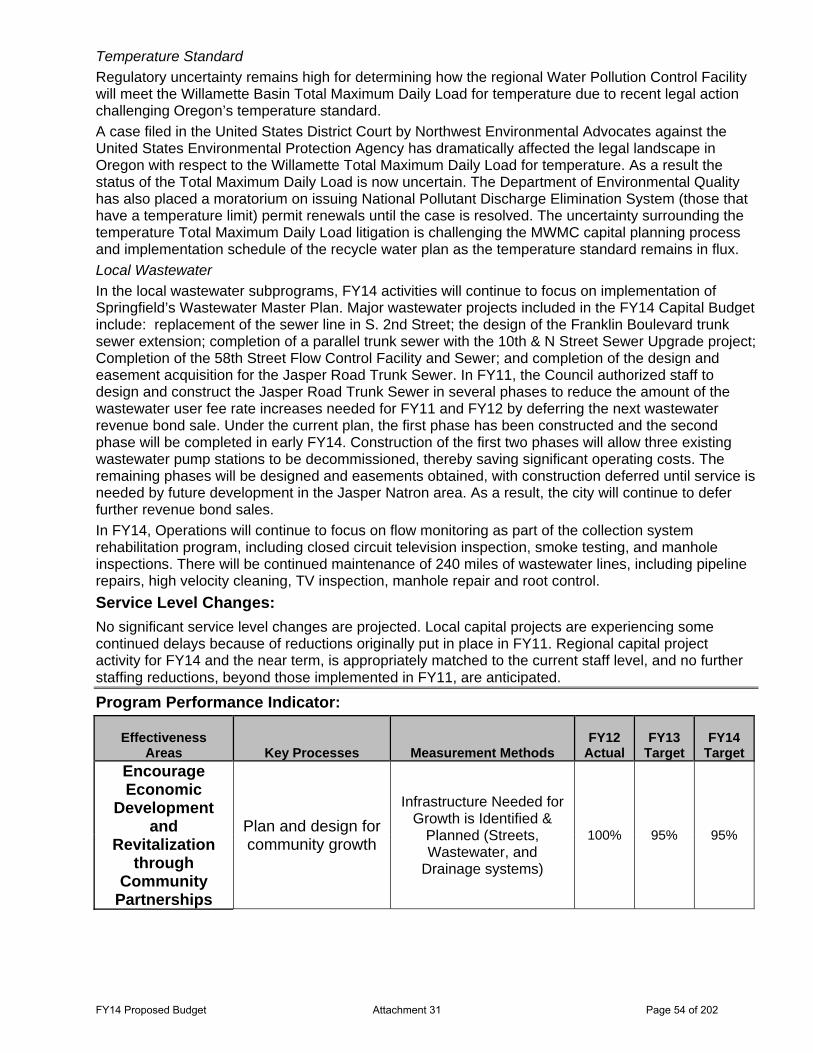
Temperature Standard Regulatory uncertainty remains high for determining how the regional Water Pollution Control Facility will meet the Willamette Basin Total Maximum Daily Load for temperature due to recent legal action challenging Oregon’s temperature standard. A case filed in the United States District Court by Northwest Environmental Advocates against the United States Environmental Protection Agency has dramatically affected the legal landscape in Oregon with respect to the Willamette Total Maximum Daily Load for temperature. As a result the status of the Total Maximum Daily Load is now uncertain. The Department of Environmental Quality has also placed a moratorium on issuing National Pollutant Discharge Elimination System (those that have a temperature limit) permit renewals until the case is resolved. The uncertainty surrounding the temperature Total Maximum Daily Load litigation is challenging the MWMC capital planning process and implementation schedule of the recycle water plan as the temperature standard remains in flux. Local Wastewater In the local wastewater subprograms, FY14 activities will continue to focus on implementation of Springfield’s Wastewater Master Plan. Major wastewater projects included in the FY14 Capital Budget include: replacement of the sewer line in S. 2nd Street; the design of the Franklin Boulevard trunk sewer extension; completion of a parallel trunk sewer with the 10th & N Street Sewer Upgrade project; Completion of the 58th Street Flow Control Facility and Sewer; and completion of the design and easement acquisition for the Jasper Road Trunk Sewer. In FY11, the Council authorized staff to design and construct the Jasper Road Trunk Sewer in several phases to reduce the amount of the wastewater user fee rate increases needed for FY11 and FY12 by deferring the next wastewater revenue bond sale. Under the current plan, the first phase has been constructed and the second phase will be completed in early FY14. Construction of the first two phases will allow three existing wastewater pump stations to be decommissioned, thereby saving significant operating costs. The remaining phases will be designed and easements obtained, with construction deferred until service is needed by future development in the Jasper Natron area. As a result, the city will continue to defer further revenue bond sales. In FY14, Operations will continue to focus on flow monitoring as part of the collection system rehabilitation program, including closed circuit television inspection, smoke testing, and manhole inspections. There will be continued maintenance of 240 miles of wastewater lines, including pipeline repairs, high velocity cleaning, TV inspection, manhole repair and root control. Service Level Changes: No significant service level changes are projected. Local capital projects are experiencing some continued delays because of reductions originally put in place in FY11. Regional capital project activity for FY14 and the near term, is appropriately matched to the current staff level, and no further staffing reductions, beyond those implemented in FY11, are anticipated.
Program Performance Indicator:
Effectiveness Areas Key Processes Measurement Methods
FY12 Actual
FY13 Target
FY14 Target
Encourage Economic
Development and
Revitalization through
Community Partnerships
Plan and design for community growth
Infrastructure Needed for Growth is Identified &
Planned (Streets, Wastewater, and
Drainage systems)
100% 95% 95%
FY14 Proposed Budget Attachment 31 Page 54 of 202

Maintain and Improve
Infrastructure and Facilities
Perform Budgeted Maintenance
Activities
Planned Infrastructure Maintenance is
Performed (Stormwater, Wastewater,
Streets)
77% 100% 100%
Preserve physical assets, streets, sewers, storm drainage and
building facilities
Preservation Projects are completed on schedule. 80% 85% 85%
Build new physical assets (buildings
and infrastructure)
Capital Projects are Constructed to Meet Expanding Needs
85% 85% 85%
Promote and Enhance Our
Hometown Feel while Focusing
on Livability and
Environmental Quality
Provide safe and efficient
conveyance of wastewater to the Water Pollution Control Facility
Wastewater infrastructure systems meet regulatory
performance requirements.
2 0 0
FY14 Proposed Budget Attachment 31 Page 55 of 202

Development and Public Works Department
Program: Special Events
Program Description: The Special Events program supports community-wide projects funded from the Transient Room Tax and appropriate expenditures from the Street Operating Fund and Drainage Operating Fund. The program provides assistance to the Veteran's Day Parade, Spring Clean-Up, hanging of holiday decorations, assistance to the holiday parade, community festivals and special projects. Examples support services include street sweeping, barricades, traffic control, event coordination and logistics support.
Budget Highlights: The Special Events program is projected to increase by approximately 11% in FY14. The increase is in Contractual Services and Program Expense in the Street and Drainage funds to provide the Depot (Chamber of Commerce) holiday lighting and expenses, and safety equipment and miscellaneous supplies for a variety of projects. Service Level Changes: A second clean up day is under consideration for FY14. The Council has directed staff to assess the feasibility of a second cleanup event. This proposal is in discussion and planning. Financial impacts have not been determined at the current time.
Program Performance Indicator:
Effectiveness Areas Key Processes Measurement Methods
FY12 Actual
FY13 Actual
FY14 Target
Promote and Enhance Our
Hometown Feel while Focusing
on Livability and Environmental
Quality
Reduce solid waste, pollutants and poor
environmental conditions in the
community
Trash is Reduced and Community Recycling is
Increased 90% 100% 100%
FY14 Proposed Budget Attachment 31 Page 56 of 202

Development and Public Works Department
Program: Streets
Program Description: The Streets program consists of sub-programs that clean and maintain, design and construct, and beautify City streets and associated assets in the City rights-of-way. Street maintenance and repair activities preserve the structural integrity of improved streets, minimize hazards to motorists and pedestrians, and respond to requests for service in a timely manner. Street engineering services design and construct new and existing street facilities and oversee the private construction of public street improvements in compliance with City standards. Street landscaping activities provide landscape maintenance in public rights-of-way.
Budget Highlights: Fuel tax and System Development Charges (SDC) revenues support the bulk of this program. In addition, a small amount of storm drainage revenue supports street sweeping activity. The program continues to struggle due to revenue failing to keep pace with service needs. Excluding funded capital replacement, the Street Program’s FY14 operating budget has increased 4.7% on an all funds basis. Although a state-wide increase in the fuel tax went into effect in January 2011, the resulting revenue is not projected at levels sufficient to stabilize the City’s Street Operating Fund in FY13 or to restore street program service levels. In FY12 the City implemented a Right of Way fee on Stormwater and Wastewater funds, which allowed a slight increase in available operating funds. This new fee generates approximately $378,000 in FY14 revenue for the Street Program and will be used to provide continued maintenance and operations services. A transfer from the Street Operating Fund to the Capital Fund of $100,000 is planned in FY14 if the fund remains stable. The Operation Division continues to struggle to maintain City streets in a fair or better condition. Without additional funding for needed street preservation projects, streets continue to deteriorate. During FY13 the Operations Division performed crack seal on several collector streets to slow street deterioration but lacked resources to do a more comprehensive crack seal program including residential streets. The Division completed a 2012 Street Conditions survey that indentified the street surface conditions had slipped to 44% fair or better condition from a 2010 survey reporting a 56.4% fair or better condition, falling substantially short of the 2008 Council endorsed 85% target for improved streets to be maintained in a fair or better condition. Each year the financial implications grow to meet the 85% target. Service Level Changes: Service levels will remain essentially unchanged in FY14. Virtually all locally-funded preservation activities have been suspended and maintenance activity remains sharply reduced. The continued deferral of the fuel tax-supported portion of street preservation activities such as street sealing and overlaying, results in a growing backlog of streets that will require full or partial reconstruction to return the street to a fair or better condition. The FY14 budget continues partial funding for sidewalk repair, street grading, local residential crack sealing. While there are some signs that the economy is finally beginning to rebound, the need for services will be compounded once economic activity resumes. The reason for this is primarily driven by the fact that public sector revenues will lag behind private sector recovery by one to two years. So while expectations for service will occur in the moment, the ability to pay for services will be a fiscal challenge until revenues catch up.
FY14 Proposed Budget Attachment 31 Page 57 of 202
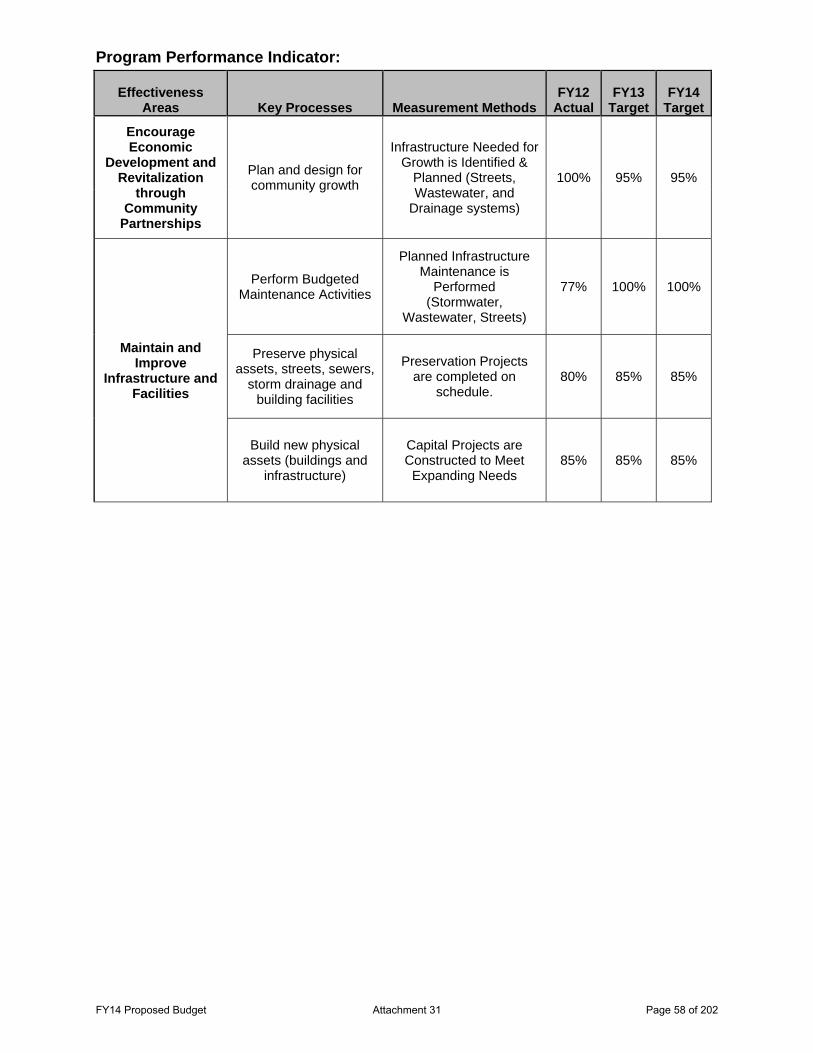
Program Performance Indicator:
Effectiveness Areas Key Processes Measurement Methods
FY12 Actual
FY13 Target
FY14 Target
Encourage Economic
Development and Revitalization
through Community
Partnerships
Plan and design for community growth
Infrastructure Needed for Growth is Identified &
Planned (Streets, Wastewater, and
Drainage systems)
100% 95% 95%
Maintain and Improve
Infrastructure and Facilities
Perform Budgeted Maintenance Activities
Planned Infrastructure Maintenance is
Performed (Stormwater,
Wastewater, Streets)
77% 100% 100%
Preserve physical assets, streets, sewers,
storm drainage and building facilities
Preservation Projects are completed on
schedule. 80% 85% 85%
Build new physical assets (buildings and
infrastructure)
Capital Projects are Constructed to Meet
Expanding Needs 85% 85% 85%
FY14 Proposed Budget Attachment 31 Page 58 of 202

Development and Public Works Department
Program: Technical Services
Program Description: The program focuses on locating, documenting and managing data concerning facilities, structures (both public and private), planning activity, code enforcement activities, and geographic features of the City. The Division provides spatial data collection, management, mapping, and integration using both traditional land surveying techniques and advanced technology. All City departments and several intergovernmental organizations receive data and support for their ongoing operations and business decisions. The range of information and support includes decision material for asset management, land use, planning and building activities, current information to support both Police and Fire and Life Safety Services operations, and support for economic development activities.
Budget Highlights: By taking advantage of the opportunity to reprioritize some revenue bond proceeds, the program will complete replacement of failing infrastructure management systems (including the replacement of hardware and software and the migration of existing data holdings). This will reduce risks associated with the City's larger geospatial and infrastructure management systems and complete initial phases of integration of facilities information into a uniform and accessible system by the end of FY13. Due to cost savings during the Asset Management System Replacement Project, funds exist and will be carried over to FY14 for progress on facilities information migration that had been planned for future phases. Separately the program has upgraded all installations of Computer Aided Design software, Geographic Information System (GIS) software and database software across the department. Overall program expenditures are not proposed to increase in FY14. Across all funds, FY14 Materials and Services expenditures decrease approximately $23,500 when compared to amended FY13. Small increases to Employee Development and Travel & Meeting Expenses are required to manage new integration technologies and fill gaps in support to ease the burden on the City’s Information Technology Department. Program resources will also remain dedicated to supporting the Accela system, capital improvement program with Land Surveying services, and support for projects of high importance to the City such as the Glenwood Refinement Plan, downtown redevelopment, and adoption of the 2030 Refinement Plan. Service Level Changes: No significant service level changes are planned in the FY14 budget except those associated with the Asset Management System replacement. GIS program funding from the General Fund has increased by approximately 4% of budget, while services, particularly Accela and GIS services, dedicated to General Fund support have increased to help offset work underway in the Information Technology Department to assist with the replacement of regional public safety and law enforcement systems.
Program Performance Indicator:
Effectiveness Areas Key Processes Measurement Methods
FY12 Actual
FY13 Target
FY14 Target
Encourage Economic
Development and Revitalization
through Community
Partnerships
Plan and design for community growth
Infrastructure Needed for Growth is Identified &
Planned (Streets, Wastewater, and
Drainage systems)
100% 95% 95%
FY14 Proposed Budget Attachment 31 Page 59 of 202

Development and Public Works Department
Program: Transportation
Program Description: The Transportation program plans and supports the construction and operation of all modes of transportation using the infrastructure that is owned by the public and operated by the City, and the many interactions with the regional transportation network of State freeways and highways, County roads, public transit, and multi-use paths. Transportation planning and engineering activities develop the capacity, safety, and efficiency of the City's transportation system as the City grows and system demand needs change, and provide electricity and maintenance for traffic control devices and street lights to maximize transportation safety and efficiency. Traffic control maintenance and construction activities provide traffic control devices, such as signals, signs and striping that are visible, informative, and effective in promoting traffic safety among all modes of transportation to comply with State and National standards. Bicycle and pedestrian facilities support a safe, interconnected and convenient system for bicyclists and pedestrians to provide trip making choices to citizens and visitors and improve community livability.
Budget Highlights: This Street Fund supported program faces the same challenges as described for the Streets program, with inadequacy of revenue streams leading to stagnation in the operating budget. In FY12 the City implemented a Right of Way fee on Stormwater and Wastewater funds, which allowed a slight increase in available operating funds. On an all funds basis, the Transportation program operating spending increases by 3.8% in FY14. To maintain program continuity, State and Federal Transportation funds will continue to be tapped to help fund City staff time devoted to regional transportation planning and to underwrite project and program-specific costs. Federal and State funds will be used to the fullest extent possible, instead of state and local gas taxes and other Street Fund revenue sources, so that those funds can be used for the street system maintenance and preservation. A major activity of the program will be completing the current update of the Transportation System Plan. The City’s Transportation SDC methodology will be reviewed in FY14 once the Plan is complete. Focus will remain on a wide variety of important transportation projects and programs in FY14. These projects and programs advance the integrated network of transportation systems of the City and its State and Regional partners. Fundamental responsibilities to respond to citizen issues in a timely and effective manner and participate in development review activities will continue to be a focus for the Transportation Program. The program objectives include the following strategic and long range planning projects, all of which are urgent matters:
1) Make substantial progress on the required federal environmental analysis for the Franklin Boulevard upgrade project;
2) Finalize plans and obtain permits for the South Bank multi-use path extension, connecting the soon to be completed path viaduct under the new I-5 Willamette River Bridge to the Franklin Boulevard/Glenwood Boulevard intersection;
3) Finalize agreement with Oregon Department of Transportation to have the City implement pedestrian crossing improvements as identified in the Main Street Pedestrian Study;
4) Work with the Neighborhood Economic Development Corporation (NEDCO) and the City’s Economic Development staff to design a downtown demonstration project along Main Street once that project has been decided upon by Downtown stakeholders;
5) Continue to implement and advance municipal street lighting cost reductions through new technologies in illumination and illumination control;
FY14 Proposed Budget Attachment 31 Page 60 of 202

6) Continue to participate in the development of a new state-mandated Regional Transportation System Plan;
7) Continue to lead City participation in the federally required Central Lane Metropolitan Planning Organization and associated activities like project prioritization and funding identification, and state mandated scenario planning;
8) Work with Lane Transit District on the Main Street and McVey Highway transit feasibility assessment; and
9) Continue to implement 2009’s MUTCD requirements related to pavement markings and street signage (e.g., retro-reflectivity).
The Operations Division provides routine and emergency maintenance on the City’s transportation system. This includes maintenance of 37 City-owned traffic signals and contractually 29 State of Oregon and 2 privately-owned traffic signals. Additionally the program oversees approximately 8000 signs and under contract with Lane County provides about 145 lane miles of striping annually. Traffic control services are provided for numerous regional and community events including University of Oregon football games, Eugene Marathon, Veteran’s and Holiday Parades. Service Level Changes: Existing staffing levels and contractual service budgets are proposed to be carried forward in FY14. Service priorities continue to be set on a ‘triage’ basis with development proposals, traffic signals, traffic signs, roadway striping, street lighting, pedestrian safety, state and federal mandates, project planning and project development, and partner agency requests for projects and participation in other program activities competing for attention. Repainting of crosswalks and pavement markers, cleaning intersection vision obstructions, and addressing substandard street light conditions will be addressed on a priority basis. Some services (e.g., curb painting, and detection device replacement) will be deferred.
Program Performance Indicator:
Effectiveness Areas Key Processes Measurement Methods FY12
Actual FY13
TargetFY14
Target
Maintain and Improve
Infrastructure and Facilities
Provide a safe and efficient transportation
system
Percent of out of service signalized intersections repaired within 48 hours
after reporting.
100% 90% 90%
FY14 Proposed Budget Attachment 31 Page 61 of 202

FY14 Proposed Budget Attachment 31 Page 62 of 202

Finance Department
Departmental Programs
• Financial Management
Department Description The Finance Department provides financial management services to City departments, the City Council and Budget Committee. The Department oversees the preparation and monitoring of the City’s annual budget, cash management and investments, and prepares the City’s Long Range Financial Forecast. The Department also provides services to Metropolitan Wastewater Management Commission, the Regional Fiber Consortium, and the Springfield Economic Development Agency (SEDA).
Mission The Finance Department provides professional oversight and consultation to City programs and services regarding financial, accounting and budgetary practices. The Department’s focus is to ensure compliance with all relevant financial and budgetary regulations, including Oregon Budget Law and State statutes governing financial information.
FY14 Proposed Budget Attachment 31 Page 63 of 202

Finance:
Finance:
FY14 OPERATING BUDGET - General Fund 32,419,061$
FY14 OPERATING BUDGET - All Funds 90,263,864$
903,874$
1,215,670$
Finance3%
All Others$31,515,187
97%
Finance1%
All Others$89,048,194
99%
FY14 Proposed Budget Attachment 31 Page 64 of 202
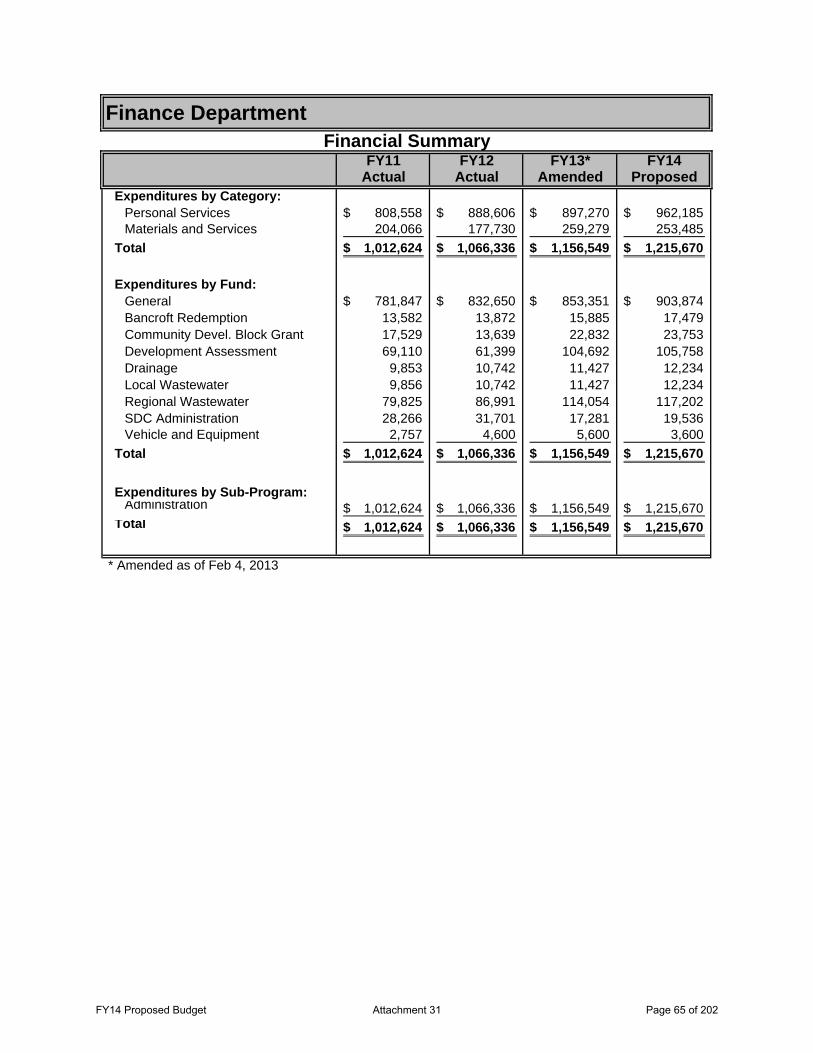
FY11 FY12 FY13* FY14Actual Actual Amended Proposed
Expenditures by Category:Personal Services 808,558$ 888,606$ 897,270$ 962,185$ Materials and Services 204,066 177,730 259,279 253,485
Total 1,012,624$ 1,066,336$ 1,156,549$ 1,215,670$
Expenditures by Fund:General 781,847$ 832,650$ 853,351$ 903,874$ Bancroft Redemption 13,582 13,872 15,885 17,479 Community Devel. Block Grant 17,529 13,639 22,832 23,753 Development Assessment 69,110 61,399 104,692 105,758 Drainage 9,853 10,742 11,427 12,234 Local Wastewater 9,856 10,742 11,427 12,234 Regional Wastewater 79,825 86,991 114,054 117,202 SDC Administration 28,266 31,701 17,281 19,536 Vehicle and Equipment 2,757 4,600 5,600 3,600
Total 1,012,624$ 1,066,336$ 1,156,549$ 1,215,670$
Expenditures by Sub-Program:Administration 1,012,624$ 1,066,336$ 1,156,549$ 1,215,670$
Total 1,012,624$ 1,066,336$ 1,156,549$ 1,215,670$
Finance DepartmentFinancial Summary
* Amended as of Feb 4, 2013
FY14 Proposed Budget Attachment 31 Page 65 of 202

Fin
ance D
irecto
r (1.0)
FIN
AN
CIA
L R
EPO
RT
IN
G
Acco
untin
g M
anager (1.0
)
LEG
AL &
C
OU
RT
See Legal / Judicia
l Sectio
n
Pro
curem
ent A
naly
st
(1.0
)
Acco
untin
g T
ech 1
(2.0
)
Cle
rk 2 (0
.5)
Acco
untant (2.0
)
Budget A
nalyst
(1.0
)
Payro
ll
Technic
ian (1.0
)
FY14 Proposed Budget Attachment 31 Page 66 of 202

Adopted Adopted Adopted ProposedFY11 FY12 FY13 FY14
General 7.98 7.43 7.27 7.27Bancroft Redemption 0.13 0.13 0.13 0.13Community Development 0.20 0.22 0.22 0.22Development Assessment 0.69 0.69 0.67 0.67Drainage Operating 0.10 0.10 0.10 0.10Local Sewer Operations 0.10 0.10 0.10 0.10Regional Sewer Operations 0.85 0.88 0.88 0.88SDC Administration 0.25 0.25 0.13 0.13Total Full-Time Equivalents 10.30 9.80 9.50 9.50
Adopted Adopted Adopted ProposedFY11 FY12 FY13 FY14
Accountant 2.00 2.00 2.00 2.00Accounting Supervisor 1.00 0.00 0.00 0.00Accounting Manager 0.00 1.00 1.00 1.00Accounting Technician 2.80 2.30 2.00 2.00Clerk 2 0.50 0.50 0.50 0.50Finance Director 1.00 1.00 1.00 1.00Management Analyst 2.00 2.00 2.00 2.00Payroll Technician 1.00 1.00 1.00 1.00Total Full-Time Equivalents 10.30 9.80 9.50 9.50
Finance Department
FTE Summary by Fund
Number of Full-Time Equivalents
Position Summary
Job Title/Classification:
FY14 Proposed Budget Attachment 31 Page 67 of 202

FY14 Proposed Budget Attachment 31 Page 68 of 202

Finance Department
Program: Financial Management The Finance Department is principally an internal service provider of financial management services to all Departments, the City Council, Budget Committee, Metropolitan Wastewater Commission, Regional Fiber Consortium and the Springfield Economic Development Agency. Externally, the Department has various reporting requirements to City residents, Federal and State grantors and bondholders of the City's municipal debt. Financial services include preparation of the City's annual budget and long-range financial projections, revenue collection, cash and investment management, debt administration, financial reporting, audit management, purchasing and accounts payable, contract development, payroll, assessment administration and billing, and collection of accounts receivable.
Budget Highlights: The Finance Department’s proposed budget for FY14 maintains the existing staffing level at 9.5 FTE. Any increase in personnel services costs over last year are the result of merit increase, change in benefit costs and any reclassification of an employee grade or step based upon duty assignments. Material & Services expenses are primarily flat over previous years with the exception of consulting services and software licenses. The City has reached the end of its current 5-year arrangement with its current auditors and is currently negotiating a possible extension to remain with the existing firm. The department also has major software license agreements, with PeopleSoft and BRASS, which annually have an escalation clause that is higher than a normal rate of inflation. This is typical for most software license agreements.
Service Level Changes: The department has several significant projects scheduled for next year that will have an impact on services provided both next year and in future years. The most significant is the introduction of an alternative to a traditional budget process referred to as priority based budgeting. This initial phase is a 7 month process involving Council and staff to review current services by identifying which current City programs best respond to the long term goals established by the Council.
A second major project for the department that also involves all city departments is a program to provide a more centralized and paperless program for processing accounts payable. The project is being planned to not increase the FTE count at the City through the use of technology by bringing existing resources into a central location.
The City’s main financial reporting system is scheduled for a software upgrade during this next fiscal year and the Finance staff will be working closely with the IT staff to complete this project.
Lastly for this next year, the department will be committing resources to a project that will be the first phase of an analysis of the City fiscal health for some of its major operating funds.
FY14 Proposed Budget Attachment 31 Page 69 of 202
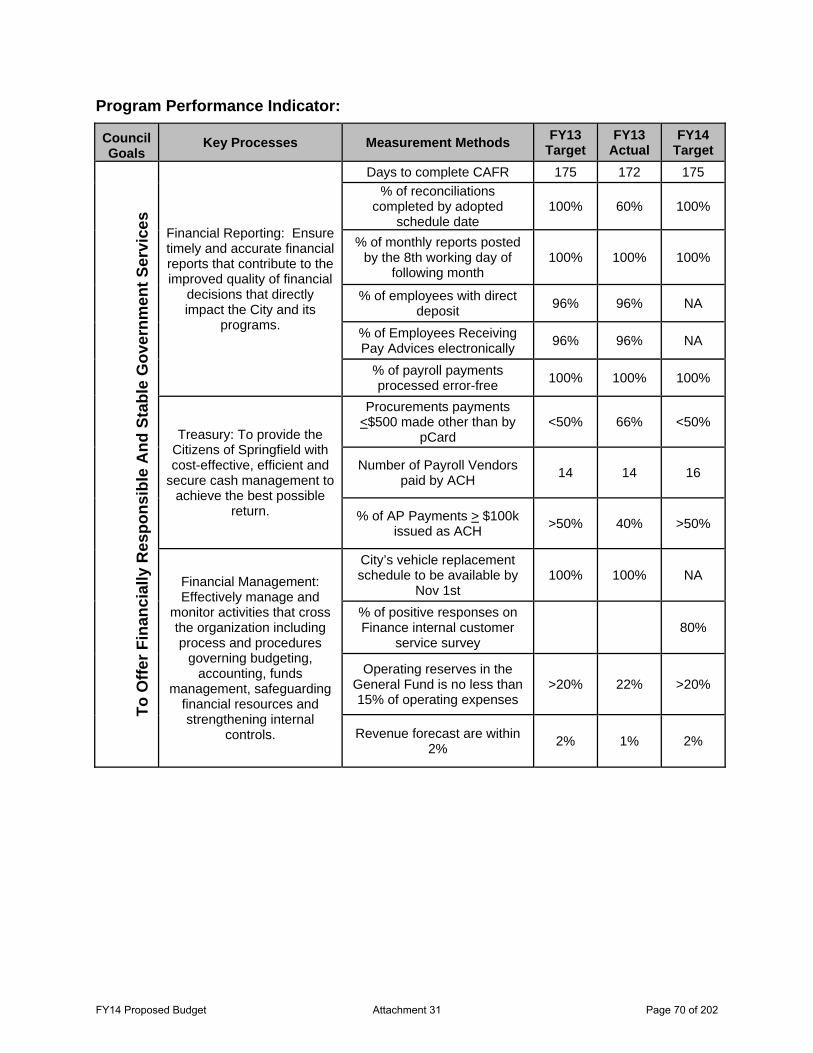
Program Performance Indicator:
Council Goals
Key Processes Measurement Methods FY13 Target
FY13 Actual
FY14 Target
To O
ffer F
inan
cial
ly R
espo
nsib
le A
nd S
tabl
e G
over
nmen
t Ser
vice
s
Financial Reporting: Ensure timely and accurate financial reports that contribute to the improved quality of financial
decisions that directly impact the City and its
programs.
Days to complete CAFR 175 172 175 % of reconciliations
completed by adopted schedule date
100% 60% 100%
% of monthly reports posted by the 8th working day of
following month 100% 100% 100%
% of employees with direct deposit 96% 96% NA
% of Employees Receiving Pay Advices electronically 96% 96% NA
% of payroll payments processed error-free 100% 100% 100%
Treasury: To provide the Citizens of Springfield with cost-effective, efficient and
secure cash management to achieve the best possible
return.
Procurements payments <$500 made other than by
pCard <50% 66% <50%
Number of Payroll Vendors paid by ACH 14 14 16
% of AP Payments > $100k issued as ACH >50% 40% >50%
Financial Management: Effectively manage and
monitor activities that cross the organization including process and procedures
governing budgeting, accounting, funds
management, safeguarding financial resources and strengthening internal
controls.
City’s vehicle replacement schedule to be available by
Nov 1st 100% 100% NA
% of positive responses on Finance internal customer
service survey 80%
Operating reserves in the General Fund is no less than 15% of operating expenses
>20% 22% >20%
Revenue forecast are within 2% 2% 1% 2%
FY14 Proposed Budget Attachment 31 Page 70 of 202
Fire and Life Safety Department
Departmental Programs
• Office-of-the-Chief • Administrative Services Bureau • Emergency Medical Services • Fire Marshal’s Office • Fire Operations • Fire and Life Safety Training
Department Description The Fire and Life Safety Department provides services that prevent the loss of life and property, and protect the environment. Administrative responsibilities include planning, supporting and controlling a diversified service delivery system for the City, the urban growth boundary, and East Lane Ambulance Service areas. Services include establishing modifying and providing fire protection and prevention services, firefighting, basic and advanced life support and ambulance transportation, illness and injury prevention, special rescue, hazardous materials control, fire safety education, code enforcement and fire cause investigation. The City also provides fire, rescue and EMS first response to three contract districts in the Springfield area – Glenwood Fire Protection District, Rainbow Fire Protection District, and a portion of Willakenzie Fire Protection District as well as ambulance service to a much larger region totaling 1,514 square miles.
Additionally, the department performs ambulance billing services for twenty-five (25) jurisdictions throughout the State, and administers the FireMed membership program for Eugene Fire & EMS, Lane Rural Fire/Rescue, and Springfield Fire & Life Safety.
Mission The Fire and Life Safety Department serves our communities by protecting and preserving life, property, and the environment through prevention, education, emergency medical services, rescue, and fire suppression services.
FY14 Proposed Budget Attachment 31 Page 71 of 202

Fire and Life Safety:
Fire and Life Safety:
FY14 OPERATING BUDGET - General Fund
16,777,521$
32,419,061$
FY14 OPERATING BUDGET - All Funds 90,263,864$
9,931,547$
Fire and Life Safety31%
All Others$22,487,514
69%
Fire and Life Safety 19%
All Others$65,069,595
81%
FY14 Proposed Budget Attachment 31 Page 72 of 202
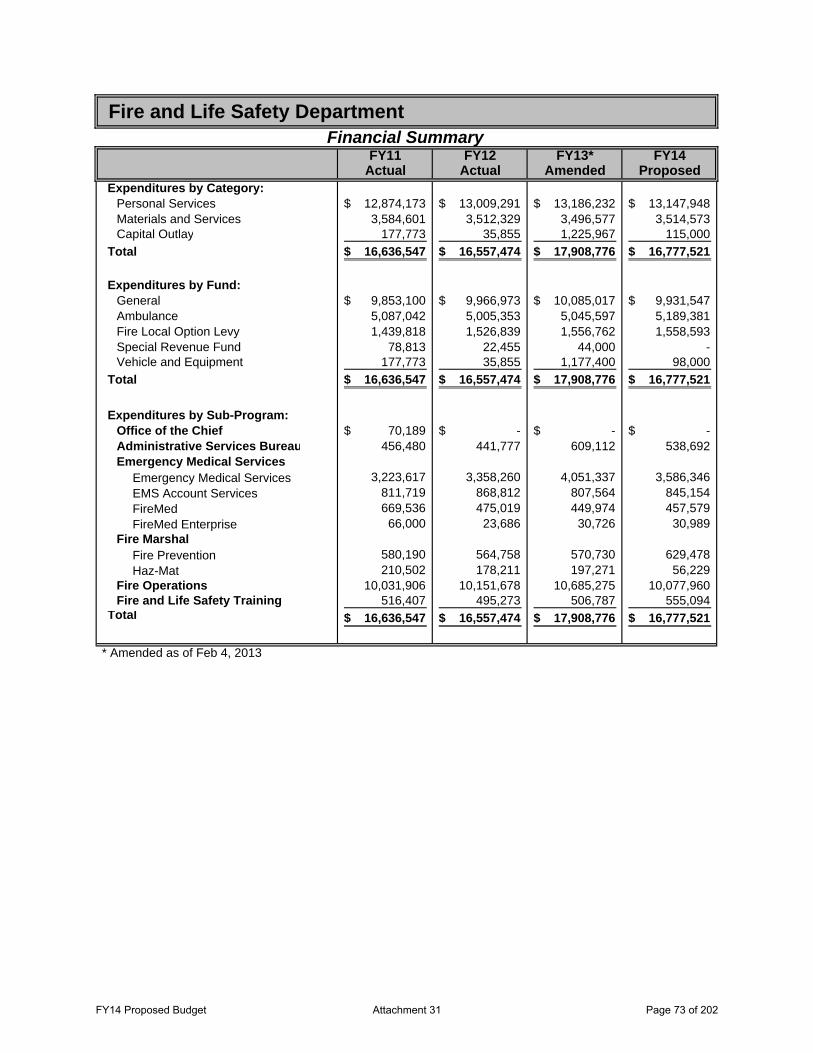
FY11 FY12 FY13* FY14Actual Actual Amended Proposed
Expenditures by Category:Personal Services 12,874,173$ 13,009,291$ 13,186,232$ 13,147,948$ Materials and Services 3,584,601 3,512,329 3,496,577 3,514,573 Capital Outlay 177,773 35,855 1,225,967 115,000
Total 16,636,547$ 16,557,474$ 17,908,776$ 16,777,521$
Expenditures by Fund:General 9,853,100$ 9,966,973$ 10,085,017$ 9,931,547$ Ambulance 5,087,042 5,005,353 5,045,597 5,189,381 Fire Local Option Levy 1,439,818 1,526,839 1,556,762 1,558,593 Special Revenue Fund 78,813 22,455 44,000 - Vehicle and Equipment 177,773 35,855 1,177,400 98,000
Total 16,636,547$ 16,557,474$ 17,908,776$ 16,777,521$
Expenditures by Sub-Program:Office of the Chief 70,189$ -$ -$ -$ Administrative Services Bureau 456,480 441,777 609,112 538,692 Emergency Medical Services
Emergency Medical Services 3,223,617 3,358,260 4,051,337 3,586,346 EMS Account Services 811,719 868,812 807,564 845,154 FireMed 669,536 475,019 449,974 457,579 FireMed Enterprise 66,000 23,686 30,726 30,989
Fire Marshal Fire Prevention 580,190 564,758 570,730 629,478 Haz-Mat 210,502 178,211 197,271 56,229
Fire Operations 10,031,906 10,151,678 10,685,275 10,077,960 Fire and Life Safety Training 516,407 495,273 506,787 555,094
Total 16,636,547$ 16,557,474$ 17,908,776$ 16,777,521$
Fire and Life Safety DepartmentFinancial Summary
* Amended as of Feb 4, 2013
FY14 Proposed Budget Attachment 31 Page 73 of 202

Adm
in/M
gt
Ana
lyst
(2.
0)
Off
ice
of t
he C
hief
(1.
0)
Exec
utiv
e A
sst
EU
G (
1.0)
Upd
ated
Feb
14,
201
3
Dep
uty
Chi
ef
Ope
ratio
ns (
1.0)
A
dmin
istra
tive
Serv
ices
Bur
eau
Mgr
(1.
0)
Acc
t Sr
vs S
upv
(1.0
)
EMS
Acc
t Te
ch
(6.0
)
Billi
ng M
gmt
Ana
lyst
2 (
1.0)
Pro
gram
Spe
c(3
.0)
Dep
uty
Chi
ef
Fire
Mar
shal
(1.
0)
Dep
t A
sst.
(1.
0)
Sr.
Mgm
t
Ana
lyst
(1.
0)
Inte
rn
(1.
0)
Sr. F
inan
ce
Mgr
(1.
0)
Pro
gram
Spe
c (1
.0)
Dep
uty
FM
(3.0
)
SFL
S FY
14 F
TE
: 100
(B
OL
D &
SH
AD
ED
) EU
GEN
E FY
14 F
TE: 2
05
Pro
g Te
ch (
1.0)
FIR
EMED
Ass
istan
t FM
(1
.0)
Pro
gram
Spe
c (1
.0)
Sr. A
dmin
Sp
ec (
1.0)
Mgm
t A
naly
st
RTK
(1.
0)
Dep
uty
FM
(5.0
)
Adm
in
Spec
(1.
0)
Pro
g Te
ch
(2.0
)
Batt
Chi
ef
(3.0
) Ba
tt C
hief
(3
.0)
Engi
neer
(2
4.0)
Cap
tain
(2
1.0)
C
apta
in
SFLS
(15
.0)
Engi
neer
SF
LS (
15.0
)
Fire
fight
er /
Pa
ram
edic
(4
5.0)
Fire
fight
er
(35.
0)
Cap
tain
(2
1.0)
Engi
neer
(2
1.0)
Fire
fight
er
(35.
0)
Batt
Chi
ef
(3.0
)
Dep
uty
Chi
ef
Spec
ial O
pera
tions
(1.
0)
IT
App
Sup
port
Te
ch (
1.0)
EMS
Chi
ef (
1.0)
EMS
Off
icer
(1
.0)
Spec
ial T
eam
s *B
att
Chi
ef
Trai
ning
(1.
0)
Pro
g Sp
ec (
EUG
)(1
.0)
Vid
eo T
ech
(1.0
)
Fire
Inst
ruct
or
(1.0
)
EMS
Trng
Co
ord
. (1
.0)
Trai
ning
Off
icer
(1
.0)
Trai
ning
Cap
t
(1.0
)
Haz
Mat
USA
R
Wat
er R
escu
e
AR
FF
Logi
stic
s
Man
ager
(1.
0)
Emer
g Eq
uip-
Tech
(2.
0)
Mai
nt W
ork
er(3
.0)
Part
s/Su
pply
(1
.0)
Trai
ning
Cap
t (1
.0)
Pro
g Te
ch
Fire
Med
(1.
0)
* C
urre
ntly
serv
ing
as a
BC
in O
pera
tions
FY14 Proposed Budget Attachment 31 Page 74 of 202

Adopted Adopted Adopted ProposedFY11 FY12 FY13 FY14
General 62.95 60.95 59.95 58.95Ambulance 34.05 33.05 32.05 32.05Fire Local Option Levy 9.00 9.00 9.00 9.00Total Full-Time Equivalents 106.00 103.00 101.00 100.00
Adopted Adopted Adopted ProposedFY11 FY12 FY13 FY14
Battalion Chief - Operations 3.00 3.00 3.00 3.00Battalion Chief - Training 1.00 1.00 1.00 1.00Clerk 2 2.00 0.00 0.00 0.00Department Assistant 1.00 1.00 1.00 1.00Deputy Chief - Operations 1.00 1.00 0.00 0.00Deputy Chief - Fire Marshal/HazMat 1.00 1.00 1.00 1.00Deputy Fire Marshal 1 1.00 1.00 1.00 0.00Deputy Fire Marshal 2 3.00 3.00 3.00 3.00EMS Account Services Supervisor 1.00 1.00 1.00 1.00EMS Accounting Technician 7.00 7.00 6.00 6.00EMS Program Officer 0.00 1.00 1.00 1.00Fire Captain 15.00 15.00 16.00 16.00Fire Chief 0.00 0.00 0.00 0.00Fire Engineer 15.00 15.00 15.00 15.00Firefighter/Paramedic 45.00 45.00 45.00 45.00Management Analyst, Senior 2.00 1.00 1.00 1.00Program Technician 5.00 4.00 4.00 4.00Service Bureau Manager 1.00 1.00 1.00 1.00Training Officer 2.00 2.00 1.00 1.00Total Full-Time Equivalents 106.00 103.00 101.00 100.00
Fire and Life Safety Department
FTE Summary by Fund
Number of Full-Time Equivalents
Position Summary
Job Title/Classification:
FY14 Proposed Budget Attachment 31 Page 75 of 202

FY14 Proposed Budget Attachment 31 Page 76 of 202

Fire and Life Safety Department
Program: Office of the Chief Program Description: The Office of the Chief ensures that City Council goals and targets are met, represents the Department in community, interagency, and media relations and provides management direction and support of the entire Department in order to maintain a high level of community fire and life safety services delivery.
Budget Highlights: Exploring opportunities for efficiencies, standardization and consolidation between Eugene Fire & EMS and Springfield Fire & Life Safety, as well as working with staff and elected officials to find on-going solutions for sustainability of the ambulance transport system, will continue to be the focus in FY14.
Service Level Changes: The consolidated Office of the Chief will continue in FY14, with primary focus on consolidation/merger initiatives in all divisions of the department as well as maintenance of existing, or enhanced, service levels already established.
Program Performance Indicator:
Council Goals Key Processes
Measurement Methods
FY13 Target
FY13 Actual
FY14 Target
Fina
ncia
lly S
ound
and
St
able
Gov
ernm
ent
Serv
ices
Provide Information to City Staff:
Content
Annual Reviews Current 100% 100% 100%
FY14 Proposed Budget Attachment 31 Page 77 of 202

Fire and Life Safety Department
Program: Administrative Services Bureau Program Description: The Administrative Services Bureau (ASB) supervises and manages the revenue-generating programs: Ambulance Account Services and FireMed. In addition, the ASB is responsible for budget development, grant management, accounts payable, payroll, contract coordination, and fiscal monitoring. It provides support services for the Office of the Chief, Operations Division, Training, Ambulance Transport, Fire Marshal's Office, FireMed and Ambulance Account Services.
Budget Highlights: The FireMed Ambulance Membership Program in FY13 saw a slight decrease for Springfield memberships. With further reductions in advertising spending and increased reliance on volunteers to run the campaign, the overall consolidated campaign held steady. The effectiveness of FireMed’s marketing efforts are constantly being evaluated and focused to achieve the best results for the dollars available. For FY14, FireMed has a new advertising and marketing contractor. With a fresh perspective and a new look to the campaign, the Spring 2013 campaign should be an exciting one. Membership marketing will continue to face obstacles in the regional economic climate, but we project that membership will grow in FY14
Ambulance Account Services continues their ambulance account enterprise, with billing services for 25 government entities besides Springfield. Account Services staff provide a level of expertise found in few other local government agencies. Low reimbursement rates for Medicare patient ambulance transports continue to make balancing the fund a challenge. Account Services has implemented several process improvements to maximize revenues and gain efficiencies in processing in an attempt to offset declining revenues. FY13 collection percentages held constant. The addition of five (5) small clients in FY13 should provide approximately $25,000 in additional revenue in FY14.
Service Level Changes: Integration of some Logistics functions and continued efforts to standardize equipment and processed across the metro area will continue to be a focus in FY14. Continuous Process Improvement (CPI), Benchmarking, and Best Practices will be applied to the consolidated function to gain further efficiencies in FY14.
FY14 Proposed Budget Attachment 31 Page 78 of 202

Program Performance Indicator:
Council Goals Key Processes
Measurement Methods
FY13
Target FY13
Actual FY14
Target Fi
nanc
ially
Sou
nd a
nd S
tabl
e G
over
nmen
t Se
rvic
es
Manage Financial Resources:
Obtain Funding
Net Enterprise Contribution to
Ambulance Fund ($1000)
360
360 360
Ambulance - Net Collection % (Spfld
only)
80% 75% 80%
Ambulance Bills - Net # days in
accounts receivable (Spfld
only)
55 90 55
FireMed - Market share (eligible households in
Springfield)
29.0% 29.0% 29.0%
FY14 Proposed Budget Attachment 31 Page 79 of 202

Fire and Life Safety Department
Program: Emergency Medical Services Program Description: The Emergency Medical Services (EMS) program provides high-quality pre-hospital emergency medical treatment and ambulance transportation throughout the City of Springfield and much of eastern Lane County.
Budget Highlights: Revenues continue to outpace expenses and short and long-term solutions are still being sought. The Emergency Medical Services Officer (SFLS), and Battalion Chief of EMS (Eugene) are working on standardizing equipment, protocols, SOP’s, and training throughout the joint EMS system. System efficiencies in FY14 are expected to reduce costs and improve overall division performance.
Both Eugene and Springfield are taking delivery on new ambulances in late FY13/early FY14. These new units, four (4) for Eugene and two (2) for Springfield, will be identical, based on the recommendations of the Joint Apparatus Committee. The new, smaller, lighter ambulances will incorporate a smoother ride, additional safety features, and be a major upgrade to the ambulance fleet throughout the 3-Battalion system.
Service Level Changes: No service level changes are anticipated in FY14.
Program Performance Indicator:
Council Goals Key Processes
Measurement Methods
FY13
Target FY13
Actual
FY14
Target
Pres
erve
Pub
lic S
afet
y
Maintain Public Works and Core
Services
% emergency ambulance
response within 8 minutes
90% 83% 90%
FY14 Proposed Budget Attachment 31 Page 80 of 202

Fire and Life Safety Department
Program: Fire Marshal’s Office Program Description: The Fire Marshal's Office (FMO) is responsible for services aimed at providing and maintaining a high fire safety awareness in the community. These services are presented to the public through code enforcement, control of hazardous materials use, life safety inspections, educational classes, fire cause investigations, issuance of operational permits, and correction of fire code violations in buildings. The primary goal of the FMO is reducing life and property loss. This program meets the minimum requirements for State Mandated Exempt Status (ORS 476.030(3), OAR 837-039-0010). The program also meets hazardous material mandates as outlined by federal and state governments.
Budget Highlights: The division has been providing the program functions that relate to the City of Springfield's partial exemption status and will maintain that status in FY14. The FMO is tasked with ensuring that buildings are maintained as designed and approved during construction by the Building Official. Deputy Fire Marshals respond and conduct fire investigations and assist in the prosecution of arsonists with Springfield Police and the Lane County District Attorney.
Certain State of Oregon licensing programs require that a record of a facility fire code inspection has been performed within specified time frames. These facilities are primarily high life hazard occupancies where occupants have limited ability to self evacuate or protect themselves in the event of an emergency. Hospitals, jails, day care centers, and elder living and care facilities are examples of these facilities. Deputy Fire Marshals perform the inspections and coordinate facility emergency plans for fire department response with the facilities. Coordination with facility managers and Deputies is a collaborative effort where relationship-building leads to code compliance and meeting licensing requirements.
The FMO contributes significant revenue to the general fund each year through fees-for-service charges.
Service Level Changes: Integration of the workforce of the two fire departments will continue in FY14. Implementation of the new Records Management System (RMS), slated for 4th quarter FY13, will provide a fully integrated database for managing all fire prevention activities across the metro area. FLS will reduce 1 FTE Deputy Fire Marshal in FY14 to meet general fund budget targets. The impact of the reduction will be felt in the Fire Protection System Maintenance program that ensures operational readiness of the 863 life safety systems across the city and delays to citizen inquiries.
FY14 Proposed Budget Attachment 31 Page 81 of 202

Program Performance Indicator:
Council Goals Key Processes
Measurement Methods
FY13 Target
FY13 Actual
FY14 Target
Preserve
Pub
lic Safety
Secure Property and Personal Safety
Dollar loss per fire ‐ Business (perform better than 50% of
similar cities) 100% 100% 100%
Dollar loss per fire ‐ Residential (perform better than 75% of
similar cities) 75% 75% 75%
Dollar loss per fire – All (perform better than 75% of similar
cities) 75% 75% 75%
% Springfield occupancies with
Fire Protection Systems in
compliance or verified as maintained
80% 51% 25%**
Com
mun
ity a
nd E
cono
mic
D
evel
opm
ent a
nd
Rev
italiz
atio
n
Interact With Citizens
% Juvenile Firesetter referral
service and/or intervention for youth requests fulfilled annually
100% 97% 100%
** Due to loss of 1 FTE DFM
FY14 Proposed Budget Attachment 31 Page 82 of 202
Fire and Life Safety Department
Program: Fire Operations Program Description: Fire Operations provides fire and emergency medical response to citizen calls for assistance in a variety of emergencies. This program provides the personnel, training, specialized vehicles, equipment, and supplies to respond to emergencies in the community that threaten life, property, and the environment. This includes fires, rescues, natural and man-made disasters, hazardous material incidents, medical emergencies, and ambulance transportation. In addition, personnel perform work assigned by the Administrative Services Bureau, Fire Marshal's Office, and Emergency Medical Services programs and keep all equipment and apparatus maintained and ready for emergency response.
Fire Operations is also responsible for assisting in procuring grant program funds. Seeking alternative funding sources is ongoing.
Budget Highlights: The Public Safety Levy was renewed by voters in November 2010 and will continue to fund staffing for a fifth engine company in FY14. Fire Operations continues to work cooperatively with Eugene Fire and EMS in a "3 Battalion" system. Working cooperatively with Eugene Fire and EMS, efforts to improve processes and gain efficiencies in both systems will continue in FY14.
A new contract with IAFF and an expanded IGA with the City of Eugene will bring us to the ‘next steps’ in the merger/consolidation process in FY14. The new Contract further aligns with the Eugene Firefighter’s new Contract with the ultimate goal of a blend of Springfield and Eugene Firefighters working together in both cities in FY15. Cross-functional teams are being formed to identify key areas needing work, with the goal of implementing necessary changes throughout FY14.The new computerized Records Management System was implemented in FY13, and some Logistics services are now being provided by Eugene to Springfield.
Eugene and Springfield Battalion Chiefs in all three battalions are rotating assignments throughout the two cities, providing a broader understanding of metro operations for all Operations managers.
Service Level Changes: FLS took delivery in FY13 on a new Pierce aerial platform. This is the largest apparatus in the FLS fleet, and is a major upgrade to the 2002 model. Fire apparatus replacement fund contributions are still below desired levels, but increased contributions the past few years, and use of leases, has improved the fund overall. Additional increases in replacement fund contributions will be necessary to maintain the fleet and replace worn out apparatus and vehicles.
FY14 Proposed Budget Attachment 31 Page 83 of 202

Program Performance Indicator:
Council Goals Key Processes
Measurement Methods
FY13 Target
FY13 Actual
FY14 Target
Pres
erve
Pub
lic
Safe
ty
Secure Property and Personal
Safety
% of fire responses within 5 minutes 80% 60% 80%
FY14 Proposed Budget Attachment 31 Page 84 of 202
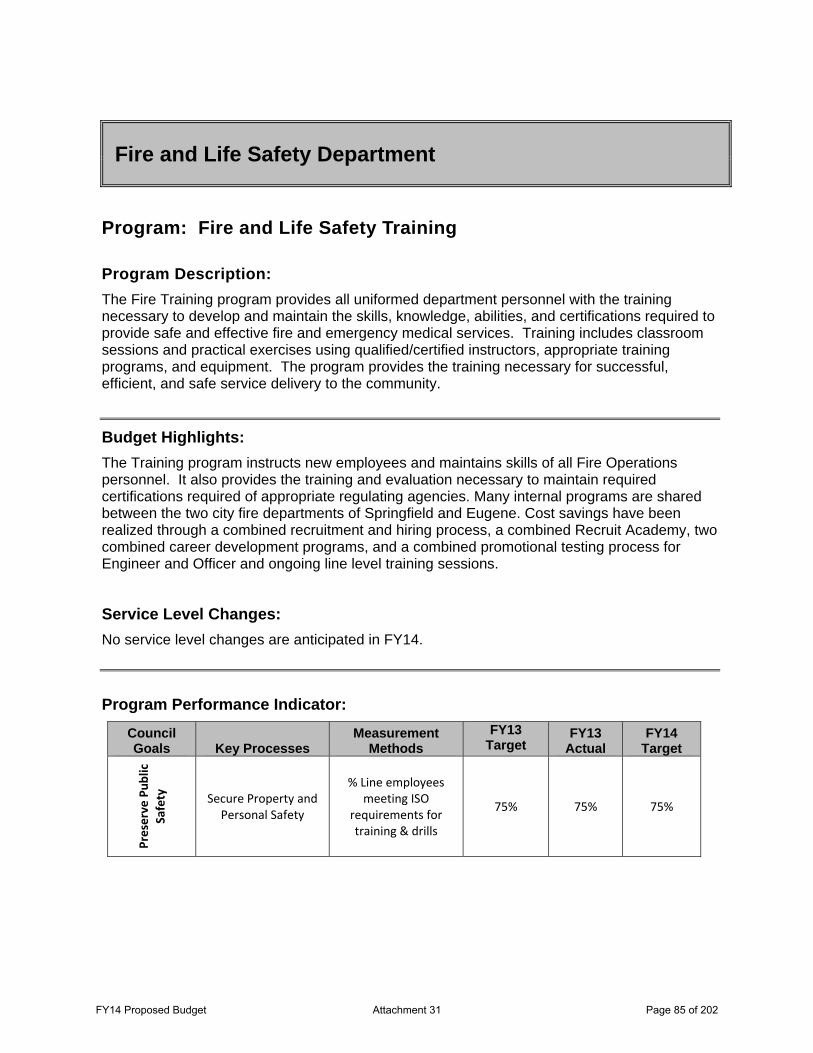
Fire and Life Safety Department
Program: Fire and Life Safety Training Program Description: The Fire Training program provides all uniformed department personnel with the training necessary to develop and maintain the skills, knowledge, abilities, and certifications required to provide safe and effective fire and emergency medical services. Training includes classroom sessions and practical exercises using qualified/certified instructors, appropriate training programs, and equipment. The program provides the training necessary for successful, efficient, and safe service delivery to the community.
Budget Highlights: The Training program instructs new employees and maintains skills of all Fire Operations personnel. It also provides the training and evaluation necessary to maintain required certifications required of appropriate regulating agencies. Many internal programs are shared between the two city fire departments of Springfield and Eugene. Cost savings have been realized through a combined recruitment and hiring process, a combined Recruit Academy, two combined career development programs, and a combined promotional testing process for Engineer and Officer and ongoing line level training sessions.
Service Level Changes: No service level changes are anticipated in FY14.
Program Performance Indicator:
Council Goals Key Processes
Measurement Methods
FY13 Target
FY13 Actual
FY14 Target
Preserve
Pub
lic
Safety
Secure Property and Personal Safety
% Line employees meeting ISO
requirements for training & drills
75% 75% 75%
FY14 Proposed Budget Attachment 31 Page 85 of 202

FY14 Proposed Budget Attachment 31 Page 86 of 202

Human Resources Department
Departmental Programs
• Recruitment, Selection, & Retention • Employee & Labor Relations • City Wide Training • Risk Management • Benefits
Department Description The Human Resources Department serves as a support system to and strategic partner with other City departments by providing all major employment, risk, and benefit services for the City. These services are delivered through five major program areas: Employee Recruitment, Selection & Retention; Employee & Labor Relations; City-Wide Training; Risk Management; and Employee Benefits.
Human Resources administers a job classification system that is relevant, flexible and fair, oversees the City’s compensation practices to ensure compliance with State and Federal compensation regulations, and develops competitive compensation strategies that will enable the City to attract and retain talented employees. In addition, Human Resources strives to work collaboratively with the City's collective bargaining units in administering the labor contracts, resolving disputes, and handling grievances. Human Resources builds positive relationships with employees through implementation of equitable employment policies, performance management practices, employee recognition programs, and the City’s training program. This training program includes new employee orientation, supervisory development, and other mandatory and discretionary training.
The City’s Employee Benefits program includes: health, life, and disability insurance; employee leave administration; employee wellness; and retirement. The Department is also responsible for City-wide Risk Management, including loss prevention planning, workplace health and safety, litigation coordination, workers compensation, and insurance and liability claim administration.
Human Resources staff must stay abreast of new federal, state and local laws and regulations impacting each of our five program areas.
Mission The mission of the Human Resources Department is to serve the organization by providing professional organizational development & technical counsel, strategic guidance, service, leadership, and training for issues related to the City’s work force to our partner departments.
FY14 Proposed Budget Attachment 31 Page 87 of 202
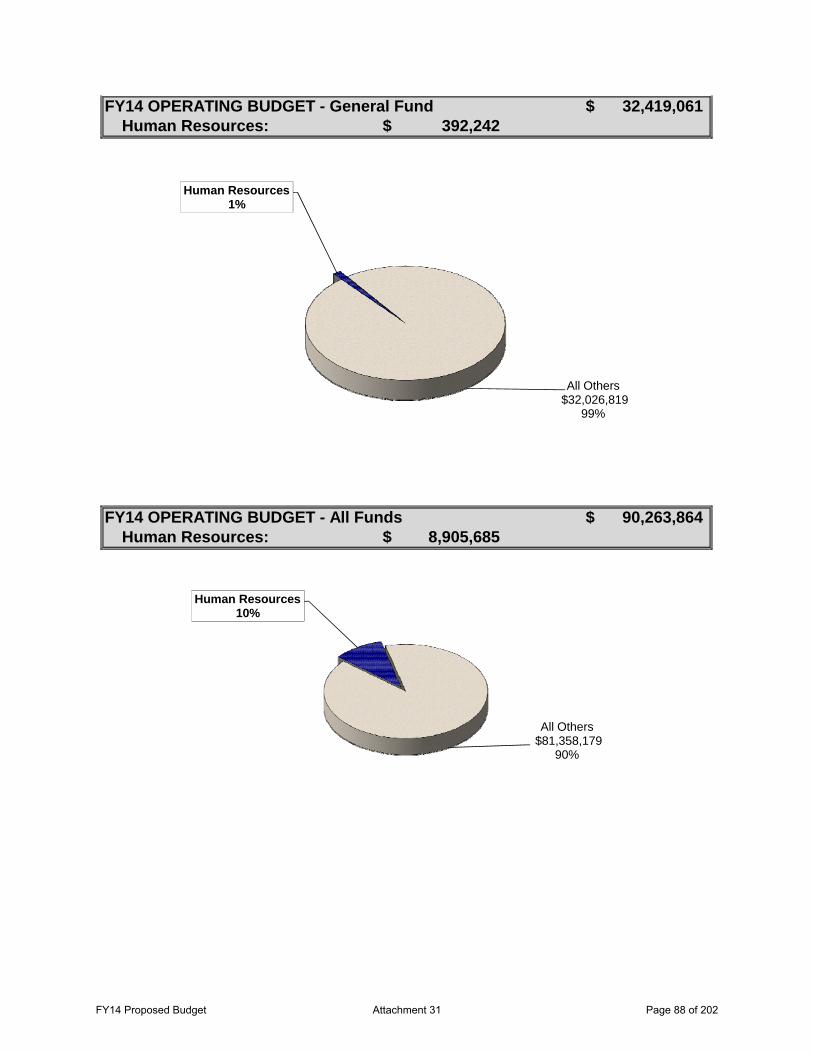
Human Resources:
Human Resources:
FY14 OPERATING BUDGET - General Fund 32,419,061$
FY14 OPERATING BUDGET - All Funds 90,263,864$
392,242$
8,905,685$
Human Resources1%
All Others$32,026,819
99%
Human Resources10%
All Others$81,358,179
90%
FY14 Proposed Budget Attachment 31 Page 88 of 202

FY11 FY12 FY13* FY14Actual Actual Amended Proposed
Expenditures by Category:Personal Services 535,686$ 581,818$ 596,635$ 612,781$ Materials and Services 548,299 498,440 4,070,092 8,292,904
Total 1,083,985$ 1,080,258$ 4,666,727$ 8,905,685$
Expenditures by Fund:General 391,502$ 374,108$ 401,064$ 392,242$ Insurance 692,483 704,550 4,255,663 8,513,443 Vehicle and Equipment - 1,600 10,000 -
Total 1,083,985$ 1,080,258$ 4,666,727$ 8,905,685$
Expenditures by Sub-Program:Personnel Administration 359,798$ 352,444$ 371,846$ 363,024$ Support Services 18,893 17,698 17,678 17,678 Citywide Training 12,812 5,565 21,540 11,540 Employee Benefits 444,563 441,904 458,403 484,382 Risk Management 159,780 156,317 240,677 233,803 Workers Compensation 88,140 106,329 114,771 110,220 Self Funded Insurance - - 3,441,812 7,685,038
Total 1,083,985$ 1,080,258$ 4,666,727$ 8,905,685$
Human Resources DepartmentFinancial Summary
* Amended as of Feb 4, 2013
FY14 Proposed Budget Attachment 31 Page 89 of 202

HR
Dir
ecto
r (1
.0)
Hum
an R
eso
urce
s Sp
ecia
list
(1.0
)
HR
Ana
lyst
(4.
0)
FY14 Proposed Budget Attachment 31 Page 90 of 202
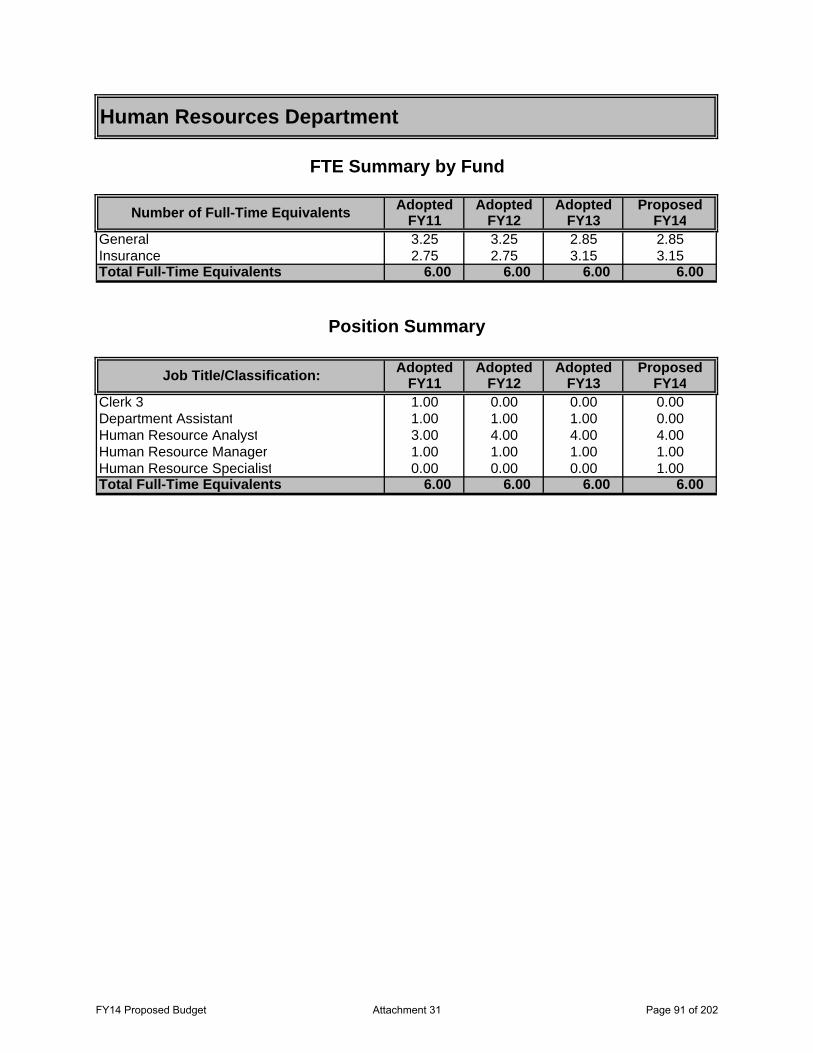
Adopted Adopted Adopted ProposedFY11 FY12 FY13 FY14
General 3.25 3.25 2.85 2.85Insurance 2.75 2.75 3.15 3.15Total Full-Time Equivalents 6.00 6.00 6.00 6.00
Adopted Adopted Adopted ProposedFY11 FY12 FY13 FY14
Clerk 3 1.00 0.00 0.00 0.00Department Assistant 1.00 1.00 1.00 0.00Human Resource Analyst 3.00 4.00 4.00 4.00Human Resource Manager 1.00 1.00 1.00 1.00Human Resource Specialist 0.00 0.00 0.00 1.00Total Full-Time Equivalents 6.00 6.00 6.00 6.00
Human Resources Department
FTE Summary by Fund
Number of Full-Time Equivalents
Position Summary
Job Title/Classification:
FY14 Proposed Budget Attachment 31 Page 91 of 202

FY14 Proposed Budget Attachment 31 Page 92 of 202

Human Resources Department
Program: Recruitment, Selection, & Retention Program Description: This program serves internal and external customers and clients through:
• Citywide recruitment and selection activities, which include strategic planning to meet Citywide staffing needs and applicant pool development; oversight of applicant screening and selection; successor planning; affirmative action and Equal Employment Opportunity oversight; and applicant tracking.
• Job classification and pay practice oversight, including the development of competitive compensation strategies, the evaluation of relevant labor markets, and compliance with State and Federal regulations and with collective bargaining agreements.
• Maintenance of City personnel records, including performance records, personnel action administration, records retention compliance, and HR’s database.
• Developing and administering the City’s employee recognition program.
• Participating with other local public agencies to enhance the City’s inclusion and diversity efforts in alignment with Council goals.
Budget Highlights: • Hosted community workshops and events to attract applicants of color to City jobs and
opportunities.
• Partnered with the City of Eugene in firefighter/paramedic recruitment process as part of Fire Department merger effort.
• Worked with other State and local agencies to encourage junior-high-school-aged girls to consider non-traditional careers through “Options Unlimited” sponsoring and thereby further diversifying our future workforce.
Service Level Changes: To expand and leverage our resources we have prioritized working with other public agencies. The result is a more robust delivery of service to our own employees, and a greater opportunity to learn best practices. With our continued slow local economy, the City has had few open positions but having more knowledge about other agency opportunities has helped prepare us for future growth. Inclusion and diversity efforts have become a major work focus. In addition we are preparing to implement a new module of our HR Information System application that will greatly improve our e-recruit presence and interface with job applicants.
FY14 Proposed Budget Attachment 31 Page 93 of 202
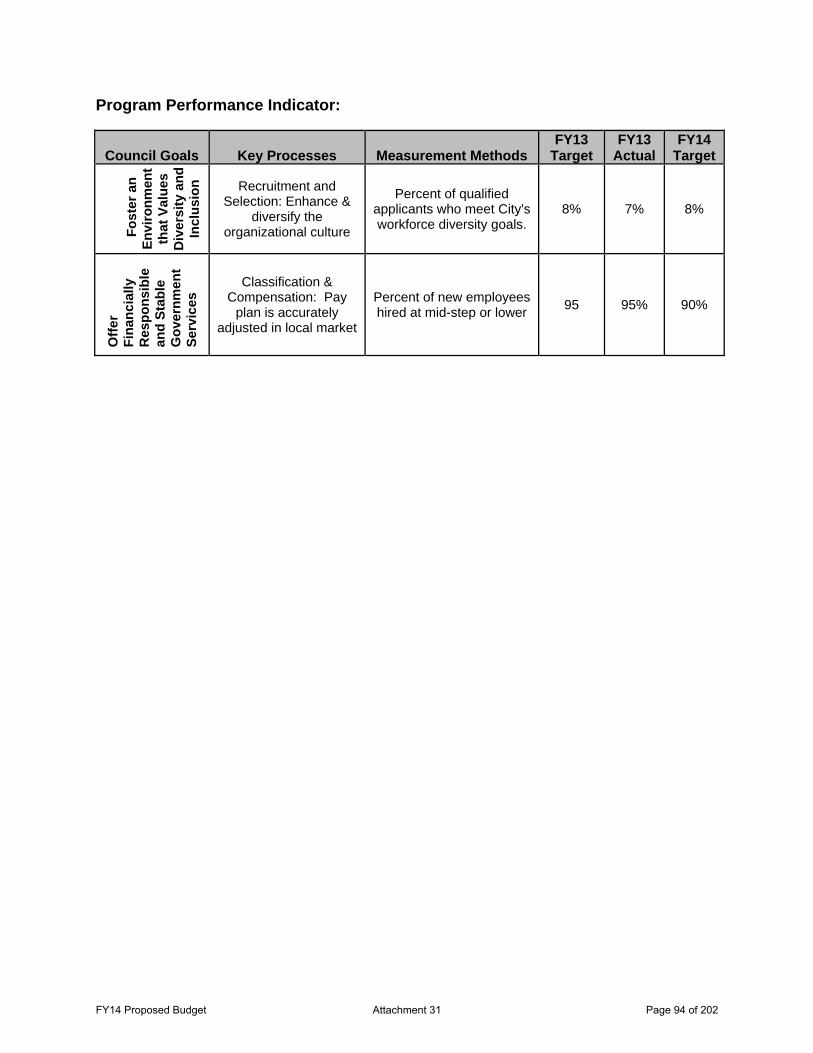
Program Performance Indicator:
Council Goals Key Processes Measurement Methods FY13
Target FY13
Actual FY14
Target
Fos
ter a
n En
viro
nmen
t th
at V
alue
s D
iver
sity
and
In
clus
ion
Recruitment and
Selection: Enhance & diversify the
organizational culture
Percent of qualified applicants who meet City's workforce diversity goals.
8% 7% 8%
Offe
r Fi
nanc
ially
R
espo
nsib
le
and
Stab
le
Gov
ernm
ent
Serv
ices
Classification & Compensation: Pay
plan is accurately adjusted in local market
Percent of new employees hired at mid-step or lower 95 95% 90%
FY14 Proposed Budget Attachment 31 Page 94 of 202

Human Resources Department
Program: Employee & Labor Relations Program Description: This program supports supervisors and employees alike in understanding and navigating the many regulations, rules, and contract provisions that govern the employment relationship between the City and its employees. This is achieved by developing, implementing, and administering the City’s policies and procedures in collaboration with our employees, and in negotiating and administering the contracts the City has with its four collective bargaining units. Essential functions of this program are:
• Providing guidance, consultation, advice, and training to supervisors and employees in dealing with workplace issues (including union grievances).
• Encouraging fair and positive performance management practices and, in alignment with Council direction, a pay-for-performance system.
• Investigating discrimination and harassment complaints.
• Investigating employment rule violation allegations.
• Negotiating and resolving workplace disputes.
• Assisting in responding to Equal Employment Opportunity Commission investigations and employee litigation.
Budget Highlights: • Taking the lead on reorganizing, updating, and rewriting all City-wide policies and
procedures; have completed ten new administrative rules to reduce City’s risk exposure and decrease liability insurance premium costs.
• Working with City of Eugene’s human resources department to align labor contracts and policies and procedures impacting the two Fire Departments and respective collective bargaining units to facilitate merger work.
• Convened joint labor & management committees with City’s two general service bargaining units, SEIU and AFSCME. Issues are informally reviewed and addressed to avoid grievances.
Service Level Changes: Have taken a leadership role in the Oregon Public Employers Labor Relations Association in order to be more informed about State collective bargaining issues, and to have more input in how unions impact public service. Working with other public agencies has become a priority in expanding and leveraging our resources. The result is a more robust delivery of service to our own employees, and a greater opportunity to learn best practices. In addition, Human Resource
FY14 Proposed Budget Attachment 31 Page 95 of 202

staff is now holding office hours at other City facilities (i.e. the Justice Center and Public Works-Maintenance) in order to be more familiar with our workforce and its needs. These office hours also provide more convenient access to Human Resources for employees who do not work a traditional schedule or at City Hall.
Program Performance Indicator:
Council Goals Key Process Measurement
Methods FY13
Target FY13
Actual FY14
Target
Offe
r Fi
nanc
ially
R
espo
nsib
le
and
Stab
le
Gov
ernm
ent
Serv
ices
Develop or revise City policies and procedures with new Administrative Rules.
Number of different Admin Rules adopted per year.
15 10 10
FY14 Proposed Budget Attachment 31 Page 96 of 202

Human Resources Department
Program: City-Wide Training Program Description: Coordinating the delivery of City-provided training and communicating opportunities for outside training are key functions of this program. Required City trainings include:
• New employee orientation;
• Employee development planning and counseling;
• Mandatory legal and regulatory obligations, such as anti-harassment and discrimination training; and
• Diversity and inclusion training.
Human Resources also provide other training opportunities that address current trends and topics and support our employees’ development.
Budget Highlights: The majority of FY13’s training budget was expended in one major area: inclusion & diversity training. “Working Better Together” is a “train-the-trainer” program already in place at the City of Eugene and Lane County, and the City of Springfield has contracted with the training developer to offer it to our employees as well.
Other trainings offered included:
• “Getting to Yes” negotiation and collaboration training;
• “Crucial Conversations”; how to have difficult discussions with coworkers and supervisors
• Supervisory training updates: recruitment and selection process; emotional intelligence; and legal updates.
Service Level Changes: Without the ability to collaborate with other local public agencies and professional associations, the limited funds available for City wide training would not be sufficient to stay abreast of the changes in employment law and work place issues. Leveraging those relationships allows us to offer our employees a wider array of training opportunities and avoid duplicating services and draining resources.
FY14 Proposed Budget Attachment 31 Page 97 of 202

Human Resources Department
Program: Risk Management Program Description: The City’s Risk Management program includes:
• Loss control – Accident investigation coordination, occupational health and safety coordination, OSHA compliance, coordination of City safety committees, accident prevention education, and risk training.
• Claims administration – Litigation coordination, workers compensation administration, City property and liability insurance coverage administration, and risk records administration.
Budget Highlights: • Ongoing partnership with the City of Eugene in developing consistent and best practices for
administering fire risk programs.
• Have received more intense training in performing ergonomic reviews for employees with actual or potential workers’ compensations claims.
• Statewide revision in how experience rating to be calculated projected to increase rating and premium costs.
Service Level Changes: New risk accounting procedures will allow for the payment of claims more quickly, result in fewer supplemental budget changes, and create more accurate tracking of claim expenditures.
Allocation model will encourage departments to participate more fully in risk prevention.
Program Performance Indicator: Council Goals Key Processes
Measurement Methods
FY13 Target
FY13 Actual
FY14 Target
Offe
r Fi
nanc
ially
R
espo
nsib
le
and
Stab
le
Gov
ernm
ent
Serv
ices
Risk Management: Maintain Workers'
Compensation experience rating at 1.0 or lower.
Tracked annually, data provided by Worker’s
Compensation Carrier. .90 .91 1.0
FY14 Proposed Budget Attachment 31 Page 98 of 202

Human Resources Department
Program: Employee Benefits Program Description: The Employee Benefits Program is responsible for coordination and administration of benefits which include:
• Retirement. (Oregon Public Retirement System, City of Springfield Retirement Plan, and Deferred Compensation programs)
• Employee Health insurance (self-funded). • Short-Term Disability Insurance. • Long-Term Disability Insurance. • Life Insurance. • Health Reimbursement Account. (HRA) • Flexible Spending Account.(FSA) • Employee Assistance. (Counseling Services) • Employee Leave benefits, including Federal- and State-mandated benefits such as family
medical leave, Americans with Disabilities Act, military leave, and crime victims leave.
In addition, Human Resources staff oversees the SpringWell program, which is designed to keep health insurance cost increases lower than national and regional trends and increase employee productivity. Features of the SpringWell program are:
• Providing on-site employee health clinic services (Wellness Center); • Partnering with Willamalane to provide employees membership to fitness facilities and
programs; • Weight Watchers at Work and other nutrition programs; • Education on complete employee wellness during our annual Wellness Fair.
Budget Highlights: • As part of Fire Department merger efforts, we have partnered with City of Eugene in
developing consistent and best practices for administering health benefits and are now analyzing the potential for significant cost reduction by moving from fully insured to self-insured status.
• Improved utilization of health benefits have resulted in level costs (i.e. no increase).
Service Level Changes: Increased number of highly complex protected leave situations continue to require extensive coordination and analysis. Example: Family Medical Leave overlapping with Workers’ Compensation injury and use of sick leave/vacation and unpaid leave.
FY14 Proposed Budget Attachment 31 Page 99 of 202

Human Resources staff, along with Finance staff, will continue the implementation of transitioning our health benefits from a fully-insured plan to a self-insured plan. We anticipate a higher than normal workload with the transition itself but have yet to determine how it will impact staffing resources in the long run.
Program Performance Indicator:
Council Goals Key Processes Measurement
Methods FY13
Target FY13
Actual FY14
Target
Offe
r Fi
nanc
ially
R
espo
nsib
le
and
Stab
le
Gov
ernm
ent
Serv
ices
Maintain health insurance premium costs at trend or below through wellness
initiatives and plan design.
Percent differential between trend and our rate of premium cost increase or decrease.
0% 0% 0%
FY14 Proposed Budget Attachment 31 Page 100 of 202
Information Technology Department
Departmental Programs
• Information Technology
Department Description The Information Technology Department assists other City Departments develop innovative and efficient IT solutions through a series of services that includes implementing and integrating computer systems, coordinating and providing training, negotiating and managing information technology-related contracts, performing application development, and technology assistance and support. The Department creates the technology environment that enables City employees to quickly access vital information using the most efficient and cost effective system hardware and software. The Department is also responsible for providing effective voice communications utilizing a combination of Public Branch Exchange (PBX) and Voice over IP (VoIP) technologies.
Mission The Information Technology Department assists City Departments in responding to the needs of the citizens by enabling City employees to quickly access vital information and make data-driven decisions. We are dedicated to providing quality service through teamwork, partnerships, and developing team and individual strengths.
FY14 Proposed Budget Attachment 31 Page 101 of 202

Information Technology:
Information Technology:
FY14 OPERATING BUDGET - General Fund 32,419,061$
FY14 OPERATING BUDGET - All Funds 90,263,864$
1,391,062$
1,658,627$
Information Technology
4%
All Others$31,027,999
96%
Information Technology
2%2%
All Others$88,605,237
98%
FY14 Proposed Budget Attachment 31 Page 102 of 202

FY11 FY12 FY13* FY14Actual Actual Amended Proposed
Expenditures by Category:Personal Services 1,002,986$ 1,066,527$ 1,137,897$ 1,118,979$ Materials and Services 325,643 333,272 327,320 435,648 Capital Outlay 86,213 9,142 70,000 104,000
Total 1,414,843$ 1,408,940$ 1,535,217$ 1,658,627$
Expenditures by Fund:General 1,275,045$ 1,339,119$ 1,400,217$ 1,391,062$ Vehicle and Equipment 139,798 69,821 135,000 267,565
Total 1,414,843$ 1,408,940$ 1,535,217$ 1,658,627$
Expenditures by Sub-Program:Information Services 1,410,648$ 1,408,362$ 1,531,217$ 1,654,627$ Telecommunications 4,194 578 4,000 4,000
Total 1,414,843$ 1,408,940$ 1,535,217$ 1,658,627$
Information Technology DepartmentFinancial Summary
* Amended as of Feb 4, 2013
FY14 Proposed Budget Attachment 31 Page 103 of 202

Info
rm
atio
n T
echno
logy D
irecto
r (1.0)
Netw
ork M
anager (1.0
)
Netw
ork A
naly
st (1.0
)
Netw
ork A
naly
st (1.0
)
No
n-C
ertifie
d
Reso
urce A
ssis
tant (1.0
)
Help
D
esk
Pro
gram
mer / A
nalyst 3 (1.0
)
Pro
gram
mer / A
nalyst 2 (2.0
)
System
A
dm
inis
trato
r (1.0
)
Database A
dm
inis
trato
r (1.0
)
FY14 Proposed Budget Attachment 31 Page 104 of 202

Adopted Adopted Adopted ProposedFY11 FY12 FY13 FY14
General 10.00 10.00 10.00 10.00Total Full-Time Equivalents 10.00 10.00 10.00 10.00
Adopted Adopted Adopted ProposedFY11 FY12 FY13 FY14
Database Administrator 1.00 1.00 1.00 1.00Information Technology Director 1.00 1.00 1.00 1.00Network Analyst 1.00 1.00 2.00 2.00Network Analyst Non-Certified 1.00 1.00 1.00 1.00Network Manager 1.00 1.00 1.00 1.00Programmer Analyst 2 2.00 2.00 1.00 1.00Programmer Analyst 3 1.00 1.00 1.00 1.00Resource Assistant (I.T.) 1.00 1.00 1.00 1.00System Administrator 1.00 1.00 1.00 1.00Total Full-Time Equivalents 10.00 10.00 10.00 10.00
Information Technology Department
FTE Summary by Fund
Number of Full-Time Equivalents
Position Summary
Job Title/Classification:
FY14 Proposed Budget Attachment 31 Page 105 of 202

FY14 Proposed Budget Attachment 31 Page 106 of 202
Information Technology Department
Program: Information Technology Program Description: The Information Technology Department helps City departments deliver quality services by providing real time access to operational and strategic information. This is accomplished by:
♦ Supporting the decision-making process from the office to the field with integrated, mobile applications;
♦ Providing customer service and support for computer systems;
♦ Assisting with the purchase, installation and management of over 520 personal computers and servers on Citywide local and wide area networks;
♦ Contributing expertise with Business Area Analysis and Business System Design, and offering consulting support services to City departments.
♦ Direct service to citizens is provided through the City’s web site, including online applications, online document archives, and information about the City Government.
♦ Telephone contact is frequently the citizen’s first interaction with City services; it is imperative that the system be managed effectively to provide excellent customer service. This is accomplished by:
♦ Providing quality, cost effective telecommunication services to all City departments;
♦ Implementing Voice over IP technology to extend telecommunications capabilities at lower unit costs.
Budget Highlights: FY13 was a busy and productive year for the IT Department and our customers. New applications were acquired and implemented for Business Licenses and Dog Licenses. Public Wi-Fi was installed at the Springfield Justice Center, extending Internet access throughout the building and strengthening emergency/disaster response capabilities. A significant infrastructure upgrade (PeopleTools) was applied to our core financial and accounting system. Multiple software systems and dozens of PCs were upgraded or replaced as part of our enterprise Windows 7 upgrade project.
One of the more significant projects in recent years is the replacement of legacy Public Safety systems commonly referred to as “AIRS”.
• Springfield went “Live” with the Tyler Version X municipal courts product in October 2012. New functionality includes a 2-way interface with our collections agency to streamline revenue collection and efficiency, a web payments option, and many new automated functions such as officer notifications, macros and group updates.
FY14 Proposed Budget Attachment 31 Page 107 of 202

• Springfield went “Live” with FireHouse Records Management System in November 2012. This product replaces outdated FDM software, and includes modules for training, State reporting, logistics, etc.
• Springfield partnered with Eugene to publish and award an RFP to replace Police Records and Dispatch software with the SunGard OSSI suite. The new software includes Field Based Reporting which populates police reports completed in the field with electronic information from the incident, greatly reducing data entry and administrative tasks. The new suite also includes e-Citations which will streamline the traffic citation process, and Crime Analysis Plus and Link Analysis that will enable Springfield to utilize metrics and analytics in force deployment, in alignment with data-based policing tactics. The projected Go-Live date is November 2013.
• Springfield partnered with Lane County to acquire a new Jail Management system from EIS, Inc. This new system will maintain full integration efficiencies with the Lane County Jail system. The EIS Jail system is projected to Go-Live in October 2013.
Service Level Changes: FY14 shapes up to be a difficult budget year. The IT Equipment Replacement reserves are being liquidated to defray some of the public safety system acquisition costs. This means that regular hardware/server replacements starting in FY15 will need to be accomplished with Budget Issue Papers.
IT staffing was reduced again, through vacancy management of a retiring employee’s position. The IT Department, which has been at 10 FTE for 13-years, will be down to 8 FTE (plus the analyst assigned full-time to the Police/Fire implementation projects) for most of FY14. This will have a detrimental impact on funded innovation projects planned for Police, Fire, Finance, HR and DPW.
Program Performance Indicator:
Council Goals Key Processes
Measurement Methods
FY13 Target
FY13 Actual
FY14 Target
Fina
ncia
lly S
ound
and
Sta
ble
Gov
ernm
ent S
ervi
ces
IT Infrastructure: Ensure reliable, high
performance access to City data and applications
IT infrastructure including
telecommunications, servers and network
is available 99.9% 99.7% 99.9%
Workstations are available; down PCs
are returned to service within 1 day,
or a loaner is provided 99.8% 99.9% 99.8%
Help Desk calls receive a response
within 5-minutes 90.0% 93.5% 90.0%
FY14 Proposed Budget Attachment 31 Page 108 of 202

New Infrastructure Meets Customer
Expectations 95.0% 100% 95.0%
Data Accessibility: Data is stored, managed and
available to support operations and
management decisions
Applications will receive periodic upgrades within
vendor-recommended
maintenance cycles 80.0% 80.0% 80.0%
Enhancements and customizations to
existing applications will meet customer
expectations 85.0% 100.0% 85.0%
New applications will meet customer expectations 85.0% 85.0% 85.0%
Performance Indicators continued:
FY14 Proposed Budget Attachment 31 Page 109 of 202

FY14 Proposed Budget Attachment 31 Page 110 of 202
Legal and Judicial Services Department
Departmental Programs
• City Attorney • City Prosecutor • Municipal Court
Department Description The City Attorney, City Prosecutor and the Municipal Court comprise the service area identified as Legal and Judicial Services. The City Council oversees City Attorney services via a contract with an outside legal firm. The program reports directly to the City Council and is responsible for attending all City Council and Planning Commission meetings and for supplying the City Council and staff with legal opinions regarding existing or proposed City operations and activities. All ordinances, resolutions, contracts and activities having legal implications are reviewed and approved by the City Attorney to assure compliance with intent, Charter, State and Federal laws as well as the possibility of liability exposure or litigation.
The City Manager’s Office oversees the City Prosecutor services via a contract. The City Prosecutor represents the City in Municipal Court and Appellate Courts. Prosecution services are provided for all misdemeanor criminal and traffic crimes and for any violation cases in which the defendant has retained counsel. The City Prosecutor represents the City in trials by court or by jury.
The Municipal Judges report to the City Council. The operations of the Municipal Court report to the Finance Director. The Municipal Court provides judicial services for the administration of justice, case and jury management, the appointment of attorneys for indigent defense, probation monitoring, providing interpreters, and the enforcement and collection of bail, fines, and fees. The Municipal court has jurisdiction over misdemeanor criminal, traffic crimes and violations cited by the Springfield Police Department, Nuisance Code Enforcement, Animal Control and Parking Control Officers.
Mission The City Attorney’s Office strives to provide practical legal advice, effectively interpret laws, reviews and drafts City ordinances, resolutions and contracts and works to minimize the City’s exposure to liability and legal expenses.
The City Prosecutor’s Office strives to maintain public confidence in the ability of the legal judicial system to pursue prosecution of criminal conduct, to resolve legal contests in a timely manner, and to compel compliance with the laws that protect the safety and quality of life in the community.
Municipal Court strives to maintain public confidence in the ability of the legal judicial system to uphold the rule of law, fairly and impartially resolve legal contests in a timely manner, and to compel compliance with the laws that protect the safety and quality of life in the community.
FY14 Proposed Budget Attachment 31 Page 111 of 202

Legal and Judicial Services:
Legal and Judicial Services: 1,834,475$
FY14 OPERATING BUDGET - General Fund 32,419,061$
FY14 OPERATING BUDGET - All Funds 90,263,864$
1,427,087$
Legal and Judicial Services
4%
All Others$30,991,974
96%
Legal and Judicial Services
2%
All Others$88,429,389
98%
FY14 Proposed Budget Attachment 31 Page 112 of 202

FY11 FY12 FY13* FY14Actual Actual Amended Proposed
Expenditures by Category:Personal Services 614,969$ 681,909$ 791,840$ 849,924$ Materials and Services 966,176 1,017,593 977,044 984,551 Capital Outlay - 68,691 135,406 -
Total 1,581,145$ 1,768,193$ 1,904,290$ 1,834,475$
Expenditures by Fund:General 1,246,609$ 1,402,593$ 1,486,661$ 1,427,087$ Police Local Option Levy 332,772 364,627 417,629 407,388 Vehicle and Equipment 1,764 974 - -
Total 1,581,145$ 1,768,193$ 1,904,290$ 1,834,475$
Expenditures by Sub-Program:City Attorney 337,295$ 353,353$ 341,353$ 332,060$ City Prosecutor 256,792 258,086 250,893 214,163 Municipal Court 987,058 1,156,754 1,312,044 1,288,252
Total 1,581,145$ 1,768,193$ 1,904,290$ 1,834,475$
Legal and Judicial ServicesFinancial Summary
* Amended as of Feb 4, 2013
FY14 Proposed Budget Attachment 31 Page 113 of 202

MU
NIC
IPA
L C
OU
RT
OPE
RA
TIO
NS
Fina
nce
Dir
ecto
r
(See
Fin
ance
Sec
tion)
Co
urt
Supe
rviso
r (1
.0)
Seni
or
Co
urt
Cle
rk (
1.0)
Co
urt
Cle
rk (
6.0)
* N
ote
: 0
.84
FTE
for
Mun
icip
al C
our
t Ju
dges
rep
ort
dir
ectly
to
the
City
Co
unci
l and
do
no
t ap
pear
o
n an
y de
part
men
tal o
rgan
izat
ion
char
t, a
ltho
ugh
the
posit
ions
are
fun
ded
thro
ugh
Lega
l and
Jud
icia
l Se
rvic
es.
FY14 Proposed Budget Attachment 31 Page 114 of 202

Adopted Adopted Adopted ProposedFY11 FY12 FY13 FY14
General 7.04 6.62 6.61 6.61Police Local Option Levy 2.01 2.23 2.23 2.23Total Full-Time Equivalents 8.55 8.85 8.84 8.84
Adopted Adopted Adopted ProposedFY10 FY11 FY12 FY14
Court Clerk 6.00 6.00 6.00 6.00Court Clerk, Senior 1.00 1.00 1.00 1.00Court Supervisor 1.00 1.00 1.00 1.00Judge 0.55 0.55 0.65 0.50Judge Pro-Tem 0.00 0.00 0.20 0.34Total Full-Time Equivalents 8.55 8.55 8.85 8.84
NOTE: 0.84 FTE for Municipal Court Judges and Judge Pro-Tem report directly to the City Council and do not appear on any departmental organization chart; although the positions are funded through Legal and Judicial Services.
Legal and Judicial Services
FTE Summary by Fund
Number of Full-Time Equivalents
Position Summary
Job Title/Classification:
FY14 Proposed Budget Attachment 31 Page 115 of 202

FY14 Proposed Budget Attachment 31 Page 116 of 202

Legal and Judicial Services Department
Program: City Attorney Program Description: The Municipal Court has jurisdiction over misdemeanor criminal, traffic crimes and violations cited by the Springfield Police Department, Nuisance Code Enforcement, and Parking Control officers. The Court provides judicial services for the administration of justice, case and jury management, appointments of attorneys for indigent defense and interpreters, probation monitoring and enforcement and collection of bail, fines, and fees. The Court strives to maintain public confidence in the ability of the legal judicial system to uphold the rule of law, resolve legal contests in a fair and timely manner and to compel compliance with the laws that protect the safety and quality of life in the community.
Budget Highlights: Provide general counsel to City Council, Planning Commission and staff regarding planning and development proposals, economic development initiatives, contract development and review, code enforcement, Justice Center, Glenwood Development, Gateway Area, Human Resources, BOLI Issues, Environmental Services, Municipal Court, risk consultation, OLCC issues, public records, public meetings, ethics, and general counsel to Council and staff. An additional service that has been added this past year is labor negotiations.
Service Level Changes: No FY12 changes to the program. Actual recorded hours based on tracking for FY10 were 2,999. Our hours for FY11are estimated to increase from 2,124 to 2,316. Our proposed hours for FY12 are still scheduled to remain at 2,316. The hourly rate charged by the firm will change from $149.21 to $152.57
FY14 Proposed Budget Attachment 31 Page 117 of 202

Legal and Judicial Services Department
Program: City Prosecutor Program Description: The City contracts for Prosecution Services with David Logan. The City Prosecutor represents the City in Municipal Court and Appellate courts. Prosecution services are provided for all misdemeanor criminal and traffic crimes and for any violation cases in which the defendant has retained counsel. Services provided include screening of reports filed, negotiations for settlement of cases and for representation of the City in trials by court or by jury. The City Prosecutor also recommends revisions to the Municipal Code to conform with case law and state statutes, provides legal advice and training for the Police Department and maintains the criminal law library.
Budget Highlights: The opening of the municipal jail has created an additional demand on the City Prosecutor’s Office, particularly in the areas of completing discovery and preparation for trial. During FY11 additional resources were provided mid-year through the special levy for prosecutor services to allow for temporary help. Additional process improvement steps are being considered that would address this need on an ongoing basis.
Service Level Changes: None at this time. The possible impacts upon the City Prosecutor’s Office as a result of the municipal jail opening during this fiscal year are still under consideration. Caseloads and any change in trial patterns will be watched closely during the first part of the fiscal year.
FY14 Proposed Budget Attachment 31 Page 118 of 202

Legal and Judicial Services Department
Program: Municipal Court Program Description: The Municipal Court has jurisdiction over misdemeanor criminal, traffic crimes and violations cited by the Springfield Police Department, Nuisance Code Enforcement, and Parking Control officers. The Court provides judicial services for the administration of justice, case and jury management, appointments of attorneys for indigent defense and interpreters, probation monitoring and enforcement and collection of bail, fines, and fees. The Court strives to maintain public confidence in the ability of the legal judicial system to uphold the rule of law, resolve legal contests in a fair and timely manner and to compel compliance with the laws that protect the safety and quality of life in the community.
Budget Highlights: Since adoption of State statutes in November of 1997, case filings at the Municipal rather than state level has ensured prosecution of misdemeanor crimes committed in the City of Springfield.
The opening of the Springfield Municipal Jail on January 29, 2010, increased the ability of the court to hold offenders accountable and to increase the ability of the Court to compel compliance with sentencing orders, including payment of monetary penalties.
Caseload filings are currently estimated at 12,252 for FY13, with a total of $1,556,784 estimated in total fines imposed. Criminal case adjudication rates for FY13 are anticipated at 93%. Total collection for this fiscal year is currently estimated at $1,555,439 which includes fines and fee revenue to the city, and state fees.
The Court implemented new computer software on October 29, 2012. The new Tyler Technologies system offers enhanced customer services through on-line case adjudication options for violations and on-line web payments. The system will allow the Court to move closer to a “near paperless” operation and provides electronic signatures for Judges and defendants as well as automated workflows. The new system, however, does not provide integration to other local criminal justice agency systems or data propagation and coupled with the scope of changes implemented and/or to be implemented with the Tyler system, the transition will continue to have significant impact for Court staff until all functionality is brought fully operational. Police and Jail computer systems are scheduled to be implemented in late 2014, and these new systems will also have some impact for Court operations.
Service Level Changes: No service level change for FY14
FY14 Proposed Budget Attachment 31 Page 119 of 202

Program Performance Indicator:
Council Goals Key Processes Measurement Methods FY 13
Target FY 13 Actual
FY 14 Target
Pres
erve
Pub
lic S
afet
y Adjudication Services: Provide timely and expeditious case
processing
% of Violation cases meeting National Trial Court Standard 2.1.2 for consistent trend of 1:1 ration of cases filed to
disposed
100% 101% 100%
% of Misdemeanor cases meeting National Trial Court
Standard 2.1.2 for consistent trend of 1:1 ratio of cases
filed to disposed
100% 93% 100%
% of Misdemeanor cases meeting standard for 100% disposition within 90 days
(measurement includes FTA days)
75% 84% 100%
% of Misdemeanor Custody Trials Dismissed for "Lack of
Speedy Trial" (settings in excess of statutory 60 days)
0% 0% 0%
Trial Date Certainty: % of cases meeting National Trial
Court Standard 2.1.4 for disposition at first trial
75% 67% 80%
Probation Monitoring and Enforcement Services: Provide action to enforce court orders to
avoid patterns of systematic failure to fulfill criminal sentences
Overall Compliance Rate for collection of Victim Restitution
payments 75% 42% 80%
Fina
ncia
lly S
ound
and
Sta
ble
Gov
ernm
ent
Financial Services - Accounts Receivables: Provide and ensure timely and accurate receipting of
funds
% of days with 100% accuracy in balancing 100% 99% 100%
Financial Services - Accounts Payables: Provide and ensure timely payment of goods and
services received
% of non-payment delinquent penalties 0% 0% 0%
Financial Services - Financial Reporting: Provide and ensure
timely and accurate reporting and disbursement of funds
% of days with timely reporting of cash receipting
and distribution of funds 100% 98% 100%
FY14 Proposed Budget Attachment 31 Page 120 of 202
Library Department
Departmental Programs
• Adult/Reference Services • Community Services • Support Services • Youth Services
Department Description The Springfield Library is an essential community resource providing citizens of all ages, backgrounds, and economic statuses access to information, education, early literacy training, and a wide range of family friendly programs. In addition, we provide high speed internet service as well as the ability to download digital audio books and e-books from home. Early Literacy Outreach has become a focal point of our service to youth with staff assignments and grant funding directed at improving every Springfield child’s ability to enter school “Ready to Read”. Another area of emphasis has been service to our Latino community where the Library has mounted award winning bi-lingual programs. Springfield teens are active at the library and this year the Teen Advisory Board won the 2012 Youth Volunteer Group of the Year Award from United Way and the Eugene Register Guard newspaper. This year we’ve added classes on using social media, downloading books to your e-reader, and citizen emergency response planning. The Library continues to excel at enlisting the support of community members through its active volunteer program and its citizen fund-raising groups. We continue to partner with other area libraries in expanding access to materials for all of our patrons through our shared, online, catalog and inter-library loan program. From emergent literacy for infants to job retraining for adults the Library strives to support all members of its community in achieving their educational and economic aspirations.
Mission The Library Department places a strong and continuing focus on the importance of public service contacts with our citizens. The Library continues to emphasize the importance of providing diverse materials and instructional and cultural programming for our patrons.
FY14 Proposed Budget Attachment 31 Page 121 of 202

Library:
Library:
FY14 OPERATING BUDGET - General Fund 32,419,061$
FY14 OPERATING BUDGET - All Funds 90,263,864$
1,483,283$
1,621,748$
Library5%
All Others$30,935,778
95%
Library2%
All Others$88,642,116
98%
FY14 Proposed Budget Attachment 31 Page 122 of 202
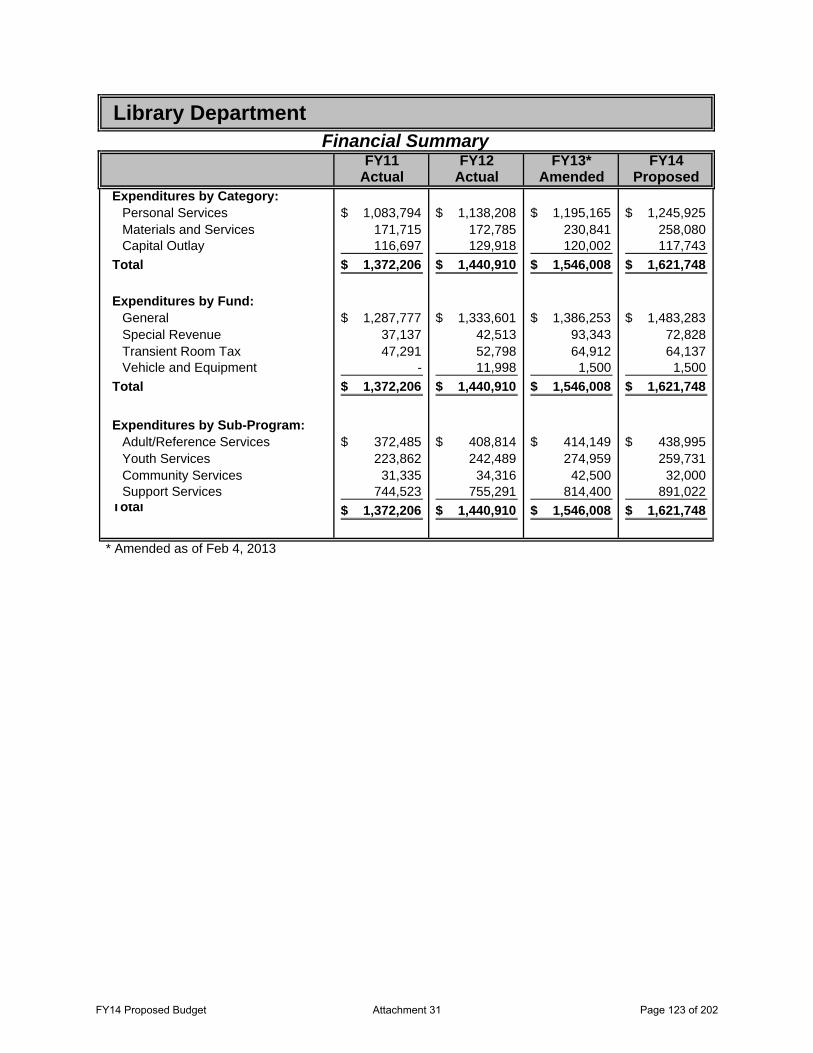
FY11 FY12 FY13* FY14Actual Actual Amended Proposed
Expenditures by Category:Personal Services 1,083,794$ 1,138,208$ 1,195,165$ 1,245,925$ Materials and Services 171,715 172,785 230,841 258,080 Capital Outlay 116,697 129,918 120,002 117,743
Total 1,372,206$ 1,440,910$ 1,546,008$ 1,621,748$
Expenditures by Fund:General 1,287,777$ 1,333,601$ 1,386,253$ 1,483,283$ Special Revenue 37,137 42,513 93,343 72,828 Transient Room Tax 47,291 52,798 64,912 64,137 Vehicle and Equipment - 11,998 1,500 1,500
Total 1,372,206$ 1,440,910$ 1,546,008$ 1,621,748$
Expenditures by Sub-Program:Adult/Reference Services 372,485$ 408,814$ 414,149$ 438,995$ Youth Services 223,862 242,489 274,959 259,731 Community Services 31,335 34,316 42,500 32,000 Support Services 744,523 755,291 814,400 891,022
Total 1,372,206$ 1,440,910$ 1,546,008$ 1,621,748$
Library DepartmentFinancial Summary
* Amended as of Feb 4, 2013
FY14 Proposed Budget Attachment 31 Page 123 of 202

Libr
ary
Dir
ecto
r (1
.0)
Libr
aria
n 1
(1.0
)
Libr
ary
Tech
nici
an
2 (3
.6)
Libr
aria
n 1
(0.5
)
Libr
ary
Tech
nica
l
Spec
ialis
t 2
(1.0
)
Libr
aria
n 1
(2.0
)
CO
MM
UN
ITY
SER
VIC
ES
SUPP
OR
T SE
RV
ICES
Libr
ary
Man
ager
(1.
0)
CH
ILD
REN
/YO
UTH
AD
ULT
Libr
ary
Ass
oc.
Man
ager
(.5
)
AD
ULT
/REF
EREN
CE
Libr
ary
Ass
oc.
Man
ager
(.5
)
Libr
aria
n 1
(1.5
)
FY14 Proposed Budget Attachment 31 Page 124 of 202
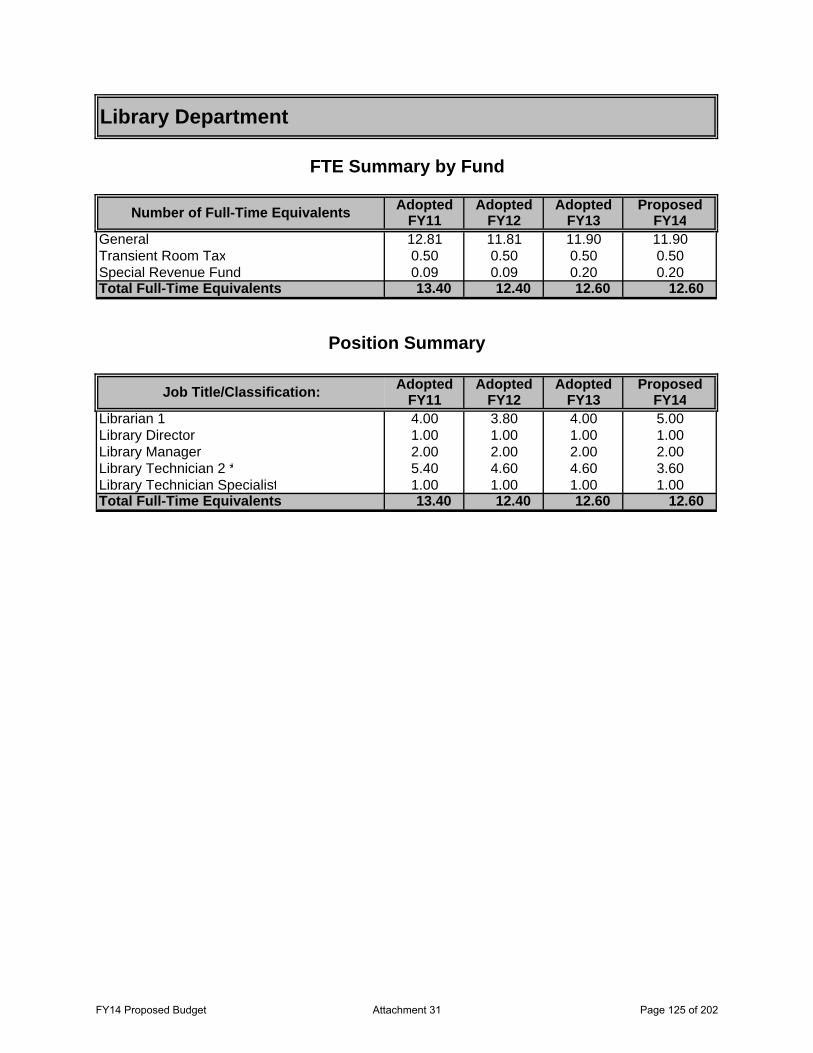
Adopted Adopted Adopted ProposedFY11 FY12 FY13 FY14
General 12.81 11.81 11.90 11.90Transient Room Tax 0.50 0.50 0.50 0.50Special Revenue Fund 0.09 0.09 0.20 0.20Total Full-Time Equivalents 13.40 12.40 12.60 12.60
Adopted Adopted Adopted ProposedFY11 FY12 FY13 FY14
Librarian 1 4.00 3.80 4.00 5.00Library Director 1.00 1.00 1.00 1.00Library Manager 2.00 2.00 2.00 2.00Library Technician 2 * 5.40 4.60 4.60 3.60Library Technician Specialist 1.00 1.00 1.00 1.00Total Full-Time Equivalents 13.40 12.40 12.60 12.60
Position Summary
Job Title/Classification:
Library Department
FTE Summary by Fund
Number of Full-Time Equivalents
FY14 Proposed Budget Attachment 31 Page 125 of 202

FY14 Proposed Budget Attachment 31 Page 126 of 202

Library Department
Program: Adult/Reference Services Program Description: Adult/Reference Services strives to meet the informational, educational and recreational needs of adult users within our diverse community. Materials provided include books, magazines, newspapers, audio books, CDs, and DVDs in English and Spanish, as well as public access to the internet, reference databases, and downloadable media including audio and e-books. A reference help desk is staffed every hour that the library is open, providing skilled reference assistance in locating desired information, referrals or materials, including interlibrary loan service for borrowing items not found in the Library’s collection. Educational programming is offered on a periodic basis to provide cultural opportunities for adults within the community. Other services include meeting rooms and exam proctoring.
Budget Highlights: The Adult Reference Services budget provides funds for purchasing books and other print, audiovisual and electronic resources for the adult community; providing skilled reference staff assistance to Library users, including help with accessing information in various electronic formats; and sponsoring special programs geared primarily toward adult users.
Service Level Changes: None.
Program Performance Indicator:
Council Goals Key Processes Measurement Methods FY13 Target
FY13 Actual
FY14
Target
To P
rese
rve
the
Hom
etow
n Fe
el,
Liva
bilit
y an
d En
viro
nmen
tal
Qua
lity The Quality of
Information Services is
Improved
Number of reference queries 19,000 21,786 22,000
Volumes added to the collection 13,500 13,106 13,200
Number of citizens accessing
Library web site 55,000 68,660 75,000
Number of public computer and
database uses 80,000 74,436 72,000
Attendance at adult programs 400 374 400
FY14 Proposed Budget Attachment 31 Page 127 of 202
Library Department
Program: Community Services Program Description: Community Services works with the Library Board, Friends of the Library, the Library Foundation and the Teen Advisory Board to improve community dialogue with the Library, develop planning and funding strategies for future services, and to augment library revenues in order to improve and expand current services. In addition, the Library facilitates the work of the Springfield Arts Commission in increasing citizen awareness and support for the arts through youth workshops, monetary grants, a variety of public arts exhibits, the creation and maintenance of ART ALLEY, and support for the Downtown Artwalk program.
Budget Highlights: Both the Friends of the Springfied Library and the Springfield Library Foundation have established successful fund-raising activities that continue to generate significant contributions even in a down economy. Since 2009 they have donated $76,388 to support library services and programs from Summer Reading to Community Emergency Preparedness; from Early Literacy Outreach to “Friending” on Facebook, the entire community benefits from their hard work and generosity. The Library Advisory Board has grown to seven members in an effort to better represent our growing community; they will meet in work session with the City Council later this spring to explore service and funding options for future library services. The Teen Advisory Board has actively participated in the planning of programs and services for their peers, as well as assisting as volunteers for other Library programs. They were recognized this past spring as the Youth Volunteer Group of the Year by United Way and the Eugene Register-Guard.
In FY14 the Springfield Arts Commission has three specific goals. First, continue to increase the variety of programs that we can fund through the Heritage Arts Grants. In FY13 we continued to increase funding for a wider variety of programs. We hope to continue this trend going forward. Second, the Arts Commission will continue to promote and participate in the Second Friday Artwalks with a featured exhibit, a reception, and live music each month at City Hall. In FY13 we funded outdoor signs to advertise the Artwalk on Main Street, making the Arts Commission a listed sponsor of the project. In FY14, the Arts Commission hopes to explore more ways to collaborate with other community groups to bring to the Artwalks meaningful activities that will engage a growing number of residents. Third, the Arts Commission will continue to recruit and coordinate quality exhibits in the City Hall Gallery while increasing the participation of local artists. In addition to the Community Art Show and Mayor’s Art Show, the City Hall Gallery exhibited a new show each month including community focused shows by the Community Alliance of Lane County, the Grid Project and A3 high school students.
Service Level Changes: None.
FY14 Proposed Budget Attachment 31 Page 128 of 202
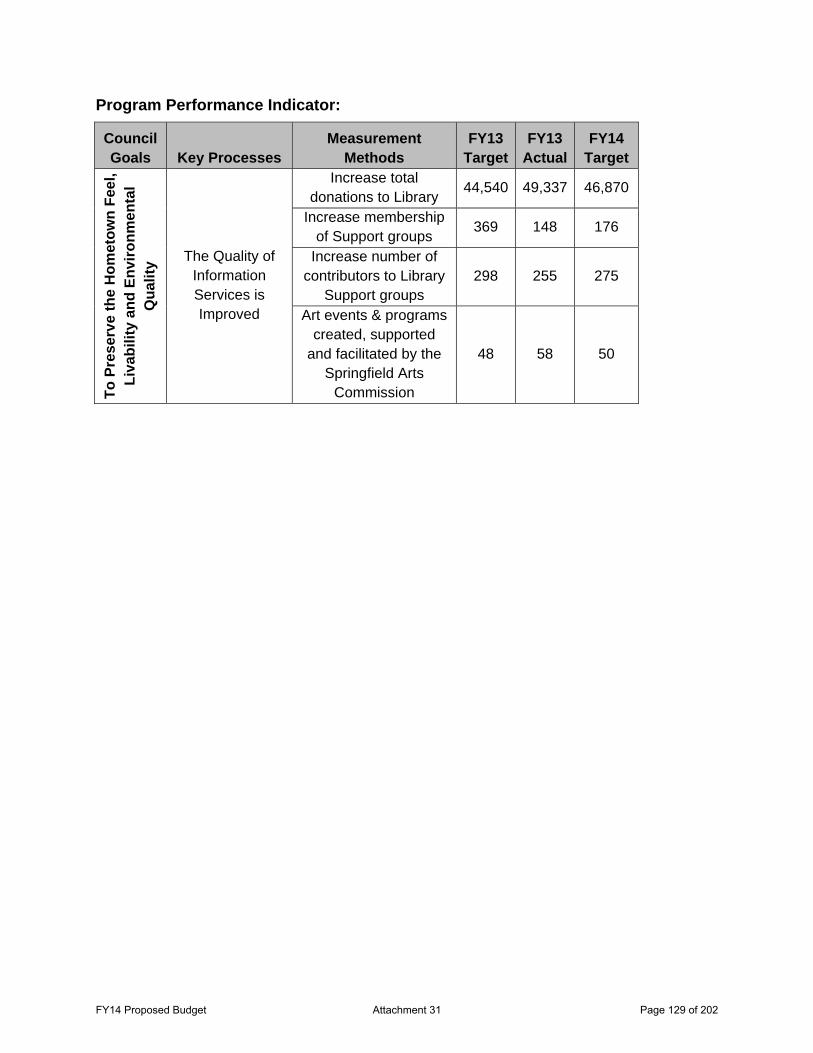
Program Performance Indicator:
Council Goals Key Processes
Measurement Methods
FY13 Target
FY13 Actual
FY14 Target
To P
rese
rve
the
Hom
etow
n Fe
el,
Liva
bilit
y an
d En
viro
nmen
tal
Qua
lity The Quality of
Information Services is Improved
Increase total donations to Library 44,540 49,337 46,870
Increase membership of Support groups 369 148 176
Increase number of contributors to Library
Support groups 298 255 275
Art events & programs created, supported
and facilitated by the Springfield Arts
Commission
48 58 50
FY14 Proposed Budget Attachment 31 Page 129 of 202

Library Department
Program: Support Services Program Description: The Support Services Division is responsible for the cataloging, processing, circulation, shelving and repair of library materials. The Division is also responsible for overall administration of the Library department, and supervision of the volunteer program.
Budget Highlights: The Support Services budget contains funds for support services staffing, as well as all centralized activities, such as utilities, telephone, contractual services, and training. Administrative services, budget preparation and public desk scheduling are included in this program. Support Services orders, receives, and catalogs all Library materials. This program runs a successful volunteer program that re-shelved some 300,741 items in 2012. Circulation services, which include overdue notices, damage notices, and patron registration, are a highlight of Support Services, serving some 18,600 Library users.
Service Level Changes: No service level changes anticipated.
Program Performance Indicator:
Council Goals Key Processes Measurement
Methods FY13
Target FY13
Actual FY14
Target
To P
rese
rve
the
Hom
etow
n Fe
el, L
ivab
ility
and
En
viro
nmen
tal Q
ualit
y
Access to Library Services and Collections Improved
Total Circulation 358,369 354,120 363,929
Patron Visits 183,618 176,585 157,938 Number of Library
cards issued 6,060 6,571 6,129
Volunteer hours 5,500 4,841 5,009
FY14 Proposed Budget Attachment 31 Page 130 of 202

Library Department
Program: Youth Services Program Description: Youth Services provides a wide range of informational, educational, and recreational materials for children and young adults in our community. Materials include books, magazines, audio books, CDs and DVDs in English and Spanish, as well as public access to the internet, reference databases and downloadable media including audio and e-books. Skilled reference staff provides assistance locating information and resources for children, teens and adults. Special programs and activities are offered for cultural education and enrichment. Story hours, a summer reading program, a puppet festival, guest artists, teachers, authors and performers are scheduled throughout the year. Youth Services staff also provides tours and presentations to community groups and classrooms. Other services include a teen advisory board, educational game computers, and literacy-related activities such as puzzles and board games.
Budget Highlights: The Youth Services budget provides funds for purchasing books, magazines, audio-visual materials and Internet access for children and young adults. It provides reference staff for children and adults and special programs and activities for the educational and cultural enrichment of youth in our community.
Service Level Changes: None.
Program Performance Indicator:
Council Goals Key Processes Measurement
Methods FY13
Target FY13
Actual FY14
Target
To P
rese
rve
the
Hom
etow
n Fe
el, L
ivab
ility
and
En
viro
nmen
tal Q
ualit
y
Student Success and Community
Literacy is Supported
Participation in Early Literacy Education
8,800 9,004 9,200
Participation in Elementary age
programs
10,667 13,734 15,000
Participation in Teen programs 500 346 500
FY14 Proposed Budget Attachment 31 Page 131 of 202

FY14 Proposed Budget Attachment 31 Page 132 of 202
Police Department
Departmental Programs
• Office of the Chief • Patrol Bureau • Investigations and Records • Municipal Jail • Services Bureau
Department Description The Police Department consists of the Office of the Chief, the Patrol Bureau, the Investigations and Records Bureau, and the Services Bureau.
The Office of the Chief manages the department's budget; recruits, selects and trains staff and develops, monitors and enforces department policies. This bureau has primary responsibility for interacting with other City departments and for representing the department in local and regional coordination efforts. Internal investigations, when necessary, are conducted by this bureau as well.
The Patrol Bureau staffs 5 or more police officers on the street, 24 hours a day and 7 days a week, and responded to 57,212 calls for service, dispatching officers to 49,345 of those, in 2012.
The Investigations and Records Bureau is responsible for follow-up investigations in criminal matters. In 2012 our Property Control Officers handled and tracked evidence for 4,393 criminal cases and worked to return recovered stolen property to the rightful owners. Records and Dispatch staff receive over 85,000 incoming telephone calls from the public, and in 2012 handled about 8,000 calls for service over the phone, which would otherwise require Police Officers to respond.
The Springfield Municipal Jail continues to provide detention space for municipal offenders in Springfield and provides Municipal Court Security and Prisoner Transports. In 2012, the Jail leased an average of 9 beds per day to other agencies, generating nearly $244,000 in revenue, and booked in 2248 inmates.
The Services Bureau develops the department's budget, seeks grant funding to implement special projects, and oversees support functions within the Department including Animal Control, Crime Prevention and the School Resource Officer program. During 2012, the volunteer program provided over 3500 hours of fleet maintenance support, and over 1500 hours of Crime Prevention and Animal Control support. During the holiday season, volunteers maintained a visible presence in Springfield shopping mall parking lots as a theft deterrent during evening hours.
The Department works closely with other agencies to coordinate services and provide the highest quality, lowest cost service to the citizens of Springfield.
Mission The Springfield Police Department strives to respond to the emergency and law enforcement needs of the community through response to calls for service in accordance with established priorities, visible police patrols, enforcement of traffic laws, investigation of crime and coordination with community service agencies, programs and activities.
FY14 Proposed Budget Attachment 31 Page 133 of 202
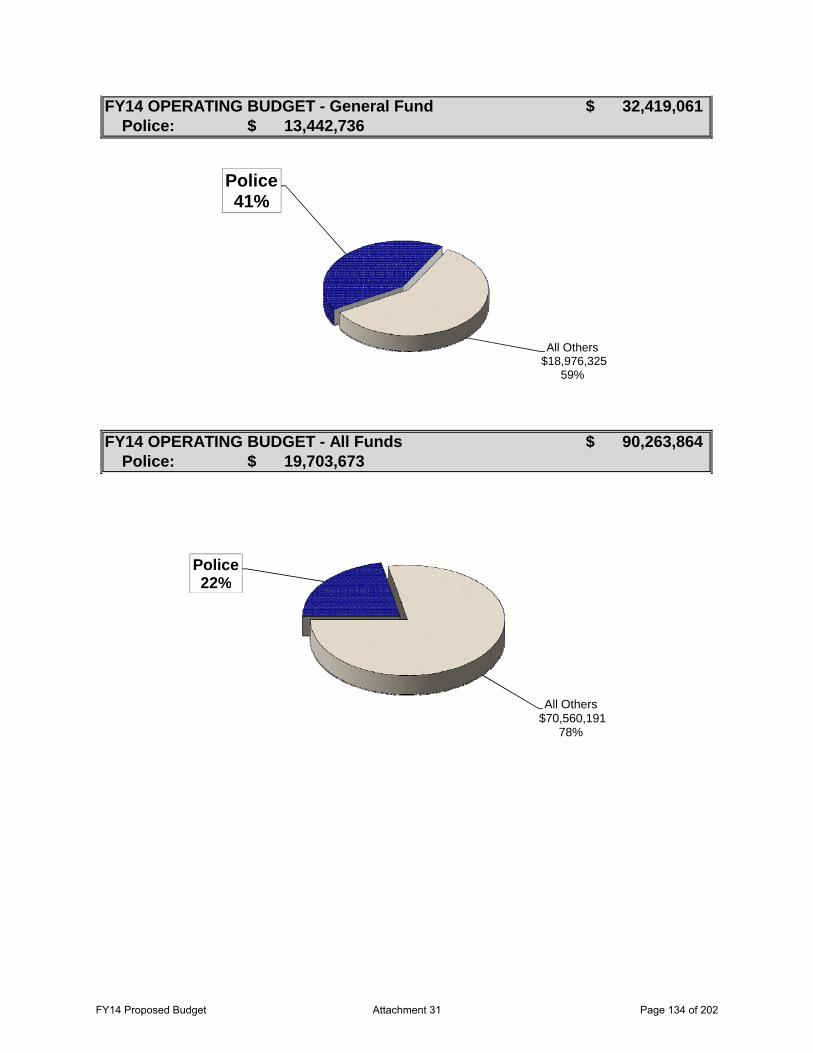
Police:
Police:
FY14 OPERATING BUDGET - General Fund 32,419,061$
FY14 OPERATING BUDGET - All Funds 90,263,864$
13,442,736$
19,703,673$
Police41%
All Others$18,976,325
59%
Police 22%22%
All Others$70,560,191
78%
FY14 Proposed Budget Attachment 31 Page 134 of 202

FY11 FY12 FY13* FY14Actual Actual Amended Proposed
Expenditures by Category:Personal Services 13,929,413$ 14,604,933$ 15,312,989$ 16,011,818$ Materials and Services 2,766,489 3,106,852 3,361,036 3,203,855 Capital Outlay 214,023 296,431 655,476 488,000
Total 16,909,925$ 18,008,216$ 19,329,501$ 19,703,673$ Expenditures by Fund:
General 11,532,906$ 12,270,639$ 12,947,948$ 13,442,736$ Jail Operations 2,345,357 2,461,956 2,743,976 2,855,191 Police Local Option Levy 2,075,840 2,136,984 2,347,284 2,548,950 Special Revenue 797,185 879,551 801,593 623,796 Vehicle and Equipment 158,637 259,087 488,700 233,000
Total 16,909,925$ 18,008,216$ 19,329,501$ 19,703,673$ Expenditures by Sub-Program:
Office of the ChiefOffice of the Chief 1,263,081$ 2,531,416$ 2,677,238$ 2,545,857$ Professional Standards 391,906 273,629 290,545 303,920 State Confiscations/DEQ 11,857 15,505 35,000 25,000 Federal Confiscation - 2,820 90,000 100,000
InvestigationsInvestigations 2,252,128 2,069,572 2,035,344 1,978,778 Property Control 218,827 196,270 203,620 213,794 Records 711,994 828,412 943,524 1,006,204
Municipal JailJail Operations 2,326,656 2,453,629 2,725,963 2,836,111
Patrol BureauPatrol 6,549,611 6,394,938 6,563,298 6,803,719 Communications - 1,202,855 1,324,901 1,368,238 Traffic Enforcement 458,221 351,284 643,688 620,858 Patrol Community Services 333,795 346,959 392,037 408,608
Services BureauCommunity Services 337,143 411,943 353,479 399,884 Communications 1,474,827 328,514 461,447 425,000 Animal Control 90,679 121,948 119,803 162,516 Crime Prevention 207,460 211,480 196,966 209,778 School Resource Program 281,743 267,044 272,648 295,408
Total 16,909,925$ 18,008,216$ 19,329,501$ 19,703,673$
Police DepartmentFinancial Summary
* Amended as of Feb 4, 2013
FY14 Proposed Budget Attachment 31 Page 135 of 202

OFFIC
E O
F T
HE C
HIEF
Chie
f o
f Po
lice (1.0
)
Pro
fessio
nal Stand
ards
& T
rain
ing Sgt. (1.0
)
Po
lice C
usto
dia
n (2.0
)
PA
TR
OL
Captain
(1.0
)
Watch C
om
mander Sgt. (6.0
)
Co
mm
unic
atio
ns (12.0
)
Po
lice O
ffic
er (39.0
)
Traffic
T
eam
(4.0
)
CO
MM
UN
ITY
SER
VIC
ES
Bureau M
anager (1.0
)
Sergeant (1.0
)
Anim
al C
ontro
l C
SO
1 (1.0
)
Crim
e Preventio
n C
SO
2 (2.0
)
Scho
ol R
eso
urce O
ffic
er (2.0
)
Detectiv
e (12.0
)
Offic
e Superviso
r (1.0
)
IN
VEST
IG
AT
IO
NS
Captain
(1.0
)
Sergeant (1.0
)
Pro
perty C
lerk (2.0
)
Call T
aker / R
eco
rds C
lerk (9.0
)
Po
lice Pro
gram
T
ech (1.0
)
Jail O
peratio
ns Supervis
or (1.0
)
Detentio
n Supervis
or (6.0
)
Detentio
n O
ffic
ers (10
.0
)
Detentio
n C
lerk (1.0
)
Departm
ental A
ssis
tant (1.0
)
Patro
l C
om
munit
y Servic
e O
ffic
er
(4.0
)
FY14 Proposed Budget Attachment 31 Page 136 of 202
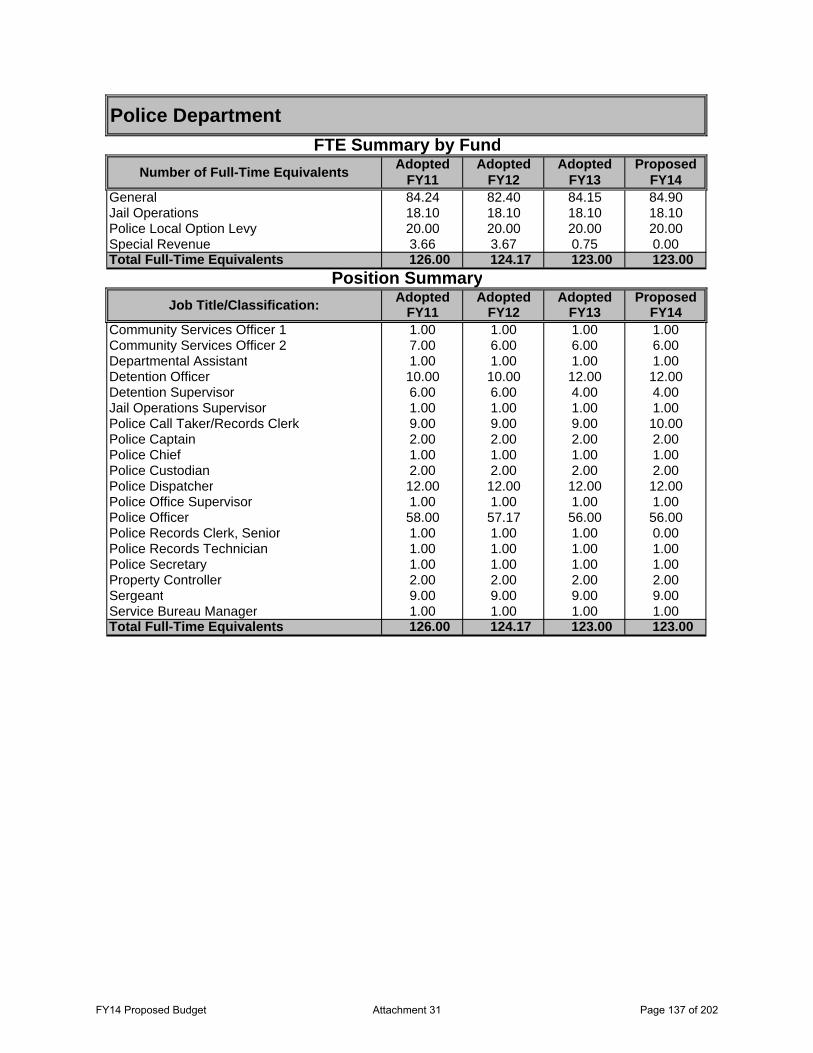
Adopted Adopted Adopted ProposedFY11 FY12 FY13 FY14
General 84.24 82.40 84.15 84.90Jail Operations 18.10 18.10 18.10 18.10Police Local Option Levy 20.00 20.00 20.00 20.00Special Revenue 3.66 3.67 0.75 0.00Total Full-Time Equivalents 126.00 124.17 123.00 123.00
Adopted Adopted Adopted ProposedFY11 FY12 FY13 FY14
Community Services Officer 1 1.00 1.00 1.00 1.00Community Services Officer 2 7.00 6.00 6.00 6.00Departmental Assistant 1.00 1.00 1.00 1.00Detention Officer 10.00 10.00 12.00 12.00Detention Supervisor 6.00 6.00 4.00 4.00Jail Operations Supervisor 1.00 1.00 1.00 1.00Police Call Taker/Records Clerk 9.00 9.00 9.00 10.00Police Captain 2.00 2.00 2.00 2.00Police Chief 1.00 1.00 1.00 1.00Police Custodian 2.00 2.00 2.00 2.00Police Dispatcher 12.00 12.00 12.00 12.00Police Office Supervisor 1.00 1.00 1.00 1.00Police Officer 58.00 57.17 56.00 56.00Police Records Clerk, Senior 1.00 1.00 1.00 0.00Police Records Technician 1.00 1.00 1.00 1.00Police Secretary 1.00 1.00 1.00 1.00Property Controller 2.00 2.00 2.00 2.00Sergeant 9.00 9.00 9.00 9.00Service Bureau Manager 1.00 1.00 1.00 1.00Total Full-Time Equivalents 126.00 124.17 123.00 123.00
Police DepartmentFTE Summary by Fund
Number of Full-Time Equivalents
Position SummaryJob Title/Classification:
FY14 Proposed Budget Attachment 31 Page 137 of 202

FY14 Proposed Budget Attachment 31 Page 138 of 202

Police Department
Program: Office of the Chief Program Description: The Office of the Chief is responsible for providing direction for the Police Department through planning, administering and coordinating department activities. It provides for management of the budget; facilities; fleet; reporting, evaluation and treatment procedures related to employee exposure to hazardous materials and injuries; policy development; recruitment; selection; training; and internal investigations.
Budget Highlights: The Office of the Chief will pursue opportunities to enhance the training program and career development opportunities for Department employees.
Service Level Changes: None
Program Performance Indicator:
Council Goals Key Processes Measurement Methods
FY13 Target
FY13 Actual
FY14 Target
Fina
ncia
lly S
ound
and
Sta
ble
Gov
ernm
ent S
ervi
ces
Provide Human Resources to City Staff- Retention
# of Training Hours exclusive of Mandated
Training 2000 2056 2000
Provide Human Resources to City Staff- Retention
# of Training Hours average per Officer per
year 45 46 45
Secure Property and Personal Safety # Injuries and exposures 25 49 50
Pres
erve
Pu
blic
Sa
fety
Provide Human Resources to City Staff
% of Employees completing Mandatory
Training 100% 95% 100%
FY14 Proposed Budget Attachment 31 Page 139 of 202

Program Performance Indicator Cont.:
Council Goals Key Processes Measurement Methods
FY13 Target
FY13 Actual
FY14 Target
Pres
erve
Hom
etow
n Fe
el, L
ivab
ility
and
Env
ironm
enta
l Q
ualit
y
Interact with Citizens % Citizens satisfied with
Service 95% 91% 95%
Interact with Citizens
% Citizens rating Dept. as good to excellent in protecting community 90% 86% 90%
Interact with Citizens
% Citizens reporting they feel safe in their
neighborhoods at night 75% 69% 75%
Interact with Citizens
% Citizens reporting they feel safe in their
neighborhoods in Daytime 98% 96% 98%
Interact with Citizens
% Citizens reporting they had contact with
Department during last year 50% 40% 40%
FY14 Proposed Budget Attachment 31 Page 140 of 202

Police Department
Program: Patrol Bureau Program Description: Members of the Patrol Bureau quickly respond to emergency calls for service. Officers abate criminal activity by arresting offenders, issuing traffic citations, reporting criminal activity and serving arrest warrants. Officers investigate traffic accidents and give aid to injured participants. Bureau members provide focused dispatch, traffic enforcement and parking and abandoned vehicle enforcement or removal. Patrol Bureau members provide police response to special and/or critical events, providing a sense of community safety while interacting with community members through outreach programs.
Budget Highlights: The Patrol Bureau will continue to respond to emergency and non-emergency calls for police service.
Service Level Changes: None
Program Performance Indicator:
Council Goals Key Processes Measurement Methods
FY13 Target
FY13 Actual
FY14 Target
Pres
erve
Pub
lic S
afet
y
Continuously Improve Processes
60 Seconds Received to Dispatch for High Priority
Calls 90% 67% 90%
Continuously Improve Processes
5 Minutes Received to Dispatch for Medium
Priority Calls 75% 80% 75%
Continuously Improve Processes
10 Minutes Received to Dispatch on Low Priority
Calls 60% 64% 60%
Continuously Improve Processes
% of Abandoned Vehicles removed within
30 days 90% 96% 90%
Secure Property and Personal Safety
Crime Rate per 10,000 residents for Property
Crimes 622 770 650
Secure Property and Personal Safety
Crime Rate per 10,000 residents for Persons
Crimes 177 171 165
FY14 Proposed Budget Attachment 31 Page 141 of 202
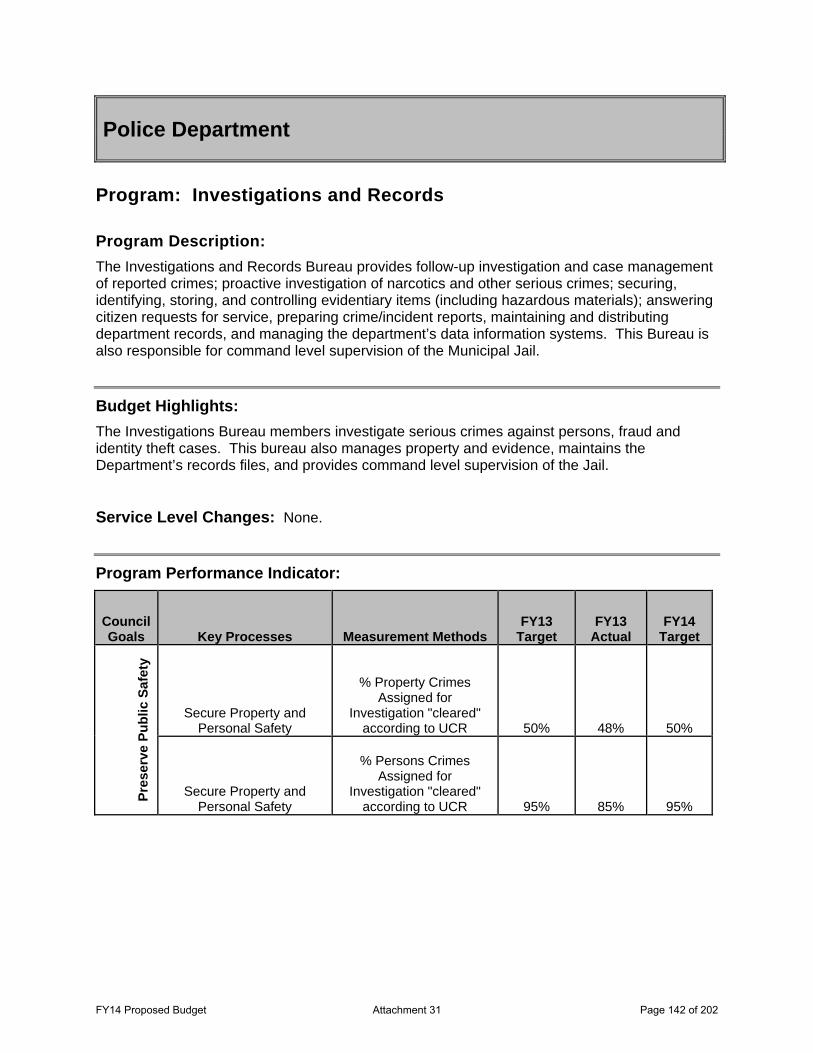
Police Department
Program: Investigations and Records Program Description: The Investigations and Records Bureau provides follow-up investigation and case management of reported crimes; proactive investigation of narcotics and other serious crimes; securing, identifying, storing, and controlling evidentiary items (including hazardous materials); answering citizen requests for service, preparing crime/incident reports, maintaining and distributing department records, and managing the department’s data information systems. This Bureau is also responsible for command level supervision of the Municipal Jail.
Budget Highlights: The Investigations Bureau members investigate serious crimes against persons, fraud and identity theft cases. This bureau also manages property and evidence, maintains the Department’s records files, and provides command level supervision of the Jail.
Service Level Changes: None.
Program Performance Indicator:
Council Goals Key Processes Measurement Methods
FY13 Target
FY13 Actual
FY14 Target
Pres
erve
Pub
lic S
afet
y
Secure Property and Personal Safety
% Property Crimes Assigned for
Investigation "cleared" according to UCR 50% 48% 50%
Secure Property and Personal Safety
% Persons Crimes Assigned for
Investigation "cleared" according to UCR 95% 85% 95%
FY14 Proposed Budget Attachment 31 Page 142 of 202
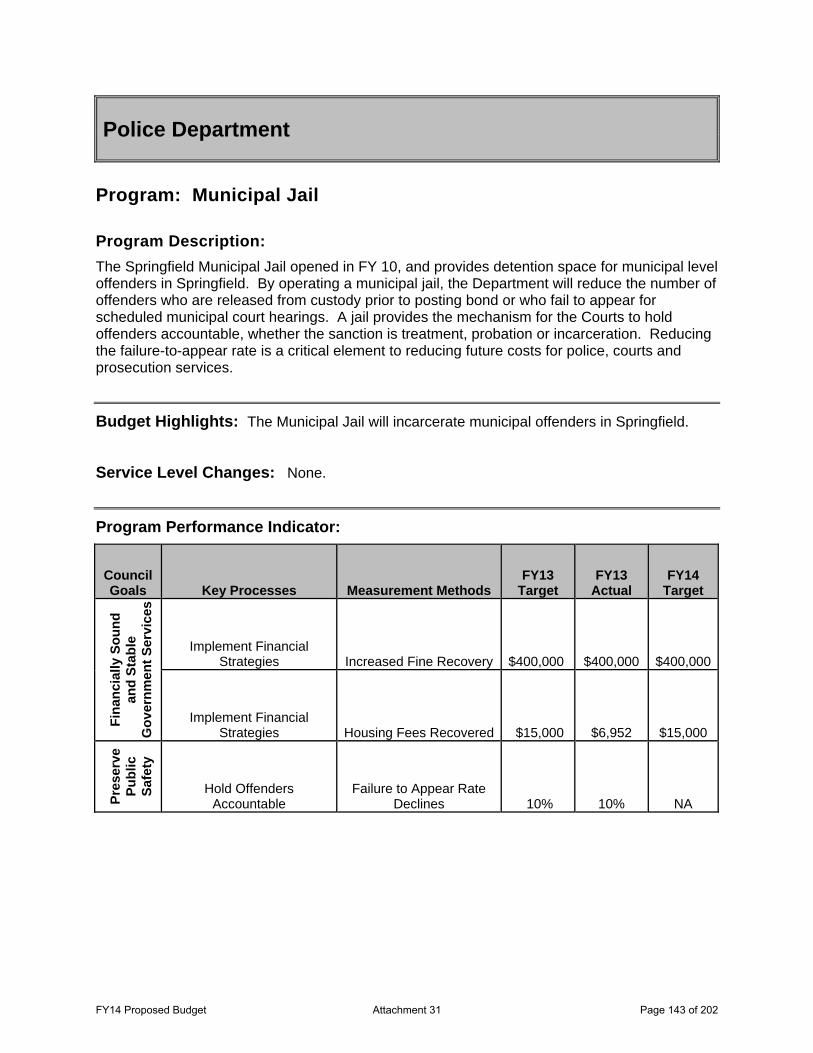
Police Department
Program: Municipal Jail Program Description: The Springfield Municipal Jail opened in FY 10, and provides detention space for municipal level offenders in Springfield. By operating a municipal jail, the Department will reduce the number of offenders who are released from custody prior to posting bond or who fail to appear for scheduled municipal court hearings. A jail provides the mechanism for the Courts to hold offenders accountable, whether the sanction is treatment, probation or incarceration. Reducing the failure-to-appear rate is a critical element to reducing future costs for police, courts and prosecution services.
Budget Highlights: The Municipal Jail will incarcerate municipal offenders in Springfield.
Service Level Changes: None.
Program Performance Indicator:
Council Goals Key Processes Measurement Methods
FY13 Target
FY13 Actual
FY14 Target
Fina
ncia
lly S
ound
an
d St
able
G
over
nmen
t Ser
vice
s
Implement Financial Strategies Increased Fine Recovery $400,000 $400,000 $400,000
Implement Financial Strategies Housing Fees Recovered $15,000 $6,952 $15,000
Pres
erve
Pu
blic
Sa
fety
Hold Offenders Accountable
Failure to Appear Rate Declines 10% 10% NA
FY14 Proposed Budget Attachment 31 Page 143 of 202

Police Department
Program: Services Bureau Program Description: Members of the Services Bureau provide support services for Patrol and Investigations Bureaus. Bureau members provide crime prevention, animal control and school liaison services. The Services Bureau is also responsible for the development and implementation of budgets and grants, monitoring fiscal activities; and the procurement of vehicles and specialized equipment.
Budget Highlights: The Services Bureau will continue to provide support services to the rest of the Department.
Service Level Changes: None.
Program Performance Indicator:
Council Goals Key Processes Measurement Methods
FY13 Target
FY13 Actual
FY14 Target
Pres
erve
Hom
etow
n Fe
el,
Liva
bilit
y an
d En
viro
nmen
tal
Qua
lity Interact with Citizens
Neighborhood Watch Membership 2000 969 1500
Interact with Citizens Citizen Police Academy
Graduates 30 35 30
Interact with Citizens # Dogs Licensed 5500 3318 4500
FY14 Proposed Budget Attachment 31 Page 144 of 202

CAPITAL BUDGET Introduction The FY14 Capital Budget, which follows, is based on the City's Capital Improvement Program (CIP), A Community Reinvestment Plan, which is a five‐year outlook of the City's planned physical improvements. The CIP includes cost estimates and projected financing for maintaining, improving, or adding to the City's increasing investment in fixed assets. These estimates, in turn, are derived from long term facilities master plans designed to anticipate City needs over a 20 year horizon. These fixed assets include streets, sidewalks, traffic signs and signals, street lights, sanitary sewer and drainage systems, and city‐owned buildings and property. The City's actual commitment to expend public funds occurs in the annual City budget process, with the first year of the CIP acting as a guide for the capital portion of the budget. In addition, the Capital Budget includes projects proposed for the Regional Wastewater Collection and Treatment Systems. These projects are included based on the actions of the Metropolitan Wastewater Management Commission (MWMC), which owns and oversees the Regional Wastewater Facilities serving the Eugene‐Springfield metropolitan area. The Springfield Capital Budget includes appropriations for these items to fulfill the City’s responsibilities under the Intergovernmental Agreement between the City, the City of Eugene, and Lane County which created the MWMC, and assigns financial and capital management functions to the City of Springfield. Each year City staff reviews cash flow projections, organizes and summarizes new projects along with unfunded projects from prior years, and develops a proposed allocation of project funding and a draft Capital Budget. This draft is reviewed by the City Manager, the Budget Committee, and the City Council before adoption of the final budget. Major funding sources include State and local fuel taxes, loans, revenue bonds, sewer and drainage user fees, assessments, and, as appropriate, revenues from System Development Charges (SDCs) previously collected. Additionally, from time to time the city receives grants, loans and other revenues from other levels of government, and from private entities, which are targeted to specific capital improvements. The Capital Budget appropriates these revenues as well, to the extent they pass through the City’s accounts. Because of limited revenues, many projects are either partially funded or simply cannot be funded during the next five years. Thus, projects that appear in the first year of the CIP may not be included in the FY14 Capital Budget. The proposed FY14 Capital Budget of $36.5 million is nearly $6 million less than the adopted FY13 Capital Budget, which reflects the completion or significant advancement of several City of Springfield wastewater projects. The MWMC portion of the capital budget remains steady and represents approximately one third of the capital budget total. The remaining $23.0 million is focused on necessary improvement and rehabilitation of City of Springfield facilities, with nearly 60% directed at wastewater and stormwater facilities. This level of activity reflects the City selling $10 million in storm drainage revenue bonds in October 2010 to fund several major capital projects related to the City’s obligation to address stormwater quality, permitting and threatened fish impacts.1 Additionally, the City anticipates spending the remaining 2009 wastewater revenue bond proceeds by the end of the first quarter of FY14. When these wastewater bonds were sold, the expectation was to complete the more than 40,000 linear feet of rehabilitation required in the 2001 Wet Weather Flow Management Plan and the Jasper Trunk Line Extension. However, as a result of the favorable bidding climate occasion by the recent recession, over 85,000 linear feet of sanitary sewer pipe rehabilitation was completed, as well as the installation of 11,150 linear feet of sanitary sewer upgrades, and 11,100 linear feet of the Jasper Trunk Line Extension. With the number of high priority projects accomplished with the initial bond proceeds, future bonds sales can be postponed beyond 2014, unless Council finds it necessary to elevate the priority of the remaining projects driven by growth and community development. For FY14, State and local fuel tax revenues continue to decline because of the recent recession and increased fuel efficiency that reduces revenue even in the face of increased miles traveled. While the Council has increased storm drainage and local wastewater user fees to maintain and enhance the level of preservation for those systems, the City does not have the authority to increase its local fuel tax until FY15. While the State Legislature approved an increase in
1 For bonding purposes, the local wastewater and stormwater utilities are combined into a single sewer utility.
FY14 Proposed Budget Attachment 31 Page 145 of 202
the State fuel tax that became effective on January 1, 2011, the City has found that the increased revenue it receives from the State is insufficient to reverse the trend of declining revenues to support the City’s transportation system. This trend has led to the absence of regular street preservation activities in the capital and operating budgets resulting in a sharp decline in the condition of the local street system. In response, the City has embarked on a public outreach and education program to communicate the serious cost implications of deferring maintenance and preservation activities that had routinely been a part of both the operating and capital budgets to maintain our over $400 million (2008 value) transportation asset. Staff is now engaged in an effort to develop and present revenue alternatives to the Council to recover from a period of deferred maintenance and preservation before end of life cycle of the assets. Once a street segment reaches the end of its useful life it can no longer be preserved and must be reconstructed or allowed to completely deteriorate. In 2011, the City Council approved a new revenue source in the transportation system ‐ a Right‐of‐Way Use Fee for the Local Wastewater and Stormwater Utilities. The Fee is three percent of gross revenues from each Utility and helps fund ongoing operations and maintenance of the transportation system. However, the revenue from the Fee is not enough to fund the major capital preservation activity needed for within the City’s transportation system. A second significant aspect of capital funding is the continuing imbalance between user fees and SDCs as sources of capital funding. City staff has documented that in many cases user fees are funding a disproportionate share of capital projects. This condition is a result of the sluggishness of new building construction, which is the primary source of SDC revenue. In 2008, the City adopted updated wastewater and stormwater facility plans that identify significant new capital project and financing needs, and the SDC methodologies and rates were updated to reflect new projects and costs. Even though the increases in SDC rates tend to restore a proper balance between user fees and SDCs as the typical revenue sources for infrastructure financing, SDCs are designed to build up reserves of funding to permit construction of larger projects that typically provide capacity for community growth and development, not to provide immediate resources. The build‐up of SDC reserves has been slowed due to the sluggish economy and downturn in new development, and the decision by the City Council in FY12 and FY13 to temporarily reduce SDCs as an attempt at local economic stimulus.
FY14 Proposed Budget Attachment 31 Page 146 of 202

Major Projects
Among the major capital projects included in the Capital Budget are the following: ♦ Franklin Boulevard Sanitary Sewer System Expansion – The expansion of the Franklin Boulevard Trunk Sewer
extends the Glenwood wastewater system from the end of the existing trunk line in Franklin Boulevard south to the Urban Growth Boundary. The City Council has made the redevelopment of Glenwood and the reconstruction of Franklin Boulevard a priority to promote development and community growth. The City has recently applied for funding to begin construction of the roadway project, elevating the priority for the sewer extension project. Funding to begin the planning and design phase was programmed and budgeted in FY13. It is proposed that construction funding be programmed for FY14 to ensure the sewer extension project is progressing ahead of any street construction work. Funding for the project is secured through wastewater user fee collections.
♦ Jasper Trunk Sewer Extension – The Jasper Trunk Sewer Extension will provide sewer service to the
Jasper/Natron urban growth area that is currently not serviced. The City Council has made this a priority project to promote development and community growth. In FY12 the project was divided into four separate construction contracts. Construction on the first phase is complete, and construction on the second phase is underway with completion anticipated in the first quarter of FY14. Construction of the first phase allowed for the decommissioning of the Lucerne Meadows Pump Station, which was due for major upgrades, and construction of the second phase will allow for the decommissioning of two more pump stations. Additionally, the design for the final phases of the project and acquisition of necessary easements will be complete by the end of FY13. Funding for the project was secured through the issuance of revenue bonds in 2009.
♦ Franklin Boulevard Reconstruction – The City has secured $1.2 million in a combination of Metropolitan Planning Organization (MPO), Springfield Economic Development Agency (SEDA), Transportation System Development Charges (SDC), and Lane Transit District (LTD) funds to complete the required documentation under the National Environmental Policy Act (NEPA) prior to project development and delivery. The NEPA process is recently underway, with the first step to clarify design elements and potential environmental impacts in order to reach agreement with Federal Highway Administration (FHWA) and ODOT on the necessary level of environmental documentation. In the coming months Council will be asked to support a ‘build alternative’ that will likely be evaluated as either an Environmental Assessment (EA) or a Categorical Exclusion (CE). The CE is much less expensive and time consuming than the EA, but may not be realistic based on the community’s values and goals for this project. The Franklin concept endorsed by Council in 2008 envisions sections of improved arterial and sections of a multi‐way boulevard treatment that includes access lanes and parking adjacent to the arterial. Project elements include roundabout intersections, median control, relocated EmX station platforms, space preserved for future dedicated EmX guideways, and provision of high quality bicycle and pedestrian facilities. The City has recently made application to the Statewide Transportation Improvement Program (2015‐2018 STIP) for $6 million, and will match that with a $3.5 to $5 million Oregon Transportation Infrastructure Bank loan to complete a Phase 1 improvement from the Franklin/McVey intersection to a logical terminus to the west. Construction is anticipated in 2016.
♦ Over‐Under Channel Pipe Replacement – The Over‐Under Channel is part of the City’s stormwater system serving mid‐Springfield from 5th to 28th Streets and from Main Street to Highway 126. The name of the Channel comes from the configuration of the system where stormwater is collected and conveyed in both an open channel and in a large pipe located under and adjacent to the channel. A portion of the piped system, from the east side of Silke Field to the outfall of the system into the Q Street Channel at Moffitt School, is a corrugated metal arch pipe (CMP) installed in the late 1950s and early 1960s. Staff has found that this CMP has reached the end of its useful life and is showing signs of corrosion and minor failures. In FY11, the City Council approved funding to design a replacement pipe system and identify the amount of additional funds needed for construction. Staff has been gathering data and will hire a consultant to evaluate the drainage basin and make recommendations for rehabilitating or upgrading the Over‐Under Channel Pipe in FY13. It is anticipated that project design will begin in FY14. FY14 Proposed Budget Attachment 31 Page 147 of 202

♦ Asset Management System Replacement Project – Replacement of failing Geographic Information Systems (GIS)
and Facilities Management (FM) systems that manage electronic inventories of City infrastructure and provide reliable and well integrated information for asset management and mapping functions. Functions serve activities such as planning, designing, constructing, maintaining, reporting, accounting, forecasting and operating City facilities, i.e., managing City facilities valued at approximately one billion dollars. Current phases of the project (wastewater and stormwater facilities information integration) are advancing under budget and on schedule to be completed FY13. Should sufficient funds become available staff will request authorization to complete the Street Integration Phase.
The CIP identifies capital projects by major systems and/or improvement categories and lists the various uses of capital funds. The following table shows the proposed Capital Budget funding by the various categories.
2013/2014 CAPITAL BUDGET Capital Projects By Category Stormwater Capital Improvements $ 6,234,650 Wastewater Capital Improvements $ 7,399,000 Transportation and Street Capital Improvements $ 519,477 Building and Facilities Capital Improvements $ 624,585 Miscellaneous Capital Improvements $ 424,000 Regional Wastewater $ 13,456,982 Dedicated Reserves $ 7,837,072
Total $ 36,495,766
FY14 Proposed Budget Attachment 31 Page 148 of 202

Funding for the City’s Capital Budget comes from a number of the City’s accounting funds, depending upon the nature of the project. The following table shows spending in the proposed Capital Budget by fund.
Capital Projects by Fund Type Amount Local Wastewater Capital Fund $ 7,419,000 Wastewater Capital Fund Dedicated Reserve $ 2,373,000 Development Projects Fund $ 224,007 Drainage Capital Fund $ 5,196,000 Drainage Capital Fund Dedicated Reserve $ 4,554,500 Regional Wastewater Capital Bond Fund $ 10,469,756 Regional Wastewater Capital Fund $ 2,987,226 Street Capital Fund $ 133,000 Street Capital Fund Dedicated Reserve $ 170,896 SDC Local Storm Improvement Fund $ 1,134,650 SDC Local Storm Improvement Dedicated Reserve $ 149,176 SDC Local Storm Reimbursement Fund $ 66,000 SDC Local Wastewater Improvement Fund $ 127,000 SDC Local Wastewater Reimbursement Fund $ 54,000 SDC Regional Wastewater Improvement Fund $ 0 SDC Regional Wastewater Reimbursement Fund $ 0 SDC Transportation Reimbursement Fund $ 0 SDC Transportation Improvement Fund $ 442,477 SDC Transportation Improvement Dedicated Reserve $ 589,500 Booth‐Kelly Fund $ 250,000
Total $ 36,495,766 Three of the funds listed above have no capital expenditures budgeted for FY14. These are the SDC Regional Wastewater Reimbursement Fund, SDC Regional Wastewater Improvement Fund, and the SDC Transportation Reimbursement Fund. MWMC opted in FY10 to limit expenditures in the two Regional SDC funds to debt service payments and to continue the capital program using the Regional Wastewater Capital Bond Fund and the Regional Wastewater Capital Fund. Therefore, no expenditures are shown in the Capital Budget for the two SDC funds and they are shown here for reporting purposes. Also shown above in italics are the designated dedicated reserves within five of the funds: Wastewater Capital Fund Dedicated Reserve, Drainage Capital Fund Dedicated Reserve, Street Capital Fund Dedicated Reserve, SDC Local Storm Improvement Dedicated Reserve, and the SDC Transportation Improvement Dedicated Reserve. These five dedicated reserves contain funds that have been set aside for specific projects but that are not expected to be needed for those projects in FY14.
Operating Impact of the Capital Budget The City's financial management policies require that the City’s operating budget reflect the effect of projects in the Capital Budget. Many capital projects that are classified as preservation projects are intended to limit increases in operating and maintenance expenditures by preserving and extending the useful life of the City's infrastructure. Long‐term financial plans prepared for the City's operating funds consider the impact of these improvements on efficiency when forecasting growth in operating expenditures for the next several years. Other capital improvement projects that involve development of new facilities or new and expanded infrastructure may result in additional operating costs or savings in future years.
FY14 Proposed Budget Attachment 31 Page 149 of 202

For example, while new fire station construction will result in additional staffing and operations costs, repaving a street, or bringing it to full City standards typically results in a reduced need for maintenance. These costs or savings are not included in the capital budget estimates, but rather are incorporated into the operating budget beginning in the year that the facility is anticipated to become operational. An important element of the CIP process is the consideration of any future increases in operating costs that may result from capital activity so that estimates of those costs can be incorporated in the appropriate long‐term financial plans for the affected funds. In a governmental setting, these operating impacts often occur in funds other than those in which the capital expenditure is recorded. As projects move from the CIP into the Capital Budget they are reviewed to evaluate the impact on the appropriate operating fund budget. Analysis of the FY14 Capital Budget indicates that a large number of projects do not have a measurable operating impact. In many cases these projects are planning activities, which do not result in additional infrastructure or equipment. For example, projects that do not have any impact on the City’s operational budget include expenditures to participate in a regional waterways study, to plan Franklin Boulevard improvements, and to complete base map updating. The Capital Budget includes approximately $1 million in the category of projects that appear to have no significant operational impact. A second category of capital projects that are not estimated to have operating impacts are those where the capital expenditure is designed to replace or upgrade existing systems. In many cases, there may be operating efficiencies or future cost avoidance that results from the improvements, but these impacts are not presently quantifiable and are believed to be marginal. Examples in this project category include preservation projects for streets, drainage and sanitary sewers where the only operating impact is potential avoidance of future costs that might occur if repairs or replacement do not occur on a timely basis. Approximately $4.2 million is budgeted for such projects. Projects such as the $1,000,000 budgeted for replacing the wastewater main South 2nd Street may have little or no operational impact, but instead prevent the need to make significant capital investments that might otherwise be required to increase the handling capacity of the sanitary system. A third category of projects not presently estimated to have an impact on the operating budget includes those where the scope of the project is not sufficiently defined to develop an estimate. An example of this category of projects where definition is inadequate to determine operational impact is the $131,000 budgeted for City participation in private projects. These expenditures will be used to support a variety of capital improvements such as streets and sewers that are constructed by private developers. The City’s participation pays for portions of those capital expenditures which are principally for the benefit of the general public, not the particular development. While there will be an operating impact to the City after these projects are completed by developers and the infrastructure is donated to the City, the maintenance impact of the City participation portion of project costs is not calculated. In dollar terms, the cost of capital projects expected to result in increased operating expenditures, excluding MWMC projects and dedicated reserves, total over $16 million. The increased operating costs resulting from these capital improvements are estimated to be about $130,000 annually. The majority of this cost is for projects that will result in the need to increase staffing in future years as the infrastructure asset base grows. However, it is typical that not all projects are constructed in the same year they are funded. Therefore, the project and operating values are typically less than stated above.
FY14 Proposed Budget Attachment 31 Page 150 of 202
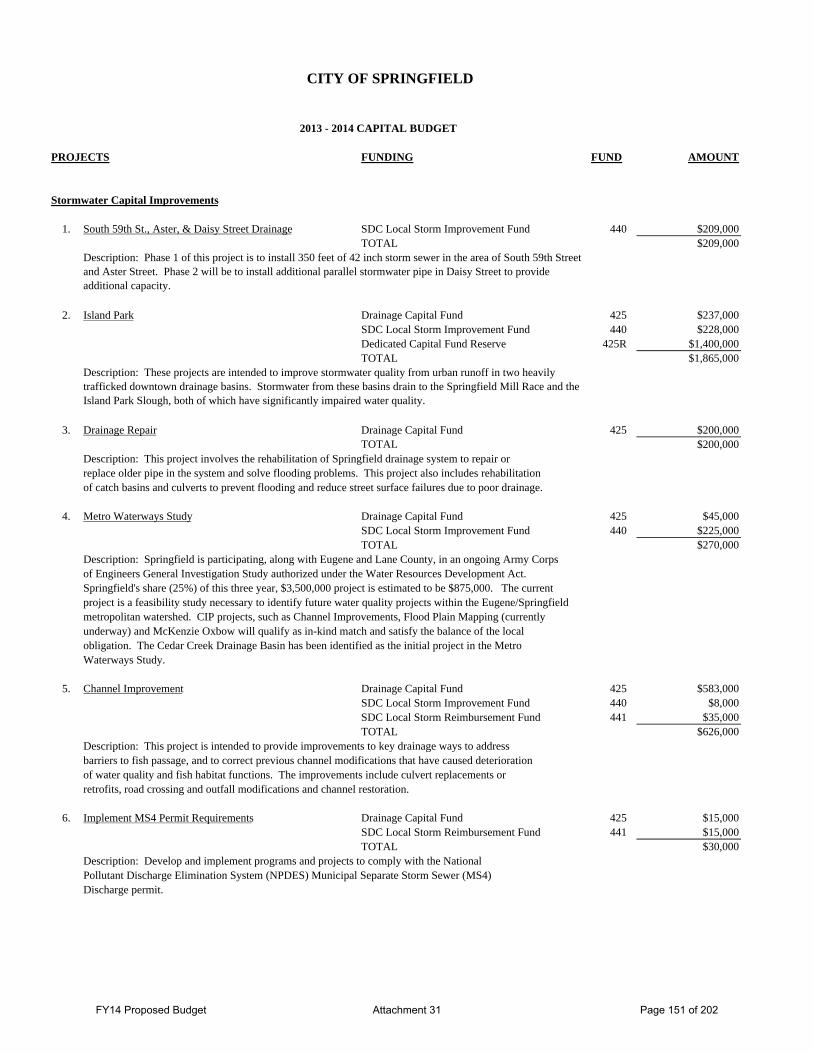
CITY OF SPRINGFIELD
2013 - 2014 CAPITAL BUDGET
PROJECTS FUNDING FUND AMOUNT
Stormwater Capital Improvements
1. South 59th St., Aster, & Daisy Street Drainage SDC Local Storm Improvement Fund 440 $209,000TOTAL $209,000
2. Island Park Drainage Capital Fund 425 $237,000SDC Local Storm Improvement Fund 440 $228,000Dedicated Capital Fund Reserve 425R $1,400,000TOTAL $1,865,000
3. Drainage Repair Drainage Capital Fund 425 $200,000TOTAL $200,000
Description: This project involves the rehabilitation of Springfield drainage system to repair or replace older pipe in the system and solve flooding problems. This project also includes rehabilitation of catch basins and culverts to prevent flooding and reduce street surface failures due to poor drainage.
4. Metro Waterways Study Drainage Capital Fund 425 $45,000SDC Local Storm Improvement Fund 440 $225,000TOTAL $270,000
Description: Springfield is participating, along with Eugene and Lane County, in an ongoing Army Corps of Engineers General Investigation Study authorized under the Water Resources Development Act. Springfield's share (25%) of this three year, $3,500,000 project is estimated to be $875,000. The currentproject is a feasibility study necessary to identify future water quality projects within the Eugene/Springfieldmetropolitan watershed. CIP projects, such as Channel Improvements, Flood Plain Mapping (currently underway) and McKenzie Oxbow will qualify as in-kind match and satisfy the balance of the local obligation. The Cedar Creek Drainage Basin has been identified as the initial project in the MetroWaterways Study.
5. Channel Improvement Drainage Capital Fund 425 $583,000SDC Local Storm Improvement Fund 440 $8,000SDC Local Storm Reimbursement Fund 441 $35,000TOTAL $626,000
Description: This project is intended to provide improvements to key drainage ways to address barriers to fish passage, and to correct previous channel modifications that have caused deterioration of water quality and fish habitat functions. The improvements include culvert replacements orretrofits, road crossing and outfall modifications and channel restoration.
6. Implement MS4 Permit Requirements Drainage Capital Fund 425 $15,000SDC Local Storm Reimbursement Fund 441 $15,000TOTAL $30,000
Description: Develop and implement programs and projects to comply with the National Pollutant Discharge Elimination System (NPDES) Municipal Separate Storm Sewer (MS4) Discharge permit.
Description: Phase 1 of this project is to install 350 feet of 42 inch storm sewer in the area of South 59th Street and Aster Street. Phase 2 will be to install additional parallel stormwater pipe in Daisy Street to provide additional capacity.
Description: These projects are intended to improve stormwater quality from urban runoff in two heavily trafficked downtown drainage basins. Stormwater from these basins drain to the Springfield Mill Race and the Island Park Slough, both of which have significantly impaired water quality.
FY14 Proposed Budget Attachment 31 Page 151 of 202

CITY OF SPRINGFIELD
2013 - 2014 CAPITAL BUDGET
PROJECTS FUNDING FUND AMOUNT
7. Riparian Land Management/Acquisition Drainage Capital Fund 425 $33,000SDC Local Storm Improvement Fund 440 $242,650SDC Local Storm Reimbursement Fund 441 $16,000TOTAL $291,650
Description: This project provides funding for consultant services to evaluate riparian buffer areas,City and other activities affecting them, and for purchase of riparian area lands from private propertyowners where needed to meet City regulatory objectives for stormwater management, flood control and habitat protection.
8. Stormwater Facilities Master Plan Drainage Capital Fund 425 $85,000SDC Local Storm Improvement Fund 440 $85,000TOTAL $170,000
Description: Provides consultant services to update the current City-wide Stormwater Facility Master Plan to address stormwater conveyance and quality management throughout the City and itsurbanizable area.
9. Booth Kelly Storm Water Drainage Plan Implementation Booth Kelly Fund 425 $299,000618 $50,000
TOTAL $349,000Description: Drainage master plan implementation for the Booth Kelly site.
10. Gray Creek Flow Enhancements SDC Local Storm Improvement Fund Reserve 440R $149,176TOTAL $149,176
Description: Design and construct Channel improvements to relieve flooding in Gray Creekand to provide capacity for anticipated flows from future developments.
11. Glenwood Blvd. Drainage Improvements SDC Local Storm Improvement Fund 425 $50,000TOTAL $50,000
12. Millrace Study/Design Drainage Capital Fund 425 $65,000425 $138,000
TOTAL $203,000Description: Continuation of the design and construction of new flow control requirements forthe Millrace, mandated by federal and state regulators.
13. Channel 6 Drainage Capital Fund 425 $457,000SDC Local Storm Improvement Fund 440 $16,000TOTAL $473,000
Description: Improvements to the existing storm drainage pipes and channel, a proposed by-pass pipe,and construction of a new regional detention facility.
14. Fire Station Washrack Drainage Capital Fund 425 $1,000TOTAL $1,000
Description: This project creates basic vehicle wash facilities at each fire house to ensure that vehicle washwater does not enter the storm system. Presently, three of five stations have been completed with Station #4 and Station #14 remaining.
Description: The City owns the Glenwood Boulevard Bridge over the Union Pacific Railroad tracks. Staff has determined that the existing measures for collecting stormwater runoff from Glenwood Boulevard and the Bridge are insufficient to protect the bridge and supporting embankments from water and erosion damage. This project involves installing new drainage infrastructure on the southerly approach to the Bridge to intercept the water and convey it safely down slope.
FY14 Proposed Budget Attachment 31 Page 152 of 202

CITY OF SPRINGFIELD
2013 - 2014 CAPITAL BUDGET
PROJECTS FUNDING FUND AMOUNT
15. Mill Race Stormwater Facility Drainage Capital Fund 425 $491,000SDC Local Storm Improvement Fund 440 $80,000Dedicated Capital Fund Reserve 425R $1,254,500TOTAL $1,825,500
16. Jasper-Natron Drainage Capital Fund 425 $220,000Dedicated Capital Fund Reserve 425R $500,000TOTAL $720,000
17. Over/Under Channel Drainage Capital Fund 425 $1,839,000TOTAL $1,839,000
18. Cedar Creek (Intake Reconstruction) Dedicated Capital Fund Reserve 425R $500,000TOTAL $500,000
19. Lower Mill Race Drainage Capital Fund 425 $180,000Dedicated Capital Fund Reserve 425R $900,000TOTAL $1,080,000
20. Channel 6 FIRM Update Drainage Capital Fund 425 $19,000TOTAL $19,000
21. Mill Race FIRM Update Drainage Capital Fund 425 $19,000TOTAL $19,000
22. 42nd Street Dike Study Drainage Capital Fund 425 $49,000TOTAL $49,000
Total Stormwater Improvements $10,938,326
Description: Stormwater treatment facility as part of the Mill Race Restoration Project located on land immediately north of the present Mill Pond.
Description: The funding provided in the capital budget is for the first phase of a estimated $4,000,000 need. The first phase is of this project provides additional studies to identify the downstream impacts and design the project and its mitigation measures.
Description: The Over-Under Channel system includes about 3,900 linear feet of corrugated metal arch pipe (CMP) under the existing channel. This project is intended to replace the existing CMP with a new pipe, as well as provide a parallel pipe for additional capacity as recommended in the 2008 Stormwater Facility Master Plan.
Description: This project, the first of those identified in the multi-year study (Metro Waterways Study), is the reconstruction of the intake structure and associated channel improvements to the inlet of Cedar Creek from the McKenzie River.
Description: Construct a daylight or diversion pretreatment structure, an offline water quality treatment facility, and a green pipe open channel improvement. Additional detail for this multi-faceted project are in WQ-12 project of the Stormwater Facilities Master Plan.
Description: Using consulting services, prepare a scope document for a new flood plain study to update the Flood Insurance Rate Map (FIRM) for SCS Channel 6 from 10th Street to the I-5 Channel to incorporate numerous construction changes that have occurred along SCS Channel 6 in the past 40 years.
Description: Using consulting services, prepare a scope document for a new flood plain study to update the Flood Insurance Rate Map (FIRM) for the Springfield Mill Race from the inlet at Clearwater Park to the outlet at Island Park to incorporate construction changes.
Description: Conduct a study of the condition of the High Banks Road (42nd Street) Dike to identify any structural or non-structural deficiencies and to evaluate the potential for obtaining federal accreditation of this Dike as a flood control facility under the National Flood Insurance Program and for compliance with the NationalLevee Safety Program.
FY14 Proposed Budget Attachment 31 Page 153 of 202

CITY OF SPRINGFIELD
2013 - 2014 CAPITAL BUDGET
PROJECTS FUNDING FUND AMOUNT
Wastewater Capital Improvements
1. S. 2nd Street Sewer Replacement Local Wastewater Capital Fund 409 $1,000,000TOTAL $1,000,000
2. 10th and "N" Street Upgrade Local Wastewater Capital Fund 409 $3,316,000TOTAL $3,316,000
3. 58th Street Flow Control Facility Local Wastewater Capital Fund 409 $660,000TOTAL $660,000
Description: Construct approximately 4,900 linear feet of 15 inch wastewater pipe as a wet weather flowcontrol facility. This project is identified in the 2008 Wastewater Master Plan as a priority project to eliminate potential sanitary sewer overflows.
4. Wastewater Master Plan Update Local Wastewater Capital Fund 409 $43,000SDC Local Wastewater Improvement Fund 443 $42,000TOTAL $85,000
Description: Provides funding for planned 5 year review and update of the 2008 Wastewater Master Plan.
5. Jasper Road Trunk Sewer Local Wastewater Capital Fund 409 $981,000TOTAL $981,000
Description: Design of 18,000 feet of 27 to 10 inch diameter sewer along Jasper Road from 42nd Streetto Natron. This budget allocation will also fund the purchase of easements for the future constructionproject.
6. Sanitary Sewer Repair SDC Local Wastewater Reimbursement Fund 409 $212,000TOTAL $212,000
7. Hayden Lo Pump Station Local Wastewater Capital Fund 409 $200,000TOTAL $200,000
8. River Glen Pump Station Local Wastewater Capital Fund 409 $250,000TOTAL $250,000
Description: This project involves the contracted repair or replacement of sanitary sewers to Natron. This budgeallocation will also fund the purchase of easements for the future construction project.
Description: Replace the sanitary sewer line in S. 2nd Street, upgrading a portion of the line from 8 inch to 12 inch to better accommodate the permitted industrial discharges, as well as the future Harbor Drive Pump Station. The project will also correct identified grade issues as well as inflow/infiltration concerns.
Description: Construct approximately 6,500 linear feet of 24 inch wastewater pipe parallel to the existing 24 inchwastewater pipe. This project will require the line to be bored under Highway 126. This project is identified in the 2008 Wastewater Master Plan as a priority project to eliminate potential sanitary sewer overflows.
Description: The 2008 Wastewater Master Plan recommends that the existing pump station be upgraded to provide 2 pumps with a minimum of 494 gpm capacity each.
Description: The 2008 Wastewater Master Plan recommends that the existing pump station be upgraded to provide 2 pumps with a minimum of 664 gpm capacity each.
FY14 Proposed Budget Attachment 31 Page 154 of 202
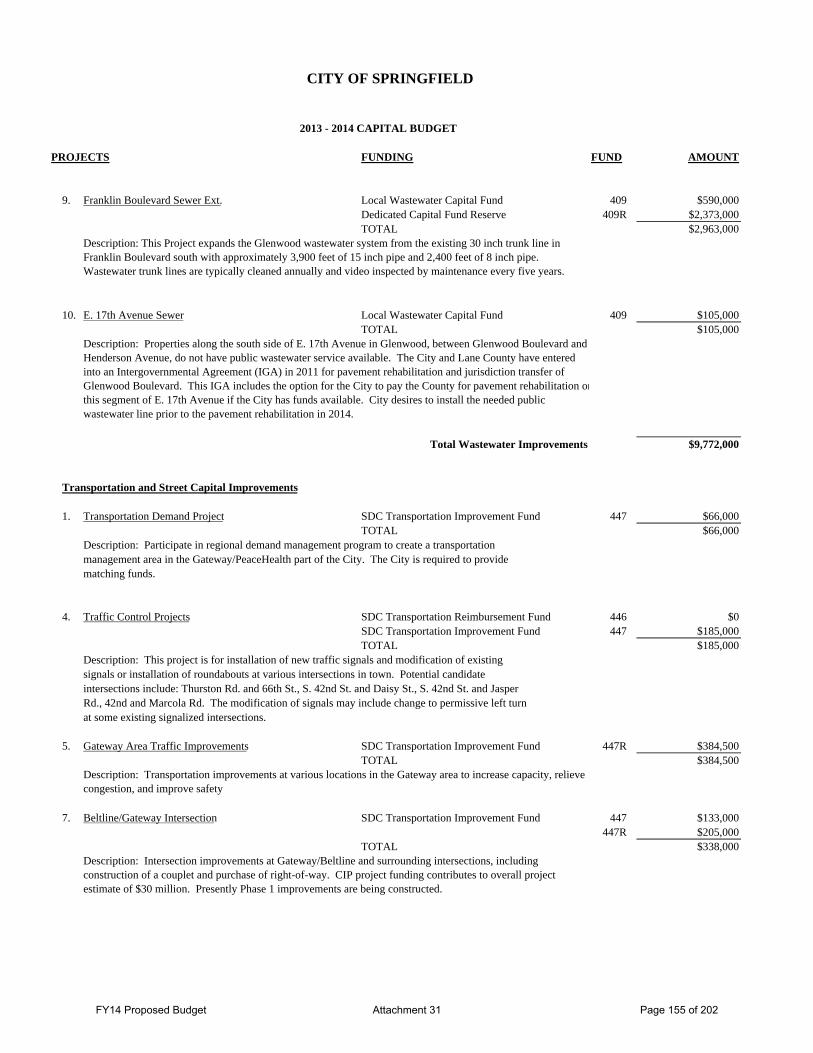
CITY OF SPRINGFIELD
2013 - 2014 CAPITAL BUDGET
PROJECTS FUNDING FUND AMOUNT
9. Franklin Boulevard Sewer Ext. Local Wastewater Capital Fund 409 $590,000Dedicated Capital Fund Reserve 409R $2,373,000TOTAL $2,963,000
10. E. 17th Avenue Sewer Local Wastewater Capital Fund 409 $105,000TOTAL $105,000
Total Wastewater Improvements $9,772,000
Transportation and Street Capital Improvements
1. Transportation Demand Project SDC Transportation Improvement Fund 447 $66,000TOTAL $66,000
Description: Participate in regional demand management program to create a transportation management area in the Gateway/PeaceHealth part of the City. The City is required to providematching funds.
4. Traffic Control Projects SDC Transportation Reimbursement Fund 446 $0SDC Transportation Improvement Fund 447 $185,000TOTAL $185,000
Description: This project is for installation of new traffic signals and modification of existing signals or installation of roundabouts at various intersections in town. Potential candidate intersections include: Thurston Rd. and 66th St., S. 42nd St. and Daisy St., S. 42nd St. and JasperRd., 42nd and Marcola Rd. The modification of signals may include change to permissive left turn at some existing signalized intersections.
5. Gateway Area Traffic Improvements SDC Transportation Improvement Fund 447R $384,500TOTAL $384,500
7. Beltline/Gateway Intersection SDC Transportation Improvement Fund 447 $133,000447R $205,000
TOTAL $338,000
Description: Properties along the south side of E. 17th Avenue in Glenwood, between Glenwood Boulevard and Henderson Avenue, do not have public wastewater service available. The City and Lane County have entered into an Intergovernmental Agreement (IGA) in 2011 for pavement rehabilitation and jurisdiction transfer of Glenwood Boulevard. This IGA includes the option for the City to pay the County for pavement rehabilitation onthis segment of E. 17th Avenue if the City has funds available. City desires to install the needed public wastewater line prior to the pavement rehabilitation in 2014.
Description: This Project expands the Glenwood wastewater system from the existing 30 inch trunk line in Franklin Boulevard south with approximately 3,900 feet of 15 inch pipe and 2,400 feet of 8 inch pipe. Wastewater trunk lines are typically cleaned annually and video inspected by maintenance every five years.
Description: Intersection improvements at Gateway/Beltline and surrounding intersections, including construction of a couplet and purchase of right-of-way. CIP project funding contributes to overall project estimate of $30 million. Presently Phase 1 improvements are being constructed.
Description: Transportation improvements at various locations in the Gateway area to increase capacity, relieve congestion, and improve safety
FY14 Proposed Budget Attachment 31 Page 155 of 202

CITY OF SPRINGFIELD
2013 - 2014 CAPITAL BUDGET
PROJECTS FUNDING FUND AMOUNT
9. Franklin NEPA SDC Transportation Improvement Fund 420 $0447 $15,027
TOTAL $15,027
11. ITS - Gateway/Beltline Development Projects Fund 447 $3,450TOTAL $3,450
12. Glenwood Boulevard Bridge Repairs Development Projects Fund 434 $4,000TOTAL $4,000
13. South Bank Viaduct Extension Street Capital Fund 434 $83,000SDC Transportation Improvement Fund 447 $5,000TOTAL $88,000
14. Street Light Pole Test, Treat & Replace Development Projects Fund 434 $25,000TOTAL $25,000
15. S. 42nd Street Reserve Street Capital Fund 434R $170,896TOTAL $170,896
Total Transportation and Street Improvements $1,279,873
Description: ITS projects in various locations to increase communications, capacity, safety and traveler information. Funding is set aside in this program and as projects are identified that fit into this category they are given an individual account and at that time another source of funding will be identified to match the allowable SDC funds. This funding is set aside to support the communications for the Gateway/Beltline Project.
Description: The Glenwood Connector Path Extension (GCPE) is located along the south bank of the Willamette River between the Oldham property on the north side of Franklin Boulevard and the Glenwood Blvd. intersection. The Glenwood Connector Path Extension temporarily connects the Glenwood Connector Path to Franklin Blvd., until the planned Glenwood Riverfront Path is constructed.
Description: Test and treat light poles at 10 year intervals and replace rotting poles and broken conduits in the City owned street light system.
Description: The City owns the Glenwood Boulevard Bridge over the Union Pacific Railroad tracks. Staff has determined that the joints between the bridge deck and the adjoining pavement are insufficient to protect the bridge deck and pavement from damage due to thermal expansion and contraction.
Description: Money set aside from the State deposit for jurisdictional transfer. This money is set aside for future preservation activities on S. 42nd Street.
Description: Complete project refinement, including National Environmental Policy Act (NEPA) documentation for future improvements to Franklin Boulevard, the Franklin/Glenwood and Franklin/McVay intersections to support Glenwood redevelopment and regional mobility for transit, bicycles/pedestrians, and autos. Contribute to the required local match for any federal funding received.
FY14 Proposed Budget Attachment 31 Page 156 of 202

CITY OF SPRINGFIELD
2013 - 2014 CAPITAL BUDGET
PROJECTS FUNDING FUND AMOUNT
Building and Facilities Capital Improvements
1. Building Preservation Building Preservation Fund 420 $194,007TOTAL $194,007
2. Justice Center Planned Facilities 428 $155,578TOTAL $155,578
Description: Major maintenance contracted activities and unanticipated emergency facility equipment replacement. There is a fund balance maintained in the event of a major, unforeseen expenditure. It is anticipated that more funds are needed and will be added once identified.
2. Booth Kelly Roof Repair Booth Kelly Fund 618 $100,000TOTAL $100,000
Description: Structural repair and improvements to the Booth-Kelly Center buildings.
3. Booth Kelly Building Repair Booth Kelly Fund 618 $40,000TOTAL $40,000
4. Firing Range Decommissioning Drainage Capital Fund 425 $75,000TOTAL $75,000
5. Booth Kelly Water Isolation and Repair Booth Kelly Fund 618 $30,000TOTAL $30,000
6. Booth Kelly Facilities Assessment and Plan Booth Kelly Fund 618 $30,000TOTAL $30,000
Total Building and Facilities Improvements $624,585
Description: This project involves the clean-up of the outdoor firing range formerly used by the Police Department, including lead mining, removal of miscellaneous materials, and overall environmental assessment of the site.
Description: Perform preservation, maintenance and repair projects on City-owned buildings, including City Hall, Fire Stations, Museum, Justice Center, and Maintenance Facilities. Projects can include the repair, renovation or replacement of structural, mechanical, electrical, and plumbing systems. Other projects can includepainting, roofing, lighting, alarm and elevator projects as well as repair and/or upgrades to aesthetic and architectural elements.
Description: Repair a small building at the Booth Kelly site. This project is related to the Mill Race Restoration Project.
Description: This project will consist of a water isolation analysis to the Booth Kelly Complex grounds in order to locate a slow water leakage.
Description: Hire a consultant to do a comprehensive assement of the Booth Kelly facilities and produce a report with necessary repair work prioritized.
FY14 Proposed Budget Attachment 31 Page 157 of 202

CITY OF SPRINGFIELD
2013 - 2014 CAPITAL BUDGET
PROJECTS FUNDING FUND AMOUNT
Miscellaneous Capital Improvements
1. City Participation in Private ProjectsSDC Transportation Reimbursement Fund 446 $0SDC Local Wastewater Reimbursement Fund 442 $33,000SDC Local Storm Reimbursement Fund 441 $0SDC Transportation Improvement Fund 447 $35,000SDC Local Wastewater Improvement Fund 443 $34,000Drainage Capital Fund 425 $34,000Local Wastewater Capital Fund 409 $0SDC Local Storm Improvement Fund 440 $28,000TOTAL $164,000
2. Special Projects Development Projects Fund 420 $30,000TOTAL $30,000
Description: Special Projects provides funding for FY11 Economic Development and relatedprojects in which the City may wish to participate. The City Manager manages the Special Projects budget.
3. Topographic ReMapping Local Wastewater Capital Fund 409 $21,000Drainage Capital Fund 425 $21,000Street Capital Fund 434 $21,000SDC Local Storm Improvement 440 $13,000SDC Local Wastewater Improvement Fund 443 $51,000SDC Local Wastewater Reimbursement 442 $21,000TOTAL $148,000
4. Asset Management Development Projects Fund 434 $0425 $41,000409 $41,000
TOTAL $82,000
Total Miscellaneous Improvements $424,000
Description: Replace out-of-date topographic maps (base maps) for the entire City that were last developed in 2000. The new maps will capture the new development and other changes that have occurred over the past decade.
Description: City cost participation in public improvements constructed in private developments under the City's Construction Permit process. To respond to known and potential private development projects, it is necessary to budget $100,000 each fiscal year in each infrastructure program area, i.e. Transportation, Local Wastewater and Stormwater, and the programmed funds for FY11 are only those necessary to meet that need. Currently other programmed funds are not yet tied to specific projects.
Description: Replace failing Geographic Information Systems (GIS) and Facilities Management (FM) systems that manage electronic inventories of City infrastructure and provide reliable and well integrated information for asset management and mapping functions.
FY14 Proposed Budget Attachment 31 Page 158 of 202

CITY OF SPRINGFIELD
2013 - 2014 CAPITAL BUDGET
PROJECTS FUNDING FUND AMOUNT
Regional Wastewater Program
1. Facilities Plan Engineering Services Regional Wastewater Capital Bond Fund 412 $70,000TOTAL $70,000
3. Influent PS/Willakenzie PS/Headworks Regional Wastewater Capital Bond Fund 412 $306,256TOTAL $306,256
Description: This project provides influent pumping improvements and headworks expansion requiredto accommodate the 2025 peak wet weather flow of 277 mgd.
7. Primary Sludge Thickening Regional Wastewater Capital Fund 433 $30,320TOTAL $30,320
9. Biosolids Force Main Rehab Regional Wastewater Capital Bond Fund 412 $1,373,000TOTAL $1,373,000
10. Sodium Hypochlorite Conversion Regional Wastewater Capital Bond Fund 412 $328,500Regional Wastewater Capital Fund 433 $2,632,166TOTAL $2,960,666
11. Tertiary Filtration I Regional Wastewater Capital Bond Fund 412 $500,000TOTAL $500,000
Description: Filtration: includes infrastructure/support facilities for 30 mgd of filters; install filtercells sufficient for only 10 mgd.
12. Regional Wastewater Capital Fund 433 $184,740TOTAL $184,740
14. Line Biosolids Lagoons Phase IV Regional Wastewater Capital Bond Fund 412 $2,132,000TOTAL $2,132,000
Description: Reline existing lagoons, Phase 4 at the Biosolids Management Facility (BMF).
Capacity Management Operation and Maintenance (CMOM)
Convert existing chlorine gas system to sodium hypochlorite for base flow. Retain the existing chlorine contact basins. Install system with capability for high rate disinfection of primary effluent diversion assuming high dosages of chlorine into a new chlorine contact basin.
Description: Thin Primary sludge pumping and piping systems to gravity thickeners, two, 50 foot diameter gravity thickeners (covered for odor control), supernatant overflow pumping and piping, thickened sludge piping/pumping to digesters. Includes funds for landscaping in vicinity of thickeners.
Description: Engineering services for analysis, interpretation, cost estimating and assistance related to the 2004 MWMC Facilities Plan..
Description: This project (formerly identified as the WWFMP Update project) supports and guides ongoing collection system capacity management, operations and maintenance (CMOM) programs to address Inflow and Infiltration (I/I) and sanitary sewer overflows (SSO’s).
Description: Investigate, repair, and/or replace sections of the biosolids force main (piping system)where struvite deposits reduce the pipe diameter and cannot be removed by an acid washing method.
FY14 Proposed Budget Attachment 31 Page 159 of 202

CITY OF SPRINGFIELD
2013 - 2014 CAPITAL BUDGET
PROJECTS FUNDING FUND AMOUNT
15. Thermal Load Mitigation: Pre-Implementation Regional Wastewater Capital Fund 433 $140,000Regional Wastewater Capital Bond Fund 412 $560,000TOTAL $700,000
16. Thermal Load Mitigation: Implementation 1 Regional Wastewater Capital Bond Fund 412 $700,000TOTAL $700,000
17. Tertiary Filitration - Phase 2 Regional Wastewater Capital Bond Fund 412 $3,000,000TOTAL $3,000,000
18. WPCF Lagoon Removal/Decommissioning Regional Wastewater Capital Bond Fund 412 $1,500,000TOTAL $1,500,000
Total Regional Wastewater Program $13,456,982
$28,658,694$7,837,072
$36,495,766
Description: The phased work program will install infrastructure/support facilities for 30 mgd of filters for tertiary filtration of secondary treated effluent. Phase 2 is planned to install filter system technology sufficient foranother 10 mgd of treatment that will increase the total filtration capacity to 20 mgd. The Phase 3 project will install the remaining filtration technology to meet the capacity needs identified in the 2004 MWMC Facilities Plan.
Description: This project decommissions the existing biosolids lagoon at the Water Pollution Control Facility (WPCF) and adds solids handling facilities to manage biosolids during digester cleaning events.
Description: This project includes the phased recycled water planning effort and feasibility studies, study and planning of associated thermal load mitigation measures such as riparian shading and water quality trading credit activities, and permit negotiation and legal strategy related to the temperature TMDL and NPDES permit renewal.
Description: This project implements thermal load mitigation projects strategized for regulatory compliance and additional environmental and community benefits. The projects will include recycled water use expansion at MWMC and/or community partner facilities, riparian shade projects (initially being implemented on Cedar Creek and Springfield Mill Race), and potentially water quality trading credit strategies through shade credit investments and collaborative partnerships for permit compliance.
TOTAL
TOTAL CAPITAL BUDGET TOTAL DEDICATED RESERVES
FY14 Proposed Budget Attachment 31 Page 160 of 202
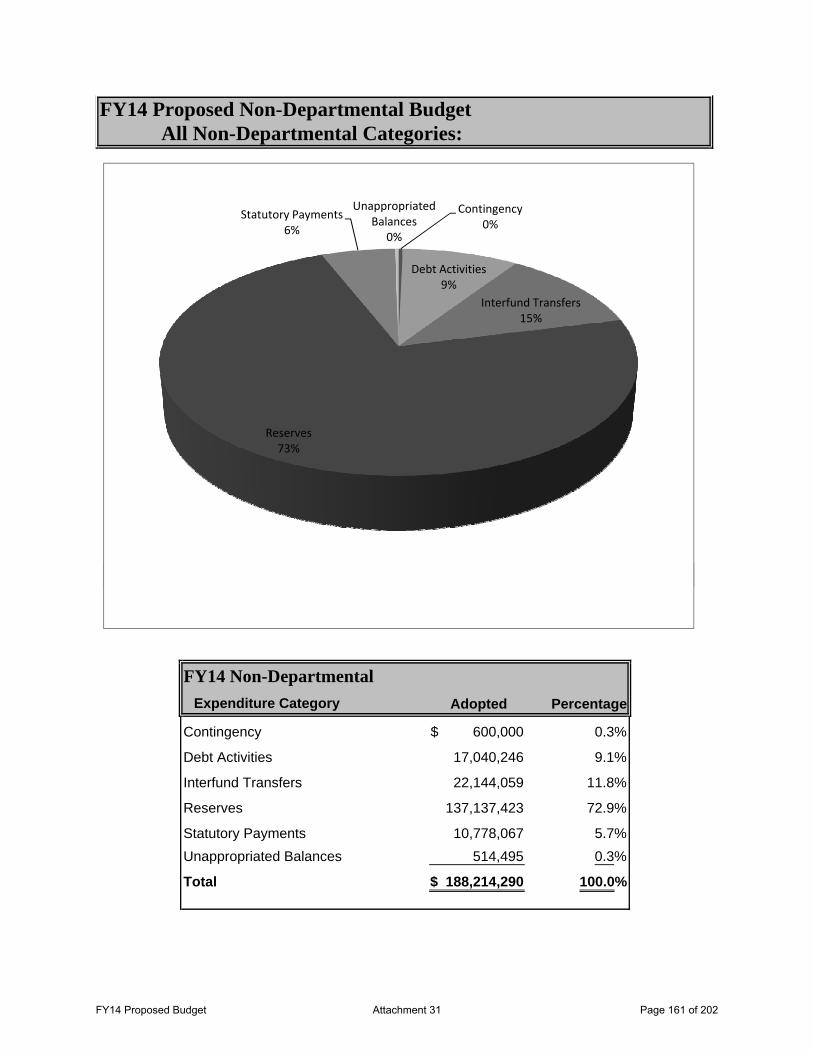
FY14 Proposed Non-Departmental BudgetAll Non-Departmental Categories:
Contingency0%
Debt Activities9%
Interfund Transfers15%
Reserves73%
Statutory Payments6%
Unappropriated Balances
0%
Expenditure Category Adopted Percentage
Contingency 600,000$ 0.3%
Debt Activities 17,040,246 9.1%
Interfund Transfers 22,144,059 11.8%
Reserves 137,137,423 72.9%
Statutory Payments 10,778,067 5.7%Unappropriated Balances 514,495 0.3%
Total 188,214,290$ 100.0%
FY14 Non-Departmental
FY14 Proposed Budget Attachment 31 Page 161 of 202

NON-DEPARTMENTALContingency
FY14Proposed
General Fund 600,000$
Total Contingency 600,000$
Contingency appropriations are authorized by ORS 294.435 to provide a resource for occurrences or emergencies which cannot be foreseen at the time of budget preparation. Authorization by the City Council is required prior to the use of these funds. When authorization is granted, appropriations are transferred from the Contingency appropriation to the designated approved expenditure appropriation.
Financial Summary - by Fund
FY14 Proposed Budget Attachment 31 Page 162 of 202

FY14Proposed
Bond Sinking Fund 3,287,968$ Booth-Kelly Fund 1,130,122 General Fund 230,715 Regional Wastewater Debt Service Fund 7,711,426 Regional Wastewater Fung 1,358,543 SDC Administration Fund 589,217 Storm Drainage Operations Fund 705,375 Sewer Operations Fund 2,026,880
Total Debt Payments - Principal and Interest 17,040,246$
The City’s long-term debt is used to create or renovate capital infrastructure. The City does not borrow externally on a short-term basis to support operations. The City relies on property tax-supported bonds, revenue-backed general obligation bonds, or revenue for most long-term debt. General obligation bonds must be approved by the voters. Revenue backed general obligation bonds may be used in enterprise funds where fees and charges are used to service debt. Revenue bonds may be used to finance enterprise fund capital improvements if appropriate. Certain public improvements such as sidewalks, streets, and sewers are financed by assessments.
NON-DEPARTMENTALDebt Activities
Debt service appropriations provide for the payment of principal and interest on bonds, certificate of participation, notes, and lines of credit. The debt service budget also recognizes the repayment of interfund loans.
Debt Payments
FY14 Proposed Budget Attachment 31 Page 163 of 202

Financial Summary of Transfers and Loans - All Funds
From General FundTo Steet Fund 377,220 To Jail Operations Fund 373,685 To Special Revenue 730
Subtotal 751,635$
From Street FundTo Street Capital Fund 100,000$
Subtotal 100,000$
From Special RevenueTo General Fund 20,000$
Subtotal 20,000$
From Transient Room Tax FundTo General Fund 542,850$
Subtotal 542,850$
From Police Local Option Levy FundTo Jail Operations Fund 1,935,164$
Subtotal 1,935,164$
From Bancroft Redemption FundTo Developmnet Projects Fund 30,000$
Subtotal 30,000$
From Development Assessment Capital FundTo Bancroft Redemption 16,905$
Subtotal 16,905$
Interfund transfers are authorized by ORS 294.352 and ORS 294.361 and represent transfers of resources between funds for the repayment of costs incurred by one fund on behalf of another, or represent transfer of equity between funds.
NON-DEPARTMENTALInterfund Transfers and Loans
Interfund loans are authorized by ORS 294.460 and represent loans made from one fund to another. Oregon Local Budget Law requires that loans appropriated for operating purposes be paid back in the following fiscal year, while capital loans must be repaid within five years.
FY14 Proposed Budget Attachment 31 Page 164 of 202

Financial Summary of Transfers and Loans - ContinuedFrom Development Projects Fund
To General Fund 91,159$ To SEDA Downtown 250,000$ Loan to SEDA - Downtown 175,000 Loan to SEDA - Glenwood 400,000
Subtotal 916,159$
From SDC Storm Improvement FundTo Bond Sinking Fund 25,649$
Subtotal 25,649$
From SDC Sanitary Improvement FundTo Bond Sinking Fund 45,662$
Subtotal 45,662$
From SDC Regional Wastewater Reimbursement FundTo Regional Wastewater Fund 17,520$
Subtotal 17,520$
From SDC Regional Wastewater Improvement FundTo Regional Wastewater Debt Service Fund 1,400,000$
Subtotal 1,400,000$
From SDC Transportation Reimbursement FundTo Bond Sinking Fund 10,374$
Subtotal 10,374$
From Sanitary Sewer Operations FundTo Sanitary Sewer Capital Fund 1,750,000$
Subtotal 1,750,000$
From Regional Wastewater FundTo Regional Wastewater Debt Service Fund 6,311,426$ To Regional Wastewater Capital Fund 6,500,000
Subtotal 12,811,426$
From Drainage Operating FundTo Drainage Capital Fund 1,540,000$
Subtotal 1,540,000$
From Insurance FundTo General Fund 230,715$
Subtotal 230,715$
Total Interfund Transfers and Loans** 22,144,059$ **Includes operating transfers
FY14 Proposed Budget Attachment 31 Page 165 of 202

NON-DEPARTMENTALMiscellaneous Fiscal Transactions
FY14Proposed
Regional Wastewater Revenue Bond Capital Project Fund Miscellaneous Fiscal Transactions -$
Total Miscellaneous Fiscal Transactions -$
Miscellaneous fiscal transactions are accounts that represent specific bond or district debt expense other than debt service (such as bond sale expense or bond insurance). These expenditures are fund-specific and not department-specific, and therefore are identified as non-departmental costs.
Financial Summary of Miscellaneous Fiscal Transactions
FY14 Proposed Budget Attachment 31 Page 166 of 202

Financial Summary of Reserves - All Funds
General Fund Non-Dedicated 7,235,617$
Subtotal 7,235,617$
Street Fund Non-Dedicated 641,497$
Subtotal 641,497$
Jail Operations Fund Non-Dedicated 62,421$
Subtotal 62,421$
Special Revenue Fund Dedicated Reserve 18,895$
Police Forfeit Reserve 256,476 Gifts & Memory Reserve 89,203 Police Forefeits Post 1/1/02 Reserve 83,549
Subtotal 448,123$
Transient Room Tax Fund Dedicated Tourism Promotion Reserve 231,798$
Subtotal 231,798$
Community Development Fund Dedicated CDBG Reserve 142,600$
Subtotal 142,600$
NON-DEPARTMENTALReserves: Non-Dedicated and Dedicated Budgets
Reserves - Non-Dedicated Balance accounts represent the estimated resources which remain undesignated for current or future appropriation. These accounts provide for cash flow requirements during the fiscal year. This estimate appears in the budget for balancing purposes only. These funds cannot be expended without specific authorization by the City Council.
Reserves - Dedicated Balance accounts represent the estimated resources which have been established as the result of contributions to the specific reserve for future appropriation needs. Dedicated reserves provides for cash flow requirements during the fiscal year. This estimate appears in the budget for balancing purposes only. These funds can only be transferred for expenditure based on authorization by the City Council.
FY14 Proposed Budget Attachment 31 Page 167 of 202

Financial Summary of Reserves - Continued
Building Code Fund Dedicated Operating Reserve 24,096$
Subtotal 24,096$
Fire Local Option Levy Dedicated Operating Reserve 364,272$
Subtotal 364,272$
Police and Court Local Option Levy Dedicated Operating Reserve 1,414,492$
Subtotal 1,414,492$
Bancroft Redemption Fund Non-Dedicated 65,799$
Subtotal 65,799$
Sewer Capital Projects Fund Non-Dedicated 5,494,653$ DedicatedFranklin Blvd Exit Reserve 2,373,000
Subtotal 7,867,653$
Regional Wastewater Revenue Bonds Capital Projects Fund Dedicated Capital Reserve 6,371,342$ MWMC 2008 Bond Reserve 4,000,000
Subtotal 10,371,342$
Development Assessment Capital Fund Dedicated Assessment Service Reserve 198,987$ Assessments Finance Reserve 803,617
Subtotal 1,002,604$
Development Projects Fund Non-Dedicated 3,141,490$ Dedicated Building Preservation Reserve - Capital/Ed Reserve 21,596 Corporate Way Pond Rehab Reserve 35,200 SDC Facilities Reserve -
Subtotal 3,198,286$
FY14 Proposed Budget Attachment 31 Page 168 of 202

Financial Summary of Reserves - Continued
Drainage Capital Fund Non-Dedicated 4,792,578$ Dedicated
Storm Bond Reserve 2011 708,050 Island Park Reserve 1,400,000 Lower Millrace Reserve 900,000 Millrace Stormwater Facility Reserve 1,254,500 Jasper-Natron Reserve 500,000 Cedar Creek Reserve 500,000
Subtotal 10,055,128$
Regional Wastewater Capital Fund Dedicated Capital Reserve 50,052,926$ Equipment Replacement Reserve 11,108,106
Subtotal 61,161,032$
Street Capital Fund Non-Dedicated 317,674$ Dedicated South 42nd St., Main-Jasper Road 170,896
Subtotal 488,570$
SDC Storm Improvement Fund Dedicated SDC Reserve 352,170$
Grey Creek Reserve 149,176 Subtotal 501,346$
SDC Storm Reimbursement Fund Dedicated SDC Reserve 3,046$
Subtotal 3,046$
SDC Sanitary Reimbursement Fund Dedicated SDC Reserve 1,071,867$
Subtotal 1,071,867$
SDC Sanitary Improvement Fund Dedicated SDC Reserve 202,034$
Subtotal 202,034$
FY14 Proposed Budget Attachment 31 Page 169 of 202
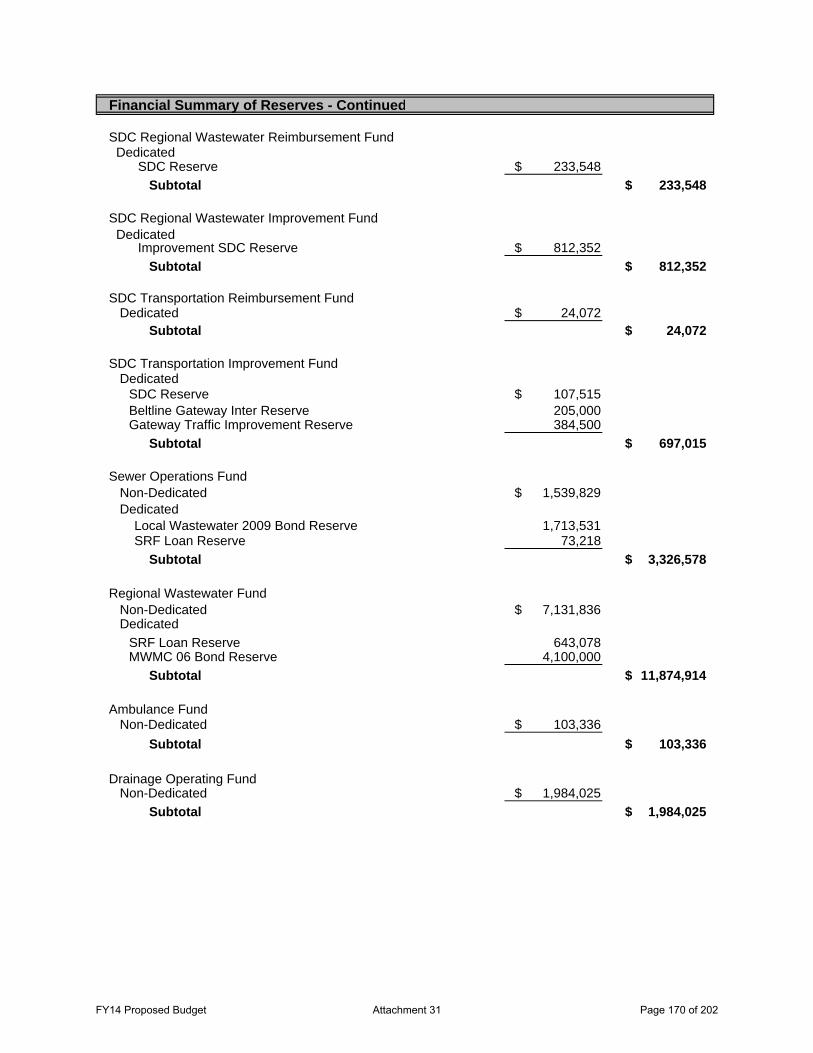
Financial Summary of Reserves - Continued
SDC Regional Wastewater Reimbursement Fund Dedicated SDC Reserve 233,548$
Subtotal 233,548$
SDC Regional Wastewater Improvement Fund Dedicated Improvement SDC Reserve 812,352$
Subtotal 812,352$
SDC Transportation Reimbursement Fund Dedicated 24,072$
Subtotal 24,072$
SDC Transportation Improvement Fund Dedicated
SDC Reserve 107,515$ Beltline Gateway Inter Reserve 205,000 Gateway Traffic Improvement Reserve 384,500
Subtotal 697,015$
Sewer Operations Fund Non-Dedicated 1,539,829$ Dedicated Local Wastewater 2009 Bond Reserve 1,713,531 SRF Loan Reserve 73,218
Subtotal 3,326,578$
Regional Wastewater Fund Non-Dedicated 7,131,836$ Dedicated
SRF Loan Reserve 643,078 MWMC 06 Bond Reserve 4,100,000
Subtotal 11,874,914$
Ambulance Fund Non-Dedicated 103,336$
Subtotal 103,336$
Drainage Operating Fund Non-Dedicated 1,984,025$
Subtotal 1,984,025$
FY14 Proposed Budget Attachment 31 Page 170 of 202

Financial Summary of Reserves - Continued
Booth-Kelly Fund Non-Dedicated 422,750$
Subtotal 422,750$
Regional Fiber Consortium Fund Non-Dedicated 157,248$
Subtotal 157,248$
Insurance Fund Dedicated Self Funded Insurance Reserve 1,045,225$ Insurance Reserve 604,575 Workers Compensation Reserve 1,608,726
Subtotal 3,258,526$
Vehicle and Equipment Fund Dedicated Equipment Replacement Reserve 69,096$ Lease Payments - MS Enterprise Charge Reserve 149,682 Telephone Lease Reserve 153,689 Computer Equipment Reserves: 546,922 Vehicle and Equipment Reserves: 6,692,276
Subtotal 7,611,665$
SDC Administration Fund Dedicated 77,771$
Subtotal 77,771$
Total Reserves 137,137,423
Summary by Type of Reserve: Non-Dedicated 33,090,753$
Dedicated 104,046,670 Total Reserves * 137,137,423
FY14 Proposed Budget Attachment 31 Page 171 of 202

Statutory Payments represents payments required by State law or contract, and are of two types:
FY14Proposed
Insurance Fund Contractual
Property/Casualty Premium 665,000$ Workers' Compensation Premium 282,000 Premium Taxes 26,000 Workers' Compensation Claims 246,968
Subtotal 1,219,968$
Pass -Through Dental Premium -$ Disability Premium 166,919 FICA Payments 2,289,184 Wells Fargo Police Retirement 2,022,681 Pre-Retirement Life Premium 13,080 Mandatory Life 2,028 PERS Pension Expenditure 5,002,970 Basic Life 61,237 Pacific Source Medical -
Subtotal 9,558,099$
Total Insurance Fund Statutory Payments 10,778,067$
NON-DEPARTMENTALStatutory Payments
Contractual Payments are insurance premiums based on the number and type of FTE in each fund, and are transferred from those funds to the Insurance Fund on a monthly basis. Premium payments are then made from the Insurance Fund when due.
Financial Summary of Statutory Payments - All Funds
Pass-Through Payments are insurance premiums or other payments that are associated with particular individuals, and are collected through the payroll process. For ease of record-keeping, withholdings are collected from each fund via the payroll process and are accumulated in the Insurance Fund; payments are then made from the Insurance Fund when due.
FY14 Proposed Budget Attachment 31 Page 172 of 202

NON-DEPARTMENTALUnappropriated Balances
FY14Proposed
Bond Sinking Fund Unappropriated Balance 514,495$
Total Unappropriated Balance 514,495$
Unappropriated ending fund balance accounts represent the estimated resources which remain undesignated for current or future appropriation. This account provides for cash flow requirements during the fiscal year. This estimate appears in the budget for balancing purposes only. These funds cannot be expended without specific authorization by the City Council.
Financial Summary of Unappropriated Balances - All Funds
FY14 Proposed Budget Attachment 31 Page 173 of 202

FY14 Proposed Budget Attachment 31 Page 174 of 202

FY14 Proposed Budget - By Fund TypeResources and Requirements Summary
Department Capital Non-Fund FTE Resources Operating Projects Departmental
General FundTotal General Fund 208.49 41,237,028$ 32,419,061$ -$ 8,817,967$
Special Revenue FundsStreet Fund 30.07 6,139,414$ 5,397,917$ -$ 741,497$ Jail Operations Fund 18.10 2,917,612 2,855,191 - 62,421 Special Revenue Fund 0.20 1,180,477 712,354 - 468,123 Transient Room Tax Fund 1.95 1,184,750 410,102 - 774,648 Community Development Fund 2.58 923,346 780,746 - 142,600 Building Fund Fund 5.85 853,743 829,647 - 24,096 Fire Local Option Levy Fund 9.00 1,922,865 1,558,593 - 364,272 Police Local Option Levy Fund 22.23 6,305,994 2,956,338 - 3,349,656 Total Special Revenue Funds 89.98 21,428,201$ 15,500,888$ -$ 5,927,313$
Debt Service FundsBancroft Redemption Fund 0.13 113,278$ 17,479$ -$ 95,799$ Bond Sinking Fund - 3,802,463 - - 3,802,463 Regional Wastewater Debt Service Fund - 7,711,426 - - 7,711,426 Total Debt Service Funds 0.13 11,627,167$ 17,479$ -$ 11,609,688$
Capital Projects FundsSewer Capital Project Fund - 15,286,653$ -$ 7,419,000$ 7,867,653$ Reg. Wastewater Rev. Bond Cap. Proj. Fund - 20,841,098 - 10,469,756 10,371,342 Development Assessment Fund 0.67 1,125,267 105,758 - 1,019,509 Development Projects Fund - 4,338,452 - 224,007 4,114,445 Police Building Bond Capital Project Fund 155,578 - 155,578 - Drainage Capital Fund Fund - 15,251,128 - 5,196,000 10,055,128 Regional Wastewater Capital Fund - 65,187,790 1,039,532 2,987,226 61,161,032 Street Capital Fund - 621,570 - 133,000 488,570 SDC Storm Improvement Fund - 1,699,613 37,968 1,134,650 526,995 SDC Storm Drainage Reimb Fund - 100,264 31,218 66,000 3,046 SDC Sanitary Reimbursement Fund - 1,287,015 161,148 54,000 1,071,867 SDC Sanitary Improvement Fund - 450,631 75,935 127,000 247,696 SDC Regional Wastewater Reimbursement Fund - 253,068 2,000 - 251,068 SDC Regional Wastewater Improvement Fund - 2,215,352 3,000 - 2,212,352 SDC Transportation Reimbursement Fund - 72,414 37,968 - 34,446 SDC Transportation Improvement Fund - 1,270,267 130,775 442,477 697,015 Total Capital Projects Funds 0.67 130,156,160$ 1,625,302$ 28,408,694$ 100,122,164$
Enterprise FundsSewer Operations Fund 20.40 10,747,145$ 3,643,687$ -$ 7,103,458$ Regional Wastewater Fund 15.89 42,392,676 16,347,793 - 26,044,883 Ambulance Fund 32.05 5,292,717 5,189,381 - 103,336 Drainage Operating Fund 30.99 9,079,703 4,850,303 - 4,229,400 Booth-Kelly Fund 1.53 2,361,735 558,863 250,000 1,552,872 Regional Fiber Consortium Fund - 203,348 46,100 - 157,248 Total Enterprise Funds 100.86 70,077,324$ 30,636,127$ 250,000$ 39,191,197$
Internal Service FundsInsurance Fund 3.15 22,780,751$ 8,513,443$ -$ 14,267,308$ Vehicle and Equipment Fund - 9,182,022 981,140 - 8,200,882 SDC Administration Fund 3.41 648,195 570,424 - 77,771 Total Internal Service Funds 6.56 32,610,968$ 10,065,007$ -$ 22,545,961$
Total Amount of Budget 406.69 307,136,848$ 90,263,864$ 28,658,694$ 188,214,290$
FY14 Proposed Budget Attachment 31 Page 175 of 202
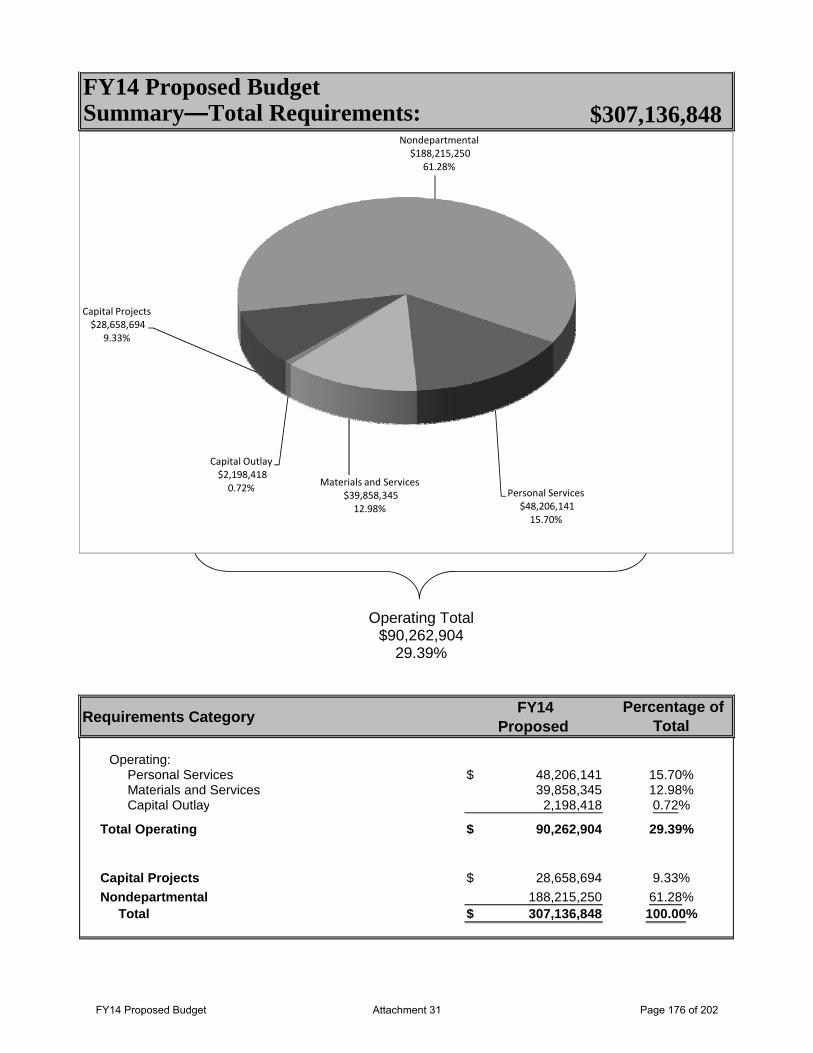
Summary—Total Requirements: $307,136,848FY14 Proposed Budget
Personal Services$48,206,141 15.70%
Materials and Services$39,858,345 12.98%
Capital Outlay$2,198,418 0.72%
Capital Projects$28,658,694
9.33%
Nondepartmental$188,215,250
61.28%
Requirements Category FY14Proposed
Percentage of Total
Operating:Personal Services 48,206,141$ 15.70%Materials and Services 39,858,345 12.98%Capital Outlay 2,198,418 0.72%
Total Operating 90,262,904$ 29.39%
Capital Projects 28,658,694$ 9.33%Nondepartmental 188,215,250 61.28%
Total 307,136,848$ 100.00%
Operating Total$90,262,904
29.39%
FY14 Proposed Budget Attachment 31 Page 176 of 202

TOTAL CITY EMPLOYEES—Full Time Equivalents (FTE)Comparison by Fund
FundNumber Fund Name
AdoptedFY13
ProposedFY14 Change
100 General Fund 209.20 208.49 -0.71201 Street Fund 29.75 30.07 0.32202 Jail Operations Fund 18.10 18.10 0.00204 Special Revenue Fund 0.95 0.20 -0.75208 Transient Room Tax Fund 1.95 1.95 0.00210 Community Development Fund 3.38 2.58 -0.80224 Building Fund 6.90 5.85 -1.05235 Fire Local Option Levy Fund 9.00 9.00 0.00236 Police Local Option Levy Fund 22.23 22.23 0.00305 Bancroft Redemption Fund 0.13 0.13 0.00419 Development Assessment Capital Fund 0.67 0.67 0.00611 Sewer Operations Fund 19.72 20.40 0.68612 Regional Wastewater Fund 15.83 15.89 0.06615 Ambulance Fund 32.05 32.05 0.00617 Drainage Operating Fund 30.98 30.99 0.01618 Booth-Kelly Fund 0.90 1.53 0.63707 Insurance Fund 3.15 3.15 0.00719 SDC Administration 3.60 3.41 -0.19
Total Full-Time Equivalents 408.49 406.69 -1.80
FY14 Proposed Budget Attachment 31 Page 177 of 202
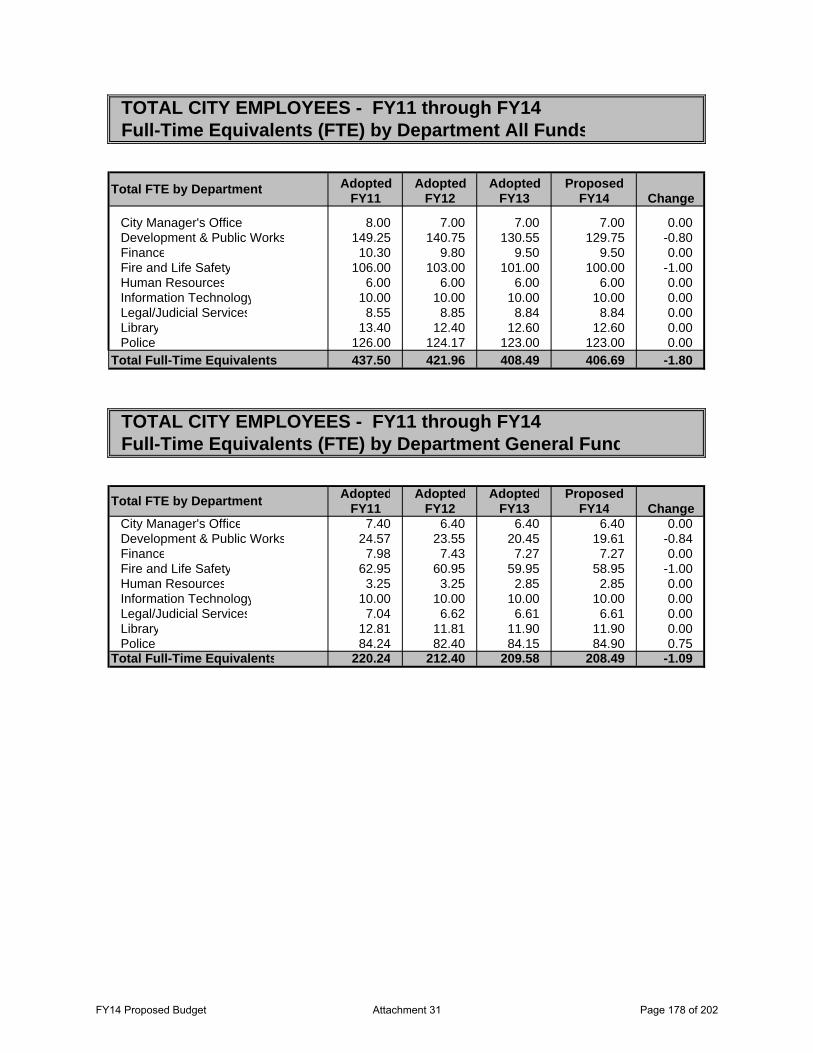
TOTAL CITY EMPLOYEES - FY11 through FY14Full-Time Equivalents (FTE) by Department All Funds
Adopted Adopted Adopted ProposedFY11 FY12 FY13 FY14
City Manager's Office 8.00 7.00 7.00 7.00 0.00Development & Public Works 149.25 140.75 130.55 129.75 -0.80Finance 10.30 9.80 9.50 9.50 0.00Fire and Life Safety 106.00 103.00 101.00 100.00 -1.00Human Resources 6.00 6.00 6.00 6.00 0.00Information Technology 10.00 10.00 10.00 10.00 0.00Legal/Judicial Services 8.55 8.85 8.84 8.84 0.00Library 13.40 12.40 12.60 12.60 0.00Police 126.00 124.17 123.00 123.00 0.00
Total Full-Time Equivalents 437.50 421.96 408.49 406.69 -1.80
TOTAL CITY EMPLOYEES - FY11 through FY14Full-Time Equivalents (FTE) by Department General Fund
Adopted Adopted Adopted ProposedFY11 FY12 FY13 FY14
City Manager's Office 7.40 6.40 6.40 6.40 0.00Development & Public Works 24.57 23.55 20.45 19.61 -0.84Finance 7.98 7.43 7.27 7.27 0.00Fire and Life Safety 62.95 60.95 59.95 58.95 -1.00Human Resources 3.25 3.25 2.85 2.85 0.00Information Technology 10.00 10.00 10.00 10.00 0.00Legal/Judicial Services 7.04 6.62 6.61 6.61 0.00Library 12.81 11.81 11.90 11.90 0.00Police 84.24 82.40 84.15 84.90 0.75
Total Full-Time Equivalents 220.24 212.40 209.58 208.49 -1.09
Total FTE by DepartmentChange
Total FTE by Department Change
FY14 Proposed Budget Attachment 31 Page 178 of 202

Resources, All Fund Types FY11 Actual FY12 Actual FY13* Amended FY14 Proposed
Revenues, Summary LevelTaxes (Current and Delinquent) 27,716,200$ 28,379,525$ 29,077,921$ 30,336,066$ Licenses, Permits and Fees 3,488,137 3,189,451 3,380,768 3,263,600 Intergovernmental 9,600,505 9,016,491 9,565,162 8,280,699 Charges for Service 53,602,910 55,276,692 58,634,137 63,555,557 Fines and Forfeitures 1,809,533 1,737,151 1,751,198 1,752,200 Use of Money and Property 2,951,252 2,793,940 2,257,908 2,607,296 Special Assessments 1,200,625 48,934 27,290 26,000 Miscellaneous Receipts 1,248,267 1,060,350 965,582 978,540 Other Financing Sources 51,621,896 46,438,285 42,091,343 34,383,083
Total Current Revenues 153,239,325$ 147,940,819$ 147,751,309$ 145,183,041$
Beginning Cash 145,570,507$ 161,484,828$ 165,975,173$ 161,953,807$
Total Resources, All Sources 298,809,832$ 309,425,647$ 313,726,482$ 307,136,848$
* Amended as of Feb 4, 2013
TOTAL BUDGET SUMMARY — FY11 through FY14Resources Only
FY14 Proposed Budget Attachment 31 Page 179 of 202

Revenue - All Sources, By Revenue Type and Account
FY11Actual
FY12Actual
FY13*Amended
FY14Preposed
TaxesCurrent Taxes 16,616,637$ 17,301,093$ 17,612,000$ 18,047,168$ Delinquent Taxes 522,563 347,537 525,044 475,000
Total Taxes 17,139,200$ 17,648,630$ 18,137,044$ 18,522,168$
Licenses and Permits Sanipac Franchise 340,741$ 262,242$ 383,000$ 396,000$ AT&T/Comcast Franchise 607,170 605,160 676,000 600,000 Qwest Franchise 255,612 145,736 233,000 145,000 NW Natural Gas 427,674 422,806 390,000 400,000 Spring Franchise - 121,771 24,000 32,000 ROW Fee 191 - - - ATG Right of Way 5,353 3,120 4,300 3,100 EPUD Right-of-Way Fees 8,598 11,046 8,500 8,500 Telecomm Licenses 2,665 - - - Library Receipts 24,395 24,138 24,218 27,500 Library Photocopy Charges 1,453 1,108 1,400 1,000 Animal Licenses/Impound 23,570 30,320 30,000 31,000 Police Impound Fees 131,251 18,635 20,000 22,000 Offense Surcharge - - - - Fire Code Permits 129,848 152,420 140,000 145,000 FLS Safety Systems Plan Review 5,828 11,506 8,000 12,500 FLS New Construction Sq Ft Fee 28,240 22,073 20,000 9,200 Planning Fees 110,385 90,163 146,250 178,000 Peer Review Riverbend 111 - - - DSD Postage Fees 2,945 2,465 9,200 5,000 Building Fees 152 - - - Technology Fee 46,671 40,018 47,000 40,000 Code Requirement Fees 106,990 79,691 94,000 75,000
Total Licenses and Permits 2,259,845$ 2,044,417$ 2,258,868$ 2,130,800$
Intergovernmental Team Spgfld Bicycle Patrol -$ -$ 10,000$ 10,000$ Liquor Apportionment 683,323 761,008 720,000 750,000 Cigarette Apportionment 89,441 87,106 82,000 87,000 State Revenue Sharing 494,990 535,431 512,000 540,000 State Conflagration Funds 2,980 8,548 - - District 19 School Resource 136,521 93,470 102,000 110,000 Mohawk Banner Program 660 - - - SUB in-Lieu-of-Tax 1,804,922 1,800,870 1,782,260 1,800,000 EWEB in-Lieu-of-Tax 526,482 546,226 520,000 600,000 Electric Co-Ops in-Lieu-of-Tax 10,423 10,983 10,000 16,400 McKenzie Village in-Lieu-of-Tax 28,509 - 15,000 - Willamalane Bicycle Patrol - 13,627 - 13,500
Total Intergovernmental 3,778,249$ 3,857,269$ 3,753,260$ 3,926,900$
GENERAL FUND REVENUE DETAIL - FY11 through FY14
FY14 Proposed Budget Attachment 31 Page 180 of 202

Revenue - All Sources, By Revenue Type and Account
FY11Actual
FY12Actual
FY13*Amended
FY14Preposed
Charges for ServiceInternal Facility Rental - 154,233 237,570 236,085 Internal Building Maintenance Chgs 303,449 281,855 302,418 288,746 Internal Contractual Services 40,000 - - - Internal Vehicle Maintenance Chgs 151,327 175,567 164,769 189,787 ROW Fee Sanitary Sewer - 194,752 208,000 205,920 ROW Fee Storm Drainage - 162,921 170,000 171,300 Police Services U of O 17,829 24,833 20,000 20,000 Special Events Services 6,046 5,739 - - Police Alarm Monitoring - - 10,000 10,000 HR Training Revenue 263 - - - Rainbow Fire Protection 1,073,206 1,084,970 1,105,402 1,137,474 Glenwood Fire Protection 155,683 153,133 165,164 168,467 Willakenzie Fire Protection 334,358 332,916 342,893 342,693 Grass/Weeds Cutting Chgs - 300 - - MVA First Response - 3,150 15,000 15,000 Fire License Facility Inspection - 4,330 10,000 7,000 Willamalane Collection Fee 19,792 17,142 21,000 15,000 Library Services Pass-Through - - 4,515 - Library Automation Fee 45,011 45,249 47,000 49,000 Internal Engineering Fee 726 1,473 - 30,000 Staff Reimbursement 139,006 201,326 78,717 226,098
Total Charges for Service 2,286,697$ 2,843,890$ 2,902,448$ 3,112,570$
Fines and ForfeituresMunicipal Court Revenues 1,567,131$ 1,531,896$ 1,710,000$ 1,725,000$ Library Fines 26,859 28,691 39,598 27,000 Restitution 1,879 4,792 400 - Federal Forfeitures 632 - - - Unclaimed/Forfeited Property 11,530 8,126 - -
Total Fines and Forfeitures 1,608,031$ 1,573,505$ 1,749,998$ 1,752,000$
Use of Money and PropertyInterest Income 136,084$ 37,782$ 130,000$ 65,000$ Variance in FMV of Investments (54,649) 42,202 - - Unsegregated Tax Interest (12,553) (14,182) - - County Assess Interest 6,023 7,284 10,000 7,500 County Assess Interest - - - 80,000 Property Sales 33,743 - - -
Total Use of Money and Property 108,648$ 73,085$ 140,000$ 152,500$
Miscellaneous ReceiptsClaims Recovery 3,520 - - - Cash Over/Short 2,647 788 - - Miscellaneous Receipts 71,866 262,076 82,077 40,000 PY Eng Rev 273 - - - Testing 5,225 1,560 - - Muni. Court Interest on Delinquencies 143,568 166,173 111,159 161,040
Total Miscellaneous Receipts 227,098$ 430,597$ 193,236$ 201,040$
GENERAL FUND REVENUE DETAIL - Continued
FY14 Proposed Budget Attachment 31 Page 181 of 202

Revenue - All Sources, By Revenue Type and Account
FY11Actual
FY12Actual
FY13*Amended
FY14Preposed
Indirect Charges Indirect Charges Fund 201 442,468$ 417,678$ 417,257$ 443,314$ Indirect Charges Fund 202 241,200 242,540 247,970 267,808 Indirect Charges Fund 204 13,400 2,680 - - Indirect Charges Fund 208 - - 15,070 - Indirect Charges Fund 210 3,000 - - - Indirect Charges Fund 224 146,864 136,011 113,573 81,920 Indirect Charges Fund 305 1,742 1,742 1,781 1,923 Indirect Charges Fund 419 9,246 9,246 9,179 9,913 Indirect Charges Fund 611 279,926 274,834 281,398 300,917 Indirect Charges Fund 612 209,040 211,720 322,103 306,318 Indirect Charges Fund 615 300,000 400,001 399,999 474,212 Indirect Charges Fund 617 445,173 425,986 432,783 456,030 Indirect Charges Fund 618 2,010 5,025 10,275 16,218 Indirect Charges Fund 719 61,908 61,238 48,361 51,902
Total Indirect Charges 2,155,977$ 2,188,701$ 2,299,749$ 2,410,475$
Interfund Transfers Transfer From Fund 204 - 40,000 123,847 20,000 Transfer From Fund 208 427,091 486,193 517,000 542,850 Transfer From Fund 224 54,100 27,050 - - Transfer From Fund 305 300,000 - - - Transfer From Fund 713 - 102,820 165,000 - Transfer From Fund 420 77,064 83,000 87,000 91,159 Transfer From Fund 618 35,736 35,736 - - Transfer From Fund 707 247,215 713,618 346,975 230,715
Total Interfund Transfers 1,141,206$ 1,488,417$ 1,239,822$ 884,724$
Beginning Cash Balance Beginning Cash Balance 7,808,672$ 7,551,136$ 7,754,752$ 8,143,851$
Total Beginning Cash Balance 7,808,672$ 7,551,136$ 7,754,752$ 8,143,851$ GRAND TOTAL 38,513,623$ 39,699,648$ 40,429,177$ 41,237,028$
* Amended as of Feb 4, 2013
GENERAL FUND REVENUE DETAIL - Continued
FY14 Proposed Budget Attachment 31 Page 182 of 202

FY14 - ASSESSED VALUATION, LEVY & TAX REVENUE INFORMATION
Rate Per
$1,000 Assessed Valuation Levy Net Tax
Revenue
General Fund FY13 Assessed Valuation $ 3,998,513,269 Plus: 2.0% Increase from Added Value 79,970,265
FY14 Assessed Valuation (estimated)
$ 4,078,483,534 Less: Urban Renewal Excess (estimated) (53,981,957)
Total Estimated Assessed Valuation net of Urban Renewal $ 4,024,501,577 City of Springfield Permanent Rate Levy $ 4.7403
Estimated Taxes Raised for FY14 (rate x AV/1000) $19,077,345Less Allowances for Discounts, Delinquencies*: (1,030,177)
Total Available General Fund Tax Revenue for Appropriation $18,047,168
Fire Local Option Levy Fund
City of Springfield Five-Year Tax Rate (FY12 - FY16) $ 0.3600 Estimated Taxes Raised for FY14 (rate x AV/1000) $ 1,468,254
Less Allowances for Discounts, Delinquencies*: (79,286) Total Available Tax Revenue for Appropriation $ 1,388,968
Police Local Option Levy Fund
City of Springfield Five-Year Tax Rate (FY14 - FY18) $ 1.2800 Estimated Taxes Raised for FY14 (rate x AV/1000) $ 5,220,459
Less Allowances for Discounts, Delinquencies*: (281,905)
Total Available Tax Revenue for Appropriation $4,938,554
Bond Sinking Fund
Levy Required for General Obligation Bonds $ 3,389,306
Estimated Tax Rate (Levy/AV) $0.8311 Less Allowances for Discounts, Delinquencies*: (183.023)
Total Available Bond Sinking Fund Tax Revenue for Appropriation $3,206,283 Est. Total Tax Rate and Tax Revenue Collection $7.2114
* Current allowance for Discounts and Delinquencies: 5.4%
FY14 Proposed Budget Attachment 31 Page 183 of 202

FY14 ASSESSED VALUATION Levy and Tax Revenue Information
The City has historically levied a local property tax each year to fund that portion of its operating budget not supported by other revenue sources. Since the General Fund is the general operating fund of the City, all property taxes collected for general governmental operating purposes are accounted for in the City’s General Fund. As with other jurisdictions throughout Oregon, the City of Springfield’s property tax is a primary source of revenue for City general operations. Current property taxes provide 55% of the funding for the City’s General Fund operating activities. General Operations include the following:
City Council and City Administration Legal services, Municipal Court and Judicial services Basic Police services Fire First Response, Suppression and Fire Marshal services Development and Land Use Planning services Building and Structure Maintenance services Finance, Information Technology, and Human Resource services
Two Local Option Levies to Provide Dedicated Funding for Fire and Police Enhanced Services In November, 2002, City of Springfield voters passed two public safety measures – one for Fire Services and one for Police and Court Services. In 2006, the Fire Services Levy was renewed for four years (FY08-FY11) and again in 2010 for five years (FY12-FY16). The Police Services Levy was renewed for five years (FY09-FY13) with added staff for the new Justice Center and again in 2012 for five years (FY14-FY18). For the Police Levy there was a one-year separation (FY08) between the expiration of the old levy and the beginning of the new levy. The taxation information on the two levies is provided in this section of the budget document. For more detail on specific funding, see the Fire & Life Safety, Police, and Legal/Judicial Services pages in this budget document. Overall, funding from the two levies provided the following:
Local Option Levies Amount FTE
Fire Services operating costs $ 1,558,593 9.0 FTEFire levy dedicated reserve 364,272
Fire Services Local Option Levy Funding $ 1,922,865
Public Safety Services operating costs $ 2,956,338 20.0 FTEPolice levy dedicated reserve 1,414,492 Transfer to Jail Operations Fund Legal and Judicial services operating costs
1,935,164 2.23 FTE
Police Services Local Option Levy Funding $ 6,305,994
Total Funding Provided by Levies $ 8,228,859 31.23 FTE
Detail by Type of Costs Funded: Departmental Operating costs $ 4,514,931 31.23 FTEInter-fund Transfers Dedicated Reserves
1,935,164 1,778,764
Total Funding Provided by Levies $ 8,228,859 31.23 FTE
FY14 Proposed Budget Attachment 31 Page 184 of 202

Property Tax History Effective July 1, 1997 Springfield began operating on a rate based system for its operating levies. From 1997 (FY98) through FY00 the rate essentially remained within the same values. In response to Measure 50, in FY99 the state assigned the City a new permanent rate of $4.7403
Overall City Levy Information: Historical and Current The following are the actual levies (all funds) by the City of Springfield over the past five years, the FY13 revised estimate, and the estimated levy for FY14.
Fiscal Year Actual FY08
Actual FY09
Actual FY10
Actual FY11
Actual FY12
EstimatedFY13
Projected FY14
Tax Base/Rate Levy* $ 15,233,858 $ 15,461,263 $ 16,472,084 $ 16,616,637 $ 17,301,094 $ 17,612,000 $ 18,047,168
Fire Local Option 1,293,389 1,316,104 1,395,770 1,408,752 1,319,613 1,359,000 1,313,964
Police Local Option N/A 3,586,384 3,805,284 3,838,848 3,995,493 4,110,000 4,671,872
Subtotal $ 16,527,247 $ 20,363,751 $ 21,673,138 $ 21,864,237 $ 22,616,200 $ 23,081,000 $ 24,033,004
Bonds 3,295,555 3,283,022 3,295,915 3,036,915 3,061,863 3,087,796 3,206,283
Total $ 19,822,802 $ 23,656,773 $ 24,969,053 $ 24,901,152 $ 25,678,063 $ 26,168,796 $ 27,209,287
Assessed Value** $3,436,084,339 $3,502,295,304 $3,726,631,985 $3,726,631,985 $3,883,712,564 $3,998,513,269 $4,078,483,534
Rate for Operations $ 5.1403 $ 6.2303 $ 6.2303 $ 6.2303 $ 6.2303 $ 6.1903 $ 6.3803
Bonds 1.0211 1.0005 .9465 .8645 .8372 0.8200 0.8311
Total Rate $ 6.1614 $ 7.2353 $ 7.1768 $ 7.0948 $ 7.0675 $ 7.0103 $ 7.2114
* tax rate levy is for general operations in the General Fund ** not adjusted to remove Urban Renewal
A Fire Local Option Levy and a Police Local Option Levy were passed by the voters in November, 2002 for an effective date of July 1, 2003 (FY04). In 2006, the Fire Services Levy was renewed for four years (FY08-FY11) and again in 2010 for five years (FY12-FY16). The Police Services Levy was renewed for five years (FY09-FY13) and again in 2012 for five years (FY14-FY18). There was a one-year break (FY08) between the expiration of the old levy and the beginning of the new levy. The Fire Levy is in effect for five years only—FY12 through FY016. The Police Levy is in effect for five years only (FY14-FY18). The levy funds are separated from all other taxes by separate reporting funds: Fire Local Option Levy Fund and Police Local Option Fund.
FY14 Proposed Budget Attachment 31 Page 185 of 202
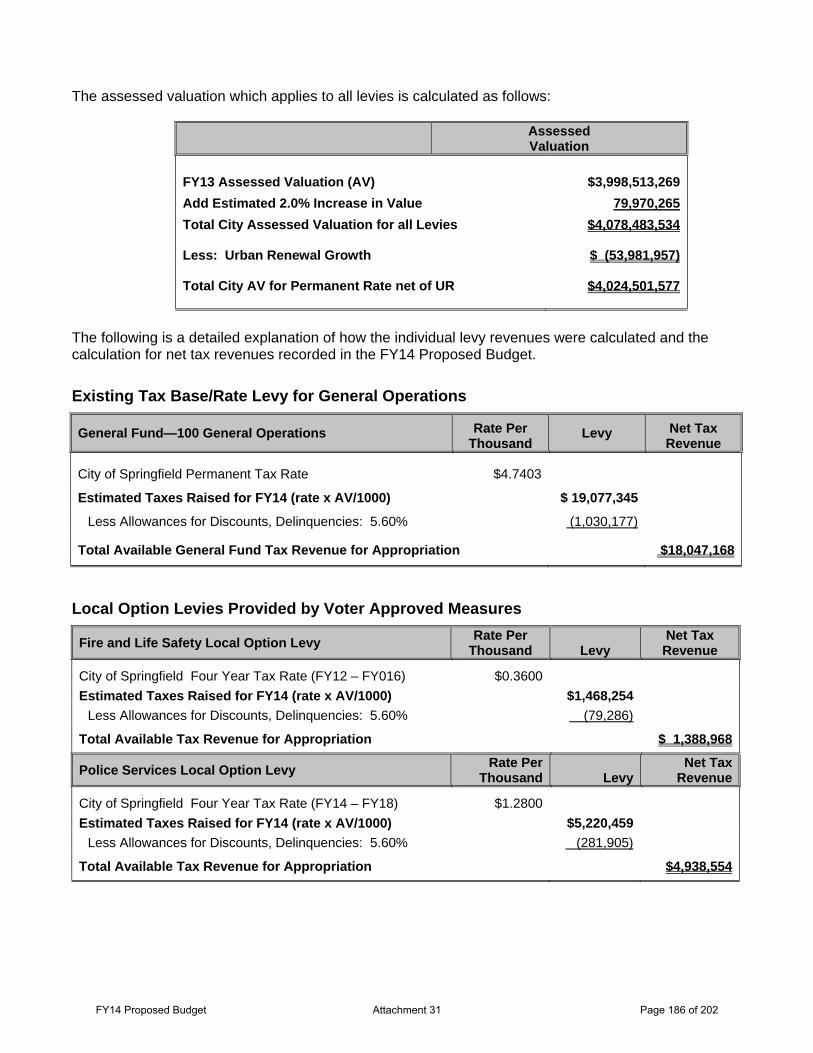
The assessed valuation which applies to all levies is calculated as follows:
Assessed Valuation
FY13 Assessed Valuation (AV) $3,998,513,269Add Estimated 2.0% Increase in Value 79,970,265Total City Assessed Valuation for all Levies $4,078,483,534 Less: Urban Renewal Growth $ (53,981,957) Total City AV for Permanent Rate net of UR $4,024,501,577
The following is a detailed explanation of how the individual levy revenues were calculated and the calculation for net tax revenues recorded in the FY14 Proposed Budget.
Existing Tax Base/Rate Levy for General Operations
General Fund—100 General Operations Rate Per Thousand
Levy Net Tax Revenue
City of Springfield Permanent Tax Rate $4.7403
Estimated Taxes Raised for FY14 (rate x AV/1000) $ 19,077,345
Less Allowances for Discounts, Delinquencies: 5.60% (1,030,177)
Total Available General Fund Tax Revenue for Appropriation $18,047,168
Local Option Levies Provided by Voter Approved Measures
Fire and Life Safety Local Option Levy Rate Per Thousand
Levy
Net Tax Revenue
City of Springfield Four Year Tax Rate (FY12 – FY016) $0.3600 Estimated Taxes Raised for FY14 (rate x AV/1000) $1,468,254
Less Allowances for Discounts, Delinquencies: 5.60% (79,286)
Total Available Tax Revenue for Appropriation $ 1,388,968
Police Services Local Option Levy Rate PerThousand
Levy
Net TaxRevenue
City of Springfield Four Year Tax Rate (FY14 – FY18) $1.2800 Estimated Taxes Raised for FY14 (rate x AV/1000) $5,220,459
Less Allowances for Discounts, Delinquencies: 5.60% (281,905)
Total Available Tax Revenue for Appropriation $4,938,554
FY14 Proposed Budget Attachment 31 Page 186 of 202

Bond Sinking Fund
Bond Sinking Fund Rate Tax Levy
Levy Required for General Obligation Bonds $ 3,389,306 Estimated Tax Rate (Levy/AV) $0.8311 Less Allowances for Discounts, Delinquencies: 5.60% (183,023)
Total Available Bond Sinking Fund Tax Revenue for Appropriation $ 3,206,283
Summation of Tax Revenues FY14
General Operations $18,047,168 Fire Services 1,331,964 Police Services 4,671,872 Total Tax Revenues for Operations $24,033,004 Bond Sinking Fund 3,206,283 Total Collections $27,209,287*
* Represents current tax rate for operations and does not include prior year discounts or delinquencies collected ($635,000) nor any other taxation revenue source (such as Fuel Taxes, Transient Room Tax or 911 taxes totaling $5,895,340). All General Fund tax sources total $18,522,168).
FY14 Tax Rates The City of Springfield’s revised property tax rate per thousand is $7.2114, consisting of the following funding sources. (See above for details on the Bond Sinking Fund rate.)
Tax Levy for Operations: General Fund $4.7403 Fire Local Option Levy Fund 0.3600 Police Local Option Levy Fund 1.2800 Rate for Operations $6.3803 Bond Sinking Fund (Est.) $0.8311
Total City Rate $7.2114
FY14 Proposed Budget Attachment 31 Page 187 of 202
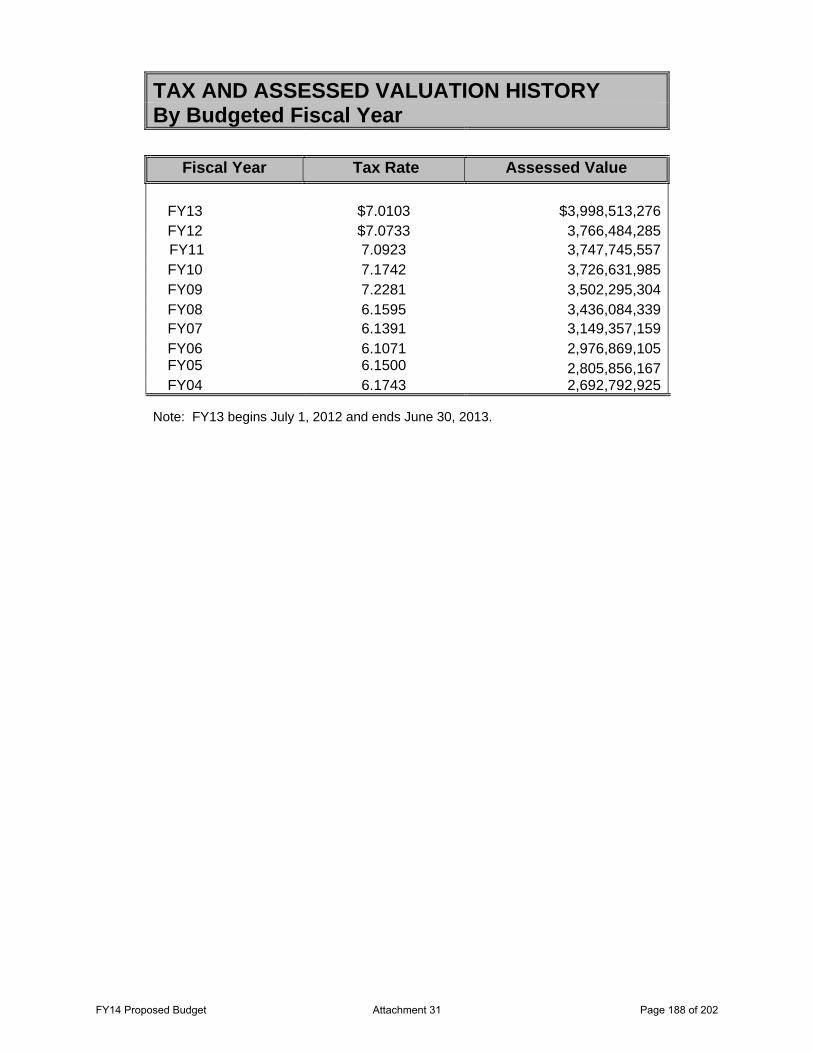
TAX AND ASSESSED VALUATION HISTORY By Budgeted Fiscal Year
Fiscal Year Tax Rate Assessed Value
FY13 $7.0103 $3,998,513,276FY12 $7.0733 3,766,484,285
FY11 7.0923 3,747,745,557 FY10 7.1742 3,726,631,985FY09 7.2281 3,502,295,304 FY08 6.1595 3,436,084,339 FY07 6.1391 3,149,357,159 FY06 6.1071 2,976,869,105 FY05 6.1500 2,805,856,167 FY04 6.1743 2,692,792,925
Note: FY13 begins July 1, 2012 and ends June 30, 2013.
FY14 Proposed Budget Attachment 31 Page 188 of 202

City Fund Types
The City of Springfield groups funds into two broad fund categories:
• Governmental Funds
• Proprietary Funds
Funds are further categorized into six generic fund types:
• General Fund • Special Revenue Funds • Debt Service Funds • Capital Project Funds • Enterprise Funds and • Internal Service Funds
Governmental Fund Category Governmental Funds are those through which most governmental functions of the City are financed and include the
• General Fund • Special Revenue Funds • Debt Service Funds and • Capital Project Funds
The financial measurement focus for governmental funds is on the determination of the change in spendable financial resources, rather than upon determination of net income.
• General Fund The General Fund serves as the primary reporting vehicle for current government operations. The General Fund, by definition, accounts for all current financial resources not required by law or administrative action to be accounted for in another fund.
General Fund Accounts for the general operations of the City including Library, Police, Fire, Public Works, Municipal Court, Planning, and the General Administrative business support activities.
• Special Revenue Funds Special revenue funds account for the proceeds of specific revenue sources (other than major capital projects) that are legally restricted to expenditure for specific purposes.
Building Code Fund Accounts for the cost of building permit and inspection services, through the dedicated revenues generated in providing these services. As a result of Senate Bill 587, revenues from building permit fees are required to be used only for the administration and enforcement of the State Building Code.
FY14 Proposed Budget Attachment 31 Page 189 of 202

Community Development Block Grant Fund (CDBG) Required by federal law to account for receipt and expenditure of Community Development Block Grant funds.
Fire Local Option Levy Fund Accounts for the receipt of the local option levy passed in November, 2002 and effective for FY04 through FY07 to provide funding for enhanced fire services as well as houses the expenditures made for the increased services.
Jail Operations Fund Established in FY08, the fund accounts for revenues and expenditures associated with the operations of the Springfield Jail.
Police Local Option Levy Fund Accounts for the receipt of the local option levy passed in November, 2002 and effective for FY04 through FY07 to provide funding for enhanced police services as well as houses the expenditures made for the increased services.
Riverbend Development Fund Established in FY03, this fund accounts for the revenues received and expenditures made on behalf of the long term project identified as the Riverbend Development Project.
Special Revenue Fund Accounts for receipt of transient room taxes dedicated to the University of Oregon Hayward Field renovation, receipt of telephone tax dedicated to the 911 program and grant activities.
Street Fund Required by state law for receipt and expenditure of state shared gas tax. One percent of gas tax is required to be spent on bicycle facilities.
Transient Room Tax Fund Accounts for the receipt of transient room taxes, hotel and motel, and for expenditures that will enhance tourism.
• Debt Service Funds Debt service funds account for the accumulation of resources for, and the payment of, general long–term debt principal and interest.
Bancroft Redemption Fund Accounts for assessment bond debt service payments; supported by property owners’ principal and interest payments assessed in the past.
Bond Sinking Fund Accounts for payments on City debt including general obligation bonds supported by property taxes. Regional Wastewater Debt Service Fund Established in FY08, this fund accounts for revenue bond payments supported by regional wastewater (MWMC) revenues.
FY14 Proposed Budget Attachment 31 Page 190 of 202
• Capital Project Funds Capital project funds account for financial resources to be used for the acquisition or construction of major capital facilities (other than those financed by proprietary funds)
Development Assessment Fund Accounts for the cost of local public improvements (supported by assessments to benefiting properties) to construct streets, storm sewers, sidewalks, street lighting, sewers and other public improvement projects.
Development Projects Fund Accounts for the cost to construct streets, facilities and other public improvements; supported by system development charges, grants, contracts, and capital reserves. Projects funded by assessments are excluded from this fund and are accounted for in separate funds.
Drainage Capital Project Fund Accounts for storm sewer (drainage) capital improvement costs supported by drainage system connection fees and by storm sewer user fees through transfers from the Drainage Operating Fund.
G. O. Bond Capital Projects Fund Accounts for the cost of capital projects and improvements financed by general obligation (G.O.) bonds.
Police Building Bond Capital Project Fund To account for costs to construct a new municipal building to house the Police Department, Municipal Court, City Prosecutor and a city jail. Financing will be provided by issuance of debt.
Regional Wastewater Revenue Bond Capital Projects Fund Established in FY08, this fund accounts for regional wastewater (MWMC) capital projects funded by MWMC revenue bond receipts.
Regional Wastewater Capital Fund Accounts for regional sewer capital improvement costs supported by sewer user fees, through transfers from the Regional Wastewater Operation Fund, and proceeds of debt issuance. SDC Local Storm Improvement Fund Established in July, 2005 (FY06), this fund accounts for capacity-increasing public storm drainage improvements supported by system development charges. Financing is provided by charges paid by developers for new construction, as allowed by law.
SDC Local Wastewater Improvement Fund Established in July, 2005 (FY06), this fund accounts for local capacity-increasing public sanitary sewer improvements supported by system development charges. Financing is provided by charges paid by developers for new construction, as allowed by law.
FY14 Proposed Budget Attachment 31 Page 191 of 202

SDC Local Wastewater Reimbursement Fund Established in July, 2005 (FY06), this fund accounts for public sanitary sewer improvements supported by reimbursement system development charges. Financing is provided by charges paid by developers for new construction, as allowed by law.
SDC Regional Wastewater Improvement Fund Established in July, 2005 (FY06), this fund accounts for regional (MWMC) capacity-increasing public sanitary sewer improvements supported by system development charges. Financing is provided by charges paid by developers for new construction, as allowed by law.
SDC Regional Wastewater Reimbursement Fund Established in July, 2005 (FY06), this fund accounts for regional (MWMC) public sanitary sewer improvements supported by reimbursement system development charges. Financing is provided by charges paid by developers for new construction, as allowed by law.
SDC Transportation Improvement Fund Established in July, 2005 (FY06), this fund accounts for local capacity-increasing public transportation improvements supported by system development charges. Financing is provided by charges paid by developers for new construction, as allowed by law.
SDC Transportation Reimbursement Fund Established in July, 2005 (FY06), this fund accounts for public transportation improvements supported by reimbursement system development charges. Financing is provided by charges paid by developers for new construction, as allowed by law.
Sewer Capital Projects Fund Accounts for sewer capital improvement costs supported by sewer connection fees and by sewer user fees through transfers from the Sewer Operating Fund.
Street Capital Fund Established as of July, 2002 (FY03), this fund accounts for transportation capital improvement costs. Costs are supported by transfers from the Street Operating Fund.
Proprietary Fund Category Proprietary Funds are used to account for the City’s ongoing activities which are similar to those often found in the private sector and include
• Enterprise Funds and • Internal Service Funds
The focus of financial measurement for proprietary funds is on the determination of net income, financial position and changes in financial position.
FY14 Proposed Budget Attachment 31 Page 192 of 202

• Enterprise Funds Enterprise funds account for operations that are financed and operated in a manner similar to private business enterprises – where the intent of the governing body is that the costs of providing goods or services to the general public on a continuing basis be financed or recovered primarily through user changes. An enterprise program is managed much like a business in that it is self-supporting in nature.
Ambulance Fund (formerly Emergency Medical Service Fund) Accounts for the cost of emergency medical services, ambulance and medic supported by user fees and subscription memberships in the FireMed Program.
Booth-Kelly Fund Accounts for the cost of the improvements and operating expenses of the Booth-Kelly Center; program supported through grants and revenue generated by the leasing of commercial space to local industry.
Drainage Operating Fund Accounts for operations and maintenance costs of the local public storm drainage system supported by local storm drainage fees.
Regional Fiber Consortium Fund Accounts for the financial affairs of the Regional Fiber Consortium. The Regional Fiber Consortium is an intergovernmental entity which manages the operation costs of the Fiber Consortium; supported by membership dues and franchise fees.
Regional Wastewater Fund Accounts for the financial affairs of the Metropolitan Wastewater Management Commission (MWMC). The MWMC is an intergovernmental entity which manages the construction, operations and maintenance costs of the regional sewer system; supported by grants and regional sewer user fees.
Sewer Operations Fund Accounts for operations and maintenance costs of local sanitary and storm sewer systems supported by local sewer user fees.
• Internal Service Funds Internal service funds account for the financing of goods and services provided by one department to another department on a cost-reimbursement basis.
Insurance Fund An internal service fund that accounts for risk management, property/casualty insurance premium, damage claim and employee benefit costs; supported by service charges to departmental operating budgets.
Vehicle and Equipment Fund A sinking fund for the future replacement of vehicles and major equipment; supported by charges to departmental operating budgets.
SDC Administration Fund Established in July, 2005 (FY06), this fund accounts for activities supporting setting methodologies for, calculation, planning and accounting for System Development Charges. Financing is provided by administrative fees charged on SDCs and administrative fees charged to SDC Capital Projects funds.
FY14 Proposed Budget Attachment 31 Page 193 of 202

DESCRIPTION OF FUNDS
A fund is a separate budgeting and accounting entity with balancing appropriations and estimated revenues. All of the City's funds are briefly described below:
Ambulance Fund (615): Accounts for the cost of emergency medical services, ambulance and medic supported by user fees and subscription memberships in the FireMed Program.
Bancroft Redemption Fund (305): Accounts for assessment bond debt service payments; supported by property owners’ principal and interest payments assessed in the past.
Bond Sinking Fund (306): Accounts for payments on City debt including general obligation bonds supported by property taxes.
Booth-Kelly Fund (618): Accounts for the cost of the improvements and operating expenses of the Booth-Kelly Center; program supported through grants and revenue generated by the leasing of commercial space to local industry.
Building Code Fund (224): Accounts for the cost of building permit and inspection services, through the dedicated revenues generated in providing these services. As a result of Senate Bill 587, revenues from building permit fees are required to be used only for the administration and enforcement of the State Building Code.
Community Development Block Grant Fund (CDBG) (210): Required by federal law to account for receipt and expenditure of Community Development Block Grant funds.
Development Assessment Fund (419): Accounts for the cost of local public improvements (supported by assessments to benefiting properties) to construct streets, storm sewers, sidewalks, street lighting, sewers and other public improvement projects.
Development Projects Fund (420): The fund is used to account for costs of constructing and improving city-owned buildings and for infrastructure projects with shared funding. Financing is provided by pre-1991 system development charges, grants, contracts, intergovernmental revenues and other non-recurring revenues.
Drainage Capital Projects Fund (425): Accounts for storm sewer (drainage) capital improvement costs supported by stormsewer connection fees and by storm sewer user fees through transfers from the Drainage Operating Fund.
FY14 Proposed Budget Attachment 31 Page 194 of 202
Drainage Operating Fund (617): Accounts for operations and maintenance costs of local stormsewer (drainage) systems supported by stormsewer user fees.
Fire and Life Safety Local Option Levy Fund (235): Accounts for the receipt of the local option levy passed in November, 2002 and effective for FY04 through FY07 to provide funding for enhanced fire services as well as houses the expenditures made for the increased services.
General Fund (100): Accounts for the general operations of the City including Library, Police, Fire, Public Works, Municipal Court, Planning, Building and General Administrative business support activities.
G.O. Bond Capital Projects Fund (427): Accounts for the cost of capital projects and improvements financed by general obligation (G.O.) bonds. A $12.7 million general obligation bond measure was passed by the voters on November 7, 1995.
Insurance Fund (707): An internal service fund that accounts for risk management, property/casualty insurance premium, damage claim and employee benefit costs; supported by service charges to departmental operating budgets.
Jail Operations Fund (202): Established in FY08, this fund accounts for revenues and expenditures associated with the operations of the Springfield Jail.
Police Building Bond Capital Project Fund (428): The fund is used to account for costs of constructing a Justice Center. Financing consists of bond proceeds.
Police Local Option Levy Fund (236): Accounts for the receipt of the local option levy passed in November, 2002 and effective for FY04 through FY07 to provide funding for enhanced police services as well as houses the expenditures made for the increased services.
Regional Fiber Consortium Fund (629): Accounts for the financial affairs of the Regional Fiber Consortium. The Regional Fiber Consortium is an intergovernmental entity which manages the operation costs of the Fiber Consortium; supported by membership dues and franchise fees.
Regional Wastewater Fund (612): Accounts for the financial affairs of the Metropolitan Wastewater Management Commission (MWMC). The MWMC is an intergovernmental entity which manages the construction, operations and maintenance costs of the regional sanitary sewer system; supported by grants and regional sanitary sewer user fees.
FY14 Proposed Budget Attachment 31 Page 195 of 202

Regional Wastewater Capital Fund (433): Accounts for regional sanitary sewer capital improvement costs supported by sewer user fees, other user fees, reimbursement system development charges (SDCs) and County Service District contributions through transfers from the Regional Wastewater Operation Fund.
Regional Wastewater Debt Service Fund (312): Established in FY08, the fund accounts for revenue bond payments supported by regional wastewater (MWMC) revenues.
Regional Wastewater Revenue Bond Capital Projects Fund (412):
Established in FY08, this fund accounts for regional wastewater (MWMC) capital projects funded by MWMC revenue bond receipts.
SDC Administration Fund (719): An internal service fund that accounts for activities supporting setting methodologies for, calculating, planning, and accounting for System Development Charges. Financing is provided by administrative fees charged on SDCs and administrative fees charged to SDC Capital Projects funds.
SDC Local Storm Improvement Fund (440): Established in July, 2005 (FY06), this fund accounts for capacity-increasing public storm drainage improvements supported by system development charges. Financing is provided by charges paid by developers for new construction, as allowed by law.
SDC Storm Drainage Reimbursement Fund (441): Established in July, 2009 (FY10), this fund accounts for public storm drainage improvements supported by reimbursement system development charges. Financing is provided by charges paid by developers for new construction, as allowed by law.
SDC Local Wastewater Reimbursement Fund (442): Established in July, 2005 (FY06), this fund accounts for public sanitary sewer improvements supported by reimbursement system development charges. Financing is provided by charges paid by developers for new construction, as allowed by law.
SDC Local Wastewater Improvement Fund (443): Established in July, 2005 (FY06), this fund accounts for local capacity-increasing public sanitary sewer improvements supported by system development charges. Financing is provided by charges paid by developers for new construction, as allowed by law.
SDC Regional Wastewater Reimbursement Fund (444): Established in July, 2005 (FY06), this fund accounts for regional (MWMC) public sanitary sewer improvements supported by reimbursement system development charges. Financing is provided by charges paid by developers for new construction, as allowed by law.
SDC Regional Wastewater Improvement Fund (445): Established in July, 2005 (FY06), this fund accounts for regional (MWMC) capacity-increasing public sanitary sewer improvements supported by system development charges. Financing is provided by charges paid by developers for new construction, as allowed by law.
FY14 Proposed Budget Attachment 31 Page 196 of 202

SDC Transportation Reimbursement Fund (446): Established in July, 2005 (FY06), this fund accounts for public transportation improvements supported by reimbursement system development charges. Financing is provided by charges paid by developers for new construction, as allowed by law.
SDC Transportation Improvement Fund (447): Established in July, 2005 (FY06), this fund accounts for local capacity-increasing public transportation improvements supported by system development charges. Financing is provided by charges paid by developers for new construction, as allowed by law.
Sewer Capital Projects Fund (409): Accounts for sanitary sewer capital improvement costs supported by sanitary sewer connection fees and by sanitary sewer user fees through transfers from the Sewer Operations Fund.
Sewer Operations Fund (611): Accounts for operations and maintenance costs of local sanitary sewer systems supported by local sewer user fees.
Special Revenue Fund (204): Accounts for receipt of transient room taxes dedicated to the University of Oregon Hayward Field renovation, receipt of telephone tax dedicated to the 911 program and Development Services Department's grants.
Street Fund (201): Required by state law for receipt and expenditure of state shared gas tax. One percent of gas tax is required to be spent on bicycle facilities. Street Capital Fund (434): Accounts for transportation capital improvement costs. Costs are supported by transfers from the Street Operating Fund.
Transient Room Tax Fund (208): Accounts for the receipt of transient room taxes, hotel and motel, and for expenditures that will enhance tourism.
Vehicle and Equipment Fund (713): A sinking fund for the future replacement of vehicles and major equipment; supported by charges to departmental operating budgets.
FY14 Proposed Budget Attachment 31 Page 197 of 202

DESCRIPTIONS OF BUDGET TERMS
Ad Valorem Tax • A tax based on the assessed value of a property. Adopted Budget • Financial plan which forms the basis and limits for appropriations and is adopted by the City
Council. Appropriation • Legal authorization granted by the City Council for spending a specific amount of money for
a specific purpose during a specific period of time. Assessed Valuation (AV) • The value set on taxable property as a basis for levying property taxes. Assessment • Any fee, charge or assessment that does not exceed the actual cost incurred by a unit of
government for design, construction, and financing of local improvements such as street paving, sidewalks, and sewers.
Assets • Resources having a monetary value and that are owned or held by an entity. Beginning Cash Balance • Includes unexpended resources from the previous years. A portion of these resources will
appear in the Reserve balances of City funds. Reserves are dedicated and non- dedicated. The non dedicated reserves portion is the amount available to fund City operations. For the General Fund and in some of the Special Revenue funds, reserves must fund operations until the first receipt of taxes, which may be as late as six months into the fiscal year.
Bond or Bond Issue • A certificate of debt guaranteeing payment of the original investment plus interest on specific
dates. Budget Committee • Fiscal planning board of the City consisting of City Council members plus an equal number
of lay members appointed by the Council. Budget Document • A written report showing a government’s comprehensive financial plan for a specified period,
usually one year, which includes both the capital and operating budgets. Budget Message • Written explanation of the budget and the City's financial priorities for the next fiscal year;
prepared by the City Manager
FY14 Proposed Budget Attachment 31 Page 198 of 202

Budget Officer • Person appointed by the City Council to assemble the budget; for the City of Springfield the
City Manager serves in this role. Budget Review Team • Team consisting of the City Manager, Assistant City Manager, Finance Director and the
Budget Manager. Capital Budget • The City's budget for projects, major repairs, and improvements or additions to the City's
fixed assets (streets, sidewalks, traffic signals, sewers, drainage and buildings.) Capital Improvement • A term defined in ORS 310.410(10) to include land, structures, facilities, machinery,
equipment, or furnishings having a useful life longer than one year. Capital Improvement Program (CIP) • A major budgeting and planning tool through which needed capital projects are identified,
evaluated, priced and discussed with the general public and the Budget Committee. Capital Outlay • City policy requires the use of capital outlay for capital items with a cost of $5,000 or more.
It also allows, but does not require, the use of capital outlay for capital items which cost less than $5,000.
Capital Projects • Major repairs, improvements or additions to the City's fixed assets, including rental property.
(Streets, sidewalks, traffic signals, sewers, drainage and buildings, etc.) Cash Basis • A basis of accounting under which transactions are recognized only when cash changes
hands. Cash Carryover • Cash that is remaining after subtracting prior year’s actual expenditures from prior year’s
total resources. Cash carryover is classified as revenue. Referred to as Beginning Cash Balance.
Charges for Service • Includes a wide variety of fees charged for services provided to the public and other
agencies. Comprehensive Annual Financial Report (CAFR) • The annual audited results of the City’s financial position and activity. Contingency • A special appropriation set aside for unforeseen and unplanned expenses. Contingencies
may not be spent without approval by resolution of the City Council.
FY14 Proposed Budget Attachment 31 Page 199 of 202

Debt Service • The payment of general long-term debt, consisting of principal and interest. Electors • A qualified voter who has the right to vote for the adoption of any measure.
Encumbrance • A contractual commitment for which the payment is contingent upon the future delivery of
specified goods or services. Encumbrance Cash Balance • A cash carryover which is used as a resource to provide funds for prior year items which are
re-budgeted in the new fiscal year. Ending Working Capital • Funds which allow the City to meet current cash flow requirements, shortfalls in revenue, or
unexpected demands until tax revenue are available. Enterprise Funds • Funds that are usually self-supporting and are operated and financed in a manner that is
similar to private business enterprises. Enterprise funds are usually financed through some type of user charges.
Executive Team • The team consisting of the department executive directors, the Assistant City Manager and
the City Manager. Fines and Forfeitures Revenue • Includes fines charged for traffic citations, library fines and fines for City Code violations. Fiscal Year • Twelve month period from July 1 to June 30 of the following year. Fixed Assets • Assets with a long-term character such as land, buildings, streets and major equipment. Full time Equivalent (FTE) • A full-time position is one that is 40 hours per week for the entire fiscal year and is
designated as 1.0 FTE. Fund • A budgetary and accounting entity with balancing revenues and appropriations. Fund Balance • The difference between a fund’s resources and its requirements. In budget years, the
resources must equal requirements. In actual years, the difference between resources and requirements is the fund balance’s Ending Working Capital.
FY14 Proposed Budget Attachment 31 Page 200 of 202

Generally Accepted Accounting Procedures (GAAP) • Standards established by the American Institute of Certified Public Accountants for the
conduct and reporting of financial audits. General Government Tax Rate • A category of tax rate defined by State of Oregon Ballot Measure 5. It includes revenues
raised to fund general government operations, such as cities, counties and special districts. The total rate of tax for all entities on this category is limited to $10 per $1,000 of real market value.
General Obligation Bonds • Form of debt that is backed by the taxing power of the City of Springfield. General
obligation bonds are issued to provide the capital needed to build structures and improvements that will be used by the entire community.
Governing Body • City Council, board of trustees, board of directors, or other governing board of a local
government. HOME • A grant supported program with the purpose of developing viable urban communities by
providing decent, safe and affordable housing for persons of low income. Impact Fees • Fees charged to developers to cover, in whole or in part, the anticipated cost of
improvements that will be necessary as a result of the development (e.g., parks or sidewalks). See also System Development Charges.
Infrastructure • Public domain fixed assets such as roads, bridges, streets and sidewalks and similar assets
that are immovable and of value only to the government unit. Indirect Charges • Administrative costs that are incurred in the General Fund to support the operations of other
funds. These charges are shown as a reimbursement revenue to the General Fund and an expense in all other funds.
Interfund Transfers • Appropriation category used in the City's budget resolution which includes amounts
distributed from one fund to pay for services provided by another fund. Transfers from the other funds appear as non departmental expenditures called “Interfund Transfers”.
Intergovernmental Revenue • Includes grants from federal, state and local governments as well as state cigarette and
liquor taxes. Issue Papers • Summary of departments requests for funding of services that are in addition to those
services that have historically been funded through the base budget.
FY14 Proposed Budget Attachment 31 Page 201 of 202
Levy • Gross amount of property taxes imposed on taxable property. The net amount received by
a government will be less than the gross levy as a result of delinquent or uncollectable payments or early payment discounts. Budgets are developed on the basis of the projected amount of property taxes receivable.
Licenses and Permits Revenue • Includes revenues collected per City ordinance and state law including the collection of fees
and franchises. Line Item Budget • The traditional form of budget, where proposed appropriations are based on individual
objects of expense within a department or division. Long Range Financial Projections • A multi-year financial projection of revenues and expenditures for the General Fund that is
an integral part of the City of Springfield’s strategic planning and budget process. These projections enable the Council, Budget Committee and the City staff to evaluate the impact of service level changes, as well as to anticipate the effects of revenue and expenditure trends.
Limited Tax General Obligation Bond • A bond that is secured by the pledge of a government’s taxing authority that is limited as to
the rate or amount. Local Budget Law • Oregon Revised Statutes (ORS) dictates local budgeting practices. ORS Chapter 294
contains Local Budget Law provisions. Local Option Levy • Under Measure 50, local governments and special districts were given the ability to ask
voters for temporary authority to increase taxes through approval of a local option levy. The maximum length of time for a local option levy is 10 years, depending on the purpose of the levy. A local option levy must be approved by a majority of voters at a general election occurring in an even-numbered year, or at any election with at least a 50 % voter turnout.
Materials and Services • An object classification which includes contractual and other services, consumable materials
and supplies, and other operating costs. Measure 5 • On November 6, 1990, voters of Oregon passed Measure 5, a property tax limitation. Under
M5, the combined property tax rate was split into a portion for schools and one for general governments (cities, counties, special districts). The combined rate limit for schools is $5 per $1,000 of real market value and the rate for general governments is $10 per $1,000 of real market value. These rates are not comparable to the tax rates under Measure 50 because those tax rates are applied to a lower assessed value. See Assessed Valuation.
FY14 Proposed Budget Attachment 31 Page 202 of 202

Measure 50 • On May 20, 1997, the voters of Oregon passed Measure 50, which fundamentally changed
the Oregon property tax system. Under M50, each jurisdiction was assigned a permanent tax rate limit. In addition the assessed value of each property was reduced in Fiscal Year 1998 and future increases in assessed value were capped. See Assessed Valuation and Permanent Tax Rate.
Millage • An increment of taxation measured in units of one-tenth of one cent or 0.001 of one dollar.
Millage is the rate used in calculating taxes based upon the value of property, expressed in mills per dollar of assessed value.
Miscellaneous Receipts • Includes the total revenue from assessments. Miscellaneous Revenue • Includes a variety of miscellaneous revenues received by the City, the most significant being
Special Assessments. In the budget document, miscellaneous revenues are more detailed in the “Combined Statement of Revenues, Expenditures and Changes in Fund Balance Statement”. (See Financial Summaries and Statistics section of this document.)
Modified Accrual • Basis of accounting in which expenditures, other than accrued interest on general long-term
debt, are recorded at the time liabilities are incurred and revenues are recorded when received, except for material and/or available revenues that should be accrued to reflect taxes levied or revenue earned.
Non-Department Budget • The part of the budget summarizing expenditures or reductions to reserve accounts that are
not associated with, nor under the authority of, a department budget, including interfund transfers, reserves, contingency, unappropriated fund balance , debt service payments, miscellaneous fiscal transactions, and statutory payments. See Non Department Expenditure.
Non-Department Expenditure • Non department identified expenditures of a fund that are not associated with, nor under the
authority of, a department budget, including debt service, interfund transfers, contingency, reserves, balance available and unappropriated fund balance.
Non-Operating Budget • Part of the budget composed of the Insurance Fund and fiscal transactions (interfund
transfers, reserves, contingency, unappropriated fund balance, insurance premiums and debt service payments.)
Objective • The course of action to obtain a stated goal.
FY14 Proposed Budget Attachment 31 Page 203 of 202

Operating Budget • The day to day departmental and program operating costs of the City. Includes
expenditures for personal services, materials and services and capital outlay only. Overlapping Tax Rate • The tax rate paid to several governments, such as a city, county and school district. Permanent Tax Rate • Under Measure 50, each school district, local government and special district was assigned
a permanent tax rate limit in FY98. This permanent tax rate applies to property taxes for operations. The City of Springfield’s permanent tax rate is $4.7403 per $1,000 of assessed value.
Personal Services • Object classification for costs of employees, including salary, overtime, taxes and benefits. Property Tax • A tax assessed equally against the assessed value of all taxable property within a
government’s boundaries. The first receipt of property taxes usually occurs in November or December of each year.
Proposed Budget • A financial and operating program prepared by the City Manager and submitted to the public
and the Budget Committee for review. Real Market Value • The real market value of a property was defined under Measure 50 to be the amount of cash
that could reasonably be expected to be paid by an informed buyer to an informed seller, each acting without compulsion in an arm’s length transaction occurring as of the assessment date for the tax year.
Reserves • An accumulation of funds for a specific future purpose. Reserves may only be spent by
resolution of the City Council. Resolution • A special or temporary order of a legislative body requiring City Council action. Revenue • Funds received by the City from either tax or non-tax sources. Special Assessment • Charges imposed against property in a particular locality because that property receives a
special benefit by virtue of some public improvement, separate and apart from the general benefit accruing to the public at large. Special assessments must be apportioned according to the value of the benefit received, rather than the cost of improvement and may not exceed the value of such benefit.
FY14 Proposed Budget Attachment 31 Page 204 of 202

Special Assessment Bond • A bond issue payable from the payments on special assessments imposed against
properties that have been specially benefited by the construction of public improvements, such as sidewalks or sewer systems.
Supplemental Budget • Appropriations established to meet needs not anticipated at the time the budget was
originally adopted. A supplemental budget may not increase the tax levy. System Development Charge (SDC) • Designed to finance the construction, extension, or enlargement of a park, street, storm
sewer or sewerage or disposal system. SDC’s are imposed by a governmental unit as a condition to issuance of any occupancy permit or imposed by a governmental unit at such other time as, by ordinance, it may determine.
Tax • Compulsory charges levied by a government for the purpose of raising revenue. Taxes are
used to pay for services or improvements provided for the general public benefit. Tax Levy • The total amount of property taxes needed to pay for General Fund operations and for
principal and interest on bonds. Tax Rate • The amount of tax stated in terms of a unit of the tax base, for example $6.00 per $1,000 of
assessed value of taxable property. Tax Revenue • Includes property taxes, local fuel taxes, 911 taxes, and hotel and motel room taxes. Tax Roll • The official list showing the amount of taxes levied against each property. The Lane County
Department of Assessment and Taxation compiles and maintains the tax roll for the City of Springfield.
Unappropriated Balance • An amount set aside as cash working capital for the next year's budget. Funds designated
as unappropriated may not be spent within the current year. Use of Money and Property Revenue • Includes a variety of revenues including interest on the City’s investments and assessments. User Fees • Charges or fees established to recover part or all of the costs incurred in the provision of
services by a government; based on the philosophy that the recipient of the benefit should pay for the services. Also called charges for service.
FY14 Proposed Budget Attachment 31 Page 205 of 202
BUDGET ACRONYMS AND ABBREVIATIONS
ACWA Association of Clean Water Agencies
ADA Americans with Disabilities Act
ADMIN Administration
AIRS Area Information Records System
A/R Accounts Receivable
AV Assessed Value
BAN Bond Anticipation Note
BLM Bureau of Land Management
BPA Bonneville Power Administration
CAFR
Comprehensive Annual Financial Report
CDAC Community Development Advisory Committee
CDBG Community Development Block Grant
CDC Community Development Corporation
CIP Capital Improvement Program
CMO City Manager's Office
CPI Consumer Price Index
DARE Drug Abuse Resistance Education
DLCD Department of Land Conservation and Development
DP Data Processing
DPW Development & Public Works Department
DUII Driving Under the Influence of Intoxicants
ED Economic Development
EEO Equal Employment Opportunity
FY14 Proposed Budget Attachment 31 Page 206 of 202

EMS Emergency Medical Services
EMT Emergency Medical Technician
EPA Environmental Protection Agency
EWEB Eugene Water and Electric Board
FIREMED Ambulance Membership Program
FLS Fire and Life Safety
FMLA Family and Medical Leave Act
FRS Federal Revenue Sharing
FTE Full-Time Equivalent Employee
FY Fiscal Year
GAAP
Generally Accepted Accounting Principals
GFOA Government Finance Officers Association
GRAC Glenwood Redevelopment Advisory Committee
HAZ-MAT Hazardous Materials
HOME Home Investment Partnership Program
HR Human Resources Department
HUD Housing and Urban Development
ICMA International City Managers Association
I/I Inflow and Infiltration
IT Information Technology Department
JR / YA Junior / Young Adult
LAN Local Area Network
LCC Lane Community College
LCDC Land Conservation and Development Commission
FY14 Proposed Budget Attachment 31 Page 207 of 202

LCJ Lane County Jail
LCOG Lane Council of Governments
LOC League of Oregon Cities
LRAPA Lane Regional Air Pollution AuthorityM5
Measure 5 – Tax Limitation Measure
M50
Measure 50 – Tax Limitation Measure
MGMT Management
M&S Materials and Services
MWMC Metropolitan Wastewater Management Commission
NLC National League of Cities
OCLC On-line Computer Library Center
ODOT Oregon Department of Transportation
O&M Operations and Maintenance
ORS Oregon Revised Statutes
OSPWF Oregon Special Public Works Fund
OTIA Oregon Transportation Improvement Act
PS Personal Services
P / T Part-time position
SCUSA Springfield Comprehensive Urbanization Study and Annexation
SDC System Development Charges
SEDA Springfield Economic Development Agency
SHOP
Springfield Home Ownership Program
SHPO State Historic Preservation Office
SOPP Standard Operating Procedure Policy
FY14 Proposed Budget Attachment 31 Page 208 of 202

SRF State Revolving Fund
SUB Springfield Utility Board
TCV True Cash Value
TDD Telecommunications Device for the Deaf
UB or UEFB Unappropriated Balance / Unappropriated Ending Fund Balance
FY14 Proposed Budget Attachment 31 Page 209 of 202

FY14 Proposed Budget Attachment 31 Page 210 of 202

City
of S
prin
gfie
ldTo
tal O
pera
ting
Expe
nditu
res
Dec
reas
e bu
dget
>5%
5%A
ll Fu
nds
0%In
crea
se b
udge
t >5%
-5%
-25%
City
Man
ager
's O
ffice
Acc
ount
FY1
1 A
ctua
l F
Y12
Act
ual
FY1
3 Es
t Act
ual
FY1
3 A
men
ded
Bud
get
Pro
pose
d FY
14
Bud
get
% C
hang
e O
ver A
men
d
FY11
-FY1
3 A
vg %
C
hang
e A
ctua
l
Sal
arie
s59
6,31
9
522,
355
637,
051
63
7,05
1
66
4,00
1
-4%
-13%
Ove
rtim
e20
8
-
-
-
-
100%
100%
Frin
ge B
enef
its53
,942
47
,730
52
,661
52,6
61
54,4
59
-3%
-6%
Med
ical
/Den
tal I
nsur
ance
149,
074
12
7,43
4
14
4,28
8
144,
288
147,
684
-2
%-5
%P
ER
S/O
PS
RP
77,2
48
87,1
79
104,
855
10
4,85
5
13
6,72
9
-30%
-52%
Car
Allo
wan
ce7,
264
6,36
5
7,
248
7,24
8
7,
248
0%-4
%C
ell P
hone
Allo
wan
ce1,
986
1,78
9
1,
980
1,98
0
3,
276
-65%
-71%
Pers
onne
l Ser
vice
s88
6,04
1
792,
850
948,
083
948,
083
1,01
3,39
7
-7%
-16%
Con
tract
ual S
ervi
ces
21,7
88
13,9
31
16,4
17
16
,657
16
,417
1%
6%E
mer
genc
y M
anag
emen
t Pro
gram
3,45
9
2,
514
2,00
0
2,
000
2,00
0
0%
25%
Tele
phon
e, C
ellu
lar,P
ager
4,35
7
1,
558
4,20
8
4,
208
1,91
6
54
%43
%C
ompu
ter E
quip
men
t7,
837
4,63
1
1,
500
1,50
0
3,
900
-160
%16
%A
dver
tisin
g1,
038
550
1,
338
1,33
8
1,
338
0%-3
7%D
uplic
atin
g S
uppl
ies
6,74
9
24
5
2,11
4
2,
114
2,11
4
0%
30%
Trav
el &
Mee
ting
Exp
ense
s19
,921
16
,521
13
,571
14,1
78
13,5
71
4%19
%M
anda
ted
Doc
umen
t/Mee
ting
Exp
3
-
-
-
-
10
0%10
0%C
ounc
il R
eim
burs
emen
t4,
866
10,6
58
10,9
22
10
,922
13
,422
-2
3%-5
2%G
over
nmen
t eth
ics
Com
m c
harg
es26
9
260
67
6
676
67
6
0%-6
8%U
tiliti
es3,
870
4,02
2
5,
053
5,05
3
5,
466
-8%
-27%
Mem
bers
hips
, Boo
ks, S
ubsc
rips
5,54
0
4,
335
3,29
2
3,
292
3,29
2
0%
25%
Pos
tage
& S
hipp
ing
Cha
rges
543
51
6
1,22
2
1,
222
1,22
2
0%
-61%
Offi
ce S
uppl
ies
1,85
9
2,
908
2,34
4
2,
344
2,34
4
0%
1%P
rogr
am E
xpen
se1,
344
2,68
9
10
,400
14,5
80
10,4
00
29%
-116
%M
etro
Par
tner
ship
Inc
50,0
00
50,0
00
50,0
00
50
,000
-
10
0%10
0%Le
ague
Of O
rego
n C
ities
37,2
71
37,5
03
38,1
17
38
,117
38
,117
0%
-1%
Inte
rgvt
Hum
an S
rvcs
148,
394
15
0,39
5
12
8,39
4
156,
894
128,
394
18
%10
%M
etro
Pla
nnin
g/M
pc10
,000
-
-
-
-
10
0%10
0%L-
CO
G27
,300
31
,554
23
,417
23,4
17
23,4
17
0%15
%C
ham
ber O
f Com
mer
ce35
,000
35
,000
35
,000
35,0
00
35,0
00
0%0%
His
t Dis
t Sig
nage
-
-
750
75
0
750
0%
-200
%R
oom
Tax
Col
lect
5,26
4
5,
324
6,00
0
6,
000
6,00
0
0%
-9%
Air
Pol
lutio
n-LR
AP
A56
,760
-
21
,224
21,2
24
-
100%
100%
Team
Spr
ingf
ield
17,9
82
10,7
69
20,0
00
20
,000
20
,000
0%
-23%
Spr
ingf
ield
Mus
eum
55,0
00
45,0
00
45,0
00
45
,000
45
,000
0%
7%O
lym
pic
Tria
ls-
50
,000
50
,000
50,0
00
50,0
00
0%-5
0%
Operating Expenditures by Department Attachment 4 Page 1 of 24

City
Man
ager
's O
ffice
Acc
ount
FY1
1 A
ctua
l F
Y12
Act
ual
FY1
3 Es
t Act
ual
FY1
3 A
men
ded
Bud
get
Pro
pose
d FY
14
Bud
get
% C
hang
e O
ver A
men
d
FY11
-FY1
3 A
vg %
C
hang
e A
ctua
l
Em
eral
d E
mpi
re A
rt A
ssoc
iatio
n19
,897
-
-
-
-
10
0%10
0%FI
MB
A E
vent
2,91
9
-
-
-
-
10
0%10
0%S
usta
inab
le C
ities
-
121,
090
39,0
00
39
,000
-
10
0%10
0%M
ohaw
k O
pen
Ban
ners
-
-
-
-
730
-1
00%
-100
%C
omm
unity
Rel
atio
ns P
rgrm
Exp
-
-
-
-
15,0
00
-100
%-1
00%
Equ
ipm
ent M
aint
enan
ce40
4
341
2,
389
2,38
9
2,
389
0%-1
29%
Em
ploy
ee D
evel
opm
ent
1,60
5
2,
204
2,26
0
2,
260
2,26
0
0%
-12%
Mat
eria
l & S
ervi
ce55
1,23
8
604,
518
536,
608
570,
135
445,
135
22%
21%
Inte
rnal
Insu
ranc
e C
hgs
829
88
2
4,74
7
4,
747
4,74
7
0%
-121
%In
t Com
pute
r Equ
ip C
hgs
445
1,
032
1,03
2
1,
032
1,03
2
0%
-23%
Inte
rnal
Bld
g M
aint
Chg
s-
1,
903
1,16
4
1,
164
1,27
3
-9
%-2
5%In
tern
al V
eh &
Equ
ip R
ent
720
75
6
756
75
6
756
0%
-2%
Indi
rect
Cos
ts-
-
8,
220
8,22
0
-
10
0%10
0%In
tern
al E
mpl
oyee
Ben
efit
Chg
5,65
6
4,
948
5,29
9
5,
299
5,50
9
-4
%-4
%In
tern
al M
S E
nter
pris
e A
gree
men
t86
2
1,27
4
1,
022
1,02
2
1,
022
0%3%
Int B
ldng
Pre
serv
atio
n C
hrgs
5,38
4
4,
130
4,13
0
4,
130
4,21
4
-2
%7%
Inte
rnal
Cha
rges
13,8
96
14,9
25
26
,370
26
,370
18
,553
30%
-1%
Tota
l All
Fund
s1,
451,
174
$
1,41
2,29
4$
1,51
1,06
1$
1,
544,
588
$
1,47
7,08
5$
4%-1
%-
-
-
-
-
Operating Expenditures by Department Attachment 4 Page 2 of 24
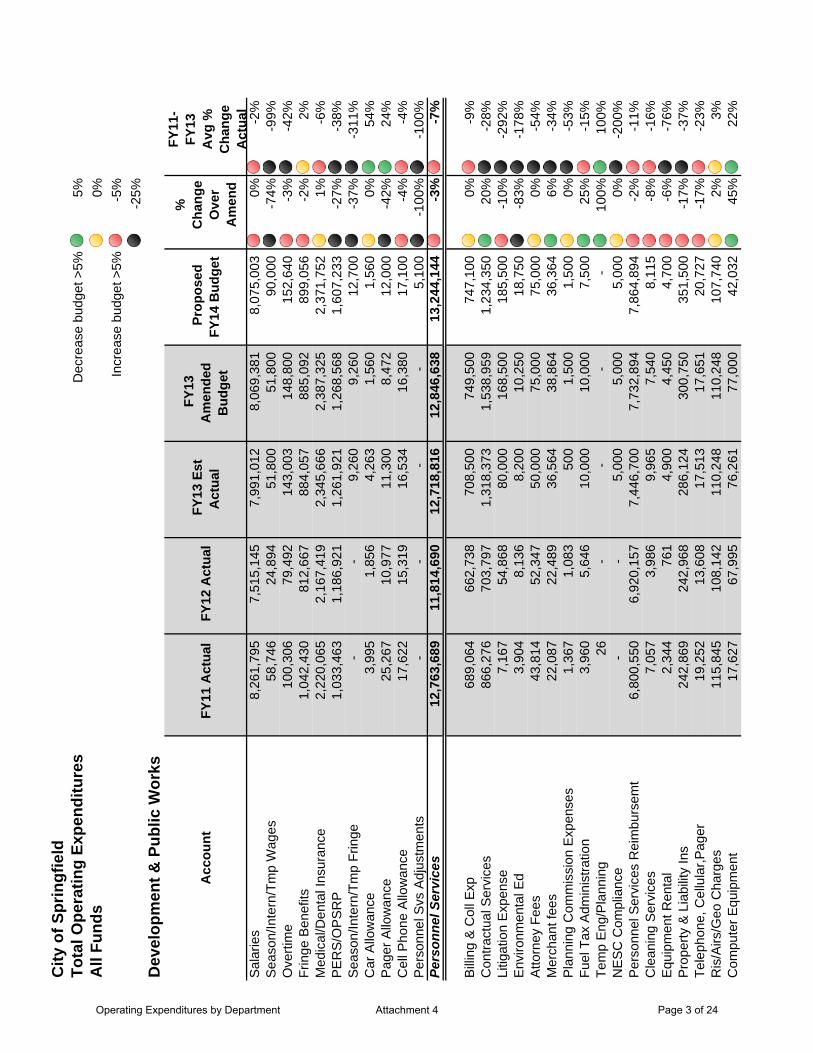
City
of S
prin
gfie
ldTo
tal O
pera
ting
Expe
nditu
res
Dec
reas
e bu
dget
>5%
5%A
ll Fu
nds
0%In
crea
se b
udge
t >5%
-5%
-25%
Dev
elop
men
t & P
ublic
Wor
ks
Acc
ount
FY1
1 A
ctua
l F
Y12
Act
ual
FY1
3 Es
t A
ctua
l
FY1
3 A
men
ded
Bud
get
Pro
pose
d FY
14 B
udge
t
%
Cha
nge
Ove
r A
men
d
FY11
-FY
13
Avg
%
Cha
nge
Act
ual
Sal
arie
s8,
261,
795
7,
515,
145
7,
991,
012
8,
069,
381
8,
075,
003
0%
-2%
Sea
son/
Inte
rn/T
mp
Wag
es58
,746
24
,894
51,8
00
51
,800
90,0
00
-7
4%-9
9%O
verti
me
100,
306
79,4
92
14
3,00
3
14
8,80
0
15
2,64
0
-3
%-4
2%Fr
inge
Ben
efits
1,04
2,43
0
812,
667
884,
057
885,
092
899,
056
-2%
2%M
edic
al/D
enta
l Ins
uran
ce2,
220,
065
2,
167,
419
2,
345,
666
2,
387,
325
2,
371,
752
1%
-6%
PE
RS
/OP
SR
P1,
033,
463
1,
186,
921
1,
261,
921
1,
268,
568
1,
607,
233
-2
7%-3
8%S
easo
n/In
tern
/Tm
p Fr
inge
-
-
9,
260
9,
260
12
,700
-37%
-311
%C
ar A
llow
ance
3,99
5
1,
856
4,
263
1,
560
1,
560
0%
54%
Pag
er A
llow
ance
25,2
67
10,9
77
11
,300
8,47
2
12,0
00
-4
2%24
%C
ell P
hone
Allo
wan
ce17
,622
15
,319
16,5
34
16
,380
17,1
00
-4
%-4
%P
erso
nnel
Svs
Adj
ustm
ents
-
-
-
-
5,
100
-1
00%
-100
%Pe
rson
nel S
ervi
ces
12,7
63,6
89
11
,814
,690
12
,718
,816
12
,846
,638
13,2
44,1
44
-3%
-7%
Bill
ing
& C
oll E
xp68
9,06
4
66
2,73
8
70
8,50
0
74
9,50
0
74
7,10
0
0%
-9%
Con
tract
ual S
ervi
ces
866,
276
703,
797
1,31
8,37
3
1,53
8,95
9
1,23
4,35
0
20%
-28%
Litig
atio
n E
xpen
se7,
167
54,8
68
80
,000
168,
500
185,
500
-10%
-292
%E
nviro
nmen
tal E
d3,
904
8,13
6
8,20
0
10,2
50
18
,750
-83%
-178
%A
ttorn
ey F
ees
43,8
14
52,3
47
50
,000
75,0
00
75
,000
0%-5
4%M
erch
ant f
ees
22,0
87
22,4
89
36
,564
38,8
64
36
,364
6%-3
4%P
lann
ing
Com
mis
sion
Exp
ense
s1,
367
1,08
3
500
1,50
0
1,50
0
0%-5
3%Fu
el T
ax A
dmin
istra
tion
3,96
0
5,
646
10
,000
10,0
00
7,
500
25
%-1
5%Te
mp
Eng
/Pla
nnin
g26
-
-
-
-
10
0%10
0%N
ES
C C
ompl
ianc
e-
-
5,00
0
5,00
0
5,00
0
0%-2
00%
Per
sonn
el S
ervi
ces
Rei
mbu
rsem
t6,
800,
550
6,
920,
157
7,
446,
700
7,
732,
894
7,
864,
894
-2
%-1
1%C
lean
ing
Ser
vice
s7,
057
3,98
6
9,96
5
7,54
0
8,11
5
-8%
-16%
Equ
ipm
ent R
enta
l2,
344
761
4,90
0
4,45
0
4,70
0
-6%
-76%
Pro
perty
& L
iabi
lity
Ins
242,
869
242,
968
286,
124
300,
750
351,
500
-17%
-37%
Tele
phon
e, C
ellu
lar,P
ager
19,2
52
13,6
08
17
,513
17,6
51
20
,727
-17%
-23%
Ris
/Airs
/Geo
Cha
rges
115,
845
108,
142
110,
248
110,
248
107,
740
2%3%
Com
pute
r Equ
ipm
ent
17,6
27
67,9
95
76
,261
77,0
00
42
,032
45%
22%
Operating Expenditures by Department Attachment 4 Page 3 of 24

Dev
elop
men
t & P
ublic
Wor
ks
Acc
ount
FY1
1 A
ctua
l F
Y12
Act
ual
FY1
3 Es
t A
ctua
l
FY1
3 A
men
ded
Bud
get
Pro
pose
d FY
14 B
udge
t
%
Cha
nge
Ove
r A
men
d
FY11
-FY
13
Avg
%
Cha
nge
Act
ual
Adv
ertis
ing
5,79
8
5,
978
12
,325
17,7
75
18
,075
-2%
-125
%D
uplic
atin
g S
uppl
ies
11,7
82
13,8
30
14
,237
18,3
64
16
,025
13%
-21%
Prin
ting
6,63
7
2,
718
7,
546
15
,150
9,20
0
39%
-63%
Adv
ertis
ing
-
-
20
0
20
0
-
100%
100%
Trav
el &
Mee
ting
Exp
ense
s35
,170
25
,110
46,0
72
59
,460
56,7
24
5%
-60%
Inte
rnal
Mee
ting
2,79
5
1,
999
3,
646
3,
761
3,
661
3%
-30%
Cou
ncil
Rei
mbu
rsem
ent
-
-
-
-
-
100%
100%
Sof
twar
e Li
cens
e Fe
e37
,100
71
,592
147,
791
147,
981
170,
201
-15%
-99%
Rec
ordi
ng F
ees
189
55
82
5
82
5
82
5
0%
-132
%P
rope
rty T
axes
61,9
45
60,6
70
79
,301
80,0
00
77
,900
3%-1
6%N
PD
ES
Per
mits
99,8
62
101,
723
102,
850
129,
600
128,
000
1%-2
6%G
over
nmen
t eth
ics
Com
m c
harg
es52
5
767
1,33
3
1,39
0
1,40
0
-1%
-60%
RO
W F
ee-
35
7,67
3
37
4,50
0
37
8,00
0
38
0,22
0
-1
%-5
6%E
ng/S
urve
y S
uppl
ies
83
1,18
1
5,05
0
5,05
0
5,15
0
-2%
-145
%C
ode
Enf
orce
Sup
ply
633
56
1
80
0
80
0
-
100%
100%
Pre
treat
men
t Sup
plie
s1,
607
2,76
2
3,10
0
4,00
0
4,00
0
0%-6
1%S
afet
y C
loth
ing/
Eq
10,4
28
11,8
85
12
,589
12,3
89
12
,589
-2%
-8%
Cle
anin
g S
uppl
ies
-
-
20
0
20
0
20
0
0%
-200
%G
asol
ine
& O
il13
0,84
6
14
3,44
0
16
3,60
1
16
3,97
5
17
3,72
2
-6
%-1
9%U
tiliti
es16
6,40
3
87
,218
87,6
51
98
,586
63,7
85
35
%44
%E
lect
ricity
-
-
-
-
10
0
-1
00%
-100
%N
atur
al G
as-
-
-
-
-
10
0%10
0%S
treet
Lig
htin
g E
lect
ricity
152,
441
156,
151
150,
500
150,
500
155,
000
-3%
-1%
Traf
fic S
igna
l Ele
ctric
ity31
,553
28
,897
35,0
00
55
,200
35,0
00
37
%-1
0%S
UB
Wat
er-
25
,196
24,3
93
23
,344
35,6
93
-5
3%-1
16%
SU
B S
ewer
& D
rain
age
-
6,48
3
5,32
0
4,78
0
10,5
90
-1
22%
-169
%S
UB
Ele
ctric
ity-
71
,668
52,7
44
46
,819
89,7
79
-9
2%-1
16%
Mem
bers
hips
, Boo
ks, S
ubsc
rips
23,5
23
26,8
61
29
,859
36,1
79
38
,149
-5%
-43%
Dire
ct M
ail
-
14
-
-
-
10
0%10
0%P
osta
ge &
Shi
ppin
g C
harg
es11
,545
9,
637
10
,082
18,0
40
16
,340
9%-5
7%O
ffice
Sup
plie
s9,
899
12,8
90
20
,578
25,8
60
22
,588
13%
-56%
Com
pute
r Sup
plie
s1,
699
91
200
200
200
0%70
%C
ompu
ter S
oftw
are
63,9
02
44,6
51
92
,990
104,
631
93,5
71
11
%-3
9%S
mal
l Fur
nitu
re &
app
lianc
es1,
276
833
3,77
5
4,27
5
3,87
5
9%-9
8%S
torm
wat
er S
ampl
ing
Sup
plie
s3,
301
2,13
9
3,00
0
5,00
0
4,50
0
10%
-60%
Operating Expenditures by Department Attachment 4 Page 4 of 24

Dev
elop
men
t & P
ublic
Wor
ks
Acc
ount
FY1
1 A
ctua
l F
Y12
Act
ual
FY1
3 Es
t A
ctua
l
FY1
3 A
men
ded
Bud
get
Pro
pose
d FY
14 B
udge
t
%
Cha
nge
Ove
r A
men
d
FY11
-FY
13
Avg
%
Cha
nge
Act
ual
Clo
thin
g A
llow
ance
17,7
40
15,0
21
25
,485
25,4
85
25
,400
0%-3
1%C
omm
uter
Trip
Red
uctio
n1,
188
1,97
7
3,07
0
3,05
0
3,84
0
-26%
-85%
Par
ts &
Mat
eria
ls7,
752
6,75
6
10,0
00
10
,000
10,0
00
0%
-22%
Stre
et M
aint
Mat
eria
ls32
,956
38
,236
70,0
00
70
,000
70,0
00
0%
-49%
Sw
eepe
r Sup
plie
s5,
122
7,07
5
13,5
00
15
,250
14,5
00
5%
-69%
Dra
inag
e M
aint
Mat
eria
ls48
,508
44
,447
52,0
00
55
,735
55,8
35
0%
-16%
Sew
er M
aint
Mat
eria
ls20
,746
23
,722
33,0
00
38
,000
38,0
00
0%
-47%
Cle
ang/
Mai
nt M
ater
ials
18,6
81
18,6
26
17
,000
17,0
00
17
,000
0%6%
Pro
gram
Exp
ense
55,7
15
40,9
84
10
0,83
2
12
7,68
5
13
3,37
6
-4
%-1
03%
Traf
f Mai
nt M
ater
ials
103,
841
110,
540
118,
479
119,
000
121,
000
-2%
-9%
Land
Mai
nt M
ater
ials
14,7
50
17,2
53
21
,000
21,0
00
21
,000
0%-1
9%S
treet
Tre
e R
epla
cem
ent
1,97
6
2,
467
12
,000
12,0
00
12
,000
0%-1
19%
GIS
Pro
gram
Exp
ense
-
273
1,50
0
1,50
0
1,50
0
0%-1
54%
Per
mit
Pro
ject
Exp
684
-
34,3
67
35
,000
35,0
00
0%
-200
%C
itize
n S
urve
y-
-
-
-
-
10
0%10
0%1s
t Tim
e H
omeb
uyer
s33
3,86
0
10
1,98
4
10
0,00
0
10
0,00
0
-
100%
100%
Inte
rgvt
Hum
an S
rvcs
-
-
-
-
45
,252
-100
%-1
00%
LCO
G/C
able
Reg
319
-
1,00
0
3,50
0
3,50
0
0%-6
96%
Eug
ene
Ope
ratio
ns2,
909,
605
3,
030,
191
3,
151,
400
3,
541,
133
3,
661,
309
-3
%-2
1%E
ugen
e In
dire
ct C
osts
984,
201
801,
147
829,
300
1,18
7,90
2
1,13
7,50
0
4%-3
1%B
icyc
le P
rogr
am S
uppl
ies
935
2,
013
80
0
2,
000
2,
000
0%
-60%
Eug
ene
Cap
ital O
utla
y(1
,911
)
2,60
3
47,8
00
47
,828
52,3
28
-9
%-2
24%
Em
erge
ncy
Ren
tal A
ssis
tanc
e5,
058
314
-
-
-
10
0%10
0%S
prin
g C
lean
Up
-
1,00
0
500
500
1,00
0
-100
%-1
00%
Cat
holic
Com
mun
ity S
ervi
ces
30,3
29
30,3
31
15
,317
15,3
17
-
100%
100%
Food
for L
ane
Cou
nty
36,0
81
18,4
99
18
,501
18,5
01
-
100%
100%
Rel
ief N
urse
ry14
,247
14
,247
14,2
47
14
,247
-
10
0%10
0%S
t. V
ince
nt d
e P
aul
10,8
02
11,7
84
11
,784
11,7
84
-
100%
100%
Whi
te B
ird8,
029
8,02
9
8,02
9
8,02
9
-
10
0%10
0%S
DC
Prio
r Yea
r Ref
unds
-
25,7
53
7
53
,554
8
100%
100%
SD
C C
redi
ts P
aid
13,5
57
14,2
18
7
8
8
0%
100%
EE
EE
CB
G -
City
of S
prin
gfie
ld18
2,46
6
2,
098
-
-
-
100%
100%
EE
CB
G -
Will
amal
ane
135,
371
-
-
-
-
100%
100%
EE
CB
G -
SS
D#1
918
8,64
5
-
-
-
-
10
0%10
0%M
illra
ce S
pons
orsh
ip-
-
-
20
0,00
0
-
100%
100%
Operating Expenditures by Department Attachment 4 Page 5 of 24

Dev
elop
men
t & P
ublic
Wor
ks
Acc
ount
FY1
1 A
ctua
l F
Y12
Act
ual
FY1
3 Es
t A
ctua
l
FY1
3 A
men
ded
Bud
get
Pro
pose
d FY
14 B
udge
t
%
Cha
nge
Ove
r A
men
d
FY11
-FY
13
Avg
%
Cha
nge
Act
ual
Ced
ar C
reek
Spo
nsor
ship
-
-
-
250,
000
-
10
0%10
0%S
usta
inab
le C
ities
-
50,6
35
4,
450
4,
490
-
100%
100%
CH
OR
E1,
575
250
985
985
-
10
0%10
0%B
reth
ren
Hou
sing
HU
D 8
1116
4,56
8
-
-
-
-
10
0%10
0%H
abita
t for
Hum
anity
44,5
33
35,0
72
69
,905
69,9
05
-
100%
100%
NE
DC
O A
cqui
stio
n-
-
50,0
00
50
,000
-
10
0%10
0%La
ne M
icro
Bus
ines
s18
,177
13
,721
6,27
7
6,27
7
-
10
0%10
0%Lo
ckou
t Crim
e P
roje
ct1,
284
18,8
76
21
,556
21,5
56
-
100%
100%
Bra
ttain
Pla
ygro
und
9,25
0
-
-
-
-
10
0%10
0%R
elie
f Nur
sery
Fac
ility
27,2
24
19,3
77
41
,399
41,3
99
-
100%
100%
Nei
ghbo
rhoo
d Im
prov
emen
ts-
-
-
-
442,
816
-100
%-1
00%
CD
BG
-R S
pec
Sch
ool P
roj
61,2
27
-
-
-
-
100%
100%
Alv
ord
Tayl
or-
11
,337
-
-
-
10
0%10
0%M
ains
tream
Hou
sing
13,2
13
-
-
-
-
100%
100%
Full
Acc
ess
Ele
vato
r44
,211
23
,716
-
-
-
10
0%10
0%S
ectio
n 10
8 R
epay
men
t Xfr
14,1
79
16,3
57
34
,443
34,4
43
29
,658
14%
-37%
Vol
unte
ers
in M
edic
ine
60,0
00
-
-
-
-
100%
100%
Bus
ines
s D
evel
opm
ent L
oans
4,27
7
2,
120
5,
603
5,
603
-
100%
100%
Mt.
Ver
non
Pla
ygro
und
35,3
70
-
30
,000
30,0
00
-
100%
100%
NE
DC
O F
ood
Hub
-
153,
577
58,0
00
58
,000
-
10
0%10
0%E
mer
ald
Art
Cen
ter
-
38,9
13
-
-
-
100%
100%
Alv
ord
Tayl
or G
roup
Hom
e-
9,
658
29
,000
29,0
00
-
100%
100%
NE
DC
O F
orec
losu
re R
ecov
ery
-
-
18
3,12
8
18
3,12
8
-
100%
100%
HA
CS
A R
iver
Poi
nt P
lace
-
-
96
,500
96,5
00
-
100%
100%
AR
C o
f Lan
e C
ount
y-
-
12,0
00
12
,000
-
10
0%10
0%N
ED
CO
HA
TCH
-
-
23
,033
23,0
33
-
100%
100%
BR
ING
Rec
yclin
g-
-
57,0
00
57
,000
-
10
0%10
0%C
ity F
ount
ain
Pla
za-
-
30,0
00
30
,000
-
10
0%10
0%N
ED
CO
Fac
ade
Impr
ovem
ent
-
-
25
,000
25,0
00
-
100%
100%
Stre
et L
ight
Mai
nt94
,021
93
,900
100,
000
100,
000
100,
000
0%-4
%E
quip
men
t Mai
nten
ance
85,9
77
43,9
97
78
,489
78,4
39
66
,169
16%
5%B
ldg
Mai
nten
ance
56,3
82
41,9
51
46
,253
40,9
14
43
,914
-7%
9%B
k-E
lect
rical
Mai
nt-
30
0
-
-
-
100%
100%
Veh
icle
Mai
nten
ance
2,08
2
44
,173
45,0
03
45
,003
45,0
75
0%
-48%
Sig
nal D
etec
tor R
epai
r16
,009
35
,581
45,0
00
47
,500
47,5
00
0%
-48%
Operating Expenditures by Department Attachment 4 Page 6 of 24

Dev
elop
men
t & P
ublic
Wor
ks
Acc
ount
FY1
1 A
ctua
l F
Y12
Act
ual
FY1
3 Es
t A
ctua
l
FY1
3 A
men
ded
Bud
get
Pro
pose
d FY
14 B
udge
t
%
Cha
nge
Ove
r A
men
d
FY11
-FY
13
Avg
%
Cha
nge
Act
ual
Sid
ewal
k R
epai
r10
,180
17
,845
17,5
00
17
,500
17,5
00
0%
-15%
Gua
rd R
ail R
epai
r-
1,
221
2,
500
2,
500
2,
500
0%
-102
%W
ire T
heft
Rem
edia
tion
36,1
93
7,65
6
20,0
00
40
,000
40,0
00
0%
-88%
Trai
ning
Aid
s30
8
-
20
0
20
0
80
0
-3
00%
-373
%E
mpl
oyee
Dev
elop
men
t54
,755
39
,036
78,0
09
94
,663
92,3
27
2%
-61%
Org
aniz
atio
n D
evel
opm
ent
1,55
7
63
1
96
0
1,
100
1,
450
-3
2%-3
8%Tu
ition
Rei
mbu
rsem
ent
1,94
0
-
-
-
-
10
0%10
0%M
isc
Ben
efit
Exp
ense
-
3,09
3
-
-
-
10
0%10
0%R
ecru
itmen
t Exp
ense
-
-
90
0
90
0
75
0
17
%-1
50%
Reh
ab L
oans
5,18
7
5,
594
50
,000
50,0
00
-
100%
100%
Pro
ject
Inve
stm
ents
-
-
12
1,80
9
12
1,80
9
-
100%
100%
Hom
e R
evol
ving
Loa
n-
91
,552
427,
792
427,
792
-
10
0%10
0%M
ater
ial &
Ser
vice
15,7
59,0
83
15
,355
,121
18
,184
,525
20
,312
,087
18,7
29,6
49
8%-1
4%
Inte
rnal
Insu
ranc
e C
hgs
245,
648
193,
735
264,
042
264,
224
264,
225
0%-1
3%In
tern
al V
eh M
t Chg
s14
8,29
9
17
0,63
3
15
9,82
6
15
9,82
6
18
4,39
5
-1
5%-1
6%In
tern
al F
ac R
ent
-
129,
756
202,
669
202,
950
201,
465
1%-8
2%In
t Com
pute
r Equ
ip C
hgs
38,9
08
38,0
40
53
,832
53,8
32
84
,144
-56%
-93%
Inte
rnal
Bld
g M
aint
Chg
s24
8,61
3
21
8,33
8
21
3,61
2
21
3,89
5
19
8,86
9
7%
12%
Inte
rnal
Veh
& E
quip
Ren
t45
5,58
0
43
7,40
0
49
2,84
0
49
2,84
0
45
9,61
2
7%
1%In
dire
ct C
osts
1,59
7,75
9
1,52
9,14
2
1,61
0,96
0
1,61
1,50
8
1,64
0,06
9
-2%
-4%
Inte
rnal
Em
ploy
ee B
enef
it C
hg10
3,91
1
99
,918
107,
881
107,
983
103,
097
5%1%
Inte
rnal
Adm
in F
ee44
5,00
0
42
0,00
0
42
0,00
3
42
0,00
3
47
5,00
1
-1
3%-1
1%In
tern
al M
S E
nter
pris
e A
gree
men
t36
,455
25
,020
20,2
75
20
,275
19,1
24
6%
30%
Int B
ldng
Pre
serv
atio
n C
hrgs
100,
313
81,1
08
96
,224
96,3
01
91
,911
5%1%
Inte
rnal
Cha
rges
3,42
0,48
7
3,34
3,09
1
3,
642,
164
3,64
3,63
7
3,72
1,91
2
-2
%-7
%
Bac
khoe
705
80-
85
,662
-
-
-
10
0%10
0%V
ehic
les
-
22,3
51
35
8,39
8
42
9,78
6
29
2,16
8
32
%-1
30%
Stre
et M
aint
enan
ce E
quip
men
t-
23
,267
11,8
00
11
,800
-
10
0%10
0%S
ewer
Mai
nten
ance
Equ
ipm
ent
-
27,5
83
8,
000
24
,500
19,0
00
22
%-6
0%S
urfa
ce M
aint
enan
ce E
quip
men
t-
4,
212
-
-
-
100%
100%
Traf
fic M
aint
. Equ
ipm
ent
-
-
8,
120
12
,000
-
10
0%10
0%E
quip
men
t Rep
lace
men
t25
8,99
8
62
4,17
8
27
7,50
0
29
5,00
2
54
2,18
1
-8
4%-4
0%M
ajor
Reh
ab72
,961
42
5,34
7
39
8,00
0
48
1,54
0
49
7,35
1
-3
%-6
6%
Operating Expenditures by Department Attachment 4 Page 7 of 24
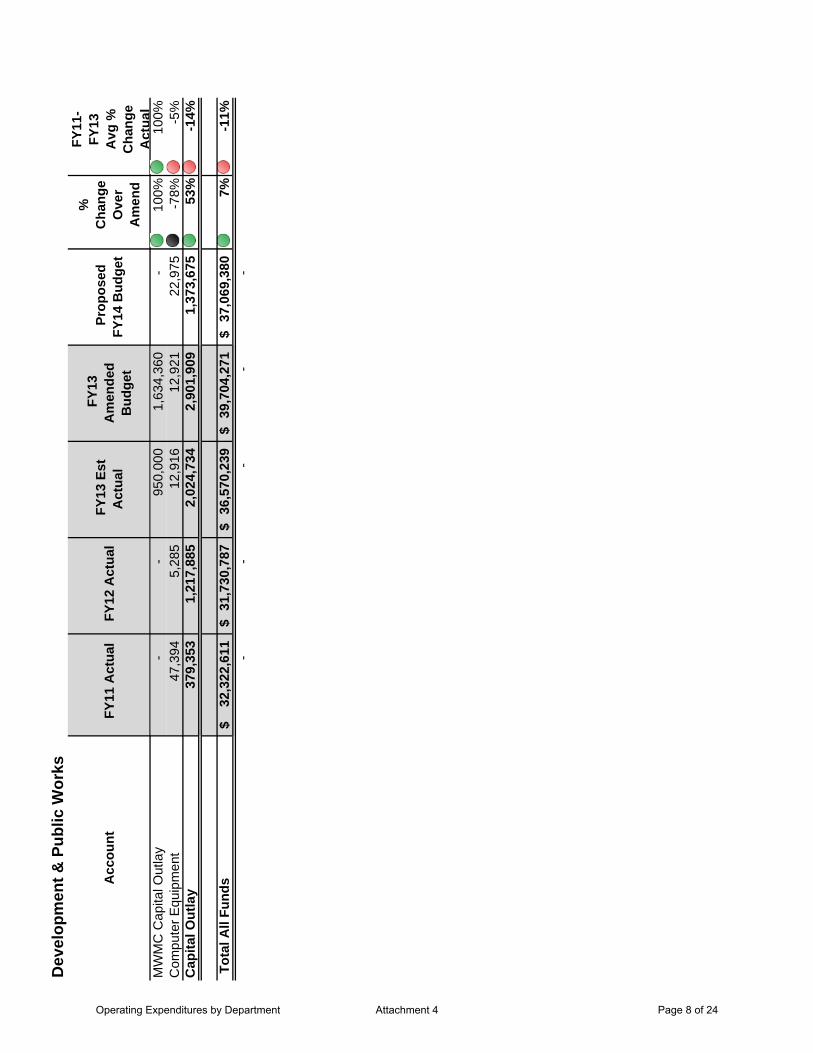
Dev
elop
men
t & P
ublic
Wor
ks
Acc
ount
FY1
1 A
ctua
l F
Y12
Act
ual
FY1
3 Es
t A
ctua
l
FY1
3 A
men
ded
Bud
get
Pro
pose
d FY
14 B
udge
t
%
Cha
nge
Ove
r A
men
d
FY11
-FY
13
Avg
%
Cha
nge
Act
ual
MW
MC
Cap
ital O
utla
y-
-
950,
000
1,63
4,36
0
-
10
0%10
0%C
ompu
ter E
quip
men
t47
,394
5,
285
12
,916
12,9
21
22
,975
-78%
-5%
Cap
ital O
utla
y37
9,35
3
1,
217,
885
2,02
4,73
4
2,
901,
909
1,
373,
675
53%
-14%
Tota
l All
Fund
s32
,322
,611
$
31,7
30,7
87$
36
,570
,239
$
39,7
04,2
71$
37
,069
,380
$
7%-1
1%-
-
-
-
-
Operating Expenditures by Department Attachment 4 Page 8 of 24

City
of S
prin
gfie
ldTo
tal O
pera
ting
Expe
nditu
res
Dec
reas
e bu
dget
>5%
5%A
ll Fu
nds
0%In
crea
se b
udge
t >5%
-5%
-25%
Fina
nce
Acc
ount
FY1
1 A
ctua
l F
Y12
Act
ual
FY1
3 Es
t A
ctua
l
FY1
3 A
men
ded
Bud
get
Pro
pose
d FY
14 B
udge
t
%
Cha
nge
Ove
r A
men
d
FY11
-FY
13
Avg
%
Cha
nge
Act
ual
Sal
arie
s54
8,37
5
58
8,49
9
59
5,27
9
59
5,27
9
62
5,18
0
-5
%-8
%O
verti
me
1,79
1
93
6
-
-
-
100%
100%
Frin
ge B
enef
its47
,710
50
,852
52,2
68
52
,268
54,6
81
-5
%-9
%M
edic
al/D
enta
l Ins
uran
ce15
8,27
0
17
2,43
7
16
8,57
4
17
3,57
4
17
7,54
0
-2
%-7
%P
ER
S/O
PS
RP
52,4
12
75,8
82
76
,149
76,1
49
10
4,78
4
-3
8%-5
4%Pe
rson
nel S
ervi
ces
808,
558
888,
606
89
2,27
0
897,
270
962,
185
-7
%-1
1%
Con
tract
ual S
ervi
ces
69,9
71
60,2
23
10
2,22
9
98
,575
100,
255
-2%
-29%
Con
tract
ual T
empo
rary
Hel
p15
,020
-
-
-
-
10
0%10
0%Te
leph
one,
Cel
lula
r,Pag
er92
6
718
855
1,20
0
850
29%
-2%
Com
pute
r Equ
ipm
ent
2,82
3
4,
600
25
0
5,
850
3,
850
34
%-5
1%A
dver
tisin
g1,
063
490
1,80
0
3,50
0
2,45
8
30%
-120
%D
uplic
atin
g S
uppl
ies
-
-
56
0
56
0
56
0
0%
-200
%P
rintin
g3,
947
1,06
2
1,05
0
1,10
0
1,10
0
0%46
%Tr
avel
& M
eetin
g E
xpen
ses
414
1,
814
2,
200
3,
210
3,
210
0%
-117
%M
anda
ted
Doc
umen
t/Mee
ting
Exp
80
-
-
-
-
100%
100%
Mile
age
Rei
mbu
rsem
ent
31
-
-
-
-
100%
100%
Sof
twar
e Li
cens
e Fe
e51
,200
52
,055
54,8
56
60
,115
57,3
92
5%
-9%
Mem
bers
hips
, Boo
ks, S
ubsc
rips
7,33
1
7,
920
8,
750
9,
000
9,
000
0%
-12%
Pos
tage
& S
hipp
ing
Cha
rges
11
-
12
5
27
5
27
5
0%
-505
%O
ffice
Sup
plie
s4,
217
2,76
0
4,80
0
4,85
0
4,80
0
1%-2
2%C
ompu
ter S
oftw
are
199
15
4
91
3
20
0
20
0
0%
53%
Sm
all F
urni
ture
& a
pplia
nces
553
-
173
-
-
100%
100%
Pro
gram
Exp
ense
3,49
2
1,
462
2,
750
4,
000
3,
500
13
%-3
6%E
quip
men
t Mai
nten
ance
585
-
-
86
5
56
5
35
%-1
90%
City
EE
Rec
ogni
tion
114
87
-
210
210
0%-2
13%
Em
ploy
ee D
evel
opm
ent
3,33
7
3,
268
4,
300
7,
333
6,
500
11
%-7
9%O
rgan
izat
ion
Dev
elop
men
t-
47
-
80
80
0%-4
13%
Mat
eria
l & S
ervi
ce16
5,31
3
13
6,66
0
185,
611
20
0,92
3
19
4,80
5
3%-2
0%
Operating Expenditures by Department Attachment 4 Page 9 of 24

Fina
nce
Acc
ount
FY1
1 A
ctua
l F
Y12
Act
ual
FY1
3 Es
t A
ctua
l
FY1
3 A
men
ded
Bud
get
Pro
pose
d FY
14 B
udge
t
%
Cha
nge
Ove
r A
men
d
FY11
-FY
13
Avg
%
Cha
nge
Act
ual
Inte
rnal
Insu
ranc
e C
hgs
718
89
0
5,
518
5,
582
5,
582
0%
-135
%In
tern
al F
ac R
ent
-
-
-
-
4,
493
-1
00%
-100
%In
t Com
pute
r Equ
ip C
hgs
1,93
5
3,
588
-
-
-
100%
100%
Inte
rnal
Bld
g M
aint
Chg
s3,
224
4,72
5
5,57
0
5,57
0
4,73
2
15%
-5%
Indi
rect
Cos
ts17
,018
17
,018
32,0
52
32
,052
28,3
86
11
%-2
9%In
tern
al E
mpl
oyee
Ben
efit
Chg
7,38
9
7,
015
7,
419
7,
419
7,
870
-6
%-8
%In
tern
al M
S E
nter
pris
e A
gree
men
t1,
432
1,89
8
1,38
7
1,38
7
1,46
0
-5%
7%In
t Bld
ng P
rese
rvat
ion
Chr
gs7,
037
5,93
6
6,31
5
6,34
6
6,15
7
3%4%
Inte
rnal
Cha
rges
38,7
52
41,0
70
58
,261
58,3
56
58
,680
-1%
-27%
Tota
l All
Fund
s1,
012,
624
$
1,
066,
336
$
1,13
6,14
2$
1,
156,
549
$
1,
215,
670
$
-5%
-13%
-
-
-
-
-
Operating Expenditures by Department Attachment 4 Page 10 of 24

City
of S
prin
gfie
ldTo
tal O
pera
ting
Expe
nditu
res
Dec
reas
e bu
dget
>5%
5%A
ll Fu
nds
0%In
crea
se b
udge
t >5%
-5%
-25%
Fire
& L
ife S
afet
y
Acc
ount
FY1
1 A
ctua
l F
Y12
Act
ual
FY1
3 Es
t A
ctua
l
FY1
3 A
men
ded
Bud
get
Pro
pose
d FY
14 B
udge
t
%
Cha
nge
Ove
r A
men
d
FY11
-FY
13
Avg
%
Cha
nge
Act
ual
Sal
arie
s7,
905,
060
7,
667,
235
7,
715,
606
7,
753,
253
7,
799,
242
-1
%0%
Sea
son/
Inte
rn/T
mp
Wag
es2,
164
8,34
9
58,0
00
47
,000
47,0
00
0%
-106
%O
verti
me
1,05
8,67
8
1,32
5,04
8
1,03
4,25
2
952,
792
918,
024
4%19
%Fr
inge
Ben
efits
1,32
1,83
5
1,14
0,75
2
1,04
7,03
3
986,
937
1,00
1,05
5
-1%
14%
Med
ical
/Den
tal I
nsur
ance
1,82
4,33
0
1,81
6,58
5
1,82
2,69
7
2,00
2,45
8
2,04
7,28
4
-2%
-12%
PE
RS
/OP
SR
P75
7,63
8
1,
046,
918
1,
017,
590
98
9,11
8
1,
331,
023
-3
5%-4
1%C
ell P
hone
Allo
wan
ce4,
468
4,40
4
4,50
0
4,50
0
4,32
0
4%3%
Per
sona
l Svs
Adj
ustm
ents
-
-
15
0,00
0
45
0,17
4
-
100%
100%
Pers
onne
l Ser
vice
s12
,874
,173
13,0
09,2
91
12,8
49,6
78
13,1
86,2
32
13
,147
,948
0%
-2%
Dis
patc
h C
ontra
ct54
4,33
3
55
2,73
9
62
3,29
0
62
3,29
0
66
0,68
7
-6
%-1
5%C
ontra
ctua
l Ser
vice
s47
,136
43
,556
63,2
80
74
,740
117,
240
-57%
-128
%M
erch
ant f
ees
18,1
21
21,4
56
32
,430
16,4
00
16
,400
0%32
%S
pace
Ren
tal
16,6
87
16,4
90
3,
000
5,
474
3,
624
34
%70
%Te
leph
one,
Cel
lula
r,Pag
er18
,755
17
,897
17,3
81
20
,295
19,4
76
4%
-8%
Ris
/Airs
/Geo
Cha
rges
6,57
8
7,
379
7,
129
7,
129
5,
600
21
%20
%C
ompu
ter E
quip
men
t8,
045
43,9
92
88
,200
91,4
00
9,
200
90
%80
%A
dver
tisin
g30
9,22
6
23
3,88
1
98
,500
98,5
00
98
,500
0%54
%D
uplic
atin
g S
uppl
ies
5,59
5
5,
121
4,
250
6,
100
6,
100
0%
-22%
Prin
ting
317
23
2
1,
200
1,
400
1,
400
0%
-140
%Tr
avel
& M
eetin
g E
xpen
ses
13,3
01
7,70
3
15,5
25
13
,825
12,8
25
7%
-5%
Inte
rnal
Mee
ting
-
12
-
-
-
10
0%10
0%Fi
re S
tatio
n Li
nens
146
-
-
-
-
10
0%10
0%M
edic
al S
uppl
ies
152,
854
145,
630
138,
000
140,
000
140,
000
0%4%
Saf
ety
Clo
thin
g/E
q29
,771
59
,545
46,6
50
50
,750
50,7
50
0%
-12%
Cle
anin
g S
uppl
ies
14,1
41
14,4
94
10
,000
9,70
0
9,70
0
0%25
%U
nifo
rms
12,6
96
23,1
18
13
,000
13,0
00
13
,000
0%20
%P
erso
nnel
Pro
tect
ive
Equ
ipm
ent
28,1
30
-
-
-
-
100%
100%
Gas
olin
e &
Oil
107,
151
123,
244
132,
750
123,
160
131,
675
-7%
-9%
Operating Expenditures by Department Attachment 4 Page 11 of 24
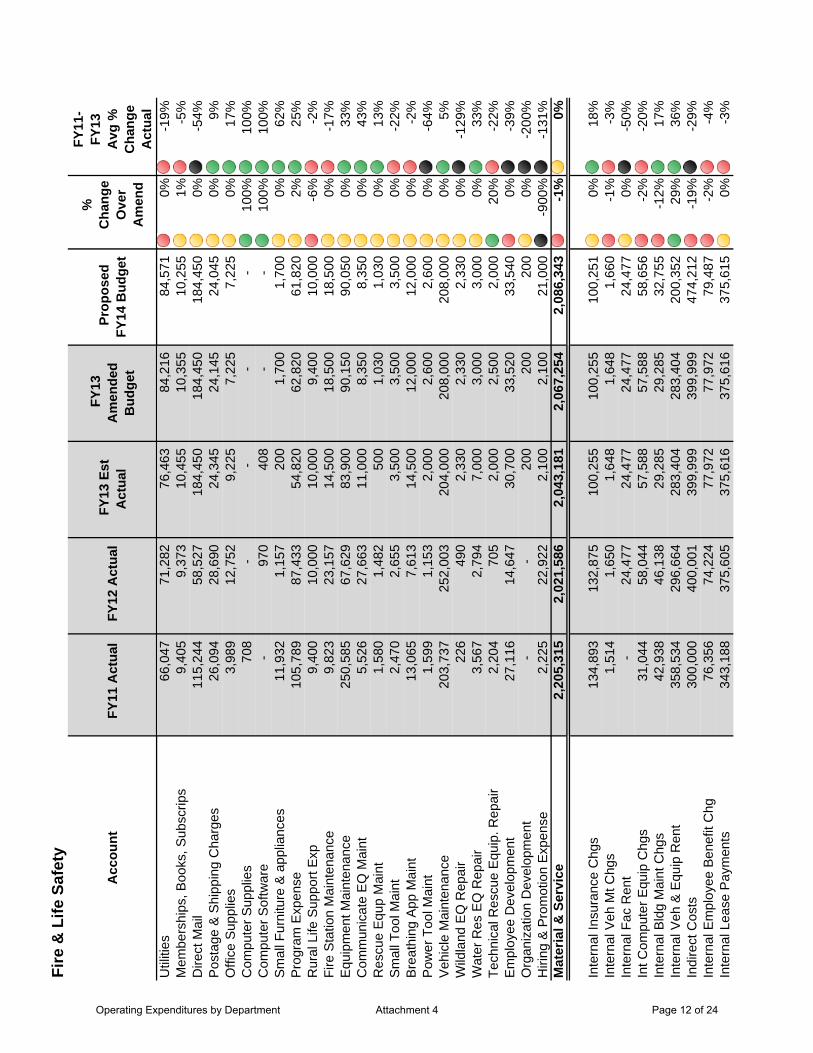
Fire
& L
ife S
afet
y
Acc
ount
FY1
1 A
ctua
l F
Y12
Act
ual
FY1
3 Es
t A
ctua
l
FY1
3 A
men
ded
Bud
get
Pro
pose
d FY
14 B
udge
t
%
Cha
nge
Ove
r A
men
d
FY11
-FY
13
Avg
%
Cha
nge
Act
ual
Util
ities
66,0
47
71,2
82
76
,463
84,2
16
84
,571
0%-1
9%M
embe
rshi
ps, B
ooks
, Sub
scrip
s9,
405
9,37
3
10,4
55
10
,355
10,2
55
1%
-5%
Dire
ct M
ail
115,
244
58,5
27
18
4,45
0
18
4,45
0
18
4,45
0
0%
-54%
Pos
tage
& S
hipp
ing
Cha
rges
26,0
94
28,6
90
24
,345
24,1
45
24
,045
0%9%
Offi
ce S
uppl
ies
3,98
9
12
,752
9,22
5
7,22
5
7,22
5
0%17
%C
ompu
ter S
uppl
ies
708
-
-
-
-
10
0%10
0%C
ompu
ter S
oftw
are
-
970
408
-
-
100%
100%
Sm
all F
urni
ture
& a
pplia
nces
11,9
32
1,15
7
200
1,70
0
1,70
0
0%62
%P
rogr
am E
xpen
se10
5,78
9
87
,433
54,8
20
62
,820
61,8
20
2%
25%
Rur
al L
ife S
uppo
rt E
xp9,
400
10,0
00
10
,000
9,40
0
10,0
00
-6
%-2
%Fi
re S
tatio
n M
aint
enan
ce9,
823
23,1
57
14
,500
18,5
00
18
,500
0%-1
7%E
quip
men
t Mai
nten
ance
250,
585
67,6
29
83
,900
90,1
50
90
,050
0%33
%C
omm
unic
ate
EQ
Mai
nt5,
526
27,6
63
11
,000
8,35
0
8,35
0
0%43
%R
escu
e E
qup
Mai
nt1,
580
1,48
2
500
1,03
0
1,03
0
0%13
%S
mal
l Too
l Mai
nt2,
470
2,65
5
3,50
0
3,50
0
3,50
0
0%-2
2%B
reat
hing
App
Mai
nt13
,065
7,
613
14
,500
12,0
00
12
,000
0%-2
%P
ower
Too
l Mai
nt1,
599
1,15
3
2,00
0
2,60
0
2,60
0
0%-6
4%V
ehic
le M
aint
enan
ce20
3,73
7
25
2,00
3
20
4,00
0
20
8,00
0
20
8,00
0
0%
5%W
ildla
nd E
Q R
epai
r22
6
490
2,33
0
2,33
0
2,33
0
0%-1
29%
Wat
er R
es E
Q R
epai
r3,
567
2,79
4
7,00
0
3,00
0
3,00
0
0%33
%Te
chni
cal R
escu
e E
quip
. Rep
air
2,20
4
70
5
2,
000
2,
500
2,
000
20
%-2
2%E
mpl
oyee
Dev
elop
men
t27
,116
14
,647
30,7
00
33
,520
33,5
40
0%
-39%
Org
aniz
atio
n D
evel
opm
ent
-
-
20
0
20
0
20
0
0%
-200
%H
iring
& P
rom
otio
n E
xpen
se2,
225
22,9
22
2,
100
2,
100
21
,000
-900
%-1
31%
Mat
eria
l & S
ervi
ce2,
205,
315
2,
021,
586
2,04
3,18
1
2,
067,
254
2,
086,
343
-1%
0%
Inte
rnal
Insu
ranc
e C
hgs
134,
893
132,
875
100,
255
100,
255
100,
251
0%18
%In
tern
al V
eh M
t Chg
s1,
514
1,65
0
1,64
8
1,64
8
1,66
0
-1%
-3%
Inte
rnal
Fac
Ren
t-
24
,477
24,4
77
24
,477
24,4
77
0%
-50%
Int C
ompu
ter E
quip
Chg
s31
,044
58
,044
57,5
88
57
,588
58,6
56
-2
%-2
0%In
tern
al B
ldg
Mai
nt C
hgs
42,9
38
46,1
38
29
,285
29,2
85
32
,755
-12%
17%
Inte
rnal
Veh
& E
quip
Ren
t35
8,53
4
29
6,66
4
28
3,40
4
28
3,40
4
20
0,35
2
29
%36
%In
dire
ct C
osts
300,
000
400,
001
399,
999
399,
999
474,
212
-19%
-29%
Inte
rnal
Em
ploy
ee B
enef
it C
hg76
,356
74
,224
77,9
72
77
,972
79,4
87
-2
%-4
%In
tern
al L
ease
Pay
men
ts34
3,18
8
37
5,60
5
37
5,61
6
37
5,61
6
37
5,61
5
0%
-3%
Operating Expenditures by Department Attachment 4 Page 12 of 24

Fire
& L
ife S
afet
y
Acc
ount
FY1
1 A
ctua
l F
Y12
Act
ual
FY1
3 Es
t A
ctua
l
FY1
3 A
men
ded
Bud
get
Pro
pose
d FY
14 B
udge
t
%
Cha
nge
Ove
r A
men
d
FY11
-FY
13
Avg
%
Cha
nge
Act
ual
Inte
rnal
MS
Ent
erpr
ise
Agr
eem
ent
18,1
35
19,1
12
14
,894
14,8
94
14
,748
1%15
%In
t Bld
ng P
rese
rvat
ion
Chr
gs72
,684
61
,953
64,1
85
64
,185
66,0
17
-3
%0%
Inte
rnal
Cha
rges
1,37
9,28
6
1,49
0,74
3
1,
429,
323
1,42
9,32
3
1,42
8,23
0
0%
0%
Veh
icle
s17
7,77
3
28
,694
486,
000
1,06
5,00
0
50,0
00
95
%78
%R
escu
e E
quip
men
t-
-
44,0
00
55
,000
-
10
0%10
0%C
ompu
ter E
quip
men
t-
7,
161
-
-
48
,000
-100
%-1
911%
Com
pute
r Sof
twar
e-
-
21,5
00
21
,500
-
10
0%10
0%P
ublic
Saf
ety
Info
Sys
tem
-
-
84
,467
84,4
67
17
,000
80%
40%
Cap
ital O
utla
y17
7,77
3
35
,855
635,
967
1,
225,
967
11
5,00
0
91%
59%
Tota
l All
Fund
s16
,636
,547
$
16,5
57,4
74$
16
,958
,149
$
17,9
08,7
76$
16
,777
,521
$
6%0%
-
-
-
-
-
Operating Expenditures by Department Attachment 4 Page 13 of 24

City
of S
prin
gfie
ldTo
tal O
pera
ting
Expe
nditu
res
Dec
reas
e bu
dget
>5%
5%A
ll Fu
nds
0%In
crea
se b
udge
t >5%
-5%
-25%
Hum
an R
esou
rces
Acc
ount
FY1
1 A
ctua
l F
Y12
Act
ual
FY1
3 Es
t A
ctua
l
FY1
3 A
men
ded
Bud
get
Pro
pose
d FY
14 B
udge
t
%
Cha
nge
Ove
r A
men
d
FY11
-FY
13
Avg
%
Cha
nge
Act
ual
Sal
arie
s37
9,48
1
40
8,63
9
40
8,29
8
40
8,29
8
41
0,62
4
-1
%-3
%Fr
inge
Ben
efits
33,2
80
36,2
17
36
,357
36,3
57
36
,360
0%-3
%M
edic
al/D
enta
l Ins
uran
ce78
,006
78
,473
84,7
26
84
,726
86,6
76
-2
%-8
%P
ER
S/O
PS
RP
42,1
22
54,6
28
61
,100
61,1
00
75
,101
-23%
-43%
Car
Allo
wan
ce2,
435
3,49
9
3,48
0
2,44
8
3,48
0
-42%
-11%
Cel
l Pho
ne A
llow
ance
361
36
2
54
0
54
0
54
0
0%
-28%
Par
t-tim
e/Te
mpo
rary
-
-
3,
166
3,
166
-
100%
100%
Pers
onne
l Ser
vice
s53
5,68
6
58
1,81
8
597,
667
59
6,63
5
61
2,78
1
-3%
-7%
Con
tract
ual S
ervi
ces
135,
919
129,
793
162,
000
165,
000
155,
000
6%-9
%Li
tigat
ion
Exp
ense
37,8
68
5,01
6
50,0
00
50
,000
50,0
00
0%
-61%
Equ
ipm
ent R
enta
l1,
149
6,25
1
-
-
6,29
1
-100
%-1
55%
Tele
phon
e, C
ellu
lar,P
ager
1,26
2
97
1
1,
489
1,
546
1,
546
0%
-25%
Com
pute
r Equ
ipm
ent
-
1,69
3
4,50
0
10,0
00
-
100%
100%
Dup
licat
ing
Sup
plie
s4,
051
2,56
5
7,29
1
7,29
1
1,00
0
86%
78%
Trav
el &
Mee
ting
Exp
ense
s5,
751
1,49
7
5,63
5
6,40
0
6,40
0
0%-4
9%In
tern
al M
eetin
g65
-
-
-
-
10
0%10
0%P
rope
rty T
axes
47
-
-
-
-
100%
100%
Mem
bers
hips
, Boo
ks, S
ubsc
rips
5,02
7
3,
989
4,
707
5,
607
5,
607
0%
-23%
Pos
tage
& S
hipp
ing
Cha
rges
6,70
4
6,
447
6,
510
6,
510
6,
510
0%
1%O
ffice
Sup
plie
s1,
369
2,27
7
1,69
7
1,69
7
1,69
7
0%5%
Com
pute
r Sup
plie
s28
3
110
550
550
550
0%-7
5%C
ompu
ter S
oftw
are
500
-
500
500
500
0%-5
0%S
mal
l Fur
nitu
re &
app
lianc
es1,
114
-
-
-
-
100%
100%
Pro
gram
Exp
ense
9,93
8
34
,901
4,89
0
5,39
0
4,22
8
22%
74%
Dam
age
Cla
ims
45,8
69
61,2
08
60
,000
60,0
00
60
,000
0%-8
%E
quip
men
t Mai
nten
ance
-
-
1,
400
1,
400
1,
400
0%
-200
%C
ity E
E R
ecog
nitio
n12
,241
4,
081
5,
000
7,
000
7,
000
0%
2%E
mpl
oyee
Dev
elop
men
t6,
067
2,04
1
7,10
0
8,10
0
8,10
0
0%-6
0%
Operating Expenditures by Department Attachment 4 Page 14 of 24

Hum
an R
esou
rces
Acc
ount
FY1
1 A
ctua
l F
Y12
Act
ual
FY1
3 Es
t A
ctua
l
FY1
3 A
men
ded
Bud
get
Pro
pose
d FY
14 B
udge
t
%
Cha
nge
Ove
r A
men
d
FY11
-FY
13
Avg
%
Cha
nge
Act
ual
Org
aniz
atio
n D
evel
opm
ent
809
36
2
-
-
-
100%
100%
City
Ee
Rec
ogni
tion
- Tax
able
-
25
-
-
-
10
0%10
0%W
elln
ess
Cen
ter
98,1
96
73,6
61
88
,000
88,0
00
88
,000
0%-2
%S
elf F
unde
d In
s P
rogr
am-
-
265,
000
265,
000
-
10
0%10
0%U
nem
ploy
men
t Rei
mbu
rse
89,3
92
85,2
83
10
0,00
0
10
0,00
0
10
0,00
0
0%
-9%
Ret
iree
Med
ical
Pre
miu
m49
,560
53
,884
65,0
00
65
,000
65,0
00
0%
-16%
Em
ploy
ee B
enef
it A
djus
tmen
t6,
233
(2,6
72)
-
-
-
100%
100%
SF
Med
ical
Adm
in F
ee-
-
213,
005
213,
005
181,
963
15%
-156
%S
F M
ed S
top
Loss
Pre
m-
-
19,0
31
19
,031
592,
719
-301
4%-9
243%
SF
Med
Agg
rega
te S
L P
rem
-
-
26
0,05
0
26
0,05
0
39
,788
85%
54%
SF
Med
Opt
iona
ls-
-
-
-
5,26
1
-100
%-1
00%
SF
Den
tal A
dmin
Fee
-
-
16
,728
16,0
00
35
,006
-119
%-5
28%
2013
Den
tal C
laim
s-
-
253,
513
253,
513
644,
065
-154
%-6
62%
2013
Med
ical
Cla
ims
-
-
2,
115,
213
2,
415,
213
6,
186,
236
-1
56%
-777
%R
ecru
itmen
t Exp
ense
8,25
5
3,
682
8,
200
8,
200
8,
200
0%
-22%
Late
Cha
rges
19
-
-
-
-
100%
100%
Mat
eria
l & S
ervi
ce52
7,68
9
47
7,06
4
3,72
7,00
9
4,
040,
003
8,
262,
067
-105
%-4
24%
Inte
rnal
Insu
ranc
e C
hgs
496
49
6
3,
646
3,
646
3,
646
0%
-136
%In
tern
al F
ac R
ent
-
-
-
10,1
43
10
,143
0%-1
00%
Int C
ompu
ter E
quip
Chg
s1,
005
2,32
8
2,00
4
2,00
4
2,00
4
0%-1
3%In
tern
al B
ldg
Mai
nt C
hgs
6,84
8
8,
879
5,
337
5,
337
5,
834
-9
%17
%In
tern
al E
mpl
oyee
Ben
efit
Chg
4,24
2
4,
312
4,
542
4,
542
4,
722
-4
%-8
%In
tern
al L
ease
Pay
men
ts5,
010
651
-
-
-
10
0%10
0%In
tern
al M
S E
nter
pris
e A
gree
men
t56
5
1,11
1
876
876
876
0%-3
%In
t Bld
ng P
rese
rvat
ion
Chr
gs2,
464
3,59
9
3,54
1
3,54
1
3,61
2
-2%
-13%
Inte
rnal
Cha
rges
20,6
29
21,3
76
19
,946
30,0
89
30
,837
-2%
-49%
Tota
l All
Fund
s1,
084,
004
$
1,
080,
258
$
4,34
4,62
2$
4,
666,
727
$
8,
905,
685
$
-91%
-310
%-
-
-
-
-
Operating Expenditures by Department Attachment 4 Page 15 of 24

City
of S
prin
gfie
ldTo
tal O
pera
ting
Expe
nditu
res
Dec
reas
e bu
dget
>5%
5%A
ll Fu
nds
0%In
crea
se b
udge
t >5%
-5%
-25%
Info
rmat
ion
Tech
nolo
gy
Acc
ount
FY1
1 A
ctua
l F
Y12
Act
ual
FY1
3 Es
t A
ctua
l
FY1
3 A
men
ded
Bud
get
Pro
pose
d FY
14 B
udge
t
%
Cha
nge
Ove
r A
men
d
FY11
-FY
13
Avg
%
Cha
nge
Act
ual
Sal
arie
s69
5,89
1
71
8,93
5
76
9,87
8
76
9,87
8
75
1,77
9
2%
-3%
Frin
ge B
enef
its63
,069
63
,620
68,7
49
68
,749
66,9
42
3%
-3%
Med
ical
/Den
tal I
nsur
ance
138,
911
146,
810
153,
828
153,
828
131,
220
15%
10%
PE
RS
/OP
SR
P96
,639
12
8,64
4
13
6,71
8
13
6,71
8
16
0,31
4
-1
7%-3
3%C
ar A
llow
ance
1,56
4
1,
569
1,
560
1,
560
1,
560
0%
0%P
ager
Allo
wan
ce4,
763
4,77
6
5,00
4
5,00
4
5,00
4
0%-3
%C
ell P
hone
Allo
wan
ce2,
150
2,17
3
2,16
0
2,16
0
2,16
0
0%0%
Pers
onne
l Ser
vice
s1,
002,
986
1,
066,
527
1,13
7,89
7
1,
137,
897
1,
118,
979
2%-5
%
Con
tract
ual S
ervi
ces
13,8
77
5,70
4
1,98
5
1,00
0
1,00
0
0%86
%Te
leph
one,
Cel
lula
r,Pag
er12
,532
12
,704
17,0
52
17
,052
17,0
52
0%
-21%
Ris
/Airs
/Geo
Cha
rges
86,0
06
81,8
17
81
,817
81,8
17
80
,787
1%3%
Com
pute
r Equ
ipm
ent
1,97
7
19
,944
15,5
84
15
,584
115,
949
-644
%-8
27%
Trav
el &
Mee
ting
Exp
ense
s1,
002
4,02
6
2,00
0
3,00
0
3,00
0
0%-2
8%In
tern
al M
eetin
g37
5
56
145
-
-
100%
100%
Sof
twar
e Li
cens
e Fe
e94
,247
89
,681
90,0
00
90
,000
88,2
00
2%
3%U
tiliti
es11
,137
11
,666
16,0
00
16
,000
16,0
00
0%
-24%
Mem
bers
hips
, Boo
ks, S
ubsc
rips
139
41
7
30
0
30
0
30
0
0%
-5%
Pos
tage
& S
hipp
ing
Cha
rges
85
-
10
0
10
0
10
0
0%
-62%
Offi
ce S
uppl
ies
154
30
4
80
0
40
0
40
0
0%
5%C
ompu
ter S
uppl
ies
3,16
5
6,
307
10
,000
10,0
00
10
,000
0%-5
4%C
ompu
ter S
oftw
are
64,1
32
16,0
49
8,
800
5,
000
5,
000
0%
83%
Sm
all F
urni
ture
& a
pplia
nces
-
250
500
-
-
100%
100%
Com
mut
er T
rip R
educ
tion
78
-
-
-
-
100%
100%
Pro
gram
Exp
ense
1,44
6
49
3
50
0
50
0
11
,898
-228
0%-1
364%
Equ
ipm
ent M
aint
enan
ce14
,139
20
,817
6,00
0
9,00
0
9,00
0
0%34
%C
ity E
E R
ecog
nitio
n-
20
50
0
50
0
1,
000
-1
00%
-477
%E
mpl
oyee
Dev
elop
men
t-
41
0
5,
000
8,
000
8,
000
0%
-344
%M
ater
ial &
Ser
vice
304,
490
270,
665
25
7,08
3
258,
253
367,
686
-4
2%-3
3%
Operating Expenditures by Department Attachment 4 Page 16 of 24
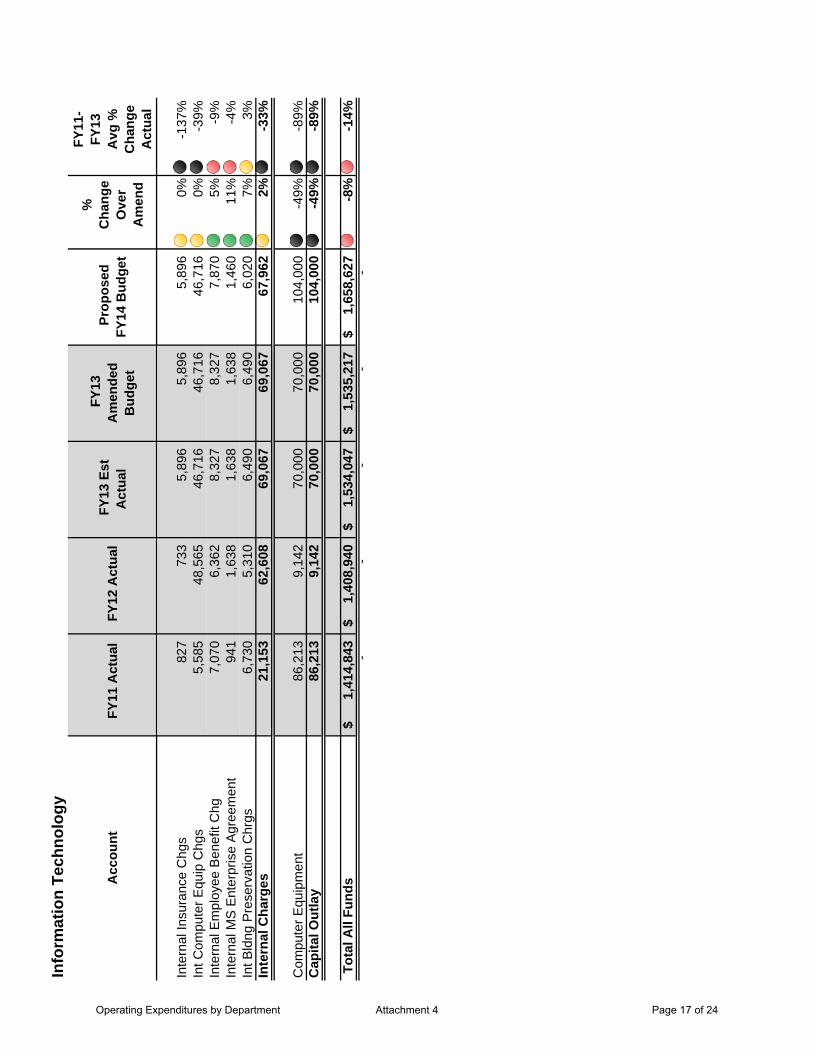
Info
rmat
ion
Tech
nolo
gy
Acc
ount
FY1
1 A
ctua
l F
Y12
Act
ual
FY1
3 Es
t A
ctua
l
FY1
3 A
men
ded
Bud
get
Pro
pose
d FY
14 B
udge
t
%
Cha
nge
Ove
r A
men
d
FY11
-FY
13
Avg
%
Cha
nge
Act
ual
Inte
rnal
Insu
ranc
e C
hgs
827
73
3
5,
896
5,
896
5,
896
0%
-137
%In
t Com
pute
r Equ
ip C
hgs
5,58
5
48
,565
46,7
16
46
,716
46,7
16
0%
-39%
Inte
rnal
Em
ploy
ee B
enef
it C
hg7,
070
6,36
2
8,32
7
8,32
7
7,87
0
5%-9
%In
tern
al M
S E
nter
pris
e A
gree
men
t94
1
1,63
8
1,63
8
1,63
8
1,46
0
11%
-4%
Int B
ldng
Pre
serv
atio
n C
hrgs
6,73
0
5,
310
6,
490
6,
490
6,
020
7%
3%In
tern
al C
harg
es21
,153
62
,608
69,0
67
69
,067
67,9
62
2%
-33%
Com
pute
r Equ
ipm
ent
86,2
13
9,14
2
70,0
00
70
,000
104,
000
-49%
-89%
Cap
ital O
utla
y86
,213
9,
142
70,0
00
70
,000
104,
000
-4
9%-8
9%
Tota
l All
Fund
s1,
414,
843
$
1,
408,
940
$
1,53
4,04
7$
1,
535,
217
$
1,
658,
627
$
-8%
-14%
-
-
-
-
-
Operating Expenditures by Department Attachment 4 Page 17 of 24

City
of S
prin
gfie
ldTo
tal O
pera
ting
Expe
nditu
res
Dec
reas
e bu
dget
>5%
5%A
ll Fu
nds
0%In
crea
se b
udge
t >5%
-5%
-25%
Lega
l and
Jud
icia
l Ser
vice
s
Acc
ount
FY1
1 A
ctua
l F
Y12
Act
ual
FY1
3 Es
t A
ctua
l
FY1
3 A
men
ded
Bud
get
Pro
pose
d FY
14 B
udge
t
%
Cha
nge
Ove
r A
men
d
FY11
-FY
13
Avg
%
Cha
nge
Act
ual
Sal
arie
s42
8,26
4
46
9,54
4
51
2,65
5
55
1,90
7
56
9,09
1
-3
%-2
1%O
verti
me
6,37
4
5,
945
6,
000
-
-
10
0%10
0%Fr
inge
Ben
efits
37,6
95
41,0
18
34
,108
47,8
38
49
,425
-3%
-31%
Med
ical
/Den
tal I
nsur
ance
102,
145
104,
379
109,
932
126,
102
144,
420
-15%
-37%
PE
RS
/OP
SR
P39
,892
60
,480
59,3
21
65
,453
86,4
48
-3
2%-6
2%C
ity R
etire
men
t Pla
n59
-
-
-
-
10
0%10
0%C
ell P
hone
Allo
wan
ce54
2
543
540
540
540
0%0%
Pers
onne
l Ser
vice
s61
4,96
9
68
1,90
9
722,
556
79
1,84
0
84
9,92
4
-7%
-26%
Inte
rpre
ter F
ees
5,77
2
5,
653
6,
000
6,
000
5,
000
17
%14
%B
illin
g &
Col
l Exp
106,
410
119,
392
130,
357
130,
357
131,
000
0%-1
0%C
ontra
ctua
l Ser
vice
s59
0,53
9
59
8,00
7
55
0,81
8
57
4,94
9
51
2,22
2
11
%12
%Li
tigat
ion
Exp
ense
2,15
8
-
5,00
0
5,00
0
5,00
0
0%-1
10%
Indi
gent
Rep
rese
ntat
ion
199,
279
219,
732
201,
108
176,
000
181,
834
-3%
12%
Mer
chan
t fee
s7,
044
7,25
1
9,00
0
9,00
0
10,0
00
-1
1%-2
9%M
enta
l Hea
lth E
val
1,95
0
7,
900
3,
000
2,
292
3,
000
-3
1%30
%S
peci
al P
rose
cuto
r Ser
vice
s-
-
3,00
0
3,00
0
3,00
0
0%-2
00%
Tele
phon
e, C
ellu
lar,P
ager
1,00
4
77
4
72
1
94
4
85
4
10
%-3
%C
ompu
ter E
quip
men
t2,
576
9,10
3
5,07
7
-
-
100%
100%
Dup
licat
ing
Sup
plie
s3,
383
4,20
1
4,52
5
5,00
0
5,00
0
0%-2
4%Tr
avel
& M
eetin
g E
xpen
ses
2,50
9
3,
566
3,
100
4,
500
4,
380
3%
-43%
Sub
poen
a &
Jur
y Fe
es99
6
1,17
4
2,00
0
3,00
0
2,00
0
33%
-44%
Witn
ess
Fees
325
2,
236
35
0
3,
850
2,
400
38
%-1
47%
Mem
bers
hips
, Boo
ks, S
ubsc
rips
3,63
0
2,
540
3,
467
3,
350
2,
100
37
%35
%P
osta
ge &
Shi
ppin
g C
harg
es7,
434
9,34
6
7,44
8
9,25
0
8,25
0
11%
-2%
Offi
ce S
uppl
ies
6,49
9
5,
163
3,
544
6,
000
5,
500
8%
-9%
Sof
twar
e Li
cens
e Fe
e-
-
-
-
70,2
24
-1
00%
-100
%P
rogr
am E
xpen
se9,
648
3,11
6
3,65
8
6,50
0
7,99
7
-23%
-46%
Equ
ipm
ent M
aint
enan
ce50
-
300
600
500
17%
-329
%
Operating Expenditures by Department Attachment 4 Page 18 of 24

Lega
l and
Jud
icia
l Ser
vice
s
Acc
ount
FY1
1 A
ctua
l F
Y12
Act
ual
FY1
3 Es
t A
ctua
l
FY1
3 A
men
ded
Bud
get
Pro
pose
d FY
14 B
udge
t
%
Cha
nge
Ove
r A
men
d
FY11
-FY
13
Avg
%
Cha
nge
Act
ual
Em
ploy
ee D
evel
opm
ent
310
20
0
2,
500
6,
512
4,
000
39
%-2
99%
Mat
eria
l & S
ervi
ce95
1,51
5
99
9,35
2
944,
973
95
6,10
4
96
4,26
1
-1%
0%
Inte
rnal
Insu
ranc
e C
hgs
706
62
7
2,
899
2,
899
2,
899
0%
-106
%In
t Com
pute
r Equ
ip C
hgs
979
6,
522
5,
532
5,
532
4,
032
27
%7%
Inte
rnal
Em
ploy
ee B
enef
it C
hg6,
045
5,30
2
6,05
2
6,05
2
7,08
3
-17%
-22%
Inte
rnal
MS
Ent
erpr
ise
Agr
eem
ent
1,17
6
1,
365
1,
241
1,
241
1,
460
-1
8%-1
6%In
t Bld
ng P
rese
rvat
ion
Chr
gs5,
755
4,42
5
5,21
6
5,21
6
4,81
6
8%6%
Inte
rnal
Cha
rges
14,6
61
18,2
41
20
,940
20,9
40
20
,290
3%-1
3%
Pro
gram
Equ
ipm
ent
-
2,55
0
-
-
-
10
0%10
0%P
ublic
Saf
ety
Info
Sys
tem
-
66,1
41
12
3,57
2
13
5,40
6
-
100%
100%
Cap
ital O
utla
y-
68,6
91
12
3,57
2
135,
406
-
10
0%10
0%
Tota
l All
Fund
s1,
581,
145
$
1,
768,
193
$
1,81
2,04
1$
1,
904,
290
$
1,
834,
475
$
4%-7
%-
-
-
-
-
Operating Expenditures by Department Attachment 4 Page 19 of 24
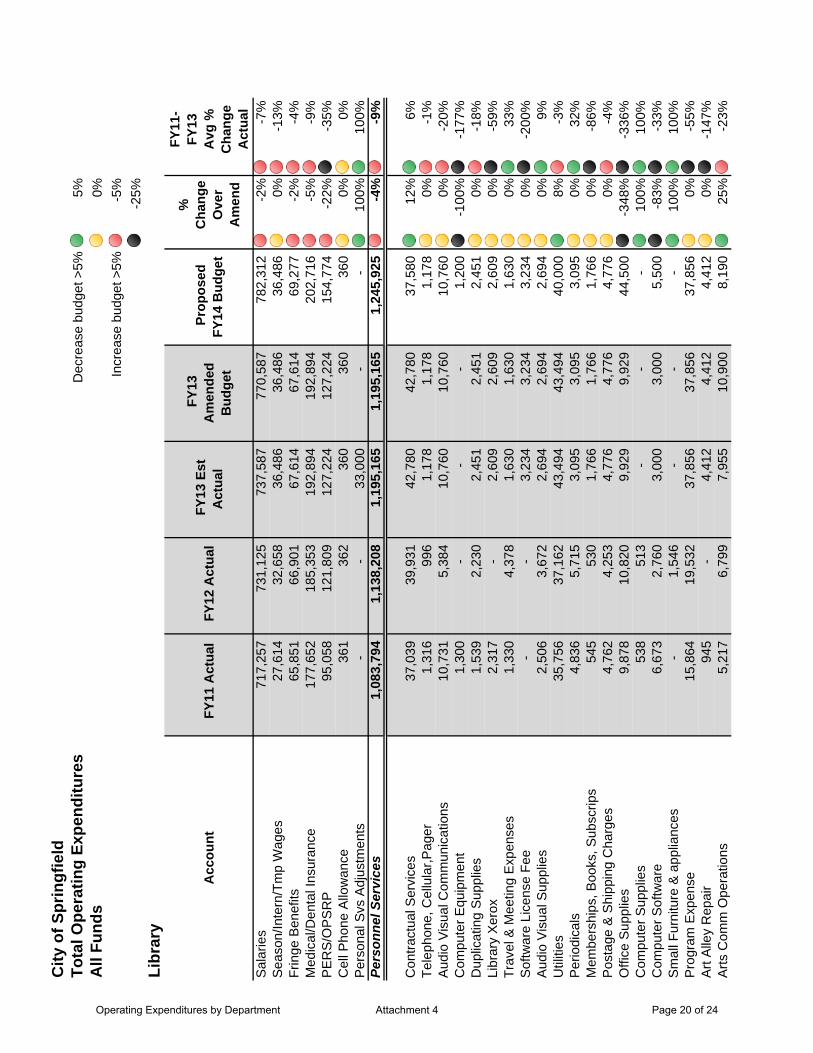
City
of S
prin
gfie
ldTo
tal O
pera
ting
Expe
nditu
res
Dec
reas
e bu
dget
>5%
5%A
ll Fu
nds
0%In
crea
se b
udge
t >5%
-5%
-25%
Libr
ary
Acc
ount
FY1
1 A
ctua
l F
Y12
Act
ual
FY1
3 Es
t A
ctua
l
FY1
3 A
men
ded
Bud
get
Pro
pose
d FY
14 B
udge
t
%
Cha
nge
Ove
r A
men
d
FY11
-FY
13
Avg
%
Cha
nge
Act
ual
Sal
arie
s71
7,25
7
73
1,12
5
73
7,58
7
77
0,58
7
78
2,31
2
-2
%-7
%S
easo
n/In
tern
/Tm
p W
ages
27,6
14
32,6
58
36
,486
36,4
86
36
,486
0%-1
3%Fr
inge
Ben
efits
65,8
51
66,9
01
67
,614
67,6
14
69
,277
-2%
-4%
Med
ical
/Den
tal I
nsur
ance
177,
652
185,
353
192,
894
192,
894
202,
716
-5%
-9%
PE
RS
/OP
SR
P95
,058
12
1,80
9
12
7,22
4
12
7,22
4
15
4,77
4
-2
2%-3
5%C
ell P
hone
Allo
wan
ce36
1
362
360
360
360
0%0%
Per
sona
l Svs
Adj
ustm
ents
-
-
33
,000
-
-
100%
100%
Pers
onne
l Ser
vice
s1,
083,
794
1,
138,
208
1,19
5,16
5
1,
195,
165
1,
245,
925
-4%
-9%
Con
tract
ual S
ervi
ces
37,0
39
39,9
31
42
,780
42,7
80
37
,580
12%
6%Te
leph
one,
Cel
lula
r,Pag
er1,
316
996
1,17
8
1,17
8
1,17
8
0%-1
%A
udio
Vis
ual C
omm
unic
atio
ns10
,731
5,
384
10
,760
10,7
60
10
,760
0%-2
0%C
ompu
ter E
quip
men
t1,
300
-
-
-
1,
200
-1
00%
-177
%D
uplic
atin
g S
uppl
ies
1,53
9
2,
230
2,
451
2,
451
2,
451
0%
-18%
Libr
ary
Xer
ox2,
317
-
2,
609
2,
609
2,
609
0%
-59%
Trav
el &
Mee
ting
Exp
ense
s1,
330
4,37
8
1,63
0
1,63
0
1,63
0
0%33
%S
oftw
are
Lice
nse
Fee
-
-
3,
234
3,
234
3,
234
0%
-200
%A
udio
Vis
ual S
uppl
ies
2,50
6
3,
672
2,
694
2,
694
2,
694
0%
9%U
tiliti
es35
,756
37
,162
43,4
94
43
,494
40,0
00
8%
-3%
Per
iodi
cals
4,83
6
5,
715
3,
095
3,
095
3,
095
0%
32%
Mem
bers
hips
, Boo
ks, S
ubsc
rips
545
53
0
1,
766
1,
766
1,
766
0%
-86%
Pos
tage
& S
hipp
ing
Cha
rges
4,76
2
4,
253
4,
776
4,
776
4,
776
0%
-4%
Offi
ce S
uppl
ies
9,87
8
10
,820
9,92
9
9,92
9
44,5
00
-3
48%
-336
%C
ompu
ter S
uppl
ies
538
51
3
-
-
-
100%
100%
Com
pute
r Sof
twar
e6,
673
2,76
0
3,00
0
3,00
0
5,50
0
-83%
-33%
Sm
all F
urni
ture
& a
pplia
nces
-
1,54
6
-
-
-
10
0%10
0%P
rogr
am E
xpen
se15
,864
19
,532
37,8
56
37
,856
37,8
56
0%
-55%
Art
Alle
y R
epai
r94
5
-
4,
412
4,
412
4,
412
0%
-147
%A
rts C
omm
Ope
ratio
ns5,
217
6,79
9
7,95
5
10,9
00
8,
190
25
%-2
3%
Operating Expenditures by Department Attachment 4 Page 20 of 24
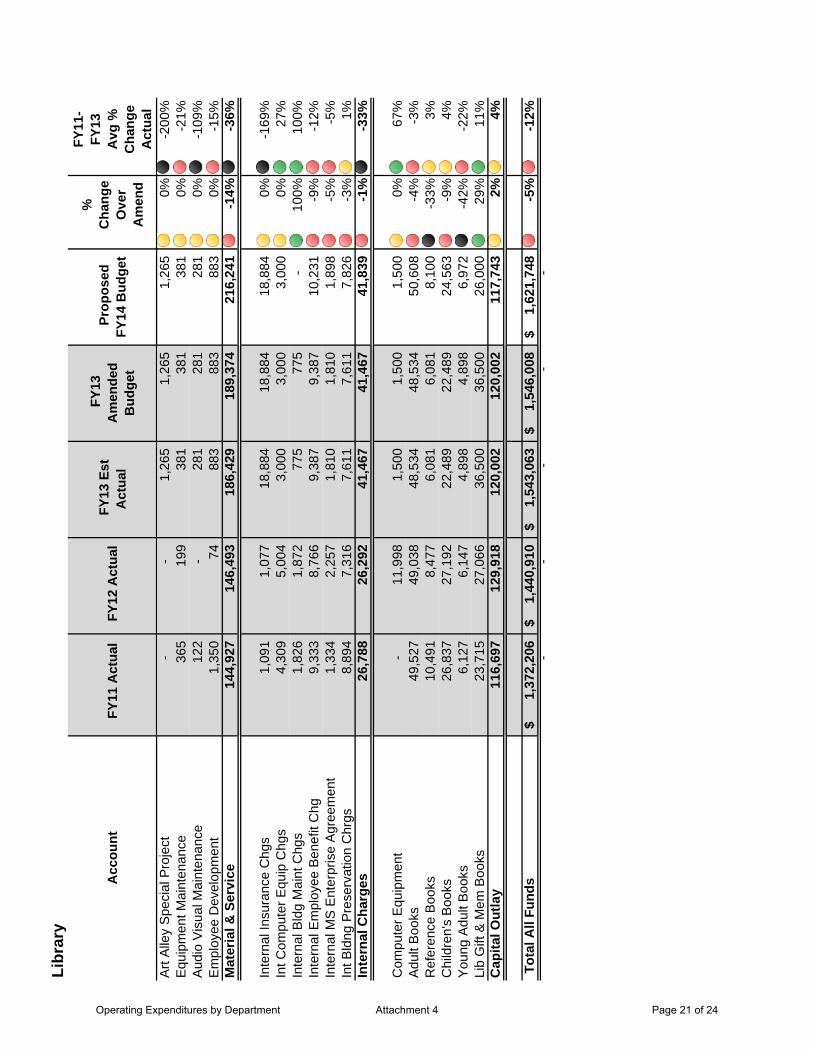
Libr
ary
Acc
ount
FY1
1 A
ctua
l F
Y12
Act
ual
FY1
3 Es
t A
ctua
l
FY1
3 A
men
ded
Bud
get
Pro
pose
d FY
14 B
udge
t
%
Cha
nge
Ove
r A
men
d
FY11
-FY
13
Avg
%
Cha
nge
Act
ual
Art
Alle
y S
peci
al P
roje
ct-
-
1,26
5
1,26
5
1,26
5
0%-2
00%
Equ
ipm
ent M
aint
enan
ce36
5
199
381
381
381
0%-2
1%A
udio
Vis
ual M
aint
enan
ce12
2
-
28
1
28
1
28
1
0%
-109
%E
mpl
oyee
Dev
elop
men
t1,
350
74
883
883
883
0%-1
5%M
ater
ial &
Ser
vice
144,
927
146,
493
18
6,42
9
189,
374
216,
241
-1
4%-3
6%
Inte
rnal
Insu
ranc
e C
hgs
1,09
1
1,
077
18
,884
18,8
84
18
,884
0%-1
69%
Int C
ompu
ter E
quip
Chg
s4,
309
5,00
4
3,00
0
3,00
0
3,00
0
0%27
%In
tern
al B
ldg
Mai
nt C
hgs
1,82
6
1,
872
77
5
77
5
-
100%
100%
Inte
rnal
Em
ploy
ee B
enef
it C
hg9,
333
8,76
6
9,38
7
9,38
7
10,2
31
-9
%-1
2%In
tern
al M
S E
nter
pris
e A
gree
men
t1,
334
2,25
7
1,81
0
1,81
0
1,89
8
-5%
-5%
Int B
ldng
Pre
serv
atio
n C
hrgs
8,89
4
7,
316
7,
611
7,
611
7,
826
-3
%1%
Inte
rnal
Cha
rges
26,7
88
26,2
92
41
,467
41,4
67
41
,839
-1%
-33%
Com
pute
r Equ
ipm
ent
-
11,9
98
1,
500
1,
500
1,
500
0%
67%
Adu
lt B
ooks
49,5
27
49,0
38
48
,534
48,5
34
50
,608
-4%
-3%
Ref
eren
ce B
ooks
10,4
91
8,47
7
6,08
1
6,08
1
8,10
0
-33%
3%C
hild
ren'
s B
ooks
26,8
37
27,1
92
22
,489
22,4
89
24
,563
-9%
4%Y
oung
Adu
lt B
ooks
6,12
7
6,
147
4,
898
4,
898
6,
972
-4
2%-2
2%Li
b G
ift &
Mem
Boo
ks23
,715
27
,066
36,5
00
36
,500
26,0
00
29
%11
%C
apita
l Out
lay
116,
697
129,
918
12
0,00
2
120,
002
117,
743
2%
4%
Tota
l All
Fund
s1,
372,
206
$
1,
440,
910
$
1,54
3,06
3$
1,
546,
008
$
1,
621,
748
$
-5%
-12%
-
-
-
-
-
Operating Expenditures by Department Attachment 4 Page 21 of 24

City
of S
prin
gfie
ldTo
tal O
pera
ting
Expe
nditu
res
Dec
reas
e bu
dget
>5%
5%A
ll Fu
nds
0%In
crea
se b
udge
t >5%
-5%
-25%
Polic
e
Acc
ount
FY1
1 A
ctua
l F
Y12
Act
ual
FY1
3 Es
t A
ctua
l
FY1
3 A
men
ded
Bud
get
Pro
pose
d FY
14 B
udge
t
%
Cha
nge
Ove
r A
men
d
FY11
-FY
13
Avg
%
Cha
nge
Act
ual
Sal
arie
s7,
860,
355
7,
905,
904
7,
895,
770
8,
407,
725
8,
552,
053
-2
%-8
%O
verti
me
618,
726
569,
552
618,
640
481,
316
468,
516
3%22
%Fr
inge
Ben
efits
1,19
9,30
0
926,
200
930,
488
932,
655
957,
805
-3%
6%M
edic
al/D
enta
l Ins
uran
ce2,
158,
688
2,
303,
823
2,
416,
925
2,
485,
998
2,
529,
042
-2
%-1
0%C
ity R
etire
men
t Pla
n1,
197,
331
57
3,12
9
58
0,62
4
55
8,23
8
66
9,36
1
-2
0%15
%P
ER
S/O
PS
RP
737,
885
952,
756
947,
740
1,06
7,12
9
1,32
1,67
7
-24%
-50%
CR
P In
tere
st G
uara
ntee
-
1,21
5,55
5
1,21
5,00
0
1,21
5,00
0
1,35
2,00
0
-11%
-67%
Uni
form
Allo
wan
ce15
1,00
1
15
2,68
4
15
9,46
6
15
8,44
8
15
4,52
4
2%
0%C
ell P
hone
Allo
wan
ce6,
128
5,32
9
6,07
2
6,48
0
6,84
0
-6%
-17%
Pers
onne
l Ser
vice
s13
,929
,413
14,6
04,9
33
14,7
70,7
25
15,3
12,9
89
16
,011
,818
-5
%-1
1%
Con
tract
ual S
ervi
ces
422,
533
506,
906
608,
228
640,
326
607,
500
5%-1
9%P
rison
er E
xp M
edic
al18
6,90
1
21
9,63
5
22
0,00
0
18
0,00
0
23
3,00
0
-2
9%-1
2%D
rug
Pre
vent
ion/
Ed
24,3
78
15,5
05
29
,000
35,0
00
25
,000
29%
-9%
Mer
chan
t fee
s13
,625
14
,640
15,0
00
5,
000
11
,000
-120
%24
%Te
leph
one,
Cel
lula
r,Pag
er32
,096
32
,917
33,0
00
33
,789
36,6
66
-9
%-1
2%R
is/A
irs/G
eo C
harg
es33
8,92
0
38
7,57
6
30
5,00
0
37
1,25
8
15
0,00
0
60
%56
%C
ompu
ter E
quip
men
t6,
064
42,6
27
11
1,07
4
14
1,87
4
-
100%
100%
Adv
ertis
ing
509
83
3
-
-
-
100%
100%
Dup
licat
ing
Sup
plie
s6,
236
8,80
4
4,00
0
9,00
0
5,00
0
44%
21%
Pub
lish
Pro
mo
Mtrl
s16
2
-
-
-
-
100%
100%
Prin
ting
8,45
0
20
,083
26,8
60
8,
500
11
,800
-39%
36%
Trav
el &
Mee
ting
Exp
ense
s8,
170
7,43
1
8,20
0
11,0
00
11
,000
0%-3
9%In
tern
al M
eetin
g3,
538
2,67
4
800
-
-
100%
100%
Aud
io V
isua
l Sup
plie
s-
45
2
-
-
-
100%
100%
Med
ical
Sup
plie
s2,
789
4,60
0
6,00
0
500
6,00
0
-110
0%-3
4%S
afet
y C
loth
ing/
Eq
11,6
66
19,9
82
7,
850
15
,000
18,0
00
-2
0%-3
7%P
olic
e W
eapo
ns19
,742
56
,667
90,0
00
50
,000
-
10
0%10
0%In
mat
e S
uppl
ies
15,4
19
14,6
31
10
,000
25,0
00
17
,000
32%
-27%
Operating Expenditures by Department Attachment 4 Page 22 of 24

Polic
e
Acc
ount
FY1
1 A
ctua
l F
Y12
Act
ual
FY1
3 Es
t A
ctua
l
FY1
3 A
men
ded
Bud
get
Pro
pose
d FY
14 B
udge
t
%
Cha
nge
Ove
r A
men
d
FY11
-FY
13
Avg
%
Cha
nge
Act
ual
Pris
oner
Mea
l Exp
ense
110,
693
131,
352
115,
000
128,
000
128,
000
0%-8
%G
asol
ine
& O
il17
8,60
8
21
5,08
5
21
4,25
0
20
2,75
0
20
6,90
0
-2
%-2
%U
tiliti
es10
1,87
8
10
9,57
0
87
,000
110,
000
115,
433
-5%
-16%
Mem
bers
hips
, Boo
ks, S
ubsc
rips
4,43
9
3,
649
3,
800
2,
700
4,
000
-4
8%-1
%P
osta
ge &
Shi
ppin
g C
harg
es9,
882
9,87
6
9,20
0
10,0
00
8,
000
20
%17
%O
ffice
Sup
plie
s11
,672
15
,444
19,8
00
31
,200
27,7
00
11
%-7
7%C
ompu
ter S
uppl
ies
8,77
7
27
4
-
-
-
100%
100%
Com
pute
r Sof
twar
e65
9
9,04
7
2,13
4
17,3
96
7,
396
57
%-8
7%S
mal
l Fur
nitu
re &
app
lianc
es71
5
996
900
-
-
100%
100%
Clo
thin
g A
llow
ance
31,3
89
26,2
96
28
,800
30,0
00
32
,000
-7%
-11%
Cle
ang/
Mai
nt M
ater
ials
27,3
77
25,4
32
25
,500
19,0
00
25
,000
-32%
4%P
rogr
am E
xpen
se91
,607
13
7,84
9
14
2,64
6
76
,138
75,5
00
1%
39%
Can
ine
Don
atio
ns E
xpen
ditu
res
9,51
6
19
,133
23,5
01
21
,000
30,0
00
-4
3%-7
3%C
itize
n S
urve
y90
9
518
1,50
0
1,50
0
1,50
0
0%-5
4%R
egio
n Tr
aini
ng P
lan
5,00
0
5,
000
5,
000
5,
000
5,
000
0%
0%H
azm
at67
1
933
500
-
-
100%
100%
Equ
ipm
ent M
aint
enan
ce17
,622
24
,223
12,9
00
13
,000
13,0
00
0%
29%
Bld
g M
aint
enan
ce17
,368
3,
299
5,
600
2,
500
6,
000
-1
40%
31%
Veh
icle
Mai
nten
ance
54,6
92
53,5
80
50
,500
47,5
00
48
,500
-2%
8%C
opie
r Mai
nten
ance
930
79
7
-
-
-
100%
100%
City
EE
Rec
ogni
tion
874
2,
552
60
0
60
0
60
0
0%
55%
Em
ploy
ee D
evel
opm
ent
30,4
39
25,9
91
18
,286
37,1
14
13
9,50
0
-2
76%
-460
%Tu
ition
Rei
mbu
rsem
ent
43,3
22
27,9
68
40
,000
32,5
00
37
,500
-15%
-1%
Rec
ruitm
ent E
xpen
se14
,536
8,
495
4,
000
12
,000
12,0
00
0%
-33%
Mat
eria
l & S
ervi
ce1,
874,
773
2,
213,
322
2,28
6,42
9
2,
326,
145
2,05
5,49
5
12
%3%
Inte
rnal
Insu
ranc
e C
hgs
289,
257
285,
488
335,
730
335,
730
335,
729
0%-1
1%In
tern
al V
eh M
t Chg
s1,
514
3,28
4
3,29
5
3,29
5
3,73
2
-13%
-38%
Int C
ompu
ter E
quip
Chg
s13
,081
-
-
-
39,9
96
-1
00%
-817
%In
tern
al B
ldg
Mai
nt C
hgs
-
-
46
,392
46,3
92
45
,780
1%-1
96%
Inte
rnal
Veh
& E
quip
Ren
t14
4,12
0
18
0,86
4
21
5,50
8
21
5,50
8
26
1,68
4
-2
1%-4
5%In
dire
ct C
osts
241,
200
242,
540
247,
970
247,
970
267,
808
-8%
-10%
Inte
rnal
Em
ploy
ee B
enef
it C
hg89
,082
87
,067
94,7
54
94
,754
96,8
01
-2
%-7
%In
tern
al L
ease
Pay
men
ts10
,992
-
-
-
-
10
0%10
0%In
tern
al M
S E
nter
pris
e A
gree
men
t18
,735
22
,416
18,1
04
18
,104
17,9
58
1%
9%
Operating Expenditures by Department Attachment 4 Page 23 of 24

Polic
e
Acc
ount
FY1
1 A
ctua
l F
Y12
Act
ual
FY1
3 Es
t A
ctua
l
FY1
3 A
men
ded
Bud
get
Pro
pose
d FY
14 B
udge
t
%
Cha
nge
Ove
r A
men
d
FY11
-FY
13
Avg
%
Cha
nge
Act
ual
Int B
ldng
Pre
serv
atio
n C
hrgs
84,8
28
72,6
68
73
,138
73,1
38
78
,872
-8%
-3%
Inte
rnal
Cha
rges
892,
809
894,
327
1,
034,
891
1,03
4,89
1
1,
148,
360
-11%
-22%
Veh
icle
s15
6,11
5
18
6,49
4
34
8,70
0
34
8,70
0
23
3,00
0
33
%-1
%O
ffice
Fur
nitu
re4,
222
3,07
3
-
-
-
10
0%10
0%Tr
aini
ng E
quip
men
t-
7,
194
-
-
-
100%
100%
Per
sonn
el S
afe
Equ
ip-
-
3,00
0
3,00
0
-
10
0%10
0%P
rogr
am E
quip
men
t53
,686
62
,893
21,3
26
21
,326
-
10
0%10
0%C
ompu
ter E
quip
men
t-
29
,966
29,9
66
-
-
10
0%10
0%C
omm
unic
atio
n E
quip
men
t-
6,
811
-
-
-
100%
100%
Tele
phon
e E
quip
men
t-
-
-
40
,000
-
10
0%10
0%P
ublic
Saf
ety
Info
Sys
tem
-
-
-
242,
450
255,
000
-5%
-100
%C
apita
l Out
lay
214,
023
296,
431
40
2,99
2
655,
476
48
8,00
0
26%
-60%
Tota
l All
Fund
s16
,911
,017
$
18,0
09,0
13$
18
,495
,037
$
19,3
29,5
01$
19
,703
,673
$
-2%
-11%
-
-
-
-
-
Operating Expenditures by Department Attachment 4 Page 24 of 24
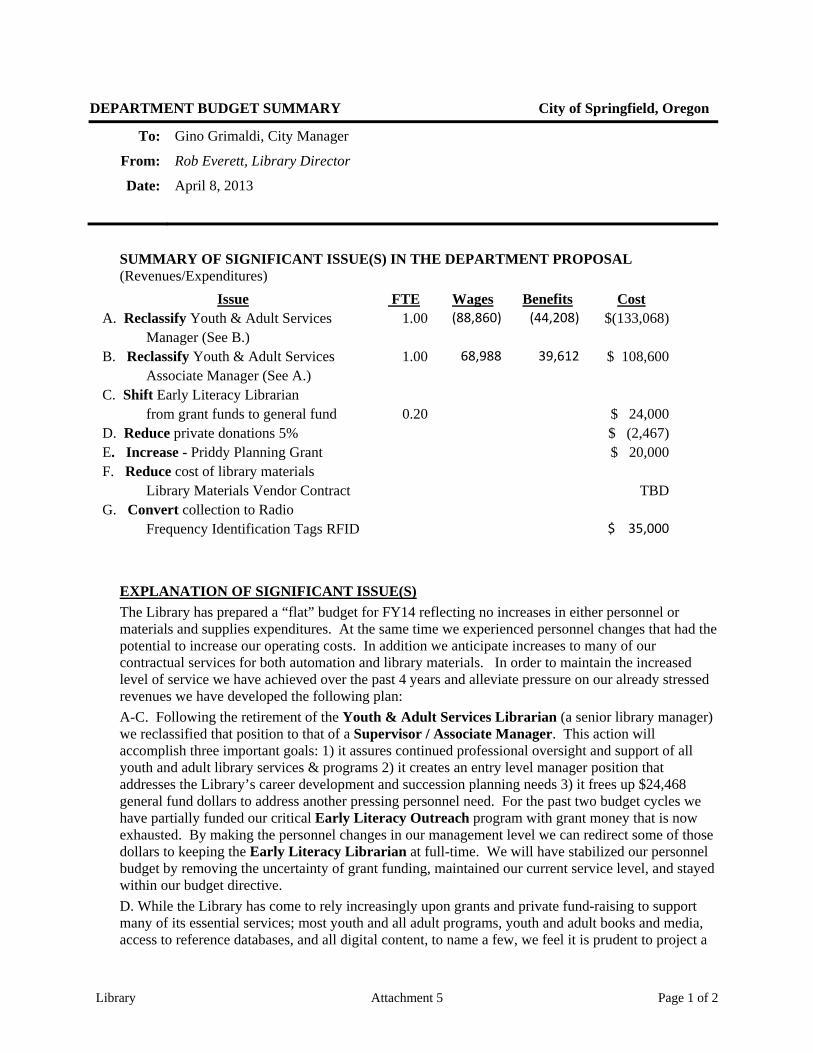
Library Attachment 5 Page 1 of 2
DEPARTMENT BUDGET SUMMARY City of Springfield, Oregon
To: Gino Grimaldi, City Manager
From: Rob Everett, Library Director
Date: April 8, 2013
SUMMARY OF SIGNIFICANT ISSUE(S) IN THE DEPARTMENT PROPOSAL (Revenues/Expenditures)
Issue FTE Wages Benefits Cost A. Reclassify Youth & Adult Services 1.00 (88,860) (44,208) $(133,068)
Manager (See B.) B. Reclassify Youth & Adult Services 1.00 68,988 39,612 $ 108,600
Associate Manager (See A.) C. Shift Early Literacy Librarian
from grant funds to general fund 0.20 $ 24,000 D. Reduce private donations 5% $ (2,467)E. Increase - Priddy Planning Grant $ 20,000 F. Reduce cost of library materials
Library Materials Vendor Contract TBD G. Convert collection to Radio
Frequency Identification Tags RFID $ 35,000 EXPLANATION OF SIGNIFICANT ISSUE(S) The Library has prepared a “flat” budget for FY14 reflecting no increases in either personnel or materials and supplies expenditures. At the same time we experienced personnel changes that had the potential to increase our operating costs. In addition we anticipate increases to many of our contractual services for both automation and library materials. In order to maintain the increased level of service we have achieved over the past 4 years and alleviate pressure on our already stressed revenues we have developed the following plan: A-C. Following the retirement of the Youth & Adult Services Librarian (a senior library manager) we reclassified that position to that of a Supervisor / Associate Manager. This action will accomplish three important goals: 1) it assures continued professional oversight and support of all youth and adult library services & programs 2) it creates an entry level manager position that addresses the Library’s career development and succession planning needs 3) it frees up $24,468 general fund dollars to address another pressing personnel need. For the past two budget cycles we have partially funded our critical Early Literacy Outreach program with grant money that is now exhausted. By making the personnel changes in our management level we can redirect some of those dollars to keeping the Early Literacy Librarian at full-time. We will have stabilized our personnel budget by removing the uncertainty of grant funding, maintained our current service level, and stayed within our budget directive. D. While the Library has come to rely increasingly upon grants and private fund-raising to support many of its essential services; most youth and all adult programs, youth and adult books and media, access to reference databases, and all digital content, to name a few, we feel it is prudent to project a

Library Attachment 5 Page 2 of 2
decrease in our private donations given the ongoing economic downturn. Both our Friends and our Foundation have overachieved in recent years but it is not something we can or should continue to count on. E. Last summer the Library received a Library Planning Grant from the Wichita Falls Area Community Foundation – Betsy Priddy Donor Advised Fund – for $20,000. We have sought the assistance of Library Development staff at the State Library in Salem to help us most effectively use this one-time funding to create a path to better library service for Springfield. We will be enlisting elected officials, community leaders, and Springfield citizens to assist us in this process. F. Last Fall the Library, with the help of the Finance Department, completed an RFP for Library Materials Vendor Services. We now have 6 major vendors, including the two largest US book wholesalers, under contract. This agreement will help us capture the most competitive pricing, the lowest shipping rates, and ultimately allow us to fully automate our selection, ordering, and receiving functions. This was the first comprehensive review of our materials vendor services in nearly 20 years. G. Just as the Library is reconfiguring its staff to provide innovative, relevant, and cost-effective service, so too, it is reconfiguring its’ technology to do the same. We have been allocated funds to convert library collections from “barcode” identification strips to Radio Frequency Identification tags. These “tags” contain all the information about a particular item and attach that information to a specific patron’s information when the item is checked out. These RFID “tags” allow stacks of books to be checked out rather than having to scan each individual book. In addition they allow easy, patron directed, self-service to occur for check- out, renewal, and for self-service holds pick-up. They also create the possibility for using remotely located, automated, book kiosks in the manner of “Redbox” video dispensing units. This technology empowers patrons to manage their own library use, allows limited staff to focus on those patron needs that require human assistance while freeing them from repetitive, mechanical, tasks, and incorporates both the identification and the security components into one, powerful, unit. CONCLUSION Mindful of current and future economic conditions the Library has reduced its personnel budget through staff reductions and reclassification of specific positions. We have supplemented library collections through private contributions, and increased programming almost completely with grant and private funds. In addition we have increased our hours of operation and have retained them even though we have fewer staff and fewer dollars than when we implemented them. Finally, we have not abandoned the future of the Library and have used both Foundation and Priddy Planning Grant funds to continue building the future of Springfield Public Library. COUNCIL GOALS/POLICIES/DEPARTMENT PERFORMANCE MEASURES AFFECTED
Council Goal: To Preserve the Hometown Feel, Livability, and Environmental Quality Performance Measures: Quality of Information Services Access to Library Services & Collections Student Success & Community Literacy RE 04/08/2013

Lib
rary
FY 2
014
Library Presentation Attachment 6 Page 1 of 12
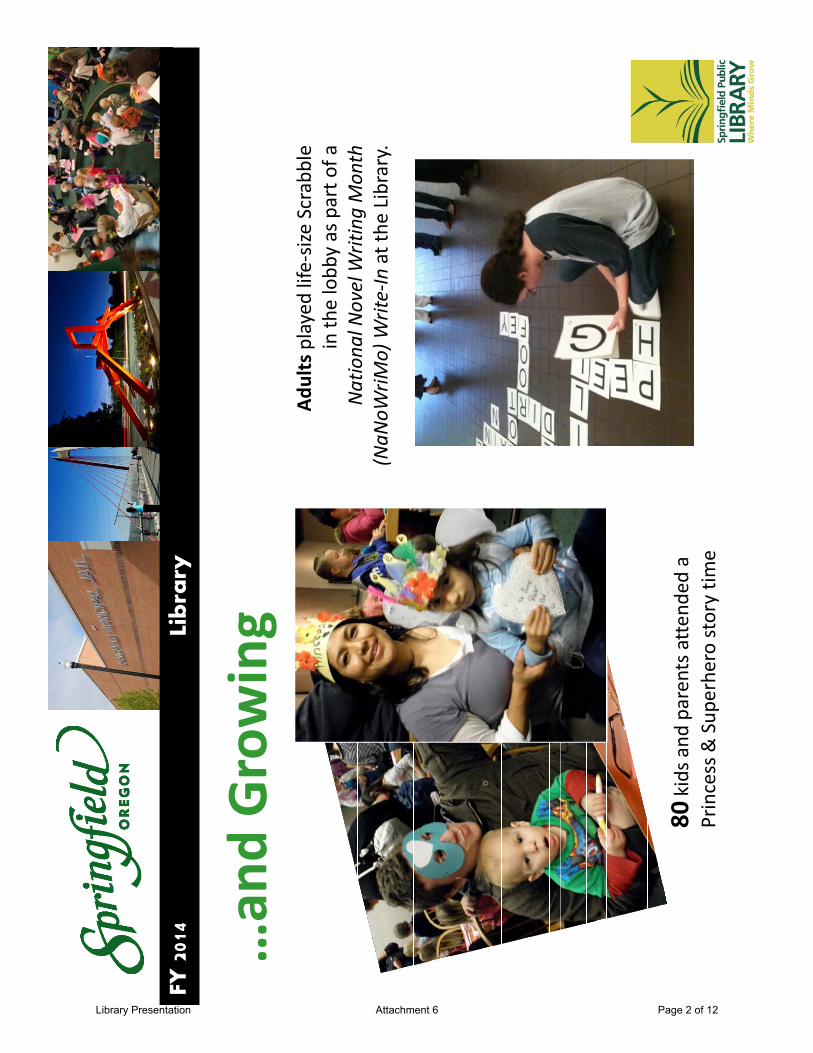
Lib
rary
FY 2
014 an
dGrowing
…an
d Growing
Adultsplayed
life‐size
Scrabble
in th
e lobb
y as part o
f aNationa
lNovelWritingMon
thNationa
l Novel W
riting Mon
th
(NaN
oWriM
o) W
rite‐In at the
Library.
80kids and
parents atten
ded a
Princess & Sup
erhe
ro story tim
e
Library Presentation Attachment 6 Page 2 of 12
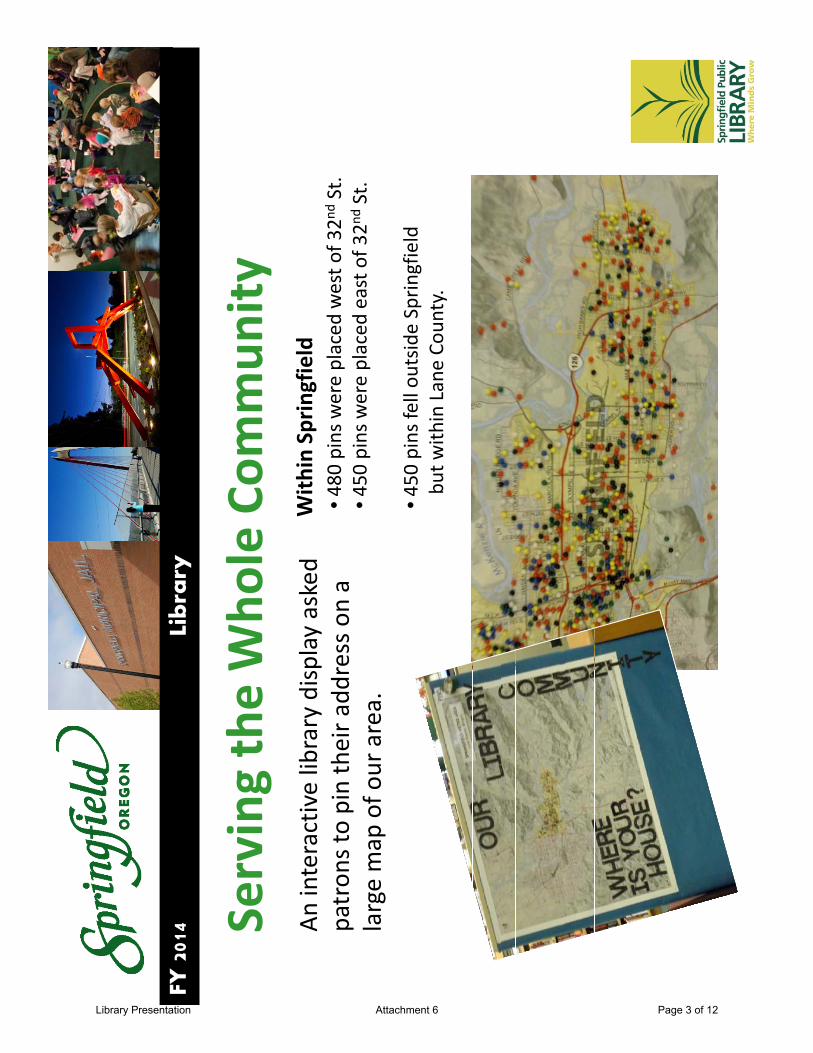
Lib
rary
FY 2
014 ServingtheWho
leCo
mmun
ityAn
interactive library disp
lay asked
patron
s to pin their a
ddress on a
•480
pins w
ere placed
west o
f 32n
dSt.
450
il
dt
f32n
dSt
With
in Springfield
Serving the Who
le Com
mun
ity
large map
of o
ur area.
•450
pins w
ere placed
east o
f 32n
dSt.
•450
pins fell outsid
e Sprin
gfield
but w
ithin Lane Co
unty.
Library Presentation Attachment 6 Page 3 of 12

Lib
rary
FY 2
014
Programs =
Creativity
At left, a visit from She
reKh
an of the
Eugene
Ballet p
rodu
ction of
Mow
gli: TheJung
le Boo
kand above,
th2013
bk
kt
ti
the 2013
boo
kmark contest w
inne
rs.
Library Presentation Attachment 6 Page 4 of 12
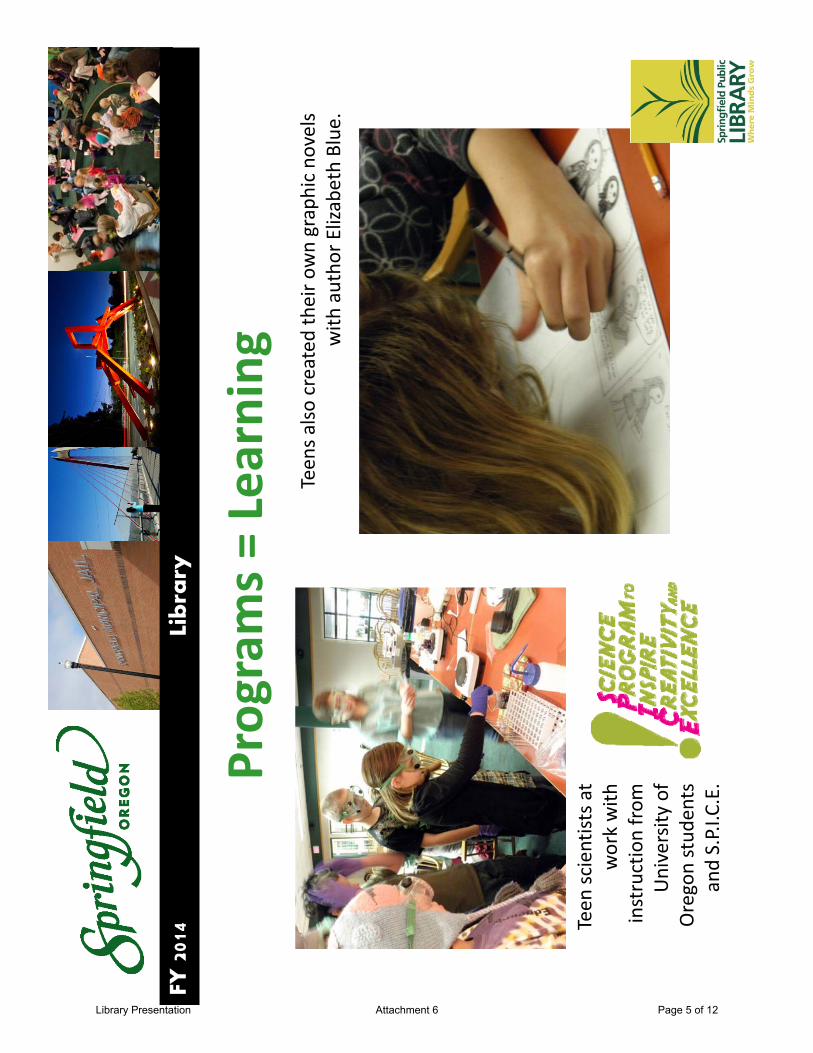
Lib
rary
FY 2
014
Programs=
Learning
Teen
s also
created
their o
wn graphic no
vels
with
autho
r Elizabeth Blue
.
Programs =
Learning
Teen
scientists a
t work with
instruction from
University
ofUniversity
of
Oregon stud
ents
and S.P.I.C
.E.
Library Presentation Attachment 6 Page 5 of 12

Lib
rary
FY 2
014 Together with
Springfield Pub
lic Schoo
ls and
Sprin
gfield‐area Ro
tary clubs, the
library is providing
every first grade
r with
their o
wn library card.
Library Presentation Attachment 6 Page 6 of 12

Lib
rary
FY 2
014
Dìade
losN
iños
Dìade
los N
iños
Library Presentation Attachment 6 Page 7 of 12

Lib
rary
FY 2
014
Controlling
Costs
Library Materials
Vend
or Services
Controlling
Costs
•Captures b
est p
ricing
•Low
est shipp
ing rates
•Allows a
utom
ated
ordering
Library Presentation Attachment 6 Page 8 of 12

Lib
rary
FY 2
014 LibraryGrants
Library Grants
•Library Fou
ndation and Friend
s of th
e Library
•Readto
Read
Grant
from
theState
•Read to Read Grant from
the State
•Gray Family Fun
d•H
erita
ge Arts G
rant from
the Sprin
gfield Arts
Commissionforo
ur“Yearo
fStorie
s”programmingDo
wnloa
d your boo
ks!
Commission for o
ur Year of Storie
s program
ming
•$20
,000
Betsy Prid
dyFund
plann
ing grant
Library Presentation Attachment 6 Page 9 of 12

Lib
rary
FY 2
014 Plan
ning
Vancou
ver P
ublic Library
Plan
ning
The library has re
ceived
a
$20000
idd
li
$20,000 Priddy
planning
grant
as we look
toward ou
r future.
One
ofmanydesig
nideasreceived
One
of m
any desig
n ideas received
from
the U of O
architecture stud
ents
durin
g the Sustaina
ble Citie
s program
.
Library Presentation Attachment 6 Page 10 of 12

Lib
rary
FY 2
014
RFID
RFID
(Radio Frequ
ency Iden
tification)
Library Presentation Attachment 6 Page 11 of 12

Lib
rary
FY 2
014 Ntth
Ed
Not th
e En
dbu
t the
Be
ginn
ing…
Library Presentation Attachment 6 Page 12 of 12
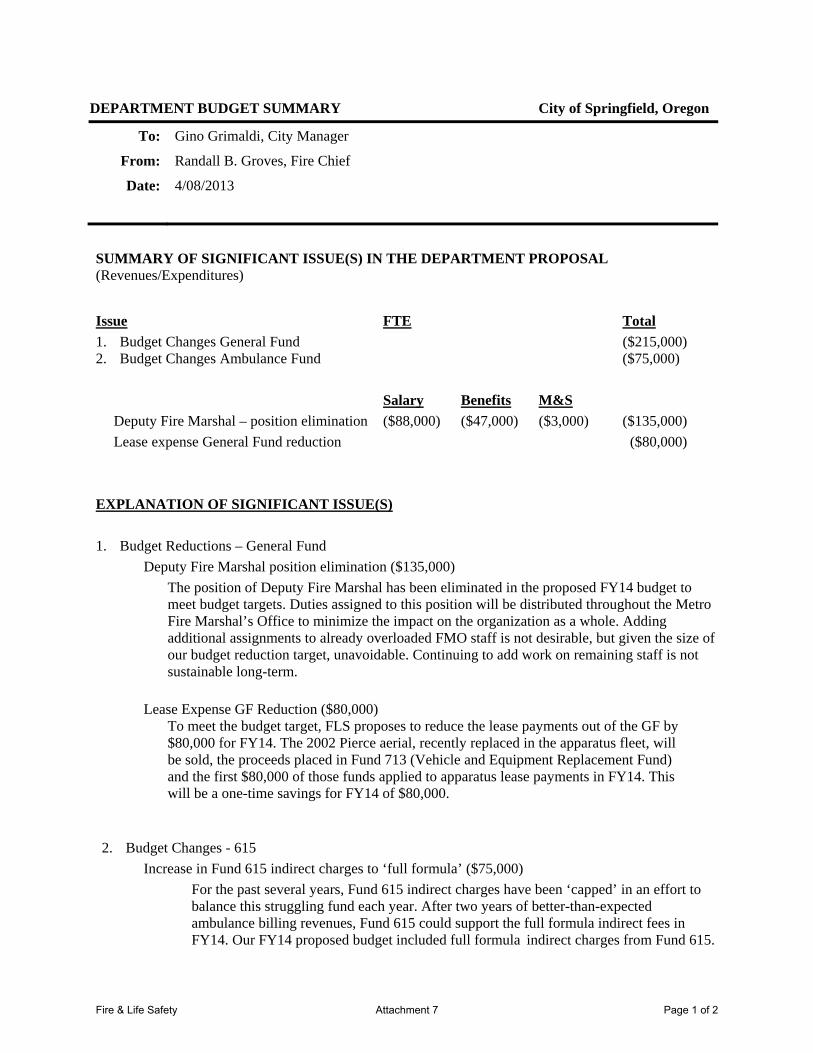
DEPARTMENT BUDGET SUMMARY City of Springfield, Oregon
To: Gino Grimaldi, City Manager
From: Randall B. Groves, Fire Chief
Date: 4/08/2013
SUMMARY OF SIGNIFICANT ISSUE(S) IN THE DEPARTMENT PROPOSAL (Revenues/Expenditures)
Issue FTE Total 1. Budget Changes General Fund ($215,000) 2. Budget Changes Ambulance Fund ($75,000) Salary Benefits M&S
Deputy Fire Marshal – position elimination ($88,000) ($47,000) ($3,000) ($135,000) Lease expense General Fund reduction ($80,000)
EXPLANATION OF SIGNIFICANT ISSUE(S)
1. Budget Reductions – General Fund
Deputy Fire Marshal position elimination ($135,000) The position of Deputy Fire Marshal has been eliminated in the proposed FY14 budget to meet budget targets. Duties assigned to this position will be distributed throughout the Metro Fire Marshal’s Office to minimize the impact on the organization as a whole. Adding additional assignments to already overloaded FMO staff is not desirable, but given the size of our budget reduction target, unavoidable. Continuing to add work on remaining staff is not sustainable long-term.
Lease Expense GF Reduction ($80,000) To meet the budget target, FLS proposes to reduce the lease payments out of the GF by $80,000 for FY14. The 2002 Pierce aerial, recently replaced in the apparatus fleet, will be sold, the proceeds placed in Fund 713 (Vehicle and Equipment Replacement Fund) and the first $80,000 of those funds applied to apparatus lease payments in FY14. This will be a one-time savings for FY14 of $80,000.
2. Budget Changes - 615
Increase in Fund 615 indirect charges to ‘full formula’ ($75,000) For the past several years, Fund 615 indirect charges have been ‘capped’ in an effort to balance this struggling fund each year. After two years of better-than-expected ambulance billing revenues, Fund 615 could support the full formula indirect fees in FY14. Our FY14 proposed budget included full formula indirect charges from Fund 615.
Fire & Life Safety Attachment 7 Page 1 of 2
CONCLUSION Reductions in the past several budget cycles have created difficult situation in FLS. With continuing to increases in fixed costs, maintenance costs, and training requirements, the need for more expenditure vs. less is evident. M&S increases are expected in FY14. Additionally, the new IAFF labor agreement will result in a number of significant changes in FY14. The implementation of Kelly Days and Comp Days (January 1, 2013) may have budget impacts. Use of overtime could increase due to additional people being potentially off duty on any given shift. Although the experience of other jurisdictions, including Eugene, has shown this system is manageable, we do not have any experience to pull from in Springfield. Therefore, the actual impact is unknown at this point and time. We will be closely monitoring the changes throughout the FY14 budget year. If further adjustments need to be made to achieve budget targets for FY14, a service-reduction may need to be implemented. The merger initiative will continue to take center stage in FY14. Focus will be on further actions to consolidate processes, standardize equipment specifications, and capitalize on efficiencies that can be gained in a metro fire model. Significant strides have been made in the past three years, even in these difficult budget times, with more improvements planned in the near future. At the same time, we believe we have hit our limits with staff reductions without impacting line operations. It should also be noted that nearly 50% of FLS operations are funded outside of General Fund property taxes. One engine company is funded by the Fire Levy, the equivalent of one station funded out fees received by the General Fund for servicing our three fire protection contract districts, and paramedics assigned to ambulances (who also perform firefighting functions), funded by the ambulance enterprise fund. FLS has proposed an FY14 budget that is challenging, but possible to meet in our current operational environment. COUNCIL GOALS/POLICIES/DEPARTMENT PERFORMANCE MEASURES AFFECTED Enhance Public Safety – FLS’s requests tie directly to the maintenance and delivery of public safety services. Appropriate staffing levels, training, and equipment, are required to ensure quality public safety services are delivered to the community.
Fire & Life Safety Attachment 7 Page 2 of 2
Fire
& L
ife
Sa
fety
FY 2
014
Pre
serv
ing
Life
, Pro
perty
, an
dan
d th
e E
nviro
nmen
t
Fire & Life Safety Presentation Attachment 8 Page 1 of 19

Fire
& L
ife
Sa
fety
FY 2
014
Phase2:
Ph3
Ph2
Phase 2:
Restated
IGA
Dec 2012
Phase 3:
The Longer Term
Phase 2:
Implem
entatio
n
Normalize
d IAFF
contracts
Logistics integratio
n
Merged Am
bulance Billiing
System
s
The who
le is greater th
an th
e sum of the
parts.
Fire & Life Safety Presentation Attachment 8 Page 2 of 19

Senior Staff
Senior Staff
Off
ice
of t
he
Chi
fCh
ief
Shift
Ope
ratio
ns(A
IC)
Spec
ial
Ope
ratio
ns ,
Trai
ning
, & E
MS
Adm
inis
trat
ive
Serv
ices
Bur
eau
Fire
Mar
shal
’sO
ffic
e
Fire & Life Safety Presentation Attachment 8 Page 3 of 19

Fire
& L
ife
Sa
fety
FY 2
014
16 fire stations, 3
Battalions
Fire & Life Safety Presentation Attachment 8 Page 4 of 19
Partne
rships & Affiliatio
ns•
Metro/Cou
nty Standard Ope
ratin
g Proced
ures (SOP)
•Au
tomatic and
Mutual A
id Agencies
•Lane
Cou
nty Fire Defen
se Board
•OregonMed
icalAssociation
•Oregon Med
ical Associatio
n•
International A
ssociatio
n of Fire
Chiefs
•Oregon State Am
bulance Association
•Oregon Fire Chief’s Association
•Oregon State Fire M
arshal’s Office
•Sacred
Heart Hospital
•IAFF Local 1395 & 851
–Firefighter’s Union
s•
AFSCMELocal1148&75
–Supp
ortS
taffUnion
sAF
SCME Local 1148 & 75
Supp
ort S
taff Union
s•
SEIU Local 503
–Supp
ort S
taff Union
•Looking Glass –Project S
afe Place
•Am
erican
Red
Cross
Ci
•Lane
Cou
nty Fair
•Lane
Com
mun
ity College (LCC
)•
OR‐OSH
A
Fire & Life Safety Presentation Attachment 8 Page 5 of 19
Fire
& L
ife
Sa
fety
FY 2
014
OG
lO
ur G
oal:
Impr
ove
Effi
cien
cy &
Eh
Si
Eff
tiE
nhan
ce S
ervi
ce E
ffect
iven
ess
Fire & Life Safety Presentation Attachment 8 Page 6 of 19

Fire
& L
ife
Sa
fety
FY 2
014
Budget/Fire
MergerImpa
cts
Budget/Fire
Merger Impa
cts
SLFS
cost sa
vings/redu
ctions:
Functio
nal con
solidation of Chief & DC OPS
$320
,000
Budget & staff red
uctio
ns
$391
,000
‐includ
es re
duction of 1 FTE DFM
in FY14
Eugene
Fire
&EM
Scostsavings/redu
ctions:
Eugene
Fire
& EMS cost sa
vings/redu
ctions:
Functio
nal con
solidation of FMO, TrngBC
, DC Ad
min
$462
,000
Budget & staff red
uctio
ns
$133
,000
Est. total savings in
FY14
$1,306
,000
Ongoing
savings in pe
rson
nel costs due
to con
solidation, re
duction, and
resource
re‐allocatio
nre
allocatio
n.
Fire & Life Safety Presentation Attachment 8 Page 7 of 19
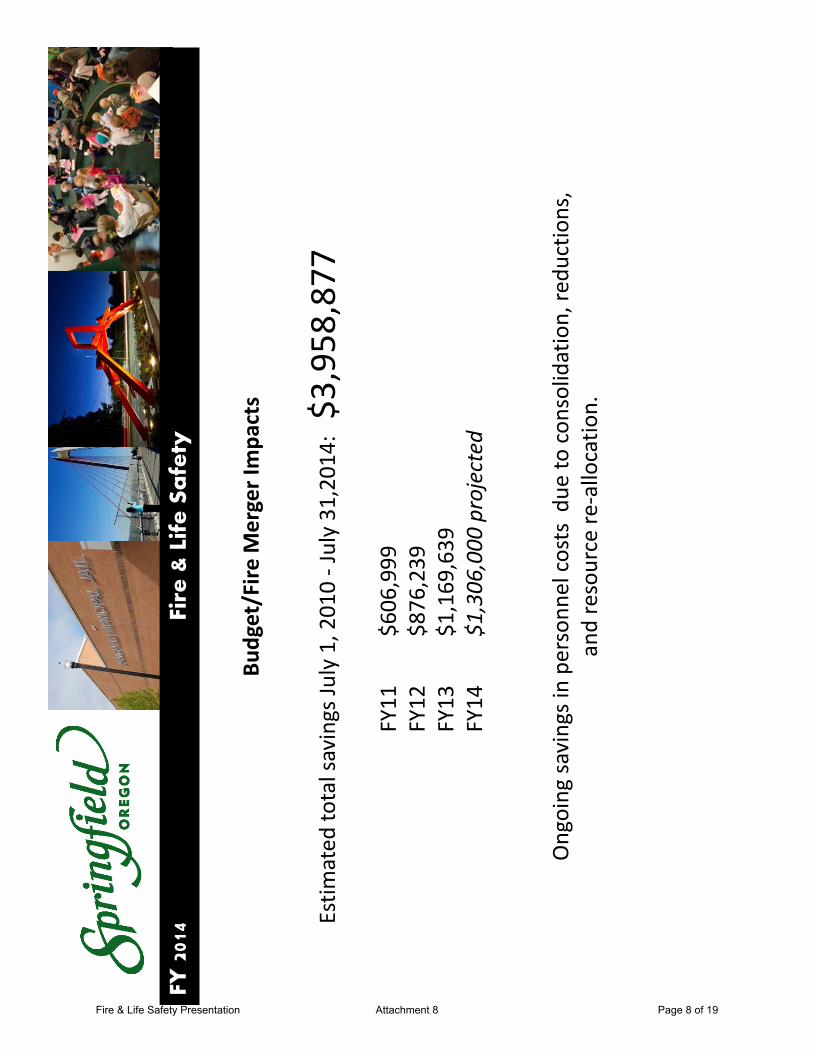
Fire
& L
ife
Sa
fety
FY 2
014
Budget/Fire
MergerImpa
cts
Budget/Fire
Merger Impa
cts
Estim
ated
total savings Ju
ly 1, 2010 ‐July 31
,201
4: $3
,958
,877
FY11
$606
,999
FY12
$876
,239
FY13
$1,169
,639
FY14
$1,306
,000
projected
Ongoing
savingsinpe
rson
nelcosts
dueto
consolidationredu
ctions
Ongoing
savings in pe
rson
nel costs due
to con
solidation, re
ductions,
and resource re
‐allocatio
n.
Fire & Life Safety Presentation Attachment 8 Page 8 of 19

Fire
& L
ife
Sa
fety
FY 2
014
FY13
Accom
plish
ments:
•Normalize
d IAFF
contracts (FY15)
•New
RMSSystem
•Joint App
aratus & Equ
ip Stnds
–Am
bulances ordered
•Logistics integration –some
functio
ns started Jan 20
13•D
elivery of new
100
’ aerial
Fire & Life Safety Presentation Attachment 8 Page 9 of 19
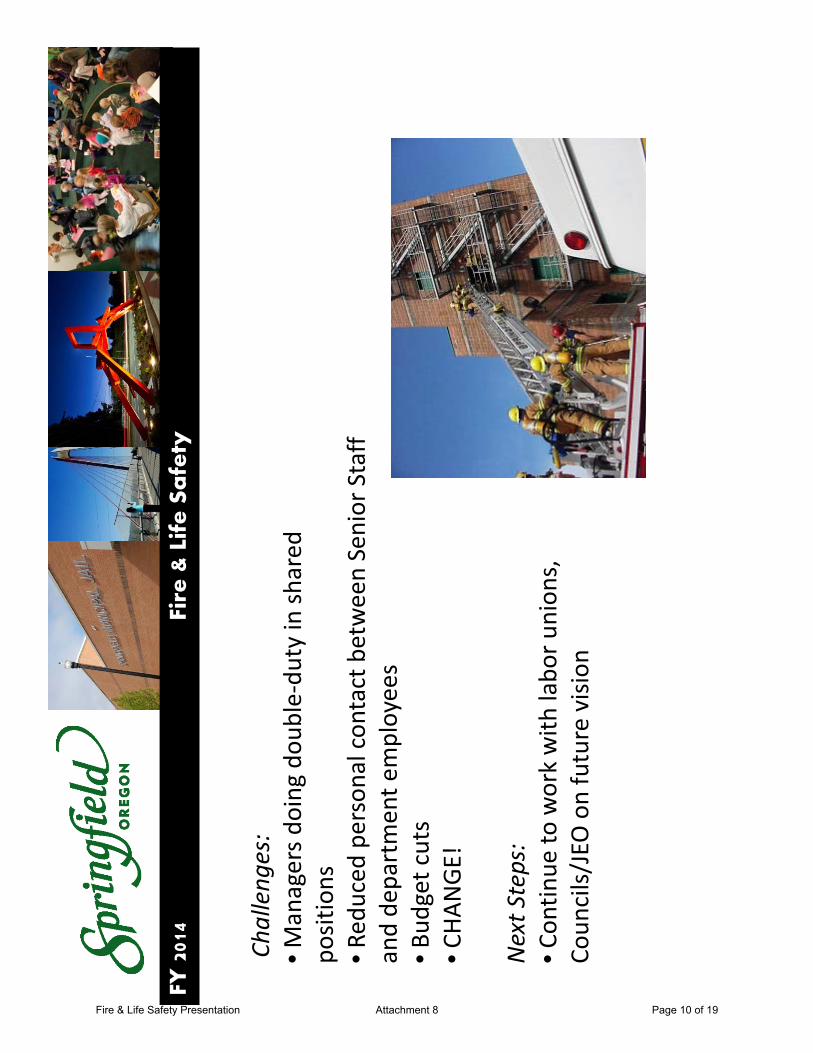
Fire
& L
ife
Sa
fety
FY 2
014
Chll
Challeng
es:
•Managers do
ing do
uble‐duty in sh
ared
po
sitions
•Red
uced
person
alcontactb
etweenSenior
Staff
•Red
uced
personal con
tact between Senior Staff
and de
partmen
t employees
•Bud
get cuts
• CHA
NGE!
CHAN
GE!
Next Steps:
•Con
tinue
to work with
labo
r union
s,
Coun
cils/JEO on future vision
Fire & Life Safety Presentation Attachment 8 Page 10 of 19

Fire
& L
ife
Sa
fety
FY 2
014
Bud get Highlights
FY13
:•A
ddition
al bud
get red
uctio
ns re
q’delim
ination of Dep
uty
Chiefp
osition
($16
0,00
0)
gg
g
Chief p
osition
($16
0,00
0)•A
ddition
al Red
uctio
ns in
Personal Services ($1
40,000
)•F
ederal Grant re
c’d to
replace Water Rescue Bo
at
($55
,000
)
FY14
:•A
ddition
al bud
get red
uctio
ns re
q’delim
ination of Dep
uty
Fire M
arshal position
($13
5,00
0)p
()
•Full Formula Indirectsto be
paid by Ambu
lance Fund
to GF
($75
,000
increase in
cost to Fund
615)
•Ambu
lance and Levy Fun
ds to
use re
serves to
balance
Fire & Life Safety Presentation Attachment 8 Page 11 of 19
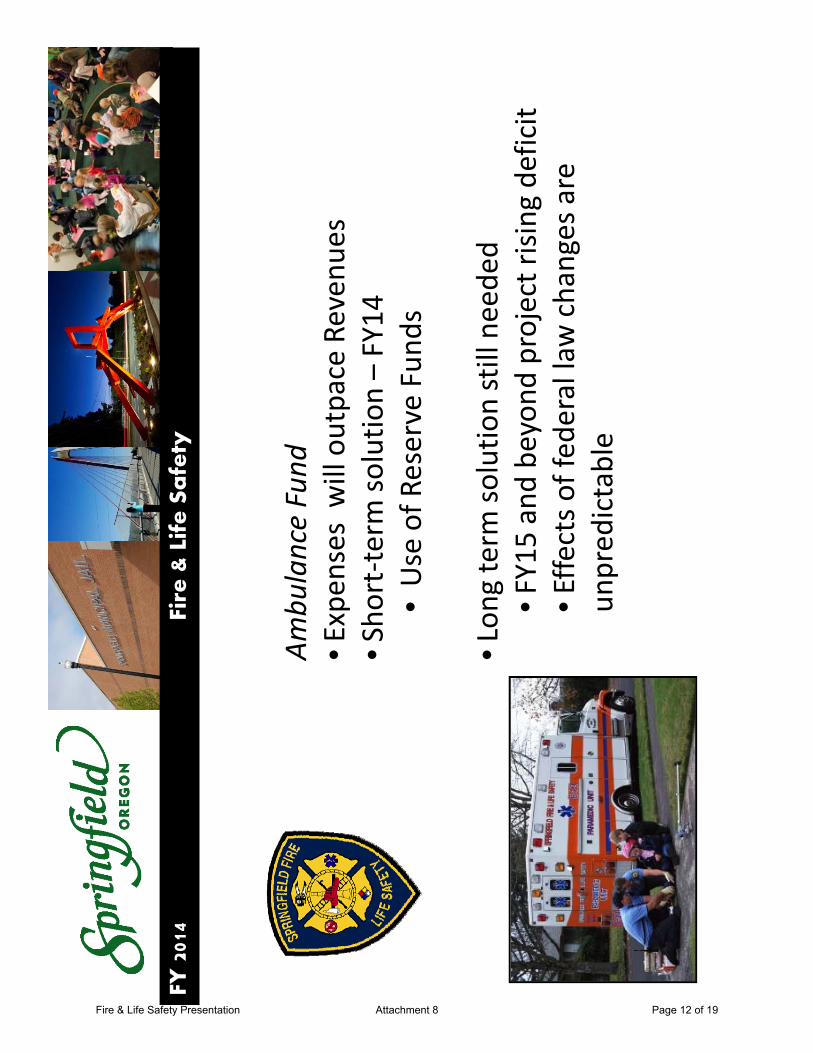
Fire
& L
ife
Sa
fety
FY 2
014
Ambu
lance Fund
•E
xpen
ses will outpace Reven
ues
•Sho
rt‐term so
lutio
n –FY14
•Use of R
eserve Fun
ds
•Lon
g term
solutio
n still neede
d •F
Y15 and be
yond
project risin
g deficit
•Effe
ctso
ffed
erallawchangesa
re•E
ffects o
f fed
eral law changes are
unpred
ictable
Fire & Life Safety Presentation Attachment 8 Page 12 of 19

Fire
& L
ife
Sa
fety
FY 2
014
4%14%
Whe
re our Peo
ple Are
4%
Fire Ope
ratio
ns
Fire M
arshal
Admin/Sup
port
100 Total FTE
1 FTE Re
duction
FY10
108FTE
82%
Admin/Sup
port
Allocatio
n of hum
an re
sources be
tween fire/rescue
ope
ratio
ns,
admin/sup
port, and
fire prevention (cod
e en
forcem
ent, fire cause
FY10
–10
8 FTE
/pp
,p
(,
investigations and
pub
lic edu
catio
n functio
ns).
Fire & Life Safety Presentation Attachment 8 Page 13 of 19

Fire
& L
ife
Sa
fety
FY 2
014
FY14
SFL
S Fu
ndin
g So
urce
s
Total Reven
ue:
$17147129
Regular G
eneral
Fund
$
EMS Fund
$5,292
,717
31%
$17,147,129
Total Expen
ses:
$16,67
9,52
1
$8,094
,213
47%
Levy
$1,922
,865
11%
Fire M
arshal
$188
,700
Fire Con
tracts
$1,648
,634
$188
,700
1%$1
,648
,634
10%
Fire & Life Safety Presentation Attachment 8 Page 14 of 19

Fire
& L
ife
Sa
fety
FY 2
014
Bud
get R
educ
tion
Impa
cts
Elim
ination of Dep
uty Fire M
arshal position
($13
5,00
0)•
Net re
duction in FMOstaffin
g be
tween Eu
gene
& Springfield
Increased Indirect costs to
Fun
d 615
•Ongoing
savings to GF, $7
5,00
0 increased expe
nse to Fun
d 615
•Not su
stainable with
large deficits in
Fun
d 615 projected FY15
andbe
yond
and be
yond
Transitione
d some Logistics fun
ctions to
EUGLogistics
•Re
duced OT costs, but increased Co
ntractual Services c
osts as
part of IGAfor Logistics services
•Long
term
–efficiencies expe
cted
to produ
ce savings
Partne
rship with
IAFF
1395
will achieve bud
get targets.
Ifne
cessary,redu
ceam
bulances
services
mid‐year.
If ne
cessary, re
duce ambu
lances se
rvices m
idyear.
Fire & Life Safety Presentation Attachment 8 Page 15 of 19

Fire
& L
ife
Sa
fety
FY 2
014 S
tn12
= 24
hou
r Metro Ambu
lance
= Peak Activity
/Overlo
ad Ambu
lance
Ú
Ú
Ú
Ú
Stn
12
Stn
11
Ú
ÚÚ
ÚÚ
Ú
Ú
Ú
Ú
Stn
7
Stn
8
St
2
Stn
9S
tn 6
Stn
5
ÚÚ
Ú
ÚÚÚ
ÚÚ
Ú
ÚÚ
Ú
Stn
2
Stn
1S
tn 1
3S
tn 1
0
Stn
4S
tn 3
Stn
14
Stn
16
ÚÚS
tn 1
5
Fire & Life Safety Presentation Attachment 8 Page 16 of 19

Fire
& L
ife
Sa
fety
FY 2
014
Fire Protection Co
ntracts:
•Don
’t requ
ire add
ition
al
tti
ttff
stations, app
aratus, or staff
•Provide
s app
rox. 10%
of
Fire
Gen
eralFund
revenu
e
•Glenw
oodWater
District
Fire Gen
eral Fun
d revenu
e
•Glenw
ood Water District
•Rainb
ow W
ater District
•Willaken
zie Fire
District
Fire & Life Safety Presentation Attachment 8 Page 17 of 19
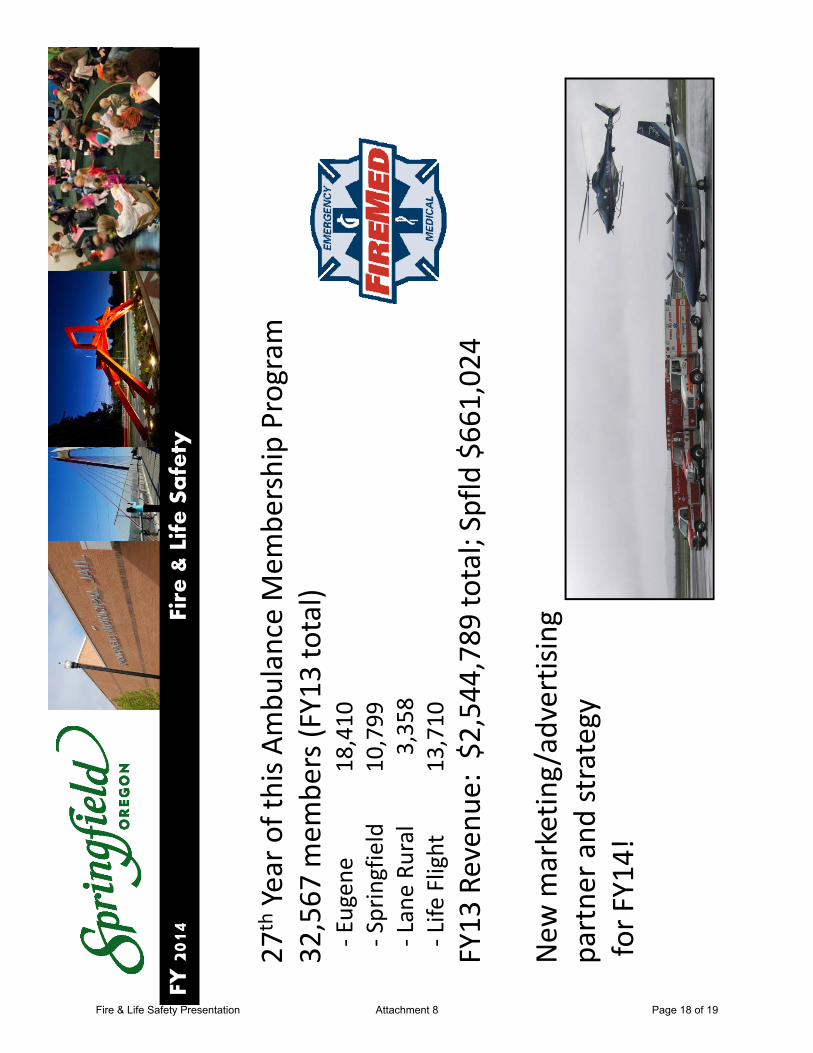
Fire
& L
ife
Sa
fety
FY 2
014
27thYear of this A
mbu
lance Mem
bership Program
32,567
mem
bers (FY13 total)
‐Eugen
e18
,410
g,
‐Springfield
10,799
‐Lane Ru
ral
3,35
8‐Life
Flight
13,710
$$
FY13
Reven
ue: $2
,544,789
total; Spfld
$661,024
New
marketin
g/advertising
g/
gpartne
r and
strategy
for F
Y14!
Fire & Life Safety Presentation Attachment 8 Page 18 of 19
Fire
& L
ife
Sa
fety
FY 2
014
New
Pierce
100’Ae
rialA
pparatus
–Tower
3New
Pierce 100 Aerial A
pparatus Tower 3
Fire & Life Safety Presentation Attachment 8 Page 19 of 19

DEPARTMENT BUDGET SUMMARY City of Springfield, Oregon
To: Gino Grimaldi, City Manager
From: Greta Utecht, Human Resources Director
Date: February 19, 2013
SUMMARY OF SIGNIFICANT ISSUE(S) IN THE DEPARTMENT PROPOSAL (Revenues/Expenditures)
Issue FTE Cost
Implementation of self-funding for employee health insurance; transitioning from being fully insured.
TBD: Short term (less than 1 year) part-time resource need
Potential SAVINGS of $200,000-$400,000.
Review of Workers Compensation insurance options; may result in program changes effective 7/1/2013.
TBD: Short term (less than 1 year) part-time resource need
See above.
Continue to implement Fire Merger NA
EXPLANATION OF SIGNIFICANT ISSUE(S) The City has been fully insured for employee health insurance for several years, meaning that we purchased an insurance policy to pay for our employees’ and their dependents’ health care. Until January 1, 2013 our insurer was PacificSource, and the premium we paid for the insurance was based primarily on our usage of health care. PacificSource reviewed our history, looked at our demographics, looked at health care costs and trends, and then took the risk of determining what they thought our health care usage would cost. If they guessed too low and set our premiums too low, they lost. If they guessed too high, we had a provision in our contract with them that provided us a refund up to a certain percentage of the over-payment. Because of the risk they were taking, we paid them a higher level of administrative fees to somewhat protect them, and because of being fully insured, we also paid State taxes that we won’t be paying now that we’ve become self-funded. Now the City will be taking the risk and paying for our employees’ health costs. Although no longer serving as our insurer, PacificSource continues to be our Third Party Administrator and provides the interface between our employees and their health care providers. From the employees’ perspective, nothing has changed. Claims continue to be processed through PacificSource but fully paid by the City. At this point we are evaluating whether being fully insured will have workload implications on Human Resources or Finance, which is why the FTE column above indicates “To Be Determined”. In addition to changes in health insurance provision, the City is contemplating changes in our Workers Compensation program that will blend with our payroll system more seamlessly. We are currently working with our insurance broker top to ascertain what options we may have. If we determine that changing carriers is the best option, that transition will undoubtedly have a workload impact on Human Resources staff, given the experience we’ve had with health insurance changes.
Human Resources Attachment 9 Page 1 of 2
Finally, the Fire Department Merger has had a substantial workload impact this past year, particularly with two contract negotiations and implementation of a new pay structure. The result is that other work priorities (such as revamping the performance evaluation process and reviewing leave accrual caps) have been delayed or taken off the list. Our ability to cope with the health and workers compensation insurance changes will determine how and when we are able to resume those other projects. CONCLUSION More than ever, effective utilization of our benefits will be important, and maintaining our employees’ wellness for both occupational and non-occupational areas will have immediate impacts on our costs. Our goal is to minimize the impact of ever-increasing health industry costs (8% on average each year) and keep our costs level. COUNCIL GOALS/POLICIES/DEPARTMENT PERFORMANCE MEASURES AFFECTED GOAL: To Offer Financially Responsible and Stable Government Services Department Performance Measure: Maintain health insurance premium costs at trend or below through wellness initiatives and plan design.
Lower our workers compensation experience rating and program complexity.
Human Resources Attachment 9 Page 2 of 2