CITY OF SARATOGA ROAD MAINTENANCE FEES ANALYSIS
10
CITY OF SARATOGA ROAD MAINTENANCE FEES ANALYSIS Prepared by CSG Consultants, Inc. June, 2007 1700 South Amphlett Blvd., Third Floor, San Mateo, CA 94402 (650) 522-2500 | (650) 522-2599 | www.csgwebsite.com San Mateo • Sacramento • Pleasanton • Salinas • Costa Mesa
-
Upload
khangminh22 -
Category
Documents
-
view
2 -
download
0
Transcript of CITY OF SARATOGA ROAD MAINTENANCE FEES ANALYSIS
CITY OF SARATOGA
ROAD MAINTENANCE FEES ANALYSIS
Prepared by CSG Consultants, Inc.June, 2007
1700 South Amphlett Blvd., Third Floor, San Mateo, CA 94402
(650) 522-2500 | (650) 522-2599 | www.csgwebsite.com
San Mateo • Sacramento • Pleasanton • Salinas • Costa Mesa
Saratoga Road Maintenance Fees Analysis: June, 2007 | 1
ROAD MAINTENANCE FEES ANALYSIS
Executive Summary
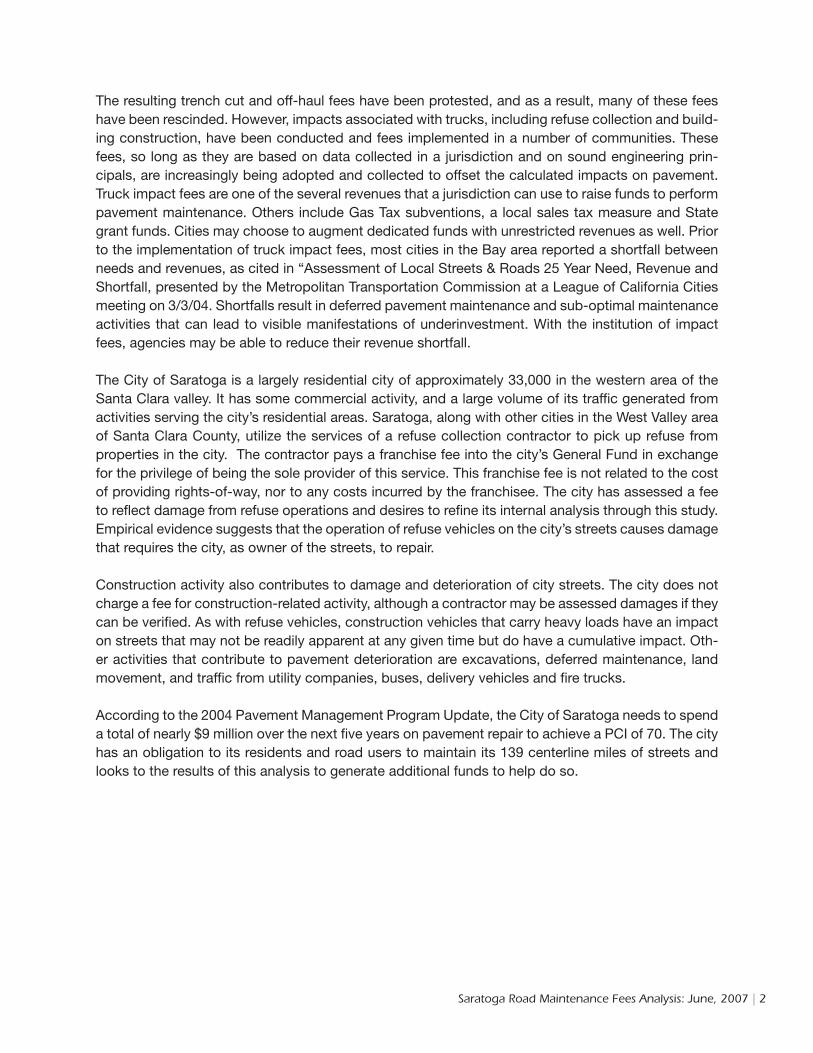
The City of Saratoga contracted with the City of Campbell to work with other West Valley cities to analyze fiscal impacts of refuse and construction vehicles on road maintenance and to develop fees that might justifiably be assessed to users to mitigate costs of damage or deterioration in pavements. A fee of $62,989 has been calculated as a fair assessment of impact of refuse vehicles on city streets and a fee up to $.77 per $100 of building valuation has been calculated as a fair assessment of impact of construction-related vehicles on city streets. A summary of annual deterioration costs is presented below in Table 1.
Table 1: Cost of Deterioration by Vehicle Class
CLASS DETERIORATION ANNUAL COST Refuse and recycling 5.96% $62,989 Construction 59.86% $632,079 Other trucks 33.71% $356,030 All other vehicles .46% $4,902
TOTAL 100% Not applicable
Purpose of the Study
The City of Saratoga desires to determine the impact of trucks on town streets that will be assessed to offset the costs of pavement damage or deterioration to city-maintained streets. To do so, the City desires to have an engineering analysis performed that develops a nexus between the proposed fee and the cost of maintaining its pavement. Further, the City desires to assess a fair and reasonable fee that can be relatively easily and inexpensively collected from those user groups that have a business relationship with the city.
Background Cities in the San Francisco Bay area have developed Pavement Management Programs (PMP) begin-ning with a pilot program managed by the Metropolitan Transportation Commission in 1984. Since then, 106 Bay area cities and agencies have used the PMP to evaluate roads, estimate budget needs and select optimal pavement rehabilitation strategies. As pavement evaluation was conducted on an on-going basis, agencies began to recognize that there are a number of factors that contribute to pavement damage and have attempted to quantify these factors. Studies done for San Francisco, Santa Ana and several other large cities focused on the deterioration due to trench cuts. Another study conducted for Morgan Hill focused on damage caused by trucks as well as that caused by numerous water line breaks. Other studies focused on damage caused by off-haul of excavated dirt.
Saratoga Road Maintenance Fees Analysis: June, 2007 | 2
The resulting trench cut and off-haul fees have been protested, and as a result, many of these fees have been rescinded. However, impacts associated with trucks, including refuse collection and build-ing construction, have been conducted and fees implemented in a number of communities. These fees, so long as they are based on data collected in a jurisdiction and on sound engineering prin-cipals, are increasingly being adopted and collected to offset the calculated impacts on pavement. Truck impact fees are one of the several revenues that a jurisdiction can use to raise funds to perform pavement maintenance. Others include Gas Tax subventions, a local sales tax measure and State grant funds. Cities may choose to augment dedicated funds with unrestricted revenues as well. Prior to the implementation of truck impact fees, most cities in the Bay area reported a shortfall between needs and revenues, as cited in “Assessment of Local Streets & Roads 25 Year Need, Revenue and Shortfall, presented by the Metropolitan Transportation Commission at a League of California Cities meeting on 3/3/04. Shortfalls result in deferred pavement maintenance and sub-optimal maintenance activities that can lead to visible manifestations of underinvestment. With the institution of impact fees, agencies may be able to reduce their revenue shortfall.
The City of Saratoga is a largely residential city of approximately 33,000 in the western area of the Santa Clara valley. It has some commercial activity, and a large volume of its traffic generated from activities serving the city’s residential areas. Saratoga, along with other cities in the West Valley area of Santa Clara County, utilize the services of a refuse collection contractor to pick up refuse from properties in the city. The contractor pays a franchise fee into the city’s General Fund in exchange for the privilege of being the sole provider of this service. This franchise fee is not related to the cost of providing rights-of-way, nor to any costs incurred by the franchisee. The city has assessed a fee to reflect damage from refuse operations and desires to refine its internal analysis through this study. Empirical evidence suggests that the operation of refuse vehicles on the city’s streets causes damage that requires the city, as owner of the streets, to repair.
Construction activity also contributes to damage and deterioration of city streets. The city does not charge a fee for construction-related activity, although a contractor may be assessed damages if they can be verified. As with refuse vehicles, construction vehicles that carry heavy loads have an impact on streets that may not be readily apparent at any given time but do have a cumulative impact. Oth-er activities that contribute to pavement deterioration are excavations, deferred maintenance, land movement, and traffic from utility companies, buses, delivery vehicles and fire trucks.
According to the 2004 Pavement Management Program Update, the City of Saratoga needs to spend a total of nearly $9 million over the next five years on pavement repair to achieve a PCI of 70. The city has an obligation to its residents and road users to maintain its 139 centerline miles of streets and looks to the results of this analysis to generate additional funds to help do so.
Saratoga Road Maintenance Fees Analysis: June, 2007 | �
Procedure
This study is based on relatively simple and straight-forward analysis. Pavements are designed to bear the load of vehicles by spreading axle loads through the pavement and base to the sub-base. Heavier axle loads place greater demand on pavement, in a non-linear manner, and consequently “use up” more of the pavement life than lighter loads. Studies conducted on behalf of various agen-cies suggest that pavement deteriorates through the repeated loading of vehicles and can be miti-gated through design that considers the bearing capacity of the pavement. Periodic maintenance is necessary to mitigate the effects of oxidation by solar radiation, deterioration due to water intrusion and deterioration due to loads. The study compares the cost of maintenance plus the deferred cost of maintenance at a given level to the impacts of traffic measured on city streets and develops a nexus between costs and several types of traffic activity. It analyzes two types of traffic and their impacts in particular, refuse collection (excluding roll-off type bins) and building and site construc-tion vehicles. Following is a description of tasks performed to quantify these impacts. Factors which affect both types of vehicles are presented first, followed by an analysis of refuse collection and then analysis of construction vehicles.
Overall Study Tasks
Determine the Pavement Condition Index Evaluation of the roads of the City of Saratoga was contracted by the Metropolitan Transportation Commission to perform pavement condition surveys under the Pavement Management Technical Assistance Program (P-TAP) Round 5 to update the Pavement Management Program (PMP). The study evaluated the overall condition of the City’s street network consisting of 86.7 center-line miles of paved streets.
Estimate Cost of Roadway Deterioration The PMP includes a number of analyses that are useful in quantifying the costs of pavement maintenance and deterioration. The PMP uses unit cost data and observations of pavement to develop projections of costs for a ten-year horizon. Although pavement wears out through use every day, the visual manifestation of deterioration may not become evident for several years. However, taken as observations over time, the PMP does provide several useful numbers. As part of the report’s analysis, it estimates the costs over a 10-year period to maintain the PCI. For the basis of this study, maintenance cost for five years was considered, as variables beyond this time frame are difficult to estimate. Similar studies use a 20 year horizon, based on the assumption that pavement has a 20 year life span and can be fully depreciated over that time. However, the PMP does not calculate a residual value, so the shorter time frame was used. If the PCI is maintained at a constant level, then the cost of maintenance should just equal the deterioration, so the annual cost can be used to assess users. This figure was calculated in 2004, with calculations showing that over the next 5 years, maintaining the PCI will require a total expenditure of $9 million, or an annual cost of nearly $1.8 million in roadway maintenance that was used to spread costs to users.
1.
2.

Saratoga Road Maintenance Fees Analysis: June, 2007 | 4
Perform Traffic Volume Counts Vehicle counts were done at several locations represent-ing traffic in the city. Since manual counts were done for periods less than 24 hours, the hours represented were compared to the percentage for those hours in a 24 hour machine count for similar class of street and the physical counts were expanded to a 24 hour day. For truck traffic, the figures were expanded based on a five day work week.
Determine Truck Traffic Volumes and Classifications Traffic volumes by functional class of vehicle, using Federal Highway Administration classifications, were taken on a number of streets in Saratoga. The counts were performed on weekdays when both construction and refuse collection activity occur and covered approximately 3-hour intervals. The numbers obtained were then expanded by using the total average ap-plicable machine-derived 24 hour traffic counts for arterial, collector, or residential streets to attain a percentage consisting of different classed vehicles compared with the total vehicle count. The vehicles are classified according to weight and the dis-tribution of their loads over the number of axles standardized into Equivalent Single Axle Loadings (ESAL). The classifications range from passenger vehicles and pickup trucks, whose loadings are considered negligible, to larger 5-axle single trailer trucks whose loadings do significant damage to the pavement. Additional counting was per-formed in Campbell to count trucks and buses only. Vehicles were classified by visual observation by the following types: trades, delivery, landscaping service, excavation, construction support and materials, buses and other.
Refuse Collection Vehicles Analysis
Refuse vehicles represent one of the more easily identifiable users who travel on city streets every weekday. They travel at least once in each direction along every city street, and make multiple trips on some streets going to and from their base of operation to their collection routes. In our observa-tions, few other vehicles have as high an ESAL as refuse collection vehicles, and the other observed vehicles are not scheduled nor do they often travel on city streets, except for arterials and other com-mercial-serving streets. Therefore, one of the two major analyses of the impact of vehicles on streets focuses on refuse collection vehicles. This study determines refuse vehicle frequency and weight and uses these figures to calculate the impact that these vehicles have as a percentage of all vehicles on city streets.
An analysis based on observations of refuse collection operations in similar jurisdictions was used to develop vehicle routing information. The prospective refuse franchisee was contacted and fur-nished information on proposed refuse collection vehicles and both front and rear axle loading, but did not furnish information on routing or frequency. City staff provided information that refuse is col-lected weekly, with separate trucks for trash and recycling, with the latter truck also collecting green waste.
3.
4.
Saratoga Road Maintenance Fees Analysis: June, 2007 | 5
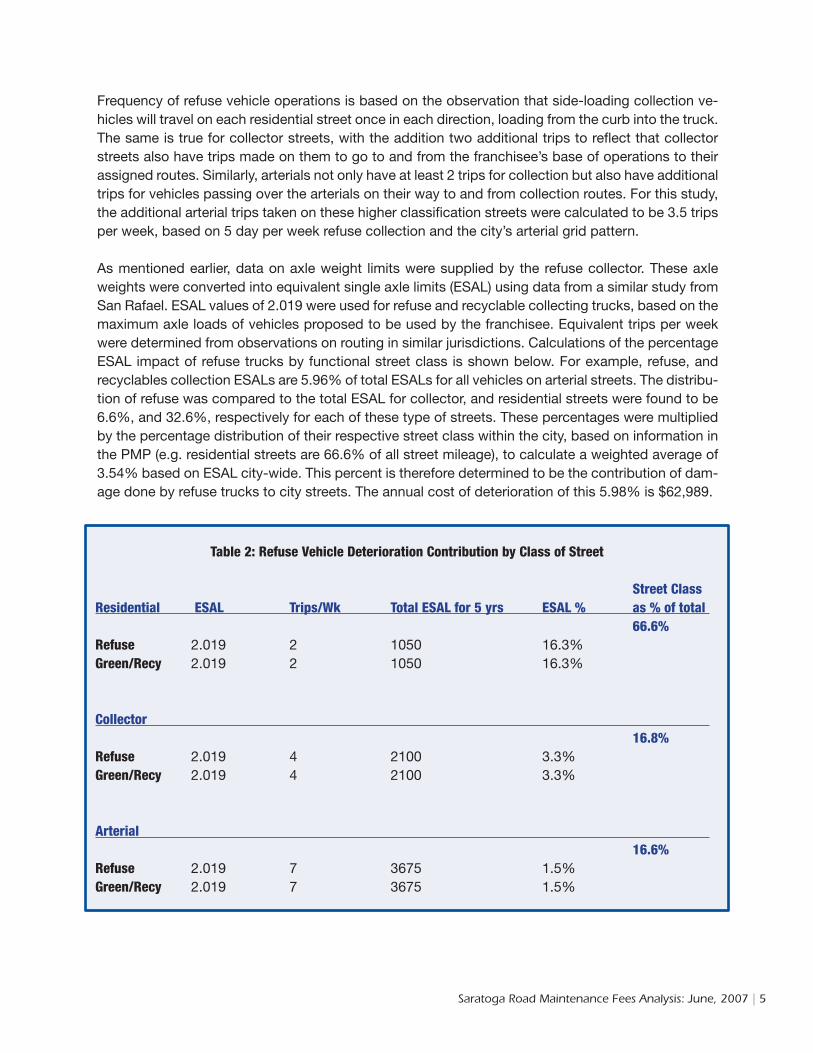
Frequency of refuse vehicle operations is based on the observation that side-loading collection ve-hicles will travel on each residential street once in each direction, loading from the curb into the truck. The same is true for collector streets, with the addition two additional trips to reflect that collector streets also have trips made on them to go to and from the franchisee’s base of operations to their assigned routes. Similarly, arterials not only have at least 2 trips for collection but also have additional trips for vehicles passing over the arterials on their way to and from collection routes. For this study, the additional arterial trips taken on these higher classification streets were calculated to be 3.5 trips per week, based on 5 day per week refuse collection and the city’s arterial grid pattern.
As mentioned earlier, data on axle weight limits were supplied by the refuse collector. These axle weights were converted into equivalent single axle limits (ESAL) using data from a similar study from San Rafael. ESAL values of 2.019 were used for refuse and recyclable collecting trucks, based on the maximum axle loads of vehicles proposed to be used by the franchisee. Equivalent trips per week were determined from observations on routing in similar jurisdictions. Calculations of the percentage ESAL impact of refuse trucks by functional street class is shown below. For example, refuse, and recyclables collection ESALs are 5.96% of total ESALs for all vehicles on arterial streets. The distribu-tion of refuse was compared to the total ESAL for collector, and residential streets were found to be 6.6%, and 32.6%, respectively for each of these type of streets. These percentages were multiplied by the percentage distribution of their respective street class within the city, based on information in the PMP (e.g. residential streets are 66.6% of all street mileage), to calculate a weighted average of 3.54% based on ESAL city-wide. This percent is therefore determined to be the contribution of dam-age done by refuse trucks to city streets. The annual cost of deterioration of this 5.98% is $62,989.
Table 2: Refuse Vehicle Deterioration Contribution by Class of Street Street ClassResidential ESAL Trips/Wk Total ESAL for 5 yrs ESAL % as % of total 66.6%Refuse 2.019 2 1050 16.3% Green/Recy 2.019 2 1050 16.3%
Collector 16.8%Refuse 2.019 4 2100 3.3% Green/Recy 2.019 4 2100 3.3%
Arterial 16.6%Refuse 2.019 7 3675 1.5% Green/Recy 2.019 7 3675 1.5%

Saratoga Road Maintenance Fees Analysis: June, 2007 | 6
Construction Vehicles Analysis
Vehicles engaged in building and site construction represent another of the more easily identifiable users who travel on city streets every weekday. Vehicles in this category include transports carry-ing earthmoving and construction materials handling equipment, dump trucks, and trades vehicles including plumbers, electricians, HVAC and sheet metal contractors, masons and carpenters. Ex-cluded from this category were vehicles primarily carrying landscaping tools, as well as delivery vans, buses, vehicles not towing commercial equipment and buses. The following tasks were performed in this analysis.
Determine Construction Vehicle Volume Construction vehicle volume and classification was determined through manual counting of vehicles in classes 2 through 10. Delivery and service vehicles were excluded. Data was expanded into daily volumes based on hourly counts and matching the hours in this study’s counts. A weighted ESAL, using FHWA ESAL figures by class, was calculated based on total truck traffic for each class and road type in the city. This weighted measure was used to calculate the impact of construction vehicle activity.
Calculate Load Volume for Building Construction Activity Load estimates were ascer-tained by summarizing building permit data from FY 2005–2006 obtained from the City of Saratoga Building Department. Data was given in the form of square footage or valuation of a specific type of construction. The square footage was converted to weight according to the type of construction materials involved (i.e. deck, retaining walls, roofing). If only valuations were given, an approximation was made by dividing the valuation amount by cost per square foot of construction according to the average based on other homes built or remodeled in the area. Estimates of construction traffic were derived by dividing the total weight of each type of construction by an assumed class-7 construction truck load capacity which resulted in number of trips made by these vehicles. (A class-7 truck is defined as “All trucks on a single frame with four or more axles”). These trips were then converted to their respective ESAL values (ESAL = .42 for class 7).
Following this analysis, staff considered the results and compared them to the analysis performed above. In a similar study, the number of truck trips were estimated based on the capacity of a single class of truck and the assumed weight of buildings, based on building code load characteristics. While this method might be useful in analyzing the number of truck trips to import or export soil, it was rejected in favor of the analysis described below. However, it served to develop an understand-ing of the type of activity that a building permit represents. Because any permit might generate a truck trip in class 5 or above, whether it be a delivery vehicle delivering a water heater, roofing mate-rial, or any other building material or service, this study will include all building permits as the base for assessing costs.
1.
2.

Saratoga Road Maintenance Fees Analysis: June, 2007 | 7
The values in the tables below were derived from the traffic counts and show construction vehicles and other trucks converted to ESAL.
Estimate Equivalent Single Axle Loading due to Construction Activity ESAL values of 0.28, 0.29 and 0.27 were used for construction vehicles on arterial, collector and residential streets, based on weighting by class of vehicle counted on each class of street. Our traffic counts indicated that there were approximately 2,090, 499 and 38 trips per week from construction vehicles for arterial, collector and residential streets, respec-tively. Converting these values and determining the percent value of these ESALs compared to the total ESALs, by all vehicles, resulted in 62%, 59% and 41.5% for arterial, collector, and residential streets due to construction vehicles. The weighted average due to ESALs was found to 59.86% of the total deterioration due to con-struction vehicles.
Apportion Cost of Roadway Deterioration by Traffic Type Using the traffic volume counts and the estimate of Equivalent Single Axle Loadings due to construction activity, we can approximate the value of deterioration due to construction by multiplying the total cost of roadway deterioration (due to load), by the impacts, on a percentage basis of total trips, due to construction vehicles. This will give us a dollar value for cost of roadway deterioration due to construction vehicles. The cost of roadway deterioration due to all traffic was found to be $8.8 million
3.
4.
Table 3: Construction Vehicle Deterioration Contribution by Class of Street
Residential Weighted ESAL Trips/Wk Total ESAL for 5 yrs. 66.6%Const. Veh. 0.27 38 2667.6Other trucks 0.27 22 1544.4
Collector 16.8%Const. Veh. 0.29 499 37624.6Other trucks 0.29 281 21187.4
Arterial 16.6%Const. Veh. 0.28 2090 152152Other trucks 0.28 1175 85540
Saratoga Road Maintenance Fees Analysis: June, 2007 | �
The impact due to load may vary by jurisdiction. Only one jurisdiction’s PMP included an estimate of deterioration by load, and it was based on the definition of load-related distress as defined in MTC’s pavement evaluation process. In the absence of this determination, the figure of 60% of the deterio-ration in pavement that can be attributed to load, taken from a similar study performed for the City of Monterey, is used. Use of this figure is reasonable in that both areas have moderate temperature changes and climate and lack the significant impact of freeze-thaw damage.
Using the above figure, calculations yield $5.28 million due to load. Using the ESALs and the weight-ed amounts of refuse, construction, trucks, and other vehicles on arterial, collector, and residential streets, we found that construction vehicles contributed 59.86% of the total deterioration of the streets, with an annual cost of $632,079.
The total valuation for construction in Saratoga for 2005-06 was $82 million. This amount was pro-vided by summing up the valuations indicated on all of the building permits provided by the City of Saratoga. Due to the impracticality of calculating weight of construction activity, valuation was used as a surrogate for level of activity. This is reasonable when one considers that even a simple water heater repair could require the delivery of a heater from a class 5 or even class 8 truck. Based on the most recent past year’s volume of building permit activity, this calculates to construction vehicles causing about $1.5 million in roadway deterioration annually. Roadway deterioration value is almost 0.0077% of the total valuation taken from the building permits. A fee up to this amount should be ap-plicable to companies doing construction in the city. Contractors should be responsible for roadway deterioration based on their cumulative damage to streets.
Saratoga Road Maintenance Fees Analysis: June, 2007 | 9
Appendix
Analysis of Variability
Many factors have been considered in an analysis of impacts on street maintenance. These factors may vary depending on jurisdiction, data collected and conclusions drawn by others, and similar variations. Among the variables to consider are the following:
locations for counts were selected based on available datatraffic counts were conducted in summer, a time when construction activity might be higher than averagehours and days of the week when truck traffic counts were takenuse of tradesman vehicles for activities not requiring permitsvaluation variations year to year for building permitsPMP evaluations and resulting maintenance and deferred maintenance calculationsnumber and frequency of refuse collection trips by streetmethod of refuse collection by routeESAL calculations and the assumptions about vehicle load and capacityallocation of costs and revenue of State and Federal fuel and excise taxes allocation of costs and revenue of State weight-related vehicle registration fees.
Significant differences in cost allocation may be derived depending on data collected and its utilization.
Bibliography
“City of Saratoga 2004 Pavement Management Program Update”, Harris & Assoc.
“Assessment of Local Streets & Roads 25-year Need, Revenue and Shortfall”, League of California Cities, PWOI, 03/03/2004
“Pavement Maintenance Fee Study for Morgan Hill”, CHEC Consultants, 1993
“The Effect of Utility Cuts on the Service Life of Pavements in San Francisco”, Engineering Design Center, SFSU, 05/1995
“Approving Construction Activity Road Impact Fee”, City of Monterey DPW, 09/12/2005
“Refuse Vehicle and Construction Vehicle Impact Analysis-Final Report”, City of San Rafael, by Hilton Farnkopf & Hobson, LLC, 11/14/2003
“Refuse and Construction Vehicle Street Maintenance Cost Analysis-Final Report”, Town of Hillsborough, Hilton Farnkopf & Hobson, LLC, 08/26/2005
“Final Report- Road Impact Fee Evaluation”, Town of Atherton, Kimley Horn & Associates, 03/14/2005
“Design Parameters-Module 4”, Washington State DOT
“Preliminary Assessment of Pavement Damage Due to Heavier Loads on Louisiana Pave-ments”, Louisiana Transportation Research Center, 05/1999
••
•••••••••
1)
2)
3)
4)
5)
6)
7)
8)
9)
10)