city of richmond
310
-
Upload
khangminh22 -
Category
Documents
-
view
0 -
download
0
Transcript of city of richmond

The City ofRichmond, CaliforniaFY2018-19 Operating BudgetADOPTED - June 26, 2018


City of Richmond, California
City of Pride and Purpose
FY 2018-19 Adopted Budget Presented by
Bill Lindsay, City Manager And
Belinda Warner, Finance Director/Treasurer


i
CITY OF RICHMOND
FISCAL YEAR 2018-19
ADOPTED OPERATING BUDGET
TABLE OF CONTENTS PAGE
INTRODUCTION: RICHMOND CITY COUNCIL .................................................................................................................................. 9 CITY OFFICIALS ............................................................................................................................................... 11 ACKNOWLEDGEMENTS ...................................................................................................................................... 13
MISSION, VISION, AND VALUES .......................................................................................................................... 15 BUDGET AWARDS ............................................................................................................................................. 17 BUDGET MESSAGE ............................................................................................................................................ 19 RESOLUTIONS .................................................................................................................................................. 30 ANNUAL APPROPRIATIONS LIMIT ......................................................................................................................... 35 BUDGET SUMMARIES: CITYWIDE ORGANIZATIONAL CHART……………………………………………………………………………………...41 BUDGET SUMMARIES ......................................................................................................................................... 42 CITYWIDE GRANTS LISTING .............................................................................................................................. 102
MULTI-YEAR COMPARATIVE POSITION LISTING .................................................................................................... 104 TRANSFERS SCHEDULE ................................................................................................................................... 123
DEPARTMENT SUMMARIES GENERAL GOVERNMENT:

ii
OFFICE OF THE MAYOR................................................................................................................................... 125 CITY COUNCIL ............................................................................................................................................... 131 CITY CLERK ................................................................................................................................................... 136 CITY MANAGER’S OFFICE ................................................................................................................................. 141 OFFICE OF NEIGHBORHOOD SAFETY................................................................................................................ 149 CITY ATTORNEY ............................................................................................................................................. 154 CITIZENS POLICE REVIEW COMMISSION ............................................................................................................. 159 FINANCE DEPARTMENT ................................................................................................................................... 164 HUMAN RESOURCES ...................................................................................................................................... 169 INFORMATION TECHNOLOGY ........................................................................................................................... 175 PUBLIC SAFETY: POLICE DEPARTMENT ..................................................................................................................................... 181 FIRE DEPARTMENT ......................................................................................................................................... 189 PUBLIC WORKS: INFRASTRUCTURE MAINTENANCE AND OPERATIONS ........................................................................................... 195
COMMUNITY DEVELOPMENT: WATER RESOURCE RECOVERY ........................................................................................................................ 203 CAPITAL IMPROVEMENT .................................................................................................................................. 209
PLANNING AND BUILDING SERVICES ................................................................................................................. 215 CULTURAL AND RECREATIONAL: LIBRARY AND CULTURAL SERVICES: ................................................................................................................ 221 COMMUNITY SERVICES .................................................................................................................................... 227 HOUSING AND REDEVELOPMENT: COMMUNITY AND ECONOMIC DEVELOPMENT: HOUSING DEPARTMENT ........................................................................................................................ 233

iii
EMPLOYMENT AND TRAINING ................................................................................................................ 239 RICHMOND HOUSING AUTHORITY ......................................................................................................... 245 RENT CONTROL ................................................................................................................................... 253
PORT OF RICHMOND: PORT OF RICHMOND ............................................................................................................................ 257 NON-DEPARTMENTAL: GENERAL GOVERNMENT ................................................................................................................................. 263 MARINA OPERATIONS ..................................................................................................................................... 264 DEBT SUMMARY ............................................................................................................................................. 265
APPENDICES: BUDGETED FUNDS –SOURCES AND USES……………………… ………………………………………………….......269 GLOSSARY OF TERMS……………………………………………………………………………………………….......279
LIST OF ACRONYMS…………………………………………………………………………………………………......307

iv

Richmond City Council
Tom Butt Mayor
Melvin Willis Vice Mayor
Jovanka Beckles Councilmember
Ben Choi Councilmember
Eduardo Martinez Councilmember
Jael Myrick Councilmember
Ada Recinos Councilmember
9

This page is intentionally left blank
10

CITY OFFICIALS
JUNE 26, 2018
CITY COUNCIL
Mayor ….…………………………………..……………………………………………………………………………………………….………………………….……..…………….......Tom Butt
Vice Mayor ...….………………………………………………….……………………….……..…..…................................................................................................................ Melvin Willis
Councilmember ………………………………..……………………………………………………….………………………………………………………...……….................Jovanka Beckles Councilmember ………….…………………………………….……………………………………………….......................................................................................................... Ben Choi Councilmember ….……………………………………..…….…………………………………………………………………………………………………………………......Eduardo Martinez Councilmember ………….………………………………….…......................................................................................................................................................................... Jael Myrick Councilmember ...………………………………….………....…….....………………………………………………………………………………………………..................……..Ada Recinos
ADMINISTRATION AND DEPARTMENT HEADS
City Manager ……………………………...............…………........……………………………………………………………………………………………………………………… Bill Lindsay Capital Improvement Director.............................................................................................................................................................................................................. Yader Bermudez City Attorney …………………......……………………………................................................................................................................................................................ Bruce Goodmiller City Clerk ………………………...………………………….....................……………………………………………………………………………………….……..……........Pamela Christian Community Services Director.................................................................................................................................................................................................................. Rochelle Monk Employment & Training Director ……………………….…..............….……..…………………………………………………………………………………………………...…….…. Sal Vaca Finance Director/Treasurer …........………............................................................................................................................................................................................. Belinda Warner Fire Chief…....…........................…….……………………………………………………………………………………………………………….……………………….……. Adrian Sheppard Housing Authority Director....................................................................................................................................................................................................................................Vacant Human Resources Director ……………........………………………………………………………………………………..……….………………………………................. Lisa Stephenson Information Technology Director …………………….……………………………………………………………………………………………………………………………....… Sue Hartman Infrastructure Maintenance & Operations Director...................................................................................................................................................................................... Tim Higares Library and Cultural Services Director ……………….….................................................................................................................................................................................. Katy Curl Planning Director................................................................................................................................................................................................................................... Richard Mitchell Police Chief............................................................................................................................................................................................................................................... Allwyn Brown Port Director.............................................................................................................................................................................................................................................. Jim Matzorkis Rent Control Executive Director..............................................................................................................................................................................................................Nicolas Traylor Water Resource Recovery Manager............................................................................................................................................................................................................ Ryan Smith
11

This page is intentionally left blank
12

CITY OF RICHMOND
FISCAL YEAR 2018-19 ADOPTED BUDGET
SPECIAL ASSISTANCE – DEPARTMENTS & OFFICES
Office of the Mayor City Council
City Clerk’s Office City Manager’s Office
Office of Neighborhood Safety City Attorney’s Office
Police Commission Finance Department
Human Resources Information Technology
Police Department Fire Department
Infrastructure Maintenance & Operations Water Resource Recovery
Capital Improvement Department Planning & Building Services
Library & Cultural Services Community Services
Housing Department Employment and Training
Richmond Housing Authority Port of Richmond Rent Control
BUDGET TEAM
Belinda Warner Finance Director
Markisha Guillory Budget Administrator
Mubeen Qader Senior Budget Analyst
Vrenesia Ward
Budget Analyst II Bert Jones
Budget Analyst I
Leah J. Clark Budget Analyst I
Antonio Banuelos Revenue Manager
Andreia Stewart Payroll Manager
Theresa Austin Executive Secretary II
13

This page is intentionally left blank
14

The City of Richmond shall provide services that enhance economic vitality, the environment and the quality of life of our community.
HonestyExcellent Customer Service
TeamworkCommitment
Innovation, Creativity and Risk-Taking
Richmond will develop all of its neighborhoods and businesses as quality places to live, work, shop and play, with its 32 miles of shorelines as a widely recognized symbol of the City’s success.
VISION
CITY OF RICHMOND
VALUES
15

This page is intentionally left blank
16

California Society of Municipal Finance Officers
Certificate of Award
Operating Budget Excellence Award Fiscal Year 2017-2018
Presented to the
City of Richmond
For meeting the criteria established to achieve the Operating Budget Excellence Award.
February 7, 2018
Drew Corbett Craig Boyer, Chair CSMFO President Professional Standards and Recognition Committee Dedicated Excellence in Municipal Financial Reporting
17

18

June 26, 2018 Page 1 of 11
FINANCE DEPARTMENT
DATE: June 26, 2018
TO: Mayor Butt and Members of the City Council
FROM: Bill Lindsay, City Manager Belinda Warner, Finance Director SUBJECT: Proposed Fiscal Year 2018-19 Operating Budget and Proposed Fiscal
Years 2018-19 to 2022-23 Capital Improvement Plan
STATEMENT OF THE ISSUE:
Staff has completed development of the Fiscal Year 2018-19 Annual Operating Budget and the Fiscal Years 2018-23 Five-Year Capital Improvement Plan Budget based on City Council direction, and is submitting these for adoption.
RECOMMENDED ACTION:
ADOPT resolutions approving: (1) Fiscal Year 2018-19 Annual Operating Budget and (2) Fiscal Years 2018-23 Five-Year Capital Improvement Plan Budget.
FINANCIAL IMPACT OF RECOMMENDATION:
There is no financial impact as a result of this item.
DISCUSSION:
Overview
In February 2018, the City began developing its operating and capital improvement budget. This process began with a kick-off meeting during which departments received the budget message and directions for preparing their budgets. Departments entered their operating and capital improvement budgets in the City’s financial system. Budget hearings were held with departments individually during which budgets were reviewed, discussed, and modified where necessary.
After budget hearings, the draft operating and capital improvement budget was prepared and submitted to the City Council at its meeting on May 1, 2018. At that time, the General Fund budget reflected a shortfall of $9.2 million. Staff worked to reduce the
AGENDA
REPORT
19
June 26, 2018
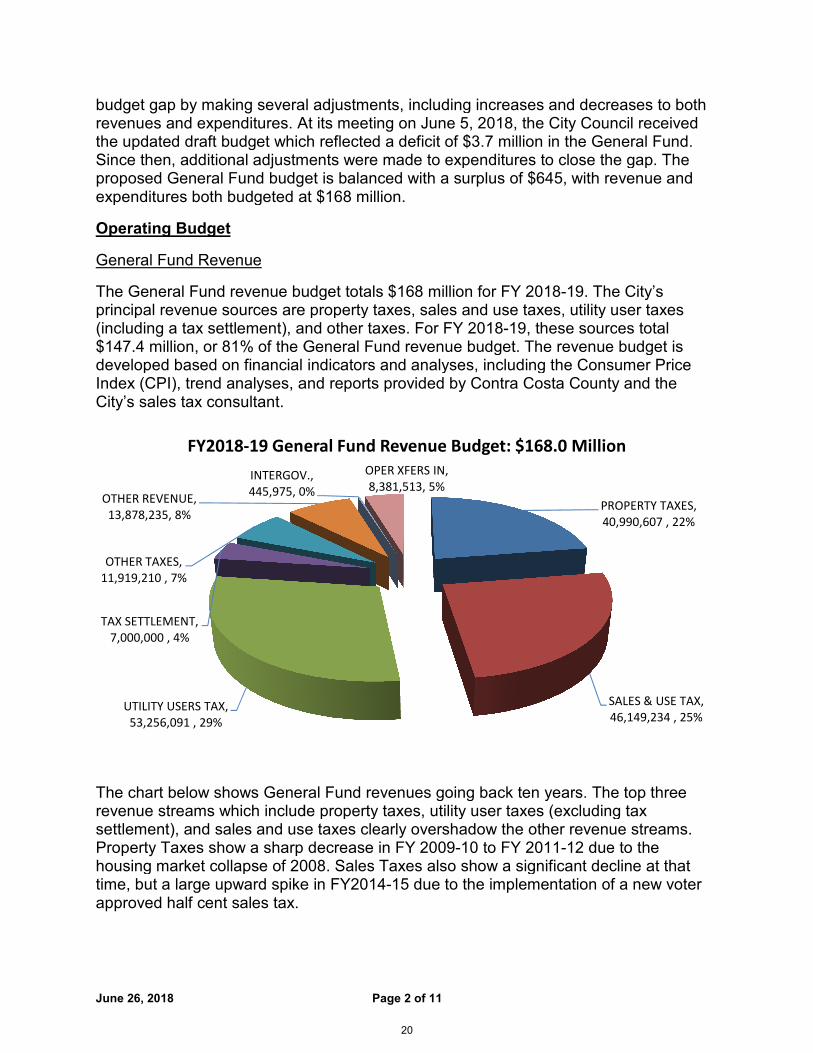
budget gap by making several revenues and expenditures. At its meeting on June 5, 2018the updated draft budget which reflected a Since then, additional adjustmproposed General Fund budget is bexpenditures both budgeted at $168
Operating Budget
General Fund Revenue
The General Fund revenue budgetprincipal revenue sources are property taxes, sales and use taxes, (including a tax settlement), and other taxes. For FY 2018$147.4 million, or 81% of the General Fund revenue budget. developed based on financial indicators and analyses, includingIndex (CPI), trend analyses, and reports provided by Contra Costa County and the City’s sales tax consultant.
The chart below shows General Fund revenues going back ten yearrevenue streams which includesettlement), and sales and use taxes clearly overshadow the other revenue streams. Property Taxes show a sharp decreasehousing market collapse of 2008. Sales Taxes atime, but a large upward spike in FY2014approved half cent sales tax.
UTILITY USERS TAX,
53,256,091 , 29%
TAX SETTLEMENT,
7,000,000 , 4%
OTHER TAXES,
11,919,210 , 7%
OTHER REVENUE,
13,878,235, 8%
INTERGOV.,
445,975, 0%
FY2018-19 General Fund Revenue Budget: $168.0 Million
Page 2 of 11
several adjustments, including increases and decreases to both itures. At its meeting on June 5, 2018, the City Council
the updated draft budget which reflected a deficit of $3.7 million in the General Fundments were made to expenditures to close the gap. The
proposed General Fund budget is balanced with a surplus of $645, with revenue and penditures both budgeted at $168 million.
budget totals $168 million for FY 2018-19. The City’s principal revenue sources are property taxes, sales and use taxes, utility user taxes
t), and other taxes. For FY 2018-19, these sourc% of the General Fund revenue budget. The revenue budget is
developed based on financial indicators and analyses, including the Consutrend analyses, and reports provided by Contra Costa County and the
he chart below shows General Fund revenues going back ten years. The top three which include property taxes, utility user taxes (excluding tax
settlement), and sales and use taxes clearly overshadow the other revenue streams. show a sharp decrease in FY 2009-10 to FY 2011-12 due to the
housing market collapse of 2008. Sales Taxes also show a significant decline at that time, but a large upward spike in FY2014-15 due to the implementation of a new voter
PROPERTY TAXES,
40,990,607 , 22%
INTERGOV.,
445,975, 0%
OPER XFERS IN,
8,381,513, 5%
19 General Fund Revenue Budget: $168.0 Million
including increases and decreases to both City Council received in the General Fund.
ents were made to expenditures to close the gap. The with revenue and
. The City’s utility user taxes
, these sources total The revenue budget is
the Consumer Price trend analyses, and reports provided by Contra Costa County and the
s. The top three property taxes, utility user taxes (excluding tax
settlement), and sales and use taxes clearly overshadow the other revenue streams. 12 due to the
significant decline at that the implementation of a new voter
PROPERTY TAXES,
40,990,607 , 22%
SALES & USE TAX,
46,149,234 , 25%
19 General Fund Revenue Budget: $168.0 Million
20

June 26, 2018 Page 3 of 11
Property Taxes
General Fund Property Taxes category consists of several different revenue streams. The primary segment is Secured Property Taxes which makes up 85% of this category. Secured Property Taxes change from year to year based on changes to the Assessed Valuation (AV) as determined by the Contra Costa County Assessor’s Office. The projection of the AV growth (or decline) is based on prior year data including CPI increase limit per Proposition 13, sold properties and their subsequent new valuation, and prediction of the properties that will change from Proposition 8 status back to the normal Proposition 13 maximum valuation as determined by the Contra Costa County Assessor’s Office. Very generally, Proposition 8 provides that taxable value does not exceed the current market value of the property. Once a value is temporarily reduced under Proposition 8, it is reviewed annually and adjusted, according to the market value. Once the market value exceeds the adjusted base value, it will be restored. Other revenue streams within the Property Taxes category change from year to year, based on different criteria. Those changes are usually projected based on CPI changes or prior year trends.
FY09-10 FY10-11 FY11-12 FY12-13 FY13-14 FY14-15 FY15-16 FY16-17 FY17-18 FY18-19
PROPERTY TAXES 29,747 26,277 28,360 32,490 28,950 32,711 33,232 36,970 38,361 40,991
SALES & USE TAX 25,000 23,026 27,788 29,866 29,628 33,131 40,877 41,620 42,877 46,149
UTILITY USERS TAX 35,299 34,341 35,318 34,732 35,034 35,300 36,365 37,966 39,628 39,256
TAX SETTLEMENT 5,000 15,667 15,667 13,667 13,000 13,000 7,000 7,000 7,000 7,000
OTHER TAXES 6,092 7,824 6,551 6,247 7,054 9,918 11,629 12,567 12,093 11,919
OTHER REVENUE 10,129 9,769 15,086 8,097 9,606 11,184 10,564 14,768 14,739 13,878
INTERGOV. 1,545 2,759 2,445 2,088 1,355 2,218 1,906 3,978 559 446
OP. TRANSFER-IN 9,301 14,830 14,826 9,773 8,194 4,107 4,952 9,468 6,212 8,382
-5,000
10,000 15,000 20,000 25,000 30,000 35,000 40,000 45,000 50,000
Th
ou
san
ds
General Fund 10-Year Revenue
21

June 26, 2018
Property Tax revenue has seen large swings, both up and down, based on changes to the valuation of the Chevron Refinery and the valuation of residential properties. economic factors impacting the future of this revenue stream include:
• Future changes to the price of crude oil of the refinery. Furthermore, the valuation of the refinery will be impacted by the current modernization project taking place there. In brief, the valuation is based on the profitability of the refinery as determined by the County Assessor.
• The housing crash from the previous decade had a long lasting effect on Property Tax revenue in lost during the housing market crash, and the subsequent reCounty Assessor under the Proposition 8 framework, has been regained although not all. Many factors will affect this segment of thegoing forward including new housing construction, of which there are several large projects in the initial stages throughout Richmond. Also, sale prices during the previous year will imp
• The sale of warehouses in Richmond It is assumed that this has happened because investors are speculating that these will be good locations for marijuana Proposition 64.
Utility Users Tax
The City collects a Utility Users Tax (UUT) from utility users within the City’s boundaries. Such users are charged 10% of the total bill for electricity and gas services, and 9.5% of the total bill for telecommunication and cable television services.
-
5,000
10,000
15,000
20,000
25,000
30,000
35,000
40,000
45,000
FY09-
10
FY10
PROPERTY TAXES 29,747 26,277
Th
ou
san
ds
General Fund Property Taxes
Page 4 of 11
Property Tax revenue has seen large swings, both up and down, based on changes to the valuation of the Chevron Refinery and the valuation of residential properties. economic factors impacting the future of this revenue stream include:
Future changes to the price of crude oil which will continue to affect the valuation Furthermore, the valuation of the refinery will be impacted by the
dernization project taking place there. In brief, the valuation is based on the profitability of the refinery as determined by the County Assessor.
The housing crash from the previous decade had a long lasting effect on Property Tax revenue in Richmond. After several years, most of the valuation lost during the housing market crash, and the subsequent re-valuation by the County Assessor under the Proposition 8 framework, has been regained although not all. Many factors will affect this segment of the revenue stream going forward including new housing construction, of which there are several large projects in the initial stages throughout Richmond. Also, sale prices during the previous year will impact the Assessed Valuation (AV).
warehouses in Richmond which have taken place in recent months.It is assumed that this has happened because investors are speculating that these will be good locations for marijuana cultivation with the passage of
ity collects a Utility Users Tax (UUT) from utility users within the City’s boundaries. Such users are charged 10% of the total bill for electricity and gas services, and 9.5% of the total bill for telecommunication and cable television services.
FY10-
11
FY11-
12
FY12-
13
FY13-
14
FY14-
15
FY15-
16
FY16-
17
26,277 28,360 32,490 28,950 32,711 33,232 36,970
General Fund Property Taxes
Property Tax revenue has seen large swings, both up and down, based on changes to the valuation of the Chevron Refinery and the valuation of residential properties. Other
will continue to affect the valuation Furthermore, the valuation of the refinery will be impacted by the
dernization project taking place there. In brief, the valuation is based on the profitability of the refinery as determined by the County Assessor.
The housing crash from the previous decade had a long lasting effect on After several years, most of the valuation
valuation by the County Assessor under the Proposition 8 framework, has been regained –
revenue stream going forward including new housing construction, of which there are several large projects in the initial stages throughout Richmond. Also, sale prices during
have taken place in recent months. It is assumed that this has happened because investors are speculating that
with the passage of
ity collects a Utility Users Tax (UUT) from utility users within the City’s boundaries. Such users are charged 10% of the total bill for electricity and gas services, and 9.5% of the total bill for telecommunication and cable television services.
FY17-
18
FY18-
19
38,361 40,991
22

June 26, 2018
The tax is not applicable to State, County, or City agencies, insurance companies or banks. The Utility Users Tax, combined with the UUT largest revenue source for the City in
As mentioned above, UUT consists wireless cards – new revenue as approved by the State of California in 2014 with the passage of Assembly Bill 1717.
The City has two revenue streams related to the Chevron RefineryThe refinery opts to use the maximum UUT provision on a consistent basis. Additionally, within the UUT category the City has settlement payments related to litigation with the refinery. These two Chevron related streams account for over 6whole.
Each UUT segment is analyzed independently based on prior year data and trends happening locally and legislation or changes happening at the state level. For example, for both cable television and telecommunications, there are less people subscribing tothese services (i.e. landlines), often opting for non
For many years, this revenue stream was the steadiest of Richmond’s major revenue streams. With ever changing technologies, there have been significant declines of the categories that make up revenue stream include:
• Telecommunications: The City has experienced significsegment. The decreases stem from many landlines or using prepaid cards which State approved AB1717 which imposed UUT on prepaid cards. This means cities will be able to recoup some
-
10,000
20,000
30,000
40,000
50,000
60,000
FY09-
10
TAX SETTLEMENT 5,000
UTILITY USERS TAX 35,299
Th
ou
san
ds
Utility User Tax and Tax Settlement
Page 5 of 11
is not applicable to State, County, or City agencies, insurance companies or , combined with the UUT Tax Settlement, represents
largest revenue source for the City in FY 2018-19.
consists of taxes to utilities, and now includesnew revenue as approved by the State of California in 2014 with the
Assembly Bill 1717.
he City has two revenue streams related to the Chevron Refinery related to the UUT. finery opts to use the maximum UUT provision on a consistent basis. Additionally,
within the UUT category the City has settlement payments related to litigation with the refinery. These two Chevron related streams account for over 65% of the
is analyzed independently based on prior year data and trends happening locally and legislation or changes happening at the state level. For example, for both cable television and telecommunications, there are less people subscribing tothese services (i.e. landlines), often opting for non-taxed services (dish services).
For many years, this revenue stream was the steadiest of Richmond’s major revenue streams. With ever changing technologies, there have been significant declines of the categories that make up UUT. Other economic factors impacting the future of this
: The City has experienced significant decreases in this . The decreases stem from many consumers moving away from
using prepaid cards which were previously not taxed. Last year, the State approved AB1717 which imposed UUT on prepaid cards. This means cities will be able to recoup some of the UUT that was being lost.
FY10-
11
FY11-
12
FY12-
13
FY13-
14
FY14-
15
FY15-
16
FY16-
17
15,667 15,667 13,667 13,000 13,000 7,000 7,000
35,299 34,341 35,318 34,732 35,034 35,300 36,365 37,966
Utility User Tax and Tax Settlement
is not applicable to State, County, or City agencies, insurance companies or , represents the
and now includes prepaid new revenue as approved by the State of California in 2014 with the
related to the UUT. finery opts to use the maximum UUT provision on a consistent basis. Additionally,
within the UUT category the City has settlement payments related to litigation with the the UUT as a
is analyzed independently based on prior year data and trends happening locally and legislation or changes happening at the state level. For example, for both cable television and telecommunications, there are less people subscribing to
taxed services (dish services).
For many years, this revenue stream was the steadiest of Richmond’s major revenue streams. With ever changing technologies, there have been significant declines in two
. Other economic factors impacting the future of this
ant decreases in this consumers moving away from
were previously not taxed. Last year, the State approved AB1717 which imposed UUT on prepaid cards. This means cities
- FY17-
18
FY18-
19
7,000 7,000 7,000
37,966 39,628 39,256
23

June 26, 2018
• Cable TV: The City has also seen stagsubscribers. This is the result of which are exempt from UUT, and from such as Netflix, Hulu and YouTube which are currently not taxed.cities are looking at possibly starting to charge UUT on such services.
• Gas and Electricity: Because of increased rates charged by the utility company,
corresponding UUT revenues will also reflect an increase
• Operation: This segment of UUT revenue stems from a provision in Municipal Code that allows any party in Richmond to opt to pay a Maximum Tax without having to disclose actual utility usage. The rate changes from year to year based on changes to the CPI.
• Settlements: The City has
various litigations with Chevron. 25 with specific payment amounts stipulated for each year.
Sales and Use Taxes
The Sales Tax category is made of several collected by the State of California’s Board of Equalization. Rtwo voter-approved extra half-76% of this revenue stream. The City works with revenue consultants, MuniServices, to produce these forecasts. The updated five-year forecasts, and performance information at the local, county, and state levels.
The other revenue streams within the Sales Tax category change from year to yearare based on different criteria. Those streams are analyzed individually and projected based on trends from prior years. One revenue stream in particular, the VehiclFee Backfill Swap, is based directly on changes to AV. For this stream in particular, the City uses the same AV change as used for Secured Property Taxes.
-
10,000
20,000
30,000
40,000
50,000
FY09-
10
SALES & USE TAX 25,000
Th
ou
san
ds
General Fund Sales & Use Tax
Page 6 of 11
: The City has also seen stagnation and decreases to UUT from cable subscribers. This is the result of consumers switching over to dish providers, which are exempt from UUT, and from consumers using over the top TV (OTT) such as Netflix, Hulu and YouTube which are currently not taxed. Many California cities are looking at possibly starting to charge UUT on such services.
: Because of increased rates charged by the utility company, corresponding UUT revenues will also reflect an increase in collections.
his segment of UUT revenue stems from a provision in Municipal Code that allows any party in Richmond to opt to pay a Maximum Tax without having to disclose actual utility usage. The rate changes from year to year based on changes to the CPI.
has one settlement related to UUT and that stems from various litigations with Chevron. The settlement in place goes through FY25 with specific payment amounts stipulated for each year.
The Sales Tax category is made of several segments. Of significance are those fornia’s Board of Equalization. Regular sales -cent sales taxes--Measure U and Measure Q
% of this revenue stream. The City works with revenue consultants, MuniServices, to produce these forecasts. The consultant provides quarterly updates that contain
, and performance information at the local, county, and state
The other revenue streams within the Sales Tax category change from year to yearbased on different criteria. Those streams are analyzed individually and projected
based on trends from prior years. One revenue stream in particular, the VehiclFee Backfill Swap, is based directly on changes to AV. For this stream in particular, the City uses the same AV change as used for Secured Property Taxes.
FY10-
11
FY11-
12
FY12-
13
FY13-
14
FY14-
15
FY15-
16
FY16-
17
23,026 27,788 29,866 29,628 33,131 40,877 41,620
General Fund Sales & Use Tax
nation and decreases to UUT from cable switching over to dish providers,
using over the top TV (OTT) Many California
cities are looking at possibly starting to charge UUT on such services.
: Because of increased rates charged by the utility company, collections.
his segment of UUT revenue stems from a provision in the City’s Municipal Code that allows any party in Richmond to opt to pay a Maximum Tax without having to disclose actual utility usage. The rate changes from year to
one settlement related to UUT and that stems from through FY 2024-
. Of significance are those egular sales tax and the
Measure U and Measure Q--make up % of this revenue stream. The City works with revenue consultants, MuniServices, to
dates that contain , and performance information at the local, county, and state
The other revenue streams within the Sales Tax category change from year to year and based on different criteria. Those streams are analyzed individually and projected
based on trends from prior years. One revenue stream in particular, the Vehicle License Fee Backfill Swap, is based directly on changes to AV. For this stream in particular, the
FY17-
18
FY18-
19
41,620 42,877 46,149
24

June 26, 2018 Page 7 of 11
Richmond has relatively well diversified sales tax segments with General Retail leading the sales categories at 31%, Transportation at 26%, Business to Business at 24%, Construction at 9% and Food Products at 10%. This diversification helps smooth out the revenue stream although each segment is susceptible to its ups and downs due to various factors. Additionally, Richmond has two voter-approved extra half cent sales tax measures – neither of which have sunset clauses. Other economic factors impacting the future of this revenue stream include:
• General Retail: Richmond has several big box retailers including Costco, Wal-Mart and Target; and also a large regional mall with anchor tenants Macy’s and Sears.
• Transportation: This segment includes car sales and gasoline sales. It is affected by oil prices and interest rates as well as the overall regional economy. With a large auto plaza in Richmond, the number of sales to customers from outside of Richmond boosts the regular Sales Tax. The extra half cent sales taxes are only applied to car sales to Richmond residents whether in Richmond or somewhere else in the State.
• Construction: This segment is highly influenced by the housing market, especially new construction.
• Marijuana: Richmond currently has three permitted medical marijuana dispensaries. With Proposition 64—which legalizes recreational use of marijuana-- this segment may realize significant increases soon.
Other Taxes
Other taxes include franchise fees, transient occupancy tax, and documentary transfer tax which is the largest amount collected under this revenue source. The City collects a tax (the “Documentary Transfer Tax”) on all transfers by deeds, instruments, writings or any other document by which lands, tenements, or other interests in real property are sold at a rate of $7.00 for each $1,000 or fractional part thereof of the consideration.
Other Revenue
Other revenue sources include Licenses, Permits & Fees, Charges for Services, Intergovernmental (Grants), and Transfers in. These revenue streams are received mostly at the department level for services provided directly to the public except for Transfers in. Each category is analyzed individually and forecasted based on historical trends and other known factors, such as fee increases and grant stipulations.
General Fund Expenditures
The General Fund expenditure budget totals $168 million for FY 2018-19. From the expenditure charts below, it can be seen that salaries and benefits make up the largest component, or 70%, of the budget. With regard to function, public safety makes up 59% of the budget. The expenditure budget is developed based on financial indicators and
25

June 26, 2018 Page 8 of 11
analyses, including trend analyses and Memorandums of Understanding (MOUs) with bargaining groups.
General
Government
31,029,474
19%
Public Safety
99,127,582
59%
Cultural and
Recreational
12,105,743
7%
Public Works
25,757,420
15%
FY2018-19 General Fund Expenditure Budget by Function:
$168 million
Salaries & Wages
73,091,207
41%
Benefits
52,030,561
29%
Professional Svcs.
8,919,839
5%
Other Operating
7,546,048
4%
Utilities
3,526,344
2%
Cost Pool
15,023,723
9%
A87 Cost Plan
(4,484,606)
-3%
Debt Service
1,381,054
1%
Transfers Out
10,986,050
6%
FY2018-19 General Fund Expenditure Budget by Type:
$168 million
26

June 26, 2018 Page 9 of 11
Non-General Fund
Non-General Funds includes other operating, special revenue, debt service, enterprise, and internal service funds. These funds are self-sustaining with their own revenue sources and reserves available to fund expenditures. One exception is the operating fund group, which receives General Fund subsidies as their operations are not 100% cost recoverable; Engineering Cost Recovery is an example. For FY 2018-19, the non-General Fund expenditure budget totals $204 million, or 55% of the total city-wide expenditure budget. The total budget including all funds is $372 million.
Capital Improvement Projects
The Capital Improvement Plan (CIP) is a five-year outlook of the City’s capital improvement projects. The CIP is managed continuously by measuring progress and anticipating future needs; and the budget is adopted annually alongside the operating budget. For FY 2018-19, expenditures budgeted in CIP funds total $25.1 million. The major sources of funding for these projects include:
• State Gas Tax, which are monies received from the State under the provision of the Streets and Highway Code. These monies are restricted to uses for street construction activities. The City’s allocation increased by $1.7 million due to the Governor’s new bill SB1, the Road Repair and Accountability Act of 2017.
General Fund
168,020,220
45%
Other Operating
22,505,354
6%
Special Revenue
27,471,446
7%
Capital Improvement
25,087,600
7%
Debt Service
24,762,339
7%
Enterprise
39,065,682
10%
Internal Service
31,851,093
9%
Housing Department
6,248,278
2%
Richmond Housing
Authority
27,295,835
7%
FY2018-19 All Funds Expenditure Budget: $372 million
27

June 26, 2018
• Measure J, which are monies received from the Contra Costa County Transportation Authority from a voter
• Grants, which are monies received from various external agencies to fund specific projects, such Transportation Authority (CCTA), 37Road Projects, both are funded bythe California Transportation Commission/CTransportation.
Other capital projects are funded by operating funds, including enterpservices funds. For FY 2018-19, these expenditures total $15.5operations and maintenance costs of capital projects are budgeted in the operating budget.
Priority capital projects for FY 2018Improvements - $1.2 million; IInterconnect – $1.2 million. The CIP document contains detailed information on projects and sources/uses of funding.
Long-Range Financial Forecast
In 2015, the City began working with the PFM Group, Inc. through the National Resource Network to develop and implement its fiveprojected General Fund revenue and expenditures five years into the future based on five years of historical audited actuals and a comprehensive set of assumptions. It serves as a budgeting and decisionaddress future issues, such as budget deficits.
Prior to the development of the FY 2018budget gap of at least $4.6 million based on application of the financial modeldepartments were directed to prepare baseline budgets with no increases to discretionary operating expenditures, and withbudget gap was eliminated.
1.7 0.2
8.9 9.1
(15)
(10)
(5)
0
5
10
15
2016 2017
$ (
in m
illi
on
s)
Page 10 of 11
, which are monies received from the Contra Costa County sportation Authority from a voter-approved sales tax.
, which are monies received from various external agencies to fund specific projects, such as I-80 Central Interchange funded by Contra Costa Transportation Authority (CCTA), 37th Street Improvements and Yellow Brick Road Projects, both are funded by the Federal Highway Administration thr
California Transportation Commission/California Department of
Other capital projects are funded by operating funds, including enterprise and inte19, these expenditures total $15.5 million. On
operations and maintenance costs of capital projects are budgeted in the operating
ity capital projects for FY 2018-19 include Street Paving - $4.7 million; million; I-80 Central Interchange - $2.3 million; Traffic Signal
. The CIP document contains detailed information on projects and sources/uses of funding.
Forecast
In 2015, the City began working with the PFM Group, Inc. through the National Resource Network to develop and implement its five-year financial model. The model
General Fund revenue and expenditures five years into the future based on ve years of historical audited actuals and a comprehensive set of assumptions. It
serves as a budgeting and decision-making tool that enables the City to proactively address future issues, such as budget deficits.
Prior to the development of the FY 2018-19 budget, the City anticipated a of at least $4.6 million based on application of the financial model
departments were directed to prepare baseline budgets with no increases to tionary operating expenditures, and with these and other measures, the projected
(4.5) (4.6) (4.3)(5.9)
4.6
(0.0)
(4.3)
(10.2)
2018 2019 2020 2021
, which are monies received from the Contra Costa County
, which are monies received from various external agencies to fund 80 Central Interchange funded by Contra Costa
and Yellow Brick Federal Highway Administration through
Department of
rise and internal million. On-going
operations and maintenance costs of capital projects are budgeted in the operating
million; 37th Street Traffic Signal
. The CIP document contains detailed information on projects
In 2015, the City began working with the PFM Group, Inc. through the National year financial model. The model
General Fund revenue and expenditures five years into the future based on ve years of historical audited actuals and a comprehensive set of assumptions. It
making tool that enables the City to proactively
, the City anticipated a potential of at least $4.6 million based on application of the financial model. With that,
departments were directed to prepare baseline budgets with no increases to these and other measures, the projected
(10.2)
2021
FY Surplus / (Deficit)
FY Ending Fund Balance
28

June 26, 2018 Page 11 of 11
Conclusion
Over the last several fiscal years, it has been a challenge to prepare balanced budgets while still trying to meet the growing needs of the community. Average annual growth in the City’s top three revenue sources has averaged less than 1.7% per year during the past ten years – a level close to inflation. It was only in fiscal year 2016-17 that the City’s property taxes finally exceeded pre-recession levels that existed eight years earlier. These revenue struggles were against the backdrop of significantly higher costs, especially pension-related costs, and an aging infrastructure. Achieving budget balances and favorable operating results during the past three fiscal years has created difficult policy choices for the City Council, but these difficult choices were successfully made. While fiscal year 2018-19 was, in many ways, no less difficult in achieving financial goals, staff was able to work closely with the various City departments to craft a budget that we believe offers a stable baseline for the coming years.
DOCUMENTS ATTACHED:
1. Resolution – FY2018-19 Operating Budget 2. Resolution – FY2018-19 to FY2022-23 Capital Improvement Plan Budget 3. Complete Operating Budget (under separate cover) 4. Complete Capital Improvement Plan (under separate cover)
29

RESOLUTION NO. _____
RESOLUTION OF THE COUNCIL OF THE CITY OF RICHMOND, CALIFORNIA,
ADOPTING THE FISCAL YEAR 2018-2019 OPERATING BUDGET WHEREAS, pursuant to Section 1(b) of Article IV of the Richmond City Charter the City Manager is required to prepare an annual budget for the review and approval by the City Council; and WHEREAS, all appropriations for the prior fiscal years shall lapse at the end of Fiscal Year 2017-18 and any remaining amounts shall be credited against their respective fund balances except for any encumbered amounts for specific obligations outstanding at the end of said Fiscal Year; and WHEREAS, all grants received per the attached grants listing shall be appropriated and spent according to grant guidelines; and WHEREAS, the City Council has reviewed the proposed budget for Fiscal Year 2018-2019 at public meetings on June 5 and June 19, 2018; and WHEREAS, the City Council will review additional requests at a public meeting on June 26, 2018 to determine if said requests will be included in the adopted budget. NOW, THEREFORE, BE IT RESOLVED, that the City Council hereby adopts the 2018-2019 Operating Budget for the following funds:
Funds FY2018-19
General Fund $168,020,220
Other Operating 22,505,354
Special Revenues 27,471,446
Capital Improvement 25,087,600
Debt Service 24,762,339
Enterprise 39,065,682
Internal Service 31,851,093
Housing Department 6,248,278
Richmond Housing Authority 27,295,835
Total $372,307,847
BE IT FURTHER RESOLVED, that the budget for the Capital Improvement Funds will be adopted as a separate document.
*****
30

I certify that the foregoing resolution was passed and adopted by the Council of the City of Richmond, California, at a regular meeting thereof held June 26, 2018, by the following vote:
AYES:
NOES:
ABSTENTIONS:
ABSENT:
____________________________________
CLERK OF THE CITY OF
RICHMOND
(SEAL)
Approved:
_________________________________
Mayor
Approved as to Form:
_________________________________
City Attorney
31
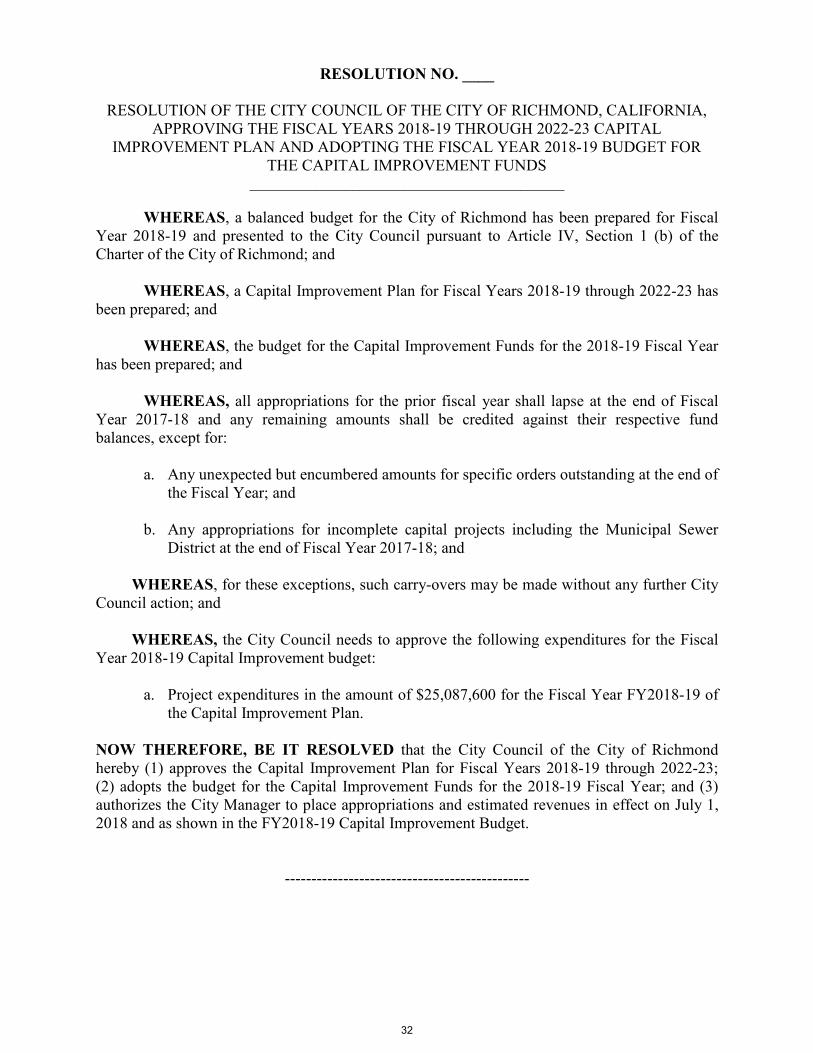
RESOLUTION NO. ____
RESOLUTION OF THE CITY COUNCIL OF THE CITY OF RICHMOND, CALIFORNIA,
APPROVING THE FISCAL YEARS 2018-19 THROUGH 2022-23 CAPITAL IMPROVEMENT PLAN AND ADOPTING THE FISCAL YEAR 2018-19 BUDGET FOR
THE CAPITAL IMPROVEMENT FUNDS ___________________________________________
WHEREAS, a balanced budget for the City of Richmond has been prepared for Fiscal Year 2018-19 and presented to the City Council pursuant to Article IV, Section 1 (b) of the Charter of the City of Richmond; and
WHEREAS, a Capital Improvement Plan for Fiscal Years 2018-19 through 2022-23 has been prepared; and
WHEREAS, the budget for the Capital Improvement Funds for the 2018-19 Fiscal Year
has been prepared; and
WHEREAS, all appropriations for the prior fiscal year shall lapse at the end of Fiscal Year 2017-18 and any remaining amounts shall be credited against their respective fund balances, except for:
a. Any unexpected but encumbered amounts for specific orders outstanding at the end of
the Fiscal Year; and b. Any appropriations for incomplete capital projects including the Municipal Sewer
District at the end of Fiscal Year 2017-18; and
WHEREAS, for these exceptions, such carry-overs may be made without any further City Council action; and
WHEREAS, the City Council needs to approve the following expenditures for the Fiscal
Year 2018-19 Capital Improvement budget:
a. Project expenditures in the amount of $25,087,600 for the Fiscal Year FY2018-19 of the Capital Improvement Plan.
NOW THEREFORE, BE IT RESOLVED that the City Council of the City of Richmond hereby (1) approves the Capital Improvement Plan for Fiscal Years 2018-19 through 2022-23; (2) adopts the budget for the Capital Improvement Funds for the 2018-19 Fiscal Year; and (3) authorizes the City Manager to place appropriations and estimated revenues in effect on July 1, 2018 and as shown in the FY2018-19 Capital Improvement Budget.
----------------------------------------------
32

I hereby certify that the foregoing resolution of the Council of the City of Richmond was duly passed and adopted at the regular meeting thereof held June 26, 2018 by the following vote:
AYES:
NOES:
ABSTENTIONS:
ABSENT:
_____________________________________ Clerk of the City of Richmond (SEAL)
Approved: _______________________________________ Mayor Approved as to form: ________________________________________ City Attorney
33

34

June 26, 2018 Page 1 of 2
FINANCE DEPARTMENT
DATE: June 26, 2018 TO: Mayor Butt and Members of the City Council FROM: Bill Lindsay, City Manager Belinda Warner, Finance Director SUBJECT: FISCAL YEAR 2018-19 ANNUAL APPROPRIATIONS LIMIT
STATEMENT OF THE ISSUE:
The 2018-19 Appropriations Limit for the City of Richmond needs to be increased and adopted pursuant to Article XIIIB of the Constitution of the State of California. RECOMMENDED ACTION: ADOPT a resolution approving the fiscal year 2018-19 Appropriations Limit for the City of Richmond pursuant to Article XIIIB, as amended, of the Constitution of the State of California.
FINANCIAL IMPACT OF RECOMMENDATION:
The Annual Appropriations Limit establishes the maximum amount that can be appropriated to the General Fund.
DISCUSSION:
Article XIIIB of the California Constitution was approved by California voters in 1979 and has been amended a number of times since its adoption. Article XIIIB creates a restriction on the amount of revenue that can be appropriated in any fiscal year. Article XIIIB requires all local government entities to establish annual appropriations limits. The appropriation subject to limitation is to be based on the 1978-79 appropriation adjusted for changes in the cost of living and population.
AGENDA REPORT
35

June 26, 2018 Page 2 of 2
California Government Code Section 7910 requires each local government to establish its appropriation limit by resolution. Adoption of the attached resolution will approve the fiscal year 2018-19 Annual Appropriations Limit. For FY2018-19, the Appropriations Limit has been determined to be $390,473,736. DOCUMENTS ATTACHED:
Attachment 1 – Resolution Attachment 2 – Appropriations Limit Schedule
36

37

38

39

40

Program Development
City Council Policy
Pt. Molate
Transportation Division
Health in All Policies
Mayor and City Council
Tom Butt
City Attorney
Police Commission
City Clerk
Human
Resources
City Manager
Fire
Department
Police
Department
Engineering &
CIP
Finance
Department
Library &
Cultural
Services
Planning & Bldg
Services
Dept. of
Infrastructure
Maintenance &
Operations
Port
Housing
Department
Information
Technology
Housing
Authority
Agenda Prep
Resolutions
Ordinances
Contracts
Contract Review
Court Appearances
Legal Opinions
Investigate Complaints &
Appeals
Review RPD Policy
Appeal Hearings
Office of
Neighborhood
Safety
City of Richmond
FY2018-19 Organizational Chart
Citizens of Richmond
Community
Services
Water Resource
Recovery
Employment &
Training
Rent Control
41

City of Richmond
FY2018-19 Adopted Budget Summary
ALL FUNDS
Capital
General Other Special Improve- Debt Enterprise Internal Housing Housing Pension
Fund Operations Revenues ments Service Funds Service Subtotal Department Authority Trusts Total
ESTIMATED BEGINNING BALANCE 07/01/18 16,778,263 (5,721,842) 14,009,255 8,722,938 6,897,396 31,623,745 31,165,234 103,474,989 (722,095) - - 102,752,894
Revenues
30 Property Tax 40,990,607 1,574,783 11,411,059 - 11,490,551 - - 65,467,000 - - - 65,467,000
31 Sales Tax 46,149,234 - - - - - - 46,149,234 - - - 46,149,234
32 Utility Users Tax 46,256,091 - - - - - - 46,256,091 - - - 46,256,091
33 Other Taxes 11,919,210 - - - - - - 11,919,210 - - - 11,919,210
34 Licenses, Permits and Fees 8,124,618 6,129,781 3,681,606 3,777,285 - 1,980,000 - 23,693,290 276,260 1,208,918 - 25,178,468
35 Fines, Forfeitures and Penalties 922,238 2,000 19,000 - - - - 943,238 - - - 943,238
36 Interest and Investment Income 72,200 4,000 16,565 - - - 100,000 192,765 127,162 - - 319,927
37 Charges for Services 3,581,369 5,103,897 202,000 - 5,816,725 23,638,011 22,592,748 60,934,750 - - - 60,934,750
Charges for Internal Services - - - - - - - - - - - -
38 Other Revenues 258,200 961,917 33,475 - - - 2,730,346 3,983,938 664,115 114,300 - 4,762,353
39 Rental Income 840,610 7,980 - - - 10,799,621 - 11,648,211 - 865,200 - 12,513,411
3A State and Local Taxes 60,000 - - 4,701,669 - - - 4,761,669 - 155,976 - 4,917,645
3B Federal Grant Revenue - 1,621,319 39,926 5,747,527 - - - 7,408,772 674,406 23,509,587 - 31,592,765
3C State Grant Revenue 350,000 991,377 105,956 3,456,277 - - - 4,903,610 2,151,022 - - 7,054,632
3D Other Grant Revenue 35,975 3,173,085 9,399,001 5,257,613 - - - 17,865,674 - - - 17,865,674
3H Pension Stabilization Revenue - - - - - - - - - - - -
60 Proceeds from Sale of Property 55,000 - - - - - - 55,000 55,000 - - 110,000
61 Loan/Bond Proceeds 24,000 - 83,196 - - - 1,230,660 1,337,856 445,670 - - 1,783,527
Total Revenues 159,639,352 19,570,139 24,991,785 22,940,371 17,307,276 36,417,632 26,653,754 307,520,308 4,393,635 25,853,981 337,767,925
42

City of Richmond
FY2018-19 Adopted Budget Summary
ALL FUNDS
Capital
General Other Special Improve- Debt Enterprise Internal Housing Housing Pension
Fund Operations Revenues ments Service Funds Service Subtotal Department Authority Trusts Total
Expenditures
40 Salaries and Wages 73,091,207 5,632,557 1,171,735 - - 2,224,235 6,309,805 88,429,538 273,976 1,391,906 - 90,095,420
Salary savings - - - - - - - - - - - -
41 Benefits 52,030,561 3,585,931 703,179 - - 1,212,461 2,020,990 59,553,122 158,506 1,129,271 2,187,200 63,028,099
Benefits savings - - - - - - - - - - - - -
42 Professional Services 8,919,839 4,705,304 11,163,915 1,920,566 - 8,591,833 1,620,115 36,921,572 194,399 364,500 - 37,480,470
43 Other Operating 5,386,692 560,799 352,056 165,237 - 316,331 35,000 6,816,115 14,641 603,395 - 7,434,151
44 Utilities 3,526,344 224,745 20,600 - - 1,303,874 50,000 5,125,563 719 251,700 - 5,377,983
45 Equipment & Contractual Svcs. 1,582,379 229,082 60,000 947,781 - 666,080 69,246 3,554,568 - 1,042,868 - 4,597,436
46 Provision for Insurance Loss 3,200 - 25,000 - - 30,000 17,332,112 17,390,312 - 49,825 - 17,440,137
47 Cost Pool 15,023,723 4,004,633 386,383 - - 1,462,770 1,458,840 22,336,349 215,728 835,108 - 23,387,185
48 Asset & Capital Outlay 495,525 1,000 2,493,228 22,034,015 - 8,962,779 2,954,985 36,941,533 2,215,279 212,742 - 39,369,554
Capital Improvement Projects - - - - - - - - - - - -
49 Debt Service Expenditures 1,381,054 72,742 - - 24,762,339 14,192,266 - 40,408,402 - - - 40,408,402
50 Grant Expenditures 78,252 2,445,834 11,000 20,000 - - - 2,555,086 - 21,299,634 - 23,854,720
51 CDBG/Home/Hsg Proj - - 60,000 - - - - 60,000 2,781,892 - - 2,841,892
52 Employment & Training Allocations - 842,727 - - - - - 842,727 - - - 842,727
53 RHA Cost Allocation - - - - - - - - - - - -
4A A87 Cost Plan Reimbursement (4,484,606) (4,484,606) - (4,484,606)
Other Operating Savings - - - - - - - - - - - -
Total Expenditures 157,034,170 22,305,354 16,447,096 25,087,600 24,762,339 38,962,629 31,851,093 316,450,281 5,855,141 27,180,949 2,187,200 351,673,571
43

City of Richmond
FY2018-19 Adopted Budget Summary
ALL FUNDS
Capital
General Other Special Improve- Debt Enterprise Internal Housing Housing Pension
Fund Operations Revenues ments Service Funds Service Subtotal Department Authority Trusts Total
90 Transfers in from:
General Fund - 2,403,188 - - 2,735,743 - 4,939,190 10,078,121 - - 907,929 10,986,050
Operations 200,000 - - - - - - 200,000 - - - 200,000
Special Revenue 8,094,735 - - - 1,821,467 - - 9,916,202 - - 1,279,271 11,195,473
Capital Improvements - - - - - - - - - - - -
Debt Service - - - - - - - - - - - -
Enterprise Fund 86,778 - 16,275 - - 23,171,321 - 23,274,374 - - - 23,274,374
Internal Service Funds - - - - - - - - - - - -
Housing Department - - - - - - - - - - - -
Successor Agency - - - - - - - - - - - -
Housing Authority - - - - - - - - - - - -
Total transfers in 8,381,513 2,403,188 16,275 - 4,557,210 23,171,321 4,939,190 43,468,697 - - 2,187,200 45,655,897
91 Transfers out to:
General Fund - 200,000 8,094,735 - - 86,778 - 8,381,513 - - - 8,381,513
Operations 2,403,188 - - - - - - 2,403,188 - - - 2,403,188
Special Revenue - - - - - 16,275 - 16,275 - - - 16,275
Capital Improvements - - - - - - - - - - - -
Debt Service 2,735,743 - 1,821,467 - - - - 4,557,210 - - - 4,557,210
Enterprise Fund - - - - - 23,171,321 - 23,171,321 - - - 23,171,321
Internal Service Funds 4,939,190 - - - - - - 4,939,190 - - - 4,939,190
Housing Department - - - - - - - - - - - -
Successor Agency - - - - - - - - - - - -
Housing Authority - - - - - - - - - - - -
Garfield Pension 102,140 1,270,466 1,372,606 - 1,372,606
General Pension 805,789 8,805 814,594 - 814,594
-
Total transfers out 10,986,050 200,000 11,195,473 - - 23,274,374 - 45,655,897 - - - 45,655,897
Net transfers in/out (2,604,537) 2,203,188 (11,179,198) - 4,557,210 (103,053) 4,939,190 (2,187,200) - - 2,187,200 -
Excess/(Deficiency) 645 (532,027) (2,634,509) (2,147,229) (2,897,853) (2,648,050) (258,149) (11,117,172) (1,461,505) (1,326,968) - (13,905,646)
ENDING BALANCE 16,778,908 (6,253,869) 11,374,746 6,575,709 3,999,543 28,975,695 30,907,084 92,357,817 (2,183,600) (1,326,968) - 88,847,248
44

City of Richmond
FY2018-19 Adopted Budget Summary
GENERAL FUND
General
Fund
FUND 0001
Estimated Beginning Balance 07/01/18 16,778,263
Revenues
30 Property Tax 40,990,607
31 Sales Tax 46,149,234
32 Utility Users Tax 46,256,091
33 Other Taxes 11,919,210
34 Licenses, Permits and Fees 8,124,618
35 Fines, Forfeitures and Penalties 922,238
36 Interest and Investment Income 72,200
37 Charges for Services 3,581,369
Charges for Internal Services
38 Other Revenues 258,200
39 Rental Income 840,610
3A State and Local Taxes 60,000
3B Federal Grant Revenue -
3C State Grant Revenue 350,000
3D Other Grant Revenue 35,975
3H Pension Stabilization Revenue -
60 Proceeds from Sale of Property 55,000
61 Loan/Bond Proceeds 24,000
Total Revenues 159,639,352
45

City of Richmond
FY2018-19 Adopted Budget Summary
GENERAL FUND
General
Fund
FUND 0001
Expenditures
40 Salaries and Wages 73,091,207
Salary savings
41 Benefits 52,030,561
Benefits savings
42 Professional Services 8,919,839
43 Other Operating 5,386,692
44 Utilities 3,526,344
45 Equipment & Contractual Svcs. 1,582,379
46 Provision for Insurance Loss 3,200
47 Cost Pool 15,023,723
48 Asset & Capital Outlay 495,525
Capital Improvement Projects
49 Debt Service Expenditures 1,381,054
50 Grant Expenditures 78,252
51 CDBG/Home/Hsg Proj -
52 Employment & Training Allocations -
53 RHA Cost Allocation -
4A A87 Cost Plan Reimbursement (4,484,606)
Other Operating Savings
Total Expenditures 157,034,170
46

City of Richmond
FY2018-19 Adopted Budget Summary
GENERAL FUND
General
Fund
FUND 0001
90 Transfers in from:
General Fund
Operations 200,000
Special Revenue 8,094,735
Capital Improvements
Debt Service
Enterprise Fund 86,778
Internal Service Funds
Housing Department
Successor Agency
Housing Authority
Total transfers in 8,381,513
91 Transfers out to:
General Fund
Operations 2,403,188
Special Revenue
Capital Improvements
Debt Service 2,735,743
Enterprise Fund
Internal Service Funds 4,939,190
Housing Department
Successor Agency
Housing Authority
Garfield Pension 102,140
General Pension 805,789
Total transfers out 10,986,050
Net transfers in/out (2,604,537)
Excess/(Deficiency) 645
Ending Balance 16,778,908
47

City of Richmond
FY2018-19 Adopted Budget Summary
OTHER OPERATING
Planning/Bldging Engineering
Transportation Hilltop Marina Bay Cost Cost
Operations L&L L&L Recovery Recovery
FUND 1003 1012 1015 1050 1051
Estimated Beginning Balance 07/01/18 (1,829,588) 229,058 898,762 403,119 (2,442,932)
Revenues
30 Property Tax - 983,902 590,881 - -
31 Sales Tax - - - - -
32 Utility Users Tax - - - - -
33 Other Taxes - - - - -
34 Licenses, Permits and Fees - - - 6,054,781 -
35 Fines, Forfeitures and Penalties - - - - -
36 Interest and Investment Income - - 4,000 - -
37 Charges for Services - - - 2,089,000 1,015,119
Charges for Internal Services
38 Other Revenues 40,000 - 7,500 500 -
39 Rental Income - - - - -
3A State and Local Taxes - - - - -
3B Federal Grant Revenue - - - - -
3C State Grant Revenue - - - - -
3D Other Grant Revenue 840,000 - - - -
3H Pension Stabilization Revenue - - - - -
60 Proceeds from Sale of Property - - - - -
61 Loan/Bond Proceeds - - - - -
Total Revenues 880,000 983,902 602,381 8,144,281 1,015,119
48

City of Richmond
FY2018-19 Adopted Budget Summary
OTHER OPERATING
Planning/Bldging Engineering
Transportation Hilltop Marina Bay Cost Cost
Operations L&L L&L Recovery Recovery
FUND 1003 1012 1015 1050 1051
Expenditures
40 Salaries and Wages 244,984 574,544 428,611 2,170,094 482,903
Salary savings
41 Benefits 266,954 364,780 243,491 1,282,718 291,889
Benefits savings
42 Professional Services 420,585 43,115 53,504 2,332,327 199,650
43 Other Operating 9,923 67,191 63,454 83,306 725
44 Utilities 2,000 41,000 134,395 9,000 2,800
45 Equipment & Contractual Svcs. 280 75,000 7,075 6,727 -
46 Provision for Insurance Loss - - - - -
47 Cost Pool 402,406 127,620 68,934 1,979,985 793,735
48 Asset & Capital Outlay - - - 1,000 -
Capital Improvement Projects
49 Debt Service Expenditures - 72,742 - - -
50 Grant Expenditures - - - - -
51 CDBG/Home/Hsg Proj - - - - -
52 Employment & Training Allocations - - - - -
53 RHA Cost Allocation - - - - -
4A A87 Cost Plan Reimbursement - - - - -
Total Expenditures 1,347,132 1,365,992 999,464 7,865,157 1,771,702
49

City of Richmond
FY2018-19 Adopted Budget Summary
OTHER OPERATING
Planning/Bldging Engineering
Transportation Hilltop Marina Bay Cost Cost
Operations L&L L&L Recovery Recovery
FUND 1003 1012 1015 1050 1051
90 Transfers in from:
General Fund 197,637 410,866 756,583
Operations
Special Revenue
Capital Improvements
Debt Service
Enterprise Fund
Internal Service Funds
Housing Department
Successor Agency
Housing Authority
Total transfers in - 197,637 410,866 - 756,583
91 Transfers out to:
General Fund
Operations
Special Revenue
Capital Improvements
Debt Service
Enterprise Fund
Internal Service Funds
Housing Department
Successor Agency
Housing Authority
Total transfers out - - - - -
Net transfers in/out - 197,637 410,866 - 756,583
Excess/(Deficiency) (467,132) (184,453) 13,783 279,124 -
Ending Balance (2,296,720) 44,605 912,545 682,243 (2,442,932)
50

City of Richmond
FY2018-19 Adopted Budget Summary
OTHER OPERATING
Transportation
FUND
Estimated Beginning Balance 07/01/18
Revenues
30 Property Tax
31 Sales Tax
32 Utility Users Tax
33 Other Taxes
34 Licenses, Permits and Fees
35 Fines, Forfeitures and Penalties
36 Interest and Investment Income
37 Charges for Services
Charges for Internal Services
38 Other Revenues
39 Rental Income
3A State and Local Taxes
3B Federal Grant Revenue
3C State Grant Revenue
3D Other Grant Revenue
3H Pension Stabilization Revenue
60 Proceeds from Sale of Property
61 Loan/Bond Proceeds
Total Revenues
Code Employment Operations
Enforcement & Training Stormwater Total
1053 1205 4006
(2,764,414) 1,311,439 (1,527,286) (5,721,842)
- - - 1,574,783
- - - -
- - - -
- - - -
- - 75,000 6,129,781
- - 2,000 2,000
- - - 4,000
- 145,077 1,854,701 5,103,897
-
61,000 852,917 - 961,917
- 3,600 4,380 7,980
- - - -
- 1,621,319 - 1,621,319
- 991,377 - 991,377
- 2,333,085 - 3,173,085
- - - -
- - - -
- - - -
61,000 5,947,375 1,936,081 19,570,139
51

City of Richmond
FY2018-19 Adopted Budget Summary
OTHER OPERATING
Transportation
FUND
Expenditures
40 Salaries and Wages
Salary savings
41 Benefits
Benefits savings
42 Professional Services
43 Other Operating
44 Utilities
45 Equipment & Contractual Svcs.
46 Provision for Insurance Loss
47 Cost Pool
48 Asset & Capital Outlay
Capital Improvement Projects
49 Debt Service Expenditures
50 Grant Expenditures
51 CDBG/Home/Hsg Proj
52 Employment & Training Allocations
53 RHA Cost Allocation
4A A87 Cost Plan Reimbursement
Total Expenditures
Code Employment Operations
Enforcement & Training Stormwater Total
1053 1205 4006
- 1,614,215 117,206 5,632,557
-
- 1,088,562 47,537 3,585,931
-
- 54,637 1,601,486 4,705,304
61,000 268,200 7,000 560,799
- 14,300 21,250 224,745
- 140,000 - 229,082
- - - -
- 517,002 114,951 4,004,633
- - - 1,000
-
- - - 72,742
- 2,445,834 - 2,445,834
- - - -
- 842,727 - 842,727
- - - -
- - - -
61,000 6,985,477 1,909,430 22,305,354
52

City of Richmond
FY2018-19 Adopted Budget Summary
OTHER OPERATING
Transportation
FUND
90 Transfers in from:
General Fund
Operations
Special Revenue
Capital Improvements
Debt Service
Enterprise Fund
Internal Service Funds
Housing Department
Successor Agency
Housing Authority
Total transfers in
91 Transfers out to:
General Fund
Operations
Special Revenue
Capital Improvements
Debt Service
Enterprise Fund
Internal Service Funds
Housing Department
Successor Agency
Housing Authority
Total transfers out
Net transfers in/out
Excess/(Deficiency)
Ending Balance
Code Employment Operations
Enforcement & Training Stormwater Total
1053 1205 4006
1,038,102 2,403,188
-
-
-
-
-
-
-
-
-
- 1,038,102 - 2,403,188
200,000 200,000
-
-
-
-
-
-
-
-
200,000 - - 200,000
(200,000) 1,038,102 - 2,203,188
(200,000) - 26,651 (532,027)
(2,964,414) 1,311,439 (1,500,635) (6,253,869)
53

City of Richmond
FY2018-19 Adopted Budget Summary
SPECIAL REVENUE
Secured Emergency Veolia N. Rich.
Pension Library Medical Mitigation Waste Mit.
Override Fund Services Funds Funds
FUND 1001 1005 1007 1009 1010
Estimated Beginning Balance 07/01/18 24,078 467,644 353,822 166,847 25,407
Revenues
30 Property Tax 11,195,473 - 215,586 - -
31 Sales Tax - - - - -
32 Utility Users Tax - - - - -
33 Other Taxes - - - - -
34 Licenses, Permits and Fees - - - 25,000 196,714
35 Fines, Forfeitures and Penalties - 19,000 - - -
36 Interest and Investment Income - - - - -
37 Charges for Services - - - - -
Charges for Internal Services
38 Other Revenues - 8,475 - - -
39 Rental Income - - - - -
3A State and Local Taxes - - - - -
3B Federal Grant Revenue - 39,926 - - -
3C State Grant Revenue - 105,956 - - -
3D Other Grant Revenue - 38,666 - - -
3H Pension Stabilization Revenue - - - - -
60 Proceeds from Sale of Property - - - - -
61 Loan/Bond Proceeds - - - - -
Total Revenues 11,195,473 212,023 215,586 25,000 196,714
54

City of Richmond
FY2018-19 Adopted Budget Summary
SPECIAL REVENUE
Secured Emergency Veolia N. Rich.
Pension Library Medical Mitigation Waste Mit.
Override Fund Services Funds Funds
FUND 1001 1005 1007 1009 1010
Expenditures
40 Salaries and Wages - - - - -
Salary savings
41 Benefits - - - - -
Benefits savings
42 Professional Services - 375,464 92,210 100,000 192,714
43 Other Operating - 23,365 144,500 - 2,000
44 Utilities - 17,400 - - 2,000
45 Equipment & Contractual Svcs. - - 60,000 - -
46 Provision for Insurance Loss - - - - -
47 Cost Pool - - - - -
48 Asset & Capital Outlay - 71,315 20,000 - -
Capital Improvement Projects
49 Debt Service Expenditures - - - - -
50 Grant Expenditures - 11,000 - - -
51 CDBG/Home/Hsg Proj - - - - -
52 Employment & Training Allocations - - - - -
53 RHA Cost Allocation - - - - -
4A A87 Cost Plan Reimbursement - - - - -
Total Expenditures - 498,544 316,710 100,000 196,714
55

City of Richmond
FY2018-19 Adopted Budget Summary
SPECIAL REVENUE
Secured Emergency Veolia N. Rich.
Pension Library Medical Mitigation Waste Mit.
Override Fund Services Funds Funds
FUND 1001 1005 1007 1009 1010
90 Transfers in from:
General Fund
Operations
Special Revenue
Capital Improvements
Debt Service
Enterprise Fund 16,275
Internal Service Funds
Housing Department
Successor Agency
Housing Authority
Total transfers in - 16,275 - - -
91 Transfers out to:
General Fund 8,094,735
Operations
Special Revenue
Capital Improvements
Debt Service 1,821,467
Enterprise Fund
Internal Service Funds
Housing Department
Successor Agency
Housing Authority
Garfield Pension 1,270,466
General Pension 8,805
Total transfers out 11,195,473 - - - -
Net transfers in/out (11,195,473) 16,275 - - -
Excess/(Deficiency) [1] - (270,246) (101,124) (75,000) -
Ending Balance 24,078 197,398 252,698 91,847 25,407
56

City of Richmond
FY2018-19 Adopted Budget Summary
SPECIAL REVENUE
FUND
Estimated Beginning Balance 07/01/18
Revenues
Property Tax
Sales Tax
Utility Users Tax
Other Taxes
Licenses, Permits and Fees
Fines, Forfeitures and Penalties
Interest and Investment Income
Charges for Services
Charges for Internal Services
Other Revenues
Rental Income
State and Local Taxes
Federal Grant Revenue
State Grant Revenue
Other Grant Revenue
Pension Stabilization Revenue
Proceeds from Sale of Property
Loan/Bond Proceeds
Total Revenues
Chevron Special
Hazmat EDA Revolving Modernization Encroachments Rent Control Revenue
Grant Loan Fund Project Fund Total
1013 1014 1017 1055 1018
11,373 345,890 12,043,607 194,471 376,116 14,009,255
- - - - - 11,411,059
- - - - - -
- - - - - -
- - - - - -
- - - 654,967 2,804,925 3,681,606
- - - - - 19,000
- 16,565 - - - 16,565
- - - 202,000 - 202,000
-
- 22,500 - 2,500 - 33,475
- - - - - -
- - - - - -
- - - - - 39,926
- - - - - 105,956
360,335 - 9,000,000 - - 9,399,001
- - - - - -
- - - - - -
- 83,196 - - - 83,196
360,335 122,262 9,000,000 859,467 2,804,925 24,991,785
57

City of Richmond
FY2018-19 Adopted Budget Summary
SPECIAL REVENUE
FUND
Expenditures
Salaries and Wages
Salary savings
Benefits
Benefits savings
Professional Services
Other Operating
Utilities
Equipment & Contractual Svcs.
Provision for Insurance Loss
Cost Pool
Asset & Capital Outlay
Capital Improvement Projects
Debt Service Expenditures
Grant Expenditures
CDBG/Home/Hsg Proj
Employment & Training Allocations
RHA Cost Allocation
A87 Cost Plan Reimbursement
Total Expenditures
Chevron Special
Hazmat EDA Revolving Modernization Encroachments Rent Control Revenue
Grant Loan Fund Project Fund Total
1013 1014 1017 1055 1018
- - - 239,762 931,973 1,171,735
-
- - - 217,635 485,544 703,179
-
321,444 5,338 9,610,545 - 466,200 11,163,915
38,891 2,000 41,000 - 100,300 352,056
- - - - 1,200 20,600
- - - - - 60,000
- - - - 25,000 25,000
- - - 226,808 159,575 386,383
- - 2,380,230 - 21,683 2,493,228
-
- - - - - -
- - - - - 11,000
- 60,000 - - - 60,000
- - - - - -
- - - - - -
- - - - - -
360,335 67,338 12,031,775 684,205 2,191,475 16,447,096
58

City of Richmond
FY2018-19 Adopted Budget Summary
SPECIAL REVENUE
FUND
Transfers in from:
General Fund
Operations
Special Revenue
Capital Improvements
Debt Service
Enterprise Fund
Internal Service Funds
Housing Department
Successor Agency
Housing Authority
Total transfers in
Transfers out to:
General Fund
Operations
Special Revenue
Capital Improvements
Debt Service
Enterprise Fund
Internal Service Funds
Housing Department
Successor Agency
Housing Authority
Garfield Pension
General Pension
Total transfers out
Net transfers in/out
Excess/(Deficiency) [1]
Ending Balance
Chevron Special
Hazmat EDA Revolving Modernization Encroachments Rent Control Revenue
Grant Loan Fund Project Fund Total
1013 1014 1017 1055 1018
-
-
-
-
-
16,275
-
-
-
-
- - - - - 16,275
8,094,735
-
-
-
1,821,467
-
-
-
-
-
- - - - - 9,916,202
- - - (9,899,927)
- 54,924 (3,031,775) 175,262 613,450 (1,355,238)
11,373 400,814 9,011,832 369,733 989,566 12,654,017
59
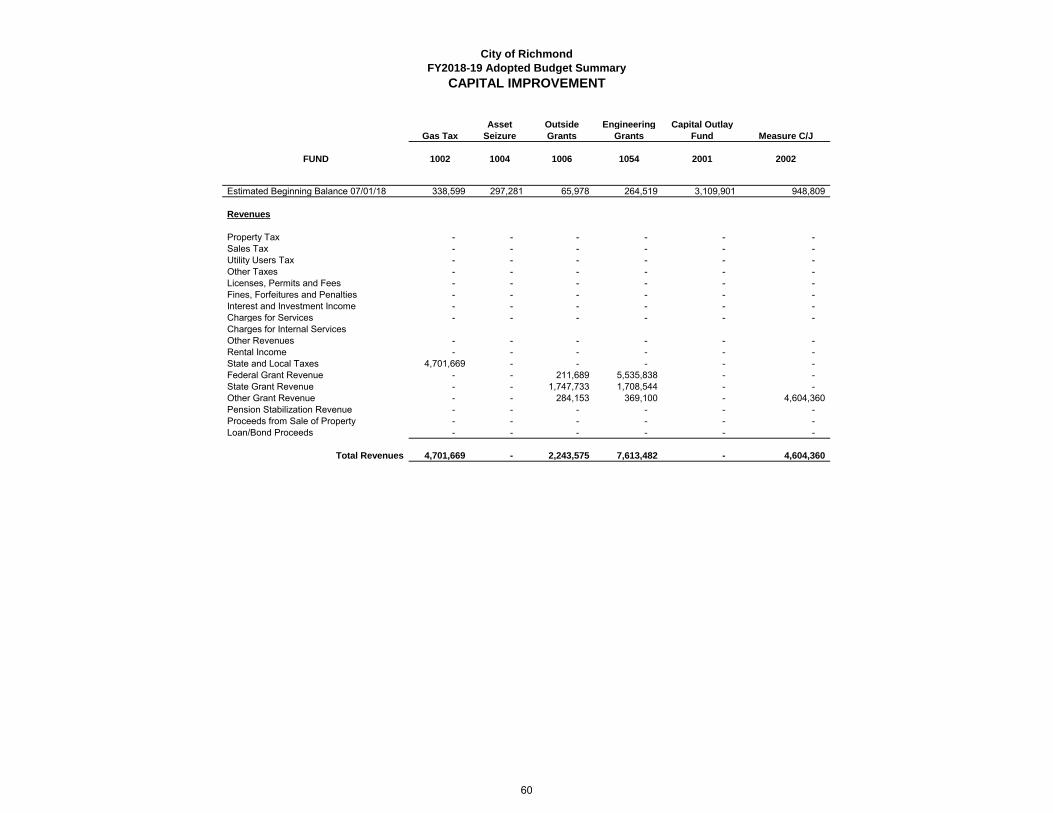
City of Richmond
FY2018-19 Adopted Budget Summary
CAPITAL IMPROVEMENT
Asset Outside Engineering Capital Outlay
Gas Tax Seizure Grants Grants Fund Measure C/J
FUND 1002 1004 1006 1054 2001 2002
Estimated Beginning Balance 07/01/18 338,599 297,281 65,978 264,519 3,109,901 948,809
Revenues
Property Tax - - - - - -
Sales Tax - - - - - -
Utility Users Tax - - - - - -
Other Taxes - - - - - -
Licenses, Permits and Fees - - - - - -
Fines, Forfeitures and Penalties - - - - - -
Interest and Investment Income - - - - - -
Charges for Services - - - - - -
Charges for Internal Services
Other Revenues - - - - - -
Rental Income - - - - - -
State and Local Taxes 4,701,669 - - - - -
Federal Grant Revenue - - 211,689 5,535,838 - -
State Grant Revenue - - 1,747,733 1,708,544 - -
Other Grant Revenue - - 284,153 369,100 - 4,604,360
Pension Stabilization Revenue - - - - - -
Proceeds from Sale of Property - - - - - -
Loan/Bond Proceeds - - - - - -
Total Revenues 4,701,669 - 2,243,575 7,613,482 - 4,604,360
60

City of Richmond
FY2018-19 Adopted Budget Summary
CAPITAL IMPROVEMENT
Asset Outside Engineering Capital Outlay
Gas Tax Seizure Grants Grants Fund Measure C/J
FUND 1002 1004 1006 1054 2001 2002
Expenditures
Salaries and Wages - - - - - -
Salary savings
Benefits - - - - - -
Benefits savings
Professional Services 3,000 - 1,536,380 - 98,786 140,000
Other Operating - - 15,066 - -
Utilities - - - - - -
Equipment & Contractual Svcs. 900,000 - - - - -
Provision for Insurance Loss - - - - - -
Cost Pool - - - - - -
Asset & Capital Outlay 4,137,268 135,000 672,128 7,613,482 3,010,343 5,413,169
Capital Improvement Projects
Debt Service Expenditures - - - - - -
Grant Expenditures - - 20,000 - - -
CDBG/Home/Hsg Proj - - - - - -
Employment & Training Allocations - - - - - -
RHA Cost Allocation - - - - - -
A87 Cost Plan Reimbursement - - - - - -
Total Expenditures 5,040,268 135,000 2,243,575 7,613,482 3,109,129 5,553,169
61

City of Richmond
FY2018-19 Adopted Budget Summary
CAPITAL IMPROVEMENT
Asset Outside Engineering Capital Outlay
Gas Tax Seizure Grants Grants Fund Measure C/J
FUND 1002 1004 1006 1054 2001 2002
Transfers in from:
General Fund
Operations
Special Revenue
Capital Improvements
Debt Service
Enterprise Fund
Internal Service Funds
Housing Department
Successor Agency
Housing Authority
Total transfers in - - - - - -
Transfers out to:
General Fund
Operations
Special Revenue
Capital Improvements
Debt Service
Enterprise Fund
Internal Service Funds
Housing Department
Successor Agency
Housing Authority
Total transfers out - - - - - -
Net transfers in/out - - - - - -
Excess/(Deficiency) (338,599) (135,000) - - (3,109,129) (948,809)
Ending Balance - 162,281 65,978 264,519 772 -
62

City of Richmond
FY2018-19 Adopted Budget Summary
CAPITAL IMPROVEMENT
FUND
Estimated Beginning Balance 07/01/18
Revenues
Property Tax
Sales Tax
Utility Users Tax
Other Taxes
Licenses, Permits and Fees
Fines, Forfeitures and Penalties
Interest and Investment Income
Charges for Services
Charges for Internal Services
Other Revenues
Rental Income
State and Local Taxes
Federal Grant Revenue
State Grant Revenue
Other Grant Revenue
Pension Stabilization Revenue
Proceeds from Sale of Property
Loan/Bond Proceeds
Total Revenues
Parks Harbor Park Traffic Fire Police Recreation
Projects Fund Impact Fee Impact Fee Impact Fee Impact Fee Impact Fee
2006 2007 2110 2111 2113 2114 2115
43,644 60,014 389,789 167,400 182,659 339,406
- - - - - - -
- - - - - - -
- - - - - - -
- - - - - - -
- - - - - - -
- - - - - - -
- - - - - - -
- - - - - - -
- - - - - - -
- - - - - - -
- - - - - - -
- - - - - - -
- - - - - - -
- - - - - - -
- - - - - - -
- - - - - - -
- - - - - - -
- - - - - - -
63

City of Richmond
FY2018-19 Adopted Budget Summary
CAPITAL IMPROVEMENT
FUND
Expenditures
Salaries and Wages
Salary savings
Benefits
Benefits savings
Professional Services
Other Operating
Utilities
Equipment & Contractual Svcs.
Provision for Insurance Loss
Cost Pool
Asset & Capital Outlay
Capital Improvement Projects
Debt Service Expenditures
Grant Expenditures
CDBG/Home/Hsg Proj
Employment & Training Allocations
RHA Cost Allocation
A87 Cost Plan Reimbursement
Total Expenditures
Parks Harbor Park Traffic Fire Police Recreation
Projects Fund Impact Fee Impact Fee Impact Fee Impact Fee Impact Fee
2006 2007 2110 2111 2113 2114 2115
- - - - - - -
- - - - - - -
- - - - - - -
- - - - 150,171 - -
- - - - - - -
- - - - - 41,000 6,781
- - - - - - -
- - - - - - -
- - 15,000 379,000 - - 332,625
- - - - - - -
- - - - - - -
- - - - - - -
- - - - - - -
- - - - - - -
- - - - - - -
- - 15,000 379,000 150,171 41,000 339,406
64

City of Richmond
FY2018-19 Adopted Budget Summary
CAPITAL IMPROVEMENT
FUND
Transfers in from:
General Fund
Operations
Special Revenue
Capital Improvements
Debt Service
Enterprise Fund
Internal Service Funds
Housing Department
Successor Agency
Housing Authority
Total transfers in
Transfers out to:
General Fund
Operations
Special Revenue
Capital Improvements
Debt Service
Enterprise Fund
Internal Service Funds
Housing Department
Successor Agency
Housing Authority
Total transfers out
Net transfers in/out
Excess/(Deficiency)
Ending Balance
Parks Harbor Park Traffic Fire Police Recreation
Projects Fund Impact Fee Impact Fee Impact Fee Impact Fee Impact Fee
2006 2007 2110 2111 2113 2114 2115
- - - - - - -
- - - - - - -
- - - - - - -
- - (15,000) (379,000) (150,171) (41,000) (339,406)
- 43,644 45,014 10,789 17,229 141,659 -
65

City of Richmond
FY2018-19 Adopted Budget Summary
CAPITAL IMPROVEMENT
FUND
Estimated Beginning Balance 07/01/18
Revenues
Property Tax
Sales Tax
Utility Users Tax
Other Taxes
Licenses, Permits and Fees
Fines, Forfeitures and Penalties
Interest and Investment Income
Charges for Services
Charges for Internal Services
Other Revenues
Rental Income
State and Local Taxes
Federal Grant Revenue
State Grant Revenue
Other Grant Revenue
Pension Stabilization Revenue
Proceeds from Sale of Property
Loan/Bond Proceeds
Total Revenues
Facility Fee Library Hilltop Impact Storm Drain Wastewater CIP
Parks Impact Fee Fee Impact Fee Impact Fee Total
2116 2117 2118 2119 2120
460,874 649,689 30,302 307,410 1,066,664 8,722,938
- - - - - -
- - - - - -
- - - - - -
- - - - - -
- - - 438,693 3,338,592 3,777,285
- - - - - -
- - - - - -
- - - - - -
-
- - - - - -
- - - - - -
- - - - - 4,701,669
- - - - - 5,747,527
- - - - - 3,456,277
- - - - - 5,257,613
- - - - - -
- - - - - -
- - - - - -
- - - 438,693 3,338,592 22,940,371
66

City of Richmond
FY2018-19 Adopted Budget Summary
CAPITAL IMPROVEMENT
FUND
Expenditures
Salaries and Wages
Salary savings
Benefits
Benefits savings
Professional Services
Other Operating
Utilities
Equipment & Contractual Svcs.
Provision for Insurance Loss
Cost Pool
Asset & Capital Outlay
Capital Improvement Projects
Debt Service Expenditures
Grant Expenditures
CDBG/Home/Hsg Proj
Employment & Training Allocations
RHA Cost Allocation
A87 Cost Plan Reimbursement
Total Expenditures
Facility Fee Library Hilltop Impact Storm Drain Wastewater CIP
Parks Impact Fee Fee Impact Fee Impact Fee Total
2116 2117 2118 2119 2120
-
-
-
-
- 142,400 - - - 1,920,566
- - - - - 165,237
- - - - - -
- - - - - 947,781
- - - - - -
- - - - - -
- 326,000 - - - 22,034,015
-
- - - - - -
- - - - - 20,000
- - - - - -
- - - - - -
- - - - - -
- - - - - -
- 468,400 - - - 25,087,600
67

City of Richmond
FY2018-19 Adopted Budget Summary
CAPITAL IMPROVEMENT
FUND
Transfers in from:
General Fund
Operations
Special Revenue
Capital Improvements
Debt Service
Enterprise Fund
Internal Service Funds
Housing Department
Successor Agency
Housing Authority
Total transfers in
Transfers out to:
General Fund
Operations
Special Revenue
Capital Improvements
Debt Service
Enterprise Fund
Internal Service Funds
Housing Department
Successor Agency
Housing Authority
Total transfers out
Net transfers in/out
Excess/(Deficiency)
Ending Balance
Facility Fee Library Hilltop Impact Storm Drain Wastewater CIP
Parks Impact Fee Fee Impact Fee Impact Fee Total
2116 2117 2118 2119 2120
-
-
-
- - -
-
-
-
-
-
-
- - - - - -
-
-
-
- - -
-
-
-
-
-
-
- - - - - -
- - - - - -
- (468,400) - 438,693 3,338,592 (2,147,229)
460,874 181,289 30,302 746,103 4,405,256 6,575,709
68

City of Richmond
FY2018-19 Adopted Budget Summary
DEBT SERVICE
2005 99A 2016
TAXBLE PENSION Lease Debt Svc
POBS OBG Revenue Total
FUND 3001 3002 3005
Estimated Beginning Balance 07/01/18 6,929,908 (244) (32,268) 6,897,396
Revenues
30 Property Tax 11,490,551 - - 11,490,551
31 Sales Tax - - - -
32 Utility Users Tax - - - -
33 Other Taxes - - - -
34 Licenses, Permits and Fees - - - -
35 Fines, Forfeitures and Penalties - - - -
36 Interest and Investment Income - - - -
37 Charges for Services - - 5,816,725 5,816,725
Charges for Internal Services -
38 Other Revenues - - - -
39 Rental Income - - - -
3A State and Local Taxes - - - -
3B Federal Grant Revenue - - - -
3C State Grant Revenue - - - -
3D Other Grant Revenue - - - -
3H Pension Stabilization Revenue - - - -
60 Proceeds from Sale of Property - - - -
61 Loan/Bond Proceeds - - - -
Total Revenues 11,490,551 - 5,816,725 17,307,276
69
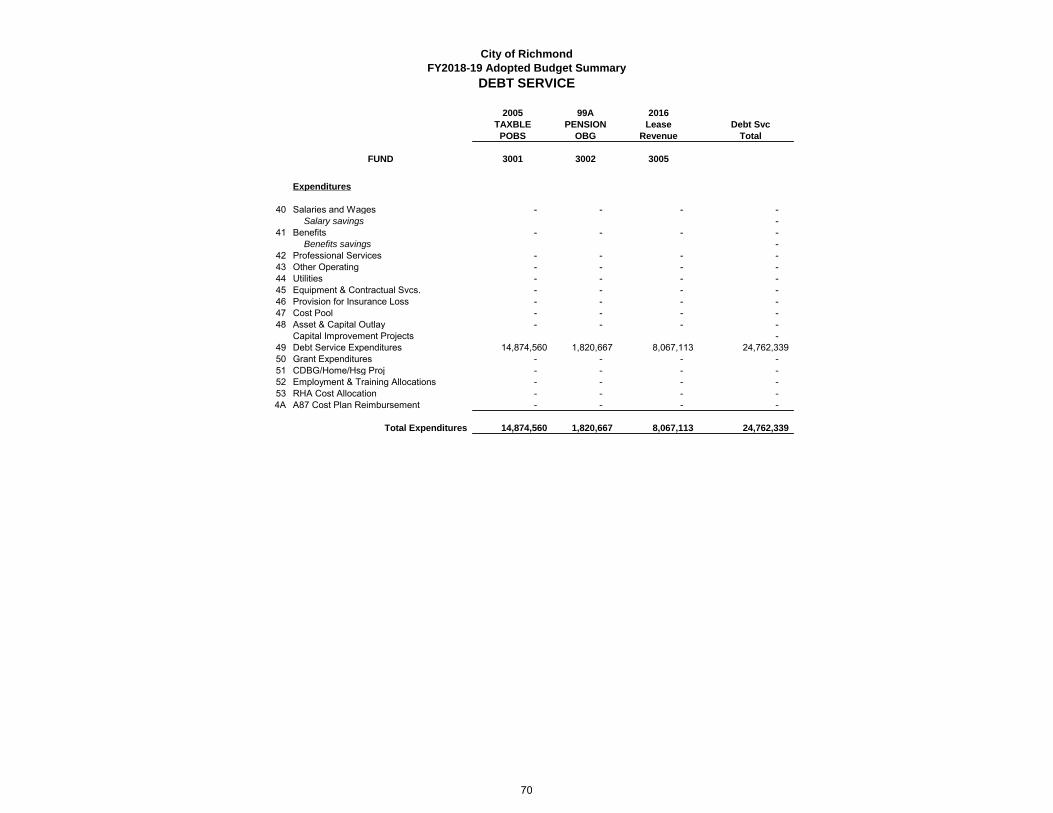
City of Richmond
FY2018-19 Adopted Budget Summary
DEBT SERVICE
2005 99A 2016
TAXBLE PENSION Lease Debt Svc
POBS OBG Revenue Total
FUND 3001 3002 3005
Expenditures
40 Salaries and Wages - - - -
Salary savings -
41 Benefits - - - -
Benefits savings -
42 Professional Services - - - -
43 Other Operating - - - -
44 Utilities - - - -
45 Equipment & Contractual Svcs. - - - -
46 Provision for Insurance Loss - - - -
47 Cost Pool - - - -
48 Asset & Capital Outlay - - - -
Capital Improvement Projects -
49 Debt Service Expenditures 14,874,560 1,820,667 8,067,113 24,762,339
50 Grant Expenditures - - - -
51 CDBG/Home/Hsg Proj - - - -
52 Employment & Training Allocations - - - -
53 RHA Cost Allocation - - - -
4A A87 Cost Plan Reimbursement - - - -
Total Expenditures 14,874,560 1,820,667 8,067,113 24,762,339
70

City of Richmond
FY2018-19 Adopted Budget Summary
DEBT SERVICE
2005 99A 2016
TAXBLE PENSION Lease Debt Svc
POBS OBG Revenue Total
FUND 3001 3002 3005
90 Transfers in from:
General Fund 221,855 2,513,888 2,735,743
Operations -
Special Revenue 1,821,467 1,821,467
Capital Improvements -
Debt Service -
Enterprise Fund -
Internal Service Funds -
Housing Department -
Successor Agency -
Housing Authority -
Total transfers in 221,855 1,821,467 2,513,888 4,557,210
91 Transfers out to:
General Fund -
Operations -
Special Revenue -
Capital Improvements -
Debt Service -
Enterprise Fund -
Internal Service Funds -
Housing Department -
Successor Agency -
Housing Authority -
Total transfers out - - - -
Net transfers in/out 221,855 1,821,467 2,513,888 4,557,210
Excess/(Deficiency) (3,162,154) 800 263,501 (2,897,853)
Ending Balance 3,767,754 556 231,233 3,999,543
71

City of Richmond
FY2018-19 Adopted Budget Summary
ENTERPRISE FUNDS
Port Port Port Port Port
Operations CIP Debt Service Special Revenue Total
FUND 4001 4001 4001 4001 4001
Estimated Beginning Balance 07/01/18 1,996,072 1,996,072
Revenues
30 Property Tax - -
31 Sales Tax - -
32 Utility Users Tax - -
33 Other Taxes - -
34 Licenses, Permits and Fees - -
35 Fines, Forfeitures and Penalties - -
36 Interest and Investment Income - -
37 Charges for Services - -
Charges for Internal Services -
38 Other Revenues - -
39 Rental Income 10,249,621 10,249,621
3A State and Local Taxes - -
3B Federal Grant Revenue - -
3C State Grant Revenue - -
3D Other Grant Revenue - -
3H Pension Stabilization Revenue - -
60 Proceeds from Sale of Property - -
61 Loan/Bond Proceeds - -
Total Revenues 10,249,621 - - - 10,249,621
72

City of Richmond
FY2018-19 Adopted Budget Summary
ENTERPRISE FUNDS
Port Port Port Port Port
Operations CIP Debt Service Special Revenue Total
FUND 4001 4001 4001 4001 4001
Expenditures
40 Salaries and Wages 605,615 605,615
Salary savings -
41 Benefits 328,381 328,381
Benefits savings -
42 Professional Services 1,182,314 1,182,314
43 Other Operating 17,000 17,000
44 Utilities 295,400 295,400
45 Equipment & Contractual Svcs. 322,000 322,000
46 Provision for Insurance Loss 30,000 30,000
47 Cost Pool 487,689 487,689
48 Asset & Capital Outlay 1,183,725 1,183,725
Capital Improvement Projects -
49 Debt Service Expenditures 5,446,794 5,446,794
50 Grant Expenditures - -
51 CDBG/Home/Hsg Proj - -
52 Employment & Training Allocations - -
53 RHA Cost Allocation - -
4A A87 Cost Plan Reimbursement - -
Total Expenditures 3,268,399 1,183,725 5,446,794 - 9,898,918
73

City of Richmond
FY2018-19 Adopted Budget Summary
ENTERPRISE FUNDS
Port Port Port Port Port
Operations CIP Debt Service Special Revenue Total
FUND 4001 4001 4001 4001 4001
90 Transfers in from:
General Fund -
Operations -
Special Revenue -
Capital Improvements -
Debt Service -
Enterprise Fund 1,200,000 5,446,794 6,646,794
Internal Service Funds -
Housing Department -
Successor Agency -
Housing Authority -
Total transfers in - 1,200,000 5,446,794 - 6,646,794
91 Transfers out to:
General Fund -
Operations -
Special Revenue 16,275 16,275
Capital Improvements -
Debt Service -
Enterprise Fund 6,646,794 6,646,794
Internal Service Funds -
Housing Department -
Successor Agency -
Housing Authority -
Total transfers out 6,663,069 - - - 6,663,069
Net transfers in/out (6,663,069) 1,200,000 5,446,794 - (16,275)
Excess/(Deficiency) 318,153 16,275 0 - 334,428
Ending Balance 2,314,225 16,275 0 - 2,330,500
74
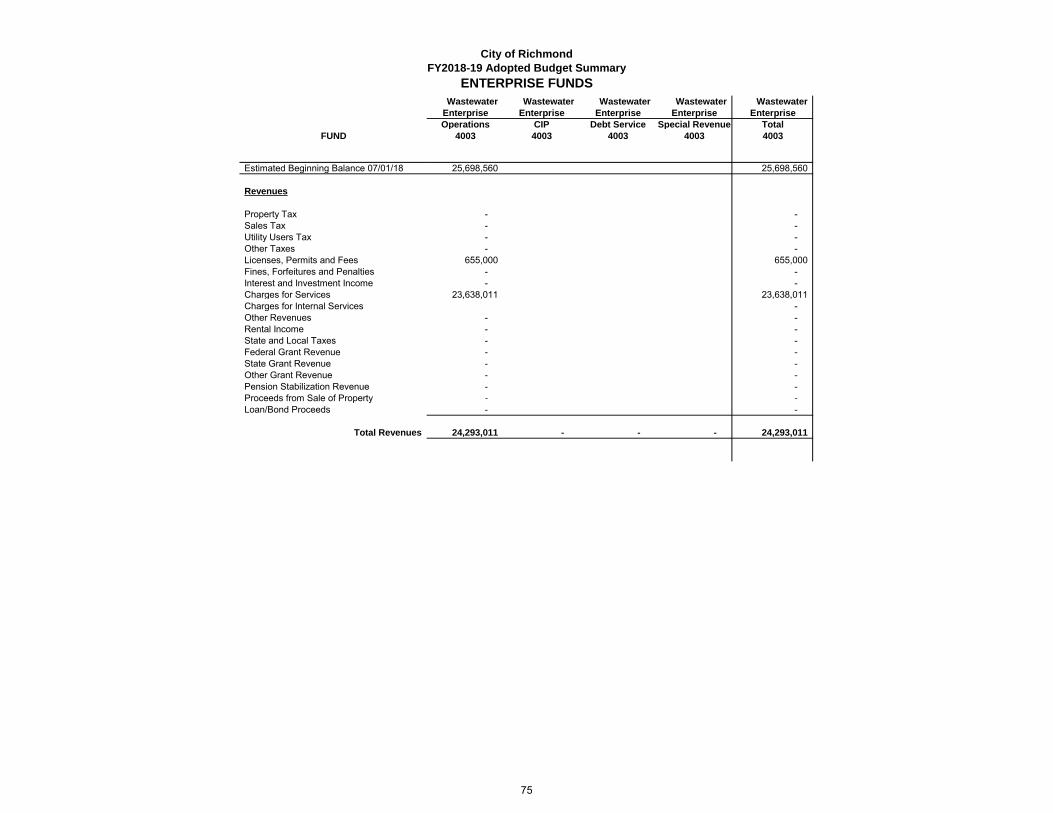
City of Richmond
FY2018-19 Adopted Budget Summary
ENTERPRISE FUNDS
FUND
Estimated Beginning Balance 07/01/18
Revenues
Property Tax
Sales Tax
Utility Users Tax
Other Taxes
Licenses, Permits and Fees
Fines, Forfeitures and Penalties
Interest and Investment Income
Charges for Services
Charges for Internal Services
Other Revenues
Rental Income
State and Local Taxes
Federal Grant Revenue
State Grant Revenue
Other Grant Revenue
Pension Stabilization Revenue
Proceeds from Sale of Property
Loan/Bond Proceeds
Total Revenues
Wastewater Wastewater Wastewater Wastewater Wastewater
Enterprise Enterprise Enterprise Enterprise Enterprise
Operations CIP Debt Service Special Revenue Total
4003 4003 4003 4003 4003
25,698,560 25,698,560
- -
- -
- -
- -
655,000 655,000
- -
- -
23,638,011 23,638,011
-
- -
- -
- -
- -
- -
- -
- -
- -
- -
24,293,011 - - - 24,293,011
75

City of Richmond
FY2018-19 Adopted Budget Summary
ENTERPRISE FUNDS
FUND
Expenditures
Salaries and Wages
Salary savings
Benefits
Benefits savings
Professional Services
Other Operating
Utilities
Equipment & Contractual Svcs.
Provision for Insurance Loss
Cost Pool
Asset & Capital Outlay
Capital Improvement Projects
Debt Service Expenditures
Grant Expenditures
CDBG/Home/Hsg Proj
Employment & Training Allocations
RHA Cost Allocation
A87 Cost Plan Reimbursement
Total Expenditures
Wastewater Wastewater Wastewater Wastewater Wastewater
Enterprise Enterprise Enterprise Enterprise Enterprise
Operations CIP Debt Service Special Revenue Total
4003 4003 4003 4003 4003
1,044,796 1,044,796
-
492,113 492,113
-
7,363,119 7,363,119
259,931 259,931
950,274 950,274
344,080 344,080
- -
772,278 772,278
7,414,054 7,414,054
-
8,538,658 8,538,658
- -
- -
- -
- -
- -
11,226,590 7,414,054 8,538,658 - 27,179,302
76

City of Richmond
FY2018-19 Adopted Budget Summary
ENTERPRISE FUNDS
FUND
Transfers in from:
General Fund
Operations
Special Revenue
Capital Improvements
Debt Service
Enterprise Fund
Internal Service Funds
Housing Department
Successor Agency
Housing Authority
Total transfers in
Transfers out to:
General Fund
Operations
Special Revenue
Capital Improvements
Debt Service
Enterprise Fund
Internal Service Funds
Housing Department
Successor Agency
Housing Authority
Total transfers out
Net transfers in/out
Excess/(Deficiency)
Ending Balance
Wastewater Wastewater Wastewater Wastewater Wastewater
Enterprise Enterprise Enterprise Enterprise Enterprise
Operations CIP Debt Service Special Revenue Total
4003 4003 4003 4003 4003
-
-
-
-
-
7,414,054 8,538,658 15,952,712
-
-
-
-
- 7,414,054 8,538,658 - 15,952,712
-
-
-
-
-
15,952,712 15,952,712
-
-
-
-
15,952,712 - - - 15,952,712
(15,952,712) 7,414,054 8,538,658 - -
(2,886,291) - 0 - (2,886,291)
22,812,269 - 0 - 22,812,269
77

City of Richmond
FY2018-19 Adopted Budget Summary
ENTERPRISE FUNDS
FUND
Estimated Beginning Balance 07/01/18
Revenues
Property Tax
Sales Tax
Utility Users Tax
Other Taxes
Licenses, Permits and Fees
Fines, Forfeitures and Penalties
Interest and Investment Income
Charges for Services
Charges for Internal Services
Other Revenues
Rental Income
State and Local Taxes
Federal Grant Revenue
State Grant Revenue
Other Grant Revenue
Pension Stabilization Revenue
Proceeds from Sale of Property
Loan/Bond Proceeds
Total Revenues
Marina Marina Marina Marina Marina
Operations Operations Operations Operations Operations
Operations CIP Debt Service Special Revenue Total
4005 4005 4005 4005 4005
3,413,156 3,413,156
- -
- -
- -
- -
- -
- -
- -
- -
-
- -
550,000 550,000
- -
- -
- -
- -
- -
- -
- -
550,000 550,000
78

City of Richmond
FY2018-19 Adopted Budget Summary
ENTERPRISE FUNDS
FUND
Expenditures
Salaries and Wages
Salary savings
Benefits
Benefits savings
Professional Services
Other Operating
Utilities
Equipment & Contractual Svcs.
Provision for Insurance Loss
Cost Pool
Asset & Capital Outlay
Capital Improvement Projects
Debt Service Expenditures
Grant Expenditures
CDBG/Home/Hsg Proj
Employment & Training Allocations
RHA Cost Allocation
A87 Cost Plan Reimbursement
Total Expenditures
Marina Marina Marina Marina Marina
Operations Operations Operations Operations Operations
Operations CIP Debt Service Special Revenue Total
4005 4005 4005 4005 4005
- -
-
- -
-
- -
- -
- -
- -
- -
- -
325,000 325,000
-
206,815 206,815
- -
- -
- -
- -
- -
- 325,000 206,815 - 531,815
79

City of Richmond
FY2018-19 Adopted Budget Summary
ENTERPRISE FUNDS
FUND
Transfers in from:
General Fund
Operations
Special Revenue
Capital Improvements
Debt Service
Enterprise Fund
Internal Service Funds
Housing Department
Successor Agency
Housing Authority
Total transfers in
Transfers out to:
General Fund
Operations
Special Revenue
Capital Improvements
Debt Service
Enterprise Fund
Internal Service Funds
Housing Department
Successor Agency
Housing Authority
Total transfers out
Net transfers in/out
Excess/(Deficiency)
Ending Balance
Marina Marina Marina Marina Marina
Operations Operations Operations Operations Operations
Operations CIP Debt Service Special Revenue Total
4005 4005 4005 4005 4005
-
-
325,000 206,815 531,815
- 325,000 206,815 - 531,815
86,778 86,778
-
531,815 531,815
618,593 - - - 618,593
(618,593) 325,000 206,815 - (86,778)
(68,593) - - - (68,593)
3,344,563 - - - 3,344,563
80

City of Richmond
FY2018-19 Adopted Budget Summary
ENTERPRISE FUNDS
FUND
Estimated Beginning Balance 07/01/18
Revenues
Property Tax
Sales Tax
Utility Users Tax
Other Taxes
Licenses, Permits and Fees
Fines, Forfeitures and Penalties
Interest and Investment Income
Charges for Services
Charges for Internal Services
Other Revenues
Rental Income
State and Local Taxes
Federal Grant Revenue
State Grant Revenue
Other Grant Revenue
Pension Stabilization Revenue
Proceeds from Sale of Property
Loan/Bond Proceeds
Total Revenues
Enterprise Fund
KCRT KCRT KCRT KCRT KCRT Total
Operations CIP Debt Service Special Revenue Total
4008 4008 4008 4008 4008
511,110 515,957 31,623,745
- - -
- - -
- - -
- - -
1,325,000 1,325,000 1,980,000
- - -
- - -
- - 23,638,011
- -
- - -
- - 10,799,621
- - -
- - -
- - -
- - -
- - -
- - -
- - -
1,325,000 1,325,000 36,417,632
81

City of Richmond
FY2018-19 Adopted Budget Summary
ENTERPRISE FUNDS
FUND
Expenditures
Salaries and Wages
Salary savings
Benefits
Benefits savings
Professional Services
Other Operating
Utilities
Equipment & Contractual Svcs.
Provision for Insurance Loss
Cost Pool
Asset & Capital Outlay
Capital Improvement Projects
Debt Service Expenditures
Grant Expenditures
CDBG/Home/Hsg Proj
Employment & Training Allocations
RHA Cost Allocation
A87 Cost Plan Reimbursement
Total Expenditures
Enterprise Fund
KCRT KCRT KCRT KCRT KCRT Total
Operations CIP Debt Service Special Revenue Total
4008 4008 4008 4008 4008
573,824 573,824 2,224,235
- -
391,967 391,967 1,212,461
- -
46,400 46,400 8,591,833
39,400 39,400 316,331
58,200 58,200 1,303,874
- - 666,080
- - 30,000
202,803 202,803 1,462,770
40,000 40,000 8,962,779
- -
- - 14,192,266
- - -
- - -
- - -
- - -
- - -
1,312,594 40,000 1,352,594 38,962,629
82

City of Richmond
FY2018-19 Adopted Budget Summary
ENTERPRISE FUNDS
FUND
Transfers in from:
General Fund
Operations
Special Revenue
Capital Improvements
Debt Service
Enterprise Fund
Internal Service Funds
Housing Department
Successor Agency
Housing Authority
Total transfers in
Transfers out to:
General Fund
Operations
Special Revenue
Capital Improvements
Debt Service
Enterprise Fund
Internal Service Funds
Housing Department
Successor Agency
Housing Authority
Total transfers out
Net transfers in/out
Excess/(Deficiency)
Ending Balance
Enterprise Fund
KCRT KCRT KCRT KCRT KCRT Total
Operations CIP Debt Service Special Revenue Total
4008 4008 4008 4008 4008
-
-
-
- -
-
40,000 40,000 23,171,321
-
-
-
-
- 40,000 - - 40,000 23,171,321
- 86,778
-
16,275
-
-
40,000 40,000 23,171,321
-
-
-
-
40,000 - 40,000 23,274,374
(40,000) 40,000 - - - (103,053)
(27,594) - (27,594) (2,648,050)
483,516 - - - 488,363 28,975,695
83

City of Richmond
FY2018-19 Adopted Budget Summary
INTERNAL SERVICE FUNDS
Internal
Risk Mngmnt Equipment Police CAD Police RMS Compensated Service
Insurance Replacement System System Absences Total
FUND 5001 5003 5005 5006 5008
Estimated Beginning Balance 07/01/18 28,675,777 1,682,438 652,934 154,085 - 31,165,234
Revenues
30 Property Tax - - - - - -
31 Sales Tax - - - - - -
32 Utility Users Tax - - - - - -
33 Other Taxes - - - - - -
34 Licenses, Permits and Fees - - - - - -
35 Fines, Forfeitures and Penalties - - - - - -
36 Interest and Investment Income 100,000 - - - - 100,000
37 Charges for Services 21,368,269 426,000 798,479 - - 22,592,748
Charges for Internal Services -
38 Other Revenues - - 205,500 24,846 2,500,000 2,730,346
39 Rental Income - - - - - -
3A State and Local Taxes - - - - - -
3B Federal Grant Revenue - - - - - -
3C State Grant Revenue - - - - - -
3D Other Grant Revenue - - - - - -
3H Pension Stabilization Revenue - - - - - -
60 Proceeds from Sale of Property - - - - - -
61 Loan/Bond Proceeds - 1,230,660 - - - 1,230,660
Total Revenues 21,468,269 1,656,660 1,003,979 24,846 2,500,000 26,653,754
84

City of Richmond
FY2018-19 Adopted Budget Summary
INTERNAL SERVICE FUNDS
Internal
Risk Mngmnt Equipment Police CAD Police RMS Compensated Service
Insurance Replacement System System Absences Total
FUND 5001 5003 5005 5006 5008
Expenditures
40 Salaries and Wages 1,137,342 - 2,530,283 142,180 2,500,000 6,309,805
Salary savings -
41 Benefits 606,385 - 1,326,655 87,950 - 2,020,990
Benefits savings -
42 Professional Services 1,057,700 - 409,540 152,875 - 1,620,115
43 Other Operating 31,000 - 3,000 1,000 - 35,000
44 Utilities - - 50,000 - - 50,000
45 Equipment & Contractual Svcs. - - 21,500 47,746 - 69,246
46 Provision for Insurance Loss 17,332,112 - - - 17,332,112
47 Cost Pool 511,100 - 886,009 61,731 - 1,458,840
48 Asset & Capital Outlay 10,000 2,911,985 33,000 - - 2,954,985
Capital Improvement Projects -
49 Debt Service Expenditures - - - - - -
50 Grant Expenditures - - - - - -
51 CDBG/Home/Hsg Proj - - - - - -
52 Employment & Training Allocations - - - - - -
53 RHA Cost Allocation - - - - - -
4A A87 Cost Plan Reimbursement - - - - - -
Total Expenditures 20,685,639 2,911,985 5,259,987 493,482 2,500,000 31,851,093
85

City of Richmond
FY2018-19 Adopted Budget Summary
INTERNAL SERVICE FUNDS
Internal
Risk Mngmnt Equipment Police CAD Police RMS Compensated Service
Insurance Replacement System System Absences Total
FUND 5001 5003 5005 5006 5008
90 Transfers in from:
General Fund 100,000 4,361,119 478,071 4,939,190
Operations -
Special Revenue -
Capital Improvements -
Debt Service -
Enterprise Fund -
Internal Service Funds -
Housing Department -
Successor Agency -
Housing Authority -
Total transfers in - 100,000 4,361,119 478,071 - 4,939,190
91 Transfers out to:
General Fund -
Operations -
Special Revenue -
Capital Improvements -
Debt Service -
Enterprise Fund -
Internal Service Funds -
Housing Department -
Successor Agency -
Housing Authority -
Total transfers out - - - - - -
Net transfers in/out - 100,000 4,361,119 478,071 - 4,939,190
Excess/(Deficiency) 782,630 (1,155,325) 105,111 9,435 - (258,149)
Ending Balance 29,458,407 527,112 758,045 163,520 - 30,907,084
86

City of Richmond
FY2018-19 Adopted Budget Summary
HOUSING DEPARTMENT FUNDS
Housing Home NSP NSP Successor Housing
Admin CDBG Program (Non-Profit) (City) Agency
FUND 1200 1201 1202 1203 1207 1208
Estimated Beginning Balance 07/01/18 (1,084,437) (91,885) (768,926) 48,312 (82,687) 1,410,300
Revenues
30 Property Tax - - - - - -
31 Sales Tax - - - - - -
32 Utility Users Tax - - - - - -
33 Other Taxes - - - - - -
34 Licenses, Permits and Fees - - - - - -
35 Fines, Forfeitures and Penalties - - - - - -
36 Interest and Investment Income - 30,383 - 352 - 94,244
37 Charges for Services - - - - - -
Charges for Internal Services
38 Other Revenues 600,618 - - - - 63,497
39 Rental Income - - - - - -
3A State and Local Taxes - - - - - -
3B Federal Grant Revenue - 674,406 - - - -
3C State Grant Revenue - - - - - -
3D Other Grant Revenue - - - - - -
3H Pension Stabilization Revenue - - - - - -
60 Proceeds from Sale of Property - - - - 55,000 -
61 Loan/Bond Proceeds - 345,961 880 - - 78,660
Total Revenues 600,618 1,050,750 880 352 55,000 236,401
87

City of Richmond
FY2018-19 Adopted Budget Summary
HOUSING DEPARTMENT FUNDS
Housing Home NSP NSP Successor Housing
Admin CDBG Program (Non-Profit) (City) Agency
FUND 1200 1201 1202 1203 1207 1208
Expenditures
40 Salaries and Wages 150,206 7,453 - - - 107,263
Salary savings
41 Benefits 84,741 4,866 - - - 62,569
Benefits savings
42 Professional Services 153,184 19,292 322 20,000 - -
43 Other Operating 11,019 157 - - 3,465 -
44 Utilities 719 - - - - -
45 Equipment & Contractual Svcs. - - - - - -
46 Provision for Insurance Loss - - - - - -
47 Cost Pool 190,087 25,641 - - - -
48 Asset & Capital Outlay - - - - - -
Capital Improvement Projects
49 Debt Service Expenditures - - - - - -
50 Grant Expenditures - - - - - -
51 CDBG/Home/Hsg Proj - 1,369,704 - - - 850,000
52 Employment & Training Allocations - - - - - -
53 RHA Cost Allocation - - - - - -
4A A87 Cost Plan Reimbursement - - - - - -
Total Expenditures 589,956 1,427,113 322 20,000 3,465 1,019,832
88

City of Richmond
FY2018-19 Adopted Budget Summary
HOUSING DEPARTMENT FUNDS
Housing Home NSP NSP Successor Housing
Admin CDBG Program (Non-Profit) (City) Agency
FUND 1200 1201 1202 1203 1207 1208
90 Transfers in from:
General Fund
Operations
Special Revenue
Capital Improvements
Debt Service
Enterprise Fund
Internal Service Funds
Housing Department
Successor Agency to RCRA
Housing Authority
Housing In Lieu
Total transfers in - - - - - -
91 Transfers out to:
General Fund
Operations
Special Revenue
Capital Improvements
Debt Service
Enterprise Fund
Internal Service Funds
Housing Department
Successor Agency to RCRA
Housing Authority
Housing In Lieu
Total transfers out - - - - - -
Net transfers in/out - - - - - -
Excess/(Deficiency) 10,662 (376,363) 558 (19,648) 51,535 (783,431)
Ending Balance (1,073,775) (468,248) (768,368) 28,664 (31,152) 626,869
89

City of Richmond
FY2018-19 Adopted Budget Summary
HOUSING DEPARTMENT FUNDS
FUND
Estimated Beginning Balance 07/01/18
Revenues
Property Tax
Sales Tax
Utility Users Tax
Other Taxes
Licenses, Permits and Fees
Fines, Forfeitures and Penalties
Interest and Investment Income
Charges for Services
Charges for Internal Services
Other Revenues
Rental Income
State and Local Taxes
Federal Grant Revenue
State Grant Revenue
Other Grant Revenue
Pension Stabilization Revenue
Proceeds from Sale of Property
Loan/Bond Proceeds
Total Revenues
Cal Home Housing Iron Housing Department
Grant In-Lieu Funds Triangle Total
1209 1302 2125 2126
(36,631) (746,940) 654,245 (23,446) (722,095)
- - - - -
- - - - -
- - - - -
- - - - -
- 276,260 - - 276,260
- - - - -
1,977 201 5 - 127,162
- - - - -
-
- - - - 664,115
- - - - -
- - - - -
- - - 674,406
235,743 - - 1,915,279 2,151,022
- - - - -
- - - - -
- - - - 55,000
20,170 - - - 445,670
-
257,890 276,461 5 1,915,279 4,393,635
Housing Capital
Project Fund
90

City of Richmond
FY2018-19 Adopted Budget Summary
HOUSING DEPARTMENT FUNDS
FUND
Expenditures
Salaries and Wages
Salary savings
Benefits
Benefits savings
Professional Services
Other Operating
Utilities
Equipment & Contractual Svcs.
Provision for Insurance Loss
Cost Pool
Asset & Capital Outlay
Capital Improvement Projects
Debt Service Expenditures
Grant Expenditures
CDBG/Home/Hsg Proj
Employment & Training Allocations
RHA Cost Allocation
A87 Cost Plan Reimbursement
Total Expenditures
Cal Home Housing Iron Housing Department
Grant In-Lieu Funds Triangle Total
1209 1302 2125 2126
Housing Capital
Project Fund
9,053 - - - 273,976
-
6,332 - - - 158,506
-
1,600 - - - 194,399
- - - - 14,641
- - - - 719
- - - - -
- - - - -
- - - - 215,728
300,000 - 1,915,279 2,215,279
-
- - - - -
- - - - -
235,743 276,461 49,984 - 2,781,892
- - - - -
- - - - -
- - - - -
252,728 576,461 49,984 1,915,279 5,855,141
91

City of Richmond
FY2018-19 Adopted Budget Summary
HOUSING DEPARTMENT FUNDS
FUND
Transfers in from:
General Fund
Operations
Special Revenue
Capital Improvements
Debt Service
Enterprise Fund
Internal Service Funds
Housing Department
Successor Agency to RCRA
Housing Authority
Housing In Lieu
Total transfers in
Transfers out to:
General Fund
Operations
Special Revenue
Capital Improvements
Debt Service
Enterprise Fund
Internal Service Funds
Housing Department
Successor Agency to RCRA
Housing Authority
Housing In Lieu
Total transfers out
Net transfers in/out
Excess/(Deficiency)
Ending Balance
Cal Home Housing Iron Housing Department
Grant In-Lieu Funds Triangle Total
1209 1302 2125 2126
Housing Capital
Project Fund
-
-
-
-
-
-
-
-
-
-
-
- - - - -
-
-
-
-
-
-
-
-
-
-
-
- - - - -
- - - - -
5,162 (300,000) (49,979) - (1,461,505)
(31,469) (1,046,940) 604,266 (23,446) (2,183,600)
92

City of Richmond
FY2018-19 Adopted Budget Summary
HOUSING AUTHORITY FUNDS
RHA
RHA RHA HSNG Choice Voucher RHA RHA
Public Housing Capital Fund Section 8 RAD Central Office Cost Ctr.
FUND 4401:4409 4201 4101 4102 4501
Estimated Beginning Balance 07/01/18 -
Revenues
Property Tax - - - - -
Sales Tax - - - - -
Utility Users Tax - - - - -
Other Taxes - - - - -
Licenses, Permits and Fees - - - 30,000 1,178,918
Fines, Forfeitures and Penalties - - - - -
Interest and Investment Income - - - - -
Charges for Services - - - - -
Charges for Internal Services
Other Revenues 59,300 - 25,000 30,000 -
Rental Income 865,200 - - - -
State and Local Taxes 155,976 - - - -
Federal Grant Revenue 1,312,884 574,434 21,622,269 - -
State Grant Revenue - - - - -
Other Grant Revenue - - - - -
Pension Stabilization Revenue - - - - -
Proceeds from Sale of Property - - - - -
Loan/Bond Proceeds - - - - -
Total Revenues 2,393,360 574,434 21,647,269 60,000 1,178,918
93

City of Richmond
FY2018-19 Adopted Budget Summary
HOUSING AUTHORITY FUNDS
RHA RHA HSNG Choice Voucher RHA RHA
Public Housing Capital Fund Section 8 RAD Central Office Cost Ctr.
FUND 4401:4409 4201 4101 4102 4501
Expenditures
Salaries and Wages 345,253 - 521,886 - 524,767
Salary savings
Benefits 344,149 - 424,675 - 360,447
Benefits savings
Professional Services 10,000 - 204,500 25,000 125,000
Other Operating 548,895 5,000 44,500 5,000 -
Utilities 233,500 - 12,000 6,200 -
Equipment & Contractual Svcs. 1,042,368 - 500 - -
Provision for Insurance Loss 49,825 - - - -
Cost Pool 283,601 - - - 551,507
Asset & Capital Outlay - 212,742 - - -
Capital Improvement Projects
Debt Service Expenditures - - - - -
Grant Expenditures 437,176 414,135 20,252,796 45,527 150,000
CDBG/Home/Hsg Proj - - - - -
Employment & Training Allocations - - - - -
RHA Cost Allocation - - - - -
A87 Cost Plan Reimbursement - - - - -
Total Expenditures 3,294,767 631,877 21,460,857 81,727 1,711,721
94

City of Richmond
FY2018-19 Adopted Budget Summary
HOUSING AUTHORITY FUNDS
RHA RHA HSNG Choice Voucher RHA RHA
Public Housing Capital Fund Section 8 RAD Central Office Cost Ctr.
FUND 4401:4409 4201 4101 4102 4501
Transfers in from:
General Fund
Operations
Special Revenue
Capital Improvements
Debt Service
Enterprise Fund
Internal Service Funds
Housing Department
Successor Agency
Housing Authority
Total transfers in - - - - -
Transfers out to:
General Fund
Operations
Special Revenue
Capital Improvements
Debt Service
Enterprise Fund
Internal Service Funds
Housing Department
Successor Agency
Housing Authority
Total transfers out - - - - -
Net transfers in/out
Excess/(Deficiency) (901,407) (57,443) 186,412 (21,727) (532,803)
Ending Balance (901,407) (57,443) 186,412 (21,727) (532,803)
95

City of Richmond
FY2018-19 Adopted Budget Summary
HOUSING AUTHORITY FUNDS
FUND
Estimated Beginning Balance 07/01/18
Revenues
Property Tax
Sales Tax
Utility Users Tax
Other Taxes
Licenses, Permits and Fees
Fines, Forfeitures and Penalties
Interest and Investment Income
Charges for Services
Charges for Internal Services
Other Revenues
Rental Income
State and Local Taxes
Federal Grant Revenue
State Grant Revenue
Other Grant Revenue
Pension Stabilization Revenue
Proceeds from Sale of Property
Loan/Bond Proceeds
Total Revenues
Housing
Authority
Total
-
-
-
-
-
1,208,918
-
-
-
-
114,300
865,200
155,976
23,509,587
-
-
-
-
-
25,853,981
96

City of Richmond
FY2018-19 Adopted Budget Summary
HOUSING AUTHORITY FUNDS
FUND
Expenditures
Salaries and Wages
Salary savings
Benefits
Benefits savings
Professional Services
Other Operating
Utilities
Equipment & Contractual Svcs.
Provision for Insurance Loss
Cost Pool
Asset & Capital Outlay
Capital Improvement Projects
Debt Service Expenditures
Grant Expenditures
CDBG/Home/Hsg Proj
Employment & Training Allocations
RHA Cost Allocation
A87 Cost Plan Reimbursement
Total Expenditures
Authority
Total
1,391,906
-
1,129,271
-
364,500
603,395
251,700
1,042,868
49,825
835,108
212,742
-
-
21,299,634
-
-
-
-
27,180,949
97
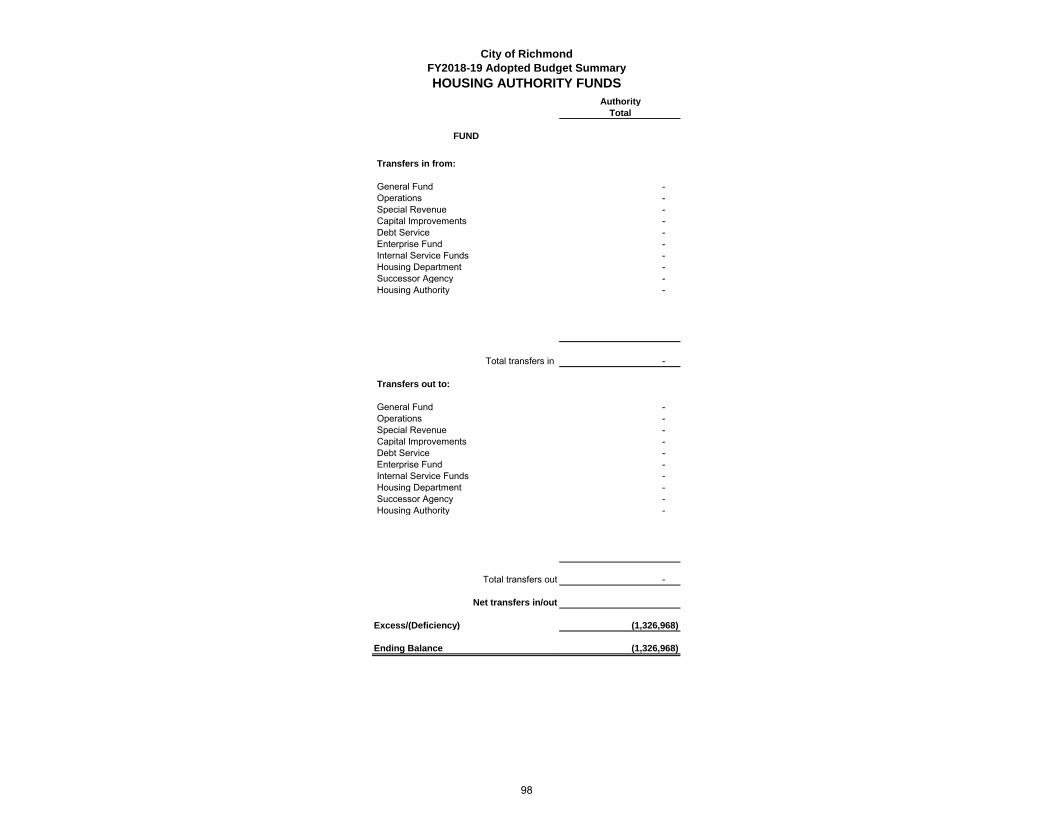
City of Richmond
FY2018-19 Adopted Budget Summary
HOUSING AUTHORITY FUNDS
FUND
Transfers in from:
General Fund
Operations
Special Revenue
Capital Improvements
Debt Service
Enterprise Fund
Internal Service Funds
Housing Department
Successor Agency
Housing Authority
Total transfers in
Transfers out to:
General Fund
Operations
Special Revenue
Capital Improvements
Debt Service
Enterprise Fund
Internal Service Funds
Housing Department
Successor Agency
Housing Authority
Total transfers out
Net transfers in/out
Excess/(Deficiency)
Ending Balance
Authority
Total
-
-
-
-
-
-
-
-
-
-
-
-
-
-
-
-
-
-
-
-
-
-
(1,326,968)
(1,326,968)
98
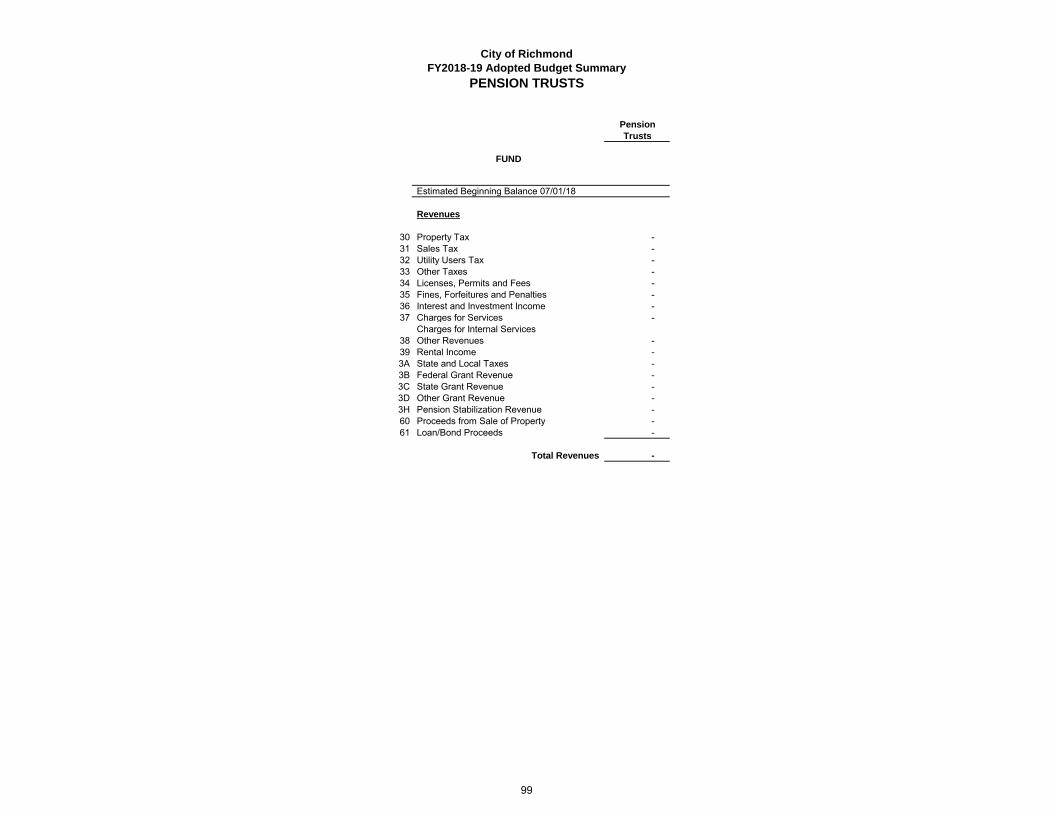
City of Richmond
FY2018-19 Adopted Budget Summary
PENSION TRUSTS
Pension
Trusts
FUND
Estimated Beginning Balance 07/01/18
Revenues
30 Property Tax -
31 Sales Tax -
32 Utility Users Tax -
33 Other Taxes -
34 Licenses, Permits and Fees -
35 Fines, Forfeitures and Penalties -
36 Interest and Investment Income -
37 Charges for Services -
Charges for Internal Services
38 Other Revenues -
39 Rental Income -
3A State and Local Taxes -
3B Federal Grant Revenue -
3C State Grant Revenue -
3D Other Grant Revenue -
3H Pension Stabilization Revenue -
60 Proceeds from Sale of Property -
61 Loan/Bond Proceeds -
Total Revenues -
99
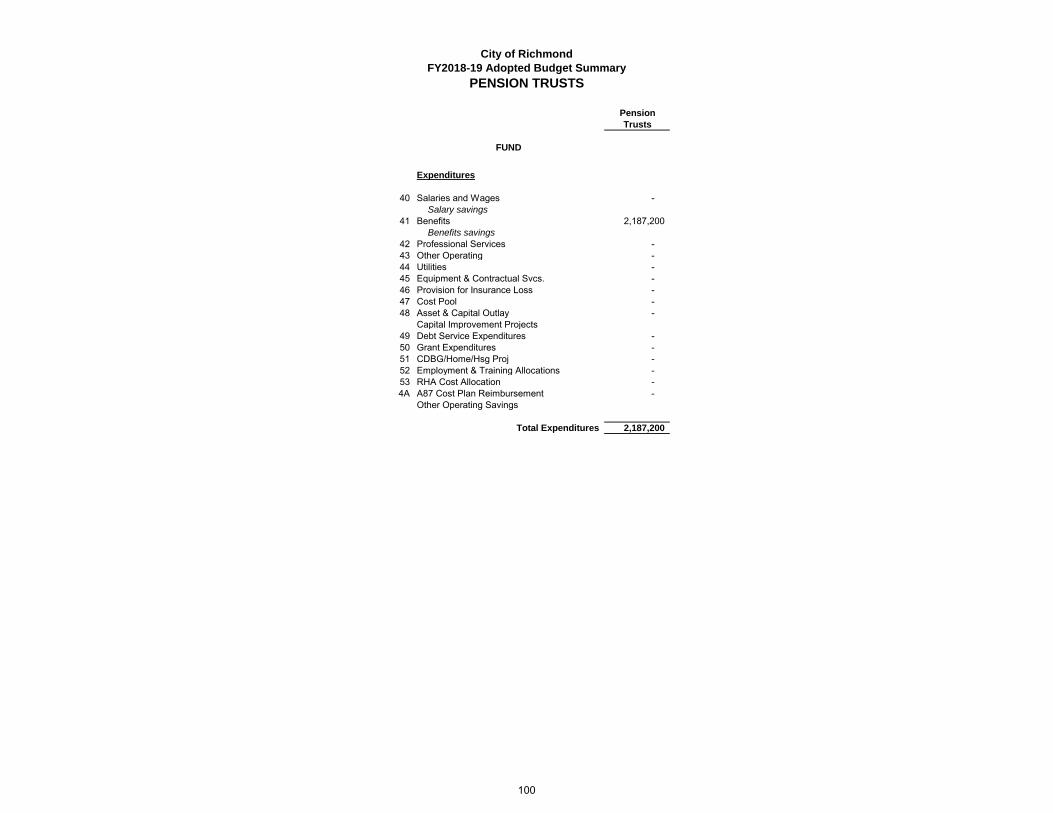
City of Richmond
FY2018-19 Adopted Budget Summary
PENSION TRUSTS
Pension
Trusts
FUND
Expenditures
40 Salaries and Wages -
Salary savings
41 Benefits 2,187,200
Benefits savings
42 Professional Services -
43 Other Operating -
44 Utilities -
45 Equipment & Contractual Svcs. -
46 Provision for Insurance Loss -
47 Cost Pool -
48 Asset & Capital Outlay -
Capital Improvement Projects
49 Debt Service Expenditures -
50 Grant Expenditures -
51 CDBG/Home/Hsg Proj -
52 Employment & Training Allocations -
53 RHA Cost Allocation -
4A A87 Cost Plan Reimbursement -
Other Operating Savings
Total Expenditures 2,187,200
100

City of Richmond
FY2018-19 Adopted Budget Summary
PENSION TRUSTS
Pension
Trusts
FUND
90 Transfers in from:
General Fund 907,929
Operations
Special Revenue 1,279,271
Capital Improvements
Debt Service
Enterprise Fund
Internal Service Funds
Housing Department
Successor Agency
Housing Authority
Total transfers in 2,187,200
91 Transfers out to:
General Fund
Operations
Special Revenue
Capital Improvements
Debt Service
Enterprise Fund
Internal Service Funds
Housing Department
Successor Agency
Housing Authority
Total transfers out -
Net transfers in/out 2,187,200
Excess/(Deficiency) -
Ending Balance -
101

FY2017-18 FY2018-19Project Code Project Name Grant Source Type* Grant Award YTD Expenditures Adopted
City Manager2AA09 Illegal Disp. Site & LF Cleanup Remed. CA- Dept. of Resources and Recovery S 434,300 43,561 350,740 2AA10 Integrated and Equitable Multimodeal Mobility CA- Dept. of Transportation S 259,730 28,041 211,689 2AA11 Beverage Container Recycling FY1617 CA- Dept. of Resources and Recovery S 27,707 27,707 2AA14 CalRecycle Food Waste Rescue and Prevention CA-CalRecycle S 327,500 327,500
Total 1,049,237 71,602 917,636
Capital Improvement 29109 Section 130 S Cutting Blvd AT-Grade Crossing Imporvements US. Dept. of Transportation F 260,550 5,118 255,432 29105 37th Street Improvement US. Dept. of Transportation/CA-Dept. of Transportation F/P 286,600 286,600 29113 Yellow Brick Road US. Dept. of Transportation/CA- Dept. of Transportation F/P 6,209,000 545,042 5,282,406 29103 Harbour Way Improvement Metropolitan Transportation Commission -TDA, article 3 S 82,500 82,500 29115 Urban Greening - Iron Triagle CA-State Coastal Conservancy S 500,000 500,000 29117 16-Housing Related Parks Program CA-Dept. of Housing and Community Development S 1,708,544 1,708,544
Total 9,047,194 550,160 8,115,482
Infrastructure Maintenance & Operations23002 Wellness Trail Fitness Zone Kaiser Foundation O 75,000 75,000
Total 75,000 - 75,000
Community Services2AX01 Volunteer Management Plan Bechtel Jr. Grant O 75,000 40,833 35,975 20F06 Chevron-Trust for Public Land Chevron-Trust for Public Land O 13,000 8,000 5,000 20F10 2017-18 Points of Light Service Work Points of Light O 25,000 24,745 20F08 JFK Park Basketball Court CA- Natural Resources Agency S 182,740 182,740 20F09 Unity Park Basketball Court CA- Natural Resources Agency S 167,650 167,650
Total 463,390 48,833 416,110
Employment & Traning22942 EPA Workforce EPA- Environmental Protection Agency F 200,000 36,824 114,055 22091 Storm 2017 NDWG US. Dept. of Labor/CA- Employment Development Dept. F/P 300,000 178,106 113,036 22102 Workforce Accelerator 5.0 US. Dept. of Labor/CA- Employment Development Dept. F/P 150,000 22,760 22115 Workforce Acclerator 6.0 US. Dept. of Labor/CA- Employment Development Dept. F/P 150,000 135,000 22116 East Bay ACES US. Dept. of Labor/CA- Employment Development Dept. F/P 50,000 50,000 22292 Rapid Response Layoff Aversion US. Dept. of Labor/CA- Employment Development Dept. F/P 68,694 44,599 20,000 22901 WIOA - Adult program US. Dept. of Labor/CA- Employment Development Dept. F/P 769,855 1,066,590 436,203 22902 WIOA Disclocated Worker US. Dept. of Labor/CA- Workforce Investment Board F/P 588,575 763,753 293,159 22907 WIOA Adult Porgram US. Dept. of Labor/CA- Employment Development Dept. F/P 105,000 105,000 22923 WIOA Youth US. Dept. of Labor/CA- Employment Development Dept. F/P 790,229 1,135,068 302,106 22943 East Bay Regional Planning Unit US. Dept. of Labor/Contra Costa County F/P 30,000 30,000 22109 AB109 Innovative Re-Entry CA-Department of Health Care Service S 175,000 165,000 22715 ETP 2012 Employment & Training Panel S 310,350 94,843 122,497 22819 Prop 39 2017 California Workforce Development Board S 450,000 187,506 213,190 22822 Prop 39 Ex Offenders Grant California Workforce Development Board S 637,500 490,690
Total 4,775,203 3,507,289 2,612,696
Fire25P01 Emergency Management Performance Grant Federal Emergency Management Agency F/P 20,000 20,000 20,000
Total 20,000 20,000 20,000
Grants List FY2018-19
102

FY2017-18 FY2018-19Project Code Project Name Grant Source Type* Grant Award YTD Expenditures Adopted
Grants List FY2018-19
Library29A26 WIOA Title II US. Dept. of Labor/CA Dept. of Education F/P 39,926 39,926 29A14 CENIC Broadband CALIFA - CENIC O 67,500 39,652 17,400 29Z01 Sprinter Conversion Van Richmond Public Library Foundation O 68,000 55,535 4,000 29A20 Web Development Training for Teens Best Buy Inc. O 6,410 4,969 1,441 29A27 Richmond Police Activity League Richmond Police Activity League O 2,000 2,000 29A28 Rubicon Elevate Rubicon O 13,825 13,825 29A13 Laptops for Online High School Program CA-Library- CALIFA Group S 12,000 12,039 29A25 CLLS Library Literacy CA-State Library S 105,956 105,956
Total 275,691 112,195 144,622
Office of Neighborhood Safety2BQ02 Cal VIP 18-20 Beloved Community Next Level CA-Board of State & Community Corrections S 500,000 250,000 2BU01 East Bay Community Foundation East Bay Community Foundation O 20,000 138 20,000
Total 520,000 138 270,000
Information Technology26A01 Public Internet-Nevin Plaza CA-Public Utility Commission S 41,520 41,520 26A02 Public Internet-Triangle Court CA-Public Utility Commission S 43,080 43,080 29A03 Public Internet-Friendship Manor CA-Public Utility Commission S 25,152 25,152
Total 109,752 - 109,752
Police24107 Community Policing Development Program US. Dept. of Justice F 81,644 81,644 24A02 Edward Byrne Memorial Justice Assistance Grant 2015 US. Dept. of Justice F 81,526 21,165 59,579 24109 Edward Byrne Memorial Justice Assistance Grant 2016 US. Dept. of Justice/Contra Cost County F/P 83,155 79,829
Total 246,325 21,165 221,052
Housing03C06-03G06 CDBG Grant - Public Facility ADA Rehabilitation CDBG Remaining Grant Balance F 814,000 674,406
F1209 Loans- HILP Cal Home S 1,000,000 1,261,246 235,743 07572 Miraflores Sustainable Community Greenbelt Project-ARRA CA- Natural Reso. Agen.-Urban Greening- ARRA-Prop 84 S 1,664,319 1,664,319 07572 Miraflores-Bexter Creek CA- Coastal Conservancy S 500,000 250,960
Total 3,978,319 1,261,246 2,825,428
Grand Total 20,560,111 5,592,628 15,727,778 * F=Federal, F/P=Federal Passthru, S=State, O=Other
103

City of Richmond
Multi-Year Comparative Position Listing
Department Adopted
FY2014-2015
Adopted
FY2015-2016
Adopted
FY2016-2017
Adopted
FY2017-2018
Mid-year
FY2017-18
Adopted
FY2018-19
MAYOR'S OFFICE
Mayor 1.0 1.0 1.0 1.0 1.0 1.0
Admin Trainee 1.0 1.0 3.0 3.0 2.1
Assistant to the Mayor 1.8 2.0 1.0
Executive Secretary II 1.0
Management Analyst II 1.0 1.0 1.0
Office Assistant 1.0
Total Full-Time Equivalents (FTEs) 3.8 4.0 4.0 5.0 5.0 4.1
CITY COUNCIL
Staff Assistant to the City Council 1.0
Senior Administrative Analyst 1.0 1.0 1.0 1.0 1.0
Total Full-Time Equivalents (FTEs) 1.0 1.0 1.0 1.0 1.0 1.0
CITY CLERK
City Clerk 1.0 1.0 1.0 1.0 1.0 1.0
City Clerk Technician 1.0
Assistant City Clerk 2.0 2.0 2.0 2.0 2.0
Deputy City Clerk 2.0
Total Full-Time Equivalents (FTEs) 3.0 3.0 3.0 3.0 3.0 4.0
104

City of Richmond
Multi-Year Comparative Position Listing
Department Adopted
FY2014-2015
Adopted
FY2015-2016
Adopted
FY2016-2017
Adopted
FY2017-2018
Mid-year
FY2017-18
Adopted
FY2018-19
CITY MANAGER
Administrative Aide 1.0 1.0
Administrative Chief 0.8 0.8 1.0 1.0 1.0
Assistant Administrative Analyst 0.9
City Manager 1.0 1.0 1.0 1.0 1.0 1.0
Community Affairs Coordinator 1.0 1.0
Community & Economic Dev. Director 1.0
Community Services Technician 1.0
Development Project Manager II 1.0 1.0 1.0
Economic Development Administrator 1.0 1.0 1.0 1.0 1.0 1.0
Environmental Services Manager 1.0
Environmental Manager 1.0 1.0 1.0 1.0 1.0
Executive Assistant to the City Manager 1.0 1.0 1.0 1.0 1.0 1.0
Management Analyst 1.0 1.0 1.0 2.0
Management Analyst II 2.0 1.6 1.0 1.0 1.0 1.0
Office Specialist 1.0
Senior Management Analyst 2.0 1.0 1.0 1.0 1.0 1.0
Sustainability Coordinator 1.0
Sub-total City Manager 10.8 8.4 9.0 10.0 11.0 10.9
TRANSPORTATION
Code Enforcement Superintendent 1.0 1.0 1.0
Management Analyst II 1.0
Paratransit Assistant 1.0 1.0 1.0 1.0 1.0 1.0
Paratransit Coordinator 1.0 1.0 1.0 1.0 1.0
Paratransit Driver 4.0 6.0 5.0 5.0 5.0 3.0
Paratransit Driver Leadworker 1.0 1.0 1.0 1.0 1.0 1.0
Project Manager I 1.0
Project Manager II 1.0 1.0 1.0 1.0 1.0 1.0
Sub-total Transportation 8.0 10.0 10.0 10.0 10.0 8.0
Total Full-Time Equivalents (FTEs) 18.8 18.4 19.0 20.0 21.0 18.9
105

City of Richmond
Multi-Year Comparative Position Listing
Department Adopted
FY2014-2015
Adopted
FY2015-2016
Adopted
FY2016-2017
Adopted
FY2017-2018
Mid-year
FY2017-18
Adopted
FY2018-19
OFFICE OF NEIGHBORHOOD SAFETY
Community Services Program Manager 1.0
Neighborhood Change Agents 5.0 2.0 3.0 3.0 3.0 3.0
Neighborhood Safety Director 1.0
ONS Program Manager 1.0
Program Coordinator 1.0
Project Coordinator 1.0 1.0 1.0 1.0 1.0
Recreation Program Coordinator 2.0 1.0 2.0
Redevelopment Contract Administrator 1.0
Total Full-Time Equivalents (FTEs) 7.0 3.0 6.0 6.0 6.0 6.0
CITY ATTORNEY
Assistant City Attorney 4.0 2.8 2.8 3.0 3.0 3.0
City Attorney 1.0 1.0 1.0 1.0 1.0 1.0
Executive Secretary II 1.0 1.0 1.0 1.0 1.0 1.0
Senior Assistant City Attorney 2.0 3.0 3.0 3.0 3.0 3.0
Supervising Office Assistant 1.0 1.0 1.0 1.0 0.7 0.7
Total Full-Time Equivalents (FTEs) 9.0 8.8 8.8 9.0 8.7 8.7
POLICE COMMISSION
Assistant Administrative Analyst 0.1
Executive Secretary I 1.0
Total Full-Time Equivalents (FTEs) 1.0 0.0 0.0 0.0 0.0 0.1
106

City of Richmond
Multi-Year Comparative Position Listing
Department Adopted
FY2014-2015
Adopted
FY2015-2016
Adopted
FY2016-2017
Adopted
FY2017-2018
Mid-year
FY2017-18
Adopted
FY2018-19
FINANCE
Accountants I 7.0 7.0 2.0 1.0 1.0 1.0
Accountant II 3.0 5.0 5.0 5.0
Accounting Assistant I 1.0 1.0 1.0
Accounting Assistant II 1.0 1.0 2.0 3.0 7.0 8.0
Accounting Manager 1.0 2.0 2.0 2.0 3.0 2.4
Administrative Services Analyst 1.0 1.0
Budget Administrator 1.0 1.0 1.0 1.0 1.0
Budget Analyst l 3.0 3.0 1.0 1.0 1.0 2.0
Budget Analyst II 1.0 1.0 3.0 2.0 2.0 1.0
Business License Specialist 1.0 1.0 1.0 1.0 1.0 2.0
Buyer II 2.0 2.0 1.0 1.0 1.0
Executive Secretary I 1.0 1.0 1.0 1.0
Executive Secretary II 1.0 1.0 1.0 1.0 1.0
Finance Director 1.0 1.0 1.0 1.0 1.0 1.0
Finance Manager I 1.0 1.0
Finance Manager II 1.0
Investment Analyst 1.0 1.0 1.0
Office Aide 0.8 0.8 0.8 0.8 0.8
Office Assistant II 1.0 1.0
Payroll Coordinator 2.0 2.0 2.0 2.0 2.0 2.0
Payroll Supervisor 1.0 1.0 1.0 1.0 1.0 1.0
Payroll Specialist 1.0
Purchasing Assistant 1.0
Revenue Collection Manager 1.0 1.0 1.0 1.0 1.0 1.0
Senior Accountant 3.0 2.0 4.0 3.0 2.0 1.5
Senior Budget Analyst 2.0 1.0 1.0 2.0 1.0 1.0
Senior Buyer 1.0 1.0 1.0 1.0 1.0 1.0
Total Full-Time Equivalents (FTEs) 32.8 32.8 32.8 32.8 34.8 32.9
107

City of Richmond
Multi-Year Comparative Position Listing
Department Adopted
FY2014-2015
Adopted
FY2015-2016
Adopted
FY2016-2017
Adopted
FY2017-2018
Mid-year
FY2017-18
Adopted
FY2018-19
HUMAN RESOURCES
Administrative Services Analyst 1.0 1.0
Benefits Analyst 1.0 1.0 1.0 1.0
Employee Benefits Analyst 1.0 1.0 1.0 1.0 1.0
Finance Manager 1.0 1.0 1.0 0.0
Human Resources Mgt. Director 1.0 1.0 1.0 1.0 1.0
Human Resources Personnel Officer 1.0 1.0 1.0 1.0 2.0 2.0
Human Resources Technician I 1.0
Human Resources Technician II 0.8 1.0 1.0 2.0 1.0 1.0
Human Resources Technician III 2.0 0.8 0.8 0.8 1.0
Labor Relations / Training Manager 1.0 1.0 1.0 1.0
Payroll Coordinator 1.0
Personnel Analyst I 1.0 1.0 1.0 2.0
Personnel Analyst II 1.0 1.0
Personnel Assistant 1.0 1.0 1.0 1.0 1.0
Principal Personnel Analyst 1.0 1.0 1.0 1.0 2.0 3.0
Project Manager I 1.0
Risk Manager 1.0 1.0 1.0 1.0 1.0 1.0
Senior Employee Benefits Analyst 1.0 1.0 1.0 1.0 1.0
Senior Human Resources Administrator 1.0 1.0
Senior Management Analyst 1.0 1.0
Senior Personnel Analyst 1.0 1.0 1.0
Total Full-Time Equivalents (FTEs) 12.8 13.8 13.8 14.8 15.0 15.0
108

City of Richmond
Multi-Year Comparative Position Listing
Department Adopted
FY2014-2015
Adopted
FY2015-2016
Adopted
FY2016-2017
Adopted
FY2017-2018
Mid-year
FY2017-18
Adopted
FY2018-19
INFORMATION TECHNOLOGY
Admin Service Analyst 1.0 0.2
Business Systems Manager 1.0 1.0 1.0 1.0 1.0 1.0
Cable TV Administrator 1.0 1.0 1.0 1.0
Cable TV Engineering Support Asst. 1.0 1.0 1.0
Cable TV Programming Coordinator 1.0 1.0 1.0 1.0 1.0
Cable TV Production Support Assistant 2.0 1.0 1.0 1.0 1.0 1.0
Cable TV Engineer Coordinator 1.0 1.0
Duplicating/Mail Assistant II 1.0 1.0 1.0 1.0 1.0 1.0
GIS Administrator 1.0 1.0 1.0 1.0 1.0 1.0
Information Technology Assistant 1.0 1.0
Information Technology Director 1.0 1.0 1.0 1.0 1.0 1.0
Microcomputer Support Specialist II 1.0 1.0 1.0 1.0 1.0
Network & Systems Manager 1.0 1.0 1.0 1.0 1.0 1.0
Network & Systems Specialist II 2.0 2.0 2.0 1.0 1.0 1.0
Network & Systems Engineer 1.0 1.0 1.0
Office Specialist 1.0
Senior Cable TV Production Assistant 1.0 1.0 1.0 1.0 1.0 1.0
Senior Programmer Analyst 1.0 1.0 1.0 1.0 1.0 1.0
Telephone Radio Specialist 1.0 1.0 1.0 1.0 1.0 1.0
Total Full-Time Equivalents (FTEs) 16.0 15.0 14.2 15.0 15.0 15.0
109

City of Richmond
Multi-Year Comparative Position Listing
Department Adopted
FY2014-2015
Adopted
FY2015-2016
Adopted
FY2016-2017
Adopted
FY2017-2018
Mid-year
FY2017-18
Adopted
FY2018-19
POLICE
SWORN
Asst Police Chief 1.0 1.0 1.0
Deputy Chief 2.0 1.5 0.0
Police Captain 4.0 4.0 4.0 3.5 4.0 4.0
Police Chief 1.0 1.0 1.0 1.0 1.0 1.0
Police Lieutenant 12.0 12.0 10.0 8.0 8.0 8.0
Police Officer 141.0 132.0 135.0 130.0 128.0 128.0
Police Officer Trainee 8.0 6.0 4.0 6.0 8.0 8.0
Police Sergeant 28.0 28.0 28.0 28.0 28.0 28.0
Sub-total Sworn 196.0 184.5 182.0 177.5 178.0 178.0
NON-SWORN
Accountant II 1.0 1.0 1.0 1.0 1.0 1.0
Administrative Aide 2.0 2.0 1.0 2.0 2.0 2.0
Administrative Trainee 2.0 2.0 2.0 2.0 2.0 2.0
Assistant Police Property Technician 2.0 2.0 2.0 2.0 2.0 2.0
Administrative Service Analyst 1.0 2.0 1.0 1.0 1.0
Building Inspector 1.0 1.0
Building Trades Worker II 1.0 1.0
CCTV Wireless & Systems Specialist 1.0 1.0 1.0 1.0 1.0 1.0
Code Enforcement Manager 1.0 1.0
Code Enforcement IY 1.0 1.0
Code Enforcement Officer I 1.0 2.0
Code Enforcement Officer II 4.0 4.0 1.0 1.0 1.0 1.0
Code Enforcement Superintendent 1.0 1.0
Code Enforcement Supervisor 1.0
Communications Call Taker 2.0 2.0 2.0 2.0 2.0 1.0
Communications Dispatcher I 8.0 7.0 8.0 1.0 3.0 4.0
Communications Dispatcher II 14.0 14.0 13.0 14.0 12.0 12.0
Communications Manager 1.0 1.0 1.0 1.0 1.0 1.0
Communications Shift Supervisor 4.0 4.0 4.0 4.0 4.0 4.0
110

City of Richmond
Multi-Year Comparative Position Listing
Department Adopted
FY2014-2015
Adopted
FY2015-2016
Adopted
FY2016-2017
Adopted
FY2017-2018
Mid-year
FY2017-18
Adopted
FY2018-19
Construction & Maintenance Supervisor 1.0 1.0
Crime Analysis Assistant 1.0
Crime Analysis Technician 1.0 1.0 1.0 1.0 1.0
Crime Analyst 1.0 1.0 1.0 1.0 1.0 1.0
Crime Prevention Manager 1.0 1.0 1.0 1.0
Crime Scene Technician 2.0 1.0 3.0 3.0 3.0
Equipment Operator 1.0 1.0
Executive Secretary II 1.0
Finance Manager 1.0
Jailer 6.0 6.0 6.0 5.0 5.0 5.0
Lead Records Specialist 1.0 1.0
Maintenance Lead Worker 1.0 1.0
Maintenance Worker I 7.0 5.0
Maintenance Worker II 1.0 2.0
Network and Systems Specialist I 1.0 1.0 1.0 1.0 1.0 1.0
Network and Systems Specialist II 1.0 1.0 1.0 1.0 1.0 1.0
Office Assistant II 2.0 1.0 1.0 1.0 1.0 1.0
Office Specialist 1.0 1.0
Parking Enforcement Representative 5.0 5.0 5.0 5.0 5.0 5.0
Police Assistant 1.0 1.0 1.0
Police Property Technician 1.0 1.0 1.0 1.0 1.0 1.0
Police Records Specialist 9.0 9.0 9.0 9.0 9.0 9.0
Police Records Supervisor 1.0 1.0 1.0 1.0 1.0 1.0
Project Manager II 1.0 1.0 1.0 1.0
Public Safety Technology Supervisor 1.0 1.0 1.0 1.0 1.0 1.0
Secretary 1.0 1.0 1.0
Senior Accountant 1.0 1.0 1.0 1.0 1.0
Systems Administrator 1.0 1.0 1.0 1.0 1.0 1.0
Utility Worker II 1.0 1.0
Sub-total Non-Sworn 94.0 95.0 72.0 67.0 67.0 67.0
Total Full-Time Equivalents (FTEs) 290.0 279.5 254.0 244.5 245.0 245.0
111

City of Richmond
Multi-Year Comparative Position Listing
Department Adopted
FY2014-2015
Adopted
FY2015-2016
Adopted
FY2016-2017
Adopted
FY2017-2018
Mid-year
FY2017-18
Adopted
FY2018-19
FIRE
SWORN
Fire Chief 1.0 1.0 1.0 1.0 1.0 1.0
Battalion Chief 4.0 4.0 4.0 4.0 4.0 4.0
Deputy Fire Chief 1.0 1.0 1.0 1.0 1.0
Fire Captain 24.0 24.0 24.0 24.0 23.0 24.0
Fire Engineer 24.0 24.0 24.0 24.0 24.0 24.0
Fire Fighter 29.0 31.0 31.0 31.0 32.0 31.0
Fire Fighter Trainee 6.0 1.0 2.0
Fire Inspector I 1.0 1.0 1.0
Fire Inspector II 5.0 5.0 4.0 4.0 4.0 3.0
Fire Marshal 1.0 1.0 1.0
Sub-total Sworn 94.0 91.0 90.0 91.0 91.0 90.0
NON-SWORN
Administrative Aide 1.0 1.0 1.0 2.0
Administrative Services Analyst 1.0 1.0 1.0 1.0
Assistant Administrative Analyst 1.0 1.0
Associate Administrative Analyst 1.0
Emergency Services Manager 1.0 1.0 1.0 1.0 1.0 1.0
Executive Secretary II 2.0 1.0 1.0 1.0 1.0 1.0
Operations Administrator 1.0
Office Assistant II 1.0 1.0
Senior Administrative Analyst 1.0 1.0 1.0
Sub-total Non-Sworn 6.0 5.0 5.0 5.0 5.0 5.0
Total Full-Time Equivalents (FTEs) 100.0 96.0 95.0 96.0 96.0 95.0
112

City of Richmond
Multi-Year Comparative Position Listing
Department Adopted
FY2014-2015
Adopted
FY2015-2016
Adopted
FY2016-2017
Adopted
FY2017-2018
Mid-year
FY2017-18
Adopted
FY2018-19
INFRASTRUCTURE MAINTENANCE & OPERATIONS
Administrative Aide 3.0 3.0 4.0 4.0 4.0 4.0
Building Maintenance Supervisor 1.0 1.0
Building Trades Worker I 1.0 1.0 1.0 1.0
Building Trades Worker II 1.0 1.0 1.0 1.0 1.0 2.0
Carpenter 2.0 2.0 2.0 2.0 2.0 2.0
Code Enforcement Officer I 1.0 1.0 1.0
Code Enforcement Officer II 4.0 5.0 5.0 6.0
Code Enforcement Officer IY 1.0
Code Enforcement Superintendent 1.0
Code Enforcement Supervisor 1.0 1.0 1.0
Combo Equipment Mechanic 5.0 5.0 5.0 5.0 5.0 7.0
Combo Equipment Mechanic Leadworker 1.0 1.0
Construction & Maintenance Supervisor 1.0 1.0 1.0 1.0 1.0
Custodial Maintenance Supervisor 1.0 1.0 1.0 1.0 1.0 1.0
Development Project Manager II 1.0
Director, Infrastructure & Maintenance 1.0 1.0 1.0 1.0
Electrical Supervisor 1.0 1.0 1.0 1.0
Electrician 5.0 5.0 5.0 5.0
Equipment Mechanic II 1.0 1.0 1.0
Equipment Mechanic III 1.0 1.0 1.0
Equipment Mechanic IV 4.0 4.0 4.0 4.0 4.0 2.0
Equipment Operator 8.0 8.0 1.0 1.0 1.0 1.0
Equipment Parts Specialist 1.0 1.0 1.0 1.0 1.0 1.0
Equipment Storekeeper 1.0 1.0 1.0 1.0 1.0 1.0
Equipment Services Superintendent 1.0 1.0 1.0 1.0 1.0
Equipment Supervisor 1.0 1.0 1.0 1.0
Executive Secretary II 1.0 1.0 1.0 1.0 1.0 1.0
Gardener 4.0 4.0 4.0 4.0 4.0 3.0
113

City of Richmond
Multi-Year Comparative Position Listing
Department Adopted
FY2014-2015
Adopted
FY2015-2016
Adopted
FY2016-2017
Adopted
FY2017-2018
Mid-year
FY2017-18
Adopted
FY2018-19
Groundskeeper/Gardener 13.0 15.0 14.0 14.0 14.0 14.0
Maintenance Leadworker 6.0 7.0 5.0 5.0 5.0 4.0
Maintenance Worker I 4.0 3.0 3.0 3.0
Maintenance Worker II 12.0 11.0 2.0 3.0 3.0 3.0
Office Assistant II 1.0 1.0
Painter 3.0 2.0 2.0 2.0 2.0 2.0
Parks & Landscaping Superintendent 1.0 1.0 1.0 1.0
Parks Construction & Maintenance Worker 9.0 9.0 9.0 9.0 9.0 9.0
Parks Supervisor 3.0 3.0 2.0 2.0 2.0 3.0
Public Works Operations & Maintenance Director1.0 1.0
Public Works Administrative Manager 1.0 1.0 1.0 1.0 1.0 1.0
Public Works Facilities Maintenance Superintendent 1.0 1.0 1.0 1.0 1.0
Public Works Streets Maintenance Superintendent1.0 1.0
PW Superintendent 1.0
Senior Civil Engineer 3.0
Stationery Engineer 4.0 4.0 3.0 3.0 3.0 3.0
Stationery Engineer Supervisor 1.0 1.0 1.0 1.0 1.0
Tree Leadworker 1.0 1.0 1.0 1.0 1.0 1.0
Utility Worker I 3.0 1.0
Utility Worker II 11.0 11.0 9.0 10.0 10.0 10.0
Total Full-Time Equivalents (FTEs) 109.0 112.0 103.0 100.0 94.0 95.0
114

City of Richmond
Multi-Year Comparative Position Listing
Department Adopted
FY2014-2015
Adopted
FY2015-2016
Adopted
FY2016-2017
Adopted
FY2017-2018
Mid-year
FY2017-18
Adopted
FY2018-19
WATER RESOURCE RECOVERY
Associate Civil Engineer 2.0 1.0
Administrative Aide 1.0 1.0 1.0
Admin Services Analyst 1.0
Capital Projects Manager 1.0
Construction Inspector I 2.0 2.0
Construction Inspector II 1.0
Director of Water Resource Recovery 1.0 1.0
Environmental Compliance Inspector 2.0 3.0
Environmental Manager 1.0
Environmental Services Manager 1.0 1.0
Infrastructure Administrator 1.0 1.0 1.0 1.0 1.0 1.0
Management Analyst I 1.0 1.0
Office Assistant II 1.0 2.0 1.0
Operations Administrator 1.0
Project Manager I 1.0
Project Manager II 1.0 1.0 1.0
Project Coordinator 1.0 1.0 1.0 1.0 1.0
Senior Admin Analyst 1.0 1.0
Senior Civil Engineer 2.0 1.0 1.0 0.0 1.0
Source Control Inspector I 2.0 2.0
Source Control Inspector III 2.0 1.0 1.0
Source Control Inspector (I-III) 3.0 3.0
Source Control Superintendent 1.0
Wastewater Stormwater Manager 1.0
Total Full-Time Equivalents (FTEs) 17.0 12.0 9.0 10.0 10.0 10.0
115

City of Richmond
Multi-Year Comparative Position Listing
Department Adopted
FY2014-2015
Adopted
FY2015-2016
Adopted
FY2016-2017
Adopted
FY2017-2018
Mid-year
FY2017-18
Adopted
FY2018-19
PLANNING & BUILDING SERVICES
Accountant II 1.0 1.0 1.0 1.0 1.0 1.0
Administrative Services Analyst 1.0 1.0 1.0 1.0
Associate Administrative Analyst 1.0 1.0 1.0
Building Inspector 1.0 1.0 1.0 1.0 1.0 1.0
Building Inspector Supervisor 1.0 1.0 1.0 1.0 1.0
Building Official 1.0 1.0 1.0
Community Service Tech. II 1.0 1.0
Executive Secretary II 1.0
Permit Technician I 1.0
Permit Technician II 4.0 4.0 4.0 4.0 4.0 3.0
Plan Checking Engineer 2.0 2.0 2.0 2.0 2.0 2.0
Planner I 1.0
Planner II 1.0 1.0 2.0 2.0 1.0
Planner II/Associate Planner 1.0 1.0 1.0
Planning & Building Services Director 1.0 1.0 1.0 1.0 1.0 1.0
Planning Manager 1.0
Project Manager I 1.0 1.0 1.0
Project Manager II 1.0 1.0 1.0 1.0 1.0
Senior Administrative Analyst 1.0 1.0
Senior Building Inspector 4.0 4.0 4.0 4.0 4.0 4.0
Senior Planner 3.0 2.0 2.0 2.0 2.0 2.0
Total Full-Time Equivalents (FTEs) 21.0 22.0 22.0 22.0 22.0 22.0
116

City of Richmond
Multi-Year Comparative Position Listing
Department Adopted
FY2014-2015
Adopted
FY2015-2016
Adopted
FY2016-2017
Adopted
FY2017-2018
Mid-year
FY2017-18
Adopted
FY2018-19
LIBRARY & CULTURAL SERVICES
Administrative Aide 1.0
Administrative Librarian 2.0 2.0 2.0 2.0 2.0 2.0
Administrative Services Analyst 1.0
Arts & Culture Manager 1.0 1.0 1.0 1.0 1.0 1.0
Assistant Admin Analyst 1.0
Book Mobile Driver Library Assistant 1.0
Executive Secretary II 1.0 1.0 1.0 1.0 1.0 1.0
Family Literacy Specialist 1.0 1.0 1.0 1.0 1.0 1.0
Head of Reference 2.0 1.0 1.0 1.0 1.0
Learning Center Manager II 1.0 1.0 1.0 1.0 1.0 1.0
Librarian I 8.0 7.0
Librarian II 7.0 7.0 7.0 7.0
Library & Cultural Services Director 1.0 1.0 1.0 1.0 1.0 1.0
Library Aide (group 1) 1.3 1.3 1.3 0.7 0.7 0.6
Library Assistant I 2.0 1.0 1.0
Library Assistant II 8.0 5.0 5.0 4.0 5.0 5.0
Library Associate 3.0 3.0 3.0 3.0 3.0 3.0
Library Information Systems Support Technician1.0 1.0 1.0 1.0 1.0 1.0
Literacy Program Manager 1.0 1.0 1.0 1.0 1.0 1.0
Office Assistant II 0.7 0.7 0.7 0.7 0.7 0.7
Office Specialist 1.0 1.0 1.0 1.0
Senior Library Assistant 2.0 2.0 2.0 2.0 2.0 2.0
Volunteer Tutor/Learner Coordinator 3.0 3.0 3.0 3.0 3.0 3.0
Total Full-Time Equivalents (FTEs) 39.0 33.0 33.0 33.3 33.3 33.3
117

City of Richmond
Multi-Year Comparative Position Listing
Department Adopted
FY2014-2015
Adopted
FY2015-2016
Adopted
FY2016-2017
Adopted
FY2017-2018
Mid-year
FY2017-18
Adopted
FY2018-19
COMMUNITY SERVICES
Accountant II 1.0 1.0 1.0 1.0
Administrative Aide 1.0 1.0 1.0 2.0 2.0 2.0
Administrative Trainee 1.0
Aquatics Specialist 1.0 1.0
Associate Admin Analyst 1.0
Auditorium Aide 3.2 3.2 3.2 3.2 3.2 3.2
Community Services Director 1.0 1.0 1.0 1.0 1.0
Community Services Administrative Manager 1.0 1.0 1.0 1.0 1.0 1.0
Community Services Program Manager 1.0
Executive Secretary II 1.0 1.0 1.0 1.0 1.0 1.0
Finance Manager I 1.0 1.0 1.0 1.0
Finance Manager II 1.0 1.0
Office Assistant II 1.0 1.0 1.0 1.0 1.0
Office Specialist 2.0 2.0 1.0 2.0 2.0 2.0
Recreation Director 1.0
Recreation Program Coordinator 11.0 12.0 11.0 11.0 11.0 9.0
Recreation Program Specialist 0.8 0.8 0.8 0.8 1.6 1.6
Recreation Supervisor 3.0 1.0 1.0 3.0
Senior Lifeguard 1.6 1.6
Total Full-Time Equivalents (FTEs) 27.0 26.0 25.6 26.0 26.8 28.4
118

City of Richmond
Multi-Year Comparative Position Listing
Department Adopted
FY2014-2015
Adopted
FY2015-2016
Adopted
FY2016-2017
Adopted
FY2017-2018
Mid-year
FY2017-18
Adopted
FY2018-19
EMPLOYMENT & TRAINING
Administrative Aide 1.0 1.0 1.0 1.0 1.0 1.0
Administrative Services Analyst 1.0 1.0 2.0 1.0 2.0 2.0
Administrative Trainee 3.0 3.0 2.0
Contract Compliance Specialist II 1.0 1.0 1.0
Director, Employment & Training 1.0 1.0 1.0 1.0 1.0 1.0
Employment Program Manager 1.0 2.0 2.0 3.0 2.0 3.0
Employment Program Specialist I 1.0 2.0 2.0 2.0
Employment Program Specialist II 6.0 6.0 6.0 6.0
Employment Program Specialist I/II 6.0 8.0
Finance Manager 1.0 1.0 1.0 1.0 1.0 1.0
Management Analyst 1.0
Office Assistant II 1.0 1.0 1.0
Project Coordinator 2.0 1.5 1.0 1.0 1.0 1.0
Senior Employment Program Specialist 1.0 1.0 1.0 1.0 1.0 1.0
Total Full-Time Equivalents (FTEs) 18.0 21.5 19.0 18.0 18.0 19.0
119

City of Richmond
Multi-Year Comparative Position Listing
Department Adopted
FY2014-2015
Adopted
FY2015-2016
Adopted
FY2016-2017
Adopted
FY2017-2018
Mid-year
FY2017-18
Adopted
FY2018-19
CAPITAL IMPROVEMENT/RIGHT-OF-WAY MAINTENANCE
Administrative Aide 1.0 1.0 1.0
Capital Projects Manager 1.0
Construction Inspector I 2.0 2.0 2.0 2.0
Construction & Maint Supv 1.0
Development Project Manager II 1.0 1.0 1.0 1.0
Development Project Manager (I-II) 2.0
Electrical Supervisor 1.0 1.0
Electrician 5.0 5.0
Equipment Operator 8.0 8.0 8.0 10.0
Executive Secretary II 1.0
Maintenance Lead Worker 3.0 3.0 3.0 3.0
Maintenance Worker II 7.0 7.0 7.0 7.0
Maintenance Worker I 4.0 4.0 4.0 4.0
Management Analyst II 1.0
Office Assistant I 1.0
Office Assistant II 1.0 2.0 2.0 2.0
PW Maintenance & Operations Director 1.0 1.0 1.0 1.0
PW Streets Maintenance Superintendent 1.0 1.0 1.0 1.0
Redevelopment Specialist III 0.2
Redevelopment Specialist (I-III) 1.0
Senior Civil Engineer 3.0 3.0 3.0 3.0
Total Full-Time Equivalents (FTEs)* 0.0 4.0 33.2 33.0 39.0 43.0
* Positions transferred from other departments
120

City of Richmond
Multi-Year Comparative Position Listing
Department Adopted
FY2014-2015
Adopted
FY2015-2016
Adopted
FY2016-2017
Adopted
FY2017-2018
Mid-year
FY2017-18
Adopted
FY2018-19
HOUSING Comm. & Econ. Dev. Operations
Specialist II 1.0 1.0
Comm. & Econ. Dev. Director 0.1
Development Project Manager. II 1.8 1.8 1.8 1.8
Development Project Manager. (I-II) 1.8
Office Assistant II 1.0
Senior Admin Analyst 1.0 1.0 1.0
Senior Accountant 2.0 1.0 1.0 1.0 1.0
Total Full-Time Equivalents (FTEs) 0.0 5.9 3.8 3.8 3.8 3.8
RICHMOND HOUSING AUTHORITY
Accountant I/II 1.0 2.0
Accountant I 1.0
Accountant II 1.0 1.0 1.0 1.0
Accounting Assistant II 1.0 1.0 1.0 1.0
Asset Manager 1.0
Asset Specialist 1.0
Assisted Housing Manager 1.0 1.0 1.0 1.0 1.0
Building Trades Worker II 1.0
Building Trades Worker III 1.0
Executive Director 1.0 1.0 1.0 1.0 1.0 1.0
Executive Secretary II 1.0 1.0 1.0 1.0 1.0 1.0
Finance Manager 1.0 1.0 1.0 1.0 1.0 1.0
Housing Program Analyst 2.0 2.0 2.0 1.0 1.0 1.0
Housing Program Specialist II 5.0 5.0 2.0 2.0 2.0 2.0
Housing Program Specialist III 2.0 2.0 4.0 4.0 4.0 4.0
Management Analyst II 1.0 1.0 1.0
Office Assistant I 2.0 2.0 2.0
Project Manager I 1.0 1.0 1.0
Project Manager II 2.0 2.0 2.0
Resident Services Admin Officer 1.0 1.0 1.0 1.0
Resident Housing Manager 4.0 4.0 3.0 2.0 3.0 3.0Total Full-Time Equivalents (FTEs) 25.0 23.0 21.0 19.0 19.0 20.0
121

City of Richmond
Multi-Year Comparative Position Listing
Department Adopted
FY2014-2015
Adopted
FY2015-2016
Adopted
FY2016-2017
Adopted
FY2017-2018
Mid-year
FY2017-18
Adopted
FY2018-19
RENT CONTROL
Administrative Trainee 1.0
Administrative Aide 1.0 2.0
Assistant Admin Analyst 1.0 1.0
Assistant City Attorney 2.0
Associate Admin Analyst 1.0 1.0 2.0
Code Enforcement Officer I 0.5
Deputy Director Rent Program 1.0
Executive Director Housing 1.0
Executive Director Rent Program 1.0
Hearing Examiner Rent Program 1.0
Management Analyst 1.0
Management Analyst II 1.0
Project Manager I 1.0
Project Manager II 1.0
Senior Management Analyst 1.0
Staff Attorney Rent Program 1.0
Total Full-Time Equivalents(FTEs) 0.0 0.0 0.0 6.5 7.0 9.0
PORT
Administrative Services Analyst 1.0
Development Project Manager II 1.0
Executive Secretary II 1.0 1.0 1.0 1.0 1.0
Finance Manager II 1.0
Operations Administrator 1.0 1.0 1.0 1.0 1.0
Maintenance Lead Worker 1.0
Port Director 1.0 1.0 1.0 1.0 1.0 1.0
Port Marketing/Operations Manager 1.0 1.0 1.0 1.0 1.0 1.0
Total Full-Time Equivalents (FTEs) 6.0 4.0 4.0 4.0 4.0 4.0
GRAND TOTAL ALL DEPARTMENTS 757.2 738.7 725.2 722.7 727.4 733.2
122

City of Richmond
FY2018-19
Transfers In / Transfers Out Schedule
TRANSFERS OUT TRANSFERS IN JUSTIFICATION
Operating Transfers Out - General Fund Operating Transfers In
Org-Object Org-Object
01917090-400901 Non-Departmental Activity 197,637$ 11233731-391994 Hilltop LMD 197,637$ City contribution to Hilltop LMD
01917090-400901 Non-Departmental Activity 410,866$ 11533931-391994 Marina Bay LMD 410,866$ City contribution to Marina Bay LMD
01917090-400901 Non-Departmental Activity 474,377$ 15191331-391994 CR-Engineering - Capital Improvement 474,377$ General Fund subsidy of services
01917090-400901 Non-Departmental Activity 140,589$ 15195731-391994 CR-Engineering - Traffic 140,589$ General Fund subsidy of services
01917090-400901 Non-Departmental Activity 141,617$ 15195831-391994 CR-Engineering - Engineering 141,617$ General Fund subsidy of services
01917090-400901 Non-Departmental Activity 517,002$ 12571041-391994 Employment & Training 517,002$ ISF subsidy
01917090-400901 Non-Departmental Activity 75,000$ 12571041-391994 Employment & Training 75,000$ Grants writing and matching
01917090-400901 Non-Departmental Activity 311,000$ 12571041-391994 Employment & Training 311,000$ Contract compliance
01917090-400901 Non-Departmental Activity 135,100$ 12578341-391994-42850 Employment & Training 135,100$ RichmondBuild rental lease with RHA
01917090-400902 Non-Departmental Activity 2,513,888$ 30511090-391994 Debt Service-2007 Lease Rev 2,513,888$ 2007 Refunding & Civic Center
01917090-400902 Non-Departmental Activity 221,855$ 30111090-391992 Debt Service-2005 Taxable POB 221,855$ Five-year repayment plan to cure negative balance
01917090-400901 Non-Departmental Activity 100,000$ 50362917-391994 IT Equipment Replacement 100,000$ Computer refresh
01191021-400904 Non-Departmental Activity 3,432,391$ 50597921-391991 Police Telecommunications - CAD 3,432,391$ CAD services provided to Police
01202022-400904 Non-Departmental Activity 928,728$ 50597921-391991 Police Telecommunications - CAD 928,728$ CAD services provided to Fire
01191021-400904 Non-Departmental Activity 478,071$ 50697121-391991 Police Telecommunications - RMS 478,071$ RMS services provided to Police
01917090-400901 Non-Departmental Activity 805,789$ 65015090-391991 General Pension 805,789$ General Pension ARC
01917090-400901 Non-Departmental Activity 102,140$ 65215090-391991 Garfield Pension 102,140$ Garfield Pension ARC
Total General Fund 10,986,050$ 10,986,050$
Operating Transfers Out - Other Funds Operating Transfers In
Org-Object Org-Object
10114090-400904 Secured Pension Override 8,094,735$ 01917090-391991 Non-Departmental Activity 8,094,735$ From PTORS - Utilized for one-time operating costs
15398621-400901 Code Enforcement - Abatement 200,000$ 01917090-391991 Non-Departmental Activity 200,000$ Solid Waste JPA proceeds for abatement/illegal dumping
40591082-400901 Marina Fund 86,778$ 01131013-391991 Infrastructure Maintenance & Operations 86,778$ Portion of Development Project Manager II's salary
10114090-400902 Secured Pension Override 1,821,467$ 30211090-391992 Debt Service-99A POB 1,821,467$ Portion of unfunded accrued actuarial liability in Pension Fund
40183080-400901-08Q01 Port of Richmond 10,500$ 10545055-391991-08Q01 Library Fund 10,500$ 1.5% of the Port dock repair project for public art
40183080-400901-08R01 Port of Richmond 5,775$ 10545055-391991-08R01 Library Fund 5,775$ 1.5% of the Port storm drainage project for public art
Total Other Funds 10,219,255$ Total Other Funds 10,219,255$
10114090-400901 Secured Pension Override 1,270,466$ 65115090-391991 Police & Fire Pension 1,270,466$ Police & Fire Pension ARC
10114090-400901 Secured Pension Override 8,805$ 65015090-391991 General Pension 8,805$ General Pension ARC
Total Transfers-Out 22,484,576$ 22,484,576$
123

124

Mayor’s Office
FY2018-19 Budget
Mission:
To serve the best interests of Richmond’s residents by providing leadership to enhance the quality of life, ensure public services, and promote strong civic and community engagement. The Charter designates the mayor as “the chief elected officer and ceremonial head of the City, responsible for providing civic leadership and taking issues to the people, and marshalling public interest in and support for municipal activity. The Mayor shall be concerned with the general development of the community and the general level of City services and activity programs and may develop and inform City residents of policies and programs which he or she believes are necessary for the welfare of the City.” (Charter of the City of Richmond, Article III-A Sec. 2.)
Strategic Priorities
The mayor, supported by the Mayor’s Office staff, carries out the specific responsibilities described in the Charter, and endeavors to advance community development goals through the development and strengthening of policies and programs by:
1. Serving as leadership on numerous regional boards and commissions, including the West Contra Costa Transportation Advisory Committee, Contra Costa Transportation Authority, Bay Conservation and Development Commission, Local Agency Formation Commission, Association of Bay Area Governments, MCE Clean Energy, Resilient By Design, Local Government Commission, League of California Cities, Contra Costa Mayors Conference, West County Mayors and Supervisors, and U.S. Conference of Mayors, all of which provide opportunities to push funding and public policy initiatives in Richmond’s favor, raise Richmond’s regional profile and share successful policy experience for Richmond’s benefit.
2. Communicating through social and news media outlets to promote Richmond for the benefit of residents and businesses. 3. Providing awards and recognitions for notable accomplishments, initiatives, and occasions that are significant to the Richmond
community. 4. Fielding complaints and requests for service from constituent and helping to resolve them through the appropriate channels. 5. Providing support for grant applications by the City and community organizations as well as nominations for awards. 6. Representing the City of Richmond at numerous community events. 7. Publicizing the important public resources and information through the Mayor’s Office Website, printed guides and brochures. 8. Engaging county, state and federal officials to advocate for issues of importance to Richmond, including testifying before legislative
bodies.
125

Mayor’s Office
FY2018-19 Budget
Strategic Priorities Continued
Mayor Tom Butt’s broad priorities were established in the State of the City presentation of January 2015, and he has continued to advance and refine each in the following ways:
1) Business, Jobs and Economic Development:
a. Conducting Business Roundtables to highlight investment and improve the city’s connection to the business community. b. Promoting future development of Point Molate, the downtown corridor, and other priority sites. c. Supporting development of major housing sites with high-density mixed-use projects. d. Bringing Ferry service to Richmond. e. Advocating for investments in public infrastructure and gaining commitments from agencies and business groups. f. Funding and developing a Richmond Branding and Marketing Initiative and establishing a Richmond Visitor Center. g. Supporting the city’s arts and culture initiatives to generate civic pride and build community.
2) Environment and Sustainability:
a. Representing Richmond at MCE Clean Energy and advocating for increased enrollment in “Deep Green” (100% renewable). b. Strengthening policies to reduce plastic waste and prevent contamination of our open space and waterways. c. Introducing policies to protect residents from noise aggravations and light pollution. d. Demanding accountability and health/safety regulations for industrial sources of public nuisances and pollution hazards. e. Advancing the expansion and improvements to the Bay Trail, Richmond Greenway and bicycle/pedestrian infrastructure. f. Increasing awareness and supporting implementation of projects funded by the Chevron Environmental & Community Investment
Agreement. g. Supporting Richmond’s neighborhood beautification, place-making and social programs.
3) Equity and Quality of Life:
a. Conducting a Food Census and preparing a comprehensive report on access to healthy food in Richmond. b. Raising funds and distributing youth sports grants through the Mayor’s Community Fund. c. Partnering with agencies to reduce homelessness through supportive housing projects. d. Advancing the public process and supporting community participation in the annexation of North Richmond. e. Building equity through the Government Alliance on Race & Equity, Richmond Rainbow Pride and other community initiatives. f. Supporting crime prevention efforts and promoting participation in the Community Safety Academy and related initiatives. g. Increasing support for the Richmond Promise to create pathways to higher education. h. Developing sidewalk maintenance policies to improve safety and accessibility for families and disabled people. i. Researching and advocating for ways to strengthen the City’s finances in order to provide improved public services.
126

MAYOR'S OFFICE
PROGRAM ORGANIZATIONAL CHART
* Develops and Supports
Healthy and Sustainable
Policies and Programs for
Richmond Communities
Department Partnerships
* Appointments to
* Represents City at
Regional, State and
National Organizations
Committees
Commissions and
* Leads and Fosters
Community and City
Development
* Budget and Policy
* Leadership
Mayor's Office
127

Mayor’s OfficeFY2018-19 Organizational Chart
Administrative Trainee
(2.1)
Tom ButtMayor
(1)
Mayor’s Office
Existing FTE = 5, Adopted FTE = 4.1
Legend:
Sub-Program
Main ProgramExisting Pos.
Proposed Pos.
Reclassification
Management Analyst
(1)
128

City of RichmondMulti-Year Comparative Position Listing
Department Adopted FY2014-2015
Adopted FY2015-2016
Adopted FY2016-2017
Adopted FY2017-2018
Mid-year FY2017-18
Adopted FY2018-19
MAYOR'S OFFICEMayor 1.0 1.0 1.0 1.0 1.0 1.0Admin Trainee 1.0 1.0 3.0 3.0 2.1Assistant to the Mayor 1.8 2.0 1.0Executive Secretary II 1.0Management Analyst II 1.0 1.0 1.0Office Assistant 1.0Total Full-Time Equivalents (FTEs) 3.8 4.0 4.0 5.0 5.0 4.1
129

Thru Mar -2018
SOURCES BY FUND (INCLUDES REVENUE AND/OR FUND BALANCE)
General Fund-0001 280,188 393,793 286,446 396,658 2,865 1%TOTAL SOURCES BY FUND 280,188 393,793 286,446 396,658 2,865 1%
Salaries 264,489 276,211 203,169 271,867 (4,344) -2%Benefits 181,824 225,188 169,530 226,650 1,462 1%Professional Services 14,801 13,700 6,429 12,400 (1,300) -9%Other Operating Expenses 3,461 3,800 1,142 2,600 (1,200) -32%Utilities 1,368 1,370 1,032 1,370 - 0%Equipment & Contract Services - -Provision for Insurance Loss - -Cost Pool 20,363 20,363 15,272 28,610 8,247 40%Asset/Capital Outlay - -A87 Cost Plan Reimbursement (206,118) (146,839) (110,128) (146,839) - 0%Grant Expenditures - -TOTAL USES BY TYPE 280,188 393,793 286,446 396,658 2,865 1%
Office of the Mayor (Admin)-01101011 280,188 393,793 286,446 396,658 2,865 1%TOTAL USES BY ORG CODE 280,188 393,793 286,446 396,658 2,865 1%
FY2018-19 Budget
Office of the Mayor-10Summary
$ Chg From FY17-18
% Chg From FY17-18
FY2016-17Actual
FY2017-18Adjusted
FY2017-18Actual
TOTAL BUDGET - HISTORICAL COMPARISON
USES BY ORG CODE
USES BY TYPE
FY2018-19 Budget
130

City Council
FY2018-19 Budget
Mission:
The City Council establishes comprehensive goals and objectives for the City; provides leadership in establishing policies for the conduct of municipal affairs; formulates priorities for allocation of City resources; supports special legislative bodies; represents the City at local, regional, state, and nation-wide organizations; and holds regularly-scheduled meetings, hearings, and study sessions to receive community input and conduct business in a public forum.
Key Objectives for Strategic Goals:
1. Maintain and enhance the physical environment
Maintain the historical Civic Center and continue to revitalize downtown.
Continue to implement efforts to maintain City streets, landscaping, parks and historical buildings.
Enforce abatement ordinances to combat graffiti, vacant buildings, illegal dumping and overgrown vegetation throughout the City.
2. Promote a safe and secure community
Support community-policing policies.
Support and market recreation and youth programs. Communicate with the West Contra Costa Unified School District (WCCUSD) to foster a supportive collaboration to sustain a healthy
learning environment for Richmond youth.
3. Promote economic vitality
Seek opportunities to develop programs and projects that promote job creation and employment for Richmond residents.
Expand economic opportunities for business and employment opportunities for Richmond residents.
Support efforts to attract and sustain businesses through effective and efficient permitting processes.
4. Promote sustainable communities
Support and implement programs that will address blight.
Promote environmentally-friendly options.
Support efforts of the City of Richmond’s Environmental Initiative Division to promote sustainability within the organization.
Sustain and augment programs that promote general and higher education for our youth.
5. Promote effective government
Remain updated on infrastructure bonds, the state budget, and key legislation to broaden local programs and services by participating in courses, seminars and conferences provided through association memberships.
Implement, maintain, and respond to the biennial community survey through sound policy measures.
Provide public policy education for all City Council members to enhance the effectiveness of policy decisions.
Strengthen avenues of communication with the community through collaborations, outreach, and public meetings.
131

CITY COUNCIL
PROGRAM ORGANIZATIONAL CHART
• Allocation of Resources
And Policy Development • Formulates Priorities
• Coordination between
Departments & Community • Represents City at Local,
Regional & Nation-wide Organizations
• Conducts regularly scheduled meetings,
hearings, and study sessions to receive citizens’ input.
City Council
132

Richmond City CouncilFY2018-19 Organizational Chart
Councilmember(1)
Vice Mayor(1)
Existing FTE = 7, Adopted FTE = 7
Legend:
Sub-Program
Main ProgramExisting Pos.
Proposed Pos.
Reclassification
Senior Administrative
Analyst(1)
Councilmember(1)
Councilmember(1)
Councilmember(1)
Councilmember(1)
133

City of RichmondMulti-Year Comparative Position Listing
Department Adopted FY2014-2015
Adopted FY2015-2016
Adopted FY2016-2017
Adopted FY2017-2018
Mid-year FY2017-18
Adopted FY2018-19
CITY COUNCILStaff Assistant to the City Council 1.0Senior Administrative Analyst 1.0 1.0 1.0 1.0 1.0Total Full-Time Equivalents (FTEs) 1.0 1.0 1.0 1.0 1.0 1.0
134

Thru Mar -2018
General Fund-0001 204,482 349,106 212,496 353,859 4,753 1%TOTAL SOURCES BY FUND 204,482 349,106 212,496 353,859 4,753 1%
Salaries 267,512 281,779 188,353 279,059 (2,720) -1%Benefits 130,386 190,182 127,446 176,782 (13,400) -7%Professional Services 19,430 23,550 8,639 26,046 2,496 11%Other Operating Expenses 15,016 20,300 13,172 15,400 (4,900) -24%Utilities 1,030 1,100 739 1,100 - 0%Equipment & Contract Services - -Provision for Insurance Loss - -Cost Pool 33,938 33,938 25,454 57,215 23,277 69%Asset/Capital Outlay 1,062 - -A87 Cost Plan Reimbursement (263,892) (201,743) (151,307) (201,743) - 0%Grant Expenditures - -TOTAL USES BY TYPE 204,482 349,106 212,496 353,859 4,753 1%
Council/City Council Div-01115011 199,404 339,271 208,200 343,863 4,592 1%Council Member(1) (S-Div)-01115111 - -Council Member(2) (S-Div)-01115211 - -Council Member(3) (S-Div)-01115311 1,667 1,429 1,666 (1) 0%Council Member(4) (S-Div)-01115411 114 1,667 575 1,666 (1) 0%Council Member(5) (S-Div)-01115511 1,667 35 1,666 (1) 0%Council Member(6) (S-Div)-01115611 1,667 1,666 (1) 0%Council Member(7) (S-Div)-01115711 2,031 1,167 1,666 499 43%Council Member(8) (S-Div)-01115811 2,933 2,000 2,256 1,666 (334) -17%TOTAL USES BY ORG CODE 204,482 349,106 212,496 353,859 4,753 1%
FY2018-19 Budget
City Council-11Summary
$ Chg From FY17-18
% Chg From FY17-18
FY2016-17Actual
FY2017-18Adjusted
FY2017-18Actual
TOTAL BUDGET - HISTORICAL COMPARISON
USES BY ORG CODE
USES BY TYPE
SOURCES BY FUND(INCLUDES REVENUE AND/OR FUND BALANCE)
FY2018-19Budget
135

City Clerk’s Office
FY2018-19 Budget
Mission:
The mission of the City Clerk’s Office is to serve as a responsible link between the public and local government to ensure legislative processes are open to the public, to record, maintain, and provide timely access to City documents and legislative actions of the City Council and other City agencies to promote transparency, and community participation and awareness.
Key Objectives for Strategic Goals:
2. Promote a safe and secure community
Publish and promote City policies regarding a Drug-Free Workplace, Violence in the Workplace and Workplace Harassment.
4. Promote sustainable communities
Enable records research and review of ordinances, resolutions, agendas, minutes, and contracts through the City’s website.
5. Promote effective government
Ensure that all ordinances and resolutions are executed, recorded, and incorporated into municipal code, where applicable.
Ensure that City records are maintained in an orderly and accessible manner.
Increase the amount of information made available electronically to City staff and the public.
Continue automated correspondence and application procedures.
Purge and destroy offsite files with expired dates.
Ensure City Council, Committee, Commission and other official meetings are properly noticed to encourage public participation in conformance with legal mandates.
Facilitate the Municipal Election process within the City to ensure that elections are conducted properly and ethically in accordance with federal, state, and local laws.
Oversee the filing of Campaign Disclosure Statements and Statements of Economic Interest as required by the Fair Political Practices Commission.
Collaborate with other departments to improve efficiency and best practices.
Develop and install a kiosk system in the lobby of the Council Chamber for the public to request to speak on agenda items.
136

CITY CLERK'S OFFICE
PROGRAM ORGANIZATIONAL CHART
City Clerk
* Preparation and publishing of agendas and packet
* Minutes preparation and publishing
* Research Service
* Public Information Requests
* Accepts claims against the City of Richmond
* Approves requests for the use/rental of the City Council Chambers
* Record Deeds, Street Vacations, Liens with * Administers Oaths of Office
* Publishes legal notices
* Bid Openings
County Recorder
* Accepts subpoenas, summons, etc.
* Custodian of legislative history and records
* Elections Official
* Resolutions - attest and publish
* Ordinances - attest, publish and codify
* Monitor and Track Terms, Absences, and
Resignations of Boards and Commissions
* Schedule appeals and regular hearings
* Codification and Maintenance of Municipal Code
* Records Management/Retention Schedule
* Fair Political Practice Commission Filings (FPPC)
* Contracts/Agreements - execute and publish
* Staff City Council Meetings and other agencies
137
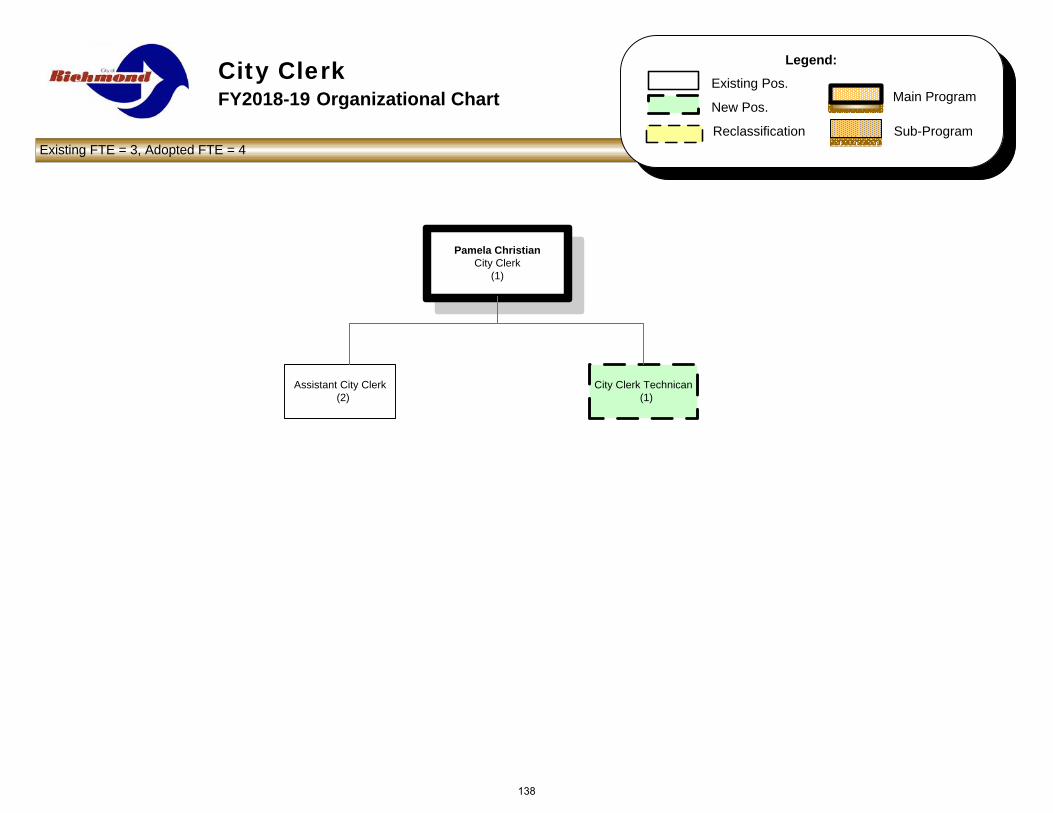
City ClerkFY2018-19 Organizational Chart
Pamela ChristianCity Clerk
(1)
Assistant City Clerk(2)
Existing FTE = 3, Adopted FTE = 4
Legend:
Sub-Program
Main ProgramExisting Pos.
New Pos.
Reclassification
City Clerk Technican(1)
138

City of RichmondMulti-Year Comparative Position Listing
Department Adopted FY2014-2015
Adopted FY2015-2016
Adopted FY2016-2017
Adopted FY2017-2018
Mid-year FY2017-18
Adopted FY2018-19
CITY CLERKCity Clerk 1.0 1.0 1.0 1.0 1.0 1.0City Clerk Technician 1.0Assistant City Clerk 2.0 2.0 2.0 2.0 2.0Deputy City Clerk 2.0Total Full-Time Equivalents (FTEs) 3.0 3.0 3.0 3.0 3.0 4.0
139

Thru Mar-2018
General Fund-0001 576,313 669,767 377,077 913,102 243,335 36%TOTAL USES BY FUND 576,313 669,767 377,077 913,102 243,335 36%
Salaries 300,238 337,927 240,629 374,683 36,756 11%Benefits 198,552 203,187 165,388 262,068 58,881 29%Professional Services 245,643 220,610 54,794 363,225 142,615 65%Other Operating Expenses 12,625 21,800 6,091 21,800 - 0%Utilities 1,080 1,500 750 1,500 - 0%Cost Pool 24,154 24,154 18,115 29,237 5,083 21%Asset/Capital Outlay 1,286 7,250 1,304 7,250 - 0%A87 Cost Plan Reimbursement (207,265) (146,661) (109,995) (146,661) - 0%TOTAL USES BY TYPE 576,313 669,767 377,077 913,102 243,335 36%
City Clerk (Admin)-01141013 576,313 669,767 377,077 913,102 243,335 36%TOTAL USES BY ORG CODE 576,313 669,767 377,077 913,102 243,335 36%
TOTAL BUDGET - HISTORICAL COMPARISON
FY2016-17Actual
FY2017-18Adjusted
FY2017-18Actual
City Clerk-14Summary
FY2018-19 Budget
SOURCES BY FUND(INCLUDES REVENUE AND/OR FUND BALANCE)
FY2017-18 $ Change
FY2017-18 % Change
FY2018-19Budget
USES BY ORG CODE
USES BY TYPE
140

Office of the City Manager
FY2018-19 Budget
Key Objectives for Strategic Goals:
1. Maintain and enhance the physical environment • Increase the supply of mixed income housing opportunities, such as 12th and Macdonald and Metro Walk Phase II, which recognize and
promote smart growth principles. • Participate in collaborations and oversee grants and mitigation funds to ensure that an attractive, safe, and healthy physical
environment is maintained throughout the community. • Work collaboratively with City departments, residents, and outside organizations to ensure the successful implementation of the
Nystrom United Revitalization Effort (NURVE) through the development of specific capital projects and programs. • Continue to evaluate opportunities for streetlight improvements including underpasses, parks, and decorative lights. • Continue to support the infrastructure of Electric Vehicle stations throughout the City to promote car-sharing and ride-sharing programs
and services to reduce pollutants generated by vehicles, and to meet transportation control measures recommended by the BAAQMD. • Work with City departments, community organizations, and regional agencies to minimize vehicle emissions by reducing automobile
use and encouraging alternative means of transportation. • Continue to implement the City’s Commuter Benefits Ordinance to encourage the use of alternative transportation options for Richmond
employees and residents. • Promote the development of transportation facilities and services that encourage transit ridership, reduce traffic congestion, improve air
quality, increase vehicle occupancy, and improve pedestrian and bicycle access. • Continue to manage the Paratransit program and the implementation of strategies to improve services. • Oversee the environmental remediation process at Pt. Molate and to obtain a desirable development option. • Provide oversight for the City’s property and asset management program which includes environmental remediation oversight and
lease management.
2. Promote a safe and secure community • Support the Office of Neighborhood Safety and the Richmond Police Department, and support the work of local community-based
organizations in their efforts to reduce the crime rate and prevent gang violence. • Ensure that community concerns regarding neighborhood issues are addressed by appropriate City departments and entities. • Provide support to the City’s neighborhood councils and community-based organizations to help them improve the livability, safety, and
appearance of their communities.
Mission: The City Manager’s Office implements City Council policy through effective day-to-day oversight of operating departments, and through the initiation, development, and implementation of programs that provide for the efficient, effective, and equitable delivery of services to all who live and work in the City of Richmond.
141

Office of the City Manager
FY2018-19 Budget
3. Promote economic vitality • Collaborate with City departments to develop and implement financial plans and balanced budgets, ensure adherence to financial
practices and policies, and determine effective methods to increase revenue generation. • Provide small business loans and loan modifications to Richmond small businesses, including management of the City’s Revolving
Loan Fund. • Provide assistance and access to resources to local small businesses, including collaboration with KIVA, a non-profit organization, to
support local start-up businesses. • Facilitate the creation of Business Improvement Districts (BID) (e.g., downtown, Cutting Boulevard, 23rd Street, Point Richmond, and
San Pablo Avenue) to support economic vitality of local commercial districts. • Support the work of the National Park Service to promote Richmond’s history and image through collaboration on events and outreach. • Continue to partner with the Economic Development Commission and community stakeholders on the development and refinement of
economic development strategies, policies, and activities within the Richmond community. • Collaborate with the Economic Development Commission and City departments to design and implement events, such as the Taste of
Richmond, and publications, such as the San Francisco Business Times, that positively market and promote the City. • Collaborate with businesses and organizations located within the City’s major thoroughfares, such as the 23rd Street Merchants
Association and Richmond Main Street, on business assistance needs, and to develop area-specific marketing strategies. • Work with Richmond Convention and Visitors Bureau to promote local restaurants and hotels. • Work with the Water Emergency Transportation Authority to launch the City’s ferry service.
4. Promote sustainable and healthy communities • Work with the Planning Department and other City departments to ensure General Plan policies and actions, including those identified
in the Community Health and Wellness Element and Energy and Climate Change Element, are implemented through the Five-Year Strategic Business Plan.
• Develop outreach strategies and materials to reduce municipal, commercial, and residential environmental impacts. • Manage and effectively implement the community-based programs, greenhouse gas reduction programs, and solar projects funded by
the Chevron Environmental and Community Investment Agreement (ECIA). • Launch the Climate Action Plan (CAP) data dashboard to provide an interactive tool to track and measure the implementation of the
CAP. • Continue to manage and perform outreach on the Community Air Monitoring Program and expand community-based air monitoring in
Richmond for a suite of industrial air pollutants. • Lead the implementation of zero waste initiatives through the negotiation for the expansion of services available at no additional costs
including weekly curbside recycling and compost service, commercial composting, and bulky item service. • Implement energy efficiency, renewable and diversion programs such as Energize Richmond which leverage MCE & PGE incentives to
provide energy efficiency rebates for Richmond’s commercial businesses and multi-family properties.
142

Office of the City Manager
FY2018-19 Budget
• Partner with local artists, City Parks staff, and community to install recycling bins and tile mosaic art on trash receptacles located along public right-of-ways and install solar compact trash receptacles in parks.
• Actively pursue grants, in collaboration with City departments and outside entities, to assist the City in implementing prioritized goals and objectives.
• Develop on-going training & practice guide for City staff and public outreach/communication of HiAP & Health Equity work. • Continue partnerships with UC Berkeley to implement and evaluate the City’s HiAP Strategy. • Continue to work with Contra Costa Health Services to reduce health disparities and receive relevant health equity data and increase
enrollment in health supporting programs at City sites and through City programs. • Develop outreach strategies, materials, events and partnerships to promote health resources, affordable health care options, and
services to residents (ex. Covered CA, Medi-Cal, etc.). • Continue connections and involvement of the City’s environmental and health initiatives work, such as the Y-PLAN program, at
Richmond elementary schools and high schools. • Oversee the implementation of the North Richmond Mitigation Fund which funds strategies to defray the annual costs associated with
collection and disposal of illegally dumped waste and associated impacts in North Richmond. • Oversee the implementation of the Veolia Mitigation Fund to offset the environmental impacts of the hazardous waste company through
community driven grant awards. • Facilitate compost, fruit tree, and garden seed giveaways to residents, local schools, and community gardens to increase local,
sustainable urban agriculture and healthy food access. • Support and actively participate in an inter-governmental working group to develop and implement a racial equity action plan.
5. Promote effective government • Implement City Council directives and communicate regularly to the City Council through weekly reports and bi-monthly meetings. • Work with the Finance Department to develop and ensure effective tracking of performance measurements to promote transparency,
accountability, effectiveness, and efficiency in City operations. • Work with the Finance Department and other City departments to assist with the implementation of the Five-Year Strategic Business
Plan, including the integration of health equity actions identified by the HiAP Strategy into the plan and bi-annual budget. • Continue convening Interdepartmental HiAP Working Group to ensure the implementation of health equity priorities across City
operations. • Develop the HiAP report to assess and report on the implementation of the HiAP Strategy and Ordinance. • Ensure issues raised in the bi-annual community surveys are discussed and/or addressed in City operations and policies. • Regularly provide public information to the community through various forms of media and provide metrics of use (social media, apps,
website, etc.). • Implement a streamlined regulatory process through cooperative efforts of all City departments working with community-based
organizational needs.
143

CITY MANAGER'S OFFICE PROGRAM ORGANIZATIONAL CHART
Health In All Policies
* Health Equity Integration into City Plans and Documents
* Partnerships with City Departments, UC Berkeley, other piblic institutions and not-for-profit organziations to support HiAP implementation, data tracking and analysis
* Council Communication and Information Provision
* Policy Recommendations
* Transportation and Circulation Plan Implementation
* Contract and Grant Administration
* Climate Action Plan Development and Implementation
Environmental Initiatives
* City Budget Oversight and Resource Allocation
* Sustainable Transportation Program Development & Implementation
* Inter and Intra-Governmental Relations
* Paratransit Program Administration
* Regional and State Energy Program Collaboration
* Public Administration and Information
* Contract and Grant Administration
* City - Philanthropic Partnership Development
* Non-Governmental Organization Support
City Manager/City Council Program/Policy Development
* Inter-Departmental Collaboration
* Policy Research, Implementation and Development
*Agenda Packet Preparation
* Community Relations
* Management Oversight of City Departmental Services
* Organizational and Employee Development
* Environmental Mitigation Program Funding Oversight
* Inter-Governmental Relations and Engagement with Agencies such as WCCUSD, EPA, DOL, DOE and Contra Costa County
Transportation and Transit Connectivity
* Parking Management Plan Development and Implementation
* Grant Research and Administration
* Energy Efficiency Program Development and Implementation
* Energy Efficiency Community Block Grant Program Planning and Implementation
* City-Wide Grant Seeking
* Enviornmental & Community Investment Agreement Implementation, Support and Oversight
* Solid Waste and Recycling Contract Administration
* Waste Reduction Program Development
* Coordination and Support of Richmond Residents in the Enrollment and Participation in Health Supporting Programs
* Transportation Demand Strategy Support and Implementation * Community Engagement
Community and Economic Development
* Richmond Business Retention, Attraction, Incentives, Promotion and Support
* Small Business Support Through Classes, Seminars, Collaborations and Technical Assistance
* Developer Tour Hosting and Support
* Revolving Loan Fund Management
* Business Improvement Districts Initiation and Management
* Development Project Analysis and Review, Developers Selection and Strategy and Financing Tools Recommendations
* City of Richmond Promotion and Marketing
* Health in All Policies (HiAP) Ordinance and Strategy Implementation
* Opportunity Site Development for Housing, Retail and Transportaion Services.
* Environmental Remediation Oversight
* Economic Development Commission and Richmond Revolving Loan Fund Board Staffing and Support
* Development and Refinement of Economic Development Strategies, Policies, and Activities
* Property and Asset Management Program Oversight
144

City Manager’s Office
FY2018-19 Organizational Chart
Bill Lindsay
City Manager
(1)
Management
Analyst II
(1)
Executive Assistant
to the City Manager
(1)
Existing FTE = 21, Adopted FTE = 18.9
Legend:
Sub-Program
Main ProgramExisting Pos.
Proposed Pos.
Reclassification
Community & Economic
Development Director
(1)
Management
Analyst I
(1)
Management
Analyst I
(1)
Economic
Development
Administrator
(1)
Environmental
Services Manager
(1)
Administration
Project Manager II
(1)
Environmental
Initiatives
Health &
Community
Development
Transportation
R-Transit
Property
Management
Development
Project Manager
(1)
Paratransit Driver
Lead Worker
(1)
Paratransit
Assistant
(1)
Paratransit Driver
(3)
Senior
Management
Analyst
(1)
Project Manager I
(1)
Assistant
Administrative
Analyst (.9)
Management
Analyst II
(1)
Management
Analyst II
(1)
145

City of RichmondMulti-Year Comparative Position Listing
Department Adopted FY2014-2015
Adopted FY2015-2016
Adopted FY2016-2017
Adopted FY2017-2018
Mid-year FY2017-18
Adopted FY2018-19
CITY MANAGERAdministrative Aide 1.0 1.0Administrative Chief 0.8 0.8 1.0 1.0 1.0Assistant Administrative Analyst 0.9City Manager 1.0 1.0 1.0 1.0 1.0 1.0Community Affairs Coordinator 1.0 1.0Community & Economic Dev. Director 1.0Community Services Technician 1.0Development Project Manager II 1.0 1.0 1.0Economic Development Administrator 1.0 1.0 1.0 1.0 1.0 1.0Environmental Services Manager 1.0Environmental Manager 1.0 1.0 1.0 1.0 1.0Executive Assistant to the City Manager 1.0 1.0 1.0 1.0 1.0 1.0Management Analyst 1.0 1.0 1.0 2.0Management Analyst II 2.0 1.6 1.0 1.0 1.0 1.0Office Specialist 1.0Senior Management Analyst 2.0 1.0 1.0 1.0 1.0 1.0Sustainability Coordinator 1.0Sub-total City Manager 10.8 8.4 9.0 10.0 11.0 10.9TRANSPORTATIONCode Enforcement Superintendent 1.0 1.0 1.0Management Analyst II 1.0Paratransit Assistant 1.0 1.0 1.0 1.0 1.0 1.0Paratransit Coordinator 1.0 1.0 1.0 1.0 1.0Paratransit Driver 4.0 6.0 5.0 5.0 5.0 3.0Paratransit Driver Leadworker 1.0 1.0 1.0 1.0 1.0 1.0Project Manager I 1.0Project Manager II 1.0 1.0 1.0 1.0 1.0 1.0Sub-total Transportation 8.0 10.0 10.0 10.0 10.0 8.0Total Full-Time Equivalents (FTEs) 18.8 18.4 19.0 20.0 21.0 18.9
146

Thru Mar -2018
General Fund-0001 3,652,177 11,510,013 3,432,539 10,649,016 (860,997) -7%Transportation-1003 549,101 1,071,000 115,437 880,000 (191,000) -18%Outside Funded Grants-1006 739 721,737 27,707 917,636 195,899 27%Pt. Molate-1008 364,758 Veolia-1009 25,863 25,000 19,339 25,000 - 0%N. Richmond Mitigation-1010 164,090 951 196,714 196,714 -ECIA-1017 - -General Capital-2001 103,300 422,898 317,175 (422,898) -100%TOTAL SOURCES BY FUND 4,860,028 13,750,648 3,913,148 12,668,366 (1,082,282) -8%
Salaries 1,619,009 1,734,555 1,388,744 1,678,152 (56,403) -3%Benefits 1,036,411 1,196,538 845,777 1,009,246 (187,292) -16%Professional Services 2,055,820 10,081,326 1,110,226 9,401,040 (680,286) -7%Other Operating Expenses 55,272 66,908 25,500 73,275 6,367 10%Utilities 6,955 7,515 3,084 7,000 (515) -7%Equipment & Contract Services 29,067 4,553 123 280 (4,273) -94%Cost Pool 475,480 494,592 378,073 520,857 26,265 5%Asset/Capital Outlay 9,997 472,359 396,145 291,214 (181,145) -38%A87 Cost Plan Reimbursement (427,984) (312,698) (234,524) (312,698) - 0%Operating Transfer Out 5,000 (5,000) -100%TOTAL USES BY TYPE 4,860,028 13,750,648 3,913,148 12,668,366 (1,082,282) -8%
% Ch
SOURCES BY FUND (INCLUDES REVENUE AND/OR FUND BALANCE)
City Manager's Office-13Summary
TOTAL BUDGET - HISTORICAL COMPARISON$ Chg From
FY17-18% Chg From
FY17-18FY2018-19
Budget
USES BY TYPE
FY2016-17Actual
FY2017-18Adjusted
FY2017-18Actual
147

Thru Mar -2018
% Ch
City Manager's Office-13Summary
TOTAL BUDGET - HISTORICAL COMPARISON$ Chg From
FY17-18% Chg From
FY17-18FY2018-19
BudgetFY2016-17
ActualFY2017-18Adjusted
FY2017-18Actual
Administration-01131013 1,078,068 1,375,712 1,027,318 1,479,418 103,706 8%Pt. Molate-01131913 1,462 - -Environmental-01132713 570,501 595,226 395,861 585,329 (9,897) -2%Volunteer-01134913 597 - -City Manager Transportation-01135013 226,788 Transportation Operations-10335013 1,108,575 1,211,779 758,382 1,250,413 38,634 3%Transportation Non-Operations-10335113 122,763 64,771 139,437 984 (63,787) -98%Parking Management-10335913 196,466 191,357 210,647 95,735 (95,622) -50%Outside Funded Grants-10632713 10,101 749,072 62,239 917,636 168,564 23%Veolia-10932813 75,000 100,000 25,000 33%North Richmond Mitigation-11032913 162,037 187,774 12,422 196,714 8,940 5%ECIA-11731013 1,577,170 8,826,286 949,035 7,640,349 (1,185,937) -13%Capital Outlay-20131031 32,288 473,671 357,684 175,000 (298,671) -63%Parking Authority Enterprise-40931013 123 - -TOTAL USES BY ORG CODE 4,860,028 13,750,648 3,913,148 12,668,366 (1,082,282) -8%
FY2018-19 Budget
USES BY ORG CODE
148

Office of Neighborhood Safety
Mission: The Office of Neighborhood Safety (ONS) builds healthy communities and increases public safety through reducing gun violence. ONS builds and sustains strategic partnerships and initiatives that develop, focus, connect and sustain human service resources to and on behalf of those identified as most likely to commit gun violence in Richmond, California.
Key Objectives for Strategic Goals:
1. Maintain and enhance the physical environment • Build capacity and create alignment within public systems, community and faith-based organizations to implement innovative best
practice-based gun violence prevention and intervention strategies and programs that aid in enhancing the physical environment of the Richmond community.
2. Promote a safe and secure community • Coordinate City-initiated gun violence prevention and intervention initiatives. • Design and implement City-initiated programs that reduce gun violence. • Evaluate City/community-based partnerships and programs that reduce and prevent gun violence. • Coordinate collaborative community efforts to reduce gun violence. • Identify "best practices" and community needs to reduce and prevent gun violence.
3. Promote economic vitality • Fund economic development that promotes reducing gun violence. • Pursue opportunities to leverage and re-deploy existing resources as well as pursue state, federal and philanthropic resources.
4. Promote sustainable communities • Build capacity and create alignment within public systems, community and faith-based organizations to implement innovative best
practice-based gun violence prevention and intervention strategies and programs that promote a healthy and sustainable Richmond community.
5. Promote effective government • Facilitate and strengthen the City’s interdepartmental coordination of efforts designed to build and advance meaningful human service
delivery opportunities on behalf of those most likely to be involved in gun violence.
FY2018-19 Budget
149

OFFICE OF NEIGHBORHOOD SAFETY PROGRAM ORGANIZATIONAL CHART
Neighborhood Safety
*Coordination of City- initiated violence prevention initiatives *Coordination of collaborative community efforts to reduce gun violence *Development of funding sources for gun violence reduction strategies
*Identification of "best practices" and community needs to prevent gun violence *Evaluation and provision of funding to community organizations for gun violence prevention strategies *Design and implementation of programs that reduce gun violence
150
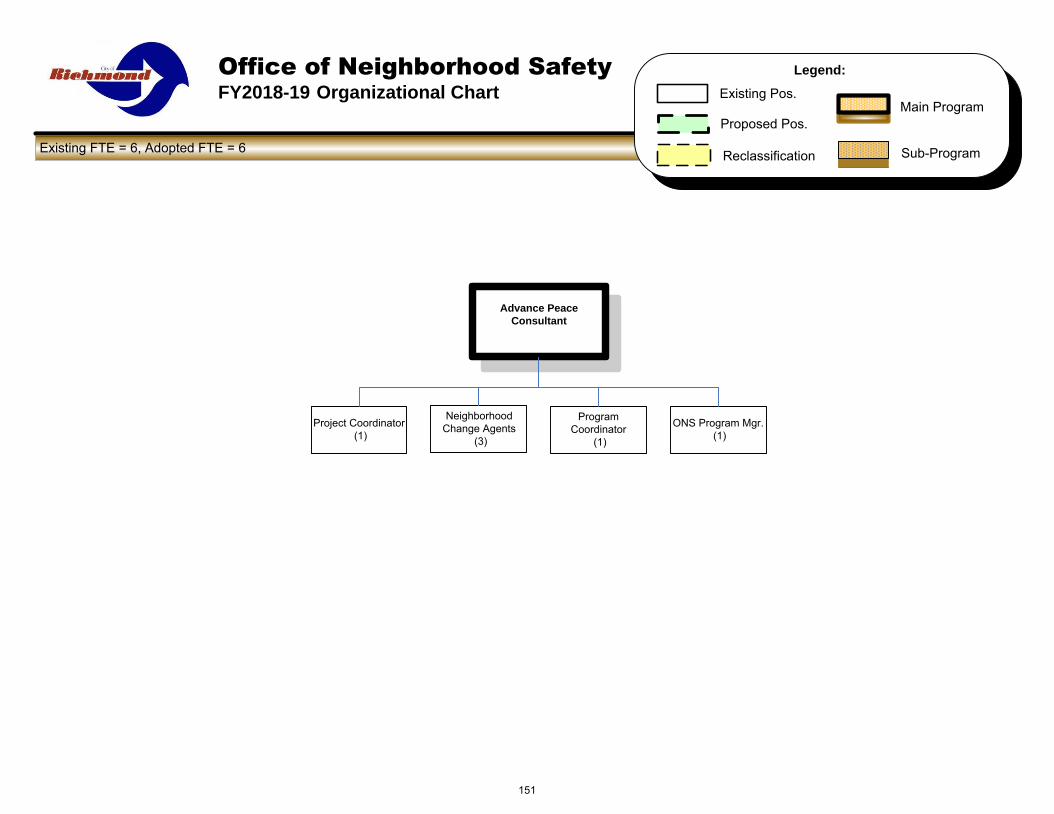
Office of Neighborhood Safety
FY2018-19 Organizational Chart
Advance Peace
Consultant
Project Coordinator
(1)
Existing FTE = 6, Adopted FTE = 6
Legend:
Sub-Program
Main ProgramExisting Pos.
Proposed Pos.
Neighborhood
Change Agents
(3)
Program
Coordinator
(1)
ONS Program Mgr.
(1)
Reclassification
151

City of RichmondMulti-Year Comparative Position Listing
Department Adopted FY2014-2015
Adopted FY2015-2016
Adopted FY2016-2017
Adopted FY2017-2018
Mid-year FY2017-18
Adopted FY2018-19
OFFICE OF NEIGHBORHOOD SAFETYCommunity Services Program Manager 1.0Neighborhood Change Agents 5.0 2.0 3.0 3.0 3.0 3.0Neighborhood Safety Director 1.0ONS Program Manager 1.0Program Coordinator 1.0Project Coordinator 1.0 1.0 1.0 1.0 1.0Recreation Program Coordinator 2.0 1.0 2.0Redevelopment Contract Administrator 1.0Total Full-Time Equivalents (FTEs) 7.0 3.0 6.0 6.0 6.0 6.0
152

Thru Mar -2018
General Fund-0001 1,495,260 1,533,860 1,218,299 1,230,816 (303,044) -20%Outside Funded Services-Grants-1006 14,793 41,034 270,000 228,966 558%ECIA-1017 58,000 58,000 58,000 58,000 - 0%TOTAL SOURCES BY FUND 1,568,053 1,632,894 1,276,299 1,558,816 -74,078 -5%
Salaries 491,250 565,083 442,800 574,835 9,752 2%Benefits 16,780 357,073 287,758 390,326 33,253 9%Professional Services 860,163 439,869 318,236 369,815 (70,054) -16%Other Operating Expenses 21,473 31,226 15,271 31,848 622 2%Utilities 8,573 16,000 7,701 16,000 - 0%Cost Pool 40,741 40,741 30,556 68,320 27,579 68%Asset/Capital Outlay 10,693 5,600 2,100 9,600 4,000 71%Grant Expenditures 118,381 119,302 113,876 98,072 (21,230) -18%TOTAL USES BY TYPE 1,568,053 1,574,894 1,218,299 1,558,816 -16,078 -1%
Administration-01211013 715,529 1,132,861 866,199 1,230,816 97,955 9%Grants-01212013 779,731 342,999 322,219 250,000 (92,999) -27%Outside Funded Services-Grants-10612051 14,793 41,034 880 20,000 (21,034) -51%ECIA-01171013 58,000 58,000 29,000 58,000 - 0%TOTAL USES BY ORG CODE 1,568,053 1,574,894 1,218,299 1,558,816 (16,078) -1%
Office of Neighborhood Safety-21Summary
FY2018-19 Budget
SOURCES BY FUND (INCLUDES REVENUE AND/OR FUND BALANCE)
$ Chg From FY17-18
% Chg From FY17-18
FY2018-19 Budget
USES BY ORG CODE
USES BY TYPE
TOTAL BUDGET - HISTORICAL COMPARISON
FY2016-17Actual
FY2017-18Adjusted
FY2017-18Actual
153

City Attorney’s Office
FY2018-19 Budget
Mission: The City Attorney’s Office is dedicated to providing timely and reliable legal services to assist City officials and departments in performing their critically important public functions. The City’s public attorneys continue to educate themselves in developing areas of the law and learn new specialty areas of law to enhance the ability of the City Attorney’s Office to serve as a full service public law office while minimizing the need to utilize outside counsel.
Key Objectives for Strategic Goals: 1. Maintain and enhance the physical environment • Work cooperatively with, and provide timely legal advice to, the Police Department, Code Enforcement, Planning and Building, Public
Works and other departments involved in code enforcement to improve the quality of life in all Richmond neighborhoods. 2. Promote a safe and secure community • Provide legal advice to the Police Department to assist in designing and implementing innovative strategies to combat crime. • Act as City Prosecutor to improve municipal code enforcement. • Provide timely legal advice to other departments charged with protecting public safety. 3. Promote economic vitality • Work closely with the Successor Agency and staff to promote the City’s revitalization. 4. Promote sustainable communities • Assist in the development and drafting of the City’s environmental policies, ensuring a concerted effort toward a “greener” environment
at the municipal level. • Continue to provide advice on proposed policies regarding air and water quality, green building, recycling, public health, socioeconomic
conditions and transportation. 5. Promote effective government • Support City Council as its legal advisor and act as general counsel to all City departments, Successor Agency, Port, and the
Richmond Housing Authority. • Increase staff expertise in areas of municipal law, including finance, human resources, and real estate development.
154

CITY ATTORNEYPROGRAM ORGANIZATIONAL CHART
Administration City Advisory Services
Operational Services
* City Council * Court Appearances* In-House Attorneys
* Commissions * Contract Review* Contract Attorneys
* Support Staff * Opinions* Successor Agency
* Ordinances
* Resolutions
* Housing Authority
* Port
* Muncipal Sewer * Code Enforcement District
155

City Attorney
FY2018-19 Organizational Chart
Bruce Reed Goodmiller
City Attorney
(1)
Administration
Operational
Services
Senior Assistant
City Attorney
(3)
Supervising Office
Assistant
(.7)
Executive
Secretary II
(1)
Existing FTE = 9, Adopted FTE = 8.7
Legend:
Sub-Program
Main ProgramExisting Pos.
Proposed Pos.
Reclassification
Assistant City
Attorney
(3)
156

City of RichmondMulti-Year Comparative Position Listing
Department Adopted FY2014-2015
Adopted FY2015-2016
Adopted FY2016-2017
Adopted FY2017-2018
Mid-year FY2017-18
Adopted FY2018-19
CITY ATTORNEYAssistant City Attorney 4.0 2.8 2.8 3.0 3.0 3.0City Attorney 1.0 1.0 1.0 1.0 1.0 1.0Executive Secretary II 1.0 1.0 1.0 1.0 1.0 1.0Senior Assistant City Attorney 2.0 3.0 3.0 3.0 3.0 3.0Supervising Office Assistant 1.0 1.0 1.0 1.0 0.7 0.7Total Full-Time Equivalents (FTEs) 9.0 8.8 8.8 9.0 8.7 8.7
157

Thru Mar -2018
General Fund-0001 1,072,358 1,405,046 1,041,644 1,341,108 (63,938) -5%TOTAL SOURCES BY FUND 1,072,358 1,405,046 1,041,644 1,341,108 (63,938) -5%
Salaries 965,791 985,258 747,104 968,912 (16,346) -2%Benefits 559,982 490,266 415,530 458,911 (31,355) -6%Professional Services 67,567 121,650 25,639 67,700 (53,950) -44%Other Operating Expenses 16,032 15,500 9,127 16,500 1,000 6%Utilities 766 - -Equipment & Contract Services 508 200 115 200 - 0%Cost Pool 76,289 76,289 57,218 113,002 36,713 48%A87 Cost Plan Reimbursement (614,577) (284,117) (213,089) (284,117) - 0%TOTAL USES BY TYPE 1,072,358 1,405,046 1,041,644 1,341,108 (63,938) -5%
City Attorney (Admin)-01151014 1,072,358 1,405,046 1,041,644 1,341,108 (63,938) -5%TOTAL USES BY ORG CODE 1,072,358 1,405,046 1,041,644 1,341,108 (63,938) -5%
FY2017-18Adjusted
FY2017-18Actual
City Attorney-15Summary
TOTAL BUDGET - HISTORICAL COMPARISON
FY2018-19 Budget
$ Chg From FY17-18
% Chg From FY17-18
FY2018-19 Budget
USES BY ORG CODE
USES BY TYPE
SOURCES BY FUND (INCLUDES REVENUE AND/OR FUND BALANCE)
FY2016-17Actual
158

Citizens Police Review Commission
FY2018-19 Budget
Mission:
The purpose of the Citizens Police Review Commission (formally known as the Police Commission) is to advise the City Council, City Manager, and Chief of Police on all matters pertaining to the administration of the Richmond Police Department
Key Objectives for Strategic Goals:
5. Promote effective government
• To have sufficient staff hours to provide a timely and professional response to public inquiries over the CPRC office telephone line, and to facilitate the business of the CPRC by having sufficient staff support to accomplish tasks promptly and efficiently. • To continue our efforts at community outreach in order that the public will know of this resource - accomplishing this goal requires
materials for education (handcards) and items to bring people in - kids and adults - so, like giveaways. • To have CPRC participation in NACOLE, the national association of civilian oversight of law enforcement. NACOLE provides
opportunities for sharing information and learning from the experience of other police commissions. • To run a businesslike, professional monthly meeting, with all support services readily available, such as copying, etc. • To conduct a retreat in order to give the CPRC an opportunity to have extended conversations about matters within our purview,
input from experts and others, self-examination and an opportunity to identify and strategize toward a more effective CPRC. • To increase the visibility of CPRC commissioners and to clearly identify CPRC commissioners as being distinct from RPD
employees during community events, training events and ridealongs.
159

POLICE COMMISSION
PROGRAM ORGANIZATIONAL CHART
* Investigate Appeals
* Review RPD Policies
* Promote Positive
Police-Community
Relations
* Conduct Appeal
Hearings
* Investigate Complaints
Police Commission
160

FY2018-19 Organizational Chart
Existing FTE = 0 , Adopted FTE = .1
Legend:
Sub-Program
Main ProgramExisting Pos.
New Pos.
AssistantAdministrative
Analyst (.1)
Lucky NarainConfidential Investigative
Appeals Officer
Appeals
161

City of RichmondMulti-Year Comparative Position Listing
Department Adopted FY2014-2015
Adopted FY2015-2016
Adopted FY2016-2017
Adopted FY2017-2018
Mid-year FY2017-18
Adopted FY2018-19
POLICE COMMISSIONAssistant Administrative Analyst 0.1Executive Secretary I 1.0Total Full-Time Equivalents (FTEs) 1.0 0.0 0.0 0.0 0.0 0.1
162

Thru Mar -2017
General Fund-0001 25,144 82,285 39,551 87,405 5,120 6%TOTAL SOURCES BY FUND 25,144 82,285 39,551 87,405 5,120 6%
Salaries 30,151 66,135 34,934 70,237 4,102 6%Benefits 12,164 5,600 3,386 7,068 1,468 26%Professional Services 10,000 919 9,000 (1,000) -10%Other Operating Expenses 467 550 312 1,100 550 100%Utilities - -Equipment & Contract Services - -Provision for Insurance Loss - -Cost Pool - -Asset/Capital Outlay - -A87 Cost Plan Reimbursement (17,638) - -Grant Expenditures - -TOTAL USES BY TYPE 25,144 82,285 39,551 87,405 5,120 6%
Police Commission (Admin)-101121011 25,144 82,285 39,551 87,405 5,120 6%TOTAL USES BY ORG CODE 25,144 82,285 39,551 87,405 5,120 6%
FY2018-19 Budget
Police Commission-12Summary
$ Chg From FY17-18
% Chg From FY17-18
FY2016-17Actual
FY2017-18Adjusted
FY2017-18Actual
TOTAL BUDGET - HISTORICAL COMPARISON
USES BY ORG CODE
USES BY TYPE
FY2018-19 Budget
SOURCES BY FUND(INCLUDES REVENUE AND/OR FUND BALANCE)
163

Finance Department
FY2018-19 Budget
Mission
The Finance Department’s mission is to achieve excellence in financial management by maintaining the highest standards in budgeting, auditing, payroll, treasury, accounting, accounts receivable, contracts, grants management, technology, capital planning and purchasing.
Key Objectives for Strategic Goals:
1. Maintain and enhance the physical environment
Provide administrative support to City departments to ensure an attractive physical environment is maintained throughout the community.
2. Promote a safe and secure community
Provide administrative support to City departments for the reduction of violence in the community.
3. Promote economic vitality
Develop and make available on the City's website the Five-Year Capital Improvement Plan to enable better capital investment decisions.
Develop prudent budgetary management strategies for improved fiscal planning based on multi-year revenue forecasting.
4. Promote sustainable communities
Reduce paper use by printing double-sided and making reports available electronically on the City’s website.
Converting to a paperless payroll process and generating electronic data to our employees for services such as direct deposit notification and year-end W2s.
Continue implementation of the Environmental Purchasing Policy that will attract more environmentally-friendly companies and contracts throughout the City.
Leverage other funding sources to improve health outcomes.
5. Promote effective government
Achieve the Government Finance Officers Association Distinguished Budget Preparation and the California Society of Municipal Finance Officers awards for operating and capital budgets, public communications, budget innovation, and annual financial reporting.
Promote Richmond City government transparency by making financial reports, including budget, investments, and debt policies, available on the City's website.
Develop and implement a system for the City Manager and department heads to receive real-time variance reports and other tools for decision making.
Enhance financial infrastructure enterprise system to improve financial reporting.
Achieve improved credit ratings with Standard & Poor's and Moody's rating agencies.
Monitor and ensure City-wide adherence to Municipal Code 2.52 Contracting and Purchasing Procedures.
164

FINANCE DEPARTMENT
PROGRAM ORGANIZATIONAL CHART
*Manage Overall Operations of the Finance Department
*Capital Improvement Plan Budgeting
*MUNIS Accounting System Maintenance
*Cash Management
*Purchase Order Receiving *Operating Budgeting *General Ledger Maintenance *Rating Agency/Credit Reports
*Contract Processing *Monthly Variance Analysis *Financial Analysis & Reporting *Debt Management
*Website Management *Position Control *Fixed Assets Accounting *Banking Services
*Maintain all files associated with Personnel and Training
*MUNIS User Training *Grants Management
*Audit Management *Internal Controls
*State Controller’s Reports *Cash Flow Reporting
*Performance Measures Reporting
*Financial Guidance to Departments
*Trustees Liaison
*Five-Year Financial Planning *Revenue Collections & Analysis
*State, Federal & Local Government Reporting
*Financial Policies *Arbitrage & Continuing Disclosure
*Master Fee Schedule
*Comprehensive Annual Financial Report (CAFR)
*Investments Maintenance & Reporting
*Accounts Receivable *Process Invoices *City Purchasing Agent *Annual Salary & Benefit Projection
*Collections *1099 Miscellaneous Reporting *Develop Policy and Procedures *Medical Reimbursements
*Business License *Process Cal-Card Statements *Purchasing Order Maintenance *Garnishment Payments
*Payment Processing *Process Utility Payments *Manage BidsOnline System *Retiree Pension
*Petty Cash *Quarterly Diesel Fuel and Sales Tax Reporting
*Maintain Vendor Database *Annual State Controller’s Report
*Return Checks *Contract Management *Federal & State Payroll Reporting
*Wastewater & Stormwater Processing
*CAL-Card Program Administration *Payroll Services for Active Employees
*Refunds *W-2 & 1099R Reconciliation and Filing
*Compliance with Memorandum of Understandings (MOUs) and State & Federal Laws
Administration General Accounting Budget Treasury
Revenue Accounts Payable Purchasing Payroll
165

Belinda WarnerFinance Director/Treasurer
(1)
Finance FY2018-19 Organizational Chart
PayrollSupervisor
(1)
Budget Administrator (1)
Budget Analyst I(1)
Accounting Assistant II(1)
Accountant II(1)
Accounting Assistant II(1)
Accountant II (1)
Accountant I(1)
Revenue Division
PurchasingDivision
Accounting Manager(1)
Accounts PayableDivision
Existing FTE = 35, Adopted FTE = 32.9
Payroll Coordinator
(1)
Accountant II(1)
Administrative Service Analyst
(1)
Budget Analyst I(1)
Financial Operations
Senior Budget Analyst(1)
PayrollCoordinator
(1)
Public Safety/Grants Management
Accounting Assistant II(1)
Legend:
Existing Pos.
Proposed Pos.
Reclassification
Main Program
Sub-Program
Accounting Assistant II(2)
Daily Operations
Budget Analysis Budget AnalysisBudget Analysis/Capital
Improvement Plan
Budget Analyst II(1)
Cash ManagementDebt Management
Police and Miscellaneous Payroll
Fire Payroll & Medical Reimbursements
Senior Buyer(1)
Daily Operations Procurement Services
Invoice Management/Data ProcessingTax Reporting
Business License/CashierReceipting
GLManagement
Cost Recovery/Impact Fees
GL ManagementFixed Asset & GLManagement
Accountant II(1)
Housing Authority
Accountant II(1)
Finance Management
Accounting Assistant II(1)
Note: The Housing Department, Successor Agency and Housing Authority are located in the Finance Department but will continue to be supported by their department’s budget. Accounting Manager is allocated 60% Successor Agency and 40% Finance. The Senior Accountant under Financial operations is split evenly between the Port and Finance.
Bank Reconciliations
Business License Specialist
(2)
Senior Accountant(1)
Accounting Manager(.4)
Successor Agency
Accounting Assistant II(1)
Housing Department
Senior Accountant(1)
Accounting Assistant II(1)
GLManagement
Accountant II (1)
Billing/Collections
Auditing & Financial Reporting Budget & Financial
Planning
Finance Manager(1)
Grant Accounting & GL Management
Accounting Assistant II(1)
Revenue Manager(1)
Buyer II(1)
Cal Card Management
Accounting Manager(1)
Training/Special Projects
Pension/OPEB
Senior Accountant(.5)
Garnishments & Tax Reporting
166

City of RichmondMulti-Year Comparative Position Listing
Department Adopted FY2014-2015
Adopted FY2015-2016
Adopted FY2016-2017
Adopted FY2017-2018
Mid-year FY2017-18
Adopted FY2018-19
FINANCE Accountants I 7.0 7.0 2.0 1.0 1.0 1.0Accountant II 3.0 5.0 5.0 5.0Accounting Assistant I 1.0 1.0 1.0Accounting Assistant II 1.0 1.0 2.0 3.0 7.0 8.0Accounting Manager 1.0 2.0 2.0 2.0 3.0 2.4Administrative Services Analyst 1.0 1.0Budget Administrator 1.0 1.0 1.0 1.0 1.0Budget Analyst l 3.0 3.0 1.0 1.0 1.0 2.0Budget Analyst II 1.0 1.0 3.0 2.0 2.0 1.0Business License Specialist 1.0 1.0 1.0 1.0 1.0 2.0Buyer II 2.0 2.0 1.0 1.0 1.0Executive Secretary I 1.0 1.0 1.0 1.0Executive Secretary II 1.0 1.0 1.0 1.0 1.0Finance Director 1.0 1.0 1.0 1.0 1.0 1.0Finance Manager I 1.0 1.0Finance Manager II 1.0Investment Analyst 1.0 1.0 1.0Office Aide 0.8 0.8 0.8 0.8 0.8Office Assistant II 1.0 1.0Payroll Coordinator 2.0 2.0 2.0 2.0 2.0 2.0Payroll Supervisor 1.0 1.0 1.0 1.0 1.0 1.0Payroll Specialist 1.0Purchasing Assistant 1.0Revenue Collection Manager 1.0 1.0 1.0 1.0 1.0 1.0Senior Accountant 3.0 2.0 4.0 3.0 2.0 1.5Senior Budget Analyst 2.0 1.0 1.0 2.0 1.0 1.0Senior Buyer 1.0 1.0 1.0 1.0 1.0 1.0Total Full-Time Equivalents (FTEs) 32.8 32.8 32.8 32.8 34.8 32.9
167

Thru Mar -2018
SOURCES BY FUND(INCLUDES REVENUE AND/OR FUND BALANCE)General Fund-0001 3,842,951 4,109,238 2,668,062 4,414,024 304,786 7%TOTAL USES BY FUND 3,842,951 4,109,238 2,668,062 4,414,024 304,786 7%
Salaries 2,593,609 2,636,221 1,825,090 2,766,317 130,096 5%Benefits 1,702,539 1,800,725 1,249,966 1,866,837 66,112 4%Professional Services 563,434 701,791 384,307 725,756 23,965 3%Other Operating Expenses 61,117 70,329 36,434 70,729 400 1%Utilities 1,274 2,500 861 2,171 (329) -13%Equipment & Contract Services 113 2,620 115 2,620 - 0%Provision for Insurance Loss - - - - -Cost Pool 193,047 193,047 144,786 277,589 84,542 44%Asset/Capital Outlay - - - -A87 Cost Plan Reimbursement (1,272,181) (1,297,995) (973,497) (1,297,995) - 0%Grant Expenditures - - - -TOTAL USES BY TYPE 3,842,951 4,109,238 2,668,062 4,414,024 304,786 7%
Finance/Administration-01171115 738,875 694,032 394,471 747,314 53,282 8%Finance/General Accounting-01172015 866,178 1,112,757 619,158 978,999 (133,758) -12%Finance/Budget-01173415 762,387 1,060,410 696,420 696,925 (363,485) -34%Finance/Payroll-01173415 309,414 341,859 261,336 353,405 11,546 3%Finance/Treasury-01175815 249,627 411,601 147,857 547,915 136,314 33%Finance/Accounts Payable-01176015 159,260 177,206 135,074 276,905 99,699 56%Finance/Revenue Collection-011777015 560,299 67,250 204,639 541,753 474,503 706%Finance/Purchasing-01178015 196,910 244,123 209,108 270,808 26,685 11%TOTAL USES BY ORG CODE 3,842,951 4,109,238 2,668,062 4,414,024 304,786 7%
FY2018-19 Budget
USES BY ORG CODE
USES BY TYPE
FY2018-19Budget
Finance-17Summary
$ Chg From FY17-18
% Chg From FY17-18
FY2016-17Actual
FY2017-18Adjusted
FY2017-18Actual
TOTAL BUDGET - HISTORICAL COMPARISON
168

Human Resources Department
FY2018-19 Budget
Mission: The Human Resources Management Department supports our customers in accomplishing their missions by attracting, training, and retaining a highly skilled and diversified workforce that is fairly compensated and rewarded for its effort in an equitable, safe and responsible work environment. This is accomplished within existing resources, in an environment of change, with integrity, and in a manner that is consistent with City policies, Code of Ethics, merit system principles, collective bargaining agreements, and federal and state laws.
Key Objectives for Strategic Goals:
1. Maintain and enhance the physical environment
Hire skilled and competent staff in the Department of Infrastructure Maintenance & Operations.
2. Promote a safe and secure community
Assist the Police and Fire Departments in hiring dedicated and skilled public safety personnel.
Hire capable and community-oriented staff in our libraries and community centers.
3. Promote economic vitality
Offer competitive salaries and benefits to our employees.
Successfully implement the Affordable Care Act for our employees.
4. Promote sustainable communities
Provide an electronic job application submission process to reduce paper waste and to simplify processes.
Expand Health and Wellness Fair to include an environmental awareness component.
5. Promote effective government
Create a workplace that promotes employee health and well-being by developing a comprehensive risk management, safety, employee recognition, and health and wellness program.
Streamline personnel processes and improve use of the Human Resource (HR) module of the Enterprise Resource Planning (ERP) system.
Create a comprehensive training program to increase customer service and ensure that the work force is fully trained.
Actively participate with the City of Richmond’s Efficiency Committee to promote efficiencies within the organization.
Provide HR forms in electronic format to employees through the intranet to reduce paper waste where feasible.
169

HUMAN RESOURCES
PROGRAM ORGANIZATIONAL CHART
*Employee Verification
Risk Management Benefit Services
*New Employee Orientation
*Grievance Handling
*Discipline Handling
*Finger Print Processing *Management Consultation
Personnel ServicesAdministration
* Leadership
* Program Oversight
*Personnel Board
*HR Website Maintenance
*Contract Administration
* Inventory Control
* Accounts
Payable/Purchasing
* Budget
* Policy & Procedure
Development &
Implementation
* Recruitment & Testing
* Organizational Studies
* Application Tracking* Payroll Services
* Salary & Compensation
Administration
* ERP Administration &
Maintenance
* Job Classification
* Worker's Compensation
* Claims Management
* Safety & Loss Control
* Special Event & Property
Use Permits
* Third Party Administration
& Management
* Return to Work Program
* Insurance Procurement
* Disability Retirement
* General Liability
*Management Academy
* Benefits Administration
* Employee Wellness Program
* Employee Assistance Program
* Retirement Liaison
*Training
*Employee Recognition
Program
*Union Negotiations
*Discrimination Complaints
* Job Posting & Hotline
* Employment Lists
*Personnel Action Form
Processing
*Applicant Input and
Tracking
170

Human Resources Management
FY2018-19 Organizational Chart
Lisa Stephenson
Human Resources
Management Director
(1)
Personnel
Services
Risk
Management
Risk Manager
(1)
Project Manager I
(1)
Human Resources
Technician II
(1)
Existing FTE = 15, Adopted FTE = 15
Legend:
Sub-Program
Main ProgramExisting Pos.
Proposed Pos.
Administration
Principal Personnel
Analyst
(1)
Reclassification
Labor Relations
Training Manager
(1)
Human Resources
Personnel Officer
(2)
Personnel
Analyst II
(1)
Principal Personnel
Analyst
(1)
Personnel
Assistant
(1)
Principal Personnel
Analyst
(1)
Personnel
Analyst I
(2)
Senior Personnel
Analyst
(1)
171

City of RichmondMulti-Year Comparative Position Listing
Department Adopted FY2014-2015
Adopted FY2015-2016
Adopted FY2016-2017
Adopted FY2017-2018
Mid-year FY2017-18
Adopted FY2018-19
HUMAN RESOURCESAdministrative Services Analyst 1.0 1.0Benefits Analyst 1.0 1.0 1.0 1.0Employee Benefits Analyst 1.0 1.0 1.0 1.0 1.0Finance Manager 1.0 1.0 1.0 0.0Human Resources Mgt. Director 1.0 1.0 1.0 1.0 1.0Human Resources Personnel Officer 1.0 1.0 1.0 1.0 2.0 2.0Human Resources Technician I 1.0Human Resources Technician II 0.8 1.0 1.0 2.0 1.0 1.0Human Resources Technician III 2.0 0.8 0.8 0.8 1.0Labor Relations / Training Manager 1.0 1.0 1.0 1.0Payroll Coordinator 1.0Personnel Analyst I 1.0 1.0 1.0 2.0Personnel Analyst II 1.0 1.0Personnel Assistant 1.0 1.0 1.0 1.0 1.0Principal Personnel Analyst 1.0 1.0 1.0 1.0 2.0 3.0Project Manager I 1.0Risk Manager 1.0 1.0 1.0 1.0 1.0 1.0Senior Employee Benefits Analyst 1.0 1.0 1.0 1.0 1.0Senior Human Resources Administrator 1.0 1.0Senior Management Analyst 1.0 1.0Senior Personnel Analyst 1.0 1.0 1.0Total Full-Time Equivalents (FTEs) 12.8 13.8 13.8 14.8 15.0 15.0
172

Thru Mar -2018
SOURCES BY FUND
(INCLUDES REVENUE AND/OR FUND BALANCE)
General Fund-0001 1,121,976 1,302,777 1,021,564 1,774,812 472,035 36%
Risk Management-5001 12,167,577 20,156,545 13,414,169 20,685,639 529,094 3%
TOTAL SOURCES BY FUND 13,289,553 21,459,322 14,435,733 22,460,451 1,001,129 5%
Salaries 1,814,207 1,916,020 1,509,004 2,175,862 259,842 14%
Benefits 1,079,767 1,082,880 851,307 1,135,394 52,514 5%
Professional Services 292,990 995,665 599,885 1,146,300 150,635 15%
Other Operating Expenses 65,034 45,625 26,928 49,625 4,000 9%
Utilities 1,000 215 1000.00 - 0%
Equipment & Contract Services - -
Provision for Insurance Loss 8,919,815 13,328,486 9,322,583 17,332,112 4,003,626 30%
Cost Pool 626,030 629,357 472,016 882,078 252,721 40%
Asset/Capital Outlay 680,699 3,532,209 1,657,735 10,000 (3,522,209) -100%
A87 Cost Plan Reimbursement (389,009) (271,920) (203,940) (271,920) - 0%
Grant Expenditures 200,000 200,000 200,000 (200,000) -100%
TOTAL USES BY TYPE 13,289,533 21,459,322 14,435,733 22,460,451 1,001,129 5%
Human Resources (Admin)-01181016 1,121,976 1,302,777 1,021,564 1,774,812 472,035 36%
Risk Mgmt (Admin)-50182116 2,785,496 3,312,588 2,382,486 3,051,617 (260,971) -8%
Risk Mgmt Worker's Comp-50182216 7,981,916 8,851,587 5,405,327 8,958,120 106,533 1%
Risk Mgmt General Liability-50182316 1,400,164 7,992,370 5,626,356 8,675,902 683,532 9%
TOTAL USES BY ORG CODE 13,289,553 21,459,322 14,435,733 22,460,451 1,001,129 5%
FY2018-19 Budget
USES BY ORG CODE
USES BY TYPE
FY2019-20
Budget
Human Resources-18
Summary
$ Chg From
FY17-18
% Chg From
FY17-18
FY2016-17
Actual
FY2017-18
Adjusted
FY2017-18
Actual
TOTAL BUDGET - HISTORICAL COMPARISON
173

174

Information Technology Department
FY2018-19 Budget
Mission:
Information Technology’s (IT) mission is to be customer-centric. The IT Department will be the best provider of comprehensive and innovative support services and training for information services in the eyes of its customers.
Key Objectives for Strategic Goals:
1. Maintain and enhance the physical environment
Help promote a safe and secure environment through increased computer literacy skills and the use of state-of-the-art technology tools.
2. Promote a safe and secure community
Provide technology support to City departments for the reduction of violence in the community.
Implement and maintain surveillance camera infrastructure.
Maintain an up-to-date disaster recovery plan in case of a communication system failure.
3. Promote economic vitality
Improve the Internet and Intranet by providing revenue-centric, constituent-friendly web services (i.e., Economic Development opportunites, Heath and Wellness), and updating and enhancing commonly-used forms and applications.
4. Promote sustainable communities
Implement state-of-the-art communication systems that use energy-efficient and sustainable computer products or technologies to reduce power consumption. Continue the commitment to e-waste computer recycling.
Educate employees on methods to reduce energy consumed by computer products.
Set default settings on employee printers to double-sided printing.
5. Promote effective government
Achieve the Municipal Information Systems Association of California Information Technology Practices Certification.
Replace aging network systems and desktop computers City-wide.
Provide industry standard training programs for desktop applications.
Manage and enhance the enterprise system for financial, human resources, work order and permit reporting.
Implement City-wide document management system.
Manage and enhance technology infrastructure in the Civic Center Campus.
Collaborate with departments to effectively keep information on the City’s website and social media current. Provide links to other Boards and agendas.
175

Assistance
*Social Media
*Management
*Development
*Maintenance
*Support *Postage and Mail Room Services
*Security *Duplicating / Copy Center Services
*Training
*Marquee Manitenance
INFORMATION TECHNOLOGY PROGRAM ORGANIZATIONAL CHART
*Network Support
*KCOR Operations
*Network Security
*Network Upgrades
*Budget
*Training *Training*Contracts
*Desktop Refresh Project
*Crisis Emergency Info
*Document Storage Project
*Cable Franchise Monitoring
*Maintenance
*Support
*Network Design
*Procurement
IT Administration and Services Telephones/Radios
*Policy *Security
*IT Leadership *Management
*Strategic Planning *Maintenance
Equipment Check Out &
*Development *Promote City Services & Events
*Support
Video System Designs,
*Telecom Lease Negotiations
Duplicating / Mail Sevices*KCRT Projects
Geographical Information
IT CIP Projects
Media Communications
*KCRT Operations*Management
*A/V Technical Assistance & Video Production
*Help Desk Support
*Desktop Maintenance
*Desktop Training
*Network Maintenance
*Software Replacement
*Hardware Replacement
*Website Maintenance
Application Processing
176

Information Technology FY2018-19 Organizational Chart
Sue HartmanIT Director
(1)
Network Communications & Desktop Systems
Data Processing Support GIS
Cable TV Engineering Coordinator
(1)
Cable TV Programming Coordinator
(1)
Sr. Production Assistant
(1)
Network & Systems Manager
(1)
Network & Systems Specialist I/II
(1)
Business Systems Manager
(1)
Sr. Programmer Analyst
(1)
GIS Administrator(1)
KCRT
Existing FTE = 15, Adopted FTE = 15
Legend:
Sub-Program
Main ProgramExisting Pos.
Network ServicesApplication Services
Reclass Pos.
Cable TV Production Support
Assistant(1)
Duplicating / Mail
Duplicating / MailAssistant
(1)Telephone Support
Telephone Specialist
(1)
Proposed Pos.
Cable TV Engineering
Support Assistant(1)
Network & SystemsEngineer
(1)
Information Technology Assistant
(1)
177

City of RichmondMulti-Year Comparative Position Listing
Department Adopted FY2014-2015
Adopted FY2015-2016
Adopted FY2016-2017
Adopted FY2017-2018
Mid-year FY2017-18
Adopted FY2018-19
INFORMATION TECHNOLOGYAdmin Service Analyst 1.0 0.2Business Systems Manager 1.0 1.0 1.0 1.0 1.0 1.0Cable TV Administrator 1.0 1.0 1.0 1.0Cable TV Engineering Support Asst. 1.0 1.0 1.0Cable TV Programming Coordinator 1.0 1.0 1.0 1.0 1.0Cable TV Production Support Assistant 2.0 1.0 1.0 1.0 1.0 1.0Cable TV Engineer Coordinator 1.0 1.0Duplicating/Mail Assistant II 1.0 1.0 1.0 1.0 1.0 1.0GIS Administrator 1.0 1.0 1.0 1.0 1.0 1.0Information Technology Assistant 1.0 1.0Information Technology Director 1.0 1.0 1.0 1.0 1.0 1.0Microcomputer Support Specialist II 1.0 1.0 1.0 1.0 1.0Network & Systems Manager 1.0 1.0 1.0 1.0 1.0 1.0Network & Systems Specialist II 2.0 2.0 2.0 1.0 1.0 1.0Network & Systems Engineer 1.0 1.0 1.0Office Specialist 1.0Senior Cable TV Production Assistant 1.0 1.0 1.0 1.0 1.0 1.0Senior Programmer Analyst 1.0 1.0 1.0 1.0 1.0 1.0Telephone Radio Specialist 1.0 1.0 1.0 1.0 1.0 1.0Total Full-Time Equivalents (FTEs) 16.0 15.0 14.2 15.0 15.0 15.0
178

Thru Mar -2018
General Fund-0001 1,742,980 2,451,549 1,284,586 2,353,921 (97,628) -4%Outside Funded Services-1006 109,752 109,752 - 0%Chevron Modernization-1017 99,619 750,000 24,973 556,024 (193,976) -26%General Capital-2001 166,230 24,967 119,201 (47,029) -28%KCRT - Cable Television-4008 1,028,185 1,396,105 954,353 1,352,594 (43,511) -3%Equipment Services-5003 61,284 100,000 18,145 67,325 (32,675) -33%TOTAL SOURCES BY FUND 2,932,068 4,973,636 2,307,023 4,558,817 -414,819 -8%
Salaries 1,426,329 1,484,756 908,522 1,448,609 (36,147) -2%Benefits 575,039 903,336 558,721 921,477 18,141 2%Professional Services 375,820 932,777 360,483 1,046,800 114,023 12%Other Operating Expenses 70,553 87,359 51,595 107,521 20,162 23%Utilities 431,725 437,141 246,779 440,141 3,000 1%Equipment & Contract Services 593,070 612,800 296,859 558,000 (54,800) -9%Provision for Insurance Loss - -Cost Pool 305,481 314,306 209,534 345,812 31,506 10%Asset/Capital Outlay 217,635 866,982 118,411 366,278 (500,704) -58%A87 Cost Plan Reimbursement (1,063,584) (665,821) (443,881) (665,821) - 0%Grant Expenditures - -Operating Transfer Out - -TOTAL USES BY TYPE 2,932,068 4,973,636 2,307,023 4,568,817 -404,819 -8%
GF-Info Tech/Admin-01261017 327,235 819,576 465,600 1,020,412 200,836 25%GF-I.T./Telecommunications-01262117 325,147 407,983 243,929 355,993 (51,990) -13%GF-Info Tech/(Gis)-01262217 192,418 201,252 113,788 201,133 (119) 0%GF-Info Tech/Erp&App-01262417 666,919 702,698 343,435 698,938 (3,760) -1%GF-Info Tech/Dsktp Sp-01262917 108,116 134,983 9,944 (27,167) (162,150) -120%GF-IT/Mail Room & Duplication-01263090 123,146 185,057 107,890 104,612 (80,445) -43%Outside Funded Grant-10662117 109,752 109,752 - 0%Chevron ECIA-11761017 99,619 750,000 24,973 556,024 (640,248) -85%Capital Outlay-20162317 166,230 24,967 119,201 389,794 234%I.T.-KCRT Cable TV Operations-40864181 965,697 1,305,105 904,866 1,312,594 (1,185,904) -91%I.T.-KCRT Cable TV-40864281 62,487 91,000 49,487 40,000 1,221,594 1342%ISF-Info Tech/Desktop-50362917 61,284 100,000 18,145 67,325 (60,000) -60%
TOTAL USES BY ORG CODE 2,932,068 4,973,636 2,307,023 4,558,817 (414,819) -8%
FY2018-19 Budget
USES BY ORG CODE
USES BY TYPE
SOURCES BY FUND(INCLUDES REVENUE AND/OR FUND BALANCE)
FY2018-19Budget
Information Technology-26Summary
$ Chg From FY17-18
% Chg From FY17-18
FY2016-17Actual
FY2017-18Adjusted
FY2017-18Actual
TOTAL BUDGET - HISTORICAL COMPARISON
179

180

Police Department
FY2018-19 Budget
Mission:
The Police Department’s mission is to improve the quality of life in Richmond by providing professional andefficient police services while striving to attain the highest standards of integrity, innovation and accountability, inpartnership with the community.
Key Objectives for Strategic Goals:
1. Maintain and enhance the physical environment
Provide enforcement and administrative support to ensure a safe and attractive physical environment is maintained throughout thecommunity.
Increase the number of abandoned vehicles towed from Richmond public streets by 50%.
Achieve 95% reporting of the graffiti and dumped garbage within neighborhoods through increased resident involvement, support fromother City departments, and the use of Closed-Circuit Television (CCTV).
Fully staff and train Code Enforcement Unit personnel who will provide support to other City departments and relevant communityorganizations.
Achieve a noticeable reduction of blight in the community, utilizing the Public Works Department, Comcate, street sweeping, and timelyremoval of abandoned vehicles.
Increase the number of line level employees who are trained and certified in Crime Prevention through Environmental Design (CPTED).
Expand the Crime-Free Multi-Housing Program to additional housing units throughout the City.
Continue the increased street lighting campaign in partnership with PG&E.
2. Promote a safe and secure community
Achieve and maintain sworn staff level at a ratio of 2.0 officers per 1,000 residents (current ratio = 1.7; national average = 2.4).
Achieve a DUI arrest versus DUI-related accident index of 10 to 1.
Increase community participation in crime prevention efforts with the goal of reducing crime and improving quality of life through thecreation of new Neighborhood Watch groups, ongoing efforts of the Department’s Crime Prevention Committee, and implementation ofthe Department’s Crime-Free Multi-Housing Program.
Reduce gun crimes by 10%.
Improve the Department’s homicide clearance rate to greater than 50%.
Recruit and hire sufficient sworn and civilian personnel to achieve authorized full staffing levels.
Coordinate with the City Attorney’s Office to continually review and update the public safety sections of the Richmond Municipal Code.
Coordinate with the District Attorney’s Office to expedite filing of felony and misdemeanor cases.
181

Police Department
FY2018-19 Budget
Pinpoint intelligence-lead enforcement to target emerging crime trends based on in-depth analysis reports generated by the CrimeAnalysis Unit.
Use video surveillance to expand the reach of police patrols in neighborhoods covered by CCTV.
Expand traffic enforcement strategies to include traffic safety checkpoints focused on unlicensed and DUI drivers.
Increase enforcement of quality of life crimes such as abandoned vehicles, unlawful collection of recyclables, and disorderly conduct.
Augment the truancy effort to increase the number of truants contacted by 25%.
3. Promote economic vitality
Create, publish, and disseminate an RPD Annual Report which highlights the Department’s activities and accomplishments over theprior year.
4. Promote sustainable communities
Implement a paper-recycling program within the new Hall of Justice building to reduce waste and improve recycling efforts involvingpaper, plastic and glass items by 75%.
Utilize e-mail to issue all departmental policies, procedures, and memorandums; continuously update the electronic version of theDepartment’s Policy and Procedures manual.
Ensure Police Department vehicles are not left idling (unless appropriate under specifically delineated circumstances) throughincreased training and supervision.
Ensure Police Department vehicles are driven at appropriate speeds to improve safety and fuel economy through the implementation ofthe Automated Vehicle Locator (AVL) system, as well as increased training and supervision.
Implement a program to power down unused equipment and lighting during idle hours.
Partner with the business community to purchase non-emission producing patrol vehicles such as Segways and bicycles.
5. Promote effective government
Continue developing the Department’s crime analysis and COMPSTAT process, which will improve Department efficiency andresponse to crime and disorder.
Enhance community policing efforts through effective working relationships with other City departments and allied agencies, includingthe Office of Neighborhood Safety (ONS).
Strengthen community confidence and awareness in the Department’s citizen complaint process and other forms of police performanceoversight through the implementation of a new “Use of Force Committee,” as well as ongoing performance audits.
Revise, implement, and expand the City’s False Alarm Ordinance enforcement to reduce the number of unnecessary police responsesto alarms, and to increase officer availability to work on community policing strategies.
182

POLICE PROGRAM ORGANIZATIONAL CHART
* Outreach to the Community
Center
*Plan for Equipment Purchase and Upgrades
*Maintain all Files Associated with Personnel, Backgrounds
*Provide Professional *Manage CAD, RMS,
Storage and
Data Computers
* Contract Management
*Annual and Mid-year Budget Preparation COMPSTAT Program Prosecution
Center
Technical Service RMS Records Management
Technical Services CAD Enhancement Maintenance
*Operation of Consolidated Dispatch
for Communications
* Misdemeanor
Professional Standards
Community
*Serve over 10,000
Programs Community
* Liaison with
* Comfort/support*Early Warning
Police Activity League
Personnel and Training Police Chaplains
Department Training
*Recruiting, Hiring, and Retention
Administration Chief's Office
Police Department
* Crime Prevention
*Leadership
Operations of the Children Through
*Coordinate all *Manage Overall
Patrol Division Policing Bureau Support Services
Investigations Division Policing
Bureau
* Risk Management
*Investigations into Activity Detrimental to Police Function
Tracking System
* Crime Analysis/
*Traffic Enforcement
*Multi-jurisdiction Task Force
*Marine Patrol
Intelligence
Police Services
*Youth and School *Prepare Cases for Programs Court
Investigations
Operations Center
*Coordinate Records
*Obtain Criminal
Technology
*Implement New
*Communications
*Operate the Jail *Provide Records
*Maintain Mobile
Management Software and Hardware
and Mobile *Monthly Variance Reporting
*Revenue Projections
*Procurement
*Accounts Payable
and Training
*Grant Management
Information Technology
Technology
Dissemination
Financial Services
*Conduct Criminal
183

Police DepartmentFY2018-19 Organizational Chart
Existing FTE = 244.5, Adopted FTE = 245
Legend:
Sub-Program
Main ProgramExisting Pos.
Proposed Pos.
Reclassification
Policing Bureau
InvestigationsDivision
Prevention Services
School Resource Officers
(6)
Crime AnalysisUnit
Detention/Jail(6)
Administrative Services Analyst
(1)
Admin Aide(1)
Police Records Supervisor
(1)
Systems Administrator
(1)
Network Specialist II
(1)
CommunicationsSupervisor
(4)
Dispatcher(16)
Call Taker(1)
Crime Prevention Manager
(1)
ParkingEnforcement
(4)
Foot/Housing Patrol
(3)
Sergeant(4)
Administrative Trainee
(1)
Crime Scene Technician
(3)
Officer(26)
Sergeant (1)
Officer(7)
Lieutenant(1)
Sergeant(5)
Officer(26)
Homicide/RobberyUnit
Sergeant(2)
Officer(11)
Property CrimesUnit
Sergeant(1)
Officer(5)
Domestic and Sexual Violence/
FJC Unit
Sergeant(1)
Officer(6)
Gangs/ParoleUnit
Sergeant(1)
Officer(9)
Narcotics/Firearms Unit
Sergeant(1)
Officer(5)
OPA Manager(1)
Sergeant(2)
Lieutenant(1)
Sergeant(1)
Officer(2)
Sergeant(1)
Officer(1)
Code Enforcement Officer
(1)
Property Technician
(1)
Assistant PropertyTechnician
(2)
Public Safety Technology Supvr.
(1)
Communications Manager
(1)
Senior Accountant(1)
Accountant II(1)
CCTV Tech Specialist
(1)
Administrative Trainee
(1)
Crime Analyst(1)
Crime Analysis Technician
(1)
Network Specialist I
(1)
Marine Unit
ADA Parking Enforcement
(1)
Records Specialist(9)
Finance Unit Budgets/Grants
Assistant Police Chief
(1)
Chief of Staff/P.I.C.Lieutenant
(1)
Captain(1)
Office Assistant II(1)
Ofc of Professional Accountability
Lieutenant(1)
Regulatory Services Unit
Youth Crimes(2)
Sergeant (1)
Sergeant (1)
School Resource Section
Sergeant(1)
Traffic Safety Section
Special Enforcement
Section
Special Projects Section
Lieutenant(1)
PatrolDivision
AdministrationDivision
Central DistrictNorthern District
Captain(1)
Captain(1)
Captain(1)
Traffic & SpecialEvents Division
PatrolDivision
PatrolDivision
Southern District
Lieutenant(1)Lieutenant
(1)
Sergeant(5)
Officer(27)
Lieutenant(1)
AdministrativeAide(1)
Allwyn BrownPolice Chief
Criminal Investigations
Special Investigations
InvestigationsDivision
Records Section
Personnel & Training Section
Compliance Policy Development Police IT Section Communications
Center
184

City of RichmondMulti-Year Comparative Position Listing
Department Adopted FY2014-2015
Adopted FY2015-2016
Adopted FY2016-2017
Adopted FY2017-2018
Mid-year FY2017-18
Adopted FY2018-19
POLICE SWORNAsst Police Chief 1.0 1.0 1.0Deputy Chief 2.0 1.5 0.0Police Captain 4.0 4.0 4.0 3.5 4.0 4.0Police Chief 1.0 1.0 1.0 1.0 1.0 1.0Police Lieutenant 12.0 12.0 10.0 8.0 8.0 8.0Police Officer 141.0 132.0 135.0 130.0 128.0 128.0Police Officer Trainee 8.0 6.0 4.0 6.0 8.0 8.0Police Sergeant 28.0 28.0 28.0 28.0 28.0 28.0Sub-total Sworn 196.0 184.5 182.0 177.5 178.0 178.0
NON-SWORNAccountant II 1.0 1.0 1.0 1.0 1.0 1.0Administrative Aide 2.0 2.0 1.0 2.0 2.0 2.0Administrative Trainee 2.0 2.0 2.0 2.0 2.0 2.0Assistant Police Property Technician 2.0 2.0 2.0 2.0 2.0 2.0Administrative Service Analyst 1.0 2.0 1.0 1.0 1.0Building Inspector 1.0 1.0Building Trades Worker II 1.0 1.0CCTV Wireless & Systems Specialist 1.0 1.0 1.0 1.0 1.0 1.0Code Enforcement Manager 1.0 1.0Code Enforcement IY 1.0 1.0Code Enforcement Officer I 1.0 2.0Code Enforcement Officer II 4.0 4.0 1.0 1.0 1.0 1.0Code Enforcement Superintendent 1.0 1.0Code Enforcement Supervisor 1.0Communications Call Taker 2.0 2.0 2.0 2.0 2.0 1.0Communications Dispatcher I 8.0 7.0 8.0 1.0 3.0 4.0Communications Dispatcher II 14.0 14.0 13.0 14.0 12.0 12.0Communications Manager 1.0 1.0 1.0 1.0 1.0 1.0Communications Shift Supervisor 4.0 4.0 4.0 4.0 4.0 4.0
185
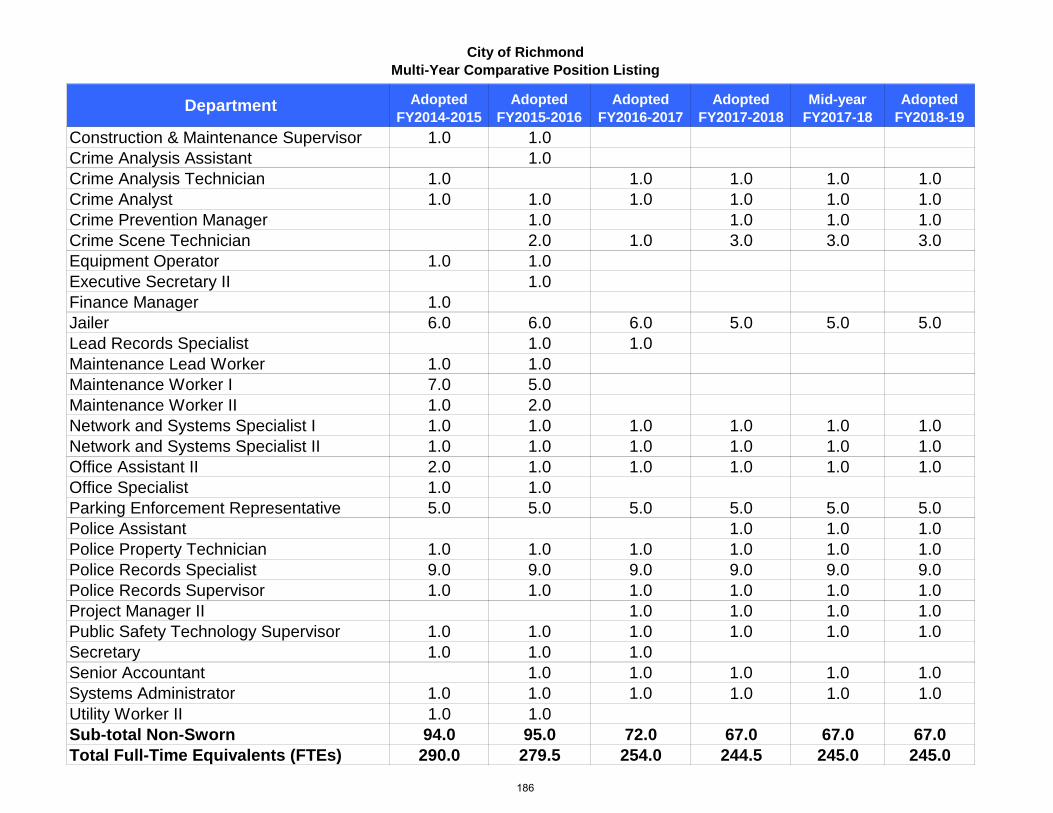
City of RichmondMulti-Year Comparative Position Listing
Department Adopted FY2014-2015
Adopted FY2015-2016
Adopted FY2016-2017
Adopted FY2017-2018
Mid-year FY2017-18
Adopted FY2018-19
Construction & Maintenance Supervisor 1.0 1.0Crime Analysis Assistant 1.0Crime Analysis Technician 1.0 1.0 1.0 1.0 1.0Crime Analyst 1.0 1.0 1.0 1.0 1.0 1.0Crime Prevention Manager 1.0 1.0 1.0 1.0Crime Scene Technician 2.0 1.0 3.0 3.0 3.0Equipment Operator 1.0 1.0Executive Secretary II 1.0Finance Manager 1.0Jailer 6.0 6.0 6.0 5.0 5.0 5.0Lead Records Specialist 1.0 1.0Maintenance Lead Worker 1.0 1.0Maintenance Worker I 7.0 5.0Maintenance Worker II 1.0 2.0Network and Systems Specialist I 1.0 1.0 1.0 1.0 1.0 1.0Network and Systems Specialist II 1.0 1.0 1.0 1.0 1.0 1.0Office Assistant II 2.0 1.0 1.0 1.0 1.0 1.0Office Specialist 1.0 1.0Parking Enforcement Representative 5.0 5.0 5.0 5.0 5.0 5.0Police Assistant 1.0 1.0 1.0Police Property Technician 1.0 1.0 1.0 1.0 1.0 1.0Police Records Specialist 9.0 9.0 9.0 9.0 9.0 9.0Police Records Supervisor 1.0 1.0 1.0 1.0 1.0 1.0Project Manager II 1.0 1.0 1.0 1.0Public Safety Technology Supervisor 1.0 1.0 1.0 1.0 1.0 1.0Secretary 1.0 1.0 1.0Senior Accountant 1.0 1.0 1.0 1.0 1.0Systems Administrator 1.0 1.0 1.0 1.0 1.0 1.0Utility Worker II 1.0 1.0Sub-total Non-Sworn 94.0 95.0 72.0 67.0 67.0 67.0Total Full-Time Equivalents (FTEs) 290.0 279.5 254.0 244.5 245.0 245.0
186

Thru Mar-2018SOURCES BY FUND (INCLUDES REVENUE AND/OR FUND BALANCE)
General Fund-0001 63,726,290 65,875,536 48,657,857 68,531,885 2,656,350 4%Assest Seizure Fund-1004 229,712 40,000 29,212 135,000 95,000 238%Outside Funded Services-Grants-1006 736,835 721,226 299,075 221,052 (500,174) -69%ECIA-1017 54,949 108,000 62,563 108,000 - 0%CR- Code Enforcement-1053 852,300 622,898 467,177 200,000 (422,898) -68%General Capital Fund-2001 74,983 18,654 - -Impact Fee-Police-2114 159,626 144,000 41,000 (103,000) -72%CAD Dispatch System-5005 5,054,595 5,337,369 3,511,151 5,259,987 (77,382) -1%RMS Records Services-5006 370,741 526,803 288,571 493,482 (33,321) -6%TOTAL SOURCES BY FUND 71,260,031 73,375,831 53,334,259 74,990,406 1,614,575 2%
Salaries 34,063,839 34,150,827 25,826,850 34,616,600 465,772 1%Benefits 20,912,570 22,174,236 16,134,461 23,442,648 1,268,412 6%Professional Services 4,626,637 4,279,250 2,671,066 4,101,626 (177,624) -4%Other Operating Expenses 2,200,217 2,347,547 1,734,919 2,416,653 69,105 3%Utilities 213,199 244,667 157,688 326,723 82,056 34%Equipment & Contract Services 357,015 395,703 243,243 499,119 103,416 26%Provision for Insurance Loss - -Cost Pool 7,097,448 7,766,858 5,630,179 4,517,213 (3,249,645) -42%Asset/Capital Outlay 651,541 1,157,684 232,516 723,203 (434,481) -38%A87 Cost Plan Reimbursement - -Grant Expenditures - -Debt Service Expenditure 260,713 236,160 236,160 236,160 (0) 0%Operating Transfer Out 876,853 622,898 467,177 4,110,462 3,487,564 560%TOTAL USES BY TYPE 71,260,031 73,375,831 53,334,259 74,990,406 1,614,575 2%
Police-19Summary
$ Chg From FY17-18
% Chg From FY17-18
FY2018-19 Budget
USES BY TYPE
TOTAL BUDGET - HISTORICAL COMPARISON
FY2016-17Actual
FY2017-18Adjusted
FY2017-18Actual
187

Thru Mar-2018
Police-19Summary
$ Chg From FY17-18
% Chg From FY17-18
FY2018-19 Budget
TOTAL BUDGET - HISTORICAL COMPARISON
FY2016-17Actual
FY2017-18Adjusted
FY2017-18Actual
Administration-01191021 60,590,418 62,397,522 46,130,792 65,604,493 3,206,971 5%Patrol-01192021 465,426 591,332 340,824 8,750 (582,582) -99%Crime Prevention-01193021 318,544 347,548 235,523 333,401 (14,147) -4%Cops Grant-01194021 1,177,616 1,194,496 991,693 1,276,045 81,549 7%Regulatory-01196021 690,054 741,696 527,828 721,301 (20,395) -3%GF-Parking Enforcement-01199021 484,232 602,942 431,196 587,895 (15,047) -2%State Asset Seizure-10491521 229,712 40,000 29,212 135,000 95,000 238%Outside Funded Grant-Police-10691021 736,835 721,226 299,075 221,052 (500,174) -69%ECIA-11791021 54,949 108,000 62,563 108,000 - 0%CR-Code Enforcement-15398021 - -CR-Code Enforcement-Abatement-15398621 852,300 622,898 467,177 (622,898) -100%Capital Outlay-20191021 74,983 - -Impact Fee-21491021 159,626 144,000 18,654 41,000 (103,000) -72%CAD - Enhancement-50597321 7,419 600,000 97,281 205,500 (394,500) -66%CAD - Maintenance-50597921 5,047,176 4,737,369 3,413,870 5,054,487 317,118 7%Records Mgt Sys-Maintenance-50697121 349,333 391,803 283,271 468,636 76,833 20%Records Mgt Sys-Enhancement-50697421 21,408 135,000 5,300 24,846 (110,154) -82%TOTAL USES BY ORG CODE 71,260,031 73,375,831 53,334,259 74,790,406 1,414,575 2%
FY2018-19 Budget
USES BY ORG CODE
188

Fire Department
FY2018-19Budget
Mission:The Richmond Fire Department exists to protect people, property and the environment from the harmful effects offire, hazardous materials and natural acts, and to provide emergency medical care. We seek opportunities to servethe community and strive to provide the most effective prevention, public education, preparedness and emergencyresponse services.
Key Objectives for Strategic Goals:
1. Maintain and enhance the physical environment
Undertake capital improvement projects to maintain and improve the physical appearance, the functionality, and safety of our firestations and training center.
2. Promote a safe and secure community
Provide the most professional level of fire suppression, emergency medical care, hazardous material mitigation, fire prevention andeducation to the residents of our community.
Provide consistent quality customer service to our residents, City staff, and Richmond Fire personnel.
3. Promote economic vitality
Hire qualified local residents whenever possible for entry-level positions.
Improve fire inspection and plan review programs in order to maximize revenue potential.
Create and support programs to assist City residents with employment opportunities.
Undertake capital improvement projects that promote economic development and job creation in our community.
4. Promote sustainable communities
Continue with REACT/CERT training in order to provide our residents with the knowledge and training necessary to survive a disaster.
Continue working towards providing our community with the highest level of emergency medical care possible.
Prioritize plan check reviews for projects that promote economic development and job creation.
5. Promote effective government
Promote transparency and inclusion within the Fire Department to maximize the effectiveness and potential of all personnel.
Promote public education programs through community outreach and the Fire Department website.
Increase participation in the Richmond Youth Academy and look for additional funding sources.
189

FIRE DEPARTMENTPROGRAM ORGANIZATIONAL CHART
*Fire Trainee Academy
*Personnel Oversight *Emergency Medical *Grant Writing *EMT Training *Plan Checking *Emergency Services Response Plans for
Disaster* Record Keeping *Haz Mat Program *Station Maintenance *Fire Suppression *Public Education
Training *Emergency*Policies and Procedures *Equipment Evaluation * Fire Reports Preparation Training
and Testing *General Oversight of All to Community*Budget Training Programs * Vegetation
Management* Fire Department
* Hiring and Promotions
Administration
*General Department Management
*REACT/CERT Community Drills
Office of Emergency Services
*Apparatus Design
Fire Prevention Bureau
*Fire Safety Code
Support Services
and Acquisition
* Research & Development
*Cost Recovery
Emergency Operations Training Division
Enforcement*Fire Suppression
Payroll Services
190

Fire FY2018-19 Organizational Chart
Adrian SheppardFire Chief
(1)
Emergency Operations
SupportServices
FirePrevention
Emergency Services
AdministrativeAide(1)
Battalion Chief(3)
Fire Captain(24)
Fire Engineer(24)
Firefighter(31)
Fire Inspector I/II(4)
Emergency Services Manager
(1)
Existing FTE = 96, Adopted FTE = 95
Legend:
Sub-Program
Main ProgramExisting Pos.
Proposed Pos.
Administration
Battalion Chief(1)
Reclassification
Sr. Administrative Analyst
(1)
Training Division
Administrative Aide(1)
Deputy Fire Chief(1)
Executive Secretary II
(1)Fire Marshal
(1)
191

City of RichmondMulti-Year Comparative Position Listing
Department Adopted FY2014-2015
Adopted FY2015-2016
Adopted FY2016-2017
Adopted FY2017-2018
Mid-year FY2017-18
Adopted FY2018-19
FIRE SWORNFire Chief 1.0 1.0 1.0 1.0 1.0 1.0Battalion Chief 4.0 4.0 4.0 4.0 4.0 4.0Deputy Fire Chief 1.0 1.0 1.0 1.0 1.0Fire Captain 24.0 24.0 24.0 24.0 23.0 24.0Fire Engineer 24.0 24.0 24.0 24.0 24.0 24.0Fire Fighter 29.0 31.0 31.0 31.0 32.0 31.0Fire Fighter Trainee 6.0 1.0 2.0Fire Inspector I 1.0 1.0 1.0Fire Inspector II 5.0 5.0 4.0 4.0 4.0 3.0Fire Marshal 1.0 1.0 1.0Sub-total Sworn 94.0 91.0 90.0 91.0 91.0 90.0
NON-SWORNAdministrative Aide 1.0 1.0 1.0 2.0Administrative Services Analyst 1.0 1.0 1.0 1.0Assistant Administrative Analyst 1.0 1.0Associate Administrative Analyst 1.0Emergency Services Manager 1.0 1.0 1.0 1.0 1.0 1.0Executive Secretary II 2.0 1.0 1.0 1.0 1.0 1.0Operations Administrator 1.0Office Assistant II 1.0 1.0Senior Administrative Analyst 1.0 1.0 1.0Sub-total Non-Sworn 6.0 5.0 5.0 5.0 5.0 5.0Total Full-Time Equivalents (FTEs) 100.0 96.0 95.0 96.0 96.0 95.0
192

Thru Mar-2018SOURCES BY FUNDS (INCLUDES REVENUE AND/OR FUND BALANCE)
General Fund-0001 29,597,168 29,724,995 22,281,706 30,595,697 870,702 3%Outside Funded Svc-1006 33,212 25,603 20,000 (5,603) -22%Emergency Med Svc-1007 209,851 311,889 (95,956) 316,710 4,821 2%Hazmat-1013 304,608 371,708 270,662 360,335 (11,373) -3%ECIA-1017 57,416 108,584 57,416 100,168 (8,416) -8%Impact Fee-2113 187,000 46,401 150,171 (36,829) -20%TOTAL SOURCES BY FUND 30,202,256 30,729,779 22,560,229 31,543,081 813,302 3%
Salaries 15,870,275 16,077,000 12,159,142 16,059,896 (17,104) 0%Benefits 10,937,864 10,745,104 8,398,115 11,061,612 316,508 3%Professional Services 848,701 1,149,994 579,553 998,156 (151,838) -13%Other Operating Expenses 298,483 496,014 184,111 477,892 (18,122) -4%Utilities 31,381 26,562 19,375 29,800 3,238 12%Equipment & Contract Services 119,911 107,975 -168,095 135,790 27,815 26%Provision for Insurance Loss 3,178 3,143 3,143 3,200 57 2%Cost Pool 1,536,823 1,526,206 1,119,395 1,358,487 (167,719) -11%Asset/Capital Outlay 72,006 72,584 70,030 48,000 (24,584) -34%Debt Service Expenditure 115,916 341,676 57,818 441,520 99,844 29%Grant Expenditures 678 - -Operating Transfer Out 367,039 183,520 137,641 928,728 745,208 406%TOTAL USES BY TYPE 30,202,256 30,729,779 22,560,229 31,543,081 813,302 3%
FY2016-17Actual
FY2017-18Adjusted
FY2017-18Actual
Fire-20Summary
FY2017-18 $ Change
FY2017-18 % Change
FY2018-19 Budget
USES BY TYPE
TOTAL BUDGET - HISTORICAL COMPARISON
193

Thru Mar-2018
FY2016-17Actual
FY2017-18Adjusted
FY2017-18Actual
Fire-20Summary
FY2017-18 $ Change
FY2017-18 % Change
FY2018-19 Budget
TOTAL BUDGET - HISTORICAL COMPARISON
Administration-01201022 1,850,840 1,795,977 1,411,307 2,552,755 756,778 42%Suppression-01202022 25,038,885 24,697,671 19,062,851 24,996,766 299,095 1%Prevention -01203022 1,256,430 1,395,552 825,656 1,356,854 (38,698) -3%Chevron Prevention-01203722 859,462 934,261 444,873 819,902 (114,359) -12%Support Services-01204022 308,149 340,659 165,383 337,481 (3,178) -1%Training-01205022 157,603 368,482 239,570 367,890 (592) 0%Office of Emergency Med Svc-01206022 125,801 192,393 132,066 164,049 (28,344) -15%Outside Funded Grant-10601022 33,212 25,603 20,000 (5,603) -22%Office of Emergency Svc-10706022 209,851 311,889 (95,956) 316,710 4,821 2%Hazmat Training-11305022 304,608 371,708 270,662 360,335 (11,373) -3%ECIA-11702022 57,416 108,584 57,416 100,168 (8,416) -8%Impact Fees/Fire-21301022 187,000 46,401 150,171 (36,829) -20%TOTAL USES BY ORG CODE 30,202,256 30,729,779 22,560,229 31,543,081 813,302 3%
FY2018-19 Budget
USES BY ORG CODE
194

Infrastructure Maintenance & Operations
FY2018-19 Budget
Key Objectives for Strategic Goals:
1. Maintain and enhance the physical environment Enhance and maintain the physical appearance of city buildings. Use bay-friendly landscaping techniques in city parks. Improve the attractiveness of city parks, Bay Trail and other open spaces through scheduled maintenance. Eradicate and eliminate illegal dumping and blight throughout our neighborhoods
2. Promote a safe and secure community Improve safety of city streets by promptly repairing street light outages and repairing or replacing traffic signals. Ensure that the quality and quantity of street lights are adequate to create a safe nighttime atmosphere. Enforce vacant property ordinances and demolish nuisance properties to improve our residents quality of life. Provide a progressive and proactive code enforcement unit that focuses on property maintenance and neighborhood nuisance issues.
3. Promote economic vitality Encourage visits to the City of Richmond by improving the aesthetic appeal of the city’s streetscapes, medians, and entry ways. Enhance the usability of city parks, Bay Trail, and other open spaces to increase number of outdoor events within the city. Provide an infrastructure that allows for latest technology. Increase city’s housing stock by partnering with the Richmond Community Foundation’s Housing Rehabilitation Program.
4. Promote sustainable communities Increase use of solar energy in city buildings. Recycle all chip cuttings and reapply as mulch to public lands to the extent possible. Incorporate hybrid and alternate fuel vehicles where feasible in replacement of city fleet. Increase tree planting throughout Richmond. Incorporate use of high performing green cleaners and other environmentally-preferable products as determined feasible. Develop and implement an Integrated Pest Management Policy. Reduce diesel consumption and emissions from city fleet and equipment. Research opportunities to reduce idling and improve traffic flow in Richmond to reduce transportation-related emissions.
Mission: Infrastructure Maintenance & Operations Department aims to design, construct, maintain, clean and ensure the safety of the city’s infrastructure, parks and open space, city vehicles and equipment, street and traffic lights, and buildings and structures. The department also provides quality and timely maintenance services to the public and other city departments to enhance the quality of life for our citizens.
195

Infrastructure Maintenance & Operations
FY2018-19 Budget
Research and implement strategies in city buildings to reduce energy consumption and increase energy efficiency. Replace existing light fixtures with LED technology in city-owned street lights to reduce energy consumption. Incorporate equipment and alternate fuel and technologies. Support health and wellness implementation (prioritize improvements adjacent to schools).
5. Promote effective government Provide comprehensive recycling services to all city buildings. Update and replace heavy duty diesel equipment to meet Bay Area Air Quality Management District (BAAQMD) requirements. Improve community engagement and outreach to traditionally underserved communities.
196

Administrative Services Division
Abatement Services Division
Code Enforcement Division
Equipment Services Division
Facilities Maintenance Division
Parks & Landscaping Division
Administrative Abatement Code Enforcement Fleet Building Services Parks & DistrictsProgram Vision Pick up illegally Proactive field Fleet services for Repair & remodel Maintenance of parks
dumped trash and checks for possible all City-owned City-owned buildings facility grounds, Leadership bulk debris from violations of city vehicles medians, R-O-Ws &
public streets and codes Electrical Services open spacesPolicies & Procedures sidewalks Maintenance Street lights & traffic
Investigate & Maintenance of signal maintenance & Planting & maintenanceUser Training Weed abatement resolve violations small engines & repairs of city-owned trees
on city-owned motorized tools Personnel, leave balance, vacant lots, alleys Coordinates Provide electrical HilltopInjury reporting, & file and other properties inspections & maintenance service to Richmond Parkwaymaintenance dispositions of cases city-owned and city maintenance
Assist with with various city leased facilitiesClerical support neighborhood departments, county Marina
clean-ups agencies and other Stationary Engineers Bay Trail & pathwayPrep docs for City Council local agencies Operate & maintain lightingapproval Abate weeds and City's HVAC &
remove debris from oversee maintenance ofFinancial Support N. Richmond photovoltaic systemsUtility Management System mitigation areasutility billing, processing & Utility Servicesreporting Clear out Police Provides custodial impounded vehicles services to city-ownedInvoicing for damage and city leased facilitiesto City property Board, secure &
monitor vacant or Pt. MolateProvide field support abandoned Caretaker
propertiesCapital projects & Maintenance of parks,on call', professional service, City wide graffiti facility grounds & trees& construction contracts removalmanagement
Demolition ofWork authorizations & city-owned &work order management private properties
Bidding & Request for Proposal process
Revenue management
INFRASTRUCTURE MAINTENANCE & OPERATIONSPROGRAM ORGANIZATIONAL CHART
197

Existing FTE = 95, Adopted FTE = 95
Department of Infrastructure Maintenance & Operations FY2018-19 Organizational Chart
Legend:
Sub-Program
Main ProgramExisting Pos.
Proposed Pos.
TIM HIGARESDirector
Equipment Services
Administrative Services
Abatement Services
Facilities Maintenance
Parks & Landscaping
Reclassification
Equipment SvcsAdministration
Facilities MtcAdministration
ParksAdministration
Public Works Administrative Mgr
(1)
ExecutiveSecretary II
(1)
Maintenance Leadworker
(1)
Equipment Operator
(1) FleetMaintenance
Equipment Supervisor
(1)
Administrative Aide(1)
UtilityServices
Building Services
Carpenters(2)
Custodial Maintenance Supervisor
(1)
Parks EqmtParts Spec
(1)
Hilltop LMDLandscape& Western Richmond
Fire Safety/Grnwy/St Lndscp/ Tree Maint. & Eastern
Richmond
Marina Bay & SouthernRichmond
Supervisor(1)
Construction &Maintenance Wkr
(2)
Gardener(1)
GroundskeeperGardener
(5)
Supervisor(1)
Construction &Maintenance Wkr
(2)
Gardener(1)
GroundskeeperGardener
(4)
Tree Leadworker(1)
Construction & Maintenance Wkr
(5)
Gardener(2)
Painters(2)
Administrative Aide(1)
AdministrativeAide(1)
Groundskeeper Gardener
(5)
Equipment PartsStorekeeper
(1)
Utility Worker II(1)
MaintenanceLeadworker
(3)
Building Trades Worker
(1)
Building Trades Worker I
(1)
Public Works Superintendent
(1)
Combo Equipment Mechanic
(7)
Utility Worker I/II
(10)
Stationary Engineering
Stationary EngineerSupervisor
(1)
Equipment Mechanic II & IV
(3)
Stationary Engineers
(3)Maintenance
Worker I/II(6)
Code Enforcement
Administrative Aide(1)
Code Enforcement
Officer I/II(6)
Parks & Landscaping Supt
(1)
PW Facilities Maintenance
Superintendent(1)
Public Works Equipment
Superintendent (1)
Code Enforcement Superintendent
(1)
Combo Equipment Mechanic
(2)
Pt. Molate Maintenance
Building Trade Worker II
(1)
198

City of RichmondMulti-Year Comparative Position Listing
Department Adopted FY2014-2015
Adopted FY2015-2016
Adopted FY2016-2017
Adopted FY2017-2018
Mid-year FY2017-18
Adopted FY2018-19
INFRASTRUCTURE MAINTENANCE & OPERATIONS Administrative Aide 3.0 3.0 4.0 4.0 4.0 4.0Building Maintenance Supervisor 1.0 1.0Building Trades Worker I 1.0 1.0 1.0 1.0Building Trades Worker II 1.0 1.0 1.0 1.0 1.0 2.0Carpenter 2.0 2.0 2.0 2.0 2.0 2.0Code Enforcement Officer I 1.0 1.0 1.0Code Enforcement Officer II 4.0 5.0 5.0 6.0Code Enforcement Officer IY 1.0Code Enforcement Superintendent 1.0Code Enforcement Supervisor 1.0 1.0 1.0Combo Equipment Mechanic 5.0 5.0 5.0 5.0 5.0 7.0Combo Equipment Mechanic Leadworker 1.0 1.0Construction & Maintenance Supervisor 1.0 1.0 1.0 1.0 1.0Custodial Maintenance Supervisor 1.0 1.0 1.0 1.0 1.0 1.0Development Project Manager II 1.0Director, Infrastructure & Maintenance 1.0 1.0 1.0 1.0Electrical Supervisor 1.0 1.0 1.0 1.0Electrician 5.0 5.0 5.0 5.0Equipment Mechanic II 1.0 1.0 1.0Equipment Mechanic III 1.0 1.0 1.0Equipment Mechanic IV 4.0 4.0 4.0 4.0 4.0 2.0Equipment Operator 8.0 8.0 1.0 1.0 1.0 1.0Equipment Parts Specialist 1.0 1.0 1.0 1.0 1.0 1.0Equipment Storekeeper 1.0 1.0 1.0 1.0 1.0 1.0Equipment Services Superintendent 1.0 1.0 1.0 1.0 1.0Equipment Supervisor 1.0 1.0 1.0 1.0Executive Secretary II 1.0 1.0 1.0 1.0 1.0 1.0Gardener 4.0 4.0 4.0 4.0 4.0 3.0
199

City of RichmondMulti-Year Comparative Position Listing
Department Adopted FY2014-2015
Adopted FY2015-2016
Adopted FY2016-2017
Adopted FY2017-2018
Mid-year FY2017-18
Adopted FY2018-19
Groundskeeper/Gardener 13.0 15.0 14.0 14.0 14.0 14.0Maintenance Leadworker 6.0 7.0 5.0 5.0 5.0 4.0Maintenance Worker I 4.0 3.0 3.0 3.0Maintenance Worker II 12.0 11.0 2.0 3.0 3.0 3.0Office Assistant II 1.0 1.0Painter 3.0 2.0 2.0 2.0 2.0 2.0Parks & Landscaping Superintendent 1.0 1.0 1.0 1.0Parks Construction & Maintenance Worker 9.0 9.0 9.0 9.0 9.0 9.0Parks Supervisor 3.0 3.0 2.0 2.0 2.0 3.0Public Works Operations & Maint. Director 1.0 1.0Public Works Administrative Manager 1.0 1.0 1.0 1.0 1.0 1.0PW Facilities Maint. Superintendent 1.0 1.0 1.0 1.0 1.0PW Streets Maintenance Superintendent 1.0 1.0Public Works Superintendent 1.0Senior Civil Engineer 3.0Stationery Engineer 4.0 4.0 3.0 3.0 3.0 3.0Stationery Engineer Supervisor 1.0 1.0 1.0 1.0 1.0Tree Leadworker 1.0 1.0 1.0 1.0 1.0 1.0Utility Worker I 3.0 1.0Utility Worker II 11.0 11.0 9.0 10.0 10.0 10.0Total Full-Time Equivalents (FTEs) 109.0 112.0 103.0 100.0 94.0 95.0
200

Thru Mar -2018
SOURCES BY FUND (INCLUDES REVENUE AND/OR FUND BALANCE)General Fund-0001 18,628,777 16,372,992 12,164,586 16,909,194 536,202 3%State Gas Tax-1002 - -Outside Funded Services-Grants-1006 404,292 717,952 507,935 75,000 (642,952) -90%Hilltop Landscape Maint. Dist.-1012 1,138,546 1,416,706 853,991 1,365,992 (50,714) -4%Marina Bay Landscape & Light Dist.-1015 789,012 962,147 718,345 999,464 37,317 4%ECIA-1017 88,337 170,000 105,032 316,168 146,168 86%CR-Code Enforcement-1053 61,000 61,000 -Impact Fee Parks/Open-2116 12,502 - -Equipment Services 5003 1,492,305 1,611,307 311,388 2,844,660 1,233,353 77%TOTAL SOURCES BY FUND 22,553,771 21,251,104 14,661,275 22,571,478 1,320,374 6%
Salaries 7,566,993 7,173,984 5,220,505 7,705,185 531,201 7%Benefits 5,257,581 5,445,314 3,919,199 5,660,855 215,541 4%Professional Services 498,632 741,760 237,109 649,054 (92,705) -12%Other Operating Expenses 2,044,527 2,267,343 1,447,906 2,354,673 87,330 4%Utilities 3,104,881 2,014,317 1,781,026 2,044,782 30,465 2%Equipment & Contract Services 1,128,041 1,222,758 934,471 398,971 (823,787) -67%Cost Pool 1,789,638 1,618,945 1,324,749 1,750,507 131,562 8%Asset/Capital Outlay 1,551,961 1,492,387 153,890 2,919,028 1,426,641 96%Debt Service 688,246 258,616 450,078 72,742 (185,874) -72%A87 Cost Plan Reimbursement (1,089,230) (984,319) (807,659) (984,319) - 0%Operating Transfer Out 12,502 - -TOTAL USES BY TYPE 22,553,771 21,251,104 14,661,275 22,571,478 1,320,373 6%
GF-PW Admin Division-01231031 758,985 598,816 372,050 662,533 63,717 11%GF-PW Faclilities Maint./Admin-01232131 1,556,966 1,336,715 822,004 1,367,341 30,626 2%GF-FM Stationary Engineers-01232231 687,655 1,036,339 627,760 849,922 (186,417) -18%GF-FM Building Services-01232331 753,622 897,478 549,663 903,841 6,363 1%GF-FM Utility Section-01232431 1,197,005 1,364,220 989,609 1,812,741 448,521 33%GF-FM Electirc-01232531 412,971 829 - -GF-FM Street Lights & Signals-01232831 2,635,833 715,413 32,000 32,000 -GF-Parks & Landscape Maint. Admin.-01233631 4,372,668 4,545,073 3,476,379 4,698,388 153,315 3%GF-PW Streets Admin-01234231 1,770 1,149 - -
Infrastructure Maintenance & Operations-23Summary
$ Chg From FY17-18
% Chg From FY17-18
FY2016-17Actual
FY2017-18Adjusted
FY2017-18Actual
TOTAL BUDGET - HISTORICAL COMPARISON
USES BY ORG CODE
USES BY TYPE
FY2018-19 Budget
201

Thru Mar -2018
Infrastructure Maintenance & Operations-23Summary
$ Chg From FY17-18
% Chg From FY17-18
FY2016-17Actual
FY2017-18Adjusted
FY2017-18Actual
TOTAL BUDGET - HISTORICAL COMPARISON
FY2018-19 Budget
GF-PW Street Sweeping-01234331 - (224) - -GF-PW Pavement Maint.-01234431 4,812 1,627 - -GF-PW Traffic Signals & Lanes-01234531 1,083 101 650 (101) -100%GF-PW Equipment Services-01235031 3,268,957 3,472,364 2,372,957 3,465,994 (6,370) 0%GF-I&M Abatement Svcs-01237031 1,454,736 1,551,512 1,136,257 1,703,884 152,372 10%GF-I&M Code Enforcement-01238031 1,324,630 1,535,374 1,097,851 1,412,550 (122,824) -8%GF-I&M Property & Assets Mgmt-01239031 197,084 35,000 612 (35,000) -100%Gas Tax Paveent Maint.-10234431 - -Outside Funded Grants-10633031 404,292 717,952 507,935 75,000 (642,952) -90%Hilltop Landscaping & Maint. Dist.-11233731 1,138,546 1,416,706 853,991 1,365,992 (50,714) -4%Marina Bay Landscaping & Lights Dist.-11533931 789,012 962,147 718,345 999,464 37,317 4%ECIA-11733631 88,337 170,000 105,032 316,168 146,168 86%CR-PW Engineering Services-15131131 - -CR-Code Enforcement-Richmond Fou.-15330065 61,000 Public Works Grants Admin.-15436431 - -Capital Oultay-20136031 - -Measure J Public Works-20236031 - -Harbor Fund I&M CIP Division-20736031 - -Impact Fee-Open Parks-21633131 12,502 -Marina I&M CIP Division-40536031 - -Impact Fee Parks-Public Works-21033131 - -ISF-PW Equipment Svcs-50335031 273,057 183,520 176,109 (183,520) -100%Equipment Svcs CIP Division-50336031 1,219,248 1,427,787 135,278 2,844,660 1,416,873 99%TOTAL USES BY ORG CODE 22,553,771 21,251,104 14,661,275 22,571,478 1,259,373 6%
FY2018-19 Budget
202

Water Resource Recovery Department
FY2018-19 Budget
Mission:
Protecting Richmond’s public health and environment, and transforming stormwater and wastewater into resources.
Key Objectives for Strategic Goals:
1. Product Quality
Compliance with regulatory and reliability requirements
Remain consistent with customer, public health and environmental needs.
2. Customer Satisfaction
Provide reliable, responsive, and affordable services
Respond to customer needs and emergencies in a timely fashion with accurate information
3. Infrastructure stability
Improve the aged storm drainage, sanitary sewer, and wastewater treatment systems
Ensure ongoing sustainable performance improvements
Maintain and enhance the conditions of all assets over the long-term at the lowest possible life-cycle cost and acceptable risk
4. Promote sustainable communities
Remain attentive to impacts on community and environment health and welfare.
Maintain and enhance environmental and community sustainability through pollution prevention, conservation and public education.
5. Promote effective government
Provide information on the City’s website for: Pollution Prevention, Fats, Oils and Grease and Stormwater Programs.
Actively involve stakeholders in decisions that will affect them.
Obtain understanding and support from oversight bodies, community interests, and regulatory bodies for services levels, rate structures, operating budgets, and capital improvement program decisions.
Operationalize racial equity through the City’s Racial Equity Action Plan
203

VEOLIA CAPITAL PROGRAM
MANAGEMENT
VEOLIA OPERATIONS &
MAINTENANCE
SOURCE CONTROL &
ENVIRONMENTAL COMPLIANCEADMINISTRATIVE SERVICES
INFRASTRUCTURE SUPPORT
SERVICESSEWER LATERAL COMPLIANCE
CIP Projects Wastewater Treatment Plant Stormwater System Pollutant
Reduction
Administrative Recordkeeping Sewer Lateral Grant Program
Delivery of capital improvement
projects at the treatment plant, and in
the sanitary and storm sewer systems
Operate and maintain the wastewater
treatment plant
Ensure NPDES and MRP permit
compliance
Policies & Procedures Record Drawings Managing Resident Grant Applications
Adherence to City contracting and
procurement procedures
Adequate staffing of operators,
mechanics, laboratory technicians, and
admin staff
Participation in the Contra Costa County
Clean Water Program
Employee Training Department Webpage Managing HOA Grant Applications
Master planning and other
engineering studies
NPDES Permit Compliance and
Reporting
Industrial/Commercial Stormwater
Inspection Program
Customer service on phone and at the
counterDepartment record database
maintenance
Oversight of Lateral Grant budget
Investigation and Abatement of Harmful
Non-Stormwater Discharges
Clerical Support
Wastewater Collection System
Operations
Trash Reduction Plans Affecting
Waterways
Prepare agenda documents for City
Council
GIS Mapping and Management
Operate and maintain the sanitary
sewers, pump stations, and force mains in
the Richmond Municipal Sewer District
Mercury and PCB's Pilot Studies for Load
Reduction
Safety Compliance GIS Mapping and Management Sewer Lateral Inspection Program
Adequate staffing of sewer cleaning and
inspection crews, and admin staff
Public Outreach on Stormwater Issues Baykeeper Settlement Agreement
Compliance & Reporting
Geotechnical Investigation
Database
Ensuring sewer laterals are compliant
with Richmond Municipal Code §12.17
Ensure compliance with the Baykeeper
settlement agreement and Waste
Discharge Requirement (WDR and
NPDES)
Coast/Watershed Clean Up Programs SSO WDR Reporting & Compliance Monthly Utility Coordination
meetings
Commercial & Industrial Lateral
Inspection Oversight
GIS Management Construction Site Run-off/Erosion &
Sediment Control
Ordinance Updates as required Issue certificates of lateral compliance
SSO Reporting Stormwater Treatment in Development
Projects Other Technical Support
Financial Inspection & Plan Checking
Stormwater Collection System Pretreatment Program Request for Proposals and Bids
Operate and maintain the storm sewer
system (pipes, V-ditches, and open
drainage channels) and stormwater pump
stations within the Richmond city limits
Administration of Federal Pretreatment
Program (40 CFR 403)
Invoice Processing
GIS Management Administration of Fats, Oils, & Grease
(FOG) Program
Contract Management
Slug Response and Investigation Permits
NPDES Permit Compliance Budget Oversight
Public Outreach Calculation of Annual Sanitary and Storm
Fees
WATER RESOURCE RECOVERY DEPARTMENT'S
PROGRAM ORGANIZATIONAL CHART
204

Existing FTE = 10, Adopted FTE = 10
Water Resource RecoveryFY 2018-19 Organizational Chart
Legend:
Sub-Program
Main ProgramExisting Pos.
Proposed Pos.
Ryan SmithDirector
(1)
Environmental Compliance
Inspector(3)
Reclassification
Engineering Infrastructure Administrator
(1)
Source Control & Environmental
ComplianceEngineering Services
Environmental Services Manager
(1)
Stormwater Collections
(Veolia)
Wastewater Collections
(Veolia)
Operations andMaintenance
Wastewater Treatment Plant
(Veolia)
CPM Team(Veolia)
Capital ProgramManagement
Project Manager I(1)
AdministrativeAide(1)
AdministrativeServices
Project Coordinator(1)
Sewer LateralCompliance
AdministrativeServices Analyst
(1)
205

City of RichmondMulti-Year Comparative Position Listing
Department Adopted FY2014-2015
Adopted FY2015-2016
Adopted FY2016-2017
Adopted FY2017-2018
Mid-year FY2017-18
Adopted FY2018-19
WATER RESOURCE RECOVERYAssociate Civil Engineer 2.0 1.0Administrative Aide 1.0 1.0 1.0Admin Services Analyst 1.0Capital Projects Manager 1.0Construction Inspector I 2.0 2.0Construction Inspector II 1.0Director of Water Resource Recovery 1.0 1.0Environmental Compliance Inspector 2.0 3.0Environmental Manager 1.0Environmental Services Manager 1.0 1.0Infrastructure Administrator 1.0 1.0 1.0 1.0 1.0 1.0Management Analyst I 1.0 1.0Office Assistant II 1.0 2.0 1.0Operations Administrator 1.0Project Manager I 1.0Project Manager II 1.0 1.0 1.0Project Coordinator 1.0 1.0 1.0 1.0 1.0Senior Admin Analyst 1.0 1.0Senior Civil Engineer 2.0 1.0 1.0 0.0 1.0Source Control Inspector I 2.0 2.0Source Control Inspector III 2.0 1.0 1.0Source Control Inspector (I-III) 3.0 3.0Source Control Superintendent 1.0Wastewater Stormwater Manager 1.0Total Full-Time Equivalents (FTEs) 17.0 12.0 9.0 10.0 10.0 10.0
206

Thru Mar -2018
SOURCES BY FUND
(INCLUDES REVENUE AND/OR FUND BALANCE)
Engineering Grants-1054 - 2,500,000 1,363,449 - (2,500,000) -100%
Impact Fee Storm Drain-2119 691,609 350,000 54,848 - (350,000) -100%
Impact Fee Wastewater-2120 -
Wastewater-4003 17,863,419 45,467,470 22,844,265 27,179,302 (18,288,168) -40%
Stormwater-4006 2,320,730 1,846,323 820,542 1,909,430 63,107 3%
TOTAL SOURCES BY FUND 20,875,758 50,163,793 25,083,104 29,088,732 (21,075,061) -42%
Salaries 923,783 1,075,792 759,825 1,162,001 86,209 8%
Benefits 691,449 534,997 426,386 539,650 4,653 1%
Professional Services 9,118,824 9,708,101 4,458,503 8,964,605 (743,496) -8%
Other Operating Expenses 394,611 72,383 37,442 266,931 194,548 269%
Utilities 998,290 940,250 545,287 971,524 31,274 3%
Equipment & Contract Services 402,531 571,817 410,457 344,080 (227,737) -40%
Provision for Insurance Loss - -
Cost Pool 1,084,513 962,690 722,012 887,229 (75,461) -8%
Asset/Capital Outlay 3,047,403 29,653,558 11,331,476 7,414,054 (22,239,504) -75%
A87 Cost Plan Reimbursement - -
Grant Expenditures - -
Debt Service 3,894,468 6,644,206 6,391,717 8,538,658 1,894,452 29%
Operating Transfer-Out 319,887 -
TOTAL USES BY TYPE 20,875,758 50,163,793 25,083,104 29,088,732 (21,075,062) -42%
Water Resource Recovery-22
Summary
$ Chg From
FY17-18
% Chg From
FY17-18
FY2017-18
Adjusted
FY2017-18
Actual
TOTAL BUDGET - HISTORICAL COMPARISON
USES BY TYPE
FY2018-19
Budget
FY2016-17
Actual
207
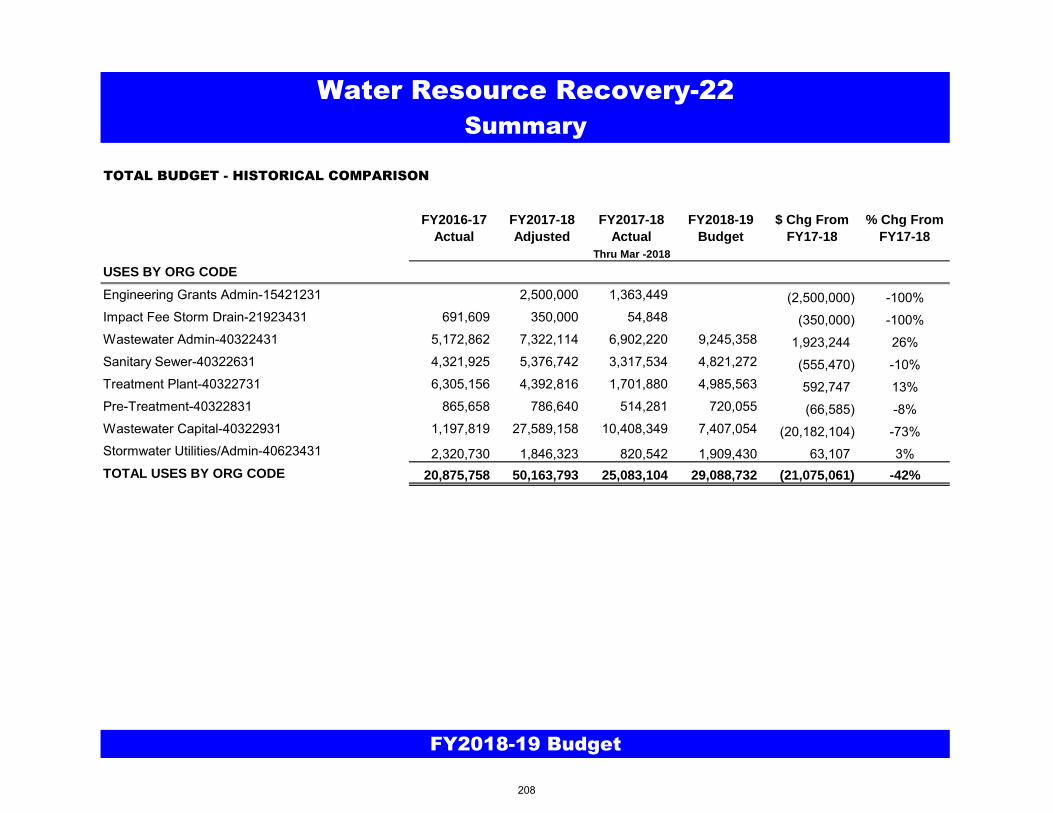
Thru Mar -2018
Water Resource Recovery-22
Summary
$ Chg From
FY17-18
% Chg From
FY17-18
FY2017-18
Adjusted
FY2017-18
Actual
TOTAL BUDGET - HISTORICAL COMPARISON
FY2018-19
Budget
FY2016-17
Actual
Engineering Grants Admin-15421231 2,500,000 1,363,449 (2,500,000) -100%
Impact Fee Storm Drain-21923431 691,609 350,000 54,848 (350,000) -100%
Wastewater Admin-40322431 5,172,862 7,322,114 6,902,220 9,245,358 1,923,244 26%
Sanitary Sewer-40322631 4,321,925 5,376,742 3,317,534 4,821,272 (555,470) -10%
Treatment Plant-40322731 6,305,156 4,392,816 1,701,880 4,985,563 592,747 13%
Pre-Treatment-40322831 865,658 786,640 514,281 720,055 (66,585) -8%
Wastewater Capital-40322931 1,197,819 27,589,158 10,408,349 7,407,054 (20,182,104) -73%
Stormwater Utilities/Admin-40623431 2,320,730 1,846,323 820,542 1,909,430 63,107 3%
TOTAL USES BY ORG CODE 20,875,758 50,163,793 25,083,104 29,088,732 (21,075,061) -42%
FY2018-19 Budget
USES BY ORG CODE
208

Capital Improvement Department
FY2018-19 Budget
Mission:
To enhance the City’s physical environment, including infrastructure, community facilities and City-owned properties, to the greatest degree possible as efficiently as possible, in order to promote economic vitality and enhance the quality of life of the citizens in Richmond.
Key Objectives for Strategic Goals:
1. Maintain and enhance the physical environment
Improve the street lighting system
Make Richmond more pedestrian and bicycle friendly
Improve the interior and exterior appearance and functionality of public facilities
Expand the tree canopy
Improve accessibility to City facilities and modes of transportation
2. Promote a safe and secure community
Reduce blight
Improve traffic and pedestrian safety
3. Promote economic vitality
Build-out the General Plan
Revitalize and enhance key commercial areas
Increase grant revenues
4. Promote sustainable communities
Promote and support the creation of healthy town centers and neighborhoods
Promote community health and wellness
209

Administrative Services CIP Traffic Engineering
Administrative Project Planning *Crosswalk improvement program Design
*Program vision & leadership *Capital improvement planning & coordination with *Traffic safety improvement program *Capital Improvement program*Policies, procdures, and user training Planning Department *Railroad crossing improvement program *Pavement management program*Personnel, leave balance, injury reporting, *Regional transportation planning coordination *Traffic Reviews of new development *Sidewalk program & file maintenance WCCTAC, CCTA and MTC committee & traffic control plans, truck route permits, & *ADA curb ramp upgrade program*Clerical support participation regional transportation projects *Surface drainage program*Documents preparation for city council approval *Interagency/interjursidictional CIP coordination *Conducts traffic counts, speed survey, *Street light master plan
*Project grant funding - monitor sources and engineering studies, site visits, & *Master plan & studiesFinancial Support secure grants measurements, submit*Capital projects & on call, professional service *Public outreach during development of CIP work orders Construction
*Contract management projects *Coordinate federally funded transportation projects *Right of Way - Investigation of *Work authorizations & work order management infrastructure issues & claims*Bidding & request for proposal process Project Management Electrical *Materials testing
*Administer design and construction of CIP *Traffic signal maintenance & repair *Land surveys projects that result in a substantive change to * Street light maintenance & repair *Improvement Act of 1911 the existing facility and exceed $100k in value * City-owned facilities electrical maintenance *Administrator of Pipeline*Public outreach in support of CIP projects & repair *Franchise Coordination*Administration of project grants
Encroachments *Manage remediation of City-owned contaminated Streets* Inspection services,encroachment permits properties* Coordinate outside utility agencies *Manage quiet zone projects and monitoring Pavement Maintenance
- AT&T requirements *Pothole repair - EBMUD *Street resurfacing - PG&E *Minor drainage & excavation* Bond reimbursements* Fiber Optics Contractors Traffic Signs & Lines
*Sign fabrication, maintenance, repair & installation*Pavement marking removal, installation, maintenance, & repair Street Sweeping
*Monthly & weekly sweeping of medians, residential, and commercial streets
ENGINEERING & CAPITAL IMPROVEMENT PROJECTSPROGRAM ORGANIZATIONAL CHART
210
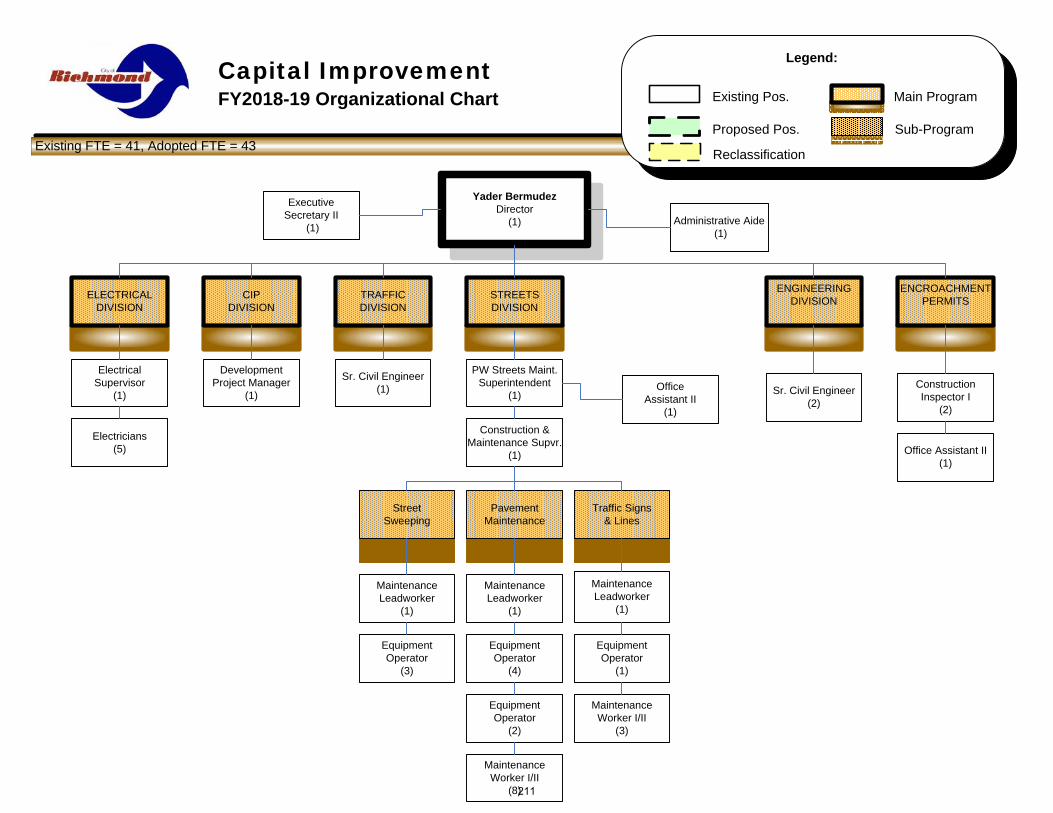
Capital ImprovementFY2018-19 Organizational Chart
Yader BermudezDirector
(1) Administrative Aide(1)
Existing FTE = 41, Adopted FTE = 43
Legend:
Sub-Program
Main ProgramExisting Pos.
Proposed Pos.
Reclassification
STREETSDIVISION
ENGINEERING DIVISION
ENCROACHMENT PERMITSTRAFFIC
DIVISIONCIP
DIVISION
Office Assistant II
(1)
PavementMaintenance
StreetSweeping
Traffic Signs& Lines
Maintenance Leadworker
(1)
Equipment Operator
(4)
Maintenance Leadworker
(1)
EquipmentOperator
(3)
MaintenanceLeadworker
(1)
Equipment Operator
(1)
Maintenance Worker I/II
(3)
Maintenance Worker I/II
(8)
PW Streets Maint. Superintendent
(1) Sr. Civil Engineer(2)
Construction Inspector I
(2)
Office Assistant II(1)
Sr. Civil Engineer(1)
Development Project Manager
(1)
Equipment Operator
(2)
ELECTRICALDIVISION
Electrical Supervisor
(1)
Electricians(5)
Construction & Maintenance Supvr.
(1)
Executive Secretary II
(1)
211

City of RichmondMulti-Year Comparative Position Listing
Department Adopted FY2014-2015
Adopted FY2015-2016
Adopted FY2016-2017
Adopted FY2017-2018
Mid-year FY2017-18
Adopted FY2018-19
CAPITAL IMPROVEMENT/RIGHT-OF-WAY MAINTENANCEAdministrative Aide 1.0 1.0 1.0Capital Projects Manager 1.0Construction Inspector I 2.0 2.0 2.0 2.0Construction & Maint Supv 1.0Development Project Manager II 1.0 1.0 1.0 1.0Development Project Manager (I-II) 2.0Electrical Supervisor 1.0 1.0Electrician 5.0 5.0Equipment Operator 8.0 8.0 8.0 10.0Executive Secretary II 1.0Maintenance Lead Worker 3.0 3.0 3.0 3.0Maintenance Worker II 7.0 7.0 7.0 7.0Maintenance Worker I 4.0 4.0 4.0 4.0Management Analyst II 1.0Office Assistant I 1.0Office Assistant II 1.0 2.0 2.0 2.0PW Maintenance & Operations Director 1.0 1.0 1.0 1.0PW Streets Maintenance Superintendent 1.0 1.0 1.0 1.0Redevelopment Specialist III 0.2Redevelopment Specialist (I-III) 1.0Senior Civil Engineer 3.0 3.0 3.0 3.0Total Full-Time Equivalents (FTEs)* 0.0 4.0 33.2 33.0 39.0 43.0* Positions transferred from other departments
212

Thru Mar -2018
SOURCES BY FUND
(INCLUDES REVENUE AND/OR FUND BALANCE)
General Fund-0001 3,828,119 7,494,310 4,888,142 8,848,226 1,353,916 18%
State Gas Tax-1002 2,395,340 3,440,415 1,783,257 5,040,268 1,599,853 47%
ECIA-1017 201,026 2,025,191 244,844 2,055,111 29,920 1%
Outside Grants-1006 - - - 500,000 500,000 -
CR-Engineering-1051 1,695,325 1,598,230 1,087,985 1,771,702 173,472 11%
Engineering Grants-1054 892,054 4,725,220 1,840,312 7,738,482 3,013,262 64%
Encroachment-1055 637,982 587,447 421,021 684,205 96,758 16%
General Capital-2001 1,178,052 5,260,642 3,586,222 2,617,553 (2,643,089) -50%
Measure J-2002 1,933,872 5,188,930 1,224,123 5,568,319 379,389 7%
Impact Fee Parks-2110 - 30,000 30,000 15,000 (15,000) -50%
Impact Fee Traffic-2111 - - - 379,000 379,000 -
Impact Fee Parks Open Space-2116 150,000 114,139 114,139 - (114,139) -100%
TOTAL SOURCES BY FUND 12,911,771 30,464,524 15,220,045 35,217,866 4,753,342 16%
Salaries 2,255,782 3,093,189 2,319,627 3,486,275 393,086 13%
Benefits 1,780,684 2,410,299 1,754,135 2,715,680 305,381 13%
Professional Services 796,455 4,326,466 4,049,642 1,012,764 (3,313,702) -77%
Other Operating Expenses 105,982 218,797 165,471 202,951 (15,846) -7%
Utilities 7,699 921,972 610,304 919,020 (2,952) 0%
Equipment & Contract Services 1,373,460 1,958,297 880,276 1,130,000 (828,297) -42%
Provision for Insurance Loss -
Cost Pool 1,838,713 1,669,177 1,141,337 2,702,969 1,033,792 62%
Asset/Capital Outlay 4,752,996 15,218,722 4,224,101 22,370,733 7,152,011 47%
Debt Services 647,605 75,152 677,474 29,869 5%
TOTAL USES BY TYPE 12,911,771 30,464,524 15,220,045 35,217,866 4,753,342 16%
Capital Improvement-29
Summary
$ Chg From
FY17-18
% Chg From
FY17-18
FY2017-18
Adjusted
FY2017-18
Actual
TOTAL BUDGET - HISTORICAL COMPARISON
FY2016-17
Actual
USES BY TYPE
FY2018-19
Budget
213

Thru Mar -2018
Capital Improvement-29
Summary
$ Chg From
FY17-18
% Chg From
FY17-18
FY2017-18
Adjusted
FY2017-18
Actual
TOTAL BUDGET - HISTORICAL COMPARISON
FY2016-17
Actual
FY2018-19
Budget
GF-Streets Sweeping-01229331 797,160 530,592 374,507 520,234 (10,358) -2%
GF-Pavement Maintenance-01229431 1,417,937 1,935,431 1,472,802 1,951,262 15,831 1%
GF-Traffic Signs & Lines-01229531 616,047 641,037 479,054 651,690 10,653 2%
GF-Admin Services-01291031 352,136 660,336 451,604 611,831 (48,505) -7%
GF-Streets Admin-01292231 641,851 621,886 443,308 2,126,806 1,504,920 242%
GF-ECIP/Electric-01292531 607,958 666,123 932,987 325,029 53%
GF-ECIP/Strt Lts & Sgnl-01292831 2,988 2,497,070 1,000,744 2,053,416 (443,654) -18%
Gas Tax-CIP-10291331 2,395,340 3,440,415 1,783,257 5,040,268 1,599,853 47%
Outside Funded Grants-10692031 500,000 500,000 -
ECIA-CAP PROJECT-11791331 201,026 2,025,191 244,844 2,055,111 29,920 1%
Cost Recovery CIP-15191331 530,906 849,576 570,378 893,749 44,173 5%
CR-E/Traffic-15195731 202,195 266,522 145,689 237,589 (28,933) -11%
CR-E/Engineering-15195831 962,225 482,132 371,917 640,364 158,232 33%
CIP Grants-15491331 892,054 4,725,220 1,840,312 7,738,482 3,013,262 64%
CIP-Encroachment Serv-15591031 637,982 587,447 421,021 684,205 96,758 16%
Capital Improvement PR-20191331 1,178,052 5,260,642 3,586,222 2,617,553 (2,643,089) -50%
Measure J CIP-20291331 1,933,872 5,188,930 1,224,123 5,568,319 379,389 7%
Impact Fees Parks/Eng-21095031 30,000 30,000 15,000 (15,000) -50%
Impact Fees Parks Open Space/Eng-21695031 150,000 114,139 114,139(114,139) -100%
Impact Fees Traffic-21190031 379,000
TOTAL USES BY ORG CODE 12,911,771 30,464,524 15,220,045 35,217,866 4,374,342 16%
FY2018-19 Budget
USES BY ORG CODE
214

Planning and Building Services
FY2018-19 Budget
Mission: The Department of Planning and Building Services regulates land use and construction. Planners provide technical expertise to customers that reflect General Plan Policies, zoning, sustainability, building codes, and community preferences. The Department also maintains the capacity to respond to sudden increases in the demand for planning and permitting services following catastrophic events such as earthquakes, floods, and wild fires.
Key Objectives for Strategic Goals: 1. Maintain and enhance the physical environment • Implement the policies contained in the General Plan by regulating land use. • Promote land use outcomes that improve neighborhoods and commercial districts. • Promote restoration of the City’s ‘Heritage’ neighborhoods and residential subdivisions. • Promote sustainable urban design. • Increase customer access to building codes and construction standards. • Periodically inspect all structures located within City limits. 2. Promote a safe and secure community • Promote urban design solutions that reduce crime and improve community health. • Inform customers about building outcomes that increase safety and security. • Educate customers about safe and unsafe building products. • Promote construction job site safety. • Inspect residential rental units. • Increase capacity to provide emergency services following catastrophic events. • Establish a program to reduce damage to multi-family residences as a result of a catastrophic event. 3. Promote economic vitality • Promote urban design solutions that support economic development. • Support efforts to modernize and beautify industrial operations. • Craft land use strategies that attract innovative and green businesses. • Work with industrial customers to safely complete inspection commitments. • Shorten review time for plan checks to promote economic development and create jobs.
215

Planning and Building Services
FY2018-19 Budget
4. Promote sustainable communities • Educate contractors and builders about sustainable building practices and technologies. • Promote development standards and practices that improve public health. • Train all planners, inspectors and permit technicians as green building professionals. • Expand construction and demolition debris recycling. • Develop and implement Health & Wellness programs. • Apply for grants to support Health & Wellness planning. 5. Promote effective government • Increase access to planning and building services through the City website. • Streamline the entitlement process.
216

PLANNING AND BUILDING SERVICES PROGRAM ORGANIZATIONAL CHART
*Zoning & General Land Use Interpretation*Conditional Use *Implement Green Permits Building practice*Subdivision &
*Personnel Parcel Map Review
*Region & Local Planning Participation
*Urban Design *Grant writing
*Construction *Customer Service Inspection *Issue permits*Code Enforcement
*Health & Safety
Oriented Development
*Rental Unit Inspections
& Wellness
General Plan
*Encourage Transit
*Community Health
Sustainability Planning
Report*Housing Element Progress
*Ordinance Modifications
*RBSP
*Zoning Update
*Encourage "In Fill"
Administrative Services
Support*Administrative
Current & Long Range Planning
*Purchasing*Budget Coordination
*Design Review
*Maintain Contracts
Planning Master Plan
Building Inspections
Response
Plan Check Industrial Operations
*On-site plan review
*Handle procedural*Code Interpretation
*Review and approve plans (CBC)
*Emergency Questions
Rental Inspection
*On-site Inspection
*CEQA Review
*Transportation *Climate Action Plan
*Complete Street Design
*Emergency Response
*Tenant Health & Safety
Development
Permit Center
*Customer Service
*Urban Greening
217

Planning and Building Services
FY2018-19 Organizational Chart
Richard Mitchell
Director
(1)
Accountant II
(1)
Existing FTE = 22, Adopted FTE = 22
Legend:
Sub-Program
Main ProgramExisting Pos.
Proposed Pos.
Building
Planning
Administrative
Services
Sr. Admin
Analyst
(1)
Assoc. Admin
Analyst
(1)
Current/
Advanced
Planning
Planning Manager
(1)
Senior Planner
(2)Planner II
(1)
Permits/Building
Inspections
Chevron
Rental
Inspection
Plan
Check
Reclassification
Permit Technician
II
(3)
Building Official
(1)
Plan Check
Engineer
(1)
Plan Check
Engineer
(1)
Senior Building
Inspector
(1)
Senior Building
Inspector
(3)
Building Inspector
(1)
Planner I
(1)
Building Inspector
Supervisor
(1)
Permit Technician
I
(1)
218

City of RichmondMulti-Year Comparative Position Listing
Department Adopted FY2014-2015
Adopted FY2015-2016
Adopted FY2016-2017
Adopted FY2017-2018
Mid-year FY2017-18
Adopted FY2018-19
PLANNING & BUILDING SERVICESAccountant II 1.0 1.0 1.0 1.0 1.0 1.0Administrative Services Analyst 1.0 1.0 1.0 1.0Associate Administrative Analyst 1.0 1.0 1.0Building Inspector 1.0 1.0 1.0 1.0 1.0 1.0Building Inspector Supervisor 1.0 1.0 1.0 1.0 1.0Building Official 1.0 1.0 1.0Community Service Tech. II 1.0 1.0Executive Secretary II 1.0Permit Technician I 1.0Permit Technician II 4.0 4.0 4.0 4.0 4.0 3.0Plan Checking Engineer 2.0 2.0 2.0 2.0 2.0 2.0Planner I 1.0Planner II 1.0 1.0 2.0 2.0 1.0Planner II/Associate Planner 1.0 1.0 1.0Planning & Building Services Director 1.0 1.0 1.0 1.0 1.0 1.0Planning Manager 1.0Project Manager I 1.0 1.0 1.0Project Manager II 1.0 1.0 1.0 1.0 1.0Senior Administrative Analyst 1.0 1.0Senior Building Inspector 4.0 4.0 4.0 4.0 4.0 4.0Senior Planner 3.0 2.0 2.0 2.0 2.0 2.0Total Full-Time Equivalents (FTEs) 21.0 22.0 22.0 22.0 22.0 22.0
219

Thru Mar -2018
Cost Recovery-1050 9,798,840 8,473,741 9,227,527 8,144,281 (329,460) -4%ECIA-1017 - - TOTAL SOURCES BY FUND 9,798,840 8,473,741 9,227,527 8,144,281 (329,460) -4%
Salaries 2,080,040 2,228,697 1,523,029 2,170,094 (58,603) -3% Benefits 1,265,009 1,332,137 906,234 1,282,718 (49,419) -4% Professional Services 2,900,087 3,413,479 1,211,282 2,357,327 (1,056,152) -31% Other Operating Expenses (288,329) 76,806 39,147 83,306 6,500 8% Utilities 8,221 10,350 4,445 9,000 (1,350) -13% Equipment & Contract Services 17,110 6,727 (10,383) -61% Cost Pool 2,207,933 1,945,429 1,459,069 1,979,985 34,556 2%Asset/Capital Outlay 2,821 1,000 180 1,000 - 0% TOTAL USES BY TYPE 8,175,783 9,025,008 5,143,387 7,890,157 (1,134,851) -13%
ECIA-11762019 363,551 45,000 29,999 25,000 (20,000) -44% Planning Current-15061219 3,942,911 4,490,707 2,181,121 3,329,416 (1,161,291) -26% Planning General-15062019 101,983 104,309 61,948 114,920 10,611 10% Rental Inspection-15063519 347,108 270,479 159,779 284,615 14,136 5% Building Registration-15063619 3,420,231 4,114,513 2,710,539 4,136,206 21,693 1% TOTAL USES BY ORG CODE 8,175,783 9,025,008 5,143,387 7,890,157 (1,134,851) -13%
Planning & Building-16Summary
TOTAL BUDGET - HISTORICAL COMPARISON
FY2018-19 Budget
SOURCES BY FUND (INCLUDES REVENUE AND/OR FUND BALANCE)
USES BY ORG CODE
USES BY TYPE
FY2018-19 Budget
FY2016-17Actual
FY2017-18Adjusted
FY2017-18Actual
$ Chg From FY17-18
% Chg From FY17-18
220

Library & Cultural Services Department
FY2018-19 Budget
Mission:
The Library & Cultural Services Department provides diverse materials and services to meet the community’s personal, cultural, educational, and professional needs. The Library & Cultural Services Department is committed to supporting a lifelong enjoyment of reading, learning, and the arts.
Key Objectives for Strategic Goals:
1. Maintain and enhance the physical environment
Update library furniture and equipment and improve signage and ergonomics to create a “user friendly” atmosphere.
Incorporate public art into General Fund capital improvement projects, public facilities, and neighborhoods.
Install rotating art exhibitions and arts and cultural programming in the library.
Offer comfortable and attractive interior and exterior public spaces that allow library users to explore their interests, meet their information needs and contribute positively to the community.
2. Promote a safe and secure community
Provide diverse programs to users of all ages, races and ethnic groups as an alternative to violence.
Provide accessibility to people of all ages and physical abilities.
3. Promote economic vitality
Partner with educational, cultural, social institutions and the business community to promote economic and personal development.
Develop and promote library services and programs to business organizations.
4. Promote sustainable communities
Improve access to services and resources that encourage lifelong learning for community members of all ages.
Increase literacy levels to allow more of the community to participate fully in business, education, government and civic efforts.
Offer programming supporting a healthy lifestyle.
Provide educational and cultural programs that attract local/regional participation.
Provide volunteer opportunities for youth, adults, and seniors.
Provide tutoring and homework assistance to library and LEAP users in support of education.
Provide advocacy and support to artists, art non-profits, and cultural organizations.
Build a collection of library and cultural services, resources and programs that meet the interests and information needs of the communities we serve.
5. Promote effective government
Streamline processes for more efficient and effective delivery of services to the community.
Assist the community in accessing information about the City of Richmond through technology and training.
1221
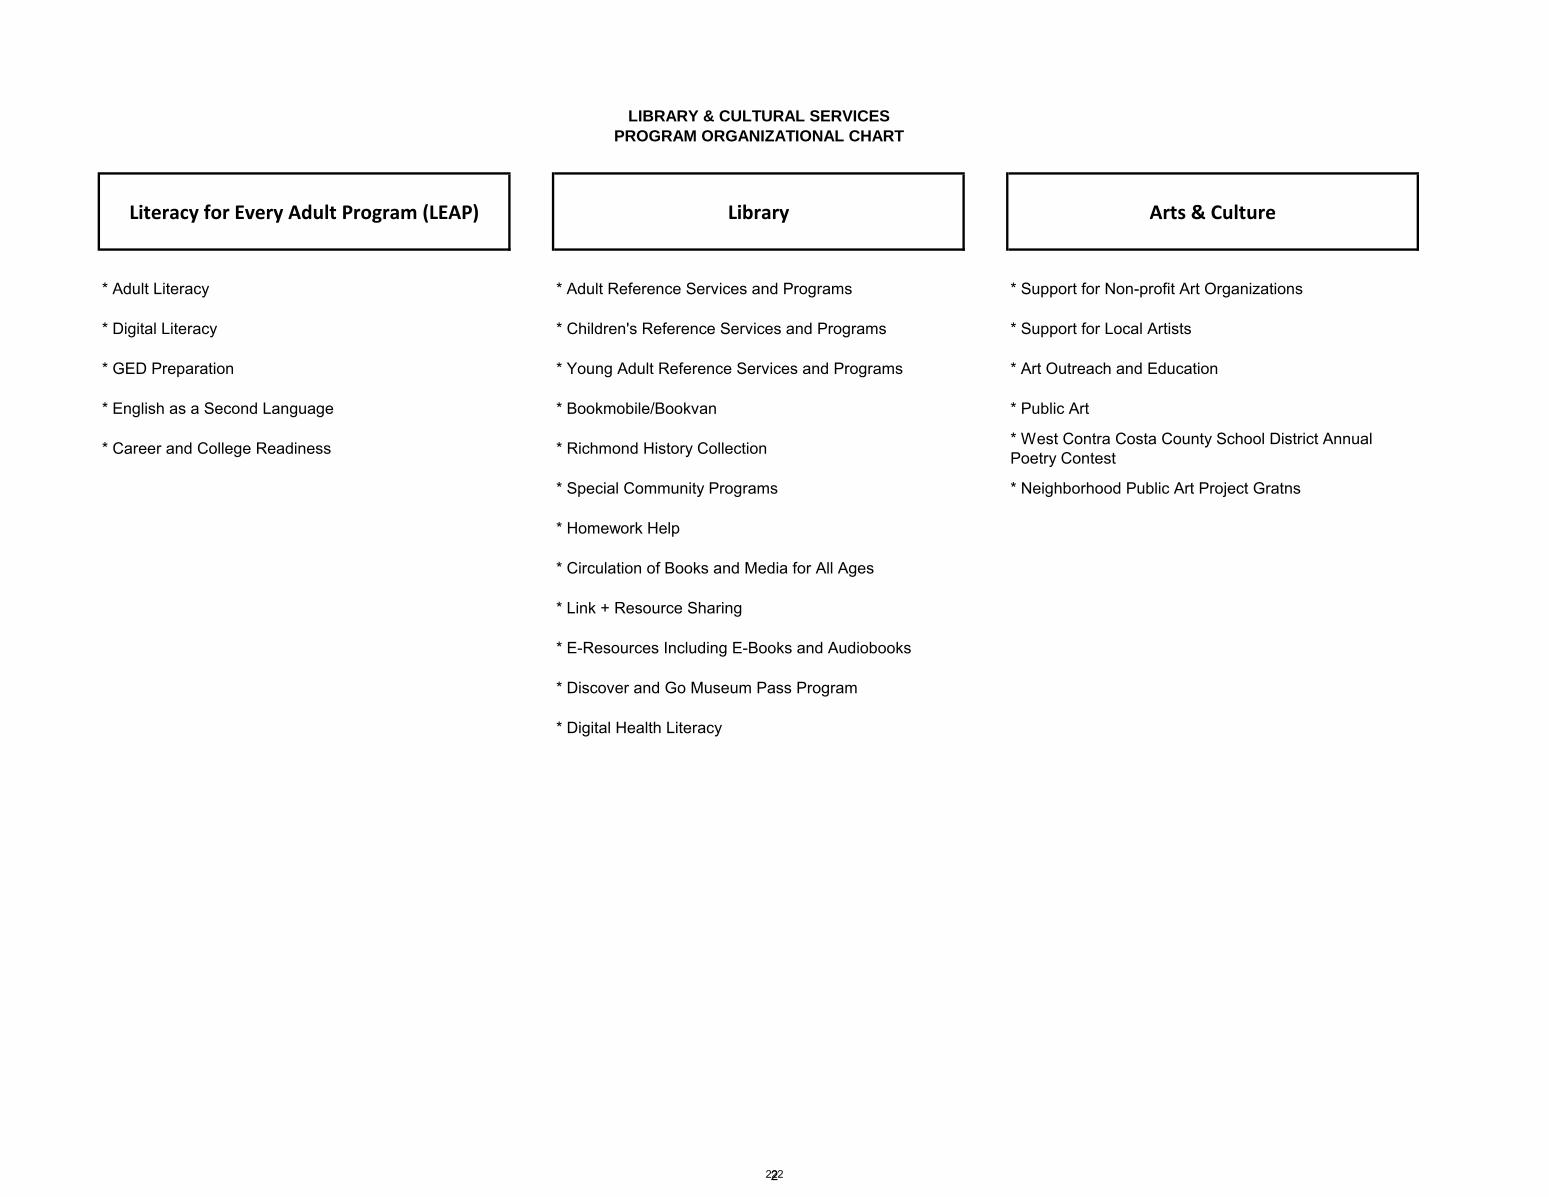
Literacy for Every Adult Program (LEAP) Library Arts & Culture
* Adult Literacy * Adult Reference Services and Programs * Support for Non-profit Art Organizations
* Digital Literacy * Children's Reference Services and Programs * Support for Local Artists
* GED Preparation * Young Adult Reference Services and Programs * Art Outreach and Education
* English as a Second Language * Bookmobile/Bookvan * Public Art
* Career and College Readiness * Richmond History Collection* West Contra Costa County School District Annual
Poetry Contest
* Special Community Programs * Neighborhood Public Art Project Gratns
* Homework Help
* Circulation of Books and Media for All Ages
* Link + Resource Sharing
* E-Resources Including E-Books and Audiobooks
* Discover and Go Museum Pass Program
* Digital Health Literacy
LIBRARY & CULTURAL SERVICES
PROGRAM ORGANIZATIONAL CHART
2222

Library & Cultural ServicesFY2018-19 Organizational Chart
Legend:
Sub-Program
Main ProgramExisting Pos.
Proposed Pos.
Katy Curl Director
(1)
Administrative Librarian
(1)
Administrative Services
Existing FTE = 33.3, Adopted FTE = 33.3
Reference & Programing
Reclassification
Literacy Program Manager
(1)
Arts & Culture Manager
(1)
Family Literacy Specialist
(1)
Volunteer Tutor/Learner
Coordinator (3)
Assistant Administrative
Analyst (1)
Administrative Services Analyst
(1)
Senior Library Assistant
(1)
Library Info. Systems Support
Tech (1)
Library Assistant II (3)
Administrative Librarian
(1)
Branch Services Teen/Adult Children’s Services/
Bookmobile
Librarian II (1)
Librarian II (3)
Librarian II (2)
Senior Library Assistant
(1)
Borrower/Material Services
Library Aid (0.6)Library Assistant
II(1)
Office Assistant(0.7)
Library Associate(1)
Learning Center Manager (1)
Library Associate (.5)
Library Assistant II
(1)
Executive Secretary II(1)
Literacy for Every Adult Program
(LEAP)
Arts and Culture Program
Bookmobile/Book Van
Librarian II (1)
Library Associate (1)
Library Assistant I (1)
Library Associate(.5)
223
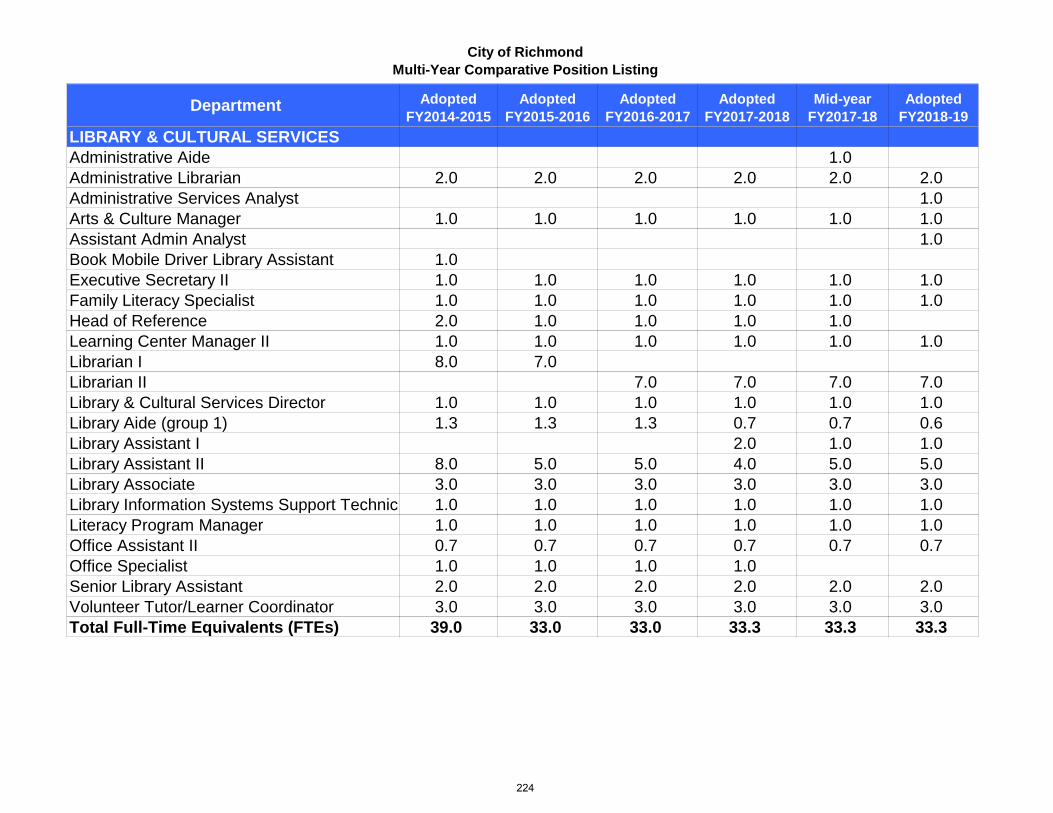
City of RichmondMulti-Year Comparative Position Listing
Department Adopted FY2014-2015
Adopted FY2015-2016
Adopted FY2016-2017
Adopted FY2017-2018
Mid-year FY2017-18
Adopted FY2018-19
LIBRARY & CULTURAL SERVICES Administrative Aide 1.0Administrative Librarian 2.0 2.0 2.0 2.0 2.0 2.0Administrative Services Analyst 1.0Arts & Culture Manager 1.0 1.0 1.0 1.0 1.0 1.0Assistant Admin Analyst 1.0Book Mobile Driver Library Assistant 1.0Executive Secretary II 1.0 1.0 1.0 1.0 1.0 1.0Family Literacy Specialist 1.0 1.0 1.0 1.0 1.0 1.0Head of Reference 2.0 1.0 1.0 1.0 1.0Learning Center Manager II 1.0 1.0 1.0 1.0 1.0 1.0Librarian I 8.0 7.0Librarian II 7.0 7.0 7.0 7.0Library & Cultural Services Director 1.0 1.0 1.0 1.0 1.0 1.0Library Aide (group 1) 1.3 1.3 1.3 0.7 0.7 0.6Library Assistant I 2.0 1.0 1.0Library Assistant II 8.0 5.0 5.0 4.0 5.0 5.0Library Associate 3.0 3.0 3.0 3.0 3.0 3.0Library Information Systems Support Technic 1.0 1.0 1.0 1.0 1.0 1.0Literacy Program Manager 1.0 1.0 1.0 1.0 1.0 1.0Office Assistant II 0.7 0.7 0.7 0.7 0.7 0.7Office Specialist 1.0 1.0 1.0 1.0Senior Library Assistant 2.0 2.0 2.0 2.0 2.0 2.0Volunteer Tutor/Learner Coordinator 3.0 3.0 3.0 3.0 3.0 3.0Total Full-Time Equivalents (FTEs) 39.0 33.0 33.0 33.3 33.3 33.3
224

Thru Mar -2018
General Fund-0001 5,126,468 5,550,967 3,374,435 5,876,274 325,307 6%Library Fund-1005 379,040 543,148 191,897 498,544 (44,604) -8%ECIA-1017 198,483 215,000 170,157 212,955 (2,045) -1%Impact Fee - Library-2117 17,748 421,000 1,358 468,400 47,400 11%TOTAL USES BY FUND 5,721,738 6,730,115 3,737,848 7,056,173 326,058 5%
Salaries 2,359,825 2,413,655 1,501,901 2,518,863 105,208 4%Benefits 1,488,202 1,690,848 1,052,429 1,755,098 64,250 4%Professional Services 1,019,163 1,507,154 661,713 1,437,573 (69,581) -5%Other Operating Expenses 481,266 438,254 284,052 409,164 (29,090) -7%Utilities 24,179 25,400 7,666 25,400 - 0%Equipment & Contract Services - 2,000 2,693 (2,000) -100%Provision for Insurance Loss - -Cost Pool 320,275 320,275 213,515 501,760 181,485 57%Asset/Capital Outlay 19,324 318,625 2,239 397,315 78,690 25%A87 Cost Plan Reimbursement - -Grant Expenditures 9,504 13,904 8,640 11,000 (2,904) -21%TOTAL USES BY TYPE 5,721,738 6,730,115 3,734,848 7,056,173 326,058 5%
Library & Cultural Services-24Summary
$ Chg From FY16-17
% Chg From FY16-17
FY2016-17Actual
FY2017-18Adjusted
FY2017-18Actual
TOTAL BUDGET - HISTORICAL COMPARISON
USES BY TYPE
SOURCES BY FUND(INCLUDES REVENUE AND/OR FUND BALANCE)
FY2018-19Budget
225

Thru Mar -2018
Library & Cultural Services-24Summary
$ Chg From FY16-17
% Chg From FY16-17
FY2016-17Actual
FY2017-18Adjusted
FY2017-18Actual
TOTAL BUDGET - HISTORICAL COMPARISON
FY2018-19Budget
GF-Administration-01241055 3,477,033 3,705,582 2,297,877 4,002,148 296,566 8%GF-Ls/Ref Services-01242155 183,148 244,875 146,319 231,875 (13,000) -5%GF-Ls/Access Services-01242255 6,007 31,500 14,960 27,700 (3,800) -12%GF-Ls/Children's Services-01242755 81,663 63,250 37,222 65,467 2,217 4%GF-Ls/Circulation-01242855 91,221 100,463 80,745 98,229 (2,234) -2%GF-Ls/Extension Services-01242955 39,548 73,200 26,361 98,200 25,000 34%GF-Leap-01243055 620,193 665,387 425,105 711,539 46,152 7%GF-Public Art-01244055 627,656 666,710 345,846 641,116 (25,594) -4%Library-Administration-10541055 35,993 30,100 13,526 96,628 66,528 221%Library Leap-10543055 20,394 29,475 285 9,475 (20,000) -68%Library Public Art-10544055 5,817 250,564 56,680 191,618 (58,946) -24%Library Grants-10545055 316,835 233,009 121,407 200,823 (32,186) -14%ECIA-11743055 198,483 215,000 170,157 212,955 (2,045) -1%Impact Fee-21741055 17,748 421,000 1,358 468,400 47,400 11%TOTAL USES BY ORG CODE 5,721,738 6,730,115 3,737,848 7,056,173 326,058 5%
FY2018-19 Budget
USES BY ORG CODE
226

Community Services
FY2018-19 Budget
Mission:Community Services Department is dedicated to improving the quality of life in Richmond by celebrating thediversity of its residents and building understanding through interactions in its recreation programs, park facilities,and cultural events. The Department is committed to providing the highest quality recreation, parks, programs, andservices at good value to our customers.
Key Objectives for Strategic Goals:
1. Maintain and enhance the physical environment
Maintain a “customer friendly” atmosphere in the community centers for people to recreate and socialize.
Provide attractive, safe and accessible multi-purpose facilities that promote a positive community image and enhance social, physicaland educational benefits.
2. Promote a safe and secure community
Maintain a client/participant attendance tracking system to provide controlled access to facilities.
Maintain adequate staffing at the community facilities.
Promote and assist cultural understanding, and celebrate our growing diversity through recreation programs.
3. Promote economic vitality
Increase facility rental usage by upgrading facilities to attract and retain resident and business interest.
Provide quality structured programs, activities, and fee-based classes.
4. Promote sustainable communities
Require all recreation users to recycle at all recreation events, activities, and community and neighborhood centers to promote zerowaste.
Convert/upgrade athletic fields, play areas, and outdoor athletic facilities with use of recycled products.
Promote Online Program Registration.
Encourage participation in physical fitness opportunities to support improved health outcomes.
5. Promote effective government
Expand activities, sports programs, recreation programs, and excursions for youth and adults, including where feasible theimplementation of Joint Use Agreements with West Contra Costa Unified School District (WCCUSD) and East Bay Regional ParkDistrict.
Maintain and expand outside collaborative partnerships with human service organizations.
Expand and upgrade Learning Resource Centers at all community centers to provide educational, academic, and life skills information.
Provide quality Paratransit services for seniors and the disabled population.
227

228

Existing FTE = 27.2 Adopted FTE = 28.4
Community Services Department
FY ’18 – ‘19 Organizational Chart
Legend:
Sub-Program
Main Program
Existing Pos.
Proposed Pos.
Reclassification
Community Services
Director (1)
Executive
Secretary II
(1)
Finance Manager II
(1)
Finance & Budget
Operations
Recreation
Services
Administrative Aide
(1)
Office Specialist
(1)
Auditorium Aide
(3.2)
Recreation
Specialist
(1.6)
Recreation
Program
Coordinator (1)
Accountant II
(1)
Neighborhood &
Volunteer Services
Administrative
Aide
(1)
Recreation
Program
Coordinator (3)
Recreation
Supervisor
(1)
RPAL - Recreation
Program
Coordinator (1)
Administration & Registration
Community
Services Admin.
Manager (1)
Recreation
Supervisor
(1)
Recreation
Supervisor
(1)
Recreation
Program
Coordinator (4)
Sr. Lifeguard
(1.6)
Associate Admin
Analyst
(1)
229

City of RichmondMulti-Year Comparative Position Listing
Department Adopted FY2014-2015
Adopted FY2015-2016
Adopted FY2016-2017
Adopted FY2017-2018
Mid-year FY2017-18
Adopted FY2018-19
COMMUNITY SERVICESAccountant II 1.0 1.0 1.0 1.0Administrative Aide 1.0 1.0 1.0 2.0 2.0 2.0Administrative Trainee 1.0Aquatics Specialist 1.0 1.0Associate Admin Analyst 1.0Auditorium Aide 3.2 3.2 3.2 3.2 3.2 3.2Community Services Director 1.0 1.0 1.0 1.0 1.0Community Services Administrative Manager 1.0 1.0 1.0 1.0 1.0 1.0Community Services Program Manager 1.0Executive Secretary II 1.0 1.0 1.0 1.0 1.0 1.0Finance Manager I 1.0 1.0 1.0 1.0Finance Manager II 1.0 1.0Office Assistant II 1.0 1.0 1.0 1.0 1.0Office Specialist 2.0 2.0 1.0 2.0 2.0 2.0Recreation Director 1.0Recreation Program Coordinator 11.0 12.0 11.0 11.0 11.0 9.0Recreation Program Specialist 0.8 0.8 0.8 0.8 1.6 1.6Recreation Supervisor 3.0 1.0 1.0 3.0Senior Lifeguard 1.6 1.6Total Full-Time Equivalents (FTEs) 27.0 26.0 25.6 26.0 26.8 28.4
230

Thru Mar -2018
General Fund-0001 1,129,262 5,692,172 4,032,595 6,766,250 1,074,078 19%Paratransit Operations-1003 (50) - #DIV/0!Outside Funded Services-Grants-1006 6,605 497,285 24,000 380,135 (117,150) -24%Outside Funded Services-Grants-1011 - #DIV/0!General Capital Fund-2001 - #DIV/0!Impact Fee-2115 162,139 94,695 53,159 (94,695) TOTAL SOURCES BY FUND 1,297,956 6,284,152 4,109,754 7,146,385 862,233 14%
Salaries 2,574,599 2,711,120 1,971,091 2,950,288 239,168 9%Benefits 1,398,069 1,617,109 1,399,809 1,937,615 320,506 20%Professional Services 362,793 478,869 300,572 441,696 (37,173) -8%Other Operating Expenses 46,699 115,296 25,413 141,247 25,951 23%Utilities 11,178 12,218 7,631 18,132 5,914 48%Equipment & Contract Services 30,000 16,781 (13,219) -44%Cost Pool 520,004 520,004 390,002 746,846 226,842 44%Asset/Capital Outlay 54,817 796,536 12,416 893,599 97,063 12%Grant Expenditures 11,800 3,000 2,820 180 (2,820) -94%TOTAL USES BY TYPE 4,979,960 6,284,152 4,109,754 7,146,385 862,233 14%
FY2017-18Actual
SOURCES BY FUND (INCLUDES REVENUE AND/OR FUND BALANCE)
Community Services-25Summary
$ Chg From FY17-18
% Chg From FY17-18
USES BY TYPE
TOTAL BUDGET - HISTORICAL COMPARISON
FY2018-19 Budget
FY2016-17Actual
FY2017-18Adjusted
231

Cities of Service-01250051 148,715 198,763 125,145 192,125 (6,638) -3%Administration- 01251051 1,880,103 2,095,042 1,446,556 2,815,567 720,525 34%Booker T Center-01253251 206,636 230,547 193,521 177,915 (52,632) -23%Nevin Center-01253451 199,211 225,654 140,388 234,144 8,490 4%Shields Reid-01253551 238,427 264,364 225,628 133,256 (131,108) -50%Point Richmond-01253651 6,253 364,238 300,504 (364,238) -100%Recreation Compled-01253751 392,804 213,284 145,086 291,974 78,690 37%Parchester Center-01253851 203,574 254,200 212,858 233,363 (20,837) -8%May Valley Center-01253951 226,448 59,037 50,048 285,582 226,545 384%Special Events-01254551 53,847 246,814 181,284 59,037 (187,777) -76%Recreation (DPRC)-01254651 227,081 155,330 129,400 256,687 101,357 65%Senior Center-01254751 155,476 74,543 122,073 178,935 104,392 140%Senior Center-Annex-01254851 74,618 309,615 227,187 229,145 (80,470) -26%Aquatics-01256051 281,108 476,709 366,746 365,258 (111,451) -23%Convention Center-01257051 424,675 303,727 224,158 392,352 88,625 29%Plunge-01259051 254,379 497,285 19,172 384,130 (113,155) -23%Outside Funded Grants-10651051 6,605 315,000 380,135 65,135 21%Capital Outlay-20151051 197,375 197,375 #DIV/0!Impact Fee-21551051 315,000 339,406 24,406 8%TOTAL USES BY ORG CODE 4,979,960 6,284,152 4,109,754 7,146,385 325,452 5%
FY2018-19 Budget
USES BY ORG CODE
232

City of Richmond Housing & Community Development
FY2018-19 Budget
Mission: To develop quality neighborhoods viable urban communities by providing decent housing and suitable living environment and expanding economic opportunities in business and employment for low and moderate income residents.
Key Objectives for Strategic Goals: 1. Maintain and enhance the physical environment • Complete CDBG ADA/public rehabilitation projects that removed barriers that restricted mobility and accessibility of elderly or disabled
persons. • Renovation and rehabilitation programs - Improve and preserve the existing affordable housing stock, where feasible and appropriate. • Minimize the impact of potential governmental constrains on the maintenance, improvement and development of housing. • Support the preservation of affordable housing, i.e. protect and conserve the existing housing stock where possible and appropriate and
community economic development programs. 2. Promote a safe and secure community • Coordinate capital project design and development with public safety departmental needs. • Complete housing projects for the conservation of affordable housing for low income households and to address homelessness. • Continue to expand CCCC (Contra Costa County Consortium) outreach effort to focus on chronically homeless persons whom law
enforcement had identified as highly vulnerable and with problematic street behavior. 3. Promote economic vitality • Maximize the positive impacts of the Business Opportunity Ordinance and the Local Employment Ordinance in coordination with the
Employment & Training Department to stimulate growth and job opportunities. • Maximize the inventory of affordable housing units to which formerly homeless clients can eventually transition. • Address the emergency shelter and transitional housing needs of homeless persons particularly in providing direct medical care, social
support which includes mental health and substance abuse programs.
233

City of Richmond Housing & Community Development
FY2018-19 Budget
4. Promote sustainable communities • Encourage energy conservation and green building policies and practices in residential development. • Waste reduction - reduce paper consumption by use of electronic documents and the use of double-sided printing when possible. • Provide accessibility to transportation services and make more efficient use of the regional and sub-regional transportation system. • Compliance with lead-based paint regulations to existing Rental Rehabilitation and Neighborhood Stabilization Programs. 5. Promote effective government • Actively seek community input on CDBG, HOME and all other housing projects. • Monitor legislative changes and legal interpretations of laws and regulations pertaining to Housing and Community Development
Department. • Maintain balanced budget and increase revenue sources available for housing programs. • Significantly reduce and/or eliminate the number of audit findings.
234

Housing FY 2018-19 Program Chart
Housing and Community Development Dept.
HCD Director (Vacant)
Administration Project Management Financial Management
Contract Mgmt. Office Administration
Legal Senior Accountant
Dev. Project Managers
Financial Reporting
IDIS Financial Reporting Federal Reporting Single Audit (SEFA)
State Reporting
CDBG/HOME/ Cal HOME/Housing Programs
Housing Assistance
Senior Admin Analyst
Assistant City Attorney
Contra Costa County Consortium
Public Facility Rehab Public Services
Loan Portfolio Management
Sub-recipient Monitoring IDIS/DRGR Reporting Asset Management
Purchasing, Requisition & Invoice Processing
Record Keeping
Grants Management & Accounting, Reporting
Loan Portfolio Management & Report
Budgeting, Planning and Performance Measure
Davis Bacon- Section 3 Labor Review
Environmental Review
Technical Support City Data Services
Legal Review Counsel
Contract- HCD Director (Int) Alan Wolken
235

Housing
FY2018-19 Organizational Chart
CommunityHousing
Existing FTE = 3.8, Adopted FTE = 3.8
Legend:
Sub-Program
Main ProgramExisting Pos.
Proposed Pos.
Development
Project Manager II
(1.8)
Sr. Admin Analyst
(1)
Senior Accountant
(1)
Interim Director
Reclassification
236

City of RichmondMulti-Year Comparative Position Listing
Department Adopted FY2014-2015
Adopted FY2015-2016
Adopted FY2016-2017
Adopted FY2017-2018
Mid-year FY2017-18
Adopted FY2018-19
HOUSING II 1.0 1.0Comm. & Econ. Dev. Director 0.1Development Project Manager. II 1.8 1.8 1.8 1.8Development Project Manager. (I-II) 1.8Office Assistant II 1.0Senior Admin Analyst 1.0 1.0 1.0Senior Accountant 2.0 1.0 1.0 1.0 1.0Total Full-Time Equivalents (FTEs) 0.0 5.9 3.8 3.8 3.8 3.8
237

Thru Mar -2018
Housing Administration-1200 341,444 861,545 605,781 600,618 (260,927) -30%CDBG-1201 3,812,547 1,473,227 691,897 1,444,048 (29,179) -2%HOME-1202 57,448 440 440 - 0%NSP (Non-Profit)-1203 118,713 538,306 256,125 352 (537,954) -100%CDBG Recovery-1204 366,063 - -NSP (City)-1207 8,914 14,940 2,871 55,000 40,060 268%Successor Housing-1208 2,880,521 97,125 190,773 236,401 139,276 143%Cal-Home Grant-1209 990,752 396,370 215,113 257,890 (138,480) -35%Housing in Lieu Fee-Developer-1302 544,086 158,500 1,108,019 276,461 117,961 74%Iron Triangle-2125 199 400,005 4 5 (400,000) -100%Housing CIP-2126 2,774,319 1,915,279 (859,040) -31%TOTAL SOURCES BY FUND 9,120,687 6,714,777 3,070,583 4,786,494 (1,928,283) -29%
Salaries 379,052 415,796 275,029 273,976 (141,820) -34%Benefits 166,797 91,175 151,532 158,506 67,331 74%Professional Services 195,312 50,475 8,345 194,238 143,763 285%Other Operating Expenses 25,031 21,720 64,817 14,641 (7,079) -33%Utilities 2,537 1,620 1,563 719 (901) -56%Cost Pool 227,615 215,728 161,794 215,728 - 0%Asset/Capital Outlay 2,774,319 63,906 2,215,279 (559,040) -20%CDBG/HOME/HSG PROJ 7,508,751 3,185,381 3,286,680 2,781,892 (403,489) -13%Operating Transfer Out 1,828,873 260,202 649,060 393,298 133,096 51%TOTAL USES BY TYPE 10,333,968 7,016,416 4,662,725 6,248,278 (768,138) -11%
Housing-Operating 1,458,579 1,494,754 1,237,123 1,007,250 (487,504) -33%Housing-Program 2,883,597 4,494,698 139,042 3,618,397 (876,301) -19%Housing-Projects 5,991,791 1,026,964 3,286,560 1,622,631 595,667 58%TOTAL USES BY ORG CODE 10,333,968 7,016,416 4,662,725 6,248,278 (768,138) -11%
TOTAL BUDGET - HISTORICAL COMPARISONFY2016-17
ActualFY2017-18Adjusted
FY2017-18Actual
Housing-33Summary
FY2018-19 Budget
SOURCES BY FUND (INCLUDES REVENUE AND/OR FUND BALANCE)
$ Chg From FY17-18
% Chg From FY17-18
FY2018-19 Budget
USES BY TYPE
238

Employment & Training
FY2018-19 Budget
Mission: The Employment & Training Department is committed to the development and growth of our community that enhances quality of life in Richmond. This will be accomplished through establishing effective private/public partnerships and implementing strategies and programs that develop a skilled, talented, educated, and competitive workforce.
Key Objectives for Strategic Goals: 1. Maintain and enhance the physical environment Facilitate and complete projects as outlined in the Richmond Workforce Development Board Local Plan (2017-2020) and aligning the
overall goals with the City’s Strategic Plan.
2. Promote a safe and secure community Develop effective private/public partnerships. Engage elected officials, business, education, and non-profits in identifying workforce development as a top priority for our community. Devise community planning efforts that use demographic data to identify present and future skill requirements in key industries.
3. Promote economic vitality Devise and implement strategies and programs that develop a skilled and prepared local workforce to address employers’ current and
future workforce needs. Match job seekers with employers by utilizing the On-the-Job Training (OJT) model. Support programs and initiatives that provide youth and young adults with the requisite skills to enter the labor force and or post-secondary
educational programs. Support and implement strategies that promote economic vitality and enhance business growth and expansion. 4. Promote sustainable communities Support and implement programs encouraging the use of green building materials and technologies. Reduce paper consumption by use of electronic documents and the use of double-sided printing when possible.
5. Promote effective government Implement strategies that ensure compliance with federal, state and local regulations.
239

* Accounting * WIOA Youth * WIOA Adult * Construction Skills Training
*
* Budgeting * Summer Youth Employment
* WIOA Dislocated Worker
* Contractors' Resource Center
* MIS Services * Youth Career Services (ECIA)
* WIOA Rapid Response * HazMat Training *
* Audit ‐ Independent and Internal
* WIOA Rapid Response Layoff Aversion
* Chevron Stage
* Subrecipient Fiscal Monitoring
* ACES Academy * RB Career Services (ECIA)
*
* Accounts Payable * One‐Stop Career Center
* Accounts Receivable * Training Services * Monitoring Labor Compliance
* Grant Reporting * Employer Services * Construction Bid Analysis
* Contract Management * RW Career Services (ECIA)
* Procurement & Inventory
* Participant Payroll
Monitoring Compliance with Minimum Wage Ordinance
CONTRACT COMPLIANCE
Monitoring Compliance with Local Employment Ordinance
Monitoring Compliance with Business Opportunity Ordinance
EMPLOYMENT & TRAINING DEPARTMENTPROGRAM ORGANIZATIONAL CHART
YOUTHWORKSFISCAL SERVICESRICHMONDWORKS
ONE STOPRICHMONDBUILD
240

Employment & TrainingFY2018-19 Organizational Chart
Sal VacaEmployment & Training
Director
RichmondWORKSOne Stop
YouthWORKS
Existing FTE = 18, Adopted FTE = 19
Legend:
Sub-Program
Main ProgramExisting Pos.
Proposed Pos.
Richmond Workforce Development Board
Senior Employment Program Specialist
(1)
Employment Program Manager
(1)
Employment Program Specialist
I/II(5)
Project Coordinator (1)
Reclassification
Fiscal Services RichmondBuild
Administrative Aide(1)
AdministrativeServices Analyst
(1)
Finance Manager(1)
Office Assistant II(1)
Employment Program Specialist
I/II(2)
Employment Program Manager
(1)
Contract Compliance
AdministrativeServices Analyst
(1)
Employment Program Specialist
I/II(1)
Employment Program Manager
(1)
241

City of RichmondMulti-Year Comparative Position Listing
Department Adopted FY2014-2015
Adopted FY2015-2016
Adopted FY2016-2017
Adopted FY2017-2018
Mid-year FY2017-18
Adopted FY2018-19
EMPLOYMENT & TRAINING Administrative Aide 1.0 1.0 1.0 1.0 1.0 1.0Administrative Services Analyst 1.0 1.0 2.0 1.0 2.0 2.0Administrative Trainee 3.0 3.0 2.0Contract Compliance Specialist II 1.0 1.0 1.0Director, Employment & Training 1.0 1.0 1.0 1.0 1.0 1.0Employment Program Manager 1.0 2.0 2.0 3.0 2.0 3.0Employment Program Specialist I 1.0 2.0 2.0 2.0Employment Program Specialist II 6.0 6.0 6.0 6.0Employment Program Specialist I/II 6.0 8.0Finance Manager 1.0 1.0 1.0 1.0 1.0 1.0Management Analyst 1.0Office Assistant II 1.0 1.0 1.0Project Coordinator 2.0 1.5 1.0 1.0 1.0 1.0Senior Employment Program Specialist 1.0 1.0 1.0 1.0 1.0 1.0Total Full-Time Equivalents (FTEs) 18.0 21.5 19.0 18.0 18.0 19.0
242

Thru Mar -2018
SOURCES BY FUND (INCLUDES REVENUE AND/OR FUND BALANCE)ECIA-1017 944,438 950,000 787,499 950,000 - 0%Employment & Training-1205 4,276,805 8,167,070 3,068,888 6,985,477 (1,181,593) -14%TOTAL SOURCES BY FUND 5,221,243 9,117,070 3,856,387 7,935,477 (1,181,593) -13%
Salaries 1,473,636 1,516,184 945,202 1,614,215 98,031 6%Benefits 966,355 1,046,848 685,594 1,088,562 41,714 4%Other Operating Expenses 137,734 225,500 100,192 322,837 97,337 43%Utilities 56,609 35,800 7,777 14,300 (21,500) -60%Equipment & Contract Services 348,046 259,400 235,012 140,000 (119,400) -46%Cost Pool 417,444 478,539 358,905 517,002 38,463 8%Asset/Capital Outlay 21,843 10,000 34,043 - (10,000) -100%Grant Expenditures 1,799,575 5,544,799 1,489,661 4,238,561 (1,306,238) -24%
TOTAL SOURCES BY TYPE 5,221,243 9,117,070 3,856,387 7,935,477 (1,181,593) -13%
RichmondWORKS 2,558,409 4,467,364 1,889,629 3,888,384 (578,981) -13%RichmondBUILD 1,374,510 2,697,633 1,039,356 2,307,707 (389,926) -14%Richmond YouthWORKS 939,824 1,641,073 694,150 1,428,386 (212,687) -13%Contract Compliance 348,500 311,000 233,252 311,000 - 0%TOTAL USES BY DIVISION 5,221,243 9,117,070 3,856,386 7,935,477 (1,181,593) -13%
FY2018-19 Budget
Employment & Training-27Summary
$ Chg From FY17-18
% Chg From FY17-18
FY2016-17Actual
FY2017-18Adjusted
FY2017-18Actual
TOTAL BUDGET - HISTORICAL COMPARISON
USES BY DIVISION
USES BY TYPE
FY2018-19 Budget
243

244

Richmond Housing Authority
FY2018-19 Budget
Mission: The Richmond Housing Authority is committed to providing decent, safe and sanitary affordable housing and coordinating supportive services for low-income residents and program participants of the City of Richmond.
Key Objectives for Strategic Goals: 1. Maintain and enhance the physical environment Improve Public Housing management. Improve Housing Choice Voucher Section 8 management. Renovate and convert Public Housing units through the Rental Assistance Demonstration (RAD) Program. Expand the Project Real Lead Abatement Program. 2. Promote a safe and secure community Initiate Crime Prevention Through Environmental Design (CPTED) reviews of all developments. Enhance applicant screenings and criminal background checks for prospective housing program participants. Address crime and safety concerns through aggressive lease enforcement. 3. Promote economic vitality Promote or attract supportive services to increase self-sufficiency amongst housing program participants. Expand the Housing Choice Voucher Section 8 Program. Implement measures to promote income mixing in Public Housing developments.
4. Promote sustainable communities Provide diversity of affordable housing opportunities that recognize and promote smart growth principles. Support the creation of healthy, vibrant town centers and districts. Provide access to quality recreational, educational and cultural activities. Support environmentally-sensitive resource management. Promote health and wellness concepts among housing program participants. Build capacity with local non-profits and community-based organizations. Assist in providing access to a healthy home for program participants.
245

Richmond Housing Authority
FY2018-19 Budget
5. Promote effective government Streamline operation to provide more efficient program administration. Provide effective and innovative budget oversight to make the most of limited federal resources. Pursue alternative sources of revenues for the costs of operations and affordable housing development. Partner with other City departments to leverage resources and implement mutually-beneficial programs and projects. Develop and maintain good working relationships with community-based organizations and neighborhood groups.
246

Administration Low Income Public Housing Section 8 HCV Program
Leadership Rent Collections Program Administration
Coordination of Efforts Monthly Reporting H.Q.S. Inspections
Program Oversight Lease Enforcement Case Management
State, Federal and Local Government Reporting
State, Federal and Local Government Reporting Information Hearings
Financial Management Application Intake State, Federal, and Local Government Reporting
Audits Routine Maintenance Landlord Outreach
Payroll Vacancy Turnaround
IT Eviction Activity
Annual Plan Resident Services
RHA Grants Development
Capital Planning EH Project Management
Modernization Construction Management
Contractor/Project Management Monitoring and Grant Compliance
State, Federal and Local Government Reporting
State, Federal, and Local Government Reporting
Rental Assistance Demonstration (RAD)
RICHMOND HOUSING AUTHORITYPROGRAM CHART
247

FY2018-19 Organizational Chart
Housing Program Specialist III
(4)
VacantExecutive Director
Pub Hsg / Sec 8Programs
Administration
Finance Mgr(1)
Accountant II(1)
Existing FTE = 19, Adopted FTE = 20
Legend:
Sub-Program
Main ProgramExisting Pos.
Proposed Pos.
Development
Accounting Asst.II(1)
Housing Program Specialist II
(2)
ExecutiveSecretary II
(1)
Reclassification
Assisted Housing Manager
(1)
Resident Housing Manager
(2)
Housing Program Analyst
(1)
Resident Svcs
Resident Svcs Adm Officer
(1)
Office Asst. II (2)
Building Trades Worker II (1)
Building Trades Wrkr III
(1)
248

City of RichmondMulti-Year Comparative Position Listing
Department Adopted FY2014-2015
Adopted FY2015-2016
Adopted FY2016-2017
Adopted FY2017-2018
Mid-year FY2017-18
Adopted FY2018-19
EMPLOYMENT & TRAINING Administrative Aide 1.0 1.0 1.0 1.0 1.0 1.0Administrative Services Analyst 1.0 1.0 2.0 1.0 2.0 2.0Administrative Trainee 3.0 3.0 2.0Contract Compliance Specialist II 1.0 1.0 1.0Director, Employment & Training 1.0 1.0 1.0 1.0 1.0 1.0Employment Program Manager 1.0 2.0 2.0 3.0 2.0 3.0Employment Program Specialist I 1.0 2.0 2.0 2.0Employment Program Specialist II 6.0 6.0 6.0 6.0Employment Program Specialist I/II 6.0 8.0Finance Manager 1.0 1.0 1.0 1.0 1.0 1.0Management Analyst 1.0Office Assistant II 1.0 1.0 1.0Project Coordinator 2.0 1.5 1.0 1.0 1.0 1.0Senior Employment Program Specialist 1.0 1.0 1.0 1.0 1.0 1.0Total Full-Time Equivalents (FTEs) 18.0 21.5 19.0 18.0 18.0 19.0
249

Thru March -2018
Housing Choice Voucher -Section 8-4101 20,208,608 21,887,256 17,258,185 21,460,857 (426,399) -2%Hope 6-4102 408,970 98,000 182,912 81,727 (16,273) -17%Project Real-4103 55,097 (639,995) -100%Capital Fund-4201 747,777 639,995 254,567 746,763 359,513 93%Hacienda-4401 83,310 387,250 229,823 599,868 599,868 -Friendship Manor-4402 179,718 (1,046,616) -100%Triangle Court-4403 376,713 - (4) (796,938) -100%Nevin Plaza-4404 1,395,135 1,046,616 872,710 1,284,864 992,492 339%Nystrom Village-4405 1,184,855 796,938 544,975 893,015 736,370 470%Richmond Village One-4406 51,603 292,372 190,806 303,648 240,822 -Richmond Village Two-4407 57,105 156,645 71,077 155,976 146,976 -Richmond Village Three-4408 12,240 62,826 39,171 57,396 99,586 159%Local Fund-4409 705 9,000 - (9,000) -100%Central Office Cost Center-4501 (350,953) (42,190) 610,380 1,711,721 1,753,911 -4157%TOTAL SOURCES BY FUND 24,410,884 25,334,708 20,254,602 27,295,835 1,994,317 8%
Salaries 1,635,199 1,183,641 796,127 1,391,906 208,265 18% Benefits (573,687) 1,029,661 656,586 1,129,271 99,610 10% Professional Services 530,156 721,873 386,115 364,500 (357,373) -50% Other Operating Expenses 707,168 657,720 389,733 603,395 (54,325) -8% Utilities 612,515 343,667 454,339 251,700 (91,967) -27% Equipment & Contract Services 813,107 905,609 618,792 1,042,868 137,259 15% Provision for Insurance Loss 52,300 49,825 49,825 - 0% Cost Pool 672,070 116,000 835,108 719,108 620% Asset/Capital Outlay 319,817 339,112 92,951 212,742 (126,370) -37% A87 Cost Plan Reimbursement - - Grant Expenditures 19,642,238 21,181,798 16,859,958 21,299,634 117,836 1% RHA Cost Allocation (1,194,197) 1,194,197 -100% Operating Transfer Out 114,886 114,886 - TOTAL USED BY TYPE 24,410,884 25,334,709 20,254,602 27,295,835 1,961,126 8%
USES BY TYPE
SOURCES BY FUND(INCLUDES REVENUE AND/OR FUND BALANCE)
FY2018-19 Budget
Richmond Housing Authority-34Summary
$ Chg From FY17-18
% Chg From FY17-18
FY2016-17Actual
FY2017-18Adjusted
FY2017-18Actual
TOTAL BUDGET - HISTORICAL COMPARISON
250

Thru March -2018
FY2018-19 Budget
Richmond Housing Authority-34Summary
$ Chg From FY17-18
% Chg From FY17-18
FY2016-17Actual
FY2017-18Adjusted
FY2017-18Actual
TOTAL BUDGET - HISTORICAL COMPARISON
Housing Choice Voucher -Section 8-41141191 20,208,608 21,887,256 17,258,185 21,460,857 (426,399) -2% Hope 6 Administration-41242191 408,970 98,000 182,912 81,727 (16,273) -17% Project Real Administration-41343191 55,097 - - Capital Fund Administration-42141191 747,777 639,995 254,567 746,763 106,768 17% Hacienda Administration-44141191 83,310 387,250 229,823 599,868 212,618 55% Friendship Manor Administration-44242191 179,718 - - Triangle Court Administration-44343191 376,713 (4) - - Nevin Plaza Administration-44444191 1,395,135 1,046,616 872,710 1,284,864 238,248 23% Nystrom Village Administration-44545191 1,184,855 796,938 544,975 893,015 96,077 12% Richmond Village One Administration-44646191 51,603 292,372 190,806 303,648 11,276 4% Richmond Village Two Administration-44747191 57,105 156,645 71,077 155,976 (669) -1% Richmond Village Three Administration-44848191 12,240 62,826 39,171 57,396 (5,430) - Local Fund Administration-449149191 705 9,000 (9,000) -100%Central Office Cost Center Administration-45141191 2,456 - -
Central Office CC-45142091 61,835 53,549 581,181 581,181 - Central Office Executive-45142391 (919,752) (647,588) 259,066 1,130,540 1,778,128 -275% Central Office CC Finance-45142491 504,507 605,398 297,765 (605,398) -100% TOTAL USES BY ORG CODE 24,410,884 25,334,708 20,254,602 27,295,835 1,961,127 8%
FY2018-19 Budget
USES BY ORG CODE
251

252

Rent Program
FY2018-19 Budget
Mission: The mission of the Rent Program is to strengthen the community by providing housing stability for Richmond residents. The Rent Program strives to ensure housing stability for Richmond residents by limiting rent increases and protecting Tenants in good standing from unwarranted, arbitrary, discriminatory, or retaliatory evictions while ensuring a fair return on investment for rental property owners. The primary objectives of the Rent Program are (1) to provide housing stability for tenants similar to the housing stability and financial predictability that homeowners on a fixed-term mortgage enjoy, and (2) encourage and maintain the social, cultural, and economic diversity the City of Richmond proudly represents.
Key Objectives for Strategic Goals:
Establish a robust rent registration/rent tracking database/program.
Establish a fully operational hearings unit (i.e. clear the backlog of petitions already filed). This includes developing all petition forms and getting them online.
Train Rent Program Services Analyst and other senior staff on conducting mediations.
Get the Mediation Program fully up and running.
Publish the “Guide to Rent Control in Richmond.”
Expand the use of innovative outreach tools: create informational/info-graphic educational videos, create social media presence, and conduct “targeted” outreach to problem properties.
Work collaboratively with other City departments to improve housing inspection options and strengthen affordable housing policy.
Improve website and develop online registration of new tenancies, and other administrative forms.
253

Rent Program
FY2018-19 Organizational Chart
Nicolas Traylor
Rent Program Director
(1)
Public Information and
Compliance Unit
Administrative Aide
(2)
Associate
Administrative
Analyst
(2)
Existing = 7, Adopted = 9
Legend:
Sub-Program
Main ProgramExisting Pos.
Proposed Pos.
Hearings Unit
Reclassification
Assistant
Administrative
Analyst
(1)
Hearing Examiner
(1)
Staff Attorney
(1)
Deputy Director
(1)
Richmond Rent Board
(Five Members)
254

City of RichmondMulti-Year Comparative Position Listing
Department Adopted FY2014-2015
Adopted FY2015-2016
Adopted FY2016-2017
Adopted FY2017-2018
Mid-year FY2017-18
Adopted FY2018-19
RENT CONTROLAdministrative Trainee 1.0Administrative Aide 1.0 2.0Assistant Admin Analyst 1.0 1.0Assistant City Attorney 2.0Associate Admin Analyst 1.0 1.0 2.0Code Enforcement Officer I 0.5Deputy Director Rent Program 1.0Executive Director Housing 1.0Executive Director Rent Program 1.0Hearing Examiner Rent Program 1.0Management Analyst 1.0Management Analyst II 1.0Project Manager I 1.0Project Manager II 1.0Senior Management Analyst 1.0Staff Attorney Rent Program 1.0Total Full-Time Equivalents(FTEs) 0.0 0.0 0.0 6.5 7.0 9.0
255

Thru Mar -2018
SOURCES BY FUND
(INCLUDES REVENUE AND/OR FUND BALANCE)
Rent Control-1018 1,951,919 705,735 2,191,475 239,556 12%
TOTAL SOURCES 0 1,951,919 705,735 2,191,475 239,556 12%
Salaries 85,664 727,073 300,494 931,973 204,900 28%
Benefits 35,619 278,722 166,192 485,544 206,822 74%
Professional Services 550,268 632,408 105,064 466,200 (166,208) -26%
Other Operating Expenses 7,591 146,000 36,432 100,300 (45,700) -31%
Utilities 1,200 1200.00 - 0%
Equipment & Contract Services - -
Provision for Insurance Loss 25,000 25,000 - 0%
Cost Pool 105,620 129,867 97,401 159,575 29,708 23%
Asset/Capital Outlay 4,830 11,649 153 21,683 10,034 86%
A87 Cost Plan Reimbursement - -
Grant Expenditures - -
TOTAL USES BY TYPE 789,592 1,951,919 705,735 2,191,475 239,556 12%
Rent Control Program-11850065 789,592 1,951,919 705,735 2,191,475 239,556 12%
TOTAL USES BY ORG CODE 789,592 1,951,919 705,735 2,191,475 239,556 12%
FY2018-19 Budget
Rent Control-35
Summary
$ Chg From
FY17-18
% Chg From
FY17-18
FY2016-17
Actual
FY2017-18
Adjusted
FY2017-18
Actual
TOTAL BUDGET - HISTORICAL COMPARISON
USES BY ORG CODE
USES BY TYPE
FY2018-19
Budget
256

Port of Richmond
FY2018-19 Budget
Mission:
The Port of Richmond is responsible for developing, marketing, leasing, operating, and maintaining all City-owned marine terminals to obtain the maximum financial benefit to the City. The Port Department performs its function through two divisions: Administration and Operations. Port revenue is generated through the application of the Port Tariff and property lease agreements, which are used to fund operations, maintenance, capital improvements, and debt service.
Key Objectives for Strategic Goals:
1. Maintain and enhance the physical environment
Set and maintain reserve fund to implement Port capital improvements.
Improve City-owned port facilities and gateways to the Port.
Promote environmental leadership among Port stakeholders.
2. Promote a safe and secure community
Maximize opportunities for obtaining federal and state funds to improve security of the Richmond Harbor.
Comply with federal and state Homeland Security regulations.
3. Promote economic vitality
Maximize Port finances through effective business development.
Create jobs from Port business activities.
4. Promote sustainable communities
Reduce the Port’s impact on the local and global environment.
Maintain Port clear air action plan.
5. Promote effective government
Collaborate with other City departments, port organizations, and regulatory agencies to streamline the Port’s development process.
257

Port of Richmond Program Organizational Chart
*Office Administration *Business Plan
*Insurance Compliance *Contracting
*Procurement Compliance *Lease Negotiations
*Purchasing *Marketing
*Accounts Payable *Permitting (CEQA)
*Accounts Receivable *Project Planning
*Property Management *Construction
*Record Retention *CIP Project Management
*Regulatory Compliance *Engineering
*Tariff Compliance *Facility Security
*Tonnage Statistic *Maintenance
*Vessel A/D Data *Safety Compliance
*Special Projects
*Vessel Scheduling
*Grants Projects Management
AdministrationBusiness Development/
Operations
258

Port of RichmondFY2018-19 Organizational Chart
Administrative Services Analyst
(1)
Port Marketing/Operations Mgr
(1)
Port DirectorJim Matzorkis
Existing FTE = 4, Adopted FTE=4
Legend:
Sub-Program
Main ProgramExisting Pos.
Proposed Pos.
AdministrationBusiness
Development / Operations
Executive Secretary II(1)
Reclassification
259

City of RichmondMulti-Year Comparative Position Listing
Department Adopted FY2014-2015
Adopted FY2015-2016
Adopted FY2016-2017
Adopted FY2017-2018
Mid-year FY2017-18
Adopted FY2018-19
PORTAdministrative Services Analyst 1.0Development Project Manager II 1.0Executive Secretary II 1.0 1.0 1.0 1.0 1.0Finance Manager II 1.0Operations Administrator 1.0 1.0 1.0 1.0 1.0Maintenance Lead Worker 1.0Port Director 1.0 1.0 1.0 1.0 1.0 1.0Port Marketing/Operations Manager 1.0 1.0 1.0 1.0 1.0 1.0Total Full-Time Equivalents (FTEs) 6.0 4.0 4.0 4.0 4.0 4.0
260

Thru Mar -2018
SOURCES BY FUND
(INCLUDES REVENUE AND/OR FUND BALANCE)
Harbor Fund-2007 - 740,813 740,813 - (740,813) -100%
Port Fund-4001 10,102,104 11,542,345 5,706,749 9,915,193 (1,627,152) -14%
Marina-4005 (7,213) 99,421 99,421 - (99,421) -100%
TOTAL SOURCES BY FUND 10,094,891 12,382,579 6,546,983 9,915,193 (2,467,386) -24%
Salaries 635,960 609,829 449,124 605,615 (4,214) -1%
Benefits 259,377 315,493 241,220 328,381 12,888 4%
Professional Services 1,260,734 1,210,713 612,618 1,182,314 (28,399) -2%
Other Operating Expenses 3,836 17,000 7,302 17,000 - 0%
Utilities 337,772 311,400 215,665 295,400 (16,000) -5%
Equipment & Contract Services 43,486 324,000 266,563 322,000 (2,000) -1%
Provision for Insurance Loss 25,934 30,000 25,935 30,000 - 0%
Cost Pool 459,988 457,896 343,422 487,689 29,793 7%
Asset/Capital Outlay 4,480,867 3,647,454 1,995,040 1,183,725 (2,463,729) -68%
A87 Cost Plan Reimbursement - -
Grant Expenditures - -
Debt Service 2,586,937 5,458,794 2,390,094 5,446,794 (12,000) 0%
Operating Transfer-Out 16,275 16,275 -
TOTAL USES BY TYPE 10,094,891 12,382,579 6,546,983 9,915,193 (2,467,386) -24%
Harbor/Port-20711090 740,813 740,813 (740,813) -100%
Port Ops/Port Admin-40181080 5,903,110 8,277,125 4,226,548 8,303,193 26,068 0%
Pt. Potrero Marine-Auto-40182380 14,985 340,000 64,114 65,000 (275,000) -81%
Port Ops/Terminal 1-40182480 14,820 - -
Port Ops/Terminal 2-40182580 3,476 6,000 2,946 3,500 (2,500) -42%
Port Ops/Terminal 3-40182680 (9,642) 315,000 - (315,000) -100%
Port Ops/Terminal 4-40182780 8,583 57,000 3,268 53,500 (3,500) -6%
Pt. Potrero Marina Othrs-40182880 463,040 425,000 261,773 290,000 (135,000) -32%
Port Ops/CIP-40183080 3,703,732 2,122,220 1,148,100 1,200,000 (922,220) -43%
Marina Ops/Port-40583080 (7,213) 99,421 99,421 (99,421) -100%
TOTAL USES BY ORG CODE 10,094,891 12,382,579 6,546,983 9,915,193 (2,467,386) 24%
FY2018-19 Budget
Port of Richmond-28
Summary
$ Chg From
FY17-18
% Chg From
FY17-18
FY2016-17
Actual
FY2017-18
Adopted
TOTAL BUDGET - HISTORICAL COMPARISON
USES BY ORG CODE
USES BY TYPE
FY2017-18
Actual
FY2018-19
Budget
261

262

Thru Mar -2018
SOURCES BY FUND
(INCLUDES REVENUE AND/OR FUND BALANCE)
General Fund-0001 -
Property Taxes 33,232,038 38,361,265 23,405,232 40,990,607 2,629,342 7%
Sales & Use Taxes 40,877,124 42,876,659 24,870,638 46,149,234 3,272,575 8%
Utility User Tax 43,365,249 46,627,843 35,017,626 46,256,091 (371,752) -1%
Other Taxes 11,628,518 12,093,174 6,483,016 11,979,210 (113,964) -1%
Other Revenue 4,313,699 5,842,369 5,401,019 5,548,838 (293,531) -5%
Operating Transfer In 4,951,813 6,120,302 6,921,766 8,294,735 2,174,433 36%
TOTAL SOURCES 138,368,442 151,921,612 102,099,298 159,218,715 7,297,103 5%
Salaries 3,501,454 2,000,000 1,499,999 2,500,000 500,000 25%
Salary Savings (666,667) (1,000,000) (333,333) 50%
Benefits 3,714,309 3,500,000 2,885,268 3,800,000 300,000 9%
Benefits Savings (333,333) (1,000,000) (666,667) 200%
Professional Services 1,180,368 1,453,888 761,918 1,132,200 (321,688) -22%
Other Operating Expenses 730,854 130,000 99,779 120,400 (9,600) -7%
Other Operating Savings (381,000) (435,000) (54,000) 14%
Utilities 398 - -
Equipment & Contract Services 928 - -
Cost Pool 4,431,263 4,392,191 3,294,143 4,404,367 12,176 0%
Asset/Capital Outlay 100,000 100,000 - 0%
Debt Service Expenditure 27,107 24,091 18,256 25,900 1,809 8%
A87 Cost Plan Reimbursement (464,250) (172,493) (129,359) (172,493) - 0%
Operating Transfers Out 7,304,414 6,767,694 4,444,833 6,146,860 (620,834) -9%
TOTAL USES BY TYPE 20,425,916 16,814,371 12,875,766 15,622,234 -1,192,137 -7%
Non-Dept/City Festivals-01910090 42,500 55,000 37,500 55,000 - 0%
Non-Dept/CalTrans Home Loan-01911190 27,107 24,091 18,256 25,900 1,809 8%
Non-Dept/Assets Management-01913990 296,388 97,279 294,700 (1,688) -100%
Non-Dept/Grants Match - 01914390 939 - -100%
Non-Dept/Non-Dept Activities-01917090 16,664,439 12,938,892 9,836,523 11,446,634 (1,492,258) -12%
Non-Dept/Health Insurance Reimb-01918090 3,691,870 3,500,000 2,885,268 3,800,000 300,000 9%
TOTAL USES BY ORG CODE 20,425,916 16,814,371 12,875,766 15,622,234 (1,192,137) -7%
FY2018-19 Budget
General Government-91
Summary
$ Chg From
FY17-18
% Chg From
FY17-18
FY2016-17
Actual
FY2017-18
Adjusted
FY2017-18
Actual
TOTAL BUDGET - HISTORICAL COMPARISON
USES BY ORG CODE
USES BY TYPE
FY2019-20
Budget
263
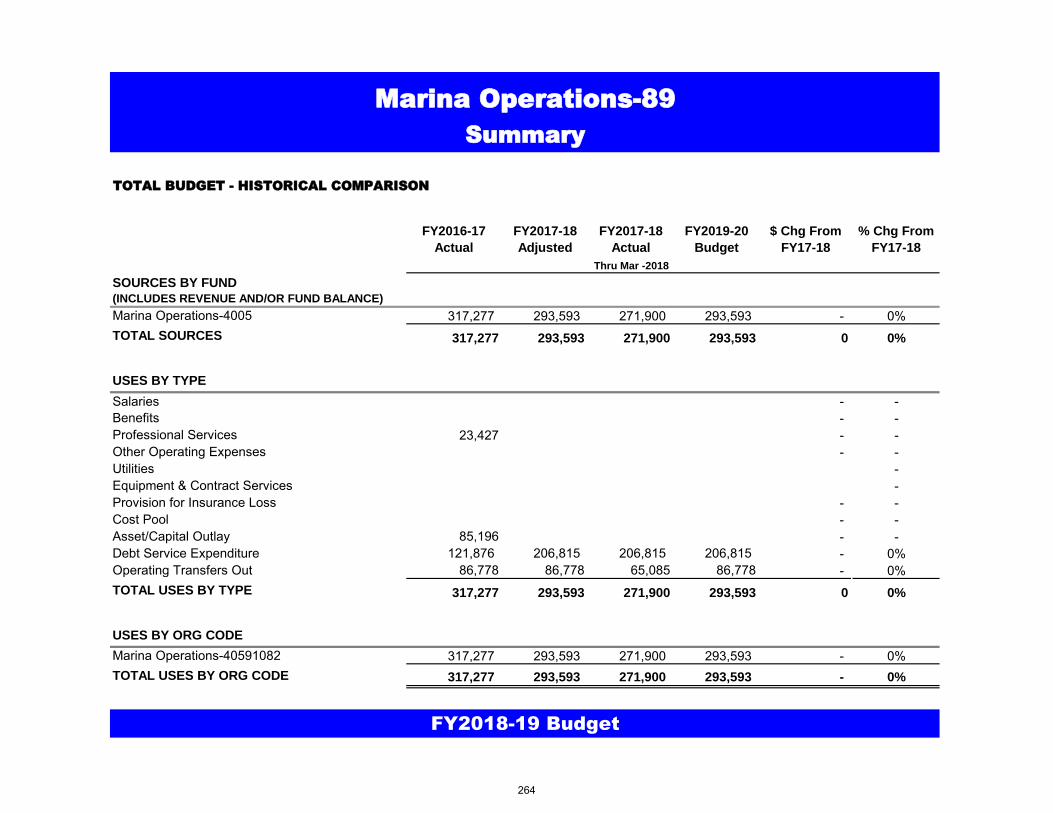
Thru Mar -2018
SOURCES BY FUND
(INCLUDES REVENUE AND/OR FUND BALANCE)
Marina Operations-4005 317,277 293,593 271,900 293,593 - 0%
TOTAL SOURCES 317,277 293,593 271,900 293,593 0 0%
Salaries - -
Benefits - -
Professional Services 23,427 - -
Other Operating Expenses - -
Utilities -
Equipment & Contract Services -
Provision for Insurance Loss - -
Cost Pool - -
Asset/Capital Outlay 85,196 - -
Debt Service Expenditure 121,876 206,815 206,815 206,815 - 0%
Operating Transfers Out 86,778 86,778 65,085 86,778 - 0%
TOTAL USES BY TYPE 317,277 293,593 271,900 293,593 0 0%
Marina Operations-40591082 317,277 293,593 271,900 293,593 - 0%
TOTAL USES BY ORG CODE 317,277 293,593 271,900 293,593 - 0%
FY2018-19 Budget
USES BY ORG CODE
USES BY TYPE
FY2019-20
Budget
Marina Operations-89
Summary
$ Chg From
FY17-18
% Chg From
FY17-18
FY2016-17
Actual
FY2017-18
Adjusted
FY2017-18
Actual
TOTAL BUDGET - HISTORICAL COMPARISON
264

Page 1 of 3
City of Richmond
Debt Service Long Term Payment Obligations
Fiscal Year 2019 - 2043
Beginning Balance as of Ending Balance as of
Acct String Description 7/1/2018 FY2018-19 TOTAL 6/30/2019
Loans Payable
40591082-400751 California Department of Boating and Waterways #21 503,001.69 PRINCIPAL 20,332.92 482,668.77
40591082-400752 Finance Marina construction projects. INTEREST 22,635.08 42,968.00
40591082-400751 California Department of Boating and Waterways #22 1,621,199.50 PRINCIPAL 44,657.02 1,576,542.48 40591082-400752 Finance Marina construction projects. INTEREST 72,953.98
117,611.00
40591082-400751 California Department of Boating and Waterways #81 62,690.19 PRINCIPAL 1,407.94 61,282.25 40591082-400752 Finance Marina Transit Dock Loan. INTEREST 2,821.06
4,229.00
40591082-400751 California Department of Boating and Waterways #117 429,416.52 PRINCIPAL 22,683.26 406,733.26
40591082-400752
Finance Small Craft Harbor Loan - Marina Restructured loan Dredging Design
Work and Dredging Construction INTEREST 19,323.74 42,007.00
01292831-400751 California Energy Commission Loan #1 404,693.24 PRINCIPAL 48,887.21 355,806.03 01292831-400752 Replace streetlights with new LED lights INTEREST 11,778.11
60,665.32
01292831-400751 California Energy Commission Loan #2 1,011,195.89 PRINCIPAL 79,724.40 931,471.49 01292831-400752 Replace streetlights with new LED lights INTEREST 9,913.76
89,638.16
01911190-400751 CalTrans Home Loan 428,877.62 PRINCIPAL 24,000.00 404,877.62 01911190-400752 INTEREST 1,900.00
25,900.00
Capital Leases
11233731-400671 Holman Capital Corporation Lease #3 71,139.99 PRINCIPAL 71,139.99 -
11233731-400672 Hilltop Directional Signs INTEREST 1,601.67
72,741.66
01191021-400671 Holman Capital Corporation #4 1,058,324.33 PRINCIPAL 204,217.20 854,107.13
01191021-400672 West Contra Costa Family Justice Center INTEREST 31,943.18
236,160.38
01232831-400671 BancAmerica Merrill Lynch 3,467,167.79 PRINCIPAL 352,158.04 3,115,009.75
01232831-400672 Finance the purchase of streetlights from PG&E and associated upgrades INTEREST 86,211.74
438,369.78
Bonds Payable
30211090-40751 Pension Obligation Bonds 99A 6,490,000.00 PRINCIPAL 1,375,000.00 5,115,000.00
30211090-400752Fund portion of unfunded accrued actuarial liability in Police & Fireman
Pension Fund. INTEREST 440,967.00
30211090-400755 BOND ADMIN FEES (estimated) 4,700.00
1,820,667.00
30111090-400751 2005 POBs (CABs) 95,148,172.50 PRINCIPAL 7,720,000.00 87,428,172.50
30111090-400751 2023 CABS MATURITY -
30111090-400752 INTEREST 3,410,559.60
30111090-400755 BOND ADMIN FEES 4,000.00
30111090-400759 SWAP PMT TO C-PARTY 4,000,000.00
30111090-400760 SWAP PMT FROM C-PARTY (260,000.00)
14,874,559.60 265

Page 2 of 3
City of Richmond
Debt Service Long Term Payment Obligations
Fiscal Year 2019 - 2043
Beginning Balance as of Ending Balance as of
Acct String Description 7/1/2018 FY2018-19 TOTAL 6/30/2019
40322431-400751 Wastewater Revenue Bonds Series 2008A 32,875,000.00 PRINCIPAL 20,000.00 32,855,000.00
40322431-400752 Fund Wastewater Capital Projects. INTEREST 1,280,749.06
40322431-400755 BOND ADMIN FEES 7,200.00
40322431-400759 SWAP PYMT TO C-PARTY 1,500,000.00
40322431-400760 SWAP PYMT FROM C-PARTY (145,000.00)
40322431-400757 REMARKETING FEES 28,000.00
40322431-400770 LETTER OF CREDIT FEES 220,000.00
2,910,949.06
40181080-400751 Point Potrero Lease Revenue Bonds, Series 2009A 26,830,000.00 PRINCIPAL 0.00 26,830,000.00
40181080-400752 Finance Improvements needed for Honda Port of Entry INTEREST 1,676,875.00
40181080-400755 BOND ADMIN FEES 4,500.00
1,681,375.00
40181080-400751 Point Potrero Lease Revenue Bonds, Series 2009B 6,920,000.00 PRINCIPAL 3,320,000.00 3,600,000.00
40181080-400752 Finance Improvements needed for Honda Port of Entry INTEREST 441,418.75
40181080-400755 BOND ADMIN FEES 4,000.00
3,765,418.75
40322431-400751 Wastewater Revenue Bonds Series 2010B 40,010,000.00 PRINCIPAL 1,145,000.00 38,865,000.00
40322431-400752 Fund Wastewater Capital Projects. INTEREST 2,397,358.56
40322431-400772 INTEREST SUBSIDY (800,000.00)
40322431-400755 ADMIN FEES 7,200.00
2,749,558.56
01292831-400751 Qualified Energy Conservation Bonds Series 2010 622,148.89 PRINCIPAL 70,591.16 551,557.73
01292831-400752 Fund Energy Efficiency and Streetlight Upgrades INTEREST 41,053.74
01292831-400772 INTEREST SUBSIDY (22,844.00)
88,800.90
01204022-400751 Recovery Zone Economic Development Bonds Series 2010 744,414.27 PRINCIPAL 88,203.33 656,210.94
01204022-400752 Fund Improvements to Various City Facilities INTEREST 46,966.32
01204022-400772 INTEREST SUBSIDY (19,668.09)
115,501.56
30511090-400751 JPFA Lease Revenue Bond Series 2009 (Civic Center) 81,585,000.00 PRINCIPAL 2,080,000.00 79,505,000.00
30511090-400752 Refund JPFA Lease Revenue Bonds Series 2007 INTEREST 4,627,237.50
30511090-400755 BOND ADMIN FEES 6,000.00
6,713,237.50
30511090-400751 JPFA Lease Revenue Bond Series 2016 (Civic Center) 28,390,000.00 PRINCIPAL 0.00 28,390,000.00
30511090-400752 Refund JPFA Lease Revenue Bonds Series 2009 terminating the SWAP INTEREST 1,343,375.00
30511090-400755 BOND ADMIN FEES 10,500.00
1,353,875.00
40322431-400751 Wastewater Revenue Bond, Series 2017A 33,530,000.00 PRINCIPAL 1,220,000.00 32,310,000.00
40322431-400752 Refund the Wastewater Revenue Bond Series 2006A & New Issue INTEREST 1,650,950.00
40322431-400755 BOND ADMIN FEES 7,200.00
2,878,150.00
Reassessments
65811090-400751Richmond Redevelopment Agency Community Facility District No. 1998-1
(Marina Westshore) Special Tax Bond, Series 1998 2,535,000.00 PRINCIPAL 175,000.00 2,360,000.00 266

Page 3 of 3
City of Richmond
Debt Service Long Term Payment Obligations
Fiscal Year 2019 - 2043
Beginning Balance as of Ending Balance as of
Acct String Description 7/1/2018 FY2018-19 TOTAL 6/30/2019
65811090-400752Acquire & Construct Improvements to service property in Marina Westshore
Development Project INTEREST 132,033.75
65811090-400755 BOND ADMIN FEES 12,000.00
319,033.75
66011090-400751 Richmond JPFA Reassessment Revenue Refunding Bonds, Series 2011A 1,530,000.00 PRINCIPAL 750,000.00 780,000.00
66011090-400752 Refunding the JPFA Revenue Reassessment Bond, Series 2003-01 INTEREST 45,262.50
66011090-400755 BOND ADMIN FEES 10,000.00
805,262.50
65911090-400751Richmond JPFA Reassessment Revenue Refunding Bonds (County Club
Vista), Series 2016 7,435,000.00 PRINCIPAL 485,000.00 6,950,000.00
65911090-400752
Refund the JPFA Reassessment Revenue District Revenue Refunding Bond,
Series 2006 A&B and the Limited Obligation REFDG Bonds, Reassessement
Dist 1999-1 (Country Club Vista) INTEREST 184,128.00
65911090-400755 BOND ADMIN FEES 15,000.00
684,128.00
TOTAL ALL DEBT (CITY) 373,702,442.42 41,890,807.48 41,890,807.48 353,901,771.18
267

268

City of Richmond
Budgeted Funds - Sources and Uses
Off
ice
of
the
May
or
Cit
y C
ou
nci
lC
ity
Cle
rkC
ity
Man
ager
O
ffic
e o
f N
eigh
bo
rho
od
Saf
ety
Cit
y A
tto
rney
Po
lice
Co
mm
issi
on
Fin
ance
Dep
artm
ent
Hu
man
Res
ou
rces
Info
rmat
ion
Tec
hn
olo
gyP
olic
e D
epar
tmen
tFi
re D
epar
tmen
tIn
fras
tru
ctu
re M
ain
ten
ance
& O
per
atio
ns
Wat
er R
eso
urc
e R
eco
very
Cap
ital
Imp
rove
men
t D
epar
tmen
t
Pla
nn
ing
& B
uild
ing
Serv
ices
Lib
rary
& C
ult
ura
l Ser
vice
sC
om
mu
nit
y Se
rvic
esH
ou
sin
g D
epar
tmen
tSu
cces
sor
Age
ncy
Emp
loym
ent
& T
rain
ing
Ric
hm
on
d H
ou
sin
g A
uth
ori
tyP
ort
of
Ric
hm
on
dR
ent
Co
ntr
ol
No
n-D
epar
tmen
tal
Fund Fund Description Primary Source of Funds Primary Use of Funds
Operating Funds
0001 General Fund Majority collected through taxes
(property, sales, and utility users),
fees, and service charges
General purpose operations
1003 Transportation Operation On-going CCTA grant; some fees
from ridership and electric charging
stations
Transportation operations
accommodating elderly and
disabled citizens
1012 Hilltop Landscape Maintenance District Special property tax assessment;
operating transfer in from General
Fund
Landscaping and maintenance
within district boundaries
1015 Marina Bay Landscape & Lighting District Special property tax assessment;
operating transfer in from General
Fund
Landscaping and maintenance
within district boundaries
1050 Planning & Building Cost Recovery Majority from building permits and
conditional use of permits
Operating costs of providing
planning and building regulation
services
1051 Engineering Cost Recovery Charges for services provided to
the public, developers, and city
departments
Operating costs of providing
engineering services
1053 Code Enforcement (will be closed after FY2017-18) Proceeds from disbandment of
Solid Waste Joint Powers Authority
(JPA)
Abatement programs
1205 Employment & Training Federal, state and local grants; and
operating transfer in from General
Fund
Job training programs for various
demographic groups through
partnerships with local employers
4006 Stormwater Storm water fees collected through
property taxes
Maintenance of a clean storm
sewer system for compliance with
the federally mandated Storm
Water Pollution Prevention
Program
Operating Funds
269

City of Richmond
Budgeted Funds - Sources and Uses
Off
ice
of
the
May
or
Cit
y C
ou
nci
lC
ity
Cle
rkC
ity
Man
ager
O
ffic
e o
f N
eigh
bo
rho
od
Saf
ety
Cit
y A
tto
rney
Po
lice
Co
mm
issi
on
Fin
ance
Dep
artm
ent
Hu
man
Res
ou
rces
Info
rmat
ion
Tec
hn
olo
gyP
olic
e D
epar
tmen
tFi
re D
epar
tmen
tIn
fras
tru
ctu
re M
ain
ten
ance
& O
per
atio
ns
Wat
er R
eso
urc
e R
eco
very
Cap
ital
Imp
rove
men
t D
epar
tmen
t
Pla
nn
ing
& B
uild
ing
Serv
ices
Lib
rary
& C
ult
ura
l Ser
vice
sC
om
mu
nit
y Se
rvic
esH
ou
sin
g D
epar
tmen
tSu
cces
sor
Age
ncy
Emp
loym
ent
& T
rain
ing
Ric
hm
on
d H
ou
sin
g A
uth
ori
tyP
ort
of
Ric
hm
on
dR
ent
Co
ntr
ol
No
n-D
epar
tmen
tal
Fund Fund Description Primary Source of Funds Primary Use of Funds
1001 Secured Pension Override Pension tax override collected
through property taxes
Pension-related expenses,
including debt service principal and
interest payments
1005 Library Fund Federal, state and local grants,
donations, collection of late fees,
and public art fee
Literacy for every adult program,
public art mini grants, and other
grant funded projects
1007 Emergency Medical Services Measure H County Tax Support emergency medical
services in the city
1009 Veolia Mitigation Funds Annual license fee of $25,000 as a
requirement of Richmond
Municipal Code Section 7.04.125
and Conditional Use Permit 92-49
Programs and/or projects in the
North Richmond and Iron Triangle
areas
1010 North Richmond Waste Mitigation Monthly mitigation fees paid by
Republic Service dependent upon
multiple variables (e.g. number of
tons of recovered materials vs.
solid waste, per ton gate rate
charged and amount of CPI
adjusted
per ton mitigation fee)
Defray annual costs associated
with collection and disposal of
illegally dumped waste and
associated impacts in North
Richmond and adjacent areas,
subject to the joint control of the
city and county
1013 Hazmat Grant Contra Costa Health Services Funding for supplies and training to
support fire department response
to hazardous materials incidents in
the city
1014 Economic Development Administration (EDA)
Revolving Loan Fund
Principal and interest payments on
revolving loans made to businesses
Loans to businesses; and
professional services (audit,
management, and consulting fees)
Special Revenue Funds
270

City of Richmond
Budgeted Funds - Sources and Uses
Off
ice
of
the
May
or
Cit
y C
ou
nci
lC
ity
Cle
rkC
ity
Man
ager
O
ffic
e o
f N
eigh
bo
rho
od
Saf
ety
Cit
y A
tto
rney
Po
lice
Co
mm
issi
on
Fin
ance
Dep
artm
ent
Hu
man
Res
ou
rces
Info
rmat
ion
Tec
hn
olo
gyP
olic
e D
epar
tmen
tFi
re D
epar
tmen
tIn
fras
tru
ctu
re M
ain
ten
ance
& O
per
atio
ns
Wat
er R
eso
urc
e R
eco
very
Cap
ital
Imp
rove
men
t D
epar
tmen
t
Pla
nn
ing
& B
uild
ing
Serv
ices
Lib
rary
& C
ult
ura
l Ser
vice
sC
om
mu
nit
y Se
rvic
esH
ou
sin
g D
epar
tmen
tSu
cces
sor
Age
ncy
Emp
loym
ent
& T
rain
ing
Ric
hm
on
d H
ou
sin
g A
uth
ori
tyP
ort
of
Ric
hm
on
dR
ent
Co
ntr
ol
No
n-D
epar
tmen
tal
Fund Fund Description Primary Source of Funds Primary Use of Funds
1017 Chevron Modernization Project Chevron Products Company as part
of the Environmental & Community
Investment Agreement (ECIA)
related to Chevron Refinery
Modernization Project
Various community-based
programs, including greenhouse
reduction programs, and
community-based programs as
outlined in the ECIA and approved
by City Council
1018 Rent Control Fees imposed to support Richmond
Fair Rent, Just Cause for Eviction,
and Homeowner Protection
Operating costs of administering
the programs
1055 Encroachments Encroachment fees and charges for
engineering services
Operating costs of providing
encroachment services
1002 Gas Tax An excise fuel tax (also known as a
petrol, gasoline or gas tax, or as
a fuel duty) imposed on the sale
of fuel.
Restricted to uses for research,
planning, construction,
improvements, maintenance, and
operation of public streets and
highways
1004 Asset Seizure Forfeitures of assets gained
through involvement in illegal
activities
Law enforcement equipment and
supplies
1006 Outside Funded Grants Federal, state, and other grants Grant funded services and
programs
1054 Engineering Grants Federal, state, and other grants Grant funded capital and non-
capital projects
2001 Capital Outlay Fund Bonds, grants, insurance proceeds,
and settlement agreements
Restricted monies that are to be
used for the specific purposes
related to capital improvements
Capital Improvement Funds
271

City of Richmond
Budgeted Funds - Sources and Uses
Off
ice
of
the
May
or
Cit
y C
ou
nci
lC
ity
Cle
rkC
ity
Man
ager
O
ffic
e o
f N
eigh
bo
rho
od
Saf
ety
Cit
y A
tto
rney
Po
lice
Co
mm
issi
on
Fin
ance
Dep
artm
ent
Hu
man
Res
ou
rces
Info
rmat
ion
Tec
hn
olo
gyP
olic
e D
epar
tmen
tFi
re D
epar
tmen
tIn
fras
tru
ctu
re M
ain
ten
ance
& O
per
atio
ns
Wat
er R
eso
urc
e R
eco
very
Cap
ital
Imp
rove
men
t D
epar
tmen
t
Pla
nn
ing
& B
uild
ing
Serv
ices
Lib
rary
& C
ult
ura
l Ser
vice
sC
om
mu
nit
y Se
rvic
esH
ou
sin
g D
epar
tmen
tSu
cces
sor
Age
ncy
Emp
loym
ent
& T
rain
ing
Ric
hm
on
d H
ou
sin
g A
uth
ori
tyP
ort
of
Ric
hm
on
dR
ent
Co
ntr
ol
No
n-D
epar
tmen
tal
Fund Fund Description Primary Source of Funds Primary Use of Funds
2002 Measure J Contra Costa County collects one
half of one percent sales and use
tax; 20% is allocated to the city
Improvement of local
transportation, including streets
and roads
2007 Harbor Fund Special limited obligation bond
established in 1996
Port of Richmond dredging and
deepening the Richmond Harbor
2110 Impact Fee - Parks Fees collected by the city on new
commercial and residential
development projects
Infrastructure improvements
2111 Impact Fee - Traffic Fees collected by the city on new
commercial and residential
development projects
Infrastructure improvements
2113 Impact Fee - Fire Fees collected by the city on new
commercial and residential
development projects
Infrastructure improvements
2114 Impact Fee - Police Fees collected by the city on new
commercial and residential
development projects
Infrastructure improvements
2115 Impact Fee - Comm/Aquatic Fees collected by the city on new
commercial and residential
development projects
Infrastructure improvements
2116 Impact Fee - Parks/Open Fees collected by the city on new
commercial and residential
development projects
Infrastructure improvements
272

City of Richmond
Budgeted Funds - Sources and Uses
Off
ice
of
the
May
or
Cit
y C
ou
nci
lC
ity
Cle
rkC
ity
Man
ager
O
ffic
e o
f N
eigh
bo
rho
od
Saf
ety
Cit
y A
tto
rney
Po
lice
Co
mm
issi
on
Fin
ance
Dep
artm
ent
Hu
man
Res
ou
rces
Info
rmat
ion
Tec
hn
olo
gyP
olic
e D
epar
tmen
tFi
re D
epar
tmen
tIn
fras
tru
ctu
re M
ain
ten
ance
& O
per
atio
ns
Wat
er R
eso
urc
e R
eco
very
Cap
ital
Imp
rove
men
t D
epar
tmen
t
Pla
nn
ing
& B
uild
ing
Serv
ices
Lib
rary
& C
ult
ura
l Ser
vice
sC
om
mu
nit
y Se
rvic
esH
ou
sin
g D
epar
tmen
tSu
cces
sor
Age
ncy
Emp
loym
ent
& T
rain
ing
Ric
hm
on
d H
ou
sin
g A
uth
ori
tyP
ort
of
Ric
hm
on
dR
ent
Co
ntr
ol
No
n-D
epar
tmen
tal
Fund Fund Description Primary Source of Funds Primary Use of Funds
2117 Impact Fee - Library Fees collected by the city on new
commercial and residential
development projects
Infrastructure improvements
2118 Impact Fee - Hilltop Fees collected by the city on new
commercial and residential
development projects
Infrastructure improvements
2119 Impact Fee - Storm Drainage Fees collected by the city on new
commercial and residential
development projects
Infrastructure improvements
2120 Impact Fee - Developer Fees collected by the city on new
commercial and residential
development projects
Infrastructure improvements
3001 2005 Taxable Pension Obligation Bonds Transfers from the general Fund
and the Pension Tax Override Fund
Debt service principal and interest
payments on the 2005 Pension
Obligation Bonds
3002 99A Pension Obligation Bonds Transfers from the Pension Tax
Override Fund
Debt service principal and interest
payments on the 1999A Pension
Obligation Bonds
3005 2016 Lease Revenue Bonds Transfer from the general fund and
charges to operating departments
based on square footage occupied
at Civic Center
Debt service principal and interest
payments on the Civic Center Lease
Revenue Bonds
4001 Port Operations Rental income from Port tenants,
dockage and wharfage
Operating costs; and capital
improvements which includes
maintenance dredging
Debt Service Funds
Enterprise Funds
273

City of Richmond
Budgeted Funds - Sources and Uses
Off
ice
of
the
May
or
Cit
y C
ou
nci
lC
ity
Cle
rkC
ity
Man
ager
O
ffic
e o
f N
eigh
bo
rho
od
Saf
ety
Cit
y A
tto
rney
Po
lice
Co
mm
issi
on
Fin
ance
Dep
artm
ent
Hu
man
Res
ou
rces
Info
rmat
ion
Tec
hn
olo
gyP
olic
e D
epar
tmen
tFi
re D
epar
tmen
tIn
fras
tru
ctu
re M
ain
ten
ance
& O
per
atio
ns
Wat
er R
eso
urc
e R
eco
very
Cap
ital
Imp
rove
men
t D
epar
tmen
t
Pla
nn
ing
& B
uild
ing
Serv
ices
Lib
rary
& C
ult
ura
l Ser
vice
sC
om
mu
nit
y Se
rvic
esH
ou
sin
g D
epar
tmen
tSu
cces
sor
Age
ncy
Emp
loym
ent
& T
rain
ing
Ric
hm
on
d H
ou
sin
g A
uth
ori
tyP
ort
of
Ric
hm
on
dR
ent
Co
ntr
ol
No
n-D
epar
tmen
tal
Fund Fund Description Primary Source of Funds Primary Use of Funds
4003 Wastewater Enterprise Sewer use tax fees, plan checking
fees and sewer lateral fees; also,
pre-treatment permits and design
review fees
Operating costs; and capital
improvements for the Wastewater
Treatment Plant and throughout
the City
4005 Marina Operations Rental income from lease rentals Debt service principal and interest
payments to Dept. of Boating &
Waterways; portion of project
manager's salary for managing
Marina projects
4008 KCRT Cable Television Revenues received from cable
franchise fees and charges for
services
Administrative and operating costs
of the enterprise
4101 RHA-Housing Choice Voucher-Sec 8 Department of Housing and Urban
Development (HUD)
Provide housing assistance to
program participants
4102 RHA-Hope 6 Department of Housing and Urban
Development (HUD)
Re-vitalization of easter hill
development
4103 RHA-Project Real Department of Housing and Urban
Development (HUD)
Lead abatement in privately owned
homes
4201 RHA-Capital Fund Department of Housing and Urban
Development (HUD)
Capital improvements for public
housing developments
4401 RHA-Hacienda Department of Housing and Urban
Development (HUD)
Provide housing for low income
eligible participants
4402 RHA-Friendship Manor Department of Housing and Urban
Development (HUD)
Provide housing for low income
eligible participants
4403 RHA-Triangle Court Department of Housing and Urban
Development (HUD)
Provide housing for low income
eligible participants
4404 RHA-Nevin Plaza Department of Housing and Urban
Development (HUD)
Provide housing for low income
eligible participants
4405 RHA-Nystrom Village Department of Housing and Urban
Development (HUD)
Provide housing for low income
eligible participants
4406 RHA-Richmond Village One Department of Housing and Urban
Development (HUD)
Provide housing for low income
eligible participants
274

City of Richmond
Budgeted Funds - Sources and Uses
Off
ice
of
the
May
or
Cit
y C
ou
nci
lC
ity
Cle
rkC
ity
Man
ager
O
ffic
e o
f N
eigh
bo
rho
od
Saf
ety
Cit
y A
tto
rney
Po
lice
Co
mm
issi
on
Fin
ance
Dep
artm
ent
Hu
man
Res
ou
rces
Info
rmat
ion
Tec
hn
olo
gyP
olic
e D
epar
tmen
tFi
re D
epar
tmen
tIn
fras
tru
ctu
re M
ain
ten
ance
& O
per
atio
ns
Wat
er R
eso
urc
e R
eco
very
Cap
ital
Imp
rove
men
t D
epar
tmen
t
Pla
nn
ing
& B
uild
ing
Serv
ices
Lib
rary
& C
ult
ura
l Ser
vice
sC
om
mu
nit
y Se
rvic
esH
ou
sin
g D
epar
tmen
tSu
cces
sor
Age
ncy
Emp
loym
ent
& T
rain
ing
Ric
hm
on
d H
ou
sin
g A
uth
ori
tyP
ort
of
Ric
hm
on
dR
ent
Co
ntr
ol
No
n-D
epar
tmen
tal
Fund Fund Description Primary Source of Funds Primary Use of Funds
4407 RHA-Richmond Village Two Department of Housing and Urban
Development (HUD)
Provide housing for low income
eligible participants
4408 RHA-Richmond Village Three Department of Housing and Urban
Development (HUD)
Provide housing for low income
eligible participants
4409 RHA-Local Fund Rental income from RHA owned
non federal funded properties
(Westridge)
Public housing operations through
out housing authority
4501 RHA-Central Office Cost Center Housing authority programs Operations and administrative
overhead
5001 Insurance Reserves Charges to operating
departments/funds based on
number of full-time equivalents
(general liability) and a percentage
of payroll each pay period
(worker's compensation)
Employee claims due to industrial
injuries and general claims against
the city for damages incurred
5003 Equipment Replacement Charges to operating
departments/funds for equipment
usage
Purchase of equipment and or
replacement of equipment that is
no longer efficient in its operation
5005 Police CAD (Computer Aided Dispatch) System Internal service charges to General
Fund - Police
Communication centers'
operations for public safety and
emergency services
5006 Police RMS (Records Management System) Internal service charges to General
Fund - Police
Law enforcement records
management
5008 Compensated Absences Charges to operating
departments/funds
Sick, vacation, and compensatory
leave payouts to employees
1200 Housing Administration Section 108 Loan repayments, and
transfer in from General Fund
Administrative and operating costs;
and all other operating costs not
specified in other housing funds
Housing Department Funds
Internal Service Funds
275

City of Richmond
Budgeted Funds - Sources and Uses
Off
ice
of
the
May
or
Cit
y C
ou
nci
lC
ity
Cle
rkC
ity
Man
ager
O
ffic
e o
f N
eigh
bo
rho
od
Saf
ety
Cit
y A
tto
rney
Po
lice
Co
mm
issi
on
Fin
ance
Dep
artm
ent
Hu
man
Res
ou
rces
Info
rmat
ion
Tec
hn
olo
gyP
olic
e D
epar
tmen
tFi
re D
epar
tmen
tIn
fras
tru
ctu
re M
ain
ten
ance
& O
per
atio
ns
Wat
er R
eso
urc
e R
eco
very
Cap
ital
Imp
rove
men
t D
epar
tmen
t
Pla
nn
ing
& B
uild
ing
Serv
ices
Lib
rary
& C
ult
ura
l Ser
vice
sC
om
mu
nit
y Se
rvic
esH
ou
sin
g D
epar
tmen
tSu
cces
sor
Age
ncy
Emp
loym
ent
& T
rain
ing
Ric
hm
on
d H
ou
sin
g A
uth
ori
tyP
ort
of
Ric
hm
on
dR
ent
Co
ntr
ol
No
n-D
epar
tmen
tal
Fund Fund Description Primary Source of Funds Primary Use of Funds
1201 Community Block Development Grant (CDBG) Community Development Block
Grant
CDBG grant programs for low and
moderate income participants and
other eligible programs such as
public services, public facility
rehabilitation, home improvement
loans and other affordable housing
programs
1202 Home Program HOME Investment and Partnership
Grant
For use in the development,
rehabilitation and construction of
affordable housing for low and
moderate income families. The
city participates in Contra Costa
County Consortium in an effort to
expand supply of decent and
affordable housing in the city
1203 NSP (Neighborhood Stabilization Program) (Non-
Profit)
NSP 1 program income Activities which include, but are
not limited to:
a. Establishing financing
mechanisms for purchase and
redevelopment of foreclosed
homes and residential properties
b) Purchase and rehabilitate
homes/residential properties
abandoned or foreclosed
c) Demolish blighted structures
and redevelop demolished or
vacant properties
276

City of Richmond
Budgeted Funds - Sources and Uses
Off
ice
of
the
May
or
Cit
y C
ou
nci
lC
ity
Cle
rkC
ity
Man
ager
O
ffic
e o
f N
eigh
bo
rho
od
Saf
ety
Cit
y A
tto
rney
Po
lice
Co
mm
issi
on
Fin
ance
Dep
artm
ent
Hu
man
Res
ou
rces
Info
rmat
ion
Tec
hn
olo
gyP
olic
e D
epar
tmen
tFi
re D
epar
tmen
tIn
fras
tru
ctu
re M
ain
ten
ance
& O
per
atio
ns
Wat
er R
eso
urc
e R
eco
very
Cap
ital
Imp
rove
men
t D
epar
tmen
t
Pla
nn
ing
& B
uild
ing
Serv
ices
Lib
rary
& C
ult
ura
l Ser
vice
sC
om
mu
nit
y Se
rvic
esH
ou
sin
g D
epar
tmen
tSu
cces
sor
Age
ncy
Emp
loym
ent
& T
rain
ing
Ric
hm
on
d H
ou
sin
g A
uth
ori
tyP
ort
of
Ric
hm
on
dR
ent
Co
ntr
ol
No
n-D
epar
tmen
tal
Fund Fund Description Primary Source of Funds Primary Use of Funds
1207 NSP (Neighborhood Stabilization Program) (City) NSP 3 grant and program income Purchase and rehabilitate homes
and residential properties
abandoned or foreclosed, demolish
blighted properties and develop
them making the properties
available for low and moderate
income families
1208 Successor Housing Agency Bond monitoring fees, program
income (i.e., loan repayments
principal and interest, residual
receipts and others non-grant
receipts)
Development, rehabilitation and
construction of affordable housing
as well as financial and/or rental
assistance to low and moderate
income families to avoid
homelessness; also, the fund can
also be used to provide housing
and/or assist in the prevention of
homelessness
1209 Cal Home Grant Cal Home State grant Provide loans to qualified
individuals (low and moderate
income participants) to
rehabilitate/repair, improve and
remove health and safety hazards
and to provide financial assistance
such as down payment assistance
to qualified low and moderate
income homebuyers
1302 Housing In-Lieu Funds Developer fees Development, rehabilitation and
construction of affordable housing
available for low and moderate
income families and to increase the
affordable housing stock
277

City of Richmond
Budgeted Funds - Sources and Uses
Off
ice
of
the
May
or
Cit
y C
ou
nci
lC
ity
Cle
rkC
ity
Man
ager
O
ffic
e o
f N
eigh
bo
rho
od
Saf
ety
Cit
y A
tto
rney
Po
lice
Co
mm
issi
on
Fin
ance
Dep
artm
ent
Hu
man
Res
ou
rces
Info
rmat
ion
Tec
hn
olo
gyP
olic
e D
epar
tmen
tFi
re D
epar
tmen
tIn
fras
tru
ctu
re M
ain
ten
ance
& O
per
atio
ns
Wat
er R
eso
urc
e R
eco
very
Cap
ital
Imp
rove
men
t D
epar
tmen
t
Pla
nn
ing
& B
uild
ing
Serv
ices
Lib
rary
& C
ult
ura
l Ser
vice
sC
om
mu
nit
y Se
rvic
esH
ou
sin
g D
epar
tmen
tSu
cces
sor
Age
ncy
Emp
loym
ent
& T
rain
ing
Ric
hm
on
d H
ou
sin
g A
uth
ori
tyP
ort
of
Ric
hm
on
dR
ent
Co
ntr
ol
No
n-D
epar
tmen
tal
Fund Fund Description Primary Source of Funds Primary Use of Funds
2125 Iron Triangle Remaining interest on Economic
Development Initiative (EDI) Grant
Repayment of Section 108 loans;
remaining funds will be returned to
HUD
2126 Housing Capital Project Fund State Grants - Prop 84 Baxter
Creek, State IIG Prop 1C , California
Coastal Baxter Creek
Restore the Baxter Creek and Park
surrounding the Miraflores Senior
Housing development site
278

Budget Glossary
FY2018-19 Budget
The glossary includes terms that will help you understand the technical language often used in a capital improvements program. Glossary terms are listed alphabetically under each alphabet letter, and include a brief description and an acronym, as applicable. A Accounting System: The total set of records and procedures which are used to record, classify, and report information on the financial status and operations of an entity. Accounts Payable (A/P): Amounts owing to private persons, firms, or corporation for goods and services received. Accounts Receivable (A/R): Amounts owing from private persons, firms or corporation for goods and services furnished. Accrual Basis: The basis of accounting whereby revenues are recognized when earned and measurable regardless of when collected; and expenses are recorded on a matching basis when incurred. All proprietary and fiduciary funds use the accrual basis of accounting. Accrue: To record revenues and expenditures (expenses) when they meet the recognition criteria of the fund type involved regardless of when the cash activity occurs. Accrued Expenditures (Expenses): Expenses or expenditures that meet the appropriate recognition criteria of the fund type involved but have not been paid. Accrued expenditures are expected to be paid in a subsequent accounting period. Accrued Revenues: Revenues that meet the appropriate recognition criteria of the fund type invoiced, but are not realized during the accounting period. Refer to accrual basis, accrual and modified accrual basis.
Actual: Actual refers to the expenditures and/or revenues realized in the past. Adjusted Budget: The status of appropriations as of a specific date between July 1st, at the beginning of the fiscal period, and June 30th, at the end of the fiscal period. Includes the adopted budget, budget amendments, prior year encumbrances, approved project carry forwards from prior years, and transfers between accounts, divisions and departments. Adopted Budget: Revenues and appropriations approved by the City Council immediately preceding the new fiscal period effective July 1st.
279

Budget Glossary
FY2018-19 Budget
Agency/Department: A major unit of the municipal organization which is managed by an Agency/Department Director and comprised of a number of divisions which are functionally related to one another. Allocation: The practice of spreading costs among various cost centers on some predetermined reasonable basis (e.g., percentages based on allocation plan) as opposed to distribution of expenses on a unit charge or direct identification basis. Americans with Disabilities Act (ADA): Legislation passed in 1990 that prohibits discrimination against people with disabilities. Under this Act, discrimination against a disabled person is illegal in employment, transportation, public accommodations, communications and government activities. The law prohibits private employers, state and local governments, employment agencies and labor unions from discriminating against the disabled. Employers are required to make reasonable accommodations in order for the disabled person to perform their job function. Annexation: A change in existing community boundaries resulting from the incorporation of additional land. Appraisal: The process through which conclusions of property value are obtained; also refers to the report that sets forth the process of estimation and conclusion of value. Appropriated Expenditure: In the Fiscal Year Budget, an amount set aside for a specific acquisition or purpose. Appropriation: Is the legal authority authorized by the City Council to expend up to a certain amount of funds during a budget period. For the City, the adopted budget is the source of appropriations. Appropriation limit: Imposed by Propositions 4 and 111, creates a restriction on the amount of revenue which can be appropriated in any fiscal year. The limit is based on actual appropriations, and is increased each year using the growth of population and inflation. Not all revenue are restricted by the limit; only those which are referred to as "proceeds of taxes." Appropriation Resolution: The official enactment by the City Council to establish legal authority for City officials to obligate and expend funds. Assessed Valuation (AV): The valuation set upon real estate and certain personal property by the County Assessor as a basis for levying property taxes. Assets: The entries on a balance sheet showing all properties and claims against others that may be used directly or indirectly to cover liabilities.
280

Budget Glossary
FY2018-19 Budget
Audit: Prepared by an independent Certified Public Accountant (CPA), the primary objective of an audit is to determine if the City's financial statements present fairly the City's financial position and results of operations in conformity with generally accepted accounting principles. In conjunction with their performance of an audit, it is customary for an independent auditor to issue a Management Letter stating the adequacy of the City's internal controls as well as recommending improvements to the City's financial management practices. B Balanced Budget: A budget in which current revenues in combination with current fund balances equal or exceed current expenditures. Balance Sheet: A statement purporting to present the financial position of an entity by disclosing its assets, liabilities, and fund equities as of a specific date. Baseline Schedule: This is the first schedule the project team gains from the Pre-Design Phase of the project based on knowledge about project context and requirements as well as historical data from previous projects. It is a fixed project schedule used in measuring project progress and contract performance. Any change caused by change in scope of the project invalidates the original schedule and necessitates a new baseline schedule. Base Line Budget: Previous year adopted budget with adjustments or current salaries, benefits, indirect, internal service rates. Bidder: An individual, partnership, firm, corporation, or joint venture, submitting a bid for a construction project. Bid Items: Specific items of work, either materials, finished products, or bodies of work that a bidder bids a price on in their pursuit of a construction project; bid items are those items in a construction contract that will be paid for directly. Bid Package: The package of materials that is given out to prospective bidders for their use in bidding on a construction project; the package includes a copy of the Invitation to Bid; various notices, forms and contract provisions, Proposal, Special Provisions, wage rates, Plan Set, permits/approvals, addenda, and subsurface boring logs (if any). Biennial Budget: A biennial budget is one that lasts for two years, so any funding initiated by this budget is covered for a two-year period.
281

Budget Glossary
FY2018-19 Budget
Bond (Debt Instrument): A written promise to pay (debt) a specified sum of money (called principal or face value) at a specified future date (called the maturity date) along with periodic interest paid at a specified percentage of the principal (interest rate). Bonds are typically used for long-term debt to pay for specific capital expenditures. Budget: A financial plan for a specific period of time (fiscal period) that matches all planned revenues and expenditures with various municipal services. Budget Adjustment: A legal procedure utilized by City staff to revise a budget appropriation. City staff has the prerogative to adjust expenditures within departmental budgets. City Council approval is required for transfers between funds, and for additional appropriations from fund balance or new revenue sources. Budget Calendar: The schedule of key dates or milestones that the City follows in the preparation, adoption and administration of the budget. Budget Document: A financial and planning tool that reflects the proposed (and later adopted) revenues and appropriations for the City (including operating and capital), performance standards, targets, organizational structure and goals, along with historical financial information. Budget Year: The fiscal year for which a budget is being considered. Budgetary Amendments: The City Council has the sole responsibility for adopting the City's budget, and may amend or supplement the budget at any time after adoption by majority vote. The City Manager has the authority to approve administrative adjustments to the budget as long as those changes are between objects within the same expenditure category. Budgetary Basis: The process by which budgeted expenditures are adopted through the passage of a resolution. This resolution constitutes the maximum authorized expenditures for the fiscal year and cannot legally be exceeded except by subsequent amendments of the budget by the City Council. Budgetary Control: The control or management of a governmental unit or enterprise in accordance with an approved budget for the purpose of keeping expenditures within the limitations of available resources. C California Department of Transportation (Caltrans): State agency that builds and maintains state highways and administers transportation programs within the state.
282

Budget Glossary
FY2018-19 Budget
California Environmental Quality Act (CEQA): Is a statute that requires all jurisdictions in the State of California to evaluate the extent of environmental degradation posed by proposed development or project. A 1970 law which requires those state agencies to regulate planning and development activity, with major consideration for environmental protection. The basic purposes of CEQA are to:
Inform governmental decision-makers and the public about the potential significant environmental effects of a proposed planning or development activity;
Identify ways environmental damage can be avoided or significantly reduced (mitigation); Prevent significant, avoidable environmental damage by requiring changes in projects through the use of alternative
measures when those measures are feasible; and (Overriding consideration) Disclose to the public the reasons why a governmental agency approved a project in the manner
the agency chose if significant environmental effects are involved.
California Public Utility Commission (CPUC): Regulates privately owned telecommunications, electric, natural gas, water, railroad, rail transit, and passenger transportation companies. The CPUC is responsible for assuring California utility customers have safe, reliable utility service at reasonable rates, protecting utility customers from fraud, and promoting the health of California's economy. California Transportation Commission (CTC): Is a body established by Assembly Bill 402 (AB 402) and appointed by the Governor to advise and assist the Secretary of the Business, Transportation and Housing Agency and the Legislature in formulating and evaluating state policies and plans for transportation. Capacity Enhancements: Are new facilities projects and operational improvements, which add through lanes. Capital Assets: Assets of significant value and having a useful life of more than one year. Capital assets are also called fixed assets. Capital Budget: A plan of proposed capital expenditures and the means of financing them. The capital budget is enacted as part of the City's consolidated budget which includes both operating and capital outlays, and is based on a Capital Improvement Plan (CIP). Capital Expenditure: An outlay that results in or contributes to the acquisition or construction of a capital asset.
283

Budget Glossary
FY2018-19 Budget
Capital Improvement Plan (CIP): Is a long-range plan of proposed Capital Improvement Projects with single and multiple-year capital expenditures. The CIP is updated annually. Appropriations for each approved project are presented in the annual budget, with some projects spanning multiple fiscal years. Capital Improvement Program or Capital Projects: A plan for capital expenditures for the acquisition, expansion or rehabilitation of an element of the City’s physical plant to be incurred within a fixed period of several future years. Capital Improvements: Are permanent additions to the City's assets, including the design, construction or purchase of land, buildings or facilities or major renovations of the same. They can be new improvements or existing infrastructure whose operation has been extended or enhanced as result of the project. Capital Outlay: Expenditures relating to the purchase of equipment, facility modifications, land, and other fixed assets. Capital Project Fund: Used to account for financial resources used for the acquisition or construction of major capital facilities (other than those financed by Proprietary Funds). Capital Reinvestment Fund: General Fund monies expended on capital projects. Carry forward: Appropriations brought forward from a previous fiscal year to continue or complete a specific project, program or activity. Cash Basis: A basis of accounting in which transactions are recognized only when cash is increased or decreased. Categorical Exclusion: A category of project actions which a federal agency identifies in its National Environmental Policy Act (NEPA) procedures that do not individually or cumulatively have a significant effect on the environment. Central Business District (CBD): Is the downtown core area of a city, generally an area of high land valuation, traffic flow, and concentration of retail, business offices, theaters, hotels, and service businesses. Change Order: A written account of changes in quantities or work during the Construction Phase. Change orders must be approved at the appropriate level of authority as defined in the Change Order Management policy. Circulation Mitigation: Developer impact fees for traffic and street improvements. Clean Water Act: Legislation that provides statutory authority for the National Pollutant Discharge Elimination System (NPDES) program; Public law 92-500; 33 U.S.C. 1251 et seq. Also known as the Federal Water Pollution Control Act.
284

Budget Glossary
FY2018-19 Budget
Close Out: The managerial process of finalizing the project. During this process, all physical work is completed, project records are filed, required closure notifications are distributed, and necessary or requested audits are conducted. Commitment: Planned expenditures from the general ledger details are rolled-up in a commitment line item. City Council approved budget is based on a commitment item Community Advisory Group (CAG): A Community Advisory Group is a committee, task force, or board made up of residents of a community with Superfund or other environmental problems. The Community Advisory Group enhances public participation in the cleanup process and other environmental decision-making by providing a public forum where community representatives can discuss their diverse interests, needs, and concerns. Community Development Agency: Is responsible for maintaining the City's infrastructure system, utilities and community facilities, as well as providing the necessary improvements in order to accommodate long-term growth. Community Facility District (CFD): Special taxes levied on property owners for capital improvements in their community. Community Involvement Plan: A plan developed with support from Department of Transportation’s (DOT) Community Relations staff, Communications staff and Public Affairs staff that forms the basis of project-related external communications with the public. Comprehensive Annual Financial Report (CAFR): Official annual report of a government. In addition to a combined, combining (assembling of data for all funds within a type), and individual balance sheet, the following are also presented as appropriate: (1) statement of revenues, expenditures, and changes in fund balance (all funds); (2) statement of revenues, expenditures, and changes in fund balance, budget and actual (for general and special revenue funds); (3) statement of revenues, expenses, and changes in retained earnings (for proprietary funds); and (4) statement of changes in financial position (for proprietary funds). Concept: Is a strategy for future improvements that will reduce congestion or maintain the existing level of service on a specific route. Concurrency: A requirement that development and the extension of infrastructure occurs at the same time. This is used to prevent sprawling development in areas that do not have infrastructure in place, and to ease the financial burden on the localities that build it. Condemnation: A judicial or administrative proceeding to exercise the power of eminent domain, through which a government agency takes private property for public use and compensates the owner. Congestion: Is defined by Caltrans as reduced speeds of less than 35 mile per hour for longer than 15 minutes.
285

Budget Glossary
FY2018-19 Budget
Congestion Management Plan: The monitoring and mitigation of increased congestion on regional routes and transit systems. Congestion Management Program (CMP): Is an integrated approach to programming transportation improvements. This approach requires detailed consideration of the complex relationships among transportation, land use and air quality. Congestion Management System (CMS): Is required by Inter modal Surface Transportation Efficiency Act (ISTEA) to be implemented by states to improve transportation planning. Construction Contract: A signed, written agreement between the City and the Contractor that describes, among other things, what work will be done and when; who provides labor and materials; and how the Contractor will be paid. Construction Phase: A specific phase of the project during which project design is implemented. Consumer Price Index (CPI): A statistical description of price levels provided by the U.S. Department of Labor. The change in the index from year to year is used to measure the cost of living and economic inflation. Contingency (Reserve): A budget reserve set aside for emergencies or unforeseen expenditures not otherwise budgeted for. Please see “Supplemental” portion of this Policy Budget for details on the City Council's reserve policies. Contract Total: The sum of the total estimated costs from the list of Contractor bid items. Contractor: The individual, partnership, firm, corporation, or joint venture, contracting with the City to do prescribed work as defined in the construction contract. Contractual Services: Expenditures for services the City received from an outside company. Professional and technical services performed by non-City of Richmond (COR) staff is considered contractual services. Coordination Meeting: A meeting conducted just prior to one of the following milestones: 30% PS&E, 70% PS&E, 95% PS&E. The purpose of a coordination meeting is open discussion of issues and comments related to a project’s design, Plan Set, Specifications Package, and Engineer’s Estimate. Corridor: A major transportation route which can consist of one or more highways, arterial streets, transit lines, rail lines and/or bikeways.
286

Budget Glossary
FY2018-19 Budget
Council of Governments (COG): Is a voluntary consortium of local government representatives, from contiguous communities, meeting on a regular basis, and formed to cooperate on common planning and solve common development problems of their area. COGs can function as the RTPAs and MPOs in urbanized areas. County Road Engineer (CRE): Individual responsible for establishing and maintaining engineering standards, practices and professionalism for the Road Services Division, and approving and stamping final plans and record drawings. Critical Area: Any of those areas that are subject to natural hazards or those land features that support unique, fragile or valuable natural resources including fishes, wildlife and other organisms and their habitat, and such resources that carry, hold or purify water in their natural state. Critical areas include: aquatic area, coal mine hazard area, critical aquifer recharge area, erosion hazard area, flood hazard area, landslide hazard area, seismic hazard area, steep slope hazard area, volcanic hazard area, wetlands, wildlife habitat conservation area, and wildlife habitat network. D Debt Service: Payment of interest and repayment of principal to holders of the City's debt instruments. Debt Service Fund: This fund type is used to account for the payment and accumulation of resources related to general long-term debt principal and interest. Dedicated Funds; Federal, state or local funds which can be used only for specific purposes or by specific agencies. Deficit: 1) The excess of entity's liabilities over its assets (See Fund Balance). 2) The excess of expenditures or expenses over revenues during a single accounting period. Demand Capacity Ratio (D/C): Is the relationship between the demands for vehicle trips on a facility versus the number of vehicle trips that can be accommodated on that facility. Demonstration Funds (DEMO): Federal transportation acts sometime target specific projects in various states in addition to general programs for federal support. This funding category includes "demonstration" funding provided under the ISTEA, as well as "high priority project" funding provided under TEA-21. These projects for "demonstration" or "high priority project" funding often have special rules applying to their use. Department/Agency: A major unit of the municipal organization which is managed by an Agency/Department Director and comprised of a number of divisions which are functionally related to one another.
287

Budget Glossary
FY2018-19 Budget
Department of Transportation (DOT): A federal agency that implements the nation's overall transportation policy. The DOT establishes overall transportation policy for the United States. Under the DOT umbrella are 11 administrations whose jurisdictions include highway planning, development, and construction; urban mass transit; railroads; aviation; and the safety of ports, highways, and oil and gas pipelines. Decisions made by the department in conjunction with appropriate state and local officials can significantly affect other programs such as land planning, energy conservation, scarce resource utilization, and technological change. Depreciation: 1) Expiration in the service life of capital assets attributable to wear and tear, deterioration and or action of the physical elements. 2) That portion of the cost of capital asset which is charged as an expense during a particular period. Design Phase: A specific phase of the project when the concept is formulated into plans and specifications. Development: Means the following activities: (1) the division of a parcel of land into two or more parcels; (2) the construction, reconstruction, conversion, structural alteration, relocation, enlargement, or demolition of a structure, excavation, landfill, or deposition; and (3) any use, or change in the use, of any structure, or land, or extension of use of land. Disadvantaged Business Enterprise (DBE): A DBE is a for-profit small business concern that is at least 51 percent owned by one or more individuals who are both socially and economically disadvantaged. In the case of a corporation, 51 percent of the stock is owned by one or more such individuals; and, whose management and daily business operations are controlled by one or more of the socially and economically disadvantaged individuals who own it. Disbursement: The expenditure of monies from an account. Discretionary Funds: Federal, state and local funds which can be used for a variety of purposes are determined by local needs and priorities. District System Management Plan (DSMP): Is a part of the system planning process and refers to a long-range plan for management of transportation systems in its jurisdiction. Division: A unit of the municipal organization which reports to a department or agency. Documentary Transfer Tax: This is a 0.7% tax on the fair market value that is imposed on the transfer or sale of real property.
288

Budget Glossary
FY2018-19 Budget
E Easement: A right to use the land of another for a specific purpose, sometimes referred to as a “deed restriction''. Easements may be purchased from the property owner or donated by the owner to an agency. The holder of an easement agrees to perform periodic inspections and to take the legal action, if necessary, to ensure that easement provisions are met. Easement by Necessity: An easement allowed by law as necessary for the full enjoyment of a parcel of real estate; for example, a right of ingress and egress over a grantor's land. Economic Development: Investment of resources to create financial self-sufficiency and prosperity in a community, including the industrial, commercial, and service sectors. Educational Revenue Augmentation Fund (ERAF): In 1992, the State of California found itself in a serious deficit position. To meet its obligations to fund education at specified levels under Proposition 98, the state enacted legislation that shifted partial financial responsibility for funding education to local government (cities, counties and special districts). The state did this by instructing county auditors to shift the allocation of local property tax revenues from local government to “educational revenue augmentation funds” (ERAFs), directing that specified amounts of city, county and other local agency property taxes be deposited into these funds to support schools. Eminent Domain: The right of a government or municipal quasi-public body to acquire property for public use through a court action called condemnation, in which the court decides that the use is a public use and determines the compensation to be paid to the owner. Encroachment: A structure or part of a structure that occupies the property of another. Encumbrance: Funds designated out of an appropriation to be spent on a specific purpose. The function of an encumbrance is to guarantee dollars will be available to pay bills when due. Engineer’s Estimate: A detailed construction cost estimate including a list of contractor bid items, estimated quantities and estimated unit prices, the Contract Total, sales tax, contingency costs, cost of work to be done by City crews, cost of work to be done by others, value of material furnished by City, estimated cost of incentives, and reimbursable. Engineer’s Estimates are generally labeled as 70% Engineer’s Estimate, 95% Engineer’s Estimate, and 100% Engineer’s Estimate.
289

Budget Glossary
FY2018-19 Budget
Enterprise Fund: A governmental accounting fund in which the services provided are financed and operated similarly to those of a private business. The rate schedules for these services are established to ensure that the revenues are adequate to meet all necessary expenditures. Environmental and Community Investment Agreement (ECIA): On July 29, 2014, the Richmond City Council approved the Environmental and Community Investment Agreement (ECIA), which will invest $90 million dollars to the Richmond community over 10-years. The ECIA includes investments in community programs, a scholarship program, competitive community grants, community-based greenhouse gas reduction programs, and a photovoltaic solar farm. Environmental Impact Report (EIR): A study of all the factors which a land development or construction project would have on the environment in the area, including population, traffic, schools, fire protection, endangered species, archeological artifacts, and community beauty. Many states require such reports be submitted to local governments before the development or project can be approved, unless the governmental body finds there is no possible impact, which finding is called a "negative declaration." Environmental Impact Statement (EIS): An environmental review document prepared in accordance with Environmental Protection Agency (EPA) and/or National Environmental Policy Act (NEPA) when the lead agency determines a proposal is likely to result in significant adverse environmental impacts. Environmental Protection Agency (EPA): An independent federal agency, created in 1970, that sets and enforces rules and standards that protect the environment and control pollution. Equal Employment Opportunity (EEO): EEO laws make it illegal for employers to discriminate against an employee or potential employee in certain workplaces. Expense: Charges incurred (whether paid immediately or unpaid) for operations, maintenance, interest, or other charges. F Federal Emergency Management Agency (FEMA): The FEMA is the federal agency responsible for coordinating emergency planning, preparedness, risk reduction, response, and recovery. The agency works closely with state and local governments by funding emergency programs and providing technical guidance and training. These coordinated activities at the federal, state, and local levels ensure a broad-based emergency program to insure public safety and protect property. Federal Highway Administration (FHWA): The federal agency responsible for the approval of transportation projects that affect the federal highway system. Administratively, FHWA is part of the DOT.
290

Budget Glossary
FY2018-19 Budget
Federal Transportation Improvement Program (FTIP): Also referred to as the Transportation Improvement Program (TIP). This is a short-range action plan to the long-range Regional Transportation Plan (RTP). It identifies specifically what projects will be funded within the next 3 - 7 years. Fiduciary Funds: Account for assets held in a trustee or agency capacity for others, and therefore cannot be used to support the government's own program. Financial Plan: A parent document for the budget which establishes management policies, goals, and objectives for all programs within the City over a one-year period (see Budget). Finding of No Significant Impact (FONSI): Is a document prepared by a federal agency showing why a proposed action would not have a significant impact on the environment and thus would not require preparation of an EIS. A FONSI is based on the results of an environmental assessment. Fines and Forfeitures: Fines and Forfeitures consist primarily of fines for parking violations on the City’s streets, Municipal Court fines and Library fines. Fiscal Impact Analysis: The analysis of the estimated taxes that a development project would generate in comparison to the cost of providing municipal services demanded by that project. Fiscal Year: The 12-month operating period of the government. For the City, this period begins July 1st and ends June 30th. Fixed Assets: Assets of long-term nature such as land, buildings, machinery, furniture, and other equipment. The City has defined such assets as those with an expected life in excess of one year and an acquisition cost in excess of $5,000. Fixed Charges: Are items of expenditures for services rendered by internal operations of the City. Rental of City equipment, computer services, building rental, indirect operating expenses, and depreciation are examples of fixed charges. Flood Control: The specific regulations and practices that reduce or prevent the damage caused by storm water runoff. Franchise Fees: A .5% to 5% fee imposed on franchise revenue in accordance with franchise agreements with utility companies. Freeway Capacity: Is the maximum sustained 15 minute rate of flow that can be accommodated by a uniform freeway segment under prevailing traffic and roadway conditions in a specified direction.
291

Budget Glossary
FY2018-19 Budget
Fringe Benefits: These include employee retirement, social security, health, dental, life insurance, worker's compensation, uniforms, and deferred compensation plans. Full-Time Equivalent (FTE): An FTE or full-time equivalent is defined as a staff year. For example, two employees who work one-half time are considered one full-time equivalent. Functional Classification: Guided by federal legislation, refers to a process by which streets and highways are grouped into classes or systems, according to the character of the service that is provided, i.e., Principal Arterials, Minor Arterial Roads, Collector Roads, Local Roads. Fund: A set of internal accounts that records revenue, expenditures, and obligations related to a specific purpose. Fund Accounting: Governments use funds to account for activities within the entity. Fund Balance: The net effect of assets less liabilities at any given point in time. The total fund balance includes a designated/reserved portion, usually for encumbrances, projects, or other prior commitments, as well as an undesignated/unreserved (i.e., “available”) portion. G General Fund: The fund supported by taxes, fees and other revenues that may be used for any lawful purpose. The general fund accounts for all financial resources except those required to be accounted for in another fund. General Ledger (GL): Central repository of the accounting information of an agency in which the summaries of all financial transactions (culled from subsidiary ledgers) during an accounting period are recorded. Includes revenue and expenditure transactions for all accounts within the agency.
Generally Accepted Accounting Principles (GAAP): Uniform minimum standards for financial accounting and recording, encompassing the conventions, rules, and procedures that define accepted accounting principles. Governmental Funds: Account for activities that are primarily tax-supported operations or other mandatory payments. Grant: A contribution by a government, other organization, or a private individual to support a particular function. Grants may be classified as either categorical or block, depending upon the amount of discretion allowed the grantee. Grants may be competitive or based on allocation.
292

Budget Glossary
FY2018-19 Budget
Growth Management: The conscious public decision to restrain, accommodate or induce development in any geographic setting and at any governmental level. Growth management systems provide a means for governments to establish comprehensive goals and objectives designed to address the problems of growth through an integrated system of administrative, financial and regulatory programs. H High Occupancy Vehicle (HOV): Are a lane of freeway reserved for the use of vehicles with more than a preset number of occupants; such vehicles often include buses, taxis and carpools. Highway Capacity Manual (HCM): Revised in 1994 by the Transportation Research Board of the National Research Council, the HCM presents various methodologies for analyzing the operation (see Level of Service) of transportation systems as freeways, arterial, transit, and pedestrian facilities. I Impact Fees: Costs imposed on new development to fund public facility improvements required by new development and ease fiscal burdens on localities. Infrastructure: Those capital facilities and land assets under public ownership, or operated or maintained for public benefit, that are necessary to support development and redevelopment and to protect the public health, safety, and welfare. Infrastructure systems may include, but are not limited to, transportation, energy, telecommunications, farmland retention, water supply, wastewater disposal, storm water management, shore protection, open space and recreation, solid waste disposal, public health care, public education, higher education, arts, historic resources, public safety, justice, public administration, and public housing. Initial Study: The preliminary analysis that the lead agency prepares in order to determine whether to prepare a negative declaration or an Environmental Impact Report (EIR) and, if necessary, to identify the impacts to be analyzed in the EIR. When the agency determines that an EIR is unnecessary, the study serves the purpose of providing documentation of the factual basis for concluding that a negative declaration will suffice. Inspector: The Project Engineer’s representative who inspects construction contract performance in detail, including how the approved design is implemented in the field.
293

Budget Glossary
FY2018-19 Budget
Intelligent Transportation System (ITS): Applications of information technology to enhance transportation system management, e.g., real-time information about traffic incidents, routing alternatives and/or the guidance of vehicles through remotely-controlled equipment. Inter-fund Transfers: The movement of monies between funds of the same governmental entity. Intermodal Surface Transportation Efficiency Act (ISTEA): Federal legislation which provided for major restructuring of the federal funding program. Re-authorized as the Transportation Equity Act for the 21st Century (TEA-21). Internal Service Charges: The charges to user departments for internal service provided by another government agency, such as fleet maintenance or insurance funded from a central pool. Interregional Road System (IRRS): Is a series of Interregional state highway routes, outside the urbanized areas, that provide access to, and links between, the state's economic centers, major recreational areas, and urban and rural regions. Interregional Transportation Strategic Plan (ITSP): Describes and communicates the framework in which the state will carry out its responsibilities for the Interregional Improvement Program (IIP). It also identifies how Caltrans will work with regional agencies to consult and seek consensus on the relative priority of improvements. The plan is evaluated in terms of its progress in carrying out its objectives, strategies and actions and updated accordingly on a biennial basis. Investment: Securities and real estate purchased and held for the production of income in the form of interest, dividends, rental or base payments. J There are no terms at this time. K There are no terms at this time. L Land Use Planning: Generic term used to describe zoning results such as environmental impact, allowable development uses, historic/cultural preservation, etc.
294

Budget Glossary
FY2018-19 Budget
Lead Agency: The agency or agencies that have taken the primary responsibility for preparing the environmental impact statement. Legal Description: A method of describing a particular parcel of land in such a way that it uniquely describes the particular parcel and no other. A legal description may be a simple reference to a lot as shown on a subdivision plat, or be described by metes and bounds. To be adequate, it should be sufficient to locate the property without oral testimony. Letter of Transmittal: The opening section of the budget, which provides the City Council and the public with a general summary of the most important aspects of the budget, changes from the previous fiscal years, and the views and recommendations of the City Administrator. Level of Service (LOS): Is a qualitative measure describing operational conditions within a traffic stream; generally described in terms of such factors as speed and travel time, freedom to maneuver, traffic interruptions, comfort and convenience, and safety. LOS A represents free flow, and LOS F represents gridlock. Liability: Debt or other legal obligation arising out of transaction in the past which must be liquidated, renewed or refunded at some future date; financial obligations entered in the balance sheet. Note: The term doesn't include encumbrances. Licenses and Permits: Revenues under this category are from fees for business licenses, building regulation and planning permits. In Richmond, the Business License Tax is charged annually at different rates depending on the Business Tax Category. Licenses and Permits revenue comes from construction permits from the construction of sidewalks, driveways, sewer, grading and excavating, encroachment and obstruction. Line Item Budget: A budget that lists detailed expenditure categories (salary, material, telephone service, travel, etc.) separately, along with the amount budgeted for each specified category. The City uses a line-item detail to maintain and record for financial reporting and control purpose. (See General Ledger Accounts & Commitment Item) Local Agency Investment Fund (LAIF): Program established by the state to enable treasurers to place idle funds in a pool for investment. Each agency is currently limited to LAIF of an investment of $20 million plus any bond proceeds. Local and Regional Level of Service Standards: Identifies the level of service standards set by local and regional jurisdictions in general plans and congestion management programs. Long Range Transportation Plan: A 15 to 20 year forecast plan that must consider a wide range of social, environmental, energy and economic factors. The plan addresses overall regional goals and how transportation can best meet those goals within financial limits.
295

Budget Glossary
FY2018-19 Budget
M Market Value: What a willing seller could reasonably expect to receive if he/she were to sell the property on the open market to a willing buyer. Master Plan: A plan prepared to specify and coordinate the provision of one or more infrastructure systems and related services. Maturities: The dates on which the principal or stated values of investments or debt obligations mature and may be reclaimed. Measure Q - City Sales Tax: A one-half of one percent (1/2%) sales tax increment approved by Richmond voters in the November 2004 election. This increased the Richmond tax from 8.25% to 8.75%.
Memorandum of Understanding (MOU): A document that expresses mutual accord on an issue between two or more parties. Memoranda of understanding are generally recognized as binding, even if no legal claim could be based on the rights and obligations laid down in them. To be legally operative, a memorandum of understanding must (1) identify the contracting parties, (2) spell out the subject matter of the agreement and its objectives, (3) summarize the essential terms of the agreement, and (4) must be signed by the contracting parties.
Metropolitan Planning Organization (MPO): A federally required planning body responsible for the transportation planning and project selection in its region. The Governor designates an MPO in every urbanized area with a population of over 50,000 people. Metropolitan Transportation Improvement Program (MTIP): A listing of highway and transit projects that the region hopes to fund. Milestone: A tangible point in time that tells how far along a project is in the process. Mission Statement: Provides policy guidance and direction for the highest priority objectives to be accomplished during the budget period. Over the last several years, the City Council has developed community goals and long-range vision for the City, which best summarize expectations of the community. Mitigated Negative Declaration: Under the CEQA, if an initial study reveals substantial evidence that significant environmental effects might occur, the project proponent can modify the project so as to eliminate all such possible significant impacts or reduce them to a level of insignificance.
296

Budget Glossary
FY2018-19 Budget
Mitigation: One or more of the following approaches to mitigate environmental impact(s) with an emphasis on attempting those measures in the sequence in which they are listed: (1) avoiding the impact altogether by not taking a certain action or parts of an action; (2) minimizing impacts by limiting the degree or magnitude of the action and its implementation; (3) rectifying the impact by repairing, rehabilitating, or restoring the impacted environment; (4) reducing or eliminating the impact over time by preservation and maintenance operations during the life of the action; and (5) compensating for the impact by replacing or providing substitute resources or environments. Model, Mode Choice: Is a model used to forecast the proportion of total person trips on each of the available transportation modes. Modified Accrual Basis: The basis of accounting under which expenditures, whether paid or unpaid, are formally recognized when incurred against the account, but revenues are recognized only when they become both measurable and available to finance expenditures of the current accounting period. All governmental funds use the modified accrual basis of accounting. Municipal Bonds: Interest-bearing obligations issued by state or local governments to finance operating or capital costs. The principal characteristic that has traditionally set municipal bonds apart from other capital market securities is the exemption of interest income from Federal income tax. N National Environmental Policy Act (NEPA): Federal legislation that requires consideration of environmental consequences of a project before the project can begin. If a study indicates that there are undesirable environmental consequences of a proposed project, they requires either that consideration be given to "mitigating" measures built into the project that would lessen the environmental damage, or that alternatives (different ways of accomplishing the project goals) be considered that would be less damaging to the environment. NEPA applies to any major federal, state, county, city, or industrial projects that require a Federal permit or receive funding from a Federal agency. National Highway System (NHS): Consists of 155,00 miles (plus or minus 15 percent) of the major roads in the U.S. Included will be all Interstate routes, a large percentage of urban and rural principal arterials, the defense strategic highway network, and strategic highway connectors. National Pollutant Discharge Elimination System (NPDES): Two-phased surface water quality program authorized by Congress as part of the 1987 Clean Water Act. Natural Diversity Information: Identifies special status of habitats and species found within 300 meters of centerline of the existing highway facility.
297

Budget Glossary
FY2018-19 Budget
Negative Declaration: Under the CEQA, a Negative Declaration is prepared when, after completing an initial study, a lead agency determines that a project "would not have a significant effect on the environment". Non-Attainment Area: An air basin that does not meet existing state or federal air quality standards. Notice of Completion (NOC): The CEQA requires a notice to the public that a draft environmental impact report has been completed. Notice of Determination (NOD): Under the CEQA, a Notice of Determination is filed by the lead environmental regulatory agency once it has decided to implement or approve a project for which it has approved a negative declaration. Notice of Intent (NOI): Under NEPA, the first formal step in the environmental impact statement process, consisting of a notice with the following information: a description of the proposed action and alternatives; a description of the agency's proposed scoping process, including scoping meetings; and the name and address of the persons to contact within the lead agency regarding the environmental impact statement. Notice of Preparation (NOP): The CEQA requires this notice to the public that an EIR will be prepared for a proposed development. It allows time for members of the community to submit their environmental concerns regarding a proposed development. Notice to Proceed: A letter signed by the Project Engineer and issued to the Contractor granting notice that construction must begin within a designated period. O Objectives: Departmental statements describing significant activities to be accomplished during the fiscal year. Obligation: The Federal government's legal commitment (promise) to pay or reimburse the states or other entities for the Federal share of a project's eligible costs. Operating Budget: A financial plan for the provision of City services and basic governmental functions. The operating budget contains appropriations for such expenditures as personnel services, fringe benefits, commodities, services and minor capital expenses. It does not include Capital Improvement Plan expenditures. Operations and Maintenance: Expenditures related to operating costs including supplies, commodities, contract services, materials, utilities and educational services.
298

Budget Glossary
FY2018-19 Budget
Ordinance: A formal legislative enactment by the governing board (City Council) of a municipality. If it is not in conflict with any higher form of law, it has the full force and effect of law within the boundaries of the municipality to which it applies. Outfall: The point where wastewater or drainage discharges from a sewer pipe, ditch, or other conveyance to a receiving body of water. P Performance Measures: Specific quantitative measures of work performed within an activity or program (e.g., total miles of streets cleaned). Also, a specific quantitative measure of results obtained through a program or activity (e.g., reduced incidence of vandalism due to new street lighting program). Permits/Approvals: Required permissions from regulatory agencies with jurisdiction over the work or location of the project. Permitting Authority: The NPDES authorized state agency or EPA regional office that administers the NPDES program, issuing permits, providing compliance assistance, conducting inspections, and enforcing the NPDES program. Personnel Services: Expenditures related to employee compensation including wages and salaries, fringe benefits, retirement, premiums, allowances and special/supplemental pay such as shift differentials. Phase: Series of related activities during a project’s lifecycle, usually culminating in the completion of a major deliverable. Plat Map: A map of a town, section or subdivision indicating the location and boundaries of individual properties. Pre-construction Conference (Precon): A meeting held with the Contractor and City of Richmond staff with the purpose of introducing all parties involved in project construction, identifying critical project issues, and answering Contractor questions. The meeting occurs between contract execution and Notice to Proceed. Program: An activity, or division, within a department which furthers the objectives of the City Council, by providing services or a product. Program Budget: Programs, and associated program codes, are created to articulate the programmatic functions performed by the City organization. The budget (both revenues and expenditures) can be described in programmatic terms. This enables the Mayor and City Council to view how much is being committed and/or spent to achieve their goals and objectives.
299

Budget Glossary
FY2018-19 Budget
Programming: The designation of funds for transportation projects which when approved is included in the TIP. Project: A temporary endeavor undertaken to create a unique product or service. It can be considered to be any series of activities and tasks that have: (1) A specific objective to be completed within certain specifications; (2) defined start and end dates; and (3) funding limits and consumed resources. Generally, this is a construction project but could be any undertaking requiring a joint effort wherein a scope, schedule, budget, and desired outcome has been defined. Project Closeout Phase: A specific phase of the project when construction tasks are completed, contractual and administrative requirements are completed and the project files are archived. Project Manager: The person responsible for leading the team; delivering the project within an approved scope, schedule and budget; conducting quality assurance of the project products; monitoring project progress; and overseeing the project from Pre-Design Phase through Project Close Out Phase. Project Report: Is a conceptual engineering report that describes the work in more detail than the PSR. Project Study Report (PSR): Is the pre-programming document required before a project may be included in the State Transportation Improvement Program (STIP). Property Tax: A major portion of the revenues of the City is from property taxes. Property such as land, structures and improvements is subject to tax which is applied to a property’s value. In 1978, Proposition 13 revised the calculation of the California property taxes by establishing a fixed rate of one percent of a property’s value and thereby limiting the growth in assessed valuation to 2% per year. The exception to this is when property changes hands, in which case fair value becomes the basis of valuation. The City receives its share of property taxes during the months of December, April and June of each fiscal year at 55%, 40% and 5% of the total amount. Of the total property tax received, approximately 48% is General Fund, 16% is Sewer, 24% is Pension Tax Override and 12% is from Assessment Districts. Proprietary Funds: Account for activities that are primarily funded by income from operations resulting from payments for goods and services provided to users. PS&E: Plans, Specifications and Estimates Punchlist: A list of items generated following the Final Inspection consisting of work the Contractor must complete before the project is considered complete and the Notice of Completion and Acceptance is issued.
300

Budget Glossary
FY2018-19 Budget
Q There are no terms at this time. R Ready-to-Ad: A document that confirms funds is available for construction; it is signed by the Finance Manager of the Capital Improvement Plan Unit and CRE and is required prior to advertisement of the project. Recognized Obligation Payment Schedules (ROPS): A six month period schedule that sets forth the nature, amount, and source of payment for all enforceable obligations of the Successor Agency to the Redevelopment Agency. Record of Decision (ROD): Under the NEPA, a public document that reflects the agency's final decision, rationale behind that decision, and commitments to monitoring and mitigation. Redevelopment Agency: The governing body created to designate redevelopment project areas, supervise and coordinate planning for a project area, and implement the development program. Redevelopment Plan: Plan for revitalization and redevelopment of land within the project area in order to eliminate blight and remedy the conditions that caused it. Redevelopment Property Tax Trust Fund (RPTTP): A trust fund from the collection of the property tax revenues from the dissolved redevelopment agencies that’s used to pay enforceable obligations. Reimbursements: Payments remitted by another agency, department, or fund to help defray the costs of a particular service or activity for which some benefit was obtained by the reimbursing party. These amounts are recorded as expenditures, or expenses in the reimbursing fund and as a reduction of expenditures, or expenses, in the fund that is reimbursed. Relocation: The effort to assist and facilitate re-housing of families and single persons, businesses or organizations that are displaced due to redevelopment activities. Relocation Assistance: Relocation payments help to assist families, individuals, businesses, and non-profit organizations that are displaced as a result of redevelopment activities. This includes aid in finding a new location, payments to help cover moving costs, and additional payments for certain other costs.
301

Budget Glossary
FY2018-19 Budget
Reserved Fund Balance: A portion of a fund’s balance that is legally restricted for a specific purpose and is, therefore, not available for general appropriation. Resolution: A special order of the City Council which requires less legal formality than an Ordinance in terms of public notice and the number of public readings prior to approval. A Resolution has lower legal standing than an Ordinance. The adopted operating budget is approved by Resolution and requires a majority vote of the City Council members present at the time of adoption. Revenue: Funds that the City receives as income. It includes such items as taxes, licenses, user fees/charges for services, fines/penalties, grants, and internal revenue. Revenue Estimates: A formal estimate of how much revenue will be earned from a specific revenue source for some future period; typically, a future fiscal year. Right-of-Way (ROW): The right given by one landowner to another to pass over the land actually transferring ownership. ROW is granted by deed or easement, for construction and maintenance according to a designated use. This may include highways, streets, canals, ditches, or other uses. Runoff: Drainage or flood discharge that leaves an area as surface flow or as pipeline flow. S Salaries and Benefits: An operating budget category which generally accounts for full-time and part-time salaries, overtime costs, and fringe benefits.
Sales and Use Tax: The current Sales Tax rate in Richmond is 8.75%. The City’s share of this is 1% percent, with the State getting 6.25%. Sales tax revenue is influenced by different factors such as the number of retail outlets, the interest rates, disposable income, and the rate of inflation. Richmond also has revenue sharing agreements with the City of El Cerrito. Schedule: The planned dates for performing activities and the planned dates for meeting milestones. Secondary Access: A second means for vehicles to get into or leave a neighborhood or development. Having more than one means of access tends to distribute traffic more evenly, and is considered critical for emergency vehicle access. Sewer: Any pipe or conduit used to collect and carry away sewage or storm water runoff from the generating source to the treatment plant or receiving stream.
302

Budget Glossary
FY2018-19 Budget
Sewer Capital: Fees collected by the City for future expansion and capacity increases of the sewer and waste water systems. Source of Revenue: Revenues are classified according to their source or point of origin. Special Revenue Fund: Used to account for the proceeds of special revenue sources that are restricted by law (or administrative action) to expenditures for specific purposes. Specifications Package: A packet of information made up of Standard Specifications and Special Provisions that forms the basis of the construction contract defining the work to be done, the material requirements, the construction requirements, the methods of measurement, and the methods of payment during construction. The Specifications Package is generally referred to as either 70% Spec Package, 95% Spec Package or 100% Spec Package. State Transportation Improvement Program (STIP): The statewide CIP adopted biennially by the California Transportation Commission, which includes all major transportation projects funded by state or Federal funds. Statement of Overriding Considerations: Provides an agency with a means to adopt a project with unmitigated significant environmental impacts. The CEQA requires the decision-maker to balance the benefits of a proposed project against its unavoidable environmental risks in determining whether to approve the project. If the benefits of a proposed project outweigh the unavoidable adverse environmental effects, the adverse environmental effects may be considered acceptable. Storm Drain: An opening leading to an underground pipe or open ditch for carrying surface runoff, separate from the sanitary sewer or wastewater system. Storm Drain Fund: Fees received from developers for storm drain facilities. Stormwater: Precipitation that accumulates in natural and/or constructed storage and storm water systems during and immediately following a storm event. Stormwater Pollution Prevention Plan (SWPPP): A plan to describe a process though which a facility thoroughly evaluates potential pollutant sources at a site and selects and implements appropriate measures designed to prevent or control the discharge of pollutants in storm water runoff. Street, Arterial: A thoroughfare designed to carry vehicular traffic between neighborhoods and from surrounding areas into and out of the city.
303

Budget Glossary
FY2018-19 Budget
Street, Collector: A street that directs neighborhood vehicular traffic to the arterial street system; it basically serves the surrounding neighborhoods, not the wider community. Street, Local: A street that provides access to adjacent properties and allows for vehicular traffic circulation within a neighborhood. Successor Agency: An agency that is authorized by law to accept and maintain the legal title, custody, and dominion of records that were created by the former redevelopment agencies. Supplemental Appropriation: An act appropriating funds in addition to those in an annual appropriation act. Supplemental appropriations provide additional budget authority beyond the original estimates for programs or activities (including new programs authorized after the date of the original appropriation act) in cases where the need for funds is too urgent to be postponed until enactment of the next regular appropriation bill. Supplies and Services: This budget category accounts for all personnel, and capital outlay expenses. Surface Runoff: The portion of rainfall that moves over the ground toward a lower elevation and does not infiltrate the soil. Sustainable Development: Development with the goal of preserving environmental quality, natural resources and livability for present and future generations. Sustainable initiatives work to ensure efficient use of resources. System Capacity: The ability of natural, infrastructure, social and economic systems to accommodate growth and development without degrading or exceeding the limits of those systems, as determined by a carrying capacity analysis. T Tax Allocation Bond: A bond or financial obligation issued by the agency in order to generate funds to implement the redevelopment plan. The bond is repaid with tax increments flowing to the agency as a result of actions of the agency to revitalize the project area. Tax Increment: The increase in property taxes within the redevelopment project area that result from increases in the project area assessed value that exceeds the base year assessed value. Transfer: A movement of budgetary or actual revenues or expenditures between organizational units, accounts, projects, programs or funds. Transfers between funds appear as an expenditure (“transfer out”) in one fund and revenue (“transfer in”) in the other.
304

Budget Glossary
FY2018-19 Budget
Transfers between fiscal years represent the carry forward of funds received in previous years to be expended in the new year and appear as revenue in the new year. Transfers between departments, funds or from one fiscal year to another must be approved by City Council. Transfers In/Out: Payments from one fund to another fund, primarily for work or services provided. Transient Occupancy Tax (TOT): The TOT at 10% is imposed on and paid by the hotel/motel lodgers who stay less than thirty days. The tax is collected and remitted by hotel/motel operators. Triple Flip State: On July 1, 2004 the State began reducing the Sales Tax Allocation to Cities by .25%. The .25% reduction was used for security for the State’s “Economy Recovery Bonds”. This was replaced dollar-for-dollar by an allocation of local property tax from the County Educational Revenue Augmentation Fund (ERAF) funds paid to the Cities in two payments in January and May. Trust and Agency Funds: Also known as Fiduciary Fund Types, these funds are used to account for assets held by the City in a trustee capacity or as an agent for private individuals, organizations, or other governmental agencies. The fiduciary funds used by the City include expendable trust and agency funds. Expendable trust funds are accounted for in the same manner as Governmental Funds (general, special revenues, debt service, and capital project funds). Agency funds are custodial in nature (assets equal liabilities) and do not measure the results of operations. U Urban Transportation Planning System (UTPS): Is a tool for multi-modal transportation planning developed by the Urban Mass Transportation Administration (now the Federal Transit Administration) and the Federal Highway Administration. It is used for both long and short-range planning, particularly system analysis and covers both computerized and manual planning methods. UTPS consists of computer programs, attendant documentation, user guides and manuals that cover one or more of five analytical categories: highway network analysis, transit network analysis, demand estimation, data capture and manipulation, and sketch planning. Utilities: Generally referring to any outside service agency, including but not limited to, public and private utilities, public transportation agencies, postal services, emergency services, city agencies, and railroads. Utility Users Tax (UUT): A 10% tax imposed on utility (telecommunication, gas, electricity, water and video) revenue.
305

Budget Glossary
FY2018-19 Budget
V Vehicle License Fee (VLF) Backfill: In FY2004, the State dropped the Motor VLF from 2% to .67%. In FY 2004 the State backfilled the fee reduction with other State funds. In fiscal year 2005, the backfill was replaced with an allocation of local property tax from County Educational Revenue Augmentation Fund (ERAF) funds that was paid to the Cities in two payments in January and May. W Working Capital: Also known as financial position in private sector accounting and in enterprise fund accounting in the public sector, working capital is the excess of current assets over current liabilities. For the enterprise funds, this term is used interchangeably with "fund balance”, a comparable financial position concept in the governmental fund types. X There are no terms at this time. Y There are no terms at this time. Z Zero Base Budget: A process emphasizing management's responsibility to plan, budget, and evaluate. Zero-base budgeting provides for analysis of alternative methods of operation and various levels of effort. It places new programs on an equal footing with existing programs by requiring that program priorities be ranked, thereby providing a systematic basis for allocating resources.
306

Budget Glossary
FY2018-19 Budget
List of Acronyms AV ADA
Assessed Valuation
Americans with Disabilities Act
A/P Accounts Payable
A/R Accounts Receivable
CAFR Comprehensive Annual Financial Report
CAG Community Advisory Group
CalPERS California Public Employees' Retirement System
Caltrans California Department of Transportation
CBD Central Business District
CEQA California Environmental Quality Act
CFD Community Facility District
CIP Capital Improvement Plan
CMP Congestion Management Program
CMS Congestion Management System
COG Council of Governments
COR City of Richmond
CPA Certified Public Accountant
CPI Consumer Price Index
CPUC California Public Utility Commission
CRE County Road Engineer
CTC California Transportation Commission
DBE Disadvantaged Business Enterprise
307

Budget Glossary
FY2018-19 Budget
D/C Demand Capacity Ratio
DEMO Demonstration Funds
DSMP District System Management Plan
DOT Department of Transportation
EAP Environmental Protection Agency
ECIA EEO
Environmental and Community Investment Agreement
Equal Employment Opportunity
EIR Environmental Impact Report
EIS Environmental Impact Statement
ERAF Educational Revenue Augmentation Fund
FEMA Federal Emergency Management Agency
FHWA Federal Highway Administration
FONSI Finding of No Significant Impact
FTE Full-Time Equivalent
FTIP Federal Transportation Improvement Program
GAAP Generally Accepted Accounting Principles
GL General Ledger
HCM Highway Capacity Manual
HOV High Occupancy Vehicle
HR Human Resources
HUD Federal Department of Housing and Urban Development
IRRS Interregional Road System
ISTEA Intermodal Surface Transportation Efficiency Act
IT Information Technology
308

Budget Glossary
FY2018-19 Budget
ITS Intelligent Transportation System
ITSP Interregional Transportation Strategic Plan
LAIF Local Agency Investment Fund
LOS Level of Service
LTFP Long-term Financial Plan
MOU Memorandum of Understanding
MPO Metropolitan Planning Organization
MTIP Metropolitan Transportation Improvement Program
NEPA National Environmental Policy Act
NHS National Highway System
NOC Notice of Completion
NOD Notice of Determination
NOI Notice of Intent
NOP Notice of Preparation
NPDES National Pollutant Discharge Elimination System
OPEB Other Post-Employment Benefits
PAF Personnel Action Form
PO Purchase Order
PR Purchase Requisition
Precon Pre-construction Conference
PSR Project Study Report
RFP Request for Proposal
RFQ Request for Qualification
ROD Record of Decision
309

Budget Glossary
FY2018-19 Budget
ROPS Recognized Obligation Payment Schedules
ROW Right-of-Way
RPTTP Redevelopment Property Tax Trust Fund
SEC Security and Exchange Commission
STIP State Transportation Improvement Plan
SWPPP Stormwater Pollution Prevention Plan
TIP Transportation Improvement Program
TOT Transient Occupancy Tax
UTPS Urban Transportation Planning System
UUT Utility Users Tax
VLF Vehicle License Fee
310