Peoples-Trial-Brief.pdf - San Francisco City Attorney's Office
Upload
khangminh22Category
view
4download
0
City and County of San Francisco
2020-2021 Consolidated Annual Performance and Evaluation Report
(CAPER)
Mayor’s Office of Housing and Community Development Office of Economic and Workforce Development Department of Homelessness and Supportive Housing One South Van Ness Avenue, Fifth Floor San Francisco, CA 94103 Phone: 415-701-5500; TDD: 415-701-5503 Website: www.sfmohcd.org

Mayor’s Office of Housing and Community Development (MOHCD) Overview of Plans - Context for this Document HUD-Required Plans Additional MOHCD Plans
MOHCD Strategic Plan Overarching department goals
Progress to Strategic Plan goals; includes legislatively-mandated reporting
MOHCD Annual Report
HIV Housing Plan Goals for addressing the housing needs of HIV+ households
Analysis of Impediments (to Fair Housing Choice) - Analysis of conditions that affect the location, availability and accessibility of housing
CAPER (Consolidated Annual Performance and Evaluation Report) - Progress to Consolidated Plan goals
Summary of activities and resources for Consolidated Plan goals
Annual Action Plan
Vision and activities for achieving racial equity in department policies and practices
Racial Equity Action Plan
Digital Equity Plan Goals for improving digital access and literacy
Consolidated Plan Housing and community development goals

CAPER
1
OMB Control No: 2506-0117 (exp. 06/30/2018)
Contents CR-05 - Goals and Outcomes .................................................................................................................... 2
CR-10 - Racial and Ethnic composition of families assisted .................................................................... 27
CR-15 - Resources and Investments 91.520(a) ....................................................................................... 28
CR-20 - Affordable Housing 91.520(b) .................................................................................................... 55
CR-25 - Homeless and Other Special Needs 91.220(d, e); 91.320(d, e); 91.520(c) – ............................. 57
CR-30 - Public Housing 91.220(h); 91.320(j) ........................................................................................... 63
CR-35 - Other Actions 91.220(j)-(k); 91.320(i)-(j) .................................................................................... 71
CR-40 - Monitoring 91.220 and 91.230 ................................................................................................... 87
CR-45 - CDBG 91.520(c) .......................................................................................................................... 90
CR-50 - HOME 91.520(d) ......................................................................................................................... 91
CR-55 - HOPWA 91.520(e) ...................................................................................................................... 93
APPENDIX A: ESG Attachment .............................................................................................................. 105
CR-60 – Subrecipient Information ........................................................................................................ 105
CR-65 - Persons Assisted ....................................................................................................................... 110
CR-70 – ESG 91.520(g) - Assistance Provided and Outcomes ............................................................... 113
CR-75 – Expenditures ............................................................................................................................ 114
APPENDIX B: HOPWA Information, Data Tables and Certifications ..................................................... 116
APPENDIX C: Proof of Publication for Notice of Availability of Draft 2020-2021 CAPER for Public Review and Comment ........................................................................................................................... 164

CAPER
2
OMB Control No: 2506-0117 (exp. 06/30/2018)
CR-05 - Goals and Outcomes Progress the jurisdiction has made in carrying out its strategic plan and its action plan. 91.520(a) This could be an overview that includes major initiatives and highlights that were proposed and executed throughout the program year. The overarching objectives for San Francisco’s use of funds, including CDBG, ESG, HOME and HOPWA funds, as reflected in its 2020-2024 Consolidated Plan are the following:
• Families and individuals are stably housed; • Families and individuals are resilient and economically self-sufficient; • Communities have healthy physical, social and business infrastructure; • Communities at risk of displacement are stabilized; and • The City works to eliminate the causes of racial disparities.
For each objective, there are priority needs and for each priority need, there are goals. The City is dedicated to the articulation of specific performance measures for each goal, to ensure that we are investing our resources to achieve optimal outcomes for our communities. We developed a Five-Year Funding and Indicators of Success Table to assess investment outcomes across the 2020-2024 timeframe of the Consolidated Plan. Performance under each indicator will be tracked against a five-year goal and a one-year goal.
CAPER
3
OMB Control No: 2506-0117 (exp. 06/30/2018)
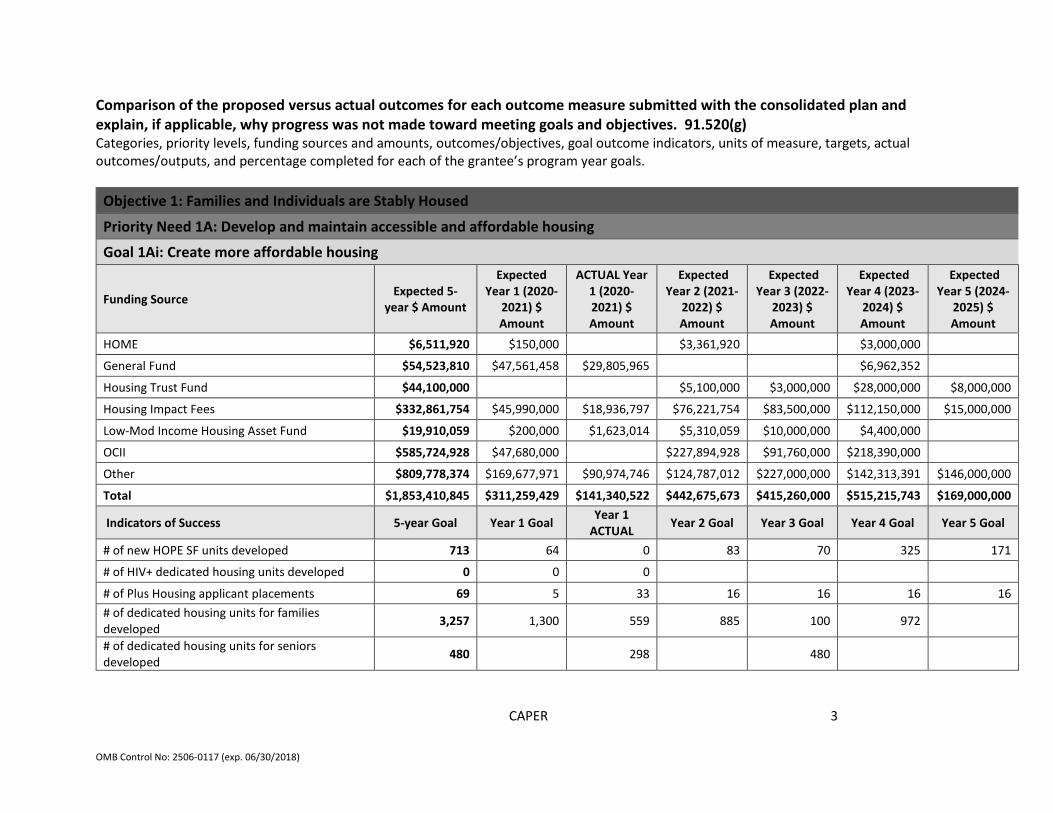
Comparison of the proposed versus actual outcomes for each outcome measure submitted with the consolidated plan and explain, if applicable, why progress was not made toward meeting goals and objectives. 91.520(g) Categories, priority levels, funding sources and amounts, outcomes/objectives, goal outcome indicators, units of measure, targets, actual outcomes/outputs, and percentage completed for each of the grantee’s program year goals.
Objective 1: Families and Individuals are Stably Housed
Priority Need 1A: Develop and maintain accessible and affordable housing
Goal 1Ai: Create more affordable housing
Funding Source Expected 5-year $ Amount
Expected Year 1 (2020-
2021) $ Amount
ACTUAL Year 1 (2020-2021) $ Amount
Expected Year 2 (2021-
2022) $ Amount
Expected Year 3 (2022-
2023) $ Amount
Expected Year 4 (2023-
2024) $ Amount
Expected Year 5 (2024-
2025) $ Amount
HOME $6,511,920 $150,000 $3,361,920 $3,000,000
General Fund $54,523,810 $47,561,458 $29,805,965 $6,962,352
Housing Trust Fund $44,100,000 $5,100,000 $3,000,000 $28,000,000 $8,000,000
Housing Impact Fees $332,861,754 $45,990,000 $18,936,797 $76,221,754 $83,500,000 $112,150,000 $15,000,000
Low-Mod Income Housing Asset Fund $19,910,059 $200,000 $1,623,014 $5,310,059 $10,000,000 $4,400,000
OCII $585,724,928 $47,680,000 $227,894,928 $91,760,000 $218,390,000
Other $809,778,374 $169,677,971 $90,974,746 $124,787,012 $227,000,000 $142,313,391 $146,000,000
Total $1,853,410,845 $311,259,429 $141,340,522 $442,675,673 $415,260,000 $515,215,743 $169,000,000
Indicators of Success 5-year Goal Year 1 Goal Year 1 ACTUAL Year 2 Goal Year 3 Goal Year 4 Goal Year 5 Goal
# of new HOPE SF units developed 713 64 0 83 70 325 171
# of HIV+ dedicated housing units developed 0 0 0
# of Plus Housing applicant placements 69 5 33 16 16 16 16 # of dedicated housing units for families developed 3,257 1,300 559 885 100 972
# of dedicated housing units for seniors developed 480 298 480

CAPER
4
OMB Control No: 2506-0117 (exp. 06/30/2018)
# of mobility/ADA units developed 18 4 14
Goal 1Aii: Preserve affordable housing
Funding Source Expected 5-year $ Amount
Expected Year 1 (2020-
2021) $ Amount
ACTUAL Year 1 (2020-2021) $ Amount
Expected Year 2 (2021-
2022) $ Amount
Expected Year 3 (2022-
2023) $ Amount
Expected Year 4 (2023-
2024) $ Amount
Expected Year 5 (2024-
2025) $ Amount
CDBG $8,104,310 $2,548,910 $5,555,400
General Fund $39,727,000 $37,956,000 $43,809,817 $1,771,000
Housing Trust Fund $89,554,144 $11,079,000 $3,617,200 $35,176,127 $3,324,890 $36,974,127 $3,000,000
Housing Impact Fees $4,375,137 $840,180 $2,536,560 $818,397 $90,000 $90,000
Low-Mod Income Housing Asset Fund $12,363,305 $12,363,305 $5,678,590
Other $68,544,000 $2,500,000 $16,507,000 $44,589,000 $21,455,000
Total $222,667,896 $67,287,395 $69,612,607 $84,072,687 $25,598,287 $42,619,527 $3,090,000
Indicators of Success 5-year Goal Year 1 Goal Year 1 ACTUAL Year 2 Goal Year 3 Goal Year 4 Goal Year 5 Goal
# of Small Sites units preserved/made permanently affordable 742 171 109 171 0 400 0
# of units made code compliant (for example, seismic, fire) or received health and safety improvements
113 113 88
# of low-income homeowners who have assessments completed and home modifications installed that increase safety, accessibility and health outcomes
25 5 68 5 5 5 5
# of low-income homeowners who have solar assessments completed and solar modifications installed
8 8 0 0
Decrease in number of out of compliance (with Planning or MOHCD program requirements) homeowners and property owners
150 30 30 30 30 30
# of HOPE SF public housing units replaced or # of HOPE VI units rehabilitated 247 121 194 63 63

CAPER
5
OMB Control No: 2506-0117 (exp. 06/30/2018)
# of RAD-like conversion units rehabilitated 224 154 0 70
Goal 1Aiii: Improve data and analytics on affordable housing inventory and placements Funding Source
No funding to sub-recipients
Indicators of Success
No Indicators of Success
Priority Need 1B: Make housing more affordable
Goal 1Bi: Reduce development costs to help leverage local housing resources and serve lower income households Funding Source
No funding to sub-recipients
Indicators of Success
No indicators
Goal 1Bii: Increase affordability of rental housing
Funding Source Expected 5-year $ Amount
Expected Year 1 (2020-
2021) $ Amount
ACTUAL Year 1 (2020-2021) $ Amount
Expected Year 2 (2021-
2022) $ Amount
Expected Year 3 (2022-
2023) $ Amount
Expected Year 4 (2023-
2024) $ Amount
Expected Year 5 (2024-
2025) $ Amount
CDBG-CV $0 $1,597,222
HOPWA $17,333,535 $3,466,707 $3,155,915 $3,466,707 $3,466,707 $3,466,707 $3,466,707
HOPWA-CV $0 $66,667
HOPWA Competitive $0 $463,667
HOPWA Competitive-CV $0 $53,153
General Fund $122,335,690 $13,532,934 $19,610,989 $26,324,596 $22,793,754 $27,831,745 $31,852,662
Housing Trust Fund $0 $336,849
Treasury Rental Assistance $0 $2,941,176
Other $9,800,000 $3,800,000 $6,666,667 $4,000,000 $1,000,000 $1,000,000
Total $149,469,225 $20,799,641 $34,892,305 $33,791,303 $27,260,461 $32,298,452 $35,319,369

CAPER
6
OMB Control No: 2506-0117 (exp. 06/30/2018)
Indicators of Success 5-year Goal Year 1 Goal Year 1 ACTUAL Year 2 Goal Year 3 Goal Year 4 Goal Year 5 Goal
# of residents receiving rental subsidies 1,100 220 220 220 220 220 # of housing subsidies and vouchers for HIV+ households 899 187 184 178 178 178 178
# of LOSP units funded 14,922 2,713 1,342 2,871 2,903 3,200 3,235
Goal 1Biii: Increase opportunities for sustainable homeownership
Funding Source Expected 5-year $ Amount
Expected Year 1 (2020-
2021) $ Amount
ACTUAL Year 1 (2020-2021) $ Amount
Expected Year 2 (2021-
2022) $ Amount
Expected Year 3 (2022-
2023) $ Amount
Expected Year 4 (2023-
2024) $ Amount
Expected Year 5 (2024-
2025) $ Amount
CDBG $1,422,120 $334,520 $397,720 $271,900 $271,900 $271,900 $271,900
General Fund $5,518,364 $970,480 $992,984 $1,136,971 $1,136,971 $1,136,971 $1,136,971
Housing Trust Fund $0 $105,916
Total $6,940,484 $1,305,000 $1,496,620 $1,408,871 $1,408,871 $1,408,871 $1,408,871
Indicators of Success 5-year Goal Year 1 Goal Year 1 ACTUAL Year 2 Goal Year 3 Goal Year 4 Goal Year 5 Goal
# of residents receiving homeownership education and counseling 16,000 3,200 3,564 3,200 3,200 3,200 3,200
# of residents receiving homeownership counseling services who successfully become homeowners
1,725 345 29 345 345 345 345
# of homeowners who receive post-purchase education and counseling 1,250 250 362 250 250 250 250
# of homeowners who receive legal representation to avoid foreclosure 100 20 170 20 20 20 20
# of higher-income households, including first responders and educators, who receive DALP 150 30 2 30 30 30 30
# of homebuyers served from previously underserved select demographic populations 45 5 8 10 10 10 10
Goal 1Biv: Increase access to rental and homeownership housing

CAPER
7
OMB Control No: 2506-0117 (exp. 06/30/2018)
Funding Source Expected 5-year $ Amount
Expected Year 1 (2020-
2021) $ Amount
ACTUAL Year 1 (2020-2021) $ Amount
Expected Year 2 (2021-
2022) $ Amount
Expected Year 3 (2022-
2023) $ Amount
Expected Year 4 (2023-
2024) $ Amount
Expected Year 5 (2024-
2025) $ Amount
CDBG $0 $42,091
General Fund $5,398,268 $873,624 $1,251,629 $1,131,161 $1,131,161 $1,131,161 $1,131,161
Housing Trust Fund $5,398,888 $1,336,376 $1,347,298 $1,015,628 $1,015,628 $1,015,628 $1,015,628
Other $0 $37,500
Total $10,797,156 $2,210,000 $2,678,518 $2,146,789 $2,146,789 $2,146,789 $2,146,789
Indicators of Success 5-year Goal Year 1 Goal Year 1 ACTUAL Year 2 Goal Year 3 Goal Year 4 Goal Year 5 Goal
# of residents receiving rental housing education and counseling 18,000 3,600 3,914 3,600 3,600 3,600 3,600
# of residents submitting at least one application for a rental housing opportunity 1,000,000 200,000 217,000 200,000 200,000 200,000 200,000
# of residents who successfully move into MOHCD-sponsored affordable housing 3,750 750 485 750 750 750 750
# of new DAHLIA accounts created 120,000 20,000 16,000 25,000 25,000 25,000 25,000 # of leasing agents, lenders and housing counselors who receive training on MOHCD housing programs
1,175 235 440 235 235 235 235
# of housing education opportunities for HIV+ persons 25 5 5 5 5 5 5
# of HIV+ residents receiving rental housing counseling services who successfully move into MOHCD-sponsored affordable housing
29 5 5 6 6 6 6
# of households receiving rental housing at HOPE SF sites via the HOPE SF Right to Return legislation
65 25 10 10 10 10
Priority Need 1C: Prevent and reduce homelessness
Goal 1Ci: Improve systems to help each person find the right path to permanent housing Funding Source

CAPER
8
OMB Control No: 2506-0117 (exp. 06/30/2018)
See Goal 1CVi for funding
Indicators of Success 5-year Goal Year 1 Goal Year 1 ACTUAL Year 2 Goal Year 3 Goal Year 4 Goal Year 5 Goal
% of successful exits from Coordinated Entry 85% 75% 86% 75% 80% 80% 85%
Goal 1Cii: Reduce homelessness for adults, youth and families Funding Source
See Goal 1Ai for funding for PSH units
Indicators of Success 5-year Goal Year 1 Goal Year 1 ACTUAL Year 2 Goal Year 3 Goal Year 4 Goal Year 5 Goal
# of permanent supportive housing units for adults developed 443 29 305 25 84
# of permanent supportive housing units for youth developed 42 32 10
# of permanent supportive housing units for families developed 406 110 91 205
Ratio of homeless families to 6 months average housing placement rate 16 8 6.18 5 1 1 1
# of chronic homeless adults 7,288 2,050 2,754 2,050 1,069 1,069 1,050
# of homeless youth 3,846 900 1,178 900 682 682 682
Goal 1Ciii: Ensure no families with children are unsheltered Funding Source
See Goal 1CVi for Funding
Indicators of Success 5-year Goal Year 1 Goal Year 1 ACTUAL Year 2 Goal Year 3 Goal Year 4 Goal Year 5 Goal
# of unsheltered families 0 0 12 0 0 0 0
Goal 1Civ: Improve the City’s response to street homelessness and end large, long-term encampments Funding Source
See Goal 1CVi for funding
Indicators of Success 5-year Goal Year 1 Goal Year 1 ACTUAL Year 2 Goal Year 3 Goal Year 4 Goal Year 5 Goal

CAPER
9
OMB Control No: 2506-0117 (exp. 06/30/2018)
# of large, long-term encampments 0 0 0 0 0 0 0
Goal 1Cv: Further align MOHCD’s work with Department of Homelessness and Supportive Housing Funding Source
No funds to sub-recipient
Indicators of Success 5-year Goal Year 1 Goal Year 1 ACTUAL Year 2 Goal Year 3 Goal Year 4 Goal Year 5 Goal
# of MOHCD placements to HOPWA units 25 5 6 5 5 5 5
Goal 1Cvi: Expand services to prevent homelessness and stabilize housing for formerly homeless households and those at risk of homelessness
Funding Source Expected 5-year $ Amount
Expected Year 1 (2020-
2021) $ Amount
ACTUAL Year 1 (2020-2021) $ Amount
Expected Year 2 (2021-
2022) $ Amount
Expected Year 3 (2022-
2023) $ Amount
Expected Year 4 (2023-
2024) $ Amount
Expected Year 5 (2024-
2025) $ Amount
ESG $6,934,855 $1,386,971 $1,595,423 $1,386,971 $1,386,971 $1,386,971 $1,386,971
General Fund $1,200,000,000 $240,000,000 $284,175,569 $240,000,000 $240,000,000 $240,000,000 $240,000,000
Total $1,206,934,855 $241,386,971 $285,770,992 $241,386,971 $241,386,971 $241,386,971 $241,386,971
Indicators of Success 5-year Goal Year 1 Goal Year 1 ACTUAL Year 2 Goal Year 3 Goal Year 4 Goal Year 5 Goal
# of households who reached a problem solving resolution or were diverted from homelessness 15,000 2,000 841 2,500 3,000 3,500 4,000
Priority Need 1D: Provide services to maintain housing stability
Goal 1Di: Reduce rate of evictions
Funding Source Expected 5-year $ Amount
Expected Year 1 (2020-
2021) $ Amount
ACTUAL Year 1 (2020-2021) $ Amount
Expected Year 2 (2021-
2022) $ Amount
Expected Year 3 (2022-
2023) $ Amount
Expected Year 4 (2023-
2024) $ Amount
Expected Year 5 (2024-
2025) $ Amount
CDBG $17,947,845 $3,704,618 $3,714,618 $3,129,373 $3,704,618 $3,704,618 $3,704,618
CDBG-CV $0 $125,294
General Fund $19,860,286 $3,557,685 $7,492,602 $4,806,551 $3,737,793 $3,831,238 $3,927,019
Housing Trust Fund $26,059,584 $4,860,808 $5,213,053 $5,491,908 $5,106,886 $5,234,559 $5,365,423

CAPER
10
OMB Control No: 2506-0117 (exp. 06/30/2018)
Treasury Rental Assistance $0 $63,529
Total $63,867,715 $12,123,111 $16,609,096 $13,427,832 $12,549,297 $12,770,415 $12,997,060
Indicators of Success 5-year Goal Year 1 Goal Year 1 ACTUAL Year 2 Goal Year 3 Goal Year 4 Goal Year 5 Goal
# of tenants facing eviction who receive full legal representation 9,800 1,800 1,298 2,000 2,000 2,000 2,000
# of tenants facing eviction who were able to stay in their current unit 6,100 900 376 1,300 1,300 1,300 1,300
# of tenants receiving emergency rental assistance to stabilize their housing 18,730 730 1,366 4,500 4,500 4,500 4,500
# of tenants receiving Alternative Dispute Resolution (ADR) services 3,800 600 458 800 800 800 800
# of residents receiving tenants' rights counseling/education 5,700 900 1,435 1,200 1,200 1,200 1,200
Goal 1Dii: Increase access to services for residents of public and publicly subsidized housing, RAD projects, HOPWA subsidized housing, and single room occupancy hotels
Funding Source Expected 5-year $ Amount
Expected Year 1 (2020-
2021) $ Amount
ACTUAL Year 1 (2020-2021) $ Amount
Expected Year 2 (2021-
2022) $ Amount
Expected Year 3 (2022-
2023) $ Amount
Expected Year 4 (2023-
2024) $ Amount
Expected Year 5 (2024-
2025) $ Amount
CDBG $4,086,563 $923,047 $906,047 $790,879 $790,879 $790,879 $790,879
General Fund $21,296,035 $3,598,559 $5,706,096 $4,424,369 $4,424,369 $4,424,369 $4,424,369
HOPWA $0 $100,000
HOPWA-CV $0 $170,304
Housing Trust Fund $550,000 $150,000 $467,030 $100,000 $100,000 $100,000 $100,000
Other $0 $160,000
Total $25,932,598 $4,671,606 $7,509,477 $5,315,248 $5,315,248 $5,315,248 $5,315,248
Indicators of Success 5-year Goal Year 1 Goal Year 1 ACTUAL Year 2 Goal Year 3 Goal Year 4 Goal Year 5 Goal

CAPER
11
OMB Control No: 2506-0117 (exp. 06/30/2018)
# of HOPE SF and RAD residents participating in community building activities that increase cohesion and trust, provide leadership opportunities, and lead to healthier outcomes for residents
20,000 4,000 16,806 4,000 4,000 4,000 4,000
# of resident leaders who successfully support or lead the implementation of programming at their site
200 40 95 40 40 40 40
# of clients receiving information and referral, service connection and case coordination services
6,500 1,300 2,384 1,300 1,300 1,300 1,300
# of clients engaged in case management, including development of Individual Service Plan 1,500 300 324 300 300 300 300
# of clients who complete at least 50% of the goals from their Individual Service Plan 750 150 224 150 150 150 150
# of clients receiving housing retention services residing in new and existing HOPWA units 899 187 183 178 178 178 178
Goal 1Diii: Provide support for other affordable housing residents to ensure success in their housing placement
Funding Source Expected 5-year $ Amount
Expected Year 1 (2020-
2021) $ Amount
ACTUAL Year 1 (2020-2021) $ Amount
Expected Year 2 (2021-
2022) $ Amount
Expected Year 3 (2022-
2023) $ Amount
Expected Year 4 (2023-
2024) $ Amount
Expected Year 5 (2024-
2025) $ Amount
HOPWA $850,000 $50,000 $0 $200,000 $200,000 $200,000 $200,000
Total $850,000 $50,000 $0 $200,000 $200,000 $200,000 $200,000
Indicators of Success 5-year Goal Year 1 Goal Year 1 ACTUAL Year 2 Goal Year 3 Goal Year 4 Goal Year 5 Goal
# of welcome packets received by new tenants in MOHCD-sponsored affordable housing projects
400 100 0 100 100 100
# of MOHCD affordable housing tenants at risk of eviction that receive notification of eviction support services
8,280 1,024 54 1,548 1,748 1,930 2,030

CAPER
12
OMB Control No: 2506-0117 (exp. 06/30/2018)
Goal 1Div: Increase collaboration between healthcare and housing systems by increasing mobility between levels of care (high to low acuity) in residential settings for HIV+ households
Funding Source Expected 5-year $ Amount
Expected Year 1 (2020-
2021) $ Amount
ACTUAL Year 1 (2020-2021) $ Amount
Expected Year 2 (2021-
2022) $ Amount
Expected Year 3 (2022-
2023) $ Amount
Expected Year 4 (2023-
2024) $ Amount
Expected Year 5 (2024-
2025) $ Amount
HOPWA $23,295,244 $2,504,336 $2,979,712 $5,197,727 $5,197,727 $5,197,727 $5,197,727
HOPWA-CV $0 $422,667
General Fund $7,096,468 $1,586,608 $1,254,249 $1,377,465 $1,377,465 $1,377,465 $1,377,465
Total $30,391,712 $4,090,944 $4,656,628 $6,575,192 $6,575,192 $6,575,192 $6,575,192
Indicators of Success 5-year Goal Year 1 Goal Year 1 ACTUAL Year 2 Goal Year 3 Goal Year 4 Goal Year 5 Goal
# of acuity-based assessments for housing placements 477 5 118 118 118 118 118
Objective 2: Families and Indiviudals are Resilient and Eonomically Self-Sufficient
Priority Need 2A: Promote workforce development
Goal 2Ai: Provide access to employment opportunities across multiple sectors for unemployed and underemployed populations
Funding Source Expected 5-year $ Amount
Expected Year 1 (2020-
2021) $ Amount
ACTUAL Year 1 (2020-2021) $ Amount
Expected Year 2 (2021-
2022) $ Amount
Expected Year 3 (2022-
2023) $ Amount
Expected Year 4 (2023-
2024) $ Amount
Expected Year 5 (2024-
2025) $ Amount
CDBG $7,325,145 $1,465,029 $1,405,029 $1,465,029 $1,465,029 $1,465,029 $1,465,029 Leverage dollars (General Funds, other funds) directed to agencies based in NRSA $5,800,000 $2,000,000 $2,149,471 $950,000 $950,000 $950,000 $950,000
Total $13,125,145 $3,465,029 $3,554,500 $2,415,029 $2,415,029 $2,415,029 $2,415,029
Indicators of Success 5-year Goal Year 1 Goal Year 1 ACTUAL Year 2 Goal Year 3 Goal Year 4 Goal Year 5 Goal
# of unemployed and underemployed residents that successfully enroll into workforce services in aim of securing employment
5,600 1200 1,667 1100 1100 1100 1100
CAPER
13
OMB Control No: 2506-0117 (exp. 06/30/2018)
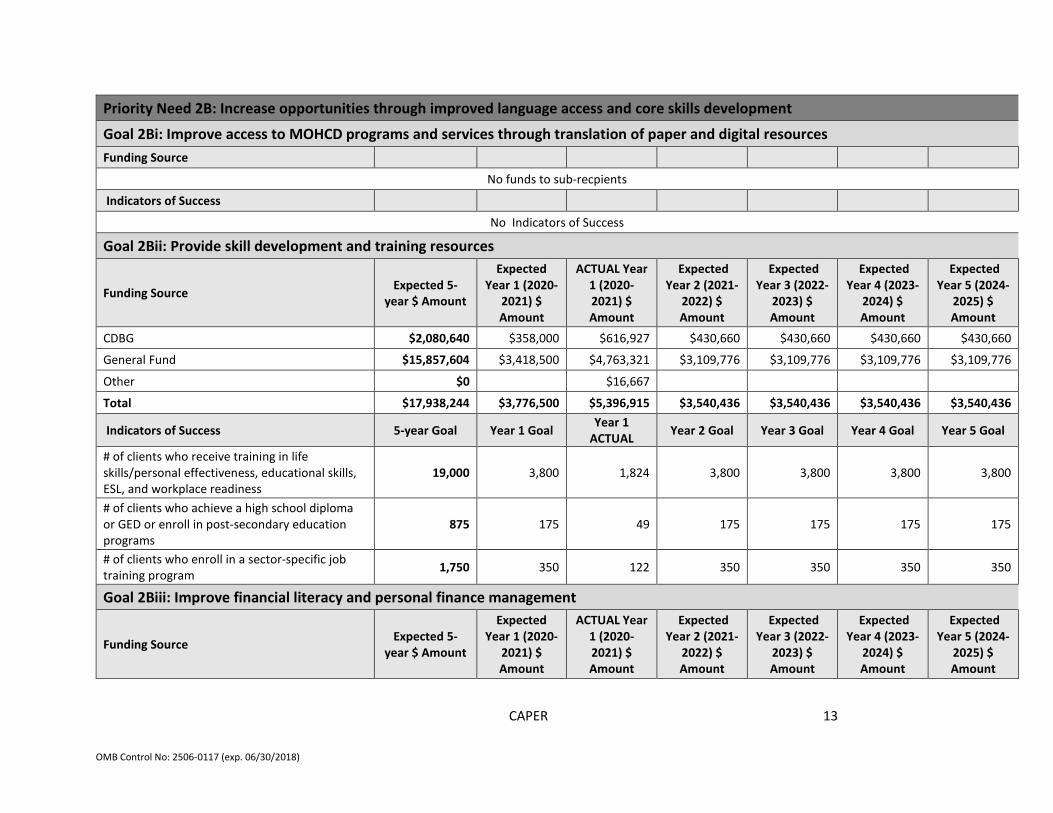
Priority Need 2B: Increase opportunities through improved language access and core skills development
Goal 2Bi: Improve access to MOHCD programs and services through translation of paper and digital resources Funding Source
No funds to sub-recpients
Indicators of Success
No Indicators of Success
Goal 2Bii: Provide skill development and training resources
Funding Source Expected 5-year $ Amount
Expected Year 1 (2020-
2021) $ Amount
ACTUAL Year 1 (2020-2021) $ Amount
Expected Year 2 (2021-
2022) $ Amount
Expected Year 3 (2022-
2023) $ Amount
Expected Year 4 (2023-
2024) $ Amount
Expected Year 5 (2024-
2025) $ Amount
CDBG $2,080,640 $358,000 $616,927 $430,660 $430,660 $430,660 $430,660
General Fund $15,857,604 $3,418,500 $4,763,321 $3,109,776 $3,109,776 $3,109,776 $3,109,776
Other $0 $16,667
Total $17,938,244 $3,776,500 $5,396,915 $3,540,436 $3,540,436 $3,540,436 $3,540,436
Indicators of Success 5-year Goal Year 1 Goal Year 1 ACTUAL Year 2 Goal Year 3 Goal Year 4 Goal Year 5 Goal
# of clients who receive training in life skills/personal effectiveness, educational skills, ESL, and workplace readiness
19,000 3,800 1,824 3,800 3,800 3,800 3,800
# of clients who achieve a high school diploma or GED or enroll in post-secondary education programs
875 175 49 175 175 175 175
# of clients who enroll in a sector-specific job training program 1,750 350 122 350 350 350 350
Goal 2Biii: Improve financial literacy and personal finance management
Funding Source Expected 5-year $ Amount
Expected Year 1 (2020-
2021) $ Amount
ACTUAL Year 1 (2020-2021) $ Amount
Expected Year 2 (2021-
2022) $ Amount
Expected Year 3 (2022-
2023) $ Amount
Expected Year 4 (2023-
2024) $ Amount
Expected Year 5 (2024-
2025) $ Amount

CAPER
14
OMB Control No: 2506-0117 (exp. 06/30/2018)
CDBG $260,000 $52,000 $115,000 $52,000 $52,000 $52,000 $52,000
General Fund $2,374,304 $488,000 $391,207 $471,576 $471,576 $471,576 $471,576
Total $2,634,304 $540,000 $506,207 $523,576 $523,576 $523,576 $523,576
Indicators of Success 5-year Goal Year 1 Goal Year 1 ACTUAL Year 2 Goal Year 3 Goal Year 4 Goal Year 5 Goal
# of clients receiving financial counseling 10,000 2,000 867 2,000 2,000 2,000 2,000 # of clients who increase savings by at least one week of income 2,075 415 50 415 415 415 415
# of clients who decrease debt by at least 10% 1,125 225 33 225 225 225 225 # of clients who increase their credit score by at least 35 points 1,250 250 39 250 250 250 250
# of clients who open safe and affordable bank accounts 1,000 200 62 200 200 200 200
# of programs being implemented on-site at RAD and HOPE SF housing developments 30 6 17 6 6 6 6
Goal 2Biv: Improve digital literacy
Funding Source Expected 5-year $ Amount
Expected Year 1 (2020-
2021) $ Amount
ACTUAL Year 1 (2020-2021) $ Amount
Expected Year 2 (2021-
2022) $ Amount
Expected Year 3 (2022-
2023) $ Amount
Expected Year 4 (2023-
2024) $ Amount
Expected Year 5 (2024-
2025) $ Amount
General Fund $455,000 $175,000 $145,634 $70,000 $70,000 $70,000 $70,000
Total $455,000 $175,000 $145,634 $70,000 $70,000 $70,000 $70,000
Indicators of Success 5-year Goal Year 1 Goal Year 1 ACTUAL Year 2 Goal Year 3 Goal Year 4 Goal Year 5 Goal
# of clients who receive free or low-cost digital devices 1,350 150 366 300 300 300 300
# of clients who receive training in digital skills, including basic digital literacy, online safety, privacy, information literacy, and advanced education or employment related skills
2,250 250 297 500 500 500 500
# of clients in affordable housing with increased access to high-speed internet 13,500 2,700 2,540 2,700 2,700 2,700 2,700
CAPER
15
OMB Control No: 2506-0117 (exp. 06/30/2018)
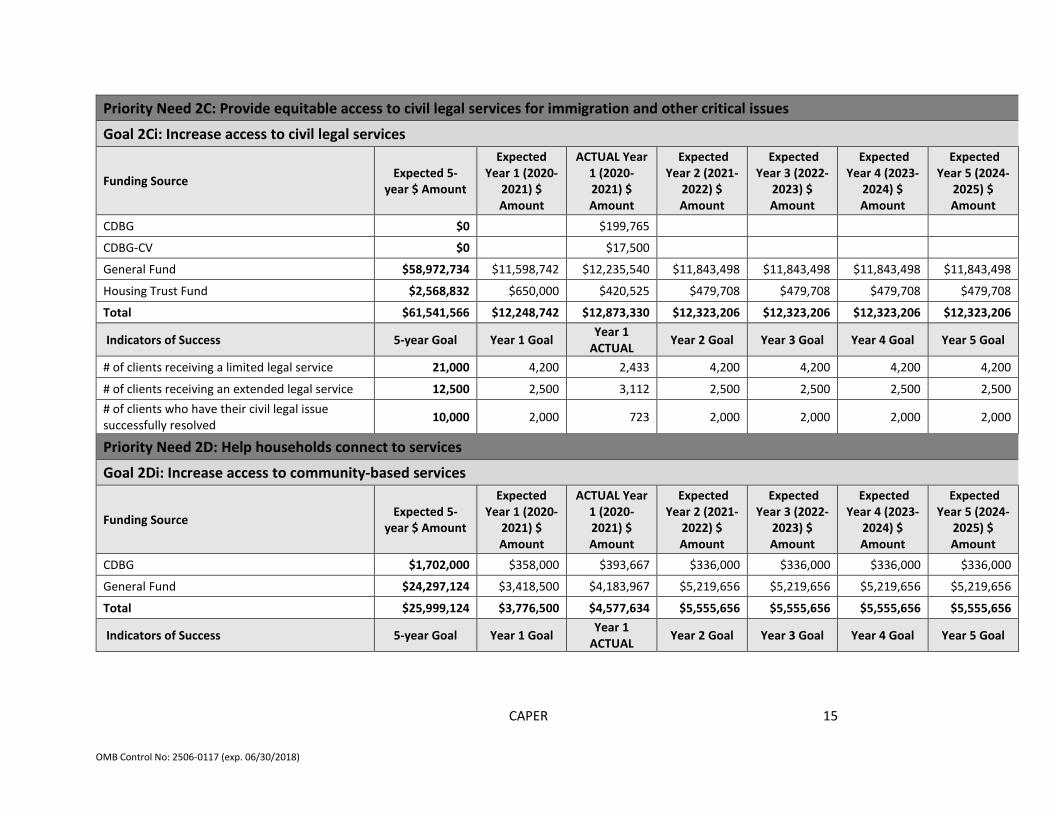
Priority Need 2C: Provide equitable access to civil legal services for immigration and other critical issues
Goal 2Ci: Increase access to civil legal services
Funding Source Expected 5-year $ Amount
Expected Year 1 (2020-
2021) $ Amount
ACTUAL Year 1 (2020-2021) $ Amount
Expected Year 2 (2021-
2022) $ Amount
Expected Year 3 (2022-
2023) $ Amount
Expected Year 4 (2023-
2024) $ Amount
Expected Year 5 (2024-
2025) $ Amount
CDBG $0 $199,765
CDBG-CV $0 $17,500
General Fund $58,972,734 $11,598,742 $12,235,540 $11,843,498 $11,843,498 $11,843,498 $11,843,498
Housing Trust Fund $2,568,832 $650,000 $420,525 $479,708 $479,708 $479,708 $479,708
Total $61,541,566 $12,248,742 $12,873,330 $12,323,206 $12,323,206 $12,323,206 $12,323,206
Indicators of Success 5-year Goal Year 1 Goal Year 1 ACTUAL Year 2 Goal Year 3 Goal Year 4 Goal Year 5 Goal
# of clients receiving a limited legal service 21,000 4,200 2,433 4,200 4,200 4,200 4,200
# of clients receiving an extended legal service 12,500 2,500 3,112 2,500 2,500 2,500 2,500 # of clients who have their civil legal issue successfully resolved 10,000 2,000 723 2,000 2,000 2,000 2,000
Priority Need 2D: Help households connect to services
Goal 2Di: Increase access to community-based services
Funding Source Expected 5-year $ Amount
Expected Year 1 (2020-
2021) $ Amount
ACTUAL Year 1 (2020-2021) $ Amount
Expected Year 2 (2021-
2022) $ Amount
Expected Year 3 (2022-
2023) $ Amount
Expected Year 4 (2023-
2024) $ Amount
Expected Year 5 (2024-
2025) $ Amount
CDBG $1,702,000 $358,000 $393,667 $336,000 $336,000 $336,000 $336,000
General Fund $24,297,124 $3,418,500 $4,183,967 $5,219,656 $5,219,656 $5,219,656 $5,219,656
Total $25,999,124 $3,776,500 $4,577,634 $5,555,656 $5,555,656 $5,555,656 $5,555,656
Indicators of Success 5-year Goal Year 1 Goal Year 1 ACTUAL Year 2 Goal Year 3 Goal Year 4 Goal Year 5 Goal

CAPER
16
OMB Control No: 2506-0117 (exp. 06/30/2018)
# of clients receiving information and referral, service connection and case coordination services
20,000 4,000 4,165 4,000 4,000 4,000 4,000
# of clients engaged in case management, including development of Individual Service Plan 7,500 1,500 1,120 1,500 1,500 1,500 1,500
# of clients who complete at least 50% of the goals from their Individual Service Plan 5,000 1,000 606 1,000 1,000 1,000 1,000
Objective 3: Communities Have Healthy Physical, Social, and Business Infrastruture
Priority Need 3A: Enhance community facilities and spaces
Goal 3Ai: Ensure nonprofit service providers have high quality, stable facilities
Funding Source Expected 5-year $ Amount
Expected Year 1 (2020-
2021) $ Amount
ACTUAL Year 1 (2020-2021) $ Amount
Expected Year 2 (2021-
2022) $ Amount
Expected Year 3 (2022-
2023) $ Amount
Expected Year 4 (2023-
2024) $ Amount
Expected Year 5 (2024-
2025) $ Amount
CDBG $2,121,584 $196,780 $91,134 $481,201 $481,201 $481,201 $481,201
HOPWA $11,351,916 $3,200,992 $0 $2,037,731 $2,037,731 $2,037,731 $2,037,731
General Fund $174,004 $0 $0 $43,501 $43,501 $43,501 $43,501
Other $0 $700,000
Total $13,647,504 $3,397,772 $791,134 $2,562,433 $2,562,433 $2,562,433 $2,562,433
Indicators of Success 5-year Goal Year 1 Goal Year 1 ACTUAL Year 2 Goal Year 3 Goal Year 4 Goal Year 5 Goal
# of facilities receiving capital improvements 48 2 12 12 12 12 # of facilities receiving capital needs assessments 5 1 3 1 1 1 1
Goal 3Aii: Enhance public spaces
Funding Source Expected 5-year $ Amount
Expected Year 1 (2020-
2021) $ Amount
ACTUAL Year 1 (2020-2021) $ Amount
Expected Year 2 (2021-
2022) $ Amount
Expected Year 3 (2022-
2023) $ Amount
Expected Year 4 (2023-
2024) $ Amount
Expected Year 5 (2024-
2025) $ Amount
Housing Trust Fund $1,500,000 $0 $0 $0 $500,000 $500,000 $500,000

CAPER
17
OMB Control No: 2506-0117 (exp. 06/30/2018)
Total $1,500,000 $0 $0 $0 $500,000 $500,000 $500,000
Indicators of Success 5-year Goal Year 1 Goal Year 1 ACTUAL Year 2 Goal Year 3 Goal Year 4 Goal Year 5 Goal
# of communities facing increased housing density receiving community amenities 12 0 0 0 4 4 4
Priority Need 3B: Strengthen small businesses and commercial corridors
Goal 3Bi: Encourage the development and sustainability of thriving locally owned businesses
Funding Source Expected 5-year $ Amount
Expected Year 1 (2020-
2021) $ Amount
ACTUAL Year 1 (2020-2021) $ Amount
Expected Year 2 (2021-
2022) $ Amount
Expected Year 3 (2022-
2023) $ Amount
Expected Year 4 (2023-
2024) $ Amount
Expected Year 5 (2024-
2025) $ Amount
CDBG $4,819,328 $1,088,869 $1,711,869 $1,092,439 $879,340 $879,340 $879,340
General Fund $15,911,150 $3,182,230 $3,309,300 $3,182,230 $3,182,230 $3,182,230 $3,182,230
Total $20,730,478 $4,271,099 $5,021,169 $4,274,669 $4,061,570 $4,061,570 $4,061,570
Indicators of Success 5-year Goal Year 1 Goal Year 1 ACTUAL Year 2 Goal Year 3 Goal Year 4 Goal Year 5 Goal
# of startup businesses assisted 708 160 85 161 129 129 129
# of existing businesses assisted 2,170 490 491 492 396 396 396 # of businesses engaged in a language other than English 220 50 108 50 40 40 40
Total dollar amount value of loans accessed $15,490,503 $3,500,000 $14,316,084 $3,511,000 $2,826,501 $2,826,501 $2,826,501
# of loans funded 242 55 473 55 44 44 44
Total dollar amount value of equity invested $7,745,753 $1,750,000 $7,623,122 $1,756,000 $1,413,251 $1,413,251 $1,413,251 # of jobs retained via business technical assistance 1,550 350 342 351 283 283 283
# of jobs created via business technical assistance 1,550 350 202 351 283 283 283
# of new businesses established via technical assistance provided 220 50 58 50 40 40 40
# of leases strengthened and businesses stabilized 198 45 63 45 36 36 36
CAPER
18
OMB Control No: 2506-0117 (exp. 06/30/2018)
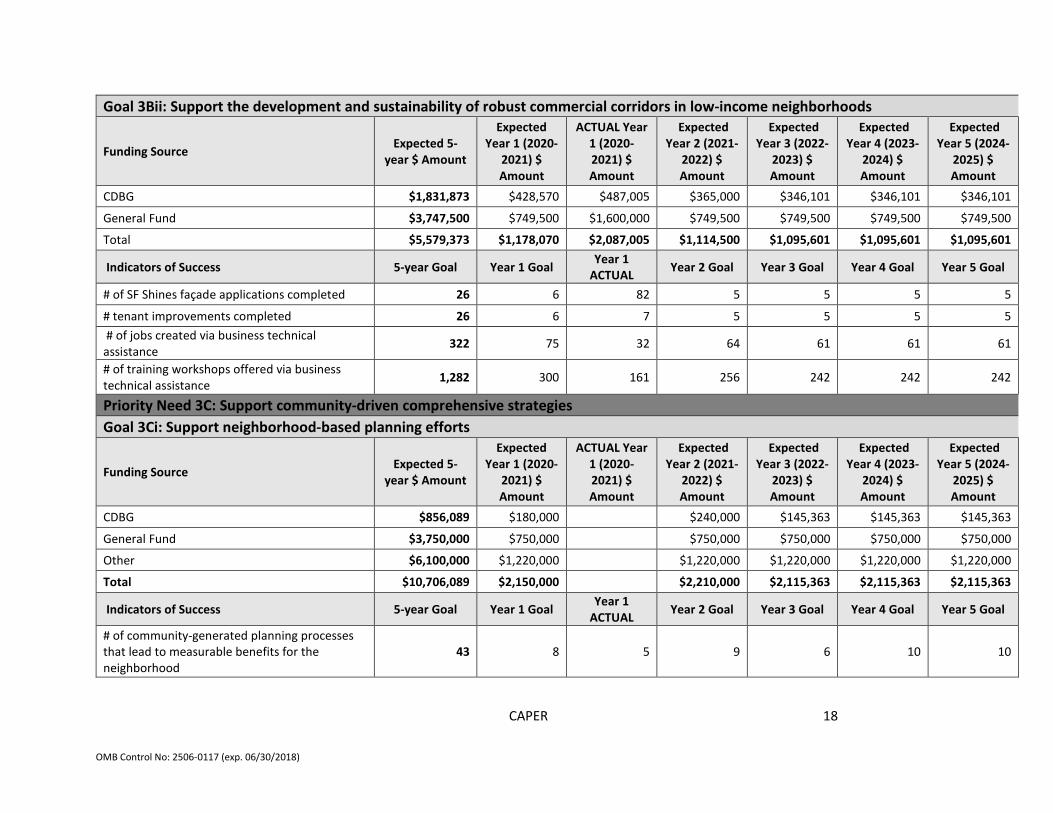
Goal 3Bii: Support the development and sustainability of robust commercial corridors in low-income neighborhoods
Funding Source Expected 5-year $ Amount
Expected Year 1 (2020-
2021) $ Amount
ACTUAL Year 1 (2020-2021) $ Amount
Expected Year 2 (2021-
2022) $ Amount
Expected Year 3 (2022-
2023) $ Amount
Expected Year 4 (2023-
2024) $ Amount
Expected Year 5 (2024-
2025) $ Amount
CDBG $1,831,873 $428,570 $487,005 $365,000 $346,101 $346,101 $346,101
General Fund $3,747,500 $749,500 $1,600,000 $749,500 $749,500 $749,500 $749,500
Total $5,579,373 $1,178,070 $2,087,005 $1,114,500 $1,095,601 $1,095,601 $1,095,601
Indicators of Success 5-year Goal Year 1 Goal Year 1 ACTUAL Year 2 Goal Year 3 Goal Year 4 Goal Year 5 Goal
# of SF Shines façade applications completed 26 6 82 5 5 5 5
# tenant improvements completed 26 6 7 5 5 5 5 # of jobs created via business technical assistance 322 75 32 64 61 61 61
# of training workshops offered via business technical assistance 1,282 300 161 256 242 242 242
Priority Need 3C: Support community-driven comprehensive strategies Goal 3Ci: Support neighborhood-based planning efforts
Funding Source Expected 5-year $ Amount
Expected Year 1 (2020-
2021) $ Amount
ACTUAL Year 1 (2020-2021) $ Amount
Expected Year 2 (2021-
2022) $ Amount
Expected Year 3 (2022-
2023) $ Amount
Expected Year 4 (2023-
2024) $ Amount
Expected Year 5 (2024-
2025) $ Amount
CDBG $856,089 $180,000 $240,000 $145,363 $145,363 $145,363
General Fund $3,750,000 $750,000 $750,000 $750,000 $750,000 $750,000
Other $6,100,000 $1,220,000 $1,220,000 $1,220,000 $1,220,000 $1,220,000
Total $10,706,089 $2,150,000 $2,210,000 $2,115,363 $2,115,363 $2,115,363
Indicators of Success 5-year Goal Year 1 Goal Year 1 ACTUAL Year 2 Goal Year 3 Goal Year 4 Goal Year 5 Goal
# of community-generated planning processes that lead to measurable benefits for the neighborhood
43 8 5 9 6 10 10

CAPER
19
OMB Control No: 2506-0117 (exp. 06/30/2018)
# of nonprofit organizations that will produce cultural events, arts, cultural activities, and public place keeping projects
115 23 17 23 23 23 23
# of businesses assisted as part of a community-driven comprehensive strategy (Cultural Districts, neighborhood strategy)
165 35 87 46 28 28 28
# of jobs created via business technical assistance as part of a community-driven comprehensive strategy
142 30 57 40 24 24 24
# of jobs retained via business technical assistance as part of a community-driven comprehensive strategy
142 30 27 40 24 24 24
Goal 3Cii: Support locally-based community building
Funding Source Expected 5-year $ Amount
Expected Year 1 (2020-
2021) $ Amount
ACTUAL Year 1 (2020-2021) $ Amount
Expected Year 2 (2021-
2022) $ Amount
Expected Year 3 (2022-
2023) $ Amount
Expected Year 4 (2023-
2024) $ Amount
Expected Year 5 (2024-
2025) $ Amount
General Fund $8,311,636 $1,154,000 $4,085,480 $1,789,409 $1,789,409 $1,789,409 $1,789,409
Other $3,000,000 $3,000,000 $541,367 $0 $0 $0 $0
Total $11,311,636 $4,154,000 $4,626,847 $1,789,409 $1,789,409 $1,789,409 $1,789,409
Indicators of Success 5-year Goal Year 1 Goal Year 1 ACTUAL Year 2 Goal Year 3 Goal Year 4 Goal Year 5 Goal
# of community-driven reports completed 50 10 10 10 10 10 Priority Need 3D: Support capacity needs of community-based organizations and professional partners Goal 3Di: Increase capacity of community-based organizations
Funding Source Expected 5-year $ Amount
Expected Year 1 (2020-
2021) $ Amount
ACTUAL Year 1 (2020-2021) $ Amount
Expected Year 2 (2021-
2022) $ Amount
Expected Year 3 (2022-
2023) $ Amount
Expected Year 4 (2023-
2024) $ Amount
Expected Year 5 (2024-
2025) $ Amount
CDBG $0 $40,070
General Fund $7,082,650 $975,886 $205,534 $1,526,691 $1,526,691 $1,526,691 $1,526,691
Housing Trust Fund $0 $84,118

CAPER
20
OMB Control No: 2506-0117 (exp. 06/30/2018)
Other $0 $124,533
Total $7,082,650 $975,886 $454,255 $1,526,691 $1,526,691 $1,526,691 $1,526,691
Indicators of Success 5-year Goal Year 1 Goal Year 1 ACTUAL Year 2 Goal Year 3 Goal Year 4 Goal Year 5 Goal
# of organizations receiving capacity building and technical assistance 400 80 155 80 80 80 80
# of organizations who successfully achieved at least one of their capacity building goals, as measured by pre- and post-assessment
75 15 15 15 15 15
Objective 4: Communities At Risk of Displacement Are Stablized Priority Need 4A: Address inequitable impacts of economic growth through anti-displacement measures for residents and businesses Goal 4Ai: Implement policies and programs that prioritize current residents Funding Source
No funding to sub-recipients
Indicators of Success 5-year Goal Year 1 Goal Year 1 ACTUAL Year 2 Goal Year 3 Goal Year 4 Goal Year 5 Goal
# of residents who accessed affordable housing through the COP, DTHP and NRHP lottery preference programs
1,250 250 175 250 250 250 250
# of “Mixed Status Families” stabilized via support services and subsidies 715 130 165 140 145 150 150
Goal 4Aii: Encourage commercial tenants to locate on ground-floor spaces of MOHCD’s affordable housing developments Funding Source
No funding to sub-recipients
Indicators of Success
No Indicators of Success
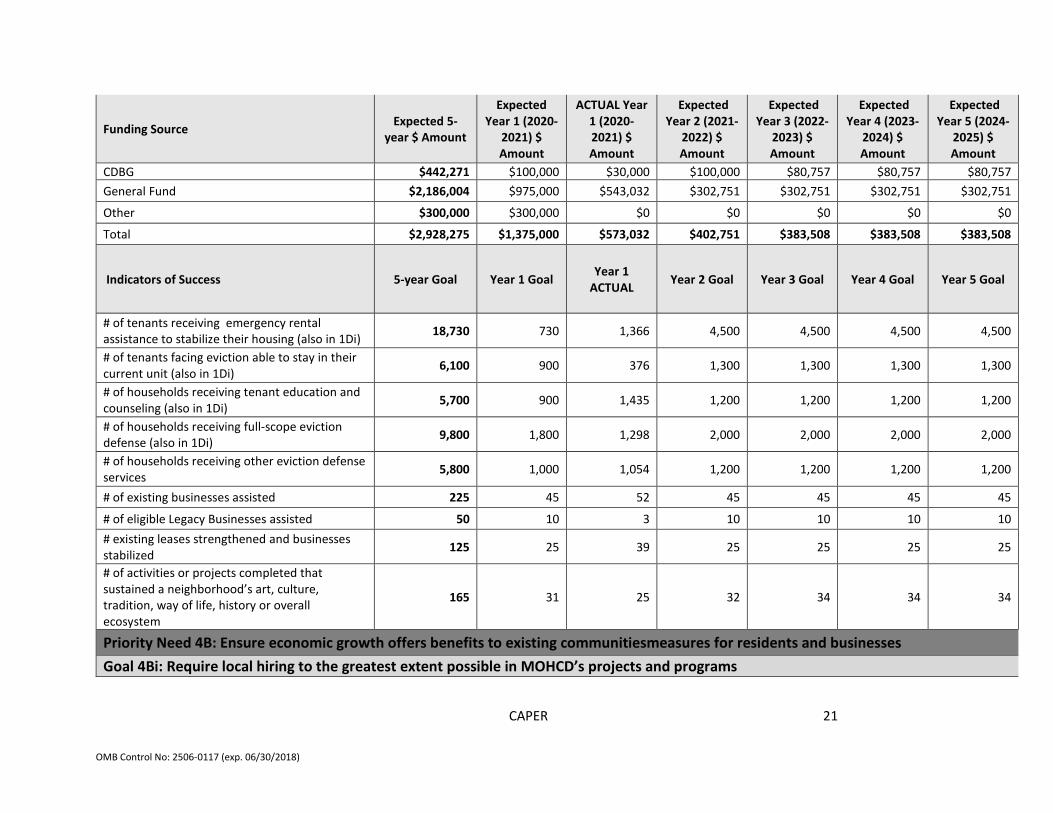
Goal 4Aiii: Reduce displacement of residents and businesses
CAPER
21
OMB Control No: 2506-0117 (exp. 06/30/2018)
Funding Source Expected 5-year $ Amount
Expected Year 1 (2020-
2021) $ Amount
ACTUAL Year 1 (2020-2021) $ Amount
Expected Year 2 (2021-
2022) $ Amount
Expected Year 3 (2022-
2023) $ Amount
Expected Year 4 (2023-
2024) $ Amount
Expected Year 5 (2024-
2025) $ Amount
CDBG $442,271 $100,000 $30,000 $100,000 $80,757 $80,757 $80,757 General Fund $2,186,004 $975,000 $543,032 $302,751 $302,751 $302,751 $302,751
Other $300,000 $300,000 $0 $0 $0 $0 $0
Total $2,928,275 $1,375,000 $573,032 $402,751 $383,508 $383,508 $383,508
Indicators of Success 5-year Goal Year 1 Goal Year 1 ACTUAL Year 2 Goal Year 3 Goal Year 4 Goal Year 5 Goal
# of tenants receiving emergency rental assistance to stabilize their housing (also in 1Di) 18,730 730 1,366 4,500 4,500 4,500 4,500
# of tenants facing eviction able to stay in their current unit (also in 1Di) 6,100 900 376 1,300 1,300 1,300 1,300
# of households receiving tenant education and counseling (also in 1Di) 5,700 900 1,435 1,200 1,200 1,200 1,200
# of households receiving full-scope eviction defense (also in 1Di) 9,800 1,800 1,298 2,000 2,000 2,000 2,000
# of households receiving other eviction defense services 5,800 1,000 1,054 1,200 1,200 1,200 1,200
# of existing businesses assisted 225 45 52 45 45 45 45
# of eligible Legacy Businesses assisted 50 10 3 10 10 10 10 # existing leases strengthened and businesses stabilized 125 25 39 25 25 25 25
# of activities or projects completed that sustained a neighborhood’s art, culture, tradition, way of life, history or overall ecosystem
165 31 25 32 34 34 34
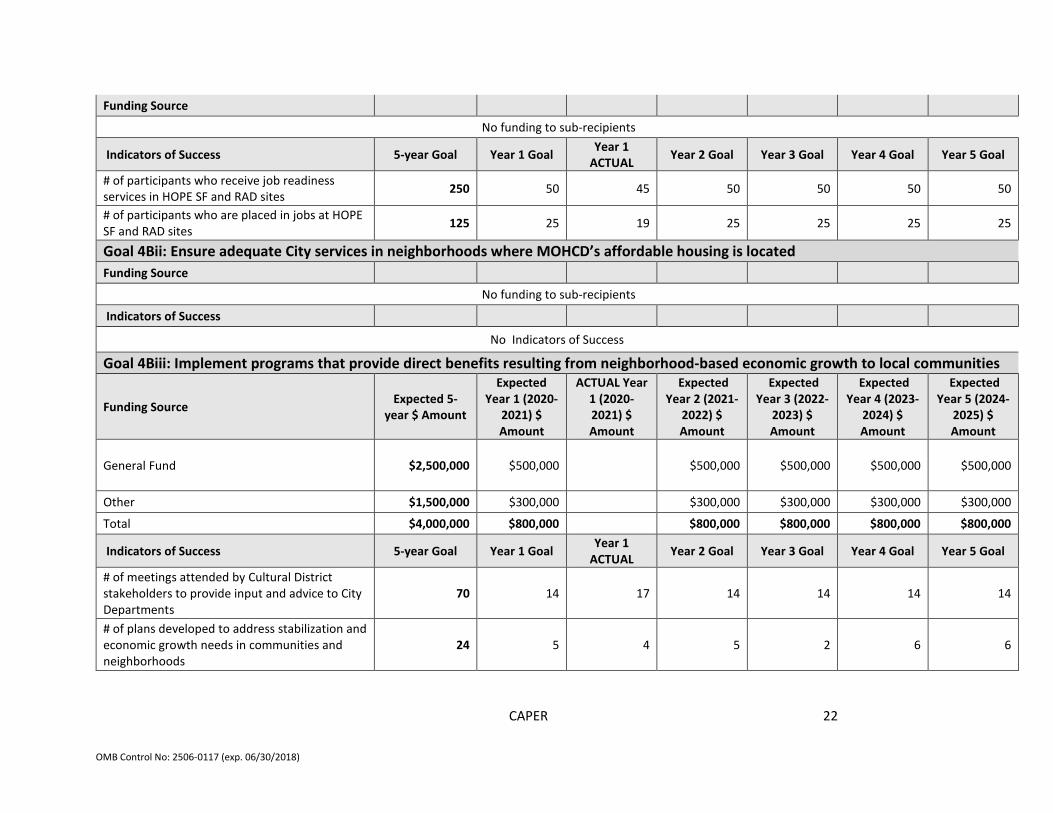
Priority Need 4B: Ensure economic growth offers benefits to existing communitiesmeasures for residents and businesses Goal 4Bi: Require local hiring to the greatest extent possible in MOHCD’s projects and programs
CAPER
22
OMB Control No: 2506-0117 (exp. 06/30/2018)
Funding Source
No funding to sub-recipients
Indicators of Success 5-year Goal Year 1 Goal Year 1 ACTUAL Year 2 Goal Year 3 Goal Year 4 Goal Year 5 Goal
# of participants who receive job readiness services in HOPE SF and RAD sites 250 50 45 50 50 50 50
# of participants who are placed in jobs at HOPE SF and RAD sites 125 25 19 25 25 25 25
Goal 4Bii: Ensure adequate City services in neighborhoods where MOHCD’s affordable housing is located Funding Source
No funding to sub-recipients
Indicators of Success
No Indicators of Success
Goal 4Biii: Implement programs that provide direct benefits resulting from neighborhood-based economic growth to local communities
Funding Source Expected 5-year $ Amount
Expected Year 1 (2020-
2021) $ Amount
ACTUAL Year 1 (2020-2021) $ Amount
Expected Year 2 (2021-
2022) $ Amount
Expected Year 3 (2022-
2023) $ Amount
Expected Year 4 (2023-
2024) $ Amount
Expected Year 5 (2024-
2025) $ Amount
General Fund $2,500,000 $500,000 $500,000 $500,000 $500,000 $500,000
Other $1,500,000 $300,000 $300,000 $300,000 $300,000 $300,000
Total $4,000,000 $800,000 $800,000 $800,000 $800,000 $800,000
Indicators of Success 5-year Goal Year 1 Goal Year 1 ACTUAL Year 2 Goal Year 3 Goal Year 4 Goal Year 5 Goal
# of meetings attended by Cultural District stakeholders to provide input and advice to City Departments
70 14 17 14 14 14 14
# of plans developed to address stabilization and economic growth needs in communities and neighborhoods
24 5 4 5 2 6 6

CAPER
23
OMB Control No: 2506-0117 (exp. 06/30/2018)
Objective 5: The City Works to Eliminate the Causes of Racial Disparities Priority Need 5A: Ensure racially equitable access to programs and services, in coordination with other City departments Goal 5Ai: Develop specific funding, policies and practices to ensure equitable access to MOHCD and OEWD programs Funding Source
No funding to sub-recipients
Indicators of Success 5-year Goal Year 1 Goal Year 1 ACTUAL Year 2 Goal Year 3 Goal Year 4 Goal Year 5 Goal
# of City staff who attend GARE training workshops 35 7 0 7 7 7 7
# of staff trained in trauma informed systems and self-care activities 150 50 0 50 50
Execution of racial equity analysis in MOHCD RFQ/RFP selection criteria 1 1 1
Creation of MOHCD community outreach strategies that address racial disparities, historically underserved populations,cultural competency, and cultural humility
5 1 1 1 1 1 1
Priority Need 5B: Instill racial equity and trauma-informed values and practices in the work of MOHCD and its partners
Goal 5Bi: Incorporate cultural competency, trauma-informed systems, and other equity training and resources for MOHCD’s partners Funding Source
No funding to sub-recipients
Indicators of Success 5-year Goal Year 1 Goal Year 1 ACTUAL Year 2 Goal Year 3 Goal Year 4 Goal Year 5 Goal
# of partner staff trained in implicit bias, cultural competency, trauma informed systems and equity trainings
50 10 12 10 10 10 10
# of HIV-specific education seminars and trainings 5 1 0 1 1 1 1
# of trainings for community partners hosted by MOHCD and OEWD 5 1 55 1 1 1 1
Goal 5Bii: Incorporate racial equity principles in MOHCD’s hiring and promotion practices

CAPER
24
OMB Control No: 2506-0117 (exp. 06/30/2018)
Funding Source
No funding to sub-recipients
Indicators of Success 5-year Goal Year 1 Goal Year 1 ACTUAL Year 2 Goal Year 3 Goal Year 4 Goal Year 5 Goal
Execute MOHCD Racial Equity plan 3 1 1 1 1
Goal 5Bii: Incorporate racial equity principles in MOHCD’s hiring and promotion practices Funding Source
No funding to sub-recipients
Indicators of Success 5-year Goal Year 1 Goal Year 1 ACTUAL Year 2 Goal Year 3 Goal Year 4 Goal Year 5 Goal
Execute MOHCD Racial Equity plan 3 1 1 1 1
Implement changes to MOHCD internal policies 5 1 3 1 1 1 1 Inclusion of Trauma Champions, Catalysts, and Leaders in MOHCD’s Racial Equity Working group
15 3 3 3 3 3 3
Table 1 - Accomplishments – Program Year & Strategic Plan to Date

CAPER
25
OMB Control No: 2506-0117 (exp. 06/30/2018)
Assess how the jurisdiction’s use of funds, particularly CDBG, addresses the priorities and specific objectives identified in the plan, giving special attention to the highest priority activities identified. In program year 2020-2021, CDBG, ESG, HOME and HOPWA investments were made in the following program areas:
• CDBG and HOME Affordable Housing Development; • CDBG Capital Projects; • CDBG Economic Development; • CDBG Planning and Capacity Building; • CDBG Public Services; • ESG Rapid Re-Housing, Homeless Prevention and Emergency Shelter; and • HOPWA Capital Projects, Rental Assistance Program and Supportive Services and Operating
Subsidies. Over the course of the 2020-2021 program year, San Francisco strategically used housing and community development funds, including CDBG, ESG, HOME and HOPWA funds, to support affordable housing; support public housing developments; support housing for people with AIDS; renovate and develop community facilities; improve ADA access to community facilities; deliver timely, relevant and effective social services; provide low-income residents with employment readiness skills; support the placement of residents in jobs that pay living wages; provide housing-related services including tenant rights counseling, eviction prevention counseling, tenant-based rental assistance and homeownership counseling; deliver services that help to prevent homelessness; provide shelter and essential social services to homeless individuals and families; and assist small businesses and micro-enterprises. Additionally, CDBG funds were used to support nonprofit organizational capacity building.
Select highlights of the 2020-2021 program year specific to the use of federal funding include:
• 687 units of affordable housing were funded to be created • 391 existing affordable housing units were funded to be preserved • Two capital projects were funded, of which one was funded with CDBG • More than 40,000 individuals received a wide range of services, including eviction prevention,
assistance with finding and applying for housing, and housing and homebuying counseling; o 9,816 individuals received CDBG-funded public services; o 1,030 individuals received ESG-funded homeless, homeless prevention or rapid re-
housing services; o 505 households received HOPWA-funded housing assistance, of which 402 were in San
Francisco; • 1,674 small businesses and micro-enterprises received business technical assistance; • 321 jobs were created or retained; • Significant progress towards the five-year goals for the six NRSAs; • The City’s leveraging of significant resources through public, private and not for profit support of
programs that strengthen and optimize federal funds; • Increased coordination of services; and • Improved monitoring and management of sub-recipients.

CAPER
26
OMB Control No: 2506-0117 (exp. 06/30/2018)
In general, housing and community development activities that were implemented during program year 2020-2021 served the identified needs. The five-year funding and indicators of success table above shows how the City performed against the goals that were set in the five-year strategic plan and the one-year action plan. The comparison of accomplishment data to goals indicate that the Consolidated Plan activities made a positive impact on the identified needs. However, due to the complexity and extent of the needs in the City, the identified needs are still significant.
CAPER
27
OMB Control No: 2506-0117 (exp. 06/30/2018)
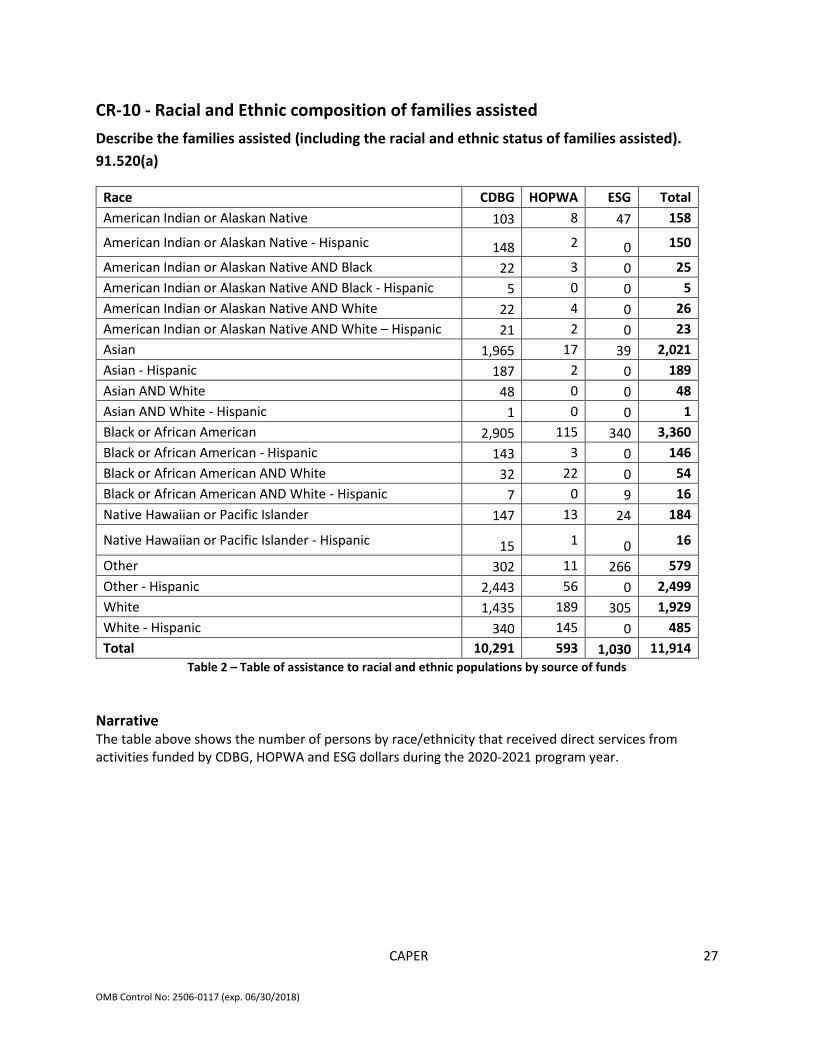
CR-10 - Racial and Ethnic composition of families assisted Describe the families assisted (including the racial and ethnic status of families assisted). 91.520(a)
Race CDBG HOPWA ESG Total American Indian or Alaskan Native 103 8 47 158
American Indian or Alaskan Native - Hispanic 148 2 0 150
American Indian or Alaskan Native AND Black 22 3 0 25 American Indian or Alaskan Native AND Black - Hispanic 5 0 0 5 American Indian or Alaskan Native AND White 22 4 0 26 American Indian or Alaskan Native AND White – Hispanic 21 2 0 23 Asian 1,965 17 39 2,021 Asian - Hispanic 187 2 0 189 Asian AND White 48 0 0 48 Asian AND White - Hispanic 1 0 0 1 Black or African American 2,905 115 340 3,360 Black or African American - Hispanic 143 3 0 146 Black or African American AND White 32 22 0 54 Black or African American AND White - Hispanic 7 0 9 16 Native Hawaiian or Pacific Islander 147 13 24 184
Native Hawaiian or Pacific Islander - Hispanic 15 1 0 16
Other 302 11 266 579 Other - Hispanic 2,443 56 0 2,499 White 1,435 189 305 1,929 White - Hispanic 340 145 0 485 Total 10,291 593 1,030 11,914
Table 2 – Table of assistance to racial and ethnic populations by source of funds
Narrative The table above shows the number of persons by race/ethnicity that received direct services from activities funded by CDBG, HOPWA and ESG dollars during the 2020-2021 program year.

CAPER
28
OMB Control No: 2506-0117 (exp. 06/30/2018)
CR-15 - Resources and Investments 91.520(a) Identify the resources made available
Sources of Funds Resources Made Available
CDBG $10,267,179 CDBG-CV $1,740,016 HOME $0 HOPWA $3,440,728 HOPWA-CV $659,637 HOPWA Competitive $463,667 HOPWA Competitive-CV $53,153 ESG $1,423,716 Other - General Obligation Bond $102,333,612 Other - Housing Impact Fees $21,884,931 Other - Low-Mod Income Housing Asset Fund $7,301,604 Other - Local General Fund $132,645,289 Other - Local Housing Trust Fund $12,000,917 Other - Treasury Rental Assistance $3,004,706 Other Funds $13,941,120 Total $311,160,277
Table 3a – Resources Made Available by Funding Source
Program Areas Resources Made Available
Capital Improvements to Public Facilities $791,134 Downpayment Assistance $6,837,381 Economic Development $2,515,717 Multi-Family Housing Development $210,474,779 Planning and Organizational Capacity Building $5,081,102 Public Services $85,460,164 Total $311,160,277
Table 3b – Resources Made Available by Program Area Narrative Tables 3a and 3b above show all resources that were made available during program year 2020-2021 by funding source and by program area, respectively.

CAPER
29
OMB Control No: 2506-0117 (exp. 06/30/2018)
Identify the geographic distribution and location of investments
Target Area Planned Percentage of Allocation
Actual Percentage of Allocation
Narrative Description
Bayview Hunters Point 10% 6% See below Chinatown 10% 1% See below Mission 10% 18% See below South of Market 10% 18% See below Tenderloin 10% 14% See below Visitacion Valley 10% 0% See below
Table 4 – Identify the geographic distribution and location of investments
Narrative Bayview Hunters Point The following are the priority activities that will be carried out under the 2020-2024 Consolidated Plan in the Bayview Hunter’s Point NRSA, organized by the Plan’s Objectives and Priority Needs. Objective 1: Families and Individuals are Stably Housed Priority Need 1A: Develop and maintain accessible and affordable housing
Continue to implement affordable housing components of HOPE SF at Hunters View and Alice Griffith
Complete 23 new affordable housing projects currently in the development pipeline for completion between 2020-2024 in the neighborhood, which will add 750 of affordable housing
Priority Need 1B: Made housing more affordable
Robustly funded Homeownership counseling programs based in the neighborhood Robustly funded home modification programs that focus on helping low-income
homeowners (a significant population in Bayview Hunters Point) modify and be able to stay in their homes
Robustly funded Rental Housing Counseling programs based in the neighborhood Priority Need 1C: Worked to prevent and reduce homelessness
Reduced the inflow of households entering the homeless response system by engaging in diversion or funding prevention services
Maintained support to homeless outreach, shelters and social services for people actively experiencing homelessness in the southeast sector
Increased the outflow from the homeless response system by supporting the development of affordable housing and rental assistance
Priority Need 1D: Provided services to maintain housing stability

CAPER
30
OMB Control No: 2506-0117 (exp. 06/30/2018)
Provided robust support for RAD Family Services projects at Hunters Point East, Hunters Point West, and Westbrook housing developments
Provided robust support for HOPE SF Housing Retention and Case Management services Locate other key services, such as tenant counseling and eviction prevention, legal
services, financial education and counseling, on-site at HOPE SF and RAD projects Continued to support community building and resident leadership development
programs Supported Tenant Right to Counsel providers based in the neighborhood, to ensure that
residents have access to full scope legal representation when facing eviction Objective 2: Families and Individuals are Resilient and Economically Self-Sufficient Priority Need 2A: Promote workforce development
Provide a full range of employment and training services through The Bayview-Hunters Point Job Center, including
o Job readiness workshops, job search assistance, career planning and connections to employment.
o Certifications and license(s) attainment assistance to enhance employment. o Outreach, hiring and training of residents for HOPE SF housing sites in BVHP. o Open computer lab with staff assistance available. o Targeted outreach to neighborhood seniors and older adults for employment
assistance. Support Bayview-Hunters Point organizations for youth workforce services. This includes
sector services, youth development for the workforce, barrier removal services and paid internship opportunities.
Priority Need 2B: Increased opportunities through improved language access and core skills
development Supported skills development programs in areas including life skills and personal
effectiveness, educational skills (including GED and diploma programs), English as a Second Language training, and workplace readiness skills
Supported programs that create clear pathways to more advanced training opportunities, including post-secondary educational programs, more advanced ESL programming at San Francisco City College, and sector-specific job training programs through OEWD and other entities
Ensured that skill development programs based in Bayview Hunters Point are funded, and that these programs are accessible to RAD and HOPE SF residents,
Supported financial counseling and education, including intensive one-on-one financial coaching; ensure that these services are located in Bayview Hunters Point including on-site at HOPE SF and RAD housing sites
Supported digital literacy programs, including programs that provide Internet access and assist with digital literacy for affordable housing residents and sites, especially at HOPE SF and RAD housing sites
Priority Need 2C: Provided equitable access to civil legal services for immigration and other
critical issues Ensured that a comprehensive civil legal services provider is located in Bayview Hunters

CAPER
31
OMB Control No: 2506-0117 (exp. 06/30/2018)
Point, and that residents have access to legal counseling and representation in a wide range of crucial legal areas
Priority Need 2D: Helped households connect to services
Supported a comprehensive continuum of services including enhanced information and referral, service connection to identify and meet short-term client goals, case management to address more complex and/or longer term needs, and case coordination to coordinate services for a client between multiple providers and systems. Ensure that these services are located in the Bayview.
Objective 3: Communities Have Healthy Physical, Social and Business Infrastructure Priority Need 3A: Enhanced community facilities
Ensured nonprofit service providers have high quality, stable facilities Priority Need 3B: Strengthen small businesses and commercial corridors
Continue to provide business technical assistance through community partners Support economic revitalization and façade improvement efforts along the Third Street
Commercial Corridor- Evans to Jamestown Avenues Led 6 month community engagement process to develop and prioritize goals in the
Cultural District strategy Priority Need 3C: Supported community-driven comprehensive strategies
Through the African American Arts and Cultural District in Bayview Hunters Point, provided infrastructure for the community to launch, lead, and determine its own cultural stabilization strategies, with extensive support from City Agencies
Supported neighborhood planning processes focused on Bayview Hunters Point, including supporting convening of nonprofits services in Southeast San Francisco, and collaboratives of organizations led by underrepresented populations (including African-American led organizations)
Priority Need 3D: Supported capacity needs of community-based organizations and MOHCD
professional partners Built organizational capacity of MOHCD’s Bayview Hunters Point grantees/providers
through outreach, relationship building and recruitment, organizational assessments, trainings and coaching, cohort-based and project-based work, subject matter experts, and other technical assistance methodologies
Objective 4: Communities At Risk of Displacement are Stabilized Priority Need 4A: Address inequitable impacts of economic growth through anti-displacement
measures for residents and businesses Leverage African-American Arts & Cultural District to support anti-displacement policies Play a key role in strategy and program development, coordinating resources for small
businesses and property owners, supporting inter-agency and community collaborations, and facilitate community engagement for the Bayview/Third Street Corridor merchants

CAPER
32
OMB Control No: 2506-0117 (exp. 06/30/2018)
Priority Need 4B: Ensure economic growth offers benefits to existing communities Coordinate with OEWD for job readiness and job placement on affordable housing
projects Continue to support job readiness and placement for RAD and HOPE SF projects Coordinated Cultural District programming with other community development
initiatives to provide maximum economic benefit to neighborhood residents Chinatown The following are the priority activities that will be carried out under the Consolidated Plan in the Chinatown NRSA, organized by the Plan’s Objectives and Priority Needs. Objective 1: Families and Individuals are Stably Housed Priority Need 1A: Develop and maintain accessible and affordable housing
Completed Ping Yuen North RAD rehabilitation project, providing 199 affordable units Complete 772 Pacific Avenue project, providing an estimated 49 affordable units
Priority Need 1B: Made housing more affordable
Robustly funded Homeownership counseling programs that can serve neighborhood residents, including monolingual Chinese speakers
Robustly funded Rental Housing Counseling programs based in the neighborhood, and ones that can serve neighborhood residents, including monolingual Chinese speakers
Priority Need 1C: Worked to prevent and reduce homelessness
Reduced the inflow of households entering the homeless response system by engaging in diversion or funding prevention services
Maintained support to homeless outreach, shelters and social services for people actively experiencing homelessness in the northwest sector
Increased the outflow from the homeless response system by supporting the development of affordable housing and rental assistance
Priority Need 1D: Provided services to maintain housing stability
Provided robust support for RAD Family Services projects at Ping Yuen and Ping Yuen North
Ensured that other key services, such as tenant counseling and eviction prevention, legal services, financial education and counseling, are accessible to residents of these RAD projects
Continued to support community building and resident leadership development programs
Supported Tenant Right to Counsel providers based in the neighborhood, to ensure that residents have access to full scope legal representation when facing eviction
Supported tenant counseling and education organizations based in the neighborhood Objective 2: Families and Individuals are Resilient and Economically Self-Sufficient Priority Need 2A: Promote workforce development
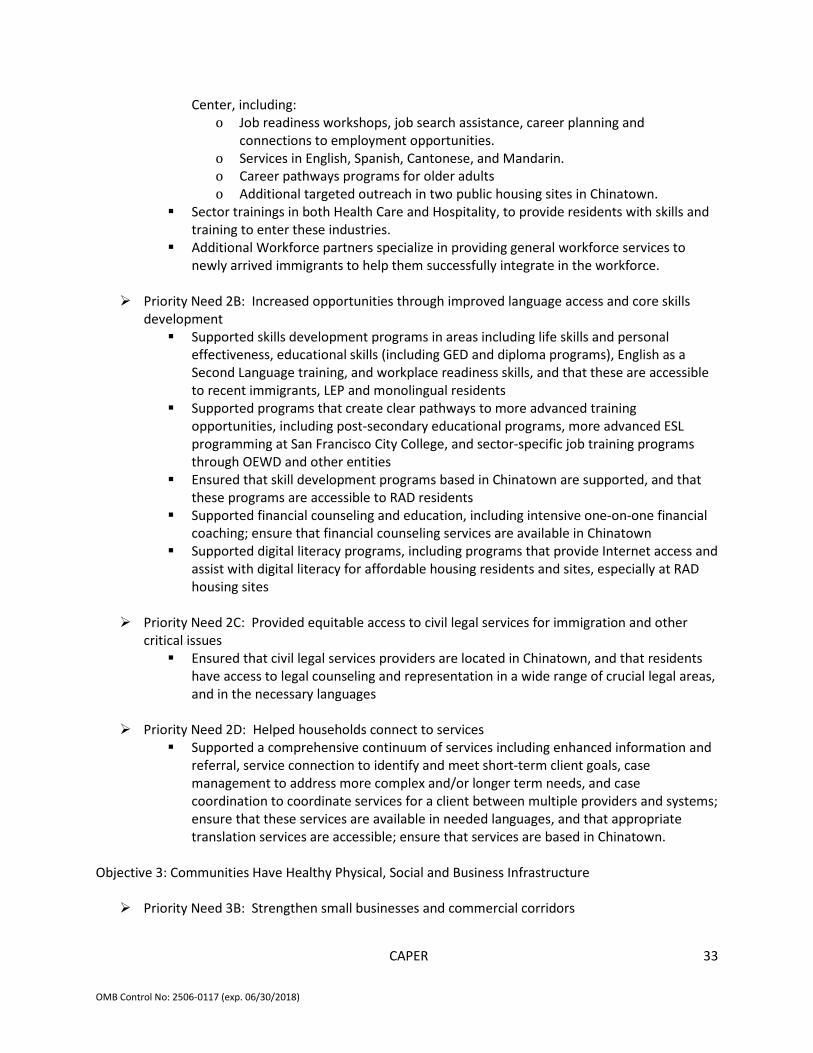
Provide employment and training services to local residents through the Chinatown Job
CAPER
33
OMB Control No: 2506-0117 (exp. 06/30/2018)
Center, including: o Job readiness workshops, job search assistance, career planning and
connections to employment opportunities. o Services in English, Spanish, Cantonese, and Mandarin. o Career pathways programs for older adults o Additional targeted outreach in two public housing sites in Chinatown.
Sector trainings in both Health Care and Hospitality, to provide residents with skills and training to enter these industries.
Additional Workforce partners specialize in providing general workforce services to newly arrived immigrants to help them successfully integrate in the workforce.
Priority Need 2B: Increased opportunities through improved language access and core skills
development Supported skills development programs in areas including life skills and personal
effectiveness, educational skills (including GED and diploma programs), English as a Second Language training, and workplace readiness skills, and that these are accessible to recent immigrants, LEP and monolingual residents
Supported programs that create clear pathways to more advanced training opportunities, including post-secondary educational programs, more advanced ESL programming at San Francisco City College, and sector-specific job training programs through OEWD and other entities
Ensured that skill development programs based in Chinatown are supported, and that these programs are accessible to RAD residents
Supported financial counseling and education, including intensive one-on-one financial coaching; ensure that financial counseling services are available in Chinatown
Supported digital literacy programs, including programs that provide Internet access and assist with digital literacy for affordable housing residents and sites, especially at RAD housing sites
Priority Need 2C: Provided equitable access to civil legal services for immigration and other
critical issues Ensured that civil legal services providers are located in Chinatown, and that residents
have access to legal counseling and representation in a wide range of crucial legal areas, and in the necessary languages
Priority Need 2D: Helped households connect to services
Supported a comprehensive continuum of services including enhanced information and referral, service connection to identify and meet short-term client goals, case management to address more complex and/or longer term needs, and case coordination to coordinate services for a client between multiple providers and systems; ensure that these services are available in needed languages, and that appropriate translation services are accessible; ensure that services are based in Chinatown.
Objective 3: Communities Have Healthy Physical, Social and Business Infrastructure Priority Need 3B: Strengthen small businesses and commercial corridors

CAPER
34
OMB Control No: 2506-0117 (exp. 06/30/2018)
Expand services to existing businesses to help them stay and grow in the Central Subway Station and Grant Avenue area
Provide support to and invest in local revitalization and marketing initiatives Priority Need 3C: Supported community-driven comprehensive strategies
Supported work of the API Council to convene and coordinate efforts of organizations that serve Chinatown and other API communities
Supported work of the API Council to convene and coordinate efforts of organizations that serve Chinatown and other API communities
Priority Need 3D: Supported capacity needs of community-based organizations and MOHCD
professional partners Built organizational capacity of MOHCD’s Chinatown grantees/providers through
outreach, relationship building and recruitment, organizational assessments, trainings and coaching, cohort-based and project-based work, subject matter experts, and other technical assistance methodologies
Objective 4: Communities At Risk of Displacement are Stabilized Priority Need 4A: Address inequitable impacts of economic growth through anti-displacement
measures for residents and businesses OEWD Corridor Manager will provide business engagement and vacancy tracking
Priority Need 4B: Ensure economic growth offers benefits to existing communities
Coordinate with OEWD for job readiness and job placement on affordable housing projects
Continue to support job readiness and placement for RAD projects Economic Development activities focusing on vacancy activation, including short-term
“pop up” businesses and improvements to attract long-term tenants Mission The following are the priority activities that will be carried out under the Consolidated Plan in the Mission NRSA, organized by the Plan’s Objectives and Priority Needs. Objective 1: Families and Individuals are Stably Housed Priority Need 1A: Develop and maintain accessible and affordable housing
30 affordable housing projects currently in development in the neighborhood that are estimated to be completed between 2020-2024, which will add or rehabilitate 720 units of affordable housing
This includes primarily new construction, along with small sites acquisition, rehabilitation, and inclusionary housing
Priority Need 1B: Made housing more affordable
Robustly funded Homeownership counseling programs based in the neighborhood Robustly funded Rental Housing Counseling programs based in the neighborhood Continue and complete Bernal Dwellings RAD rehabilitation project, providing

CAPER
35
OMB Control No: 2506-0117 (exp. 06/30/2018)
affordable 160 units Priority Need 1C: Prevented and reduced homelessness
Reduced the inflow of households entering the homeless response system by engaging in diversion or funding prevention services
Maintained support to homeless outreach, shelters and social services for people actively experiencing homelessness in the Mission
Increased the outflow from the homeless response system by supporting the development of affordable housing and rental assistance
Priority Need 1D: Provided services to maintain housing stability
Supported Tenant Right to Counsel providers based in the neighborhood, to ensure that residents have access to full scope legal representation when facing eviction
Support tenant counseling and education organizations based in the neighborhood Objective 2: Families and Individuals are Resilient and Economically Self-Sufficient Priority Need 2A: Promote workforce development
Provided virtual employment and training services to local residents, through the Mission Job Center due to COVID, including:
o Job readiness workshops, job search assistance, career planning and connections to employment opportunities.
o Services in English and Spanish. o Career pathways programs for public housing residents, and targeted outreach
in five public housing sites in the Mission. o Training for tech careers and office administration.
Additional Mission-based Workforce partners specialize in providing workforce and training services in hospitality and healthcare.
Priority Need 2B: Increased opportunities through improved language access and core skills
development Supported skills development programs in areas including life skills and personal
effectiveness, educational skills (including GED and diploma programs), English as a Second Language training, and workplace readiness skills
Supported programs that create clear pathways to more advanced training opportunities, including post-secondary educational programs, more advanced ESL programming at San Francisco City College, and sector-specific job training programs through OEWD and other entities
Ensured that skill development programs based in the Mission are funded, and that these programs are accessible to RAD residents
Supported financial counseling and education, including intensive one-on-one financial coaching; ensure that these services are located in the Mission
Supported digital literacy programs, including programs that provide Internet access and assist with digital literacy for affordable housing residents and sites, especially at RAD housing sites in the Mission
Priority Need 2C: Provided equitable access to civil legal services for immigration and other

CAPER
36
OMB Control No: 2506-0117 (exp. 06/30/2018)
critical issues Ensured that civil legal services providers are located in the Mission, and that residents
have access to legal counseling and representation in a wide range of crucial legal areas, and in the necessary languages
Due to large number of immigrant families, ensured that legal services are available to them in the neighborhood, and in the necessary languages
Priority Need 2D: Helped households connect to services
Supported a comprehensive continuum of services including enhanced information and referral, service connection to identify and meet short-term client goals, case management to address more complex and/or longer term needs, and case coordination to coordinate services for a client between multiple providers and systems; ensure that these services are available in needed languages (including Spanish as well as Mayan and other indigenous languages), that appropriate translation services are accessible, and that providers are located in the Mission
Objective 3: Communities Have Healthy Physical, Social and Business Infrastructure Priority Need 3A: Enhanced community facilities
Ensured Mission nonprofit service providers have high quality, stable facilities Priority Need 3B: Strengthen small businesses and commercial corridors
Provide small businesses with individualized technical assistance through community partners
Support neighborhood events to attract people to the corridor, fill vacancies, improve business storefronts, and conduct business outreach and tailored business services
Priority Need 3C: Supported community-driven comprehensive strategies
Leveraged Mission 2020 and Mission Promise Zone planning processes Strengthened economic development strategies and activities in community-driven
plans Priority Need 3D: Supported capacity needs of community-based organizations and MOHCD
professional partners Built organizational capacity of MOHCD’s Mission neighborhood grantees/providers
through outreach, relationship building and recruitment, organizational assessments, trainings and coaching, cohort-based and project-based work, subject matter experts, and other technical assistance methodologies
Objective 4: Communities at Risk of Displacement are Stabilized Priority Need 4A: Addressed inequitable impacts of economic growth through anti-
displacement measures for residents and businesses Leverage Calle 24 Latino/a Cultural District to support anti-displacement policies Look to the Mission Action Plan as a guide for implementing strategies that reduce
displacement and seek stabilization Priority Need 4B: Ensured economic growth offers benefits to existing communities

CAPER
37
OMB Control No: 2506-0117 (exp. 06/30/2018)
Calle 24 Latino/a Cultural District will be an economically vibrant community that is inclusive of diverse income households and businesses that together compassionately embrace the unique Latino/a heritage and cultures of 24th Street and that celebrate Latino/a cultural events, foods, businesses, activities, art and music.
Coordinate with OEWD for job readiness and job placement on affordable housing projects
Continue to support job readiness and placement for RAD projects South of Market The following are the priority activities that will be carried out under the Consolidated Plan in the South of Market NRSA, organized by the Plan’s Objectives and Priority Needs. Objective 1: Families and Individuals are Stably Housed Priority Need 1A: Develop and maintain accessible and affordable housing
Complete 38 new affordable housing projects currently in development in the neighborhood, which will add or rehabilitate 1,582 units of affordable housing
Includes new construction, rehabilitation, and inclusionary units Includes both rental and homeownership opportunities
Priority Need 1B: Made housing more affordable
Robustly funded Homeownership counseling programs based in the neighborhood Robustly funded Rental Housing Counseling programs based in the neighborhood
Priority Need 1C: Worked to prevent and reduce homelessness
Reduced the inflow of households entering the homeless response system by engaging in diversion or funding prevention services
Maintained support to homeless outreach, shelters and social services for people actively experiencing homelessness in SOMA
Increased the outflow from the homeless response system by supporting the development of affordable housing and rental assistance
Priority Need 1D: Provided services to maintain housing stability
Supported Tenant Right to Counsel providers based in the neighborhood, to ensure that residents have access to full scope legal representation when facing eviction
Supported tenant counseling and education organizations based in the neighborhood Objective 2: Families and Individuals are Resilient and Economically Self-Sufficient Priority Need 2A: Promote workforce development
Provided employment and training services virtually to local residents through the SOMA Job Center, due to COVID including:
o Job readiness workshops, job search assistance, career planning and connections to employment opportunities.
o Access to paid training and on the job training opportunities. o Partnerships with other city/state agencies that offer public assistance, disability
and unemployment services.

CAPER
38
OMB Control No: 2506-0117 (exp. 06/30/2018)
Additional SOMA-based Workforce partners specialized in providing workforce and training services to veterans and those with developmental disabilities.
Priority Need 2B: Increased opportunities through improved language access and core skills
development Supported skills development programs in areas including life skills and personal
effectiveness, educational skills (including GED and diploma programs), English as a Second Language training, and workplace readiness skills
Supported programs that create clear pathways to more advanced training opportunities, including post-secondary educational programs, more advanced ESL programming at San Francisco City College, and sector-specific job training programs through OEWD and other entities
Ensured that skill development programs based in SOMA are funded Priority Need 2C: Provided equitable access to civil legal services for immigration and other
critical issues Ensured that civil legal services providers are located in SOMA, and that residents have
access to legal counseling and representation in a wide range of crucial legal areas, and in the necessary languages
Priority Need 2D: Helped households connect to services
Supported a comprehensive continuum of services including enhanced information and referral, service connection to identify and meet short-term client goals, case management to address more complex and/or longer term needs, and case coordination to coordinate services for a client between multiple providers and systems; ensure that these services are available in needed languages, and that appropriate translation services are accessible; ensure that these providers are located in SOMA
Objective 3: Communities Have Healthy Physical, Social and Business Infrastructure Priority Need 3A: Enhanced community facilities
Ensured SOMA nonprofit service providers have high quality, stable facilities Priority Need 3B: Strengthen small businesses and commercial corridors
Provide business retention & attraction services for neighborhood-serving businesses on the Sixth Street action zone
Complete 6th Street Pedestrian Safety Project, to make street safer, more accessible, and more attractive; provide construction mitigation support
Foster events and activations to strengthen foot traffic and build community Priority Need 3C: Supported community-driven comprehensive strategies
Implemented and refreshed Mayor’s Central Market/Tenderloin Strategy, which includes SOMA
Supported Cultural District planning and strategies Supported block specific groups and strategies, such as on Stevenson and Jessie Street

CAPER
39
OMB Control No: 2506-0117 (exp. 06/30/2018)
Priority Need 3D: Supported capacity needs of community-based organizations and MOHCD professional partners Built organizational capacity of MOHCD’s SOMA neighborhood grantees/providers
through outreach, relationship building and recruitment, organizational assessments, trainings and coaching, cohort-based and project-based work, subject matter experts, and other technical assistance methodologies
Objective 4: Communities At Risk of Displacement are Stabilized Priority Need 4A: Addressed inequitable impacts of economic growth through anti-
displacement measures for residents and businesses Leveraged two cultural districts in this neighborhood: o SoMa Pilipinas – Filipino Cultural District, whose mission is to prevent the displacement
of the Filipino community, protect its historic and cultural assets, help develop and sustain its legacy institutions and support its anchor community organizations, while improving the living conditions of the whole community.
o Leather and LGBTQ+ Cultural District, whose mission is to preserve, advance, and promote San Francisco’s Leather and LGBTQ+ Cultural District as a local, national, and international resource, and as a culturally and commercially enriched neighborhood and district.
Priority Need 4B: Ensure economic growth offers benefits to existing communities
Leveraged Central SOMA cultural preservation and community services for current residents
Coordinated with OEWD for job readiness and job placement on affordable housing projects
Continued to support job readiness and placement for RAD projects Tenderloin The following are the priority activities that will be carried out under the Consolidated Plan in the Tenderloin NRSA, organized by the Plan’s Objectives and Priority Needs. Objective 1: Families and Individuals are Stably Housed Priority Need 1A: Develop and maintain accessible and affordable housing
Complete 21 new or rehabbed affordable housing projects currently in development in the neighborhood, which will add or rehabilitate 927 units of affordable housing
Includes new construction, rehabilitation, and inclusionary units Includes both rental and homeownership opportunities
Priority Need 1B: Made housing more affordable
Robustly funded Homeownership counseling programs based in the neighborhood Robustly funded Rental Housing Counseling programs based in the neighborhood
Priority Need 1C: Worked to prevent and reduce homelessness
Reduced the inflow of households entering the homeless response system by engaging in diversion or funding prevention services

CAPER
40
OMB Control No: 2506-0117 (exp. 06/30/2018)
Maintained support to homeless outreach, shelters and social services for people actively experiencing homelessness in the Tenderloin
Increased the outflow from the homeless response system by supporting the development of affordable housing and rental assistance
Priority Need 1D: Provided services to maintain housing stability
Supported Tenant Right to Counsel providers based in the neighborhood, to ensure that residents have access to full scope legal representation when facing eviction
Supported tenant counseling and education organizations based in the neighborhood Objective 2: Families and Individuals are Resilient and Economically Self-Sufficient Priority Need 2A: Promote workforce development
Provide employment and training services to local residents through the Tenderloin Job Center, including:
o Job readiness workshops, job search assistance, career planning and connections to employment opportunities.
o Services/information in English, Spanish and Vietnamese. o Assistance with employment barrier removal such as basic computer, substance
abuse and temporary housing. Additional Tenderloin-based Workforce partners specialize in providing workforce and
training services to the Vietnamese community, to residents wanting tech training/employment and working the hotel lobby/hospitality industry.
Priority Need 2B: Increased opportunities through improved language access and core skills
development Supported skills development programs in areas including life skills and personal
effectiveness, educational skills (including GED and diploma programs), English as a Second Language training, and workplace readiness skills
Supported programs that create clear pathways to more advanced training opportunities, including post-secondary educational programs, more advanced ESL programming at San Francisco City College, and sector-specific job training programs through OEWD and other entities
Ensured that skill development programs based in the Tenderloin are funded Priority Need 2C: Provided equitable access to civil legal services for immigration and other
critical issues Ensured that civil legal services providers are located in the Tenderloin, and that
residents have access to legal counseling and representation in a wide range of crucial legal areas, and in the necessary languages
Priority Need 2D: Helped households connect to services
Supported a comprehensive continuum of services including enhanced information and referral, service connection to identify and meet short-term client goals, case management to address more complex and/or longer term needs, and case coordination to coordinate services for a client between multiple providers and systems; ensure that these services are available in needed languages, and that appropriate

CAPER
41
OMB Control No: 2506-0117 (exp. 06/30/2018)
translation services are accessible; ensure that these providers are located in the Tenderloin
Objective 3: Communities Have Healthy Physical, Social and Business Infrastructure Priority Need 3A: Enhanced community facilities
Ensured Tenderloin nonprofit service providers have high quality, stable facilities Priority Need 3B: Strengthen small businesses and commercial corridors
Continue to increase efficiency of technical business assistance Continue business attraction efforts that provide affordable goods and services; use SF
Shines façade and tenant improvement grants to help facilitate this. Support efforts to upgrade the exterior of commercial buildings and undertake efforts
to bring positive activation to storefronts and sidewalks Priority Need 3C: Support community-driven comprehensive strategies
Participation on block groups, such as Golden Gate Safety Group, to support small businesses and residents and address safety and security concerns
Priority Need 3D: Supported capacity needs of community-based organizations and MOHCD
professional partners Built organizational capacity of MOHCD’s Tenderloin neighborhood grantees/providers
through outreach, relationship building and recruitment, organizational assessments, trainings and coaching, cohort-based and project-based work, subject matter experts, and other technical assistance methodologies
Objective 4: Communities At Risk of Displacement are Stabilized Priority Need 4A: Addressed inequitable impacts of economic growth through anti-
displacement measures for residents and businesses Leveraged Compton’s Transgender Cultural District to address displacement of this
community The mission of the district is to create an urban environment that fosters the rich
history, culture, legacy, and empowerment of transgender people and its deep roots in the southeastern Tenderloin neighborhood.
The transgender district aims to stabilize and economically empower the transgender community through ownership of homes, businesses, historic and cultural sites, and safe community spaces.
Priority Need 4B: Ensure economic growth offers benefits to existing communities
Coordinate with OEWD for job readiness and job placement on affordable housing projects
Continue to support job readiness and placement for RAD projects Visitacion Valley The following are the priority activities that were carried out under the Consolidated Plan in the Visitacion Valley NRSA, organized by the Plan’s Objectives and Priority Needs.

CAPER
42
OMB Control No: 2506-0117 (exp. 06/30/2018)
Objective 1: Families and Individuals are Stably Housed Priority Need 1A: Develop and maintain accessible and affordable housing Continue phased construction and development of Sunnydale HOPE SF mixed-income housing
775 public housing replacement units will be constructed within 12 buildings on site, along with 196 affordable units (set at 60% AMI, selected through lottery process)
Each building will be 75% replacement units and 25% affordable units Completed leasing up Parcel Q, the first development, with 55 units Continue and complete Block 6 construction and lease up with 167 units Block 3, with about 150 units of affordable housing, and the Community Center will both
start construction in 2023 Priority Need 1C: Prevented and reduced homelessness
Reduced the inflow of households entering the homeless response system by engaging in diversion or funding prevention services
Maintained support to homeless outreach, shelters and social services for people actively experiencing homelessness in Visitacion Valley
Increased the outflow from the homeless response system by supporting the development of affordable housing and rental assistance
Priority Need 1D: Provided services to maintain housing stability
Supported Tenant Right to Counsel providers based in the neighborhood, to ensure that residents have access to full scope legal representation when facing eviction
Supported tenant counseling and education organizations based in the neighborhood Objective 2: Families and Individuals are Resilient and Economically Self-Sufficient Priority Need 2A: Promote workforce development
Provided employment and training services virtually to local residents through the Visitacion Valley Job Center due to COVID, including:
o Job readiness workshops, job search assistance, career planning, public computer access, and connections to employment opportunities.
o Services/information in English, Spanish and Chinese. o Assistance with employment opportunities at San Francisco Airport. o Assistance with driving opportunities with San Francisco Muni.
OEWD partners with Visitacion Valley based partners who prioritized providing workforce and training services to residents under the HOPE SF program.
Priority Need 2B: Increased opportunities through improved language access and core skills
development Supported skills development programs in areas including life skills and personal
effectiveness, educational skills (including GED and diploma programs), English as a Second Language training, and workplace readiness skills
Supported programs that create clear pathways to more advanced training opportunities, including post-secondary educational programs, more advanced ESL programming at San Francisco City College, and sector-specific job training programs through OEWD and other entities
Ensured that skill development programs are based in Visitacion Valley, and can provide

CAPER
43
OMB Control No: 2506-0117 (exp. 06/30/2018)
services to diverse population (including services in English, Spanish and Chinese) Priority Need 2C: Provided equitable access to civil legal services for immigration and other
critical issues Ensured that civil legal services providers have regular presence in Visitacion Valley, and
that residents have access to legal counseling and representation in a wide range of crucial legal areas, and in the necessary languages
Priority Need 2D: Helped households connect to services
Supported a comprehensive continuum of services including enhanced information and referral, service connection to identify and meet short-term client goals, case management to address more complex and/or longer term needs, and case coordination to coordinate services for a client between multiple providers and systems; ensure that these services are available in needed languages, and that appropriate translation services are accessible; ensure that these providers are located in Visitacion Valley
Objective 3: Communities Have Healthy Physical, Social and Business Infrastructure Priority Need 3A: Enhanced community facilities
Ensured Visitacion Valley nonprofit service providers have high quality, stable facilities Priority Need 3B: Strengthen small businesses and commercial corridors
Continue to provide small businesses with individualized technical assistance through community partners
Continue supporting neighborhood events to attract people to the Leland Street corridor, fill vacancies, improve business storefronts, and conduct business outreach and tailored business services
Priority Need 3D: Support capacity needs of community-based organizations and MOHCD
professional partners Build organizational capacity of MOHCD’s Visitacion Valley neighborhood
grantees/providers through outreach, relationship building and recruitment, organizational assessments, trainings and coaching, cohort-based and project-based work, subject matter experts, and other technical assistance methodologies
Objective 4: Communities At Risk of Displacement are Stabilized Priority Need 4A: Address inequitable impacts of economic growth through anti-displacement
measures for residents and businesses Leveraged Cultural Districts to support anti-displacement policies Increase access to resources for small businesses in low-income neighborhoods that
want to stay in San Francisco Provide technical assistance and access to resources to existing business to support their
stabilization and growth within the neighborhood. Priority Need 4B: Ensure economic growth offers benefits to existing communities
Coordinated with HOPE SF and OEWD for job readiness and job placement on affordable

CAPER
44
OMB Control No: 2506-0117 (exp. 06/30/2018)
housing projects, particularly on the Sunnydale HOPE SF site Continued to support job readiness and placement for HOPE SF and RAD projects
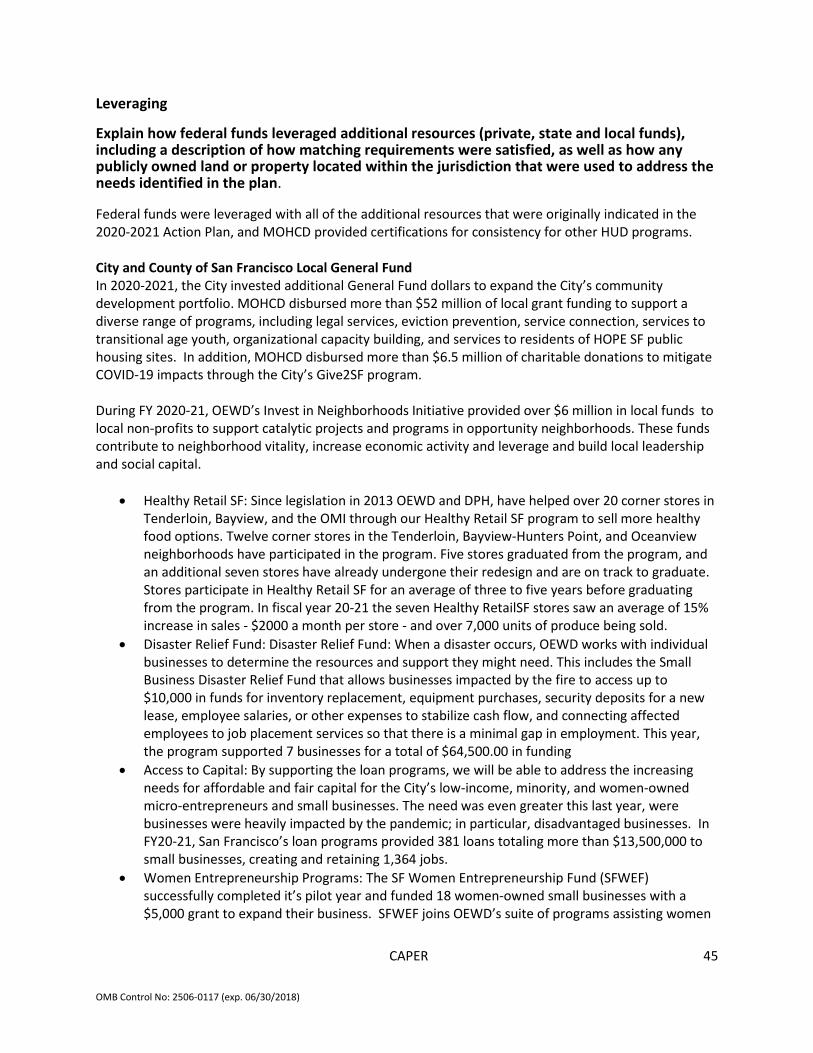
CAPER
45
OMB Control No: 2506-0117 (exp. 06/30/2018)
Leveraging
Explain how federal funds leveraged additional resources (private, state and local funds), including a description of how matching requirements were satisfied, as well as how any publicly owned land or property located within the jurisdiction that were used to address the needs identified in the plan.
Federal funds were leveraged with all of the additional resources that were originally indicated in the 2020-2021 Action Plan, and MOHCD provided certifications for consistency for other HUD programs. City and County of San Francisco Local General Fund In 2020-2021, the City invested additional General Fund dollars to expand the City’s community development portfolio. MOHCD disbursed more than $52 million of local grant funding to support a diverse range of programs, including legal services, eviction prevention, service connection, services to transitional age youth, organizational capacity building, and services to residents of HOPE SF public housing sites. In addition, MOHCD disbursed more than $6.5 million of charitable donations to mitigate COVID-19 impacts through the City’s Give2SF program. During FY 2020-21, OEWD’s Invest in Neighborhoods Initiative provided over $6 million in local funds to local non-profits to support catalytic projects and programs in opportunity neighborhoods. These funds contribute to neighborhood vitality, increase economic activity and leverage and build local leadership and social capital.
• Healthy Retail SF: Since legislation in 2013 OEWD and DPH, have helped over 20 corner stores in Tenderloin, Bayview, and the OMI through our Healthy Retail SF program to sell more healthy food options. Twelve corner stores in the Tenderloin, Bayview-Hunters Point, and Oceanview neighborhoods have participated in the program. Five stores graduated from the program, and an additional seven stores have already undergone their redesign and are on track to graduate. Stores participate in Healthy Retail SF for an average of three to five years before graduating from the program. In fiscal year 20-21 the seven Healthy RetailSF stores saw an average of 15% increase in sales - $2000 a month per store - and over 7,000 units of produce being sold.
• Disaster Relief Fund: Disaster Relief Fund: When a disaster occurs, OEWD works with individual businesses to determine the resources and support they might need. This includes the Small Business Disaster Relief Fund that allows businesses impacted by the fire to access up to $10,000 in funds for inventory replacement, equipment purchases, security deposits for a new lease, employee salaries, or other expenses to stabilize cash flow, and connecting affected employees to job placement services so that there is a minimal gap in employment. This year, the program supported 7 businesses for a total of $64,500.00 in funding
• Access to Capital: By supporting the loan programs, we will be able to address the increasing needs for affordable and fair capital for the City’s low-income, minority, and women-owned micro-entrepreneurs and small businesses. The need was even greater this last year, were businesses were heavily impacted by the pandemic; in particular, disadvantaged businesses. In FY20-21, San Francisco’s loan programs provided 381 loans totaling more than $13,500,000 to small businesses, creating and retaining 1,364 jobs.
• Women Entrepreneurship Programs: The SF Women Entrepreneurship Fund (SFWEF) successfully completed it’s pilot year and funded 18 women-owned small businesses with a $5,000 grant to expand their business. SFWEF joins OEWD’s suite of programs assisting women

CAPER
46
OMB Control No: 2506-0117 (exp. 06/30/2018)
entrepreneurs launch and grow in the City. Other long-standing programs include Bayview Women/Ren Tank, Established Women, La Cocina’s Food Incubator Program, and Wu Yee Family Child Care Small Business Development Program.
• Round 2 of the Central Subway Directed Business Support Grant has disbursed to date $446,250 to 74 small businesses. Beginning in 2021, the Van Ness Directed Business Support Grant program has provided (to date) full grant awards to 15 businesses for a total disbursement of $120,000. All businesses are able to receive one-on-one business assistance, resources and grants in the amount of $5,000 or $10,000 based on direct or indirect construction impact to help them improve their revenue and business operations. This year for both grant programs we did take into consideration the impacts of COVID-19 and allowed for reimbursements for COVID-19 related expenses to be used as a use for Phase 2 funds (25% of grant award)
• San Francisco Small Business Development Center (SBDC): OEWD applied and was awarded a Small Business Administrations (SBA) grant of $207,704 to implement the SBDC program, a program that provided no-cost business training and business consulting to San Francisco-based businesses. OEWD was awarded an additional $267,500 by the State of California to implement an Access to Capital Program and Expand Technical assistance under the SBDC.
o Fiscal Year 2020-21 Milestones: Counseled 1,401 Unique Clients Provided 5,908 Hours of Consulting Trained 1,390 Workshop Participants Offered 72 Workshops Change in Sales: $25,289,064.28 Dollar Amount of Loans: $24,572,470.09 Dollar Amount of Equity: $14,470,380 Jobs Created: 342 Jobs Retained: 5,609 New Businesses Created: 7
• Business Retention / Strengthening: Our top priority has been to deploy targeted programs that retain and strengthen our small businesses including real estate and legal assistance, business planning, façade and tenant improvements, and continuation of the Women Entrepreneurship’s Fund programs.
• Retention / Relocation: The Retention and Relocation program is a collaboration with Working Solutions and the Small Business Development Center (SBDC) focused on the proactive outreach to neighborhood-serving small businesses to strengthen their operations and leases to stay in the City. In Fiscal year 2020-21, the program assisted 91 clients, reviewed 47 leases, submitted 19 letters of intent, and signed 8 new leases. Additionally, the program helped clients access $522,358 in loans.
City and County of San Francisco Local Housing Trust Fund In 2012, the voters of San Francisco approved the creation of the Housing Trust Fund, with funding to begin in 2013. The Housing Trust Fund began with a set aside of $20 million in general fund revenue and will increase to $50 million over time. An estimated $1.1 billion will be invested in affordable housing production over the next 30 years, with more than $34 million disbursed or encumbered in FY20-21. The Housing Trust Fund will:

CAPER
47
OMB Control No: 2506-0117 (exp. 06/30/2018)
• Develop thousands of units of permanently affordable housing for residents whose average median income (AMI) is 60 percent or below. Those projects include the HOPE SF rebuild of Sunnydale and Potrero;
• Preserve the affordability of existing rent-controlled housing by acquiring the properties through MOHCD’s Small Sites Program and enforcing affordability restrictions while not displacing any current residents;
• Invest in the conversion of over 3,400 distressed public housing to stable nonprofit private ownership and management under HUD’s Rental Assistance Demonstration Program;
• Invest in a down payment assistance program for residents to purchase a home in San Francisco with no-interest loans to first-time homebuyers, with more than $24 million dedicated to this use through June 2021;
• Create a Complete Neighborhoods program that invests in improved community amenities in neighborhoods impacted by increased housing density;
• Support increased access to rental and ownership housing services; • Support increased eviction prevention services, and • Fund a Homeowner Emergency Loan Program to help distressed homeowners remain in their
homes. San Francisco General Obligation Bonds In November 2015, San Francisco voters approved a $310 million General Obligation Bond to finance the construction, acquisition, improvement, rehabilitation, preservation and repair of affordable housing for low and middle-income households. The entire amount of the bonds has been issued, with $80 million allocated to public housing revitalization; $150 million for low-income housing with $50 million of that dedicated to the Mission neighborhood and $25 million dedicated to the Small Sites program; and $80 million for middle income housing (80%-175% AMI), funding downpayment assistance and development of new middle income housing units, including units specifically targeted to public school teachers. As of June 2021, approximately $224 million of the bond proceeds have been spent on projects. A total of 1,515 affordable units are anticipated to be produced or preserved by bond proceeds. As of June 2021, 456 units are in predevelopment, 543 units are in construction, and 516 units are completed. In November 2016, San Francisco voters approved Proposition C which repurposed existing bond authority to issue up to $260.7 million to address critical housing needs, protect residents and stabilize communities. These bonds are being be used to fund MOHCD’s Preservation and Seismic Safety Program (PASS), which 1) preserves affordability in existing housing at risk of market-rate conversion, 2) protects San Franciscans living in apartments at risk of displacement, and 3) improves the earthquake resilience of San Francisco’s building stock. PASS provides MOHCD’s borrowers with low-cost and long-term access to debt financing to acquire, rehabilitate, and preserve existing buildings as permanently affordable housing. Eligible projects may be small buildings like those typically funded by the City’s Small Sites Program (e.g. 5 to 25 units), larger multifamily structures (e.g. 25+ units), or Single Room Occupancy hotels (SROs) of all sizes. The first two issuances totaling $175 million have been completed and as of June 2021 the funds are anticipated to support 45 projects with 1,048 residential and 49 commercial units. In November 2019, San Francisco voters approved a $600 million General Obligation Bond for affordable housing, with $150 million dedicated to public housing, $220 million for low-income housing, $60 million for preservation and middle income housing, $150 million for senior housing, and $20 million for

CAPER
48
OMB Control No: 2506-0117 (exp. 06/30/2018)
educator housing. The first issuance of these bonds in the amount of $254 million occurred in March 2021. Through June 30, 2021, over $62 million has been spent or encumbered. Housing Impact Fees MOHCD receives various housing impact fees paid by market rate housing developers as a means to meet their inclusionary housing obligations. MOHCD also receives housing impact fees from developers of non-residential development under the Jobs-Housing Linkage ordinance. Additional housing impact fees in specific plan areas are developed by the Planning Department and approved by the Board of Supervisors. Percentages of some fees are dedicated to MOHCD’s Small Sites Program. In 2020-2021, MOHCD spent or encumbered almost $58 million of impact fees. These loans will support for the construction of 203new affordable housing units for low-income families and preconstruction activities for 257 units for families, seniors, transition-age youth, and formerly homeless households. Program Income from former Redevelopment Agency Assets (Low-Mod Income Housing Asset Fund) With the dissolution of redevelopment agencies in 2011, MOHCD assumed responsibility of all former San Francisco Redevelopment Agency housing assets, including administration of any program income received from those assets. In 2020-2021 MOHCD expended or encumbered over $18M of these funds, primarily supporting public housing projects at Sunnydale, Potrero, and Hayes Valley. Office of Community Investment and Infrastructure (OCII) Funding The sources of funding for OCII’s affordable housing include taxable housing bonds authorized under Redevelopment Dissolution law, “pay-go” tax increment, and developer fees such as jobs-housing linkage fees. South of Market Community Stabilization Fund (SoMa Fund) The SoMa Fund was created in 2005 to mitigate the impacts of residential development and provide community stabilization benefits in the South of Market (SoMa) neighborhood. Funds are used to address the impacts of rapid development and gentrification on residents and businesses in SoMa, including affordable housing, workforce and economic development, community cohesion, capital projects and physical infrastructure. A Community Advisory Committee, comprised of seven members representing various stakeholder groups in the neighborhood, makes recommendations to the San Francisco Board of Supervisors on the SoMa Fund’s priorities and expenditures. In 2020-2021, the SoMa Fund expended $2.44 million on services and community facilities, including trauma informed services for the local public school, improvements to a cultural and small business space and the acquisition of a community facility for an anchor nonprofit that has been serving low income vulnerable residents in the neighborhood for more than fifty years. Programmatic Agreement for Compliance with National Historic Preservation Act The City and County of San Francisco, acting through the Mayor’s Office of Housing and Community Development, negotiated a Programmatic Agreement (PA) with the California State Historic Preservation Officer (SHPO) and the Advisory Council on Historic Preservation (ACHP) in January 2007. The PA ensures that the City and County of San Francisco meets its obligations under Section 106 of the National Historic Preservation Act and establishes the standards, stipulations and procedures which govern the Section 106 review of City and County of San Francisco projects subject to 24 CFR Part 58. The agreement allows for the expedited review of construction projects which have the potential to

CAPER
49
OMB Control No: 2506-0117 (exp. 06/30/2018)
affect cultural resources and which are subject to 24 CFR Part 58. Projects subject to 24 CFR Part 58 include the Community Development Block Grant, Emergency Solutions Grant, HOME Investment Partnership, Housing Opportunities for Persons with AIDS, and other numerous HUD programs. The review process contemplated by the PA also allows for the exemption of routine capital projects necessary to maintain public facilities in good repair and ensure they comply with existing building codes. Examples of such projects include the replacement of roofing materials, the upgrading of electrical wiring and the repair of fencing. In addition, the PA sets forth methodology for the determining the eligibility of cultural resources for listing on the National Register of Historic Places, consultation with Native Americans, and setting the boundaries of the Area of Potential Effects of different types of projects. The PA does not reduce the level of protection afforded by the National Historic Preservation Act to cultural resources; the PA expedites and streamlines review under the National Environmental Policy Act. The PA is authorized by 36 CFR §800.14(b). The PA has been used to successfully conduct Section 106 reviews on projects ranging from routine rehabilitation to the construction of housing developments of over 3,600 units. The programmatic agreement has considerably reduced project implementation time and costs. Every six months, the City files a Programmatic Agreement Compliance Report (PACR) with the California Office of Historic Preservation and the Advisory Council on Historic Preservation. The PACR summarizes Part 58 activities subject to the PA during the previous six months. To date, 27 PACRS have been filed with the SHPO and the ACHP. ESG Match The ESG program requires a match in an amount that equals the amount of ESG funds provided by HUD. Matching contributions may be obtained from any source, including any federal resource other than the ESG program, as well as state, local, and private sources. According to ESG regulations, the City may comply with this requirement by providing the matching funds itself, or through matching funds provided by any ESG sub-recipient. For program year 2020-2021, a total of $1,595,423 in non-ESG funds was provided by ESG sub-recipients to support the emergency shelter, rapid re-housing, and homeless prevention activities funded by ESG. HOME Match HOME regulations also require that localities provide a 25% match for HOME project expenditures. The City met its HOME Match amount by committing $5,617,528 in local funds to HOME-funded projects in FY2020-2021. CDBG Program Income MOHCD receives CDBG program income from repayments of economic development or housing loans, or from sale/rental of real property purchased with CDBG or Urban Renewal funds. All program income is receipted in the corresponding revolving loan pool in IDIS and is used for CDBG-eligible activities. In 2020-2021, a total of $4.0M in CDBG program income expenditures were reported in IDIS, with approximately $2.7M spent on development of new facilities at Shoreview Park in the Bayview, including a children’s play area, picnic area, outdoor fitness area, and new landscaping, irrigation and lighting and the balance spent on public services in the Bayview.

CAPER
50
OMB Control No: 2506-0117 (exp. 06/30/2018)
In addition, pursuant to the Yerba Buena Center Redevelopment Project Closeout Agreement that was executed in 1983 between the former Redevelopment Agency and the City, with HUD concurrence, any income generated from Yerba Buena Gardens (YBG) leasehold revenue or disposition of YBG properties is treated as CDBG program income. Income generated from leases is used exclusively by YBG to cover CDBG-eligible operating costs as described in the closeout agreement. Below is a summary of income and expenses for YBG for program year 2020-21. The City’s Real Estate Department maintains both a cash flow and a capital expenditures database for YBG that document the ongoing capital needs that program income balances will be used for.
Summary of Income and Expenses for YBG for 2020-2021 Beginning Balance, July 1 $10,983,575 2020-2021 Income 7,420,590 2020-2021 Expenses (8,621,270) Net Income/Loss (1,200,680) Ending Balance, June 30 $9,782,895
Publicly Owned Land and Property San Francisco currently leverages publicly owned land to strategically deliver essential services when possible. For example, a number of social service hubs are operated out of City-owned buildings that are master-leased to community based organizations. In addition, many youth services are located within elementary, middle, or high schools within the public school system. Visitacion Valley, a HUD-approved NRSA, is an excellent example of this leveraging, as it has two different multi-tenant buildings owned by the City and leased to nonprofits to provide a range of childcare, youth, family resource, and senior services, in addition to a public-school base youth services. In 2002, the City of San Francisco passed an ordinance requiring the transfer of underutilized or surplus property to the Mayor's Office of Housing for the development of affordable housing, particularly housing for the homeless. Properties that are suitable for housing development are to be sold or leased to a non-profit for the development of affordable housing for the homeless and households earning less than 20 percent of Area Median Income or the property is sold and those proceeds are used to develop affordable housing for the homeless, or affordable housing for households earning less than 60 percent of AMI. Additionally MOHCD works with other agencies not subject to the Surplus Property Ordinance to acquire properties they deem surplus and develop the sites into affordable housing such as land from the San Francisco Unified School District, the San Francisco Municipal Transportation Agency (SFMTA), and the Port of San Francisco. In 2020-2021, MOHCD continued construction on surplus Federal property, completed construction on Port-owned property and continued preconstruction activities on property owned by the school district and SFMTA and land formerly owned by the California Transportation Agency. These projects include

CAPER
51
OMB Control No: 2506-0117 (exp. 06/30/2018)
affordable housing for low-income and homeless families or special need populations such as very low-income seniors or transition-age youth as well as low and moderate-income households.
Fiscal Year Summary – HOME Match 1. Excess match from prior Federal fiscal year 23,684,423 2. Match contributed during current Federal fiscal year 5,617,528 3. Total match available for current Federal fiscal year (Line 1 plus Line 2) 29,301,951 4. Match liability for current Federal fiscal year 0 5. Excess match carried over to next Federal fiscal year (Line 3 minus Line 4) 29,301,951
Table 5 – Fiscal Year Summary - HOME Match Report

CAPER
52
OMB Control No: 2506-0117 (exp. 06/30/2018)
Match Contribution for the Federal Fiscal Year Project No. or
Other ID Date of
Contribution Cash
(non-Federal sources)
Foregone Taxes, Fees,
Charges
Appraised Land/Real Property
Required Infrastructure
Site Preparation, Construction
Materials, Donated labor
Bond Financing Total Match
500 Turk GOB 6/30/2021 5,617,528 0 0 0 0 0 5,617,528 Table 6 – Match Contribution for the Federal Fiscal Year
HOME MBE/WBE report
Program Income – Enter the program amounts for the reporting period Balance on hand at
begin-ning of reporting period
$
Amount received during reporting period
$
Total amount expended during reporting period
$
Amount expended for TBRA
$
Balance on hand at end of reporting period
$
2,666,950 308,234 2,431,853 0 543,331 Table 7 – Program Income
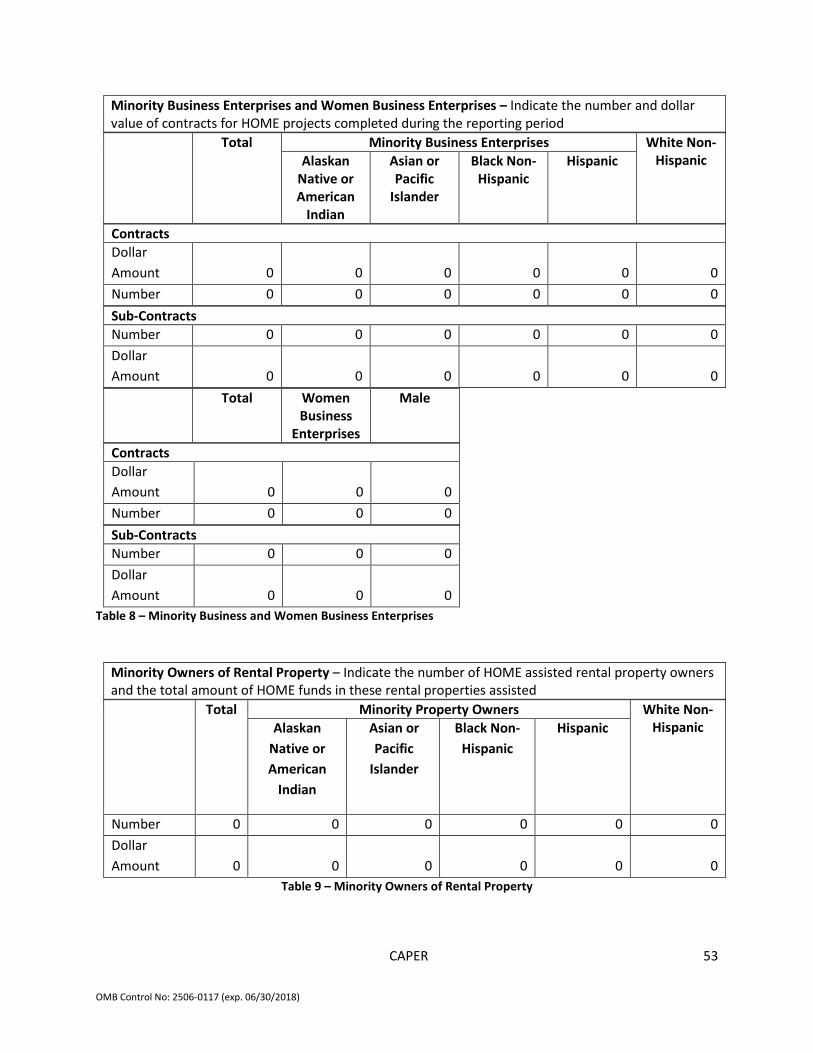
CAPER
53
OMB Control No: 2506-0117 (exp. 06/30/2018)
Minority Business Enterprises and Women Business Enterprises – Indicate the number and dollar value of contracts for HOME projects completed during the reporting period Total Minority Business Enterprises White Non-
Hispanic Alaskan Native or American
Indian
Asian or Pacific
Islander
Black Non-Hispanic
Hispanic
Contracts Dollar Amount 0 0 0 0 0 0 Number 0 0 0 0 0 0 Sub-Contracts Number 0 0 0 0 0 0 Dollar Amount 0 0 0 0 0 0 Total Women
Business Enterprises
Male
Contracts Dollar Amount 0 0 0 Number 0 0 0 Sub-Contracts Number 0 0 0 Dollar Amount 0 0 0
Table 8 – Minority Business and Women Business Enterprises
Minority Owners of Rental Property – Indicate the number of HOME assisted rental property owners and the total amount of HOME funds in these rental properties assisted
Total Minority Property Owners White Non-Hispanic Alaskan
Native or American
Indian
Asian or Pacific
Islander
Black Non-Hispanic
Hispanic
Number 0 0 0 0 0 0 Dollar Amount 0 0 0 0 0 0
Table 9 – Minority Owners of Rental Property

CAPER
54
OMB Control No: 2506-0117 (exp. 06/30/2018)
Relocation and Real Property Acquisition – Indicate the number of persons displaced, the cost of relocation payments, the number of parcels acquired, and the cost of acquisition Parcels Acquired 0 0 Businesses Displaced 0 0 Nonprofit Organizations Displaced 0 0 Households Temporarily Relocated, not Displaced 0 0
Households Displaced
Total Minority Property Enterprises White Non-Hispanic Alaskan
Native or American
Indian
Asian or Pacific
Islander
Black Non-Hispanic
Hispanic
Number 0 0 0 0 0 0 Cost 0 0 0 0 0 0
Table 10 – Relocation and Real Property Acquisition

CAPER
55
OMB Control No: 2506-0117 (exp. 06/30/2018)
CR-20 - Affordable Housing 91.520(b) Evaluation of the jurisdiction's progress in providing affordable housing, including the number and types of families served, the number of extremely low-income, low-income, moderate-income, and middle-income persons served.
One-Year Goal Actual Number of homeless households to be provided affordable housing units
279 50
Number of non-homeless households to be provided affordable housing units
97 486
Number of special-needs households to be provided affordable housing units
0 30
Total 376 566 Table 11 – Number of Households
One-Year Goal Actual Number of households supported through rental assistance
2,713 1,342
Number of households supported through the production of new units
1,364 857
Number of households supported through the rehab of existing units
388 282
Number of households supported through the acquisition of existing units
171 109
Total 4,636 2,590 Table 12 – Number of Households Supported
Discuss the difference between goals and outcomes and problems encountered in meeting these goals. MOHCD did not meet its overall housing production goals due to numerous project approval delays and the lack of state and tax-exempt bond financing to fill funding gaps. Discuss how these outcomes will impact future annual action plans. As discussed above, any projects delayed from funding in 2020-2021 will be applied toward the 2021-2022 Action Plan and its affordable housing goals.
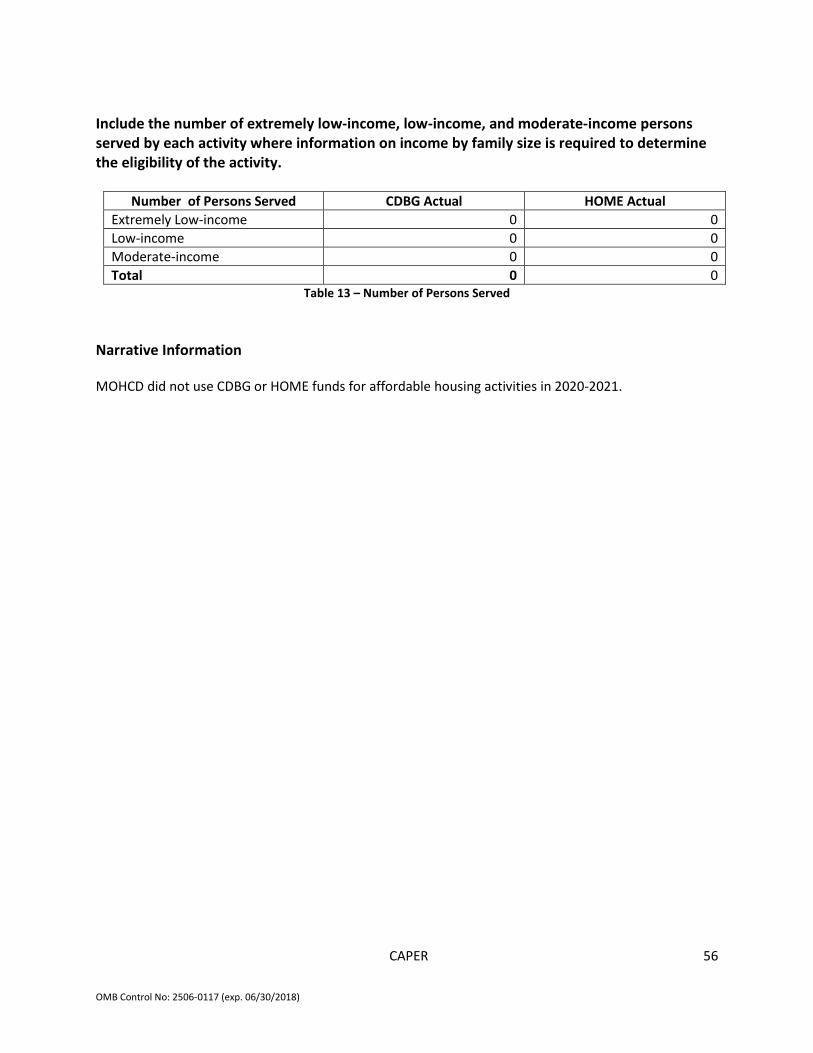
CAPER
56
OMB Control No: 2506-0117 (exp. 06/30/2018)
Include the number of extremely low-income, low-income, and moderate-income persons served by each activity where information on income by family size is required to determine the eligibility of the activity.
Number of Persons Served CDBG Actual HOME Actual Extremely Low-income 0 0 Low-income 0 0 Moderate-income 0 0 Total 0 0
Table 13 – Number of Persons Served Narrative Information MOHCD did not use CDBG or HOME funds for affordable housing activities in 2020-2021.

CAPER
57
OMB Control No: 2506-0117 (exp. 06/30/2018)
CR-25 - Homeless and Other Special Needs 91.220(d, e); 91.320(d, e); 91.520(c) – Evaluate the jurisdiction’s progress in meeting its specific objectives for reducing and ending homelessness through: Reaching out to homeless persons (especially unsheltered persons) and assessing their individual needs San Francisco’s Department of Homelessness and Supportive Housing (HSH) has a vision to make homelessness rare, brief, and one-time. HSH’s aim is a significant, sustained reduction in homelessness, and is accomplishing this by partnering with City stakeholders to achieve goals outlined in the 5-Year Strategic Framework. HSH partners across City departments to triage and coordinate a response to unsheltered homelessness and street conditions, with the goal of connecting individuals experiencing homelessness to services. The San Francisco Homeless Outreach Team (SFHOT) engages and stabilizes the most vulnerable individuals by connecting them to shelter, housing placements, and other resources. In response to requests for assistance, HSH dispatches SFHOT outreach workers to perform wellness checks and to connect individuals to the Homeless Response System. SFHOT’s Encampment Response Team (ERT) ensures that long-term encampments are minimal and that those living in cars/vehicles have access to available resources. To make placements, SFHOT works in small teams to provide outreach and case management to people experiencing homelessness who are living on the streets, and to find Permanent Supportive Housing through the following:
• Stabilization Care Management – This service provides short-term stabilization care management for high-risk individuals assessed through Coordinated Entry (CE) as Housing Referral Status who cannot navigate health and human services systems on their own. Care Managers accept referrals from SFHOT through HSH coordinated services, and through high user treatment programs. Within six to twelve months, SFHOT aims to: (1) Stabilize individuals into temporary shelter/supportive housing; (2) Remove barriers to attaining Permanent Supportive Housing (PSH); (3) Secure PSH; and (4) serve as care coordinators for San Francisco Health Network (SFHN) members.
• Street Outreach Team – This service provides outreach, engagement, and warm handoffs from
the street to (or between) urgent/emergent institutions. First Responders operate 24/7 and respond to requests from 311, Care Coordinators, Police, Fire, and urgent/emergent institutions for transports. Within two hours, they respond to and determine if the individual can be cleared for transport and handoff. First Responders provide targeted outreach to High Users of Multiple Systems (HUMS) and other high-risk individuals identified by 311 and health care coordinators, perform wellness checks, and refer to services, Case Management teams, and other resources.
• San Francisco Public Library – This service includes a Psychiatric Social Worker situated at the
Civic Center Main Branch who conducts outreach to homeless, marginally housed, and mentally ill library patrons and connects patrons to available services. They educate library staff to improve understanding of behaviorally vulnerable patrons; these trainings help staff to serve this group according to their needs and decrease the number and severity of incidents requiring

CAPER
58
OMB Control No: 2506-0117 (exp. 06/30/2018)
security intervention. A dedicated social worker also supervises four part-time Health and Safety Associates (HaSAs), library patrons experiencing homelessness served by SFHOT case management. HaSAs reach out to patrons experiencing homelessness and encourage them to accept case management and other services.
FY20-21 Successes: Outreach efforts in FY20-21 focused on combatting the COVID-19 pandemic to reduce transmission of the virus. Initiatives included mask delivery, food/water delivery, hygiene and health education, and expanded wellness checks. 51,893 wellness checks were completed as part of COVID response in FY20-21, along with 13,713 non-COVID wellness checks. SFHOT also played a pivotal role in housing placements in FY20-21, placing 672 individuals into Shelter In Place (SIP) hotels, 406 individuals in congregate shelter, and 277 individuals in non-congregate shelter. 6,717 individuals received hand sanitizer, 5,314 received hygiene kits, and 16,107 received surgical face masks. Under the COVID Command Center (CCC), HSH deployed handwashing stations to impacted areas to increase access to hygiene. SFHOT provided staff to support outreach requests for the Health Streets Operations Center (HSOC), a partnership across fourteen City agencies to develop an emergency command center to respond to unsheltered homelessness and street conditions. HSOC focused on resolving large encampments by offering appropriate resources to unsheltered individuals and educating them on public health guidance. Ongoing outreach efforts include conducting quarterly tent and vehicle counts in partnership with HSOC and supporting HSOC to reduce encampments by outreaching to inhabitants and offering temporary shelter placements. Addressing the emergency shelter and transitional housing needs of homeless persons The City’s Ten-Year Plan to End Chronic Homelessness directed HSH to move its focus away from traditional emergency shelters and toward shelters with 24-hour crisis clinics and sobering centers. In 2017, HSH published its first 5-Year Strategic Framework which identifies clear goals with benchmarks that include reducing chronic homelessness by 50%, ending homelessness for families with minor children, ending unsheltered family homelessness, and reducing homelessness among Transition Aged Youth (TAY) by 50% by 2023. Coordinated Entry (CE) is an integral part in achieving these goals, tying all programs of the Homeless Response System (HRS) together. CE provides an equitable, standardized assessment that matches households with the most appropriate available resources, prioritizes resources, and tracks those seeking assistance. CE also prioritizes participants to ensure that those with the highest need can navigate the complexities of different programs. Community Access Points provide CE Problem Solving and assess for housing solutions if Problem Solving cannot resolve homelessness. Problem Solving engages individuals in exploratory conversations around resources outside of shelters and the HRS, and helps to ensure that safe, alternative resources have been explored prior to accessing the HRS. This intervention increases HRS efficiency by supporting low-cost, timely resolution. Since HRS resources are limited, alternative solutions are critical to increase system capacity. HSH continues to expand its Navigation Center portfolio, a type of Temporary Shelter. Navigation Centers are low-barrier shelters with flexible hours and mealtimes which provide services geared to navigate

CAPER
59
OMB Control No: 2506-0117 (exp. 06/30/2018)
people to housing. Guests can enter with partners, pets, and property. Although permanent housing is the primary goal for people experiencing homeless, transitional housing is necessary until the stock of affordable housing increases. HSH continues to work to make transitional housing safe and accessible with access to housing and treatment services. FY20-21 Specific Accomplishments: In response to COVID-19, HSH in partnership with other City departments opened, filled, and operated 25 SIP Hotels, one Recreational Vehicle (RV) Village with 120 RVs and trailers, and a temporary congregate site serving up to 200 individuals. These programs minimized disruptions from shelter closures and resulting capacity reductions due to COVID-19. Temporary shelter was provided for over 6,000 people in 2020, including 4,500 unique guests in SIP congregate shelters, the SIP RV program, and the SIP hotels. COVID-19 prevention and mitigation strategies were implemented across the shelter system, including physical distancing and enhanced cleaning protocols. HSH partnered with the Department of Public Health to implement health screenings and a response system for shelters with guests who are symptomatic or COVID-positive, creating rapid response plans for outbreaks in shelters. HSH reactivated the adult shelter system by adding additional beds while maintaining spacing and robust safety measures, including daily health screening, social distancing, enhanced cleaning, testing and other preventative measures. Once the Department of Public Health determines that it is safe to do so, HSH will return capacity in the adult shelter system to pre-COVID levels, reopening approximately 1,000 placements in previously existing shelter locations. Additional FY20-21 accomplishments included:
• An 86% success rate of exits from CE, as measured by exit destinations in the ONE system according to HUD System Performance Measure 7;
• Assisting 841 households to reach a Problem Solving resolution or to divert them from homelessness; and
• Opening two new navigation centers, adding 278 beds at the Bayview SAFE Navigation Center (203 beds) and the first-of-its-kind Transitional Age Youth Navigation Center (78 beds) for individuals ages 18-24.
Helping low-income individuals and families avoid becoming homeless, especially extremely low-income individuals and families and those who are: likely to become homeless after being discharged from publicly funded institutions and systems of care (such as health care facilities, mental health facilities, foster care and other youth facilities, and corrections programs and institutions); and, receiving assistance from public or private agencies that address housing, health, social services, employment, education, or youth needs Prevention is a key component of achieving HSH’s Strategic Framework goals. Prevention strategies include eviction prevention and working with larger systems like criminal justice, child welfare, and public health systems to reduce the number of people exiting these programs/facilities into homelessness. Prevention is integral for a robust Homeless Response System (HRS) as it reduces inflow and is critical to reducing inequity in homelessness. Effective prevention requires early identification and assistance to help people avoid losing their housing, and HSH is part of a citywide Prevention system to comprehensively prevent homelessness.

CAPER
60
OMB Control No: 2506-0117 (exp. 06/30/2018)
Prevention strategies include: • Flexible financial and rental assistance to cover a range of potential needs tied to securing or
retaining housing for households at risk of homelessness; • Supportive services including housing arrangement coordination, monitoring, and/or delivery of
services to help stabilize and prevent homelessness, including financial counseling and developing housing stability plans;
• Engagement and collaboration with partner systems, such as workforce development, schools, and affordable housing providers to identify those at highest risk of homelessness. Public agencies (social services, health clinics, schools, foster care, etc.) play an important role as they are often in contact with these households and can provide information and referrals;
• Access to eviction prevention through education and outreach, expanded legal services, and eviction prevention programs; and
• Implementation of prioritization tools in eligibility processes that target vulnerability factors related to homelessness and focus assistance on those at highest risk.
Prevention services are offered by HSH at Coordinated Entry (CE) Access Points and other locations across the City. To prevent homelessness among those leaving publicly funded institutions and systems of care, HSH CE works directly with at-risk individuals leaving jail and prison, and with hospitals, mental health case management agencies, and substance use facilities to ensure access to the Homeless Response System. Known as Access Partners, these organizations include citywide stabilization, psychiatric emergency services, the San Francisco Homeless Outreach Team (SFHOT), and the Zuckerberg San Francisco General Hospital. Pending partnerships include one with the Citywide Case Management Forensic Program which provides intensive outpatient services to individuals experiencing mental illness who are involved in the criminal justice system; with the San Francisco Health Plan which is a local Medi-Cal provider; and with the San Francisco Fully Integrated Recovery Services Team (SF FIRST) which provides intensive wraparound services to high users of multiple services (HUMS). Helping homeless persons (especially chronically homeless individuals and families, families with children, veterans and their families, and unaccompanied youth) make the transition to permanent housing and independent living, including shortening the period of time that individuals and families experience homelessness, facilitating access for homeless individuals and families to affordable housing units, and preventing individuals and families who were recently homeless from becoming homeless again HSH’s strategic framework outlines a commitment to help each person find the right path to permanent housing, with different options depending on individual need. Permanent solutions to homelessness include subsidies and housing placements, and time-limited supports (ex: Rapid Rehousing) and time-flexible programs (ex: rent subsidies and Permanent Supportive Housing). Rapid Rehousing (RRH) is a housing program model that assists individuals and families experiencing homeless to move quickly into permanent housing usually in the private market. Permanent Supportive Housing (PSH) is affordable housing designed for adults and families with chronic illnesses, disabilities, mental health issues, and/or substance use disorders who have experienced long-term or repeated homelessness and provides subsidized housing and supportive services. Rent subsidies help individual households rather than subsidizing rental projects and stay with tenants as they move. The Coordinated Entry (CE) system is the system through which individuals gain access to permanent housing solutions. To assist households with

CAPER
61
OMB Control No: 2506-0117 (exp. 06/30/2018)
the highest need for services, CE prioritizes based on highest need for permanent housing solutions, including those experiencing long-term homelessness. Ending Family Homelessness: HSH’s current strategic framework prioritizes ending family homelessness by December 2022. As of 2021, San Francisco had effectively ended unsheltered homelessness among families with children. Veteran Permanent Housing Solutions: Veterans are an important subpopulation who are historically overrepresented in the homeless population and have experiences that require specific services. To reduce the number of chronically homeless veterans, San Francisco set specific rehousing goals and identified the need to seek additional funding for rent subsidies and rapid rehousing, aimed at ending chronic homelessness among this population. These strategies included incorporating veterans into the CE system, prioritizing Veterans Affairs (VA) ineligible veterans for City services, and expanding service-enriched housing environments for veterans experiencing chronic homelessness. Permanent Housing among Youth: Permanent Supportive Housing (PSH) is a key intervention San Francisco is using to meet its strategic goal of reducing youth homelessness by 50% by 2023. HSH is currently launching a new PSH site with 44 single room occupancy units for youth. Wraparound support services will include case management, and referrals to education, employment training, and healthcare, including mental health and substance abuse treatment. A portion of placements to the site will be made through CE referrals for housing priority status clients currently in COVID-19 sites. Linkages among City Departments: Many people experiencing or at risk of homelessness are in touch with the City’s public institutions and systems of care, including hospitals, mental health programs, detoxification and treatment programs, foster care, and the criminal justice system. These institutions play an important role in identifying those needing assistance to maintain or gain housing. Through comprehensive transition, or “discharge” planning, these individuals upon release can be linked with housing, treatment, and services to facilitate stability and prevent future homelessness. Key aspects of effective discharge planning include assessment of housing and service-related needs at intake; development of comprehensive discharge plans and assignment of a discharge planner/case manager to oversee plan implementation; provision of services that will promote long-term housing stability while in custody/care; and expansion of housing options for people being discharged. For individuals experiencing homelessness who are involved with the criminal justice system with non-violent petty misdemeanors and for frequent users of the hospital system, diversion strategies focus on addressing housing, treatment and service needs to prevent recurring homelessness, repeat offenses, and to improve health outcomes. “Respite” beds with appropriate medical care are available to recuperate post-hospitalization and can provide a link to community services and housing opportunities. Paths from COVID Shelter in Place sites to Permanent Housing: The process of re-housing Shelter-In-Place (SIP) participants to stable permanent housing is currently underway. To support the demobilization of COVID SIP hotels, HSH has begun launching new Permanent Supportive Housing (PSH) programs, and will begin operating buildings and expand scattered site PSH options for adults and seniors. Rapid Rehousing (RRH) will continue as an important tool for youth and families when exiting COVID emergency shelter. HSH is expanding adult RRH to support COVID-vulnerable adults not prioritized for PSH to safely exit SIP hotels to permanent housing solutions.
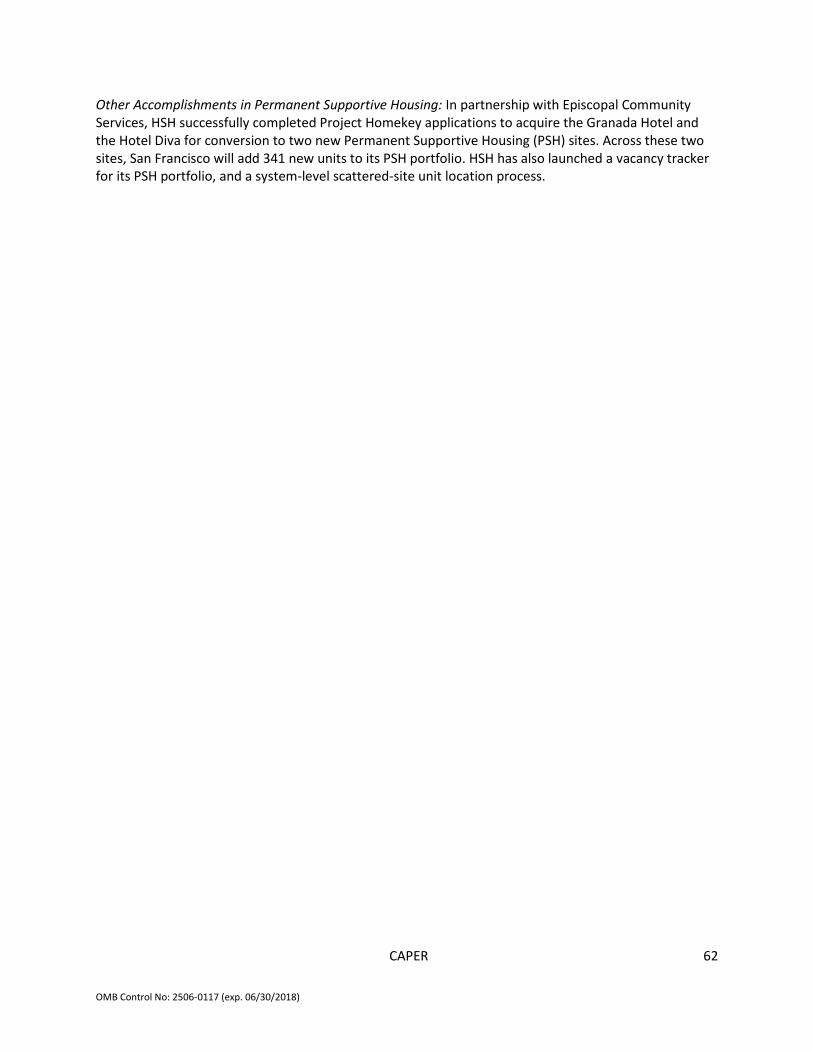
CAPER
62
OMB Control No: 2506-0117 (exp. 06/30/2018)
Other Accomplishments in Permanent Supportive Housing: In partnership with Episcopal Community Services, HSH successfully completed Project Homekey applications to acquire the Granada Hotel and the Hotel Diva for conversion to two new Permanent Supportive Housing (PSH) sites. Across these two sites, San Francisco will add 341 new units to its PSH portfolio. HSH has also launched a vacancy tracker for its PSH portfolio, and a system-level scattered-site unit location process.

CAPER
63
OMB Control No: 2506-0117 (exp. 06/30/2018)
CR-30 - Public Housing 91.220(h); 91.320(j) Actions taken to address the needs of public housing In 2015, MOHCD closed the financing for Phase 1 of the City’s Rental Assistance Demonstration Program (RAD), a HUD initiative that allows for the transfer of public housing buildings to nonprofit ownership. Through this transfer, selected affordable housing teams undertook substantial rehabilitation and preservation work at the properties. In 2016, MOHCD closed RAD Phase 2, bringing the total number of public housing units rehabilitated and preserved to 3,480, and the total value of new resources employed in the effort, including public and private funding, to over $2 billion. As of September 2020, all 28 projects have completed rehabilitation. A historic transformation effort, San Francisco’s RAD program ensures that thousands of the City’s most vulnerable residents can permanently enjoy safe, decent, and affordable housing, with new and comprehensive supportive services in every building. Since 2017, MOHCD has provided technical assistance to owners of 23 San Francisco projects originally subsidized by HUD’s Section 8 Moderate Rehabilitation program, in support of RAD conversions that will result in increased operating income for these projects. Comprising a total of 1,052 units, these legacy projects date from the 1980s and 1990s and primarily house formerly homeless individuals. Only one of the 23 projects remains to convert under RAD. MOHCD is also supporting the transition of six existing HOPE VI projects out of the public housing program and into Housing Choice Vouchers, including a five-site, 70-unit scattered sites project that is currently in predevelopment and will commence rehabilitation beginning in early 2022. While not technically a RAD project, the scattered sites transaction incorporates key RAD principles including a right to return for all residents, the provision of new supportive services for residents, and the opportunity to transfer to other RAD units in case of any emergency. HOPE SF Background Launched in 2007 and now spanning four mayoral administrations, HOPE SF is a twenty-year human and real estate capital commitment aimed at creating racially equitable, mixed-income communities in which the original public housing residents can experience the benefits of neighborhood transformation. Leveraging MOHCD’s investments in public housing and affordable housing transformation, HOPE SF takes a place-based approach by expanding conditions of inclusion and the re-enfranchisement of public housing residents through deep investments in education, economic mobility, health, and community leadership across four of the largest and most historically isolated former public housing communities in the City: Hunters View, Alice Griffith, Potrero Terrace & Annex, and Sunnydale. Real Estate Development and Infrastructure Hunters View. With the completion of Block 10, the final 54 former public housing households at Hunters View were successfully re-housed in their community bringing the percentage of legacy families successfully relocated and retained to 70%, a remarkable achievement compared to the national rate of return of 27.6% for all public housing residents in HOPE VI developments from 1993 to 2014. A total of 286 units have been built. Block 10 also houses both a childcare facility and a health and wellness center; it will serve as the community hub of the Hunters View development. The market-rate developer City Ventures is close to finalizing a deal to build 80 for-sale townhomes in the community, advancing the mixed-income vision of HOPE SF. Predevelopment on Phase III, which will bring another

CAPER
64
OMB Control No: 2506-0117 (exp. 06/30/2018)
118 affordable units to the community, including 53 public housing replacement units, is underway, with construction on the infrastructure starting in Fall 2021 and the housing portion scheduled to start in 2022. Alice Griffith. Across four phases, 333 units of newly built affordable housing were completed in Double Rock successfully housing all of the former public housing households, and bringing the retention rate to 82%. Phases 5 and 6, which will provide another 30 public housing replacement units, will begin predevelopment in 2023, pending completion of infrastructure improvements by the master developer. Potrero Hill. In January 2019, for the first time in three generations, new construction at Potrero Hill was complete, with 1101 Connecticut delivering 72 state-of-the-art affordable units, 53 of which are set aside for residents of Potrero’s public housing units. Infrastructure construction is underway in Phase 2 in preparation for Block B, the next vertical development, which is scheduled to start construction in 2022. Block B will deliver up to 167 affordable units, 75% of which will be public housing replacement units, as well as a child care center and a new park. Block A, a market rate project adjacent to Block B, is in its planning stages and will proceed as a rental housing project in 2022. Sunnydale. The first public housing replacement project at Sunnydale, called Casala (55 units), completed construction and leased up in Fall 2019. 41 Sunnydale public housing residents have been rehoused in brand new units. Construction on Block 6 (167 units) began in November 2019 and will be complete in October 2022, delivering 125 public housing replacement units. Blocks 3A and 3B are in predevelopment and between them will start construction on 172 affordable units in 2023 and 2022, respectively. These blocks will also contain 30,000 square feet of community serving space including a child care center. The next infrastructure “megaphase” is in predevelopment, as are the next replacement housing projects, Blocks 7 and 9. Rental Assistance Demonstration (RAD) MOHCD, San Francisco’s affordable housing developers, and the San Francisco Housing Authority (SFHA) successfully joined forces to preserve public housing through HUD’s Rental Assistance Demonstration (RAD) program. Our San Francisco initial “RAD Portfolio” included:
• 28 projects in 8 neighborhood clusters • 3,480 units • 2 phases
Conversion to nonprofit ownership and operations under RAD meant new project ownership and property management, rehabilitation, and onsite service providers. RAD converted existing public housing funding to long term Section 8 operating subsidies, using both RAD and non-RAD subsidies made available through the disposition of eight SFHA buildings. The combination of RAD and Section 18 rental subsidies allowed the City to leverage over $720 million in tax credit equity and an additional $240 million in debt to address rehabilitation needs for 3,480 units of public housing. All 28 projects have finished their rehabilitation and are fully operational with their new owners/operators. Below are the annual updates for FY20-21:
• City supplemental Services Contracts awarded for all 28 projects in July 2020 • Quarterly meetings for RAD Housing Retention working group (property management teams)
with a focus on housing stability support • Quarterly meetings for RAD Services working group (services partners) with a focus on
community building, health and wellness, economic self-sufficiency and housing stability • Legal Status update

CAPER
65
OMB Control No: 2506-0117 (exp. 06/30/2018)
o Phase 1 (from January – December 2019) = 1422 Households 16 Legal Cases (1.1%)
2 evictions 6 stipulated/ mediated agreements 8 pending
54 Repayment Agreements (3.8%) 50 Voluntary Move Outs – (3.5%) (primarily death, higher level of care, moving to next
opportunity, etc.) o Phase 2 (January – December 2019) = 2066 households 35 Legal Cases – (1.7%)
2 evictions 23 stipulated/ mediated agreements 10 pending
55 Repayment Agreements (2.6%) 54 Voluntary Move Outs (2.6%) (primarily death, higher level of care, moving to next
opportunity, etc.) Other RAD conversions outside of the 28-unit portfolio were completed in 2015-2017 and include new units at Alice Griffith and Hunters View HOPE SF sites, as well as a turnkey conversion of Valencia Gardens, San Francisco’s most recently completed HOPE VI project, which required no rehabilitation to convert. In FY20-21 the City moved forward with RAD conversions of three additional HOPE VI projects – Bernal Homes, Hayes Valley North, and Hayes Valley South -- in order to move them from public housing to Section 8 and support full rehabilitation of the property. These projects have followed the same process as our Initial RAD projects by adopting timelines and best practices for conversion and occupied rehabilitation projects. Below are some highlights:
• Applications submitted to and approved by SFHA for non-RAD PBV vouchers • All three projects received bond allocations and tax credit awards • All three projects received City approved soft financing commitments • All three projects submitted Relocation plans, Housing Retention plans, and Tenant Selection
plans • All three projects are in contract with a relocation consultant, Overland Pacific & Cutler, Inc • Family Briefings completed with all residents • HAP contracts completed for both properties • City supplemental Services Contracts awarded for projects in July 2020 • MOU established between the Tenant Council and Owners • Construction is currently underway • Owner has subcontracted with John Stewart Company for property management operations
Legal Status update (Valencia Gardens, Bernal Homes, and Hayes Valley North and South • Hope 6 projects - 614 Households
o 1 Legal Cases (.0016%) 0 evictions 0 stipulated/ mediated agreements 1 pending
o 10 Repayment Agreements (1.6%) o 6 Voluntary Move Outs – (.0097%) (primarily death, higher level of care, moving to next
opportunity, etc.)
CAPER
66
OMB Control No: 2506-0117 (exp. 06/30/2018)
RAD conversions are also being explored for San Francisco’s two remaining HOPE VI projects – Plaza East and North Beach Apartments. Actions taken to encourage public housing residents to become more involved in management and participate in homeownership The RAD and HOPE SF revitalization programs will increase tenant engagement activities and tenant services substantially. The RAD Services Model and Engagement strategies follows below. At HOPE SF properties, this level of connection is exceeded, with deep case management services and community building supports available to all residents, as further described below. RAD Services Model Establish trust; Map assets and identify needs; Begin community activities; Build resident base; Develop neighborhood partnerships Foundational and ongoing work with residents and community members of Housing Developments by all service providers or those who conduct work there. Community Building – Community organizing and events; Increased information and opportunities; Deeper resident and neighborhood partnerships; Implement peer leadership activities; Development of Health and Wellness, Educational, and Economic Mobility activities Deeper foundational and ongoing work that builds upon Community Engagement. As residents and community members become accustomed to providers staff can begin recruiting peers and engaging them in leadership and skills building activities. This then establishes them as part of the team. Work at this level also includes activities to reduce social isolation, celebrations, and educational/ informational workshops or classes. Service Connection – Enhanced information and referral with follow up; Intentional Support for Housing Stabilization; Ongoing Health and Wellness, Educational, and Economic Mobility Activities Once engaged the consistent staff teams who participate in Community Engagement and Community Building work are available for ongoing resources and activities (Health and Wellness, Educational, Economic Mobility) to learn and expose the community to new choices. One-on-one support is available for residents regarding any needs but especially related to housing stabilization. Staff teams are made up of paraprofessional to professional providers who respond quickly to requests with follow up to ensure information / activities are helpful and accurate. Important key element is for onsite providers to have a relationship with offsite city service providers. RAD Engagement Strategies
• Weekly meetings between Property Management and Services to coordinate efforts to support tenants to remain stably housed.
• Monthly meetings between Services and Tenant Councils for coordination of activities and to gather insight into outreach and engagement of tenants.
• Monthly community meetings to inform tenants about what is happening in their development and provide opportunities for community voice
• Monthly newsletters • Monthly calendar of activities • Door to door outreach

CAPER
67
OMB Control No: 2506-0117 (exp. 06/30/2018)
HOPE SF Resident Services and Community Building Each of the four HOPE SF sites will continue to integrate intensive resident services and community building activities, executed by lead on-site service providers in collaboration with neighboring CBOs and city-wide programming. Services teams will focus their efforts towards preparing HOPE SF site residents for the transition to non-profit management, continuing to stabilize the tenant populations, and developing pathways towards economic mobility. They will achieve this through service connection and on-site programming in areas of resident leadership, housing stability, economic advancement, public safety, health and wellness, and education. In program year 2019-2020, the final two HOPE SF sites (Sunnydale and Potrero Hill) have completed phase one construction of replacement and affordable housing units, and successful relocation of 95 (42 Sunnydale and 53 Potrero Hill) original families into new units. As such, there continues to be services investments in housing stability activities across the four sites to ensure the successful transition and retention in new housing. New investments in Sunnydale and Potrero will leverage learnings from Hunters View and Alice Griffith, encouraging a collaborative approach to tenant education and intensive housing stability supports at the sites. Across the HOPE SF portfolio, providers will continue to coordinate the training and placement of residents in construction jobs occurring on site. Developers will continue to engage Residents in community space planning efforts across all four sites, managed by the non-profit developers. Additionally, services and programming assisting with the transition to non-profit management will be ramped up, such as those related to financial literacy, workforce development, and tenant education. Community building activities -- such as senior, teen & family programming, community gardening, and community-wide celebrations -- will also continue to be executed at each of the four HOPE SF sites. All four HOPE SF sites will continue to build on past success of the Peer Health Leadership program and pilot Health & Wellness Centers, with 4 DPH-led on-site wellness centers and activities launched. Similarly, HOPE SF sites will continue to deepen their educational strategies which are executed in collaboration with the four on-site Educational Liaisons, 8 HOPE SF schools, and families at each of the sites. At Hunters View, the Bayview YMCA has successfully transitioned on-site households into new units. The YMCA will continue to support housing stability activities, as well as act as lead agency for community building and resident engagement activities at the site. At Alice Griffith, we continue to support and intensify resident focused programs as we have fully transitioned from CHOICE Neighborhoods funding. The Bayview Hunters-Point Multi Services team will continue to link residents with senior programs, family support programming, youth and education programming, afterschool activities, health and wellness activities, and workforce development opportunities. Bayview YMCA will provide support for belonging and community engagement activities. Bayview Association for Youth will more intensively provide education supports to Alice Griffith residents, through the HOPE SF Education Liaison program. At Potrero Annex/Terrace, Bridge Housing continues to provide community building activities and foster individual participation in planning sessions. These activities included leadership development and safety workshops, healthy living and parenting groups,

CAPER
68
OMB Control No: 2506-0117 (exp. 06/30/2018)
gardening/sustainability programs, social activities. Potrero Hill Family support Center (Urban Services YMCA) works with residents to assess, connect and support them in workforce, family support, and educational opportunities. The Potrero Hill Neighborhood House will focus primarily on case management and workforce development of transitional-aged youth. Shanti will work as lead agency in a collaborative intended to support housing stability at the site.
At Sunnydale, Mercy Housing, the Bayview YMCA, APA/Visitation Valley Strong Families, and Sunnydale Teen Center work collaboratively to provide outreach, family support, service connections, health and wellness, and educational activities and community convenings to Sunnydale residents. Mercy will work as lead agency in a collaborative intended to support housing stability at the site. Actions taken to provide assistance to troubled PHAs By a letter from HUD to the Authority dated March 7, 2019, HUD determined that the SFHA was in default under its HCV Consolidated Annual Contributions Contract (“HCV ACC”) and its Low Rent Public Housing Consolidated Annual Contributions Contract (“LRPH ACC”). After a determination of default, HUD has the authority to take possession of all or a part of the Authority or require the Authority to make other arrangements consistent with HUD requirements that are in the best interests of the public housing residents and families assisted by HUD. Under the Default Letter, HUD determined that it is in the best interests of the Authority’s public housing residents and assisted families to allow the Authority the opportunity to cure the SFHA Default as follows: (i) the City’s assumption of responsibility of the programmatic and financial functions under the HCV ACC and LRPH ACC, including financial management, program management, wait list and admissions, inspections, eligibility determinations, and lease and grievance procedures, and (ii) outsourcing programmatic and financial administration of the HCV program and LRPH program, including continued outsourcing of Authority’s financial management. The City approved a Memorandum of Understanding (MOU) between SFHA and the City in December 2019, and reviewed by HUD, outlining the preliminary terms of the City’s assumption of Housing Authority functions as shown below: Labor Relations SFHA gave notice to its existing employees on the reduction in Housing Authority staffing, resulting from the City’s assumption of and contracting out of SFHA functions, as required by HUD. SFHA developed severance packages for employees who were impacted and is partnering with the City to assist with finding City jobs for these employees when possible. Restructuring of the Housing Authority The MOU provided a preliminary restructuring plan that included:
• Appointment of City staff to provided executive management oversight of Housing Authority functions;
• Plan to contract out the Housing Authority’s public housing and HCV programs; and • Development of a specific timeline to integrate the Housing Authority’s systems, processes, and
the policies with the City for financial oversight, information technology, human resources, real estate, purchasing, and legal oversight. The MOU further provided for the parties (HUD, Housing

CAPER
69
OMB Control No: 2506-0117 (exp. 06/30/2018)
Authority, City) to commit to the capital funding necessary to redevelop the public housing under HOPE SF; and to continue to convert the public housing units to project based vouchers.
Shortfall Funding HUD maintains a fund to annually augment local housing authorities’ budgets that have a shortfall in their housing voucher programs. HUD provided $10 million in shortfall funding to the Housing Authority in 2018. According to the MOU, the Housing Authority will apply for HUD’s shortfall funding annually, or as frequently as needed. Executive Management and Shared Services
• The City will provide executive management staff to the Housing Authority, including a chief executive officer reporting to the Mayor or the Mayor’s designee.
• The Housing Authority will integrate with City services over time, including information technology, human resources, purchasing, real estate, financial systems, and other services. The timing and process of integration will be developed in consultation with MOHCD, Controller, and General Services Agency. Administration and Oversight
• The annual Housing Authority budget will be submitted to the Mayor and the Board of Supervisors, who may accept or reject the budget. The budget submission will be consistent with City procedures and HUD timelines and requirements.
• Administration of the HCV program and public housing will be contracted to third parties, as required by HUD and discussed above. The Housing Authority will work with the City to procure third-party contractors, but the contracting process must conform to HUD requirements. Contracts for property transactions will be subject to third-party appraisal with the exception of properties conveyed for development of affordable housing.
• Financial management of the Housing Authority will be contracted to a third party with expertise and experience in HUD financial Introduction Budget and Legislative Analyst’s Office 10 reporting and requirements. Currently, the Housing Authority contracts with BDO USA LLP for financial management and reporting.
• Issuance of debt by the Housing Authority must be approved by the Authority and the Board of Supervisors.
• Any material amendment to the MOU is subject to prior approval by the Board of Supervisors. Housing Authority Commission
• The Housing Authority Commission is authorized by state law to have seven members, appointed by the Mayor, two of whom must be Housing Authority residents. Under the proposed MOU, the Mayor would appoint four members directly, and three members recommended by motion at the sole discretion of the Board of Supervisors. Of the Mayor’s four appointments, at least one must be a Housing Authority resident. Of the Board’s three appointments, at least one must be a Housing Authority resident 62 years of age or older.
Non-Housing Assets
• The Housing Authority will (a) inventory non-housing assets, including the building at 1815 Egbert Street, vehicles, and other assets; (b) identify which assets are needed for ongoing operations; and (c) plan disposition of surplus assets in accordance with HUD requirements Loans made by the City to the Housing Authority will be repaid from surplus funds from the disposition of assets, subject to HUD requirements.
CAPER
70
OMB Control No: 2506-0117 (exp. 06/30/2018)
In 2020 and 2021, SFHA will convert its 1,911 remaining units of public housing to the HCV program via HUD’s disposition programs: the Rental Assistance Demonstration (RAD) program and the Section 18 Demo/Dispo program. Given SFHA’s financial difficulties, HUD has approved the early conversion of these units to HCV in order to stabilize the agency’s finances and operations.

CAPER
71
OMB Control No: 2506-0117 (exp. 06/30/2018)
CR-35 - Other Actions 91.220(j)-(k); 91.320(i)-(j) Actions taken to remove or ameliorate the negative effects of public policies that serve as barriers to affordable housing such as land use controls, tax policies affecting land, zoning ordinances, building codes, fees and charges, growth limitations, and policies affecting the return on residential investment. 91.220 (j); 91.320 (i) Addressing Barriers to Housing Production1 Identify Sites Appropriate for Housing Development San Francisco is relatively dense, and has limited opportunities for infill development. It is critical to identify and make available, through appropriate zoning, adequate sites to meet the City’s housing needs—especially affordable housing. The San Francisco Planning Department has successfully developed neighborhood specific housing plans to accommodate the majority of new housing needs anticipated. In an effort to identify specific sites for housing, as well as areas that can be zoned for housing development, all City agencies subject to the Surplus Property Ordinance annually report their surplus properties and those properties are evaluated with regard to their potential for affordable housing development. To the extent that land is not suitable for housing development, the City sells surplus property and uses the proceeds for affordable housing development. In order to reduce the land required for non-housing functions, such as parking, the Planning Department will consider requiring parking lifts to be supplied in all new housing developments seeking approval for parking at a ratio of 1:1 or above. Also through area plans, especially in transit-rich neighborhoods, parking may be allowed at a ratio of less than 1:1 in order to encourage the use of public transit and maximize a site’s use for housing. Furthermore MOHCD worked closely with the Planning Department to enhanced the State Density Bonus law to fit the San Francisco context, ultimately developing an affordable housing density bonus program for San Francisco whereby additional residential density above what is permitted by regular zoning would be permitted if the development is 100% affordable housing. Encourage “Affordability by Design”: Small Units & Rental Units Using less expensive building materials and building less expensive construction types (e.g. wood frame midrise rather that steel frame high-rise) and creating smaller units can reduce development costs per/unit. High development costs are a major barrier to affordable housing development. The City encourages this type of affordability by design.
1 The following section on Addressing Barriers to Housing Production is cited from the June 2010 Draft Housing Element. The role of the Housing Element is to provide policy background for housing programs and decisions and broad directions towards meeting the City’s housing goals. However, parameters specified in the Zoning Map and Planning Code can only be changed through a community process and related legislative process. Thus, not all strategies identified in the Housing Element are certain to be implemented. The Mayor’s Office of Housing and Community Development will explore recommendations of the Housing Element as they pertain to findings from the 2013 Analysis of Impediments to Fair Housing Choice.

CAPER
72
OMB Control No: 2506-0117 (exp. 06/30/2018)
Secondary Units Secondary units (in-law or granny units) are smaller dwellings within a structure that contains a much larger unit, using a space that is surplus to the primary dwelling. Secondary units represent a simple and cost-effective method of expanding the housing supply. Such units can be developed to meet the needs of seniors, people with disabilities, and others who, because of modest incomes or lifestyles, prefer or need small units at relatively low rents. Within community planning processes, the City has explored where secondary units can occur without adversely affecting the neighborhood. To that end the Board of Supervisors approved legislation making it easier to legalize in-law units in certain neighborhoods in San Francisco. Smaller Units Density standards in San Francisco have traditionally encouraged larger units by setting the number of dwelling units in proportion to the size of the building lot. However, in some areas, the City uses the building envelope to regulate the maximum residential square footage. This will encourage smaller units in neighborhoods where building types are well suited for increased density. Moreover, the Planning Department allows a density bonus of twice the number of dwelling units when the housing is specifically designed for and occupied by senior citizens, physically or mentally disabled persons. As stated above MOHCD work with the Planning Department to develop a local affordable housing density program that will allow increased density, including 3 additional residential floors above the site’s height limit if the housing is 100% affordable. Rental Units In recent years the production of new housing has yielded primarily ownership units, but low-income and middle-income residents are usually renters. The City encourages the continued development of rental housing, including market-rate rentals that can address moderate and middle income needs. Recent community planning efforts have explored incentives such as fee waivers and reductions in inclusionary housing requirements in return for the development of deed-restricted, long-term rental housing. The Planning Department will monitor the construction of middle income housing under new provisions included within the inclusionary requirements of the Eastern Neighborhoods Area Plans and may consider expanding those provisions Citywide if they are successful. Identify and Implement Creative Financing Strategies Due to the high cost of housing subsidies required to provide a unit to low and very low income households (subsidy of $275,000-$350,000 required per unit), financing is amongst the most challenging barriers to affordable housing production. Federal and State programs that historically have supported affordable housing development are not being funded. For example, the Federal Low Income Housing Tax Credit program (LIHTC) has, in years past, financed about 90% of affordable housing. In this economic climate and with the elimination of redevelopment agencies and their required commitment of 20% of their tax increment to affordable housing, it the City of San Francisco has stepped up with solutions to finance affordable housing production and preservation with local legislation and bond measures. Jobs-Housing Linkage Program New commercial and other non-residential development increase the City’s employment base and thereby increase the demand for housing. The City’s Jobs-Housing Linkage Program, which collects fees
CAPER
73
OMB Control No: 2506-0117 (exp. 06/30/2018)
for affordable housing production from commercial developments, will continue to be enforced and monitored. Historic Rehabilitation Tax Credits Planning and OEWD will promote the use of the Historic Rehabilitation Tax Credits to help subsidize rental projects where appropriate, and continue to provide information about such preservation incentives to repair, restore, or rehabilitate historic resources towards rental housing in lieu of demolition. Citywide Inclusionary Housing Program Planning and MOHCD will continue to implement the Citywide Inclusionary Housing Program, which requires the inclusion of permanently affordable units in housing developments of 10 or more units. MOHCD is also looking to expand the program to allow developers to target higher incomes than what is currently allowed under the Inclusionary Housing Program in exchange for more affordable housing units to be built. Tax Increment Financing Tax Increment dollars in the major development projects of Mission Bay, Hunters Point Shipyard and Transbay will continue to be set aside for affordable housing as required by the development agreements for those major development projects and subject to the State Department of Finance’s approval. Housing Trust Fund San Francisco voters approved Proposition C in November 2012, which amended the City’s charter to enable creation of the Housing Trust Fund. It is a fund that shall exist for 30 years payable from set-asides from the City’s general fund and other local sources. MOHCD is implementing housing programs or modifying existing programs to account for this funding source and began using funds from the Housing Trust Fund in July 2013. 2015 Proposition A General Obligation Bond Proceeds San Francisco voters approved Proposition A in November 2015, which approved the sale of $310 million in general obligation bonds to finance the construction, acquisition, improvement, rehabilitation, preservation and repair of affordable housing for low and middle income households, including funding specifically for new development in the Mission neighborhood. Please see the section above for more detail about uses of the bond in 2019-2020. Reduce Regulatory Barriers Public processing time, staffing, and fees related to City approval make up a considerable portion of affordable development costs. The City has implemented Priority Application Processing through coordination with the Planning Department, Department of Building Inspection, and Department of Public Works for 100% affordable projects. This expedites the review and development process and reduces overall development costs. Current City policy also allows affordable housing developers to pursue zoning accommodations through rezoning and application of a Special Use District. The Planning Department, in consultation with MOHCD and the development community, is implementing of a San Francisco-specific density bonus program expanding upon the State Density Bonus law, which enables a more expeditious land use entitlement process for projects that are 100% affordable housing than

CAPER
74
OMB Control No: 2506-0117 (exp. 06/30/2018)
required by local law and granting unlimited zoning exceptions including an increase in height by 3 floors and substantial increase in residential density. The City is also exploring mechanisms that maintain the strength of the California Environmental Quality Act (CEQA) and its use as a tool for environmental protection while eliminating aspects of its implementation that are not appropriate and unnecessarily delay proposed projects. For instance, the Planning Department will continue to prioritize projects that comply with CEQA requirements for infill exemptions by assigning planners immediately upon receipt of such applications. Other improvements to CEQA implementation are underway. For example, a recent Board of Supervisors report studied how to meaningfully measure traffic impacts in CEQA. Address NIMBYISM Neighborhood resistance to new development, especially affordable housing development, poses a significant barrier. However, NIMBYism can be reduced by engaging neighbors in a thorough and respectful planning process. In order to increase the supply and affordability of housing, the City has engaged in significant planning for housing through Area Plans and other processes that respect community voice and neighborhood character. In general, the Planning Department’s review of projects and development of guidelines builds on community local controls, including Area plans, neighborhood specific guidelines, neighborhood Covenants, Conditions, and Restrictions (CC&R’s) and other resident-driven standards for development. Public education about the desirability and necessity of affordable housing is also an ongoing effort. Planning, DBI and other agencies will continue to provide informational sessions at Planning Commission Department of Building Inspection Commission and other public hearings to educate citizens about affordable housing. As one of the most expensive cities in the United States to live, the need for affordable housing is more acute than elsewhere in the country. Consequently the need to remove barriers to the production or preservation of affordable housing has become an even more important priority for MOHCD. MOHCD is working closely with other City departments to revisit the City regulations that may serve one public purpose, such as increasing indoor air quality in residential buildings near major roadways, but is becoming a barrier to affordable housing production by increasing the development cost of affordable housing by requiring more expensive mechanical ventilation systems. MOHCD will also continue to work with other City departments to improve City process improvements that will help expedite the production of affordable housing be it with the Planning or Building Inspection departments. Actions taken to address obstacles to meeting underserved needs. 91.220(k); 91.320(j) Obstacles to meeting underserved needs for San Francisco are related to the extent of need in the City and the diversity of the population of the City. Major obstacles are limited funds, language barriers and gaps in institutional structure. Due to high housing costs, economic conditions, poverty and unemployment, a significantly large number of low-income San Franciscans are not economically self-sufficient. The limited resources that are available to support programs and services that help individuals and families to become self-sufficient are inadequate. The situation is made worse by reductions in funding at the federal, state and

CAPER
75
OMB Control No: 2506-0117 (exp. 06/30/2018)
local government levels at the same time as needs are increasing due to the weak economy. To minimize the impact of the City’s limited resources, MOHCD HSH and OEWD have increased our strategic coordination with other City departments in an effort to avoid duplication of services and to maximize the leveraging of federal, state and local dollars. Another major set of obstacles are language barriers. San Francisco has historically been a haven for immigrants. Language barriers impact immigrants’ abilities to access necessities such as employment, healthcare, and police protection. Many adult immigrants and refugees are not necessarily literate in their own native languages, and struggle to master the complexities of English. In particular, sophisticated transactions such as legal issues or governmental forms may be confusing. Of all San Franciscans over the age of five, 43% speak a language other than English at home, with the largest language groups being Chinese, Spanish, and Filipino. Fifty-seven percent of the population that speak an Asian language at home are of limited English proficiency (LEP), meaning that they speak English less than “very well.” Thirty percent of Asian children are identified as LEP. Twelve percent of San Francisco households are “linguistically isolated” as of 2015 with no one in the household over the age of 14 indicating that they speak English “well” or “very well.” Among Asian households, that number increases to 35%. At the individual level, about 21% of all San Franciscans in the 2018 ACS five-year survey indicated that they did not speak English “very well.” In response to this particular obstacle, San Francisco uses CDBG and general fund resources to provide language-appropriate services to linguistically and culturally isolated individuals and families, including translation services, legal services, vocational ESL instruction, information and referral, and case management. Services are provided through these funds to neighborhood-based multi-service community centers. Another action that will be taken will be granting those households displaced by Ellis Act evictions, owner move-in evictions, fire damage, and former San Francisco Redevelopment Agency displacement first preference to any affordable housing under MOHCD’s purview. These households were forcibly displaced from their homes so the San Francisco Board of Supervisors deemed them to have higher priority to be screened for eligibility for MOHCD’s affordable housing stock. In order to qualify for this housing, these households must be certified by MOHCD that they meet specific displacement criteria, such as having lived in their residence for at least 10 years (or 5 years if they were seniors or disabled) prior to receiving an eviction notice under the State Ellis Act. MOHCD will also certify if a household was living in the Western Addition or Hunters Point area during the San Francisco Redevelopment Agency’s large-scale displacement of residents from those areas under its 1960s urban renewal policies. Should these households be certified that they were displaced by an Ellis Act eviction or by the Redevelopment Agency and given a certificate of preference, then these households would be prioritized for eligibility screening for MOHCD’s affordable housing. These certificate of preference holders must meet the housing’s eligibility criteria, such as income and household size, for the housing they applied to. Actions taken to reduce lead-based paint hazards. 91.220(k); 91.320(j) The City’s response system is comprised of several City agencies and non-profit partners to address the problem of lead poisoning, prohibited nuisances code enforcement and dilapidated housing. Over the past 20 years, MOHCD has developed a highly collaborative infrastructure of City agencies and non-profit organizations to address childhood lead poisoning, lead hazards, and other health conditions
CAPER
76
OMB Control No: 2506-0117 (exp. 06/30/2018)
stemming from poor quality housing in low-income communities. DPH collaborates with the Family Childcare Association, the Children’s Council, the San Francisco Head Start Program, and other private preschools serving low-income families – to ensure families are educated on lead poisoning prevention and timely lead blood level testing of children under the age of six. As a result, low-income children attending targeted preschools are regularly tested for lead blood content as a commitment to a healthy educational start. Children with a detectable lead blood level are case managed by DPH. Fundamental to the response system, the DPH code enforcement unit has the legislative authority to cite property owners with a notice of violation whenever there is visibly deteriorated paint in the exterior or interior of a pre-1978 building where children under six may be exposed to the lead hazard. These violations become direct referrals to MOHCD, which provides lead remediation services of lead hazards as part of its single-family home rehab loan program. Any housing built before 1978 that are or could be occupied by families and will be rehabilitated with MOHCD’s financial assistance is required to be assessed for lead-based paint hazards. Should lead-based paint hazards be found then remediation becomes part of the rehabilitation scope of work. In addition, MOHCD requires funded housing, tenant rights, and other non-profit housing related agencies to provide lead poisoning prevention education to tenant families with young children, information on the Federal Lead Hazard Disclosure Law, and information on MOHCD’s Home Rehab program. Actions taken to reduce the number of poverty-level families. 91.220(k); 91.320(j) Coordinated Entry In August 2016, Mayor Edwin M. Lee launched HSH to fundamentally change the way the City and County of San Francisco addresses homelessness. HSH—relying on guidance from people experiencing homelessness, service providers, and other stakeholders in San Francisco—developed a Five-Year Strategic Framework outlining specific goals for HSH’s vision to make homelessness a rare, brief, and one-time event with the overall aim of significant, sustained reductions in homelessness. To accomplish this goal, HSH will coordinate alignment of all programs into a Homelessness Response System (HRS) that treats homelessness as an emergency to be responded to quickly and effectively. Please note that the Homelessness Response System covers the entire geographic region defined as the San Francisco CoC. Coordinated Entry (CE) is a key component of this response system. CE is a consistent, community wide intake process to match people experiencing homelessness to available community resources that are the best fit for their situation. CE includes a clear set of entry points, a standardized method to assess and prioritize people needing assistance, and a streamlined process for rapidly connecting people to a housing solution. All homeless individuals and families in San Francisco will complete a standardized assessment process that considers the household’s situation and identifies the best type of housing intervention to address their needs. Permanent housing programs—including permanent supportive housing (PSH) and rapid rehousing (RRH)—will fill spaces in their programs from a community pool of eligible households generated from the standard assessment process. CE will also fully integrate into the Online Navigation and Entry (ONE) System—San Francisco’s implementation of the Homeless Management and Information System (HMIS). The assessment will build upon the standard intake and
CAPER
77
OMB Control No: 2506-0117 (exp. 06/30/2018)
be entered directly into ONE and referrals to transitional and permanent housing will be made through the ONE System. This coordinated process will dramatically reduce the burden placed on people experiencing homelessness by removing the necessity to seek assistance from every provider separately and instead streamline access to all the resources in our Homelessness Response System. HSH has launched Adult Coordinated Entry, Family Coordinated Entry and Coordinated Entry for Youth and their Community Access Points. Healthy Retail SF The grassroots activism to provide healthy food options in the Bayview District and the Tenderloin has led to institutional change within city government. In 2013, Supervisor Eric Mar introduced legislation that created Healthy Retail SF, which is led by OEWD’s Invest in Neighborhoods division, in conjunction with the DPH. San Francisco has about 1,150 food retail stores, about 1,000 are corner stores. This program supports these mom-and-pop businesses while providing healthy and affordable food access, especially to underserved neighborhoods. In certain parts of the City, there is a lack of quality full-service neighborhood markets with fresh produce, and an overabundance of corner stores selling alcohol, tobacco, and highly processed foods that are high in salt, fat, and sugar and low in nutrients. In communities that lack supermarkets, families depend on corner stores for food purchases, and the choices at those stores are often limited to packaged food and very little, if any, fresh produce. For example, a 2011 assessment of 19 corner stores in the City’s Bayview Hunters Point neighborhood found that 20% of the stores stocked a variety of fresh fruits and vegetables, only 11% stocked whole grain bread, and only 37% stocked low-fat milk. The presence of a large number of stores selling low quality foods in a community can undermine public efforts to promote health and send a message that normalizes the use of unhealthy products in that neighborhood, placing these communities at greater risk for obesity and chronic disease. A high number of convenience stores per capita is associated with higher rates of mortality, diabetes, and obesity. Proximity to convenience stores within a neighborhood is associated with higher rates of obesity and diabetes. The impact of convenience stores on health is even greater in low-income neighborhoods. Healthy Retail SF created an expert healthy retail advisory group, designed program structures and tools, and implements neighborhood wide outreach meetings with store owners. Each participating store receives an assessment and tailored 13-page Individualized Development Plan (IDP) that outlines activities, timelines, persons responsible and budget in three areas: business operations, physical changes to the store, and community engagement and marketing. Community Food Advocates called Food Guardians and Food Justice Leaders are a critical element of the model. Healthy Retail SF provides funds for participating businesses to make improvements based on their IDP. Improvements include installation of equipment, community engagement and marketing support, technical assistance with sustainable business practices, and store space redesign. Participating businesses commit 35% of its selling area to fresh produce, whole grants, lean proteins, and low-fat dairy products, while limiting the sale of tobacco and alcohol to 20% of the selling space. Homeowner Emergency Loan Program (HELP) The purpose of the MOHCD HELP program is to assist San Francisco homeowners in need of a one-time emergency financial assistance loan due to an unforeseen financial hardship.

CAPER
78
OMB Control No: 2506-0117 (exp. 06/30/2018)
HELP Funds may be used for: • Past due mortgage Payments • Past due HOA monthly dues • Past due property taxes • Special assessments (e.gp renovation costs passed down to residents) • BMR homeowners in need of financial assistance to complete necessary repairs in order to sell
property HOPE SF HOPE SF is an ambitious cross-sector initiative to transform San Francisco’s most distressed public housing sites into vibrant and healthy communities. It began with a study. In 2005, the HSA released an analysis of at-risk families known as the “Seven Street Corners Study.” The study came out of an effort to create a consolidated youth database with data from the child welfare and juvenile justice systems. When the data was walking distance of just seven street corners in the city — street corners that overlapped with obsolete public housing sites where families were living geographically, socially, and economically cut off from San Francisco’s robust resources. In response, Mayor Gavin Newsom set a bold vision of rebuilding dilapidated public housing developments into thriving mixed-income communities that integrated holistic family services, high quality schools, new businesses, public transportation, and green buildings. HOPE SF drew on more than 15 years of learning from HUD’s HOPE VI housing revitalization program. However, unlike the HUD projects in which only a small percentage of residents returned to redeveloped housing sites, San Francisco committed to the principle that families would not be displaced. In 2007, the mayor and Board of Supervisors secured $95 million in local bond funding, an amount that eclipsed the nationwide HOPE VI funding for that year, to launch HOPE SF. From the beginning, the initiative brought together expertise from the public, nonprofit, and philanthropic sectors, working together to improve the lives of public housing residents and break the cycle of poverty. Today, the City and County of San Francisco, the San Francisco Foundation, and Enterprise Community Partners collaborate on HOPE SF with the involvement of many organizations and longtime residents. HOPE SF will rebuild four housing developments in three southeastern San Francisco neighborhoods: Hunters View and Alice Griffith in the Bayview, Potrero Terrace and Annex in Potrero Hill, and Sunnydale-Velasco in Visitacion Valley. Located in isolated and mostly undeveloped areas, these sites were originally built to temporarily house shipyard workers during and after World War II. By tripling density, HOPE SF will replace 1,900 public housing units one-for-one and add low-income and market-rate units, ultimately building more than 5,300 homes at multiple levels of affordability. Construction is phased so that residents can remain on site and take part in the transformation of their communities. Alice Griffith Originally built in 1962 adjacent to the now-demolished Candlestick Park, Alice Griffith received a $30.5 million HUD Choice Neighborhood Award in 2012 and is part of the Hunters Point Shipyard/Candlestick

CAPER
79
OMB Control No: 2506-0117 (exp. 06/30/2018)
Point Neighborhood Development plan. In 2019, all original residents had been rehoused, achieving nearly 90% retention. Two more affordable projects, including 30 public housing replacement units, will be constructed in 2024-2025. Five Point, the Master developer, is responsible for developing market rate, inclusionary and workforce units. When completed, there will be expanded transit, retail and office space, a research and development campus, and over 300 acres of open space. The proposed total number of units will be 1,150. Hunters View Hunters View, originally built in 1956, was the first HOPE SF site to undergo revitalization. Perched on a grassy hill above the old naval shipyard, it has spectacular views of the San Francisco Bay. Of the original families, 70% were retained through the transition between public housing and mixed-income development. Amenities include open spaces, a community center, a childcare facility, a wellness center, a sound studio, and playgrounds. The Phase 3 — affordable and the first two phases of market-rate homes will break ground in 2020. The proposed total number of units will be 600. Potrero Terrace and Annex Home to nearly 1,300 people, Potrero Terrace and Potrero Annex — together known as Potrero — are two of the oldest public housing developments in San Francisco. Located at the southeastern edge of the Potrero Hill neighborhood, they were hastily constructed in 1941 and 1955. HOPE SF will rebuild both sections of the 38-acre site into a unified mixed-income development with buildings of varying heights and a park. Phase 1 — construction of the first 72 units was completed in February 2019. The proposed total number of units will be 1,400-1,600. Sunnydale/Velasco Sunnydale, San Francisco’s largest public housing community, is undergoing a transformation into a mixed-income development of new affordable and market rate housing, street and utility infrastructure, and open spaces. Located at the foot of McLaren Park, the 50-acre site will also include an exciting neighborhood hub and the city’s first recreation center in decades, a Boys & Girls Club, and early childhood education centers. The proposed total number of units will be 1,400-1,770. Opportunities for All Opportunities for All is a mayoral initiative to address economic inequality by ensuring that all young people can be a part of San Francisco's thriving economy. The initiative serves thousands of high school-aged youth who are ready and interested in working, as well as provides opportunities for youth who might need additional support, as part of Mayor Breed’s efforts to provide paid internships for youth in San Francisco. Opportunities for All connects young people to employment, training and post-secondary opportunities. Youth work an average of four weeks and earn $15 per hour for up to 20 hours a week, receive mentorship, and visit local businesses to help them identify careers of interest and begin to plan for their future. Opportunities for All builds on existing work-based learning programs and funding. Across the globe, work-based programs are celebrated for preparing young people for work, keeping them engaged in school and promoting self-efficacy. Opportunities for All works with the SFUSD, OEWD and DCYF to align efforts and recruit youth participants. This initiative also develops a framework where non-profit service providers and employers

CAPER
80
OMB Control No: 2506-0117 (exp. 06/30/2018)
have shared understanding and language around work expectations for youth, track youth progress, and provide tools that help youth plan for their future. Our Children Our Families Initiative In November 2014, San Francisco voters approved Proposition C, the Children and Families First Initiative, which created the OCOF Council with the purpose of aligning strategies across City agencies, the School District, and community partners to improve the lives of children, youth, and their families. Prop C outlines OCOF’s mandates in addition to extending the Public Education Enrichment Fund and the Children’s Fund for another 25 years respectively. OCOF Council knows that the challenges facing our children, youth and families; safety, housing stability, economic security, health, education, and employment, are interconnected and cannot be addressed in isolation. In order to achieve the impact we seek, we must work in partnership across all sectors. Our strategies involve a collective impact approach, where we work together in three key areas: data and research, training and capacity building and service delivery system improvement. These strategies will serve as a roadmap for our collaboration across the City, District and Community. Data and Research Data and research is at the heart of OCOF’s work. We aim to use data to inform all decision making for OCOF’s work but also to encourage and promote the use of data across all child and family serving systems. Focus Areas:
• Convene a Data and Research Advisory Group: The purpose of this group will be to serve as an advisory body to OCOF around measuring the outcomes in the framework, as well as identifying data and research projects that align with OCOF outcomes.
• Monitoring outcomes measures: Develop a plan for monitoring the measures in the Outcomes Framework and informing policy and practice change.
• Support use of shared data for policy and program development: OCOF will use targeted data sharing across the city, school district and community to improve research, policy and/or practice. Work with various experts and stakeholders to develop policies and protocols that facilitate data sharing, as well as identifying existing shared data projects across the city that align and advance OCOF outcomes.
Training and Capacity Building Strengthening the existing workforce and developing a strong pipeline of new employees across San Francisco through curriculum designed to build capacity and skills of the workforce to understand the impact of trauma on the lives of children, youth and families and develop the skills to build resilience and connection is critical to impacting the outcomes we seek to improve. Focus Areas:
• Develop curriculum and pilot implementation plans: Develop implementation plans for 5 Training and Capacity Building pillars with a primary focus on a Healing City and a Welcoming City.
• Establish an evaluation plan for each pilot: Along with each pilot plan, the development of an evaluation plan will be necessary to demonstrate the challenges and successes for each pilot. This will inform the scaling and sustainability of the pilot.

CAPER
81
OMB Control No: 2506-0117 (exp. 06/30/2018)
Service Delivery System Improvement Service delivery system improvement is at the heart of much of OCOF’s mission. The activities for this strategy will focus on changes to systems in addition to service delivery and programs. Focus Areas:
• Advance strategies that support service navigation: The goals of the service navigation focus area are to identify gaps and redundancies in services and to help families and service providers easily access available services from all agencies. Within this focus area, there are two components: a service inventory for system navigators and a family friendly service navigating website – www.sffamilies.org.
• Coordinating budgets to achieve shared outcomes: The goal of ultimately coordinating budgets across systems is so that efforts are coordinated to generate additional funding and blended resources are integrated into budget planning. An integral part of achieving coordinated budgets will be the Citywide Spending Analysis, which will determine where resources are spent on child and family serving programs. This will include a landscape of services that link the identified spending categories to specific services.
• Identify and support family friendly City policies and protocols: The goal of advancing protocols and policies that designate San Francisco a “Family Friendly City” is so that families are put at the center of decision making across the city, school district and community.
• Improve Citywide service coordination: The goal of this focus area is to identify gaps and redundancies across various collective impact efforts working with vulnerable children, youth and families in order to improve connections and eliminate duplication of efforts. OCOF will lead and participate in efforts that bring together key decision makers to develop strategies to address service overlap and gaps related to service coordination within San Francisco.
San Francisco Financial Justice Project The San Francisco Financial Justice Project is the nation’s first effort embedded in government to assess and reform fines and fees that have a disproportionate and adverse impact on low-income residents and communities of color. Since its inception in 2016, the Project has worked with partners to eliminate or adjust dozens of fines and fees, and to lift millions of dollars in debt off of tens of thousands of low-income people. Housed in the Office of the San Francisco Treasurer, the Financial Justice Project has two main goals: First, to listen to community groups and local residents to identify fine and fee pain points. Second, to identify and implement doable solutions for government and the courts. Over the last three years, The Financial Justice Project has worked with dozens of community partners, city departments and the courts to enact a range of reforms. Read more here about The Financial Justice Project’s reforms; and here is a list of fine and fee discounts for low-income San Franciscans. Sector Based Approach to Workforce Development The Workforce Development Division of OEWD connects job seekers in San Francisco with employment opportunities in growing industries such as Technology, Health Care, Hospitality and Construction. We provide industry aligned job training and access to job search assistance at community-based neighborhood access points throughout the City, to help provide employers with skilled workers. See Construction Training Programs The CityBuild Academy (CBA)

CAPER
82
OMB Control No: 2506-0117 (exp. 06/30/2018)
CityBuild Academy aims to meet the demands of the construction industry by providing comprehensive pre-apprenticeship and construction administration training to San Francisco residents. CityBuild began in 2006 as an effort to coordinate City-wide construction training and employment programs and is administered by OEWD in partnership with City College of San Francisco, various community non-profit organizations, labor unions, and industry employers. Construction Administration & Professional Service Academy (CAPSA) The Construction Administration and Professional Service Academy (CAPSA) is a semester-long program offered at the City College of San Francisco, Mission Campus. The program prepares San Francisco residents for entry-level careers as professional construction office administrators. CityBuild Women's Mentorship Program The CityBuild Women's Mentorship Program is a volunteer program that connects women construction leaders with experienced professionals and student-mentors who offer a myriad of valuable resources: professional guidance; peer support; life-skills coaching; networking opportunities; and access to community resources. Health Care Training Program Launched in January 2010, the HealthCare Academy falls under OEWD's sector strategy and is designed to improve the responsiveness of the workforce system to meet the demands of the growing industry. Through a dual customer approach, the HealthCare Academy provides employers with skilled workers while expanding employment opportunities for local residents. The health care industry and health care occupations have been identified both nationally and locally as a priority for workforce investment due to stable and/or increasing demand for new workers, replacement of retirees, and skills development in response to new technologies and treatment options, as well as evolving service delivery options (including local and federal health care initiatives, such as the Affordable Care Act). Because the health care sector encompasses occupations in such a wide variety of settings and requires various levels of education and skill, it presents excellent opportunities for a broad spectrum of local jobseekers. The HealthCare Academy engages with industry partners to identify key needs of the industry, including skill requirements, vetting and approving a programmatic framework, review of training curriculum, identifying partnership opportunities, and providing programmatic oversight of any workforce programs related to the health care sector. Collaborative partners include the San Francisco Hospital Council, the DPH (and affiliated hospitals), SEIU-UHW West, UC Berkely's Center for the Public Health Practice, California Health Workforce Initiative, and industry employers: California Pacific Medical Center, Dignity Health, Kaiser Permanente, San Francisco Community Clinics Consortium, Chinese Hospital and Homebridge. Hospitality Training Program The Hospitality Initiative, launched in 2011, was designed to effectively coordinate training and employment resources that support the growth of a diverse and well-qualified hospitality sector workforce in San Francisco. In support of this goal are the following objectives: To prepare San Francisco residents for training and employment opportunities in the hospitality sector; to fulfill hiring needs of hospitality sector employers with qualified candidates that are job ready, posses the skills and abilities to perform job duties, and hold knowledge and passion for the industry; to educate workforce system

CAPER
83
OMB Control No: 2506-0117 (exp. 06/30/2018)
service providers and jobseekers about the hospitality industry and to provide them with relevant and current information on connecting to jobs, careers, and/or relevant training. Industry partnerships play a critical role in establishing sector programming. Collaborative partners include San Francisco Hotel Council (and affiliated members), Golden Gate Restaurant Association (and affiliated members), San Francisco Travel, Moscone Center, City College of San Francisco, SFUSD, Unite Here Local 2, and community based organizations and industry employers. Technology Training Program Launched in 2012, TechSF is an initiative of OEWD designed to provide education, training and employment assistance to locals who are interested in landing a job within San Francisco’s tech sector. TechSF is committed to:
• Providing tech training, free of charge, to San Francisco residents who are interested in landing a job in a tech occupation;
• Partnering with educators, training organizations and employers to ensure our participants have opportunities to skill up and land in a job;
• Ensuring our trainings meet local employer demand; and • Ensuring our participants are trained not only in in-demand technical skills, but also receive
career readiness supports. TechSF aims to ensure that a highly-skilled and diverse talent pool connects to, and thrive in, opportunities in tech while meeting industry talent needs. Careers in tech are not solely isolated to the tech sector. TechSF believes that the skills learned in TechSF training programs can open doors to working in a tech job in many different industries. TechSF provides opportunities for anyone interested in a career in technology. From the exploratory tech learner to the well-versed programmer who is looking to gain a competitive edge, TechSF has opportunities to step outside your comfort zone. The TechSF Apprenticeship Accelerator offers job seekers the unique opportunity to acquire essential experience and training to get established in a career in tech. TechSF provides the opportunity to connect directly with Tech Sector employers through exposure and networking events. Smart Money Coaching Program The Smart Money Coaching program by the Office of Financial Empowerment provides free, confidential, one-on-one, personalized financial guidance. A certified financial coach helps households to address financial challenges and goals, including reducing debt, establishing and improving credit score, opening a safe and affordable bank account, and increasing savings. Smart Money Coaching has locations throughout San Francisco and is available to anyone living, working or receiving services in San Francisco. This initiative is funded through MOHCD, HSA, DAAS, and the Treasurer’s Office. These services are available at over twenty sites on a regular basis, including HOPE SF and RAD housing sites, the San Francisco Main Library, and at nonprofit partners of MOHCD and other city departments.

CAPER
84
OMB Control No: 2506-0117 (exp. 06/30/2018)
Tenant Right to Counsel: San Francisco’s Eviction Defense System San Francisco voters passed the “No Eviction Without Representation Act of 2018,” then-known as Proposition F, on June 5, 2018. This local law went into effect on July 11, 2019. It establishes a policy that all residential tenants facing eviction have a right to legal representation, known as a tenant right to counsel. The ballot initiative that brought about the local law did not create a revenue source to fund the Tenant Right to Counsel (TRC) program. However, through the City’s budget process, the Mayor and Board of Supervisors have significantly increased funding for the TRC program since its passage. MOHCD allocated $9.6 million in Fiscal Year 2019-2020 (July 1, 2019-June 30, 2020) to the TRC program. Legal representation is provided by a network of nine City-funded legal services organizations (with a combined 47 attorneys supported by social workers & paralegals) and is subject to availability. During the first six months of implementation (July-December 2019), the TRC program provided the mandated full-scope legal representation to approximately two-thirds of all tenant households who availed themselves of assistance. The remaining one-third received limited legal services, including pro per assistance with completing the prescribed court form that must be filed at the court within five calendar days of being served with the eviction lawsuit in order to assert their defense, and limited-scope representation during the mandatory, pre-trial settlement conference. The TRC program is providing full-scope legal representation to an unprecedented number of tenants facing eviction. Program-level data and other relevant studies suggest that full-scope legal representation get far superior results for clients than limited legal services. In San Francisco, approximately 67% of clients receiving full-scope legal representation stay in their homes, as compared to less than 40% of clients receiving limited-scope legal representation. Actions taken to enhance coordination between public and private housing and social service agencies. 91.220(k); 91.320(j) The Director of MOHCD meets on a weekly basis with the Director of Planning, the Director of the Building Inspection, the Executive Director of the Office of Community Investment and Infrastructure, the Mayor’s Senior Advisor on Housing, staff from the Mayor’s Budget Office, and the Director of Development for the Office of Economic and Workforce Development to discuss affordable and market-rate housing development issues citywide. The City’s HOPE SF initiative, focusing on the revitalization of four selected public housing sites at Hunters View, Alice Griffith, Sunnydale, and Potrero Terrace/Annex, brings together a bi-monthly Leadership Team consisting of deputy-level City staff representing health, human services, children and youth, workforce development, public housing, community development, affordable housing, and private philanthropy. Affordable housing developers in San Francisco have formed a council that meets on a monthly basis to assist in the coordinated development of affordable housing throughout the City. Staff from MOHCD participates in these monthly meetings to provide a two-way channel of communication between these community based organizations and the City representatives who are responsible for overseeing City-financed affordable housing.
CAPER
85
OMB Control No: 2506-0117 (exp. 06/30/2018)
The City agencies also coordinate in the decision-making at the project level on affordable housing developments in the City, including at the level of individual project funding decisions. The Citywide Affordable Housing Loan Committee makes funding recommendations to the Mayor for affordable housing development throughout the City or to the OCII Commission for affordable housing under their jurisdiction. Committee Members consist of the directors or the director’s representative from the Mayor’s Office of Housing and Community Development, Department of Homelessness and Supportive Housing, and the Office of Community Investment and Infrastructure as successor to the San Francisco Redevelopment Agency (OCII). MOHCD also works closely with OCII and the Department of Homelessness and Supportive Housing to issue requests for proposals (RFPs) or notices of funding availability (NOFAs) on a regular basis to seek applications for particular types of developments. NOFAs are generally issued for projects to serve specific populations (family renters, single adults, seniors, people requiring supportive services, etc.), while RFPs are generally issued for specific development sites. Staff develops funding and general policy recommendations to the Loan Committee. Staff from MOHCD, OCII, the Department of Homelessness and Supportive Housing also meet on a bi-monthly basis to coordinate the development and operation of the City’s permanent supportive housing pipeline and portfolio. This bi-monthly convening provides a regular forum to discuss issues of services coordination, policy, new initiatives, funding opportunities, and emerging needs specific for permanent supportive housing funded by these departments. The Mayor’s Office of Housing and Community Development also is a member of the Long Term Care Coordinating Council (LTCCC). This body is charged to: (1) advise, implement, and monitor community-based long term care planning in San Francisco; and (2) facilitate the improved coordination of home, community-based, and institutional services for older adults and adults with disabilities. It is the single body in San Francisco that evaluates all issues related to improving community-based long-term care and supportive services. The LTCCC has 41 membership slots. Membership categories were created to ensure representation from a variety of consumers, advocates, and service providers (non-profit and public). The Mayor appoints people to fill 32 slots, which represent non-profit service provider organizations, consumers, and advocates. The additional 9 slots represent City and County departments including: Human Services, Aging and Adult Services, Public Health (two slots), Mayor's Office on Disability, Mayor's Office of Housing, San Francisco Housing Authority, and the Municipal Railway, plus one non-voting slot to enable representation of the Mayor's Office. The LTCCC evaluates how service delivery systems interact to serve people, and recommends ways to improve service coordination and system interaction. Workgroups responsible for carrying out the activities in the plan provide periodic progress reports through presentations to the LTCCC. MOHCD also coordinates its HOPWA housing activities closely with the San Francisco Housing Authority, in particular when a HOPWA subsidized unit is also supported by a project-based Section 8 voucher. Identify actions taken to overcome the effects of any impediments identified in the jurisdictions analysis of impediments to fair housing choice. 91.520(a) MOHCD has worked on various initiatives to address the impediments identified in the City’s Analysis of Impediments to Fair Housing Choice report, including addressing the Impediments to Affordable Housing Development, Impediments to Utilization of Assisted Housing Programs, and Impediments Facing People With a Criminal Record. MOHCD has focused its efforts on increasing affordable housing

CAPER
86
OMB Control No: 2506-0117 (exp. 06/30/2018)
production through site placement, working with other city agencies to remove regulatory barriers, and creating new financing sources all in order to increase the production of affordable housing as discussed above. In an attempt to overcome the impediment of utilizing assisted housing programs, MOHCD is developing a centralized online housing notification and application system called DAHLIA. This will centralize how people learn about affordable housing opportunities. It will also simplify and centralize how people apply to those housing opportunities. Additionally MOHCD continued to work closely with the Human Rights Commission to implement San Francisco’s Fair Chance Ordinance in all City-assisted affordable housing in order to address the impediment facing people with a criminal record. The Fair Chance Ordinance requires that affordable housing providers must first screen housing applicants for all other resident selection criteria before reviewing an applicants criminal record.

CAPER
87
OMB Control No: 2506-0117 (exp. 06/30/2018)
CR-40 - Monitoring 91.220 and 91.230 Describe the standards and procedures used to monitor activities carried out in furtherance of the plan and used to ensure long-term compliance with requirements of the programs involved, including minority business outreach and the comprehensive planning requirements Monitoring for Community Development Activities Managing Grants and Loans In program year 2020-21, the Community Development Division of MOHCD administered CDBG public facility, non-workforce development public service and organizational planning/capacity building activities; and HOPWA rental assistance and supportive services programs. MOHCD’s Housing Division administered the housing activities of the CDBG and HOPWA programs; and all HOME activities. The Office of Economic and Workforce Development (OEWD) administered CDBG economic development and workforce development activities. The Department of Homelessness and Supportive Housing administered all of the ESG activities. Activities under the CDBG, ESG and HOPWA community development programs were provided primarily through grant agreements with community-based non-profit organizations which provide a range of services, including legal, job training and placement, case management, information and referral, technical assistance to small businesses and micro-enterprises, homeless, homeless prevention and housing services. MOHCD and OEWD provided fiscal and programmatic monitoring of each project that received CDBG, ESG and/or HOPWA funds. Monitoring included both internal and on-site reviews. In addition, MOHCD monitored construction projects for labor standards compliance related to the Davis-Bacon regulations. MOHCD also monitored for access requirements related to Section 504 of the Rehabilitation Act and the Americans With Disabilities Act. Fair Housing, EEO and Local Business Enterprise (LBE) contracting is monitored by the City's Contract Monitoring Division. Since program year 2006-2007, MOHCD has been part of the steering committee for the City's Joint Fiscal and Compliance Monitoring Task Force, which serves to consolidate fiscal and compliance monitoring among various City departments. This consolidation effort increases communication among city departments, reduces multiple fiscal and compliance site visits to a single joint site visit or self-assessment, and decreases the administrative burden on both non-profit entities and City departments. For CDBG, ESG and HOPWA Grants Each agency receiving a CDBG, ESG and/or HOPWA grant entered into a grant agreement which stipulates the conditions upon which the grant was awarded, the performance outputs and program outcomes to be met, and the budget. Regular program performance reports were required of grant recipients, along with financial reports. Program site visits were conducted to determine client eligibility, compliance with Federal and local requirements and program progress. Since most CDBG Public Services grants qualified as limited clientele activities, recipient organizations had to demonstrate that they were verifying income eligibility for their clients to MOHCD and OEWD grant coordinators/community builders at site visits.

CAPER
88
OMB Control No: 2506-0117 (exp. 06/30/2018)
For each grant, a MOHCD/OEWD grant coordinator/community builder was responsible for providing technical assistance, reviewing progress reports, conducting on-site visits when appropriate, and evaluating performance outputs and program outcomes. The grant coordinator/community builder was also responsible for reviewing monthly expenditure reports and monitoring for fiscal compliance with regulations and accounting policies. In 2020-21, MOHCD continued to dedicate a full-time staff person to focus exclusively on fiscal and compliance monitoring for all of its federally-funded grants. For COVID-19 Emergency Business Loans The COVID-19 Emergency Business Loan programs targeted low-income, women-owned, and minority-owned businesses by design, but in particular during outreach. Moreover, wach loan recipient was required to enter into an agreement that stipulates the loan conditions and repayment schedule. Capacity Building for MOHCD/OEWD Staff and Delegate Agencies In 2020-2021, MOHCD and OEWD continued to invest in the training of its staff to build internal capacity so that MOHCD and OEWD could better assist its delegate agencies on both organizational and programmatic development. Organizational capacity building needs of delegate agencies include financial management, human resource management, technical assistance with compliance with federal and local regulations, Board of Directors development and program evaluation. MOHCD and OEWD collaborated on aligning requests for proposals to minimize administrative burden for delegate agencies. During the program year, MOHCD and OEWD staff worked closely with the Controller's Office and other City departments in assisting grantees to build internal capacity and to ensure compliance with all city, state and federal requirements. Monitoring for Housing Activities Single Family (Owner-Occupied) Properties MOHCD closely monitored it’s single-family owner-occupied MOHCD-funded properties to ensure ongoing compliance with the program requirements, specifically that owners continue to reside in the assisted property; that they retain title to the property; and that property taxes are current. While completing the monitoring process during the pandemic provided unique challenges to MOHCD and it’s homeowners, physical monitoring of all owner-occupied properties will continue in 2021 on a rolling basis to ensure compliance with regulations and standards of the City's housing programs. In 2020-2021, MOHCD staff brought 12 households into compliance and referred an additional 6 non-program compliant homeowners to the City Attorney’s Office for the collection of over $500,000 in legal settlements from these noncompliant homeowners. Multifamily Properties MOHCD monitors the compliance of 389 City-assisted multifamily rental projects, including 136 CDBG- and HOME-funded rental housing projects to assure compliance with program requirements. Monitoring activities included review of: (1) tenant income and rent schedules; (2) management and maintenance reports; and (3) income and expense statements, including financial statements and use of program income. MOHCD continues to work with rental property owners and their property management agents to ensure ongoing compliance with tenant income and rent restrictions as well as HUD housing quality standards and local code.

CAPER
89
OMB Control No: 2506-0117 (exp. 06/30/2018)
The multi-family monitoring encompassed a wide range of housing types, including family and senior housing; housing for people with special needs; housing for people with AIDS/HIV; permanent housing for the homeless and those at risk of becoming homeless; and transitional housing for homeless families and individuals. MOHCD suspended all HOME inspections for 2020-2021 due to COVID-19 shelter-in-place orders. MOHCD informed HUD of its suspension of HOME inspections on March, 31, 2020 and on April 1, 2020 received acknowledgement and acceptance of the inspection suspension by HUD-CPD staff. Citizen Participation Plan 91.105(d); 91.115(d) Describe the efforts to provide citizens with reasonable notice and an opportunity to comment on performance reports. The Draft 2020-2021 CAPER was available to the public for review and comment between September 10, 2021 and September 24, 2021. The City published a notice on the MOHCD, OEWD and HSH websites on September 3, 2021 informing the public of the availability of the draft document for review and comment. The notice was also emailed to MOHCD’s list of community organizations and stakeholders that is used for outreach purposes. See Appendix C for the proof of publication for the notice of availability of the Draft 2020-2021 CAPER for public review and comment. The public had access to an electronic copy of the draft document on the MOHCD, OEWD and HSH websites. No comments were received regarding the draft document.
CAPER
90
OMB Control No: 2506-0117 (exp. 06/30/2018)
CR-45 - CDBG 91.520(c) Specify the nature of, and reasons for, any changes in the jurisdiction’s program objectives and indications of how the jurisdiction would change its programs as a result of its experiences.
No changes.
Does this Jurisdiction have any open Brownfields Economic Development Initiative (BEDI) grants?
No
[BEDI grantees] Describe accomplishments and program outcomes during the last year.

CAPER
91
OMB Control No: 2506-0117 (exp. 06/30/2018)
CR-50 - HOME 91.520(d) Include the results of on-site inspections of affordable rental housing assisted under the program to determine compliance with housing codes and other applicable regulations Please list those projects that should have been inspected on-site this program year based upon the schedule in §92.504(d). Indicate which of these were inspected and a summary of issues that were detected during the inspection. For those that were not inspected, please indicate the reason and how you will remedy the situation. In 2020-2021, MOHCD was scheduled to inspect 12 HOME- funded properties, but suspended all HOME inspections due to coronavirus shelter-in-place directives starting in March 2020. MOHCD staff informed HUD of the inspection suspension on March 31, 2020. Please see CR-40 for a specific list of HOME-funded properties originally scheduled to be inspected. MOHCD designates all units as HOME-assisted units in any project that receives HOME funding. MOHCD requires the owner of each HOME-assisted project to submit a signed certification annually that includes the following statements:
The project has met affordability and other leasing provisions set forth in the funding agreement/s entered into with CCSF during the entire reporting period. As of the end date of the reporting period, _____ units (supply exact number) were occupied or held vacant and available for rental by low-income tenants meeting the income qualifications pursuant to the funding agreement/s entered into with CCSF. The undersigned has obtained a tenant income certification and/or third party documentation to support that certification from each tenant household occupying a unit restricted to occupancy by income-qualified tenants. All income certifications are maintained onsite with respect to each qualified tenant who resides in a unit or resided therein during the immediately preceding business year. The total charges for rent and a utility allowance to each income-qualified tenant in a restricted unit do not exceed the maximum rent specified in the funding agreement/s entered into with CCSF as adjusted by the most recent HUD income and rent figures, which have been taken from the figures that are supplied by MOHCD on its website.
Provide an assessment of the jurisdiction's affirmative marketing actions for HOME units. 92.351(b) MOHCD continues to rigorously review the affirmative marketing efforts of all of its borrowers at initial marketing and when developers open their wait lists. Monitoring marketing efforts continued to improve greatly and became even more efficient in 2020-2021 with MOHCD expanding its online application and listing system called Database of Affordable Housing Listings and Applications (DAHLIA) for new rental opportunities and the replenishment of waitlists for existing affordable housing.

CAPER
92
OMB Control No: 2506-0117 (exp. 06/30/2018)
Refer to IDIS reports to describe the amount and use of program income for projects, including the number of projects and owner and tenant characteristics MOHCD did not commit any HOME Program funding in Fiscal Year 2020-2021. Describe other actions taken to foster and maintain affordable housing. 91.220(k) (STATES ONLY: Including the coordination of LIHTC with the development of affordable housing). 91.320(j) The maintenance and preservation of existing affordable housing is a key housing activity for San Francisco given the age of its affordable housing stock. To this end San Francisco periodically issues Notice of Funding Availability for addressing the most pressing capital needs of existing affordable housing, especially those that impact the health and safety and ultimately the long-term livability of the properties.

CAPER
93
OMB Control No: 2506-0117 (exp. 06/30/2018)
CR-55 - HOPWA 91.520(e) Identify the number of individuals assisted and the types of assistance provided
Table for report on the one-year goals for the number of households provided housing through the use of HOPWA activities for: short-term rent, mortgage, and utility assistance payments to prevent homelessness of the individual or family; tenant-based rental assistance; and units provided in housing facilities developed, leased, or operated with HOPWA funds.
Number of Households Served Through: One-year Goal Actual Short-term rent, mortgage, and utility assistance payments
107 103
Tenant-based rental assistance 187 183 Units provided in transitional housing facilities developed, leased, or operated with HOPWA funds
28
152
Units provided in permanent housing facilities developed, leased, or operated with HOPWA funds
232
66
Total 554 504 Table 14 – HOPWA Number of Households Served
Narrative San Francisco’s Mayor’s Office of Housing and Community Development (MOHCD) is the lead agency to apply for, accept and expend HOPWA funds on behalf of the San Francisco EMSA, which includes the county of San Mateo. For both the Five-Year Consolidated Plan and the 2020-2021 annual performance periods, HOPWA program goals and objectives were substantially met as evidenced by maximum occupancy of capital projects and rental assistance programs, service utilization, and program stability. HOPWA funds were disbursed and utilized in a timely way. Outside of COVID-19 business closures and work from home mandates, no other challenges impacted overall HOPWA Program delivery or success, the exorbitant cost of living and inflated San Francisco housing market continually provided barriers, such as longer and more competitive housing searches, for HOPWA tenants. The HOPWA Program is effectively meeting the local needs of the AIDS housing community to the extent that funding has allowed. MOHCD continues to be very involved with HOPWA contractors to get mutual feedback and collaboration regarding any changing needs or program improvements that need to be made. MOHCD’s HIV Housing programs manager has worked to expand the community organizations that partner in ensuring HIV Housing services are provided in a fair and equitable manner. This has culminated in the recent publication of the HIV Housing plan for 2020-2025.

CAPER
94
OMB Control No: 2506-0117 (exp. 06/30/2018)
For fiscal year 2020-2021, MOHCD entered into an inter-governmental fiscal agreement with the San Mateo County AIDS Program which determines priorities for funding, selects project sponsors, administers the HOPWA funds, and ensures that all HOPWA regulations have been satisfied for their jurisdiction. Funding for 2020-2021 is summarized as follows:
County Funding Per Action Plan
FY 20-21 Expenditures
CARES funding per Action Plan
FY 20-21 CARES
Expenditures San Francisco $6,255,164 $7,328,191 $303,434 $526,630 San Mateo $812,065 $812,065 $118,179 $118,179 Total – San Francisco EMSA $7,067,229 $8,140,256 $421,613 $644,809
The following sections (by county) provide an overview of the grantee and community, annual performance under the Action Plan, and barriers and trends as required under Part 1, Sections 5a through 5c, of the HOPWA CAPER Measuring Performances Outcomes. All required charts and certifications are located at Appendix B. San Francisco Priorities, Allocations and Accomplishments Grantee and Community Overview The U.S. Department of Housing and Urban Development (HUD) estimates that, in 2017, 2,280 individuals in California were simultaneously living with HIV/AIDS and experiencing homelessness. Ensuring HIV/AIDS households are able to navigate housing resources and secure housing is critical to preventing homelessness for the PLWHA community. The San Francisco Department of Public Health noted in the 2019 HIV Epidemiology report that 18% of new HIV diagnosis’ were among those that are homeless.2 Due to the nature of transmission, the conditions of homelessness can create further spread of HIV. According to data from Ward 86, the largest clinic in San Francisco serving PLWHA, nearly a third of the 2,600 patients who visit the clinic are extremely impacted by housing instability. According to San Francisco’s Department of Public Health (SFDPH), the rates of viral suppression are far lower for individuals with HIV who are also experiencing homelessness. Examining the time trends of financial support available for HIV/AIDS housing services suggests a discouraging outlook. Ryan White CARE and General Fund support have remained approximately the same since 2007. Given inflation, significant increases in housing costs and increasing costs of service delivery over time, plateaus in funding effectively amount to fewer resources available for HIV/AIDS housing. Support from HOPWA funding in 2021 is less than that available in 2007, although costs have increased in every area of housing over the past 10 years.
22019 SF HIV Epidemology Report: https://www.sfdph.org/dph/files/reports/RptsHIVAIDS/AnnualReport2019_Indigo_20200914_Web_fixed.pdf

CAPER
95
OMB Control No: 2506-0117 (exp. 06/30/2018)
Looking forward, a new HOPWA funding formula has been signed into law as a result of the Housing Opportunity Through Modernization Act of 2016 that was signed into law on July 29, 2016. This new formula is based in part on the number persons living with HIV/AIDS rather than cumulative AIDS cases, and incorporates local housing costs and poverty rates into the formula. The combination of these factors will negatively impact San Francisco’s allocation significantly. The projection released by HUD in August, 2017 indicated that this new formula could result in a reduction in HOPWA funding to San Francisco of as much as $1.3 million by 2022. The impact of this formula change in San Francisco has the potential to further reduce the number of HOPWA funded subsides as well as reductions in capital. The strategic planning process also focused on system improvements to make the current array of programs and services more responsive to client needs and the current housing market. System change discussions focused on:
• Matching clients with the best housing program to meet their need. • Developing a more agile system to respond to clients’ changing housing and health needs, as
well as other changes to their situations (e.g. income changes). • Ensuring that the array of housing programs more proportionally matches the needs of the
current HIV+ population. Since the creation of the initial Five-Year Plan, the annual HOPWA budget has been developed in consultation with DPH’s HIV Health Services Office and the Planning Council. The FY 2020-2021 annual budget was presented to the public through the MOHCD website, at a public hearing for citizens and consumers, and before San Francisco’s Board of Supervisors prior to final approval. The FY 2020-2021 Action Plan anticipated $8,267,229 in HOPWA funding from annual formula allocation of $7,067,229 and program income of $1,200,000. Expenditures during FY 20-21 totaled $7,328,191 of which $7,328,191 was funded from annual formula funds. CARES expenditures during FY20-21 totaled $526,630.
Funding Per Action Plan
FY 20-21 Expenditures
Funding Per
Action Plan CARES
FY 20-21 Expenditures
CARES
Capital Improvement Projects $100,992 $97,817 $0 $0 Rental Assistance Program $3,414,182 $3,453,381 $60,005 $1,575 Supportive Services and Operating Costs
$2,641,676 $3,375,809 $243,429 $525,055
Housing Information/Referral Services $48,000 $53,940 $0 $0 Grantee Administration and Other Activities
$187,654 $347,244 $0 $0
Total $7,067,229 $7,328,191 $303,434 $526,630 The priorities and objectives of the HOPWA program as reflected in the 2020-2021 Action Plan included:
• Rental Assistance Program (183 tenant based rental assistance subsidies) During 2020-2021, $3.5 million was spent on rental assistance (47% of total expenditures). The program provided monthly rental subsidies and housing advocacy services to 183 households during FY 2020-21.
CAPER
96
OMB Control No: 2506-0117 (exp. 06/30/2018)
In addition, case management services and employment assistance/training were provided to 60 clients through the Second Start Program. Partial rent subsidies for the 60 households were funded by a separate HOPWA Competitive Grant. The cost per unit for tenant based rental assistance (TBRA) continues to be above the national average for this category. This is mainly due to very high housing costs in San Francisco.
• Services and operating subsidies for five licensed residential care facilities for people with HIV/AIDS and two other facilities for people with HIV/AIDS (102 transitional short-term housing facilities).
During 2020-2021, $3.4 million was spent on supportive services and operating subsidies at these 7 facilities (46% of total expenditures) with 228 unduplicated residents assisted. This program was also supplemented with $1.6 million in San Francisco General Funds during the fiscal year. All residents are required to have an income below HUD’s very low-income standard—50% of Area Median Income (AMI). Case managers at the programs coordinate care for residents ensuring maximum usage of available resources. HOPWA provides the largest percentage of funding to these projects, covering supportive services (including nursing care) and a portion of operating expenses. Funding for these programs and facilities are supplemented with federal Ryan White funds, Section 8 project-based vouchers, project sponsor contributions, and private sector funding including grants and donations.
• Capital Improvement Projects: During FY 2020-2021, $97,817 was spent on two capital improvement projects approved in prior years of which none of the projects were completed. Two projects are in progress with completion projected in the next year. There are three other capital improvement projects which have been approved for funding through the Request for Proposal (RFP) process, but not yet started. All HOPWA activities are targeted to very low-income persons living with HIV/AIDS. Every effort is made to ensure that ethnic and gender diversity is achieved during the selection of eligible clients. Each applicant is required to complete a comprehensive eligibility intake to verify medical diagnosis, income level, and place of residency. Project sponsors are required to provide program evaluation reports on an annual basis. The HIV Housing Referral List (HHRL), a waitlist managed by the SF Department of Public Health, served persons with HIV/AIDS for programs including HOPWA’s Housing Subsidy Assistance Services. HHRL has been closed to new applicants, but in the fall of 2017, a new housing access placement program, called “Plus Housing” was created as part of MOHCD’s new affordable housing data portal, Database for Affordable Housing Listings, Information, and Applications (DAHLIA). Since it’s creation the Plus Housing access placement program has provided a waitlist in which HIV positive households are able to request assistance obtaining a HOPWA subsidized unit as well as a HOPWA full or partial subsidy. As of August 2021, there were over 900 applicants requesting assistance; this highlights the difficulty HOPWA programs face with little to no increase in funding within the last 5 years. COVID-19 and CARES Act:

CAPER
97
OMB Control No: 2506-0117 (exp. 06/30/2018)
Beginning in January 2020, the San Francisco Bay area began to feel the effects, as did the world, noting work from home mandates. Many business closed their doors and began operating at a very limited capacity. Unfortunately, many people have lost their lives due to COVID-19 and at the time of publication of this document people continue to be effected by COVID-19 infections, including the delta variant. As a result, US Congress in early Spring 2020, passed the CARES Act legislation providing funding to assist households served that have been adversely effected by COVID-19 and in an effort to reduce continued transmission and infection. MOHCD reached out to all current HOPWA grantees via email and phone the week of April 6th once HUD announced that it would be awarding funding from the recently passed CARES act to help support HOPWA participants in San Francisco that have been adversely affected by COVID-19. MOHCD requested from each program to have the program manager and their teams talk with all participants being served through each HOPWA program to ask how they had been adversely impacted by COVID-19 and what resources could be helpful and supportive during this crisis. Through several meetings by phone and by video conference each grantee communicated to MOHCD the needs that HOPWA participants requested due to COVID-19.
HOPWA Entitlement: San Francisco $303,434 San Mateo $118,179 $421,613 Proposed Use $ Amount Notes PPE $80,000 Provides funding for subgrantees to
purchase Personal Protective Equipment (PPE) for staff and residents.
Nutrition Services $26,667 Provides funding to provide meals, groceries, delivery of food to tenants. May also provide funding to supplement food pantry services currently being provided by subgrantees.
Infection Control $66,895
Provides funding for prevention and education to residents in alignment with the COVID-19 prevention efforts of the City and County of SF/DPH.
Rental Assistance $66,895
Provides funding to assist with tenant due to income loss related to COVID-19, meant to allow for increase in monthly subsidy as well as utility overages.
Administrative Costs $62,977 These funds will be redistributed as a reserve pool for any overages unforeseen as the crisis changes.
$303,435
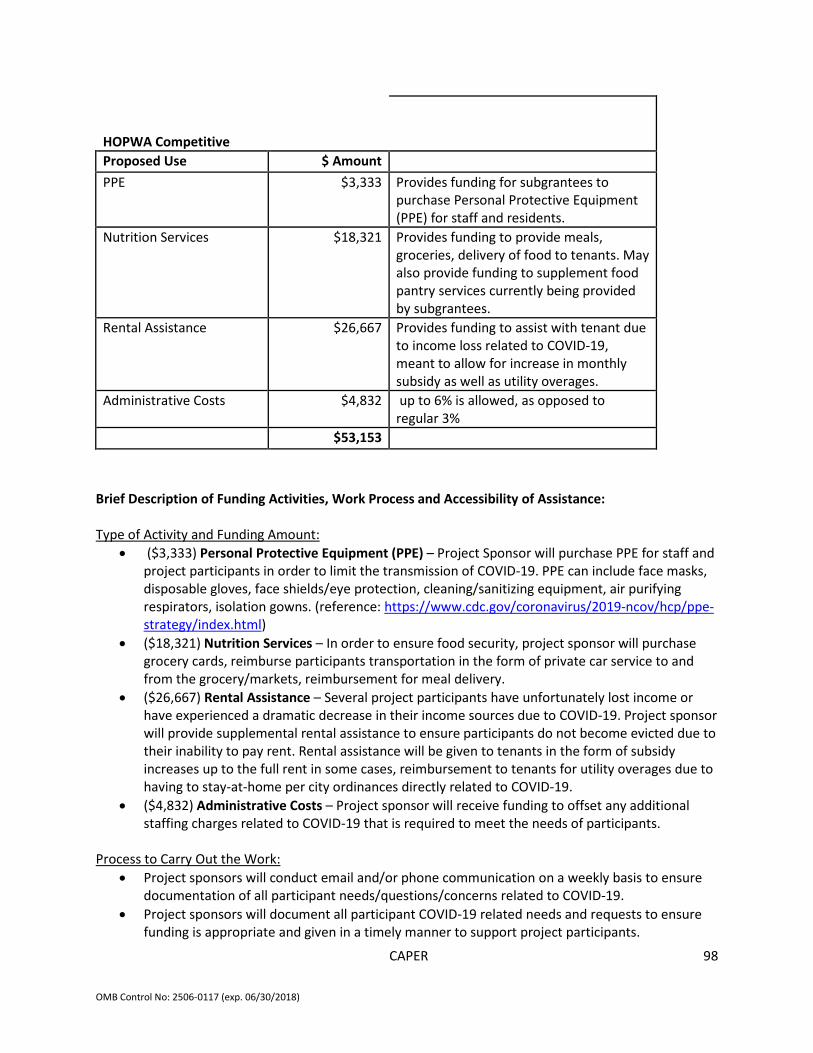
CAPER
98
OMB Control No: 2506-0117 (exp. 06/30/2018)
HOPWA Competitive
Proposed Use $ Amount PPE $3,333 Provides funding for subgrantees to
purchase Personal Protective Equipment (PPE) for staff and residents.
Nutrition Services $18,321 Provides funding to provide meals, groceries, delivery of food to tenants. May also provide funding to supplement food pantry services currently being provided by subgrantees.
Rental Assistance $26,667 Provides funding to assist with tenant due to income loss related to COVID-19, meant to allow for increase in monthly subsidy as well as utility overages.
Administrative Costs $4,832 up to 6% is allowed, as opposed to regular 3%
$53,153
Brief Description of Funding Activities, Work Process and Accessibility of Assistance: Type of Activity and Funding Amount:
• ($3,333) Personal Protective Equipment (PPE) – Project Sponsor will purchase PPE for staff and project participants in order to limit the transmission of COVID-19. PPE can include face masks, disposable gloves, face shields/eye protection, cleaning/sanitizing equipment, air purifying respirators, isolation gowns. (reference: https://www.cdc.gov/coronavirus/2019-ncov/hcp/ppe-strategy/index.html)
• ($18,321) Nutrition Services – In order to ensure food security, project sponsor will purchase grocery cards, reimburse participants transportation in the form of private car service to and from the grocery/markets, reimbursement for meal delivery.
• ($26,667) Rental Assistance – Several project participants have unfortunately lost income or have experienced a dramatic decrease in their income sources due to COVID-19. Project sponsor will provide supplemental rental assistance to ensure participants do not become evicted due to their inability to pay rent. Rental assistance will be given to tenants in the form of subsidy increases up to the full rent in some cases, reimbursement to tenants for utility overages due to having to stay-at-home per city ordinances directly related to COVID-19.
• ($4,832) Administrative Costs – Project sponsor will receive funding to offset any additional staffing charges related to COVID-19 that is required to meet the needs of participants.
Process to Carry Out the Work:
• Project sponsors will conduct email and/or phone communication on a weekly basis to ensure documentation of all participant needs/questions/concerns related to COVID-19.
• Project sponsors will document all participant COVID-19 related needs and requests to ensure funding is appropriate and given in a timely manner to support project participants.

CAPER
99
OMB Control No: 2506-0117 (exp. 06/30/2018)
• Project sponsors will meet with project participants over the phone or web to ensure participants know how to request assistance and when/how they will receive said assistance (ex: reimbursement, obtainment of gift cards, etc.)
• Project sponsors will only reimburse participants for COVID-19 related costs/services once participant has provided receipt of COVID-19 related purchase, copy of utility bill, etc.
• A written policy and procedure letter specific to COVID-19 relief services will be given to each project participant for record purposes and to ensure timely communication of service accessibility.
• Grantee will communicate with project sponsor via email, web or phone at minimum every two weeks to ensure procedures are followed and to support any challenges faced with services rendered.
• As COVID-19 prevention continues to evolve, updates to project sponsors Policies and Procedures will be necessary necessary to ensure services are rendered in a timely manner. Grantee will provide an update to Policies and Procedures for project sponsors by July 1st, 2020.
Accessing Assistance for Project Participants:
• Although many businesses are still closed to the public due to COVID-19 related city ordinances, project sponsors are making every effort to ensure timely communication and service updates to tenants by email, phone and web technology (video conferencing, etc.).
• Grantee remains available by phone and email. Project sponsors are available by phone and email. Project sponsors have increased email and phone communication with project participants to ensure availability.
• A communication/service protocol guide will be developed to detail how clients can access services and support during COVID-19 by July 1st, 2020. Until then project sponsors will remain available to project participants by phone and email.
Projects selected to receive HOPWA funding are required to provide supportive services and to demonstrate the ability to access community-based HIV services, such as those funded under the Ryan White Care Act and other public and private sources. Barrier and Trends Overview The following barriers were encountered during the program year:
HOPWA/HUD Regulations Planning Housing Availability Rent Determination and Fair Market Rents Discrimination/Confidentiality Multiple Diagnoses Eligibility Technical Assistance or Training Supportive Services Credit History Rental History Criminal Justice History Housing Affordability Other, please explain further
HOPWA/HUD Regulations: Since the full housing needs of very low income people living with HIV/AIDS have never been fully met with HOPWA funds, increased HOPWA formula funds would best serve the community. In San Francisco, primarily due to access and adherence to anti-retrovirals, there are more people living with HIV/AIDS every year, meaning that there are more people who need housing assistance provided by HOPWA funds each year. It is very difficult to sustain our current programs, let alone meet the increasing need within the current and recent HOPWA funding allocations. Additional HOPWA funding is needed for capital improvements, repairs of existing projects, and for rental subsidies that are lost over time to attrition due to rising costs. Due to the recent decline in HOPWA funding, San Francisco’s ability to provide support for capital improvements will come at the cost of direct services to individuals, a reduction in rental subsidies, and/or a reduction to operating cost support of residential

CAPER
100
OMB Control No: 2506-0117 (exp. 06/30/2018)
facilities. The flexibility to use a portion of HOPWA formula funds for shallow rent subsidy programs would allow the HOPWA program in San Francisco to lose fewer rental subsidies to attrition over time. Supportive Services: Long-term residential programs often struggle with the need to provide ongoing mental health support services to long-time survivors with intensive mental health needs. Because these mental health needs often exceed the capacity of existing supportive services offered in these facilities, providers often struggle to balance the needs of the individual who may be struggling with mental and behavioral issues, and the needs of the other facility residents who may have difficulty dealing with the resident as he or she works through their complicated issues. Substance abuse treatment has also been a supportive service area in which providers have asked for more assistance. Housing Affordability and Availability: Securing subsidies to remain in housing is a key solution to achieving healthy outcomes for PLWHA. In San Francisco, non-payment of rent is the leading cause of eviction. The aforementioned stigma and cost associated with HIV/AIDS care and treatment can create situations that interrupt the ability to pay a fixed rent. A 2012 analysis conducted by the Centers for Disease Control and Prevention found that housing status is the strongest predictor of HIV/AIDS health outcomes. Preserving the housing of PLWHA is a fundamental support to ensure positive health outcomes. Multiple Diagnoses: The overwhelming majority of HOPWA-served people are multiply diagnosed with substance abuse and/or mental health issues. For those living in or seeking independent subsidized housing, these issues can be barriers to finding and maintaining appropriate housing. While services are available at all HOPWA-funded housing programs, participants must be able to locate housing to participate. For those living in supportive HOPWA-funded housing, mental health and substance abuse issues can make living within a community more difficult for those affected by these issues and others living at the sites. HOPWA-funded housing programs do an excellent job in providing services to people who are multiply diagnosed, but these issues can still present barriers to people as they try to live within a supportive community or the greater community. Long Term Survivor Health Issues: Though antiretroviral medications continue to sustain and enhance the lives of people living with AIDS, AIDS-related health issues, such as the high prevalence of Hepatitis C and cancers, such as lymphoma, continue to make living with AIDS an unpredictable medical experience. These health issues and the fear and anxiety regarding possible loss of benefits in returning to work continue to be barriers for those already very disabled with AIDS to be able to increase their incomes. Most recently, individuals are beginning to outlive their long-term disability insurance policies, putting their housing status at risk because of the imminent loss of income. Credit, Rental, and Criminal Justice History: Credit, rental, and criminal justice history can be a barrier for many HOPWA-eligible people, particularly those who are seeking independent housing. As was previously mentioned, San Francisco’s rental housing market is extremely competitive, so prospective landlords can be highly selective when choosing tenants. Often HOPWA-eligible people without stellar rental histories have difficulty finding housing even once they have received a rental subsidy. Fair Market Rents: San Francisco is one of the most expensive and competitive rental housing markets in the country. This further limits the pool of housing available to people who have received HOPWA subsidies. Appropriate increases to FMR’s should also be considered when determining the amount of HOPWA funding available to an area.

CAPER
101
OMB Control No: 2506-0117 (exp. 06/30/2018)
Program Contact Mayor’s Office of Housing and Community Development – Manuel S. Vasquez, HIV Housing Programs Manager (415-701-5253, [email protected]) San Mateo Priorities, Allocations and Accomplishments Grantee and Community Overview San Mateo County’s share of HOPWA funding for FY 2020-21 totaled $812,065, and San Mateo County’s share of HOPWA CARES totaled $118,179 for a grand total of $930,244 and was fully expended during the fiscal year.
Categories Funding Per Action Plan
FY 20-21 HOPWA
Expenditures
FY 20-21 HOPWA CARES
Expenditures Rental Assistance Program $719,440 $619,004 $100,440 Supportive Services $159,561 $149,382 $10,179 Project Sponsor Administrative Exp $25,000 $25,000 $0 Total $930,244 $812,065 $118,179
From the total amount of the award, $744,440 or 80% was utilized to provide housing services including, short-term rent, mortgage, emergency financial assistance, move-in costs, housing information and related project sponsor administrative expenses. $159,561 or 17% of funding was used to provide case management services. Housing affordability has turned out to be a long-term challenge for residents of San Mateo County. Housing affordability in the County continues to decline every year, while market average rents continue to climb higher and higher. According to July 2021 County-Level Historic Estimates reports from Apartmentlist.com (https://www.apartmentlist.com/research/category/data-rent-estimates), San Mateo’s median rent for a single bedroom unit was $2,225 and for two bedrooms was $2,827. This is a 4% decrease from the previous year. Policymakers, state and county legislators have been trying to come up with legislation to help alleviate the housing crisis. Some proposed bills to help finance affordable housing may eventually help, but at the present time our clients are not getting a lot a relief. According to a recent study by the National Low Income Housing Coalition (NLIHC), a “fair-market” one-bedroom rate of $2,500 rent would require at least an annual income of $99,960 or an hourly rate of $48.06. These amounts are too high for clients of the program to be able to afford; the difficulty of clients finding employment in general further increases the challenges of affordable housing. In the past few years, the Housing Authority and some shelters had arrangements/contracts for some units of affordable housing. The number of those units has also decreased due to the demand from the population at large, leaving our clients with even less choices. The effect of the high cost of housing has also affected the price of inexpensive hotels/motels, which are also having a higher demand and are able to increase their prices. All of these factors have had a negative impact on clients of the program. They are having to wait longer for the few housing options available, having to pay more from their

CAPER
102
OMB Control No: 2506-0117 (exp. 06/30/2018)
disposable income for their housing, sometimes travel farther away to their medical appointments, and some have decided to move to other counties where housing has not been impacted as hard as the bay area and San Mateo County. A. Rental Assistance Program: 103 households were assisted during this fiscal year with short-term/emergency rental assistance and 14 of these households also received housing placement services. The 2020-2021 Action Plan anticipated that 90 households would be served during the fiscal year. Also, 158 households received housing information services during the year. One Hundred percent (100%) of clients who responded to a survey reported that the services they received from the program helped them maintain or improve their quality of live. One hundred percent (100%) of clients who responded to a survey reported being satisfied, or very satisfied with the services they received during the previous year. During the year, announcements of openings at three new apartment complexes were sent to clients, as well as to the social workers at Edison Clinic (most referrals to our program come from Edison Clinic). The program made use of CARES Act funds to pay rents for people whose income had been reduced because of COVID-19 precautions (e.g. workplace closures), resulting in recipients not having to worry about how to pay rent that was withheld, due to lack of income, during the pandemic. The Mental Health Association of San Mateo County took COVID-19 precautions early in the pandemic for the safety of clients and staff. One of the precautions was to work with clients remotely, via Zoom, email, texts and the U.S. mail, instead of meeting face-to-face. No one who doesn’t live, or work, on the property is permitted to enter the buildings or grounds. As a result, we no longer needed a receptionist, which has reduced program staffing by .80 FTE. B. Supportive Services: For the 2020-21 Action Plan, Supportive Services/Medical Case management projected that 180 persons would receive case management services. 417 individuals received case management for need assessments, information and referrals and comprehensive case management, including treatment adherence and community-based services aimed to increase their access to care, improve their opportunities of achieving a more stable living environment, and reduce their risk of becoming homeless. Our 2020 San Mateo County STD/HIV Program Client Satisfaction Survey had a smaller sample size of 49 due to COVID-19. In general 91% are satisfied with their social work and 100% are satisfied with their benefits counseling services. 69% responded that the benefits counselor or social worker improved their access to medical care with 30% stating “I don’t know”. 45% said the support services they received at the clinic reduced their risk of homelessness with 29% stating “I don’t know”. Barrier and Trends Overview The following barriers were encountered during the program year:
HOPWA/HUD Regulations Planning Housing Availability Rent Determination and Fair Market Rents Discrimination/Confidentiality Multiple Diagnoses Eligibility Technical Assistance or Training Supportive Services Credit History Rental History Criminal Justice History

CAPER
103
OMB Control No: 2506-0117 (exp. 06/30/2018)
Housing Affordability Other, please explain further
HOPWA/HUD Regulations HOPWA regulations limit service to 21 weeks per year. This isn’t always practical as it can take more time than that for clients to make progress toward stability. For example, it regularly takes 6 months to receive a response to a Social Security Disability application and clients rarely have enough income to pay rent while they wait. Unemployment Insurance and COVID-19 We had hoped that the people who received CARES Act-funded services would be able to pay their own rents after receiving State Unemployment Insurance (UIB), which we assumed would take about a month. It turned out to be a longer process than anyone anticipated. MHA used STRMU funds to support these people, along with the resources of local agencies that had received substantial amounts of CARES Act funds. Housing Affordability/Availability The high cost and unavailability of housing in San Mateo County continue to be barriers to stable housing for our clients. The average, annual gross income for the people who received services last year was just over $14,100. According to Statista, (https://www.statista.com/statistics/203399/us-two-bedroom-housing-wage-by-county/) someone living in San Mateo County must have an hourly wage of $68.33, or $132,000 annually, to be able to afford a 2 bedroom apartment. Business Insider (https://www.businessinsider.com/san-francisco-bay-area-rent-least-affordable-housing-in-us-2021-7) reports that it takes an hourly wage of between $31 and $68 to be able to afford a one-bedroom apartment. At an average income of $14,100, our clients are making the equivalent of about $7.50 per hour, far below the estimated amount needed to pay rent for a one or two bedroom apartment in San Mateo County. COVID-19 COVID-19 precautions have had an impact on working MHA clients. The majority have jobs in businesses that have closed, or that have reduced work hours (e.g. restaurants). Many are not eligible for benefit or insurance programs, which makes HOPWA one of the few resources that they can turn to. Additionally, because of the high cost of living in the County, many share their apartment or house with several people, putting them at increased risk of contracting the disease than if they lived alone or with fewer people. Fortunately, with insight, San Mateo County has created a program to house people who have been exposed to COVID-19 and who need help isolating. This should reduce the burden on family members when someone needs to isolate. Need for more boards and care facilities There is a continuing need of more, and affordable, boards and care facilities for people who would benefit from supported housing and, especially, a board and care. Both are in short supply in San Mateo County; our clients cannot afford the rents charged by boards and care. Program Contacts San Mateo County STD/HIV Program - Matt Geltmaker, STD/HIV Program Director Mental Health Association of San Mateo County - Susan Platte, Program Coordinator
CAPER
104
OMB Control No: 2506-0117 (exp. 06/30/2018)
HOPWA Performance Charts and Other Required Data All required charts and data of the HOPWA CAPER Measuring Performance Outcomes, not included in this section, are located at Appendix B.
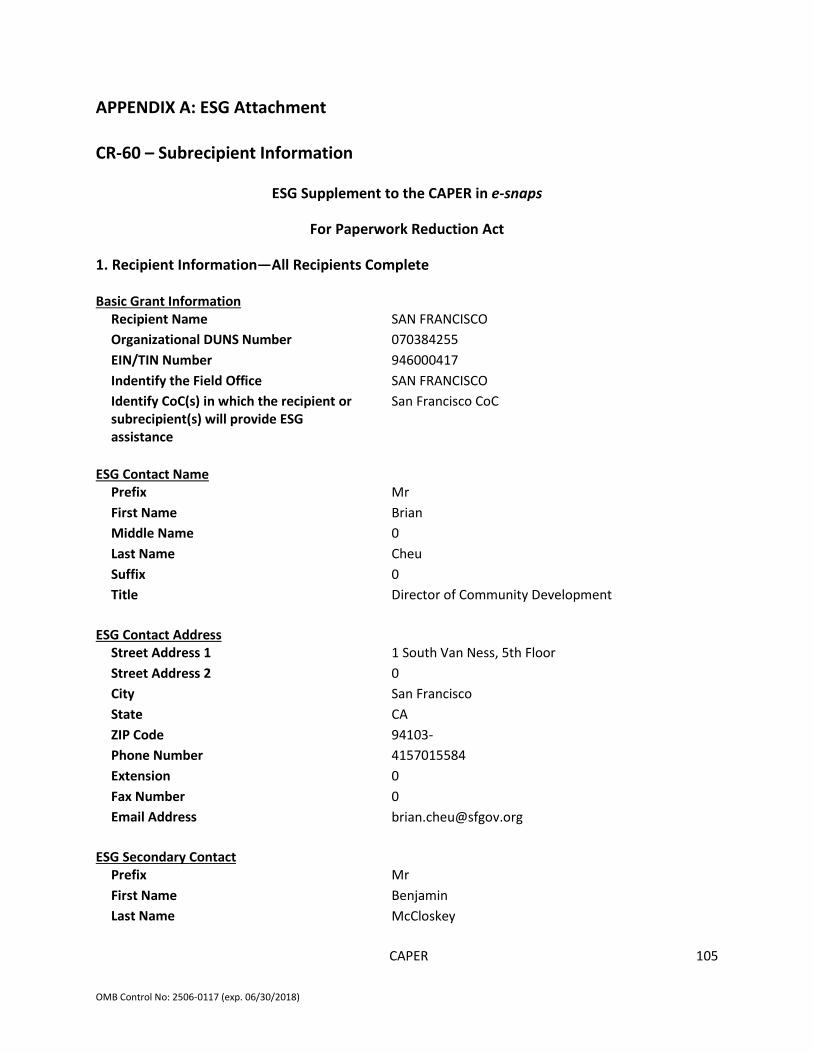
CAPER
105
OMB Control No: 2506-0117 (exp. 06/30/2018)
APPENDIX A: ESG Attachment CR-60 – Subrecipient Information
ESG Supplement to the CAPER in e-snaps
For Paperwork Reduction Act
1. Recipient Information—All Recipients Complete Basic Grant Information
Recipient Name SAN FRANCISCO Organizational DUNS Number 070384255 EIN/TIN Number 946000417 Indentify the Field Office SAN FRANCISCO Identify CoC(s) in which the recipient or subrecipient(s) will provide ESG assistance
San Francisco CoC
ESG Contact Name
Prefix Mr First Name Brian Middle Name 0 Last Name Cheu Suffix 0 Title Director of Community Development
ESG Contact Address
Street Address 1 1 South Van Ness, 5th Floor Street Address 2 0 City San Francisco State CA ZIP Code 94103- Phone Number 4157015584 Extension 0 Fax Number 0 Email Address [email protected]
ESG Secondary Contact
Prefix Mr First Name Benjamin Last Name McCloskey

CAPER
106
OMB Control No: 2506-0117 (exp. 06/30/2018)
Suffix 0 Title Deputy Director - Finance and Administration Phone Number 4157015575 Extension 0 Email Address [email protected]
2. Reporting Period—All Recipients Complete
Program Year Start Date 07/01/2020 Program Year End Date 06/30/2021
3a. Subrecipient Form – Complete one form for each subrecipient
Subrecipient or Contractor Name: SAN FRANCISCO City: San Francisco State: CA Zip Code: 94102, 4604 DUNS Number: 070384255 Is subrecipient a victim services provider: N Subrecipient Organization Type: Unit of Government ESG Subgrant or Contract Award Amount: 171707 Subrecipient or Contractor Name: CENTRAL CITY HOSPITALITY HOUSE City: San Francisco State: CA Zip Code: 94102, 3808 DUNS Number: 053295085 Is subrecipient a victim services provider: N Subrecipient Organization Type: Other Non-Profit Organization ESG Subgrant or Contract Award Amount: 73000 Subrecipient or Contractor Name: COMMUNITY AWARENESS AND TREATMENT SERVICES City: San Francisco State: CA Zip Code: 94103, 1519 DUNS Number: 363949678 Is subrecipient a victim services provider: N Subrecipient Organization Type: Other Non-Profit Organization ESG Subgrant or Contract Award Amount: 55000

CAPER
107
OMB Control No: 2506-0117 (exp. 06/30/2018)
Subrecipient or Contractor Name: COMPASS FAMILY SERVICES City: San Francisco State: CA Zip Code: 94102, 2853 DUNS Number: 832017953 Is subrecipient a victim services provider: N Subrecipient Organization Type: Other Non-Profit Organization ESG Subgrant or Contract Award Amount: 149944 Subrecipient or Contractor Name: DOLORES STREET COMMUNITY SERVICES City: San Francisco State: CA Zip Code: 94110, 2321 DUNS Number: 617708888 Is subrecipient a victim services provider: N Subrecipient Organization Type: Other Non-Profit Organization ESG Subgrant or Contract Award Amount: 55000 Subrecipient or Contractor Name: EPISCOPAL COMMUNITY SERVICES City: San Francisco State: CA Zip Code: 94103, 2726 DUNS Number: 151172095 Is subrecipient a victim services provider: N Subrecipient Organization Type: Faith-Based Organization ESG Subgrant or Contract Award Amount: 142943 Subrecipient or Contractor Name: HAMILTON FAMILY CENTER City: San Francisco State: CA Zip Code: 94117, 1326 DUNS Number: 806779633 Is subrecipient a victim services provider: N Subrecipient Organization Type: Other Non-Profit Organization ESG Subgrant or Contract Award Amount: 246943

CAPER
108
OMB Control No: 2506-0117 (exp. 06/30/2018)
Subrecipient or Contractor Name: LA CASA DE LAS MADRES City: San Francisco State: CA Zip Code: 94103, 2474 DUNS Number: 036202661 Is subrecipient a victim services provider: Y Subrecipient Organization Type: Other Non-Profit Organization ESG Subgrant or Contract Award Amount: 165000 Subrecipient or Contractor Name: LARKIN STREET YOUTH SERVICES City: San Francisco State: CA Zip Code: 94109, 6434 DUNS Number: 147566517 Is subrecipient a victim services provider: N Subrecipient Organization Type: Other Non-Profit Organization ESG Subgrant or Contract Award Amount: 112000 Subrecipient or Contractor Name: PROVIDENCE FOUNDATION City: San Francisco State: CA Zip Code: 94124, 2359 DUNS Number: 110573438 Is subrecipient a victim services provider: N Subrecipient Organization Type: Faith-Based Organization ESG Subgrant or Contract Award Amount: 50000 Subrecipient or Contractor Name: CATHOLIC CHARITIES CYO City: San Francisco State: CA Zip Code: 94105, 1614 DUNS Number: 074654880 Is subrecipient a victim services provider: N Subrecipient Organization Type: Faith-Based Organization ESG Subgrant or Contract Award Amount: 212943

CAPER
109
OMB Control No: 2506-0117 (exp. 06/30/2018)
Subrecipient or Contractor Name: HOMELESS CHILDREN'S NETWORK City: San Francisco State: CA Zip Code: 94124, 1443 DUNS Number: 138011509 Is subrecipient a victim services provider: N Subrecipient Organization Type: Other Non-Profit Organization ESG Subgrant or Contract Award Amount: 55000 Subrecipient or Contractor Name: Mission Neighborhood Health Center City: San Francisco State: CA Zip Code: 94110, 1323 DUNS Number: 030967392 Is subrecipient a victim services provider: N Subrecipient Organization Type: Other Non-Profit Organization ESG Subgrant or Contract Award Amount: 55943 Subrecipient or Contractor Name: The San Francisco Particular Council of the Society of St Vincent De Paul City: San Francisco State: CA Zip Code: 94103, 3926 DUNS Number: 078773173 Is subrecipient a victim services provider: N Subrecipient Organization Type: Other Non-Profit Organization ESG Subgrant or Contract Award Amount: 50000

CAPER
110
OMB Control No: 2506-0117 (exp. 06/30/2018)
CR-65 - Persons Assisted 4. Persons Served
4a. Complete for Homelessness Prevention Activities
Number of Persons in Households
Total
Adults 71 Children 17 Don't Know/Refused/Other 0 Missing Information 4 Total 92
Table 15 – Household Information for Homeless Prevention Activities
4b. Complete for Rapid Re-Housing Activities
Number of Persons in Households
Total
Adults 31 Children 29 Don't Know/Refused/Other 0 Missing Information 0 Total 60
Table 16 – Household Information for Rapid Re-Housing Activities
4c. Complete for Shelter
Number of Persons in Households
Total
Adults 676 Children 200 Don't Know/Refused/Other 0 Missing Information 2 Total 878
Table 17 – Shelter Information

CAPER
111
OMB Control No: 2506-0117 (exp. 06/30/2018)
4d. Street Outreach
Table 18 – Household Information for Street Outreach
4e. Totals for all Persons Served with ESG
Number of Persons in Households
Total
Adults 778 Children 246 Don't Know/Refused/Other 0 Missing Information 6 Total 1,030
Table 19 – Household Information for Persons Served with ESG
5. Gender—Complete for All Activities
Total Male 457 Female 542 Transgender 7 Don't Know/Refused/Other 0 Missing Information 24 Total 1,030
Table 20 – Gender Information
Number of Persons in Households
Total
Adults 6,760 Children 0 Don't Know/Refused/Other 0 Missing Information 0 Total 6,760

CAPER
112
OMB Control No: 2506-0117 (exp. 06/30/2018)
6. Age—Complete for All Activities
Table 21 – Age Information
7. Special Populations Served—Complete for All Activities
Number of Persons in Households Subpopulation Total Total
Persons Served –
Prevention
Total Persons Served –
RRH
Total Persons
Served in Emergency
Shelters Veterans 12 0 0 12 Victims of Domestic Violence 0 0 0 0 Elderly 0 0 0 0 HIV/AIDS 0 0 0 0 Chronically Homeless 295 0 13 282 Persons with Disabilities: Severely Mentally Ill 2 2 0 0 Chronic Substance Abuse 0 0 0 0 Other Disability 0 0 0 0 Total (Unduplicated if possible) 2 2 0 0
Table 22 – Special Population Served
Total Under 18 246 18-24 112 25 and over 666 Don't Know/Refused/Other 0 Missing Information 6 Total 1,030

CAPER
113
OMB Control No: 2506-0117 (exp. 06/30/2018)
CR-70 – ESG 91.520(g) - Assistance Provided and Outcomes 8. Shelter Utilization
Number of New Units - Rehabbed 0 Number of New Units - Conversion 0 Total Number of bed-nights available 439,095 Total Number of bed-nights provided 410,118 Capacity Utilization 93.40%
Table 23 – Shelter Capacity
9. Project Outcomes Data measured under the performance standards developed in consultation with the CoC(s)
Performance measures and outcomes for only the 2020-2021 ESG projects are listed below: • Number of individuals/households served by homelessness prevention and rapid re-housing activities a. Total individuals: 139 b. Total households: 93 • Number of individuals/households served by emergency shelter activities a. Total individuals: 876 b. Total households: 728 • Number and percentage of individuals/households who transitioned to permanent housing: 172

CAPER
114
OMB Control No: 2506-0117 (exp. 06/30/2018)
CR-75 – Expenditures 11. Expenditures
11a. ESG Expenditures for Homelessness Prevention
Dollar Amount of Expenditures in Program Year 2018 2019 2020 Expenditures for Rental Assistance 0 0 0 Expenditures for Housing Relocation and Stabilization Services - Financial Assistance 79,190 72,564 58,197 Expenditures for Housing Relocation & Stabilization Services - Services 0 31,098 63,224 Expenditures for Homeless Prevention under Emergency Shelter Grants Program 0 0 213,224 Subtotal Homelessness Prevention 79,190 103,662 334,645
Table 24 – ESG Expenditures for Homelessness Prevention
11b. ESG Expenditures for Rapid Re-Housing
Dollar Amount of Expenditures in Program Year 2018 2019 2020 Expenditures for Rental Assistance 0 0 124,465 Expenditures for Housing Relocation and Stabilization Services - Financial Assistance 79,190 67,380 58,197 Expenditures for Housing Relocation & Stabilization Services - Services 0 36,282 63,224 Expenditures for Homeless Assistance under Emergency Shelter Grants Program 0 0 0 Subtotal Rapid Re-Housing 79,190 103,662 245,886
Table 25 – ESG Expenditures for Rapid Re-Housing
11c. ESG Expenditures for Emergency Shelter
Dollar Amount of Expenditures in Program Year 2018 2019 2020 Essential Services 32,175 711,149 678,437 Operations 0 0 124,547 Renovation 0 0 0 Major Rehab 0 0 0 Conversion 0 0 0

CAPER
115
OMB Control No: 2506-0117 (exp. 06/30/2018)
Subtotal 32,175 711,149 802,984 Table 26 – ESG Expenditures for Emergency Shelter
11d. Other Grant Expenditures
Dollar Amount of Expenditures in Program Year 2018 2019 2020 Street Outreach 0 0 0 HMIS 0 0 60,622 Administration 0 22,853 111,085
Table 27 - Other Grant Expenditures
11e. Total ESG Grant Funds
Total ESG Funds Expended
2018 2019 2020
2,687,103 190,555 941,326 1,555,222 Table 28 - Total ESG Funds Expended
11f. Match Source
2018 2019 2020 Other Non-ESG HUD Funds 0 0 0 Other Federal Funds 0 724,683 0 State Government 0 265,323 55,000 Local Government 0 10,508,102 1,433,800 Private Funds 0 2,471,184 0 Other 0 78,226 0 Fees 0 0 0 Program Income 0 0 0 Total Match Amount 0 14,047,518 1,488,800
Table 29 - Other Funds Expended on Eligible ESG Activities
11g. Total
Total Amount of Funds Expended on ESG
Activities
2018 2019 2020
18,223,421 190,555 14,988,844 3,044,022 Table 30 - Total Amount of Funds Expended on ESG Activities

CAPER
116
OMB Control No: 2506-0117 (exp. 06/30/2018)
APPENDIX B: HOPWA Information, Data Tables and Certifications Per requirements in the HOPWA Consolidated Annual Performance and Evaluation Report (CAPER) Measuring Performance Outcomes with expiration date of 11/30/2023.
Part 1: Grantee Executive Summary 1. Grantee Information
HUD Grant Number CAH18F003; CAH19F003; CAH20F003; CAH20FHW003
Operating Year for this report From (mm/dd/yy) 07/01/2020 To (mm/dd/yy) 06/30/2021
Grantee Name Mayor’s Office of Housing and Community Development (MOHCD)/ City and County of SF
Business Address
1 South Van Ness Ave. – 5th Floor
City, County, State, Zip
San Fracisco
CA
94103
Employer Identification Number (EIN) or Tax Identification Number (TIN)
94-6000417
DUN & Bradstreet Number (DUNs): 07-038-4255 System for Award Management (SAM):: Is the grantee’s SAM status currently active? ☒ Yes ☐ No If yes, provide SAM Number:
Congressional District of Grantee’s Business Address
8th
*Congressional District of Primary Service Area(s)
8th 12th
*City(ies) and County(ies) of Primary Service Area(s)
Cities: San Francisco San Mateo
Counties: San Francisco
Organization’s Website Address https://sf.gov/departments/mayors-office-housing-and-community-development
Is there a waiting list(s) for HOPWA Housing Subsidy Assistance Services in the Grantee Service Area? ☐ Yes ☒ No If yes, explain in the narrative section what services maintain a waiting list and how this list is administered.
* Service delivery area information only needed for program activities being directly carried out by the grantee.
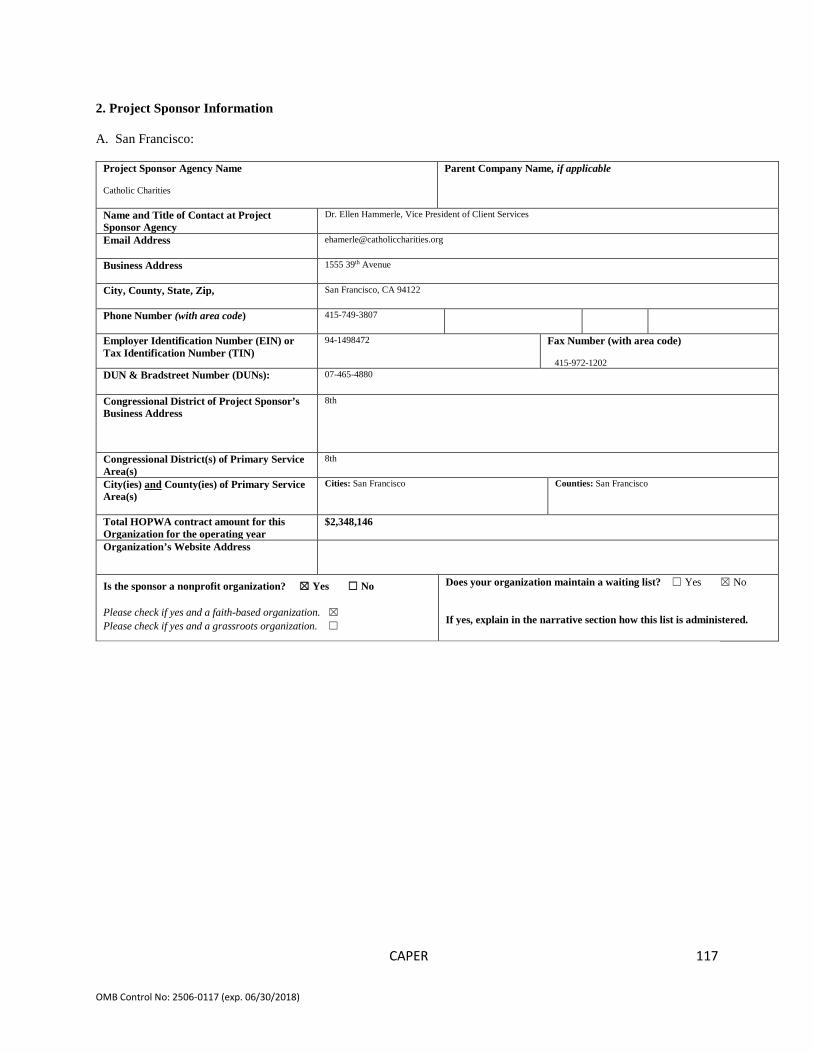
CAPER
117
OMB Control No: 2506-0117 (exp. 06/30/2018)
2. Project Sponsor Information A. San Francisco:
Project Sponsor Agency Name Catholic Charities
Parent Company Name, if applicable
Name and Title of Contact at Project Sponsor Agency
Dr. Ellen Hammerle, Vice President of Client Services
Email Address
Business Address
1555 39th Avenue
City, County, State, Zip,
San Francisco, CA 94122
Phone Number (with area code)
415-749-3807
Employer Identification Number (EIN) or Tax Identification Number (TIN)
94-1498472 Fax Number (with area code) 415-972-1202
DUN & Bradstreet Number (DUNs): 07-465-4880
Congressional District of Project Sponsor’s Business Address
8th
Congressional District(s) of Primary Service Area(s)
8th
City(ies) and County(ies) of Primary Service Area(s)
Cities: San Francisco Counties: San Francisco
Total HOPWA contract amount for this Organization for the operating year
$2,348,146
Organization’s Website Address
Is the sponsor a nonprofit organization? ☒ Yes ☐ No Please check if yes and a faith-based organization. ☒ Please check if yes and a grassroots organization. ☐
Does your organization maintain a waiting list? ☐ Yes ☒ No If yes, explain in the narrative section how this list is administered.

CAPER
118
OMB Control No: 2506-0117 (exp. 06/30/2018)
Project Sponsor Agency Name
Dolores Street Community Services
Parent Company Name, if applicable
Name and Title of Contact at Project Sponsor Agency
Enrique Roldan, Program Director
Email Address
Business Address
938 Valencia Street
City, County, State, Zip
San Francisco San Francisco CA 94110
Phone Number (with area code)
(415) 282-6209 Fax Number (with area code) (415) 282-2826
Employer Identification Number (EIN) or Tax Identification Number (TIN)
94-2919302
DUN & Bradstreet Number (DUNs): 61-770-8888
Congressional District of Project Sponsor’s Business Address
8th
Congressional District(s) of Primary Service Area(s)
8th
City(ies) and County(ies) of Primary Service Area(s)
Cities: San Francisco
Counties: San Francisco
Total HOPWA contract amount for this Organization for the operating year
$579,350
Organization’s Website Address www.dscs.org
Does your organization maintain a waiting list? Yes No If yes, explain in the narrative section how this list is administered. Is the sponsor a nonprofit organization? Yes No
Please check if yes and a faith-based organization. Please check if yes and a grassroots organization.

CAPER
119
OMB Control No: 2506-0117 (exp. 06/30/2018)
Project Sponsor Agency Name Larkin Street Youth Services
Parent Company Name, if applicable
Name and Title of Contact at Project Sponsor Agency
Marnie Regen, Director of Public Funding
Email Address
Business Address
134 Golden Gate Avenue
City, County, State, Zip
San Francisco San Francisco CA 94102
Phone Number (with area code)
(415) 673-0911 Fax Number (with area code) (415) 749-3838
Employer Identification Number (EIN) or Tax Identification Number (TIN)
94-2917999
DUN & Bradstreet Number (DUNs): 14-756-6517
Congressional District of Project Sponsor’s Business Address
12th
Congressional District(s) of Primary Service Area(s)
12th
City(ies) and County(ies) of Primary Service Area(s)
Cities: San Francisco
Counties: San Francisco
Total HOPWA contract amount for this Organization for the operating year
$458,144
Organization’s Website Address www.larkinstreetyouth.org
Does your organization maintain a waiting list? Yes No If yes, explain in the narrative section how this list is administered. Is the sponsor a nonprofit organization? Yes No
Please check if yes and a faith-based organization. Please check if yes and a grassroots organization.

CAPER
120
OMB Control No: 2506-0117 (exp. 06/30/2018)
Project Sponsor Agency Name Maitri Compassionate Care
Parent Company Name, if applicable
Name and Title of Contact at Project Sponsor Agency
Rusty Smith, Executive Director
Email Address
Business Address
401 Duboce Avenue
City, County, State, Zip
San Francisco San Francisco CA 94117
Phone Number (with area code)
(415) 558-3001 Fax Number (with area code) (415) 558-3010
Employer Identification Number (EIN) or Tax Identification Number (TIN)
94-3189198
DUN & Bradstreet Number (DUNs): 78-685-1444
Congressional District of Project Sponsor’s Business Address
8th
Congressional District(s) of Primary Service Area(s)
8th
City(ies) and County(ies) of Primary Service Area(s)
Cities: San Francisco
Counties: San Francisco
Total HOPWA contract amount for this Organization for the operating year
$576,954
Organization’s Website Address www.maitrisf.org
Does your organization maintain a waiting list? Yes No If yes, explain in the narrative section how this list is administered. Is the sponsor a nonprofit organization? Yes No
Please check if yes and a faith-based organization. Please check if yes and a grassroots organization.

CAPER
121
OMB Control No: 2506-0117 (exp. 06/30/2018)
Project Sponsor Agency Name Rafiki Coalition for Health and Wellness
Parent Company Name, if applicable
Name and Title of Contact at Project Sponsor Agency
Monique LeSarre, Executive Director
Email Address
Business Address
601 Cesar Chavez Street
City, County, State, Zip
San Francisco San Francisco CA 94124
Phone Number (with area code)
(415) 615-9945 Fax Number (with area code) (415) 615-9943
Employer Identification Number (EIN) or Tax Identification Number (TIN)
94-3098879
DUN & Bradstreet Number (DUNs): 60-810-0186
Congressional District of Project Sponsor’s Business Address
12th
Congressional District(s) of Primary Service Area(s)
12th
City(ies) and County(ies) of Primary Service Area(s)
Cities: San Francisco
Counties: San Francisco
Total HOPWA contract amount for this Organization for the operating year
$160,000
Organization’s Website Address www.rafikicoalition.org
Does your organization maintain a waiting list? Yes No If yes, explain in the narrative section how this list is administered. Is the sponsor a nonprofit organization? Yes No
Please check if yes and a faith-based organization. Please check if yes and a grassroots organization.

CAPER
122
OMB Control No: 2506-0117 (exp. 06/30/2018)
Project Sponsor Agency Name Derek Silva Community
Parent Company Name, if applicable Mercy Housing California XVII, LP
Name and Title of Contact at Project Sponsor Agency
Julie Sontag, Senior Asset Manager
Email Address
Business Address
1600 Broadway, Ste 2000
City, County, State, Zip
Denver Denver CO 80202
Phone Number (with area code)
(415) 355-7108 Fax Number (with area code) (415) 355-7101
Employer Identification Number (EIN) or Tax Identification Number (TIN)
94-3400496
DUN & Bradstreet Number (DUNs): 07-954-2182 Congressional District of Project Sponsor’s Business Address
8th
Congressional District(s) of Primary Service Area(s)
8th
City(ies) and County(ies) of Primary Service Area(s)
Cities: San Francisco
Counties: San Francisco
Total HOPWA contract amount for this Organization for the operating year
$110,304
Organization’s Website Address www.mercyhousing.org
Does your organization maintain a waiting list? Yes No If yes, explain in the narrative section how this list is administered. Is the sponsor a nonprofit organization? Yes No
Please check if yes and a faith-based organization. Please check if yes and a grassroots organization.

CAPER
123
OMB Control No: 2506-0117 (exp. 06/30/2018)
Project Sponsor Agency Name Bernal Heights Housing Corp.
Parent Company Name, if applicable
Name and Title of Contact at Project Sponsor Agency
Ayanna Weathersby, Asset & Relocation Manager
Email Address
Business Address
515 Cortland Avenue
City, County, State, Zip
San Francisco San Francisco CA 94110
Phone Number (with area code)
415-206-2140 x147 Fax Number (with area code)
Employer Identification Number (EIN) or Tax Identification Number (TIN)
94-314-2001
DUN & Bradstreet Number (DUNs): 80-900-2637
Congressional District of Project Sponsor’s Business Address
8th
Congressional District(s) of Primary Service Area(s)
8th
City(ies) and County(ies) of Primary Service Area(s)
Cities: San Francisco
Counties: San Francisco
Total HOPWA contract amount for this Organization for the operating year
$44,100
Organization’s Website Address www.bhnc.org
Does your organization maintain a waiting list? Yes No If yes, explain in the narrative section how this list is administered. Is the sponsor a nonprofit organization? Yes No
Please check if yes and a faith-based organization. Please check if yes and a grassroots organization.
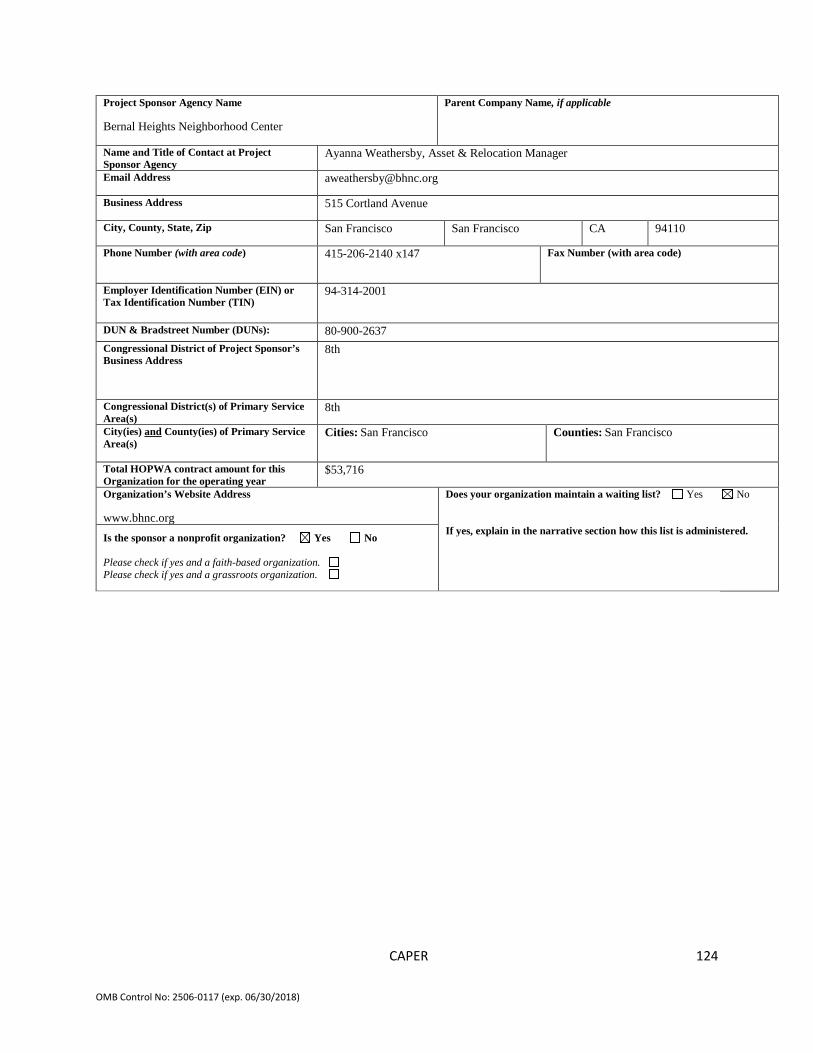
CAPER
124
OMB Control No: 2506-0117 (exp. 06/30/2018)
Project Sponsor Agency Name Bernal Heights Neighborhood Center
Parent Company Name, if applicable
Name and Title of Contact at Project Sponsor Agency
Ayanna Weathersby, Asset & Relocation Manager
Email Address
Business Address
515 Cortland Avenue
City, County, State, Zip
San Francisco San Francisco CA 94110
Phone Number (with area code)
415-206-2140 x147 Fax Number (with area code)
Employer Identification Number (EIN) or Tax Identification Number (TIN)
94-314-2001
DUN & Bradstreet Number (DUNs): 80-900-2637
Congressional District of Project Sponsor’s Business Address
8th
Congressional District(s) of Primary Service Area(s)
8th
City(ies) and County(ies) of Primary Service Area(s)
Cities: San Francisco
Counties: San Francisco
Total HOPWA contract amount for this Organization for the operating year
$53,716
Organization’s Website Address www.bhnc.org
Does your organization maintain a waiting list? Yes No If yes, explain in the narrative section how this list is administered. Is the sponsor a nonprofit organization? Yes No
Please check if yes and a faith-based organization. Please check if yes and a grassroots organization.

CAPER
125
OMB Control No: 2506-0117 (exp. 06/30/2018)
B. San Mateo County:
Project Sponsor Agency Name Mental Health Association of San Mateo County
Parent Company Name, if applicable
Name and Title of Contact at Project Sponsor Agency
Susan Platte, Program Coordinator
Email Address
Business Address
2686 Spring Street
City, County, State, Zip
Redwood City San Mateo County CA 94063
Phone Number (with area code)
(650) 363-2834 Fax Number (with area code) (510) 350-9176
Employer Identification Number (EIN) or Tax Identification Number (TIN)
94-6034112
DUN & Bradstreet Number (DUNs): 01-873-5159
Congressional District of Project Sponsor’s Business Address
14th
Congressional District(s) of Primary Service Area(s)
Parts of 14th and 18th Districts
City(ies) and County(ies) of Primary Service Area(s)
Cities: All Cities in San Mateo County
Counties: San Mateo County
Total HOPWA contract amount for this Organization for the operating year
$770,683
Organization’s Website Address www.mhasmc.org
Does your organization maintain a waiting list? Yes No If yes, explain in the narrative section how this list is administered. Is the sponsor a nonprofit organization? Yes No
Please check if yes and a faith-based organization. Please check if yes and a grassroots organization.

CAPER
126
OMB Control No: 2506-0117 (exp. 06/30/2018)
Project Sponsor Agency Name (Admin Sub-recipient) County of San Mateo
Parent Company Name, if applicable
Name and Title of Contact at Project Sponsor Agency
Matt Geltmaker, STD/HIV Program Director
Email Address
Business Address 225 – 37th Avenue
City, State, Zip, County
San Mateo San Mateo CA 94403
Phone Number (with area code) (650) 573-2077 Fax Number (with area code) (650) 573-2875
Employer Identification Number (EIN) or Tax Identification Number (TIN)
94-6000532
DUN & Bradstreet Number (DUNs): 62-513-9170
Congressional District of Project Sponsor’s Business Address
12th
Congressional District(s) of Primary Service Area(s)
Parts of 12th and 14th districts
City(ies) and County(ies) of Primary Service Area(s)
Cities: All Cities in San Mateo County
Counties: San Mateo County
Total HOPWA contract amount for this Organization for the operating year
$159,561
Organization’s Website Address https://www.smchealth.org
Does your organization maintain a waiting list? Yes No If yes, explain in the narrative section how this list is administered. Is the sponsor a nonprofit organization? Yes No
Please check if yes and a faith-based organization. Please check if yes and a grassroots organization.
5. Grantee Narrative and Performance Assessment Grantee and Community Overview, Annual Performance under the Action Plan, and Barriers and Trends Overview are included in the main narrative section of this report.
End of PART 1

CAPER
127
OMB Control No: 2506-0117 (exp. 06/30/2018)
PART 2: Sources of Leveraging and Program Income 1. Sources of Leveraging
A. Source of Leveraging Chart
[1] Source of Leveraging
[2] Amount
of Leveraged
Funds [3] Type of
Contribution
[4] Housing Subsidy Assistance or Other
Support Public Funding
Ryan White-Housing Assistance $198,689 Facility Op erating
☒ Housing Subsidy Assistance ☐ Other Support
Ryan White-Other $2,497,306 Case Management and other services
☐ Housing Subsidy Assistance ☒ Other Support
Housing Choice Voucher Program $2,176,049 Rent/Operating ☒ Housing Subsidy Assistance ☐ Other Support
Housing Choice Voucher Program $231,566 Supportive Services
☐ Housing Subsidy Assistance ☒ Other Support
Continuum of Care $27,684 Housing Subsidy ☒ Housing Subsidy Assistance ☐ Other Support
General Funds – San Francisco $3,112,727 Case Management and other services
☐ Housing Subsidy Assistance ☒ Other Support
Emergency Solutions Grant ☐ Housing Subsidy Assistance ☐ Other Support
Other Public: ☐ Housing Subsidy Assistance ☒ Other Support
Other Public: ☐ Housing Subsidy Assistance ☐ Other Support
Other Public: ☐ Housing Subsidy Assistance ☐ Other Support
Other Public: ☐ Housing Subsidy Assistance ☐ Other Support
Other Public: ☐ Housing Subsidy Assistance ☐ Other Support
Private Funding
Grants $12,313 Various program and administrative
☐ Housing Subsidy Assistance ☒ Other Support
Individual Donations, Fundraising Events and Bequests $386,538 Various program and administrative
☐ Housing Subsidy Assistance ☒ Other Support
Other Private: ☐ Housing Subsidy Assistance ☐ Other Support
Other Private: ☐ Housing Subsidy Assistance ☐ Other Support
Other Funding
Grantee/Project Sponsor (Agency) Cash $878,854 Various program and administrative
☐ Housing Subsidy Assistance ☒ Other Support
Resident Rent Payments by Client to Private Landlord $726,530
TOTAL (Sum of all Rows) $10,248,256
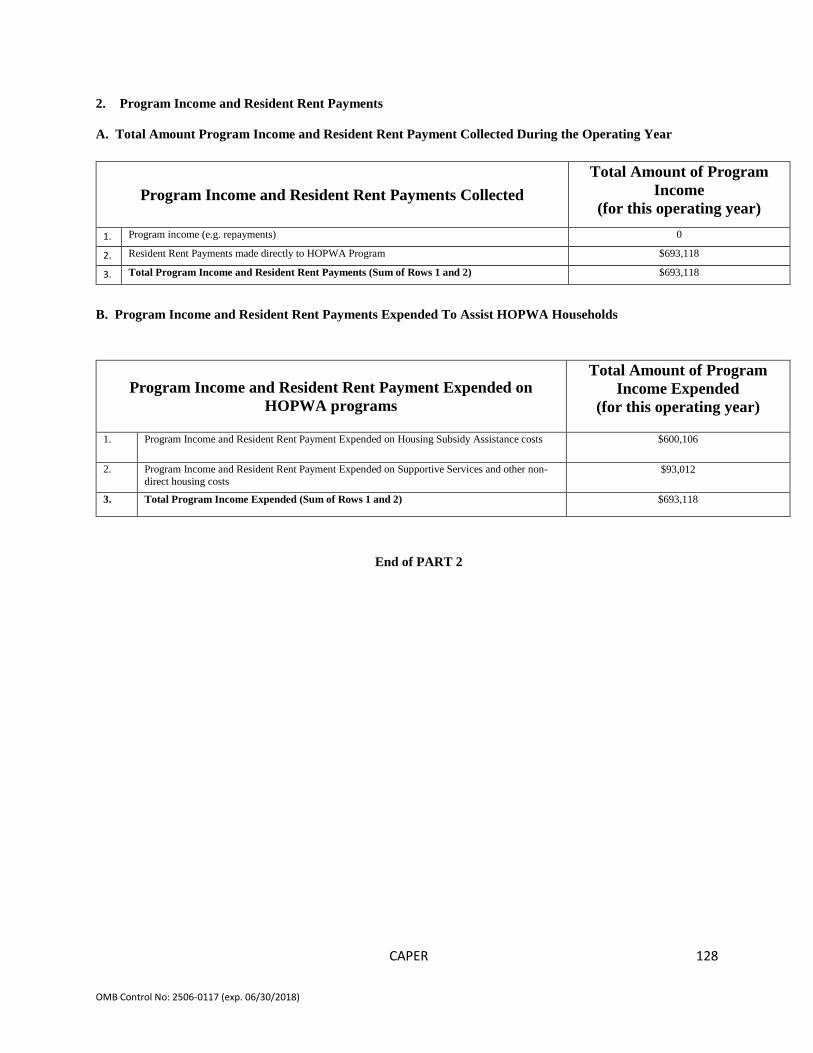
CAPER
128
OMB Control No: 2506-0117 (exp. 06/30/2018)
2. Program Income and Resident Rent Payments
A. Total Amount Program Income and Resident Rent Payment Collected During the Operating Year
B. Program Income and Resident Rent Payments Expended To Assist HOPWA Households
End of PART 2
Program Income and Resident Rent Payments Collected Total Amount of Program
Income (for this operating year)
1. Program income (e.g. repayments) 0
2. Resident Rent Payments made directly to HOPWA Program $693,118
3. Total Program Income and Resident Rent Payments (Sum of Rows 1 and 2) $693,118
Program Income and Resident Rent Payment Expended on HOPWA programs
Total Amount of Program Income Expended
(for this operating year)
1. Program Income and Resident Rent Payment Expended on Housing Subsidy Assistance costs $600,106
2. Program Income and Resident Rent Payment Expended on Supportive Services and other non-direct housing costs
$93,012
3. Total Program Income Expended (Sum of Rows 1 and 2) $693,118

CAPER
129
OMB Control No: 2506-0117 (exp. 06/30/2018)
PART 3: Accomplishment Data Planned Goal and Actual Outputs 1. HOPWA Performance Planned Goal and Actual Outputs
HOPWA Performance Planned Goal
and Actual
[1] Output: Households [2] Output: Funding
HOPWA Assistance
Leveraged Households HOPWA Funds
a. b. c. d. e. f.
Goa
l
Act
ual
Goa
l
Act
ual
HO
PWA
Bu
dget
HO
PWA
A
ctua
l
HOPWA Housing Subsidy Assistance [1] Output: Households [2] Output: Funding
1. Tenant-Based Rental Assistance 200 186 200 186 $3,153,166 $3,122,922 2a. Permanent Housing Facilities:
Received Operating Subsidies/Leased units (Households Served) 230 198 230 198 $1,398,554 $1,697,734 2b. Transitional/Short-term Facilities:
Received Operating Subsidies/Leased units (Households Served) 13 13 $53,454 $91,316
3a. Permanent Housing Facilities:
Capital Development Projects placed in service during the operating year (Households Served)
3b. Transitional/Short-term Facilities: Capital Development Projects placed in service during the operating year (Households Served)
4. Short-Term Rent, Mortgage and Utility Assistance 90 103 90 103 $664,029 $439,548 5. Permanent Housing Placement Services
15 14 15 14 $25,000 $25,000 6. Adjustments for duplication (subtract)
15 14 15 14 7. Total HOPWA Housing Subsidy Assistance
(Columns a – d equal the sum of Rows 1-5 minus Row 6; Columns e and f equal the sum of Rows 1-5) 520 500 520 500 $5,294,203 $5,376,520
Housing Development (Construction and Stewardship of facility based housing) [1] Output: Housing Units [2] Output: Funding
8. Facility-based units; Capital Development Projects not yet opened (Housing Units)
9. Stewardship Units subject to 3- or 10- year use agreements 25 25 10. Total Housing Developed
(Sum of Rows 8 & 9) 25 25 Supportive Services [1] Output: Households [2] Output: Funding 11a. Supportive Services provided by project sponsors that also delivered HOPWA
housing subsidy assistance 353 337 $1,567,621
$2,306,522 11b. Supportive Services provided by project sponsors that only provided
supportive services. 180 163 $159,561 $230,249 12. Adjustment for duplication (subtract) 13. Total Supportive Services
(Columns a – d equals the sum of Rows 11 a & b minus Row 12; Columns e and f equal the sum of Rows 11a & 11b) 533 500 $1,727,182 $2,536,771
Housing Information Services
[1] Output: Households
[2] Output: Funding 14. Housing Information Services 228 300 $78,415 $308,836
15. Total Housing Information Services 228 300 $78,415 $308,836

CAPER
130
OMB Control No: 2506-0117 (exp. 06/30/2018)
Grant Administration and Other Activities
[1] Output: Households
[2] Output: Funding
16. Resource Identification to establish, coordinate and develop housing assistance
resources $104,752 17. Technical Assistance
(if approved in grant agreement) 18. Grantee Administration
(maximum 3% of total HOPWA grant) $187,654 $242,492 19. Project Sponsor Administration
(maximum 7% of portion of HOPWA grant awarded) $201,389 $215,693 20. Total Grant Administration and Other Activities
(Sum of Rows 16 – 19) $389,043 $562,937
Total Expended [2] Outputs: HOPWA Funds
Expended
Budget Actual 21. Total Expenditures for operating year (Sum of Rows 7, 10, 13, 15, and 20) $7,488,843 $8,785,064
2. Listing of Supportive Services
Supportive Services [1] Output: Number of Households [2] Output: Amount of HOPWA Funds Expended
1. Adult day care and personal assistance 111 $539,836
2. Alcohol and drug abuse services
3. Case management 414 $668,776
4. Child care and other child services
5. Education 7 $7,102
6. Employment assistance and training 72 $12,043
7.
Health/medical/intensive care services, if approved
Note: Client records must conform with 24 CFR §574.310
85 $857,182
8. Legal services 46 $6,075
9. Life skills management (outside of case management) 17 $83,784
10. Meals/nutritional services 88 $49,921
11. Mental health services 51 $69,675
12. Outreach 66 $1,413
13. Transportation 84 $14,488
14. Other Activity (if approved in grant agreement). Specify: COVID-19 assistance
264 $226,476
15. Sub-Total Households receiving Supportive Services (Sum of Rows 1-14)
1,305
16. Adjustment for Duplication (subtract) 805
17.
TOTAL Unduplicated Households receiving Supportive Services (Column [1] equals Row 15 minus Row 16; Column [2] equals sum of Rows 1-14)
500 $2,536,771

CAPER
131
OMB Control No: 2506-0117 (exp. 06/30/2018)
3. Short-Term Rent, Mortgage and Utility Assistance (STRMU) Summary
Housing Subsidy Assistance Categories (STRMU)
[1] Output: Number of Households Served
[2] Output: Total HOPWA Funds Expended
on STRMU during Operating Year
a. Total Short-term mortgage, rent and/or utility (STRMU) assistance 103 $439,548
b. Of the total STRMU reported on Row a, total who received assistance with mortgage costs ONLY. 2 $11,749
c. Of the total STRMU reported on Row a, total who received assistance with mortgage and utility costs. 0 0
d. Of the total STRMU reported on Row a, total who received assistance with rental costs ONLY. 101 $312,049
e. Of the total STRMU reported on Row a, total who received assistance with rental and utility costs. 0 0
f. Of the total STRMU reported on Row a, total who received assistance with utility costs ONLY. 0 0
g.
Direct program delivery costs (e.g., program operations staff time)
$115,750
End of PART 3

CAPER
132
OMB Control No: 2506-0117 (exp. 06/30/2018)
Part 4: Summary of Performance Outcomes
Section 1. Housing Stability: Assessment of Client Outcomes on Maintaining Housing Stability (Permanent Housing and Related Facilities) A. Permanent Housing Subsidy Assistance [1] Output:
Total Number of Households
Served
[2] Assessment: Number of Households that Continued Receiving HOPWA Housing Subsidy Assistance into the
Next Operating Year
[3] Assessment: Number of Households that exited this HOPWA Program; their
Housing Status after Exiting
[4] HOPWA Client Outcomes
Tenant-Based Rental
Assistance
186 186
1 Emergency Shelter/Streets
Unstable Arrangements
2 Temporary Housing Temporarily Stable, with Reduced Risk of Homelessness
3 Private Housing
Stable/Permanent Housing (PH)
4 Other HOPWA
5 Other Subsidy
6 Institution
7 Jail/Prison Unstable Arrangements
8 Disconnected/Unknown
9 Death Life Event
Permanent Supportive
Housing Facilities/
Units
198
198
1 Emergency Shelter/Streets
Unstable Arrangements
2 Temporary Housing Temporarily Stable, with Reduced Risk of Homelessness
3 Private Housing
Stable/Permanent Housing (PH)
4 Other HOPWA
5 Other Subsidy
6 Institution
7 Jail/Prison
Unstable Arrangements 8 Disconnected/Unknown
9 Death Life Event
B. Transitional Housing Assistance
[1] Output: Total Number of Households
Served
[2] Assessment: Number of Households that Continued Receiving HOPWA Housing Subsidy Assistance into the
Next Operating Year
[3] Assessment: Number of Households that exited this HOPWA Program; their
Housing Status after Exiting
[4] HOPWA Client Outcomes
Transitional/ Short-Term
Housing Facilities/
Units
13
13
1 Emergency Shelter/Streets
Unstable Arrangements
2 Temporary Housing Temporarily Stable with Reduced Risk of Homelessness
3 Private Housing
Stable/Permanent Housing (PH) 4 Other HOPWA
5 Other Subsidy
6 Institution

CAPER
133
OMB Control No: 2506-0117 (exp. 06/30/2018)
7 Jail/Prison Unstable Arrangements
8 Disconnected/unknown
9 Death Life Event
B1: Total number of households receiving transitional/short-term housing assistance whose tenure exceeded 24 months
Section 2. Prevention of Homelessness: Assessment of Client Outcomes on Reduced Risks of Homelessness (Short-Term Housing Subsidy Assistance) Assessment of Households that Received STRMU Assistance
[1] Output: Total number of households
[2] Assessment of Housing Status [3] HOPWA Client Outcomes
103
Maintain Private Housing without subsidy (e.g. Assistance provided/completed and client is stable, not likely to seek additional support)
12
Stable/Permanent Housing (PH)
Other Private Housing without subsidy (e.g. client switched housing units and is now stable, not likely to seek additional support)
2
Other HOPWA Housing Subsidy Assistance
Other Housing Subsidy (PH)
Institution (e.g. residential and long-term care)
Likely that additional STRMU is needed to maintain current housing arrangements
88
Temporarily Stable, with Reduced Risk of Homelessness
Transitional Facilities/Short-term (e.g. temporary or transitional arrangement)
Temporary/Non-Permanent Housing arrangement (e.g. gave up lease, and moved in with family or friends but expects to live there less than 90 days)
Emergency Shelter/street
Unstable Arrangements Jail/Prison
Disconnected 1
Death Life Event 1a. Total number of those households that received STRMU Assistance in the operating year of this report that also received STRMU assistance in the prior operating year (e.g. households that received STRMU assistance in two consecutive operating years).
66
1b. Total number of those households that received STRMU Assistance in the operating year of this report that also received STRMU assistance in the two prior operating years (e.g. households that received STRMU assistance in three consecutive operating years).
50

CAPER
134
OMB Control No: 2506-0117 (exp. 06/30/2018)
Section 3. HOPWA Outcomes on Access to Care and Support 1a. Total Number of Households
Total Number of Households 1. For Project Sponsors that provided HOPWA Housing Subsidy Assistance: Identify the total number of households that received the
following HOPWA-funded services: a. Housing Subsidy Assistance (duplicated)-TBRA, STRMU, PHP, Facility-Based Housing, and Master Leasing 514 b. Case Management 414 c. Adjustment for duplication (subtraction) 14 d. Total Households Served by Project Sponsors with Housing Subsidy Assistance (Sum of Rows a and b minus
Row c) 928
2. For Project Sponsors did NOT provide HOPWA Housing Subsidy Assistance: Identify the total number of households that received the following HOPWA-funded service:
a. HOPWA Case Management b. Total Households Served by Project Sponsors without Housing Subsidy Assistance 0
1b. Status of Households Accessing Care and Support
Categories of Services Accessed [1] For project sponsors that
provided HOPWA housing subsidy assistance, identify the households who demonstrated the following:
[2] For project sponsors that did NOT provide HOPWA housing subsidy assistance, identify the households who demonstrated the following:
Outcome Indicator
1. Has a housing plan for maintaining or establishing stable on-going housing
500
Support for Stable
Housing 2. Had contact with case manager/benefits counselor consistent with the schedule specified in client’s individual service plan (may include leveraged services such as Ryan White Medical Case Management)
60
Access to Support
3. Had contact with a primary health care provider consistent with the schedule specified in client’s individual service plan
No Info
Access to Health Care
4. Accessed and maintained medical insurance/assistance 99
Access to Health Care
5. Successfully accessed or maintained qualification for sources of income
75
Sources of Income
1c. Households that Obtained Employment
Categories of Services Accessed
[1 For project sponsors that provided HOPWA housing subsidy assistance, identify
the households who demonstrated the following:
[2] For project sponsors that did NOT provide HOPWA housing subsidy assistance, identify the
households who demonstrated the following:
Total number of households that obtained an income-producing job
37
End of PART 4
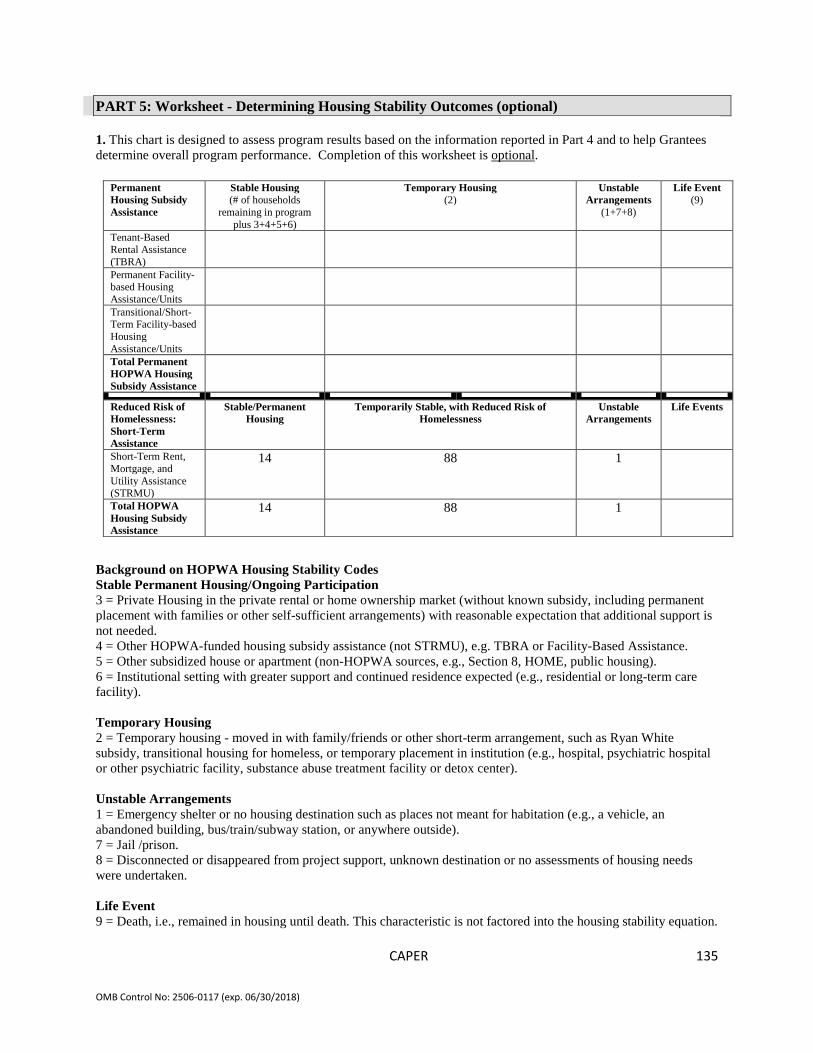
CAPER
135
OMB Control No: 2506-0117 (exp. 06/30/2018)
PART 5: Worksheet - Determining Housing Stability Outcomes (optional) 1. This chart is designed to assess program results based on the information reported in Part 4 and to help Grantees determine overall program performance. Completion of this worksheet is optional.
Permanent Housing Subsidy Assistance
Stable Housing (# of households
remaining in program plus 3+4+5+6)
Temporary Housing (2)
Unstable Arrangements
(1+7+8)
Life Event (9)
Tenant-Based Rental Assistance (TBRA)
Permanent Facility-based Housing Assistance/Units
Transitional/Short-Term Facility-based Housing Assistance/Units
Total Permanent HOPWA Housing Subsidy Assistance
Reduced Risk of Homelessness: Short-Term Assistance
Stable/Permanent Housing
Temporarily Stable, with Reduced Risk of Homelessness
Unstable Arrangements
Life Events
Short-Term Rent, Mortgage, and Utility Assistance (STRMU)
14 88
1
Total HOPWA Housing Subsidy Assistance
14 88 1
Background on HOPWA Housing Stability Codes Stable Permanent Housing/Ongoing Participation 3 = Private Housing in the private rental or home ownership market (without known subsidy, including permanent placement with families or other self-sufficient arrangements) with reasonable expectation that additional support is not needed. 4 = Other HOPWA-funded housing subsidy assistance (not STRMU), e.g. TBRA or Facility-Based Assistance. 5 = Other subsidized house or apartment (non-HOPWA sources, e.g., Section 8, HOME, public housing). 6 = Institutional setting with greater support and continued residence expected (e.g., residential or long-term care facility). Temporary Housing 2 = Temporary housing - moved in with family/friends or other short-term arrangement, such as Ryan White subsidy, transitional housing for homeless, or temporary placement in institution (e.g., hospital, psychiatric hospital or other psychiatric facility, substance abuse treatment facility or detox center). Unstable Arrangements 1 = Emergency shelter or no housing destination such as places not meant for habitation (e.g., a vehicle, an abandoned building, bus/train/subway station, or anywhere outside). 7 = Jail /prison. 8 = Disconnected or disappeared from project support, unknown destination or no assessments of housing needs were undertaken. Life Event 9 = Death, i.e., remained in housing until death. This characteristic is not factored into the housing stability equation.

CAPER
136
OMB Control No: 2506-0117 (exp. 06/30/2018)
Tenant-based Rental Assistance: Stable Housing is the sum of the number of households that (i) remain in the housing and (ii) those that left the assistance as reported under: 3, 4, 5, and 6. Temporary Housing is the number of households that accessed assistance, and left their current housing for a non-permanent housing arrangement, as reported under item: 2. Unstable Situations is the sum of numbers reported under items: 1, 7, and 8. Permanent Facility-Based Housing Assistance: Stable Housing is the sum of the number of households that (i) remain in the housing and (ii) those that left the assistance as shown as items: 3, 4, 5, and 6. Temporary Housing is the number of households that accessed assistance, and left their current housing for a non-permanent housing arrangement, as reported under item 2. Unstable Situations is the sum of numbers reported under items: 1, 7, and 8. Transitional/Short-Term Facility-Based Housing Assistance: Stable Housing is the sum of the number of households that (i) continue in the residences (ii) those that left the assistance as shown as items: 3, 4, 5, and 6. Other Temporary Housing is the number of households that accessed assistance, and left their current housing for a non-permanent housing arrangement, as reported under item 2. Unstable Situations is the sum of numbers reported under items: 1, 7, and 8. Tenure Assessment. A baseline of households in transitional/short-term facilities for assessment purposes, indicate the number of households whose tenure exceeded 24 months. STRMU Assistance: Stable Housing is the sum of the number of households that accessed assistance for some portion of the permitted 21-week period and there is reasonable expectation that additional support is not needed in order to maintain permanent housing living situation (as this is a time-limited form of housing support) as reported under housing status: Maintain Private Housing with subsidy; Other Private with Subsidy; Other HOPWA support; Other Housing Subsidy; and Institution. Temporarily Stable, with Reduced Risk of Homelessness is the sum of the number of households that accessed assistance for some portion of the permitted 21-week period or left their current housing arrangement for a transitional facility or other temporary/non-permanent housing arrangement and there is reasonable expectation additional support will be needed to maintain housing arrangements in the next year, as reported under housing status: Likely to maintain current housing arrangements, with additional STRMU assistance; Transitional Facilities/Short-term; and Temporary/Non-Permanent Housing arrangements Unstable Situation is the sum of number of households reported under housing status: Emergency Shelter; Jail/Prison; and Disconnected.
End of PART 5

CAPER
137
OMB Control No: 2506-0117 (exp. 06/30/2018)
PART 6: Annual Report of Continued Usage for HOPWA Facility-Based Stewardship Units (ONLY) 1. General information
HUD Grant Number(s)
Operating Year for this report From (mm/dd/yy) To (mm/dd/yy) ☐ Final Yr ☐ Yr 1; ☐ Yr 2; ☐ Yr 3; ☐ Yr 4; ☐ Yr 5; ☐ Yr 6; ☐ Yr 7; ☒ Yr 8; ☐ Yr 9; ☐ Yr 10
Grantee Name
Date Facility Began Operations (mm/dd/yy) 12/1/2013
2. Number of Units and Non-HOPWA Expenditures
Facility Name: Rene Cazanave Apartments Number of Stewardship Units Developed with HOPWA
funds
Amount of Non-HOPWA Funds Expended in Support of the Stewardship Units during the Operating Year
Total Stewardship Units
(subject to 3- or 10- year use periods) 9
3. Details of Project Site
Project Sites: Name of HOPWA-funded project Rene Cazenave Apartments
Site Information: Project Zip Code(s) 94105
Site Information: Congressional District(s) 6
Is the address of the project site confidential? ☐ Yes, protect information; do not list
☒ Not confidential; information can be made available to the public
If the site is not confidential: Please provide the contact information, phone, email address/location, if business address is different from facility address
Community Housing Partnership, 20 Jones Street, Suite 200, San Francisco, CA 94102
(415) 852-5300

CAPER
138
OMB Control No: 2506-0117 (exp. 06/30/2018)
PART 6: Annual Report of Continued Usage for HOPWA Facility-Based Stewardship Units (ONLY) 1. General information
HUD Grant Number(s)
Operating Year for this report From (mm/dd/yy) To (mm/dd/yy) ☐ Final Yr ☐ Yr 1; ☐ Yr 2; ☐ Yr 3; ☐ Yr 4; ☒ Yr 5; ☐ Yr 6; ☐ Yr 7; ☐ Yr 8; ☐ Yr 9; ☐ Yr 10
Grantee Name
Date Facility Began Operations (mm/dd/yy) 11/10/2016
2. Number of Units and Non-HOPWA Expenditures
Facility Name: OpenHouse Senior Community Number of Stewardship Units Developed with HOPWA
funds
Amount of Non-HOPWA Funds Expended in Support of the Stewardship Units during the Operating Year
Total Stewardship Units
(subject to 3- or 10- year use periods) 8 109,918
3. Details of Project Site
Project Sites: Name of HOPWA-funded project OpenHouse Senior Community aka 55 Laguna aka Mercy Housing Richardson Hall
Site Information: Project Zip Code(s) 94102
Site Information: Congressional District(s) 12
Is the address of the project site confidential? ☐ Yes, protect information; do not list
☒ Not confidential; information can be made available to the public
If the site is not confidential: Please provide the contact information, phone, email address/location, if business address is different from facility address
OpenHouse Senior Community aka 55 Laguna aka Mercy Housing Richardson Hall
55 Laguna Street, San Francisco 94102
415-296-8995

CAPER
139
OMB Control No: 2506-0117 (exp. 06/30/2018)
PART 6: Annual Report of Continued Usage for HOPWA Facility-Based Stewardship Units (ONLY) 1. General information
HUD Grant Number(s)
Operating Year for this report From (mm/dd/yy) To (mm/dd/yy) ☐ Final Yr ☐ Yr 1; ☐ Yr 2; ☒ Yr 3; ☐ Yr 4; ☐ Yr 5; ☐ Yr 6; ☐ Yr 7; ☐ Yr 8; ☐ Yr 9; ☐ Yr 10
Grantee Name
Date Facility Began Operations (mm/dd/yy) 4/25/19
2. Number of Units and Non-HOPWA Expenditures
Facility Name: 95 Laguna aka Laguna Senior Housing
Number of Stewardship Units Developed with HOPWA
funds
Amount of Non-HOPWA Funds Expended in Support of the Stewardship Units during the Operating Year
Total Stewardship Units
(subject to 3- or 10- year use periods) 6 79,898
3. Details of Project Site
Project Sites: Name of HOPWA-funded project 95 Laguna aka Laguna Senior Housing
Site Information: Project Zip Code(s) 94102
Site Information: Congressional District(s) 12
Is the address of the project site confidential? ☐ Yes, protect information; do not list
☒ Not confidential; information can be made available to the public If the site is not confidential: Please provide the contact information, phone, email address/location, if business address is different from facility address
95 Laguna aka Laguna Senior Housing
95 Laguna Street, San Francisco, CA 94102
415-813-3710
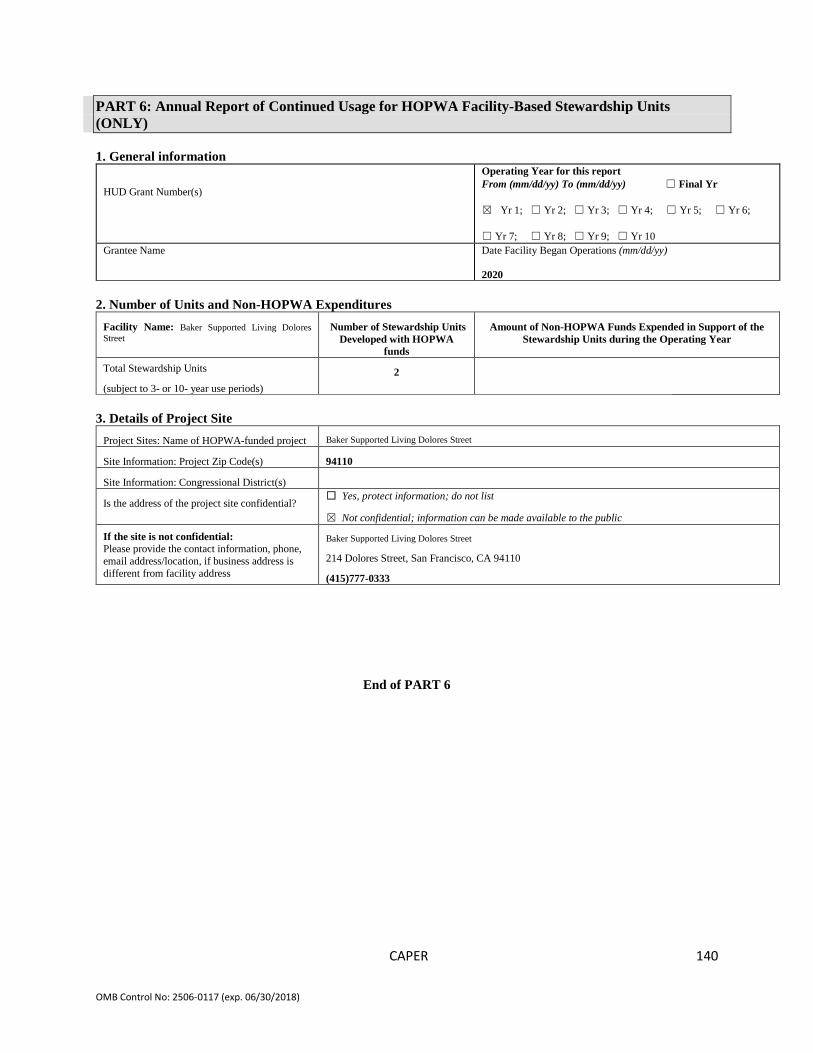
CAPER
140
OMB Control No: 2506-0117 (exp. 06/30/2018)
PART 6: Annual Report of Continued Usage for HOPWA Facility-Based Stewardship Units (ONLY) 1. General information
HUD Grant Number(s)
Operating Year for this report From (mm/dd/yy) To (mm/dd/yy) ☐ Final Yr ☒ Yr 1; ☐ Yr 2; ☐ Yr 3; ☐ Yr 4; ☐ Yr 5; ☐ Yr 6; ☐ Yr 7; ☐ Yr 8; ☐ Yr 9; ☐ Yr 10
Grantee Name
Date Facility Began Operations (mm/dd/yy) 2020
2. Number of Units and Non-HOPWA Expenditures
Facility Name: Baker Supported Living Dolores Street
Number of Stewardship Units Developed with HOPWA
funds
Amount of Non-HOPWA Funds Expended in Support of the Stewardship Units during the Operating Year
Total Stewardship Units
(subject to 3- or 10- year use periods) 2
3. Details of Project Site
Project Sites: Name of HOPWA-funded project Baker Supported Living Dolores Street
Site Information: Project Zip Code(s) 94110
Site Information: Congressional District(s)
Is the address of the project site confidential? ☐ Yes, protect information; do not list
☒ Not confidential; information can be made available to the public
If the site is not confidential: Please provide the contact information, phone, email address/location, if business address is different from facility address
Baker Supported Living Dolores Street
214 Dolores Street, San Francisco, CA 94110
(415)777-0333
End of PART 6

CAPER
141
OMB Control No: 2506-0117 (exp. 06/30/2018)
Part 7: Summary Overview of Grant Activities A. Information on Individuals, Beneficiaries, and Households Receiving HOPWA Housing Subsidy Assistance (TBRA, STRMU, Facility-Based Units, Permanent Housing Placement and Master Leased Units ONLY)
Section 1. HOPWA-Eligible Individuals Who Received HOPWA Housing Subsidy Assistance a. Total HOPWA Eligible Individuals Living with HIV/AIDS
Individuals Served with Housing Subsidy Assistance Total Number of individuals with HIV/AIDS who qualified their household to receive HOPWA housing subsidy assistance.
500
Chart b. Prior Living Situation In Chart b, report the prior living situations for all Eligible Individuals reported in Chart a. In Row 1, report the total number of individuals who continued to receive HOPWA housing subsidy assistance from the prior operating year into this operating year. In Rows 2 through 17, indicate the prior living arrangements for all new HOPWA housing subsidy assistance recipients during the operating year. Data Check: The total number of eligible individuals served in Row 18 equals the total number of individuals served through housing subsidy assistance reported in Chart a above.
Category
Total HOPWA Eligible Individuals Receiving Housing Subsidy Assistance
1. Continuing to receive HOPWA support from the prior operating year 381
New Individuals who received HOPWA Housing Subsidy Assistance support during Operating Year
2. Place not meant for human habitation (such as a vehicle, abandoned building, bus/train/subway station/airport, or outside)
3
3. Emergency shelter (including hotel, motel, or campground paid for with emergency shelter voucher) 2
4. Transitional housing for homeless persons 9
5. Total number of new Eligible Individuals who received HOPWA Housing Subsidy Assistance with a Prior Living Situation that meets HUD definition of homelessness (Sum of Rows 2 – 4)
14
6. Permanent housing for formerly homeless persons (such as Shelter Plus Care, SHP, or SRO Mod Rehab)
2
7. Psychiatric hospital or other psychiatric facility 0
8. Substance abuse treatment facility or detox center 8
9. Hospital (non-psychiatric facility) 0
10. Foster care home or foster care group home 0
11. Jail, prison or juvenile detention facility 0
12. Rented room, apartment, or house 87
13. House you own 0
14. Staying or living in someone else’s (family and friends) room, apartment, or house 6
15. Hotel or motel paid for without emergency shelter voucher 0
16. Other 2
17. Don’t Know or Refused 0
18. TOTAL Number of HOPWA Eligible Individuals (sum of Rows 1 and 5-17) 500

CAPER
142
OMB Control No: 2506-0117 (exp. 06/30/2018)
c. Homeless Individual Summary In Chart c, indicate the number of eligible individuals reported in Chart b, Row 5 as homeless who also are homeless Veterans and/or meet the definition for Chronically Homeless (See Definition section of CAPER). The totals in Chart c do not need to equal the total in Chart b, Row 5.
Category Number of Homeless Veteran(s)
Number of Chronically Homeless
HOPWA eligible individuals served with HOPWA Housing Subsidy Assistance 1 10
Section 2. Beneficiaries In Chart a, report the total number of HOPWA eligible individuals living with HIV/AIDS who received HOPWA housing subsidy assistance (as reported in Part 7A, Section 1, Chart a), and all associated members of their household who benefitted from receiving HOPWA housing subsidy assistance (resided with HOPWA eligible individuals). Note: See definition of HOPWA Eligible Individual Note: See definition of Transgender. Note: See definition of Beneficiaries. Data Check: The sum of each of the Charts b & c on the following two pages equals the total number of beneficiaries served with HOPWA housing subsidy assistance as determined in Chart a, Row 4 below. a. Total Number of Beneficiaries Served with HOPWA Housing Subsidy Assistance
Individuals and Families Served with HOPWA Housing Subsidy Assistance Total Number 1. Number of individuals with HIV/AIDS who qualified the household to receive HOPWA housing subsidy assistance (equals the number of HOPWA Eligible Individuals reported in Part 7A, Section 1, Chart a) 500
2. Number of ALL other persons diagnosed as HIV positive who reside with the HOPWA eligible individuals identified in Row 1 and who benefitted from the HOPWA housing subsidy assistance 4
3. Number of ALL other persons NOT diagnosed as HIV positive who reside with the HOPWA eligible individual identified in Row 1 and who benefited from the HOPWA housing subsidy
89
4. TOTAL number of ALL beneficiaries served with Housing Subsidy Assistance (Sum of Rows 1, 2, & 3) 593
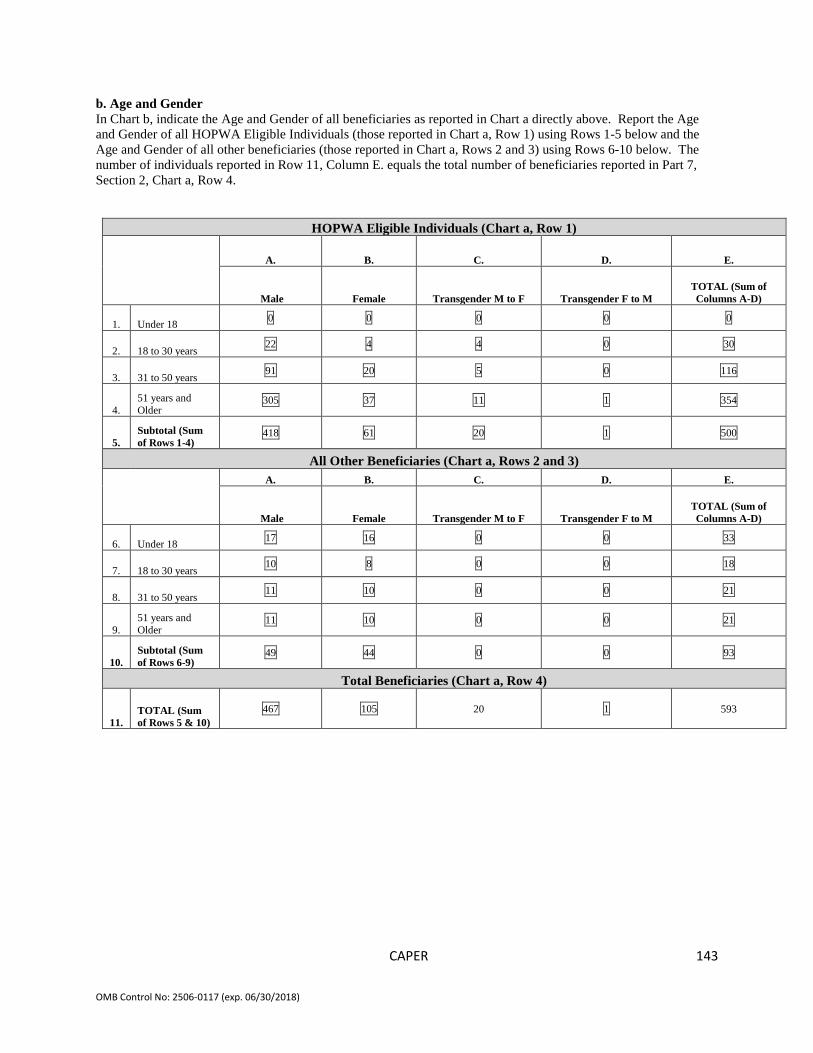
CAPER
143
OMB Control No: 2506-0117 (exp. 06/30/2018)
b. Age and Gender In Chart b, indicate the Age and Gender of all beneficiaries as reported in Chart a directly above. Report the Age and Gender of all HOPWA Eligible Individuals (those reported in Chart a, Row 1) using Rows 1-5 below and the Age and Gender of all other beneficiaries (those reported in Chart a, Rows 2 and 3) using Rows 6-10 below. The number of individuals reported in Row 11, Column E. equals the total number of beneficiaries reported in Part 7, Section 2, Chart a, Row 4.
HOPWA Eligible Individuals (Chart a, Row 1)
A. B. C. D. E.
Male Female Transgender M to F Transgender F to M TOTAL (Sum of Columns A-D)
1. Under 18 0 0 0 0 0
2. 18 to 30 years 22 4 4 0 30
3. 31 to 50 years 91 20 5 0 116
4. 51 years and Older
305 37 11 1 354
5. Subtotal (Sum of Rows 1-4)
418 61 20 1 500
All Other Beneficiaries (Chart a, Rows 2 and 3) A. B. C. D. E.
Male Female Transgender M to F Transgender F to M TOTAL (Sum of Columns A-D)
6. Under 18 17 16 0 0 33
7. 18 to 30 years 10 8 0 0 18
8. 31 to 50 years 11 10 0 0 21
9. 51 years and Older
11 10 0 0 21
10. Subtotal (Sum of Rows 6-9)
49 44 0 0 93
Total Beneficiaries (Chart a, Row 4)
11. TOTAL (Sum of Rows 5 & 10)
467 105 20 1 593

CAPER
144
OMB Control No: 2506-0117 (exp. 06/30/2018)
c. Race and Ethnicity* In Chart c, indicate the Race and Ethnicity of all beneficiaries receiving HOPWA Housing Subsidy Assistance as reported in Section 2, Chart a, Row 4. Report the race of all HOPWA eligible individuals in Column [A]. Report the ethnicity of all HOPWA eligible individuals in column [B]. Report the race of all other individuals who benefitted from the HOPWA housing subsidy assistance in column [C]. Report the ethnicity of all other individuals who benefitted from the HOPWA housing subsidy assistance in column [D]. The summed total of columns [A] and [C] equals the total number of beneficiaries reported above in Section 2, Chart a, Row 4.
Category
HOPWA Eligible Individuals All Other Beneficiaries
[A] Race [all individuals
reported in Section 2, Chart a,
Row 1]
[B] Ethnicity [Also identified as
Hispanic or Latino]
[C] Race [total of
individuals reported in
Section 2, Chart a, Rows 2 & 3]
[D] Ethnicity [Also identified as
Hispanic or Latino]
1. American Indian/Alaskan Native 10 2 0 0 2. Asian 14 2 5 0 3. Black/African American 109 1 9 2 4. Native Hawaiian/Other Pacific Islander 11 1 3 0 5. White 265 85 69 60
6. American Indian/Alaskan Native & White 5 2 1 0
7. Asian & White 0 0 0 0 8. Black/African American & White 22 0 0 0
9. American Indian/Alaskan Native & Black/African American 2 0 1 0
10. Other Multi-Racial 62 51 5 5 11. Column Totals (Sum of Rows 1-10) 500 144 93 67
Data Check: Sum of Row 11 Column A and Row 11 Column C equals the total number HOPWA Beneficiaries reported in Part 3A, Section 2, Chart a, Row 4.
*Reference (data requested consistent with Form HUD-27061 Race and Ethnic Data Reporting Form) Section 3. Households Household Area Median Income Report the income(s) for all households served with HOPWA housing subsidy assistance. Data Check: The total number of households served with HOPWA housing subsidy assistance should equal Part 3C, Row 7, Column b and Part 7A, Section 1, Chart a. (Total HOPWA Eligible Individuals Served with HOPWA Housing Subsidy Assistance). Note: Refer to https://www.huduser.gov/portal/datasets/il.html for information on area median income in your community.
Percentage of Area Median Income Households Served with HOPWA Housing Subsidy Assistance
1. 0-30% of area median income (extremely low) 481 2. 31-50% of area median income (very low) 16 3. 51-80% of area median income (low) 3 4. Total (Sum of Rows 1-3) 500

CAPER
145
OMB Control No: 2506-0117 (exp. 06/30/2018)
Part 7: Summary Overview of Grant Activities B. Facility-Based Housing Assistance
Complete one Part 7B for each facility developed or supported through HOPWA funds. Do not complete this Section for programs originally developed with HOPWA funds but no longer supported with HOPWA funds. If a facility was developed with HOPWA funds (subject to ten years of operation for acquisition, new construction and substantial rehabilitation costs of stewardship units, or three years for non-substantial rehabilitation costs), but HOPWA funds are no longer used to support the facility, the project sponsor should complete Part 6: Continued Usage for HOPWA Facility-Based Stewardship Units (ONLY). Complete Charts 2a, Project Site Information, and 2b, Type of HOPWA Capital Development Project Units, for all Development Projects, including facilities that were past development projects, but continued to receive HOPWA operating dollars this reporting year. 1. Project Sponsor Agency Name (Required)
Catholic Charities
2. Capital Development 2a. Project Site Information for HOPWA Capital Development of Projects (For Current or Past Capital Development Projects that receive HOPWA Operating Costs this reporting year) Note: If units are scattered-sites, report on them as a group and under type of Facility write “Scattered Sites.”
Type of Development this operating
year
HOPWA Funds
Expended this operating
year (if applicable)
Non-HOPWA funds Expended
(if applicable)
Name of Facility: Leland House
☐ New construction $
$
Type of Facility [Check only one box.] ☒ Permanent housing ☐ Short-term Shelter or Transitional housing ☐ Supportive services only facility
☐ Rehabilitation $
$
☐ Acquisition $
$
☒ Operating $490,008
$37,970
a. Purchase/lease of property: Date (mm/dd/yy): 3/14/1994
b. Rehabilitation/Construction Dates: Date started: Date Completed:
c. Operation dates: Date residents began to occupy: 2/8/1997 ☐ Not yet occupied
d. Date supportive services began: Date started: 2/8/1997 ☐ Not yet providing services
e. Number of units in the facility: HOPWA-funded units = 46 Total Units = 46
f. Is a waiting list maintained for the facility? ☐ Yes ☒ No If yes, number of participants on the list at the end of operating year
g. What is the address of the facility (if different from business address)? 141 Leland Avenue, San Francisco, CA 94134
h. Is the address of the project site confidential?
☒ Yes, protect information; do not publish list

CAPER
146
OMB Control No: 2506-0117 (exp. 06/30/2018)
☐ No, can be made available to the public
2b. Number and Type of HOPWA Capital Development Project Units (For Current or Past Capital Development Projects that receive HOPWA Operating Costs this Reporting Year) For units entered above in 2a, please list the number of HOPWA units that fulfill the following criteria:
Number Designated for the Chronically
Homeless
Number Designated to
Assist the Homeless
Number Energy-Star Compliant
Number 504 Accessible – Mobility Units - Sensory Units
Rental units constructed (new) and/or acquired with or without rehab
Rental units rehabbed
Homeownership units constructed (if approved)
3. Units Assisted in Types of Housing Facility/Units Leased by Project Sponsor Charts 3a, 3b, and 4 are required for each facility. In Charts 3a and 3b, indicate the type and number of housing units in the facility, including master leased units, project-based or other scattered site units leased by the organization, categorized by the number of bedrooms per unit. Note: The number units may not equal the total number of households served. Please complete separate charts for each housing facility assisted. Scattered site units may be grouped together. 3a. Check one only
Permanent Supportive Housing Facility/Units Short-term Shelter or Transitional Supportive Housing Facility/Units
3b. Type of Facility Complete the following Chart for all facilities leased, master leased, project-based, or operated with HOPWA funds during the reporting year. Name of Project Sponsor/Agency Operating the Facility/Leased Units:
Type of housing facility operated by the project sponsor
Total Number of Units in use during the Operating Year Categorized by the Number of Bedrooms per Units
SRO/Studio/0 bdrm 1 bdrm 2 bdrm 3 bdrm 4 bdrm 5+bdrm
a. Single room occupancy dwelling
b. Community residence 46
c. Project-based rental assistance units or leased units
d. Other housing facility Specify:
4. Households and Housing Expenditures Enter the total number of households served and the amount of HOPWA funds expended by the project sponsor on subsidies for housing involving the use of facilities, master leased units, project based or other scattered site units leased by the organization.
Housing Assistance Category: Facility Based Housing Output: Number of Households
Output: Total HOPWA Funds Expended during Operating Year by Project Sponsor

CAPER
147
OMB Control No: 2506-0117 (exp. 06/30/2018)
a. Leasing Costs
b. Operating Costs 46 $490,008
c. Project-Based Rental Assistance (PBRA) or other leased units
d. Other Activity (if approved in grant agreement) Specify:
e. Adjustment to eliminate duplication (subtract)
f. TOTAL Facility-Based Housing Assistance (Sum Rows a through d minus Row e) 46
$490,008

CAPER
148
OMB Control No: 2506-0117 (exp. 06/30/2018)
Part 7: Summary Overview of Grant Activities B. Facility-Based Housing Assistance
1. Project Sponsor Agency Name (Required)
Catholic Charities
2. Capital Development 2a. Project Site Information for HOPWA Capital Development of Projects (For Current or Past Capital Development Projects that receive HOPWA Operating Costs this reporting year) Note: If units are scattered-sites, report on them as a group and under type of Facility write “Scattered Sites.”
Type of Development this operating
year
HOPWA Funds
Expended this operating
year (if applicable)
Non-HOPWA funds Expended
(if applicable)
Name of Facility: Peter Claver Community
☐ New construction $
$
Type of Facility [Check only one box.] ☒ Permanent housing ☐ Short-term Shelter or Transitional housing ☐ Supportive services only facility
☐ Rehabilitation $
$
☐ Acquisition $
$
☒ Operating $174,386
$221,916
a. Purchase/lease of property: Date (mm/dd/yy): 9/30/1994
b. Rehabilitation/Construction Dates: Date started: Date Completed:
c. Operation dates: Date residents began to occupy: 9/30/1994 ☐ Not yet occupied
d. Date supportive services began: Date started: 9/30/1994 ☐ Not yet providing services
e. Number of units in the facility: HOPWA-funded units = 32 beds Total Units = 32 beds
f. Is a waiting list maintained for the facility? ☐ Yes ☒ No If yes, number of participants on the list at the end of operating year
g. What is the address of the facility (if different from business address)? 1340 Golden Gate Avenue, San Francisco, CA 94115
h. Is the address of the project site confidential?
☒ Yes, protect information; do not publish list
☐ No, can be made available to the public 2b. Number and Type of HOPWA Capital Development Project Units (For Current or Past Capital Development Projects that receive HOPWA Operating Costs this Reporting Year) For units entered above in 2a, please list the number of HOPWA units that fulfill the following criteria:
Number Designated for the Chronically
Homeless
Number Designated to
Assist the Homeless
Number Energy-Star Compliant
Number 504 Accessible – Mobility Units - Sensory Units
Rental units constructed (new) and/or acquired with or without rehab

CAPER
149
OMB Control No: 2506-0117 (exp. 06/30/2018)
Rental units rehabbed
Homeownership units constructed (if approved)
3. Units Assisted in Types of Housing Facility/Units Leased by Project Sponsor Charts 3a, 3b, and 4 are required for each facility. In Charts 3a and 3b, indicate the type and number of housing units in the facility, including master leased units, project-based or other scattered site units leased by the organization, categorized by the number of bedrooms per unit. Note: The number units may not equal the total number of households served. Please complete separate charts for each housing facility assisted. Scattered site units may be grouped together. 3a. Check one only
Permanent Supportive Housing Facility/Units Short-term Shelter or Transitional Supportive Housing Facility/Units
3b. Type of Facility Complete the following Chart for all facilities leased, master leased, project-based, or operated with HOPWA funds during the reporting year. Name of Project Sponsor/Agency Operating the Facility/Leased Units:
Type of housing facility operated by the project sponsor
Total Number of Units in use during the Operating Year Categorized by the Number of Bedrooms per Units
SRO/Studio/0 bdrm 1 bdrm 2 bdrm 3 bdrm 4 bdrm 5+bdrm
a. Single room occupancy dwelling 32
b. Community residence
c. Project-based rental assistance units or leased units
d. Other housing facility Specify:
4. Households and Housing Expenditures Enter the total number of households served and the amount of HOPWA funds expended by the project sponsor on subsidies for housing involving the use of facilities, master leased units, project based or other scattered site units leased by the organization.
Housing Assistance Category: Facility Based Housing Output: Number of Households
Output: Total HOPWA Funds Expended during Operating Year by Project Sponsor
a. Leasing Costs
b. Operating Costs 32 $174,386
c. Project-Based Rental Assistance (PBRA) or other leased units
d. Other Activity (if approved in grant agreement) Specify:
e. Adjustment to eliminate duplication (subtract)
f. TOTAL Facility-Based Housing Assistance (Sum Rows a through d minus Row e) 32 $174,386

CAPER
150
OMB Control No: 2506-0117 (exp. 06/30/2018)
Part 7: Summary Overview of Grant Activities B. Facility-Based Housing Assistance
1. Project Sponsor Agency Name (Required)
Dolores Street Community Services 2. Capital Development 2a. Project Site Information for HOPWA Capital Development of Projects (For Current or Past Capital Development Projects that receive HOPWA Operating Costs this reporting year)
Type of Development this
operating year
HOPWA Funds Expended this operating year (if applicable)
Non-HOPWA funds Expended
(if applicable)
Name of Facility: Richard M. Cohen Residence
New construction $
$
Type of Facility [Check only one box.] Permanent housing Short-term Shelter or Transitional housing Supportive services only facility
Rehabilitation $ $
Acquisition $
$
Operating $327,094
$336,450
a. Purchase/lease of property: Date (mm/dd/yy): 3/09/1994
b. Rehabilitation/Construction Dates: Date started: Date Completed:
c. Operation dates: Date residents began to occupy: 12/15/1994 Not yet occupied
d. Date supportive services began: Date started: 1995 Not yet providing services
e. Number of units in the facility: HOPWA-funded units = 10 beds Total Units = 10 beds
f. Is a waiting list maintained for the facility? Yes No
If yes, number of participants on the list at the end of operating year
g. What is the address of the facility (if different from business address)? 220 Dolores Street, San Francisco, CA 94110
h. Is the address of the project site confidential?
Yes, protect information; do not publish list
No, can be made available to the public 2b. Number and Type of HOPWA Capital Development Project Units (For Current or Past Capital Development Projects that receive HOPWA Operating Costs this Reporting Year) For units entered above in 2a. please list the number of HOPWA units that fulfill the following criteria:
Number Designated for the Chronically
Homeless
Number Designated to
Assist the Homeless
Number Energy-Star Compliant
Number 504 Accessible
Rental units constructed (new) and/or acquired with or without rehab
Rental units rehabbed

CAPER
151
OMB Control No: 2506-0117 (exp. 06/30/2018)
Homeownership units constructed (if approved)
3. Units Assisted in Types of Housing Facility/Units Leased by Project Sponsor 3a. Check one only
Permanent Supportive Housing Facility/Units Short-term Shelter or Transitional Supportive Housing Facility/Units
3b. Type of Facility Complete the following Chart for all facilities leased, master leased, project-based, or operated with HOPWA funds during the reporting year. Name of Project Sponsor/Agency Operating the Facility/Leased Units: Dolores Street Community Services
Type of housing facility operated by the project sponsor
Total Number of Units in use during the Operating Year Categorized by the Number of Bedrooms per Units
SRO/Studio/0 bdrm 1 bdrm 2 bdrm 3 bdrm 4 bdrm 5+bdrm
a. Single room occupancy dwelling 10
b. Community residence
c. Project-based rental assistance units or leased units
d. Other housing facility Specify:
4. Households and Housing Expenditures Enter the total number of households served and the amount of HOPWA funds expended by the project sponsor on subsidies for housing involving the use of facilities, master leased units, project based or other scattered site units leased by the organization.
Housing Assistance Category: Facility Based Housing Output: Number of Households
Output: Total HOPWA Funds Expended during Operating Year by Project Sponsor
a. Leasing Costs
b. Operating Costs 10 $327,094
c. Project-Based Rental Assistance (PBRA) or other leased units
d. Other Activity (if approved in grant agreement) Specify:
e. Adjustment to eliminate duplication (subtract)
f. TOTAL Facility-Based Housing Assistance (Sum Rows a. through d. minus Row e.) 10 $327,094

CAPER
152
OMB Control No: 2506-0117 (exp. 06/30/2018)
Part 7: Summary Overview of Grant Activities B. Facility-Based Housing Assistance
1. Project Sponsor Agency Name (Required)
Larkin Street Youth Services 2. Capital Development 2a. Project Site Information for HOPWA Capital Development of Projects (For Current or Past Capital Development Projects that receive HOPWA Operating Costs this reporting year)
Type of Development this
operating year
HOPWA Funds Expended this operating year (if applicable)
Non-HOPWA funds Expended
(if applicable)
Name of Facility: Assisted Care Facility
New construction $
$
Type of Facility [Check only one box.] Permanent housing Short-term Shelter or Transitional housing Supportive services only facility
Rehabilitation $ $
Acquisition $
$
Operating $154,597
$111,076
a. Purchase/lease of property: Date (mm/dd/yy): 6/7/1996
b. Rehabilitation/Construction Dates: Date started: Date Completed:
c. Operation dates: Date residents began to occupy: 1/15/1998 Not yet occupied
d. Date supportive services began: Date started: 1/15/1998 Not yet providing services
e. Number of units in the facility: HOPWA-funded units = 12 beds Total Units = 12 beds
f. Is a waiting list maintained for the facility? Yes No
If yes, # of participants on the list at the end of operating year
g. What is the address of the facility (if different from business address)? 129 Hyde Street, San Francisco, CA 94102
h. Is the address of the project site confidential?
Yes, protect information; do not publish list
No, can be made available to the public 2b. Number and Type of HOPWA Capital Development Project Units (For Current or Past Capital Development Projects that receive HOPWA Operating Costs this Reporting Year) For units entered above in 2a. please list the number of HOPWA units that fulfill the following criteria:
Number Designated for the Chronically
Homeless
Number Designated to
Assist the Homeless
Number Energy-Star Compliant
Number 504 Accessible
Rental units constructed (new) and/or acquired with or without rehab
Rental units rehabbed

CAPER
153
OMB Control No: 2506-0117 (exp. 06/30/2018)
Homeownership units constructed (if approved)
3. Units Assisted in Types of Housing Facility/Units Leased by Project Sponsor 3a. Check one only
Permanent Supportive Housing Facility/Units Short-term Shelter or Transitional Supportive Housing Facility/Units
3b. Type of Facility Complete the following Chart for all facilities leased, master leased, project-based, or operated with HOPWA funds during the reporting year. Name of Project Sponsor/Agency Operating the Facility/Leased Units: Larkin Street Youth Services
Type of housing facility operated by the project sponsor
Total Number of Units in use during the Operating Year Categorized by the Number of Bedrooms per Units
SRO/Studio/0 bdrm 1 bdrm 2 bdrm 3 bdrm 4 bdrm 5+bdrm
a. Single room occupancy dwelling
b. Community residence 12
c. Project-based rental assistance units or leased units
d. Other housing facility Specify:
4. Households and Housing Expenditures Enter the total number of households served and the amount of HOPWA funds expended by the project sponsor on subsidies for housing involving the use of facilities, master leased units, project based or other scattered site units leased by the organization.
Housing Assistance Category: Facility Based Housing Output: Number of Households
Output: Total HOPWA Funds Expended during Operating Year by Project Sponsor
a. Leasing Costs
b. Operating Costs 12 $154,597
c. Project-Based Rental Assistance (PBRA) or other leased units
d. Other Activity (if approved in grant agreement) Specify:
e. Adjustment to eliminate duplication (subtract)
f. TOTAL Facility-Based Housing Assistance (Sum Rows a. through d. minus Row e.) 12 $154,597

CAPER
154
OMB Control No: 2506-0117 (exp. 06/30/2018)
Part 7: Summary Overview of Grant Activities B. Facility-Based Housing Assistance
1. Project Sponsor Agency Name (Required)
Maitri 2. Capital Development 2a. Project Site Information for HOPWA Capital Development of Projects (For Current or Past Capital Development Projects that receive HOPWA Operating Costs this reporting year)
Type of Development this
operating year
HOPWA Funds Expended this operating year (if applicable)
Non-HOPWA funds Expended
(if applicable)
Name of Facility: Maitri
New construction $
$
Type of Facility [Check only one box.] Permanent housing Short-term Shelter or Transitional housing Supportive services only facility
Rehabilitation $
Acquisition $
$
Operating $345,061
$2,235,745
a. Purchase/lease of property: Date (mm/dd/yy): 7/31/1995
b. Rehabilitation/Construction Dates: facility operational during rehab Date started: Date Completed:
c. Operation dates: Date residents began to occupy: 12/15/1997 Not yet occupied
d. Date supportive services began: Date started: 1997 Not yet providing services
e. Number of units in the facility: HOPWA-funded units = 14 beds Total Units = 15 beds
f. Is a waiting list maintained for the facility? Yes No
If yes, # of participants on the list at the end of operating year 5
g. What is the address of the facility (if different from business address)? 401 Duboce Avenue, San Francisco, CA 94117
h. Is the address of the project site confidential?
Yes, protect information; do not publish list
No, can be made available to the public 2b. Number and Type of HOPWA Capital Development Project Units (For Current or Past Capital Development Projects that receive HOPWA Operating Costs this Reporting Year) For units entered above in 2a. please list the number of HOPWA units that fulfill the following criteria:
Number Designated for the Chronically
Homeless
Number Designated to
Assist the Homeless
Number Energy-Star Compliant
Number 504 Accessible
Rental units constructed (new) and/or acquired with or without rehab
Rental units rehabbed

CAPER
155
OMB Control No: 2506-0117 (exp. 06/30/2018)
Homeownership units constructed (if approved)
3. Units Assisted in Types of Housing Facility/Units Leased by Project Sponsor 3a. Check one only
Permanent Supportive Housing Facility/Units Short-term Shelter or Transitional Supportive Housing Facility/Units
3b. Type of Facility Complete the following Chart for all facilities leased, master leased, project-based, or operated with HOPWA funds during the reporting year. Name of Project Sponsor/Agency Operating the Facility/Leased Units: Maitri
Type of housing facility operated by the project sponsor
Total Number of Units in use during the Operating Year Categorized by the Number of Bedrooms per Units
SRO/Studio/0 bdrm 1 bdrm 2 bdrm 3 bdrm 4 bdrm 5+bdrm
a. Single room occupancy dwelling
b. Community residence 14
c. Project-based rental assistance units or leased units
d. Other housing facility Specify:
4. Households and Housing Expenditures Enter the total number of households served and the amount of HOPWA funds expended by the project sponsor on subsidies for housing involving the use of facilities, master leased units, project based or other scattered site units leased by the organization.
Housing Assistance Category: Facility Based Housing Output: Number of Households
Output: Total HOPWA Funds Expended during Operating Year by Project Sponsor
a. Leasing Costs
b. Operating Costs 30 $345,061
c. Project-Based Rental Assistance (PBRA) or other leased units
d. Other Activity (if approved in grant agreement) Specify: Rehab/Cap Improvements
e. Adjustment to eliminate duplication (subtract)
f. TOTAL Facility-Based Housing Assistance (Sum Rows a. through d. minus Row e.) 30 $345,061
,

CAPER
156
OMB Control No: 2506-0117 (exp. 06/30/2018)
Part 7: Summary Overview of Grant Activities B. Facility-Based Housing Assistance
1. Project Sponsor Agency Name (Required)
Mercy Housing California XVII, LP 2. Capital Development 2a. Project Site Information for HOPWA Capital Development of Projects (For Current or Past Capital Development Projects that receive HOPWA Operating Costs this reporting year)
Type of Development this
operating year
HOPWA Funds Expended this operating year (if applicable)
Non-HOPWA funds Expended
(if applicable)
Name of Facility: Derek Silva Community
New construction $
$
Type of Facility [Check only one box.] Permanent housing Short-term Shelter or Transitional housing Supportive services only facility
Rehabilitation $ $
Acquisition $
$
Operating $108,772
$1,352,813
a. Purchase/lease of property: Date (mm/dd/yy): 12/15/2001
b. Rehabilitation/Construction Dates: Date started: Date Completed:
c. Operation dates: Date residents began to occupy: 12/1/2004 Not yet occupied
d. Date supportive services began: Date started: 12/1/2004 Not yet providing services
e. Number of units in the facility: HOPWA-funded units = 68 Total Units = 68
f. Is a waiting list maintained for the facility? Yes No
If yes, # of participants on the list at the end of operating year
g. What is the address of the facility (if different from business address)? 20 Franklin Street, San Francisco, CA 94102
h. Is the address of the project site confidential?
Yes, protect information; do not publish list
No, can be made available to the public 2b. Number and Type of HOPWA Capital Development Project Units (For Current or Past Capital Development Projects that receive HOPWA Operating Costs this Reporting Year) For units entered above in 2a. please list the number of HOPWA units that fulfill the following criteria:
Number Designated for the Chronically
Homeless
Number Designated to
Assist the Homeless
Number Energy-Star Compliant
Number 504 Accessible
Rental units constructed (new) and/or acquired with or without rehab
Rental units rehabbed

CAPER
157
OMB Control No: 2506-0117 (exp. 06/30/2018)
Homeownership units constructed (if approved)
3. Units Assisted in Types of Housing Facility/Units Leased by Project Sponsor 3a. Check one only
Permanent Supportive Housing Facility/Units Short-term Shelter or Transitional Supportive Housing Facility/Units
3b. Type of Facility Complete the following Chart for all facilities leased, master leased, project-based, or operated with HOPWA funds during the reporting year.17 under Name of Project Sponsor/Agency Operating the Facility/Leased Units: Mercy Housing California XVII, LP
Type of housing facility operated by the project sponsor
Total Number of Units in use during the Operating Year Categorized by the Number of Bedrooms per Units
SRO/Studio/0 bdrm 1 bdrm 2 bdrm 3 bdrm 4 bdrm 5+bdrm
a. Single room occupancy dwelling
b. Community residence
c. Project-based rental assistance units or leased units 36 27 5
d. Other housing facility Specify:
4. Households and Housing Expenditures Enter the total number of households served and the amount of HOPWA funds expended by the project sponsor on subsidies for housing involving the use of facilities, master leased units, project based or other scattered site units leased by the organization.
Housing Assistance Category: Facility Based Housing Output: Number of Households
Output: Total HOPWA Funds Expended during Operating Year by Project Sponsor
a. Leasing Costs
b. Operating Costs 68 $108,772
c. Project-Based Rental Assistance (PBRA) or other leased units
d. Other Activity (if approved in grant agreement) Specify: Rehab
e. Adjustment to eliminate duplication (subtract)
f. TOTAL Facility-Based Housing Assistance (Sum Rows a. through d. minus Row e.) 68 $108,772

CAPER
158
OMB Control No: 2506-0117 (exp. 06/30/2018)
Part 7: Summary Overview of Grant Activities B. Facility-Based Housing Assistance
1. Project Sponsor Agency Name (Required)
Rafiki Coalition for Health and Wellness 2. Capital Development 2a. Project Site Information for HOPWA Capital Development of Projects (For Current or Past Capital Development Projects that receive HOPWA Operating Costs this reporting year)
Type of Development this
operating year
HOPWA Funds Expended this operating year (if applicable)
Non-HOPWA funds Expended
(if applicable)
Name of Facility: Brandy Moore House
New construction $
$
Type of Facility [Check only one box.] Permanent housing Short-term Shelter or Transitional housing Supportive services only facility
Rehabilitation $ $
Acquisition $
$
Operating $91,316
$
a. Purchase/lease of property: Date (mm/dd/yy): 5/24/1996
b. Rehabilitation/Construction Dates: Date started: 02/01/1997 Date Completed: 05/31/1998
Date started: 02/01/2010 Date Completed: 06/30/2011
c. Operation dates: Date residents began to occupy: 7/01/1998 Not yet occupied
d. Date supportive services began: Date started: 7/01/1998 Not yet providing services
e. Number of units in the facility: HOPWA-funded units = 11 beds Total Units = 11 beds
f. Is a waiting list maintained for the facility? Yes No
If yes, # of participants on the list at the end of operating year
g. What is the address of the facility (if different from business address)? 1761 Turk Street, San Francisco, CA 94115
h. Is the address of the project site confidential?
Yes, protect information; do not publish list
No, can be made available to the public 2b. Number and Type of HOPWA Capital Development Project Units (For Current or Past Capital Development Projects that receive HOPWA Operating Costs this Reporting Year) For units entered above in 2a please list the number of HOPWA units that fulfill the following criteria:
Number Designated for the Chronically
Homeless
Number Designated to
Assist the Homeless
Number Energy-Star Compliant
Number 504 Accessible
Rental units constructed (new) and/or acquired with or without rehab
Rental units rehabbed

CAPER
159
OMB Control No: 2506-0117 (exp. 06/30/2018)
Homeownership units constructed (if approved)
3. Units Assisted in Types of Housing Facility/Units Leased by Project Sponsor 3a. Check one only
Permanent Supportive Housing Facility/Units Short-term Shelter or Transitional Supportive Housing Facility/Units
3b. Type of Facility Complete the following Chart for all facilities leased, master leased, project-based, or operated with HOPWA funds during the reporting year. Name of Project Sponsor/Agency Operating the Facility/Leased Units: Rafiki Coalition for Health and Wellness
Type of housing facility operated by the project sponsor
Total Number of Units in use during the Operating Year Categorized by the Number of Bedrooms per Units
SRO/Studio/0 bdrm 1 bdrm 2 bdrm 3 bdrm 4 bdrm 5+bdrm
a. Single room occupancy dwelling
b. Community residence 11
c. Project-based rental assistance units or leased units
d. Other housing facility Specify:
4. Households and Housing Expenditures Enter the total number of households served and the amount of HOPWA funds expended by the project sponsor on subsidies for housing involving the use of facilities, master leased units, project based or other scattered site units leased by the organization.
Housing Assistance Category: Facility Based Housing Output: Number of Households
Output: Total HOPWA Funds Expended during Operating Year by Project Sponsor
a. Leasing Costs
b. Operating Costs 13 $91,316
c. Project-Based Rental Assistance (PBRA) or other leased units
d. Other Activity (if approved in grant agreement) Specify:
e. Adjustment to eliminate duplication (subtract)
f. TOTAL Facility-Based Housing Assistance (Sum Rows a. through d. minus Row e.) 13 $91,316

CAPER
160
OMB Control No: 2506-0117 (exp. 06/30/2018)
Part 7: Summary Overview of Grant Activities B. Facility-Based Housing Assistance
1. Project Sponsor Agency Name (Required)
Bernal Heights Housing Corporation 2. Capital Development 2a. Project Site Information for HOPWA Capital Development of Projects (For Current or Past Capital Development Projects that receive HOPWA Operating Costs this reporting year)
Type of Development this
operating year
HOPWA Funds Expended this operating year (if applicable)
Non-HOPWA funds Expended
(if applicable)
Name of Facility: Positive Match
New construction $
$
Type of Facility [Check only one box.] Permanent housing Short-term Shelter or Transitional housing Supportive services only facility
Rehabilitation $44,100 $
Acquisition $
$
Operating $
$232,938
a. Purchase/lease of property: Date (mm/dd/yy): 09/12/98
b. Rehabilitation/Construction Dates: Current Rehab Date started: 05/01/17 Date Completed:
c. Operation dates: Date residents began to occupy: 09/01/02 Not yet occupied
d. Date supportive services began: Date started: 09/01/02 Not yet providing services
e. Number of units in the facility: HOPWA-funded units = 7 Total Units = 7
f. Is a waiting list maintained for the facility? Yes No
If yes, # of participants on the list at the end of operating year
g. What is the address of the facility (if different from business address)? 1652 Eddy Street, San Francisco, CA 94115
h. Is the address of the project site confidential?
Yes, protect information; do not publish list
No, can be made available to the public 2b. Number and Type of HOPWA Capital Development Project Units (For Current or Past Capital Development Projects that receive HOPWA Operating Costs this Reporting Year) For units entered above in 2a please list the number of HOPWA units that fulfill the following criteria:
Number Designated for the Chronically
Homeless
Number Designated to
Assist the Homeless
Number Energy-Star Compliant
Number 504 Accessible
Rental units constructed (new) and/or acquired with or without rehab
Rental units rehabbed
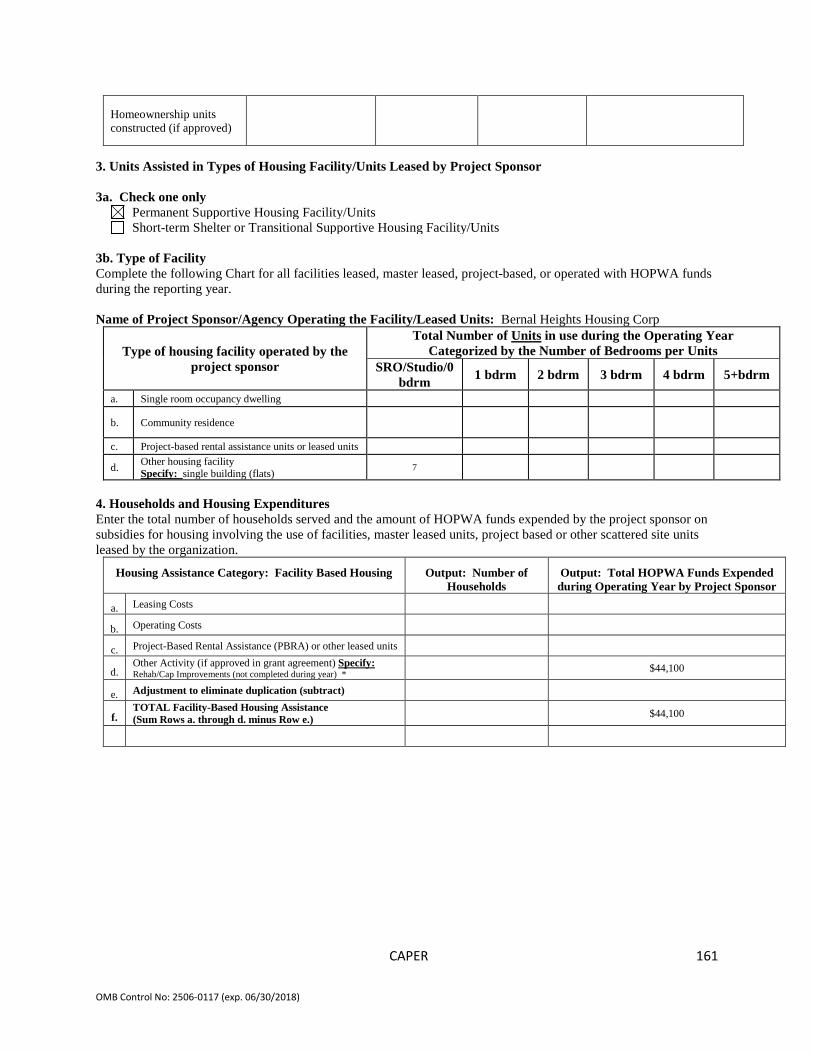
CAPER
161
OMB Control No: 2506-0117 (exp. 06/30/2018)
Homeownership units constructed (if approved)
3. Units Assisted in Types of Housing Facility/Units Leased by Project Sponsor 3a. Check one only
Permanent Supportive Housing Facility/Units Short-term Shelter or Transitional Supportive Housing Facility/Units
3b. Type of Facility Complete the following Chart for all facilities leased, master leased, project-based, or operated with HOPWA funds during the reporting year. Name of Project Sponsor/Agency Operating the Facility/Leased Units: Bernal Heights Housing Corp
Type of housing facility operated by the project sponsor
Total Number of Units in use during the Operating Year Categorized by the Number of Bedrooms per Units
SRO/Studio/0 bdrm 1 bdrm 2 bdrm 3 bdrm 4 bdrm 5+bdrm
a. Single room occupancy dwelling
b. Community residence
c. Project-based rental assistance units or leased units
d. Other housing facility Specify: single building (flats) 7
4. Households and Housing Expenditures Enter the total number of households served and the amount of HOPWA funds expended by the project sponsor on subsidies for housing involving the use of facilities, master leased units, project based or other scattered site units leased by the organization.
Housing Assistance Category: Facility Based Housing Output: Number of Households
Output: Total HOPWA Funds Expended during Operating Year by Project Sponsor
a. Leasing Costs
b. Operating Costs
c. Project-Based Rental Assistance (PBRA) or other leased units
d. Other Activity (if approved in grant agreement) Specify: Rehab/Cap Improvements (not completed during year) *
$44,100
e. Adjustment to eliminate duplication (subtract)
f. TOTAL Facility-Based Housing Assistance (Sum Rows a. through d. minus Row e.)
$44,100

CAPER
162
OMB Control No: 2506-0117 (exp. 06/30/2018)
Part 7: Summary Overview of Grant Activities B. Facility-Based Housing Assistance
1. Project Sponsor Agency Name (Required)
Bernal Heights Housing Corporation 2. Capital Development 2a. Project Site Information for HOPWA Capital Development of Projects (For Current or Past Capital Development Projects that receive HOPWA Operating Costs this reporting year)
Type of Development this
operating year
HOPWA Funds Expended this operating year (if applicable)
Non-HOPWA funds Expended
(if applicable)
Name of Facility: Hazel Betsey
New construction $
$
Type of Facility [Check only one box.] Permanent housing Short-term Shelter or Transitional housing Supportive services only facility
Rehabilitation $53,716 $
Acquisition $
$
Operating $
$108,511
a. Purchase/lease of property: Date (mm/dd/yy): 1-1997
b. Rehabilitation/Construction Dates: Current Rehab Date started: 08/02/2017 Date Completed:
c. Operation dates: Date residents began to occupy: 03/1997 Not yet occupied
d. Date supportive services began: Date started: 03/1997 Not yet providing services
e. Number of units in the facility: HOPWA-funded units = 9 Total Units = 9
f. Is a waiting list maintained for the facility? Yes No
If yes, # of participants on the list at the end of operating year
g. What is the address of the facility (if different from business address)? 3554-17th Street, San Francisco, CA 94110
h. Is the address of the project site confidential?
Yes, protect information; do not publish list
No, can be made available to the public 2b. Number and Type of HOPWA Capital Development Project Units (For Current or Past Capital Development Projects that receive HOPWA Operating Costs this Reporting Year) For units entered above in 2a please list the number of HOPWA units that fulfill the following criteria:
Number Designated for the Chronically
Homeless
Number Designated to
Assist the Homeless
Number Energy-Star Compliant
Number 504 Accessible
Rental units constructed (new) and/or acquired with or without rehab
Rental units rehabbed

CAPER
163
OMB Control No: 2506-0117 (exp. 06/30/2018)
Homeownership units constructed (if approved)
3. Units Assisted in Types of Housing Facility/Units Leased by Project Sponsor 3a. Check one only
Permanent Supportive Housing Facility/Units Short-term Shelter or Transitional Supportive Housing Facility/Units
3b. Type of Facility Complete the following Chart for all facilities leased, master leased, project-based, or operated with HOPWA funds during the reporting year. Name of Project Sponsor/Agency Operating the Facility/Leased Units: Bernal Heights Housing Corp
Type of housing facility operated by the project sponsor
Total Number of Units in use during the Operating Year Categorized by the Number of Bedrooms per Units
SRO/Studio/0 bdrm 1 bdrm 2 bdrm 3 bdrm 4 bdrm 5+bdrm
a. Single room occupancy dwelling
b. Community residence
c. Project-based rental assistance units or leased units
d. Other housing facility Specify: PSH 6 3
4. Households and Housing Expenditures Enter the total number of households served and the amount of HOPWA funds expended by the project sponsor on subsidies for housing involving the use of facilities, master leased units, project based or other scattered site units leased by the organization.
Housing Assistance Category: Facility Based Housing Output: Number of Households
Output: Total HOPWA Funds Expended during Operating Year by Project Sponsor
a. Leasing Costs
b. Operating Costs
c. Project-Based Rental Assistance (PBRA) or other leased units
d. Other Activity (if approved in grant agreement) Specify: Rehab/Cap Improvements (not completed during year) *
$53,716
e. Adjustment to eliminate duplication (subtract)
f. TOTAL Facility-Based Housing Assistance (Sum Rows a. through d. minus Row e.)
$53,716

CAPER
164
OMB Control No: 2506-0117 (exp. 06/30/2018)
APPENDIX C: Proof of Publication for Notice of Availability of Draft 2020-2021 CAPER for Public Review and Comment
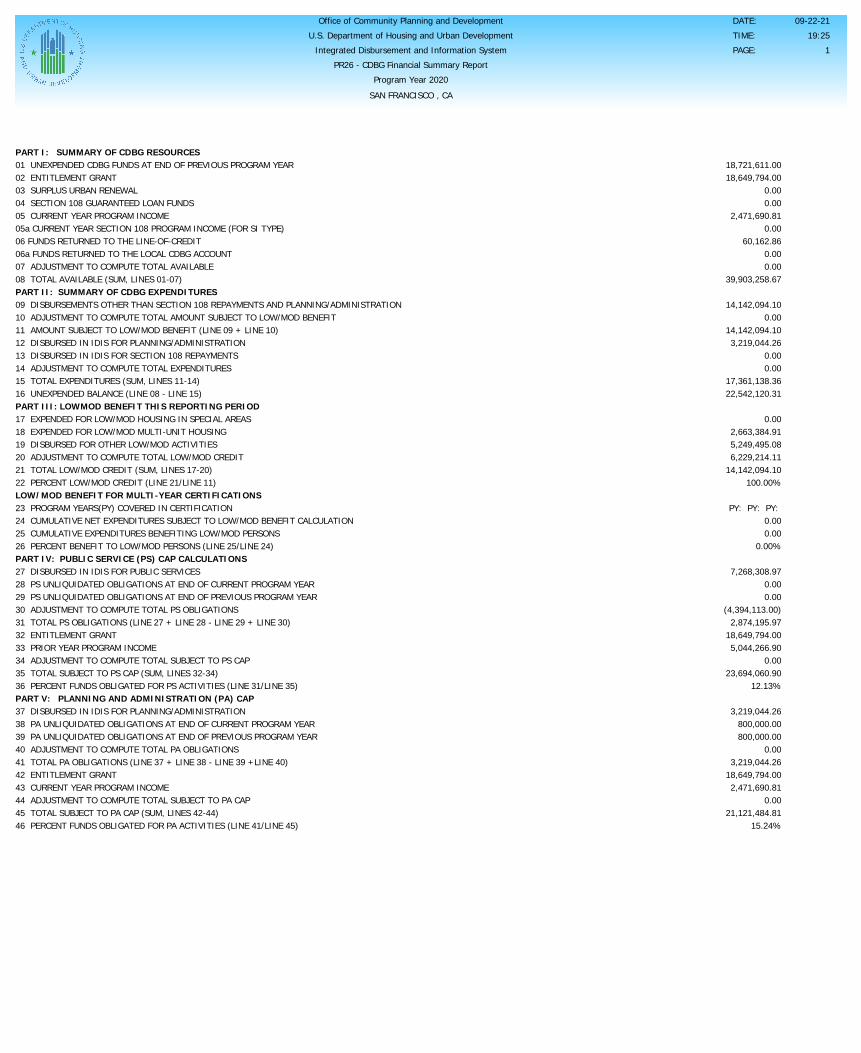
PR26 - CDBG Financial Summary Report
U.S. Department of Housing and Urban DevelopmentOffice of Community Planning and Development
Integrated Disbursement and Information System
DATE: TIME: PAGE: 1
19:2509-22-21
Program Year 2020SAN FRANCISCO , CA
MetricsGranteeProgram YearPART I: SUMMARY OF CDBG RESOURCES01 UNEXPENDED CDBG FUNDS AT END OF PREVIOUS PROGRAM YEAR02 ENTITLEMENT GRANT03 SURPLUS URBAN RENEWAL04 SECTION 108 GUARANTEED LOAN FUNDS05 CURRENT YEAR PROGRAM INCOME05a CURRENT YEAR SECTION 108 PROGRAM INCOME (FOR SI TYPE)06 FUNDS RETURNED TO THE LINE-OF-CREDIT06a FUNDS RETURNED TO THE LOCAL CDBG ACCOUNT07 ADJUSTMENT TO COMPUTE TOTAL AVAILABLE08 TOTAL AVAILABLE (SUM, LINES 01-07)PART II: SUMMARY OF CDBG EXPENDITURES09 DISBURSEMENTS OTHER THAN SECTION 108 REPAYMENTS AND PLANNING/ADMINISTRATION10 ADJUSTMENT TO COMPUTE TOTAL AMOUNT SUBJECT TO LOW/MOD BENEFIT11 AMOUNT SUBJECT TO LOW/MOD BENEFIT (LINE 09 + LINE 10)12 DISBURSED IN IDIS FOR PLANNING/ADMINISTRATION13 DISBURSED IN IDIS FOR SECTION 108 REPAYMENTS14 ADJUSTMENT TO COMPUTE TOTAL EXPENDITURES15 TOTAL EXPENDITURES (SUM, LINES 11-14)16 UNEXPENDED BALANCE (LINE 08 - LINE 15)PART III: LOWMOD BENEFIT THIS REPORTING PERIOD17 EXPENDED FOR LOW/MOD HOUSING IN SPECIAL AREAS18 EXPENDED FOR LOW/MOD MULTI-UNIT HOUSING19 DISBURSED FOR OTHER LOW/MOD ACTIVITIES20 ADJUSTMENT TO COMPUTE TOTAL LOW/MOD CREDIT21 TOTAL LOW/MOD CREDIT (SUM, LINES 17-20)22 PERCENT LOW/MOD CREDIT (LINE 21/LINE 11)LOW/MOD BENEFIT FOR MULTI-YEAR CERTIFICATIONS23 PROGRAM YEARS(PY) COVERED IN CERTIFICATION24 CUMULATIVE NET EXPENDITURES SUBJECT TO LOW/MOD BENEFIT CALCULATION25 CUMULATIVE EXPENDITURES BENEFITING LOW/MOD PERSONS26 PERCENT BENEFIT TO LOW/MOD PERSONS (LINE 25/LINE 24)PART IV: PUBLIC SERVICE (PS) CAP CALCULATIONS27 DISBURSED IN IDIS FOR PUBLIC SERVICES28 PS UNLIQUIDATED OBLIGATIONS AT END OF CURRENT PROGRAM YEAR29 PS UNLIQUIDATED OBLIGATIONS AT END OF PREVIOUS PROGRAM YEAR30 ADJUSTMENT TO COMPUTE TOTAL PS OBLIGATIONS31 TOTAL PS OBLIGATIONS (LINE 27 + LINE 28 - LINE 29 + LINE 30)32 ENTITLEMENT GRANT33 PRIOR YEAR PROGRAM INCOME34 ADJUSTMENT TO COMPUTE TOTAL SUBJECT TO PS CAP35 TOTAL SUBJECT TO PS CAP (SUM, LINES 32-34)36 PERCENT FUNDS OBLIGATED FOR PS ACTIVITIES (LINE 31/LINE 35)PART V: PLANNING AND ADMINISTRATION (PA) CAP37 DISBURSED IN IDIS FOR PLANNING/ADMINISTRATION38 PA UNLIQUIDATED OBLIGATIONS AT END OF CURRENT PROGRAM YEAR39 PA UNLIQUIDATED OBLIGATIONS AT END OF PREVIOUS PROGRAM YEAR40 ADJUSTMENT TO COMPUTE TOTAL PA OBLIGATIONS41 TOTAL PA OBLIGATIONS (LINE 37 + LINE 38 - LINE 39 +LINE 40)42 ENTITLEMENT GRANT43 CURRENT YEAR PROGRAM INCOME44 ADJUSTMENT TO COMPUTE TOTAL SUBJECT TO PA CAP45 TOTAL SUBJECT TO PA CAP (SUM, LINES 42-44)46 PERCENT FUNDS OBLIGATED FOR PA ACTIVITIES (LINE 41/LINE 45)
SAN FRANCISCO , CA2,020.00
18,721,611.0018,649,794.00
0.000.00
2,471,690.810.00
60,162.860.000.00
39,903,258.67
14,142,094.100.00
14,142,094.103,219,044.26
0.000.00
17,361,138.3622,542,120.31
0.00
2,663,384.915,249,495.086,229,214.11
14,142,094.10100.00%
PY: PY: PY:
0.000.00
0.00%
7,268,308.970.000.00
(4,394,113.00)2,874,195.97
18,649,794.005,044,266.90
0.0023,694,060.90
12.13%
3,219,044.26800,000.00800,000.00
0.003,219,044.26
18,649,794.002,471,690.81
0.0021,121,484.81
15.24%

PR26 - CDBG Financial Summary Report
U.S. Department of Housing and Urban DevelopmentOffice of Community Planning and Development
Integrated Disbursement and Information System
DATE: TIME: PAGE: 2
19:2509-22-21
Program Year 2020SAN FRANCISCO , CA
LINE 17 DETAIL: ACTIVITIES TO CONSIDER IN DETERMINING THE AMOUNT TO ENTER ON LINE 17
Report returned no data.
LINE 18 DETAIL: ACTIVITIES TO CONSIDER IN DETERMINING THE AMOUNT TO ENTER ON LINE 18
PlanYear
IDISProject IDIS Activity Activity Name Matrix
CodeNationalObjective Drawn Amount
20172017 Total
202202
87899343
MF-Midtown (Fifth Amendment Mgnt Lease Midtown)MF-MHDC SOUTH PARK
14B14B14B
LMHLMHMatrix Code 14B
$7,463.72$2,655,921.19
$2,663,384.91$2,663,384.91
LINE 19 DETAIL: ACTIVITIES INCLUDED IN THE COMPUTATION OF LINE 19
PlanYear
IDISProject
IDISActivity
VoucherNumber Activity Name Matrix
CodeNationalObjective Drawn Amount
2016201620172017201920192019 20182018 20182018201820182018201920192019201920192019201920192019201920192019201920192019201920192019201920192019201920192019201920192019 201920192019 19941994 20202020 2020
148148185185126126126
137137
136140140140140119119119124124125138138138138138138138138138138139139139139139139139142144144144
118147147
22
106106
104
9122912293319331893289328932
91479147
91508916891689168916892589258925893089309304906090609060906090609060906090609060906090619061906190619061906190619109911191119111
892493399339
22
93239323
9313
6419149648312464720336502827641914764370566462297
64622966502824
64298506419147642984564370546450196641914964370566472033645019664502016511058641914964298506437056645020164622976472033648312465028276511059652984464191496437056647203364921416492152651108065298566437054643705664501966450201
650282464720336529844
64652946474819
65028266529843
6481885
The Arch of San Francisco (83167-16)The Arch of San Francisco (83167-16)Hearing & Speech Center of Northern California (110106-17)Hearing & Speech Center of Northern California (110106-17)Oakes Children's Center, Inc (125226-19)Oakes Children's Center, Inc (125226-19)Oakes Children's Center, Inc (125226-19)
Mission Neighborhood Centers, Inc.Mission Neighborhood Centers, Inc.
Mission Area Health Associates (117162-18)03E Vietnamese Youth Dev Center - (92316-17)03E Vietnamese Youth Dev Center - (92316-17)03E Vietnamese Youth Dev Center - (92316-17)03E Vietnamese Youth Dev Center - (92316-17)Centro Del Pueblo (101499-17)Centro Del Pueblo (101499-17)Centro Del Pueblo (101499-17)La Cocina, Inc. (125205-19)La Cocina, Inc. (125205-19)Bayview Opera House, Inc (125223-19)San Francisco Study Center, Incorporated, fiscal sponsor of AND Architecture + Community PlanningSan Francisco Study Center, Incorporated, fiscal sponsor of AND Architecture + Community PlanningSan Francisco Study Center, Incorporated, fiscal sponsor of AND Architecture + Community PlanningSan Francisco Study Center, Incorporated, fiscal sponsor of AND Architecture + Community PlanningSan Francisco Study Center, Incorporated, fiscal sponsor of AND Architecture + Community PlanningSan Francisco Study Center, Incorporated, fiscal sponsor of AND Architecture + Community PlanningSan Francisco Study Center, Incorporated, fiscal sponsor of AND Architecture + Community PlanningSan Francisco Study Center, Incorporated, fiscal sponsor of AND Architecture + Community PlanningSan Francisco Study Center, Incorporated, fiscal sponsor of AND Architecture + Community PlanningSan Francisco Study Center, Incorporated, fiscal sponsor of AND Architecture + Community PlanningSan Francisco Study Center, Inc, AND Architecture + Community Planning (114777-18)San Francisco Study Center, Inc, AND Architecture + Community Planning (114777-18)San Francisco Study Center, Inc, AND Architecture + Community Planning (114777-18)San Francisco Study Center, Inc, AND Architecture + Community Planning (114777-18)San Francisco Study Center, Inc, AND Architecture + Community Planning (114777-18)San Francisco Study Center, Inc, AND Architecture + Community Planning (114777-18)San Francisco Study Center, Inc, AND Architecture + Community Planning (114777-18)Baker Places, Inc03E Korean American Community Center of San Francisco & Bay Area (134677-19)03E Korean American Community Center of San Francisco & Bay Area (134677-19)03E Korean American Community Center of San Francisco & Bay Area (134677-19)
Young Men's Christian Association of SF (Mission Branch) 110110-1903M Wu Yee Children's Services03M Wu Yee Children's Services
CDBG COMMITTED FUNDS ADJUSTMENTCDBG COMMITTED FUNDS ADJUSTMENT
05C-Swords to Plowshares: Veterans Right Organization05C-Swords to Plowshares: Veterans Right Organization
Mercy Housing California
03B03B03B03B03B03B03B03B03D03D03D03E03E03E03E03E03E03E03E03E03E03E03E03E03E03E03E03E03E03E03E03E03E03E03E03E03E03E03E03E03E03E03E03E03M03M03M03M03Z03Z03Z05C05C05C05D
LMCLMCLMCLMCLMCLMCLMCMatrix Code 03BLMCLMCMatrix Code 03DLMCLMCLMCLMCLMCLMCLMCLMCLMCLMCLMCLMCLMCLMCLMCLMCLMCLMCLMCLMCLMCLMCLMCLMCLMCLMCLMCLMCLMCLMCLMCLMCMatrix Code 03ELMCLMCLMCMatrix Code 03MLMALMAMatrix Code 03ZLMCLMCMatrix Code 05CLMC
$25,741.79$68,518.21
$600.00$2,322.00$5,900.00$9,600.00$4,937.85
$117,619.85$38,137.50$7,627.50
$45,765.00$233,000.00$39,247.00$9,735.00$8,000.00
$34,143.22$73,530.00$35,429.00$27,867.00$6,911.60
$410.00$125,344.80
$1,028.20$1,332.52
$933.79$1,469.42$2,721.28$1,736.59$1,797.30$2,555.08$2,446.29$2,446.29$3,156.42$5,370.77
$520.92$217.95
$2,971.36$4,351.08$6,076.59
$43,723.78$76,950.00$5,319.00$3,231.00
$763,973.25$60,234.23$6,572.50$1,949.26
$68,755.99($5,196.55)
$5,196.55$0.00
$33,102.35$55,346.78
$88,449.13$43,898.90

PR26 - CDBG Financial Summary Report
U.S. Department of Housing and Urban DevelopmentOffice of Community Planning and Development
Integrated Disbursement and Information System
DATE: TIME: PAGE: 3
19:2509-22-21
Program Year 2020SAN FRANCISCO , CA
PlanYear
IDISProject
IDISActivity
VoucherNumber Activity Name Matrix
CodeNationalObjective Drawn Amount
2020 201920192019201920192020202020202020202020202020202020202020202020202020202020202020202020202020202020202020202020202020202020202020202020202020202020202020 202020202020202020202020 201520162016201720172018201820192020202020202020202020202020202020202020 2020
105
127676761079202025252525282828282828555757575757575757646464646476767677777777
232375757575
13211711858119119119134858585858585858585103
29
9314
898090399039903990769201921292129217921792179217922092209220922092209220924692479247924792479247924792479247925392539253925392539262926292629263926392639263
917991799261926192619261
816783768391890686298881888189549271927192719271927192719271927192719312
9221
6481885
640968864720336502827652984464096836529855651108065298556462302650283265110806529856646230264720546483139650283265110806529856652985664502126462302647205464831396492152650283265110806529856646230264720546483139651108065298566502832651108065298566462302647205465110806529856
643705364921346483134649214865028296529849
646529564652966465296640968364652976437054646529864331086429854643705864502096462299648313464921486502829651107065298496481885
6483136
Young Community Developers, Inc.
America Works of California, Inc.OEWD-WF Program DeliveryOEWD-WF Program DeliveryOEWD-WF Program DeliveryUpwardly GlobalAmerica Works of California, Inc.Compass Family ServicesCompass Family ServicesFive Keys Schools and ProgramsFive Keys Schools and ProgramsFive Keys Schools and ProgramsFive Keys Schools and ProgramsHomebridge, Inc. (146839-20)Homebridge, Inc. (146839-20)Homebridge, Inc. (146839-20)Homebridge, Inc. (146839-20)Homebridge, Inc. (146839-20)Homebridge, Inc. (146839-20)PS - Office of Economic and Workforce Development - Workforce Development Prougram DeliveryPRCPRCPRCPRCPRCPRCPRCPRCSan Francisco Lesbian Gay Bisexual Transgender Community CenterSan Francisco Lesbian Gay Bisexual Transgender Community CenterSan Francisco Lesbian Gay Bisexual Transgender Community CenterSan Francisco Lesbian Gay Bisexual Transgender Community CenterSan Francisco Lesbian Gay Bisexual Transgender Community CenterThe Arc San FranciscoThe Arc San FranciscoThe Arc San FranciscoUpwardly GlobalUpwardly GlobalUpwardly GlobalUpwardly Global
05K Eviction Defense Collaborative (142356-20)05K Eviction Defense Collaborative (142356-20)Tenderloin Housing ClinicTenderloin Housing ClinicTenderloin Housing ClinicTenderloin Housing Clinic
Together United Recommitted Forever (T.U.R.F.)Together United Recommitted Forever (T.U.R.F.)YMCA of San Francisco (Bayview)/Together United Recommitted Forever (T.U.R.F.)MOHCD HOPE SF Program DeliveryYMCA of San Francisco (Bayview)/Together United Recommitted Forever (T.U.R.F.)Young Men's Christian Association of San Francisco (Bayview Branch), fiscal sponsor of Together UnitYoung Men's Christian Association of San Francisco (Bayview Branch), fiscal sponsor of Together UnitYoung Community Developers, fiscal agent of 100% College Prep InstituteYoung Men's Christian Association of San Francisco (Urban Services Branch)Young Men's Christian Association of San Francisco (Urban Services Branch)Young Men's Christian Association of San Francisco (Urban Services Branch)Young Men's Christian Association of San Francisco (Urban Services Branch)Young Men's Christian Association of San Francisco (Urban Services Branch)Young Men's Christian Association of San Francisco (Urban Services Branch)Young Men's Christian Association of San Francisco (Urban Services Branch)Young Men's Christian Association of San Francisco (Urban Services Branch)Young Men's Christian Association of San Francisco (Urban Services Branch)Bayview Hunters Point Multipurpose Senior Services, Inc.
Kultivate Labs
05D05D05H05H05H05H05H05H05H05H05H05H05H05H05H05H05H05H05H05H05H05H05H05H05H05H05H05H05H05H05H05H05H05H05H05H05H05H05H05H05H05H05K05K05K05K05K05K05K05Z05Z05Z05Z05Z05Z05Z05Z05Z05Z05Z05Z05Z05Z05Z05Z05Z05Z05Z14E14E
LMCMatrix Code 05DLMCLMCLMCLMCLMCLMCLMCLMCLMCLMCLMCLMCLMCLMCLMCLMCLMCLMCLMCLMCLMCLMCLMCLMCLMCLMCLMCLMCLMCLMCLMCLMCLMCLMCLMCLMCLMCLMCLMCMatrix Code 05HLMCLMCLMCLMCLMCLMCMatrix Code 05KLMCLMCLMCLMCLMCLMCLMCLMCLMCLMCLMCLMCLMCLMCLMCLMCLMCLMCMatrix Code 05ZLMAMatrix Code 14E
$31,683.64$75,582.54
$8,764.27$55,604.75
$249.64$7,715.30$9,819.26
$84,175.38$21,472.37$53,527.63$35,000.00$21,578.56$5,889.68$6,183.61
$17,930.35$31,173.27$10,389.00
$151.57$79.37$66.36
$52,370.26$44,501.09$4,707.00
$235.24$16,752.29$9,967.38$8,832.65$9,027.90$5,521.42
$18,452.32$12,693.41$5,081.57$5,228.18
$50,560.59$37,500.00$25,934.15$11,267.81
$733.67$813.32
$3,641.07$2,311.94
$695,903.63$49,092.68$1,712.32
$32,035.78$62,089.26
$146,523.04$352,068.47
$643,521.55($8,667.66)($6,425.35)($9,909.56)$21,069.40
($20,451.50)$11,626.48
($14,708.79)$36,924.70$40,923.83$26,159.90$40,798.36$18,269.37$19,244.84$17,465.65$22,878.34$25,554.73$28,704.98
$188,696.50$438,154.22
$31,785.00$31,785.00

PR26 - CDBG Financial Summary Report
U.S. Department of Housing and Urban DevelopmentOffice of Community Planning and Development
Integrated Disbursement and Information System
DATE: TIME: PAGE: 4
19:2509-22-21
Program Year 2020SAN FRANCISCO , CA
PlanYear
IDISProject
IDISActivity
VoucherNumber Activity Name Matrix
CodeNationalObjective Drawn Amount
2018201920192019201920202020202020202020202020202020 201920192019202020202020202020202020202020202020202020202020202020202020202020202020202020202020202020202020202020202020202020202020202020202020202020202020202020202020202020202020202020202020202020202020202020202020202020202020
57565656563636363636363636
707070101011111111112424242424313131314747515254545454545959595959596161616161616166666868686868686969696969707070
8826902290229022902292289228922892289228922892289228
908690869086920292029203920392039203920392169216921692169216922392239223922392409240924292439245924592459245924592499249924992499249924992519251925192519251925192519255925592579257925792579257925792589258925892589258925992599259
6483117640968864191496429850646229764502096462302647205464831396492152650283165110806529855
640968864370566462297648313465298496462299648313465028296511070652985364622996483134650282965110706529853648313665028296511070652985365110766529853647205064831366462299648313664921486511076652985364502096462299647205064831366511076652985364502096462299647205464831366502831651107665298536511076652985564720546483136649215265028316511076652985564623026483136650283165110766529855646230264831366502831
MOHCD - CDBG19 Housing Program DeliveryMOHCD-Housing Program Delivery PoolMOHCD-Housing Program Delivery PoolMOHCD-Housing Program Delivery PoolMOHCD-Housing Program Delivery PoolMayor's Office of Housing and Community Development - Housing Program DeliveryMayor's Office of Housing and Community Development - Housing Program DeliveryMayor's Office of Housing and Community Development - Housing Program DeliveryMayor's Office of Housing and Community Development - Housing Program DeliveryMayor's Office of Housing and Community Development - Housing Program DeliveryMayor's Office of Housing and Community Development - Housing Program DeliveryMayor's Office of Housing and Community Development - Housing Program DeliveryMayor's Office of Housing and Community Development - Housing Program Delivery
18B North of Market Neighborhood Improv Corp (123341-19; 139291-19)18B North of Market Neighborhood Improv Corp (123341-19; 139291-19)18B North of Market Neighborhood Improv Corp (123341-19; 139291-19)ASIAN, Inc.ASIAN, Inc.Bay Area Community Resources (fiscal sponsor to Portola Neighborhood Association)Bay Area Community Resources (fiscal sponsor to Portola Neighborhood Association)Bay Area Community Resources (fiscal sponsor to Portola Neighborhood Association)Bay Area Community Resources (fiscal sponsor to Portola Neighborhood Association)Bay Area Community Resources (fiscal sponsor to Portola Neighborhood Association)Excelsior Action GroupExcelsior Action GroupExcelsior Action GroupExcelsior Action GroupExcelsior Action GroupLawyers' Committee for Civil Rights of the San Francisco Bay AreaLawyers' Committee for Civil Rights of the San Francisco Bay AreaLawyers' Committee for Civil Rights of the San Francisco Bay AreaLawyers' Committee for Civil Rights of the San Francisco Bay AreaMission Economic Development AgencyMission Economic Development AgencyNorth of Market/Tenderloin Community Benefit CorporationNorth of Market/Tenderloin Community Benefit CorporationOcean Avenue AssociationOcean Avenue AssociationOcean Avenue AssociationOcean Avenue AssociationOcean Avenue AssociationRenaissance Entrepreneurship CenterRenaissance Entrepreneurship CenterRenaissance Entrepreneurship CenterRenaissance Entrepreneurship CenterRenaissance Entrepreneurship CenterRenaissance Entrepreneurship CenterRenaissance Entrepreneurship CenterRenaissance Entrepreneurship CenterRenaissance Entrepreneurship CenterRenaissance Entrepreneurship CenterRenaissance Entrepreneurship CenterRenaissance Entrepreneurship CenterRenaissance Entrepreneurship CenterSan Francisco Small Business Development CenterSan Francisco Small Business Development CenterSelf-Help for the ElderlySelf-Help for the ElderlySelf-Help for the ElderlySelf-Help for the ElderlySelf-Help for the ElderlySelf-Help for the ElderlySFMade, Inc.SFMade, Inc.SFMade, Inc.SFMade, Inc.SFMade, Inc.Southeast Asian Community CenterSoutheast Asian Community CenterSoutheast Asian Community Center
14G14G14G14G14G14G14G14G14G14G14G14G14G14G18B18B18B18B18B18B18B18B18B18B18B18B18B18B18B18B18B18B18B18B18B18B18B18B18B18B18B18B18B18B18B18B18B18B18B18B18B18B18B18B18B18B18B18B18B18B18B18B18B18B18B18B18B18B18B18B18B
LMHLMHLMHLMHLMHLMHLMHLMHLMHLMHLMHLMHLMHMatrix Code 14GLMALMALMALMJLMJLMALMALMALMALMALMALMALMALMALMALMJLMJLMJLMJLMJLMJLMALMALMJLMJLMJLMJLMJLMALMALMALMALMALMALMJLMJLMJLMJLMJLMJLMJLMJLMJLMJLMJLMJLMJLMJLMJLMJLMJLMJLMJLMJLMJLMJLMJ
$175.22$70,628.63$40,060.53$39,394.08$28,709.94$56,478.96$52,291.73$48,161.96$50,579.83$47,895.32$47,070.96$46,346.83$36,236.53
$564,030.52$10,000.00$35,593.18$9,670.82
$26,553.89$12,315.11$41,561.19$6,645.46
$14,927.85$6,522.86
$342.64$7,449.31$8,177.69$8,201.67
$21,868.76$863.57
$66,666.08$16,666.52$8,333.26$8,334.14
$17,217.13$17,117.06$48,238.00$11,105.00$6,666.66
$19,999.98$3,333.33$3,333.33$6,666.70$6,525.87$1,526.04$1,903.52$6,295.51
$16,563.67$6,437.39$4,552.24$4,778.17$5,282.65$1,840.09$2,814.79$9,770.55
$10,620.52$17,193.75
$182,806.25$1,215.24$4,439.15$1,151.42$1,778.99$3,120.41$1,785.86
$37,916.69$5,416.67
$11,402.93$5,131.87$5,131.84
$43,749.84$6,250.00
$12,500.00

PR26 - CDBG Financial Summary Report
U.S. Department of Housing and Urban DevelopmentOffice of Community Planning and Development
Integrated Disbursement and Information System
DATE: TIME: PAGE: 5
19:2509-22-21
Program Year 2020SAN FRANCISCO , CA
PlanYear
IDISProject
IDISActivity
VoucherNumber Activity Name Matrix
CodeNationalObjective Drawn Amount
20202020202020202020 201720172017201920202020202020202020202020202020202020202020202020202020202020202020202020202020202020202020202020202020202020202020202020202020202020202020202020202020 20192019201920192019 Total
7071717171
203203203931616303033414141414142424243435858585858586060606060606565656578787878787878
7373737373
92599260926092609260
883088308830908792089208922292229225923592359235923592359236923692369237923792489248924892489248924892509250925092509250925092549254925492549264926492649264926492649264
89958995899589958995
65298556462302648313665028316529855
643310864378416448208640968865110706529853651107065298536529853647205064831366502829651107665298536502831651107665298536511076652985364622996472050648313665028316511076652985364622996472050648313665028316511076652985364623026483136651107665298556450209646230264720546492152650283165110766529855
64370566450201648312464921416529844
Southeast Asian Community CenterSoutheast Asian Community CenterSoutheast Asian Community CenterSoutheast Asian Community CenterSoutheast Asian Community Center
2017-18 Small Business Revolving Loan Fund2017-18 Small Business Revolving Loan Fund2017-18 Small Business Revolving Loan FundSan Francisco Small Business Development CenterChildren's Council of San FranciscoChildren's Council of San FranciscoLa Cocina, Inc.La Cocina, Inc.Main Street LaunchMission Asset FundMission Asset FundMission Asset FundMission Asset FundMission Asset FundMission Economic Development AgencyMission Economic Development AgencyMission Economic Development AgencyMission Economic Development AgencyMission Economic Development AgencyRenaissance Entrepreneurship CenterRenaissance Entrepreneurship CenterRenaissance Entrepreneurship CenterRenaissance Entrepreneurship CenterRenaissance Entrepreneurship CenterRenaissance Entrepreneurship CenterRenaissance Entrepreneurship CenterRenaissance Entrepreneurship CenterRenaissance Entrepreneurship CenterRenaissance Entrepreneurship CenterRenaissance Entrepreneurship CenterRenaissance Entrepreneurship CenterSan Francisco Lesbian Gay Bisexual Transgender Community CenterSan Francisco Lesbian Gay Bisexual Transgender Community CenterSan Francisco Lesbian Gay Bisexual Transgender Community CenterSan Francisco Lesbian Gay Bisexual Transgender Community CenterWu Yee Children's ServicesWu Yee Children's ServicesWu Yee Children's ServicesWu Yee Children's ServicesWu Yee Children's ServicesWu Yee Children's ServicesWu Yee Children's Services
Community Vision Capital & ConsultingCommunity Vision Capital & ConsultingCommunity Vision Capital & ConsultingCommunity Vision Capital & ConsultingCommunity Vision Capital & Consulting
18B18B18B18B18B18B18C18C18C18C18C18C18C18C18C18C18C18C18C18C18C18C18C18C18C18C18C18C18C18C18C18C18C18C18C18C18C18C18C18C18C18C18C18C18C18C18C18C18C19C19C19C19C19C19C
LMJLMJLMJLMJLMJMatrix Code 18BLMJLMJLMJLMCMCLMCMCLMCMCLMCMCLMCMCLMCMCLMCMCLMCMCLMCMCLMCMCLMCMCLMCMCLMCMCLMCMCLMCMCLMCMCLMCMCLMCMCLMCMCLMCMCLMCMCLMCMCLMCMCLMCMCLMCMCLMCMCLMCMCLMCMCLMCMCLMCMCLMCMCLMCMCLMCMCLMCMCLMCMCLMCMCLMCMCLMCMCLMCMCMatrix Code 18CLMCLMCLMCLMCLMCMatrix Code 19C
$12,500.16$32,083.15$4,583.35$9,166.70$9,166.80
$931,773.27$25,401.25
$353.00$425.74
$86,434.25$36,911.56$14,043.76$17,496.00$52,504.00$25,034.66$5,833.33
$40,833.31$5,833.33
$11,666.66$5,833.37$6,120.59
$30,281.40$37,292.39$23,249.10$25,961.34$35,662.79$4,829.65$6,466.65
$13,817.71$10,077.64$4,145.56
$20,527.78$2,853.40$3,517.22$3,537.84$6,300.14$3,263.62
$18,040.00$15,660.15$17,328.20$18,952.85$11,422.91$20,350.35$10,210.79$14,889.70$11,856.71$20,382.11$7,806.49
$733,409.30$9,344.72$5,483.72$8,374.01$5,600.76
$21,968.62$50,771.83
$5,249,495.08
LINE 27 DETAIL: ACTIVITIES INCLUDED IN THE COMPUTATION OF LINE 27
PlanYear
IDISProject
IDISActivity
VoucherNumber
Activity toprevent,prepare for,and respondtoCoronavirus
Activity Name Grant Number FundType
MatrixCode
NationalObjective
Drawn Amount20202020 20202020
106106
104105
93239323
93139314
65028266529843
64818856481885
NoNo
NoNo
05C-Swords to Plowshares: Veterans Right Organization05C-Swords to Plowshares: Veterans Right Organization
Mercy Housing CaliforniaYoung Community Developers, Inc.
B17MC060016B17MC060016
B18MC060016B19MC060016
ENEN
RLRL
05C05C05C05D05D05D
LMCLMCMatrix Code 05CLMCLMCMatrix Code 05D
$33,102.35$55,346.78
$88,449.13$43,898.90$31,683.64
$75,582.54

PR26 - CDBG Financial Summary Report
U.S. Department of Housing and Urban DevelopmentOffice of Community Planning and Development
Integrated Disbursement and Information System
DATE: TIME: PAGE: 6
19:2509-22-21
Program Year 2020SAN FRANCISCO , CA
PlanYear
IDISProject
IDISActivity
VoucherNumber
Activity toprevent,prepare for,and respondtoCoronavirus
Activity Name Grant Number FundType
MatrixCode
NationalObjective
Drawn Amount2019201920192019201920202020202020202020202020202020202020202020202020202020202020202020202020202020202020202020202020202020202020202020202020202020202020202020202020202020202020202020
202020202020202020202020202020202020202020202020202020202020202020202020202020202020
12767676107914141414141414151515151515181818191919202022222222222222222525252528282828282855
575757575757575764646464647676767777777781
8980903990399039907692019206920692069206920692069206920792079207920792079207921092109210921192119211921292129214921492149214921492149214921492179217921792179220922092209220922092209246
924792479247924792479247924792479253925392539253925392629262926292639263926392639267
6409688647203365028276529844640968365298556450212646230264720546492152650283165110806529855645021264623026492152650283165110806529855650283165110806529855647205464831396529855651108065298556450212646230264720546483139649215265028316511080652985664623026502832651108065298566462302647205464831396502832651108065298566529856
645021264623026472054648313964921526502832651108065298566462302647205464831396511080652985665028326511080652985664623026472054651108065298566483139
NoNoNoNoNoNoNoNoNoNoNoNoNoNoNoNoNoNoNoNoNoNoNoNoNoNoNoNoNoNoNoNoNoNoNoNoNoNoNoNoNoNoNoNoNoNo
NoNoNoNoNoNoNoNoNoNoNoNoNoNoNoNoNoNoNoNoNo
America Works of California, Inc.OEWD-WF Program DeliveryOEWD-WF Program DeliveryOEWD-WF Program DeliveryUpwardly GlobalAmerica Works of California, Inc.Central City Hospitality HouseCentral City Hospitality HouseCentral City Hospitality HouseCentral City Hospitality HouseCentral City Hospitality HouseCentral City Hospitality HouseCentral City Hospitality HouseCentral City Hospitality HouseCentral City Hospitality HouseCentral City Hospitality HouseCentral City Hospitality HouseCentral City Hospitality HouseCentral City Hospitality HouseCommunity Housing PartnershipCommunity Housing PartnershipCommunity Housing PartnershipCommunity Housing PartnershipCommunity Housing PartnershipCommunity Housing PartnershipCompass Family ServicesCompass Family ServicesEpiscopal Community Services of San FranciscoEpiscopal Community Services of San FranciscoEpiscopal Community Services of San FranciscoEpiscopal Community Services of San FranciscoEpiscopal Community Services of San FranciscoEpiscopal Community Services of San FranciscoEpiscopal Community Services of San FranciscoEpiscopal Community Services of San FranciscoFive Keys Schools and ProgramsFive Keys Schools and ProgramsFive Keys Schools and ProgramsFive Keys Schools and ProgramsHomebridge, Inc. (146839-20)Homebridge, Inc. (146839-20)Homebridge, Inc. (146839-20)Homebridge, Inc. (146839-20)Homebridge, Inc. (146839-20)Homebridge, Inc. (146839-20)PS - Office of Economic and Workforce Development - WorkforceDevelopment Prougram DeliveryPRCPRCPRCPRCPRCPRCPRCPRCSan Francisco Lesbian Gay Bisexual Transgender Community CenterSan Francisco Lesbian Gay Bisexual Transgender Community CenterSan Francisco Lesbian Gay Bisexual Transgender Community CenterSan Francisco Lesbian Gay Bisexual Transgender Community CenterSan Francisco Lesbian Gay Bisexual Transgender Community CenterThe Arc San FranciscoThe Arc San FranciscoThe Arc San FranciscoUpwardly GlobalUpwardly GlobalUpwardly GlobalUpwardly GlobalYoung Community Developers, Inc.
B19MC060016B19MC060016B19MC060016B19MC060016B17MC060016B20MC060016B20MC060016B20MC060016B20MC060016B20MC060016B20MC060016B20MC060016B20MC060016B20MC060016B20MC060016B20MC060016B20MC060016B20MC060016B20MC060016B20MC060016B20MC060016B20MC060016B20MC060016B20MC060016B20MC060016B20MC060016B20MC060016B20MC060016B20MC060016B20MC060016B20MC060016B20MC060016B20MC060016B20MC060016B20MC060016B20MC060016B20MC060016B20MC060016B20MC060016B20MC060016B20MC060016B20MC060016B20MC060016B20MC060016B20MC060016B20MC060016
B20MC060016B20MC060016B20MC060016B20MC060016B20MC060016B20MC060016B20MC060016B20MC060016B20MC060016B20MC060016B20MC060016B20MC060016B20MC060016B20MC060016B20MC060016B20MC060016B20MC060016B20MC060016B20MC060016B20MC060016B20MC060016
ENENENENENENENENENENENENENENENENENENENENENENENENENENENENENENENENENENENENENENENENENENENENENEN
ENENENENENENENENENENENENENENENENENENENENEN
05H05H05H05H05H05H05H05H05H05H05H05H05H05H05H05H05H05H05H05H05H05H05H05H05H05H05H05H05H05H05H05H05H05H05H05H05H05H05H05H05H05H05H05H05H05H
05H05H05H05H05H05H05H05H05H05H05H05H05H05H05H05H05H05H05H05H05H
LMCLMCLMCLMCLMCLMCLMCLMCLMCLMCLMCLMCLMCLMCLMCLMCLMCLMCLMCLMCLMCLMCLMCLMCLMCLMCLMCLMCLMCLMCLMCLMCLMCLMCLMCLMCLMCLMCLMCLMCLMCLMCLMCLMCLMCLMC
LMCLMCLMCLMCLMCLMCLMCLMCLMCLMCLMCLMCLMCLMCLMCLMCLMCLMCLMCLMCLMC
$8,764.27$55,604.75
$249.64$7,715.30$9,819.26
$84,175.38$29,401.62$12,623.54
$3,099.68$8,369.59
$25,882.06$8,744.51
$11,879.00$42,668.32$33,026.67$28,813.52$59,380.18$17,999.55$18,111.76$28,394.69
$9,651.54$26,456.03$16,437.55
$1,243.35$37,953.14$21,472.37$53,527.63$16,015.73
$3,304.55$5,534.81$2,498.53$8,631.03$2,565.44
$11,296.05$5,667.28
$35,000.00$21,578.56
$5,889.68$6,183.61
$17,930.35$31,173.27$10,389.00
$151.57$79.37$66.36
$52,370.26
$44,501.09$4,707.00
$235.24$16,752.29
$9,967.38$8,832.65$9,027.90$5,521.42
$18,452.32$12,693.41
$5,081.57$5,228.18
$50,560.59$37,500.00$25,934.15$11,267.81
$733.67$813.32
$3,641.07$2,311.94
$225,157.22
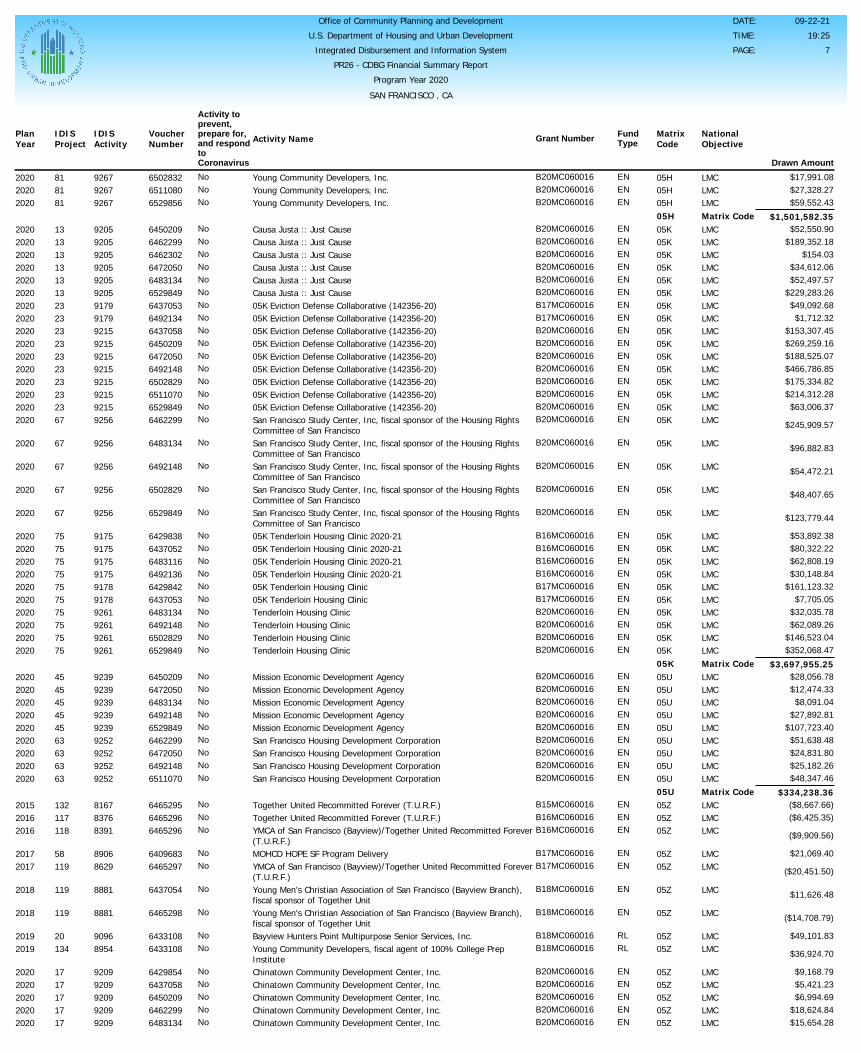
PR26 - CDBG Financial Summary Report
U.S. Department of Housing and Urban DevelopmentOffice of Community Planning and Development
Integrated Disbursement and Information System
DATE: TIME: PAGE: 7
19:2509-22-21
Program Year 2020SAN FRANCISCO , CA
PlanYear
IDISProject
IDISActivity
VoucherNumber
Activity toprevent,prepare for,and respondtoCoronavirus
Activity Name Grant Number FundType
MatrixCode
NationalObjective
Drawn Amount202020202020 2020202020202020202020202020202020202020202020202020202020202020
2020
2020
2020
2020
2020202020202020202020202020202020202020 202020202020202020202020202020202020 201520162016
20172017
2018
2018
20192019
20202020202020202020
818181
13131313131323232323232323232367
67
67
67
67
75757575757575757575
454545454563636363
132117118
58119
119
119
20134
1717171717
926792679267
9205920592059205920592059179917992159215921592159215921592159256
9256
9256
9256
9256
9175917591759175917891789261926192619261
923992399239923992399252925292529252
816783768391
89068629
8881
8881
90968954
92099209920992099209
650283265110806529856
6450209646229964623026472050648313465298496437053649213464370586450209647205064921486502829651107065298496462299
6483134
6492148
6502829
6529849
6429838643705264831166492136642984264370536483134649214865028296529849
645020964720506483134649214865298496462299647205064921486511070
646529564652966465296
64096836465297
6437054
6465298
64331086433108
64298546437058645020964622996483134
NoNoNo
NoNoNoNoNoNoNoNoNoNoNoNoNoNoNoNo
No
No
No
No
NoNoNoNoNoNoNoNoNoNo
NoNoNoNoNoNoNoNoNo
NoNoNo
NoNo
No
No
NoNo
NoNoNoNoNo
Young Community Developers, Inc.Young Community Developers, Inc.Young Community Developers, Inc.
Causa Justa :: Just CauseCausa Justa :: Just CauseCausa Justa :: Just CauseCausa Justa :: Just CauseCausa Justa :: Just CauseCausa Justa :: Just Cause05K Eviction Defense Collaborative (142356-20)05K Eviction Defense Collaborative (142356-20)05K Eviction Defense Collaborative (142356-20)05K Eviction Defense Collaborative (142356-20)05K Eviction Defense Collaborative (142356-20)05K Eviction Defense Collaborative (142356-20)05K Eviction Defense Collaborative (142356-20)05K Eviction Defense Collaborative (142356-20)05K Eviction Defense Collaborative (142356-20)San Francisco Study Center, Inc, fiscal sponsor of the Housing RightsCommittee of San FranciscoSan Francisco Study Center, Inc, fiscal sponsor of the Housing RightsCommittee of San FranciscoSan Francisco Study Center, Inc, fiscal sponsor of the Housing RightsCommittee of San FranciscoSan Francisco Study Center, Inc, fiscal sponsor of the Housing RightsCommittee of San FranciscoSan Francisco Study Center, Inc, fiscal sponsor of the Housing RightsCommittee of San Francisco05K Tenderloin Housing Clinic 2020-2105K Tenderloin Housing Clinic 2020-2105K Tenderloin Housing Clinic 2020-2105K Tenderloin Housing Clinic 2020-2105K Tenderloin Housing Clinic05K Tenderloin Housing ClinicTenderloin Housing ClinicTenderloin Housing ClinicTenderloin Housing ClinicTenderloin Housing Clinic
Mission Economic Development AgencyMission Economic Development AgencyMission Economic Development AgencyMission Economic Development AgencyMission Economic Development AgencySan Francisco Housing Development CorporationSan Francisco Housing Development CorporationSan Francisco Housing Development CorporationSan Francisco Housing Development Corporation
Together United Recommitted Forever (T.U.R.F.)Together United Recommitted Forever (T.U.R.F.)YMCA of San Francisco (Bayview)/Together United Recommitted Forever(T.U.R.F.)MOHCD HOPE SF Program DeliveryYMCA of San Francisco (Bayview)/Together United Recommitted Forever(T.U.R.F.)Young Men's Christian Association of San Francisco (Bayview Branch),fiscal sponsor of Together UnitYoung Men's Christian Association of San Francisco (Bayview Branch),fiscal sponsor of Together UnitBayview Hunters Point Multipurpose Senior Services, Inc.Young Community Developers, fiscal agent of 100% College PrepInstituteChinatown Community Development Center, Inc.Chinatown Community Development Center, Inc.Chinatown Community Development Center, Inc.Chinatown Community Development Center, Inc.Chinatown Community Development Center, Inc.
B20MC060016B20MC060016B20MC060016
B20MC060016B20MC060016B20MC060016B20MC060016B20MC060016B20MC060016B17MC060016B17MC060016B20MC060016B20MC060016B20MC060016B20MC060016B20MC060016B20MC060016B20MC060016B20MC060016
B20MC060016
B20MC060016
B20MC060016
B20MC060016
B16MC060016B16MC060016B16MC060016B16MC060016B17MC060016B17MC060016B20MC060016B20MC060016B20MC060016B20MC060016
B20MC060016B20MC060016B20MC060016B20MC060016B20MC060016B20MC060016B20MC060016B20MC060016B20MC060016
B15MC060016B16MC060016B16MC060016
B17MC060016B17MC060016
B18MC060016
B18MC060016
B18MC060016B18MC060016
B20MC060016B20MC060016B20MC060016B20MC060016B20MC060016
ENENEN
ENENENENENENENENENENENENENENENEN
EN
EN
EN
EN
ENENENENENENENENENEN
ENENENENENENENENEN
ENENEN
ENEN
EN
EN
RLRL
ENENENENEN
05H05H05H05H05K05K05K05K05K05K05K05K05K05K05K05K05K05K05K05K
05K
05K
05K
05K
05K05K05K05K05K05K05K05K05K05K05K05U05U05U05U05U05U05U05U05U05U05Z05Z05Z
05Z05Z
05Z
05Z
05Z05Z
05Z05Z05Z05Z05Z
LMCLMCLMCMatrix Code 05HLMCLMCLMCLMCLMCLMCLMCLMCLMCLMCLMCLMCLMCLMCLMCLMC
LMC
LMC
LMC
LMC
LMCLMCLMCLMCLMCLMCLMCLMCLMCLMCMatrix Code 05KLMCLMCLMCLMCLMCLMCLMCLMCLMCMatrix Code 05ULMCLMCLMC
LMCLMC
LMC
LMC
LMCLMC
LMCLMCLMCLMCLMC
$17,991.08$27,328.27$59,552.43
$1,501,582.35$52,550.90
$189,352.18$154.03
$34,612.06$52,497.57
$229,283.26$49,092.68
$1,712.32$153,307.45$269,259.16$188,525.07$466,786.85$175,334.82$214,312.28
$63,006.37
$245,909.57
$96,882.83
$54,472.21
$48,407.65
$123,779.44
$53,892.38$80,322.22$62,808.19$30,148.84
$161,123.32$7,705.05
$32,035.78$62,089.26
$146,523.04$352,068.47
$3,697,955.25$28,056.78$12,474.33
$8,091.04$27,892.81
$107,723.40$51,638.48$24,831.80$25,182.26$48,347.46
$334,238.36($8,667.66)($6,425.35)
($9,909.56)
$21,069.40
($20,451.50)
$11,626.48
($14,708.79)
$49,101.83
$36,924.70
$9,168.79$5,421.23$6,994.69
$18,624.84$15,654.28
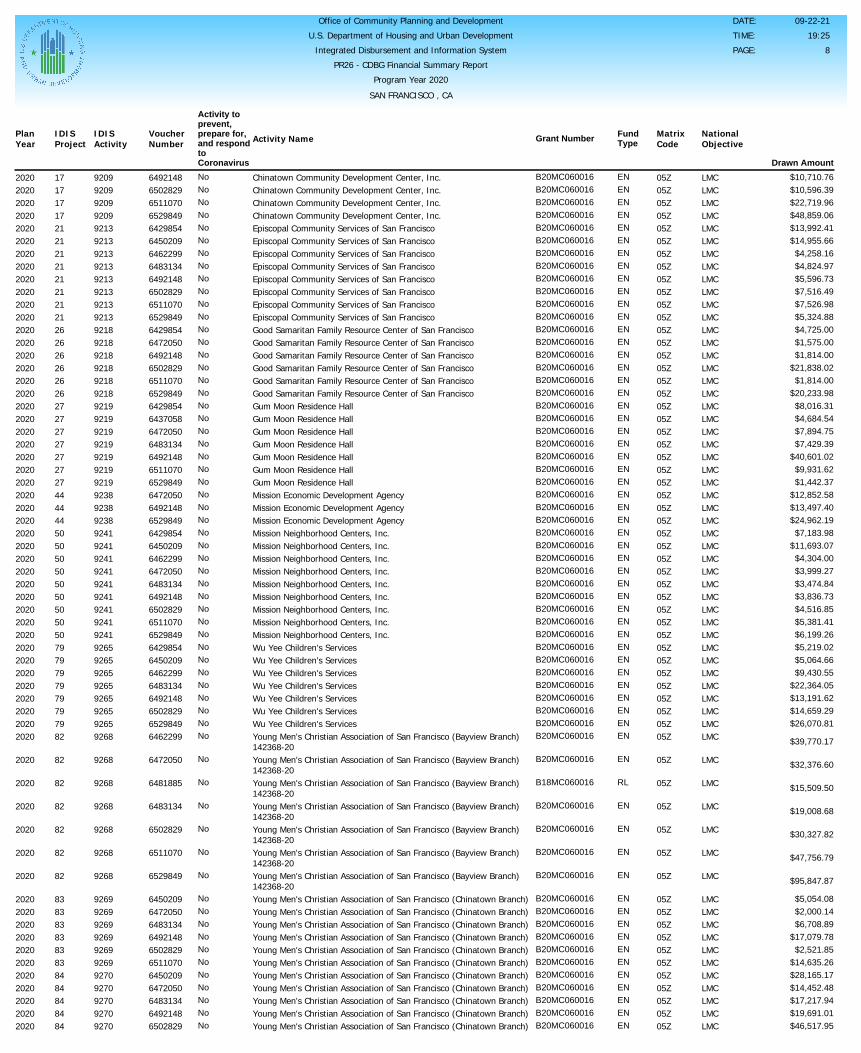
PR26 - CDBG Financial Summary Report
U.S. Department of Housing and Urban DevelopmentOffice of Community Planning and Development
Integrated Disbursement and Information System
DATE: TIME: PAGE: 8
19:2509-22-21
Program Year 2020SAN FRANCISCO , CA
PlanYear
IDISProject
IDISActivity
VoucherNumber
Activity toprevent,prepare for,and respondtoCoronavirus
Activity Name Grant Number FundType
MatrixCode
NationalObjective
Drawn Amount202020202020202020202020202020202020202020202020202020202020202020202020202020202020202020202020202020202020202020202020202020202020202020202020202020202020202020202020202020202020
2020
2020
2020
2020
2020
2020
20202020202020202020202020202020202020202020
171717172121212121212121262626262626272727272727274444445050505050505050507979797979797982
82
82
82
82
82
82
8383838383838484848484
920992099209920992139213921392139213921392139213921892189218921892189218921992199219921992199219921992389238923892419241924192419241924192419241924192659265926592659265926592659268
9268
9268
9268
9268
9268
9268
92699269926992699269926992709270927092709270
649214865028296511070652984964298546450209646229964831346492148650282965110706529849642985464720506492148650282965110706529849642985464370586472050648313464921486511070652984964720506492148652984964298546450209646229964720506483134649214865028296511070652984964298546450209646229964831346492148650282965298496462299
6472050
6481885
6483134
6502829
6511070
6529849
64502096472050648313464921486502829651107064502096472050648313464921486502829
NoNoNoNoNoNoNoNoNoNoNoNoNoNoNoNoNoNoNoNoNoNoNoNoNoNoNoNoNoNoNoNoNoNoNoNoNoNoNoNoNoNoNoNoNo
No
No
No
No
No
No
NoNoNoNoNoNoNoNoNoNoNo
Chinatown Community Development Center, Inc.Chinatown Community Development Center, Inc.Chinatown Community Development Center, Inc.Chinatown Community Development Center, Inc.Episcopal Community Services of San FranciscoEpiscopal Community Services of San FranciscoEpiscopal Community Services of San FranciscoEpiscopal Community Services of San FranciscoEpiscopal Community Services of San FranciscoEpiscopal Community Services of San FranciscoEpiscopal Community Services of San FranciscoEpiscopal Community Services of San FranciscoGood Samaritan Family Resource Center of San FranciscoGood Samaritan Family Resource Center of San FranciscoGood Samaritan Family Resource Center of San FranciscoGood Samaritan Family Resource Center of San FranciscoGood Samaritan Family Resource Center of San FranciscoGood Samaritan Family Resource Center of San FranciscoGum Moon Residence HallGum Moon Residence HallGum Moon Residence HallGum Moon Residence HallGum Moon Residence HallGum Moon Residence HallGum Moon Residence HallMission Economic Development AgencyMission Economic Development AgencyMission Economic Development AgencyMission Neighborhood Centers, Inc.Mission Neighborhood Centers, Inc.Mission Neighborhood Centers, Inc.Mission Neighborhood Centers, Inc.Mission Neighborhood Centers, Inc.Mission Neighborhood Centers, Inc.Mission Neighborhood Centers, Inc.Mission Neighborhood Centers, Inc.Mission Neighborhood Centers, Inc.Wu Yee Children's ServicesWu Yee Children's ServicesWu Yee Children's ServicesWu Yee Children's ServicesWu Yee Children's ServicesWu Yee Children's ServicesWu Yee Children's ServicesYoung Men's Christian Association of San Francisco (Bayview Branch)142368-20Young Men's Christian Association of San Francisco (Bayview Branch)142368-20Young Men's Christian Association of San Francisco (Bayview Branch)142368-20Young Men's Christian Association of San Francisco (Bayview Branch)142368-20Young Men's Christian Association of San Francisco (Bayview Branch)142368-20Young Men's Christian Association of San Francisco (Bayview Branch)142368-20Young Men's Christian Association of San Francisco (Bayview Branch)142368-20Young Men's Christian Association of San Francisco (Chinatown Branch)Young Men's Christian Association of San Francisco (Chinatown Branch)Young Men's Christian Association of San Francisco (Chinatown Branch)Young Men's Christian Association of San Francisco (Chinatown Branch)Young Men's Christian Association of San Francisco (Chinatown Branch)Young Men's Christian Association of San Francisco (Chinatown Branch)Young Men's Christian Association of San Francisco (Chinatown Branch)Young Men's Christian Association of San Francisco (Chinatown Branch)Young Men's Christian Association of San Francisco (Chinatown Branch)Young Men's Christian Association of San Francisco (Chinatown Branch)Young Men's Christian Association of San Francisco (Chinatown Branch)
B20MC060016B20MC060016B20MC060016B20MC060016B20MC060016B20MC060016B20MC060016B20MC060016B20MC060016B20MC060016B20MC060016B20MC060016B20MC060016B20MC060016B20MC060016B20MC060016B20MC060016B20MC060016B20MC060016B20MC060016B20MC060016B20MC060016B20MC060016B20MC060016B20MC060016B20MC060016B20MC060016B20MC060016B20MC060016B20MC060016B20MC060016B20MC060016B20MC060016B20MC060016B20MC060016B20MC060016B20MC060016B20MC060016B20MC060016B20MC060016B20MC060016B20MC060016B20MC060016B20MC060016B20MC060016
B20MC060016
B18MC060016
B20MC060016
B20MC060016
B20MC060016
B20MC060016
B20MC060016B20MC060016B20MC060016B20MC060016B20MC060016B20MC060016B20MC060016B20MC060016B20MC060016B20MC060016B20MC060016
ENENENENENENENENENENENENENENENENENENENENENENENENENENENENENENENENENENENENENENENENENENENENEN
EN
RL
EN
EN
EN
EN
ENENENENENENENENENENEN
05Z05Z05Z05Z05Z05Z05Z05Z05Z05Z05Z05Z05Z05Z05Z05Z05Z05Z05Z05Z05Z05Z05Z05Z05Z05Z05Z05Z05Z05Z05Z05Z05Z05Z05Z05Z05Z05Z05Z05Z05Z05Z05Z05Z05Z
05Z
05Z
05Z
05Z
05Z
05Z
05Z05Z05Z05Z05Z05Z05Z05Z05Z05Z05Z
LMCLMCLMCLMCLMCLMCLMCLMCLMCLMCLMCLMCLMCLMCLMCLMCLMCLMCLMCLMCLMCLMCLMCLMCLMCLMCLMCLMCLMCLMCLMCLMCLMCLMCLMCLMCLMCLMCLMCLMCLMCLMCLMCLMCLMC
LMC
LMC
LMC
LMC
LMC
LMC
LMCLMCLMCLMCLMCLMCLMCLMCLMCLMCLMC
$10,710.76$10,596.39$22,719.96$48,859.06$13,992.41$14,955.66
$4,258.16$4,824.97$5,596.73$7,516.49$7,526.98$5,324.88$4,725.00$1,575.00$1,814.00
$21,838.02$1,814.00
$20,233.98$8,016.31$4,684.54$7,894.75$7,429.39
$40,601.02$9,931.62$1,442.37
$12,852.58$13,497.40$24,962.19
$7,183.98$11,693.07
$4,304.00$3,999.27$3,474.84$3,836.73$4,516.85$5,381.41$6,199.26$5,219.02$5,064.66$9,430.55
$22,364.05$13,191.62$14,659.29$26,070.81
$39,770.17
$32,376.60
$15,509.50
$19,008.68
$30,327.82
$47,756.79
$95,847.87
$5,054.08$2,000.14$6,708.89
$17,079.78$2,521.85
$14,635.26$28,165.17$14,452.48$17,217.94$19,691.01$46,517.95

PR26 - CDBG Financial Summary Report
U.S. Department of Housing and Urban DevelopmentOffice of Community Planning and Development
Integrated Disbursement and Information System
DATE: TIME: PAGE: 9
19:2509-22-21
Program Year 2020SAN FRANCISCO , CA
PlanYear
IDISProject
IDISActivity
VoucherNumber
Activity toprevent,prepare for,and respondtoCoronavirus
Activity Name Grant Number FundType
MatrixCode
NationalObjective
Drawn Amount202020202020
2020
2020
2020
2020
2020
2020
2020
2020
2020
Total
848485
85
85
85
85
85
85
85
85
103
927092709271
9271
9271
9271
9271
9271
9271
9271
9271
9312
651107065298496429854
6437058
6450209
6462299
6483134
6492148
6502829
6511070
6529849
6481885
NoNoNo
No
No
No
No
No
No
No
No
No
No
Young Men's Christian Association of San Francisco (Chinatown Branch)Young Men's Christian Association of San Francisco (Chinatown Branch)Young Men's Christian Association of San Francisco (Urban ServicesBranch)Young Men's Christian Association of San Francisco (Urban ServicesBranch)Young Men's Christian Association of San Francisco (Urban ServicesBranch)Young Men's Christian Association of San Francisco (Urban ServicesBranch)Young Men's Christian Association of San Francisco (Urban ServicesBranch)Young Men's Christian Association of San Francisco (Urban ServicesBranch)Young Men's Christian Association of San Francisco (Urban ServicesBranch)Young Men's Christian Association of San Francisco (Urban ServicesBranch)Young Men's Christian Association of San Francisco (Urban ServicesBranch)Bayview Hunters Point Multipurpose Senior Services, Inc.
Activity to prevent, prepare for, and respond to Coronavirus
B20MC060016B20MC060016B20MC060016
B20MC060016
B20MC060016
B20MC060016
B20MC060016
B20MC060016
B20MC060016
B20MC060016
B20MC060016
B18MC060016
ENENEN
EN
EN
EN
EN
EN
EN
EN
EN
RL
05Z05Z05Z
05Z
05Z
05Z
05Z
05Z
05Z
05Z
05Z
05Z05Z
LMCLMCLMC
LMC
LMC
LMC
LMC
LMC
LMC
LMC
LMC
LMCMatrix Code 05Z
$82,539.71$3,415.74
$40,923.83
$26,159.90
$40,798.36
$18,269.37
$19,244.84
$17,465.65
$22,878.34
$25,554.73
$28,704.98
$188,696.50$1,570,501.34$7,268,308.97$7,268,308.97
LINE 37 DETAIL: ACTIVITIES INCLUDED IN THE COMPUTATION OF LINE 37
PlanYear
IDISProject
IDISActivity
VoucherNumber Activity Name Matrix
CodeNationalObjective Drawn Amount
20192019 2016201720172018201820182018201820182018201820192019201920192019201920192020202020202020202020202020202020202020202020202020202020202020202020202020
154154
63616161616161616161615454545454545439393939393939393939393939393939393939
91709170
8315856285628818881888188818881888188818881890909090909090909090909090909231923192319231923192319231923192319231923292329233923392339233923392339233
64096886450201
6409681640968364921346409686641914764298456437054645019664622966472017648311764096886419149642985064720336492141650282765110596429854643705864502096462302647205464831396492152650283165110766529855647205465298566429854643705864502096462302647205464831396492152
Lavender Youth Recreation and Information Center, Inc (103946-17)Lavender Youth Recreation and Information Center, Inc (103946-17)
MOHCD-CDBG AdministrationMOHCD- CDBG AdministrationMOHCD- CDBG AdministrationMOHCD - CDBG19 Administration & PlanningMOHCD - CDBG19 Administration & PlanningMOHCD - CDBG19 Administration & PlanningMOHCD - CDBG19 Administration & PlanningMOHCD - CDBG19 Administration & PlanningMOHCD - CDBG19 Administration & PlanningMOHCD - CDBG19 Administration & PlanningMOHCD - CDBG19 Administration & PlanningMOHCD-CDBG AdministrationMOHCD-CDBG AdministrationMOHCD-CDBG AdministrationMOHCD-CDBG AdministrationMOHCD-CDBG AdministrationMOHCD-CDBG AdministrationMOHCD-CDBG Administration21A MOHCD CDBG Admin - $3,281,82721A MOHCD CDBG Admin - $3,281,82721A MOHCD CDBG Admin - $3,281,82721A MOHCD CDBG Admin - $3,281,82721A MOHCD CDBG Admin - $3,281,82721A MOHCD CDBG Admin - $3,281,82721A MOHCD CDBG Admin - $3,281,82721A MOHCD CDBG Admin - $3,281,82721A MOHCD CDBG Admin - $3,281,82721A MOHCD CDBG Admin - $3,281,82721A OEWD CDBG Admin - $329,04021A OEWD CDBG Admin - $329,040200 MOHCD Planning - $119,750200 MOHCD Planning - $119,750200 MOHCD Planning - $119,750200 MOHCD Planning - $119,750200 MOHCD Planning - $119,750200 MOHCD Planning - $119,750200 MOHCD Planning - $119,750
20202021A21A21A21A21A21A21A21A21A21A21A21A21A21A21A21A21A21A21A21A21A21A21A21A21A21A21A21A21A21A21A21A21A21A21A21A21A
Matrix Code 20
$9,071.10$6,064.95
$15,136.05$1,075.45
$732.97$42.90
$34,505.36$1,209.76
$177.68$495.09$967.53$132.75
$10,485.63$799.45
$327,291.87$170,584.90$184,489.46$141,427.70
$214.00$500.85
$2,147.13$215.93
$77.27$292,484.15$186,097.10$230,566.59$245,793.65$197,450.51$203,762.02$185,953.60$335,436.91
$81,122.36$247,917.64
$48,471.55$12,493.12$18,836.42$12,790.78$12,790.74$12,770.13
$1,597.26

PR26 - CDBG Financial Summary Report
U.S. Department of Housing and Urban DevelopmentOffice of Community Planning and Development
Integrated Disbursement and Information System
DATE: TIME: PAGE: 10
19:2509-22-21
Program Year 2020SAN FRANCISCO , CA
PlanYear
IDISProject
IDISActivity
VoucherNumber Activity Name Matrix
CodeNationalObjective Drawn Amount
Total
21A Matrix Code 21A$3,203,908.21$3,219,044.26
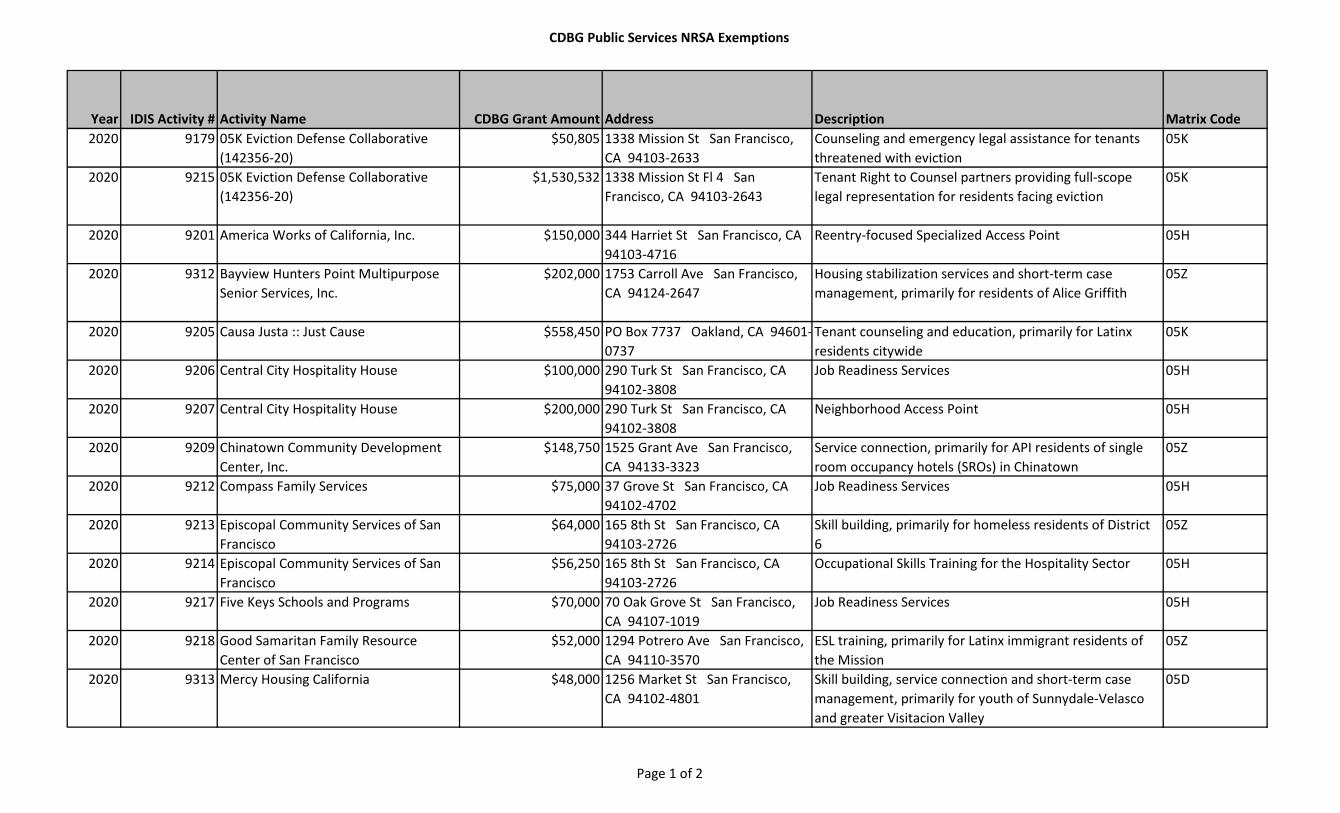
CDBG Public Services NRSA Exemptions
Year IDIS Activity # Activity Name CDBG Grant Amount Address Description Matrix Code2020 9179 05K Eviction Defense Collaborative
(142356-20)$50,805 1338 Mission St San Francisco,
CA 94103-2633Counseling and emergency legal assistance for tenants threatened with eviction
05K
2020 9215 05K Eviction Defense Collaborative (142356-20)
$1,530,532 1338 Mission St Fl 4 San Francisco, CA 94103-2643
Tenant Right to Counsel partners providing full-scope legal representation for residents facing eviction
05K
2020 9201 America Works of California, Inc. $150,000 344 Harriet St San Francisco, CA 94103-4716
Reentry-focused Specialized Access Point 05H
2020 9312 Bayview Hunters Point Multipurpose Senior Services, Inc.
$202,000 1753 Carroll Ave San Francisco, CA 94124-2647
Housing stabilization services and short-term case management, primarily for residents of Alice Griffith
05Z
2020 9205 Causa Justa :: Just Cause $558,450 PO Box 7737 Oakland, CA 94601-0737
Tenant counseling and education, primarily for Latinx residents citywide
05K
2020 9206 Central City Hospitality House $100,000 290 Turk St San Francisco, CA 94102-3808
Job Readiness Services 05H
2020 9207 Central City Hospitality House $200,000 290 Turk St San Francisco, CA 94102-3808
Neighborhood Access Point 05H
2020 9209 Chinatown Community Development Center, Inc.
$148,750 1525 Grant Ave San Francisco, CA 94133-3323
Service connection, primarily for API residents of single room occupancy hotels (SROs) in Chinatown
05Z
2020 9212 Compass Family Services $75,000 37 Grove St San Francisco, CA 94102-4702
Job Readiness Services 05H
2020 9213 Episcopal Community Services of San Francisco
$64,000 165 8th St San Francisco, CA 94103-2726
Skill building, primarily for homeless residents of District 6
05Z
2020 9214 Episcopal Community Services of San Francisco
$56,250 165 8th St San Francisco, CA 94103-2726
Occupational Skills Training for the Hospitality Sector 05H
2020 9217 Five Keys Schools and Programs $70,000 70 Oak Grove St San Francisco, CA 94107-1019
Job Readiness Services 05H
2020 9218 Good Samaritan Family Resource Center of San Francisco
$52,000 1294 Potrero Ave San Francisco, CA 94110-3570
ESL training, primarily for Latinx immigrant residents of the Mission
05Z
2020 9313 Mercy Housing California $48,000 1256 Market St San Francisco, CA 94102-4801
Skill building, service connection and short-term case management, primarily for youth of Sunnydale-Velasco and greater Visitacion Valley
05D
Page 1 of 2
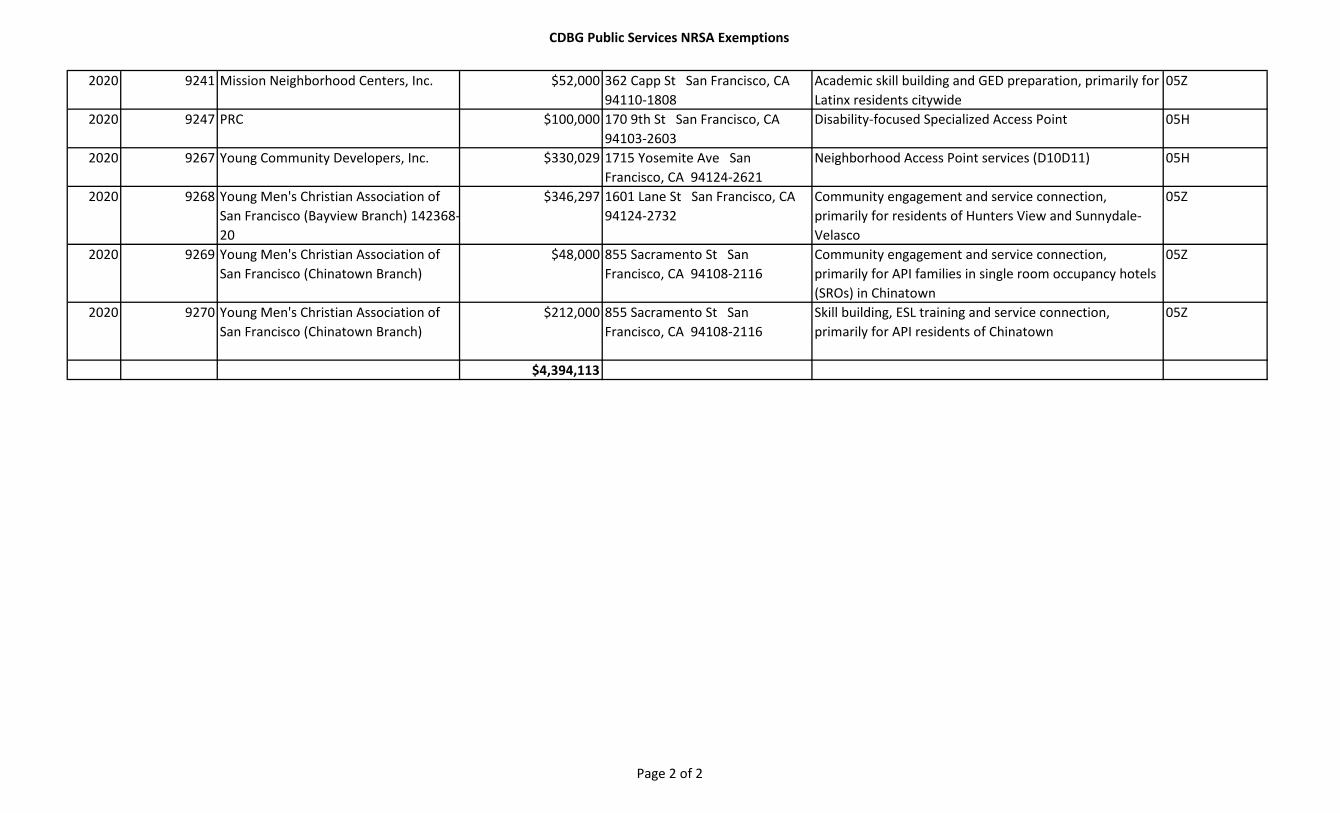
CDBG Public Services NRSA Exemptions
2020 9241 Mission Neighborhood Centers, Inc. $52,000 362 Capp St San Francisco, CA 94110-1808
Academic skill building and GED preparation, primarily for Latinx residents citywide
05Z
2020 9247 PRC $100,000 170 9th St San Francisco, CA 94103-2603
Disability-focused Specialized Access Point 05H
2020 9267 Young Community Developers, Inc. $330,029 1715 Yosemite Ave San Francisco, CA 94124-2621
Neighborhood Access Point services (D10D11) 05H
2020 9268 Young Men's Christian Association of San Francisco (Bayview Branch) 142368-20
$346,297 1601 Lane St San Francisco, CA 94124-2732
Community engagement and service connection, primarily for residents of Hunters View and Sunnydale-Velasco
05Z
2020 9269 Young Men's Christian Association of San Francisco (Chinatown Branch)
$48,000 855 Sacramento St San Francisco, CA 94108-2116
Community engagement and service connection, primarily for API families in single room occupancy hotels (SROs) in Chinatown
05Z
2020 9270 Young Men's Christian Association of San Francisco (Chinatown Branch)
$212,000 855 Sacramento St San Francisco, CA 94108-2116
Skill building, ESL training and service connection, primarily for API residents of Chinatown
05Z
$4,394,113
Page 2 of 2

PR26 - CDBG-CV Financial Summary Report
U.S. Department of Housing and Urban DevelopmentOffice of Community Planning and Development
Integrated Disbursement and Information System
DATE: TIME: PAGE: 1
16:0409-17-21
SAN FRANCISCO , CA
MetricsNew Grantee (CV)PART I: SUMMARY OF CDBG-CV RESOURCES01 CDBG-CV GRANT02 FUNDS RETURNED TO THE LINE-OF-CREDIT03 FUNDS RETURNED TO THE LOCAL CDBG ACCOUNT04 TOTAL AVAILABLE (SUM, LINES 01-03)PART II: SUMMARY OF CDBG-CV EXPENDITURES05 DISBURSEMENTS OTHER THAN SECTION 108 REPAYMENTS AND PLANNING/ADMINISTRATION06 DISBURSED IN IDIS FOR PLANNING/ADMINISTRATION07 DISBURSED IN IDIS FOR SECTION 108 REPAYMENTS08 TOTAL EXPENDITURES (SUM, LINES 05 - 07)09 UNEXPENDED BALANCE (LINE 04 - LINE8 )PART III: LOWMOD BENEFIT FOR THE CDBG-CV GRANT10 EXPENDED FOR LOW/MOD HOUSING IN SPECIAL AREAS11 EXPENDED FOR LOW/MOD MULTI-UNIT HOUSING12 DISBURSED FOR OTHER LOW/MOD ACTIVITIES13 TOTAL LOW/MOD CREDIT (SUM, LINES 10 - 12)14 AMOUNT SUBJECT TO LOW/MOD BENEFIT (LINE 05)15 PERCENT LOW/MOD CREDIT (LINE 13/LINE 14)PART IV: PUBLIC SERVICE (PS) CALCULATIONS16 DISBURSED IN IDIS FOR PUBLIC SERVICES17 CDBG-CV GRANT18 PERCENT OF FUNDS DISBURSED FOR PS ACTIVITIES (LINE 16/LINE 17)PART V: PLANNING AND ADMINISTRATION (PA) CAP19 DISBURSED IN IDIS FOR PLANNING/ADMINISTRATION20 CDBG-CV GRANT21 PERCENT OF FUNDS DISBURSED FOR PA ACTIVITIES (LINE 19/LINE 20)
SAN FRANCISCO , CA
20,599,657.000.000.00
20,599,657.00
3,663,497.080.000.00
3,663,497.0816,936,159.92
0.000.00
3,663,497.083,663,497.083,663,497.08
100.00%
3,663,497.0820,599,657.00
17.78%
0.0020,599,657.00
0.00%

PR26 - CDBG-CV Financial Summary Report
U.S. Department of Housing and Urban DevelopmentOffice of Community Planning and Development
Integrated Disbursement and Information System
DATE: TIME: PAGE: 2
16:0409-17-21
SAN FRANCISCO , CA
LINE 10 DETAIL: ACTIVITIES TO CONSIDER IN DETERMINING THE AMOUNT TO ENTER ON LINE 10
Report returned no data.
LINE 11 DETAIL: ACTIVITIES TO CONSIDER IN DETERMINING THE AMOUNT TO ENTER ON LINE 11
Report returned no data.
LINE 12 DETAIL: ACTIVITIES INCLUDED IN THE COMPUTATION OF LINE 12
Plan Year IDIS Project IDISActivity
VoucherNumber Activity Name Matrix
CodeNationalObjective Drawn Amount
2020
Total
91
92
93
95
126131
133
9315
9316
9320
9319
93689373
9375
648314064921556502833652985764831406511081646230464831406492155650283365110816529857648314064921556511081652985765334116533411654178665334116541786
Catholic Charities CYO of the Archdiocese of San Francisco (145041-20)Catholic Charities CYO of the Archdiocese of San Francisco (145041-20)Catholic Charities CYO of the Archdiocese of San Francisco (145041-20)Catholic Charities CYO of the Archdiocese of San Francisco (145041-20)Eviction Defense Collaborative, Inc. (145042-20)Eviction Defense Collaborative, Inc. (145042-20)La Raza Community Resource Center (147045-20)La Raza Community Resource Center (147045-20)La Raza Community Resource Center (147045-20)La Raza Community Resource Center (147045-20)La Raza Community Resource Center (147045-20)La Raza Community Resource Center (147045-20)Young Community Developers, Inc.Young Community Developers, Inc.Young Community Developers, Inc.Young Community Developers, Inc.San Francisco Food BankMission Neighborhood Centers, Inc.Mission Neighborhood Centers, Inc.Young Community Developers, Inc.Young Community Developers, Inc.
05Q05Q05Q05Q05Q05Q05Q05Q05Q05Q05Q05Q05Q05Q05Q05Q05Z05Q05Q05Q05Q
LMCLMCLMCLMCLMCLMCLMCLMCLMCLMCLMCLMCLMCLMCLMCLMCLMCLMCLMCLMCLMC
$31,246.76$58,253.96$99,766.11$25,385.15
$229,597.93$110,992.50$268,731.00$121,338.66$171,897.70
$57,450.76$22,737.25$31,923.02$35,580.59
$6,421.45$6,145.26
$42,576.81$2,243,061.00
$17,970.21$10,510.85$42,423.14$29,486.97
$3,663,497.08
LINE 16 DETAIL: ACTIVITIES INCLUDED IN THE COMPUTATION OF LINE 16
Plan Year IDIS Project IDISActivity
VoucherNumber Activity Name Matrix
CodeNationalObjective Drawn Amount
2020
Total
91
92
93
95
126131
133
9315
9316
9320
9319
93689373
9375
648314064921556502833652985764831406511081646230464831406492155650283365110816529857648314064921556511081652985765334116533411654178665334116541786
Catholic Charities CYO of the Archdiocese of San Francisco (145041-20)Catholic Charities CYO of the Archdiocese of San Francisco (145041-20)Catholic Charities CYO of the Archdiocese of San Francisco (145041-20)Catholic Charities CYO of the Archdiocese of San Francisco (145041-20)Eviction Defense Collaborative, Inc. (145042-20)Eviction Defense Collaborative, Inc. (145042-20)La Raza Community Resource Center (147045-20)La Raza Community Resource Center (147045-20)La Raza Community Resource Center (147045-20)La Raza Community Resource Center (147045-20)La Raza Community Resource Center (147045-20)La Raza Community Resource Center (147045-20)Young Community Developers, Inc.Young Community Developers, Inc.Young Community Developers, Inc.Young Community Developers, Inc.San Francisco Food BankMission Neighborhood Centers, Inc.Mission Neighborhood Centers, Inc.Young Community Developers, Inc.Young Community Developers, Inc.
05Q05Q05Q05Q05Q05Q05Q05Q05Q05Q05Q05Q05Q05Q05Q05Q05Z05Q05Q05Q05Q
LMCLMCLMCLMCLMCLMCLMCLMCLMCLMCLMCLMCLMCLMCLMCLMCLMCLMCLMCLMCLMC
$31,246.76$58,253.96$99,766.11$25,385.15
$229,597.93$110,992.50$268,731.00$121,338.66$171,897.70
$57,450.76$22,737.25$31,923.02$35,580.59
$6,421.45$6,145.26
$42,576.81$2,243,061.00
$17,970.21$10,510.85$42,423.14$29,486.97
$3,663,497.08

PR26 - CDBG-CV Financial Summary Report
U.S. Department of Housing and Urban DevelopmentOffice of Community Planning and Development
Integrated Disbursement and Information System
DATE: TIME: PAGE: 3
16:0409-17-21
SAN FRANCISCO , CA
LINE 19 DETAIL: ACTIVITIES INCLUDED IN THE COMPUTATION OF LINE 19
Report returned no data.

PR26 - Activity Summary by Selected GrantDate Generated: 09/24/2021Grantee: SAN FRANCISCOGrant Year: 2021, 2020, 2019, 2018, 2017, 2016, 2015Formula and Competitive Grants only
State Grantee Amount DrawnGrantGrant Activity Matrix National IDIS Activity Amount FundedTotal Grant Amount for 2020 Grant year = $18,649,794.00
% of CDBG Drawn Total CDBG Funded Total CDBG DrawnName From Selected GrantNumberYear Group Code Objective Activity Status From Selected Grant From Selected Amount Amount
Grant/GrantAmount
(All Years All Sources) (All Years All Sources)
Activity to prevent,prepare for, and
respond to CoronavirusCA SAN FRANCISCO 2020 B20MC060016 Administrative And Planning 21A 9090 Open $33,610.00 $33,610.00 $3,192,226.61$3,194,698.00NoCA SAN FRANCISCO 2020 B20MC060016 Administrative And Planning 21A 9231 Open $3,244,926.00 $2,322,515.70 $2,322,515.70$3,278,536.00NoCA SAN FRANCISCO 2020 B20MC060016 Administrative And Planning 21A 9232 Completed $329,040.00 $329,040.00 $329,040.00$329,040.00NoCA SAN FRANCISCO 2020 B20MC060016 Administrative And Planning 21A 9233 Completed $119,750.00 $119,750.00 $119,750.00$119,750.00No
Total Administrative And Planning 15.04%$3,727,326.00 $2,804,915.70 $6,922,024.00 $5,963,532.31CA SAN FRANCISCO 2020 B20MC060016 Economic Development 14E LMA 9221 Open $31,785.00 $31,785.00 $31,785.00$31,785.00NoCA SAN FRANCISCO 2020 B20MC060016 Economic Development 14E LMA 9244 Open $31,785.00 $0.00 $31,785.00NoCA SAN FRANCISCO 2020 B20MC060016 Economic Development 18A LMJ 9224 Open $39,869.00 $0.00 $717,869.00NoCA SAN FRANCISCO 2020 B20MC060016 Economic Development 18B LMA 9203 Open $70,000.00 $70,000.00 $70,000.00$70,000.00NoCA SAN FRANCISCO 2020 B20MC060016 Economic Development 18B LMA 9216 Open $46,561.00 $46,561.00 $46,561.00$46,561.00NoCA SAN FRANCISCO 2020 B20MC060016 Economic Development 18B LMA 9242 Open $80,000.00 $48,238.00 $48,238.00$80,000.00NoCA SAN FRANCISCO 2020 B20MC060016 Economic Development 18B LMA 9243 Open $20,000.00 $11,105.00 $11,105.00$20,000.00NoCA SAN FRANCISCO 2020 B20MC060016 Economic Development 18B LMA 9249 Open $40,000.00 $39,252.00 $39,252.00$40,000.00NoCA SAN FRANCISCO 2020 B20MC060016 Economic Development 18B LMJ 9202 Open $38,869.00 $38,869.00 $38,869.00$38,869.00NoCA SAN FRANCISCO 2020 B20MC060016 Economic Development 18B LMJ 9223 Open $100,000.00 $100,000.00 $100,000.00$100,000.00NoCA SAN FRANCISCO 2020 B20MC060016 Economic Development 18B LMJ 9240 Open $35,000.00 $34,334.19 $34,334.19$35,000.00NoCA SAN FRANCISCO 2020 B20MC060016 Economic Development 18B LMJ 9245 Open $40,000.00 $40,000.00 $40,000.00$40,000.00NoCA SAN FRANCISCO 2020 B20MC060016 Economic Development 18B LMJ 9251 Open $40,000.00 $39,659.01 $39,659.01$40,000.00NoCA SAN FRANCISCO 2020 B20MC060016 Economic Development 18B LMJ 9255 Open $200,000.00 $200,000.00 $200,000.00$200,000.00NoCA SAN FRANCISCO 2020 B20MC060016 Economic Development 18B LMJ 9257 Open $15,000.00 $13,491.07 $13,491.07$15,000.00NoCA SAN FRANCISCO 2020 B20MC060016 Economic Development 18B LMJ 9258 Open $65,000.00 $65,000.00 $65,000.00$65,000.00NoCA SAN FRANCISCO 2020 B20MC060016 Economic Development 18B LMJ 9259 Open $75,000.00 $75,000.00 $75,000.00$75,000.00NoCA SAN FRANCISCO 2020 B20MC060016 Economic Development 18B LMJ 9260 Open $55,000.00 $55,000.00 $55,000.00$55,000.00NoCA SAN FRANCISCO 2020 B20MC060016 Economic Development 18B LMJ 9272 Open $55,000.00 $0.00 $55,000.00No

CA SAN FRANCISCO 2020 B20MC060016 Economic Development 18C LMCMC 9208 Open $55,000.00 $50,955.32 $50,955.32$55,000.00NoCA SAN FRANCISCO 2020 B20MC060016 Economic Development 18C LMCMC 9222 Open $70,000.00 $70,000.00 $70,000.00$70,000.00NoCA SAN FRANCISCO 2020 B20MC060016 Economic Development 18C LMCMC 9225 Open $30,000.00 $25,034.66 $25,034.66$30,000.00NoCA SAN FRANCISCO 2020 B20MC060016 Economic Development 18C LMCMC 9235 Open $70,000.00 $70,000.00 $70,000.00$70,000.00NoCA SAN FRANCISCO 2020 B20MC060016 Economic Development 18C LMCMC 9236 Open $75,000.00 $73,694.38 $73,694.38$75,000.00NoCA SAN FRANCISCO 2020 B20MC060016 Economic Development 18C LMCMC 9237 Open $50,000.00 $49,210.44 $49,210.44$50,000.00NoCA SAN FRANCISCO 2020 B20MC060016 Economic Development 18C LMCMC 9248 Open $75,000.00 $75,000.00 $75,000.00$75,000.00NoCA SAN FRANCISCO 2020 B20MC060016 Economic Development 18C LMCMC 9250 Open $40,000.00 $40,000.00 $40,000.00$40,000.00NoCA SAN FRANCISCO 2020 B20MC060016 Economic Development 18C LMCMC 9254 Open $70,000.00 $69,981.20 $69,981.20$70,000.00NoCA SAN FRANCISCO 2020 B20MC060016 Economic Development 18C LMCMC 9264 Open $100,000.00 $96,919.06 $96,919.06$100,000.00No
Total Economic Development 8.20%$1,713,869.00 $1,529,089.33 $2,391,869.00 $1,529,089.33CA SAN FRANCISCO 2020 B20MC060016 Housing 14G LMH 9227 Open $5,803,410.00 $0.00 $5,803,410.00NoCA SAN FRANCISCO 2020 B20MC060016 Housing 14G LMH 9228 Open $641,390.00 $459,050.71 $492,660.71$675,000.00NoCA SAN FRANCISCO 2020 B20MC060016 Housing 14H LMH 9334 Open $33,610.00 $0.00 $45,286.51No
Total Housing 2.46%$6,478,410.00 $459,050.71 $6,523,696.51 $492,660.71CA SAN FRANCISCO 2020 B20MC060016 Public Improvements 03E LMC 9061 Open $100,000.00 $14,922.82 $89,922.82$175,000.00NoCA SAN FRANCISCO 2020 B20MC060016 Public Improvements 03E LMC 9226 Open $96,780.00 $0.00 $96,780.00No
Total Public Improvements 0.08%$196,780.00 $14,922.82 $271,780.00 $89,922.82CA SAN FRANCISCO 2020 B20MC060016 Public Services 05H LMC 9201 Open $150,000.00 $84,175.38 $84,175.38$150,000.00NoCA SAN FRANCISCO 2020 B20MC060016 Public Services 05H LMC 9206 Completed $100,000.00 $100,000.00 $100,000.00$100,000.00NoCA SAN FRANCISCO 2020 B20MC060016 Public Services 05H LMC 9207 Completed $200,000.00 $200,000.00 $200,000.00$200,000.00NoCA SAN FRANCISCO 2020 B20MC060016 Public Services 05H LMC 9210 Completed $64,502.26 $64,502.26 $64,502.26$64,502.26NoCA SAN FRANCISCO 2020 B20MC060016 Public Services 05H LMC 9211 Completed $55,634.04 $55,634.04 $55,634.04$55,634.04NoCA SAN FRANCISCO 2020 B20MC060016 Public Services 05H LMC 9212 Completed $75,000.00 $75,000.00 $75,000.00$75,000.00NoCA SAN FRANCISCO 2020 B20MC060016 Public Services 05H LMC 9214 Completed $55,513.42 $55,513.42 $55,513.42$55,513.42NoCA SAN FRANCISCO 2020 B20MC060016 Public Services 05H LMC 9217 Completed $68,651.85 $68,651.85 $68,651.85$68,651.85NoCA SAN FRANCISCO 2020 B20MC060016 Public Services 05H LMC 9220 Open $60,000.00 $59,789.92 $59,789.92$60,000.00NoCA SAN FRANCISCO 2020 B20MC060016 Public Services 05H LMC 9246 Open $90,000.00 $52,370.26 $52,370.26$90,000.00NoCA SAN FRANCISCO 2020 B20MC060016 Public Services 05H LMC 9247 Open $100,000.00 $99,544.97 $99,544.97$100,000.00NoCA SAN FRANCISCO 2020 B20MC060016 Public Services 05H LMC 9253 Open $110,000.00 $92,016.07 $92,016.07$110,000.00NoCA SAN FRANCISCO 2020 B20MC060016 Public Services 05H LMC 9262 Completed $74,701.96 $74,701.96 $74,701.96$74,701.96NoCA SAN FRANCISCO 2020 B20MC060016 Public Services 05H LMC 9263 Open $7,500.00 $7,500.00 $7,500.00$7,500.00NoCA SAN FRANCISCO 2020 B20MC060016 Public Services 05H LMC 9267 Completed $330,029.00 $330,029.00 $330,029.00$330,029.00No

CA SAN FRANCISCO 2020 B20MC060016 Public Services 05K LMC 9205 Completed $558,450.00 $558,450.00 $558,450.00$558,450.00NoCA SAN FRANCISCO 2020 B20MC060016 Public Services 05K LMC 9215 Completed $1,530,532.00 $1,530,532.00 $1,530,532.00$1,530,532.00NoCA SAN FRANCISCO 2020 B20MC060016 Public Services 05K LMC 9256 Open $569,500.00 $569,451.70 $569,451.70$569,500.00NoCA SAN FRANCISCO 2020 B20MC060016 Public Services 05K LMC 9261 Open $599,331.00 $592,716.55 $592,716.55$599,331.00NoCA SAN FRANCISCO 2020 B20MC060016 Public Services 05U LMC 9239 Open $184,520.00 $184,238.36 $184,238.36$184,520.00NoCA SAN FRANCISCO 2020 B20MC060016 Public Services 05U LMC 9252 Completed $150,000.00 $150,000.00 $150,000.00$150,000.00NoCA SAN FRANCISCO 2020 B20MC060016 Public Services 05Z LMC 9209 Completed $148,750.00 $148,750.00 $148,750.00$148,750.00NoCA SAN FRANCISCO 2020 B20MC060016 Public Services 05Z LMC 9213 Completed $63,996.28 $63,996.28 $63,996.28$63,996.28NoCA SAN FRANCISCO 2020 B20MC060016 Public Services 05Z LMC 9218 Completed $52,000.00 $52,000.00 $52,000.00$52,000.00NoCA SAN FRANCISCO 2020 B20MC060016 Public Services 05Z LMC 9219 Completed $80,000.00 $80,000.00 $80,000.00$80,000.00NoCA SAN FRANCISCO 2020 B20MC060016 Public Services 05Z LMC 9229 Open $45,000.00 $0.00 $45,000.00NoCA SAN FRANCISCO 2020 B20MC060016 Public Services 05Z LMC 9238 Open $52,000.00 $51,312.17 $51,312.17$52,000.00NoCA SAN FRANCISCO 2020 B20MC060016 Public Services 05Z LMC 9241 Completed $50,589.41 $50,589.41 $50,589.41$50,589.41NoCA SAN FRANCISCO 2020 B20MC060016 Public Services 05Z LMC 9265 Open $96,000.00 $96,000.00 $96,000.00$96,000.00NoCA SAN FRANCISCO 2020 B20MC060016 Public Services 05Z LMC 9268 Open $296,297.00 $265,087.93 $280,597.43$346,297.00NoCA SAN FRANCISCO 2020 B20MC060016 Public Services 05Z LMC 9269 Completed $48,000.00 $48,000.00 $48,000.00$48,000.00NoCA SAN FRANCISCO 2020 B20MC060016 Public Services 05Z LMC 9270 Completed $212,000.00 $212,000.00 $212,000.00$212,000.00NoCA SAN FRANCISCO 2020 B20MC060016 Public Services 05Z LMC 9271 Completed $240,000.00 $240,000.00 $240,000.00$240,000.00NoCA SAN FRANCISCO 2020 B20MC060016 Public Services 05Z LMC 9386 Open $14,910.78 $0.00 $14,910.78No
Non CARES Related Public Services 33.85%$6,533,409.00 $6,312,553.53 $6,583,409.00 $6,328,063.03Total 2020 59.63%$18,649,794.00 $11,120,532.09 $14,403,268.20$22,692,778.51
State Grantee Amount DrawnGrantGrant Activity Matrix National IDIS Activity Amount FundedTotal Grant Amount for 2019 Grant year = $18,157,109.00
% of CDBG Drawn Total CDBG Funded Total CDBG DrawnName From Selected GrantNumberYear Group Code Objective Activity Status From Selected Grant From Selected Amount Amount
Grant/GrantAmount
(All Years All Sources) (All Years All Sources)
Activity to prevent,prepare for, and
respond to CoronavirusCA SAN FRANCISCO 2019 B19MC060016 Administrative And Planning 20 9170 Completed $36,081.00 $36,081.00 $36,081.00$36,081.00NoCA SAN FRANCISCO 2019 B19MC060016 Administrative And Planning 21A 9089 Completed $116,612.00 $116,612.00 $116,612.00$116,612.00NoCA SAN FRANCISCO 2019 B19MC060016 Administrative And Planning 21A 9090 Open $3,161,088.00 $3,158,616.61 $3,192,226.61$3,194,698.00NoCA SAN FRANCISCO 2019 B19MC060016 Administrative And Planning 21A 9091 Completed $320,111.00 $320,111.00 $320,111.00$320,111.00NoCA SAN FRANCISCO 2019 B19MC060016 Administrative And Planning 21A 9231 Open $33,610.00 $0.00 $2,322,515.70$3,278,536.00No
Total Administrative And Planning 20.00%$3,667,502.00 $3,631,420.61 $6,946,038.00 $5,987,546.31CA SAN FRANCISCO 2019 B19MC060016 Economic Development 18A LMJ 8952 Completed $203,869.00 $203,869.00 $329,869.00$329,869.00NoCA SAN FRANCISCO 2019 B19MC060016 Economic Development 18A LMJ 9092 Cancel $0.00 $0.00 $0.00No
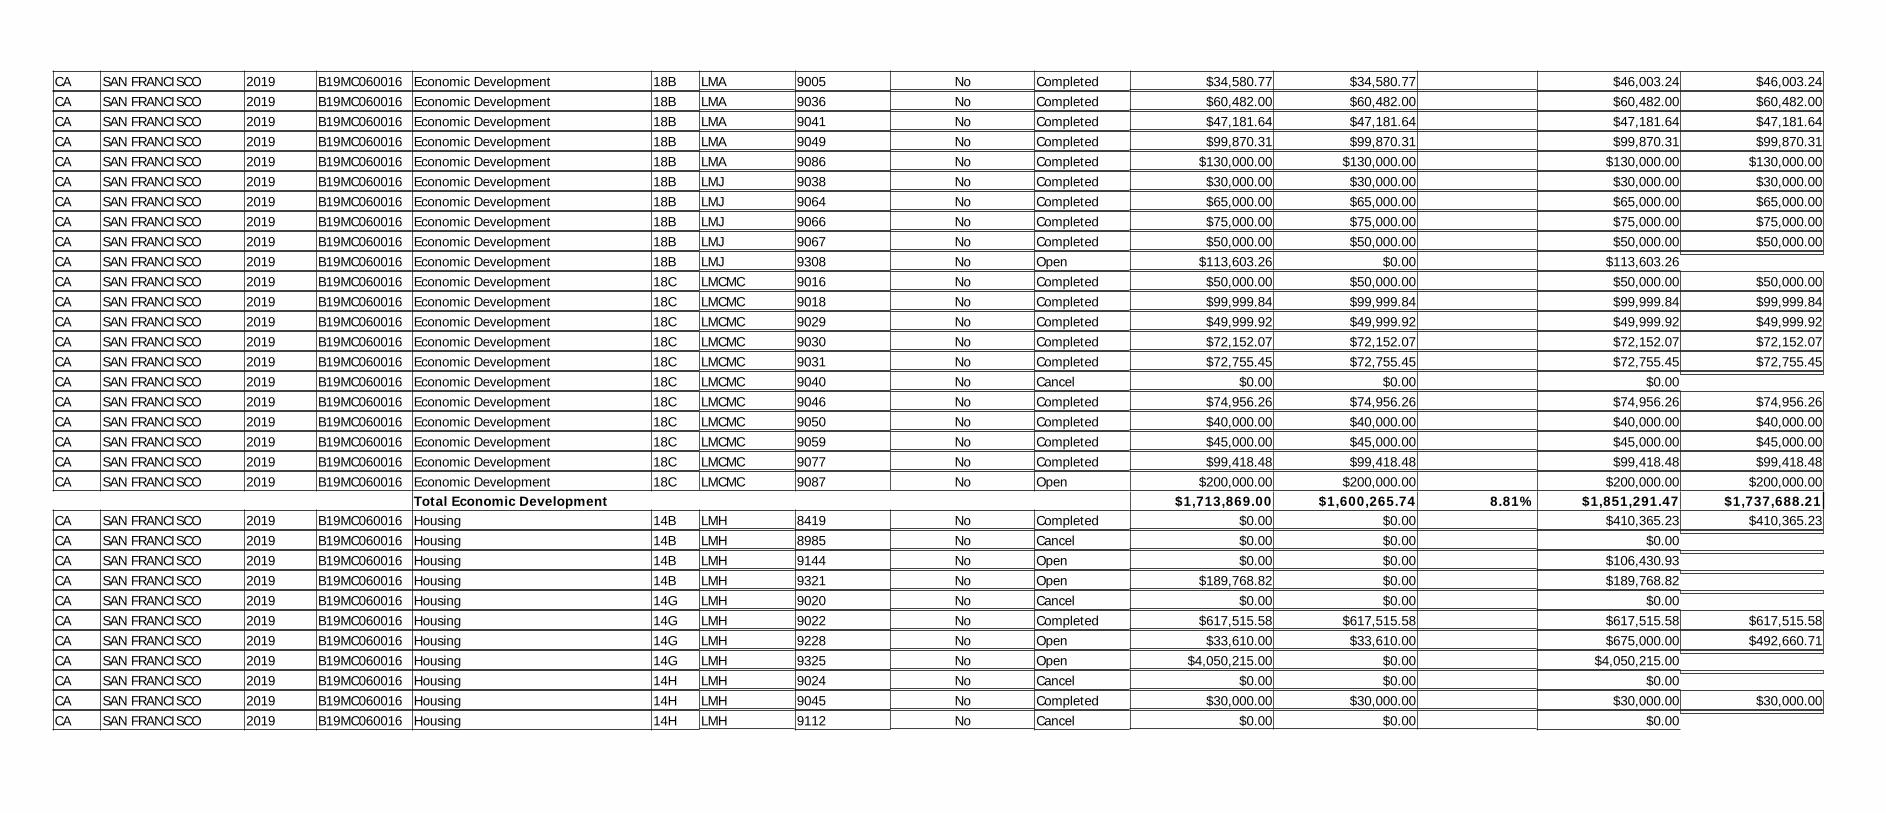
CA SAN FRANCISCO 2019 B19MC060016 Economic Development 18B LMA 9005 Completed $34,580.77 $34,580.77 $46,003.24$46,003.24NoCA SAN FRANCISCO 2019 B19MC060016 Economic Development 18B LMA 9036 Completed $60,482.00 $60,482.00 $60,482.00$60,482.00NoCA SAN FRANCISCO 2019 B19MC060016 Economic Development 18B LMA 9041 Completed $47,181.64 $47,181.64 $47,181.64$47,181.64NoCA SAN FRANCISCO 2019 B19MC060016 Economic Development 18B LMA 9049 Completed $99,870.31 $99,870.31 $99,870.31$99,870.31NoCA SAN FRANCISCO 2019 B19MC060016 Economic Development 18B LMA 9086 Completed $130,000.00 $130,000.00 $130,000.00$130,000.00NoCA SAN FRANCISCO 2019 B19MC060016 Economic Development 18B LMJ 9038 Completed $30,000.00 $30,000.00 $30,000.00$30,000.00NoCA SAN FRANCISCO 2019 B19MC060016 Economic Development 18B LMJ 9064 Completed $65,000.00 $65,000.00 $65,000.00$65,000.00NoCA SAN FRANCISCO 2019 B19MC060016 Economic Development 18B LMJ 9066 Completed $75,000.00 $75,000.00 $75,000.00$75,000.00NoCA SAN FRANCISCO 2019 B19MC060016 Economic Development 18B LMJ 9067 Completed $50,000.00 $50,000.00 $50,000.00$50,000.00NoCA SAN FRANCISCO 2019 B19MC060016 Economic Development 18B LMJ 9308 Open $113,603.26 $0.00 $113,603.26NoCA SAN FRANCISCO 2019 B19MC060016 Economic Development 18C LMCMC 9016 Completed $50,000.00 $50,000.00 $50,000.00$50,000.00NoCA SAN FRANCISCO 2019 B19MC060016 Economic Development 18C LMCMC 9018 Completed $99,999.84 $99,999.84 $99,999.84$99,999.84NoCA SAN FRANCISCO 2019 B19MC060016 Economic Development 18C LMCMC 9029 Completed $49,999.92 $49,999.92 $49,999.92$49,999.92NoCA SAN FRANCISCO 2019 B19MC060016 Economic Development 18C LMCMC 9030 Completed $72,152.07 $72,152.07 $72,152.07$72,152.07NoCA SAN FRANCISCO 2019 B19MC060016 Economic Development 18C LMCMC 9031 Completed $72,755.45 $72,755.45 $72,755.45$72,755.45NoCA SAN FRANCISCO 2019 B19MC060016 Economic Development 18C LMCMC 9040 Cancel $0.00 $0.00 $0.00NoCA SAN FRANCISCO 2019 B19MC060016 Economic Development 18C LMCMC 9046 Completed $74,956.26 $74,956.26 $74,956.26$74,956.26NoCA SAN FRANCISCO 2019 B19MC060016 Economic Development 18C LMCMC 9050 Completed $40,000.00 $40,000.00 $40,000.00$40,000.00NoCA SAN FRANCISCO 2019 B19MC060016 Economic Development 18C LMCMC 9059 Completed $45,000.00 $45,000.00 $45,000.00$45,000.00NoCA SAN FRANCISCO 2019 B19MC060016 Economic Development 18C LMCMC 9077 Completed $99,418.48 $99,418.48 $99,418.48$99,418.48NoCA SAN FRANCISCO 2019 B19MC060016 Economic Development 18C LMCMC 9087 Open $200,000.00 $200,000.00 $200,000.00$200,000.00No
Total Economic Development 8.81%$1,713,869.00 $1,600,265.74 $1,851,291.47 $1,737,688.21CA SAN FRANCISCO 2019 B19MC060016 Housing 14B LMH 8419 Completed $0.00 $0.00 $410,365.23$410,365.23NoCA SAN FRANCISCO 2019 B19MC060016 Housing 14B LMH 8985 Cancel $0.00 $0.00 $0.00NoCA SAN FRANCISCO 2019 B19MC060016 Housing 14B LMH 9144 Open $0.00 $0.00 $106,430.93NoCA SAN FRANCISCO 2019 B19MC060016 Housing 14B LMH 9321 Open $189,768.82 $0.00 $189,768.82NoCA SAN FRANCISCO 2019 B19MC060016 Housing 14G LMH 9020 Cancel $0.00 $0.00 $0.00NoCA SAN FRANCISCO 2019 B19MC060016 Housing 14G LMH 9022 Completed $617,515.58 $617,515.58 $617,515.58$617,515.58NoCA SAN FRANCISCO 2019 B19MC060016 Housing 14G LMH 9228 Open $33,610.00 $33,610.00 $492,660.71$675,000.00NoCA SAN FRANCISCO 2019 B19MC060016 Housing 14G LMH 9325 Open $4,050,215.00 $0.00 $4,050,215.00NoCA SAN FRANCISCO 2019 B19MC060016 Housing 14H LMH 9024 Cancel $0.00 $0.00 $0.00NoCA SAN FRANCISCO 2019 B19MC060016 Housing 14H LMH 9045 Completed $30,000.00 $30,000.00 $30,000.00$30,000.00NoCA SAN FRANCISCO 2019 B19MC060016 Housing 14H LMH 9112 Cancel $0.00 $0.00 $0.00No

CA SAN FRANCISCO 2019 B19MC060016 Housing 14H LMH 9121 Cancel $0.00 $0.00 $0.00NoCA SAN FRANCISCO 2019 B19MC060016 Housing 14H LMH 9334 Open $11,676.51 $0.00 $45,286.51No
Total Housing 3.75%$4,932,785.91 $681,125.58 $6,124,582.07 $1,550,541.52CA SAN FRANCISCO 2019 B19MC060016 Other 19C LMC 8995 Open $70,410.00 $51,899.81 $51,899.81$70,410.00NoCA SAN FRANCISCO 2019 B19MC060016 Other 19C LMC 9011 Completed $45,000.00 $45,000.00 $45,000.00$45,000.00NoCA SAN FRANCISCO 2019 B19MC060016 Other 19C LMC 9051 Completed $38,000.00 $38,000.00 $38,000.00$38,000.00No
Total Other 0.74%$153,410.00 $134,899.81 $153,410.00 $134,899.81CA SAN FRANCISCO 2019 B19MC060016 Public Improvements 03A LMC 8719 Completed $912.80 $912.80 $200,000.00$200,000.00NoCA SAN FRANCISCO 2019 B19MC060016 Public Improvements 03A LMC 9047 Cancel $0.00 $0.00 $0.00NoCA SAN FRANCISCO 2019 B19MC060016 Public Improvements 03A LMC 9327 Cancel $0.00 $0.00 $0.00NoCA SAN FRANCISCO 2019 B19MC060016 Public Improvements 03B LMC 8932 Open $78,892.00 $14,537.85 $20,437.85$200,000.00NoCA SAN FRANCISCO 2019 B19MC060016 Public Improvements 03B LMC 9106 Cancel $0.00 $0.00 $0.00NoCA SAN FRANCISCO 2019 B19MC060016 Public Improvements 03B LMC 9122 Open $94,260.00 $94,260.00 $94,260.00$94,260.00NoCA SAN FRANCISCO 2019 B19MC060016 Public Improvements 03B LMC 9331 Open $99,300.00 $2,922.00 $2,922.00$99,300.00NoCA SAN FRANCISCO 2019 B19MC060016 Public Improvements 03D LMC 9107 Completed $34,800.00 $34,800.00 $34,800.00$34,800.00NoCA SAN FRANCISCO 2019 B19MC060016 Public Improvements 03E LMC 8050 Completed $25,201.84 $25,201.84 $209,214.04$209,214.04NoCA SAN FRANCISCO 2019 B19MC060016 Public Improvements 03E LMC 8147 Completed $0.00 $0.00 $7,470.00$7,470.00NoCA SAN FRANCISCO 2019 B19MC060016 Public Improvements 03E LMC 8657 Completed $7,841.00 $7,841.00 $106,051.00$106,051.00NoCA SAN FRANCISCO 2019 B19MC060016 Public Improvements 03E LMC 8696 Cancel $0.00 $0.00 $0.00NoCA SAN FRANCISCO 2019 B19MC060016 Public Improvements 03E LMC 8910 Cancel $0.00 $0.00 $0.00NoCA SAN FRANCISCO 2019 B19MC060016 Public Improvements 03E LMC 8917 Completed $0.00 $0.00 $152,000.00$152,000.00NoCA SAN FRANCISCO 2019 B19MC060016 Public Improvements 03E LMC 8925 Open $166,666.00 $166,666.00 $278,666.00$278,666.00NoCA SAN FRANCISCO 2019 B19MC060016 Public Improvements 03E LMC 8928 Cancel $0.00 $0.00 $0.00NoCA SAN FRANCISCO 2019 B19MC060016 Public Improvements 03E LMC 8930 Open $410.00 $410.00 $146,432.95$146,433.00NoCA SAN FRANCISCO 2019 B19MC060016 Public Improvements 03E LMC 9019 Cancel $0.00 $0.00 $0.00NoCA SAN FRANCISCO 2019 B19MC060016 Public Improvements 03E LMC 9021 Completed $341,826.00 $341,826.00 $341,826.00$341,826.00NoCA SAN FRANCISCO 2019 B19MC060016 Public Improvements 03E LMC 9060 Open $70,000.00 $43,312.81 $43,312.81$70,000.00NoCA SAN FRANCISCO 2019 B19MC060016 Public Improvements 03E LMC 9061 Open $75,000.00 $75,000.00 $89,922.82$175,000.00NoCA SAN FRANCISCO 2019 B19MC060016 Public Improvements 03E LMC 9105 Open $80,000.00 $650.00 $650.00$80,000.00NoCA SAN FRANCISCO 2019 B19MC060016 Public Improvements 03E LMC 9111 Open $80,181.00 $80,181.00 $85,500.00$85,500.00NoCA SAN FRANCISCO 2019 B19MC060016 Public Improvements 03E LMC 9116 Cancel $0.00 $0.00 $0.00NoCA SAN FRANCISCO 2019 B19MC060016 Public Improvements 03E LMC 9150 Open $233,000.00 $233,000.00 $233,000.00$233,000.00NoCA SAN FRANCISCO 2019 B19MC060016 Public Improvements 03E LMC 9302 Cancel $0.00 $0.00 $0.00No

CA SAN FRANCISCO 2019 B19MC060016 Public Improvements 03E LMC 9324 Open $1,175,955.96 $0.00 $1,175,955.96NoCA SAN FRANCISCO 2019 B19MC060016 Public Improvements 03E LMC 9338 Open $141,667.00 $0.00 $141,667.00NoCA SAN FRANCISCO 2019 B19MC060016 Public Improvements 03M LMC 9117 Cancel $0.00 $0.00 $0.00NoCA SAN FRANCISCO 2019 B19MC060016 Public Improvements 03M LMC 9339 Open $60,000.00 $26,906.01 $26,906.01$60,000.00NoCA SAN FRANCISCO 2019 B19MC060016 Public Improvements 03Z LMC 8436 Open $12,674.30 $12,674.30 $68,675.70$70,000.00No
Total Public Improvements 6.39%$2,778,587.90 $1,161,101.61 $3,961,143.00 $2,142,047.18CA SAN FRANCISCO 2019 B19MC060016 Public Services 05B LMC 9073 Completed $50,000.00 $50,000.00 $50,000.00$50,000.00NoCA SAN FRANCISCO 2019 B19MC060016 Public Services 05C LMC 8979 Completed $81,993.42 $81,993.42 $81,993.42$81,993.42NoCA SAN FRANCISCO 2019 B19MC060016 Public Services 05C LMC 8988 Completed $100,000.00 $100,000.00 $100,000.00$100,000.00NoCA SAN FRANCISCO 2019 B19MC060016 Public Services 05C LMC 9043 Completed $49,941.85 $49,941.85 $49,941.85$49,941.85NoCA SAN FRANCISCO 2019 B19MC060016 Public Services 05C LMC 9070 Completed $81,111.00 $81,111.00 $81,111.00$81,111.00NoCA SAN FRANCISCO 2019 B19MC060016 Public Services 05C LMC 9119 Completed $21,921.20 $21,921.20 $150,000.00$150,000.00NoCA SAN FRANCISCO 2019 B19MC060016 Public Services 05F LMC 9007 Completed $55,000.00 $55,000.00 $55,000.00$55,000.00NoCA SAN FRANCISCO 2019 B19MC060016 Public Services 05G LMC 8987 Completed $102,000.00 $102,000.00 $102,000.00$102,000.00NoCA SAN FRANCISCO 2019 B19MC060016 Public Services 05G LMC 9008 Completed $54,114.59 $54,114.59 $54,114.59$54,114.59NoCA SAN FRANCISCO 2019 B19MC060016 Public Services 05G LMC 9048 Completed $26,678.00 $26,678.00 $26,678.00$26,678.00NoCA SAN FRANCISCO 2019 B19MC060016 Public Services 05H LMC 8980 Completed $139,924.22 $139,924.22 $139,924.22$139,924.22NoCA SAN FRANCISCO 2019 B19MC060016 Public Services 05H LMC 8989 Completed $100,000.00 $100,000.00 $100,000.00$100,000.00NoCA SAN FRANCISCO 2019 B19MC060016 Public Services 05H LMC 8990 Completed $200,000.00 $200,000.00 $200,000.00$200,000.00NoCA SAN FRANCISCO 2019 B19MC060016 Public Services 05H LMC 8992 Completed $72,140.72 $72,140.72 $72,140.72$72,140.72NoCA SAN FRANCISCO 2019 B19MC060016 Public Services 05H LMC 8993 Completed $54,679.86 $54,679.86 $54,679.86$54,679.86NoCA SAN FRANCISCO 2019 B19MC060016 Public Services 05H LMC 8999 Completed $75,000.00 $75,000.00 $75,000.00$75,000.00NoCA SAN FRANCISCO 2019 B19MC060016 Public Services 05H LMC 9004 Completed $51,976.77 $51,976.77 $51,976.77$51,976.77NoCA SAN FRANCISCO 2019 B19MC060016 Public Services 05H LMC 9006 Completed $69,999.97 $69,999.97 $69,999.97$69,999.97NoCA SAN FRANCISCO 2019 B19MC060016 Public Services 05H LMC 9009 Completed $59,999.99 $59,999.99 $99,999.99$99,999.99NoCA SAN FRANCISCO 2019 B19MC060016 Public Services 05H LMC 9039 Completed $90,000.00 $90,000.00 $90,000.00$90,000.00NoCA SAN FRANCISCO 2019 B19MC060016 Public Services 05H LMC 9042 Completed $99,997.63 $99,997.63 $99,997.63$99,997.63NoCA SAN FRANCISCO 2019 B19MC060016 Public Services 05H LMC 9058 Completed $92,763.75 $92,763.75 $92,763.75$92,763.75NoCA SAN FRANCISCO 2019 B19MC060016 Public Services 05H LMC 9072 Completed $75,000.00 $75,000.00 $75,000.00$75,000.00NoCA SAN FRANCISCO 2019 B19MC060016 Public Services 05H LMC 9076 Completed $7,500.00 $7,500.00 $125,000.00$125,000.00NoCA SAN FRANCISCO 2019 B19MC060016 Public Services 05H LMC 9078 Completed $330,029.00 $330,029.00 $456,529.00$456,529.00NoCA SAN FRANCISCO 2019 B19MC060016 Public Services 05H LMC 9309 Open $36,017.09 $0.00 $36,017.09NoCA SAN FRANCISCO 2019 B19MC060016 Public Services 05K LMC 8991 Completed $50,000.00 $50,000.00 $50,000.00$50,000.00No

CA SAN FRANCISCO 2019 B19MC060016 Public Services 05K LMC 9062 Completed $59,934.50 $59,934.50 $59,934.50$59,934.50NoCA SAN FRANCISCO 2019 B19MC060016 Public Services 05K LMC 9071 Completed $64,661.88 $64,661.88 $758,203.00$758,203.00NoCA SAN FRANCISCO 2019 B19MC060016 Public Services 05M LMC 9074 Completed $50,000.00 $50,000.00 $50,000.00$50,000.00NoCA SAN FRANCISCO 2019 B19MC060016 Public Services 05U LMC 8994 Completed $54,680.00 $54,680.00 $54,680.00$54,680.00NoCA SAN FRANCISCO 2019 B19MC060016 Public Services 05U LMC 9001 Completed $50,000.00 $50,000.00 $50,000.00$50,000.00NoCA SAN FRANCISCO 2019 B19MC060016 Public Services 05U LMC 9010 Completed $65,000.00 $65,000.00 $65,000.00$65,000.00NoCA SAN FRANCISCO 2019 B19MC060016 Public Services 05U LMC 9013 Completed $50,000.00 $50,000.00 $50,000.00$50,000.00NoCA SAN FRANCISCO 2019 B19MC060016 Public Services 05U LMC 9015 Completed $12,132.33 $12,132.33 $12,132.33$12,132.33NoCA SAN FRANCISCO 2019 B19MC060016 Public Services 05U LMC 9025 Cancel $0.00 $0.00 $0.00NoCA SAN FRANCISCO 2019 B19MC060016 Public Services 05U LMC 9052 Completed $36,000.00 $36,000.00 $36,000.00$36,000.00NoCA SAN FRANCISCO 2019 B19MC060016 Public Services 05U LMC 9055 Completed $100,000.00 $100,000.00 $100,000.00$100,000.00NoCA SAN FRANCISCO 2019 B19MC060016 Public Services 05U LMC 9057 Completed $50,000.00 $50,000.00 $50,000.00$50,000.00NoCA SAN FRANCISCO 2019 B19MC060016 Public Services 05U LMC 9063 Completed $48,957.20 $48,957.20 $48,957.20$48,957.20NoCA SAN FRANCISCO 2019 B19MC060016 Public Services 05U LMC 9065 Open $95,454.00 $95,454.00 $95,454.00$95,454.00NoCA SAN FRANCISCO 2019 B19MC060016 Public Services 05U LMC 9326 Open $79,546.00 $0.00 $79,546.00NoCA SAN FRANCISCO 2019 B19MC060016 Public Services 05X LMC 9000 Completed $97,147.57 $97,147.57 $97,147.57$97,147.57NoCA SAN FRANCISCO 2019 B19MC060016 Public Services 05X LMC 9028 Completed $65,000.00 $65,000.00 $65,000.00$65,000.00NoCA SAN FRANCISCO 2019 B19MC060016 Public Services 05X LMC 9032 Completed $49,315.26 $49,315.26 $49,315.26$49,315.26NoCA SAN FRANCISCO 2019 B19MC060016 Public Services 05X LMC 9035 Completed $34,390.00 $34,390.00 $50,000.00$50,000.00NoCA SAN FRANCISCO 2019 B19MC060016 Public Services 05X LMC 9037 Completed $50,000.00 $50,000.00 $50,000.00$50,000.00NoCA SAN FRANCISCO 2019 B19MC060016 Public Services 05X LMC 9054 Completed $50,000.00 $50,000.00 $50,000.00$50,000.00NoCA SAN FRANCISCO 2019 B19MC060016 Public Services 05Z LMC 8986 Completed $42,846.02 $42,846.02 $42,846.02$42,846.02NoCA SAN FRANCISCO 2019 B19MC060016 Public Services 05Z LMC 8996 Completed $49,959.08 $49,959.08 $49,959.08$49,959.08NoCA SAN FRANCISCO 2019 B19MC060016 Public Services 05Z LMC 8997 Completed $106,979.46 $106,979.46 $106,979.46$106,979.46NoCA SAN FRANCISCO 2019 B19MC060016 Public Services 05Z LMC 8998 Completed $109,935.00 $109,935.00 $109,935.00$109,935.00NoCA SAN FRANCISCO 2019 B19MC060016 Public Services 05Z LMC 9002 Completed $32,482.79 $32,482.79 $32,482.79$32,482.79NoCA SAN FRANCISCO 2019 B19MC060016 Public Services 05Z LMC 9003 Completed $70,000.00 $70,000.00 $70,000.00$70,000.00NoCA SAN FRANCISCO 2019 B19MC060016 Public Services 05Z LMC 9012 Completed $47,158.63 $47,158.63 $47,158.63$47,158.63NoCA SAN FRANCISCO 2019 B19MC060016 Public Services 05Z LMC 9014 Completed $0.00 $0.00 $225,000.00$225,000.00NoCA SAN FRANCISCO 2019 B19MC060016 Public Services 05Z LMC 9017 Completed $49,063.10 $49,063.10 $49,063.10$49,063.10NoCA SAN FRANCISCO 2019 B19MC060016 Public Services 05Z LMC 9023 Completed $45,000.00 $45,000.00 $45,000.00$45,000.00NoCA SAN FRANCISCO 2019 B19MC060016 Public Services 05Z LMC 9026 Completed $59,099.13 $59,099.13 $59,099.13$59,099.13NoCA SAN FRANCISCO 2019 B19MC060016 Public Services 05Z LMC 9027 Completed $99,521.60 $99,521.60 $99,521.60$99,521.60No

CA SAN FRANCISCO 2019 B19MC060016 Public Services 05Z LMC 9033 Completed $45,455.39 $45,455.39 $45,455.39$45,455.39NoCA SAN FRANCISCO 2019 B19MC060016 Public Services 05Z LMC 9034 Completed $50,000.00 $50,000.00 $50,000.00$50,000.00NoCA SAN FRANCISCO 2019 B19MC060016 Public Services 05Z LMC 9044 Completed $50,000.00 $50,000.00 $50,000.00$50,000.00NoCA SAN FRANCISCO 2019 B19MC060016 Public Services 05Z LMC 9053 Completed $48,899.30 $48,899.30 $48,899.30$48,899.30NoCA SAN FRANCISCO 2019 B19MC060016 Public Services 05Z LMC 9056 Completed $147,195.49 $147,195.49 $147,195.49$147,195.49NoCA SAN FRANCISCO 2019 B19MC060016 Public Services 05Z LMC 9068 Completed $49,814.97 $49,814.97 $49,814.97$49,814.97NoCA SAN FRANCISCO 2019 B19MC060016 Public Services 05Z LMC 9069 Completed $50,000.00 $50,000.00 $50,000.00$50,000.00NoCA SAN FRANCISCO 2019 B19MC060016 Public Services 05Z LMC 9075 Completed $55,000.00 $55,000.00 $55,000.00$55,000.00NoCA SAN FRANCISCO 2019 B19MC060016 Public Services 05Z LMC 9079 Completed $49,390.81 $49,390.81 $49,390.81$49,390.81NoCA SAN FRANCISCO 2019 B19MC060016 Public Services 05Z LMC 9080 Completed $114,734.05 $114,734.05 $224,716.36$224,716.36NoCA SAN FRANCISCO 2019 B19MC060016 Public Services 05Z LMC 9088 Completed $49,814.63 $49,814.63 $49,814.63$49,814.63NoCA SAN FRANCISCO 2019 B19MC060016 Public Services 05Z LMC 9142 Cancel $0.00 $0.00 $0.00NoCA SAN FRANCISCO 2019 B19MC060016 Public Services 05Z LMC 9382 Open $98,596.94 $0.00 $98,596.94No
Non CARES Related Public Services 25.87%$4,910,954.19 $4,696,794.16 $6,367,166.42 $6,153,006.39Total 2019 65.57%$18,157,109.00 $11,905,607.51 $17,705,729.42$25,403,630.96
State Grantee Amount DrawnGrantGrant Activity Matrix National IDIS Activity Amount FundedTotal Grant Amount for 2018 Grant year = $18,139,217.00
% of CDBG Drawn Total CDBG Funded Total CDBG DrawnName From Selected GrantNumberYear Group Code Objective Activity Status From Selected Grant From Selected Amount Amount
Grant/GrantAmount
(All Years All Sources) (All Years All Sources)
Activity to prevent,prepare for, and
respond to CoronavirusCA SAN FRANCISCO 2018 B18MC060016 Acquisition 01 LMH 8919 Open $2,074,215.00 $2,074,215.00 $2,074,215.00$2,074,215.00NoCA SAN FRANCISCO 2018 B18MC060016 Acquisition 08 LMA 8653 Completed $0.00 $0.00 $28,336.25$28,336.25No
Total Acquisition 11.43%$2,074,215.00 $2,074,215.00 $2,102,551.25 $2,102,551.25CA SAN FRANCISCO 2018 B18MC060016 Administrative And Planning 20 8891 Completed $116,612.00 $116,612.00 $116,612.00$116,612.00NoCA SAN FRANCISCO 2018 B18MC060016 Administrative And Planning 21A 8818 Completed $3,191,446.73 $3,191,446.73 $3,191,446.73$3,191,446.73NoCA SAN FRANCISCO 2018 B18MC060016 Administrative And Planning 21A 8890 Completed $319,785.00 $319,785.00 $319,785.00$319,785.00No
Total Administrative And Planning 20.00%$3,627,843.73 $3,627,843.73 $3,627,843.73 $3,627,843.73CA SAN FRANCISCO 2018 B18MC060016 Economic Development 14E LMA 8805 Completed $35,000.00 $35,000.00 $35,000.00$35,000.00NoCA SAN FRANCISCO 2018 B18MC060016 Economic Development 14E LMA 8861 Cancel $0.00 $0.00 $0.00NoCA SAN FRANCISCO 2018 B18MC060016 Economic Development 18B LMA 8738 Completed $70,000.00 $70,000.00 $70,000.00$70,000.00NoCA SAN FRANCISCO 2018 B18MC060016 Economic Development 18B LMA 8834 Completed $87,114.00 $87,114.00 $87,114.00$87,114.00NoCA SAN FRANCISCO 2018 B18MC060016 Economic Development 18B LMA 8835 Completed $100,000.00 $100,000.00 $100,000.00$100,000.00NoCA SAN FRANCISCO 2018 B18MC060016 Economic Development 18B LMA 8847 Completed $96,905.15 $96,905.15 $96,905.15$96,905.15NoCA SAN FRANCISCO 2018 B18MC060016 Economic Development 18B LMA 8956 Cancel $0.00 $0.00 $0.00No
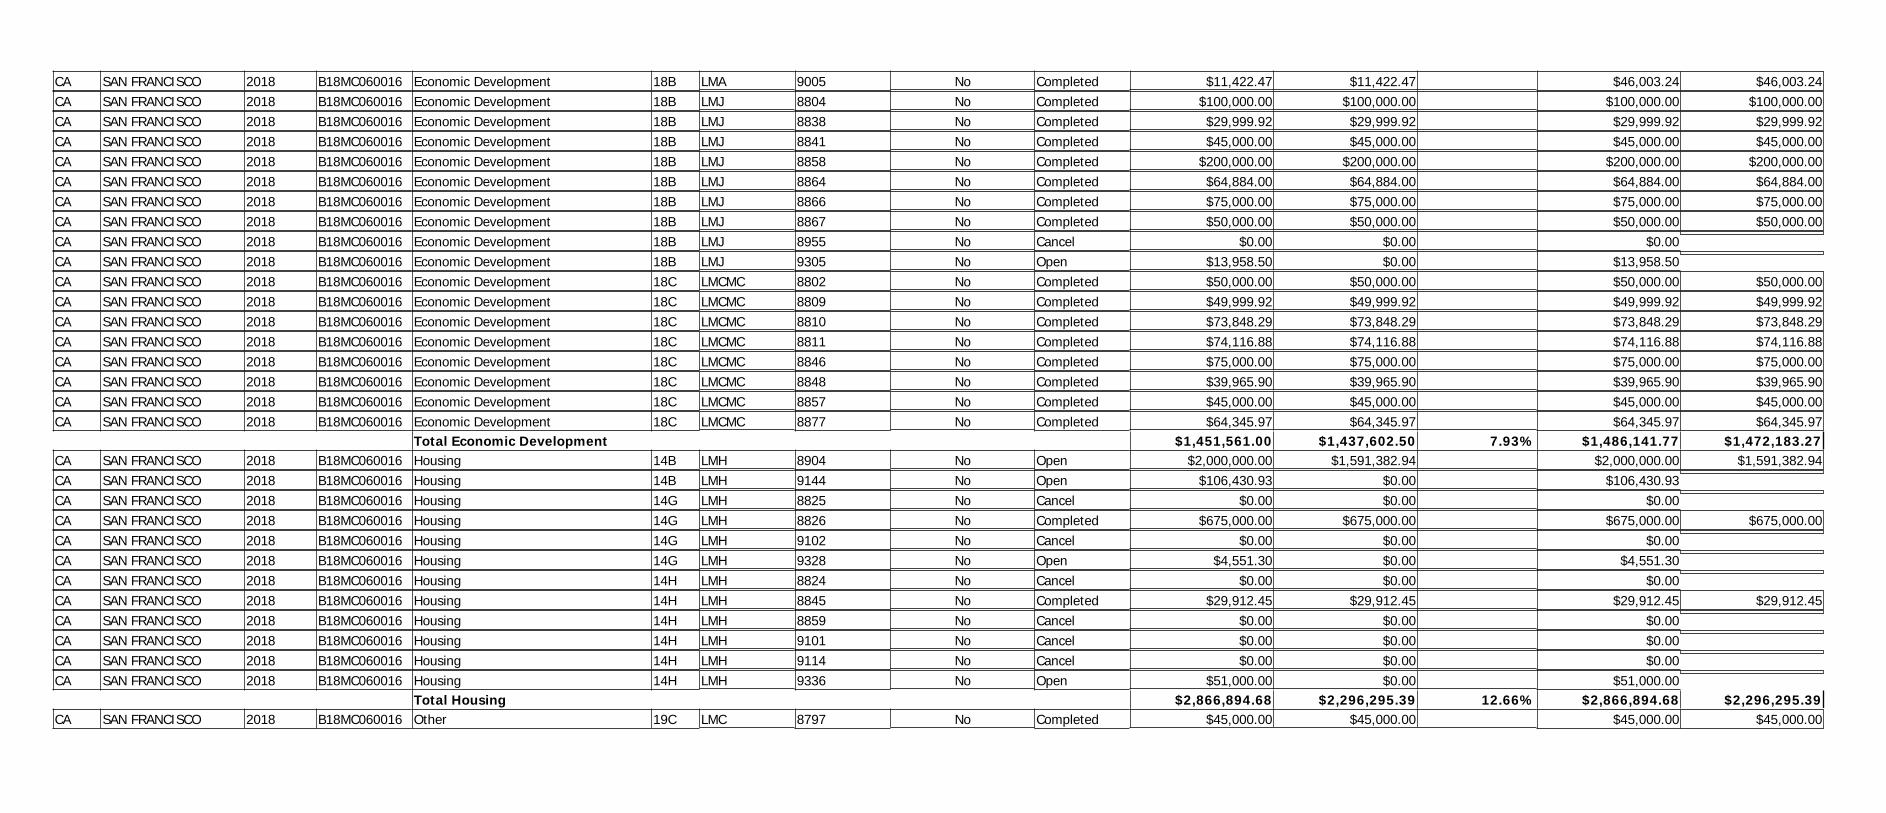
CA SAN FRANCISCO 2018 B18MC060016 Economic Development 18B LMA 9005 Completed $11,422.47 $11,422.47 $46,003.24$46,003.24NoCA SAN FRANCISCO 2018 B18MC060016 Economic Development 18B LMJ 8804 Completed $100,000.00 $100,000.00 $100,000.00$100,000.00NoCA SAN FRANCISCO 2018 B18MC060016 Economic Development 18B LMJ 8838 Completed $29,999.92 $29,999.92 $29,999.92$29,999.92NoCA SAN FRANCISCO 2018 B18MC060016 Economic Development 18B LMJ 8841 Completed $45,000.00 $45,000.00 $45,000.00$45,000.00NoCA SAN FRANCISCO 2018 B18MC060016 Economic Development 18B LMJ 8858 Completed $200,000.00 $200,000.00 $200,000.00$200,000.00NoCA SAN FRANCISCO 2018 B18MC060016 Economic Development 18B LMJ 8864 Completed $64,884.00 $64,884.00 $64,884.00$64,884.00NoCA SAN FRANCISCO 2018 B18MC060016 Economic Development 18B LMJ 8866 Completed $75,000.00 $75,000.00 $75,000.00$75,000.00NoCA SAN FRANCISCO 2018 B18MC060016 Economic Development 18B LMJ 8867 Completed $50,000.00 $50,000.00 $50,000.00$50,000.00NoCA SAN FRANCISCO 2018 B18MC060016 Economic Development 18B LMJ 8955 Cancel $0.00 $0.00 $0.00NoCA SAN FRANCISCO 2018 B18MC060016 Economic Development 18B LMJ 9305 Open $13,958.50 $0.00 $13,958.50NoCA SAN FRANCISCO 2018 B18MC060016 Economic Development 18C LMCMC 8802 Completed $50,000.00 $50,000.00 $50,000.00$50,000.00NoCA SAN FRANCISCO 2018 B18MC060016 Economic Development 18C LMCMC 8809 Completed $49,999.92 $49,999.92 $49,999.92$49,999.92NoCA SAN FRANCISCO 2018 B18MC060016 Economic Development 18C LMCMC 8810 Completed $73,848.29 $73,848.29 $73,848.29$73,848.29NoCA SAN FRANCISCO 2018 B18MC060016 Economic Development 18C LMCMC 8811 Completed $74,116.88 $74,116.88 $74,116.88$74,116.88NoCA SAN FRANCISCO 2018 B18MC060016 Economic Development 18C LMCMC 8846 Completed $75,000.00 $75,000.00 $75,000.00$75,000.00NoCA SAN FRANCISCO 2018 B18MC060016 Economic Development 18C LMCMC 8848 Completed $39,965.90 $39,965.90 $39,965.90$39,965.90NoCA SAN FRANCISCO 2018 B18MC060016 Economic Development 18C LMCMC 8857 Completed $45,000.00 $45,000.00 $45,000.00$45,000.00NoCA SAN FRANCISCO 2018 B18MC060016 Economic Development 18C LMCMC 8877 Completed $64,345.97 $64,345.97 $64,345.97$64,345.97No
Total Economic Development 7.93%$1,451,561.00 $1,437,602.50 $1,486,141.77 $1,472,183.27CA SAN FRANCISCO 2018 B18MC060016 Housing 14B LMH 8904 Open $2,000,000.00 $1,591,382.94 $1,591,382.94$2,000,000.00NoCA SAN FRANCISCO 2018 B18MC060016 Housing 14B LMH 9144 Open $106,430.93 $0.00 $106,430.93NoCA SAN FRANCISCO 2018 B18MC060016 Housing 14G LMH 8825 Cancel $0.00 $0.00 $0.00NoCA SAN FRANCISCO 2018 B18MC060016 Housing 14G LMH 8826 Completed $675,000.00 $675,000.00 $675,000.00$675,000.00NoCA SAN FRANCISCO 2018 B18MC060016 Housing 14G LMH 9102 Cancel $0.00 $0.00 $0.00NoCA SAN FRANCISCO 2018 B18MC060016 Housing 14G LMH 9328 Open $4,551.30 $0.00 $4,551.30NoCA SAN FRANCISCO 2018 B18MC060016 Housing 14H LMH 8824 Cancel $0.00 $0.00 $0.00NoCA SAN FRANCISCO 2018 B18MC060016 Housing 14H LMH 8845 Completed $29,912.45 $29,912.45 $29,912.45$29,912.45NoCA SAN FRANCISCO 2018 B18MC060016 Housing 14H LMH 8859 Cancel $0.00 $0.00 $0.00NoCA SAN FRANCISCO 2018 B18MC060016 Housing 14H LMH 9101 Cancel $0.00 $0.00 $0.00NoCA SAN FRANCISCO 2018 B18MC060016 Housing 14H LMH 9114 Cancel $0.00 $0.00 $0.00NoCA SAN FRANCISCO 2018 B18MC060016 Housing 14H LMH 9336 Open $51,000.00 $0.00 $51,000.00No
Total Housing 12.66%$2,866,894.68 $2,296,295.39 $2,866,894.68 $2,296,295.39CA SAN FRANCISCO 2018 B18MC060016 Other 19C LMC 8797 Completed $45,000.00 $45,000.00 $45,000.00$45,000.00No
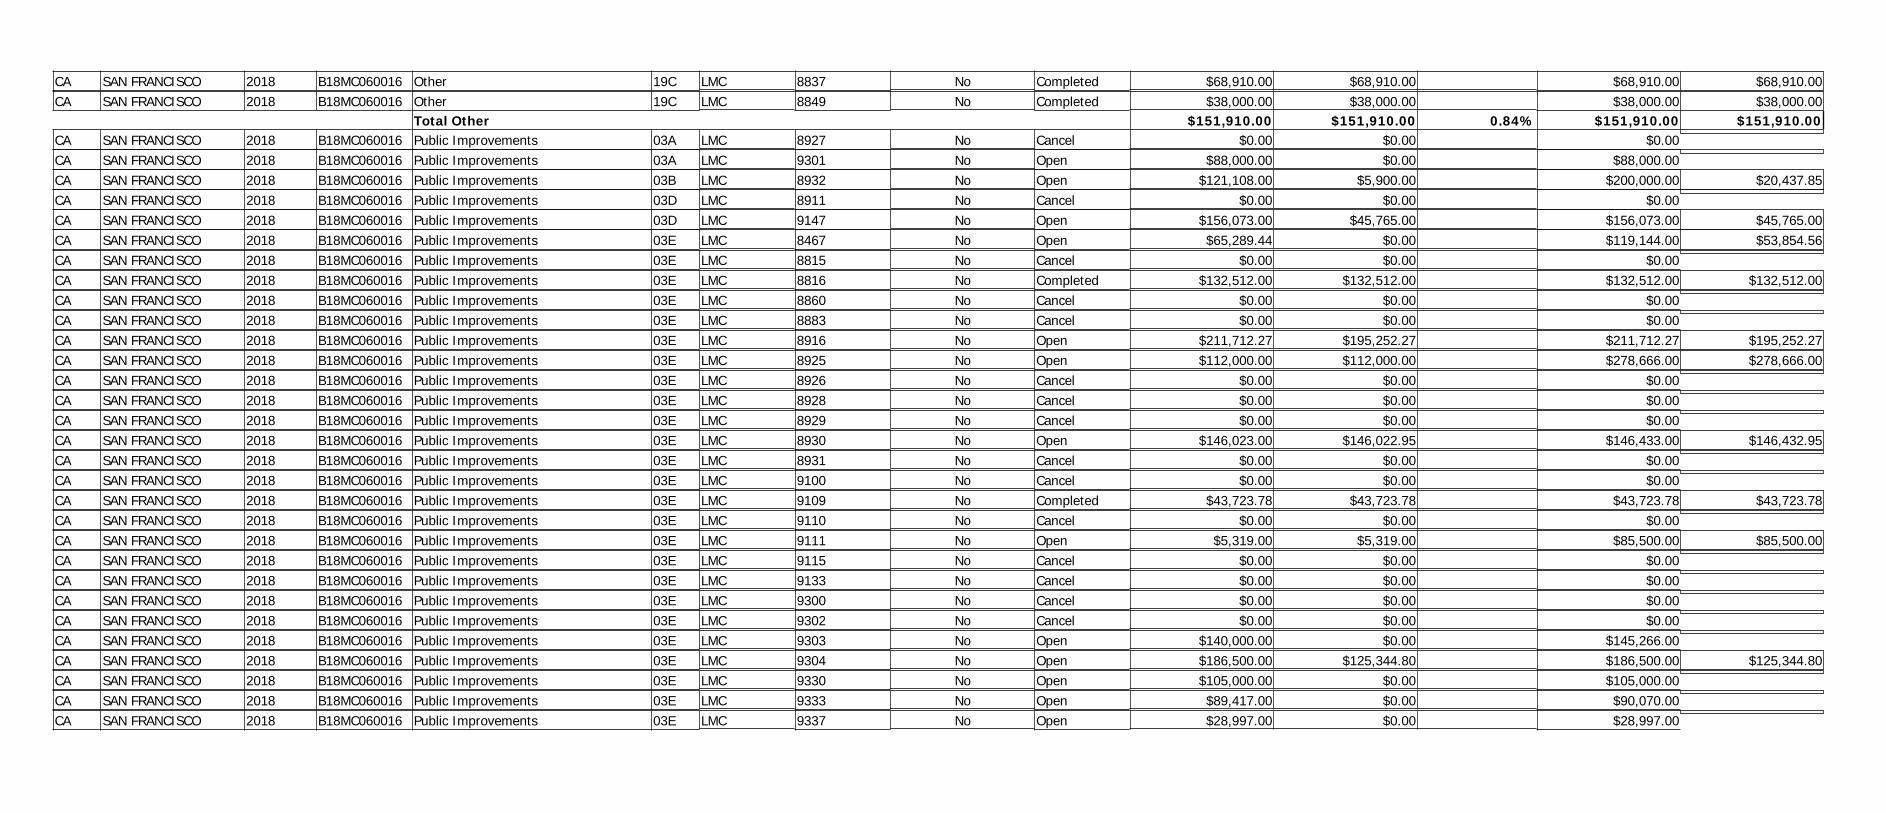
CA SAN FRANCISCO 2018 B18MC060016 Other 19C LMC 8837 Completed $68,910.00 $68,910.00 $68,910.00$68,910.00NoCA SAN FRANCISCO 2018 B18MC060016 Other 19C LMC 8849 Completed $38,000.00 $38,000.00 $38,000.00$38,000.00No
Total Other 0.84%$151,910.00 $151,910.00 $151,910.00 $151,910.00CA SAN FRANCISCO 2018 B18MC060016 Public Improvements 03A LMC 8927 Cancel $0.00 $0.00 $0.00NoCA SAN FRANCISCO 2018 B18MC060016 Public Improvements 03A LMC 9301 Open $88,000.00 $0.00 $88,000.00NoCA SAN FRANCISCO 2018 B18MC060016 Public Improvements 03B LMC 8932 Open $121,108.00 $5,900.00 $20,437.85$200,000.00NoCA SAN FRANCISCO 2018 B18MC060016 Public Improvements 03D LMC 8911 Cancel $0.00 $0.00 $0.00NoCA SAN FRANCISCO 2018 B18MC060016 Public Improvements 03D LMC 9147 Open $156,073.00 $45,765.00 $45,765.00$156,073.00NoCA SAN FRANCISCO 2018 B18MC060016 Public Improvements 03E LMC 8467 Open $65,289.44 $0.00 $53,854.56$119,144.00NoCA SAN FRANCISCO 2018 B18MC060016 Public Improvements 03E LMC 8815 Cancel $0.00 $0.00 $0.00NoCA SAN FRANCISCO 2018 B18MC060016 Public Improvements 03E LMC 8816 Completed $132,512.00 $132,512.00 $132,512.00$132,512.00NoCA SAN FRANCISCO 2018 B18MC060016 Public Improvements 03E LMC 8860 Cancel $0.00 $0.00 $0.00NoCA SAN FRANCISCO 2018 B18MC060016 Public Improvements 03E LMC 8883 Cancel $0.00 $0.00 $0.00NoCA SAN FRANCISCO 2018 B18MC060016 Public Improvements 03E LMC 8916 Open $211,712.27 $195,252.27 $195,252.27$211,712.27NoCA SAN FRANCISCO 2018 B18MC060016 Public Improvements 03E LMC 8925 Open $112,000.00 $112,000.00 $278,666.00$278,666.00NoCA SAN FRANCISCO 2018 B18MC060016 Public Improvements 03E LMC 8926 Cancel $0.00 $0.00 $0.00NoCA SAN FRANCISCO 2018 B18MC060016 Public Improvements 03E LMC 8928 Cancel $0.00 $0.00 $0.00NoCA SAN FRANCISCO 2018 B18MC060016 Public Improvements 03E LMC 8929 Cancel $0.00 $0.00 $0.00NoCA SAN FRANCISCO 2018 B18MC060016 Public Improvements 03E LMC 8930 Open $146,023.00 $146,022.95 $146,432.95$146,433.00NoCA SAN FRANCISCO 2018 B18MC060016 Public Improvements 03E LMC 8931 Cancel $0.00 $0.00 $0.00NoCA SAN FRANCISCO 2018 B18MC060016 Public Improvements 03E LMC 9100 Cancel $0.00 $0.00 $0.00NoCA SAN FRANCISCO 2018 B18MC060016 Public Improvements 03E LMC 9109 Completed $43,723.78 $43,723.78 $43,723.78$43,723.78NoCA SAN FRANCISCO 2018 B18MC060016 Public Improvements 03E LMC 9110 Cancel $0.00 $0.00 $0.00NoCA SAN FRANCISCO 2018 B18MC060016 Public Improvements 03E LMC 9111 Open $5,319.00 $5,319.00 $85,500.00$85,500.00NoCA SAN FRANCISCO 2018 B18MC060016 Public Improvements 03E LMC 9115 Cancel $0.00 $0.00 $0.00NoCA SAN FRANCISCO 2018 B18MC060016 Public Improvements 03E LMC 9133 Cancel $0.00 $0.00 $0.00NoCA SAN FRANCISCO 2018 B18MC060016 Public Improvements 03E LMC 9300 Cancel $0.00 $0.00 $0.00NoCA SAN FRANCISCO 2018 B18MC060016 Public Improvements 03E LMC 9302 Cancel $0.00 $0.00 $0.00NoCA SAN FRANCISCO 2018 B18MC060016 Public Improvements 03E LMC 9303 Open $140,000.00 $0.00 $145,266.00NoCA SAN FRANCISCO 2018 B18MC060016 Public Improvements 03E LMC 9304 Open $186,500.00 $125,344.80 $125,344.80$186,500.00NoCA SAN FRANCISCO 2018 B18MC060016 Public Improvements 03E LMC 9330 Open $105,000.00 $0.00 $105,000.00NoCA SAN FRANCISCO 2018 B18MC060016 Public Improvements 03E LMC 9333 Open $89,417.00 $0.00 $90,070.00NoCA SAN FRANCISCO 2018 B18MC060016 Public Improvements 03E LMC 9337 Open $28,997.00 $0.00 $28,997.00No

CA SAN FRANCISCO 2018 B18MC060016 Public Improvements 03E LMC 9340 Open $68,235.63 $0.00 $68,235.63NoCA SAN FRANCISCO 2018 B18MC060016 Public Improvements 03M LMC 8888 Cancel $0.00 $0.00 $0.00NoCA SAN FRANCISCO 2018 B18MC060016 Public Improvements 03M LMC 8924 Completed $123,000.00 $123,000.00 $123,000.00$123,000.00NoCA SAN FRANCISCO 2018 B18MC060016 Public Improvements 03M LMC 9132 Cancel $0.00 $0.00 $0.00NoCA SAN FRANCISCO 2018 B18MC060016 Public Improvements 03M LMC 9346 Open $98,081.59 $0.00 $250,000.00YesCA SAN FRANCISCO 2018 B18MC060016 Public Improvements 03Z LMA 2 Open $0.00 $0.00 $138,337,589.69$138,337,589.69NoCA SAN FRANCISCO 2018 B18MC060016 Public Improvements 03Z LMC 8436 Open $20,000.00 $18,675.70 $68,675.70$70,000.00NoCA SAN FRANCISCO 2018 B18MC060016 Public Improvements 03Z LMC 8905 Completed $0.00 $0.00 $98,225.08$98,225.08No
Total Public Improvements 5.26%$1,940,991.71 $953,515.50 $140,964,647.45 $139,754,979.68CA SAN FRANCISCO 2018 B18MC060016 Public Services 05B LMC 8872 Completed $50,000.00 $50,000.00 $50,000.00$50,000.00NoCA SAN FRANCISCO 2018 B18MC060016 Public Services 05C LMC 8735 Completed $81,999.46 $81,999.46 $81,999.46$81,999.46NoCA SAN FRANCISCO 2018 B18MC060016 Public Services 05C LMC 8741 Completed $100,000.00 $100,000.00 $100,000.00$100,000.00NoCA SAN FRANCISCO 2018 B18MC060016 Public Services 05C LMC 8844 Completed $50,000.00 $50,000.00 $50,000.00$50,000.00NoCA SAN FRANCISCO 2018 B18MC060016 Public Services 05C LMC 8869 Completed $81,111.00 $81,111.00 $81,111.00$81,111.00NoCA SAN FRANCISCO 2018 B18MC060016 Public Services 05F LMC 8792 Completed $55,000.00 $55,000.00 $55,000.00$55,000.00NoCA SAN FRANCISCO 2018 B18MC060016 Public Services 05G LMC 8737 Completed $102,000.00 $102,000.00 $102,000.00$102,000.00NoCA SAN FRANCISCO 2018 B18MC060016 Public Services 05G LMC 8793 Completed $55,000.00 $55,000.00 $55,000.00$55,000.00NoCA SAN FRANCISCO 2018 B18MC060016 Public Services 05G LMC 8801 Completed $26,678.00 $26,678.00 $26,678.00$26,678.00NoCA SAN FRANCISCO 2018 B18MC060016 Public Services 05H LMC 8736 Completed $144,458.85 $144,458.85 $144,458.85$144,458.85NoCA SAN FRANCISCO 2018 B18MC060016 Public Services 05H LMC 8743 Completed $100,000.00 $100,000.00 $100,000.00$100,000.00NoCA SAN FRANCISCO 2018 B18MC060016 Public Services 05H LMC 8744 Completed $200,000.00 $200,000.00 $200,000.00$200,000.00NoCA SAN FRANCISCO 2018 B18MC060016 Public Services 05H LMC 8746 Completed $75,000.00 $75,000.00 $75,000.00$75,000.00NoCA SAN FRANCISCO 2018 B18MC060016 Public Services 05H LMC 8747 Completed $56,250.00 $56,250.00 $56,250.00$56,250.00NoCA SAN FRANCISCO 2018 B18MC060016 Public Services 05H LMC 8768 Completed $75,000.00 $75,000.00 $75,000.00$75,000.00NoCA SAN FRANCISCO 2018 B18MC060016 Public Services 05H LMC 8777 Completed $52,334.19 $52,334.19 $52,334.19$52,334.19NoCA SAN FRANCISCO 2018 B18MC060016 Public Services 05H LMC 8791 Completed $70,000.00 $70,000.00 $70,000.00$70,000.00NoCA SAN FRANCISCO 2018 B18MC060016 Public Services 05H LMC 8795 Completed $59,763.82 $59,763.82 $59,763.82$59,763.82NoCA SAN FRANCISCO 2018 B18MC060016 Public Services 05H LMC 8840 Completed $90,000.00 $90,000.00 $90,000.00$90,000.00NoCA SAN FRANCISCO 2018 B18MC060016 Public Services 05H LMC 8842 Completed $100,000.00 $100,000.00 $100,000.00$100,000.00NoCA SAN FRANCISCO 2018 B18MC060016 Public Services 05H LMC 8853 Completed $150,000.00 $150,000.00 $150,000.00$150,000.00NoCA SAN FRANCISCO 2018 B18MC060016 Public Services 05H LMC 8856 Completed $101,383.13 $101,383.13 $101,383.13$101,383.13NoCA SAN FRANCISCO 2018 B18MC060016 Public Services 05H LMC 8871 Completed $75,000.00 $75,000.00 $75,000.00$75,000.00NoCA SAN FRANCISCO 2018 B18MC060016 Public Services 05H LMC 8873 Completed $100,000.00 $100,000.00 $100,000.00$100,000.00No

CA SAN FRANCISCO 2018 B18MC060016 Public Services 05H LMC 8875 Completed $7,500.00 $7,500.00 $7,500.00$7,500.00NoCA SAN FRANCISCO 2018 B18MC060016 Public Services 05H LMC 8878 Completed $207,995.53 $207,995.53 $207,995.53$207,995.53NoCA SAN FRANCISCO 2018 B18MC060016 Public Services 05H LMC 8957 Cancel $0.00 $0.00 $0.00NoCA SAN FRANCISCO 2018 B18MC060016 Public Services 05H LMC 9306 Open $40,343.48 $0.00 $40,343.48NoCA SAN FRANCISCO 2018 B18MC060016 Public Services 05K LMC 8745 Completed $50,000.00 $50,000.00 $50,000.00$50,000.00NoCA SAN FRANCISCO 2018 B18MC060016 Public Services 05K LMC 8862 Completed $59,500.00 $59,500.00 $59,500.00$59,500.00NoCA SAN FRANCISCO 2018 B18MC060016 Public Services 05K LMC 8870 Completed $758,203.00 $758,203.00 $758,203.00$758,203.00NoCA SAN FRANCISCO 2018 B18MC060016 Public Services 05K LMC 8953 Completed $3,454.00 $3,454.00 $150,000.00$150,000.00NoCA SAN FRANCISCO 2018 B18MC060016 Public Services 05M LMC 8794 Completed $49,955.25 $49,955.25 $49,955.25$49,955.25NoCA SAN FRANCISCO 2018 B18MC060016 Public Services 05U LMC 8773 Completed $49,678.02 $49,678.02 $49,678.02$49,678.02NoCA SAN FRANCISCO 2018 B18MC060016 Public Services 05U LMC 8796 Completed $65,000.00 $65,000.00 $65,000.00$65,000.00NoCA SAN FRANCISCO 2018 B18MC060016 Public Services 05U LMC 8799 Completed $50,000.00 $50,000.00 $50,000.00$50,000.00NoCA SAN FRANCISCO 2018 B18MC060016 Public Services 05U LMC 8800 Completed $31,334.30 $31,334.30 $31,334.30$31,334.30NoCA SAN FRANCISCO 2018 B18MC060016 Public Services 05U LMC 8827 Cancel $0.00 $0.00 $0.00NoCA SAN FRANCISCO 2018 B18MC060016 Public Services 05U LMC 8850 Completed $35,996.94 $35,996.94 $35,996.94$35,996.94NoCA SAN FRANCISCO 2018 B18MC060016 Public Services 05U LMC 8854 Completed $100,000.00 $100,000.00 $100,000.00$100,000.00NoCA SAN FRANCISCO 2018 B18MC060016 Public Services 05U LMC 8855 Completed $50,000.00 $50,000.00 $50,000.00$50,000.00NoCA SAN FRANCISCO 2018 B18MC060016 Public Services 05U LMC 8863 Completed $47,678.33 $47,678.33 $47,678.33$47,678.33NoCA SAN FRANCISCO 2018 B18MC060016 Public Services 05U LMC 8865 Completed $95,454.00 $95,454.00 $95,454.00$95,454.00NoCA SAN FRANCISCO 2018 B18MC060016 Public Services 05U LMC 9103 Cancel $0.00 $0.00 $0.00NoCA SAN FRANCISCO 2018 B18MC060016 Public Services 05U LMC 9329 Open $76,092.00 $0.00 $76,092.00NoCA SAN FRANCISCO 2018 B18MC060016 Public Services 05Z LMC 8739 Completed $42,415.16 $42,415.16 $42,415.16$42,415.16NoCA SAN FRANCISCO 2018 B18MC060016 Public Services 05Z LMC 8740 Completed $44,940.65 $44,940.65 $44,940.65$44,940.65NoCA SAN FRANCISCO 2018 B18MC060016 Public Services 05Z LMC 8748 Completed $54,978.43 $54,978.43 $54,978.43$54,978.43NoCA SAN FRANCISCO 2018 B18MC060016 Public Services 05Z LMC 8752 Completed $49,773.04 $49,773.04 $49,773.04$49,773.04NoCA SAN FRANCISCO 2018 B18MC060016 Public Services 05Z LMC 8753 Completed $109,758.78 $109,758.78 $109,758.78$109,758.78NoCA SAN FRANCISCO 2018 B18MC060016 Public Services 05Z LMC 8769 Completed $87,619.52 $87,619.52 $87,619.52$87,619.52NoCA SAN FRANCISCO 2018 B18MC060016 Public Services 05Z LMC 8774 Completed $50,000.00 $50,000.00 $50,000.00$50,000.00NoCA SAN FRANCISCO 2018 B18MC060016 Public Services 05Z LMC 8775 Completed $70,000.00 $70,000.00 $70,000.00$70,000.00NoCA SAN FRANCISCO 2018 B18MC060016 Public Services 05Z LMC 8798 Completed $46,346.43 $46,346.43 $46,346.43$46,346.43NoCA SAN FRANCISCO 2018 B18MC060016 Public Services 05Z LMC 8803 Completed $50,000.00 $50,000.00 $50,000.00$50,000.00NoCA SAN FRANCISCO 2018 B18MC060016 Public Services 05Z LMC 8807 Completed $55,365.92 $55,365.92 $55,365.92$55,365.92NoCA SAN FRANCISCO 2018 B18MC060016 Public Services 05Z LMC 8808 Completed $65,000.00 $65,000.00 $65,000.00$65,000.00No

CA SAN FRANCISCO 2018 B18MC060016 Public Services 05Z LMC 8812 Completed $49,847.71 $49,847.71 $49,847.71$49,847.71NoCA SAN FRANCISCO 2018 B18MC060016 Public Services 05Z LMC 8813 Completed $53,883.14 $53,883.14 $53,883.14$53,883.14NoCA SAN FRANCISCO 2018 B18MC060016 Public Services 05Z LMC 8814 Completed $49,974.61 $49,974.61 $49,974.61$49,974.61NoCA SAN FRANCISCO 2018 B18MC060016 Public Services 05Z LMC 8832 Completed $45,000.00 $45,000.00 $45,000.00$45,000.00NoCA SAN FRANCISCO 2018 B18MC060016 Public Services 05Z LMC 8833 Completed $50,000.00 $50,000.00 $50,000.00$50,000.00NoCA SAN FRANCISCO 2018 B18MC060016 Public Services 05Z LMC 8836 Completed $50,000.00 $50,000.00 $50,000.00$50,000.00NoCA SAN FRANCISCO 2018 B18MC060016 Public Services 05Z LMC 8843 Completed $50,000.00 $50,000.00 $50,000.00$50,000.00NoCA SAN FRANCISCO 2018 B18MC060016 Public Services 05Z LMC 8851 Completed $49,999.97 $49,999.97 $49,999.97$49,999.97NoCA SAN FRANCISCO 2018 B18MC060016 Public Services 05Z LMC 8852 Completed $50,000.00 $50,000.00 $50,000.00$50,000.00NoCA SAN FRANCISCO 2018 B18MC060016 Public Services 05Z LMC 8868 Completed $50,000.00 $50,000.00 $50,000.00$50,000.00NoCA SAN FRANCISCO 2018 B18MC060016 Public Services 05Z LMC 8874 Completed $55,000.00 $55,000.00 $55,000.00$55,000.00NoCA SAN FRANCISCO 2018 B18MC060016 Public Services 05Z LMC 8876 Completed $50,000.00 $50,000.00 $50,000.00$50,000.00NoCA SAN FRANCISCO 2018 B18MC060016 Public Services 05Z LMC 8879 Completed $52,531.84 $52,531.84 $52,531.84$52,531.84NoCA SAN FRANCISCO 2018 B18MC060016 Public Services 05Z LMC 8880 Completed $222,738.41 $222,738.41 $222,738.41$222,738.41NoCA SAN FRANCISCO 2018 B18MC060016 Public Services 05Z LMC 8881 Completed $75,696.23 $75,696.23 $75,696.23$75,696.23NoCA SAN FRANCISCO 2018 B18MC060016 Public Services 05Z LMC 8884 Completed $103,321.36 $103,321.36 $103,321.36$103,321.36NoCA SAN FRANCISCO 2018 B18MC060016 Public Services 05Z LMC 8885 Completed $64,541.49 $64,541.49 $64,541.49$64,541.49NoCA SAN FRANCISCO 2018 B18MC060016 Public Services 05Z LMC 8886 Completed $65,239.40 $65,239.40 $65,239.40$65,239.40NoCA SAN FRANCISCO 2018 B18MC060016 Public Services 05Z LMC 8887 Open $14,708.79 $0.00 $14,708.79NoCA SAN FRANCISCO 2018 B18MC060016 Public Services 05Z LMC 8958 Cancel $0.00 $0.00 $0.00NoCA SAN FRANCISCO 2018 B18MC060016 Public Services 05Z LMC 9307 Open $175,329.33 $0.00 $175,329.33No
Non CARES Related Public Services 31.02%$5,933,173.51 $5,626,699.91 $6,079,719.51 $5,773,245.91CA SAN FRANCISCO 2018 B18MC060016 Repayments Of Section 108 Loans 19F 8839 Cancel $0.00 $0.00 $0.00NoCA SAN FRANCISCO 2018 B18MC060016 Repayments Of Section 108 Loans 19F 9145 Cancel $0.00 $0.00 $0.00NoCA SAN FRANCISCO 2018 B18MC060016 Repayments Of Section 108 Loans 19F 9381 Open $92,627.37 $0.00 $92,627.37No
Total Repayments Of Section 108 Loans 0.00%$92,627.37 $0.00 $92,627.37 $0.00Total 2018 89.13%$18,139,217.00 $16,168,082.03 $155,179,009.23$157,372,335.76
State Grantee Amount DrawnGrantGrant Activity Matrix National IDIS Activity Amount FundedTotal Grant Amount for 2017 Grant year = $16,431,172.00
% of CDBG Drawn Total CDBG Funded Total CDBG DrawnName From Selected GrantNumberYear Group Code Objective Activity Status From Selected Grant From Selected Amount Amount
Grant/GrantAmount
(All Years All Sources) (All Years All Sources)
Activity to prevent,prepare for, and
respond to CoronavirusCA SAN FRANCISCO 2017 B17MC060016 Administrative And Planning 21A 8562 Completed $2,799,204.79 $2,799,204.79 $2,799,204.79$2,799,204.79NoCA SAN FRANCISCO 2017 B17MC060016 Administrative And Planning 21A 8632 Completed $319,784.90 $319,784.90 $319,784.90$319,784.90No
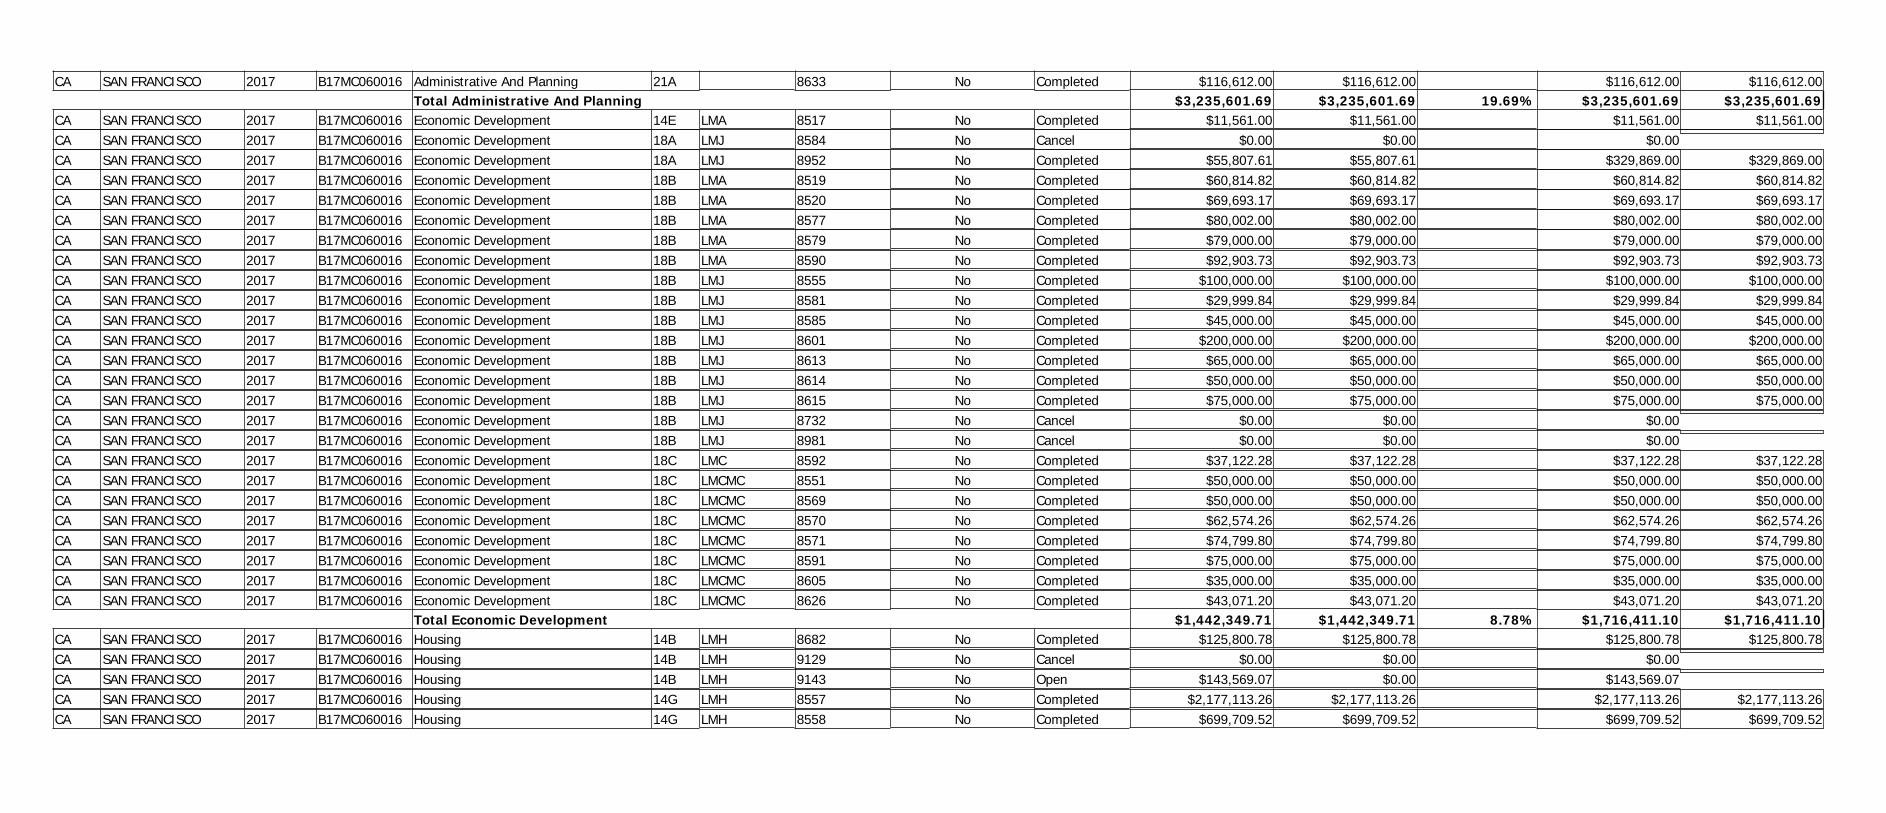
CA SAN FRANCISCO 2017 B17MC060016 Administrative And Planning 21A 8633 Completed $116,612.00 $116,612.00 $116,612.00$116,612.00NoTotal Administrative And Planning 19.69%$3,235,601.69 $3,235,601.69 $3,235,601.69 $3,235,601.69
CA SAN FRANCISCO 2017 B17MC060016 Economic Development 14E LMA 8517 Completed $11,561.00 $11,561.00 $11,561.00$11,561.00NoCA SAN FRANCISCO 2017 B17MC060016 Economic Development 18A LMJ 8584 Cancel $0.00 $0.00 $0.00NoCA SAN FRANCISCO 2017 B17MC060016 Economic Development 18A LMJ 8952 Completed $55,807.61 $55,807.61 $329,869.00$329,869.00NoCA SAN FRANCISCO 2017 B17MC060016 Economic Development 18B LMA 8519 Completed $60,814.82 $60,814.82 $60,814.82$60,814.82NoCA SAN FRANCISCO 2017 B17MC060016 Economic Development 18B LMA 8520 Completed $69,693.17 $69,693.17 $69,693.17$69,693.17NoCA SAN FRANCISCO 2017 B17MC060016 Economic Development 18B LMA 8577 Completed $80,002.00 $80,002.00 $80,002.00$80,002.00NoCA SAN FRANCISCO 2017 B17MC060016 Economic Development 18B LMA 8579 Completed $79,000.00 $79,000.00 $79,000.00$79,000.00NoCA SAN FRANCISCO 2017 B17MC060016 Economic Development 18B LMA 8590 Completed $92,903.73 $92,903.73 $92,903.73$92,903.73NoCA SAN FRANCISCO 2017 B17MC060016 Economic Development 18B LMJ 8555 Completed $100,000.00 $100,000.00 $100,000.00$100,000.00NoCA SAN FRANCISCO 2017 B17MC060016 Economic Development 18B LMJ 8581 Completed $29,999.84 $29,999.84 $29,999.84$29,999.84NoCA SAN FRANCISCO 2017 B17MC060016 Economic Development 18B LMJ 8585 Completed $45,000.00 $45,000.00 $45,000.00$45,000.00NoCA SAN FRANCISCO 2017 B17MC060016 Economic Development 18B LMJ 8601 Completed $200,000.00 $200,000.00 $200,000.00$200,000.00NoCA SAN FRANCISCO 2017 B17MC060016 Economic Development 18B LMJ 8613 Completed $65,000.00 $65,000.00 $65,000.00$65,000.00NoCA SAN FRANCISCO 2017 B17MC060016 Economic Development 18B LMJ 8614 Completed $50,000.00 $50,000.00 $50,000.00$50,000.00NoCA SAN FRANCISCO 2017 B17MC060016 Economic Development 18B LMJ 8615 Completed $75,000.00 $75,000.00 $75,000.00$75,000.00NoCA SAN FRANCISCO 2017 B17MC060016 Economic Development 18B LMJ 8732 Cancel $0.00 $0.00 $0.00NoCA SAN FRANCISCO 2017 B17MC060016 Economic Development 18B LMJ 8981 Cancel $0.00 $0.00 $0.00NoCA SAN FRANCISCO 2017 B17MC060016 Economic Development 18C LMC 8592 Completed $37,122.28 $37,122.28 $37,122.28$37,122.28NoCA SAN FRANCISCO 2017 B17MC060016 Economic Development 18C LMCMC 8551 Completed $50,000.00 $50,000.00 $50,000.00$50,000.00NoCA SAN FRANCISCO 2017 B17MC060016 Economic Development 18C LMCMC 8569 Completed $50,000.00 $50,000.00 $50,000.00$50,000.00NoCA SAN FRANCISCO 2017 B17MC060016 Economic Development 18C LMCMC 8570 Completed $62,574.26 $62,574.26 $62,574.26$62,574.26NoCA SAN FRANCISCO 2017 B17MC060016 Economic Development 18C LMCMC 8571 Completed $74,799.80 $74,799.80 $74,799.80$74,799.80NoCA SAN FRANCISCO 2017 B17MC060016 Economic Development 18C LMCMC 8591 Completed $75,000.00 $75,000.00 $75,000.00$75,000.00NoCA SAN FRANCISCO 2017 B17MC060016 Economic Development 18C LMCMC 8605 Completed $35,000.00 $35,000.00 $35,000.00$35,000.00NoCA SAN FRANCISCO 2017 B17MC060016 Economic Development 18C LMCMC 8626 Completed $43,071.20 $43,071.20 $43,071.20$43,071.20No
Total Economic Development 8.78%$1,442,349.71 $1,442,349.71 $1,716,411.10 $1,716,411.10CA SAN FRANCISCO 2017 B17MC060016 Housing 14B LMH 8682 Completed $125,800.78 $125,800.78 $125,800.78$125,800.78NoCA SAN FRANCISCO 2017 B17MC060016 Housing 14B LMH 9129 Cancel $0.00 $0.00 $0.00NoCA SAN FRANCISCO 2017 B17MC060016 Housing 14B LMH 9143 Open $143,569.07 $0.00 $143,569.07NoCA SAN FRANCISCO 2017 B17MC060016 Housing 14G LMH 8557 Completed $2,177,113.26 $2,177,113.26 $2,177,113.26$2,177,113.26NoCA SAN FRANCISCO 2017 B17MC060016 Housing 14G LMH 8558 Completed $699,709.52 $699,709.52 $699,709.52$699,709.52No
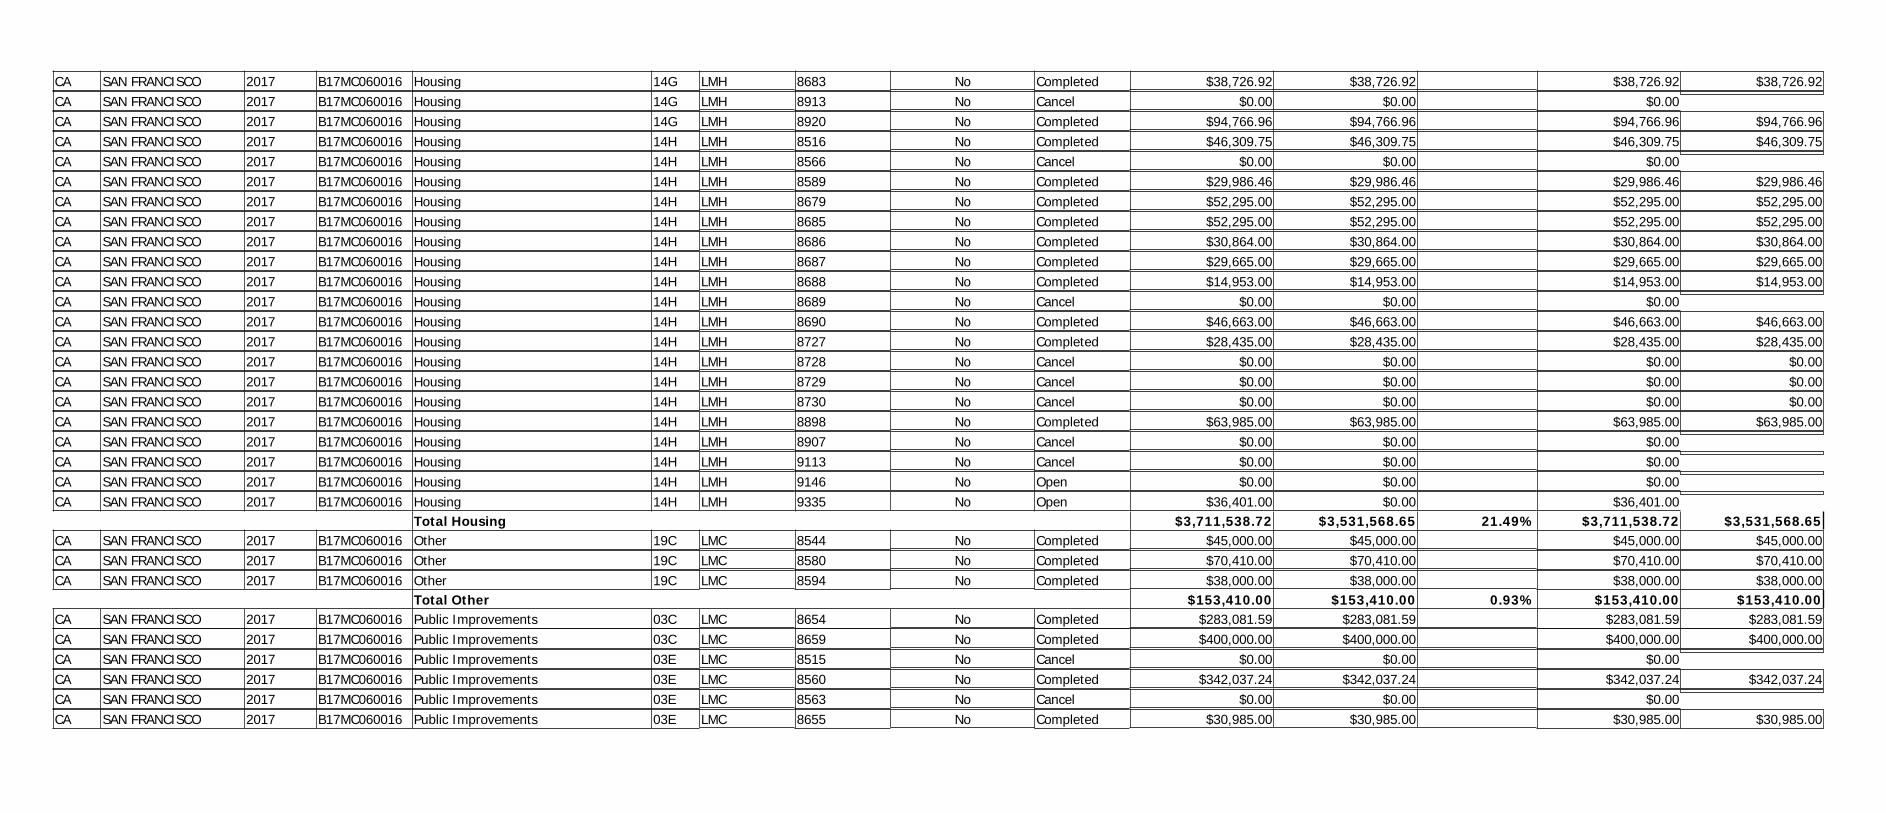
CA SAN FRANCISCO 2017 B17MC060016 Housing 14G LMH 8683 Completed $38,726.92 $38,726.92 $38,726.92$38,726.92NoCA SAN FRANCISCO 2017 B17MC060016 Housing 14G LMH 8913 Cancel $0.00 $0.00 $0.00NoCA SAN FRANCISCO 2017 B17MC060016 Housing 14G LMH 8920 Completed $94,766.96 $94,766.96 $94,766.96$94,766.96NoCA SAN FRANCISCO 2017 B17MC060016 Housing 14H LMH 8516 Completed $46,309.75 $46,309.75 $46,309.75$46,309.75NoCA SAN FRANCISCO 2017 B17MC060016 Housing 14H LMH 8566 Cancel $0.00 $0.00 $0.00NoCA SAN FRANCISCO 2017 B17MC060016 Housing 14H LMH 8589 Completed $29,986.46 $29,986.46 $29,986.46$29,986.46NoCA SAN FRANCISCO 2017 B17MC060016 Housing 14H LMH 8679 Completed $52,295.00 $52,295.00 $52,295.00$52,295.00NoCA SAN FRANCISCO 2017 B17MC060016 Housing 14H LMH 8685 Completed $52,295.00 $52,295.00 $52,295.00$52,295.00NoCA SAN FRANCISCO 2017 B17MC060016 Housing 14H LMH 8686 Completed $30,864.00 $30,864.00 $30,864.00$30,864.00NoCA SAN FRANCISCO 2017 B17MC060016 Housing 14H LMH 8687 Completed $29,665.00 $29,665.00 $29,665.00$29,665.00NoCA SAN FRANCISCO 2017 B17MC060016 Housing 14H LMH 8688 Completed $14,953.00 $14,953.00 $14,953.00$14,953.00NoCA SAN FRANCISCO 2017 B17MC060016 Housing 14H LMH 8689 Cancel $0.00 $0.00 $0.00NoCA SAN FRANCISCO 2017 B17MC060016 Housing 14H LMH 8690 Completed $46,663.00 $46,663.00 $46,663.00$46,663.00NoCA SAN FRANCISCO 2017 B17MC060016 Housing 14H LMH 8727 Completed $28,435.00 $28,435.00 $28,435.00$28,435.00NoCA SAN FRANCISCO 2017 B17MC060016 Housing 14H LMH 8728 Cancel $0.00 $0.00 $0.00$0.00NoCA SAN FRANCISCO 2017 B17MC060016 Housing 14H LMH 8729 Cancel $0.00 $0.00 $0.00$0.00NoCA SAN FRANCISCO 2017 B17MC060016 Housing 14H LMH 8730 Cancel $0.00 $0.00 $0.00$0.00NoCA SAN FRANCISCO 2017 B17MC060016 Housing 14H LMH 8898 Completed $63,985.00 $63,985.00 $63,985.00$63,985.00NoCA SAN FRANCISCO 2017 B17MC060016 Housing 14H LMH 8907 Cancel $0.00 $0.00 $0.00NoCA SAN FRANCISCO 2017 B17MC060016 Housing 14H LMH 9113 Cancel $0.00 $0.00 $0.00NoCA SAN FRANCISCO 2017 B17MC060016 Housing 14H LMH 9146 Open $0.00 $0.00 $0.00NoCA SAN FRANCISCO 2017 B17MC060016 Housing 14H LMH 9335 Open $36,401.00 $0.00 $36,401.00No
Total Housing 21.49%$3,711,538.72 $3,531,568.65 $3,711,538.72 $3,531,568.65CA SAN FRANCISCO 2017 B17MC060016 Other 19C LMC 8544 Completed $45,000.00 $45,000.00 $45,000.00$45,000.00NoCA SAN FRANCISCO 2017 B17MC060016 Other 19C LMC 8580 Completed $70,410.00 $70,410.00 $70,410.00$70,410.00NoCA SAN FRANCISCO 2017 B17MC060016 Other 19C LMC 8594 Completed $38,000.00 $38,000.00 $38,000.00$38,000.00No
Total Other 0.93%$153,410.00 $153,410.00 $153,410.00 $153,410.00CA SAN FRANCISCO 2017 B17MC060016 Public Improvements 03C LMC 8654 Completed $283,081.59 $283,081.59 $283,081.59$283,081.59NoCA SAN FRANCISCO 2017 B17MC060016 Public Improvements 03C LMC 8659 Completed $400,000.00 $400,000.00 $400,000.00$400,000.00NoCA SAN FRANCISCO 2017 B17MC060016 Public Improvements 03E LMC 8515 Cancel $0.00 $0.00 $0.00NoCA SAN FRANCISCO 2017 B17MC060016 Public Improvements 03E LMC 8560 Completed $342,037.24 $342,037.24 $342,037.24$342,037.24NoCA SAN FRANCISCO 2017 B17MC060016 Public Improvements 03E LMC 8563 Cancel $0.00 $0.00 $0.00NoCA SAN FRANCISCO 2017 B17MC060016 Public Improvements 03E LMC 8655 Completed $30,985.00 $30,985.00 $30,985.00$30,985.00No

CA SAN FRANCISCO 2017 B17MC060016 Public Improvements 03E LMC 8656 Completed $46,000.00 $46,000.00 $46,000.00$46,000.00NoCA SAN FRANCISCO 2017 B17MC060016 Public Improvements 03E LMC 8657 Completed $98,210.00 $98,210.00 $106,051.00$106,051.00NoCA SAN FRANCISCO 2017 B17MC060016 Public Improvements 03E LMC 8658 Completed $70,000.00 $70,000.00 $70,000.00$70,000.00NoCA SAN FRANCISCO 2017 B17MC060016 Public Improvements 03E LMC 8725 Cancel $0.00 $0.00 $0.00NoCA SAN FRANCISCO 2017 B17MC060016 Public Improvements 03E LMC 8726 Cancel $0.00 $0.00 $0.00NoCA SAN FRANCISCO 2017 B17MC060016 Public Improvements 03E LMC 8901 Cancel $0.00 $0.00 $0.00NoCA SAN FRANCISCO 2017 B17MC060016 Public Improvements 03E LMC 8902 Cancel $0.00 $0.00 $0.00NoCA SAN FRANCISCO 2017 B17MC060016 Public Improvements 03E LMC 8929 Cancel $0.00 $0.00 $0.00NoCA SAN FRANCISCO 2017 B17MC060016 Public Improvements 03E LMC 9104 Cancel $0.00 $0.00 $0.00NoCA SAN FRANCISCO 2017 B17MC060016 Public Improvements 03E LMC 9108 Cancel $0.00 $0.00 $0.00NoCA SAN FRANCISCO 2017 B17MC060016 Public Improvements 03E LMC 9110 Cancel $0.00 $0.00 $0.00NoCA SAN FRANCISCO 2017 B17MC060016 Public Improvements 03E LMC 9303 Open $5,266.00 $0.00 $145,266.00NoCA SAN FRANCISCO 2017 B17MC060016 Public Improvements 03E LMC 9330 Open $0.00 $0.00 $105,000.00NoCA SAN FRANCISCO 2017 B17MC060016 Public Improvements 03E LMC 9332 Open $91,500.00 $0.00 $91,500.00NoCA SAN FRANCISCO 2017 B17MC060016 Public Improvements 03E LMC 9333 Open $653.00 $0.00 $90,070.00NoCA SAN FRANCISCO 2017 B17MC060016 Public Improvements 03M LMC 9346 Open $151,918.41 $0.00 $250,000.00YesCA SAN FRANCISCO 2017 B17MC060016 Public Improvements 03Z LMA 2 Open $0.00 $0.00 $138,337,589.69$138,337,589.69NoCA SAN FRANCISCO 2017 B17MC060016 Public Improvements 03Z LMC 8905 Completed $35,000.00 $35,000.00 $98,225.08$98,225.08No
Total Public Improvements 7.94%$1,554,651.24 $1,305,313.83 $140,395,805.60 $139,713,969.60CA SAN FRANCISCO 2017 B17MC060016 Public Services 05B LMC 8620 Completed $50,000.00 $50,000.00 $50,000.00$50,000.00NoCA SAN FRANCISCO 2017 B17MC060016 Public Services 05C LMC 8502 Completed $81,987.14 $81,987.14 $81,987.14$81,987.14NoCA SAN FRANCISCO 2017 B17MC060016 Public Services 05C LMC 8514 Completed $52,000.00 $52,000.00 $52,000.00$52,000.00NoCA SAN FRANCISCO 2017 B17MC060016 Public Services 05C LMC 8521 Completed $99,999.93 $99,999.93 $99,999.93$99,999.93NoCA SAN FRANCISCO 2017 B17MC060016 Public Services 05C LMC 8525 Completed $80,000.00 $80,000.00 $80,000.00$80,000.00NoCA SAN FRANCISCO 2017 B17MC060016 Public Services 05C LMC 8537 Completed $49,163.75 $49,163.75 $49,163.75$49,163.75NoCA SAN FRANCISCO 2017 B17MC060016 Public Services 05C LMC 8548 Completed $60,000.00 $60,000.00 $60,000.00$60,000.00NoCA SAN FRANCISCO 2017 B17MC060016 Public Services 05C LMC 8552 Completed $44,072.33 $44,072.33 $44,072.33$44,072.33NoCA SAN FRANCISCO 2017 B17MC060016 Public Services 05C LMC 8553 Completed $80,000.00 $80,000.00 $80,000.00$80,000.00NoCA SAN FRANCISCO 2017 B17MC060016 Public Services 05C LMC 8587 Completed $50,000.00 $50,000.00 $50,000.00$50,000.00NoCA SAN FRANCISCO 2017 B17MC060016 Public Services 05C LMC 8618 Completed $81,111.00 $81,111.00 $81,111.00$81,111.00NoCA SAN FRANCISCO 2017 B17MC060016 Public Services 05C LMC 9119 Completed $51,935.09 $51,935.09 $150,000.00$150,000.00NoCA SAN FRANCISCO 2017 B17MC060016 Public Services 05C LMC 9323 Open $250,000.00 $103,919.06 $103,919.06$250,000.00NoCA SAN FRANCISCO 2017 B17MC060016 Public Services 05F LMC 8540 Completed $55,000.00 $55,000.00 $55,000.00$55,000.00No

CA SAN FRANCISCO 2017 B17MC060016 Public Services 05G LMC 8518 Completed $102,000.00 $102,000.00 $102,000.00$102,000.00NoCA SAN FRANCISCO 2017 B17MC060016 Public Services 05G LMC 8541 Completed $54,987.83 $54,987.83 $54,987.83$54,987.83NoCA SAN FRANCISCO 2017 B17MC060016 Public Services 05G LMC 8550 Completed $26,678.00 $26,678.00 $26,678.00$26,678.00NoCA SAN FRANCISCO 2017 B17MC060016 Public Services 05H LMC 8511 Completed $163,424.63 $163,424.63 $163,424.63$163,424.63NoCA SAN FRANCISCO 2017 B17MC060016 Public Services 05H LMC 8526 Completed $100,000.00 $100,000.00 $100,000.00$100,000.00NoCA SAN FRANCISCO 2017 B17MC060016 Public Services 05H LMC 8527 Completed $196,053.61 $196,053.61 $196,053.61$196,053.61NoCA SAN FRANCISCO 2017 B17MC060016 Public Services 05H LMC 8529 Completed $150,000.00 $150,000.00 $150,000.00$150,000.00NoCA SAN FRANCISCO 2017 B17MC060016 Public Services 05H LMC 8530 Cancel $0.00 $0.00 $0.00NoCA SAN FRANCISCO 2017 B17MC060016 Public Services 05H LMC 8531 Completed $75,000.00 $75,000.00 $75,000.00$75,000.00NoCA SAN FRANCISCO 2017 B17MC060016 Public Services 05H LMC 8534 Completed $75,000.00 $75,000.00 $75,000.00$75,000.00NoCA SAN FRANCISCO 2017 B17MC060016 Public Services 05H LMC 8575 Completed $10,000.00 $10,000.00 $10,000.00$10,000.00NoCA SAN FRANCISCO 2017 B17MC060016 Public Services 05H LMC 8582 Completed $90,000.00 $90,000.00 $90,000.00$90,000.00NoCA SAN FRANCISCO 2017 B17MC060016 Public Services 05H LMC 8588 Completed $100,000.00 $100,000.00 $100,000.00$100,000.00NoCA SAN FRANCISCO 2017 B17MC060016 Public Services 05H LMC 8599 Completed $149,997.00 $149,997.00 $149,997.00$149,997.00NoCA SAN FRANCISCO 2017 B17MC060016 Public Services 05H LMC 8600 Completed $70,000.00 $70,000.00 $70,000.00$70,000.00NoCA SAN FRANCISCO 2017 B17MC060016 Public Services 05H LMC 8604 Completed $62,350.72 $62,350.72 $62,350.72$62,350.72NoCA SAN FRANCISCO 2017 B17MC060016 Public Services 05H LMC 8616 Completed $47,996.49 $47,996.49 $47,996.49$47,996.49NoCA SAN FRANCISCO 2017 B17MC060016 Public Services 05H LMC 8621 Completed $50,000.00 $50,000.00 $50,000.00$50,000.00NoCA SAN FRANCISCO 2017 B17MC060016 Public Services 05H LMC 8623 Completed $100,000.00 $100,000.00 $100,000.00$100,000.00NoCA SAN FRANCISCO 2017 B17MC060016 Public Services 05H LMC 8630 Completed $166,908.38 $166,908.38 $166,908.38$166,908.38NoCA SAN FRANCISCO 2017 B17MC060016 Public Services 05H LMC 8660 Completed $67,947.25 $67,947.25 $67,947.25$67,947.25NoCA SAN FRANCISCO 2017 B17MC060016 Public Services 05H LMC 8734 Cancel $0.00 $0.00 $0.00NoCA SAN FRANCISCO 2017 B17MC060016 Public Services 05H LMC 8940 Cancel $0.00 $0.00 $0.00NoCA SAN FRANCISCO 2017 B17MC060016 Public Services 05H LMC 8945 Cancel $0.00 $0.00 $0.00NoCA SAN FRANCISCO 2017 B17MC060016 Public Services 05H LMC 8946 Cancel $0.00 $0.00 $0.00NoCA SAN FRANCISCO 2017 B17MC060016 Public Services 05H LMC 8983 Cancel $0.00 $0.00 $0.00NoCA SAN FRANCISCO 2017 B17MC060016 Public Services 05H LMC 9009 Completed $40,000.00 $40,000.00 $99,999.99$99,999.99NoCA SAN FRANCISCO 2017 B17MC060016 Public Services 05H LMC 9076 Completed $117,500.00 $117,500.00 $125,000.00$125,000.00NoCA SAN FRANCISCO 2017 B17MC060016 Public Services 05H LMC 9078 Completed $97,700.00 $97,700.00 $456,529.00$456,529.00NoCA SAN FRANCISCO 2017 B17MC060016 Public Services 05K LMC 8522 Cancel $0.00 $0.00 $0.00NoCA SAN FRANCISCO 2017 B17MC060016 Public Services 05K LMC 8528 Completed $50,000.00 $50,000.00 $50,000.00$50,000.00NoCA SAN FRANCISCO 2017 B17MC060016 Public Services 05K LMC 8549 Completed $10,000.00 $10,000.00 $10,000.00$10,000.00NoCA SAN FRANCISCO 2017 B17MC060016 Public Services 05K LMC 8602 Completed $58,443.17 $58,443.17 $58,443.17$58,443.17No

CA SAN FRANCISCO 2017 B17MC060016 Public Services 05K LMC 8619 Completed $42,500.00 $42,500.00 $42,500.00$42,500.00NoCA SAN FRANCISCO 2017 B17MC060016 Public Services 05K LMC 8953 Completed $66,546.00 $66,546.00 $150,000.00$150,000.00NoCA SAN FRANCISCO 2017 B17MC060016 Public Services 05K LMC 9178 Open $168,828.37 $168,828.37 $168,828.37$168,828.37NoCA SAN FRANCISCO 2017 B17MC060016 Public Services 05K LMC 9179 Completed $50,805.00 $50,805.00 $50,805.00$50,805.00NoCA SAN FRANCISCO 2017 B17MC060016 Public Services 05K LMC 9383 Open $120,000.00 $0.00 $120,000.00NoCA SAN FRANCISCO 2017 B17MC060016 Public Services 05M LMC 8542 Completed $49,950.02 $49,950.02 $49,950.02$49,950.02NoCA SAN FRANCISCO 2017 B17MC060016 Public Services 05U LMC 8536 Completed $50,000.00 $50,000.00 $50,000.00$50,000.00NoCA SAN FRANCISCO 2017 B17MC060016 Public Services 05U LMC 8543 Completed $65,000.00 $65,000.00 $65,000.00$65,000.00NoCA SAN FRANCISCO 2017 B17MC060016 Public Services 05U LMC 8546 Completed $49,999.92 $49,999.92 $49,999.92$49,999.92NoCA SAN FRANCISCO 2017 B17MC060016 Public Services 05U LMC 8547 Completed $34,231.04 $34,231.04 $34,231.04$34,231.04NoCA SAN FRANCISCO 2017 B17MC060016 Public Services 05U LMC 8565 Cancel $0.00 $0.00 $0.00NoCA SAN FRANCISCO 2017 B17MC060016 Public Services 05U LMC 8595 Completed $36,000.00 $36,000.00 $36,000.00$36,000.00NoCA SAN FRANCISCO 2017 B17MC060016 Public Services 05U LMC 8598 Completed $100,000.00 $100,000.00 $100,000.00$100,000.00NoCA SAN FRANCISCO 2017 B17MC060016 Public Services 05U LMC 8603 Completed $45,691.99 $45,691.99 $45,691.99$45,691.99NoCA SAN FRANCISCO 2017 B17MC060016 Public Services 05U LMC 8606 Completed $50,000.00 $50,000.00 $50,000.00$50,000.00NoCA SAN FRANCISCO 2017 B17MC060016 Public Services 05U LMC 8670 Completed $47,064.14 $47,064.14 $47,064.14$47,064.14NoCA SAN FRANCISCO 2017 B17MC060016 Public Services 05U LMC 8672 Completed $18,000.00 $18,000.00 $18,000.00$18,000.00NoCA SAN FRANCISCO 2017 B17MC060016 Public Services 05U LMC 8695 Completed $67,240.27 $67,240.27 $67,240.27$67,240.27NoCA SAN FRANCISCO 2017 B17MC060016 Public Services 05U LMC 8908 Cancel $0.00 $0.00 $0.00NoCA SAN FRANCISCO 2017 B17MC060016 Public Services 05X LMC 8933 Completed $65,325.00 $65,325.00 $100,000.00$100,000.00NoCA SAN FRANCISCO 2017 B17MC060016 Public Services 05Z LMC 8512 Completed $48,840.70 $48,840.70 $48,840.70$48,840.70NoCA SAN FRANCISCO 2017 B17MC060016 Public Services 05Z LMC 8513 Completed $43,962.58 $43,962.58 $43,962.58$43,962.58NoCA SAN FRANCISCO 2017 B17MC060016 Public Services 05Z LMC 8523 Completed $0.00 $0.00 $95,879.13$95,879.13NoCA SAN FRANCISCO 2017 B17MC060016 Public Services 05Z LMC 8524 Completed $0.00 $0.00 $200,000.00$200,000.00NoCA SAN FRANCISCO 2017 B17MC060016 Public Services 05Z LMC 8532 Completed $49,960.50 $49,960.50 $49,960.50$49,960.50NoCA SAN FRANCISCO 2017 B17MC060016 Public Services 05Z LMC 8533 Completed $11,264.31 $11,264.31 $11,264.31$11,264.31NoCA SAN FRANCISCO 2017 B17MC060016 Public Services 05Z LMC 8535 Completed $99,785.91 $99,785.91 $99,785.91$99,785.91NoCA SAN FRANCISCO 2017 B17MC060016 Public Services 05Z LMC 8538 Completed $50,000.00 $50,000.00 $50,000.00$50,000.00NoCA SAN FRANCISCO 2017 B17MC060016 Public Services 05Z LMC 8539 Completed $69,761.63 $69,761.63 $69,761.63$69,761.63NoCA SAN FRANCISCO 2017 B17MC060016 Public Services 05Z LMC 8545 Completed $49,733.81 $49,733.81 $49,733.81$49,733.81NoCA SAN FRANCISCO 2017 B17MC060016 Public Services 05Z LMC 8554 Completed $50,000.00 $50,000.00 $50,000.00$50,000.00NoCA SAN FRANCISCO 2017 B17MC060016 Public Services 05Z LMC 8556 Cancel $0.00 $0.00 $0.00NoCA SAN FRANCISCO 2017 B17MC060016 Public Services 05Z LMC 8559 Cancel $0.00 $0.00 $0.00No

CA SAN FRANCISCO 2017 B17MC060016 Public Services 05Z LMC 8561 Completed $45,000.00 $45,000.00 $45,000.00$45,000.00NoCA SAN FRANCISCO 2017 B17MC060016 Public Services 05Z LMC 8567 Completed $61,845.46 $61,845.46 $61,845.46$61,845.46NoCA SAN FRANCISCO 2017 B17MC060016 Public Services 05Z LMC 8568 Completed $64,999.92 $64,999.92 $64,999.92$64,999.92NoCA SAN FRANCISCO 2017 B17MC060016 Public Services 05Z LMC 8572 Completed $50,000.00 $50,000.00 $50,000.00$50,000.00NoCA SAN FRANCISCO 2017 B17MC060016 Public Services 05Z LMC 8573 Completed $50,000.00 $50,000.00 $50,000.00$50,000.00NoCA SAN FRANCISCO 2017 B17MC060016 Public Services 05Z LMC 8574 Completed $55,000.00 $55,000.00 $55,000.00$55,000.00NoCA SAN FRANCISCO 2017 B17MC060016 Public Services 05Z LMC 8576 Completed $50,000.00 $50,000.00 $50,000.00$50,000.00NoCA SAN FRANCISCO 2017 B17MC060016 Public Services 05Z LMC 8578 Completed $50,000.00 $50,000.00 $50,000.00$50,000.00NoCA SAN FRANCISCO 2017 B17MC060016 Public Services 05Z LMC 8586 Completed $50,000.00 $50,000.00 $50,000.00$50,000.00NoCA SAN FRANCISCO 2017 B17MC060016 Public Services 05Z LMC 8596 Completed $49,998.28 $49,998.28 $49,998.28$49,998.28NoCA SAN FRANCISCO 2017 B17MC060016 Public Services 05Z LMC 8597 Completed $50,000.00 $50,000.00 $50,000.00$50,000.00NoCA SAN FRANCISCO 2017 B17MC060016 Public Services 05Z LMC 8617 Completed $50,000.00 $50,000.00 $50,000.00$50,000.00NoCA SAN FRANCISCO 2017 B17MC060016 Public Services 05Z LMC 8622 Completed $50,000.00 $50,000.00 $50,000.00$50,000.00NoCA SAN FRANCISCO 2017 B17MC060016 Public Services 05Z LMC 8624 Completed $55,000.00 $55,000.00 $55,000.00$55,000.00NoCA SAN FRANCISCO 2017 B17MC060016 Public Services 05Z LMC 8625 Completed $50,000.00 $50,000.00 $50,000.00$50,000.00NoCA SAN FRANCISCO 2017 B17MC060016 Public Services 05Z LMC 8627 Completed $52,048.80 $52,048.80 $52,048.80$52,048.80NoCA SAN FRANCISCO 2017 B17MC060016 Public Services 05Z LMC 8628 Completed $204,578.24 $204,578.24 $204,578.24$204,578.24NoCA SAN FRANCISCO 2017 B17MC060016 Public Services 05Z LMC 8629 Completed $78,643.36 $78,643.36 $78,643.36$78,643.36NoCA SAN FRANCISCO 2017 B17MC060016 Public Services 05Z LMC 8733 Cancel $0.00 $0.00 $0.00NoCA SAN FRANCISCO 2017 B17MC060016 Public Services 05Z LMC 8906 Completed $89,840.40 $89,840.40 $89,840.40$89,840.40NoCA SAN FRANCISCO 2017 B17MC060016 Public Services 05Z LMC 8982 Cancel $0.00 $0.00 $0.00NoCA SAN FRANCISCO 2017 B17MC060016 Public Services 05Z LMC 9118 Completed $50,000.00 $50,000.00 $100,000.00$100,000.00NoCA SAN FRANCISCO 2017 B17MC060016 Public Services 05Z LMC 9380 Open $0.00 $0.00 $0.00No
Non CARES Related Public Services 35.96%$6,174,701.97 $5,908,621.03 $7,163,104.00 $6,897,023.06CA SAN FRANCISCO 2017 B17MC060016 Repayments Of Section 108 Loans 19F 8564 Cancel $0.00 $0.00 $0.00NoCA SAN FRANCISCO 2017 B17MC060016 Repayments Of Section 108 Loans 19F 8583 Cancel $0.00 $0.00 $0.00NoCA SAN FRANCISCO 2017 B17MC060016 Repayments Of Section 108 Loans 19F 8899 Cancel $0.00 $0.00 $0.00NoCA SAN FRANCISCO 2017 B17MC060016 Repayments Of Section 108 Loans 19F 8900 Cancel $0.00 $0.00 $0.00NoCA SAN FRANCISCO 2017 B17MC060016 Repayments Of Section 108 Loans 19F 9145 Cancel $0.00 $0.00 $0.00NoCA SAN FRANCISCO 2017 B17MC060016 Repayments Of Section 108 Loans 19F 9176 Open $0.00 $0.00 $0.00NoCA SAN FRANCISCO 2017 B17MC060016 Repayments Of Section 108 Loans 19F 9177 Open $158,918.67 $0.00 $158,918.67No
Total Repayments Of Section 108 Loans 0.00%$158,918.67 $0.00 $158,918.67 $0.00Total 2017 94.80%$16,431,172.00 $15,576,864.91 $155,247,984.10$156,534,789.78

State Grantee Amount DrawnGrantGrant Activity Matrix National IDIS Activity Amount FundedTotal Grant Amount for 2016 Grant year = $16,485,875.00
% of CDBG Drawn Total CDBG Funded Total CDBG DrawnName From Selected GrantNumberYear Group Code Objective Activity Status From Selected Grant From Selected Amount Amount
Grant/GrantAmount
(All Years All Sources) (All Years All Sources)
Activity to prevent,prepare for, and
respond to CoronavirusCA SAN FRANCISCO 2016 B16MC060016 Acquisition 08 LMA 8653 Completed $28,336.25 $28,336.25 $28,336.25$28,336.25No
Total Acquisition 0.17%$28,336.25 $28,336.25 $28,336.25 $28,336.25CA SAN FRANCISCO 2016 B16MC060016 Administrative And Planning 21A 8315 Open $2,875,655.37 $2,859,320.46 $2,875,780.46$2,892,115.37NoCA SAN FRANCISCO 2016 B16MC060016 Administrative And Planning 21A 8358 Completed $117,000.00 $117,000.00 $117,000.00$117,000.00NoCA SAN FRANCISCO 2016 B16MC060016 Administrative And Planning 21A 8360 Completed $320,850.00 $320,850.00 $320,850.00$320,850.00No
Total Administrative And Planning 20.00%$3,313,505.37 $3,297,170.46 $3,329,965.37 $3,313,630.46CA SAN FRANCISCO 2016 B16MC060016 Economic Development 18A LMJ 8952 Completed $70,192.39 $70,192.39 $329,869.00$329,869.00NoCA SAN FRANCISCO 2016 B16MC060016 Economic Development 18B LMA 8272 Completed $60,693.73 $60,693.73 $60,693.73$60,693.73NoCA SAN FRANCISCO 2016 B16MC060016 Economic Development 18B LMA 8273 Completed $69,793.83 $69,793.83 $69,793.83$69,793.83NoCA SAN FRANCISCO 2016 B16MC060016 Economic Development 18B LMA 8338 Completed $45,000.00 $45,000.00 $45,000.00$45,000.00NoCA SAN FRANCISCO 2016 B16MC060016 Economic Development 18B LMA 8339 Completed $75,000.00 $75,000.00 $75,000.00$75,000.00NoCA SAN FRANCISCO 2016 B16MC060016 Economic Development 18B LMA 8353 Completed $92,019.74 $92,019.74 $92,019.74$92,019.74NoCA SAN FRANCISCO 2016 B16MC060016 Economic Development 18B LMJ 8308 Completed $100,000.00 $100,000.00 $100,000.00$100,000.00NoCA SAN FRANCISCO 2016 B16MC060016 Economic Development 18B LMJ 8342 Completed $30,000.00 $30,000.00 $30,000.00$30,000.00NoCA SAN FRANCISCO 2016 B16MC060016 Economic Development 18B LMJ 8343 Completed $166,561.00 $166,561.00 $166,561.00$166,561.00NoCA SAN FRANCISCO 2016 B16MC060016 Economic Development 18B LMJ 8348 Completed $45,000.00 $45,000.00 $45,000.00$45,000.00NoCA SAN FRANCISCO 2016 B16MC060016 Economic Development 18B LMJ 8369 Completed $65,000.00 $65,000.00 $65,000.00$65,000.00NoCA SAN FRANCISCO 2016 B16MC060016 Economic Development 18B LMJ 8370 Completed $50,000.00 $50,000.00 $50,000.00$50,000.00NoCA SAN FRANCISCO 2016 B16MC060016 Economic Development 18B LMJ 8371 Completed $75,000.00 $75,000.00 $75,000.00$75,000.00NoCA SAN FRANCISCO 2016 B16MC060016 Economic Development 18B LMJ 8384 Completed $105,835.88 $105,835.88 $105,835.88$105,835.88NoCA SAN FRANCISCO 2016 B16MC060016 Economic Development 18B LMJ 8477 Cancel $0.00 $0.00 $0.00NoCA SAN FRANCISCO 2016 B16MC060016 Economic Development 18B LMJ 8897 Cancel $0.00 $0.00 $0.00NoCA SAN FRANCISCO 2016 B16MC060016 Economic Development 18C LMCMC 8304 Completed $50,000.00 $50,000.00 $50,000.00$50,000.00NoCA SAN FRANCISCO 2016 B16MC060016 Economic Development 18C LMCMC 8322 Completed $49,999.92 $49,999.92 $49,999.92$49,999.92NoCA SAN FRANCISCO 2016 B16MC060016 Economic Development 18C LMCMC 8329 Completed $50,000.00 $50,000.00 $50,000.00$50,000.00NoCA SAN FRANCISCO 2016 B16MC060016 Economic Development 18C LMCMC 8330 Completed $74,103.97 $74,103.97 $74,103.97$74,103.97NoCA SAN FRANCISCO 2016 B16MC060016 Economic Development 18C LMCMC 8354 Completed $74,568.25 $74,568.25 $74,568.25$74,568.25NoCA SAN FRANCISCO 2016 B16MC060016 Economic Development 18C LMCMC 8355 Completed $37,792.29 $37,792.29 $37,792.29$37,792.29NoCA SAN FRANCISCO 2016 B16MC060016 Economic Development 18C LMCMC 8366 Completed $20,000.00 $20,000.00 $35,000.00$35,000.00No

CA SAN FRANCISCO 2016 B16MC060016 Economic Development 18C LMCMC 8388 Completed $45,000.00 $45,000.00 $45,000.00$45,000.00NoTotal Economic Development 8.80%$1,451,561.00 $1,451,561.00 $1,726,237.61 $1,726,237.61
CA SAN FRANCISCO 2016 B16MC060016 Housing 14B LMH 8419 Completed $0.00 $0.00 $410,365.23$410,365.23NoCA SAN FRANCISCO 2016 B16MC060016 Housing 14B LMH 8432 Completed $97,377.88 $97,377.88 $97,377.88$97,377.88NoCA SAN FRANCISCO 2016 B16MC060016 Housing 14B LMH 8676 Open $52,690.05 $52,690.05 $52,690.05$52,690.05NoCA SAN FRANCISCO 2016 B16MC060016 Housing 14B LMH 8681 Completed $256,330.06 $256,330.06 $256,330.06$256,330.06NoCA SAN FRANCISCO 2016 B16MC060016 Housing 14B LMH 9144 Open $0.00 $0.00 $106,430.93NoCA SAN FRANCISCO 2016 B16MC060016 Housing 14C LMH 8652 Completed $10,651.38 $10,651.38 $10,651.38$10,651.38NoCA SAN FRANCISCO 2016 B16MC060016 Housing 14G LMH 8310 Completed $1,248,814.12 $1,248,814.12 $1,248,814.12$1,248,814.12NoCA SAN FRANCISCO 2016 B16MC060016 Housing 14G LMH 8311 Completed $840,444.96 $840,444.96 $840,444.96$840,444.96NoCA SAN FRANCISCO 2016 B16MC060016 Housing 14G LMH 8408 Completed $1,561,392.88 $1,561,392.88 $1,561,392.88$1,561,392.88NoCA SAN FRANCISCO 2016 B16MC060016 Housing 14H LMH 8318 Cancel $0.00 $0.00 $0.00NoCA SAN FRANCISCO 2016 B16MC060016 Housing 14H LMH 8352 Completed $29,999.49 $29,999.49 $29,999.49$29,999.49NoCA SAN FRANCISCO 2016 B16MC060016 Housing 14H LMH 8649 Cancel $0.00 $0.00 $0.00NoCA SAN FRANCISCO 2016 B16MC060016 Housing 14H LMH 8914 Cancel $0.00 $0.00 $0.00NoCA SAN FRANCISCO 2016 B16MC060016 Housing 14H LMH 9121 Cancel $0.00 $0.00 $0.00NoCA SAN FRANCISCO 2016 B16MC060016 Housing 14I LMH 8404 Completed $0.00 $0.00 $5,196.90$5,196.90No
Total Housing 24.86%$4,097,700.82 $4,097,700.82 $4,619,693.88 $4,513,262.95CA SAN FRANCISCO 2016 B16MC060016 Other 19C LMC 8297 Completed $45,000.00 $45,000.00 $45,000.00$45,000.00NoCA SAN FRANCISCO 2016 B16MC060016 Other 19C LMC 8341 Completed $70,410.00 $70,410.00 $70,410.00$70,410.00NoCA SAN FRANCISCO 2016 B16MC060016 Other 19C LMC 8356 Completed $38,000.00 $38,000.00 $38,000.00$38,000.00No
Total Other 0.93%$153,410.00 $153,410.00 $153,410.00 $153,410.00CA SAN FRANCISCO 2016 B16MC060016 Public Improvements 03B LMC 8932 Open $0.00 $0.00 $20,437.85$200,000.00NoCA SAN FRANCISCO 2016 B16MC060016 Public Improvements 03D LMC 8647 Completed $80,000.00 $80,000.00 $80,000.00$80,000.00NoCA SAN FRANCISCO 2016 B16MC060016 Public Improvements 03D LMC 8648 Completed $249,869.00 $249,869.00 $249,869.00$249,869.00NoCA SAN FRANCISCO 2016 B16MC060016 Public Improvements 03E LMC 8147 Completed $0.00 $0.00 $7,470.00$7,470.00NoCA SAN FRANCISCO 2016 B16MC060016 Public Improvements 03E LMC 8465 Cancel $0.00 $0.00 $0.00NoCA SAN FRANCISCO 2016 B16MC060016 Public Improvements 03E LMC 8466 Completed $195,000.00 $195,000.00 $195,000.00$195,000.00NoCA SAN FRANCISCO 2016 B16MC060016 Public Improvements 03E LMC 8467 Open $53,854.56 $53,854.56 $53,854.56$119,144.00NoCA SAN FRANCISCO 2016 B16MC060016 Public Improvements 03E LMC 8468 Completed $72,250.00 $72,250.00 $72,250.00$72,250.00NoCA SAN FRANCISCO 2016 B16MC060016 Public Improvements 03E LMC 8917 Completed $0.00 $0.00 $152,000.00$152,000.00NoCA SAN FRANCISCO 2016 B16MC060016 Public Improvements 03E LMC 8926 Cancel $0.00 $0.00 $0.00NoCA SAN FRANCISCO 2016 B16MC060016 Public Improvements 03E LMC 9019 Cancel $0.00 $0.00 $0.00No

CA SAN FRANCISCO 2016 B16MC060016 Public Improvements 03E LMC 9109 Completed $0.00 $0.00 $43,723.78$43,723.78NoCA SAN FRANCISCO 2016 B16MC060016 Public Improvements 03M LMC 8423 Completed $16,460.00 $16,460.00 $22,600.00$22,600.00NoCA SAN FRANCISCO 2016 B16MC060016 Public Improvements 03Z LMA 2 Open $0.00 $0.00 $138,337,589.69$138,337,589.69NoCA SAN FRANCISCO 2016 B16MC060016 Public Improvements 03Z LMC 8269 Completed $15,225.00 $15,225.00 $15,225.00$15,225.00NoCA SAN FRANCISCO 2016 B16MC060016 Public Improvements 03Z LMC 8313 Completed $365,123.36 $365,123.36 $365,123.36$365,123.36NoCA SAN FRANCISCO 2016 B16MC060016 Public Improvements 03Z LMC 8470 Cancel $0.00 $0.00 $0.00NoCA SAN FRANCISCO 2016 B16MC060016 Public Improvements 03Z LMC 8892 Cancel $0.00 $0.00 $0.00NoCA SAN FRANCISCO 2016 B16MC060016 Public Improvements 03Z LMC 8905 Completed $19,775.00 $19,775.00 $98,225.08$98,225.08No
Total Public Improvements 6.48%$1,067,556.92 $1,067,556.92 $139,958,219.91 $139,713,368.32CA SAN FRANCISCO 2016 B16MC060016 Public Services 05B LMC 8375 Completed $50,000.00 $50,000.00 $50,000.00$50,000.00NoCA SAN FRANCISCO 2016 B16MC060016 Public Services 05C LMC 8263 Completed $81,982.13 $81,982.13 $81,982.13$81,982.13NoCA SAN FRANCISCO 2016 B16MC060016 Public Services 05C LMC 8268 Completed $52,000.00 $52,000.00 $52,000.00$52,000.00NoCA SAN FRANCISCO 2016 B16MC060016 Public Services 05C LMC 8274 Completed $100,000.00 $100,000.00 $100,000.00$100,000.00NoCA SAN FRANCISCO 2016 B16MC060016 Public Services 05C LMC 8276 Completed $80,000.00 $80,000.00 $80,000.00$80,000.00NoCA SAN FRANCISCO 2016 B16MC060016 Public Services 05C LMC 8285 Completed $48,812.31 $48,812.31 $48,812.31$48,812.31NoCA SAN FRANCISCO 2016 B16MC060016 Public Services 05C LMC 8301 Completed $60,000.00 $60,000.00 $60,000.00$60,000.00NoCA SAN FRANCISCO 2016 B16MC060016 Public Services 05C LMC 8305 Completed $50,000.00 $50,000.00 $50,000.00$50,000.00NoCA SAN FRANCISCO 2016 B16MC060016 Public Services 05C LMC 8306 Completed $80,000.00 $80,000.00 $80,000.00$80,000.00NoCA SAN FRANCISCO 2016 B16MC060016 Public Services 05C LMC 8350 Completed $45,576.43 $45,576.43 $45,576.43$45,576.43NoCA SAN FRANCISCO 2016 B16MC060016 Public Services 05C LMC 8373 Completed $81,111.00 $81,111.00 $81,111.00$81,111.00NoCA SAN FRANCISCO 2016 B16MC060016 Public Services 05C LMC 9119 Completed $70,820.44 $70,820.44 $150,000.00$150,000.00NoCA SAN FRANCISCO 2016 B16MC060016 Public Services 05F LMC 8290 Completed $55,000.00 $55,000.00 $55,000.00$55,000.00NoCA SAN FRANCISCO 2016 B16MC060016 Public Services 05G LMC 8270 Completed $102,000.00 $102,000.00 $102,000.00$102,000.00NoCA SAN FRANCISCO 2016 B16MC060016 Public Services 05G LMC 8292 Completed $55,000.00 $55,000.00 $55,000.00$55,000.00NoCA SAN FRANCISCO 2016 B16MC060016 Public Services 05G LMC 8303 Completed $26,678.00 $26,678.00 $26,678.00$26,678.00NoCA SAN FRANCISCO 2016 B16MC060016 Public Services 05H LMC 8275 Completed $75,000.00 $75,000.00 $75,000.00$75,000.00NoCA SAN FRANCISCO 2016 B16MC060016 Public Services 05H LMC 8277 Completed $100,000.00 $100,000.00 $100,000.00$100,000.00NoCA SAN FRANCISCO 2016 B16MC060016 Public Services 05H LMC 8279 Completed $75,000.00 $75,000.00 $75,000.00$75,000.00NoCA SAN FRANCISCO 2016 B16MC060016 Public Services 05H LMC 8282 Completed $49,999.99 $49,999.99 $49,999.99$49,999.99NoCA SAN FRANCISCO 2016 B16MC060016 Public Services 05H LMC 8289 Completed $99,309.39 $99,309.39 $99,309.39$99,309.39NoCA SAN FRANCISCO 2016 B16MC060016 Public Services 05H LMC 8291 Completed $110,539.29 $110,539.29 $110,539.29$110,539.29NoCA SAN FRANCISCO 2016 B16MC060016 Public Services 05H LMC 8294 Completed $41,746.43 $41,746.43 $41,746.43$41,746.43NoCA SAN FRANCISCO 2016 B16MC060016 Public Services 05H LMC 8295 Completed $71,860.00 $71,860.00 $71,860.00$71,860.00No

CA SAN FRANCISCO 2016 B16MC060016 Public Services 05H LMC 8332 Completed $147,028.54 $147,028.54 $147,028.54$147,028.54NoCA SAN FRANCISCO 2016 B16MC060016 Public Services 05H LMC 8333 Completed $190,529.00 $190,529.00 $200,000.00$200,000.00NoCA SAN FRANCISCO 2016 B16MC060016 Public Services 05H LMC 8335 Completed $100,000.00 $100,000.00 $100,000.00$100,000.00NoCA SAN FRANCISCO 2016 B16MC060016 Public Services 05H LMC 8345 Completed $90,000.00 $90,000.00 $90,000.00$90,000.00NoCA SAN FRANCISCO 2016 B16MC060016 Public Services 05H LMC 8351 Completed $49,434.50 $49,434.50 $99,434.50$99,434.50NoCA SAN FRANCISCO 2016 B16MC060016 Public Services 05H LMC 8368 Completed $119,992.00 $119,992.00 $119,992.00$119,992.00NoCA SAN FRANCISCO 2016 B16MC060016 Public Services 05H LMC 8377 Completed $55,000.00 $55,000.00 $55,000.00$55,000.00NoCA SAN FRANCISCO 2016 B16MC060016 Public Services 05H LMC 8382 Completed $75,000.00 $75,000.00 $75,000.00$75,000.00NoCA SAN FRANCISCO 2016 B16MC060016 Public Services 05H LMC 8392 Completed $75,760.90 $75,760.90 $75,760.90$75,760.90NoCA SAN FRANCISCO 2016 B16MC060016 Public Services 05H LMC 8476 Cancel $0.00 $0.00 $0.00NoCA SAN FRANCISCO 2016 B16MC060016 Public Services 05H LMC 8896 Cancel $0.00 $0.00 $0.00NoCA SAN FRANCISCO 2016 B16MC060016 Public Services 05H LMC 8946 Cancel $0.00 $0.00 $0.00NoCA SAN FRANCISCO 2016 B16MC060016 Public Services 05H LMC 9078 Completed $28,800.00 $28,800.00 $456,529.00$456,529.00NoCA SAN FRANCISCO 2016 B16MC060016 Public Services 05K LMC 8278 Completed $50,000.00 $50,000.00 $50,000.00$50,000.00NoCA SAN FRANCISCO 2016 B16MC060016 Public Services 05K LMC 8302 Completed $10,000.00 $10,000.00 $10,000.00$10,000.00NoCA SAN FRANCISCO 2016 B16MC060016 Public Services 05K LMC 8363 Completed $55,567.07 $55,567.07 $55,567.07$55,567.07NoCA SAN FRANCISCO 2016 B16MC060016 Public Services 05K LMC 8374 Completed $42,500.00 $42,500.00 $42,500.00$42,500.00NoCA SAN FRANCISCO 2016 B16MC060016 Public Services 05K LMC 8694 Completed $3,060.16 $3,060.16 $3,060.16$3,060.16NoCA SAN FRANCISCO 2016 B16MC060016 Public Services 05K LMC 8731 Completed $139,445.58 $139,445.58 $139,445.58$139,445.58NoCA SAN FRANCISCO 2016 B16MC060016 Public Services 05K LMC 8953 Completed $80,000.00 $80,000.00 $150,000.00$150,000.00NoCA SAN FRANCISCO 2016 B16MC060016 Public Services 05K LMC 9175 Open $227,171.63 $227,171.63 $227,171.63$227,171.63NoCA SAN FRANCISCO 2016 B16MC060016 Public Services 05M LMC 8293 Completed $49,873.17 $49,873.17 $49,873.17$49,873.17NoCA SAN FRANCISCO 2016 B16MC060016 Public Services 05U LMC 8284 Completed $50,000.00 $50,000.00 $50,000.00$50,000.00NoCA SAN FRANCISCO 2016 B16MC060016 Public Services 05U LMC 8296 Completed $65,000.00 $65,000.00 $65,000.00$65,000.00NoCA SAN FRANCISCO 2016 B16MC060016 Public Services 05U LMC 8299 Completed $49,989.11 $49,989.11 $49,989.11$49,989.11NoCA SAN FRANCISCO 2016 B16MC060016 Public Services 05U LMC 8300 Completed $33,895.23 $33,895.23 $33,895.23$33,895.23NoCA SAN FRANCISCO 2016 B16MC060016 Public Services 05U LMC 8320 Cancel $0.00 $0.00 $0.00NoCA SAN FRANCISCO 2016 B16MC060016 Public Services 05U LMC 8357 Completed $36,000.00 $36,000.00 $36,000.00$36,000.00NoCA SAN FRANCISCO 2016 B16MC060016 Public Services 05U LMC 8362 Completed $100,000.00 $100,000.00 $100,000.00$100,000.00NoCA SAN FRANCISCO 2016 B16MC060016 Public Services 05U LMC 8364 Completed $50,000.00 $50,000.00 $50,000.00$50,000.00NoCA SAN FRANCISCO 2016 B16MC060016 Public Services 05U LMC 8367 Completed $50,000.00 $50,000.00 $50,000.00$50,000.00NoCA SAN FRANCISCO 2016 B16MC060016 Public Services 05U LMC 8650 Cancel $0.00 $0.00 $0.00NoCA SAN FRANCISCO 2016 B16MC060016 Public Services 05U LMC 8912 Cancel $0.00 $0.00 $0.00No

CA SAN FRANCISCO 2016 B16MC060016 Public Services 05X LMC 8933 Completed $34,675.00 $34,675.00 $100,000.00$100,000.00NoCA SAN FRANCISCO 2016 B16MC060016 Public Services 05Z LMC 8266 Completed $37,519.58 $37,519.58 $37,519.58$37,519.58NoCA SAN FRANCISCO 2016 B16MC060016 Public Services 05Z LMC 8267 Completed $42,981.49 $42,981.49 $42,981.49$42,981.49NoCA SAN FRANCISCO 2016 B16MC060016 Public Services 05Z LMC 8271 Cancel $0.00 $0.00 $0.00NoCA SAN FRANCISCO 2016 B16MC060016 Public Services 05Z LMC 8280 Completed $49,724.02 $49,724.02 $49,724.02$49,724.02NoCA SAN FRANCISCO 2016 B16MC060016 Public Services 05Z LMC 8281 Completed $49,479.31 $49,479.31 $49,479.31$49,479.31NoCA SAN FRANCISCO 2016 B16MC060016 Public Services 05Z LMC 8283 Completed $99,931.16 $99,931.16 $99,931.16$99,931.16NoCA SAN FRANCISCO 2016 B16MC060016 Public Services 05Z LMC 8286 Completed $50,000.00 $50,000.00 $50,000.00$50,000.00NoCA SAN FRANCISCO 2016 B16MC060016 Public Services 05Z LMC 8288 Completed $70,000.00 $70,000.00 $70,000.00$70,000.00NoCA SAN FRANCISCO 2016 B16MC060016 Public Services 05Z LMC 8298 Completed $46,736.57 $46,736.57 $46,736.57$46,736.57NoCA SAN FRANCISCO 2016 B16MC060016 Public Services 05Z LMC 8307 Completed $50,000.00 $50,000.00 $50,000.00$50,000.00NoCA SAN FRANCISCO 2016 B16MC060016 Public Services 05Z LMC 8309 Completed $50,000.00 $50,000.00 $82,138.00$82,138.00NoCA SAN FRANCISCO 2016 B16MC060016 Public Services 05Z LMC 8312 Completed $51,699.27 $51,699.27 $51,699.27$51,699.27NoCA SAN FRANCISCO 2016 B16MC060016 Public Services 05Z LMC 8314 Completed $45,000.00 $45,000.00 $45,000.00$45,000.00NoCA SAN FRANCISCO 2016 B16MC060016 Public Services 05Z LMC 8321 Completed $64,380.85 $64,380.85 $64,380.85$64,380.85NoCA SAN FRANCISCO 2016 B16MC060016 Public Services 05Z LMC 8328 Completed $64,999.92 $64,999.92 $64,999.92$64,999.92NoCA SAN FRANCISCO 2016 B16MC060016 Public Services 05Z LMC 8331 Completed $50,000.00 $50,000.00 $50,000.00$50,000.00NoCA SAN FRANCISCO 2016 B16MC060016 Public Services 05Z LMC 8334 Completed $50,000.00 $50,000.00 $50,000.00$50,000.00NoCA SAN FRANCISCO 2016 B16MC060016 Public Services 05Z LMC 8336 Completed $52,058.82 $52,058.82 $52,058.82$52,058.82NoCA SAN FRANCISCO 2016 B16MC060016 Public Services 05Z LMC 8337 Completed $50,000.00 $50,000.00 $50,000.00$50,000.00NoCA SAN FRANCISCO 2016 B16MC060016 Public Services 05Z LMC 8340 Completed $50,000.00 $50,000.00 $50,000.00$50,000.00NoCA SAN FRANCISCO 2016 B16MC060016 Public Services 05Z LMC 8349 Completed $49,686.92 $49,686.92 $49,686.92$49,686.92NoCA SAN FRANCISCO 2016 B16MC060016 Public Services 05Z LMC 8359 Completed $50,000.00 $50,000.00 $50,000.00$50,000.00NoCA SAN FRANCISCO 2016 B16MC060016 Public Services 05Z LMC 8361 Completed $50,000.00 $50,000.00 $50,000.00$50,000.00NoCA SAN FRANCISCO 2016 B16MC060016 Public Services 05Z LMC 8372 Completed $50,000.00 $50,000.00 $50,000.00$50,000.00NoCA SAN FRANCISCO 2016 B16MC060016 Public Services 05Z LMC 8376 Completed $42,618.31 $42,618.31 $42,618.31$42,618.31NoCA SAN FRANCISCO 2016 B16MC060016 Public Services 05Z LMC 8380 Completed $55,000.00 $55,000.00 $55,000.00$55,000.00NoCA SAN FRANCISCO 2016 B16MC060016 Public Services 05Z LMC 8386 Completed $49,841.00 $49,841.00 $49,841.00$49,841.00NoCA SAN FRANCISCO 2016 B16MC060016 Public Services 05Z LMC 8389 Completed $53,467.20 $53,467.20 $53,467.20$53,467.20NoCA SAN FRANCISCO 2016 B16MC060016 Public Services 05Z LMC 8390 Completed $244,463.81 $244,463.81 $244,463.81$244,463.81NoCA SAN FRANCISCO 2016 B16MC060016 Public Services 05Z LMC 8391 Completed $39,345.29 $39,345.29 $39,345.29$39,345.29NoCA SAN FRANCISCO 2016 B16MC060016 Public Services 05Z LMC 8475 Cancel $0.00 $0.00 $0.00NoCA SAN FRANCISCO 2016 B16MC060016 Public Services 05Z LMC 8895 Cancel $0.00 $0.00 $0.00No

CA SAN FRANCISCO 2016 B16MC060016 Public Services 05Z LMC 9376 Open $0.00 $0.00 $0.00NoNon CARES Related Public Services 32.94%$5,430,090.82 $5,430,090.82 $6,163,933.38 $6,163,933.38
CA SAN FRANCISCO 2016 B16MC060016 Repayments Of Section 108 Loans 19F 8316 Completed $681,405.82 $681,405.82 $681,405.82$681,405.82NoCA SAN FRANCISCO 2016 B16MC060016 Repayments Of Section 108 Loans 19F 8317 Cancel $0.00 $0.00 $0.00NoCA SAN FRANCISCO 2016 B16MC060016 Repayments Of Section 108 Loans 19F 8346 Completed $262,308.00 $262,308.00 $262,308.00$262,308.00No
Total Repayments Of Section 108 Loans 5.72%$943,713.82 $943,713.82 $943,713.82 $943,713.82Total 2016 99.90%$16,485,875.00 $16,469,540.09 $156,555,892.79$156,923,510.22
State Grantee Amount DrawnGrantGrant Activity Matrix National IDIS Activity Amount FundedTotal Grant Amount for 2015 Grant year = $16,489,944.00
% of CDBG Drawn Total CDBG Funded Total CDBG DrawnName From Selected GrantNumberYear Group Code Objective Activity Status From Selected Grant From Selected Amount Amount
Grant/GrantAmount
(All Years All Sources) (All Years All Sources)
Activity to prevent,prepare for, and
respond to CoronavirusCA SAN FRANCISCO 2015 B15MC060016 Administrative And Planning 21A 8105 Open $2,868,804.75 $2,860,137.09 $2,875,747.09$2,884,414.75NoCA SAN FRANCISCO 2015 B15MC060016 Administrative And Planning 21A 8178 Completed $117,000.00 $117,000.00 $117,000.00$117,000.00NoCA SAN FRANCISCO 2015 B15MC060016 Administrative And Planning 21A 8179 Completed $320,850.00 $320,850.00 $320,850.00$320,850.00NoCA SAN FRANCISCO 2015 B15MC060016 Administrative And Planning 21A 8183 Completed $0.00 $0.00 $865,743.65$865,743.65No
Total Administrative And Planning 20.00%$3,306,654.75 $3,297,987.09 $4,188,008.40 $4,179,340.74CA SAN FRANCISCO 2015 B15MC060016 Economic Development 17C LMA 8662 Completed $57,033.00 $57,033.00 $205,907.00$205,907.00NoCA SAN FRANCISCO 2015 B15MC060016 Economic Development 18A LMA 8108 Completed $50,000.00 $50,000.00 $50,000.00$50,000.00NoCA SAN FRANCISCO 2015 B15MC060016 Economic Development 18B LMA 8046 Completed $68,924.08 $68,924.08 $68,924.08$68,924.08NoCA SAN FRANCISCO 2015 B15MC060016 Economic Development 18B LMA 8047 Completed $46,709.22 $46,709.22 $46,709.22$46,709.22NoCA SAN FRANCISCO 2015 B15MC060016 Economic Development 18B LMA 8123 Completed $44,999.84 $44,999.84 $44,999.84$44,999.84NoCA SAN FRANCISCO 2015 B15MC060016 Economic Development 18B LMA 8124 Completed $75,000.00 $75,000.00 $75,000.00$75,000.00NoCA SAN FRANCISCO 2015 B15MC060016 Economic Development 18B LMA 8127 Completed $30,000.00 $30,000.00 $30,000.00$30,000.00NoCA SAN FRANCISCO 2015 B15MC060016 Economic Development 18B LMA 8139 Completed $98,403.75 $98,403.75 $98,403.75$98,403.75NoCA SAN FRANCISCO 2015 B15MC060016 Economic Development 18B LMJ 8097 Completed $75,000.00 $75,000.00 $75,000.00$75,000.00NoCA SAN FRANCISCO 2015 B15MC060016 Economic Development 18B LMJ 8128 Completed $166,560.57 $166,560.57 $166,560.57$166,560.57NoCA SAN FRANCISCO 2015 B15MC060016 Economic Development 18B LMJ 8132 Completed $45,000.00 $45,000.00 $45,000.00$45,000.00NoCA SAN FRANCISCO 2015 B15MC060016 Economic Development 18B LMJ 8157 Completed $65,000.00 $65,000.00 $65,000.00$65,000.00NoCA SAN FRANCISCO 2015 B15MC060016 Economic Development 18B LMJ 8158 Completed $155,000.00 $155,000.00 $155,000.00$155,000.00NoCA SAN FRANCISCO 2015 B15MC060016 Economic Development 18B LMJ 8159 Completed $50,000.00 $50,000.00 $50,000.00$50,000.00NoCA SAN FRANCISCO 2015 B15MC060016 Economic Development 18B LMJ 8160 Completed $75,000.00 $75,000.00 $75,000.00$75,000.00NoCA SAN FRANCISCO 2015 B15MC060016 Economic Development 18B LMJ 8258 Cancel $0.00 $0.00 $0.00NoCA SAN FRANCISCO 2015 B15MC060016 Economic Development 18B LMJ 8607 Cancel $0.00 $0.00 $0.00No
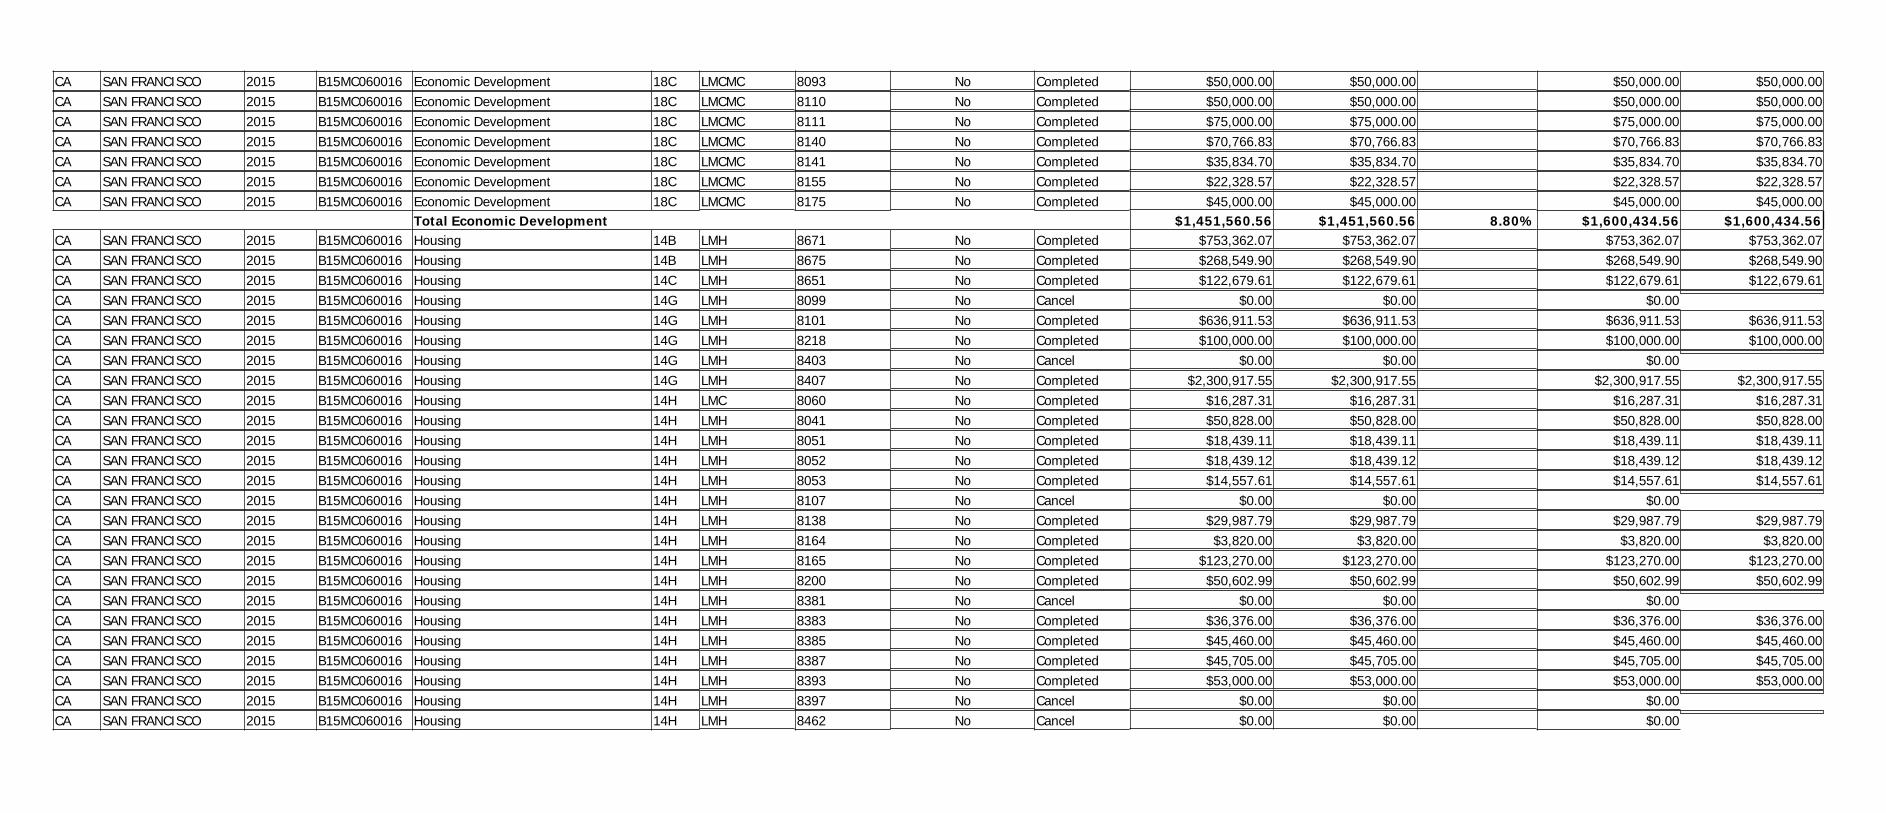
CA SAN FRANCISCO 2015 B15MC060016 Economic Development 18C LMCMC 8093 Completed $50,000.00 $50,000.00 $50,000.00$50,000.00NoCA SAN FRANCISCO 2015 B15MC060016 Economic Development 18C LMCMC 8110 Completed $50,000.00 $50,000.00 $50,000.00$50,000.00NoCA SAN FRANCISCO 2015 B15MC060016 Economic Development 18C LMCMC 8111 Completed $75,000.00 $75,000.00 $75,000.00$75,000.00NoCA SAN FRANCISCO 2015 B15MC060016 Economic Development 18C LMCMC 8140 Completed $70,766.83 $70,766.83 $70,766.83$70,766.83NoCA SAN FRANCISCO 2015 B15MC060016 Economic Development 18C LMCMC 8141 Completed $35,834.70 $35,834.70 $35,834.70$35,834.70NoCA SAN FRANCISCO 2015 B15MC060016 Economic Development 18C LMCMC 8155 Completed $22,328.57 $22,328.57 $22,328.57$22,328.57NoCA SAN FRANCISCO 2015 B15MC060016 Economic Development 18C LMCMC 8175 Completed $45,000.00 $45,000.00 $45,000.00$45,000.00No
Total Economic Development 8.80%$1,451,560.56 $1,451,560.56 $1,600,434.56 $1,600,434.56CA SAN FRANCISCO 2015 B15MC060016 Housing 14B LMH 8671 Completed $753,362.07 $753,362.07 $753,362.07$753,362.07NoCA SAN FRANCISCO 2015 B15MC060016 Housing 14B LMH 8675 Completed $268,549.90 $268,549.90 $268,549.90$268,549.90NoCA SAN FRANCISCO 2015 B15MC060016 Housing 14C LMH 8651 Completed $122,679.61 $122,679.61 $122,679.61$122,679.61NoCA SAN FRANCISCO 2015 B15MC060016 Housing 14G LMH 8099 Cancel $0.00 $0.00 $0.00NoCA SAN FRANCISCO 2015 B15MC060016 Housing 14G LMH 8101 Completed $636,911.53 $636,911.53 $636,911.53$636,911.53NoCA SAN FRANCISCO 2015 B15MC060016 Housing 14G LMH 8218 Completed $100,000.00 $100,000.00 $100,000.00$100,000.00NoCA SAN FRANCISCO 2015 B15MC060016 Housing 14G LMH 8403 Cancel $0.00 $0.00 $0.00NoCA SAN FRANCISCO 2015 B15MC060016 Housing 14G LMH 8407 Completed $2,300,917.55 $2,300,917.55 $2,300,917.55$2,300,917.55NoCA SAN FRANCISCO 2015 B15MC060016 Housing 14H LMC 8060 Completed $16,287.31 $16,287.31 $16,287.31$16,287.31NoCA SAN FRANCISCO 2015 B15MC060016 Housing 14H LMH 8041 Completed $50,828.00 $50,828.00 $50,828.00$50,828.00NoCA SAN FRANCISCO 2015 B15MC060016 Housing 14H LMH 8051 Completed $18,439.11 $18,439.11 $18,439.11$18,439.11NoCA SAN FRANCISCO 2015 B15MC060016 Housing 14H LMH 8052 Completed $18,439.12 $18,439.12 $18,439.12$18,439.12NoCA SAN FRANCISCO 2015 B15MC060016 Housing 14H LMH 8053 Completed $14,557.61 $14,557.61 $14,557.61$14,557.61NoCA SAN FRANCISCO 2015 B15MC060016 Housing 14H LMH 8107 Cancel $0.00 $0.00 $0.00NoCA SAN FRANCISCO 2015 B15MC060016 Housing 14H LMH 8138 Completed $29,987.79 $29,987.79 $29,987.79$29,987.79NoCA SAN FRANCISCO 2015 B15MC060016 Housing 14H LMH 8164 Completed $3,820.00 $3,820.00 $3,820.00$3,820.00NoCA SAN FRANCISCO 2015 B15MC060016 Housing 14H LMH 8165 Completed $123,270.00 $123,270.00 $123,270.00$123,270.00NoCA SAN FRANCISCO 2015 B15MC060016 Housing 14H LMH 8200 Completed $50,602.99 $50,602.99 $50,602.99$50,602.99NoCA SAN FRANCISCO 2015 B15MC060016 Housing 14H LMH 8381 Cancel $0.00 $0.00 $0.00NoCA SAN FRANCISCO 2015 B15MC060016 Housing 14H LMH 8383 Completed $36,376.00 $36,376.00 $36,376.00$36,376.00NoCA SAN FRANCISCO 2015 B15MC060016 Housing 14H LMH 8385 Completed $45,460.00 $45,460.00 $45,460.00$45,460.00NoCA SAN FRANCISCO 2015 B15MC060016 Housing 14H LMH 8387 Completed $45,705.00 $45,705.00 $45,705.00$45,705.00NoCA SAN FRANCISCO 2015 B15MC060016 Housing 14H LMH 8393 Completed $53,000.00 $53,000.00 $53,000.00$53,000.00NoCA SAN FRANCISCO 2015 B15MC060016 Housing 14H LMH 8397 Cancel $0.00 $0.00 $0.00NoCA SAN FRANCISCO 2015 B15MC060016 Housing 14H LMH 8462 Cancel $0.00 $0.00 $0.00No

CA SAN FRANCISCO 2015 B15MC060016 Housing 14H LMH 8713 Cancel $0.00 $0.00 $0.00NoCA SAN FRANCISCO 2015 B15MC060016 Housing 14H LMH 9112 Cancel $0.00 $0.00 $0.00NoCA SAN FRANCISCO 2015 B15MC060016 Housing 14I LMH 8100 Cancel $0.00 $0.00 $0.00NoCA SAN FRANCISCO 2015 B15MC060016 Housing 14I LMH 8404 Completed $5,196.90 $5,196.90 $5,196.90$5,196.90No
Total Housing 28.47%$4,694,390.49 $4,694,390.49 $4,694,390.49 $4,694,390.49CA SAN FRANCISCO 2015 B15MC060016 Other 19C LMC 8086 Completed $45,000.00 $45,000.00 $45,000.00$45,000.00NoCA SAN FRANCISCO 2015 B15MC060016 Other 19C LMC 8126 Completed $64,076.00 $64,076.00 $64,076.00$64,076.00NoCA SAN FRANCISCO 2015 B15MC060016 Other 19C LMC 8137 Completed $19,465.56 $19,465.56 $19,465.56$19,465.56NoCA SAN FRANCISCO 2015 B15MC060016 Other 19C LMC 8143 Completed $37,985.02 $37,985.02 $37,985.02$37,985.02NoCA SAN FRANCISCO 2015 B15MC060016 Other 19C LMC 8260 Completed $23,450.00 $23,450.00 $23,450.00$23,450.00NoCA SAN FRANCISCO 2015 B15MC060016 Other 19C LMC 8261 Completed $23,450.00 $23,450.00 $23,450.00$23,450.00No
Total Other 1.29%$213,426.58 $213,426.58 $213,426.58 $213,426.58CA SAN FRANCISCO 2015 B15MC060016 Public Improvements 03A LMC 8719 Completed $199,087.20 $199,087.20 $200,000.00$200,000.00NoCA SAN FRANCISCO 2015 B15MC060016 Public Improvements 03B LMC 8932 Open $0.00 $0.00 $20,437.85$200,000.00NoCA SAN FRANCISCO 2015 B15MC060016 Public Improvements 03C LMC 8078 Completed $70,000.00 $70,000.00 $70,000.00$70,000.00NoCA SAN FRANCISCO 2015 B15MC060016 Public Improvements 03C LMC 8216 Completed $15,610.00 $15,610.00 $375,000.00$375,000.00NoCA SAN FRANCISCO 2015 B15MC060016 Public Improvements 03D LMC 8055 Completed $42,500.00 $42,500.00 $42,500.00$42,500.00NoCA SAN FRANCISCO 2015 B15MC060016 Public Improvements 03D LMC 8439 Completed $26,000.00 $26,000.00 $26,000.00$26,000.00NoCA SAN FRANCISCO 2015 B15MC060016 Public Improvements 03E LMC 8050 Completed $184,012.20 $184,012.20 $209,214.04$209,214.04NoCA SAN FRANCISCO 2015 B15MC060016 Public Improvements 03E LMC 8062 Cancel $0.00 $0.00 $0.00NoCA SAN FRANCISCO 2015 B15MC060016 Public Improvements 03E LMC 8072 Cancel $0.00 $0.00 $0.00NoCA SAN FRANCISCO 2015 B15MC060016 Public Improvements 03E LMC 8091 Cancel $0.00 $0.00 $0.00NoCA SAN FRANCISCO 2015 B15MC060016 Public Improvements 03E LMC 8133 Cancel $0.00 $0.00 $0.00NoCA SAN FRANCISCO 2015 B15MC060016 Public Improvements 03E LMC 8142 Cancel $0.00 $0.00 $0.00NoCA SAN FRANCISCO 2015 B15MC060016 Public Improvements 03E LMC 8147 Completed $7,470.00 $7,470.00 $7,470.00$7,470.00NoCA SAN FRANCISCO 2015 B15MC060016 Public Improvements 03E LMC 8438 Cancel $0.00 $0.00 $0.00NoCA SAN FRANCISCO 2015 B15MC060016 Public Improvements 03E LMC 8465 Cancel $0.00 $0.00 $0.00NoCA SAN FRANCISCO 2015 B15MC060016 Public Improvements 03E LMC 8816 Completed $0.00 $0.00 $132,512.00$132,512.00NoCA SAN FRANCISCO 2015 B15MC060016 Public Improvements 03E LMC 8910 Cancel $0.00 $0.00 $0.00NoCA SAN FRANCISCO 2015 B15MC060016 Public Improvements 03E LMC 8915 Completed $195,000.00 $195,000.00 $195,000.00$195,000.00NoCA SAN FRANCISCO 2015 B15MC060016 Public Improvements 03E LMC 8917 Completed $152,000.00 $152,000.00 $152,000.00$152,000.00NoCA SAN FRANCISCO 2015 B15MC060016 Public Improvements 03E LMC 8918 Cancel $0.00 $0.00 $0.00NoCA SAN FRANCISCO 2015 B15MC060016 Public Improvements 03E LMC 8928 Cancel $0.00 $0.00 $0.00No

CA SAN FRANCISCO 2015 B15MC060016 Public Improvements 03E LMC 8930 Open $0.00 $0.00 $146,432.95$146,433.00NoCA SAN FRANCISCO 2015 B15MC060016 Public Improvements 03M LMC 8074 Cancel $0.00 $0.00 $0.00NoCA SAN FRANCISCO 2015 B15MC060016 Public Improvements 03M LMC 8174 Completed $64,473.00 $64,473.00 $64,473.00$64,473.00NoCA SAN FRANCISCO 2015 B15MC060016 Public Improvements 03M LMC 8441 Cancel $0.00 $0.00 $0.00NoCA SAN FRANCISCO 2015 B15MC060016 Public Improvements 03M LMC 8721 Cancel $0.00 $0.00 $0.00NoCA SAN FRANCISCO 2015 B15MC060016 Public Improvements 03P LMC 8720 Cancel $0.00 $0.00 $0.00NoCA SAN FRANCISCO 2015 B15MC060016 Public Improvements 03S LMC 8098 Cancel $0.00 $0.00 $0.00NoCA SAN FRANCISCO 2015 B15MC060016 Public Improvements 03Z LMA 2 Open $0.00 $0.00 $138,337,589.69$138,337,589.69NoCA SAN FRANCISCO 2015 B15MC060016 Public Improvements 03Z LMC 8042 Completed $42,866.68 $42,866.68 $42,866.68$42,866.68NoCA SAN FRANCISCO 2015 B15MC060016 Public Improvements 03Z LMC 8103 Completed $327,512.00 $327,512.00 $327,512.00$327,512.00NoCA SAN FRANCISCO 2015 B15MC060016 Public Improvements 03Z LMC 8192 Cancel $0.00 $0.00 $0.00NoCA SAN FRANCISCO 2015 B15MC060016 Public Improvements 03Z LMC 8470 Cancel $0.00 $0.00 $0.00NoCA SAN FRANCISCO 2015 B15MC060016 Public Improvements 03Z LMC 8472 Cancel $0.00 $0.00 $0.00NoCA SAN FRANCISCO 2015 B15MC060016 Public Improvements 03Z LMC 8893 Cancel $0.00 $0.00 $0.00NoCA SAN FRANCISCO 2015 B15MC060016 Public Improvements 03Z LMC 8905 Completed $2,133.32 $2,133.32 $98,225.08$98,225.08No
Total Public Improvements 8.06%$1,328,664.40 $1,328,664.40 $140,626,795.49 $140,447,233.29CA SAN FRANCISCO 2015 B15MC060016 Public Services 05C LMC 8037 Completed $81,999.46 $81,999.46 $81,999.46$81,999.46NoCA SAN FRANCISCO 2015 B15MC060016 Public Services 05C LMC 8040 Completed $52,000.00 $52,000.00 $52,000.00$52,000.00NoCA SAN FRANCISCO 2015 B15MC060016 Public Services 05C LMC 8048 Completed $99,999.73 $99,999.73 $99,999.73$99,999.73NoCA SAN FRANCISCO 2015 B15MC060016 Public Services 05C LMC 8057 Completed $80,000.00 $80,000.00 $80,000.00$80,000.00NoCA SAN FRANCISCO 2015 B15MC060016 Public Services 05C LMC 8071 Completed $48,453.16 $48,453.16 $48,453.16$48,453.16NoCA SAN FRANCISCO 2015 B15MC060016 Public Services 05C LMC 8090 Completed $60,000.00 $60,000.00 $60,000.00$60,000.00NoCA SAN FRANCISCO 2015 B15MC060016 Public Services 05C LMC 8094 Completed $50,000.00 $50,000.00 $50,000.00$50,000.00NoCA SAN FRANCISCO 2015 B15MC060016 Public Services 05C LMC 8095 Completed $80,000.00 $80,000.00 $80,000.00$80,000.00NoCA SAN FRANCISCO 2015 B15MC060016 Public Services 05C LMC 8122 Completed $75,000.00 $75,000.00 $75,000.00$75,000.00NoCA SAN FRANCISCO 2015 B15MC060016 Public Services 05C LMC 8135 Completed $49,998.83 $49,998.83 $49,998.83$49,998.83NoCA SAN FRANCISCO 2015 B15MC060016 Public Services 05C LMC 8162 Completed $81,111.00 $81,111.00 $81,111.00$81,111.00NoCA SAN FRANCISCO 2015 B15MC060016 Public Services 05C LMC 8172 Completed $49,610.51 $49,610.51 $49,610.51$49,610.51NoCA SAN FRANCISCO 2015 B15MC060016 Public Services 05C LMC 9119 Completed $5,323.27 $5,323.27 $150,000.00$150,000.00NoCA SAN FRANCISCO 2015 B15MC060016 Public Services 05H LMC 8049 Completed $75,000.00 $75,000.00 $75,000.00$75,000.00NoCA SAN FRANCISCO 2015 B15MC060016 Public Services 05H LMC 8059 Completed $100,000.00 $100,000.00 $100,000.00$100,000.00NoCA SAN FRANCISCO 2015 B15MC060016 Public Services 05H LMC 8063 Completed $70,000.00 $70,000.00 $70,000.00$70,000.00NoCA SAN FRANCISCO 2015 B15MC060016 Public Services 05H LMC 8064 Completed $74,999.56 $74,999.56 $74,999.56$74,999.56No

CA SAN FRANCISCO 2015 B15MC060016 Public Services 05H LMC 8068 Completed $50,000.00 $50,000.00 $50,000.00$50,000.00NoCA SAN FRANCISCO 2015 B15MC060016 Public Services 05H LMC 8076 Completed $97,842.65 $97,842.65 $97,842.65$97,842.65NoCA SAN FRANCISCO 2015 B15MC060016 Public Services 05H LMC 8079 Completed $112,174.08 $112,174.08 $112,174.08$112,174.08NoCA SAN FRANCISCO 2015 B15MC060016 Public Services 05H LMC 8083 Completed $40,769.17 $40,769.17 $40,769.17$40,769.17NoCA SAN FRANCISCO 2015 B15MC060016 Public Services 05H LMC 8084 Completed $69,519.68 $69,519.68 $69,519.68$69,519.68NoCA SAN FRANCISCO 2015 B15MC060016 Public Services 05H LMC 8114 Completed $152,000.00 $152,000.00 $152,000.00$152,000.00NoCA SAN FRANCISCO 2015 B15MC060016 Public Services 05H LMC 8115 Completed $140,529.00 $140,529.00 $140,529.00$140,529.00NoCA SAN FRANCISCO 2015 B15MC060016 Public Services 05H LMC 8117 Completed $99,999.91 $99,999.91 $99,999.91$99,999.91NoCA SAN FRANCISCO 2015 B15MC060016 Public Services 05H LMC 8130 Completed $90,000.00 $90,000.00 $90,000.00$90,000.00NoCA SAN FRANCISCO 2015 B15MC060016 Public Services 05H LMC 8136 Completed $50,000.00 $50,000.00 $50,000.00$50,000.00NoCA SAN FRANCISCO 2015 B15MC060016 Public Services 05H LMC 8153 Completed $23,897.26 $23,897.26 $23,897.26$23,897.26NoCA SAN FRANCISCO 2015 B15MC060016 Public Services 05H LMC 8154 Completed $120,000.00 $120,000.00 $120,000.00$120,000.00NoCA SAN FRANCISCO 2015 B15MC060016 Public Services 05H LMC 8168 Completed $55,000.00 $55,000.00 $55,000.00$55,000.00NoCA SAN FRANCISCO 2015 B15MC060016 Public Services 05H LMC 8170 Completed $75,000.00 $75,000.00 $75,000.00$75,000.00NoCA SAN FRANCISCO 2015 B15MC060016 Public Services 05H LMC 8173 Completed $59,563.58 $59,563.58 $59,563.58$59,563.58NoCA SAN FRANCISCO 2015 B15MC060016 Public Services 05H LMC 8253 Cancel $0.00 $0.00 $0.00NoCA SAN FRANCISCO 2015 B15MC060016 Public Services 05H LMC 8510 Cancel $0.00 $0.00 $0.00NoCA SAN FRANCISCO 2015 B15MC060016 Public Services 05H LMC 8667 Completed $22,631.00 $22,631.00 $35,000.00$35,000.00NoCA SAN FRANCISCO 2015 B15MC060016 Public Services 05K LMC 8061 Completed $50,000.00 $50,000.00 $50,000.00$50,000.00NoCA SAN FRANCISCO 2015 B15MC060016 Public Services 05K LMC 8067 Completed $40,000.00 $40,000.00 $40,000.00$40,000.00NoCA SAN FRANCISCO 2015 B15MC060016 Public Services 05K LMC 8092 Completed $10,000.00 $10,000.00 $10,000.00$10,000.00NoCA SAN FRANCISCO 2015 B15MC060016 Public Services 05K LMC 8150 Completed $57,375.26 $57,375.26 $57,375.26$57,375.26NoCA SAN FRANCISCO 2015 B15MC060016 Public Services 05K LMC 8163 Completed $42,469.83 $42,469.83 $42,469.83$42,469.83NoCA SAN FRANCISCO 2015 B15MC060016 Public Services 05K LMC 9071 Completed $47,953.10 $47,953.10 $758,203.00$758,203.00NoCA SAN FRANCISCO 2015 B15MC060016 Public Services 05U LMC 8080 Completed $34,068.72 $34,068.72 $34,068.72$34,068.72NoCA SAN FRANCISCO 2015 B15MC060016 Public Services 05U LMC 8085 Completed $65,000.00 $65,000.00 $65,000.00$65,000.00NoCA SAN FRANCISCO 2015 B15MC060016 Public Services 05U LMC 8089 Completed $34,679.43 $34,679.43 $34,679.43$34,679.43NoCA SAN FRANCISCO 2015 B15MC060016 Public Services 05U LMC 8144 Completed $70,616.37 $70,616.37 $70,616.37$70,616.37NoCA SAN FRANCISCO 2015 B15MC060016 Public Services 05U LMC 8152 Completed $22,197.54 $22,197.54 $22,197.54$22,197.54NoCA SAN FRANCISCO 2015 B15MC060016 Public Services 05X LMC 9035 Completed $15,610.00 $15,610.00 $50,000.00$50,000.00NoCA SAN FRANCISCO 2015 B15MC060016 Public Services 05Z LMC 8038 Completed $38,374.73 $38,374.73 $38,374.73$38,374.73NoCA SAN FRANCISCO 2015 B15MC060016 Public Services 05Z LMC 8039 Completed $17,861.49 $17,861.49 $17,861.49$17,861.49NoCA SAN FRANCISCO 2015 B15MC060016 Public Services 05Z LMC 8045 Completed $50,000.00 $50,000.00 $50,000.00$50,000.00No
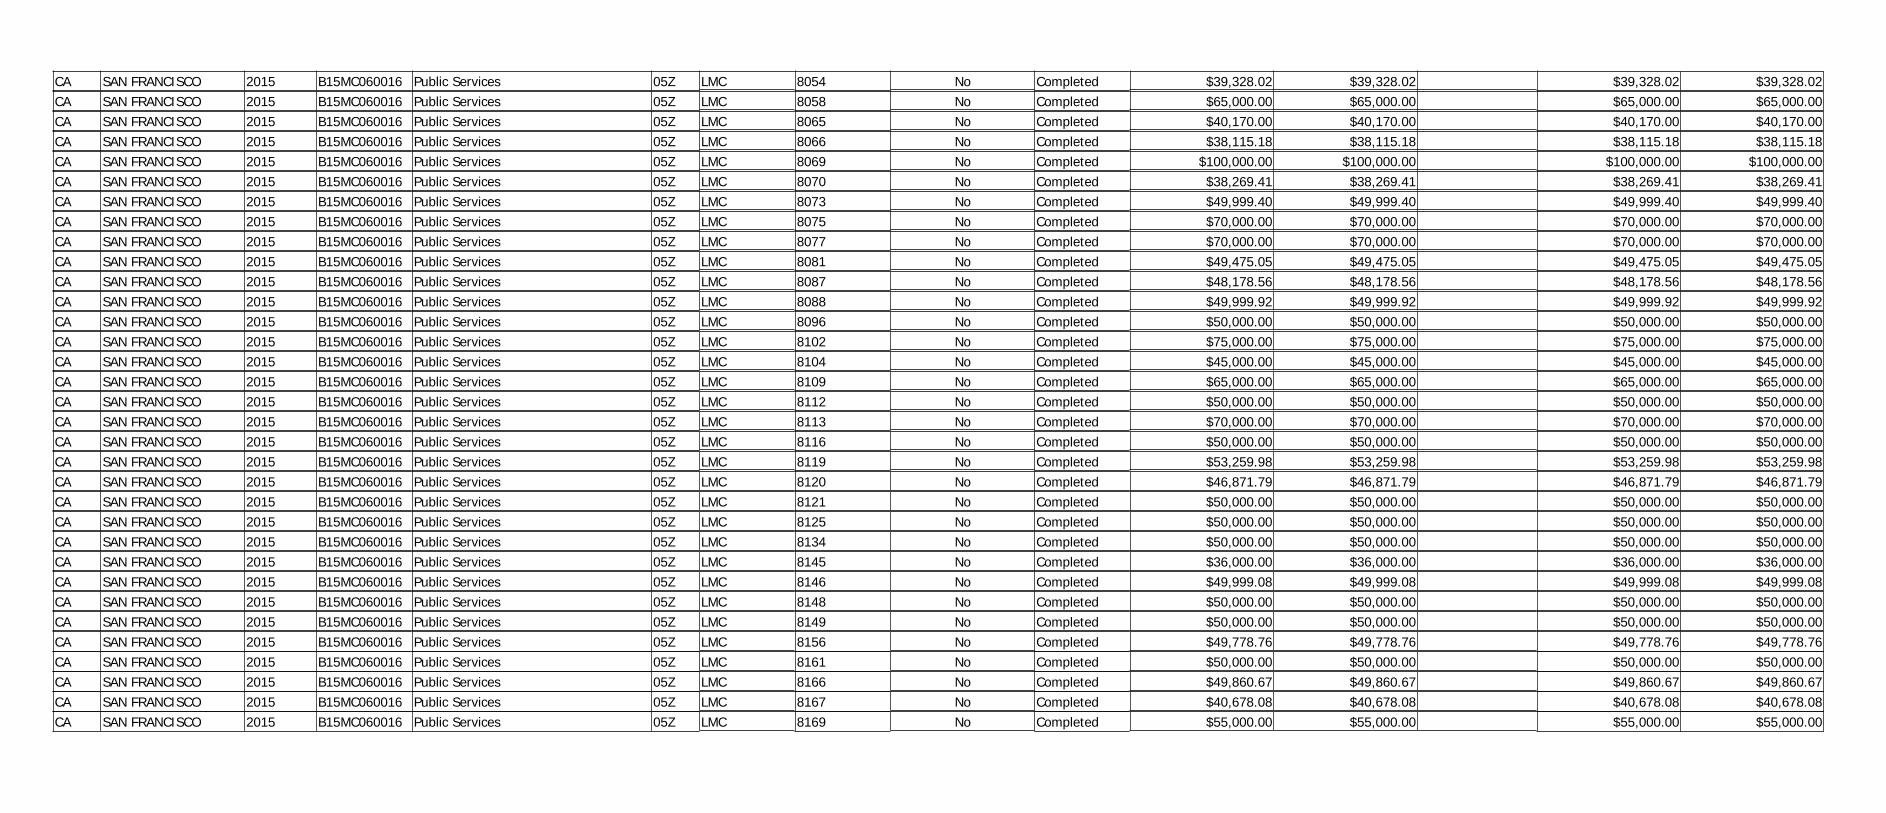
CA SAN FRANCISCO 2015 B15MC060016 Public Services 05Z LMC 8054 Completed $39,328.02 $39,328.02 $39,328.02$39,328.02NoCA SAN FRANCISCO 2015 B15MC060016 Public Services 05Z LMC 8058 Completed $65,000.00 $65,000.00 $65,000.00$65,000.00NoCA SAN FRANCISCO 2015 B15MC060016 Public Services 05Z LMC 8065 Completed $40,170.00 $40,170.00 $40,170.00$40,170.00NoCA SAN FRANCISCO 2015 B15MC060016 Public Services 05Z LMC 8066 Completed $38,115.18 $38,115.18 $38,115.18$38,115.18NoCA SAN FRANCISCO 2015 B15MC060016 Public Services 05Z LMC 8069 Completed $100,000.00 $100,000.00 $100,000.00$100,000.00NoCA SAN FRANCISCO 2015 B15MC060016 Public Services 05Z LMC 8070 Completed $38,269.41 $38,269.41 $38,269.41$38,269.41NoCA SAN FRANCISCO 2015 B15MC060016 Public Services 05Z LMC 8073 Completed $49,999.40 $49,999.40 $49,999.40$49,999.40NoCA SAN FRANCISCO 2015 B15MC060016 Public Services 05Z LMC 8075 Completed $70,000.00 $70,000.00 $70,000.00$70,000.00NoCA SAN FRANCISCO 2015 B15MC060016 Public Services 05Z LMC 8077 Completed $70,000.00 $70,000.00 $70,000.00$70,000.00NoCA SAN FRANCISCO 2015 B15MC060016 Public Services 05Z LMC 8081 Completed $49,475.05 $49,475.05 $49,475.05$49,475.05NoCA SAN FRANCISCO 2015 B15MC060016 Public Services 05Z LMC 8087 Completed $48,178.56 $48,178.56 $48,178.56$48,178.56NoCA SAN FRANCISCO 2015 B15MC060016 Public Services 05Z LMC 8088 Completed $49,999.92 $49,999.92 $49,999.92$49,999.92NoCA SAN FRANCISCO 2015 B15MC060016 Public Services 05Z LMC 8096 Completed $50,000.00 $50,000.00 $50,000.00$50,000.00NoCA SAN FRANCISCO 2015 B15MC060016 Public Services 05Z LMC 8102 Completed $75,000.00 $75,000.00 $75,000.00$75,000.00NoCA SAN FRANCISCO 2015 B15MC060016 Public Services 05Z LMC 8104 Completed $45,000.00 $45,000.00 $45,000.00$45,000.00NoCA SAN FRANCISCO 2015 B15MC060016 Public Services 05Z LMC 8109 Completed $65,000.00 $65,000.00 $65,000.00$65,000.00NoCA SAN FRANCISCO 2015 B15MC060016 Public Services 05Z LMC 8112 Completed $50,000.00 $50,000.00 $50,000.00$50,000.00NoCA SAN FRANCISCO 2015 B15MC060016 Public Services 05Z LMC 8113 Completed $70,000.00 $70,000.00 $70,000.00$70,000.00NoCA SAN FRANCISCO 2015 B15MC060016 Public Services 05Z LMC 8116 Completed $50,000.00 $50,000.00 $50,000.00$50,000.00NoCA SAN FRANCISCO 2015 B15MC060016 Public Services 05Z LMC 8119 Completed $53,259.98 $53,259.98 $53,259.98$53,259.98NoCA SAN FRANCISCO 2015 B15MC060016 Public Services 05Z LMC 8120 Completed $46,871.79 $46,871.79 $46,871.79$46,871.79NoCA SAN FRANCISCO 2015 B15MC060016 Public Services 05Z LMC 8121 Completed $50,000.00 $50,000.00 $50,000.00$50,000.00NoCA SAN FRANCISCO 2015 B15MC060016 Public Services 05Z LMC 8125 Completed $50,000.00 $50,000.00 $50,000.00$50,000.00NoCA SAN FRANCISCO 2015 B15MC060016 Public Services 05Z LMC 8134 Completed $50,000.00 $50,000.00 $50,000.00$50,000.00NoCA SAN FRANCISCO 2015 B15MC060016 Public Services 05Z LMC 8145 Completed $36,000.00 $36,000.00 $36,000.00$36,000.00NoCA SAN FRANCISCO 2015 B15MC060016 Public Services 05Z LMC 8146 Completed $49,999.08 $49,999.08 $49,999.08$49,999.08NoCA SAN FRANCISCO 2015 B15MC060016 Public Services 05Z LMC 8148 Completed $50,000.00 $50,000.00 $50,000.00$50,000.00NoCA SAN FRANCISCO 2015 B15MC060016 Public Services 05Z LMC 8149 Completed $50,000.00 $50,000.00 $50,000.00$50,000.00NoCA SAN FRANCISCO 2015 B15MC060016 Public Services 05Z LMC 8156 Completed $49,778.76 $49,778.76 $49,778.76$49,778.76NoCA SAN FRANCISCO 2015 B15MC060016 Public Services 05Z LMC 8161 Completed $50,000.00 $50,000.00 $50,000.00$50,000.00NoCA SAN FRANCISCO 2015 B15MC060016 Public Services 05Z LMC 8166 Completed $49,860.67 $49,860.67 $49,860.67$49,860.67NoCA SAN FRANCISCO 2015 B15MC060016 Public Services 05Z LMC 8167 Completed $40,678.08 $40,678.08 $40,678.08$40,678.08NoCA SAN FRANCISCO 2015 B15MC060016 Public Services 05Z LMC 8169 Completed $55,000.00 $55,000.00 $55,000.00$55,000.00No

CA SAN FRANCISCO 2015 B15MC060016 Public Services 05Z LMC 8171 Completed $54,747.27 $54,747.27 $54,747.27$54,747.27NoCA SAN FRANCISCO 2015 B15MC060016 Public Services 05Z LMC 8176 Completed $54,336.78 $54,336.78 $54,336.78$54,336.78NoCA SAN FRANCISCO 2015 B15MC060016 Public Services 05Z LMC 8177 Completed $49,948.94 $49,948.94 $49,948.94$49,948.94NoCA SAN FRANCISCO 2015 B15MC060016 Public Services 05Z LMC 8201 Cancel $0.00 $0.00 $0.00NoCA SAN FRANCISCO 2015 B15MC060016 Public Services 05Z LMC 8309 Completed $32,138.00 $32,138.00 $82,138.00$82,138.00NoCA SAN FRANCISCO 2015 B15MC060016 Public Services 05Z LMC 8463 Cancel $0.00 $0.00 $0.00NoCA SAN FRANCISCO 2015 B15MC060016 Public Services 05Z LMC 9014 Completed $202,088.01 $202,088.01 $225,000.00$225,000.00NoCA SAN FRANCISCO 2015 B15MC060016 Public Services 05Z LMC 9344 Open $0.00 $0.00 $0.00No
Non CARES Related Public Services 31.09%$5,126,871.22 $5,126,871.22 $6,101,468.84 $6,101,468.84CA SAN FRANCISCO 2015 B15MC060016 Repayments Of Section 108 Loans 19F 8131 Cancel $0.00 $0.00 $0.00NoCA SAN FRANCISCO 2015 B15MC060016 Repayments Of Section 108 Loans 19F 8398 Completed $262,308.00 $262,308.00 $262,308.00$262,308.00NoCA SAN FRANCISCO 2015 B15MC060016 Repayments Of Section 108 Loans 19F 8435 Completed $106,068.00 $106,068.00 $106,068.00$106,068.00No
Total Repayments Of Section 108 Loans 2.23%$368,376.00 $368,376.00 $368,376.00 $368,376.00Total 2015 99.95%$16,489,944.00 $16,481,276.34 $157,604,670.50$157,792,900.36
84.06%Grand Total $104,353,111.00 $87,721,902.97 $656,696,554.24$676,719,945.59

9/29/21, 8:37 PM Sage: Reports: HUD ESG CAPER FY2020
https://www.sagehmis.info/secure/reports/filterpages/galactic.aspx?reportID=118&client_ID=78754&157.4340=118264&iid=118264&autoexecute=true&Medium=true 1/11
Report Date Range7/1/2020 to 6/30/2021
Q01a. Contact InformationFirst name
Middle name
Last name
Su�x
Title
Street Address 1
Street Address 2
City
State
ZIP Code
E-mail Address
Phone Number
Extension
Fax Number
Q01b. Grant Information
ESG Information from IDIS
CAPER reporting includes funds used from �scal year:
Project types carried out during the program yearEnter the number of each type of projects funded through ESG during thisprogram year.
Street Outreach
Emergency Shelter
Transitional Housing (grandfathered under ES)
Day Shelter (funded under ES)
Rapid Re-Housing
Homelessness Prevention
Q01c. Additional Information
HMIS
Comparable DatabaseAre 100% of the project(s) funded through ESG, which are allowed to use HMIS, entering data into HMIS?
Have all of the projects entered data into Sage via a CSV - CAPER Report upload?
Are 100% of the project(s) funded through ESG, which are allowed to use a comparable database, entering data into the comparable database?
Have all of the projects entered data into Sage via a CSV - CAPER Report upload?
HUD ESG CAPER FY2020Grant: ESG: San Francisco - CA - Report Type: CAPER
Gloria
Woo
Director of Data, Evaluation and Compliance
Mayor’s O�ce of Housing and Community Development (MOHCD) 1 South Van Ness Avenue, 5th Floor,
San Francisco
California
94103
(415)701-5500
As of 9/24/2021
2020 E20MC060016 $1,595,423.00 $941,328.15 $654,094.85 7/31/2020 7/31/2022
2019 E19MC060016 $1,539,152.00 $1,539,152.00 $0 7/23/2019 7/23/2021
2018 E18MC060016 $1,479,175.00 $1,479,175.00 $0 10/3/2018 10/3/2020
2017 E17MC060016 $1,484,181.00 $1,484,181.00 $0 10/19/2017 10/19/2019
2016 E16MC060016 $1,484,425.00 $1,484,425.00 $0 8/22/2016 8/22/2018
2015 E15MC060016 $1,482,125.00 $1,482,125.00 $0 7/23/2015 7/23/2017
2014 E14MC060016 $1,393,730.00 $1,393,730.00 $0 7/28/2014 7/28/2016
2013 E13MC060016 $1,182,146.00 $1,182,146.00 $0 9/12/2013 9/12/2015
2012
2011
Total $11,640,357.00 $10,986,262.15 $654,094.85
FiscalYear Grant Number
Current AuthorizedAmount Total Drawn Balance
ObligationDate
ExpenditureDeadline
2020
0
10
0
0
2
3
Yes
Yes
Yes
Yes

9/29/21, 8:37 PM Sage: Reports: HUD ESG CAPER FY2020
https://www.sagehmis.info/secure/reports/filterpages/galactic.aspx?reportID=118&client_ID=78754&157.4340=118264&iid=118264&autoexecute=true&Medium=true 2/11
Q04a: Project Identi�ers in HMIS
La Casa delas Madres
ProvidenceFoundation
HospitalityHouse
CommunityForward SF
CompassFamilyServices
Dolores StreetCommunityServices(DSCS)
EpiscopalCommunityServices(ECS)
HamiltonFamilies
HomelessChildren'sNetwork
Larkin StreetYouthServices
CompassFamilyServices
MissionNeighborhoodHealth Center
CatholicCharities CYO
EpiscopalCommunityServices(ECS)
HamiltonFamilies
Q05a: Report Validations Table
Total Number of Persons Served
Number of Adults (Age 18 or Over)
Number of Children (Under Age 18)
Number of Persons with Unknown Age
Number of Leavers
Number of Adult Leavers
Number of Adult and Head of Household Leavers
Number of Stayers
Number of Adult Stayers
Number of Veterans
Number of Chronically Homeless Persons
Number of Youth Under Age 25
Number of Parenting Youth Under Age 25 with Children
Number of Adult Heads of Household
Number of Child and Unknown-Age Heads of Household
Heads of Households and Adult Stayers in the Project 365 Days or More
OrganizationName
OrganizationID
ProjectName
ProjectID
HMISProjectType
MethodforTrackingES
A�liatedwith aresidentialproject
ProjectIDs ofa�liations
CoCNumber Geocode
VictimServiceProvider
HMISSoftwareName
ReportStartDate
ReportEndDate
CSVException?
Uploadedviaemailedhyperlink?
1234
La Casa delasMadres-VSP
1234 1 0 CA-501 63228 1 SalesForce 2020-07-01
2021-06-30 No Yes
49
ESG-ProvidenceFoundationShelterProgram
181 1 0 CA-501 063228 0 Clarity HS 2020-07-01
2021-06-30 No Yes
48
ESG-HospitalityHouseEmergencyShelterProgram
195 1 0 CA-501 063228 0 Clarity HS 2020-07-01
2021-06-30 No Yes
10ESG -CommunityForward SF
68 1 0 CA-501 063228 0 Clarity HS 2020-07-01
2021-06-30 No Yes
12CompassFamilyShelter
43 1 0 CA-501 063228 0 Clarity HS 2020-07-01
2021-06-30 No Yes
15
ESG-DoloresShelterProgram
63 1 0 CA-501 063228 0 Clarity HS 2020-07-01
2021-06-30 No Yes
16ESG-ECSShelterProgram
66 1 0 CA-501 063228 0 Clarity HS 2020-07-01
2021-06-30 No Yes
19
HamiltonFamilyEmergencyCenter(HFEC)
100 1 0 CA-501 063228 0 Clarity HS 2020-07-01
2021-06-30 No Yes
47ESG-HCNCMServices
69 1 0 CA-501 063228 0 Clarity HS 2020-07-01
2021-06-30 No Yes
21Lark Inn forYouth (SiteAF)
347 1 0 CA-501 063228 0 Clarity HS 2020-07-01
2021-06-30 No Yes
12
ESG-CompassHomelessPreventionProgram
61 12 0 CA-501 63228 0 Clarity HS 2020-07-01
2021-06-30 No Yes
70 MNRC-ESG-HPA 555 12 0 CA-501 063228 0 Clarity HS 2020-
07-012021-06-30 No Yes
6
ESG-CCCYOHomelessPreventionProgram
58 12 0 CA-501 63228 0 Clarity HS 2020-07-01
2021-06-30 No Yes
16
RapidRehousingfor Adults -ESG
623 13 0 CA-501 063228 0 Clarity HS 2020-07-01
2021-06-30 No Yes
19
ESG-HamiltonRapidRehousingProgram
71 13 0 CA-501 063228 0 Clarity HS 2020-07-01
2021-06-30 No Yes
1030
777
247
6
650
472
475
380
305
12
297
187
31
731
92
84

9/29/21, 8:37 PM Sage: Reports: HUD ESG CAPER FY2020
https://www.sagehmis.info/secure/reports/filterpages/galactic.aspx?reportID=118&client_ID=78754&157.4340=118264&iid=118264&autoexecute=true&Medium=true 3/11
Q06a: Data Quality: Personally Identifying Information (PII)
Data Element
Name
Social Security Number
Date of Birth
Race
Ethnicity
Gender
Overall Score
Q06b: Data Quality: Universal Data Elements
Veteran Status
Project Start Date
Relationship to Head of Household
Client Location
Disabling Condition
Q06c: Data Quality: Income and Housing Data Quality
Destination
Income and Sources at Start
Income and Sources at Annual Assessment
Income and Sources at Exit
Q06d: Data Quality: Chronic Homelessness
ES, SH, StreetOutreach
TH
PH (All)
Total
Q06e: Data Quality: Timeliness
0 days
1-3 Days
4-6 Days
7-10 Days
11+ Days
Q06f: Data Quality: Inactive Records: Street Outreach & Emergency Shelter
Contact (Adults and Heads of Household in Street Outreach or ES - NBN)
Bed Night (All Clients in ES - NBN)
Q07a: Number of Persons Served
Adults
Children
Client Doesn't Know/ Client Refused
Data Not Collected
Total
For PSH & RRH – the total persons served who moved into housing
Q08a: Households Served
Total Households
For PSH & RRH – the total households served who moved into housing
Client Doesn't Know/Refused Information Missing Data Issues Total% of
Error Rate
0 6 6 12 1.17 %
66 62 47 175 16.99 %
2 4 1 7 0.68 %
62 47 0 109 10.58 %
6 28 0 34 3.30 %
0 19 0 19 1.84 %
233 22.62 %
Error Count% of
Error Rate
52 6.69 %
13 1.26 %
2 0.19 %
0 0.00 %
262 25.44 %
Error Count% of
Error Rate
246 37.85 %
131 15.92 %
45 53.57 %
165 34.74 %
Count of TotalRecords
MissingTime in Institution
MissingTime in Housing
Approximate Date StartedDK/R/missing
Number of TimesDK/R/missing
Number of MonthsDK/R/missing
% of Records Unable toCalculate
604 0 0 0 183 171 32.78 %
0 0 0 0 0 0 --
31 0 0 0 0 0 0.00 %
635 0 0 0 0 0 31.18 %
Number of Project Start Records
Number of Project Exit Records
147 173
64 48
24 11
38 2
420 281
# of Records # of Inactive Records
% of Inactive Records
0 0 --
0 0 --
Total Without Children With Children and Adults With Only Children Unknown Household Type
777 595 182 0 0
247 0 241 1 5
2 0 0 0 2
4 0 0 0 4
1030 595 423 1 11
29 4 25 0 0
Total Without Children With Children and Adults With Only Children Unknown Household Type
823 585 231 1 6
13 4 9 0 0
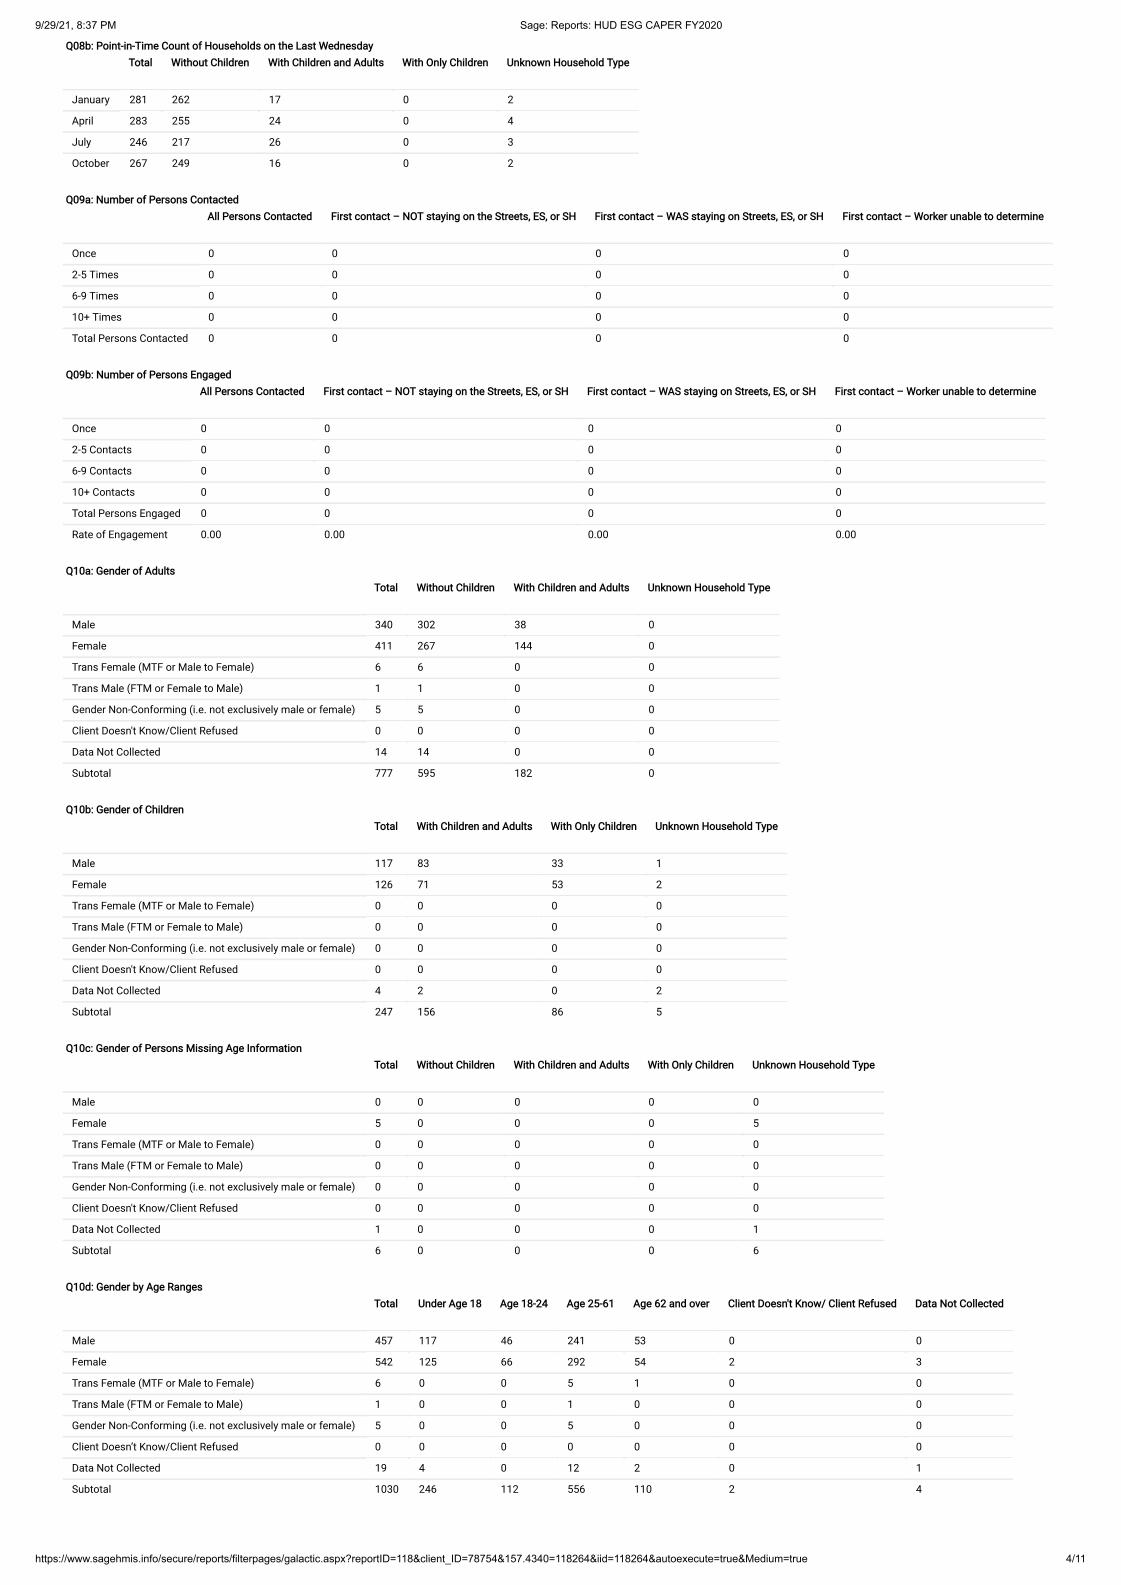
9/29/21, 8:37 PM Sage: Reports: HUD ESG CAPER FY2020
https://www.sagehmis.info/secure/reports/filterpages/galactic.aspx?reportID=118&client_ID=78754&157.4340=118264&iid=118264&autoexecute=true&Medium=true 4/11
Q08b: Point-in-Time Count of Households on the Last Wednesday
January
April
July
October
Q09a: Number of Persons Contacted
Once
2-5 Times
6-9 Times
10+ Times
Total Persons Contacted
Q09b: Number of Persons Engaged
Once
2-5 Contacts
6-9 Contacts
10+ Contacts
Total Persons Engaged
Rate of Engagement
Q10a: Gender of Adults
Male
Female
Trans Female (MTF or Male to Female)
Trans Male (FTM or Female to Male)
Gender Non-Conforming (i.e. not exclusively male or female)
Client Doesn't Know/Client Refused
Data Not Collected
Subtotal
Q10b: Gender of Children
Male
Female
Trans Female (MTF or Male to Female)
Trans Male (FTM or Female to Male)
Gender Non-Conforming (i.e. not exclusively male or female)
Client Doesn't Know/Client Refused
Data Not Collected
Subtotal
Q10c: Gender of Persons Missing Age Information
Male
Female
Trans Female (MTF or Male to Female)
Trans Male (FTM or Female to Male)
Gender Non-Conforming (i.e. not exclusively male or female)
Client Doesn't Know/Client Refused
Data Not Collected
Subtotal
Q10d: Gender by Age Ranges
Male
Female
Trans Female (MTF or Male to Female)
Trans Male (FTM or Female to Male)
Gender Non-Conforming (i.e. not exclusively male or female)
Client Doesn’t Know/Client Refused
Data Not Collected
Subtotal
Total Without Children With Children and Adults With Only Children Unknown Household Type
281 262 17 0 2
283 255 24 0 4
246 217 26 0 3
267 249 16 0 2
All Persons Contacted First contact – NOT staying on the Streets, ES, or SH First contact – WAS staying on Streets, ES, or SH First contact – Worker unable to determine
0 0 0 0
0 0 0 0
0 0 0 0
0 0 0 0
0 0 0 0
All Persons Contacted First contact – NOT staying on the Streets, ES, or SH First contact – WAS staying on Streets, ES, or SH First contact – Worker unable to determine
0 0 0 0
0 0 0 0
0 0 0 0
0 0 0 0
0 0 0 0
0.00 0.00 0.00 0.00
Total Without Children With Children and Adults Unknown Household Type
340 302 38 0
411 267 144 0
6 6 0 0
1 1 0 0
5 5 0 0
0 0 0 0
14 14 0 0
777 595 182 0
Total With Children and Adults With Only Children Unknown Household Type
117 83 33 1
126 71 53 2
0 0 0 0
0 0 0 0
0 0 0 0
0 0 0 0
4 2 0 2
247 156 86 5
Total Without Children With Children and Adults With Only Children Unknown Household Type
0 0 0 0 0
5 0 0 0 5
0 0 0 0 0
0 0 0 0 0
0 0 0 0 0
0 0 0 0 0
1 0 0 0 1
6 0 0 0 6
Total Under Age 18 Age 18-24 Age 25-61 Age 62 and over Client Doesn't Know/ Client Refused Data Not Collected
457 117 46 241 53 0 0
542 125 66 292 54 2 3
6 0 0 5 1 0 0
1 0 0 1 0 0 0
5 0 0 5 0 0 0
0 0 0 0 0 0 0
19 4 0 12 2 0 1
1030 246 112 556 110 2 4

9/29/21, 8:37 PM Sage: Reports: HUD ESG CAPER FY2020
https://www.sagehmis.info/secure/reports/filterpages/galactic.aspx?reportID=118&client_ID=78754&157.4340=118264&iid=118264&autoexecute=true&Medium=true 5/11
Q11: Age
Under 5
5 - 12
13 - 17
18 - 24
25 - 34
35 - 44
45 - 54
55 - 61
62+
Client Doesn't Know/Client Refused
Data Not Collected
Total
Q12a: Race
White
Black or African American
Asian
American Indian or Alaska Native
Native Hawaiian or Other Paci�c Islander
Multiple Races
Client Doesn't Know/Client Refused
Data Not Collected
Total
Q12b: Ethnicity
Non-Hispanic/Non-Latino
Hispanic/Latino
Client Doesn't Know/Client Refused
Data Not Collected
Total
Q13a1: Physical and Mental Health Conditions at Start
Mental Health Problem
Alcohol Abuse
Drug Abuse
Both Alcohol and DrugAbuse
Chronic Health Condition
HIV/AIDS
Developmental Disability
Physical Disability
The "With Children and Adults" column is retired as of 10/1/2019 and replaced with the columns "Adults in HH with Children & Adults" and "Children in HH with Children & Adults".
Q13b1: Physical and Mental Health Conditions at Exit
Mental Health Problem
Alcohol Abuse
Drug Abuse
Both Alcohol and DrugAbuse
Chronic Health Condition
HIV/AIDS
Developmental Disability
Physical Disability
The "With Children and Adults" column is retired as of 10/1/2019 and replaced with the columns "Adults in HH with Children & Adults" and "Children in HH with Children & Adults".
Total Without Children With Children and Adults With Only Children Unknown Household Type
108 0 108 0 0
98 0 94 0 4
40 0 38 1 1
110 69 41 0 0
155 75 80 0 0
159 125 34 0 0
133 111 22 0 0
111 108 3 0 0
110 107 3 0 0
2 0 0 0 2
4 0 0 0 4
1030 595 423 1 11
Total Without Children With Children and Adults With Only Children Unknown Household Type
305 225 79 1 0
340 196 142 0 2
42 24 18 0 0
44 29 14 0 1
33 10 23 0 0
69 31 38 0 0
62 36 23 0 3
135 44 86 0 5
1030 595 423 1 11
Total Without Children With Children and Adults With Only Children Unknown Household Type
584 407 222 0 2
365 164 196 1 4
6 5 1 0 0
28 19 4 0 5
1030 595 423 1 11
TotalPersons
WithoutChildren
Adults in HH with Children &Adults
Children in HH with Children &Adults
With Children andAdults
With OnlyChildren
Unknown HouseholdType
248 214 29 3 -- 0 2
39 37 2 0 -- 0 0
50 49 1 0 -- 0 0
35 35 0 0 -- 0 0
173 158 9 6 -- 0 0
11 11 0 0 -- 0 0
74 61 3 10 -- 0 0
186 173 12 1 -- 0 0
TotalPersons
WithoutChildren
Adults in HH with Children &Adults
Children in HH with Children &Adults
With Children andAdults
With OnlyChildren
Unknown HouseholdType
86 69 15 2 -- 0 0
11 11 0 0 -- 0 0
24 23 1 0 -- 0 0
9 9 0 0 -- 0 0
57 49 2 6 -- 0 0
2 2 0 0 -- 0 0
22 14 1 7 -- 0 0
51 44 6 1 -- 0 0

9/29/21, 8:37 PM Sage: Reports: HUD ESG CAPER FY2020
https://www.sagehmis.info/secure/reports/filterpages/galactic.aspx?reportID=118&client_ID=78754&157.4340=118264&iid=118264&autoexecute=true&Medium=true 6/11
Q13c1: Physical and Mental Health Conditions for Stayers
Mental Health Problem
Alcohol Abuse
Drug Abuse
Both Alcohol and DrugAbuse
Chronic Health Condition
HIV/AIDS
Developmental Disability
Physical Disability
The "With Children and Adults" column is retired as of 10/1/2019 and replaced with the columns "Adults in HH with Children & Adults" and "Children in HH with Children & Adults".
Q14a: Domestic Violence History
Yes
No
Client Doesn't Know/Client Refused
Data Not Collected
Total
Q14b: Persons Fleeing Domestic Violence
Yes
No
Client Doesn't Know/Client Refused
Data Not Collected
Total
Q15: Living Situation
Homeless Situations
Emergency shelter, including hotel or motel paid for with emergency shelter voucher
Transitional housing for homeless persons (including homeless youth)
Place not meant for habitation
Safe Haven
Host Home (non-crisis)
Interim Housing
Subtotal
Institutional Settings
Psychiatric hospital or other psychiatric facility
Substance abuse treatment facility or detox center
Hospital or other residential non-psychiatric medical facility
Jail, prison or juvenile detention facility
Foster care home or foster care group home
Long-term care facility or nursing home
Residential project or halfway house with no homeless criteria
Subtotal
Other Locations
Permanent housing (other than RRH) for formerly homeless persons
Owned by client, no ongoing housing subsidy
Owned by client, with ongoing housing subsidy
Rental by client, with RRH or equivalent subsidy
Rental by client, with HCV voucher (tenant or project based)
Rental by client in a public housing unit
Rental by client, no ongoing housing subsidy
Rental by client, with VASH subsidy
Rental by client with GPD TIP subsidy
Rental by client, with other housing subsidy
Hotel or motel paid for without emergency shelter voucher
Staying or living in a friend’s room, apartment or house
Staying or living in a family member’s room, apartment or house
Client Doesn’t Know/Client Refused
Data Not Collected
Subtotal
Total
Interim housing is retired as of 10/1/2019.
TotalPersons
WithoutChildren
Adults in HH with Children &Adults
Children in HH with Children &Adults
With Children andAdults
With OnlyChildren
Unknown HouseholdType
117 103 11 1 -- 0 2
26 24 2 0 -- 0 0
24 24 0 0 -- 0 0
18 18 0 0 -- 0 0
81 76 4 1 -- 0 0
6 6 0 0 -- 0 0
28 23 2 3 -- 0 0
97 93 4 0 -- 0 0
Total Without Children With Children and Adults With Only Children Unknown Household Type
289 130 159 0 0
401 307 90 1 3
10 9 1 0 0
169 149 17 0 3
869 595 267 1 6
Total Without Children With Children and Adults With Only Children Unknown Household Type
207 64 143 0 0
89 73 16 0 0
0 0 0 0 0
2 2 0 0 0
289 130 159 0 0
Total Without Children With Children and Adults With Only Children Unknown Household Type
0 0 0 0 0
346 276 70 0 0
25 20 5 0 0
188 139 48 0 1
6 6 0 0 0
0 0 0 0 0
0 0 0 0 0
565 441 123 0 1
0 0 0 0 0
0 0 0 0 0
3 3 0 0 0
4 4 0 0 0
0 0 0 0 0
0 0 0 0 0
1 1 0 0 0
0 0 0 0 0
8 8 0 0 0
0 0 0 0 0
3 1 2 0 0
4 1 3 0 0
0 0 0 0 0
3 2 1 0 0
1 1 0 0 0
11 2 8 0 1
106 21 82 1 2
1 1 0 0 0
2 2 0 0 0
25 23 2 0 0
8 5 3 0 0
11 3 8 0 0
36 7 28 0 1
8 2 6 0 0
77 75 1 0 1
296 146 144 1 5
869 595 267 1 6

9/29/21, 8:37 PM Sage: Reports: HUD ESG CAPER FY2020
https://www.sagehmis.info/secure/reports/filterpages/galactic.aspx?reportID=118&client_ID=78754&157.4340=118264&iid=118264&autoexecute=true&Medium=true 7/11
Q16: Cash Income - Ranges
No income
$1 - $150
$151 - $250
$251 - $500
$501 - $1000
$1,001 - $1,500
$1,501 - $2,000
$2,001+
Client Doesn't Know/Client Refused
Data Not Collected
Number of Adult Stayers Not Yet Required to Have an Annual Assessment
Number of Adult Stayers Without Required Annual Assessment
Total Adults
Q17: Cash Income - Sources
Earned Income
Unemployment Insurance
SSI
SSDI
VA Service-Connected Disability Compensation
VA Non-Service Connected Disability Pension
Private Disability Insurance
Worker's Compensation
TANF or Equivalent
General Assistance
Retirement (Social Security)
Pension from Former Job
Child Support
Alimony (Spousal Support)
Other Source
Adults with Income Information at Start and Annual Assessment/Exit
Q19b: Disabling Conditions and Income for Adults at Exit
Earned Income
SupplementalSecurity Income(SSI)
Social SecurityDisabilityInsurance (SSDI)
VA Service-ConnectedDisabilityCompensation
Private DisabilityInsurance
Worker'sCompensation
TemporaryAssistance forNeedy Families(TANF)
Retirement Incomefrom SocialSecurity
Pension orretirement incomefrom a former job
Child Support
Other source
No Sources
Unduplicated TotalAdults
Income at Start Income at Latest Annual Assessment for Stayers Income at Exit for Leavers
215 0 84
36 0 20
11 0 5
44 0 11
144 0 54
76 0 34
23 0 18
35 0 23
5 0 3
116 0 156
0 254 0
0 43 0
705 297 408
Income at Start Income at Latest Annual Assessment for Stayers Income at Exit for Leavers
72 0 42
24 0 11
126 0 48
30 0 9
3 0 0
0 0 0
1 0 0
2 0 1
73 0 30
45 0 24
8 0 2
2 0 2
4 0 1
0 0 0
16 0 12
0 0 246
AO: AdultwithDisablingCondition
AO: AdultwithoutDisablingCondition
AO:TotalAdults
AO: % withDisablingCondition bySource
AC: AdultwithDisablingCondition
AC: AdultwithoutDisablingCondition
AC:TotalAdults
AC: % withDisablingCondition bySource
UK: AdultwithDisablingCondition
UK: AdultwithoutDisablingCondition
UK:TotalAdults
UK: % withDisablingCondition bySource
5 14 19 26.32 % 0 12 12 0.00 % 0 0 0 --
20 10 30 66.67 % 1 4 5 20.00 % 0 0 0 --
5 1 6 83.34 % 0 1 1 0.00 % 0 0 0 --
0 0 0 -- 0 0 0 -- 0 0 0 --
0 0 0 -- 0 0 0 -- 0 0 0 --
0 0 0 -- 0 1 1 0.00 % 0 0 0 --
1 3 4 25.00 % 2 22 24 8.33 % 0 0 0 --
2 0 2 100.00 % 0 0 0 -- 0 0 0 --
1 0 1 100.00 % 0 0 0 -- 0 0 0 --
0 0 0 -- 0 1 1 0.00 % 0 0 0 --
14 9 23 60.87 % 1 10 11 9.09 % 0 0 0 --
14 41 55 25.46 % 1 22 23 4.35 % 0 0 0 --
60 77 137 4 63 67 0 0 0

9/29/21, 8:37 PM Sage: Reports: HUD ESG CAPER FY2020
https://www.sagehmis.info/secure/reports/filterpages/galactic.aspx?reportID=118&client_ID=78754&157.4340=118264&iid=118264&autoexecute=true&Medium=true 8/11
Q20a: Type of Non-Cash Bene�t Sources
Supplemental Nutritional Assistance Program
WIC
TANF Child Care Services
TANF Transportation Services
Other TANF-Funded Services
Other Source
Q21: Health Insurance
Medicaid
Medicare
State Children's Health Insurance Program
VA Medical Services
Employer Provided Health Insurance
Health Insurance Through COBRA
Private Pay Health Insurance
State Health Insurance for Adults
Indian Health Services Program
Other
No Health Insurance
Client Doesn't Know/Client Refused
Data Not Collected
Number of Stayers Not Yet Required to Have an Annual Assessment
1 Source of Health Insurance
More than 1 Source of Health Insurance
Q22a2: Length of Participation – ESG Projects
0 to 7 days
8 to 14 days
15 to 21 days
22 to 30 days
31 to 60 days
61 to 90 days
91 to 180 days
181 to 365 days
366 to 730 days (1-2 Yrs)
731 to 1,095 days (2-3 Yrs)
1,096 to 1,460 days (3-4 Yrs)
1,461 to 1,825 days (4-5 Yrs)
More than 1,825 days (> 5 Yrs)
Data Not Collected
Total
Q22c: Length of Time between Project Start Date and Housing Move-in Date
7 days or less
8 to 14 days
15 to 21 days
22 to 30 days
31 to 60 days
61 to 180 days
181 to 365 days
366 to 730 days (1-2 Yrs)
Total (persons moved into housing)
Average length of time to housing
Persons who were exited without move-in
Total persons
Bene�t at Start Bene�t at Latest Annual Assessment for Stayers Bene�t at Exit for Leavers
214 0 92
5 0 0
1 0 1
0 0 0
0 0 0
4 0 4
At Start At Annual Assessment for Stayers At Exit for Leavers
437 0 191
66 0 26
4 0 4
2 0 0
10 0 5
1 0 1
2 0 2
13 0 6
0 0 0
9 0 7
172 0 77
19 0 9
166 45 202
0 313 0
489 0 213
27 0 14
Total Leavers Stayers
109 109 0
74 53 21
28 28 0
37 31 6
89 54 35
75 44 31
139 85 54
240 74 166
67 30 37
5 5 0
7 1 6
2 0 2
1 1 0
157 0 0
1030 515 358
Total Without Children With Children and Adults With Only Children Unknown Household Type
0 0 0 0 0
0 0 0 0 0
0 0 0 0 0
5 0 5 0 0
13 2 11 0 0
11 2 9 0 0
0 0 0 0 0
0 0 0 0 0
29 4 25 0 0
56.00 52.00 57.00 -- --
0 0 0 0 0
29 4 25 0 0

9/29/21, 8:37 PM Sage: Reports: HUD ESG CAPER FY2020
https://www.sagehmis.info/secure/reports/filterpages/galactic.aspx?reportID=118&client_ID=78754&157.4340=118264&iid=118264&autoexecute=true&Medium=true 9/11
Q22d: Length of Participation by Household Type
7 days or less
8 to 14 days
15 to 21 days
22 to 30 days
31 to 60 days
61 to 90 days
91 to 180 days
181 to 365 days
366 to 730 days (1-2 Yrs)
731 to 1,095 days (2-3 Yrs)
1,096 to 1,460 days (3-4 Yrs)
1,461 to 1,825 days (4-5 Yrs)
More than 1,825 days (> 5 Yrs)
Data Not Collected
Total
Q22e: Length of Time Prior to Housing - based on 3.917 Date Homelessness Started
7 days or less
8 to 14 days
15 to 21 days
22 to 30 days
31 to 60 days
61 to 180 days
181 to 365 days
366 to 730 days (1-2 Yrs)
731 days or more
Total (persons moved into housing)
Not yet moved into housing
Data not collected
Total persons
Total Without Children With Children and Adults With Only Children Unknown Household Type
156 102 52 1 1
87 39 48 0 0
40 15 25 0 0
42 19 23 0 0
115 41 74 0 0
91 32 59 0 0
163 76 83 0 4
254 217 37 0 0
67 42 20 0 5
5 3 2 0 0
7 7 0 0 0
2 1 0 0 1
1 1 0 0 0
0 0 0 0 0
1030 595 423 1 11
Total Without Children With Children and Adults With Only Children Unknown Household Type
110 103 7 0 0
12 3 9 0 0
12 3 9 0 0
16 4 12 0 0
32 13 17 0 2
94 36 58 0 0
78 30 48 0 0
66 46 20 0 0
290 257 33 0 0
710 495 213 0 2
31 3 28 0 0
197 13 25 0 2
938 511 266 0 4

9/29/21, 8:37 PM Sage: Reports: HUD ESG CAPER FY2020
https://www.sagehmis.info/secure/reports/filterpages/galactic.aspx?reportID=118&client_ID=78754&157.4340=118264&iid=118264&autoexecute=true&Medium=true 10/11
Q23c: Exit Destination – All persons
Permanent Destinations
Moved from one HOPWA funded project to HOPWA PH
Owned by client, no ongoing housing subsidy
Owned by client, with ongoing housing subsidy
Rental by client, no ongoing housing subsidy
Rental by client, with VASH housing subsidy
Rental by client, with GPD TIP housing subsidy
Rental by client, with other ongoing housing subsidy
Permanent housing (other than RRH) for formerly homeless persons
Staying or living with family, permanent tenure
Staying or living with friends, permanent tenure
Rental by client, with RRH or equivalent subsidy
Rental by client, with HCV voucher (tenant or project based)
Rental by client in a public housing unit
Subtotal
Temporary Destinations
Emergency shelter, including hotel or motel paid for with emergency shelter voucher
Moved from one HOPWA funded project to HOPWA TH
Transitional housing for homeless persons (including homeless youth)
Staying or living with family, temporary tenure (e.g. room, apartment or house)
Staying or living with friends, temporary tenure (e.g. room, apartment or house)
Place not meant for habitation (e.g., a vehicle, an abandoned building, bus/train/subway station/airport oranywhere outside)
Safe Haven
Hotel or motel paid for without emergency shelter voucher
Host Home (non-crisis)
Subtotal
Institutional Settings
Foster care home or group foster care home
Psychiatric hospital or other psychiatric facility
Substance abuse treatment facility or detox center
Hospital or other residential non-psychiatric medical facility
Jail, prison, or juvenile detention facility
Long-term care facility or nursing home
Subtotal
Other Destinations
Residential project or halfway house with no homeless criteria
Deceased
Other
Client Doesn’t Know/Client Refused
Data Not Collected (no exit interview completed)
Subtotal
Total
Total persons exiting to positive housing destinations
Total persons whose destinations excluded them from the calculation
Percentage
Total WithoutChildren
With Children andAdults
With OnlyChildren
Unknown HouseholdType
0 0 0 0 0
0 0 0 0 0
2 1 0 1 0
0 0 0 0 0
27 14 13 0 0
0 0 0 0 0
0 0 0 0 0
52 26 26 0 0
13 13 0 0 0
55 15 41 0 0
0 0 0 0 0
21 2 19 0 0
4 3 1 0 0
5 3 2 0 0
179 77 102 1 0
0 0 0 0 0
106 28 78 0 0
0 0 0 0 0
24 11 13 0 0
8 1 7 0 0
8 3 5 0 0
9 8 1 0 0
0 0 0 0 0
3 0 3 0 0
1 1 0 0 0
154 52 102 0 0
0 0 0 0 0
0 0 0 0 0
0 0 0 0 0
0 0 0 0 0
1 1 0 0 0
1 1 0 0 0
0 0 0 0 0
2 2 0 0 0
0 0 0 0 0
0 0 0 0 0
2 2 0 0 0
37 32 5 0 0
5 3 2 0 0
265 182 78 0 5
309 219 85 0 5
650 350 294 1 5
160 48 112 0 0
27 10 17 0 0
25.68% 14.12 % 40.43 % 0.00 % 0.00 %

9/29/21, 8:37 PM Sage: Reports: HUD ESG CAPER FY2020
https://www.sagehmis.info/secure/reports/filterpages/galactic.aspx?reportID=118&client_ID=78754&157.4340=118264&iid=118264&autoexecute=true&Medium=true 11/11
Q24: Homelessness Prevention Housing Assessment at Exit
Able to maintain the housing they had at project start--Without a subsidy
Able to maintain the housing they had at project start--With the subsidy they had at project start
Able to maintain the housing they had at project start--With an on-going subsidy acquired since projectstart
Able to maintain the housing they had at project start--Only with �nancial assistance other than asubsidy
Moved to new housing unit--With on-going subsidy
Moved to new housing unit--Without an on-going subsidy
Moved in with family/friends on a temporary basis
Moved in with family/friends on a permanent basis
Moved to a transitional or temporary housing facility or program
Client became homeless – moving to a shelter or other place un�t for human habitation
Client went to jail/prison
Client died
Client doesn’t know/Client refused
Data not collected (no exit interview completed)
Total
Q25a: Number of Veterans
Chronically Homeless Veteran
Non-Chronically Homeless Veteran
Not a Veteran
Client Doesn't Know/Client Refused
Data Not Collected
Total
Q26b: Number of Chronically Homeless Persons by Household
Chronically Homeless
Not Chronically Homeless
Client Doesn't Know/Client Refused
Data Not Collected
Total
Total WithoutChildren
With Children andAdults
With OnlyChildren
Unknown HouseholdType
6 5 0 1 0
19 19 0 0 0
0 0 0 0 0
2 1 1 0 0
0 0 0 0 0
0 0 0 0 0
0 0 0 0 0
0 0 0 0 0
0 0 0 0 0
0 0 0 0 0
0 0 0 0 0
0 0 0 0 0
1 0 1 0 0
42 11 26 0 5
78 44 28 1 5
Total Without Children With Children and Adults Unknown Household Type
6 6 0 0
6 6 0 0
641 504 137 0
4 4 0 0
48 47 1 0
705 567 138 0
Total Without Children With Children and Adults With Only Children Unknown Household Type
297 230 67 0 0
543 215 326 1 1
15 10 5 0 0
175 140 25 0 10
1030 595 423 1 11
Copyright © 2022 FDOKUMEN