
Circulation of European films outside Europe - rm .coe. int/C
77
The circulation of European films outside Europe - Key figures 2016
-
Upload
khangminh22 -
Category
Documents
-
view
2 -
download
0
Transcript of Circulation of European films outside Europe - rm .coe. int/C

The circulation of European films outside Europe
- Key figures 2016

The circulation of European films outside Europe Key figures 2016 © European Audiovisual Observatory (Council of Europe), Strasbourg, 2017 Director of publication Susanne Nikoltchev Executive Director, European Audiovisual Observatory Author Martin Kanzler Film Analyst, Department for Information on Markets and Financing, European Audiovisual Observatory [email protected] Supervising editor Gilles Fontaine Head of the Department for Information on Markets and Financing, European Audiovisual Observatory Marketing Markus Booms, European Audiovisual Observatory, [email protected] Press and Public Relations Alison Hindhaugh, European Audiovisual Observatory, [email protected] Acknowledgements The Audiovisual Observatory would like to thank the EFARN network and all of our contacts in organisations across Europe who regularly provide us with the necessary data to keep our LUMIERE database up-to-date.

The circulation of European films outside Europe - Key figures 2016
Martin Kanzler


Table of contents
1. EXECUTIVE SUMMARY ...................................................................................................... 1
SYNTHÈSE ............................................................................................................................... 5
ZUSAMMENFASSUNG ............................................................................................................. 9
2. INTRODUCTION & METHODOLOGY................................................................................. 13
2.1. Introduction .................................................................................................................................................................................................. 13
2.2. Data scope & sources ............................................................................................................................................................................... 14
2.3. Methodology remarks & definitions .................................................................................................................................................... 16
3. THE BIG PICTURE 2016 .................................................................................................... 23
3.1. Theatrical market volume of European films ........................................................................................................................................ 23
4. MARKET VOLUME OUTSIDE EUROPE IN 2016 ............................................................. 28
4.1. European film releases outside Europe .............................................................................................................................................. 28
4.2. Admissions to European films outside Europe ................................................................................................................................ 35
4.3. GBO to European films outside Europe .............................................................................................................................................. 41
5. BREAKING IT DOWN… .................................................................................................... 43
5.1. The most important theatrical markets for European films outside Europe ........................................................................ 43
5.2. The leading European film export countries .................................................................................................................................... 46
5.3. Concentration of admissions outside Europe ................................................................................................................................... 52
5.4. Diversity of European film offering outside Europe ...................................................................................................................... 57
5.5. Top 100 European films outside Europe ............................................................................................................................................ 62
6. APPENDIX ........................................................................................................................ 65
6.1. Number of films tracked in LUMIERE .................................................................................................................................................. 66
6.2. Admissions tracked in LUMIERE............................................................................................................................................................ 67
6.3. Estimated LUMIERE coverage rates ..................................................................................................................................................... 68
6.4. Treatment of EUR inc films ..................................................................................................................................................................... 69


Figures Figure 1. European films on release outside Europe in 2012-2016 ................................................................................................................... 1 Figure 2. Admissions to European films outside Europe 2012-2016 (in million) .......................................................................................... 2 Figure 3. Market shares of European films outside Europe 2012-2016 ............................................................................................................ 2 Figure 4. Admissions to European films outside Europe 2016 – by market and origin ............................................................................. 3 Figure 5. At a glance: "Worldwide" theatrical market volume of European films in 2016 ..................................................................... 24 Figure 6. Number of European films on release outside Europe 2012 – 2016 (estimates) ................................................................... 29 Figure 7. Market share of European films in terms of films on release - 2016 (prov) .............................................................................. 33 Figure 8. Admissions to European films outside Europe – 2012 to 2016 ..................................................................................................... 36 Figure 9. Market share of European films in terms of admissions - 2016 (estimated)............................................................................. 38 Figure 10. Market share of European films outside Europe 2012-2016 (estimated) ................................................................................... 38 Figure 11. Market shares in terms of admissions - by region / country of origin 2016 (estimated) ..................................................... 40 Figure 12. GBO to European films outside Europe – 2016 (estimated) ............................................................................................................ 41 Figure 13. Breakdown of “worldwide” admissions to the top 10 European film exporting countries by origin of
admissions generation - 2016 (estimated) ............................................................................................................................................. 50 Figure 14. Concentration of admissions to European films outside Europe 2016 ....................................................................................... 52 Figure 15. Share of European films with only 1 or 2 non-European release markets 2016 ..................................................................... 57 Figure 16. Share of French and UK films on non-European markets 2016 ..................................................................................................... 60 Figure 17. Share of „recent“ European films on non-European release markets 2016 .............................................................................. 61
Tables Table 1. Number of European films on release by release region 2012 – 2016 ...................................................................................... 25 Table 2. Admissions and GBO to European films “worldwide” 2012 – 2016 ............................................................................................. 26 Table 3. “National” vs “non-national“ market volume of European films 2012 – 2016 ...................................................................... 27 Table 4. Number of European films on release outside Europe 2012-2016 .............................................................................................. 30 Table 5. European first releases outside Europe (narrow definition) 2012 – 2016 (estimated) ......................................................... 31 Table 6. European first releases outside Europe (wide definition) 2012 – 2016 (estimated) ............................................................. 32 Table 7. Market share of European films in terms of films on release 2012 – 2016 (estimated) .................................................... 34 Table 8. Admissions to European films on release outside Europe 2012-2016 ...................................................................................... 37 Table 9. Market share of European films in terms of admissions 2012 – 2016 (estimated) ............................................................... 39 Table 10. GBO to European films on release outside Europe 2012-2016 (estimated).............................................................................. 42 Table 11. Number of European film releases outside Europe 2016 ................................................................................................................. 44 Table 12. Admissions & GBO for European films outside Europe 2016 ......................................................................................................... 45 Table 13. Number of European film releases outside Europe by country of origin 2016 ........................................................................ 48 Table 14. Admissions to European films outside Europe by country of origin 2016 ................................................................................. 49 Table 15. Admissions breakdown for European films 2016 – “national” vs. “non-national” .................................................................. 51 Table 16. Number and admissions of European films by „admissions brackets“ 2016 ............................................................................. 53 Table 17. Number of European films by „admissions brackets“ 2012-2016 ................................................................................................. 53 Table 18. Admissions to European films by „admissions brackets“ 2012-2016 – in mio ........................................................................ 54 Table 19. Admissions to European films by „admissions brackets“ 2012-2016 – in % ............................................................................ 54 Table 20. Concentration of admissions to European films by „top brackets“ 2016 ................................................................................... 55 Table 21. Admissions to European films by „top brackets“ 2012-2016 – in % ............................................................................................ 56 Table 22. Admissions to European films by „top brackets“ 2012-2016 – in million ................................................................................. 56 Table 23. Concentration of European films outside Europe by number of release markets 2016 ....................................................... 58 Table 24. European film releases outside Europe by number of release markets 2012-2016 .............................................................. 58 Table 25. Admissions to European films outside Europe by number of release markets 2012-2015 – in million ....................... 59 Table 26. Admissions to European films outside Europe by number of release markets 2012-2016 – in % .................................. 59 Table 27. Concentration of European films outside Europe by production year 2016 ............................................................................ 61 Table 28. Short profiles of top 5 European films outside Europe 2016 .......................................................................................................... 62 Table 29. Top 100 European films in terms of admissions generated outside Europe 2016 (est) ....................................................... 63 Table 30. Number of films tracked in LUMIERE database by territory 2012-2016 ................................................................................... 66 Table 31. Admissions tracked in LUMIERE database by territory 2012-2016 ............................................................................................. 67 Table 32. Estimated LUMIERE coverage rate of individual territories 2012-2016 (in %) ........................................................................ 68 Table 33. EUR INC films considered as European films in this report ............................................................................................................. 69 Table 34. EUR INC films considered as US films in this report .......................................................................................................................... 69

The Circulation of European films outside Europe - Key figures 2016
© European Audiovisual Observatory (Council of Europe) 2017
Page 1
1. EXECUTIVE SUMMARY
This report focuses on the theatrical exploitation of European films outside Europe. It has to be kept in mind that the theatrical window is only one out of – broadly speaking – four market segments.TV, Video and VOD markets may also constitute relevant market potential for European films but cannot be quantified due to intransparency of corresponding consumption data.
Theatrical market volume of European films outside Europe in 2016
An estimated total of 650 European films were on theatrical release in at least one of the 12 non-European markets covered in this report. This is the largest number of European films released outside Europe in the past five years and represents about 11% of the total number of European films on release worldwide (see Figure 1 below).
These 650 films cumulatively generated about 82 million admissions outside Europe. This is in line with admission levels observed in 2013 and 2014 but below the five year average of 97 million admissions (see Figure 2 overleaf). Applying local average ticket prices this corresponds with an estimated EUR 475 million in gross box office earned by European films outside Europe in 2016.
European films accounted for 19% of the tracked number of films on release (in line with the 5 year average) and 2% of the admissions generated in the 12 non-European sample markets. This is the lowest market share in the past five years (average 3%).
Figure 1. European films on release outside Europe in 2012-2016
Estimated. As tracked in LUMIERE.
Source: European Audiovisual Observatory / LUMIERE, comScore
583
5 yearaverage
10%

The Circulation of European films outside Europe - Key figures 2016
© European Audiovisual Observatory (Council of Europe) 2017
Page 2
Figure 2. Admissions to European films outside Europe 2012-2016 (in million)
As tracked in LUMIERE. Pro-forma estimates for China for 2012 and 2013.
Source: European Audiovisual Observatory / LUMIERE, comScore, Oanda
Figure 3. Market shares of European films outside Europe 2012-2016
Estimated. As tracked in LUMIERE.
Source: European Audiovisual Observatory / LUMIERE, comScore
North America is the largest market for European films outside Europe
The North American market maintained its position as the most important “overseas” market for European films in terms of admissions. In 2016 an estimated 29.8 and 2.7 million tickets were sold to European films in the US and Canada respectively. The US market hence represents the single largest market for European films, accounting for 32% of total admissions to European films outside Europe, while the Canadian market accounted for 4%.
Despite the very limited number of European releases, China clearly came in as the second largest market for European films in terms of admissions with 18.6 million tickets sold in 2016, accounting for 23% of total admission, followed by Mexico (12%), Australia (7%) and South Korea (6%).
97 mio
5 yearaverage
22%
131
80 82
108
82
28%20% 18%
24%19%
2012 2013 2014 2015 2016
Admissions to European films outside of Europe (in mio)
% share of worldwide admissions to European films that is generated outside Europe
5 yearaverage
19%
3%
5%3% 3% 3% 2%
19% 19%21% 20% 19%
2012 2013 2014 2015 2016
Market share of European films outside of Europe (admissions)
Market share of European films outside of Europe (films on release)
The Circulation of European films outside Europe - Key figures 2016
© European Audiovisual Observatory (Council of Europe) 2017
Page 3
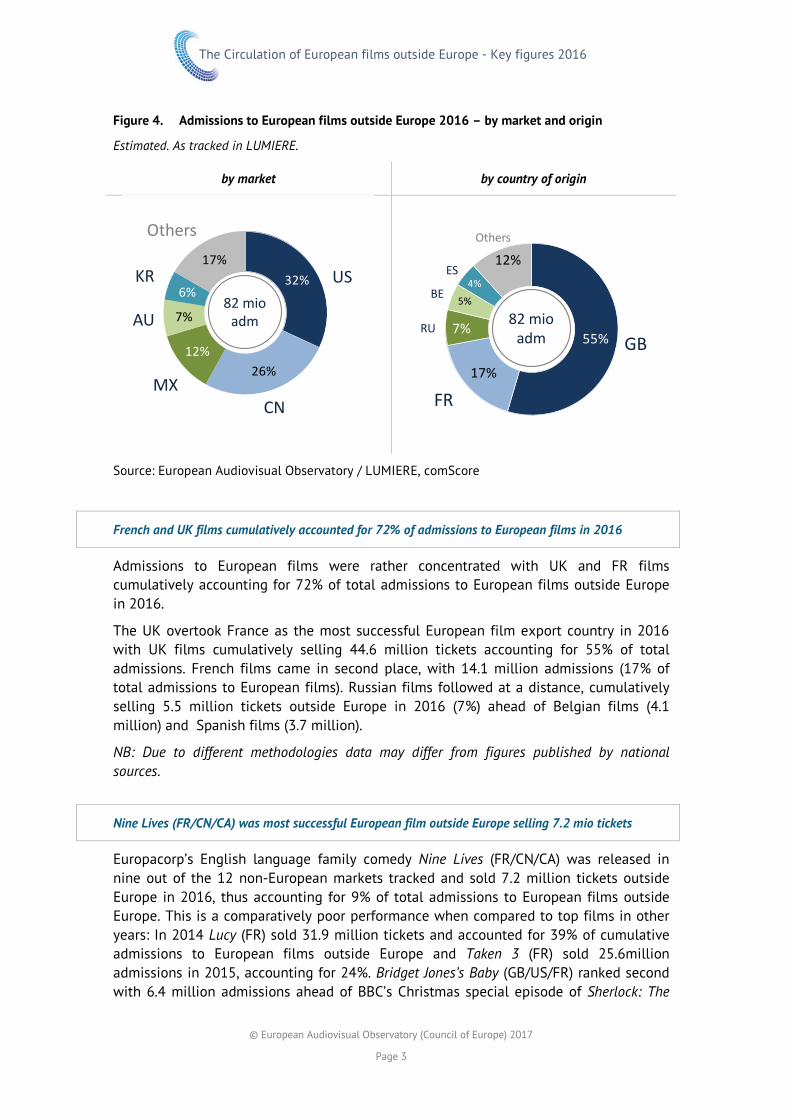
Figure 4. Admissions to European films outside Europe 2016 – by market and origin
Estimated. As tracked in LUMIERE.
by market by country of origin
Source: European Audiovisual Observatory / LUMIERE, comScore
French and UK films cumulatively accounted for 72% of admissions to European films in 2016
Admissions to European films were rather concentrated with UK and FR films cumulatively accounting for 72% of total admissions to European films outside Europe in 2016.
The UK overtook France as the most successful European film export country in 2016 with UK films cumulatively selling 44.6 million tickets accounting for 55% of total admissions. French films came in second place, with 14.1 million admissions (17% of total admissions to European films). Russian films followed at a distance, cumulatively selling 5.5 million tickets outside Europe in 2016 (7%) ahead of Belgian films (4.1 million) and Spanish films (3.7 million).
NB: Due to different methodologies data may differ from figures published by national sources.
Nine Lives (FR/CN/CA) was most successful European film outside Europe selling 7.2 mio tickets
Europacorp’s English language family comedy Nine Lives (FR/CN/CA) was released in nine out of the 12 non-European markets tracked and sold 7.2 million tickets outside Europe in 2016, thus accounting for 9% of total admissions to European films outside Europe. This is a comparatively poor performance when compared to top films in other years: In 2014 Lucy (FR) sold 31.9 million tickets and accounted for 39% of cumulative admissions to European films outside Europe and Taken 3 (FR) sold 25.6million admissions in 2015, accounting for 24%. Bridget Jones’s Baby (GB/US/FR) ranked second with 6.4 million admissions ahead of BBC’s Christmas special episode of Sherlock: The
32%
26%12%
7%
6%
17%
82 mioadm
US
CNMX
KR
AU
Others
55%
17%
7%
5%
4%
12%
82 mioadm GB
FR
ES
BE
RU
Others

The Circulation of European films outside Europe - Key figures 2016
© European Audiovisual Observatory (Council of Europe) 2017
Page 4
Abominable Bride (GB) which was released in theatres in 4 non-European territories and sold 5.6 million tickets. These three films were the only European films to sell more than 5 million tickets outside Europe, in contrast to 2015 when six films managed to do so.

The Circulation of European films outside Europe - Key figures 2016
© European Audiovisual Observatory (Council of Europe) 2017
Page 5
SYNTHÈSE Le présent rapport porte sur l’exploitation en salles des films européens hors d’Europe. Il convient de garder à l’esprit que la fenêtre d’exploitation en salles n’est, généralement parlant, qu’un des quatre segments de marché existants. Les marchés de la télévision, de la vidéo et de la VOD peuvent également présenter un réel potentiel pour les films européens. Toutefois, ils ne peuvent pas être quantifiés en raison de l’opacité des données de consommation pertinentes.
Volume du marché des salles pour les films européens hors d’Europe en 2016
Il est estimé qu’un total de 650 films européens est sorti en salles sur au moins l’un des 12 marchés non européens couverts par le présent rapport. Il s’agit du plus grand nombre de films européens sortis en salles hors d’Europe des cinq dernières années et cela représente environ 11% du nombre total de films européens sortis en salles au niveau mondial (voir graphique 1).
Ces 650 films ont cumulativement généré quelque 82 millions d’entrées en salles hors d’Europe. Ce résultat est conforme aux niveaux observés en 2013 et en 2014 mais inférieur à la moyenne sur cinq ans qui s’établit à 97 millions d’entrées (voir graphique 2). En appliquant le prix moyen du billet local, il est estimé que les films européens ont généré 475 millions d’EUR de recettes brutes au guichet hors d’Europe en 2016.
Les films européens représentent 19 % du nombre de films sortis en salles suivis (chiffre conforme à la moyenne sur 5 ans) et 2 % des entrées en salles générées sur les 12 marchés non européens de l’échantillon (voir graphique 3). Il s’agit de leur deuxième plus faible part de marché des cinq dernières années (moyenne 3 %).
Graphique 1. Films européens sortis en salles hors d’Europe, 2012-2016
Estimation. Selon LUMIERE.
Source : Observatoire européen de l’audiovisuel/LUMIERE, comScore
583
5 yearaverage
10%

The Circulation of European films outside Europe - Key figures 2016
© European Audiovisual Observatory (Council of Europe) 2017
Page 6
Graphique 2. Entrées en salles des films européens hors d’Europe, 2012-2016 (en millions)
Selon LUMIERE. Estimations pro forma pour la Chine pour 2012 et 2013.
Source : Observatoire européen de l’audiovisuel/LUMIERE, comScore, Oanda
Graphique 3. Parts de marché des films européens hors d’Europe, 2012-2016
Estimation. Selon LUMIERE.
Source : Observatoire européen de l’audiovisuel/LUMIERE, comScore
L’Amérique du Nord est le principal marché pour les films européens hors d’Europe
Le marché nord-américain reste le marché « étranger » le plus important pour les films européens pour ce qui est des entrées en salles. En 2016, il est estimé que les films européens ont vendu 29,8 et 2,7 millions de billets respectivement aux États-Unis et au Canada. Par conséquent, avec 32% du total des entrées réalisées par les films européens hors d’Europe, le marché américain représente le marché unique le plus important pour les films européens. La part du marché canadien est de 4 %.
Malgré un nombre très restreint de sorties européennes, la Chine s’est clairement imposée comme le deuxième marché le plus important pour les films européens pour ce qui est des entrées en salles avec 18,6 millions de billets vendus en 2016, soit 23 % du total des entrées, suivie par le Mexique (12 %), l’Australie (7 %) et la Corée du Sud (6 %).
97 mio
5 yearaverage
22%
131
80 82
108
82
28%20% 18%
24%19%
2012 2013 2014 2015 2016
Admissions to European films outside of Europe (in mio)
% share of worldwide admissions to European films that is generated outside Europe
5 yearaverage
19%
3%
5%3% 3% 3% 2%
19% 19%21% 20% 19%
2012 2013 2014 2015 2016
Market share of European films outside of Europe (admissions)
Market share of European films outside of Europe (films on release)

The Circulation of European films outside Europe - Key figures 2016
© European Audiovisual Observatory (Council of Europe) 2017
Page 7
Graphique 4. Entrées réalisées par les films européens hors d’Europe en 2016 – par marché et par origine
Estimation. Selon LUMIERE.
par marché par pays d’origine
Source : Observatoire européen de l’audiovisuel/LUMIERE, comScore
Les films français et britanniques représentent cumulativement 72% des entrées des films européens en 2016
Les entrées en salles des films européens sont assez concentrées : les films français et britanniques représentent cumulativement 72 % du total des entrées des films européens hors d’Europe en 2016.
Le Royaume-Uni a pris à la France la place de premier pays exportateur de films européens en 2016, les films britanniques ayant vendu 44,6 millions de billets, soit 55 % du total des entrées. Les films français arrivent en deuxième position, avec 14,1 millions d’entrées (17 % du total des entrées des films européens). Les films russes suivent à distance, avec 5,5 millions de billets vendus hors d’Europe en 2016 (7 %), devant les films belges (4,1 millions) et espagnols (3,7 millions).
N.B. : compte tenu des différences de méthodologie, les données peuvent différer des chiffres publiés par les sources nationales.
Nine Lives (FR/CN/CA) est le film européen qui a connu le plus grand succès hors d’Europe avec 7,2 millions de billets vendus
Nine Lives (FR/CN/CA), la comédie familiale en langue anglaise d’EuropaCorp, est sorti sur les 12 marchés non européens suivis et a vendu 7,2 millions de billets hors d’Europe en 2016, représentant ainsi 9 % du total des entrées réalisées par les films européens hors d’Europe. Il s’agit d’un résultat comparativement médiocre par rapport aux meilleurs films des années précédentes : en 2014 Lucy (FR) a vendu 31,9 millions de
32%
26%12%
7%
6%
17%
82 mioadm
US
CNMX
KR
AU
Others
55%
17%
7%
5%
4%
12%
82 mioadm GB
FR
ES
BE
RU
Others

The Circulation of European films outside Europe - Key figures 2016
© European Audiovisual Observatory (Council of Europe) 2017
Page 8
billets, soit 39 % du total des entrées réalisées par les films européens hors d’Europe et Taken 3 (FR) a vendu 25,6 millions de billets en 2015 (24 %). Bridget Jones’s Baby (GB/US/FR) arrive en deuxième posution avec 6,4 millions d’entrées devant l’épisode spécial Noël de Sherlock: The Abominable Bride (GB) proposé par la BBC qui est sorti en salles dans 4 territoires non européens et a vendu 5,6 millions de billets. Ces trois films sont les seuls films européens à avoir vendu plus de 5 millions de billets hors d’Europe, alors que six films avaient passé ce seuil en 2015.

The Circulation of European films outside Europe - Key figures 2016
© European Audiovisual Observatory (Council of Europe) 2017
Page 9
ZUSAMMENFASSUNG Der Schwerpunkt dieses Berichts liegt auf der Kinoauswertung europäischer Filme ausserhalb Europas. Dabei ist zu berücksichtigen, dass - allgemein gesagt - die Auswertung im Kino nur eines von vier Marktsegmenten darstellt. Auch die TV-, Video- und VoD-Märkte können für europäische Filme ein wichtiges Marktpotenzial darstellen, doch sind quantitative Angaben dazu aufgrund der fehlenden Transparenz der entsprechenden Konsumdaten nicht möglich.
Das Volumen des Kinomarkts für europäische Filme außerhalb Europas 2016
Schätzungsweise wurden insgesamt 650 europäische Filme in mindestens einem der 12 in diesem Bericht erfassten nichteuropäischen Märkte im Kino ausgewertet. Das ist die höchste Anzahl von europäischen Filmen, die in der letzten fünf Jahren außerhalb Europas im Kino gezeigt wurden, und entspricht ca. 11% sämtlicher europäischer Filme, die weltweit im Kino laufen (siehe Abb. 1).
Diese 650 Filme wurden außerhalb Europas von insgesamt ca. 82 Mio. Kinobesuchern gesehen. Dies entspricht den Besucherzahlen der Jahre 2013 bzw. 2014; der Wert liegt jedoch unter dem 5-Jahres-Durchschnitt von 97 Mio. (siehe Abb. 2). Unter Ansatz lokaler Eintrittspreise wurde mit europäischen Filmen außerhalb Europas ein ein geschätztes Bruttoeinspielergebnis in Höhe von EUR 475 Mio. erzielt.
Europäische Filme machen 19% der im Kino gezeigten Filme (dies entspricht dem 5-Jahresdurchschnitt) und 2% der Besucherzahlen in den erfassten 12 nichteuropäischen Märkten aus. Das ist der geringste Marktanteil in den letzten fünf Jahren (der Durchschnitt liegt bei 3%) (siehe Abb. 3).
Abb. 1 Anzahl europäischer Filme mit Kinoauswertung außerhalb Europas 2012-2016
Geschätzt. Wie in LUMIERE dargestellt.
Quelle: Europäische Audiovisuelle Informationsstelle / LUMIERE; comScore
583
5 yearaverage
10%

The Circulation of European films outside Europe - Key figures 2016
© European Audiovisual Observatory (Council of Europe) 2017
Page 10
Abb. 2 Besucherzahlen europäischer Filme außerhalb Europas 2012-2016 (in Mio.)
Wie in LUMIERE dargestellt. Pro-forma-Schätzungen für China für 2012 und 2013.
Quelle: Europäische Audiovisuelle Informationsstelle / LUMIERE; comScore, Oanda
Abb. 3 Marktanteile europäischer Filme außerhalb Europas 2012-2016
Geschätzt. Wie in LUMIERE dargestellt.
Quelle: Europäische Audiovisuelle Informationsstelle / LUMIERE; comScore
Nordamerika ist der größte Markt für europäische Filme außerhalb Europas
Der nordamerikanische Markt hat seine Stellung als wichtigster „Überseemarkt“ für europäische Filme in Bezug auf Besucherzahlen gehalten. Im Jahr 2016 wurden in den USA und Kanada 29,8 bzw. 2,7 Mio. Kinokarten für europäische Filme verkauft. Der US-amerikanische Markt ist somit der größte Einzelmarkt für europäische Filme, auf den 32% der Gesamtbesucherzahlen europäischer Filme außerhalb Europas entfallen; auf den kanadischen Markt entfallen 4%.
Trotz der sehr begrenzten Anzahl von europäischen Filmen mit Kinoauswertung in China ist dieses Land mit 18,6 Mio. verkauften Kinokarten 2016 eindeutig – gemessen am Volumen der Besucherzahlen - der zweitgrößte Markt für europäische Filme ausserhalb
97 mio
5 yearaverage
22%
131
80 82
108
82
28%20% 18%
24%19%
2012 2013 2014 2015 2016
Admissions to European films outside of Europe (in mio)
% share of worldwide admissions to European films that is generated outside Europe
5 yearaverage
19%
3%
5%3% 3% 3% 2%
19% 19%21% 20% 19%
2012 2013 2014 2015 2016
Market share of European films outside of Europe (admissions)
Market share of European films outside of Europe (films on release)

The Circulation of European films outside Europe - Key figures 2016
© European Audiovisual Observatory (Council of Europe) 2017
Page 11
Europas. Dies entspricht 23% der Gesamtbesucherzahlen; auf den Plätzen folgen Mexiko (12%), Australien (7%) und Südkorea (6%).
Abb. 4 Besucherzahlen europäischer Filme außerhalb Europas – nach Markt und Herkunft
Geschätzt. Wie in LUMIERE dargestellt.
nach Markt nach Herkunftsland
Quelle: Europäische Audiovisuelle Informationsstelle / LUMIERE; comScore
Auf französische und britische Filme zusammengenommen entfallen 2016 72% der Besucherzahlen europäischer Filme
Bei den Besucherzahlen liegt eine starke Konzentration auf Filme aus dem Vereinigten Königreich (UK) und Frankreich (FR) vor; im Jahr 2016 entfielen 72% der Gesamtbesucherzahlen europäischer Filme außerhalb Europas auf Filme aus diesen beiden Ländern. Dabei hat das Vereinigte Königreich Frankreich als das erfolgreichste Filmexportland überholt: 2016 wurden für britische Filme insgesamt 44,6 Mio. Kinokarten verkauft; dies entspricht 55% der Gesamtbesucherzahlen europäischer Filmer. Auf dem zweiten Platz folgen französische Filme mit 14,1 Mio. Besuchern (17%). Mit Abstand folgen russische Filme, für die 2016 außerhalb Europas insgesamt 5,5 Mio. Kinokarten verkauft wurden (7%); die weiteren Plätze belegen belgische (4,1 Mio.) und spanische Filme (3,7 Mio.).
NB: Aufgrund methodologischer Unterschiede können sich im Vergleich zu den von nationalen Filmagenturen veröffentlichten Zahlen Abweichungen ergeben.
32%
26%12%
7%
6%
17%
82 mioadm
US
CNMX
KR
AU
Others
55%
17%
7%
5%
4%
12%
82 mioadm GB
FR
ES
BE
RU
Others

The Circulation of European films outside Europe - Key figures 2016
© European Audiovisual Observatory (Council of Europe) 2017
Page 12
Mit 7,2 Mio. verkauften Tickets war der Film Nine Lives (FR/CN/CA) [deutscher Titel: „Voll verkatert“] der erfolgreichste europäische Film außerhalb Europas
Die von EuropaCorp produzierte englischsprachige Familienkomödie Nine Lives [deutscher Titel: Voll verkatert] war in 9 von 12 der hier berücksichtigten nichteuropäischen Märkten im Kino zu sehen. Für den Film wurden 2016 außerhalb Europas 7,2 Mio. Tickets verkauft; dies entspricht 9% der Gesamtbesucherzahlen europäischer Filme außerhalb Europas. Im Vergleich zu den Top-Filmen früherer Jahre ist das ein relativ schwaches Ergebnis: 2014 wurden für Lucy (FR), auf den 39% der Gesamtbesucherzahlen europäischer Filme außerhalb Europas entfielen, 31,9 Mio. Kinokarten verkauft, und für Taken 3 (FR) wurden 25,6 Mio. Karten verkauft, was 24% der Besucher entsprach.
Bridget Jones’s Baby (GB/US/FR) liegt mit 6,4 Mio. Besuchern auf dem zweiten Platz, gefolgt von einer Weihnachtssonderfolge der Sherlock-Serie der BBC Sherlock - The abominable bride [deutscher Titel: Sherlock - Die Braut des Grauens]. Für diesen Film, der in 4 nichteuropäischen Gebieten im Kino zu sehen war, wurden 5,6 Mio. Tickets verkauft. Die genannten drei Filme waren die einzigen europäischen Filme, für die außerhalb von Europa mehr als 5 Mio. Kinokarten verkauft wurden - 2015 erreichten noch sechs Filme diesen Wert.

The Circulation of European films outside Europe - Key figures 2016
© European Audiovisual Observatory (Council of Europe) 2017
Page 13
2. INTRODUCTION & METHODOLOGY
2.1. Introduction
About this report
This report aims to provide a high-level analysis of the theatrical markets for European films outside Europe based on admissions data provided by comScore for 12 non-European markets including the North American market, five Latin American markets, China and South Korea as well as Australia and New Zealand. The analysis focuses on 2016 data but is complemented by five-year data series for the period 2012 to 2016 for all major indicators.
The report focuses on providing a „big picture“ overview of the circulation of European films as a whole rather than analysing the film exports of individual European countries. The latter may require different – sometimes country specific – methodological choices / research angles which are beyond the scope of this report. It is particularly important to note that because of the Observatory’s choices regarding the allocation of a unique country of origin based on the majority financing share as well as the exclusion of films financed with incoming foreign investment data presented in this report may differ significantly from data published by national sources such as the British Film Institute or the CNC / UniFrance. For the analysis of the export of films originating from a specific country, please refer to national sources. See methodological remarks for further details.
The report addresses in particular the following research questions:
How important is non-national exploitation, particularly outside Europe, for European films? How many European films are theatrically released outside Europe? How many admissions and GBO do they generate?
What is their market share in the respective non-European markets?
What are the most important theatrical markets for European films outside Europe?
For which European countries is export outside Europe particularly important?
Which European films performed particularly well outside Europe?
About the European Audiovisual Observatory www.obs.coe.int
The European Audiovisual Observatory (hereafter ‘Observatory’) is a European public service body comprising 41 Member States and the European Union, represented by the European Commission. It operates within the legal framework of the Council of Europe and works alongside a number of partner and professional organisations from within the audiovisual industries. The mission of the Observatory is to collect, process and publish
The Circulation of European films outside Europe - Key figures 2016
© European Audiovisual Observatory (Council of Europe) 2017
Page 14
information about the various audiovisual industries, i.e. primarily film, TV, home entertainment and on-demand industries in Europe.
In these areas the Observatory systematically collects statistical data and provides market as well as legal analysis which are distributed e.g. in the form of:
print or electronic publications, including a statistical Yearbook, as well as newsletters and thematic reports or the Observatory’s website;
free databases on film admissions (LUMIERE), TV & on-demand services (MAVISE), AV law information (IRIS Merlin);
contributions to conferences.
2.2. Data scope & sources
Data scope
In principle the data set covers title-by-title admissions data for all feature films on release, i.e. films with at least one commercial theatrical screening in one of the markets covered. This includes holdovers, re-releases, retrospectives, paid festival screenings etc. Alternative content screenings and short film compilations are not taken into account.
This report covers 2016 admissions data for 12 non-European markets and puts them in the context of admissions data for another 33 European markets covered in the LUMIERE database:
Market region Countries covered in 2016 North America Canada (CA)
USA (US)
Latin America Argentina (AR)
Brazil (BR)
Chile (CL)
Colombia (CO)
Mexico (MX)
Venezuela (VE)
Oceania Australia (AU),
New Zealand (NZ)
Asia China (CN),
South Korea (KR)
Europe (covered at least partially)
Austria, Belgium, Bulgaria, Bosnia-Herzegovina, Croatia, Czech Republic, Denmark, Estonia, Finland, France, Germany, Georgia, Greece, Hungary, Iceland, Italy, Latvia, Lithuania, Montenegro, Netherlands, Norway, Poland, Portugal, Romania, Russian Federation, Slovakia, Slovenia, Spain, Sweden, Switzerland, Turkey, UK & Ireland (treated as one market)
Please note that there are differences in the coverage rate of individual markets which can distort the direct comparability of statistical indicators between years or countries. This is particularly true with regard to the number of films on release: In many European countries LUMIERE seems to cover a higher number of smaller and “repertoire” films with very few admissions than comScore outside Europe. The number of films on release

The Circulation of European films outside Europe - Key figures 2016
© European Audiovisual Observatory (Council of Europe) 2017
Page 15
in Europe is hence portrayed as significantly higher than outside Europe. Given the lack of comprehensive and fully comparable data sets, it cannot be determined to which degree these are structural differences and to which degree this is simply caused by more limited data sets for non-European markets. Also note, that comScore data for the US and Canadian market appear to not provide full coverage of admissions to French language films e.g. in Québec. Hence, all data in this report drawn from LUMIERE are to be interpreted as estimated minimum figures.
Data sources
The data sample analysed in this report comes from two sources: Admissions data for the 12 non-European markets covered in this report have been provided comScore. While data for the years 2013 to 2016 have been purchased by the European Audiovisual Observatory on behalf of a buying group consisting of several EFARN members, data for the year 2012 have been kindly provided by the French CNC and the European Union's MEDIA Programme. All European admissions data come from the European Audiovisual Observatory's LUMIERE database which collates annual admissions from a wide variety of sources.
www.comscore.com
comScore
comScore is a global cross-platform measurement company that measures audiences, brands and consumer behaviour across all screens. It completed its merger with Rentrak Corporation in January 2016. The company now offers its clients proprietary digital, TV and movie intelligence with vast demographic details to quantify consumers’ multiscreen behaviour at massive scale.
www.lumiere.obs.coe.int
LUMIERE database on film admissions
The Observatory’s LUMIERE database is a free database which tracks cinema admissions to films in Europe since 1996. Admissions data come from a wide variety of sources, including national film agencies and statistics offices, inter-industry bodies, distributors’ and exhibitors’ associations, the trade press and a small number of private tracking bodies. This is supplemented and completed by data from the European Union’s MEDIA Programme, on the basis of declarations made by distributors to its Automatic Distribution Support scheme.
www.cnc.fr
CNC (Centre national du cinéma et de l’Image animée)
The CNC (the French national centre of cinematography) is a public administrative organisation with a legal entity status and financial autonomy. It operates under the authority of the Ministry of Culture and Communication. The CNC’s principal responsibilities are (i) regulation, (ii) support for the economy of the film, television video, multimedia and technical industries, (iii), the promotion of films and television productions and their dissemination to all audiences and (iv) the preservation and enhancement of cinema heritage.
https://eacea.ec.europa.eu/creative-europe_en
MEDIA Programme
The MEDIA sub-programme of Creative Europe supports the EU film and audiovisual industries financially in the development, distribution and promotion of their work. It helps to launch projects with a European dimension and nurtures new technologies; it enables European films and audiovisual works including feature films, television drama, documentaries and new media to find markets beyond national and European borders; it funds training and film development schemes.
LUMIERE

The Circulation of European films outside Europe - Key figures 2016
© European Audiovisual Observatory (Council of Europe) 2017
Page 16
2.3. Methodology remarks & definitions
How to measure “film market volume”?
Theatrical feature films are commercially exploited across a variety of different distribution windows. However, it is practically impossible to quantify the total market volume for theatrical films across all these windows. This is primarily due to methodological challenges faced by the variety of business models through which theatrical films can be commercially exploited on the one hand, and the intransparency of certain market segments with regard to consumption data on the other hand.
The approach chosen in this report is to measure market volume in terms of consumer expenditures on film. Methodologically speaking this approach can be easily applied to measure the market volume of theatrical markets (gross box office), physical video retail and rental markets as well as transactional VOD markets. It gets however more complicated when it comes to the exploitation of films on TV or SVOD services, where there is generally no direct link between consumer expenditures and the consumption of theatrical films. In order to overcome this issue one could e.g. estimate corresponding retail equivalent values as done for instance by the British Film Institute.
However it is the intransparency of most exploitation markets with regard to consumption data which poses the major obstacle in measuring film market volume across the various windows. The theatrical cinema market is practically the only window for which reliable data are available. While in most countries data are in fact being tracked for the home entertainment (DVD / Blu-ray retail and rental), and TV markets they are generally not made available to the general public and are sold at prohibitive prices which makes their tracking practically impossible for an organisation like the Observatory. In the case of VOD markets, the situation is even worse as they still remain more or less completely intransparent with regard to consumer expenditures in the vast majority of markets.
Given these difficulties, this report focuses on measuring the theatrical market volume for European films in terms of admissions (number of cinema tickets sold) and GBO (gross box office) which is estimated by multiplying admissions with annual average ticket prices – converted to Euros using the average annual bid rates – within each territory covered in this report.
Why may data presented in this report differ from data published by other sources?
Broadly speaking, data differences may be caused by different data sets and / or different methodological choices. Given the focus of this report on providing a „big picture“ overview of the circulation of European films as a whole rather than analysing the film exports of individual European countries, the Observatory’s methodological choices – in particular regarding the allocation of a unique country of origin based on the majority financing share as well as the exclusion of films financed with incoming foreign investment – may differ from methodologies applied by national sources who seek to analyse the export of films originating from their countries. Data presented in this report may hence differ significantly from data published by national sources such

The Circulation of European films outside Europe - Key figures 2016
© European Audiovisual Observatory (Council of Europe) 2017
Page 17
as the British Film Institute or the CNC / UniFrance. For the analysis of the export of films originating from a specific country, please refer to national sources.
What is the definition of “film” in the context of this report?
In principle the data set covers all feature fiction, documentary or animation films on theatrical release, i.e. films with at least one commercial theatrical screening in one of the markets covered. This includes - from a methodological perspective - holdovers, re-releases, retrospectives, paid festival screenings etc. Alternative content screenings, concert recordings and short film compilations are not taken into account for the purposes of this analysis.
What does the term “film offering” stand for?
In the context of this report the term “film offering” refers to the number of films on release. It should of course be noted that the number of films on release is the most basic indicator for measuring the theatrical film offering in a country and - in itself - has limited informational value with regard to how many European films were actually accessible to audiences It does not provide any information about the actual availability of a film - which depends entirely on the number of screens the film is shown on and the frequency of screenings, as well as the number of days / weeks it remains in cinemas. These data could however not be analysed within the scope of this report.
What does “on release” mean?
Any film that has at least one commercial theatrical screening in a territory is considered as a film “on release”. This includes first releases, holdovers, re-releases, retrospectives, paid festival screenings etc. Please note that differences in the coverage rate of individual markets and in particular differences between Europe and non-European markets regions can limit the direct comparability of the indicator “number of films on release” and distort any related statistical analysis: In many European countries LUMIERE seems to cover a higher number of smaller and repertoire films with very few admissions than covered by comScore data outside Europe. The number of films on release hence is portrayed as significantly higher in some markets than in others. Given the lack of comprehensive and fully comparable data sets, it cannot be determined to what degree these are structural differences and to which degree this is simply caused by more limited data sets for non-European markets.
What is a “first release“?
A “first release” is defined as a film which gets commercially released for the first time in a specific territory. The concept of “first release” is by definition linked to a specific market, as films can be released in one market in one year and in another the subsequent year and will appear as first releases in different years in national statistics in both markets.
It is difficult to identify the number of first releases: On the one hand, there is an issue with regard to data quality: release dates may be missing or may refer to the “release date” in a particular year rather than the original release date of the film. Hence some

The Circulation of European films outside Europe - Key figures 2016
© European Audiovisual Observatory (Council of Europe) 2017
Page 18
re-releases / holdovers / festival releases might be counted as commercial first releases and all data are to be considered estimates. On the other hand, there is an inherent methodological issue in defining a “first release” on a multi-territory basis which is best illustrated by an example: A French film can be released in France in 2013, in the US in 2014 and in China in 2015. Should this film be counted as a first release outside Europe in 2015?
In answering this question, one can apply two different definitions:
Wide definition: A first release outside Europe refers to films that were first released in at least one non-European market in a specific year. According to this definition the above mentioned film is considered a first release in 2015, as it is counted as such in China.
Narrow definition: A first release outside Europe refers to films which were first released in at least one non-European market in a specific year and have never been released in any other non-European market before. When applying this definition to a region, the region is treated as if it were a single market. According to this definition the above mentioned film is considered a first release outside Europe in 2014 and an “other release” in 2015.
What are “admissions”?
Admissions refer to the number of cinema tickets sold for the theatrical screening of a film.
What is “GBO”?
GBO stands for gross box office and refers to consumer expenditure on cinema tickets. As LUMIERE only covers admissions data, GBO figures are estimated by applying the average ticket price in a market to the number of admissions. In some markets where only GBO figures but no admissions data were available, the same method is used to estimate admissions.
What is the definition of a “European film”?
European films are all films considered to be of European origin, i.e. to be produced and majority financed by a European country. In the context of this report all member states of the Council of Europe are considered to be European states.
European films produced with incoming investment from US studios such as the Harry Potter or the James Bond franchises (“INC” films as defined below) are in principle not considered to be European in the context of this sample. Because of their untypically high box office potential they would distort admission and global circulation statistics for ‘typical’ European films. In the context of this report they are hence generally considered as US films.
However, INC films designated as European films by the European Commission or Europa Cinemas are counted as European films. A list of “EUR INC” films counted as European films in the context of this report can be found in the appendix

The Circulation of European films outside Europe - Key figures 2016
© European Audiovisual Observatory (Council of Europe) 2017
Page 19
Please note that this exclusion of “INC films” concerns primarily UK films and may hence result in significant differences to publications on film exports by national sources such as the British Film Institute.
What is the definition of “Europe”?
Europe as a region of origin is defined as the 47 member states of the Council of Europe (see http://www.coe.int/en/web/portal/47-members-states) and Belarus.
Europe as a market refers to the entirety of the European markets for which at least partial admissions data is available in the Observatory’s LUMIERE database (see data scope). This figure ranges between 30 and 34 European markets in any of the years between 2012 and 2016.
What is an “INC” film?
The “INC” marker is a contraction of “incoming investment”. An “incoming investment” film is defined as one for which the main producer is a company established in a country but under the ownership and/or control of a company registered in another country (mostly a US studio).
Thus a film categorised as “GB inc / US” is a film produced in the United Kingdom (GB) where the main producer is a United Kingdom-registered company which may be wholly or partially owned or controlled by a US company. A “FR inc / US” film is a work produced in France (FR) where the main producer is French-registered company wholly or partially owned or controlled by a US company. These films are particularly hard to identify as the Observatory does not have access to detailed production information on films. There may hence be mistakes in the classification of „INC“ films and the Observatory occasionally revises its attribution when further information becomes available. Readers noticing any inaccurate origin allocation for a specific film are invited to contact the Observatory team under [email protected].
As mentioned above EUR INC films are – by default – not considered to be European films in the context of this report. A full list of EUR INC films is however provided in the appendix for the benefit of those readers who would like to include them in the analysis
How is the “country of origin” of a film determined?
In order to calculate market shares by country of origin without double counting films, each film has is allocated a unique country of origin within the LUMIERE database.
Defining the nationality of a film is a complex task. There are no widely accepted international or even European definitions of the criteria to be used to determine the country of origin of a film. This is both a legal and a statistical problem. Different national records - and the statistics on which they are based - can show the same film as having a whole range of nationalities.
Adopting a pragmatic approach, the Observatory considers as the country of origin of a specific film the country out of which the film is financed. In the case of international co-productions (defined below) the film is assigned to the country which provides the majority share of production financing. The Observatory tries to list all co-producing
The Circulation of European films outside Europe - Key figures 2016
© European Audiovisual Observatory (Council of Europe) 2017
Page 20
countries in the order of their financial investment in the film (whether known or assumed), with the country having provided the majority financial investment in the production in first place, e.g. a “FR/DE” co-production is considered to be French film in the context of this report.
Please note, that the allocation of a country of origin in LUMIERE may differ from the allocation applied by national film agencies or other organisations, and so may consequently any statistics based on the country of origin.
What is the definition of “co-production”?
A co-production is defined as a film whose production budget is financed by sources stemming from two or more countries. The country providing the majority of the financing, i.e. the majority coproduction country, is considered to be the country of origin. In the case of an parity co-production, e.g. Germany 40% / France 40% / Spain 20%, the nationality of the director and subsidiarily the cultural content of the film determine to which country the film is allocated on a case-by-case basis.
Co-productions are indicated in LUMIERE by the allocation of at least two countries of origin, e.g. “AT / DE” stands for an Austrian majority and German minority co-production.
This definition of a co-production is not identical with the qualification as an “official co-production” (which is based on satisfying the requirements set out in the relevant co-production treaties, or those of the European Convention on Cinematographic Co-production) but also includes co-productions that are not necessarily registered by the national film agencies. For instance this can be the case where national broadcasters co-produce feature films with foreign partners.
The Observatory identifies co-productions on the basis of information provided by various sources. When a new film is created the system will, by default, apply the countries of origin as indicated on IMDB. These data are consequently checked and adjusted by using information provided by national film agencies and / or the trade press.
As a consequence the qualification of a film as a co-production and its allocation to a specific country of origin by the Observatory may differ from co-production listings published by other sources.
As the Observatory does not have access to detailed production information on films, it does not claim to have got its identification right in every case and it occasionally revises its attribution when further information becomes available. Readers noticing any inaccurate origin allocation for a specific film are invited to contact the Observatory team under [email protected]
What are “national” / “non-national” admissions / markets?
The country of origin is considered to be the “national“ market of a film. All other markets are referred to as “non-national“ markets. Accordingly, “national“ admissions are defined as admissions in the country of origin of the film, i.e. 100% national or majority co-producing country. All other markets – including other (minority) co-producing countries – are considered as non-national markets. For example Spain is considered

The Circulation of European films outside Europe - Key figures 2016
© European Audiovisual Observatory (Council of Europe) 2017
Page 21
the national market for Planet 51, an ES/UK co-production, while the UK release is counted as a non-national release. „Non-national“ admissions are consequently admissions generated outside of the national home market.
What does “worldwide” refer to?
In the context of this report the term "worldwide“ refers to the entirety of the 30 to 34 European and 12 non-European markets which are – at least partially – covered in this report.
What does “outside Europe” / ”non-European” mean exactly?
In the context of this report the terms "outside Europe“ or „non-European markets“ refer to the 12 non-European markets covered in this report.
The Circulation of European films outside Europe - Key figures 2016
© European Audiovisual Observatory (Council of Europe) 2017
Page 22
How is “average” defined?
In the context of this study an average value can be expressed either as the “mean” or the “median” value. The mean refers to the arithmetical total of all the values in the array divided by the number of values. The median is found by arranging the values in order and selecting the middle value. If not pointed out otherwise the term “average” refers to the mean value.
How reliable are the underlying data sets?
The Observatory collects data from what it considers to be the most reliable data sources in each territory. However, there can be significant differences in the coverage rates among individual markets and / or years which may have an impact on the interpretation of the data. The coverage rates of each market for the years 2011 to 2015 are shown in the appendix.
Evidently, the number of films covered has a direct impact on the number of films tracked to be on release. It has however hardly any impact on the other indicators, i.e. the number of first releases, admissions and GBO. Nevertheless, all 2016 data are to be considered as provisional data .
The Observatory is furthermore in no position to verify the accuracy of the data provided by the various third party data sources. Neither the Observatory nor its third party sources can warrant that the provided data are free of errors, omissions or other inaccuracies.
How were comScore and OBS film data matched?
The title-by-title admissions lists provided by comScore were imported into the LUMIERE database via a process of title matching. In cases where comScore could not provide any admission figures, admissions were estimated by dividing the gross box office result by the average annual ticket price of the market in question.
By integrating the non-European admissions into LUMIERE the European Audiovisual Observatory was in a position to calculate market shares for European films in non-European countries based on the same methodology as for the European markets. Of particular importance in this context is the allocation of a country of origin to any individual film (see above).

The Circulation of European films outside Europe - Key figures 2016
© European Audiovisual Observatory (Council of Europe) 2017
Page 23
3. THE BIG PICTURE 2016
3.1. Theatrical market volume of European films
Total “film market volume” obscure due to intransparent markets
It is practically impossible to quantify the total market volume for theatrical films across their value chain. As set forth in the methodological remarks this is partly due to methodological challenges faced by the variety of business models through which theatrical films can be commercially exploited along the different windows. But methodological difficulties aside, it is primarily the intransparency of certain market segments which makes it impossible to quantify corresponding consumer expenditures.
The theatrical cinema market is practically the only exploitation window for which reliable consumption data are available. In most countries data for the physical video, transactional VOD, television and subscription VOD markets are either not available at all or are sold at prohibitive prices which makes their tracking practically impossible for an organisation like the Observatory. As a consequence, this report can only analyse the theatrical exploitation of European films. It is however important to keep in mind that the theatrical exploitation window is only one out of - broadly speaking - four main market segments all of which may provide relevant - though not quantifiable in the research context of this report - market potential for European films outside Europe. 1
Theatrical market volume of European films worldwide in 2016
Theatrical market volume can be measured in terms of film offering, i.e. the number of films on release, admissions and gross box office (GBO). Figure 5 overleaf provides a „big picture“ overview of the volume and breakdown of worldwide market volume to European films in 2016. As mentioned above the term „worldwide“ refers to cumulative data for the 33 European and 12 non-European markets covered in this report2. Given this partial coverage data have to be interpreted as minimum values.
1 In the UK – which is one of the few countries in which consumer expenditures or retail equivalents – were measured for all market segments the data suggest that theatrical GBO accounted for 27% of total revenues in 2013, representing the third largest market segment behind TV (38%) and physical video sales and rentals which in 2013 were still slightly above box office levels. Data for the French market for instance suggest that the market share of French films is twice is high on the theatrical market than it is on the physical video market. Given the lack of data it remains however unclear to which extent these results are representative for film exploitation in other European countries. 2 See chapter 2 for details on data sources and data scope.

The Circulation of European films outside Europe - Key figures 2016
© European Audiovisual Observatory (Council of Europe) 2017
Page 24
Figure 5. At a glance: "Worldwide" theatrical market volume of European films – 2016
Provisional estimates.
Source: European Audiovisual Observatory / LUMIERE, comScore
6 184 films on release
2016 (prov)
Theatrical> 423 mioadmissions
DVD / BluRay
N/A
TVOD / SVOD
N/A
> 423 mio admissions
generated on national markets ...
… in non-natmarkets
40%60%
168 million«non-national» admissions
with national release only
with non-national release
54%46%
3 203 «exported» films
N/A
Pay / Free TV
~ 86 millionnon-national admissions
within Europe
~ 82 millionadmissions
outside Europe
19%21%
Share of total admissions
Split of non-nat admissions
2 991 filmsexported
within Europe
650 films on release
outside Europe
93%
20%
11%
48%
Share of total films on release
Share of «export» films3 203 export films
51% 49%
168 mio. export adm
The Circulation of European films outside Europe - Key figures 2016
© European Audiovisual Observatory (Council of Europe) 2017
Page 25
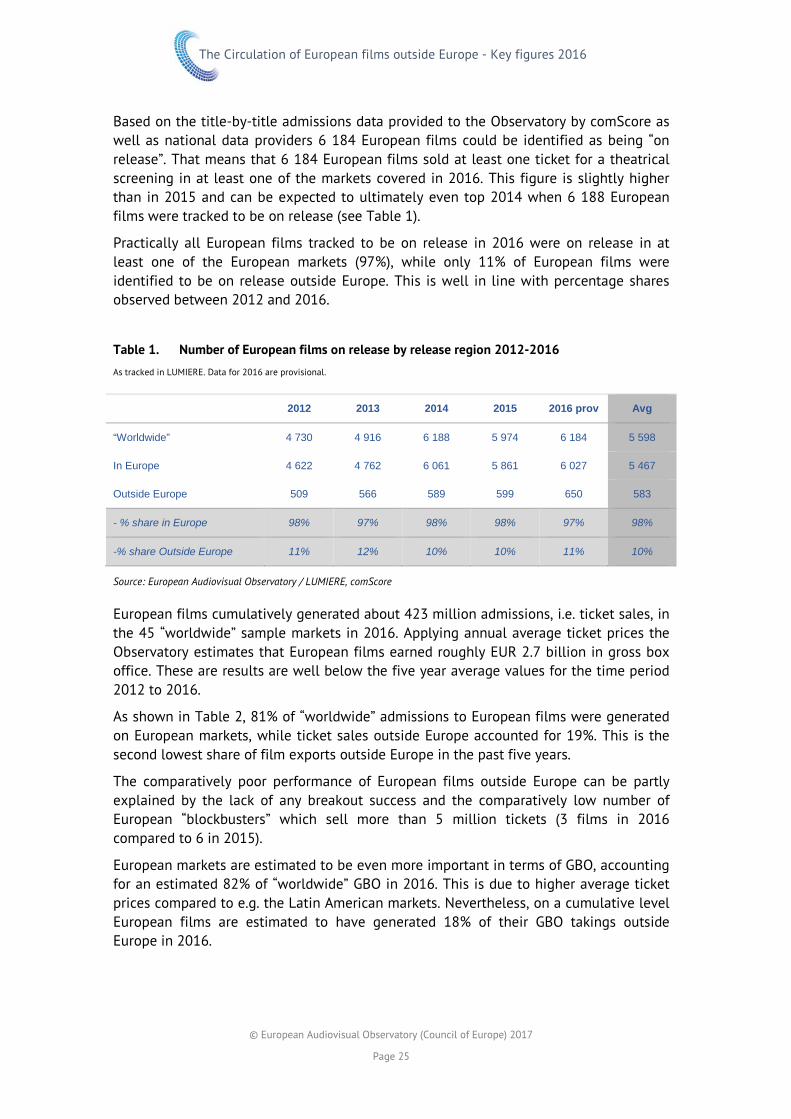
Based on the title-by-title admissions data provided to the Observatory by comScore as well as national data providers 6 184 European films could be identified as being “on release”. That means that 6 184 European films sold at least one ticket for a theatrical screening in at least one of the markets covered in 2016. This figure is slightly higher than in 2015 and can be expected to ultimately even top 2014 when 6 188 European films were tracked to be on release (see Table 1).
Practically all European films tracked to be on release in 2016 were on release in at least one of the European markets (97%), while only 11% of European films were identified to be on release outside Europe. This is well in line with percentage shares observed between 2012 and 2016.
Table 1. Number of European films on release by release region 2012-2016 As tracked in LUMIERE. Data for 2016 are provisional.
2012 2013 2014 2015 2016 prov Avg
“Worldwide” 4 730 4 916 6 188 5 974 6 184 5 598
In Europe 4 622 4 762 6 061 5 861 6 027 5 467
Outside Europe 509 566 589 599 650 583
- % share in Europe 98% 97% 98% 98% 97% 98%
-% share Outside Europe 11% 12% 10% 10% 11% 10%
Source: European Audiovisual Observatory / LUMIERE, comScore
European films cumulatively generated about 423 million admissions, i.e. ticket sales, in the 45 “worldwide” sample markets in 2016. Applying annual average ticket prices the Observatory estimates that European films earned roughly EUR 2.7 billion in gross box office. These are results are well below the five year average values for the time period 2012 to 2016.
As shown in Table 2, 81% of “worldwide” admissions to European films were generated on European markets, while ticket sales outside Europe accounted for 19%. This is the second lowest share of film exports outside Europe in the past five years.
The comparatively poor performance of European films outside Europe can be partly explained by the lack of any breakout success and the comparatively low number of European “blockbusters” which sell more than 5 million tickets (3 films in 2016 compared to 6 in 2015).
European markets are estimated to be even more important in terms of GBO, accounting for an estimated 82% of “worldwide” GBO in 2016. This is due to higher average ticket prices compared to e.g. the Latin American markets. Nevertheless, on a cumulative level European films are estimated to have generated 18% of their GBO takings outside Europe in 2016.

The Circulation of European films outside Europe - Key figures 2016
© European Audiovisual Observatory (Council of Europe) 2017
Page 26
Table 2. Admissions and GBO to European films “worldwide” 2012-2016 Pro-forma estimates for China for 2012 and 2013 otherwise as tracked in LUMIERE. GBO estimated based on average ticket prices and converted to Euro at average annual exchange rate.
Admissions (in mio) 2012 2013 2014 2015 2016 prov Avg
“Worldwide” 474 397 458 447 423 440
In Europe 343 317 376 341 341 344
Outside Europe 131 80 82 108 82 97
- % share in Europe 72% 80% 82% 76% 81% 78%
-% share outside Europe 28% 20% 18% 24% 19% 22%
GBO (in MEUR) 2012 2013 2014 2015 2016 prov Avg
“Worldwide” 3 090 2 538 3 092 2 932 2 684 2 867
In Europe 2 368 2 121 2 597 2 322 2 209 2 323
Outside Europe 722 416 496 610 475 544
- % share in Europe 77% 84% 84% 79% 82% 81%
-% share outside Europe 23% 16% 16% 21% 18% 19%
Source: European Audiovisual Observatory / LUMIERE, comScore
2016: share of European film exports stable, while share of export admissions decreases
3 203 European films – 52% of European films identified to be on theatrical release in 2016 - were exported, i.e. released in at least one non-national market. This is the highest number tracked in the past five years, albeit it exceeds the 2014 level of 3 181 export films only marginally.
More or less all of these “export” films received a release on a non-national market within Europe, while 650 of them were on release in at least one of the 12 non-European territories covered. Thus, in 2016 about 11% of all European films on release were screened outside Europe.
On a cumulative level, European films generated 60% of their total admissions on their respective national markets while theatrical exports, i.e. non-national admissions, accounted for about 40% of the overall admissions.
Breaking non-national admissions further down, the data suggest that about 86 million tickets were sold on non-national European markets while 82 million tickets were sold in the 12 non-European markets covered. These figures show that - on a cumulative level - theatrical exploitation outside Europe continued to contribute a significant, albeit a somewhat lower, share of the overall theatrical market volume of European films: About 19% of estimated worldwide admissions and almost half of non-national admissions (49%) to European films were generated outside Europe.

The Circulation of European films outside Europe - Key figures 2016
© European Audiovisual Observatory (Council of Europe) 2017
Page 27
Table 3. “National” vs. “non-national“ market volume of European films 2012-2016 Pro-forma admission estimates for China for 2012 and 2013 otherwise as tracked in LUMIERE.
Films on release 2012 2013 2014 2015 2016 prov Avg
“Worldwide” 4 730 4 916 6 188 5 974 6 184 5 598
On national market 2 687 2 895 4 124 3 961 4 074 3 548
On non-national market 2 827 2 794 3 181 3 084 3 203 3 018
% share national 57% 59% 67% 66% 66% 63%
% share “export films” 60% 57% 51% 52% 52% 54%
- Non-nat. in Europe 2 671 2 611 3 006 2 930 2 991 2 842
- Non-nat. outside Europe 509 566 589 599 650 583
% share export within Europe 56% 53% 49% 49% 48% 51%
% share outside Europe 11% 12% 10% 10% 11% 10%
Admissions (in mio) 2012 2013 2014 2015 2016 prov Avg
“Worldwide” 474 397 458 447 423 440
On national market 227 237 277 244 255 248
On non-national market 247 160 181 203 168 192
% share national 48% 60% 60% 55% 60% 57%
% share “export films” 52% 40% 40% 45% 40% 43%
- Non-nat. in Europe 116 80 99 95 86 95
- Non-nat. outside Europe 131 80 82 108 82 96
% share export within Europe 24% 20% 22% 21% 20% 22%
% share outside Europe 28% 20% 18% 24% 19% 22%
Source: European Audiovisual Observatory / LUMIERE, comScore
The Circulation of European films outside Europe - Key figures 2016
© European Audiovisual Observatory (Council of Europe) 2017
Page 28
4. MARKET VOLUME OUTSIDE EUROPE IN 2016
4.1. European film releases outside Europe
As explained in the methodology section, measuring film releases, particularly across multiple territories, is a difficult exercise where no clear-cut definitions can be applied and no individual indicator emerges as the sole reference indicator. Consequently, two complementary indicators will be analysed in the context of this report: the number of films on release as well as the number of first releases.
The film on release indicator counts any film that has at least one commercial theatrical screening (i.e. generated at least one cinema ticket sale) in any sample market tracked3 .This represents the widest possible definition of a film release. This indicator definition also underlies the quantification of admissions and GBO which are measured for all films on release.
The first releases indicator on the other hand only counts films which get a proper commercial release for the first time in a specific territory or region4 . This represents the narrowest possible definition of a film release. Even though representing a comparatively small share of the films on release, first releases generally account for the vast majority of admissions.
3 Important note: Given the methodological difficulties linked to classifying films by release type (first release, holdover, re-release, etc.) the number of films “on release” provides a methodologically consistent figure which allows the comparison over time. It should however be noted, that the number of films on release is directly linked to the coverage rate achieved by comScore in a specific market and year. Differing coverage rates can hence introduce a technical bias which can limit the ability to correctly identify trends over time. Given the lack of alternative data, the existence and / or extent of this bias cannot be evaluated by the Observatory. Details on the coverage rates for all markets and years are provided in the appendix. 4 Important note: Apart from the difficulties linked to defining and identifying a “proper commercial release” there are methodological issues when it comes to defining a “first release” on a multi-territory basis. Two definitions are introduced in Chapter 2: a “wide definition” (films which were first released in at least one non-European market in a specific year) and a “narrow definition” (films which were first released in at least one non-European market in a specific year and have never been released in any other non-European market before). Which of the two definitions is more appropriate may differ depending on the research question to be analysed.
The Circulation of European films outside Europe - Key figures 2016
© European Audiovisual Observatory (Council of Europe) 2017
Page 29
By analysing both of these two indicators one can define the maximum and minimum values of the bandwidth within which one can reasonably quantify the number of film releases. Depending on the question to be addressed readers can pick the most appropriate indicator out of these two or estimate a reasonable value within the bandwidth.
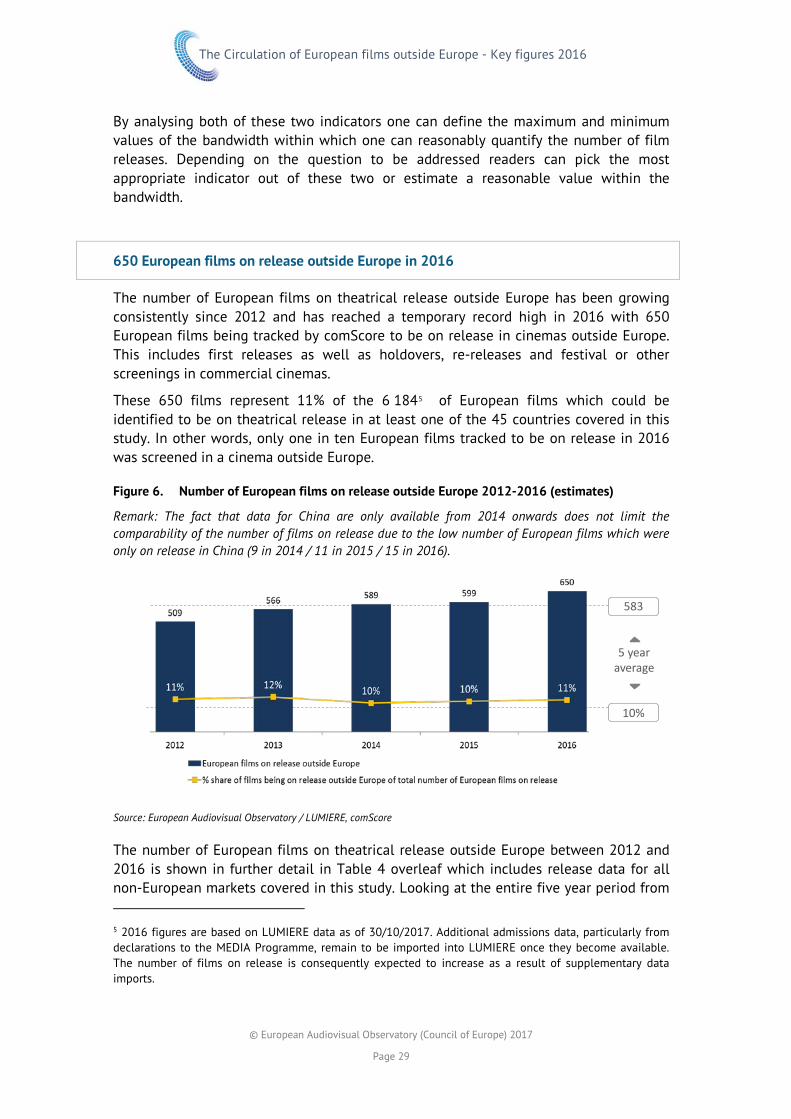
650 European films on release outside Europe in 2016
The number of European films on theatrical release outside Europe has been growing consistently since 2012 and has reached a temporary record high in 2016 with 650 European films being tracked by comScore to be on release in cinemas outside Europe. This includes first releases as well as holdovers, re-releases and festival or other screenings in commercial cinemas.
These 650 films represent 11% of the 6 1845 of European films which could be identified to be on theatrical release in at least one of the 45 countries covered in this study. In other words, only one in ten European films tracked to be on release in 2016 was screened in a cinema outside Europe.
Figure 6. Number of European films on release outside Europe 2012-2016 (estimates)
Remark: The fact that data for China are only available from 2014 onwards does not limit the comparability of the number of films on release due to the low number of European films which were only on release in China (9 in 2014 / 11 in 2015 / 15 in 2016).
Source: European Audiovisual Observatory / LUMIERE, comScore
The number of European films on theatrical release outside Europe between 2012 and 2016 is shown in further detail in Table 4 overleaf which includes release data for all non-European markets covered in this study. Looking at the entire five year period from 5 2016 figures are based on LUMIERE data as of 30/10/2017. Additional admissions data, particularly from declarations to the MEDIA Programme, remain to be imported into LUMIERE once they become available. The number of films on release is consequently expected to increase as a result of supplementary data imports.
583
5 yearaverage
10%

The Circulation of European films outside Europe - Key figures 2016
© European Audiovisual Observatory (Council of Europe) 2017
Page 30
2012 to 2016 the number of European film releases has grown in all world regions with the exception of the North American market as well as South Korea.
The growth in the number of European films on release in 2016 is linked primarily to an increasing number of European films being screened in the Latin American sample countries where 418 European films were screened, compared to 376 in 2015 and 216 in 2012. In contrast, the number of European films tracked to be on release in Oceania (140 films) and China (37 films) and continued to decrease in the North American market (from 277 films in 2012 to 210 films in 2015 to 193 in 2016). 2016 also did not show any increase in European film releases in South Korea, where the number of European films on releases remained at 97 films, compared to 180 films in 2013.
Table 4. Number of European films on release outside Europe 2012-2016
As tracked in LUMIERE.
2012 2013 2014 2015 2016 Average
Outside Europe 509 566 589 599 650 583
US & CA 277 273 218 210 193 234
Latin America 216 226 318 376 418 311
AU & NZ 101 102 126 127 140 119
CN & KR - - 155 128 126 136
CA 149 133 94 88 88 110
US 217 202 188 174 174 191
AR 74 58 87 117 117 91
BR 93 111 144 194 195 147
CL 31 30 40 58 58 43
CO 61 63 94 124 125 93
MX 87 75 130 160 161 123
VE 34 24 23 5 36 24
AU 87 75 110 120 120 102
NZ 60 70 72 74 74 70
CN - - 22 34 37 31
KR 114 180 142 97 97 126
Source: European Audiovisual Observatory / LUMIERE, comScore

The Circulation of European films outside Europe - Key figures 2016
© European Audiovisual Observatory (Council of Europe) 2017
Page 31
Number of European first releases outside Europe increases to 361 films in 2016
Applying the narrow definition of a “first release” (treating all non-European sample markets as one single territory) an estimated 361 European films premiered in cinemas outside Europe in 2016. In other words, 56% of the European films on release had never been released in cinemas in any of the 12 non-European sample markets before 2016. By implications this means that 44% of the European films on release outside Europe were holdovers and/or re-releases.
In contrast to previous years, the growth in the number of European films on release in 2016 hence stems from an increasing number of first releases. Up until 2015 growth had been driven by an increasing number of holdovers and/or re-releases, growing from 169 in 2012 to 300 in 2015 (see Table 5). The increase in the number of holdovers and / or re-releases over this time period cannot be explained with reliable certainty. One possible explanation for this trend could be that digital cinema has increased the international demand for limited releases / screenings of holdovers or repertoire films. Another reason could be a shortening in the time lag for the international release of films, i.e. that European films released in the past two years were released internationally within one, rather than two years. Yet another - technical - reason can lie in the improved data coverage of comScore over the years. Without a detailed title-by-title analysis, which is beyond the scope of this report, it cannot be determined which of these potential factors impacted the data to which degree.
Table 5. European first releases outside Europe (narrow definition) 2012-2016 (estimated)
Remark: The narrow definition of a first releases refers to films which were first released in at least one non-European market in a specific year and have never been released in any other non-European market before.
2012 2013 2014 2015 2016 Avg
Films on release 509 566 589 599 650 583
First releases 340 358 300 299 361 332
Other 169 208 289 300 289 251
% share First Releases 67% 63% 51% 50% 56% 57%
% share Other 33% 37% 49% 50% 44% 43%
Source: European Audiovisual Observatory / LUMIERE, comScore

The Circulation of European films outside Europe - Key figures 2016
© European Audiovisual Observatory (Council of Europe) 2017
Page 32
The number of first releases is naturally a bit higher, when applying the wide definition of a first release as it includes films which were first releases in one territory but holdovers in another. In that case an estimated 475 European films premiered in 2016 in at least one of the 12 non-European markets covered in the data sample. That means that 73% of the European films on release outside Europe were released for the first time in at least one of the sample markets in 2016. As illustrated in Table 6 this is the highest level of first releases registered in the past five years.
Table 6. European first releases outside Europe (wide definition) 2012-2016 (estimated)
The wide definition of a first releases refers to films which were first released in at least one non-European market in a given year.
2012 2013 2014 2015 2016 Avg
Films on release 509 566 589 599 650 583
First releases 474 525 429 415 475 464
Other 35 41 160 184 175 119
% share First Releases 93% 93% 73% 69% 73% 80%
% share Other 7% 7% 27% 31% 27% 20%
Source: European Audiovisual Observatory / LUMIERE, comScore
European films accounted for about 19% of the film offering outside Europe
Measured in terms of number films on release in the 45 sample markets tracked, European films accounted for an estimated 55% of the11 271 films tracked to be on theatrical release in the LUMIERE database at the time of writing6. This high share is of course due to the high share of European film releases on European markets, which account for 33 out of the 45 markets tracked worldwide. In Europe, European films accounted for 66% of the approximately 9°200 films identified to have been screened at least once in one of the 33 European markets in 2016.
Outside Europe, European films accounted for 19% of the approximately 3°400 films identified to have been screened at least once in the 12 non-European markets in 2016. In other words, one out of five films on theatrical release outside Europe was of European origin.
6 2016 figures are are based on LUMIERE data as of 30/10/2017. Additional admissions data, particularly from declarations to the MEDIA Programme, remain to be imported into LUMIERE once they become available. The number of films on release is consequently expected to increase as a result of supplementary data imports.

The Circulation of European films outside Europe - Key figures 2016
© European Audiovisual Observatory (Council of Europe) 2017
Page 33
When measured in terms of first releases - European films accounted for 21% of the approximate 2 281 films which are estimated to have been theatrically released for the first time in at least one7 of the 12 non-European markets covered.
Figure 7. Market share of European films in terms of films on release 2016
Provisional estimates.
Important note: As mentioned in the methodological remarks in Chapter 2 the number of films on release is an indicator which is directly linked to the coverage rates of individual markets which can significantly limit the direct comparability of this indicator across different territories or regions. For instance, the magnitude of the difference between European and non-European market with regard to the number of films identified as on release suggests that this indicator is probably not directly comparable in absolute terms. However, assuming that the proportional share by origin of films identified resembles the proportional distribution of films not identified in certain markets, the percentage share of European films can be considered to be a valid indicator when estimating the share of European films as portion of the total number of theatrical films on offer.
Source: European Audiovisual Observatory / LUMIERE, comScore
7 This figure is based on the „wide“ definition of a „first release“ (see methodological remarks in Chapter 2). Applying the narrow definition, i.e. treating a region as one single market, the percentage share of European first releases drops to 18% (361 European films out of an estimated total of 1 981 first releases outside Europe).
<<<
Outside Europe
19%A total of
~3 400 filmsregistered to be
on release
In Europe
A total of~9 200 films
registered to beon release
72%66%

The Circulation of European films outside Europe - Key figures 2016
© European Audiovisual Observatory (Council of Europe) 2017
Page 34
As shown in Table 7, the share of European films in the tracked film offering in 2016 is fairly comparable from region to region, ranging between 25% in Latin America and 22% in Australia & New Zealand. Only Asia, represented by China and South Korea, stands out with a comparatively low share of European films (13%) due to the low number of European films with a theatrical release in China, where European films accounted for only 4% of the tracked film offering in 2016.
Table 7. Market share of European films in terms of films on release 2012-2016 (estimated)
2012 2013 2014 2015 2016 Average
Outside Europe 19% 19% 21% 20% 19% 19%
US & CA 21% 19% 24% 23% 21% 21%
Latin America 26% 24% 24% 26% 27% 25%
AU & NZ 25% 22% 22% 21% 21% 22%
CN & KR - - 16% 12% 10% 13%
CA 28% 23% 20% 17% 18% 21%
US 18% 16% 23% 21% 21% 20%
AR 23% 17% 18% 23% 22% 20%
BR 28% 27% 26% 32% 30% 28%
CL 16% 17% 16% 21% 23% 19%
CO 29% 26% 27% 33% 29% 29%
MX 28% 20% 23% 28% 28% 25%
VE 21% 14% 12% 2% 14% 13%
AU 23% 19% 21% 21% 20% 21%
NZ 23% 24% 22% 21% 18% 22%
CN - - 5% 5% 4% 5%
KR 24% 25% 24% 19% 20% 22%
Source: European Audiovisual Observatory / LUMIERE, comScore
As noted in the methodological remarks, the number of films on release is the most basic indicator for measuring the theatrical film offering in a country. It does not provide any information about the actual availability of a film - which depends on the number of screens the film is shown on and the frequency of screenings, as well as the number of days / weeks it remains in cinemas. These data could however not be analysed within the scope of this report.
The Circulation of European films outside Europe - Key figures 2016
© European Audiovisual Observatory (Council of Europe) 2017
Page 35
4.2. Admissions to European films outside Europe
82 million tickets sold to European films outside Europe in 2016
In 2016 European films generated 82 million ticket sales in the 12 non-European markets covered. This means that at least 19% of total “worldwide” admissions to European films occurred outside Europe.
Like in 2014 the vast majority of these admissions were generated by first releases: the 475 European films estimated to have premiered in 2016 in at least one of the 12 non-European markets covered cumulatively generated 80 million admissions, accounting for 98% of total admissions while representing 73% of European films on release outside Europe.
2016 results are significantly lower when compared to 2015 or 2012, when a comparatively large number of European “blockbusters” boosted admissions to European films outside Europe to well above average levels. They are however well in line with results observed in 2013 and 2014.
A look at the five year time series as illustrated in Figure 8, hence suggests that the base line market volume for European films outside Europe is quite stable, amounting to around 80 million admissions per year. Higher admission levels seems to be the exception and are linked to an exceptionally high number of European “blockbuster “ releases: In “normal” years there are between one and three European films which manage to sell more than 5 million admissions outside Europe, while in the “exceptional” years of 20128 and 2015 it was six such films.
In fact the stable market volume of EUR 80 million can only be achieved due to significant growth in admissions on the Chinese market which contributed 15.5 million in 2014 and over 21 million admissions in both 2015 and 20169. Indeed China’s share in the cumulative admissions to European films outside Europe has been increasing from an estimated 10% in 2012 to 26% in 2016. At the same time, the Chinese market has been accessible only for an extremely limited number of European films (less than 30 first releases) and does not (yet) offer a realistic market potential for the vast, vast majority of European films.
Taking out China the base line market volume for European films drops to 60 to 67 million admissions. Seen in this light, 2016 results are actually the lowest in the past
8 2012 clearly stands out as a year with exceptionally good results for European films outside Europe as a total of six European films succeeded in generating more than 5 mio admissions [Taken 2 (26.8 mio), Les Misérables (15 mio), The Woman in Black (10.6 mio), Intouchables (7.3 mio), The Artist (6.7 mio), The Iron Lady (5.6 mio)] while in other years only 1 to 3 films managed to surpass this benchmark. 9 Please note that admission values for 2012 to 2013 are pro-forma estimates for all 12 non-European markets as reported by Rentrak in 2014 and 2015, including China. Pro-forma estimates for admissions to European films in China for the years 2012 to 2013 are based on the European market share in China in 2014 and are adjusted for Chinese market growth and relative performance of European films in the other non-European markets in each year. The accuracy of these estimates could not be validated due a a lack of data.

The Circulation of European films outside Europe - Key figures 2016
© European Audiovisual Observatory (Council of Europe) 2017
Page 36
five years. The comparatively poor performance of European films outside Europe in 2016 is primarily due to decreasing admissions on the North and Latin American markets.
Figure 8. Admissions to European films outside Europe 2012 to 2016
Pro-forma admissions estimates for China for 2012 and 2013 otherwise as tracked in LUMIERE.
Pro-forma estimates for cumulative admissions in 11 non-European sample markets EXCLUDING CHINA
Source: European Audiovisual Observatory / LUMIERE, comScore
With 29.8 million admissions North America remained nevertheless the largest market for European films outside Europe accounting for 36% of total admissions in non-European markets as shown in Table 8 overleaf.
Despite registering a decline in admissions in 2016, Asia, represented by China and South Korea, overtook Latin America as the second most important export region for European films with 25.8 million admissions (32%).
Admissions to European films in Latin American dropped from 32.7 million to 18.6 million in 2016, the lowest level in the past five years. Nevertheless Latin American
97 mio
5 yearaverage
22%
131
80 82
108
82
28%20% 18%
24%19%
2012 2013 2014 2015 2016
Admissions to European films outside of Europe (in mio)
% share of worldwide admissions to European films that is generated outside Europe
80 mio
5 yearaverage117
68 66
85
60
2012 2013 2014 2015 2016

The Circulation of European films outside Europe - Key figures 2016
© European Audiovisual Observatory (Council of Europe) 2017
Page 37
markets remained an important export region for European films accounting for 23% of total admissions to European films outside Europe.
Australia and New Zealand was the only region which registered an increase to European films in 2016, as cumulative admissions increased from 5.1 million to 7.4 million, accounting for 9% of total admissions to European films outside Europe.
See Chapter 7 for further details on the importance of the individual overseas territories for European films.
Table 8. Admissions to European films on release outside Europe 2012-2016
Pro-forma admissions estimates for China for 2012 and 2013 otherwise as tracked in LUMIERE.
2012 2013 2014 2015 2016 Average
Outside Europe 130.9 80.0 82.0 108.2 81.6 96.5
US & CA 67.2 36.6 30.7 42.1 29.8 41.3
Latin America 31.1 19.0 21.2 32.7 18.6 24.5
AU & NZ 7.2 5.0 7.0 5.1 7.4 6.3
CN & KR 25.4 19.3 23.1 28.2 25.8 24.4
CA 6.3 3.4 3.4 4.2 3.5 4.2
US 60.8 33.3 27.4 37.9 26.2 37.1
AR 4.2 2.7 1.7 2.9 2.0 2.7
BR 6.6 5.3 6.4 8.1 3.7 6.0
CL 0.7 0.7 0.6 1.1 0.6 0.8
CO 3.0 2.2 2.2 3.8 1.8 2.6
MX 15.3 7.4 9.5 15.4 10.0 11.5
VE 1.3 0.7 0.7 1.4 0.4 0.9
AU 6.0 4.0 5.9 4.1 5.9 5.2
NZ 1.1 1.0 1.1 1.1 1.5 1.2
CN est 13.4 12.2 15.5 22.7 21.2 17.0
KR 12.0 7.1 7.5 5.5 4.7 7.4
Source: European Audiovisual Observatory / LUMIERE, comScore

The Circulation of European films outside Europe - Key figures 2016
© European Audiovisual Observatory (Council of Europe) 2017
Page 38
2% market share for European films in terms of admissions outside Europe
With 82 million admissions generated in 2016 European films accounted for around 2% of the cumulative 3.6 billion admissions generated by all films tracked in the 12 non-European markets covered in this report (see Figure 9). In comparison, European films claimed a market share of 27% in Europe, generating over 341 million admissions in 2016.
Figure 9. Market share of European films in terms of admissions 2016
Estimates. As tracked in LUMIERE.
Source: European Audiovisual Observatory / LUMIERE, comScore
As illustrated in Figure 10, the market share of European films outside Europe has remained fairly stable over the past five years: In terms of the number of films tracked to be on release in the 12 non-European markets, European films accounted for 19% in 2016. This corresponds exactly to the average value over the past five years.
In terms of admissions share, European films generally accounted for 2% of the total number of cinema tickets sold in the 12 non-European markets covered. The 2016 market share is hence the lowest in the past five years, albeit only marginally lower than the five-year average value of 3%.
Figure 10. Market share of European films outside Europe 2012-2016
Estimated percentage share of number of films on release / admissions in 12 markets covered.
Source: European Audiovisual Observatory / LUMIERE, comScore
Outside Europe
A total of~3.6 billionadmissions
In Europe
A total of~1.2 billionadmissions
2%
27%
European films
European films
5 yearaverage
19%
3%
5%3% 3% 3% 2%
19% 19%21% 20% 19%
2012 2013 2014 2015 2016
Market share of European films outside of Europe (admissions)
Market share of European films outside of Europe (films on release)

The Circulation of European films outside Europe - Key figures 2016
© European Audiovisual Observatory (Council of Europe) 2017
Page 39
Like in 2015 the highest market share of European films was registered in New Zealand (9%), followed by Australia (6%) and Argentina (6%). In contrast the lowest market shares of European films were observed in China (2%), the US, Canada, Chile and Venezuela (3%). More detailed figures including a time series of market shares in the individual non-European territories are shown in Table 9 below.
A breakdown of European market share by films originating from individual European countries is shown in Figure 11 overleaf.
Table 9. Market share of European films in terms of admissions 2012-2016 Pro-forma estimates for China for 2012 and 2013 otherwise as tracked in LUMIERE.
2012 2013 2014 2015 2016 Average
Outside Europe 5% 3% 3% 3% 2% 3%
US & CA 5% 3% 2% 3% 2% 3%
Latin America 6% 4% 4% 5% 3% 4%
AU & NZ 8% 6% 8% 5% 8% 7%
CN & KR 4% 2% 2% 2% 2% 2%
CA 5% 3% 3% 4% 3% 3%
US 5% 3% 2% 3% 2% 3%
AR 9% 6% 4% 6% 4% 6%
BR 5% 4% 4% 5% 2% 4%
CL 4% 4% 3% 4% 2% 3%
CO 8% 5% 5% 6% 3% 5%
MX 7% 3% 4% 5% 3% 4%
VE 5% 2% 2% 5% 2% 3%
AU 7% 5% 8% 5% 7% 6%
NZ 9% 10% 10% 8% 10% 9%
CN 3% 2% 2% 2% 2% 2%
KR 6% 3% 4% 3% 2% 4%
Source: European Audiovisual Observatory / LUMIERE, comScore

The Circulation of European films outside Europe - Key figures 2016
© European Audiovisual Observatory (Council of Europe) 2017
Page 40
Where did European films generate the highest market share?
Figure 11. Market shares in terms of admissions - by region / country of origin 2016 (estimated)
Markets ranked by market share of European films.
EUR films
GB FR RU BE ES IE DE Other
10% 88% 1% - 1% 1% 2% 2% 5%
7% 86% 5% 0% 0% 1% 1% 0% 7%
4% 25% 17% 0% 4% 35% 1% 3% 16%
3% 43% 17% 0% 3% 20% 1% 6% 11%
3% 73% 14% 3% 4% 0% 2% 0% 3%
3% 35% 28% 4% 1% 8% 2% 7% 14%
2% 31% 21% 11% 4% 12% - 1% 20%
2% 54% 4% 1% 3% 2% 12% 4% 21%
2% 70% 13% 4% 3% 0% 5% 0% 5%
2% 39% 16% 7% 6% 15% 3% 4% 9%
2% 39% 11% 4% 9% 12% - 4% 21%
2% 35% 31% 19% 10% - 3% 2% 0%
Source: European Audiovisual Observatory / LUMIERE, comScore
North America Latin America Asia Oceania Europe
76% 4% 10% 10%NZ
88% 7%AU
82% 13% 4%AR
89% 7% 3%MX
95% 3%CA
89% 7% 3%CO
95%VE
42% 55%KR
97%US
82%BR
15%
90% 1%CL
41% 58%CN
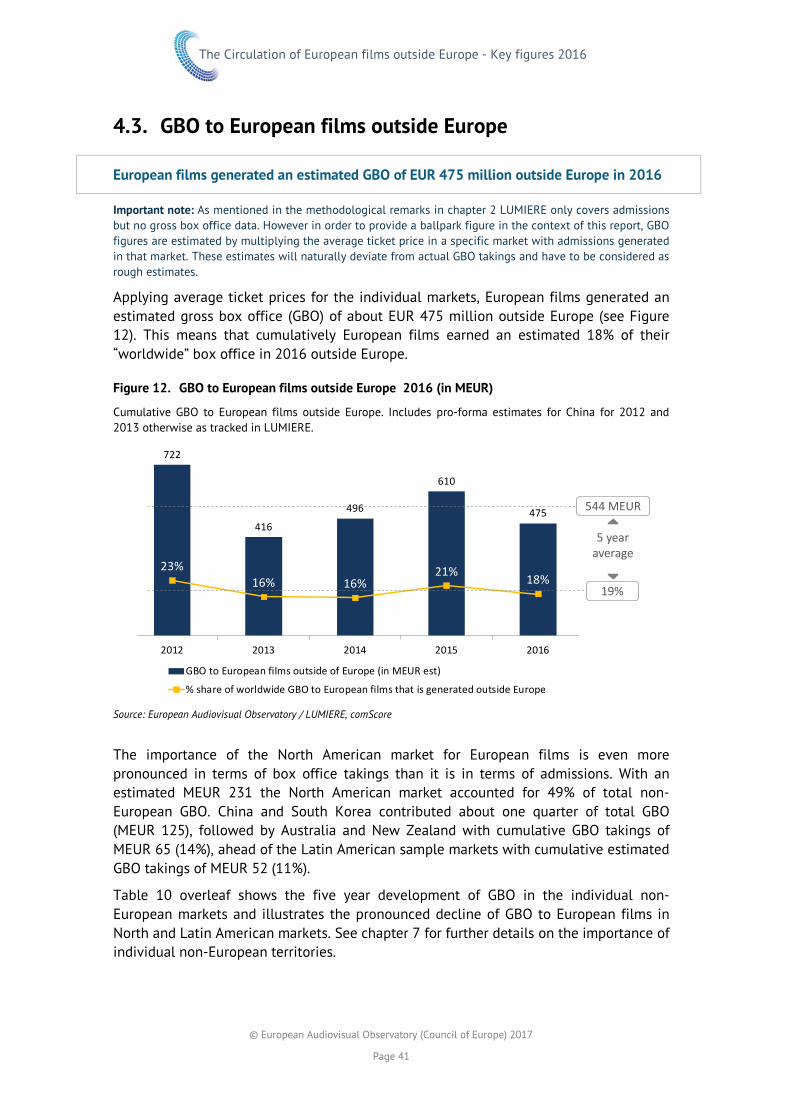
The Circulation of European films outside Europe - Key figures 2016
© European Audiovisual Observatory (Council of Europe) 2017
Page 41
4.3. GBO to European films outside Europe
European films generated an estimated GBO of EUR 475 million outside Europe in 2016
Important note: As mentioned in the methodological remarks in chapter 2 LUMIERE only covers admissions but no gross box office data. However in order to provide a ballpark figure in the context of this report, GBO figures are estimated by multiplying the average ticket price in a specific market with admissions generated in that market. These estimates will naturally deviate from actual GBO takings and have to be considered as rough estimates.
Applying average ticket prices for the individual markets, European films generated an estimated gross box office (GBO) of about EUR 475 million outside Europe (see Figure 12). This means that cumulatively European films earned an estimated 18% of their “worldwide” box office in 2016 outside Europe.
Figure 12. GBO to European films outside Europe 2016 (in MEUR)
Cumulative GBO to European films outside Europe. Includes pro-forma estimates for China for 2012 and 2013 otherwise as tracked in LUMIERE.
Source: European Audiovisual Observatory / LUMIERE, comScore
The importance of the North American market for European films is even more pronounced in terms of box office takings than it is in terms of admissions. With an estimated MEUR 231 the North American market accounted for 49% of total non-European GBO. China and South Korea contributed about one quarter of total GBO (MEUR 125), followed by Australia and New Zealand with cumulative GBO takings of MEUR 65 (14%), ahead of the Latin American sample markets with cumulative estimated GBO takings of MEUR 52 (11%).
Table 10 overleaf shows the five year development of GBO in the individual non-European markets and illustrates the pronounced decline of GBO to European films in North and Latin American markets. See chapter 7 for further details on the importance of individual non-European territories.
722
416
496
610
475
23%16% 16%
21% 18%
2012 2013 2014 2015 2016
GBO to European films outside of Europe (in MEUR est)
% share of worldwide GBO to European films that is generated outside Europe
544 MEUR
5 yearaverage
19%

The Circulation of European films outside Europe - Key figures 2016
© European Audiovisual Observatory (Council of Europe) 2017
Page 42
As GBO has been estimated by applying average local ticket prices to underlying admissions, the estimated market share of European films in terms of GBO corresponds with the estimated market shares in terms of admissions as shown in Table 8 in chapter 4.2.
Table 10. GBO to European films on release outside Europe 2012-2016 (in MEUR)
Estimates calculated by applying local average ticket prices to admissions as tracked in LUMIERE except for pro-forma estimates for China for 2012 and 2013.
2012 2013 2014 2015 2016 Average
Outside Europe 722 416 496 610 475 544
US & CA 420 224 222 319 231 283
Latin America 108 62 80 100 53 81
AU & NZ 72 41 67 44 65 58
CN & KR 122 90 126 146 125 122
CA 41 21 24 32 28 29
US 379 203 197 287 204 254
AR 17 11 8 12 10 12
BR 28 21 30 30 14 25
CL 3 3 3 5 2 3
CO 10 7 8 10 5 8
MX 42 20 30 41 22 31
VE 8 1 1 3 1 3
AU 60 33 58 36 53 48
NZ 11 7 9 8 12 10
CN est 60 53 80 115 97 81
KR 62 37 46 31 28 41
Source: European Audiovisual Observatory / LUMIERE, comScore

The Circulation of European films outside Europe - Key figures 2016
© European Audiovisual Observatory (Council of Europe) 2017
Page 43
5. BREAKING IT DOWN…
5.1. The most important theatrical markets for European films outside Europe
In terms of number of releases
As first releases cumulatively accounted for 98% of total admissions to European films outside Europe, it makes sense to analyse non-European markets in terms of European first releases and films on release separately. As can be seen in Table 11 overleaf, Brazil, the US and Mexico stand out with between 144 and 111 European films being released for the first time in 2016 in their respective territories. Other countries with a comparatively large number of European first releases include Argentina (94), Colombia (89), Australia (83) and South Korea (81). The strongly regulated Chinese market as well as Venezuela featured the lowest number of European first releases with only 27 respectively 25 European first releases tracked in 2016.
Given the comparatively low number of holdovers / re-releases / on-demand screenings / festival releases etc. tracked in the data set10 , the picture is quite similar in terms of the total number of films on release: the Brazil, the US and Mexico stand out with 195 to 161 European films on release, followed by Colombia, Australia and Argentina with around 120 European films on release. Again, China and Venezuela rank lowest with only 37 and 36 European films on release in 2016.
In terms of admissions and GBO
Not surprisingly, the North American market is also by far the most important overseas market for European films in terms of admissions. In 2016 an estimated 26.2 and 3.5 million tickets were sold to European films in the US and Canada respectively. The US market hence represents the single largest market for European films, accounting for 32% of total admissions to European films outside Europe. The Canadian market accounted for 4%, so that cumulatively 36% of total non-European admissions were generated in the US and Canada (see Table 12 overleaf). Despite the very limited number of European releases on its territory, China clearly came in as the second largest market for European films in terms of admissions with 21.2 million tickets sold in 2016, accounting for 26% of total admissions to European films in the 12 markets covered.
10 Which can either indicate a lower offer of “repertoire” films outside of Europe and / or less comprehensive coverage of these films with regard to data collection.

The Circulation of European films outside Europe - Key figures 2016
© European Audiovisual Observatory (Council of Europe) 2017
Page 44
Mexico, Australia, and South Korea follow with admissions between 10.0 and 5.5 million while European films sold 3.7 million or fewer tickets in any the remaining five Latin American markets, Canada and New Zealand.
Table 11. Number of European film releases outside Europe 2016
As tracked in LUMIERE. Ranked by the number of first releases.
# Market First releases (estimated)
Other releases1) (estimated)
Films on release
1 BR - Brazil 144 51 195
2 US - USA 132 42 174
3 MX - Mexico 111 50 161
4 AR - Argentina 94 23 125
5 CO - Colombia 89 36 120
6 AU - Australia 83 37 117
7 KR - South Korea 81 16 97
8 CA - Canada 71 17 88
9 NZ - New Zealand 63 11 74
10 CL - Chile 49 9 58
11 CN - China 27 10 37
12 VE - Venezuela 25 11 36
Total Outside Europe 475 175 650 1) “Other releases” include holdovers, re-releases, “on-demand” screenings, festival screenings, etc. (“repertoire films”)
Source: European Audiovisual Observatory / LUMIERE, comScore

The Circulation of European films outside Europe - Key figures 2016
© European Audiovisual Observatory (Council of Europe) 2017
Page 45
Table 12. Admissions & GBO for European films outside Europe 2016
In million. Ranked by admissions. GBO estimated based on average ticket prices.
# Market Adm to First Releases
Adm to Other Releases
Total Adm
% GBO (in
MEUR)
%
US & CA 24.5 5.3 29.8 36% 231 49%
Latin America 17.5 1.0 18.6 23% 53 11%
AU & NZ 7.0 0.4 7.4 9% 65 14%
CN & KR est 25.1 0.7 25.8 32% 125 26%
1 US - USA 21.7 4.5 26.2 32% 204 43%
2 CN - China 21.1 0.0 21.2 26% 97 20%
3 MX - Mexico 9.3 0.7 10.0 12% 22 5%
4 AU - Australia 5.6 0.3 5.9 7% 53 11%
5 KR - South Korea 4.0 0.7 4.7 6% 28 6%
6 BR - Brazil 3.6 0.1 3.7 5% 14 3%
7 CA - Canada 2.7 0.8 3.5 4% 28 6%
8 AR - Argentina 2.0 0.0 2.0 3% 10 2%
9 CO - Colombia 1.7 0.1 1.8 2% 5 1%
10 NZ - New Zealand 1.4 0.1 1.5 2% 12 3%
11 CL - Chile 0.5 0.0 0.6 1% 2 1%
12 VE - Venezuela 0.4 0.1 0.4 1% 1 0%
Outside Europe 80.0 1.6 81.6 100% 475 100%
Source: European Audiovisual Observatory, comScore
In terms of GBO
Thanks to a comparatively high average ticket price, the importance of the North American market is even more pronounced in terms of gross box office takings. Based on the data available, the Observatory estimates that European films took MEUR 204 and MEUR 28 at the US and Canadian box offices respectively, accounting for a cumulative 49% of total non-European GBO takings. In other words, every other Euro grossed by European films outside Europe was earned on the two North American markets. About MEUR 97 were generated in China, followed by Australia (MEUR 53), Canada (MEUR 28) and South Korea (MEUR 28).

The Circulation of European films outside Europe - Key figures 2016
© European Audiovisual Observatory (Council of Europe) 2017
Page 46
5.2. The leading European film export countries
Important note: As specified in the methodological remarks, this report focuses on providing a „big picture“ overview of the circulation of European films as a whole rather than analysing the film exports of individual European countries which is beyond the scope of this report as it may require different – sometimes country specific – methodological choices. Please note that in particular because of the Observatory’s choices regarding the allocation of a unique country of origin based on the majority financing share as well as the exclusion of films financed with incoming foreign investment the country specific data presented in this report, and in particular in this chapter, may differ significantly from data published by national sources such as the BFI or UniFrance. For a proper analysis of the export of films originating from a specific country, please refer to national sources.
In terms of releases
In 2016, as in past years, France and the UK exported by far the largest number of films to non-European territories among the European countries. As shown in Table 13 overleaf, France leads both in terms of first releases as well as total films on release with 136 French first releases throughout the year and a total of 194 French films on release in at least one of the 12 non-European markets covered in this report. France is followed by the UK with 89 first releases outside Europe and a total of 125 films on release. On a cumulative basis French and UK films accounted for 49% of the total number of European films on release outside Europe. In other words, like in 2015, one out of two European films screened outside Europe in 2016 were majority produced in either France or the UK.
Spain ranked third in 2016 with 45 first releases and a total of 59 films on release, followed closely by Italy and Germany with 41 and 36 first releases and a total 58 and 49 films on release respectively. In addition, two Scandinavian countries (Sweden, Norway) as well as the Netherlands, Ireland, Belgium and Russia made it onto the top 10 list of European film export countries with 15 to 11 films on release outside Europe in 2016. On a cumulative level these eleven top ranking countries accounted for 85% of the total number of European films on release outside Europe.
In terms of admissions
The picture is even more concentrated when it comes to admissions generated by European films: On a cumulative level UK and French films accounted for 72% of total admissions to European films outside Europe in 2016, significantly down from 87% in 2016.
Accounting for 8 out of the top 10 European export films in 2016, UK films clearly dominated European film exports outside Europe in 2016 and overtook France as the most successful film exporter in terms of admissions. Led by Bridget Jones’s Baby (6.4 million admissions), Sherlock: The Abominable Bride (5.6 million) and Florence Foster Jenkins (3.9 million), UK films cumulatively sold 44.5 million tickets outside Europe and accounted for 55% of total admissions to European films outside Europe (see Table 14).
Led by Europacorp’s Nine Lives (7.2 million )French films came in second place, with 14.1 million admissions, accounting for 17% of total admissions to European films. France was followed at a distance by Russia whose productions cumulatively generated 5.5
The Circulation of European films outside Europe - Key figures 2016
© European Audiovisual Observatory (Council of Europe) 2017
Page 47
million ticket sales in 2016 (7%) ahead of Belgium (4.1 million), Spain (3.7 million) and Ireland (3.0 million).
A list of the top 100 European films in terms of admissions generated outside Europe in 2016 is shown in chapter 5.5.
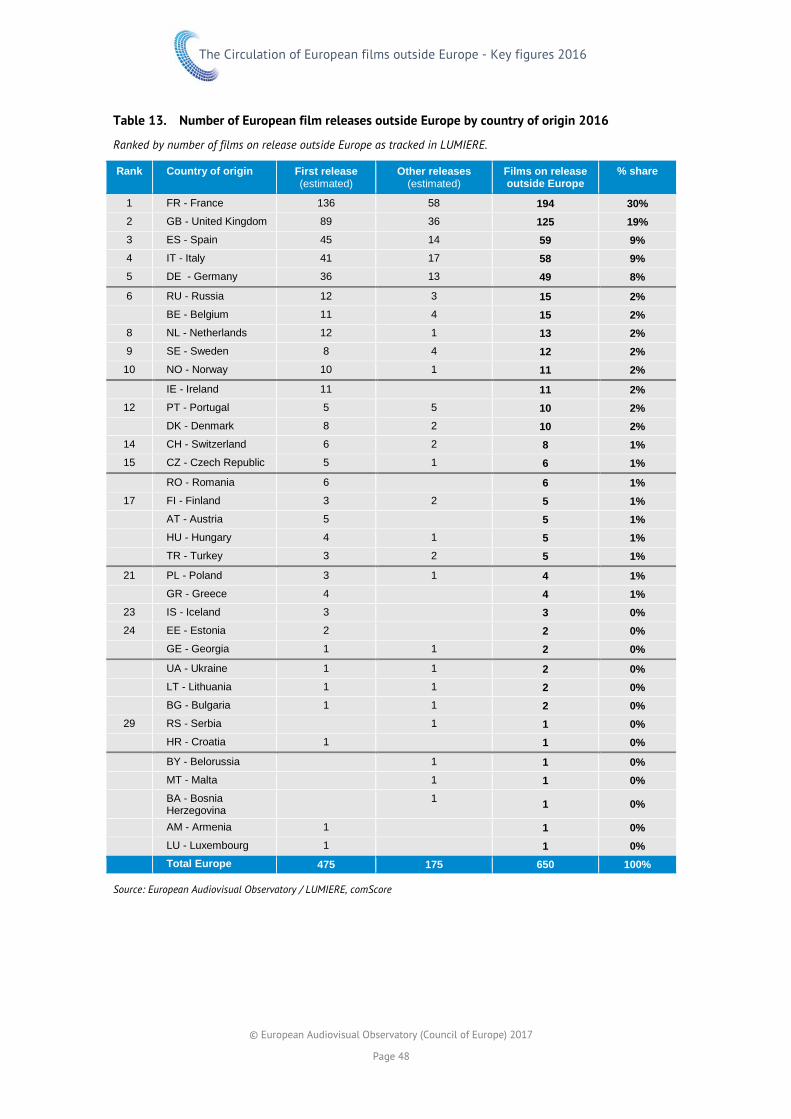
The Circulation of European films outside Europe - Key figures 2016
© European Audiovisual Observatory (Council of Europe) 2017
Page 48
Table 13. Number of European film releases outside Europe by country of origin 2016
Ranked by number of films on release outside Europe as tracked in LUMIERE.
Rank Country of origin First release (estimated)
Other releases (estimated)
Films on release outside Europe
% share
1 FR - France 136 58 194 30% 2 GB - United Kingdom 89 36 125 19% 3 ES - Spain 45 14 59 9% 4 IT - Italy 41 17 58 9% 5 DE - Germany 36 13 49 8%
6 RU - Russia 12 3 15 2% BE - Belgium 11 4 15 2% 8 NL - Netherlands 12 1 13 2% 9 SE - Sweden 8 4 12 2%
10 NO - Norway 10 1 11 2%
IE - Ireland 11 11 2% 12 PT - Portugal 5 5 10 2% DK - Denmark 8 2 10 2%
14 CH - Switzerland 6 2 8 1% 15 CZ - Czech Republic 5 1 6 1%
RO - Romania 6 6 1% 17 FI - Finland 3 2 5 1% AT - Austria 5 5 1% HU - Hungary 4 1 5 1% TR - Turkey 3 2 5 1%
21 PL - Poland 3 1 4 1% GR - Greece 4 4 1%
23 IS - Iceland 3 3 0% 24 EE - Estonia 2 2 0% GE - Georgia 1 1 2 0%
UA - Ukraine 1 1 2 0% LT - Lithuania 1 1 2 0% BG - Bulgaria 1 1 2 0%
29 RS - Serbia 1 1 0% HR - Croatia 1 1 0%
BY - Belorussia 1 1 0% MT - Malta 1 1 0% BA - Bosnia
Herzegovina 1 1 0%
AM - Armenia 1 1 0% LU - Luxembourg 1 1 0% Total Europe 475 175 650 100%
Source: European Audiovisual Observatory / LUMIERE, comScore

The Circulation of European films outside Europe - Key figures 2016
© European Audiovisual Observatory (Council of Europe) 2017
Page 49
Table 14. Admissions to European films outside Europe by country of origin 2016
Ranked by total admissions outside Europe as tracked in LUMIERE.
Rank Country of origin Admissions to First Releases
(estimated)
Admissions to Other releases
(estimated)
Admissions outside Europe
% share
1 GB - United Kingdom 44 355 012 220 425 44 575 437 55% 2 FR - France 13 691 779 438 313 14 130 092 17% 3 RU - Russia 5 422 629 91 291 5 513 920 7% 4 BE - Belgium 4 071 534 1 398 4 072 932 5% 5 ES - Spain 3 645 030 20 027 3 665 057 4%
6 IE - Ireland 3 015 669 3 015 669 4% 7 DE - Germany 1 441 306 181 188 1 622 494 2% 8 IT - Italy 1 459 225 28 476 1 487 701 2% 9 SE - Sweden 528 873 642 485 1 171 358 1%
10 NO - Norway 824 602 36 824 638 1%
11 HU - Hungary 359 475 158 359 633 0% 12 CZ - Czech Republic 298 089 839 298 928 0% 13 AT - Austria 178 282 178 282 0% 14 NL - Netherlands 169 924 3 169 927 0% 15 IS - Iceland 115 211 115 211 0%
16 GR - Greece 109 399 109 399 0% 17 FI - Finland 91 635 851 92 486 0% 18 DK - Denmark 66 550 1 590 68 140 0% 19 RO - Romania 37 324 37 324 0% 20 EE - Estonia 34 652 34 652 0%
21 PL - Poland 17 248 12 382 29 630 0% 22 CH - Switzerland 15 098 400 15 498 0% 23 HR - Croatia 10 954 10 954 0% 24 PT - Portugal 3 070 6 559 9 629 0% 25 GE - Georgia 4 674 481 5 155 0%
26 BG - Bulgaria 3 762 1 004 4 766 0% 27 UA - Ukraine 2 480 17 2 497 0% 28 LT - Lithuania 950 391 1 341 0% 29 TR - Turkey 958 106 1 064 0% 30 LU - Luxembourg 628 628 0%
31 BA - Bosnia Herzeg. 411 411 0% 32 AM - Armenia 259 259 0% 33 MT - Malta 222 222 0% 34 RS - Serbia 107 107 0% 35 BY - Belorussia 4 4 0% Total Europe 79 976 281 1 649 164 81 625 445 100%
Source: European Audiovisual Observatory / LUMIERE, comScore

The Circulation of European films outside Europe - Key figures 2016
© European Audiovisual Observatory (Council of Europe) 2017
Page 50
In terms of “importance” of non-European markets
How important are admissions outside Europe for the various European countries? Figure 13 shows the percentage shares of admissions in national, non-national European and non-European markets for each of the top 10 European film exporting countries in terms of admissions outside Europe as identified in Table 14 on the previous page. The complete breakdown for all European countries can be found in Table 15 overleaf.
In 2016, two out of the top 10 European film exporting countries generated more than a third of their total theatrical admissions on the 12 non-European markets covered in this report: generating almost half of its worldwide ticket sales (47%) outside of Europe, the UK clearly had the highest “exposure to non-European markets, followed by Belgium whose film productions generated 38% of their worldwide admissions outside Europe, largely thanks to Robinson Crusoe (BE/FR) which became Europe’s fifth most successful export film outside Europe in 2016 (3.5 million admission).
Sweden and Norway sold 22% and 18% of their worldwide admissions outside Europe, while non-European markets accounted between 15% (FR) and 4% (IT) for all other top European film exporting countries as illustrated in Figure 13.
Figure 13. Breakdown of “worldwide” admissions to the top 10 European film exporting countries by origin of admissions generation 2016 (estimated)
Ranked by share of admissions outside Europe.
* The breakdown for Irish films could not be estimated due to the fact that the Irish and UK market are treated as one market in the LUMIERE database. National and non-national admissions can hence not be calculated in a reliable manner.
Source: European Audiovisual Observatory / LUMIERE, comScore
47%
38%
22%
18%
15%
14%
13%
5%
4%
33%
43%
29%
15%
21%
20%
5%
25%
10%
20%
19%
49%
67%
65%
66%
83%
70%
86%
% outside Europe
% non-national admissionsin Europe% national admissions
BE
NO
ES
RU
DE
IT
GB
FR
SE
IE* n.a.

The Circulation of European films outside Europe - Key figures 2016
© European Audiovisual Observatory (Council of Europe) 2017
Page 51
Table 15. Admissions breakdown for European films 2016 – “national” vs. “non-national”
As tracked in LUMIERE. Ranked alphabetically. Estimated.
Country of origin % Share – National adm
% Share- Non-nat. adm
% Share – Non-nat. adm
in Europe
% Share – Non-nat. adm
outside Europe
AT Austria 40% 60% 46% 14% BE Belgium 19% 81% 43% 38% BG Bulgaria 93% 7% 5% 3% CH Switzerland 37% 63% 62% 1% CZ Czech Republic 78% 22% 17% 5%
DE Germany 70% 30% 25% 5% DK Denmark 72% 28% 27% 2% EE Estonia 77% 23% 15% 8% ES Spain 66% 34% 20% 14% FI Finland 87% 13% 9% 4%
FR France 65% 35% 21% 15% GB United Kingdom 20% 80% 33% 47% GE Georgia 68% 32% 16% 16% GR Greece 73% 27% 19% 9% HR Croatia 59% 41% 36% 5%
HU Hungary 36% 64% 37% 27% IS Iceland 11% 89% 74% 15% IT Italy 86% 14% 10% 4% LT Lithuania 96% 4% 4% 0% LV Latvia 93% 7% 7% 0%
ME Montenegro 100% 0% 0% 0% NL Netherlands 90% 10% 6% 4% NO Norway 67% 33% 15% 18% PL Poland 96% 4% 4% 0% PT Portugal 80% 20% 17% 2%
RO Romania 50% 50% 45% 4% RU Russia 83% 17% 5% 13% SE Sweden 49% 51% 29% 22% SI Slovenia 97% 3% 3% 0%
SK Slovak Rep. 84% 16% 16% 0%
TR Turkey 97% 3% 3% 0%
Total Europe 60% 40 20% 19% Remark: This breakdown cannot be provided for the following countries due to a lack of (sufficient) 2016 admissions data in their respective home markets in the LUMIERE database: Bosnia-Herzegovina (BA), Belarus (BY), Cyprus (CY), Georgia (GE), Ireland (IE), Luxemburg (LU), Lichtenstein (LI), Montenegro (ME), FYROM (MK), Malta (MT), Serbia (RS), Ukraine (UA)
Source: European Audiovisual Observatory / LUMIERE, comScore

The Circulation of European films outside Europe - Key figures 2016
© European Audiovisual Observatory (Council of Europe) 2017
Page 52
5.3. Concentration of admissions outside Europe
Evidently, the cumulative figures for European films do not offer any information about how many European films actually generated a significant number of admissions outside Europe. This chapter takes a closer look at the concentration of admissions among European films. It reveals that the number of European films generating large amounts of ticket sales is actually quite small.
As shown in Figure 14, 60 films, i.e. only 9% of the 650 films on release, accounted for 90% of total admissions generated by European films outside Europe in 2016. In other words, nine out of ten tickets sold for European films outside Europe were sold for a screening of one of only 60 European films, which cumulatively generated 73.1 million ticket sales. The remaining 590 European films on release (91% of the total number of European films on release outside Europe) cumulatively generated only 8.5 million admissions.
Figure 14. Concentration of admissions to European films outside Europe 2016
As tracked in LUMIERE.
Source: European Audiovisual Observatory / LUMIERE, comScore
82% of European films generated fewer than 50 000 ticket sales outside Europe in 2016
Yet another way to look at the concentration of admissions among the various European films is to count the number of films by admissions brackets. As can be seen in Table 16 overleaf, eight out of ten European films (82%) generated fewer than 50 000 admissions outside Europe and one in three European film exports (31%) even sold less than 1 000 tickets outside Europe in 2016.
Compared to 2015, the number of European “blockbuster” films which managed to sell more than five million tickets outside Europe dropped from six to three films. The time series depicted in Table 17 suggests that the years 2012 and 2015 with six such European blockbusters are exceptional while in an average year, this number ranges between one and three films.
On the other hand, 2016 featured an exceptionally high number of European films selling between one and five million admissions (16 films) as another 18 films sold
90%
Films on release Admissions
650 films 60 films9%

The Circulation of European films outside Europe - Key figures 2016
© European Audiovisual Observatory (Council of Europe) 2017
Page 53
between 500 000 and one million tickets. These are the highest number of films in these admissions brackets in the past five years.
Table 16. Number and admissions of European films by „admissions brackets“ 2016
As tracked in LUMIERE. Figures may not sum to totals due to rounding.
Admissions bracket
Number of films
% share Cumulative admissions outside Europe
(in mio)
% share Average admissions
within bracket
[5 mio - [ 3 0% 19.2 24% 6.4 mio
[1 mio - 5 mio[ 16 2% 34.5 42% 2.2 mio
[500' - 1 mio[ 18 3% 11.8 14% 657 000
[100' - 500'[ 44 7% 10.4 13% 237 000
[50' - 100'[ 33 5% 2.4 3% 72 000
[10' - 50'[ 112 17% 2.4 3% 21 000
[1' - 10'[ 220 34% 0.9 1% 4 000
[1 - 1'[ 204 31% 0.1 0% 320
Grand total 650 100% 81.6 100% 126 000
Source: European Audiovisual Observatory / LUMIERE, comScore
Table 17. Number of European films by „admissions brackets“ 2012-2016
As tracked in LUMIERE. Does not include data for CN in 2012 and 2013 (not available).
Admissions bracket
2012 2013 2014 2015 2016 5 year average
[5 mio - [ 6 3 1 6 3 4
[1 mio - 5 mio[ 10 9 12 8 16 11
[500' - 1 mio[ 12 8 13 13 18 13
[100' - 500'[ 46 36 49 41 44 43
[50' - 100'[ 30 34 29 40 33 33
[10' - 50'[ 103 110 113 113 112 110
[1' - 10'[ 184 206 210 191 220 202
[1 - 1'[ 118 160 162 187 204 166
Grand total 509 566 589 599 650 583
Source: European Audiovisual Observatory / LUMIERE, comScore

The Circulation of European films outside Europe - Key figures 2016
© European Audiovisual Observatory (Council of Europe) 2017
Page 54
Table 18. Admissions to European films by „admissions brackets“ 2012-2016 – in million
As tracked in LUMIERE. Does not include data for CN in 2012 and 2013 (not available).
Admissions bracket
2012 2013 2014 2015 2016 5 year average
[5 mio - [ 72.0 23.0 31.9 66.8 19.2 42.6
[1 mio - 5 mio[ 22.3 25.3 24.6 15.6 34.5 24.5
[500' - 1 mio[ 7.8 5.7 8.8 8.9 11.8 8.6
[100' - 500'[ 9.8 7.9 11.2 10.5 10.4 10.0
[50' - 100'[ 2.1 2.3 2.1 2.8 2.4 2.3
[10' - 50'[ 2.6 2.6 2.6 2.6 2.4 2.6
[1' - 10'[ 0.7 0.8 0.8 0.7 0.9 0.8
[1 - 1'[ 0.0 0.1 0.1 0.1 0.1 0.1
Grand total 117.5 67.7 82.0 108.2 81.6 91.4
Source: European Audiovisual Observatory / LUMIERE, comScore
Table 19. Admissions to European films by „admissions brackets“ 2012-2016 – in %
As tracked in LUMIERE. Does not include data for CN in 2012 and 2013 (not available).
Admissions bracket
2012 2013 2014 2015 2016 5 year average
[5 mio - [ 61% 34% 39% 62% 24% 44%
[1 mio - 5 mio[ 19% 37% 30% 14% 42% 29%
[500' - 1 mio[ 7% 8% 11% 8% 14% 10%
[100' - 500'[ 8% 12% 14% 10% 13% 11%
[50' - 100'[ 2% 3% 3% 3% 3% 3%
[10' - 50'[ 2% 4% 3% 2% 3% 3%
[1' - 10'[ 1% 1% 1% 1% 1% 1%
[1 - 1'[ 0% 0% 0% 0% 0% 0%
Grand total 117.5 67.7 82.0 108.2 81.6 100%
Source: European Audiovisual Observatory / LUMIERE, comScore

The Circulation of European films outside Europe - Key figures 2016
© European Audiovisual Observatory (Council of Europe) 2017
Page 55
Admission concentration on top 10 films drops from 71% to 59% in 2016
Another way to measure admission concentration levels is shown in Table 20 which measures cumulative market share for various „top brackets“: With “only” 7.2 million admissions Nine Lives, the most successful European film outside Europe in 2016, accounted on its own for 9%r of cumulative admissions to European films in the 12 non-European markets covered. The top 10 films (2% of the European films on release outside Europe) cumulatively accounted for 50% of total admissions, the top 50 films for 87% and the top 100 films for 95%.
As shown in Table 21 these concentration levels are significantly lower in 2016 compared to the preceding four years. This is particularly true for the concentration of admissions on the top ranking film and the top 10 performing titles. Accounting for only 9% of total admissions outside Europe and selling 7.2 million tickets, Nine Lives, is the top ranking film with the weakest performance in the past five years: In 2014 Lucy (FR) sold 31.9 million tickets outside Europe and accounted for 39% of total admissions to European films outside Europe. In 2012, Taken 2 (FR) sold 26.8 million tickets (23%) and in 2015 Taken 3 (FR) generated 25.6 million admissions (24%).
2016 was hence a year with a comparatively diversified distribution of admissions with more films generating more admissions from their theatrical release outside Europe.
Given the comparatively low number of European films on release outside Europe, the concentration level is nevertheless naturally significantly higher compared to the European market where the top 100 films accounted for an estimated 57% of total European admissions. The two can therefore not be directly compared.
Table 20. Concentration of admissions to European films by „top brackets“ 2016
As tracked in LUMIERE. Cumulative admissions indicated in million.
Top bracket Number of films % share Cumulative admissions outside Europe
% share
Top 1 1 0% 7.2 9%
Top 10 10 2% 41.2 50%
Top 50 50 8% 70.6 87%
Top 100 100 15% 77.5 95%
Other 550 85% 4.1 5%
Total 650 100% 81.6 100%
Source: European Audiovisual Observatory / LUMIERE, comScore

The Circulation of European films outside Europe - Key figures 2016
© European Audiovisual Observatory (Council of Europe) 2017
Page 56
Table 21. Admissions to European films by „top brackets“ 2012-2016 – in %
As tracked in LUMIERE. Does not include data for CN in 2012 and 2013 (not available).
Admissions bracket
2012 2013 2014 2015 2016 5 year average
Top 1 23% 14% 39% 24% 9% 22%
Top 10 71% 67% 65% 71% 50% 65%
Top 50 92% 90% 89% 92% 87% 90%
Top 100 97% 95% 96% 96% 95% 96%
Other 3% 5% 4% 4% 5% 4%
Total (in mio) 117.5 67.7 82.0 108.2 81.6 91.4
Source: European Audiovisual Observatory / LUMIERE, comScore
Table 22. Admissions to European films by „top brackets“ 2012-2016 – in million
As tracked in LUMIERE. Does not include data for CN in 2012 and 2013 (not available).
Admissions bracket
2012 2013 2014 2015 2016 5 year average
Top 1 26.8 9.6 31.9 25.6 7.2 20.2
Top 10 83.7 45.6 53.1 76.9 41.2 60.1
Top 50 108.5 61.3 72.7 99.1 70.6 82.5
Top 100 113.9 64.7 78.4 104.3 77.5 87.7
Other 3.5 3.1 3.7 3.8 4.1 3.6
Total 117.5 67.7 82.0 108.2 81.6 91.4
Source: European Audiovisual Observatory / LUMIERE, comScore

The Circulation of European films outside Europe - Key figures 2016
© European Audiovisual Observatory (Council of Europe) 2017
Page 57
5.4. Diversity of European film offering outside Europe
Important note: Assessing diversity in a more qualitative sense is a complex task which is beyond the scope of this report. As specified in the methodological remarks term “film offering” refers to the number of films on release, which is the most basic indicator for measuring the theatrical film offering in a country and - in itself - has limited informational value with regard to how many European films were really accessible to audiences. There are, however, a few aspects that can be addressed by an analysis of the data sample, such as the question as to whether the portfolio of European films differed significantly from one international market to another or whether more or less the same films were shown across non-European markets. This chapter furthermore provides a breakdown by country of origin and age of productions.
European film portfolio varies significantly from one market to the next
As illustrated in Figure 15 and Table 23 overleaf, 66% of the 650 European films on theatrical release outside Europe in 2016 were screened in only one single territory (427 films). Another 86 films (14%) were on release only in two markets.
On the other hand a total of only 40 European films (6%) were on release six or more non-European markets in 2016. This is the second highest level observed in the past five years (see Table 24). These 40 films cumulatively accounted for 61% of the total admissions to European films outside Europe.
These figures suggest that – even though growing - only a very small number of European films manage to be released in a large number of non-European territories while the vast majority of films were released in only one or two markets. This means that the portfolio of European films on release outside Europe actually varies to a large extent from one territory to another.
Figure 15. Share of European films with only 1 or 2 non-European release markets 2016
As tracked in LUMIERE.
Source: European Audiovisual Observatory / LUMIERE, comScore
Films on releaseoutside Europe
Admissionsoutside Europe
427 films with only 1 release market66%
89 films with 2 release markets14%
13%7%
6% 40 films with 6 or more release m.
61%

The Circulation of European films outside Europe - Key figures 2016
© European Audiovisual Observatory (Council of Europe) 2017
Page 58
Table 23. Concentration of European films outside Europe by number of release markets 2016
As tracked in LUMIERE.
Nr. of non-European release markets
European films
% share Cumulative admissions
% share Average admissions
1 427 66% 10.3 13% 24 000
2 89 14% 5.4 7% 61 000
3 53 8% 4.5 6% 86 000
4 21 3% 9.3 11% 441 000
5 20 3% 1.9 2% 96 000
6 8 1% 5.5 7% 686 000
7 8 1% 1.8 2% 226 000
8 5 1% 3.3 4% 660 000
9 7 1% 12.8 16% 1 830 000
10 6 1% 7.0 9% 1 163 000
11 5 1% 16.5 20% 3 297 000
12 1 0% 3.3 4% 3 264 000
Total 650 100% 81.6 100% 126 000
6 or more 40 6% 50.1 61% 1 253 331
Source: European Audiovisual Observatory / LUMIERE, comScore
Table 24. European film releases outside Europe by number of release markets 2012-2016
As tracked in LUMIERE. Does not include data for CN in 2012 and 2013 (not available).
Nr. of non-European release markets
2012 2013 2014 2015 2016 5 year average
1 303 366 368 365 427 366
2 109 105 98 97 89 100
3 33 38 47 46 53 43
4 22 17 29 26 21 23
5 14 16 11 20 20 16
6 8 7 14 10 8 9
7 3 4 7 10 8 6
8 4 7 6 7 5 6
9 6 3 4 8 7 6
10 3 3 3 3 6 4
11 4 0 1 3 5 3
12 ~ ~ 1 4 1 2
Total 509 566 589 599 650 583
6 or more 28 24 36 45 40 35
Source: European Audiovisual Observatory / LUMIERE, comScore
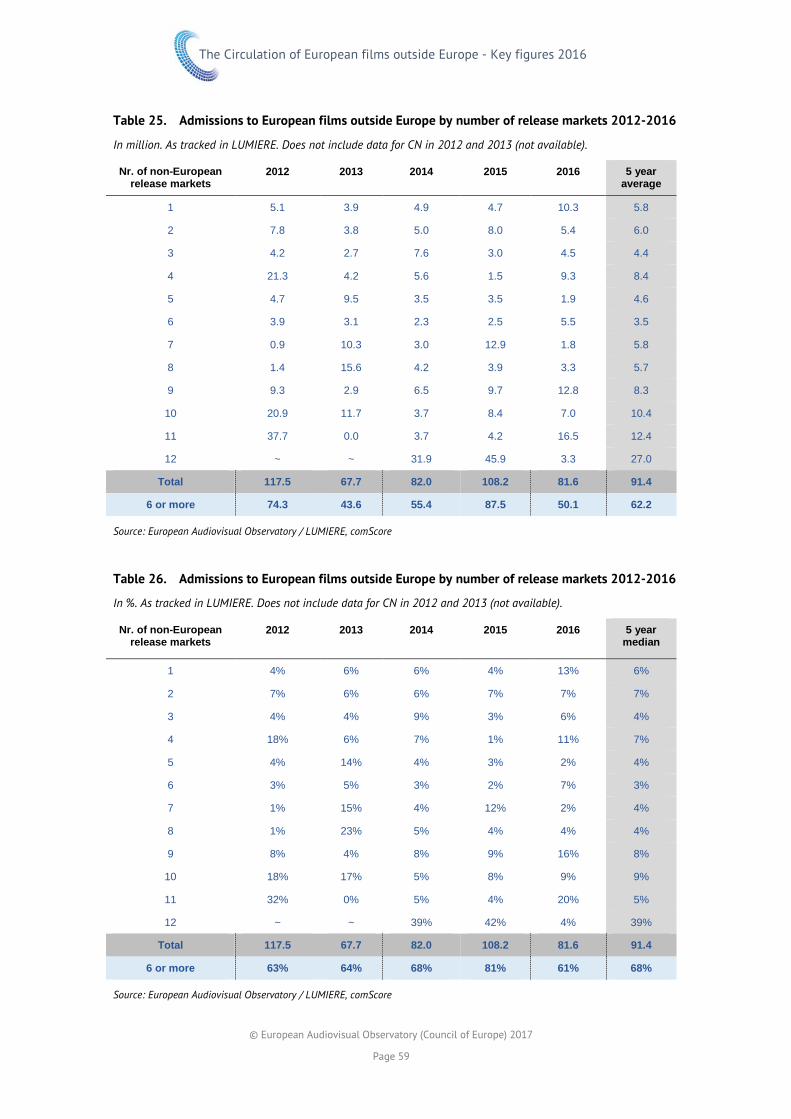
The Circulation of European films outside Europe - Key figures 2016
© European Audiovisual Observatory (Council of Europe) 2017
Page 59
Table 25. Admissions to European films outside Europe by number of release markets 2012-2016
In million. As tracked in LUMIERE. Does not include data for CN in 2012 and 2013 (not available).
Nr. of non-European release markets
2012 2013 2014 2015 2016 5 year average
1 5.1 3.9 4.9 4.7 10.3 5.8
2 7.8 3.8 5.0 8.0 5.4 6.0
3 4.2 2.7 7.6 3.0 4.5 4.4
4 21.3 4.2 5.6 1.5 9.3 8.4
5 4.7 9.5 3.5 3.5 1.9 4.6
6 3.9 3.1 2.3 2.5 5.5 3.5
7 0.9 10.3 3.0 12.9 1.8 5.8
8 1.4 15.6 4.2 3.9 3.3 5.7
9 9.3 2.9 6.5 9.7 12.8 8.3
10 20.9 11.7 3.7 8.4 7.0 10.4
11 37.7 0.0 3.7 4.2 16.5 12.4
12 ~ ~ 31.9 45.9 3.3 27.0
Total 117.5 67.7 82.0 108.2 81.6 91.4
6 or more 74.3 43.6 55.4 87.5 50.1 62.2
Source: European Audiovisual Observatory / LUMIERE, comScore
Table 26. Admissions to European films outside Europe by number of release markets 2012-2016
In %. As tracked in LUMIERE. Does not include data for CN in 2012 and 2013 (not available).
Nr. of non-European release markets
2012 2013 2014 2015 2016 5 year median
1 4% 6% 6% 4% 13% 6%
2 7% 6% 6% 7% 7% 7%
3 4% 4% 9% 3% 6% 4%
4 18% 6% 7% 1% 11% 7%
5 4% 14% 4% 3% 2% 4%
6 3% 5% 3% 2% 7% 3%
7 1% 15% 4% 12% 2% 4%
8 1% 23% 5% 4% 4% 4%
9 8% 4% 8% 9% 16% 8%
10 18% 17% 5% 8% 9% 9%
11 32% 0% 5% 4% 20% 5%
12 ~ ~ 39% 42% 4% 39%
Total 117.5 67.7 82.0 108.2 81.6 91.4
6 or more 63% 64% 68% 81% 61% 68%
Source: European Audiovisual Observatory / LUMIERE, comScore
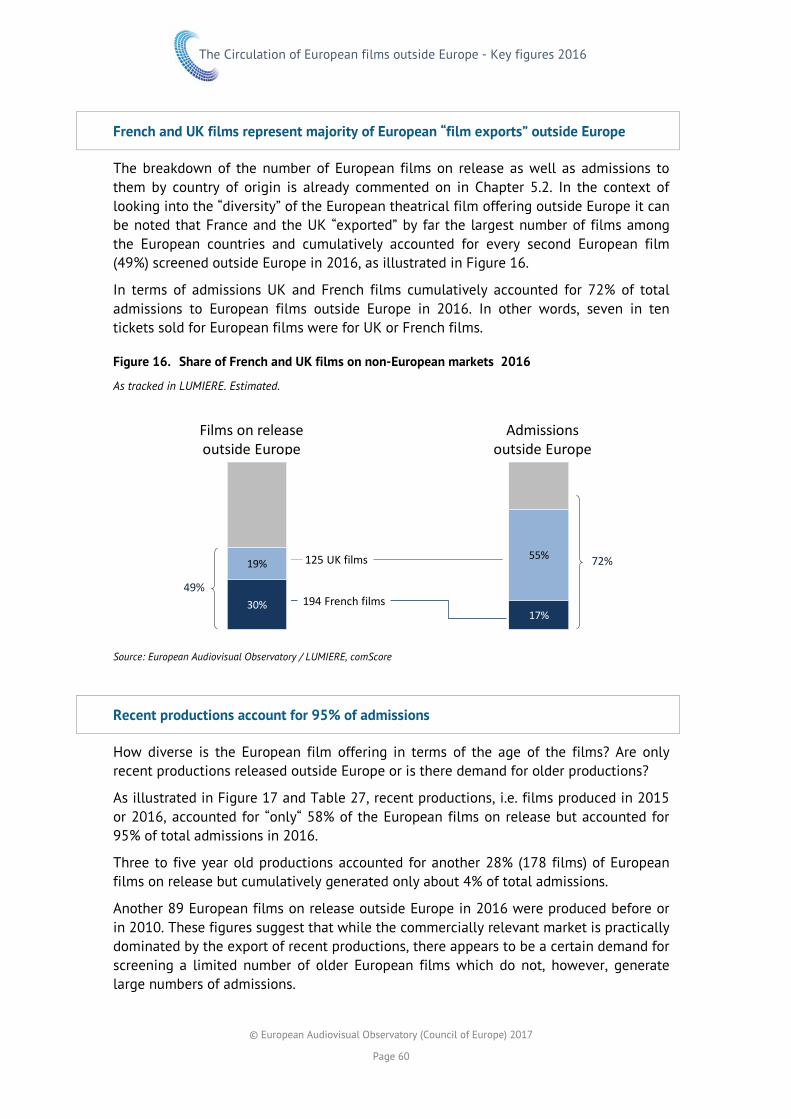
The Circulation of European films outside Europe - Key figures 2016
© European Audiovisual Observatory (Council of Europe) 2017
Page 60
French and UK films represent majority of European “film exports” outside Europe
The breakdown of the number of European films on release as well as admissions to them by country of origin is already commented on in Chapter 5.2. In the context of looking into the “diversity” of the European theatrical film offering outside Europe it can be noted that France and the UK “exported” by far the largest number of films among the European countries and cumulatively accounted for every second European film (49%) screened outside Europe in 2016, as illustrated in Figure 16.
In terms of admissions UK and French films cumulatively accounted for 72% of total admissions to European films outside Europe in 2016. In other words, seven in ten tickets sold for European films were for UK or French films.
Figure 16. Share of French and UK films on non-European markets 2016
As tracked in LUMIERE. Estimated.
Source: European Audiovisual Observatory / LUMIERE, comScore
Recent productions account for 95% of admissions
How diverse is the European film offering in terms of the age of the films? Are only recent productions released outside Europe or is there demand for older productions?
As illustrated in Figure 17 and Table 27, recent productions, i.e. films produced in 2015 or 2016, accounted for “only“ 58% of the European films on release but accounted for 95% of total admissions in 2016.
Three to five year old productions accounted for another 28% (178 films) of European films on release but cumulatively generated only about 4% of total admissions.
Another 89 European films on release outside Europe in 2016 were produced before or in 2010. These figures suggest that while the commercially relevant market is practically dominated by the export of recent productions, there appears to be a certain demand for screening a limited number of older European films which do not, however, generate large numbers of admissions.
Films on releaseoutside Europe
Admissionsoutside Europe
194 French films
125 UK films
49%
72%
30%30%
19%
17%
55%
x

The Circulation of European films outside Europe - Key figures 2016
© European Audiovisual Observatory (Council of Europe) 2017
Page 61
The figures also show a certain time lag with a significant number of European films being released outside Europe one or two years after their production year.
Figure 17. Share of „recent“ European films on non-European release markets 2016
As tracked in LUMIERE. Estimated.
Source: European Audiovisual Observatory / LUMIERE, comScore
Table 27. Concentration of European films outside Europe by production year 2016
As tracked in LUMIERE. Estimated.
Production year
Films on release
% Cumulative %
Admissions) % Cumulative %
2015 133 20% 20% 46 180 730 57% 57%
2014 250 38% 59% 31 366 474 38% 95%
2013 121 19% 78% 2 461 365 3% 98%
2012 45 7% 84% 428 930 1% 99%
2011 12 2% 86% 29 736 0% 99%
[2001-2010] 45 7% 93% 782 919 1% 100%
[1991-2000] 6 1% 94% 44 880 0% 100%
[1900-1990] 38 6% 100% 330 411 0% 100%
TOTAL 650 100% 81 625 445 100%
Source: European Audiovisual Observatory / LUMIERE, comScore
Films on releaseoutside Europe
Admissionsoutside Europe
113 films produced in 2016
61% 250 films produced in 2015 58%
95%
20%
38%
57%
38%

The Circulation of European films outside Europe - Key figures 2016
© European Audiovisual Observatory (Council of Europe) 2017
Page 62
5.5. Top 100 European films outside Europe
Table 28. Short profiles of top 5 European films outside Europe 2016
Admissions refer to cumulative admissions up until Dec 2015. „Int.“ stands for 12 non-European markets covered in this report.
1
Nine Lives (2016) Country of origin: FR / CN / CA
Director: Barry Sonnenfeld
European admissions: 2.1 mio.
Int. admissions: 7.2 mio.
Int. release markets: 9
Genre: Comedy, Family, Drama
Language: English
Plot: A stuffy businessman finds himself trapped inside the body of his family's cat.
Remark: Europacorp production
2
Bridget Jones’s Baby (2016) Country of origin: GB / FR
Director: Sharon Maguire
European admissions: 18.0 mio.
Int. admissions: 6.4 mio.
Int. release markets: 11
Genre: Comedy, Romance
Language: English
Plot: Bridget's focus on single life and her career is interrupted when she finds herself pregnant, but with one hitch ... she can only be fifty per cent sure of the identity of her baby's father.
3
Sherlock: The Abominable Bride (2016) Country of origin: GB
Director: Douglas Mackinnon
European admissions: 0.1 mio.
Int. admissions: 5.6 mio.
Int. release markets: 4
Genre: Crime, Drama, Mystery
Language: English
Plot: Holmes and Watson must use all their cunning to combat an enemy seemingly from beyond the grave and the final, shocking truth about...the Abominable Bride!
Remark: Christmas special of the BBC TV series Sherlock
4
Florence Foster Jenkins (2016) Country of origin: GB
Director: Stephen Frears
European admissions: 2.3 mio.
Int. admissions: 3.9 mio.
Int. release markets: 9
Genre: Biography, Comedy, Drama
Language: English
Plot: The story of Florence Foster Jenkins, a New York heiress who dreamed of becoming an opera singer, despite having a terrible singing voice.
5
Robinson Crusoe (2016) aka The Wild Life Country of origin: BE / FR
Directors: Vincent Kesteloot , Ben Stassen , Mimi Maynard
European admissions: 3.1 mio.
Int. admissions: 3.5 mio.
Int. release markets: 11
Genre: Animation, Adventure, Comedy
Language: English
Plot: A daring parrot recounts how Robinson Crusoe came to be stranded on a tropical island.
Source: European Audiovisual Observatory / LUMIERE, comScore, IMDB

The Circulation of European films outside Europe - Key figures 2016
© European Audiovisual Observatory (Council of Europe) 2017
Page 63
Table 29. Top 100 European films in terms of admissions generated outside Europe 2016 (est)
N° Film Countries of origin
Prod. year
# of release markets
Adm. 2016 outside Europe
Adm. 2016 US/CA
Adm. 2016 Latin
America
Adm. 2016 AU/NZ
Adm. 2016 CN/KR
1 Nine Lives FR / CN / CA 2016 9 7 230 958 2 290 701 1 120 296 3 819 961
2 Bridget Jones's Baby GB / US / FR 2016 11 6 404 369 2 820 048 1 313 728 1 449 960 820 633
3 Sherlock: The Abominable Bride GB 2016 4 5 557 542 12 808 103 5 544 631
4 Florence Foster Jenkins GB 2016 9 3 933 381 3 184 158 276 350 334 084 138 789
5 Robinson Crusoe BE / FR 2016 11 3 449 340 930 881 613 847 36 832 1 867 780
6 Eddie the Eagle GB INC / US 2016 12 3 263 533 1 835 974 355 471 637 406 434 682
7 Brooklyn GB / IE / CA 2015 10 3 147 119 2 181 249 384 393 531 177 50 300
8 The Danish Girl GB / US / BE /DK/ DE 2015 11 3 144 131 768 322 2 005 545 238 122 132 142
9 Eye in the Sky GB 2015 11 2 952 025 2 174 952 488 384 274 339 14 350
10 The Lady in the Van GB 2015 6 2 089 887 1 159 709 45 121 885 057
11 Carol GB / US / AU 2015 10 1 912 841 1 036 087 330 867 231 558 314 329
12 Love & Friendship GB / IE / FR / NL 2016 8 1 896 813 1 629 833 55 190 205 592 6 198
13 On - drakon RU 2015 1 1 838 258 1 838 258
14 Absolutely Fabulous: The Movie GB INC / US 2016 4 1 253 617 554 901 698 716
15 Bastille Day GB INC / US 2016 10 1 213 284 5 845 582 243 45 692 579 504
16 Le Paon de Nuit FR / CN 2015 1 1 164 095 1 164 095
17 Hardcore Henry RU / US 2015 6 1 154 006 1 075 817 32 043 46 146
18 Sing Street IE / GB / US 2016 6 1 042 558 376 408 42 746 65 069 558 335
19 The Lobster IE / FR / GB / NL / GR
2015 4 1 033 371 1 011 671 21 344 356
20 Ekipazh RU / KH 2016 2 884 116 7 831 876 285
21 Loving GB / US 2016 2 861 550 861 550
22 Atrapa la bandera ES 2015 7 777 463 734 505 42 958
23 A Hologram for the King GB / FR / DE / US/MX
2016 6 758 574 489 824 266 113 2 637
24 Bølgen NO 2015 8 716 825 20 628 680 560 15 637
25 Warrior's Gate FR / CN 2016 1 708 985 708 985
26 45 Years GB 2015 9 658 989 477 399 67 020 92 456 22 114
27 Mafiya: Igra na vyzhivanie RU 2016 1 651 786 651 786
28 Missing Boy SE 2001 1 634 756 634 756
29 Les nouvelles aventures d'Aladin FR / BE 2015 1 633 788 633 788
30 Summer Camp ES / US 2015 3 632 042 630 993 1 049
31 Thomas & Friends: Sodor's … GB 2015 1 615 304 615 304
32 Mortadelo y Filemón contra … ES 2014 3 582 962 582 962
33 Quackerz RU / US / CN 2016 1 564 486 564 486
34 Song of the Sea IE / LU / BE / FR / DK 2014 2 542 544 542 544
35 Ooops! Noah is Gone... DE / BE / LU / IE 2015 3 538 658 132 543 406 115
36 Julieta ES 2016 11 536 659 17 533 487 351 25 358 6 417
37 Our Kind of Traitor GB / FR 2016 8 532 988 366 645 69 732 96 611
38 Kidnapping Mr. Heineken BE / NL / US / GB 2015 1 481 914 481 914
39 En man som heter Ove SE / NO 2015 3 474 059 384 087 2 558 87 414
40 Denial GB INC / US 2016 2 473 656 473 656
41 Youth IT / FR / GB / CH 2015 9 453 594 163 478 169 133 40 261 80 722
42 Collide GB / DE / US / CN 2016 1 434 860 434 860
43 Blood Father FR 2016 7 421 619 39 372 327 727 54 520
44 Miss Sloane FR / US 2016 2 403 459 403 459
45 Saul fia HU / US / FR / IL / BA 2015 10 356 647 192 007 123 256 19 618 21 766
46 Cien años de perdón ES / FR / AR 2016 3 353 416 353 416
47 I.T. IE / FR / US 2016 3 344 976 153 414 191 562
48 A Bigger Splash IT 2015 5 309 198 235 359 59 385 14 454
49 Pinocchio DE 2013 2 306 697 306 697
50 Absolutely Anything GB INC / US 2015 2 303 253 303 253
Source: European Audiovisual Observatory / LUMIERE, comScore

The Circulation of European films outside Europe - Key figures 2016
© European Audiovisual Observatory (Council of Europe) 2017
Page 64
Table 29 contd. N° Film Countries
of origin Prod. year
# of release markets
Adm. 2016 outside Europe
Adm. 2016 US/CA
Adm. 2016 Latin
America
Adm. 2016 AU/NZ
Adm. 2016 CN/KR
51 Suffragette GB 2015 9 290 461 5 253 80 500 177 403 27 305
52 Tini: El gran cambio de Violetta ES / IT / AR 2016 6 268 812 268 812
53 The Hallow GB / US / IE 2015 5 268 108 268 108
54 Masha i Medved: Zaputannyye … RU 2015 1 265 360 265 360
55 Aimer, Boire et Chanter FR 2014 1 255 813 255 813
56 The Eagle Huntress GB / MN / US 2016 2 243 093 243 093
57 Genius GB INC / US 2016 5 237 659 158 260 79 399
58 Truman ES / AR 2015 7 221 885 193 852 28 033
59 Miss You Already GB 2015 4 214 504 214 504
60 Mustang FR / DE / TR 2015 10 206 994 78 912 78 397 43 616 6 069
61 Les innocentes FR / PL 2016 5 195 099 123 921 71 178
62 Ghoul CZ / UA 2015 4 189 299 189 299
63 Born to Be Blue GB / CA 2015 3 171 636 79 901 91 735
64 Les saisons FR / DE 2015 2 165 763 11 571 154 192
65 Dough GB / HU 2015 3 164 845 133 523 31 322
66 Schachnovelle DE 1960 1 161 406 161 406
67 Elle FR / DE / BE 2016 5 153 779 99 043 37 826 16 910
68 Ich seh, Ich seh AT 2014 4 151 326 151 326
69 Marguerite FR / CZ / BE 2015 10 139 716 55 042 58 110 20 817 5 747
70 Mon roi FR 2015 9 139 160 6 195 128 651 136 4 178
71 I, Daniel Blake GB / FR / BE 2016 3 127 325 78 661 48 664
72 Le tout nouveau testament BE / LU / FR 2015 7 119 900 5 855 98 807 15 238
73 La vache FR 2016 5 113 592 113 592
74 High-Rise GB / BE 2015 5 113 465 40 287 34 154 15 800 23 224
75 Se Dio vuole IT 2015 4 112 554 52 582 59 972
76 Quo vado? IT 2016 4 111 299 59 871 51 428
77 De Surprise NL / BE / DE / IE 2015 4 108 832 100 149 8 683
78 Dark Horse GB 2015 2 107 576 107 576
79 Hrútar IS / DK / NO / PL 2015 9 104 197 17 210 17 638 67 944 1 405
80 Francofonia FR / DE / NL 2015 6 103 562 35 702 59 501 5 169 3 190
81 La famille Bélier FR / BE 2014 2 103 229 103 229
82 Im Labyrinth des Schweigens DE 2014 8 97 111 4 107 68 531 24 473
83 Little Men GR / BR / US 2016 5 95 163 81 690 9 552 3 921
84 Ich bin dann mal weg DE 2015 1 91 122 91 122
85 American Honey GB / US 2016 4 88 395 77 120 6 914 4 361
86 Belka i Strelka. Zvezdnye sobaki RU 2010 3 87 184 87 184
87 Un homme à la hauteur FR 2016 4 85 935 65 286 12 334 8 315
88 Antigang GB / FR 2015 1 85 275 85 275
89 Gespensterjäger DE / AT / IE 2015 3 84 926 78 852 6 074
90 Louder Than Bombs NO / FR / DK 2015 5 84 476 19 047 51 813 3 717 9 899
91 La corrispondenza IT 2016 4 82 619 82 619
92 Mia madre IT / FR 2015 7 78 001 35 232 21 523 21 246
93 Chocolat FR 2016 3 76 610 76 610
94 Miekkailija FI / EE / DE 2015 2 75 763 50 535 25 228
95 David Brent: Life on the Road GB INC / US 2016 2 75 098 75 098
96 Médecin de campagne FR 2016 3 73 924 73 924
97 The Little Prince FR / US 2015 7 70 888 49 935 20 953
98 Demain FR 2015 3 69 006 57 494 11 512
99 Ballerina FR / CA 2016 1 68 671 68 671
100 My Scientology Movie GB / US 2015 2 68 276 68 276
Source: European Audiovisual Observatory / LUMIERE, comScore

The Circulation of European films outside Europe - Key figures 2016
© European Audiovisual Observatory (Council of Europe) 2017
Page 65
6. APPENDIX

The Circulation of European films outside Europe - Key figures 2016
© European Audiovisual Observatory (Council of Europe) 2017
Page 66
6.1. Number of films tracked in LUMIERE
Table 30. Number of films tracked in LUMIERE database by territory 2012-2016
Source: European Audiovisual Observatory / LUMIERE, comScore
Territory 2012 2013 2014 2015 2016EUROPE
1 AT Austria 514 510 534 567 457
2 BA Bosnia-Herzegovina 19 201 218
3 BE Belgium 485 343 504 272 911
4 BG Bulgaria 281 283 312 318 330
5 CH Switzerland 1 676 1 671 1 643 1 642 1 834
6 CY Cyprus 5 4 153 18 141
7 CZ Czech Republic 1 124 1 228 1 076 1 179 1 251
8 DE Germany 598 652 2 362 2 444 2 357
9 DK Denmark 246 260 260 287 281
10 EE Estonia 397 377 351 377 376
11 ES Spain 1 234 1 463 1 473 585 693
12 FI Finland 329 337 338 328 328
13 FR France 790 933 935 958 856
14 GB United Kingdom 740 798 2 560 2 587 2 745
15 GE Georgia 194
16 GR Greece 303 329 351 406 320
17 HR Croatia 185 247 226 250 208
18 HU Hungary 288 302 556 553 613
19 IE Ireland 34 30 28 20
20 IS Iceland 30 7 161 196 199
21 IT Italy 906 1 110 1 196 1 261 1 398
22 LT Lithuania 43 304 267 290 288
23 LU Luxembourg 110 76 104 112
24 LV Latvia 480 13 517 233 304
25 ME Montenegro (from June 2006) 177 182 163 162
26 MK Former Yugoslav Republic of Macedonia 80 221 23
27 NL Netherlands 1 113 1 201 1 133 562 610
28 NO Norway 483 483 496 595 586
29 PL Poland 474 507 547 556 497
30 PT Portugal 816 956 995 1 030 867
31 RO Romania 398 411 416 412 447
32 RU Russian Federation 401 497 622 658 748
33 SE Sweden 536 575 537 881 868
34 SI Slovenia 399 442 430 505 473
35 SK Slovakia 611 566 609 607 100
36 TR Turkey 491 498 564 522 526OUTSIDE OF EUROPE
1 AR Argentina 335 366 499 525 539
2 AU Australia 410 432 569 621 680
3 BR Brazil 358 467 613 648 687
4 CA Canada 568 601 484 532 494
5 CL Chile 209 203 281 289 259
6 CN China 422 648 890
7 CO Colombia 215 241 343 385 432
8 KR South Korea 492 729 591 518 487
9 MX Mexico 323 376 586 594 592
10 NZ New Zealand 288 311 355 382 441
11 US United States of America 1 221 1 238 815 833 832
12 VE Venezuela 166 166 199 269 255
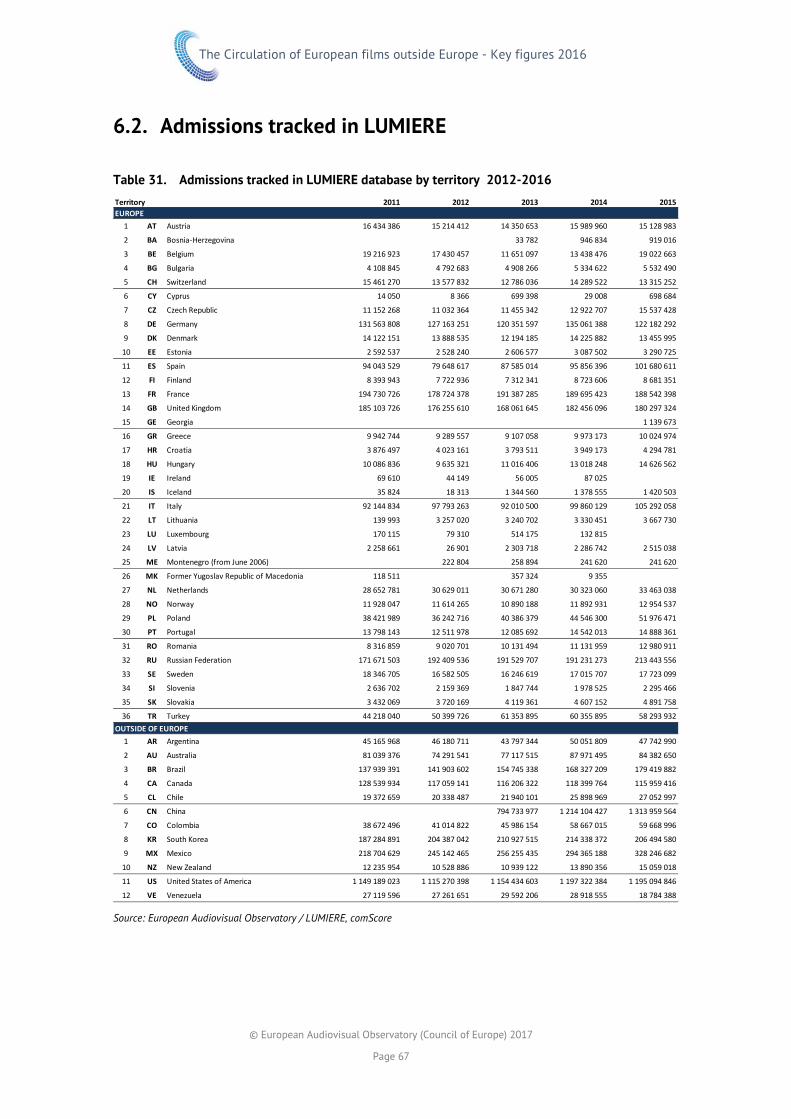
The Circulation of European films outside Europe - Key figures 2016
© European Audiovisual Observatory (Council of Europe) 2017
Page 67
6.2. Admissions tracked in LUMIERE
Table 31. Admissions tracked in LUMIERE database by territory 2012-2016
Source: European Audiovisual Observatory / LUMIERE, comScore
Territory 2011 2012 2013 2014 2015EUROPE
1 AT Austria 16 434 386 15 214 412 14 350 653 15 989 960 15 128 983
2 BA Bosnia-Herzegovina 33 782 946 834 919 016
3 BE Belgium 19 216 923 17 430 457 11 651 097 13 438 476 19 022 663
4 BG Bulgaria 4 108 845 4 792 683 4 908 266 5 334 622 5 532 490
5 CH Switzerland 15 461 270 13 577 832 12 786 036 14 289 522 13 315 252
6 CY Cyprus 14 050 8 366 699 398 29 008 698 684
7 CZ Czech Republic 11 152 268 11 032 364 11 455 342 12 922 707 15 537 428
8 DE Germany 131 563 808 127 163 251 120 351 597 135 061 388 122 182 292
9 DK Denmark 14 122 151 13 888 535 12 194 185 14 225 882 13 455 995
10 EE Estonia 2 592 537 2 528 240 2 606 577 3 087 502 3 290 725
11 ES Spain 94 043 529 79 648 617 87 585 014 95 856 396 101 680 611
12 FI Finland 8 393 943 7 722 936 7 312 341 8 723 606 8 681 351
13 FR France 194 730 726 178 724 378 191 387 285 189 695 423 188 542 398
14 GB United Kingdom 185 103 726 176 255 610 168 061 645 182 456 096 180 297 324
15 GE Georgia 1 139 673
16 GR Greece 9 942 744 9 289 557 9 107 058 9 973 173 10 024 974
17 HR Croatia 3 876 497 4 023 161 3 793 511 3 949 173 4 294 781
18 HU Hungary 10 086 836 9 635 321 11 016 406 13 018 248 14 626 562
19 IE Ireland 69 610 44 149 56 005 87 025
20 IS Iceland 35 824 18 313 1 344 560 1 378 555 1 420 503
21 IT Italy 92 144 834 97 793 263 92 010 500 99 860 129 105 292 058
22 LT Lithuania 139 993 3 257 020 3 240 702 3 330 451 3 667 730
23 LU Luxembourg 170 115 79 310 514 175 132 815
24 LV Latvia 2 258 661 26 901 2 303 718 2 286 742 2 515 038
25 ME Montenegro (from June 2006) 222 804 258 894 241 620 241 620
26 MK Former Yugoslav Republic of Macedonia 118 511 357 324 9 355
27 NL Netherlands 28 652 781 30 629 011 30 671 280 30 323 060 33 463 038
28 NO Norway 11 928 047 11 614 265 10 890 188 11 892 931 12 954 537
29 PL Poland 38 421 989 36 242 716 40 386 379 44 546 300 51 976 471
30 PT Portugal 13 798 143 12 511 978 12 085 692 14 542 013 14 888 361
31 RO Romania 8 316 859 9 020 701 10 131 494 11 131 959 12 980 911
32 RU Russian Federation 171 671 503 192 409 536 191 529 707 191 231 273 213 443 556
33 SE Sweden 18 346 705 16 582 505 16 246 619 17 015 707 17 723 099
34 SI Slovenia 2 636 702 2 159 369 1 847 744 1 978 525 2 295 466
35 SK Slovakia 3 432 069 3 720 169 4 119 361 4 607 152 4 891 758
36 TR Turkey 44 218 040 50 399 726 61 353 895 60 355 895 58 293 932OUTSIDE OF EUROPE
1 AR Argentina 45 165 968 46 180 711 43 797 344 50 051 809 47 742 990
2 AU Australia 81 039 376 74 291 541 77 117 515 87 971 495 84 382 650
3 BR Brazil 137 939 391 141 903 602 154 745 338 168 327 209 179 419 882
4 CA Canada 128 539 934 117 059 141 116 206 322 118 399 764 115 959 416
5 CL Chile 19 372 659 20 338 487 21 940 101 25 898 969 27 052 997
6 CN China 794 733 977 1 214 104 427 1 313 959 564
7 CO Colombia 38 672 496 41 014 822 45 986 154 58 667 015 59 668 996
8 KR South Korea 187 284 891 204 387 042 210 927 515 214 338 372 206 494 580
9 MX Mexico 218 704 629 245 142 465 256 255 435 294 365 188 328 246 682
10 NZ New Zealand 12 235 954 10 528 886 10 939 122 13 890 356 15 059 018
11 US United States of America 1 149 189 023 1 115 270 398 1 154 434 603 1 197 322 384 1 195 094 846
12 VE Venezuela 27 119 596 27 261 651 29 592 206 28 918 555 18 784 388

The Circulation of European films outside Europe - Key figures 2016
© European Audiovisual Observatory (Council of Europe) 2017
Page 68
6.3. Estimated LUMIERE coverage rates
Table 32. Estimated LUMIERE coverage rate of individual territories 2012-2016 (in %)
Source: European Audiovisual Observatory / LUMIERE, comScore
Territory 2012 2013 2014 2015 2016EUROPE
1 AT Austria 100 100 100 99 94
2 BA Bosnia-Herzegovina 3 100 97
3 BE Belgium 87 83 54 61 86
4 BG Bulgaria 100 99 100 100 100
5 CH Switzerland 99 99 98 99 92
6 CY Cyprus 1 1 100 3 94
7 CZ Czech Republic 99 99 99 99 100
8 DE Germany 97 98 98 97 87
9 DK Denmark 100 100 99 100 94
10 EE Estonia 100 98 100 99 100
11 ES Spain 100 100 100 100 100
12 FI Finland 100 99 100 99 98
13 FR France 95 92 91 92 91
14 GB United Kingdom 100 100 100 100 100
15 GE Georgia 99
16 GR Greece 98 100 100 100 100
17 HR Croatia 95 100 100 100 100
18 HU Hungary 100 94 100 100 100
19 IE Ireland
20 IS Iceland 2 1 99 96 99
21 IT Italy 92 91 92 93 98
22 LT Lithuania 4 100 100 99 100
23 LU Luxembourg 13 6 45 10
24 LV Latvia 98 1 99 96 100
25 ME Montenegro (from June 2006) 100 80 80
26 MK Former Yugoslav Republic of Macedonia 58 99 2
27 NL Netherlands 93 99 99 92 100
28 NO Norway 98 98 98 98 100
29 PL Poland 99 99 99 99 100
30 PT Portugal 99 99 99 100 100
31 RO Romania 99 99 99 100 100
32 RU Russian Federation 100 100 100 100 100
33 SE Sweden 100 99 99 99 100
34 SI Slovenia 96 92 95 96 100
35 SK Slovakia 99 99 99 100 100
36 TR Turkey 100 99 99 99 96OUTSIDE OF EUROPE
1 AR Argentina 100 100 96 96 94
2 AU Australia 94 90 98 100 100
3 BR Brazil 92 94 99 100 100
4 CA Canada 99 91 95 97 95
5 CL Chile 100 100 100 100 100
6 CN China 95 100 100
7 CO Colombia 94 94 98 100 100
8 KR South Korea 96 95 98 99 96
9 MX Mexico 95 98 100 100 100
10 NZ New Zealand 83 71 73 92 100
11 US United States of America 93 91 100 100 100
12 VE Venezuela 92 90 98 96 98

The Circulation of European films outside Europe - Key figures 2016
© European Audiovisual Observatory (Council of Europe) 2017
Page 69
6.4. Treatment of EUR inc films
As mentioned in the methodological remarks in chapter 2, European films financed with incoming US investment („EUR inc films“) are by default not counted as European but rather US films in the context of this report. The following EUR inc films however represent an exception to this rule as they feature as European films in the European Commission’s Executive Agency EAC’s film database (https://eacea.ec.europa.eu/mediaPgm/tabsMenu.do) and / or in Europa Cinema’s film database (http://www.europa-cinemas.org/en/Resources/Film-Database). Please note that Observatory’s „INC“ classification is not based on the same criteria as the British Film Institute’s classification of „inward investment“ films in the UK. The Observatory’s „INC“ classification is more restrictive and counts less films as „GB“ or „GB inc“ films than the BFI counts „UK films“.
Table 33. EUR INC films considered as European films in this report
N° Film COO (FINAL) Prod Year
Director ADM outside Europe - 2015
1 Eddie the Eagle GB INC / US 2016 Dexter Fletcher 3 263 533
2 Absolutely Fabulous: The Movie GB INC / US 2016 Mandie Fletcher 1 253 617
3 Bastille Day GB INC / US 2016 James Watkins 1 213 284
4 Denial GB INC / US 2016 Mick Jackson 473 656
5 Absolutely Anything GB INC / US 2015 Terry Jones 303 253
6 Genius GB INC / US 2016 Michael Grandage 237 659
7 David Brent: Life on the Road GB INC / US 2016 Ricky Gervais 75 098
8 Dancer GB INC / US 2016 Steven Cantor 19 759
9 Rush GB INC / US / DE 2013 Ron Howard 1 913
Source: European Audiovisual Observatory / LUMIERE, comScore
For reference purposes, the following films which are classified as GB inc films in LUMIERE were considered as US film in the context of this analysis:
Table 34. EUR INC films considered as US films in this report
N° Film COO (Original) Prod Year
Director ADM outside Europe -
2015
1 Children of Men US / GB INC / JP 2006 Alfonso Cuarón 18 862
2 Walking with Dinosaurs 3D US / GB INC / IN / AU 2013 B. Cook, N. Nightingale 7 695
6 Magic in the Moonlight US / GB INC 2014 Woody Allen 17
7 Exodus: Gods and Kings US / GB INC / ES 2014 Ridley Scott 378
8 Maleficent US / GB INC 2014 Robert Stromberg 734
9 The Monuments Men US / DE / GB INC 2014 George Clooney 103
Source: European Audiovisual Observatory / LUMIERE, comScore