Chris Hani District Municipality Tourism Integrated Plan Kyle ...
83
Chris Hani District Municipality Tourism Integrated Plan (39/2007/DPA (MM)) FINAL DRAFT VERSION 1.5 31 May 2009 Prepared by: Kyle Business Projects 53 Mackay Street, Central, Port Elizabeth • P O Box 13882, Humewood, 6013 Telephone: +27 41 582 5289 • Fax: +27 41 582 3068 [email protected] • www.kylebusiness.co.za
-
Upload
khangminh22 -
Category
Documents
-
view
4 -
download
0
Transcript of Chris Hani District Municipality Tourism Integrated Plan Kyle ...

Chris Hani District Municipality
Tourism Integrated Plan
(39/2007/DPA (MM))
FINAL DRAFT VERSION 1.5
31 May 2009
Prepared by:
Kyle Business Projects
53 Mackay Street, Central, Port Elizabeth • P O Box 13882, Humewood, 6013 Telephone: +27 41 582 5289 • Fax: +27 41 582 3068
[email protected] • www.kylebusiness.co.za

Chris Hani District Municipality Tourism Integrated Plan Prepared by: Kyle Business Projects
FINAL DRAFT VERSION 1.5 Page 2 of 177
Contents
1 Introduction .................................................................................................. 11
1.1 A Functioning Tourism System ...................................................................................... 11
1.2 Methodology ................................................................................................................ 12
2 Contextual Analysis ....................................................................................... 14
2.1 The Study Area ............................................................................................................ 14
2.2 Socio-Economic Status of the Chris Hani District ............................................................. 15
2.3 Integrated Development Planning ................................................................................. 18
2.4 Regional Economic Development Strategy ..................................................................... 20
2.5 Policy and Legal Framework for Responsible Tourism ..................................................... 25
3 Market Analysis ............................................................................................. 27
3.1 Tourism Supply ............................................................................................................ 27
3.1.1 Tourism Product Elements in the Chris Hani District Municipality ............................. 27
3.1.2 Tourism Attractions and Activities in the Chris Hani District Municipality ................... 28
3.1.3 Tourism Accommodation in the Chris Hani District Municipality ............................... 29
3.2 Tourism Demand in the Chris Hani District Municipality ................................................... 33
4 Triple Bottom Line Assessment ..................................................................... 36
4.1 Economic Impact of Tourism ......................................................................................... 36
4.2 Social Impact of Tourism .............................................................................................. 38
4.3 Environmental Impact of Tourism .................................................................................. 40
4.3.1 Protected Areas .................................................................................................... 42
5 Focused Assessments and Analysis ............................................................... 44
5.1 Institutional Assessment ............................................................................................... 44
5.2 Tourist Information Management and Marketing Assessment .......................................... 44
5.3 Assessment of Emergency Services and Infrastructure ................................................... 44
5.4 Assessment of Transport Infrastructure ......................................................................... 46
5.4.1 Communications ................................................................................................... 47
5.5 Issues Analysis ............................................................................................................. 48
5.6 SWOT Analysis ............................................................................................................. 49
5.6.1 Strengths ............................................................................................................. 49
5.6.2 Weaknesses ......................................................................................................... 50

Chris Hani District Municipality Tourism Integrated Plan Prepared by: Kyle Business Projects
FINAL DRAFT VERSION 1.5 Page 3 of 177
5.6.3 Opportunities ....................................................................................................... 50
5.6.4 Threats ................................................................................................................ 51
6 Tourism Vision and Strategy ......................................................................... 52
6.1 Introduction ................................................................................................................. 52
6.2 Tourism Vision ............................................................................................................. 52
6.3 Tourism Mission ........................................................................................................... 53
6.4 Tourism Development Strategy ..................................................................................... 54
6.4.1 Goals of the Strategy ............................................................................................ 54
6.4.2 Definition of the Product ....................................................................................... 55
6.4.3 Target Market Segments and Constraints ............................................................... 55
6.4.4 Product Development Strategy .............................................................................. 57
6.4.5 Product Marketing Strategy ................................................................................... 57
6.4.6 Benchmarks ......................................................................................................... 58
6.5 Tourism Institutional Framework ................................................................................... 63
6.5.1 Background ......................................................................................................... 63
6.5.2 Developing an effective Visitor Information Network............................................... 64
6.5.3 Proposed Tourism Institutional Framework Model for the Chris Hani District ............ 65
6.5.4 Application of the Proposed Tourism Institutional Framework Model for the Chris Hani
District ......................................................................................................................... 67
6.5.5 Internal Structure & Operations of the LTO ............................................................ 69
6.5.6 The Board of the LTO ........................................................................................... 71
6.5.7 Resource Requirements for the LTO ...................................................................... 74
6.5.8 Internal Structure, Operations and Resource Requirements for the DTO .................. 77
7 Tourism Spatial Development Plan ................................................................ 80
7.1 Purpose of the Tourism Spatial Development Plan .......................................................... 80
7.2 Topography, Biomes, and Conservation Areas ................................................................ 80
7.3 Current Tourism Environment ....................................................................................... 80
7.4 Proposed Tourism Environment ..................................................................................... 90
8 Tourism Development Plan ........................................................................... 91
8.1 Tourism Product Development ...................................................................................... 91
8.2 Human Resource and SMME Development ..................................................................... 92
8.2.1 Tourism Learnership Project (TLP) ........................................................................ 93
8.3 Marketing Plan ............................................................................................................. 94
8.3.1 Destination Marketing ........................................................................................... 94
8.3.2 Overall Marketing Strategy .................................................................................... 98
8.3.3 Marketing Identity ................................................................................................ 98

Chris Hani District Municipality Tourism Integrated Plan Prepared by: Kyle Business Projects
FINAL DRAFT VERSION 1.5 Page 4 of 177
8.3.4 Target Markets ..................................................................................................... 99
8.3.5 The Marketing Mix .............................................................................................. 100
8.3.6 Marketing Budget ............................................................................................... 103
8.3.7 Marketing Tools ................................................................................................. 104
9 Implementation Plan ................................................................................... 107
9.1 107
9.2 107
10 References / Bibliography ........................................................................... 108
10.1 Bibliography ............................................................................................................... 108
10.2 Websites .................................................................................................................... 108
Appendix 1 – Acronyms, Marketing Terms, Tourism Definitions, TGCSA
Definitions ................................................................................................... 109
Appendix 2 – Health Facilities in the Chris Hani District Municipality........... 117
Appendix 3 – Nature-Based Tourism Elements in the Chris Hani District ..... 119
Appendix 4 – Heritage-Based Tourism Elements in the Chris Hani District .. 121
Appendix 5 – Tourist Attractions / Activities in the Chris Hani District ........ 123
Appendix 6 – Database of Tourism Products in the Chris Hani District
Municipality ................................................................................................... 130
Appendix 7 – Economic Model of the Impact of Tourism in the Chris Hani
District Municipality ........................................................................................... 142
Appendix 8 – Protected Areas in the Chris Hani District ............................... 147
Appendix 9 – SWOT Analyses of each of the Local Municipalities in the Chris
Hani District ................................................................................................... 148
Appendix 10 – Constructing & Marketing an Air-Inclusive Tour Program ...... 170
Appendix 11 – LSM Group Definitions ............................................................. 171
Appendix 12 – Key Tourism Organisations and Trade Associations in South
Africa ................................................................................................... 173

Chris Hani District Municipality Tourism Integrated Plan Prepared by: Kyle Business Projects
FINAL DRAFT VERSION 1.5 Page 5 of 177
Appendix 13 – Sources of Funding for Tourism Businesses ............................ 174
Appendix 14 – Register of Workshops and Meetings Held with Roleplayers in
the Study Area During the Project ..................................................................... 175
Appendix 15 Meetings Held with Roleplayers in the Study Area During the
Project ................................................................................................... 176

Chris Hani District Municipality Tourism Integrated Plan Prepared by: Kyle Business Projects
FINAL DRAFT VERSION 1.5 Page 6 of 177
List of Figures
Figure 1: Schematic of a functioning tourism system. ....................................................................11
Figure 2: Environmental influences on the tourism system. All these elements need to operate correctly for the tourism system to operate optimally. ................................................................12
Figure 3: The Chris Hani District Municipality is located in the north-eastern part of the Eastern Cape Province. ........................................................................................................................14
Figure 4: The current (2008) Municipal boundaries in the Chris Hani District Municipality (Source: Municipal Demarcation Board). ...................................................................................15
Figure 5: The overall population breakdown by Municipality in the Chris Hani District Municipality. (Source: Stats SA, 2007 Community Survey). .........................................................15
Figure 6: The total population breakdown by race in the Chris Hani District Municipality. (Source: Stats SA, 2007 Community Survey). ............................................................................16
Figure 7: The age profile of the population in Chris Hani. (Source: Stats SA, 2007 Community Survey). ..................................................................................................................................16
Figure 8: The age profile of the population in the Chris Hani District, compared to the age profile of the entire South Africa population. (Source: Stats SA, 2007 Community Survey). ..........17
Figure 9: The educational levels attained by the residents in the Chris Hani District Municipality. (Source: Stats SA, Community Survey 2007). ............................................................................17
Figure 10: Industry in which individuals (ages 15 to 65) are employed in the Chris Hani District Municipality. (Source: Stats SA, 2007 Community Survey). .........................................................18
Figure 11: The profile of household incomes in the Chris Hani District Municipality and Eastern Cape. (Source: Stats SA, Census 2001). ....................................................................................18
Figure 12: The geographic corridors of economic development and the development nodes identified in the Chris Hani District Nubicipality Regional Economic Development Strategy. (Source: CHDM REDS, 2008)). ..................................................................................................22
Figure 13: Analysis of the tourist accommodation establishments and beds inventory in the Chris Hani District, by category of accommodation defined by the TGCSA. ..................................31
Figure 14: Analysis of the proportion of the total tourist accommodation establishments and beds inventory in the Chris Hani District in each of the categories defined by the TGCSA. ............32
Figure 15: Analysis of the relative share of the tourist accommodation establishments and beds inventory in the Chris Hani District in each of the Local Municipalities, and the average number of beds in each establishment. Municipalities where the balance lies above the center line have on average a larger proportion of the beds than establishments, and Municipalities where the balance lies below the center line have on average a smaller proportion of beds than establishments. The average number of beds per establishment in each Local Municipality and the Chris Hani District is indicated by the numbers on the bars. ........33
Figure 16: The institutional relationships between the national, provincial, district and local levels in the tourism industry in South Africa. ............................................................................64
Figure 17: The proposed Tourism Institutional Framework Model for the Chris Hani District. .............65
Figure 18: The proposed tourism institutional framework for the Chris Hani District, after applying the model described in Section 6.5.3. ..........................................................................68
Figure 19: The general structure of successful LTOs. ......................................................................69

Chris Hani District Municipality Tourism Integrated Plan Prepared by: Kyle Business Projects
FINAL DRAFT VERSION 1.5 Page 7 of 177
Figure 20: The key elements of the structure of a successful LTO focus on the core business of the organization to drive its strategy and achieve its strategic objectives. ...................................70
Figure 21: The Tourism Pyramid, illustrating the application of the four “P’s” of marketing in the tourism industry. .....................................................................................................................70
Figure 22: The internal market segments for the LTO, defined by the interactions with stakeholders required in order to achieve its strategic objective. .................................................71
Figure 23: The South African tourism landscape. ............................................................................72
Figure 24: Example of the segmentation of the potential funding market for LTOs. ..........................77
Figure 25: The main topographical features of the Chris Hani District Municipality. ...........................84
Figure 26: The biomes in the Chris Hani District Municipality. ..........................................................85
Figure 27: The protected areas in the Hani District Municipality. ......................................................86
Figure 28: The current tourism environment with points of interest in the Chris Hani District Municipality .............................................................................................................................87
Figure 29: The current tourism environment indicating the areas of interest in the Chris Hani District Municipality ..................................................................................................................88
Figure 30: The proposed tourism environment in the Chris Hani District Municipality. .......................89
Figure 31: Typical distribution system of a manufacturer of a tangible product................................95
Figure 32: The tourism distribution system. ..................................................................................96
Figure 33: The distribution chain for international tourists to local product owners. .........................97

Chris Hani District Municipality Tourism Integrated Plan Prepared by: Kyle Business Projects
FINAL DRAFT VERSION 1.5 Page 8 of 177
List of Tables
Table 1: The economic assets for tourism identified during the development of the Regional Economic Development Strategy for the CHDM in 2008. ............................................................23
Table 2: The perceived economic opportunities for tourism identified during the development of the Regional Economic Development Strategy for the CHDM in 2008 ......................................23
Table 3: The strategic objective and key interventions in tourism for the CHDM LED Unit, derived from the CHDM Growth and Development Summit and the CHDM REDS. ........................24
Table 4: Summary of the inventory of nature-based tourism product elements in the Chris Hani area. .......................................................................................................................................27
Table 5: Summary of the inventory of heritage-based tourism product elements in the Chris Hani area. ...............................................................................................................................28
Table 6: Summary of the inventory of tourism attractions in the Chris Hani area. .............................29
Table 7: Tourist Accommodation in the Chris Hani District Municipality, as determined from the Tourism Sector Plans for each Local Municipality / primary research in the area, identified by the accommodation categories used by Statistics SA. .................................................................30
Table 8: The average bed occupancies of the different types of accommodation in the Chris Hani District Municipality, and the derived total number of bednights sold per annum for 2007/8. The average bed occupancies are calculated as a weighted average of the bed occupancies in each Local Municipality. .....................................................................................34
Table 9: The estimated annual tourist volumes visiting the Chris Hani District Municipality, including local and foreign and VFR and non-VFR visitors. These estimates are calculated from the bednights sold, the approximate profile of visitors to the Chris Hani area, and using Tourism SA statistics for percentages of tourists which are VFR. .................................................34
Table 10: The projected economic contribution of tourism to the Chris Hani Districti Municipality for the forecast period 2009 to 2016. Data is calculated using the model included in Appendix 4. Key parameters which are calculated include the total direct expenditure by tourists, the total contribution of the tourism economy, the total economic activity generated by tourism, net contribution by the tourism industry to jobs, the total contribution of the tourism economy (including the tourism industry) to jobs, and the net contribution to SMME creation. .................................................................................................37
Table 11: Summary of the inventory of protected areas in the Chris Hani area. ................................43
Table 12: Number of health facilities in the Chris Hani District Municipality. ....................................45
Table 13: Police Stations in the Chris Hani District Municipality. ......................................................45
Table 14: Analysis of the common elements of the Tourism Vision Statements of the Local Municipalities in the Chris Hani District. .....................................................................................53
Table 15: Chris Hani – Domestic Tourism Product-Market fit. .........................................................56
Table 16: Chris Hani – Overseas Tourism Product-Market fit. .........................................................57
Table 17: Chris Hani bednights compared to 2005 Provincial & National statistics. ...........................60
Table 18: The average length of stay by domestic and foreign holiday tourists in the Eastern Cape and in South Africa in 2005. .............................................................................................60
Table 19: The average spend per day for foreign tourists in South Africa, by purpose of visit. ..........61

Chris Hani District Municipality Tourism Integrated Plan Prepared by: Kyle Business Projects
FINAL DRAFT VERSION 1.5 Page 9 of 177
Table 20: The average spend per trip for foreign tourists in South Africa, by category of expense. .................................................................................................................................61
Table 21: Estimated occupancy rates in tourism accommodation in the Chris Hani District Municipality. The average room occupancy rates in South Africa for the 13-month period December 2005 to December 2006 are shown for comparison (Source: Stats SA December 2006 Accommodation Occupancy Statistics). .............................................................................62
Table 22: The estimated number of employers and employees in the tourism industry in South Africa in 2000. .........................................................................................................................62
Table 23: The Tourism BEE Scorecard, showing the 2006 national baseline degree of compliance of small tourism enterprises (turnover < R5 million) with the 2009 targets. ...............63
Table 24: The composition of the Management Board of the Tourism Business Council of South Africa, illustrating the mix of skills and industries required to ensure successful operation and representation. ........................................................................................................................73
Table 25: Key non-governmental tourism organizations in South Africa, representing the interests of their member sectors. ............................................................................................73
Table 26: Example operating budget for an LTO for a period of 3 years. Some of these amounts may be scaled depending on the overall size of the LTO. For example, salaries & wages expenses depends on the number of staff. ................................................................................75
Table 27: The tourism products identified by the project and marked on the spatial plan of the current tourism environment in Figure 28. The ID number refers to the identification number on the spatial plan. Full details of the products are provided in Appendix 6. ................................83
Table 28: Important strategic tourism marketing actions, prioritized for implementation, depending on the current stage of development of the marketing programme. ...........................98
Table 29: The potential tourism market segments for the Chris Hani area, ranked by priority. Note that an entry of “1” in the column headed “5” indicates the first priority item (1) of the high priority items (5). ........................................................................................................... 100
Table 30: Key elements of the marketing mix for the Chris Hani tourism area, ranked in order of priority. Note that an entry of “1” in the column headed “5” indicates the first priority item (1) of the high priority items (5). ............................................................................................ 102
Table 31: Typical elements of the destination marketing budget. ................................................. 103
Table 32: Print media selection according to circulation and cost. ................................................. 106
Table 33: The Tourism Action Plan for the Chris Hani Tourism Organisation. ................................. 107

Chris Hani District Municipality Tourism Integrated Plan Prepared by: Kyle Business Projects
FINAL DRAFT VERSION 1.5 Page 10 of 177
Note
The opinions and recommendations contained in this report are based on the information that was
available to the Project Team at the time of the research. The estimates and projections included in
this report are not presented as results or outcomes that are inevitable under any circumstances, but
are, instead, subject to the various assumptions and bases stated in the report.
It is strongly recommended that all data and strategic plans and actions be reviewed and updated
periodically (at least annually) to take account of changing market and social conditions, and the
effects of the implementation of the strategies.

Chris Hani District Municipality Tourism Integrated Plan Prepared by: Kyle Business Projects
FINAL DRAFT VERSION 1.5 Page 11 of 177
1 Introduction
The objective of the Tourism Integrated Plan is to provide guidelines and make recommendations to
enable the Chris Hani District Municipality to develop a functioning tourism system through the
application of a defined strategy and specific actions.
1.1 A Functioning Tourism System
Tourism is an inter-related system of supply and demand factors (the tourism market), and a broad
range of societal / environmental influences. Together, these comprise the tourism system.
The tourism market is composed of both supply (an industry) and demand (an activity). These are
linked through marketing, research, distribution, global and national tourism organisations and
transportation. The inter-relation of elements in the tourism market is shown schematically in Figure
1.
Demand
Supply
PopulationInterest in travelAbility to travel
AttractionsResource development:
quality visitor satisfaction
ServicesVariety & quality: food,
lodging, products
Information &Promotion
TransportationVolume & quality:
all modes
Figure 1: Schematic of a functioning tourism system.
• The supply side of tourism focuses on the most fundamental resources that attract tourists to
regions and what the tourism industry brings to the tourist: the natural and cultural resources.
• The demand side of tourism comprises those needs and motivations that drive individuals to
become tourists.

Chris Hani District Municipality Tourism Integrated Plan Prepared by: Kyle Business Projects
FINAL DRAFT VERSION 1.5 Page 12 of 177
• The tourism distribution system focuses on distributing tourism from the tourism sectors to
the potential tourist. Tourism distribution can therefore be defined as the extension of the
number of points of sale or access away from the location at which the services are
performed.
The overall environment in which tourism operates affects supply and demand because it reflects
historical, current and future legislative, technological, social and economic trends. This is shown
schematically in Figure 2.
In a functioning tourism system, these market and environmental elements all operate correctly and
are inter-related.
FunctioningTourism System
Finance
Entrepreneurship
Community Involvement
Organisation Leadership
Cultural Resources
Natural Resources
Government Policy
CompetitionFunctioningTourism System
Figure 2: Environmental influences on the tourism system. All these elements need to operate
correctly for the tourism system to operate optimally.
1.2 Methodology
The process followed in the compiling of the Tourism Integrated Plan (TIP) has four principal stages,
as described in the following sections.
• Stage One: Contextual and Situational Analysis - Policy and Legal Framework for Responsible
Tourism, Contextual Analysis of the Chris Hani District Municipality, Analysis of Tourism
Demand in Chris Hani District Municipality, Inventory and Analysis of Tourism Supply in the
Chris Hani District Municipality, Triple – Bottom-Line Assessment, Institutional Assessment,
Tourist Information Management and Marketing Assessment, Infrastructure and Emergency
Services
• Stage Two: Tourism Integrated Plan - Spatial Development Plan, Infrastructure Development
Plan and Emergency Services, Product Development Plan / Investment Program, Human
Resource and SMME Development Plan, Tourist Information and Marketing Plan,
Implementation Plan

Chris Hani District Municipality Tourism Integrated Plan Prepared by: Kyle Business Projects
FINAL DRAFT VERSION 1.5 Page 13 of 177
• Stage Three: Environmental Assessment - An independent environmental assessment will be
undertaken of the Tourism Integrated Plan to ensure the environmental integrity of the plan
and its compliance with the relevant environmental legislation. This assessment will also
highlight any environmental gateways that must be negotiated for the implementation of the
elements of the plan. This is specifically relevant for the development of existing and new
tourism products.
• Stage Four: Reporting Phase - Contextual and Situation Assessment, Tourism Integrated Plan
(GIS maps of the current tourism offerings and the potential expansion and new
developments, GIS-linked database of the tourism offerings, sourced from the Local
Municipality TSPs, Integration into the CHDM Information Development System),
Environmental Assessment of the Tourism Integrated Plan

Chris Hani District Municipality Tourism Integrated Plan Prepared by: Kyle Business Projects
FINAL DRAFT VERSION 1.5 Page 14 of 177
2 Contextual Analysis
2.1 The Study Area
The Chris Hani District Municipality is located in the north-eastern sector of the Eastern Cape. It
includes one DMA (Mountain Zebra Park) and the following eight Local Municipalities:
• Lukhanji
• Inxuba Yethemba
• Tsolwana
• Inkwanca
• Emalahleni
• Intsika Yethu
• Sakhisizwe
• Engcobo
The total geographical area of the municipality is 36,963.8158 square kilometers.
Figure 3: The Chris Hani District Municipality is located in the north-eastern part of the Eastern Cape
Province.

Chris Hani District Municipality Tourism Integrated Plan Prepared by: Kyle Business Projects
FINAL DRAFT VERSION 1.5 Page 15 of 177
2.2 Socio-Economic Status of the Chris Hani District
The most recent population demographics of the Chris Hani area are derived from the 2001 Census by
Statistics SA, adjusted to the current municipal boundaries as defined by the Municipal Demarcation
Board. All of the Stats SA population and demographic data reported here is drawn from this source.
Figure 4: The current (2008) Municipal boundaries in the Chris Hani District Municipality (Source:
Municipal Demarcation Board).
0
50,000
100,000
150,000
200,000
250,000
Inxuba Y
ethemba
Engcobo
Sakhisi
zwe
Emalahlen
i
Inkwan
ca
Intsika
Yeth
u
Tsolw
ana
Lukhan
ji
Municipality
Popu
latio
n
African Coloured Indian White
Figure 5: The overall population breakdown by Municipality in the Chris Hani District Municipality.
(Source: Stats SA, 2007 Community Survey).

Chris Hani District Municipality Tourism Integrated Plan Prepared by: Kyle Business Projects
FINAL DRAFT VERSION 1.5 Page 16 of 177
Indian 0.06% White
1.96%
African 93.97%
Coloured 2.76%
Figure 6: The total population breakdown by race in the Chris Hani District Municipality. (Source:
Stats SA, 2007 Community Survey).
Youth31%
Children37%
Elderly9%
Middle Age23%
Figure 7: The age profile of the population in Chris Hani. (Source: Stats SA, 2007 Community
Survey).
The bulk of the population (63%) in Chris Hani is concentrated in the south-eastern region of the
District, in the Lukhanji, Intsika Yethu and Engcobo Local Municipalities. Just more than half of the
population is female (51.77%).
The age distribution of the population shows a similar profile to that of the entire South Africa
population. In South Africa as a whole, the population shows a weighting to the younger age groups
(67.5% below age 34). A similar weighting is observed in the Chris Hani District (68.46% below age
34). The population in the Chris Hani District however shows a significantly lower weighting in the
economically active age-group (15 – 64) – only 53.12% in the Chris Hanui District compared to
63.59% in the entire SA population (see Figure 8). This could be attributable to the migration of the
economically active elements of the population away from the rural areas towards the more urbanised
centers for education and employment.

Chris Hani District Municipality Tourism Integrated Plan Prepared by: Kyle Business Projects
FINAL DRAFT VERSION 1.5 Page 17 of 177
31.03%
36.47%
27.12%
5.39%
37.91%
8.97%
22.57%
30.55%
0.00%
5.00%
10.00%
15.00%
20.00%
25.00%
30.00%
35.00%
40.00%
0-14 15-34 35-64 65+
Age Groups
SA Chris Hani
Figure 8: The age profile of the population in the Chris Hani District, compared to the age profile of
the entire South Africa population. (Source: Stats SA, 2007 Community Survey).
Of the entire population over 20 in Chris Hani, 50.66% have either no education or only a primary
level of education. A further 35.89% have some secondary education (high school). Cumulatively, this
means that 86.55% of the population over 20 years have not completed high school. 8.43% of the
population have successfully completed high school (Matric) as their highest level of education, and
5.02% have some tertiary qualification. This data is shown graphically in Figure 9.
2.46%
1.22%
1.82%
0.73%
8.43%35.89%
7.93%
26.64%
16.10%
0.78%
0.27%0.20%
No schooling
Some primary
Completed primary
Some secondary
Grade 12/Std 12
Certificate with Grade 12
Diploma with Grade 12
Bachelors degree
Bachelors degree anddiplomaHonours degree
Higher degree
Figure 9: The educational levels attained by the residents in the Chris Hani District Municipality.
(Source: Stats SA, Community Survey 2007).
Amongst individuals of employable age (15 to 65 years), the community, social & personal services is
the largest employer (25.41%), followed by the Wholesale & Retail Trade (17.13%), Manufacturing
(10.21%), Financial, Insurance, Real Estate and Business Services (7.53%) and Construction (6.48%).
Combined, these sectors account for nearly 67% of the employment (see Figure 10).

Chris Hani District Municipality Tourism Integrated Plan Prepared by: Kyle Business Projects
FINAL DRAFT VERSION 1.5 Page 18 of 177
25.41%
17.13%7.53%
6.48%
1.07%
0.31%
4.83%
0.71%
2.74%
28.41%
10.21% Undetermined
Community; social andpersonal servicesWholesale and retail trade
Manufacturing
Financial; insurance; realestate and business servicesConstruction
Transport; storage andcommunicationAgriculture; hunting; forestryand fishingElectricity; gas and watersupplyMining and quarrying
Figure 10: Industry in which individuals (ages 15 to 65) are employed in the Chris Hani District
Municipality. (Source: Stats SA, 2007 Community Survey).
32.15%
9.0%
28.1%
15.3%
0.1%
10.0%
6.8%
4.6%
2.4%
0.6%
0.1%
7.5%
4.3%
2.3%
0.0%
0.1%
0.2%
0.9%
0.2%
22.3%
29.53%
15.0%
8.2%
0.2%
0.00% 5.00% 10.00% 15.00% 20.00% 25.00% 30.00% 35.00%
None
R1 – R4,800
R4,801 - R9,600
R9,601 – R19,200
R19,201 – R38,400
R38,401 – R76,800
R76,801 – R153,600
R153,601 – R307,200
R307,201 – R614,400
R614,401 – R1,228,800
R1,228,801 – R2,457,600
Over R2,457,600
Indi
vidu
al A
nnua
l Inc
ome
(R)
% of Individuals
Eastern Cape Chris Hani
Figure 11: The profile of household incomes in the Chris Hani District Municipality and Eastern Cape.
(Source: Stats SA, Census 2001).
2.3 Integrated Development Planning
The development strategies of the Chris Hani District Municipality, as articulated in the 2008/9 IDP,
identifies 5 strategic focus areas:
o Institutional transformation
o Infrastructure delivery and services
o Local economic development and poverty alleviation
Chris Hani District Municipality Tourism Integrated Plan Prepared by: Kyle Business Projects
FINAL DRAFT VERSION 1.5 Page 19 of 177
o Financial management
o Good governance and public participation
Within these focus areas, the following priority needs are identified:
o Local Economic Development
o Poverty alleviation and food security
o Water and sanitation
o Municipal Health and environmental management
o Corporate governance including IGR, monitoring and evaluation and Integrated Planning
o Fire services and Disaster Management
o Special programmes such as youth, women, children, the elderly and people with disabilities
o Transport (regulation of passenger services)
These development strategies are considered in a spatial context based on the objectives defined in
the Chris Hani District Spatial Development Framework (SDF):
Sustainable Economic Development, through the various prospects for economic development:
o The development of forestry and maize production in the east.
o Industrial development at Queenstown
o The development of tourism and heritage resources in the west
o The development of irrigation agriculture at Xonxa, Lubisi and Ncora Dams
o The development of local fishing in Emalahleni
Integrated Infrastructure Development, through the development of roads, water and electrical
power not only to improve the quality of life of people but to focus on areas identified for economic
development in order to kick-start developments in those areas.
Social sustainability, by increasing the access of people to resources, i.e.
o Rural food production
o Management of livestock
o Production of wood
o Fishing along the coast
o Health services, education facilities etc
Environmental sustainability, through careful planning and protection by
o Managing grazing land
o Planning woodlots
o Conserving sensitive areas

Chris Hani District Municipality Tourism Integrated Plan Prepared by: Kyle Business Projects
FINAL DRAFT VERSION 1.5 Page 20 of 177
Land reform, through reform of the archaic land laws still applicable in Chris Hani District
Municipality and by localizing delivery of land reform.
The following spatial development strategies have been defined:
1. An urban renewal strategy for Queenstown to revive it as a major industrial, business and
administrative centre.
2. Development and implementation of LED and Agriculture strategies, which will identify land
for maize production and provide strategies to manage the development of livestock etc in
terms of environmental management procedures.
3. A tourism development strategy for Chris Hani District Municipality.
4. A strategy for the development of coal in Emalahleni.
5. A development strategy for the irrigation schemes at the Xonxa, Lubisi and Ncora Dams.
The IDP process uses the identified priorities and needs to derive objectives, projects and specific
actions to drive development in the area.
2.4 Regional Economic Development Strategy
The regional economic development strategy of the Chris Hani District Municipality is documented in
the Chris Hani District Municipality Regional Economic Development Strategy (CHDM REDS), dated
November 2008.
The basis for the REDS is defined in terms of the understanding of strategy:
Strategy is about positioning the region in such a way as to maximise the economic potential offered
by its natural endowments and making choices about where to allocate scarce resources to ensure
maximum impact so that the region gets the best possible economic leverage to achieve its economic
and social objectives
Sectors within CHDM which are identified as having a relative comparative advantage on which to
build include:
• Manufacturing
• Mining
• Business tourism
• Leisure tourism
• Retail and business services

Chris Hani District Municipality Tourism Integrated Plan Prepared by: Kyle Business Projects
FINAL DRAFT VERSION 1.5 Page 21 of 177
Although the broadly defined agriculture sector and the timber production and related value-adding
activities are isolated as the sectors which have the most economic development potential in the
district, and therefore receive priority focus, the CHDM REDS nevertheless does analyse and provide
elements of strategy towards the development of the tourism industry in the CHDM.
The geographic focus of the REDS is on identified geographic corridors and nodes:
- Corridor 1: Queenstown Cofimvaba Tsomo Ngcobo
- Corridor 2: Queenstown Lady Frere Cala Elliot Indwe Dordrecht
- Corridor 3: Middelberg Queenstown Hofmeyr Takastad Cradock
- Corridor 4: Queenstown Molteno Sterkstroom Middelberg
These are shown graphically in Figure 12.
The economic strategy development process identified specific strengths / assets and opportunities for
tourism. These are shown in Table 1 and Table 2 respectively.

Chris Hani District Municipality Tourism Integrated Plan Prepared by: Kyle Business Projects
FINAL DRAFT VERSION 1.5 Page 22 of 177
Figure 12: The geographic corridors of economic development and the development nodes identified in the Chris Hani District Nubicipality Regional
Economic Development Strategy. (Source: CHDM REDS, 2008)).

Chris Hani District Municipality Tourism Integrated Plan Prepared by: Kyle Business Projects
FINAL DRAFT VERSION 1.5 Page 23 of 177
Broad category Assets for Tourism and HospitalityWater and water infrastructure
Dams, rivers, waterfalls / adventure and aqua-culture tourism
Climate and natural beauty
Climate, natural environment / eco-tourism potential /
Economic infrastructure Accommodation infrastructure
Transport infrastructure and physical location
Existing tourism route / business tourism due to central locality / location on the N6 / easy access
Human resources Friendly people
Specific existing assets Established sport events with facilities to explore more sporting event
Historical, political liberation and cultural heritage / rock painting / battles sites / well-conserved heritage sites
Potential assets Game farming tourism / agro- tourism / township tourism / musical jazz and afro-pop / craft linked to local culture
(Source: CHDM REDS, 2008)
IDENTIFIED ECONOMIC ASSETS FOR TOURISM IN THE CHDM
Table 1: The economic assets for tourism identified during the development of the Regional
Economic Development Strategy for the CHDM in 2008.
Town Opportunities for Tourism and HospitalityQueenstown Five star hotel, / entertainment centre / conference centre / business
and sport tourism / gambling accommodationCofimvaba Liberation route / dams for sporting events as tourist attractions
Ngcobo Liberation heritage sites
Dordrecht Mountain hiking trails hotel
Indwe Golf course resort restaurants development of tour guides
Elliot Dam for picnics / caravan park hiking trails, bird watching, caves (Water Kloof), fishing, cultural village golf course country club, sports fields
Cala rock paintings restaurant conference facilities hospitality, cultural dances hiking trails tour guides, fishing on Tsomo river
Lady Frere clay arts and crafts, eco-tourisms, hiking and off road adventures Xonga dam for hiking and water sport tourism meander hospitality and conference centre cultural village , hotel and restaurant, craft centre
Queenstown Fishing, sport tourism hotels
Middelberg conference facilities marketing of facilities like b&bs windmill craft production
Takastad sports bar /tavern for township, b&b facilities in township tour guides Provision of more tourist attractions
Cradock windmill craft productions natural beauty, provision of more tourist attractions, tour operators and guides, marketing
Molteno tourist attraction battle fields, develop Molteno dam (picnic sites), spa-paradise (tourism)
Sterkstroom Hunting tourism catering rock art tourism
(Source: CHDM REDS, 2008)
PERCIEVED ECONOMIC OPPORTUNITIES FOR TOURISM IN THE CHDM
Table 2: The perceived economic opportunities for tourism identified during the development of the
Regional Economic Development Strategy for the CHDM in 2008

Chris Hani District Municipality Tourism Integrated Plan Prepared by: Kyle Business Projects
FINAL DRAFT VERSION 1.5 Page 24 of 177
The comparative and competitive advantage of the CHDM for tourism is identified in two specific
elements:
• Business tourism: conferences, week-night accommodation and related services, etc. -
predominantly in Queenstown and Cradock.
• Leisure tourism – throughout the district, with emphaisis on the Liberation Route,
heritage tours, adventure tourism and game/nature reserves and game hunting.
It was noted that the business tourism is dominated by government business, and predominates in
Queenstown and Cradock. Opportunities in provision of venues, accommodation and related services
were noted.
Although it was noted that the Liberation Route and heritage tours are important assets of the CHDM,
it was also noted that large investment in product development, the establishment of the necessary
infrastructure and related services, and in marketing is required in order to unlock theses assets to
competitive advantage.
To promote the development of the tourism sector, and optimise the comparative advantages of the
sector, the CHDM REDS defines a specific strategic objective and key interventions which the CHDM
LED Unit should pursue. The tourism objective and interventions are shown in .
Main initiatives from the GDS Strategic interventions: CHDM LED Unit
Develop a tourist master plan for the District Ensure necessary infrastructure and services are in place Promote the Great Karroo Gateway Biosphere Allocate resources on the basis of a District wide master plan
Strengthen the Liberation / Heritage route by linking to existing tourist initiatives
Ensure quality standards
Establish and strengthen tourist information centres(particularly in Queenstown)
Ensure inclusion on integrated tourism development plans in IDPs of local municipalities
(Source: CHDM REDS, 2008)
STRATEGIC OBJECTIVE AND INTERVENTIONS FOR TOURISM IN THE CHDM
Strategic Objective: CHDM is recognised as a tourist destination locally, nationally, and internationally
Table 3: The strategic objective and key interventions in tourism for the CHDM LED Unit, derived
from the CHDM Growth and Development Summit and the CHDM REDS.
Overall, the CHDM REDS recommends the adoption of an enabling framework for the development of
tourism through the initiatives identified in the Responsible Tourism Sector Plans of the Local
Municipalities, and the development of the overall District-level tourism framework through the CHDM
Tourism Integrated Plan.

Chris Hani District Municipality Tourism Integrated Plan Prepared by: Kyle Business Projects
FINAL DRAFT VERSION 1.5 Page 25 of 177
2.5 Policy and Legal Framework for Responsible Tourism
A number of items of legislation and policy documents have relevance to and impact on tourism in
South Africa today, including:
Macro Strategies
• Accelerated and Shared Growth Initiative for South Africa (ASGISA)
• Tourism Growth Strategy, (2005 – 2007)
• Domestic Tourism Growth Strategy (2004 - 2007)
• Tourism Investment Mobilisation Strategy for South Africa (2001 – 2011)
• HIV/AIDS Handbook for South African Tourism and Hospitality Companies
• National Tourism Safety & Awareness Strategy
Acts
• National Tourism Act, Act 72 of 1993
• Tourism Amendment Act, Act 8 of 2000
• Tourism Second Amendment Act, Act 70 of 2000
• Eastern Cape Tourism Act, Act 8 of 2003
• Municipal Structures Act, Act 117 of 1998
• Municipal Systems Act, Act 32 of 2000
• Municipal Demarcation Act, Act 27 of 1998
• Municipal Finance Management Act, Act 56 of 2003
• Public Finance Management Act, Act 1 of 1999
• National Environmental Management Act, Act 107 of 1998
• Development Facilitation Act, Act 67 of 1995
• Disaster Management Act, Act 57 of 2002
• National Heritage Resources Act, Act 25 of 1999
• World Heritage Convention Act, Act 49 of 1999
• Spatial Data Infrastructure Act, Act 54 of 2003
• National Sport and Recreation Act, Act 110 of 1998
Policy Documents
• Tourism White Paper, May 1996
• Responsible Tourism Manual for South Africa, July 2002
• Tourism BEE Charter and Scorecard 2005
• Eastern Cape Provincial Growth Development Plan (PGDP) 2003
• Integrated Development Plans (IDPs)

Chris Hani District Municipality Tourism Integrated Plan Prepared by: Kyle Business Projects
FINAL DRAFT VERSION 1.5 Page 26 of 177
Cognisance of this relevant local legislation is critical in developing and implementing the Tourism
Integrated Plan, and taking advantage of the opportunities and complying with the requirements of
the Acts and Policies.

Chris Hani District Municipality Tourism Integrated Plan Prepared by: Kyle Business Projects
FINAL DRAFT VERSION 1.5 Page 27 of 177
3 Market Analysis
3.1 Tourism Supply
3.1.1 Tourism Product Elements in the Chris Hani District Municipality
The tourism product elements that are of specific relevance to the Chris Hani area, namely nature-
based and heritage tourism product elements, are described in the following sub-sections.
Foreign tourist’s main reasons for visiting South Africa are wildlife, scenic beauty, warm hospitality,
business opportunities, culture, heritage and history. Chris Hani has the resources to provide such
reasons for visiting the area but these resources need to be developed.
3.1.1.1 Nature-Based Tourism Product Elements
Nature-based tourism product elements are those natural features and nature-based locations which
form tourist attractions. A summary of the inventory of nature-based product elements in the Chris
Hani District is shown in Table 4 below, and the identification of the product elements is given in
Appendix 2.
Local Municpality NumberInxuba Yethemba 6Emalahleni 6Lukhanji 8Intsika Yethu 1Inkwanca 9Tsolwana 37Sakhisizwe 14Engcobo 15TOTAL 96
Nature-Based Tourism Product Elements
Table 4: Summary of the inventory of nature-based tourism product elements in the Chris Hani area.
3.1.1.2 Heritage-Based Tourism Product Elements
Heritage-based tourism product elements are those elements of an area which reflect, identify and
showcase the history and heritage of the area, specifically with regard to the human history, and
which do or can form tourist attractions. A summary of the inventory of heritage-based product

Chris Hani District Municipality Tourism Integrated Plan Prepared by: Kyle Business Projects
FINAL DRAFT VERSION 1.5 Page 28 of 177
elements in the Chris Hani District is shown in Table 5 below, and the identification of the product
elements is given in Appendix 4.
Local Municpality NumberInxuba Yethemba 34Emalahleni 8Lukhanji 21Intsika Yethu 36Inkwanca 8Tsolwana 23Sakhisizwe 14Engcobo 28TOTAL 172
Heritage/History Tourism Product Elements
Table 5: Summary of the inventory of heritage-based tourism product elements in the Chris Hani
area.
3.1.2 Tourism Attractions and Activities in the Chris Hani District Municipality
Tourist attractions can be divided into four main elements within the destination’s environment:
• Natural Attractions
• Built Attractions
• Cultural Attractions
• Social Attractions
The tourist attractions and activities in the Chris Hani District Municipality have been analysed
according to these categories. The destination mix should be matched with different tourism markets
according to the various product offerings. Generally the greater the mix of attractions the more
popular the destination.
A summary of the inventory of tourism attractions in the Chris Hani District is shown in Table 6 below,
and the identification of the attractions is given in Appendix 5.

Chris Hani District Municipality Tourism Integrated Plan Prepared by: Kyle Business Projects
FINAL DRAFT VERSION 1.5 Page 29 of 177
LOCAL MUNICIPALITY
THINGS TO SEE AND DO NATURAL BUILT CULTURAL SOCIAL
Inxuba Yethemba 8 63 30 72Tsolwana 13 6 23 4Inkwanca 16 6 0 1Lukhanji 7 19 1 0Emalahleni 3 7 3 0Intsika Yethy 0 8 17 14Sakhisizwe 20 22 5 1Engcobo 21 12 7 0
TOTAL 88 143 86 92
ELEMENTS
SURVEY OF CHRIS HANI DISTRICT MUNICIPALITY TOURIST ATTRACTIONS / ACTIVITIES
Table 6: Summary of the inventory of tourism attractions in the Chris Hani area.
3.1.3 Tourism Accommodation in the Chris Hani District Municipality
The Chris Hani District Municipality has a reasonable selection of accommodation available to the
visitor. These include country hotels, town-based guest houses and B&Bs, guest farms (farm stays),
guest cottages, game farms, lodges and camping / caravan sites. In each type, there is a reasonable
selection of different establishments.
The number of accommodation establishments and tourist beds in the Chris Hani District Municipality,
divided into these categories, is shown in Table 7.

Chris Hani District Municipality Tourism Integrated Plan Prepared by: Kyle Business Projects
FINAL DRAFT VERSION 1.5 Page 30 of 177
Inxuba Yethamba
(March 2008)
Tsolwana (Aug 2007)
Inkwanca (Feb 2009)
Lukhanji (Feb 2009)
Emalahleni ( Aug 2008)
Intsika Yethu (July
2008)
Sakhisizwe (Aug 2008)
Engcobo (Aug 2007)
Backpacker & Hostelling 0 0 0 0 0 0 0 0 0Bed & Breakfast 8 4 5 32 2 9 6 3 69Guest houses & Guest farms 30 8 0 18 4 8 0 0 68Country House 4 0 0 1 0 0 0 0 5Hotels 2 2 2 1 0 0 2 1 10Lodge 5 6 0 4 1 0 2 0 18Self-Catering 9 3 2 9 0 0 2 0 25Caravan parks and camping sites 6 1 0 0 0 0 2 0 9
TOTAL 64 24 9 65 7 17 14 4 204
Inxuba Yethamba
(March 2008)
Tsolwana (Aug 2007)
Inkwanca (Feb 2009)
Lukhanji (Feb 2009)
Emalahleni ( Aug 2008)
Intsika Yethu (July
2008)
Sakhisizwe (Aug 2008)
Engcobo (Aug 2007)
Backpacker & Hostelling 0 0 0 0 0 0 0 0 0Bed & Breakfast 75 25 45 416 23 114 91 30 819Guest houses & Guest farms 530 188 0 324 57 88 0 0 1,187Country House 22 0 0 25 0 0 0 0 47Hotels 103 48 21 64 0 0 49 13 298Lodge 70 95 0 84 23 0 22 0 294Self-Catering 155 22 8 137 0 0 10 0 332Caravan parks and camping sites 422 10 0 0 0 0 0 0 432
TOTAL 1,377 388 74 1,050 103 202 172 43 3,409
(Compiled by Kyle Business Projects)
Accommodation Type Number of Establishments in Chris Hani
Accommodation Type Number of Beds Chris Hani
Total Number of Establishments in
Chris Hani
CHRIS HANI DISTRICT MUNICIPALITY TOURIST ACCOMMODATION
Total Number of Beds in Chris Hani
Table 7: Tourist Accommodation in the Chris Hani District Municipality, as determined from the
Tourism Sector Plans for each Local Municipality / primary research in the area, identified by the
accommodation categories used by Statistics SA.
The accommodation inventory in the Chris Hani District is analysed in the charts in Figure 13, Figure
14 and Figure 15.

Chris Hani District Municipality Tourism Integrated Plan Prepared by: Kyle Business Projects
FINAL DRAFT VERSION 1.5 Page 31 of 177
Tourist Accommodation Establishments by Category of Accommodation
0%
10%
20%
30%
40%
50%
60%
70%
80%
90%
100%
Caravan parks and camping sites 6 1 0 0 0 0 2 0
Hotels 2 2 2 1 0 0 2 1
Country House 4 0 0 1 0 0 0 0
Self‐Catering 9 3 2 9 0 0 2 0
Lodge 5 6 0 4 1 0 2 0
Guest houses & Guest farms 30 8 0 18 4 8 0 0
Bed & Breakfast 8 4 5 32 2 9 6 3
Backpacker & Hostel ling 0 0 0 0 0 0 0 0
Inxuba Yethamba
(March
Tsolwana (Aug 2007)
Inkwanca (Feb 2009)
Lukhanji (Feb 2009)
Emalahleni ( Aug 2008)
Intsika Yethu (July
2008)
Sakhisizwe (Aug 2008)
Engcobo (Aug 2007)
Tourist Beds by Category of Accommodation
0%
10%
20%
30%
40%
50%
60%
70%
80%
90%
100%
Caravan parks and camping sites 422 10 0 0 0 0 0 0
Hotels 103 48 21 64 0 0 49 13
Country House 22 0 0 25 0 0 0 0
Self‐Catering 155 22 8 137 0 0 10 0
Lodge 70 95 0 84 23 0 22 0
Guest houses & Guest farms 530 188 0 324 57 88 0 0
Bed & Breakfast 75 25 45 416 23 114 91 30
Backpacker & Hostel ling 0 0 0 0 0 0 0 0
Inxuba Yethamba
(March
Tsolwana (Aug 2007)
Inkwanca (Feb 2009)
Lukhanji (Feb 2009)
Emalahleni ( Aug 2008)
Intsika Yethu (July
2008)
Sakhisizwe (Aug 2008)
Engcobo (Aug 2007)
Figure 13: Analysis of the tourist accommodation establishments and beds inventory in the Chris
Hani District, by category of accommodation defined by the TGCSA.

Chris Hani District Municipality Tourism Integrated Plan Prepared by: Kyle Business Projects
FINAL DRAFT VERSION 1.5 Page 32 of 177
Proportion of Tourist Accommodation Establishments by Category in the CHDM
Caravan parks and camping sites, 9,
4%
Self‐Catering, 25, 12%
Lodge, 18, 9%
Hotels, 10, 5%
Country House, 5, 2%
Guest houses & Guest farms, 68,
33%
Bed & Breakfast, 69, 35%
Backpacker & Hostelling, 0, 0%
Proportion of Tourist Beds by Category in the CHDM
Backpacker & Hostelling, 0, 0%
Bed & Breakfast, 819, 24%
Guest houses & Guest farms, 1,187, 34%
Country House, 47, 1%
Hotels, 298, 9%
Lodge, 294, 9%
Self‐Catering, 332, 10%
Caravan parks and camping sites, 432,
13%
Figure 14: Analysis of the proportion of the total tourist accommodation establishments and beds
inventory in the Chris Hani District in each of the categories defined by the TGCSA.

Chris Hani District Municipality Tourism Integrated Plan Prepared by: Kyle Business Projects
FINAL DRAFT VERSION 1.5 Page 33 of 177
Relative Share of Tourist Accommodation Establishments / Beds and Average Number of Beds per Establishment in each LM
Establishments 31.37% 11.76% 4.41% 31.86% 3.43% 8.33% 6.86% 1.96% 100.00%
Beds 40.39% 11.38% 2.17% 30.80% 3.02% 5.93% 5.05% 1.26% 100.00%
Inxuba Yethamba
(March
Tsolwana (Aug 2007)
Inkwanca (Feb 2009)
Lukhanji (Feb 2009)
Emalahleni ( Aug 2008)
Intsika Yethu (July
2008)
Sakhisizwe (Aug 2008)
Engcobo (Aug 2007)
Chris Hani District (2009)
21.52
16.17
8.22
16.1514.71
11.88 12.2910.75
16.71
Figure 15: Analysis of the relative share of the tourist accommodation establishments and beds
inventory in the Chris Hani District in each of the Local Municipalities, and the average number of beds
in each establishment. Municipalities where the balance lies above the center line have on average a
larger proportion of the beds than establishments, and Municipalities where the balance lies below the
center line have on average a smaller proportion of beds than establishments. The average number of
beds per establishment in each Local Municipality and the Chris Hani District is indicated by the
numbers on the bars.
3.2 Tourism Demand in the Chris Hani District Municipality
The Chris Hani District Municipality has a total of 204 tourist accommodation establishments,
providing 3,409 tourist beds (see Table 7).
Using the total number of beds and the average occupancy of the accommodation aggregated from
the individual Tourism Sector Plans, the total number of tourist bednights sold per annum (calculated
for the over 2007/8 year) is calculated to be 339,810 (see Table 8), at an overall average bed
occupancy of 27.31%.

Chris Hani District Municipality Tourism Integrated Plan Prepared by: Kyle Business Projects
FINAL DRAFT VERSION 1.5 Page 34 of 177
Accommodation Type Number of Beds in Chris
Hani
Average bed occupancy in
Chris Hani
Bednights Sold per annum
2007/8
Backpacker & Hostelling 0 0.00% 0Bed & Breakfast 819 37.79% 112,973Guest houses & Guest farms 1187 30.60% 132,595Country House 47 25.32% 4,344Hotels 298 18.06% 19,640Lodge 294 17.83% 19,133Self-Catering 332 23.12% 28,021Caravan parks and camping sites 432 14.65% 23,105
TOTAL 3,409 27.31% 339,810
(Compiled by Kyle Business Projects)
CHRIS HANI DISTRICT MUNICIPALITY TOURIST ACCOMMODATION OCCUPANCIES & BEDNIGHTS SOLD
Table 8: The average bed occupancies of the different types of accommodation in the Chris Hani
District Municipality, and the derived total number of bednights sold per annum for 2007/8. The
average bed occupancies are calculated as a weighted average of the bed occupancies in each Local
Municipality.
The total number of tourist bednights sold per annum is the primary metric currently accepted for the
size of the tourism industry and the economic impact of the industry. However, it is also of interest to
derive the total number of visitors to the area over the same period, which can be evaluated from
further analysis of the data and secondary sources, as this allows an estimate of the size of the VFR
demand. The estimated total number of visitors to the Chris Hani District Municipality per annum in
2007/8 is calculated in Table 9.
Total bednights sold 339,810Bednights sold to foreign tourists (7.97%) 32,690Bednights sold to local tourists (92.03%) 307,120Total number of non-VFR tourists 307,727Total number of non-VFR foreign tourists (ave length of stay 1 night) 32,690Total number of non-VFR local tourists (ave length of stay 1.12 nights) 275,037Est Total Number of VFR 984,235Est Total number of foreign VFR (1.568% of foreign tourists) 521Est Total number of local VFR (78.15% of local tourists) 983,714Est Total Visitors 1,291,962Est Total foreign visitors 33,210Est Total local visitors 1,258,752
ESTIMATED TOTAL NUMBER OF VISITORS 1,291,962
(Compiled by Kyle Business Projects)
CHRIS HANI DISTRICT MUNICIPALITYESTIMATED ANNUAL TOURIST VOLUMES 2007/8
Table 9: The estimated annual tourist volumes visiting the Chris Hani District Municipality, including
local and foreign and VFR and non-VFR visitors. These estimates are calculated from the bednights

Chris Hani District Municipality Tourism Integrated Plan Prepared by: Kyle Business Projects
FINAL DRAFT VERSION 1.5 Page 35 of 177
sold, the approximate profile of visitors to the Chris Hani area, and using Tourism SA statistics for
percentages of tourists which are VFR.

Chris Hani District Municipality Tourism Integrated Plan Prepared by: Kyle Business Projects
FINAL DRAFT VERSION 1.5 Page 36 of 177
4 Triple Bottom Line Assessment
4.1 Economic Impact of Tourism
The economic value of tourism to the Chris Hani area is derived from the direct spend of tourists in
the area, and from the jobs supported by tourism.
The direct contribution to GDP is calculated from the total tourist bednights sold in the area. According
to the SA Tourism Domestic Tourism Report for 2005 (the most recent available) and the SA Tourism
Annual Report for 2007, the average daily spend for domestic and foreign tourists in South Africa are:
• Average spend domestic transit tourists = R146 per day
• Average spend domestic VFR tourists = R94 per day
• Average spend domestic business tourists = R190 per day
• Average spend foreign transit tourists = R620 per day
• Average spend foreign VFR tourists = R400 per day
The projected economic impact of tourism is calculated using the international simulated Tourism
Satellite Accounting (TSA) system developed by the World Travel & Tourism Council / Accenture, in
conformance with the conceptual structure of the WTO/UN TSA. Current TSA multipliers are calculated
from the WTTC / Accenture 2007 Report on South Africa. From this base, the economic impact of
tourism in the Chris Hani District Municipality has been calculated over the forecast period 2008 to
2016, and is shown in Table 10. The potential growth of these economic contributions is also
calculated, in four scenarios:
1. Expected natural growth in demand – this growth is driven by the anticipated growth in
tourism demand in the Eastern Cape (i.e. the baseline);
2. Impact of additional 1% growth in demand;
3. Impact of additional 3% growth in demand;
4. Impact of additional 5% growth in demand.

Chris Hani District Municipality Tourism Integrated Plan Prepared by: Kyle Business Projects
FINAL DRAFT VERSION 1.5 Page 37 of 177
2008 2009 2010 2011 2012 2013 2014 2015 2016 2017Y -1 Y1 Y2 Y3 Y4 Y5 Y6 Y7 Y8 Y9
Total Direct Expenditure by Tourists into the Tourism Industry (Rm)Natural Growth 65.335 70.047 75.114 80.563 86.427 92.736 99.528 106.841 114.717 123.202
+ 1% 65.335 70.725 76.575 82.924 89.818 97.305 105.438 114.274 123.878 134.317 + 3% 65.335 72.082 79.539 87.784 96.900 106.984 118.138 130.481 144.140 159.261 + 5% 65.335 73.439 82.560 92.830 104.394 117.418 132.090 148.621 167.249 188.246
Total Contribution of the Tourism Economy to the Chris Hani District Municipality GDP (Rm)Natural Growth 166.108 178.087 190.969 204.824 219.731 235.773 253.041 271.633 291.657 313.228
+ 1% 166.108 179.812 194.683 210.827 228.354 247.389 268.066 290.531 314.947 341.488 + 3% 166.108 183.261 202.220 223.181 246.360 271.995 300.355 331.734 366.462 404.904 + 5% 166.108 186.710 209.901 236.010 265.411 298.525 335.826 377.853 425.214 478.596
Total Economic Activity (Total Demand) Generated by the Tourism Economy (Rm)Natural Growth 247.228 265.057 284.230 304.852 327.038 350.915 376.615 404.288 434.090 466.195
+ 1% 247.228 267.624 289.759 313.785 339.872 368.203 398.977 432.414 468.753 508.256 + 3% 247.228 272.758 300.976 332.174 366.671 404.826 447.035 493.738 545.426 602.642 + 5% 247.228 277.891 312.408 351.268 395.027 444.311 499.829 562.381 632.871 712.322
Net contribution by the Tourism Industry to employment in the Chris Hani District Municipality (# of jobs)Natural Growth 473 476 480 484 487 491 495 500 504 509
+ 1% 473 481 489 498 507 516 525 535 544 555 + 3% 473 490 508 527 546 567 588 610 633 658 + 5% 473 499 527 557 589 622 658 695 735 777
Total contribution by the Tourism Economy to employment in the Chris Hani District Municipality (# of jobs)Natural Growth 1,078 1,086 1,095 1,104 1,113 1,123 1,133 1,144 1,155 1,166
+ 1% 1,078 1,097 1,116 1,136 1,157 1,179 1,201 1,223 1,247 1,271 + 3% 1,078 1,118 1,159 1,203 1,248 1,296 1,345 1,397 1,451 1,507 + 5% 1,078 1,139 1,203 1,272 1,345 1,422 1,504 1,591 1,683 1,781
Net contribution to SMME creation in the Chris Hani District Municipality (# of SMMEs)Natural Growth 72 72 73 74 74 75 76 76 77 78
+ 1% 72 73 74 76 77 79 80 82 83 85 + 3% 72 75 77 80 83 86 90 93 97 100 + 5% 72 76 80 85 90 95 100 106 112 119
Table 10: The projected economic contribution of tourism to the Chris Hani Districti Municipality for
the forecast period 2009 to 2016. Data is calculated using the model included in Appendix 4. Key
parameters which are calculated include the total direct expenditure by tourists, the total contribution
of the tourism economy, the total economic activity generated by tourism, net contribution by the
tourism industry to jobs, the total contribution of the tourism economy (including the tourism
industry) to jobs, and the net contribution to SMME creation.
From the model it is calculated that tourism currently contributes as follows to the local economy of
Chris Hani:
• R65.3m in direct tourism spend;
• R166.1m contribution to the GDP by the tourism economy;
• R247.2m total economic activity generated by tourism (i.e. total demand);
• supports 473 jobs in the tourism industry;
• supports a total of 1,078 jobs in the tourism economy (including the tourism industry);
• supports the equivalent of 72 SMMEs in the tourism economy, outside the tourism industry.
In this data, the employment levels are calculated from the total direct tourism spend, and the
average direct spend required to support one job – derived from the WTTC / Accenture TSA data for

Chris Hani District Municipality Tourism Integrated Plan Prepared by: Kyle Business Projects
FINAL DRAFT VERSION 1.5 Page 38 of 177
2007. This data indicates that in South Africa it requires on average R147,000.00 direct tourism
expenditure to create 1 job within the tourism industry, and on average R164,000.00 to create 1 job
in the tourism economy. In the Chris Hani District Municipality it is believed that the cost of creating a
job could be as much as 40% lower, and so the number of jobs in the tourism industry could be as
high as 788, and in the tourism economy about 1,796.
4.2 Social Impact of Tourism
Tourism is only one of many drivers of change in society, and some caution must be used in isolating
the cause and effect, and assigning specific effects to tourism.
The positive social impacts of tourism which are currently being experienced or can be expected in the
Chris Hani area include:
• Improvement in local living standards due to increased levels of income, derived from jobs
and enterprises in the tourism industry;
• Development of the sense of entrepreneurship to take advantage of SMME opportunities in
tourism;
• Improvement of local community facilities supported by increased tax revenue derived from
tourism developments;
• Improvement in skills levels to satisfy the needs of the tourism industry and economy;
• Improvement of general infrastructure to support tourism, but which also benefits local
residents;
• Stimulating new markets for local products;
• Development of new and improved retail, recreation and cultural facilities;
• Improvement in the overall quality of the environment, to provide the attractive, clean and
unpolluted environment preferred by tourists;
• Improved conservation of local heritage and resources;
• Improved environmental awareness in the local community;
• Improved sense of cultural identity, reinforced by observing tourists enjoying the local culture
and heritage.
Broadly, the negative social impact of tourism can be perceived in the following key areas:
• Morality of the society – drugs, alcoholism, crime, prostitution – These are seldom specifically
caused by tourism, but may be exacerbated by it. These are usually driven by the differences
in economic status between the tourists and the local residents, and the perception that
tourists are a soft and lucrative target.

Chris Hani District Municipality Tourism Integrated Plan Prepared by: Kyle Business Projects
FINAL DRAFT VERSION 1.5 Page 39 of 177
• Loss of authenticity of traditional products and cultures – Products may be “enhanced” or
adapted to make them more appealing / palatable to tourists, which may lead to the loss of
elements of the unique cultural identity of the area.
• Language – foreign vocabulary and idiomatic expression may be introduced into the local
language, and the use of the local language may be distorted or discouraged even outside the
tourism sphere.
• Health – Ailments and diseases may be introduced into an area by tourists, these could
include simple ailments such as colds and flu, to more serious diseases such as Asian Flu,
Hepatitis, Tuberculosis, and the sexually-transmitted diseases such as HIV and AIDS.
• Economic patterns – Individuals may migrate from the area to cities in search of better
economic prospects, the economic differential between members of the community may
increase, modified consumption patterns, and changes to the labour force resulting in
changes to the roles of individuals in society.
These identified social impacts of tourism can all be expected in the Chris Hani area at some stage in
the development of tourism. Specific negative impacts which are currently evident are:
• Crime and prostitution, specifically targeting tourists and at tourist sites;
• Proliferation of begging;
• Over-commercialisation of traditional products;
• Increased economic differentials between members of the community;
• Health impacts, including HIV/ Aids, tuberculosis, general health;
• Declining mental Health;
• Lack of training;
• Lack of benefits for local people;
• Lack of transformation of tourism;
• Seasonal employment
The social impacts of tourism may be managed by reinforcing the positive social impacts, while
mitigating the potential negative impacts. This can be achieved by expanding the community
involvement in tourism – residents must understand how tourism works, participate in decision-
making on tourism planning, development and management, and have the opportunity to receive the
benefits from tourism. Tourism should also be developed on a scale and at a rate which is appropriate
for the local community to adapt to it, to allow for the early identification of negative impacts and
application of remedial measures.
The Local Municipality can also take specific measures to reinforce positive impacts and mitigate
negative impacts by for example:

Chris Hani District Municipality Tourism Integrated Plan Prepared by: Kyle Business Projects
FINAL DRAFT VERSION 1.5 Page 40 of 177
• Educate residents about tourism through public awareness programs, increasing awareness of
the positive benefits of tourism to the community;
• Educate tourists about local customs and expected behaviour. This could include an official
guide to behaviour which specifically discourages tourists engaging with local residents who
are undertaking undesirable activities (for example prostitution, roving street hawkers,
beggars etc), and identifies potential problem areas for crime.
• Establish strong linkages between tourism and the other economic sectors in the area;
• Develop and encourage local employment in and ownership and management of tourism
enterprises;
• Provide inexpensive or subsidized accommodation and recreation facilities for use by local
residents;
• Ensure that local residents have affordable access to their local tourist attractions, through
free access for residents on certain days, and free access to youth and elderly groups;
• Control the badgering of tourists by local vendors and hawkers, by establishing serviced craft
and goods markets at designated locations;
• Engaging with the SAPS to ensure the strict enforcement of laws on drugs, prostitution and
crime.
4.3 Environmental Impact of Tourism
Many features of the natural and built environment are attractions for tourists, and their use for
tourism can contribute to the protection of the environment. The overall quality of the environment is
important to both residents and tourists, and so well-planned and managed tourism development is
required to generate positive environmental impacts. These positive impacts can include:
• The cost of conservation of natural areas and features can be justified on the basis of their
value to tourism;
• Improvement in the overall environmental quality and attractiveness of the area, as this
attracts tourists;
• Increases the overall environmental awareness and sensitivity of the local residents.
Specific negative impacts on the environment which are observed or anticipated in the Chris Hani Area
include:
• Potential pollution of water resources and ground water through inadequate capacity in
sewerage treatment or access to water-borne sewerage;
• Pollution of watercourses and degradation of the riverine environment through illegal dumping
along river banks;

Chris Hani District Municipality Tourism Integrated Plan Prepared by: Kyle Business Projects
FINAL DRAFT VERSION 1.5 Page 41 of 177
• Visual pollution and unattractive landscapes and townscapes. This is mainly due to
unattractive and excessive signage;
• Littering and vandalism;
• Degradation of the built environment in towns through lack of public toilet facilities and
uncontrolled access by vagrants and street hawkers;
• Destruction of the built heritage of the area through poor planning and control of the
development process.
These impacts are not currently specifically caused by tourism, but certainly have a negative impact
on tourism and the development of the tourism potential of the area.
The Chris Hani District Environmental Management Plan (EMP) highlights areas of the environment
which should be conserved and protected. Animal and vegetation species and cover are mapped and
identified. Present and future environmental problems, and renewable resources are identified in each
Local Municipality. The EMP identifies the following objectives and strategies.
1) Ensure clear delegation of responsibilities, consistency of functions in departments and ensure
clear reporting and communication channels.
a) undertake an institutional structure audit and develop organograms for each LM and
the DM to allocate and align responsibilities of departments
b) employ an environmental manager
2) Promote environmental awareness and build capacity
a) develop an environmental awareness and capacity building strategy
b) conduct broad environmental training for DM and LM personnel and Councillors
3) Ensure that all projects consider environmental issues and EIA’s performed where appropriate
4) Ensure environmental reserve flow requirements are considered in any water supply projects
5) Promote environmental awareness in LM IDP process
6) Ensure land use planning considers environmental sensitivity and other constraints
7) Promote legal and regulatory compliance
a) employ a dedicated Environmental Manager
b) implement an environmental management system (EMS)
8) Improve water and effluent monitoring
a) develop programme for monitoring water resources and effluent discharges
9) Promote environmental conservation
a) effectively manage existing and identify new conservation areas
10) Promote better use and management of commonage and other land
a) develop a land use and management plan
b) implement and environmental management system (EMS)

Chris Hani District Municipality Tourism Integrated Plan Prepared by: Kyle Business Projects
FINAL DRAFT VERSION 1.5 Page 42 of 177
11) Eradicate invasive alien species
a) develop invasive species management plan
12) Promote wetland protection
a) map wetlands and develop a wetland management plan
13) Promote more effective pollution monitoring and response
a) develop pollution monitoring and response plan as part of a Disaster Management
Plan
14) Promote awareness and conservation of heritage sites
a) develop heritage site management and awareness plan
15) Implement by-laws where deemed appropriate
a) identify areas where by-laws are needed for environmental management
16) Ensure compliance with air quality legislation
a) appoint an air quality officer to coordinate matters relating to air quality management
in the municipality
b) prepare an Air Quality Management Plan in its IDP
17) Promote game farming and eco-tourism opportunities
a) commission a feasibility study into further expanding game farming and eco-tourism
projects
18) Water use management
a) undertake a thorough assessment of the water demand
These objectives and strategies, although mostly not aimed specifically at tourism, will if pursued have
the effect of improving the overall environment in Chris Hani, making the area more attractive for
tourists as well as for residents.
4.3.1 Protected Areas
The primary protected areas in the Chris Hani District Municipality include local nature reserves and
parks, Provincial nature reserves, and National parks. Many of the areas identified constitutre the
surroundings of water reservoirs and dams. The inventory of protected areas is summarized in Table
11, and the details are contained in Appendix 8.

Chris Hani District Municipality Tourism Integrated Plan Prepared by: Kyle Business Projects
FINAL DRAFT VERSION 1.5 Page 43 of 177
Local Municpality NumberInxuba Yethemba 2
Emalahleni 9
Lukhanji 3
Intsika Yethu 1
Inkwanca 3
Tsolwana 21
Sakhisizwe 12
Engcobo 12TOTAL 63
Protected Areas
Table 11: Summary of the inventory of protected areas in the Chris Hani area.

Chris Hani District Municipality Tourism Integrated Plan Prepared by: Kyle Business Projects
FINAL DRAFT VERSION 1.5 Page 44 of 177
5 Focused Assessments and Analysis
5.1 Institutional Assessment
The Chris Hani DTO is organized around a Tourist Information Office in Queenstown.
Ideally, an institutional arrangement with a small staff complement should allow for the
implementation of the core functions of a fully-fledged destination marketing organisation (DMO),
namely:
• Facilitator
• Initiator
• Matchmaker
• Communicator
The Chris Hani DTO’s capacity to progress much beyond the core functions of facilitator and
communicator to include the functions of matchmaker and initiator will depend on human resource
capacity and the relevant skills for such tasks as tourism development, inward investment, project
development, partnership development, special event and conference development.
5.2 Tourist Information Management and Marketing Assessment
Management of tourist information and marketing in the Chris Hani District Municipality is handled in a
distributed manner, with individual LTO / Tourism Association structures in the LMs undertaking
limited individual marketing of the activities within their own area / town, and usually not even across
their own entire LM.
There is currently no District-wide coordinated marketing which focuses on promoting tourism in the
District in its entirety.
5.3 Assessment of Emergency Services and Infrastructure
The importance of emergency services and infrastructure from a tourism perspective is two-fold:
• Access to appropriate emergency services and infrastructure, specifically medical services;
• Availability of information regarding emergency services.

Chris Hani District Municipality Tourism Integrated Plan Prepared by: Kyle Business Projects
FINAL DRAFT VERSION 1.5 Page 45 of 177
State hospitals are situated throughout the Chris Hani area, and these provide a broad range of basic
medical care and ambulance emergency services. In addition, the area has a number of supporting
clinics and mobile clinics (see Appendix 2 for complete list off all the facilities available).
Inxuba Yethemba Local Municipality 18Tsolwana Local Municipality 16Lukhanji Local Municipality 42Emalahleni Local Municipality 36Sakhisizwe Local Municipality 15Engcobo Local Municipality 21Intsika Yethu Local Municipality 36
(Source: Kyle Business Projects from Municipal Demarcation Board, Municipal Profiles 2006)
HEALTH FACILITIES IN THE CHRIS HANI DISTRICT MUNICIPALITY
Table 12: Number of health facilities in the Chris Hani District Municipality.
1 CALA 18 DALASILE
2 SCHOOMBEE 19 GLEN GREY
3 MOLTENO 20 TSOMO
4 KLEINBULHOEK 21 BOLOTWA
5 CRADOCK 22 MORTIMER
6 HENDERSON 23 THORNHILL CISKEI
7 COFIMVABA 24 ELLIOT
8 XALANGA 25 HOFMEYR
9 BRIDGE CAMP 26 MIDDELBURG(K)
10 TYLDEN 27 KOLOMANE
11 ENGCOBO 28 NTABETHEMBA
12 DORDRECHT 29 QUEENSTOWN
13 INDWE 30 WHITTLESEA
14 BACELA 31 LADY FRERE
15 STERKSTROOM 32 TARKASTAD
16 GUBENXA 33 EZIBELENI
17 IDA 34 ILINGE
POLICE STATIONS IN THE CHRIS HANI DISTRICT MUNICIPALITY
Table 13: Police Stations in the Chris Hani District Municipality.
The South African Police Services operate in 34 police stations in the area as shown in Table 13.
Whilst crime remains a serious issue within the District, the South African Police Services (SAPS) are
undertaking numerous strategies through which to combat crime. SAPS records the incidence of
crime on a daily basis, and utilises this information to manage the crime situation in the region.

Chris Hani District Municipality Tourism Integrated Plan Prepared by: Kyle Business Projects
FINAL DRAFT VERSION 1.5 Page 46 of 177
Some of the key challenges faced by SAPS in addressing crime relate to the poor quality of some
roads which lead to police stations. This is most notable in rural areas. The result is such that it is
difficult for the residents of the area to access police stations. In addition, infrastructure capacity –
particularly with regards to the holding cells is an issue. There is currently insufficient jail
accommodation in the area. As a result, many convicted prisoners are kept in holding cells.
It is noteworthy that the SAPS boundaries and those of the Local and District Municipalities do not
coincide. As a result, the coordination of activities is often a challenge.
There is no effective engagement between operators in the tourism industry and the SAPS to ensure a
tourism-friendly response from the SAPS to incidents involving tourists.
The DTO / Tourism Development Officer should facilitate this development of the SAPS through
tourism sensitization and capacity-building.
Although the Chris Hani IDP identifies strategies to promote the safety and security of residents and
visitors, no specific measures are documented to ensure that the peculiar difficulties experienced by
tourists (eg language barriers, loss of travel documents and financial instruments, medical or
pharmaceutical requirements etc) are adequately managed.
5.4 Assessment of Transport Infrastructure
Roads in the Chris Hani area are a combination of tarred and gravel surfaces, in fair to poor condition.
The roads throughout the District are as follows:
• The R56 trunk road runs through Dordrecht and Indwe towards Elliot in an east / west
direction, and the the R344 main road runs between Sterkstroom and Dordrecht, while the
R392 link road runs between Queenstown and Dordrecht – these are all in a fair to poor
condition.
• The R393 (linking Lady Frere to Cala in the east) and R396 (linking Lady Frere to Indwe in the
North) are both gravel roads in poor condition, but are currently earmarked for or undergoing
improvement.
• The main N10 trunk road between Cradock and Middelburg has recently undergone major
repairs, and is now in a fair condition.
• The R61 (Graaff-Reinet – Cradcok – Queenstown, R390 (Cradock – Steynsburg), and part of
the R56 (Middelburg – Steynsburg) are tarred and in fair condition.
• The R58 between Engcobo and Elliot is a tarred road in a reasonable state of repair.
• The R408 & R409 is tarred and in a reasonable stae of repair.

Chris Hani District Municipality Tourism Integrated Plan Prepared by: Kyle Business Projects
FINAL DRAFT VERSION 1.5 Page 47 of 177
• The main road trough Engcobo, Tarkastad and Hofmeyr is a tarred road in a good state of
repair.
• The R344 between Tarkastad and Balfour is a gravel road in a bad state of repair. The
Department of roads are in the process of repairing a portion of the road from Bedford.
• The R391 (Hofmeyer – R56) is a gravel road in a reasonable condition.
• The R401 (R61 – Hofmeyr) is tarred for 27km whilst 18km is gravel.
• The R401 (Hofmeyr – N10) is a gravel road in a reasonable condition.
• All District Roads in the Engcobo/Tsolwana area are gravel and in a bad state of repair –
require extensive maintenance.
• The R58 (links Elliot with Cala and Engcobo to the south and Barkley East to the north) is
tarred and in a reasonable condition.
• The R56 (links Elliot with Ugie to the north and Indwe to the south) is tarred and in
reasonable condition.
• The TR 07401 (links Cala to Elliot via the R58) is tarred and in a reasonable condition.
• The DR 08040 (Cala - Lady Frere) is tarred and in a very good condition.
• The DR 08038 (Cala - R61) is a gravel road.
Within the urban areas the condition of the roads is with a few exceptions generally poor, and in
many areas the handling of stormwater is problematic. Access across streams and watercourses is
generally poor during rainstorms, and there is a district-wide need for the construction of appropriate
causeways and bridges.
The following airstrips exist:
• at Engcobo – requires upgrading
• at Cradock and Middelburg
• at Tarkastad – requires upgrading
• at Blanco Guest Farm in the Tsolwana Local Municipality
• at Elliot
5.4.1 Communications
Communications infrastructure in the Chris Hani area comprises Telkom fixed lines and cellular base
stations.
Although access to Telkom fixed-line service is limited, Telkom is promoting the deployment of DECT-
based microwave systems throughout the area. Cellular service from the 3 networks is generally
available to approximately 85% of the Chris Hani area.

Chris Hani District Municipality Tourism Integrated Plan Prepared by: Kyle Business Projects
FINAL DRAFT VERSION 1.5 Page 48 of 177
Access to cellular telephone signals in the more remote areas and along the main roads is critical for
tourism. The further deployment of network coverage into unserviced areas should be addressed with
the network operators.
5.5 Issues Analysis
The following key tourism-related issues have been identified in the Chris Hani area:
1. Roads:
• Quality and state of repair of the primary roads in and through the Chris Hani District
• Quality of secondary roads in the area
2. Maximise synergy with and extract value from:
• Karoo Heartland Route
• Liberation Heritage Route
• Friendly N6 Route
• the Mountain Zebra National Park
3. Definition of the tourism product
• Clearly define the tourism product in terms of the region’s strengths
4. Black empowerment:
• tourism must benefit the individuals in the community;
• new tourism products
• training & employment
• measurement of job creation by tourism
• measurement of HDI involvement in tourism
5. Training:
• Local guides
• Hospitality industry
• Schools offer tourism-relevant curriculum
6. Product quality:
• Guest houses – quality and registration
7. Marketing:
• of the Chris Hani area
• the individual towns
• products
8. Distribution of tourism – spread to the other areas of Chris Hani by distributing new products
9. Organisational structure & responsibilities
• Chris Hani Tourism
• Relationship and functionality of individual Tourism Associations
10. Support:

Chris Hani District Municipality Tourism Integrated Plan Prepared by: Kyle Business Projects
FINAL DRAFT VERSION 1.5 Page 49 of 177
• Support for SMMEs – SEDA office in Queenstown
• Link community to opportunities & advise on support
• Negative impacts of tourism on the lifestyle of residents
• Management of heritage
5.6 SWOT Analysis
The SWOT analysis is a strategic planning tool used to evaluate the Strengths, Weaknesses,
Opportunities, and Threats involved in a project or industry. It involves firstly specifying the objective
of the project, and then identifying the internal and external factors that are favorable and
unfavorable to achieving that objective.
The SWOT are defined as:
• Strengths: attributes of the organization that are helpful to achieving the objective.
• Weaknesses: attributes of the organization that are harmful to achieving the objective.
• Opportunities: external conditions that are helpful to achieving the objective.
• Threats: external conditions that are harmful to achieving the objective
The identified SWOTs are used as inputs to the development of possible strategies, through repeated
posing of the questions:
How can we Use each Strength?
How can we Eliminate each Weakness?
How can we Exploit each Opportunity?
How can we Defend against each Threat?
In the context of the Chris Hani District Integrated Tourism Plan, the SWOT analysis represents an
aggregation of the SWOT analyses of the individual Local Municipalities, to identify the SWOTs which
are common and therefore District-wide. These SWOT are then relevant as a basis for the
development of District-based strategic actions, in order to promote the development of a growing,
vibrant and sustainable tourism industry in the Chris Hani District.
The aggregated SWOT analysis for the Chris Hani District is given in the following sub-sections. The
complete SWOT analyses for the individual Local Municipalities are given in Appendix 9.
5.6.1 Strengths
• Location – stop-over en route coast / inland
• Accessible – coastal cities (captive markets)

Chris Hani District Municipality Tourism Integrated Plan Prepared by: Kyle Business Projects
FINAL DRAFT VERSION 1.5 Page 50 of 177
• Existing tourism routes & potential new routes (Liberation Heritage, N6, Karoo Heartland,
Agritourism, Khoisan, Maluti)
• Range of heritage products (khoi-San, frontier, Xhosa, British settler, liberation, fossils, rock
art)
• Natural environments – parks, reserves
• Range and distribution of accommodation
5.6.2 Weaknesses
• Tourism brand: Lack of tourism brand identity for the District
• Marketing: Low cooperative marketing and promotion of the area
• Products and attractions: no critical mass of attractions, lack of cohesion in the tourism
product
• Cooperation: Low cooperation between product owners / tourism roleplayers
• Transport infrastructure: Large distances between towns/ attractions, quality of road
infrastructure
• LTOs – formal structures often lacking
• Tourist information / LTOs - quality & availability of tourist information (after hours), low
cooperation and not benefiting from synergies with regional/provincial/national tourism
organisations;
• Community tourism awareness - Lack of awareness about what tourism means to the
community
• Tourism product signage
• Services and infrastructure: Capacity of bulk services, appearance of towns, emergency
services
5.6.3 Opportunities
• Develop as preferred inland / coast stop-over destination: development of facilities and
attractions for this market
• Develop a range of attractions to provide a varied tourism experience (heritage, environment,
nature, fossils, rock art, agriculture)
• Coordinated marketing of the area through a brand strategy
• Develop tourism cluster destinations to encourage longer length of stay by targeting niche
markets
• Improve cooperation and coordination between product owners – build itineraries
• Develop clusters and community-based products based on tourist routes
• Development of LTOs and tourist information centres / services
• Development of events and festivals

Chris Hani District Municipality Tourism Integrated Plan Prepared by: Kyle Business Projects
FINAL DRAFT VERSION 1.5 Page 51 of 177
5.6.4 Threats
• Seasonality and maintaining sustainable occupancy levels
• Overdevelopment of nature-based tourism attractions & negative impact on the natural
environment
• Lack of involvement of HDI community
• Poor support from ECTB / focus on coast
• Global warming and climate change
• Crime targeting tourists
• Competing Districts / Provinces

Chris Hani District Municipality Tourism Integrated Plan Prepared by: Kyle Business Projects
FINAL DRAFT VERSION 1.5 Page 52 of 177
6 Tourism Vision and Strategy
6.1 Introduction
A vision statement is a statement of what an organization or industry intends to be in the future, and
so facilitate understanding, planning and execution of the course of action necessary to achieve that
vision. It is an expression of a long-term ambition, and serves to inspire the development of the
organization in the direction of the vision, and at the same time provides a guide to decision-making.
Defining the vision is an act of leadership – it provides ongoing leadership to the organization over
time. The vision is intended to galvanize roleplayers to achieve defined objectives, even if they are
stretch objectives, provided the objectives are specific, measurable, achievable, relevant and time-
bound.
A good example of an effective Vision statement comes from New Zealand, which has the vision “Be
the cleanest, greenest and most pristine country in the world”. This translates into a tourism
positioning statement: “New Zealand - The best holiday left on earth”
A Mission statement tells you the fundamental purpose of the organization or broader goal for being
in existence or in the business. It concentrates on the present, and typically explains what the
organization provides to its clients. It could define the customer, the critical processes, and inform of
the desired level of performance.
6.2 Tourism Vision
The Tourism Vision for the Chris Hani District Municipality was developed through a workshop process
with the stakeholders in the area and the Project Steering Committee, and is derived to encompass
the Tourism Vision statements of the Local Municipalities.
An analysis of the common elements of the Tourism Vision Statements of the Local Municipalities is
shown in Table 14.

Chris Hani District Municipality Tourism Integrated Plan Prepared by: Kyle Business Projects
FINAL DRAFT VERSION 1.5 Page 53 of 177
Local Municipalities Tourism Vision Common ElementsInxuba YethembaTo be the preferred destination for nature-based, heritage andcultural responsible tourism experiences in the Eastern Capeprovince for the benefit of all.
Nature-based; Diverse culture; benefits to all
Tsolwana
InkwancaTo make the Inwanca area a sustainable eco-tourism, cultural(including rock art) and adventure tourism destination.
Eco-tourism, cultural and adventure tourism destination
LukhanjiTo make Lukhanji a sustainable tourism destination to the benefit of all its people.
Sustainability; benefits to all
EmalahleniTo be the preferred destination for farm stays, nature-basedand heritage responsible tourism experiences in the EasternCape province for the benefit of all.
Nature-based; heritage; benefits to all
Sakhisizwe
Intsika YethuA responsible and sustainable tourism destination of choice for historical and adventurous experiences in the Eastern Cape
Sustainability; historical and adventure experience
Engcobo
ANALYSIS OF TOURISM VISIONS IN THE CHRIS HANI DISTRICT
Table 14: Analysis of the common elements of the Tourism Vision Statements of the Local
Municipalities in the Chris Hani District.
The common elements of the Vision Statements include the following:
• Sustainability;
• Benefits to all people in the area;
• Nature-based tourism;
• Farmstays and agri-tourism;
• Heritage tourism;
The Tourism Vision for the Chris Hani District should articulate these common elements either
explicitly or implicitly. The agreed Tourism Vision for the Chris Hani District is therefore expressed as:
“The Chris Hani District - a sustainable tourism destination offering visitors a quality
nature-based and heritage experience with benefits for all people”
6.3 Tourism Mission
The Tourism Mission for the Chris Hani District Municipality District Tourism Organisation (DTO) was
developed through a workshop process with the tourism stakeholders in the area and the Project

Chris Hani District Municipality Tourism Integrated Plan Prepared by: Kyle Business Projects
FINAL DRAFT VERSION 1.5 Page 54 of 177
Steering Committee, and is premised on enabling the Chris Hani District to achieve its tourism vision.
The agreed tourism mission for the Chris Hani District Municipality DTO has been defined as:
“Creating an enabling environment which encourages the development and promotion of
the tourism industry through cooperation and coordination, and the inclusion of all
stakeholders and roleplayers”
6.4 Tourism Development Strategy
A Tourist Destination is a combination of different products appealing to different market segments at
each stage of development. The tourism development strategy identifies the business portfolio to be
offered to the market, and is derived through an analysis of the tourism product offering and the
potential target markets, and active selection of products and markets for emphasis in order to
achieve the defined goals.
The process of developing the tourism strategy entails asking and answering the questions:
o What are the goals of the strategy?
o What are the products and product strengths in the area?
o What are the target markets?
o What is the product development strategy?
o How should the product be marketed?
o How do we measure development?
6.4.1 Goals of the Strategy
The growth and development strategy must be aimed at achieving the Tourism Vision of the tourism
sector, “The Chris Hani District - a sustainable tourism destination offering visitors a
quality nature-based and heritage experience with benefits for all people”. The strategy
must drive development through the elements of the Mission of tourism in the area, namely
“Creating an enabling environment which encourages the development and promotion of
the tourism industry through cooperation and coordination, and the inclusion of all
stakeholders and roleplayers”.
To achieve this, the Chris Hani area must maintain and grow its existing markets, and at the same
time attract new markets to become a primary tourism destination.
Ultimately, the strategy must nurture a tourism industry which is growing in line with the defined
benchmarks, and so is providing employment and prosperity for all the local stakeholders, and a
satisfying tourism experience for visitors.
Chris Hani District Municipality Tourism Integrated Plan Prepared by: Kyle Business Projects
FINAL DRAFT VERSION 1.5 Page 55 of 177
6.4.2 Definition of the Product
A tourism product is satisfying activity at a desired destination provided by the suppliers. It is a
service rather than a tangible good. Tourism products exist as ideas in the minds of prospective
buyers. The main service providers in the broader travel & tourism industry are the accommodation
sector, the attractions sector, the transportation sector, the retail travel sector and the wholesale tour
operators.
In the Chris Hani area, the accommodation sector and the attraction sector currently offer the main
products.
Two factors contribute to the attractiveness of a tourism region, the primary features and the
secondary destination features. Primary features include its climate, ecology, cultural traditions,
traditional architecture and its landforms. Secondary destination features are the developments
introduced specifically for tourists, such as hotels, catering, transport, activities and amusements.
Description of the product in the Chris Hani District Municipality
The Chris Hani tourism product focuses predominantly on:
• nature-based attractions and activities: National Park, nature reserves, game reserves,
geological features, karoo experiences, hunting, paleontology-based attractions (fossils etc),
farm stays and activities;
• heritage-based attractions and activities: the built heritage in the towns (architecture),
the cultural heritage, liberation heritage, rock art;
This product is based on and reflects / showcases the strengths of the area, including the tranquility,
remoteness, un-touched natural experience, and the natural environment.
6.4.3 Target Market Segments and Constraints
6.4.3.1 Definition of Target Market
The top 5 niche markets which were identified in the Chris Hani Municipality are:
1. Heritage tourism
2. Nature-tourism
3. Agri-tourism
4. Adventure tourism
5. Avi-tourism
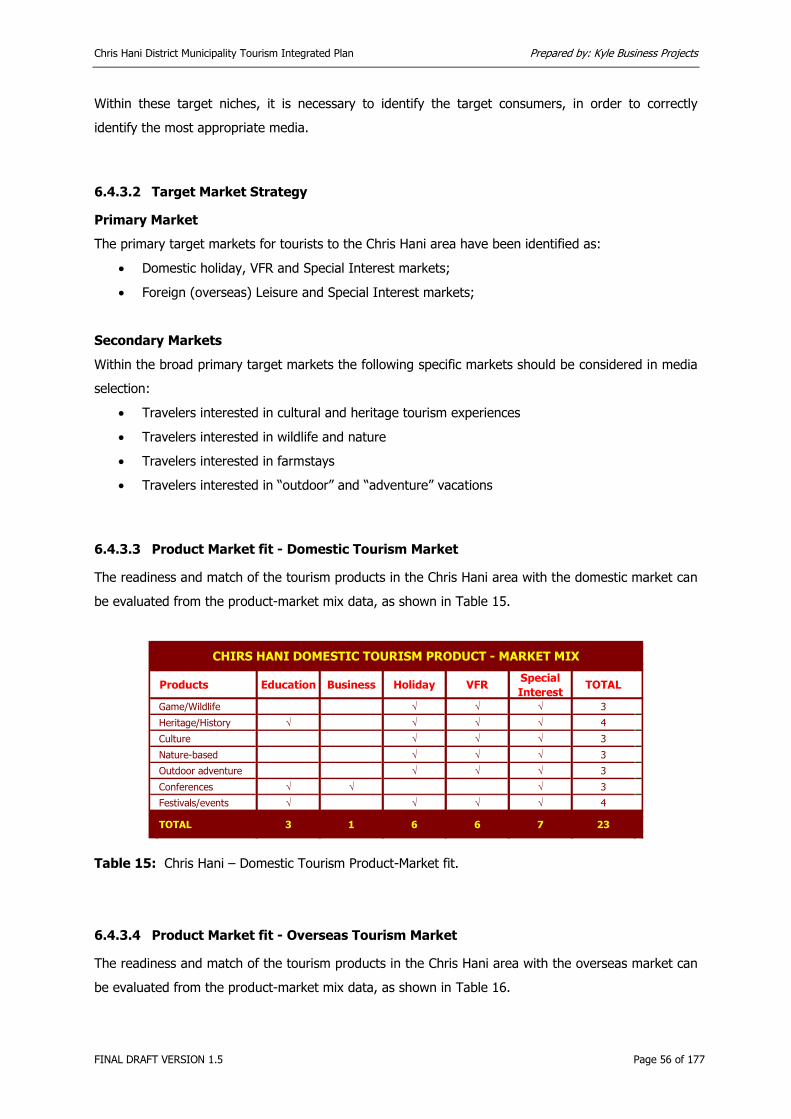
Chris Hani District Municipality Tourism Integrated Plan Prepared by: Kyle Business Projects
FINAL DRAFT VERSION 1.5 Page 56 of 177
Within these target niches, it is necessary to identify the target consumers, in order to correctly
identify the most appropriate media.
6.4.3.2 Target Market Strategy
Primary Market
The primary target markets for tourists to the Chris Hani area have been identified as:
• Domestic holiday, VFR and Special Interest markets;
• Foreign (overseas) Leisure and Special Interest markets;
Secondary Markets
Within the broad primary target markets the following specific markets should be considered in media
selection:
• Travelers interested in cultural and heritage tourism experiences
• Travelers interested in wildlife and nature
• Travelers interested in farmstays
• Travelers interested in “outdoor” and “adventure” vacations
6.4.3.3 Product Market fit - Domestic Tourism Market
The readiness and match of the tourism products in the Chris Hani area with the domestic market can
be evaluated from the product-market mix data, as shown in Table 15.
Products Education Business Holiday VFR Special Interest
TOTAL
Game/Wildlife √ √ √ 3
Heritage/History √ √ √ √ 4
Culture √ √ √ 3
Nature-based √ √ √ 3
Outdoor adventure √ √ √ 3
Conferences √ √ √ 3
Festivals/events √ √ √ √ 4
TOTAL 3 1 6 6 7 23
CHIRS HANI DOMESTIC TOURISM PRODUCT - MARKET MIX
Table 15: Chris Hani – Domestic Tourism Product-Market fit.
6.4.3.4 Product Market fit - Overseas Tourism Market
The readiness and match of the tourism products in the Chris Hani area with the overseas market can
be evaluated from the product-market mix data, as shown in Table 16.

Chris Hani District Municipality Tourism Integrated Plan Prepared by: Kyle Business Projects
FINAL DRAFT VERSION 1.5 Page 57 of 177
Products Education Business Holiday VFR Special Interest
TOTAL
Game/Wildlife √ √ √ 3
Heritage/History √ √ √ √ 4
Culture √ √ √ 3
Nature-based √ √ √ 3
Outdoor adventure √ √ √ 3
Conferences √ √ 2
Festivals/events √ √ √ 3
TOTAL 1 1 6 6 7 21
CHRIS HANI FOREIGN TOURISM PRODUCT - MARKET MIX
Table 16: Chris Hani – Overseas Tourism Product-Market fit.
6.4.4 Product Development Strategy
The main focus of the Chris Hani DTO is marketing the Chris Hani area. This includes existing
products and new products ready for marketing. Although product development is mainly the function
of the private sector and service providers, the DTO can play a role in highlighting opportunities for
product development in line with the tourism development strategy/priorities, and facilitating
cooperation between product owners.
The product strategy for the Chris Hani Municipality encompasses:
• Include new products ready for marketing in route maps and other promotional literature
produced by the LTO and DTO as marketing tools,
• Differentiation of product offerings;
• Local diversification of product offerings;
• Development of product linkages and clustering on a District basis;
• Promote and facilitate tourist route development;
• Include community-based tourism projects in marketing efforts;
• Include festivals and special events in marketing actions.
6.4.5 Product Marketing Strategy
The opportunity for Chris Hani Tourism to grow domestic tourism in the Chris Hani area depends on
fitting the product offerings with the market segment profiles and then targeting these consumer
segments with specific marketing campaigns. These marketing campaigns should be both initiated by
Chris Hani Tourism, for example in the local Eastern Cape press and radio, and also piggy-backing on
tourism promotions of the District, Provincial and National tourism organizations, such as the seasonal
SA domestic tourism promotions (City Breaks, Mountain Escapes, Coastal Getaways, Cultural
Discoveries, Countryside Meanders, Bush Retreats and Event Wonders).

Chris Hani District Municipality Tourism Integrated Plan Prepared by: Kyle Business Projects
FINAL DRAFT VERSION 1.5 Page 58 of 177
The challenge is to cluster the natural, built, cultural and social tourist attractions into packaged tours,
itineraries and product offerings for the different consumer tourism segments.
For international tourist markets, the focus must be on the primary channels used by overseas tourists
– the internet and word of mouth. In addition, the DTO should target international tourists through
the international marketing and promotion campaigns of SA Tourism, by ensuring that the Chris Hani
tourism products are aligned with the SA Tourism marketing strategy for South Africa.
An important consideration is that all advertising and promotional material should support the Chris
Hani brand identity and corporate communications strategy. All Chris Hani stakeholders should be
encouraged to buy into the brand equity. Corporate business should also be encouraged to support
and use the Chris Hani logo on all their corporate stationery and advertisements. This increases the
exposure of the brand identity in different markets.
6.4.6 Benchmarks
6.4.6.1 Definition and Purpose
It is important before implementing the tourism growth strategy that realistic goals are set to measure
performance against agreed targets. This assists the organization to be result-oriented and undertake
a review of performance on a regular basis. Performance also needs to be benchmarked against other
players in the tourism sector.
A benchmark is an index against which performance can be measured. It is a tool for determining
whether certain functions are being performed effectively, and whether their growth is in line with
other, comparable destinations, and what improvements need to be made. The starting point for
establishing benchmarks for growth is to get a clear fix on the indicators of successful strategy
execution. Once these have been established and the process of aligning the indicators with the
tourism goals has been developed, then these indicators can be benchmarked against the best-in-
industry, best-at-destination, best-in-world, best practice etc. The benchmarks chosen therefore need
to be indicators which can be measured, and which give a good indication of performance against
strategic objectives, and which can be measured against competitors and industry norms.
With a relatively poor database of tourism statistics, whether on supply or demand, this becomes a
difficult task. However, as more reliable information becomes available then the performance
standards can be updated and substantially improved.

Chris Hani District Municipality Tourism Integrated Plan Prepared by: Kyle Business Projects
FINAL DRAFT VERSION 1.5 Page 59 of 177
6.4.6.2 Identified Tourism Benchmarks for the Chris Hani District Municipality
The following tourism benchmarks have been identified for the Chris Hani District Municipality:
• Total number of bednights occupied by international / domestic tourists;
• Average duration of stay of international (8.4n) / domestic tourists (7.6n);
• Average spend per person per day for international tourists (R550), and per person per trip
for domestic tourists (R1092) [R143 per person per day];
• Occupancy rates in the different categories of tourist accommodation;
• Number of people employed in the tourism sector;
• Percentage HDI involvement in the tourism industry.
These benchmarks are in line with the statistics reported by SA Tourism, and are defined in more
detail in the following sections. At this stage the benchmarks are defined, but the methodology for
measuring the required data for comparison with the benchmarks will need to be defined and
implemented.
6.4.6.3 Data Collection Methodology and Interpretation
At this stage the benchmarks required for the measurement of the tourism industry in the Chris Hani
District Municipality are defined, in line with the tourism statistics available on a national and
international basis.
The methodology for measuring the required data for comparison with the benchmarks is not in place,
and can be a significant hurdle which needs to be overcome.
In practice, although accurate measurement of the performance of the tourism industry is to the
advantage of every participant and product owner, product owners are very reluctant to provide the
information which is required in order to calculate the performance. This hurdle must be overcome,
possibly through the use of a respected third party, to ensure confidentiality of the data and also
confidence in the results.
Although in each case a comparison is made to available Provincial and / or national statistics, these
comparisons are not necessarily useful. In effect, the tourism industry in the Chris Hani area should
measure its performance in a current year against its own performance in previous years, informed by
a comparison of the current year’s performance on a provincial and/or national basis with the same
previous years.

Chris Hani District Municipality Tourism Integrated Plan Prepared by: Kyle Business Projects
FINAL DRAFT VERSION 1.5 Page 60 of 177
6.4.6.4 Total Number of Bednights – International / Domestic Tourists
The number of tourist bednights spent in the tourist accommodation in the Chris Hani area compared
to the Eastern Cape and SA bednights, is shown in Table 17.
Domestic Foreign TotalChris Hani - - 339,810*Eastern Cape 14,840,000 3,775,830 18,615,830*South Africa 154,900,000 62,930,500 217,830,500
(* Source: Derived from SA Tourism, 2005)
CHRIS HANI BEDNIGHTS COMPARED TO 2005 PROVINCIAL & NATIONAL STATISTICS
Table 17: Chris Hani bednights compared to 2005 Provincial & National statistics.
The total bednights in Chris Hani (339,810), contributes 1.83% of the total Eastern Cape bednights,
and 0.16% of the total SA bednights.
A breakdown of the total bednights spent in the Chris Hani area between domestic and foreign
tourists is not currently available.
6.4.6.5 Average Duration of Stay
The average duration of stay by domestic and foreign holiday tourists in the Eastern Cape and South
Africa in 2005 is shown in Table 18.
Domestic ForeignChris Hani*Eastern Cape 3.8 6.5*South Africa 6.3 11.0
(* Source: Derived from SA Tourism, 2005)
AVERAGE STAY (NIGHTS) IN CHRIS HANI COMPARED TO 2005 PROVINCIAL & NATIONAL STATISTICS
Table 18: The average length of stay by domestic and foreign holiday tourists in the Eastern Cape
and in South Africa in 2005.
A breakdown of the average length of stay of domestic and foreign tourists in the Chris Hani area is
not currently available.

Chris Hani District Municipality Tourism Integrated Plan Prepared by: Kyle Business Projects
FINAL DRAFT VERSION 1.5 Page 61 of 177
6.4.6.6 Average Spend
The average spend by foreign tourists per day, analysed by the purpose of the visit, is shown in Table
19. This data indicates that foreign Holiday Tourists, part of the primary target market for the Chris
Hani area, spend approximately R734.00 per person per day. The average spend per trip for all
foreign tourists is analysed by category of expenditure in Table 20. Although the spending patterns for
Holiday Tourists are expected to differ from the average, approximately 22.5% of expenditure is on
local services such as accommodation, food & beverages, and leisure & entertainment.
Year All Foreign Tourists Holiday Tourists Business Tourists VFR Tourists Other Tourists
2004 R 1,400 R 860 R 2,636 R 629 R 1,038
2005 R 1,472 R 861 R 1,151 R 579 R 788
2006 R 1,000 R 700 R 900 R 400 R 400
2007 R 880 R 734 R 800 R 447
(Compiled by Kyle Business Projects from SA Annual Tourism Reports)
FOREIGN TOURISTS SPEND PER DAY IN SA BY PURPOSE OF VISIT
Table 19: The average spend per day for foreign tourists in South Africa, by purpose of visit.
2004 % 2005 % 2006 %Accommodation R 2,200 11.2% R 2,300 10.0% R 2,400 12.0%Transport R 1,000 5.1% R 1,100 4.8% R 1,100 5.5%Food & Beverage R 1,000 5.1% R 900 3.9% R 900 4.5%Leisure & Entertainment R 1,100 5.6% R 1,200 5.2% R 1,200 6.0%Medical R 2,500 12.7% R 3,000 13.1% R 3,300 16.5%Shopping R 4,500 22.8% R 5,300 23.1% R 5,600 28.0%Other R 7,400 37.6% R 9,100 39.7% R 5,500 27.5%
TOTAL R 19,700 100% R 22,900 100% R 20,000 100%
(Source: Kyle Business Projects from SA Tourism Annual Report 2006)
FOREIGN TOURISTS SPEND PER TRIP IN SA BY CATEGORY
Table 20: The average spend per trip for foreign tourists in South Africa, by category of expense.
Combining this data indicates that of the R734.00 average spend per person per day by foreign
holiday tourists, approximately R165.00 should be spent on local services in the Chris Hani area.
6.4.6.7 Occupancy rates
The estimated occupancy rates in tourist accommodation in the Chris Hani Municipality are shown in
Table 21. These data are grouped into accommodation types as defined in the Statistics SA
accommodation occupancy statistics, which are shown for the 13-month period from December 2005
to December 2006.

Chris Hani District Municipality Tourism Integrated Plan Prepared by: Kyle Business Projects
FINAL DRAFT VERSION 1.5 Page 62 of 177
Inxuba Yethemba
Tsolwana Inkwanca Lukhanji Emalahleni Intsika Yethu
Sakhisizwe Engcobo
Backpacker & Hostelling 0 0 0 0 0 0 0 0 0.00%Bed & Breakfast 75 25 45 416 23 114 91 30 37.79% 46.00%Guest houses & Guest farms 530 188 0 324 57 88 0 0 30.60% 46.00% / 39.00%Country House 22 0 0 25 0 0 0 0 25.32%Hotels 103 48 21 64 0 0 49 13 18.06% 66.00%Lodge 70 95 0 84 23 0 22 0 17.83% 39.00%Self-Catering 155 22 8 137 0 0 10 0 23.12%
Caravan parks and camping sites 422 10 0 0 0 0 0 0 14.65% 18.00%
TOTAL 1,377 388 74 1,050 103 202 172 43 27.31%
(Compiled by Kyle Business Projects)
CHRIS HANI DISTRICT MUNICIPALITY TOURIST ACCOMMODATION OCCUPANCIES
Average room occupancy Chris
Hani
Average room occupancy SA
(Dec 2005 - Dec 2006)
Number of BedsAccommodation Type
Table 21: Estimated occupancy rates in tourism accommodation in the Chris Hani District
Municipality. The average room occupancy rates in South Africa for the 13-month period December
2005 to December 2006 are shown for comparison (Source: Stats SA December 2006 Accommodation
Occupancy Statistics).
Although the national occupancy statistics provide a benchmark figure, these average a wide range of
grades of accommodation which may not necessarily be available in the Chris Hani area. For example,
the national “Hotel” figures average all grades of hotels, from 0 star to 5 star, and all areas (urban,
suburban, peri-urban and rural). These average figures may not be representative of the grades of
accommodation available in the Chris Hani area.
6.4.6.8 Number of people employed in the tourism sector
Group Employers % Employees %Hospitality 35,830 85.0% 476,700 80.0%
Gambling and lotteries 850 2.0% 20,500 3.0%
Tourism & travel services 2,870 7.0% 38,600 6.0%
Sport & recreation 1,560 4.0% 34,400 6.0%
Conservation and leisure 900 2.0% 30,300 5.0%
TOTAL 42 000 100.0% 600 000 100.0%
(Source: Kyle Business Projects from Sector Skills Plan – 2000)
SUMMARY OF ESTIMATED TOURISM EMPLOYER AND EMPLOYEE NUMBERS 2000
Table 22: The estimated number of employers and employees in the tourism industry in South Africa
in 2000.
6.4.6.9 HDI Involvement in the Tourism Industry
HDI involvement in the tourism industry is measured nationally against the Tourism BEE Charter and
Scorecard. The Charter and Scorecard measure participation in 7 main areas, namely ownership,
strategic representation, employment equity, skills development, preferential procurement, enterprise
development, and social development. A national baseline study was conducted on small tourism

Chris Hani District Municipality Tourism Integrated Plan Prepared by: Kyle Business Projects
FINAL DRAFT VERSION 1.5 Page 63 of 177
enterprises (turnover < R5 million) in 2006. The measured degree of compliance against the 2009
targets is shown in Table 23.
Measure Chris Hani 2009 National Baseline 2006 (% compliance
with 2009
2009Weighting
2009 Sub-Weighting
2009 Target
Ownership 6.00% 15.00% 15.00% 21.00%Strategic representationBlack people at board level 3.00% 14.00% 3.50% 30.00%Black women at board level 0.00% 3.50% 15.00%Black people in Executive Management 2.00% 3.50% 30.00%Black women in Executive Management 0.00% 3.50% 15.00%Employment EquityBlack people in Management 1.00% 14.00% 2.50% 35.00%Black women in Management 1.00% 2.50% 18.00%Black people in Supervisory / Skilled Roles 2.00% 2.50% 45.00%Black women in Supervisory / Skilled Roles 0.00% 2.50% 23.00%Black people in Staff Establishment 13.00% 2.00% 53.00%Black women in Staff Establishment 13.00% 2.00% 28.00%Skills Development% Payroll spend on accredited skills development 10.00% 20.00% 5.00% 3.00%% of Skills Dev spend on black employees 5.00% 75.00%# of learnerships as % of total employees 5.00% 2.00%# of black learners as % of total learners 5.00% 80.00%Preferential Procurement 11.00% 15.00% 15.00% 40.00%Enterprise Development 33.00% 14.00% 14.00% 1.00%Social DevelopmentCSI spend as % of post-tax profits 28.00% 8.00% 3.00% 1.00%% of new recruits with no prior work experience 2.00% 10.00%Status of TOMSA levy collector 3.00% YES
(Source: Kyle Business Projects from Tourism BEE Charter Council - Baseline Study: Small Tourism Enterprises)
CHRIS HANI DISTRICT MUNICIPALITY TOURISM BEE SCORECARD
Table 23: The Tourism BEE Scorecard, showing the 2006 national baseline degree of compliance of
small tourism enterprises (turnover < R5 million) with the 2009 targets.
The degree of compliance with the Scorecard by the tourism enterprises in the Chris Hani District
Municipality is not currently known. Each tourism enterprise should be encouraged to evaluate
themselves against this Scorecard, and so provide data on the HDI involvement in the tourism
industry in the Chris Hani area.
6.5 Tourism Institutional Framework
6.5.1 Background
An overview of the institutional relationships between the national, provincial, district and local levels
in the tourism industry in South Africa, including the public and private sector, is shown in Figure 16.
An understanding of these relationships is important for an DTO to ensure success in making use of
collaborative (piggy-back) marketing of the local tourism products with Provincial and National
campaigns.

Chris Hani District Municipality Tourism Integrated Plan Prepared by: Kyle Business Projects
FINAL DRAFT VERSION 1.5 Page 64 of 177
Figure 16: The institutional relationships between the national, provincial, district and local levels in
the tourism industry in South Africa.
6.5.2 Developing an effective Visitor Information Network
Although tourist information centres carry different names in different countries, in effect they
basically do the same job. Distinction should however be made between the role and function of a
Destination Marketing Organisation (DMO) and a Tourist Information Centre (TIC).
A DMO's main function is the actual marketing of the destination and a TIC's main function is
providing tourist/visitor information. TIC's are usually a division/department of a DMO, especially in
large cities, whereas in small towns the local tourist information centre is both a DMO and a TIC
because of limited resources. Some TIC's operate out of a Library building and are not either visible or
accessible One has to add to the equation regional tourism organizations (RTO's) who network with
the larger destination marketing agencies but assist the smaller towns with co-operative marketing
actions. DMA's receive funds from local municipalities and subscribing members but RTO's only
receive funds from district municipalities unless they are a Section 21 Company.
The District Tourism Organisation (DTO) should in effect play a coordinating role, and develop an
effective visitor information network thereby linking all the fully functioning LTOs in the District.

Chris Hani District Municipality Tourism Integrated Plan Prepared by: Kyle Business Projects
FINAL DRAFT VERSION 1.5 Page 65 of 177
6.5.3 Proposed Tourism Institutional Framework Model for the Chris Hani
District
The proposed Tourism Institutional Framework Model for the Chris Hani District is shown in Figure 17.
PRODUCT OWNERS
AccommodationAttractionsTour Operatorsetc
Functions:Operating own productMarketing &development of ownproductNetworking &collaboration withcomplementaryproducts
MUNICIPALITY
Local Economic Development /Tourism Development
Officer
Functions:Enabling environmentPublic tourism facilitiesTourism SafetyTourism DevelopmentRepresentation on LTO
LTO
Section 21 / Association(Municipality / Product Owners
Joint Venture)
Functions:Marketing the areaInformation CenterPromotion of the areaNetworking &collaborationRoute & itinerarydevelopmentResearch & tourismintelligence
TOURISM DEVELOPMENT
New products:SMMEsHDI
New Attractions:SMMEsHDI
Enabling Environment:Network with SMMESupport ProvidersTourism education &awareness
EnablingFacilitationSupport
Strategic Alignment
Funding
Expertise
Funding
Start-up support
Assistance,Mentorship &
Market
Membership
OUTSIDEAGENCIES
Figure 17: The proposed Tourism Institutional Framework Model for the Chris Hani District.

Chris Hani District Municipality Tourism Integrated Plan Prepared by: Kyle Business Projects
FINAL DRAFT VERSION 1.5 Page 66 of 177
In this model, the LTO is structured as an independent organization which is a joint venture between
local government and the product owners in the area.
Tourism product owners contribute to the LTO through subscriptions and by providing specialist
expertise to the Board of the LTO.
Local government contributes to the LTO by providing funding and strategic alignment through the
Board of the LTO with the goals and objectives for tourism in the area.
The LTO itself undertakes the activities required to achieve the first strategic priority, namely growing
the tourism economy by increasing the number of visitors, and so increasing the economic benefits of
tourism to the area as a whole.
The performance and success of the LTO against this strategic priority can be measured, inter alia by
measuring the growth of the bednights sold in the area per annum and the effectiveness of the
marketing programme.
Through its existing structures but informed by (and in some cases in collaboration with) the LTO,
local government undertakes activities to ensure an enabling environment for tourism and public
facilities and attractions.
In addition, through the LED / Tourism Development Officer local government undertakes the
development of new products and attractions specifically with emerging tourism entrepreneurs and
SMMEs. This development will also in some cases involve collaboration with existing product owners,
specifically for assistance, mentorship, and access to the market. This element can be facilitated
through the LTO, but takes place outside the core function of the LTO, such as in a development
forum.
In this manner, local government takes on the tasks required to achieve the second strategic priority,
namely diversifying the tourism industry to all sectors of the population.
The success of this strategic priority can be measured by measuring the growth in numbers of
emerging tourism entrepreneurs and SMMEs, the growth in their businesses, and by the growth in
membership of the LTO.

Chris Hani District Municipality Tourism Integrated Plan Prepared by: Kyle Business Projects
FINAL DRAFT VERSION 1.5 Page 67 of 177
6.5.4 Application of the Proposed Tourism Institutional Framework Model for the
Chris Hani District
The proposed tourism institutional framework model described in Section 6.5.3, has been applied to
the Chris Hani District in Figure 18.
This structure essentially makes provision for the following:
o The Chris Hani District Municipality has an LED/Tourism Development Officer;
o The Chris Hani District has an RTO / DTO with a senior marketing person;
o Each local municipality has an LED / Tourism Development Officer
o Each local municipal area has an LTO, which has:
o A person with marketing expertise;
o Tourist information offices in all the main centers, manned by Information Officers.
Within this structure, the District-level resources undertake activities on a district level, liaise with
parties from other Districts and the Eastern Cape Province, and provide some coordination of the
activities at the Local Municipality level. One of the key tasks at the district level is to facilitate
networking between the parties in the Local Municipalities.
The resources at the local level undertake activities within the local municipality.
This structure is an ideal solution, but may only be achieved over a period of time as the necessary
resources are developed or become available.

Chris Hani District Municipality Tourism Integrated Plan Prepared by: Kyle Business Projects
FINAL DRAFT VERSION 1.5 Page 68 of 177
MUNICIPALITY
CradockLED/Tourism Development
Officer(Bandisiwe Mda)
LTO
CEO / Marketing(_____________)
CradockTourism Information Officer
(_____________)Information Office(_____________)
MiddelburgTourism Information Officer
(Rialize Hayes)Information Office(8 Meintjies Street)
MUNICIPALITY
Lady FrereLED/Tourism Development
Officer(_____________)
LTO
CEO / Marketing(_____________)
Lady FrereTourism Information Officer
(_____________)Information Office(_____________)
DordrechtTourism Information Officer
(_____________)Information Office(_____________)
TSOLWANA MUNICIPALITY
EMALAHLENI MUNICIPALITY SAKHISIZWE MUNICIPALITY ENGCOBO MUNICIPALITY
INKWANCA MUNICIPALITY
INTSIKA YETHU MUNICIPALITY
LUKHANJI MUNICIPALITYINXUBA YETHEMBA MUNICIPALITY
CHRIS HANI DISTRICT MUNICIPALITY
MUNICIPALITY
QueenstownLED/Tourism Development
Officer(Mongezi Madyibi)
DTO
CEO / Marketing(_____________)
MUNICIPALITY
CofimvabaLED/Tourism Development
Officer(Hazel Sijadu)
LTO
CEO / Marketing(_____________)
CofimvabaTourist Information Officer
(_____________)Tourism Information Office
(_____________)
MUNICIPALITY
CalaLED/Tourism Development
Officer(_____________)
LTO
CEO / Marketing(_____________)
CalaTourist Information Officer
(_____________)Tourism Information Office
(_____________)
ElliotTourist Information Officer
(_____________)Tourism Information Office
(_____________)
MUNICIPALITY
EngcoboLED/Tourism Development Officer
(_____________)
LTO
CEO / Marketing(_____________)
EngcoboTourist Information Officer
(_____________)Tourism Information Office
(_____________)
MUNICIPALITY
MoltenoLED/Tourism Development
Officer(_____________)
LTO
CEO / Marketing(_____________)
MoltenoTourism Information Officer
(_____________)Information Office(_____________)
MUNICIPALITY
TarkastadLED / Tourism Development
Officer(_____________)
LTO
CEO / Marketing(_____________)
TarkastadTourism Information Officer
(_____________)Information Office(_____________)
MUNICIPALITY
QueenstownLED / Tourism Development
Officer(_____________)
NON- MUNICIPALITY
CEO / Marketing(_____________)
QueenstownTourism Information Officer
(_____________)Information Office(_____________)
Figure 18: The proposed tourism institutional framework for the Chris Hani District, after applying the model described in Section 6.5.3.

Chris Hani District Municipality Tourism Integrated Plan Prepared by: Kyle Business Projects
FINAL DRAFT VERSION 1.5 Page 69 of 177
6.5.5 Internal Structure & Operations of the LTO
The internal structure of the LTO must be focused on pursuing its strategy and achieving its objectives
through the activities it undertakes.
The structure of successful LTOs internationally is generally similar to the structure shown in Figure
19. This structure can accommodate very large organizations with many tens or hundreds of staff, but
can also be adapted to suit small organizations.
MEMBERS
CHIEF EXECUTIVEOFFICER
BOARD OF DIRECTORS
COMMUNICATIONSDEPARTMENT
OPERATIONS/ADMINISTRATION
DEPARTMENT
SALES AND MARKETINGDEPARTMENT
CONVENTIONSALES TOURISM SALES
CONVENTION/TOURISMSERVICES
FINANCE MEMBERSHIP PUBLICATIONS
INFORMATIONSERVICES
PUBLIC RELATIONS
Figure 19: The general structure of successful LTOs.
The key elements of the structure of an LTO are shown in Figure 20. This structure clearly focuses on
the core business of the LTO if it is to achieve its strategic objective of growing the tourism economy
by increasing the number of visitors, and so increasing the economic benefits of tourism to the area
as a whole. Although the Figure refers to the CEO, this structure equally defines the activities and
focus areas of a small LTO operated by a single person. The structure also makes clear that the Board
is involved in the LTO through specialist committees, through which specialist expertise is available to
the LTO.
Again, in a small organization, the members of the Board may contribute their specialist skills directly
by assisting and guiding the staff of the LTO.

Chris Hani District Municipality Tourism Integrated Plan Prepared by: Kyle Business Projects
FINAL DRAFT VERSION 1.5 Page 70 of 177
THE BOARD AND ITS COMMITTEES
CEO
ADMINISTRATIONMARKETINGFUNDRAISING &MEMBERSHIP
Figure 20: The key elements of the structure of a successful LTO focus on the core business of the
organization to drive its strategy and achieve its strategic objectives.
As discussed in Section 6.5.3 and shown in Figure 17, the primary focus of the LTO is on marketing
and promoting the area for tourism. Within this focus, the LTO must be familiar with and apply the
four “P’s” of marketing, which apply to any industry and stand for:
o Product
o Price
o Place (Distribution)
o Promotion
In the context of the tourism industry these four foundation pillars of destination marketing are
explained in Appendix 1 – Destination Marketing, and are encapsulated in the “Tourism Pyramid”,
illustrated in Figure 21.
LTO
TOURISTSPRICE PROMOTION
PLACE
PRODUCT
Figure 21: The Tourism Pyramid, illustrating the application of the four “P’s” of marketing in the
tourism industry.

Chris Hani District Municipality Tourism Integrated Plan Prepared by: Kyle Business Projects
FINAL DRAFT VERSION 1.5 Page 71 of 177
Once the internal structure and focus of the LTO is defined, the interactions with the stakeholders can
be defined in terms of the market segments for the LTO, as shown in Figure 22.
Tran
spor
ters
(Pub
lic &
Priv
ate)
Public Sector/Local Authorities
Other Business
Interests 4
Tourist Attra
ction
Operators
Non
-bus
ines
sIn
tere
sts³
Educational
InstitutionsArts
and
Cultural
Community
Tourism
Facilitators²
Tourist
Accommodation
Providers¹
The General Public
¹ Hotels, motels, bed & breakfast, etc.
² Tour operators, travel agents, advertising agents, etc.
³ Environmentalists, conservationists, etc.4 Retailers, restaurants, industrial interests, etc.
LTOTr
ansp
orte
rs(P
ublic
&Pr
ivat
e)
Public Sector/Local Authorities
Other Business
Interests 4
Tourist Attra
ction
Operators
Non
-bus
ines
sIn
tere
sts³
Educational
InstitutionsArts
and
Cultural
Community
Tourism
Facilitators²
Tourist
Accommodation
Providers¹
The General Public
¹ Hotels, motels, bed & breakfast, etc.
² Tour operators, travel agents, advertising agents, etc.
³ Environmentalists, conservationists, etc.4 Retailers, restaurants, industrial interests, etc.
LTO
Figure 22: The internal market segments for the LTO, defined by the interactions with stakeholders
required in order to achieve its strategic objective.
6.5.6 The Board of the LTO
The Board of the LTO is critical to ensure the success of the LTO. Particularly in the case of a small
LTO with limited resources, the members of the Board provide valuable skills and specialist expertise
to drive the functioning of the LTO.
The structure and composition of the Board should be informed by the South African tourism
landscape, the presence and activities of tourism organizations or their members in the area, and the
requirement to provide specialized expertise to the Board and the staff of the LTO.
6.5.6.1 The South African Tourism Landscape
The South African tourism landscape, comprising key players from government, industry and NGOs, is
illustrated in Figure 23.

Chris Hani District Municipality Tourism Integrated Plan Prepared by: Kyle Business Projects
FINAL DRAFT VERSION 1.5 Page 72 of 177
Government Industry Non-GovernmentOrganizations
Department ofEnvironmental
Affairs and Tourism
IndustryAssociations
BEE CharterCouncil
Tourism EnterpriseProgramme
Fair Trade inTourism South
Africa
Tourism BusinessCouncil of South
Africa
Department ofTrade and Industry
South AfricanTourism
IndustrialDevelopmentCorporation
Tourism GradingCouncil of South
Africa
South AfricanTourism
Landscape
Figure 23: The South African tourism landscape.
6.5.6.2 The Tourism Business Council of South Africa (TBCSA)
The TBCSA is the united voice of the tourism business sector involved in tourism - it does not replace
the trade associations but rather represents the combined interests of the business sector. Its primary
purpose is to engage with all stakeholders in developing macro strategies that create an enabling
environment for tourism development.
The composition of the Management Board of the TBCSA, which is shown in Table 24, illustrates the
diverse skills and industries which represent the basic skillsets required for a management board.
MEMBER POSITION / ORGANISATION
Chairperson MD: The Don Suite Group
Vice Chairperson CEO: Tourvest Investment Corporation
Member CEO: City Lodges Hotels
Member CEO: Southern African Tourism Services Association
Member Director: Kifaru Tourism
Member GM: Airports Company of South Africa
Member GM: Southern African Vehicle Rental & Leasing Association
Member PR & Communications Director: Coca Cola Southern Africa
Member Executive Director: Tourism - South African National Parks
Member Director: Face to Face Tours
Member MD: Winchester Mansions Hotel
Member Public Relations: National Automobile Association
Member Chairperson: TOMSA and Savoy Hotels
Member CEO: Board of Airline Representatives of South Africa
Member MD: Southern Sun Hotels, Inns & Resorts
Member MD: Bid Travel
Member CEO: Association of South African Travel Agents
Member Chairperson: SA Association for the Conference Industry
Member CEO: Fair Trade in Tourism South Africa
Member Chairperson: Federated Hospitality Association of South Africa
Member Chairperson: Community Tourism Association of KZN
TOURISM BUSINESS COUNCIL OF SOUTH AFRICACOMPOSITION OF THE MANAGEMENT BOARD

Chris Hani District Municipality Tourism Integrated Plan Prepared by: Kyle Business Projects
FINAL DRAFT VERSION 1.5 Page 73 of 177
Table 24: The composition of the Management Board of the Tourism Business Council of South
Africa, illustrating the mix of skills and industries required to ensure successful operation and
representation.
6.5.6.3 Key Non-Governmental Tourism Organisations in South Africa
Non-governmental organizations (NGOs) in the tourism sector generally comprise all the industry
associations, which represent and promote the interests of the industry and their member sectors (see
Table 25). It is possible that each of these NGOs are represented in each local municipality, even
through the membership of the NGOs by a local product, and so it may be feasible to obtain
membership of the Board of the LTO derived from the different industry sectors represented by the
NGOs.
TRADE ASSOCIATION/ORGANISATION ACRONYM ROLE AND FUNCTION
Association of South African Travel Agents ASATA Represents over 500 travel agents and tour operators Bed & Breakfast Association of South Africa BABASA A voluntary association of owners/managers of SMME accommodationBoard of Airline Representatives of South Africa BARSA A business association to facilitate, promote, represent & protect its membersBackpackers South Africa BTSA Expressed purpose to ensure that its members provide good serviceCoach Operators Association of Southern Africa COASA Affiliated to SABOA but represents luxury long-distance tour bus operatorsFederated Hospitality Association of South Africa FEDHASA Functions both as a Trade and Employers’ Association Field Guides Association of South Africa FGASA Sets standards for Field Guides throughout Southern AfricaGuesthouse Association of Southern Africa GHASA Represents a group of over 200 unique and quality guesthouses Restaurateurs Association of South Africa RASA Ensures that there is a lobby and a voice to speak on behalf of restaurateursSouthern African Association for the Conference Industry SAACI Represents over 600 members dedicated to maintaining & improving standardsSouthern African Bus Operators Association SABOA Represents the interests of bus operators in South AfricaSouthern African Tourism Services Association SATSA Represents the private sector of the incoming tourism industrySouthern African Vehicle Rental & Leasing Association SAVRALA A trade association representing vehicle renting, leasing & fleet managementTourism Business Council of South Africa TBCSA The voice of the business sector involved in tourismTourism Enterprise Partnership TEP Facilitates the growth and development of tourism SMMEsTourism Marketing South Africa TOMSA A trust account that collects funds via a consumer levy on tourism products
TOURISM NGOs IN SOUTH AFRICA
Table 25: Key non-governmental tourism organizations in South Africa, representing the interests of
their member sectors.
6.5.6.4 Recommended Structure / Composition of the Board of the LTO
Depending on the size of the tourism industry in the area, the Board of the LTO should consist of
about 5 – 8 members, at least half of which should be active in the tourism industry. Key skills and
expertise which should be included are:
o Attorney
o Accountant
o Community representative
o Non-tourism business
o Tourism business (accommodation, attractions, service providers)
o Marketing

Chris Hani District Municipality Tourism Integrated Plan Prepared by: Kyle Business Projects
FINAL DRAFT VERSION 1.5 Page 74 of 177
o Representative of the Municipality
6.5.7 Resource Requirements for the LTO
The resource requirements for the LTO can be categorized as:
o Physical (premises, equipment etc);
o Financial (start-up capital, ongoing revenue);
o Human (staff).
These resources are briefly discussed in the following sections.
6.5.7.1 Physical Resources
The key physical resources required for the LTO include:
o Premises: these should be well-located for access by tourists, and preferably independent of
any of the product owners. The site should be easy to get to for the general public and
tourists. The premises should have sufficient internal space for the layout of the information
office, as well as for administrative offices. The parking area should be accessible for public
and private transport including busses, and sufficient for the envisaged traffic. The premises
must have electricity, water, sanitation, and telephone connections. The premises must be
clearly signposted
o Equipment: The LTO will require the appropriate office furniture (desks etc), as well as
display racks for information brochures. Telephone, fax and PC with internet access and e-
mail facilities are required. An outside display area for after-hours reference should be
available.
o Stock: The LTO should have stock of information brochures:
o All attractions and tourist facilities in the local area;
o Most attractions and tourist facilities in the neighboring areas / District;
o Major attractions and tourist facilities in the Province;
6.5.7.2 Financial Resources
The financial resources required for the successful start-up and operation of the LTO include start-up
capital for the purchase of the required equipment and establishment of the information office, and
operating capital to pay the annual operating expenses.
The start-up capital should cover the acquisition and set-up of the required physical resources.
Assuming that the premises are either leased or provided at no cost by the municipality, and

Chris Hani District Municipality Tourism Integrated Plan Prepared by: Kyle Business Projects
FINAL DRAFT VERSION 1.5 Page 75 of 177
depending on the scale of the LTO, a capital cost of about R50,000.00 should be sufficient for the
basic requirements.
An example of an operating budget for an LTO is shown in Table 26. This budget can serve as a
guideline for the development of a specific budget to suit the intended size and operations of the LTO,
and the available funding.
Budget
Income
Municipal Subsidy R 276,365 61.0% R 303,900 59.8% R 335,000 58.6%
Membership Subscriptions R 32,575 7.2% R 49,000 9.6% R 53,000 9.3%
Other (sales, commissions) R 144,303 31.8% R 155,185 30.5% R 183,380 32.1%
TOTAL INCOME R 453,243 100.0% R 508,085 100.0% R 571,380 100.0%
Expenditure
Salaries & Wages R 246,817 53.9% R 275,000 55.0% R 317,200 55.5%
Admin & Office Costs R 142,260 31.1% R 143,875 28.8% R 157,250 27.5%
Travel R 10,605 2.3% R 12,000 2.4% R 15,000 2.6%
Brochures R 24,876 5.4% R 21,600 4.3% R 24,800 4.3%
Trade & Consumer Shows R 10,587 2.3% R 22,000 4.4% R 25,000 4.4%
Advertising & Promotions R 2,500 0.5% R 3,600 0.7% R 6,000 1.1%
Internet (Direct Marketing) R 9,600 2.1% R 11,000 2.2% R 12,000 2.1%
PR & Media R 6,288 1.4% R 6,000 1.2% R 6,750 1.2%
HR Development R 4,317 0.9% R 5,250 1.0% R 7,300 1.3%
TOTAL EXPENDITURE R 457,850 100.0% R 500,325 100.0% R 571,300 100.0%
EXAMPLE OF A TOURISM MARKETING AND DEVELOPMENT BUDGET FOR AN LTO
First Year Second Year Third Year
Table 26: Example operating budget for an LTO for a period of 3 years. Some of these amounts may
be scaled depending on the overall size of the LTO. For example, salaries & wages expenses depends
on the number of staff.
6.5.7.3 Human Resources
As in most organizations, having the right human resources is critical to ensuring the success of the
LTO. Having the wrong people or the wrong skills will doom the LTO to mediocrity of failure.
The primary focus of the LTO is in marketing and networking. It is therefore critical that the key staff
in the LTO have the appropriate marketing skills and temperament. To ensure that the marketing
approach is followed within the organization, the most senior person on the staff should be from a
marketing background, preferably with experience in the tourism industry.
If separate staff are employed to operate the tourist information office, these staff should also have a
marketing / customer service background, and should receive job-specific training on customer
service, marketing, the tourism industry, and specific orientation on the local products and attractions.

Chris Hani District Municipality Tourism Integrated Plan Prepared by: Kyle Business Projects
FINAL DRAFT VERSION 1.5 Page 76 of 177
Critical for the success of a small LTO with a limited budget is having access to specialized expertise
through the composition of the Board. Members of the Board should be selected to provide a mixture
of tourism marketing, development and operating expertise and experience, as well as if possible
financial and legal expertise. The Board then will be a valuable resource for the LTO, providing
specialized guidance for the LTO in all its activities.
6.5.7.4 Funding the LTO
Funding the LTO is always a challenge. The main function of the LTO is marketing the area, and this
entails advertising, promotion, networking, and giving away free information to visitors and the
industry. The LTO is therefore essentially a cost center, rather than a revenue center.
Generally, funding for the LTO comes from 3 main sources:
o Municipal subsidy
o Membership subscriptions
o Other sources (commissions on reservations, sale of information material, fundraising)
Although the municipal subsidy is generally the primary source, especially at start-up, the success of
the LTO can drive the balance of funding for the LTO to a point where the membership subscriptions
and other sources make up a substantial proportion of the total. Without income from the transient
room tax (TOMSA fund), the municipal subsidy will remain an important source of funds for the LTO.
Annual membership subscriptions should be set at a level to provide some income to the LTO, but
also provide value to the product owner in terms of benefits received. Typical benefits which the LTO
can offer to product owners include:
o Collective branding and marketing of the area and special events;
o Networking with other product owners and neighboring areas;
o Central reservations / referrals;
o Representation of the product as part of itineraries to local and international trade shows;
o Access to media during media tours, and for special events;
o Networking with emerging entrepreneurs to provide services and attractions.
Funding for the LTO can also be derived from fundraising, specifically from local businesses. This can
be motivated on the economic benefit derived by the area from an increase in direct tourism
spending. According to the World Travel and Tourism Council’s simulated Tourism Satellite Account
model for South Africa in 2007, every R1 directly spent by a tourist enables the tourism economy to
contribute R2.54 to the GDP, amounting to a total of R3.78 total economic activity. Growth in the
tourism industry is therefore in the interests of all businesses in the area, not just the tourism product
owners.

Chris Hani District Municipality Tourism Integrated Plan Prepared by: Kyle Business Projects
FINAL DRAFT VERSION 1.5 Page 77 of 177
In considering potential sources of funding for the LTO, the funding market should be segmented and
the appropriate approach devised for each selected target segment. An example of the segmentation
of the funding market is shown in Figure 24.
TYPE
PublicPrivate
INDUSTRY
RetailCateringTransportIndustrial
MiningAgriculture
Accommodation
SIZE
LargeMediumSmall
LIKELY EMPHASIS
DonationsSponsorships
Joint marketing
MAJOR VALUES IN FUND-GIVING
Job CreationCommunity upliftment
Corporate imageAdvertising benefits
Participation in tourism products
Figure 24: Example of the segmentation of the potential funding market for LTOs.
6.5.8 Internal Structure, Operations and Resource Requirements for the DTO
Similarly to the LTO, the internal structure of the DTO must be focused on pursuing its strategy and
achieving its objectives.
Successful District Tourism Organizations (DTO) are formed around the same fundamental principle:
appropriate tourism business can be attracted to a destination more effectively through a
representative organization than through independent individual actions. A DTO therefore serves like a
co-operative, representing all components of a District / destination’s tourism industry, including
hotels, restaurants, tour operators, attractions, transport carriers, local authorities as well as the retail
and commercial resources that are important to tourists.
The key action words are cooperation and coordination. In effect this means forging mutually
beneficial cooperative alliances to increase the competitive advantage of the district.

Chris Hani District Municipality Tourism Integrated Plan Prepared by: Kyle Business Projects
FINAL DRAFT VERSION 1.5 Page 78 of 177
Each component of the tourism industry of a destination is extremely competitive; yet they share that
competitive spirit with the DTO in order to make it an effective organization able to carry out a
comprehensive, unified marketing program for their community. A new word was coined during the
process of collaborative economic development (cluster process) i.e. co-opetition (cooperation in
order to become more competitive). The DTO is therefore a destination or community’s single most
important marketing organization, projecting an image for that destination into the various target
markets.
In a district where a local municipality has commissioned the preparation of a Tourism Sector Plan
(TSP) for the municipal area, the DTO has an important task to consolidate the various local
municipality TSP’s into a single TSP for the district i.e. a Tourism Master Plan. Thereafter, in
fulfilling this key task the Core Function of a DTO is to effectively implement an integrated Plan of
Action and this requires an Appropriate Structure and an overall Tourism Strategy for the
district.
Where necessary and appropriate, the DTO must further provide vital district-wide coordination and
support for the individual LTOs in the District. The support roles could include direct funding support
through grants, provision of specific training, capacity building and human resource development, and
support and coordination of joint marketing efforts among the LTOs. The DTO should also provide an
avenue for interface with external support service providers for the development of products and the
industry in the District, and interface to District and Provincial Government structures, and to national
structures such as the SAPS.
The structure of successful DTOs internationally is generally similar to the structure of successful LTOs
shown in Figure 19, but with a greater emphasis on the coordination and management of District-wide
tourism development and marketing activities.. This structure can accommodate very large
organizations with many tens or hundreds of staff, but can also be adapted to suit small
organizations.
The resource requirements for the DTO are again similar to those required for an LTO, except that the
premises should be geared mainly for office use, and not primarily for access by the public. They may
be located adjacent to the premises of the local LTO.
The financial resources required for the DTO are similar to those for the LTO, but with the addition of
a budget item for support activities to the LTOs. These costs include those for funding capacity
building workshops and training, public tourism awareness-building workshops, and general
coordination activities and support.

Chris Hani District Municipality Tourism Integrated Plan Prepared by: Kyle Business Projects
FINAL DRAFT VERSION 1.5 Page 79 of 177
It is clear that small towns in rural areas will require financial support through means of a subsidy to
establish a LTO. It is recommended that this subsidy should be provided through the DTO (CHARTO in
the CHDM). The DTO should therefore receive sufficient funding to operate effectively, and also
provide the subsidy to the rural towns wishing to establish a LTO. The availability of the subsidy from
the DTO would provide an incentive to establish a LTO, and ensure greater cooperation and
communication between the CHDTO and LTOs in the area. The subsidy should be linked to
performance, and any LTO failing to operate effectively would have the annual subsidy withdrawn.
The total financial budget for the DTO should reflect the additional costs expected for the coordination
and support activities of the DTO, in addition to the amounts shown in Table 26, adjusted for the
anticipated scale of the activities and the total resources available. It is anticipated that the annual
budget of the DTO in the Chris Hani District (CHARTO) should amount to between R1.5m and R2
million, and the annual subsidy granted to LTOs would amount to at least R50 000 per annum.
Chris Hani District Municipality Tourism Integrated Plan Prepared by: Kyle Business Projects
FINAL DRAFT VERSION 1.5 Page 80 of 177
7 Tourism Spatial Development Plan
7.1 Purpose of the Tourism Spatial Development Plan
The spatial characteristics of any area provide a varied mixture of natural features, resources,
infrastructure, settlements and attractions, upon which the area’s unique tourism experiences are
offered. These spatial characteristics could include mountainous regions and sparsely populated
farmlands, densely settled areas, coastal regions, the cities and towns, the farm tracks and freeways,
railways and harbours and the unique cultural milieu, which are all intrinsic to the area. In order for
the Responsible Tourism Sector Plan (RTSP) to be an effective guide for future spatial distribution of
tourism development, a thorough understanding of these spatial characteristics is required.
The Spatial Development Plan (SDP) should highlight the areas of opportunity, describe the tourism
sub-regions, identify the existing tourist routes and relate these features to the appropriate gateways,
staging posts, distribution points and existing major attractions. The purpose of the SDP is to identify
the various components which influence tourism activities and development potential giving
consideration to the tourism project proposals included in the IDP. The various attributes are then
mapped together to generate a Tourism SDP.
7.2 Topography, Biomes, and Conservation Areas
The topographical features, biomes and conservation areas in the Chris Hani District Municipality are
shown in Figure 25, Figure 26, and Figure 27 respectively.
7.3 Current Tourism Environment
The current tourism environment in the Chris Hani District Municipality is shown in Figure 28. This
plan shows the existing defined tourism routes, and the location of the tourism products in the area.
The list of the marked tourism products, with their map ID numbers, is given in Table 27. The
complete details of the tourism products are given in Appendix 6.
Areas of specific interest for tourism are identified in Figure 29.

Chris Hani District Municipality Tourism Integrated Plan Prepared by: Kyle Business Projects
FINAL DRAFT VERSION 1.5 Page 81 of 177
ID # NAME ID # NAME ID # NAME ID # NAME
LK1 Ailsa Cottage LK41 Val's Guest House IK19 Johannes Meintjies Art Gallery IT39 Egg RockLK2 Aloe Grove Guest Farm LK42 Masonic Hotel IK20 Vegkoppies Boer War Memorial Site IT40 Erin Country House & Farm CottageLK3 Camelot B&B LK43 Rose n Crown IT1 150 Years of the Great Trek IT41 Fish River CottageLK4 Carnarvon Estates/ The Stagger Inn LK44 Sterling Hotel IT2 Aloes Guest House IT42 Funky FarmLK5 Carthews Cornor LK45 Queenstown Airport IT3 Amali Guest house IT43 Gereformeerde KerkLK6 Cosy Cottage LK46 Entrance to Lawrence De Lange Game Reserve IT4 André Bed & Breakfast IT44 Grave of Olive Schreiner
LK7 Cottage The / Dew Drop Inn B&B LK47 Lawrence De Lange Game Reserve Entertainment Area
IT5 Annie's House IT45 Grootfontein Agricultural Institute
LK8 Grace Land Lodge LK48 Longhill Nature Reserve Picnic Area IT6 at Schoombee Karoo Accommodation IT46 Haystead & Ford BuildingLK9 KB's Exclusive LK49 Longhill Nature Reserve Entrance IT7 Audreyana B&B IT47 Heritage HouseLK10 Kelbricks B&B LK50 Walter Everitt Gardens IT8 Beaulahland IT48 Hillston Farm CottageLK11 Linga Longa LK51 Queenstown Town Hall IT9 Beestekuil Holiday Farm IT49 Hotel Middelburg LodgeLK12 Longview Lodge LK52 Queenstown - Hexagon IT10 Betjieskraal Guest House IT50 Joan's OvernightLK13 Milner Cottage LK53 Ruth Lock Shell Art Gallery IT11 Breë Street IT51 Karel Theron Primary SchoolLK14 Mountain Splendour LK54 JC Marshall Art Gallery IT12 British Military Pumping Station IT52 Karoo Country Inn HotelLK15 MX Overnight LK55 Queenstown Library IT13 Brittish Officers Mess IT53 Karoo HerbergLK16 Norwegian Wood LK56 Queenstown Museum IT14 BrookField IT54 Karoo Manor HouseLK17 Parkside LK57 Queenstown Memorial Gardens IT15 Brulberg Reserve IT55 Karoo Ouberg LodgeLK18 Rose Lodge LK58 Queenstown Golf Club IT16 Burger Monument IT56 Karoo Pred-A-ToursLK19 Siesta B&B LK59 Entrance to Imvani Game Lodge IT17 Butterfly Way IT57 Karoo River Rafting & CabinsLK20 Studio The LK60 Bongolo Dam IT18 Cape Education Department Museum IT58 Karoo Safari LodgeLK21 Tiny Gecko B&B LK61 Waterdown Dam IT19 Carlton Heights Guest Farm IT59 Karoo Wire ArtLK22 Twin Oaks LK62 Bullhoek Masacre Memorial Site IT20 Carochalets & Camping IT60 Koelfontein Karoo Guest FarmLK23 Victoria Manor IK1 Central Hotel IT21 Celtis Garden Cottage IT61 La FonteinLK24 Wagon Inn IK2 Phoenix Hotel IT22 Chair Monument IT62 Lazy GeckoLK25 Wainwright Cottage IK3 Die Herberg IT23 College Road Guest House IT63 Lemon Hoek Guest FarmLK26 Whistler's Corner IK4 Valschfontein IT24 Commando Drift Nature Reserve & Dam IT64 LouvainLK27 Imvani Game Lodge IK5 Mountain Lodge Safaris IT25 Conway Lodge/Halali Safari IT65 Lynfaden B & BLK28 Tsolwana Game Reserve IK6 Laetita Farm Lodge IT26 Cradock Four Gallery IT66 Maliphuhle Lilinge LamakhosikaziLK29 Aristocrats IK7 Suurfontein Guest Farm IT27 Cradock Inn IT67 Manor Holme cottageLK30 Avenue Guest House IK8 Branston Lodge IT28 Cradock Municipal Caravan Park IT68 Market SquareLK31 Burrough Guest Lodge The IK9 Valschfontein Guest Farm IT29 Cradock Spa IT69 Market StreetLK32 Buxton Lodge IK10 Hazelmere IT30 Cradock Tourist Information Office IT70 Memorial at Kwanonzame TownshipLK33 Carrickmoor Guest Farm IK11 Stagger Inn IT31 Cumnor Guest House IT71 Mi kasa Su CasaLK34 De Oude Werf Guesthouse IK12 Black Eagle Lodge IT32 Desert Inn IT72 Middelburg ManorLK35 Heritage Guest House IK13 Rooipoort IT33 Die Oude Pastorie IT73 Middelburg Municipal Caravan ParkLK36 Hexagon Guest House IK14 Jenny’s Cottage IT34 Die Tuishuise IT74 Middelburg Tourist Information OfficeLK37 Homestead The IK15 Broughton IT35 Dit en Dat IT75 Mount Melsetter Karoo HouseLK38 McDonald's Guest House & Caravan Park IK16 Molteno Dam IT36 Dorpshuis Guest House IT76 Mountain Zebra National ParkLK39 Meerlin Guest House IK17 Molteno Library / Museum IT37 Dundas Street IT77 My Home Your HomeLK40 Mountain View Guest House IK18 Molteno NG Church IT38 Dutch Reformed "Mother" Church IT78 Nannheim B & B

Chris Hani District Municipality Tourism Integrated Plan Prepared by: Kyle Business Projects
FINAL DRAFT VERSION 1.5 Page 82 of 177
ID # NAME ID # NAME ID # NAME ID # NAME
IT79 Nickye & Co Cottage EM6 Highveld Lodge EG37 Grave of Nobengula( Nyanga ) SA30 Agricultural Technical Services BuildingIT80 Nietgemand B&B EM7 Dordrecht Kloof EG38 King Rharhabe Grave ( Ngqogi ) SA31 Hota Mbuleni WaterfallIT81 Old Waterpump EM8 Bradgate B&B EG39 Engcobo Guest House SA32 Mbenge WaterfallIT82 Oukop "Hill" EM9 Highland Lodge EG40 Mastandi Guest House SA33 Mahlungu WaterfallsIT83 Oukor Overnight Rooms EG1 Ngqobusini Waterfall EG41 Ulundi Hotel SA34 Mbodlane WaterfallIT84 Palm House EG2 At Khovoti Forest EG42 The White House B&B SA35 Intaba Lodge WaterfallIT85 Protea Place EG3 Khalinga Mountain EG43 Fundani Community Centre SA36 Farm Waterval WaterfallIT86 PW Vorster Museum EG4 Singeni Location EG44 Ikwezi Lomso Community Centre SA37 Farm Brosdile WaterfallIT87 Rooipoort Guest Farm EG5 Tsazo Paintings EG45 Xuka Art Centre SA38 Farm Suainabhal WaterfallIT88 Schooling House EG6 Elucwecwe Paintings EG46 Isivivane Rain Mountain SA39 Langanci ForestIT89 Schoombeesklip EG7 Kwa Xoxo Paintings EG47 Ezihogweni Evil Forest SA40 Mahlungulu ForestIT90 Shalom Guest Lodge EG8 Hill of Vultures SA1 Cala Town SA41 Cala ForestIT91 Sherborne B & B Farm EG9 Qoba Mountain SA2 Mnxe SA42 Drakensberg MountainIT92 Sir John Cradock Guesthouse EG10 Ngqobusini Waterfalls SA3 Tiwane SA43 Mtinggwevu MountainIT93 Sonnett Olls Gallery EG11 Mnyoko Mountain/Forest SA4 Upper Lufuta SA44 Mbenge MountainsIT94 Steam Roller EG12 Mkonkotho Forest SA5 Mbodlane SA45 Cape Vulture Colony (Ixhalanga )IT95 The Cradock Club EG13 Khovoti Forest SA6 Sifondile( Lahlangubo Caves) SA46 Thompson Dam Nature ReserveIT96 The Cradock Four Memorial EG14 Khalinyanga Mountain SA7 Intaba SA47 Mnxe MissionIT97 The Cradock House EG15 Mtuntloni Mountain SA8 Inkciyo SA48 DRC MissionIT98 The early 20th century horse drinking trough EG16 Kumanina Forest SA9 Denorbin SA49 Monument for Political Heroes in CalaIT99 The Fish Eagle EG17 Ngxangxasi Wetland SA10 Xalanga Sandstone Bridge at Cala SA50 Chief Gecelo's Grave at MbhengeIT100 The Great Fish River Museum EG18 Gulandodo Forest SA11 Cala Magistrate Court SA51 Hota Mbeleni Peach ProjectIT101 The Inxuba Yethemba Municipal Park EG19 All Saints Forest SA12 Cala Town Hall SA52 Masithembe Arts and Crafts (Cala )IT102 The Irelander EG20 Manzana Forest SA13 Cala Anglican Church SA53 Elliot Beaders ( Elliot )IT103 The Jurie Lombard Watermill EG21 Khalinyanga Forest SA14 Cala Roman Catholic Church SA54 Mbenge Beadwork ProjectIT104 The Schreiner House EG22 Cefane Forest SA15 Cala Dutch Reformed Church SA55 Nyalasa Beadwork ProjectIT105 The Stables EG23 Ezihogweni Forest SA16 Cala High School SA56 La Gilda HotelIT106 Tjaart’s Lodge EG24 Satans Nek SA17 Cala Hospital SA57 Sinako B&BIT107 Uncedo Lwethu Women's Group EG25 Qhulunqu Mass Grave SA18 Cala Holy Cross Convent SA58 The Palace B&BIT108 Victoria Manor EG26 King Ngubencuka's Grave SA19 Cala Old Prison SA59 Kwa Nokhaya B&BIT109 Vusubuntu Cultural Village EG27 Clarkbury Mission SA20 Cala Road Police Station SA60 Topiary B&BIT110 Wall of Rememberance EG28 St Albans Mission SA21 Cala Road Railway Station SA61 The Stone Post Self CateringIT111 Warden House EG29 Mjanyana Leper Institute SA22 Xalanga Hotel and Bar SA62 Myburgh LodgeIT112 Witkrans Lodge EG30 Manzana Mission SA23 Old Farm House SA63 The Rose GardenIT113 Wolwevlei B & B EG31 Lehehewini MK Camp SA24 Transkei/RSA Border Post SA64 Merino HotelEM1 Indwe Resort EG32 All Saints Mission SA25 Dutch Reformed Church SA65 Elliot Caravan ParkEM2 Indwe Hotel EG33 Njanga High School ( Thabo Mbeki) SA26 Du Plessis Hall ( First Church ) SA66 Thompson Dam ResortEM3 Washington Guest Farm EG34 Quthubeni Village ( Walter Sisulu ) SA27 Town Hall SA67 Langhurst B&BEM4 Jonashoek B&B EG35 Quthubeni Great Place SA28 Anglican Church SA68 Intaba LodgeEM5 97 Grey Street B&B EG36 Ntaka Battlefield SA29 Library SA69 Tulloch Self Catering

Chris Hani District Municipality Tourism Integrated Plan Prepared by: Kyle Business Projects
FINAL DRAFT VERSION 1.5 Page 83 of 177
ID # NAME ID # NAME ID # NAME ID # NAME
TS1 The Royal Hotel TS24 Commando Drift Nature Reserve TS47 Isolomzi Dancers IY5 Gcibala2TS2 Lesleys B & B TS25 Tsolwana Game Reserve TS48 Itekeng Bead project IY6 Gcibala3TS3 Carrickmoor Guest Farm TS26 Ratelshoek Guest Farm TS49 Tsarona Pottery IY7 LutuliTS4 Blanco Guest Farm TS27 Falcon Ridge TS50 Maluti Sotho Hats Project IY8 LutuliTS5 Knowley Cottage TS28 Groen Fontein TS51 Thandolwethu Beadwork IY9 SibondaTS6 Redcliffe TS29 Lelik Poortjie TS52 Traditional Dancing Group IY10 MbuluTS7 Highland Home TS30 Hartbeesfontein TS53 Tsolwana Game Reserve IY11 Tsomo Information Lay-byeTS8 Tsolwana Game Reserve TS31 Carrickmoor Guest Farm TS54 Amaqwati Tribal Area IY12 Tsomo Methodist ChurchTS9 Commando Drift Nature Reserve TS32 Amajuba TS55 Commando Drift nature Reserve IY13 R61 - Gateway Information OfficeTS10 Ratelshoek Guest Farm TS33 Wildschutsberg TS56 Vlekpoort Nature Area IY14 Cofimvaba Information OfficeTS11 Rhino Inn Caravan Park TS34 Modderfontein Battle Site TS57 Fenella Falls, Spring Valley IY15 Tsomo Methodist ChurchTS12 Glenetive TS35 Olive Schreiner house TS58 Amajuba Farm IY16 St Marks ChurchTS13 Athlone Guest House TS36 Hendrik Potgieter House TS59 Swallow Kranz Game Reserve IY17 St Marks Town CentreTS14 Die Pondokkie TS37 Slagtersnek Rebellion Site TS60 Wildschutsberg Game Reserve IY18 St Marks Gateway Information CentreTS15 Zeta’s B & B TS38 Bulhoek Massacre Site TS61 Rietfontein Game Reserve IY19 Qamata Traditional CouncilTS16 Pieterien B & B TS39 Commando Drift Battle Site TS62 Bowers Hope Game Reserve IY20 Qamata B&BTS17 Victoria Hotel TS40 Dutch Reform Church TS63 Winterberg Conservancy IY21 Horse Riding Ground - St MarksTS18 Lilyfontein Lodge, Ntabathemba TS41 Anglo-Boer War Memorial TS64 Toorberg IY22 Camama Chesiro B&BTS19 Swallow Kranz Hunting Lodge TS42 Hofmeyer Museum TS65 Bamboesberg IY23 Lubisi Resort DamTS20 Bowers Hope Hunting Lodge TS43 Covenant Memorial, Fonteintjie IY1 Esigubude IY24 Heritage (Ncora)TS21 Hunters Hill Hunting Lodge TS44 Ncedisizwe Cooperative IY2 NyhabaTS22 Rietfontein Hunting Lodge TS45 Amahlubi Dancers IY3 ElaliniTS23 Bamboes Guest Farm TS46 Zamukulunga Dancers IY4 Gcibala1
(Source: Kyle Business Projects)
Table 27: The tourism products identified by the project and marked on the spatial plan of the current tourism environment in Figure 28. The ID number
refers to the identification number on the spatial plan. Full details of the products are provided in Appendix 6.