Child Victimizers: Violent Offenders and Their Victims
32
Jointly published with the Office of Juvenile Justice and Delinquency Prevention U.S. Department of Justice Office of Justice Programs Child Victimizers: Violent Offenders and Their Victims 0% 20% 40% 60% 80% 100% All violent crimes Murder Kidnaping Forcible rape Sexual assault Robbery Assault Negligent man- slaughter Victims 12 or younger Victims age 13 to 17 Offense Percent of State prison inmates with victims under age 18 19% of violent State prison inmates committed their crime against a child; 78% of those convicted of sexual assault had abused a child Bureau of Justice Statistics
-
Upload
khangminh22 -
Category
Documents
-
view
0 -
download
0
Transcript of Child Victimizers: Violent Offenders and Their Victims

Jointly published with the Office of Juvenile Justice
and Delinquency Prevention
U.S. Department of JusticeOffice of Justice Programs
Child Victimizers: ViolentOffenders and Their Victims
0%
20%
40%
60%
80%
100%
All violent crimes
Murder Kidnaping Forciblerape
Sexualassault
Robbery AssaultNegligent man-slaughter
Victims 12 or younger
Victims age 13 to 17
Offense
Percent of State prison inmates with victims under age 18
19% of violent State prison inmates committed their crime against a child; 78% of those convicted of sexual assault had abused a child
Bureau of Justice Statistics
Child Victimizers: ViolentOffenders and their Victims
Jointly published with the Office of Juvenile Justice and Delinquency Prevention
By Lawrence A. GreenfeldStatistician, Bureau of Justice Statistics
March 1996, NCJ-153258
U.S. Department of JusticeOffice of Justice ProgramsBureau of Justice Statistics
U.S. Department of JusticeBureau of Justice Statistics
Jan M. Chaiken, Ph.D.Director
This report was written by Lawrence A.Greenfeld of the Bureau of Justice Sta-tistics. Tracy Snell and Jodi Brown as-sisted with verification. Tom Hesterand Yvonne Boston edited and pro-duced the report. Marilyn Marbrooksupervised publication. The authorwould like to express appreciation toPatrick A. Langan, Ph.D., Carol J. De-Frances, Ph.D., and Marianne Zawitzof BJS and to Jeffrey Slowikowski ofthe Office of Juvenile Justice and De-linquency Prevention for their thought-ful comments and suggestions. Inaddition, Melissa H. Sickmund, Ph.D., and Howard N. Snyder of the NationalCenter for Juvenile Justice and JamesAlan Fox, Ph.D., Dean, College ofCriminal Justice, Northeastern Univer-sity, facilitated the analysis of the mostrecent data on child murder.
The data analyzed for this report maybe obtained from the National Archiveof Criminal Justice Data, Box 1248,Ann Arbor, MI 48106 (800-999-0960).The two datasets are cataloged asSurvey of Inmates of State Correc-tional Facilities, 1991 (ICPSR6068)and Uniform Crime Reports: Supple-mentary Homicide Reports 1976-92(ICPSR6387). Supplementary Homi-cide Reports for 1993-94 will be avail-able in the near future.
An electronic version of this report andthe data analyzed in the report may befound on the Internet at http://www.ojp.usdoj.gov/bjs/
Foreword iii
Highlights iv
Violent offenders who committedcrimes against children 1
Criminal history of prisoners who victimized children 3
Characteristics of offenders who victimized children 5
Characteristics of child victims of violent crime 9 Number of victims per offender Sex and race of victim and offender Victim-offender relationship
Characteristics of violent crimeswith child victims 12 Where the crimes occurred Use of weapons Injuries
Child murder: Victims and offenders 15
Explanatory notes 23 Methodology Numbers for graphs
ii Child Victimizers: Violent Offenders and Their Victims
Contents
Child Victimizers: Violent Offenders and Their Victims iii
Foreword
This report, utilizing the responses of a nationally represen-tative sample of State prisoners, together with homicidedata assembled by law enforcement agencies, sheds newlight on the most serious types of child abuse and victimiza-tion those offenses for which a term of imprisonmentwas imposed or in which the child was murdered.
The vast majority of prison inmates whose victims were un-der age 18 had committed some form of sexual assault ormolestation. The victims were typically children whom theyhad known, not randomly selected strangers. Nearly a thirdof those serving time in State prisons for violence againstchildren had victimized their own child or a stepchild.
The problems of family violence and sexual assault cometogether when the victim is a child. This study reveals howdifferent the child victimizer is from the adult victimizer inboth criminal history and social background. The violent
child victimizer in prison, though usually having a less ex-tensive criminal past than other prisoners, more often has a background of having been sexually abused in childhood.
The findings on child murder, drawn from detailed informa-tion from nearly 37,000 child murders since 1976, confirmand elaborate on our agencies' recent reports evidencinggrowing numbers of victims in the 15-17 age group, increases in the murder of both white and minority youth,and increases in both murders with handguns and murdersby strangers or unidentified perpetrators.
We hope that you will find this report, a cooperative effort of the Bureau of Justice Statistics and the Office of Juvenile Justice and Delinquency Prevention, to be of interest and value for helping to lay the foundation for addressing the problem of violence against children.
Jan M. Chaiken, Ph.D
Director
Bureau of Justice Statistics
Shay Bilchik
Administrator
Office of Juvenile Justice andDelinquency Prevention
Based on the reports of offenders inthe Survey of Inmates of State Correc-tional Facilities:
Characteristics of offenses against children
An estimated 18.6% of inmates serv-ing time in State prisons in 1991 forviolent crimes, or about 61,000 offend-ers nationwide, had been convicted ofa crime against a victim under age 18.
1 in 5 violent offenders serving timein a State prison reported having vic-timized a child.
More than half the violent crimescommitted against children involvedvictims age 12 or younger.
7 in 10 offenders with child victimsreported that they were imprisoned fora rape or sexual assault.
Two-thirds of all prisoners convictedof rape or sexual assault had commit-ted their crime against a child.
Characteristics of the offenders
All but 3% of offenders who commit-ted violent crimes against childrenwere male.
Offenders who had victimized achild were on average 5 years olderthan the violent offenders who hadcommitted their crimes against adults.Nearly 25% of child victimizers wereage 40 or older, but about 10% of theinmates with adult victims fell in thatage range.
While nearly 70% of those servingtime for violent crimes against childrenwere white, whites accounted for 40%of those imprisoned for violent crimesagainst adults.
Inmates who victimized childrenwere less likely than other inmates tohave a prior criminal record nearly a
third of child-victimizers had neverbeen arrested prior to the current of-fense, compared to less than 20% ofthose who victimized adults.
Violent child-victimizers were sub-stantially more likely than those withadult victims to have been physicallyor sexually abused when they werechildren, though the majority of violentoffenders, regardless of victim age, didnot have a history of such abuse.
About 14% of child victimizers car-ried a weapon during the violent crime,compared to nearly half of those whovictimized adults.
About 10% of violent offenders withchild victims received life or death sen-tences and the average prison termwas 11 years, somewhat shorter aver-age sentences than received by thosewith adult victims.
Characteristics of the victims
3 in 10 child victimizers reportedthat they had committed their crimesagainst multiple victims; they weremore likely than those who victimizedadults to have had multiple victims.
3 in 4 child victims of violence werefemale.
For the vast majority of child-victimizers in State prison, the victimwas someone they knew before thecrime:
A third had committed their crimeagainst their own child.
About half had a relationship withthe victim as a friend, acquaintance,or relative other than offspring.
About 1 in 7 reported the victim to have been a stranger to them.
Three-quarters of the violent vic-timizations of children took place ineither the victim’s home or the of-fender’s home.
4 in 10 child victims of violence suf-fered either a forcible rape or anotherinjury.
Child murder victims
Based on incident-level homicide datacollected by the FBI:
Children under the age of 18 ac-counted for 11% of all murder victimsin the United States in 1994. Nearlyhalf of the 2,660 child victims were be-tween ages 15 and 17. About 1 in 5child victims were known to be killedby another child.
Between 1976 and 1994 an esti-mated 37,000 children were murdered.
Since the mid-1980's the increasesin both the number and the rate ofmurder among persons age 15 to 17,and particularly among black youth in this age range, have outpacedchanges in murder in all other agegroups.
The victim-offender relationship inchild murder varies with the age of thevictim: In most murders of a youngchild, a family member killed the child,while in most murders of an olderchild, age 15 to 17, the perpetratorwas an acquaintance to the victim orwas unknown to law enforcementauthorities. About 1 in 5 child murderswere committed by a family member.
Half of all child murders in 1994were committed with a handgun; about7 in 10 victims age 15 to 17 were killedwith a handgun.
iv Child Victimizers: Violent Offenders and Their Victims
Highlights
About the sources of data
Descriptions of the 1991 Survey ofInmates in State Correctional Facili-ties and of the Supplementary Homi-cide Reports begin on page 23.
Nearly two-thirds of rapists andsexual assaulters in State prisoncommitted their crime against achild
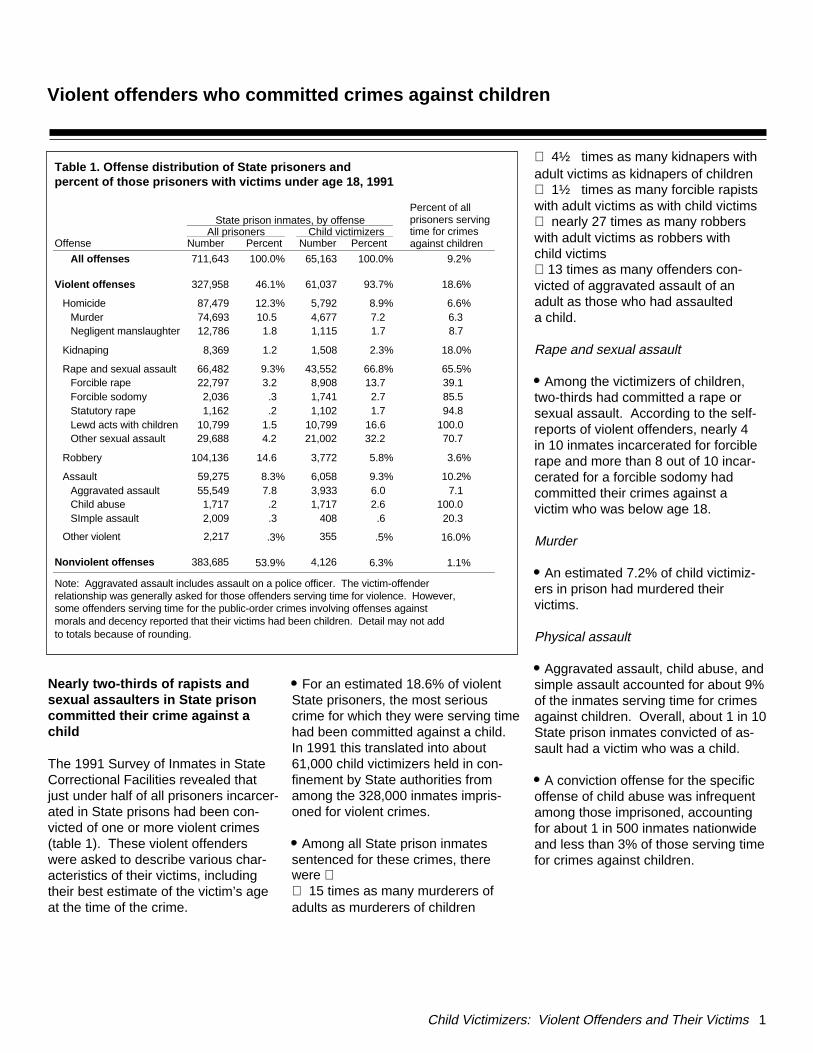
The 1991 Survey of Inmates in StateCorrectional Facilities revealed thatjust under half of all prisoners incarcer-ated in State prisons had been con-victed of one or more violent crimes(table 1). These violent offenderswere asked to describe various char-acteristics of their victims, includingtheir best estimate of the victim’s ageat the time of the crime.
For an estimated 18.6% of violentState prisoners, the most seriouscrime for which they were serving timehad been committed against a child.In 1991 this translated into about61,000 child victimizers held in con-finement by State authorities fromamong the 328,000 inmates impris-oned for violent crimes.
Among all State prison inmates sentenced for these crimes, therewere 15 times as many murderers ofadults as murderers of children
4½ times as many kidnapers withadult victims as kidnapers of children 1½ times as many forcible rapistswith adult victims as with child victims nearly 27 times as many robberswith adult victims as robbers with child victims13 times as many offenders con-victed of aggravated assault of anadult as those who had assaulted a child.
Rape and sexual assault
Among the victimizers of children,two-thirds had committed a rape orsexual assault. According to the self-reports of violent offenders, nearly 4 in 10 inmates incarcerated for forciblerape and more than 8 out of 10 incar-cerated for a forcible sodomy had committed their crimes against a victim who was below age 18.
Murder
An estimated 7.2% of child victimiz-ers in prison had murdered their victims.
Physical assault
Aggravated assault, child abuse, andsimple assault accounted for about 9%of the inmates serving time for crimesagainst children. Overall, about 1 in 10State prison inmates convicted of as-sault had a victim who was a child.
A conviction offense for the specificoffense of child abuse was infrequentamong those imprisoned, accountingfor about 1 in 500 inmates nationwideand less than 3% of those serving timefor crimes against children.
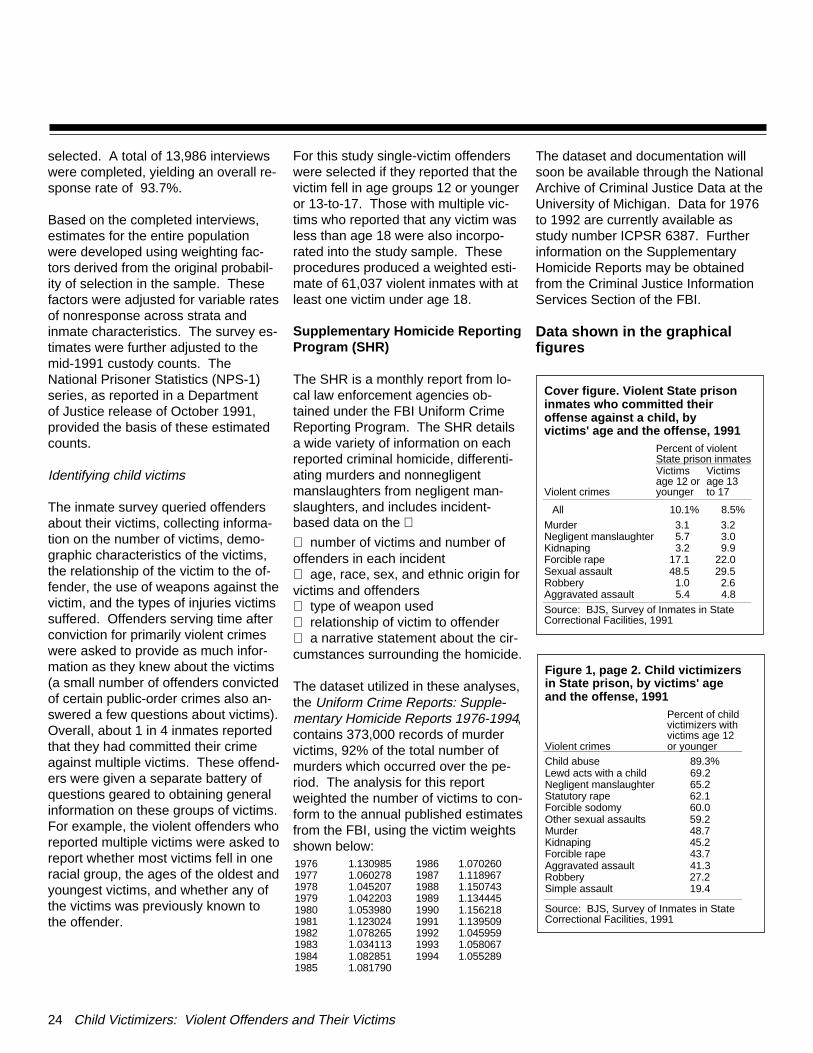
Child Victimizers: Violent Offenders and Their Victims 1
Table 1. Offense distribution of State prisoners and percent of those prisoners with victims under age 18, 1991
State prison inmates, by offensePercent of allprisoners servingtime for crimesagainst children
All prisoners Child victimizersOffense Number Percent Number Percent
All offenses 711,643 100.0% 65,163 100.0% 9.2%
Violent offenses 327,958 46.1% 61,037 93.7% 18.6%
Homicide 87,479 12.3% 5,792 8.9% 6.6%Murder 74,693 10.5 4,677 7.2 6.3Negligent manslaughter 12,786 1.8 1,115 1.7 8.7
Kidnaping 8,369 1.2 1,508 2.3% 18.0%
Rape and sexual assault 66,482 9.3% 43,552 66.8% 65.5%Forcible rape 22,797 3.2 8,908 13.7 39.1Forcible sodomy 2,036 .3 1,741 2.7 85.5Statutory rape 1,162 .2 1,102 1.7 94.8Lewd acts with children 10,799 1.5 10,799 16.6 100.0Other sexual assault 29,688 4.2 21,002 32.2 70.7
Robbery 104,136 14.6 3,772 5.8% 3.6%
Assault 59,275 8.3% 6,058 9.3% 10.2%Aggravated assault 55,549 7.8 3,933 6.0 7.1Child abuse 1,717 .2 1,717 2.6 100.0SImple assault 2,009 .3 408 .6 20.3
Other violent 2,217 .3% 355 .5% 16.0%
Nonviolent offenses 383,685 53.9% 4,126 6.3% 1.1%
Note: Aggravated assault includes assault on a police officer. The victim-offender relationship was generally asked for those offenders serving time for violence. However, some offenders serving time for the public-order crimes involving offenses against morals and decency reported that their victims had been children. Detail may not add to totals because of rounding.
Violent offenders who committed crimes against children
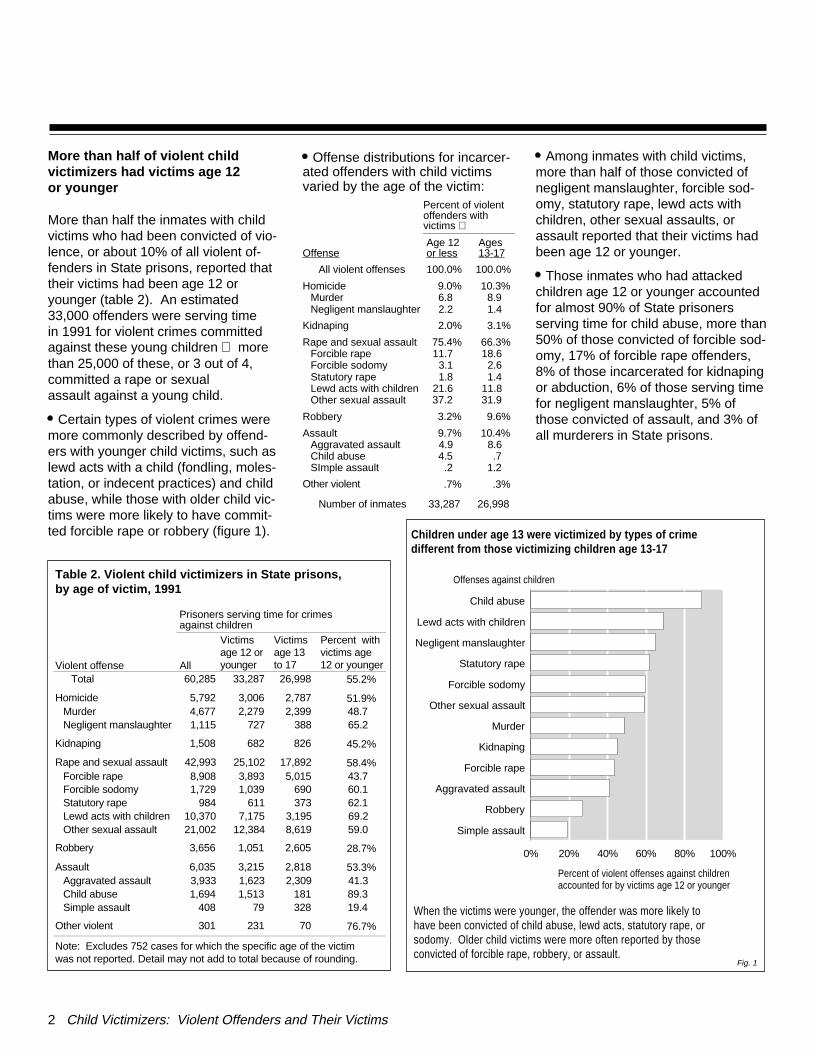
More than half of violent child victimizers had victims age 12 or younger
More than half the inmates with childvictims who had been convicted of vio-lence, or about 10% of all violent of-fenders in State prisons, reported thattheir victims had been age 12 oryounger (table 2). An estimated33,000 offenders were serving time in 1991 for violent crimes committedagainst these young children morethan 25,000 of these, or 3 out of 4,committed a rape or sexual assault against a young child.
Certain types of violent crimes weremore commonly described by offend-ers with younger child victims, such aslewd acts with a child (fondling, moles-tation, or indecent practices) and childabuse, while those with older child vic-tims were more likely to have commit-ted forcible rape or robbery (figure 1).
Among inmates with child victims,more than half of those convicted ofnegligent manslaughter, forcible sod-omy, statutory rape, lewd acts withchildren, other sexual assaults, or assault reported that their victims hadbeen age 12 or younger.
Those inmates who had attackedchildren age 12 or younger accountedfor almost 90% of State prisonersserving time for child abuse, more than50% of those convicted of forcible sod-omy, 17% of forcible rape offenders,8% of those incarcerated for kidnapingor abduction, 6% of those serving timefor negligent manslaughter, 5% ofthose convicted of assault, and 3% ofall murderers in State prisons.
2 Child Victimizers: Violent Offenders and Their Victims
Offense distributions for incarcer-ated offenders with child victimsvaried by the age of the victim:
Percent of violentoffenders with victims
OffenseAge 12or less
Ages13-17
All violent offenses 100.0% 100.0%
Homicide 9.0% 10.3%Murder 6.8 8.9Negligent manslaughter 2.2 1.4
Kidnaping 2.0% 3.1%
Rape and sexual assault 75.4% 66.3%Forcible rape 11.7 18.6Forcible sodomy 3.1 2.6Statutory rape 1.8 1.4Lewd acts with children 21.6 11.8Other sexual assault 37.2 31.9
Robbery 3.2% 9.6%
Assault 9.7% 10.4%Aggravated assault 4.9 8.6Child abuse 4.5 .7SImple assault .2 1.2
Other violent .7% .3%
Number of inmates 33,287 26,998
Child abuse
Lewd acts with children
Negligent manslaughter
Statutory rape
Forcible sodomy
Other sexual assault
Murder
Kidnaping
Forcible rape
Aggravated assault
Robbery
Simple assault
0% 20% 40% 60% 80% 100%
Offenses against children
Percent of violent offenses against childrenaccounted for by victims age 12 or younger
When the victims were younger, the offender was more likely to have been convicted of child abuse, lewd acts, statutory rape, or sodomy. Older child victims were more often reported by those convicted of forcible rape, robbery, or assault.
Children under age 13 were victimized by types of crime different from those victimizing children age 13-17
Fig. 1
Table 2. Violent child victimizers in State prisons, by age of victim, 1991
Prisoners serving time for crimes against children
Violent offense All
Victims age 12 oryounger
Victims age 13 to 17
Percent withvictims age12 or younger
Total 60,285 33,287 26,998 55.2%
Homicide 5,792 3,006 2,787 51.9%Murder 4,677 2,279 2,399 48.7Negligent manslaughter 1,115 727 388 65.2
Kidnaping 1,508 682 826 45.2%
Rape and sexual assault 42,993 25,102 17,892 58.4%Forcible rape 8,908 3,893 5,015 43.7Forcible sodomy 1,729 1,039 690 60.1Statutory rape 984 611 373 62.1Lewd acts with children 10,370 7,175 3,195 69.2Other sexual assault 21,002 12,384 8,619 59.0
Robbery 3,656 1,051 2,605 28.7%
Assault 6,035 3,215 2,818 53.3%Aggravated assault 3,933 1,623 2,309 41.3Child abuse 1,694 1,513 181 89.3Simple assault 408 79 328 19.4
Other violent 301 231 70 76.7%
Note: Excludes 752 cases for which the specific age of the victim was not reported. Detail may not add to total because of rounding.
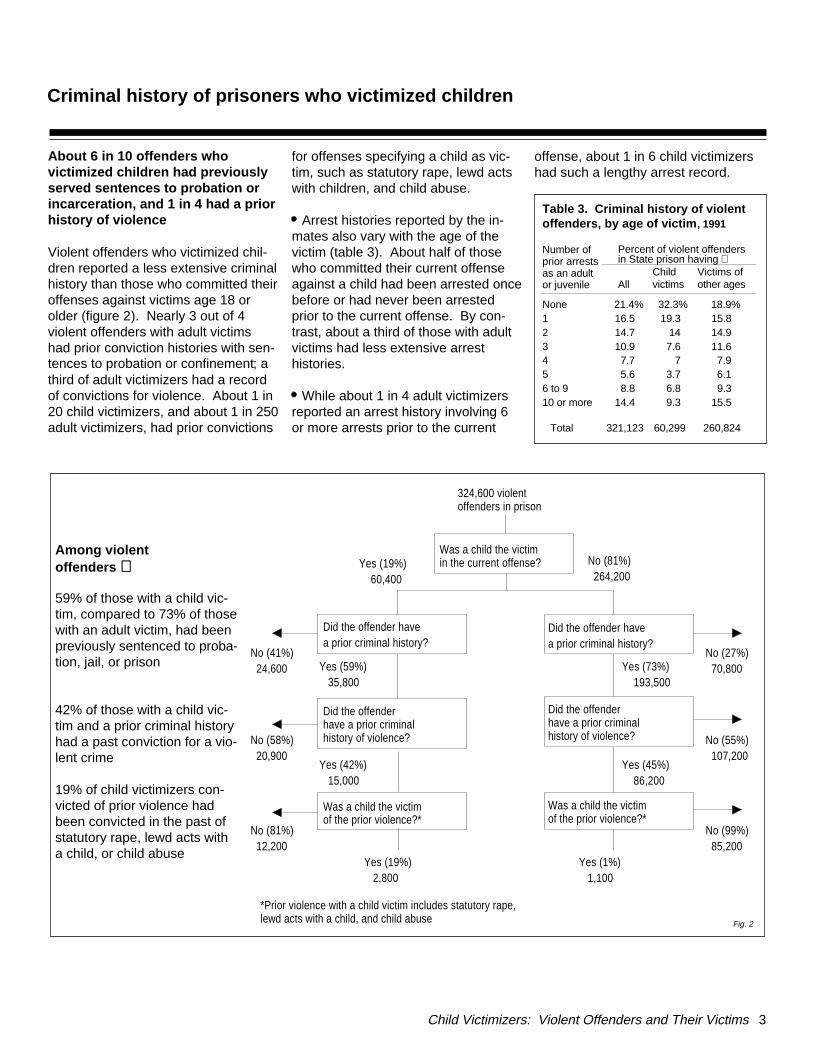
About 6 in 10 offenders who victimized children had previouslyserved sentences to probation orincarceration, and 1 in 4 had a priorhistory of violence
Violent offenders who victimized chil-dren reported a less extensive criminalhistory than those who committed theiroffenses against victims age 18 orolder (figure 2). Nearly 3 out of 4violent offenders with adult victims had prior conviction histories with sen-tences to probation or confinement; athird of adult victimizers had a recordof convictions for violence. About 1 in20 child victimizers, and about 1 in 250adult victimizers, had prior convictions
for offenses specifying a child as vic-tim, such as statutory rape, lewd actswith children, and child abuse.
Arrest histories reported by the in-mates also vary with the age of thevictim (table 3). About half of thosewho committed their current offenseagainst a child had been arrested oncebefore or had never been arrestedprior to the current offense. By con-trast, about a third of those with adultvictims had less extensive arresthistories.
While about 1 in 4 adult victimizersreported an arrest history involving 6or more arrests prior to the current
offense, about 1 in 6 child victimizershad such a lengthy arrest record.
Child Victimizers: Violent Offenders and Their Victims 3
Did the offender havea prior criminal history?
Did the offender havea prior criminal history?
Was a child the victim in the current offense?
Did the offender have a prior criminal history of violence?
Did the offender have a prior criminal history of violence?
Was a child the victim of the prior violence?*
No (41%) 24,600 Yes (59%)
35,800
No (58%) 20,900
Yes (42%) 15,000
No (81%) 12,200
Yes (19%) 2,800
No (81%) 264,200
Yes (73%) 193,500
No (27%) 70,800
No (55%) 107,200
No (99%) 85,200
Yes (1%) 1,100
Yes (45%) 86,200
Yes (19%) 60,400
Was a child the victim of the prior violence?*
324,600 violent offenders in prison
*Prior violence with a child victim includes statutory rape, lewd acts with a child, and child abuse Fig. 2
Criminal history of prisoners who victimized children
Table 3. Criminal history of violent offenders, by age of victim , 1991
Number of prior arrests as an adultor juvenile
Percent of violent offenders in State prison having
AllChild victims
Victims ofother ages
None 21.4% 32.3% 18.9%1 16.5 19.3 15.82 14.7 14 14.93 10.9 7.6 11.64 7.7 7 7.95 5.6 3.7 6.16 to 9 8.8 6.8 9.310 or more 14.4 9.3 15.5
Total 321,123 60,299 260,824
Among violent offenders
59% of those with a child vic-tim, compared to 73% of thosewith an adult victim, had beenpreviously sentenced to proba-tion, jail, or prison
42% of those with a child vic-tim and a prior criminal historyhad a past conviction for a vio-lent crime
19% of child victimizers con-victed of prior violence hadbeen convicted in the past ofstatutory rape, lewd acts witha child, or child abuse
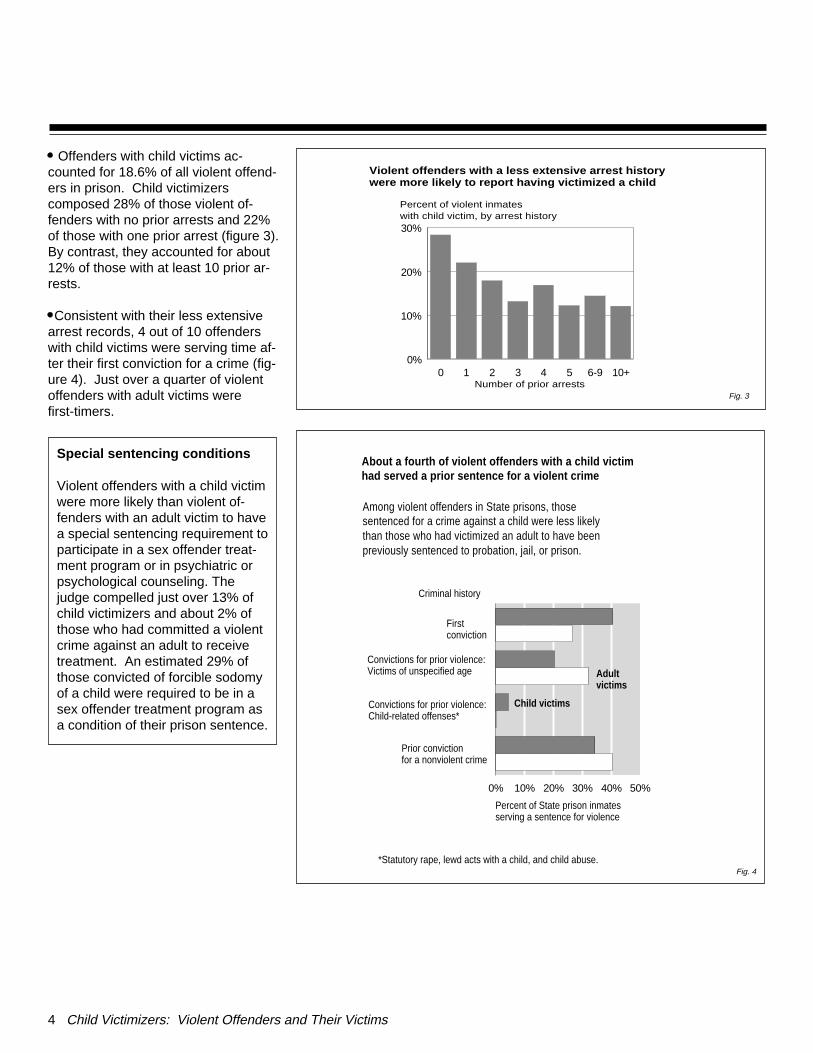
Offenders with child victims ac-counted for 18.6% of all violent offend-ers in prison. Child victimizerscomposed 28% of those violent of-fenders with no prior arrests and 22%of those with one prior arrest (figure 3).By contrast, they accounted for about12% of those with at least 10 prior ar-rests.
Consistent with their less extensivearrest records, 4 out of 10 offenderswith child victims were serving time af-ter their first conviction for a crime (fig-ure 4). Just over a quarter of violentoffenders with adult victims werefirst-timers.
4 Child Victimizers: Violent Offenders and Their Victims
0% 10% 20% 30% 40% 50%
Child victims
Adult victims
First conviction
Prior convictionfor a nonviolent crime
Percent of State prison inmatesserving a sentence for violence
Criminal history
About a fourth of violent offenders with a child victim had served a prior sentence for a violent crime
Among violent offenders in State prisons, thosesentenced for a crime against a child were less likely than those who had victimized an adult to have been previously sentenced to probation, jail, or prison.
*Statutory rape, lewd acts with a child, and child abuse.
Convictions for prior violence:Victims of unspecified age
Convictions for prior violence:Child-related offenses*
Fig. 4
Special sentencing conditions
Violent offenders with a child victimwere more likely than violent of-fenders with an adult victim to havea special sentencing requirement toparticipate in a sex offender treat-ment program or in psychiatric orpsychological counseling. Thejudge compelled just over 13% ofchild victimizers and about 2% ofthose who had committed a violentcrime against an adult to receivetreatment. An estimated 29% ofthose convicted of forcible sodomyof a child were required to be in asex offender treatment program asa condition of their prison sentence.
0 1 2 3 4 5 6-9 10+0%
10%
20%
30%
Number of prior arrests
Violent offenders with a less extensive arrest historywere more likely to report having victimized a child
Percent of violent inmateswith child victim, by arrest history
Fig. 3
Inmates convicted of violenceagainst children were more likely tohave been white, to have been mar-ried, and to have been older thanoffenders who victimized adults
The characteristics and backgroundsof inmates who committed their of-fenses against children differed mark-edly from those offenders whoreported an adult victim. Though both
groups of offenders weresimilar in being com-posed almost entirely ofmen, significant con-trasts were found in thefollowing:
Race
Among imprisoned vio-lent offenders, aboutequal percentages werewhite (48.0%) or black(48.1%) (table 4). Bycontrast, nearly 70% of child victimizers were
white, while just over 25% of child vic-timizers were black.
White inmates were nearly 3 timesmore likely than black inmates to havehad a child victim. About 27% of allwhite inmates in State prisons for vio-lent crimes committed their crimesagainst a child; less than 10% of blackinmates serving time for violence had a child victim.
Hispanic origin
Little difference in the percentagesof Hispanic prisoners existed betweenthose serving time for violence againstchildren 11.1% were Hispanic and those convicted for violenceagainst adults 14.5% were His-panic. About 1 in every 7 Hispanic in-
mates imprisoned for aviolent crime reported thattheir victim was under age18.
Marital status
Marital status distin-guished child victimizersfrom adult victimizers in theviolent State inmate popu-lation. Child victimizerswere substantially morelikely than adult victimizersto have ever been married.Nearly two-thirds of thosewho reported having com-mitted their crime against achild had married; nearly 6in 10 adult victimizers hadnever married.
Child Victimizers: Violent Offenders and Their Victims 5
Characteristics of offenders who victimized children
Table 4. Demographic characteristics of violent offenders, by victim age, 1991
Percent of violent offendersin State prison having
Characteristic of violent offenders All
Childvictims
Adultvictims
Total 100.0 % 100.0 % 100 .0%
Sex Male 96.2% 96.6% 96.1%Female 3.8 3.4 3.9
RaceWhite 48.0% 69.7% 43.1%Black 48.1 25.5 53.3Other 3.9 4.8 3.6
Hispanic originHispanic 13.9% 11.1% 14.5%Non-Hispanic 86.1 88.9 85.5
Marital statusMarried 17.1% 23.3% 15.7%Widowed 2.6 2.0 2.7Divorced 21.4 32.7 18.9Separated 5.6 5.4 5.6Never married 53.3 36.5 57.1
Age at arrest for current offense17 or younger 3.0% 2.1% 3.2%18-24 38.1 26.1 40.825-29 22.1 17.6 23.130-34 15.0 16.9 14.635-39 8.8 12.0 8.140-44 5.0 7.9 4.445-49 3.4 6.2 2.750-54 1.7 4.1 1.255-59 1.5 4.3 .960 or older 1.4 2.8 1.0
Mean age at arrest 29 yr 33 yr 28 yrMedian age at arrest 27 31 26
Education8th grade or less 13.5% 17.1% 12.7%9th grade 12.1 11.4 12.210th grade 16.2 12.9 1711th grade 17.9 14.0 18.712th grade 26.0 26.9 25.8College 14.3 17.7 13.6
Employment in month before arrest
Employed 69.6% 78.0% 67.7%Unemployed 30.4 22.0 32.3
Total number 327,958 61,037 266,920
<18
18-24
25-29
30-34
35-39
40-44
45-49
50-54
55-59
60+
0% 20% 40% 60%
Age at arrest
State prisoners who had committed their crime against a child comprised over 45%of violent inmates arrested in their 50's and under 14% of those arrested in their 20's.
Percent of violent State prison inmates who were serving a sentence for victimizing a child
Fig. 5
Age
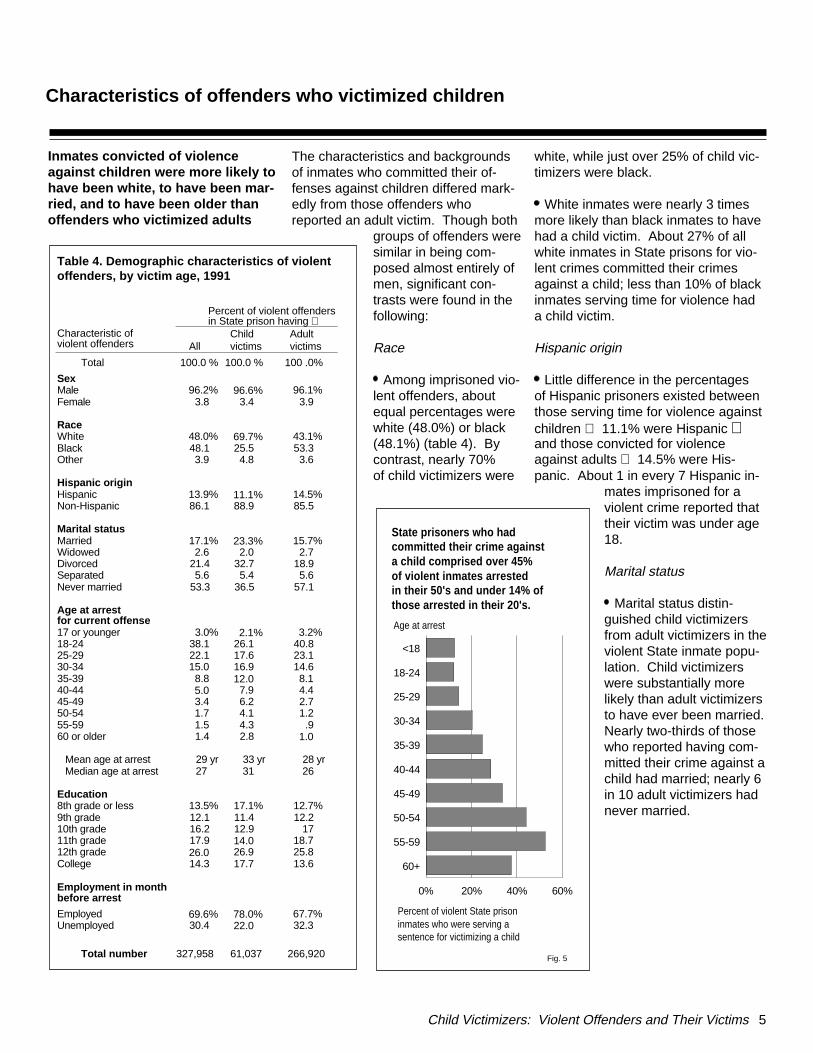
The age of victims varied inverselywith the age of offenders inmateswho were older at the time of the ar-rest for the violent crimes for whichthey had been imprisoned were morelikely to have had child victims (figure5). At the time of the arrest for theviolent crime which brought them toprison, child victimizers were an aver-age 5 years older than those who vic-timized adults.
While about 11% of child victimizerswere age 50 or older when arrested,about 3% of those who victimizedadults were at least 50. Among thosewho had been arrested at age 24 oryounger, about 1 in 8 had victimized achild; among those age 55 or older,nearly 4 in 8 had a child victim.
Offenders serving time for crimesagainst children were more likely to have grown up in homes withboth parents present and to havesuffered sexual abuse as a child
Overall, in terms of the type of familybackground they had as children,white and black violent offenders dif-fered sharply 56% of the whites and31% of the blacks grew up in homeswith both parents present. The familybackground of white offenders, whomade up three-fourths of those with achild victim, characterized a majority ofchild victimizers (table 5).
Black victimizers of children had thesame family background as black vic-timizers of adults. White victimizers ofchildren were more likely than white
victimizers of adults to have lived withboth parents.
Adult and child victimizers did notsubstantially differ in the percentagewho had ever been in an institution orfoster home as a child, the percentagewho said their parents or guardianshad abused drugs or alcohol, and thepercentage who reported that an im-mediate family member, parent, or sib-ling had ever served time for a crime.
6 Child Victimizers: Violent Offenders and Their Victims
Table 5. Family background of violent offenders, by age of victim, 1991
Percent of violent offenders in State prison having
Characteristicof violent offenders All Child victims
Victims ofother ages
Total 100.0% 100.0% 100.0%
Primarily grew up with Mother only 39.0% 30.1% 41.0%Father only 3.6 2.8 3.8Both parents 43.7 54.2 41.2Grandparents 7.3 5.7 7.7Other relatives 3.0 2.2 3.2Foster home or institution 2.7 4.3 2.3Other .7 .7 .8
Ever spent time in a foster home or institutionYes 18.5% 16.6% 18.8%No 81.6 83.4 81.2
Parents/guardiansabused drugs or alcoholYes 27.7% 31.5% 26.9%No 72.3 68.5 73.1
Immediate family memberever served timeYes 37.0% 35.6% 37.3%No 63.0 64.4 62.7
Total number 327,958 61,037 266,920
Table 6. Prior physical or sexual abuse experienced by violentoffenders, by age of victim, 1991
Percent of violent offenders in State prison having
Characteristicof violent offenders All Child victims
Victims ofother ages
Total 100.0% 100.0% 100.0%
Ever physically or sexually abusedNo 82.9% 69.0% 86.1%Yes 17.1 31.0 13.9
Physical abuse only 8.2 8.8 8.1Sexual abuse only 3.1 8.7 1.9Both physical and sexual abuse 5.7 13.5 4.0
Age at which abuse occurredNo abuse 82.9% 69.0% 86.1%Abused 17.1 31.0 13.9
Less than 18 years old 12.4 25.7 9.318 years old or older 2.0 1.4 2.1Both as a child and an adult 2.9 3.9 2.6
Who the abuser wasNo prior abuse 82.9% 69.0% 86.1%Stranger 2.0 2.7 1.9Known 15.1 28.3 12.0
Parent/guardian 7.9 13.7 6.5Other relative 2.9 6.4 2.1Acquaintance 4.3 8.1 3.4
Total number 327,958 61,037 266,920
Note: Other relatives includes spouses and ex-spouses and acquaintances includes boyfriends and girlfriends. Detail may not add to total because ofrounding.
Primarily grewup with
Childvictimizers White Black
Adultvictimizers White Black
Single parent 25% 55% 34% 53%Both parents 63 30 53 31Other 12 15 13 16
The majority of violent offenders, re-gardless of the age of the victim oftheir imprisonment offense, reportedno prior experience as a child or anadult with having been physically orsexually abused (table 6). Inmates with child victims were more
than twice as likely as inmates withadult victims to report having sufferedprior instances of physical or sexualabuse. The differences were particu-larly striking with respect to sexualabuse. While an estimated 22% ofchild victimizers reported having beensexually abused, less than 6% of adultvictimizers reported such back-grounds.
Among all violent offenders with ahistory of having been sexually
abused, nearly half had child victims.Among all violent offenders with a his-tory of having been physically abused,nearly 30% had child victims. Amongviolent offenders with no history ofphysical or sexual abuse, 15.5% hadchild victims.
About 95% of child victimizers and86% of adult victimizers who reportedhaving been abused physically orsexually said that such abuse had oc-curred while they were children.Among those who suffered physical orsexual abuse before age 18, 36% hadchild victims; among those who suf-fered abuse after entering adulthood,13% had child victims.
For about 9 out of 10 violent offend-ers experiencing prior physical or sex-ual abuse, the abuser was someonethey had known. For both inmateswith child victims and inmates withadult victims, about half reported thatthe abuse they suffered was by a par-ent or guardian. However, child vic-timizers (13.7%) were about twice aslikely as adult victimizers (6.5%) tohave suffered parental abuse. Thepercentage of child victimizers variedaccording to who had abused them:
Violent offenders with child victimsreported less involvement thanadult victimizers with drugs or alcohol at the time of the crime
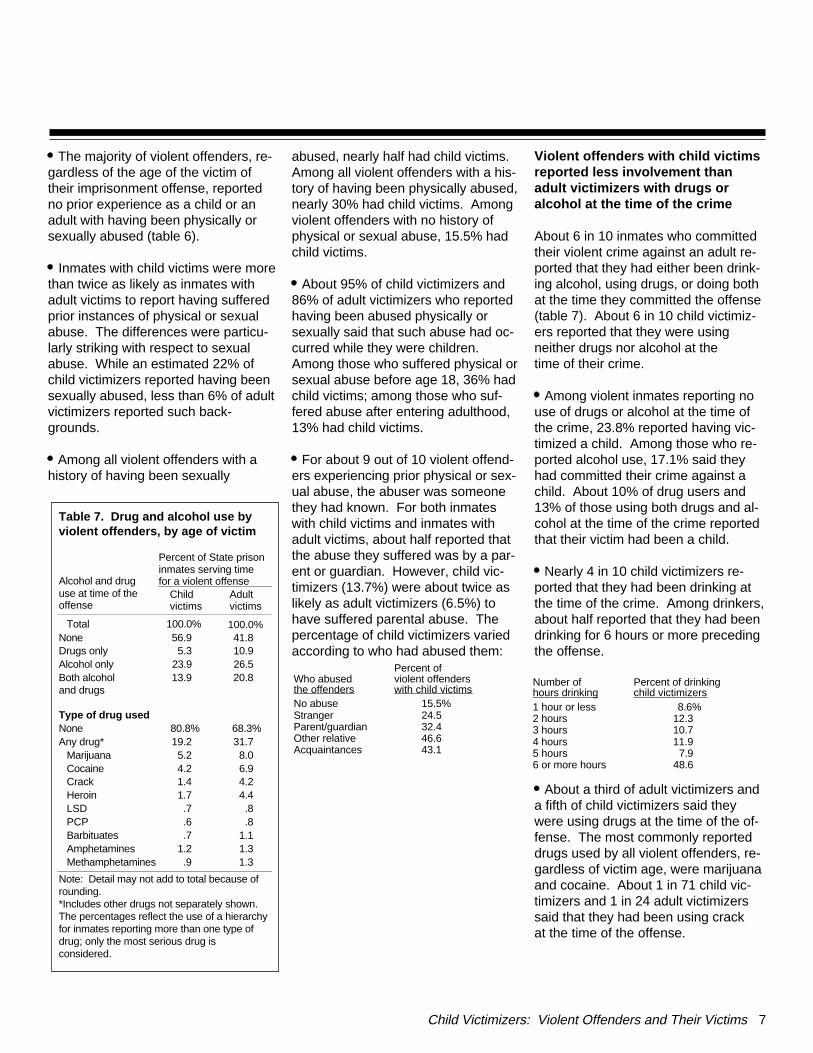
About 6 in 10 inmates who committedtheir violent crime against an adult re-ported that they had either been drink-ing alcohol, using drugs, or doing bothat the time they committed the offense(table 7). About 6 in 10 child victimiz-ers reported that they were using neither drugs nor alcohol at the time of their crime.
Among violent inmates reporting nouse of drugs or alcohol at the time ofthe crime, 23.8% reported having vic-timized a child. Among those who re-ported alcohol use, 17.1% said theyhad committed their crime against achild. About 10% of drug users and13% of those using both drugs and al-cohol at the time of the crime reportedthat their victim had been a child.
Nearly 4 in 10 child victimizers re-ported that they had been drinking atthe time of the crime. Among drinkers,about half reported that they had beendrinking for 6 hours or more precedingthe offense.
About a third of adult victimizers anda fifth of child victimizers said theywere using drugs at the time of the of-fense. The most commonly reporteddrugs used by all violent offenders, re-gardless of victim age, were marijuanaand cocaine. About 1 in 71 child vic-timizers and 1 in 24 adult victimizerssaid that they had been using crack at the time of the offense.
Child Victimizers: Violent Offenders and Their Victims 7
Who abused the offenders
Percent of violent offenderswith child victims
No abuse 15.5%Stranger 24.5Parent/guardian 32.4Other relative 46.6Acquaintances 43.1
Table 7. Drug and alcohol use by violent offenders, by age of victim
Alcohol and drug use at time of theoffense
Percent of State prisoninmates serving time for a violent offense
Childvictims
Adultvictims
Total 100.0% 100.0%None 56.9 41.8Drugs only 5.3 10.9Alcohol only 23.9 26.5Both alcohol and drugs
13.9 20.8
Type of drug usedNone 80.8% 68.3%Any drug* 19.2 31.7
Marijuana 5.2 8.0Cocaine 4.2 6.9Crack 1.4 4.2Heroin 1.7 4.4LSD .7 .8PCP .6 .8Barbituates .7 1.1Amphetamines 1.2 1.3Methamphetamines .9 1.3
Note: Detail may not add to total because ofrounding.*Includes other drugs not separately shown. The percentages reflect the use of a hierarchyfor inmates reporting more than one type ofdrug; only the most serious drug isconsidered.
Number of hours drinking
Percent of drinkingchild victimizers
1 hour or less 8.6%2 hours 12.33 hours 10.74 hours 11.95 hours 7.96 or more hours 48.6
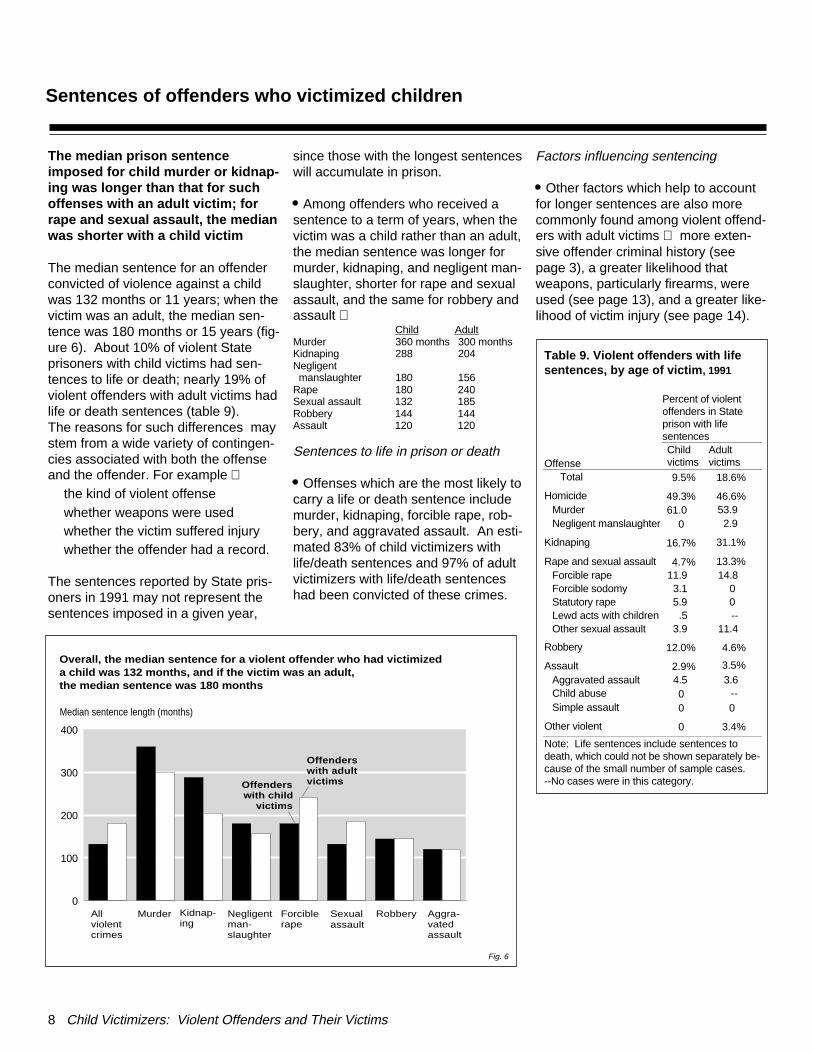
The median prison sentence imposed for child murder or kidnap-ing was longer than that for suchoffenses with an adult victim; forrape and sexual assault, the medianwas shorter with a child victim
The median sentence for an offenderconvicted of violence against a childwas 132 months or 11 years; when thevictim was an adult, the median sen-tence was 180 months or 15 years (fig-ure 6). About 10% of violent Stateprisoners with child victims had sen-tences to life or death; nearly 19% ofviolent offenders with adult victims hadlife or death sentences (table 9). The reasons for such differences maystem from a wide variety of contingen-cies associated with both the offenseand the offender. For example
the kind of violent offense whether weapons were used whether the victim suffered injurywhether the offender had a record.
The sentences reported by State pris-oners in 1991 may not represent thesentences imposed in a given year,
since those with the longest sentenceswill accumulate in prison.
Among offenders who received asentence to a term of years, when thevictim was a child rather than an adult,the median sentence was longer formurder, kidnaping, and negligent man-slaughter, shorter for rape and sexualassault, and the same for robbery andassault
Child AdultMurder 360 months 300 monthsKidnaping 288 204 Negligent manslaughter 180 156 Rape 180 240 Sexual assault 132 185 Robbery 144 144Assault 120 120
Sentences to life in prison or death
Offenses which are the most likely tocarry a life or death sentence includemurder, kidnaping, forcible rape, rob-bery, and aggravated assault. An esti-mated 83% of child victimizers withlife/death sentences and 97% of adultvictimizers with life/death sentenceshad been convicted of these crimes.
Factors influencing sentencing
Other factors which help to accountfor longer sentences are also morecommonly found among violent offend-ers with adult victims more exten-sive offender criminal history (seepage 3), a greater likelihood thatweapons, particularly firearms, wereused (see page 13), and a greater like-lihood of victim injury (see page 14).
8 Child Victimizers: Violent Offenders and Their Victims
Table 9. Violent offenders with life sentences, by age of victim , 1991
Percent of violent offenders in Stateprison with lifesentences
OffenseChild victims
Adultvictims
Total 9.5% 18.6%
Homicide 49.3% 46.6%Murder 61.0 53.9Negligent manslaughter 0 2.9
Kidnaping 16.7% 31.1%
Rape and sexual assault 4.7% 13.3%Forcible rape 11.9 14.8Forcible sodomy 3.1 0 Statutory rape 5.9 0 Lewd acts with children .5 --Other sexual assault 3.9 11.4
Robbery 12.0% 4.6%
Assault 2.9% 3.5%Aggravated assault 4.5 3.6Child abuse 0 --Simple assault 0 0
Other violent 0 3.4%
Note: Life sentences include sentences todeath, which could not be shown separately be-cause of the small number of sample cases.--No cases were in this category.
0
100
200
300
400
Offenders with adult victimsOffenders
with child victims
Murder Forciblerape
Sexual assault
RobberyNegligentman-slaughter
Aggra-vated assault
All violentcrimes
Kidnap-ing
Overall, the median sentence for a violent offender who had victimized a child was 132 months, and if the victim was an adult, the median sentence was 180 months
Median sentence length (months)
Fig. 6
Sentences of offenders who victimized children
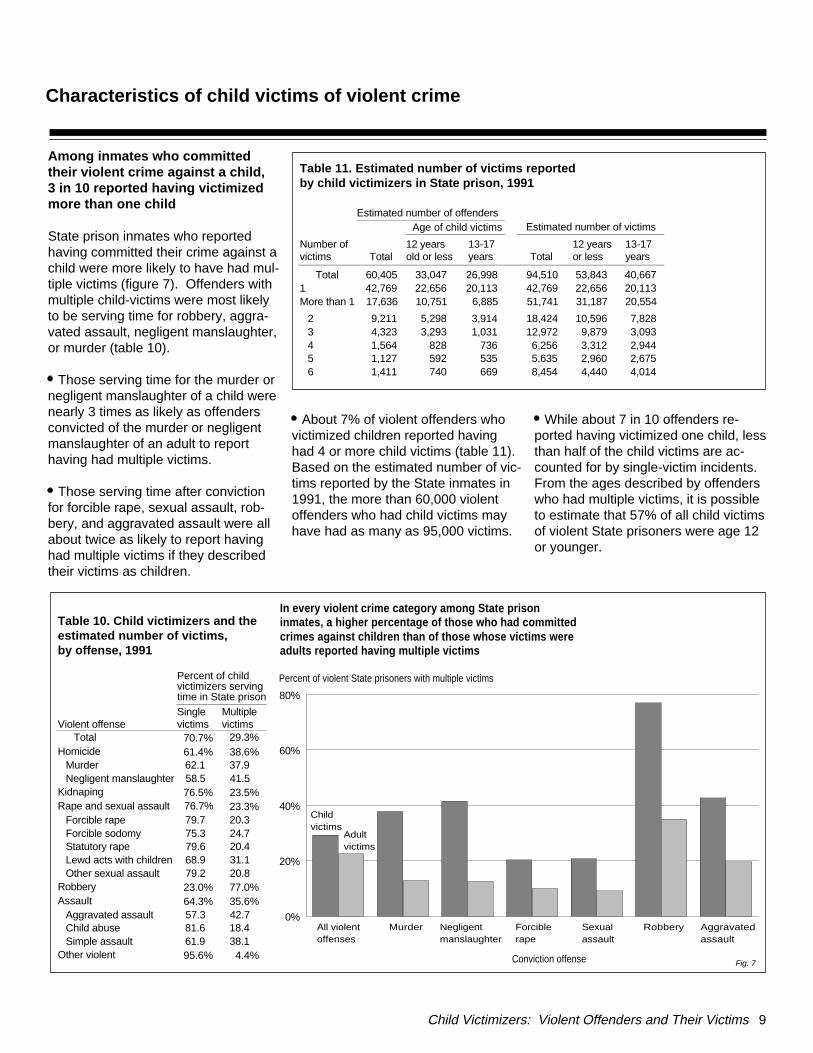
Among inmates who committedtheir violent crime against a child, 3 in 10 reported having victimizedmore than one child
State prison inmates who reportedhaving committed their crime against achild were more likely to have had mul-tiple victims (figure 7). Offenders withmultiple child-victims were most likelyto be serving time for robbery, aggra-vated assault, negligent manslaughter,or murder (table 10).
Those serving time for the murder ornegligent manslaughter of a child werenearly 3 times as likely as offendersconvicted of the murder or negligentmanslaughter of an adult to report having had multiple victims.
Those serving time after convictionfor forcible rape, sexual assault, rob-bery, and aggravated assault were allabout twice as likely to report havinghad multiple victims if they describedtheir victims as children.
About 7% of violent offenders whovictimized children reported havinghad 4 or more child victims (table 11).Based on the estimated number of vic-tims reported by the State inmates in1991, the more than 60,000 violentoffenders who had child victims mayhave had as many as 95,000 victims.
While about 7 in 10 offenders re-ported having victimized one child, lessthan half of the child victims are ac-counted for by single-victim incidents.From the ages described by offenderswho had multiple victims, it is possibleto estimate that 57% of all child victimsof violent State prisoners were age 12or younger.
Child Victimizers: Violent Offenders and Their Victims 9
Characteristics of child victims of violent crime
Table 10. Child victimizers and theestimated number of victims, by offense, 1991
Percent of childvictimizers servingtime in State prison
Violent offenseSingle victims
Multiplevictims
Total 70.7% 29.3%Homicide 61.4% 38.6%
Murder 62.1 37.9Negligent manslaughter 58.5 41.5
Kidnaping 76.5% 23.5%Rape and sexual assault 76.7% 23.3%
Forcible rape 79.7 20.3Forcible sodomy 75.3 24.7Statutory rape 79.6 20.4Lewd acts with children 68.9 31.1Other sexual assault 79.2 20.8
Robbery 23.0% 77.0%Assault 64.3% 35.6%
Aggravated assault 57.3 42.7Child abuse 81.6 18.4Simple assault 61.9 38.1
Other violent 95.6% 4.4%
0%
20%
40%
60%
80%
Childvictims
Adult victims
All violentoffenses
Murder Negligentmanslaughter
Forciblerape
Sexualassault
Robbery Aggravatedassault
Percent of violent State prisoners with multiple victims
In every violent crime category among State prison inmates, a higher percentage of those who had committed crimes against children than of those whose victims were adults reported having multiple victims
Conviction offense
Table 11. Estimated number of victims reported by child victimizers in State prison, 1991
Estimated number of offenders Age of child victims Estimated number of victims
Number of victims Total
12 yearsold or less
13-17years Total
12 yearsor less
13-17years
Total 60,405 33,047 26,998 94,510 53,843 40,6671 42,769 22,656 20,113 42,769 22,656 20,113More than 1 17,636 10,751 6,885 51,741 31,187 20,554
2 9,211 5,298 3,914 18,424 10,596 7,8283 4,323 3,293 1,031 12,972 9,879 3,0934 1,564 828 736 6,256 3,312 2,9445 1,127 592 535 5,635 2,960 2,6756 1,411 740 669 8,454 4,440 4,014
Fig. 7
Three out of four child victims ofviolent offenders were female andnearly a third were the offender’sown child or stepchild
Inmates convicted of violent crimesagainst children described a wide vari-ety of characteristics of their victims.Because most inmate descriptions of characteristics of victims in single vic-tim incidents do not differ greatly fromthe characteristics of those in multiplevictim incidents, this section focusesupon describing child victims utilizing
the 70% of offenders who had onevictim.
Among violent offenders who victim-ized children, the vast majority (75%)reported the victim had been a female(table 12).
These child victims, like the inmateswho described them, were more likelyto have been white than the adult vic-tims of violent offenders. Overall, fornearly 9 out of 10 child victims, the of-fender was of the same race.
Just over half the imprisoned violentoffenders reported that their victim had been age 12 or younger. An estimated 86% of child victimiz-
ers reported that a prior relationshipexisted with the victim (tables 12 and13). About 14% of those serving time in State prisons for violent crimesagainst children had committed theircrime against a stranger.
More than 40% of offenders withchild victims said the victim had beena relative or member of their immedi-ate family. For 3 out of 4 of these offenders, and about a third of childvictimizers overall, the victim was their own child or a stepchild.
10 Child Victimizers: Violent Offenders and Their Victims
Table 12. Characteristics ofchild victims in single victimincidents, 1991
Characteristic ofchild victims
Percent of childvictims
Total 100.0%
SexMale 24.7%Female 75.3
RaceWhite 71.6%Black 24.5Other 3.9
EthnicityHispanic 9.4%Non-Hispanic 90.6
AgeLess than age 12 52.9%Age 12 to 17 47.1
Victim/offenderrelationshipStranger 14.1%Known 85.9
Own child/stepchild 32.2Sibling 1.0Other relative 10.3Girlfriend/ex-girlfriend 3.7Acquaintance 36.6By sight only 2.0
Total number of offenderswith single victims 42,946
Offender race/ victim race
Percent of childvictimizations
White/white 65.9% Black/black 21.5All other combinations 12.7
Table 13. Victim-offender relationship among prisoners serving time for violence against children, 1991
Numberof Stateprisoninmates
Percent of State prison inmates serving time for aviolent crime, by relationship to their child victim
Single-victim incident StrangerOwn childa
Otherfamily
Acquaint-ance Intimateb
Total 42,616 14.6% 32.1% 11.1% 38.4% 3.8%
Homicide 3,545 29.5% 23.3% 8.2% 37.4% 1.6%Murder 2,906 29.1 23.3 9.3 38.3 0 Negligent manslaughter 639 31.5 23.3 2.8 33.7 8.7
Kidnaping 1,153 55.5% 7.1 7.5 16.8 13.1
Rape and sexual assault 32,923 9.9% 33.4% 12.5% 40.1% 4.1%Forcible rape 7,099 11.9 36.2 8.9 36.9 6.0Forcible sodomy 1,303 4.3 35.9 27.9 22.2 9.6Statutory rape 878 0 27.9 0 72.1 0 Lewd acts with children 7,136 6.9 31.9 17.9 40.8 2.6Other sexual assault 16,507 11.3 32.9 11.2 40.9 3.6
Robbery 811 55.3% 8.4% 6.5% 22.6% 7.3%
Assault 3,895 20.3% 39.1% 4.6% 35.9% 0 Aggravated assault 2,253 29.8 25.7 5.4 39.1 0 Child abuse 1,390 4.3 63.9 4.3 27.5 0 Simple assault 252 -- -- -- -- --
Other violent 288 -- -- -- -- --
--Too few sample cases for an accurate estimate.aIncludes stepchildren.bBoyfriend or girlfriend.

Child Victimizers: Violent Offenders and Their Victims 11
Less than 10% of inmates serving time for the rape or sexual assaultof a child reported that the victim had been a stranger to them
The victim-offender relationship is a major factor distinguishing adult victims of violence from child victims. Among offenders serving time for violence, adult victimizers are substantially less likely to have had aprior relationship with their victim than is true for those who committed their crimes against children.
Among robbers and kidnapers who reported having victims younger than18, more than half reported the victim to be a stranger (table 13). Crimesinvolving sexual assault and rape were the least likely crimes, as reportedby the offenders, to involve strangers. About a third of child-murderersserving time in State prison reported that the victim had been their ownchild or another relative.
A victim who had been an acquaintance of the inmate accounted fornearly 4 out of 10 child victims of violence. Crimes involving rape and sexual assault accounted for 81% of those serving time for crimes againstacquaintances who were children. By type of victim-offender relationship,the offense distribution of child victimizers was
Compared to violent offenders with adult victims, child victimizers inprison were 6 times as likely to have had a victim who was a relative 43% versus 7% (figure 8). Conversely, adult victimizers were nearly 4times more likely than child victimizers to have had a victim who was astranger to them 55% versus 15% (figure 9).
The offense backgrounds of child victimizers varied with the victim-offender relationship. More than two-thirds of offenders who were strang-ers to their victims reported having a prior conviction record and nearly athird of those who committed violent crimes against children who werestrangers said that they had a prior history of violence.
Stranger Acquaintance Own child Other familyTotal 100.0% 100.0% 100.0% 100.0%
Murder 13.6 6.8 5.0 5.7Rape 13.5 16.0 18.8 13.3Sexual assault 38.6 64.7 61.5 73.7Robbery 7.2 1.1 0.5 1.1Assault 12.8 8.5 11.1 3.9All other 14.3 2.9 3.1 2.3
Stranger Family/intimate AcquaintanceTotal 100.0% 100.0% 100.0%
First-timer 32.7 47.4 37.5Recidivist 67.3 52.6 62.5
No prior violence 35.7 35.9 36.0Prior violence 31.6 16.8 26.6
Child victim* 6.0 3.1 5.5*Prisoners reported prior convictions for lewd acts with children, child abuse, orstatutory rape.
0% 20% 40% 60% 80% 100%
Family member
0% 20% 40% 60% 80% 100%
Stranger
All violent offenses
Murder
Negligentmanslaughter
Forcible rape
Robbery
Aggravated assault
All violent offenses
Murder
Negligentmanslaughter
Forcible rape
Robbery
Aggravated assault
Child victimsAdult victims
Child victims
Adult victims
In 1991 among violent State inmates whose crime was against one victim-- An estimated 43% of the child victims and 7% of the adult victimswere a relative of the offender
An estimated 15% of the child victims and 55% of the adult victimswere a stranger to the offender
Violent State prisoners were about 6 times as likely to have been related to a child victim as to an adult victim
Figs. 8 & 9
Child victimizers in prison weremuch more likely than violent offenders against adults to havecommitted the crime in their own home or the victim’s home
The environment in which victims andoffenders come together varies widelywith the age of the victim. More thanthree-quarters of the violent victimiza-tions of children, as reported by Stateprisoners, took place in either the vic-tim’s home (41%) or the offender’shome (35%) (figure 10). By contrast,about 40% of violent crimes againstadults were reported to have takenplace in either of these two locations.
Crimes involving the sex-ual assault of a child wereabout equally likely to havetaken place in the victim’shome or in the offender’shome (table 14).
Half of the offendersserving time for negligentmanslaughter of a child re-ported that the offensetook place in a public placesuch as a street or park.More than half of the childabuse offenders said thatthe offense took place intheir own home.
12 Child Victimizers: Violent Offenders and Their Victims
Home Victim's Offender's
Public place
Total 100.0% 100.0% 100.0%Murder 9.2 3.6 15.5Negligent manslaughter .7 1.1 8.0Rape 15.7 15.6 12.6Sexual assault 58.7 68.4 35.1Robbery 4.9 1.6 6.6Assault 8.0 8.4 18.8Other crimes 2.8 1.3 3.4
More than 8 in 10 violent crimes against chil-dren that offenders reported took place in theirown homes were forcible rapes or sexual as-saults. The offense distribution of crimesagainst children, by the location in which thecrime took place, was as follows:
Table 14. Place of occurrence of violent crimes against children, 1991
Percent of specified violent crimes against children
Type of violent offense All
Home Victim's Offender's
Commer-cial place
Public place
Otherlocations
Total 100% 41.1% 35.4% 6.7% 11.6% 5.2%
Homicide 100% 42.8% 17.8% 6.5% 28.6% 4.4%
Murder 100 49.2 16.7 6.8 23.3 4.0Negligent manslaughter 100 16.1 21.7 5.2 50.7 6.3
Kidnaping 100% 36.8% 9.1% 17.5% 15.6% 21.0%
Rape and sexual assault 100% 42.9% 41.8% 2.7% 7.7% 4.9%Forcible rape 100 44.3 38.0 3.1 10.0 4.5Forcible sodomy 100 49.1 28.0 9.5 10.3 3.2Statutory rape 100 46.5 48.1 0 0 5.4Lewd acts with children 100 41.4 45.1 2.2 6.0 5.2Other sexual assault 100 42.3 42.4 2.4 7.8 5.1
Robbery 100% 32.5% 9.3% 44.2% 12.3% 1.8%
Assault 100% 32.9% 29.7% 9.9% 21.8% 5.7%Aggravated assault 100 31.2 20.8 15.3 28.6 4.0Child abuse 100 35.4 53.8 0 6.9 3.8Simple assault -- -- -- -- -- --
Other violent -- -- -- -- -- --
--Too few sample cases for an accurate estimate.
Characteristics of violent crimes with child victims
Victim's home
Offender's home
Public place
Commercial place
Other locations
0% 25% 50%
Percent of violent State prison inmates
Over 75% of the violent crimes against children took place in the victim's or the offender's home, whereas about 40% of such crimes against adults occurred there.
Adult victims
Child victims
Prisoners had committed most of the violent crimes against children in homes and most of those against adults in public places or businesses
Fig. 10
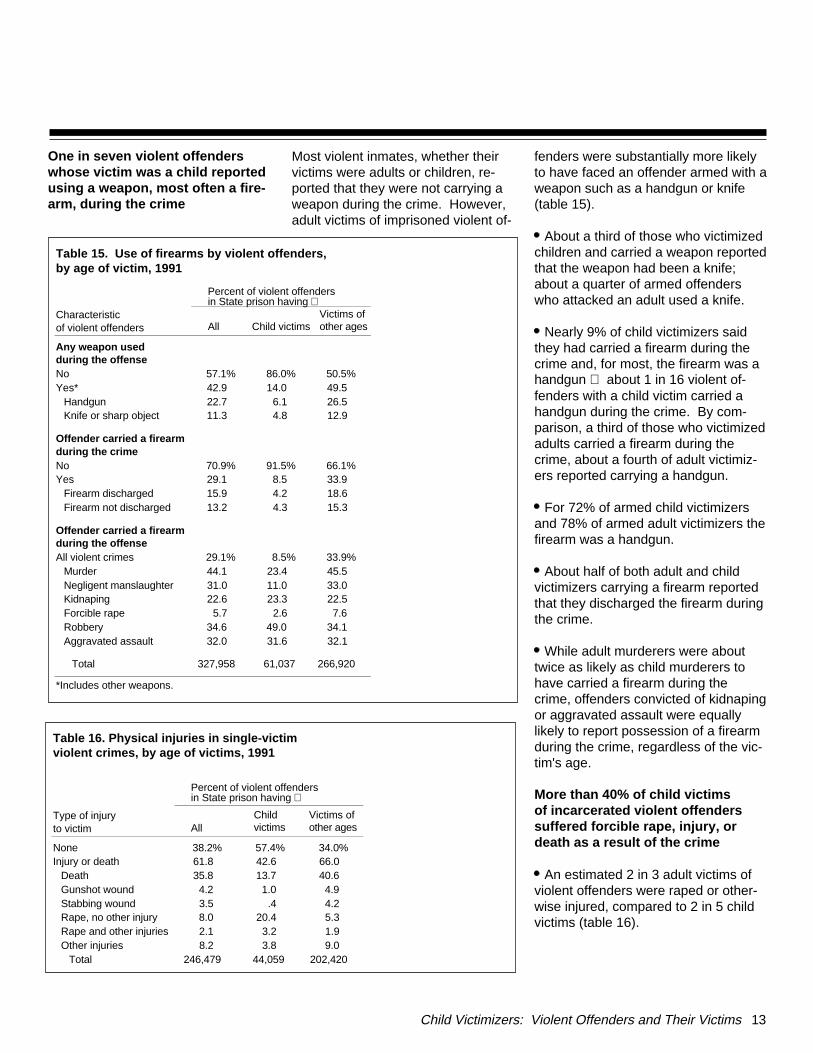
One in seven violent offenderswhose victim was a child reportedusing a weapon, most often a fire-arm, during the crime
Most violent inmates, whether theirvictims were adults or children, re-ported that they were not carrying aweapon during the crime. However,adult victims of imprisoned violent of-
fenders were substantially more likelyto have faced an offender armed with aweapon such as a handgun or knife(table 15).
About a third of those who victimizedchildren and carried a weapon reportedthat the weapon had been a knife;about a quarter of armed offenderswho attacked an adult used a knife.
Nearly 9% of child victimizers saidthey had carried a firearm during thecrime and, for most, the firearm was ahandgun about 1 in 16 violent of-fenders with a child victim carried ahandgun during the crime. By com-parison, a third of those who victimizedadults carried a firearm during thecrime, about a fourth of adult victimiz-ers reported carrying a handgun.
For 72% of armed child victimizersand 78% of armed adult victimizers thefirearm was a handgun.
About half of both adult and child victimizers carrying a firearm reportedthat they discharged the firearm duringthe crime.
While adult murderers were abouttwice as likely as child murderers tohave carried a firearm during thecrime, offenders convicted of kidnapingor aggravated assault were equallylikely to report possession of a firearmduring the crime, regardless of the vic-tim's age.
More than 40% of child victims of incarcerated violent offenders suffered forcible rape, injury, ordeath as a result of the crime
An estimated 2 in 3 adult victims ofviolent offenders were raped or other-wise injured, compared to 2 in 5 childvictims (table 16).
Child Victimizers: Violent Offenders and Their Victims 13
Table 15. Use of firearms by violent offenders, by age of victim, 1991
Percent of violent offenders in State prison having
Characteristicof violent offenders All Child victims
Victims ofother ages
Any weapon used during the offenseNo 57.1% 86.0% 50.5%Yes* 42.9 14.0 49.5
Handgun 22.7 6.1 26.5Knife or sharp object 11.3 4.8 12.9
Offender carried a firearm during the crimeNo 70.9% 91.5% 66.1%Yes 29.1 8.5 33.9
Firearm discharged 15.9 4.2 18.6Firearm not discharged 13.2 4.3 15.3
Offender carried a firearm during the offenseAll violent crimes 29.1% 8.5% 33.9%
Murder 44.1 23.4 45.5Negligent manslaughter 31.0 11.0 33.0Kidnaping 22.6 23.3 22.5Forcible rape 5.7 2.6 7.6Robbery 34.6 49.0 34.1Aggravated assault 32.0 31.6 32.1
Total 327,958 61,037 266,920
*Includes other weapons.
Table 16. Physical injuries in single-victim violent crimes, by age of victims, 1991
Percent of violent offenders in State prison having
Type of injuryto victim All
Child victims
Victims ofother ages
None 38.2% 57.4% 34.0%Injury or death 61.8 42.6 66.0
Death 35.8 13.7 40.6Gunshot wound 4.2 1.0 4.9Stabbing wound 3.5 .4 4.2Rape, no other injury 8.0 20.4 5.3Rape and other injuries 2.1 3.2 1.9Other injuries 8.2 3.8 9.0
Total 246,479 44,059 202,420
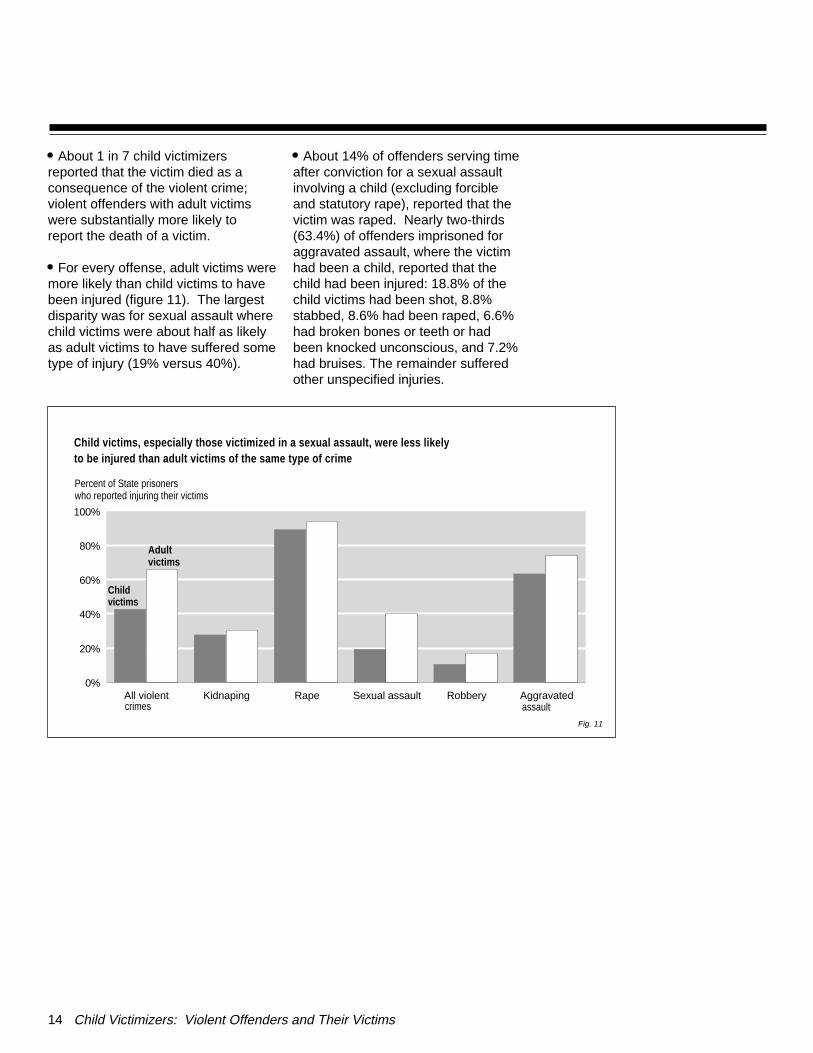
About 1 in 7 child victimizers reported that the victim died as a consequence of the violent crime; violent offenders with adult victimswere substantially more likely to report the death of a victim.
For every offense, adult victims weremore likely than child victims to havebeen injured (figure 11). The largestdisparity was for sexual assault wherechild victims were about half as likelyas adult victims to have suffered sometype of injury (19% versus 40%).
About 14% of offenders serving timeafter conviction for a sexual assaultinvolving a child (excluding forcibleand statutory rape), reported that thevictim was raped. Nearly two-thirds(63.4%) of offenders imprisoned foraggravated assault, where the victimhad been a child, reported that thechild had been injured: 18.8% of thechild victims had been shot, 8.8%stabbed, 8.6% had been raped, 6.6%had broken bones or teeth or hadbeen knocked unconscious, and 7.2%had bruises. The remainder sufferedother unspecified injuries.
14 Child Victimizers: Violent Offenders and Their Victims
All violent Kidnaping Rape Sexual assault Robbery Aggravated0%
20%
40%
60%
80%
100%
crimes assault
Childvictims
Adult victims
Percent of State prisonerswho reported injuring their victims
Child victims, especially those victimized in a sexual assault, were less likely to be injured than adult victims of the same type of crime
Fig. 11
The number of child murders hasbeen growing since the mid-1980's,with the increases concentrated inthe age group 15 to 17
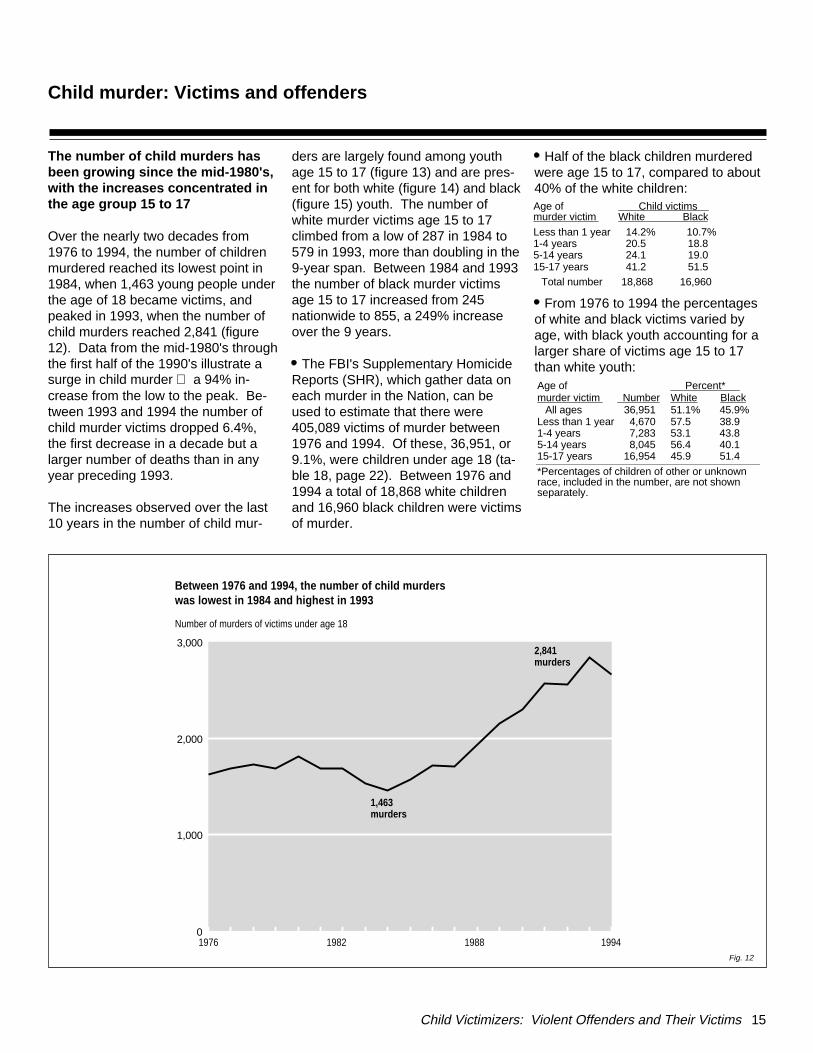
Over the nearly two decades from1976 to 1994, the number of childrenmurdered reached its lowest point in1984, when 1,463 young people underthe age of 18 became victims, andpeaked in 1993, when the number ofchild murders reached 2,841 (figure12). Data from the mid-1980's throughthe first half of the 1990's illustrate asurge in child murder a 94% in-crease from the low to the peak. Be-tween 1993 and 1994 the number ofchild murder victims dropped 6.4%,the first decrease in a decade but alarger number of deaths than in anyyear preceding 1993.
The increases observed over the last10 years in the number of child mur-
ders are largely found among youthage 15 to 17 (figure 13) and are pres- ent for both white (figure 14) and black(figure 15) youth. The number ofwhite murder victims age 15 to 17climbed from a low of 287 in 1984 to579 in 1993, more than doubling in the9-year span. Between 1984 and 1993the number of black murder victimsage 15 to 17 increased from 245 nationwide to 855, a 249% increaseover the 9 years.
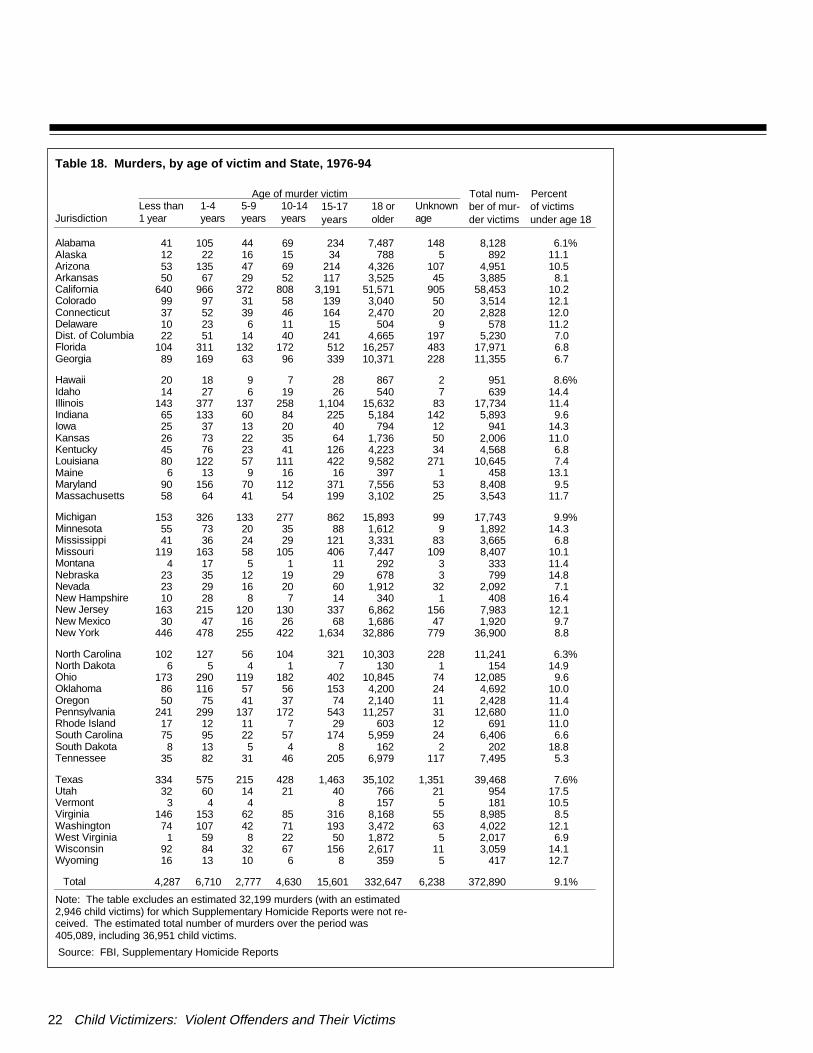
The FBI's Supplementary HomicideReports (SHR), which gather data oneach murder in the Nation, can beused to estimate that there were405,089 victims of murder between1976 and 1994. Of these, 36,951, or9.1%, were children under age 18 (ta-ble 18, page 22). Between 1976 and1994 a total of 18,868 white childrenand 16,960 black children were victimsof murder.
Half of the black children murdered were age 15 to 17, compared to about40% of the white children:
From 1976 to 1994 the percentagesof white and black victims varied byage, with black youth accounting for alarger share of victims age 15 to 17than white youth:
Child Victimizers: Violent Offenders and Their Victims 15
Age of murder victim Number
Percent* White Black
All ages 36,951 51.1% 45.9%Less than 1 year 4,670 57.5 38.91-4 years 7,283 53.1 43.85-14 years 8,045 56.4 40.115-17 years 16,954 45.9 51.4
*Percentages of children of other or unknownrace, included in the number, are not shownseparately.
Age of murder victim
Child victims White Black
Less than 1 year 14.2% 10.7%1-4 years 20.5 18.85-14 years 24.1 19.015-17 years 41.2 51.5
Total number 18,868 16,960
Between 1976 and 1994, the number of child murders was lowest in 1984 and highest in 1993
0
1,000
2,000
3,000
Number of murders of victims under age 18
1,463murders
2,841murders
1976 19941982 1988Fig. 12
Child murder: Victims and offenders
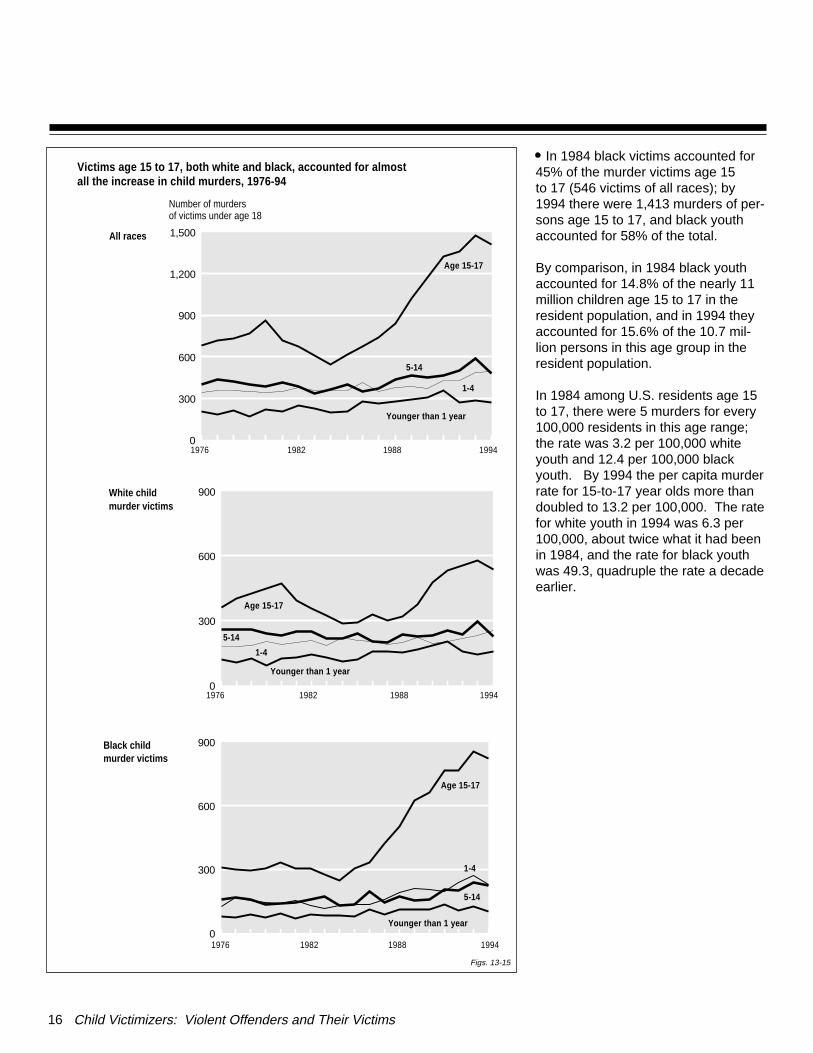
In 1984 black victims accounted for45% of the murder victims age 15 to 17 (546 victims of all races); by1994 there were 1,413 murders of per-sons age 15 to 17, and black youthaccounted for 58% of the total.
By comparison, in 1984 black youthaccounted for 14.8% of the nearly 11million children age 15 to 17 in theresident population, and in 1994 theyaccounted for 15.6% of the 10.7 mil-lion persons in this age group in theresident population.
In 1984 among U.S. residents age 15to 17, there were 5 murders for every100,000 residents in this age range;the rate was 3.2 per 100,000 whiteyouth and 12.4 per 100,000 blackyouth. By 1994 the per capita murderrate for 15-to-17 year olds more thandoubled to 13.2 per 100,000. The ratefor white youth in 1994 was 6.3 per100,000, about twice what it had beenin 1984, and the rate for black youthwas 49.3, quadruple the rate a decadeearlier.
16 Child Victimizers: Violent Offenders and Their Victims
All races
Number of murders of victims under age 18
0
300
600
900
1,200
1,500
Age 15-17
5-14
1-4
Younger than 1 year
1976 1982 19941988
Victims age 15 to 17, both white and black, accounted for almost all the increase in child murders, 1976-94
White child murder victims
0
300
600
900
Age 15-17
5-14
1-4
Younger than 1 year
1976 1982 1988 1994
Black childmurder victims
0
300
600
900
Age 15-17
1-4
5-14
Younger than 1 year
1976 1982 1988 1994
Figs. 13-15
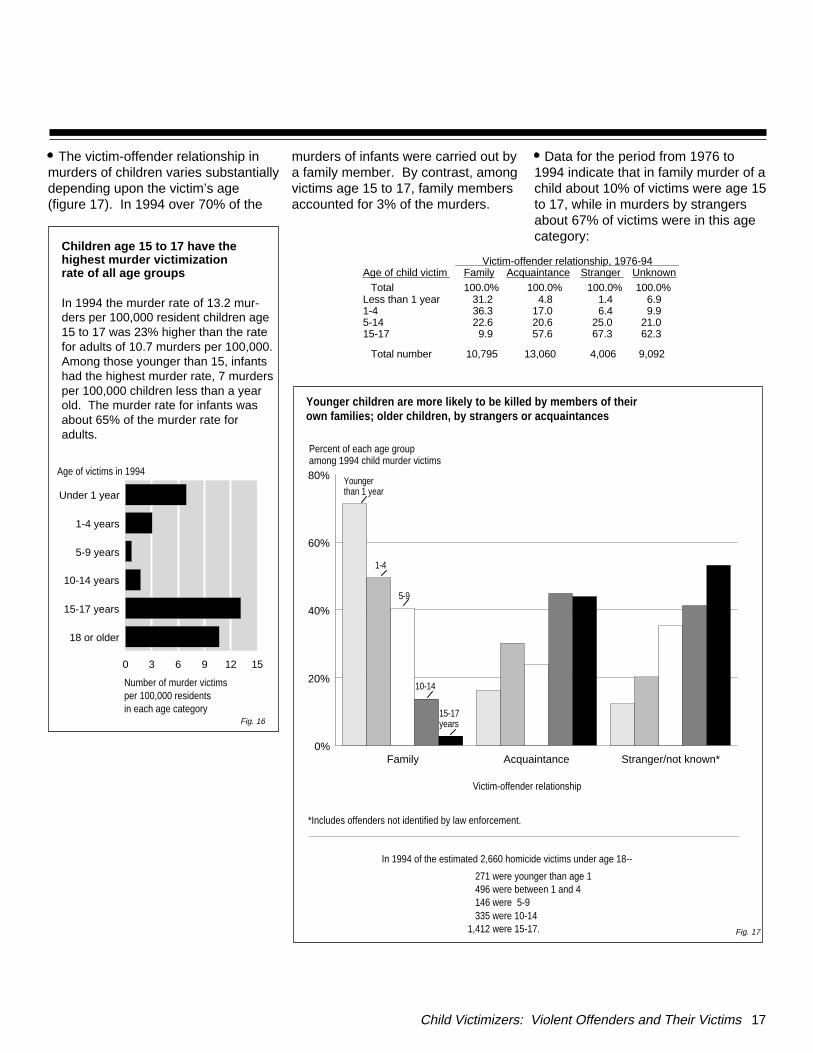
The victim-offender relationship inmurders of children varies substantiallydepending upon the victim’s age (figure 17). In 1994 over 70% of the
murders of infants were carried out bya family member. By contrast, amongvictims age 15 to 17, family membersaccounted for 3% of the murders.
Data for the period from 1976 to1994 indicate that in family murder of achild about 10% of victims were age 15to 17, while in murders by strangersabout 67% of victims were in this agecategory:
Child Victimizers: Violent Offenders and Their Victims 17
Family Acquaintance Stranger/not known*0%
20%
40%
60%
80%
5-9
10-14
1-4
15-17years
Youngerthan 1 year
*Includes offenders not identified by law enforcement.
Victim-offender relationship
Percent of each age group among 1994 child murder victims
Younger children are more likely to be killed by members of their own families; older children, by strangers or acquaintances
271 were younger than age 1 496 were between 1 and 4 146 were 5-9 335 were 10-141,412 were 15-17.
In 1994 of the estimated 2,660 homicide victims under age 18--
Fig. 17
Children age 15 to 17 have the highest murder victimization rate of all age groups
In 1994 the murder rate of 13.2 mur-ders per 100,000 resident children age15 to 17 was 23% higher than the ratefor adults of 10.7 murders per 100,000.Among those younger than 15, infantshad the highest murder rate, 7 murdersper 100,000 children less than a yearold. The murder rate for infants wasabout 65% of the murder rate foradults.
Under 1 year
1-4 years
5-9 years
10-14 years
15-17 years
18 or older
0 3 6 9 12 15
Number of murder victims per 100,000 residents in each age category
Age of victims in 1994
Fig. 16
Victim-offender relationship, 1976-94Age of child victim Family Acquaintance Stranger Unknown
Total 100.0% 100.0% 100.0% 100.0%Less than 1 year 31.2 4.8 1.4 6.91-4 36.3 17.0 6.4 9.95-14 22.6 20.6 25.0 21.015-17 9.9 57.6 67.3 62.3
Total number 10,795 13,060 4,006 9,092
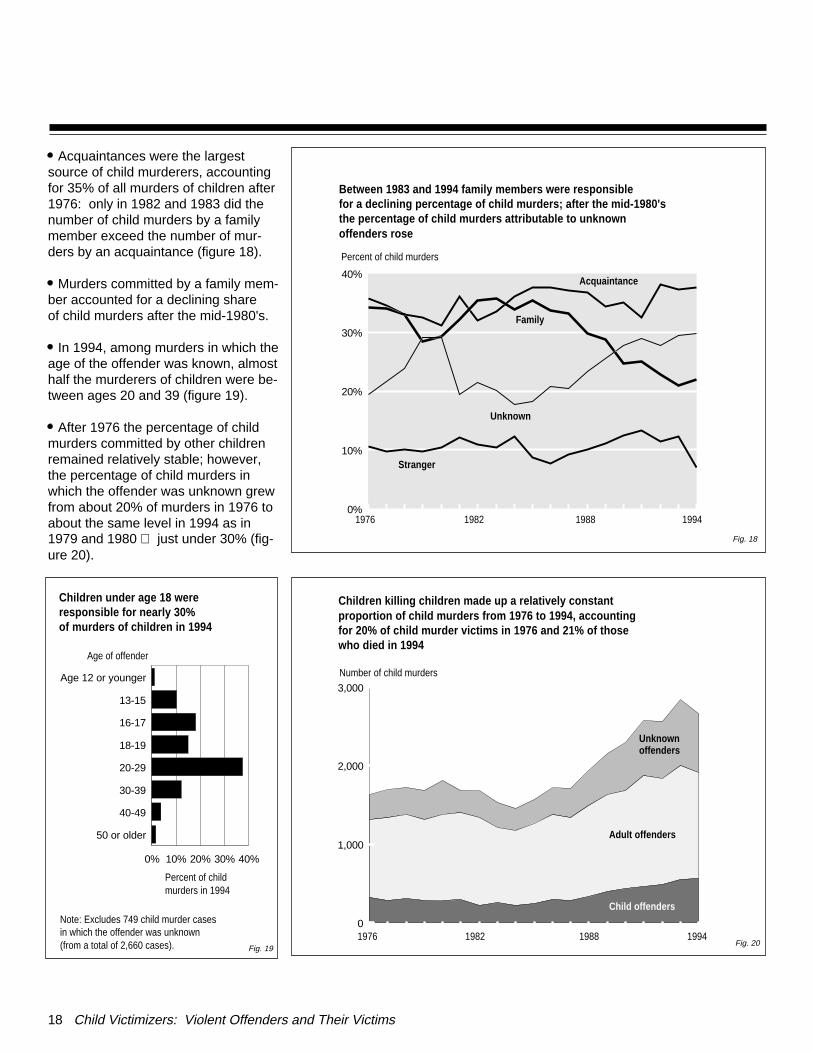
Acquaintances were the largestsource of child murderers, accountingfor 35% of all murders of children after1976: only in 1982 and 1983 did thenumber of child murders by a familymember exceed the number of mur-ders by an acquaintance (figure 18).
Murders committed by a family mem-ber accounted for a declining share of child murders after the mid-1980's.
In 1994, among murders in which theage of the offender was known, almosthalf the murderers of children were be-tween ages 20 and 39 (figure 19).
After 1976 the percentage of childmurders committed by other childrenremained relatively stable; however,the percentage of child murders inwhich the offender was unknown grewfrom about 20% of murders in 1976 toabout the same level in 1994 as in1979 and 1980 just under 30% (fig-ure 20).
18 Child Victimizers: Violent Offenders and Their Victims
Age 12 or younger
13-15
16-17
18-19
20-29
30-39
40-49
50 or older
0% 10% 20% 30% 40%
Age of offender
Percent of childmurders in 1994
Children under age 18 were responsible for nearly 30% of murders of children in 1994
Note: Excludes 749 child murder casesin which the offender was unknown (from a total of 2,660 cases). Fig. 19
Percent of child murders
19760%
10%
20%
30%
40%
1982 1988 1994
Stranger
Unknown
Family
Acquaintance
Between 1983 and 1994 family members were responsiblefor a declining percentage of child murders; after the mid-1980'sthe percentage of child murders attributable to unknown offenders rose
Fig. 18
0
1,000
2,000
3,000
Adult offenders
Unknown offenders
Child offenders
Number of child murders
1976 1982 1988 1994
Children killing children made up a relatively constantproportion of child murders from 1976 to 1994, accountingfor 20% of child murder victims in 1976 and 21% of thosewho died in 1994
Fig. 20
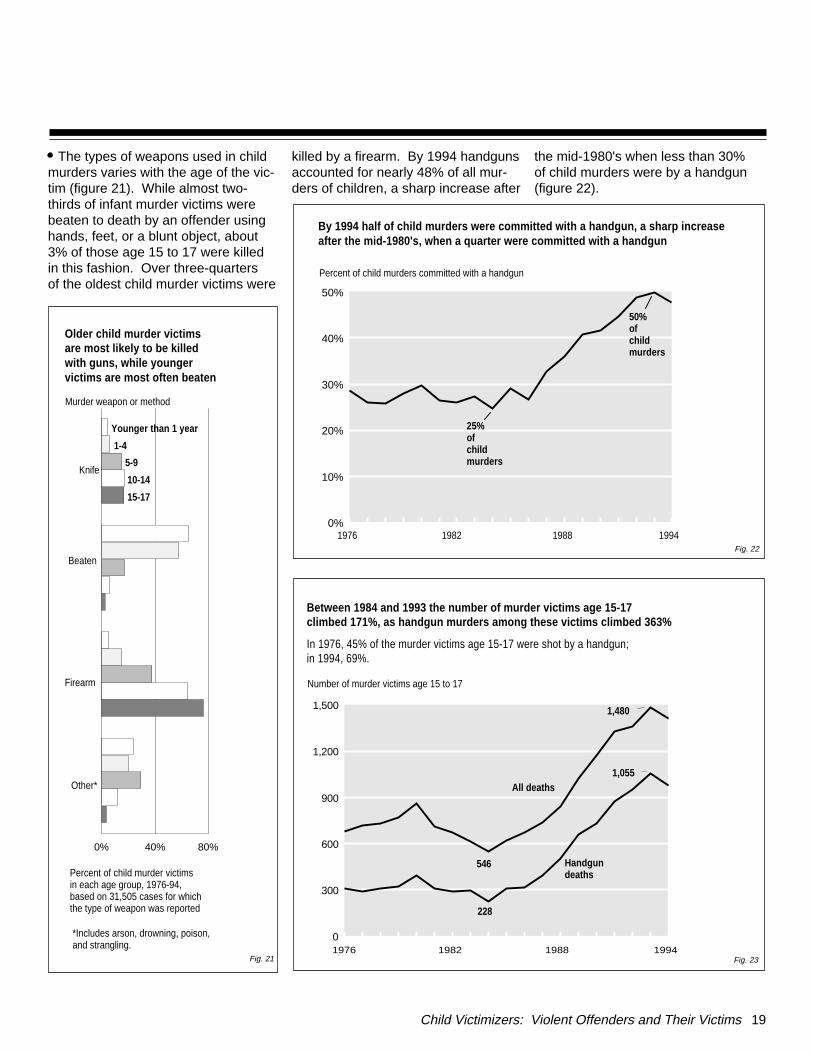
The types of weapons used in childmurders varies with the age of the vic-tim (figure 21). While almost two-thirds of infant murder victims werebeaten to death by an offender usinghands, feet, or a blunt object, about3% of those age 15 to 17 were killed in this fashion. Over three-quarters of the oldest child murder victims were
killed by a firearm. By 1994 handgunsaccounted for nearly 48% of all mur-ders of children, a sharp increase after
the mid-1980's when less than 30% of child murders were by a handgun(figure 22).
Child Victimizers: Violent Offenders and Their Victims 19
10-14
5-9
Younger than 1 year
15-17
1-4
Older child murder victimsare most likely to be killedwith guns, while youngervictims are most often beaten
*Includes arson, drowning, poison, and strangling.
Othermethods 0% 40% 80%
Murder weapon or method
Knife
Beaten
Firearm
Other*
Percent of child murder victims in each age group, 1976-94,based on 31,505 cases for which the type of weapon was reported
Fig. 21
19760%
10%
20%
30%
40%
50%
1982 1988 1994
25%ofchildmurders
50% ofchildmurders
Percent of child murders committed with a handgun
By 1994 half of child murders were committed with a handgun, a sharp increase after the mid-1980's, when a quarter were committed with a handgun
Fig. 22
1976
Number of murder victims age 15 to 17
0
300
600
900
1,200
1,500
Handgundeaths
All deaths
1982 1988 1994
Between 1984 and 1993 the number of murder victims age 15-17climbed 171%, as handgun murders among these victims climbed 363%
546
228
1,480
1,055
In 1976, 45% of the murder victims age 15-17 were shot by a handgun; in 1994, 69%.
Fig. 23
In 1994 States varied substantially in the number of child murders per capita
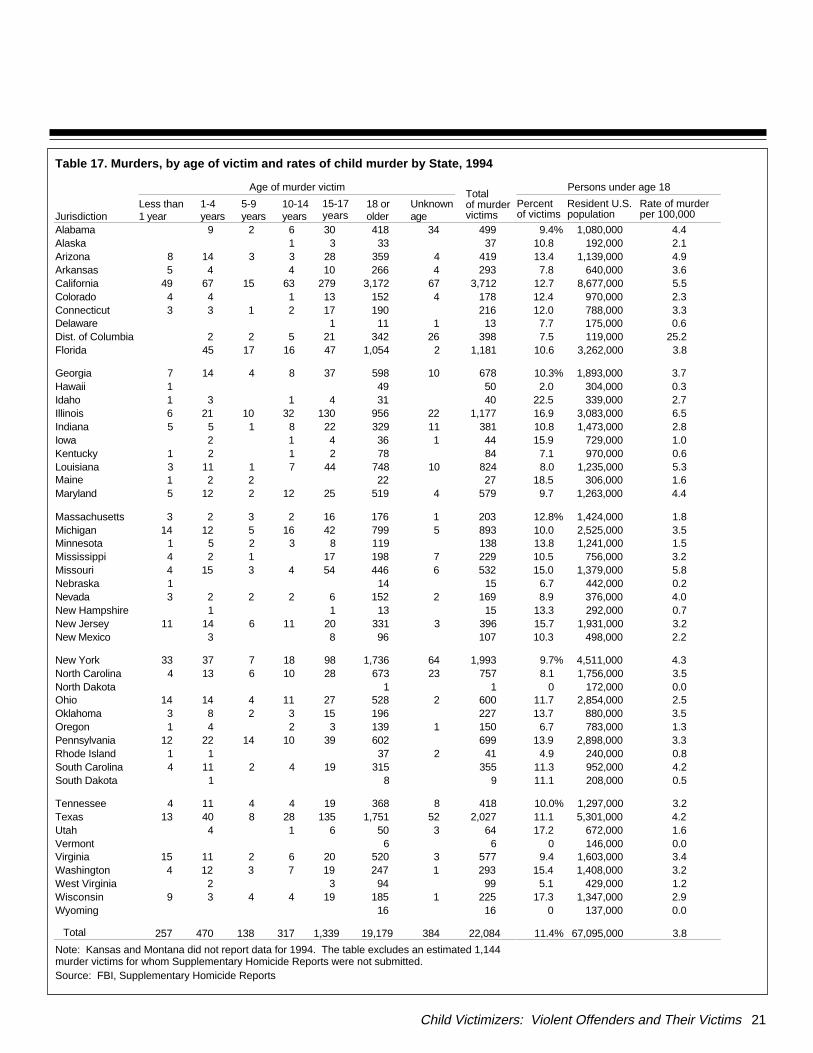
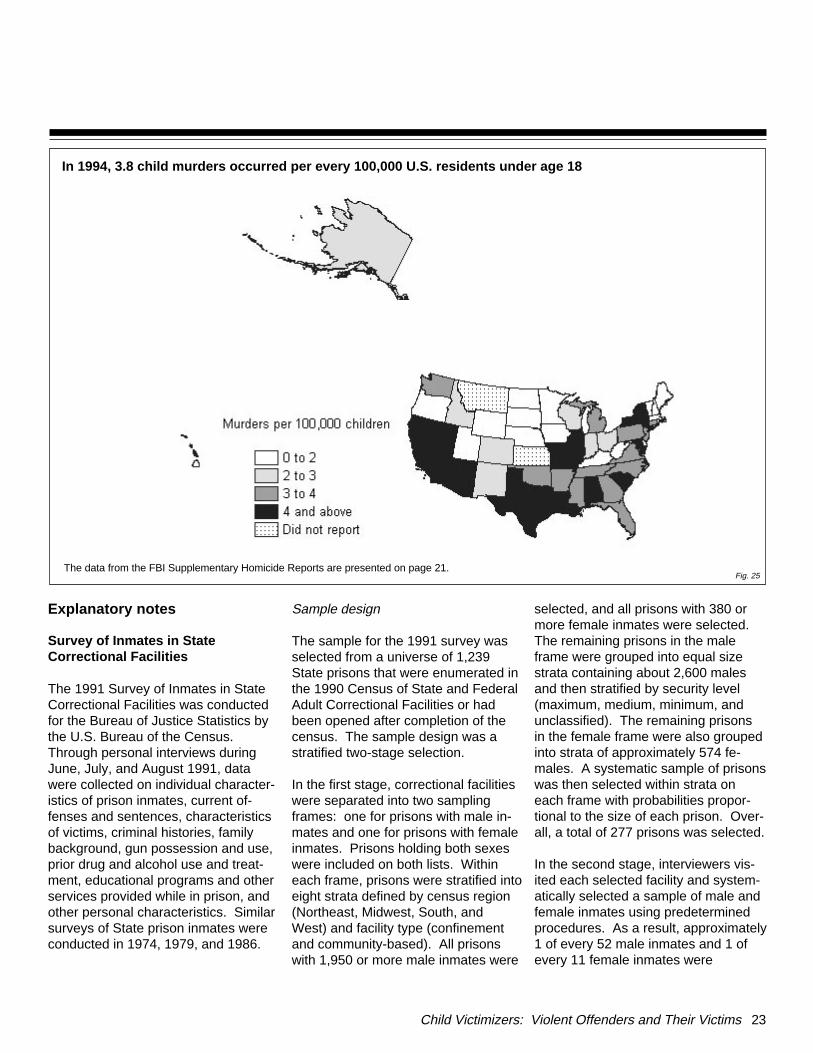
Three States, North Dakota (1 adultmurder victim), Vermont (6 adult mur-der victims), and Wyoming (16 adultmurder victims) reported no murders ofchildren during 1994 (table 17). Basedon those jurisdictions reporting in 1994and excluding the wholly urban Districtof Columbia, the highest per capitarates of child murder occurred in Illi-nois (6.5 murders per 100,000 childrenunder age 18), California (5.5 murders
per 100,000), and Louisiana (5.3 per100,000). (See the map on page 23for a national representation of childmurder rates.) These States ac-counted for 19% of all children living in the reporting States in 1994 butnearly 30% of the child murder victimsthat year.
Between 1976 and 1994 an esti-mated 405,089 murders occurred inthe United States. Of these, an esti-mated 36,951 had been murders ofchildren below age 18. Over the 19years for which the FBI collected
Supplementary Homicide Reports,about 92% of all murders resulted inthe submission of a report 34,005reports for child victims and 338,885reports for victims who were adults or of unknown age (table 18).
The national estimate that 36,951children were murdered over the pe-riod from 1976 to 1994 translates intoan average of about 1,945 child mur-der victims per year or about 5 per dayin the United States. The number ofmurders in 1994 translates into an av-erage of about 7 victims per day.
20 Child Victimizers: Violent Offenders and Their Victims
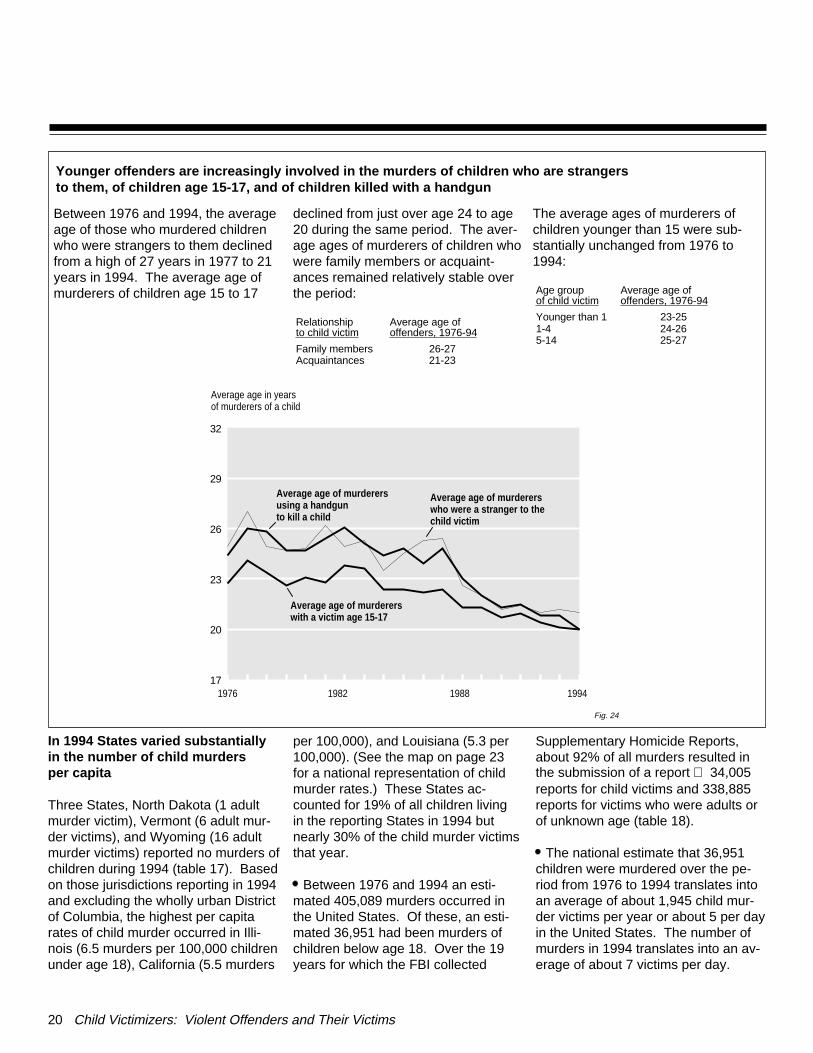
Between 1976 and 1994, the averageage of those who murdered childrenwho were strangers to them declinedfrom a high of 27 years in 1977 to 21years in 1994. The average age ofmurderers of children age 15 to 17
declined from just over age 24 to age20 during the same period. The aver-age ages of murderers of children whowere family members or acquaint-ances remained relatively stable overthe period:
The average ages of murderers ofchildren younger than 15 were sub-stantially unchanged from 1976 to1994:
197617
20
23
26
29
32
Average age of murdererswho were a stranger to thechild victim
Average age in years of murderers of a child
1982 1988 1994
Average age of murderersusing a handgun to kill a child
Average age of murdererswith a victim age 15-17
Relationshipto child victim
Average age ofoffenders, 1976-94
Family members 26-27Acquaintances 21-23
Age groupof child victim
Average age ofoffenders, 1976-94
Younger than 1 23-251-4 24-265-14 25-27
Fig. 24
Younger offenders are increasingly involved in the murders of children who are strangers to them, of children age 15-17, and of children killed with a handgun
Child Victimizers: Violent Offenders and Their Victims 21
Table 17. Murders, by age of victim and rates of child murder by State, 1994
Age of murder victimTotalof murdervictims
Persons under age 18
JurisdictionLess than1 year
1-4 years
5-9 years
10-14years
15-17years
18 orolder
Unknownage
Percent of victims
Resident U.S.population
Rate of murderper 100,000
Alabama 9 2 6 30 418 34 499 9.4% 1,080,000 4.4Alaska 1 3 33 37 10.8 192,000 2.1Arizona 8 14 3 3 28 359 4 419 13.4 1,139,000 4.9Arkansas 5 4 4 10 266 4 293 7.8 640,000 3.6California 49 67 15 63 279 3,172 67 3,712 12.7 8,677,000 5.5Colorado 4 4 1 13 152 4 178 12.4 970,000 2.3Connecticut 3 3 1 2 17 190 216 12.0 788,000 3.3Delaware 1 11 1 13 7.7 175,000 0.6Dist. of Columbia 2 2 5 21 342 26 398 7.5 119,000 25.2Florida 45 17 16 47 1,054 2 1,181 10.6 3,262,000 3.8
Georgia 7 14 4 8 37 598 10 678 10.3% 1,893,000 3.7Hawaii 1 49 50 2.0 304,000 0.3Idaho 1 3 1 4 31 40 22.5 339,000 2.7Illinois 6 21 10 32 130 956 22 1,177 16.9 3,083,000 6.5Indiana 5 5 1 8 22 329 11 381 10.8 1,473,000 2.8Iowa 2 1 4 36 1 44 15.9 729,000 1.0Kentucky 1 2 1 2 78 84 7.1 970,000 0.6Louisiana 3 11 1 7 44 748 10 824 8.0 1,235,000 5.3Maine 1 2 2 22 27 18.5 306,000 1.6Maryland 5 12 2 12 25 519 4 579 9.7 1,263,000 4.4
Massachusetts 3 2 3 2 16 176 1 203 12.8% 1,424,000 1.8Michigan 14 12 5 16 42 799 5 893 10.0 2,525,000 3.5Minnesota 1 5 2 3 8 119 138 13.8 1,241,000 1.5Mississippi 4 2 1 17 198 7 229 10.5 756,000 3.2Missouri 4 15 3 4 54 446 6 532 15.0 1,379,000 5.8Nebraska 1 14 15 6.7 442,000 0.2Nevada 3 2 2 2 6 152 2 169 8.9 376,000 4.0New Hampshire 1 1 13 15 13.3 292,000 0.7New Jersey 11 14 6 11 20 331 3 396 15.7 1,931,000 3.2New Mexico 3 8 96 107 10.3 498,000 2.2
New York 33 37 7 18 98 1,736 64 1,993 9.7% 4,511,000 4.3North Carolina 4 13 6 10 28 673 23 757 8.1 1,756,000 3.5North Dakota 1 1 0 172,000 0.0Ohio 14 14 4 11 27 528 2 600 11.7 2,854,000 2.5Oklahoma 3 8 2 3 15 196 227 13.7 880,000 3.5Oregon 1 4 2 3 139 1 150 6.7 783,000 1.3Pennsylvania 12 22 14 10 39 602 699 13.9 2,898,000 3.3Rhode Island 1 1 37 2 41 4.9 240,000 0.8South Carolina 4 11 2 4 19 315 355 11.3 952,000 4.2South Dakota 1 8 9 11.1 208,000 0.5
Tennessee 4 11 4 4 19 368 8 418 10.0% 1,297,000 3.2Texas 13 40 8 28 135 1,751 52 2,027 11.1 5,301,000 4.2Utah 4 1 6 50 3 64 17.2 672,000 1.6Vermont 6 6 0 146,000 0.0Virginia 15 11 2 6 20 520 3 577 9.4 1,603,000 3.4Washington 4 12 3 7 19 247 1 293 15.4 1,408,000 3.2West Virginia 2 3 94 99 5.1 429,000 1.2Wisconsin 9 3 4 4 19 185 1 225 17.3 1,347,000 2.9Wyoming 16 16 0 137,000 0.0
Total 257 470 138 317 1,339 19,179 384 22,084 11.4% 67,095,000 3.8
Note: Kansas and Montana did not report data for 1994. The table excludes an estimated 1,144murder victims for whom Supplementary Homicide Reports were not submitted.Source: FBI, Supplementary Homicide Reports
22 Child Victimizers: Violent Offenders and Their Victims
Table 18. Murders, by age of victim and State, 1976-94
Age of murder victim Total num- Percent
JurisdictionLess than1 year
1-4 years
5-9 years
10-14years
15-17years
18 orolder
Unknownage
ber of mur-der victims
of victimsunder age 18
Alabama 41 105 44 69 234 7,487 148 8,128 6.1%Alaska 12 22 16 15 34 788 5 892 11.1Arizona 53 135 47 69 214 4,326 107 4,951 10.5Arkansas 50 67 29 52 117 3,525 45 3,885 8.1California 640 966 372 808 3,191 51,571 905 58,453 10.2Colorado 99 97 31 58 139 3,040 50 3,514 12.1Connecticut 37 52 39 46 164 2,470 20 2,828 12.0Delaware 10 23 6 11 15 504 9 578 11.2Dist. of Columbia 22 51 14 40 241 4,665 197 5,230 7.0Florida 104 311 132 172 512 16,257 483 17,971 6.8Georgia 89 169 63 96 339 10,371 228 11,355 6.7
Hawaii 20 18 9 7 28 867 2 951 8.6%Idaho 14 27 6 19 26 540 7 639 14.4Illinois 143 377 137 258 1,104 15,632 83 17,734 11.4Indiana 65 133 60 84 225 5,184 142 5,893 9.6Iowa 25 37 13 20 40 794 12 941 14.3Kansas 26 73 22 35 64 1,736 50 2,006 11.0Kentucky 45 76 23 41 126 4,223 34 4,568 6.8Louisiana 80 122 57 111 422 9,582 271 10,645 7.4Maine 6 13 9 16 16 397 1 458 13.1Maryland 90 156 70 112 371 7,556 53 8,408 9.5Massachusetts 58 64 41 54 199 3,102 25 3,543 11.7
Michigan 153 326 133 277 862 15,893 99 17,743 9.9%Minnesota 55 73 20 35 88 1,612 9 1,892 14.3Mississippi 41 36 24 29 121 3,331 83 3,665 6.8Missouri 119 163 58 105 406 7,447 109 8,407 10.1Montana 4 17 5 1 11 292 3 333 11.4Nebraska 23 35 12 19 29 678 3 799 14.8Nevada 23 29 16 20 60 1,912 32 2,092 7.1New Hampshire 10 28 8 7 14 340 1 408 16.4New Jersey 163 215 120 130 337 6,862 156 7,983 12.1New Mexico 30 47 16 26 68 1,686 47 1,920 9.7New York 446 478 255 422 1,634 32,886 779 36,900 8.8
North Carolina 102 127 56 104 321 10,303 228 11,241 6.3%North Dakota 6 5 4 1 7 130 1 154 14.9Ohio 173 290 119 182 402 10,845 74 12,085 9.6Oklahoma 86 116 57 56 153 4,200 24 4,692 10.0Oregon 50 75 41 37 74 2,140 11 2,428 11.4Pennsylvania 241 299 137 172 543 11,257 31 12,680 11.0Rhode Island 17 12 11 7 29 603 12 691 11.0South Carolina 75 95 22 57 174 5,959 24 6,406 6.6South Dakota 8 13 5 4 8 162 2 202 18.8Tennessee 35 82 31 46 205 6,979 117 7,495 5.3
Texas 334 575 215 428 1,463 35,102 1,351 39,468 7.6%Utah 32 60 14 21 40 766 21 954 17.5Vermont 3 4 4 8 157 5 181 10.5Virginia 146 153 62 85 316 8,168 55 8,985 8.5Washington 74 107 42 71 193 3,472 63 4,022 12.1West Virginia 1 59 8 22 50 1,872 5 2,017 6.9Wisconsin 92 84 32 67 156 2,617 11 3,059 14.1Wyoming 16 13 10 6 8 359 5 417 12.7
Total 4,287 6,710 2,777 4,630 15,601 332,647 6,238 372,890 9.1%
Note: The table excludes an estimated 32,199 murders (with an estimated2,946 child victims) for which Supplementary Homicide Reports were not re-ceived. The estimated total number of murders over the period was405,089, including 36,951 child victims.
Source: FBI, Supplementary Homicide Reports
Explanatory notes
Survey of Inmates in State Correctional Facilities
The 1991 Survey of Inmates in StateCorrectional Facilities was conductedfor the Bureau of Justice Statistics bythe U.S. Bureau of the Census.Through personal interviews duringJune, July, and August 1991, datawere collected on individual character-istics of prison inmates, current of-fenses and sentences, characteristicsof victims, criminal histories, familybackground, gun possession and use,prior drug and alcohol use and treat-ment, educational programs and otherservices provided while in prison, andother personal characteristics. Similarsurveys of State prison inmates wereconducted in 1974, 1979, and 1986.
Sample design
The sample for the 1991 survey wasselected from a universe of 1,239State prisons that were enumerated inthe 1990 Census of State and FederalAdult Correctional Facilities or hadbeen opened after completion of thecensus. The sample design was astratified two-stage selection.
In the first stage, correctional facilitieswere separated into two samplingframes: one for prisons with male in-mates and one for prisons with femaleinmates. Prisons holding both sexeswere included on both lists. Withineach frame, prisons were stratified intoeight strata defined by census region(Northeast, Midwest, South, andWest) and facility type (confinementand community-based). All prisonswith 1,950 or more male inmates were
selected, and all prisons with 380 ormore female inmates were selected.The remaining prisons in the maleframe were grouped into equal sizestrata containing about 2,600 malesand then stratified by security level(maximum, medium, minimum, andunclassified). The remaining prisons in the female frame were also groupedinto strata of approximately 574 fe-males. A systematic sample of prisonswas then selected within strata oneach frame with probabilities propor-tional to the size of each prison. Over-all, a total of 277 prisons was selected.
In the second stage, interviewers vis-ited each selected facility and system-atically selected a sample of male andfemale inmates using predeterminedprocedures. As a result, approximately1 of every 52 male inmates and 1 ofevery 11 female inmates were
Child Victimizers: Violent Offenders and Their Victims 23
In 1994, 3.8 child murders occurred per every 100,000 U.S. residents under age 18
The data from the FBI Supplementary Homicide Reports are presented on page 21.Fig. 25
selected. A total of 13,986 interviewswere completed, yielding an overall re-sponse rate of 93.7%.
Based on the completed interviews,estimates for the entire populationwere developed using weighting fac-tors derived from the original probabil-ity of selection in the sample. Thesefactors were adjusted for variable ratesof nonresponse across strata and inmate characteristics. The survey es-timates were further adjusted to the mid-1991 custody counts. The National Prisoner Statistics (NPS-1) series, as reported in a Department of Justice release of October 1991,provided the basis of these estimatedcounts.
Identifying child victims
The inmate survey queried offendersabout their victims, collecting informa-tion on the number of victims, demo-graphic characteristics of the victims,the relationship of the victim to the of-fender, the use of weapons against thevictim, and the types of injuries victimssuffered. Offenders serving time afterconviction for primarily violent crimeswere asked to provide as much infor-mation as they knew about the victims(a small number of offenders convictedof certain public-order crimes also an-swered a few questions about victims).Overall, about 1 in 4 inmates reportedthat they had committed their crimeagainst multiple victims. These offend-ers were given a separate battery ofquestions geared to obtaining generalinformation on these groups of victims.For example, the violent offenders whoreported multiple victims were asked toreport whether most victims fell in oneracial group, the ages of the oldest andyoungest victims, and whether any ofthe victims was previously known tothe offender.
For this study single-victim offenderswere selected if they reported that thevictim fell in age groups 12 or youngeror 13-to-17. Those with multiple vic-tims who reported that any victim wasless than age 18 were also incorpo-rated into the study sample. Theseprocedures produced a weighted esti-mate of 61,037 violent inmates with atleast one victim under age 18.
Supplementary Homicide ReportingProgram (SHR)
The SHR is a monthly report from lo-cal law enforcement agencies ob-tained under the FBI Uniform CrimeReporting Program. The SHR detailsa wide variety of information on eachreported criminal homicide, differenti-ating murders and nonnegligent manslaughters from negligent man-slaughters, and includes incident-based data on the number of victims and number ofoffenders in each incident age, race, sex, and ethnic origin forvictims and offenders type of weapon used relationship of victim to offender a narrative statement about the cir-cumstances surrounding the homicide.
The dataset utilized in these analyses,the Uniform Crime Reports: Supple-mentary Homicide Reports 1976-1994,contains 373,000 records of murdervictims, 92% of the total number ofmurders which occurred over the pe-riod. The analysis for this reportweighted the number of victims to con-form to the annual published estimatesfrom the FBI, using the victim weightsshown below:
The dataset and documentation willsoon be available through the NationalArchive of Criminal Justice Data at theUniversity of Michigan. Data for 1976to 1992 are currently available asstudy number ICPSR 6387. Furtherinformation on the SupplementaryHomicide Reports may be obtainedfrom the Criminal Justice InformationServices Section of the FBI.
Data shown in the graphicalfigures
24 Child Victimizers: Violent Offenders and Their Victims
Cover figure. Violent State prison inmates who committed their offense against a child, by victims' age and the offense, 1991
Percent of violentState prison inmates
Violent crimes
Victimsage 12 oryounger
Victims age 13 to 17
All 10.1% 8.5%
Murder 3.1 3.2Negligent manslaughter 5.7 3.0Kidnaping 3.2 9.9Forcible rape 17.1 22.0Sexual assault 48.5 29.5Robbery 1.0 2.6Aggravated assault 5.4 4.8
Source: BJS, Survey of Inmates in StateCorrectional Facilities, 1991
Figure 1, page 2. Child victimizersin State prison, by victims' ageand the offense, 1991
Violent crimes
Percent of childvictimizers withvictims age 12or younger
Child abuse 89.3%Lewd acts with a child 69.2Negligent manslaughter 65.2Statutory rape 62.1Forcible sodomy 60.0Other sexual assaults 59.2Murder 48.7Kidnaping 45.2Forcible rape 43.7Aggravated assault 41.3Robbery 27.2Simple assault 19.4
Source: BJS, Survey of Inmates in StateCorrectional Facilities, 1991
1976 1.130985 1986 1.0702601977 1.060278 1987 1.1189671978 1.045207 1988 1.1507431979 1.042203 1989 1.1344451980 1.053980 1990 1.1562181981 1.123024 1991 1.1395091982 1.078265 1992 1.0459591983 1.034113 1993 1.0580671984 1.082851 1994 1.0552891985 1.081790
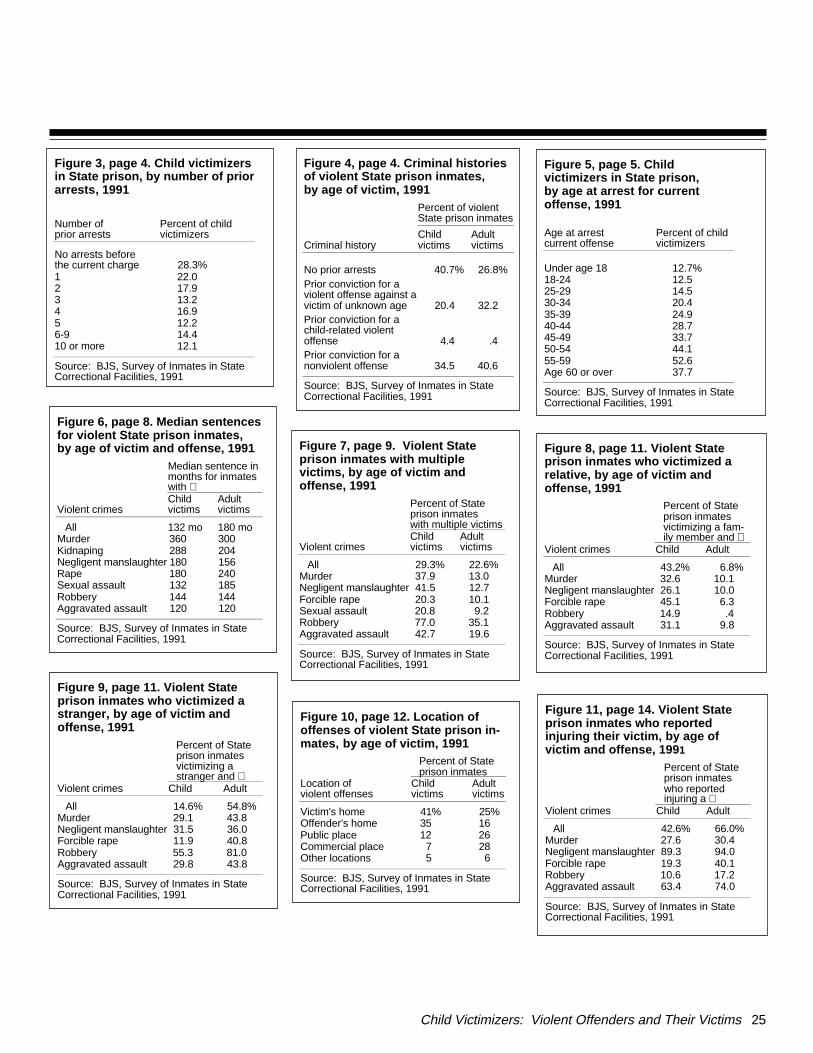
Child Victimizers: Violent Offenders and Their Victims 25
Figure 11, page 14. Violent Stateprison inmates who reported injuring their victim, by age of victim and offense, 199 1
Percent of Stateprison inmates who reported injuring a
Violent crimes Child Adult
All 42.6% 66.0%Murder 27.6 30.4Negligent manslaughter 89.3 94.0Forcible rape 19.3 40.1Robbery 10.6 17.2Aggravated assault 63.4 74.0
Source: BJS, Survey of Inmates in StateCorrectional Facilities, 1991
Figure 10, page 12. Location of offenses of violent State prison in-mates, by age of victim, 1991
Percent of Stateprison inmates
Location of violent offenses
Child victims
Adultvictims
Victim's home 41% 25%Offender's home 35 16Public place 12 26Commercial place 7 28Other locations 5 6
Source: BJS, Survey of Inmates in StateCorrectional Facilities, 1991
Figure 9, page 11. Violent Stateprison inmates who victimized astranger, by age of victim and offense, 1991
Percent of Stateprison inmates victimizing astranger and
Violent crimes Child Adult
All 14.6% 54.8%Murder 29.1 43.8Negligent manslaughter 31.5 36.0Forcible rape 11.9 40.8Robbery 55.3 81.0Aggravated assault 29.8 43.8
Source: BJS, Survey of Inmates in StateCorrectional Facilities, 1991
Figure 8, page 11. Violent Stateprison inmates who victimized arelative, by age of victim and offense, 1991
Percent of Stateprison inmates victimizing a fam-ily member and
Violent crimes Child Adult
All 43.2% 6.8%Murder 32.6 10.1Negligent manslaughter 26.1 10.0Forcible rape 45.1 6.3Robbery 14.9 .4Aggravated assault 31.1 9.8
Source: BJS, Survey of Inmates in StateCorrectional Facilities, 1991
Figure 7, page 9. Violent Stateprison inmates with multiple victims, by age of victim andoffense, 1991
Percent of Stateprison inmates with multiple victims
Violent crimesChildvictims
Adultvictims
All 29.3% 22.6%Murder 37.9 13.0Negligent manslaughter 41.5 12.7Forcible rape 20.3 10.1Sexual assault 20.8 9.2Robbery 77.0 35.1Aggravated assault 42.7 19.6
Source: BJS, Survey of Inmates in StateCorrectional Facilities, 1991
Figure 6, page 8. Median sentencesfor violent State prison inmates, by age of victim and offense, 1991
Median sentence inmonths for inmateswith
Violent crimesChildvictims
Adultvictims
All 132 mo 180 moMurder 360 300Kidnaping 288 204Negligent manslaughter 180 156Rape 180 240Sexual assault 132 185Robbery 144 144Aggravated assault 120 120
Source: BJS, Survey of Inmates in StateCorrectional Facilities, 1991
Figure 5, page 5. Child victimizers in State prison, by age at arrest for current offense, 1991
Age at arrestcurrent offense
Percent of childvictimizers
Under age 18 12.7%18-24 12.525-29 14.530-34 20.435-39 24.940-44 28.745-49 33.750-54 44.155-59 52.6Age 60 or over 37.7
Source: BJS, Survey of Inmates in StateCorrectional Facilities, 1991
Figure 4, page 4. Criminal histories of violent State prison inmates, by age of victim, 1991
Percent of violentState prison inmates
Criminal historyChildvictims
Adultvictims
No prior arrests 40.7% 26.8%Prior conviction for aviolent offense against avictim of unknown age 20.4 32.2Prior conviction for achild-related violentoffense 4.4 .4Prior conviction for anonviolent offense 34.5 40.6
Source: BJS, Survey of Inmates in StateCorrectional Facilities, 1991
Figure 3, page 4. Child victimizersin State prison, by number of priorarrests, 1991
Number of prior arrests
Percent of childvictimizers
No arrests beforethe current charge 28.3%1 22.02 17.93 13.24 16.95 12.26-9 14.410 or more 12.1
Source: BJS, Survey of Inmates in StateCorrectional Facilities, 1991
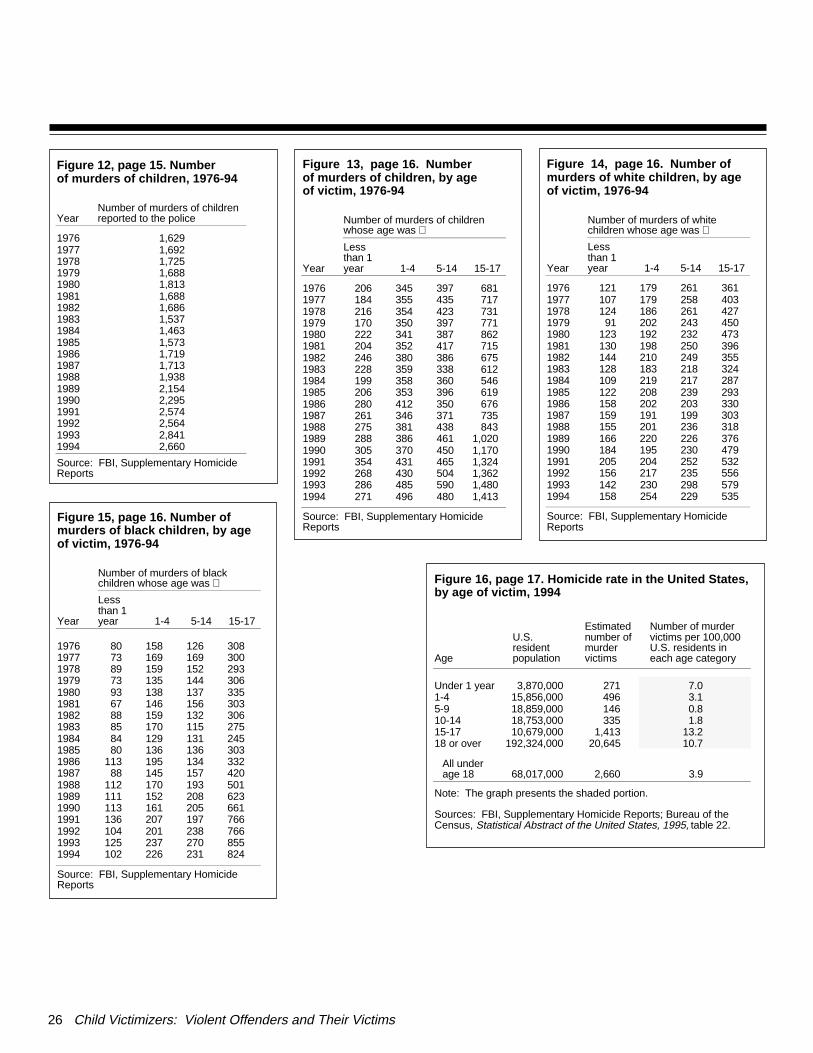
26 Child Victimizers: Violent Offenders and Their Victims
Figure 16, page 17. Homicide rate in the United States,by age of victim, 1994
Age
U.S.residentpopulation
Estimatednumber of murder victims
Number of murder victims per 100,000U.S. residents ineach age category
Under 1 year 3,870,000 271 7.01-4 15,856,000 496 3.15-9 18,859,000 146 0.810-14 18,753,000 335 1.815-17 10,679,000 1,413 13.218 or over 192,324,000 20,645 10.7
All underage 18 68,017,000 2,660 3.9
Note: The graph presents the shaded portion.
Sources: FBI, Supplementary Homicide Reports; Bureau of theCensus, Statistical Abstract of the United States, 1995, table 22.
Figure 15, page 16. Number ofmurders of black children, by ageof victim, 1976-94
Number of murders of blackchildren whose age was
Year
Lessthan 1year 1-4 5-14 15-17
1976 80 158 126 3081977 73 169 169 3001978 89 159 152 2931979 73 135 144 3061980 93 138 137 3351981 67 146 156 3031982 88 159 132 3061983 85 170 115 2751984 84 129 131 2451985 80 136 136 3031986 113 195 134 3321987 88 145 157 4201988 112 170 193 5011989 111 152 208 6231990 113 161 205 6611991 136 207 197 7661992 104 201 238 7661993 125 237 270 8551994 102 226 231 824
Source: FBI, Supplementary HomicideReports
Figure 14, page 16. Number of murders of white children, by age of victim, 1976-94
Number of murders of white children whose age was
Year
Lessthan 1year 1-4 5-14 15-17
1976 121 179 261 3611977 107 179 258 4031978 124 186 261 4271979 91 202 243 4501980 123 192 232 4731981 130 198 250 3961982 144 210 249 3551983 128 183 218 3241984 109 219 217 2871985 122 208 239 2931986 158 202 203 3301987 159 191 199 3031988 155 201 236 3181989 166 220 226 3761990 184 195 230 4791991 205 204 252 5321992 156 217 235 5561993 142 230 298 5791994 158 254 229 535
Source: FBI, Supplementary HomicideReports
Figure 13, page 16. Number of murders of children, by age of victim, 1976-94
Number of murders of childrenwhose age was
Year
Lessthan 1year 1-4 5-14 15-17
1976 206 345 397 6811977 184 355 435 7171978 216 354 423 7311979 170 350 397 7711980 222 341 387 8621981 204 352 417 7151982 246 380 386 6751983 228 359 338 6121984 199 358 360 5461985 206 353 396 6191986 280 412 350 6761987 261 346 371 7351988 275 381 438 8431989 288 386 461 1,0201990 305 370 450 1,1701991 354 431 465 1,3241992 268 430 504 1,3621993 286 485 590 1,4801994 271 496 480 1,413
Source: FBI, Supplementary HomicideReports
Figure 12, page 15. Number of murders of children, 1976-94
YearNumber of murders of childrenreported to the police
1976 1,6291977 1,6921978 1,7251979 1,6881980 1,8131981 1,6881982 1,6861983 1,5371984 1,4631985 1,5731986 1,7191987 1,7131988 1,9381989 2,1541990 2,2951991 2,5741992 2,5641993 2,8411994 2,660
Source: FBI, Supplementary HomicideReports
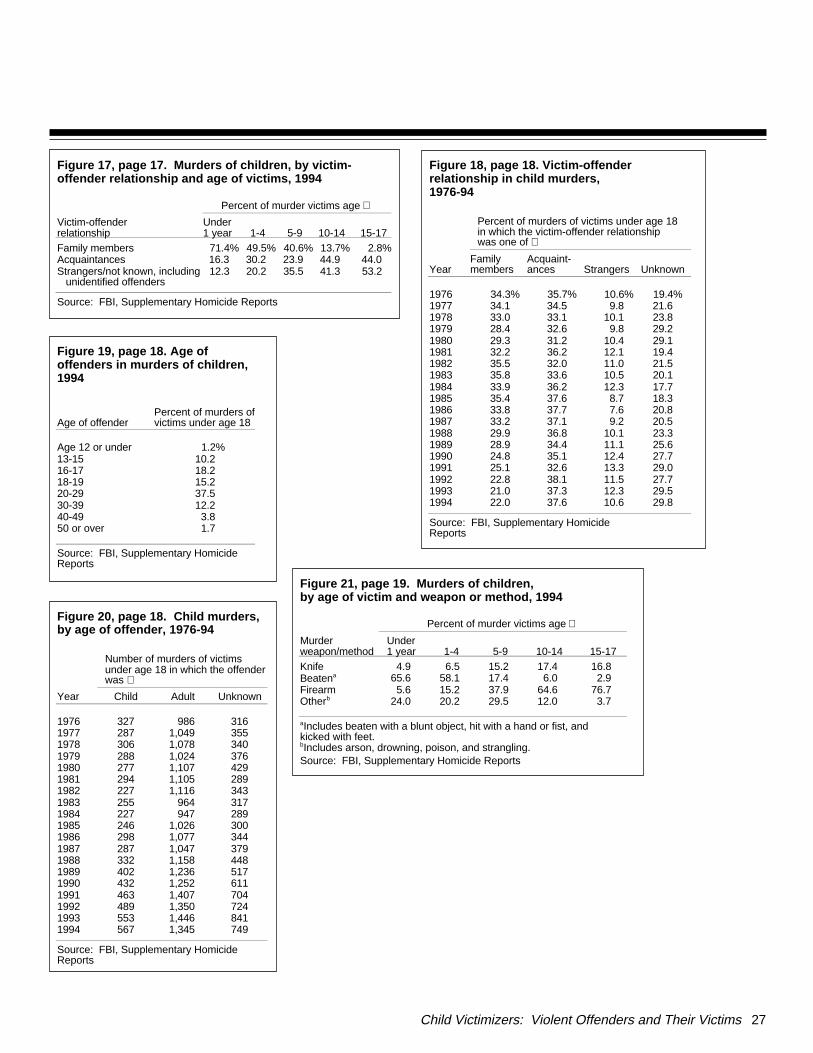
Child Victimizers: Violent Offenders and Their Victims 27
Figure 20, page 18. Child murders,by age of offender, 1976-94
Number of murders of victims under age 18 in which the offenderwas
Year Child Adult Unknown
1976 327 986 3161977 287 1,049 3551978 306 1,078 3401979 288 1,024 3761980 277 1,107 4291981 294 1,105 2891982 227 1,116 3431983 255 964 3171984 227 947 2891985 246 1,026 3001986 298 1,077 3441987 287 1,047 3791988 332 1,158 4481989 402 1,236 5171990 432 1,252 6111991 463 1,407 7041992 489 1,350 7241993 553 1,446 8411994 567 1,345 749
Source: FBI, Supplementary HomicideReports
Figure 21, page 19. Murders of children, by age of victim and weapon or method, 1994
Percent of murder victims age Murderweapon/method
Under1 year 1-4 5-9 10-14 15-17
Knife 4.9 6.5 15.2 17.4 16.8Beatena 65.6 58.1 17.4 6.0 2.9Firearm 5.6 15.2 37.9 64.6 76.7Otherb 24.0 20.2 29.5 12.0 3.7
aIncludes beaten with a blunt object, hit with a hand or fist, and kicked with feet. bIncludes arson, drowning, poison, and strangling.Source: FBI, Supplementary Homicide Reports
Figure 19, page 18. Age of offenders in murders of children,1994
Age of offenderPercent of murders ofvictims under age 18
Age 12 or under 1.2%13-15 10.216-17 18.218-19 15.220-29 37.530-39 12.240-49 3.850 or over 1.7
Source: FBI, Supplementary HomicideReports
Figure 18, page 18. Victim-offenderrelationship in child murders,1976-94
Percent of murders of victims under age 18 in which the victim-offender relationship was one of
YearFamilymembers
Acquaint-ances Strangers Unknown
1976 34.3% 35.7% 10.6% 19.4%1977 34.1 34.5 9.8 21.61978 33.0 33.1 10.1 23.81979 28.4 32.6 9.8 29.21980 29.3 31.2 10.4 29.11981 32.2 36.2 12.1 19.41982 35.5 32.0 11.0 21.51983 35.8 33.6 10.5 20.11984 33.9 36.2 12.3 17.71985 35.4 37.6 8.7 18.31986 33.8 37.7 7.6 20.81987 33.2 37.1 9.2 20.51988 29.9 36.8 10.1 23.31989 28.9 34.4 11.1 25.61990 24.8 35.1 12.4 27.71991 25.1 32.6 13.3 29.01992 22.8 38.1 11.5 27.71993 21.0 37.3 12.3 29.51994 22.0 37.6 10.6 29.8
Source: FBI, Supplementary HomicideReports
Figure 17, page 17. Murders of children, by victim-offender relationship and age of victims, 1994
Percent of murder victims age Victim-offenderrelationship
Under1 year 1-4 5-9 10-14 15-17
Family members 71.4% 49.5% 40.6% 13.7% 2.8%Acquaintances 16.3 30.2 23.9 44.9 44.0Strangers/not known, including unidentified offenders
12.3 20.2 35.5 41.3 53.2
Source: FBI, Supplementary Homicide Reports