Black and Asian offenders on probation
92
Home Office Research Study 277 Black and Asian offenders on probation Adam Calverley, Bankole Cole, Gurpreet Kaur, Sam Lewis, Peter Raynor, Soheila Sadeghi, David Smith, Maurice Vanstone and Ali Wardak The views expressed in this report are those of the authors, not necessarily those of the Home Office (nor do they reflect Government policy). Home Office Research, Development and Statistics Directorate March 2004
-
Upload
independent -
Category
Documents
-
view
5 -
download
0
Transcript of Black and Asian offenders on probation

Home Office Research Study 277
Black and Asian offenders on probation
Adam Calverley, Bankole Cole, Gurpreet Kaur, Sam Lewis, Peter Raynor,Soheila Sadeghi, David Smith, Maurice Vanstone and Ali Wardak
The views expressed in this report are those of the authors, not necessarily those of the Home Office (nor do they reflect Government policy).
Home Office Research, Development and Statistics DirectorateMarch 2004

Home Office Research Studies
The Home Office Research Studies are reports on research undertaken by or on behalf ofthe Home Office. They cover the range of subjects for which the Home Secre t a ry hasre s p o n s i b i l i t y. Other publications produced by the Research, Development and StatisticsDirectorate include Findings, Statistical Bulletins and Statistical Papers.
The Research, Development and Statistics Directorate
RDS is part of the Home Office. The Home Off i c e ’s purpose is to build a safe, just and tolerantsociety in which the rights and responsibilities of individuals, families and communities arep roperly balanced and the protection and security of the public are maintained.
RDS is also part of National Statistics (NS). One of the aims of NS is to inform Parliament andthe citizen about the state of the nation and provide a window on the work and perf o rm a n c eof government, allowing the impact of government policies and actions to be assessed.
T h e re f o re –
R e s e a rch Development and Statistics Directorate exists to improve policy making, decisiontaking and practice in support of the Home Office purpose and aims, to provide the public andParliament with information necessary for informed debate and to publish information forfuture use.
First published 2004Application for reproduction should be made to the Communications and Development Unit,Room 201, Home Office, 50 Queen Anne’s Gate, London SW1H 9AT.© Crown copyright 2004 ISBN 1 84473 186 3
ISSN 0072 6435
Black and Asian offenders on probation

Foreword
This report presents the findings of a survey which was commissioned to help inform thedevelopment of probation work with black and Asian offenders. For interventions withoffenders to be effective in reducing reoffending, it is essential to understand not only thefactors directly associated with offending (criminogenic needs) but also how they vary fordifferent groups of offenders. Hitherto, little has been known about how criminogenic needsv a ry between diff e rent ethnic groups. This survey aimed to examine their criminogenicneeds, explore their views of probation supervision and to inform decisions aboutappropriate interventions.
In total, 483 black and Asian offenders were surveyed. The re s e a rch found that black,Asian and mixed heritage offenders showed less evidence of crime-prone attitudes andbeliefs, and lower levels of self-re p o rted problems than comparison groups of whiteoffenders. In addition, only a third of offenders wanted to be supervised by someone fromthe same ethnic group. There was also very limited support from those attendingprogrammes for groups containing only members from minority ethnic groups.
This report is an important contribution both to development of probation practice and towider debates on the treatment of minority ethnic groups in the criminal justice system.F u rther re s e a rch is underway to increase our knowledge of ‘what works’ for black andAsian offenders.
Chloe ChittyProgramme DirectorOffending and Criminal Justice (What Works)
i

Acknowledgments
We are particularly grateful to all those staff of the National Probation Service, in theDirectorate and the areas, who helped us with information and access; to all the membersof the Steering Group; to Robin Elliott and Gina Taylor of RDS; and particularly to all theprobationers who allowed us to interview them, and shared their views and experiences sowillingly. We hope this report does them justice.
RDS would like to thank Coretta Phillips of the London School of Economics for her peerreview of the paper that contained valuable advice and expertise.
Adam Calverley, Bankole Cole, Gurpreet Kaur, Sam Lewis, Peter Raynor, Soheila Sadeghi,David Smith, Maurice Vanstone and Ali Wardak
(Adam Calverley and Ali Wardak are at the University of Glamorgan; Bankole Cole andG u r p reet Kaur are at the University of Lincoln; Sam Lewis, Peter Raynor and MauriceVanstone are at the University of Wales, Swansea; and Soheila Sadeghi and David Smithare at the University of Lancaster.)
Black and Asian offenders on probation
ii

iii
Contents
Acknowledgements ii
Executive summary v
Chapter 1 Introduction 1
Chapter 2 The conduct of the research 11
Chapter 3 Survey respondents and their criminogenic needs 17
Chapter 4 Experiences of probation and programmes 31
Chapter 5 Social exclusion and experiences of criminal justice 41
Chapter 6 Conclusions and implications 55
Appendix 1 Some problems of fieldwork in the probation service 61
Appendix 2 Additional tables 63
References 69

Black and Asian offenders on probation
iv

v
Executive summary
This study involved interviews with 483 offenders under supervision by the Pro b a t i o nS e rvice and identified by probation re c o rds as black or Asian. The interviews collectedinformation about their ‘criminogenic needs’1; their experiences of supervision on communityrehabilitation orders and programmes; their contact with other parts of the criminal justicesystem; and their wider experiences of life as black and Asian people in Britain. The samplealso included a number of offenders who classified themselves as of mixed ethnic origin,described in the report as mixed heritage.
The 483 respondents included 241 black, 172 Asian, 57 mixed heritage and 13 ‘other’offenders, drawn from a range of areas with varying densities of minority ethnic population.They included 236 who were attending or had been attending a programme, and 247 whowere being or had been supervised without a programme. Some categories of offender andtypes of area were oversampled to ensure that useful numbers would be available foranalysis, and the sample was then weighted to reflect, as far as possible, the actualproportions and locations of minority ethnic people in the national caseload of communityrehabilitation orders. Findings are re p o rted on the basis of the weighted sample exceptwhere otherwise indicated.
Criminogenic needs
The main quantitative assessment of criminogenic needs was carried out using the CRIME-PICS II questionnaire, which is designed to elicit information about crime-prone attitudes andbeliefs and about social and personal difficulties experienced by offenders (‘self-re p o rt e dproblems’). Key findings were:
● All three minority ethnic groups (black, Asian and mixed heritage) showed lessevidence of crime-prone attitudes and beliefs, and lower levels of self-re p o rt e dp roblems, than relevant comparison groups of white offenders. The diff e re n c e sbetween this survey sample as a whole and the main white comparison groupwere statistically significant on all subscales of CRIME-PICS II.
1. ‘Criminogenic needs’ are characteristics of people or their circumstances which are associated with ani n c reased risk of offending. They are also sometimes described as ‘dynamic risk factors’. In this re p o rt ,criminogenic needs are addressed in two ways: comparatively, using a standardised instrument (see Chapter 3),and in a more qualitative way through interviews about individual experiences (see Chapter 6).

● Within the minority ethnic sample, offenders of mixed heritage had the highestaverage scores on most measures of crime-prone attitudes and self-re p o rt e dproblems, and Asians the lowest2.
● This evidence therefore lends no support to the idea that offenders on probationwho belong to minority ethnic groups tend to have distinctively different or greatercriminogenic needs than white probationers. This resembles the findings of othercomparative studies (reviewed in Chapter 3). Their experiences are likely to differf rom those of white probationers in other ways, however, which are discussedbelow.
● These findings suggest that the minority ethnic offenders in the sample hadreceived the same community sentences as white offenders who had higher levelsof criminogenic need. This finding, based on small but statistically significantd i ff e rences, may have a number of explanations. However, one way in whichsuch a result could be produced is through some degree of differential sentencing.This could result in minority ethnic offenders with low criminogenic needs facing aslightly higher risk than comparable white offenders of receiving a communitysentence rather than a less serious sentence. Another possibility is that minorityethnic offenders with high needs may be less likely to receive a communitysentence than comparable white offenders. These possibilities would need to beinvestigated through further research, but they also suggest a need for continuingvigilance in relation to diversity issues in sentencing and in the preparation of pre-sentence reports.
● Offenders on orders with an additional requirement to attend a programme hadslightly lower scores for crime-prone attitudes and beliefs and for self-re p o rt e dp roblems than those on ord i n a ry orders, although the diff e rence was onlysignificant in relation to self-reported problems. There was no evidence that thiswas due to a programme effect. The programme group had a higher averageO ffender Group Reconviction Scale (OGRS) score, however, indicating moreprevious convictions.
● T h e re was some indication that Asian offenders were less likely to accessp rogrammes, which may have been partly due to their lower average OGRSscores.
Black and Asian offenders on probation
vi
2. The only exception to this was the V or ‘victim hurt denial’ scale on which offenders of mixed heritage scoredlow and Asians high. See Chapter 3 for details.

Experiences of probation
The majority of respondents’ comments on their experiences of probation were bro a d l yfavourable, in line with other consumer studies covering mainly white probationers. Keyfindings were:
● A good probation officer was one who treated people under supervision fairlyand with respect, listened to them and showed understanding.
● About a third (35%) wanted to be supervised by someone from the same ethnicgroup, 56 per cent said that it made no difference, ten per cent did not knowwhether it mattered, and two per cent were opposed to the idea. (These figuresdo not add up to 100 because a small number of respondents said that having aminority ethnic supervisor might be a good thing and a bad thing.)
● P rogrammes also attracted favourable comments, although a substantial minority ofp a rticipants (22%) re p o rted not liking anything about their programme. Most(86%) programme participants said that the group leaders had treated them fairly.
● Of those who attended programmes, about a third (33%) said that the ethniccomposition of the group was unimportant; of the re m a i n d e r, most said it should bemixed. There was very limited support (only eight respondents, all from areas withhigh ethnic minority populations, equivalent to a weighted five per cent of thep rogramme sample) for groups containing only members from minority ethnic gro u p s .
● These findings tended to support a policy of running mixed programme groupsrather than groups consisting only of minority ethnic offenders. Mixed staff i n gcould be advantageous but was not thought by most respondents to be essential.
● The indications re g a rding ‘singleton’ placements where only one member of agroup is from an ethnic minority are less clear. Eleven per cent of the 95 per centof programme participants who described the ethnic composition of theirprogramme group experienced ‘singleton placements’, and this proved to be anu n c o m f o rtable experience for some. Nevertheless, in ‘low density’ are a s ,singleton placements would sometimes be the only alternative to eff e c t i v e l yexcluding minority ethnic offenders from programmes, which would itself beundesirable.
vii
Executive summary

Social disadvantage
● The interviews explored a number of areas of possible social disadvantage, andthere was evidence of substantial social exclusion and disadvantage in relation toemployment, income, education and training.
● H o w e v e r, respondents were not, on average, significantly more sociallydisadvantaged than white offenders on probation. Black and Asian people ingeneral are known to experience more disadvantage than white people in Britain(see Chapter 5), but these differences did not appear clearly among the smallerselected population of offenders on probation. Black, Asian, and mixed heritagep robationers all showed substantial evidence of disadvantage, as whiteprobationers also did in other studies.
● Within the sample, there were noticeable diff e rences in levels of socialdisadvantage between minority ethnic groups. For example, while 41 per cent ofthe sample re p o rted a generally negative experience of school, Indians,Pakistanis and black Africans were less likely to have had a negative experienceof school than Bangladeshi, black Caribbean or mixed heritage offenders. Thirty-five per cent of mixed heritage offenders had been in local authority care ,compared to 22 per cent of black Caribbeans, nine per cent of black Africans,and four per cent of Asians. (The corresponding figure for white probationers isgiven in other studies as 19 per cent.)
● When asked about reasons for disadvantage, many respondents attributedadverse experiences, particularly in relation to employment and education, toracial prejudice, hostility or discrimination.
Experiences of criminal justice
Many respondents reported experiences of unfair treatment in various parts of the criminaljustice system. Key findings included the following:
● Although very litt le ‘white’ comparative information was available here ,respondents reported a number of negative experiences (in relation, for example,to racial abuse or oppressively frequent ‘stop and search’) which they believedwould be less likely to happen to a white offender.
Black and Asian offenders on probation
viii
● While probation staff were generally described as behaving fairly, other parts ofthe criminal justice system, particularly the police, were described much lessfavourably.
● This evidence suggests that the Probation Service should be aware that negativeexperiences of criminal justice are likely to affect perceptions of the legitimacy ofthe system, and this in turn can affect motivation and compliance.
● Visible re p resentation of minority ethnic communities in the staffing of criminaljustice agencies was seen as helpful.
● Probation staff also need to be aware of the particular needs and experiences ofoffenders of mixed heritage, who have received less research and policy attentionthan other ethnic minority groups.
Other implications
● It was clear from contacts with Probation Service managers and staff that therewas a general awareness of the need to avoid, at one extreme, the ‘colour-blind’practice that ignores diversity of culture, experience and opport u n i t y. However,this study has also demonstrated the range of views and experiences to be foundwithin each minority ethnic group, as well as some diff e rences in re s p o n s e sbetween black, Asian and mixed heritage probationers.
● This suggests that it is important not to treat minority ethnic status as a definingidentity from which personal characteristics, experiences and needs can bereliably inferred. This, however benignly intended, is itself a form of ethnicstereotyping.
● Respondents in this study expected to be treated fairly, as individuals, as ‘anormal person’, by staff who listened to them and respected their views. Policiesand practice there f o re need to be informed by awareness of diversity, but notbased on untested assumptions about what diversity implies.
ix
Executive summary

Black and Asian offenders on probation
x

Chapter 1: Introduction
This report presents the findings of a study which aimed to identify the criminogenic needsof black and Asian offenders, to explore their views about probation supervision, and toinform decisions about appropriate service provision. The study was commissioned againstthe background of long-standing concern about the possibility that people from minorityethnic groups may be subject to disadvantageous treatment at all stages of the criminaljustice process, even if this does not result from overt racist discrimination (Phillips andB rown, 1998). It was this concern that led to the provision in Section 95 of the 1991Criminal Justice Act that the Home Office should publish annually ‘information…facilitatingthe perf o rmance of such persons [those engaged in the administration of justice] of theirduty to avoid discriminating against any persons on the ground of race or sex or any otherimproper ground’. As the Foreword to the most recent report, Race and the Criminal JusticeSystem, states:
A modern, fair, effective criminal justice system is not possible whilst significantsections of the population perceive it as discriminatory and lack confidence in itdelivering justice (Home Office, 2002a: 1).
We review below the evidence that people from minority ethnic groups perceive the criminaljustice system in this light.
Ethnic minorities and criminal justice
There is recent evidence (from the 2000 British Crime Survey) that black and particularlyAsian people are more likely than whites to say that the criminal justice system is effective inbringing offenders to justice, dealing with cases promptly and efficiently, and meeting theneeds of crime victims. Minority ethnic people were, however, less confident that the systemrespected the rights of suspects and treated them fairly, and black respondents especiallywere less likely than whites to believe that the police treated witnesses well (Mirrlees-Black,2001). Ethnic minorities’ perceptions of the system as a whole were found to be morepositive than whites’ except in relation to prisons and, more emphatically, the police. The2000 Survey also found that black people were more likely than either Asians or whites tohave been stopped by the police, whether on foot or in a vehicle, and that people from allminority ethnic groups were less likely to say that, when they were stopped, they were
1

t reated fairly and politely, or that they were satisfied with the behaviour of the police(Clancy et al., 2001). Young black men (under the age of 25) were the group most likely tobe stopped by the police, and while being black was not found to increase the likelihood ofbeing stopped while on foot (a finding unlike those of the Surveys of 1993 and 1995), itdid increase the chances of being stopped while in a car.
In relation to victimisation, the 2000 British Crime Survey found that while people fro mminority ethnic groups do not experience higher rates of victimisation than whites living insimilar areas, they – particularly Pakistanis and Bangladeshis – are more likely say that theyare very worried about becoming victims of crime, and more likely to interpret crimes ofwhich they have been victims as racially motivated (Clancy et al., 2001). Among peoplewho reported crimes to the police, those from minority ethnic groups were less likely thanwhites to express satisfaction with the police response. Being a victim of crime predicted alower rating of police perf o rmance: only 33 per cent of victims of racially motivatedincidents thought that the police were doing a good job.
Much discussion of the possibility that people – and in particular black people – in minorityethnic groups are discriminated against in criminal justice decision-making has centred onthe dramatic over-representation of black people in the prison population. The Home Office(2002a) estimates that in 2000 the rate of incarceration of black males was about ninetimes as high as that for white males, and about fifteen times as high for black as for whitefemales. Only some of the dispro p o rtion can be explained by the presence in thesepopulations of foreign nationals, many arrested on entry into Britain; there remains aproblem about how far the discrepancy can be explained by differences in the volume andtypes of crime committed by black people (compared with both whites and Asians), andhow far it is to be attributed to diff e rential and possibly discriminatory treatment in thecriminal justice system.
There is no doubt that minority ethnic people in Britain are, overall, more likely than whitesto experience the kinds of disadvantage that are known to be risk factors for involvement incrime. The Home Office (2000a) uses Labour Force Survey figures to show that all minorityethnic groups are less likely than whites to be employed, and that rates of unemploymentare particularly high in the most crime-prone age group (16-24). Pakistani, Bangladeshi andblack African groups have the highest pro p o rtion of working-age people living inhouseholds in which no one is in paid employment, and Pakistani and Bangladeshichildren, and people of working age from these ethnic groups, are the most likely to live infamilies with the lowest incomes. Children from the same groups, along with black children,a re least likely to obtain five passes at A-C level in the GCSE examination, and black
Black and Asian offenders on probation
2
children in all categories are more likely than any other ethnic group to be excluded fromschool. All these factors – povert y, low educational achievement, problems at school,unemployment – could plausibly be associated with an increased risk of criminalinvolvement.
There is also evidence, however, that minority ethnic people may be (further) disadvantagedby their treatment by criminal justice agencies, and that this applies especially to blacks.Since they – and to a lesser extent Asians – are more likely to be stopped by the police andmore likely to be arrested (Home Office, 2002a), their chances of becoming available to bep rocessed by the criminal justice system are higher than those of whites. There is alsoconsistent evidence that once they are in the system the kinds of decisions made on blackand Asian people differ from those made on whites (Phillips and Brown, 1998; Bowling andPhillips, 2002). Black people are more likely to be charged rather than cautioned, morelikely to be charged with more rather than less serious offences, and more likely (perhaps asa consequence) to be remanded in custody. Both blacks and Asians are more likely thanwhites to plead not guilty, and more likely to be acquitted. If convicted of offences ofviolence, they are more likely to receive custodial sentences. The overall pattern suggeststhat, certainly in the earlier stages of the criminal justice process, the decisions made onminority ethnic people differ from those made on whites in a way that increases theirchances of being drawn further into the system, and ultimately increases the risk of custody.
In its review of the evidence and statement of intended action, the Home Office (2002b, p.10) itself concludes that the differences ‘are such that it would be implausible to argue thatnone are due to discrimination’. While recognising that factors other than racism may havecontributed to these diff e rences, the Home Office statement goes on to describe actionalready taken or in prospect to reduce discrimination in the criminal justice system and toi m p rove understanding of the processes involved. The action taken includes theimplementation of the Race Relations (Amendment) Act in April 2001, which brings mostcriminal justice agencies under the scope of legislation that makes discrimination on thebasis of race illegal. Further action involves the full implementation of the recommendationsof the Macpherson Report (1999) on the murder of Stephen Lawrence, re s e a rch in theCrown Prosecution Service and the Lord Chancellor’s Department (now the Department forConstitutional Affairs) on possible areas of discriminatory practice, research and work onthe development of good practice in the National Probation Service and the Youth JusticeB o a rd, and the promotion of anti-racist practice in the Prison Service. The Home Off i c e(2002b) also announced the establishment of a new unit with a cross-departmental brief towork towards a better understanding of patterns of over- and under-representation of ethnicminorities in the criminal justice system, identify barriers to improvement, propose a
3
Introduction

p rogramme of action to eliminate discrimination, draw together and disseminate goodpractice, and make recommendations on what statistics should be collected and how theyshould be publicised. Issues of racism and discrimination in criminal justice are, then,recognised as an important policy priority.
Race issues and the Probation Service
Such issues are of current concern in the Probation Service as in other criminal justiceagencies. Introducing a report on the service’s work on race issues, the then Chief Inspectorof Probation declared himself ‘dismayed by many of the findings’, especially those whichsuggested disparities between the approach to work with white and minority ethnico ffenders (Her Majesty’s Inspectorate of Probation, 2000: 1). Subsequently Powis andWalmsley (2002) undertook a study of current and past probation programmes for Blackand Asian offenders with a view to extracting lessons for the development of practice. Theresearch which is the subject of this report is intended to complement Powis and Walmsley’swork by adding to knowledge of Black and Asian men’s perceptions of probation and theirideas on what kinds of practice are likely to be most helpful. The research is to be furthercomplemented by the National Probation Directorate, which has identified five models ofworking with Black and Asian offenders and is committed to testing their eff e c t i v e n e s s(Powis and Walmsley, 2002, p. 44).
Despite their current salience, attention to issues of ethnicity, racism and anti-discriminationin the Probation Service is relatively recent. In some of the earliest research on these themes,Denney and Carrington (1981) found stereotypical attitudes among probation off i c e r st o w a rds Rastafarians, and Whitehouse (1983) identified negative attitudes to blackdefendants in social enquiry reports (today’s pre-sentence reports). Green (1989) criticisedthe service for a ‘colour-blind’ approach that denied the reality of racism in the lives ofminority ethnic offenders, and Denney (1992) argued that court re p o rts more oftenp resented negative accounts of black than of white defendants. Hood (1992) found thatminority ethnic defendants in Crown Courts were more likely than whites to be sentencedwithout reports. Holdaway and Allaker (1990) argued that the Probation Service had beenslow to respond to such criticisms, and noted that at the time of their survey only ten areashad a strategic approach to the supervision of minority ethnic offenders. There were ,h o w e v e r, examples in the 1980s of local eff o rts to develop more appropriate forms ofpractice: the service in the West Midlands supported the Handsworth Alternative Scheme, aprobation-linked project which specifically liaised with training and employment projects runby black people (Denney, 1992); and the team serving the St. Paul’s area of Bristol,
Black and Asian offenders on probation
4

following riots there in 1981, adopted a ‘community-based and detached’ appro a c h(Lawson, 1984). In 1984, the Association of Black Probation Officers (ABPO) held its firstgeneral meeting, and in 1987 the National Association of Asian Probation Staff (NAAPS)was formed, on the basis that Asian perspectives were not adequately covered by the term‘black’ (HMIP, 2000).
Previous research on the needs and perceptions of minority ethnic people supervised by theProbation Service has typically been on a small scale. For example, Lawrence et al. (1992),working in collaboration with the then Inner London Probation Service (ILPS), interviewed asample of black offenders, black and white workers, and staff of interested agencies, ands c rutinised 59 court re p o rts. They concluded that most black offenders wanted specialprovision, but also observed that popular perceptions of this client group were ‘wide of themark. Indeed, in many respects, both with regard to the social characteristics of the blackclient group seen by ILPS and patterns of offending, black clients do not differ appreciablyfrom white clients’ (p. 7). Jeffers (1995) interviewed 44 offenders (28 minority ethnic and16 white men and women) and observed contact between officers and offenders. Heconcluded that black and white offenders shared a desire for respect, trust, credibility andpractical assistance, and observed that black offenders’ perception of probation ‘may be asmuch to do with its symbolic location, relative to the criminal justice system as a whole andthe degree to which this wider system is seen as racially discriminating’ (p. 33). Jeff e r sidentified two characteristic probation approaches: firstly, ‘minimal managerial anti-racismand equal opportunities strategies’, i.e. the recruitment of black staff, equality of treatmentand ethnic monitoring; and second, a ‘more politicised anti-racist project’ involving, forexample, the development of black empowerment groups designed to ‘counter the negativeself images black offenders may have through the medium of groupwork and help them takecontrol of their lives through increasing their self esteem’(p. 16). The scope and nature ofspecial provision for minority ethnic offenders are discussed at greater length below.
In a recent study of pre-sentence re p o rts on Asian and white defendants in the north ofEngland, Hudson and Bramhall (2002) re p o rted serious deficiencies in the re c o rding of dataon offenders’ ethnicity, a point which is discussed in more detail below. They also foundi m p o rtant diff e rences in the style and content of re p o rts. Reports on Asians tended to be‘thinner’, in the sense that they gave less information, and they were more likely to use‘distancing’ language when discussing information given by the defendant (‘he tells me that…’,and the like). Asian defendants were less likely to be presented as showing remorse andaccepting responsibility for the offence, and their problems were more often attributed to theirindividual characteristics than to externally observable difficulties such as substance misuse.T h e re were also diff e rences in sentencing proposals: community punishment orders were more
5
Introduction

likely to be proposed for Asians, and community rehabilitation orders for whites; and re p o rt son Asians were more likely to make no positive proposal, or to present a custodial sentence asinevitable. The authors concluded that Asians received community punishment orders and shortcustodial sentences in cases where whites would receive community rehabilitation orders, andthat this disparity in sentencing was a result of the proposals in re p o rts. These conclusions arebased on a relatively small sample and on re p o rts in one probation area, but the studysuggests, as did the HMIP re p o rt (2000) that there is no room for complacency in theP robation Service about its practice with minority ethnic off e n d e r s .
Developments in policy and practice
Probation policy and practice on minority ethnic offenders have not developed smoothly orc o n s i s t e n t l y. On the policy level, the Probation Inspectorate (HMIP, 2000) noted that theimportance of anti-discriminatory practice was stressed in the 1992 National Standards forprobation, was much less evident in the 1995 version, and became more prominent againin 2000. The Inspectorate also observed that equal opportunities and anti-discriminationissues were not mentioned in the three-year plans for the service covering 1996-2000.T h e re is also evidence of continuing (and worsening) problems of data collection andmonitoring, which are highly relevant to the present study: although such data have officiallybeen collected since 1992, the Home Office (2002a) was unable to include ethnic data onpersons supervised by the Probation Service in its annual presentation of statistics on raceand the criminal justice system, and observed (p. 3): ‘Over recent years the proportion ofethnic data missing has risen substantially’. It is therefore not surprising that data on minorityethnic probationers in Probation Statistics proved an unreliable source in the planningstages of this study.
The development of practice has also been uneven and patchy. Accounts exist of a numberof local projects, sometimes accompanied by resource packs or training manuals (Jenkinsand Lawrence, 1993; Kett et al., 1992; de Gale et al., 1993; Briggs, 1995; Johnson et al.,1996; Butt, 2001; Durrance et al., 2001; Williams, 2001), but such developments havetended to be local initiatives dependent on the energy and enthusiasm of a few staff. Wherethey have received some publicity they have not led to general changes in approach, and in1999 it was judged that there was insufficient evidence of effectiveness for any programmesfor black and Asian offenders to be awarded ‘Pathfinder’ status (Powis and Wa l m s l e y,2002, p. 1). Powis and Wa l m s l e y ’s survey of such programmes was conducted in thesummer of 2000. It found little re s e a rch data on criminogenic factors, no pro g r a m m e ss u fficiently evidence-based to meet accreditation criteria, ambivalence about special
Black and Asian offenders on probation
6
provision and about the mixing of black and Asian offenders, and inconsistency over ethnicdefinitions. Powis and Walmsley identified 13 programmes that had run at some time, in tend i ff e rent probation areas, but only five that were running at the time of the surv e y.Programmes were categorised as Black Empowerment Groups, Black Empowerment withinGeneral Offending, Black Empowerment and Reintegration, and Offence SpecificProgrammes. Staff were positive about the programmes, but the researchers concluded:
There are many arguments that support running separate programmes but also somethat advocate mixed group-work provision. There is, as yet, little empirical evidenceto substantiate either position (p. 11).
More recently, Durrance and Williams (2003) have argued that there are good grounds forbelieving that some minority ethnic offenders could benefit from special provision of the kindaimed at by programmes containing an element of empowerment, and that it is prematureto suppose that ‘what works’ with white offenders will by definition work with other ethnicgroups. They suggest that the experience of racism may have a negative impact on the self-concept of black and Asian people, and that work may therefore be required to enable orempower them to acquire a more positive sense of identity. They use their own evaluationfindings to suggest that empowerment is a feasible and potentially valuable approach toworking with offenders who have experienced some form of institutionalised discrimination.
The present research: aims and design
The present study was intended to fill some of the gaps in knowledge identified by Powisand Walmsley, and to provide a stronger empirical base to inform arguments about the bestform of provision for minority ethnic offenders. Its aims were:
● to collect some systematic information on the criminogenic needs of black andAsian offenders;
● to explore the views of black and Asian offenders about their experiences ofs u p e rvision by the Probation Service, particularly in their current probation (orcommunity rehabilitation) order, and their experiences of probation programmes;and
● to draw an overall picture of the problems faced by black and Asian offendersand how they respond to attempts to address them.
7
Introduction
The research design originally envisaged conducting 500 structured interviews with blackand Asian men currently on probation or community rehabilitation orders. Women were notincluded in the Home Office’s specification for the research. In the event, 483 interviewswere conducted that produced valid data for analysis; practical difficulties in the conduct ofthe fieldwork are discussed in the following chapter. The study did not include a whitecomparison group: comparisons are made with data on white offenders from other studies.
The intended sample was highly structured, by ethnicity, area, and type and stage of order.The aim was to interview 200 offenders on orders with 1A conditions – i.e. that they shouldparticipate in a groupwork programme – and 300 on ‘standard’ orders. The sample was tobe made up of 200 offenders recorded in probation records as ‘Asian’ and 300 recordedas ‘black’; therefore 80 Asian and 120 black offenders subject to 1A conditions were to bei n t e rviewed, and 120 Asian and 180 black offenders subject to standard ord e r s3. Thesample of probation areas was chosen to cover areas with high, medium and lowproportions or ‘densities’ of minority ethnic people on probation4 as a percentage of thetotal probation caseload. The Home Office assigned probation areas to a density categoryon the basis of figures provided by the areas. Sample sizes for each area were arrived aton the basis of a one-seventh sample of the estimated total population of black and Asianpeople on probation in high density areas, one-third in medium density areas, and one-halfin low density areas. This sampling strategy was adopted to ensure adequate representationin the sample of offenders from each type of area. For similar reasons, some oversamplingof Asian offenders was built into the sampling strategy. The sample number for each areafor both 1A and standard orders was, as far as possible, divided by four to cover offendersnear the start of orders, those at an intermediate stage, those coming to the end of an order,and those who had been breached for failing to comply with their order’s requirements5.The interviews actually conducted broadly followed the sampling strategy, with adjustmentsas necessary to approximate the target of 500 interviews in total.
Black and Asian offenders on probation
8
3. The interview schedule asked respondents to categorise their ethnic origin as one of: black African, blackCaribbean, black Other, Pakistani, Bangladeshi, Indian, Asian Other, mixed heritage and Other, which isconsistent with the definitions of ethnicity used in the 2001 Population Census.
4 In this report we have generally used the old-fashioned term ‘probation order’ rather than the more cumbersomecommunity rehabilitation order, since the former was more readily understood by respondents, and we suspect itwill still be more familiar to many readers.
5 In the event, this aspect of the sampling strategy did not show any interesting diff e rences between diff e re n tstages beyond those which would in any case have been expected: for example, people interviewed very earlyin orders or programmes were not able to give as much information about them as those interviewed later, andthose who failed to complete or breached orders or programmes had slightly but significantly higher scores oncrime-prone attitudes and self-reported problems (P<0.01 and P<0.05 respectively for orders, and P<0.01 inboth cases for programmes).

The structure of the report
Chapter 2 describes the conduct of the fieldwork for the research and discusses some of theproblems encountered and the reasons for them; further material on this is in Appendix 1.Chapter 3 describes the basic demographic characteristics of the sample and begins toexplore the question of whether the criminogenic needs of black and Asian offenders aredistinct from those of white offenders. Chapter 4 summarises respondents’ views ofp robation and programmes. Chapter 5 discusses evidence of social exclusion anddeprivation among respondents, and their experiences of the criminal justice system.Chapter 6 reviews the findings and discusses implications for probation policy and practice.
9
Introduction

Black and Asian offenders on probation
10

Chapter 2: The conduct of the research
Planning and organisation
The research contract began on 1 August 2001. The research team designed 800 flyersand 500 large colour posters to publicise the project; these were for distribution in thep robation offices taking part in the study, and described the nature and duration of theresearch, its main aims, and the staff involved. The team distributed these materials to therelevant probation areas, and produced separate information sheets for offenders andprobation officers. A form was produced on which offenders were to indicate their consentto the interview and acknowledge receipt of the £10 paid for each interview in recognitionof the time and effort involved.
The project required nine researchers in four geographically dispersed universities to workeffectively as a team, and to maintain contact with the Home Office, the National ProbationDirectorate (NPD), and the various probation areas involved. The research was introducedto the participating areas by a Diversity Workshop, which was organised by the Research,Development and Statistics Directorate of the Home Office (RDS) and the NPD, and held inLondon in October 2001. RDS formed a Steering Group including members of NAPO,ABPO and NAAPS6 to inform and support the research.
Two important tasks for the preliminary period of the research were to agree a samplingstrategy and develop a data collection instrument to be used in pilot interviews andmodified as necessary. The highly structured nature of the sample as originally planned hasbeen described in Chapter 1. The breakdown of the target figure by area is shown in thefirst column of figures in Table 2.1, which gives the target sample number for each area,categorised by the ‘density’ of the minority ethnic population; the second column shows thenumber of interviews eventually achieved. (The target figures were set on the understandingthat the team might need to be flexible about numbers across areas in order to achieve theintended overall sample.)
In the first few weeks of the project, the team also worked to develop a data collectioninstrument – essentially an interview schedule – that would address the research questionsspecified for the project. The aim was to produce an instrument that could capture both
11
6. The National Association of Probation Officers, the Association of Black Probation Officers, and the NationalAssociation of Asian Probation Staff.

quantitative and qualitative data. The schedule consisted of five main sections, following anintroductory set of questions that covered basic personal details and information about thec u rrent order and past experiences of probation supervision. The first section covere dexperiences of individual supervision and ideas on what constituted helpful and appropriateprobation practice. The second dealt with experiences of programmes, and was thereforenot relevant to all interviewees. It explored perceptions of the purpose and value ofp rogrammes and experiences of being a member of a group. The third section wasconcerned with the interviewee’s current situation; it was mainly concerned with housing,employment, family life, and drug and alcohol use. The CRIME-PICS II instrument wasa d m i n i s t e red after this set of questions (see Chapter 3). The following section used theCRIME-PICS responses to explore interviewees’ criminogenic needs, their perceptions of whythey had got into trouble, and what changes they thought would help them stay out oft rouble in future. The fifth and final section dealt with experiences of the criminal justicesystem, both as an offender and, where relevant, as a victim.
The conduct of the research
The members of the research team involved in interviewing were a diverse group in terms ofgender, ethnicity and culture. The majority7 of the interviews were conducted by black andAsian re s e a rchers, and each re s e a rcher interviewed offenders from all ethnic groups toguard against biases resulting from interviewers’ ethnicity. There were very few indicationsof differences in response patterns on account of interviewers’ ethnicity (but see Chapter 4for a discussion of those that were found). Also, checks were made periodically forconsistent diff e rences among interviewers in the type and quality of data obtained ininterviews, and none were found.
The schedule was piloted and modified in November 2001. Fourteen pilot interviews8 wereheld in probation offices in Manchester and Cardiff, and lasted from one hour and fifteenminutes (the shortest) to two hours and ten minutes. Final revisions to the schedule weremade following the pilot and further discussion in a Steering Group meeting. The schedulesubsequently proved a robust and reliable data collection instrument.
The experience of piloting the schedule was useful not only for allowing improvements to bemade to the interview schedule but for showing that the process of fieldwork and datacollection would be much more complex than we had expected. The main reason for this
Black and Asian offenders on probation
12
7. Minority ethnic researchers conducted 69 per cent of the interviews (unweighted figure).8. These were not included in the final analysis.

was that (as we might have predicted, given the Home Office’s own criticisms of the qualityof probation data on ethnicity, discussed in Chapter 1) the data held centrally in probationareas had proved to be inaccurate and often out of date; this meant, among other things,that it was impossible accurately to identify offenders in the categories re q u i red for stricta d h e rence to the sampling strategy. A number of other practical lessons, re i n f o rced bysubsequent experience, were drawn from the pilot study. Firstly, it was clear that researchi n t e rviews were much more likely to be successfully arranged and conducted when theyimmediately followed or preceded an appointment with the offender’s probation supervisor.S e c o n d l y, we learned that we ought to expect a high rate of non-attendance even forinterviews arranged in this way, and that the approach to sampling needed to take accountof this, and be guided by considerations of opportunity and feasibility. Thirdly, it was cleareven from the pilot that our presence as researchers could quickly become irksome to busyprobation staff, if, for example, it was necessary to arrange more than one appointmentwith an off e n d e r. Some of the difficulties encountered in the course of the re s e a rch arediscussed further in Appendix 1.
In order to maintain a reasonable rate of pro g ress towards the target figure of 500i n t e rviews, additional staff were re c ruited on a sessional basis by the Glamorgan andLincoln teams, and conducted a total of 41 interviews. It was also necessary to diverge fromthe target figures for each area when numbers apparently unavailable for interview in onearea could be made up in another. It was also decided to include a relatively small numberof interviews (53) with offenders who, whilst not subject to a probation order, were able todiscuss the probation element of a different disposal (usually a community punishment andrehabilitation order).
Table 2.1 shows the final breakdown of interviews by area, and compares the targ e tnumbers with those actually achieved.
13
The conduct of the research

Table 2.1: Target and actual interview numbers by area
Typology of areas Offenders: target sample N of interviews achieved
High densityBedfordshire 9 11Greater Manchester 30 38Leicestershire 9 11London 191 210Nottinghamshire 13 14Thames Valley 18 18West Midlands 78 64Subtotal 348 368
Medium densityAvon and Somerset 17 15Hertfordshire 6 3Warwickshire 7 2West Yorkshire 52 41Wiltshire 6 4Subtotal 88 65
Low densityDevon/Cornwall 4 5Essex 7 3Lancashire 31 23Lincolnshire 5 5South Wales 17 16Subtotal 64 52
Total 500 483
As the table makes clear, the impact of the problems discussed above and in Appendix 1was greater in medium and low density areas than in high density areas, with the exceptionof the West Midlands, where workload pre s s u res on probation staff had led to a policy ofminimal contact with certain categories of off e n d e r. This may suggest that probation are a swith a high density of black and Asian offenders on probation and community re h a b i l i t a t i o no rders have been generally more successful in developing practice that allows for constru c t i v es u p e rvision and a better sense of offenders’ current status. It should be noted, however, thateven low density areas can contain small localities of high density, and it is important that theneeds and interests of minority ethnic offenders in these localities should not be overlooked.
Black and Asian offenders on probation
14

Overall, 241 interviews were conducted with subjects who defined themselves as black(compared with a target figure of 300) and 172 with subjects who defined themselves asAsian (compared with a target figure of 200) – making a total of 413. The remaining 70interviewees defined themselves in ways not envisaged in the original scheme, as of mixedheritage (57 cases) and in some other way (13 cases). High density areas were over-sampled in comparison with the target figure, and medium and low density areas wereu n d e r-sampled. As a final comparison with the sample originally envisaged, 237interviewees were or had been on orders entailing participation in a programme, when thetarget figure had been 200. This discrepancy reflects the fact that a growing proportion ofoffenders under probation supervision are required to attend a programme. Since the datathat produced the original sampling scheme are known to be defective, there is no reason tore g a rd these divergences from the sample originally envisaged as having introduced adamaging element of unrepresentativeness.
For purposes of analysis, the sample was weighted (by area and ethnicity) to reflect, as faras possible, the actual distribution of minority ethnic probationers reported in the ProbationStatistics for England and Wales 2001 (Home Office 2002b). This corrects any biasesresulting from the differential sampling of high, medium and low density areas, and ensuresthat responses are as representative as possible of minority ethnic people on Probation orCommunity Rehabilitation Orders at the time of the study. All findings are therefore reportedin terms of the weighted sample except where they are specifically stated to be unweighted.Each respondent was assigned a weighting factor which was the product, to two decimalplaces, of the weighting by area and the weighting by ethnicity. The factors are shown inTable 2.2.
Table 2.2: Weighting factors used in presenting the results
Ethnicity High density Medium density Low density
Black 1.40 0.85 0.52Asian 0.59 0.36 0.22Mixed heritage 1.55 0.94 0.57Other 1.53 0.93 0.57
15
The conduct of the research

Conclusions
It is not unusual for difficulties to arise in social re s e a rch that relies for contact with itsresearch subjects on the support and facilitation of an organisation whose primary purposeis not research. That was the case here, even though with few exceptions the formal positionof probation areas’ senior management was supportive of the research. Deficiencies andinconsistencies in probation service records were the most obvious source of the obstaclesthe researchers had to overcome, but other problems arose from variations in the quality ofthe relationship between offenders and supervisors, ambivalence about the research amongprobation staff, and organisational policies that made relevant offenders difficult to identifyand contact. The re s e a rchers had to adopt a pragmatic and sometimes opport u n i s t i ca p p roach in order to achieve a total number of interviews close to the original targ e t .Appendix 1 provides a more detailed account of the many problems encountered.
Black and Asian offenders on probation
16

Chapter 3: Surveying respondents and their criminogenic needs9
Characteristics of the sample
Ethnicity was classified under four general headings: black, Asian, mixed heritage, and other.The terms ‘black’ and ‘Asian’ were used in accordance with the 1991 Census of Populationcodes where black is defined as African, Caribbean, and black other, and Asian is defined asPakistani, Bangladeshi, Indian and Asian Other. In addition, a number of interviewees definedthemselves as of mixed heritage or mixed race, and it appeared useful to count these as anadditional category. Interviewees described as being mixed heritage tended to have one whitep a rent and one minority ethnic pare n t1 0. Table 3.1 shows the ethnic breakdown of the sample:
Table 3.1: Ethnic composition of the (unweighted and weighted) sample
Ethnicity Frequency Per cent Frequency Per cent(unweighted) (unweighted) (weighted) (weighted)
Black African 60 12.4 77 16.0Black Caribbean 146 30.2 187 38.7Black Other 35 7.2 45 9.2All black 241 49.9 309 63.9Pakistani 74 15.3 36 7.4Bangladeshi 12 2.5 6 1.3Indian 62 12.8 31 6.5Asian other 24 5.0 13 2.6All Asian 172 35.6 86 17.8Mixed heritage 57 11.8 72 15.0Other 13 2.7 16 3.3TOTAL 483 100 483 100
17
9 The figures up to and including those in Table 3.4 are unweighted as they simply describe the people who wereinterviewed, rather than seeking to infer any characteristics applicable to the minority ethnic probation caseloadas a whole. The only exception to this is in Table 3.1, where the data are unweighted and weighted. The figuresin the rest of the chapter are weighted unless otherwise stated.
10 Of the 40 mixed heritage interviewees who gave details of their parents’ ethnic origin, 33 (82.5%) said that oneparent (usually their father) fell into one of the ‘black’ categories, whilst the other parent was white. It is notpossible to say whether the same applies to the 17 minority mixed heritage interviewees who did not providethese details. However, there was no indication that this group differed in any major respect from the 40 whodid provide this information.

The ‘Other’ category includes people such as one interviewee who described his ethnicorigin as ‘international’, one who said he was an Arab, and another who, when asked howhe would describe his ethnic background said:
[It is] kind of confused. I’ve got Irish and Scottish blood in me, because of [my]parents I’m half Somalian and Jamaican. I’ve been around black Americans all mylife.
Areas, disposals and orders
Table 2.1 in Chapter 2 lists the probation areas involved in the study, and whether theyhave a high, medium or low proportion of inhabitants from minority ethnic groups. Table3.2, below, shows the ethnicity of the interviewees. Eighty-nine per cent of interv i e w e e sw e re or had been on a probation (or community rehabilitation) order (n = 430). Theremaining respondents discussed the probation supervision and in some cases attendanceat a probation programme that they had experienced as part of another order (n = 53),such as a community punishment and rehabilitation order (CPRO). Almost half of theinterviewees (49%) were or had been on a probation (or community rehabilitation) orderthat included an additional re q u i rement to attend a probation-led programme. Theremainder were or had been on an ‘ord i n a ry’ probation order with no such stipulation.Tables 3.3 and 3.4 show the breakdown of interviewees by type and stage of order11:
Table 3.2: Number and ethnicity of respondents from high and medium/low density are a s
Ethnicity High density Medium and low Total
Black 200 41 241Asian 120 52 172Mixed heritage 37 20 57Other 9 4 13TOTAL 366 117 483
Black and Asian offenders on probation
18
11. I n t e rviewees who were on a CPRO, and the small number on other orders, were allocated to the ‘ord i n a ryo rder’ group or the ‘programme order’ group depending on whether they had experience of attending aprobation-led programme.

Table 3.3: Number and percentage of interviewees at different stages of a‘programme order’
Stage of programme order Frequency Per cent of those Per cent ofon a programme order total sample
Current 91 38.6 18.8Completed programmebut still on order 78 33.1 16.1
Failed to complete/breached 30 12.7 6.2Had yet to start 37 15.7 7.7TOTAL 236 100 12 48.9
Table 3.4: Number and percentage of interviewees at different stages of a non-programme order
Stage of ordinary order Frequency Per cent of those Per cent ofon an ordinary order total sample
Early 87 35.2 18.0Mid 57 23.1 11.8Late 77 31.2 15.9Failed to complete/breached 26 10.5 5.4TOTAL 247 100 51.1
Less than half of the respondents (44%) said that this was their first experience of probations u p e rvision. Of those who had had previous experience (56%), 45 per cent re p o rt e dhaving done community service, 45 per cent had received a probation order, 31 per centhad been given a supervision order, and 30 per cent had had a detention and trainingorder, youth offender licence, or a borstal or youth custody licence.
19
Surveying respondents and their criminogenic needs
12. Percentages total 100.1 because of rounding

Length of probation order
Table 3.5: The length of orders given to probationers in 2001, and to the interv i e w e e s
Length of probation Persons starting probation Survey respondentsorder order in 200113
Frequency % Frequency Valid %
Under 12 months 6,657 12.2 29 6.112 months 29,094 53.4 216 45.913-24 months 17,572 32.3 208 44.225-36 months 1,147 2.1 18 3.8All lengths (Total) 54,470 100.0 470 100.0Average length of order (months) 15.9 16.8
(Here, as in many of the tables, N is less than 483 as not all interviewees answered or wereable to answer the question.) Survey respondents had been given longer sentences than theprobation population as a whole, with just 52 per cent receiving orders of 12 months orless, compared with 66 per cent of the general probation population. The average length ofsentence was longer for survey respondents than amongst probationers generally, and abreakdown of the average length of order by ethnicity showed that the difference was evenmore marked for some minority ethnic groups.14
The index (main current) offence15
Table 3.6 shows which offence(s) led to the interviewees being placed on probation 16 (Note:p e rcentages do not add to 100 because some offenders had been convicted of multipleoffences.)
Black and Asian offenders on probation
20
13. Home Office (2002c): Table 3.14.14 Average length of orders in months by ethnicity: black African 15.7, black Caribbean 16.5, black Other 18.1,
Pakistani 17.5, Bangladeshi 12.4, Asian Other 17.2, mixed heritage 16.9, Other 22.6.15 It should be noted that information regarding the nature of the index offence usually came from the interviewees
themselves, and whilst every effort was made to confirm this information with independent sources, for exampleby talking to the interviewees supervising officer or by looking at the case file, often this was not possible.
16 Lists of the offences that fall within each offence category can be found in the Home Office (2000b) OASysmanual (version 5), pp.146-151.

Table 3.6: The index offence
Offence category Frequency Per cent
Violence against the person 84 17.5Sexual offences 11 2.3Burglary 31 6.4Robbery 24 5.0Theft and handling 104 21.6Fraud, forgery and deception 35 7.1Criminal damage 18 3.7Drug offences 45 9.2Other offences 51 10.6Motoring offences 142 29.5
The index offence varied according to ethnicity. Black interviewees were more likely to havebeen convicted of criminal damage than Asian or mixed heritage interviewees. Asianinterviewees were more likely to have been convicted of sexual offences, fraud, forgery anddeception, drug offences and motoring offences, than their black and mixed heritagec o u n t e r p a rts. Mixed heritage respondents were more likely to have been convicted ofviolence against the person, burglary, robbery and theft and handling, than the black andAsian people in the sample (see Table A1, Appendix). Of all men starting probation ordersin 2001, theft and handling (25%), violence against the person (10%) and burglary (6%)represented the largest specific offence groups17 (Home Office, 2002c: Table 3.4).
Composition of the sample by age
The mean age of respondents at interview was 29.7 years. A breakdown of the mean ageof respondents by ethnicity found slight variations in mean age by ethnic group.18 The agedistribution of the survey sample is broadly similar to that found for male pro b a t i o n e r sgenerally, although more survey respondents were in the 21-29 age band, and fewer in thelower age bands, than in the general probation population.
21
Surveying respondents and their criminogenic needs
17. The offence group sizes in Table 3.6 and the Home Office figures are not directly comparable. The Home Officefigures include indictable offences only, whilst Table 3.6 includes summary and indictable offences.
18 Mean ages: black African 28.1, black Caribbean 30.9, black Other 27.4, Pakistani 27.3, Bangladeshi 22.0,Indian 31.2, Asian Other 27.4, mixed heritage 31.1, Other 30.7.

Table 3.7: The ages of men starting a probation order in 2001, and of the interviewees
Age range Age of males starting a Age of survey respondentsprobation order in 200119 at interview
Frequency % Frequency Valid %
16-17 468 1.1 0 018-20 7,938 18.4 84 17.421-29 16,591 38.5 191 39.730 and over 18,097 42.0 207 42.9TOTAL 43,094 100.0 482 100.0
P a t t e rns of offending tend to differ according to age (see Mair and May, 1997: Ta b l e3.14), and the survey respondents proved to be no exception. Interviewees aged from 18and 20 were more likely to have been convicted of ro b b e ry, burg l a ry, criminal damageand/or motoring offences than those in other age groups. Respondents aged from 21 and29 were more likely to have been convicted of theft and handling, fraud, forg e ry anddeception and/or drug offences than their older and younger counterparts. Interv i e w e e saged 30 and over were more likely to have been convicted of violent and/or sexualoffences than younger respondents (see Table A2, Appendix 2).
Other characteristics
The majority of interviewees (83%) said that they were British. Christianity and Islam werethe most common religions followed by respondents: 45 per cent said that they wereChristian, and 16 per cent reported being Muslim. A further 27 per cent of respondentssaid that they did not follow any religion. Christian respondents were usually black, whilstMuslim respondents tended to be Asian.
Measuring criminogenic need
A central aim of this study was to attempt some quantitative assessment of the majorcriminogenic needs of minority ethnic offenders on probation, to inform decisions aboutwhat kind of services should be developed for or offered to them. ‘Criminogenic needs’ inthis context should be understood as characteristics of a person or his/her situation whichi n c rease the risk of offending, but are in principle capable of change; in other word s ,
Black and Asian offenders on probation
22
19 Source: Home Office (2002c): Table 3.3.

‘dynamic risk factors’ (see, for example, Andrews and Bonta, 1998). In this chapter weconcentrate on needs that can be assessed in a standardised way and therefore comparedwith studies of other groups. It is important to note that other needs not covered in thischapter, such as experiences of social exclusion or discrimination, may also be criminogenicin some circumstances. These possibilities are discussed further in Chapter 5.
Assessing the criminogenic needs of respondents re q u i red a standardised instru m e n tcapable of reasonably convenient use with a small amount of training, but known to havean acceptable level of reliability and some relationship with offending. The possibility ofusing the Offender Assessment System20 (OASys Development Team, 2001) was considered,but it was clear that it would take a considerable time to administer, preventing researchersf rom covering other ground in interviews. It was important to ensure that the interv i e w scovered other material in order to gather information about experiences of probation andother life-experiences, both to meet other objectives of the study and to reduce the risk thatthe agenda of the interviews might be unduly restricted by the use of an instrument basedmainly on research with white offenders (which is the basis of all standardised measures ofcriminogenic need known to the research team).
The instrument eventually chosen was the CRIME-PICS II questionnaire (Frude et al., 1994)that had a number of characteristics appropriate to this study. It is relatively quick andsimple to administer, relying on offenders’ responses to questions and their self-reports aboutp roblems rather than on interviewers’ judgments; it has a history of use in pro b a t i o nresearch; it is currently widely used in ‘pathfinder’ project evaluations; and it is known to berelated to reconviction risk (Raynor, 1998). It has also been used in the past with groups ofwhite or predominantly white offenders, offering the possibility of useful comparisons withthe current sample. CRIME-PICS II concentrates particularly on attitudes and beliefs whicha re conducive to offending and on self-re p o rted life problems, producing scores on fivescales known as G, A, V, E and P. (These stand for General attitude to off e n d i n g ,Anticipation of re o ffending, Victim hurt denial, Evaluation of crime as worthwhile, andProblems.) Both raw and scaled (standardised) scores are produced for G, A, V, E and P,and a separate score for each of the fifteen problem areas covered by P.
23
Surveying respondents and their criminogenic needs
20 The Offender Assessment System is a structured risk/need assessment instrument designed for use by probationand prison staff, drawing on official records as well as interviews. It requires a significant amount of training.

Comparison groups for CRIME-PICS II
A number of studies that have used CRIME-PICS II were examined to identify possiblecomparison groups for this study. Some of them were unsuitable because of the way in whichfindings were re p o rted (for example, mean scores with no standard deviations (SD)2 1 or noi n f o rmation about ethnicity), or because they were drawn from very diff e rent sentences or part sof the penal system where diff e rent scores might be expected anyway. Many studies omittedgeneral risk measures such as OGRS (the Offender Group Reconviction Scale) or OGRS 2 (alater version of OGRS)2 2 that might help to establish comparability. For example, Wi l k i n s o n(1998) gave results for 205 probationers, but without SD or ethnic breakdown, although abouto n e - t h i rd of his sample was black. Harper (1998) covered 65 probationers, but again with noSD or ethnic breakdown. McGuire et al. (1995) provided only problem scores, and Surre yP robation Service (1996) provided change information but no scores, and had a low numberof offenders. The re s e a rch re p o rt on resettlement pathfinders (Lewis et al., 2003) gave fullCRIME-PICS II data on 843 offenders, but comparability is limited as the offenders were short -t e rm prisoners (some ethnic comparisons from this study are mentioned below). Other studies( M a g u i re et al., 1996 on Automatic Conditional Release prisoners; Richards, 1996 on theC a m b r i d g e s h i re Intensive Probation Centre; and Jones, 1996 on another probation centre inDyfed) involved small numbers and in some cases diff e rent kinds of off e n d e r.
M o re promising were: a study of a probation centre in the Midlands (Davies, 1995) whichinvolved 117 offenders known to be 87 per cent white and 81 per cent male; a study byHatcher and McGuire (2001) of the early pilots of the ‘Think First’ programme which pro v i d e ddata on 357 offenders, clearly mainly white and 94 per cent male; the data kindly supplied bythe Cambridge team evaluating community punishment pathfinders (see Rex et al., 2002),which enabled us to extract scores for 1,341 white male offenders; and, most usefully, theoriginal validation sample for CRIME-PICS II in Mid Glamorgan (Frude et al., 1994). Thisc o v e red 422 offenders supervised by the Mid Glamorgan service between 1991 and 1993(including the STOP evaluation cohort – Raynor, 1998), almost entirely male, at a time when theMid Glamorgan caseload was 99.5 per cent white (Home Office, 1994). OGRS scores werenot available for all these groups, but the average OGRS score for the community punishmentstudy is re p o rted as 47 per cent, and the average risk of reconviction for probationers in 1993is given by May (1999) as 53 per cent, which is consistent with other information suggestingthat the Mid Glamorgan sample would score well below 55 per cent. All the CRIME-PICS II
Black and Asian offenders on probation
24
21 The standard deviation is the normal statistical measure of the dispersion of scores in a sample. It is required tocalculate the significance of differences between the means.
22 It is likely that the scores in some of the reports discussed below were calculated using OGRS whilst others werecalculated using OGRS 2, because of the different times at which the offenders were assessed. For simplicity werefer to OGRS throughout the rest of the report.

comparisons in this re p o rt are either within the survey sample or with these four groups, andp a rticularly with the original validation sample. Although none of these comparison groups wasweighted to improve its re p resentativeness of offenders under supervision in general, the generalcharacteristics of the validation sample resemble those of probationers at the time, includingM a y ’s sample (1999) which was selected to re p resent a range of areas. Overall the availableCRIME-PICS II studies re p resent the best available comparison information on the criminogenicneeds of white offenders until large volumes of OASys data become available in the future .
It was also envisaged that a number of offenders in the sample would have been assessedusing the assessment instruments LSI-R (Level of Service Inventory Revised) or ACE(Assessment, Case Management and Evaluation) that could then be compared to norm sestablished in previous studies (Raynor et al., 2000). Some OASys assessments might alsohave been carried out. However, so few examples of such assessments were made availablethat no meaningful analysis could be attempted. In 90 cases (equivalent to a weighted 78cases) OGRS scores were provided, which were of some value in comparing static risk levels.The latest national information available at the time of writing indicated that the averageOGRS score for offenders on community rehabilitation orders in the first quarter of 1999 was52.8 (Home Office, 2003), which is close to the survey sample’s weighted average of 51.8.
CRIME-PICS II scores in the sample and the comparison groups
Table 3.8 and Figure 3.1 show the raw G, A, V, E and P scores for the survey samplec o m p a red to the CRIME-PICS II validation sample (‘white comparison’)23. The score sshowed little variation between high, medium and low density areas24. The table alsoshows scores for each of the main ethnic groups (omitting the 13 members of theheterogeneous ‘Other’ group). Scores are not available for one of the 483 respondents, soN = 482. OGRS scores are included, and significant differences (derived from t-tests25) areindicated in the CRIME-PICS II scores. For the identified ethnic groups, the indicatedprobabilities refer to the significance of differences between the particular ethnic group andthe remainder of the full survey sample. In the final column they refer to the significance ofdifferences between the full survey sample and the CRIME-PICS II validation sample. In bothcases * = p<0.05, ** = p<0.01.
25
Surveying respondents and their criminogenic needs
23 See p.31, above for an explanation of the G, A, V, E and P scales.24 The average unweighted scores in high (H) and medium and low (ML) density areas were: G (H = 37.85, ML =
37.07), A (H = 12.04, ML = 11.63), V (H = 8.22, ML = 8.10), E (H = 10.33, ML = 10.44), and P (H = 26.72,ML = 26.43).
25 T-Tests are a way of calculating the significance of a difference between the average scores recorded by twogroups on the same measure. They show the probability that the difference could have come about by chance:the lower the probability (p), the higher the significance.

Table 3.8: Raw CRIME-PICS II scores compared
Scale Full weighted Black Asian Mixed Whitesample heritage comparison
Weighted N 482 308 86 72
(Unweighted) (482) (240) (172) (57) (422)G 38.28 38.48 35.66** 40.61 * 44.84**A 12.20 12.27 11.15** 13.16 * 13.89**V 8.04 8.09 8.74* 6.79 ** 8.58**E 10.50 10.59 9.73** 11.14 12.03**P 26.62 26.33 26.86 27.36 28.62**OGRS 51.8 49.7 44.6 62.6 53.026
(No. of OGRS scores available) (N=90) (N=36) (N=38) (N=14)
Figure 3.1: Raw CRIME-PICS II scores compared
It is immediately clear that the survey sample shows lower scores than the white comparisongroup on all scales, apart from Asian offenders on the V scale. Within the survey samplethere are also a number of differences between ethnic groups: black offenders were slightlybut not significantly higher than the sample as a whole on all scales except the P scale;
Black and Asian offenders on probation
26
26 This is an estimate based on the data collected for the STOP study (Raynor and Vanstone 1997).

Asian offenders were significantly lower on G, A and E but higher on V; and offenders ofmixed heritage were significantly high on G and A but low on V. All group scores, eventhose which were high for the sample, were lower than for the white group. A fullbreakdown of the problem scores is given in Table A.3 in Appendix 2: the only problemareas in which the survey subjects reported greater difficulties than the white comparisonsample were relationships, housing (particularly among black offenders), health (particularlyamong Asian offenders) and not feeling good about oneself (particularly among offendersof mixed heritage).
Table 3.9: Other CRIME-PICS II comparisons
Scale Full weighted Probation Think First Community Programme Non- sample Centre Hatcher and Punishment subsample programme
(Davies, ( McGuire, (Rex et al., (weighted) subsample 1995) 2001) 2002) (weighted)
N 482 117 357 1341 250 247G 2.5 4.1 4.6 2.0 2.5 2.6A 3.8 4.5 5.4 3.1 3.8 3.8V 4.0 4.3 3.5 4.1 3.8 4.2E 3.7 4.5 5.0 2.8 3.6 3.7P 4.1 4.6 5.3 3.1 3.8 4.3OGRS 51.8 55.0 44.8
(N=90) (N=60) (N=30)
Table 3.9 compares the survey sample with the other studies identified above. Scaled scoresa re used here as some studies only provided these. Diff e rences are in the expecteddirections: the Think First and Probation Centre groups score higher than the survey sample,and the community punishment group scores lower, reflecting the known tendency forpeople on community punishment orders to have fewer problems than those onprobation/community rehabilitation orders (Raynor, 1998).
The table also compares those members of the survey sample who were involved inp rogrammes with those who were supervised without programmes. It is interesting thato ffenders on programmes had a higher risk of reconviction (as indicated by their higheraverage OGRS score), but fewer crime-prone attitudes and beliefs and self-re p o rt e dproblems (as indicated by their lower CRIME-PICS II scores) than those not on programmes,although the differences in CRIME-PICS II scores were only statistically significant on the P
27
Surveying respondents and their criminogenic needs

scale27. There was no evidence that these differences were due to a programme effect, sincethe CRIME-PICS II scores for those who had completed a programme were not significantlylower than for those who were part way through a programme, and were not lower thanscores for those who had yet to start. There were statistically significant differences28 in theproportion of different ethnic groups who were on programmes (51.5% of black offenders,39.5 % of Asian offenders and 66 % of mixed heritage offenders were on programmes).This may have been at least partly due to differences in OGRS scores.
Other comparative studies
It is interesting to compare these findings with those of some other studies which haveincluded direct comparisons between minority ethnic offenders and white offenders withinthe British penal system. The numbers of black and Asian offenders in these studies arelower than in the present study, but the parallels are interesting.
The second pilot study undertaken for the OASys instrument in 1999-2000 covered 2,031o ffenders of whom 180 are described as black and 83 as ‘south Asian’ (Clark et al., 2002).Both black and Asian offenders had lower average OASys scores than white off e n d e r s ,indicating a lower level of criminogenic need and probably a lower risk of re o ffending. Inp a rt i c u l a r, black offenders showed significantly lower scores on lifestyle and associates,alcohol misuse, drug misuse and emotional problems. Asian offenders scored significantlylower on criminal history, accommodation problems, educational need, financial pro b l e m s ,lifestyle, drug misuse, ‘interpersonal problems’ and thinking skills. Among offenders located inthe community rather than in prison, the pro p o rtion of black and particularly Asian off e n d e r swho showed the appropriate level and profile of needs to be assessed as well ‘fitted’ to ano ffending behaviour programme was lower than the corresponding pro p o rtion of whiteo ffenders. This is a further indication of lower assessed need.
A study reported by Merrington (2001) of assessments carried out by probation officers inGreater Manchester using the ACE assessment system (see Roberts et al., 1996) covered3,746 offenders, of whom 365 were black or Asian. The analysis did not separate blackf rom Asian offenders, but it showed that black/Asian offenders had lower ‘off e n d i n g -related’ scores (the ACE measure of criminogenic need) and were less likely than whiteo ffenders to be assessed as having problems with accommodation, alcohol and dru g s ,mental health, emotional stability and self-esteem. There were ‘no areas in which ethnicminorities are judged to have more criminogenic problems than whites’ (p. 8).
Black and Asian offenders on probation
28
27 P<0.05.28 P<0.01.

Finally, direct comparisons of CRIME-PICS II scores between ethnic groups were possible inthe first phase of the ‘pathfinder’ evaluation of resettlement projects for short-term prisoners(Lewis et al., 2003). Initial scores were available for 730 white, 67 black and 25 Asianprisoners. Minority ethnic offenders showed lower criminogenic needs and problem scores,though the differences were not statistically significant. Overall, the convergence betweenthese other studies and the current study is quite striking, particularly as some of them (thoseusing OASys and ACE) were based on assessments by professionals, and others (usingCRIME-PICS II) were based on offenders’ own statements.
Implications of the CRIME-PICS II findings
Analysis of the CRIME-PICS II scores within the survey sample showed lower levels of crime-p rone attitudes and beliefs than other studies have found in white offenders subject toprobation/community rehabilitation orders. This is true of both black and Asian offenders inthe sample, with the largest difference found among Asian offenders. Offenders of mixedethnic origin scored closest to white probationers, but still had slightly lower scores. Levels ofs e l f - re p o rted problems showed less diff e rence between black, Asian and mixed heritageoffenders and were closer to (but still in most problem areas lower than) those recorded forwhite probationers. These findings are important when considered alongside the knowno v e r- re p resentation of minority ethnic people in the criminal justice system (Home Off i c e2002a) and the fact that the survey respondents were serving probation orders of greaterthan average length (see above, p. 35).
The finding that the criminogenic needs of minority ethnic probationers were, on average,lower than those of their white counterparts suggests that minority ethnic offenders weretending to receive the same community sentences as white offenders who had higher levelsof criminogenic need. This finding, based on small but significant differences in levels ofcriminogenic need, may have a number of explanations; however, one possibility thatdeserves consideration is that it was at least partly a result of differential sentencing. In otherwords, it raises the possibility that at least some comparable white offenders were receivingless serious sentences, and that some minority ethnic offenders were more likely thancomparable white offenders to receive sentences above the community sentence range.
There were no significant differences in CRIME-PICS II scores between those on programmesand those not on programmes, except that those not on programmes reported slightly butsignificantly more problems29. There was no evidence that this was due to any effect of the
29
Surveying respondents and their criminogenic needs
29 P<0.05
programmes on those who attended them. The average OGRS score was higher for thoseon programmes, suggesting that allocation to programmes had reflected differences in staticrisk factors rather than differences in criminogenic needs. Asian offenders (who, as a group,had the lowest mean OGRS scores) were less likely to have been allocated to a programmethan other offenders in the sample (the difference was statistically significant), and mixedheritage offenders (who had higher OGRS scores) were significantly more likely to havebeen allocated to a programme.
The findings concerning attitudes, beliefs and self-reported problems suggest that a balanceneeds to be struck between two kinds of provision: services designed to address attitudesand beliefs, and services designed to address problems and social disadvantages. Theappropriate balance between these should reflect assessed needs, and the evidence in thisstudy suggests that for many minority ethnic offenders a focus on opportunities to addressp roblems and disadvantages might be helpful. The next chapter re p o rts experiences ofp robation and programmes, and Chapter 5 explores the nature of social disadvantagewithin the sample in more detail.
Black and Asian offenders on probation
30

Chapter 4: Experiences of probation and programmes
Introduction
This chapter examines interviewees’ experiences of probation supervision and programmes.Particular attention is paid to whether the supervising officer, and the content of supervisionand programmes, recognised and addressed respondents’ needs and experiences as blackand Asian offenders. This is generally regarded (see, for example, Powis and Walmsley,2002) as an important aspect of responsivity (which, broadly speaking, refers to the ‘fit’between programme provision and the needs and learning styles of pro g r a m m eparticipants), and therefore as a likely contributor to the effectiveness of probation.
Supervision plans
The National Standards for the Supervision of Offenders in the Community (revised in2002) state that a written supervision plan must be completed within 15 days of the start ofa community rehabilitation order, and that offenders should be involved in its formulation.Of the 97 per cent of interviewees who answered the relevant question, 77 per centre p o rted having seen a plan, whilst the rest said that they had not. This compare sfavourably with the findings of Mair and May (1997); in their study of 1,213 mainly white30
offenders on probation, 66 per cent said that a supervision plan had been drawn up, 19per cent said that it had not, and 15 per cent could not remember.
Offenders were asked whether their views had been considered during the formulation ofthe plan. Of the 72 per cent of offenders who had seen a plan and who answered therelevant question, 57 per cent (41% of whole sample) said that their views had been takeninto account, 24 per cent said that they had not been, and 19 per cent did not know. Mairand May (1997) report that three-quarters of offenders said that their probation officer hadasked what they thought should go into the plan, the remainder of respondents saying thatthey had not been asked or could not remember.
I n t e rviewees were asked whether they had talked with their main supervisor about theirfeelings and needs as a black or Asian off e n d e r. Ninety per cent of interv i e w e e sresponded, and 30 per cent of these said that such a conversation had taken place. In over
31
30 Ninety-three per cent of offenders were white.

half of these cases, however, the issues discussed were not related to being black or Asian(52%, or 15% of whole sample). Where relevant matters were discussed, the topics mostcommonly mentioned were racism (18%, 5% of whole sample) and cultural needs andissues (6%, 2% of whole sample).
Orders, supervisors and supervision
The vast majority of interviewees – 86 per cent – reported having been treated fairly bytheir superv i s o r3 1, with little variation in the positive response rate between members ofdifferent minority ethnic groups32. The most frequent reasons for saying that they had beentreated fairly were that they had been treated with respect, as a ‘normal’ person, equally,etc. (18% of the whole sample), they could talk to their supervisor or their supervisor listenedto them (14%), and they received help with needs and problems (13%).
In the unweighted sample33, seventy-two per cent of main supervisors were white, 22 percent were black, six per cent were Asian, and less than one per cent were of mixedheritage. These figures varied considerably between different density areas. In high densityareas, 27 per cent of offenders had a black supervisor whilst six per cent had an Asiansupervisor. In medium and low density areas these figures were eight per cent and four percent respectively. Since 89 per cent of all probation officers on 31 March 2002 were white,whilst just seven per cent were black and two per cent were Asian (Home Office, 2002c:Table 7.10), high density probation areas in particular seem to have operated a policy ofallocating minority ethnic offenders to minority ethnic supervisors.
Interviewees were asked whether having a minority ethnic supervisor had (or would have)made a positive difference. Thirty-five per cent of participants34 said that it was (or wouldhave been) a benefit. Interestingly, less than half (41%) of those being supervised by a black
Black and Asian offenders on probation
32
31 Ninety-seven per cent of the 429 probationers surveyed by Ros Harper in a study published by MiddlesexProbation Service (2000), of whom 84 per cent were male and 58 per cent were white, reported having being‘treated fairly’ by probation staff.
32 Eighty-five per cent of black respondents, 84 per cent of Asian interviewees, and 86 per cent of mixed heritagerespondents reported having been treated fairly or very fairly.
33 The weighted figures are as follows: 69 per cent of main supervisors were white, 25 per cent were black, fiveper cent were Asian, and less than one per cent were of mixed heritage. In high density areas, 28 per cent ofoffenders had a black supervisor whilst six per cent had an Asian supervisor. In medium and low density areasthese figures were eight per cent and five per cent respectively.
34 This group did not differ from the rest of the sample in relation to offence profile. Just 8.9 per cent of this grouphad participated in programmes exclusively for minority ethnic offenders, whilst the rest had not. They did scoresignificantly higher on the CRIME-PICS II G (P<0.05), A (P<0.01) and E (P<0.05) scales, however. This isprobably because the majority (80.9%) of those favouring a minority ethnic supervisor were black or mixedheritage, and these groups had the highest average CRIME-PICS II scores.

or Asian probation officer gave this response. Fifty-six per cent said that superv i s o r s ’ethnicity made no difference, ten per cent said that they did not know, and two per centwere opposed to the idea35. Offenders interviewed by black and Asian researchers weresignificantly36 more likely than those interviewed by white researchers to report favouring aminority ethnic supervisor. This was one of the very few situations in which the ethnicity ofinterviewers may have affected responses, but its impact on overall findings was limited bythe fact that most interviews were not carried out by white researchers.
The most frequent reasons given for wanting a supervisor from a minority ethnic group werethat he or she would be more able to understand the background, culture and experiencesof a black or Asian person (22% of the whole sample), that they would be easier to talk to(8%), and that they would make the interviewee feel more comfortable (6 %):
[Having an Asian supervisor makes a difference] because he understands me fully,we’re from the same place … For example he knows that in our communities youcan’t speak openly about our problems. I’d feel ashamed if I did but in front of himyou can say what you need to and he knows the pressures I’ve been under. Yo uwouldn’t get that understanding of my situation from a white supervisor.
When I’m trying to explain things in my own slang he knows what I’m saying. I’dprefer to have a black supervisor but I don’t really mind. I think it’s easier and morecomfortable. Sometimes you talk about deep stuff and perhaps a white personwouldn’t understand my upbringing. I don’t know how they can help you if they don’tknow your way of life.
When asked whether minority ethnic offenders should have supervisors from the same ethnicb a c k g round, 36 per cent of respondents agreed, 43 per cent disagreed, and 21 per centw e re indiff e rent (n=475). It should be noted that offenders interviewed by minority ethnici n t e rviewers were significantly3 7 m o re likely than those seen by white re s e a rchers to agree withthis assertion, which again suggests that responses were affected by interviewers’ ethnicity.
Interviewees were asked what made a good supervisor of a black or Asian person. Themost frequent responses were that a good supervisor should be easy to talk to or shouldlisten to the offender (27% of the whole sample); be understanding and sympathetic (27%);and understand the offender’s needs, feelings and experiences as a black or Asian person
33
Experiences of probation and programmes
35 Percentages do not add up to 100 because a small number of respondents said that having a minority ethnicsupervisor might be a good thing and a bad thing.
36 P<0.01.37 P<0.01.

(20%). Just three per cent of interviewees defined a good supervisor as one who was blackor Asian38, and there was no evidence that the ethnicity of the supervisor was significantlyrelated to the perceived helpfulness of supervision, or to whether the order was breached.
When asked what they liked about their supervision, the most common responses werehaving someone to talk to or someone who listens (17% of the whole sample), and receivinghelp with needs and problems (21%). Thirty-five per cent of participants said that there wasnothing that they had liked39. When asked what they had not liked about their supervision,12 per cent reported disliking having to attend at all, seven per cent said that it had notbeen helpful, had made no difference, or had been a waste of time, and seven per centsaid that it was restrictive and inconvenient. Thirty-eight per cent of interviewees said thatthey had not disliked anything about their supervision40.
Programmes
As noted in Chapter 3, almost half of the unweighted sample was or had been on an orderwith an additional re q u i rement to attend a probation-led programme (49%). This gro u paccounted for 52 per cent of the weighted sample. The majority (63%) were or had beenon, or were due to do ‘Think First’ or ‘Think First for Black and Asian offenders’ (57% and6% respectively). Other programmes attended included anger management pro g r a m m e s(10%), ‘Enhanced Thinking Skills’ (5%), ‘Reasoning and Rehabilitation’ (5%), and the ‘Blackself-development programme’ (4%). Just ten per cent of the programme sample had been onprogrammes that were exclusively for minority ethnic offenders. Those who were waiting tostart their programme, and had no previous programme experience, were excluded fromthe analysis and are not included in the remaining findings reported in this chapter41.
When asked why they had been put on the programme, respondents said that it was to stopthem committing crime (40% of the programme sample), to help them to think first and be lessimpulsive (31%), and to help with anger management (10%). Just four per cent mentionedpunishment as being among the reasons why they had been re q u i red to attend a pro g r a m m e .
Black and Asian offenders on probation
34
38 A complete list of responses is provided in Table A4 in Appendix 2.39 Thirty-seven of the 160 participants who said that there was nothing that they had liked about their supervision
also said that there was nothing they had disliked, suggesting indifference towards rather than a particular likeor dislike of their supervision.
40 Thirty-seven of the 184 interviewees who said that they had not disliked anything about their supervision alsosaid that there was nothing they had liked, again suggesting indifference.
41 Two hundred and thirty-six of those in the unweighted sample were or had been on a probation order with anadditional re q u i rement to attend a programme. Thirty-seven people had not started at the time of interv i e w,however, and had no other experience of a probation programme. Thus only the responses from the remaining199 interviewees were used in the analysis, accounting for 45 per cent of the weighted sample.

When asked whether the programme leaders had explained the purposes of theprogramme, the vast majority (90%) of programme participants who responded (96% of theprogramme sample) said that they had. These were most often given as to teach participantsto be less impulsive and to think of the consequences of their actions (33% of thep rogramme sample), to help offenders to avoid trouble and crime, to consider theiroffending behaviour etc. (28%), and problem solving (11%). When asked what they andthe group leaders did, the most common responses were role-plays, ‘dilemmas’, problemsolving etc. (59% of the programme sample); consideration of offending behaviour (22%);learning to be less impulsive and to think of the consequences of actions (15%); and raisingempathy and victim awareness (8%).
Ninety-six per cent of programme participants described the ethnicity of their programmeleaders. The ethnicity of the probation teams delivering these programmes was as followsfor the unweighted (and weighted) sample: 51 per cent all white staff (42%); 34 per cent(39%) both white and minority ethnic staff; 16 per cent (19%) minority ethnic staff only.When asked whether the group leaders were aware of their needs as a black or Asianperson on probation, 40 per cent of those who responded (93%) said yes, 49 per cent saidno (in some cases because they did not see themselves as having special needs), and theremainder did not know. A significantly4 2 higher pro p o rtion of those on pro g r a m m e sdesigned exclusively for ethnic minority offenders said that the group leaders were aware oftheir needs (77%).
Ninety-five per cent of programme participants described the ethnic composition of theirp rogramme group, the majority (72%) of which were ‘mixed’, containing white and minorityethnic offenders. Eleven per cent of respondents, usually in medium or low density are a s ,re p o rted being the only minority ethnic participant. Such singleton placements proved to be anu n c o m f o rtable experience for some, as illustrated by one interviewee who said, ‘I felt isolated’.Some groups were made up entirely of participants from minority ethnic groups (17%).
When asked whether the ethnic composition of a group matters, most (66%) of thoseprogramme participants who responded (94%) said that composition is important43. The vastmajority of those for whom composition mattered (87%, 54% of the whole pro g r a m m esample) thought that it should be mixed:
[The composition of the group] has got to represent life out there, hasn’t it? If youwere … in a group with no black people you’d feel out of place. [There would be]
35
Experiences of probation and programmes
42. P<0.0143 Respondents were significantly (P<0.05) more likely to say that group composition matters when interviewed by
a minority ethnic researcher, indicating the presence of bias.

no-one to relate [to] on your level or understand about being black in this country. [Atthe] same time if you went in a group and they were all black you’d think ‘why doonly black people get on these courses?’ [Groups] need to be mixed.
Some of those who wanted mixed groups were more specific, preferring mixed groups withmore than one person from each minority ethnic group (13% of the programme sample), orwith an equal split between members of different minority ethnic groups (4%)44:
When there is an even number of each race, people would be more comfortable totalk about themselves, and they can’t make fun of each other.
If I was the only black [person] in the group I [would] just feel like they are talkingbehind my back. I [would] think that I am [being] left out and I would be very shy totalk about myself.
The most common reasons for wanting a mixed group were that participants would feelmore relaxed (22% of the whole programme sample), that a mixed group would provide agood learning experience (10%), and that participants would be more likely to talk aboutthemselves (9%).
Just eight per cent of those who said that group composition is important favoured groupsfor ethnic minority offenders only (5% of the whole programme sample). As already noted,just ten per cent of programme participants had actually been on programmes that wereexclusively for minority ethnic offenders. Interestingly, these individuals were not significantlymore likely to say that they favoured groups specifically for minority ethnic offenders thanthe remainder of the programme sample45.
Eighty-six per cent of the programme participants said that their group leaders had treatedthem fairly, whilst just three per cent said that they had been treated unfairly. The remaining11 per cent said that they did not know whether their treatment had been fair, or that it hadbeen ‘mixed’, or had failed to respond. The most common reasons for giving a positiveaccount were that all participants were treated equally (23% of the whole pro g r a m m esample), with respect, as a ‘normal person’ etc. (18%), and that the facilitators werefriendly, patient, down-to-earth etc. (13%). Just three per cent of participants reported beingtreated unfairly by other members of the group.
Black and Asian offenders on probation
36
44 It is possible that some of those who said that groups should be ‘mixed’ would have preferred there to be morethan one person from each ethnic group, or an equal split between members of different ethnic groups, but theirresponses were too vague to code as such.
45 This was calculated using Fisher’s exact test.

P a rticipants were asked what they liked about their programme. The most fre q u e n tresponses were that it was educational and informative (16% of the whole pro g r a m m esample), that they had made new friends, met old friends, and got on well with other groupmembers (13%), that they had liked the group discussions (11%), and that they hadaddressed their offending behaviour (9%). A substantial minority of participants said thatthey had not liked anything about their programme (22%)46.
When participants were asked what they had disliked, the most common complaints werethat the programmes were not relevant, a waste of time, or had not helped (17% of thewhole programme sample), they were boring or repetitive (16%), that participants weretreated like children or it was like being at school (11%), and that the programmes wererestrictive and prevented participants from doing other things (9%)47. Eighteen per cent of allparticipants said that they had not disliked anything48. Twelve per cent of participants failedto complete their programme. Two-thirds of these non-completions were due to the offender’smisbehaviour49. The remainder were due to circumstances beyond his control50.
When asked what kind of programme could best address the needs of black and Asiano ffenders, many participants said that programmes should provide practical help andadvice (24% of the whole programme sample), and should deal with black or Asian issues(20%) such as racism and black history. Eight per cent of the sample suggested thatp rogrammes should be tailored to the individual, saying that generic ‘one-style-fits-all’programmes did not suit everyone. Seven per cent of participants said that a programmerun exclusively by and for black and/or Asian people would best meet the needs of blackand Asian offenders. It is interesting to note that almost all of those making this commenthad not actually attended a programme specifically designed for minority ethnic offenders,and most had been in mixed groups.
The impact of probation and programmes
I n t e rviewees were asked whether being on probation had changed the way that theythought about or approached problems. Of those who responded (98%), the majority (67%)said that it had. There was no significant difference in the positive response rates of black
37
Experiences of probation and programmes
46 Four of the people who said that there was nothing that they had liked also said there was nothing that they haddisliked, suggesting indifference rather than a particular like or dislike of their programme.
47 Similar comments were made by some of those attending a probation programme who were interviewed for the‘STOP’ research (Raynor and Vanstone, 1997: 54-55).
48 See n.45.49 For example his being removed from the programme for non-compliance, or because he was sent to prison.50 For example as a result of the offender’s illness, or inability to speak English.

and Asian respondents, or of those at the early and late stages of an ord i n a ry ord e r.Amongst the programme sample, those who had completed a programme weresignificantly51 more likely to give a positive response than those who had yet to start. Twenty-two per cent of the whole sample said that they were less impulsive or more likely toconsider the consequences of their actions52. Sixteen per cent said that they were trying torefrain from anti-social or criminal behaviour and seven per cent said that they had or werenow trying to address their substance misuse problems. Thirty-three per cent of respondentssaid that the order had not affected their thinking, claiming that it had been a waste of time,irrelevant, had not helped etc. (7% of the whole sample), and that they still had practicalproblems to be addressed (4%).
Interviewees were asked how helpful they had found their contact with the Probation Serviceas a black or Asian person. Sixty-three per cent of those who responded (96%) said that itwas helpful, 16 per cent said that it was unhelpful, and the remainder described theirexperience as ‘mixed’. There was no significant difference in the positive response rates ofblack and Asian respondents. In a study of mainly white probationers by Mair and May(1997), 87 per cent of respondents described their probation order as useful. In the currentstudy, the most frequently cited reasons for giving a positive response were that probationhad provided practical help and advice, or help with needs and problems (30% of thewhole sample), that it had helped them to stay out of trouble or prison (10%), and that itwas good to have someone to talk to or someone who listens (6%). These resemble thefindings of Mair and May (1997)53. Interviewees giving a negative response often said thatthey had not gained anything from the order, it had been irrelevant to them or had beenuseless (8% of the whole sample), and that they had not received sufficient help withpractical problems (4%).
On the whole, then, the accounts given of supervision and programmes were mostlypositive. This result is in line with the findings of other recent (post-1991) studies of white ormainly white groups of probationers. Mair and May (1997) found that 87 per cent of their1,213 mainly white and male respondents thought probation helpful, as compared to 63per cent in this study. Farrall (2002) found that 52 per cent of his 199 mainly white andmale probationers thought that their ‘obstacles’ or problems were successfully re s o l v e dduring their probation orders. In Mantle’s (1999) similar sample of 492 probationers, 71
Black and Asian offenders on probation
38
51 P<0.05.52 This again echoes the findings of Raynor and Vanstone (1997): in their study of 64 white men on the ‘Straight
Thinking on Probation’ programme, ‘thinking before acting, speaking or offending’ and ‘thinking ofconsequences’ were the first and third most frequently self-reported changes in thinking.
53 In the study by Mair and May (1997), the most frequently cited ‘good points about being on probation’ werehaving someone independent to talk to (54%), getting practical help and advice (33%), and being helped tokeep out of trouble (19%).

per cent found their probation officer helpful; Bailey and Ward (1992) found 15 out of 22expressing a similar view, while Rex (1997) found that 52 of her 60 mainly white and malesubjects saw themselves as receiving guidance from their probation officers, and 37 saidthey received active help. Similarly, 89 per cent of the white male programme completers ofthe STOP programme (Raynor and Vanstone, 1997) found it helpful. The positive attitude toprobation shown by the majority of respondents was therefore comparable with results froma number of studies of mainly white probationers, but towards the lower end of the range.
The vast majority of participants reported being treated fairly by their supervisor and (whererelevant) their programme leaders, and two-thirds described their contact with probation ashelpful. Some interviewees did not want or expect their ethnicity to be an issue, preferring tobe treated like any other probationer:
[My ethnicity has] never needed to be brought up. I don’t think it needs to bediscussed. It might be an issue for other people but not for me … I’ve been aroundwhite people all my life – mum’s white, girlfriend’s white, gran’s white. Not an issuefor me is it?
This was not true for many interviewees, however. One-third of interviewees expressed apreference for a minority ethnic supervisor. Over half of all programme participants wantedprogramme groups to be mixed or, in a few cases, exclusively for minority ethnic offenders,and some of those who found themselves the only minority ethnic member in a gro u preported feeling uncomfortable and excluded. For some black and Asian probationers, then,equality of outcome does not mean simply being treated the same as their whitecounterparts.
39
Experiences of probation and programmes

Black and Asian offenders on probation
40

Chapter 5. Social exclusion and experiences of criminal justice
[Social exclusion] is a shorthand label for what can happen when individuals orareas suffer from a combination of linked problems such as unemployment, poorskills, low incomes, poor housing, high crime environments, bad health and familybreakdown. (Social Exclusion Unit, 1998).
The data collected in this study indicated that the black, Asian and mixed heritage offenderswho took part suffered, to differing degrees, from social exclusion or disadvantage in threemain areas: economic, educational and geographical. These areas are discussed in turn inthe first part of this chapter, with comparable information from studies of white offenderswhere this is available. The second part of the chapter discusses respondents’ views of theirexperiences in the criminal justice system, and their beliefs about how their ethnic originsaffected the way they were treated.
Economic disadvantage
Economic exclusion is generally related to an individual’s (or family’s or community’s )unemployment, work status, benefit dependency, lack of housing ownership, substandardquality of housing, lack of satisfactory educational qualifications, etc. In the current study,unemployment, low income, and benefit dependency are indicators of economic exclusion.
The 2001 Census found that men and women from minority ethnic groups had higherunemployment rates than white people. Figure 5.1 shows the unemployment rates for menfrom different ethnic groups54.
41
54 Figure 5.1 was compiled using data from the Census 2001: National Report for England and Wales, p.134,Table S108, using the International Labour Organisation (ILO) definition of the unemployment rate as apercentage of all those who were economically active. The unemployment figures quoted for the current studygive the number of unemployed as a percentage of all respondents. Whilst the ‘unemployment rates’ in Figure5.1 and Table 5.1 are not directly comparable, they illustrate the level of economic exclusion experienced bythe interviewees (whose unemployment rate is even higher when calculated using the ILO definition).

Figure 5.1: Unemployment rates for men by ethnic group
All but one of the interviewees described their employment status. Table 5.1, below, showsthat 66 per cent of respondents were unemployed. Just 17 per cent were in full timeemployment. As Table 5.2 shows, 69 per cent of those who answered the relevant question(99% of the sample) said that state benefits were their main source of income, 23 per centsaid that their own wages were their main source of income, and four per cent claimed tohave no income source.
Table 5.1: Work situation or employment status (n=482)
Work situation/employment status Valid %
Full-time 16.6Part-time 5.3Temporary/casual 3.0Unemployed 65.9Unavailable for work 9.2TOTAL 100
Black and Asian offenders on probation
42

Table 5.2: Main source of income (n=479)
Main source of income Valid %
Wages (self) 22.7Wages (partner) 0.9Wages (other) 0.1Pension/maintenance 0.5State benefits 69.2Loans 0.1No income source 3.6Other 2.1Do not know 0.7TOTAL 100
Many of the respondents blamed racial discrimination in the job market for the highunemployment rate of many minority ethnic people in Britain:
In this country I think colour is part of the reason why black and Asian people don’tget the same opportunities. I’ve been to jobs where I’ve been more qualified thanwhite people have but I haven’t got the job because of racism.
Another respondent said:
Loads of my black friends, like me, don’t have jobs. It’s very hard to get a job ifyou’re black, and even worse if you’ve been in prison. And another thing, even ifyou do get a job it’s nearly always a shit job that doesn’t pay well or is boring.
Other respondents blamed discrimination in the job market on the unique lifestyle of manyblack and other minority ethnic people in Britain:
I’ve applied for so many jobs [and] sent CVs, but it’s really hard getting a job if you’rea young black man. I applied for McDonald’s but they said that they couldn’t give mea job ’cause of my haircut, but that’s my ethnic identity, it’s my culture. What wouldyou think if I told you to cut your hair to do what you’re doing? It’s ridiculous innit?
Black/Caribbean, black/Other, mixed heritage and Bangladeshi groups had the highestlevels of unemployment (71%, 77%, 71% and 67% respectively) and the lowest levels offull-time employment. Conversely, the unemployment rates for Indian and Pakistani
43
Social exclusion and experiences of criminal justice

interviewees were more than ten per cent lower than the sample average, whilst their fulland part time employment rates were approximately ten per cent higher than the sampleaverage. This pattern was repeated for many of the measures considered in this chapter.Not surprisingly, money and employment were the most frequently mentioned factors whenpeople were asked which problems from the CRIME-PICS II problem checklist hadcontributed to their getting into trouble (see Table A5 in Appendix 2). Corresponding figuresf rom studies of white or mainly white offenders were 54 per cent of pro b a t i o n e r sunemployed (Mair and May, 1997), and 64 per cent unemployed in a study based onp robation officers’ assessments of younger offenders (Stewart and Stewart, 1993). It isinteresting that overall, the survey respondents rated employment as a slightly less seriousproblem than the CRIME-PICS white comparison sample, but this may be due to differencesin perceived problem severity. Given the evidence reviewed here, it is unlikely to be due toa difference in actual unemployment rates in favour of the survey sample.
Educational disadvantage and exclusion
Of those respondents who answered the relevant question (99.6%), most (66%) re p o rt e dhaving educational or vocational qualifications, whilst 37 per cent said that they had noqualifications. Ve ry few had higher educational qualifications, however, such as degrees (3%of the whole sample), higher vocational qualifications such as HND or NVQ 4 or 5 (4%), orf u rther educational qualifications such as A levels or their equivalent (6%). As illustrated inTable 5.3 below, only 36 per cent of the whole sample said they had any GCSEs at all.
Table 5.3: Educational qualifications
Qualification Number of interviewees who %reported having this qualification
Basic vocational qualification 168 34.7Higher vocational or professional qualifications 21 4.3CSE/GCSE/O Level 174 35.9OA or AS Level 1 0.1A level or equivalent 30 6.1Degree/postgraduate qualification or equivalent 15 3.1
Other qualification 31 6.3
Black and Asian offenders on probation
44

F i g u res for comparison from other studies are 41 per cent of probationers with noqualifications (Mair and May, 1997) and 80 per cent who left school with no qualifications,based on probation officer assessments, in Stewart and Stewart (1993). The initially highproportion of the sample (63%) who reported that they had educational qualifications tendsto disguise the number who left school without qualifications, as many qualifications weregained outside school, in job centre training schemes or in prison (see Table 5.3). One ofthe main reasons why many respondents did not have higher qualifications appeared to berelated to their experiences of school in Britain. As Table 5.4 shows, many respondents hadu n s a t i s f a c t o ry experiences of school, and this was particularly true of black and mixedheritage probationers. This is not surprising, as re s e a rch shows that black children inparticular tend to be negatively labelled by teachers, as unlikely to do well academicallyand as likely to behave badly (see Gillborn and Mirza, 2000).
Table 5.4: School experiences and ethnicity (N=468)
Ethnicity Generally Generally Mixed Did not gopositive negative
Valid % (n) Valid % (n) Valid% (n) Valid% (n)
Black 33.7 (101) 41.7 (125) 24.0 (72) 0.7 (3)Asian 43.0 (34) 34.2 (57) 22.8 (18)Mixed heritage 30.6 (22) 47.2 (34) 18.1 (13) 4.2 (3)Other 47.1 (8) 29.4 (5) 11.8 (2) 11.8 (2)TOTAL 35.3 (165) 40.8 (191) 22.4 (105) 1.5 (7)
T h e re are also marked diff e rences within these ethnic categories (n=469). Black Africanrespondents were significantly55 more likely to give positive accounts of school than allother ethnic groups. While a majority of black African offenders described their feelingsabout school as generally positive (56%), only a quarter of black Caribbean (27%) andblack Other (24%) offenders and a third of mixed heritage (31%) offenders did likewise.Black African offenders were also less likely than black Caribbean offenders to report thatthey truanted or were suspended. They were also significantly more favourable in theirresponses to their teachers: two-thirds gave positive accounts of their teachers compared too n e - t h i rd of black Caribbean responses. Finally, black Africans were less likely to re p o rtexperiencing racism at school from either the teachers or the pupils (12%) than the blackCaribbean (19%), Pakistani (14%), Bangladeshi (33%), Indian (23%) and mixed heritage(24%) interviewees.
45
Social exclusion and experiences of criminal justice
55 P<0.01.

Fifteen per cent of the whole sample reported having been suspended from school. Therewas considerable variation in suspension rates between members of different minority ethnicg roups. Whilst 16 per cent of black African and 22 per cent of black Caribbeaninterviewees said that they had been suspended, alongside 11 per cent of those of mixedheritage, this figure fell to just three per cent of Pakistani and three per cent of Indianoffenders. Similar findings emerged in relation to school exclusions. Whilst 15 per cent ofthe whole sample reported having been excluded, exclusion rates were higher amongst theblack African (10%), black Caribbean (16%) and mixed heritage (19%) interviewees thanamongst their Pakistani (8%) and Indian (3%) counterparts56.
One fifth (20%) of the total sample said they experienced racism at school either from thepupils, the teachers or both. Such experiences were slightly more common amongst Asian(23%) than amongst black (18%) interviewees. One-quarter (26%) of all interv i e w e e sreported that they truanted while at school, with proportions varying from 19 per cent ofPakistani and 21 per cent of black African interviewees to 30 per cent of mixed heritage,33 per cent of Bangladeshi and 33 per cent of ‘Asian Other’ offenders. A few quotationsmay help to convey what a negative experience school was for many of the interviewees:
We had white teachers. They weren’t really bothered about us. They didn’t reallycare. [I] got expelled for hitting the head teacher. [I] used to truant occasionally.
In my time there was much racism. NF [National Front] and all these things in myschool. There were only three people from ethnic minority communities, and the restwere all whites. The boys would call me nigger, sambo, jungle bunny, coon. I had tofight back and that was my problem. So all my time was spent fighting. Otherwise Iliked the school, and I wanted to be educated.
Geographical/environmental disadvantage
Geographical disadvantage in the context of the present study was indicated byre n t e d / s u p p o rted housing, low quality housing, lack of proximity to key social serv i c e s ,dislike of the neighbourhood/area, and the stigma attached to particular kinds of housingand area. Table 5.5 below shows how the respondents were accommodated.
Black and Asian offenders on probation
46
56 Two (three in unweighted sample) of all six (12 unweighted) Bangladeshi interviewees re p o rted having beingsuspended, and one reported having being excluded. Whilst the small numbers involved means that caution mustbe exercised when interpreting these figures, initial indications are that Bangladeshi’s are at a higher risk ofsuspension and equal or greater risk of exclusion than offenders from the other Asian sub-categories.
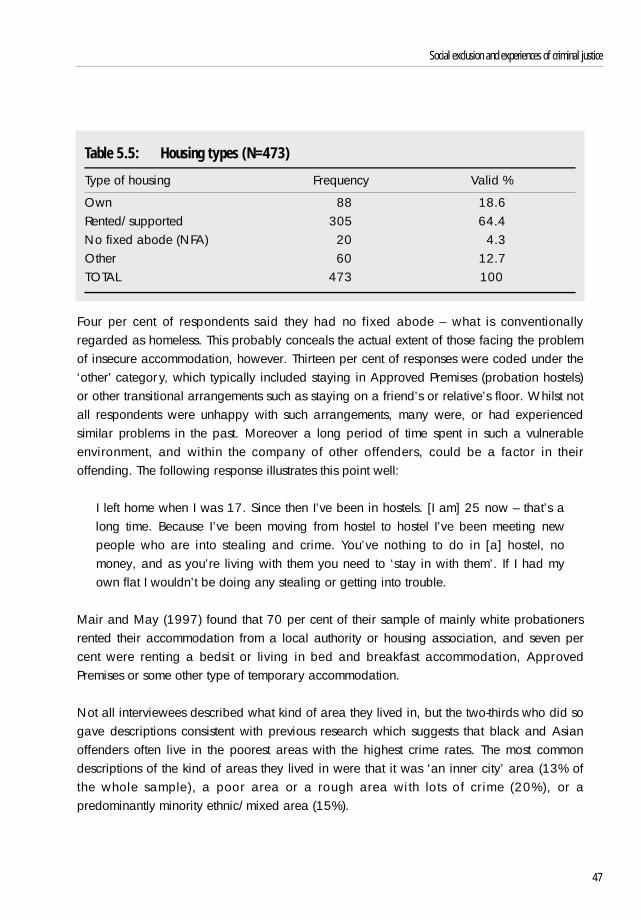
Table 5.5: Housing types (N=473)
Type of housing Frequency Valid %
Own 88 18.6Rented/supported 305 64.4No fixed abode (NFA) 20 4.3Other 60 12.7TOTAL 473 100
Four per cent of respondents said they had no fixed abode – what is conventionallyregarded as homeless. This probably conceals the actual extent of those facing the problemof insecure accommodation, however. Thirteen per cent of responses were coded under the‘other’ category, which typically included staying in Approved Premises (probation hostels)or other transitional arrangements such as staying on a friend’s or relative’s floor. Whilst notall respondents were unhappy with such arrangements, many were, or had experiencedsimilar problems in the past. Moreover a long period of time spent in such a vulnerablee n v i ronment, and within the company of other offenders, could be a factor in theiroffending. The following response illustrates this point well:
I left home when I was 17. Since then I’ve been in hostels. [I am] 25 now – that’s along time. Because I’ve been moving from hostel to hostel I’ve been meeting newpeople who are into stealing and crime. You’ve nothing to do in [a] hostel, nomoney, and as you’re living with them you need to ‘stay in with them’. If I had myown flat I wouldn’t be doing any stealing or getting into trouble.
Mair and May (1997) found that 70 per cent of their sample of mainly white probationersrented their accommodation from a local authority or housing association, and seven percent were renting a bedsit or living in bed and breakfast accommodation, Appro v e dPremises or some other type of temporary accommodation.
Not all interviewees described what kind of area they lived in, but the two-thirds who did sogave descriptions consistent with previous re s e a rch which suggests that black and Asiano ffenders often live in the poorest areas with the highest crime rates. The most commondescriptions of the kind of areas they lived in were that it was ‘an inner city’ area (13% ofthe whole sample), a poor area or a rough area with lots of crime (20%), or apredominantly minority ethnic/mixed area (15%).
47
Social exclusion and experiences of criminal justice

When interviewees were asked if they liked where they lived most (99.6%) responded, andtheir feelings were mixed. The majority (64%) reported liking their neighbourhood, whilst asmaller proportion (21%) did not57. In many cases, those who felt positively did so becausethey had many friends in the area, or knew many people, or considered theirn e i g h b o u rhood friendly (37% of those who liked their area, 24% of whole sample).Eighteen per cent said they liked their neighbourhood because it was mixed and a minorityethnic area (11% of whole sample). For those who did not like their neighbourhoods, by farthe most common reasons were that there were many social problems such as drugs, crimeand unemployment in the area. Again quotations help to give the flavour of these responses:
Nearly everybody here is into some sort of drugs. No one talks ‘successful talk’.T h e r e ’s 18 year-olds who talk like it’s the end of their life. Too much depressionfloating around.
The white people live in all the nice houses, all the nice parts, and the black peoplelive in all the shit parts . . . I’ve got white friends – they agree with me.
Interviewees were asked whether they had been in care, and of those who responded (99%of sample), a substantial minority (19%) said that they had. This figure varied betweenethnic groups, however, and was substantially higher for Bangladeshi (14%), blackCaribbean (22%), black Other (29%), and mixed heritage (35%) offenders than forPakistani (3%) and Indian (3%) offenders. This compares with the finding by Mair and May(1997) that 18 per cent of white probationers have been in care.
The interviewees’ current living arrangements were as follows: 30 per cent lived withparents, 19 per cent with partners, 12 per cent with children, six per cent with friends, 11per cent with relatives and 40 per cent alone (the figures add up to more than 100 becausesome respondents lived in more complex households, for example with their parents andtheir children).
Thirty per cent of the sample said that other members of their families had been in troublewith the law. This compares with a figure of 33 per cent for white probationers (Mair andMay, 1997).
Black and Asian offenders on probation
48
57 The remaining respondents did not know whether they liked their neighbourhood, or said that the question wasnot applicable because they were homeless.

Experiences of criminal justice
O ffenders were asked to comment on their treatment by diff e rent criminal justice pro f e s s i o n a l s .Table 5.6 shows the results. The figures for fair treatment by probation staff were not as high asthose given for actual supervisors and programme staff in Chapter 4, but other criminal justicepersonnel were much more heavily criticised. A recent study for the Lord Chancellor’sD e p a rtment (Hood, Shute and Seemungal 2003) has also indicated that many minority ethnico ffenders re p o rt various kinds of unfair treatment within the criminal justice system.
Table 5.6: In your experience with the criminal justice system, have you been treatedfairly by …?
Yes No D o n ’t know Not applicable TOTALValid % Valid % Valid % Valid % Valid %
The police (n=479) 26.6 62.0 9.2 2.2 100Your solicitor (n = 480) 79.4 11.8 7.0 1.8 100Court staff (n = 474) 67.7 14.3 13.0 5.0 100Magistrates (n = 467) 53.3 37.2 5.0 4.5 100The probation officer who wrote your report (n = 464) 78.3 9.8 10.2 1.7 100
The probation officer in court (n = 464) 53.0 6.7 16.2 24.1 100
Judges (n = 472) 42.8 24.6 5.6 27.0 100Prison staff (n = 456) 28.9 24.1 4.8 42.2 100
When asked what behaviour they regarded as unfair treatment, respondents gave variousexamples. Table A.6 in Appendix 2 lists the more frequently mentioned examples.
H i s t o r i c a l l y, the police have been at the centre of the debates on racial discrimination withinthe criminal justice system. Allegations of police stereotyping, targeting and unfair tre a t m e n tof black and Asian young people have been made in several studies on policing (Cashmoreand McLaughlin, 1991; Reiner, 1993; Pearson et al., 1989; Holdaway, 1983, 1996). It hasbeen argued that the police re p resent to young minority ethnic people in inner city areas thesymbol of a predominantly white society, and their authority is often not seen as legitimate(Hall et al., 1978; Lea and Young, 1993). As indicated in Chapter 1, studies of the court sand the Probation Service have also shown disparity in sentencing and professional practice
49
Social exclusion and experiences of criminal justice

that could be explained in terms of unfair treatment, racial discrimination or prejudice bymagistrates, judges and probation officers, although the evidence has not always beenconclusive (FitzGerald, 1993; Hood, 1992; Denney, 1992, Hood et al., 2003).
Efforts were made to determine the level of discrimination suffered by respondents at thehands of the criminal justice agencies. The median level of discrimination was calculated onthe basis of the number of different types of discrimination experienced by eachinterviewee. Thirty-seven per cent of interviewees scored above the median, having sufferedhigh levels of discrimination. Forty-four per cent of offenders scored below the median,having experienced, by comparison, relatively low levels of discrimination. The remainingrespondents experienced the median level of discrimination. It is interesting to note thatthose in the ‘high discrimination’ group had significantly58 more problems, as recorded onthe CRIME-PICS II ‘P’ scale, than those in the low discrimination group. The likelihood ofbeing referred to a probation programme was not significantly different for members of thehigh and low discrimination groups.
Stop and search
One of the most controversial areas of the operation of the criminal justice system is policestop and search. Studies have shown that blacks, and increasingly Asian young men,experience abuse of police powers in relation to stop and search (Gordon, 1983; Spencerand Hough, 2000; Bowling and Phillips, 2002). Current Home Office statistics show thatblack and Asian offenders are more likely to be stopped and searched compared with theirwhite counterparts, even in predominantly white areas (Home Office, 2002a). Thecomplaints of black and minority ethnic people with re g a rd to stop and search relate toallegations of being stopped and/or searched for no apparent reason.
Eighty-four per cent of those interviewed for this study claimed that they had been stoppedor searched by the police for no reason: 85 per cent of black, 76 per cent of Asian and 90per cent of mixed heritage interviewees made this assertion. Further analysis showed thatblack and mixed heritage respondents were significantly5 9 m o re likely than Asianrespondents to make this claim. Other studies have shown that the police have stoppedblacks on speculative grounds more often than whites, in the hope that they would discoverevidence of an offence (Norris et al., 1992; FitzGerald, 1999; Miller, Bland and Quinton,2000; Quinton, Bland and Miller, 2000). As one of the Asian offenders put it:
Black and Asian offenders on probation
50
58 P<0.05.59 P<0.05.

[The police] always assume you’re a criminal, [and] that you’re up to something. Assoon as they see a car with Asian boys in [it] that’s it, [they will say] ‘you’re actingsuspiciously’.
The majority of those who claimed to have been stopped or searched for no reason felta n g ry, annoyed, offended or ‘picked on’ (50%). Many also felt embarrassed, ashamed,degraded or upset (24%). One-fifth of respondents perceived the stop or search to be racist(20%). Seven per cent of respondents said that it happened so often that they were used toit or had come to expect it. Only 12 per cent said that the police were just doing their job,or that they did not mind being stopped and searched.
Respondents’ experiences as victims of crime
The majority of offenders interviewed (65%) claimed to have been victims of crime. This isnot surprising given that involvement in offending behaviour is recognised as one of thes t rongest correlates of victimisation and vice versa (see Van Dijk and Steinmetz, 1983;G o t t f redson, 1984; Hartless et al., 1995; Ballintyne, 1999; Farrell and Maltby, 2003).Property crimes were the most frequently experienced offences, and were reported by 31per cent of the sample. Others included non-racist violent crimes (25%), robbery (includingbeing ‘mugged’) (13%), violent crimes perceived by the victim to have a racist element(4%), non-violent racist abuse (1%), and sexual offences (0.3%). Only two-thirds (63%) ofthose who were victims re p o rted their experiences to the police, however. Lack ofconfidence that the police would do anything was the most common reason given for notreporting the crime(s). Of those who did report their victimisation to the police, the majority(51%) believed that they were not treated fairly. Again this is reminiscent of concern sexpressed in other studies and reports (for example Bowling, 1999; Macpherson, 1999).
Respondents’ suggestions for improvement
Interviewees were also asked how the treatment of minority ethnic people within the criminaljustice system could be improved. The most frequent responses were: by employing moreblack and Asian workers (27% of the whole sample); by eliminating racism (29%); and byencouraging a greater understanding of the cultures, needs and experiences of minorityethnic offenders (9%).
51
Social exclusion and experiences of criminal justice

Discussion
The comments of the respondents in this study indicated that many black and Asianoffenders did not feel that the criminal justice system represents their interests or treats themfairly either as victims or offenders. Other studies have shown that minority ethnic people donot feel that they are adequately re p resented within the criminal justice system asprofessionals (Cook and Hudson, 1993). Lack of trust and confidence in the police and thecourts were expressed by many respondents. Consequently they may be less likely to acceptthe decisions of criminal justice professionals as legitimate (Beetham, 1991; Tyler, 1990).
Without a widespread perception of legitimacy, criminal justice professionals themselvescannot do their jobs well. A reduced sense of the legitimacy of the criminal justice systemcan lead to greater law-breaking behaviour or an unwillingness to work with the police, forexample, in order to deal with crime-related problems. In an American study, Lind and Tylerinterviewed people who engaged in personal dealings with police officers and judges andfound that people who feel fairly treated are more willing to accept decisions, even if thosedecisions are unfavourable (Lind and Tyler, 1992). The authors argued that experiencingfair procedures engages people’s feelings of obligation to obey. It also leads people to viewdecisions as more consistent with their moral values (see also Tyler, 1997).
Perceptions of procedural fairness may vary from person to person. This study showed thatblack and Asian offenders’ perceptions of fairness related to unbiased (non-racist)behaviour, being treated with dignity and respect, and having their needs and concerns asblack and Asian offenders acknowledged. The following quotations sum up some of thegeneral views of the offenders on the criminal justice system and their own treatment asblack and Asian offenders:
I’ve been arrested sometimes and there have been times when it’s Ramadan and I’vebeen fasting all day or I can’t eat ’cause the sun’s come. Now I’ve been arrested andtaken to the station and the sun’s gone down and I’m starving but they won’t bringme anything even when I ask them to. The first meal they bring me is breakfast whenthe sun comes up.
[There should be] more training in the criminal justice system about people’sbackgrounds and cultures – why do people behave this way or [why are they] actingas they are. [Criminal justice workers] need more understanding about Asians andblacks … We were attending a traditional Asian stick dancing festival when thepolice arrested six of us for carrying offensive weapons. We got taken down [to] thestation and everything.
Black and Asian offenders on probation
52
Just that the system should be fair and that they should go by people’s offences, notby their colour, or the way they present themselves. The system needs to look atthemselves (sic) before looking at people because of their colour.
According to Tyler (2001), people are more likely to obey the law if they have trust andconfidence in the fairness of the procedures used by legal authorities and legal institutions.So, by ensuring that decisions are made fairly, legal authorities can build a culture in whichm o re people feel a moral responsibility to abide by the law. This is also likely to haveimplications for compliance with community sentences such as probation (Bottoms, 2001).
53
Social exclusion and experiences of criminal justice

Black and Asian offenders on probation
54
Chapter 6: Conclusions and implications
This study involved interviews with 483 offenders under supervision by the Probation Serv i c eand identified by probation re c o rds as black or Asian. The interviews collected inform a t i o nabout their criminogenic needs, their experiences of supervision on probation (or communityrehabilitation) orders and of programmes, their contact with other parts of the criminal justicesystem, and their wider experiences of life as black and Asian people in Britain. The samplealso included a number of offenders who classified themselves as of mixed ethnic origin,described in the re p o rt as mixed heritage. The 483 respondents included 241 black, 172Asian, 57 mixed heritage and 13 ‘other’ offenders, drawn from a range of areas withv a rying densities of minority ethnic population. They included 236 who were due to do, wereattending or had been attending a programme, and 247 who were being or had beens u p e rvised without a programme. Some categories of offender and types of area were over-sampled to ensure that useful numbers would be available for analysis, and the sample wasthen weighted to reflect, as far as possible, the actual pro p o rtions and locations of minorityethnic people in the national caseload of community rehabilitation ord e r s .
Criminogenic needs
In this re p o rt, criminogenic needs are addressed in two ways: comparatively, using astandardised measure, and in a more qualitative way through interviews about individualexperiences. The quantitative assessment of criminogenic needs was carried out using selfassessment by offenders using the CRIME-PICS II questionnaire, which is designed to elicitinformation about crime-prone attitudes and beliefs and self-reported problems. This part ofthe study indicated that all three minority ethnic groups (black, Asian and mixed heritage)showed less evidence of crime-prone attitudes and beliefs than relevant comparison groupsof white offenders. Self-reported problems were also lower, though closer to those reportedfor white groups. Within the minority ethnic sample, offenders of mixed heritage had thehighest average scores on most measures of crime-prone attitudes and self-re p o rt e dp roblems. Asian offenders had the lowest, except on one of the five CRIME-PICS IIsubscales60. This part of the study, like other comparative studies, therefore lent no support tothe idea that offenders on probation from minority ethnic groups are likely to havedistinctively diff e rent or greater criminogenic needs (though their experiences may diff e rfrom those of white probationers in other respects which are discussed below).
55
60 This was the V scale measuring ‘victim hurt denial’.

Other findings from this part of the study were that offenders on programmes did not havegreater needs than those who were not on programmes (though the programme group didhave a higher average OGRS score, indicating more previous convictions). The lower levelsof criminogenic need identified among those who attended programmes appeared to be aneffect of targeting and selection rather than of programme attendance, since there was noevidence that needs were significantly lower during or after programme attendance thanb e f o re. (It should be re m e m b e red that many of the programmes attended were non-a c c redited, or were in the early stages of roll-out and there f o re likely to suffer fro mimplementation problems [Hollin et al. 2002]). There was some indication that Asianoffenders were less likely to access programmes, which may have been partly due to theirlower average OGRS scores.
These findings concerning general levels of need and the comparisons with whitep robationers suggested that minority ethnic offenders were tending to receive the samecommunity sentences as white offenders who had higher levels of criminogenic need. Thisfinding, based on small but significant differences in levels of criminogenic need, may havea number of explanations; however, one possibility that deserves consideration is that it wasat least partly a result of differential sentencing. In other words, it raised the possibility thatat least some comparable white offenders had received less serious sentences (below thelevel of community sentences), and that some minority ethnic offenders were more likely thancomparable white offenders to receive sentences above the community sentence range.Whilst this study did not demonstrate that this process was occurring, the findings wereconsistent with this possibility and suggested a need for further research on this question.They also tended to support a policy of continuing vigilance in relation to diversity issues insentencing and in the preparation of pre-sentence reports.
Experiences of probation
The majority of respondents’ comments on their experiences of probation were bro a d l yfavourable, in line with other consumer studies covering mainly white pro b a t i o n e r s6 1. Agood probation officer was one who treated people fairly and with respect, who listenedand who showed understanding. About a third thought that it would be best for black orAsian offenders to be supervised by someone from the same ethnic group; the remainderd i s a g reed or thought it unimportant. People who attended programmes designed
Black and Asian offenders on probation
56
61 As noted in Chapter 2, however, the chances of an offender attending a re s e a rch interview were pro b a b l yincreased if they had a good relationship with their supervisor; if this is so, and given the relatively small numberof interviews achieved with those who had failed to complete or had breached their order, the findings mayhave a slightly positive bias.

specifically for ethnic minority offenders were not significantly more likely to suggest thatsupervisors and probationers should be of the same ethnicity than the remaining programmeparticipants, or than the rest of the sample as a whole.
P rogrammes also attracted favourable comments, but with a substantial minority makingvarious criticisms. Most programme staff were said to have treated probationers fairly. Ofthose who attended programmes, about a third said that the ethnic composition of the groupwas unimportant; of the remainder, most said it should be mixed. There was very limitedsupport (only eight respondents, all from ‘high density’ areas, equivalent to a weighted 5%of the programme sample) for groups exclusively for minority ethnic offenders. Only a smallproportion (10%) of the programme sample had actually been on programmes designed forblack and/or Asian offenders, and these people were not significantly more likely to reporta preference for such programmes than the other programme participants.
These findings tend to support a policy of running mixed programme groups rather thangroups consisting only of minority ethnic offenders. Mixed staffing could be advantageousbut was not thought by most respondents to be essential. The indications re g a rd i n g‘singleton’ placements where only one member of a group is from an ethnic minority wereless clear: for many it might not affect their participation, but for some it probably would.N e v e rtheless, in ‘low density’ areas singleton placements must sometimes have been theonly alternative to effectively excluding minority ethnic offenders from programmes. Thisa p p e a red to be an issue for individual assessment and discussion with the pro b a t i o n e rrather than for ‘one size fits all’ policies.
The National Probation Service is currently piloting four ‘pathfinder’ projects for black andAsian offenders. The relevant Probation Circular (Home Office 2001) sets out five models,of which four have been implemented and are being evaluated. Two of these involve groupsfor minority ethnic offenders only, and the other two are mixed in different ways. The surveyfindings were derived from people who were attending or had attended a variety ofp rogrammes, including accredited and non-accredited designs, and they did not includeoutcome measures. They cannot therefore provide much guidance about ‘what works’ withminority ethnic offenders, although they do contain some information about preferences. Fullevaluation of the ‘pathfinders’ will be necessary to throw light on questions of effectiveness.
57
Conclusions and implications

Social exclusion, disadvantage and perceptions of legitimacy
The interviews explored a number of areas of possible social disadvantage, and there wasevidence of substantial social exclusion and disadvantage in relation to employment,income, education and training. However, when these findings were compared with thelimited amount of similar information available concerning white probationers, it appearedthat the respondents were not on average more disadvantaged. Black and Asian people ingeneral are known to experience more disadvantage than white people in Britain, but thesed i ff e rences do not appear clearly among the smaller selected population of offenders onp robation. Black, Asian, mixed heritage and white probationers all show substantialevidence of disadvantage.
Exploration of perceived re a s o n s6 2 for disadvantage showed a rather diff e rent picture. Manyadverse experiences, particularly in relation to employment and education, were attributed byrespondents to racial prejudice, hostility or discrimination. This was particularly clear in manyaccounts of experience in the criminal justice system: although very little ‘white’ comparativei n f o rmation was available here, survey respondents re p o rted a number of experiences (inrelation, for example, to racial abuse or oppressively frequent ‘stop and search’) which wouldclearly be less likely to happen to a white off e n d e r. While probation staff were generallydescribed as behaving fairly, other parts of the criminal justice system, particularly the police,w e re described much less favourably. Most of the policy implications of this lie outside the scopeof this re p o rt, but the Probation Service needs to be aware that negative experiences of criminaljustice are likely to affect perceptions of the legitimacy of the system, and this in turn can aff e c tmotivation and compliance. Visible re p resentation of minority ethnic communities in the staffing ofcriminal justice agencies was seen as helpful. The survey evidence suggested that probation staffalso need to be aware of the particular needs and experiences of offenders of mixed heritage,who in some cases appear to suffer from negative discrimination without being fully accepted byminority ethnic communities (Alibhai-Brown 2001; Olumide 2002; Gorham 2003).
Other implications
Contact with Probation Service managers and staff clearly showed general awareness of aneed to avoid, at one extreme, the ‘colour-blind’ practice that ignores diversity of culture,experience and opportunity. However, this study also demonstrated the range of views and
Black and Asian offenders on probation
58
62 In this context it is important not to dismiss perceptions as somehow diff e rent from and inferior to ‘facts’.Perceptions are real and have real consequences: for example, legitimacy is a perceived attribute, but not animaginary one. This is recognised, for example, in the greater weight given to victim perception in the NationalCrime Recording Standard (Simmons and Dodd 2003).
experiences to be found within each minority ethnic group, as well as some differences inresponses between black, Asian and mixed heritage probationers. This suggested that it isi m p o rtant not to treat minority ethnic status as a defining identity from which personalcharacteristics, experiences and needs can be reliably inferred. This, however benignlyintended, is itself a form of ethnic stereotyping. Effective practice re q u i res the thoro u g hassessment of individual offenders. The survey respondents expected to be treated fairly, asindividuals, as ‘a normal person’, by staff who listened to them and respected their views.Policies and practice need to be informed by awareness of diversity, but not based onuntested assumptions about what diversity implies.
59
Conclusions and implications

Black and Asian offenders on probation
60

Appendix 1: Some problems of fieldwork in theprobation service
The difficulties the re s e a rchers encountered in identifying offenders for interv i e w, and inactually managing to interview them once they were identified, were a source of anxietyduring much of the period of fieldwork, and were a standard agenda item at SteeringGroup meetings. It is worth describing the problems the researchers found in practice, bothbecause they illuminate some important issues of probation practice and organisation, andbecause an understanding of the problems may be helpful in guiding future research thatrelies on the Probation Service to arrange interviews with specified categories of offender.
The first problem was that the information held by probation areas on the re l e v a n tcategories of offender was (as we had found in the pilot and perhaps should have expectedf rom the comments on data quality in Home Office Section 95 re p o rts) often unre l i a b l e .Cases for potential inclusion in the sample were initially identified in all areas from centrally-held databases, the basic criteria being that the offenders were male, black or Asian, andon a probation order or community rehabilitation order. Cases so identified turned out toinclude people who were not male, not black or Asian, or not currently on probation orcommunity rehabilitation orders. Furt h e rm o re, centrally-held re c o rds often told a diff e re n tstory from records obtained from local offices; for example, cases identified centrally wouldt u rn out to be no longer under supervision, or no longer in the area. These and otherproblems, such as absence from the record of information needed to establish the categoryof the sample into which an offender fitted, meant that identifying cases for inclusion in thestudy was a time-consuming and frustrating process. While the stru c t u red nature of theintended sample meant that we were very conscious of deficiencies in the records that mightnot seem serious to practitioners, the conclusion is inescapable that probation records aregenerally not as accurate, complete or up to date as they should be.
A second problem was that even when interviews with the ‘right’ offenders had beena rranged, there was no guarantee that they would actually take place. The re s e a rc h e r sindependently formed the impression that an interviewee was most likely to keep anappointment if the following conditions were in place: that there was a good relationshipbetween the offender and the supervising officer; that the re s e a rch interview had beenarranged to coincide with an appointment with the officer; and that the officer had beensuccessful in communicating a positive message to the offender about the value and interestof the re s e a rch. Even when these three factors were present it was not uncommon for
61

prospective interviewees to fail to keep appointments. In the absence of any one of thesefactors, the likelihood of non-attendance increased gre a t l y, making for many wastedj o u rneys and draining re s e a rchers’ time and energ y. The quality of the off e n d e r- o ff i c e rrelationship was often also an important influence on the re s e a rch interview: in general,w h e re the relationship was negative or perf u n c t o ry, interviewees were less likely to talkopenly and candidly to the researcher. These difficulties suggest that the achieved samplemay to some extent over-represent those who had a positive experience of probation: theh a rdest group to contact were the ‘failures’. (This is, of course, likely to be true of all‘consumer’ studies of probation – offenders in regular contact with the service will alwaysbe easier to contact than those who should be in regular contact but are not.)
A related problem was that some probation staff – including some with managementresponsibilities – apparently re g a rded the re s e a rch as merely a nuisance and an addedburden in an already heavy workload. This meant that even when (as was usually the case)the are a ’s senior management was formally committed to supporting and facilitating theresearch, practical co-operation was not always forthcoming on the ground. It is possible –though we have no clear evidence on this – that the subject of the research made someprobation staff particularly sensitive about the risk of negative findings.
F u rther problems arose from various features of the Probation Serv i c e ’s organisation andworking practices. For example, staff were often on leave at times that were inconvenient forthe researchers, and by the time they returned the status of the relevant offender could havechanged so as to make him unsuitable for interview within the sampling frame – if he wasnow at a diff e rent stage of the ord e r, or the order had been completed. It also pro v e dd i fficult to determine who the supervising officer actually was when offenders wereattending programmes at the start of their orders. In such cases, offenders’ contacts werewith staff running the programmes rather than with their designated supervising officer, anddirect contact with probation centre or programme staff proved more fruitful than attempts tocontact the formal supervisor. Offenders with no previous probation experience who wereattending programmes and were interviewed near the start of their orders, while relativelyeasy to contact, often had little to say to the researchers, since their knowledge was basedon only a few weeks of work on a programme. On the other hand, offenders nearing theend of orders, with longer experience of probation, were often difficult to contact, since theytended to be in only monthly (and perf u n c t o ry) contact with their supervisors. All thesefactors meant that pro g ress towards the target of 500 interviews was slower and morefraught than had been envisaged.
Black and Asian offenders on probation
62
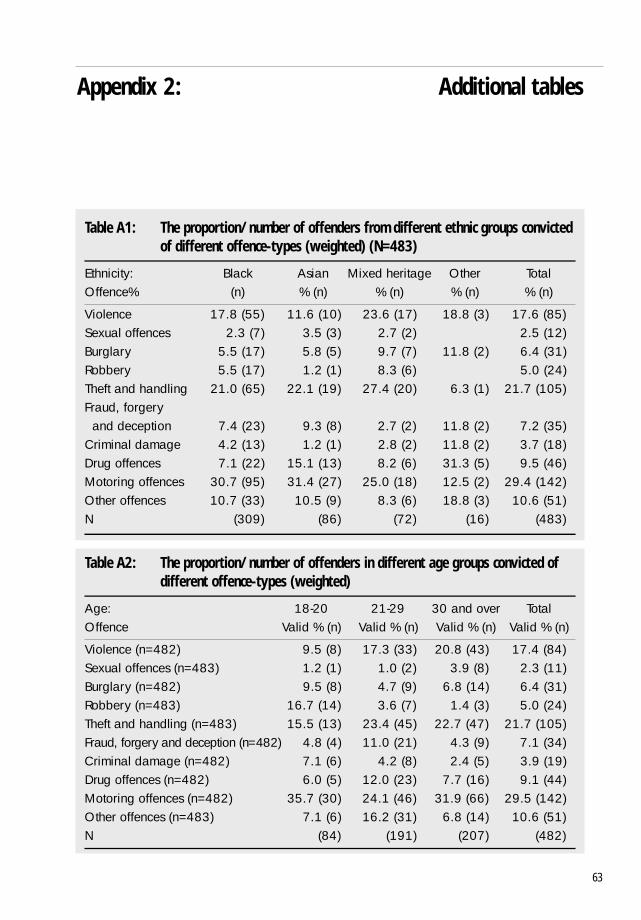
Appendix 2: Additional tables
Table A1: The proportion/number of offenders from different ethnic groups convictedof different offence-types (weighted) (N=483)
Ethnicity: Black Asian Mixed heritage Other TotalOffence% (n) % (n) % (n) % (n) % (n)
Violence 17.8 (55) 11.6 (10) 23.6 (17) 18.8 (3) 17.6 (85)Sexual offences 2.3 (7) 3.5 (3) 2.7 (2) 2.5 (12)Burglary 5.5 (17) 5.8 (5) 9.7 (7) 11.8 (2) 6.4 (31)Robbery 5.5 (17) 1.2 (1) 8.3 (6) 5.0 (24)Theft and handling 21.0 (65) 22.1 (19) 27.4 (20) 6.3 (1) 21.7 (105)Fraud, forgery and deception 7.4 (23) 9.3 (8) 2.7 (2) 11.8 (2) 7.2 (35)
Criminal damage 4.2 (13) 1.2 (1) 2.8 (2) 11.8 (2) 3.7 (18)Drug offences 7.1 (22) 15.1 (13) 8.2 (6) 31.3 (5) 9.5 (46)Motoring offences 30.7 (95) 31.4 (27) 25.0 (18) 12.5 (2) 29.4 (142)Other offences 10.7 (33) 10.5 (9) 8.3 (6) 18.8 (3) 10.6 (51)N (309) (86) (72) (16) (483)
Table A2: The proportion/number of offenders in different age groups convicted ofdifferent offence-types (weighted)
Age: 18-20 21-29 30 and over TotalOffence Valid % (n) Valid % (n) Valid % (n) Valid % (n)
Violence (n=482) 9.5 (8) 17.3 (33) 20.8 (43) 17.4 (84)Sexual offences (n=483) 1.2 (1) 1.0 (2) 3.9 (8) 2.3 (11)Burglary (n=482) 9.5 (8) 4.7 (9) 6.8 (14) 6.4 (31)Robbery (n=483) 16.7 (14) 3.6 (7) 1.4 (3) 5.0 (24)Theft and handling (n=483) 15.5 (13) 23.4 (45) 22.7 (47) 21.7 (105)Fraud, forg e ry and deception (n=482) 4.8 (4) 11.0 (21) 4.3 (9) 7.1 (34)Criminal damage (n=482) 7.1 (6) 4.2 (8) 2.4 (5) 3.9 (19)Drug offences (n=482) 6.0 (5) 12.0 (23) 7.7 (16) 9.1 (44)Motoring offences (n=482) 35.7 (30) 24.1 (46) 31.9 (66) 29.5 (142)Other offences (n=483) 7.1 (6) 16.2 (31) 6.8 (14) 10.6 (51)N (84) (191) (207) (482)
63

Table A3: CRIME-PICS II problems in weighted sample and comparison group
Problem area Full Black Asian Mixed Whitesample heritage comparison
N: Weighted 482 308 86 72Unweighted (482) (240) (172) (57) (422)Money 2.54 2.55 2.52 2.62 2.67Relationships 1.81 1.84 1.79 1.67 1.68Employment 2.46 2.51 2.25 2.62 2.74Temper 1.70 1.71 1.73 1.64 2.10Need for excitement 1.65 1.68 1.56 1.68 1.75Family 1.65 1.60 1.80 1.66 1.84Health 1.56 1.48 1.77 1.54 1.41Boredom 2.09 2.07 1.99 2.29 2.45Housing 1.94 2.07 1.58 1.82 1.83Drink/drugs 1.60 1.45 1.81 1.80 1.82Gambling 1.08 1.06 1.06 1.15 1.16Depression 1.62 1.57 1.84 1.54 1.80Not feeling good 1.57 1.53 1.54 1.73 1.54Not confident 1.54 1.47 1.61 1.72 1.74Lots of worries 1.93 1.90 2.14 1.83 2.09
Black and Asian offenders on probation
64

Table A4: Responses63 to ‘What makes a good supervisor of a black or Asianperson?’ (weighted)
Characteristic % (n) of interviewees whom e n t i o n e d this characteristic
Easy to talk to, or should listen 27 (128)Understanding and sympathetic 27 (128)Understands the offender’s needs, feelings and experiences as a black or Asian person 20 (98)
Helps with needs or problems 14 (68)Helpful or supportive (unspecific) 14 (66)Treats offender with respect, fairly, as a normal person, is polite etc. 12 (59)Seems to care, asks me how I am, always has time for me, takes an interest etc. 12 (59)
Treats everybody equally (including ‘is not racist’) 7 (36)Is not judgmental 7 (36)Experienced in dealing with offenders, knows the system well etc. 6 (27)Friendly, pleasant, has a sense of humour etc. 5 (22)Gives good advice 5 (22)Trustworthy or honest 4 (21)Well educated, knowledgeable or intelligent 4 (17)Helps clients to not reoffend 3 (14)Black or Asian 3 (14)Should try to find out why clients commit crime – get to the root of the problem 2 (12)
Open-minded 3 (14)Easy-going, not too authoritarian, flexible etc. 2 (12)An ex-offender 2 (12)Clients should feel comfortable with them 2 (8)Enthusiastic, puts a lot of effort in 1 (7)Authoritative, not too soft, strict etc. 1 (6)Reliable, does not let you down, etc. 1 (5)
65
Additional tables
63 All responses mentioned by five or more respondents are included.

Table A.5: Problems in CRIME-PICS II self-report schedule which respondents said hadcontributed to their getting into trouble (weighted)
Problem P e rcentage (n) of interviewees who said that this problem contributed to them getting
into trouble
Problems with money 40.4 (195)Problems with relationships 12.2 (59)Problems with employment 23.7 (115)Problems controlling temper 12.9 (62)Need for extra excitement 5.7 (28)Family problems 7.9 (38)Problems of health and fitness 4.3 (21)A tendency to get bored 18.0 (87)Problems with drink 11.5 (56)Problems with drugs 19.8 (96)Problems with housing 10.5 (51)Problems with gambling 1.1 (5)Depressed 10.0 (48)Problems feeling good about self 2.7 (13)Problems with lack of confidence 2.2 (11)Lots of worries 6.6 (32)
Black and Asian offenders on probation
66
67
Additional tables

Black and Asian offenders on probation
68

69
References
Alibhai-Brown, Y. (2001) Mixed Feelings: The Complex Lives of Mixed-Race Britons. London:The Women’s Press.
Andrews, D.A. and Bonta, J. (1998) The Psychology of Criminal Conduct. Cincinnati: Anderson.
B a i l e y, R. and Wa rd, D. (1992) Probation Supervision: Attitudes to Formalised Helping.Nottingham and Belfast: Centre for Social Action and Northern Ireland Probation Service.
Ballintyne, S. (1999) Unsafe Streets. London: IPPR.
Beetham, D. (1991) The Legitimation of Power. London: Macmillan.
Bottoms, A.E. (2001) Compliance and community penalties, in A.E. Bottoms, L. Gelsthorpeand S. Rex (eds.) Community Penalties: Change and Challenges. Cullompton: Willan.
Bowling, B. (1999) Violent Racism: Victimisation, Policing and Social Context ( re v i s e dedition). Oxford: Oxford University Press.
Bowling, B. and Phillips, C. (2002) Racism, Crime and Justice. London: Longman.
Briggs, C, (1995) Policing Moss Side: a probation service response, Probation Journal, 42, 2,62-66.
Butt, T. (2001) UMMID PROJECT ( 1 9 9 5 - 2 0 0 1 ) . Wakefield: West Yo r k s h i re Probation Serv i c e .
Cashmore, E., and McLaughlin, E. (1991) Out of Order? Policing Black People. London: Routledge.
Clancy, A., Hough, M., Aust, R. and Kershaw, C. (2001) Crime, Policing and Justice: the experienceof ethnic minorities. Findings from the 2000 British Crime Survey (Home Office ResearchStudy 223). London: Home Office.
Clark, D., Garnham, N. and Howard, P. (2002) An Evaluation and Validation of the Off e n d e rAssessment System (OASys). Draft report to the Home Office.

Cook, D. and Hudson, B. (1993) Racism and Criminology. London: Sage.
Davies, H. (1995) Evaluation of Probation Centres. B i rmingham: West Midlands Pro b a t i o nService.
de Gale, H., Hanlon, P., Hubbard, M., Morgan, S. and Denney, D. (1993) Improving Practice in theCriminal Justice System. A Training Manual ( N o rt h e rn Curriculum Development Pro j e c t ) .Leeds: CCETSW.
Denney, D. (1992) Racism and Anti-racism in Probation. London: Routledge.
Denney, D. and Carrington, B. (1981) Young Rastafarians and the Probation Service, ProbationJournal, 28, 4, 111-7.
D u rrance, P., Hignett, C., Merone, L. and Asamoah, A. (2001) The Greenwich and Lewisham Self-Development and Educational Attainment Group: Evaluation Report. London: LondonProbation Area.
Durrance, P. and Williams, P. (2003) Broadening the agenda around what works for black andAsian offenders, Probation Journal, 50, 3, 211-24.
Farrall, S. (2002) Rethinking What Works with Offenders. Cullompton: Willan.
F a rrall, S. and Maltby, S. (2003) ‘The victimisation of probationers’, Howard Journal, 42, 32-54.
Fitzgerald, M. (1993) Ethnic Minorities in the Criminal Justice System, Research Study 20,Royal Commission on Criminal Justice. London: Home Office.
FitzGerald, M. (1999) Searches in London under Section 1 of the Police and CriminalEvidence Act. London: Metropolitan Police.
F rude, N., Honess, T. and Maguire, M. (1994) CRIME-PICS II Manual. C a rd i ff: Michael andAssociates.
Gillborn, D and Mirza, H.S. (2000) Educational Inequality: Mapping Race, Class and Gender: ASynthesis of Research Evidence. London: OFSTED.
Gordon, P. (1983) White Law: Racism in the Police, Courts and Prisons. London: Pluto.
Black and Asian offenders on probation
70

Gorham, C. (2003) Mixing It, The Guardian Weekend Magazine, 22 October 2003, pp.34-5.
G o t t f redson, M. (1984) Victims of Crime: Dimensions of Risk. Home Office Research StudyNo. 81. London: HMSO.
Green, R. (1989) Probation and the Black offender, New Community, 16, 1, 81-91.
Hall, S., Critcher, C., Jefferson, T., Clarke, J. and Roberts, B. (1978) Policing the Crisis. L o n d o n :Macmillan.
Harper, R. (1998) An Evaluation of Motivational Interviewing. London: Middlesex ProbationService.
Harper, R. (2000) Quality of Service Survey. London: Middlesex Probation Service.
H a rtless, J., Ditton, J., Nair, G. and Phillips, S. (1995) More sinned against than sinning, B r i t i s hJournal of Criminology, 35, 1, 114-33.
H a t c h e r, R. and McGuire, J. (2001) Report on the Psychometric Evaluation of the T h i n k - F i r s tProgramme in Community Settings. Liverpool: University of Liverpool Department of ClinicalPsychology.
Her Majesty’s Inspectorate of Probation (HMIP) (2000) Towards Race Equality: A T h e m a t i cInspection. London, HMIP.
Holdaway, S. (1983) Inside the British Police. Oxford: Blackwell.
Holdaway, S. (1996) The Racialisation of British Policing. London: Macmillan.
Holdaway, S. and Allaker, J. (1990) Race Issues in the Probation Service: A Review of Policy.Wakefield: Association of Chief Officers of Probation.
Hollin, C., McGuire, J., Palmer, E., Bilby, C., Hatcher, R. and Holmes, A. (2002) Introducing PathfinderProgrammes into the National Probation Service: an interim report, Home Office ResearchStudy 247. London: Home Office.
Home Office (1994) Probation Statistics England and Wales 1993. London: Home Office.
71
References

Home Office (2000a) Race Equality in Public Services. London: Home Office.
Home Office (2000b). OASys Manual (Version 5). London: Home Office.
Home Office (2001) What Works Diversity Issues and Race, Probation Circular PC76/2001.London: National Probation Directorate.
Home Office (2002a) Race and the Criminal Justice System 2001. A Home Office Publicationunder Section 95 of the Criminal Justice Act 1991. London: Home Office.
Home Office (2002b) Race and the Criminal Justice System. London: Home Office. Available at http://www.homeoffice.gov.uk/rds/pdfs2/s95race02.pdf
Home Office (2002c) Probation Statistics England and Wales 2001. London: Home Office.
Home Office (2003) Personal communication.
Hood, R. (1992) Race and Sentencing. Oxford: Clarendon Press.
Hood, R., Shute, S. and Seemungal, F. (2003) Ethnic Minorities in the Criminal Courts: Perceptionsof Fairness and Equality. London: Lord Chancellor’s Department.
Hudson, B. and Bramhall, G. (2002) Race Equality and Criminal Justice: A Study of Pre-SentenceReports for the National Probation Service, unpublished.
Jeffers, S. (1995) ‘Black’ and Ethnic Minority Offenders’ Experience of Probation. Report tothe School for Advanced Urban Studies, University of Bristol.
Jenkins, J. and Lawrence, D. (1993) Inner London’s Black Groups Initiative, Probation Journal,40, 2, 82-84.
Johnson, E., Lotay, S., Stephens, W. and Davies, H. (1996) Black People and Offending Group. PilotProgramme, January-March 1996. Birmingham: West Midlands Probation Service.
Jones, C. (1991) A Probation Centre and Attitude Change: an Empirical Investigation,unpublished dissertation. Swansea: University of Wales, Swansea.
Kett, J., Collett, S., Barron, C. Hill, I. and Metherell, D. (1992) Managing and Developing A n t i - r a c i s tPractice within Probation: A Resource Pack for A c t i o n . Liverpool: Merseyside Probation Serv i c e .
Black and Asian offenders on probation
72

Lawrence, D., Pearson, G. and Aina, C. (1992) Black Offenders Project. Report to the Inner LondonProbation Service and the Islington Safer Cities Project. London: Department of CommunityStudies, Goldsmiths’ College.
Lawson, J. (1984) Probation in St. Paul’s. Teamwork in a multi-racial, inner city are a ,Probation Journal, 31, 3, 93-5.
Lea J and Young J., (1993) What is to be Done about Law and Order? ( revised edition).London: Pluto.
Lewis, S., Ve n n a rd, J., Maguire, M., Raynor, P., Vanstone, M., Raybould, S. and Rix, A. (2003) T h eResettlement of Short-term Prisoners: an evaluation of seven Pathfinders, re p o rt to theResearch, Development and Statistics Directorate, Home Office.
Lind, E.A., and Tyler, T. (1992) (eds.) The Social Psychology of Procedural Justice. New York:Kluwer.
Macpherson, W. (1999) The Stephen Lawrence Inquiry: Report of an Inquiry by Sir WilliamMacpherson of Cluny. Advised by Tom Cook, The Right Reverend Dr John Sentamu and DrRichard Stone (Cm 4262-1). London: Home Office.
Maguire, M., Perroud, B. and Raynor, P. (1996) Automatic Conditional Release: the first two years(Home Office Research Study 156). London: Home Office.
M a i r, G. and May, C. (1997). O ffenders on Probation. Home Office Research Study 167.London: Home Office.
Mantle, G. (1999) Control, Help and Punishment (Occasional Paper 1). Witham: EssexProbation Service.
May, C. (1999) Explaining Reconviction Following a Community Sentence: the role of socialfactors. Home Office Research Study 192. London: Home Office.
M c G u i re, J., Broomfield, D., Robinson, C. and Rowson, B. (1995) Short - t e rm impact of pro b a t i o nprograms: an evaluative study, International Journal of Offender Therapy and ComparativeCriminology, 39, 23-42.
M e rrington, S. (1995) O ffenders on Probation. Cambridge: Cambridgeshire Probation Serv i c e .
73
References
Merrington, S. (2001) ACE profiles for female, ethnic minority and young offenders: a sub-group analysis of the data used in ACE Practitioner Bulletin 4, unpublished.
Miller, J., Bland, N. and Quinton, P. (2000) The Impact of Stops and Searches on Crime in theCommunity, Police Research Series Paper 127. London: Home Office.
Mirrlees-Black, C. (2001) Confidence in the Criminal Justice System: Findings from the 2000British Crime Survey. Research Findings No. 137. London: Home Office.
Norris, C., Fielding, N., Kemp, C. and Fielding, J. (1992) Black and Blue: an Analysis of the Influenceof Race on Being Stopped by the Police, British Journal of Sociology, 43, 2, 207-223.
OASys Development Team (2001) The Offender Assessment System (OASys). London: Home Off i c e .
Olumide, J. (2002) Raiding the Gene Pool: The Social Construction of Mixed Race. London:Pluto Press.
Pearson, G., Sampson, A., Blagg, H., Stubbs, P. and Smith, D. (1989) Policing Racism in R. Morganand D.J. Smith (eds.) Coming to Terms with Policing: Perspectives on Policy. London:Routledge.
Phillips, C. and Brown, D. (1998) Entry into the Criminal Justice System: A Study of Police Arrestsand their Outcomes (Home Office Research Study 185). London: Home Office.
Powis, B. and Walmsley, R.K. (2002) Programmes for Black and Asian Offenders on Probation:Lessons for Developing Practice. Home Office Research Study 250. London: Home Office.
Quinton, P., Bland, N. and Miller, J. (2000) Police Stops, Decision-Making and Practice, PoliceResearch Series Paper 130. London: Home Office.
R a y n o r, P. (1998) Attitudes, social problems and reconvictions in the STOP pro b a t i o nexperiment, Howard Journal, 37, 1-15.
Raynor, P. and Vanstone, M. (1997). Straight Thinking on Probation (STOP): The Mid GlamorganExperiment. Probation Studies Unit Report 4. Oxford: Centre for Criminological Research.
Raynor, P., Kynch, J., Roberts, C. and Merrington, M. (2000) Risk and Need Assessment in ProbationServices: an Evaluation. Home Office Research Study 211. London: Home Office.
Black and Asian offenders on probation
74
Reiner, R. (1993) Race, crime and justice: models of interpretation, in L.R. Gelsthorpe (ed.)(1993) Minority Ethnic Groups and the Criminal Justice System. Cambridge: Institute ofCriminology.
Rex, S. (1997) Perceptions of Probation in a Context of Just Deserts, PhD thesis, Cambridge,unpublished.
Rex, S., Gelsthorpe, L., Roberts, C. and Jordan, P. (2002) An Evaluation of Community ServicePathfinder projects, re p o rt to the Research, Development and Statistics Directorate, HomeOffice.
R i c h a rds, M. (1996) Evaluat ion of the In tens ive Probation Centre . Cambridge:Cambridgeshire Probation Service.
Roberts, C., Burnett, R., Kirby, A. and Hamill, H. (1996) A System for Evaluating Probation Practice,Probation Studies Unit Report 1. Oxford: Centre for Criminological Research.
Simmons, J. and Dodd, T. (eds.) (2003) Crime in England and Wales 2002/2003, Home OfficeStatistical Bulletin 07/03. London: Home Office.
Social Exclusion Unit (1998) Bringing Britain Together: A National Strategy for NeighbourhoodRenewal (Cm 4045). London: Social Exclusion Unit.
S p e n c e r, A.J., and Hough, M. (2000) Policing Diversity: Lessons from Lambeth. Policing andReducing Crime Unit. Paper 121. London: Home Office.
S t e w a rt, G. and Stewart, J. (1993) Social Circumstances of Younger Offenders UnderSupervison. Wakefield: Association of Chief Officers of Probation.
Surrey Probation Service (1996) The Day Centre: CRIME-PICS II. Godalming: Surrey ProbationService Information and Inspection Team.
Tyler, T.R. (1990) Why People Obey the Law. New Haven: Yale University Press.
Tyler, T.R. (2001) Obeying the law in America: procedural justice and the sense of fairness,Issues of Democracy, An Electronic Journal of the U.S. Department of State, 6, 1, 16 – 21.
Ty l e r, T.R., Boeckmann, R.J., Smith, H.J. and Huo, Y.J. (1997) Social Justice in a Diverse Society.Boulder, Colo: Westview Press.
75
References

Van Dijk, J. and Steinmetz, C. (1983) Victimisation surveys: beyond measuring the volume ofcrime, Victimology: An International Journal, 8, 1-2, 291-309.
Whitehouse, P. (1983) Race, bias and social enquiry reports, Probation Journal, 30, 2, 43-9.
Wilkinson, J. (1998) Developing the evidence-base for probation programmes, PhD thesis,University of Surrey.
Williams, P. (2001) Evaluation of the Black Offender Groupwork Programme. Manchester:Greater Manchester Probation Area.
Black and Asian offenders on probation
76

77

Black and Asian offenders on probation
78

79

Black and Asian offenders on probation
80
RDS Publications
Requests for Publications
Copies of our publications and a list of those currently available may be obtained from:
Home OfficeResearch, Development and Statistics DirectorateCommunication Development UnitRoom 264, Home Office50 Queen Anne’s GateLondon SW1H 9ATTelephone: 020 7273 2084 (answerphone outside of office hours)Facsimile: 020 7222 0211E-mail: [email protected]
alternatively
why not visit the RDS web-site atInternet: http://www.homeoffice.gov.uk/rds/index.htm
w h e re many of our publications are available to be read on screen or downloaded for printing.