CHEMICALS MINING TRANSPOR T W ASTE MANA GEMENT
51
CHEMICALS TRENDS IN SUSTAINABLE DEVELOPMENT MINING TRANSPORT WASTE MANAGEMENT
-
Upload
khangminh22 -
Category
Documents
-
view
4 -
download
0
Transcript of CHEMICALS MINING TRANSPOR T W ASTE MANA GEMENT

CH
EM
ICA
LS
TRENDS IN SUSTAINABLE DEVELOPMENT
MIN
ING
TR
AN
SP
OR
T
WA
ST
EM
AN
AG
EM
EN
T

[blank, inside cover]

Department of Economic and Social Affairs Division for Sustainable Development
TRENDSIN SUSTAINABLE DEVELOPMENT
Chemicals, mining, transport and waste management
United Nations New York, 2010

DESA
The Department of Economic and Social Affairs of the United Nations Secretariat is a vital interface between global policies in the economic, social and environmental spheres and national action. The Department works in three main interlinked areas: (i) it compiles, generates and analyses a wide range of economic, social and environmental data and information on which Member States of the United Nations draw to review common problems and to take stock of policy options; (ii) it facilitates the negotia-tions of Member States in many intergovernmental bodies on joint courses of action to address ongoing or emerging global challenges; and (iii) it advises interested Governments on the ways and means of translating policy frameworks developed in United Nations conferences and summits into programmes at the country level and, through technical assistance, helps build national capacities.
NoteThe designations employed and the presentation of the material in this publication do not imply the expression of any opin-ion whatsoever on the part of the Secretariat of the United Nations concerning the legal status of any country or territory or of its authorities, or concerning the delimitations of its frontiers. The term “country” as used in the text of the present report also refers, as appropriate, to territories or areas. The designations of country groups in the text and the tables are intended solely for statistical or analytical convenience and do not necessarily express a judgment about the stage reached by a par-ticular country or area in the development process. Mention of the names of firms and commercial products does not imply the endorsement of the United Nations.
United Nations publicationSales No. E.10.II.A.3ISBN 978-92-1-104600-7Copyright © United Nations, 2010All rights reservedPrinted at the United Nations, New York

INTRODUCTION << iii >>
FOREWORD
Since the United Nations Conference on Environment and Development in 1992 and the subsequent World Summit on Sus-tainable Development in 2002, significant efforts have been made in pursuit of sustainable development. At the political level sustainable development has grown from being a movement mostly focusing on environmental concerns to a widely recognized framework utilized by individuals, governments, corporations and civil society that attempts to balance economic, social, environ-mental and inter-generational concerns in decision-making and actions at all levels. At the September 2005 World Summit, the United Nations General Assembly reiterated that “sustainable development is a key element of the overarching framework for United Nations activities, in particular for achieving the internationally agreed development goals”, including those contained in the Millennium Declaration and the Johannesburg Plan of Implementation (A/RES/59/227).
This report highlights key developments and recent trends in chemicals, mining, transport and waste management. In addition to considering these four themes, the Commission on Sustainable Development (CSD) addresses the progress of the “Ten Year Framework of Programmes on Sustainable Consumption & Production Patterns” as a thematic issue during its 18th and 19th ses-sions (2010–2011).
Tariq Banuri, Director Division for Sustainable Development Department of Economic and Social Affairs April 2010

PAgE
CONTENTS
FOREWORD . . . . . . . . . . . . . . . . . . . . . . . . . . . . . . . . . . . . . . . . . . . . . . . . . . . . iii
INTRODUCTION . . . . . . . . . . . . . . . . . . . . . . . . . . . . . . . . . . . . . . . . . . . . . . . . . . . . . . . . . . . . . . . . 1
I . ChEmICalS . . . . . . . . . . . . . . . . . . . . . . . . . . . . . . . . . . . . . . . . . . . . . . . . . . . . . . 2
II . mININg . . . . . . . . . . . . . . . . . . . . . . . . . . . . . . . . . . . . . . . . . . . . . . . . . . . . . . . . . . . . . . 8
III . TRaNSpORT . . . . . . . . . . . . . . . . . . . . . . . . . . . . . . . . . . . . . . . . . . . . . . . . . . . 15
IV . WaSTE maNagEmENT . . . . . . . . . . . . . . . . . . . . . . . . . . . . . . . 26
REFERENCES AND ENDNOTES . . . . . . . . . . . . . . . . . . . . . . . . . . . . . . . . . . . . . . . . . . . . . . . 36

INTRODUCTION << 1 >>
The implementation of a portfolio of strategies (Wedges) with different time horizons is critical to return to sustainability and to decrease humanity’s ecological footprint.
The ecological footprint is a measure of the scale of demands which human activities place on natural systems. The size of the footprint represents the amount of biologically productive land and sea area needed to regenerate the resources humanity consumes and to absorb and render harmless the corresponding wastes. The figure above suggests that human activity is cur-rently unsustainable in that it requires more than the total of all such produc-tive land and sea area — i.e., more than one planet — to support it. On cur-rent trends, by 2040 it would require two planets.
Though the ecological footprint is only one of a number of possible meas-ures of sustainability, there is broad agreement that a change to consumption and production patterns and technologies is needed in order to increase resource efficiency and reduce waste dramatically. This would permit living standards to be maintained in developed countries and to continue to rise in developing countries without exceeding the carrying capacities of critical ecosystems and life-support systems.
Using the technology wedge metaphor which Pacala and Socolow (2004) applied to greenhouse gas emissions, we can identify multiple options (or wedges) which would contribute to closing the gap between BAU and sus-tainability (i.e., living on the resources of a single planet).
The costs and degree of difficulty of different options vary from the relatively low-cost and simple — e.g., insulating buildings to conserve energy — to the longer term, more complex, such as stabilizing the world’s population.
Many interventions are possible. Individual energy and resource consump-tion can be reduced by designing cities in which walking is preferable to driving. Technological innovations can increase the efficiency of resource use, such as reducing material wastage in production processes. Rehabilitation of degraded lands can increase agricultural yields while minimizing increases in footprint associated with agricultural expansion.
Wedges can be defined around major consumption categories such as food, shelter, mobility. The footprint of food, for example, might be reduced by optimizing the relationship between the distance it is transported and the efficiency with which it can be locally produced. The energy efficiency of resi-dential and commercial buildings can often be dramatically increased, and utilities supporting them can be integrated so that wastes from one system serve as inputs for another.
INTRODUCTION
0.5
1.0
1.5
2.0
2.5
0 2060205020402030202020102000199019801970
Years
1960–2005Ecological Footprint
2005–2050, Scenarios
Num
ber
of
pla
net
eart
hs
The global ecological footprint in its current size and two trend scenarios: “Business as usual” and “Return to sustainability”
Moderate business as usual
Rapid reduction
Source: Global Footprint Network, 2009
The truly healthy environment is not merely safe but stimulating.
— William H. Stewart, Environmental Science and Technology,
February 1968

ChEmICalS << 2 >>
I . ChEmICalS
The consumption and production of chemicals in developing countries is growing much faster than in developed countries and could account for a third of global consumption by 2020.1
At the 2002 World Summit on Sustainable Development governments set the goal “that by the year 2020, chemicals will be produced and used in ways that minimize significant adverse impacts on the environment and human health” and called for implementation of the strategic approach to international chemicals management (SAICM).
On current trends, developing countries are expected to account for 37 per cent of the production of high volume industrial chemicals by 2030. Since 1987 the chemicals sector in China has been growing at an annual rate of around 16.5 per cent, which is several times the rate of most OECD coun-tries (around 1 to 4 per cent over the past 10 years). As a result, China has surpassed Germany as the third largest producer of chemicals.2
Projected changes in chemicals production by region between 2005 and 2030: Total % change, 2005-2030
World
OECD
Per cent
BRIICS
ROW
Source: OECD, 2008b
121.3%
196.6%
58.4%
86.1%
500 100 150 2000
Million USD 2001
Projected chemicals production by region (2005-2030)
5,511
6,0005,0004,0003,0002,0001,000
3,457
1,293
761
3,855
2,663
714
478
2,962
2,182
436
344
World
OECD
BRIICS
ROW
2005
2015
2030
Source: OECD, 2008b 3

ChEmICalS << 3 >>
Expanding international assessment of chemical risks: Number of high production volume (HPV) chemicals assessments
“More than 25 per cent of the global burden of disease is linked to environ-mental factors, including chemicals exposures. For example, about 800,000 children each year are affected by lead exposure, leading to lower intelligence quotients. The highest exposure levels occur predominantly in children in developing countries. Worldwide, lead exposure also accounts for 2 per cent of the ischaemic heart disease burden and 3 per cent of the cerebrovascular disease burden. Artisanal gold mining in developing countries remains a sig-nificant cause of mercury exposure, while mercury-containing medical instru-ments such as thermometers and sphygmanometers are a continuing source of exposure in both developed and developing countries. Some 9 per cent of the global disease burden of lung cancer is attributed to occupation and 5 per cent to outdoor air pollution. Cancer of the lung and mesothelioma are caused by exposure to asbestos, which remains in use in some countries. Unintentional poisonings kill an estimated 355,000 people each year. In developing coun-tries, where two thirds of these deaths occur, such poisonings are associated strongly with excessive exposure to, and inappropriate use of, toxic chemicals, including pesticides.
Source: WHO, 2009b
Assessments of chemicals are a tool to increase sustainable chemistry efforts. However, the amount of new chemicals added to the database each day makes it very difficult to keep pace with sufficient and effective assess-ments. There is a need for more systematic data and impact assessment of chemicals production and consumption, in order to ensure that new tech-nologies (e.g. nanotechnology, detergent enzymes, biocatalysts) reduce energy use and pollution without harming health and environment.4
Under the umbrella of sustainable development, “sustainable chemis-try” refers to the design, manufacture and use of efficient, effective, safe and more environmentally benign chemical products and development processes. 5
Within the framework of sustainable chemistry, the OECD carries out co-operative initial hazard assessments to determine the need for further
At the turn of the millennium international assessment of chemical risks was expanded and accelerated
Expanding international assessment of chemical risks: Number of high production volume (HPV) chemicals assessments
Source: OECD, 2009a
Number of chemicals assessments published per year
0
180
160
140
120
100
80
60
40
20
1995
2112
7 90
10
3831
92
111
157
73
61
76
1
1997 1999 2001 2003 2005 2007 2009
work. Since the programme began, some 949 chemicals were assessed (including 8 which have been re-assessed) and the results published. Between 1993 (first meeting) and 2002 (WSSD), 260 chemical assess-ments were carried out, while between 2002 and 2009 (April meeting) 689 chemicals were assessed.
The average annual number of chemicals assessments undertaken from 2001 to 2009 compared to the average number of assessments between 1995 and 2000 has multiplied by seven.
Such an increase is due to the availability of more funds for the assess-ments and a stronger commitment of the countries to conduct initial hazard assessments of high production volume (HPV) chemicals (those produced or imported in excess of 1,000 tonnes per year in at least one country or region).

ChEmICalS << 4 >>
Chemicals assessments provide a consensus scientific description of the risks of chemical exposures, which are then published in assessment reports and other related documents so that governments, international and national organizations and other stakeholders can use them as the basis for taking preventive actions against adverse health and environmental impacts.
According to the WHO, the assessment documents are often used as the basis for establishing guidelines and standards for the use of chemicals and for standards for drinking water and can assist with the implementa-tion of international agreements such as the Globally Harmonized System of Classification and Labelling of Chemicals (the GHS).6
Yearly international chemical assessments (1992-2009)
Source: WHO, 2009a
0
50
1992 1994 1996 1998 2000 2002 2004 2006 2008
100
150
200
250
Year
Num
ber
of
asse
ssm
ents
Food additives and contaminants assessment (JECFA)
Assessments for pesticide residues in food (JMPR)
Full chemical risk assessments (EHC/CICAD)
Chemical assessments for cancer classification (IARC)
International chemical assessmentsper category between 1992-2009
Source: WHO, 2009a
271
180
510
472
15428
Chemical assessments for cancer classification (IARC)
Full chemical risk assessments (EHC/CICAD)
Assessments for pesticide residues in food (JMPR)
Food additives and contaminants assessments (JECFA)
Assessments for guidelines for drinking water quality (GDWQ)
Assessments for guidelines for air quality (GDAQ)
The sound management of chemicals is essential if we are to achieve sustainable development, including the eradication of poverty and disease, the improvement of
human health and the environment and the elevation of the standard of living
in countries at all levels of development.
— Dubai Declaration on International Chemicals Management February 2006

ChEmICalS << 5 >>
The map illustrates the proportion of countries per WHO region that have at least one poison centre. The main role of the poison centres is to pro-vide advice to members of the public and health care professionals about acute poisoning situations. They also act as a source of information for authorities and the media whenever necessary. The growing number of chemicals will most likely increase the need for poison centres.
Countries with at least one Poison Centre per WHO region
Source: WHO, 2009a
WHO Regions
WHO African Region
WHO Region of the Americas
WHO South-East Asia Region
WHO European Region
WHO Eastern Mediterranean Region
WHO Western Pacific Region
62%
52%
55%
32%
15%
67%
The International Programme on Chemical Safety’s (IPCS) database INCHEM offers electronic access to thousands of searchable full-text documents on chemical risks and the sound management of chemicals, helping countries fulfill their commitments under UNCED’s Agenda 21, Chapter 19. INCHEM consolidates information from a number of inter-governmental organizations whose goal is to assist in the sound manage-ment of chemicals.
The number of searches done from the INCHEM database reached its peak in 2006 but has since gradually decreased. The most searched topics have been the Joint Expert Committee on Food Additives7, Environmental Health Criteria and Poisons Information Monographs8.
INCHEM Statistics from January 2005 to August 2009
Source: WHO, 2009a
20050
1
2
3
4
5
6
2006 2007 2008 2009
Year
Tota
l num
ber
of
do
wnl
oad
s (m
illio
ns)
Concise International Chemical Assessment Documents (CICAD)
Environmental Health Criteria (EHC)
Health and Safety Guides (HSGs)
International Agency for Research on Cancer Summaries & Evaluations (IARC)
International Chemical Safety Cards (ICSC)
Joint Expert Committee on Food Additives (JECFA)
Joint Meeting on Pesticide Residues (JMPR)
Pesticide Documents (Pesticide Data Sheets & WHO Recommended Classification of Pesticides by Hazard) (PDs)
Poisons Information Monographs (PIMs)
Screening Information Data Sets for High Production Volume Documents (SIDS)
Antidote Monographs
In 2009 the country coverage of poison centres was substan tially lower in Africa and the Western Pacific than in the rest of the world.

ChEmICalS << 6 >>
Regional comparison of chemical industry CO2 emissions intensity (in 2005 and scenario for 2030)
Regions
Countries
Developing regions with strong growth
Source: International Council of Chemicals Associations, 2009 9
Global
Asia-Pacific
North America
Eastern Europe
Western Europe
Middle East/Africa
Latin America
China
United States
Switzerland
Total emissions (2005 and 2030)MtC02e
Carbon intensitykgC02e/USD sales
2,092
836
475
253
129
621
432
2
4,507 0.81
1.03
0.67
2.34
0.41
1.11
0.42
2.17
0.70
0.05
0.76
0.84
0.51
1.50
0.30
1.03
0.33
0.86
0.53
0.04
684
451
365
436
131
1,900
620
2
2,299
2030 20052005 2030
272
71
2030 BAU
Emissions,2005
3.3 3.3 1.6 1.5
6.5
2.0 0.5
5.0
BAUemissions,
2030
Effect ofvolume growth beyond
BAU
Emissions after
abate-ment
measures imple-
mented 2030
BAUvolume growth effect
Improve-ment of
efficiency
Geo-graphic
shift effect
BeyondBAU
improve-ment
measures
2030 Abatement
Evolution of the chemicals industry emissions in the BAU scenario and abatement scenario
Source: International Council of Chemicals Associations, 2009 10
Chemical industry isexpected to doubleits output by 2030
50%
2005
The chemical industries in Asia-Pacific, Middle East/Africa and Eastern Europe are relatively carbon-intensive. Volume growth, efficiency gains and geo-graphic shift are the most important drivers in this BAU scenario. An overview of the evolution of chemicals industry emissions shows that the drivers result in an increase of the CO2 emissions from 3.3 Gt +/- 25 per cent (in 2005) to approximately 6.5 Gt +/- 35 per cent (in 2030) in a business-as-usual scenario, with potential to reduce emissions to 5 GtCO2e +/- 35 per cent if abatement measures are implemented.
Chemicals — being an ingredient in nearly every manmade material — are an important contributor to lowering energy use and greenhouse gas emissions, for example through improved insulation materials and lowtemperature detergents, to name a few.
At the same time, the chemical industry is a carbon-intensive industry. The 2030 scenario presented here shows how the chemical’s industry emissions could be expected to evolve under business-as-usual, and also the abatement it enables in other industries and by end users.

ChEmICalS << 7 >>
The graph summarizes the ratio of greenhouse gas emission savings in several categories to emissions produced in making the chemicals/mate-rials. The study from which it is taken11 found that significant emissions savings by volume come from improving building insulation materials, fuel additives, improved wind turbines, compact fluorescent lighting, marine antifouling coatings, synthetic textiles, automotive plastics, low-tempera-ture detergents, engine efficiency, and insulation used in piping. Substitut-ing materials and building components would be required to increase the impact of chemicals on greenhouse gas emission savings.
Examples of the GHG emissions savings enabled by chemistry include (ratio of emissions savings to emissions)
Source: Based on data from International Council of Chemicals Associations, 2008 11
233:1
231:1
123:1
111:1
21:1
20:1
20:1
9:1
3:1
0 50 100 150 200 250
Polymers for automotiveweight reduction
Low-temperature detergents
Compact fluorescent lighting
Marine fuel reduction due touse of anti-fouling coating
Engine efficiency
Synthetic diesel additives —fuel efficiency improvements
Glass and carbon fiber forwind turbines
Foam coating in district heating
Building insulation foam
Hundreds of millions of tiny plastic pellets, or nurdles — the raw materials for the plastic
industry — are lost or spilled every year, working their way into the sea. These pollutants act as
chemical sponges attracting manmade chemicals such as hydrocarbons and the pesticide DDT.
They then enter the food chain. ‘What goes into the ocean goes into these animals and onto your
dinner plate. It’s that simple.’
— Kathy Marks & Daniel Howden, “The World’s Dump”
The Independent UK, 6 Feb 2008

mININg << 8 >>
II . mININg
The strong demand growth for mined commodities is increasingly driven by emerging economies, while mineral and metal intensity of OECD countries is projected to continue to decrease.
In the past century, the extraction of construction minerals has increased by a factor of 34 and the extraction of ores/industrial minerals increased by a factor of 27, while biomass extraction grew by 3.6 times.12 Overall, mining operations are likely to increase their ecological footprint due to continu-ing strong global demand for mined commodities.
Metal ores and non-metallic minerals: Global distribution of resource extraction in 2002 and 2020
Source: OECD, 2008a
Met
al o
res
2020:11.2 billion tonnes
39%
34%27%
2002:5.8 billion tonnes
30%32%
38%
No
n-m
etal
ic m
iner
als
2020:35.1 billion tonnes
36%
21%
43%2002:22.9 billion tonnes55%
19%
26%
OECD
BRIICS*
ROW**
*BRIICS = Brazil, Russia, India, Indonesia, China and South Africa**ROW = Rest of the world
Global resource extraction, by major groups of resources and regions, 1980, 2002 and 2020
Source: OECD, 2008a
Data based on MOSUS MFA database, Sustainable Europe Research Institute, Vienna, http://materialflows.net; Giljum et al. 2007.
0
2020
2002
1980
10 20 30 40 50 60 70 80 90
Billion tonnes
Year
Non-metallic minerals(114% increase 1980–2020)
Biomass(68% increase 1980–2020)
Fossil energy carriers(81% increase 1980–2020)
Metal ores(200% increase 1980–2020)

mININg << 9 >>
Industry nonferrous exploration expenditures of emerging13 and advanced economies
1991 1993 1995 1997 1999 2001 2003 2005 2007
Source: Humphreys, 2009 based on data from the Metals Economics Group
0
2
4
6
8
10
12
14
Advanced economies
Emerging economies
Bill
ion
USD
Year
Estimated global nonferrous exploration compared to relative gold and copper prices from 1989 to 2009
0 0.0
0.5
1.0
1.5
2.0
2.5
3.0
1989 1994 1999 2004 2009
3
6
9
12
15
Source: Metals Economics Group, 2009 15
Exp
lora
tio
n to
tal i
n $U
S b
illio
n Relative m
etals prices (1989=
1)
Nonferrous Exploration Total
Uranium Exploration Total
Relative Gold Price
Relative Copper Price
Year
Mining and mining support services can contribute significantly to a country’s value added. While many countries (e.g. Equatorial Guinea, Libyan Arab Jamahiriya, Angola) depend on crude oil and petroleum, mining of minerals and metals represents large proportions of the valueadded in countries such as Botswana, Mauritania, Mongolia, Papua New Guinea and Chile.
Mongolia’s mining sector extracting mainly coal, copper, molybdenum, fluor spar, tin, tungsten, and gold has grown significantly since the late 1990s due to an influx of Russian, Chinese and Canadian mining operations. Due to large diamond reserves, Botswana’s mining sector is an important source of government revenue and the government maintains a 50 per cent own-ership of the largest national mining company, Debswana. Discovery of uranium reserves and concerns over exhaustion of the diamond reserves led the government to support international mining companies’ prospect-ing for diamonds, gold, uranium, copper, and even oil in the country.
The link between mineral extraction and material use on the one hand and economic growth on the other can be attenuated in three ways:14
Structural effect:1. Structural changes move the focus in economies from the primary and secondary sector towards the tertiary (service) sector.
Technology effect:2. An increasing number of applications use more material efficient technologies.
Trade effect: 3. The outsourcing of material intensive production stages to other world regions (e.g. emerging and developing countries) will increase.
The technology effect is the only one with unambiguous consequences for dematerialization at the global level.

mININg << 10 >>
Selected countries in which mining contributes16 significantly to the value added
Lao People’s Dem. Rep.
Mali
Chile
Namibia
Mongolia
Mauritania
Papua New Guinea
Sierra Leone
Botswana
0
5
10
15
20
25
30
35
40
45
50
Year
Per
cen
t o
f va
lue
add
ed
Guyana
2008200620042002200019981996
Source: United Nations, 2009d — UNSD National Accounts Database of Official Country Data
Global trends in primary metal extraction (1990 – 2007)
200620042002200019981996199419921990
100
150
200
1990
= 1
00
Source: Jackson, 2009
Year
Bauxite
Copper Nickel
Iron Ore Zinc
World GDP
Global trends in primary metal extraction and GDP show little evidence of decoupling resource use from economic growth
Besides the environmental impact of mineral extraction, primary metals as finite resources impose limits to economic growth unless relative decou-pling (decline in resource intensity per unit of economic output) and even-tually absolute decoupling (absolute decline of resource use associated with economic growth) can be achieved (Jackson, 2009). Until the mid-1990s the trend analysis reveals some improvement in resource efficiency (i.e., relative decoupling). In more recent years, however, the extraction and consumption of structural metals (iron ore, bauxite, copper and nickel) has risen faster than global GDP.
The case of Sierra Leone highlights the impact of conflict (civil war) on mining operations, which shows in a sharp drop of mining’s contribution to value added in 2001. With the official declaration to end the fighting in 2002 the mining industry started again slowly on a path of recovery. During the civil war (1991 to 2002), a declining economy paired with degrading infrastructure led to a breakdown of the formal economy at the turn of the millennium. During the 21st century mining has had an increasing effect on the value added in several countries (e.g. Lao People’s Democratic Repub-lic, Mauritania and Papua New Guinea).

mININg << 11 >>
0%
20%
40%
60%
80%
100%
Copper Iron ore Gold Bauxite Silver Zinc Nickel
The global distribution of mineral reserves (as of 2007)
Source: Humphreys, 2009, based on data from United States Geological Survey
Developing countries
Developed countries
Increasing demand for minerals means increased exploration, increasing exploitation of reserves and an increased rate of mineral depletion in various regions
The distribution of metallic mineral reserves varies considerably, but in all cases developing countries possess more than half of global reserves of high-volume metals. They are especially dominant in the case of copper, which has enjoyed buoyant demand growth over the past decade and a half.
The comparison between Africa’s current global share of mineral produc-tion and its share of global reserves reveals the potential opportunities for growth of the extractive industries, especially for mining manganese, gold and aluminium. The African region shows the potential to become the first-ranking producer for manganese and also to become an impor-tant region for aluminium production.
The global share of mineral production and reserves in Africa
Source: Based on data from the Department of Minerals and Energy of the Republic of South Africa(Mabuza, 2009) and (Twerefou, 2009)
78
54 51
40
28 27
18 18
4
4542
55
66
82
44
95
60
88
0
50
100
PlatinumChrome
Manganese GoldCobalt
Phosphate
Vanadium
Diamonds
Aluminium
African share of world production (in %)
African share of world reserves (in %)
Per
cen
t
Effective management and productive investment of resource revenues are critical to sustainable development. If instead countries use mineral revenues for unsustainable increases in consumption or for unproductive investment, growth is unlikely to prove sustainable.17
Evidence suggests that greater decentralization, accompanied by necessary improvements in local government capacity,
would enhance the impacts of mining projects.
— Kathryn McPhail Author of the article “Sustainable Development in the
Mining and Minerals Sector: The Case for Partnership at Local, National and Global Levels”

mININg << 12 >>
Mineral depletion
Note: the size of territories corresponds to the proportion of all annual mineral depletion that occurred there
Share of developing economies inglobal production of selected minerals
0
10
20
30
40
50
60
70
80
90
Steel NickelAluminium CopperIron ore
2000
Per
cen
t
2001 2002 2003 2004 2005 2006 2007 2008
Source: Humphreys, 2009, based on data from worldsteel, UNCTAD, WBMS, Brook Hunt
Year
The growing volume of metallic minerals production in developing coun-tries poses challenges, especially to those countries with weak capacity to: (i) manage resource revenues effectively for sustainable development, and (ii) minimize adverse social and environmental impacts of mining activities.18 For example, implementing effective waste management of sedimentation, acid drainage and metals deposition is key to address the environmental issues associated with mining.19 Furthermore, on the social dimension, intensified mining and unregulated distribution of min-ing concessions may contribute or lead to displacement of (indigenous) communities, to conflict, to competition with other land use options and to inequitable revenue distribution from mining operations (e.g. limited trickle down of revenues from national to local government).20
The economic impacts of mineral depletion can be represented as the fall in the financial value of a territory’s mineral resources due to current extraction rates.
Countries such as Chile have operated copper mines in an economically sustainable manner for many years. Together with increasingly diversified economies, this means depletion of natural resources may have a lesser impact than in countries which are strongly dependent on natural resources and forego strategies of diversification to address resource depletion.
Highest Mineral Depletion (1000 US$ per person 2003)
Lowest Mineral Depletion (1000 US$ per person 2003)
Rank Country Value Rank Country Value1 Australia 0.313 103 Cyprus 0.001
2 Chile 0.260 104 Honduras 0.001
3 Mauritania 0.074 105 Armenia 0.001
4 Papua New Guinea 0.041 106 Nicaragua 0.001
5 Jamaica 0.033 107 Senegal 0.001
6 Peru 0.033 108 Sao Tome & Principe 0.001
7 Brazil 0.030 108 Equatorial Guinea 0.001
8 Sweden 0.029 110 Liberia 0.000
9 Ireland 0.028 111 Ethiopia 0.000
22 South Africa 0.025 112 Burundi 0.000
Source: www.worldmapper.org, 2003c
mININg << 13 >>
High Vulnerability
MediumVulnerability
Low Vulnerability
No Data
Mineral and/or Oil DependentEconomies*
Mapping mining operations and social vulnerability
* Mineral dependence is the ratio of non-fuel mineral exports to GDP.Oil dependence is the ratio of oil, gas and coal exports to GDP.
Source: Miranda et al., 2003 21
The Johannesburg Plan of Implementation stresses the need to enhance the contribution of mining, minerals and metals to sustainable develop-ment. It calls for enhanced participation of stakeholders (including local and indigenous communities and women) in order to promote sustainabil-ity, transparency and accountability throughout the complete life-cycle of mining operations, including rehabilitation after closure.
Informed participation in decision making about mining operations is related to human development indicators like educational attainment. In some countries whose economies are heavily dependent on mineral, oil and/or gas production, those indicators are very low, pointing to social vul-nerability, including to any adverse impacts of mining activities. The popu-lations in mining areas in Papua New Guinea, the Philippines, and least-developed countries in sub-Saharan Africa (Mozambique and Angola) are among the most vulnerable.22
NAIROBI, 25 September 2009 (IRIN) — Rising unemployment following the closure of diamond and gold mines in southwestern Central African Republic (CAR), due to the global financial crisis, left many families in increasing poverty and triggered a nutrition crisis, according to Médecins Sans Frontières (MSF).
“In Boda and Nola... it is difficult to find patients only suffering from malnutrition, as many of them arrive suffering from other diseases and their condi-tion is very severe,” MSF’s Clara Delacre said. “There are many cases of malaria, diarrhoea, tuberculosis or AIDS, which further complicates children’s already delicate condition,” she added. The situation has been aggravated by poor cassava-based diets and difficult access to health facilities.
Source: United Nations Office for the Coordination of Humanitarian Affairs — Integrated Regional Information Networks (IRIN), 2009 23
Example: Central African Republic — The effects of mine closures on communities

mININg << 14 >>
Approximately 10 per cent of active mines and 20 per cent of exploratory sites are located in areas of high conservation value, while nearly 30 per cent of active mines are located in waterstressed areas
Mining concessions tend to cover smaller areas than logging concessions. Although the actual mining activity may only cover a few square kilome-tres, exploration activities may spread everywhere within the limits of the concession and the establishment of a support infrastructure extends well beyond the concession area. The map below shows that active mines and exploratory sites are sometimes in areas of high conservation value. Clus-ters of mining activity occur in the boreal forests and arctic landscapes of North America, the northern coastal and Andean regions of South Amer-ica, and northeastern and southwestern Australia.
The increasing consumption of resources (mostly energy and water) needed to extract metals as well as the pollution generated by the extraction process are main constraints to sustainability of mining operations
Overall the location of nearly one third of all active mines is in water-stressed areas and, of these mines, about two thirds are found in highly stressed areas where water scarcity is particularly acute (i.e., supplies of less than 1,000 cubic meters of water per person per year).
Water is becoming a key strategic issue for the mining industry world-wide.26 Not only does demand for water to be used in the mining sector compete with other water uses; local populations near or downstream of mining sites fear the impact on water quality.27
Contiguous intact ecosystems
Mines
0 - 1,000 Sq. Km
1,001 - 10,000 Sq. Km
>10,000 Sq. Km
Mines within intact areas of high conservation value
Mines and exploratory sites in relation to high conservation value areas
Source: Miranda et al., 200324
Exploratory sites within intact areas of high conservation value
Other active mines
Other exploratory sites
Mines and exploratory sites in water stressed areas
Source: Miranda et al., 2003 25
Water availability (m3/person/year)
<500
500 - 1,0001,000 - 1,700
Active mines in water scarce basins
1,700 - 4,0004,000 - 10,000>10,000No Data
Other active mines

TRaNSpORT << 15 >>
Transport of people and goods is integral to the functioning of economies and to economic development. With the rapid growth of international trade and tourism over the past two decades, long-distance transport has become a bigger share of the total. Miles traveled by goods and people have increased markedly and with them pollutant emissions, including car-bon dioxide (CO2).
Volume of transport matters most to economic activity but transport mix is as important for the environment, with some modes creating little or no pollution compared to others. A comprehensive approach to sustainable transport addresses issues such as access to means of transportation, con-gestion, urban pollution, climate change, noise and resource use.
A comprehensive strategy devises short-term, medium-term and long-term policies to avoid transport (e.g. shorter distances to work through better urban design), to shift towards cleaner modes of transport as well as to clean existing modes of transport through better technology (e.g. increased resource-efficiency and reduction of emissions).
Global CO2 emissions from transport grew 12 per cent between 2000 and 2005, double the rate for buildings but considerably slower than emissions from electricity generation and industry. Growth rates also vary markedly across regions and between developed and developing countries. Devel-oping countries now account for the majority of emissions from electricity and heat as well as industry, while developed countries still account for a majority of emissions in the transport and building use sectors.29
III . TRaNSpORT
Source: World Resources Institute, 2009 28
Global CO2 emissions growth in select sectors in 2000 and 2005
0
2,000
4,000
6,000
8,000
10,000
12,000
Mill
ion
met
ric
tonn
es C
0 2
Electricity & Heat+21%
Transportation+12%
Industry+21%
Building Use+6%
United StatesDeveloped Countries
Developing Countries
Rest of OECD
China
Rest of World
2000 2005 2000 2005 2000 2005 2000 2005

TRaNSpORT << 16 >>
Transport energy use per capita: 2000-2007
South Africa
Africa (excl. South Africa)
India
China
Southern and Eastern Asia (excl. China and India)
Western Asia
Mexico
Latin America
Eastern Europe and CIS
Other industrialized countries
Western Europe
North America (excl. Mexico)
2007: Transport sector energy useper capita (kgoe/cap)
2000: Transport sector energy useper capita (kgoe/cap)
Source: International Energy Agency, 2009a
0 250 500 750 1,000 1,250 1,500 1,750 2,000 2,250
kgoe/cap
With development comes mobility, and passenger travel is projected to rise significantly between 2005 and 2050. Almost all the additional travel will happen in developing countries.
The overall slight increase in passenger travel in OECD countries is mainly driven by increasing air travel, while the more than trebling of passenger travel in non-OECD countries is primarily due to an increase in road travel, much in private cars. The amount of annual passenger travel per person is starkly different between OECD countries and non-OECD countries. Dis-tance traveled per person is expected to grow in both groups of countries to 2050, but much faster in developing countries (a rough doubling) than in developed countries (a one-third increase).
The rise of private vehicle ownership is linked to rising incomes. Still, gov-ernment policy can help delink the two, as evidenced by Singapore with its auction of private vehicle ownership permits and well-developed public transit. Countries such as Mexico, Indonesia and Brazil have experienced a steep increase of motor vehicle ownership during the past 15 years. The wide gap between Western Europe in 2005 and the United States of America 15 years earlier (when the income level was comparable) is partly a function of size, partly of different patterns of urban development and levels of investment in public transport.
Since 1971, global transport energy use rose steadily by 2–2.5 per cent per year. Road transport uses the most energy and has experienced the highest growth.
To compare, in 2007, North Americans consumed more than 2,000 kilogrammes of oil equivalent (kgoe) per person for means of transportation, while in many African countries, people consumed less than 100 kgoe per person.
Global connections — Increased international air travel is one of the key
traces of globalization, bringing cities into closer contact and, at the same time,
highlighting differences between them.
— Ricky Burdett and Deyan Sudjic, authors of “The Endless City”

TRaNSpORT << 17 >>
Trend scenario of passenger travel by motorized mode and region (OECD and non-OECD) — Comparison of baseline scenarios in 2005 and 2050
0
OECD2005
Non-OECD2005
OECD2050
Non-OECD2050
10,000
20,000
30,000
40,000
50,000
60,000
70,000
Ann
ual t
rave
l per
cap
ita
(tho
usan
ds
km/c
ap)
Source: International Energy Agency, 2009b 30
Tota
l pas
send
ger
tra
vel (
bil
pkm
)
5
10
15
20
25
Air
Rail
Buses
Minibuses
Cars
Light trucks
2-wheelers
3-wheelers
Air
Rail
Buses
Minibuses
Cars
Light trucks
2-wheelers
3-wheelers
0
OECD2005
Non-OECD2005
OECD2050
Non-OECD2050
Total passenger travel
Annual passenger travel per capita
Development of private motor vehicle ownership and GDP per capita, 1990-2005
Source: The World Bank, 2008
KazakhstanBrazil
China
France
Indonesia
Japan
MexicoRussia Singapore
South AfricaSri Lanka
United Kingdom
United States
0
100
200
300
400
500
600
700
800
900
GDP per capita, PPP
Mo
tor
vehi
cles
(per
1,0
00 p
eop
le)
0 5,000 10,000 15,000 20,000 25,000 30,000 35,000 40,000 45,000 50,000
BangladeshRwandaEthiopiaUgandaSierra Leone
PakistanIndia
Senegal
0
4
8
12
16
500 1,000 1,500 2,000
Germany
Developing and least developed countries

TRaNSpORT << 18 >>
Road access rates are lowest in sub-Saharan Africa, but there are also some countries in Asia and Latin America where access is very poor. Inad-equate access to roads affects women and men and children differently. For example, in countries with lower access rates, the percentage of girls enrolled in schools is lower. Schools may be far and hard to reach, and many households prefer to fund the transport cost for boys to attend schools. Improvements in rural access have been achieved, but big differ-ences remain between and within regions.
Statistical analysis of the relationship between poverty incidence and road development shows that a decline in poverty rates can — to a significant degree — be attributed to improved road access. In rural Lao People’s Democratic Republic, for example, rural poverty incidence declined by almost ten percent between 1997–1998 and 2002–2003. Approximately 13 per cent of this decline can be attributed to improved road access.33 Similar trends were observed in regions of China and Ecuador.
In addition to the positive effect of universal road access on poverty, dynamic effects on social and economic development may include: 1) pos-sible abandonment of subsistence production by many rural people in favour of migration to urban centres; 2) changes in rural land values as roads bring previously isolated areas into the market economy; 3) new-found profitability of certain investments; and 4) improved flow of market-related information with benefits for economic efficiency.34
Lack of adequate transport infrastructure and lack of access to affordable transport services perpetuate poverty and impede achieving the Millennium Development Goals
-46
-11
-19-18
-47
-25-22
-59
-20
-35
-61
-36
3540
54
0.6
4651
2.8
37
1
49
56
10 10
4449
2.9
58
2
5157
41
54
43
% of tkmvs 2005
% of tkmvs 2005 %of tkm %of tkm
% ofL/100kmreductionvs 2005
% ofMJ/tkm
reductionvs 2005
% ofEnergy
use
% ofEnergy
use
Trends in freight traffic development along overall traffic evolution, modal shares, efficiency improvements,
biofuels share in liquid fuels (2005, 2030, 2050)
Source: International Energy Agency, 2009b 32
Per
cen
t
Note: Comparing baseline scenarios and a scenario reflecting the implementation of comprehensive policy measures
absolute per GDP road rail trucks freight rail
Trafficevolution
Modeshares
Efficiencyimprovement
Biofuels shareof liquid fuels
trucks rail
20052030 Baseline2030 Blue Map/Shifts
2050 Baseline
2050 Blue Map/Shifts
If strong policies are implemented, the three options — increased modal shift, efficiency improvements and the use of alternative fuels — could cut freighttransportrelated CO2 emissions by 70 per cent compared to baseline in 2050 (30 per cent below 2005). 31

TRaNSpORT << 19 >>
Gender equity in relation to rural transport access
Source: The World Bank, 2007 35
Middle-East & North Africa 54.2 million 90
Europe & Central Asia 47.8 million 96
Latin America and Carribean 51.2 million 102
Sub-Saharan Africa 287.8 million 84
South Asia 443.3 million 87
East Asia & Pacific 117.2 million 98
< 80 80 - 90 90 - 95 95 - 98 98 > no data
The relative size of a country is in respect of the size of the population without access to rural transport
Country without data on access to transport
Rural population without access to transportRegion Gender
equity ratio
Poverty in relation to rural transport access
Source: The World Bank, 2009 36
<10
Extreme PovertyPercentage of the population living on less than $2 a day, at international prices
30-1050-3075-50100-75 no data
The relative size of a country is in respect of the size of the population without access to rural transport
[All countries should] Promote investment and partnerships for the development of sustainable,
energy efficient multimodal transportation systems, including public mass transportation
systems and better transportation systems in rural areas, with technical and financial
assistance for developing countries and countries with economies in transition.
— The Johannesburg Plan of Implementation (JPoI), III Para. 21 (2002)

TRaNSpORT << 20 >>
The primary use of railroads differs substantially across countries. North America, excluding Mexico, contains approximately 25 per cent of the world’s railroad network and uses it almost exclusively for freight transport, accounting for 33 per cent of the total tonne-km traveled. Conversely, China, which has only about 7 per cent of the total track length, uses railways pri-marily for passenger transportation. Annually, China’s railways accommo-date travel of 788,118 million passenger kilometers, as compared to North America’s 12,991 million. In India, passenger use of railways is even more dominant.
On average, rail systems are significantly more energy efficient at mov-ing freight than almost any other motorized mode. However, apart from a few large countries that move large quantities of raw materials over long distances, such as the Russian Federation, the United States of America, Canada, Australia and China, rail accounts for only a relatively limited share of freight movement compared to truck transport.
Since 1970, the average annual growth rate for road freight measured in tonne-kms has been 3.5 per cent, while rail transport has grown by only 1.1 per cent annually37.
Railways development in industrializedand developing countries (as of 2008)
Source: International Union of Railways, 2008
3
800,000600,000400,000200,0000
1 20
South Africa
Africa (excl. South Africa)
India
China
Asia (excl. China and India)
Latin America and Mexico
Eastern Europe and CIS
Other industrializedcountries
Western Europe
North America(excl. Mexico)
Total track length and passenger kilometers
Tonne-kilometers (trillion)
Total Track Length(km)
Passenger-kilometers(millions)
Tonne-kilometers(trillions)
Rail Transport
Railways are an energy efficient and climate-friendly but capital-intensive means of land transport. Whereas most industrialized countries have an extensive railway infrastructure, often with double tracks and electrifica-tion, most developing countries have only a limited length of often single tracks. Sub-Saharan Africa, for example, contributes only 5 per cent to the world’s total railroad track length, whereas Europe has 42 per cent.
The agreement on the TransAsian Railway Network together with
the Intergovernmental Agreement on the Asian Highway Network, linking the landlocked countries, the least developed
countries, with the more prosperous coastal areas, is the tremendous way of connectivity that will increase transportation within Asia
for trade as well as for shared prosperity.
— Dr. Noeleen Heyzer United Nations Under-Secretary-General and Executive Secretary
Economic and Social Commission for Asia and the Pacific

TRaNSpORT << 21 >>
Global distribution of track length,passenger kilometres and tonne-kilometres
Source: International Union of Railways, 2008
Total track length
Tonne-kilometersPassenger-kilometers
South AfricaAfrica (excl. South Africa)
India
China
Asia (excl. China and India)
Latin Americaand Mexico
Eastern Europe and CISOther industrialized countries
Western Europe
North America(excl. Mexico)
Development of world trade and of world shipping fleet by millions of dwt (cargo carrying vessels of 100 GT and above)
Source: International Maritime Organization, 2009; UNCTAD, 2008; World Trade Organization, 2008, 2009
1980 1985 1990 1995 2000 2005 2006 2007 2008
0
200
400
600
800
1,000
1,200
Dev
elo
pm
ent
of
wo
rld
flee
t b
y m
illio
ns o
f d
wt
-2
0
2
4
6
8
10
12
Annual p
ercentage chang
e of w
orld
merchand
ise expo
rts, p
rod
uction and
gro
ss do
mestic p
rod
uct, 1980-2008
Oil Tanker
Dry Bulk
General Cargo
Container
Other
Annual % change in world GDP
Annual % change in total world production(agriculture, mining, manufacturing)
Annual % change in total world merchandise export
Year
Economic trends of shipping
The growth of shipping capacity corresponds to a period of rapid growth in world trade. Shipping costs have shown a steep decline, attributable in part to containerization, which has made long-distance trade more eco-nomical. The peaks of world production and world merchandise exports at the turn of the millennium translated into a continuous growth in the shipping fleet. However, as a consequence of the recent global crisis the decline in world production and world merchandise exports has led to significant surplus capacities in the shipping industry.

TRaNSpORT << 22 >>
Number of oils spills above seven tonnes
200820072006200520042003200220012000
Source: International Tanker Owners Pollution Federation, 2009
0
5
10
15
20
25
30 7 ≤ 700 tonnes> 700 tonnes
Year
Num
ber
s
Piracy problems
Source: International Maritime Organization, 2009
0
100
200
300
400
500
600
700
800
900
Tota
l num
ber
of
inci
den
ts a
nd p
erso
ns a
ffec
ted
0
5
10
15
20
25
30
35
40
45
50
Num
ber o
f ships affected
Number of acts Lives lost
Wounded crew Missing crew
Crew hostage/Kidnapped Crew assaulted
Skips hijacked Ships missing
200820072006200520042003200220012000
Year
The number of oil spills declined steadily throughout the last four years and the current trend may indicate better environmental safety meas-ures implemented in the shipping industry, though declining trade may explain part.
The economic pressures on the shipping industry are compounded by rising piracy in important trade lanes. Although the total number of incidents declined in the last decade, the number of hijacked ships and hijacked crews rose significantly.
Between 2003 and the end of 2008 a total of 1,845 actual or attempted acts of piracy were registered around the world which equates to an aver-age annual rate of over 300 incidents. The direct economic cost of piracy in terms of fraud, stolen cargos and delayed trips is estimated at between 1 billion USD and 16 billion USD annually.38 With average ransom settle-ments gradually increasing in the past twelve months, experts expect that the average ransom settlement may reach 3 million USD in 2010.39

TRaNSpORT << 23 >>
Air Transport
Globally air traffic increased by over 60 per cent between 1990 and 2007 and the number of registered carrier departures rose by almost 70 per cent.
In 2007, more than one third (38 per cent) of the worldwide registered carrier departures originated in North America and almost 10 per cent in East Asia and the Pacific (includes China). Compared to 1993, the share of departures has decreased in Europe and Central Asia, as well as in Latin America and the Caribbean, whereas the shares of East Asia and the Pacific and South Asia have almost doubled.
Even though the country grouping “South Asia” contains India and despite its economic growth rates, the region accounts for only 2.22 per cent of the worldwide registered carrier departures in 2007, though in absolute numbers the departures have almost tripled since 1990. The absolute numbers of departures show that the base of reference is significantly dif-ferent when comparing North America with other regions.
Global Air Traffic (24 hour-simulation)
Source: Zuercher Hochschule fuer Angewandte Wissenschaften, 2009
Note: The map is a still image from a video simulation, which captures global air traffic over 24 hours. The yellow dots on this map indicate planes in the air at a specific time.
1991 19971995 1999 2001 2003 2005 20071993
Source: World Bank, 2009 40
0
2
4
6
8
10
12
East Asia & Pacific
Europe & Central Asia
Latin America & Caribbean
Middle East & North Africa
South Asia
Sub-Saharan Africa
North America
Global comparison of air transport development between1990 and 2007 (registered carrier departures worldwide)
Year
Ab
solu
te n
umb
er o
f d
epar
ture
s (m
illio
ns)
Regional proportion of worldwide registered carrier departures
Source: World Bank, 2009 41
Distribution in 2007 Distribution in 1993
North America
East Asia & Pacific
1.58%1.19%
5.55%
4.76%
6.63%
1.17%34.89%
38.24%
9.38%
3.29%
5.85%
1.31%2.22%
1.46%
Europe & Central Asia
Latin America & Caribbean
Middle East & North Africa
South Asia
Sub-Saharan Africa

Road Network42
In 2007 there were about 33.2 million kilometres of road in the world. The highest road density (number of roads per square kilometer) can be found in Japan and the lowest in the Middle East.43
Passenger Cars44
Developed countries dominate the list of countries with the most cars per 1,000 people, with New Zea-land and Luxembourg at the top of this list. In contrast, car ownership in Africa and Asia is low.45
Rail Network46
The global rail network consisted of approximately 1 million kilometers of railway in 2010. Net 56,912 km of rail were added to the global rail network in the years from 2000 to 2007.47
Rail Freight48
In 2007, 9.5 trillion metric tonne- kilometres of rail freight were carried. The largest total amount of rail freight carried is in the United States of America (2.8 trillion metric tonne-kilometers), Russian Federa-tion and China (2.2 trillion metric tonne-kilometers).
With rising incomes and consistent with increasing demand for passen-ger travel the need for roads and the demand for car ownership in coun-tries such as China will increase.
The development of the rail networks shows a diverging trend in the years between 2000 and 2007. Some coun-tries have reduced the net amount of railway km: for example, Poland by 3,141 km, France by 3,027 km, Germany by 2,755 km and Russian Federation by 1,917 km. Other coun-tries have expanded their railway network: for example, Spain added 966 km net, South Africa 1,860 km net, China 4,981 km net, Canada 27,216 net and the United States of America build net 31,949 km of rail. The changes will impact the amount of rail freight in the respective coun-tries. Numerous countries, especially Small Island Developing States, have no railways at all.49
Mapping the global proportions of transport dimensions
(The country sizes reflect relative amounts of the respective variable)

Cargo Shipping53
The map shows tonnage by the territory of registra-tion. This map is very similar to that of oil tankers. Due to favourable legislation and tax reasons (“flags of convenience”), most ship registration by weight is in Panama and Liberia, followed by Malta and Cyprus.
Air Freight50
From 2001 to 2005 air freight transport grew steadily and reached 143,203 million tonnes-km in 2006. How-ever, the data in 2007 with a decline to 124,628 million tonnes-km (87 per cent of the previous year) is consist-ent with the increase of freight transport by maritime transport means.51
Aircraft Departures52
Over 28 million civilian aircraft departures occur every year.
Container Ports54
On average, global container port traffic grew annually by 11 per cent between 2000 and 2008. The main driv-ing countries are China (average annual growth rate of 15 per cent), the United States of America (aver-age annual growth rate of 5.8 per cent) and Singapore (average annual growth rate of 7.5 per cent). In abso-lute terms, China moved 2.5 times more containers (by capacity) than the US and almost 4 times more than Singapore.55
Between 2007 and the begin-ning of 2008, the world merchant fleet expanded by 7.2 per cent to 1.12 billion deadweight tonnes (dwt). The year 2007 also wit-nessed a strong growth of lique-fied natural gas carriers (+ 11.5 per cent) reflecting the growing use of LNG in global energy supply.56
The addition of new capacity con-tinues the reduction of the aver-age age of the total world fleet to 11.8 years in 2007. Notably, devel-oped countries have the young-est vessels (on average 10 years old in 2008) followed by devel-oping countries (on average 13 years old) and the vessels in tran-sition economies are on average 16 years old.57 The above devel-opments highlight the importance of addressing increasing mari time carbon dioxide emissions.

WaSTE maNagEmENT << 26 >>
III . WaSTE maNagEmENT
Economic growth, urbanisation and industrialisation result in increasing volumes and varieties of both solid and hazardous wastes. Globalisation can aggravate waste problems through growing international waste trade, with developing countries often at the receiving end.
Besides negative impacts on health as well as increased pollution of air, land and water, ineffective and inefficient waste management results in greenhouse gas and toxic emissions, and the loss of precious materials and resources.
An integrated waste management approach is a crucial part of interna-tional and national sustainable development strategies. In a life-cycle per-spective, waste prevention and minimization generally have priority. The remaining solid and hazardous wastes need to be managed with effective and efficient measures, including improved reuse, recycling and recovery of useful materials and energy.
The 3R concept (Reduce, Reuse, Recycle) encapsulates well this life-cycle approach to waste.
Pollution is nothing but the resources we are not harvesting.
We allow them to disperse because we’ve been
ignorant of their value.
— R. Buckminster Fuller Scientist (1895–1983)

WaSTE maNagEmENT << 27 >>
A growing share of municipal waste contains hazardous electronic or electric products. In Europe ewaste is increasing by 3–5 per cent per year.
According to UNEP, some 20 to 50 million metric tonnes of e-waste are generated worldwide every year. Other estimates expect computers, mobile telephones and television to contribute 5.5 million tonnes to the e-waste stream in 2010, a figure which could rise to almost 10 mil-lion tonnes in 2015.59 Already in 2005 it was estimated that waste electrical and electronic equipment (WEEE) constitutes about 8 per cent of munici-pal waste in developed countries and is one of the fastest growing waste components.60
More than 90 per cent of discarded computers from the developed world are exported to developing countries such as China, Ghana, Pakistan, and India, purportedly for recycling. Many end up, however, in toxic waste-lands where the heavy metals and toxic chemicals are released into the soil, atmosphere and water supply.
Hazardous Waste Generation(as of 2007 or latest figure available)
Sources: United Nations, 2009a 58
Note: data correspond to the latest year available.Units: 1,000 tonnes
0–1,000 1,001–5,000 5,001–10,000 10,001–30,000 30,001–140,000
No data available
0 4,0002,000 Km
Hazardous waste
Hazardous waste, owing to its toxic, infectious, radioactive or flammable properties, poses an actual or potential hazard to the health of humans, other living organisms, or the environment.
No data on hazardous waste generation are available for most African, Middle Eastern and Latin American countries. This is due in part to absence of proper waste management, lack of awareness about the health hazards from wastes and insufficient financial and human resources. The United States of America and Russia generate the greatest amounts of hazardous waste.
10%
10%
15%
15%20%
30%
Composition of e-waste
Source: UNEP/GRID-Arendal, 2006a 61
Monitors
Televisions
Computers, telephones, fax, printers, etc.
DVD/VCR players, CD players, radios, Hi-Fi sets, etc.
Washing machines, dryers,air-conditioners, vacuum cleaners, coffee machines, toasters, irons, etc.
RefrigeratorsElectric
waste
Electronicwaste

WaSTE maNagEmENT << 28 >>
Who gets the e-waste in Asia?
Source: UNEP/GRID-Arendal, 2006b 65
A study in India showed that 95 per cent of ewaste is segregated, dismantled and recycled in the informal sector based in urban slums62
Mumbai is the financial and commercial hub of India and most of the country’s imports and exports flow through the city. In addition, the Greater Mumbai Met-ropolitan Region is an important manufacturing hub for all industries, including the electrical and electronics sectors. Hence, Mumbai has a large base of manu-facturers, government users and companies who use office electronics such as PCs, that become e-waste at their end-of-life. There is also a large market of household users of electronic and electrical products.
At the moment there are no set procedures or legislation regulating e-waste in India. The e-waste is mostly taken by scrap dealers, either collected from various users and scavengers or bought at auctions from large companies. The re-usable parts are sold as spares and the rest is used to recover various metals. The big-gest environmental and health hazards come from the recovery of metals such as gold, silver, copper etc. The residues which contain heavy metals and toxic organic traces are often dumped in the open.
Source: Toxics Link, 2009
One of the most important legislative options available to both developed and developing countries to reduce the amount of e-waste is the adoption of extended producer responsibility, which makes manufacturers respon-sible for recovery and recycling or safe disposal of their products at the end of their useful lives. Market-based certification programs such as the e-Stewards Standard for Responsible Recycling and Reuse of Electronic Equipment63 assure consumers of sound disassembly of electronic prod-ucts and prohibit exportation of e-waste.64

WaSTE maNagEmENT << 29 >>
Municipal waste collected(in 1,000 tonnes, latest year available)
Source: United Nations, 2009b 69
Note: data correspond to the latest year available.Units: 1,000 tonnes
0–2,000 2,001–10,000 10,001–25,000 25,001–50,000 50,001–225,000
No data available
0 4,0002,000 Km
Solid waste
The overall generation of municipal waste per capita in western European countries has stabilised since 2000 at a high level. The average amount of municipal waste generated per capita in many western European countries still exceeds 550kg per year.
Since 1980 the quantity of municipal waste generated in the OECD area has risen and in 2006 exceeded 650 million tonnes (560 kg per inhabitant). “Generation intensity per capita has risen at a lower rate than private final consumption expenditure and GDP, with a significant slowdown in recent years” (OECD, 2008e). The EU-12 group — minus new member states — has seen a steady decrease in per capita generation over the same period albeit with a slight increase between 2005 and 2006.
Urban areas in the Caribbean and Latin America generate a large amount of solid waste per day and projections are that the region’s municipal solid waste will increase from 131 million tons in 2005 to roughly 179 million tons in 2030.66 Given the continuation of urbanization and economic growth, the projected amount of solid waste generation appears conservative. There is need for engineered landfills as a waste disposal solution that is more environmentally acceptable than open dumpsites and uncontrolled burning of waste.67
Urbanization and economic growth are also the main drivers of increas-ing waste generation in Africa and Asia. Of the approximately 200 million tonnes of waste generated annually in Africa, an estimated 30–50 per cent is not properly disposed and presents a severe health and environmental hazard.68
To waste, to destroy, our natural resources, to skin and exhaust the land instead of using it
so as to increase its usefulness, will result in undermining in the days of our children
the very prosperity which we ought by right to hand down to them amplified.
— Theodore Roosevelt 26th President of the United States of America

WaSTE maNagEmENT << 30 >>
Amounts of waste generation by sector 2006-2008
36 Mt
629 Mt
629 Mt
619 Mt
327 Mt
161 Mt92 Mt
68 Mt
Source: Calculations based on data from OECD, 2008d 71
Manufacturing
Mining and quarrying
Agriculture and forestry
Other
Construction
Municipal waste
Energy production
Water purification
Million tonnes (Mt)
Municipal waste generation(kg per capita, 2006 or latest available year)
Source: Calculations based on OECD, 2009c 70
ChinaPoland
Slovak RepublicCzech Republic
Mexico Korea
CanadaTurkeyJapan
South AfricaGreece
Russian FederationPortugalHungaryBelgium
FinlandSwedenFrance
ItalyIceland
GermanyOECD total
Austria United Kingdom
SpainNetherlandsLuxembourgSwitzerland
DenmarkUnited States
IrelandNorway
0 200 400 600 800
kg/cap
Municipal waste data are patchy, but for those countries with data per capita municipal waste generation varies by almost an order of magni-tude, from around 100 kg per capita in China to around 800 kg in Ireland and Norway.
In OECD data, construction is a major source of waste, equal in vol-ume (629Mt) to muni cipal waste. Manufacturing waste is only margin-ally smaller. The mining sector ranks next with an amount of waste a little over half the size of construction or municipal waste (327Mt). These wastes can constitute a serious health and safety hazard. European Environment Agency’s member countries alone account for 29 per cent of total mining waste generated.

WaSTE maNagEmENT << 31 >>
When the landfill site in Matale, a town of 40,000 people in Sri Lanka, was full, local authorities approached SEVANATHA, an NGO, for advice. As 80 per cent of the solid waste in Matale is organic, SEVANATHA suggested individual barrel compost-ing and the creation of a recycling/composting centre. The municipality provided the barrels to households and built a recyclable goods processing centre. SEVANATHA trained households on how to separate waste. This solution turned out not to be ideal as households soon stopped separating their waste and continued dumping on landfills.
In 2004 SEVANATHA proposed a new approach under which waste is treated as a resource, waste collection services are improved and waste pickers provided with better income and working conditions. Among other measures, Matale decided to build a new composting plant adjacent to the old recycling centre. Operational since 2007, the plant serves about 1,000 households and treats 3 tons of organic wastes
per day. Households pay a collection fee and separate the waste into wet and dry waste which is collected by hand carts. Since the waste collection takes place daily, this means that the organic waste does not get contaminated, which leads to high quality compost. At the plant it is sorted for a second time and the organic waste is composted and used by spice gardens around Matale. The plant meets its operating costs. Composting organic waste rather than just dumping it means avoiding meth-ane formation and release into the atmosphere.
As of 2009, the waste management approach was further developed into decentra-lized ‘Integrated Resource Recovery Centers’ (IRRCs). Besides composting, IRRCs will have bio-digesters, recyclable material processing centers and vaccu trucks to
collect sludge from septic tanks and pit latrines.
Source: UNESCAP Sustainable Urban Development Unit, 2009 (Unpublished)
Partnerships for solid waste management in Matale, Sri Lanka
50
100
150
200
250
300
350
400
Energy production from industrial waste (TeraJoule net)
Tho
usan
d T
J ne
t
Source: OECD 2009b 74
0
1980 1984 1988 1992 1996 2000 2004 2008
OECD North America
OECD Pacific OECD Europe
OECD Total
Year
Wastetoenergy is a growing field. The EU considers wastetoenergy as the preferred method of waste disposal. The facilities in Europe can provide 32 million inhabitants with heat and 25 million with electricity.
Energy recovery from industrial waste in OECD countries has shown no clear trend since the early 1990s, though OECD Pacific energy recovery has been increasing steadily from negligible levels.
Energy recovery from renewable and non-renewable municipal waste has, by contrast, shown a steady increase since the late 1980s, particularly in Europe. This is an explicit result of government policies: e.g. continuous support for the currently 420 waste-to-energy plants across Europe72 and working towards binding targets in 2020 under the EU Renewable Energy Directive73.

WaSTE maNagEmENT << 32 >>
Energy production from renewable and non-renewable municipal waste
Renewable municipal waste (TeraJoule net)
Non-renewable municipal waste (TeraJoule net)
Source: Calculations based on data from OECD, 2009b 75
1980 1984 1988 1992 1996 2000 2004 2008
100
200
300
400
500
600
0
1980 1984 1988 1992 1996 2000 2004 2008
100
200
300
400
500
600
0
Tho
usan
d T
J ne
t
Year
Year
Tho
usan
d T
J ne
t
OECD North America
OECD Pacific OECD Europe
OECD Total
OECD North America
OECD Pacific OECD Europe
OECD Total
Percentage of population connected to urban wastewater collecting system
0 4,0002,000 Km
0–30 30–60 60–80 80–90 90–100
Source: United Nations, 2009c 77
Note: data correspond to the latest year available.Units: %
No data available
Waste Water
The percentage of population connected to an urban wastewater collection system is lowest in Africa and Asia. It is highest in Europe partly because of the European Council’s Directive (91/271/EEC) on urban waste-water treatment. The objective of this directive, adopted in 1991, is to protect the environment and health from the adverse effects of untreated munici-pal waste water and industrial waste water discharges.
Chile is an example of good waste water management and connectiv-ity achieved through a modern regulatory system put in place in the late 1980s and leading to privatization of water and sanitation in the late 1990s. An innovative feature of the policy is an effective subsidy to satisfy water demand of the poor.76

WaSTE maNagEmENT << 33 >>
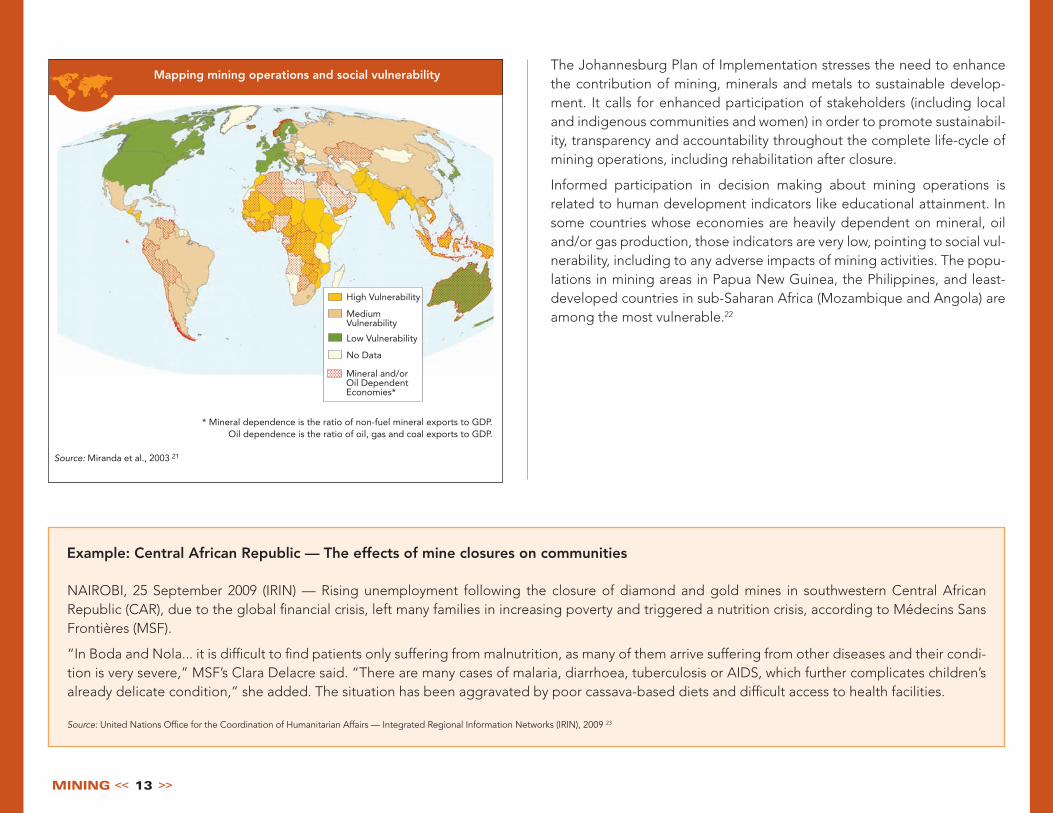
Trends in waste recycling rates for glass from 1980 to 2005 in selected countries (in % of apparent consumption)
Source: OECD, 2008d 79
0
20
40
60
80
100
1980 1987 1990 1993 1996 1999 2002 2005
USA
JapanKorea
New ZealandIceland
NorwaySwitzerland
TurkeyEU 15
Per
cen
t
Year
Global steel can recycling
Source: Worldsteel Association, 2009
0 1,000 2,000 3,000 4,000 5,000 6,000 7,000 8,000
South Korea
Turkey
Canada
South Africa
Brazil
Japan
USA
China
Europe *
Total
0 10 20 30 40 50 60 70 80 90 100
Recycled steel ('000 tonnes)
Recycling rate 2006 (%)
Recycling rate 2007 (%)
*Europe here includes EU 27, Norway and Switzerland.
Per cent
Thousand tonnes
Recycling
Recycling is an effective means to reduce energy use, CO2 emissions and waste at the same time.
The global recycling rate for steel cans was 68 per cent in 2007. The recy-cling of 7.2 million metric tons of steel cans across 37 countries reporting to the World Steel Association avoided approximately 13 mmt of CO2 emis-sions in 2007. In many OECD countries, steel can recycling rates on the national level have increased substantially. Belgium and Germany achieve the highest steel can recycling rates of 93 per cent and 91 per cent, while the United States of America reached a rate of 65 per cent in 2007 and South Africa 70 per cent.78 The recycling rates in Asia have either remained constant (in China with 75 per cent) or decreased as in Japan (from 88 per cent to 85 per cent) and South Korea (from 73 per cent to 69 per cent).
Many countries around the world have developed national policies and strategies in line with a 3R approach to waste (reduce, reuse, recycle). The 3R policy in Germany has stabilized waste volumes over the past 15 years and the country hopes to end landfilling by 2020. The Brazilian govern-ment promotes separated garbage collection in municipalities and in the private sector the aluminium can recycling rate has reached 95 per cent. This puts Brazil among the ranks of the world’s recycling leaders such as Japan. With the establishment of the “Containers and Packaging Recy-cling Act”, Japan promotes recycling as good citizenship behaviour, while Brazil uses economic incentives to encourage recycling. In addition, the size of a country and to some extent the population density matter: large total land area (e.g. the United States of America) means that the costs for landfills and waste disposal are on average lower than in countries with smaller total land area (e.g. Japan).
WaSTE maNagEmENT << 34 >>
Status of waste recycling in 2005 (or latest year available)(in % of apparent consumption)
Source: OECD, 2008d 81
Paper and cardboard
7
13
34
37
42
46
47
50
50
50
50
50
53
55
56
59
60
60
64
66
69
70
70
71
72
72
73
74
74
78
0 20 40 60 80 100
Mexico
Iceland
Per cent Per cent
Poland
Greece
Turkey
Canada
Czech Rep.
USA
Hungary
Italy
Portugal
Slovak Rep.
Australia
France
UK
Spain
Belgium
data not available
data not available
data not available
data not available
data not available
data not available
data not available
Denmark
EU
Japan
Korea
Finland
Austria
Norway
New Zealand
Netherlands
Germany
Sweden
Switzerland
Ireland
Luxembourg
Glass
13
17
22
32
38
41
45
48
49
62
62
65
70
72
72
78
81
83
85
86
90
90
92
95
96
0 20 40 60 80 100
Mexico
Greece
USA
Turkey
Australia
Portugal
Spain
UK
New Zealand
France
Italy
EU
Denmark
Finland
Korea
Netherlands
Ireland
Austria
Iceland
Germany
Norway
Japan
Belgium
Switzerland
Sweden
Canada
Czech Rep.
Hungary
Luxembourg
Poland
Slovak Rep.
Trends in waste recycling rates for paper and cardboardfrom 1980 to 2005 (in % of apparent consumption)
Source: OECD, 2008d 80
0
10
20
30
40
50
60
70
80
North America (Canada and USA)
East Asia (Japan and Korea)
Oceania (Australia and New Zealand)
New EU members in 2004 (Czech Republic, Hungary, Poland and Slovakia)
Norway
Switzerland
Turkey
EU 15
1980 1987 1990 1993 1996 1999 2002 2005
Per
cen
t
Year
Ireland (81 per cent of glass and 78 per cent of paper and cardboard), Sweden (96 per cent of glass and 74 per cent of paper and cardboard) and Switzerland (95 per cent of glass and 74 per cent of paper and card-board) lead the countries with the highest rates of waste recycling. Norway and New Zealand follow. Even though New Zealand has a low population density and is a large country in terms of total land area, its citizen appear relatively environmentally conscious. The general trend throughout the last 25 years indicates a growth in recycling rates with the exception of the United States of America and Turkey for glass recycling.
WaSTE maNagEmENT << 35 >>
As defined by the Grass Roots Recycling Network, Zero Waste includes recycling but goes beyond to address the reduction of “upstream” waste created through mining, extraction, and manufacturing of products. Zero waste maximizes recycling, minimizes waste, reduces consumption and encourages the development of products that are made to be reused, repaired or recycled back into nature or the marketplace.
Achieving zero waste by 2030 is an expressed goal of Los Angeles and is consistent with its goal to be a sustainable city. For the first time in the history of solid waste planning within the city, Los Angeles is developing a Solid Waste Integrated Resources Plan. This plan seeks input from stakeholders representing a broad section of the community, from diverse cultural backgrounds and income levels, and will result in the development and implementation of a 20 year master plan for the City’s solid waste and recycling programs.
Currently the city diverts 62 per cent of its waste from landfills and the goal set by the Mayor and City Council is 70 per cent by 2015 and 90 per cent by 2025. Los Angeles aims to, for example, encourage the establishment of small, local processing centers and will convert 80 to 90 per cent of trash into energy or reuse. Its restaurant industry will be green in ten years and government services will be paperless.
Source: http://www.zerowaste.lacity.org
Los Angeles, a case for Zero Waste
The parties to this convention are convinced that States should take necessary measures to ensure that
the management of hazardous wastes and other wastes including their
transboundary movement and disposal is consistent with the protection of human health and the environment
whatever the place of disposal.
— Basel Convention on the Control of Transboundary Movements of Hazardous Wastes and their Disposal (1992)

REFERENCES << 36 >>
REFERENCES
ACC (American Chemistry Council). (2004). Guide to the Business of Chemistry. Arlington, VA.
ACC (American Chemistry Council). (2006). American Chemistry Council: Business of Chemistry in China. Arling-ton, VA.
Bebbington, A., & Williams, M. (2008). Water and Mining Conflicts in Peru. Mountain Research and Develop-ment, 28 (3/4), 190-195.
Bitran, G. A., & Valenzula, E. P. (2009). Water Services in Chile, from http://rru.worldbank.org/documents/publicpolicyjournal/255Bitra-031103.pdf
Bogner, J., Ahmed, M. A., Diaz, C., Faaij, A., Gao, Q., Hashimoto, S., et al. (2007). Waste Management. In O. R. D. B. Metz, P.R. Bosch, R. Dave, L.A. Meyer (Ed.), Climate Change 2007: Mitigation. Contribution of Working Group III to the Fourth Assessment Report of the Intergovernmental Panel on Climate Change. Cambridge, United Kingdom and New York, NY, USA.: Cambridge University Press.
Chalk, P. (2009). Maritime Piracy, from http://www.rand.org/pubs/testimonies/2009/RAND_CT317.pdf
Cobbing, M. (2008). Toxic Tech: Not in Our Backyard. Uncovering the hidden flows of previous terme-waste (Report from Greenpeace International), from http://www.greenpeace.org/raw/content/belgium/fr/press/reports/toxic-tech.pdf
Collier, P., Plog, F. v. d., Spence, M., & Venables, A. J. (2009). Managing resource revenues in developing economies, advance online publication 21 July 2009, from http://users.ox.ac.uk/~econpco/research/pdfs/ManagingResourceRevenuesinDevelopingEconomies.pdf
DIRECTIVE 2009/28/EC OF THE EUROPEAN PARLIAMENT AND OF THE COUNCIL of 23 April 2009 on the promotion of the use of energy from renewable sources and amending and subsequently repealing Directives 2001/77/EC and 2003/30/EC(23 April 2009).
Drake, J. (2010). Ships face greater attack risk in Indian Ocean: Merchant vessels travelling in the Gulf of Aden less likely to be hijacked by pirates, from http://www.lloydslist.com/ll/news/ships-face-greater-attack-risk-in-indian-ocean/1265654565987.htm
Global Footprint Network. (2009). World Footprint, from http://www.footprintnetwork.org/en/index.php/GFN/page/world_footprint/
Hoornweg, D., & Giannelli, N. (2007). Managing municipal solid waste in Latin America and the Caribbean, from http://www.ppiaf.org/documents/gridlines/28lacsw.pdf
Humphreys, D. (2009). Emerging Players in Global Mining. Washington, D.C.: The World Bank.
International Council of Chemicals Associations. (2008). ICCA — Annual Review 2008-09: Worldwide Voice of the Chemical Industry, from http://www.icca-chem.org/ICCADocs/Icca-Review_2008-2009.pdf
International Council of Chemicals Associations. (2009). Innovations for Greenhouse Gas Reductions — A life cycle quantification of carbon abatement solutions enabled by the chemical industry, from http://www.icca-chem.org/ICCADocs/ICCA_A4_LR.pdf
International Energy Agency. (2009a). IEA World Energy Statistics and Balances — Energy Balances of OECD Countries — Extended Balances Vol 2009 release 01, from http://puck.sourceoecd.org/vl=3839426/cl=12/nw=1/rpsv/ij/oecdstats/16834240/v285n1/s3/p1
International Energy Agency. (2009b). World Energy Outlook 2009. Paris.
International Maritime Organization. (2009). International Shipping and World Trade — Facts and figures Octo-ber 2009. London.
International Tanker Owners Pollution Federation. (2009). Number of oil spills above 7 tonnes, from http://www.itopf.com/information-services/data-and-statistics/statistics/#quantities
International Transport Forum. (2009). Transport for a global economy: Policy Reflections from the Secretariat, from http://www.internationaltransportforum.org/2009/pdf/SecretariatNote.pdf
International Union of Railways. (2008). Railway Statistics — Synopsis, from http://www.uic.org/spip.php?article1347
IPCC Working Group III: Mitigation. (2001). Climate Change 2001, from http://www.ipcc.ch/ipccreports/tar/wg3/index.php?idp=122
Jackson, T. (2009). Prosperity without growth. London: Earthscan.
Jepsen, D., Joseph, B., McIntosh, B., & McKnight, B. (2005 (reprinted 2006)). Mineral exploration, mining and aborigi-nal community engagement. Vancouver: Association for Mineral Exploration British Columbia (AME BC).
Konrad-Adenauer-Stiftung. (2006). Covering maritime piracy in Southeast Asia. Singapore.
Krausmann, F., Gingrich, S., Eisenmenger, N., Erb, K.-H., Haberl, H., & Fischer-Kowalski, M. (2009). Growth in glo-bal materials use, GDP and population during the 20th century. Ecological Economics, 68(10), 2696-2705.
Mabuza, M. (2009). The role of mining in South Africa beyond 2010. Retrieved 3 November 2009, from http://www.dme.gov.za/pdfs/minerals/Mining%20Week/Mining_week_presentation.pdf
Manders, J. (2009). The renewable energy contribution from waste across Europe., from http://www.seas.columbia.edu/earth/wtert/sofos/Renew_Energy_Europe_JM_7.pdf
Metals Economics Group. (2009). Corporate exploration strategies, from http://www.metalseconomics.com/pdf/CES_Brochure%202009.pdf
Miranda, M., Burris, P., Bincang, J. F., Shearman, P., Briones, J. O., Viña, A. L., et al. (2003). Mining and Critical Ecosystems: Mapping the Risks. Washington, DC.: World Research Institute.
No author (2007). Best practice community engagement. MESA Journal, 47(December 2007), p. 36.
OECD. (2004). Sustainable Chemistry, from http://www.oecd.org/dataoecd/16/25/29361016.pdf
OECD. (2008a). Chapter 11 — Waste and Material Flows. In Environmental Outlook to 2030 (pp. 237-252). Paris: OECD.
OECD. (2008b). Chapter 18 — Chemicals. In OECD Environmental Outlook to 2030 (pp. 377 -388). Paris: OECD.
OECD. (2008c). Chapter 19 — Selected Industries. In Environmental Outlook to 2030 (pp. 389-427). Paris: OECD.
OECD. (2008d). Environmental Data Compendium 2006-2008. Paris.
OECD. (2008e). Key Environmental Indicators, from http://www.oecd.org/dataoecd/20/40/37551205.pdf
OECD. (2009a). Chemical Safety, Directories and Databases on Chemicals, from http://www.oecd.org/linklist/ 0,3435,en_2649_34365_2734144_1_1_1_1,00.html
OECD. (2009b). Energy Statistics of OECD Countries — Basic Energy Statistics. IEA World Energy Statistics and Balances, Volume 285, (Number 1 (August 2009)).
OECD. (2009c). OECD Factbook 2009: Economic, Environment and Social Statistics. Paris: OECD.
Pacala, S., & Socolow, R. (2004). Stabilization Wedges: Solving the Climate Problem for the Next 50 Years with Current Technologies. Science, 305(5686), pp. 968 — 972.

REFERENCES << 37 >>
Rolf Widmer, Heidi Oswald-Krapfa, Deepali Sinha-Khetriwalb, Max Schnellmannc, & Bön, H. (2005). Global per-spectives on e-waste. Environmental Impact Assessment Review, 25(5), 436-458.
Sjoedin, J. (2006). Determinants of the performance of public water services in Chile 1977-1999, from http://www.eclac.org/drni/noticias/documentosdetrabajo/9/28389/public_water_services_Chile_DRNI.pdf
The Center for International Environmental Law (CIEL). (2009). Discussion Draft: Addressing nanomaterials as an issue of global concern. Retrieved 2 November 2009, from http://www.ciel.org/Publications/CIEL_NanoStudy_May09.pdf
The World Bank. (2007). Gender equity related to access to rural transport, from http://www.worldbank.org/transport/transportresults/headline/rural-access/gender-equity-map.pdf
The World Bank. (2008). World Development Indicators 2008.
The World Bank. (2009). Access to rural transport, from http://www.worldbank.org/transport/transportresults/headline/rural-access/
Toxics Link. (2009). ‘Better safe than sorry’: The Heavy Metals and E-Waste Debris, from http://www.toxicslink.org/pub-view.php?pubnum=250
Twerefou, D. K. (2009). United Nations Economic Commission for Africa — Training Workshop on Trade and Environment for EAC and SADCLusaka: 27-29 May, 2009. Retrieved 3 November 2009, from http://www.uneca.org/ATPC/Workshop-Trade&EnviroMay2009/MSD%201.ppt
UNCTAD. (2008). Review of Maritime Transport 2008, from http://www.unctad.org/en/docs/rmt2008_en.pdf
UNCTAD. (2009). Review of Maritime Transport 2009, from http://www.unctad.org/Templates/webflyer.asp?docid=12455&intItemID=2068&lang=1&mode=downloads
UNEP/GRID-Arendal. (2006a). What is e-waste (UNEP/GRID-Arendal Maps and Graphics Library), from http://maps.grida.no/go/graphic/what_is_e_waste
UNEP/GRID-Arendal. (2006b). Who gets the e-waste in Asia? (UNEP/GRID-Arendal Maps and Graphics Library).
UNESCAP Sustainable Urban Development Unit. (2009 (Unpublished)). Case Study: Decentralized solid waste management in Matale, Sri Lanka.
United Nations. (2009a). Environmental Indicators — Waste (Hazardous Waste Generation), from http://unstats.un.org/unsd/environment/hazardous.htm
United Nations. (2009b). Environmental Indicators — Waste (Municipal Waste Treatment), from http://unstats.un.org/unsd/environment/wastetreatment.htm
United Nations. (2009c). Environmental Indicators — Waste (Waste Water), from http://unstats.un.org/unsd/environment/wastewater.htm
United Nations. (2009d). UNSD National Accounts Database of Official Country Data, from http://unstats.un.org/unsd/nationalaccount/default.asp
United Nations Office for the Coordination of Humanitarian Affairs — Integrated Regional Information Networks (IRIN). (2009). In brief: Mine closures in Central African Republic’s southwest trigger nutri-tion crisis. Retrieved 24 September 2009, from http://www.reliefweb.int/rw/rwb.nsf/db900SID/ACIO-7W8H54?OpenDocument
Warr, P. (2010). Roads and poverty in rural Laos:An econometric analysis. Pacific Economic Review, 15(1), 152-169.
WHO. (2009a). Compiled from data on www.who.int November 2009, from www.who.int
WHO. (2009b). Strategic Approach to International Chemicals Management — Report by the Secretariat (A62/19, Provisional agenda item 12.14 23 April 2009), from http://apps.who.int/gb/ebwha/pdf_files/A62/A62_19-en.pdf
World Bank. (2009). World Development Indicators, from http://ddp-ext.worldbank.org/ext/DDPQQ/member.do?method=getMembers&userid=1&queryId=6
World Coal Institute. (2009). Coal Mining. Retrieved 5 November 2009, from http://www.worldcoal.org/coal/coal-mining/
World Resources Institute. (2009). Global CO2 Emissions Growth in Select Sectors: 2000-2005, from http://www.wri.org/chart/global-co2-emissions-growth-select-sectors-2000-2005
World Trade Organization. (2008). International Trade Statistics 2007. Geneva.
World Trade Organization. (2009). International Trade Statistics 2009. Geneva.
Worldsteel Association. (2009, 18 Mar 2009). Global steel can recycling rate reaches highest recorded level, from http://www.worldsteel.org/?action=newsdetail&id=260
www.worldmapper.org. (2002a). Cargo Shipping (Map No. 40), from http://www.worldmapper.org/display.php?selected=40
www.worldmapper.org. (2002b). Passenger Cars (Map No. 31), from http://www.worldmapper.org/display.php?selected=31
www.worldmapper.org. (2002c). Rail Network (Map No. 36), from http://www.worldmapper.org/display.php?selected=36
www.worldmapper.org. (2002d). Road Network (Map No. 35), from http://www.worldmapper.org/display.php?selected=35
www.worldmapper.org. (2002/2003a). Container Ports (Map No. 38), from http://www.worldmapper.org/dis-play.php?selected=38
www.worldmapper.org. (2002/2003b). Rail Freight (Map No. 34), from http://www.worldmapper.org/display.php?selected=34
www.worldmapper.org. (2003a). Aircraft Departures (Map No. 27), from http://www.worldmapper.org/display.php?selected=27
www.worldmapper.org. (2003b). Aircraft Flights (Map No. 28), from http://www.worldmapper.org/display.php?selected=28
www.worldmapper.org. (2003c). Mineral depletion (313_worldmapper_data.xls), from http://www.worldmap-per.org/display.php?selected=313
Yale Environment 360 and MediaStorm (Writer) (2009). Leveling Appalachia: The Legacy of Mountaintop Removal Mining: Yale School of Forestry and Environmental Sciences.
Zuercher Hochschule fuer Angewandte Wissenschaften. (2009). AirTraffic Worldwide, from http://radar.zhaw.ch/

REFERENCES << 38 >>
Source for quotes:
p. 1: Stewart, W. H. (1968): Quote. Engineering for Human Fulfillment. Environmental Science and Technol-ogy, Volume 2, No. 1, p 21. Download available: http://www.epa.gov/region02/library/quotes.htm
p. 4: UNDP (no year): Chemicals and the Millennium Development Goals. Download available: www.undp.org/chemicals/.../Chemicals%20and%20the%20MDGs.pps
p. 7: Marks, K. & D. Howden (2008): The world’s rubbish dump: a tip that stretches from Hawaii to Japan. The Independent (5 February 2008). Download available: http://www.independent.co.uk/environment/the-worlds-rubbish-dump-a-garbage-tip-that-stretches-from-hawaii-to-japan-778016.html
p. 11: McPhail, K. (2009): The challenge of mineral wealth: Using mineral resource endowments to foster sus-tainable development (pp. 61 -74). In Mining, Society, and a sustainable world by Jeremy Richards (ed.), p. 72
p. 16: Burdett, R. & D. Sudjic (2008): The endless city. London: Phaidon Press Inc. Download available: http://www.urban-age.net/publications/theEndlessCity/_spreads/02_30-31.html
p. 19: The Johannesburg Plan of Implementation, paragraph 21 (2002).
p. 20: Zhu Li (2009): Interview —UN official sees promising prospect of Trans-Asian Railway Network. Down-load available: http://www.unescap.org/ttdw/common/TIS/TAR/text/feedback_xinhua.pdf
p. 26: Fuller, R.B. (no year). Download available: http://www.saidwhat.co.uk/quotes/favourite/r_buckminster_ fuller/pollution_is_nothing_but_the_resources_15358
p. 29: Roosevelt, T. (1907): Seventh Annual Message to Congress on 3 December 1907. Download available: http://www.pbs.org/weta/thewest/resources/archives/eight/trconserv.htm
p. 35: Basel Convention on the Control of Hazardous Wastes and Their Disposal (1992).
Photo credits:
Cover: (from left to right) (1) UN Photo; (2) ©PhotoSpin, Inc; (3) ©PhotoSpin, Inc; (4) UN Photo/Evan Schneider
p.2: (bottom left, clockwise) (1) ©PhotoSpin, Inc; (2) ©PhotoSpin, Inc; (3) UN Photo; (4) ©PhotoSpin, Inc
p.7: UN Photo/Cahail
p.8: (bottom left, clockwise) (1) UN Photo/Pendl; (2) ©PhotoSpin, Inc; (3) ©PhotoSpin, Inc; (4) UN Photo
p.15: (bottom left, clockwise) (1) UN Photo/Paulo Filgueiras; (2) UN Photo/Martine Perret; (3) ©PhotoSpin, Inc; (4) ©PhotoSpin, Inc; (5) ©PhotoSpin, Inc
p.26: (top, clockwise) (1) UN Photo/Evan Schneider; (2) UN Photo/Sophia Paris; (3) UN Photo/Evan Schneider; (4) UN Photo/Sophia Paris

ENDNOTES << 39 >>
ENDNOTES
1 UNEP 2009 — CSD 18/19: Key messages on the thematic cluster (Version 1 — 23 September 2009).
2 ACC (American Chemistry Council), 2004 — Guide to the Business of Chemistry, (August, 2004): p. 122, and ACC (American Chemistry Council), 2006 — American Chemistry Council: Business of Chemistry in China (March 2006)
3 Please note: BRIICS include Brazil, Russia, India, Indonesia, China and South Africa.
4 OECD, 2008b — OECD Environmental Outlook to 2030: Chapter 18 — Chemicals, p. 378 and (The Center for International Environmental Law (CIEL), 2009) — Discussion Draft: Addressing nanomaterials as an issue of global concern, p. 8
5 OECD, 2004 — A detailed definition of “sustainable chemistry” is included in http://www.oecd.org/dataoecd/16/25/29361016.pdf
6 WHO, 2009a — http://www.who.int/ipcs/assessment/en/
7 Toxicological evaluations of food additives and contaminants and of residues of veterinary drugs in food, produced by the Joint WHO/FAO Expert Committee on Food Additives JECFA, are used by the Codex Alimentarius Commission and national governments to set international food standards and safe levels for protection of the consumer. (http://www.inchem.org/pages/about.html#sids)
8 A global database with evaluated information on substances (chemicals, pharmaceuticals, poisonous plants, and poisonous and venomous animals) commonly involved in cases of poisoning. A PIM is a con-cise, practical document designed to facilitate the work of poisons information specialists, clinicians, and analysts. (http://www.inchem.org/pages/about.html#sids)
9, 10 Please refer to p.40 and p.42 in the full report: http://www.icca-chem.org/ICCADocs/ICCA_A4_LR.pdf?epslanguage=en. The calculations are based on analysis by McKinsey and Comp.
11 International Council of Chemicals Associations (2009). Innovations for Greenhouse Gas Reductions — A life cycle quantification of carbon abatement solutions enabled by the chemical industry. Download avilable (accessed September 2009): http://www.icca-chem.org/ICCADocs/ICCA_A4_LR.pdf and http://www.americanchemistry.com/s_acc/sec_news_article.asp?CID=206&DID=9860
Please note: The study used a life cycle carbon dioxide-equivalent (CO2e) emissions analysis to assess the global chemical industry’s impact on greenhouse gas emissions through the life cycle of chemical products and the applications they enable. Analyses were performed for over 100 individual chemical product applications. Emission savings were compared with all direct and indirect emissions linked to the chemical industry. Analyses spanned the major relevant products and sectors of the chemical industry and covered a representative portion of the emissions linked to the chemical industry. Finally, 2030 mod-eling scenarios were used to extrapolate how emissions for production and use phases may develop.
12 Krausmann et al., 2009 — Growth in global materials use, GDP and population during the 20th century. Ecological Economics, Vol. 68, No. 10, p. 2696 — 2705.
13 Mining companies in emerging economies include:
Company Country Principal products (World ranking in 2007)
ENRC United Kingdom/ Kazakhstan
Ferrochrome (1), Ferromanganese, Iron ore, Aluminum
Metalloinvest Russia Iron ore (4)Alrosa Russia Diamonds (2)PT Antam Indonesia Nickel (4)Kazakhmys United Kingdom/
KazakhstanCopper (11), Silver (5)
Gold Fields South Africa Gold (4)Vedanta Resources UK/India Zinc (5), Copper, Cobalt (5), Iron ore, AluminumImpala Platinum South Africa Platinum (2), Palladium (3)Antofagasta United Kingdom/
ChileCopper (10), Molybdenum (5)
KGHM Polska Miedz Poland Copper (9), Silver (3)Anglogold Ashanti South Africa Gold (2), Uranium (10)Grupo Mexico Mexico Copper (6), Molybdenum (3), Silver (9)Codelco Chile Copper (1), Molybdenum (2)Norilsk Nickel Russia Nickel (1), Copper (8), Platinum (4), Palladium (1), Cobalt (2)Vale Brazil Iron ore (1), Nickel (2), Platinum (7) ,Copper (14), AluminumSource: Humphreys, 2009 based on information from Deutsche Bank and Brook Hunt
14 OECD, 2008a — “Environmental Outlook to 2030 — Chapter 11: Waste and Material Flows”, p. 239.
15 Source: (Metals Economics Group, 2009) and http://www.metalseconomics.com/pdf/CES_2009.pdf. Please note: The data from 1989-2006 CES did not include uranium; uranium exploration is included for 2007-2009 and the relative metals prices for 2009 are an average through September 2009
16 Contribution of mining to value added is the percent proportion of production in the mining sector of total value added for all sectors in the country or area at current prices. According to the System of National Accounts (SNA) 2008 gross value added is “the value of output less the value of intermedi-ate consumption”. Value added is a measurement of output used for aggregating production without double counting intermediate consumption and processes. In national accounts, “mining” is defined according to the International Standard Industrial Classification (ISIC) 05-09, which includes mining of coal, lignite, and metal ores, extraction of crude petroleum and natural gas, and mining support service activities. Please note that for the purpose of this publication, countries without or without a dominance of crude petroleum and natural gas production were selected.
For more information see: http://unstats.un.org/unsd/cr/registry/isic-4.asp and http://unstats.un.org/unsd/nationalaccount/handbooks.asp
17 Collier, Plog, Spence, & Venables, 2009) — “Managing Resource Revenues in Developing Economies”, p. 1-2
18 OECD, 2008c — “Environmental Outlook to 2030 — Chapter 19: Selected Industries”, p. 418.
19 In July 2008, Peru declared a state of emergency at a mine near Lima over fears that its tailings dam, weakened by seismic activity and subterranean water filtration, could release arsenic, lead, and cadmium into the main water supply for the capital (Bebbington & Williams, 2008).
20 Miranda et al., 2003 — Mining and critical ecosystems: Mapping the risks. World Resources Institute. Download available: http://archive.wri.org/publication_detail.cfm?pubid=3874
21 See http://archive.wri.org/image.cfm?id=1774. Social vulnerability refers to the characteristics of a per-son or group and their situation that influence their capacity to anticipate, cope with, resist and recovery from the impact of a natural hazard (Wisner et al, 2004)
22 Miranda et al., 2003 — Mining and critical ecosystems: Mapping the risks. World Resources Institute (Chapter 4, p. 27). Download available: http://archive.wri.org/publication_detail.cfm?pubid=3874
23 See http://www.reliefweb.int/rw/rwb.nsf/db900SID/ACIO-7W8H54?OpenDocument
24 See http://archive.wri.org/image.cfm?id=1768; metals and precious gemstones.
25 See http://archive.wri.org/image.cfm?id=1771

ENDNOTES << 40 >>
26 In June 2010 a world congress on “Water in Mining” is to be organized by companies in the mining sector. Issues to be discussed include: water management in arid areas, watershed management, water resource quantification and management, access to water and sustainable development, integrated mine water management throughout the mine life cycle, recycling of water in mining environments, efflu-ent characterisation and management. For more information see http://www.wim2010.com/evento2010/index.php?option=com_content&task=view&id=4&Itemid=2#3
27 Bebbington & Williams, 2008 — “Water and Mining Conflicts in Peru“, Mountain Research and Develop-ment 28(3/4):190-195. 2008
28 See http://www.wri.org/chart/global-co2-emissions-growth-select-sectors-2000-2005
29 World Resources Institute, 2009: http://www.wri.org/chart/global-co2-emissions-growth-select-sectors-2000-2005
30 For details refer to chapter 5 of the report “World Energy Outlook 2009”.
31 Notes: * Baseline scenario: vehicle ownership and travel per vehicle for passenger light duty vehicles (PLDVs), trucks and other modes are consistent with IEA WEO 2008 and a world oil price of USD 100 rising to USD 120 by 2030. This scenario implies somewhat lower PLDV ownership in the developing world, at a given level of income, than has occurred historically in many OECD countries. This could be caused by a number of factors including greater urbanisation in developing countries and lower suburbanisation than in OECD countries, greater income disparities between the wealthy and the poor in non-OECD countries, and limits on the infrastructure needed to support large numbers of vehicles. This scenario also assumes a continuation of the decoupling of freight travel growth from GDP growth around the world which has clearly begun in OECD countries.
BLUE Map scenario: reflects the uptake of technologies and alternative fuels across transport modes that can help to cut CO2 emissions at up to USD 200/tonne of CO2 saved by 2050. New powertrain technolo-gies such as hybrids, plug-in hybrids (PHEVs), electric vehicles (EVs) and fuel cell vehicles (FCVs) start to penetrate the PLDV and truck markets. Strong energy efficiency gains occur for all modes. Very low GHG alternative fuels such as H2, electricity and advanced biofuels achieve large market shares.
BLUE Shifts scenario: envisages that travel is shifted towards more efficient modes and a modest reduc-tion in total travel growth as a result of better land use, the greater use of non-motorized modes and substitution by telecommunications technologies. Also there is a range of policies that could be adopted to shift passenger travel onto other more sustainable modes and most of these policies will need time to be implemented and to have a wide impact. The scenario envisages that this has happened by 2050, with passenger travel in PLDVs and aircraft approximately 25% below Baseline scenario levels as a result.
BLUE Map/Shifts scenario: is a combination of BLUE Map and BLUE Shift
32 Calculations are based on data from the presentation on “Transport, Energy and CO2: Moving Toward Sustainability” by Francois Cuenot of IEA (Slide 28). Presented at UN DESA Expert Group Meeting on Transport for Sustainable Development, 27 August 2009. S:\Denise\Trends Report\Transport\Graphics\ IEA_evolution_modal share_efficieny improvement.xls
33 Warr, 2010
34 Warr, 2010
35 See http://www.worldbank.org/transport/transportresults/headline/rural-access/gender-equity-map.pdf. Gender equality is the goal of the equality of the genders or the sexes. The ratio refers to the ratio of girls to boys.
36 See http://www.worldbank.org/transport/transportresults/headline/rural-access/
37 International Transport Forum, 2009
38 Chalk, 2009
39 Drake, 2010
40 Calculations based on World Development Indicator “Air transport, registered carrier departures world-wide” by using the latest figures available per country
41 Calculations based on World Development Indicator “Air transport, registered carrier departures world-wide” by using the latest figures available per country
42 www.worldmapper.org, 2002d
43 World Bank, 2009. Calculations based on World Development Indicator “roads, total network (in km)” by using the latest figures available per country
44 www.worldmapper.org, 2002b
45 World Bank, 2009. Calculations based on World Development Indicator “Passenger cars (per 1,000 peo-ple)” by using the latest figures available per country
46 www.worldmapper.org, 2002c
47 World Bank, 2009. Calculations based on World Development Indicator “Rail lines (total route km)” by using the latest figures available per country
48 www.worldmapper.org, 2002/2003b
49 World Bank, 2009. Calculations based on World Development Indicator “Rail lines (total route km)” by using the latest figures available per country
50 www.worldmapper.org, 2003b
51 The World Bank, 2008. Calculations based on World Development Indicator “Air transport, freight (in million ton-km)”
52 www.worldmapper.org, 2003a
53 www.worldmapper.org, 2002a
54 www.worldmapper.org, 2002/2003a
55 The World Bank, 2008. Calculations based on World Development Indicator “Container port traffic (in (TEU: 20 foot equivalent units)”
56 UNCTAD, 2009
57 UNCTAD, 2009
58 Source: http://unstats.un.org/unsd/environment/hazardous.htm based on UNSD/UNEP Questionnaires on Environment Statistics (Waste section) and OECD/Eurostat Questionnaire on the State of the Envi-ronment (Waste section) as well as Eurostat environment statistics data website http://epp.eurostat.ec.europa.eu/portal/page/portal/environment/data/main_tables
59 Cobbing, 2008
60 Rolf Widmer, Heidi Oswald-Krapfa, Deepali Sinha-Khetriwalb, Max Schnellmannc, & Bön, 2005
61 Cartographer/designer credit: Claudia Heberlein. Based on statistics by EMPA Swiss Federal Labora-tories for Materials Testing and Research (definition according to the European Union WEEE Directive. Additional information can be found: http://maps.grida.no/go/graphic/what_is_e_waste

ENDNOTES << 41 >>
62 Toxics Link, 2009: ‘Better safe than sorry’: The Heavy Metals and E-Waste Debris Report to International Conference on Heavy Metals and E-waste, organized by Toxics Link on 26th and 27th October 2009 in India. For mor information, please go to: http://www.toxicslink.org/pub-view.php?pubnum=250
63 For additional information on the “e-Stewards Standard for Responsible Recycling and Reuse of Elec-tronic Equipment®” please go to: http://www.e-stewards.org/ewaste_crisis.html
64 Chair’s Summary of the CSD Waste Management Seminar.
65 Cartographer/designer credit: Philippe Rekacewicz, (UNEP/GRID-Arendal). Based on Basel Action Network, Silicon Valley Toxics Coalition, Toxics Link India, SCOPE (Pakistan), Greenpeace China, 2002. Additional information can be found: http://maps.grida.no/go/graphic/who-gets-the-trash
66 Hoornweg & Giannelli, 2007
67 Bogner et al., 2007, see chapter “10.2.1 Waste generation”
68 IPCC Working Group III: Mitigation, 2001, see chapter “3.7.4.6 Africa”
69 http://unstats.un.org/unsd/environment/wastetreatment.htm, Based on United Nations, Department of Economic and Social Affairs, Population Division, World Population Prospects: The 2008 Revision, New York, 2009 (advanced Excel tables), UNSD/UNEP Questionnaires on Environment Statistics, Waste sec-tion, OECD/Eurostat Questionnaire on the State of the Environment, Waste section. Eurostat environ-ment statistics data website http://epp.eurostat.ec.europa.eu/portal/page/portal/environment/data/main_tables
70 Data available for download: http://titania.sourceoecd.org/vl=6246578/cl=12/nw=1/rpsv/factbook2009/ 08/02/02/08-02-02-g1.htm
71 Data available for download: http://www.oecd.org/document/49/0,3343,en_2649_34395_39011377_1_1_1_1,00.htm). Please note: calculations based on data from latest year available.
72 Manders, 2009
73 See “DIRECTIVE 2009/28/EC OF THE EUROPEAN PARLIAMENT AND OF THE COUNCIL of 23 April 2009 on the promotion of the use of energy from renewable sources and amending and subsequently repeal-ing Directives 2001/77/EC and 2003/30/EC,” 23 April 2009)
74 The calculations are based on the IEA World Energy Statistics and Balances. Please note: The graph is based on data on energy supply and consumption in original units = terajoules (TJ). Industrial waste of non-renewable origin consists of solid and liquid products (e.g. tyres) combusted directly, usually in specialised plants, to produce heat and/power. Renewable industrial waste is not included here, but with solid biomass, biogas or liquid biomass.
75 Calculations based on data from OECD, 2009b and IEA World Energy Statistics and Balances, Please note that the graph is based on data on energy supply and consumption in original units = terajoules (TJ). Municipal waste consists of products that are combusted directly to produce heat and/power and comprises wastes produced by households, industry, hospitals and the tertiary sector that are collected by local authorities for incineration at specific installations. Municipal waste is split into renewable and non-renewable.
76 For additional information, please refer to Bitran & Valenzula, 2009 and Sjoedin, 2006
77 http://unstats.un.org/unsd/environment/wastewater.htm, based on: UNSD/UNEP Questionnaires on Environment Statistics (Water section), OECD/Eurostat Questionnaire on the State of the Environment (Water section) and OECD Environmental Data Compendium (nland Waters section)
78 Worldsteel Association, 2009, Global steel can recycling rate reaches highest recorded level, 18 March 2009. Please note: The calculation of the recycling rates is based on data provided by Wordsteel Associa-tion. The criterias used differ and the data may refer to differient stages of packaging production and recycling: While food and beverage cans are the most common form of steel packaging, steel packaging also applies to industrial and household goods such as paint and air fresheners.
79 Calculations are based on data on Waste Recycling Rates for Glass from the Waste Section, Worksheet 4B, OECD, 2008d. Please note: The country grouping EU-15 consists of the following 15 countries: Austria, Belgium, Denmark, Finland, France, Germany, Greece, Ireland, Italy, Luxembourg, Netherlands, Portugal, Spain, Sweden, United Kingdom. Also note that Australia, Canada, Slovak Repuplik, Poland, Czech Repuplic and Hungary are not reflected, since data was outdated or not enough available (less than five years) and in the case of Mexico, data appears not plausible.
80 Calculations are based on data on Waste Recycling Rates for paper and cardboard from the Waste Sec-tion, Worksheet 4A, OECD, 2008d. Please note: The country grouping EU-15 consists of the following 15 countries: Austria, Belgium, Denmark, Finland, France, Germany, Greece, Ireland, Italy, Luxembourg, Netherlands, Portugal, Spain, Sweden, United Kingdom.
81 Calculations are based on data on Waste Recycling Rates for paper and cardboard from the Waste Section, Worksheets 4A and 4 B, OECD, 2008d. Please note: For “paper and cardboard” there is no current data available for Luxembourg; for “glass” no current data available for Canada, Czech Republic, Hungary, Luxembourg, Poland and Slovak Republic.

READER’S NOTES

READER’S NOTES

READER’S NOTES

United Nations, New York
10-25370—April 2010