Chemical Safety of Drinking Water Networks - Repositório Aberto da ...
268
Chemical Safety of Drinking Water Networks Mónica Sofia Freitas dos Santos Dissertation presented to obtain the degree of DOCTOR IN ENVIRONMENTAL ENGINEERING by UNIVERSITY OF PORTO SUPERVISION DOCTOR MARIA ARMINDA COSTA ALVES DOCTOR LUÍS MIGUEL PALMA MADEIRA PORTO, 2013
-
Upload
khangminh22 -
Category
Documents
-
view
5 -
download
0
Transcript of Chemical Safety of Drinking Water Networks - Repositório Aberto da ...

Chemical Safety of Drinking Water Networks
Mónica Sofia Freitas dos Santos
Dissertation presented to obtain the degree of
DOCTOR IN ENVIRONMENTAL ENGINEERING
by
UNIVERSITY OF PORTO
SUPERVISION
DOCTOR MARIA ARMINDA COSTA ALVES
DOCTOR LUÍS MIGUEL PALMA MADEIRA
PORTO, 2013


I dedicate this thesis to my parents, Aurora and Américo
my brother, Américo


Acknowledgements I wish to thank the Faculty of Engineering of the University of Porto (FEUP), the Chemical
Engineering Department (DEQ) and the Laboratory for Process, Environmental and Energy
Engineering (LEPAE) for the facilities that allowed me to conduct the scientific
experiments.
I am also grateful to “Fundação para a Ciência e a Tecnologia” (FCT) for my PhD grant
(SFRH/BD/61302/2009) and for the financial support through the project Acquasafe
(PTDC/AAC-AMB/101687/2008).
I also wish to thank to the European commission within the 7th Framework Programme
FP7-SEC-2007-1 - “Security; Increasing the security of Citizen; Water distribution
surveillance” for the financial support of the European Research Project SecurEau
(http://www.secureau.eu/ – Contract no. 217976).
I would like to express my deep sense of gratitude to my supervisor Professor Arminda
Alves and co-supervisor Professor Luís Miguel Madeira for believing in me and for giving
me the opportunity to participate in this interesting and challenging work. Thank you for
your continuous support and availability, as well as, for the scientific suggestions and
recommendations. It has been a great honor and privilege to work and learn with them.
My special thanks to Professor Luís Melo, head of the SecurEau research team in
Portugal, for accepting me as member of such great group, for helping me every time I
needed and for giving me the opportunity to participate in all SecurEau meetings.
I would like also to thank Professor Lúcia Santos for advising me to the SecurEau project. I
have no doubt that I am also writing this thesis today because of her.
My acknowledgement also go to Dr. Gabriela Schaule from the IWW Water Centre
(Rheinisch-Westfälisches Institut für Wasserforschung gemeinnützige GmbH – Mülheim
an der Ruhr, Germany) for kindly supplying the deposits from drinking water networks.
I wish to thank Syngenta Crop Protection, Lda, particularly Eng. Mónica Teixeira, for
supplying Gramoxone.
I am also grateful to Águas do Douro e Paiva company (AdDP), specially to Dr. João Vilaça
e Engª Rita Reis for supplying the detailed information about drinking water distribution
systems of the South Oporto metropolitan area.
v

Acknowledgements
My special thanks to Carmen Rodrigues (from FEUP) for being always available for helping
me in the respirometry technique and actinometry experiments.
To Cátia Oliveira (from FEUP), with whom I worked during this period, I wish to thank the
availability and all dedication.
I am grateful to Dina Martins (from FEUP) for supplying cells of Pseudomonas fluorescens
and clay for my scientific experiments, as well as, the respective
composition/characterization of the materials.
My gratitude is also towards my lab colleagues for the company, friendship and support
during these years: José, Vera, Raquel, Leandro, Nuno, Patrícia and Marzieh. I also thank
the joy and cheerfulness of our “pitufos”: Vera, Rúben, Carina, Sara, Eduardo and
Mariana. My special thanks to the technicians Sr. Serafim, Fátima, José Luís, Liliana and
Luís Carlos.
Thank you to all my friends for their support, encouragement and for the good times we
shared.
I am grateful to my family, especially to my parents and my brother, for their love,
patience, endless support and encouragement. Thank you for helping me to build a future
that I think is always better. I am indebted to you forever. Special thanks also to Jorge, for
his love, friendship, infinite patience and for helping and understanding me during the
past few years. Simão, my godson, you are still a child but I would like you to know that
your smile cheered me up in the less easy moments and was an inspiration for me. I hope
you will be very proud of your godmother.
vi

Preface This PhD thesis was developed at LEPAE (Laboratory for Process, Environmental and
Energy Engineering), in the Chemical Engineering Department of the Faculty of
Engineering-University of Porto (DEQ-FEUP), throughout the period between 2009 and
2013 and under the scholarship SFRH/BD/61302/2009 and the European Project SecurEau
(FP7-SEC-2007-1, www.secureau.eu).
The main objective of SecurEau project was to limit the impact on the population due to
safe water privation in a contamination event and to launch an appropriate response for
rapidly restoring the use of the drinking water networks, particularly after a deliberate
contamination. For defining a general strategy of rehabilitation of the distribution
network after a terrorist attack, SecurEau consortium proposed to work with
representative chemical (paraquat, chlorfenvinphos, carbofuran, BDE-100 and mercury),
biological (Bacillus anthracis, E. Coli. O157, Francisella tularensis) and radiological
(radionuclides such as Co, Sr, Cs, U, Po, Ir and Am) agents and surrogates. The CBRN
(Chemical, Biological and Radionuclides) listed above were selected based on several
criteria and represent strong candidates to be used in deliberate contamination activities.
SecurEau, acting as a demonstration project for designing and implementing an effective
and timely response upon a CBRN attack, was built with the aim to address the following
points:
1) detection of unexpected changes in water quality which could be in relation with
a deliberate contamination event, by applying commercially available or recently
developed generic sensors placed throughout the distribution systems;
2) adaptation of known analytical methods to rapidly detect specific CBRN
contaminants in water and in biofilms/deposits and to control the cleaning procedures;
3) localization of the point source (s) of contamination and subsequently the
contaminated area (via modeling reactive transport) allowing delimitation of the
corrective actions;
4) implement decontamination procedures of the distribution system including the
treatment of water extracted and used for flushing the pipe walls;
5) controlling the efficacy of the corrective actions by analyzing the water bulk and
specially the pipe walls and the deposits.
vii

Preface
The present work was centered in the second and fourth topics of SecurEau project and
two key chemicals: paraquat dichloride (PQ) and a polybrominated diphenyl ether (BDE-
100).
The dissertation is organized in nine chapters. The first one (which constitutes Part I)
corresponds to a general introduction, including a review on the state of the art of the
topics of interest: analytical methods for detection and quantification of the key
chemicals in waters and soils (because no studies were found for deposits from drinking
water networks); adsorption/desorption studies of such chemicals on solid matrices and
degradation technologies for the treatment of waters contaminated with the considered
chemicals. The Chapters 2 to 5 and 6 to 7 were organized in Part II (paraquat) and Part III
(BDE-100), respectively.
In Chapter 2, three analytical methodologies are described for the quantification of PQ in
waters in response to different scenarios: in case of a deliberate contamination event
(higher concentrations); for drinking water quality control in accordance with the
European Union legislation (lower concentrations), and for PQ confirmation purposes and
identification of PQ degradation by-products. All methods were validated and the global
uncertainty associated to the results was determined.
The analytical methodology for PQ quantification in deposits from drinking water
networks is reported in Chapter 3. The method was validated and its applicability to the
quantification of diquat in the same matrix was also tested.
Chapter 4 is mostly addressed to the interaction between PQ and three deposits
representative of those found in drinking water networks. The effect of some parameters
such as stirring speed, particle size, initial PQ concentration and temperature on the
adsorption kinetics was evaluated. Herein, the adsorption isotherms at two different
temperatures were also obtained and some desorption experiments were conducted.
The treatment of PQ-contaminated waters by oxidation with Fenton’s reagent was
examined in the last chapter of Part II (Chapter 5), where a parametric study was carried
out to study the effect of some variables on the PQ degradation. A semi-empirical kinetic
model is proposed to describe the PQ concentration histories under such a wide range of
conditions, and the biodegradability of the final effluent was assessed. Additionally, the
PQ degradation performance by the classic Fenton process is compared to the photo-
Fenton one.
viii

Preface
In Chapter 6 (Part III), a dispersive liquid-liquid microextraction – gas chromatography –
mass spectrometry method was developed and validated for BDE-100 identification and
quantification in water matrices. The effect of the extraction and dispersive solvents,
extraction solvent volume, dispersive solvent volume, extraction time and salt addition on
the extraction efficiency was studied. Moreover, the suitability of the developed method
for the quantification of other environmental abundant polybrominated diphenyl ethers
in waters was evaluated.
Chapter 7 is a preliminary study about degradation of BDE-100 in waters by photolysis
and photo-Fenton. Concerning the photolysis process, the degradation efficiency was
examined for different UV-Vis light intensities. The applicability of photo-Fenton
methodology for the treatment of BDE-100 contaminated waters is a completely new
research topic, for which preliminary results were reached by now.
Finally, Chapters 8 and 9 (Part IV) compile the main conclusions and the suggestions for
future work, respectively.
ix


Contents Acknowledgements v
Preface vii
Abstract xix
Resumo xxi
Figure captions xxiii
Table captions xxix
Nomenclature xxxiii
Chapter 1 – Introduction 3
1.1 Paraquat 5
6
1.1.1 Analytical methods for paraquat detection and quantification in
waters
1.1.1.1 The particular case of electrochemical methods 8
1.1.1.2 The particular case of liquid chromatography methods 13
1.1.2 Analytical methods for paraquat quantification in deposits from
drinking water networks
22
1.1.2.1 Characterization of deposits from drinking water distribution
systems
23
1.1.3 Sorption of paraquat on deposits from drinking water networks 28
1.1.4 Degradation technologies for paraquat in waters 33
1.2 Polybrominated diphenyl ethers (PBDEs) 38
1.2.1 Analytical Methods for PBDEs in waters 41
1.2.2 Analytical methods for PBDEs in deposits from drinking water
networks
45
1.2.3 Sorption of PBDEs on deposits from drinking water networks 49
1.2.4 Degradation technologies for PBDEs in waters 52
Part I – General Introduction
xi

Contents
1.2.4.1 Overview 52
1.2.4.2 The particular case of the photolysis process 55
1.3 References 61
Chapter 2 – Paraquat quantification in waters 83
Abstract 83
2.1 Introduction 84
2.2 Experimental Section 85
2.2.1 Standard solutions and samples 85
2.2.2 Instrumentation 85
2.2.2.1 LC-DAD 85
2.2.2.2 LC-MS 86
2.2.3 SPE procedure for the SPE-LC-DAD method 86
2.2.4 Validation parameters 86
2.2.4.1 Recovery assays for the DI-LC-DAD method 87
2.2.5 Interference studies of Fenton’s species on PQ quantification by DI-
LC-DAD
89
2.3 Results and discussion 90
2.3.1 Validation of the DI-LC-DAD method for high PQ concentrations 90
2.3.1.1 Linearity range and limits of detection and quantification 90
2.3.1.2 Precision 91
2.3.1.3 Accuracy 92
2.3.1.4 Estimation of the global uncertainty associated to the DI-LC-
DAD method
93
2.3.1.5 Specificity of the method – study of interferences from
Fenton’s reaction
95
2.3.2 Validation of the SPE-LC-DAD method for low PQ concentrations 99
2.3.2.1 Extraction technique 99
Part II – Paraquat
xii

Contents
2.3.2.2 Quantitative analysis 101
2.3.2.3 Precision and accuracy 102
2.3.2.4 Estimation of the global uncertainty associated to the SPE-LC-
DAD method
102
2.3.3 Validation of the DI-LC-MS method for confirmation purposes 104
2.3.3.1 Solvents/ Mobile phase selection 104
2.3.3.2 MS optimization procedures 104
2.3.3.3 Linearity and limits of detection and quantification 105
2.3.3.4 Precision and accuracy 107
2.3.3.5 Estimation of the global uncertainty associated to the LC-MS
method
107
2.4 Conclusions 109
2.5 References 109
Chapter 3 – Paraquat quantification in deposits from drinking water networks 113
Abstract 113
3.1 Introduction 113
3.2 Experimental section 115
3.2.1 Reagents and working solutions 115
3.2.2 Deposits 115
3.2.3 Equipment and operating conditions 115
3.2.4 Spiking of deposits with PQ/DQ 116
3.2.5 Extraction procedure for the analytical determination 116
3.2.6 Validation 116
3.3 Results and discussion 117
3.3.1 Optimization of the extraction technique 117
3.3.1.1 Effect of extraction solvent type 117
3.3.1.2 Effect of extraction solvent volume 118
3.3.1.3 Effect of the extraction time 120
3.3.2 Quantitative analysis 120
3.3.2.1 Interference studies 120
xiii

Contents
3.3.2.2 Linearity and limits of detection and quantification 121
3.3.2.3 Precision and Accuracy 122
3.3.2.4 Estimation of the global uncertainty associated to the results 122
3.3.3 Paraquat quantification in different deposits 124
3.3.4 Suitability of the extraction methodology for Diquat 125
3.4 Conclusions 126
3.5 References 126
Chapter 4 – Adsorption of paraquat herbicide on deposits from drinking water
networks
129
Abstract 129
4.1 Introduction 129
4.2 Experimental Section 130
4.2.1 Pesticides and chemicals 130
4.2.2 Deposits and other materials 130
4.2.3 Adsorption experiments with suspended particles (clay, or from real
“loose deposits”)
131
4.2.4 Desorption experiments 132
4.2.5 Analytical methods 132
4.3 Results and discussion 132
4.3.1 Adsorption kinetics 132
4.3.1.1 Parameters affecting external and internal mass transfer:
effect of the stirring speed and particle diameter
139
4.3.1.2 Effect of initial paraquat concentration 139
4.3.1.3 Effect of the temperature 140
4.3.2 Adsorption isotherms 140
4.3.3 Desorption studies 146
4.4 Conclusions 148
4.5 References 148
xiv

Contents
Chapter 5 – Paraquat removal from water by oxidation with Fenton’s reagent 153
Abstract 153
5.1 Introduction 153
5.2 Experimental section 154
5.2.1 Reagents 154
5.2.2 Standards preparation 155
5.2.3 Analytical methods 155
5.2.4 Oxidation with Fenton’s reagent 156
5.2.5 Biodegradability and Toxicity of Fenton’s reaction effluents 157
5.2.6 Oxidation by Photo-Fenton 158
5.3 Results and Discussion 158
5.3.1 Parametric study of the variables affecting the Fenton’s reaction 158
5.3.1.1 Effect of the temperature 158
5.3.1.2 Effect of iron salt concentration 160
5.3.1.3 Effect of the H2O2 concentration 162
5.3.1.4 Effect of the initial pH 163
5.3.1.5 Effect of iron salt source 165
5.3.1.6 Effect of the initial paraquat concentration 167
5.3.1.7 Effect of the mode of oxidant addition 167
5.3.2 Commercial paraquat degradation under optimal conditions 169
5.3.3 Kinetic model for paraquat degradation with the Fenton’s process 170
5.3.4 Biodegradability and toxicity of oxidation products 180
5.3.5 Preliminary experiments using photo-Fenton reaction 182
5.4 Conclusions 183
5.5 References 183
xv

Contents
Chapter 6 – Nanogram per liter level determination of PBDEs in water by a simple
DLLME-GC-MS method
189
Abstract 189
6.1 Introduction 189
6.2 Experimental Section 190
6.2.1 Reagents 190
6.2.2 Standard solutions and samples 191
6.2.3 Instrumentation 191
6.2.4 DLLME procedure 192
6.2.5 Validation parameters 192
6.3 Results and discussion 192
6.3.1 Optimization of DLLME 193
6.3.1.1 Effect of extraction and dispersive solvents 193
6.3.1.2 Effect of the extraction solvent volume 195
6.3.1.3 Effect of dispersive solvent volume 196
6.3.1.4 Effect of extraction time 196
6.3.1.5 Effect of salt addition 197
6.3.2 Quantitative analysis 197
6.3.2.1 Response linearity and detection and quantification limits 198
6.3.2.2 Precision and Accuracy 198
6.3.2.3 Estimation of the global uncertainty associated to the results 199
6.3.3 Suitability of the extraction methodology to other PBDEs 201
6.4 Conclusions 202
6.5 References 203
Part III – BDE-100
xvi

Contents
Chapter 7 – Preliminary results on the degradation of BDE-100 in waters by
photolysis and photo-Fenton
207
Abstract 207
7.1 Introduction 207
7.2 Experimental Section 208
7.2.1 Reagents 208
7.2.2 Standard solutions 208
7.2.3 Photocatalytic reactor and light source 209
7.2.4 Degradation experiments 211
7.2.4.1 Photolysis 211
7.2.4.2 Classic dark Fenton 211
7.2.4.3 Photo-Fenton 212
7.2.5 Analytical methods 212
7.3 Results and discussion 212
7.3.1 Degradation by photolysis 212
7.3.2 Degradation by Fenton and photo-Fenton 215
7.4 Conclusions 217
7.5 References 218
Chapter 8 – General Conclusions 221
Chapter 9 – Future work 225
Annex I – Estimation of the global uncertainty associated to the analytical results 229
Part IV – General Conclusions and Future Work
Annex
xvii


Abstract This work is part of a larger research project – SecurEau – which intended to contribute to
the suppression of some gaps related to the restoring of the normal function of a drinking
water distribution system after a deliberate contamination event. In particular, this thesis
aims to develop appropriate analytical methodologies to quantify and identify chemical
contaminants in water and deposits from drinking water networks, to evaluate the
sorption and affinity of the chemical contaminants to the walls/deposits/biofilms of the
pipelines and to develop cleaning/decontamination techniques able to efficiently remove
the threat.
Two chemical compounds, of the five target ones selected by SecurEau consortium, were
explored herein: paraquat dichloride (PQ) and a polybrominated diphenyl ether (BDE-
100).
In case of a suspicion of contamination, there is an urgent need to identify the specific
cause of the threat and the definition of a minimum response time is essential to mitigate
the impact of an attack. For PQ, analytical methods in water were developed and
validated for screening purposes (to detect high concentrations as those predictable in
emergency situations) by direct injection-liquid chromatography-diode array detector (DI-
LC-DAD), for trace analyses by solid phase extraction-liquid chromatography-diode array
detector (SPE-LC-DAD) and for confirmation purposes and identification of degradation
by-products by direct injection-liquid chromatography-mass spectrometry detector (DI-
LC-MS). Limits of detection of 10 µg/L, 0.04 µg/L and 20 µg/L were achieved for DI-LC-
DAD, SPE-LC-DAD and DI-LC-MS methods, respectively. Moreover, global uncertainties
below 13, 11 and 6% were found for the most part of the calibration ranges of the same
methods, respectively. Different demands were recognized for BDE-100, whose
quantification in water was only accounted for a dispersive liquid-liquid microextraction-
gas chromatography-mass spectrometry detector (DLLME-GC-MS) method due to its
extremely low water solubility. The same method could be applied for the quantification
of other PBDEs (BDEs 28, 47, 85, 99, 153, 154 and 183) in waters with limits of
quantification ranging from 2 ng/L (BDE-100) to 113 ng/L (BDE-183). All these methods
proved to be suitable for the purpose that they were designed.
xix
Abstract
Concerning the deposits, one simple and fast analytical methodology was successfully
implemented for PQ quantification in this matrix. For such purpose, three deposits
representative of those found in drinking water networks were considered: herein called
S2 and S3 (iron rich deposits) and S4 (calcium rich deposit). A limit of detection of 0.1
µgPQ/gS3 was obtained for PQ-S3 system with the expanded uncertainty ranging from
10-54% for concentrations between 193 and 5 µgPQ/gS3, respectively. The method
proved to be reliable for the quantification of PQ in all of the above mentioned deposits.
Additionally, it was demonstrated that this method is also suitable for the screening of
diquat in these samples.
The PQ adsorption on those deposits follows a pseudo-second order kinetic model and
Langmuir adsorption capacities of 5.7, 11 and 0.40 mg/g were achieved at 20 °C for S2, S3
and S4 deposits, respectively. The adsorption studies indicated that, in case of a
contamination event, it is unlikely that PQ would adsorb on such materials, unless there is
a stagnancy of the fluid for a very long period of time (closer to batch conditions).
However, adsorption of PQ in loose deposits that are transported with the flowing water
is much more insidious and cannot be neglected. On the other hand, S2 (brown) and S3
(tubercle) deposits can be used as low-cost adsorbents (often discarded upon pipes
cleaning/maintenance operations) for the treatment of PQ-contaminated waters.
Finally, the degradation of both chemicals in water was studied using procedures based
on advanced oxidation processes. Complete PQ degradation is reached after 4 h of classic
dark Fenton reaction in batch mode (T =30 °C, [Fe2+]0 = 5.0×10⁻⁴ M, [H2O2]0 = 1.6×10⁻² M,
and pH0 = 3.0, for [PQ]0 = 100 mg/L). Although only 40% of mineralization was recorded
after these 4 h of reaction, it was proved that the final effluent is less toxic than the
original one. The photo-Fenton process represents an attractive alternative for classic
dark Fenton in off-line applications because higher mineralization degrees were reached
(96% after 1 h of reaction). Concerning BDE-100, nearly 68% of the initial concentration of
this chemical in water was degraded after 5 min of exposition to UV-Vis light ([BDE-100]0
= 50 µg/L and 1.6×10⁻⁶ Einstein/s).
xx

Resumo O presente trabalho enquadra-se no âmbito de um projeto mais abrangente – SecurEau –
que pretende contribuir para a supressão de algumas lacunas relacionadas com o
restabelecimento do funcionamento normal de um sistema de distribuição de água
potável após um episódio de contaminação deliberada. Em particular, esta tese tem
como objetivo desenvolver metodologias analíticas apropriadas para a quantificação e
identificação de contaminantes químicos em águas e depósitos de uma rede de água
potável, avaliar a sorção e afinidade dos contaminantes químicos para as
paredes/depósitos/biofilmes das tubagens e desenvolver técnicas de
limpeza/descontaminação capazes de remover eficazmente a ameaça.
Esta tese focou-se em dois compostos químicos, dos cinco selecionados pelo grupo
SecurEau: dicloreto de paraquato (PQ) e um éter difenílico polibromado (BDE-100).
Em caso de suspeição de contaminação, há uma urgente necessidade de identificar a
causa específica da ameaça e a definição de um tempo mínimo de resposta é essencial
para atenuar o impacto de um ataque. Para o PQ, desenvolveram-se e validaram-se
métodos analíticos em águas para fins de rastreio (para detetar elevadas concentrações
como as previstas em situações de emergência) por injeção direta- cromatografia líquida-
deteção por arranjo de díodos (DI-LC-DAD), para análises vestigiais por extração em fase
sólida-cromatografia líquida-deteção por arranjo de díodos (SPE-LC-DAD) e para fins de
confirmação e identificação de sub-produtos de degradação por injeção direta-
cromatografia líquida-deteção por espectrometria de massa (DI-LC-MS). Obtiveram-se
limites de deteção de 10 µg/L, 0.04 µg/L and 20 µg/L para os métodos DI-LC-DAD, SPE-LC-
DAD e DI-LC-MS, respetivamente. Para além disso, encontraram-se incertezas globais
abaixo de 13, 11 e 6% para a maior parte da gama de linearidade dos mesmos métodos,
respetivamente. Diferentes necessidades foram reconhecidas para o BDE-100, cuja
quantificação em água foi apenas assegurada pelo método de microextracção dispersiva
líquido-líquido-cromatografia gasosa-deteção por espectrometria de massa devido à sua
solubilidade em água ser extremamente baixa. O mesmo método poderá ser aplicado
para a quantificação de outros PBDEs (BDEs 28, 47, 85, 99, 153, 154 e 183) em águas com
limites de quantificação que variam de 2 ng/L (BDE-100) a 113 ng/L (BDE-183). Todos os
métodos provaram ser adequados para o fim a que foram desenvolvidos.
xxi

Resumo
Relativamente aos depósitos, implementou-se uma metodologia analítica simples e
rápida para a quantificação de PQ nesta matriz. Para tal, consideraram-se três depósitos
representativos dos encontrados em redes de distribuição de água potável: aqui
designados por S2 e S3 (depósitos ricos em ferro) e S4 (depósito rico em cálcio). O
método provou ser adequado para a quantificação de PQ em todos os depósitos acima
mencionados. Adicionalmente, foi demonstrado que o método é também apropriado
para a quantificação de diquato nestas amostras.
A adsorção de PQ nestes depósitos segue um modelo cinético de pseudo-segunda ordem
e alcançaram-se capacidades de adsorção de Langmuir de 5.7, 11, 0.40 mg/g a 20 °C para
os depósitos S2, S3 and S4, respetivamente. Os estudos de adsorção indicaram que, em
caso de contaminação, é improvável que o PQ possa adsorver em tais depósitos, a menos
que haja uma estagnação do fluído por um longo período de tempo (próximo das
condições batch). Contudo, a adsorção de PQ nos depósitos que são transportados com a
corrente de água é muito mais insidiosa e não pode ser negligenciada. Por outro lado, os
depósitos S2 (castanho) e S3 (tubérculo) podem ser usados como adsorventes de baixo
custo (frequentemente descartados nas operações de manutenção e limpeza de
condutas) para o tratamento de águas contaminadas com PQ.
Finalmente, a degradação de ambos os químicos em água foi estudada usando
procedimentos baseados em processos de oxidação avançados. Atingiu-se completa
degradação de PQ após 4 h de reação por Fenton clássico em modo batch (T =30 °C,
[Fe2+]0 = 5.0×10⁻⁴ M, [H2O2]0 = 1.6×10⁻² M, e pH0 = 3.0, para [PQ]0 = 100 mg/L). Apesar de
serem registados níveis de mineralização de apenas 40% após 4 h de reação, provou-se
que o efluente final é menos tóxico que o original. O processo de foto-Fenton constitui
uma alternativa atrativa ao Fenton clássico em aplicações off-line porque permite
alcançar maiores níveis de mineralização (96% após 1 h de reação). No que diz respeito ao
BDE-100, aproximadamente 68% da concentração inicial deste químico em água foi
degradada após 5 min de exposição à luz UV-Vis (([BDE-100]0 = 50 µg/L e 1.6×10⁻⁶
Einstein/s).
xxii

Figure captions
Figure 1.1. Relative contribution of the different analytical methodologies used for
paraquat quantification in water matrices (search in data base Scopus, from 1993
to 2013).
8
Figure 1.2. Chemical structure of PBDEs (adapted from [151]). 38
Figure 1.3. Relative contribution of the different degradation technologies used for
the treatment of liquids contaminated with PBDEs (search in Scopus data base,
from 2003 to 2013).
53
Figure 1.4. Most studied PBDEs congeners (search in Scopus data base, from 2003
to 2013).
53
Figure 1.5. Number of publications performed with BDE-209, BDE-47 and others
using different degradation processes (search in data base Scopus, from 2003 to
2013).
54
Figure 1.6. Percentage of publications about PBDEs degradation in liquids
conducted at ppm and ppb levels and analytical techniques used.
55
Figure 2.1. Calibration curve for PQ quantification in water by DI-LC-DAD. 91
Figure 2.2. Relative weight of each individual source of uncertainty (bottom-up
approach/EURACHEM) for PQ quantification in waters by DI-LC-DAD.
94
Figure 2.3. Global uncertainty of the analytical methodology for PQ quantification
in waters by DI-LC-DAD.
95
Figure 2.4. Influence of the presence of FeSO4 in paraquat quantification by DI-LC-
DAD.
96
Figure 2.5. Influence of the presence of Na2SO3 and H2O2 in PQ quantification by
DI-LC-DAD.
97
xxiii

Figure captions
Figure 2.6. Calibration curve for PQ quantification in water and in different
concentrations of Na2SO3 by DI-LC-DAD.
98
Figure 2.7. Optimization of solid phase extraction methodology. 101
Figure 2.8. Relative weight of each individual source of uncertainty (bottom-up
approach/EURACHEM) for PQ quantification in waters by SPE-LC-DAD.
103
Figure 2.9. Global uncertainty of the analytical methodology for PQ quantification
in waters by SPE-LC-DAD.
103
Figure 2.10. Calibration curve for PQ quantification in water by DI-LC-MS. 106
Figure 2.11. Relative weight of each individual source of uncertainty (bottom-up
approach/EURACHEM) for PQ quantification in waters by DI-LC-MS.
108
Figure 2.12. Global uncertainty of the analytical methodology for PQ quantification
in waters by DI-LC-MS.
108
Figure 3.1. Effect of some parameters on the percentage of PQ extraction from S3
deposit and on the concentration factor (CF): (a) Effect of extraction solvent type –
0.5 g S3, 10 mL of extraction solvent, 24 h, 20 °C; (b) Effect of extraction solvent
volume – 0.5 g S3, saturated ammonium chloride solution, 24 h, 20 °C and (c)
effect of extraction time – 0.5 g S3, 1 mL saturated ammonium chloride solution,
20 °C. Error bars correspond to standard deviation.
119
Figure 3.2. Interference studies in the paraquat and diquat quantification. 121
Figure 3.3. Calibration curve obtained for PQ-S3 system by LC-DAD. 122
Figure 3.4. (a) Contribution of each source of uncertainty to the global uncertainty
for different PQ contamination levels and (b) combined and expanded global
uncertainty for PQ analysis in the S3 deposit.
123
xxiv

Figure captions
Figure 4.1. Effect of stirring speed (a) and particle size (b) on the adsorption of PQ
on S3 deposit; (a) 50 mg/L PQ, 7 g/L S3, 20 °C, average particle diameter of 165 µm
and pH = 7.2; (b) 50 mg/L PQ, 7 g/L S3, 20 °C, stirring speed of 583 rpm and pH =
7.2. Dashed line corresponds to the pseudo-second order fitted model.
136
Figure 4.2. Effect of the initial PQ concentration on the adsorption of PQ on
different pipe deposits: (a) S2 – 3 g/L S2, 20 °C, 583 rpm and pH = 3.3 (a); (b) S3 – 7
g/L S3, 20 °C, 583 rpm and pH = 7.2; (c) S4 – 7 g/L S4, 20 °C, 583 rpm and pH = 9.0.
Dashed lines correspond to the pseudo-second order fitted model.
137
Figure 4.3. Adsorption of PQ on clay – 0.3 g/L clay, 5 mg/L PQ, 20 °C, 583 rpm and
pH = 5.3. Dashed line corresponds to the pseudo-second order fitted model.
138
Figure 4.4. Temperature effect in the kinetic adsorption of PQ on different pipe
deposits: (a) S2 – 20 mg/L PQ; 3 g/L S2, 583 rpm and pH = 3.3 (a); (b) S3 – 50 mg
PQ/7 g S3, 583 rpm and pH = 7.2; (c) S4 – 5 mg PQ/7 g S4, 583 rpm and pH = 9.0.
Dashed lines correspond to the pseudo-second order fitted model.
141
Figure 4.5. Temperature effect in the adsorption isotherm of PQ on different pipe
deposits: (a) S2 – 3 g/L S2, 583 rpm and pH = 3.3 (a); (b) S3 – 7 g/L S3, 583 rpm and
pH = 7.2; (c) S4 – 7 g/L S4, 583 rpm and pH = 9.0. Lines represent fit by Langmuir
model.
143
Figure 4.6. Variation of PQ desorption percentage in successive extractions of
deposits with CaCl2.
147
Figure 5.1. Emission spectrum of a 150 W medium-pressure mercury vapor lamp
from Heraeus. 158
Figure 5.2. Temperature effect on the PQ concentration evolution (a) and on the
TOC removal (b) as a function of time ([H2O2]0 = 3.4×10⁻² M, [Fe2+]0 = 5.0×10⁻⁴ M,
pH0 = 3.0 and [PQ]0 = 3.9×10⁻⁴ M). Dashed lines are merely illustrative of the data
trend.
160
xxv

Figure captions
Figure 5.3. Fe2+ concentration effect on the PQ degradation (a) and on the TOC
removal (b) as a function of time (T = 30.0 °C, pH0 = 3.0, [H2O2]0 = 3.4×10⁻² M, and
[PQ]0 = 3.9×10⁻⁴ M). Dashed lines are merely illustrative of the data trend.
161
Figure 5.4. H2O2 concentration effect on the PQ degradation (a) and on the TOC
removal (b) as a function of time (T = 30.0 °C, pH0 = 3.0, [Fe2+]0 = 5.0×10⁻⁴ M, and
[PQ]0 = 3.9×10⁻⁴ M). Dashed lines are merely illustrative of the data trend.
163
Figure 5.5. Initial pH effect on the PQ degradation (a) and on the TOC removal (b)
as a function of time (T = 30.0 °C, [Fe2+]0 = 5.0×10⁻⁴ M, [H2O2]0 = 1.6×10⁻² M, and
[PQ]0 = 3.9×10⁻⁴ M). Dashed lines are merely illustrative of the data trend.
164
Figure 5.6. Iron salt effect on the PQ degradation at pH0 = 2 (a), pH0 = 3 (b) and at
pH0 = 5 (c) as a function of time (T = 30.0 °C, [Fe2+ or Fe3+]0 = 5.0×10⁻⁴ M, [H2O2]0 =
1.6×10⁻² M, [PQ]0 = 3.9×10⁻⁴ M). Dashed lines are merely illustrative of the data
trend.
166
Figure 5.7. Initial PQ concentration effect on the PQ degradation (a) and on the
TOC removal (b) as a function of time (T = 30.0 °C, [Fe2+]0 = 5.0×10⁻⁴ M, [H2O2]0 =
1.6×10⁻² M, and pH0 = 3.0). Dashed lines are merely illustrative of the data trend.
168
Figure 5.8. Mode of hydrogen peroxide addition effect on the PQ degradation (T =
30.0 °C, [Fe2+]0 = 5.0×10⁻⁴ M, [H2O2]T = 1.6×10⁻² M, [PQ]0 = 3.9×10⁻⁴ M and pH0 =
3.0). Dashed lines are merely illustrative of the data trend.
169
Figure 5.9. Gramoxone commercial PQ vs. analytical standard degradation as a
function of time (T = 30.0 °C, [Fe2+]0 = 5.0×10⁻⁴ M, [H2O2]0 = 1.6×10⁻² M, [PQ]0 =
3.9×10⁻⁴ M and pH0 = 3.0). Dashed lines are merely illustrative of the data trend.
172
Figure 5.10. Physical meanings of m and b terms of the Behnajady et al. [24]
model.
171
xxvi

Figure captions
Figure 5.11. Linearization of the kinetic model (equation 5.7) for one experiment
(pH0 = 3.0; [PQ]0 = 3.9×10⁻⁴ M; [H2O2]0 = 1.6×10⁻² M; [Fe2+]0 = 5.0×10⁻⁴ M and T =
30.0 °C).
172
Figure 5.12. Relation between the initial hydrogen peroxide concentration and the
inverse of the term m (equation 5.8).
175
Figure 5.13. Relation between the initial hydrogen peroxide concentration and the
inverse of the term b (equation 5.9).
175
Figure 5.14. Relation between the inverse of the absolute temperature and the
inverse of the term m (equation 5.10).
176
Figure 5.15. Relation between the absolute temperature and the inverse of the
term b (equation 5.9).
176
Figure 5.16. Comparison of the experimental data with the model predictions by
equations 5.3, 5.13 and 5.14 - continuous lines.
178
Figure 5.17. Assessment of the model response (continuous lines) for two different
experiments conducted under conditions (a) within the range considered in the
parametric study [a1 - ([H2O2]0= 3.4x10⁻² M, [Fe2+]0= 5.0x10⁻⁴ M, [PQ]0= 3.9x10⁻⁴
M, pH0= 3 and T= 40 °C); a2 - ([H2O2]0= 1.0x10⁻² M, [Fe2+]0= 5.0x10⁻⁴ M, [PQ]0=
3.9x10⁻⁴ M, pH0= 3 and T= 30 °C)] and (b) out of the range of conditions considered
in the parametric study [b1 - ([H2O2]0= 3.4x10⁻² M, [Fe2+]0= 8.0x10⁻⁵ M, [PQ]0=
3.9x10⁻⁴ M, pH0= 3 and T= 30 °C); b2 - ([H2O2]0= 3.0x10⁻³ M, [Fe2+]0= 5.0x10⁻⁴ M,
[PQ]0= 3.9x10⁻⁴ M, pH0= 3 and T= 30 °C)].
179
Figure 5.18. Parity plot comparing data used in the kinetic model and data
gathered in and out of the range considered to develop the model.
180
Figure 5.19. Proposed pathway for PQ degradation during classic Fenton (adapted
from [2]).
181
xxvii

Figure captions
Figure 5.20. Treatment of PQ-contaminated waters by photo-Fenton (T= 30 °C,
[Fe2+]0 = 5.0×10⁻⁴ M, [H2O2]0 = 1.6×10⁻² M, and pH0= 3.0, for [PQ]0 = 100 mg/L): (a)
PQ degradation and (b) mineralization degree along time.
182
Figure 6.1. Effect of chlorobenzene volume (a), acetonitrile volume (b), extraction
time (c) and salt addition (d) on the enrichment factor and extraction recovery for
BDE-100.
195
Figure 6.2. Contribution of each source of uncertainty to the total uncertainty –
U1: standards preparation, U2: calibration curve, U3: precision and U4: accuracy
(a) and global uncertainty (b) for BDE-100 analysis in water by DLLME-GC-MS.
200
Figure 6.3. Chromatogram of a standard solution of PBDEs at individual
concentration of 1 µg/L.
202
Figure 7.1. Emission spectrum of a 150 W medium-pressure mercury vapor lamp
from Heraeus.
209
Figure 7.2. BDE-100 degradation in water by photolysis using different light
intensities ([BDE-100]0= 50 µg/L; pH0= 3.0 and T= 25±3 °C).
213
Figure 7.3. Dye concentration along the degradation of BDE-100 by photolysis. 215
Figure 7.4. BDE-100 degradation in water by photolysis (A – [BDE-100]0 = 50 µg/L,
1.6×10⁻⁶ Einstein/s) and photo-Fenton (B – [BDE-100]0 = 50 µg/L, [H2O2]0 = 1×10⁻⁴
M, [Fe2+]0 = 3×10⁻⁶ M, 1.6×10⁻⁶ Einstein/s).
216
Figure 7.5. BDE-100 degradation in water by photolysis (A – [BDE-100]0 = 50 µg/L,
1.6×10⁻⁶ Einstein/s) and photo-Fenton (B – [BDE-100]0 = 50 µg/L, [H2O2]0 = 2×10⁻⁴
M, [Fe2+]0 = 3×10⁻⁶ M, 1.6×10⁻⁶ Einstein/s; C – [BDE-100]0 = 50 µg/L; [H2O2]0 =
1×10⁻⁴ M, [Fe2+]0 = 6×10⁻⁶ M, 1.6×10⁻⁶ Einstein/s).
217
xxviii

Table captions
Table 1.1. Physical and chemical properties of paraquata. 6
Table 1.2. Studies found in the literature concerning the determination of
paraquat in waters by electrochemical methods.
10
Table 1.3. Studies found in the literature concerning the determination of
paraquat in waters by liquid chromatography.
14
Table 1.4. Constitution of the water supply network of the South Oporto
metropolitan area, Portugal (information supplied by AdDP). 24
Table 1.5. Studies found in the literature concerning the analytical methods for
paraquat quantification in soils.
26
Table 1.6. Studies found in the literature about paraquat adsorption on soils, clays
and other solids.
30
Table 1.7. Studies reported in the literature about paraquat degradation in water
by AOPs.
35
Table 1.8. Physical and chemical properties of technical PBDE mixtures (adapted
from [163]).
40
Table 1.9. Some physical and chemical properties of BDE-100. 40
Table 1.10. Studies found in the literature about the analytical methods for PBDEs
quantification in waters.
42
Table 1.11. Studies found in the literature about the analytical methods for PBDEs
quantification in soils.
46
Table 1.12. Studies found in the literature concerning the photodegradation
studies of PBDEs in liquid mediums.
56
xxix

Table captions
Table 2.1. Physical-chemical composition of the deposits [4] and clay and main
characteristics.
88
Table 2.2. Precision of the DI-LC-DAD method for analytical standards. 92
Table 2.3. Recovery assays of the DI-LC-DAD analytical method. 93
Table 2.4. Quantitative parameters obtained from PQ analysis in water by SPE-LC-
DAD.
101
Table 2.5. Optimal mass spectrometry conditions for PQ determination. 105
Table 2.6. Quantitative parameters obtained from PQ analysis in water by DI-LC-
MS.
106
Table 2.7. Analytical method precision for analytical standards. 107
Table 3.1. Extraction percentages, precision and recovery for PQ-S2 and PQ-S4
systems.
124
Table 4.1. Physical-chemical composition of the real deposits [4] and clay. 131
Table 4.2. Kinetic parameters for adsorption of PQ on deposits and clay. 135
Table 4.3. Parameters of adsorption isotherms for PQ on deposits and clay. 144
Table 5.1. Condition employed in all the experiments done and obtained m and b
parameters for each case (equation 5.7).
173
Table 5.2. Estimative apparent order dependency of parameters m and b on the
oxidant, catalyst and parent compound concentrations and the absolute
temperature – equations 5.11 and 5.12.
177
Table 6.1. Retention time, quantification and qualifier ions for each PBDE by GC-
MS.
192
xxx
Table captions
Table 6.2. Analytical responses and extraction recoveries obtained when different
extraction and dispersive solvents were used on DLLME technique.
194
Table 6.3. Precision and recoveries obtained for BDE-100 standards and spiked
water samples.
199
Table 6.4. Extraction recoveries, precision and estimated LOQ for all PBDEs by
DLLME-GC-MS.
201
Table 7.1. Intensity of incident light, for different dye concentrations, determined
by potassium ferrioxalate actinometry at 366 nm.
213
xxxi


Nomenclature
Abbreviations
AC – acetone
ACN – acetonitrile
AO – anodic oxidation
API – atmospheric pressure ionization
BFRs – brominated flame retardants
BiFE – bismuth-film electrode
CAC – activated carbon F300
CB – chlorobenzene
CCG – chemically converted graphene
CDPV – cathodic differential pulse voltammetry
CF – chloroform
CFe – classic Fenton
CPE – cloud point extraction
CTC – carbon tetrachloride
CV% – coefficient of variation
CZE-DAD – capillary zone electrophoresis with diode array detector
DAD – diode array detector
DCM – dichloromethane
DI-LC-DAD – direct injection-liquid chromatography-diode array detector
DI-LC-MS – direct injection-liquid chromatography-mass spectrometry detector
DLLME – dispersive liquid-liquid microextraction
DLLME-GC-MS – dispersive liquid-liquid microextraction-gas chromatography-mass
spectrometry detector
DNA/CILE – carbon ionic liquid electrode modified by a deoxyribonucleic acid film
DPV – differential pulse voltammetry
DQ – diquat
DWDS – drinking water distribution system
ECD – electron capture detector
xxxiii

Nomenclature
EDTA – ethylenediaminetetraacetic acid
EFe – electro-Fenton
EF – enrichment factor
EI – electronic impact ionization
EPS – extracellular polymeric substances
%ER – extraction recovery in percentage
ESI – electrospray ionization
FAP-CPE – carbon paste electrode impregnated with fluoroapatite
FR – flame retardants
GA-MSPD – graphene-assisted matrix solid-phase dispersion
GC – gas chromatography
GC-MS – gas chromatography-mass spectrometry
GE/AuNPs – gold electrode modified with gold nanoparticles
GE/AuNPs/DNA – gold electrode modified with gold nanoparticles and deoxyribonucleic
acid
GMX – gramoxone
GPC – gel permeation chromatography
HAP/CPE – carbon paste electrode modified by hydroxyapatite
HFBA – heptafluorobutyric acid
HF-LPME – hollow-fiber liquid phase microextraction
HF-MMLLE – hollow-fiber microporous membrane liquid-liquid extraction
HRGC-HRMS – high resolution gas chromatography and mass spectrometry
HS-SPME – headspace solid-phase microextraction
IDMS – isotope dilution mass spectrometry
ISO – International Organization for Standardization
ISP – ionspray ionization
LC – liquid chromatography
LC-DAD – liquid chromatography-diode array detector
LC-MS – liquid chromatography-mass spectrometry detector
LC-MS-MS – liquid chromatography-tandem mass spectrometry
LC-TSP-MS – liquid chromatography thermospray mass spectrometry
LC-UV – liquid chromatography-ultraviolet detector
xxxiv

Nomenclature
LLE – liquid-liquid extraction
LLE-LC-MS/MS – liquid-liquid extraction–liquid chromatography–tandem mass
spectrometry
LOD – limit of detection
LOQ – limit of quantification
LR – linearity range
MAE – microwave-assisted extraction
MeOH – methanol
MS –mass spectrometry detector
MSWV – multiple square-wave voltammetry
MTBE – methyl tert-butyl ether
MWCNTs-DHP/CG electrode – glassy carbon electrode modified with multiwalled carbon
nanotubes within a dihexadecylhydrogen phosphate film
NCGCE – nafion coated glassy carbon electrode
NCME – nafion/clay modified electrode
NFGCE – nafion film coated glassy carbon electrode
NP-CPE – carbon paste electrode modified with natural phosphate
OPG/CoPc – ordinary pyrolitic graphite electrode modified by cobalt phthalocyanine
OUR – oxygen uptake rate
PBDEs – polybrominated diphenyl ethers
PBDFs – polybrominated dibenzofurans
PCBs – polychlorinated biphenyls
PDMS – polydimethylsiloxane
PEF – photoelectro-Fenton;
PLE – pressurized liquid extraction
PM-β-CD/OH-TSO – permethylated-β-cyclodextrin/hydroxyl-termination silicon oil
POPs – persistent Organic Pollutants
PP – polypropylene
PQ – paraquat dichloride
QA – quaternary ammonium
Rec% – recovery in percentage
RSD% – relative standard deviation
xxxv

Nomenclature
SBSE – stir bar sorptive extraction
SDME – single-drop microextraction
SFOME – solidification of floating organic drop microextraction
SIA – sequential injection analysis
SIM – selected ion-monitoring
SIMS – static secondary ion mass spectrometry
SOM – soil organic matter
SP – solid phase
SPE – solid phase extraction
SPE-LC-DAD – solid phase extraction-liquid chromatography-diode array detector
SRM – selected reaction monitoring
SWV – square-wave voltammetry
TAC – tire-derived adsorbent
TA-IL-DLLME – temperature-assisted–ionic liquid–dispersive liquid-liquid microextraction
TCE – 1,1,2,2-Tetrachloroethane
TD-GC-MS – thermal desorption-gas chromatography-mass spectrometry
THF – tetrahydrofuran
UABE – ultrasound assisted back extraction
UAE – ultrasound-assisted extraction
USAEME – ultrasound-assisted emulsification-microextraction
UV – ultraviolet
WWTP - waste water treatment plant
µECD – micro-cell electron capture detector
µSPE – micro-solid-phase extraction
Notation
ocK – organic carbon-normalized sorption coefficient
maxq – maximum adsorption capacity of Langmuir isotherm (mg/g)
LK – adsorption equilibrium constant of Langmuir isotherm (L/mg)
MSC – mathematic/model selection criterion
fK – adsorption equilibrium constant of Freundlich isotherm (mg/g/(mg/L)1/n)
xxxvi

Nomenclature
n – constant of Freundlich isotherm
A – constant of Temkin isotherm (L/mol)
B – constant of Temkin isotherm (Jg/mol2)
R – correlation coefficient
T – temperature (K or °C)
Ea – apparent activation energy (kJ/mol)
eq – paraquat concentration in the solid in the equilibrium(mg/g)
q – paraquat concentration in the solid at time t (mg/g)
t – time (min or h)
1k – adsorption kinetic constant of pseudo-first order model (L/g/min)
2k – adsorption kinetic constant of pseudo-second order model (L2/min/g/mg)
Greek symbols
ϕ – photonic flux (Einstein/s)
xxxvii


PART I. GENERAL INTRODUCTION


1 Introduction Although our planet is called “blue planet” (once 70% of it is covered with water), only 2%
is freshwater for human use, because the major part corresponds to oceans, where the
water is too salty to drink and inadequate for many applications. Of the freshwater
available on Earth, about 99% is in ice and groundwater (water underground in aquifers).
Although groundwater resources exceed salt-free surface water on earth, typically only
individual households and small towns may be served sufficiently by groundwater from
wells or springs. Large cities tend to use surface water and centralize water treatment and
distributions systems. The amount of surface water available to drink is dramatically
affected by the seasons, weather patterns and long-term shifts in climate. Additionally,
surface water is more likely to suffer anthropogenic contamination than groundwater due
to its proximity. Surface, and in some cases groundwater, could be polluted by exposition
to acid rain, storm water runoff, sewage overflow, agricultural runoff and industrial
waste. Microbial pollution of drinking water has been considered the most threat for
human health for many years [1] but there are well established and robust methods for
protecting drinking water from that [2]. On the other hand, while the consequences of
microbial contamination are quickly and fairly easily identified, chemical contamination is
usually much more insidious with effects not seen until the source has been in use for a
considerable period, usually many years.
Water plays an important role in our life being imperative to human and ecosystem
health and is the base for an economic welfare. Due to the extreme importance of this
source, water and particularly drinking water has been often a political or military target
[3]. For that also contribute the several points of vulnerability of a water distribution
system: the catchment, the raw water transport system, the treatment facilities, the
water reservoirs and the distribution systems. In this perspective, Peter H. Gleick reports
a lot of situations where water or systems were used as delivery vehicles to cause
violence to a human population [4]. A great concern about this issue has been generated
and a lot of measures have been taken to limit the impact that these kind of attacks could
represent for human life. Protection and surveillance of water infrastructures, the
detection of water quality deterioration in drinking water distribution systems and
operational procedures for decontamination of water infrastructures are needed to
3

Part I – Chapter 1
prevent or to restore quickly the functionality of the distribution system after a deliberate
(or accidental) contamination. In this context, and with some experience gained in the
past with other related projects, SecurEau, an European project (FP7-SEC-2007-1),
entitled “Security and decontamination of drinking water distribution systems following a
deliberate contamination”, was established [5]. As mentioned before, the intent of
SecurEau was to serve as a demonstration project for designing and implementing an
effective and timely response on CBRN (chemical, biological and radionuclide) agents. The
work done during the four years of the project duration and now presented in this thesis
had the intention to minimize some gaps related to the feasibility of the detection and
remediation methods, to quickly detect and eliminate the contamination, especially that
originated by emergent chemicals. The work done in this thesis was focused in two
chemicals (an herbicide and a flame retardant) among the five ones selected by SecurEau
team. Paraquat (herbicide) and BDE-100 (flame retardant) were chosen to be target
compounds due to their different physical-chemical characteristics which determine the
final effects in consumers as well as in sorption, dispersion and the accumulation patterns
in case of a deliberate contamination of drinking water distribution systems. Paraquat is
included in the “old” toxicants that may be easily acquired and manipulated, despite of
the effective control measures, and BDE-100 represents the “new” ones with lethal
effects at extremely low doses.
A state of the art concerning the topics covered during the thesis period is set out below.
First, a literature review about analytical methods for identification and quantification of
each chemical in water and soils (because no studies were found for deposits from
drinking water networks) was made. Indeed, in case of a deliberate or accidental
contamination event, appropriate analytical methodologies should be used to rapidly
detect and quantify the contaminants in these matrices. Water should be the first matrix
of being contaminated but, depending on the affinity of such compounds for the pipe
walls, deposits and/or biofilms could also be crucial zones of contaminants accumulation.
So, it has to be made sure that the deposits are not long-term reservoirs from which the
contaminants leach into the system, possibly with patches release from the surfaces.
Since the adsorption/desorption of the contaminants on deposits from drinking water
networks dictates the dispersion and accumulation of them throughout the network, the
interaction of the target chemicals on solids was other topic well reviewed (again no
4

Introduction
published data was found concerning interactions with pipe deposits). Finally, an
overview of the existing degradation methodologies for the treatment of waters
contaminated with the target chemicals was performed. Actually, the implementation of
efficient cleaning procedures is one of the main goals of this study.
1.1 Paraquat
Paraquat was first synthesized in 1882 [6]. Since 1933, it has been used as redox indicator
(under the name methyl viologen) in chemical laboratories [6]. Its herbicidal properties
were discovered in 1957 and one year later paraquat was introduced by Imperial
Chemical Industries [6]. In 1962, paraquat began to be marketed as a highly effective
contact herbicide [6]. Nowadays, this bipyridylium compound is widely used as herbicide
around the world (nearly 90 countries), despite of being prohibited in Europe [7]. Its
popularity is related to its quick and non-selective action to kill green plant tissue upon
contact. Some studies proved that paraquat is one of the few herbicides capable of
controlling the growth of weeds that became resistant as a result of over-use of non-
selective glyphosate herbicides [8, 9]. Paraquat is denoted as a class I toxicological agent,
being considered as possible carcinogenic and mutagenic molecule [10-12]. Its toxicity is
associated with the reduction of the bivalent cation (PQ2+) to a free radical (PQ•+), which
reacts with oxygen to form a superoxide radical (O2-•), hydrogen peroxide (H2O2) and
hydroxyl radical (OH•) [12]. Since the produced radicals are unstable and reactive, they
cause lesions in the cellular membrane, protein and DNA [13]. Paraquat is often
encountered in cases of poisoning [14-16]. Chronic and acute exposition effects caused by
casual ingestion or poisoning with paraquat are well known and have been documented
in the literature [17-19]. Some of these studies report respiratory distress [16, 20],
neurodegenerative disorder of the nervous system (such as Parkinson’s disease) [21, 22]
and effects on the kidneys [20].
The uncontrolled and abusive use of paraquat has generated a great concern related to
the potential risk that it represents to humans, animals and the environment [23]. For
such feelings have contributed the long residence time of paraquat in the environment (it
is a non-biodegradable and highly persistent molecule), its elevated toxicity, even at low
doses, its large availability and its relatively low cost [10, 11, 24].
5

Part I – Chapter 1
The main physical-chemical characteristics of paraquat are indicated in Table 1.1, where it
can be seen that this chemical has extremely high water solubility.
Table 1.1. Physical and chemical properties of paraquata.
Chemical structure Common Name
CAS n.º Molecular formula Molecular weight
Solubility in water at 25 °C
(g/L)
Melting point (°C)
Boiling point (°C)
Vapor pressure (mmHg)
Henry’s constant (atm. m3/mol) Log Kow
Paraquat
1910-42-5 C12H14N2Cl2
257.18 g/moL
620 108.59 351.92 1.01×10⁻⁷ 3.22×10⁻¹³ -4.5
aValues were extracted from EPI Suite TM, copyright 2000-2012 Environmental Protection Agency, United States.
This property together with those presented before, such as availability, low cost and high
toxicity, support the idea that it could be a strong candidate to be used in a deliberate
contamination; that’s why it was selected as model compound in SecurEau project.
Additionally, this polar herbicide is positively charged, non-volatile, thermally stable and
stable in acidic conditions [25]. Paraquat hydrolyzes at pH levels above 12 [26].
Concerning the European Union drinking water legislation, there are no established
values specifically for paraquat, but a maximum individual pesticide concentration in
drinking water was set at 0.1 µg/L [27].
1.1.1 Analytical methods for paraquat detection and quantification in waters
Due to the intensive use of paraquat and other pesticides on agriculture, and because the
interaction between such compounds with soils determines their biological activity,
mobility and degradation, the sorption of pesticides on soil has been subject of numerous
studies [28-36]. Indeed, the inaccessibility of micropores to microbes, the surface
stabilization against desorption of the pesticide and the reduction of aqueous-phase
concentrations to levels below those necessary for microbial utilization, compromise the
microbial attack of the compounds that are sorbed to inorganic/organic surfaces [37]. In
the particular case of paraquat, the interaction with clays, which are the main
components of the mineral fraction of soils, and organic matter, is very rapid and strong
[34, 38, 39]. In some cases, this non-selective herbicide is inactivated by irreversible
6

Introduction
adsorption on clays [40, 41]. Although this fact may induce the conclusion that paraquat
could be considered as safe for many agricultural uses, it has been detected in waters.
Watercourse contamination may result from a vertical transport through the soil profile
promoted by the dissolved colloids such as dissolved organic matter and dispersed
colloidal clay [29]. Fernández et al. analyzed water samples from irrigation channels,
rivers and lagoons taken from three different marsh areas of the Valencian community
(Spain) and a paraquat concentration of 3.95 µg/L was detected [42]. More recently
(2006), paraquat concentrations between 1.5 and 18.9 µg/L and 9.3 and 87.0 µg/L were
found in ground and surface water of Thailand, respectively [36]. Even at very low doses,
this herbicide can pass some treatment steps and reach the water distribution systems,
posing a threat to human health. Beyond the natural occurrence of paraquat in drinking
water due to its large usage in some countries, its presence may be the result of a
deliberate or accidental contamination [43, 44], which is the main focus of this thesis [5].
In those circumstances, the paraquat concentration in water could be very high, partially
due to its high solubility in water. Thus, effective analytical methods for paraquat
quantification in waters are required.
Paraquat is a cationic compound extremely soluble in water and non-volatile, which
makes its analysis rather difficult [45-47]. Many analytical approaches have been
proposed for paraquat determination in water matrices: liquid chromatography, gas
chromatography, voltammetry, capillary electrophoresis, spectrophotometry and sensors.
The number of publications found in the literature about the application of each
technique for such purpose is depicted in Figure 1.1.
As shown, the two most used techniques for paraquat quantification in water matrices
are liquid chromatography and electrochemical processes, followed by
spectrophotometry and capillary electrophoresis. Sensors represent the less popular
alternative (5% of the studies). Gas chromatography was not accounted for this list
because its applicability is quite difficult under this context, unless an extensive sample
preparation and derivatization procedures were programmed before the analysis [48].
Sensors offer some advantages over the conventional chromatographic and
electrophoretic based methods, such as lower cost and higher simplicity of use, ability to
measure pollutants in complex matrices with minimal sample preparation and possibility
of miniaturization and portability, which allows their use as field devices working on-site
7

Part I – Chapter 1
[49]. Nevertheless, they are not the preferred technique, as demonstrated by Figure 1.1,
which may be due to the higher detection limits attained [50, 51] and the necessity of
confirmation methods, even if the contaminant is detected. Although eleven percent of
the all studies are related with capillary electrophoresis, the application of this technique
combined with ultraviolet (UV), diode array (DAD) or even mass spectrometry (MS)
detectors generally leads to limits of detection higher than the EU legislated level (0.1
µg/L) [47].
0 10 20 30 40 50
Electrochemical
Liquidchromatography
Spectrophotometry
Capillaryelectrophoresis
Sensors
Percentage of publications
Figure 1.1. Relative contribution of the different analytical methodologies used for
paraquat quantification in water matrices (search in data base Scopus, from 1993 to
2013).
On the other hand, capillary electrophoresis suffers from the instability of reagents,
interferences, extensive sample treatment and high cost per analysis [23, 24].
Spectrophotometry contributes with the same percentage as capillary electrophoretic
methods for the overall studies reported in the literature.
The two most popular methodologies (liquid chromatography and voltammetry) are
explored in detail below.
1.1.1.1 The particular case of electrochemical methods
Electrochemical methods offer countless advantages in time and cost savings, as well as
simplicity. They present many of the requirements for field chemical analysis due to the
8

Introduction
speed in the acquisition of the results, portability and good sensitivity [52]. Table 1.2
compiles all developed electrochemical methods for paraquat quantification in waters.
Generally, voltammetric analytical techniques are based on processes occurring at Hg
based-surfaces because they allow a well-known and defined electrochemical behavior,
high hydrogen overpotential, good stability, reproducibility and sensitivity [53, 54].
However, the high toxicity of mercury has triggered the search for safer alternative
electrodes [54-56]. In this context, different electrode materials have been used for
paraquat quantification in waters such as gold [10, 53, 57-59], platinum [57] and carbon-
based composites [23, 53, 57, 60]. Nevertheless, in the last few years, the development of
different types of chemically-modified electrodes has been one of the most promising
areas [11]. Chemically-modified electrodes are electrodes made of a conducting or
semiconducting material, coated or mixed with a chemical modifier by charge-transfer
reactions or interfacial contact [11]. The great advantage of using these electrodes is
related to their capacity to act as redox mediators, increasing the charge transfer
between the electrode and the redox species, thus promoting an improvement in the
analytical sensitivity [11]. With this purpose in mind, different compounds have been
studied as chemical modifiers in some electrode types. Concerning paraquat analysis in
water, different chemically-modified electrodes are listed in Table 1.2., which exhibit
similar (1.9 and 3 µg/L) [23, 61] or higher sensitivity (0.1-0.7 µg/L) [12, 20, 24, 62-64] than
mercury electrodes (2 and 3 µg/L) [65, 66]. Although some of these modified electrodes
have attractive limits of detection, serious interferences from surfactants and humic
substances are sometimes reported [24].
Beyond the electrode surface composition, the size of this device is another factor that
may influence the sensitivity of the method. Microelectrodes [53, 58, 59] and
ultramicroelectrodes [57] proved to provide lower limits of detection (4-20 µg/L) than the
others of the same material (20-820 µg/L) [10, 60, 67]. The ultramicroelectrodes promote
a significant improvement of the quality of the results by increasing the resolution and
the current density and decreasing the resistance effects of the solution [68].
9

Part I – Chapter 1
Table 1.2. Studies found in the literature concerning the determination of paraquat in waters by electrochemical methods.
Electrode Instrumental technique Analytical parameters Ref
MWCNTs-DHP/CG electrode
(glassy carbon electrode modified by multiwalled carbon nanotubes within a dihexadecylhydrogen phosphate film)
SWV LR – 9-279 µg/L RSD – 3.5-6.3% LOD – 1.9 µg/L
[61]
DNA/CILE
(carbon ionic liquid electrode modified by a deoxyribonucleic acid film)
DPV LR – 9-13,038 µg/L RSD – 3.8% (reproducibility), 2.0% (repeatability) LOD – 0.7 µg/L Rec – 97-100%
[12]
BiFE
(bismuth-film electrode)
DPV LR – 123-8,940 µg/L RSD – 5.1% (reproducibility), 3.7% (repeatability) LOD – 17 µg/L Rec – 97-105%
[52]
OPG/CoPc
(ordinary pyrolitic graphite electrode modified by cobalt phthalocyanine)
SWV LR – 93-5,420 µg/L RSD – 1.58% (reproducibility), 0.58% (repeatability) LOD – 27 µg/L Rec – 93-119%
[11]
HAP/CPE
(carbon paste electrode modified by hydroxyapatite)
SWV LR – 149-3,725 µg/L RSD – 1.60% LOD – 3 µg/L
[23]
Hanging mercury drop electrode SWV LR – 10-250 µg/L RSD – 1.0-8.3% (repeatability) LOD – 2.0 µg/L
[65]
Au-ME
(gold micro-electrode)
MSWV LR – 93-1,937 µg/L RSD – 1.8% for peak 1 and 2.0% for peak 2 (reproducibility), 1.2% for peak 1 and 1.98% for peak 2 (repeatability) LOD – 0.044 µg/L (peak 1); 0.146 µg/L (peak 2) Rec – 79-99%
[58]
Gold and carbon fiber microelectrodes SWV RSD – 1.20% (peak 1) and 1.70% (peak 2) LOD – 4.51 µg/L (peak 1); 9.82 µg/L (peak 2) Rec – 89.5-95.0% (peak 1); 91.0-95.0% (peak 2)
[53]
10

Introduction
Table 1.2. Studies found in the literature concerning the determination of paraquat in waters by electrochemical methods (continued).
Electrode Instrumental technique Analytical parameters Ref
Gold microelectrodes SWV LR – 186-30,919 µg/L RSD – 1.70% for peak 1 and 1.20% for peak 2 (reproducibility), 1.60% for peak 1 and 1.20% for peak 2 (repeatability) LOD – 4.51 µg/L (peak 1) Rec – 89.5-95.0% (peak 1)
[59]
Gold electrodes SWV RSD – 2% LOD – 21 µg/L (pure water); 76.4 µg/L (polluted water) Rec – 90.5% (pure water); 101.0% (polluted water)
[10]
NCGCE
(Nafion coated glassy carbon electrode)
DPV LR – up to 12 µg/L RSD – 2.2% LOD – 0.7 µg/L Rec – 94-106%
[24]
Pt, Au or carbon fiber ultramicroelectrodes SWV LR – 800-30,919 µg/L LOD – 3.9 µg/L (Pt); 6.2 µg/L (Au); 20.3 µg/L (carbon)
[57]
NCME
(Nafion/clay modified electrode)
SWV LR – up to 80 µg/L RSD – 1-3% LOD – 0.5 µg/L Rec – 98.3%
[62]
Glassy carbon electrode SWV and DPV LR – 1000-8000 µg/L LOD – 820 µg/L (DPV); 820 µg/L (SWV) Rec – 96%
[60]
Mercury electrode SWV LR – 9-1,860 µg/L LOD – 3 µg/L
[66]
NP-CPE
(carbon paste electrode modified with natural
phosphate)
SWV LR –4-559 µg/L RSD – 2% LOD – 0.1 µg/L
[20]
Gold electrode SWV and DPV LR – up to 2×10⁵ µg/L (DPV), up to 2×10⁴ µg/L (SWV) LOD – 261 µg/L (DPV), 186 µg/L (SWV)
[67]
11

Part I – Chapter 1
Table 1.2. Studies found in the literature concerning the determination of paraquat in waters by electrochemical methods (continued).
Electrode Instrumental technique Analytical parameters Ref
GE/AuNPs
(gold electrode modified with gold
nanoparticles)
SWV and DPV LR – up to 2×10⁵ µg/L (DPV), up to 6×10⁴ µg/L (SWV) LOD – 279 µg/L (DPV), 428 µg/L (SWV)
[67]
GE/AuNPs/DNA
(gold electrode modified with gold nanoparticles
and deoxyribonucleic acid)
SWV and DPV LR – up to 2×10⁵ µg/L (DPV), up to 6×10⁴ µg/L (SWV) LOD – 242 µg/L (DPV), 354 µg/L (SWV)
[67]
FAP-CPE
(carbon paste electrode impregnated with
fluoroapatite)
SWV LR – 9-1×10⁴ µg/L RSD – 1.4% (peak 1), 1.8% (peak 2) LOD – 0.6 µg/L (paek 1), 1.4 µg/L (peak 2)
[63]
NFGCE
(nafion film coated glassy carbon electrode)
CDPV LR – 1-100 µg/L LOD – 0.5 µg/L Rec – 101%
[64]
Notes: CDPV – cathodic differential pulse voltammetry; DPV – differential pulse voltammetry; LOD – limit of detection; LR – linearity range; Rec – Recovery; RSD – relative standard deviation; SWV – square wave voltammetry.
12

Introduction
Concerning the voltammetric techniques implemented for the paraquat quantification in
water matrices, differential pulse (DPV) and square wave voltammetry (SWV) are the
most applied but, the need to obtain lower detection limits, justifies the use of an
extremely sensitive electroanalytical methodology named multiple square-wave
voltammetry (MSWV) [58]. The MSWV is a multipulse technique whose perturbation
mode is similar to the SWV [69-72], but with the difference that onto each step of the
staircase it can be applied more than one pair of potential pulses of opposing sign [73-75].
The response obtained by MSWV is produced in few seconds and it allows the
improvement of the analytical sensitivity to about 2-3 orders of magnitude (related to
SWV), even in complex samples [58, 75-78].
The automation of SWV by flow methods, proposed for the first time by Simões and co-
workers [79], is an interesting option since improves the sensitivity and reproducibility of
the analysis, as a consequence of the highly controllable conditions of mass transport
provided by the flowing solutions [65]. Sequential injection analysis (SIA) introduced by
dos Santos et al. for quantification of paraquat in natural waters, has advantages over the
flow methods [65]. By in-line dilution of a single standard stock solution, as well as sample
conditioning before the measuring step, SIA facilitates the automation for construction of
calibration and standard addition curves [65, 80, 81].
1.1.1.2 The particular case of liquid chromatography methods
All analytical methods found in the literature about paraquat quantification in waters by
liquid chromatography are compiled in Table 1.3. As can be seen, direct determination of
paraquat by liquid chromatography leads to limits of detection ranging from 5 to 2000
µg/L and above the EU legislated value (0.1 µg/L) [46-48, 82-84]. Typically, liquid
chromatography (LC) requires an enrichment and isolation procedure of paraquat prior to
its determination, if compliance with the legislation is a priority issue [25]. Liquid-liquid
extraction (LLE) is not suitable for preconcentration of this herbicide because it is highly
soluble in water [85]. Solid phase extraction (SPE) is the most widely used
preconcentration procedure for such purpose and because of that, alternative extraction
methodologies were excluded from this review.
13

Part I – Chapter 1
Table 1.3. Studies found in the literature concerning the determination of paraquat in waters by liquid chromatography.
Analytical method
Sample
volume
Extraction/Treatment Mass Detector Analytical parameters Ref.
LC-UV ------------------ ------------------ LR – 4-100 mg/L LOD – 2 mg/L
[82]
Off-line SPE-
LC-UV
250 mL Addition of humic acids (20 mg/L), lauryl sulphate (300 µg/L), NaCl (100 mg/L) and phenols (4 µg/L) to distilled water
Off-line SPE
Column – silica; Conditioning – 0.5 M H2SO4,H2O, 2% (v/v) ammonium hydroxide; Load – 250 mL; Elution – 5 mL A:B (10:90, v/v) (A: MeOH and B: 2 g tetramethylammonium hydroxide +30 g ammonium sulphate in 1 L H2O, pH 3)
------------------ RSD – 4.3-10.4% LOD – 0.08 µg/L Rec – 85-91%
[25]
25 mL Off-line SPE
Column – silica; Conditioning – 0.5 M H2SO4 (2.5 mL), H2O (5 mL), 2% (v,v) ammonium hydroxide (2.5 mL), H2O (5 mL); Load – 25 mL sample at 4 mL/min; Elution – 2.5 mL of 0.1 M sodium sulphate solution in water: MeOH (1:1, v/v) at pH 2
------------------ RSD – 6-11% LOD – 0.06 µg/L Rec – 95-98%
[86]
250 mL adjust pH of the H2O to 9 Off-line SPE
Column – silica; Load – 250 mL sample at 3-5 mL/min; Elution – 2 mL of 8% MeOH in 6.0 M HCl
------------------ LOD – 0.4 µg/L Rec – 80%
[85]
250 mL adjust pH of the H2O to 9 Off-line SPE
Column – porous graphitic carbon; Conditioning – MeOH (2 mL), H2O (2 mL); Load – 250 mL sample at 2-3 mL/min; Elution – 2 mL trifluoroacetic acid:acetonitrile (2:8, v/v)
------------------ RSD – 4-10% LOD – 0.2 µg/L Rec – 88%
[85]
14

Introduction
Table 1.3. Studies found in the literature concerning the determination of paraquat in waters by liquid chromatography (continued).
Analytical method
Sample
volume
Extraction/Treatment Mass Detector Analytical parameters Ref.
Off-line SPE-
LC-UV
1000 mL Off-line SPE
Column – ultra quat SPE; Conditioning – ACN (4 mL), H2O (4 mL); Load – 1000 mL sample at 20-25 mL/min; Elution – 2 mL + 2×2 mL of a 0.1% H3PO4 aqueous solution
------------------ RSD – 5% LOD – 0.006 µg/L Rec – 97%
[87]
1000 mL Off-line SPE
Column – silica; Conditioning – H2O (5 mL), concentrated ammonium hydroxide in H2O (2.5 mL), H2O (5 mL); Load – 1000 mL; Elution – 1 mL of a mixture of A:B (90:10, v/v) (A: 1 g tetramethylammonium hydroxide +15 g ammonium sulphate in 1 L H2O, pH 3 and B: MeOH)
------------------ LR – 0.1-25 µg/L LOD – 0.025 µg/L Rec – 91%
[88]
Off-line SPE-
LC-DAD
250 mL adjust pH of the H2O to 9
Off-line SPE
Column – C8; Conditioning – H2O (5 mL), MeOH (5 mL), H2O (5 mL), solution A (5 mL), H2O (5 mL), MeOH (5 mL), H2O (5 mL), solution B (20 mL); Load – 250 mL sample at 3-6 mL/min; Elution – 4.5 mL of solution C (solution A – 0.5 g of acetyl trimethyl ammonium bromide and 5 mL of concentrated ammonium hydroxide in 1 L H2O; solution B – 10 g of 1-hexanesulfonic acid, sodium salt and 10 mL of concentrated ammonium hydroxide in 500 mL H2O; solution C – 13.5 mL of orthophosphoric acid and 10.3 mL of diethylamine in 1 L H2O.)
------------------ RSD – 5% LOD – 0.68 µg/L Rec – 91%
[89]
15

Part I – Chapter 1
Table 1.3. Studies found in the literature concerning the determination of paraquat in waters by liquid chromatography (continued).
Analytical method
Sample
volume
Extraction/Treatment Mass Detector Analytical parameters Ref.
On-line SPE-
LC-UV
50 mL On-line SPE
Column – silica; Load – 50 mL; Elution – linear gradient from 100-50% A in 15 min and maintained for 10 min (A: 2 g tetramethylammonium hydroxide +30 g ammonium sulphate in 1 L H2O, pH 3 and B: MeOH)
------------------ RSD – 1.8-8.0% LOD – 0.1 µg/L Rec – 25-103%
[90]
50 mL On-line SPE
Column – graphitized carbon black; Conditioning – 5 mL MeOH, 5 mL H2O; Load – 50 mL at 2.5 mL/min; Elution – linear gradient from 90-20% A in 15 min and maintained for 5 min (A: 1 g tetramethylammonium hydroxide +15 g ammonium sulphate in 1 L H2O, pH 3 and B: MeOH)
------------------ LOD – 0.04 µg/L Rec – 94-98%
[91]
LC-MS
--------------- ------------------ ESI/ion trap LOD – 25 µg/L
[83]
Addition of 0.1 M nonafluoropentanoic acid to H2O
ESI/single quadrupole
RSD – 2.1% (repeatability), 7.4% (reproducibility) LOD – 0.1 µg/L Rec – 105%
[92]
------------------ ESI/single quadrupole
LOD – 11 µg/L
[46]
------------------ ESI/Ion trap LOD – 7 µg/L
[84]
16

Introduction
Table 1.3. Studies found in the literature concerning the determination of paraquat in waters by liquid chromatography (continued).
Analytical method
Sample
volume
Extraction/Treatment Mass Detector Analytical parameters Ref.
Off-line SPE-
LC-MS
200 mL Off-line SPE
Column – resin; Conditioning – H2O (5 mL), MeOH (5 mL), H2O (5 mL); Load – 200 mL at 3 mL/min; Elution – 5 mL of 1 M ammonium chloride solution in MeOH:H2O (50:50, v/v)
ESI/IDMS
LR – 10-1000 µg/L RSD – 3% LOD – 0.2 µg/L Rec – 98%
[93]
250 mL Off-line SPE
Column – silica; Load – 250 mL sample pH 9 at 2-3 mL/min; Elution – 2 mL of 6 M HCl in 8% MeOH
API/single quadrupole
RSD – 7.4-13.5% LOD – 1.8-3.8 µg/L Rec – 91.6%
[94]
250 mL Off-line SPE
Column – silica; Load – 250 mL sample pH 9 at 2-3 mL/min; Elution – 2 mL of 6 M HCl in 8% MeOH
ESI/single quadrupole
RSD – 6.5-9.4% LOD – 4.7-11.0 µg/L Rec –89.1%
[94]
250 mL Off-line SPE
Column – silica; Load – 250 mL sample pH 9 at 3-4 mL/min; Elution – 5 mL of 6 M HCl :MeOH (9:1, v/v)
ESI/single quadrupole
RSD – 5.9% LOD – 0.40 µg/L Rec – 92.8%
[95]
500 mL Addition of 3 mL MeOH to 500 mL H2O
Off-line SPE
Column – ENVI-8 DSK; Conditioning – MeOH (10 mL); Load – 500 mL sample; Elution – 5 M trifluoroacetic acid (2×6 mL)
ESI/IDMS
RSD – 12% LOD – 0.2 µg/L Rec – 46-85%
[96]
On-line SPE-
LC-MS
25 mL Addition of 1.6×10⁻³ M of surfactant to H2O On-line SPE
Column – alumina; Conditioning – 25 mL solution containing 16 mg of sodium dodecyl sulfate; Load – 50 mL sample at 2.5 mL/min; Elution – 0.1 M HFBA in MeOH at 2.5 mL/min
ESI/ion trap
RSD – 4-10% LOD – 0.020-0.030 µg/L Rec – 93-104%
[97]
17

Part I – Chapter 1
Table 1.3. Studies found in the literature concerning the determination of paraquat in waters by liquid chromatography (continued).
Analytical method
Sample
volume
Extraction/Treatment Mass Detector Analytical parameters Ref.
On-line SPE-
LC-MS
50 mL Add HFBA to obtain a 15 mM solution Adjust pH of the H2O to 9
On-line SPE
Column – C8; Conditioning – MeOH (10 mL); Load – 50 mL sample at 2 mL/min; Elution –– linear gradient from 12-40% B in 7 min and stepwise elution from 40-60% B. (A: 15 mM HFBA solution, pH 3.3; B: ACN)
ESI/single quadrupole RSD – 6-14% LOD – 0.06 µg/L Rec – 87%
[46]
50 mL Add HFBA to obtain a 15 mM solution Adjust pH of the H2O to 9
On-line SPE
Column – C8; Conditioning – MeOH (10 mL); Load – 50 mL sample at 2 mL/min; Elution –– linear gradient from 12-40% B in 7 min and stepwise elution from 40-60% B. (A: 15 mM HFBA solution, pH 3.3; B: ACN)
ESI/ion trap RSD – 7-13% LOD – 0.05 µg/L Rec – 112%
[84]
LC-MS-MS
--------------- ------------------ ESI/ion trap LOD – 5 µg/L
[83]
------------------ ISP/triple quadrupole
RSD – <10% LOD – 5 µg/L Rec – 90-110%
[48]
------------------ Turbo ionspayTM/triple quadrupole RSD – 7% (SRM) LOD – 7 µg/L (SIM), 0.2 µg/L (SRM)
[47]
------------------ Z-spray/time-of-flight RSD – 7% (SRM) LOD – 8.6 µg/L
[47]
18

Introduction
Table 1.3. Studies found in the literature concerning the determination of paraquat in waters by liquid chromatography (continued).
Analytical method
Sample
volume
Extraction/Treatment Mass Detector Analytical parameters Ref.
On-line SPE-
LC-MS-MS
10 mL On-line SPE
Column – Hysphere-Resin GP (polydivinylbenzene); Load – 10 mL at 150 µL/min; Elution – linear gradient from 7-15% B and a stepwise to 60% B (A: 20 mM HFBA in H2O, pH 2.0 and B: 20 mM HFBA in ACN)
ESI/ion trap RSD – 7.9% (repeatability); 10.1 (reproducibility) LOD – 0.03 µg/L Rec – 90%
[83]
30 mL Add HFBA to obtain a 20 mM solution Adjust pH of the H2O to 9
On-line SPE
Column – polydivinylbenzene; Conditioning – MeOH (10 mL), H2O (10 mL), 20 mM HFBA in H2O (10 mL); Load – 30 mL sample at 2 mL/min; Elution –– isocratic step of 2 min at 10% B, a linear gradient from 10-40% in 7.5 min, an isocratic step of 4 min at 40% and a stepwise elution from 40-70% in 11.5 min (A: 20 mM HFBA aqueous solution in 100 mM formic acid/ammonium formate buffer, pH 3.3; B: ACN)
Turbo ionspayTM/triple quadrupole
RSD – 7% (SRM) LOD – 0.04 µg/L (SIM), 0.002 µg/L (SRM)
[47]
Z-spray/time-of-flight RSD – 8% (SRM) LOD – 0.02 µg/L
[47]
Notes: API – atmospheric pressure ionization; DAD – diode array detection; ESI – electrospray ionization; IDMS – isotope dilution mass spectrometry; ISP – ionspray ionization; LC – liquid chromatography; LOD – limit of detection; LR – linearity range; MS – mass spectrometry detection; MS-MS – tandem mass spectrometry detection; Rec – Recovery; RSD – relative standard deviation; SPE – solid phase extraction; UV – ultraviolet detection.
19

Part I – Chapter 1
The most used packing materials for SPE extraction of paraquat contaminated water
samples are: silica [25, 85, 86, 88, 90, 94, 95], cation-exchange resins [47, 83, 93] and
apolar phases such as C8 [46, 84, 89, 96] and graphitized carbon black [85, 91]. During the
extraction procedure by SPE, competitive interaction processes occur between the target
analyte and the active sites on the solid phase or the components of the sample matrix
[88]. For the particular case of paraquat quantification in waters, the efficiency of the
preconcentration SPE procedure can be significantly affected, among other factors, by the
dissolved organic matter (as humic substances) and surfactants present in water samples
[88]. The dissolved organic matter is composed by humic substances (50%) and small
molecules (50%), such as carboxylic acids, amino acids, carbohydrates and other trace
elements [88]. Indeed, paraquat, with its divalent cationic character can react with two
negatively charged sites of humic substances, which are the most abundant components
in non-living organic materials of aquatic environments [88]. Cationic, anionic,
zwitterionic and non-ionic surfactants can also be found in water as ubiquitous pollutants
[88]. Beyond the surfactants and humic acids, it has been also observed that the presence
of other contaminants in the water matrix (such as inorganic salts, phenols, polycyclic
aromatic hydrocarbons, other pesticides or related compounds) may compromise the
analysis performance, significantly diminishing the recovery efficacy or significantly
interfering in the posterior determination [25]. Ibánez and co-workers (1996),
demonstrated that both humic substances and surfactants have a negative influence in
the extraction procedure of paraquat from waters, except cationic surfactants that
maintain, or even improve, the extraction efficiency [88]. This behaviour has been
attributed to their displacement capacity, avoiding the bound of pesticides with other
molecules [25]. In 1998, the same authors proved that cationic surfactants have the
ability to eliminate interferences associated with a diminution in the efficacy of SPE [25].
Recovery percentages above 80% were achieved when waters with high levels of humic
acids and anionic surfactants were extracted by SPE in a silica cartridge [25]. The presence
of other organic compounds in water samples did not also affect the paraquat extraction
efficiency [25].
Solid phase extraction can be operated in on-line or off-line mode. Under on-line
configuration, the concentrated analyte is directly desorbed and transferred to the
analytical column at the same time it is separated [90]. On-line coupling to LC has many
20

Introduction
advantages over off-line SPE configuration: lower risk of sample contamination;
elimination of analyte losses by evaporation or by degradation during sample
preconcentration; lower solvent consumption requirements (thereby decreasing the cost
for organic solvents waste disposal); higher sensitivity due to the transfer and analysis of
the totality of the extracted species to the analytical system; and improvement of
precision and accuracy [49]. On the other hand, using off-line SPE mode, the limits of
detection ranging between 0.06 and 11 µg/L [25, 85, 86, 89, 93-96], except for two
studies where lower limits of detection are reported (0.006 and 0.025 µg/L) [87, 88].
However, such lower limits of detection were achieved by using 1000 mL of sample,
which may be a limiting factor in the choice of the method. On-line coupling SPE to LC can
be performed by commercially available devices [90] and led to limits of detection
ranging from 0.02 to 0.1 µg/L of PQ, using only up to 50 mL of sample [46, 47, 83, 84, 90,
91, 97].
The chromatographic separation of paraquat is frequently achieved by ion-pairing
reagents, which improve the paraquat affinity to some column stationary phases, once
applied to the mobile phase. Since non-volatile ion-pairing reagents are typically
employed in chromatographic conditions of LC-UV methods, the development of a LC-MS
method from the existing one may be not possible [92]. The utilization of conventional
non-volatile ion-pairing reagents in LC-MS systems may contribute to the contamination
of the interface by alkylsulfonate salts [92].
Mass spectrometry based methods offer superior sensitivity, mass specific data and allow
the use of isotopically labelled surrogates [93]. The use of isotopically labelled surrogates
as reference masses allows a closely monitoring and compensation for any errors during
the analysis [47, 98]. Even so, the use of LC-MS as confirmatory tool is not always possible
due to the low mass resolution of some mass analysers (quadrupole and ion-trap) in
single MS mode and due to the lack of structural information provided by the
atmospheric pressure ionization techniques [47, 83]. For this reason, selected reaction
monitoring (SRM) performed on triple quadrupole has gained advantage over other tools
[83]. The presence of the target analyte can be confirmed by time-of-flight mass analyser
in a single MS mode because it has high selectivity and mass accuracy [47, 99].
21

Part I – Chapter 1
To overcome some ambiguity problems, tandem mass spectrometry is often applied;
however, this is only possible at low concentration levels when the MS-MS spectrum of
the target compounds has more than one abundant product ion [47].
In sum, electrochemical methods benefit from the possibility of working on-site,
conferred by the simplicity and portability of the equipment, and offer relatively good
sensitivities when traditional electrodes, as mercury ones, are used (2-3 µg/L). However,
a great investment must be done to reach limits of detection comparable to that offered
by liquid chromatography methodologies (0.006-0.1 µg/L using SPE prior to analysis):
investment in specific electrodes such as the chemical modified ones, small size devices
(microelectrodes and ultramicroelectrodes) and in extremely sensitive electroanalytical
methodologies (as MSWV). Taking all these points in consideration and, once the
laboratory is provided with equipment like LC-DAD and LC-MS, it was decided to use
liquid chromatography methods for the development of analytical methodologies for the
identification and quantification of PQ in water matrices and in different scenarios
(Chapter 2).
1.1.2 Analytical methods for paraquat quantification in deposits from drinking water networks
Other important matrices susceptible of being contaminated by a deliberate or accidental
chemical contamination front are the surfaces of the pipelines and/or the
deposits/biofilms formed along them, as well as those in suspension. Hence, it is of crucial
importance to develop analytical methodologies able to determine the amount of
chemicals in deposits/biofilms. Concerning biofilms, it was not possible to accomplish this
task because difficulty was encountered on the achievement of sufficient amounts of
biofilm to perform the experiments. So, methods were only developed for deposits
(mainly inorganic materials).
The definition of the best analytical methodology to extract paraquat from deposits has
to account the main properties of such materials. The formation and the composition of
deposits is dependent of several factors as the age of the pipeline, fluid dynamics,
temperature, water contents (particularly dissolved solids and organic contents), water
characteristics, the chemical composition of the pipes and joints and the treatments
applied to the water supply.
22

Introduction
1.1.2.1 Characterization of deposits from drinking water distribution systems
Presently water distribution pipelines are made of materials that may be classified in
three groups:
(1) Metallic pipes, as cast iron, steel and galvanized-iron pipes – are alloys of iron,
carbon, and silicon, contain carbon as graphite (pure carbon), as iron carbide
(Fe3C) in cementite, or as solid solution in austenite (γ phase iron) [100].
(2) Cement pipes, as cement and concrete pipes – are constituted by lime, silica
and alumina, aggregated in complex compounds. Their basic composition is
tricalcium silicate (3CaO.SiO2 – 50% wt.); dicalcium silicate (2CaO.SiO2 – 25%
wt.), tricalcium aluminate (3CaO.Al2O3 – 10% wt.), tetracalcium aluminoferrite
(4CaO.Al2O3.Fe2O3 – 5% wt.) [101].
(3) Plastic pipes, such as PVC and low-density polyethylene pipes – have different
compositions. PVC, polyvinyl chloride, is a thermoplastic polymer constructed
of repeating vinyl groups having one hydrogen replaced by chloride and unlike
most of other plastics it contains about 56.8% (wt.%) of chlorine [102].
Polyethylene is also a thermoplastic polymer consisting of long chains
produced by combining the monomer ethylene. High density polyethylene
(HDPE) has an average density of 0.940-0.970 g/cm3 and a melting
temperature of 128-136 oC [103].
Águas do Douro e Paiva (AdDP) is a private company which is responsible for the
distribution of the treated water to the local public drinking water facilities in South
Oporto metropolitan area. This company integrates three subsystems of distribution:
Lever Norte, Lever Sul and Vale do Sousa e Baixo Tâmega. The number of pipelines, the
length of the distribution systems, as well as the materials which compose them, are
summarized in Table 1.4. As indicated in Table 1.4, concrete pipelines only exist in the
Lever Norte subsystem. The pipelines made of this material were built in the 70s of the
last century and are at the end of its life cycle. All the other pipelines (including the ones
of the other subsystems) were built in the last 15 years. It is evident that the material
most used for pipeline construction is the cast iron (93% of the all 489 Km of length).
Lower contributions were registered for the other two materials: steel (5%) and concrete
23

Part I – Chapter 1
(2%). However it is important to highlight that the water networks that deliver water from
local public drinking water facilities to the intended end point or user may be
substantially different. However it is important to highlight that the water networks that
deliver water from local public drinking water facilities to the intended end point or user
may be substantially different.
Table 1.4. Constitution of the water supply network of the South Oporto metropolitan
area, Portugal (information supplied by AdDP)
Subsystem Municipalities Materials Number of
pipelines
Pipeline
length (m)
Lever Norte Porto, Matosinhos, Gondomar,
Valongo, Maia and Paredes oeste
Steel 1 5,383
Concrete 3 12,106
Cast iron 17 113,557
Lever Sul
Vila Nova de Gaia, Santa Maria da
Feira, Espinho, Ovar, São João da
Madeira, Oliveira de Azeméis,
Arouca and Vale de Cambra norte
Steel 3 18,100
Cast iron 30 148,757
Vale do Sousa e
Baixo Tâmega
Castelo de Paiva, Cinfães, Paredes
este, Lousada, Felgueiras, Paços de
Ferreira, Amarante oeste and Baião
Cast iron 40 191,399
Echeverría et al. analyzed deposit samples from several sites of the three major
subsystems of the Medellin city (Colombia) [104], where the pipelines were composed by
reinforced concrete (about 54%), ductile iron (about 27%) and steel (10%). They found
three predominant deposits across the water distribution systems that were classified in
three categories: brown, tubercle and white deposits.
According to these authors, brown deposits, formed everywhere in the studied system,
are mainly composed by aluminosilicates and humic acids. Tubercle deposits, which are
mostly mixtures of magnetite (Fe3O4), goethite (α-FeO(OH)) and in some cases
lepidocrocite (γ-FeO(OH)), are formed on metallic pipelines (steel and ductile iron). White
deposits were less abundant since they were found only at some places and are formed
by calcite, aluminosilicates and quartz [104].
Despite of the large heterogeneity of deposits formed along drinking water networks, due
to the different conditions experienced during their growth, deposits with similar
constitution have been reported in other studies [104]. Indeed, deposits with similar
24

Introduction
characteristics to tubercle and brown deposits (so that may be categorized according to
this nomenclature) were found around the world, namely in: old galvanized steel pipes
from Champaign (Illinois, USA) [105]; old cast iron pipes from Boston (Massachusetts,
USA) [105]; old cast iron pipes from midwest, west and northeast of USA [106]; cast iron
and polyethylene pipes from 16 towns of Finland (EU) [107]; old cast iron, ductile iron and
asbestos cement pipes from east central of New Jersey (USA) [108]; cast iron pipes from
Ulhasnagar (Maharashtra, India) [109] and on cast iron, galvanized steel and ductile iron
pilot-scale pipes [110]. Therefore, it is assumed that deposits from drinking water
networks may be classified in accordance with the three categories proposed by
Echeverría and co-workers [104].
In sum, it can be concluded that the analytical method to be developed for the detection
of paraquat on deposits will have to deal with the problem of a great heterogeneity of the
matrix of interest (containing iron oxides, aluminum silicate hydroxides, calcium salts and
hydroxides, etc).
Up to the author’s knowledge, no studies exist in the literature about quantification of
paraquat, or even other chemicals, in deposits from drinking water networks. Due to the
lack of information concerning this topic, it was decided to check which methodologies
have been implemented for paraquat determination in soils and to use some strategies as
starting points for the development of the new methodology in deposit samples. Even for
soil samples, a relatively low number of studies was found in the literature (Table 1.5).
Indeed, the analysis of paraquat in soils is a challenging task as a result of the strong
affinity of this herbicide to them [93, 111]. As evidenced in Table 1.5, procedures
involving refluxing or digestion of the sample (in sulfuric or hydrochloric acids, or even
under milder solvents such as in an acidified mixture of MeOH/EDTA) are the ones most
reported for extraction of paraquat from soils [29, 30, 33, 112-115]. Such drastic
extraction conditions with strong acids induce the releasing of chemicals by matrix
structure destruction [33]. This extraction step is required due to the strong interaction
between paraquat and soils, as referred before. Although digestion and refluxing
extraction techniques do not demand sophisticated equipment, they demand time (taken
hours), large solvent quantities (25-100 mL) and high sample amounts (5-100 g) [29, 30,
33, 112, 113, 115].
25

Part I – Chapter 1
Table 1.5. Studies found in the literature concerning the analytical methods for paraquat quantification in soils.
Sample amount Extraction/treatment Clean-up Instrumental
technique
Analytical parameters Year Ref
10 g Reflux with 18 N H2SO4; 5 h
SP – Dowex 50 W-X8 (H+
form)
Eluent – Saturated
ammonium chloride solution
Spectrophotometry ------------------- 1967 [33]
100 g Reflux with H2SO4
SP – Dowex 50-X8 (Na+ form)
Eluent – Ammonium chloride
solution
Spectrophotometry LR – 2.98-6.25 µg/g Rec – 95%
1988 [112]
10 g freeze-dried; extracted with DCM ------------------- LC-TSP-MS LOD – 0.17 µg/g 1993 [116]
10 g Digestion with 6 M HCl; adjust to pH 9 SP – Adsorbex silica cartridges
(400 mg)
Eluent – 0.1 M HCl in MeOH
CZE-DAD RSD – 4% LOD – 0.008 µg/g Rec – 92%
1996 [114]
5 mg ------------------- ------------------- SIMS LOD – 6 µg/g
1997 [117]
50 g Digestion with 25 mL H2SO4 5 M;
adjust to pH 9
SP – silica gel column (25 cm ×
1 cm i.d.);
Conditioning – 2×20 mL H2O
Elution – 50 mL saturated
ammonium chloride solution
Spectrofluorimetric LR – 0.3-4.5 µg/g RSD – 1% LOD – 0.1 µg/g Rec – 101%
1998 [115]
3 g MAE – 15 mL H2SO4 9 M; 1120 W; 15
cycles; 30 s/cycle
------------------- ------------------- Rec – 22.1-105.3% 2001 [118]
26

Introduction
Table 1.5. Studies found in the literature concerning the analytical methods for paraquat quantification in soils (continued).
Sample amount Extraction/treatment Clean-up Instrumental
technique
Analytical parameters Year Ref
1 g Shaking with 10 mL of a 0.02 M
EDTA/0.5 M ammonium acetate after
acidification to a pH 4.7; adjust pH to
9-10
SP – silica cartridge LC-UV Not recovery 2008 [113]
1 g MAE – 200 µL benzalkonium
chloride+8 mL HNO3 (65%)+ 2mL HCl
(37%)+2 mL HF (48%); 30 min ramp
time to reach 200 °C and hold there
for 20 min; 800 W
MAE – 20 mL 4% boric acid aqueous
solution; 15 min ramp time to reach
180 °C and hold there for 15 min; 800
W; pH adjustment to 9-10
SP – silica cartridge LC-UV RSD – 10% LOD – 0.050 µg/g Rec – 102%
2008 [113]
5 g Digestion with 30 mL of a mixture
70:30 (v/v) MeOH:5%(w/v) EDTA
acidified with 2% (v/v) formic acid ; 3
h; adjust to pH 9
SP – silica cartridge
Elution – 10 mL 70:30 (v/v)
MeOH: 6.5 M HCl
LC-UV RSD – <15% LOD – 0.020 µg/g Rec – 98-102%
2009 [29]
[30]
[113]
Notes: CZE-DAD – capillary zone electrophoresis-diode array detection; DAD – diode array detection; DCM – dichloromethane; EDTA – ethylenediaminetetraacetic acid; LC – liquid chromatography; LC-TSP-MS – liquid chromatography-thermospray-mass spectrometry; LOD – limit of detection; LR – linearity range; MAE – microwave-assisted extraction; MeOH – methanol; Rec – recovery; RSD – relative standard deviation; SP – solid phase; UV – ultraviolet detection.
27
Part I – Chapter 1
Pateiro-Moure et al. tested the ability of a mechanical shaking methodology to extract
paraquat from a contaminated soil and no recovery was attained under the conditions
employed [113]. Generally, similar limits of detection (0.008-0.1 µg/g) were achieved by
microwave-assisted extraction (MAE) and the traditional refluxing or digestion techniques
(see Table 1.5). MAE has the advantages over the others of requiring shorter extraction
times (10-50 min), less solvent quantities (10-20 mL) and lower sample amounts (1-3 g)
[113, 118, 119]. On the other hand, MAE involves sophisticated equipment, especially
when aqua regia (nitro-hydrochloric acid) is employed as extraction solvent [113].
Despite of the differences observed on the extraction time for the different techniques
and approaches referred above, generally the corresponding methods are globally time-
consuming (taken hours) since they require clean-up steps after the extraction (see Table
1.5). A substantial reduction of the sample preparation time by extraction and clean-up
steps elimination can be obtained by direct surface analysis [117]. Paraquat is easily
detected by static secondary ion mass spectrometry (SIMS), which is a direct surface
analysis technique, and offers fast analysis times, on the order of 10 min/sample [117].
On the other hand, it can be observed from Table 1.5 that the limit of detection obtained
by SIMS (6 µg/g) is higher than that achieved by the other methods (0.008-0.17 µg/g).
Additionally, chromatographic methods allow obtaining higher quantitative information
than surface [117].
In short, the search for an easy and fast extraction methodology for the extraction of PQ
from deposits, preserving matrix structure, justifies the procedure adopted in Chapter 3
by using an aqueous saturated ammonium chloride solution. Indeed, the matrix structure
destruction, as occurs in digestion and refluxing procedures, typically conducts to
complex extracts that require clean-up procedures which increase the time of analysis.
1.1.3 Sorption of paraquat on deposits from drinking water networks The study of pesticides adsorption on deposits from drinking water networks is of
paramount importance, particularly in case of an accidental or deliberate contamination
event, where high paraquat concentrations may be involved; it would be also of relevance
the use of such materials in applications like wastewater treatment, thus adding value to
those solid residues that result from water networks cleaning and maintenance
28

Introduction
operations. As occurred for methods of paraquat quantification in deposits, no studies
exist about paraquat adsorption on the same matrices. Again, the paraquat adsorption
studies on other materials were picked up from literature for comparison purposes. There
are several studies about paraquat adsorption on clays and soils (Table 1.6 – [28-36, 38,
39, 120-126]). The interaction of pesticides, as paraquat, with soils may involve either
their mineral and/or organic components. For soils that have higher organic matter levels
(>5%), the pesticide sorption process depends on the total organic matter content, being
the nature of the organic matter an insignificant aspect. On the other hand, for soils with
low organic matter content, the active components of the inorganic fraction (namely the
content and composition of the clay and identity of the major cations) are responsible for
the mobility of the pesticides. Concerning the particular case of paraquat adsorption on
soils, the interaction is frequently reported as rapid and very strong [28-30, 32, 36].
Hence, the mechanism involves ionic and charge transfer bonds [127]. Bipyridylium
herbicides such as paraquat form highly stable and unreactive bonds with the carboxyl
groups of the humic substances by ion-exchange via their cationic group [28]. In some
cases, paraquat has high affinity for clay surfaces in relation to soil organic matter,
especially as compared with inorganic cations [29]. The interaction between paraquat and
clay particles depends on the particular type of clay [29, 30]. Weber and Scott
demonstrated that paraquat binds to interlayer spacings in montmorillonites via
Coulombic and Van der Waals forces and to kaolinite via Coulombic forces alone [29].
Concerning the adsorption isotherms, Langmuir and Freundlich are the ones that better
describe the adsorption of PQ on clays, soils and the other materials (Table 1.6). For
Langmuir isotherms, maximum adsorption capacities (qmax) vary from 0.5 mg/g for
crystalline iron oxide coated quartz particles [31] to 171.48 mg/g for calcium alginate gel
beads [121]. The shapes of isotherms have been classified as L-type [31, 36, 123] and H-
type [29, 39, 126] isotherms according to the Giles classification [128]. The L-type
isotherm corresponds to a decrease of sites availability as the solution concentration
increases, which indicates saturation of the surfaces. On the other hand, H-type
adsorption isotherms are an extreme version of the L-type ones, being its adsorption in
many instances close to 100%, particularly for the lowest concentrations.
Concerning the desorption of paraquat from soils/clays, the extent of the process is
typically very small, also due to the strong interaction between both [30, 32, 34, 36].
29

Part I – Chapter 1
Table 1.6. Studies found in the literature about paraquat adsorption on soils, clays and other solids.
Adsorbent type Kind of interaction Sorption capacity/model parameters Ref. Soils Very rapid sorption (equilibrium time of minutes)
Adsorption is sensitive to pH and paraquat concentration levels ---------------------------- [28]
Paraquat is strongly adsorbed to the soils: little amount desorbed from them that ranged in 2.1 – 2.4% and 10.5-14.3% at 100 and 200 mg/L, respectively. Sorption of PQ is clearly increased with the organic matter removal from soil. Adsorption isotherms fitted with the Freundlich equation
- Freundlich isotherm: Kf = 4148-4456 Ln µmol(1-n)/kg for all soils studied, 1/n = 0.22-0.31
[29]
PQ is strongly adsorbed by both soils: the extent of desorption of PQ from both soils with CaCl2 was very small <1%. The addition of cooper at concentrations from 0 to 3.15 mM resulted in no significant increase in the PQ adsorption.
- Linear isotherm: KD =1.28×10³ L/kg for soil 1; KD = 429 L/kg (q≤4) or 24 L/kg (q>4) for soil 2
[30]
Paraquat strongly adsorbed: only 0.42% of the paraquat adsorbed on sandy loam soil is removed with CaCl2 and none extraction was observed for muck soil. Adsorption is not affected by T, pH or addition of a pesticide mixture (lindane, paraquat and glyphosate).
- Freundlich isotherm: Kf = 28.7 L/kg and 1/n = 0.60 for sandy loam soil Kf =1419 L/kg and 1/n = 1.01 for muck soil
[32]
At low concentrations, paraquat desorption requires refluxing with 18 N sulfuric acid. As the concentration in soil increases, a portion of paraquat can be desorbed by leaching with saturated ammonium chloride. At high levels, the unbounded paraquat can be leached with water.
---------------------------- [33]
It seems that paraquat interacts strongly with soil components being the most favorable mechanism the ionic bonding. Negligible desorption of paraquat from the soils (in the absence or presence of increased content of soluble fluvic).
---------------------------- [34]
Paraquat adsorption capacity depends on the clay content. Lower desorption percentages were achieved 0.04-0.17% and 0.80-5.83% for clay and sandy loam soils, respectively.
- Freundlich isotherm: Kf = 787 (mg/kg)(L/µg)1/n and 1/n = 0.247 for clay; Kf = 18 (mg/kg)(L/µg)1/n and 1/n = 0.412 for sandy loam soils
[36]
30

Introduction
Table1.6. Studies found in the literature about paraquat adsorption on soils, clays and other solids (continued).
Adsorbent type Kind of interaction Sorption capacity/model parameters Ref. Clays The bond strength of paraquat with respect to an exterior surface is much smaller
than to the interlayer. There are indications that adsorption on inorganic oxides is very weak. Montmorillonite has strong PQ adsorption capacity
- Langmuir isotherm: qmax = 41×10-6 mol/g for illite; qmax = 20×10-6 mol/g for kaolinite
[38]
The adsorption is governed by electrostatic interactions. - Langmuir isotherm: qmax = 0.18×10⁻⁶ moL/m2 for silica; 1.5×10⁻⁶ moL/m2 for kaolinite; 4×10⁻⁶ moL/m2 for illite; 0.6×10⁻⁶ moL/m2 for montmorillonite
[39]
It seems that the initial pH does not influence the kinetic constant but, the paraquat adsorption capacity increase with the pH. The adsorbed paraquat amount increased as temperature decreased –endothermic. The rate constant decrease with increasing temperature.
---------------------------- [122]
The rate of adsorption of paraquat onto clay is very fast. The intra-particle diffusion mechanism plays a significant role in the adsorption.
- Freundlich isotherm: Kf = 36.02 (mg/g)(L/mg)1/n and 1/n = 0.0294 [125]
Illite and illite modified with nonylammonium chloride are the most effective adsorbents.
- Langmuir isotherm: qmax = 12.3 mg/g for sepiolite, 42.4 mg/g for bentonite, 54.5 mg/g for illite, 9.8 mg/g for sepiolite modified with dodecylammonium chlorides, 23.1 mg/g for bentonite modified with dodecylammonium chlorides, 24.4 mg/g for illite modified with dodecylammonium chlorides, 12.3 mg/g for sepiolite modified with nonylammonium chlorides, 49.9 mg/g for bentonite modified with nonylammonium chlorides and 57.3 mg/g for illite modified with nonylammonium chlorides
[123]
Adsorption rate very fast pH and salinity were found to be considerable significance in the ion exchange process. Sorption of paraquat may occur in two steps: transfer sorbate and chemical complexation/ ion exchange at adsorbent sites
---------------------------- [126]
31

Part I – Chapter 1
Table 1.6. Studies found in the literature about paraquat adsorption on soils, clays and other solids (continued).
Notes: Isotherm equations: Linear ( CKq D= ; q is the amount of PQ adsorbed, DK is the linear coefficient of distribution and C is the concentration of PQ in the liquid phase), Langmuir (
)1/(max LL CKCqKq += ; q is the amount of PQ adsorbed, LK is the Langmuir adsorption equilibrium constant, C is the concentration of PQ in the liquid phase and maxq is the maximum
adsorption capacity) and Freundlich ( nfCKq /1= ; q is the amount of PQ adsorbed, fK is the Freundlich adsorption equilibrium constant, C is the concentration of PQ in the liquid phase and
n is the Freundlich constant)
Adsorbent type Kind of interaction Sorption capacity/model parameters Ref. Tire-derived
adsorbent (TAC) Activated carbon
F300 (CAC)
The adsorption of paraquat is weakly pH dependent. The rate of sorption of PQ onto CAC is very fast (almost 90% of the maximum possible adsorption taking place in the first 5 min)
- Langmuir isotherm: qmax = 33.7 mg/g for TAC qmax = 75.8 mg/g for CAC
[120]
Quartz and quartz iron oxide
PQ has higher sorption strength on crystalline iron oxide coated quartz particles than on amorphous ones. The maximum sorption capacity for PQ can be found, instead on amorphous iron-oxides coated quartz. The higher addition of phosphates (P) contributes to the increase of PQ maximum sorption on iron oxide coated quartz particles.
- Langmuir isotherm: qmax = 0.7 mg/g for amorphous iron oxide coated quartz particles qmax = 0.5 mg/g for crystalline iron oxide coated quartz particles
[31]
Calcium alginate gel beads
Sorption of paraquat onto the calcium alginate gel beads is pH-dependent (increase with increasing pH). Equilibrium time is 120 min Calcium compete with paraquat for the available binding sites
- Langmuir isotherm: qmax = 149.71 mg/g at pH 3 and 20 °C qmax = 171.48 mg/g at pH 7 and 20 °C
[121]
Spent diatomaceous earth from the beer brewery activated by
sodium hydroxide
The kinetic adsorption is rapid (the equilibrium is reached approximately in 30 min). It seems that the rate constant is not influenced by the initial pH. The adsorption should be a physical process, which is an exothermic process and the amount of adsorbate adsorbed onto adsorbent increases with the lowering of adsorption temperature.
- Freundlich isotherm: Kf = 3.37 (mg/g)(L/mg)1/n and 1/n = 1.89 for spent diatomaceous earth Kf= 12.80 (mg/g)(L/mg)1/n and 1/n = 13.51 for treated diatomaceous earth
[124]
32

Introduction
1.1.4 Degradation technologies for paraquat in waters To reduce the paraquat (and other pesticides) impact, powerful and practical treatment
processes for its (their) degradation in water matrices are needed. The traditional
chemical and biological treatments are not sufficiently effective for most pesticides [129].
On the other hand, in some physical processes there is a simple transfer of the pollutants
from one phase to another, not being destroyed. The advanced oxidation processes
(AOPs) are clean technologies based on the generation of extremely reactive and non-
selective hydroxyl radicals, with very high oxidative power (E0 = 2.8 V). Due to their
powerful capability to oxidize numerous organic compounds into CO2 and H2O, AOPs
have been selected for various applications. Among them, the Fenton’s reaction is a
promising process, which appeared in 1894 when Fenton strongly improved tartaric acid
oxidation by the use of ferrous ion and hydrogen peroxide [130]. Fenton’s reaction is a
non-expensive and environmental friendly oxidation method, widely used in wastewater
treatment. The process has a complex mechanism, which can even though be simplified
by the following equations [131, 132]:
,3222
•−++ ++→+ HOOHFeFeOH 111 76 −−= sMk 1.1
,..... 22 OHCOOrgHOOrg +→→→+ •• 111072 1010 −−−≈ sMk 1.2
1173 105421 −−×−= sM)..(k 1.3
,32 −+•+ +→+ OHFeHOFe 1184 1034 −−×= sM.k 1.4
,22OHHOHO →+ •• 1195 1035 −−×= sM.k 1.5
,H)HO(FeOHFe III +++ +↔+ 2222
3 36 101.3 −×=k 1.6
,HOFe)HO(FeIII •++ +→ 222
2 137 107.2 −−×= sk 1.7
Briefly, the reaction between iron and hydrogen peroxide produces hydroxyl radicals with
high oxidative power (eq. 1.1), which attack the organic matter present in the water (eq.
1.2). Unfortunately, some parallel reactions occur (eqs. 1.3-1.5), and so the hydroxyl
radicals are not only consumed to degrade the organic matter but also to produce other
radicals, with less oxidative power, or other species (so-called scavenging effect of HO•).
Besides, this leads to the undesired consumption of hydrogen peroxide (eq. 1.3). On the
,2222•• +→+ HOOHOHOH
33

Part I – Chapter 1
other hand, eqs. 1.6 and 1.7 indicate the generation of Fe2+ by the reaction between H2O2
and Fe3+ (Fenton-like process); this way ferrous ion is restored, acting as catalyst in the
overall process.
Few studies about paraquat degradation by AOPs in water were published and are hereby
compiled in Table 1.7. As can be seen, most of them refer to photocatalytic processes by
the action of TiO2 [133-138]. In these cases, high paraquat degradation values were
achieved for a wide range of initial parent compound concentrations (7.5 to 1000 mg/L).
Nevertheless, it is important to emphasize that this kind of treatment could import
excessive electricity costs. The ozonation was also tested to degrade PQ in water [139,
140]. Relatively low PQ degradation by ozonation in the presence of light was obtained by
Kearney et al. [139] (only 32.8% of paraquat was destroyed after 7 h). More recently,
Dhaouadi and Adhoum [141] used four different activated carbons as catalysts in
paraquat degradation by the heterogeneous Fenton’s process. The same researchers also
tested and compared four different advanced oxidation methods in the degradation of
paraquat: anodic oxidation (AO), electro-Fenton (EFe), photoelectro-Fenton (PEF) and
classic Fenton (CFe) [142]. All but one treatment method (CFe) was optimized. The CFe
treatment was not optimized as only one experiment was done for comparison purposes.
The paraquat concentration versus time plot indicated that the fastest initial degradation
rate was attained for the CFe method, but after 20 min no paraquat degradation was
observed. Dhaouadi and Adhoum [142] concluded that CFe has a significantly lower
oxidative ability as compared to other systems. However, this may be due to the
insufficient peroxide quantity used in the operation. Therefore, an optimized classic
Fenton process could potentially lead to comparable paraquat degradation efficiencies.
Up to the author’s knowledge, there are no other studies reported concerning paraquat
degradation by the homogeneous Fenton’s process, which was addressed in this thesis
(Chapter 5).
34

Introduction
Table 1.7. Studies reported in the literature about paraquat degradation in water by AOPs.
Treatment Operating conditions Analytical method for PQ
monitoring
Results and Comments Ref.
UV light over TiO2-
coated polythene or
polypropylene films
[PQ]0 = 50 mg/L T = 26 °C 15 mL O2/min 8.8×10⁻⁵ g TiO2/cm2 for polythene and 3.1×10⁻⁵ g TiO2/cm2 for polypropylene
UV spectrophotometer Complete degradation to CO2, NH3, HCl and small quantities of NO2-/NO3
- within ca. 6 h.
[133]
UV light over
commercial TiO2
[PQ]0 = 10, 20 and 40 mg/L UV (365 nm) 50 mL O2/min 200 mg TiO2 /L pH = 4, 6.6, 7 and 9
LC Paraquat is slowly degraded by direct photolysis in the presence of dissolved oxygen ([PQ]0 = 20 and 40 mg/L; pH0 6.6). Direct photolysis with UV light destroyed 60% of paraquat in less than three hours of reaction ([PQ]0 = 10 mg/L; pH0 6.6). In the presence of TiO2, all species were consumed after three hours of reaction at high pH values.
[134]
UV light over TiO2 [PQ]0 =1000 mg/L 0.5 L air/min TiO2 film (three-time coating) attained from the hydrothermal method UV-light intensity: 36 W/m2
Potassium ferric-oxalate
actinometrical method
About 100% of paraquat was degraded after 15 h of reaction. [135]
UV light and/ or air-
sparging over TiO2
[PQ]0 = 100 mg/L 1 L air/min 0.1 g TiO2/L UV-light intensity: 4, 8, 12, 24 and 36 W/m2
UV – spectrophotometer Paraquat removal rate was 0.54 mg/L/h with only air-sparging. In the presence of UV-light, the removal rate with air-sparging was 50% higher in 24 h than that without it. In the presence of TiO2, the removal rates in 40 h were 1.4, 1.6 and 2.2 mg/L/h at the UV light intensities of 4, 8 and 12 W/m2, respectively. In the presence of TiO2 with air-sparging, the required times for 90% removal of PQ were 18, 12 and 3 h at the UV light intensities of 12, 24 and 36 W/m2, respectively.
[143]
35

Part I – Chapter 1
Table 1.7. Studies reported in the literature about paraquat degradation in water by AOPs (continued).
Treatment Operating conditions Analytical method for PQ
monitoring
Results and Comments Ref.
UV light over TiO2
(commercial and
“home prepared”)
[PQ]0 = 7.5 mg/L 200 mg TiO2 /L pH = 4, 7 or 9
UV-visible
spectrophotometer
Under alkaline medium, paraquat degradation is almost complete after 30 min of reaction. Five compounds structures were proposed for intermediate degradation products of paraquat oxidation
[136]
UV light over
commercial TiO2
[PQ]0 = 20 mg/L 0.04 and 0.4 g TiO2/L UV-light intensity: 140 W/m2
UV spectroscopy Near complete mineralization of paraquat was achieved after ca. 3 h of irradiation by using 0.4 g/L of catalyst amount at neutral pH (ca. 5.8).
[137]
Xenon lamp over
1C60/ 1 V-TiO2
(composition in
wt%)
[PQ]0 = 15 – 50 mg/L 1 g catalyst/L pH=6.5
UV-visible
spectrophotometer
70% degradation within 4 h. [138]
UV light in the
presence of O2 or
O3
[PQ]0 = 1500 mg/L 32 g O3 /h 66 low-pressure mercury vapor lamps (254 nm)
GC Significant oxidation of PQ did not occur in the presence of oxygen during 7 h. When O3 was fed 32.8% of PQ was destroyed during 7 h. 4-carboxy-1-methylpyridinium ion, monoquat, monopyridone, 4,4’-bipyridyl, 4-picolinic acid, oxalate, malate, succinate and N-formylglycine were proposed for intermediate compounds of PQ oxidation.
[139]
O3 [PQ]0 = 231 – 2057 mg/L 38.6 L O3 /h pH = 4.2 to 8.0
LC Paraquat was degraded after 120 min of reaction at pH 8.0. N-methylisonicotinic acid, N-formyloxamic acid, ammonia, oxamic acid and nitrate were proposed for intermediate compounds of PQ oxidation.
[140]
36

Introduction
Table 1.7. Studies reported in the literature about paraquat degradation in water by AOPs (continued).
Treatment Operating conditions Analytical method for PQ
monitoring
Results and Comments Ref.
Heterogeneous
Fenton (AC-Fe as
catalyst)
[PQ]0 = 20 mg/L 1 g catalyst/L T=70 °C [H2O2]0 = 12.5 mM
LC 71.4% of chemical oxygen demand abatement was obtained under the conditions indicated.
[141]
Anodic oxidation
(AO); Electro-
Fenton (EFe);
Photoelectro-
Fenton (PEF)
[PQ]0 = 10 – 50 mg/L T = 25 °C pH = 3 [Fe2+]0 = 0.1 – 2 mM [H2O2]0 = 20 mM Current intensity: 50, 100 and 200 mA
LC The PEF is the most efficient treatment. Classic dark Fenton under the same conditions leads to a high removal rate at the initial stage of the experiment but poor degradation efficiency was obtained maybe due to the insufficient H2O2.
[142]
Homogeneous
Fenton
[PQ]0 = 50 – 200 mg/L T = 10 – 70 °C pH = 2 – 5 [Fe2+]0 = 1.0×10⁻⁴ – 5.0×10⁻⁴ M [H2O2]0 = 1.6×10⁻³ – 5.7×10⁻² M
LC Under selected conditions (T =70.0 °C, [Fe2+] = 5.0×10⁻⁴ M, [H2O2] = 3.4×10⁻² M, and pH = 3.0) nearly all the initial paraquat dichloride was degraded after 1 h and 60% of the organic matter was mineralized after 4 h. At 30 °C, complete paraquat degradation and 40 % of mineralization were reached after 4 h of reaction.
[144]
(Chap
ter 5)
Notes: AO – anodic oxidation; EFe – electro-Fenton; GC – gas chromatography; LC – liquid chromatography; PEF – photoelectro-Fenton; UV – ultraviolet.
37

Part I – Chapter 1
1.2 Polybrominated diphenyl ethers (PBDEs)
Accidental fires inflict a heavy toll in terms of economic loss, human suffering and, in the
extreme, death. As a response to this challenge, there was a need to produce and use
flame retardants (FR), as a mean to reduce the likelihood of ignition, to hind the fire
spread and to provide some extra time in the early stages of a fire when it is much easier
to escape [145]. For a long time, flame retardants were associated to safe and protection
and were used in a widespread number of applications such as: industries of plastics,
textiles, electronic equipment and in building materials. Among the organohalogenated
flame retardants the bromine-based ones are the most effective and applied [146]. Their
popularity on fire prevention is related in part to the weak bond between bromine and
the carbon atoms, which enables the bromine atom to interfere at a more favorable point
in the combustion process [145]. Brominated flame retardants (BFRs) can be classified in
reactive or additive, depending on the manner they are incorporated in the polymer.
Reactive flame retardants are chemically bonded to the material while additive flame
retardants are not covalently bonded and are often applied to the substrate surface as a
spray in a coating formulation [147]. For that reason, additive BFRs are easily leached out
from the surface of the material and thus released into the environment during their
natural operational life and also during processing, recycling or combustion [145, 148].
Polybrominated diphenyl ethers (PBDEs) are an example of additive flame retardants
[149]. As observed in Figure 1.2, they have structures similar to polychlorinated biphenyls
(PCBs) with an oxygen atom between the aromatic rings [149].
Figure 1.2. Chemical structure of PBDEs (adapted from [150]).
x+y = 1–10
x+y = 1 Mono-BDEs
x+y = 2 Di-BDEs
x+y = 3 Tri-BDEs
x+y = 4 Tetra-BDEs
x+y = 5 Penta-BDEs
x+y = 6 Hexa-BDEs
x+y = 7 Hepta-BDEs
x+y = 8 Octa-BDEs
x+y = 9 Nona-BDEs
x+y = 10 Deca-BDEs
x y
38

Introduction
Theoretically, there are 209 PBDEs congeners differing in the number and/or position of
the bromine atoms in the aromatic ring. Commercial PBDEs are typically prepared by
bromination of diphenyl ether in the presence of a catalyst. As a consequence, mixtures
of PBDEs with various bromination degrees are produced. There are three main PBDEs
commercial mixtures: penta-BDE, octa-BDE and deca-BDE. Commercial Penta-BDE is a
mixture of tetra (24-38%), penta (50-60%) and hexa (4-8%) congeners [151]. The Octa-
BDE mixture is composed by hexa (10-12%), hepta (44%), octa (31-35%) and nona (10-
11%) congeners [151]. Commercial Deca-BDE formulation contains octa (0.8%), nona
(22%) and deca (77%) congeners [152]. The main properties of technical PBDE mixtures
are indicated in Table 1.8. The uses of penta-BDE and octa-BDE commercial mixtures were
completely banned by the European Union (EU) since 2004, after a comprehensive risk
assessment analysis under the Existing Substances Regulation 793/93/EEC [153]. In May
2009, at the 4th meeting of the parties of the Stockholm Convention for Persistent Organic
Pollutants (POPs), the penta-BDE and octa-BDE commercial mixtures were officially
classified as POPs substances and were included in the Annex A (elimination of
production and use of all intentionally produced POPs) [154, 155]. In the United States,
several states have adopted legislation to ban the penta-BDE and octa-BDE mixtures and,
owing to growing apprehension, the main US chemical producer voluntarily agreed to
stop its manufacturing [156]. Deca-BDE commercial mixture has been current explored
without any restriction which, in part, has contributed to the increase on the lower PBDEs
environmental findings as a consequence of congeners debromination [156]. Indeed, the
major PBDEs findings in environmental matrices correspond to lower brominated flame
retardants, which have been considered more dangerous for humans and wildlife than
the higher brominated ones due to their high efficiency to be bioaccumulated [152, 157-
159]. The larger molecules, specially the fully brominated deca-BDE, are poorly absorbed
due to their lower ability to cross biological membranes, rapidly eliminated and thus, they
are unlikely to be bioaccumulative [145, 149]. Due to their persistence, bioaccumulation
and toxicity, ubiquity and long-range atmospheric transport, PBDEs have even been found
in the remote arctic environment [160]. Estimated half-lives in the environment between
2 and 10 years were reported for these chemicals [161]. Toxicity information about PBDEs
is scarce and the toxicity assessment of each congener in particular has not been finished
yet [148, 156].
39

Part I – Chapter 1
Table 1.8. Physical and chemical properties of technical PBDE mixtures (adapted from [162]).
Property Penta-BDE Octa-BDE Deca-BDE
Color Clear, amber to pale yellow Off-white Off-white
Physical state Highly viscous liquid Powder Powder
Melting point -7 to -3 °C (commercial) 85-89 °C (commercial) 290-306 °C
Boiling point >300 °C (decomposition starts above 200 °C) decomposes at >330 °C (commercial) decomposes at >320 °C
Density (g/mL) 2.28 at 25 °C 2.8 (commercial) 3.0
Solubility in water (µg/L) 13.3 (commercial) 1 at 25 °C (commercial) <0.1
Log Kow 6.57 (commercial) 6.29 (commercial) 6.265
Log Koc 4.89-5.10 5.92-6.22 6.80
Vapor pressure (mmHg) 3.5×10⁻⁷ (commercial) 4.9×10⁻⁸ (commercial) 3.2×10⁻⁸
Table 1.9. Some physical and chemical properties of BDE-100.
Common Name CAS n.º
Molecular formula Molecular weight (g/moL)
Chemical Structure Solubility in water (µg/L) [a] Vapor pressure (mmHg) [a] Henry’s law constant (atm. m3/mol) [a]
Log Kow [b]
BDE-100 189084-64-8
564.7 2,2´,4,4´,6-
pentabromodiphenyl ether
40 (at 25 °C) 2.15×10⁻⁷ 6.80977×10⁻⁷ 7.24
Notes:. [a] – [163]; [b] – [164]
40

Introduction
Some studies have pointed out their potential to act as hormone disruptors,
neurodevelopmental toxic and carcinogenic agents [148, 149]. However, it is
inappropriate to make generalized statements about PBDEs toxicology because their
physicochemical properties vary considerably from congener to congener [145]. As
referred in the beginning of this chapter, the thesis work was mainly focused in BDE-100
congener because it was the one selected by SecurEau team to represent the “new”
chemicals. The main properties of this specific congener are presented in Table 1.9.
1.2.1 Analytical Methods for PBDEs in waters Analytical methods for PBDEs in waters are complex and laborious, due to the necessity
of using a pre-concentration step in the extraction procedure. This pre-concentration step
is always needed in order to reach LODs low enough to determine the ultra-trace levels at
which PBDEs are present in water (normally within the ng/L or low µg/L range) [165-167].
The analytical methods found in the literature for PBDEs in waters are compiled in Table
1.10. It is organized by decreasing order of the year of publication. Concerning the
chromatographic techniques, gas chromatography with electron-capture [168] or mass
spectrometry detection [147, 149, 169-173] are the most widely used for the
determination of PBDEs in water samples, but high-performance liquid chromatography
with diode array, ultraviolet or mass spectrometry detectors may be also applied [156,
174-178].
Methods that use liquid chromatography generally lead to higher LODs (10-700 ng/L)
[174-178]. The liquid-liquid extraction–liquid chromatography–tandem mass
spectrometric (LLE-LC-MS/MS) method conducts to lower LODs (0.004-0.1 ng/L) but the
equipment is rather expensive, extremely high sample volume is required (1 L) and
significant amounts of organic solvents (non-environmental friendly) are typically used,
which limits this method for monitoring a large number of samples [156].
SPE plus dispersive liquid-liquid microextraction (DLLME) is another method used for the
extraction of PBDEs from water and plant samples, presenting low LOD (0.03-0.15 ng/L),
but with the disadvantages of requiring high sample volume and laborious experimental
procedure [168]. On the other hand, the electron-capture detector used does not allow
the identification of the compounds, which may represent a problem if any undesired
interference co-elutes with target analytes.
41

Part I – Chapter 1
Table 1.10. Studies found in the literature about the analytical methods for PBDEs quantification in waters.
Analytes Extraction Determination Analytical parameters Ref. BDEs 47,99,154,183
TA-IL-DLLME Sample volume – 5 mL; Dispersive solvent – MeOH (1 mL); Extraction solvent – [C8MIM] [PF6] (40 µL)
LC-DAD LR – 500-500,000 ng/L RSD – 1.0-3.8% LOD – 100-400 ng/L Rec – 81.0-127.1%
[174]
BDEs 28,47,99,154,183,209
SFOME Sample volume – 40 mL; Extraction solvent – 2-dodecanol (25 µL); Temperature – 60 °C; Stirring speed – 900 rpm; Extraction time – 25 min; Salt addition – no
LC-DAD
LR – 5000-500,000 ng/L (BDE-209) 500-75,000 ng/L (others) LOD – 10-40 ng/L Rec – 92-118%
[175]
BDEs 28,47,85,99,100,153,154
SPE Column – Supelclean LC-C18; Conditioning – DCM (2 mL), MeOH (5 mL), H2O (5 mL); Load – 100 mL at 10 mL/min; Elution – n-hexane (2 mL) + DLLME Sample volume – 5 mL; Disperser solvent – ACN (1 mL); Extraction solvent – 1,1,2,2-tetrachloroethane (22 µL); Salt addition – no
GC-ECD LR – 0.1-100 ng/L (BDEs 28, 47) 0.5-500 ng/L (others) RSD – 4.2-7.9% LOD – 0.030-0.15 ng/L Rec – 66.8-94.1%
[168]
BDEs 47,99,100,153,154
LLE Sample volume – 1 L; Extraction solvent – n-hexane (100 mL); Salt addition – 20 g
LC-MS-MS LR – 0.025-10 ng/L LOD – 0.004-0.1 ng/L Rec – 43-99%
[156]
BDEs 47,99,100,153
USAEME Sample volume – 10 mL; Temperature – 35 °C; Extraction solvent – chloroform (100 µL); Extraction time – 5 min
GC-MS LR – 5-5000 ng/L (BDEs 47,100) 5-10 000 ng/L (BDEs 99,153) RSD – <10.3% LOD – 1-2 ng/L Rec – ≥96%
[169]
BDEs 47,99,100,153
CPE Sample volume – 10 mL; Non-ionic surfactant – Triton X-100 (0.4 g/L); Salt addition – 400 µL of 6.15 mol/L; Temperature – 80 °C; Equilibrium time – 7 min + UABE Extraction solvent – isooctane (50 µL); Extraction time – 5 min
GC-MS LR – 4-150 ng/L RSD – ≤8.5% LOD – 1-2 ng/L Rec – 96-106%
[170]
BDE-209 DLLME Sample volume – 5 mL; Disperser solvent – THF (1 mL); Extraction solvent – tetrachloroethane (22 µL); Salt addition – no
LC-UV LR – 1000-500,000 ng/L RSD – 2.1% LOD – 200 ng/L Rec – 89.9-95.8%
[177]
42
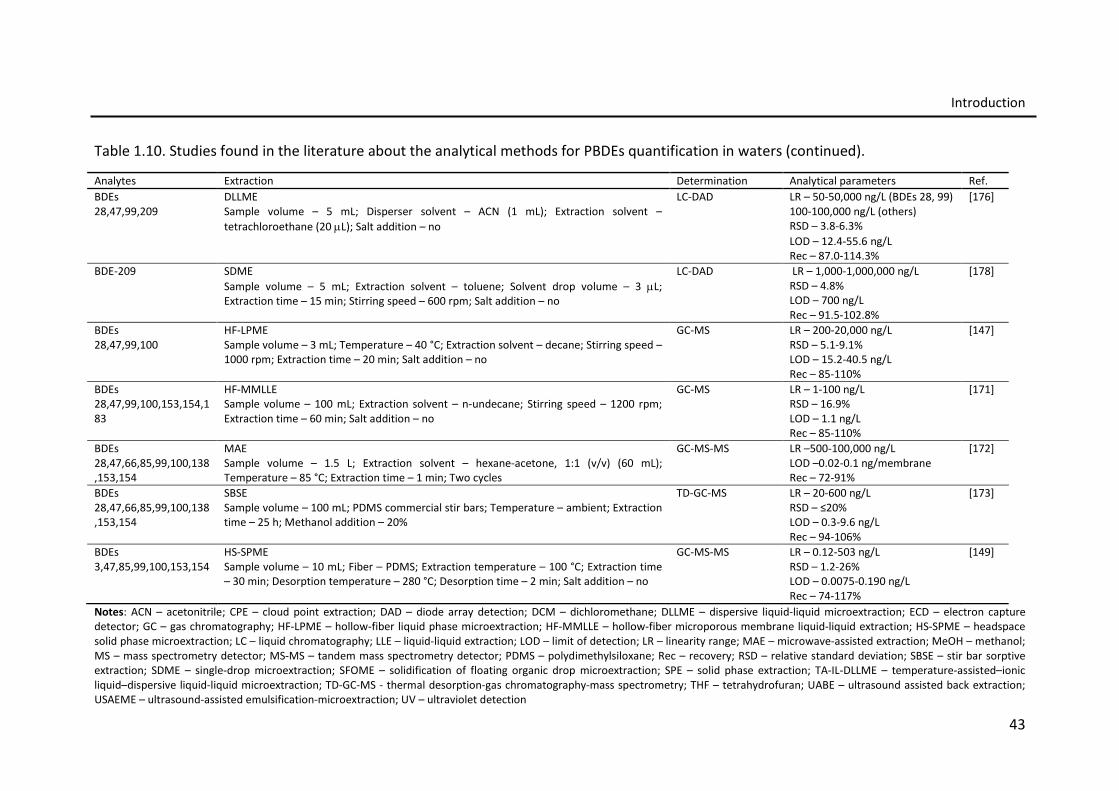
Introduction
Table 1.10. Studies found in the literature about the analytical methods for PBDEs quantification in waters (continued).
Notes: ACN – acetonitrile; CPE – cloud point extraction; DAD – diode array detection; DCM – dichloromethane; DLLME – dispersive liquid-liquid microextraction; ECD – electron capture detector; GC – gas chromatography; HF-LPME – hollow-fiber liquid phase microextraction; HF-MMLLE – hollow-fiber microporous membrane liquid-liquid extraction; HS-SPME – headspace solid phase microextraction; LC – liquid chromatography; LLE – liquid-liquid extraction; LOD – limit of detection; LR – linearity range; MAE – microwave-assisted extraction; MeOH – methanol; MS – mass spectrometry detector; MS-MS – tandem mass spectrometry detector; PDMS – polydimethylsiloxane; Rec – recovery; RSD – relative standard deviation; SBSE – stir bar sorptive extraction; SDME – single-drop microextraction; SFOME – solidification of floating organic drop microextraction; SPE – solid phase extraction; TA-IL-DLLME – temperature-assisted–ionic liquid–dispersive liquid-liquid microextraction; TD-GC-MS - thermal desorption-gas chromatography-mass spectrometry; THF – tetrahydrofuran; UABE – ultrasound assisted back extraction; USAEME – ultrasound-assisted emulsification-microextraction; UV – ultraviolet detection
Analytes Extraction Determination Analytical parameters Ref. BDEs 28,47,99,209
DLLME Sample volume – 5 mL; Disperser solvent – ACN (1 mL); Extraction solvent – tetrachloroethane (20 µL); Salt addition – no
LC-DAD LR – 50-50,000 ng/L (BDEs 28, 99) 100-100,000 ng/L (others) RSD – 3.8-6.3% LOD – 12.4-55.6 ng/L Rec – 87.0-114.3%
[176]
BDE-209 SDME Sample volume – 5 mL; Extraction solvent – toluene; Solvent drop volume – 3 µL; Extraction time – 15 min; Stirring speed – 600 rpm; Salt addition – no
LC-DAD LR – 1,000-1,000,000 ng/L RSD – 4.8% LOD – 700 ng/L Rec – 91.5-102.8%
[178]
BDEs 28,47,99,100
HF-LPME Sample volume – 3 mL; Temperature – 40 °C; Extraction solvent – decane; Stirring speed – 1000 rpm; Extraction time – 20 min; Salt addition – no
GC-MS LR – 200-20,000 ng/L RSD – 5.1-9.1% LOD – 15.2-40.5 ng/L Rec – 85-110%
[147]
BDEs 28,47,99,100,153,154,183
HF-MMLLE Sample volume – 100 mL; Extraction solvent – n-undecane; Stirring speed – 1200 rpm; Extraction time – 60 min; Salt addition – no
GC-MS LR – 1-100 ng/L RSD – 16.9% LOD – 1.1 ng/L Rec – 85-110%
[171]
BDEs 28,47,66,85,99,100,138,153,154
MAE Sample volume – 1.5 L; Extraction solvent – hexane-acetone, 1:1 (v/v) (60 mL); Temperature – 85 °C; Extraction time – 1 min; Two cycles
GC-MS-MS LR –500-100,000 ng/L LOD –0.02-0.1 ng/membrane Rec – 72-91%
[172]
BDEs 28,47,66,85,99,100,138,153,154
SBSE Sample volume – 100 mL; PDMS commercial stir bars; Temperature – ambient; Extraction time – 25 h; Methanol addition – 20%
TD-GC-MS LR – 20-600 ng/L RSD – ≤20% LOD – 0.3-9.6 ng/L Rec – 94-106%
[173]
BDEs 3,47,85,99,100,153,154
HS-SPME Sample volume – 10 mL; Fiber – PDMS; Extraction temperature – 100 °C; Extraction time – 30 min; Desorption temperature – 280 °C; Desorption time – 2 min; Salt addition – no
GC-MS-MS LR – 0.12-503 ng/L RSD – 1.2-26% LOD – 0.0075-0.190 ng/L Rec – 74-117%
[149]
43

Part I – Chapter 1
A great variety of recent extraction techniques has been applied prior to GC-MS:
ultrasound-assisted emulsification-microextraction (USAEME) [169], cloud point
extraction (CPE) with ultrasound assisted back extraction (UABE) [170], hollow-fiber liquid
phase microextraction (HF-LPME) [147], hollow-fiber microporous membrane liquid-liquid
extraction (HF-MMLLE) [171], microwave assisted extraction (MAE) [172], stir bar sorptive
extraction (SBSE) [173] and headspace solid phase microextraction (HS-SPME) [149].
Almost all extraction techniques use low sample volume (up to 10 mL) [147, 149, 169,
170]. This is particularly important if the analytical method is designed to be applied, for
instance, to degradation or sorption experiments (which is the case of the present thesis),
where several samples are taken along the time. Although advantages are recognized to
each of the described methods, some drawbacks are also pointed out. Some of them are
rather laborious, increasing the time of analysis [170, 173], other present lower precision
[147, 171], as reported by Fontana et al. [169] and Zang et al. [179], or require higher
sample volumes (up to 1.5 L) [172]. Finally, carry-over phenomena have also been pointed
as a disadvantage for SBSE and HS-SPME [149, 173].
Therefore, the search for a simple and inexpensive method, capable of being applied
either to environmental monitoring or to degradation/sorption studies of PBDEs in
aqueous samples (which require small volumes of sample and quick response) justified
the choice of DLLME in this thesis (Chapter 6).
DLLME technique has gained a great popularity due to the easiness of operation, rapidity,
low time and cost, high recovery and enrichment factor [176]. The application of this
promising technique for PBDEs determination in water samples is still very limited. Up to
the author’s knowledge, only three analytical methodologies, based exclusively on DLLME
as extraction technique, were found in the literature for such purpose [174, 176, 177]. All
of them use detectors (DAD and UV) that do not allow an unequivocal compound
confirmation. Furthermore, the LODs obtained by these methods (12-400 ng/L) are in
general not compatible with the requirements for monitoring purposes. The most recent
DLLME method uses ionic liquid as extraction solvent, but the use of such ionic liquids,
with too high viscosity, represents an important trouble for the direct injection in the
liquid chromatograph [174].
44

Introduction
1.2.2 Analytical methods for PBDEs in deposits from drinking water networks
Up to the author knowledge, there is no published data concerning analytical
methodologies for PBDEs quantification in deposits from drinking water networks. As for
paraquat, the strategy was to understand which methodologies have been implemented
for PBDEs determination in soils and take them as first analytical approaches for deposits
analysis. Unfortunately, it was not possible to work in this field during the thesis period
due to time scarcity but, here are compiled some aspects that should be taken into
account in a future work related to this matter.
In Table 1.11, it is compiled all analytical methodologies found in the literature for PBDEs
quantification in soils. Pressurized liquid extraction (PLE) is the most frequently used
extraction technique. Accordingly to Table 1.11 and for PLE procedure, the soil sample is
put in contact with the extraction solvent, typically dichloromethane (DCM), mixtures of
hexane/DCM, acetone/hexane or ethyl acetate:MeOH, at 60-120 °C and 2500-2031 psi
during a maximum of 20 min [180-184]. In this technique, the dispersion of the sample is
promoted by the addition of sand [183], diatomaceous earth [180, 182] or Spe-edTM (a
type of cleaned and sieved diatomaceous earth) [184], which also act as drying agents.
Using PLE, PBDEs recoveries are similar to those achieved with conventional Soxhlet
extraction with the advantage of using reduced solvent volumes (10-30 mL) in shorter
extraction times (5-20 min). Although widely accepted as a robust liquid-solid extraction
technique, Soxhlet has been pointed out as a time consumer method (12-24 h), which
requires high solvent volumes [185-187]. Additionally, PLE procedure typically conducts
to low standard deviations because of being an automated system. Less common, is the
ultrasonication with ethyl acetate [188] or hexane:MTBE [189]. This technique is relatively
quick when compared to Soxhlet methodology (30-60 min) and similar detection limits
were obtained (0.002-0.09 ng/g) [185-189].
As observed from Table 1.11, Soxhlet, PLE and ultrasonication extractions involve clean-
up steps before instrumental analysis due to the soil matrix complexity and the need of
extract purification in order to prevent chromatographic systems contamination. The
SPME has a great advantage over the last extraction techniques because typically does
not require the mentioned time consuming multi-step purification methods.
45

Part I – Chapter 1
Table 1.11. Studies found in the literature about the analytical methods for PBDEs quantification in soils.
Analytes Extraction Clean-up Instrumental technique
Analytical parameters Year Ref.
BDEs 17, 47, 66, 100, 153, 183
PLE 1 g soil+ 7 g Spe-edTM PSE matrix; ethyl acetate:MeOH (90:10, v/v); 80 °C; 120 bar (1740 psi); 10 min; 2 cycles; concentration to 1 mL
not applicable GC-MS-MS LR – 10-200 µg/L RSD – <12-17% LOD – 0.2-2.5 ng/g Rec – 75-102%
2012
[184]
BDEs 28, 47, 99, 100, 153, 154, 183
µ-SPE 1 g soil; 25 mL ultrapure water; µ-SPE device (copper (II) isonicotinate coordination polymer into a porous polypropylene envelope) immerged into the water; 90 °C; 60 min; rinsing µ-SPE device with ultrapure water; drying using a cheese cloth; extraction with 1 mL hexane by sonication during 20 min
not applicable . GC-µECD
LR – 0.1-200 ng/g RSD – 1.3-10.1% LOD – 0.026-0.066 ng/g Rec – 70-90%
2012 [190]
BDEs 28, 47, 66, 68, 85, 99, 138, 153, 154, 183
Ultrasonication 1 g soil; 5 mL hexane:MTBE (1:1, v/v); 20 min; 3 cycles
• Treatment with 2 g copper powder • Acid silica gel column – elution
with 40 mL DCM; evaporation; concentration to 1 mL
GC-MS RSD –5-10% LOD – 0.047-0.094 ng/g Rec – 76-109%
2012 [189]
BDEs 17, 28, 47, 66, 85
GA-MSPD SPE column with 100 mg soil+ 10 mg CCG+ 50 mg anhydrous sodium sulfate+ 50 mg florisil; elution with 2×500 µL hexane:DCM (1:1); concentration to 50 µL hexane
not applicable GC-ECD LR – 0.1-50.0 ng/g RSD – 5.7-15.7% LOD – 0.006-0.029 ng/g Rec – 69.4-104.6%
2011 [191]
BDEs 41 different congeners
PLE 10 g soil+copper powder; hexane:DCM (1:1, v/v); 1508 psi; 100 °C; 10 min; two cycles
• Concentrated H2SO4 (60 mL) treatment
• Florisil – elution with hexane:methylene chloride (1:2, v/v) (240 mL)
• Concentration to 200 µL
GC-MS RSD – 2.9-21.8% LOD – 0.01-0.03 ng/g (mono- to hepta-BDEs), 1.43 ng/g (nona-BDE) and 0.20 ng/g (deca-BDE) Rec –24-133%
2011 [181]
46

Introduction
Table 1.11. Studies found in the literature about the analytical methods for PBDEs quantification in soils (continued).
Analytes Extraction Clean-up Instrumental technique
Analytical parameters Year Ref.
BDEs 28, 47, 99, 100, 153, 154, 183
PLE 1 g soil+ 0.5 g sand; DCM; 1500 psi; 100 °C; 5 min; 1 cycle
• Acid silica:silica (10:5 or 15:0) – elution with isohexane
• Concentration to 100 µL
GC-MS LR – 0.10-30 ng/L (for BDE-183); 0.05-30 ng/g (for others) RSD – ≤3% LOD – 0.011-0.054 ng/g Rec – 81-103%
2010 [183]
BDEs 3, 17, 28, 71, 47, 66, 100, 99, 85, 154, 153, 138, 183, 190, 209
PLE 20 g soil+ 3-4 g diatomaceous earth+ 1 g Cu; DCM; 2031 psi; 120 °C; 6 min; two cycles
• GPC column – elution with hexane:DCM (1:1, v/v) (90+70+50 mL)
• SPE columns with neutral aluminum oxide and deactivated silica gel – elution with 15 mL hexane, 5 mL hexane:DCM (9:1, v/v) and 20 mL hexane: DCM (4:1, v/v)
• Concentration to 500 µL
GC-MS RSD – <20% LOD – 0.003-0.110 ng/g Rec – >88%
2010 [182]
BDEs 3, 7, 15, 17, 28, 47, 49, 66, 71, 77, 85, 99, 100, 119, 126, 138, 153, 154, 156, 183, 184, 191, 196, 197
PLE 10 g soil+ 2 g diatomaceous earth+ 2 g copper powder; acetone:hexane (1:1, v/v); 1500 psi; 60 °C; 5 min; 1 cycle
• Florisil:silica gel (1:1, v/v) column – elution with acetone:hexane (1:1, v/v)
GC-MS LR – 20-200 ng/g RSD – 2.2-11.5% LOD – 0.1-1.0 ng/g Rec – 94-109%
2009 [180]
BDEs 47, 77, 99, 100, 118, 153, 154, 181, 183, 190
Soxhlet 2 g soil; 200 mL hexane:acetone (1:1); 24 h;
• Concentrated H2SO4 treatment (2 mL)
• Alumina column – elution with 8 mL hexane and 8 mL DCM:hexane (2:3, v/v)
• Concentration to 50 µL
GC-MS RSD – <10% LOD – 0.01-0.34 ng/g Rec – 87.6% (BDE-77)
2008 [187]
BDEs 17, 47, 66, 100, 99, 85, 154, 153, 138
HS-SPME 1 g soil; PM-β-CD/OH-TSO fiber; adsorption (95 °C, 60 min); desorption (300 °C, 12 min)
not applicable GC-MS LR – 0.1-10 ng/g RSD – 6.9-9.9% LOD – 0.013-0.078 ng/g Rec – 78.2-99.2%
2007 [192]
47

Part I – Chapter 1
Table 1.11. Studies found in the literature about the analytical methods for PBDEs quantification in soils (continued).
Notes: CCG – chemically converted grapheme; DCM – dichloromethane; ECD – electron capture detector; µECD – micro-cell electron capture detector; GA-MSPD – graphene-assisted matrix solid-phase dispersion; GC – gas chromatography; HF-LPME – hollow-fiber liquid phase microextraction; HS-SPME – headspace solid phase microextraction; LOD – limit of detection; LR – linearity range; MeOH – methanol; MS – mass spectrometry detector; MS-MS – tandem mass spectrometry detector; PDMS – polydimethylsiloxane; PLE – pressurized liquid extraction; Rec – recovery; RSD – relative standard deviation; SPE – solid phase extraction; µ-SPE – micro-solid-phase extraction; UAE – ultrasound-assisted extraction.
Analytes Extraction Clean-up Instrumental technique
Analytical parameters Year Ref.
BDEs 28, 47, 99, 100
HF-LPME 0.5 g soil + 10 mL H2O with (30% MeOH); decane; 40 °C; 1000 rpm; 20 min
not applicable GC-MS LR – 0.2-20 µg/L RSD – <10% LOD – 15.2-40.5 ng/L Rec –84.5-111.7%
2007 [147]
BDEs 3, 15, 28, 47, 99, 139, 153, 154, 183
Soxhlet 1 g soil+ 10 g anhydrous sodium sulfate+ 5 g copper powder; hexane:acetone (1:1, v/v); 12 h
• Multi-step columns of silica gel and activated neutral alumina
GC-MS RSD – <10% LOD – 0.008-0.1 ng/g (10 g soil) Rec – >60%
2006 [186]
BDEs 15, 47, 49, 85, 99, 100, 153, 154
UAE 2 g sample+ 0.25 g florisil; 8 mL hexane; 360 W; 15 min + HS-SPME PDMS; 5 mL Milli-Q water; adsorption (100 °C, 60 min); desorption (280 °C, 3 min)
not applicable GC-MS-MS LR – 1.25-100 ng/g (for BDE-153); 0.5-100 ng/g (for others) RSD – 0.8-14% LOD – 0.01-1.20 ng/g Rec – 92-138%
2006 [193]
BDEs 15, 49, 47, 100, 99, 85, 154, 153
HS-SPME 0.5 g soil+2 mL water; PDMS; adsorption (100 °C, 60 min); desorption (280 °C, 3 min)
not applicable GC-MS-MS LR – 0.1-10 ng/g RSD – 1.0-16% LOD – 0.014-0.625 ng/g Rec – 95.7-105.1%
2006 [194]
BDEs 17, 47, 66, 100, 153, 183
Ultrasonication 10 g soil+ 3 g anhydrous sodium sulfate, 5 mL ethyl acetate; 15 min; 2 cycles
• Florisil column – elution with 10 mL of hexane:DCM (1:2, v/v); concentration to 1 mL
GC-MS LR – 0.01-10 ng/g RSD – 1-9% LOD – 0.002-0.030 ng/g Rec – 81-104%
2006 [188]
BDEs 3, 7, 17, 47, 66, 100, 153, 183
Soxhlet 4 g soil+ 20 g anhydrous sodium sulfate+ 15 g copper powder; hexane:acetone (1:1, v/v); 18 h; concentration to 1 mL
• 2 columns: acidic silica gel (30%, w/w) and activated neutral alumina
GC-MS RSD – 11-26% LOD – 0.013-0.25 ng/g Rec – 61-118%
2005 [185]
48

Introduction
However, specific fibers may be needed (copper (II) isonicotinate coordination polymer
into a porous polypropylene envelope [190] and PM-β-CD/OH-TSO fiber [192]) and some
problems concerning carry-over phenomena have been pointed out. Concerning the
purification techniques, soil extracts contain relatively large amounts of elemental
sulphur, which would disturb the GC analysis and must be removed [150]. Sulphur
removal methodologies comprise the treatment with copper powder, silica modified with
AgNO3 in a multi-layer silica column or desulfuration with mercury [150]. Sulphur may be
also removed during the extraction by addition of copper powder to a Soxhlet beaker
[185, 186] or a PLE cell [180-182]. Another point that should be taken into account, when
a soil matrix is extracted, is the organic matter content. Soil samples have high levels of
organic matter that compromises the purification via column chromatography [150]. For
that reason, the treatment with concentrated sulfuric acid is sometimes required prior to
the subsequent purification steps [181, 187]. The purification and fractionation of the
extract is performed using a great variety of adsorbents: silica [182, 183, 185, 186, 189],
florisil [180, 181, 188], GPC [182] and alumina [182, 185-187]. Finally, the extract is
concentrated before the analysis.
The general problem in the analysis of complex samples like soils is linked to the large
number of matrix components, still after exhaustive extraction techniques, which may
coelute with the analytes, disturbing the quantitative analysis. Concerning the
instrumental analysis, gas chromatography with mass spectrometry detection is the
method of choice for PBDEs quantification in soils. The tandem mass spectrometry
technique may surpasses others in analytical specificity but it is not widely used due to its
relatively poor sensitivity and reproducibility [150].
1.2.3 Sorption of PBDEs on deposits from drinking water networks
As occurred in the last section, no studies about PBDEs adsorption/desorption on
deposits from drinking water distribution systems were found in the literature. This topic
may have particular relevance in the context of a deliberate or accidental contamination
of drinking water networks because the sorption processes may determine the fate,
mobility and bioaccessibility or bioavailability of PBDEs in this field. Again, due to the lack
of information concerning this topic, the soil sorption studies were checked for
49

Part I – Chapter 1
comparison purposes. Even so, few studies on this matrix were found in the open
scientific literature. A brief description of the available studies is presented below.
Mueller et al. (2006) monitored the extractability of BDE-47, 99 and 100 from soils
contaminated with an environmentally relevant level of a commercial penta-BDE mixture.
Additionally, they studied the influence of plants (radish and zucchini) on penta-BDE
behavior in soil [195]. They demonstrated that the reduced recovery of PBDEs from soils
(less than 7%) is attributed to abiotic sorption processes [195]. Monoculture plantings did
not affect the recovery of PBDEs from soil but, interspecific plant interactions may
enhance their bioavailability in soil and increase the human exposure risk [195].
Liu et al. (2010) focused on the sorption dynamics of BDE-28 and BDE-47 on soils [196].
They show that the two-compartment first-order kinetic model is the one that better
describes the experimental results. This model is characterized by a fast sorption at the
beginning (0-5 h) and a subsequent phase of slow sorption (9-265 h) [196]. They assumed
that the first stage of sorption may correspond to the adsorption on soil organic matter
(SOM) fractions with loose structure and mostly located in the outer sphere of SOM,
while the slow sorption may be associated to the sorption of BDE-28 and BDE-47 to the
SOM fractions with condensed conformation and mostly distributed in inner sphere of
SOM [196]. One year later, they characterized BDE-28 and -47 sorption isotherms using
the same set of soil samples [197]. They reported satisfactory fittings of isothermal data
with both linear distribution and non-linear Freundlich models [197]. Afterwards, the
same research group published another study about BDE-28 and -47 focusing, at this
time, on the desorption kinetics and isothermal characteristics of these two PBDEs in soils
[198]. They found an appropriate description of the BDE-28 and -47 desorption results by
the two (rapid and slow)-compartment first-order kinetic model and concluded that the
SOM constituents are once again the main responsible for these findings [198].
Concerning the desorption isotherms, both linear distribution and nonlinear Freundlich
models were identified as being the most suitable for description of their results [198].
Olshansky et al. 2011 studied the adsorption and desorption behaviors of BDE-15 in soils.
The authors concluded that the amount and the structure/properties of the SOM affect
BDE-15 sorption to soils [199]. The sorptive capacities obtained for humin are higher than
that obtained for the corresponding soil. They advanced that a possible reason for that
observation is the fact that during the isolation of humin, by humic and fulvic fractions
50

Introduction
removal, the non-polar polyethylene domains are exposed enhancing the adsorption
efficiency for hydrophobic organic compounds [200, 201]. Concerning the desorption
phenomenon, negligible or no desorption was reported for soil samples in contrast to
humin, where desorption isotherm hysteresis was not pronounced [199]. Pronounced
desorption isotherm hysteresis attained for soil samples may be induced by irreversible
chemical binding, physical entrapment of molecules within the SOM matrix and/or by
deformation of the sorbent matrix [199]. In sum, PBDEs sequestration from soils is
probably governed by other SOM constituents and not by humin [199].
More recently, Xin and co-workers investigated the adsorption and desorption behaviors
of BDE-47 in single system and in binary system (in the presence of BDE-209) [202]. They
also concluded that the adsorption/desorption of BDE-47 on/from soils are really affected
not only by the amount but also by the structure and properties of the SOM. It seems that
condensed SOM (including kerogen, BC and humic acid in glassy state) exhibits higher
capacities [202]. They verified that BDE-209 can suppress the sorption of BDE-47, but the
latest caused no effect on BDE-209 sorption, which can be attributed to the higher
accessibility of more hydrophobic molecules to adsorption sites [202]. Once again,
irreversible surface adsorption between sorbent and sorbate was reported, which is
supported by the desorption hysteresis obtained [202]. More hysteretic BDE-47
desorption isotherms were achieved in the presence of BDE-209 may be due to the
accelerated sorbent state transition and the creation of new sites after BDE-209 sorption
[202].
In short, it is of widely concern that the adsorption/desorption of PBDEs on/from soils is
highly influenced by the amount and composition of SOM. The hydrophobicity of
congeners was proposed to account for their affinity to adsorption sites [202]. PBDEs
sorption on soils can be considered irreversible (negligible or no PBDEs recoveries from
soils were reported) [199]. Interspecific plant interactions may potentiate the human
exposure risk by enhancing PBDEs bioavailability in soils [195]. This may have
considerable consequences regarding the long-term fate of PBDEs in soils planted with a
multi species of plants.
The levels of total organic carbon exhibited by the soils studied in previous studies (0.09-
1.07% [199] and 0.13-0.70% [202]) are similar to the organic contents determined in
deposits analyzed during this thesis (0.2-1.0 wt.%). Although the SOM properties were
51

Part I – Chapter 1
not known for deposits, it may be advanced that, attending only on the organic content,
similar sorption behaviors can be expected on both soil and deposit matrices.
1.2.4 Degradation technologies for PBDEs in waters 1.2.4.1 Overview
Degradation of PBDEs in waters is a research topic really scarcely addressed. In fact, it
seems very difficult to carry out experiments in pure water due to the extremely low
solubility of PBDEs in this solvent, which significantly enhances any sorption process on
container walls or other materials used during the experiments [203]. Additionally,
transparency to UVB light and the ability to act as a hydrogen donor are favorable
properties of some organic solvents that suggest facile reaction in these solvents [203].
So, the tendency adopted by most researchers was to start by exploring the PBDEs
degradation behaviors in other kind of solvents: hexane [159, 203], MeOH [204, 205],
mixtures of MeOH/H2O [206, 207], THF [205, 208, 209], mixtures of THF/H2O [210-212],
ACN [213, 214], acetone/H2O [215], mixtures of hexane/benzene/acetone [216].
However, care must be taken because the kinetic constants, degradation mechanisms
and reaction products may be drastically influenced by the conditions under which the
reaction is processed and some predictions concerning real scenarios may clearly fail.
Different approaches are available in the literature for PBDEs degradation in liquids.
Proposal technologies are hydrothermal [217] and electrolytic degradation
methodologies [206, 209], photocatalysis [208, 212, 213, 218], photolysis [159, 203, 205,
207, 214, 216, 219, 220] and other remediation techniques [204, 210, 211, 215, 221-223].
Figure 1.3 depicts the weight of each methodology (in percentage) for the overall studies
found in the literature concerning this research topic; as can be observed, photolysis is
the most studied technique.
Concerning the most PBDE congeners investigated, it can be concluded from Figure 1.4
that BDE-209 is the most studied congener followed by BDE-47. A total contribution of
only 18% is reserved for the investigation of other PBDEs. It seems that a great concern
exists about the BDE-209 degradation behavior in liquid media, driven by the necessity of
understand what happens to this congener in the aqueous environment. Even so, BDE-
209 is the congener less soluble in water (EPI Suite TM, copyright 2000-2012
Environmental Protection Agency, United States) and, for that reason, it is not expected
52

Introduction
that considerable soluble concentrations will be found in the water courses. Additionally,
is generally considered to be highly recalcitrant but safe [223].
0 10 20 30 40 50
Other
Photolysis
Photocatalysis
Electrolytic
Hydrothermal
Percentage of publications
Figure 1.3. Relative contribution of the different degradation technologies used for the
treatment of liquids contaminated with PBDEs (search in Scopus data base, from 2003 to
2013).
64%18%
18%
BDE-209
BDE-47
Others
Figure 1.4. Most studied PBDEs congeners (search in Scopus data base, from 2003 to
2013).
On the other hand, BDE-209 is the main congener present in the available deca-BDE
commercial mixture [152], and the need to know which lower brominated congeners may
53

Part I – Chapter 1
occur in the environment, as a result of BDE-209 decomposition (even at a limit extent),
may justify such big investment. Indeed, BDE-209 may be a source of environmentally
abundant BDEs (BDEs 47, 99, 100, 154 and 183) [223] and a source of metabolites with
high toxicity. Lower PBDEs are actually more persistent, bioaccumulative and toxic [152,
157-159].
Figure 1.5 illustrates the number of studies performed with BDE-209, BDE-47 and other
PBDEs using different degradation processes. As demonstrated, hydrothermal and
photocatalysis approaches were implemented only for BDE-209 degradation purposes
[208, 212, 213, 217, 218]. Electrolytic technique was only tested in order to degrade the
two most studied congeners (BDE-209 and BDE-47) [206, 209].
0 20 40 60 80 100
Other
Photolysis
Photocatalysis
Electrolytic
Hydrothermal
Percentage of publications
BDE-209
BDE-47
Others
Figure 1.5. Number of publications performed with BDE-209, BDE-47 and others using
different degradation processes (search in data base Scopus, from 2003 to 2013).
Another relevant aspect that deserves attention is the initial concentration of the parent
compound in PBDEs degradation studies. Most of the available studies are conducted
with high initial parent compound concentrations (1-1000 mg/L), fact that is possible due
to the high solubility of these compounds in organic solvents, which are always used in
the preparation of the starting solutions [203-206, 209-211, 213, 216, 222]. Figure 1.6
shows that around 70% of the studies about PBDEs degradation in liquids are performed
starting from concentrations at ppm levels, extremely above of the PBDEs’ water
solubility. Again, this is another point that contributes to the deviation from real case
scenarios, complicating any extrapolation analysis. It is also evident from Figure 1.6 that
54
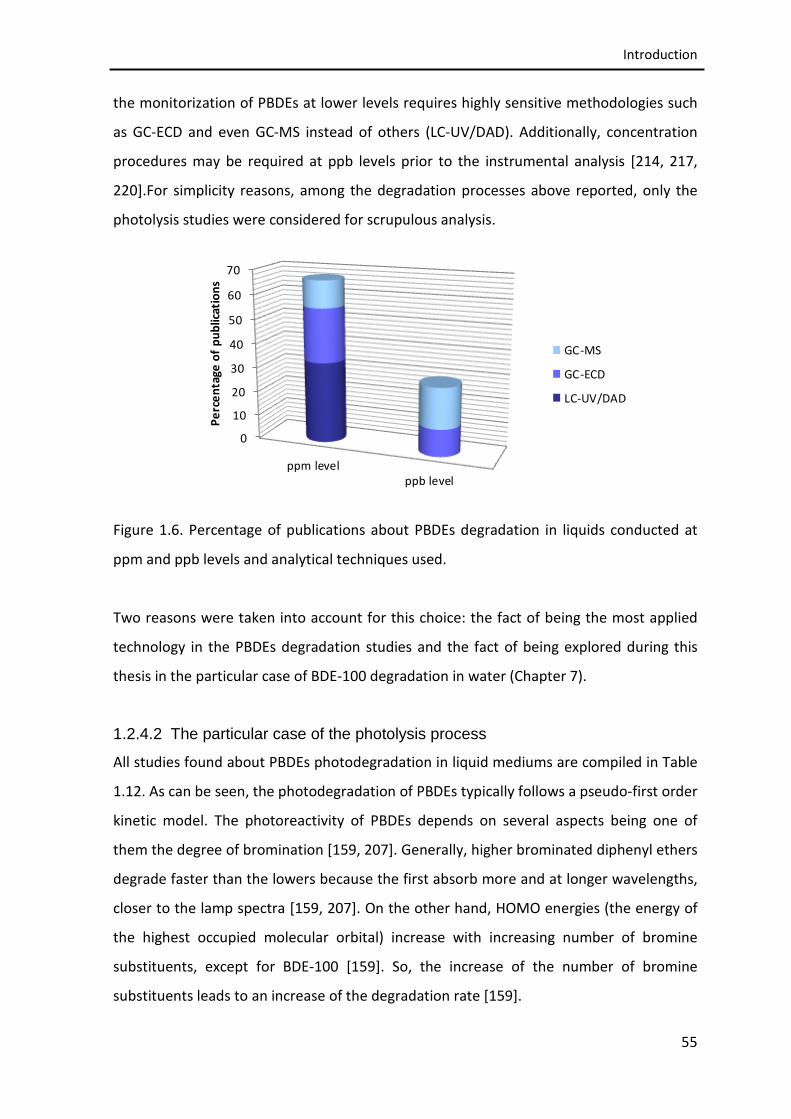
Introduction
the monitorization of PBDEs at lower levels requires highly sensitive methodologies such
as GC-ECD and even GC-MS instead of others (LC-UV/DAD). Additionally, concentration
procedures may be required at ppb levels prior to the instrumental analysis [214, 217,
220].For simplicity reasons, among the degradation processes above reported, only the
photolysis studies were considered for scrupulous analysis.
0
10
20
30
40
50
60
70
ppm levelppb level
Perc
enta
ge o
f pub
licat
ions
GC-MS
GC-ECD
LC-UV/DAD
Figure 1.6. Percentage of publications about PBDEs degradation in liquids conducted at
ppm and ppb levels and analytical techniques used.
Two reasons were taken into account for this choice: the fact of being the most applied
technology in the PBDEs degradation studies and the fact of being explored during this
thesis in the particular case of BDE-100 degradation in water (Chapter 7).
1.2.4.2 The particular case of the photolysis process
All studies found about PBDEs photodegradation in liquid mediums are compiled in Table
1.12. As can be seen, the photodegradation of PBDEs typically follows a pseudo-first order
kinetic model. The photoreactivity of PBDEs depends on several aspects being one of
them the degree of bromination [159, 207]. Generally, higher brominated diphenyl ethers
degrade faster than the lowers because the first absorb more and at longer wavelengths,
closer to the lamp spectra [159, 207]. On the other hand, HOMO energies (the energy of
the highest occupied molecular orbital) increase with increasing number of bromine
substituents, except for BDE-100 [159]. So, the increase of the number of bromine
substituents leads to an increase of the degradation rate [159].
55

Part I – Chapter 1
Table 1.12. Studies found in the literature concerning the photodegradation studies of PBDEs in liquid mediums.
PBDE
congeners
Initial
Concentration
Matrix Operating
conditions
Taken
volumes
Extraction/clean-up Analytical method Results and comments Ref.
BDEs 209,
208, 207,
206, 203,
190, 183,
181, 155,
154, 139,
138, 99,
77, 47
1×10⁻⁶ M (1
mg/L for BDE-
209 and 0.5
mg/L for BDE-
47)
MeOH:H2O
(80:20, v/v);
MeOH;
THF
Radiation
source: 20 W UV
lamp (Philips)
5 mL for
solutions in
THF; the
necessary
for injection
for other
solvents.
Only for samples in THF: 5
mL sample + 10 mL of a
mixture of ACN:H2O
(75:25)
HPLC-UV Kinetic: 1st order reaction
Rate constants: ranging from 0.003 h-1
(BDE-47) to 1.44 h-1 (BDE-209) in
MeOH:H2O; from 0.004 h-1 (BDE-47) to
2.34 h-1 (BDE-209) in MeOH; from 0.007
h-1 (BDE-47) to 2.99 h-1 (BDE-209) in
THF.
Degradation products: lower
brominated diphenyl ethers and PBDFs.
[207]
BDE-153 0.8 µg/L ACN;
Distilled
water;
Seawater
Radiation
source: 6 W UV-
lamp (302 nm) or
solar light
100 µL For distilled water and
seawater:
filtration with MgSO4;
wash with 3×250 µL
toluene:DCM (1:1, v/v);
reduction volume to 25
µL under nitrogen flow
and T.
For ACN:
reduction volume to 25
µL under nitrogen flow
and T.
HRGC-HRMS Kinetic: 1st order reaction
Rate constants: 26±6 h-1 in ACN; 9±2 h-1
in seawater; could not be calculated in
distilled water.
Degradation products: lower
brominated PBDEs, 1,2,4,7,8-PeBDF and
tetrabrominated 2-hydroxybiphenyls
(BDE-153 in ACN); only lower
brominated PBDEs (BDE-153 in distilled
and sea-waters).
[214]
56

Introduction
Table 1.12. Studies found in the literature concerning the photodegradation studies of PBDEs in liquid mediums (continued).
PBDE
congeners
Initial
Concentration
Matrix Operating
conditions
Taken
volumes
Extraction/clean-up Analytical method Results and comments Ref.
BDE-209 2-5 mg/L Hexane Radiation
source: solar
light
1 mL Not applicable GC-µECD
(quantification)
GC-MS
(identification)
Kinetic: 1st order reaction
Rate constants: 6.70 h-1 (July 2 of
2003), 4.00 h-1 (October 23 of 2003).
Main mechanism: consecutive
reductive debromination
Degradation products: lower
brominated PBDEs (43 BDEs were
detected and 21 of them were
identified).
[203]
BDEs 28,
47, 99,
100, 153
and 183
10 µg/L Hexane Radiation
source: Hg 500
W filtered with
Pyrex glass
Irradiation time:
40 h
The
necessary
for injection
Not applicable GC-ECD Kinetic: 1st order reaction
Rate constants: ranging from 0.10 h-1
(BDE-100) to 2.64 h-1 (BDE-183)
Main mechanism: consecutive
reductive debromination
Photoreactivity of bromines: decrease
from ortho to para positions for less
brominated PBDEs; no differences
were observed for higher brominated
congeners.
Degradation products: lower
brominated PBDEs.
[159]
57

Part I – Chapter 1
Table 1.12. Studies found in the literature concerning the photodegradation studies of PBDEs in liquid mediums (continued).
PBDE
congeners
Initial
Concentration
Matrix Operating
conditions
Taken
volumes
Extraction/clean-up Analytical method Results and comments Ref.
Deca-BDE 1×10⁻⁶ M (1
mg/L for BDE-
209)
THF
MeOH
THF/MeOH
Radiation
source:
Fluorescent tube
TL 20 W/09N
from Philips
Irradiation time:
100-200 min
500 mL Evaporation to dryness;
reconstitution with 4 mL
of n-Hexane.
GC-MS
(identification and
quantification of
degradation
products)
Main mechanism: consecutive
reductive debromination,
intramolecular elimination of HBr.
Degradation products: hexa- to nona-
BDEs, mono- to penta-BDFs and
methoxylated tetra- to penta-BDFs
[205]
BDE-99 3 to 63 µg/L H2O
Aqueous
surfactant
solution (Brij
35 and Brij
58)
Radiation
source: two low-
pressure Hg
lamps (254 nm,
2.28×10⁻⁷
Einstein L-1 s-1).
4 mL LLE
Extraction with hexane
(2×); concentration to 1
mL under nitrogen flow at
40 °C for GC-ECD or to
100 µL for GC-MC
analysis.
GC-µECD and GC-
MS (same samples)
Kinetic: pseudo first-order
Rate constants: ranged from 4.10 to
5.36 h-1 in surfactant solutions; 2.20 h-1
in H2O.
Main mechanism: consecutive
reductive debromination or
intramolecular elimination of HBr.
Degradation products: lower
brominated PBDEs (mono- to tetra-)
and lower brominated PBDFs (mono-
to tetra-).
Toxicity/Biodegradability: PBDFs are
more toxic photoproducts.
[219]
58

Introduction
Table 1.12. Studies found in the literature concerning the photodegradation studies of PBDEs in liquid mediums (continued).
PBDE
congeners
Initial
Concentration
Matrix Operating
conditions
Taken
volumes
Extraction/clean-up Analytical method Results and comments Ref.
BDE-100 5 µg/L H2O (ice and
liquid)
Freezer process:
in a laboratory
freezer at -20 °C.
Ice solid samples
dimensions: 6
cm diameter and
0.8 cm height.
Radiation
source: two 8 W
low-pressure Hg
lamps (254 nm).
Irradiation:
maximum 10 min
22 mL HS-SPME
Sample volume – 10 mL
Fiber – PDMS
Extraction temperature –
100 °C
Extraction time – 45 min
GC-MS Kinetic: 1st order reaction
Rate constants: 10.68 h-1 (ice), 9.72 h-1
(water)
Main mechanism: consecutive
reductive debromination and
intramolecular elimination of HBr.
Degradation products: lower
brominated PBDEs and PBDFs.
[220]
Deca-BDE 100 mg/L Hexane:
benzene:
acetone
(8:1:1, v/v)
Radiation
source: Hg lamp
(254 nm) and sun
light
Irradiation time:
16 h
5 mL Not applicable GC-ECD
(quantification)
GC-MS
(identification)
Main mechanism: consecutive
reductive debromination.
Degradation products: lower
brominated PBDEs (tri- to octa-) and
lower brominated PBDFs (mono- to
hexa-).
[216]
Notes: ACN – acetonitrile; ECD – electron capture detector; µECD – micro-cell electron capture detector; GC – gas chromatography; HRGC-HRMS – high resolution gas chromatography–mass spectrometry; HS-SPME – headspace solid phase microextraction; LC – liquid chromatography; MeOH – methanol; MS – mass spectrometry detector; THF – tetrahydrofuran; UV – ultraviolet.
59
Part I – Chapter 1
BDE-100 fails this rule and is more difficult to degrade than expected due to its stability
that is conferred by the specific brominated phenyl ring with a 2,4,6 substitution pattern
[159]. Indeed, the position of the substituted bromines is another factor that affects the
PBDEs photoreactivity. Fang et al. demonstrated that for lower brominated congeners,
bromines at ortho position showed higher photoreactivity than those at para positions,
while for higher brominated PBDEs congeners the difference became insignificant [159].
Beyond the natural PBDEs photoreactivity, the reaction rate can be influenced by other
parameters such as the type of the solvent/reaction medium [214, 219, 220] and the
intensity and kind of radiation used [205].
Photodegradation of PBDEs generally leads to the formation of lower brominated PBDE
congeners by consecutive reductive debromination. Photoproducts with lower bromine
content are more persistent and bioavailable than the parent ones [220]. Sequential
dehalogenation is often reported as the main mechanism involved in the
photodegradation of PBDEs under solar light [203] or UV radiation [159, 205, 207].
However, other relevant degradation pathways may occur and are responsible for the
formation of other classes of compounds. One of the most important is the dibenzofuran-
type ring closure process via an intermolecular elimination of HBr, which is responsible
for the formation of polybrominated dibenzofurans – PBDFs [214, 216, 219, 220]. In fact,
it has been widely reported that PBDFs are more toxic compounds than the original ones
(PBDEs) [214, 219, 220]. Another possible degradation pathway is the fragmentation to
form phenols [205, 216]. Excited degradation by-products may also react with the
surrounding solvent. Protic solvents, MeOH and H2O for example, may lead to the
formation of methoxylated or hydroxylated species, respectively [205]. These reactions
are responsible for the following findings: MeO-PBDEs, OH-PBDEs, MeO-PBDFs, OH-
PBDFs... Nevertheless, the formation of some of these compounds may be unlikely to
take place under natural conditions such as MeO-PBDFs [205].
It is finally worth stressing that the degradation pathways as well as the reaction products
may be significantly affected by the conditions under which the reaction takes place and
experiments under conditions closer to the reality are encouraged (in water and at lower
initial concentrations) in order to overcome the great gap concerning this research topic.
Preliminary results concerning this new research topic are presented in Chapter 7.
60

Introduction
1.3 References
[1] WHO, Hazards in drinking-water supply and waste management, in: Health aspects of
plumbing, 2006.
[2] J. Fawell and A.D. Hulsmann, Health effects of chemical contamination of drinking
water supplies, in: Water and Health.
[3] P.H. Gleick, G.H. Wolff, H. Cooley, M. Palaniappan, A. Samulon, E. Lee, J. Morrison and
D. Katz, The World's Water 2006-2007: The Biennial Report on Freshwater Resources,
Island Press, 2006.
[4] P.H. Gleick, Water and terrorism, Water policy 8 (2006) 481-503.
[5] SecurEau, http://www.secureau.eu/, retrieved on 05-10-2013.
[6] Y. Picó, G. Font, J.C. Moltó and J. Mañes, Solid-phase extraction of quaternary
ammonium herbicides, J. Chromatogr. A 885 (2000) 251-271.
[7] Paraquat Information Center, http://paraquat.com/, retrieved on 06-06-2013.
[8] H.J. Beckie, Herbicide-resistant weed management: focus on glyphosate, Pest Manag.
Sci. 67 (2011) 1037-1048.
[9] T.W. Eubank, D.H. Poston, V.K. Nandula, C.H. Koger, D.R. Shaw and D.B. Reynolds,
Glyphosate-resistant Horseweed (Conyza canadensis) Control Using Glyphosate-,
Paraquat-, and Glufosinate-Based Herbicide Programs, Weed Technol. 22 (2008) 16-21.
[10] D. de Souza, L. Codognoto, S.A.S. Machado and L.A. Avaca, Electroanalytical
determination of the herbicide paraquat in natural water and commercial tea samples
with gold electrodes obtained from recordable compact disc, Anal Lett 38 (2005) 331-341.
[11] I.C. Lopes, D. de Souza, S.A.S. Machado and A.A. Tanaka, Voltammetric detection of
paraquat pesticide on a phthalocyanine-based pyrolitic graphite electrode, Anal. Bioanal.
Chem. 388 (2007) 1907-1914.
[12] N. Mai, X. Liu, W. Wei, S. Luo and W. Liu, Electrochemical determination of paraquat
using a DNA-modified carbon ionic liquid electrode, Microchim Acta 174 (2011) 89-95.
[13] G.C. Schmitt, C. Paniz, D. Grotto, J. Valentini, K.L. Schott, V.J. Pomblum and S.C.
Garcia, Aspectos gerais e diagnóstico clinicolaboratorial da intoxicação por paraquat, J.
Bras. Patol. Med. Lab. 42 (2006) 235-243.
[14] L.R. Goldfrank and N.E. Flomenbau, Goldfrank's Toxicological Emergencies, 6th ed.,
McGraw-Hill Professional Publishing, 1998.
61

Part I – Chapter 1
[15] A.M. Tsatsakis, K. Perakis and E. Koumantakis, Experience with acute paraquat
poisoning in Crete, Vet. Hum. Toxicol. 38 (1996) 113-117.
[16] C.M. Chen and A.C. Lua, Lung toxicity of paraquat in the rat, J. Toxicol. Environ.
Health A. 60 (2000) 477-487.
[17] G.R. Sagar, Uses and Usefulness of Paraquat, Hum. Exp. Toxicol. 6 (1987) 7-11.
[18] B.G. Stephens and S.K. Moormeister, Homicidal Poisoning by Paraquat, Am. J.
Forensic Med. Pathol. 18 (1997) 33-39.
[19] C.D. Klaassen, M.O. Amdur and J. Doull, Casarett and Doull's Toxicology: The basic
science of poisons, Macmillan Publishing Company, New York, 1986.
[20] M.A. El Mhammedi, M. Bakasse and A. Chtaini, Electrochemical studies and square
wave voltammetry of paraquat at natural phosphate modified carbon paste electrode, J.
Hazard. Mater. 145 (2007) 1-7.
[21] R.J. Dinis-Oliveira, F. Remião, H. Carmo, J.A. Duarte, A.S. Navarro, M.L. Bastos and F.
Carvalho, Paraquat exposure as an etiological factor of Parkinson's disease,
NeuroToxicology 27 (2006) 1110-1122.
[22] R. Franco, S. Li, H. Rodriguez-Rocha, M. Burns and M.I. Panayiotidis, Molecular
mechanisms of pesticide-induced neurotoxicity: Relevance to Parkinson's disease, Chem.
Biol. Interact. 188 (2010) 289-300.
[23] M.A. El Mhammedi, M. Bakasse and A. Chtainia, Square-wave voltammetric
determination of paraquat at carbon paste electrode modified with hydroxyapatite,
Electroanal. 19 (2007) 1727-1733.
[24] U.M.F. de Oliveira, J. Lichtig and J.C. Masini, Evaluation of a nafion coated glassy
carbon electrode for determination of paraquat by differential pulse voltammetry, J. Braz.
Chem. Soc. 15 (2004) 735-741.
[25] M. Ibáñez, Y. Picó and J. Mañes, Improving the solid-phase extraction of 'quat'
pesticides from water samples: Removal of interferences, J. Chromatogr. A 823 (1998)
137-146.
[26] T.M. Chichila and S.M. Walters, Liquid chromatographic determination of paraquat
and diquat in crops using a silica column with aqueous ionic mobile phase, J. Assoc. Off.
Anal. Chem. 74 (1991) 961-967.
[27] Official Journal of the European Union, Council Directive 98/83/CE, 1998.
62

Introduction
[28] H. Muhamad, B. Ismail, M. Sameni and N. Mat, Adsorption study of 14C-paraquat in
two Malaysian agricultural soils, Environ. Monit. Assess. 176 (2011) 43-50.
[29] M. Pateiro-Moure, C. Pérez-Novo, M. Arias-Estévez, R. Rial-Otero and J. Simal-
Gándara, Effect of organic matter and iron oxides on quaternary herbicide sorption–
desorption in vineyard-devoted soils, J. Colloid Interface Sci. 333 (2009) 431-438.
[30] M. Pateiro-Moure, C. Pérez-Novo, M. Arias-Estévez, E. López-Periago, E. Martínez-
Carballo and J. Simal-Gándara, Influence of Copper on the Adsorption and Desorption of
Paraquat, Diquat, and Difenzoquat in Vineyard Acid Soils, J. Agric. Food Chem. 55 (2007)
6219-6226.
[31] M. Pateiro-Moure, A. Bermúdez-Couso, D. Fernández-Calviño, M. Arias-Estévez, R.
Rial-Otero and J. Simal-Gándara, Paraquat and Diquat Sorption on Iron Oxide Coated
Quartz Particles and the Effect of Phosphates, J. Chem. Eng. Data 55 (2010) 2668-2672.
[32] U.B. Cheah, R.C. Kirkwood and K.Y. Lum, Adsorption, Desorption and Mobility of Four
Commonly Used Pesticides in Malaysian Agricultural Soils, Pestic. Sci. 50 (1997) 53-63.
[33] B.V. Tucker, D.E. Pack and J.N. Ospenson, Adsorption of bipyridylium herbicides in
soil, J. Agric. Food. Chem. 15 (1967) 1005-1008.
[34] K.M. Spark and R.S. Swift, Effect of soil composition and dissolved organic matter on
pesticide sorption, Sci. Total Environ. 298 (2002) 147-161.
[35] M. Arienzo and A. Buondonno, Adsorption of paraquat by Terra Rossa soil and model
soil aggregates, Toxicol. Environ. Chem. 39 (1993) 193-199.
[36] W. Amondham, P. Parkpian, C. Polprasert, R.D. Delaune and A. Jugsujinda, Paraquat
Adsorption, Degradation, and Remobilization in Tropical Soils of Thailand, J. Environ. Sci.
Health, Part B 41 (2006) 485-507.
[37] C.C. Ainsworth, J.K. Fredrickson and S.C. Smith, The effect of sorption on the
degradation of aromatic acids and bases, Washington, DC, 1992.
[38] A. de Keizer, Adsorption of paraquat ions on clay minerals. Electrophoresis of clay
particles., Progr. Colloid Polym. Sci. 83 (1990) 118-126.
[39] K. Draoui, R. Denoyel, M. Chgoura and J. Rouquerol, Adsorption of Paraquat on
minerals: A thermodynamic study, J. Therm. Anal. Calorim. 58 (1999) 597-606.
[40] M. Raupach, W.W. Emerson and P.G. Slade, The arrangement of paraquat bound by
vermiculite and montmorillonite, J. Colloid Interface Sci. 69 (1979) 398-408.
63
Part I – Chapter 1
[41] P.C. Kearney and D.D.V. Kaufman, Herbicides: chemistry, degradation, and mode of
action, 1st ed., CRC Press, 1988.
[42] M. Fernández, M. Ibáñez, Y. Picó and J. Mañes, Spatial and Temporal Trends of
Paraquat, Diquat, and Difenzoquat Contamination in Water from Marsh Areas of the
Valencian Community (Spain), Arch. Environ. Contam. Toxicol. 35 (1998) 377-384.
[43] S.D.W. Committee and N.R. Council, Drinking Water and Health,Volume 1, The
National Academies Press, 1977.
[44] WHO, Public health response to biological and chemical weapons-WHO guidance,
2nd ed., Geneva, 2004.
[45] E. Mallat, C. Barzen, R. Abuknesha, G. Gauglitz and D. Barceló, Fast determination of
paraquat residues in water by an optical immunosensor and validation using capillary
electrophoresis-ultraviolet detection, Anal. Chim. Acta 427 (2001) 165-171.
[46] R. Castro, E. Moyano and M.T. Galceran, On-line ion-pair solid-phase extraction–
liquid chromatography–mass spectrometry for the analysis of quaternary ammonium
herbicides, J. Chromatogr. A 869 (2000) 441-449.
[47] O. Núñez, E. Moyano and M.T. Galceran, Time-of-flight high resolution versus triple
quadrupole tandem mass spectrometry for the analysis of quaternary ammonium
herbicides in drinking water, Anal. Chim. Acta 525 (2004) 183-190.
[48] J.C. Marr and J.B. King, A simple high performance liquid chromatography/ionspray
tandem mass spectrometry method for the direct determination of paraquat and diquat in
water, Rapid Commun. Mass Spectrom. 11 (1997) 479-483.
[49] S. Rodriguez-Mozaz, M.J. Lopez de Alda and D. Barceló, Advantages and limitations of
on-line solid phase extraction coupled to liquid chromatography–mass spectrometry
technologies versus biosensors for monitoring of emerging contaminants in water, J.
Chromatogr. A 1152 (2007) 97-115.
[50] B. Saad, M.M. Ariffin and M.I. Saleh, Paraquat sensors containing membrane
components of high lipophilicities, Anal. Chim. Acta 338 (1997) 89-96.
[51] W.H. van der Schalie, R.R. James and T.P. Gargan II, Selection of a battery of rapid
toxicity sensors for drinking water evaluation, Biosens. Bioelectron. 22 (2006) 18-27.
[52] L.C.S. de Figueiredo-Filho, V.B. dos Santosa, B.C. Janegitz, T.B. Guerreiro, O. Fatibello-
Filho, R.C. Faria and L.H. Marcolino-Junior, Differential pulse voltammetric determination
of paraquat using a bismuth-film electrode, Electroanal. 22 (2010) 1260-1266.
64

Introduction
[53] D. de Souza and S.A.S. Machado, Study of the electrochemical behavior and sensitive
detection of pesticides using microelectrodes allied to square-wave voltammetry,
Electroanal. 18 (2006) 862-872.
[54] A. Economou and P.R. Fielden, Mercury film electrodes: developments, trends and
potentialities for electroanalysis, Analyst 128 (2003) 205-212.
[55] C.D.C. Conceição, R.C. Faria, O. Fatibello and A.A. Tanaka, Electrocatalytic oxidation
and voltammetric determination of hydrazine in industrial boiler feed water using a cobalt
phthalocyanine-modified electrode, Anal. Lett. 41 (2008) 1010-1021.
[56] J. Wang, J.M. Lu, S.B. Hocevar, P.A.M. Farias and B. Ogorevc, Bismuth-coated carbon
electrodes for anodic stripping voltammetry, Anal. Chem. 72 (2000) 3218-3222.
[57] D. de Souza and S.A.S. Machado, Electroanalytical study of the paraquat herbicide in
aqueous solution by square wave voltammetry using ultramicroelectrodes, Quím. Nova 26
(2003) 644-647.
[58] D.D. de Souza, S.A.S. Machado and R.C. Pires, Multiple square wave voltammetry for
analytical determination of paraquat in natural water, food, and beverages using
microelectrodes, Talanta 69 (2006) 1200-1207.
[59] D. de Souza and S.A.S. Machado, Electrochemical detection of the herbicide paraquat
in natural water and citric fruit juices using microelectrodes, Anal. Chim. Acta 546 (2005)
85-91.
[60] T.G. Díaz, A.G. Cabanillas and F. Salinas, Square-wave and differential pulse oxidative
voltammetric determination of diquat and paraquat in alkaline medium, Electroanal. 12
(2000) 616-621.
[61] L.L.C. Garcia, L.C.S. Figueiredo-Filho, G.G. Oliveira, O. Fatibello-Filho and C.E. Banks,
Square-wave voltammetric determination of paraquat using a glassy carbon electrode
modified with multiwalled carbon nanotubes within a dihexadecylhydrogenphosphate
(DHP) film, Sensor. Actuat. B-Chem. 181 (2013) 306-311.
[62] J.M. Zen, S.H. Jeng and H.J. Chen, Determination of paraquat by square-wave
voltammetry at a perfluorosulfonated lonomer/clay-modified electrode, Anal. Chem. 68
(1996) 498-502.
[63] M.A. El Mhammedi, M. Bakasse, R. Bachirat and A. Chtaini, Square wave voltammetry
for analytical determination of paraquat at carbon paste electrode modified with
fluoroapatite, Food Chem. 110 (2008) 1001-1006.
65

Part I – Chapter 1
[64] T.H. Lu and I.W. Sun, Electrocatalytic determination of paraquat using a nafion film
coated glassy carbon electrode, Talanta 53 (2000) 443-451.
[65] L.B.O. dos Santos, C.M.C. Infante and J.C. Masini, Development of a sequential
injection-square wave voltammetry method for determination of paraquat in water
samples employing the hanging mercury drop electrode, Anal. Bioanal. Chem. 396 (2010)
1897-1903.
[66] A. Walcarius and L. Lamberts, Square wave voltammetric determination of paraquat
and diquat in aqueous solution, J. Electroanal. Chem. 406 (1996) 59-68.
[67] J.A. Ribeiro, C.A. Carreira, H.J. Lee, F. Silva, A. Martins and C.M. Pereira, Voltammetric
determination of paraquat at DNA-gold nanoparticle composite electrodes, Electrochim.
Acta 55 (2010) 7892-7896.
[68] A.J. Bard, Electroanalytical Chemistry: A series of advances, Dekker: New York, 1990.
[69] D. de Souza, S.A.S. Machado and L.A. Avaca, Square wave voltammetry. Part I:
Theoretical aspects, Quím. Nova 26 (2003) 81-89.
[70] L. Ramaley and M.S. Krause Jr, Theory of square wave voltammetry, Anal. Chem. 41
(1969) 1362-1365.
[71] J.H. Christie, J.A. Turner and R.A. Osteryoung, Square wave voltammetry at the
dropping mercury electrode: Theory, Anal. Chem. 49 (1977) 1899-1903.
[72] M. Lovrić and Š. Komorsky-Lovric, Square-wave voltammetry of an adsorbed
reactant, J. Electroanal. Chem. 248 (1988) 239-253.
[73] N. Fatouros, J.P. Simonin, J. Chevalet and R.M. Reeves, Theory of multiple square
wave voltammetries, J. Electroanal.Chem. 213 (1986) 1-16.
[74] D. Krulic, N. Fatouros and J. Chevalet, Multiple square wave voltammetry:
experimental verification of the theory, J. Electroanal. Chem. 287 (1990) 215-227.
[75] J. Chevalet, G.Y. Champagne, L. Gastonguay, R. Lacasse, M. Ladouceur, N. Fatouros
and D. Krulic, Développement d'instrumentation électroanalytique. Applications aux
mesures de faibles concentrations d'espèces électroactives dans divers domaines, J. Chim.
Phys. Phys.-Chim Biol. 93 (1996) 804-817.
[76] P. Ugo, Trace iron determination by cyclic and multiple square-wave voltammetry at
nafion coated electrodes. Application to pore-water analysis, Electroanal. 13 (2001) 661-
668.
66

Introduction
[77] L.M. Moretto, J. Chevalet, G.A. Mazzocchin and P. Ugo, Advances in multiple square
wave techniques for ion-exchange voltammetry at ultratrace levels: The europium(III)
case, J. Electroanal. Chem. 498 (2001) 117-126.
[78] L.M. Moretto, B. Brunetti, J. Chevalet and P. Ugo, Multiple square wave voltammetry
of nanomolar and subnanomolar concentrations of europium(III) at polymer-coated
electrodes, Electrochem. Commun. 2 (2000) 175-179.
[79] F.R. Simões, C.M.P. Vaz and C.M.A. Brett, Electroanalytical Detection of the Pesticide
Paraquat by Batch Injection Analysis, Anal. Lett. 40 (2007) 1800-1810.
[80] L.B.O. dos Santos and J.C. Masini, Square wave adsorptive cathodic stripping
voltammetry automated by sequential injection analysis: Potentialities and limitations
exemplified by the determination of methyl parathion in water samples, Anal. Chim. Acta
606 (2008) 209-216.
[81] L.B.O. dos Santos and J.C. Masini, Determination of picloram in natural waters
employing sequential injection square wave voltammetry using the hanging mercury drop
electrode, Talanta 72 (2007) 1023-1029.
[82] P.C. Schlecht and P.F. O'Connor, NIOSH Manual of Analytical Methods, 4th ed.,
National Institute for Occupational Safety Health, 2003.
[83] R. Castro, E. Moyano and M.T. Galceran, Determination of quaternary ammonium
pesticides by liquid chromatography-electrospray tandem mass spectrometry, J.
Chromatogr. A 914 (2001) 111-121.
[84] R. Castro, E. Moyano and M.T. Galceran, Ion-trap versus quadrupole for analysis of
quaternary ammonium herbicides by LC-MS, Chromatographia 53 (2001) 273-278.
[85] M.C. Carneiro, L. Puignou and M.T. Galceran, Comparison of silica and porous
graphitic carbon as solid-phase extraction materials for the analysis of cationic herbicides
in water by liquid chromatography and capillary electrophoresis, Anal. Chim. Acta 408
(2000) 263-269.
[86] R. Rial-Otero, B. Cancho-Grande, C. Perez-Lamela, J. Simal-Gándara and M. Arias-
Estévez, Simultaneous determination of the herbicides diquat and paraquat in water, J.
Chromatogr. Sci. 44 (2006) 539-542.
[87] Simple, sensitive HPLC/UV analysis for paraquat and diquat using high-recovery solid
phase extraction and an ultra quat HPLC column, Restek Corporation, 2005.
67

Part I – Chapter 1
[88] M. Ibáñez, Y. Picó and J. Mañes, Influence of organic matter and surfactants on solid-
phase extraction of diquat, paraquat and difenzoquat from waters, J. Chromatogr. A 727
(1996) 245-252.
[89] J.W. Munch and W.J. Bashe, Method 549.2 - Determination of diquat and paraquat in
drinking water by liquid-solid extraction and high performance liquid chromatography
with ultraviolet detection, U.S. Environmental Protection Agency, Cincinnati, Ohio 45268,
1997.
[90] M. Ibáñez, Y. Picó and J. Mañes, On-line liquid chromatographic trace enrichment and
high-performance liquid chromatographic determination of diquat, paraquat and
difenzoquat in water, J. Chromatogr. A 728 (1996) 325-331.
[91] M. Ibánez, Y. Picó and J. Manes, On-line determination of bipyridylium herbicides in
water by HPLC, Chromatographia 45 (1997) 402-407.
[92] M. Takino, S. Daishima and K. Yamaguchi, Determination of diquat and paraquat in
water by liquid chromatography/electrospray-mass spectrometry using volatile ion-
pairing reagents, Anal. Sci. 16 (2000) 707-711.
[93] L. Grey, B. Nguyen and P. Yang, Liquid chromatography-electrospray ionization
isotope dilution mass spectrometry analysis of paraquat and diquat using conventional
and multilayer solid-phase extraction cartridges, J. Chromatogr. A 958 (2002) 25-33.
[94] R. Castro, E. Moyano and M.T. Galceran, Ion-pair liquid chromatography–
atmospheric pressure ionization mass spectrometry for the determination of quaternary
ammonium herbicides, J. Chromatogr. A 830 (1999) 145-154.
[95] J.L. Martínez Vidal, A. Belmonte Vega, F.J. Sánchez López and A. Garrido Frenich,
Application of internal quality control to the analysis of quaternary ammonium
compounds in surface and groundwater from Andalusia (Spain) by liquid chromatography
with mass spectrometry, J. Chromatogr. A 1050 (2004) 179-184.
[96] V. Taguchi, S.D. Jenkins, P. Crozier and D. Wang, Determination of diquat and
paraquat in water by liquid chromatography-(electrospray ionization) mass spectrometry,
J. Am. Soc. Mass Spectrom. 9 (1998) 830-839.
[97] F. Merino, S. Rubio and D. Pérez-Bendito, Evaluation and optimization of an on-line
admicelle-based extraction-liquid chromatography approach for the analysis of ionic
organic compounds, Anal. Chem. 76 (2004) 3878-3886.
68

Introduction
[98] P. Bièvre, Isotope dilution mass spectrometry: what can it contribute to accuracy in
trace analysis?, Fresenius' J. Anal. Chem. 337 (1990) 766-771.
[99] E. Gelpi, Advances in Mass Spectrometry, Wiley, 2001.
[100] K.B. Rundman, Cast irons, in: K.H.J. Buschow, R. Cahn, M.C. Flemings, B. Ilschner, E.J.
Kramer, S. Mahajan, P. Veyssiere (Eds.) Encyclopedia of Materials: Science and
Technology, Pergamon, 2001, pp. 1003-1010.
[101] MAST-Materials Science and
Technology, http://matse1.matse.illinois.edu/concrete/prin.html, retrieved on 06-10-
2013.
[102] W.R. Sorenson, Polyvinylchloride, in: K.H.J. Buschow, R. Cahn, M.C. Flemings, B.
Ilschner, E.J. Kramer, S. Mahajan, P. Veyssiere (Eds.) Encyclopedia of Materials: Science
and Technology, 2001, pp. 7752-7755.
[103] H.F. Enderle, Polyethylene: high-density, in: K.H.J. Buschow, R. Cahn, M.C. Flemings,
B. Ilschner, E.J. Kramer, S. Mahajan, P. Veyssiere (Eds.) Encyclopedia of Materials: Science
and Technology, 2001, pp. 7172-7180.
[104] F. Echeverría, J.G. Castaño, C. Arroyave, G. Peñuela, A. Ramírez and J. Morató,
Characterization of deposits formed in a water distribution system, Rev. Chil. Ing. 17
(2009) 275-281.
[105] P. Sarin, V.L. Snoeyink, J. Bebee, W.M. Kriven and J.A. Clement, Physico-chemical
characteristics of corrosion scales in old iron pipes, Water Res. 35 (2001) 2961-2969.
[106] C.-Y. Peng, G.V. Korshin, R.L. Valentine, A.S. Hill, M.J. Friedman and S.H. Reiber,
Characterization of elemental and structural composition of corrosion scales and deposits
formed in drinking water distribution systems, Water Res. 44 (2010) 4570-4580.
[107] O.M. Zacheus, M.J. Lehtola, L.K. Korhonen and P.J. Martikainen, Soft deposits, the
key site for microbial growth in drinking water distribution networks, Water Res. 35 (2001)
1757-1765.
[108] M.W. LeChevallier, T.W. Babcock and R.G. Lee, Examination and characterization of
distribution system biofilms, Appl. Environ. Microbiol. 53 (1987) 2714-2724.
[109] V. Chawla, P.G. Gurbuxani and G.R. Bhagure, Corrosion of water pipes: a
comprehensive study of deposits, J. Miner. Mater. Charact. Eng. 11 (2012) 479-492.
69

Part I – Chapter 1
[110] Z. Tang, S. Hong, W. Xiao and J. Taylor, Characteristics of iron corrosion scales
established under blending of ground, surface, and saline waters and their impacts on iron
release in the pipe distribution system, Corros. Sci. 48 (2006) 322-342.
[111] C.M.C. Infante and J.C. Masini, Development of a Spectrophotometric Sequential
Injection Methodology for Online Monitoring of the Adsorption of Paraquat on Clay
Mineral and Soil, Spectrosc. Lett. 40 (2007) 3-14.
[112] C.M. Lozano, T.P. Ruíz, V. Tomás and E. Yagüe, Determination of paraquat in
biological and environmental samples by a photokinetic method, Anal. Chim. Acta 209
(1988) 79-86.
[113] M. Pateiro-Moure, E. Martínez-Carballo, M. Arias-Estévez and J. Simal-Gándara,
Determination of quaternary ammonium herbicides in soils: Comparison of digestion,
shaking and microwave-assisted extractions, J. Chromatogr. A. 1196–1197 (2008) 110-
116.
[114] T. Pérez-Ruiz, C. Martínez-Lozano, A. Sanz and V. Tomás, Simultaneous
determination of diquat and paraquat residues in various matrices by capillary zone
electrophoresis with diode array detection, Chromatographia 43 (1996) 468-472.
[115] T. Perez-Ruiz and J. Fenoll, Spectrofluorimetric determination of paraquat by
manual and flow injection methods, Analyst 123 (1998) 1577-1581.
[116] D. Barcel'o, G. Durand and R.J. Vreeken, Determination of quaternary amine
pesticides by thermospray mass spectrometry, J. Chromatogr. A 647 (1993) 271-277.
[117] J.C. Ingram, G.S. Groenewold, A.D. Appelhans, J.E. Delmore, J.E. Olson and D.L.
Miller, Direct surface analysis of pesticides on soil, leaves, grass, and stainless steel by
static secondary ion mass spectrometry, Environ. Sci. Technol. 31 (1997) 402-408.
[118] M.M. de Andréa, S. Papini and L.E. Nakagawa, Optimizing microwave-assisted
solvent extraction (MASE) of pesticides from soil, J. Environ. Sci. Health, Part B 36 (2001)
87-93.
[119] V. Lopez Avila, R. Young and N. Teplitsky, Microwave-assisted extraction as an
alternative to Soxhlet, sonication, and supercritical fluid extraction, J. AOAC Int. 79 (1996)
142-156.
[120] N.K. Hamadi, S. Sri and X.D. Chen, Adsorption of Paraquat dichloride from aqueous
solution by activated carbon derived from used tires, J. Hazard. Mater. 112 (2004) 133-
141.
70

Introduction
[121] M. Ruiz, J. Barron-Zambrano, V. Rodilla, A. Szygula and A.M. Sastre, Paraquat
sorption on calcium alginate gel beads, in: Proceedings of the 4th WSEAS/IASME
international conference on Dynamical systems and control, World Scientific and
Engineering Academy and Society (WSEAS), Corfu, Greece, 2008, pp. 30-35.
[122] W.-T. Tsai and C.-W. Lai, Adsorption of herbicide paraquat by clay mineral
regenerated from spent bleaching earth, J. Hazard. Mater. 134 (2006) 144-148.
[123] Y. Seki and K. Yurdakoç, Paraquat adsorption onto clays and organoclays from
aqueous solution, J. Colloid Interface Sci. 287 (2005) 1-5.
[124] W.T. Tsai, K.J. Hsien, Y.M. Chang and C.C. Lo, Removal of herbicide paraquat from an
aqueous solution by adsorption onto spent and treated diatomaceous earth, Bioresource
Technol. 96 (2005) 657-663.
[125] W.T. Tsai, C.W. Lai and K.J. Hsien, Adsorption kinetics of herbicide paraquat from
aqueous solution onto activated bleaching earth, Chemosphere 55 (2004) 829-837.
[126] W.T. Tsai, C.W. Lai and K.J. Hsien, The effects of pH and salinity on kinetics of
paraquat sorption onto activated clay, Colloid Surface A 224 (2003) 99-105.
[127] R. Calvert, Adsorption-desorption phenomena, in: R. Hance (Ed.) Interactions
between herbicides and the soil, Academic Press, European Weed Research Society, 1980,
pp. 1-30.
[128] C.H. Giles, T.H. Mac Ewan, S.N. Nakhwa and D. Smith, Studies in adsorption. Part 11.
A system of classification of solution adsorption isotherms, and its use in diagnosis of
adsorption mechanisms and measurement of scientific surface area of solids., J. Chem.
Soc. 786 (1960) 3973-3993.
[129] S. Esplugas, J. Giménez, S. Contreras, E. Pascual and M. Rodrıguez, Comparison of
different advanced oxidation processes for phenol degradation, Water Res. 36 (2002)
1034-1042.
[130] H.J.H. Fenton, LXXIII.-Oxidation of tartaric acid in presence of iron, J. Chem. Soc. 65
(1894) 899-910.
[131] J.H. Sun, S.P. Sun, M.H. Fan, H.Q. Guo, L.P. Qiao and R.X. Sun, A kinetic study on the
degradation of p-nitroaniline by Fenton oxidation process, J. Hazard. Mater. 148 (2007)
172-177.
[132] C. Jiang, S. Pang, F. Ouyang, J. Ma and J. Jiang, A new insight into Fenton and
Fenton-like processes for water treatment, J. Hazard. Mater. 174 (2010) 813-817.
71

Part I – Chapter 1
[133] K. Tennakone and I.R.M. Kottegoda, Photocatalytic mineralization of paraquat
dissolved in water by TiO2 supported on polythene and polypropylene films, J. Photochem.
Photobiol. A-Chem. 93 (1996) 79-81.
[134] E. Moctezuma, E. Leyva, E. Monreal, N. Villegas and D. Infante, Photocatalytic
degradation of the herbicide “Paraquat”, Chemosphere 39 (1999) 511-517.
[135] M. Kang, Preparation of TiO2 photocatalyst film and its catalytic performance for
1,1'-dimethyl-4,4'-bipyidium dichloride decomposition, Appl. Catal. B-Environ. 37 (2002)
187-196.
[136] M.H. Florêncio, E. Pires, A.L. Castro, M.R. Nunes, C. Borges and F.M. Costa,
Photodegradation of Diquat and Paraquat in aqueous solutions by titanium dioxide:
evolution of degradation reactions and characterisation of intermediates, Chemosphere
55 (2004) 345-355.
[137] M.J. Cantavenera, I. Catanzaro, V. Loddo, L. Palmisano and G. Sciandrello,
Photocatalytic degradation of paraquat and genotoxicity of its intermediate products, J.
Photoch. Photobio. A 185 (2007) 277-282.
[138] E. Kanchanatip, N. Grisdanurak, R. Thongruang and A. Neramittagapong,
Degradation of paraquat under visible light over fullerene modified V-TiO2, Reac. Kinet.
Mech. Cat. 103 (2011) 227-237.
[139] P.C. Kearney, J.M. Ruth, Q. Zeng and P. Mazzocchi, UV ozonation of paraquat,
J.Agric. Food Chem. 33 (1985) 953-957.
[140] R. Andreozzi, A. Insola, V. Caprio and M.G. D'Amore, Ozonation of 1, 1' dimethyl,
4,4' bipyridinium dichloride (Paraquat) in aqueous solution, Environ. Technol. 14 (1993)
695-700.
[141] A. Dhaouadi and N. Adhoum, Heterogeneous catalytic wet peroxide oxidation of
paraquat in the presence of modified activated carbon, Appl. Catal. B-Environ. 97 (2010)
227-235.
[142] A. Dhaouadi and N. Adhoum, Degradation of paraquat herbicide by electrochemical
advanced oxidation methods, J. Electroanal. Chem. 637 (2009) 33-42.
[143] J.-C. Lee, M.-S. Kim, C. Kim, C.-H. Chung, S. Cho, G. Han, K. Yoon and B.-W. Kim,
Removal of paraquat in aqueous suspension of TiO2 in an immersed UV photoreactor,
Korean J. Chem. Eng. 20 (2003) 862-868.
72

Introduction
[144] M.S.F. Santos, A. Alves and L.M. Madeira, Paraquat removal from water by
oxidation with Fenton's reagent, Chem. Eng. J. 175 (2011) 279-290.
[145] K. D'Silva, A. Fernandes and M. Rose, Brominated Organic Micropollutants—Igniting
the Flame Retardant Issue, Crit. Rev. Environ. Sci. Technol. 34 (2004) 141-207.
[146] O.I. Olukunle, O.J. Okonkwo, K.K. Kefeni and M. Lupankwa, Determination of
brominated flame retardants in Jukskei River catchment area in Gauteng, South Africa,
Water Sci. Technol. 65 (2012) 743-749.
[147] Q. Xiao, B. Hu, J. Duan, M. He and W. Zu, Analysis of PBDEs in Soil, Dust, Spiked Lake
Water, and Human Serum Samples by Hollow Fiber-Liquid Phase Microextraction
Combined with GC-ICP-MS, J. Am. Soc. Mass Spectr. 18 (2007) 1740-1748.
[148] I. Fulara and M. Czaplicka, Methods for determination of polybrominated diphenyl
ethers in environmental samples - Review, J. Sep. Sci. 35 (2012) 2075-2087.
[149] M. Polo, G. Gómez-Noya, J.B. Quintana, M. Llompart, C. García-Jares and R. Cela,
Development of a Solid-Phase Microextraction Gas Chromatography/Tandem Mass
Spectrometry Method for Polybrominated Diphenyl Ethers and Polybrominated Biphenyls
in Water Samples, Anal. Chem. 76 (2004) 1054-1062.
[150] E. Eljarrat and D. Barceló, Sample handling and analysis of brominated flame
retardants in soil and sludge samples, Trends Anal. Chem. 23 (2004) 727-736.
[151] C.A. de Wit, An overview of brominated flame retardants in the environment,
Chemosphere 46 (2002) 583-624.
[152] P.O. Darnerud, G.S. Eriksen, T. Jóhannesson, P.B. Larsen and M. Viluksela,
Polybrominated diphenyl ethers: Occurence, dietary exposure, and toxicology, Environ.
Health Perspect. 109 (2001) 49-68.
[153] Official Journal of the European Union, Directive 2003/11/EC of the European
Parliament and of the Council, 2003.
[154] A. Möller, Z. Xie, R. Sturm and R. Ebinghaus, Polybrominated diphenyl ethers
(PBDEs) and alternative brominated flame retardants in air and seawater of the European
Arctic, Environ. Pollut. 159 (2011) 1577-1583.
[155] Stockholm
Convention, http://chm.pops.int/Convention/ThePOPs/TheNewPOPs/tabid/2511/Default.
aspx, retrieved on 05-10-2013.
73

Part I – Chapter 1
[156] A. Bacaloni, L. Callipo, E. Corradini, P. Giansanti, R. Gubbiotti, R. Samperi and A.
Laganà, Liquid chromatography–negative ion atmospheric pressure photoionization
tandem mass spectrometry for the determination of brominated flame retardants in
environmental water and industrial effluents, J. Chromatogr. A 1216 (2009) 6400-6409.
[157] M.L. Hardy, The toxicology of commercial PBDE flame retardants: DecaBDE,
octaBDE, pentaBDE, Organohalogen. Comp. 47 (2000) 41-44.
[158] R. Millischer, F. Girault, R. Heywood, G. Clarke, D. Hossack and M. Clair,
Decabromobiphenyl: toxicological study, Toxicol. Eur. Res. 2 (1979) 155-161.
[159] L. Fang, J. Huang, G. Yu and L. Wang, Photochemical degradation of six
polybrominated diphenyl ether congeners under ultraviolet irradiation in hexane,
Chemosphere 71 (2008) 258-267.
[160] C.A. de Wit, M. Alaee and D.G. Muir, Levels and trends of brominated flame
retardants in the Artic, Chemosphere 64 (2006) 209-233.
[161] K. Hooper and T.A. McDonald, The PBDEs: An emerging environmental challenge
and another reason for breast-milk monitoring programs, Environ. Health Perspect. 108
(2000) 387-392.
[162] ATSDR, Health Effects, in: Toxicological profile for polybrominated biphenyls and
polybrominated diphenyl ethers, 2004, pp. 57-343.
[163] S.A. Tittlemier, T. Halldorson, G.A. Stern and G.T. Tomy, Vapor pressures, aqueous
solubilities, and Henry's law constants of some brominated flame retardants, Environ.
Toxicol. Chem. 21 (2002) 1804-1810.
[164] E. Braekevelt, S.A. Tittlemier and G.T. Tomy, Direct measurement of octanol–water
partition coefficients of some environmentally relevant brominated diphenyl ether
congeners, Chemosphere 51 (2003) 563-567.
[165] J. Sánchez-Avila, R. Tauler and S. Lacorte, Organic micropollutants in coastal waters
from NW Mediterranean Sea: Sources distribution and potential risk, Environ. Int. 46
(2012) 50-62.
[166] A.P. Daso, O.S. Fatoki, J.P. Odendaal and O.O. Olujimi, Occurrence of selected
polybrominated diphenyl ethers and 2,2',4,4',5,5'-hexabromobiphenyl (BB-153) in sewage
sludge and effluent samples of a wastewater-treatment plant in Cape Town, South Africa,
Arch. Environ. Con. Tox. 62 (2012) 391-402.
74

Introduction
[167] B.K. Hope, L. Pillsbury and B. Boling, A state-wide survey in Oregon (USA) of trace
metals and organic chemicals in municipal effluent, Sci. Total Environ. 417–418 (2012)
263-272.
[168] X. Liu, J. Li, Z. Zhao, W. Zhang, K. Lin, C. Huang and X. Wang, Solid-phase extraction
combined with dispersive liquid–liquid microextraction for the determination for
polybrominated diphenyl ethers in different environmental matrices, J. Chromatogr. A
1216 (2009) 2220-2226.
[169] A.R. Fontana, R.G. Wuilloud, L.D. Martínez and J.C. Altamirano, Simple approach
based on ultrasound-assisted emulsification-microextraction for determination of
polibrominated flame retardants in water samples by gas chromatography–mass
spectrometry, J. Chromatogr. A 1216 (2009) 147-153.
[170] A.R. Fontana, M.F. Silva, L.D. Martínez, R.G. Wuilloud and J.C. Altamirano,
Determination of polybrominated diphenyl ethers in water and soil samples by cloud point
extraction-ultrasound-assisted back-extraction-gas chromatography–mass spectrometry,
J. Chromatogr. A 1216 (2009) 4339-4346.
[171] N. Fontanals, T. Barri, S. Bergström and J.-Å. Jönsson, Determination of
polybrominated diphenyl ethers at trace levels in environmental waters using hollow-fiber
microporous membrane liquid–liquid extraction and gas chromatography–mass
spectrometry, J. Chromatogr. A 1133 (2006) 41-48.
[172] V. Yusà, A. Pastor and M. de la Guardia, Microwave-assisted extraction of
polybrominated diphenyl ethers and polychlorinated naphthalenes concentrated on
semipermeable membrane devices, Anal. Chim. Acta 565 (2006) 103-111.
[173] J. Llorca-Porcel, G. Martínez-Sánchez, B. Álvarez, M.A. Cobollo and I. Valor, Analysis
of nine polybrominated diphenyl ethers in water samples by means of stir bar sorptive
extraction-thermal desorption-gas chromatography–mass spectrometry, Anal. Chim. Acta
569 (2006) 113-118.
[174] A. Zhao, X. Wang, M. Ma, W. Wang, H. Sun, Z. Yan, Z. Xu and H. Wang, Temperature-
assisted ionic liquid dispersive liquid-liquid microextraction combined with high
performance liquid chromatography for the determination of PCBs and PBDEs in water
and urine samples, Microchim. Acta 177 (2012) 229-236.
[175] H. Liu, M. Zhang, X. Wang, Y. Zou, W. Wang, M. Ma, Y. Li and H. Wang, Extraction
and determination of polybrominated diphenyl ethers in water and urine samples using
75

Part I – Chapter 1
solidified floating organic drop microextraction along with high performance liquid
chromatography, Microchim. Acta 176 (2012) 303-309.
[176] Y. Li, G. Wei, J. Hu, X. Liu, X. Zhao and X. Wang, Dispersive liquid–liquid
microextraction followed by reversed phase-high performance liquid chromatography for
the determination of polybrominated diphenyl ethers at trace levels in landfill leachate
and environmental water samples, Anal. Chim. Acta 615 (2008) 96-103.
[177] Y. Li, J. Hu, X. Liu, L. Fu, X. Zhang and X. Wang, Dispersive liquid-liquid
microextraction followed by reversed phase HPLC for the determination of
decabrominated diphenyl ether in natural water, J. Sep. Sci. 31 (2008) 2371-2376.
[178] Y. Li, G. Wei and X. Wang, Determination of decabromodiphenyl ether in water
samples by single-drop microextraction and RP-HPLC, J. Sep. Sci. 30 (2007) 2698-2702.
[179] X.-H. Zang, Q.-H. Wu, M.-Y. Zhang, G.-H. Xi and Z. Wang, Developments of Dispersive
Liquid-Liquid Microextraction Technique, Chinese J. Anal. Chem. 37 (2009) 161-168.
[180] H.M. Park, S.M. Hong, M.R. Agustin-Camacho, W. Dirwono and K.B. Lee, Pressurized
liquid extraction for the simultaneous analysis of polychlorinated biphenyls and
polybrominated diphenyl ethers from soil by GC-TOF-MS detection, J. Chromatogr. Sci. 47
(2009) 681-688.
[181] X. Li, J. Huang, W. Zhang, G. Yu, S. Deng and S. Wang, Determination of 41
polybrominated diphenyl ethers in soil using a pressurised solvent extraction and GC-NCI-
MS method, Int. J. Environ. Anal. Chem. 91 (2011) 1135-1150.
[182] U.R. Thorenz, B.A. Musa Bandowe, J. Sobocka and W. Wilcke, Method optimization
to measure polybrominated diphenyl ether (PBDE) concentrations in soils of Bratislava,
Slovakia, Environ. Pollut. 158 (2010) 2208-2217.
[183] Z. Zhang, M. Shanmugam and S.M. Rhind, PLE and GC-MS determination of
polybrominated diphenyl ethers in soils, Chromatographia 72 (2010) 535-543.
[184] B. Albero, C. Sánchez-Brunete, E. Miguel, R.A. Pérez and J.L. Tadeo, Determination
of selected organic contaminants in soil by pressurized liquid extraction and gas
chromatography tandem mass spectrometry with in situ derivatization, J. Chromatogr. A
1248 (2012) 9-17.
[185] D. Wang, Z. Cai, J. Guibin, M.H. Wong and W.K. Wong, Gas chromatography/ion
trap mass spectrometry applied for the determination of polybrominated diphenyl ethers
in soil, Rapid Commun. Mass Spectrom. 19 (2005) 83-89.
76

Introduction
[186] Z. Cai and G. Jiang, Determination of polybrominated diphenyl ethers in soil from e-
waste recycling site, Talanta 70 (2006) 88-90.
[187] L. Zhu, B. Ma and X. Liang, Quantitative analysis of polybrominated diphenyl ethers
in earthworms and soil by gas chromatography coupled to ion-trap tandem mass
spectrometry, Rapid Commun. Mass Spectrom. 22 (2008) 394-400.
[188] C. Sánchez-Brunete, E. Miguel and J.L. Tadeo, Determination of polybrominated
diphenyl ethers in soil by ultrasonic assisted extraction and gas chromatography mass
spectrometry, Talanta 70 (2006) 1051-1056.
[189] J. Sun, J. Liu, Q. Liu, G. Qu, T. Ruan and G. Jiang, Sample preparation method for the
speciation of polybrominated diphenyl ethers and their methoxylated and hydroxylated
analogues in diverse environmental matrices, Talanta 88 (2012) 669-676.
[190] Y.-Y. Zhou, C.-Y. Zhang, Z.-G. Yan, K.-J. Li, L. Wang, Y.-B. Xie, F.-S. Li, Z. Liu and J.
Yang, The use of copper(II) isonicotinate-based micro-solid-phase extraction for the
analysis of polybrominated diphenyl ethers in soils, Anal. Chim. Acta 747 (2012) 36-41.
[191] Q. Liu, J. Shi, J. Sun, T. Wang, L. Zeng, N. Zhu and G. Jiang, Graphene-assisted matrix
solid-phase dispersion for extraction of polybrominated diphenyl ethers and their
methoxylated and hydroxylated analogs from environmental samples, Anal. Chim. Acta
708 (2011) 61-68.
[192] J. Zhou, F. Yang, D. Cha, Z. Zeng and Y. Xu, Headspace solid-phase microextraction
with novel sol-gel permethylated-β-cyclodextrin/hydroxyl-termination silicone oil fiber for
determination of polybrominated diphenyl ethers by gas chromatography-mass
spectrometry in soil, Talanta 73 (2007) 870-877.
[193] C. Salgado-Petinal, M. Llompart, C. García-Jares, M. García-Chao and R. Cela, Simple
approach for the determination of brominated flame retardants in environmental solid
samples based on solvent extraction and solid-phase microextraction followed by gas
chromatography–tandem mass spectrometry, J. Chromatogr. A 1124 (2006) 139-147.
[194] C. Salgado-Petinal, M. Garcia-Chao, M. Llompart, C. Garcia-Jares and R. Cela,
Headspace solid-phase microextraction gas chromatography tandem mass spectrometry
for the determination of brominated flame retardants in environmental solid samples,
Anal. Bioanal. Chem. 385 (2006) 637-644.
[195] K.E. Mueller, S.R. Mueller-Spitz, H.F. Henry, A.P. Vonderheide, R.S. Soman, B.K.
Kinkle and J.R. Shann, Fate of Pentabrominated Diphenyl Ethers in Soil: Abiotic Sorption,
77

Part I – Chapter 1
Plant Uptake, and the Impact of Interspecific Plant Interactions, Environ. Sci. Technol. 40
(2006) 6662-6667.
[196] W. Liu, W. Li, J. Hu, X. Ling, B. Xing, J. Chen and S. Tao, Sorption kinetic
characteristics of polybrominated diphenyl ethers on natural soils, Environ. Pollut. 158
(2010) 2815-2820.
[197] W. Liu, W. Li, B. Xing, J. Chen and S. Tao, Sorption isotherms of brominated diphenyl
ethers on natural soils with different organic carbon fractions, Environ. Pollut. 159 (2011)
2355-2358.
[198] W. Liu, F. Cheng, W. Li, B. Xing and S. Tao, Desorption behaviors of BDE-28 and BDE-
47 from natural soils with different organic carbon contents, Environ. Pollut. 163 (2012)
235-242.
[199] Y. Olshansky, T. Polubesova, W. Vetter and B. Chefetz, Sorption–desorption behavior
of polybrominated diphenyl ethers in soils, Environ. Pollut. 159 (2011) 2375-2379.
[200] M.J. Simpson and P.C.E. Johnson, Identification of mobile aliphatic sorptive domains
in soil humin by solid-state 13C nuclear magnetic resonance, Environ. Toxicol. Chem. 25
(2006) 52-57.
[201] Y. Drori, Z. Aizenshtat and B. Chefetz, Sorption of organic compounds to humin from
soils irrigated with reclaimed wastewater, Geoderma 145 (2008) 98-106.
[202] J. Xin, X. Liu, L. Jiang and M. Li, BDE-47 sorption and desorption to soil matrix in
single- and binary-solute systems, Chemosphere 87 (2012) 477-482.
[203] J. Bezares-Cruz, C.T. Jafvert and I. Hua, Solar Photodecomposition of
Decabromodiphenyl Ether: Products and Quantum Yield, Environ. Sci. Technol. 38 (2004)
4149-4156.
[204] S. Luo, S. Yang, Y. Xue, F. Liang and C. Sun, Two-stage reduction/subsequent
oxidation treatment of 2,2′,4,4′-tetrabromodiphenyl ether in aqueous solutions: Kinetic,
pathway and toxicity, J. Hazard. Mater. 192 (2011) 1795-1803.
[205] A. Christiansson, J. Eriksson, D. Teclechiel and Å. Bergman, Identification and
quantification of products formed via photolysis of decabromodiphenyl ether, Environ. Sci.
Pollut. Res. 16 (2009) 312-321.
[206] J. Su, N. Lu, J. Zhao, H. Yu, H. Huang, X. Dong and X. Quan, Nano-cubic structured
titanium nitride particle films as cathodes for the effective electrocatalytic debromination
of BDE-47, J. Hazard. Mater. 231–232 (2012) 105-113.
78

Introduction
[207] J. Eriksson, N. Green, G. Marsh and Å. Bergman, Photochemical Decomposition of 15
Polybrominated Diphenyl Ether Congeners in Methanol/Water, Environ. Sci. Technol. 38
(2004) 3119-3125.
[208] C. Sun, J. Zhao, H. Ji, W. Ma and C. Chen, Photocatalytic debromination of preloaded
decabromodiphenyl ether on the TiO2 surface in aqueous system, Chemosphere 89 (2012)
420-425.
[209] A. Konstantinov, D. Bejan, N.J. Bunce, B. Chittim, R. McCrindle, D. Potter and C.
Tashiro, Electrolytic debromination of PBDEs in DE-83TM technical decabromodiphenyl
ether, Chemosphere 72 (2008) 1159-1162.
[210] Z. Fang, X. Qiu and J. Chen, Degradation of the polybrominated diphenyl ethers by
nanoscale zero-valent metallic particles prepared from steel pickling waste liquor,
Desalination 267 (2011) 34-41.
[211] Z. Fang, X. Qiu and J. Chen, Debromination of polybrominated diphenyl ethers by
Ni/Fe bimetallic nanoparticles: Influencing factors, kinetics, and mechanism, J. Hazard.
Mater. 185 (2011) 958-969.
[212] T. An, J. Chen, G. Li, X. Ding, G. Sheng, J. Fu, B. Mai and K.E. O'Shea, Characterization
and the photocatalytic activity of TiO2 immobilized hydrophobic montmorillonite
photocatalysts: Degradation of decabromodiphenyl ether (BDE 209), Catal. Today 139
(2008) 69-76.
[213] C. Sun, D. Zhao, C. Chen, W. Ma and J. Zhao, TiO2-Mediated Photocatalytic
Debromination of Decabromodiphenyl Ether: Kinetics and Intermediates, Environ. Sci.
Technol. 43 (2008) 157-162.
[214] S. Rayne, P. Wan and M. Ikonomou, Photochemistry of a major commercial
polybrominated diphenyl ether flame retardant congener: 2,2′,4,4′,5,5′-
Hexabromodiphenyl ether (BDE153), Environ. Int. 32 (2006) 575-585.
[215] A. Li, C. Tai, Z. Zhao, Y. Wang, Q. Zhang, G. Jiang and J. Hu, Debromination of
decabrominated diphenyl ether by resin-bound iron nanoparticles, Environ. Sci. Technol.
41 (2007) 6841-6846.
[216] I. Watanabe and R. Tatsukawa, Formation of brominated dibenzofurans from the
photolysis of flame retardant decabromobiphenyl ether in hexane solution by UV and sun
light, Bull. Environ. Contam. Toxicol. 39 (1987) 953-959.
79

Part I – Chapter 1
[217] K. Nose, S. Hashimoto, S. Takahashi, Y. Noma and S.-i. Sakai, Degradation pathways
of decabromodiphenyl ether during hydrothermal treatment, Chemosphere 68 (2007)
120-125.
[218] K.L. Chow, Y.B. Man, J.S. Zheng, Y. Liang, N.F.Y. Tam and M.H. Wong, Characterizing
the optimal operation of photocatalytic degradation of BDE-209 by nano-sized TiO2, J.
Environ. Sci. 24 (2012) 1670-1678.
[219] X. Li, J. Huang, G. Yu and S. Deng, Photodestruction of BDE-99 in micellar solutions of
nonionic surfactants of Brij 35 and Brij 58, Chemosphere 78 (2010) 752-759.
[220] L. Sanchez-Prado, K. Kalafata, S. Risticevic, J. Pawliszyn, M. Lores, M. Llompart, N.
Kalogerakis and E. Psillakis, Ice photolysis of 2,2′,4,4′,6-pentabromodiphenyl ether (BDE-
100): Laboratory investigations using solid phase microextraction, Anal. Chim. Acta 742
(2012) 90-96.
[221] P. Moreira Bastos, J. Eriksson, J. Vidarson and Å. Bergman, Oxidative transformation
of polybrominated diphenyl ether congeners (PBDEs) and of hydroxylated PBDEs (OH-
PBDEs), Environ. Sci. Pollut. Res. 15 (2008) 606-613.
[222] F. Kastanek, Y. Maleterova, P. Kastanek, J. Rott, V. Jiricny and K. Jiratova, Complex
treatment of wastewater and groundwater contaminated by halogenated organic
compounds, Desalination 211 (2007) 261-271.
[223] Y.-S. Keum and Q.X. Li, Reductive Debromination of Polybrominated Diphenyl Ethers
by Zerovalent Iron, Environ. Sci. Technol. 39 (2005) 2280-2286.
80

PART II. PARAQUAT


2 Paraquat quantification in waters*
Abstract
Three analytical methodologies for paraquat dichloride (PQ) identification and
quantification in waters were developed and validated in response to different scenarios:
a direct injection liquid chromatography with diode array detector (DI-LC-DAD) method
for emergency situations, as occurs when there is a suspicion of contamination of drinking
water networks; a solid phase extraction liquid chromatography with diode array detector
(SPE-LC-DAD) method to control the drinking water quality in accordance with the
European Union legislation (maximum of 0.1 µg/L for individual pesticide) and a direct
injection liquid chromatography mass spectrometry (DI-LC-MS) method for confirmation
purposes and identification of PQ degradation by-products. Limits of detection of 10 µg/L,
0.04 µg/L and 20 µg/L PQ were reached for DI-LC-DAD, SPE-LC-DAD and DI-LC-MS
methods, respectively. The PQ analytical response of DI-LC-DAD method was tested in
different types of water and in the presence of other species or compounds resulting
from the contact of the water with deposits and Pseudomonas fluorescens cells that exist
in drinking water networks. Additionally, the method response was assessed when a PQ
commercial formulation (Gramoxone) was used as PQ source instead of the analytical
standard. Recovery percentages after spiking samples of 77, 99 and 101% on average
were attained for 0.25, 30 and 80 mg/L of PQ by DI-LC-DAD method, respectively. It was
also proved that for concentrations of Fe(II), H2O2 and Na2SO3 lower than 6.4×10⁻⁴,
5.7×10⁻² and 9.6×10⁻² M, respectively, no effects are observed in the analytical response
of DI-LC-DAD method.
Global uncertainties below 6, 11 and 13% were found for DI-LC-MS, SPE-LC-DAD and DI-
LC-DAD, respectively, for the most part of the calibration ranges. All methods proved to
be precise, accurate and suitable for the purpose that they were designed.
* Adapted from: Mónica S.F. Santos, Luís M. Madeira and A. Alves, Paraquat quantification in waters,
submitted, 2013.
83

Part II – Chapter 2
2.1 Introduction
The development of analytical methodologies for detection and quantification of PQ in
different case scenarios is one of the main goals of this chapter. In particular, it is
necessary to develop an analytical methodology to determine the PQ concentration in
water matrices in case of a deliberate contamination of a water network. Under such
conditions, it is of crucial importance to have a simple and expeditious method to
quantify high PQ concentrations with good accuracy and precision, in a short time and
using classical equipment, in order to be possible to make the analysis everywhere. Here,
a simple DI-LC-DAD is proposed for emergency situations. On the other hand, a more
sensitive methodology is also required, such as SPE-LC-DAD, to ensure that PQ levels in
drinking water are below the limit recommended by European Union (0.1 µg/L). Since one
of the main objectives of the thesis is to develop and implement effective degradation
methodologies to treat waters contaminated with chemicals, it is necessary to be able to
identify the degradation by-products in order to infer about the toxicity and
biodegradability of the generated effluents. Fenton’s reaction is an advanced oxidation
process which uses H2O2 and Fe2+ as oxidant and catalyst, respectively, to degrade the
organic matter. This degradation process was implemented for the degradation of PQ in
waters (Chapter 5). Although acceptable mineralization degrees were reported, a DI-LC-
MS method is recommended for confirmation purposes and for identification of some
degradation by-products formed during the Fenton’s process.
Methods for PQ quantification in waters are already available in the literature and they
are similar to the ones proposed here (see section 1.1.1. of Chapter 1). However, it is
important to emphasize that none of those studies considered the method validation
applied to such different samples: in the presence of deposits, cells, and different types of
water, which may represent realistic scenarios in drinking water networks. The analytical
response of DI-LC-DAD was also analysed in the presence of Fenton’s species which, to
the author knowledge, was never ever investigated before.
Additionally, a complete set of validation parameters, including the calculation of the
global uncertainty associated to the results in the range of quantification, is presented for
all developed methods.
84

Paraquat quantification in waters 2.2 Experimental Section
2.2.1 Standard solutions and samples
Paraquat dichloride (PQ) PESTANAL® analytical standard (Fluka) was purchased from
Sigma-Aldrich (St. Louis, USA). Gramoxone (GMX) with 25.6 wt. % of PQ was kindly
supplied by Syngenta Crop Protection, Lda. Heptafluorobutyric acid (HFBA) from Sigma-
Aldrich (St. Louis, USA), acetonitrile (HPLC grade) from VWR BDH Prolabo (Fontenay-sous-
Bois, France) and methanol (Lichrosolv® hypergrade for liquid chromatography) and water
(Lichrosolv® for chromatography) from Merck (Darmstadt, Germany) were used for
analysis.
Hydrogen peroxide solution (H2O2, 30% v/v), iron (II) sulfate heptahydrate (FeSO4, 99.5%)
and anhydrous sodium sulfite (Na2SO3, 96%) were purchased from Merck (Darmstadt,
Germany) and used in interference tests.
Ammonium chloride (NH4Cl, 99.9%) from Sigma-Aldrich (St. Louis, USA), methanol (HPLC
grade) from VWR BDH Prolabo (Fontenay-sous-Bois, France) and hydrochloric acid (37%
for analysis, ACS Merck) were used in solid phase extraction (SPE). The SPE columns were
SupelcleanTM LC-Si SPE tubes 3 mL from Supelco (Pennsylvania, USA) and Oasis WCX 6 cc
cartridge 150 mg from Waters (Dublin, Ireland).
Syringe filters with 0.2 µm PTFE membrane were purchased from VWR (West Chester,
USA).
2.2.2 Instrumentation 2.2.2.1 LC-DAD
Chromatographic analysis of PQ by LC-DAD was performed in a Hitachi Elite LaChrom with
a L-2130 pump, a L-2200 autosampler and a L-2455 diode array detector (DAD). For PQ
concentrations between 0.1 mg/L and 80 mg/L, quantification was done by direct
injection of 99 µL in a Purospher® STAR LiChroCART® RP-18 endcapped (240x4 mm, 5 µm)
reversed phase column from Merck (Darmstadt, Germany) and using a mobile phase of
80% (v/v) of 10 mM HFBA in water and 20% (v/v) of acetonitrile (ACN), at isocratic
conditions, with a flow rate of 1 mL/min. For lower PQ concentrations, the
chromatographic separation was achieved by a Chromolith® Performance RP-18e 100-3
(3x4.6 mm) column from Merck (Darmstadt, Germany). The mobile phase used was
85

Part II – Chapter 2
composed by 95% of HFBA 10 mM and 5% of ACN at 1 mL/min under isocratic conditions.
PQ quantification was done at 259 nm in both cases.
2.2.2.2 LC-MS
Chromatographic analyses were performed using a Varian LC-MS system (Lake Forest,
USA) constituted by a ProStar 210 Binary Solvent Delivery Module and a 500-MS LC Ion
Trap Mass Spectrometer equipped with an electrospray ionization source (ESI). Data was
acquired and processed by Varian MS Workstation Version 6.9 software. A Polaris® C18-A
column (50 mm x 2 mm i.d., particle size: 5 μm) in combination with a MetaGuard column
Pursuit® C18 (10 mm x 2.0 mm i.d., particle size: 5 μm) were supplied by Varian (Lake
Forest, USA). The mobile phase was composed of 5 mM HFBA in water (80%, v/v) and
methanol (20%, v/v), running in isocratic conditions. The analyses were done in the
positive ion mode. The flow rate was 0.2 mL/min and the injection volume was 10 μL. The
MS conditions were optimized during the experimental work, and the final conditions
were: μScan average – 3 μscans, drying gas – 20 psi at 400 °C, nebulising gas – 50 psi,
multiplier offset – 300 V, needle voltage – 3839 V, capillary voltage – 87 V, RF loading –
77%.
2.2.3 SPE procedure for the SPE-LC-DAD method
In this methodology, one litre of PQ standard (10 µg/L) at pH 9 (adjusted with NaOH) is
passed through a cartridge (silica or Oasis WCX waters), where the analyte is retained.
After that, 3 mL of a solvent (HCl 0.1 M in methanol, HCl 6 M in methanol or saturated
solution of NH4Cl in methanol) is used to elute paraquat. After solvent evaporation under
nitrogen flow, the sample was reconstituted in 1 mL of distilled water and was injected in
the HLPC-DAD (enrichment factor is 1000x).
2.2.4 Validation parameters
The validation of the analytical methods and the uncertainty measurement followed the
bottom-up approach described in the Eurachem CITAC Guide [1] and by other authors [2,
3]. It comprised a first step of in-house validation, where the main parameters were
obtained – linearity of the response, limit of detection (LOD) and limit of quantification
86

Paraquat quantification in waters (LOQ), precision and accuracy. Precision was assessed by repeatability and intermediate
precision for both DI-LC-DAD and DI-LC-MS methods at three PQ concentration levels.
Precision of the SPE-LC-DAD method was only evaluated by repeatability at 0.2, 10 and 50
µg/L of PQ. Results were expressed as the coefficient of variation (CV%) of different
replicate measurements. Accuracy was investigated by testing the analytical response
capability in the presence of other species or compounds. For DI-LC-DAD method a wide
range of interference scenarios were considered and, for that reason, a detailed
explanation is given in section 2.2.4.1. The accuracy of the SPE-LC-DAD method was
determined comparing the PQ contamination level obtained by the calibration curve and
the real amount of PQ added to the sample. Concerning the DI-LC-MS method, the
accuracy was evaluated by comparing the analytical responses for PQ standards prepared
in distilled water and in river water.
The second step of the validation is the estimation of the uncertainty associated to the
results, using the other parameters as an assumption that they represented the main
sources of uncertainty to the final result.
2.2.4.1 Recovery assays for the DI-LC-DAD method
Recovery assays were performed by the standard addition method at three PQ
concentration levels (0.25, 30 and 80 mg/L). Since the developed method should be able
to answer in different real scenarios, the analytical response under different water
matrices was evaluated: tap water, water after contact with different kind of deposits
(herein called S2, S3 and S4), clay and water after cells exposition. The applicability of this
method to quantify PQ in waters contaminated with GMX was also evaluated.
2.2.4.1.1 Tap water
Tap water was used to prepare a PQ standard and the analytical response was compared
with that obtained when the standard was prepared in distilled water.
2.2.4.1.2 Gramoxone
The analytical response was evaluated when one PQ commercial product (GMX) was
added to an aqueous sample. First, a GMX solution was prepared and the analytical
87

Part II – Chapter 2
response was obtained. Then, a known amount of PQ analytical standard was added and
the recovery was calculated by comparison of the obtained and expected mass of PQ.
2.2.4.1.3 Deposits
The deposit samples (S2, S3 and S4) used in the recovery tests were supplied by Dr.
Gabriela Schaule (IWW Water Centre, Germany). The deposits were removed from real
cast iron pipes that needed to be replaced. Deposits were submitted to dryness in an
oven (till no weight variation has been detected). Then, all deposits were sieved and were
kept in dry conditions until the experiments. An extensive physico-chemical
characterization of these deposits has been described previously [4] and, for that reason,
the nomenclature used in such study was maintained. According to the results obtained
in that study, it was possible to classify the S2, S3 and S4 samples as brown, tubercle and
white deposits, respectively, being representative of the main classes of deposits formed
in drinking water networks [4]. Clay was the other sample used in this test. The main
properties of all deposits and clay used are summarized in Table 2.1.
Table 2.1. Physical-chemical composition of the deposits [4] and clay and main
characteristics.
S2 S3 S4 Clay
Deposit classification Brown Tubercle White ---------------
ICP-OES analysis
(wt.% of the main
elements at dry basis)
Fe: 98%
Ca: 1%
Fe: 97%
P: 1%
Mn: 1%
Ca: 97%
Fe: 1%
Mg: 1%
Al2O3: 34%
SiO2: 49%
SBET, m2/g 5 36 1 Not determined
Surface area (m2/g) 3.1 19.3 0.2 Not determined
pHpzc,
20 °C
2.6 6.1 9.9 4.8
pH in water,
20 °C
3.3 7.2 9.0 5.3
Main components
identified by XRD
lepidocrocite goethite calcite (CaCO3) Not determined
Organic matter
content (wt.%)
1.0 1.0 0.2 12
88

Paraquat quantification in waters Clay chemical composition was obtained from LNEG (Laboratório Nacional de Energia e
Geologia, Portugal) and the particle size was determined by a Coulter Counter LS 230 with
small volume model. The pHpzc (point of zero charge) was obtained as for deposits [4].
The organic matter content was determined in a TOC-VCSH apparatus with a solid sample
module SSM-5000A. The total surface area was determined by mercury porosimetry.
For recovery assays, a known amount of deposit (300 mg) was put in contact with water
(10 mL), at 20 °C in the dark during 24 h (batch conditions). After filtration, the water was
used to prepare a PQ standard and the analytical response was compared with that
obtained when the standard was prepared in distilled water.
2.2.4.1.4 Cells
A sterile concentrated medium composed by 5.50 g/L of glucose, 2.50 g/L of peptone,
1.25 g/L of yeast extract, 1.88 g/L of KH2PO4 and 2.60 g/L of Na2HPO4 was inoculated
with a culture of Pseudomonas fluorescens grown on PCA medium at 37 °C overnight. Cell
suspension was incubated overnight at 37 °C on an orbital shaker and, in the next day,
they were washed with a phosphate buffer solution under sterile conditions. The optical
density of the final suspension was 0.4. Then, the cells were removed by centrifugation
and by filtration using a PTFE syringe filter. Recovery tests were performed at three PQ
concentration levels by the addition of a known amount of PQ to the filtrate. The
analytical responses were compared with that obtained when the same amount of PQ
was added to distilled water.
2.2.5 Interference studies of Fenton’s species on PQ quantification by DI-LC-DAD
A stock solution of Fe(II) was prepared by dissolving an appropriate amount of FeSO4 in
water, adjusting the pH to 3. The Na2SO3 and the H2O2 were measured directly from the
commercial reagents to prepare the standards. First of all, independent solutions of the
Fenton’s species were injected and the DAD response was analysed. Then, solutions
containing both PQ and Fenton’s species (individually) were prepared and injected. Two
Fe(II) concentrations were considered (3.6×10⁻⁴ and 6.4×10⁻⁴ M) and interference tests
with this chemical were made for 1, 5 and 80 mg/L of PQ. The interference of Na2SO3 and
H2O2 on the analytical response was assessed for 1, 5, 20, 50, 70 and 80 mg/L of PQ. The
89
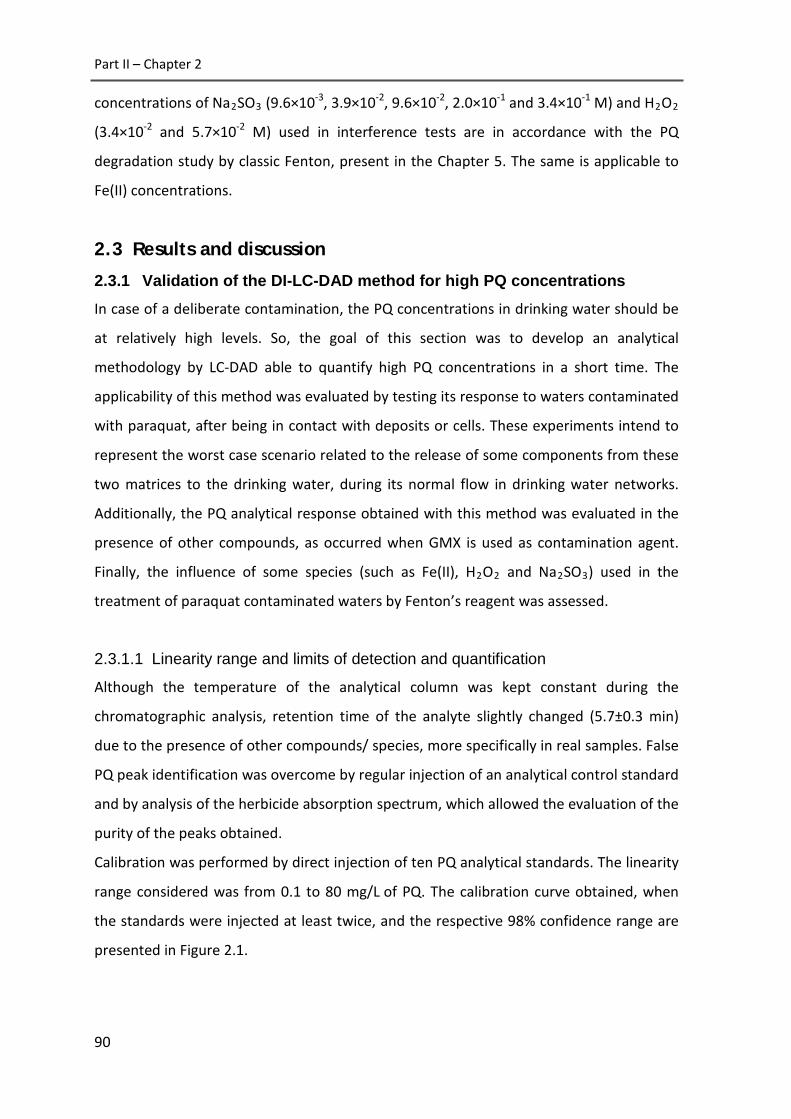
Part II – Chapter 2
concentrations of Na2SO3 (9.6×10⁻³, 3.9×10⁻², 9.6×10⁻², 2.0×10⁻¹ and 3.4×10⁻¹ M) and H2O2
(3.4×10⁻² and 5.7×10⁻² M) used in interference tests are in accordance with the PQ
degradation study by classic Fenton, present in the Chapter 5. The same is applicable to
Fe(II) concentrations.
2.3 Results and discussion
2.3.1 Validation of the DI-LC-DAD method for high PQ concentrations In case of a deliberate contamination, the PQ concentrations in drinking water should be
at relatively high levels. So, the goal of this section was to develop an analytical
methodology by LC-DAD able to quantify high PQ concentrations in a short time. The
applicability of this method was evaluated by testing its response to waters contaminated
with paraquat, after being in contact with deposits or cells. These experiments intend to
represent the worst case scenario related to the release of some components from these
two matrices to the drinking water, during its normal flow in drinking water networks.
Additionally, the PQ analytical response obtained with this method was evaluated in the
presence of other compounds, as occurred when GMX is used as contamination agent.
Finally, the influence of some species (such as Fe(II), H2O2 and Na2SO3) used in the
treatment of paraquat contaminated waters by Fenton’s reagent was assessed.
2.3.1.1 Linearity range and limits of detection and quantification
Although the temperature of the analytical column was kept constant during the
chromatographic analysis, retention time of the analyte slightly changed (5.7±0.3 min)
due to the presence of other compounds/ species, more specifically in real samples. False
PQ peak identification was overcome by regular injection of an analytical control standard
and by analysis of the herbicide absorption spectrum, which allowed the evaluation of the
purity of the peaks obtained.
Calibration was performed by direct injection of ten PQ analytical standards. The linearity
range considered was from 0.1 to 80 mg/L of PQ. The calibration curve obtained, when
the standards were injected at least twice, and the respective 98% confidence range are
presented in Figure 2.1.
90

Paraquat quantification in waters
0
20
40
60
80
100
120
140
0 20 40 60 80
PQ p
eak
area
(u.a
.)
PQ concentration (mg/L)
Upper limitLower limitExperimental data
Figure 2.1. Calibration curve for PQ quantification in water by DI-LC-DAD.
The limits of detection and quantification were calculated, based on a Signal Noise to
Ratio (S/N) of 3 and 10, and were 0.01 and 0.03 mg/L, respectively. Only one study was
found in the literature concerning the direct injection of a PQ standard in a LC-UV and a
LOD of 2 mg/L of PQ was obtained [5], which is much higher than the obtained here. To
the author´s best knowledge, none study of paraquat quantification in water by DI-LC-
DAD was published.
A relative standard deviation of the slope of 0.7% and a correlation coefficient of 0.9996
were obtained. It was also verified that the confidence limits for the interception contains
the origin. Those results prove the adequacy of the calibration curve for the purpose of
analysis [6].
2.3.1.2 Precision
Precision was evaluated by repeatability and intermediate precision and was expressed as
the coefficient of variation (CV%) of different replicate measurements. Repeatability
expresses the analytical response variability observed when, at least, six intra-day
measurements were performed for a certain standard and under the same conditions.
Intermediate precision indicates the analytical response variation observed when one of
the factors is changed (in this case the day of injection). The last one was evaluated based
Area = (163±1)×104 C(mg/L) + (2±4)×105
R=0.9996
×10-6
91

Part II – Chapter 2
on at least six replicates. Precision was assessed at three PQ concentrations (0.25, 30 and
80 mg/L) and presented in Table 2.2.
Table 2.2. Precision of the DI-LC-DAD method for analytical standards.
PQ concentration (mg/L)
n = 6 0.25 30 80
Repeatability (%) 15.5 0.2 0.2
Intermediate Precision (%) 21.0 2.0 1.6
As can be seen, there are higher variations in the response for lower PQ concentrations
but, for higher ones the precisions are well below 10%.
2.3.1.3 Accuracy
Accuracy is defined as a measure of the closeness between one analytical result and the
true value. This parameter could be assessed comparing the analytical response for a
certified reference material with the value indicated by the supplier. Alternatively, this
parameter can be evaluated by the standard addition method. By this way, as the name
itself mentions, a known amount of PQ is added to a sample and then, the expected and
obtained responses are compared. For accuracy assessment, recovery assays were
performed at three PQ concentration levels (0.25, 30 and 80 mg/L) and considering
different scenarios.
The water into the pipes is constantly in contact with deposits with different
compositions depending on the pipe material, water characteristics and region where it is
located. Despite of the large heterogeneity of deposits formed along drinking water
networks, it is assumed that these deposits may be classified in accordance with the three
categories proposed by Echeverría and co-workers (brown, tubercle and white deposits)
[7]. For that reason, three different deposits from real drinking water networks, one of
each category, were considered for recovery experiments, as well as clay, which were
analyzed in Chapter 4. The possibility of some compounds (inorganic and organic) present
in these deposits/clay leach to the water phase and interfere in the analytical method
response was screening. The same tests were performed with water after being in
contact with cells (Pseudomonas fluorescens). This was the best available approximation
92

Paraquat quantification in waters to represent the effect of the biofilm that grows in drinking water networks. The
analytical method response was also evaluated for a different type of water (tap water).
The applicability of the DI-LC-DAD method to quantify PQ in waters, when a PQ
commercial formulation (GMX) is used as contamination agent, was also assessed.
Although the composition of the commercial mixture was known, the purity in terms of
PQ was confirmed by the standard addition method. By this way, increasing amounts of
PQ analytical standard were added to a constant amount of GMX [8]. The content of PQ
was determined by the interception of the DAD response for the prepared samples with
the independent variable axis. It was verified that there are 27±2 mg of PQ per 100 mg of
GMX. This result confirms the value supplied by Syngenta, which is 25.6 wt.%.
The recovery values obtained for all referred situations are indicated in Table 2.3.
Table 2.3. Recovery assays of the DI-LC-DAD analytical method.
PQ concentration (mg/L)
Recovery (%) (n=3) 0.25 30 80
Tap water 120±3 99±1 100±1
GMX 100±6 101±1 104±1
Deposits
Clay 90±2 95±3 94±4
S4 109±4 100±1 99±1
S3 91±6 102±1 107±1
S2 23±1 95±1 105±1
Cells 6±2 100±1 97±1
Generaly the recovery percentages obtained are acceptable, except for the experiments
with S2 deposit and cells at the lowest spiking level. Recoveries on average of 77, 99 and
101% were attained for 0.25, 30 and 80 mg/L of PQ by this method, respectively. The
recovery of 23% and 6% respectively for S2 and Cells should be confirmed in future work,
but they may be due to the higher global uncertainty associated to results for this
concentration level.
2.3.1.4 Estimation of the global uncertainty associated to the DI-LC-DAD method
To evaluate the global uncertainty associated to the quantification of PQ in water by DI-
LC-DAD, the bottom-up approach was used. This methodology was proposed by the
93

Part II – Chapter 2
International Organization for Standardization (ISO) and adopted by EURACHEM/CITAC
Guide [1]. The most significant sources of uncertainty that are thought to affect the final
result are: the uncertainty associated with the preparation of the standards (U1), to the
calibration curve (U2), the uncertainty associated to the precision of the extraction and
also of the chromatographic method (U3) and to the accuracy (U4). Description of main
contributions and respective calculation formula for the global uncertainty is given in
Annex I. The contribution of these four individual uncertainties to the global uncertainty
is depicted in Figure 2.2. As illustrated, for PQ concentrations lower than 5 mg/L, the main
source of uncertainty is the uncertainty associated to the calibration curve (U2). On the
other hand, for higher concentrations of analyte, the accuracy (U4) is the main
responsible for the variation of the response. Standard preparation (U1) contributes
always with less than 10% for the global uncertainty. Precision (U3) has the same
behavior of accuracy (U4): the higher the analyte concentration, the higher the precision
and accuracy contributions.
0%
10%
20%
30%
40%
50%
60%
70%
80%
90%
100%
% o
f Tot
al u
ncer
tain
ty
PQ concentration (mg/L)
U4
U3
U2
U1
Figure 2.2. Relative weight of each individual source of uncertainty (bottom-up
approach/EURACHEM) for PQ quantification in waters by DI-LC-DAD.
Global uncertainty below 13% was found for the most part of the calibration range
(Figure 2.3). However, when concentrations approach the detection limits of the
analytical method, assessed global uncertainty increases and represents more than 100%
94

Paraquat quantification in waters of the stated value. For that reason, Figure 2.3 only represents the global uncertainty for
paraquat dichloride concentrations higher than 1 mg/L.
0
10
20
30
40
50
60
0 20 40 60 80 100
Glob
al U
ncer
tain
ty (%
)
PQ concentration (mg/L)
Figure 2.3. Global uncertainty of the analytical methodology for PQ quantification in
waters by DI-LC-DAD.
The main advantages of the DI-LC-DAD method are the simplicity and rapidity of the
determination, because results may be obtained in few minutes, with good accuracy and
precision. The equipment is also common in most analytical laboratories, which is very
important in an emergency situation. However some drawbacks should be pointed out:
1) Detection limit (10 µg/L) is higher than maximum legal limit (0.1 µg/L);
however in the event of a deliberate contamination this is an excellent
method for rapid detection;
2) A significant uncertainty is found near the limit of detection of the
method and up to 1 mg/L;
3) Possibility of co-elution of other contaminants and therefore an
unequivocal identification of the contaminant cannot be assessed,
unless other methods are used for confirmation purposes, as LC-MS.
2.3.1.5 Specificity of the method – study of interferences from Fenton’s reaction
This topic is particularly important when water samples have to be analysed following a
decontamination procedure using a chemical method, as it happens with the
95

Part II – Chapter 2
decontamination by Fenton’s reagent, which is presented later (Chapter 5). The
interference of chemicals used in the Fenton´s reaction, such as H2O2, FeSO4 and Na2SO3,
on the analytical method response was studied. It was assumed that these species
interfere with the measurement of PQ by DI-LC-DAD if the variation of the paraquat peak
area was superior to the global uncertainty for the considered PQ contamination level.
It is important to highlight the novelty of this research topic since, up to the author
knowledge it was never addressed in any other study reported in open scientific
literature.
2.3.1.5.1 Iron salt
The effect of Fe (II) was assessed by evaluating the PQ analytical response in the presence
of two FeSO4 concentrations at different PQ contamination levels. Figure 2.4 shows the
variation of the PQ peak area in relation to the value achieved for a PQ standard prepared
in water.
0
1
2
3
4
5
6
7
8
1 5 80
Δ Ar
ea (%
)
PQ concentration (mg/L)
[Fe(II)]=3.6e-4 M [Fe(II)]=6.4e-4 M
Figure 2.4. Influence of the presence of FeSO4 in paraquat quantification by DI-LC-DAD.
As can be checked from Figure 2.4, variations of the PQ peak area are below the
estimated global uncertainty for the correspondent PQ contamination level. For that
reason, it can be concluded that there is no influence of the iron salt in the PQ
quantification by the proposed method.
[Fe(II)] = 3.6×10⁻⁴ M
[Fe(II)] = 6.4×10⁻⁴ M
U = 51%
U = 12%
U = 7%
96

Paraquat quantification in waters 2.3.1.5.2 Sodium sulfite and hydrogen peroxide
Regarding the interference of Na2SO3, which is added to quench the reaction, it can be
observed from Figure 2.5 that it depends on the concentration of this species in solution.
The variation of the PQ peak area is below the global uncertainty for the three lower
concentrations of Na2SO3 (9.6×10⁻³, 3.9×10⁻² and 9.6×10⁻² M). However, for the two
higher ones (2.0×10⁻¹ and 3.4×10⁻¹ M), the variations of the PQ peak area are clearly
above the estimated global uncertainty (12% for 5 mg/L of PQ and approximately 7% for
higher PQ concentrations). The observed variations are consequence of significant
decreases on PQ peak areas in the presence of high concentrations of Na2SO3.
Figure 2.5. Influence of the presence of Na2SO3 and H2O2 in PQ quantification by DI-LC-
DAD.
The interference in the analytical response may be explained by the shift effect, in the
maximum wavelength or in the absorbance signal, which a molecule suffers in the
presence of other chemical species. The bathochromic or hypsochromic shift is the
U = 51%
U = 12%
U = 7%
[Na2SO3]=9.6×10⁻³ M
[Na2SO3]=2.0×10⁻¹ M + [H2O2]=3.4×10⁻² M
[Na2SO3]=9.6×10⁻² M
[Na2SO3]=3.4×10⁻¹ M + [H2O2]=5.7×10⁻² M
[Na2SO3]=3.9×10⁻² M
[Na2SO3]=2.0×10⁻¹ M
[Na2SO3]=3.4×10⁻¹ M
97

Part II – Chapter 2
change of spectral band position in the absorption spectrum of a molecule to a longer or
shorter wavelength, respectively. This can occur because of a change in environmental
conditions, for example, or a change in solvent polarity. On the other hand, the
hypsochromic shift is the reduction of the intensity of the absorption band.
So, it means that higher concentrations of Na2SO3 may interfere with the measurement
of PQ concentration in waters by the proposed method. Because of the decrease on the
PQ peak area, calibration curves were obtained in the absence and in the presence of the
two major concentrations of Na2SO3 studied, where influence was verified (Figure 2.6).
Figure 2.6 clearly shows that the quantification of PQ in the presence of Na2SO3 needs to
be corrected by a conversion factor depending on the concentration of this specie.
0
20
40
60
80
100
120
140
0 20 40 60 80 100
PQ p
eak
area
(u.a
.)
PQ concentration (mg/L)
Figure 2.6. Calibration curve for PQ quantification in water and in different concentrations
of Na2SO3 by DI-LC-DAD.
H2O2 is consumed along the Fenton’s reaction and its concentration was not monitored
along the experiments. Although its concentration was becoming lower with the reaction
time, the amount of Na2SO3 added to quench the reaction, whenever a sample was
withdrawn, was kept constant. The amount of Na2SO3 added corresponds to an excess of
six times related to the amount of H2O2 used in the experiment. So, the best and worst
[Na2SO3]=0 M
[Na2SO3]=2.0×10⁻¹ M
[Na2SO3]=3.4×10-1 M
×10-6
98

Paraquat quantification in waters case scenarios were considered for interference assays with H2O2. In other words, the
best situation corresponds to a H2O2 absence and the worst one to the presence of all
H2O2 dose added in the experiment at the beginning of the process. For time consuming
reasons, only the two higher H2O2 concentrations were studied (which corresponds also
to the two higher Na2SO3 concentrations) because if there were not influence on the
analytical response under these conditions it means that there were not at lower H2O2
concentration levels. As can be checked from Figure 2.5, the presence of H2O2 has no
effect on the PQ peak area.
Despite of the interference of high doses of Na2SO3 (2.0×10⁻¹ and 3.4×10⁻¹ M) on the
analytical response, is important to highlight that for the optimum PQ degradation
conditions ([Fe2+]0 = 5.0×10⁻⁴ M, [H2O2]0 = 1.6×10⁻² M and [Na2SO3] = 9.6×10⁻² M; Chapter
5), there is no influence of Fenton’s species on the PQ quantification by DI-HLPC-DAD.
2.3.2 Validation of the SPE-LC-DAD method for low PQ concentrations
As referred before, the DI-LC-DAD method has as disadvantage a limit of detection higher
than the EU legislated value (0.1 µg/L). To ensure that PQ in water is lower than the
established limit, an analytical methodology was developed to quantify paraquat at low
concentrations. For that, it was necessary to optimize a pre-concentration step prior to
the injection in the LC-DAD.
2.3.2.1 Extraction technique
Solid phase extraction was the extraction methodology selected for this study because,
according to the literature review done in Chapter 1, it has been the most used procedure
for clean-up and isolation of PQ from water matrices. Concerning the packing materials
used in SPE, it was decided to test silica and a cation exchange resin. Silica was chosen
because it is one of the most polar sorbents available for SPE and proved to be a valid
option for analysis of quaternary ammonium (QA) compounds like PQ [9-16]. The Oasis
WCX sorbent, which is a polymeric reversed-phase, weak ion exchange mixed-mode
sorbent, was also considered because it was designed for highly selective sample
preparation of strong basic compounds and quaternary amines.
For the experiments with silica, the pH of the PQ aqueous solution was adjusted to 9
before the loading step because it is well known that QA compounds are largely retained
99

Part II – Chapter 2
on silica under neutral or slightly basic conditions [9]. It was reported that recoveries for
diquat, paraquat and difenzoquat are quite acceptable in the pH 6.5-9.5 range [9]. The
same procedure was adopted for Oasis WCX sorbent because, according to the
manufacturer, PQ is eluted from this sorbent at low pH (almost 100% for pHs lower than
pH 2) [17].
For the elution step, three solvents were considered: HCl 0.1 M in methanol, HCl 6 M in
methanol and saturated ammonium chloride in methanol. The acidic eluents were
included in the list because as the QA compounds are retained in the sorbent under
neutral or slightly basic conditions, it is expected that they will desorb under acidic
medium. In particular, hydrochloric acid has been used as eluent in SPE pre-concentration
procedures for PQ in waters [10, 11, 14]. Methanol (MeOH) was tested because it is
sometimes applied in some eluents to desorb PQ from a wide range of SPE sorbents: silica
[10-16], graphitized carbon black [18], resin [19], alumina [20]. On the other hand, MeOH
has lower boiling point than water and so, the pre-concentration step of the final extract
by solvent evaporation is facilitated. Ammonium compounds such as ammonium sulphate
[12, 13, 16, 18], ammonium chloride [19], ammonium formate [21] and ammonium
hydroxide [22] have been widely used to elute PQ in SPE. Saturated ammonium chloride
is often used as PQ displacement agent in other matrices such as soils [23, 24]. For that
reason, saturated ammonium chloride was selected.
The results obtained when 1 L of PQ aqueous solution (10 µg/L) was loaded through silica
or Oasis WCX sorbents and the three above-mentioned eluents were used are outlined in
Figure 2.7.
The extraction percentages were calculated comparing the analytical response obtained
for a 10 mg/L PQ solution with that obtained for the extracted samples. As can be seen,
higher extraction percentages are attained when Oasis WCX cartridge was used. As HCl
0.1 M in MeOH is sufficient to obtain acceptable extraction percentages, this solvent was
used in the following experiments.
100

Paraquat quantification in waters
0
20
40
60
80
100
120
Silica WCX Waters
%Ex
trac
tion
HCl 6 M in MeOHHCl 0.1 M in MeOHNH4Cl in water (saturated solution)
Figure 2.7. Optimization of solid phase extraction methodology.
2.3.2.2 Quantitative analysis
The calibration curve was carried out at seven concentration levels, in the range of 0.1 to
50 µg/L of PQ. Good linearity was obtained in the concentration range studied (R =
0.9989). Quantitative parameters were obtained from the calibration curve and are
indicated in Table 2.4. The limits of detection and quantification were calculated based on
a Signal Noise to Ratio (S/N) of 3 and 10 and are 0.04 and 0.1 µg/L, respectively.
Table 2.4. Quantitative parameters obtained from PQ analysis in water by SPE-LC-DAD.
Parameters SPE-LC-DAD
Calibration curvea A = (94±1)×104 C (µg/L) + (-2±3) ×105
Range of linearity (µg/L) 0.1 – 50
Correlation coefficient (R) 0.9989
LOD (µg/L)b 0.04
LOQ (µg/L)c 0.1 a A is PQ peak area and C is the concentration in µg/L; b Limit of detection; c Limit of quantification.
The LOD of 0.04 µg/L of PQ is of the same order of magnitude [13, 15, 16, 18] or lower
[12, 14, 22] than the values reported in other studies of the literature.
HCl 6 M in MeOH HCl 0.1 M in MeOH
NH4Cl in MeOH (saturated solution)
101

Part II – Chapter 2
The relative standard deviation of the slope was 1.5% and the correlation coefficient of
the calibration curve was 0.9989. It was also verified that the confidence limits for the
interception contains the origin (b-sb˂0˂b+sb). Again, and according to these results, it
can be concluded that the calibration curve is adequate for the purpose of this analysis
[6].
2.3.2.3 Precision and accuracy
Precision was evaluated by six consecutive injections of extracts obtained from the
concentration of PQ analytical standards by SPE. The precision was inspected at three PQ
concentration levels and the results, expressed as relative standard deviation, were 8.9,
1.4 and 0.5% for 0.2, 10 and 50 µg/L, respectively.
Accuracy of this methodology was estimated comparing the PQ concentration level
obtained from the calibration curve with the expected concentration determined by the
real amount added to the water. This parameter was evaluated at two PQ concentration
levels – 10 and 50 µg/L. Recoveries were on average 84 and 101% for 10 and 50 µg/L
levels, respectively.
2.3.2.4 Estimation of the global uncertainty associated to the SPE-LC-DAD
method
The global uncertainty associated to the quantification of PQ in water by SPE-LC-DAD was
also estimated by the bottom-up approach/EURACHEM [1]. From Figure 2.8, it can be
seen that the uncertainty associated to the calibration curve (U2) represents the main
source of uncertainty, particularly for lower PQ concentration levels. For higher PQ
concentrations, the weight of the uncertainty associated to the precision (U3) for the
overall uncertainty is comparable to that attained for the uncertainty associated to the
calibration curve (U2). The uncertainties associated with the preparation of the standards
(U1) and accuracy (U4) increase for higher PQ contamination degrees, but minimal
relative individual contributions to the total uncertainty were estimated.
As shown in Figure 2.9, the lower the concentration level, the higher is the uncertainty
associated to the results.
102

Paraquat quantification in waters
0%
10%
20%
30%
40%
50%
60%
70%
80%
90%
100%
0.1 0.2 1 5 10 25 50
% o
f Tot
al u
ncer
tain
ty
PQ concentration (µg/L)
U4
U3
U2
U1
Figure 2.8. Relative weight of each individual source of uncertainty (bottom-up
approach/EURACHEM) for PQ quantification in waters by SPE-LC-DAD.
Global uncertainty below 11% was found for PQ concentrations higher than 5 µg/L (Figure
2.9). However, in the vicinity of the LOD of the analytical method, assessed global
uncertainty increases and represents more than 100% of the stated value. For that
reason, Figure 2.9 only represents the global uncertainty for PQ concentrations higher
than 1 µg/L.
0
10
20
30
40
50
60
70
0 10 20 30 40 50 60
Glob
al U
ncer
tain
ty (%
)
PQ concentration (µg/L)
Figure 2.9. Global uncertainty of the analytical methodology for PQ quantification in
waters by SPE-LC-DAD.
103

Part II – Chapter 2
2.3.3 Validation of the DI-LC-MS method for confirmation purposes A drawback of the LC–DAD methods is the impossibility of the unequivocal identification
of the contaminants/ oxidation by-products. The solution is to use an alternative method
for confirmation purposes. That is to say, in the event of detecting a possible
contamination by the rapid method (LC–DAD), a confirmation needs to be done by LC–
MS.
Paraquat may be analysed by direct injection in LC–MS in less than 5 minutes. This is the
main advantage, besides the fact that it is the only method that imparts an unequivocal
identification of the detected analyte, although the equipment is extremely expensive
and its use is reserved to high-skilled and trained technicians.
2.3.3.1 Solvents/ Mobile phase selection
Charged quaternary amines, such as paraquat, exhibit little retention on C18 or other
alkyl stationary phases and therefore a mobile phase modifier (ion-pairing reagent) needs
to be added to increase the interactions between paraquat and the stationary phase,
providing the necessary retention and resolution. For compatibility with MS detection,
however, a volatile mobile phase is needed and, therefore, low concentrations of HFBA
effectively shield the positive charges of paraquat, increasing interactions between the
quaternary amines and the stationary phase.
2.3.3.2 MS optimization procedures
The optimization of MS is achieved in three steps: mass, ionization source and
chromatographic optimization.
Firstly, a PQ standard solution (5 mg/L) was direct-infused in the electrospray mass
spectrometer. This procedure allowed obtaining the mass fragmentation pattern of PQ,
as well as, the parent ion. The most abundant peaks were the singly charged molecular
ion [M]+• (m/z 186) and the deprotonated molecule [M-H]+ (m/z 185). The highest
predominant ion which results from the fragmentation of [M-H]+ was the [M-CH3]+ (m/z
171) one.
The mass optimization was carried out by evaluating the MS response when the capillary
voltage, the needle voltage and the RF loading were changing at a time while the others
were kept constant (single factor-at-a-time approach). The value which gave the best
104

Paraquat quantification in waters single factor-at-a-time MS response was considered the optimal condition for the
parameter under study. Finally, for the best individual conditions the excitation amplitude
CID was set. The shield voltage was set at 600 V, according to the manufacturer. The
optimal values for each parameter are compiled in Table 2.5.
The optimal condition for the temperature of the drying gas, as well as, the best drying
and nebulization gas pressures were determined by direct injection of a PQ standard
solution (5 mg/L) in combination with the mobile phase (0.2 mL/min). The mobile phase
was 50% HFBA 5 mM and 50% MeOH. Again, the best conditions represent the best
individual MS responses by varying each parameter at a time (Table 2.5).
Table 2.5. Optimal mass spectrometry conditions for PQ determination.
Ionization
mode
Capillary
voltage
(V)
Needle
voltage
(V)
RF
loading
(%)
Tdrying gas
(°C)
Pdrying gas
(psi)
Pnebulization gas
(psi)
Excitation
amplitude
CID (V)
positive 87 3839 77 400 20 50 1.36
The drying and the nebulization gas pressures are related to the flow rate of the mobile
phase. Typically, values between 0.2-0.3 mL/min for the flow rate of the mobile phase
were used in LC-MS analysis. Therefore, according to the manufacturer’ reference values,
the nebulization gas pressure should be higher than 40 psi and the drying gas pressure
should range from 15 to 45 psi.
To optimize the chromatographic conditions, a PQ analytical standard (5 mg/L) was
injected in a C18 column, under the conditions optimized previously. The influence of the
amount of methanol in the mobile phase on the LC-MS response was studied. The
maximum MS response was attained when 20% of MeOH and 80% of HFBA 5 mM were
used. Under these conditions, the retention time for PQ was 4.7 min.
2.3.3.3 Linearity and limits of detection and quantification
The calibration curve for determination of PQ in water by LC–MS was obtained with ten
PQ analytical standards (from 0.1 to 10 mg/L). The analytical standards were directly
injected in the LC-MS, at least twice, with a coefficient of variation in the range of 1.9 -
9.4%. The calibration curve and the respective 98% confidence range are presented in
105

Part II – Chapter 2
Figure 2.10. The quantitative information about the method developed in LC–MS is
presented in Table 2.6.
As observed in the other proposed methods, LC-MS method is also suitable to be applied
in a quality control laboratory because the relative standard deviation of the slope is
lower than 5%, the correlation coefficient is higher than 0.995 and the confidence limits
for the interception contains the origin (b-sb˂0˂b+sb) [6].
0
20
40
60
80
100
120
140
160
180
200
0 2 4 6 8 10
PQ p
eak
area
(u.a
.)
PQ concentration (mg/L)
Upper limitLower limitExperimental data
Figure 2.10. Calibration curve for PQ quantification in water by DI-LC-MS.
Table 2.6. Quantitative parameters obtained from PQ analysis in water by DI-LC-MS.
Parameters LC-MS
Calibration curvea A = (185±2)×105 C (mg/L) + (-6±9)×105
Range of linearity (mg/L) 0.1 – 10
Correlation coefficient (R) 0.9991
LOD (mg/L)b 0.02
LOQ (mg/L)c 0.06 a A is PQ peak area and C is the concentration in mg/L; b Limit of detection; c Limit of quantification.
The limits of detection and quantification were determined based on a Signal Noise to
Ratio (S/N) of 3 and 10 and were 20 and 60 µg/L, respectively. Similar LODs (7-25 µg/L)
were found in the literature for DI-LC-MS methods [25-27].
×10-6
106

Paraquat quantification in waters 2.3.3.4 Precision and accuracy
Precision of the PQ analytical method by LC-MS was assessed by repeatability and
intermediate precision. Repeatability was determined by six consecutive injections of
three PQ analytical standards (0.2, 5 and 10 mg/L). The intermediate precision was
evaluated for the same PQ concentration levels and corresponds to the injection of each
standard in three days. The results expressed as relative standard deviation are shown in
Table 2.7.
Table 2.7. Analytical method precision for analytical standards.
PQ concentration (mg/L)
0.2 5 10
Repeatability (%) (n=6) 5.3 4.0 3.8
Intermediate Precision (%)
(n=3) 12.9 5.9 6.4
Accuracy was evaluated comparing the analytical response for a standard prepared in
distilled water with that obtained for a standard prepared in river water (Rio Ave). This
parameter was assessed in triplicate at three PQ concentrations: 0.2, 5 and 10 mg/L.
Recoveries were 94±10, 101±11 and 96±7 for 0.2, 5 and 10 mg/L of PQ.
2.3.3.5 Estimation of the global uncertainty associated to the LC-MS method
The global uncertainty associated to the results obtained by the proposed LC-MS method
was estimated by the bottom-up approach/EURACHEM. Figure 2.11 depicts the
contribution of each individual source of uncertainty for the overall uncertainty. As
demonstrated, the uncertainty of a result is mainly dependent on the uncertainty
associated to the calibration curve (U2) for low PQ concentrations. However, this source
of uncertainty contributes only with 12% to the total uncertainty at high PQ
concentration degrees while the uncertainties associated to precision (U3) and accuracy
(U4) with around 80-85%. The uncertainty associated to the preparation of the standards
(U1) is minimal in the overall range of concentrations.
The global uncertainty for all PQ linearity range (0.1 to 10 mg/L) is illustrated in Figure
2.12.
107

Part II – Chapter 2
0%
10%
20%
30%
40%
50%
60%
70%
80%
90%
100%
0.1 0.2 0.5 1 2 3 5 7 8 10
% o
f Tot
al u
ncer
tain
ty
PQ concentration (mg/L)
U4
U3
U2
U1
Figure 2.11. Relative weight of each individual source of uncertainty (bottom-up
approach/EURACHEM) for PQ quantification in waters by DI-LC-MS.
0102030405060708090
100
0 2 4 6 8 10
Glob
al U
ncer
tain
ty (%
)
PQ concentration (mg/L)
Figure 2.12. Global uncertainty of the analytical methodology for PQ quantification in
waters by DI-LC-MS.
As observed in Figure 2.12, the global uncertainty is around 6% for PQ concentrations
higher than 3 mg/L (the most part of the linearity range). For lower concentrations, the
global uncertainty associated to the results increase exponentially. In short, this method
proved to be reliable for confirmation of PQ in waters at concentrations above 20 µg/L.
108

Paraquat quantification in waters 2.4 Conclusions
The three analytical methods presented in this chapter were successfully validated as
bottom-up for PQ analysis in waters. LODs of 10 µg/L, 0.04 µg/L and 20 µg/L of PQ were
reached for DI-LC-DAD, SPE-LC-DAD and DI-LC-MS methods, respectively. Precision was
evaluated for all methods and it was verified that for medium and higher PQ
concentrations, the variations in the response are well below 10% (typically the
acceptable error). The DI-LC-DAD method proved to be accurate in the presence of other
species or compounds resulting from the contact of the water with deposits and cells,
from the PQ commercial formulation (GMX) and from other types of water. Recoveries on
average of 77, 99 and 101% were attained for 0.25, 30 and 80 mg/L of PQ by DI-LC-DAD
method, respectively. It was also shown that for concentrations of Fe(II), H2O2 and
Na2SO3 lower than 6.4×10⁻⁴, 5.7×10⁻² and 9.6×10⁻² M, respectively, no effects are
observed in the analytical response of the DI-LC-DAD method. It is important to highlight
that for the optimum PQ degradation conditions ([Fe2+]0 = 5.0×10⁻⁴ M, [H2O2]0 = 1.6×10⁻²
M and [Na2SO3] = 9.6×10⁻² M; Chapter 5), there is no influence of Fenton’s species on the
PQ quantification by this method. Average recoveries of 93 and 97% were obtained for
SPE-LC-DAD and DI-LC-MS methods, respectively, which account for they accuracy.
For all methods, the global uncertainty increase with the decrease of PQ concentration.
Global uncertainties of 6 to 13% were obtained for PQ concentrations higher than 5 mg/L
(linearity of 0.1 to 80 mg/L of PQ) by DI-LC-DAD, 5 µg/L (linearity of 0.1 to 50 µg/L of PQ)
by SPE-LC-DAD and higher than 1 mg/L (linearity of 0.1 to 10 mg/L of PQ) by DI-LC-MS.
All methods proved to be precise, accurate and suitable for the purpose that they were
designed.
2.5 References
[1] S.L.R. Ellison, M. Rosslein and A. Williams, Eurachem/ Citac Guide- Quantification
uncertainty in analytical measurement, EURACHEM/ CITAC, UK, 2000.
[2] N. Ratola, J. Amigo and A. Alves, Levels and Sources of PAHs in Selected Sites from
Portugal: Biomonitoring with Pinus pinea and Pinus pinaster Needles, Arch. Environ.
Contam. Toxicol. 58 (2010) 631-647.
109

Part II – Chapter 2
[3] S. Teixeira, C. Delerue-Matos, A. Alves and L. Santos, Fast screening procedure for
antibiotics in wastewaters by direct HPLC-DAD analysis, J. Sep. Sci. 31 (2008) 2924-2931.
[4] C. Oliveira, M.S.F. Santos, F.J. Maldonado-Hódar, G. Schaule, A. Alves and L.M.
Madeira, Use of pipe deposits from water networks as novel catalysts in paraquat
peroxidation, Chem. Eng. J. 210 (2012) 339-349.
[5] P.C. Schlecht and P.F. O'Connor, NIOSH Manual of Analytical Methods, 4th ed.,
National Institute for Occupational Safety Health, 2003.
[6] J.C. Miller and J.N. Miller, Statistics for analytical chemistry, 2nd ed., Ellis Horwood,
Chichester-England, 1988.
[7] F. Echeverría, J.G. Castaño, C. Arroyave, G. Peñuela, A. Ramírez and J. Morató,
Characterization of deposits formed in a water distribution system, Rev. Chil. Ing. 17
(2009) 275-281.
[8] D.C. Harris, Quantitative Chemical Analysis, 6th ed., W.H. Freeman, New York, 2003.
[9] Y. Picó, G. Font, J.C. Moltó and J. Mañes, Solid-phase extraction of quaternary
ammonium herbicides, J. Chromatogr. A 885 (2000) 251-271.
[10] J.L. Martínez Vidal, A. Belmonte Vega, F.J. Sánchez López and A. Garrido Frenich,
Application of internal quality control to the analysis of quaternary ammonium
compounds in surface and groundwater from Andalusia (Spain) by liquid chromatography
with mass spectrometry, J. Chromatogr. A 1050 (2004) 179-184.
[11] R. Castro, E. Moyano and M.T. Galceran, Ion-pair liquid chromatography–
atmospheric pressure ionization mass spectrometry for the determination of quaternary
ammonium herbicides, J. Chromatogr. A 830 (1999) 145-154.
[12] M. Ibáñez, Y. Picó and J. Mañes, On-line liquid chromatographic trace enrichment and
high-performance liquid chromatographic determination of diquat, paraquat and
difenzoquat in water, J. Chromatogr. A 728 (1996) 325-331.
[13] M. Ibáñez, Y. Picó and J. Mañes, Influence of organic matter and surfactants on solid-
phase extraction of diquat, paraquat and difenzoquat from waters, J. Chromatogr. A 727
(1996) 245-252.
[14] M.C. Carneiro, L. Puignou and M.T. Galceran, Comparison of silica and porous
graphitic carbon as solid-phase extraction materials for the analysis of cationic herbicides
in water by liquid chromatography and capillary electrophoresis, Anal. Chim. Acta 408
(2000) 263-269.
110

Paraquat quantification in waters [15] R. Rial-Otero, B. Cancho-Grande, C. Perez-Lamela, J. Simal-Gándara and M. Arias-
Estévez, Simultaneous determination of the herbicides diquat and paraquat in water, J.
Chromatogr. Sci. 44 (2006) 539-542.
[16] M. Ibáñez, Y. Picó and J. Mañes, Improving the solid-phase extraction of 'quat'
pesticides from water samples: Removal of interferences, J. Chromatogr. A 823 (1998)
137-146.
[17] H. White, Sample preparation strategies for water analysis, Waters Corporation,
2007.
[18] M. Ibánez, Y. Picó and J. Manes, On-line determination of bipyridylium herbicides in
water by HPLC, Chromatographia 45 (1997) 402-407.
[19] L. Grey, B. Nguyen and P. Yang, Liquid chromatography-electrospray ionization
isotope dilution mass spectrometry analysis of paraquat and diquat using conventional
and multilayer solid-phase extraction cartridges, J. Chromatogr. A 958 (2002) 25-33.
[20] F. Merino, S. Rubio and D. Pérez-Bendito, Evaluation and optimization of an on-line
admicelle-based extraction-liquid chromatography approach for the analysis of ionic
organic compounds, Anal. Chem. 76 (2004) 3878-3886.
[21] O. Núñez, E. Moyano and M.T. Galceran, Time-of-flight high resolution versus triple
quadrupole tandem mass spectrometry for the analysis of quaternary ammonium
herbicides in drinking water, Anal. Chim. Acta 525 (2004) 183-190.
[22] J.W. Munch and W.J. Bashe, Method 549.2 - Determination of diquat and paraquat in
drinking water by liquid-solid extraction and high performance liquid chromatography
with ultraviolet detection, U.S. Environmental Protection Agency, Cincinnati, Ohio 45268,
1997.
[23] B.V. Tucker, D.E. Pack and J.N. Ospenson, Adsorption of bipyridylium herbicides in
soil, J. Agric. Food. Chem. 15 (1967) 1005-1008.
[24] T. Perez-Ruiz and J. Fenoll, Spectrofluorimetric determination of paraquat by manual
and flow injection methods, Analyst 123 (1998) 1577-1581.
[25] R. Castro, E. Moyano and M.T. Galceran, Ion-trap versus quadrupole for analysis of
quaternary ammonium herbicides by LC-MS, Chromatographia 53 (2001) 273-278.
[26] R. Castro, E. Moyano and M.T. Galceran, On-line ion-pair solid-phase extraction–
liquid chromatography–mass spectrometry for the analysis of quaternary ammonium
herbicides, J. Chromatogr. A 869 (2000) 441-449.
111

Part II – Chapter 2
[27] R. Castro, E. Moyano and M.T. Galceran, Determination of quaternary ammonium
pesticides by liquid chromatography-electrospray tandem mass spectrometry, J.
Chromatogr. A 914 (2001) 111-121.
112

3 Paraquat quantification in deposits from
drinking water networks*
Abstract
The aim of this work was to develop an expedite analytical methodology to evaluate the
contamination level of paraquat in deposits from drinking water networks. This is a
completely new work since, to the author knowledge, no other study has been focused
on this matter. Three deposits representative of those typically found in drinking water
networks were used: two iron-based – S2 and S3, and a calcium rich one – S4. The
analytical method consists of an easy and fast extraction step, using a saturated
ammonium chloride solution, followed by direct injection in a liquid chromatography with
diode array detection (LC-DAD). A matrix-matched calibration was performed for
paraquat, in the range of 5 to 193 µgPQ/g deposit, and a limit of detection of 0.1 µgPQ/g
deposit was reached. The good percentages of recovery (90-101% on average) and the
low relative standard deviations for repeated analyses observed for PQ-S3 system (3, 4
and 2% for 20, 80 and 160 µgPQ/g deposit, respectively) enable a reliable quantification
of paraquat, even at the lowest contamination levels. The developed analytical
methodology can also be extended for diquat and proved to be also suitable for paraquat
quantification in different types of deposits.
3.1 Introduction
In case of an accidental or deliberated contamination event, deposits from drinking water
networks may represent crucial zones of chemicals accumulation. Although sorption
studies of PQ on representative deposits from drinking water networks (Chapter 4)
suggested that it is unlikely that this chemical may adsorb on such materials, during the
normal water distribution [1], other situations should be taken into account. In fact, in
case of stagnancy of the fluid for a very long period of time (in tanks or pipes in case of a
consumption break) or low water flow (e.g. during the night), this compound may adsorb
* Adapted from: Mónica S.F. Santos, Luís M. Madeira and A. Alves, Paraquat quantification in deposits from
drinking water networks, submitted, 2013.
113

Part II – Chapter 3
on deposits. On the other hand, adsorption on loose deposits that are transported with
the flowing water is much more likely to occur [1]. Therefore, it is imperative to develop
an analytical methodology able to quantify paraquat/diquat (PQ/DQ) in deposits formed
in the pipe walls. Ultimately, the quantification of PQ and DQ in deposits may have
particular impact and interest for society, since deposits may be used as an indirect
measure of the water quality and degree of pollution. Indeed, whenever a cleaning or
maintenance procedure is scheduled the deposits may be considered for analyses with
this purpose in mind.
Many approaches have been described for PQ and DQ extractions from solid matrices as
soils, food crops and plants. Since they have tendency to interact strongly with various
surfaces via hydrogen, ionic and π-π bonds, their extraction typically involves a
refluxing/digestion step with acid, for periods of several hours, to destroy the structure
and release the herbicides from it [2]. As explained with more detail in section 1.1.2–
Chapter 1, the traditional refluxing or digestion techniques (in acidic medium) are the
ones most reported for extraction of PQ from soils, but the microwave-assisted technique
(also implemented in acidic conditions) has gained popularity due to the shorter
extraction times, less solvent quantities and sample amounts required. However, these
techniques may be not suitable to be applied for other pesticides analysis because,
typically, they are not stable under these very acidic conditions [3]. On the other hand,
the release of chemicals by matrix structure destruction provides little or no information
on their adsorption status [3]. This can be a relevant aspect in the context proposed here,
since it is important to have an idea of the degree of interaction between chemicals and
deposits; in other words, if they have tendency to be released from them by simple
contact with “clean water”.
This chapter intends to diminish the great lack of information about analytical
methodologies able to quantify compounds in deposits formed along drinking water
networks, developing a methodology for PQ as case-study (and extensible for DQ). To the
author best knowledge, no other study is available on this matter. The simple and
inexpensive method proposed here consists of a fast and easy extraction step, which
uses small sample and solvent amounts. Furthermore, a complete set of validation
parameters is presented, including the calculation of the global uncertainty associated to
the results in the range of quantification.
114

Paraquat quantification in deposits from drinking water networks
3.2 Experimental section
3.2.1 Reagents and working solutions
Paraquat dichloride PESTANAL® analytical standard 99.2% (Fluka) and Diquat dibromide
monohydrate PESTANAL® analytical standard were purchased from Sigma-Aldrich (St.
Louis, USA). Heptafluorobutyric acid (HFBA) was from Sigma-Aldrich and acetonitrile
(ACN) and methanol (MeOH) HPLC grade were from VWR BDH Prolabo (Poole, UK).
Syringe filters with 0.2 µm PTFE membrane were purchased from VWR (West Chester,
USA) and granular anhydrous calcium chloride (93%) and ammonium chloride (99.9%)
from Sigma-Aldrich.
Stock solutions (1 g/L) of PQ and DQ were prepared in distilled water by solubilizing a
known amount of the correspondent dried salt. The saturated ammonium chloride
solution was prepared mixing 40 g of ammonium chloride salt with 100 mL of distilled
water at 20 °C.
3.2.2 Deposits
The analytical methodology developed in this work was applied to three deposits
representative of those typically found in drinking water distribution systems [4, 5].
Deposits (S2, S3 and S4) from Germany and Netherlands drinking water networks were
kindly supplied by the IWW Water Centre (Mülheim an der Ruhr, Germany) and
were already well characterized in previous published works [1, 5]. For simplicity, the
nomenclature used before was kept here: S2 and S3 are iron-rich materials and S4 is a
calcium rich deposit. Those deposits were collected from old cast iron pipes that needed
replacement. They were dried in an oven until no weight variation was detected, before
being sieved and kept dry until the experiments. Only particles sized between 38 and 64
µm were used in this work.
3.2.3 Equipment and operating conditions The amounts of PQ and DQ extracted from deposits were measured by direct injection of
99 µL of the liquid phase in a Hitachi Elite LaChrom HPLC (Darmstadt, Germany) equipped
with a L-2130 pump, a L-2200 autosampler and a L-2455 diode array detector (DAD). The
chromatographic separation was achieved by a Purospher® STAR LiChroCART® RP-18
endcapped (240×4 mm, 5 µm) reversed phase column, supplied by VWR (West Chester,
115
Part II – Chapter 3
USA), using gradient elution. The mobile phase is composed by a 10 mM HFBA aqueous
solution and ACN. Initial gradient conditions were set at 100% HFBA 10 mM for 5 min, and
then the organic phase was increased to 20% v/v during 5 min and kept for 15 min.
Finally, it was returned to 100% HFBA after 5 min and kept for 10 min. The spectra were
recorded from 220 to 400 nm, but PQ and DQ quantifications, with retention times of
16.2 and 16.0 min, were performed at 259 and 310 nm, respectively.
3.2.4 Spiking of deposits with PQ/DQ In order to have samples contaminated with different PQ/DQ concentrations, 0.5 g of
deposit was put in contact with 10 mL of a PQ/DQ solution of known concentration for 24
h at 20 °C. After that, the liquid and solid phases were separated by centrifugation in a
Hettich Rotofix 32A Centrifuge – Kirchlengern, Germany (10 min, 4000 rpm). The PQ or
DQ amount remaining in the liquid phase was measured by LC-DAD and the difference
between the amounts at the beginning and at the end of the adsorption experiment
allowed the calculation of the amount transferred to the solid phase (amount of pesticide
adsorbed to the deposit).
3.2.5 Extraction procedure for the analytical determination After PQ or DQ spiking, the deposit was freeze-dried in a lyophilizer for 12 h. After that,
several amounts of extraction solvent were added to the contaminated deposit and the
mixture was kept under agitation during several periods at 20 °C. A parametric study was
performed in order to improve the extraction efficiency. The parameters considered in
this study were: the type/nature of extraction solvent, the volume of extraction solvent
and the extraction time.
3.2.6 Validation
The validation of the analytical method, including the uncertainty measurement, followed
the bottom-up approach described in the EURACHEM CITAC Guide [6], and by other
authors [7, 8]. Description of main contributions and respective calculation formula for
the global uncertainty is given in Annex I. It comprised a first step of in-house validation,
where the main parameters were obtained – linearity of the response, limit of detection
(LOD) and limit of quantification (LOQ), precision and accuracy. The precision of the
116

Paraquat quantification in deposits from drinking water networks
method was evaluated extracting independent contaminated deposits at different
contamination levels. Results were expressed as the coefficient of variation (CV%) of
different replicate measurements. Accuracy was evaluated comparing the contamination
level obtained by the calibration curve and the real amount of PQ/DQ adsorbed to the
deposits. This parameter was evaluated at different degrees of contamination and for
different systems.
The second step was evaluated by the estimation of the uncertainty of the results, using
the other validation parameters as an assumption that they represented the main sources
of uncertainty to the final result.
3.3 Results and discussion
This work comprised a previous optimization of the extraction technique for S3 deposit
contaminated with PQ, followed by the validation of the analytical methodology, with
special care to the estimation of the global uncertainty associated to the results. S3 was
selected for method development over S2 and S4 given its higher PQ adsorption capacity,
as demonstrated in a previous study [1]. Even so, the method response was also
evaluated for the other two deposits (S2 and S4). Additionally, the analytical methodology
developed for PQ was extended to the quantification of DQ, using S3 deposit as a case-
study.
3.3.1 Optimization of the extraction technique 3.3.1.1 Effect of extraction solvent type
As explained before, no study about PQ quantification in deposits formed along drinking
water networks was found in literature. So, the selection of the extraction solvents used
to remove PQ from the deposits was based on the available information for soil matrices,
which may however have a higher load of organic constituents. Additionally, a detailed
study previously performed by our research group, about PQ adsorption on typical
deposits, was taken into consideration [1]. In such work it was demonstrated that,
although morphologically similar, soils and deposits could be very different in terms of PQ
adsorption. It was concluded that the interactions between PQ and the deposits are
extremely weak when compared to the interactions established in the major PQ-clay and
PQ-soil systems found in the literature [1]. Two major factors were pointed out as the
117

Part II – Chapter 3
main contributors for such observation: the lower organic fraction exhibited by deposits
(around 1 wt.% or less) and their lower clay mineral content. Therefore, water and a
saturated ammonium chloride solution were selected to study the extraction solvent,
because, according to Tucker and co-workers [9], these solvents were able to remove the
unbound PQ and the loosely bonded to a soil, respectively. Methanol is sometimes also
applied to extract PQ from soils [10, 11] and, for that reason, was included in the list of
solvents tested. The calcium chloride solution (0.01 M) was also selected since it is often
chosen to remove PQ from soil, although to an extremely low extent due to the strong
interactions established between analyte and adsorbent [12-14].
An S3 deposit (0.5 g) was spiked with paraquat (350 µgPQ/gS3) and was extracted with 10
mL of extraction solvent for 24 h at 20 °C. Then, a “clean” S3 deposit was extracted under
the same conditions and the final extract was spiked with the same amount of paraquat
added previously (350 µgPQ/gS3). The analytical responses for both were compared to
calculate the extraction percentage.
As shown in Figure 3.1a, the saturated ammonium chloride solution is the solvent with
higher extraction capability (95±10%) followed by the calcium chloride solution (29±1%).
Water and MeOH exhibited very low desorption percentages when compared to the
other solvents. These results indicated that, according to the classification given by
Tucker et al. [9], PQ is loosely bound to S3 because a simple ion exchange process is
sufficient to remove almost all the analyte. Since water leads to extremely low desorption
percentages, it is important to highlight that it is unlikely that PQ desorbs from S3 by
simple contact with “clean” water, as occurs in a normal drinking water flow, after the
contamination front has passed through.
Therefore, the following experiments were carried out using saturated ammonium
chloride solution as extraction solvent.
3.3.1.2 Effect of extraction solvent volume
The objective here was to use the lowest solvent volume possible, without compromising
the extraction efficiency. The lower the extraction solvent volume, the higher the PQ
concentration in the final extracts and, consequently, the lower the limit of detection
reached. The volumes tested were 1, 2, 4, 6, 8 and 10 mL of saturated ammonium
chloride solution. Volumes below 1 mL were not considered because there was not
118

Paraquat quantification in deposits from drinking water networks
enough extract for subsequent LC analysis. As seen in Figure 3.1b, the extraction
percentage is almost not affected by the solvent volume in the range of volumes studied.
0
20
40
60
80
100
120
%Ex
trac
tion
0
2
4
6
8
10
12
0
20
40
60
80
100
120
1 2 4 6 8 10
EF
%Ex
trac
tion
Volume of extraction solvent (mL)
%Extraction EF
0
20
40
60
80
100
120
0.5 1 2 4 6 8 24
%Ex
trac
tion
Extraction time (h)
Figure 3.1. Effect of some parameters on the percentage of PQ extraction from S3 deposit
and on the enrichment factor (EF): (a) Effect of extraction solvent type – 0.5 g S3, 10 mL
of extraction solvent, 24 h, 20 °C; (b) Effect of extraction solvent volume – 0.5 g S3,
saturated ammonium chloride solution, 24 h, 20 °C and (c) effect of extraction time – 0.5
g S3, 1 mL saturated ammonium chloride solution, 20 °C. Error bars correspond to
standard deviation.
MeOH H2O NH4Cl CaCl2
(b)
(c)
(a)
119

Part II – Chapter 3
This means that the lowest volume tested (1 mL) is enough to displace almost all PQ
molecules. On the other hand, the lower the extraction solvent volume the higher the
enrichment factor (EF). Experiments at higher PQ contamination levels were also carried
out and the same tendency was observed (although the amount of PQ increases for the
same volume). The worst case scenario corresponds to the higher paraquat
contamination level because the extraction with saturated ammonium chloride solution
consists in the replacement of paraquat molecules by ammonium chloride ones. So, if a
certain amount of extraction solvent is sufficient to displace all paraquat molecules (at
high contamination levels) it is assumed that no problems exist at lower contamination
levels. Thus, the solvent volume used in the following experiments was 1 mL.
3.3.1.3 Effect of the extraction time
The time of analysis is an important aspect if the analytical method is designed to be
applied either for environment monitoring or degradation/sorption studies. Additionally,
this is a crucial point, for instance, to obtain a fast response after a suspicion of
contamination. Thus, extraction times of 0.5, 1, 2, 4, 6, 8 and 24 h were tested. According
to the results shown in Figure 3.1c, after 30 min of contact 82±5% of PQ is extracted from
the deposit. An increase of the time of contact apparently does not lead to an increase on
the PQ extraction percentage, or it is marginal. This indicates that this simple and fast
extraction process has a great advantage over other time-consuming processes in use and
mentioned in the introduction section.
3.3.2 Quantitative analysis 3.3.2.1 Interference studies
The interference studies were performed to evaluate the effect of the presence of other
species in the solution, resulting from the contact between extraction solvent and
deposit, on the analytical response for PQ and DQ. With this in mind, the contamination
and extraction procedures were also conducted without PQ/DQ addition in the
contamination step (blank). After that, spiked tests were carried out and correspond to
the addition of known amounts of analyte to this final extract (spiked blanks). The
analytical response obtained for each spiked blank was compared with the correspondent
standard prepared in distilled water. The tests were carried out at different concentration
120

Paraquat quantification in deposits from drinking water networks
levels and the results are presented in Figure 3.2. The final extract (blank) was also
injected directly into the LC-DAD and none of the target compounds were detected in the
original matrices. As can be checked from Figure 3.2, the analytical responses achieved
for all spiked blanks (experiments denoted as PQ-S2, PQ-S3, PQ-S4 and DQ-S3 in Figure
3.2) are statistically equivalent to those obtained for standards prepared in water
(experiments denoted as PQ-water and DQ-water in Figure 3.2). It was concluded that the
analytical response is not affected by the presence of other species in solution.
0.0
2.0
4.0
6.0
8.0
10.0
12.0
5 10 40 50 80
Peak
are
a (u
.a.)
x 10
-6
PQ/DQ concentration (mg/L)
PQ-water
PQ-S2
PQ-S3
PQ-S4
DQ-water
DQ-S3
Figure 3.2. Interference studies in the paraquat and diquat quantification.
3.3.2.2 Linearity and limits of detection and quantification
Calibration was performed for PQ by LC-DAD using 7 S3 spiked samples (from 5 to 193
µgPQ/gS3), extracted as mentioned in the previous sections (Figure 3.3). The correlation
coefficient (R=0.996) and the linearity tests revealed a good performance for the linearity.
The LOD and LOQ calculated based on a signal-to-noise-ratio of 3 and 10 were 0.1 and 0.4
µgPQ/gS3, respectively.
121

Part II – Chapter 3
0
20
40
60
80
100
120
0 50 100 150 200
PQ p
eak
area
(u.a
.)
Contamination level (µgPQ/gS3)
Figure 3.3. Calibration curve obtained for PQ-S3 system by LC-DAD.
3.3.2.3 Precision and Accuracy
The intermediate precision was evaluated at three PQ spiking levels – 20, 80 and 160
µgPQ/gS3. Intermediate precision, as expressed here, corresponds to the relative
standard deviation (RSD%) observed when six independent samples, for each
contamination level, were extracted and injected in the same day under the same
conditions. Average precision was 3, 4 and 2% for 20, 80 and 160 µgPQ/gS3.
Accuracy was assessed comparing the contamination level obtained from the calibration
curve and the amount of PQ adsorbed on the deposit. Recoveries were 90±1%, 97±2%
and 101±1% for 20 µgPQ/gS3, 80 µgPQ/gS3 and 160 µgPQ/gS3, respectively.
The good recovery results and the low RSDs observed enable a reliable quantification of
PQ in the tested samples, even at the lowest contamination level assessed.
3.3.2.4 Estimation of the global uncertainty associated to the results
It was assumed that there are four main sources responsible for the overall uncertainty of
the results [6]: uncertainty associated with the preparation of the standards (U1),
uncertainty associated with the calibration curve (U2), uncertainty associated to the
precision of the extraction and also of the chromatographic method (U3) and the
uncertainty associated to the accuracy (U4). The contribution of each source is depicted
in Figure 3.4a.
×10-6
Area = 572580 C(µgPQ/gS3)
R=0.996
122

Paraquat quantification in deposits from drinking water networks
0%
10%
20%
30%
40%
50%
60%
70%
80%
90%
100%
5.7 15.71 40.0 80 111 145 193
% o
f Tot
al u
ncer
tain
ty
Contamination level (µgPQ/gS3)
U4
U3
U2
U1
0
10
20
30
40
50
60
0 50 100 150 200
Glob
al U
ncer
tain
ty (%
)
Contamination level (µgPQ/gS3)
Combined
Expanded
Figure 3.4. (a) Contribution of each source of uncertainty to the global uncertainty for
different PQ contamination levels and (b) combined and expanded global uncertainty for
PQ analysis in the S3 deposit.
As observed, the most significant uncertainty source at low contamination levels
corresponds to the uncertainty associated with the calibration curve. On the other hand,
an increase on the weight of the uncertainty of precision (U3) and accuracy (U4) is
evident for the highest contamination levels. Both combined and expanded uncertainties
were determined for each point of the calibration curve (Figure 3.4b). The combined
uncertainty corresponds to the standard uncertainty and, as the name implies, was
calculated from the combination of the overall uncertainty sources, as described in the
(a)
(b)
123

Part II – Chapter 3
bottom-up approach of the EURACHEM CITAC Guide [6]. The expanded was obtained
multiplying the combined uncertainty by a coverage factor of two, which provides a level
of confidence of approximately 95% [8]. The values for the expanded uncertainty are
between 10 and 54%, when the concentration ranges from 193 to 5 µgPQ/gS3. It is clearly
evident that the uncertainty increases significantly when approaching the LODs (lower
contamination levels), being around 10% for PQ concentration above 40 µgPQ/gS3.
3.3.3 Paraquat quantification in different deposits The robustness of the method was also evaluated testing its response capability when
different kind of deposits spiked with PQ were used. For that, two other deposits were
also considered (S2 and S4). The tests with S2 were made in triplicate at three PQ
contamination levels (40, 80 and 160 µgPQ/gS2). As can be seen from Table 3.1, the
extraction percentages obtained for S2 (around 30%) were much lower than those
achieved for S3 (Figure 3.1). However, the method remains precise and the recovery was
not affected even using a different deposit (Table 3.1). A limit of detection of 0.6
µgPQ/gS2 was estimated for PQ-S2 system. In this case a matrix-matched calibration is
recommended for PQ quantification. For S4, four PQ contamination levels were
considered (80, 120, 160 and 200 µgPQ/gS4). Here, the experiments were also carried out
in triplicate and the results were compiled in Table 3.1.
Table 3.1. Extraction percentages, precision and recovery for PQ-S2 and PQ-S4 systems.
System Contamination level
(µg/g) %Extraction Precision (RSD%) Recovery
(%)
PQ-S2 (n=3)
40 31±5 16 95±7
80 27±3 10 93±1
160 32±2 7 99±3
PQ-S4 (n=3)
80 32±3 9 101±4
120 50±4 9 98±5
160 66±3 5 97±4
200 72±4 6 97±5
In this case, it can be observed that the extraction percentage is dependent on the degree
of contamination (ranged from 32 to 72%). Actually, plotting the four points it can be
observed that the representation follows a linear tendency but, the trendline crosses the
124

Paraquat quantification in deposits from drinking water networks
x-axis at 63 µgPQ/gS4 (data not shown). When 0.5 g of S4 is put in contact with 1 mL of a
saturated ammonium chloride solution contaminated with increasing amounts of PQ until
equilibrium is established, a Langmuir isotherm was obtained and the calculated PQ
maximum adsorption capacity was precisely 63 µgPQ/gS4. This means that the extraction
methodology used is not suitable for the PQ-S4 system at levels below 63 µgPQ/gS4,
otherwise PQ will remain in the solid phase. Nevertheless, this analytical method is still
very useful for calcium rich deposits (like S4 sample) because, in case of a deliberate or
accidental contamination, much higher PQ contamination levels are plausible (400
µgPQ/gS4 at 20 °C and 550 µgPQ/gS4 at 4 °C) [1]. Additionally, the method proved to be
very precise and accurate (Table 3.1). Again, a matrix-matched calibration will have to be
performed to quantify PQ.
Generally, this simple analytical methodology proved to be suitable for the quantification
of PQ/DQ in different kind of deposits whenever the extraction percentages were taken
into account.
3.3.4 Suitability of the extraction methodology for Diquat The applicability of the developed analytical methodology for DQ quantification in S3
contaminated deposits was also evaluated. For that, S3 samples were contaminated with
DQ and then submitted to the same extraction procedure developed previously for PQ.
This study was performed at three different contamination levels (9, 76 and 154
µgDQ/gS3) and in triplicate. The average extraction percentages were on average
82±15%. Mean precision was 5, 3 and 2% for 9, 76 and 154 µgDQ/gS3, respectively. The
accuracy was again assigned to the difference observed between real contamination and
that determined from the calibration curve. Recoveries were 95%, 114% and 107% for 9,
76 and 154 µgDQ/gS3 contamination degrees, respectively.
Being simple and fast, this method constitutes an excellent approach for PQ/DQ
monitoring in deposits from drinking water networks, namely for sorption/degradation
studies or even for risk assessment purposes.
125

Part II – Chapter 3
3.4 Conclusions
An analytical methodology able to quantify PQ and DQ in deposits from drinking water
networks was developed for the first time. This simple and inexpensive method consists
in a fast and easy extraction step which requires small sample and solvent amounts.
Concerning the optimization of the extraction procedure, the best conditions correspond
to the use of 1 mL of a saturated ammonium chloride solution as solvent for 30 min for
each 0.5 g of deposit. A limit of detection of 0.1 µgPQ/gS3 was obtained for PQ-S3 system
with the expanded uncertainty ranging from 10-54% for concentrations between 193 and
5 µgPQ/gS3, respectively. The method was also successfully applied to the DQ
quantification in the S3 deposit. Additionally, precision and accuracy was verified when
applied to different kinds of deposits (S2 and S4), but the correspondent extraction
percentages must be taken into account to obtain the PQ/DQ contamination level.
This methodology can be easily implemented in a quality control laboratory and, due to
its simple and expedite nature proves to be a good first approach to PQ/DQ quantification
in deposits from drinking water distribution systems.
3.5 References
[1] M.S.F. Santos, G. Schaule, A. Alves and L.M. Madeira, Adsorption of paraquat herbicide
on deposits from drinking water networks, Chem. Eng. J. 229 (2013) 324-333.
[2] D.S. Kolberg, D. Mack, M. Anastassiades, M. Hetmanski, R. Fussell, T. Meijer and H.J.
Mol, Development and independent laboratory validation of a simple method for the
determination of paraquat and diquat in potato, cereals and pulses, Anal. Bioanal. Chem.
404 (2012) 2465-2474.
[3] T.R. Roberts, J.S. Dyson and M.C.G. Lane, Deactivation of the Biological Activity of
Paraquat in the Soil Environment: a Review of Long-Term Environmental Fate, J. Agric.
Food Chem. 50 (2002) 3623-3631.
[4] F. Echeverría, J.G. Castaño, C. Arroyave, G. Peñuela, A. Ramírez and J. Morató,
Characterization of deposits formed in a water distribution system, Rev. Chil. Ing. 17
(2009) 275-281.
126

Paraquat quantification in deposits from drinking water networks
[5] C. Oliveira, M.S.F. Santos, F.J. Maldonado-Hódar, G. Schaule, A. Alves and L.M.
Madeira, Use of pipe deposits from water networks as novel catalysts in paraquat
peroxidation, Chem. Eng. J. 210 (2012) 339-349.
[6] S.L.R. Ellison, M. Rosslein and A. Williams, Eurachem/ Citac Guide- Quantification
uncertainty in analytical measurement, EURACHEM/ CITAC, UK, 2000.
[7] N. Ratola, L. Martins and A. Alves, Ochratoxin A in wines-assessing global uncertainty
associated with the results, Anal. Chim. Acta 513 (2004) 319-324.
[8] S. Teixeira, C. Delerue-Matos, A. Alves and L. Santos, Fast screening procedure for
antibiotics in wastewaters by direct HPLC-DAD analysis, J. Sep. Sci. 31 (2008) 2924-2931.
[9] B.V. Tucker, D.E. Pack and J.N. Ospenson, Adsorption of bipyridylium herbicides in soil,
J. Agric. Food. Chem. 15 (1967) 1005-1008.
[10] M. Pateiro-Moure, E. Martínez-Carballo, M. Arias-Estévez and J. Simal-Gándara,
Determination of quaternary ammonium herbicides in soils: Comparison of digestion,
shaking and microwave-assisted extractions, J. Chromatogr. A. 1196–1197 (2008) 110-
116.
[11] G. Strachan, J.A. Whyte, P.M. Molloy, G.I. Paton and Porter, Development of Robust,
Environmental, Immunoassay Formats for the Quantification of Pesticides in Soil, Environ.
Sci. Technol. 34 (2000) 1603-1608.
[12] M. Pateiro-Moure, C. Pérez-Novo, M. Arias-Estévez, R. Rial-Otero and J. Simal-
Gándara, Effect of organic matter and iron oxides on quaternary herbicide sorption–
desorption in vineyard-devoted soils, J. Colloid Interface Sci. 333 (2009) 431-438.
[13] M. Pateiro-Moure, C. Pérez-Novo, M. Arias-Estévez, E. López-Periago, E. Martínez-
Carballo and J. Simal-Gándara, Influence of Copper on the Adsorption and Desorption of
Paraquat, Diquat, and Difenzoquat in Vineyard Acid Soils, J. Agric. Food Chem. 55 (2007)
6219-6226.
[14] K.M. Spark and R.S. Swift, Effect of soil composition and dissolved organic matter on
pesticide sorption, Sci. Total Environ. 298 (2002) 147-161.
127


4 Adsorption of paraquat herbicide on deposits
from drinking water networks*
Abstract
Although forbidden in Europe, paraquat dichloride (PQ) is still largely used worldwide as
herbicide. Therefore, the hypothesis of an accidental or deliberate contamination of
drinking water distribution systems (DWDS) may be posed. The interactions between PQ
and three typical deposits (S2, S3 and S4 deposits) from DWDS were investigated in order
to understand the fate of this chemical in such systems in case of contamination.
Additionally, these materials can be valorized as adsorbents in wastewater treatment
applications. The effect of stirring speed, adsorbent dose, initial PQ concentration and
temperature on the adsorption kinetics was evaluated. Good adherence was observed
between experimental data and both kinetic (pseudo-second order) and equilibrium
(Langmuir) models. The interaction between PQ and the deposits is extremely weak when
compared to those established in the PQ-clay system, where irreversible sorption was
observed. It was found that S2 and S3 may represent potential adsorbents regarding the
treatment of PQ-contaminated waters.
4.1 Introduction
Most water distribution networks have a buildup of particles in the walls – deposits.
Depending on the material used in the network construction and several water quality
parameters, deposits with different properties and characteristics may be formed [1, 2].
In spite of this large heterogeneity, typically they are classified in three main
representative groups: brown, tubercle and white deposits [3]. According to Echeverría et
al. [3], brown deposits are constituted by aluminosilicates and humic acids, tubercle
deposits are mostly mixtures of magnetite, goethite and in some cases lepidocrocite, and
white deposits are formed by calcite, aluminosilicates and quartz. There are several
* Adapted from: Mónica S.F. Santos, Gabriela Schaule, A. Alves and Luís M. Madeira, Adsorption of
paraquat herbicide on deposits from drinking water networks, Chemical Engineering Journal 229, 324-333,
2013.
129

Part II – Chapter 4
studies about PQ adsorption on clays and soils (Chapter 1) but, up to the author
knowledge, there are no studies regarding the sorption of PQ on deposits typically found
in DWDS. Although often compared to soils, deposits found in drinking water networks
may be very distinct. The main objective of this chapter is to evaluate the interaction
between PQ and the deposits found in a DWDS, which is of crucial importance to
understand the behavior and fate of PQ in aquatic systems. Besides, it would allow
exploring the use of such materials, often discarded upon pipes cleaning/maintenance
operations, as low-cost adsorbents for the treatment of PQ contaminated waters. For
that, three real deposits, representative of drinking water networks, were collected from
an old water distribution system in Germany and the Netherlands.
4.2 Experimental Section
4.2.1 Pesticides and chemicals
Paraquat dichloride PESTANAL® analytical standard (Fluka) was purchased from Sigma-
Aldrich (St. Louis, USA). Heptafluorobutyric acid (HFBA) was from Sigma-Aldrich (St. Louis,
USA), and acetonitrile (HPLC grade) from VWR BDH Prolabo (Poole, UK). Granular
anhydrous calcium chloride was obtained from Sigma-Adrich (St. Louis, USA).
4.2.2 Deposits and other materials
The deposits samples (S2, S3 and S4) used in the adsorption studies were taken from a
real DWDS. The deposits were removed from cast iron pipes that needed to be replaced.
Deposits were submitted to drying in an oven (till no weight variation has been detected).
Then, all deposits were sieved and were kept in dry conditions until the experiments. An
extensive physical-chemical characterization of these deposits has been described
previously [4] and, for that reason, the nomenclature used previously was maintained. In
the same study, and according to the results obtained, it was possible to classify the S2,
S3 and S4 samples as brown, tubercle and white deposits, respectively.
Clay was the other adsorbent used in this work. Its chemical composition was obtained
from LNEG (Laboratório Nacional de Energia e Geologia, Portugal) and the particle size
was determined by a Coulter Counter LS 230 with small volume model. The pHpzc (point
of zero charge) was obtained as for deposits [4].
130

Adsorption of paraquat herbicide on deposits from drinking water networks
The organic matter content was determined in a TOC-VCSH apparatus with a solid sample
module SSM-5000A. The total surface area was determined by mercury porosimetry.
The main properties of all adsorbents used are summarized in Table 4.1.
Table 4.1. Physical-chemical composition of the real deposits [4] and clay.
S2 S3 S4 Clay
Deposit classification Brown Tubercle White ---------------
ICP-OES analysis
(wt.% of the main
elements at dry basis)
Fe: 98%
Ca: 1%
Fe: 97%
P: 1%
Mn: 1%
Ca: 97%
Fe: 1%
Mg: 1%
Al2O3: 34%
SiO2: 49%
SBET, m2/g 5 36 1 Not determined
Surface area (m2/g) 3.1 19.3 0.2 Not determined
pHpzc,
20 ºC
2.6 6.1 9.9 4.8
pH in water,
20 ºC
3.3 7.2 9.0 5.3
Main components
identified by XRD
lepidocrocite goethite calcite (CaCO3) Not determined
Organic matter
content (wt.%)
1.0 1.0 0.2 12
4.2.3 Adsorption experiments with suspended particles (clay, or from real “loose deposits”)
A paraquat solution of 1 g/L was prepared by dissolving an appropriate amount of
paraquat dichloride salt in distilled water. The adsorbent (”loose deposit” from drinking
water pipes or clay particles) was first put in contact with 10 mL of distilled water to
obtain stable conditions (for example constant pH). After that the contamination was
done adding fixed volumes of 1 g/L paraquat solution. The experiments were performed
at fixed stirring speed, temperature and pH. Stirring was ensured by a multi-positions
magnetic stirrer from Velp Scientific (583 rpm – position 7 – unless otherwise stated). It is
important to emphasize that all adsorption experiments with clay and deposits samples
were performed at different pH values since they have different equilibrium pH in water.
The aqueous phase of the contaminated samples was analyzed along time by direct
injection-liquid chromatography with diode array detector (DI-LC-DAD) for the
131

Part II – Chapter 4
determination of the PQ concentration (kinetic experiments). In equilibrium experiments,
the concentration of PQ in the liquid phase was determined at the beginning (t = 0) and
after equilibrium has been reached. All experiments were performed in duplicate and
each sample was analyzed twice by DI-LC-DAD, to guarantee the reproducibility of the
results. A maximum coefficient of variation (CV%) of 15% was obtained for duplicates
during the experiments.
4.2.4 Desorption experiments Firstly, 0.5 g of S3 and S4 deposits were contaminated with 10 mL of a 50 mg/L paraquat
solution during 24 h. After this time, even if the equilibrium stage has not been achieved,
the solid and liquid phases were separated by centrifugation (4000 rpm; 10 min). Then,
the liquid phase was analyzed by DI-LC-DAD and the contaminated deposits were dried in
a freeze-dry during 5 h. Afterwards, 10 mL of 0.01 M CaCl2 was added to the
contaminated samples and after 24 h the supernatant was analyzed by DI-LC-DAD. The
process was repeated three times (total of four steps).
4.2.5 Analytical methods Paraquat in aqueous phase was analyzed by DI-LC-DAD (Hitachi Elite LaChrom System –
Darmstadt, Germany). The chromatographic separation was achieved by a Purospher®
STAR LiChroCART® RP-18 endcapped (240×4 mm, 5 µm) reversed phase column from
Merck (Darmstadt, Germany), using a mobile phase of 80% (v/v) of 10 mM HFBA in water
and 20% (v/v) of acetonitrile, at isocratic conditions, with a flow rate of 1 mL/min. The
calibration curve for PQ in water was performed by direct injection of 10 standards, from
0.1 to 80 mg/L of PQ. The coefficient of determination obtained was 0.9996 and the
linearity tests revealed an excellent fitness for the linearity. A detection limit of 0.01 mg/L
was reached. Precision (expressed in terms of coefficient of variation) was on average 8%
and recovery was on average 77, 99 and 101% for 0.25, 30 and 80 mg/L of PQ (Chapter 2).
4.3 Results and discussion
4.3.1 Adsorption kinetics
Simple kinetic models (such as pseudo-first and pseudo-second order) [5-7] were
considered to describe the experimental results of PQ adsorption over pipe deposits and
132

Adsorption of paraquat herbicide on deposits from drinking water networks
clay. By performing mass balances to the liquid phase in the batch vessel, assuming first
and second order kinetics for the driving force term, equations 4.1 and 4.2 are obtained,
respectively.
)(1 eCCwkdtdCV
dtdn
−=−=− 4.1
22 )( eCCwk
dtdCV
dtdn
−=−=− 4.2
In these equations, n is the mass of PQ in the liquid phase (mg), V is the volume of the
liquid phase (L), C the PQ concentration in the liquid phase (mg/L), eC the PQ
concentration in the liquid phase at equilibrium stage (mg/L), w is the mass of adsorbent
(g), t is the time of contact (min) and 1k and 2k the adsorption kinetic constants of first
(L/g/min) and second order (L2/min/g/mg), respectively.
Integrating equations 4.1 and 4.2 between the initial instant and time t , taking into
account the initial condition (i.e., for t = 0 C = 0C ), equations 4.3 and 4.4 are obtained,
respectively.
tVwk
CCCC
e
e1
0
ln −=
−−
4.3
)()(
02
0
e
ee CCwtkV
CCVCC
−+−
+= 4.4
On the other hand, equation 4.5 represents the relationship between the PQ
concentration in the liquid (C ) and solid phase ( q ), which represents the mass
conservation equation (PQ removal from the liquid phase is transferred to the solid).
Substituting all concentration of PQ in the liquid phase for the ones in the solid phase,
equations 4.3 and 4.4 are transformed into equations 4.6 and 4.7, respectively:
wVCC
q)( 0 −= 4.5
133
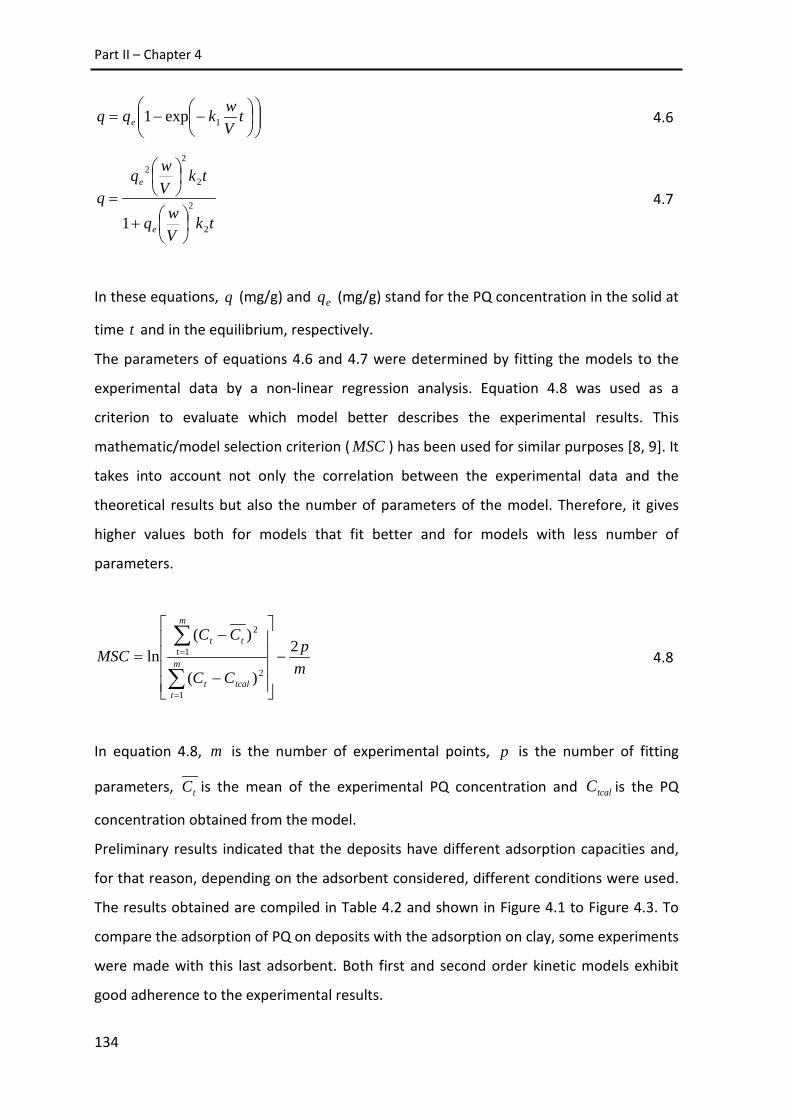
Part II – Chapter 4
−−= t
Vwkqq e 1exp1 4.6
tkVwq
tkVwq
q
e
e
2
2
2
22
1
+
= 4.7
In these equations, q (mg/g) and eq (mg/g) stand for the PQ concentration in the solid at
time t and in the equilibrium, respectively.
The parameters of equations 4.6 and 4.7 were determined by fitting the models to the
experimental data by a non-linear regression analysis. Equation 4.8 was used as a
criterion to evaluate which model better describes the experimental results. This
mathematic/model selection criterion ( MSC ) has been used for similar purposes [8, 9]. It
takes into account not only the correlation between the experimental data and the
theoretical results but also the number of parameters of the model. Therefore, it gives
higher values both for models that fit better and for models with less number of
parameters.
mp
CC
CCMSC m
ttcalt
m
ttt 2
)(
)(ln
1
2
2
1 −
−
−=
∑
∑
=
= 4.8
In equation 4.8, m is the number of experimental points, p is the number of fitting
parameters, tC is the mean of the experimental PQ concentration and tcalC is the PQ
concentration obtained from the model.
Preliminary results indicated that the deposits have different adsorption capacities and,
for that reason, depending on the adsorbent considered, different conditions were used.
The results obtained are compiled in Table 4.2 and shown in Figure 4.1 to Figure 4.3. To
compare the adsorption of PQ on deposits with the adsorption on clay, some experiments
were made with this last adsorbent. Both first and second order kinetic models exhibit
good adherence to the experimental results.
134

Adsorption of paraquat herbicide on deposits from drinking water networks
Table 4.2. Kinetic parameters for adsorption of PQ on deposits and clay.
Adsorbent
Material [PQ]0 (mg/L)
[Adsorbent]
(g/L) T (°C)
Adsorption models
Pseudo first order model Pseudo second order model
qe
(mg/g)
k1
(L/(g min)) MSC
qe
(mg/g)
k2
(L2/(g min mg)) MSC
Clay 5 0.3 20 5.9±0.3 2.0±0.3 1.49 6.2±0.2 2.2±0.7 2.22
S2
20 3 20 5.1±0.2 (2.3±0.2)×10-4 3.36 6.0±0.4 (1.4±0.3)×10-5 3.48
20 3 4 6.1±0.2 (2.7±0.3)×10-4 2.73 6.8±0.3 (1.9±0.6)×10-5 2.86
35 3 20 5.8±0.3 (2.0±0.3)×10-4 2.60 6.4±0.6 (1.2±0.3)×10-5 2.94
50 3 20 5.9±0.4 (4±1)×10-4 2.41 6.6±0.8 (1.9±0.8)×10-5 2.50
S3
50 7 20 4.9±0.2 (1.3±0.2)×10-4 1.94 5.7±0.4 (4±1)×10-6 2.02
50 7 4 6.4±0.3 (1.6±0.3)×10-4 2.43 7.3±0.4 (4±1)×10-6 2.87
60 7 20 7.1±0.7 (9±1)×10-5 2.65 8.0±3.0 (2±1)×10-6 2.72
70 7 20 7.90±0.08 (1.7±0.1)×10-4 4.85 9.2±0.1 (3.1±0.2)×10-6 5.04
S4
5 7 20 0.23±0.01 (3.0±0.8)×10-3 1.70 0.25±0.01 (4±1)×10-3 2.16
5 7 4 0.47±0.02 (1.0±0.4)×10-2 1.34 0.47±0.02 (8±4)×10-3 1.88
10 7 20 0.29±0.01 (8±3)×10-3 2.20 0.30±0.01 (7±2)×10-3 2.71
15 7 20 0.362±0.007 (1.3±0.2)×10-2 3.12 0.373±0.003 (7.7±0.6)×10-3 4.55
135

Part II – Chapter 4
0.00
1.00
2.00
3.00
4.00
5.00
6.00
7.00
0 2000 4000 6000 8000
q (m
g/g)
time (min)
583 rpm850 rpm
0.00
1.00
2.00
3.00
4.00
5.00
6.00
7.00
0 2000 4000 6000 8000
q (m
g/g)
time (min)
Figure 4.1. Effect of stirring speed (a) and particle size (b) on the adsorption of PQ on S3
deposit; (a) 50 mg/L PQ, 7 g/L S3, 20 ºC, average particle diameter of 165 µm and pH =
7.2; (b) 50 mg/L PQ, 7 g/L S3, 20 ºC, stirring speed of 583 rpm and pH = 7.2. Dashed line
corresponds to the pseudo-second order fitted model.
(a)
(b)
165 µm on average
<38 µm
136

Adsorption of paraquat herbicide on deposits from drinking water networks
0.00
1.00
2.00
3.00
4.00
5.00
6.00
7.00
0 2000 4000 6000
q (m
g/g)
time (min)
50 35 20 mg/L
0.001.002.003.004.005.006.007.008.009.00
0 2000 4000 6000
q (m
g/g)
time (min)
70 60 50 mg/L
0.00
0.05
0.10
0.15
0.20
0.25
0.30
0.35
0.40
0 1000 2000 3000 4000 5000
q (m
g/g)
time (min)
15 10 5 mg/L
Figure 4.2. Effect of the initial PQ concentration on the adsorption of PQ on different pipe
deposits: (a) S2 – 3 g/L S2, 20 ºC, 583 rpm and pH = 3.3 (a); (b) S3 – 7 g/L S3, 20 ºC, 583
rpm and pH = 7.2; (c) S4 – 7 g/L S4, 20 ºC, 583 rpm and pH = 9.0. Dashed lines correspond
to the pseudo-second order fitted model.
(c)
(a)
(b)
137

Part II – Chapter 4
0.00
1.00
2.00
3.00
4.00
5.00
6.00
7.00
0 20 40 60 80 100
q (m
g/g)
time (min)
Figure 4.3. Adsorption of PQ on clay – 0.3 g/L clay, 5 mg/L PQ, 20 ºC, 583 rpm and pH =
5.3. Dashed line corresponds to the pseudo-second order fitted model.
However, according to the MSC values obtained for each situation it is evident that the
PQ adsorption on real deposits and clay follows a second order kinetic model. These
results are in accordance with literature since the most part of studies about adsorption
of PQ in different adsorbents indicate that the pseudo-second order kinetic model is the
one that describes better the experimental data [10-14]. The first main difference that
should be highlighted among the adsorbents used is related to the time needed to reach
the equilibrium state. Although different conditions were used, it can be observed that
the adsorption kinetics of PQ on real deposits is much lower than on clay (in real deposits
it takes days to reach equilibrium while for clay only a few minutes are needed – cf.
Figure 4.1 to Figure 4.3). This behavior could be related to the fast and strong interaction
between PQ and clay minerals and/or the organic matter, as reported by other authors in
previous studies [12, 15-18]. In other words, the solid state organic fraction and the clay
mineral content in a solid sample are considered the major factors governing the sorption
of PQ [17].
The strong adsorption associated to the relatively high organic matter content is related
to the negative adsorption surface predominantly exhibited by the soil organic matter
and the delocalized positive charge displayed by PQ ion [17]; clay is the material with
higher organic matter content (Table 4.1). In case of adsorbents with high clay content
the interactions established with PQ could be of hydrogen bonds type (as C-H…O
bonding) as a result of the presence of activated C-H bond from the methyl groups in quat
138

Adsorption of paraquat herbicide on deposits from drinking water networks
structure and the oxygens of the siloxane surface of silicate clay [19]. The strong binding
of PQ to clays is evidenced by the little amount of PQ desorbed from them when CaCl2,
ammonium chloride or water were used as extraction solvents [15, 16]. In section 2.3.3
some desorption experiments done with clay also confirm these results. It is expected
that much lower organic matter content exists in deposits found in water distribution
systems networks. Indeed, the three representative deposits studied here have less than
1% (w/w) of organic matter (Table 4.1). Since Fe oxides dictate the net electrical charge as
well as the electric potential of the soils, here, these elements could play an important
role in the overall sorption [15]. As can be checked from Table 4.2, the kinetic constants
obtained for S2 and S3 are very close (which also have similar iron contents – Table 4.1)
and a slightly higher value was achieved for S4.
4.3.1.1 Parameters affecting external and internal mass transfer: effect of the
stirring speed and particle diameter
The external mass transfer coefficient increases as the stirring speed increases until a
value after which this coefficient remains constant [20]. Under such conditions,
resistances in the film should be neglected. To evaluate the effect of the stirring speed,
two experiments were performed for each deposit, at 583 rpm and 850 rpm (positions 7
and 10 in the multiple positions stirrer, respectively). For brevity reasons, only the results
obtained for S3 deposit are presented. The results are plotted in Figure 4.1 and the
dashed line corresponds to the pseudo-second order kinetic model (fitted to the
experiment at 583 rpm). It is observed that when stirring speeds is increased from 583 to
850 rpm, the PQ adsorption seems not to be influenced. Additionally, in the same figure it
is possible to observe the effect of S3 particle diameter in the PQ adsorption process
(dp<38 µm and average particle diameter of 165 µm). As can be checked from Figure 4.1,
the particle diameter has no effect on the kinetics, which means that no internal mass
transfer resistance exists. Besides, in the subsequent experiments the stirring speed was
kept at 583 rpm (thus ensuring external mass transfer resistance is also absent).
4.3.1.2 Effect of initial paraquat concentration
The influence of the PQ concentration, at the beginning of the process, in the adsorption
process is shown in Figure 4.2 for all pipe deposits. As can be seen, a decrease on the
139

Part II – Chapter 4
adsorption rate is evidenced along the contact time until the equilibrium is reached,
which is due to the decrease of the mass transfer driving force; actually, for the duration
of the experiments herein shown, equilibrium is only reached for deposit S4. In the range
of concentrations studied, it is seen that when the initial PQ concentration increases, the
initial adsorption rate is also increased, as evidenced by the higher slope at initial times
for all deposits. Additionally, the amount adsorbed at the equilibrium conditions also
seems to increase for higher concentrations of PQ at the beginning of the process.
4.3.1.3 Effect of the temperature
The effect of temperature on the PQ adsorption was studied at 4 and 20 °C. The minimum
temperature chosen is very close to that find in drinking water systems of colder
European countries [21]. On the other hand, temperatures above 20 °C were not
considered because they are not usually to occur. In addition, the World Health
Organization recommends that drinking water temperatures should be kept outside the
range of 25-50 °C and preferably 20-50 °C because higher water temperatures enhances
the growth of microorganisms [22].
The effect of temperature on the PQ adsorption by real deposits was investigated by
comparing the amount of PQ adsorbed as a function of time at the above-refereed
temperatures. The results are indicated in Figure 4.4. As shown, the amount of herbicide
adsorbed at equilibrium conditions increases with decreasing temperature, because this
is an exothermic process. The results obtained are in-line with others found in the
literature about PQ sorption in spent and treated diatomaceous earth [23] and in activate
bleaching earth [10].
4.3.2 Adsorption isotherms The adsorption isotherms of PQ on deposits were obtained by plotting the amount of PQ
adsorbed in the solid after equilibrium has been reached ( eq , mg/g) against the herbicide
remaining dose in the liquid phase, also at equilibrium ( eC , mg/L).
140

Adsorption of paraquat herbicide on deposits from drinking water networks
0.0
1.0
2.0
3.0
4.0
5.0
6.0
7.0
0 5000 10000q
(mg/
g)
time (min)
4 ºC 20 ºC
0.0
1.0
2.0
3.0
4.0
5.0
6.0
7.0
8.0
0 2500 5000 7500
q (m
g/g)
time (min)
4 ºC 20 ºC
0.0
0.1
0.2
0.3
0.4
0.5
0.6
0 2000 4000
q (m
g/g)
time (min)
4 ºC 20 ºC
Figure 4.4. Temperature effect in the kinetic adsorption of PQ on different pipe deposits:
(a) S2 – 20 mg/L PQ; 3 g/L S2, 583 rpm and pH = 3.3 (a); (b) S3 – 50 mg PQ/7 g S3, 583
rpm and pH = 7.2; (c) S4 – 5 mg PQ/7 g S4, 583 rpm and pH = 9.0. Dashed lines
correspond to the pseudo-second order fitted model.
(c)
(a)
(b)
141

Part II – Chapter 4
The fit of Langmuir, Freundlich and Temkin isotherms (equations 4.9, 4.10 and 4.11,
respectively) to the experimental results and their applicability were investigated and the
results are indicated in Figure 4.5 and Table 4.3; other models were also tested, like the
Langmuir-Freundlich, but the lack of fit led us to not include them here (for brevity
reasons).
eL
eLe CK
CKqq
+=
1max 4.9
In equation 4.9, LK is the Langmuir adsorption equilibrium constant (L/mg) and maxq the
monolayer capacity (mg/g).
n
efe CKq /1= 4.10
In equation 4.10, fK stands for the adsorption equilibrium constant (mg/g/(mg/L)1/n) and
n is the Freundlich constant.
)ln(ACeb
RTqe = 4.11
While A is the Temkin isotherm constant (L/mol), b is the Temkin constant related to
heat of sorption (Jg/mol2), R is the gas constant (8.314 J/mol/K) and T is the absolute
temperature (K).
All models describe well the experimental results but, taking into consideration the values
obtained for the MSC (Table 4.3), the Langmuir equation gives in most cases better
adherence between the theoretical and experimental data than the others.
142

Adsorption of paraquat herbicide on deposits from drinking water networks
0.0
1.0
2.0
3.0
4.0
5.0
6.0
7.0
8.0
0 10 20 30 40
q e (m
g/g)
ce (mg/L)
4 ºC 20 ºC
0.0
2.0
4.0
6.0
8.0
10.0
12.0
14.0
0 2 4 6 8 10 12
q e(m
g/g)
ce (mg/L)
4 ºC 20 ºC
0
0.1
0.2
0.3
0.4
0.5
0.6
0.7
0 4 8 12 16 20
q e(m
g/g)
ce (mg/L)
4 ºC 20 ºC
Figure 4.5. Temperature effect in the adsorption isotherm of PQ on different pipe
deposits: (a) S2 – 3 g/L S2, 583 rpm and pH = 3.3 (a); (b) S3 – 7 g/L S3, 583 rpm and pH =
7.2; (c) S4 – 7 g/L S4, 583 rpm and pH = 9.0. Lines represent fit by Langmuir model.
(b)
(a)
(c)
143

Part II – Chapter 4
Table 4.3. Parameters of adsorption isotherms for PQ on deposits and clay.
Adsorbent
Material T (°C)
Langmuir isotherm Freundlich isotherm Temkin isotherm
qmax
(mg/g)
KL
(L/mg) MSC
Kf
(mg/g/(mg/L)1/n) n MSC
A
(L/mol)
b
(Jg/mol2) MSC
Clay
20
8.6±0.3 2.4±0.6 3.27 5.9±0.4 6±1 2.73 (4±1)×107 (50±9)×107 3.13
S2 5.7±0.4 0.6±0.2 2.07 2.8±0.5 5±2 1.30 (5±2)×106 (7±2)×108 1.52
S3 11±1 0.7±0.2 2.35 5.3±0.6 3.8±0.9 2.06 (20±7)×105 (30±7)×107 2.29
S4 0.40±0.02 0.52±0.09 2.81 0.18±0.02 4.6±0.6 2.22 (3±1)×106 (10±1)×109 3.91
S2
4
6.7±0.3 1.4±0.3 2.70 3.9±0.5 6±2 1.48 (20±8)×106 (7±2)×108 1.75
S3 12±1 5±2 1.62 8.2±0.7 5±1 1.51 (4±1)×107 (40±9)×107 1.60
S4 0.55±0.01 11±3 3.32 0.50±0.02 26±12 2.93 (3±2)×1016 (4±2)×1010 2.95
144

Adsorption of paraquat herbicide on deposits from drinking water networks
The observation is consistent with other several studies which demonstrate that
Langmuir model describes well the adsorption isotherms of PQ on clays [24], iron oxide
coated quartz particles [25] and on calcium alginate gel beads [13]. Despite of the
Langmuir isotherm has been derived assuming a finite number of uniform adsorption
sites and the absence of lateral interaction between adsorbed species, this model has
been successfully applied to describe the adsorption of a wide range of chemicals in soils
[26-30]. The lack of information concerning PQ adsorption on deposits from DWDS
justifies the comparison made with soils due to their similarity.
As can be observed in Table 4.3, and focusing on the Langmuir model data, the PQ
adsorption capacity increases when the temperature decreases from 20 to 4 °C due to the
exothermicity of the adsorption process. On the other hand, the isotherms obtained for
real deposits indicated that S4 has a much lower PQ adsorption capacity (only 0.40 mg/g
against 5.7 and 11 mg/g for S2 and S3, respectively, at 20 °C). This may be associated to
the PQ interactions with the main metal ions present in each sample. Mbuk et al. [31]
studied the translocation of some metal ions to subsurface soils and concluded that,
when a soil is treated with PQ, as it happens in agriculture soils that are exposed to this
herbicide, the leaching of metal ions such as Fe (II) and Mn (II) is suppressed. They
suggested that PQ may have an ability to form complexes with these metal ions
preventing its release towards the liquid phase. Sebiomo et al. [32] also confirmed such
behavior for Fe (II) and also concluded that a significant leaching of Ca (II) is observed
when the soils are treated with PQ. A few years ago, Jang et al. [33] demonstrated that
the competition between calcium and cooper affected seriously the calcium alginate
capacity for copper adsorption. More recently, Ruiz et al. [13] studied the PQ adsorption
on calcium alginate gel beads and concluded that as adsorption of PQ proceeds, the
calcium leached increases and a competition for the binding sites between both is
observed. In short, this may suggest that PQ compete with Ca (II) for the binding sites
and, for that reason, when this element is in large quantities in the adsorbent (as is the
case of S4 sample – cf. Table 4.1), only few sites are available for PQ uptake. Additionally,
if some calcium release occurs when the adsorbent is put in contact with PQ, a
competition between both starts and the PQ adsorption is compromised. Besides the Fe
(II) and Mn (II) that may contribute to the enhancement of PQ adsorbed at the
equilibrium, as observed in S3 sample, the presence of phosphate may also represent
145

Part II – Chapter 4
another factor for such result. The presence of phosphate ions leads to a more negative
adsorbent surface facilitating the adsorption of positively charged compounds like PQ
[25]. Another relevant point for the PQ adsorption capacities may be the textural
properties. It is worth noting that the adsorption capacities follow the trend of the BET
surface areas – Table 4.1 and Table 4.3.
Comparing the PQ adsorption capacities of the deposits (Table 4.3) with those of other
adsorbents (Chapter 1 – section 1.1.3), it can be inferred that brown and tubercle
deposits (S2 and S3, respectively) may be potential adsorbents for the treatment of PQ
contaminated waters. Indeed, although slow adsorption kinetic constants were pointed
out for these materials, they are a good alternative to other expensive adsorbents for the
treatment of PQ contamination waters. On the other hand, taking into account the
contact time needed to reach significant PQ adsorption amounts and the extreme
conditions employed (high adsorbent dosage), it may be advanced that, in case of a
drinking water contamination, it is unlikely that PQ would adsorb to the deposits attached
in the pipe networks since here, much lower contact time and surface area available for
adsorption are observed, unless there is a stagnancy of the fluid for a very long period of
time. On the other hand, adsorption in loose deposits that are transported with the
flowing water is much more likely to occur. Further experiments in a pilot loop are
encouraged to support such preliminary conclusions.
In sum, if a deliberate or accidental drinking water contamination occurs with PQ the
main concern will be related to the drinking water decontamination. Two works about
decontamination of water polluted with PQ by oxidation with Fenton’s reagent were
already carried out, showing that this advanced oxidation process is feasible and effective
using as catalyst either sulfate iron [34] or the iron rich deposits (brown) [4].
4.3.3 Desorption studies In order to compare the strength of adsorption between PQ and clays and real deposits
some desorption experiments were conducted with clay, S3 and S4 adsorbents.
Concerning the samples S3 and S4, Figure 4.6 depicts the results of the sequential PQ
desorption percentages when calcium chloride solution was employed as extraction
solvent.
146

Adsorption of paraquat herbicide on deposits from drinking water networks
0 10 20 30 40
Step1
Step2
Step3
Step4
Desorption %
S4
S3
Figure 4.6. Variation of PQ desorption percentage in successive extractions of deposits
with CaCl2.
Calcium chloride solution was selected as extraction solvent because is typically used to
assess the ability of calcium to displace PQ [15, 18]. Additionally, PQ extraction with
calcium chloride solution is frequently considered as a measure of the PQ binding extent
on soil matrix [15]. As can be observed, 29% and 33% of PQ is removed from S3 and S4,
respectively, after the first step. Desorption percentages successively decrease in
subsequent extractions with calcium chloride solution. A global PQ desorption percentage
of 51% and 39% was respectively attained for S3 and S4 deposits, after 4 successive
extractions with CaCl2 solution. The desorption percentages are much higher than those
found in the literature for PQ adsorption in soils. For example, Spark and Swift [17]
concluded that negligible desorption of PQ from soils (in the absence or presence of
increased content of soluble fulvic) was obtained when an aqueous solution of 0.01 M
CaCl2 was used as extraction solvent. Pateiro-Moure et al. [18] also studied the ability of
CaCl2 to desorb PQ from two vineyard acid soils and no more than one percent of PQ
desorption was attained. More recently, Pateiro-Moure et al. [15] also reported the
strong binding of PQ to some vineyard-devoted soils and, consequently, its low
desorption percentages when calcium chloride was used as extraction solvent (it ranged
from 2.1-2.4% and 10.5-14.3% at 100 and 200 mg/g of PQ, respectively). The differences
observed may again be related to the higher clay and organic matter contents exhibited
by soil samples. In fact, a lot of desorption experiments were conducted to evaluate the
147

Part II – Chapter 4
extraction capability of some solvents to remove PQ from clay. The solvents tested were
water and aqueous solutions of calcium chloride (0.01 M), saturated ammonium chloride,
hydrochloric acid and diquat. No PQ desorption or negligible PQ removal was attained
using the listed solvents (data not shown). Only under extremely hard conditions (reflux
with concentrate sulfuric acid at 148 °C during 3h) around 70% of PQ was extracted from
clay.
These results show that the interaction between PQ and the deposits is extremely weak
when compared to the interactions established in the major PQ-clay and PQ-soil systems
found in the literature. The results also suggest that these materials may be partially
regenerated guaranteeing their reuse in other cycles of adsorption.
4.4 Conclusions
It was demonstrated that the adsorption of PQ in pipe deposit samples is an exothermic
process. The kinetic data obtained for deposits were well described by a pseudo-second
order kinetic model and revealed that the adsorption process is much slower than the
one observed for PQ-clay system, which may be related to the clay and organic matter
contents of these materials. Additionally, desorption experiments indicated that PQ is
strongly adsorbed on clay but relatively high PQ desorption percentages were attained
when CaCl2 solution was used as extraction solvent in S3 (51%) and S4 (39%) adsorbents.
Maximum PQ adsorption Langmuir capacities of 8.6, 5.7, 11 and 0.40 mg/g were achieved
at 20 °C for clay, S2, S3 and S4 samples, respectively.
It was found that deposits S2 (brown deposit) and S3 (tubercle deposit) proved to be
good adsorbents, and potential alternatives to other expensive materials, for the
treatment of PQ contaminated waters.
4.5 References
[1] P. Sarin, V.L. Snoeyink, J. Bebee, W.M. Kriven and J.A. Clement, Physico-chemical
characteristics of corrosion scales in old iron pipes, Water Res. 35 (2001) 2961-2969.
[2] C.-Y. Peng, G.V. Korshin, R.L. Valentine, A.S. Hill, M.J. Friedman and S.H. Reiber,
Characterization of elemental and structural composition of corrosion scales and deposits
formed in drinking water distribution systems, Water Res. 44 (2010) 4570-4580.
148

Adsorption of paraquat herbicide on deposits from drinking water networks
[3] F. Echeverría, J.G. Castaño, C. Arroyave, G. Peñuela, A. Ramírez and J. Morató,
Characterization of deposits formed in a water distribution system, Rev. Chil. Ing. 17
(2009) 275-281.
[4] C. Oliveira, M.S.F. Santos, F.J. Maldonado-Hódar, G. Schaule, A. Alves and L.M.
Madeira, Use of pipe deposits from water networks as novel catalysts in paraquat
peroxidation, Chem. Eng. J. 210 (2012) 339-349.
[5] V. Vadivelan and K.V. Kumar, Equilibrium, kinetics, mechanism, and process design for
the sorption of methylene blue onto rice husk, J. Colloid Interface Sci. 286 (2005) 90-100.
[6] Z. Reddad, C. Gerente, Y. Andres and P. Le Cloirec, Adsorption of Several Metal Ions
onto a Low-Cost Biosorbent: Kinetic and Equilibrium Studies, Environ. Sci. Technol. 36
(2002) 2067-2073.
[7] K.K.H. Choy, G. McKay and J.F. Porter, Sorption of acid dyes from effluents using
activated carbon, Resour. Conserv. Recycl. 27 (1999) 57-71.
[8] H. Akaike, An information criterion (AIC), Math. Sci. 14 (1976) 5-9.
[9] L. Brandão, D. Fritsch, L.M. Madeira and A.M. Mendes, Kinetics of propylene
hydrogenation on nanostructured palladium clusters, Chem. Eng. J. 103 (2004) 89-97.
[10] W.T. Tsai, C.W. Lai and K.J. Hsien, Adsorption kinetics of herbicide paraquat from
aqueous solution onto activated bleaching earth, Chemosphere 55 (2004) 829-837.
[11] W.-T. Tsai and C.-W. Lai, Adsorption of herbicide paraquat by clay mineral
regenerated from spent bleaching earth, J. Hazard. Mater. 134 (2006) 144-148.
[12] W.T. Tsai, C.W. Lai and K.J. Hsien, The effects of pH and salinity on kinetics of
paraquat sorption onto activated clay, Colloid Surface A 224 (2003) 99-105.
[13] M. Ruiz, J. Barron-Zambrano, V. Rodilla, A. Szygula and A.M. Sastre, Paraquat
sorption on calcium alginate gel beads, in: Proceedings of the 4th WSEAS/IASME
international conference on Dynamical systems and control, World Scientific and
Engineering Academy and Society (WSEAS), Corfu, Greece, 2008, pp. 30-35.
[14] N.K. Hamadi, S. Sri and X.D. Chen, Adsorption of Paraquat dichloride from aqueous
solution by activated carbon derived from used tires, J. Hazard. Mater. 112 (2004) 133-
141.
[15] M. Pateiro-Moure, C. Pérez-Novo, M. Arias-Estévez, R. Rial-Otero and J. Simal-
Gándara, Effect of organic matter and iron oxides on quaternary herbicide sorption–
desorption in vineyard-devoted soils, J. Colloid Interface Sci. 333 (2009) 431-438.
149

Part II – Chapter 4
[16] B.V. Tucker, D.E. Pack and J.N. Ospenson, Adsorption of bipyridylium herbicides in
soil, J. Agric. Food. Chem. 15 (1967) 1005-1008.
[17] K.M. Spark and R.S. Swift, Effect of soil composition and dissolved organic matter on
pesticide sorption, Sci. Total Environ. 298 (2002) 147-161.
[18] M. Pateiro-Moure, C. Pérez-Novo, M. Arias-Estévez, E. López-Periago, E. Martínez-
Carballo and J. Simal-Gándara, Influence of Copper on the Adsorption and Desorption of
Paraquat, Diquat, and Difenzoquat in Vineyard Acid Soils, J. Agric. Food Chem. 55 (2007)
6219-6226.
[19] Z.Y. Hseu, S.H. Jien and S.F. Cheng, Sorption of Paraquat on Clay Components in a
Taiwan's Oxisol, J. Environ. Sci. Health, Parte B 38 (2003) 441-449.
[20] S.D.W. Committee and N.R. Council, Drinking Water and Health,Volume 1, The
National Academies Press, 1977.
[21] R. Koskinen, T. Ali-Vehmas, P. Kämpfer, M. Laurikkala, I. Tsitko, E. Kostyal, F. Atroshi
and M. Salkinoja-Salonen, Characterization of Sphingomonas isolates from Finnish and
Swedish drinking water distribution systems, J. Appl. Microbiol. 89 (2000) 687-696.
[22] World Health Organization, Guidelines for Drinking-water Quality 2011.
[23] W.T. Tsai, K.J. Hsien, Y.M. Chang and C.C. Lo, Removal of herbicide paraquat from an
aqueous solution by adsorption onto spent and treated diatomaceous earth, Bioresource
Technol. 96 (2005) 657-663.
[24] Y. Seki and K. Yurdakoç, Paraquat adsorption onto clays and organoclays from
aqueous solution, J. Colloid Interface Sci. 287 (2005) 1-5.
[25] M. Pateiro-Moure, A. Bermúdez-Couso, D. Fernández-Calviño, M. Arias-Estévez, R.
Rial-Otero and J. Simal-Gándara, Paraquat and Diquat Sorption on Iron Oxide Coated
Quartz Particles and the Effect of Phosphates, J. Chem. Eng. Data 55 (2010) 2668-2672.
[26] M.I. Al-Wabel, G. Abdel-Nasser, A.M. Al-Turki and M.H. El-Saeid, Behavior of Atrazine
and Malathion Pesticides in Soil: Sorption and Degradation Processes, J. Applied Sci. 10
(2010) 1740-1747.
[27] E. Loffredo and N. Senesi, The role of humic substances in the fate of anthropogenic
organic pollutants in soil with emphasis on endocrine disruptor compounds, in: I.
Twardowska, H.E. Allen, M.M. Haggblom, S. Stefaniak (Eds.) Viable Methods of Soil and
Water Pollution Monitoring, Protection and Remediation, 2006, pp. 69-92.
150

Adsorption of paraquat herbicide on deposits from drinking water networks
[28] M. Schmidt, J. Halvorson, J. Gonzalez and A. Hagerman, Kinetics and binding capacity
of six soils for structurally defined hydrolyzable and condensed tannins and related
phenols, J. Soils Sediments 12 (2012) 366-375.
[29] J. Germán-Heins and M. Flury, Sorption of Brilliant Blue FCF in soils as affected by pH
and ionic strength, Geoderma 97 (2000) 87-101.
[30] J. Mead, A comparison of the Langmuir, Freundlich and Temkin equations to describe
phosphate adsorption properties of soils, Aust. J. Soil Res. 19 (1981) 333-342.
[31] R.O. Mbuk, R. Sha'Ato and N.N. Nkpa, The role of paraquat and glyphosate in
translocation of metal ions to subsurface soils, Pak. J. Anal. Environ. Chem. 10 (2009) 19 -
24.
[32] A. Sebiomo, V.W. Ogundero and S.A. Bankole, The impact of four herbicides on soil
minerals, Res. J. Environ. Earth Sci. 4 (2012) 617 - 624.
[33] L.K. Jang, W. Brand, M. Resong, W. Mainieri and G.G. Geesey, Feasibility of using
alginate to absorb dissolved copper from aqueous media, Environ. Prog. 9 (1990) 269-274.
[34] M.S.F. Santos, A. Alves and L.M. Madeira, Paraquat removal from water by oxidation
with Fenton's reagent, Chem. Eng. J. 175 (2011) 279-290.
151


5 Paraquat Removal from Water by Oxidation
with Fenton’s Reagent*
Abstract
Fenton’s reaction, an advanced oxidation process (AOP), was studied for paraquat
degradation purposes. A parametric study was conducted and the variables considered
were the temperature, the pH and the initial iron, hydrogen peroxide and paraquat
concentrations, the latter in the range 50-200 mg/L. Under the optimum conditions (T
=30 °C, [Fe2+]0 = 5.0×10⁻⁴ M, [H2O2]0 = 1.6×10⁻² M, and pH0 = 3.0, for [PQ]0 = 100 mg/L),
complete paraquat degradation and 40% of mineralization were reached after 4 h of
reaction (batch reactor). Gramoxone commercial product revealed a slower initial rate of
degradation than the paraquat analytical standard, probably due to the parallel
consumption of the hydroxyl radicals by other organic compounds. A semi-empirical
kinetic model was proposed to simulate the paraquat dichloride concentration histories
under a wide range of conditions; the adequacy of the model was statistically checked
and also validated by comparison with some additional experiments. The biodegradability
and toxicity of the final oxidation products were assessed. Preliminary experiments
concerning the degradation of PQ in water by photo-Fenton process indicated that 96% of
the chemical was mineralized after only 1 h of reaction (T =30 °C, [Fe2+]0 = 5.0×10⁻⁴ M,
[H2O2]0 = 1.6×10⁻² M, and pH0 = 3.0, for [PQ]0 = 100 mg/L).
5.1 Introduction
When contaminated water is removed from the pipes, after an accidental or deliberate
contamination, it should be treated before further disposal. Only few studies were found
in the open access literature concerning the treatment of waters contaminated with
paraquat (PQ) (Chapter 1, section 1.1.4). Most of the publications correspond to the
photocatalytic degradation of PQ using TiO2-based photocatalysts. Although advantages
are recognized in the use of such semiconductor for degradation purposes, it should be
* Adapted from: Mónica S.F. Santos, A. Alves and Luís M. Madeira, Paraquat removal from water by
oxidation with Fenton’s reagent, Chemical Engineering Journal 175, 279-290, 2011.
153

Part II – Chapter 5
emphasized that such removal technology could be very expensive, since TiO2 needs
ultraviolet light to be activated [1]. Other degradation methodologies were also applied
for the degradation of PQ in waters but some of them exhibited relatively low PQ
degradation performance [2] or may represent expensive alternatives [3, 4]. Dhaouadi
and Adhoum [5], studied the PQ degradation performance of three electrochemical
advanced oxidation processes (anodic oxidation (AO), electro-fenton (EFe) and photo-
electro-Fenton (PEF)) and compared them with that obtained for classic Fenton (CFe).
Although CFe led to the highest removal rate at the initial stage of the process, they
concluded that CFe has significantly lower oxidative ability as compared to the other
processes, due to the poor final degradation efficiency attained [5]. However, the main
variables responsible for the efficacy of the CFe process were not studied (as it was
performed for the other processes) and this result may be related to the insufficient
oxidant dose (H2O2) used in the experiment. Therefore, an optimized classic Fenton
process could potentially lead to comparable PQ degradation efficiencies. Up to the
author knowledge, there are no other studies reported concerning PQ degradation by the
homogeneous Fenton’s process.
In this chapter, a detailed parametric study was done to evaluate the pesticide
degradation performance by this AOP, in order to assess and understand the effect of
each individual operating condition in the degradation performance. Such study allows
overcoming the limitations reported in previous works and optimizing process
performance. Additionally, a kinetic model was developed to simulate the PQ degradation
performance under a wide range of conditions. The establishment of a good model is of
crucial importance for reactor design and scale-up. Some experiments were also
performed to access the response capability of the proposed model for other conditions.
The mineralization degree was measured along the reaction for all performed
experiments and the toxicity and biodegradability of the final oxidation products were
evaluated.
5.2 Experimental section
5.2.1 Reagents Paraquat dichloride PESTANAL® analytical standard 99.2% (Fluka) was purchased from
Sigma Aldrich (St. Louis, USA) and Gramoxone with 25.6 wt. % of PQ was gently supplied
154

Paraquat removal from water by oxidation with Fenton’s reagent
from Syngenta Crop Protection, Lda. Hydrogen peroxide solution (30% v/v), iron (II)
sulfate heptahydrate (99.5%), iron (III) sulfate x hydrate (76%) and anhydrous sodium
sulfite were purchased from Merck (Darmstadt, Germany). Sulfuric acid (96%) from José
M. Vaz Pereira, Lda (Lisboa, Portugal) and sodium hydroxide (98.7%) from José Manuel
Gomes dos Santos, Lda (Odivelas, Portugal) were utilized. Heptafluorobutyric acid (HFBA)
was from Sigma Aldrich, and acetonitrile (HPLC grade) from Prolabo. Syringe filters with
0.2 µm PTFE membrane were purchased from VWR (West Chester, USA).
5.2.2 Standards preparation
A PQ stock solution of analytical standard was prepared by dissolving 100 mg of PQ
analytical standard in 100 mL of distilled water. Analytical PQ solutions of 50 mg/L
(1.9×10⁻⁴ M), 100 mg/L (3.9×10⁻⁴ M) and 200 mg/L (7.8×10⁻⁴ M) were prepared by dilution
of the previous stock solution. Gramoxone is a concentrated commercial solution (SL) of
PQ, 25.6 wt. %. A PQ solution of 100 mg/L (3.9×10⁻⁴ M) was prepared in distilled water
from Gramoxone commercial product. PQ solutions were stored at 4 °C in polypropylene
containers.
5.2.3 Analytical methods The samples collected along the reaction (see section 5.2.4) were analyzed, in order to
quantify the PQ degradation, by direct injection-liquid chromatography-diode array
detector (DI-LC-DAD). Chromatographic analysis of PQ was performed by direct injection
of 99 µL in a Hitachi Elite LaChrom HPLC equipped with a L-2130 pump, a L-2200
autosampler and a L-2455 diode array detector (DAD). The chromatographic separation
was achieved by a Purospher® STAR LiChroCART® RP-18 endcapped (240×4 mm, 5 µm)
reversed phase column supplied by VWR, using a mobile phase of 80% (v/v) of 10 mM
HFBA in water and 20% (v/v) of acetonitrile, at isocratic conditions, with a flow rate of 1
mL/min. The spectra were recorded from 220 to 400 nm and the PQ quantification, at the
retention time of 5.7±0.3 min, was performed at 259 nm. The PQ degradation in water
was quantified by direct injection liquid chromatography with diode array detector (DI-LC-
DAD); this means that no concentration procedure was employed. The analytical method
was developed and the main validation parameters were obtained. The calibration curve
for PQ in water was performed by direct injection of 10 standards, from 0.1 to 80 mg/L of
155

Part II – Chapter 5
PQ. The coefficient of determination obtained was 0.9996 and the linearity tests revealed
an excellent fitness for the linearity. A detection limit of 0.01 mg/L was reached. Precision
was evaluated by the repeatability of six injections of the same analytical standard, being
the coefficient of variation (CV%) extremely low (0.2% for 30 and 80 mg/L standards,
respectively).
Mineralization degree was assessed by total organic carbon (TOC) analyses, with a
TC/TOC analyzer (Shimadzu 5000A analyzer), using the standard method 5310 D [6]. Total
organic carbon was calculated by subtracting inorganic carbon to the total carbon. For
that a calibration curve for total carbon and inorganic carbon was obtained from 5 to 100
mg/L. A limit of detection of 0.27 mg/L and 0.63 mg/L was attained for total carbon and
inorganic carbon, respectively. TOC values reported represent the average of at least two
measurements; in most cases each sample was injected three times, validation being
performed by the apparatus only if CV is smaller than 2%.
5.2.4 Oxidation with Fenton’s reagent
All Fenton experiments were carried out in a stirred jacketed batch reactor with 300 mL
of capacity. A PQ solution (250 mL) was prepared and placed into the reactor. The Huber
thermostatic bath (Polystat CC1 unit) was turned on and the desired temperature (± 1 °C)
was kept constant by recycling water through the reactor jacket. After the temperature
stabilization, pH was adjusted to the desired value, by adding small amounts of 2 M
H2SO4 or NaOH aqueous solutions. To measure the solution temperature and pH, a
thermocouple and a pH electrode (WTW, SenTix 41 model), connected to a pH-meter
from WTW (model Inolab pH Level 2), were used. To start the oxidation process, the solid
iron salt and the hydrogen peroxide were added to the reactor. Degradation assays were
run up to 240 min and periodically samples of 10 mL were taken from the reactor and the
remaining H2O2 eliminated by adding excess Na2SO3 (in order to instantaneously stop the
reaction). Subsequently, these samples were filtered with a PTFE syringe filter, if required
diluted, and analyzed as described before – section 5.2.3.
The effect of various operating parameters was systematically studied by changing one of
them while the others were kept constant. The parameters tested were: initial pH (in the
range 2.0 – 5.0), H2O2 concentration (from 1.6×10⁻³ to 5.7×10⁻² M), Fe2+ concentration
(1.0×10⁻⁴ – 5.0×10⁻⁴ M), initial PQ concentration (1.9×10⁻⁴ – 7.8×10⁻⁴ M), temperature
156

Paraquat removal from water by oxidation with Fenton’s reagent
(10.0 – 70.0 °C), and catalyst source (FeSO4.7H2O or Fe2(SO4)3. x H2O). After, two assays
were done to access if a gradual addition of H2O2 is better than the whole oxidant
addition in the beginning of the experiment. Beyond this, the best conditions found were
tested in a PQ commercial product degradation, with 25.6 wt. % of PQ, to verify possible
matrix interferences.
Some experiments were run in duplicate; in these replicates, the variations in the PQ
concentration were within the analytical uncertainty.
5.2.5 Biodegradability and Toxicity of Fenton’s reaction effluents Biodegradability and toxicity of PQ solution and its oxidation products were evaluated by
respirometry using a WTW InoLab 740 sensor. This was only made for one experiment
with relatively low hydrogen peroxide concentration (T= 30.0 °C, pH0 = 3, [Fe2+] = 5.0×10⁻⁴
M, [PQ]0 = 3.9×10⁻⁴ M, [H2O2] = 6.5×10⁻³ M) and taking the sample after 25 h to
guarantee that no oxidant remained in the solution, because it interferes with the
analysis. Other common methods used to quench the reaction interfered either with this
method, or with PQ stability (e.g. hydrolysis at high pH). The sample biodegradability was
determined by comparing the Oxygen Uptake Rate (OUR) obtained when the bacteria
consortium was fed with the oxidation sample (OURSample) with that obtained with a
completely biodegradable standard (acetic acid, OURAcetic acid I) equation 5.1. To access the
sample’s toxic character, acetic acid was fed a second time to the activated sludge that
had previously contacted with the pollutants (OURAcetic acid II) and the OUR value obtained
compared to that of OURAcetic acid I – equation 5.2. The bacteria consortium was obtained
from an aeration tank of Rabada WWTP (Santo Tirso – Portugal) – 700 mg/L in volatile
suspended solids.
100deg% ×
=
IacidAcetic
Sample
OUROUR
radabilityBio 5.1
100% ×
−=
IacidAcetic
IIacidAceticIacidAcetic
OUR
OUROURToxicity 5.2
157

Part II – Chapter 5
This approach, based on the oxygen uptake rate, is often used to evaluate the
biodegradability and toxicity of aqueous samples [7-10].
5.2.6 Oxidation by Photo-Fenton
The experiments were performed in a 1000 mL glass immersion photochemical reactor
which is equipped with an UV-visible lamp, located axially and held in a quartz immersion
tube. The radiation source was a 150 W medium-pressure mercury vapor lamp (Heraeus
TQ 150), whose more intense line is at 366 nm (Figure 5.1).
Figure 5.1. Emission spectrum of a 150 W medium-pressure mercury vapor lamp from
Heraeus.
After the charge of the photochemical reactor with 800 mL of PQ solution (100 mg/L), the
pH was adjusted to 3 as described previously and the temperature was set at 30 °C. Then,
the lamp was introduced coaxially in the reactor and the iron ([Fe2+]0 = 5.0×10⁻⁴ M) and
hydrogen peroxide ([H2O2]0 = 1.6×10⁻² M) were immediately added. It is worth noting
that the lamp was switched on before 15 min of the beginning of the reaction to
158

Paraquat removal from water by oxidation with Fenton’s reagent
guarantee constant photonic flux. The temperature of the reaction was kept at 30 °C by
the water cooling jacket placed around the radiation source. Samples were withdrawn
regularly and analyzed by DI-LC-DAD for PQ monitoring and by TOC for mineralization
degree assessment.
5.3 Results and Discussion
5.3.1 Parametric study of the variables affecting the Fenton’s reaction To assess the effect of each parameter on PQ degradation performance, a parametric
study was conducted, changing one variable at a time. Before that some control
experiments were done to confirm the PQ stability and the absence of adsorption to the
reactor/containers in the conditions employed (data not shown). It was also observed
that hydrogen peroxide alone (without iron catalyst) is not capable to degrade PQ.
5.3.1.1 Effect of the temperature
The effect of temperature in the PQ degradation by Fenton’s reagent was examined
changing the temperature between 10.0 and 70.0 °C, while keeping the H2O2
concentration, the Fe2+ dose, the pH0 and the initial PQ concentration constant (Figure
5.2). The temperature increase has a positive effect on the PQ degradation and on the
TOC removal, as expected and predicted by the Arrhenius’ law (rate constants increase
exponentially with temperature, as shown below). However, as observed in Figure 5.2a,
when the temperature is increased from 50.0 to 70.0 °C there is only a minor impact on
the degradation rate, which is attributed to the thermal decomposition of H2O2 at high
temperatures [11, 12]. Figure 5.2 shows that nearly all the initial PQ present in the reactor
was degraded after 60 min, at 70.0 °C.
On the other hand, 60% of the organic matter was totally mineralized into CO2 and H2O,
after 240 min. Longer reaction times, particularly at lower temperatures (e.g. 50.0 °C),
could result in better performances. At low temperatures the degradation slows down
considerably, particularly at 10.0 °C.
In the subsequent experiments the temperature was set to 30.0 °C because of the smaller
energy consumption in real practice and because there was only a slight improvement in
PQ degradation for temperatures above 30.0 °C. Besides, this is the temperature of
reference in related studies.
159

Part II – Chapter 5
0.0
0.2
0.4
0.6
0.8
1.0
0 50 100 150 200 250 300
C/C 0
time (min)
T = 10.0 °C
T = 30.0 °C
T = 50.0 °C
T = 70.0 °C
0.0
0.2
0.4
0.6
0.8
1.0
0 50 100 150 200 250 300
TOC/
TOC 0
time (min)
T = 10.0 °C
T = 30.0 °C
T = 50.0 °C
T = 70.0 °C
Figure 5.2. Temperature effect on the PQ concentration evolution (a) and on the TOC
removal (b) as a function of time ([H2O2]0 = 3.4×10⁻² M, [Fe2+]0 = 5.0×10⁻⁴ M, pH0 = 3.0
and [PQ]0 = 3.9×10⁻⁴ M). Dashed lines are merely illustrative of the data trend.
5.3.1.2 Effect of iron salt concentration
The relationship between PQ degradation (a) and TOC removal (b) with the initial Fe2+
concentration is shown in Figure 5.3 For the lowest catalyst dose employed (1.0×10⁻⁴ M),
both the parent compound degradation and mineralization proceed at low rate.
(a)
(b)
160

Paraquat removal from water by oxidation with Fenton’s reagent
0.0
0.2
0.4
0.6
0.8
1.0
0 50 100 150 200 250 300
C/C 0
time (min)
[Fe2+]= 1.0×10⁻⁴ M
[Fe(II)] = 2.5x10⁻⁴ M
[Fe(II)] = 5.0x10⁻⁴ M
0.0
0.2
0.4
0.6
0.8
1.0
0 50 100 150 200 250 300
TOC/
TOC 0
time (min)
[Fe(II)] = 1.0x10⁻⁴ M
[Fe(II)] = 2.5x10⁻⁴ M
[Fe(II)] = 5.0x10⁻⁴ M
Figure 5.3. Fe2+ concentration effect on the PQ degradation (a) and on the TOC removal
(b) as a function of time (T = 30.0 °C, pH0 = 3.0, [H2O2]0 = 3.4×10⁻² M, and [PQ]0 = 3.9×10⁻⁴
M). Dashed lines are merely illustrative of the data trend.
As expected, raising the Fe2+ concentration above this value has a positive effect on both
the PQ and mineralization degradation rates because the salt acts as catalyst in the
process. For the highest iron concentration studied (5.0×10⁻⁴ M) complete PQ
decomposition (within the analytical uncertainties) is reached after 180 min (Figure 5.3a),
and 35% is converted into CO2 and H2O after the same time (Figure 5.3b). Iron (II)
concentrations higher than 5.0×10⁻⁴ M were not considered because iron precipitation
occurs.
[Fe2+]= 1.0×10⁻⁴ M
[Fe2+]= 5.0×10⁻⁴ M
[Fe2+]= 2.5×10⁻⁴ M
[Fe2+]= 1.0×10⁻⁴ M
[Fe2+]= 5.0×10⁻⁴ M
[Fe2+]= 2.5×10⁻⁴ M
(a)
(b)
161

Part II – Chapter 5
5.3.1.3 Effect of the H2O2 concentration
To assess the H2O2 concentration effect on the PQ degradation, some experiments were
done by changing this parameter while keeping the others constants (T= 30.0 °C, pH0 = 3,
[Fe2+] = 5.0×10⁻⁴ M, [PQ]0 = 3.9×10⁻⁴ M). Five hydrogen peroxide concentrations were
tested, in the range 1.6×10⁻³ M – 5.7×10⁻² M, as shown in Figure 5.4. This range
corresponds to [H2O2]/[Fe(II)] and [H2O2]/[PQ] molar ratios between ca. 3 – 114 and 4 –
146, respectively. According to Dhaouadi and Adhoum [5], the stoichiometric amount of
hydrogen peroxide required for complete PQ mineralization corresponds to a molar ratio
of 31, so values clearly below and above this ratio were tested.
Figure 5.4a indicates that there is an optimum H2O2 concentration (ca. 6.5×10⁻³ – 1.6×10⁻²
M). For the lowest H2O2 concentration, 1.6×10⁻³ M, and although a rapid initial PQ
degradation was observed, the herbicide concentration remains constant after 30 min of
reaction because all hydrogen peroxide is consumed. This is also observed after 180 min
of reaction for an initial dose of 6.5×10⁻³ M. Increasing the initial H2O2 concentration, the
initial PQ degradation rate decreases, and for a H2O2 dose of 5.7×10⁻² M, the initial PQ
degradation rate is the smallest one. Hydrogen peroxide is the source of hydroxyl radicals
responsible for the organic matter degradation; so, increasing the initial H2O2
concentration should increase the PQ degradation, but this is not verified. The reason for
such behavior resides in the scavenging effect that becomes more significant at high
hydrogen peroxide doses [11, 13, 14] and/or to the fact that the oxidant species are
preferentially consumed in the oxidation of PQ by-products rather than in the parent
compound. In fact, as shown in Figure 5.4b, the highest mineralization occurs for the
higher hydrogen peroxide dose (5.7×10⁻² M). This means that for maximizing TOC removal
it is necessary to add more hydrogen peroxide than for simple PQ decomposition.
This is normal because it is easier to decompose PQ into intermediate compounds than
the latter into CO2 and H2O. For [H2O2]0 = 1.6×10⁻² M, 95% of PQ is degraded after 120
min but for the same time only 27% of PQ is totally mineralized into CO2 and H2O (a value
of 38% was reached after 240 min).
162

Paraquat removal from water by oxidation with Fenton’s reagent
0.0
0.2
0.4
0.6
0.8
1.0
0 50 100 150 200 250 300
C/C 0
time (min)
0.0
0.2
0.4
0.6
0.8
1.0
0 50 100 150 200 250 300
TOC/
TOC 0
time (min)
Figure 5.4. H2O2 concentration effect on the PQ degradation (a) and on the TOC removal
(b) as a function of time (T = 30.0 °C, pH0 = 3.0, [Fe2+]0 = 5.0×10⁻⁴ M, and [PQ]0 = 3.9×10⁻⁴
M). Dashed lines are merely illustrative of the data trend.
5.3.1.4 Effect of the initial pH
The pH of the medium plays an important role in the Fenton’s chemistry and thus in the
oxidation process [15]. There are several studies indicating that the best removal
efficiencies of organic compounds are obtained at pH values between 3.0 and 3.5 [16-18].
The PQ decomposition under different pH conditions was studied over a range of initial
[H2O2]= 1.6×10⁻³ M
[H2O2]= 6.5×10⁻³ M
[H2O2]= 1.6×10⁻² M
[H2O2]= 3.4×10⁻² M
[H2O2]= 5.7×10⁻² M
[H2O2]= 1.6×10⁻³ M
[H2O2]= 6.5×10⁻³ M
[H2O2]= 1.6×10⁻² M
[H2O2]= 3.4×10⁻² M
[H2O2]= 5.7×10⁻² M
(a)
(b)
163

Part II – Chapter 5
pH from 2.0 to 5.0 (Figure 5.5). The results show that the highest PQ degradation is
attained for pH0 of 3.0 (Figure 5.5a).
0.0
0.2
0.4
0.6
0.8
1.0
0 50 100 150 200 250 300
C/C 0
time (min)
0.0
0.2
0.4
0.6
0.8
1.0
0 50 100 150 200 250 300
TOC/
TOC 0
time (min)
Figure 5.5. Initial pH effect on the PQ degradation (a) and on the TOC removal (b) as a
function of time (T = 30.0 °C, [Fe2+]0 = 5.0×10⁻⁴ M, [H2O2]0 = 1.6×10⁻² M, and [PQ]0 =
3.9×10⁻⁴ M). Dashed lines are merely illustrative of the data trend.
This is mainly caused by the fact that when pH is higher than 3, ferrous and ferric
oxyhydroxides are formed which inhibit the reaction between Fe2+ and H2O2 and thus the
pH0= 2.0 pH0= 3.0
pH0= 4.0
pH0= 5.0
pH0= 2.0 pH0= 3.0
pH0= 4.0
pH0= 5.0
(a)
(b)
164

Paraquat removal from water by oxidation with Fenton’s reagent
hydroxyl radicals production. In addition, hydrogen peroxide stability is also smaller at
high pH values. However, in the employed conditions, even at an initial pH of 5 the
pesticide was effectively degraded, although at a much slower rate than at pH0 = 3. The
decrease of the pH along reaction time, reaching values around 3, justifies these results.
On the other hand, at lower pHs excessive H+ reacts with H2O2 to produce H3O2+, which is
stable and cannot react with iron (II) to form the HO• species. Additionally, hydroxyl
radicals can also be scavenged by excessive H+. Figure 5.5b demonstrates that pH 3 is also
the best condition for TOC removal.
5.3.1.5 Effect of iron salt source
Figure 5.6 depicts the effect of using a Fe2+ or Fe3+ salt on the PQ degradation
performance, at different pH values. As represented, a higher initial PQ degradation rate
is observed with iron (II) than with iron (III), particularly for pH0 = 2.0 (Figure 5.6a). The
main reason for this is that ferrous ions (II) react very quickly with hydrogen peroxide to
produce large amounts of hydroxyl radicals (see equation 1.1 of Chapter 1 and
corresponding rate constant), which can then react rapidly with the parent compound.
This is the reason for the sudden decrease of the PQ concentration for short reaction
times – so-called Fe2+/H2O2 stage. Ferric ions produced can then react with H2O2 to
produce hydroperoxyl radicals and restore ferrous ions (equations 1.6 and 1.7 of Chapter
1); the rate of oxidation in the second stage (Fe3+/H2O2 stage) is slower than in the first
one due to the slow production of Fe2+ from Fe3+. Because the reaction in which Fe2+ is
converted into Fe3+ is very fast, the first stage is short and afterwards the process enters
into a so-called pseudo steady-state, wherein iron is mainly in the 3+ oxidation state [12,
19]. The same behavior is observed in Figure 5.6b, which represents the PQ degradation
at pH0 = 3 when Fe(II) or Fe(III) were used.
Due to the interest of avoiding acidification of the waters/wastewaters to be treated, the
same study was conducted at pH 5, as demonstrated in Figure 5.6c. In the first 120 min of
reaction, degradation catalyzed by Fe(III) is again slightly slower, due to the low extension
of the reaction between Fe3+ and hydrogen peroxide.
165

Part II – Chapter 5
0.0
0.2
0.4
0.6
0.8
1.0
0 50 100 150 200 250 300
C/C 0
time (min)
pH0 = 2.0; Fe(II)
pH0 = 2.0; Fe(III)
0.0
0.2
0.4
0.6
0.8
1.0
0 50 100 150 200 250 300
C/C 0
time (min)
pH0 = 3.0; Fe(II)
pH0 = 3.0; Fe(III)
0.0
0.2
0.4
0.6
0.8
1.0
0 50 100 150 200 250 300
C/C 0
time (min)
pH0 = 5.0; Fe(II)
pH0 = 5.0; Fe(III)
Figure 5.6. Iron salt effect on the PQ degradation at pH0 = 2 (a), pH0 = 3 (b) and at pH0 = 5
(c) as a function of time (T = 30.0 °C, [Fe2+ or Fe3+]0 = 5.0×10⁻⁴ M, [H2O2]0 = 1.6×10⁻² M,
[PQ]0 = 3.9×10⁻⁴ M). Dashed lines are merely illustrative of the data trend.
(a)
(b)
(c)
pH0= 2.0; Fe2+
pH0= 2.0; Fe3+
pH0= 3.0; Fe2+
pH0= 3.0; Fe3+
pH0= 5.0; Fe2+
pH0= 5.0; Fe3+
166

Paraquat removal from water by oxidation with Fenton’s reagent
On the other hand, in the reaction catalyzed by iron (II) the decline of PQ concentration is
faster due to the quick hydroxyl radicals production, as mentioned above. After 120 min
of reaction, the rate of PQ degradation is nearly the same for both iron salts tested.
5.3.1.6 Effect of the initial paraquat concentration
As expected, for the lowest PQ concentration the degradation level is higher because the
same hydrogen peroxide quantity is used to degrade less pesticide; so, after 2 h all PQ has
been degraded to levels below the detection limit for [PQ]0 = 1.9×10⁻⁴ M (Figure 5.7a). For
initial PQ concentrations of 3.9×10⁻⁴ M and 7.8×10⁻⁴ M the time for complete conversion
progressively increases. It is noteworthy that the fraction of the initial parent compound
converted at a given time is smaller for an initial dose of 7.8×10⁻⁴ M, although the amount
converted is higher. The mineralization degree is also smaller for higher initial PQ
concentrations (Figure 5.7b).
5.3.1.7 Effect of the mode of oxidant addition
To assess the influence of a gradual hydrogen peroxide addition on PQ degradation, three
experiments were done. In the first case the hydrogen peroxide was added once at time
zero of the reaction, which lasted 4 h (experiments described up to now, mentioned as
0.4 mL in Figure 5.8). In the second case 1/2 of the overall hydrogen peroxide quantity
was added at time zero and the remaining peroxide was divided in equal doses and was
added after 1, 2 and 3 hours of reaction (experiment denoted as 0.19 mL + 3 × 0.07 mL in
Figure 5.8). The third case corresponds to the addition of equal hydrogen peroxide
quantities after 0, 1, 2 and 3 hours of reaction (denoted as 4 × 0.1 mL). The results
indicate that the PQ degradation rate is higher for the third case, being the lowest for the
first one. This means that the more divided is the hydrogen peroxide addition the better,
because in this way the scavenging effects are not as significant as when all H2O2 is added
at once (equation 1.3 of Chapter 1) is favored by high H2O2 concentrations). Ideally, the
oxidant should be added continuously, transforming the batch reactor into a semi-
continuous one. This approach was also suggested by other authors [20, 21] as a way of
more efficient peroxide usage. It is also beneficial for better temperature management,
167

Part II – Chapter 5
because for wastewaters containing a huge organic load, the exothermic nature of the
oxidation reactions can compromise process efficiency and safety.
0.0
0.2
0.4
0.6
0.8
1.0
0 50 100 150 200 250 300
C/C 0
time (min)
[PQ] = 1.9x10⁻⁴ M
[PQ] = 3.9x10⁻⁴ M
[PQ] = 7.8x10⁻⁴ M
0.0
0.2
0.4
0.6
0.8
1.0
0 50 100 150 200 250 300
TOC/
TOC 0
time (min)
[PQ] = 1.9x10⁻⁴ M
[PQ] = 3.9x10⁻⁴ M
[PQ] = 7.8x10⁻⁴ M
Figure 5.7. Initial PQ concentration effect on the PQ degradation (a) and on the TOC
removal (b) as a function of time (T = 30.0 °C, [Fe2+]0 = 5.0×10⁻⁴ M, [H2O2]0 = 1.6×10⁻² M,
and pH0 = 3.0). Dashed lines are merely illustrative of the data trend.
[PQ]= 1.9×10⁻⁴ M
[PQ]= 3.9×10⁻⁴ M
[PQ]= 7.8×10⁻⁴ M
[PQ]= 1.9×10⁻⁴ M
[PQ]= 3.9×10⁻⁴ M
[PQ]= 7.8×10⁻⁴ M
(a)
(b)
168

Paraquat removal from water by oxidation with Fenton’s reagent
0.0
0.2
0.4
0.6
0.8
1.0
0 50 100 150 200 250 300
C/C 0
time (min)
0.4 mL H2O2
0.19 + 3 x 0.07 mL H2O2
4 x 0.1 mL H2O2
Figure 5.8. Mode of hydrogen peroxide addition effect on the PQ degradation (T = 30.0 °C,
[Fe2+]0 = 5.0×10⁻⁴ M, [H2O2]T = 1.6×10⁻² M, [PQ]0 = 3.9×10⁻⁴ M and pH0 = 3.0). Dashed
lines are merely illustrative of the data trend.
5.3.2 Commercial paraquat degradation under optimal conditions The “best” conditions found through the parametric study were tested for Gramoxone
(commercial paraquat) degradation. In both experiments (with the analytical and
commercial product) the same initial PQ concentration was employed. The commercial
product degradation rate is lower (Figure 5.9), most probably due to the presence of
other organic compounds that also consume the hydrogen peroxide/hydroxyl radicals.
TOC results indicated that 27% of gramoxone and 38% of PQ analytical standard were
mineralized after 323 min and 240 min, respectively (data not shown). This suggests that
the analytical pesticide is easier to degrade than the commercial product but is important
to realize that the initial total organic carbon is higher for the second case.
0.19 + 3×0.07 mL H2O2
0.4 mL H2O2
4×0.1 mL H2O2
169

Part II – Chapter 5
0.0
0.2
0.4
0.6
0.8
1.0
0 50 100 150 200 250 300 350
C/C 0
time (min)
Commercial Product
Analytical Standard
Figure 5.9. Gramoxone commercial PQ vs. analytical standard degradation as a function of
time (T = 30.0 °C, [Fe2+]0 = 5.0×10⁻⁴ M, [H2O2]0 = 1.6×10⁻² M, [PQ]0 = 3.9×10⁻⁴ M and pH0 =
3.0). Dashed lines are merely illustrative of the data trend.
5.3.3 Kinetic model for paraquat degradation with the Fenton’s process To describe the transient pesticide concentration in this complex process, tens of ordinary
differential equations are required (equations 1.1 to 1.7 of Chapter 1 are merely a
simplification of the set of reactions involved). Besides, rate constants reported in the
literature differ from work to work, and in some cases temperatures are not provided
(authors simply mention that the work was done at room temperature). In addition, an
extreme sensibility of the results to some rate constants was found. Therefore, we
decided to look for a different approach, aiming to find a simple kinetic equation, even if
there is no phenomenological explanation behind. This macroscopic or engineering
approach is however still very useful if one is able to describe and predict the parent
compound degradation in a wide range of conditions, and has recently deserved the
attention of some researchers [22-25]. This is commonly done in the field of reaction
engineering, for reactor design and scale-up (by using empirical power-law rate
equations, etc.). For that purpose the model proposed by Behnajady et al. [24] was
applied:
btmt
CC
+−= 1
0
5.3
170

Paraquat removal from water by oxidation with Fenton’s reagent
where C is the parent compound concentration (M) at time t (min), 0C is the initial
parent compound concentration (M) and m and b are two characteristic constants.
According to the authors, the physical meaning of the term m can be understood by
taking the derivative of equation 5.3:
20
)(/
btmm
dtCdC
+−
= 5.4
and applying the limit when 0→t , one gets:
mdtC/dC
t
1
0
0 −=
→
5.5
As can be seen, m/1 is proportional to the initial decay rate of PQ (in a homogeneous
liquid phase batch reactor, 0→
−=
to dt
dCr ); so, the higher m/1 , the faster is the initial
decay rate of PQ (for the same initial PQ concentration), as illustrated in Figure 5.10.
On the other hand, when ∞→t , equation 5.3 yields:
∞→
−=
tCC
b 0
11 5.6
This means that parameter b/1 is related with the maximum oxidation degree attained
(Figure 5.10).
To determine the m and b terms for each experiment, equation 5.3 was linearized:
btmCC
t+=
− 0/1 5.7
171

Part II – Chapter 5
Figure 5.10. Physical meanings of m and b terms of the Behnajady et al. [24] model.
In Figure 5.11 an example of that linearization is depicted, which provides directly the
parameters required.
y = 0.915x + 18.177
0
50
100
150
200
250
300
0 50 100 150 200 250 300
t/(1
-C/C
0) (m
in)
time (min)
Figure 5.11. Linearization of the kinetic model (equation 5.7) for one experiment (pH0 =
3.0; [PQ]0 = 3.9×10⁻⁴ M; [H2O2]0 = 1.6×10⁻² M; [Fe(II)]0 = 5.0×10⁻⁴ M and T = 30.0 °C).
All m and b terms obtained for the experiments with the Fe2+/H2O2 process are
compiled in Table 5.1.
0,0
0,2
0,4
0,6
0,8
1,0
0 50 100 150 200 250 300
C/C 0
time (min)
Max = 1/b
Slope = -1/m at t=0
172

Paraquat removal from water by oxidation with Fenton’s reagent
Table 5.1. Condition employed in all the experiments done and obtained m and b
parameters for each case (equation 5.7).
pH0 [PQ]0 (M) [H2O2]0 (M) [Fe2+]0 (M) T (°C) m (min) b R2
3.0 3.9×10⁻⁴ 3.4×10⁻² 5.0×10⁻⁴ 10 99.9 0.8 0.996
30 27.1 0.9 0.994
50 10.0 0.9 0.998
70 10.0 0.9 0.998
3.0 3.9×10⁻⁴ 3.4×10⁻² 1.0×10⁻⁴ 30 92.4 1.0 0.978
2.5×10⁻⁴ 36.4 0.9 0.996
5.0×10⁻⁴ 27.1 0.9 0.994
3.0 3.9×10⁻⁴ 1.6×10⁻³ 5.0×10⁻⁴ 30 3.1 1.5 1.000
6.5×10⁻³ 10.7 1.0 0.999
1.6×10⁻² 18.2 0.9 0.999
3.4×10⁻² 27.1 0.9 0.994
5.7×10⁻² 49.6 0.8 0.983
3.0 1.9×10⁻⁴ 1.6×10⁻² 5.0×10⁻⁴ 30 8.3 1.0 0.999
3.9×10⁻⁴ 18.2 0.9 0.999
7.8×10⁻⁴ 16.3 1.0 0.999
2.0 3.9×10⁻⁴ 1.6×10⁻² 5.0×10⁻⁴ 30 91.2 0.7 0.980
3.0 18.2 0.9 0.999
4.0 82.0 0.7 0.996
5.0 61.4 0.8 0.967
For each single experiment a very good agreement to equation 5.7 was obtained, with
coefficients of determination in the range 0.967 – 1.000.
As shown in Table 5.1, the term m decreases when increasing the temperature (but only
up to 50.0 °C) or the iron concentration, because at higher temperatures or Fe2+ doses the
initial reaction rate is faster (as mentioned above m/1 is directly proportional to the
initial parent compound decay rate). At temperatures above 50.0 °C the thermal
decomposition of hydrogen peroxide might be the reason for the constant PQ oxidation
rate. On the other hand, data from Table 5.1 allow concluding that the initial reaction rate
is inversely proportional to the initial H2O2 dose (for the reasons discussed above, cf.
section 5.3.1.3) and is higher for increasing PQ concentrations (one should notice that
173

Part II – Chapter 5
01 Cm
ro ×α ). When changing the pH, smaller m values are obtained at the optimum pH of
3.0, for the reasons also described before.
Regarding parameter b , which is inversely related to the maximum oxidation degree,
Table 5.1 shows that it is nearly independent of the temperature, catalyst dose or
pesticide concentration (this means that for long enough reaction times, the parent
compound removal fraction is approximately the same). Better oxidation degrees are
reached at an initial pH of 3.0 and for higher oxidant dosages. Actually, and as mentioned
above, if the H2O2 concentration is low a fraction of the pesticide will remain in solution
without being oxidized.
With the objective of trying to relate the parameters m and b from Table 5.1 with the
experimental conditions ( iP ) of each series of experiments, simple power-law type
equations (or Arrhenius reaction rate dependency from temperature) were tested. With
such monotonous equations one can predict the values of the parameters (and inherently
the oxidation performances) at intermediate conditions, within the range of the fitting.
Therefore, whenever and optimum in the m or b parameters versus experimental
conditions was obtained (e.g. for data at different pH) or the trend was not persistent
over the all range, the ranges in this global model were limited (temperatures only up to
50.0 °C were employed, as well as MC OH3105.6
22
−×≥ , with data at 0pH = 3.0).
The power-law type equations for parameters m and b can be linearized, yielding:
)log(1log PiYiXim
+=
5.8
)log(1log PiWiZib
+=
5.9
where Xi and Zi are characteristic constants, while Yi and Wi are the apparent orders;
Pi refers to the parameter studied in each series of experiments (initial concentration of
oxidant, catalyst or PQ – [H2O2]0, [Fe(II)]0 or [PQ]0, respectively). The dependency of m/1
from temperature (Arrhenius equation) in linearized form is as follows:
TREaJi
m11ln −=
5.10
174

Paraquat removal from water by oxidation with Fenton’s reagent
where Ea is the apparent activation energy for PQ degradation, R the ideal gas constant
ant T the absolute temperature; Ji is a constant.
Figure 5.12 to Figure 5.15 show an example of the correlation between the m and b
constants and the experimental conditions, in particular the initial hydrogen peroxide
concentration and temperature.
y = -0.675x - 2.485
-2.0
-1.5
-1.0
-0.5
0.0
-2.5 -2.0 -1.5 -1.0
log(
1/m
)
log[H2O2]0
Figure 5.12. Relation between the initial hydrogen peroxide concentration and the inverse
of the term m (equation 5.8).
y = 0.092x + 0.205
-0.02
0.02
0.06
0.10
0.14
-2.5 -2.0 -1.5 -1.0
log(
1/b)
log[H2O2]0
Figure 5.13. Relation between the initial hydrogen peroxide concentration and the inverse
of the term b (equation 5.9).
175

Part II – Chapter 5
y = -5936.3x + 16.3
-5.0
-4.0
-3.0
-2.0
-1.0
0.0
0.0029 0.0032 0.0035 0.0038
ln(1
/m)
1/T(K)
Figure 5.14. Relation between the inverse of the absolute temperature and the inverse of
the term m (equation 5.10).
y = -0.144x + 0.268
-0.02
0.02
0.06
0.10
0.14
0.5 1.0 1.5 2.0
log(
1/b)
log(T)
Figure 5.15. Relation between the absolute temperature and the inverse of the term b
(equation 5.9).
From the slopes of these fittings (and similar ones for the other parameters), it was
possible to obtain the estimated apparent order dependencies (Table 5.2), assuming
power-law equations:
=
RTEaCCMCm c
IIFeb
OHaPQ exp
00220 )( 5.11
176

Paraquat removal from water by oxidation with Fenton’s reagent
'')(
''00220
dcIIFe
bOH
aPQ TCCBCb = 5.12
where M and B are constants, the exponents a , b , c , 'a , 'b , 'c and 'd represent the
apparent reaction orders, and Ea is the apparent activation energy for PQ degradation.
While for m significant dependencies (but lower than 1) were obtained, for b the
apparent orders are much less significant - cf. Table 5.2.
By combining equation 5.3 with equations 5.11 and 5.12 one has a single function that
allows predicting pesticide decay curves at any conditions, within the ranges of this study.
All these parameters were then determined by non-linear regression (minimizing the sum
of the square residues between experimental 0/ CC data and computed 0/ CC values).
As a first estimative the values from Table 5.2 were used. The following results were
obtained:
×= −−
TCCCm IIFeOHPQ
5925exp102 6.0)(
8.06.0600220
5.13
2.014.0)(
11.003.000220
08.0 TCCCb IIFeOHPQ−−−= 5.14
Table 5.2. Estimative apparent order dependency of parameters m and b on the oxidant,
catalyst and parent compound concentrations and the absolute temperature – equations
5.11 and 5.12.
a a' b b' c c' d' Ea
(kJ/mol)
0.48 0.006 0.68 -0.09 -0.77 -0.09 0.14 59.4
The comparisons of the model prediction vs. the experimental responses are given in
Figure 5.16. As shown, the model fits quite well the experimental data. The ANOVA test
was employed to evaluate the adequacy of the model [26]. The F-ratio value obtained for
the normalized PQ concentration (F1,74 = 6770.56) is much higher than the Fisher’s F-value
(F1,74 = 3.97), thus supporting the adequacy of the model (variations that occur in the
response are associated to the model, not to random errors). To access the model
response capability under different conditions than those considered, some experiments
177

Part II – Chapter 5
were conducted in the range (Figure 5.17a) and out of the range (Figure 5.17b)
considered in the kinetic study. Figure 5.17 indicates that the simple developed model
reasonably predicts the PQ degradation by classic dark Fenton’s reagent at different
conditions. The same can be concluded from Figure 5.18 in which the parity plot shows
that there are no significant differences between the data used in the kinetic model
(average absolute deviation of only 2.5%) and the data used in and out of the range
considered in the kinetic study (average absolute deviations of 4.1 and 6.3%,
respectively).
0.0
0.2
0.4
0.6
0.8
1.0
0 50 100 150 200 250 300
C/C 0
time (min)
T = 10.0 °C
T = 30.0 °C
T = 50.0 °C
0.0
0.2
0.4
0.6
0.8
1.0
0 50 100 150 200 250 300
C/C 0
time (min)
0.0
0.2
0.4
0.6
0.8
1.0
0 50 100 150 200 250 300
C/C 0
time (min)
0.0
0.2
0.4
0.6
0.8
1.0
0 50 100 150 200 250 300
C/C 0
time (min)
Figure 5.16. Comparison of the experimental data with the model predictions by
equations 5.3, 5.13 and 5.14 - continuous lines.
[Fe2+]= 1.0×10⁻⁴ M
[Fe2+]= 2.5×10⁻⁴ M
[Fe2+]= 5.0×10⁻⁴ M
[H2O2]= 6.5×10⁻³ M
[H2O2]= 1.6×10⁻² M
[H2O2]= 3.4×10⁻² M
[H2O2]= 5.7×10⁻² M
[PQ]= 1.9×10⁻⁴ M
[PQ]= 3.9×10⁻⁴ M
[PQ]= 7.8×10⁻⁴ M
178

Paraquat removal from water by oxidation with Fenton’s reagent
0.0
0.2
0.4
0.6
0.8
1.0
0 100 200 300 400
C/C 0
time (min)
a1 (Model)
a1
a2 (Model)
a2
0.0
0.2
0.4
0.6
0.8
1.0
0 100 200 300 400
C/C 0
time (min)
b1 (Model)
b1
b2 (Model)
b2
Figure 5.17. Assessment of the model response (continuous lines) for two different
experiments conducted under conditions (a) within the range considered in the
parametric study [a1 - ([H2O2]0= 3.4x10⁻² M, [Fe(II)]0= 5.0x10⁻⁴ M, [PQ]0= 3.9x10⁻⁴ M,
pH0= 3 and T= 40 °C); a2 - ([H2O2]0= 1.0x10⁻² M, [Fe(II)]0= 5.0x10⁻⁴ M, [PQ]0= 3.9x10⁻⁴ M,
pH0= 3 and T= 30 °C)] and (b) out of the range of conditions considered in the parametric
study [b1 - ([H2O2]0= 3.4x10⁻² M, [Fe(II)]0= 8.0x10⁻⁵ M, [PQ]0= 3.9x10⁻⁴ M, pH0=3 and T=
30 °C); b2 - ([H2O2]0= 3.0x10⁻³ M, [Fe(II)]0= 5.0x10⁻⁴ M, [PQ]0= 3.9x10⁻⁴ M, pH0=3 and T=
30 °C)].
(a)
(b)
179
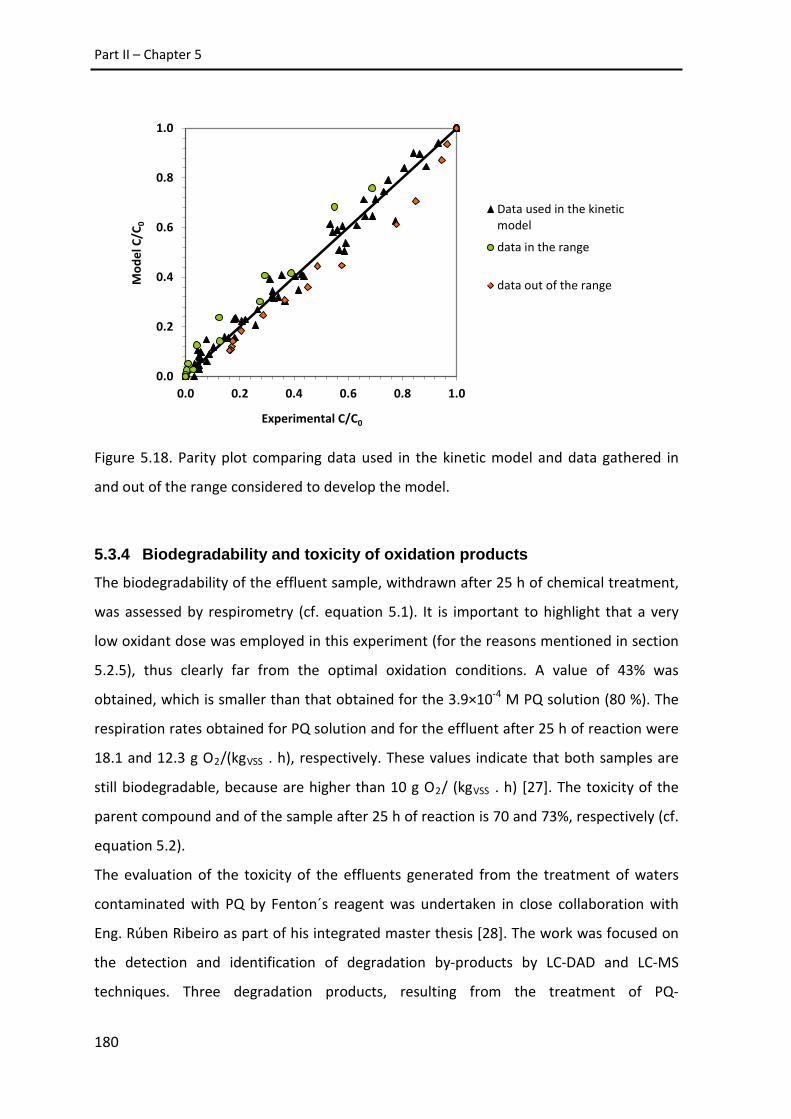
Part II – Chapter 5
0.0
0.2
0.4
0.6
0.8
1.0
0.0 0.2 0.4 0.6 0.8 1.0
Mod
el C
/C0
Experimental C/C0
Data used in the kineticmodel
data in the range
data out of the range
Figure 5.18. Parity plot comparing data used in the kinetic model and data gathered in
and out of the range considered to develop the model.
5.3.4 Biodegradability and toxicity of oxidation products
The biodegradability of the effluent sample, withdrawn after 25 h of chemical treatment,
was assessed by respirometry (cf. equation 5.1). It is important to highlight that a very
low oxidant dose was employed in this experiment (for the reasons mentioned in section
5.2.5), thus clearly far from the optimal oxidation conditions. A value of 43% was
obtained, which is smaller than that obtained for the 3.9×10⁻⁴ M PQ solution (80 %). The
respiration rates obtained for PQ solution and for the effluent after 25 h of reaction were
18.1 and 12.3 g O2/(kgVSS . h), respectively. These values indicate that both samples are
still biodegradable, because are higher than 10 g O2/ (kgVSS . h) [27]. The toxicity of the
parent compound and of the sample after 25 h of reaction is 70 and 73%, respectively (cf.
equation 5.2).
The evaluation of the toxicity of the effluents generated from the treatment of waters
contaminated with PQ by Fenton´s reagent was undertaken in close collaboration with
Eng. Rúben Ribeiro as part of his integrated master thesis [28]. The work was focused on
the detection and identification of degradation by-products by LC-DAD and LC-MS
techniques. Three degradation products, resulting from the treatment of PQ-
180

Paraquat removal from water by oxidation with Fenton’s reagent
contaminated waters by Fenton’s reagent, were detected and identified after 4 h of
reaction and correspond to oxalic acid, isonicotinic acid and 4-carboxy-1-
methylpyridinium ion (T =30 °C, [Fe2+]0 = 5.0×10⁻⁴ M, [H2O2]0 = 1.6×10⁻² M, and pH0 = 3.0,
for [PQ]0 = 100 mg/L). The degradation pathway that may be involved in the process is
depicted in Figure 5.19.
Figure 5.19. Proposed pathway for PQ degradation during classic Fenton (adapted from
[2]).
NH3C N CH3
O
NH3C N
NH3C COO
NH3C N CH3
N N
N COO
HOOH
O
O
Paraquat
Monopyridone
4-carboxy-1-methylpyridinium ion
Monoquat
4,4´-bipyridine
Isonicotinic acid
Oxalic acid
181

Part II – Chapter 5
The organic carbon remaining after such 4 h of reaction is 60% of the initial PQ (40%
mineralization). From this, it was estimated that 61% corresponds to the identified
products (oxalic acid, isonicotinic acid and 4-carboxy-1-methylpyridinium ion).
Additionally, five other molecular ions were detected in the LC-MS (m/z 201, 265, 267,
283 and 291), but none was matched to chemical structures. Toxicity values of oxalic acid,
isonicotinic acid and PQ were compared and it was concluded that both degradation
products are less toxic than the parent compound.
5.3.5 Preliminary experiments using photo-Fenton reaction To verify how much the use of UV-Vis light improves the PQ degradation, a test using the
same optimal conditions as for classic Fenton reaction (T =30 °C, [Fe2+]0 = 5.0×10⁻⁴ M,
[H2O2]0 = 1.6×10⁻² M, and pH0 = 3.0, for [PQ]0 = 100 mg/L) was performed in the presence
of the radiation emitted by a 150 W medium-pressure mercury vapor lamp (Heraeus TQ-
150). Figure 5.20 shows a very fast PQ degradation by the photo-Fenton process, as only
five minutes are needed to degrade 99% of the pesticide.
0.0
0.2
0.4
0.6
0.8
1.0
0 50 100 150 200 250
C/C 0
time (min)
Photo-Fenton
Classic Fenton
0.0
0.2
0.4
0.6
0.8
1.0
0 50 100 150 200 250
TOC/
TOC 0
time (min)
Photo-Fenton
Classic Fenton
Figure 5.20. Treatment of PQ-contaminated waters by photo-Fenton (T =30 °C, [Fe2+]0 =
5.0×10⁻⁴ M, [H2O2]0 = 1.6×10⁻² M, and pH0 = 3.0, for [PQ]0 = 100 mg/L): (a) PQ
degradation and (b) mineralization degree along time.
TOC removal is also very high when compared with the classic Fenton process. In the
photo-Fenton process 96% of PQ is totally mineralized into carbon dioxide and water
after only one hour of reaction. Longer reaction time did not lead to any improvement in
182

Paraquat removal from water by oxidation with Fenton’s reagent
the mineralization degree, evidencing that either there is no more oxidant available or
the products formed are refractory towards degradation by this AOP.
5.4 Conclusions
In the present chapter, a detailed parametric study was performed to evaluate the effect
of temperature, H2O2 concentration, Fe2+ concentration, pH, iron source and PQ
concentration on the pesticide degradation by dark Fenton’s reagent.
Under optimum conditions (T =30 °C, [Fe2+]0 = 5.0×10⁻⁴ M, [H2O2]0 = 1.6×10⁻² M, and pH0
= 3.0, for [PQ]0 = 100 mg/L) all the initial PQ present in the reactor was degraded after 4 h
and 40% of the organic matter was totally mineralized into CO2 and H2O. It was estimated
that 61% of the remaining organic carbon after 4 h of reaction was identified (oxalic acid,
isonicotinic acid and 4-carboxy-1-methyl pyridinium ion), being two of them less toxic
than PQ. The PQ present in the Gramoxone commercial product had a lower degradation
performance due to the presence of other organic compounds. A simple model was
developed and applied to the results, fitting quite well the experimental data (on average
only a 2.5 % of absolute deviation was obtained). Some experiments were performed out
of the range considered in the parametric study and the model also predicts reasonably
the PQ concentration profiles in the batch oxidation experiments.
The photo-Fenton process proved to be an attractive alternative to classic Fenton: much
higher initial PQ degradation rate and 96% of mineralization degree after 1 h of reaction
were reached.
5.5 References
[1] U.G. Akpan and B.H. Hameed, Parameters affecting the photocatalytic degradation of
dyes using TiO2-based photocatalysts: a review, J. Hazard. Mater. 170 (2009) 520-529.
[2] P.C. Kearney, J.M. Ruth, Q. Zeng and P. Mazzocchi, UV ozonation of paraquat, J.Agric.
Food Chem. 33 (1985) 953-957.
[3] R. Andreozzi, A. Insola, V. Caprio and M.G. D'Amore, Ozonation of 1, 1' dimethyl, 4,4'
bipyridinium dichloride (Paraquat) in aqueous solution, Environ. Technol. 14 (1993) 695-
700.
183

Part II – Chapter 5
[4] A. Dhaouadi and N. Adhoum, Heterogeneous catalytic wet peroxide oxidation of
paraquat in the presence of modified activated carbon, Appl. Catal. B-Environ. 97 (2010)
227-235.
[5] A. Dhaouadi and N. Adhoum, Degradation of paraquat herbicide by electrochemical
advanced oxidation methods, J. Electroanal. Chem. 637 (2009) 33-42.
[6] A.D. Eaton, L.S. Clesceri, A.E. Greenberg and M.A.H. Franson, Standard methods for
the examination of water and wastewater, 20th ed., American Public Health Association,
Washington, DC, 1998.
[7] R.C. Martins, N. Amaral-Silva and R.M. Quinta-Ferreira, Ceria based solid catalysts for
Fenton's depuration of phenolic wastewaters, biodegradability enhancement and toxicity
removal, Appl. Catal. B-Environ. 99 (2010) 135-144.
[8] A. Guisasola, J.A. Baeza, J. Carrera, C. Casas and J. Lafuente, An off-line respirometric
procedure to determine inhibition and toxicity of biodegradable compounds in biomass
from an industrial WWTP, Water Sci Technol. 48 (2004) 267-275.
[9] I.S. Kim, J.C. Young and S. Kim, Development of monitoring methodology to fingerprint
the activated sludge processes using oxygen uptake rate, Environ. Eng. Res. 6 (2001) 251-
259.
[10] N.-C. Shang, Y.-H. Yu, H.-W. Ma, C.-H. Chang and M.-L. Liou, Toxicity measurements in
aqueous solution during ozonation of mono-chlorophenols, J. Environ. Manage. 78 (2006)
216-222.
[11] I. Gulkaya, G. Surucu and F. Dilek, Importance of H2O2/Fe2+ ratio in Fenton's
treatment of a carpet dyeing wastewater, J. Hazard. Mater. 136 (2006) 763-769.
[12] J.H. Ramirez, F.M. Duarte, F.G. Martins, C.A. Costa and L.M. Madeira, Modelling of
the synthetic dye Orange II degradation using Fenton’s reagent: From batch to continuous
reactor operation, Chem. Eng. J. 148 (2009) 394-404.
[13] C. Jiang, S. Pang, F. Ouyang, J. Ma and J. Jiang, A new insight into Fenton and Fenton-
like processes for water treatment, J. Hazard. Mater. 174 (2010) 813-817.
[14] J.H. Sun, S.H. Shi, Y.F. Lee and S.P. Sun, Fenton oxidative decolorization of the azo dye
Direct Blue 15 in aqueous solution, Chem. Eng. J. 155 (2009) 680-683.
[15] M.L. Kremer, The Fenton Reaction. Dependence of the Rate on pH, J. Phys. Chem. A
107 (2003) 1734-1741.
184

Paraquat removal from water by oxidation with Fenton’s reagent
[16] C.S.D. Rodrigues, L.M. Madeira and R.A.R. Boaventura, Optimization of the azo dye
Procion Red H-EXL degradation by Fenton's reagent using experimental design, J. Hazard.
Mater. 164 (2009) 987-994.
[17] F.J. Rivas, V. Navarrete, F.J. Beltrán and J.F. Garcıa-Araya, Simazine Fenton’s oxidation
in a continuous reactor, Appl. Catal. B-Environ. 48 (2004) 249-258.
[18] T.D. Waite, Challenges and opportunities in the use of iron in water and wastewater
treatment, Rev. Environ. Sci. Biotechnol. 1 (2002) 9-15.
[19] J.H. Ramirez, C.A. Costa and L.M. Madeira, Experimental design to optimize the
degradation of the synthetic dye Orange II using Fenton's reagent, Catal. Today 107–108
(2005) 68-76.
[20] D.A. Saltmiras and A.T. Lemley, Degradation of Ethylene Thiourea (ETU) with Three
Fenton Treatment Processes, J. Agric. Food Chem. 48 (2000) 6149-6157.
[21] S.G. Poulopoulos, M. Nikolaki, D. Karampetsos and C.J. Philippopoulos,
Photochemical treatment of 2-chlorophenol aqueous solutions using ultraviolet radiation,
hydrogen peroxide and photo-Fenton reaction, J. Hazard. Mater. 153 (2008) 582-587.
[22] J. Herney-Ramirez, A.M.T. Silva, M.A. Vicente, C.A. Costa and L.M. Madeira,
Degradation of Acid Orange 7 using a saponite-based catalyst in wet hydrogen peroxide
oxidation: Kinetic study with the Fermi's equation, Appl. Catal. B-Environ. 101 (2011) 197-
205.
[23] D. Nichela, M. Haddou, F. Benoit-Marquié, M.-T. Maurette, E. Oliveros and F.S. García
Einschlag, Degradation kinetics of hydroxy and hydroxynitro derivatives of benzoic acid by
fenton-like and photo-fenton techniques: A comparative study, Appl. Catal. B-Environ. 98
(2010) 171-179.
[24] M.A. Behnajady, N. Modirshahla and F. Ghanbary, A kinetic model for the
decolorization of C.I. Acid Yellow 23 by Fenton process, J. Hazard. Mater. 148 (2007) 98-
102.
[25] C. Zaror, C. Segura, H. Mansilla, M.A. Mondaca and P. Gonzalez, Kinetic study of
Imidacloprid removal by advanced oxidation based on photo-Fenton process, Environ.
Technol. 31 (2010) 1411-1416.
[26] D.C. Montgomery and G.C. Runger, Applied statistics and probability for engineers,
2nd ed., John Wiley Sons, New York, 1999.
185

Part II – Chapter 5
[27] M. Henze, P. Harremoёs, J.l.C. Jansen and E. Arvin, Wastewater treatment: biological
and chemical processes, 2nd ed., Springer-Verlag, Berlin, 1997.
[28] Rúben Lopes Casal Ribeiro, Deteção de subprodutos resultantes da degradação do
pesticida paraquato por oxidação química, Tese de Mestrado Integrado em Engenharia
Química, Faculdade de Engenharia da Universidade do Porto, 2012.
186

PART III. BDE-100


6 Nanogram per liter level determination of
PBDEs in water by a simple DLLME-GC-MS
method1
Abstract
Dispersive liquid-liquid microextraction (DLLME) is an extraction procedure gaining
popularity in the last years due to the easiness of operation, enabling a high enrichment
factor, low cost and low consumption of organic solvents. This extraction method, prior to
gas chromatography with mass spectrometry detection (GC-MS), was optimized for the
analysis of polybrominated diphenyl ethers (PBDEs) in aqueous samples. These were
extracted with chlorobenzene (extraction solvent) and acetonitrile (dispersive solvent),
allowing an enrichment factor of about 469 for BDE-100. The calibration curve for BDE-
100 was linear in the range of 0.005-10 μg/L, with an average reproducibility of 12%
(relative standard deviation – RSD%). The limit of detection (LOD), calculated by the
signal-to-noise ratio, was 0.5 ng/L for BDE-100 and the recovery ranged from 91-107% for
all spiked samples. Overall uncertainty was concentration-dependent, reaching high
values near the limit of quantification and decreasing up to 7% for concentrations higher
than 1 µg/L of BDE-100. The dispersive liquid-liquid microextraction combined with gas
chromatography with mass spectrometry detection (DLLME-GC-MS) method could be
successfully applied to the determination of other PBDEs in water samples.
6.1 Introduction
Analytical methods for PBDEs in waters are complex and laborious, due to the necessity
of using a pre-concentration step in the extraction procedure. This pre-concentration step
is always needed in order to reach LODs low enough to determine the ultra-trace levels at
which PBDEs are present in water (normally within the ng/L or low µg/L range) [1-3]. The
analytical methods found in the literature for PBDEs quantification in water matrices are
1 Adapted from: Mónica S.F.Santos, José Luís Moreira, Luís M. Madeira and Arminda Alves, Nanogram per
liter level determination of PBDEs in water by a simple DLLME-GC-MS method, submitted, 2013.
189

Part III – Chapter 6
presented with more detail in Chapter 1 – section 1.2.1. Although advantages are
recognized to each of the described methods, some drawbacks are also pointed out. For
instance some methods are rather laborious, increasing the time of analysis [4-6], while
others present lower precision [7, 8], as reported by [9, 10], or require higher sample
volumes (up to 1.5 L) [6, 11, 12]. Finally, carry-over phenomena have also been pointed as
a disadvantage for stir bar sorptive extraction (SBSE) and headspace solid-phase
microextraction (HS-SPME) [5, 13].
Therefore, the proposed analytical methodology intends to overcome some lacks
concerning the determination of PBDEs at nanogram per litter level by using DLLME as a
quick and easy extraction step, that requires few sample volume, hyphenated to mass
spectrometry detection. Additionally, this method intends to constitute a quick and
reliable approach for identification and quantification of PBDEs in case of a deliberate or
accidental contamination (emergency situations). On the other hand, this study presents
for the first time a complete set of validation parameters, including the calculation of the
global uncertainty associated to the results in the range of quantification.
6.2 Experimental Section
6.2.1 Reagents 2,4,4’-tribromodiphenyl ether (BDE-28, 50 mg/L in isooctane), 2,2´,4,4’-
tetrabromodiphenyl ether (BDE-47, 50 mg/L in isooctane), 2,2’,3,4’,4-
pentabromodiphenyl ether (BDE-85, 50 mg/L in isooctane), 2,2’,4,4’,5-
pentabromodiphenyl ether (BDE-99, 50 mg/L in isooctane), 2,2’,4,4’,6-
pentabromodiphenyl ether (BDE-100, 50 mg/L in isooctane), 2,2’,4,4’,5,5’-
hexabromodiphenyl ether (BDE-153, 50 mg/L in isooctane), 2,2’,4,4’,5,6’-
hexabromodiphenyl ether (BDE-154, 50 mg/L in isooctane), 2,2’,3,4,4’,5’,6-
heptabromodiphenyl ether (BDE-183, 50 mg/L in isooctane) were obtained from Sigma-
Aldrich (St. Louis, USA). Distilled water was used for standards preparation. Acetonitrile
(ACN), acetone (AC) and methanol (MeOH) of LC-MS grade were obtained from VWR
(Porto, Portugal). Chlorobenzene (CB) of analytical grade and dichloromethane (DCM) for
pesticide residue analysis were purchased from VWR (Porto, Portugal). Carbon
tetrachloride (CTC) and chloroform (CF) were p.a. from Merck (Darmstadt, Germany).
1,1,2,2-Tetrachloroethane (TCE) was reagent grade from Sigma-Aldrich (St. Louis, USA).
190

Nanogram per liter level determination of PBDEs in water by a simple DLLME-GC-MS method
6.2.2 Standard solutions and samples Stock solutions were prepared by evaporating an appropriate amount of each analytical
standard under a gentle nitrogen flow. Then, the residue was redissolved in acetonitrile.
Aqueous standard solutions were prepared daily by evaporating an appropriate amount
of stock solution, under nitrogen flow, and resuspending the residue in 25 mL of water. A
calibration curve with 12 BDE-100 standards extracted by DLLME, as further described,
was obtained from 0.005 to 10 μg/L.
Three different types of water samples were used to validate the application of the
analytical methodology: a natural river water (collected from Sousa River), tap water
(from our laboratory located at the Northern region of Portugal, a relatively hard water,
pH = 6.90, TOC = 2.3 mg/L) and a mineral water (commercial water with pH = 6.39, TOC =
1.1 mg/L).
All types of water were filtered (VWR quantitative filter papers with particle retention
between 5-10 µm – West Chester, USA) and stored in amber glass bottles, at -20 °C,
protected from light until they were processed. Preliminary tests did not reveal any
retention in the filters used.
6.2.3 Instrumentation PBDEs were analyzed by a Varian 4000 GC-MS Chromatograph. The mass spectrometer
was operated in the electronic impact ionization (EI) mode. The temperatures for the
injector, trap, transfer line and manifold were held respectively at 290 °C, 200 °C, 250 °C
and 50 °C. A DB-5MS column was used (30 m x 0.25 mm ID x 0.25 µm film thickness –
Walnut Creek, CA, USA) and the oven temperature was programmed as follows: initial 60
°C for 2 min, rate of 30 °C/min to 250 °C, then 5 °C/min until 300 °C and held for 8 min. The
injected volume was 1 µL and a 701N Hamilton syringe was used. Carrier gas was Helium
(99.9999 %) at 1 mL/min flowrate. Monitoring ions in the selected ion-monitoring mode
(SIM) are listed in Table 6.1. The identification of the compounds was done by
comparison of the retention times with those obtained for standard solutions directly
injected. All PBDEs were injected separately under the optimized conditions described
below.
191

Part III – Chapter 6
Table 6.1. Retention time, quantification and qualifier ions for each PBDE by GC-MS.
PBDEs Class Retention time
(min)
Quantification ion
(m/z)
Qualifier ion
(m/z)
BDE-28 Tri-BDE 10.720 248 + 408 246
BDE-47 Tetra-BDE 12.513 326 + 486 328
BDE-85 Penta-BDE 15.954 406 + 564 404
BDE-99 Penta-BDE 14.829 406 + 566 404
BDE-100 Penta-BDE 14.227 406 + 566 564
BDE-153 Hexa-BDE 17.459 484 + 644 486
BDE-154 Hexa-BDE 16.480 484 644
BDE-183 Hepta-BDE 20.473 564 + 724 562
6.2.4 DLLME procedure
Extractions were performed in 50 mL plastic screw-cap test tubes with conical bottom. An
aqueous sample (25 mL) was extracted with given volumes of different dispersive and
extraction solvents; optimized conditions were 1 mL of ACN and 80 µl of CB. The mixture
was centrifuged for 5 min at 4000 rpm in a Hettich Rotofix 32A Centrifuge. The
sedimented-phase was collected with a syringe and was injected in the GC-MS.
6.2.5 Validation parameters Precision was evaluated by extracting 3 independent standards at 3 concentration levels:
0.01, 1 and 10 μg/L and 3 independent spiked samples (tap water, drinking water and
river water) at three concentration levels: 0.01, 1 and 10 μg/L.
Accuracy was evaluated by standard addition using tap, drinking and river waters spiked
with BDE-100 at the same 3 concentration levels.
6.3 Results and discussion
This work comprised a previous optimization of the extraction method by DLLME,
followed by the validation of the analytical methodology, with special care to the
estimation of the global uncertainty associated to the results.
192

Nanogram per liter level determination of PBDEs in water by a simple DLLME-GC-MS method
6.3.1 Optimization of DLLME The effect of some critical parameters on the DLLME performance was investigated,
among them the kind and volume of extraction and dispersive solvents, extraction time
and salt addition. For such purpose, BDE-100 was selected as a model compound to
evaluate in which manner the extraction process was affected by such parameters. So, all
results obtained in this section were carried out from aqueous solutions containing 1 µg/L
of BDE-100. The final conditions were afterwards applied to the others PBDEs. To better
understand the effects of the above-mentioned parameters on DLLME performance,
enrichment factors ( EF ) and extraction recoveries ( ER% ) were determined:
6.1
6.2
where 0C and aqV are the BDE concentration and volume of aqueous solution samples
and sedC and sedV the BDE concentration and volume of the sedimented-phase.
All experiments were performed in triplicate and injected in the GC-MS at least twice.
6.3.1.1 Effect of extraction and dispersive solvents
The kind of extraction and dispersive solvent is crucial in the extraction efficiency by
DLLME [10]. The extraction solvent must display high extraction capability for the
analytes, higher density than water, good chromatographic behavior and low water
solubility [10, 14, 15]. Typically, halogenated hydrocarbons are used due to their high
density [10]. On the other hand, the selection of the dispersive solvent should take into
account its miscibility both in water and in the extraction solvent. The commonly used
dispersive solvents include methanol, ethanol, acetonitrile, acetone and tetrahydrofuran
[10]. Usually, the selection of extraction and dispersive solvents is made separately but
the result may be compromised. In this study, this selection was made jointly to
determine which set of solvents leads to a higher extraction efficiency. Therefore, the
combinate effect of four extraction solvents (CTC, CB, DCM and CF) and three dispersive
solvents (AC, MeOH and ACN) on DLLME performance was studied. TCE was also tested as
extraction solvent with acetonitrile but this set of solvents proved to be aggressive for
0/ CCEF sed=
100)/()(% 0 ×= aqsedsed VCVCER
193

Part III – Chapter 6
some components of the equipment used, such as the GC injection syringe, and therefore
was discarded.
The experiments were performed using 1 mL of dispersive solvent containing 100 µL of
extraction solvent (Table 6.2).
Table 6.2. Analytical responses and extraction recoveries obtained when different
extraction and dispersive solvents were used on DLLME technique.
CB CTC
ACN MeOH AC ACN MeOH AC
Area (25±2)×104 (27±1)×104 (22±1)×104 (15±1)×104 (18±2)×104 (17±2)×104
%ER 75±3 71±4 73±2 63±5 77±6 70±8
The analytical responses obtained for the extracted samples were compared to those
obtained for standards prepared in the same solvent. Dichloromethane and chloroform
were automatically discarded because the formation of two phases was not observed
under the conditions employed and using the mentioned dispersive solvents. Although
similar extraction recoveries were attained for both extraction solvents (CTC and CB),
chlorobenzene was chosen because it gave higher analytical response. This last point is
very important specifically in the quantification of tracer compounds like PBDEs. On the
other hand, CTC leads to higher variation coefficients and has lower boiling point which
could represent a relevant source of error.
Yanyan Li et al. [15] used TCE and acetonitrile as extraction and dispersive solvents,
respectively. This set of solvents led to higher extraction efficiencies (extraction recovery
of around 103%) but, injections were made manually in the liquid chromatography (LC)
due to the aggressive character of the solvent mixture, which may contribute to the
decrease of the precision. The same problem arose when this organic solvent was also
applied joint with tetrahydrofuran (dispersive solvent) for BDE-209 determination in
water samples [14].
Concerning the dispersive solvent, although chlorobenzene showed good results when
combined with acetone, higher reproducibility was obtained with acetonitrile, probably
due to less leaks of solvent evaporation and therefore this was the selected dispersive
solvent, combined with the extraction solvent - chlorobenzene.
194

Nanogram per liter level determination of PBDEs in water by a simple DLLME-GC-MS method
6.3.1.2 Effect of the extraction solvent volume
To examine the effect of the chlorobenzene volume on the extraction process
performance, BDE-100-containing aqueous samples were submitted to the same DLLME
procedure by using 1 mL of acetonitrile containing different volumes of chlorobenzene
(80, 100, 150 and 200 µL). Chlorobenzene volumes below 80 µL were not considered
because a minimum safety volume of 40 µL was set for the sedimented-phase. Figure
6.1a depicts the extraction recovery and the enrichment factor versus chlorobenzene
volume, respectively. As shown in Figure 6.1a, the enrichment factor decreased as the
chlorobenzene volume increases. Indeed, higher chlorobenzene volumes lead to higher
volumes of sedimented-phase (data not shown) and consequently, lower target
compound concentrations and lower enrichment factors (Figure 6.1a).
0
100
200
300
400
500
600
80 100 150 200
%ER
/ EF
Chlorobenzene volume (mL)
%ER EF
0
100
200
300
400
500
600
0.5 1.0 1.5 2.0
%ER
/ EF
Acetonitrile volume (mL)
%ER EF
0
100
200
300
400
500
600
0 10 15 30
%ER
/ EF
Extraction time (min)
%ER EF
0
100
200
300
400
500
600
0% 1% 3% 5%
%ER
/ EF
NaCl (%w/v)
%ER EF
Figure 6.1. Effect of chlorobenzene volume (a), acetonitrile volume (b), extraction time (c)
and salt addition (d) on the enrichment factor and extraction recovery for BDE-100.
(a) (b)
(c) (d)
195

Part III – Chapter 6
On the other hand, the extraction recovery is not affected by the volume of extraction
solvent used. The same behavior has been observed by other authors which implemented
DLLME technique to determine a huge number of target compounds in different matrices
[10, 14-16]. Therefore, 80 µL of chlorobenzene was selected as the optimum volume.
6.3.1.3 Effect of dispersive solvent volume
The dispersive solvent is directly responsible for the formation of the cloudy solution and,
by this way, its volume may compromise the degree of dispersion of the extraction
solvent in the aqueous phase [10]. To evaluate the effect of dispersive solvent volume,
the experimental conditions included the use of 0.5, 1, 1.5 and 2 mL of acetonitrile,
containing 80 µL of chlorobenzene. The results show that either the extraction recovery
or the enrichment factor were not significantly affected by the volume of acetonitrile
(Figure 6.1b). Other authors have found an optimum value of dispersive solvent volume
but, different sample volumes were used (5 mL instead 25 mL) for the same dispersive
solvent volumes tested here [14-17]. So, within the range of the volumes used in this
study, the same tendency was not found and therefore, 1 mL of acetonitrile was chosen
for the subsequent experiments because it conducts to more precise results (lower
coefficient of variation).
6.3.1.4 Effect of extraction time
In DLLME, the extraction time is defined as the interval between the injection of the
extraction and dispersive solvents mixture and the centrifugation step. One remarkable
advantage of this extraction technique is the short time needed to transfer the analyte
from the aqueous phase to the organic one and thus, the equilibrium stage [10]. It is
important to study this parameter because the extraction time can influence significantly
the extraction efficiency [18]. The extraction recoveries obtained from aqueous solutions
submitted to the same DLLME procedure and different extraction times (0, 5, 10, 15 and
30 min) are shown in the Figure 6.1c.
As observed, the extraction time has no impact on the extraction efficiency within the
interval of time selected. Longer times were not considered, because the aim is to obtain
a rapid extraction with acceptable efficiency. Thus, the most time-consuming step is the
centrifuging, which lasts about 5 min. This is an important aspect since it marks the great
196

Nanogram per liter level determination of PBDEs in water by a simple DLLME-GC-MS method
advantage of this extraction technique against the others presented in the Chapter 1–
section 1.2.1. Similar results were also achieved by other researchers [14-16], meaning
that the mass transfer is very fast, occurring during the injection of the solvents/start-up
of the centrifuge.
6.3.1.5 Effect of salt addition
The increase of the aqueous sample ionic strength by salt addition may cause opposite
consequences on the recovery. Firstly, the increase of the ionic strength can lead to a
decrease of analyte and extraction solvent solubilities in the aqueous phase, which may
contribute to the increase on the extraction process recovery [10]. However, the volume
of sedimented-phase increases by increasing ionic strength and thus, the analyte
concentration decreases [10]. The ionic strength was evaluated adding sodium chloride to
the aqueous solution in the range between 0 and 5%(w/v). Under such conditions it was
not observed any significant salt addition effect on the DLLME performance (Figure 6.1d).
Similar results were already obtained by other authors [6, 19, 20]. Consequently, the
following experiments were performed without the addition of salt.
6.3.2 Quantitative analysis Quantitative analysis of contaminants as BDE-100, or ultra-trace contaminants in water
samples, is usually necessary for different objectives. The most important is to allow the
monitoring of waters in different environmental media (rivers, lakes, drinking and tap
water, etc) and for that, the main purpose of the validation is to obtain the lowest
quantification limit possible. However, other objectives include the quantification of the
contaminants for degradation studies, or other, where normally higher concentrations
are used. In this case, it is acceptable to reach somewhat higher quantification limits, but
the limiting factor is the available sample volume, because most of the time, batch
experiments are used and samples have to be taken along the time. Therefore, analytical
methods have to be able to quantify the contaminants at low levels, using low sample
volumes. In these cases, the estimation of the uncertainty of the results plays an
important role, because models will be constructed. The combination of low
quantification limits with low sample volume will have an impact in the uncertainty of the
results.
197

Part III – Chapter 6
The validation of the analytical method, including the uncertainty measurement, followed
the bottom-up approach described in EURACHEM CITAC Guide [21] and by the authors
elsewhere [22, 23]. Description of main contributions and respective calculation formula
for the global uncertainty is in Annex I. It comprised a first step of in-house validation,
where the main parameters were obtained – linearity of the response, using standards
extracted in the same mode as samples, LOD and LOQ (limit of quantification), precision
and accuracy. The second step was the estimation of the uncertainty of the results, using
the validation parameters as assumption that those represented the main sources of
uncertainty of final result.
6.3.2.1 Response linearity and detection and quantification limits
Calibration was performed for BDE-100 by DLLME-GC-MS using the 12 standards
extracted in the same conditions as the samples (from 0.005 to 10 µg/L). The correlation
coefficient (R=0.9997) and the linearity tests revealed a good performance for the
linearity. The LOD and LOQ were calculated based on a signal-to-noise-ratio of 3 and 10,
and they were found to be 0.5 and 2 ng/L, respectively. Comparing with other techniques,
whose results are reported in the Introduction, the obtained LOD is lower or, at least, of
the same order of magnitude.
6.3.2.2 Precision and Accuracy
The precision was evaluated by repeatability and intermediate precision at three BDE-100
concentration levels – 0.01, 1 and 10 µg/L. Repeatability corresponds to the RSD%
observed when one sample is injected six times in the same day under the same
conditions. Repeatability expressed as RSD% was 7, 5 and 3% for 0.01, 1 and 10 µg/L.
Intermediate precision was analyzed extracting three independent standards (ultrapure
water) and spiked samples (drinking, tap and river water) at three concentration levels
(Table 6.3). Average precision, expressed as relative standard deviation, was 12% for
standards and 13%, 12% and 10% for spiked drinking, tap and river waters, respectively.
Accuracy was evaluated by the percentage of recovery for spiked samples (drinking, tap
and river waters) because nor reference materials, neither interlaboratory or proficiency
studies were available. Recoveries were on an average higher than 91% and lower than
107% for all spiked sample considered (Table 6.3).
198

Nanogram per liter level determination of PBDEs in water by a simple DLLME-GC-MS method
Table 6.3. Precision and recoveries obtained for BDE-100 standards and spiked water
samples.
Precision (RSD%) (n=3) Recovery (%) (n=3)
0.01 µg/L 1 µg/L 10 µg/L 0.01 µg/L 1 µg/L 10 µg/L
Standard 18 10 8 ----- ----- -----
Spiked drinking water 20 6 13
96±19 107±6 88±12
Spiked tap water 19 6 11
114±22 103±6 105±11
Spiked river water 11 14 4 82±9 110±16 82±3
The good recovery results and the low RSDs observed enable an accurate evaluation of
the BDE-100 in the tested samples, even at the lowest level assessed.
The analytical response for standards prepared in ultrapure water was compared to the
response obtained for spiked drinking, tap and river waters at the same concentration
levels. It was observed that the analytical response is almost independent of the type of
water used, meaning that there is no matrix effect.
6.3.2.3 Estimation of the global uncertainty associated to the results
The four uncertainty sources that were judged more important in the contribution for the
overall uncertainty of results were uncertainty associated with the preparation of the
standards (U1), the calibration curve (U2), the precision of the extraction and also of the
chromatographic method (U3) and uncertainty associated to the accuracy (U4).
Figure 6.2a shows the contribution of each uncertainty source for the overall uncertainty.
As can be seen, the uncertainty associated with the calibration curve is the most
significant contribution at lower concentrations, showing the importance of this
estimation. For higher concentrations, the uncertainty of precision and accuracy exhibit
more importance for the global uncertainty. From Figure 6.2b, it can be observed that the
uncertainty decreases from 11 to 7% for BDE-100 concentration from 0.5 to 10 µg/L,
which is acceptable and normally obtained with other methods.
199

Part III – Chapter 6
0%
10%
20%
30%
40%
50%
60%
70%
80%
90%
100%
0.00
5
0.01
0.03
0.05 0.
1
0.5 1 2 4 6 8 10
% o
f Tot
al u
ncer
tain
ty
BDE-100 concentration (µg/L)
U4
U3
U2
U1
0
5
10
15
20
25
30
35
40
45
0 2 4 6 8 10
Glob
al U
ncer
tain
ty (%
)
BDE-100 concentration (µg/L)
Figure 6.2. Contribution of each source of uncertainty to the total uncertainty – U1:
standards preparation, U2: calibration curve, U3: precision and U4: accuracy (a) and
global uncertainty (b) for BDE-100 analysis in water by DLLME-GC-MS.
However, care must be taken when considering the results for concentrations lower than
0.5 µg/L because much higher uncertainty may be found, which is typical of trace analysis
and most authors do not evaluate the global uncertainty in the vicinity of the
quantification limit [23, 24].
(a)
(b)
200

Nanogram per liter level determination of PBDEs in water by a simple DLLME-GC-MS method
6.3.3 Suitability of the extraction methodology to other PBDEs The applicability of the developed analytical methodology (DLLME-GC-MS) for other
PBDEs quantification in water matrices was also evaluated. The PBDEs selected are the
most environmentally dominant congeners [25]. Firstly, the extraction recovery was
determined for each PBDE at two concentration levels – 1 and 10 µg/L (Table 6.4).
Table 6.4. Extraction recoveries, precision and estimated LOQ for all PBDEs by DLLME-GC-
MS.
%ER (n=3) Precision (RSD%) (n=3) Estimated LOQ
(ng/L)
1 µg/L 10 µg/L 1 µg/L 10 µg/L
BDE-28 71±6 69±7 11 12 10
BDE-47 70±6 69±6
12 13
30
BDE-85 72±9 78±6
12 12
93
BDE-99 72±7 77±5
12 9
27
BDE-100 76±7 73±5
12 10
2
BDE-153 66±6 73±5
13 11
73
BDE-154 69±8 68±4
14 11
23
BDE-183 63±7 70±5 8 9 113
For that, aqueous solutions prepared from a mixture of all PBDEs were submitted to
DLLME, under conditions optimized in the last section. Figure 6.3 shows an example of a
chromatogram obtained, where it can be observed good separation of compounds and
high resolution. As can be seen, and despite of the extraction optimization being
performed based only on the DLLME performance for BDE-100 quantification, good and
similar extraction recoveries were attained for the other PBDEs. On the other hand, it can
be observed that the extraction efficiency of BDE-100 is not affected by the presence of
the other congeners. These results prove that such extraction methodology can be
successfully applied for the other PBDEs and it seems that the extraction efficiency of
individual PBDEs is similar both when they are alone or together in the sample. In terms
of quantitative analysis, the precision was evaluated by extracting three independent
standard solutions at the same two concentration levels (1 and 10 µg/L). The results
expressed as RSD% are compiled in Table 6.4. Again, it can be advanced that the method
201

Part III – Chapter 6
remains precise, even when it was applied to a mixture of PBDEs. Estimated LOQs were
calculated based on a signal-to-noise-ratio of 10 (Table 6.4). As observed from Table 6.4
the method proposed here, beyond successful applied for all PBDEs considered, allows
reaching lower or comparable quantification limits of those existing in the literature (with
more complex or time consuming extraction techniques).
Figure 6.3. Chromatogram of a standard solution of PBDEs at individual concentration of 1
µg/L.
6.4 Conclusions
A method by DLLME-GC-MS has been described for the determination of PBDEs in water
samples. Additionally, the global uncertainty of the results was assessed for the first time,
which is important especially for low concentration levels, where most uncertainty
sources are extremely significant. The LOQ for BDE-100 was 2 ng/L and acceptable
precision (12% for standards and 13%, 12% and 10% for spiked drinking, tap and river
waters, respectively) and accuracy (91-107% of percentage of recovery for all spiked
samples) were obtained. The uncertainty decreased from 11% to 7% when concentration
202

Nanogram per liter level determination of PBDEs in water by a simple DLLME-GC-MS method
of BDE-100 increases from 0.5 µg/L to 10 µg/L. Similar extraction recoveries were
achieved when the developed method was applied to the other PBDEs. The precision
remains satisfactory (average 11%) even, when mix standards with all PBDEs were
analyzed. Lower or comparable LOQs to those reported in literature were obtained with
this cheap, fast and easy to implement method for PBDEs quantification in water (2-113
ng/L).
6.5 References
[1] J. Sánchez-Avila, R. Tauler and S. Lacorte, Organic micropollutants in coastal waters
from NW Mediterranean Sea: Sources distribution and potential risk, Environ. Int. 46
(2012) 50-62.
[2] A.P. Daso, O.S. Fatoki, J.P. Odendaal and O.O. Olujimi, Occurrence of selected
polybrominated diphenyl ethers and 2,2',4,4',5,5'-hexabromobiphenyl (BB-153) in sewage
sludge and effluent samples of a wastewater-treatment plant in Cape Town, South Africa,
Arch. Environ. Con. Tox. 62 (2012) 391-402.
[3] B.K. Hope, L. Pillsbury and B. Boling, A state-wide survey in Oregon (USA) of trace
metals and organic chemicals in municipal effluent, Sci. Total Environ. 417–418 (2012)
263-272.
[4] A.R. Fontana, M.F. Silva, L.D. Martínez, R.G. Wuilloud and J.C. Altamirano,
Determination of polybrominated diphenyl ethers in water and soil samples by cloud
point extraction-ultrasound-assisted back-extraction-gas chromatography–mass
spectrometry, J. Chromatogr. A 1216 (2009) 4339-4346.
[5] J. Llorca-Porcel, G. Martínez-Sánchez, B. Álvarez, M.A. Cobollo and I. Valor, Analysis of
nine polybrominated diphenyl ethers in water samples by means of stir bar sorptive
extraction-thermal desorption-gas chromatography–mass spectrometry, Anal. Chim. Acta
569 (2006) 113-118.
[6] X. Liu, J. Li, Z. Zhao, W. Zhang, K. Lin, C. Huang and X. Wang, Solid-phase extraction
combined with dispersive liquid–liquid microextraction for the determination for
polybrominated diphenyl ethers in different environmental matrices, J. Chromatogr. A
1216 (2009) 2220-2226.
203

Part III – Chapter 6
[7] Q. Xiao, B. Hu, J. Duan, M. He and W. Zu, Analysis of PBDEs in Soil, Dust, Spiked Lake
Water, and Human Serum Samples by Hollow Fiber-Liquid Phase Microextraction
Combined with GC-ICP-MS, J. Am. Soc. Mass Spectr. 18 (2007) 1740-1748.
[8] N. Fontanals, T. Barri, S. Bergström and J.-Å. Jönsson, Determination of
polybrominated diphenyl ethers at trace levels in environmental waters using hollow-
fiber microporous membrane liquid–liquid extraction and gas chromatography–mass
spectrometry, J. Chromatogr. A 1133 (2006) 41-48.
[9] A.R. Fontana, R.G. Wuilloud, L.D. Martínez and J.C. Altamirano, Simple approach based
on ultrasound-assisted emulsification-microextraction for determination of
polibrominated flame retardants in water samples by gas chromatography–mass
spectrometry, J. Chromatogr. A 1216 (2009) 147-153.
[10] X.-H. Zang, Q.-H. Wu, M.-Y. Zhang, G.-H. Xi and Z. Wang, Developments of Dispersive
Liquid-Liquid Microextraction Technique, Chinese J. Anal. Chem. 37 (2009) 161-168.
[11] V. Yusà, A. Pastor and M. de la Guardia, Microwave-assisted extraction of
polybrominated diphenyl ethers and polychlorinated naphthalenes concentrated on
semipermeable membrane devices, Anal. Chim. Acta 565 (2006) 103-111.
[12] A. Bacaloni, L. Callipo, E. Corradini, P. Giansanti, R. Gubbiotti, R. Samperi and A.
Laganà, Liquid chromatography–negative ion atmospheric pressure photoionization
tandem mass spectrometry for the determination of brominated flame retardants in
environmental water and industrial effluents, J. Chromatogr. A 1216 (2009) 6400-6409.
[13] M. Polo, G. Gómez-Noya, J.B. Quintana, M. Llompart, C. García-Jares and R. Cela,
Development of a Solid-Phase Microextraction Gas Chromatography/Tandem Mass
Spectrometry Method for Polybrominated Diphenyl Ethers and Polybrominated Biphenyls
in Water Samples, Anal. Chem. 76 (2004) 1054-1062.
[14] Y. Li, J. Hu, X. Liu, L. Fu, X. Zhang and X. Wang, Dispersive liquid-liquid microextraction
followed by reversed phase HPLC for the determination of decabrominated diphenyl
ether in natural water, J. Sep. Sci. 31 (2008) 2371-2376.
[15] Y. Li, G. Wei, J. Hu, X. Liu, X. Zhao and X. Wang, Dispersive liquid–liquid
microextraction followed by reversed phase-high performance liquid chromatography for
the determination of polybrominated diphenyl ethers at trace levels in landfill leachate
and environmental water samples, Anal. Chim. Acta 615 (2008) 96-103.
204

Nanogram per liter level determination of PBDEs in water by a simple DLLME-GC-MS method
[16] M. Rezaee, Y. Assadi, M.-R. Milani Hosseini, E. Aghaee, F. Ahmadi and S. Berijani,
Determination of organic compounds in water using dispersive liquid–liquid
microextraction, J. Chromatogr. A 1116 (2006) 1-9.
[17] A. Zhao, X. Wang, M. Ma, W. Wang, H. Sun, Z. Yan, Z. Xu and H. Wang, Temperature-
assisted ionic liquid dispersive liquid-liquid microextraction combined with high
performance liquid chromatography for the determination of PCBs and PBDEs in water
and urine samples, Microchim. Acta 177 (2012) 229-236.
[18] R. Sousa, V. Homem, J.L. Moreira, L.M. Madeira and A. Alves, Optimisation and
application of dispersive liquid-liquid microextraction for simultaneous determination of
carbamates and organophosphorus pesticides in waters, Anal. Method 5 (2013) 2736-
2745.
[19] P. Liang, J. Xu and Q. Li, Application of dispersive liquid-liquid microextraction and
high-performance liquid chromatography for the determination of three phthalate esters
in water samples, Anal. Chim. Acta 609 (2008) 53-58.
[20] R.R. Kozani, Y. Assadi, F. Shemirani, M.R.M. Hosseini and M.R. Jamali, Part-per-trillion
determination of chlorobenzenes in water using dispersive liquid-liquid microextraction
combined gas chromatography-electron capture detection, Talanta 72 (2007) 387-393.
[21] S.L.R. Ellison, M. Rosslein and A. Williams, Eurachem/ Citac Guide- Quantification
uncertainty in analytical measurement, EURACHEM/ CITAC, UK, 2000.
[22] N. Ratola, L. Martins and A. Alves, Ochratoxin A in wines-assessing global uncertainty
associated with the results, Anal. Chim. Acta 513 (2004) 319-324.
[23] S.L. Silva, A. Alves and L. Santos, Uncertainty Measurement of Chlorophenols and
PCBs Analyzed in Aqueous Media by SPME-GC-ECD, J. Chromatogr. Sci. 47 (2009) 103-109.
[24] H.-B. Moon, M. Choi, J. Yu, R.-H. Jung and H.-G. Choi, Contamination and potential
sources of polybrominated diphenyl ethers (PBDEs) in water and sediment from the
artificial Lake Shihwa, Korea, Chemosphere 88 (2012) 837-843.
[25] Y.-W. Qiu, G. Zhang, L.-L. Guo, G.J. Zheng and S.-Q. Cai, Bioaccumulation and
historical deposition of polybrominated diphenyl ethers (PBDEs) in Deep Bay, South
China, Mar. Environ. Res. 70 (2010) 219-226.
205


7 Preliminary results on the degradation of BDE-
100 in waters by photolysis and photo-Fenton*
Abstract
The work presented in this chapter is related to the BDE-100 degradation in waters by
advanced oxidation processes. Two technologies were considered in this study (direct
photolysis and photo-Fenton) and, for the first time, degradation experiments were
designed to treat waters contaminated with BDE-100 without adding organic solvents
(which are commonly employed to help solubilization in water and/or to work with higher
initial concentrations).
Photolysis proved to be an effective process to degrade BDE-100 in waters. Actually,
almost complete BDE-100 degradation (92%) was achieved after 6 h of irradiation
(1.6×10⁻⁶ Einstein/s), which is a very interesting result with regard to those available in
the literature. Photo-Fenton was also tested in the treatment of waters contaminated
with BDE-100, which constitutes another innovation of the present work. However,
results on this topic are still preliminary.
7.1 Introduction
BDE-100 degradation in liquid phase is a quite new research topic since, up to the author
knowledge, no more than three studies were published. Two of them are based on
degradation studies by direct photolysis [1, 2] and the other on a remediation process
with zerovalent iron [3]. The polybrominated diphenyl ethers (PBDEs) degradation
studies, including BDE-100, have been developed and optimized in the presence of
organic solvents. The rationale for conducting the experiments under such conditions is
two-fold. First, the use of organic solvents, even at low doses, allows using contaminated
solutions with high PBDEs concentrations because the solubility of PBDEs increases.
Second, the degradation process is facilitated because the tendency for PBDEs to adsorb
to surfaces, such as container walls, decreases significantly in the presence of organic
* Adapted from: Mónica S.F. Santos, Arminda Alves and Luís M. Madeira, Preliminary results on the
degradation of BDE-100 in waters by photolysis and photo-Fenton, paper in preparation, 2013.
207

Part III – Chapter 7
solvents. However, care must be taken because the performances reached, degradation
mechanisms and reaction products may be drastically influenced by the conditions under
which the reaction is processed and some predictions concerning real scenarios may fail.
In this chapter and for the first time, a degradation methodology by direct photolysis will
be implemented to treat waters contaminated with concentrations of BDE-100 close to
the limit of solubility of such congener in water, without the presence of organic solvents.
Additionally, some preliminary results concerning the degradation of BDE-100 in waters
by photo-Fenton will be discussed. It is important to highlight that this advanced
oxidation process was never addressed in the open scientific literature in this context.
7.2 Experimental Section
7.2.1 Reagents
2,2’,4,4’,6-pentabromodiphenyl ether (BDE-100, 50 mg/L in isooctane) was obtained from
Sigma-Aldrich (St. Louis, USA). Acetonitrile (ACN) of LC-MS grade and chlorobenzene (CB)
of HPLC grade were purchased from VWR (Fontenay-sous-Bois, France). Hydrogen
peroxide solution (30% v/v), iron (II) sulfate heptahydrate (99.5%) and anhydrous sodium
sulfite were from Merck (Darmstadt, Germany). Sulfuric acid (96%) from VWR BDH
Prolabo (Fontenay-sous-Bois, France) and sodium hydroxide (98.7%) from José Manuel
Gomes dos Santos, Lda (Odivelas, Portugal) were utilized.
Potassium ferrioxalate from Strem Chemicals (Newburyport-Massachusetts, USA), 1,10-
Phenantroline analytical reagent from VWR BDH Prolabo (Fontenay-sous-Bois, France),
sodium acetate (≥99.0%) from sigma-Aldrich (St. Louis, USA) and Vert Cibacrone T3G-E
from Ciba-Geigy (Delhi, India) were used in actinometry experiments.
7.2.2 Standard solutions Stock solutions of BDE-100 were prepared by evaporating an appropriate amount of the
analytical standard under a gentle nitrogen flow. Then, the residue was redissolved in
acetonitrile. Aqueous standard solutions of BDE-100 (50 µg/L) were prepared daily by
evaporating an appropriate amount of stock solution, under nitrogen flow, and
resuspending the residue in 25 mL of distilled water at pH 3.
208

Preliminary results on the degradation of BDE-100 in waters by photolysis and photo-Fenton
7.2.3 Photocatalytic reactor and light source The radiation source was a 150 W medium-pressure mercury vapor lamp (Heraeus TQ-
150), whose emission spectrum is shown in Figure 7.1.
Figure 7.1. Emission spectrum of a 150 W medium-pressure mercury vapor lamp from
Heraeus.
This lamp has a polychromatic emission in the range from 250 to 650 nm wavelength, but
the most important emission line is at 366 nm. The intensity of incident light was
measured for this wavelength (366 nm) by actinometry [4]. The potassium ferrioxalate is
the most commonly used chemical actinometer to determine the photonic flux of a
radiation source emitting in the UV spectral region [5]. For that reason, this actinometer
was selected over others for the experiments.
A potassium ferrioxalate solution (K3Fe(C2O4)3) with a concentration of 6×10⁻³ M was
prepared in 10% H2SO4 1 N. After that, 25 mL ( 1V ) of this solution was put in each of two
50 mL polypropylene (PP) flasks. One flask was maintained in dark conditions and the
other was submitted to irradiation for 5 min. One should note that the lamp was switched
on before 15 min of the irradiation period to guarantee constant photonic flux. After 5
209

Part III – Chapter 7
min, 1 mL ( 2V ) of the irradiated solution was added to a 25 mL ( 3V ) volumetric flask,
where 2 mL of 1,10-phenantroline (1 g/L) and 1 mL of a buffer constituted by sodium
acetate (0.6 N) and sulfuric acid (0.36 N) were already placed. The same procedure was
done for the non-irradiated solution. To ensure complete complexation between Fe2+ ions
and 1,10-Phenantroline (Fe(phen)32+), the final samples were left for one hour in the dark,
after which the absorbances at 510 nm were measured by molecular absorption
spectroscopy. The number of Fe2+ ions formed during the irradiation process is given by
equation 7.1 [6]:
bVAbsVVN
N AFe
51023
51031
102
ε∆
=+ 7.1
where AN is the Avogadro´s constant, 510Abs∆ corresponds to the optical difference in
absorbance between the irradiated solution and that taken in the dark at 510 nm, 510ε is
the molar absorptivity for the complex Fe(phen)32+ at 510 nm,b is the path length in cm,
1V is the irradiated volume, 2V is the aliquot of the irradiated solution taken for the
determination of the ferrous ions (Fe2+) and 3V is the final volume after complexation
with 1,10-phenantroline (all in cm3).
The photonic flux (ϕ ) emitted by the TQ-150 W lamp at 366 nm is determined by
equation 7.2 [6]:
tN
Fe
λφϕ += 2 7.2
where λφ is the quantum yield of Fe2+ production at the irradiation wavelength of 366 nm
and t is the time of irradiation.
The dependence of the quantum yield of production of Fe2+ from potassium ferrioxalate
on the irradiation wavelength has been extensively studied. The recommended value for
366 nm, obtained by different methods, is 1.21 [7].
210

Preliminary results on the degradation of BDE-100 in waters by photolysis and photo-Fenton
When necessary, the photon flux was controlled by using a quartz-glass jacket around the
light source with dye solutions of different concentrations flowing inside of it. This
strategy was already adopted by other authors [8].
7.2.4 Degradation experiments 7.2.4.1 Photolysis
BDE-100 aqueous solutions of 50 µg/L (25 mL) were irradiated in 50 mL PP flasks placed 5
cm from the lamp. The experiments were made at room temperature (25±3 °C) under
agitation. The irradiation procedure was repeated as many times as the necessary to
obtain the required irradiation times for each sample and build up the degradation kinetic
curves. After the irradiation period, the aqueous samples (25 mL) were extracted with 1
mL of acetonitrile and 80 µL of chlorobenzene, according to the dispersive liquid-liquid
microextraction (DLLME) procedure explained before (Chapter 6). The mixture was
centrifuged for 5 min at 4000 rpm in a Hettich Rotofix 32A Centrifuge. The sedimented-
phase was collected with a syringe and was analyzed by gas chromatography-mass
spectrometry (GC-MS).
7.2.4.2 Classic dark Fenton
A stock solution of Fe2+ (7.5 ×10⁻³ M) was prepared by dissolving an appropriate amount
of FeSO4 in water, adjusting the pH to 3. This solution was re-prepared on a weekly base.
A stock solution of H2O2 (2.5×10⁻¹ M) was also prepared by diluting a certain volume of
the commercial reagent in distilled water. Since hydrogen peroxide is very unstable, the
stock solution was divided in small doses and each one was stored in a separated amber
glass flask at 2-4 °C. Each flask was only open once and for a unique experiment.
The Fenton’s reaction experiments were carried out in 50 mL PP flasks, at room
temperature (25±3 °C) and in the dark. For that, appropriate amounts of oxidant (H2O2)
and catalyst (Fe2+) were added to 25 mL of BDE-100 aqueous solutions (50 µg/L; pH= 3.0)
in 50 mL PP tubes. The reaction proceeded under agitation for a preset time, after which
an excess of Na2SO3 was added to quench the degradation process; this substance reacts
instantaneously with the remaining H2O2 stopping the degradation process. Afterwards,
samples from different reaction times were extracted by DLLME and injected in the GC-
MS.
211

Part III – Chapter 7
7.2.4.3 Photo-Fenton
For photo-Fenton experiments, 25 mL of a BDE-100 aqueous solution (50 µg/L; pH= 3.0)
was put in a 50 mL PP flask. Then, appropriate amounts of H2O2 and FeSO4 stock
solutions were added to the flask and the irradiation of the solution started (t=0). The
reaction proceeds for a certain period under agitation and at room temperature (25±3
°C). The procedure was repeated for different times of irradiation in order to have a
degradation curve for BDE-100 along time.
Finally, the irradiated samples were submitted to DLLME after quenching the reaction by
the addition of an excess of Na2SO3. The final extract was analyzed by GC-MS for BDE-100
monitoring purposes.
7.2.5 Analytical methods Samples from degradation experiments were analyzed by a Varian 4000 GC-MS
Chromatograph after DLLME extraction procedure. The mass spectrometer was operated
in the electronic impact ionization (EI) mode. The temperatures for the injector, trap,
transfer line and manifold were held respectively at 290 °C, 200 °C, 250 °C and 50 °C. A DB-
5MS column was used (30 m x 0.25 mm ID x 0.25 µm film thickness – Walnut Creek, CA,
USA) and the oven temperature was programmed as follows: initial 60 °C for 2 min, rate
of 30 °C/min to 250 °C, then 5 °C/min until 300 °C and held for 8 min. The injected volume
was 1 µL and a 701N Hamilton syringe was used. Carrier gas was Helium (99.9999 %) at 1
mL/min flowrate. The quantifier and qualifier ions were m/z 406+566 and m/z 564,
respectively, in the selected ion-monitoring mode (SIM). The identification of BDE-100
was done by comparison of the retention time with that obtained for standard solution
directly injected.
Samples from actinometry experiments were analysed in a JASCO V-530 UV-Vis
Spectrophotometer.
7.3 Results and discussion
7.3.1 Degradation by photolysis The degradation of BDE-100 in water by photolysis was studied at different light
intensities. First, solutions of BDE-100 (50 µg/L) were directly irradiated by a 150 W
medium-pressure vapor lamp placed inside a quartz jacket, where water circulation was
212

Preliminary results on the degradation of BDE-100 in waters by photolysis and photo-Fenton
promoted by a Huber Thermostatic bath (Polystat CC1 unit). Then, the water flowing
through the quartz jacket was substituted by two different concentrations of a dye (Vert
Cibacrone T3G-E).
The light intensity, i.e. the photonic flux for the three situations was measured at 366 nm
by potassium ferrioxalate actinometry, as described in section 7.2.3. The radiation
intensities are listed in Table 7.1.
Table 7.1. Intensity of incident light, for different dye concentrations, determined by
potassium ferrioxalate actinometry at 366 nm.
Photonic flux
Dye concentration (mg/L) photons/s Einstein/s
0 9.7×10¹⁷ 1.6×10⁻⁶
270 4.1×10¹⁶ 6.8×10⁻⁸
930 7.8×10¹⁴ 1.3×10⁻⁹
As can be checked from Table 7.1, the Vert Cibacrone T3G-E has the ability of absorbing
light, reducing the intensity of the incident radiation.
The effect of the photonic flux on the BDE-100 degradation in water is depicted in Figure
7.2.
0.0
0.2
0.4
0.6
0.8
1.0
1.2
0 100 200 300 400 500
C/C 0
Irradiation time (min)
Series1
Series2
Series3
Figure 7.2. BDE-100 degradation in water by photolysis using different light intensities
([BDE-100]0= 50 µg/L; pH0= 3.0 and T=25±3 °C).
1.3×10⁻⁹ Einstein/s
6.8×10⁻⁸ Einstein/s
1.6×10⁻⁶ Einstein/s
213

Part III – Chapter 7
As demonstrated in Figure 7.2, the intensity of the light is an important factor on the BDE-
100 degradation by this methodology. None BDE-100 degradation was attained for a
photonic flux of 1.3×10⁻⁹ Einstein/s, which means that the dye concentration used in the
experiment was high enough to absorb the remaining radiation that could lead to BDE-
100 degradation. For the maximum light intensity (lower dye concentration in the jacket),
nearly 80% of BDE-100 was degraded after 80 min of reaction, reaching 92% after 6 h.
However, a very quick decay was observed in only 5 min of reaction time.
Up to the author knowledge, there are only three studies about degradation of BDE-100
in liquid phase [1-3]. The first study was published in 2005 and was focused in the
degradation of six polybrominated diphenyl ethers (BDEs 7, 28, 47, 66, 100 and 209) with
zerovalent iron [3]. It was shown that around 65% of the initial BDE-100 concentration
was converted after only 40 days of reaction ([BDE-100]0 = 50 mg/L in ethyl acetate, Iron
= 5 g/mL, T = 30 °C) [3]. Later, Fang et al. (2008) studied the degradation of other six PBDE
congeners (BDEs 28, 47, 99, 100, 153 and 183) in hexane under ultraviolet irradiation [1].
It was reported that 55% of the initial BDE-100 was degraded after 8 h of irradiation
([BDE-100]0 = 10 µg/L in hexane, 500 W mercury lamp) [1]. They also demonstrated that
BDE-100 exhibits lower photodegradation rates than the expected ones due to its
bromine substitution pattern [1]. In 2012, Sanchez-Prado et al. investigated the
degradation of BDE-100 in ice solid samples and in aqueous solutions (containing small
amounts of isooctane) using an artificial UV light source [2]. Concerning the aqueous
solutions, 79% of BDE-100 degradation was recorded after exposition to UV light during
10 min ([BDE-100]0 = 5 µg/L in ethyl acetate, two 8 W low-pressure mercury lamps – 254
nm) [2].
As demonstrated, besides the very scarce information concerning the BDE-100
degradation in liquid phase, the results from the available studies are very distinct. The
differences could be attributed to the nature of the removal technology applied and to
the different reaction conditions implemented, including UV light sources, initial
concentrations of BDE-100 and photolytic matrices in photodegradation studies.
However, it can be advanced that the degradation methodology proposed here conducts
to attractive results in terms of BDE-100 degradation rates.
Even so, the great advantage of this study over the others available in the literature is the
fact that this is applicable to waters without the presence of organic solvents. The others
214

Preliminary results on the degradation of BDE-100 in waters by photolysis and photo-Fenton
were based on the degradation of BDE-100 in organic solvents [1] or in aqueous solutions
prepared from organic solvent solutions [2, 3]. This is particularly important, namely in
water contamination events.
As occurred with BDE-100, dye molecules may also be degraded by exposition to the light.
For that reason, the dye concentration was monitoring along the BDE-100 degradation
process to ensure that the intensity of light was as constant as possible. Where necessary,
the dye concentration was adjusted to the desired value adding an appropriate amount of
dye. Figure 7.3 shows the evolution of the dye concentration during the reaction.
Figure 7.3. Dye concentration along the degradation of BDE-100 by photolysis.
As can be checked from Figure 7.3, the dye concentrations were approximately constant
during the degradation experiments so, a constant photonic flux was ensured.
7.3.2 Degradation by Fenton and photo-Fenton
To accelerate the process, the suitability of using a photo-Fenton methodology to
degrade BDE-100 in waters was evaluated. As referred previously in the introduction
section (Chapter 1), no other study was found in the literature concerning the application
of photo-Fenton, or even, classic Fenton, on the degradation of PBDEs in waters.
Due to the lack of information, the starting amounts of H2O2 and Fe2+ used in the photo-
Fenton experiments were estimated by a relation established with other chemical well
0
200
400
600
800
1000
1200
0 100 200 300 400 500
Dye
conc
entr
atio
n (m
g/L)
Irradiation time (min)
1.3x10⁻⁹ Einstein/s 1.3x10⁻⁹ Einstein/s1.3×10-9 Einstein/s 6.8×10⁻⁸ Einstein/s
215

Part III – Chapter 7
studied by our research team (Paraquat dichloride – PQ). PQ was effectively degraded in
water by classic Fenton under the following conditions: [Fe2+]0 = 5.0×10⁻⁴ M and [H2O2]0 =
1.6×10⁻² M (Chapter 5). For constant ratios of [compound]/[Fe2+] and [compound]/[H2O2],
it was estimated that the concentrations of Fe2+ and H2O2 should be 1×10⁻⁷ M and 4×10⁻⁶
M, respectively, for an initial BDE-100 concentration of 50 µg/L. Since the degradation
profile is highly dependent on the chemical and also on its initial concentration (beyond
other factors), a 3000× over estimation was applied to the above written concentrations.
The initial estimated values for the concentrations of Fe2+ and H2O2 were 3×10⁻⁶ M and
1×10⁻⁴ M, respectively.
Figure 7.4 illustrates the BDE-100 degradation profile in water by photolysis ([BDE-100]0 =
50 µg/L, 1.6×10⁻⁶ Einstein/s) and photo-Fenton ([BDE-100]0 = 50 µg/L, [H2O2]0 = 1×10⁻⁴ M;
[Fe2+]0 = 3×10⁻⁶ M, 1.6×10⁻⁶ Einstein/s) processes.
0.0
0.2
0.4
0.6
0.8
1.0
1.2
0 100 200 300 400 500
C/C 0
Irradiation time (min)
Series3
10+10
Figure 7.4. BDE-100 degradation in water by photolysis (A – [BDE-100]0 = 50 µg/L, 1.6×10-
6 Einstein/s) and photo-Fenton (B – [BDE-100]0 = 50 µg/L, [H2O2]0 = 1×10⁻⁴ M, [Fe2+]0 =
3×10⁻⁶ M, 1.6×10⁻⁶ Einstein/s).
As displayed in Figure 7.4, no significant differences were obtained for the degradation of
BDE-100 in water by the two processes. Two reasons may be pointed out to justify that
behavior: the light intensity is too strong to observe any difference caused by the
additional use of peroxide and Fe2+ doses; or none BDE-100 degradation results by the
action of such H2O2 and Fe2+ amounts. So, it was decided to double the amounts of H2O2
and Fe2+ in the photo-Fenton process (Figure 7.5).
A
B
216

Preliminary results on the degradation of BDE-100 in waters by photolysis and photo-Fenton
0.0
0.2
0.4
0.6
0.8
1.0
1.2
0 100 200 300 400 500
C/C 0
Irradiation time (min)
Series3
20+10
10+20
Figure 7.5. BDE-100 degradation in water by photolysis (A – [BDE-100]0 = 50 µg/L, 1.6×10-
6 Einstein/s) and photo-Fenton (B – [BDE-100]0 = 50 µg/L, [H2O2]0 = 2×10⁻⁴ M, [Fe2+]0 =
3×10⁻⁶ M, 1.6×10⁻⁶ Einstein/s; C – [BDE-100]0 = 50 µg/L; [H2O2]0 = 1×10⁻⁴ M, [Fe2+]0 =
6×10⁻⁶ M, 1.6×10⁻⁶ Einstein/s).
Again, even at double concentrations, no effects were observed in the BDE-100
degradation effectiveness by photo-Fenton. Indeed, a classic Fenton experiment was
performed at nearly the same conditions as the implemented in photo-Fenton
methodologies ([BDE-100]0 = 50 µg/L, [H2O2]0 = 2×10⁻⁴ M, [Fe2+]0 = 3×10⁻⁶ M) and none
BDE-100 degradation was attained (data not shown). This means that higher
concentrations of oxidant and catalyst must be taken into account to study the influence
of the main parameters on the overall process and to implement an effective degradation
approach for BDE-100 in waters. The possibility of the occurrence of scavenging effects
due to the use of excessive oxidant and catalyst doses is another possible explanation for
these results, which has still to be clarified.
7.4 Conclusions
The treatment of waters contaminated with concentrations of BDE-100 close to the limit
of solubility in water was ensured by direct photolysis. As expected, the degradation
efficiency is highly dependent on the intensity of the radiation. For the maximum light
intensity tested (1.6×10⁻⁶ Einstein/s), nearly 68% of BDE-100 was degraded after 5 min of
reaction reaching 92% after 6 h. This result is very attractive when compared to those
B
A
C
217

Part III – Chapter 7
achieved in the few existing studies about BDE-100 degradation in liquid phases. On the
other hand, it was tested for the first time the degradation of BDE-100 in waters by
photo-Fenton. Additional experiments must be done to obtain conclusive results.
7.5 References
[1] L. Fang, J. Huang, G. Yu and L. Wang, Photochemical degradation of six
polybrominated diphenyl ether congeners under ultraviolet irradiation in hexane,
Chemosphere 71 (2008) 258-267.
[2] L. Sanchez-Prado, K. Kalafata, S. Risticevic, J. Pawliszyn, M. Lores, M. Llompart, N.
Kalogerakis and E. Psillakis, Ice photolysis of 2,2′,4,4′,6-pentabromodiphenyl ether (BDE-
100): Laboratory investigations using solid phase microextraction, Anal. Chim. Acta 742
(2012) 90-96.
[3] Y.-S. Keum and Q.X. Li, Reductive Debromination of Polybrominated Diphenyl Ethers
by Zerovalent Iron, Environ. Sci. Technol. 39 (2005) 2280-2286.
[4] Chemical Actinometry, in: M. Montalti, A. Credi, L. Prodi, M.T. Gandolfi (Eds.)
Handbook of Photochemistry, CRC Press, 2006, pp. 601-616.
[5] H.J. Kuhn, S.E. Braslavsky and R. Schmidt, Chemical actinometry (IUPAC technical
report), Pure Appl. Chem. 76 (2004) 2105-2146.
[6] Cláudia Sofia Castro Gomes da Silva, Processos avançados de oxidação fotoquímica na
descoloração de soluções aquosas fortemente coradas, Tese de Mestrado, Faculdade de
Engenharia da Universidade do Porto, 2003.
[7] C.G. Hatchard and C.A. Parker, A New Sensitive Chemical Actinometer. II. Potassium
Ferrioxalate as a Standard Chemical Actinometer, Proc. R. Soc. Lond. A 235 (1956) 518-
536.
[8] C.G. Silva and J.L. Faria, Effect of key operational parameters on the photocatalytic
oxidation of phenol by nanocrystalline sol-gel TiO2 under UV irradiation, J. Mol. Catal. A:
Chem. 305 (2009) 147-154.
218

PART IV. GENERAL CONCLUSIONS AND FUTURE WORK


8 Conclusions The knowledge obtained during this work aimed to contribute to the definition of an
appropriate strategy for rapidly restore the use of drinking water networks after a
deliberate or accidental chemical contamination.
The work was focused in two chemicals (paraquat and BDE-100) which were considered
as potential candidates of being used in the framework of EU project SecurEau.
Since the drinking water should be the first matrix to suffer the effects of the
contamination event, different analytical methodologies were developed and validated in
order to identity and quantify the target compounds in this matrix.
For paraquat, three analytical methodologies were implemented due to the need: to have
a quick response in emergency situations, as occurs when there is a suspicion of
contamination of drinking water networks (DI-LC-DAD); to ensure that PQ concentration
in water is below the limit recommended by European Union for pesticides (SPE-LC-DAD)
and to the need of an unequivocal identification of PQ and its degradation by-products
after treatment of contaminated waters, e.g. with Fenton’s reagent (DI-LC-MS).
Concerning the DI-LC-DAD method, it was developed for relatively high PQ concentrations
(mg/L level), as expected to be found in contamination events. The DI-LC-DAD method
proved to be accurate in different circumstances which may represent realistic scenarios
in drinking water networks: in the presence of other species or compounds resulting from
the contact of the water with deposits and cells, from the PQ commercial formulation
Gramoxone (in case of being used as contamination agent instead of the analytical
standard) and from other types of water. Additionally, it was also shown that this method
is reliable for analyses of PQ in samples from decontamination procedures by Fenton’s
reagent. Indeed, under the optimum conditions to degrade PQ in waters by Fenton’s
reagent ([Fe2+]0 = 5.0×10⁻⁴ M, [H2O2]0 = 1.6×10⁻² M and [Na2SO3] = 9.6×10⁻² M; Chapter
5), no effect of Fenton’s species (Fe(II), H2O2 and Na2SO3) were noticed on the PQ
quantification by DI-LC-DAD. The limit of detection of this method was of 10 µg/L of PQ,
which is much lower than other similar alternatives published, and the global uncertainty,
evaluated by bottom-up approach, was below 13% for the most part of the calibration
range. SPE-LC-DAD, designed for the screening of low PQ concentrations in water,
presents a limit of detection of 0.04 µg/L, which is below the value recommended by
221

Part IV – Chapter 8
European Union (0.1 µg/L). DI-LC-MS method proved to be reliable for confirmation of PQ
in waters at concentrations above 20 µg/L. Global uncertainties of 11 and 6% were
obtained for PQ concentrations higher than 5 µg/L (linearity of 0.1 to 50 µg/L of PQ) by
SPE-LC-DAD and higher than 1 mg/L (linearity of 0.1 to 10 mg/L of PQ) by DI-LC-MS,
respectively. All methods proved to be precise, accurate and suitable for the purpose that
they were designed.
Concerning the other chemical, BDE-100, only one analytical methodology was developed
by DLLME-GC-MS. Herein, it was not possible to develop an analytical methodology for
high concentrations of BDE-100 and using classic equipment since its solubility in water is
extremely small and its quantification requires more sensitive equipment or extraction
procedures. Despite of this, a simple and quick extraction procedure, such as DLLME
extraction was selected over others to diminish as much as possible the time of analysis
for this method. Optimization of DLLME was performed for BDE-100 and recoveries
ranged from 91 to 107%. Although the method was only optimized and validated for BDE-
100, it proved suitable for the quantification and identification of other environmentally
abundant PBDEs (BDE 28, 47, 85, 99, 153, 154 and 183). Similar extraction recoveries
were achieved and the precision remained satisfactory (average 11%) even when mix
standards with all PBDEs were analyzed. Limits of quantification between 2 ng/L (BDE-
100) and 113 ng/L (BDE-183) were reported for this cheap, fast and easy method.
Another point that should not be neglected is the interaction of the chemical compounds
with the deposits formed in the pipe walls. Indeed, these interactions will define the
accumulation and dispersion of the contamination along the drinking water networks.
The adsorption of PQ in three different deposits (S2, S3 and S4) representative of those
found in drinking water distribution systems was studied. The PQ adsorption on such
deposits is a relatively slow process (it takes days to reach the equilibrium) and follows a
pseudo-second order kinetic model. The adsorption capacities depend on the PQ
interactions with the main metal ions present in each deposit and on their textural
properties. PQ competes with Ca(II) for the same binding sites and, for that reason, S3
deposit (calcium rich) has low PQ adsorption capacity. On the other hand, the presence of
Fe(II) and Mn (II) in the deposits improves the PQ adsorption capacity because it has the
ability to form complexes with these two metal ions. Additionally, the presence of
phosphate ions leads to a more negative adsorbent surface facilitating the adsorption of
222

Conclusions
positively charged compounds like PQ. Maximum PQ adsorption Langmuir capacities of
5.7, 11 and 0.40 mg/g were achieved at 20 °C for S2 (iron rich deposit), S3 (iron rich
deposit) and S4 samples (calcium rich deposit), respectively. It was also found that
deposits S2 (brown deposit) and S3 (tubercle deposit) can be good adsorbents, and
potential alternatives to other expensive materials, for the treatment of PQ contaminated
waters. Concerning the desorption process, relatively high PQ desorption percentages
were attained when CaCl2 solution was used as extraction solvent in S3 (51%) and S4
(39%) contaminated samples, which means that the interaction between PQ and deposits
is not so strong as those reported for soils and clays. On the other hand, taking into
account the contact time needed to reach significant PQ adsorption amounts and the
extreme conditions employed (high adsorbent dosage and batch conditions), it may be
advanced that, in case of a drinking water contamination, it is unlikely that PQ would
adsorb to the deposits attached in the pipe networks since here, much lower contact time
and surface area available for adsorption are observed. However, other situations should
be taken into account. In fact, in case of stagnancy of the fluid for a very long period of
time (in tanks or pipes in case of a consumption break) or low water flow (e.g. during the
night), this compound may adsorb on pipe deposits. On the other hand, adsorption on
loose deposits that are transported with the flowing water is much more likely to occur.
Another objective of this thesis was to develop an analytical method for PQ quantification
in such deposits. This was a challenging task since it is a completely new research topic
and the method should deal with the problem of a great heterogeneity of the matrix of
interest. A simple and inexpensive method was developed and comprises a fast and easy
extraction step using a saturated ammonium chloride solution. A limit of detection of 0.1
µgPQ/gS3 was obtained for PQ-S3 system with the expanded uncertainty ranging from
10-54% for concentrations between 193 and 5 µgPQ/gS3, respectively. The application of
this method to the quantification of PQ in the other two representative deposits (S2 and
S4) implies the consideration of the correspondent extraction percentage. The method
also proved to be suitable for the quantification of diquat in the S3 deposit.
Finally, degradation experiments were performed for both chemicals in water, ultimately
aiming to contribute to the implementation of efficient cleaning procedures for the
treatment of contaminated waters. Concerning PQ, the dark classic Fenton was
successfully implemented to degrade the pesticide in waters. Under the optimum
223

Part IV – Chapter 8
conditions (T =30 °C, [Fe2+]0 = 5.0×10⁻⁴ M, [H2O2]0 = 1.6×10⁻² M, and pH0 = 3.0, for [PQ]0 =
100 mg/L) complete PQ degradation and 40% of mineralization are reached after 4 h of
reaction. Additionally, it was proved that the final effluent is less toxic than the original
one. For the same conditions, the PQ commercial formulation (Gramoxone) exhibited
lower degradation performance due to the presence of other organic compounds. A
semi-empirical model was also developed to predict the PQ degradation profile under
selected conditions. This simple model was statistically checked and validated fitting quite
well the experimental data in a wide range of conditions. The photo-Fenton process
proved to gather some advantages over classic Fenton in the treatment of waters
contaminated with PQ: much higher degradation rate and 96% of mineralization after 1 h
of reaction are reached.
The treatment of waters contaminated with BDE-100 concentrations close to its water
solubility, and without using organic solvents, was ensured by direct photolysis. Attractive
results were achieved by using this technology since nearly 68% of BDE-100 was degraded
after 5 min of reaction reaching 92% after 6 h ([BDE-100]0 = 50 µg/L and 1.6×10⁻⁶
Einstein/s). Photo-Fenton methodology was, for the first time, tested for the treatment of
waters contaminated with BDE-100, but additional experiments must be done to obtain
conclusive results.
In sum, this work allowed the development of analytical methodologies for quantification
and identification of two key chemicals in waters in emergency situations, as those that
may occur when there is a suspicion of contamination in water networks. It also allowed
the validation and implementation of an analytical methodology for PQ quantification in
deposits formed in the pipe walls, which was never ever published in the open scientific
literature, even for other chemicals. This thesis also aimed at contributing to better
understand the fate of PQ in the drinking water networks. Indeed, it can be advanced that
if a deliberate or accidental contamination occurs with such pesticide, the main concern
will be related to the drinking water decontamination. Both classic Fenton and photo-
Fenton processes proved to be feasible and effective advanced oxidation technologies for
the treatment of waters polluted with PQ. The valorization of the iron-rich deposits from
drinking water networks as adsorbents for the treatment of waters contaminated with PQ
is another remarkable contribution of this work, as well as their potential use as catalysts
in these advanced oxidation processes.
224

9 Future work Much more has still to be done concerning surveillance and protection procedures
against deliberate or accidental contamination of drinking water networks. Indeed, any
contribution for this wide, diverse and delicate research area seems to be always
insufficient to answer all the questions addressed to real attack situations on our precious
drinking water.
So, I will indicate only some suggestions for future work that result from this thesis work:
• To study the interaction between BDE-100 and the deposits from drinking water
networks;
• To develop an analytical methodology to quantify BDE-100 in such deposits;
• To evaluate the interaction between the two chemicals considered and biofilms;
• To develop analytical methods for the quantification of both chemicals in biofilms;
• To optimize the degradation of BDE-100 in water by photo-Fenton process;
• To identify degradation by-products resulting from the degradation of BDE-100 by
photolysis and photo-Fenton processes;
• To extend this study to other chemicals;
• To design and implement a methodology using sensors able to provide an early
warning of intrusion.
225


ANNEX


Annex I – Estimation of the global uncertainty
associated to the analytical results
Global uncertainty (U ) is expressed as follows [1]:
2222 4321 UUUUU +++=
where,
1U is the uncertainty associated with the preparation of the standards (it was estimated
using the error propagation law for the different dilution steps from the stock standard
solution):
Δmi – error associated to the measurement equipment; mi – measured value.
2U is the uncertainty associated with the calibration curve (it was calculated for the
different concentration levels of the standards):
∑ −
−++==
ii
xy
oo
o
xxa
yyonma
sxx
sxU
2_
2
2_
/
)(
)(1112
osx – standard deviation of the concentration; ox – concentration; a – slope; m –
number of replicates performed; n – number of standards to build the calibration curve;
oy – y values calculated by the calibration curve from x values; _y – average of y i values
(experimental values); ix – concentration of standards used in the calibration curve; _x –
average of x i values.
3U is the uncertainty associated with the precision of the extraction and also of the
chromatographic method (it was estimated as the worse result of RSD % for each
concentration level):
∑
∆==
ist mi
miUU1
229

Annex I
nysU
med
=3
s – standard deviation of precision assays; medy – average of the area values obtained
for each concentration; n – number of assays.
4U is the uncertainty associated with the accuracy (it was calculated as the average % of
recovery obtained within all the experiments):
nsU )(4 η
=
)(ηs – relative standard deviation of the average percent recovery; n – number of
assays.
References
[1] S.L.R. Ellison, M. Rosslein and A. Williams, Eurachem/ Citac Guide- Quantification
uncertainty in analytical measurement, EURACHEM/ CITAC, UK, 2000.
230