Chemical, microbiological and sensory changes associated with fish sauce processing
10
Berna Kilinc · Sukran Cakli · Sebnem Tolasa · Tolga Dincer Chemical, microbiological and sensory changes associated with fish sauce processing Received: 28 September 2005 / Revised: 31 October 2005 / Accepted: 10 November 2005 / Published online: 15 December 2005 C Springer-Verlag 2005 Abstract The production of sardine fermented fish sauce was replicated in the laboratory in order to study the chemical, microbiological and sensory changes associated with the process. Fish sauce were produced by incubating mixtures of sardine (Sardina pilchardus) at different concentrations of sodium chloride and glucose at 37 ◦ C for 57 days. Changes in chemical composition (moisture, protein, fat contents), pH, total volatile basic nitrogen (TVB-N, mg N/100 g fish flesh), trimethylamine (TMA-N, mg/100 g fish flesh), thiobarbituric acid (TBA, mg malonaldehyde/kg fish flesh), water activity (aw), color measurement, total viable count, lactic acid bacteria count, yeast and moulds counts and sensory analyses were observed. The fish sauces with spices were determined lower bacteria counts than fish sauces without spices. The addition of glucose to the fish sauces caused a significant increasing in the bacterial counts. Staphylococcus aureus and yeast-mould counts were not detected during fermen- tation period. The use of spices in fermentation of sardine enhanced good color, aroma and taste. Keywords Fish sauce . Fermentation . Sardines . Color value . Proximate composition Introduction Fermentation is one of the oldest techniques in food preser- vation as it not only extends the shelf-life but also enhances the flavor and nutritional quality of the product [1]. Prote- olysis is one of the major biochemical events during fer- mentation. Fish sauce, a fermented product, is a brown, liquid seasoning commonly used in Asian countries. It B. Kilinc () · S. Cakli · S. Tolasa · T. Dincer Fisheries Faculty, Department of Fish Processing Technology, Ege University, 35100 Bornova, Izmir, Turkey e-mail: [email protected] Tel.: +90-232-3434000 Fax: +90-232-3883685 has various names according to producing countries: patis in the Philippines, shotturu in Japan, budu in Malaysia, nam-pla in Thailand, nuoc-mam in Vietnam, ketjapikan or bakasang in Indonesia, yu lu in China and ngapi in Myan- mar [2]. It has been used in various prepared foods and sauce with the merit of its characteristic, favorable taste and nutritive value. However, its consumption as the ta- ble additives for dishes at home or in restaurants has been limited in Japan and Europe because of distinctive odor [3]. It is basically produced from a mixture of fish and salt that has been allowed to ferment. During fermentation its degradation products, amino acids and peptides, have a considerable effect on the sensory characteristics of fish sauce. In Southeast Asia, fish sauce is not only popular as a condiment, but in some areas and certain social classes in the region, it is the main source of protein in the diet and has become a necessity in the household. Fish sauces contain about 20 g/l of nitrogen, of which 80% is in the form of amino acids; thus they may be considered an im- portant sources of protein [4]. Oetterer et al. [5] studied anchovies in their study which was entitled as monitoring the sardine (Sardinella brasiliensis) fermentation process to obtain anchovies. Brillantes and Samosorn [6] discussed the importance of histamin level in fish sauce in their study named as determination of histamine in fish sauce from Thailand using a solid phase extraction and high- performance liquid chromatograph. Another related study about the lactic acid and fermentation was characterization of anti-listerial lactic acid bacteria isolated from Thai fer- mented fish product, by Ostergaard et al. [7]. And the study about accelerated fermentation process for the manufac- ture of fish sauce using histidine was presented by Sanceda et al. [8]. The production and consumption of fish sauce could not be done in Turkey. No studies have been conducted on producing such fermented product in Turkey. This study, therefore, is aimed at investigating the chemical, microbi- ological and sensory properties of fermented sardines with a view to using it as a food condiment to flavor soups and stews and as a protein supplement in weaning food for babies or in animal feeds.
-
Upload
kirikkaleturkey -
Category
Documents
-
view
0 -
download
0
Transcript of Chemical, microbiological and sensory changes associated with fish sauce processing
Berna Kilinc · Sukran Cakli · Sebnem Tolasa ·Tolga Dincer
Chemical, microbiological and sensory changes associated with fishsauce processing
Received: 28 September 2005 / Revised: 31 October 2005 / Accepted: 10 November 2005 / Published online: 15 December 2005C© Springer-Verlag 2005
Abstract The production of sardine fermented fishsauce was replicated in the laboratory in order to studythe chemical, microbiological and sensory changesassociated with the process. Fish sauce were producedby incubating mixtures of sardine (Sardina pilchardus) atdifferent concentrations of sodium chloride and glucoseat 37 ◦C for 57 days. Changes in chemical composition(moisture, protein, fat contents), pH, total volatile basicnitrogen (TVB-N, mg N/100 g fish flesh), trimethylamine(TMA-N, mg/100 g fish flesh), thiobarbituric acid (TBA,mg malonaldehyde/kg fish flesh), water activity (aw),color measurement, total viable count, lactic acid bacteriacount, yeast and moulds counts and sensory analyses wereobserved. The fish sauces with spices were determinedlower bacteria counts than fish sauces without spices. Theaddition of glucose to the fish sauces caused a significantincreasing in the bacterial counts. Staphylococcus aureusand yeast-mould counts were not detected during fermen-tation period. The use of spices in fermentation of sardineenhanced good color, aroma and taste.
Keywords Fish sauce . Fermentation . Sardines . Colorvalue . Proximate composition
Introduction
Fermentation is one of the oldest techniques in food preser-vation as it not only extends the shelf-life but also enhancesthe flavor and nutritional quality of the product [1]. Prote-olysis is one of the major biochemical events during fer-mentation. Fish sauce, a fermented product, is a brown,liquid seasoning commonly used in Asian countries. It
B. Kilinc (�) · S. Cakli · S. Tolasa · T. DincerFisheries Faculty,Department of Fish Processing Technology,Ege University,35100 Bornova, Izmir, Turkeye-mail: [email protected].: +90-232-3434000Fax: +90-232-3883685
has various names according to producing countries: patisin the Philippines, shotturu in Japan, budu in Malaysia,nam-pla in Thailand, nuoc-mam in Vietnam, ketjapikan orbakasang in Indonesia, yu lu in China and ngapi in Myan-mar [2]. It has been used in various prepared foods andsauce with the merit of its characteristic, favorable tasteand nutritive value. However, its consumption as the ta-ble additives for dishes at home or in restaurants has beenlimited in Japan and Europe because of distinctive odor[3]. It is basically produced from a mixture of fish andsalt that has been allowed to ferment. During fermentationits degradation products, amino acids and peptides, havea considerable effect on the sensory characteristics of fishsauce. In Southeast Asia, fish sauce is not only popular asa condiment, but in some areas and certain social classesin the region, it is the main source of protein in the dietand has become a necessity in the household. Fish saucescontain about 20 g/l of nitrogen, of which 80% is in theform of amino acids; thus they may be considered an im-portant sources of protein [4]. Oetterer et al. [5] studiedanchovies in their study which was entitled as monitoringthe sardine (Sardinella brasiliensis) fermentation processto obtain anchovies. Brillantes and Samosorn [6] discussedthe importance of histamin level in fish sauce in theirstudy named as determination of histamine in fish saucefrom Thailand using a solid phase extraction and high-performance liquid chromatograph. Another related studyabout the lactic acid and fermentation was characterizationof anti-listerial lactic acid bacteria isolated from Thai fer-mented fish product, by Ostergaard et al. [7]. And the studyabout accelerated fermentation process for the manufac-ture of fish sauce using histidine was presented by Sancedaet al. [8].
The production and consumption of fish sauce could notbe done in Turkey. No studies have been conducted onproducing such fermented product in Turkey. This study,therefore, is aimed at investigating the chemical, microbi-ological and sensory properties of fermented sardines witha view to using it as a food condiment to flavor soups andstews and as a protein supplement in weaning food forbabies or in animal feeds.

Materials and methods
Raw material
Sardines (Sardina pilchardus) caught off the Aegean Seain Turkey. Fish samples were transported to the laboratorywith ice packs within 2 h after landing. They were gutted,sorted, prepared as a fillet and washed with fresh water. Ap-proximately 45 kg of sardines were used for this study andshared in six groups for different formulations of sauces.Each group was about 5 kg.
Laboratory fish sauce production
All sardines fillets were cut in to pieces about 1 cm long.On the other hand at the same time formulations of ad-ditives were prepared. The mixture of group A was 10 gNaCl and 100 g fish for each bottle of this group. Theformulation of group B was 10 g NaCl + 1 g red pep-per + 1 g garlic powder + 100 g fish samples. Group Cperformed with 10 g NaCl + 5 g glucose + 100 g fishsample. Group D was 10 g NaCl + 5 g glucose + 1 g redpepper +1 g garlic powder + 100 g fish sample. In groupE 10 g NaCl + 10 g glucose + 100 g fish were used. Andfor the last formulation, group F was prepared with 10 gNaCl + 10 g glucose + 1 g red pepper + 1 g garlic pow-der + 100 g sardine samples. The ratios were calculatedaccording to these formulas and used in each 5 kg samplespools.
For each group 70 and totally 420 bottles were used inthe study. Each bottle was filled with mixtures by hand,using plastic gloves. The capacity of the glass bottle was200 ml, the color was dark brown. The tips of the bottleswere plastic and no air could enter when they were closed.When all bottles were filled and closed they were incubatedat 37 ◦C in an incubator for 57 days. Samples were takenfrom the bottles on days 1, 5, 8, 15, 22, 27, 36, 43, 50 and 57of fermentation for chemical, microbiological and sensoryanalyses.
Over a period of 57 days a sample of seven bottles for eachgroup were analyzed. Three bottles of each batch were usedfor determining the chemical quality, as well as the colormeasurements. And three were used for determining themicrobiological quality. The remaining one was subjectedto a sensory analysis.
Chemical analysis
Proximate composition
Chemical composition of fish sauces were determined.Crude protein content was calculated by converting thenitrogen content determined by Kjeldahl’s method (6.25 ×N) [9], fat was determined using the method described byBligh and Dyer [10]. Dry matter was determined by dry-ing the samples at 105 ◦C at a constant weight [11]. The
proximate composition were determined two times, first atthe beginning of the study on day 0, and second in the lastperiod of the products on day 57. The analyses were allcarried out in triplicate.
Chemical quality analysis
Three of the bottles of the sauce were taken for each period,pooled and homogenized (for each group). The pH valuewas measured as described in [12] using a digital pH meter(HANNA). For determining the lipid oxidation thiobarbi-turic acid (TBA, mg malonaldehyde/kg fish flesh) analysiswere used [13]. Total volatile basic nitrogen (TVB-N, mgN/100 g fish flesh) values were determined [14] duringthe fermentation. Trimethylamine (TMA-N, mg/100 g fishflesh) was determined as described by FAO [15]. The anal-yses of the pooled samples were all carried out in triplicate.
Microbiological analysis
Samples (10 g) were taken aseptically from the fish saucebottles and homogenized in 90 ml of NaCl solution (9 g/l).Serial dilutions of homogenates were made and total viablecounts (TVC) were determined by the pour plate method,using Plate Count Agar (Difco, 0479-17) as the medium.Plates were incubated at 30 ◦C for 24–48 h [16]. Coagulase-positive Staphylococcus aureus count was determined byusing spread plate method. Baird Parker Agar (Difco, 0768-17-3) was used as medium. Plates were incubated at 37 ◦Cfor 24–48 h [16]. Oxytetracycline Yeast Extract Agar (LABM X89) was used for moulds-yeast count. Plates were incu-bated at 30 ◦C for 3–5 days [13]. Lactic acid bacteria countwas determined by using pour plate method using MRSA(LAB M 93) as the medium. Plates were incubated at 30 ◦Cfor 3–5 days [17]. Analyses were done on fish sauce fromeach bottle separately.
Water activity (aw)
Water activity (aw) values of fish sauce were measured byusing TESTO 650 during fermentation. The analyses of thepooled samples were all carried out in triplicate.
Color measurement
Instrument
The color measurement on fish sauce samples trials werecarried out with the spectral color meter Spectro-pen R©(Dr. Lange, Dusseldorf, Germany). This is a colorimeteroperating on the spectral method described in DIN 5033using the 45/0◦ circular viewing geometry, i.e. the sample isilluminated with polychromatic light encircling it at an an-gle of 45◦, with the optical unit observing the reflected lightfrom a horizontal angle (0◦) toward the sample surface.

Table 1 Proximatecomposition (%) of the productson days T0 and T57
Protein (%) Moisture (%) Fat (%)T0 T57 T0 T57 T0 T57
A 11.72±0.05 a 12.6±0.1 a 11.9±0.31 a 12.5±0.02 a 12.1±0.10 a 11.9±0.17 aB 11.9±0.08 a 13.5±0.01 b 11.9±0.12 a 11.4±0.04 b 11.7±0.04 b 11.5±0.5 aC 67.23±0.12 a 69.31±0.19 a 71.47±0.08 a 67.61±0.03 a 67.59±0.22 a 68.60±0.4 aD 77.35±0.28 b 80.88±0.21 b 76.31±0.32 b 77.14±0.10 b 74.62±0.17 b 77.84±0.28 bE 1.12±0.06 a 1.35±0.1 a 1.15±0.05 a 0.82±0.04 a 0.83±0.09 a 1.17±0.02 aF 0.73±0.2 b 0.65±0.07 b 0.84±0.06 b 0.68±0.03 a 0.73±0.03 a 0.76±0.05 b
Values are arithmetic means ± standard deviation. Different letters between T0 and T57 characterizesignificant differences (p<0.05), n=3. A: 10 g NaCl +100 g fish; B: 1 g red pepper + 1 g garlicpowder + 10 g NaCl + 100 g fish; C: 10 g NaCl + 5 g glucose + 100 g fish; D: 1 g red pepper + 1 ggarlic powder + 5 g glucose + 10 g NaCl + 100 g fish; E: 10 g NaCl + 10 g glucose + 100 g fish; F:1 g red pepper + 1 g garlic powder + 10 g NaCl + 10 g glucose + 100 g fish
Spectro-pen R© is a genuine grating colorimeter measuringthe visible spectral range (400–700 nm) at intervals of10 nm. A 10◦, standard observers and D65 illuminant wereused (light source: polychromatic with tungsten lamp).The PC software “spectral-QC” allows state-of-the-artdata processing. Before measuring each lot the colorimeterwas calibrated against a white standard (LZM 224).
Measurement
The color measurement on fish sauce samples trials werecarried out with the spectral color meter Spectro-pen R© (Dr.Lange, Dusseldorf, Germany). The color was measured onthe homogenates prepared in each periods for the qual-ity control analysis (pool samples of three bottles). Thehomogenate was placed in plastic petri dishes, the colorof each of homogenate was measured in 10 different lo-cations and the average values of the measurements weredetermined. In the CIE Lab system L∗ denotes lightness ona 0–100 scale from black to white; a∗, (+) red or (−) green;and b∗, (+) yellow or (−) blue [18].
Sensory analysis
Sensory analyses were done as described in [19]. Color,aroma, texture and taste were compared with sensory panel.Taste panels were composed of eight members (three menand five women) who had been trained to the standard levelof proficiency of panelists for sensory evaluation.
Statistical analysis
Analysis of variance (ANOVA) was used to search for sig-nificant differences between mean values of the differentresults. Differences between means were analyzed by one-way ANOVA followed by Tukey and Duncan tests. Theresults are presented as means ± SD.
The parallels n = 3 were used for all analyses exceptcolor measurements. In the color measurements analyseswere carried out at n = 10.
Results and discussion
Proximate composition (%) of the products on days T0 andT57 can be seen in Table 1. There were some significantdifferences in moisture and fat values of the first day andlast day of the study. The increase in moisture and decreasein the fat values can easily be seen in Table 1. There wasan increase of over 10% in moisture content in all groupsat the end of the bioconversion. And in all groups decreasein total lipid values can be monitored. These results weresimilar to the study of Soyiri [20].
Total protein of the extracts at the beginning of fermen-tations A and B were 11.72 and 12.6% and this increasedover the period of fermentation to about 11.92 and 13.50%,respectively (Table 1). The sample showed increases in pro-tein content of the fish extracts during bioconversion. Thiscould be explained by the combined effect of autolysis andmicrobial degradation of the fish muscle, which is usuallyassociated with fish sauce production. According to Ijong[21] increases in total free amino nitrogen and total solublenitrogen occur concurrently during the production of fishsauce. But the groups that contained extra glucose were ininverse correlations.
pH values of the products during fermentation can beeseen in Table 2. The raw material pH was 6.39 ± 0.01.The pH measured in processes with condiments was lowerthan in A, D and E processes (Table 2). This was probablycaused by the ingredients added to treatments, especiallysugar, which could have been used by the microorgan-isms to produce lactic acid, consequently lowering the pH.A consistent decrease in corresponding increase in titrat-able acidity was observed during fermentation of sardinellasauces to be used as soup flavorer or as protein source ininfant foods. Fermentation caused a slight decrease in to-tal viable count of microorganisms, which ranged from250 to 380 CFU g−1 and increase in protein from 16 to18 g 100 g−1 [22].
Table 2 shows the pH characteristics of fish sauce pro-duced from sardines using glucose, spice and NaCl as ad-ditional substrate for fermentation. In the fermentation pro-cess, the sauces produced from fermentation (involving theuse of glucose as added sugar) had pH values ranging from5.05 to 6.26 pH units over the fermentation period. The pH

Table 2 pH values of theproducts during fermentation
Day pHA B C D E F
1 6.28±0.01 a 6.26±0.03 a 6.25±0.01 a 6.19±0.01 b 6.06±0.17 b 6.16±0.02 b5 6.25±0.01 a 6.24±0.01 a 6.25±0.01 a 5.62±0.01 b 5.50±0.01 b 5.25±0.01 c8 6.24±0.02 a 6.20±0.01 a 6.28±0.02 a 5.30±0.02 b 5.17±0.02 b 5.25±0.01 b15 6.24±0.01 a 5.98±0.01 b 6.22±0.01 c 5.24±0.01 d 5.26±0.01 d 5.24±0.01 d22 6.24±0.01 a 5.65±0.01 b 6.38±0.01 a 5.10±0.01 c 5.19±0.02 c 5.08±0.01 c27 6.10±0.02 a 5.58±0.01 b 5.63±0.04 b 5.08±0.02 c 5.20±0.02 c 5.34±0.02 c36 6.00±0.01 a 5.50±0.02 b 5.29±0.03 c 5.20±0.01 c 5.16±0.01 c 5.17±0.01 c43 5.94±0.04 a 5.43±0.04 b 5.16±0.01 c 5.09±0.02 c 5.11±0.01 c 5.16±0.01 c50 5.05±0.01 a 5.20±0.01 b 5.13±0.01 b 5.10±0.01 b 5.10±0.01 b 5.10±0.01 b57 4.98±0.03 a 5.18±0.03 b 5.07±0.01 b 5.05±0.02 b 5.08±0.22 b 5.06±0.01 b
Values are arithmetic means ± standard deviation. Different letters between columns characterize sig-nificant differences, n=3. A: 10 g NaCl + 100 g fish; B: 1 g red pepper + 1 g garlic powder + 10 gNaCl + 100 g fish; C: 10 g NaCl + 5 g glucose + 100 g fish; D: 1 g red pepper + 1 g garlic powder + 5 gglucose + 10 g NaCl + 100 g fish; E: 10 g NaCl + 10 g glucose + 100 g fish; F: 1 g red pepper + 1 ggarlic powder + 10 g NaCl + 10 g glucose + 100 g fish
Table 3 TBA values of theproducts during fermentation(mg malonaldehyde/kg fishflesh)
Day TBAA B C D E F
1 3.31±0.24 a 2.70±0.38 b 4.49±1.00 c 3.14±0.39 a 5.34±2.12 d 5.78±1.82 e5 2.44±0.18 a 2.12±0.32 b 2.47±0.04 c 2.26±0.07 d 4.42±0.51 e 3.58±1.11 f8 1.66±0.05 a 1.22±0.06 b 2.00±0.16 c 2.39±0.34 d 2.66±0.43 e 1.90±0.48 f15 1.29±0.02 a 1.25±0.24 b 1.97±0.20 c 1.69±0.14 d 2.34±0.00 e 3.05±0.82 f22 1.59±0.25 a 0.94±0.02 b 2.50±0.15 c 2.12±0.63 d 3.11±0.07 e 2.50±0.28 f27 1.70±0.11 a 2.44±0.62 b 1.62±0.09 c 1.27±0.42 d 2.53±0.59 e 1.32±0.44 f36 1.22±0.04 a 0.86±0.02 b 1.40±0.12 c 0.73±0.01 d 1.92±0.03 e 1.36±0.09 f43 0.37±0.04 a 1.63±0.36 b 1.08±0.23 c 0.97±0.46 d 1.63±0.38 b 0.62±0.09 e50 0.75±0.04 a 1.35±0.10 b 1.04±0.13 c 0.78±0.02 d 1.84±0.20 e 1.31±0.03 f57 0.76±0.06 a 1.20±0.08 b 1.61±0.09 c 1.29±0.08 d 1.00±0.16 e 2.12±0.19 f
Values are arithmetic means ± standard deviation. Different letters between columns characterize sig-nificant differences, n=3. A: 10 g NaCl + 100 g fish; B: 1 g red pepper + 1 g garlic powder + 10 gNaCl + 100 g fish; C: 10 g NaCl + 5 g glucose + 100 g fish; D: 1 g red pepper + 1 g garlic powder + 5 gglucose + 10 g NaCl + 100 g fish; E: 10 g NaCl + 10 g glucose + 100 g fish; F: 1 g red pepper + 1 ggarlic powder + 10 g NaCl + 10 g glucose + 100 g fish
of the samples remained fairly constant during the first 22days of fermentation. After 22 days there was a significantdrop in pH in fish extract containing glucose as the sourceof carbon whilst in the samples. The increase in pH samplewas due to putrefaction leading to the formation of basic ni-trogenous compounds. In the sample to which glucose hadbeen added as carbon source for microbial growth biocon-version into fish sauce was successful. The drop in pH wasattributed to the production of acids during bioconversion.According to Frazier and Westhoff [23] the trend in pH re-duction may be explained as due to the involvement of lacticacid bacteria that were able to ferment sugars (glucose inparticular) to produce lactic acid, which then resulted inthe lowering of the pH. Differences in pH between samplescould be attributed to the availability of fermentable sugarscoupled with the population of lactic acid bacteria at thetime, as well as the presence of enzymes inherent in the rawmaterial used or produced by microbes. Lee et al. [24] havealso indicated such an inverse relationship between pH andlactic acid; and also pH and acid forming bacteria/yeast ina lactic fermented fish product called Sikhae.
TBA values of the products during fermentation can beseen in Table 3. Thiobarbituric acid analysis (TBA, mg mal-onaldehyde/g) was determined by the oxidation of fat insamples. Occurrence of bad taste and aroma because theoxidation of lipids included unsaturated lipid acid PUFAwere defined as rancidity [25]. Oxidative rancidity gener-ally occurs in fatty fish. Primary and secondary lipid oxi-dation products are the biological amino compounds, pro-teins, peptides, free amino acids and phospholipids; thesereact to produce interaction compounds and this makes thecolor of the product brown, causes a change in flavor andloss in aromatic nutrient elements [26]. In ‘‘perfect mate-rial’’ TBA value should be less than 3 mg malonaldehyde/g,in ‘‘good material’’ TBA value should not be more than5 mg malonaldehyde/g and consumption limit for TBAvalue is between 7 and 8 mg malonaldehyde/g [27]. TBAvalue in fresh fish was little bit higher (2.23±0.40) but al-most in the limits of good material. Each of the groups wasdetermined nearly in good quality at the beginning afterthey were processed but at the end of the 57th day the val-ues became all in perfect quality. The TBA numbers were

Table 4 TMA values of theproducts during fermentation(mg TMA-N/100 g fish flesh)
Day TMAA B C D E F
1 23.80±1.07 a 25.01±1.30 b 28.84±0.82 c 16.88±1.09 d 11.37±0.45 e 13.58±1.13 f5 44.89±0.15 a 36.79±1.23 b 44.28±0.25 c 28.38±2.81 d 32.77±1.17 e 29.04±1.38 f8 34.62±0.85 a 40.35±0.10 b 38.27±0.39 c 40.53±0.14 d 39.99±0.05 e 35.74±0.57 f15 44.35±0.03 a 44.36±0.01 a 40.50±0.68 b 40.37±0.57 c 43.34±0.28 d 36.23±1.02 e22 46.02±0.07 a 45.71±0.09 b 43.45±1.16 c 39.95±0.20 d 40.50±0.49 e 37.76±0.77 f27 46.18±0.07 a 46.29±0.03 b 44.55±0.21 c 38.72±0.24 d 42.29±0.18 e 40.26±0.61 f36 39.94±0.15 a 40.06±0.07 b 37.60±0.06 c 33.68±0.17 d 38.09±0.08 e 31.03±0.09 f43 44.26±0.13 a 44.45±0.07 b 42.21±1.64 c 38.15±0.75 d 43.14±1.26 e 35.60±0.83 f50 37.92±0.02 a 37.86±0.05 b 34.53±0.41 c 33.27±0.27 d 37.24±0.16 e 31.52±0.10 f57 38.42±0.12 a 37.69±0.81 b 32.86±1.02 c 33.12±0.22 d 37.11±0.99 e 29.32±0.12 f
Values are arithmetic means ± standard deviation. Different letters between columns characterize sig-nificant differences, n=3. A: 10 g NaCl + 100 g fish; B: 1 g red pepper + 1 g garlic powder + 10 gNaCl + 100 g fish; C: 10 g NaCl + 5 g glucose + 100 g fish; D: 1 g red pepper + 1 g garlic powder + 5 gglucose + 10 g NaCl + 100 g fish; E: 10 g NaCl + 10 g glucose + 100 g fish; F: 1 g red pepper + 1 ggarlic powder + 10 g NaCl + 10 g glucose + 100 g fish
within the acceptable limits as reported by Sarojnalini et al.[28]. The same results are presented in the study of Changet al. [29]. Peroxide value and TBA number of the totallipid increased gradually up to the third day of fermentationprocess and thereafter decreased. Considerable decompo-sitions of triglyceride and phospholipids in the lipid mayoccur, accompanied by the production and accumulationof large amounts of free fatty acids throughout processing.From these results, it is concluded that lipid oxidation isrestricted during fermentation, although remarkable pro-teolysis occurred. Oxidized fish oils have a characteristictaste and paint-like smell, but the acceptability of productshaving the typical taste and flavor of oxidized fats dependsvery much on local preferences. The products of fat oxi-dation take part in further reactions especially with amines[30] and with other decomposition products of proteins [31]to produce colored compounds as well as substances withodor [32]. Lipases in the fish flesh also hydrolyze the lipids[33], but the extent is dependent on the level of salting andfermentation [34]. There are formal chemical definitionsof oxidation, involving electron transfer and free radicalreactions but, in the context of fish technology, it can beconsidered as the chemical reaction in which oxygen com-bines with a compound. Most usually, the oxygen comesfrom air surrounding the product but, for some reactions,the oxygen can come from oxygen-containing compounds.In the present study just the inverse results were determinedaccording to these comments. Although in many studiesTBA values were determined in an increasing correlation.In the present study the product were all in closed bottlesthus the oxygen could not enter and surround the fish flesh.The oxidation reaction most frequently encountered in fishtechnology is oxidation of unsaturated fatty acids in the freeform or as combined in lipids. Oxidation in this case is onlythe first step in a series of reactions that result in a varietyof reaction products which are often strongly flavored andgive rise to rancid flavors.
TMA values of the products during fermentation canbee seen in Table 4. The level of TMA-N observed in thesardines in natura was 1.75 mg 100 g−1, which is below
the maximum limit determined by [15]. TMA-N levels forfresh fish lower than 8 mg 100 g−1. But after the fish wereprocessed the values of TMA-N began to increase up today 27. Table 4 shows the trimethylamine content of thesix groups. There was a slight decrease after day 27 in eachgroup. But when we compare the results of beginning andthe end of the study, the values of the day 57 were almosthigher than for day 1. Similar high TMA concentration infermented fish product was observed in [22].
That is why there was a strong odor in sauce. These val-ues show the effectness of fermentation on volatile base.These are the results of bacterial reduction of trimethy-lamine oxide (TMAO), a non-volatile and non-odoriferouscompound, to volatile trimethylamine (TMA), which hasan amoniacal smell and the formation of dimethylamine(DMA), as presented by Pearson [35].
Several studies have been carried out to study the bio-chemical pathways followed during the degradation pro-cess of fish fermentation. Reay and Shewan [36] reportedthat the strong odor in spoilt fish may be a reaction be-tween TMAD and lactic acid producing TMA and aceticacid. Tomiyasu and Zenitani [37] also incriminated organicacids in deteriorated fish. Hiltz et al. [38] reported that thevolatile bases particularly TMA, DMA and NH, are asso-ciated with changes in the organoleptic and textural qualityof fish. That is why the texture of the fish flesh becamejuicy.
TVB-N values of products during fermentation can beseen in Table 5. The level of TVB-N observed in the sar-dines in nature was 16.22 mg 100 g−1, which is below themaximum limit determined by Decree No. 1255, which re-quires TVB-N levels for fresh fish lower than 30 mg 100 g−1
[39]. The processed fish presented higher levels of TVB-N (Table 5) since the beginning of the processing, whichis in accordance with Connell [40], who reported a maxi-mum limit of 200 mg 100 g−1 for levels of TVB-N in fishprocessed with salt, according to the legislation of certaincountries. So increasing in the values can be seen in Table 5.After day 15 decreasing the values of C, D, E and F can bemonitored up to day 43 [41], levels of TVB-N obtained is

Table 5 TVB-N values ofproducts during fermentation(mg TVB-N/100 g fish flesh)
Day TVB-NA B C D E F
1 119.99±4.00 a 99.50±0.51 b 100.78±2.04 c 69.71±0.26 d 78.17±0.88 e 73.89±0.51 f5 115.17±2.68 a 105.90±4.00 b 98.51±0.15 c 73.41±1.67 d 82.45±1.11 e 87.29±1.49 f8 134.18±1.36 a 117.63±1.85 b 97.24±1.35 c 84.52±4.00 d 92.50±4.55 e 107.8±1.84 f15 136.25±2.63 a 107.58±3.10 b 118.22±6.77 c 88.66±3.87 d 59.11±2.56 e 70.34±1.02 f22 97.09±0.45 a 129.01±3.11 b 99.31±1.78 c 76.23±0.03 d 79.36±0.45 e 67.83±1.33 f27 100.67±0.59 a 121.31±2.14 b 98.94±0.94 c 73.22±0.15 d 73.82±4.79 e 67.59±0.56 f36 146.89±3.58 a 118.22±2.56 b 97.53±4.43 c 69.16±3.73 d 63.84±1.77 e 66.20±0.51 f43 167.23±1.04 a 141.88±4.08 b 105.86±4.09 c 72.20±1.00 d 73.33±0.96 e 67.90±0.61 f50 201.30±3.12 a 204.52±0.51 b 130.04±2.56 c 88.37±1.35 d 84.53±0.51 e 68.27±1.54 f57 210.58±3.07 a 203.23±1.73 b 138.92±5.52 c 93.86±1.40 d 88.23±0.99 e 74.32±1.02 f
Values are arithmetic means ± standard deviation. Different letters between columns characterize sig-nificant differences, n=3. A: 10 g NaCl + 100 g fish; B: 1 g red pepper + 1 g garlic powder + 10 gNaCl + 100 g fish; C: 10 g NaCl + 5 g glucose + 100 g fish; D: 1 g red pepper + 1 g garlic powder + 5 gglucose + 10 g NaCl + 100 g fish; E: 10 g NaCl + 10 g glucose + 100 g fish; F: 1 g red pepper + 1 ggarlic powder + 10 g NaCl + 10 g glucose + 100 g fish
around 70 mg 100 g−1 for whole preserved fish, Sardinellabrasiliensis. Total nitrogen, VBN, and Brix values are allindicators of the enrichment of the flavor components. Inthe study of Motoharu et al. [42] similar results of volatilecomponents, which was the results of increasing of lacticacid contents, were determined.
Water activity values of the products during fermenta-tion can bee seen in Table 6. There were slight decreasesin the values of water activity in each group. When wa-ter interacts with solutes and surfaces, it is unavailable forother hydration interactions. The term ‘‘water activity’’(aw) describes the (equilibrium) amount of water avail-able for hydration of materials; a value of unity indicatespure water whereas zero indicates the total absence of wa-ter molecules; addition of solutes always lower the wateractivity. Water activity reflects a combination of water–solute and water–surface interactions plus capillary forces.The nature of a hydrocolloids or protein polymer networkcan thus affect the water activity, cross-linking reduces theactivity [43]. The multi-ingredient nature of food and itsprocessing commonly results in a range of water activities.
Foods containing macroscopic or microstructural aqueouspools of different water activity will be prone to time- andeffects-dependent water migration from areas with high awto low aw, mostly because of salting of fish. Control ofwater activity (rather than water content) is very importantin the food industry as low water activity prevents micro-bial growth (increasing shelf life), causes large changes intextural characteristics.
Color values of the products can bee seen in Tables 7 (L),8 (a) and 9 (b). Color values were determined for control-ling the color changes in fish sauce during the fermentation.This instrumental analysis is normally used for collectingsupport information to determine the quality degree of thefish in sensory analysis. But in the present study it is not thepart of the analysis which had been done for determiningthe quality changes.
At the beginning of the study in all groups the lightnessvalues were varied between 34.40±8.04 and 42.36±8.71.And for each groups it is determined that the data becomelighter in each groups. That may be the cause of its beingjuicy.
Table 6 Water activity valuesof the products duringfermentation
Day aw
A B C D E F
1 0.90±0.00 a 0.91±0.02 a 0.90±0.00 a 0.90±0.00 a 0.90±0.00 a 0.91±0.00 a5 0.89±0.00 a 0.91±0.00 ab 0.90±0.00 ab 0.90±0.00 ab 0.90±0.00 ab 0.92±0.00 b8 0.88±0.00 a 0.90±0.00 a 0.89±0.00 a 0.89±0.00 a 0.89±0.00 a 0.89±0.00 a15 0.90±0.00 a 0.91±0.00 ab 0.90±0.00 ab 0.92±0.01 b 0.91±0.00 a 0.93±0.00 b22 0.86±0.00 a 0.87±0.00 ab 0.88±0.00 ab 0.91±0.00 b 0.89±0.00 b 0.89±0.00 b27 0.88±0.00 a 0.89±0.00 a 0.88±0.00 a 0.87±0.00 a 0.88±0.00 a 0.88±0.00 a36 0.89±0.00 ab 0.87±0.00 a 0.90±0.01 b 0.88±0.00 ab 0.89±0.00 ab 0.89±0.00 ab43 0.87±0.01 ab 0.85±0.00 b 0.88±0.00 ac 0.88±0.00 a 0.87±0.00 a 0.89±0.00 a50 0.86±0.00 ab 0.84±0.01 b 0.87±0.00 ac 0.88±0.00 ac 0.87±0.00 ac 0.89±0.01 c57 0.86±0.00 ab 0.86±0.01 a 0.89±0.01 b 0.88±0.00 ab 0.87±0.00 ab 0.89±0.00 b
Values are arithmetic means ± standard deviation. Different letters between columns characterize sig-nificant differences, n=3. A: 10 g NaCl + 100 g fish; B: 1 g red pepper + 1 g garlic powder + 10 gNaCl + 100 g fish; C: 10 g NaCl + 5 g glucose + 100 g fish; D: 1 g red pepper + 1 g garlic powder + 5 gglucose + 10 g NaCl + 100 g fish; E: 10 g NaCl + 10 g glucose + 100 g fish; F: 1 g red pepper + 1 ggarlic powder + 10 g NaCl + 10 g glucose + 100 g fish

Table 7 L∗ (lightness) valuesof the products duringfermentation
Day L∗
A B C D E F
1 38.22±14.21 a 42.36±8.71 a 36.48±10.99 a 34.40±8.04 a 43.46±5.28 a 39.30±4.68 a5 48.00±0.45 a 42.47±0.62 b 35.60±1.20 c 40.05±0.64 d 38.27±1.86 d 42.08±0.86 b8 48.50±4.07 a 46.67±5.76 a 47.43±1.05 a 44.05±2.30 ab 41.23±1.54 bc 38.46±1.69 c15 64.18±0.67 a 60.57±0.99 b 62.09±0.97 b 55.03±0.87 cd 57.98±0.55 c 53.46±1.20 d22 59.68±0.97 a 50.95±2.88 b 60.80±1.21 ac 57.10±0.95 ab 58.67±0.70 ab 55.85±0.45 ab27 64.25±0.92 a 60.93±0.47 b 63.78±1.21 a 59.45±1.26 b 55.83±1.27 c 54.54±0.77 c36 55.29±1.83 a 51.98±1.10 a 57.07±2.06 a 53.93±0.92 a 55.18±1.24 a 53.91±0.71 a43 63.30±1.03 a 59.57±2.08 b 59.59±0.91 b 58.04±1.77 bc 57.08±0.69 c 55.33±0.66 d50 60.94±0.93 a 57.14±1.60 b 55.12±1.43 bc 54.18±1.77 c 61.29±1.22 a 56.53±0.83 bc57 59.61±2.66 a 56.89±1.58 a 54.83±1.99 a 53.52±3.63 a 61.31±2.50 a 55.65±2.89 a
Values are arithmetic means ± standard deviation. Different letters between columns characterize signifi-cant differences; n=10 times (in the homogenization of three bottle for each group). A: 10 g NaCl + 100 gfish; B: 1 g red pepper + 1 g garlic powder + 10 g NaCl + 100 g fish; C: 10 g NaCl + 5 g glucose + 100 gfish; D: 1 g red pepper + 1 g garlic powder + 5 g glucose + 10 g NaCl + 100 g fish; E: 10 g NaCl + 10 gglucose + 100 g fish; F: 1 g red pepper + 1 g garlic powder + 10 g NaCl + 10 g glucose + 100 g fish
Table 8 Values of a∗ (redness)of the products duringfermentation
Day a∗
A B C D E F
1 4.27±1.75 ac 9.94±1.58 b 4.71±2.53 ac 10.73±2.28 b 3.04±2.09 a 8.01±1.26 bc5 2.18±0.26 a 5.17±0.59 b 2.03±0.36 a 5.71±0.74 b 4.68±0.49 b 3.85±0.22 c8 2.20±0.77 a 4.26±1.45 b 3.28±1.29 ab 2.36±1.32 a 1.87±0.84 a 4.56±1.46 b15 3.74±0.22 a 10.08±0.29 b 3.31±1.24 a 7.62±0.46 c 3.27±0.31 a 8.44±0.30 c22 3.86±0.27 a 8.86±1.58 b 4.19±0.10 a 8.85±1.48 b 3.42±0.41 a 9.40±0.49 b27 3.78±0.97 a 10.05±0.66 b 5.34±0.34 a 8.35±3.08 b 4.07±0.88 a 9.12±0.56 b36 3.89±0.98 a 9.06±1.83 b 5.25±0.56 a 8.30±0.42 b 4.62±0.36 a 9.04±1.66 b43 5.13±0.48 a 8.41±3.18 b 4.69±0.56 a 9.57±1.72 b 4.52±0.76 a 10.35±0.79 b50 4.71±0.26 a 9.86±0.77 b 4.21±0.97 a 10.89±0.47 b 4.77±1.18 a 11.08±0.35 b57 3.24±3.97 a 12.76±4.33 b 5.89±0.53 ac 10.60±2.59 bc 4.53±2.92 a 12.46±2.70 b
Values are arithmetic means ± standard deviation. Different letters between columns characterize signifi-cant differences; n=10 times (in the homogenization of three bottle for each group). A: 10 g NaCl + 100 gfish; B: 1 g red pepper + 1 g garlic powder + 10 g NaCl + 100 g fish; C: 10 g NaCl + 5 g glucose + 100 gfish; D: 1 g red pepper + 1 g garlic powder + 5 g glucose + 10 g NaCl + 100 g fish; E: 10 g NaCl + 10 gglucose + 100 g fish; F: 1 g red pepper + 1 g garlic powder + 10 g NaCl + 10 g glucose + 100 g fish
Table 9 Values of b∗(yellowness) of the productsduring fermentation
Day b∗
A B C D E F
1 13.57±3.85 ab 17.88±1.93 a 15.24±4.35 ab 17.50±3.67 b 9.85±3.64 ab 14.31±3.05 ab5 12.55±1.19 a 13.61±1.59 a 10.45±0.76 b 13.39±1.30 a 11.93±0.76 a 10.31±0.45 b8 11.32±1.43 ac 13.63±1.44 b 12.97±1.71 ab 11.26±0.87 ac 10.19±1.20 c 12.54±2.16 ac15 14.76±0.47 a 22.03±0.87 b 14.58±1.27 a 18.72±0.40 c 14.64±0.46 a 19.98±0.48 c22 15.54±0.83 a 20.37±2.62 b 15.56±0.57 a 19.93±2.23 b 15.65±0.72 a 21.79±0.52 b27 14.89±1.20 a 21.66±1.14 b 16.13±5.10 a 20.44±2.91 bc 16.41±1.70 ac 21.02±0.88 bc36 14.54±2.39 a 19.28±3.44 b 16.78±0.96 ab 19.15±0.52 bc 15.88±0.61 ac 19.44±2.61 bc43 16.99±1.27 a 21.18±0.82 b 18.02±0.41 a 21.94±1.15 b 17.03±1.76 a 23.32±0.70 b50 17.01±0.47 a 23.35±0.81 b 17.60±1.03 a 23.57±0.66 b 18.91±1.35 c 24.23±0.31 b57 18.37±4.82 a 24.07±6.93 bc 21.33±1.85 bc 21.76±5.64 bc 18.27±4.13 b 25.01±3.38 c
Values are arithmetic means ± standard deviation. Different letters between columns characterize signifi-cant differences; n=10 times (in the homogenization of three bottle for each groups). A: 10 g NaCl + 100 gfish; B: 1 g red pepper + 1 g garlic powder + 10 g NaCl + 100 g fish; C: 10 g NaCl + 5 g glucose + 100 gfish; D: 1 g red pepper + 1 g garlic powder + 5 g glucose + 10 g NaCl + 100 g fish; E: 10 g NaCl + 10 gglucose + 100 g fish; F: 1 g red pepper + 1 g garlic powder + 10 g NaCl + 10 g glucose + 100 g fish
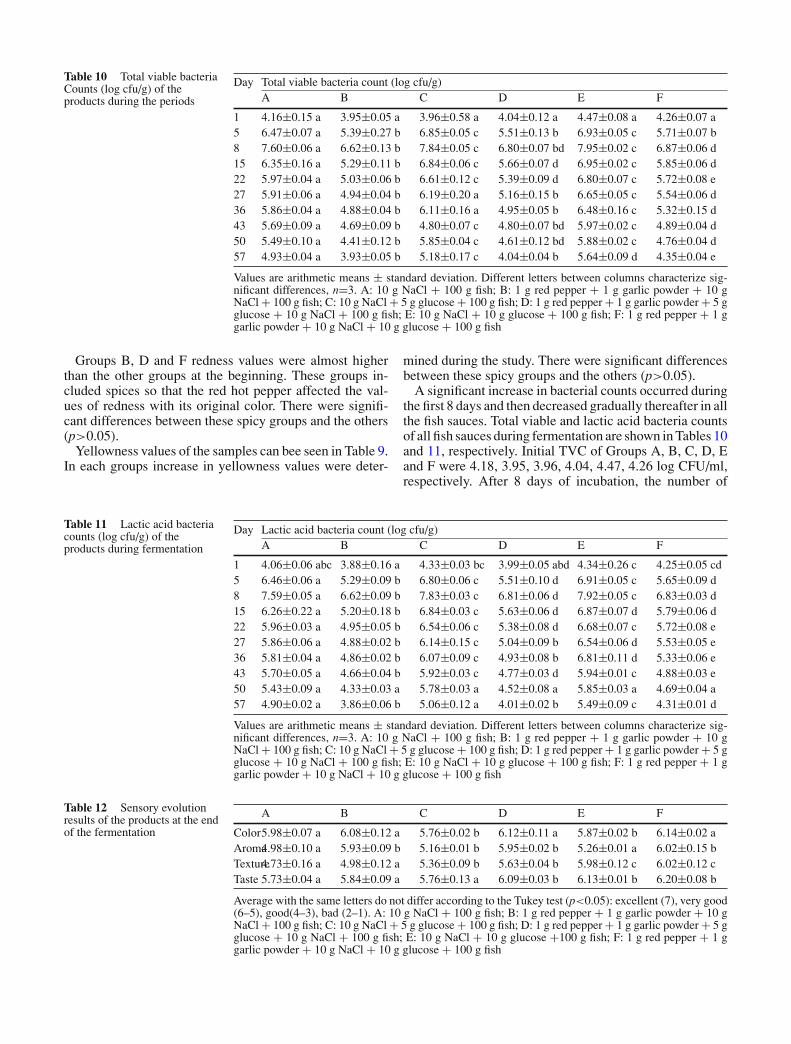
Table 10 Total viable bacteriaCounts (log cfu/g) of theproducts during the periods
Day Total viable bacteria count (log cfu/g)A B C D E F
1 4.16±0.15 a 3.95±0.05 a 3.96±0.58 a 4.04±0.12 a 4.47±0.08 a 4.26±0.07 a5 6.47±0.07 a 5.39±0.27 b 6.85±0.05 c 5.51±0.13 b 6.93±0.05 c 5.71±0.07 b8 7.60±0.06 a 6.62±0.13 b 7.84±0.05 c 6.80±0.07 bd 7.95±0.02 c 6.87±0.06 d15 6.35±0.16 a 5.29±0.11 b 6.84±0.06 c 5.66±0.07 d 6.95±0.02 c 5.85±0.06 d22 5.97±0.04 a 5.03±0.06 b 6.61±0.12 c 5.39±0.09 d 6.80±0.07 c 5.72±0.08 e27 5.91±0.06 a 4.94±0.04 b 6.19±0.20 a 5.16±0.15 b 6.65±0.05 c 5.54±0.06 d36 5.86±0.04 a 4.88±0.04 b 6.11±0.16 a 4.95±0.05 b 6.48±0.16 c 5.32±0.15 d43 5.69±0.09 a 4.69±0.09 b 4.80±0.07 c 4.80±0.07 bd 5.97±0.02 c 4.89±0.04 d50 5.49±0.10 a 4.41±0.12 b 5.85±0.04 c 4.61±0.12 bd 5.88±0.02 c 4.76±0.04 d57 4.93±0.04 a 3.93±0.05 b 5.18±0.17 c 4.04±0.04 b 5.64±0.09 d 4.35±0.04 e
Values are arithmetic means ± standard deviation. Different letters between columns characterize sig-nificant differences, n=3. A: 10 g NaCl + 100 g fish; B: 1 g red pepper + 1 g garlic powder + 10 gNaCl + 100 g fish; C: 10 g NaCl + 5 g glucose + 100 g fish; D: 1 g red pepper + 1 g garlic powder + 5 gglucose + 10 g NaCl + 100 g fish; E: 10 g NaCl + 10 g glucose + 100 g fish; F: 1 g red pepper + 1 ggarlic powder + 10 g NaCl + 10 g glucose + 100 g fish
Groups B, D and F redness values were almost higherthan the other groups at the beginning. These groups in-cluded spices so that the red hot pepper affected the val-ues of redness with its original color. There were signifi-cant differences between these spicy groups and the others(p>0.05).
Yellowness values of the samples can bee seen in Table 9.In each groups increase in yellowness values were deter-
mined during the study. There were significant differencesbetween these spicy groups and the others (p>0.05).
A significant increase in bacterial counts occurred duringthe first 8 days and then decreased gradually thereafter in allthe fish sauces. Total viable and lactic acid bacteria countsof all fish sauces during fermentation are shown in Tables 10and 11, respectively. Initial TVC of Groups A, B, C, D, Eand F were 4.18, 3.95, 3.96, 4.04, 4.47, 4.26 log CFU/ml,respectively. After 8 days of incubation, the number of
Table 11 Lactic acid bacteriacounts (log cfu/g) of theproducts during fermentation
Day Lactic acid bacteria count (log cfu/g)A B C D E F
1 4.06±0.06 abc 3.88±0.16 a 4.33±0.03 bc 3.99±0.05 abd 4.34±0.26 c 4.25±0.05 cd5 6.46±0.06 a 5.29±0.09 b 6.80±0.06 c 5.51±0.10 d 6.91±0.05 c 5.65±0.09 d8 7.59±0.05 a 6.62±0.09 b 7.83±0.03 c 6.81±0.06 d 7.92±0.05 c 6.83±0.03 d15 6.26±0.22 a 5.20±0.18 b 6.84±0.03 c 5.63±0.06 d 6.87±0.07 d 5.79±0.06 d22 5.96±0.03 a 4.95±0.05 b 6.54±0.06 c 5.38±0.08 d 6.68±0.07 c 5.72±0.08 e27 5.86±0.06 a 4.88±0.02 b 6.14±0.15 c 5.04±0.09 b 6.54±0.06 d 5.53±0.05 e36 5.81±0.04 a 4.86±0.02 b 6.07±0.09 c 4.93±0.08 b 6.81±0.11 d 5.33±0.06 e43 5.70±0.05 a 4.66±0.04 b 5.92±0.03 c 4.77±0.03 d 5.94±0.01 c 4.88±0.03 e50 5.43±0.09 a 4.33±0.03 a 5.78±0.03 a 4.52±0.08 a 5.85±0.03 a 4.69±0.04 a57 4.90±0.02 a 3.86±0.06 b 5.06±0.12 a 4.01±0.02 b 5.49±0.09 c 4.31±0.01 d
Values are arithmetic means ± standard deviation. Different letters between columns characterize sig-nificant differences, n=3. A: 10 g NaCl + 100 g fish; B: 1 g red pepper + 1 g garlic powder + 10 gNaCl + 100 g fish; C: 10 g NaCl + 5 g glucose + 100 g fish; D: 1 g red pepper + 1 g garlic powder + 5 gglucose + 10 g NaCl + 100 g fish; E: 10 g NaCl + 10 g glucose + 100 g fish; F: 1 g red pepper + 1 ggarlic powder + 10 g NaCl + 10 g glucose + 100 g fish
Table 12 Sensory evolutionresults of the products at the endof the fermentation
A B C D E F
Color5.98±0.07 a 6.08±0.12 a 5.76±0.02 b 6.12±0.11 a 5.87±0.02 b 6.14±0.02 aAroma4.98±0.10 a 5.93±0.09 b 5.16±0.01 b 5.95±0.02 b 5.26±0.01 a 6.02±0.15 bTexture4.73±0.16 a 4.98±0.12 a 5.36±0.09 b 5.63±0.04 b 5.98±0.12 c 6.02±0.12 cTaste 5.73±0.04 a 5.84±0.09 a 5.76±0.13 a 6.09±0.03 b 6.13±0.01 b 6.20±0.08 b
Average with the same letters do not differ according to the Tukey test (p<0.05): excellent (7), very good(6–5), good(4–3), bad (2–1). A: 10 g NaCl + 100 g fish; B: 1 g red pepper + 1 g garlic powder + 10 gNaCl + 100 g fish; C: 10 g NaCl + 5 g glucose + 100 g fish; D: 1 g red pepper + 1 g garlic powder + 5 gglucose + 10 g NaCl + 100 g fish; E: 10 g NaCl + 10 g glucose +100 g fish; F: 1 g red pepper + 1 ggarlic powder + 10 g NaCl + 10 g glucose + 100 g fish

microorganisms in all fish sauces increased correspondingto decreases in pH. After 15 days of incubation, the numberof microorganisms continued to decrease. The fish saucescontaining 100:100 (NaCl:glucose) g/kg had a higher TVCvalues than samples with 100:50 (NaCl:glucose) g/kg. Theaddition of glucose to the samples caused a significantdifference in bacterial counts. The decreases in pH maybe due to the production of lactic acid by LAB. In onereport LAB are reported to be important in food flavordevelopment, the presence of LAB in the sample is alsoexpected to contribute significantly to the flavor of fishsauces [44].
In this study, initial LAB of Groups A, B, C, D, E and Fwere 4.06, 3.88, 4.33, 3.99, 4.34, 4.25 log CFU/ml, respec-tively. After 8 days of incubation, the number of lactic acidbacteria count in all fish sauces increased corresponding todecreases in pH. After 15 days of incubation, the numberof lactic acid bacteria count continued to decrease. Staphy-lococcus aureus and yeast and moulds counts were notdetected during fermentation period. Fish sauces contain-ing spices had a lower TVC values than samples withoutspices. The use of spices in fermentation of sardine en-hanced good flavor as well as provided some antibacterialeffect on the fermented products. In one report it was de-termined that the use of available spice in fermentation offish provided some antibacterial effect on the fermentedproduct [22]. In another report; the importance of salt usedin fermented products was determined as a bacteriostaticagent for many bacteria including pathogenic and spoilagebacteria [21]. Similar results were reported with fish saucein the previous investigations [21, 22].
The use of spices in fermentation of sardine enhancedvery good color, aroma and taste. That is why groups B,D and F have higher degrees than the other groups; as isseen in the results of the sensory panel at the end of thestudy (Table 12). The values obtained are reflection of qual-ity or freshness of the raw material and also indicate thatthe fermented product is safe for human consumption; thesignificant difference in the value is attributable to the activ-ities of the salt and curing material (spices). This agree withthe result of [45] that showed that the presence of spiceswhich are bactericidal in nature may also have accountedfor the low figures obtained in their work.
Conclusion
The fish sauces with spices were determined to be withlower bacteria counts than fish sauces without spices. Theaddition of glucose to the fish sauces caused a significantincrease in the bacterial counts. Staphylococcus aureus andyeast-mould counts were not detected during fermentationperiod. The use of spices in fermentation of sardine en-hanced good color, aroma and taste. The groups with treat-ment spices had significant difference (p>0.05) than theother groups of the fermented products. Fermented prod-ucts are normally not consumed as such, but they may berather used as condiment to flavor soup and other products.
References
1. Visessanguan W, Benjakul S, Riebroy S, Thepkasikul P (2004)Changes in composition and functional properties of proteinsand their contributions to Nham characteristics. Food Chem66:579–588
2. Kilinc B (2003) Fish sauce technology. EU J Fish Aquatic Sci20(1/2):263–272
3. Fukami K, Satomi M, Funatsu Y, Kawasaki K, Watabe S (2004)Characterization and distribution of Staphylococcus sp. impli-cated for improvement of fish sauce odor. Fish Sci 70:916–923
4. Mizutani T, Kimizuka A, Ruddle K, Ishige N (1992) Chemicalcomponents of fermented fish products. J Food CompositionAnal 5:152–159
5. Oetterer M, Perujo SD, Gallo CR, Ferraz de Arruda L, BorghesiR, Paschoal da Cruz AM (2003) Monitoring the sardine (Sar-dinella Brasiliensis) fermentation process to obtain anchovies.Sci Agric 60(3):511–517
6. Brillantes S, Samosorn W (2001) Determination of histamine infish sauce from Thailand using a solid phase extraction and high-performance liquid chromatography. Fish Sci 67:1163–1168
7. Ostergaard A, Embarek PKB, Wedell-Neergaard C, Huss HH,Gram L (1998) Characterization of anti-listerial lactic acidbacteria isolated from Thai fermented fish products. FoodMicrobiol 15(2):223–233
8. Sanceda NG, Kurata T, Arakawa N (1996) Accelerated fermen-tation process for the manufacture of fish sauce using histidine.J Food Sci 61(1):220–225
9. AOAC (1984). Official methods of analysis, 14th edn. AOAC,Washington, DC
10. Blig EG, Dyer WJ (1959) A rapid method of total lipid extractionand purification. Can J Biochem Physiol 37:911–917
11. AOAC (1990) Official methods of analysis, 14th edn. AOAC,Washington, DC
12. Lima Dos Santos C, James D, Teutscher F (1981) Guidelinesfor chilled fish storage experiments. FAO Fish Tech Pap, 210 p
13. Tarladgis BG, Watts BM, Younathan MS, Dugan L Jr (1960)A distillation method for the quantitative determination ofmalonaldehyde in rancid foods. J Am Oil Chem Soc 37:44–48
14. Vyncke W (1996) Comparison of the official EC method forthe determination of total volatile bases in fish with routinemethods. Arch Lebensmittelhyg 47:110–112
15. FAO (1986) FAO food and nutrition paper manuals of foodquality control food analysis: Quality, adulteration, and testsof identity. Food And Agriculture Organization of the UnitedNations, Rome
16. Harrigan WF, McCance ME (1976) Laboratory methods in foodand dairy microbiology. Academic Press, London
17. Dalgaard P, Jorgensen LV (1999) Cooked and brined shrimpspacked in a modified atmosphere have a shelf life of >7 monthsat 0 ◦C, but spoiled in 4–6 days at 25 ◦C. Int J Food Sci Technol35:431–442
18. Schubring R (2002). Influence of freezing/thawing and frozenstorage on the texture and colour of brown shrimp (Crangoncrangon). Arch Lebensmittelhyg 53(2):34–36
19. Oetterer M, Perujo SD, Gallo CR, et al. (2003) Monitoring thesardine (Sardinella brasiliensis) fermentation process to obtainanchovies. Sci Agric (Piracicaba, Braz.) 60(3):511–517. ISSN0103-9016
20. Soyiri, Ireneous N, Kweku T-D, Wisdom A-A (2003) Pro-ceedings of the 2nd international workshop on food-basedapproaches for a healthy nutrition, Ouagadougou, Burkina Faso,November 23–28, 2003
21. Ijong FG, Ohta Y (1996) Physicochemical and microbiologicalchanges associated with Bakasang processing—A traditionalIndonesian fermented fish sauce. J Sci Food Agric 71:69–74
22. Achinewhu SC, Oboh CA (2002) Chemical, microbiological andsensory properties of fermented fish products from Sardinellasp. in Nigeria. J Aquatic Food Product Technol 11(2):53–59
23. Frazier WC, Westhoff DC (1988) Food microbiology. McGrawHill, New York
24. Lee CH, Lee EH, Lim MH (1986) Characteristics of Koreanfish fermentation technology. Korean J Diet Cult 3:267–279
25. Davison GW, George L, Jackson SK, Young IS, Davies B,Bailey DM, Peters JR, Ashton T (2002) Free Radic Biol Med33(11):1543–1551
26. Aubourg SP (1998) Influence of formaldehyde in the formationof fluorescence related to fish deterioration. Z Lebensm UntersForsch A 206:29–32
27. Schormuller J (1969) Handbuch der Lebensmittel Chemie,Band IV, Fette und Lipoide (Lipids). Springer-Verlag, BerlinHiedelberg New York, pp 872–878
28. Sarojnalini C, Vishwanath W (1995) Nutritional characteristicsof the two fish fermented products. J Indian Fish Assoc25:75–81
29. Chang CM, Ohshima T, Koizumi C (1992) Changes in freeamino acid, organic acid, and lipid compositions of fermentedmackerel “sushi” during processing. Bull Jpn Soc Sci Fish58(10):1961–1969
30. Saisithi P, Kasemsarn B, Liston J, Dollar AM (1966) Microbi-ology and chemistry of fermented fish. J Food Sci 31:105–110
31. Bal VV, Dominova SR (1967) Changes of fish fat during curing.II. Interaction of fish lipids and protein decomposition products.Isv Vyssh Uched Zaved Pishch Tekhnol (2):36
32. Jones NR (1966) Fish flavours. In: Schultz HW, Day EA,Libbey LM (eds) Chemistry and physiology of flavours. AviPublishing, CT, USA, p 267
33. Lovern JL (1962) The lipids of fish and changes occurring inthem during processing and storage. In: Heen E, Kreuzer R(eds) Fish in nutrition. Fishing News (Books), London
34. Amano K (1962) The influence of fermentation on the nutritivevalue of fish with special reference to fermented fish productsof Southeast Asia. In: Heen E, Kreuzer R (eds) Fish in nutrition.Fishing News (Books), London, pp 180–200
35. Pearson D (1962) The chemical analysis of food, 5th edn. J.&A.Churchill, London
36. Reay GA, Shewan JM (1949) The spoilage of fish and itspreservation by chilling. Adv Food Res 2:343–398
37. Tomiyasu Y, Zenitani WB (1957) Spoilage of fish and itspreservation by chemical agents. Adv Food Res 7:41–82
38. Hiltz DF, Lall BS, Lemon DW, Dyer WJ (1976) Deteriorativechanges during frozen storage in fillet and minced flesh of silverhake (Merluccius bilinearis) processed from round fish heldin ice and refrigerated sea water. J Fish Res Bd Can 33:2560–2567
39. Ministerio da Agricultura, Brasıl (1976) Decreto no. 1255, de 25de Junho de 1962. Brasılia, 1976. cap.7, p.76; 78: Regulamentoda inspecao industrial e sanitaria de produtos de origem animal
40. Connell JJ (1975) Control of fish quality. Fishing News, Surrey,177 pp
41. Beirao LH (1979) Parametros de avaliacao da maturacao desardinha(Sardinella brasiliensis) no processo de anchovagem.UNICAMP/FCA, Campinas, 110 pp (Tese-Mestrado)
42. Uchıda M, Ou J, Chen B-W, Yuan C-H, Hang X-H, Chen S-S,Funatsu Y, Kawasaki K-I, Satomi M, Fukuda Y (2005) Effectsof soy sauce koji and lactic acid bacteria on the fermentationof fish sauce from freshwater silver carp Hypophthalmichthysmolitrix. Fish Sci 71(2):422–430
43. . Trombetta G, Di Bona C, Grazi E (2005) The transition ofpolymers into a network of polymers alters per se the wateractivity. Int J Biol Macromol 35:15–18
44. Gibbs PA (1987) Novel use for lactic acid fermentation in foodpreservation. J Appl Bacteriol (Suppl):51S–58S
45. Akande GR, Towuru ET, Ogbonna C (1991) Production,acceptability and storage characteristics of spiced minced fishcake from BY-CATCH. In: Proceedings of the FAO on fisheries,Report No. 467, Accra, Ghana