The Microbiological Safety of Low Water Activity Foods and ...
Upload
independentCategory
view
3download
0
Journal of Water Resource and Protection, 2013, 5, 458-468 doi:10.4236/jwarp.2013.54045 Published Online April 2013 (http://www.scirp.org/journal/jwarp)
Chemical and Microbiological Parameters in Fresh Water and Sediments to Evaluate the Pollution Risk in the Reno River Watershed
(North Italy)
Chiara Ferronato, Monica Modesto, Ilaria Stefanini, Gilmo Vianello, Bruno Biavati, Livia Vittori Antisari
Department of Agricultural Science, Alma Mater Studiorum, University of Bologna, Bologna, Italy Email: [email protected]
Received January 14, 2013; revised February 26, 2013; accepted March 7, 2013
Copyright © 2013 Chiara Ferronato et al. This is an open access article distributed under the Creative Commons Attribution License, which permits unrestricted use, distribution, and reproduction in any medium, provided the original work is properly cited.
ABSTRACT
The European Water Framework (WFD) establishes a framework for the protection and the monitoring condition of all natural superficial waters of the member States. The Italian Legislative Decree n. 156/2006 implements the WFD estab- lishing a monitoring system which foresees a detailed detection of several physical, chemical and microbiological pa- rameters in order to assess the qualitative status of the water body. This study reports the freshwater quality in the Reno river basin (North Italy) from 2003 to 2011. The Reno superficial water was classified as “good” in the mountain sta- tions and at the closed basin while in all the other stations of the Po plain the quality was from “mediocre” to “poor”. The decrease of water quality was due to the flowing of artificial canals that collect discharges the wastewater of sew- age treatment plants, drainage and run-off from the urban, industrial and agricultural lands. In spring-summer 2011, characterized by severe drought, a study on the distribution of pollutants and nutrients in water of the Reno river and its tributaries highlight the impact of highway (Via Emilia) that closes the mountain basin of water courses. Along this street cities and industrial and craft have developed, increasing discharges of pollutants and nutrients in rivers. An in- crease of metals and nutrients was found from upstream to downstream, furthermore the concentration of the microbi- ological faecal indicators were two to three times higher than those determined in the water upstream of urban/industrial settlements. The thresholds of Italian Law for Hg and Pb were exceeding in all most rivers. The sediments analysis was also performed because they can be considered a sink and/or source for pollutants. In many monitoring sites the metals concentrations was higher than the thresholds of Italia Low (data not shown), but the availability of these metals was tested with mixtures of different strength extracting (EDTA, DTPA and water). The coefficient of partition solid/water (Kd) was calculated to evaluate the metals affinity to be in the aqueous phase and it increase as following Cr > Mn > Ni > Pb > Zn > Cu > Cd. Keywords: Water Quality; Sediment Quality; Reno River; Italy; Pollutants
1. Introduction
The chemical, physical and biological pollution of sur- face water is a topic of great attention all over the world. Rivers play an important role since they collect munici- pal and industrial wastewaters but also they collect pollu- tion from agricultural activities. Studies on water con- tamination have developed over the last 20 years with a view to monitoring and preventing water pollution. At international level there are different guideline systems for monitoring and assessing the quality of aquatic eco- systems. The European community, in the Water Frame-
work Directive 2000/60/EC (WFD) proposes an analytic method based on the detection of several physical, che- mical and biological parameters in order to be summa- rized in a quality index. The European objective is to obtain a “good” quality status for all the natural superfi- cial waters within the Member States by 2015. Chemical analysis of freshwater can quantify nutrients and pollut- ants in aquatic environments, but provides no direct in- dication of the potential toxic effects of these metals on aquatic biota. The excess nutrients may lead to various problems including an increase of algal bloom, loss of
Copyright © 2013 SciRes. JWARP

C. FERRONATO ET AL. 459
oxygen, fish deaths and loss of biodiversity. Agricultural and urban activities are considered to be major sources of N and P in aquatic ecosystems [1-4], while metals are collected in rivers from a variety of sources, either natu- ral or anthropogenic [5,6]. Pollutants may accumulate in microorganisms, aquatic flora and fauna and enter the human food chain. In the aquatic environment there is a continuous adsorption and desorption process between water column and bed sediment: studying these dynamics is the key to understanding the behavior of toxicants in a lotic system and its biological life. Because of different physico-chemical processes (e.g. adsorption, hydrolysis, co-precipitation) only a small portion of free metals are dissolved in water while a larger amount is deposited in sediments [7]. The ability of sediments to faithfully re- cord the “environmental impact” on freshwater ecosys- tems over time is demonstrated [8-10]. Sediment pro- vides habitats for benthic organisms, for microbial and fungal populations, and for all the species which reflect the quality and health of the ecosystem [11]. Contami- nants are not necessarily fixed permanently by the sedi- ments, and under changing environmental conditions they may be released into the water column by various processes of remobilization [12]. The marked tendency for heavy metals towards solid and water phase parti- tioning and the ability of sediments to integrate long- term information makes the sediments attractive for as- sessing the impact of industry and urban development on the fluvial environment [13,14]. Sediment contamination is indeed a worldwide problem, especially in industrial- ized countries, even though the response to this problem varies in terms of jurisdictions [15]. The Reno river is one of the most important water bodies of northern Italy to have affected the hydrographic system and develop- ment of the Po Valley (North Italy). The current con- figuration of the Reno basin is due to historical remedia- tion (from the Roman Age to the early years of the last century). The protection of the hydraulic system has led to strong anthropogenic waterways to the detriment of their naturalness, and also the presence of industrial and urban settlements has similarly decreased the quality of the water. The aim of this work was therefore to evaluate the water quality of the Reno watershed from 2003 to 2008. Besides, to understand the dynamics of water pol- lution and sediment in the Reno basin, the Via Emilia, a main road on which the majority of civil and industrial settlements are located and which is crossed by 104 - 105 vehicles per day [16], was taken as a watershed of human activities. For this reason the variations of microbiologi- cal and chemical pollutants in the river Reno and its tri- butaries were studied up- and downstream of the Via Emilia during the period spring-summer 2011. In fact, in this season the rainfall is low and the rivers are fed only by wastewater from urban and industrial centers.
2. Material and Methods
2.1. Study Area
The basin of the river Reno has a total area of 4930 sq km. The territorial network composed by the river and its tributaries is the result of the countless conversions made since Roman times, in terms of extensive remediation and hydraulic protection. The reclamation of the plain has led to a radical change in the river basin where the surface water, beyond the Via Emilia, flows within arti- ficial embankments that carry the river water to the Adri- atic Sea. The mountains of Corno alle Scale (1945 m a.s.l.) and Monte Orsigna (1555 m a.s.l.) catch the wa- tershed of the Reno river basin, with elevations varying from 1500 to 500 m a.s.l., and the territory is formed by a wide range of major and minor valleys arranged in a south-western and north-eastern direction. The hills fi- nally meet the Via Emilia, where many towns and artisan industries have developed. The geology of the hills is characterized by gullies and outcrops of gypsum, while behind them the last stretch of the high-end plain, be- tween 100 and 50 m a.s.l., consists of fluvial sediment that has given rise to the formation of cones. The area of the Via Emilia is characterized by alluvial deposits, formed by river waters over the centuries. The alluvial deposits (gravel, sand, silt) are of different sizes and these have formed cones in the direction of the plain. The plain itself is characterized by the vertical overlap of se- dimentary bodies and was formed during the flooding of many rivers in the course of history.
The Reno river basin lies between the Apennines and the Adriatic sea, in a northern temperate zone, to the south-central border of the Po Valley.
Table 1 shows the average rainfall in the mountain ba- sin of the river Reno. The less rainy months were from May to August, while those of autumn-winter were cha- racterized by higher rainfall.
2.2. Water and Sediment Sampling Survey
The water quality of Reno and its tributaries was moni- tored each month in different stations from 2003 to 2011, as established by Italian law (Legislative Decree 152/ 2006) by Agency of Environmental Protection of Emilia Romagna Region (ARPA-Emilia Romagna). The moni- toring stations (Figure 1), starting from the Apennines (193 m a.s.l.) from upstream to downstream are: Vergato (VE), Casalecchio di Reno (CR, closure of the mountain basin—70 m a.s.l.), Pieve di Cento (PC, after the conflu- ence of the artificial high water canals of the Dosolo and those of low water, and the stream Samoggia into the river Reno), Malabergo (MA, after the confluence into the river Reno of the artificial canal that passes through Bologna) and Bastia (BA, where the stream Idice and Sillaro flow into the Reno river). The Reno tributaries
Copyright © 2013 SciRes. JWARP
C. FERRONATO ET AL.
Copyright © 2013 SciRes. JWARP
460
Table 1. Average rainfall (1997-2010) in the mountain basin of the Reno watershed (data are expressed as mm of rainfall).
River Pluviometric station 1 2 3 4 5 6 7 8
Reno (REN) Porretta (352 m asl) 71 113 158 25 19 92 49 4
Samoggia (SAM) Monte Ombraro (700 m asl) 49 67 117 28 25 110 65 0
Idice (IDI) Loiano (741 m asl) 56 64 83 26 21 150 33 0
Sillaro (SIL) San Clemente (166 m asl) 62 65 96 17 47 108 63 0
Santerno (SAN) Fiorenzuola (476 m asl) 79 96 167 27 18 108 49 0
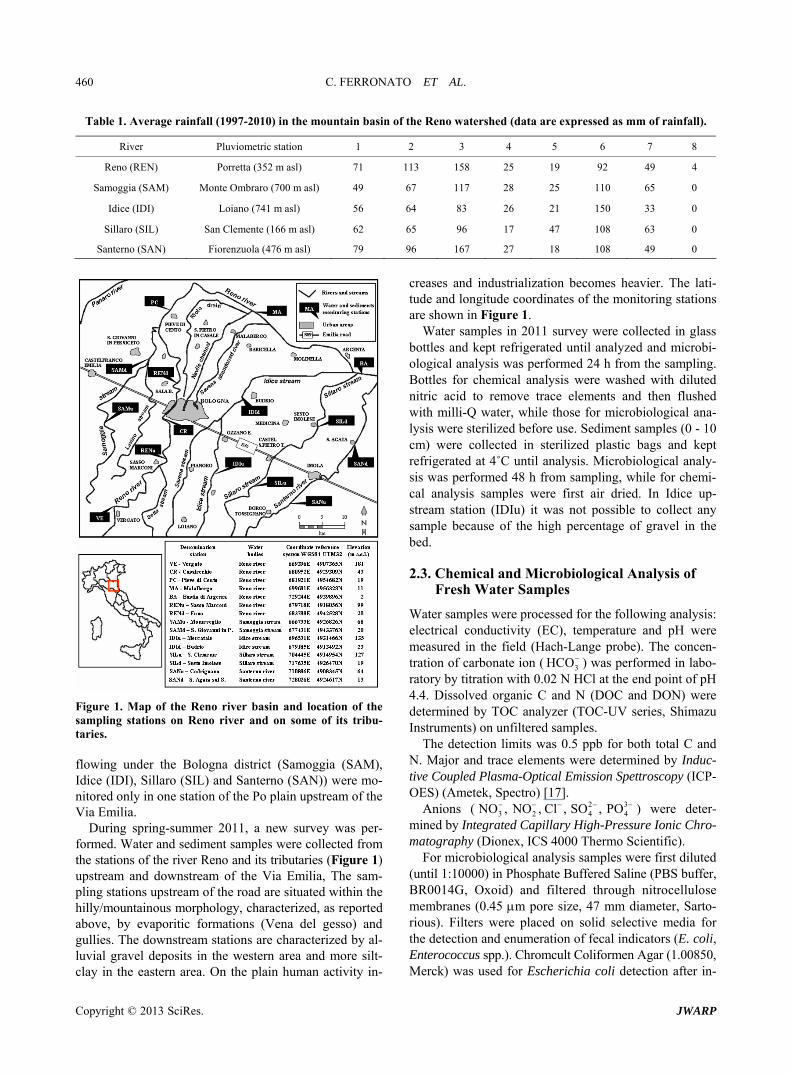
Figure 1. Map of the Reno river basin and location of the sampling stations on Reno river and on some of its tribu- taries. flowing under the Bologna district (Samoggia (SAM), Idice (IDI), Sillaro (SIL) and Santerno (SAN)) were mo- nitored only in one station of the Po plain upstream of the Via Emilia.
During spring-summer 2011, a new survey was per- formed. Water and sediment samples were collected from the stations of the river Reno and its tributaries (Figure 1) upstream and downstream of the Via Emilia, The sam- pling stations upstream of the road are situated within the hilly/mountainous morphology, characterized, as reported above, by evaporitic formations (Vena del gesso) and gullies. The downstream stations are characterized by al- luvial gravel deposits in the western area and more silt- clay in the eastern area. On the plain human activity in-
creases and industrialization becomes heavier. The lati- tude and longitude coordinates of the monitoring stations are shown in Figure 1.
Water samples in 2011 survey were collected in glass bottles and kept refrigerated until analyzed and microbi- ological analysis was performed 24 h from the sampling. Bottles for chemical analysis were washed with diluted nitric acid to remove trace elements and then flushed with milli-Q water, while those for microbiological ana- lysis were sterilized before use. Sediment samples (0 - 10 cm) were collected in sterilized plastic bags and kept refrigerated at 4˚C until analysis. Microbiological analy- sis was performed 48 h from sampling, while for chemi- cal analysis samples were first air dried. In Idice up- stream station (IDIu) it was not possible to collect any sample because of the high percentage of gravel in the bed.
2.3. Chemical and Microbiological Analysis of Fresh Water Samples
Water samples were processed for the following analysis: electrical conductivity (EC), temperature and pH were measured in the field (Hach-Lange probe). The concen- tration of carbonate ion ( 3 ) was performed in labo- ratory by titration with 0.02 N HCl at the end point of pH 4.4. Dissolved organic C and N (DOC and DON) were determined by TOC analyzer (TOC-UV series, Shimazu Instruments) on unfiltered samples.
HCO
The detection limits was 0.5 ppb for both total C and N. Major and trace elements were determined by Induc- tive Coupled Plasma-Optical Emission Spettroscopy (ICP- OES) (Ametek, Spectro) [17].
Anions ( 42
3 2 4NO , NO , Cl , SO , PO3 ) were deter- mined by Integrated Capillary High-Pressure Ionic Chro- matography (Dionex, ICS 4000 Thermo Scientific).
For microbiological analysis samples were first diluted (until 1:10000) in Phosphate Buffered Saline (PBS buffer, BR0014G, Oxoid) and filtered through nitrocellulose membranes (0.45 m pore size, 47 mm diameter, Sarto- rious). Filters were placed on solid selective media for the detection and enumeration of fecal indicators (E. coli, Enterococcus spp.). Chromcult Coliformen Agar (1.00850, Merck) was used for Escherichia coli detection after in-

C. FERRONATO ET AL. 461
cubation in aerobic conditions at 44˚C for 24 h. E. coli typically appears as blue/purple colonies whereas coli- forms appear as red/rose colonies. Testing for indole pro- duction and citocrome oxidase activity gave further con- firmation of the microorganism identity.
Slanetz & Bartley (1.05262, Merck), selective agar Wa used for Enterococcus spp. detection after incubation in aerobic conditions for 48 h at 37˚C. Membranes with red-maroon or pink colonies were then transferred to plates with Bile Aesculine Azide Agar (100072, Merck) and incubated for 2 h at 44˚C. Colonies that turned dark brown to black with a typical dark halo were considered to be fecal enterococci colonies.
Colonies were enumerated and the results were ex- pressed in CFU/100mL, according to the following equa- tion:
C A N Vs F B Vt
where C = n. of colonies confirmed in 100 ml; A = n. of colonies confirmed; B = n. of colonies to confirm; N = n. of colonies suspected; T = volume of sample analyzed; Vs = reference volume (100 ml); F = dilution factor.
2.4. Chemical and Microbiological Analysis of Sediment Samples
Sediment samples were air-dried and sieved to 2 mm. Electrical conductivity (EC, Orion) was performed on the 1:2.5 ratio w:v with distilled and on the same ratio pH was determined by potenziometric pHmeter (pH metro, Crison). Total carbonate (CaCO3) were quantified by vo- lumetric method, according to Dietrich-Fruehing. Total C (TOC) was determined according to Springer and Klee (1954) methodology [18] while Total Nitrogen (TN) with Kjeldahl method [19]. The major and trace elements con- centrations were carried out in aqua regia where 250 mg of sample, finely ground in agate mortar, ware digested in microwave oven (Millestone, 1200) with 6 mL HCl and 2 mL HNO3, suprapure (Carlo Erba), brought to 20 ml with milli-Q water, filtered on Wathmann 42. The so- lution was detect by ICP-OES. For the available metals fraction, 2.5 g of sediment sample was extracted in 25 ml EDTA (ethylenediaminetetraacetic acid buffered to pH 4.65 with ammonium acetate and acetic acid) and 10 g were extracted in 20 ml DTPA (diethylenetriamine pen- taacetic acid + TEA buffered to pH 7.3) [20]. The sus- pensions were shacked for 1 h and, after filtration with Wathman 42, the solution was detected for Cd, Co, Cr, Cu, Ni, Pb, Zn by ICP-OES. 10 g of sediment sample were extracted with distilled water (1:10 w:v) shacked for 16 h, centrifugated and filtrated with Millipore sys- tem at 0.45 µm; the solution was analyzed by ICP-OES. The partitioning coefficient Kd (l/kg, [21]) was calcu- lated according to the following equation:
Kd Cs Cw
where Cs is the pseudo total metal concentration ex- tracted with acqua regia (mg·kg−1), and Cw is the dis- solved metal concentration extracted with deionized wa- ter (mg·kg−1). Results were then expressed as log value.
Spores of Clostridium spp. were detected according to [22] with slight modifications. Breafly, 15 g of sediment sample were first placed in 135 ml of sterile Phosphate Buffered Saline (PBS buffer, BR0014G, Oxoid) plus Tween 80 (0.1%, V/V) and then stirred for 30 min to standardize the mixing. A further serial dilution (1:100) of each samples was heated at 85˚C for 10 min to facili- tate the sporulation. Each dilution (10−1 and 10−2) was tested in quintuplicate by seeding 0.5 mL of the suspen- sion in Sulfite Polymyxin Sulfadiazine Agar (110,235, Merck) and incubated in anaerobic conditions at 37˚C for 24 ± 1 h. Suspected Clostridium perfrigens black colo- nies were purified in Tryptone Soya Agar (1.05458, Merck) and identified by catalase production and bio- chemical profile (API 20 A, Biomerieux).
3. Results
3.1. Water Quality
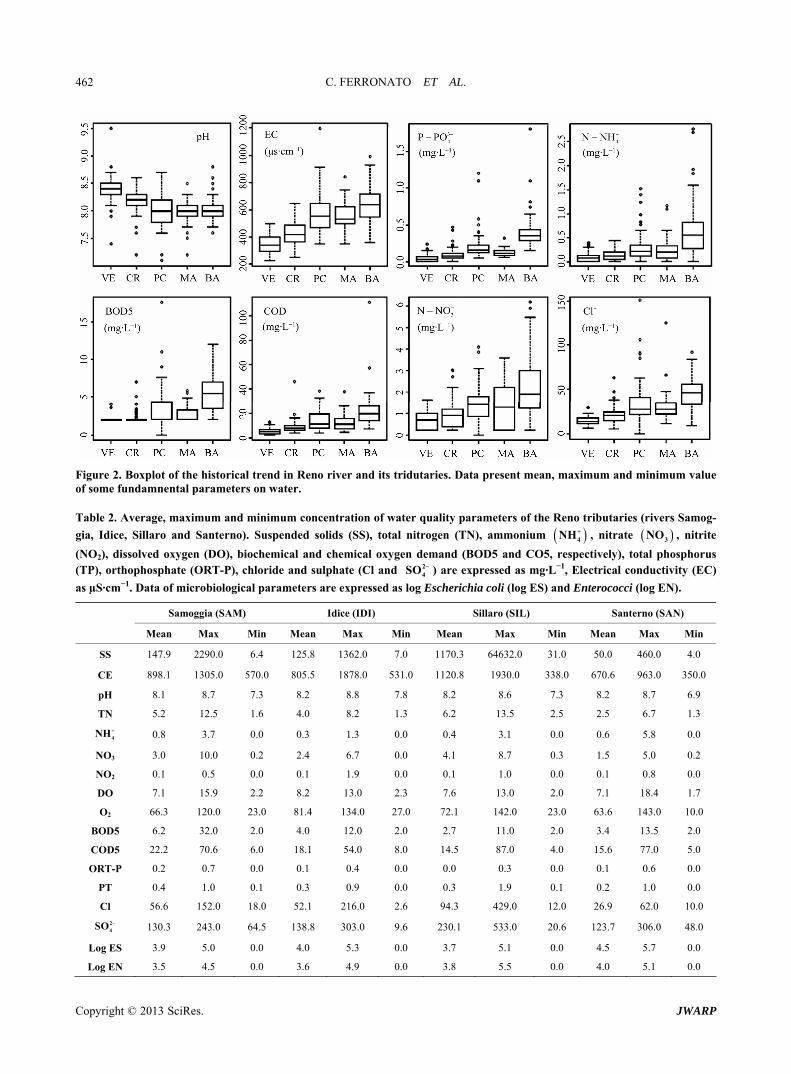
The water quality of Reno river from 2003 to 2011 was classified as “good” in the mountain stations and at the closed basin (VE and CR, respectively) while in all the other stations of the plain the quality was “mediocre” and “poor”. This trend is clearly evident in the box plot con- structed from the chemical and physical data of the time series (Figure 2). The deterioration of the water quality followed the increase in electrical conductivity (EC) and nutrient load and the first critical point was the PC sta- tion, after the closure of the basin, where Samoggia (SAM) river and the network of artificial drainage canals with a high pollutants load [23] flow into Reno. Similarly, in Bastia station (BA) high pollutants load were found after confluence of Sillaro (SIL), Idice (IDI) and artificial canals (Canale Navile and Savena Abbandonato) which cross the Bologna city and collect its municipal and in- dustrial wastewater. The nutrients concentration were high with an average amount of 4 and NH 3
4PO of 6 and 3 mg·L−1 respectively, showing an endpoint of 12 mg
14NH L and 7 mg 3
4PO L 1 (data not shown, authors’ communication). The percentage of dissolved oxygen decreases to 4% - 5% so that the quality of water in Reno was compromised. From station PC to BA Reno river was able to self-purify by pollutants, decreasing their concentrations at the Malabergo (MA) station as shown in Figure 2.
The self-purification capacity of Reno was compro- mised by the poor water quality of its tributaries than that of the artificial canals network (Table 2). The water qua- lity of tributaries was classified “poor” every years ac- cording to Italian Law (D. lgs 152/2006). The values of EC in the water of the tributaries increase as follows:
Copyright © 2013 SciRes. JWARP
C. FERRONATO ET AL.
Copyright © 2013 SciRes. JWARP
462
Figure 2. Boxplot of the historical trend in Reno river and its tridutaries. Data present mean, maximum and minimum value of some fundamnental parameters on water. Table 2. Average, maximum and minimum concentration of water quality parameters of the Reno tributaries (rivers Samog-
gia, Idice, Sillaro and Santerno). Suspended solids (SS), total nitrogen (TN), ammonium 4NH , nitrate 3NO , nitrite
(NO2), dissolved oxygen (DO), biochemical and chemical oxygen demand (BOD5 and CO5, respectively), total phosphorus (TP), orthophosphate (ORT-P), chloride and sulphate (Cl and 2
4SO ) are expressed as mg·L−1, Electrical conductivity (EC)
as µS·cm−1. Data of microbiological parameters are expressed as log Escherichia coli (log ES) and Enterococci (log EN).
Samoggia (SAM) Idice (IDI) Sillaro (SIL) Santerno (SAN)
Mean Max Min Mean Max Min Mean Max Min Mean Max Min
SS 147.9 2290.0 6.4 125.8 1362.0 7.0 1170.3 64632.0 31.0 50.0 460.0 4.0
CE 898.1 1305.0 570.0 805.5 1878.0 531.0 1120.8 1930.0 338.0 670.6 963.0 350.0
pH 8.1 8.7 7.3 8.2 8.8 7.8 8.2 8.6 7.3 8.2 8.7 6.9
TN 5.2 12.5 1.6 4.0 8.2 1.3 6.2 13.5 2.5 2.5 6.7 1.3
4NH 0.8 3.7 0.0 0.3 1.3 0.0 0.4 3.1 0.0 0.6 5.8 0.0
NO3 3.0 10.0 0.2 2.4 6.7 0.0 4.1 8.7 0.3 1.5 5.0 0.2
NO2 0.1 0.5 0.0 0.1 1.9 0.0 0.1 1.0 0.0 0.1 0.8 0.0
DO 7.1 15.9 2.2 8.2 13.0 2.3 7.6 13.0 2.0 7.1 18.4 1.7
O2 66.3 120.0 23.0 81.4 134.0 27.0 72.1 142.0 23.0 63.6 143.0 10.0
BOD5 6.2 32.0 2.0 4.0 12.0 2.0 2.7 11.0 2.0 3.4 13.5 2.0
COD5 22.2 70.6 6.0 18.1 54.0 8.0 14.5 87.0 4.0 15.6 77.0 5.0
ORT-P 0.2 0.7 0.0 0.1 0.4 0.0 0.0 0.3 0.0 0.1 0.6 0.0
PT 0.4 1.0 0.1 0.3 0.9 0.0 0.3 1.9 0.1 0.2 1.0 0.0
Cl 56.6 152.0 18.0 52.1 216.0 2.6 94.3 429.0 12.0 26.9 62.0 10.0
2
4SO 130.3 243.0 64.5 138.8 303.0 9.6 230.1 533.0 20.6 123.7 306.0 48.0
Log ES 3.9 5.0 0.0 4.0 5.3 0.0 3.7 5.1 0.0 4.5 5.7 0.0
Log EN 3.5 4.5 0.0 3.6 4.9 0.0 3.8 5.5 0.0 4.0 5.1 0.0

C. FERRONATO ET AL. 463
SIL SAM ISI SAN while the highest nutrient load was detected in water of SIL and SAM streams.
The dissolved oxygen varied from an average per- centage of 90 in SAN to 66 to 75% for the other tribu- taries. BOD5 and COD in SAM water were two and three times higher than the other fresh waters while high amount of chlorides and sulfates was detected in SIL stream. The water quality of both Reno and its tributaries was compromised by a high number of colonies of pa- thogen microorganisms. In particular the maximum num- ber of colonies of both Escherichia coli and Enterococ- cus spp. in Reno was of 15,000 and 10,000 CFU 100 mL−1 in the VE and CR stations, respectively, increasing to 68,000 and 63,000 CFU 100 mL−1 in the stations on the plain (e.g. PC and BA). The presence of E. coli colo-
nies varies as follows: IDI (220,000 CFU 100 mL−1) > SIL (127,000 CFU 100 mL−1) SAM (11,800 CFU 100 mL−1) > SAN (8000 CFU 100 mL−1), while the av- erage of the Enterococcus spp. colonies are 300,000 CFU 100 mL−1 in SIL and 73,000 CFU 100 mL−1 in IDI; lower values are found for SAM and SAN (7.800 and 600 CFU 100 mL−1 respectively). The percentage of Salmonella spp. in the Reno water ranges from 21 to 31% of positive cases of pathogen presence, while in the tributaries it is as follows: SIL 20%, IDI 28%, SAM 31% and SAN 37%.
?
The results obtained by Spring-Summer 2011 survey were showed in Table 3. High amount of major anion (e.g. 3NO , Cl−, 2
4SO and 3 ), nutrient load (dis- solved organic C, N, S and ) and pathogen micro-
HCO
34PO
Table 3. Mean concentration of chemical-physical and microbiological elements in up- and downstream stations. Chemical parameters are expressed as mg·L−1, CE is expressed as µS·cm−1 and microbiological parameters are expressed as CFU 100 mL−1.
Upstream stations 3HCO
3NO 2NO 2
4SO Cl− TDS pH CE FC E. coli EN DOM DON DOS 3
4PO
IDI u Mean 112.9 2.19 0.12 28.73 54.41 339 8.2 644 246 598 242 2.64 0.58 4.02 0.44
Max 137.2 3.69 0.44 47.85 60.33 437 8.4 830 1100 2000 540 3.93 0.73 11.49 1.04
Min 91.8 1.04 0.01 13.14 42.14 192 7.9 365 10 130 76 1.73 0.33 0.10 0.01
REN u Mean 71.7 0.98 0.02 15.41 17.06 168 8.1 319 44 512 69 2.22 1.40 2.55 0.04
Max 76.3 2.08 0.03 25.15 29.56 242 8.5 460 100 2000 110 2.79 2.65 5.82 0.07
Min 68.6 0.22 0.01 8.47 7.56 123 7.7 234 0 60 20 1.82 0.50 0.10 0.01
SAM u Mean 106.9 6.55 0.03 33.66 51.50 392 8.1 745 1566 452 452 2.22 0.76 8.45 0.04
Max 127.8 14.13 0.06 42.71 63.91 655 8.2 1245 7000 700 1270 2.83 1.05 32.09 0.08
Min 87.2 1.28 0.01 24.11 45.18 241 7.8 458 80 90 112 1.53 0.38 0.10 0.01
SAN u Mean 107.0 1.04 0.01 65.31 38.20 334 8.0 634 35 72 30 3.29 0.96 15.64 0.04
Max 156.8 2.78 0.03 145.34 54.90 537 8.4 1020 90 200 80 4.39 1.22 41.40 0.07
Min 75.4 0.01 0.00 11.36 22.96 225 7.3 429 0 3 11 2.74 0.67 5.29 0.01
SIL u Mean 96.7 1.82 0.12 29.79 81.52 455 8.0 865 107 113 72 3.14 0.83 33.25 0.04
Max 108.9 4.46 0.54 53.18 117.29 855 8.5 1625 400 200 103 5.00 1.27 107.35 0.05
Min 76.9 0.01 0.00 14.14 17.28 183 7.6 347 12 21 11 2.22 0.30 0.10 0.02
Downstream stations
IDI d Mean 117.5 4.83 0.17 42.36 62.07 375 8.0 713 314 1471 739 3.14 2.58 6.95 0.19
Max 151.4 7.14 0.38 86.18 66.83 484 8.1 920 1400 7000 3300 5.27 6.04 22.01 0.43
Min 93.6 3.67 0.03 20.15 56.52 184 7.9 349 0 0 45 2.43 0.64 0.10 0.04
REN d Mean 77.0 3.99 0.04 28.50 34.56 227 8.0 431 563 721 594 3.86 1.64 2.25 0.05
Max 112.5 16.51 0.06 38.53 67.83 295 8.4 561 2200 2200 2000 5.63 2.91 7.41 0.09
Min 61.5 0.47 0.00 21.72 22.10 132 7.4 250 20 7 0 2.04 0.57 0.10 0.02
SAM d Mean 136.2 5.51 0.05 47.58 49.56 421 8.1 801 2780 2931 525 2.90 1.10 25.00 0.24
Max 178.8 13.49 0.18 67.21 75.77 537 8.4 1020 13,000 13,000 2000 5.04 1.70 104.56 0.45
Min 86.3 0.17 0.00 13.57 15.97 236 7.7 449 20 176 80 1.26 0.27 0.10 0.10
SAN d Mean 109.3 3.89 0.06 73.83 51.11 410 8.0 780 1064 1280 199 3.90 1.75 9.30 0.25
Max 150.2 5.19 0.19 143.82 69.99 650 8.5 1235 5000 5000 660 5.08 2.04 15.73 0.54
Min 69.6 2.24 0.00 16.22 24.03 220 7.5 418 40 48 14 2.81 1.19 0.10 0.01
SIL d Mean 135.7 22.21 0.17 112.65 111.57 657 8.1 1250 1720 12,772 3272 3.78 3.12 9.71 0.27
Max 196.9 34.46 0.44 260.04 138.23 972 8.4 1848 6000 41,000 12,800 4.90 5.00 48.13 0.47
Min 77.0 6.66 0.00 20.76 95.20 404 7.8 768 40 220 60 3.22 1.06 0.10 0.08
Copyright © 2013 SciRes. JWARP
C. FERRONATO ET AL. 464
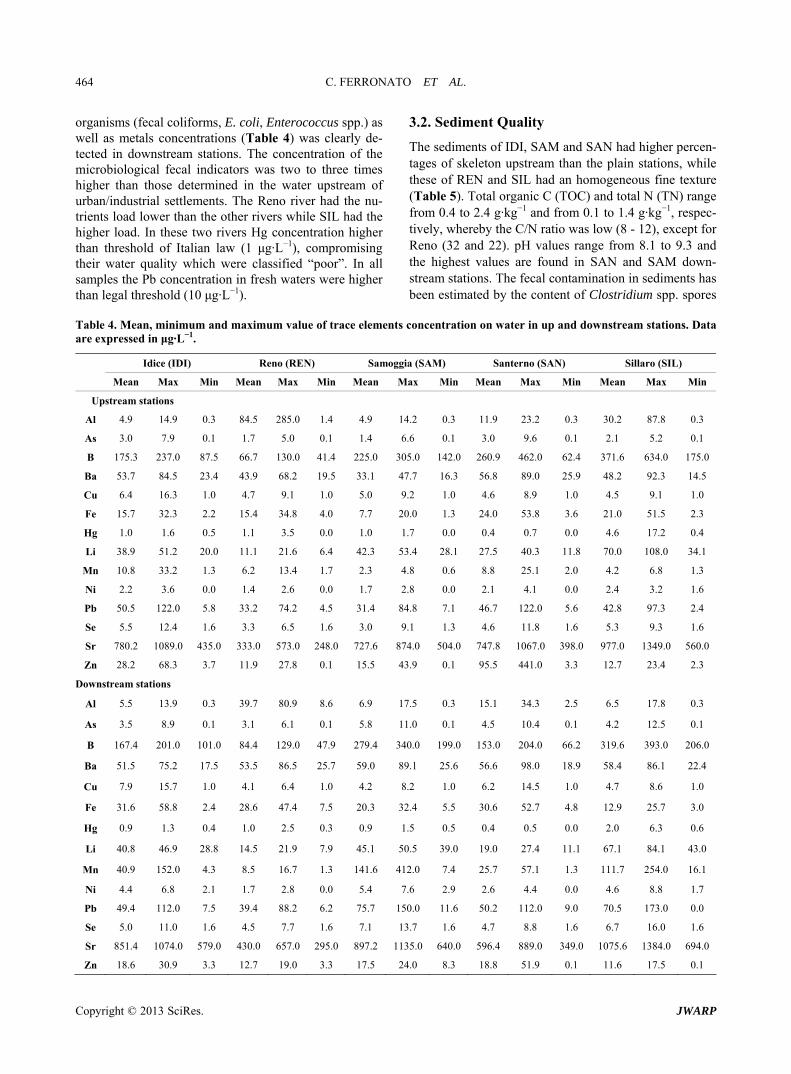
organisms (fecal coliforms, E. coli, Enterococcus spp.) as well as metals concentrations (Table 4) was clearly de- tected in downstream stations. The concentration of the microbiological fecal indicators was two to three times higher than those determined in the water upstream of urban/industrial settlements. The Reno river had the nu- trients load lower than the other rivers while SIL had the higher load. In these two rivers Hg concentration higher than threshold of Italian law (1 μg·L−1), compromising their water quality which were classified “poor”. In all samples the Pb concentration in fresh waters were higher than legal threshold (10 μg·L−1).
3.2. Sediment Quality
The sediments of IDI, SAM and SAN had higher percen- tages of skeleton upstream than the plain stations, while these of REN and SIL had an homogeneous fine texture (Table 5). Total organic C (TOC) and total N (TN) range from 0.4 to 2.4 g·kg−1 and from 0.1 to 1.4 g·kg−1, respec- tively, whereby the C/N ratio was low (8 - 12), except for Reno (32 and 22). pH values range from 8.1 to 9.3 and the highest values are found in SAN and SAM down- stream stations. The fecal contamination in sediments has been estimated by the content of Clostridium spp. spores
Table 4. Mean, minimum and maximum value of trace elements concentration on water in up and downstream stations. Data are expressed in μg·L−1.
Idice (IDI) Reno (REN) Samoggia (SAM) Santerno (SAN) Sillaro (SIL)
Mean Max Min Mean Max Min Mean Max Min Mean Max Min Mean Max Min
Upstream stations
Al 4.9 14.9 0.3 84.5 285.0 1.4 4.9 14.2 0.3 11.9 23.2 0.3 30.2 87.8 0.3
As 3.0 7.9 0.1 1.7 5.0 0.1 1.4 6.6 0.1 3.0 9.6 0.1 2.1 5.2 0.1
B 175.3 237.0 87.5 66.7 130.0 41.4 225.0 305.0 142.0 260.9 462.0 62.4 371.6 634.0 175.0
Ba 53.7 84.5 23.4 43.9 68.2 19.5 33.1 47.7 16.3 56.8 89.0 25.9 48.2 92.3 14.5
Cu 6.4 16.3 1.0 4.7 9.1 1.0 5.0 9.2 1.0 4.6 8.9 1.0 4.5 9.1 1.0
Fe 15.7 32.3 2.2 15.4 34.8 4.0 7.7 20.0 1.3 24.0 53.8 3.6 21.0 51.5 2.3
Hg 1.0 1.6 0.5 1.1 3.5 0.0 1.0 1.7 0.0 0.4 0.7 0.0 4.6 17.2 0.4
Li 38.9 51.2 20.0 11.1 21.6 6.4 42.3 53.4 28.1 27.5 40.3 11.8 70.0 108.0 34.1
Mn 10.8 33.2 1.3 6.2 13.4 1.7 2.3 4.8 0.6 8.8 25.1 2.0 4.2 6.8 1.3
Ni 2.2 3.6 0.0 1.4 2.6 0.0 1.7 2.8 0.0 2.1 4.1 0.0 2.4 3.2 1.6
Pb 50.5 122.0 5.8 33.2 74.2 4.5 31.4 84.8 7.1 46.7 122.0 5.6 42.8 97.3 2.4
Se 5.5 12.4 1.6 3.3 6.5 1.6 3.0 9.1 1.3 4.6 11.8 1.6 5.3 9.3 1.6
Sr 780.2 1089.0 435.0 333.0 573.0 248.0 727.6 874.0 504.0 747.8 1067.0 398.0 977.0 1349.0 560.0
Zn 28.2 68.3 3.7 11.9 27.8 0.1 15.5 43.9 0.1 95.5 441.0 3.3 12.7 23.4 2.3
Downstream stations
Al 5.5 13.9 0.3 39.7 80.9 8.6 6.9 17.5 0.3 15.1 34.3 2.5 6.5 17.8 0.3
As 3.5 8.9 0.1 3.1 6.1 0.1 5.8 11.0 0.1 4.5 10.4 0.1 4.2 12.5 0.1
B 167.4 201.0 101.0 84.4 129.0 47.9 279.4 340.0 199.0 153.0 204.0 66.2 319.6 393.0 206.0
Ba 51.5 75.2 17.5 53.5 86.5 25.7 59.0 89.1 25.6 56.6 98.0 18.9 58.4 86.1 22.4
Cu 7.9 15.7 1.0 4.1 6.4 1.0 4.2 8.2 1.0 6.2 14.5 1.0 4.7 8.6 1.0
Fe 31.6 58.8 2.4 28.6 47.4 7.5 20.3 32.4 5.5 30.6 52.7 4.8 12.9 25.7 3.0
Hg 0.9 1.3 0.4 1.0 2.5 0.3 0.9 1.5 0.5 0.4 0.5 0.0 2.0 6.3 0.6
Li 40.8 46.9 28.8 14.5 21.9 7.9 45.1 50.5 39.0 19.0 27.4 11.1 67.1 84.1 43.0
Mn 40.9 152.0 4.3 8.5 16.7 1.3 141.6 412.0 7.4 25.7 57.1 1.3 111.7 254.0 16.1
Ni 4.4 6.8 2.1 1.7 2.8 0.0 5.4 7.6 2.9 2.6 4.4 0.0 4.6 8.8 1.7
Pb 49.4 112.0 7.5 39.4 88.2 6.2 75.7 150.0 11.6 50.2 112.0 9.0 70.5 173.0 0.0
Se 5.0 11.0 1.6 4.5 7.7 1.6 7.1 13.7 1.6 4.7 8.8 1.6 6.7 16.0 1.6
Sr 851.4 1074.0 579.0 430.0 657.0 295.0 897.2 1135.0 640.0 596.4 889.0 349.0 1075.6 1384.0 694.0
Zn 18.6 30.9 3.3 12.7 19.0 3.3 17.5 24.0 8.3 18.8 51.9 0.1 11.6 17.5 0.1
Copyright © 2013 SciRes. JWARP

C. FERRONATO ET AL. 465
Table 5. Sediment characterization by Skeleton (Sk) and fine earth percentage and some macro descriptors. EC is expressed as µS·cm−1, CaCO3 and Total Organic Carbon (TOC) are expressed as percentage value. Total Nitrogen (TN), Total Phos- phorous (TP) and Total Sulfur (TS) are expressed as mg·kg−1. Clostridium spp. (Clos) are expressed as CFU·g−1.
Sk Fine earth pH EC CaCO3 TOC TN TP TS Clos
IDI d 81.3 18.7 8.99 175 18.4 0.4 0.5 413 708 400
REN u 1.6 95.4 8.16 379 25.5 2.4 0.6 433 969 8000
REN d 5.8 94.2 9.22 140 20.5 0.6 0.3 216 362 700
SAM u 95.2 4.8 8.84 259 37.2 0.5 0.4 278 1382 800
SAM d 0.4 99.6 9.32 113 17.3 1.5 1.4 350 612 400
SAN u 59.5 40.5 8.54 334 31.3 0.3 0.3 334 629 1800
SAN d 4.3 95.6 9.32 113 17.3 1.5 1.4 764 910 400
SIL u 0 100 9.04 142 12.9 0.7 0.8 343 664 560
SIL d 4.1 95.9 8.1 539 20.1 0.1 0.1 343 1152 5000
which were higher in upstream Reno and SAN than the other river, an increasing trend was found in SIL. The co- efficient of correlation (data not shown) showed that en- richment of Clostridium spores were influenced by in- crease of EC and total organic C and S and by decrease of pH value.
The metals concentration in sediments increased from upstream to downstream and in SAN they exceeded the threshold value for Pb and Sn (100 and 1 mg·kg−1, re- spectively) (Table 6). The percentage of available metals on total aqua regia determination decreased as a function of extracting solutions (Figure 3). As expected EDTA, an acid chelate agent (pH 4.65), extracted a greater amount than DTPA (pH 7.3), while deionized water was the weakest extract agent. The mobility of metals in the aquatic system was usually studied by the partitioning coefficient (Kd) from liquid phase and sediments. The lo- garithmic values of this coefficient ranged from 1.9 for Cd to 4.3 for Cr whereby the Kd decreased as follows:
. Cr Mn Ni Pb Zn Cu Cd
4. Discussions
The water quality of the Reno basin is strongly influ- enced by human impact related to the very high density of inhabitants. When Reno river flows in the plain its bed is hanging and its river banks manifest a reduced biodi- versity vegetation [23]; despite this, Reno river is able to implement processes of self-purification. The type of land cover can influence the water quality, which can im- prove greatly in forest areas [24] compared to agricul- tural land, where pollution is widespread. The riparian vegetation of Reno is able to decrease the pollutants and nutrients load between PC and BA stations, when no natural tributaries or artificial canals flow into its water, despite that the land-use of the plain is prevalently agri- cultural.
The Spring-Summer 2011 survey highlights how the settlements of the Via Emilia are the main cause of pol-
lution due to an increase of nutrients load, pathogens and contaminants [25]. The high concentrations of N and P downstream are due to urban wastewater discharge [7] rather than runoff from agricultural land [25]. In this re- cent years, a severe doughty in Spring and Summer time is characterized by low rainfall and increasing of the evaporation process, while the minimum vital outflow of rivers decreases and consequently the concentrations of pollutants increase. Indeed, under this latter condition the increase in EC was correlated to an increase in the nutri- ent load [26]. In this season only episodic storms that increase the soil losses due to soil erosion were observed, that fail to dilute the content of water pollutants. Tem- perature and rainfall can affect the some microorganisms growth and permanence such as E. coli and Enterococcus spp. [27,28]. The increase of pollutants load (e.g. Pb and Zn) in water can be expected with the reduction of flow, whereby the decrease of pathogens concentration can be due to high concentrations of metals (e.g. Hg and Pb) discharges in rivers. The enrichment of metals and nutri- ents concentrations in sediments, especially in those with the fine texture, highlights that the adsorption process is the prevailing self-purification mechanism [29]. As well as the sediments represent a memory of aquatic ecosys- tem [30], their role of sink of pollutants and nutrients is correlated to fine size (silt and clay) and iron and man- ganese oxides. The Clostridium spores in sediments in- dicate a fecal contamination [22] and their growth de- pends on the S and C content because they are sulphur reductive bacteria involving in the sulphur-compound de- molition in anoxic environment [31].
The high concentration of metals in sediments can compromise the life of the aquatic ecosystem [11], but the pollution risk from metals depends on their chemical speciation rather their total elemental contents [32]. The extraction with EDTA and DTPA solutions reveals a dif- ferent percentage of availability of the metals in sedi- ments and the high amount extracted by EDTA is due to
Copyright © 2013 SciRes. JWARP

C. FERRONATO ET AL. 466
Table 6. Total trace element concentration in sediment. Data are expressed in mg·kg−1 on dry weight.
As B Ba Cd Co Cr Cu Mn Ni Pb Sb Sn V Zn
RE u 2.9 38 139 0.2 24 73 36 782 47 41 1.2 0.7 42 74
RE d 2.0 12 96 0.1 10 81 13 674 30 84 1.4 0.4 17 36
SAM u 3.0 35 207 0.1 20 54 26 1472 26 84 1.1 0.4 34 57
SAM d 4.0 36 191 0.1 23 102 27 817 47 41 1.5 0.7 43 62
SAN u 5.2 13 80 0.1 15 71 14 852 27 94 1.1 0.4 26 43
SAN d 4.3 48 300 0.2 32 111 31 847 38 171 4.7 2.0 40 108
SILL u 3.6 116 202 0.1 34 84 50 546 50 78 1.1 0.7 84 95
SILL d 4.2 36 275 0.1 22 45 30 905 35 98 1.1 0.2 36 71
Figure 3. Mean, min and max value of some metal avail- ability among EDTA, DTPA and water. Data are expressed as percentage on the total fraction determined by aqua regia. the acid pH [33,34], while the DTPA with neutral pH does not extract the metals immobilized in sediments [34,35]. High percentage of Pb and Cu are extracted by both solutions highlighting a greater pollution risk than the other metals which are poorly extractable. The same trends are found by the water-sediment partitioning coef- ficient (Kd) [21], in which relatively low values of log Kd of Cd (1.85), Cu (2.07), Pb (2.76) and Zn (2.35) sug- gesting that these metals are less likely associated with sediments and more free for transportation and mobiliza- tion in water, Kd higher than 2.8 suggesting a low geo- chemical mobility in water.
5. Conclusion
The mediocre and poor water quality determined in the Reno watershed is due to the anthropogenic impact due to the municipal and industrial waters discharged into fresh water rivers. The nutrient and pollutant loads affect the self-purification capacity of the Reno river. Adsorp- tion of pollutants in sediments seems be the main self-
purification mechanism while the low pathogenic con- tamination is related to severe drought during the spring- summer period that, lowering the river flow, will in- crease the concentration of pollutants in water.
The study of the release of pollutants in sediment- water interface is therefore a very important goal to in- crease the self-purification capacity. Sediment is the sink of nutrients and pollutants and their hazard can be evalu- ated by metals speciation and by their availability. The partition coefficient (Kd) of metals from water to sedi- ment seems to be a good source of information about pollution risks. Therefore, the impact of anthropogenic activities on the fluvial ecosystems should be studied tak- ing into account the water-sediment interface.
6. Acknowledgements
This research was partially funded by the “Consorzio della Bonifica Renana” of Emilia Romagna Region.
REFERENCES
[1] D. J. Conely, H. W. Pearl, R. W. Howarth, D. F. Boesch, S. P. Seitzinger, K. E. Havens, C. Lancelot and G. E. Likens, “Controlling Eutrophication: Nitrogen and Phos- phorus,” Science, Vol. 323, No. 5917, 2009, pp. 1014- 1015. doi:10.1126/science.1167755
[2] S. Duan, T. S. Bianchi and T. O. Sampere, “Temporal Variability in the Composition and Abundance of Terres- trially-Derived Dissolved Organic Matter in the Lower Mississippi and Pearl Rivers,” Marine Chemistry, Vol. 103, No. 1-2, 2007, pp. 172-184. doi:10.1016/j.marchem.2006.07.003
[3] R. E. Turner, N. N. Rabalais, D. Justic and Q. Dortch, “Global Patterns of Dissolved Silicate and Nitrogen in Large Rivers,” Biogeochemistry, Vol. 64, No. 3, 2003, pp. 297-317.
[4] D. Voutsa, E. Manoli, C. Samara, M. Sofoniou and I. Stratis, “A Study of Surface Water Quality in Macedonia, Greece: Speciation of Nitrogen and Phosphorus,” Water Air Soil Pollution, Vol. 129, No. 1-4, 2001, pp. 13-32. doi:10.1023/A:1010315608905
Copyright © 2013 SciRes. JWARP

C. FERRONATO ET AL. 467
[5] E. O. Adaikpoh, G. E. Nwajei and J. E. Ogala, “Heavy Metals Concentrations in Coal and Sediments from River Ekulu in Enugu, Coal City of Nigeria,” Journal of Ap- plied Science of Environmental Management, Vol. 9, No. 3, 2005, pp. 5-8.
[6] O. Akoto, T. N. Bruce and G. Darko, “Heavy Metals Pol- lution Profiles in Streams Serving the Owabi Reservoir,” African Journal of Environmental Science & Technology, Vol. 2, No. 11, 2008, pp. 354-359.
[7] M. Varol and B. Sen, “Assesment of Nutrient and Heavy Metal Contamination in Surface Water and Sediment of the Upper Tigris River, Turkey,” Vol. 92, 2012, pp. 1-12.
[8] J. M. Bubb and J. N Lester, “Antropogenic Heavy Metal Imputs to Lowland River System. A Case Study. The River Stour, UK,” Water, Air, and Soil Pollution, Vol. 78, No. 3-4, 1994, pp. 279-296. doi:10.1007/BF00483037
[9] K. S. Murray, “Statistical Comparison of Heavy Metals Concentration in River Sediments,” Environmental Ge- ology, Vol. 27, No. 1, 1996, pp. 54-58. doi:10.1007/BF00770602
[10] D. D. Mac Donald, C. G. Ingersoll and T. A. Berger, “De- velopment and Evaluation of Consensus-Based Sediment Quality Guidelines for Freshwater Ecosystems,” Archive of Environmental Contamination and Toxicology, Vol. 39, No. 1, 2000, pp. 20-31. doi:10.1007/s002440010075
[11] Y. C. Kwok, D. P. H. Hsieh and P. K. Wong, “Toxicity Identification Evaluation (TIE) of Pore Water of Con- taminated Marine Sediments Collected from Hong Kong Waters,” Marine Pollution Bulletin, Vol. 51, No. 8-12, 2005, pp. 1085-1091.
[12] U. Forstner and G. T. W. Wittmann, “Metal Pollution in Aquatic Environment New York,” Springer-Verlag, Ber- lin, 1983.
[13] S. Sarmani, P. Abdullah, I. Baba and A. Majid, “Inven- tory of Heavy Metals and Organic Micropollutants in an Urban Water Catchment Drainage Basin,” Hidrobiología, Vol. 235, No. 236, 1992, pp. 669-674. doi:10.1007/BF00026255
[14] G. Birch, M. Siaka and C. Owens, “The Source of An- thropogenic Heavy Metals in Fluvial Sediments of a Ru- ral Catchment: Coxs River, Australia,” Water, Air and Soil Pollution, Vol. 126, 2001, pp. 13-35. doi:10.1023/A:1005258123720
[15] S. E. Apitz and E. A. Power, “From Risk to Sediment Management: An International Perspective,” Journal of Soils and Sediments, Vol. 2, No. 2, 2002, pp. 61-66. doi:10.1007/BF02987872
[16] L. Pieri, P. Matzneller, N. Gaspari, I. Marotti, G. Dinelli and P. Rossi, “Bulk Atmospheric Deposition in the Sou- thern Po Valley (Northern Italy),” Water Air Soil Pollu-tion, Vol. 210, No. 1, 2009, pp. 155-169. doi:10.1007/s11270-009-0238-y
[17] L. Vittori Antisari, C. Trivisano, C. Gessa, M. Gherardi, A. Simoni, G. Vianello and N. Zamboni, “Quality of Mu- nicipal Wastewater Compared to Surface Waters of the River and Artificial Canal Network in Different Areas of the Eastern Po Valley (Italy),” Water Quality Expo Healt, Vol. 2, 2010, pp. 1-13. doi:10.1007/s12403-009-0020-9
[18] U. Springer and J. Klee, “Prufung der Leistungfahigkeit vom Einigen Wichtigen Verfaren zur Bestimmung des Kohlensttoffe Mittels Chromschwefelsaure Sowie Vors- chlag Einer Neuen Schnellmethode,” Z. Pflanzenernahr, Dung, Bodenkunde, 1954.
[19] J. M. Bremner and C. S. Mulvaney, “Nitrogen-Total,” In: Methods of Soil Analysis, Agron, Madison, 1982, pp. 595- 624.
[20] H. Akcay, A. Oguz and C. Karapire, “Study of Heavy Metal Pollution and Speciation in Buyak Menderes and Gediz River Sediments,” Water Research, Vol. 37, No. 4, 2003, pp. 813-822. doi:10.1016/S0043-1354(02)00392-5
[21] H. B. Jung, S. T. Yun, B. Mayer, S. O. Kim, S. S. Park and P. K. Lee, “Transport and Sediment-Water Partition- ing of Trace Metals in Acid Mine Drainage: An Example from a the Abandoned Kwangyang Au-Ag Mine Area, South Korea,” Environmental Geology, Vol. 48, 2005, pp. 437-449. doi:10.1007/s00254-005-1257-7
[22] S. Marcheggiani, M. Iaconelli, A. D’Angelo and L. Man- cini, “Salute degli Ecosistemi Fluviali: I Clostridi Solfito- Riduttori Come Indicatori Dello Stato dei Sedimenti,” Rapporti ISTISAN, Vol. 37, 2007, pp. 1-38.
[23] L. Vittori Antisari, S. Carbone, A. Simoni, G. Vianello, V. Bevilacqua and A. Bagli, “Water Quality in the Artificial Canal Network in the Reno Basin (Bologna, Italy),” En- vironmental Quality, Vol. 3, 2010, pp. 49-56.
[24] D. L. Rosgen, “A Stream Channel Stability Assessment Methodology,” Proceeding of the Seventh Federal Inter- agency Sedimentation Conference, Vol. 2, 2001, pp. 11- 18.
[25] C. P. Tran, R. W. Bode, A. J. Smith and G. S. Klepper, “Land-Use Proximity as a Basis for Assessing Stream Water Quality in New York State (USA),” Ecological In- dicators, Vol. 10, 2010, pp. 727-733. doi:10.1016/j.ecolind.2009.12.002
[26] G. R. Wall, K. R. Murray and P. J. Phillips, “Water Qual- ity in the Husdon River Basin, 1992-1995,” US Geologi- cal Survey Circula, New York, 1998, p. 1165.
[27] C. Crabill, R. Donald, J. Snelling, R. Foust and G. Sout- ham, “The Impact of Sediment Fecal Coliform Reservoirs on Seasonal Water Quality in Oak Creek, Arizona,” Wa- ter Research, Vol. 33, 1999, pp. 2163-2171. doi:10.1016/S0043-1354(98)00437-0
[28] E. K. Lipp, R. Kurz, R. Vincent, C. Rodriguez-Palacios, S. Farrah and J. Rose, “The Effects of Seasonal Variability and Weather on Microbial Fecal Pollution and Enteric Pathogens in a Subtropical Estuary,” Estuaries, Vol. 24, 2001, pp. 266-276. doi:10.2307/1352950
[29] K. G. Taylor and P. N. Owens, “Sediment in Urban River Basin: A Review of Sediment-Contaminant Dynamics in an Environmental System Conditioned by Human Activi- ties,” Journal of Soil Sediment, Vol. 9, No. 4, 2009, pp. 281-303. doi:10.1007/s11368-009-0103-z
[30] M. C. Newman and T. McCloskey, “Predicting Relative Toxicity and Interactions of Divalent Metal Ions: Micro- tox Bioluminescence Assay,” Environmental Toxicology and Chemistry, Vol. 115, No. 3, 1996, pp. 275-281. doi:10.1002/etc.5620150308
Copyright © 2013 SciRes. JWARP

C. FERRONATO ET AL.
Copyright © 2013 SciRes. JWARP
468
[31] C. Guerrero-Barajas, C. Garibay-Orijel and L. E. Rosas- Rocha, “Sulfate Reduction and Trichloroethylene Biode- gradation by a Marine Microbial Community from Hy- drothermal Vents Sediments,” International Biodeterio- ration and Biodegradation, Vol. 65, 2011, pp. 116-123. doi:10.1016/j.ibiod.2010.10.004
[32] G. Rauret, “Extraction Procedures for the Determination of Heavy Metals in Contaminated Soil and Sediment,” Talanta, Vol. 46, No. 3, 1998, pp. 449-455. doi:10.1016/S0039-9140(97)00406-2
[33] Ph. Quevauviller, M. Lachina, E. Barahoma, A. Gomez, G. Rauret, A. Ure and H. Muntau, “Certified Reference Material Fot the Quality Control of EDTA- and DTPA- Extractable Trace Metal Contents in Calcareous Soil,”
Fresenius Journal of analytical Chemistry, Vol. 360, No. 5, 1998, pp. 505-511. doi:10.1007/s002160050750
[34] S. T. Yun, H. B. Jung and C. S. So, “Transport, Fate and Speciation of Heavy Metals (Pb, Zn, Cu, Cd) in Mine Drainage: Geochemical Modeling and Anodic Stripping Voltammetric Analysis,” Environmental Technology, Vol. 22, No. 7, 2001, pp. 749-770. doi:10.1080/095933322086180324
[35] E. Galan, J. L. Gomez-Ariza, I. Gonzalez, J. C. Fernan- dez-Caliani, E. Morales, I. Gira and I. ldez, “Heavy Metal Partitioning in River Sediments Severely Polluted by Acid Mine Drainage in the Iberian Pyrite Belt,” Aplied Geo- chemistry, Vol. 18, No. 3, 2003, pp. 409-421. doi:10.1016/S0883-2927(02)00092-6
Copyright © 2022 FDOKUMEN