Characterization of pure and copper mixed iron tartrate crystals grown in silica gel
11
PRAMANA c Indian Academy of Sciences Vol. 81, No. 1 — journal of July 2013 physics pp. 177–187 Characterization of pure and copper-doped iron tartrate crystals grown in silica gel V MATHIVANAN 1,2 and M HARIS 1, ∗ 1 Department of Physics, Karunya University, Karunya Nagar, Coimbatore 641 114, India 2 Department of Physics, United Institute of Technology, Coimbatore 641 020, India ∗ Corresponding author. E-mail: [email protected] MS received 22 January 2013; revised 11 March 2013; accepted 12 March 2013 Abstract. Single crystal growth of pure and copper-doped iron tartrate crystals bearing composi- tion Cu x Fe (1−x ) C 4 H 4 O 6 · nH 2 O, where x = 0, 0.07, 0.06, 0.05, 0.04, 0.03, is achieved using gel technique. The elemental analysis has been done using energy-dispersive X-ray analysis (EDAX) spectrum. The characterization studies such as Fourier transform infrared spectroscopy (FTIR), powder X-ray diffraction (XRD), magnetic analysis and thermal analysis have been done for crys- tals with x = 0 for pure iron tartrate and with x = 0.05 for copper-mixed iron tartrate crystals. A detailed comparison has been made between pure and doped crystals. Keywords. Gel growth; copper-doped iron tartrate; energy-dispersive X-ray analysis; Fourier transform infrared spectroscopy; X-ray diffraction; magnetic moment; thermal studies. PACS Nos 61; 61.05.cp; 61.05.−a 1. Introduction Many of the tartrate compounds find applications in medical, pharmaceutical and indus- trial fields due to their special properties. For example, injections of Na–Cr tartrate increase the susceptibility of the transplanted sarcoma to the effect of X-rays, calciphy- latic responses of various ferrous tartrate compounds prevent anemia in animals, ferrous tartrate is used as a catalyst in the manufacture of champagne, ferrous tartrate is used to tan skin and manganese tartrate crystals are used as chemical temperature indicators. Good single crystals can be grown in substances that are normally classified as gels. It has been observed that gels, particularly silica gel, are the best and the most versa- tile growth media. Crystal growth using gel method is useful for substances having low solubilities and low dissociation temperature. A series of pure and mixed crystals have been grown by several researchers with the aim of identifying new materials for practical and industrial purposes [1–5]. Compounds of tartaric acid find several practical appli- cations in science and technology because of their interesting physical properties such DOI: 10.1007/s12043-013-0564-x; ePublication: 29 June 2013 177
Transcript of Characterization of pure and copper mixed iron tartrate crystals grown in silica gel
PRAMANA c© Indian Academy of Sciences Vol. 81, No. 1— journal of July 2013
physics pp. 177–187
Characterization of pure and copper-doped iron tartratecrystals grown in silica gel
V MATHIVANAN1,2 and M HARIS1,∗1Department of Physics, Karunya University, Karunya Nagar, Coimbatore 641 114, India2Department of Physics, United Institute of Technology, Coimbatore 641 020, India∗Corresponding author. E-mail: [email protected]
MS received 22 January 2013; revised 11 March 2013; accepted 12 March 2013
Abstract. Single crystal growth of pure and copper-doped iron tartrate crystals bearing composi-tion Cux Fe(1−x)C4H4O6 · nH2O, where x = 0, 0.07, 0.06, 0.05, 0.04, 0.03, is achieved using geltechnique. The elemental analysis has been done using energy-dispersive X-ray analysis (EDAX)spectrum. The characterization studies such as Fourier transform infrared spectroscopy (FTIR),powder X-ray diffraction (XRD), magnetic analysis and thermal analysis have been done for crys-tals with x = 0 for pure iron tartrate and with x = 0.05 for copper-mixed iron tartrate crystals. Adetailed comparison has been made between pure and doped crystals.
Keywords. Gel growth; copper-doped iron tartrate; energy-dispersive X-ray analysis; Fouriertransform infrared spectroscopy; X-ray diffraction; magnetic moment; thermal studies.
PACS Nos 61; 61.05.cp; 61.05.−a
1. Introduction
Many of the tartrate compounds find applications in medical, pharmaceutical and indus-trial fields due to their special properties. For example, injections of Na–Cr tartrateincrease the susceptibility of the transplanted sarcoma to the effect of X-rays, calciphy-latic responses of various ferrous tartrate compounds prevent anemia in animals, ferroustartrate is used as a catalyst in the manufacture of champagne, ferrous tartrate is used totan skin and manganese tartrate crystals are used as chemical temperature indicators.
Good single crystals can be grown in substances that are normally classified as gels.It has been observed that gels, particularly silica gel, are the best and the most versa-tile growth media. Crystal growth using gel method is useful for substances having lowsolubilities and low dissociation temperature. A series of pure and mixed crystals havebeen grown by several researchers with the aim of identifying new materials for practicaland industrial purposes [1–5]. Compounds of tartaric acid find several practical appli-cations in science and technology because of their interesting physical properties such
DOI: 10.1007/s12043-013-0564-x; ePublication: 29 June 2013 177
V Mathivanan and M Haris
as dielectric, ferroelectric, piezoelectric and non-linear optical properties [6–10]. Manyof the tartrate compounds are insoluble in water and decompose before melting. Hence,single crystals of such compounds cannot be grown by either slow evaporation or melttechnique. Mixed crystals of tartrate have several applications in medicine, optics, etc.Hence, it was thought worthwhile to undertake an investigation on growth of crystals ofmixed tartrate and their characterization by different methods.
The present work describes the growth of pure and mixed crystals of copper–iron tar-trate in silica gel. The characterization of these mixed crystals are done for the firsttime.
2. Experimental method
The test tube single diffusion method was employed to grow pure and copper-doped irontartrate single crystals in gel medium. 0.5 M sodium metasilicate (Na2SiO3·9H2O) wastitrated with 0.5 M tartaric acid till the mixture attained the pH of 4.5. This gelling mix-ture was allowed to set in glass tubes of 200 mm length and 25 mm diameter. The gelwas set in about 24 h. The gel setting was found to be strongly dependent on pH, i.e.,gel with higher pH value takes lower time to set than gel with lower pH value. After
(a)
(b)
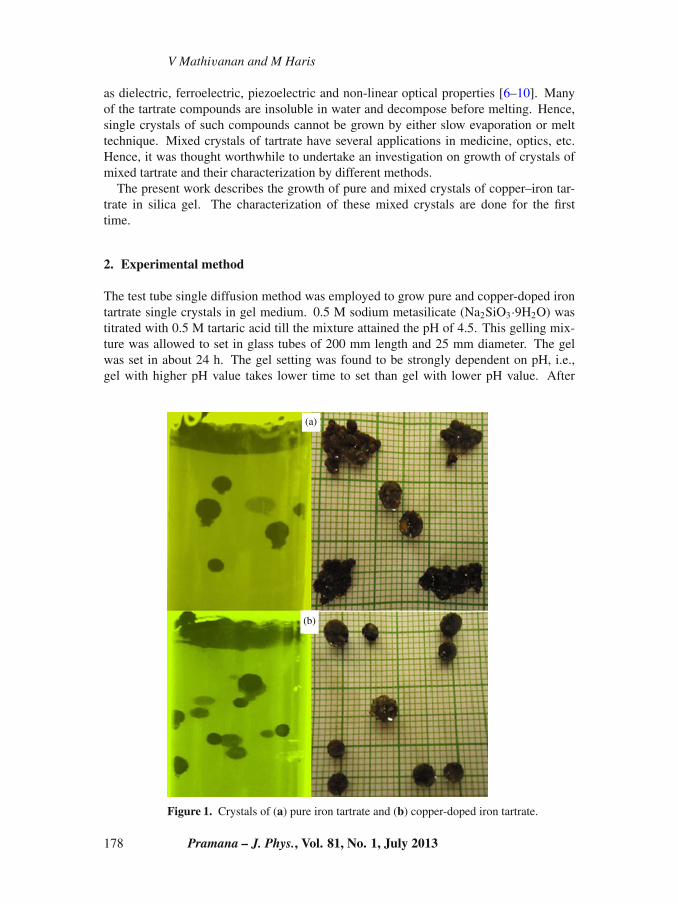
Figure 1. Crystals of (a) pure iron tartrate and (b) copper-doped iron tartrate.
178 Pramana – J. Phys., Vol. 81, No. 1, July 2013
Characterization of pure and copper-doped iron tartrate
confirming the gel setting, an aqueous solution of iron sulphate of required concentrationwas poured slowly along the sides of the test tubes, to avoid breaking of the gel surface.Similarly, for growing copper-doped iron tartrate crystals, an aqueous solution of FeSO4
and CuSO4 of required concentration has been used. Slow diffusion of the upper reac-tant ions through the narrow pores of the silica gel leads to reaction between these ionsand the ions present in the gel which acts as lower reactant.
The following reaction was expected to occur:
FeSO4 + C4H6O6 → FeC4H4O6 + H2SO4
(Pure iron tartrate)(1 − x) FeSO4 + x CuSO4+ C4H6O6 → Cux Fe(1−x)C4H4O6 + H2SO4,
where x = 0.07, 0.06, 0.05, 0.04, 0.03 (copper-doped iron tartrate).The crystals of pure and copper-doped iron tartrate crystals are shown in figure 1.
Spherulitic crystals of pure and Cu–Fe tartrate crystals exhibit slight variation in colour.
3. Results and discussion
3.1 Energy-dispersive X-ray (EDAX) analysis
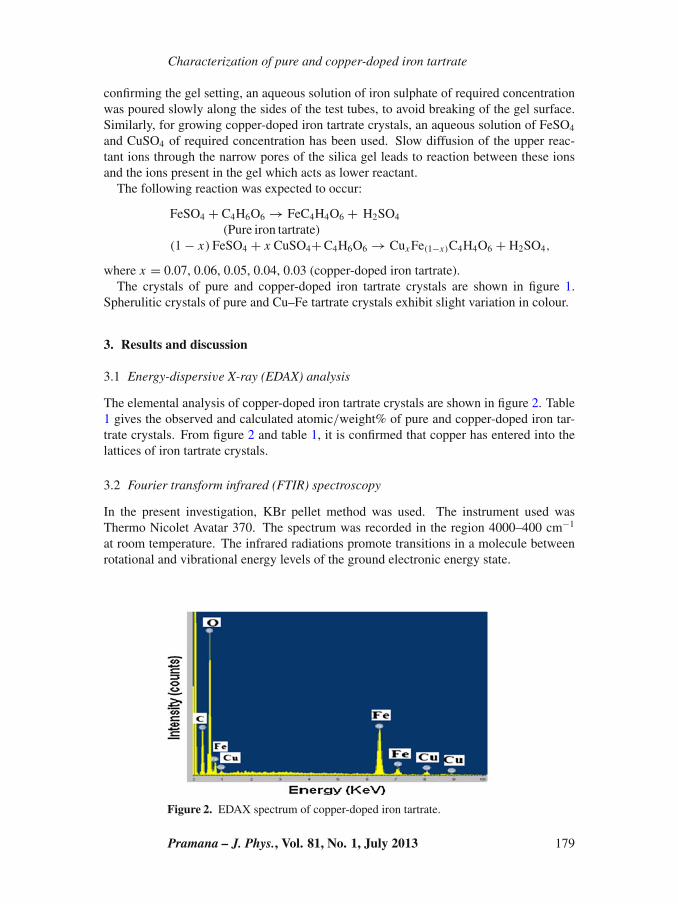
The elemental analysis of copper-doped iron tartrate crystals are shown in figure 2. Table1 gives the observed and calculated atomic/weight% of pure and copper-doped iron tar-trate crystals. From figure 2 and table 1, it is confirmed that copper has entered into thelattices of iron tartrate crystals.
3.2 Fourier transform infrared (FTIR) spectroscopy
In the present investigation, KBr pellet method was used. The instrument used wasThermo Nicolet Avatar 370. The spectrum was recorded in the region 4000–400 cm−1
at room temperature. The infrared radiations promote transitions in a molecule betweenrotational and vibrational energy levels of the ground electronic energy state.
Figure 2. EDAX spectrum of copper-doped iron tartrate.
Pramana – J. Phys., Vol. 81, No. 1, July 2013 179
V Mathivanan and M Haris
Table 1. Elemental analysis of pure and copper-doped iron tartrate crystals.
Element Calculated Observed
Atomic % Weight % Atomic % Weight %
FeC4H4O6 Fe 100 100 100 100
Cu0.07Fe 0.93C4H4O6 Fe 94 85.08 93 86.09Cu 6 14.92 7 13.91
Cu0.06Fe 0.94C4H4O6 Fe 95 86.88 94 87.95Cu 5 13.12 6 12.05
Cu0.05Fe 0.95C4H4O6 Fe 96 87.99 95 89.85Cu 4 12.01 5 10.15
Cu0.04Fe 0.96C4H4O6 Fe 97 90.12 96 91.80Cu 3 9.88 4 8.20
Cu0.03Fe 0.97C4H4O6 Fe 98 92.66 97 93.78Cu 2 7.34 3 6.22
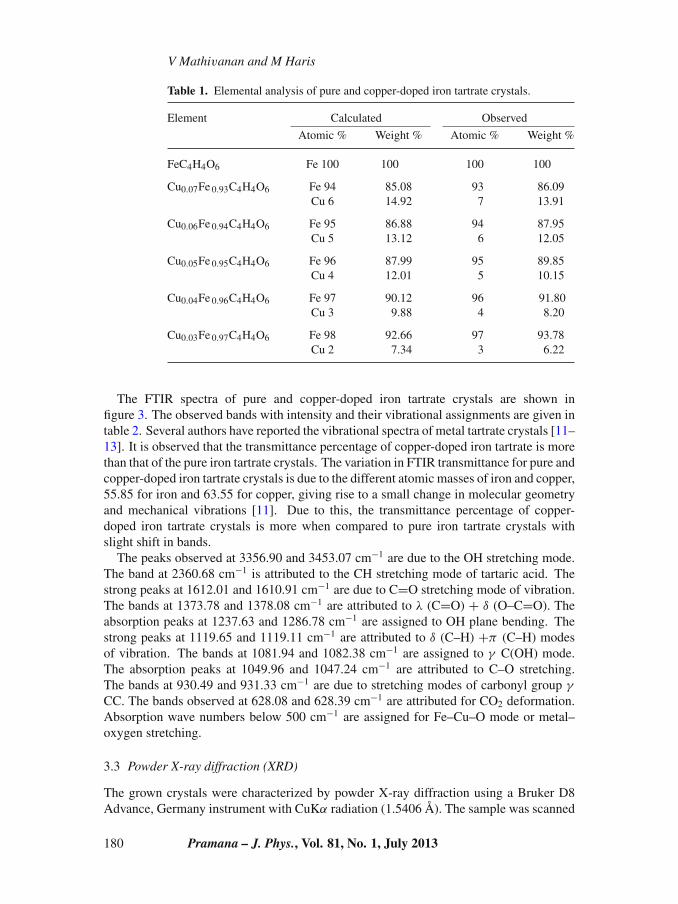
The FTIR spectra of pure and copper-doped iron tartrate crystals are shown infigure 3. The observed bands with intensity and their vibrational assignments are given intable 2. Several authors have reported the vibrational spectra of metal tartrate crystals [11–13]. It is observed that the transmittance percentage of copper-doped iron tartrate is morethan that of the pure iron tartrate crystals. The variation in FTIR transmittance for pure andcopper-doped iron tartrate crystals is due to the different atomic masses of iron and copper,55.85 for iron and 63.55 for copper, giving rise to a small change in molecular geometryand mechanical vibrations [11]. Due to this, the transmittance percentage of copper-doped iron tartrate crystals is more when compared to pure iron tartrate crystals withslight shift in bands.
The peaks observed at 3356.90 and 3453.07 cm−1 are due to the OH stretching mode.The band at 2360.68 cm−1 is attributed to the CH stretching mode of tartaric acid. Thestrong peaks at 1612.01 and 1610.91 cm−1 are due to C=O stretching mode of vibration.The bands at 1373.78 and 1378.08 cm−1 are attributed to λ (C=O) + δ (O–C=O). Theabsorption peaks at 1237.63 and 1286.78 cm−1 are assigned to OH plane bending. Thestrong peaks at 1119.65 and 1119.11 cm−1 are attributed to δ (C–H) +π (C–H) modesof vibration. The bands at 1081.94 and 1082.38 cm−1 are assigned to γ C(OH) mode.The absorption peaks at 1049.96 and 1047.24 cm−1 are attributed to C–O stretching.The bands at 930.49 and 931.33 cm−1 are due to stretching modes of carbonyl group γ
CC. The bands observed at 628.08 and 628.39 cm−1 are attributed for CO2 deformation.Absorption wave numbers below 500 cm−1 are assigned for Fe–Cu–O mode or metal–oxygen stretching.
3.3 Powder X-ray diffraction (XRD)
The grown crystals were characterized by powder X-ray diffraction using a Bruker D8Advance, Germany instrument with CuKα radiation (1.5406 Å). The sample was scanned
180 Pramana – J. Phys., Vol. 81, No. 1, July 2013
Characterization of pure and copper-doped iron tartrate
(a)
(b)
Figure 3. FTIR spectra of (a) pure and (b) copper-doped iron tartrate crystals.
in the range 5◦ to 70◦ at the scan rate of 1◦ min−1. The powder XRD patterns of pureand copper-doped iron tartrate crystals are given in figure 4. There are slight variationsbetween the pure and doped crystals [14]. The indexed XRD of the pure and doped
Table 2. FTIR assignments for pure and copper-doped iron tartrate crystals.
Absorption in wave number (cm−1) Assignments
Pure iron tartrate Copper-doped iron tartrate
3356.90 3453.07 OH stretching– 2360.68 CH stretch1612.01 1610.91 C=O stretch1373.78 1378.08 λ (C=O) + δ (O–C=O)1237.63 1286.78 OH plane bending1119.65 1119.11 δ (C–H) + π (C–H)1081.94 1082.38 γ C(OH)1049.96 1047.24 C–O stretching930.49 931.33 γ CC628.08 628.39 CO2 deformation
Below 500 Below 500 Metal–oxygen stretching
Pramana – J. Phys., Vol. 81, No. 1, July 2013 181
V Mathivanan and M Haris
(a)
(b)
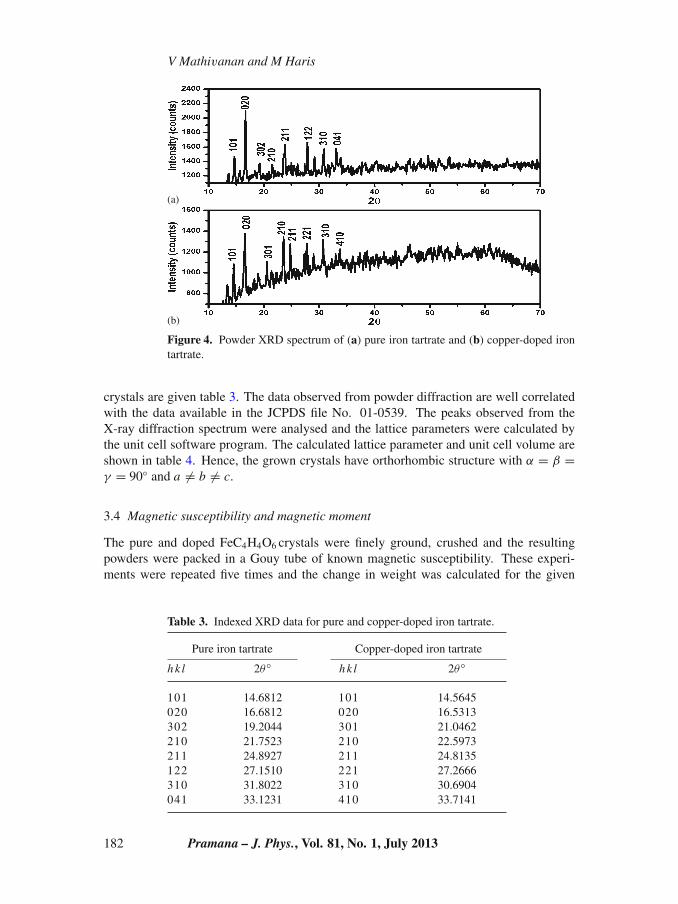
Figure 4. Powder XRD spectrum of (a) pure iron tartrate and (b) copper-doped irontartrate.
crystals are given table 3. The data observed from powder diffraction are well correlatedwith the data available in the JCPDS file No. 01-0539. The peaks observed from theX-ray diffraction spectrum were analysed and the lattice parameters were calculated bythe unit cell software program. The calculated lattice parameter and unit cell volume areshown in table 4. Hence, the grown crystals have orthorhombic structure with α = β =γ = 90◦ and a �= b �= c.
3.4 Magnetic susceptibility and magnetic moment
The pure and doped FeC4H4O6 crystals were finely ground, crushed and the resultingpowders were packed in a Gouy tube of known magnetic susceptibility. These experi-ments were repeated five times and the change in weight was calculated for the given
Table 3. Indexed XRD data for pure and copper-doped iron tartrate.
Pure iron tartrate Copper-doped iron tartrate
h k l 2θ◦ h k l 2θ◦
101 14.6812 101 14.5645020 16.6812 020 16.5313302 19.2044 301 21.0462210 21.7523 210 22.5973211 24.8927 211 24.8135122 27.1510 221 27.2666310 31.8022 310 30.6904041 33.1231 410 33.7141
182 Pramana – J. Phys., Vol. 81, No. 1, July 2013
Characterization of pure and copper-doped iron tartrate
Table 4. Comparative powder XRD data for pure and copper-doped iron tartratecrystals.
Chemical formula Interaxial angle Unit cell dimensions Unit cell(Å) volume (Å3 )
Pure FeC4H4O6 α = β = γ = 90◦ a = 9.8845, b = 7.4420, c = 8.8480 650.96Cu0.05Fe 0.95C4H4O6 α = β = γ = 90◦ a = 9.9832, b = 8.9142, c = 7.8892 702.07
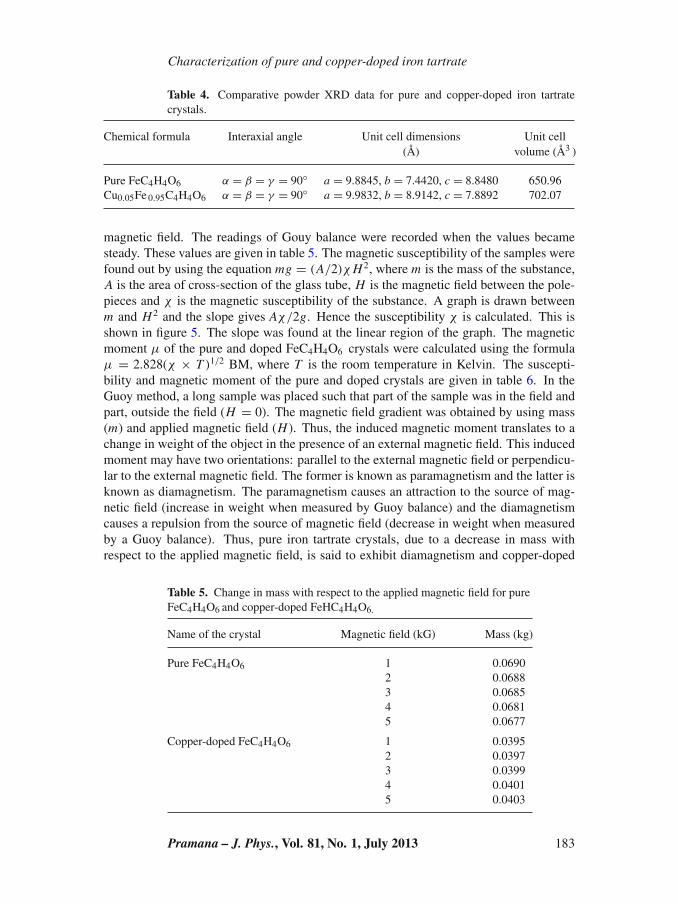
magnetic field. The readings of Gouy balance were recorded when the values becamesteady. These values are given in table 5. The magnetic susceptibility of the samples werefound out by using the equation mg = (A/2)χ H 2, where m is the mass of the substance,A is the area of cross-section of the glass tube, H is the magnetic field between the pole-pieces and χ is the magnetic susceptibility of the substance. A graph is drawn betweenm and H 2 and the slope gives Aχ/2g. Hence the susceptibility χ is calculated. This isshown in figure 5. The slope was found at the linear region of the graph. The magneticmoment μ of the pure and doped FeC4H4O6 crystals were calculated using the formulaμ = 2.828(χ × T )1/2 BM, where T is the room temperature in Kelvin. The suscepti-bility and magnetic moment of the pure and doped crystals are given in table 6. In theGuoy method, a long sample was placed such that part of the sample was in the field andpart, outside the field (H = 0). The magnetic field gradient was obtained by using mass(m) and applied magnetic field (H ). Thus, the induced magnetic moment translates to achange in weight of the object in the presence of an external magnetic field. This inducedmoment may have two orientations: parallel to the external magnetic field or perpendicu-lar to the external magnetic field. The former is known as paramagnetism and the latter isknown as diamagnetism. The paramagnetism causes an attraction to the source of mag-netic field (increase in weight when measured by Guoy balance) and the diamagnetismcauses a repulsion from the source of magnetic field (decrease in weight when measuredby a Guoy balance). Thus, pure iron tartrate crystals, due to a decrease in mass withrespect to the applied magnetic field, is said to exhibit diamagnetism and copper-doped
Table 5. Change in mass with respect to the applied magnetic field for pureFeC4H4O6 and copper-doped FeHC4H4O6.
Name of the crystal Magnetic field (kG) Mass (kg)
Pure FeC4H4O6 1 0.06902 0.06883 0.06854 0.06815 0.0677
Copper-doped FeC4H4O6 1 0.03952 0.03973 0.03994 0.04015 0.0403
Pramana – J. Phys., Vol. 81, No. 1, July 2013 183
V Mathivanan and M Haris
(a)
(b)
Figure 5. Graph between m and H2 for (a) pure iron tartrate and (b) copper-dopediron tartrate crystals.
iron tartrate crystals, due to increase in mass with respect to the applied magnetic field,said to exhibit paramagnetism.
3.5 Thermal analysis
The TGA analysis of pure and copper-doped iron tartrate crystals are shown in figure 6.The TGA analysis was done between 40 and 500◦C at a heating rate of 20◦C min−1 innitrogen atmosphere. In the case of pure iron tartrate crystals as shown in figure 6a,the first stage of decomposition is due to water of hydration. This starts at 50.42◦C andcontinues up to 325.5◦C with an observed weight loss of about 25%. The second stageof decomposition starts from 325.56◦C and continues up to 368.45◦C with an observed
Table 6. Susceptibility χ and magnetic moment μ for pure and dopedFeC4H4O6 crystal.
Name of the crystal Magnetic susceptibility Magnetic momentχ × 10−6 emu (μBM)
Pure FeC4H4O6 27.59 2.572Copper-doped FeC4H4O6 16.98 2.01
184 Pramana – J. Phys., Vol. 81, No. 1, July 2013
Characterization of pure and copper-doped iron tartrate
(a)
(b)
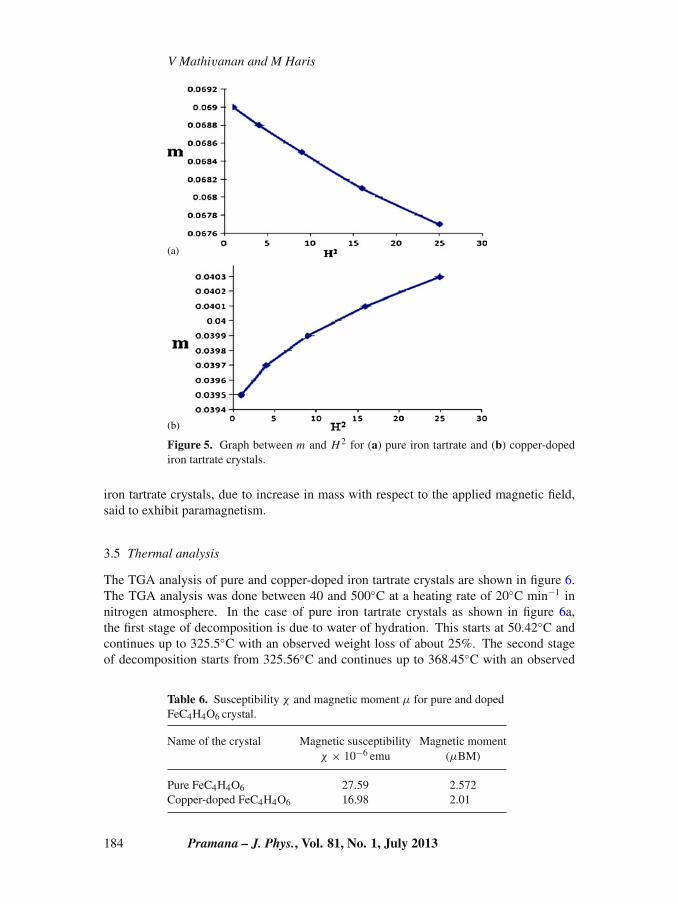
Figure 6. TGA results of (a) pure and (b) copper-doped iron tartrate crystals.
weight loss of about 14.95%. The comparison of the observed and calculated percentageweight losses suggests that the chemical formula for the given crystal is FeC4H4O6·2H2O.Similarly, in the copper-doped iron tartrate crystal shown in figure 6b, the first stage ofdecomposition starts from 50.45◦C and continues up to 123.45◦C with a weight loss ofabout 20%. The second stage of decomposition starts from 320.05◦C and continues upto 360◦C with a weight loss of about 22%. The comparison of the observed and calcu-lated percentage weight losses suggests that the chemical formula for the given crystalis Fe0.95Cu0.05C4H4O6·2H2O. The TGA results of pure and copper-doped iron tartratecrystals are shown in table 7.
DSC is a thermoanalytical technique in which the difference in the amount of heatrequired to increase the temperature of a sample and the reference material is measured
Table 7. TGA results of pure and copper-doped iron tartrate crystals.
Name of the Temperature Weight loss%
the crystal Stage range (◦C) Observed Calculated Reaction
Pure iron I 50.42–325.56 25 24.5 FeC4H4O6 ·2H2O →tartrate FeC2H4O2
II 325.56–368.45 14.95 15.08 FeC2H4O2 → FeO
Copper-doped I 50.45–123.45 20 19.58 Fe0.95Cu0.05C4H4O6 ·2H2O →iron tartrate Fe0.95Cu0.05C2H4O2
II 320.05–360 22 22.05 Fe0.95Cu0.05C2H4O2 →Fe0.95Cu0.05O
Pramana – J. Phys., Vol. 81, No. 1, July 2013 185
V Mathivanan and M Haris
(a)
(b)
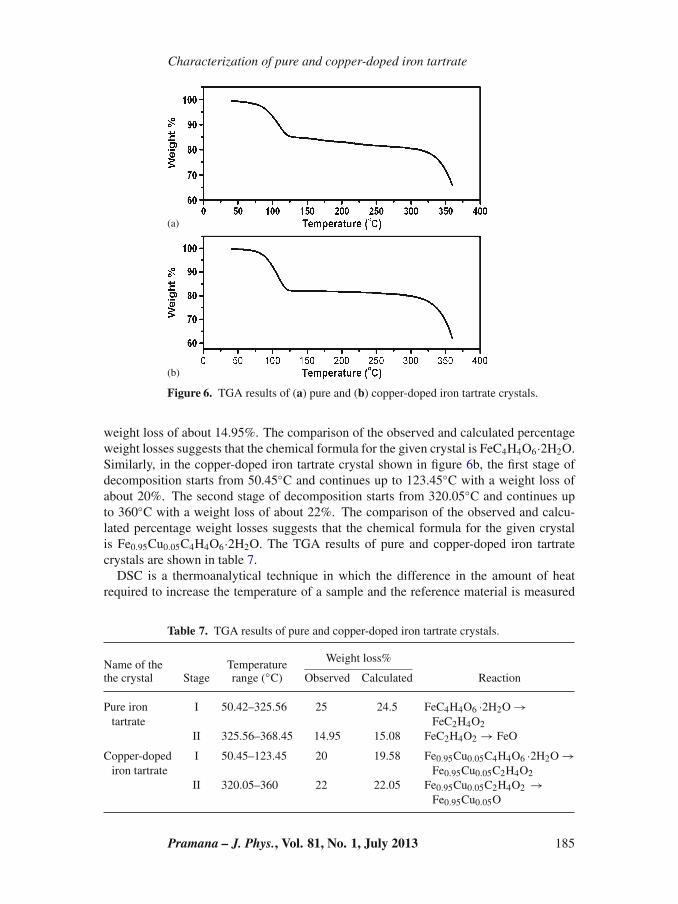
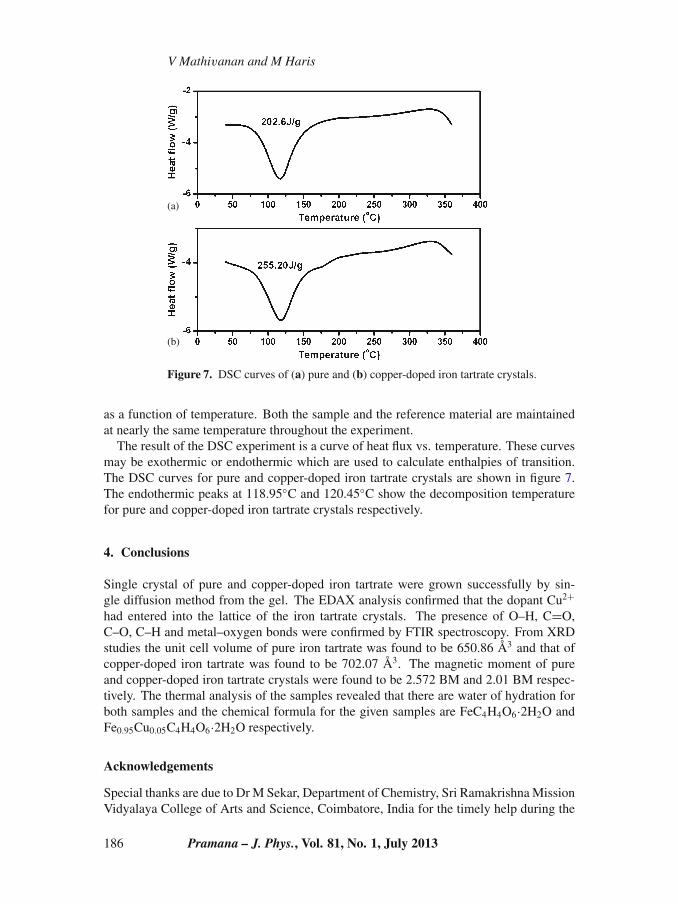
Figure 7. DSC curves of (a) pure and (b) copper-doped iron tartrate crystals.
as a function of temperature. Both the sample and the reference material are maintainedat nearly the same temperature throughout the experiment.
The result of the DSC experiment is a curve of heat flux vs. temperature. These curvesmay be exothermic or endothermic which are used to calculate enthalpies of transition.The DSC curves for pure and copper-doped iron tartrate crystals are shown in figure 7.The endothermic peaks at 118.95◦C and 120.45◦C show the decomposition temperaturefor pure and copper-doped iron tartrate crystals respectively.
4. Conclusions
Single crystal of pure and copper-doped iron tartrate were grown successfully by sin-gle diffusion method from the gel. The EDAX analysis confirmed that the dopant Cu2+had entered into the lattice of the iron tartrate crystals. The presence of O–H, C=O,C–O, C–H and metal–oxygen bonds were confirmed by FTIR spectroscopy. From XRDstudies the unit cell volume of pure iron tartrate was found to be 650.86 Å3 and that ofcopper-doped iron tartrate was found to be 702.07 Å3. The magnetic moment of pureand copper-doped iron tartrate crystals were found to be 2.572 BM and 2.01 BM respec-tively. The thermal analysis of the samples revealed that there are water of hydration forboth samples and the chemical formula for the given samples are FeC4H4O6·2H2O andFe0.95Cu0.05C4H4O6·2H2O respectively.
Acknowledgements
Special thanks are due to Dr M Sekar, Department of Chemistry, Sri Ramakrishna MissionVidyalaya College of Arts and Science, Coimbatore, India for the timely help during the
186 Pramana – J. Phys., Vol. 81, No. 1, July 2013
Characterization of pure and copper-doped iron tartrate
course of this work. The authors are thankful to Karunya University, Coimbatore forthe research facilities provided during the course of this work. The authors also wish tothank Mr Raja, Karunya University, Coimbatore for taking the EDAX and powder XRDspectrum of the samples. The corresponding author wishes to thank T V Manimaran,Head, Marketing, Pricol Castings Ltd., Coimbatore for the support during the course ofthe work.
References
[1] P Shenoy, K V Bangera and G K Shivakumar, Cryst. Res. Technol. 45(8), 825 (2010)[2] Sushama Bhat and P N Kotru, Mater. Chem. Phys. 39, 118 (1994)[3] M V John and M A Ittyachen, Cryst. Res. Technol. 36(2),141 (2001)[4] B B Parekh, R M Vyas, Sonal R Vasant and M J Joshi, Bull. Mater. Sci. 31, 143 (2008)[5] Pan Gao, Mu Gu and Xiao Lin-Liu, Cryst. Res. Technol. 43(5), 496 (2008)[6] M E Toress, T Lopez, J Peraza, J Stockel, A C Yanes, C Gonzalez-Silgo, C Ruiz-Perez and
P A Lorenzo-Luis, J. Appl. Phys. 84, 5729 (1998)[7] M E Toress, T Lopez, J F Peraza, J Stockel and A C Yanes, J. Crystal Growth 156, 421 (1995)[8] M E Toress, T Lopez, J Peraza, J Stockel, A C Yanes, C Gonzalez-Silgo, X Solan, M Garcia-
Vallés and E Rodriguez-Castellon, J. Solid State Chem. 163, 491 (2002)[9] F Fousek, L E Cross and K Seely, Ferroelectrics 1, 63 (1970)
[10] N R Ivano, Ferroelectr. Lett. 27, 45 (1984)[11] I Quasim, A Firdous, N Sahni, S K Khosa and P N Kotru, Cryst. Res. Technol. 44, 539 (2009)[12] S K Arora, A Kothari, B Amin and B Chudasama, Cryst. Res. Technol. 42, 589 (2007)[13] A Firdous, I Quasim, M M Ahmad and P N Kotru, J. Crystal Growth 311, 3855 (2009)[14] S J Joshi, Growth and characterization of iron–manganese mixed tartrate crystals and the
derivative compounds, Ph.D. Thesis (Saurashtra University, Rajkot, India, 2008)
Pramana – J. Phys., Vol. 81, No. 1, July 2013 187