OPORTUNIDADES DE NEGOCIOS EN CUBA: ¿QUE PUEDE ESPERAR PUERTO RICO? CONTENIDO
Upload
independentCategory
view
1download
0
Environ Monit Assess (2012) 184:811–830DOI 10.1007/s10661-011-2003-0
Characterization of land-based sources of pollutionin Jobos Bay, Puerto Rico: status of heavy metalconcentration in bed sediment
Dennis A. Apeti · David R. Whitall ·Anthony S. Pait · Angel Dieppa ·Adam G. Zitello · Gunnar G. Lauenstein
Received: 1 October 2010 / Accepted: 14 March 2011 / Published online: 21 April 2011© Springer Science+Business Media B.V. (outside the USA) 2011
Abstract As part of an assessment of land-basedsources of pollution in Jobos Bay, Puerto Rico,sediment samples were collected at 43 sites tocharacterize concentrations of a suite of pollu-tants, including metals. Fifteen major and tracemetals (Ag, Al, As, Cd, Cr, Cu, Fe, Hg, Mn Ni,Pb, Sb, Se, Sn, and Zn) were measured along withtotal organic carbon and grain size in surficial sedi-ments. For most metals, maximum concentrationswere seen in the eastern bay; however, valueswere still within concentration ranges found inother estuarine systems. In contrast, silver washigher in the western region. In general, metaldistribution in the bay was positively correlatedwith grain size. Additionally, correlations betweenAl and other metals suggest natural sources formetals. The data presented here suggest that, al-though the Jobos Bay watershed contains both
D. A. Apeti (B) · D. R. Whitall · A. S. Pait ·A. G. Zitello · G. G. LauensteinNational Oceanic and Atmospheric Administration,National Centers for Coastal and Ocean Science,Center for Coastal Monitoring and Assessment,1305 East-West Highway, Silver Spring,MD 20910, USAe-mail: [email protected]
A. DieppaJobos Bay National Estuarine Research Reserve,PO Box 159, Aguirre, PR 00704, USA
urban centers along with industrial and agricul-tural developments, anthropogenic inputs of met-als may be negligible.
Keywords Surficial sediment · Heavy metals ·Grain size · Total organic carbon ·Land-based sources
Introduction
Jobos Bay, located on the south-central coast ofPuerto Rico between the municipalities of Salinasand Guayama (Fig. 1), is the second largest es-tuary in Puerto Rico, with a total surface areaof about 25 km2. With a watershed that coversa total catchment area of 137 km2, and diversehabitats, including coral reefs, mangroves, mudflats, lagoons, and freshwater wetlands, the bayis an important ecosystem both ecologically andeconomically. The bay serves as an importantfeeding and nursery ground for native and mi-gratory birds and other wildlife (Dieppa et al.2008). The bay is also home to many endangeredand threatened species, like the West Indian man-atee, the hawksbill sea turtle, and the yellow-shouldered blackbird among others. In addition toits ecological importance, Jobos Bay and its wa-tershed are also economically vital with industrial,agricultural, recreational fishing, and ecotourismactivities (Dieppa et al. 2008).

812 Environ Monit Assess (2012) 184:811–830
Fig. 1 Map of Jobos Bay showing its watershed, some municipalities, the barrier islands of Cayos de Barca and CayosCaribe, and location of mangrove habitats
Jobos Bay watershed contains several centersof low-density urban municipalities as well assome industrial developments. Among the rela-tively new industrial developments established inthe vicinity of the Jobos estuary is a 454-Mv/hcoal power plant which is estimated to generateapproximately 433,000 tons of ash yearly (Dieppaet al. 2008). Other industrial activities of concernin the Jobos Bay watershed include an old pe-troleum refinery, which is now used as a largegasoline storage facility, and several major chem-ical and pharmaceutical facilities. However, thepredominant land use in the watershed is high-density agricultural activities that includes cultiva-tion of plantain, bananas, papayas, sorghum, cornand hay production, and poultry and some beefcattle production.
Industrial and commercial growth in the water-shed has been recognized as a concern to Jobos
Bay’s ecosystem health. Field et al. (2002) re-ported that residues of pesticides and fertilizersapplied in agricultural fields in the watershed arebeing transported to the bay and suggested thatrunoff of land-based pollutants, such as metals,posed the most significant threats to water qual-ity in the bay. Trace metals are of particularconcern in the Caribbean islands (Ross and De-Lorenzo 1997) because they can bioconcentrateand biomagnify along the food chain and they canbe potentially toxic to aquatic wildlife and apexpredators, including humans (Sauve et al. 2002;Reinfelder et al. 1998).
Currently, efforts to abate impacts of land-based pollutants in the bay are being addressedthrough agricultural best management practices,however, crucial monitoring efforts to assess thestatus and trends of pollutants in the bay are lack-ing. Although on a continuous basis the National

Environ Monit Assess (2012) 184:811–830 813
Status and Trends (NS&T) program monitors bi-ennially a suite of pollutants, including metalsin coastal Puerto Rico (Kimbrough et al. 2008),only one long-term site is established in JobosBay. Few other studies investigated metal concen-tration and distribution in Jobos Bay, these in-clude the most recent work by Aldarondo-Torreset al. (2010), which provided a background in-formation on sediment concentration of sevenmetals (As, Cd, Cu, Fe, Pb, Hg, and Zn), anda study by Jimenez-Velez et al. (2003), whichassessed the atmospheric deposition of a suiteof trace metals in the airborne PM10 particulatematters.
Jobos Bay and portions of the watershed arethe site of a Conservation Effects AssessmentProject, a collaborative effort involving the USDepartment of Agriculture, the Jobos Bay Na-tional Estuarine Research Reserve (NERR),NOAA, and local partners, to assess the benefitsof implementing agricultural best managementpractices by farmers on the terrestrial andnearshore marine ecosystems (NOAA 2007). Aspart of this effort, sediment samples were col-lected and analyzed to assess contamination levelsand spatial distribution of a suite of environmen-tal pollutants. This study is currently the mostcomprehensive pollution assessment in Jobos Bay.
Fig. 2 Map of Jobos Bay study area showing the location of sampling sites within the Outer, Central, and Inner Bay strata

814 Environ Monit Assess (2012) 184:811–830
While results of organic contaminant assessmentare presented elsewhere, this paper discussesmajor and trace metals data in the context of as-sessing: (1) the potential of anthropogenic enrich-ment, (2) the magnitude of metal concentrations
relative to other coastal areas, including a com-parison to NOAA’s National Status and Trends(NS&T) program data, and (3) sediment qualityby comparing measurements to published sedi-ment quality guidelines.
Table 1 Sampling locations with percent TOC, silt, and clay content at each site
Strata Site Latitude Longitude %TOC %Silt %Clay %Fine
Central Bay NERR 1 17.9302 −66.2094 0.98 42.33 13.60 55.93NERR 2 17.9248 −66.2110 0.96 22.41 7.64 30.05NERR 3 17.9341 −66.2358 2.68 60.78 22.75 83.53NERR 4 17.9409 −66.2380 10.91 39.15 21.69 60.84NERR 5 17.9361 −66.2414 3.99 55.65 22.42 78.07NERR 6 17.9303 −66.2408 2.32 26.16 22.48 48.64NERR 7 17.9268 −66.2408 1.63 60.77 25.49 86.26NERR 8 17.9176 −66.2415 1.79 58.11 19.65 77.76NERR 9 17.9335 −66.2444 2.85 49.03 25.24 74.27NERR 10 17.9383 −66.2475 3.87 8.44 14.35 22.79SWMP 11 17.9386 −66.2577 8.93 9.82 8.64 18.45SWMP 12 17.9353 −66.2385 10.89 24.41 51.88 76.29SWMP 13 17.9299 −66.2121 0.71 30.06 16.33 46.39Central 14 17.9421 −66.2134 2.06 13.85 15.61 29.45Central 15 17.9530 −66.2208 0.72 5.46 8.67 14.13Central 16 17.9245 −66.2362 1.09 69.18 21.36 90.54Central 17 17.9332 −66.2249 0.42 31.94 10.34 42.28Central 18 17.9199 −66.2254 0.57 44.75 12.39 57.14Central 19 17.9412 −66.2295 3.11 45.09 36.42 81.51Central 20 17.9252 −66.2540 1.02 58.65 22.60 81.25Central 21 17.9398 −66.2696 0.88 2.06 7.36 9.42Central 22 17.9451 −66.2729 0.76 0.48 4.78 5.25Central 23 17.9352 −66.2797 1.00 33.11 14.79 47.90
Inner Bay Inner 1 17.9445 −66.2076 1.82 28.48 35.26 63.74Inner 2 17.9500 −66.1766 1.74 60.62 31.76 92.38Inner 3 17.9449 −66.1816 1.92 50.40 46.11 96.51Inner 4 17.9391 −66.1852 2.25 44.53 42.28 86.81Inner 5 17.9442 −66.1892 1.60 43.78 42.58 86.36Inner 6 17.9478 −66.2037 1.92 46.86 40.96 87.82Inner 7 17.9578 −66.2038 2.88 43.65 51.58 95.23Inner 8 17.9568 −66.2087 3.33 41.79 49.23 91.02Inner 9 17.9508 −66.2119 3.82 34.79 51.87 86.66Inner 10 17.9555 −66.2181 2.66 19.97 16.79 36.76
Outer Bay Outer 1 17.9359 −66.2883 1.11 9.85 6.08 15.93Outer 2 17.9402 −66.2886 1.49 11.52 12.22 23.74Outer 3 17.9448 −66.2909 1.63 16.64 13.82 30.47Outer 4 17.9537 −66.2892 4.45 40.07 15.03 55.10Outer 5 17.9508 −66.2923 1.53 28.32 17.10 45.43Outer 6 17.9445 −66.2978 1.14 54.87 11.71 66.58Outer 7 17.9587 −66.2964 1.57 20.13 17.37 37.50Outer 8 17.9607 −66.3023 1.15 23.08 15.75 38.82Outer 9 17.9592 −66.3074 0.61 0.39 4.28 4.67Outer 10 17.9643 −66.3123 0.74 2.97 4.24 7.22
NERR National Estuarine Research Reserve, SWMP System Wide Monitoring Program location

Environ Monit Assess (2012) 184:811–830 815
Tab
le2
Con
cent
rati
on(m
icro
gram
spe
rgr
amof
dry
wt.)
ofm
ajor
and
trac
em
etal
sm
easu
red
inJo
bos
Bay
sedi
men
ts
Stra
taSu
b-st
rata
Site
Ag
Al
As
Cd
Cr
Cu
Fe
Hg
Mn
Ni
Pb
SbSe
SnZ
n
Cen
tral
Bay
NE
RR
10.
1041
,500
10.9
00.
0014
.00
24.3
025
,100
0.01
590
6.81
4.20
0.25
0.18
1.19
41.0
0N
ER
R2
0.09
28,6
009.
950.
009.
4313
.10
16,6
000.
0144
04.
392.
780.
000.
110.
6425
.70
NE
RR
30.
1048
,000
14.9
00.
0020
.60
33.0
029
,500
0.04
615
9.80
7.23
0.31
0.39
1.35
54.7
0N
ER
R4
0.11
42,1
0028
.10
0.17
29.4
058
.00
30,5
000.
1032
926
.60
14.0
00.
561.
562.
1077
.50
NE
RR
50.
1044
,700
20.0
00.
0027
.20
36.9
038
,500
0.06
514
15.0
08.
250.
340.
681.
2367
.70
NE
RR
60.
1331
,700
10.2
00.
0016
.00
24.3
022
,200
0.03
383
8.53
5.66
0.23
0.35
0.98
44.4
0N
ER
R7
0.09
56,4
0015
.70
0.00
24.8
039
.00
36,5
000.
0473
314
.00
8.43
0.38
0.32
1.68
70.6
0N
ER
R8
0.08
42,7
0014
.60
0.00
17.5
025
.50
26,0
000.
0253
07.
765.
070.
350.
291.
2345
.90
NE
RR
90.
1045
,300
17.7
00.
0023
.50
35.3
033
,800
0.05
527
12.2
07.
060.
230.
551.
1659
.30
NE
RR
100.
0813
,900
7.07
0.00
9.07
16.3
09,
700
0.01
117
14.1
04.
410.
000.
480.
0022
.20
SWM
P11
0.08
19,4
0023
.30
0.00
15.5
027
.60
15,5
000.
0613
231
.00
7.53
0.59
1.28
0.70
40.0
0SW
MP
120.
0724
,400
6.54
0.00
17.7
042
.00
16,0
000.
1116
424
.40
15.9
00.
000.
632.
7460
.00
SWM
P13
0.06
48,1
0012
.60
0.00
15.1
020
.30
26,7
000.
0170
17.
513.
700.
270.
160.
9242
.50
Cen
tral
140.
0928
,300
6.92
0.00
11.7
021
.60
18,7
000.
0344
06.
115.
060.
000.
160.
7938
.50
Cen
tral
150.
1438
,400
9.34
0.00
23.8
032
.10
20,9
000.
0336
822
.00
4.63
0.35
0.17
0.57
40.1
0C
entr
al16
0.07
55,4
0017
.00
0.00
21.4
037
.20
36,4
000.
0381
69.
887.
380.
310.
241.
8267
.60
Cen
tral
170.
0948
,600
12.3
00.
0015
.60
18.9
026
,600
0.01
718
6.04
3.78
0.25
0.12
1.01
42.6
0C
entr
al18
0.05
49,1
0018
.00
0.00
17.1
022
.30
29,7
000.
0176
57.
004.
450.
300.
131.
0245
.20
Cen
tral
190.
1050
,100
17.5
00.
0023
.60
44.2
037
,100
0.07
645
13.4
010
.90
0.32
0.40
1.89
82.5
0C
entr
al20
0.06
52,9
0015
.40
0.00
21.0
033
.50
33,5
000.
0375
69.
597.
090.
320.
241.
6361
.10
Cen
tral
210.
222,
690
2.22
0.00
1.33
3.09
2,78
00.
0046
0.00
0.79
0.00
0.11
0.00
5.43
Cen
tral
220.
2262
91.
790.
000.
001.
371,
060
0.00
330.
000.
230.
000.
110.
001.
57C
entr
al23
0.10
40,4
0017
.00
0.00
16.7
020
.20
26,3
000.
0260
210
.10
4.72
0.27
0.16
0.91
42.1
0In
ner
Bay
Inne
r1
0.10
51,6
0011
.30
0.00
21.7
050
.40
36,9
000.
0870
913
.00
11.4
00.
270.
291.
6586
.20
Inne
r2
0.10
70,2
0023
.10
0.00
24.1
066
.50
49,2
000.
0898
213
.10
11.4
00.
280.
281.
2487
.50
Inne
r3
0.11
70,2
0022
.40
0.00
27.6
073
.70
49,3
000.
101,
130
15.4
014
.30
0.32
0.28
1.64
102.
00In
ner
40.
1463
,800
18.5
00.
0025
.90
65.4
043
,100
0.11
925
13.8
014
.50
0.34
0.32
1.78
94.2
0In
ner
50.
1265
,400
18.0
00.
0025
.80
63.6
044
,100
0.12
943
14.5
015
.30
0.34
0.27
1.73
92.6
0In
ner
60.
1366
,100
18.7
00.
0027
.70
68.1
045
,500
0.14
963
16.0
016
.70
0.35
0.31
1.91
97.7
0In
ner
70.
1173
,700
15.5
00.
0028
.30
72.8
050
,500
0.08
799
16.7
012
.10
0.25
0.39
1.91
115.
00In
ner
80.
1268
,300
13.2
00.
0026
.20
68.5
047
,200
0.07
717
16.1
011
.30
0.27
0.48
1.73
109.
00In
ner
90.
1268
,200
12.9
00.
0028
.90
69.0
048
,100
0.07
678
18.6
012
.30
0.40
0.47
2.02
117.
00In
ner
100.
1141
,600
11.4
00.
1722
.70
44.4
029
,000
0.06
589
12.7
012
.80
0.30
0.28
1.12
60.1
0

816 Environ Monit Assess (2012) 184:811–830
Tab
le2
(con
tinu
ed)
Stra
taSu
b-st
rata
Site
Ag
Al
As
Cd
Cr
Cu
Fe
Hg
Mn
Ni
Pb
SbSe
SnZ
n
Out
erB
ayO
uter
10.
146,
570
3.06
0.00
4.40
7.12
4,93
00.
0113
90.
001.
400.
000.
000.
0010
.20
Out
er2
0.17
7,79
03.
150.
004.
517.
145,
810
0.01
102.
071.
270.
000.
180.
0010
.60
Out
er3
0.18
13,5
003.
690.
008.
8512
.40
9,98
00.
0117
34.
862.
490.
000.
260.
4320
.20
Out
er4
0.14
39,7
0016
.00
0.00
29.8
052
.30
30,7
000.
0739
714
.60
8.27
0.35
0.69
2.35
74.6
0O
uter
50.
1919
,900
9.60
0.00
12.8
020
.80
16,7
000.
0326
06.
684.
720.
000.
270.
7333
.60
Out
er6
0.09
44,1
0014
.00
0.00
19.3
026
.20
27,9
000.
0364
110
.10
6.15
0.27
0.22
1.18
51.1
0O
uter
70.
1723
,700
7.47
0.00
16.7
040
.40
17,8
000.
0427
87.
465.
890.
000.
311.
2654
.90
Out
er8
0.15
31,3
007.
830.
0029
.10
26.3
021
,800
0.02
378
10.9
03.
910.
200.
271.
1043
.40
Out
er9
0.21
1,40
02.
840.
001.
821.
842,
020
0.00
610.
001.
500.
000.
000.
002.
42O
uter
100.
1717
,300
4.63
0.00
13.7
012
.30
13,2
000.
0121
65.
621.
650.
000.
130.
0022
.40
For
sim
plic
ity,
the
term
met
alis
used
wit
hout
dist
inct
ion
betw
een
true
met
als
and
met
allo
ids
NE
RR
Nat
iona
lEst
uari
neR
esea
rch
Res
erve
,SW
MP
Syst
emW
ide
Mon
itor
ing
Pro
gram
loca
tion
,wt.
wei
ght
Study area and methods
Study area
Jobos Bay is a natural harbor protected fromoffshore wind and waves by a series of mangroveislands to the southwest and Punta Pozuelo tothe southeast (Fig. 1). Apart from discharge fromrivers such as Quebrada Coqui-Aguas Verdes andRio Seco, Jobos Bay receives most of its waterfrom the open ocean. Under prevailing southeast-erly wind conditions, surface water is flushed fromthe Inner and Central Bays in a southwesterlydirection, promoting extensive mixing along theeastern shore of the Inner Bay (PRNC 1975). Forthis study, the bay has been subdivided into threegeographic zones, the Inner Bay, Central Bay, andOuter Bay (Fig. 2) based on habitat characteristicand water circulation patterns.
The Inner Bay is the eastern-most zone ofthe estuary and is enclosed by the Puerto Ricanmainland and Punta Pozuelo on three sides. Itexperiences the least water exchange with theopen ocean as it connects only to the CentralBay on its western side. The Inner Bay is alsothe shallowest of the zones with an average depthof about 3 m; however, depths range from lessthan 1 m on the shelf near the mouth of theInner Bay to 8 m in the dredged channel near thesouth shore (NGDC 2007). The confluent Que-brada Coqui-Aguas Verdes, which runs throughurban and cultivated lands and discharges into thenorthern coast of the Inner Bay, may representthe primary surface water input to Jobos Bay.Rio Seco, which stays dry a significant part of theyear, also discharges into the Inner Bay during wetseasons. The Inner Bay has a silty bottom that isregularly stirred up by wind, creating persistentlyturbid water (PRNC 1972).
The Central Bay is the largest and most com-plex estuarine stratum of Jobos Bay. Unlike theInner Bay, the Central Bay has regular waterexchange with the Caribbean Sea. The mangroveislands Cayos Caribe and Cayos de Barca, whichform the southern boundary, allow Caribbean wa-ters to pass through their shallow channels duringincoming tides and surface wind driven currents.Furthermore, Boca Del Infierno, a natural channel

Environ Monit Assess (2012) 184:811–830 817
of 4 m depth, provides an unobstructed exchangeof water with the Caribbean Sea. The Central Bayhas an average depth of approximately 5 m, butvaries widely between the mangrove forests at thebay edges to the Aguirre Navigational Channelthrough the middle of the bay.
The Outer Bay is characterized by its exposureto the Caribbean Sea to the west and restrictedflow with the Central Bay. The Outer Bay isdistinguished from the Central Bay by extensionof the mainland at Punta Arenas. A 10- to 14-mdeep channel allows water exchange between theadjacent estuarine zones. The Outer Bay has anaverage depth of just over 4 m. Given its openexposure to the Caribbean Sea, the Outer Bay ismostly influenced by ocean currents.
Methods
Sediment sample collection
In order to make inferences about the entire studyarea and improve sampling efficiency, a stratifiedrandom sampling design was implemented. JobosBay was operationally divided into three mainstrata corresponding to the different zones. Be-tween the eastern (Inner Bay) and western(Outer Bay) strata, is the central stratum (Cen-tral Bay), which contains a sub-stratum repre-senting the NERR monitoring zones in JobosBay. Within each stratum and sub-strata, ten siteswere randomly selected in addition to three ex-isting system-wide monitoring program (SWMP)
Fig. 3 Percent sediment fine fraction in Jobos Bay

818 Environ Monit Assess (2012) 184:811–830
(NERRS 2008) sites for sediment sampling(Table 1). Surficial sediments were collected ateach station using Young-modified van Veengrab sampler following the NS&T protocols(Lauenstein and Cantillo 1998). Because the sedi-ments collected were to be analyzed for chemicalcontaminants, protocols were used to avoid con-tamination of samples by equipment and cross-contamination between samples. All equipmentwere rinsed with acetone and then distilled wa-ter just prior to use to reduce the possibilityof contaminating the sediment sample. Person-nel handling the samples also wore disposablenitrile gloves. From each grab, the top 3 cm frac-tion of the sediment were sub-sampled with a
Kynar-coated scoop and placed in certified cleanIChem® 250 ml glass containers. Rocks or bits ofseagrass were removed. If a particular grab didnot result in 200–300 g of sediment being attained,a second grab was made and composited withmaterial from the first grab. If enough sedimenthad not been collected after three deploymentsof the grab, the site was abandoned and the boatmoved on to an alternative location. Sedimentsamples for metals analysis were stored on ice inthe field and shipped frozen to the laboratory andstored at −20◦C until analyzed. Samples for grainsize analysis were stored refrigerated to avoidaltering the grain size structure of the sediment viafreezing.
Fig. 4 Percent sediment TOC distribution in Jobos Bay

Environ Monit Assess (2012) 184:811–830 819
Analytical methods
Chemical analyses were performed by TDI-Brooks Inc., a government contracted laboratory.A list of trace metals discussed in this studyis provided in Table 2. Chemical analyses ofthese metals followed procedures routinely usedin the NOAA NS&T program (Kimbrough andLauenstein 2006). For most trace and majorelements, samples were analyzed using induc-tively coupled plasma/mass spectrometry analysis.Atomic fluorescence spectrometry was utilized tomeasure arsenic and selenium, while cold vaporatomic absorption spectrometry was used for mer-cury analysis. In general, samples were homog-enized and freeze dried. Aliquots of 0.10–0.45 gdried sediment were digested in a sequence ofheating steps with metal grade HNO3, HF, andboric acid. For analysis of Hg, sediment sampleswere digested based on a modified version ofEPA method 245.5 using a concentrated H2SO4
and HNO3, followed by addition of KMnO4, andK2S2O8, and a second digestion. Before analysis,5 mL of 10% (w/w) NH2OH·HCl were added toreduce excess permanganate and the volume wasbrought to 40 mL with distilled water.
Quality control samples, including the marinesediment reference materials HISS-1, MESS-3,and PACS-2 from the National Research CouncilCanada, were processed in a manner identical tofield samples. A method blank was run with every20 samples, or with every sample set, whicheverwas more frequent. Matrix spike/matrix spikeduplicate samples were run with every 20 sam-ples, or with every sample set. Calibration stan-dards (representative of sample concentration)are prepared from dilutions of NIST-traceablemulti-element standards. The low concentrationstandard is based on instrument sensitivity (e.g.,0.05 ppb for Pb, 0.5 ppb for Al). Mid and highstandards are at 20 and 200 ppb, respectively.Other reference materials (NIST 1640 Trace Ele-ments in Water) are used as check standards. Cal-ibration verification was performed periodicallywith a blank and mid-range standard (20 ppb).Quality control criteria for target analytes specifyrecoveries between 8% and 120% for spiked sam-ples and ±20% for SRM. The results are reportedon a dry weight (wt.) basis.
Other ancillary parameters included grain sizeand total organic and inorganic carbon (TOC,TIC). TOC and TIC were determined using meth-ods involving incineration, and grain size determi-nation was based on the Wentworth scale methodwhich utilizes a combination of sifting and pipet-ting techniques (McDonald et al. 2006). Grainsize, TOC, and TIC measurements are reportedas percentages of the total sample weight.
Statistical analysis
Primary statistical analyses were conducted usingJMP-5.1™ system statistical package. The datawas tested for normality using Shapiro Wilks“goodness of fit.” Multivariate cluster analy-ses were conducted to determine natural breakswithin the concentration range of each metal.Cluster analysis was used in order to adequatelyassess the spatial distribution of metal concen-trations. Wilcoxon rank-sum or Kruskal–Wallisrank tests were used to assess differences be-tween cluster groups and inter-strata comparison.Relationships between variables (e.g., inter-metalcorrelations) were assessed using Spearman rankcorrelation. Significance of statistical tests werereported at p = 0.05.
Table 3 Metals range of concentrations (micrograms pergram of dry wt.) in surficial sediment from Jobos Bay
Analyte Minimum Maximum Median
Ag 0.051 0.219 0.105Al 629 73,700 41,850As 1.79 28.1 12.8Cd 0 0.174 0Cr 0 29.8 18.5Cu 1.37 73.7 29.9Fe 1,060 50,500 26,650Hg 0.0014 0.144 0.0309Mn 33.1 1,130 529Ni 0 31 10.1Pb 0.227 16.7 6.02Sb 0 0.589 0.269Se 0 1.56 0.276Sn 0 2.74 1.17Zn 1.57 117 48.5
Zero values represent concentrations below detectionlimitswt. weight
820 Environ Monit Assess (2012) 184:811–830
Results
Sediment grain size and TOC
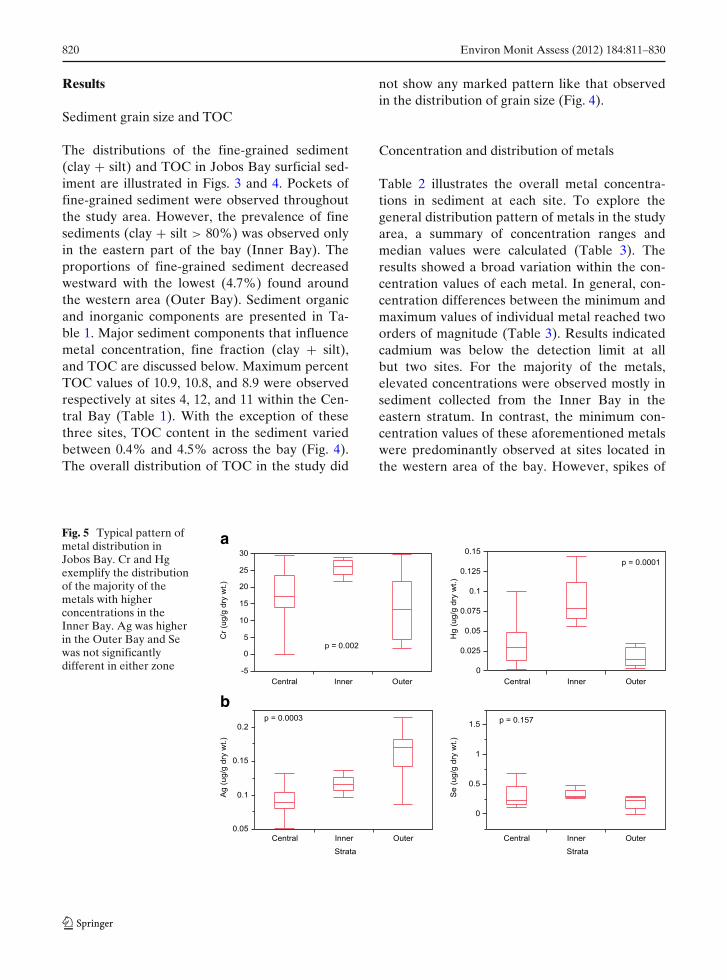
The distributions of the fine-grained sediment(clay + silt) and TOC in Jobos Bay surficial sed-iment are illustrated in Figs. 3 and 4. Pockets offine-grained sediment were observed throughoutthe study area. However, the prevalence of finesediments (clay + silt > 80%) was observed onlyin the eastern part of the bay (Inner Bay). Theproportions of fine-grained sediment decreasedwestward with the lowest (4.7%) found aroundthe western area (Outer Bay). Sediment organicand inorganic components are presented in Ta-ble 1. Major sediment components that influencemetal concentration, fine fraction (clay + silt),and TOC are discussed below. Maximum percentTOC values of 10.9, 10.8, and 8.9 were observedrespectively at sites 4, 12, and 11 within the Cen-tral Bay (Table 1). With the exception of thesethree sites, TOC content in the sediment variedbetween 0.4% and 4.5% across the bay (Fig. 4).The overall distribution of TOC in the study did
not show any marked pattern like that observedin the distribution of grain size (Fig. 4).
Concentration and distribution of metals
Table 2 illustrates the overall metal concentra-tions in sediment at each site. To explore thegeneral distribution pattern of metals in the studyarea, a summary of concentration ranges andmedian values were calculated (Table 3). Theresults showed a broad variation within the con-centration values of each metal. In general, con-centration differences between the minimum andmaximum values of individual metal reached twoorders of magnitude (Table 3). Results indicatedcadmium was below the detection limit at allbut two sites. For the majority of the metals,elevated concentrations were observed mostly insediment collected from the Inner Bay in theeastern stratum. In contrast, the minimum con-centration values of these aforementioned metalswere predominantly observed at sites located inthe western area of the bay. However, spikes of
Fig. 5 Typical pattern ofmetal distribution inJobos Bay. Cr and Hgexemplify the distributionof the majority of themetals with higherconcentrations in theInner Bay. Ag was higherin the Outer Bay and Sewas not significantlydifferent in either zone
a
b

Environ Monit Assess (2012) 184:811–830 821
relatively elevated concentrations were observedfor some metals throughout the study area. Forinstance, maximum concentrations were observedat sites 4 and 11 in Central Bay for As; Cr wereelevated at sites 4 and 8 of the Central andOuter Bays, respectively; and maximum concen-tration for Ni was found at sites 4, 11, and 12in Central Bay.
Further assessments to compare metal concen-trations in the three strata were conducted usingnonparametric Wilcoxon tests. The results showedthat the proportion of the measured metals varied
widely within strata (Fig. 5a and b) confirmingearlier observations illustrated in Table 3. Met-als concentrations were significantly higher (p <
0.05) in the Inner Bay relative to the Centraland Outer Bays (Fig. 5a), with the exception ofAg and Se (Fig. 5b). In contrast to the generalobservation, Ag was measured at significantlyhigher concentrations in the Outer Bay (p < 0.05)relative to the other zones of the study area.Concentrations of Se, on the other hand, showedno statistical difference between the three strata(p > 0.05).
Fig. 6 Distribution of Cr in the sediment of Jobos Bay

822 Environ Monit Assess (2012) 184:811–830
Cluster analysis, applied to the concentrationrange of individual metal, followed by Wilcoxontests were used to assess the spatial distributionof metals in Jobos Bay sediment. Metals suchas Al, As, Cr, Cu, Fe, Hg, Mn, Ni, Pb, Sn, andZn were shown to have similar distribution pat-terns. These distributions were illustrated by theCr and Fe results in Figs. 6 and 7. In general,these metals showed a characteristic distributionpattern with decreasing concentration from east towest (Figs. 6 and 7). The distribution of Ag, how-ever, contrasted with that of the general pattern
(Fig. 8) with elevated concentrations of Ag mainlyobserved in the western stratum.
Inter-metal and grain size correlation
Spearman rank correlations among all metals,grain size, and TOC are shown in Table 4. Spear-man coefficient Rho values of 0.707 or higherwere discussed as indicative of strong correlation,while values below 0.707 indicate weak correla-tion. Strong associations were found among sev-eral groups of metals. Among the major elements,
Fig. 7 Distribution of Fe in the sediment of Jobos Bay

Environ Monit Assess (2012) 184:811–830 823
Fig. 8 Distribution of Ag in the sediment of Jobos Bay
Al and Fe showed strong and direct correlationswith each other and with virtually all trace metalsexcept Ag. Also, Mn was positively correlatedwith Al, Fe, and all other trace elements exceptSe (p > 0.05). Apart from Ag, which had a poorand inverse correlation; the results indicated that,in general, inter-metal correlations were positive.Other studies have reported significant correla-tions between major elements, such as Al, Fe,and Mn, and trace metals in similar habitats offthe southeastern coast of the USA (Windomet al. 1989; Schropp et al. 1990; Caccia et al. 2003).These studies suggest that Al and Fe can be usedas normalizing factors for metals in natural estu-
aries and coastal environments to assess anthro-pogenic enrichment.
Grain size and sediment TOC were found tobe positively correlated with all major and traceelements, excluding Ag. Relative to TOC, grainsize showed stronger correlations (Rho > 0.707)with the major and trace metals. These resultsconfirm that elemental concentrations are ele-vated in finer sediments because of higher surfaceto volume ratio (Forstner and Wittmann 1981).The depositional zone in the Inner Bay stratumhad metal concentrations greater than the otherstrata (Figs. 6 and 7), likely due to grain size andproximity to metal sources. Total organic carbon

824 Environ Monit Assess (2012) 184:811–830
Tab
le4
Spea
rman
rank
corr
elat
ions
betw
een
met
als,
grai
nsi
ze(c
lay
+si
lt),
and
TO
Cin
sedi
men
tfro
mJo
bos
Bay
Lab
el%
TO
C%
Fin
eA
gA
lA
sC
rC
uF
eH
gM
nN
iP
bSb
SeSn
%F
ine
0.42
40.
005
Ag
−0.1
11−0
.316
0.47
90.
039
Al
0.23
90.
911
−0.3
660.
122
0.00
00.
016
As
0.40
50.
720
−0.3
980.
740
0.00
70.
000
0.00
80.
000
Cr
0.52
00.
739
−0.0
750.
752
0.70
00.
000
0.00
00.
632
0.00
00.
000
Cu
0.61
90.
822
−0.1
330.
801
0.68
30.
892
0.00
00.
000
0.39
40.
000
0.00
00.
000
Fe
0.39
00.
911
−0.2
520.
965
0.78
70.
845
0.87
30.
010
0.00
00.
102
0.00
00.
000
0.00
00.
000
Hg
0.69
30.
747
−0.1
690.
696
0.70
00.
815
0.94
10.
781
0.00
00.
000
0.27
90.
000
0.00
00.
000
0.00
00.
000
Mn
0.03
90.
839
−0.4
020.
952
0.69
60.
615
0.67
00.
887
0.58
20.
801
0.00
00.
008
0.00
00.
000
0.00
00.
000
0.00
00.
000
Ni
0.70
80.
573
−0.2
390.
555
0.63
90.
800
0.81
40.
631
0.83
10.
373
0.00
00.
000
0.12
20.
000
0.00
00.
000
0.00
00.
000
0.00
00.
014
Pb
0.68
90.
784
−0.2
330.
722
0.70
00.
798
0.93
80.
793
0.97
50.
612
0.82
40.
000
0.00
00.
132
0.00
00.
000
0.00
00.
000
0.00
00.
000
0.00
00.
000
Sb0.
368
0.55
9−0
.286
0.63
30.
790
0.72
50.
648
0.66
50.
622
0.53
90.
697
0.64
20.
015
0.00
00.
063
0.00
00.
000
0.00
00.
000
0.00
00.
000
0.00
00.
000
0.00
0Se
0.91
80.
510
−0.1
560.
353
0.52
10.
639
0.68
70.
482
0.72
10.
137
0.78
90.
709
0.49
70.
000
0.00
00.
318
0.02
00.
000
0.00
00.
000
0.00
10.
000
0.38
00.
000
0.00
00.
001
Sn0.
560
0.84
2−0
.253
0.74
70.
626
0.82
30.
887
0.79
80.
852
0.63
50.
686
0.86
80.
607
0.65
00.
000
0.00
00.
102
0.00
00.
000
0.00
00.
000
0.00
00.
000
0.00
00.
000
0.00
00.
000
0.00
0Z
n0.
541
0.90
0−0
.200
0.89
30.
720
0.89
10.
964
0.94
50.
891
0.77
70.
735
0.90
60.
654
0.62
70.
914
0.00
00.
000
0.19
90.
000
0.00
00.
000
0.00
00.
000
0.00
00.
000
0.00
00.
000
0.00
00.
000
0.00
0
Bol
ded
lett
erin
gre
pres
ents
the
Rho
valu
e(ρ
)an
dst
anda
rdsc
ript
repr
esen
tsp
valu
es

Environ Monit Assess (2012) 184:811–830 825
ranged from 0.3% to 4.3% and was only weaklycorrelated with metals.
Discussion
The highest percentages of TOC were observedin sediment from the central stratum, while sed-iments from the eastern and western strata wererelatively low in TOC content. Except for Niand Se, TOC content was not strongly correlatedwith metals suggesting that the influence of or-ganic matter on metal distribution may be far lessimportant than that of grain size. This observa-tion corroborates the assertions by Forstner andWittmann (1981) and Windom et al. (1989), whichindicated that in natural estuarine and coastalsediments, concentrations of metal are predomi-nantly determined by detrital inorganic materialrather than organic and nondetrital materials.
In Jobos Bay, the distribution of inorganic ma-terial (grain size) demonstrated a distinctive gen-eral pattern. Fine-grained material showed a de-creasing gradient from the eastern to the westernzone of the study area (Fig. 3). These findings arein agreement with previous results reported bythe PRNC (1972), which characterized the easternarea (Inner Bay) stratum as having silty bottomsediment relative to areas of the bay where sedi-ments are more or less sandy.
The predominantly elevated proportion of finesediment materials in the Inner Bay indicatedthat the area is a low-energy depositional zone.Physical conditions and the water circulation inthe Inner Bay are suitable for sedimentation ofterrigenous fine particles suspended in runoff wa-ters. Sedimentation of these fine particles in theInner Bay may be favored as a result of surfacewater input from Quebrada Coqui-Aguas Verdesand Rio Seco, the shallowness of the bay and thefact that the Inner Bay is semi-enclosed (PRNC1972).
The concentrations of the majority of met-als showed similar distributions as that of grainsize. Relative to the Outer and Central Bays,significantly high (p < 0.05) metal concentrationsare found in the Inner Bay stratum located in theeastern area of the bay (Tables 2 and 3, Figs. 6 and7). The physiographic characteristics of the stra-
tum and the sediment texture may be the causeof the relatively high metal concentrations in theInner Bay stratum. The Inner Bay is the receivingbasin for Quebrada Coqui-Aguas Verdes and RioSeco, which transport terrigenous detrital mate-rials from the upland. Being physically protectedfrom the scouring of offshore water, the InnerBay acts like a depositional area characterizedby calm waters. As a result, sediment materialstransported by Quebrada Coqui-Aguas Verdesand Rio Seco are deposited along with metals.Furthermore, the presence of metals in elevatedconcentrations in the Inner Bay may be linked toits characteristically fine-grained sediment. It hasbeen shown that because of their high surface tovolume ratio, fine sediments like those found inthe Inner Bay tend to sequester higher concen-trations of metals (Forstner and Wittmann 1981;Ujevic et al. 2000; Orescanin et al. 2004). Con-versely, the relatively low concentration of metalsfound in the Outer and Central Bays may be dueto the presence of a sandier type of sediment, andparticularly to the fact that these systems are wellflushed by offshore water.
Cadmium was measured at very low concen-trations at virtually all the sites in the studyarea. Chemically, Cd is strongly affected by di-agenic processes that impact its equilibrium be-tween pore water and the overlying water col-umn (Rosenthal et al. 1995). During this process,Cd migrates into porewater in the top oxidizedsediment layer while the inverse occurs in thereduced deeper layers. The diagenetic behaviorof Cd is usually linked to its depletion in the up-per oxidized layer of sediments (Rosenthal et al.1995; Apeti et al. 2009). Because of its low con-centrations in this study, Cd is not included in anysubsequent discussion.
Metal concentrations in Jobos Bay were com-pared to other studies from similar habitat en-vironments (Table 5). In general, concentrationvalues were within the ranges found in JobosBay (Aldarondo-Torres et al. 2010; NS&T 2011),southwest Puerto Rico (Pait et al. 2008), andsouthwest Florida (Cantillo et al. 1999a). How-ever, maximum concentrations for As, Cu, Mn,Sn, and Zn in Jobos were elevated relative tothose in Tampa Bay, which was once consid-ered polluted (Lewis et al. 1998). NOAA’s NS&T

826 Environ Monit Assess (2012) 184:811–830
Tab
le5
Ran
geof
met
alco
ncen
trat
ion
insu
rfic
ials
edim
entf
rom
Jobo
sB
ayco
mpa
red
topu
blis
hed
data
from
sim
ilar
habi
tate
nvir
onm
ents
Are
aA
gA
sC
dC
rC
uH
gM
nN
iP
bSb
SeSn
Zn
Ref
eren
ce
Thi
sst
udy
0.1–
0.2
1.8–
280.
0–0.
20.
0–30
1.4–
740.
0–0.
133
–1,1
300.
0–31
0.2–
170.
0–0.
60.
0–1.
60–
2.74
1.8–
117
Thi
sst
udy
(med
ian)
Jobo
sB
ay–
9.6–
270.
02–0
.2–
1.6–
53–
––
1.5–
22–
––
11–1
30A
ldar
ondo
-Tor
res
etal
.(20
10)
Jobo
sB
ay0.
0–0.
111
–12
0.0–
0.2
37–2
7311
–155
0.03
–0.1
508–
990
9.2–
258
6.7–
12–
0.2–
0.3
2.4–
1.4
75–1
39N
S&T
(201
1)So
uth
Flo
rida
0.1–
0.3
2.5–
100.
1–0.
320
–80
10–4
00.
1–0.
220
–100
10–2
05–
200.
2–0.
60.
2–0
.81–
320
–100
Can
tillo
etal
.(1
999a
)T
ampa
Bay
0.1–
0.2
1–5
0.3–
0.8
20–6
010
–20
0.1–
0.2
20–6
05–
1020
–60
0.3–
0.8
0.5–
1.5
20–8
0C
anti
lloet
al.
(199
9b)
Sout
hwes
tPR
<00
10.
010.
0131
.25.
21<
0.01
109
26.6
1.93
0.1
0.2
0.21
8P
aite
tal.
(200
8)E
RL
a1.
08.
21.
281
340.
15–
20.9
46.7
––
–15
0L
ong
etal
.(19
96)
ER
Ma
3.7
709.
637
027
00.
71–
51.6
––
––
410
Lon
get
al.(
1996
)
Con
cent
rati
onva
lues
are
inm
icro
gram
spe
rgr
amof
dry
wei
ght.
Val
ues
are
roun
ded
up.F
ew
asno
tin
clud
eddu
eto
lack
ofpu
blis
hed
valu
es.V
alue
sfo
rso
uthw
est
Pue
rto
Ric
o(P
aite
tal.
2008
)ar
eav
erag
esa Se
dim
entq
ualit
ygu
idel
ines
wer
eno
tdev
elop
edfo
ral
lmet
als
mon
itor
edby
the
NO
AA
’sN
atio
nalS
tatu
san
dT
rend
sP
rogr
am
program has maintained monitoring sites alongthe Puerto Rican coastline, including Jobos Bay,since 1992 (NS&T 2011). Although, concentrationranges of metals were similar (Table 5), the NS&Tdata indicated extremely high concentration forNi (258 μg/g dry wt.) and Cr (27 μg/g dry wt.)in Bahia de Boquerón. Runoff from a landfill inthe vicinity of the NST monitoring site in theregion was assumed to be the possible source ofcontamination.
Further evaluation of the degree of metal con-tamination in Jobos Bay was assessed using thepreviously published numerical sediment qual-ity guidelines (SQG) known as effects range-low(ERL) and effects range-median (ERM) devel-oped by Long and Morgan (1990) and Long et al.(1996). The SQG value was not defined for allmetals; existing guideline values are presented inTable 5. These guidelines are statistically derivedlevels of contamination above which toxic effectswould be expected to be observed with at least a50% frequency (ERM), and below which effectswere rarely (<10%) expected (ERL). In JobosBay, metals concentrations were all below theERM values, but maximum values for As, Cu,and Ni were above their respective ERL valuesat sites located in the Inner and Central strata.Mercury was found at the ERL level at site 6 of theInner Bay stratum. Overall, the degree of metalconcentrations does not suggest a high level ofsediment metal-related toxicity in the bay.
The presence of metals at relatively elevatedconcentrations in the eastern area of Jobos Baymay be linked to diffuse nonpoint sources of nat-ural and anthropogenic origins. Jobos Bay water-shed is host to a variety of residential, commer-cial, and industrial activities, most notably a coalpower plant, a petroleum refinery, and pharma-ceutical facilities (Dieppa et al. 2008), that likelycontribute pollutants to the bay. Coal burningis associated with atmospheric pollution by met-als, such as As, Cd, Cu, Hg, Pb, Ni, and Znfound in fly ash (Theis et al. 1978; McBride et al.1978). Atmospheric deposition for metals fromindustrial emissions in the vicinity of Jobos Baywere assessed (Jimenez-Velez et al. 2003, 2009;Gioda et al. 2005). Relative to other regions inPuerto Rico, concentrations of metals in airborneparticles were higher in the Salinas watershed,
Environ Monit Assess (2012) 184:811–830 827
which incorporates Jobos Bay (Jimenez-Velezet al. 2003). Gioda et al. (2005) also concludedthat the presence of Cd, Cu, Fe, Ni, Hg, and Pb inairborne particles in the Jobos Bay may be linkedto both long-range atmospheric transport andanthropogenic activities in the bay’s watershed.Rather than local industrial activities, previousstudies indicated that concerns of water quality inJobos Bay may be linked to land-based sourcesfrom agricultural runoff and soil erosion (Fieldet al. 2002).
Preliminary studies (Altieri-Rijos 2004) re-vealed that pesticides and fertilizers applied inagricultural fields were also being transported tothe Reserve bay (Field et al. 2002). Althoughmetals such as Cd, Cr, Cu, Fe, Hg, Mn, Pb, Ni,and Zn are constituents of phosphorus fertilizers(Forstner and Wittmann 1981), they also occurnaturally. Copper is also used as an agriculturalfungicide, and in anti-fouling boat paint. As aresult, it is difficult to distinguish between nat-ural and anthropogenic sources. Metallic conta-minants, whether from natural or anthropogenicsources, are supplied in solution or in associationwith fine-grained suspended solids and colloidalinorganic particles. These particles are usuallydeposited in areas of low hydrodynamic energyalong streams or are transported to estuaries orthe ocean during times of increased river flow(Simpson et al. 2000).
A number of methods, based on geochem-ical processes that control behavior and fateof metals in coastal waters, have been pro-posed (Forstner and Wittmann 1981; Schropp and
Windom 1987). In natural coastal waters, tracemetals co-precipitate with the oxide/hydroxidesof Al, Fe, and Mn usually into the fine-grainedfraction (clay or aluminosilicate) of sediments(Schropp and Windom 1987). Since aluminosili-cates are the metal-rich phase of bottom sediment,many approaches to delineate anthropogenic ver-sus natural sources are based on grain size, usingAl and Fe for normalization (Windom et al. 1989;Forstner and Wittmann 1981; MacDonald 1994).That is, without anthropogenic inputs, metal con-centrations are expected to co-vary among eachother and with Al, Fe, and Mn, given that factorssuch as precipitation or diagenesis are very small.Deviations from direct metal-Al/Fe or metal-grainsize correlations are interpreted as anthropogenicenrichment (Windom et al. 1989; MacDonald1994; Carvalho et al. 2002).
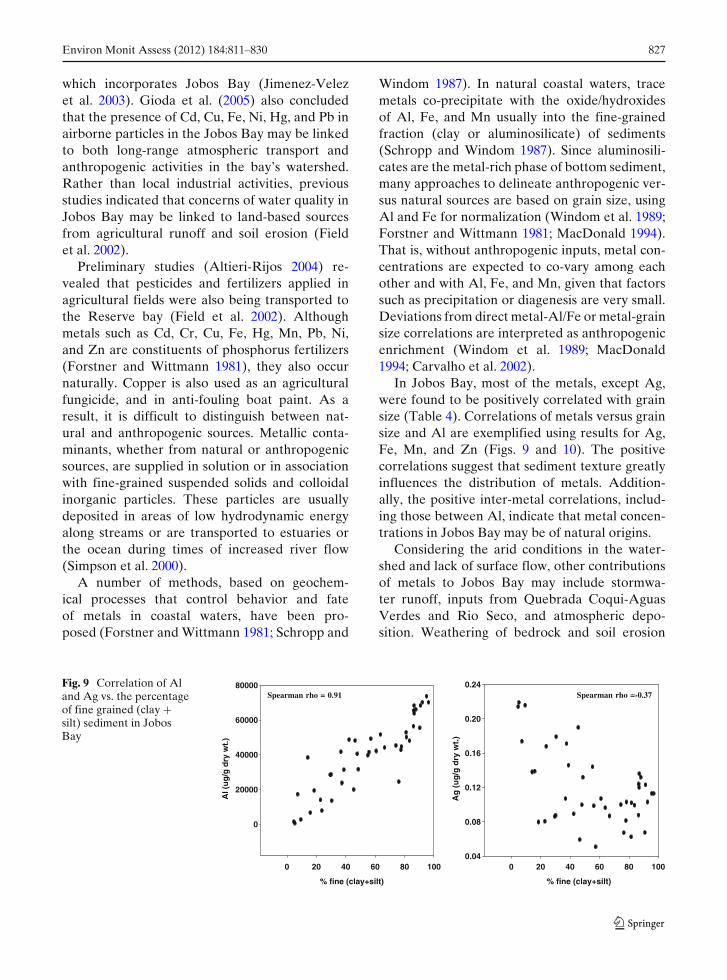
In Jobos Bay, most of the metals, except Ag,were found to be positively correlated with grainsize (Table 4). Correlations of metals versus grainsize and Al are exemplified using results for Ag,Fe, Mn, and Zn (Figs. 9 and 10). The positivecorrelations suggest that sediment texture greatlyinfluences the distribution of metals. Addition-ally, the positive inter-metal correlations, includ-ing those between Al, indicate that metal concen-trations in Jobos Bay may be of natural origins.
Considering the arid conditions in the water-shed and lack of surface flow, other contributionsof metals to Jobos Bay may include stormwa-ter runoff, inputs from Quebrada Coqui-AguasVerdes and Rio Seco, and atmospheric depo-sition. Weathering of bedrock and soil erosion
Fig. 9 Correlation of Aland Ag vs. the percentageof fine grained (clay +silt) sediment in JobosBay
% fine (clay+silt)
0 20 40 60 80 100 0 20 40 60 80 100
Al (
ug
/g d
ry w
t.)
0
20000
40000
60000
80000Spearman rho = 0.91
% fine (clay+silt)
Ag
(u
g/g
dry
wt.
)
0.04
0.08
0.12
0.16
0.20
0.24Spearman rho =-0.37

828 Environ Monit Assess (2012) 184:811–830
Zn
(ug
/g d
ry w
t.)
0
20
40
60
80
100
120Spearman rho = 0.89
Fe
(ug
/g d
ry w
t.)
0
10000
20000
30000
40000
50000Spearman rho = 0.97
Ag
(ug
/g d
ry w
t.)
0.00
0.05
0.10
0.15
0.20
0.25Spearman rho = -0.37
Al (ug/g dry wt.)
0 20000 40000 60000 80000
Al (ug/g dry wt.)
0 20000 40000 60000 80000
Al (ug/g dry wt.)
0 20000 40000 60000 80000
Al (ug/g dry wt.)
0 20000 40000 60000 80000
Mn
(u
g/g
dry
wt.
)
0
200
400
600
800
1000
1200Spearman rho = 0.95
Fig. 10 Inter-metal correlation of Fe, Mn, Zn, and Ag versus Al
produce mineral debris that are natural sources ofmetal in sediment transported into coastal waters(Forstner and Wittmann 1981). Transport of detri-tal materials within the watershed by stormwaterand runoff from Quebrada Coqui-Aguas Verdesmay constitute the largest source of metals inJobos Bay. Although Rio Seco is a seasonal in-termittent river, it may also contribute to metal-bound sediment transport into the bay, especiallyduring wet seasons. However, the characteristicdeviations of Ag from direct positive correlationwith both Al and grain size may be interpreted ashaving anthropogenic inputs.
Of the 15 metals, only Ag was found to havea spatial distribution that contrasted with that ofthe general east–west decreasing pattern (Fig. 8).Additionally, Ag did not show a direct correlationwith Al and grain size. Current levels of Ag con-
centration in Jobos Bay are lower than the ERLand ERM values, but the fact that it has relativelyelevated concentrations in the more sandy west-ern area of the bay (Fig. 8), suggests enrichment.Possible sources of Ag in the western stratum mayinclude industrial discharges or runoff.
Conclusion
Sediment characteristics, such as grain size andTOC, and baseline metal concentrations havebeen assessed in Jobos Bay. Overall, the distri-butions of sediment grain size and TOC contentsuggested heterogeneous bottom substrates inJobos Bay. Grain size appears to heavily influencethe distribution of all metals except that of Ag.Most metals were found to be significantly higher

Environ Monit Assess (2012) 184:811–830 829
in the eastern area of the bay relative to thecentral and western areas. However, maximumconcentration values were within concentrationranges found in other similar estuarine systems.Sediment normalizing factors, such Al and grainsize, were positively correlated with virtually allmetals. This suggests that although the watershedcontains several low-density population centersand some industrial plants, anthropogenic inputsmay be negligible. Likely sources of metals inJobos Bay may include natural bedrock weath-ering and transportation of detrital materials byQuebrada Coqui-Aguas Verdes and Rio Seco.The more diffuse nonpoint source of atmosphericdeposition resulting from local and long-rangetransboundary airborne particles are also possiblesources, which may be contributing to the overallmetal concentration in Jobos Bay. The lack ofcorrelation of Ag with normalizing factors sug-gested enrichment from industrial effluents forthis metal. However, the concentrations of Ag aswell as those of other metals were well belowsediment quality guidelines suggesting that metaltoxicity to biota is limited in Jobos Bay. This studyis the first comprehensive assessment of metalsin Jobos Bay and the associated data serve asbaseline information for further assessments andmonitoring.
Acknowledgements We would like to acknowledgeNOAA’s Coral Reef Conservation Program (CRCP) andthe USDA Conservation Effects Assessment Program forfunding the project. We would also like to thank CaptainClaudio Burgos of the Jobos Bay NERR for his skill andpatient captaining of the Estuarino during the collectionof samples for this project. Also, the authors would liketo acknowledge Kevin McMahon (NOAA) for his criticalreview and helpful comments.
References
Aldarondo-Torres, J. X., Samara, F., Mansilla-Rivera, I.,Aga, D. S., & Rodriguez-Sierra C. J. (2010). Tracemetals, PAHs, and PCBs in sediments from the JobosBay area in Puerto Rico. Marine Pollution Bulletin, 60,1350–1358.
Altieri-Rijos, C. (2004). Determination of pesticides in sur-face and run-off discharge into the groundwater in theJobos National Estuarine Research Reserve Gradu-ate Research Fellow, MS Thesis, University of PuertoRico/Medical Science Campus.
Apeti, D. A., Lauenstein, G. G., & Riedel G. F. (2009).Cadmium distribution in coastal sediments and mol-lusks of the US. Marine Pollution Bulletin, 58, 1016–1024.
Caccia, V.G., Millero, F.J., & Palanques A. (2003). Thedistribution of trace metals in Florida Bay sediments.Marine Pollution Bulletin, 46, 1420–1433.
Cantillo, A. Y., Lauenstein, G. G., O’Connor, T. P., &Johnson, W. E. (1999a). Status and trends of conta-minant levels in biota and sediments of South Florida.NOAA Regional Report Series, 2, 40.
Cantillo, A. Y., Lauenstein, G. G., Johnson, W. E., &O’Connor, T. P. (1999b). Status and trends of conta-minant levels in biota and sediments of Tampa Bay.NOAA Regional Report Series, 5, 43.
Carvalho, A., Shrap, S. J., & Sloane, G. M. (2002). Develop-ment of an interactive tool for assessment of metal en-richment in Florida freshwaters sediment. Tallahassee,FL: Florida Department of Environmental Protection,C2001–022.
Dieppa A., Field, R., Laboy, E. N., Capella, J., Robles,P. O., & Gonzalez, C. M. (2008). Jobos Bay estuarineprof ile: A National Estuarine Research Reserve (pp.109). Puerto Rico: JBNERR.
Field, R., Robles, P. O., Gonzalez, C. M., Laboy, E. N., &Capella, J. (Eds.) (2002). Jobos Bay estuarine prof ile:A national estuarine research reserve (pp. 107). PuertoRico: JBNERR.
Forstner, U., & Wittmann, G. T. W. (1981). Metal Pollutionin the aquatic environment. New York: Springer
Gioda, A., Perez, U., Rosa, Z., & Jimenez-Velez, N. D.(2005). Concentration of trace elements in airbornePM10 from Jobos Bay national estuary, PuertoRico. Water, Air, and Soil Pollution, 174, 141–159.http://www.ngdc.noaa.gov/mgg/bathymetry/hydro.html/.
Jimenez-Velez, B. D., Rosa, Z., Perez, U., & Gioda, A.(2003). Evaluating heavy metal concentrations in air-borne PM10 from the Jobos Bay National Estuary,at Salinas, Puerto Rico. Final Report. Center for En-vironmental and toxicological Research, Universityof Puerto Rico, Medical Science Campus, School ofMedicine.
Jimenez-Velez, B. D., Detres, Y., Armstrong, R. A., &Gioda, A. (2009). Characterization of African dust(PM2.5) across the Atlantic Ocean during AEROSE2004. Atmospheric Environment, 43, 2659–2664.
Kimbrough, K. L., & Lauenstein, G. G. (2006). Trace MetalAnalytical Methods of the National Status and TrendsProgram: 2000–2006. US Dept. Comm., NOAA Tech.Memo. 29. Silver Spring: NOS NCCOS.
Kimbrough, K. L., Johnson, W. E., Lauenstien, G. G.,Christensen, J. D., & Apeti, D. A. (2008). An as-sessment of tow decades of contaminant monitor-ing in the Nation’s Coastal Zone. Silver Spring:NOAA Technical Memorandum NOS NCCOS 74.105 pp.
Lauenstein, G. G., & Cantillo, A. Y. (1998). Sampling andAnalytical Methods of the National Status and TrendsProgram Mussel Watch Project: 1993–1996 Update.U.S. Dept. Comm., NOAA Tech. Memo. 130. SilverSpring: NOS ORCA.

830 Environ Monit Assess (2012) 184:811–830
Lewis, R. R., III, Clark, P. A., Fehring, W. K., Greening,H. S., Johanson, R. O., & Paul, R. T. (1998). The re-habilitation of the Tampa Bay estuary, Florida, USA,as an example of successful integrated coastal man-agement. Marine Pollution Bulletin, 37(8–12), 468–473.
Long, E. R., & Morgan, L. G. (1990). The potential for bio-logical effects of sediment-sorbed contaminants testedin the national status and trends program. NOAATech. Memo NOS OMA 52. NOAA, Seattle, WA. 175pp.
Long, E. R., Robertson, A., Wolfe, D. A., Hameedi, J., &Sloane, G. M. (1996). Estimates of the spatial extentof sediment toxicity in major U.S. estuaries. Environ-mental Science and Technology, 30(12), 3585–3592.
MacDonald, D. D. (1994). Approach to the Assessmentof Sediment Quality in Florida Coastal Waters. Vol.2—Application of the Sediment Quality AssessmentGuidelines. Tallahassee: Florida Department of Envi-ronmental Protection, Office of Water Policy.
McBride, J. P., Moore, R. E., Witherspoon, J. P., & Blanco,R. E. (1978). Radiological impact of airborne effluentsof coal and nuclear plants. Science, 202(4372), 1045–1050.
McDonald, S. J., Frank, D. S., Ramirez, J. A., Wang, B.,& Brooks, J. M. (2006). Ancillary Methods of the Na-tional Status and Trends Program: 2000–2006 Update.U.S. Dept. Comm., NOAA Tech. Memo. 28. SilverSpring: NOS NCCOS.
NERRS (National Estuarine Research Reserve Sys-tem) (2008). Centralized data management office.http://cdmo.baruch.sc.edu/. Accessed 2008 March 14.
NGDC (National Geophysical Data Center) (2007). NOShydrographic survey data.
NOAA (National Oceanic and Atmospheric Administra-tion) (2007). Conservation effects assessment project:Jobos Bay, Puerto Rico special emphasis water-shed study, plan of work. Online at: http://ccma.nos.noaa.gov/ecosystems/coralreef/CEAP_POW.pdf/.
NS&T (National Status and Trends) data portal online(2011). The National Status and Trend data download.http://ccma.nos.noaa.gov/about/coast/nsandt/download.html.
Orescanin, V., Lulic, S., Pavlovic, G., & Mikelic, L. (2004).Granulometric and chemical composition of the SavaRiver sediments upstream and downstream of theKrsko nuclear power plant. Environmental Geology,46, 605–613.
Pait, A. S., Whitall, D. R., Jeffrey, C. F. G., Caldow,C., Mason, A. L., Lauenstein, G. G. , et al. (2008).Chemical contamination in southwest Puerto Rico: Anassessment of trace and major elements in nearshoresediments. Marine Pollution Bulletin, 56, 1949–1956.
PRNC (Puerto Rico Nuclear Center) (1972). Aguirrepower project environmental studies 1972 Annual Re-port. PRNC-162, 464 pp.
PRNC (Puerto Rico Nuclear Center) (1975). Aguirre en-vironmental studies Jobos Bay, PR, Final Report.PRNC-196. 95 pp.
Reinfelder, J. R., Fisher, N. S., Luoma, S. N., Nichols,J. W., & Wang, W. -X., (1998). Trace element trophictransfer in aquatic organisms: A critique of the kineticmodel approach. The Science of the Total Environ-ment, 219, 117–135.
Rosenthal, Y., Lam, P., Boyle, E. A., & Thomson, J.(1995). Authigenic cadmium enrichment in suboxicsediments: Precipitation and postdepositional mobil-ity. Earth and Planetary Science Letters, 132, 99–111.
Ross, P., & DeLorenzo, M. E. , (1997). Sediment con-tamination problems in the Caribbean islands: Re-search and regulation. Environmental Toxicolologyand Chemistry, 16, 52–58.
Sauve, S., Brousseau, P., Pellerin, J., Morin, Y., Senecal,L., Goudreau, P., et al. (2002). Phagocytic activity ofmarine and freshwater bivalves: In vitro exposure ofhemocytes to metals (Ag, Cd, Hg, and Zn). AquaticToxicology, 58, 189–200.
Schropp, S. J., & Windom, H. L. (1987). A guide to the in-terpretation of metal concentrations in estuarine sed-iments. Florida Department of Environmental Regu-lation, Coastal Zone Management Section.
Schropp, S. J., Lewis, F. G., Windom, H. L., & Ryan,J. D. (1990). Interpretation of metal concentrations inestuarine sediments of Florida using aluminum as areference element. Estuaries, 13(3), 227–235.
Simpson, S. J., Fett, J. D., Long, D. T., & Patino, L.C.(2000). Understanding processes influencing patternsof chemical loadings to the environment: Sources,pathways and environmental regulations. In: 11th An-nual International Conference on Heavy Metals in theEnvironment (J. Nriagu, Editor), Contribution # 1171.University of Michigan, School of Public Health, AnnArbor, MI (CD-ROM).
Theis, T. L., Westrick, J. D., Hsu, C. L., & Marley, J. J.(1978). Field investigation of trace metals in ground-water from fly ash disposal. Water Pollution ControlFederation, 50(11), 2457–2469.
Ujevic, I., Odzak, N., & Baric, A. (2000). Trace metal ac-cumulation in different grain size fractions of the sed-iment from a semi-enclosed bay heavily contaminatedby urban and industrial wastewaters. Water Research,34(11), 3055–3061.
Windom, H. L., Schropp, S. J., Calder, F. D., Ryan, J. D.,Smith Jr., R. G., Burney, et al. (1989). Natural tracemetal concentrations in estuarine and coastal marinesediments of the southeastern United States. Environ-mental Science and Technology, 23, 314–320.
Copyright © 2022 FDOKUMEN