APÉNDICE III - Poder Judicial de Puerto Rico
98
Informe de la Comisión Especial para evaluar la nota de pase de las reválidas de derecho general y derecho notarial APÉNDICE III 26
-
Upload
khangminh22 -
Category
Documents
-
view
2 -
download
0
Transcript of APÉNDICE III - Poder Judicial de Puerto Rico

Informe de la Comisión Especial para evaluar la nota de pase
de las reválidas de derecho general y derecho notarial
APÉNDICE III
26

19 de enero de 2022
ESTADO LIBIu ASOCIADO DE PUERTO RICOTRIBUNAL SUPREMO
Lcdo. Héctor Rodríguez MulctDirector EjecutivoJunta Examinadora de Aspirantesal Ejercicio de la Abogacía y la Notaríahector.rodriguezpoderjudicial.pr
Estimado señor Director:
Reciba un saludo cordial de parte de los integrantes de la Comisión Especial paraevaluar la nota de pase de las reválidas de derecho general y derecho notarial(Comisión Especial).
De conformidad con la Resolución EC-2021-02 emitida el 28 de mayo de 2021por el Tribunal Supremo de Puerto Rico, y con el propósito de cumplir a cabalidadlas responsabilidades allí encomendadas a la Comisión Especial, necesitamos que laentidad que usted representa nos provea, a la brevedad posible, lo siguiente:
Descripción detallada del Informe de Puntuación que la Junta Examinadora deAspirantes al Ejercicio de la Abogacía y la Notaría envía a los y las spirantescon los resultados de su ejecutoria en la reválida de derecho general. Es decir,la Comisión Especial interesa que se le expliquen a profundidad (de maneraque, a su vez, esta pueda comunicar a una persona lego los procesos paracalcular la nota de pase) los siguientes aspectos del Informe de Puntuación quese le envía a la persona aspirante luego de tomar la reválida de derechogeneral:
a. En el cálculo inicial de las preguntas de discusión (la primera tabla),¿qué fórmula se aplica o qué operación estadística se realiza parapasar de la puntuación asignada a la convertida y por qué se hace?Además, ¿por qué se hace esta conversión en las preguntas dediscusión y no en las preguntas de selección múltiple?
b. En la segunda tabla del Informe de Puntuación, ¿por qué se suma lapuntuación convertida de las preguntas de discusión, se pasa comopuntuación cruda y luego se convierte en calibrada? ¿Qué fórmula se
27

Página 2
aplica o qúé operación estadística Se realiza para obtener lapuntuación calibrada y por qué se hace?
c. En cuanto a las preguntas de selección múltiple, ¿qué fórmula seaplica o qué operación estadística se realiza para obtener lapuntuación calibrada y por qué se hace?
d. Por igual, ¿cómo explicamos el razonamiento detrás del peso y suposterior resultado, es decir, la puntuación calibrada ajustada?
e. En suma, la Comisión Especial desea conocer cómo puedeexplicar de manera sencilla la valoración de los resultados en lareválida de derecho general; cómo se hace, cuál es el proceso,qué es, por qué y para qué se implementa.
2. Desempeño de los y las aspirantes primerizos(as) en la reválida de derechogeneral para septiembre de los años 2010 al 2020, por cada Escuela deDerecho.
3. Trasfondo e información oficial relacionada a los cambios en el formato oestructura de la reválida de derecho general que entraron en vigor para el año2012, así como cualquier otro dato sobre este particular.
4. Descripción o resumen de hallazgos principales y copia de los informes devalidación, a saber: Relationships Among Law School Admission Test Scores,Law School Grades, and Scores Bar Examination, para los últimos 10 años.
5. En cuanto a las fórmulas o factores que se aplican o las operacionesestadísticas que, se realizan para la conversión de las puntuaciones en lasreválidas de derecho local, nos gustaría saber si otras jurisdicciones deEstados Unidos las siguen en el cálculo de los resultados de sus respectivasreválidas.
6. Para septiembre de los años 2010 al 2020, ¿cuántas preguntas nuevas deselección múltiple (por materia) se han integrado por reválida de derechogeneral?
7. Cualquier otra información que entienda pueda ser de ayuda para el análisisque se encuentra realizando la Comisión Especial.
Agradeceremos que, tan pronto recopilen esta información, nos la faciliten. Detener alguna duda o pregunta, puede comunicarse a nuestra oficina al 787-721-6625.
28

Página 3
Cordialmente,
Ángel Co ón PérezPresidente
/
Diana Azizi ona Jua arques Di Ricardo Ramirez LugoComisionada Comisionado Comisionado
29

_______
11 Sour u
\\// untc [\J1nfludc do artc a C cco do k Ahco o NcV o
JIi�. ::'icts clii uc:E. cutvo
24 de enero de 2022
Comisión Especial para Evaluarla Nota de Pase de las Reválidasde Derecho General y Derecho NotarialTribunal Supremo de Puerto Rico
Estimados miembros de la Comisión Especial:
Espero que se encuentre bien de salud.
Acuso recibo de su solicitud de información presentada mediante carta del 19 de enerode 2022. Para propósitos de organización, pasamos a proveer la información en elmismo orden y con la misma numeración utilizada al ser requerida.
1. Es menester comenzar la explicación sobre los ajustes psicométricos realizadosa las puntuaciones de las reválidas con un trasfondo sobre las razones quejustifican estas operaciones.
Actualmente, la puntuación para aprobar las reválidas de derecho es 596 puntosajustados. Esta nota de pase es estática, es decir, no varía a través del tiempohasta que otra cosa disponga el Tribunal Supremo de Puerto Rico. Véase AnejoI. Debido a ello, los 596 puntos ajustados deben representar un mismo nivel dedesempeño, independientemente del momento en que un aspirante toma lareválida. Para que esto suceda, la Junta Examinadora de Aspirante al Ejerciciode la Abogacía (Junta) debe reducir al máximo las variables que pueden afectareste objetivo, como lo son los cambios en los niveles de dificultad de la prueba ylos distintos niveles de severidad con que corrigen los correctores, entre otrosfactores. En otras palabras, los 596 puntos ajustados no deben estar afectadospor el hecho de que una reválida particular estuvo más difícil que las demás oporque los correctores fueron más severos al otorgar los puntos en una ocasiónen comparación con otros exámenes.
Como comprenderán, la Junta utiliza diversas versiones del examen a través deltiempo para evitar que los aspirantes memoricen las preguntas y puedananticiparlas en reválidas futuras. Las preguntas de discusión son nuevas entodas las reválidas administradas. De otra parte, los miembros del Comité de
V I U ( U 1 \' ( I d dV
30

Comisión Especial24 de enero de 2022Pág. 2
Correctores cambian en cada reválida y, aun cuando se utilicen los mismoscorrectores, la adjudicación de los puntos en las preguntas de discusión se veráafectada por la severidad con que cada uno corrija, el nivel de calibración de loscorrectores que corrigen una misma pregunta y su nivel de agotamiento duranteel proceso. Igualmente, Pos cambios en el nivel de competencia de los gruposevaluados pueden afectar el significado de la puntuación asignada.
Esto significa que no habría forma de garantizar un mismo nivel de dificultadentre una reválida y otra si no se realizaran ajustes psicométricos a laspuntuaciones crudas adjudicadas. Si la Junta utilizara puntuaciones sin ajustespsicométricos para determinar quién aprueba el examen, el resultado estaríaafectado por estos factores inherentes a la redacción y la corrección del examen.Un aspirante podría reprobar un examen por el solo hecho de que su versión dereválida fue más difícil que la anterior. No habría un significado común yestandarizado entre la nota de pase de una reválida y las demás. Entonces, laJunta no podría asegurar que los aspirantes que aprobaron determinada reválidatienen los mismos conocimientos y las mismas destrezas que los demásaspirantes que han aprobado el examen anteriormente con la misma nota.
Todo lo anterior justifica que las puntuaciones crudas de la reválida seanajustadas para que estas reflejen el nivel de desempeño del aspirante sin estarafectado por factores como los antes descritos.
a) La puntuación asignada que recibe un aspirante en la parte de discusiónrepresenta la puntuación sin ajustar que fue otorgada por los dos correctoresque corrigieron determinada pregunta de discusión. Debido a que laseveridad de los correctores y el nivel de dificultad de cada pregunta dediscusión pueden variar dentro de un mismo examen, estas puntuacionesasignadas son convertidas a otra escala de puntos. Las puntuacionesadjudicadas por los correctores pueden ser otorgadas entre O y 40 puntos. Lanueva escala convierte estos puntos asignados entre O y 10 puntos. En esteproceso se ajusta la distribución de puntos de cada pregunta de tal forma quetodas tengan un promedio común (5 puntos) y una desviación estándarcomún1 (1 punto). El orden de los aspirantes, según su puntuación originalasignada por los correctores a cada pregunta, queda inalterado en estaconversión. Véase la Tabla de Conversión para la reválida de DerechoGeneral de septiembre de 2021 en el Anejo II.
Desde un punto de vista estadístico, este proceso asegura que ningunapregunta sea considerada más difícil o más fácil que las demás pues elpromedio de puntuaciones asignadas en cada pregunta estará ubicado en 5puntos convertidos en la nueva escala. Además, ninguna pregunta tendrámayor peso que las demás pues se ajusta la desviación estándar de laspuntuaciones para que su distribución sea común en todas las preguntas.
La desviación estándar mide la dispersión de una distribución de datos, por lo que mientras más dispersa está unadistribución de datos, más grande es su desviación estándar.
31

Comisión Especial24 de enero de 2022Pág. 3
Supongamos, por ejemplo, que el promedio de puntos asignados en laPregunta Número 1 fue de 4 puntos y el promedio de puntos asignados en laPregunta Número 2 fue de 12 puntos. Esto significa que la Pregunta Número1 resultó ser más difícil para el grupo evaluado en comparación con laPregunta Número 2. Al ubicar ambos promedios en la nueva escala depuntos convertidos, los 4 puntos asignados de la Pregunta Número 1estarían ubicados al mismo nivel que los 12 puntos asignados de la PreguntaNúmero 2, o sea, en o alrededor de 5 puntos convertidos en la nueva escala.Este efecto también se vería en las demás puntuaciones dentro de la escalapues las puntuaciones en la pregunta poseerán una misma desviaciónestándar. Por tanto, se nivela el efecto de la disparidad en puntos causadopor la dificultad relativa de una pregunta. Luego del proceso de ajuste,ninguna pregunta culmina con más valor que las demás. La Junta no podríaredactar preguntas más difíciles para que más aspirante reprueben oviceversa.
Esta operación no se realiza en la parte de selección múltiple. Es precisodestacar que esta parte del examen es completamente objetiva, corregidamediante un lector óptico que contiene la clave de esta parte del examen, porlo que la severidad con la que se corrige no es un factor que incide sobre lacorrección. Asimismo, esta parte del examen permite repetir en diferentesreválidas un número determinado de preguntas, las cuales se denominancalibradores. Los calibradores se utilizan para determinar los cambios endificultad entre un examen y otro, ya que permiten evaluar si un grupo en unareválida se desempeña mejor que otro grupo en otra reválida.
En vista de que podemos utilizar calibradores en la parte de selecciónmúltiple para determinar las diferencias en dificultad de esta parte en unexamen y otro, no es necesario aplicar Ja conversión de puntos descrita quese aplica en la parte de discusión.
b) Las puntuaciones convertidas que un aspirante obtiene en las preguntas dediscusión se suman para obtener la puntuación convertida total en esta partedel examen. Para propósitos del Informe de Puntuaciones, esta puntuaciónconvertida total en la parte de discusión se denomina puntuación cruda pues,al igual que la puntuación cruda obtenida en la parte de selección múltiple,todavía no ha sido calibrada mediante la aplicación de la fórmula establecidapor el psicómetra para cada una de las partes del examen.
Como expresamos en el acápite anterior, la puntuación convertida tiene elpropósito de ajustar las diferencias entre niveles de dificultad de laspreguntas de discusión dentro de un mismo examen. Sin embargo, hastaese momento, la puntuación no se ha ajustado en consideración a ladiferencia en dificultad de diversos exámenes a través del tiempo. Esto sehace aplicando a Ja parte de discusión la información que se obtiene sobrelos cambios en dificultad entre una reválida y otra en la parte de selecciónmúltiple.
32

Comisión Especial24 de enero de 2022Pág. 4
Como hemos adelantado, las puntuaciones de las preguntas de selecciónmúltiple son ajustadas utilizando preguntas administradas en reválidaspasadas. Este proceso, por tanto, permite considerar la dificultad histórica enlas reválidas pasadas. Este proceso de calibración en la parte de selecciónmúltiple se "extrapola" a la parte de discusión, la cual carece de preguntascalibradoras, pues todas las preguntas son nuevas. Esto es necesario puestoque, aun cuando se ajuste la parte de selección múltiple para considerar ladiferencia en dificultad entre diversas versiones del examen, no se ha hecholo mismo con respecto a la parte de discusión. La ausencia de un procesosimilar en la parte de discusión nos traería el siguiente problema:
The difficulty of the questions/items, the proficiency of the group ofexaminees taking the exam, and the graders (and the stringency withwhich they grade) may also change. All three of these variables canaffect the grades assigned by graders to examinees' responses tothese written components of the exam and can have the potential tocause variation in the level of performance the grades representacross administrations.2
Para evitar esta variabilidad, se utiliza la información adquirida durante lacalibración de la parte de selección múltiple --la cual produce una constanciaen el significado de las puntuaciones a través del tiempo-- para ajustarestadísticamente la puntuación convertida total de la parte de discusión. Elajuste estadístico se realiza para que, colectivamente, estas puntuacionesconvertidas en la parte de discusión tengan el mismo promedio y desviaciónestándar que se utilizó cuando se ajustó la parte de selección múltiple. Así,se calibra la parte de discusión a través del cómputo realizado anteriormentecon los calibradores en la parte de selección múltiple. Esto es posible porqueambas partes del examen evalúan el mismo contenido y guardan unacorrelación alta entre ellas.
La fórmula que se aplica a la puntuación convertida total de la parte dediscusión (denominada puntuación cruda en el Informe de Puntuaciones) esla siguiente:
Puntuación Calibrada (((Puntuación Convertida Total - promedio de laPuntuación Convertida Total) / desviación estándar de la PuntuaciónConvertida Total) * desviación estándar de la Puntuación Calibrada deSelección Múltiple) + Promedio de la Puntuación Calibrada de SelecciónMúltiple).
c) La puntuación cruda en la parte de selección múltiple representa el total decontestaciones correctas que un aspirante obtuvo en esta parte del examen.Como es de notar, esta puntuación no refleja ningún ajuste relacionado con
2 The Testing Column: Q&A: NCBE Testing and Research Department Staff Members Answer Your Questions, 86(Núm. 4) The Bar Examiner (2017-2018), disponible en https://thebarexaminer.org/article/winter-2017-2018/the-testing-column-ga-nche-testing-and-research-department-staff-members-answer-your-guestions/.
33

Comisión Especial24 de enero de 2022Pág. 5
la dificultad relativa de esta parte en comparación con pasadasadministraciones de la reválida. Para garantizar que las puntuaciones noestén afectadas por estos cambios en niveles de dificultad entre una parte deselección múltiple y otra administrada anteriormente, se utiliza el proceso decalibración.
Los calibradores son preguntas que cubren todas las materias evaluadas enel examen y presentan las características psicométricas esperadas en laspreguntas de selección múltiple. Aunque las versiones del examen seandistintas, estos calibradores constituyen un mini examen idéntico en lasadministraciones que utilicen el mismo grupo de calibradores. De esta forma,los psicómetras pueden evaluar las diferencias en desempeño entre losgrupos de esas reválidas y determinar si se deben a la diferencia en ladificultad de una versión del examen versus la otra.
El proceso de evaluación de la información provista por los calibradores sedescribe así:
If the two groups did equally well on the common items (and thecommon items are indeed a "mini test"), then any differences in thegroups' average raw scores on the two forms should be due todifferences in the difficulty levels of the two forms. For example, ifthe two groups did equally well on the common items and if GroupA did better on Form A than Group B did on Form B, then Form Awould be considered easier overall than Form B. If the group thattook Form A did better on the common items than the group thattook Form B, and if Group A did proportionally better on the testoverall, it suggests that the two forms have the same difficulty. IfGroup A did better than would be expected on Form A relative toGroup B's performance on Form B, then Form A would bedetermined to be easier overall than Form B and vice versa. Theuse of common items allows a comparison of the abilities of the twogroups on identical items. Once the group factor is accounted for,the form difficulty difference can be determined, and theappropriate statistical adjustment to raw scores can be made toensure that the reported scale scores for both forms are equivalent.Statistical equating procedures are designed to make these kindsof adjustments, so that the scale scores have the same meaningregardless of which test form an examinee took.3
El proceso de calibración utiliza la información estadística que se obtuvo delas preguntas comunes (calibradores) a ambos exámenes como medida dedesempeño de cada grupo. Este desempeño es comparado con eldesempeño demostrado en las restantes preguntas (no calibradores) paradeterminar si un examen de selección múltiple fue más difícil que otro.
Harris, Deborah, Equating the Multistate Bar Examination, 72 (Núm. 3) The Bar Examination (2003), pág. 14,disponible en https:/!thebarexaminer.org/wp-conient!uploads/PDFs/720303-harris.pdf.
34

Comisión Especial24 de enero de 2022Pág. 6
A través de métodos de ajuste lineal, la puntuación cruda en la parte deselección múltiple es ajustada para atemperarla a los cambios en la dificultadde esta parte del examen. Luego de este ajuste, obtenemos la puntuacióncalibrada. Debido al proceso, esta puntuación calibrada puede serinterpretada consistentemente a través de diversas administraciones deselección múltiple. Es decir, un aspirante que obtiene 500 puntos calibradosen esta parte del examen ha demostrado el mismo nivel de conocimiento yhabilidad que otro aspirante que tomó la reválida en otra ocasión y queobtuvo 500 puntos calibrados.
La fórmula que se utiliza en esta calibración es muy complicada.Simplemente, me limitaré a citar textualmente la fórmula, según redactadapor el Dr. Roger Bolus:
The notation for the calculations is as follows:A= Applicants taking the current testB Applicants taking the prior testT= All applicantsC = Items that are in common to both tests, i.e., equatorsX = All items on current testY = All items on prior testM=MeanS = Standard DeviationR = Correlation coefficientB = Regression CoefticientMXA Mean on test X for group ASXA = Standard Deviation on test X for group AMYB = Mean on test Y for group BSYB = Standard Deviation on test Y for group BMCA = Mean on test C for group ASCA = Standard Deviation on test C for group AMCB Mean on test C for group BSCB = Standard Deviation on test C for group BRXCA= Part-whole correlation between test C and X in group ARYCB= Part-whole correlation between test C and Y in group BMCT = Mean on test C for group TSCT = Standard Deviation on test C for group TCalculations:BXCA = RXCA*(SXAISCA);BYCB = RYCB*(SYB/SCB)MXT = MXA + (BXCA*(MCTMCA))MYT = MYB + (BYCB*(MCTMCB))SXT2 - (SXA**2) + ((BXCA**2) * (SCT**2 - SCA**2))SYT2 = (SYB**2) + ((BYCB**2) * (SCT**2 - SCB**2))P = (SQRT(SYT2))/(SQRT(SXT2)) - MultiplierO = MYT - (P*MXT) - Constant
35

Comisión Especial24 de enero de 2022Pág. 7
d) Al producirse una puntuación calibrada para cada parte del examen, la Juntaobtiene un beneficio adicional. Ahora las puntuaciones en cada parte delexamen se encuentran en una misma escala de puntos. Esto nos permiteasignarle el peso que cada parte va a tener en la nota final del aspirante sintener que intervenir con ninguno de los cómputos hechos hasta el momentosobre las puntuaciones y sin tener que cambiar la nota de pase.
El peso que cada parte del examen tiene en la nota final del aspirante es unasunto de política pública. Sin embargo, esta decisión debe consideraralgunos factores como, por ejemplo, cuál parte del examen tiene mayorconfiabilidad, en qué parte se evalúan más conceptos, cuál de las destrezasevaluadas resulta ser más importante para ejercer la profesión y el númerode partes que componen el examen, entre otros elementos. Al considerar loanterior, una junta o un tribunal puede determinar si desea conceder máspeso a una parte que a otras en el resultado final de la prueba.
En nuestro caso, la parte de selección múltiple es la parte más objetiva delexamen y en la que se evalúan más conceptos. También resulta ser la partecon mayor confiabilidad. Ahora bien, la parte de discusión es la que mide laexpresión escrita, una destreza muy importante para ejercer la abogacía. Envista de todo lo anterior, la Junta decidió conceder igual peso a ambas partesdel examen.
Por lo anterior, para calcular la puntuación final del aspirante, debemosmultiplicar la puntuación calibrada obtenida en cada parte del examen por .50para obtener los puntos que cada parte va a aportar a esa nota final. Elproducto de estas dos multiplicaciones se suma para obtener la puntuacióncalibrada ajustada o, lo que es lo mismo, la puntuación final en el examen.
2. Se incluye la información como Anejo Ill.
3. La estructura antigua de la reválida de Derecho General consistía en 124 preguntasde selección múltiple y 12 preguntas de discusión. Este examen era administradoen dos días y medio. Considerando que hay 13 materias objeto de examen, deordinario, cada pregunta de discusión era redactada para evaluar una de lasmaterias objeto de examen de forma aislada a las demás. La parte de selecciónmúltiple tenía un peso de 45% en la nota final del aspirante y la parte de discusióntenía un peso de 55%. Esta estructura fue utilizada por casi tres décadas.
Posteriormente, y en consulta con varios psicómetras, la Junta decidió aumentar laspreguntas de selección múltiple a 184 y reducir las preguntas de discusión a 8. Elexamen es administrado en dos días. Cada parte del examen tiene el mismo pesoen la nota final.
Debido a que se evalúan 13 materias en 8 preguntas de discusión, cada preguntaintegra problemas jurídicos de varias materias. Esto ayuda a fomentar elpensamiento crítico e integrado del derecho entre los evaluados.
36

Comisión Especial24 de enero de 2022Pág. 8
El aumento en las preguntas de selección múltiple ofrece la oportunidad de evaluarmuchos más conceptos jurídicos sin que aumente demasiado la duración delexamen. Esto, además, representa un aumento y consistencia en la confiabilidad deesta parte del examen.
Para más información, se incluye la resolución de la Junta fechada el 19 dediciembre de 2011 (Anejo IV).
4. Con el propósito de validar los resultados obtenidos en la reválida de DerechoGeneral mediante el análisis de información externa a este examen, la Junta realizaestudios sobre cada reválida administrada en septiembre. A través de estosestudios, se determina la relación que existe entre las puntuaciones de losaspirantes en la reválida, el promedio académico en el Juris Doctor, y laspuntuaciones obtenidas en los exámenes de admisión a la escuela de derecho(LSAT y EXADEP). Cada estudio ha demostrado que las puntuaciones del examenguardan una relación mayor con los promedios académicos del grado de JurisDoctor. Igualmente, se ha determinado que mientras mayor sea este promedioacadémico, mayor es la probabilidad de un aspirante de aprobar el examen. Estosdatos sostienen la validez del examen para medir los conocimientos adquiridos enla escuela de derecho. Véase Anejo V.
5. Los procesos de calibración y de conversión de puntos que hemos explicado en elprimer acápite de este informe son ampliamente utilizados en otras reválidasprofesionales para ajustar los puntos asignados. Véase, por ejemplo, la publicacióndel National Conference of Bar Examiners, Bar Exam Fundamentals for LegalEducators, páginas 14-16, en la cual se incluye una explicación sencilla de estosprocesos, según utilizados para calibrar y ajustar los puntos de las reválidas dederecho administradas en los Estados Unidos. Anejo VI.4
Como norma general, la mayoría de las reválidas y certificaciones profesionalesadministradas en los Estados Unidos pasan por algún proceso psicométrico paraajustar las diferencias en dificultad que presentan las distintas versiones del examenen diversas administraciones.5 Por ejemplo, el examen de Contador PúblicoAutorizado utiliza puntuaciones ajustadas para informar sus resultados.6 En lareválida nacional de médicos también se realizan ajustes y calibración de susexámenes para atender las posibles diferencias en dificultad de la prueba a través
Véanse, además, los artículos citados en las notas 2 y 3 de este informe y Susan M. Case, The Testing Column:Scaling, Revisited, 89 (Núm. 1), The Bar Examination (2020), disponible en https:/!theharexaminer.ncbex.org/article/fall -2020/the-testing-column-3/.
"Equating is a statistical procedure used for most large-scale standardized tests to adjust examinee scores tocompensate for differences in difficulty among test forms so that scores on the forms have the same meaning and aredirectly comparable." The Testing Column, supra, nota 2.6 "Scaled scores on the MCQ and TBS portions of the Exam are calculated using formulas that take into account
factors such as whether the question was answered correctly and the relative difficulty of each question". Véase,Certified Public Accountant Exam Scoring, American Institute of Certified Public Accountants, disponible enhttps ://www .aicpa.org/hecomeacpalcpaexamlpsychometricsandscoring.html.
37

Comisión Especial24 de enero de 2022Pág. 9
del tiempo.7 Sobre estos procesos, el Board of Pharmacy Specialties (BPS) informaen su página cibernética que:
BPS creates new versions, or forms, of all of its tests on a regular basis. Inassembling the new forms, BPS and its testing consultants follow bestpractices in certification testing so that all forms are comparable in contentand difficulty. Once the examination forms have been equated, a procedurecalled scaling is used to convert the actual number of correct answers, orraw scores, to a uniform scale. These converted scores are called scaledscores. Equated, scaled scores ensure that all candidates for a BPSspecialty certification demonstrate at least the same level of knowledge inorder to pass the examination.8
6. La cantidad de preguntas de selección múltiple nuevas administradas entreseptiembre 2010 y septiembre de 2020 fueron las siguientes:
Septiembre 2010Cantidad Materia
3 Derecho de Familia1 Derecho de Sucesiones1 Derechos Reales2 Obligaciones y Contratos3 Derecho Administrativo2 Derecho Constitucional2 Derecho Probatorio3 Procedimiento Civil1 Responsabilidad Extracontractual2 Etica2 Derecho Penal3 Procedimiento Criminal2 Derecho Hipotecario
Septiembre 2011Cantidad Materia
5 Derecho de Familia5 Derecho de Sucesiones2 Derechos Reales4 Obligaciones y Contratos2 Derecho Administrativo4 Derecho Constitucional3 Derecho Probatorio6 Procedimiento Civil4 Responsabilidad Extracontractual
"Score information is collected during each testing period so that calibration and equating can be performed, whichensures comparability of score outcomes regardless of test date, test form, or test site." United States MedicalLicensing Examination, disponible en https:/!www.usmle.org/freguently-asked -guestions/#scores.8 Board of Pharmacy Specialties, https://www.bpsweb.org/specialty-exams/scoring-process/.
38

Comisión Especial24 de enero de 2022Pág. 10
4 Etica3 Derecho Penal5 Procedimiento Criminal2 Derecho Hipotecario
Septiembre 2012Cantidad Materia
1 Derecho de Familia1 Derecho de Sucesiones1 Derechos Reales4 Obligaciones y Contratos2 Derecho Administrativo2 Derecho Constitucional1 Derecho Probatorio2 Procedimiento Civil4 Responsabilidad Extracontractual3 Etica5 Derecho Penal1 Derecho Hipotecario
Septiembre 2013Cantidad Materia
2 Derecho de Sucesiones3 Derechos Reales3 Obligaciones y Contratos1 Derecho Administrativo2 Derecho Constitucional2 Derecho Probatorio2 Derecho Penal1 Procedimiento Criminal2 Derecho Hipotecario
Septiembre 2014Cantidad Materia
1 Derecho de Familia1 Derecho de Sucesiones1 Obligaciones y Contratos2 Derecho Administrativo2 Derecho Constitucional1 Procedimiento Civil2 Responsabilidad Extracontractual1 Derecho Penal3 Procedimiento Criminal
39

Comisión Especial24 de enero de 2022Pág. 11
Septiembre 2015Cantidad Materia
2 Derecho de Familia1 Derecho de Sucesiones3 Derechos Reales1 Obligaciones y Contratos2 Derecho Penal1 Derecho Hipotecario
Septiembre 2016Cantidad Materia
2 Derecho de Familia1 Derecho de Sucesiones3 Derechos Reales2 Procedimiento Civil1 Responsabilidad Extracontractual1 Procedimiento Criminal4 Derecho Hipotecario
Septiembre 2017Cantidad Materia
1 Obligaciones y Contratos1 Derecho Administrativo1 Derecho Constitucional3 Procedimiento Civil1 Etica2 Derecho Hipotecario
Septiembre 2018Cantidad Materia
2 Derecho de Familia4 Derecho Penal1 Procedimiento Criminal
Septiembre 2019No hubo preguntas nuevas
Septiembre 2020Cantidad Materia
1 Derecho de Sucesiones2 Derechos Reales2 Derecho Hipotecario
40

Comisión Especial24 de enero de 2022Pág. 12
7. Información adicional
Puntuación Promedio en las Reválidas de Derecho General de Septiembre (2007 al 2020)
610
600
590
583.08
580
570
560
77.59
17567 68
5628563 81
_________________5626
550 ------------------------------------------------------------------
2007 2008 2009 2010 2011 2012 2013 2014 2015 2016 2017 2018 2019 2020
Año de la Reválida
Nota de Pase 596 -intuación Promedio Total Nota de Pase Sugerida 569-575
Esta gráfica muestra la tendencia en declive de las puntuaciones promedio de las reválidas de septiembreadministradas entre el 2007 y el 2020. En casi diez años, la puntuación promedio en estos exámenes se redujo más de20 puntos ajustados (de 583.08 puntos en el 2010 a 562.36 en el 2019). Fijar la nota de pase en alguna de laspuntuaciones sugeridas podría aumentar el porcentaje de aprobación en la reválida de Derecho General. Sin embargo,esto no necesariamente revertiría la tendencia mostrada en esta gráfica.
Espero que la información suministrada les sea de utilidad. De surgir la necesidad deotra información, favor de contactarme nuevamente.
Cordi ente,
ctor Rodríguez Mulet
Anejos
41

Comisión Especial24 de enero de 2022Pág. 13
ÍNDICE DE ANEJOS
Pág.
Anejo I - Resolución del Tribunal Supremo del 21 de enero de 1994 .................... 1
Anejo II - Tabla de Conversión de Puntos Asignados - Septiembre 2021 ..............2
Anejo Ill - Desempeño de primerizos por Escuela de Derecho ...........................3
Anejo IV - Resolución del 19 de diciembre de 2011 ...........................................9
Anejo V - Informes de validez ...................................................................... 11
Anejo VI - Bar Exam Fundamentals for Legal Educators ................................... 62
42

ANEJO I
EN EL TRIBUNAL SUPREMO DE PUERTO RICO
In re
Nota de Pase para lasrev&iidas general y notarialde marzo de 1994 y enmiendaa las Reglas 6.2 y 7(f) delReglamento de la JuntaExaminadora de Aspirantesal Ejercicio de la Abogacía
Núm.
RESOLUCION
San Juan, Puerto Rico, a 21 de enero de 1994.
A tenor con las resoluciones del 29 de enerode 1987 y del 11 de junio de 1993, y luego deconsiderar las recomendaciones de la JuntaExaminadora de Aspirantes al Ejercicio de laAbogacía, se fija en 596 puntos ajustados conocalificación mínima necesaria pars aprobar losexámenes de reválida general y notarial hasta tantoeste Tribunal disponga otra1 cosa.
Lo acordó el Tribuna1L y certifica el señorSecretario General. /
ranciscSecretario General
43

flfl
AP
EN
DIC
EI
REVA
UDA
DE
AS
PIR
AN
TES
AL
EJE
RC
ICIO
DE
LAAB
OG
ACÍA
TA
BlA
DE
CONV
ERSI
ÓND
ELA
SPU
N1I
JAC
ION
ESD
EDI
SCUS
IÓN
AS
IGN
AD
AS
, CO
NVE
R11
DAS
AU
NA
DiST
RIBU
CIÓN
CO
NU
NP
RO
ME
DIO
DE
5.00
YU
NA
DESV
IACI
ÓNES
TÁND
ARD
E1.
00
SE
PTI
EM
BR
ED
E20
21
RAW
ESSAY
ESSAY
ESSAY
ESSAY
SCORE
#1#2
#3#4
03.27
2.03
200
1.73
13.41
2.12
2.14
1.87
23.
552.
322.29
2.01
33.
682.47
2.43
2.15
43.82
2.61
2.58
2.29
53.95
2.76
2.72
2.42
64.09
2.91
2.87
2.56
74.23
3.05
3.01
2.70
84.36
3.20
3.16
2.84
94.50
3.34
3.30
2.97
104.64
3.49
3.45
3.11
114.77
3.63
3.59
3.25
124.
913.78
3.74
3.39
135.05
3.92
3.88
3.53
14
5.18
4.07
4.02
3.66
155.32
4.21
4.17
3.80
16
5.45
4.36
4.31
3.94
17
5.59
4.50
4.46
4.08
185.73
4.65
4.60
4.22
19
5.86
4.79
4.75
4.35
20
6.00
4.94
4.89
4.49
21
6.14
5.09
5.04
4.63
226.27
5.23
5.18
4.77
23
6.41
5.38
5.33
4.90
246.54
5.52
5.47
5.04
25
6.68
5.67
5.62
5.18
26
6.82
5.81
5.16
5.32
276.
955.96
5.91
5.46
287.09
6.10
6.05
5.59
29
7.23
6.25
6.19
5.73
307.36
6.39
6.34
5.87
317.50
6.54
6.48
6.01
327.63
6.68
6.63
6.14
33
7.77
6.83
6.77
6.28
347.91
6.97
6.92
6.42
358.04
7.12
7.06
6.56
36
8.18
7.26
7.21
6.70
37
8.32
7.41
7.35
6.83
388.45
7.56
7.50
6.97
398.59
7.70
7.64
7.11
408.73
7.85
7.79
7.25
I>N
i2 in
IC-
44

ANEJO III
SEPTIEMBRE DE 2010
UNIVERSIDAD DE PUERTO RICO
119 Primerizos de los cuales 89 o 75 % Aprobaron
SEPTIEMBRE DE 2011
UNIVERSIDAD DE PUERTO RICO
197 Primerizos de los cuales 122 o 62 % Aprobaron
SEPTIEMBRE DE 2012
UNIVERSIDAD DE PUERTO RICO
166 Primerizos de los cuales 99 o 60 % Aprobaron
SEPTIEMBRE DE 2013
UNIVERSIDAD DE PUERTO RICO
157 Primerizos de los cuales 86 o 55 % Aprobaron
SEPTIEMBRE DE 2014
UNIVERSIDAD DE PUERTO RICO
170 Primerizos de los cuales 96 o 56 % Aprobaron
SEPTIEMBRE DE 2015
UNIVERSIDAD DE PUERTO RICO
153 Primerizos de los cuales 87057 % Aprobaron
SEPTIEMBRE DE 2016
UNIVERSIDAD DE PUERTO RICO
155 Primerizos de los cuales 78 o 50 % Aprobaron
SEPTIEMBRE DE 2017
UNIVERSIDAD DE PUERTO RICO
72 Primerizos de los cuales 39 o 54% Aprobaron
SEPTIEMBRE DE 2018
UNIVERSIDAD DE PUERTO RICO
148 Primerizos de los cuales 70 o 47 % Aprobaron
3
45

SEPTIEMBRE DE 2019
UNIVERSIDAD DE PUERTO RICO
145 Primerizos de los cuales 73 o 50 % Aprobaron
SEPTIEMBRE DE 2020
UNIVERSIDAD DE PUERTO RICO
147 Primerizos de los cuales 61 o 42 % Aprobaron
o
46

SEPTIEMBRE DE 2010
UNIVERSIDAD INTERAMERICANA DE PUERTO RICO
184 Primerizos de los cuales 101 o 55 % Aprobaron
SEPTIEMBRE DE 2011
UNIVERSIDAD INTERAMERICANA DE PUERTO RICO
172 Primerizos de los cuales 83 o 48 % Aprobaron
SEPTIEMBRE DE 2012
UNIVERSIDAD INTERAMERICANA DE PUERTO RICO
152 Primerizos de los cuales 80 o 53 % Aprobaron
SEPTIEMBRE DE 2013
C) UNIVERSIDAD INTERAMERICANA DE PUERTO RICO
172 Primerizos de los cuaJes 98 o 57 % Aprobaron
SEPTIEMBRE DE 2014
UNIVERSIDAD INTERAMERICANA DE PUERTO RICO
138 Primerizos de los cuales 60 o 43 % Aprobaron
SEPTIEMBRE DE 2015
UNIVERSIDAD INTERAMERICANA DE PUERTO RICO
114 Primerizos de los cuales 35 o 31 % Aprobaron
SEPTIEMBRE DE 2016
UNIVERSIDAD INTERAMERICANA DE PUERTÓ RICO
120 Primerizos de los cuales 36 o 30 % Aprobaron
SEPTIEMBRE DE 2017
UNIVERS1DAD INTERAMERICANA DE PUERTO RICO
131 Primerizos de los cuales 50 o 38% Aprobaron
SEPTIEMBRE DE 2018
UNIVERSIDAD INTERAMERICANA DE PUERTO RICO
124 Primerizos de los cuales 36 o 29 % Aprobaron
5
47

SEPTIEMBRE DE 2019
UNIVERSIDAD INTERAMERICANA DE PUERTO RICO
118 Primerizos de los cuales 31 o 26% Aprobaron
SEPTIEMBRE DE 2020
UNIVERSIDAD INTERAMERICANA DE PUERTO RICO
113 Primerizos de los cuales 36 o 32 % Aprobaron
o
o
48

SEPTIEMBRE DE 2010
UNIVERSIDAD CATÓLICA
loo Primerizos de los cuales 42 o 42 % Aprobaron
SEPTIEMBRE DE 2011
UNIVERSIDAD CATÓLICA
134 Primerizos de los cuales 36 o 27 % Aprobaron
SEPTIEMBRE DE 2012
UNIVERSIDAD CATÓLiCA
142 Primerizos de los cuales 47 o 33 % Aprobaron
OSEPTIEMBRE DE 2013
UNIVERSIDAD CATÓLICA
151 Primerizos de los cuales 53 o 35 % Aprobaron
SEPTIEMBRE DE 2014
UNIVERSIDAD CATÓLICA
136 Primerizos de los cuales 54 o 40 % Aprobaron
SEPTIEMBRE DE 2015
UNIVERSIDAD CATÓLICA107 Primerizos de los cuales 36 o 34% Aprobaron
SEPTIEMBRE DE 2016
() UNIVERSIDAD CATÓLICA82 Primerizos de los cuales 28 o 34 % Aprobaron
SEPTIEMBRE DE 2017
UNIVERSIDAD CATÓLICA82 Primerizos de los cuales 30 o 37 % Aprobaron
SEPTIEMBRE DE 2018
UNIVERSIDAD CATÓLICA79 Primerizos de los cuales 30038 %Aprobaron
SEPTIEMBRE DE 2019
UNIVERSIDAD CATÓLICA67 Primerizos de los cuales 17 o 25 % Aprobaron
7
49

SEPTIEMBRE'DE 2020
UNIVERSIDAD CATÓLICA97 Primerizos de los cuales 31 o 32 % Aprobaron
O
50

ANEJO IV,
EN EL TRIBUNAL SUPREMO DE PUERTO RICOJUNTA EXAMINADORA DE ASPIRANTES AL E,JERCLCIO
DE LA ABOGACÍA Y LA NOTARÍA
o
Cambios en el formato delexamen de Reválida General
RESOLUCIÓN
o
Sari Juan, Puerto Rico, a 19 de diciembre de 2011.
Con el propósito de fomentar el pensamiento crítico eintegrado del Derecho en los aspirantes al ejercicio de laabogacía, así como procurar una evaluación más abarcadorade las figuras y los conceptos jurídicos en el examen deadmisión a esta profesión --sin menoscabar su validez yconfiabilidad como instrumento de medición psicométrica-- laJunta Examinadora de Apirantes al Ejercicio de la Abogacía y leNotarla resuelve modificar el formato del examen de ReválidaGeneral.
Conforme alas Reglas 2.5.1(b)y 5.3.1 del Reglamentopara la Admisión de Aspirantes al Ejercicio de la Abogacia y laNotaría (1998) (el Reglamento), 4 L.P.R.A. Ap. XVII-B, la JuntaExaminadora tiene a facultad de determinar la proporción, elnúmero y el peso que habrán de tener as preguntas de lareválida, así como los períodos requeridos para contestar cadaparte del examen.
Luego de una cuidadosa evaluación de los.aspectospsicométricos necesarios para garantizar la validez yconfiabilidad del examen logradas hasta el presente, y paraalcanzar una mayor integración de las materias objeto deexamen, de acuerdo con la Regla 2.5.1(c) del Reglamento, laJunta Examinadora resuelve administrar la Revalida Generalcon el siguiente formato:
51

o
o
-2-
1) Dos (2) sesiones de preguntas de selección múltiple, con unaduración de tres horas y media cada una, en las que seadministrarán noventa y dos (92) preguntas por sesión,
2) Dos (2) sesiones de preguntas de discusión, con una duraciónde tres horas cada una, en las que se administrarán cuatro (4)preguntas por sesión.
Las sesiones de preguntas de selección múltiple serán administradasdurante las mañanas del primer y segundo día de examen. Las sesiones depreguntas de discusión serán administradas durante Las tardes del primer ysegundo día de examen.
La parte de selección múltiple tendrá un peso total de cincuenta porciento (50%) en la nota de pase, mientras que el restante cincuenta por ciento(50%) corresponderá a la parte de preguntas de discusión.
Esta Resolución entrará en vigor inmediatamente, por lo que el nuevoformato será utilizado a partir de la próxima Reválida General de marzo de2012,
Lo acordó la Junta Examinadora y lo certifica el Director Ejecutivo.
drlguez MuletDirector Ejecutivo
52

ANEJO V
RELACIÓN ENTRE EXÁMENES DE INGRESO A ESCUELA DE DERECHO,ÍNDICE ACADÉMICO EN ESTA ESCUELA Y LA PUNTUACIÓN
EN EL EXAMEN DE REVÁLIDA DE ABOGADOSDE SEPTIEMBRE DE 2010
INTRODUCCIÓN:
Este informe provee información sobre la relación que existe entre las vaables; exámenes deingreso a escuela de derecho (PAEG y LSAT); índice académico en esta escuela (LGPA); y lapuntuación en las preguntas de selección múltiple y discusión del examen de reválida de abogados delos aspirantes egresados de escuelas de derecho en Puerto Rico. Los resultados se presentan porescuela de derecho y para todos los aspirantes en conjunto. La puntuación en el examen del PAEGfue convertida a una puntuación a escala utilizando para ello el índice académico en escuela dederecho. Esto se hizo para ajustar las diferencias en el índice académico por escuelas de derecho,
oHALLAZGOS:
En términos generales, mientras más alta es la puntuación del aspirante en tos exámenes deingreso a escuela de derecho (PAEG y LSAT), mayor es su índice académico en escuela de derecho yPor la tanto, mayor es su probabilidad de aprobar el examen de reválida de abogados.
La tabla 1 demuestra que las puntuaciones en el LSAT y en el PAEG generalmente colocan alos estudiantes en orden de rango bastante similar pero en términos generales las puntuaciones en elPAEG SOíi un mejor predictor del índice académico en escuelas de derecho (LGPA), que laspuntuaciones obtenidas en el LSAT.
TABLA IoCORRELACIÓN ENTRE IA PUNTUACIÓN EN LOS EXÁMENES DE
INGRESO A ESCUELA DE DERECHO (LSAT Y PAEG) Y EL ÍNDICEACADÉMICO EN ESTA ESCUELA (LGPA)
UPR 150 .60 -.16 .03
UIA 261 .38 .04 -.05
UCPR 173 .37 .03 11
EMH 67 .52 -.05 .20
¡1
53

TABLA 2
o
o
CORRELACIÓN ENTRE LA PUNTUACIÓN EN EL EXAMEN DE REVÁLIDAY LA PUNTUACIÓN EN EL LSAT Y PAEG
UPR .01 .06
UIA .17 .03
UCPR .09 .13
EMH -.01 .24
Una comparación entre las Tablas 1 y 2 demuestra que la puntuación en el LSAT y el PAEGtiene una correlación mayor con el índice académico, que con la puntuación total en el examen dereválida de abogados, y con la puntuación en las preguntas de selección múltiple y discusión delexamen de reválida, para todas las escuelas de derecho. O sea, el índice académico en escuela dederecho, es un mejor predictor de éxito en el examen de reválida que la puntuación en los exámenesde ingreso a esta escuela.
Se demostró una correlación moderada hacia alta entre el índice académico en escuela dederecho y la puntuación en el examen de reválida en casi todas las escuelas. En términos generales,el índice académico en escuela de derecho, correlacionó igual de alto con la puntuación en laspreguntas de selección múltiple y en las de discusión.
TABLA 3
CORRELACIÓN ENTRE LA PUNTUACIÓN EN EL EXAMEN DEREVÁLIDA DE ABOGADOS Y EL ÍNDICE ACADÉMICO EN LA
ESCUELA DE DERECHO A ESCALA
UPR .53 .47 .53
UIA .50 .52 .54
UCPR .44 .47 .49
EMH .47 .50 .51
54

TABLA 4
POR CIENTOS DE PASANTÍA POR CUARTILES DE ÍNDICE ACADÉMICOY PUNTUACIÓN EN EL PAEG A ESCALA
Primeros 20% 82 64
Próximos 20% 59 60
Medianos 20% 42 37
Próximos 20% 32 38
C) Últimos 20% 19 35
Los resultados de la tabla anterior demuestran una fuerte relación entre el índice académicoen escuela de derecho y la posibilidad de aprobar o fracasar en el examen de reválida de abogados.Los aspirantes en el primer quintillo del indice académico a escala, tienen una probabilidad mayor deaprobar, que los del próximo quintillo quienes a su vez tiene una probabilidad mayor que los delmediano quintillo y éstos a su vez que los del próximo y así sucesivamente.
Así mismo estos resultados demuestran que el índice académico en escuela de derecho es unmejor predictor de resultados en el examen de reválida de lo que es el PAEG. La diferencia en los porcientos de pasantía entre el primer quintillo y el último fue de 63 puntos en el indice académico y sólode 29 puntos en el PAEG.
ED En cada Escuela de Derecho, mientras más alto es el índice académico de un aspirante,mayor probabilidad tiene de aprobar el examen de reválida de abogado (Tabla 5). Sólo 10% de losaspirantes de la UPR demostraron cuartiles de indice académico bajos y el 88% de los aspirantes deEMH demostraron índices en los dos cuartiles más bajos. Las diferencias en los por cientos depasantía entre las escuelas generalmente corresponden a diferencias en los promedios de puntuaciónen los exámenes de ingreso a escuela de derecho de estos aspirantes.
3
13
55

TABLA 5
POR CIENTOS DE PASANTÍA POR CUARTILES DE ÍNDICE AcADÉMICO YELPROMEDIO EN IA PUNTUACIÓN EN EL PAEG
Primeros 25% 81 78 100 67 80
Próximos 25% 33 52 63 60 51
Próximos 25% 36 34 41 23 36
últimos 25% 25 16 23 17 20
TOTAL 67. 48 38 ¯. 24.. ¯.. 47. .: .
O.. PROMEDIO EN PAEG 648 601 565 542 596
TABLA 6
PROMEDIO Y POR CIENTOS DE PASANTÍA PARAPRIMERIZOS Y REPETIDORES
O Primerizos 139 606 514 595 597 597 57
Repetidores 137 579 566 561 558 560 29
TOTAL 138 596 596 58 583 584 47
Los resultados de esta tabla demuestran que los 413 aspirantes pmerizos obtuvieron unapuntuación promedio mayor en el índice académico, en los resultados en el examen de reválida y enel por ciento de pasantía, que Fa que obtuvieron los 238 aspirantes repetidores.
Nótese que los análisis indicados en este informe hacen referencia a los aspirantes de lascuatro escuelas de derecho de los cuales se tienen los datos completos, Por lo tanto, estos resultadospudieran diferir de los datos estadísticos totales para el examen de reválida general de exámenesanteriores.
4
14
56

CONCLUSIÓN:
Los resultados anteriores demuestran que Fa puntuación en el examen de reválida deabogados y la probabilidad de aprobar o fracasar este examen, está altamente relacionada con elíndice académico del aspirante. Esta relación es mucho más fuerte que la encontrada entre el indiceacadémico y la puntuación en los exámenes de ingreso a escuela de derecho. Estos resultados sonconsistentes con los estudios de validez anteriores y proveen un fuerte apoyo a la validez del examende reválida de abogados de Puerto Rico.
o
o
5
15
57

RELATIONSHIPS AMONG LAW SCHOOL ADMISSION TESTSCORES, LAW SCHOOL GRADES, AND SCORES ON THE
SEPTEMBER 2011 BAR EXAMINATION
Stephen P. Klein, Ph.D.GANSK & ASSOCIATES
November 21, 2011
This report provides information about the relationships among LSAT scores,
PAEG scores, law school grades (LGPA), and scores on the multiple choice and essay
sections of the September Puerto Rico Bar Examination for all the applicants (first timersC) and repeaters) with complete data from Puerto Rico law schools. Results are presented
separately by school and for all applicants combined, For the latter analysis, LGPAs at a
school were scaled to that school's PAEG scores. This step adjusted the LGPAs for
possible differences in admission and grading standards among schools.
In general, the higher a student's admission test scores, the higher that student's
LGPA. Table I shows that LSAT and PAEG scores generally rank order students in
roughly the same way but overall, PAEG scores were a slightly better predictor of LGPA
than were LSAT scores.
Table 1
Q CORRELATIONS AMONG SCALED LGPA, LSAT, AND PAEG SCORES
Number of LSAT & LSAT & PAEG &Law School Applicants PAEG LGPA LGPA
University of Puerto Rico 232 .65 .00 .07
Interamerican University 244 .31 .00 .09
Catholic University 215 .40 .03 .11
Eugina Maria de Hostos 46 .70 .30 .54
All Applicants 737 .71 .43 .51
16
58

A comparison of Tables 1 and 2 shows that across al! the applicants from the four
Puerto Rico schools, LSAT and PAEG scores had generally higher correlations with law
school grades than they did with bar exam multiple choice, essay, and total scores.
Table 2
CORRELATION OF BAR EXAM SCORES WITH LSAT AND PAEG SCORES
Multiple Total BarChoice Essay Exam Score
Law School LSAT PAEG LSAT PAEG LSAT PAEG
UniversityofPuertoRico .08 .10 .07 .16 .14 .16
Interamerican University .10 .03 .05 -.08 .07 -.03
Catholic University .10 .14 .06 .08 .08 .12
Eugina Maria de Hostos .39 .45 .35 .35 .39 .42
All Applicants .31 .33 .21 .22 .27 .29
There was a moderate to high correlation between law school grades and bar
exam scores at most schools (Table 3). In general, law school grades correlated just as
highly with bar exam multiple-choice scores as they did with bar exam essay scores.
Table 3
CORRELATION OF BAR EXAM SCORESWITH SCALED LAW SCHOOL GRADES
Multiple Total BarLaw School Choice Essay Exam Score
University of Puerto Rico .52 .50 .55
Interamerican University .59 .54 .60
Catholic University .43 .56 .55
Eugina Maria de Hostos .47 .53 .53
All Applicants-
.59-
.53 .60
17
59

3
Table 4 shows the strong relationship between law school grades and pass/fail
status on the bar exam. Students in the highest quintile of scaled LGPA are more likely
to pass than those in the next quintile who in turn are more likely to pass than those in the
next quintile, and so on. This table also shows that LOPA was a much better predictor of
bar scores than was PAEG--the difference in passing rates between the highest and
lowest quintiles was 65 percentage points on LGPA, but only 32 points on PAEG.
Table 4PERCENT PASSING BY QUNTILE OF SCALED LGPA AND PAEG SCORE
Quintile LOPA PAEGHighest 20% 86 57Next 20% 84 50Middle 20% 61 43Next 20% 39 32Lowest 20% 21 25
The higher an applicant's LOPA, the more likely that applicant was to pass (Table
5). Only 40 of the 232 UPR graduates (17%) had scaled LGPAs in the lowest two
quartiles of law school GPAs whereas 39 of the 46 Eugina Maria de Hostos graduates
(85%) were in these quartiles. Differences in passing rates among schools generally
correspond to differences in the mean PAEG scores of their graduates.
Table 5U PERCENT PASSING BY LGPA QUARTILE AND SCHOOL
AND MEAN PAEG SCORES BY SCHOOL
Quartile Univ. of Interamerican Catholic Eugina Maria Allof LGPA Puerto Rico University University de Hostos Applicants
Highest25% 76 77 88 100 77Next 25% 47 58 64 50 55Next 25% 27 14 25 38 21
Lowest 25% 21 10 11 19 13
Total 60 41 24 30 42Mean PAEG 647 605 565 550 603
18
60

4
Table 6 shows that the 515 first time takers had higher mean admission scores,
LUPAs, bar exam scores, and passing rates than did the 222 repeaters. Note that all the
analyses in this report are restricted to just the candidates from the four law schools that
had complete data. Thus, these results may differ somewhat from those discussed in the
technical report for some previous exams.
Table 6
MEAN SCORES AND PASSiNG RATES FOR FIRST TIMERS AND REPEATERS
Admissions Bar Exam ResultsTest Scores Scaled Multiple Percent
-- -' Group LSAT PAEG LGPA Choice Essay Total Passing
First Timers 140 609 617 585 584 585 48
Repeaters 137 588 572 552 557 556 26
Total 139 603 603 575 576 576 42
Taken together, the results presented in this report show that an applicant's bar
exam scores and pass/fail status are highly related to that applicant's law school grades.
This relationship is much stronger than the one between law school grades and admission
test scores. These findings provide strong support for the validity of Puerto Rico's bar
exam.J.
19
61

RELATIONSHIPS AMONG LAW SCHOOL ADMISSION TESTSCORES, LAW SCHOOL GRADES, AND SCORES ON THE
SEPTEMBER 2012 BAR EXAMINATION
Stephen P. Klein, Ph.D.GANSK & ASSOCIATES
November 28, 2012
This report provides information about the relationships among LSAT scores,
PAEG scores, law school grades (LGPA), and scores on the multiple choice and essay
sections of the September Puerto Rico Bar Examination for all the applicants (first timers
ED and repeaters) with complete data from Puerto Rico law schools. Results are presented
separately by school and for all applicants combined. For the latter analysis, LGPAs at a
school were scaled to that school's PAEG scores This step adjusted the LUPAs for
possible differences in admission and grading standards among schools.
In general, the higher a student's admission test scores, the higher that student's
LGPA. Table I shows that LSAT and PAEG scores generally rank order students in
roughly the same way but overall, PAEG scores were a slightly better predictor of LGPA
than were LSAT scores.
Table 1
Q CORRELATIONS AMONG SCALED LUPA, LSAT, AND PAEG SCORES
Number of LSAT & LSAT & PAEG &Law School Applicants PAEG LGPA LUPA
University of Puerto Rico 205 .49 .07 .11
Interamerican University 246 .50 .03 .04
Catholic University 253 .44 .02 .08
Eugina Maria de Hostos 31 .77 .44 .49
All Applicants 735 .69 .47 .53
AI]
62

91
A comparison of Tables I and 2 shows that across all the applicants from the four
Puerto Rico schools, LSAT and PAEG scores had generally higher correlations with law
school grades than they did with bar exam multiple choice, essay, and total scores.
Table 2
CORRELATION OF BAR EXAM SCORES WITH LSAT AND PAEG SCORES
Multiple Total BarChoice Essay Exam Score
Law School LSAT PAEG
University of Puerto Rico .14 .11
Interamerican University .03 .00
Catholic University .08 .08
Eugina Maria de Hostos .38 .46
LSAT PAEG
.01 .03
-.04 -.05
.02 .01
.36 .33
LSAT PAEG
.08 .08
.00 -.03
.06 .05
.38 .41
All Applicants .24 .25 .12 .14 .19 .21
There was a moderate to high correlation between law school grades and bar
exam scores at most schools (Table 3). In general, law school grades correlated just as
highly with bar exam multiple-choice scores as they did with bar exam essay scores.
Table 3
CORRELATION OF BAR EXAM SCORESO WITH SCALED LAW SCHOOL GRADES
Multiple Total BarLaw School Choice Essay Exam Score
University of Puerto Rico .57 .50 .57
Interamerican University .59 .54 .60
Catholic University .60 .55 .61
Eugina Maria de Hostos .77 .70 .77
All Applicants .59 .50 .58
21
63

3
Table 4 shows the strong relationship between law school grades and pass/fail
status on the bar exam. Students in the highest quintile of scaled LGPA are more likely
to pass than those in the next quintile who in turn are more likely to pass than those in the
next quintile and so on. This table also shows that LGPA was a much better predictor of
bar scores than was PAEG--the difference in passing rates between the highest and
lowest quintiles was 67 percentage points on LGPA, but only 28 points on PAEG.
Table 4PERCENT PASSiNG BY QUINTILE OF SCALED LOPA AND PAEG SCORE
Quintile LGPA PAEGHighest 20% 77 54
Next20% 59 44
Middle 20% 34 44Next 20% 23 35Lowest 20% 10 26
Within a law school, the higher an applicant's LGPA, the more likely that
applicant was to pass (Table 5). Only 12% of the UPR graduates had scaled LGPAs in
the lowest two quartiles whereas 81% of the Eugina Maria de Hostos graduates were in
these quartiles. Differences in passing rates among schools generally correspond to
differences in the average law school admissions scores of these schools graduates.
ED Table 5PERCENT PASSING BY LUPA QUARTILE AND SCHOOL
AND MEAN PAEG SCORES BY SCHOOL
Quartile Univ. of Interamerican Catholic Eugina Maria Allof LGPA Puerto Rico University University de Hostos Applicants
Highest 25% 71 75 100 100 73Next 25% 31 53 82 40 52Next 25% 39 15 34 14 26
Lowest25% 0 11 15 0 13
Total 56 42 30 16 41
Mean PAEG 647 606 562 565 601
22
64

4
Table 6 shows that the 471 first time takers had higher mean admission scores,
LGPAs, bar exam scores, and passing rates than did the 264 repeaters. Note that all the
analyses in this report are restricted to just the candidates from the four law schools that
had complete data. Thus, these results may differ somewhat from those discussed in the
technical report for some previous exams.
Table 6
MEAN SCORES AND PASSING RATES FOR FIRST TIMERS AND REPEATERS
Admissions Bar Exam Results
O Test Scores Scaled Multiple PercentGroup LSAT PAEG LGPA Choice Essay Total Passing
Firstlimers 140 608 615 585 583 585 49
Repeaters 137 587 575 554 559 558 26
Total 139 601 601 574 575 575 41
Taken together, the results presented in this report show that an applicants bar
exam scores and pass/fail status are highly related to that applicant's law school grades.
This relationship is much stronger than the one between law school grades and admission
test scores. These findings provide strong support for the validity of Puerto Rico's bar
exam.
23
65

RELATIONSHIPS AMONG LAW SCHOOL ADMISSION TESTSCORES, LAW SCHOOL GRADES, AND SCORES ON THE
SEPTEMBER 2013 BAR EXAMINATION
Stephen P. Klein, Ph.DRoger E. Bolus, Ph.D
GANSK & ASSOCIATES
December 19, 2013
This report provides information about the relationships among LSAT scores,
PAEO scores, law school grades (LGPA), and scores on the multiple choice and essay
sections of the September Puerto Rico Bar Examination for all the applicants (first timers
and repeaters) with complete data from Puerto Rico law schools. Results are presented
separately by school and for all applicants combined. For the latter analysis, LGPAs at a
school were scaled to that school's PAEG scores. This step adjusted the LGPAs for
possible differences in admission and grading standards among schools.
In general, the higher a student's admission test scores, the higher that student's
LGPA. Table 1 shows that LSAT and PAEG scores generally rank order students in
roughly the same way but overall, PABO scores were a slightly better predictor of LGPA
than were LSAT scores.
C) Table 1
CORRELATIONS AMONG SCALED LGPA, LSAT, AND PAEG SCORES
Number of LSAT & LSAT & PAEG &Law School Applicants PAEG LGPA LGPA
University of Puerto Rico 202 0.549 0.089 0.089
Interamerican University 257 0.381 0.082 0.028
Catholic University 264 0.205 -0.035 0.041
Eugina Maria de Hostos 25 0.707 0.276 0.165
All Applicants* 748 0.66 0.45 0.49* At these 4 schools only.
24
66

A comparison of Tables I and 2 shows that across all the applicants from the four PuertoRico schools, LSAT and PAEG scores had generally higher correlations with law schoolgrades than they did with bar exam multiple choice, essay, and total scores.
Table 2
CORRELATION OF BAR EXAM SCORES WITH LSAT AND PAEG SCORES
Multiple Total BarChoice Essay Exam Score
Law School LSAT PAEG LSAT PAEG LSAT PAEG
University of Puerto Rico 0.19 0.07 0.16 0.06 0.18 0.06
Interamerican University 0.18 0.01 0.10 0.03 0.15 0.03
Catholic University -0.05 0.04 -0.04 -0.02 -0.05 0.02
C) Eugina Maria de Hostos 0.08 0.01 0.16 0.04 0.13 0.03
All Applicants 0.40 0.13 0.38 0.11 0.41 0.14
There was a moderate to high correlation between law school grades and bar
exam scores at most schools (Table 3). In general, law school grades correlated just as
highly with bar exam multiple-choice scores as they did with bar exam essay scores.
Table 3
CORRELATION OF BAR EXAM SCORESWITH SCALED LAW SCHOOL GRADES
O Multiple Total BarLaw School Choice Essay Exam Score
University of Puerto Rico 0.573 0.496 0.566
Interamerican University 0.567 0.530 0.5 86
Catholic University 0.591 0.5 37 0.603
EuginaMariadeHostos 0.312 0.538 0.475
All Applicants* 0.569 0.485 0.561
25
67

Table 4 shows the strong relationship between law school grades and pass/fail
status on the bar exam. Students in the highest quintile of scaled LGPA are more likely
to pass than those in the next quintile who in turn are more likely to pass than those in the
next quintile, and so on. This tab!e also shows that LGPA was a much better predictor of
bar scores than was PAEG--the difference in passing rates between the highest and
lowest quintiles was 60 percentage points on LGPA, but only 18 points on PAEG.
Table 4PERCENT PASSING BY QUINTILE OF SCALED LOPA AND PAEG SCORE
Quintile LGPA PAEGHighest 20% 86.58 54.00
('. Next 20% 74.67 46.67Middle 20% 53.69 40.27Next 20% 46.00 35.24Lowest 20% 26.67 36.33
Within a law school, the higher an applicant's LGPA, the more likely that
applicant was to pass (Table 5). Only 11 % UPR graduates had scaled LGPAs in the
lowest two quartiles whereas 72 % of the Eugina Maria de Hostos graduates were in
these quartiles. Differences in passing rates among schools generally correspond to
differences in the average law school admissions scores of these schools' graduates.
Table 5PERCENT PASSING BY LGPA QUARTILE AND SCHOOL
AND MEAN PAEG SCORES BY SCHOOL
Quartile Univ. of interamerican Catholic Eugina Maria AllOf LGPA Puerto Rico University University de Hostos Applicants
Highest25% 64.10 78.13 75.00 0.00 68.45
Next 25% 40.32 53.57 72.22 40.00 52.41Next25% 20.00 32.50 42.17 25.00 35.29Lowest25% 0.00 6.90 16.31 7.14 13.90
Total 51.49 47.86 32,95 16.00 42.51
Mean PAEG 653.44 609.62 560.25 559.84 602.37
26
68

Table 4 shows the strong relationship between law school grades and pass/fail
status on the bar exam. Students in the highest quintile of scaled LGPA are more likely
to pass than those in the next quintile who in turn are more likely to pass than those in the
next quintile, and so on. This table also shows that LGPA was a much better predictor of
bar scores than was PAEG--the difference in passing rates between the highest and
lowest quintiles was 67 percentage points on LGPA, but only 28 points on PAEG.
Table 4PERCENT PASSING BY QU1NTILE OF SCALED LGPA AND PAEG SCORE
Quintile LGPA PAEGHighest 20% 77 54Next 20% 59 44
Middle 20% 34 44Next 20% 23 35Lowest 20% 10 26
Within a law school, the higher an applicant's LGPA, the more likely that
applicant was to pass (Table 5). Only 12% of the UPR graduates had scaled LGPAs in
the lowest two quartiles whereas 81% of the Eugina Maria de Hostos graduates were in
these quartiles. Differences in passing rates among schools generally correspond to
differences in the average law school admissions scores of these schools' graduates.
I Table 5PERCENT PASSING BY LGPA QUARTILE AND SCHOOL
AND MEAN PAEG SCORES BY SCHOOL
Quartile Univ. of Interamerican Catholic Eugina Maria AllOf LGPA Puerto Rico University University de Hostos Applicants
Highest25% 64 78 75 100 68
Next 25% 40 54 72 40 52Next 25% 20 33 42 25 35Lowest 25% 0 7 16 7 13
Total 51 48 33 16 42
Mean PAEG 653 609 560 559 602
27
69

Table 6 shows that the 497 first time takers had higher mean admissions scores, LGPAs,
bar exam scores, and passing rates than did the 267 repeaters. Note that all the analyses
in this report are restricted to just the candidates from the four law schools that had
complete data. Thus, these results may differ somewhat from those discussed in the
technical report for some previous exams.
Table 6
MEAN SCORES AND PASSING RATES FOR FIRST TIMERS AND REPEATERS
MeanAdmissions Mean Bar Exam ScoresTest Scores Scaled Multiple Percent
Group LSAT PAEG LUPA Choice Essay Total Passing
FirstTimers 139.6 610.2 615.8 584.26 584.08 585.61 48.36%
Repeaters 137.6 587.6 577.2 561.62 561.90 562.72 31.54%
Total 138.8 602.3 602.3 576.39 577.02 577.06 42.28%
Taken together, the results presented in this report show that an applicant's bar
exam scores and pass/fail status are highly related to that applicant's law school grades.
This relationship is much stronger than the one between law school grades and admission
test scores. These findings provide strong support for the validity of PuertO Rico's bar
exam.
28
70

RELATIONSHIPS AMONG LAW SCHOOL ADMISSION TESTSCORES, LAW SCHOOL GRADES, AND SCORES ON THE
SEPTEMBER 2014 BAR EXAMINATION
Roger E. Bolus, Ph.D
RESEARCH SOLUTIONS GROUP
November22, 2014
This report provides information about the relationships among LSAT scores,
PAEG scores, law school grades (LGPA), and scores on the multiple choice and essay
sections of the September Puerto Rico Bar Examination for all the applicants (first timers
and repeaters) with complete data from Puerto Rico law schools. Results are presented
separately by school and for all applicants combined. For the latter analysis, LGPAs at a
school were scaled to that school's PAEG scores. This step adjusted the LGPAs for
possible differences in admission and grading standards among schools.
In general, the higher a student's admission test scores, the higher that student's
LGPA. Table 1 shows that LSAT and PAEG scores generally rank order students in
roughly the same way but overall, PAEG scores were a slightly better predictor of LGPA
than were LSAT scores.
Table 1
O CORRELATIONS AMONG SCALED LGPA, LSAT, AND PAEG SCORES
Number of LSAT & LSAT & PAEG &Law School Applicants PAEG LGPA LGPA
University of Puerto Rico 208 .576 -.01 1 .138
Interamerican University 224 .471 .120 .102
Catholic University 241 .276 .100 .124
EuginaMariadeHostos 10 .059 .159 -562
All Applicants* 683 .651 .404 .510* At these 4 schools only. Note also that there were only 10 EMil graduates taking the
September 2014 exam
29
71

A comparison of Tables 1 and 2 shows that across all the applicants from the four
Puerto Rico schools, LSAT and PAEG scores had generally higher correlations with law
school grades than they did with bar exam multiple choice, essay, and total scores.
Table 2
CORRELATION OF BAR EXAM SCORES WITH LSAT AND PAEG SCORES
Multiple Total BarChoice Essay Exam Score
Law School LSAT PAEG LSAT PAEG LSAT PAEG
University of Puerto Rico .126 .166 .066 -.001 .102 .085
Interamerican University .100 .012 .091 .053 .102 .036
Q Catholic University .159 .115 .137 .128 .157 .129
Eugina Maria de Hostos -.321 -.3 16 -.002 -.344 -.174 -.344
All Applicants* .231 .208 .190 .165 .225 .200* At these 4 schools only.
There was a moderate to high correlation between law school grades and bar
exam scores at most schools (Table 3). In general, law school grades correlated just as
highly with bar exam multiple-choice scores as they did with bar exam essay scores.
Table 3
O CORRELATION OF BAR EXAM SCORESWITH SCALED LAW SCHOOL GRADES
Multiple Total BarLaw School Choice Essay Exam Score
University of Puerto Rico .589 .489 .577
Interamerican University .427 .493 .497
Catholic University .571 .597 .620
Eugina Maria de Hostos .173 .343 .266
All Applicants* .516 .506 .546* At these 4 schools only.
30
72

Table 4 shows the strong relationship between law school grades and pass/fail,.-
status on the bar exam. Students in the highest quintile of scaled LGPA are more likely
to pass than those in the next quintile who in turn are more likely to pass than those in the
next quintile, and so on. This table also shows that LGPA was a much better predictor of
bar scores than was PAEG--the difference in passing rates between the highest and
lowest quintiles was 60 percentage points on LGPA, but only 18 points on PAEG.
Table 4
PERCENT PASSING BY QUINTILE OF SCALED LGPA AND PAEG SCORE
Quintile LGPA PAEG
Highest20% 72.26% 48.18%
Next 20% 53.28% 53.28%Middle 20% 42.65% 43.38%
Next 20% 32.12% 36.50%Lowest 20% 11.76% 30.88%
Within a law school, the higher an applicant's LGPA, the more likely that
applicant was to pass (Table 5). Over 54 % UPR graduates had scaled LGPAs in the top
quartile, compared to 24% of UIA graduates, 2% of UCPR graduates and none of the
Eugina Maria de Hostos graduates Differences in passing rates among schools generally
correspond to differences in the average law school admissions scores of these schools'
C) graduates.
Table 5
PERCENT PASSING BY LGPA QUARTILE AND SCHOOLAND MEAN PAEG SCORES BY SCHOOL
Quartile Univ. of Interamerican Catholic Eugina Maria AllOf LGPA Puerto Rico University University de Hostos Applicants
Highest 25% 66.4% 72.2% 100.0% N/A 69.0%
Next 25% 43.1% 42.7% 69.0% 50.0% 47.4%Next 25% 52.1% 25.0% 52.8% 0% 40.4%Lowest 25% 0.0% 12.5% 14.0% 16.7% 12.9%
Total* 54.3% 42.0% 33.6% 20.0% 42.5%
Mean PAEG 647.17 612.10 560.25 562.05 604.25* At these 4 schools only.
31
73

Consistent with historical findings, Table 6 shows that the 439 first time takers had
higher mean admissions scores, LGPAs, bar exam scores, and passing rates than did the
244 repeaters.
Table 6
MEAN SCORES AND PASSING RATES FOR FIRST TIMERS AND REPEATERS
MeanAdmissions
Test Scores
o Group LSAT PAEG
Mean Bar Exam Scores
Scaled Multiple Percent
LGPA Choice Essay Total Passing
First Timers 140.2 610.5 619.1 582.5 587.8 596.0 47.6%
Repeaters 137.0 593.0 577.5565.8 559.5 563.6 33.2%
Total 139.0 604.3 604.3 576.6 577.6 578.0 42.5%
It is worth noting again here that all the analyses in this report are restricted to just
the candidates from the four law sch901s that had complete data. Thus, these results may
differ somewhat from those discussed in the technical report for some previous exams.
Taken together, the results presented in this report show that an applicant's bar
ED exam scores and pass/fail status are highly related to that applicant's law school grades.
This relationship is much stronger than the one between law school grades and admission
test scores. These findings continue to provide strong support for the validity of Puerto
Rico's bar exam.
32
74

RELATIONSHiPS AMONG LAW SCHOOL ADMISSION TESTSCORES, LAW SCHOOL GRADES, AND SCORES ON THE
SEPTEMBER 2015 BAR EXAMINATION
Roger E. Bolus, Ph.D
RESEARCH SOLUTIONS GROUP
November 20, 2015
This report provides information about the relationships among LSAT scores,
PAEG scores, law school grades (LGPA), and scores on the multiple choice and essay
sections of the September Puerto Rico Bar Examination for all the applicants (first timers
CD and repeaters) with complete data from Puerto Rico law schools. Results are presented
separately by school and for all applicants combined. For the latter analysis, LGPAs at a
school were scaled to that school's PAEG scores. This step adjusted the LGPAs for
possible differences in admission and grading standards among schools.
In general, the student's admission test scores as measured by the PAEG and
LSAT tend to be strongly related. When viewed across schools, those test scores tend to
moderately correlate with student's LGPA. Table I shows that LSAT and PAEG scores
generally rank order students in roughly the same way but overall, PAEG scores were a
slightly better predictor of LGPA than were LSAT scores.
Table 1
CORRELATIONS AMONG SCALED LGPA, LSAT, AND PAEG SCORES
Number of LSAT & LSAT & PAEG &Law School Applicants PAEG LGPA LGPA
University of Puerto Rico 211 .627 .000 .096
Interamerican University 197-
.514 .120 .061
Catholic University 254 .482 .163 .131
Eugina Maria de Hostos 3 .824 -.174 .414
All Applicants* 665 .712 .398 .449* At these 4 schools only. Note also that there were only 3 EMJ-I graduates with complete data
taking the September 201 5 exam so the correlations should be interpreted with caution.
33
75

A comparison of Tables 1 and 2 shows that across all the applicants from the four
Puerto Rico schools (and consistent with historical findings), LSAT and PAEG scores
had generally higher correlations with law school grades than they did with bar exam
multiple choice, essay, and total scores.
Table 2
CORRELATION OF BAR EXAM SCORES WITH LSAT AND PAEG SCORES
MultipleChoice
LSAT PAEG
.106 .108
-.002 -.074
.142 .084
.999 .821
.220 .205
Essay
Law School
University of Puerto Rico
() Interamerican University
Catholic University
Eugina Maria de Hostos
All Applicants*
o
LSAT PAEG
.056 .072
.032 -.031
.147 .081
.600 .947
.179 .171
Total BarExam Score
LSAT PAEG
.085 .096
.016 -.057
.154 .088
.921 .979
.213 .201* At these 4 schools only. EMH results based on only 3 cases.
There continues to be a moderate to high correlation between law school grades
and bar exam scores at most schools (Table 3). In general, law school grades correlated
just as highly with bar exam multiple-choice scores as they did with bar exam essay
scores.
Table 3
CORRELATION OF BAR EXAM SCORESWITH SCALED LAW SCHOOL GRADES
Multiple Total BarLaw School Choice Essay Exam Score
University of Puerto Rico .554 .501 .559
Interamerican University .526 .490 .550
Catholic University .479 .496 .518
Eugina Maria de Hostos -.179 .683 .222
All Applicants* .538 .502 .554* At these 4 schools only. EMH results based on only 3 cases.
34
76

Table 4 illustrates the strong relationship between law school grades and pass/fail
status on the bar exam. Students in the highest quintile of scaled LGPA are much more
likely to pass than those in the next quintile who in turn are more likely to pass than those
in the next quintile, and so on. This table also shows that LGPA was a much better
predictor of bar scores than was PAEG--the difference in passing rates between the
highest and lowest quintiles was 56 percentage points on LGPA, but less than half that
amount (i.e., only 23 points) on PAEG.
Table 4
PERCENT PASSING BY QUINTILE OF SCALED LGPA AND PAEG SCORE
Quintile LGPA PAEG
() Highest 20% 69.92% 47.37%
Next 20% 48.87% 46.62%
Middle 20% 30.08% 32.33%
Next20% 18.05% 30.08%
Lowest 20% 13.53% 24.06%
Within a law school, the higher an applicants LGPA, the more likely that
applicant was to pass (Table 5). Within each of the schools, the top quarter of the class
passed at a significant higher rate than in any other quartile; The difference in passing
rates between the top and bottom quartiles ranged from 65% at Catholic University to
59% at the U. of Puerto Rico..
Table 5
PERCENT PASSiNG BY LGPA QUARTILE AND SCHOOLAND MEAN PAEG SCORES BY SCHOOL
Quartile Univ. of Interamerican Catholic Eugina Maria AllOf LGPA Puerto Rico University University de Hostos Applicants
Highest 25% 65.3% 73.2% 80.0% N/A 67.7%
Next25% 51,9% 24.7% 55.0% 0.0% 40.4%
Next25% 21.7% 20.9% 23.7% N/A 22.3%
Lowest25% 6.7% 12.5% 15.0% 0.0% 13.9%
Total* 53.1% 32.5% 33.6% 0.0% 36.1%
Mean PAEG 638.41 601.19 557.93 510.01 596.07* At these 4 schools only. EMH results based on only 3 cases.
35
77

Consistent with historical findings, Table 6 shows that the 373 first time takers had
higher mean admissions scores, and LGPAs than the 292 repeaters. Bar exam scores, and
passing rates followed the same patterns.
Table 6
MEAN SCORES AND PASSiNG RATES FOR FIRST TIMERS AND REPEATERS
MeanAdmissions Mean Bar Exam ScoresTest Scores Scaled Multiple Percent
Group LSAT PAEG LGPA Choice Essay Total Passing
(' First Timers 140.3 603.2 612.2 572.7 574.2 574.3 41.8%
Repeaters 137.5 587.0 575.4 559.8 560.0 560.8 28.8%
Total 139.1 596.1 596.1 567.0 568.0 568.4 39.1%
(It is worth noting again here that all the analyses in this report are restricted to
just the candidates from the four law schools that had complete data. Thus, these results
may differ somewhat from those discussed in the technical report for some previous
exams.)
C) Taken together, the results presented in this report show that an applicant's bar
exam scores and pass/fail status are highly related to that applicant's law school grades,
the best performance indicator of students as they leave law school. This relationship is
much stronger than the one between admission test scores and bar exam performance,
which is over 3 years removed from the time of the bar examination. These findings
provide continuing evidence for the strong concurrent validity of Puerto Rico's bar
examination.
36
78

RELATIONSHIPS AMONG LAW SCHOOL ADMISSION TESTSCORES, LAW SCHOOL GRADES, AND SCORES ON THE
SEPTEMBER 2016 BAR EXAMINATION
Roger E. Bolus, Ph.D
RESEARCH SOLUTIONS GROUP
November 18, 2016
This report provides information about the relationships among LSAT scores,
PAEG scores, law school grades (LGPA), and scores on the multiple choice and essay
sections of the September Puerto Rico Bar Examination for all the applicants (first timers
ED and repeaters) with complete data from Puerto Rico law schools. Results are presented
separately by school and for all applicants combined. For the latter analysis, LGPAs at a
school were scaled to that school's PAEG scores. This step adjusted the LGPAs for
possible differences in admission and grading standards among schools.
In general, the student's admission test scores as measured by the PAEG and
LSAT tend to be moderately related, though we do see a difference by school. When
viewed across schools, PAEG scores tend to correlate more highly with student's LUPA.
Table 1 shows that PAEG scores generally rank order students in roughly the same way
as LGPA (.654), whereas LSAT scores were a slightly less able predictor of LUPA
oTable I
CORRELATIONS AMONG SCALED LGPA, LSAT, AND PAEG SCORES
Number of LSAT & LSAT & PAEG &Law School Applicants PAEG LUPA LGPA
University of Puerto Rico 208 .572 .049 .145
Interamerican University 204 .425 .101 .063
Catholic University 186 .365 .048 -.057
All Applicants* 598 .654 .373 .654* There are no longer EME graduates with available data for this analysis
37
79

A comparison of Tables I and 2 shows that across all the applicants from the three
Puerto Rico schools (and consistent with historical findings), LSAT and PAEG scores
had generally higher correlations with law school grades than they did with bar exam
multiple choice, essay, and total scores. This result is consistent with other research on
predictors of bar examination performance.
Table 2
CORRELATION OF BAR EXAM SCORES WITH LSAT AND PAEG scosMultiple Total BarChoice Essay Exam Score
Law School LSAT PAEG LSAT PAEG LSAT PAEG
University of Puerto Rico .165 .193 .010 .072 .140 .139
Interamerican University .091 .001 .029 -.068 .063 -.036
Catholic University .002 -.084 -.049 -.020 -.024 -.150
All Applicants .163 .129 .068 .005 .123 .071
There continues to be a reasonable consistent and moderate to high correlation
between law school grades and bar exam scores at the law schools (TabJe 3). In general,
law school grades correlated just as highly with bar exam multiple-choice scores as they
did with bar exam essay scores.
C)CORRELATION OF BAR EXAM SCORESWITH SCALED LAW SCHOOL GRADES
Law SchoolMultipleChoice Essay
Total BarExam Score
University of Puerto Rico .604 .528 .600
Interamerican University .434 .365 .424
Catholic University .512 .585 .582
All Applicants .497 .427 .491
38
80

Table 4 illustrates the strong relationship between law school grades and pass/fail
status on the bar exam. Students in the highest quintile of scaled LGPA are much more
likely to pass than those in the next quintile who in turn are more likely to pass than those
in the next quintile, and so on. The bottom 40% of law schools' students do pass at
approximately the same rate (20%). The table also shows that LGPA was a much better
predictor of bar scores than was PAEG--the difference in passing rates between the
highest and lowest quintiles was 52 percentage points on LGPA, but only 9 percentage
points on PAEG. While LGPA has maintained its discriminating power vis-a-vis bar
passage rate, PAEG's discriminating power has gotten smaller.
Table 4
0 PERCENT PASSING BY QUINTILE OF SCALED LGPA AND PAEG SCORE
Quintile LGPA PAEG
Highest 20% 72.50% 45.83%
Next 20% 44.17% 40.83%
Middle 20% 34,45% 31.09%
Next 20% 20.00% 3 6.67%
Lowest 20% 20.17% 36.97%
Table 5 illustrates that within a law school, the higher an applicantts LGPA, the
more likely that applicant was to pass. Within each of the schools, the top quarter of the
class passed at a significant higher rate than in any other quartile; The difference in
passing rates between the top and bottom quartiles ranged from 80% at Catholic
University to 38% at the U. of Puerto Rico.
Consistent with historical findings, Table 6 shows that the 353 first time takers
had higher mean admissions scores and LGPAs than the 245 repeaters. Bar exam scores
and passing rates followed the same patterns, though the gap in the passing rate between
first time takers and repeaters has gotten progressively lower since 2012 (23% in 2012,
17% in 2013, 17% in 2014, 14% in 2015 and just 4% in 2016).
39
81

Table 5
PERCENT PASSING BY LGPA QUARTILE AND SCHOOLAND MEAN PAEG SCORES BY SCHOOL
Quartile Univ. of Interamerican Catholic AllOf LGPA Puerto Rico University University Applicants
Highest25% 63.1% 61.8% 100.0% 64.0%
Next 25% 37.5% 32.9% 67.7% 41.6%
Next25% 12.1% 26.8% 41.2% 29.3%
Lowest25% 25.0% 11.8% 19.2% 18.1%
Total 46.2% 32.8% 35.5% 38.3%
MeanPAEG 629.43 592.18 557.39 594.32
oTable 6
o
MEAN SCORES AND PASSING RATES FOR FIRST TIMERS AND REPEATERS
MeanAdmissions Mean Bar Exam Scores
Test Scores Scaled Multiple Percent
Group LSAT PAEG LGPA Choice Essay Total Passing
FirstTimers 140.2 597.2 611.1 565.8 568.1 567.9 39.9%
Repeaters 137.8 590.2 570.2 564.4 562.8 564.6 35.9%
Total 139.2 594.3 594.3 565.2 565.9 566.5 38.3%
(It is worth noting again here that all the analyses in this report are restricted to
just the candidates from the three law schools that had complete data. Thus, these results
may differ somewhat from those discussed in the technical report for some previous
exams.)
Taken together, the results presented in this report show that an applicant's bar
exam scores and pass/fail status are highly related to that applicant's law school grades,
the best performance indicator of students as they leave law school. This relationship is
much stronger than the one between admission test scores and bar exam performance,
40
82

which is over 3 years removed from the time a student sits for the bar examination.
These findings provide continuing evidence for the strong concurrent validity of Puerto
Rico's bar examination.
o
83

RELATIONSHIPS AMONG LAW SCHOOL ADMISSION TESTSCORES, LAW SCHOOL GRADES, AND SCORES ON THE
SEPTEMBER 2016 BAR EXAMINATION
Roger E. Bolus, Ph.D.
RESEARCH SOLUTIONS GROUP
December 17, 2017
This report provides information about the relationships among LSAT scores,
PAEG scores, law school grades (LOPA), and scores on the multiple choice and essay
sections of the September Puerto Rico Bar Examination for all the applicants (first timers
() and repeaters) with complete data from Puerto Rico law schools. Results are presented
separately by school and for all applicants combined. For the latter analysis, LGPAs at a
school were scaled to that school's PAEG scores. This step adjusted the LGPAs for
possible differences in admission and grading standards among schools.
In general, the student's admission test scores as measured by the PAEG and
LSAT tend to be moderately related, though we do see a range between schools (.203 to
.499). When viewed across schools, for this cohort, PAEG scores tend to correlate about
the same with student's LGPA as LSAT does. Table I shows that LSAT to LOPA
relationship was .356 while the PAEG relationship with LGPA was .301. Because of the
restriction in the ranges of these scores at each school, there was little to no relationship
of LOP with either LSAT or PAEG scores within any of the three schools (r's ranging
from -.054 to .158)
Table I
CORRELATIONS AMONG SCALED LGPA, LSAT, AND PAEG SCORES
Number of LSAT & LSAT & PAEG &Law School Applicants PAEG LGPA LGPA
University of Puerto Rico 123 .499 .058 .020
Interamerican University 217 .203 -.030 -.085
Catholic University 171 .313 .158 -.054
AllApplicants* 511 .550 .356 .301* There are no longer EMH graduates with available data for this analysis
42
84

A comparison of Tables I and 2 shows that across all the applicants from the three
Puerto Rico schools (and consistent with historical findings), LSAT and PAEG scores
had generally higher correlations with law school grades than they did with bar exam
multiple choice, essay, and total scores, This result is consistent with other research on
predictors of bar examination performance.
Table 2
CORRELATION OF BAR EXAM SCORES WITH LSAT AND PAEG SCORES
Multiple Total BarChoice Essay Exam Score
Law School LSAT PAEG LSAT PAEG LSAT PAEG
() University of Puerto Rico .174 .006 .140 -.071 .170 -.043
Interamerican University .076 -.106 .031 -.157 .058 -.139
Catholic University .041 -.067 .028 -.059 .036 -.067
All Applicants .191 .071 .103 -.024 .158 .026
There continues to be a reasonable consistent and moderate to high correlation
between law school grades and bar exam scores at the law schools (Table 3). In general,
law school grades correlated slightly higher with bar exam multiple-choice scores than
they did with bar exam essay scores. These relationships could be observed within each
school as well as across all applicants.
oTable 3
CORRELATION OF BAR EXAM SCORESWITH SCALED LAW SCHOOL GRADES
Multiple Total BarLaw School Choice Essay Exam Score
University of Puerto Rico .537 .486 .557
Interamerican University .521 .501 .545
Catholic University .517 .507 .547
All Applicants .536 .457 .533
43
85

Table 4 illustrates the strong relationship between law school grades and pass/fail
status on the bar exam. Students in the highest quintile (i.e., highest 20%) of scaled
LGPA are much more likely to pass than those in the next quintile who in turn are more
likely to pass than those in the next quintile, and so on. This trend remains consistent all
through the LGPA distribution. The table also shows that LGPA was a much better
predictor of bar scores than was PAEG--the difference in passing rates between the
highest and lowest quintiles was 60 percentage points on LGPA, but only 2 percentage
points on PAEG. While LGPA has maintained its discriminating power vis-a-vis bar
passage rate, PAEG's discriminating power has continued to get smaller.
Table 4
PERCENT PASSING BY QUINTILE OF SCALED LOPA AND PAEG SCORE
Quintile LOPA PAEGHighest 20% 69.90% 42.72%
Next 20% 48.04% 31.37%
Middle 20% 33.33% 37.25%
Next 20% 20.59% 30.39%
Lowest 20% 9.80% 40.20%
Table 5 illustrates that within a law school, the higher an applicant's LGPA, the
more likely that applicant was to pass. Within each of the schools, the top quarter of the
class passed at a significant higher rate than in any other quartile; The difference in
passing rates between the top and bottom quartiles ranged at each school was 72% at
Catholic University, 61% at University of PR, and 54% at Interamerican.
Showing a departure from historical findings, Table 6 shows that the first-time
takers and repeaters had fairly similar mean admissions scores; while LGPAs were
significantly higher for first time takers (594.8) than for repeaters (562.9). Bar exam
scores and passing rates were higher for first-time takers (41.6% vs. 30.0%), reversing a
trend the narrowing gaps in the passing rate between the two groups that started in 2012
(23%in2012, 17% in 2013, 17% in 2014, 14% in2015,4% in 2016).
44
86

Table 5
PERCENT PASSING BY LGPA QUARTILE AND SCHOOLAND MEAN PAEG SCORES BY SCHOOL
Quartile Univ. of Interamerican Catholic AllOf LGPA Puerto Rico University University Applicants
Highest 25% 60.8% 75.0% 77.8% 66.4%Next 25% 19.0% 41.9% 57.8% 43.8%Next25% 33.3% 22.2% 21.3% 23.4%Lowest25% 0.0% 21.5% 5.7% 11.8%
Total 47.2% 37.3% 27.5% 36.4%
Mean PAEG 625.71 575.35 554.44 580.47
oTable 6
O
MEAN SCORES AND PASSING RATES FOR FIRST TIMERS AND REPEATERS
MeanAdmissions Mean Bar Exam ScoresTest Scores Scaled Multiple Percent
Group LSAT PAEG LGPA Choice Essay Total Passing
First Timers 139.3 575.5 594.8 573.4 573.6 574.4 41.6%
Repeaters 138.1 586.6 562.9 558.9 558.9 560.5 30.0%
Total 138.7 580.4 580.4 566.9 567.6 568.2 36.4%
Taken together, the results presented in this report continue to show that an
applicant's bar exam scores and pass/fail status are highly related to that applicant's law
school grades, the best performance indicator of students as they leave law school. This
relationship is much stronger than the one between admission test scores and bar exam
performance, which is over 3 years removed from the time a student sits for the bar
examination. These findings provide continuing evidence for the strong concurrent
validity of Puerto Rico's bar examination.
45
87

RELATIONSHIPS AMONG LAW SCHOOL ADMISSION TESTSCORES, LAW SCHOOL GRADES, AND SCORES ON THE
SEPTEMBER 2018 BAR EXAMINATION
Roger E. Bolus, Ph.D.
RESEARCH SOLUTIONS GROUP
November 14, 2018
This report provides information about the relationships among LSAT scores,
PAEG scores, law school grades (LGPA), and scores on the multiple choice and essay
sections of the September Puerto Rico Bar Examination for all the applicants (first timers
ED and repeaters) with complete data from Puerto Rico law schools. Results are presented
separately by school and for all applicants combined. For the latter analysis, LGPAs at a
school were scaled to that schools PAEG scores. This step adjusted the LGPAs for
possible differences in admission and grading standards among schools.
In general, the student's admission test scores as measured by the PAEG and
LSAT tend to be moderately related, though we do continue to see a range between
schools (.26 to .57). When viewed across schools, for this cohort, PAEG scores tend to
correlate about the same with student's LGPA as LSAT does. Table I shows that LSAT
to LOPA relationship was .383 while the PAEG relationship with LUPA was .327.
Because of the restriction in the ranges of these scores at each school, there was little to
IID no relationship of LGPA with either LSAT or PAEG scores within any of the three
schools (r's ranging from -.063 to .13 1)
Table I
CORRELATIONS AMONG SCALED LGPA, LSAT, AND PAEG SCORES
Number of LSAT & LSAT & PAEG &Law School Applicants PAEG LGPA LGPA
University of Puerto Rico 189 .567 .131 .100
Interamerican University 204 .218 .086 .021
Catholic University 172 .262 .130 -.063
All Applicants* 565 .576 .383 .327
88

A comparison of Tables 1 and 2 shows that across all the applicants from the three
Puerto Rico schools (and consistent with historical findings), LSAT and PAEG scores
continue to have higher correlations with law school grades than they did with bar exam
multiple choice, essay, and total scores. This result is consistent with other research on
predictors of bar examination performance.
Table 2
CORRELATION OF BAR EXAM SCORES WITH LSAT AND PAEG SCORES
Multiple Total BarChoice Essay Exam Score
Law School LSAT PAEG LSAT PAEG LSAT PAEG
University of Puerto Rico .180 .143 .086 .154 .138 .156
Interamerican University .086 .034 .047 -.08 1 .071 -.024
Catholic University .048 .087 .001 .031 .027 .062
All Applicants .174 .151 .055 .055 .121 .109
There continues to be a reasonable consistent and moderate to high correlation
between law school grades and bar exam scores at the law schools (Table 3). In general,
law school grades correlated slightly higher with bar exam multiple-choice scores than
they did with bar exam essay scores. These relationships could be observed within each
school as well as across all applicants.
oTable 3
CORRELATION OF BAR EXAM SCORESWITH SCALED LAW SCHOOL GRADES
Law SchoolMultipleChoice Essay
Total BarExam Score
University of Puerto Rico .605 .568 .616
Interamerican University .513 .466 .523
Catholic University .550 .580 .594
All Applicants .527 .519 .519
47
89

Table 4 illustrates the strong relationship between law school grades and pass/fail
status on the bar exam. Students in the highest quintile (i.e., top 20%) of scaled LGPA
are much more likely to pass than those in the next quintile who in turn are more likely to
pass than those in the next quintile, and so on. This trend remains consistent all through
the LGPA distribution. The table also shows that LGPA was a much better predictor of
bar scores than was PAEG--the difference in passing rates between the highest and
lowest quintiles was 57 percentage points on LGPA, but only 20 percentage points on
PAEG. Note also that there is relatively little difference in pass rates in the bottom 4
quintiles. While LGPA has maintained its discriminating power vis-a-vis bar passage
rate, PAEG's discriminating power has continued to get smaller.
Table 4
PERCENT PASSING BY QUINTILE OF SCALED LOPA AND PAEG SCORE
Quintile LUPA PAEGHighest 20% 74.34% 52.21%
Next 20% 44.25% 32.74%
Middle 20% 30.97% 37.17%
Next 20% 20.3 5% 32.74%
Lowest 20% 17.70% 32.74%
Table 5 illustrates that within a law school, the higher an applicant's LUPA, the
more likely that applicant was to pass. Within each of the schools, the top quarter of the
class passed at a significant higher rate than in any other quartile; The difference in
passing rates between the top and bottom quartiles ranged at each school was 60% at
Catholic University, 45% at University of PR, and 52% at Interamerican.
Similar to 2017, Table 6 shows that the first-time takers and repeaters had fairly
similar mean admissions scores; while LUPAs remained significantly higher for first time
takers (591.5) than for repeaters (546.2). On this examination, Bar exam scores arid
passing rates were almost identical for first-time takers and repeaters (37.8% vs. 37.0%),
reverting to the trend in the narrowing gaps in the passing rate between the two groups
thatstarted 1n2012 (23% in 2012, 17%in 2013, 17% in 2014, 14%in2015,4%1n2016).
48
90

Table 5
PERCENT PASSING BY LGPA QUARTILE AND SCHOOLAND MEAN PAEG SCORES BY SCHOOL
Quartile Univ. of Interamerican Catholic AllOf LGPA Puerto Rico University University Applicants
Highest 25% 69.5% 66.7% 80.0% 69.7%
Next 25% 20.5% 33.3% 82.1% 39.0%
Next 25% 25.0% 17.6% 29.8% 22.7%
Lowest25% 25.0% 14.7% 19.5% 18.4%
Total 48.2% 28.9% 36.1% 37.5%
Mean PAEG 612.24 570.46 536.94 574.23
o
o
Table 6
MEAN SCORES AND PASSING RATES FOR FIRST TIMERS AND REPEATERS
Mean Bar Exam ScoresTest Scores Scaled Multiple Percent
Group LSAT PAEG LGPA Choice Essay Total Passing
MeanAdmissions
First Timers 140.1 576.5 591.5 565.8 566.2 566.9 37.8%
Repeaters 137.0 570.6 546.2 567.5 568,9 569.1 37.0%
Total 138.9 574.2 574.2 566.5 567.2 567.8 37.5%
Taken together, the results presented in this report continue to show that an
applicant's bar exam scores and pass/fail status are highly related to that applicant's law
school grades, the best performance indicator of students as they leave law school. This
relationship is much stronger than the one between admission test scores and bar exam
performance, which is over 3 years removed from the time a student sits for the bar
examination. These findings provide continuing evidence for the strong concurrent
validity of Puerto Rico's bar examination.
49
91

RELATIONSHIPS AMONG LAW SCHOOL ADMISSION TESTSCORES, LAW SCHOOL GRA]ES, AND SCORES ON THE
SEPTEMBER 2019 BAR EXAMINATION
Roger E. Bolus, Ph.D.
RESEARCH SOLUTIONS GROUP
November 11,2019
This report provides information about the relationships among LSAT scores,
PAEG scores, law school grades (LGPA), and scores on the multiple choice and essay
sections of the September Puerto Rico Bar Examination (PRX) for all the applicants (first
timers and repeaters) with complete data from operating Puerto Rico law schools. Results
are presented separately by school and for all applicants combined, For the latter analysis,
LGPAs at a school were scaled to that school's PAEG scores. This step adjusted the LGPAs
for possible differences in admission and grading standards among schools.
Table 1 presents the correlations of admission scores and law school performance.
In general, the studentts admission test scores as measured by the PAEG and LSAT tend to
be moderately related, though we do continue to see a range between schools (.20 to .46).
When viewed across schools, for this cohort, PAEG scores tend to correlate about the same
with student's LGPA as LSAT does (.299). Relationships within schools tend to be much
lower due to the restriction in the ranges of these scores at each school. There was little to
no relationship of LGPA with either LSAT or PAEG scores within any of the three schools
(r's ranging from -.08 1 to .054). It should be noted that these correlations are further
attenuated due to the fact that these are graduating students who sat for the bar exam.
Table]
CORRELATIONS AMONG SCALED LOPA, LSAT, AND PAEG SCORES
Law SchoolNumber ofApplicants
LSAT &PAEG
LSAT &LGPA
PAEG &LOPA
University of Puerto Rico 196 .426 -.056 .054
Interamerican University 235 .20] .040 .022
Catholic University 161 .324 .021 -.081
All Applicants 592 .533 .299 .299
50
92

A comparison of Tables 1 and 2 shows that across all the applicants from the three
Puerto Rico schools LSAT and PAEG scores continue to have higher correlations with
law school grades than they did with bar exam multiple choice, essay, and total scores.This result is consistent with other research on predictors of bar examination performance
and similar to the patterns observed previous validity studies on the PRX.
Table 2
CORRELATION OF BAR EXAM SCORES WITH LSAT AND PAEG SCORES
Multiple Total BarChoice Essay Exam Score
Law School LSAT PAEG LSAT PAEG LSAT PAEG
University of Puerto Rico .014 -.013 .019 .053 .019 .022
Interamerican University .241 .141 .216 .087 .242 .121
Catholic University .008 .048 .015 .044 .012 .049
All Applicants .217 .175 .159 .135 .200 .165
There continues to be a reasonable consistent and moderate to high correlation
between law school grades and bar exam scores at the law schools (Table 3). In general,
law school grades correlated slightly higher with bar exam multiple-choice scores than they
did with bar exam essay scores. These relationships could be observed within each schoolas well as across all applicants. The .518 correlation between grades and total PRX scoresis comparable to the .52 average correlation over the previous 8 years.
Table 3
CORRELATION OF BAR EXAM SCORESWITH SCALED LAW SCHOOL GRADES
Law SchoolMultipleChoice Essay
Total BarExam Score
University of Puerto Rico .581 .477 .560
Interamerican University .483 .361 .447
Catholic University .483 .390 .469
All Applicants .549 .424 .518
Ial
93

Table 4 further illustrates the strong relationship between law school grades and
pass/fail stath on the bar exam. Students in the highest quintile (i.e., top 20%) of scaled
LGPA are much more likely to pass (74%) than those in the next quintile who in turn are
more likely to pass than those in the next quintile (38%), and so on. This trend remains
consistent all through the LGPA distribution. The table also shows that LGPA was a much
better predictor of bar scores than was PAEG--the difference in passing rates between the
highest and lowest quintiles was 56 percentage points on LGPA, but only 17 percentage
points on PAEG. Note also that there is relatively little difference in pass rates in the bottom
4 quintiles of the PAEG. While LGPA has maintained its discriminating power vis-a-vis
bar passage rate, PAEG's discriminating power has continued to get smaller over the years.
Table 4
PERCENT PASSG BY QUTILE OF SCALED LGPA AND PAEG SCO
Quintile LGPA PAEGHighest 20% 73.95% 42.86%
Next 20% 38.14% 37.29%
Middle 20% 32.77% 34.45%Next 20% 13.56% 36.44%Lowest 20% 17.80% 25.42%
Table 5 illustrates that also within a law school, the higher an applicant's LGPA,
the more likely that applicant was to pass. Within each of the schools, the top quarter of
the class passed at a significant higher rate than in any other quartile; The difference in
passing rates between the top and bottom quartiles ranged at each school was 63% at
Catholic University, 49% at University of PR, and Jnteramerican.
Similar to 2017, Table 6 shows that the first-time takers and repeaters had fairly
similar mean admissions scores; while LOPAs remained significantly higher for first time
takers (586.4) than for repeaters (545,5). On this examination, PRX passing rates wereslightly higher for first-time takers than repeaters (37.0% vs. 33.2%), continuing the trend
in the narrowing gaps in the passing rate between the two groups that started in 2012 (23%
in 2012, 17% in 2013, 17% in 2014, 14% in 2015 vs. ,4% in 2016, .8% in 2018).
52
94

Table 5
PERCENT PASSING BY LGPA QUARTILE AND SCHOOLAND MEAN PAEG SCORES BY SCHOOL
Quartile Univ. of Interamerican Catholic AllOf LGPA Puerto Rico University University Applicants
Highest 25% 72.5% 52.5% 80.0% 67.5%Next 25% 25.9% 35.2% 57.9% 34.5%Next25% 26.1% 22.5% 24,4% 23.7%Lowest 25% 23.5% 9.1% 17.2% 15.5%
Total 49.0% 28.9% 28.0% 35.3%
Mean PAEG 603.6 564.8 528.9 567.9
Table 6
MEAN SCORES AND PASSING RATES FOR FIRST TIMERS AND REPEATERS
MeanAdmissions
Test Scores ScaledGroup LSAT PAEG LGPA
Mean Bar Exam ScoresMultiple Percent
Choice Essay Total Passing
QFirstTimers 139.3 572.5 586.4 562.7 561.9 563.3 37.0%
Repeaters 137.0 562.2 545.5 560.5 565.6 564.0 33.2%
Total 138.3 567.9 567.9 561.7 563.6 563.6 35.3%
Taken together, the results presented in this report continue to show that an
applicant's bar exam scores and pass/fail status are highly related to that applicant's law
school grades, the best performance indicator of students as they leave Jaw school. This
relationship continues to be much stronger than the one between admission test scores and
bar exam performance, which is over 3 years removed from the time a student sits for the
bar examination. These findings offer continuing evidence for the strong concurrent
validity of the PRX.
53
95

RELATIONSHIPS AMONG LAW SCHOOL ADMISSION TESTSCORES, LAW SCHOOL GRADES, AND SCORES ON THE
SEPTEMBER 2020 BAR EXAMINATION
Roger E. Bolus, Ph.D.
RESEARCH SOLUTIONS GROUP
November 17, 2020
This report provides information about the relationships among LSAT scores,
PAEG scores, law school grades (LGPA), and scores on the multiple choice and essay
sections of the September Puerto Rico Bar Examination (PRX) for all the applicants (first
timers and repeaters) with complete data from operating Puerto Rico law schools. Results
EI are presented separately by school and for all applicants combined. For the latter analysis,
LGPAs at a school were scaled to that school's PAEG scores. This step adjusted the LGPAs
for possible differences in admission and grading standards among schools.
Table I presents the correlations of admission scores and law school performance.
Consistent with previous years, student's admission test scores as measured by the PAEG
and LSAT tend to be moderately related, varying slightly by school (.25 to .55). When
viewed across schools, for this cohort, PAEG scores continue to correlate about the same
with student's LGPA as LSAT does (.266 vs. 323). Relationships within schools tend to
be much lower due to the restriction in the ranges of these scores at each school. There
continues to be little to no relationship of LOPA with either LSAT or PAEG scores within
any of the three schools (r's ranging from -.10 to .17). It should be noted that these
correlations are further attenuated due to the fact that these are graduating students who sat
for the bar exam.
Table 1
CORRELATIONS AMONG SCALED LGPA, LSAT, AND PAEG SCORES
Law SchoolNumber ofApplicants
LSAT &PAEG
LSAT &LGPA
PAEG &LGPA
University of Puerto Rico 224 .551 .036 .050
Interamerican University 219 .250 .168 .010
Catholic University 167 .347 -.032 -.100
All Applicants 610 .584 .323 .266
54
96

A comparison of Tables 1 and 2 shows that across all the applicants from the three
Puerto Rico schools LSAT and PAEG scores continue to have higher correlations with law
school grades than they did with bar exam multiple choice, essay, and total scores. This
result is consistent with other research on predictors of bar examinatioft performance and
similar to the patterns observed previous validity studies on the PRX,
Table 2
CORRELATION OF BAR EXAM SCORES WITH LSAT AND PAEG SCORES
Multiple Total BarChoice Essay Exam Score
Law School LSAT PAEG LSAT PAEG LSAT PAEG
() University of Puerto Rico .120 .099 .145 .089 .141 .100
Interamerican University .144 .070 .121 .049 .144 .063
Catholic University -.0 19 -.044 -.0 17 -.126 -.019 -.09 1
All Applicants .154 .118 .151 .083 .164 .108
There continues to be a reasonable consistent and moderate to high correlation
between law school grades and bar exam scores at the law schools (Table 3). In general,
law school grades correlated slightly higher with bar exam multiple-choice scores than they
did with bar exam essay scores. These relationships could be observed within each school
as well as across all applicants. The .518 correlation between grades and total PRX scores
ED is identical to last September and comparable to the .52 average correlation over the
previous 9 years.
Table 3
CORRELATION OF BAR EXAM SCORESWITH SCALED LAW SCHOOL GRADES
Law SchoolMultipleChoice Essay
Total BarExam Score
University of Puerto Rico .550 .475 .544
Interamerican University .435 .414 .460
Catholic University .511 .553 .574
All Applicants .498 .468 .518
55
97

Table 4 further illustrates the strong relationship between law school grades and
pass/fail status on the bar exam. Students in the highest quintile (i.e., top 20%) of scaled
LGPA are much more likely to pass (62%) than those in the next quintile (42%) who in
turn are more likely to pass than those in the next quintile (34%), and so on. This trend
remains consistent all through the LGPA distribution. The table also shows that LGPA
was a much better predictor of bar scores than was PAEG--the difference in passing rates
between the highest and lowest quintiles was 49 percentage points on LGPA, but only 11
percentage points on PAEG. Note also that the pass rate in the bottom 20% of the PAEG
is actually higher than in the quintile above it (29.5% vs 23.8%). While LGPA has
maintained its discriminating power vis-a-vis bar passage rate, PAEG's discriminating
power has continued to get smaller as initially noted in last year's report.
o Table 4
PERCENT PASSING BY QU1NTILE OF SCALED LGPA AND PAEG SCORE
Quintile LGPA PAEGHighest20% 61.5% 41.0%
Next20% 41.8% 40.2%Middle 20% 3 3.6% 33.6%
Next20% 18.9% 23.8%Lowest 20% 12.3% 29.5%
oTable 5 illustrates that also within a law school, the higher an applicant's LGPA,
the more likely that applicant was to pass. Within each of the schools, the top quarter of
the class passed at a significant higher rate than in any other quartile; The difference in
passing rates between the top and bottom quartiles ranged at each school was 73% at
Catholic University, 43% at University of PR, and 33% at Interamerican. Results aresimilar to recent validity studies conducted in California.
Similar to results from past reports, Table 6 shows that the first-time takers and
repeaters had fairly similar mean admissions scores; while LGPAs remained significantly
higher for first time takers (581 1) than for repeaters (539.8). On this examination, PRX
passing rates were slightly higher for first-time takers than repeaters (36% vs. 31%),
reversing a trend of narrowing gaps in the passing rate between the two groups.
56
98

Table 5
PERCENT PASSiNG BY LGPA QUARTILE AND SCHOOLAND MEAN PAEG SCORES BY SCHOOL
Quartile Univ. of Interamerican Catholic AllOf LUPA Puerto Rico University University Applicants
Highest 25% 57.7% 55.8% 100.0% 58.8%Next 25% 32.1% 37.5% 62.5% 40.8%Next 25% 27.9% 20,6% 14.9% 20.9%Lowest 25% 23.5% 12.2% 15.9% 13.8%
Total 41.1% 30.1% 27.5% 33.6%
Mean PAEG 597.8 560.0 522.7 563.6
oTable 6
MEAN SCORES AND PASSiNG RATES FOR FIRST TIMERS AND REPEATERS
MeanAdmissions Mean Bar Exam ScoresTest Scores Scaled Multiple Percent
Group LSAT PAEG LUPA Choice Essay Total Passing
First Timers 138.9 560.6 581.1 563.2 567.5 566.3 35.5%
Repeaters 138.0 567.9 539.8 563.6 558.8 562.1 31.0%
O Total 138.5 563.7 563.7 563.4 563.8 564.5 33.6%
The results presented in this report continue to demonstrate that an applicant's bar
exam scores and pass/fail status are highly related to that applicant's law school grades, the
best performance indicator of students as they leave law school. This relationship, a
measure of convergent validity, held up even when the current examination was one-half
the length of past administrations. The divergent validity of the examination continues to
be evidenced by the expected smaller relationship between admission test scores and bar
exam performance, which is over 3 years removed from the time a student sits for the bar
examination. These findings offer continuing evidence for the strong concurrent validity
of the PRX.
57
99

RELATIONSHIPS AMONG LAW SCHOOL ADMISSION TESTSCORES, LAW SCHOOL GRADES, AND SCORES ON THE
SEPTEMBER 2021 BAR EXAMINATION
Roger E. Bolus, Ph.D.
RESEARCH SOLUTIONS GROUP
November 18, 2021
This report provides information about the relationships among LSAT scores,
PAEG scores, law school grades (LGPA), and scores on the multiple choice and essay
sections of the September Puerto Rico Bar Examination (PRX) for all the applicants (first
timers and repeaters) with complete data from operating Puerto Rico law schools. Results
CD are presented separately by school and for afl applicants combined. For the latter analysis,
LOPAs at a school were scaled to that school's PAEG scores. This step adjusted the LGPAs
for possible differences in admission and grading standards among schools.
Table 1 presents the correlations of admission scores and law school performance.
In general, the student's admission test scores as measured by the PAEG and LSAT tend to
be only moderately related, though we do continue to see variation between schools (r.26
to .62). When viewed across schools, for this cohort, PAEG scores tend to correlate slightly
lower with student's graduating LGPA (r.201) than LSAT does (.316). Relationships
within schools tend to be much lower due to the restriction n the ranges of these scores at
each school. There was little to no relationship ofLGPA with either LSAT or PAEG scoresC) within any of the three schools (r's ranging from .004 to .182). It should be noted that these
correlations are further attenuated by the fact that these are limited to graduating students
who sat for the bar exam, and not all students that matriculated.
Table 1
CORRELATIONS AMONG SCALED LGPA, LSAT, AND PAEG SCORES
Law SchoolNumber ofApplicants
LSAT &PAEG
LSAT &LGPA
PAEG &LGPA
University of Puerto Rico 160 .626 .053 .004
Interamerican University 200 .255 .106 .049
Catholic University 111 .484 .182 .022
All Applicants 471 .605 .316 .201
58
100

A comparison of Tables I and 2 shows that across all the applicants from the
three Puerto Rico schools LSAT and PAEG scores continue to have higher correlations
with law school grades than they did with bar exam multiple choice, essay, and total
scores. This result is consistent with other research on predictors of bar examination
performance and similar to the patterns observed previous validity studies on the PRX.
Table 2
CORRELATION OF BAR EXAM SCORES WITH LSAT AND PAECI SCORES
Multiple Total BarChoice Essay Exam Score
Law School LSAT PAEG LSAT PAEG LSAT PAEG
(J) University of Puerto Rico .099 .141 .002 .029 .050 .089
Interamerican University .026 .011 .023 -.062 .027 -.028
Catholic University .186 .062 .163 .022 .188 .045
AllApplicants .111 .092 .048 .004 .085 .051
There continues to be a reasonable, consistent and moderate correlation between
Jaw school grades and bar exam scores at the law schools (Table 3). On this exam, law
school grades correlated about as high with bar exam multiple-choice scores as they did
with bar exam essay scores. These relationships could be observed within each school as
well as across all applicants (.421 and .417 across all applicants). The .448 correlation
between grades and total PRX scores is slightly lower than, but within range of, the .52
average correlation over the previous 9 years.
Table 3
CORRELATION OF BAR EXAM SCORESWITH SCALED LAW SCHOOL GRADES
Law SchoolMultipleChoice Essay
Total BarExam Score
University of Puerto Rico .392 .410 .425
Interamerican University .517 .558 .576
Catholic University .448 .398 .455
All Applicants .421 .417 .448
59
101

Table 4 further illustrates the strong relationship between law school grades and pass/fail
status on the bar exam. Students in the highest quintile (i.e., top 20%) of scaled LUPA
are much more likely to pass (67%) than those in the next quintile (46%) who in turn are
more likely to pass than those in the next quintile (22%), and so on. This trend remains
consistent all through the LUPA distribution. The table also shows that LUPA was a
much better predictor of bar scores than was PAEG--the difference in passing rates
between the highest and lowest quintiles was 53 percentage points on LUPA, but only 5
percentage points on PAEG. While LGPA has maintained its discriminating power vis-a-
vis bar passage rate, PAEG's discriminating power has continued to get smaller over the
years.
C) Table 4
PERCENT PASSING BY QUINTILE OF SCALED LUPA AND PAEG SCORE
Quintile LGPA PAEGHighest 20% 67.37% 36.84%
Next 20% 46.81% 34.04%Middle 20% 22.34% 27.66%Next 20% 17.02% 37.23%
Lowest20% 13.83% 31.91%
Table 5 illustrates that also within a law school, the higher an applicant's LUPA,
the more likely that applicant was to pass. Within each of the schools, the top quarter of
the class passed at a significant higher rate than in any other quartile; The difference in
passing rates between the top and bottom quartiles ranged at each school was 84% at
Interamerican, 69% at Catholic University and 45% at University of PR.
Similar to previous years, Table 6 shows that the first-time takers and repeaters
had fairly similar mean admissions scores; while LGPAs remained significantly higher for
first time takers (578.5) than for repeaters (523.5). On this examination, PRX passing rates
were 9% higher for first-time takers than repeaters (37.7% vs. 28.4%).
60
102

Table 5
PERCENT PASSING BY LGPA QUARTILE AND SCHOOLAND MEAN PAEG SCORES BY SCHOOL
Quartile Univ. of Interamerican Catholic AllOf LGPA Puerto Rico University University Applicants
Highest 25% 58.9% 90.9% 85.7% 69.5%Next25% 17.1% 37.9% 52.6% 33.1%Next 25% 21.1% 14.3% 27.8% 19.5%Lowest25% 13.6% 6.5% 16.3% 12.0%Total 37.5% 32.0% 28.0% 33.6%Mean PAEG 584.] 548.2 520.5 553.8
oTable 6
MEAN SCORES AND PASSING RATES FOR FIRST TIMERS AND REPEATERS
MeanAdmissions Mean Bar Exam ScoresTest Scores Scaled Multiple Percent
Group LSAT PAEG LOPA Choice Essay Tota] Passing
First Timers 139.5 552.3 578.5 562.4 565.4 564.7 37.7%
Repeaters 137.2 555.8 523.5 563.1 561.2 563.1 28.4%
Total 138.5 553.8 553.8 562.6 563.5 564.0 33.5%
The results presented in this report continue to illustrate that an applicant's bar exam
scores and pass/fail status are highly related to that applicant's law school GPA, the best
available performance indicator of students as they leave law school. This relationship
continues to be much stronger than the one between admission test scores and bar exam
performance, which is over 3 years removed from the time a student sits for the bar
examination. However, we do note that the slight decrease in 15t timer pass rate onSeptember exams over the past several years appears to be tracking with the slight decrease
in their mean LSAT scores. When taken as a whole, these findings offer continuing
evidence for the strong concurrent validity of the PRX,
[11
103

*
National Conference of Bar Examiners
S
104

Contents1 Greetings from the NCBE President
2 What is NCBE?
3 How does NCBE partnerwith law schools?
4 How is the bar exam developed?
8 How does NCBE know that the barexam tests knowledge and skillsthat are relevant for new lawyers?
10 How does NCBE ensure that thebar exam is fair for everyone?
12 How is the bar exam scored?
'LC N4atiuni!Confciiiicc of
E Bar Eximiners
302 South Bedíord Street Madison, WI 53703ncbex.org I thebarexaminer.org
/ncbexaminers
1 company/ncbex
V (uThcbex
3 /ncbexarniners
13 Why aren't bar exam resultsavailable immediately?
14 Why do bar exam scores need tobe equated and scaled?
15 What is equating and how doesit work?
16 What is scaling and how doesit work?
17 What support is available forjurisdiction graders?
Back coverAdditional resources
2020 Notional Conlerence oí Bar Examiners. AH tights reserved.
105

Greetings from the NCBE PresidentEducating and licensing lawyers to provide competent
legal assistance to those who need it is vitally Importantwork, At the National Conference of Bar Examiners (NCBE),
we are proud to partner with law schools and jurisdiction
bar admission agencies to help ensure that the public willbe served by qualified attorneys, and we are committed tosupporting the legal education community as you work toprepare the next generation of lawyers
The questions we address in this publication are drawn from
conversations we've had with legal educators across thecountry; we hope the answers we provide will be valuable
for you. We believe that the more information you andyour students have about how the bar exam is developed,
administered, and scored, the better prepared yourstudents will be to take and pass the bar exam.
Sincerely,
Judith A. GundersenNCBE President and CEO
64
106

What is NCBE?The National Conference of Bar Examiners (NCBE) is a not-for-profit organization
that develops the licensing and professional responsibility exams used by
most US jurisdictions for admission to the bar. We develop the MultistateBar Examination (MBE), the Multistate Essay Examination (MEE), the MultistatePerformance Test (MPT), and the Multistate Professional Responsibility
Examination (MPRE). The bar admission agency in each jurisdiction is responsible
for administering the bar exam in that jurisdiction.
We also provide education and support to bar admission agencies and legaleducators, perform character and fitness investigations on behalf of somejurisdictions, provide score services to candidates, and conduct research ontopics relevant to bar admissions and high -stakes testing. Additionally, ourwebsites and Bar Examiner magazine serve as authoritative sources for baradmissions news and information.
Our MissionNCBE promotes fairness, integrity, and best practices in admission fo the legalprofession for the benefit and protection of the public. We serve admIssionauthorities, courts, the legal education community, and candidates by
providing high -quality
Lassessmenf products, services, and research
wcharacter investigations
¯ informational and educational resources and programs
Our Visioncompetent, ethical, and diverse legal profession.
107

How does NCBE partner with law schools?Support for YourProfessional Development
We regularly offer educationalworkshops and conferences forlaw school faculty and staff. Somerecent offerings:
conference for law school faculty
and staff aimed to advanceunderstanding of testing andassessment principles andimplementation In support of lawschools' educational missions.
previous administrations of thebar exam.
For more Information, visitncbex.org/study-alds or [email protected].
Multiple -Choice QuestionWriting Workshop. This workshop
for tenured law school faculty
members who teach coresubjects represented on the MBEfeatured training sessions led by
law school faculty with experience
writing MBE questions.
UnpackIng the Bar Exam:A Conference for AcademicSupport Professionals.Academic supporf educatorsfrom law schools across thecountry attended this two-day
conference, which provided
an In-depth look at manyaspects of the bar exam andbar performance, as well asthe opportunity for educatorsand NCBE staff to exchange
Ideas about current Issues andchallenges In legal educationand bar admissions.
Best Practices In High -StakesTesting: What Legal EducatorsNeed to Know. Cosponsored
by NCBE and the Law SchoolAdmission Council, this
More educational opportunities
are being planned.
Support for Your BarPrep Classes
You and your students can get
bar exam study aids straight fromthe source with BarNow, NCBE'seLearning platform.
With BarNow, students can login anytime, anywhere, andcomplete practice questions andsimulated exams to study for thebar exam.
BarNow also has special featuresfor legal educators. You canuse BarNow in your curriculum totrack students' progress as theycomplete simulated exams.
Prefer a paper study tool? TheMBE Study Aid, available as a PDFor In hard copy, offers 210 MBEpractice questions organized bysubject area.
All the questions includedin NCBE's study aids are realquestions that were used on
Support for StudentSuccess
NCBE Is proud to collaboratewith the Council on LegalEducation Opportunity, Inc.(OLEO) In support of our sharedgoal of increasing diversity andinclusion In the legal profession.
NCBE has provided funding tobolster CLEO's programs thathelp Individuals from traditionallyunderrepresented racial andethnic groups and disadvantagedcommunities achieve success Inlaw school and prepare to takeand pass the bar exam.
Support for Data -DrivenSolutions
NCBE provides bar exam resultsand school-specific pass/fail listsfo law schools on behalf of certainjurisdictions.
A new initiative, currently underway, will soon allow us to beginsharing summary MPRE candidatedata with law schools.
3
66
108

How is the bar examdeveloped?Each jurisdiction determines the content of its own bar exam. Most jurisdictions useone or more of the exam components developed by NC BE:
¯ the Multistate Bar Examination (MBE)
¯ the Multistate Essay Examination (MEE)
¯ the Multistate Performance Test (MPT)
A majority of these jurisdictions use the Uniform Bar Examination (UBE), which consistsof the MBE, the MEE, and the MPT, and results in a portable score that can betransferred to other UBE jurisdictions.
MBE, MEE, and MPT questions are developed by the volunteer members of nineNCBE drafting committees with the support of NCBE's attorney editors. Questions gothrough multiple stages of drafting, review, and revision by the practicing attorneys,
judges, and law school faculty members that compose the drafting committees,
along with NCBE's attorney editors.
New questions are pretested (a best practice for high-stakes exams) so that theirperformance can be evaluated before they are used on a future exam.
4
109

TEST DEVELOPMENT AND PRODUCTION
Building the bar exam
INCBE's drafting committee
members write Items(questions) following NCBEsresearch-based guidelines.
Qq,The full drafting Two external reviewers
committee and NCBEs check the revised itemsattorney editors review for content, bias, difficulty,
the Items. clarity, and relevance.
Recently licensed attorneys Drafting committee chairspretest MEE and MPT Items, and attorney editors select
scored Items for use on anew test form.
The full drafting committeereviews the new test form
at least twice.
MEE and MPT test forms receIvetwo stakeholder levels of review
by NCBEs MEE/MPT PolicyCommittee and user Jurisdictions.
NCBE test productionstaff members prepare and
review exam materials.
LEJ,EJ 'oo'Exam materIals are shipped
to the JurisdIctions.
Drafting committee chairsand attorney editors selectMBE items to be placed asunscored pretest Items on
a new test form.
NCBE test productionstaff members perform a
final quality-control checkon exam materials.
I%IV Exams are
administered.
5
68
110

The process of developing MBE items (questions) begins with the members of the seven MBEdrafting committees. Each member, or drafter, individually drafts initial versions of new items.Drafters are provided with test specifications that identify the topics to be tested within eachsubject area (e.g.. from the MBE Contracts subject-maffer outline, this might be "formation ofcontracts" or "contract content and meaning"). With this general guidance, the most difficultstage of the drafting process begins-conceptualizing an item, In generating ideas foritems, drafters may turn to cases, treatises, Restatements of the Law, and their experiences asprofessors, practitioners, and judges.
Drafting principles
The four principles that guide drafters in item writing are based on best practices derived frompsychometric research and specify that items should
1. be clear and concise;
2. use only the minimum number of actors and facts necessary to support the correctnessof the key (the correct answer) and the plausibility of the distractors (the incorrectanswers);
3, test core concepts rather than trivial or obscure topics; and
4. assess examinees' knowledge of legal doctrine and their ability to apply legalreasoning and lawyering skills and strategies rather than rote memorization.
These principles also instruct drafters to aim for a level of difficulty that corresponds to theminimum competency expected of newly licensed attorneys.
69
111

The review process
The attorney editor
After a committee member drafts a set ofitems, the items are submitted to the NCBEattorney editor assigned to that particularcommittee. Committee members alsoprovide a citation to the rule, case, or otherlegal authority that supports each item.Attorney editors engage in a detailed reviewof each item, focused on its compliancewith NCBE best practices. Attorney editorssend comments fo drafters, who then havean opportunity to respond to the editor'sconcerns.
The outside experts
Items are also reviewed by two outsidecontent experts, a practicing lawyer anda law professor, both with subject-areaexpertise. These reviewers engage in aprocess similar to that of attorney editors butfocus primarily on whether a question tests acore concept and is realistic and whether thekey (correct answer) represents an accuratereflection of the current law on the topic beingtested. The reviewers also determine whetherthe item is at the appropriate level of difficulty,
whether more than one option is potentiallycorrect, whether a question Is imbued withany subtle bias, and whether each distractor(incorrect answer) Is plausible. Externalreviewers' written comments are shared withthe entire committee for discussion.
Committee revisions
Committee members subsequently discussand edit items in response to the concernsraised by the attorney editor and the externalreviewers, as well as one another's concerns.If editing fails to resolve a concern, an itemwill either be assigned to a commiffeemember for further revisions or retired (neverplaced on an exam). Items that have beenrevised to address concerns or those forwhich there are no concerns are promoted topretest-ready status,
PretestingThe attorney editor and the committee chairselect items to be pretested from this groupof pretest-ready items. At each administrationof the bar exam, 25 of the 200 items thatappear on the MBE are items that are beingpretested and are therefore not scored. (Theremaining 175 scored items have alreadysuccessfully passed the pretest process.)Examinees' performance on these pretestquestions is carefully evaluated to determinewhether the questions meet NCBE statisticalstandards and can be included as scoredquestions on a future MBE. Pretest items thatfall outside of these statistical standards aresubmitted for review by the committee, whichhas the opportunity either to edit the items orto retire them.
Adopted from Dro(ting MBE Items: A Truly CollaborativeProcess," by Pofessor Timothy Davis, chair of NCBE's MBEContracts Drafting Committee (The Bar Examiner, Fail 20191.
70
112

How does NCBE knowthat the bar exam testsknowledge and skillsthat are relevant fornew lawyers?
NCBE periodically conducts studies to ensure that the content of the bar examremains relevant and appropriate for a legal licensure exam. Additionally,
the expertise of the attorneys, judges, and law school faculty members who
compose our drafting committees helps to ensure that content remains current
and relevant.
n 2018, NCBE appointed a Testing Task Force charged with undertaking acomprehensive three-year study fo ensure that the bar exam continues lo test
the knowledge, skills, and abilities required for competent entry-level legal
practice in a changing profession.
Ii,
113

72
114

How does NCBE ensurethat the bar exam is fairfor everyone?Fairness on the bar exam begins with the questions themselves. All question writersand editors receive bias training, and should have fairness in mind as they draftand review bar exam questions. Once drafted, questions undergo additional
review for potential bias; if there is any concern that a subset of candidates (such
as one based on race, ethnicity, age, or socioeconomic background) might beat a disadvantage, the question is archived or revised and resubmitted for a newreview. Multiple rounds of statistical review also help evaluate each item's fairness.
To provide a fair exam for every candidate, NCBE also provides extensive training
and support to jurisdiction bar admission administrators, helping fo ensure that theexam is administered under standardized testing conditions following consistentpolicies and procedures. And, because test security is also necessary to examfairness, NCBE takes multiple steps to keep exam material secure from the
beginning fo the end of the testing process.
Finally, fairness and consistency in scoring are crucial to a fair bar exam. Toolslike the Grading Workshop sponsored by NCBE for jurisdiction graders after eachexam support consistency in written scores, while equating the MB[ and scalingthe written components of the exam help us ensure that test scores mean the samething over time.
115

74
116
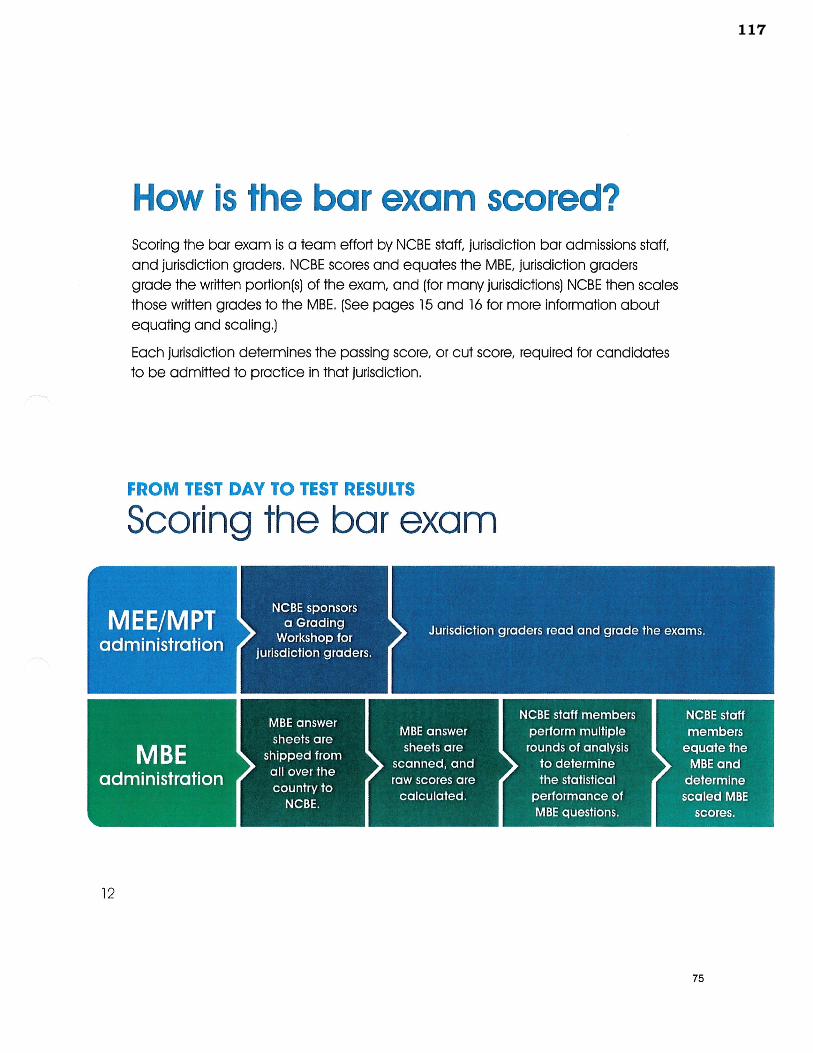
How is the bar exam scored?Scoring the bar exam is a team effort by NCBE staff, jurisdiction bar admissions staff,
and jurisdiction graders. NCBE scores and equates the MBE, jurisdiction graders
grade the written portion(s) of the exam, and (for many jurisdictions) NCBE then scalesthose written grades to the MBE. (See pages 15 and 16 for more information aboutequating and scaling.)
Each jurisdiction determines the passing score, or cut score, required for candidatesto be admitted to practice in that jurisdiction.
FROM TEST DAY TO TEST RESULTS
Scoring the bar exam
12
75
117

Why aren't bar exam resultsavailable immediately?Scoring the bar exam is a multistep process. Simply put, it takes time to equate andscore the MBE, to read and grade the written portions of the exam, and to produce
final combined scores, In addition, every stage of the process receives multiplequality checks. The diagram below shows the sequence of events in the scoringprocess (the details and timing of the process vary by jurisdiction).
MBE scoring process complete.
MEE/MPTscoringprocess
complete.
76
13
118

Why do bar examscores need to beequated and scaled?Equating and scaling are best practices for high-stakes testing. Although theprocedures for equating the MBE and scaling written scores are different, bothare performed for similar reasons: so that scores will remain consistent, no matterwhere or when the bar exam is taken.
The bar exam provides a consistent and accurate measure of candidates'proficiency. Differences in bar exam scores should reflect differences inproficiency-nothing more. To help ensure that this is the case, we need a way toadjust for other factors that could potentially (and inappropriately) affect scores-
for example, differences in the difficulty of the questions, or, in the case of writtenexam components, differences between graders. Equating the MBE and scalingwritten scores fo equated MBE scores allow us to do that.
14
77
119

What is equating andhow does ¡t work?
What isequating?Equating is a statistical
procedure that
makes adjustments to
candidates' MBE scores to
compensate for variations
in exam difficulty.
Why isthe MBEequated?While NCBE constructs the
MBE carefully to minimize
differences in difficulty
from one exam to another,
some variation in difficulty
is unavoidable. Equating
helps us ensure that current
candidates' scores accurately
reflect only their proficiency
rather than any potential
differences in the difficulty of
the questions they answered.
How isthe MBEequated?There are many equating
methods available; the
approach used for the
MBE is to include a set of
previously administeredquestions known asequators on each exam.We can then compare theperformance of current
candidates with that ofprevious candidates on this
common set of questions.
15
120

What is scaling andhow does it work?
What isscaling?Scaling is a procedure
fhof statistically adjusts
a jurisdictions rawscores on the writtencomponents of thebar exam (the MEE
and the MPT) so thatcollectively they have
the same mean andstandard deviation asthe jurisdiction's scaledMBE scores.
Why are writtenscores scaled?Performance on the written campo
nents of the bar exam cannot beequated the way MBE performance
can. Written questions are toomemorable and there are too fewof them fo create and embed amini test of previously administeredmaterials on a current examination.
Instead, to ensure that written
scores accurately reflect candidateproficiency, they are scaled to theMBE. This process takes advantageof equated MBE scores, which haveconsistent meaning over time. It
uses those MBE scores as an anchorfor statistically adjusting the writtenscores to account for fluctuationsin written exam difficulty and/orgrader stringency, while preserving
the rank order of the written scores.Having written scores on the samescale as MBE scores also makes itpossible to combine them into asingle total bar exam score.
How arewritten scoresscaled?To produce scaled scores, wefirst determine the position ofeach raw written score relativeto the mean and standarddeviation for all the writtenscores in the same jurisdiction onthe same administration of theexam. We then use a formulato anchor this information tothe jurisdiction's scaled MBEmean and standard deviation,
preserving the information abouteach score's position relative tothose anchor points.
Linking written scores fo MBEscores in this way is feasiblebecause the content andconcepts assessed on the MBEand the written components
are aligned, and performance
on the MBE and the writtencomponents is stronglycorrelated.
16
121

What support is availablefor jurisdiction graders?Every Jurisdiction that uses the MEE or the MPT receives grading materials from NCBE toprovide to their graders. These materials provide detailed discussions by item draftersof the issues raised in the exam questions, as well as suggested resolutions or analyses
of those issues.
Additionally, after every administration of the bar exam, NCBE sponsors a hands-onGrading Workshop for jurisdiction graders. Hundreds of graders attend each workshop.
Individual workshop sessions, led by members of NCBE's MEE and MPT DraftingCommittees, are held for each question. Participants are given real candidateanswers (submitted by bar administrators from all over the country) and asked toassign a grade to each answer using a relative score scale. An in-depth discussionbetween graders and facilitators follows.
The Grading Workshop alerts graders to common answer trends and gives them ahead start on calibraflon-the development of coherent and identifiable grading
Judgments so that rank-ordering is consistent throughout the grading process as wellas across multiple graders.
17
80
122

Additional resourcesThe Bar Examiner magazine and website
NCBE's quarterly magazine, the Bar Examiner, is aone-stop resource for news and in-depth articlesrelating to all aspects of the bar admissionsprocess. A wealth of information about testing,
bar admissions, legal education, and the legal
profession is available on the Bar Examiner websiteat thebarexaminer.org,
Statistics
Each spring, NCBE publishes annual barexamination and admission statistics gathered
from all US jurisdictions, Statistics are available atthebarexaminer.org/statistics/.
The Comprehensive Guide toBar Admission Requirements
The Comprehensive Guide to Bar AdmissionRequirements, published in collaborationwith the American Bar Association, provides
annually updated information on bar admissionrequirements in all US jurisdictions, including adirectory of state bar admission agencies. View it at
ncbex.org/publications/bar-admissions-guide/.
Ready to learnmore abouttesting concepts?Try these Bar Examiner articles:
¯ Scaling: It's Not Just for Fish orMountains (December 2014)
¯ Equating the MBE (September 2015)
¯ It's All Relative-MEE and MPTGrading, That Is (June 2016)
¯ Q&A: NCBE Testing and ResearchDepartment Staff Members Answer YourQuestions (Winter 201 7-20 1 8)
¯ Bar Exam Q&A: 1 3 Questions fromInquiring Minds (FaIl 201 8)
¯ How Are Questions Written for NCBE'sExams? Part One: Two Multiple-ChoiceQuestion Drafters Share the Process(Fall 201 9)
¯ How Are Questions Written for NCBE'sExams? Part Two: Two Written-ComponentQuestion Drafters Share the Process(Winter 2019-2020)
thebarexaminer.org
123