Characterization and Optimization of Mechanical Properties of ABS Parts Manufactured by the Fused...
14
Research Article Characterization and Optimization of Mechanical Properties of ABS Parts Manufactured by the Fused Deposition Modelling Process Godfrey C. Onwubolu and Farzad Rayegani School of Mechanical and Electrical Engineering & Technology, Faculty of Applied Science and Technology, Sheridan Institute of Technology and Advanced Learning, Brampton, ON, Canada L6Y 5H9 Correspondence should be addressed to Godfrey C. Onwubolu; [email protected] Received 7 July 2014; Accepted 10 October 2014; Published 10 November 2014 Academic Editor: Luigino Filice Copyright © 2014 G. C. Onwubolu and F. Rayegani. is is an open access article distributed under the Creative Commons Attribution License, which permits unrestricted use, distribution, and reproduction in any medium, provided the original work is properly cited. While fused deposition modelling (FDM) is one of the most used additive manufacturing (AM) techniques today due to its ability to manufacture very complex geometries, the major research issues have been to balance ability to produce aesthetically appealing looking products with functionality. In this study, five important process parameters such as layer thickness, part orientation, raster angle, raster width, and air gap have been considered to study their effects on tensile strength of test specimen, using design of experiment (DOE). Using group method of data handling (GMDH), mathematical models relating the response with the process parameters have been developed. Using differential evolution (DE), optimal process parameters have been found to achieve good strength simultaneously for the response. e optimization of the mathematical model realized results in maximized tensile strength. Consequently, the additive manufacturing part produced is improved by optimizing the process parameters. e predicted models obtained show good correlation with the measured values and can be used to generalize prediction for process conditions outside the current study. Results obtained are very promising and hence the approach presented in this paper has practical applications for design and manufacture of parts using additive manufacturing technologies. 1. Introduction Stratasys Inc. developed the fused deposition modeling (FDM) system which is one such layered manufacturing technology that produces parts with complex geometries by the layering of extruded materials, such as acrylonitrile butadiene styrene (ABS) thermoplastic [1, 2] as shown in Figure 1. In the FDM process, the build material is initially in the raw form of a flexible filament. e feedstock filament is then partially melted and extruded though a heated nozzle within a temperature controlled environment for building of the part. e material is extruded in a thin layer onto the previously built model layer on the build platform in the form of a prescribed two-dimensional (-) layer pattern. e deposited material cools, solidifies, and bonds with adjoining material. Aſter an entire layer is deposited, the build platform moves downward along the -axis by an increment equal to the filament height (layer thickness) and the next layer is deposited on top of it. e platen or table on which the build sheet is placed lies on the x-y plane. e properties of built parts depend on settings of various process parameters fixed at the time of fabrication. Additive manufacturing (AM) is a new manufacturing technology, driven by computer-aided design (CAD) that makes it pos- sible for companies to significantly cut design and manufac- turing cycle times [1]. is new manufacturing paradigm is seamless because it has the capability of producing exactly any simple or complex part represented by a CAD system which is submitted to it. is paper first proposes a framework for additive manufacturing. In this framework, there are three main domains that drive AM: CAD-based, AM process planning and technologies, and materials/testing/inductive modeling. e designer chooses a CAD system for modeling from a suite of CATIA, SolidWorks, Inventor, and AutoCAD 3D. en the design engineer utilizes design of experiment (DOE) for optimized process plan for different options of Hindawi Publishing Corporation International Journal of Manufacturing Engineering Volume 2014, Article ID 598531, 13 pages http://dx.doi.org/10.1155/2014/598531
-
Upload
independent -
Category
Documents
-
view
4 -
download
0
Transcript of Characterization and Optimization of Mechanical Properties of ABS Parts Manufactured by the Fused...

Research ArticleCharacterization and Optimization ofMechanical Properties of ABS Parts Manufactured bythe Fused Deposition Modelling Process
Godfrey C Onwubolu and Farzad Rayegani
School of Mechanical and Electrical Engineering amp Technology Faculty of Applied Science and TechnologySheridan Institute of Technology and Advanced Learning Brampton ON Canada L6Y 5H9
Correspondence should be addressed to Godfrey C Onwubolu godfreyonwubolusheridancollegeca
Received 7 July 2014 Accepted 10 October 2014 Published 10 November 2014
Academic Editor Luigino Filice
Copyright copy 2014 G C Onwubolu and F Rayegani This is an open access article distributed under the Creative CommonsAttribution License which permits unrestricted use distribution and reproduction in any medium provided the original work isproperly cited
While fused deposition modelling (FDM) is one of the most used additive manufacturing (AM) techniques today due to its abilityto manufacture very complex geometries the major research issues have been to balance ability to produce aesthetically appealinglooking products with functionality In this study five important process parameters such as layer thickness part orientationraster angle raster width and air gap have been considered to study their effects on tensile strength of test specimen usingdesign of experiment (DOE) Using group method of data handling (GMDH) mathematical models relating the response withthe process parameters have been developed Using differential evolution (DE) optimal process parameters have been found toachieve good strength simultaneously for the response The optimization of the mathematical model realized results in maximizedtensile strength Consequently the additive manufacturing part produced is improved by optimizing the process parameters Thepredicted models obtained show good correlation with the measured values and can be used to generalize prediction for processconditions outside the current study Results obtained are very promising and hence the approach presented in this paper haspractical applications for design and manufacture of parts using additive manufacturing technologies
1 Introduction
Stratasys Inc developed the fused deposition modeling(FDM) system which is one such layered manufacturingtechnology that produces parts with complex geometriesby the layering of extruded materials such as acrylonitrilebutadiene styrene (ABS) thermoplastic [1 2] as shown inFigure 1 In the FDM process the build material is initiallyin the raw form of a flexible filament The feedstock filamentis then partially melted and extruded though a heated nozzlewithin a temperature controlled environment for building ofthe part The material is extruded in a thin layer onto thepreviously built model layer on the build platform in the formof a prescribed two-dimensional (119909-119910) layer pattern Thedeposited material cools solidifies and bonds with adjoiningmaterial After an entire layer is deposited the build platformmoves downward along the 119911-axis by an increment equal tothe filament height (layer thickness) and the next layer is
deposited on top of it The platen or table on which the buildsheet is placed lies on the x-y plane
The properties of built parts depend on settings of variousprocess parameters fixed at the time of fabrication Additivemanufacturing (AM) is a new manufacturing technologydriven by computer-aided design (CAD) that makes it pos-sible for companies to significantly cut design and manufac-turing cycle times [1] This new manufacturing paradigm isseamless because it has the capability of producing exactly anysimple or complex part represented by a CAD system whichis submitted to it This paper first proposes a framework foradditive manufacturing In this framework there are threemain domains that drive AM CAD-based AM processplanning and technologies and materialstestinginductivemodeling The designer chooses a CAD system for modelingfrom a suite of CATIA SolidWorks Inventor and AutoCAD3D Then the design engineer utilizes design of experiment(DOE) for optimized process plan for different options of
Hindawi Publishing CorporationInternational Journal of Manufacturing EngineeringVolume 2014 Article ID 598531 13 pageshttpdxdoiorg1011552014598531
2 International Journal of Manufacturing Engineering
Motor
FDM-head
Heating
Build sheet Tip Material canister
xy
z Support material Model material
Figure 1 FDM process
a part intermediate software such as Insight is used for toolpaths optimization A decision has to be made regardingwhich type ofmachine to use depending on thematerial usedfor producing the part(s) For example Fortus 900mc and400mc are useful for producing parts made from thermo-plastics SpectrumZ510 are suited for powdermaterials whileSolidscape suits waxmaterialThese are some of the decisionsand choices to bemadeThepresentation of this paper followsthis framework
Fused deposition modelling (FDM) is a fast growingadditive manufacturing (AM) technology due to its abilityto build functional parts that have complex geometricalshapes in reasonable build time [1 2] Reduction of productdevelopment cycle time is a major concern in industries toremain competitive in the marketplace Several sources havehighlighted the advantages of additive manufacturing tech-niques such as additive manufacturing (AM) over traditionalproduct development methodology [3ndash5] Using AM speedsup the whole product development process especially whenproducing very complicated parts which may be challengingusing traditional manufacturing methods It is argued thatsince three-dimensional CAD is being used as the startingpoint and the transfer to AM is relatively seamless thereis less concern over interpretation of the design intent [1]The seamlessness can also be seen in terms of reduction inprocess steps because regardless of the complexity of parts tobe built buildingwith anAMmachine is generally performedin a single step unlike in most other manufacturing processeswhich normally require multiple and iterative stages to becarried out In addition to these advantages other advantagesof using AM are significant reduction in the number ofprocesses and resources required Consequently focus is fastshifting from traditional product development methodologyto additive manufacturing technology [1] References [1 2]are excellent resources for the processes involved in andadvantages of additive manufacturing
Producing aesthetically appealing AM products that havecomplex shapes is not difficult given available AM technolo-gies The challenge is to produce manufactured AM partsthat are functionally reliable Therefore this paper reportsthe work that has been done to investigate the functionalityof manufactured AM parts The motivation for this emphasisis that no company will want to make commitment to atechnology that may produce aesthetically appealing prod-ucts that are not functionally reliable A critical review ofliterature suggests that properties of AM parts are a functionof various process related parameters and can be signifi-cantly improved with proper adjustment Since mechanicalproperties are important for functional parts it is absolutelyessential to study the influence of various process parameterson mechanical properties so that improvement can be madethrough selection of best settings The present study focuseson assessment of one of the mechanical properties namelytensile strength of fused depositionmodelling- (FDM-) basedfabricated parts by first developing a model predictionand then optimizing the process parameter settings andresponses
2 Literature Review
Although AM is an efficient technology full scale applicationhas not gained much attention because of compatibilityof presently available materials with AM technologies [6]Despite several design and environmental advantages of AMtechnologies over other manufacturing processes the adop-tion of AM as a means for fabricating end-use componentshas historically been setback by the technologiesrsquo narrowselection of available materials The majority of materialsused presently by modern AM techniques are proprietarypolymers There are also possibilities to use some metals(such as steel alloys and titanium) and ceramics Whilethere are different types of materials that can be used inAM the material properties are typically not as strong astheir conventionally manufactured counterparts due to theanisotropy caused by the layer-by-layer [7] To overcomethis limitation one approach may be development of newmaterials having superior characteristics than conventionalmaterials and its compatibility with technology Anotherconvenient approach may be suitably adjusting the pro-cess parameters during fabrication stage so that propertiesmay improve [8 9] Several researchers have specificallyconsidered the anisotropic characteristics of FDM parts inrecent years Rodrıguez et al [10] investigated the tensilestrength and elasticmodulus of FDM specimens with varyingmesostructures in comparison with the properties of the ABSmonofilament feedstock The outcome of their investigationis that the tensile strengthwas the greatest for parts with fibersaligned with the axis of the tension force The mechanicalproperties of FDMparts are not solely controlled by the buildmaterial of the original filament but are also significantlyinfluenced by a directionally dependent production processthat fabricates components with anisotropic characteristicsassociated with the inherent layering [11] A material inwhich the elastic properties depend on the orientation ofthe sample is said to be anisotropic Ahn et al [11] designed
International Journal of Manufacturing Engineering 3
a factorial experiment to quantify the effects of model tempe-rature bead width raster orientation air gap and acry-lonitrile butadiene styrene (ABS) color on both tensile andcompressive strengths of FDM parts They determined thatboth air gap and raster orientation had significant effects onthe resulting tensile strength while compressive strength wasnot affected by these factors Their results include a set ofrecommended build rules for designing FDM parts Soodet al [12] carried out similar study with varying factorsof layer thickness build orientation raster angle rasterwidth and air gap They used response surface methodology(RSM) to analyze the functional relationship between processparameters and specimen strength and found that the testedfactors influence themesostructural configuration of the builtpart as well as the bonding and distortion within the partSood et al [13] further examined the effect of the same fiveprocess parameters on the subsequent compressive strengthof test specimens Their results show the importance offiber-to-fiber bond strength and the control of distortionduring the build process Lee et al [14] concluded thatlayer thickness raster angle and air gap influence the elasticperformance of compliant ABS prototypes manufactured byfused deposition Lee et al [15] focused on the compressivestrength of layered parts as a function of build directionand determined that the compressive strength is greater forthe axial FDM specimens than for the transverse Pandaet al [16] performed experiments on the impact of processparameters on dimensional accuracy surface roughness andmechanical strengths using response surface methodology(RSM) [17] for modelling and bacterial foraging for findingoptimal process parameter settings and responses
From the literature it is found that good amount ofwork has been done in FDM strength modelling howeverlittle amount of work has been done to develop the strengthmodel in terms of FDM process parameters for predictionpurpose Most published work on predictive model of FDMparts are based on response surface methodology (RSM)which is restrictive in modelling because it is not ldquodata-drivenrdquo that is it is not inductive Since the relation betweena particular mechanical property and process parametersrelated to it is difficult to establish attempt has been madein this paper to derive the empirical model between the pro-cessing parameters and mechanical properties using groupmethod of data handling (GMDH) [18] which is one of themost robust existing inductive modelling The present studyreported in this paper uses the group method of data han-dling (GMDH) modelling approach to derive the requiredrelationship among respective process parameters and tensilestrength The models derived serve as predictive modelswhich can be used to anticipate the theoretical best parametersettings that would result in optimal response characteristicThe predictive models are therefore the objective functionswhile the lower and upper bounds used from the designof experiment (DOE) [19] are the constraints so that theproblem becomes constrained optimization which can besolved using any of the existing optimization techniques Inour case we used differential evolution (DE) [20] to solve theoptimization problem The solutions give the optimal tensileresponse and optimal process parameter settings
120572
h
Figure 2 Height of slices or layout of layer thickness Source [26]
3 Design of Experiment (DOE) andExperimentation Setup
In this study five important process parameters such as layerthickness (A) part orientation (B) raster angle (C) rasterwidth (D) and air gap (E) have been considered to study theireffects on tensile strength (TS) ABS material is used that isthe material is constant The temperature is also consideredconstant
The definitions of FDM variable parameters in this studyare as follows
(A) The layer thickness which is recognized as the heightof deposited slice from the FDM nozzle is shown inFigure 2 The layer thickness parameter is used toexamine the influence of building thicker or thinnerlayers on the outcome quality
(B) The orientation of part is defined as how the partshould be positioned when produced as shown inFigure 3 (vertical position (a) inclined position (b)horizontal position (c))
(C) Raster angle or orientation which is measured fromthe 119909-axis on the bottom part layer as shown inFigure 4 It also refers to the direction of the beads ofmaterial (roads) relative to the loading of the partThedeposited roads can be built at different angles to fillthe interior part
(D) The raster width or road width which refers to thewidth of the deposition path related to tip size It alsorefers to the tool path width of the raster pattern usedto fill interior regions of the part curves as shown inFigure 5 Narrow andwide filling pattern (roads) wereconsidered to be examined
(E) The air gap parameter which is defined as the spacebetween the beads of deposited FDM material isshown in Figure 6 Hence the influence of applyingpositive and negative gap between the depositedbeads was investigated
31 Experimental Procedure The 3D models of specimenwere modelled in SolidWorks and exported as STL file TheSTL file is imported to FDM Insight software (Figure 7)
4 International Journal of Manufacturing Engineering
(a)
45∘
(b) (c)
Figure 3 Orientation of part Source [11]
120572
Figure 4 Raster angle parameter Source [11]
w
Figure 5 Raster width parameter Source [11]
+ air gap 0 air gap minus air gap
Figure 6 Air gap application Source [11]
Figure 8 reveals the internal structure of the model show-ing the raster width raster angle and air gap This internalstructure was obtained by slicing the model midway along itslength for raster angle of 45∘ raster width of 001610158401015840 and airgap of 00210158401015840 in order to clarify the concepts covered in theearlier part of this section Understanding of these conceptsis important because the design of experiments described inthe later part of this section is based on the different settings
Figure 7 STL file of 3D model exported to FDM Insight software
Raster width
Air gap
Raster angle
Figure 8 Internal structure of the model showing the raster widthraster angle and air gap
of the FDM parameters used for our experimentation whichare essentially raster angle raster width and air gap togetherwith layer thickness and part orientation
All testing specimens were constructed in a StratasysFDM Fortus 400mc System (Figure 9) in the AdvancedManufacturing and Robotics laboratory at Sheridan Instituteof Technology The laboratory is equipped with both Fortus400mc and 900mc Systems The tensile test was performedusing United Testing System (UTS) Model SSTM Serial1210555 with capacity of 20 kN (Figure 10) in accordance withISO R5271966 and ISO R1781975 respectively
32 Design of Experiment (DOE) In this work factors asshown Table 1 are set as per experiment plan (Table 2)
International Journal of Manufacturing Engineering 5
Table 1 Variable process parameters and their selected low and high levels
Variable parameter Unit Low level (minus1) High level (+)Layer thickness (119860) inmm 000510158401015840(0127) 001310158401015840(03302)Part orientation (119861) Degree 0∘ 90∘
Raster angle (119862) Degree 0∘ 45∘
Raster width (119863) inmm 000810158401015840(02032) 002210158401015840(05588)Air gap (119864) inmm minus0000110158401015840(minus000254) 002210158401015840(05588)
Table 2 Input process parameters that affect output responses
Run 119860 [layer thickness] 119861 [part orientation] 119862 [raster angle] 119863 [raster width] 119864 [air gap] Measured (MPa)1 0127 0 0 02032 minus000254 32562 0127 0 0 02032 05588 6523 0127 0 0 05588 minus000254 24814 0127 0 0 05588 05588 10445 0127 0 45 02032 minus000254 34616 0127 0 45 02032 05588 4787 0127 0 45 05588 minus000254 30158 0127 0 45 05588 05588 8089 0127 90 0 02032 minus000254 128610 0127 90 0 02032 05588 43911 0127 90 0 05588 minus000254 235512 0127 90 0 05588 05588 95613 0127 90 45 02032 minus000254 15114 0127 90 45 02032 05588 40115 0127 90 45 05588 minus000254 24316 0127 90 45 05588 05588 80917 03302 0 0 04572 minus000254 314618 03302 0 0 04572 09652 84319 03302 0 0 09652 minus000254 249920 03302 0 0 09652 09652 93921 03302 0 45 04572 minus000254 314222 03302 0 45 04572 09652 71223 03302 0 45 09652 minus000254 289424 03302 0 45 09652 09652 110725 03302 90 0 04572 minus000254 205526 03302 90 0 04572 09652 88927 03302 90 0 09652 minus000254 247228 03302 90 0 09652 09652 112829 03302 90 45 04572 minus000254 249630 03302 90 45 04572 09652 88231 03302 90 45 09652 minus000254 273532 03302 90 45 09652 09652 1163
using design of experiment (DOE) methodology [19] Theengineering material used for test specimen fabrication isacrylonitrile butadiene styrene (ABS P400) The specimensare fabricated using FDM 400mc machine for respectivestrength measurement The main FDM variable parametersare considered in this research in Table 1 to evaluate thecorrelation between these parameters and the proposedresponse characteristics Tests on produced parts are carriedout according to the American standard ASTM D638 at an
ambient temperature of 23 plusmn 2∘C and a relative humidity50 plusmn 5
The rationale for considering the five variable processparameters for experimentation is given here The layerthickness is known to affect the AM end-product becausethe smaller the layer thickness the stronger the finished AMpart will be when subjected to axial load Part orientationis important because when the part is built inclined itwill have the tendency to withstand greater loading in
6 International Journal of Manufacturing Engineering
Figure 9 FORTUS 400mc System used for the research
Figure 10 UTS System used for the research
x-direction and y-direction Raster angle will have the ten-dency to affect the internal structure of the finished productEach neighbouring layer has a raster angle perpendicular tothe immediate preceding layer The raster width is knownto affect the finished AM part in such a way that the largerthe raster angle the greater the tendency for the finished partto withstand higher tensile stress Negative air gap is knownto produce finished AM part that withstands higher tensilestress A number of researchers have considered negative airgap and reached these conclusions in their studies similarto our hypothesis Bagsik and Schoppner [21] investigatedthe influence of the orientation and the air gap for themanufactured parts based on the mechanical data analysedThe outcome of the investigation was that best results wereachieved for all directions by using a negative raster airgap while with thick filaments better mechanical data wasachieved for the x and z build direction while a thinnerfilament improves the strength properties for y-specimen
Using DOE approach the 32 full factorial conditions (25)were generated as shown in Table 2 for the experimental runsFor each run three replications were made and averagedTherefore the reported measured values are averages ofthree readings per run Each run in the design consists ofcombination of FDM parameters levels and each run resultwill contain response of tensile strength (UTS) As already
Figure 11 Tested tensile specimen (on the right side of UTSmachine-bed)
discussed these parameters are clearly described in Figure 9The parameters are varied to obtain the 32 different AMproducts The values for layer thickness raster width and airgap given in Table 2 are inmillimetre unit since themeasuredtensile strength (last column) is in MPa
An image of tested tensile specimen on the table of theUTS machine is shown in Figure 11 The specimen shown isnumber 14 and this number is marked on the specimen toavoid being mixed up with other specimens It is importantthat each specimen is carefully marked after being removedfrom the FDM machine so that they could be properlyidentified Each specimen is 510158401015840 (127mm) long cross-sectionof 375010158401015840 times 375010158401015840 (953mm times 953mm) while the middlehaving a width of 187510158401015840 (476mm) Fillet radius is 090010158401015840(22mm)
4 Group Method for Data Handling (GMDH)
The framework for modeling chosen for this applied researchis based on the Group Method for Data Handling (GMDH)introduced by Ivakhnenko (details are found in [18 22 23]) asa means of identifying nonlinear relations between input andoutput variablesThemultilayered iteration (MIA) network isone of the variants of GMDHTheMIA relationship betweenthe inputs and the output of a multiple inputs single outputself-organizing network can be represented by an infiniteVolterra-Kolmogorov-Gabor (VKG) polynomial of the form[18 22 23]
119910119899= 1198860+
119872
sum
119894=1
119886119894119909119894+
119872
sum
119894=1
119872
sum
119895=1
119886119894119895119909119894119909119895
+
119872
sum
119894=1
119872
sum
119895=1
119872
sum
119896=1
119886119894119895119896119909119894119909119895119909119896sdot sdot sdot
(1)
International Journal of Manufacturing Engineering 7
Output
Layer 3Layer 2Layer 1Input
GMDH network
x1
x2
x1
x3
x2
x3
x1
x4
x2
x4
x3
x4
y(1)1
y(1)4
y(2)2
y(2)6
y(3)1
y(3)2
y(3)4
y(3)5
y(3)6
y(1)
lowast
3
y(2)
lowast
1
y(2)
lowast
3y(3)
lowast
3
y(2)
lowast
4
y(2)
lowast
5
y(1)
lowast
1
y(1)
lowast
5
y(1)
lowast
6
Figure 12 GMDH forward feed functional network
where 119883 = (1199091 1199092 119909
119872) is the vector of input variables
and 119860 = (1198860 119886119894 119886119894119895 119886119894119895119896 ) is the vector of coefficients or
weightsWhen the GMDH network is completed there is a set
of original inputs that filtered through the layers to theoptimal output node This is the computational network thatis to be used in computing predictions (in our applicationclassifications are implied) The best nodes in the input layer(starred nodes in Figure 12) are retained and form the input tothe next layer The inputs for layer 1 are formed by taking allcombinations of the surviving output approximations fromthe input layer nodes It is seen that at each layer the order ofthe polynomial approximation is increased by two Layer 2rsquosbest nodes for approximating the system output are retainedand form layer 3 inputs This process is repeated until thecurrent layerrsquos best approximation is inferior to the previouslayerrsquos best approximation
41 Advantages of Basic GMDH Technique The advantageof using pairs of input is that only six weights (coefficients)have to be computed for each neuron The number ofneurons in each layer increases approximately as the squareof the number of inputs During each training cycle thesynaptic weights of each neuron that minimize the errornorm between predicted and measured values are computedand those branches that contribute least to the output of theneuron are discarded the remaining branches being retainedand their synaptic weights kept unchanged thereafter A newlayer is subsequently added and the procedure is repeateduntil the specified termination conditions are met
There could be summarized that the GMDH-type poly-nomial networks influence the contemporary artificial neuralnetwork algorithms with several other advantages [23]
(1) they offer adaptive network representations that canbe tailored to the given task
(2) they learn the weights rapidly in a single step bystandard ordinary least square (OLS) fitting whicheliminates the need to search for their values andwhich guarantees finding locally good weights due tothe reliability of the fitting technique
(3) these polynomial networks feature sparse connectiv-itywhichmeans that the best discovered networks canbe trained fast
42 Limitations of GMDH Technique Although standardGMDH provides for a systematic procedure of system mod-eling and prediction it has also a number of shortcomingsAnastasakis and Mort [24] have carried out a comprehensivestudy of the shortcomings of GMDH
421 Selection of Input Arguments One of the main featuresof GMDH is its ability to objectively select themost appropri-ate input arguments amongst a set of candidates Howeverthe identification of these candidate input arguments is notstraightforward and may affect its performance
422 Inaccuracies in Parameter Estimation The method ofleast square estimates is themost popularmethod to calculatethe coefficients of partial descriptions If the data matrix iswell defined its estimates will be accurate however in themajority of real world systems the data matrix is ill-definedand the least squares are biased
423 Multicollinearity Another problem found exclusivelyin multilayer algorithm which affects the stability of coeffi-cients is that of multicollinearity
8 International Journal of Manufacturing Engineering
424 Reduction of Complexity Another shortcoming foundGMDH approach is a tendency to generate quite complexpolynomial (since the complexity of the network increaseswith each training and selection cycle through addition ofnew layers) for relatively simple systems (data input) alsoan inclination to producing overly complex network (model)when dealing with highly nonlinear systems owing to its lim-ited generic structure (quadratic two-variable polynomial)
425 Formulas of Partial Descriptions Despite the widerange of partial descriptions majority of researchers followthe argument that Volterra series are capable of identifyingany nonlinear system and therefore have adopted polynomialpartial descriptions similar to Ivakhnenko polynomial How-ever due to the complexity of the model and the requirementof including the theory behind the object many modifi-cations have been designed in order to adapt to systemrsquosproperties
426 Over Fitting A consequence of complexity is theoverfitting problem and poor generalization
427 Partition of Data The objectiveness of GMDH algo-rithm is based on the utilization of an external criterion toselect the optimummodel which requires the partition of thedata
428 Low Accuracy in GMDH Method In many cases andparticularly in applications of long range prediction theGMDH has been observed to be inaccurate
43 Hybrid-GMDH Network Based on the shortcomingsof the basic GMDH hybrids of GMDH were proposed tosignificantly enhance the performance of GMDH [24] Forease of reference and clarity to readers the main designsteps for the hybrid group method for data handling-geneticalgorithm (GMDH-GA) based approach used for the workreported in this paper which applies to similar hybrid-typesare summarized here (interested readers may refer to [25] fordetails on hybrid-GMDH)
Step 1 (configuration of input variable) The system inputvariables shown in Table 1 are the layer thickness (a) partorientation (b) raster angle (c) raster width (d) and air gap(e)
Step 2 (form training and testing data) Three-quarters of thedataset was used in designing the training data while theremaining one-quarter was used in designing the testing data
Step 3 (decision of initial information for constructing thehybrid GMDH-GA structure) The number of generationspopulation size crossover rate and mutation rate werechosen as 25 50 09 and 01 respectively
Step 4 (determine polynomial neuron (PN) structure) Thevector number of input variables of two the polynomial orderof Type 2 (quadratic) and the input variables were assignedto each node of the corresponding layer
e
a
b
c
d
cebd
cbde
cebdcbde
Figure 13 Hybrid GMDH-GA structural network for 5-inputprocess parameters
Step 5 (parametric optimization) Coefficient estimation ofthe polynomial corresponding to the selected node (PN)the vector of the coefficients of the partial descriptors (PDs)is determined using a standard mean square error for thetraining dataset subsets
Step 6 (structural optimization) Select nodes (PNs) with thebest predictive capability and construct their correspondinglayer all nodes of the corresponding layer of the hybridGMDH-GA architecture are constructed by optimization(see Figure 13)
Step 7 (termination criterion) After the iteration process thefinal generation of population consists of highly fit solutionpopulation that provides optimum solutions
5 GMDH-Based Predictive Model ofTensile Strength
Theprocess parametersA BCD and E and tensile responseof Table 2 were submitted to the MATLAB coded hybridGMDH-GA software system to develop predictivemodel thatrelates the tensile strength to the process parametersThe lastcolumn of Table 3 shows the predicted values obtained fromthe GMDH modelling system while the second to the lastcolumn shows the experimental values Figure 14 shows theexperimental (measured) and predicted values in a graphicalform for the thirty two runs As could be observed ourGMDHmodelling system predicts very well the behaviour ofthe tensile strength response with very little deviation
The GMDHmodel for the part produced by the StratasysFDM 400mc System based on Table 2 is
119910UTS = 153577 + 546221199091 + 01199092 + 01199093 + 2049231199094
minus 476271199095minus 01122119909
11199092+ 00774119909
11199093
minus 37529911990911199094+ 186233119909
11199095minus 00001119909
21199093
+ 0099611990921199094+ 00801119909
31199095+ 00066119909
31199094
International Journal of Manufacturing Engineering 9
Table 3 Input process parameters that affect output responses
Run 119860 [layer thickness] 119861 [part orientation] 119862 [raster angle] 119863 [raster width] 119864 [air gap] Measured (MPa) Predicted (MPa)1 0127 0 0 02032 minus000254 3256 27762 0127 0 0 02032 05588 652 4743 0127 0 0 05588 minus000254 2481 28144 0127 0 0 05588 05588 1044 8585 0127 0 45 02032 minus000254 3461 30966 0127 0 45 02032 05588 478 4397 0127 0 45 05588 minus000254 3015 31968 0127 0 45 05588 05588 808 8849 0127 90 0 02032 minus000254 1286 126010 0127 90 0 02032 05588 439 51011 0127 90 0 05588 minus000254 2355 238912 0127 90 0 05588 05588 956 85813 0127 90 45 02032 minus000254 151 143314 0127 90 45 02032 05588 401 49615 0127 90 45 05588 minus000254 243 266716 0127 90 45 05588 05588 809 87817 03302 0 0 04572 minus000254 3146 283218 03302 0 0 04572 09652 843 91919 03302 0 0 09652 minus000254 2499 258520 03302 0 0 09652 09652 939 113521 03302 0 45 04572 minus000254 3142 320522 03302 0 45 04572 09652 712 90623 03302 0 45 09652 minus000254 2894 294224 03302 0 45 09652 09652 1107 109625 03302 90 0 04572 minus000254 2055 223026 03302 90 0 04572 09652 889 86427 03302 90 0 09652 minus000254 2472 251428 03302 90 0 09652 09652 1128 105329 03302 90 45 04572 minus000254 2496 249230 03302 90 45 04572 09652 882 85831 03302 90 45 09652 minus000254 2735 278532 03302 90 45 09652 09652 1163 1034
minus 0089911990931199095minus 27021119909
41199095minus 600811119909
2
1
minus 000111199092
2
+ 000121199092
3
minus 68741199092
4
+ 2479081199092
5
(2)where 119909
1= 119860 (layer thickness) 119909
2= 119861 (part orientation)
1199093= 119862 (raster angle) 119909
4= 119863 (raster width) 119909
5= 119864 (air gap)
In order to assess the quality of the model realized forthe work reported in this paper some statistical data aregiven The sum of square residual SS residual 119869 = 04525the sum of square deviation SS deviation from mean 119878 =96918119890 + 03 hence the coefficient of determination givenas 1 minus 119869119878 is given as 119903-squared value 1199032 = 099995 Theregression sum of square SS regression = 000249 the errorsum of square SS error = 61089119890 minus 27 the mean squareregression MSE regression = 49999119890 minus 04 the mean squareerror MSE error = 21817119890 minus 28 the 119865-value = 22917119890 + 24
Figure 15 shows the surface plot of the process parametersfor the runs 1ndash4 while Figure 16 shows the surface plot ofthe process parameters for the runs 1ndash32 confirming that themodelling search space is highly complex
51 Examining the Breakage Modes of Specimens Specimens13 and 29 (left-most) 3 and 19 (middle) 5 and 21 (right-most)in Figures 15ndash17 were examined It is noticed that each packhas three specimens used for experimentation
The slice height of number 13 is 000510158401015840 (0127mm) whilethat of number 29 is 013910158401015840 (03302mm) both printed withtheir longitudinal axis vertical the raster angle for bothis 45∘ while the raster widths are 000810158401015840 (02032mm) and001810158401015840 (04572mm) respectively The air gap is the same
for both specimens (minus000110158401015840 or minus000254mm) The brokenareas confirm the internal structures represented in Table 3
10 International Journal of Manufacturing Engineering
000
500
1000
1500
2000
2500
3000
3500
4000
1 3 5 7 9 11 13 15 17 19 21 23 25 27 29 31
Tens
ile st
reng
th (M
Pa)
ABS AM tensile strength
MeasuredPredicted
Figure 14 Measured and predicted tensile strength response
Figure 15 Specimens 13 and 29 (left-most) 3 and 19 (middle) 5 and21 (right-most)
Breakage took place virtually perpendicular to the directionof application of load
The slice height of number 3 is 000510158401015840 (0127mm) whilethat of number 19 is 013910158401015840 (03302mm) both printed withtheir longitudinal axis vertical the raster angle for bothis 0∘ while the raster widths are 002210158401015840 (05588mm) and003810158401015840 (0965mm) respectively The air gap is the same
for both specimens (minus000110158401015840 or minus000254mm) The brokenareas confirm the internal structures represented in Table 3Breakage took place virtually perpendicular to the directionof application of load in a very neat manner
The parameters for numbers 5 and 21 are respectivelythe same as those for numbers 13 and 29 respectively exceptthat they are printed with the longitudinal axis horizontalBreakage surface for number 5 is uneven (in a ridge form)this specimen has the largest tensile strength for all thespecimens tested Specimen number 21 shows slight unevenbreakage surface
6 Optimization of Process Parameters forTensile Strength Prediction
61Mathematical Formulation of the Tensile Strength ProblemThe hybrid GMDH tensile strength model developed wasutilized by the continuous DE for optimization in order todetermine the optimal combinations of layer thickness (A)part orientation (B) raster angle (C) raster width (D) and airgap (E) that result inmaximizing tensile strength for the FDM
Figure 16 Specimens as in Figure 15 but with more exposure ofbroken surfaces
Figure 17 Specimens as in Figure 15 but with most exposure ofbroken surfaces
partThe optimization problem is essentially that of using (2)as objective function with constraints taken from Table 2
The tensile strength optimization problem can now befully mathematically stated as follows
119910UTS = 153577 + 546221199091 + 01199092 + 01199093
+ 2049231199094minus 47627119909
5minus 01122119909
11199092
+ 0077411990911199093minus 375299119909
11199094+ 186233119909
11199095
minus 0000111990921199093+ 00996119909
21199094+ 00801119909
31199095
+ 0006611990931199094minus 00899119909
31199095minus 27021119909
41199095
minus 6008111199092
1
minus 000111199092
2
+ 000121199092
3
minus 68741199092
4
+ 2479081199092
5
(3)
st 0127 le 1199091le 03302
0 le 1199092le 90
0 le 1199093le 45
02034 le 1199094le 09652
minus 000254 le 1199095le 09652
(4)
62 Differential Evolution Scheme The differential evolution(DE) algorithm introduced by Storn and Price [20] is a novelparallel direct search method which utilizes Np parametervectors as a population for each generation G DE is one ofthe extant evolutionary approaches used to solve complexreal-life problems It was primarily designed for continuousdomain space formulation but was reformulated to solvepermutative problems by Donald and Onwubolu [27] Thesteps involved in the classical DE are summarized as follows
Step 1 initializationStep 2 mutationStep 3 crossover
International Journal of Manufacturing Engineering 11
Table 4 DE control parameters used for experimentation
Population size NP 50Number of parameter 5Mutation probability 119865 020Crossover probability CR 060Number of generations 500
Table 5 Optimal cutting parameters from DE
Tensile strength MPa 3276Layer thickness (119860) inmm 0011015840101584002778Part orientation (119861) Degree 905∘
Raster angle (119862) Degree 45∘
Raster width (119863) inmm 002210158401015840(05588)Air gap (119864) inmm 0000110158401015840(00025)
Step 4 selectionStep 5 stopping criteria
Using DE which is one of the extant evolutionaryapproaches the optimal parameter settings for the FDMtensile test were found DE was used for optimizing thetensile strength optimization problem expressed in (3) and(4) The control conditions used for optimization are shownin Table 4 The approach of using the hybrid GMDH model(3) as objective functions with constraints given in (4) foroptimizing the tensile strength problem is more straightfor-ward than when ANN is employed in modeling This typeof mathematical formulation makes the GMDH responsemodels to bemore useful to the end-user since themodels forthe problem being solved are transparent and could be usedfor future applications Moreover the mathematical modelsare easy to be used as the objective functions bymost standardoptimization techniques for determining optimal cutting andresponse conditions
For the experimentation the optimal process parametersand tensile strength optimization problem that the DE foundare given in Table 5
7 Results and Discussions
The results are discussed under specific and general casesThe specific discussion of the results is based on howtensile strength relates with the process parameters of layerthickness part orientation raster angle raster width and airgap The general discussions relate to the conditions underwhich the weakest and strongest AM part is produced
Effect of Layer Thickness on Tensile Strength The highesttensile strength occurs for the minimum layer thickness of000510158401015840(0127mm) on run 5 (3461MPa) The next high-
est value also occurs for the minimum layer thickness of000510158401015840(0127mm) in run 1 (3256MPa) These values of
tensile strength are greater than the highest tensile strength
obtained for themaximum layer thickness of 001310158401015840(03302)Consequently we conclude that the maximum tensilestrength occurs when the layer thickness is a minimum
Effect of Part Orientation on Tensile Strength Comparingthe tensile strength values for run 1 (3256MPa) and run9 (1286MPa) respectively run 2 (652MPa) and run 10(439MPa) respectively and so forth it is observed that partorientation significantly affects the tensile strength of AMpartsThe zero angle part orientation is the strongest becausethe layers are parallel to the direction inwhich load is appliedParts that have 90∘ orientation during production are theweakest
Effect of Raster Angle on Tensile Strength In this case wecompare the strength values for run 1 (3256MPa) and run5 (3461MPa) respectively run 2 (652MPa) and run 6(478MPa) and so forth This trend is repeated throughoutthe entire measured results Therefore it is concluded thattensile strength increases with increase in raster angle how-beit the increase is not of much magnitude
Effect of Raster Width on Tensile Strength The effect of rasterwidth on tensile strength is studied by comparing cases inwhich only raster width changes In this case we comparerun 1 (3256MPa) and run 3 (2481MPa) respectively run5 (3461MPa) and run 5 (3461MPa) respectively run 29(2496MPa) and run 31 (2735MPa) respectively and run 30(882MPa) and run 32 (1163MPa) respectively and so forthFrom the observations we conclude that the tensile strengthincreases with minimum raster width
Effect of Air Gap on Tensile Strength To study the effect of airgap on tensile strength two consecutive runs are comparedrun 1 (3256MPa) and run 2 (652MPa) respectively run3 (2481MPa) and run 4 (1044MPa) and so forth It isobserved that negative air gap results in the strongest AMpart
In general the following observations are made
(1) The weakest AM parts are produced when air gap ismaximum (runs 2 6 10 14 and 16 for layer thicknessof 000510158401015840(0127) and runs 18 20 22 26 and 30 forlayer thickness of 001310158401015840(03302))
(2) The strongest AM parts are produced with negativeair gap (NAG) (runs 1 3 5 and 7 for layer thicknessof 000510158401015840(0127) and runs 17 19 21 23 27 29 and 31for layer thickness of 001310158401015840(03302))
However from our experimentation for themaximum rasterwidth of 0022 an air gap of minus0001 gave very poor qualityproduct with ldquoover-fillrdquo in which the printed material spilledbeyond the expected positions The air gap was reduced tominus00001 to give good quality results To get good results thepercentage of the air gap to themaximum raster width shouldbe 045 ((000010022) lowast 100)
12 International Journal of Manufacturing Engineering
8 Conclusions
In this work functional relationship between process param-eters and tensile strength for FDM process has been devel-oped using group method for data modelling for predictionpurpose An initial test was carried out to determine whetherpart orientation and raster angle variations affect the tensilestrength It was found that both process parameters affecttensile strength response For the more elaborate experimen-tation the process parameters considered are layer thicknessorientation raster angle rasterwidth and air gapTheprocessparameters and the experimental results were submitted toa hybrid GMDH-GA system resulting in predicted outputin which the predicted output values were found to correlatevery closely with the measured values
Since FDM process is a complex one it is really chal-lenging to determine good functional relationship betweenresponses and process parameters Using differential evolu-tion (DE) which is one of the extant evolutionary approachesoptimal parameter settings were found Our investigationshave shown the following
(1) Minimum layer thickness improves tensile strengthalthough is more costly due to more material usagefor manufacturing parts
(2) Negative air gap significantly improves the tensilestrength
(3) Minimum raster widths also improve tensile strength(4) Part orientation plays a major role as could be
observed from the results For zero part orientation(with the part orientation coinciding with the direc-tion of tensile loading) maximum tensile strength isobtained
(5) Increased raster angle also improves tensile strengthalthough not very significantly The optimized solu-tions that DE found agree very reasonably with ourobservations from Table 2
(6) Our experimental results in Table 2 show that maxi-mum tensile strength is obtained in run 5 for whichthe part orientation is zero and raster angle andraster width are maximum with negative air gap DEoptimal solutionsmatch these observations with partorientation being 905∘
Consequently the conclusions reached in this research arereliable and can be applied to real life applications Futurework will include the investigation of other mechanical prop-erties such as compressive strength and torsional strengthMicrostructure investigation of broken parts during testingwill be done using high powered microscope
Nomenclature
1199091 A (layer thickness)1199092 B (part orientation)1199093 C (raster angle)1199094 D (raster width)1199095 E (air gap)
Conflict of Interests
The authors declare that there is no conflict of interestsregarding the publication of this paper
Acknowledgments
The two technologists Attila Nagy and Andrew Orton inthe Sheridan Centre for Advanced Manufacturing amp DesignTechnology (CAMDT) assisted the authors with the AM labprocedures and they are gratefully appreciated
References
[1] I Gibson D W Rosen and B Stucker Additive ManufacturingTechnologies Rapid Prototyping to Direct DigitalManufacturingSpringer Heidelberg Germany 2010
[2] N Hopkinson R J M Hagur and P H Dickens RapidManufacturing An Industrial Revolution for the Digital AgeJohn Wiley amp Sons London UK 2006
[3] B Wiedemann and H-A Jantzen ldquoStrategies and applicationsfor rapid product and process development in Daimler-BenzAGrdquo Computers in Industry vol 39 no 1 pp 11ndash25 1999
[4] SUpcraft andR Fletcher ldquoThe rapid prototyping technologiesrdquoAssembly Automation vol 23 no 4 pp 318ndash330 2003
[5] S Mansour and R Hague ldquoImpact of rapid manufacturing ondesign for manufacture for injection mouldingrdquo Proceedingsof the Institution of Mechanical Engineers Part B Journal ofEngineering Manufacture vol 217 no 4 pp 453ndash461 2003
[6] G N Levy R Schindel and J P Kruth ldquoRapid manufacturingand rapid tooling with layer manufacturing (LM) technologiesstate of the art and future perspectivesrdquo CIRP Annals Manufac-turing Technology vol 52 no 2 pp 589ndash609 2003
[7] O Ivanova C Williams and T Campbell ldquoAdditive manufac-turing (AM) and nanotechnology promises and challengesrdquoRapid Prototyping Journal vol 19 no 5 pp 353ndash364 2013
[8] P K Jain PM Pandey and P VM Rao ldquoEffect of delay time onpart strength in selective laser sinteringrdquo International Journalof Advanced Manufacturing Technology vol 43 no 1-2 pp 117ndash126 2009
[9] K Chockalingam N Jawahar and U Chandrasekhar ldquoInflu-ence of layer thickness on mechanical properties in stere-olithographyrdquo Rapid Prototyping Journal vol 12 no 2 pp 106ndash113 2006
[10] J F Rodrıguez J P Thomas and J E Renaud ldquoMechanicalbehavior of acrylonitrile butadiene styrene (ABS) fused depo-sitionmaterials Experimental investigationrdquo Rapid PrototypingJournal vol 7 no 3 pp 148ndash158 2001
[11] S-H Ahn M Montero D Odell S Roundy and P K WrightldquoAnisotropic material properties of fused deposition modelingABSrdquo Rapid Prototyping Journal vol 8 no 4 pp 248ndash257 2002
[12] A K Sood R K Ohdar and S S Mahapatra ldquoParametricappraisal of mechanical property of fused depositionmodellingprocessed partsrdquo Materials and Design vol 31 no 1 pp 287ndash295 2010
[13] A K Sood R K Ohdar and S S Mahapatra ldquoExperimentalinvestigation and empirical modelling of FDMprocess for com-pressive strength improvementrdquo Journal of Advanced Researchvol 3 no 1 pp 81ndash90 2012
[14] B H Lee J Abdullah and Z A Khan ldquoOptimization of rapidprototyping parameters for production of flexible ABS objectrdquo
International Journal of Manufacturing Engineering 13
Journal ofMaterials Processing Technology vol 169 no 1 pp 54ndash61 2005
[15] C S Lee S G Kim H J Kim and S H Ahn ldquoMeasurementof anisotropic compressive strength of rapid prototyping partsrdquoJournal of Materials Processing Technology vol 187-188 pp 627ndash630 2007
[16] S K Panda S Padheee A K Sood and S S MahapatraldquoOptimization of fused deposition modelling (FDM) processparameters using bacterial foraging techniquerdquo Intelligent Infor-mation Management vol 1 pp 89ndash97 2009
[17] K Thrimurthulu P M Pandey and N V Reddy ldquoOptimumpart deposition orientation in fused deposition modelingrdquoInternational Journal ofMachine Tools andManufacture vol 44no 6 pp 585ndash594 2004
[18] H R Madala and A G Ivakhnenko Inductive Learning Algo-rithms for Complex Systems Modelling CRC Press Boca RatonFla USA 1994
[19] D C Montgomery Design and Analysis of Experiments JohnWiley amp Sons Singapore 5th edition 2003
[20] R Storn and K Price ldquoDifferential evolutionmdasha simple andefficient heuristic for global optimization over continuousspacesrdquo Journal of Global Optimization vol 11 no 4 pp 341ndash359 1997
[21] A Bagsik and V Schoppner ldquoMechanical properties of fuseddeposition modeling parts manufactured with Ultemlowast9085rdquoin Proceedings of the 69th Annual Technical Conference of theSociety of Plastics Engineers (ANTEC rsquo11) pp 1294ndash1298 BostonMass USA May 2011
[22] A G Ivakhnenko ldquoPolynomial theory of complex systemsrdquoIEEETransactions on SystemsMan andCybernetics vol SMC-1no 4 pp 364ndash378 1971
[23] N Y Nikolaev and H Iba ldquoPolynomial harmonic GMDHlearning networks for time series modelingrdquo Neural Networksvol 16 no 10 pp 1527ndash1540 2003
[24] L Anastasakis and N Mort ldquoThe development of self-orga-nization techniques inmodelling a review of the groupmethodof data handling (GMDH)rdquo Research Report 813 Departmentof Automatic Control amp Systems EngineeringTheUniversity ofSheffield Sheffield UK 2001
[25] G C Onwubolu EdOnwubolu Hybrid Self-Organizing Model-ing Systems Springer 2009
[26] G C Onwubolu ldquoSelection of drilling operations parametersfor optimal tool loading using integrated response surfacemethodology a Tribes approachrdquo International Journal of Pro-duction Research vol 44 no 5 pp 959ndash980 2006
[27] G C Onwubolu and D Davendra Eds Differential EvolutionA Handbook for Global Permutation-Based Combinatorial Opti-mization Studies in Computational Intelligence Springer NewYork NY USA 2009
Submit your manuscripts athttpwwwhindawicom
VLSI Design
Hindawi Publishing Corporationhttpwwwhindawicom Volume 2014
International Journal of
RotatingMachinery
Hindawi Publishing Corporationhttpwwwhindawicom Volume 2014
Hindawi Publishing Corporation httpwwwhindawicom
Journal ofEngineeringVolume 2014
Hindawi Publishing Corporationhttpwwwhindawicom Volume 2014
Shock and Vibration
Hindawi Publishing Corporationhttpwwwhindawicom Volume 2014
Mechanical Engineering
Advances in
Hindawi Publishing Corporationhttpwwwhindawicom Volume 2014
Civil EngineeringAdvances in
Acoustics and VibrationAdvances in
Hindawi Publishing Corporationhttpwwwhindawicom Volume 2014
Hindawi Publishing Corporationhttpwwwhindawicom Volume 2014
Electrical and Computer Engineering
Journal of
Hindawi Publishing Corporationhttpwwwhindawicom Volume 2014
Distributed Sensor Networks
International Journal of
The Scientific World JournalHindawi Publishing Corporation httpwwwhindawicom Volume 2014
SensorsJournal of
Hindawi Publishing Corporationhttpwwwhindawicom Volume 2014
Modelling amp Simulation in EngineeringHindawi Publishing Corporation httpwwwhindawicom Volume 2014
Hindawi Publishing Corporationhttpwwwhindawicom Volume 2014
Active and Passive Electronic Components
Hindawi Publishing Corporationhttpwwwhindawicom Volume 2014
Chemical EngineeringInternational Journal of
Control Scienceand Engineering
Journal of
Hindawi Publishing Corporationhttpwwwhindawicom Volume 2014
Antennas andPropagation
International Journal of
Hindawi Publishing Corporationhttpwwwhindawicom Volume 2014
Hindawi Publishing Corporationhttpwwwhindawicom Volume 2014
Navigation and Observation
International Journal of
Advances inOptoElectronics
Hindawi Publishing Corporation httpwwwhindawicom
Volume 2014
RoboticsJournal of
Hindawi Publishing Corporationhttpwwwhindawicom Volume 2014
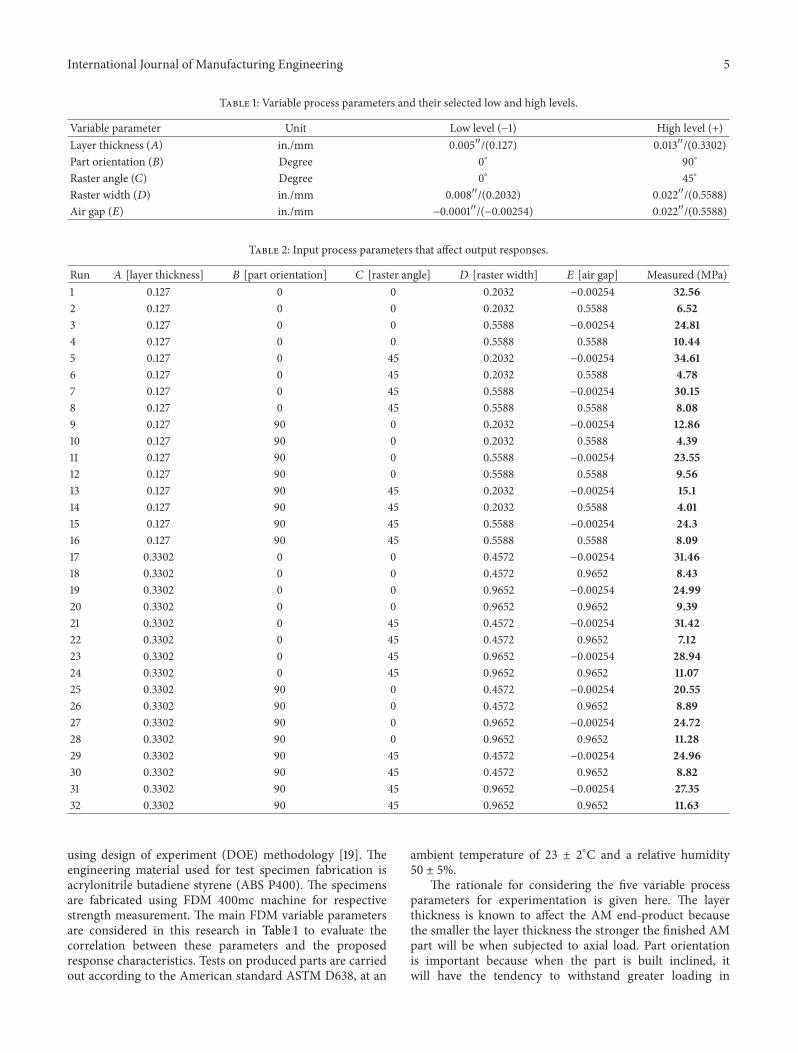
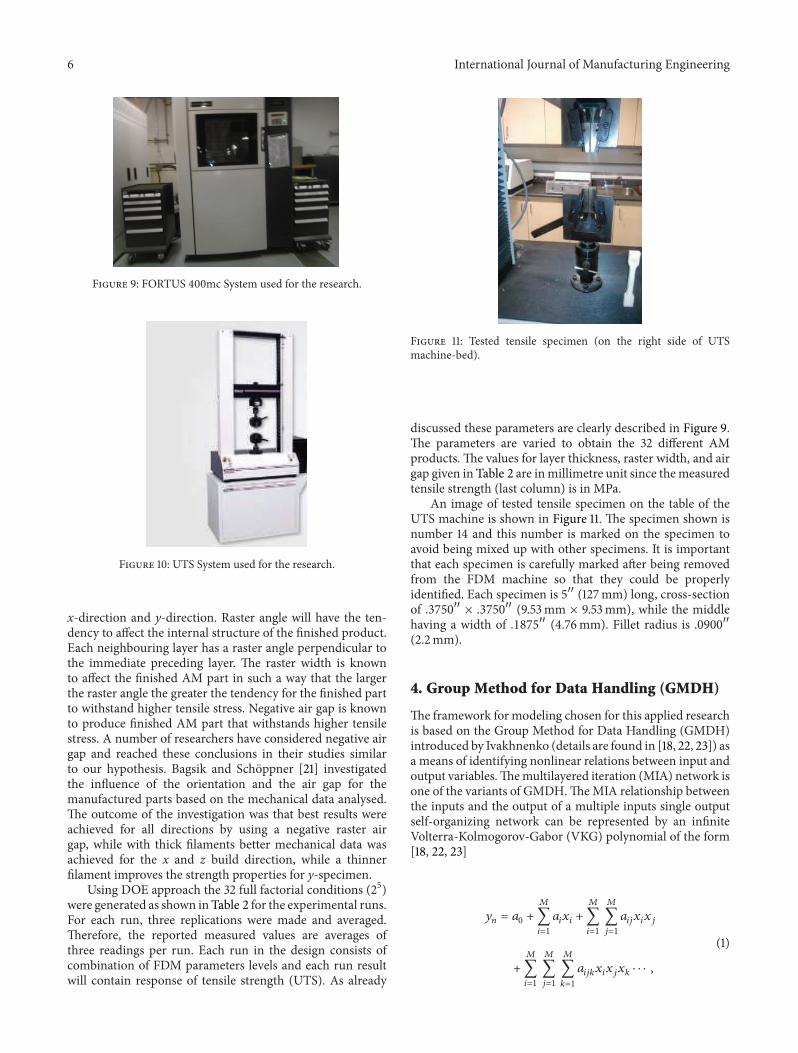
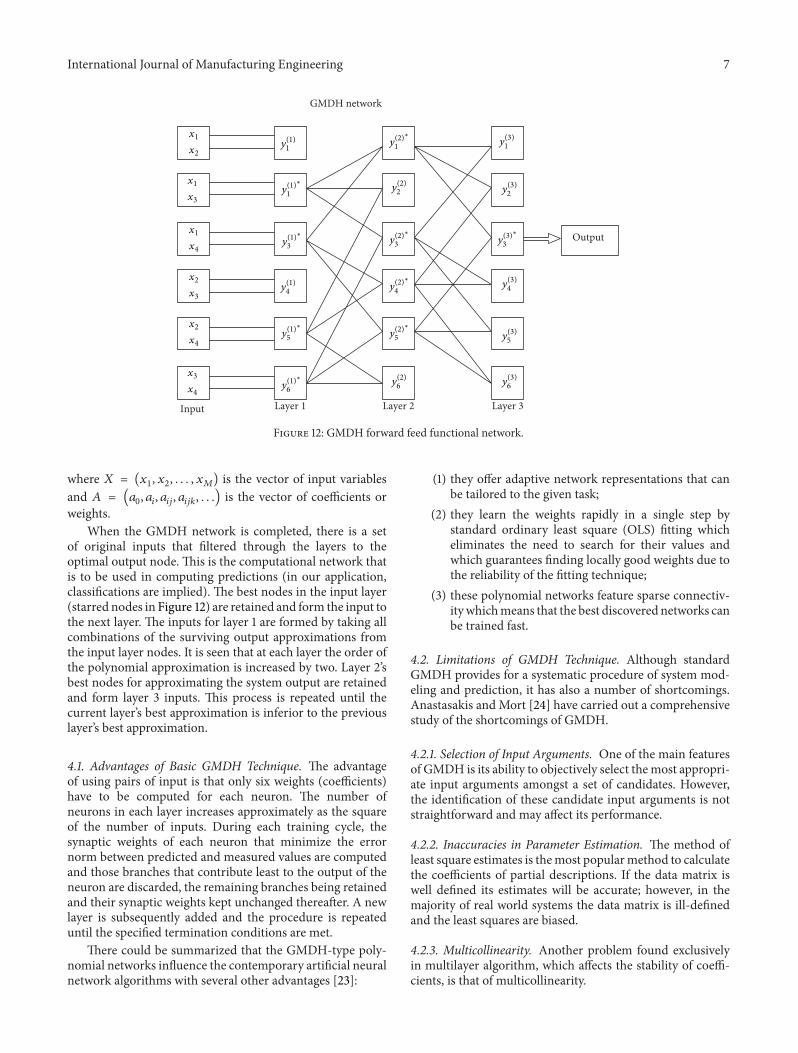
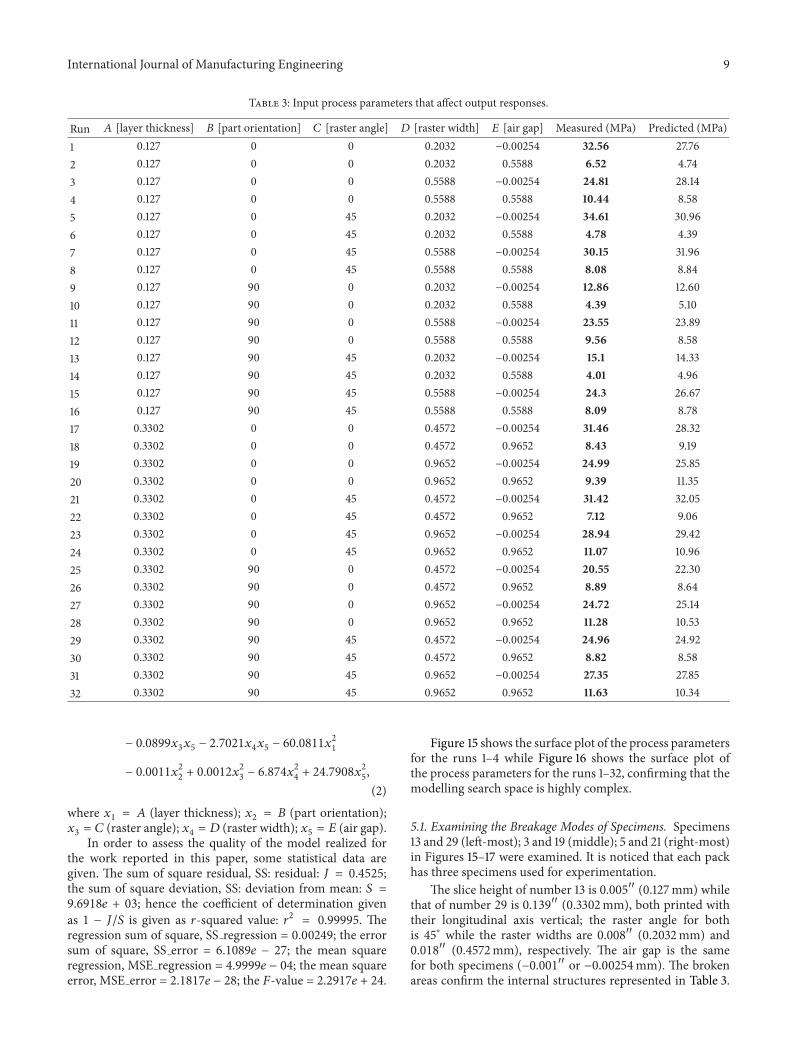
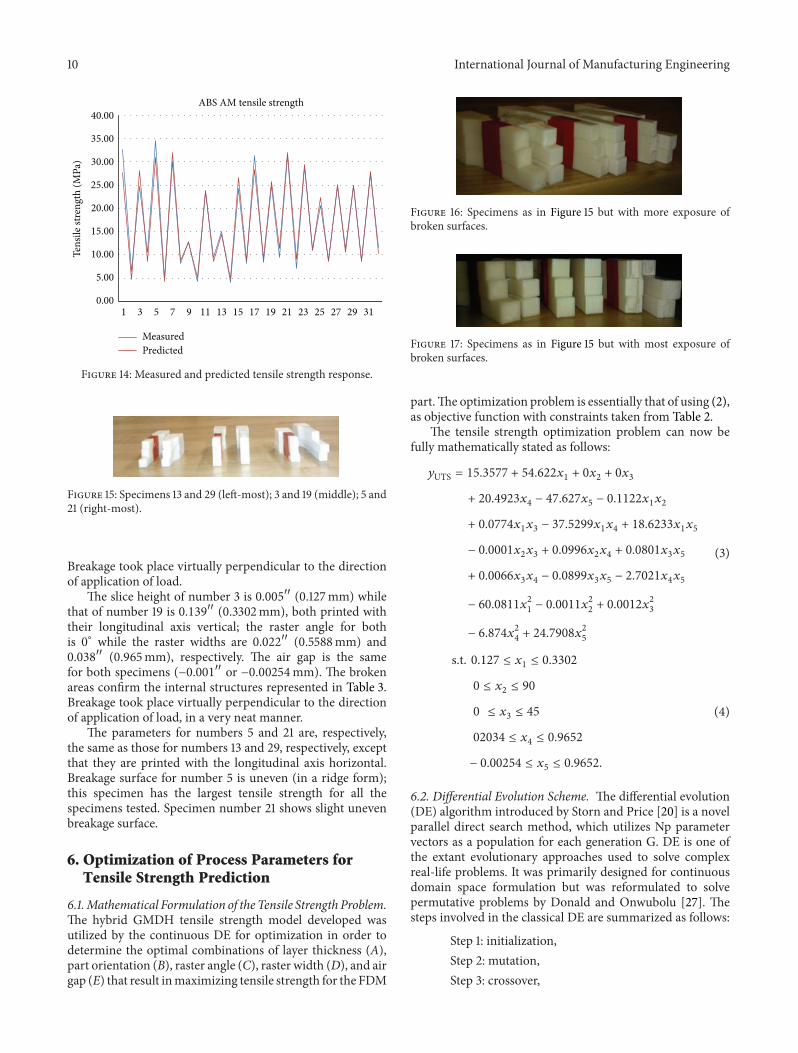
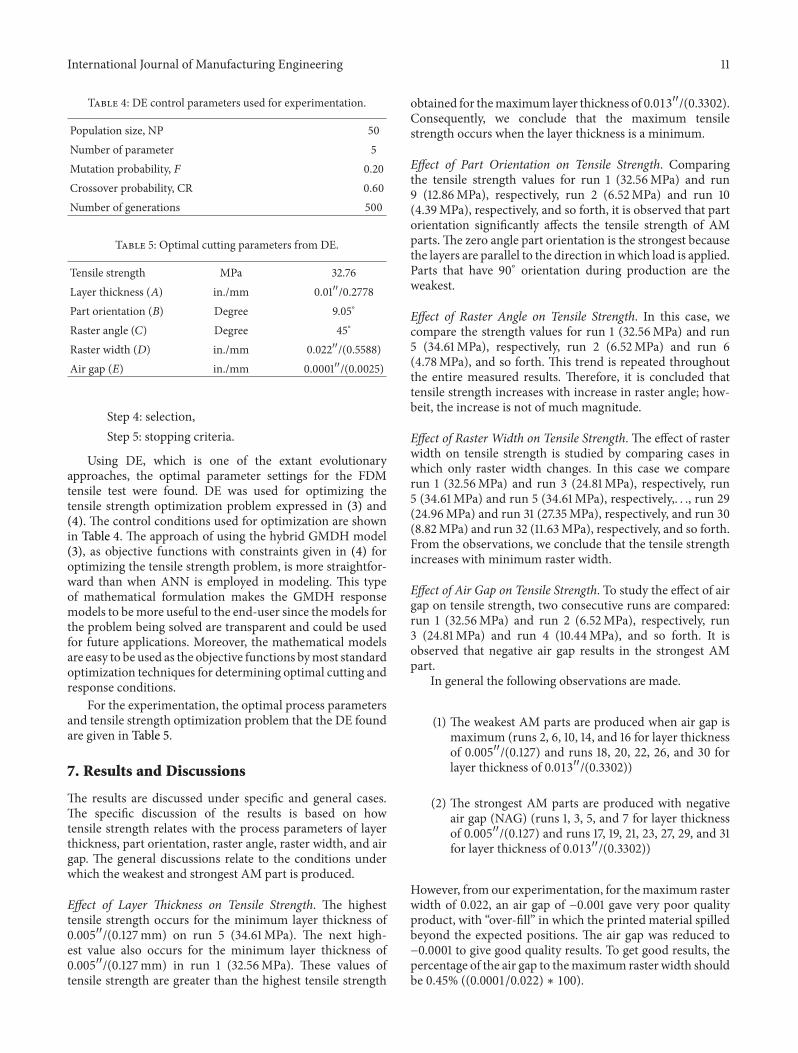