Characteristics of tritanopia and other researches into ...
328
CHARACTERISTICS OF TRITANOPIA AND OTHER RESEARCHES INTO DEFECTIVE COLOUR VISION by BARRY LEIGHTON COLE Submitted in partial fulfillment of the regulations for the degree of Master of Applied Science.
-
Upload
khangminh22 -
Category
Documents
-
view
2 -
download
0
Transcript of Characteristics of tritanopia and other researches into ...

CHARACTERISTICS OF TRITANOPIA
AND OTHER RESEARCHES INTO DEFECTIVE COLOUR VISION
by
BARRY LEIGHTON COLE
Submitted in partial fulfillment of the regulations for the degree of Master of Applied Science.

C OIdTENT S
AUTHOR'S NOTE 1
CtuAiiACTERIJI'ICS OF `l'iclTtiNOPIti AND OT1iFi1 iZESEiRCIiEz,
TRIT1i.ti0PIA AND :tTM.i1ED FORMS OF COLOi,':t VISION : ftEVIEV OF THE LITERATURE • 4
Introduction 4 Tritanopia o0 7 Tritanomaly ........o....••••..•.••...o...••.•.••• 16 Tetartanopia 25 Inheritance of Congenital Tritan Defects ...•., 31 Foveal Tritanopia .. 42 Acquired Tritanopia .• 48 Explanations of Tritanopia . 53 The Blue i.eceptor 70
REPORT OF THE INVESTIGaTI:.%N OF NINE T_iITANS 1
Introduction .... .......o0 1 I Survey and Pedigree of a Family with Nine Members
Exhibiting a Trito—Defect 2
II Determination of the Threshold of ColoYtimetric — Purity Clow to Ahite for 3 Tritans . 23
III Disc Colorimetry 45
IV Colottmetric Investigation 50
Principal Conclusions 86
REFERENCES 88
APPENDIX
Published paper. The inheritance of tritanopia with the report of an extensive pedigree. Ann. Hum. Gen, 27, 219, 1963 (with G. h. denry and J.Natnan,

OTHER P.ES rARC ES
Recognition of ,load Traific Signal Ligits by Normal and Colour—Vision Defective Observers (with J. Nathan and G. H. Henry). Manuscript of paper in press J. Opt. Soc. Amer.
Published paper. Recognition of Road Traffic Signal Lights by Persons with Normal and Defective Colour Vision (with J. Nathan and G. H. Henry) Aust, Road Research, 1, 30, 1963.
Published paper. Misuse of the Ishihara Test for Colour Blindness. Brit.J. Physiol. Optics,20, 113, 1963.
Published paper. Some comments on colour vision tests and -éheir use for selection. bust. J. Optom., 417, 56, 1964.

AUTHOR'S NOTE
This thesis reports the results of a series of investigations into defective colour vision which were commenced in 1961. The bulk of the thesis is concerned with tritanopia and there is a literature survey preceding the report of the investigation of a family with 9 members exhibiting a trite-defect. The report of this investigation is essentially chronological. The early sections were undertaken with the simplest of apparatus and, as problems were met, more sophisticated apparatus and methods were introduced as experience and the funds available permitted.
The principal work, other than the investigation into tritanopia, is an experiment concerned with the recognition of road-traffic signal-lights and this is reported in the form of a manuscript which is at present in press (Journal of the Optical Society of America). A preliminary report was published in Australian Road Research and an off-print of this publication is included.
This experiment was supported by a grant from the Australian Road Research Board.
In order to obtain subjects for the traffic signal experiment a survey of all University of Melbourne freshers was conducted in 1961. This survey was intended only as a means of selecting colour defectives, and the Ishihara and AOHRR pseudoisochromatic plates were used. Those who failed this screening examination were asked to present for a more detailed diagnostic examination which included the Nagel anomaloscope, and the Farnsworth-Munsell 100 Hue Test. At the same time a few simple occupational tests involving col-our recognition were given.
This procedure provided considerable experience in the use of colour vision tests and although the data obtained was by no means unique, two papers were published using the data and experience gained from these diagnostic procedures. Off-prints of these papers are included (Mis-use of the Ishihara Test for Colour Blindness, Brit. J. Physiol.Optics, 20, 113, 1963 and Some comments on colour vision tests and their use for selection. Aust. J. Optom, 46, 56, 1961+.)

COLLAROR.Ai ION
The work reported in this thesis was undertaken in collaboration with G. H. Henry, B.Sc., B. App. Sc., L.O.Sc. and J. Nathan B.Sc., L.O.Sc., and in accordance with regulation 3.67, section 5, the following statement is submitted as to the extent of the authors own share.
Literature survey. This entirely, is the work of the present author.
R t of the Investigation of 9 Tritans.
Section 1. Survey and Pedigree. The planning of this survey and the adminstration of the tests was shared equally amongst the three collaborators. The discussion following the presentation of the results draws on the pub-lished paper "The inheritance of tritanopia with the report of an extensive pedigree" but extends the criticism and discussion of this paper.
Section 11. Measurement of Purity Thresholds. The planning, execution and the account given of this experi-ment are entirely the work of the present author.
Section 111. Disc Colorimetry. The work reported in this section was exploratory. The data was collected by the present author and the account is entirely his. Preliminary discussions were joint. Preliminary measurements made on "red-green" dichromats undertaken for experience (and not reported here) were undertaken jointly .
Section 1V. Colorimetric Investigation. The planning of the procedures was undertaken by joint discussion. The modification of the apparatus and the setting-up of individ-ual work programmes for an experimental run was largely the work of the present author. Actual experimental work was shared amongst the co-workers. Calculations were initially the work of the present author and most of these were checked by G. H. Henry. The account given of the work is entirely the work of the present author.
APPENDIX Published paper (Ann. Hum. Gen. 27, 219 , 1963.) This paper reports the results obtained from the
survey of the family (Section 1) although additional data has been collected since this paper was published. The preparation of this paper was in the hands of G. H. Henry, and drafts were discussed and modified by the co-authors.

Other Researches
Recognition of Traffic Signals. The original plan-ning of this experiment was the work of J. Nathan, subject to discussion and modification by the authors. The appar-atus was constructed under the supervision of the present author and the experimental work was carried out jointly. The statistical analysis was carried out by G. H. Henry in collaboration with Mr. J. S. Maritz of the Statistics Department at the University of Melbourne. Correlation statistics were done by J. Nathan who also checked the statistical calculations of G. H. Henry. Calculations of chromaticities were done initially by J. Nathan and checked by D. E. Mitchell, a graduate student who assisted with some of the experimental work. Spectrophotometry of filters was carried out by Mr. B. Clarke of Defense Standards Labora-tories. Photometric measurements were carried out by the present author.
The manuscript was written by J. Nathan and this was discussed and modified by the co-authors.
Published paper. Recognition of Traffic Signals. (Aust. Road Res. 1, 30, 1963.) This is a preliminary report written for an audience of traffic-engineers and others con-cerned with roads and road traffic. An original draft was prepared by J. Nathan and this was re-written by the present author.
Other published papers. These papers draw on data collected during the diagnostic survey. This survey was carried out by all 3 collaborators although a greater proportion was undertaken by the present author. The accounts given in the 2 papers are the work of the present author.

TRITANOPIA AND RELATED FORMS OF COLOUR VISION :
,VIEW OF TIE LITERATURE
INT R O DUCT I O N
The so called "red-green" forms of defective colour vision are relatively common and have been actively studied since the end of the nineteenth century. Helmholtz (1909) and other German physiologists and physicists made the first precise colorimetric-investigations of human vision. Since this "German period" the study of colour vision was pursued principally by Anglo-saxon physicists and physiologists. In 1935, Pitt published his monograph Characteristics of Dichromatic Yision and W. D. Wright published his Resear-ches on Normal and Defective Colour Vision in 1947. Both these publications continue to form a foundation for current research in defective colour vision.
Whilst our knowledge of "red-green" defective colour vision became remarkably accurate and detailed the so called "Blue-yellow" defects were neglected. Wright (1947) refers briefly to tritahopia and tritanomaly commenting that "the amount of reliable information about tritanopia is meagre" (p297) and that "no tritanomalous observers have yet been discovered who could make tests at the colorimeter" (p320).
The comparitive rarity of these blue-yellow colour vision defects was the principal reason for the neglect. Wright (1947) at the time suggested the incidences of tritan-opia and tritanomaly were both one in a million but warned that these figures "are necessarily very approximate" (p303). However Schmidt (1943) had screened 21,000 visitors to an exhibition and found one case of tritanomaly. The rarity of these two defects is to some extent the product of the kind of screening tests employed. The Ishihara plates make no attempt to test for "blue-yellow" defects and the Nagel anomaloscope uses the Rayleigh equation. An attempt to modify the Nagel anomaloscope to provide a BG equation was not successful (Jaeger 1955). The Stilling pseudo-iso chromatic plates included some plates for the detection of blue-yellow defects, but the Ishihara suplanted this test in many countries.
The identification of blue-yellow defects in mass and routine colour vision testing was made practicable by Farns-worth. Farnsworth (1943) produced his Farnsworth-Munsell 100 Hue test and has devised single pseudoisomatic plates which have been shown to be a very effective means of iden-tifying this class of colour vision defect (Jaeger, 1955).

5 -I-
One of these plates was used by Wright (1952) in a mass survey which yielded 17 confirmed cases of tritanopia. On the basis of this survey Wright calculated that the incidence of tritanopia was between 1 in 13,000 and 1 in 65,000, the higher freauency being the more likely. This is a much higher incidence than the 1 in 1,000,000 that had suggested previously, but much lower than the 2 in 100 of red-green dichromats among men.
Terminology
Colour vision researchers have not always adopted a uniform terminology for the "blue-yellow" defects. The term "blue-yellow" defect is in itself a confusing one since the predominant colour confusions made by this class of observers are between blues, blue greens and greens. At the colorimeter a blue of 430 mu can be matched to a green of 530 mu and the term "blue-green"defect is equally applicable. The usual term "blue-yellow"defect, arises from a yellow being matchable to a blue, although Wright (1952) has found that the blue to which the yellow is matched must have a little red added to it.
The "blue-yellow" colour vision defects may be divided thus : the defect may be congenital or acquired; of the congenital defects there is the dichromatic form, tritanopia and the anomalous trichromatic form, tritanomaly. A second dichromatic form, tetartanopia has been postulated (Müller 1924) but there is no evidence to suggest the existence of tetartanomaly (Walls, 1959). The acquired "blue-yellow" defects may be conveniently thought of as having a trichrom-atic stage and a dichromatic stage. (Francois and Verriest, 1961.)
Table 1 shows a general classification of congenital defective colour vision which has been adapted from Judd (1949.)
Table 2 shows the terminology for the "blue-yellow" defects which has been adopted here.

TABLE 11
CLASSIFICATIONS OF DEFECTIVE COLOUR BLINDNESS
Designation According to Non-Theoretical Theoretical Number- of Designation of Designations Components V. Kries Young-Helmholtz of Hering
Luminosity Wave- Curve lengths
Regions of Max. of reducedNeutral Reduced
G. E. Miller (mu) luminosityPoints Discrimination
TRICIIROMATISM Normal system Normal system Normal system Normal system 555
Protanomaly Abnormal red function
Alteration systm 540 red --- red-green
Deuteranomaly Abnormal green Red-green function weakness
Alteration system 560 red-green
Tritanomaly2 Abnormal violet Yellow-blue function weakness
Alteration system 560 yellow-blue
Extreme protanomaly3 ---
Extreme deuteranomaly -
red --- red-green
red-green
DICHROMATISM Protanopia6 Red blindness Outer red-green 540 blindness
red 493 red-green
Deuteranopia6 Green blindness Red-green blindness
Inner red-green 560 blindness
497 red-green
Tritanopia Violet blindness --- Outer yellow-blue 555 blindness
568 yellow-blue
Tetartanopia4 Yellow-blue Inner yellow-blue 560 470 yellow-blue blindness blindness 580
MONOCHROMATISM Congenital total colour blindness
Cone blindness 510 red No wavelength discrimination
Acquired total Total colour Inner total 560 No wavelength colour blindness blindness colour blindness discrimination
Type I
11111 lam IMO Inner total 540 colour blindness Type II 7

1. After Judd (19494
2. This extension of V. Kries was proposed by Engleking (1925)
3. This extension is recognised by Francois (1961) and Walls (1959)
4. This extension of V. Kries terminology was proposed by Müller (1924)
5. The term alteration system was originally proposed by V. Kries (1897, 1924). Müller also uses Nagel's terminology.
6. Protanapic observers are sometimes called scoterythrons
7. See Pitt (1944 h)

6 -,-
Table 2
CLASSIFICATION OF "BLUE-YELLOW" DEFECTIVE COLOUR VISION
Congenital
"7rito-Defects" Tritanomaly
Tritanopia
Tetartanopia
Acquired1
Trichromatic Stage of Acquired Blue-Yellow Deficiency
Dichromatic Stage of Acquired Blue-Yellow Deficiency
1Terminology of acquired defects is that of Francois and 7erriest, (1961).
The existence of tetartanopia is not universally accepted. No claims have been made for tetartanomaly although Hardy, Rand and Rittler have coined the collective "tetartan" but only to earn the scorn of Walls (1959). Walls himself has erred terminologically by the use of the term tritanopia for acquired "blue-yellow" defects and tetartanopia for congenital tritanopia (Walls and Mathews 152).
The collectives, trito defects for tritanomaly and tritanopia and tritans for persons exhibiting one of these defects are useful.

7
TRITANOPIA
Early Reports
she first case of tritanopia appears to be that repor-ted by Stilling (1878). Stilling's tritanope saw spectral blues and violet as colourless although at high intensities these regions of the spectum appeared red. Between 1878 and 1951 a number of other cases were reported, and these are summarised in table 3.
In general the investigations reported prior to 1950 did not employ rigorous methods of investigation and lacked the sophiticated colorimetric technique developed largely by W. D. Wright (1947) . Most of these investigations rely on colour naming, subjective observation of the spectrum and sorting tests such as the Holmgren Wool Test. Accordingly these reports contribute little.
Some information may be salvaged from observations of the spectrum. The report of a neutral zone suggests dichro-masy and some estimate of the position of the neutral point may be made. The lack of a comparison white of known colour temperature results in a neutral zone of considerable width and precludes comparison of cases.
Hue discrimination can only be assessed from reported colour confusions and the relative luminous efficiency can only be guessed from reports of subjective judgments of rel-ative brightness.
In some cases such as that reported by Huntington (1932) the investigation leaves so much to be desired that even the existence of the defect in the subjects may be doubted.
Non-uniformity of technique and the failure of most investigations to specify testing conditions in significant and precise physical terms make any conclusions derived from these cases extremely dubious. Moreover, not all investi-gations have taken the precaution of precluding the presence of eye disease which can frequently mimic tritanopia (Fran-cois and Ierriest (1961). Neither Hermann (1882) nor. Hunting-ton (1932) took this precaution. Gothlin (1943) implies that the tritanopia exhibited by his subject is not the result of ocular disease yet reports that a posterior stapholoma, an associated sign of degenerative myopia, was observed on ophthalmoscopic examination. Francois and Verriest (1961) report acouired tritanopia associated with myopia gravis.

TABLE 3.
CASES OF CONGENITAL TRITANOPIA REPORTED IN THE LITERATURE 1878-1964
Designation Year Neutral Max Spectral Hue Discrimina- Principal Exclusion of Case Point V Colour tion Methods of
(mu) (mn) Names of Invest- Disease igation
Stilling 1878 Bine or "green"throigh- Citedby Violet out spectrum. Gôthlin "Red" in violet 1943 at high
intensity.
Donders 1880 Yellow r560 fled, Blue B=G=V Spectral Yes Observa-tion
ehrli NO DATA AVAILABLE BLE
Levy-Suhl 1906 578 Red, Green & Blues confused Wool test, Yes Blue.Uncertain with green spectrum in Yellow observa-
tion, matching at color-imeter
Koellner 1909 580- 555 cited 586 Boellner (1927)
Huntington 1932 -
Y=B=grey
Greens & Specially No yellows constructed confused also pseudo- green-blue & isochrom- blue-green, atic plates blue with grey.
Judd,Plaza 1950 5861 580 See text for details.
Farnsworth
Wrignt2 1952 568-3 550- See text for details. 574 560
Casellato 1955 Not available for study. & Spallino (2 Cases)
Sperling 1960
1. With respect to 29000K. 2. Wright confirmed 17 cases of tritanopia in the laboratory and reported
detailed results for seven. 3. With respect to illuminant B.
Munsell
Yes papers. Colorimeter
W.D.W. Colorimeter
555 Not measured. Tristimulus Yes Colorimeter

- 8_
KONIG'S ACQUIRED TRITANOPES (1897)
Four cases of tritanopia precede König's (1897) inves-tigation of acquired tritanopia, yet it is reasonable and usual to date the beginnings of the study of tritanopia from these investigations. His means of investigation were thorough enough and sufficiently sophisticated for his data to be useful to later theorists. Pitt (1944), for example derived a fundamental blue sensation and response curves for the trichromatic system using König's data, as does Judd (19451946) in his consideration of standard response func-tions. Again Judd, Plaza and Farnsworth (1950) assume a model for "classical" tritanopia based on Königs cases in their analysis of a tritanope with abnormally heavy macular pigmentation. Königs "model" for tritanopia, even though based on pathological cases, remained pre-eminent until 1952.
König's subjects did not confuse red with green but did confuse blue-green with blue, orange with reddish purple and yellowish-green with bluish-violet. Both yellow and blue could be matched with grey and a neutral band was observed between 568 mu and 598 mu. The violet end of the spectrum appeared colourless but was of good luminosity and showed no marked shortening.
From this description it is clear that the loci of chromaticities which look the same radiate from the "blue corner" of a chromaticity diagram. The colour matches between various parts of the spectrum and a two part mixture of spec-tral lights (apparently 48o mu and 560 mu) and the reports of colour perceptions of Königs observers do not allow the co-punctal point to be determined exactly. However Pitt has derived a co-punctal point for his RGB system as -
B' = 0.020 R - 0.055 G + 1.035 B.
Judd (191+5) has shown that Königs theoretical account (1897,1903) sets the co-punctal point to correspond to what we know as x = 0.18, y = 0.00 for the xyz system. (CIE 1931 standard). On the CIE chromaticity chart 1951 revis-ion)the point is x = 0.1691+, y = .0099.
Convergence of the isocolour lines to a co-punctal point implies according to the argument of Helmholtz (1924) that the co-punctal point represents a missing fundamental sensation. Assuming the point B' (fig.* represents a fundamental sensation and using Walter's (1942) data for the red and green fundamental sensation (the `°o being confir- med by Pitts deductions from the convergence of isocolour lines in protanopia), Pitt derived a set of fundamental response curves for the trichromatic system. (see section on the blue receptor).

- 7 "
JUDD, PLAZA AND FARNSWORTH' S TRIT'ANOPE (1950)
Use is made of Königs measurements by Judd, Plaza and Farnsworth (1950) in the assessment of a congenital tritanope. This case of tritanopia appears to be first repor-ted by 'Farnsworth (1943) as a paper contributed to Optical Society of America. The subject was identified as tritanopic with the Farnsworth-Munsell 100 hue test and the Farnsworth Dichotomous Test and its congenital nature implied by a history of confusion of blue and green since the age of 21. There was no evidence of ocular disease although his crystal-line lenses became cataractous two years after the investi-gation.
Spectral colours below 585 mu were called "blue" or "blue green" and colours of wave-length greater than 588 mu "red or reddish". The absolute limit of sensation was found to be at 447 or 450 mu. A neutral point was found at 586 mu for 2900°K with disk colorimetry using Munsell papers.
Measurements of the relative luminous efficiency curve, des-pite uncertainties arising from the equipment, demonstrated unequivocally (a) a depression of the short wave side of the curve, and; (b) a maximum luminous efficiency at 580 mu instead of the usual 555 mu.
Judd et al took Königs data as their model of "classical" tritanopia and noted that their subject differed from this model in three respects. These were: (a) the isocolour lines intercepted the x axis at x = 0.12 to 0.11 instead of x = 0.165 to 0.18 as anticipated by König's model (b) the neutral point with respect to a white of 2900° K was found at 586 mu rather than 578 to 579 mu. (c) The spectrum was truncated on the short wave side of the spectrum. They argue that these dif-ferences are the result of abnormally heavy ocular pigmenta-tion. They demonstrate this conclusion by comparing the chromaticity matches made by their subject with those expected of a classical tritanope with heavy ocular pigment. They assume the spectral transmittance data for the ocular media of the human eye obtained by Ludvigh and McCarthy (1938): The matches made by their subject in 1943 correspond to a "classical" tritanope with 5 times the normal amount of lens pigment and the matches made in 1945 to those which would be made by a "classical" tritanope with 6 times the normal amount of pigment. They use the co-punctal point x = 0.165, y =0.00 required by Müllers theory of vision but
This data has been questioned since the total luminous transmittance is so low compared with aniimil experiments (Pitts1961). This does not however seriously impairenthe argument of Judd et al.

- / U -
the case could have analysed with equal success using amni_s measurements. The latter data would have yielded slightly greater density of ocular pigment.
Judd et al do not appear to suggest that the defect in this case is entirely the result of heavy ocular pigmen-tation but do suggest that the characteristics measured can-not be regarded as typical. At no time do they claim that the differences exhibited by their subject when compared with pathological tritanopia are because the defect is congenital and not pathological in origin. This attitude reflects the long standing suspicion that congenital tritanopia did not exist. K5nigs cases were demonstratably pathological in origin as were the cases of Piper (1905) and Collin and Nagel (1906). The exclusion of ocular disease in other reports was not always unequivocal. Parsons (1915) wrote "cases of tri- tanopia are rare and mostly due to disease" (p180) and Pitt (1944- considered that "tritanopia is almost invariably due to disease ---- it is probable that very few cases of tritanopia which have been reported when the eye is not diseased are merely simulations of tritanopia caused by jaundice or sclerosis of the crystalline lens or extremely dense macular pigmentation."
TRITANOPES OF WRIGHT (1952)
The existence of congenital tritanopia has since been established as the result of Wright's (1952) mass survey and colorimetric investigation. Wright makes no report of precau-tions made to ensure that his subjects were free from ocular disease and from his paper we cannot be sure that his tritanopes are not pathological in origin. A genetical study was under-taken by Kalmus (1955) using Wrighte tritanopes as propositi and the familial nature of the defect strongly suggests that these tritanopes are in fact congenital.
Wright obtained his tritanopes by means of a Farnsworth pseudo-isochromatic plate published in the British periodical, Picture Post. Readers failing to see the 5 on this chart were invited to write to the Picture Post office or to the Imperial College. Some 900 letters were received and on the basis of the information given in the letters 17 possible tritanopes, 12 probable tritanopes and 29 almost certain tri-tanooes were selected. The last group were invited to attend the Împerial College for confirmatory tests and 17 cases of tritanopia were confirmed in the laboratory. The confirmatory tests comprised matching 530 mu with 420 mu by adjustment of luminosity alone, and matching 580 mu with a mixture of 650 mu and 480 mu. Extended observations were carried out with 7 of these 17 persons..

The programme of detailed tests included:-
(1) Measurement of the relative luminous efficiency curve VA ;
(2) Determination of the spectral dichromatic co-efficients; (3) Measurement of wavelength discrimination curves, and; (4) A preliminary investigation of confusion loci using
Munsell papers.
Relative luminous efficiency curves
The relative luminous efficiency curves obtained by Wright are shown in figures 1 and 2. A wide spread between individuals is to be noted at the blue end of the spectrum. A simili7spread is to be found among normal observers and is usually assumed to be due to variations in the amount of pigmentation in the eye although it could be due simply to variations in retinal sensitivity at short wavelengths.
The mean relative luminous efficiency curve for the 7 observers is slightly below Wright s own V curve at the blue end. No statistical evaluation was made of the differ-ence between the 7 tritanopes and normal observers as a whole. Wright comments that "there is little evidence here of any significant lowering of the tritanopic curve at short wavelengths especially relative to the wide spread for both normals and tritanopes". A reduced sensitivity might be expected since it is commonly postulated that tritanopia is the result of the loss of the blue receptor. However, the blue receptor is not usually thought to contribute greatly in normal vision to the photometric value of light as the blue receptor is close to the alychne.
The maximum relative luminous efficiency is at 555 mu with little individual variation. The range is 550 to 560 mu. Judd pt al (1950) showed their tritanope to have
at 580 mu well outside the range for 'vJright6 tritan-opes.
There does not appear to be any shortening of the spectrum except for Wright's observer C. All the observers recorded bumps on the short wave side of the curve but these are also to be found with normal observers.
It seems that the relative luminous efficiency curve does not differ from that of the normal.

070}► 050 0.60 WAVELENGTH
050 060
WAVELENGTH
Fig. 1. Relative Luminous Efficiency Curves for 7 Tritanopes (Wright, 1952).
Fig. 2. Relative Luminous" Efficiency Curves for the Tritanope Compared with the Normal (dotted Line) (Wright, 1(:132).
Cao 040 070»
20
I0
> ° B,
00
F
-IC
I ,, Il
\ , \
A I + ° ,
ï /
' . /, ti' \ 4 -
/
\ . C
— /
/
/ /
/ ,. --_.-- - - — i
/ F
-10
20
1.0 E C F D
A
> o
CT, O'0
J

-- l2 -
Spectral dichromatic co-efficients (rA , gA) and spectral mixture functions (V,. , . )
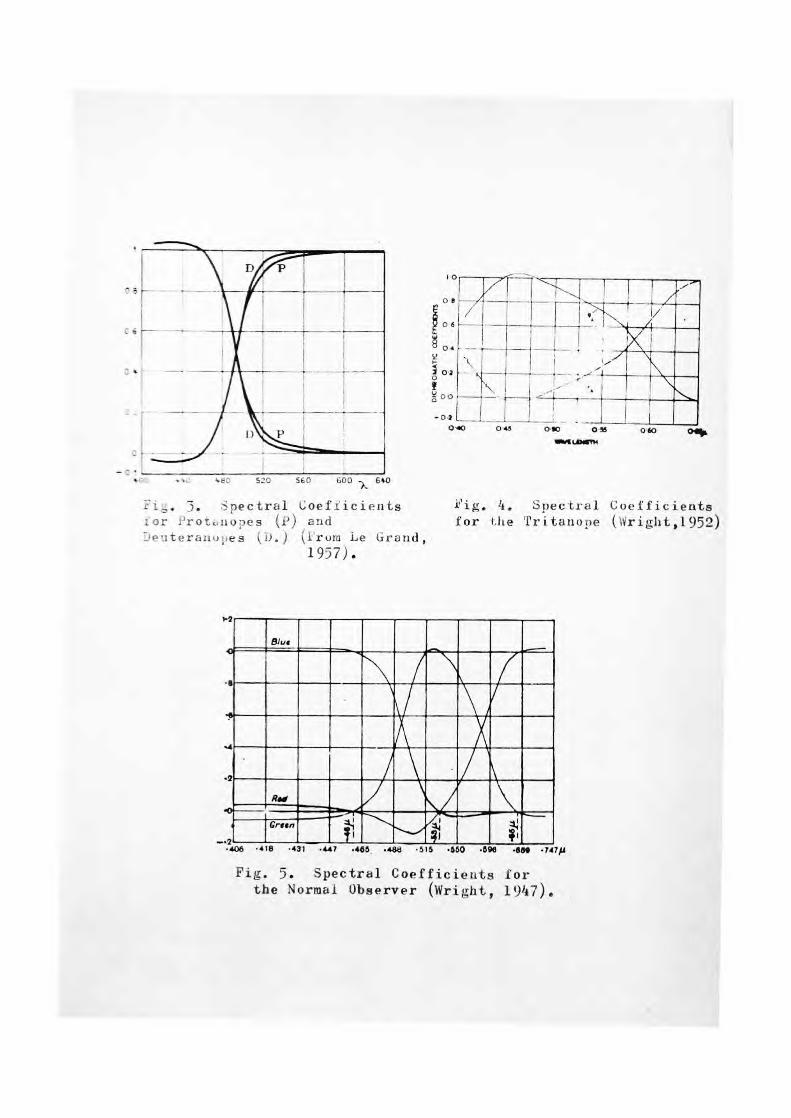
Spectral dichromatic co-efficients (rA and gA ) were determined by Wright using a mixture of 650 mu and 480 mu adjusted so that their units were equal in the match with 582.5 mu. The average dichromatic co-efficients for the 7 tritanopes are shown in fig. 4 and can be compared with the data (Wright 1947) for protanopes, deuteranopes and normal observers (figs.3,4, 5, A.)
The spectral mixture functions were calculated in the usual way (Wright 1947) using the V>, curve, the spectral co-efficients and the relative luminances of the matching stimili. The average spectral mixture curves for the 7 tri-tanopes are shown in figure 7 which includes the V), curve on a linear scale.
Assuming the tritanopic vision is a loss system medi-ated by 2 receptor processes only, these spectral mixture curves must be closely related to the spectral sensitivities of such processes. Wright draws attention to the fact that the V,4i curve is similiar to the corresponding green curve in normal trichromatic vision and to the VA curve in protan-opic vision (where the red receptor is generally thought to be absent.) It is also similiar to the green curve in deuteranopic vision. The implication is that this V4.ß curve represents or very closely corresponds to the sensitivity curve of the "green' receptor. Wright also notes that the VO, curve is in "general agreement with the positions of the maxima of other red mixture curves (see figures 8, 9, 10.
Confusion loci and the co-punctal point.
Using 6 Munsell papers illuminated with standard illuminant B confusion loci were determined using a mixture of 650 mu and 480 mu to match the Munsell papers. The con-fusion loci derived are shown in figure 11. They converge toward the blue corner but do not have a common intersection.
These confusion lines are not sufficiently co-punctal to locate with precision the fundamental stimulus associated with the process supposedly absent in tritanopia. A second method of setting- up the confusion loci was used by Thomson and Wright (1953). They used the dichromatic curves deter-mined by Wright (1952) for his 7 tritanopes. Pairs of wave-lengths which match each other in the tritanopes spectrum can be found by noting the 2 wavelengths at which a given line parallel to the abscina intersects the rA curve in figure 7. Eight pairs of confusion wavelerths were found in
\\ L
i/
.
i A
i f.
I OW 0 %
IIINKUOW.N 045 060 os}
2 02 0
00
-07 O
Blue
R I
520 560 coo -)„` 610
5. Spectral Coefficients for Protanopes (p) and Deuteranu;;es (_).) (From be Grand,
1957) .
i'ig. 4. Spectral Coefficients for lite Tritanoae (Wright,1952)
Fig. 5. Spectral Coefficients for the Normal Observer (Wright, 1947).

100
80
60
V
40
20
0 0.40 0 50 0.60
WAVELENGTH
070)L 040 010 0.60
WAVELENGTH
Fig. 6e, f.
Fig. 6. Spectral Mixture Functions for 7 Tritanopes
(A — F)
w
so
ao
40
20
O
so
60
40
7C
1 i ii .°bk
A
ILIl
`/ YR ',. a
L
i V*_ 1 oD B
■ V
Ra
r
V ;
1
/ ill
Ah ! 11. 0.50 0.60
WAVELENGTH
Fig. Ga, b.
050 060
WAVELENGTH
Fig. 6c, d,
0 .7or O 40 0>n j,
--
v,
-- obs. E
,-- - L—_
Ip.,.
v •
,
toi
I,
III:
`` obs
vR
I
F
1 V„
I 1
R i
Î
o_ 0+40 050 0.60 O. .
WAVELENGTH
Fig. 7. Average Spectral Mixture Function (Wright,1952).
Pig. 6g. 100
100
8O
60
V 40
20
0
8
6
V 4
2
07op
80
60
V 40
20

P E
0 50
0 25
D 2
._ - _ _
//_ __
._-._._.
— —
. -- -___
U
- - __._.-
ioo
0 75
0
-0 25 10r
for 1947).
040 045 0 50 Q5S
4va:efcng! rig. 8. Spectral Mixture Functions
Normal Observer (Wright,
75
J SO
- 75
00
0.W Oo
Spectralrv' 1 i ure Functions for Protauope (Wright,1947).
I
C.25 O 45
Fig. 9. 1.0
0 l,i,.
075
0 50 ô
C 25
cc
O 5 - ., 0 60 00 070,,
- 075
0 40 0.45
€
1:'d.ciclf'n.
Fig. 10. Spectral Mixture Function or Deuteranope Wrifiht, 1)E7 .
0 05 060
0 '50

p . , I I) 'L,
,, 400
1.!
05
SOO • 00
i ,..
I/
/
li /
/
/
;\
W .. :1,
/ C
Y,' .
Fig. 11, Confusion Loci for the Tritanope Determined by Wright, 1952.
pig. 12. Fundamental Response Curves _expressed ou a PhotometricBasis as Determined by Thomson & Wright (1953). Abscissas : Wavelength mu. Ordinates : Relative Photometric Units.
Fig. 13. Fundamental Response Curves for an Equi—Energy Spectrum as Determined by Thomson & Wright (1953) Abscissas : Wavelength mu. Ordinates : Distribution Coefficients.

- /3-
this manner and plotted on the 1951 revision of the CIE chromaticity diagram The extrapolation of the 8 confusion lines beyond the spectrum locus showed that they all passed close to a point x, = 0.1748 and y, = 0.0044. This point is not far removed from that assumed by Judd et al (1950) (x, = 0.165, y, = 0.00 for 1931 CIE data) and by Pitt (1944a) (x,= 0.1694 y = 0.0099 for 1951 CIE revision).
On the basis of the re-determination of the "blue fundamental stimulus Thomson and Wright re-assess the pos-ition of the green fundamental sensation as x, = 5.942 y, = 6.9140 which is in the neighborhood of the position found by Walters (1942) from adaption experiments. Using these new determinations of fundamental stimuli, Thomson and Wright calculated the fundamental response curves again in terms of the 1951 revised standard observer, These are shown in figures 12, 13, and although the "red" and "green" curves are siniliar to that derived by others (Walters 1942, Pitt 19++a) Stiles 1939), the "blue" curve shows some dif-ferences. The maximum is shifted from about 460 mu to 448 mu although Stiles (1939) did locate the maximum at this wave-length. The new position of the maximum is of course due in part to assumption of the revised standard observer data.
Neutral points
Neutral points for congenital tritanopia are not expli-citly stated by Wright (1952) but his table 1V (p317) shows neutral points for 5 observers with respect to illuminant B. These range from 568.5 mu to 573.8 mu with an average value of 571.5 mu. These measurements are in no way independent
-*Fry (1955), on the other hand, considers that the tritan-opes hue discrimination between 430 and 460 mu is too poor to justify Thomson and Wrights proceduria. Furthermore he shows that the tritanopic co-punctal does not locate the blue fundamental, it locates only a line on which the funda-mental stimulus will lie, since different co-punctal are located with different choices of luminosity co-efficients of the two mixture colours. Initially he claimed to prove that the tritanopic co-punctal lay on the CIE alchyne spec-ifically at x = 0.15, y = 0 but as the result of discussion following the presentation of the paper revised this claim.

-
of macular pigmentation since Wright used N7/ Munsell paper matched to a mixture of two monochromatic stimuli, Mono-chromatic light is unaffected by ocular pigmentation but the chromaticity of the Munsell paper will be altered by indivi-dual variations in pigmentation.
Assuming the co-punctal point derived byThomson and Wright (1Q53) a neutral point of 569.4 mu can4predicted graph-ically. This calculation of neutral point is based on data obtained with monochromatic stimuli and is independent of pigmentation of the eye. Clearly Wrights 5 tritanopic obser-vers do not have an abnormal amount of ocular pigment since their neutral points determined by these 2 methods do not differ greatly. The expected neutral point with respect to 2900°K is 578.2 mu (calnulated graphically from Thomson and Wright co-punctal). The tritanope of Judd et al (1950) with a N.P. of 586 mu for 2900° K is considerably different from the expected of 578.2 mu.
Wavelgrlgtk . 41seriminatIQ
Four of Wright's tritanopes made observations to determine wavelength discrimination and the results are shown in figure 14. The curves for all the observers had essentially the same features, namely good discrimination in the yellow and in the far violet with poor discrimination in the blue-green. The discrimination in the far violet seems to be better than that of normal observers.
These characteristics of the wavelength discrimination curves can be predicted from the confusion loci (as shown
in figure 15 ) The confusion loci cut the spectral locus for the red, yellow and green parts of the spectrum. The violet part of the spectral locus is also cut by the confusion locus for the co-punctal point lies outside the spectral locus whilst the spectral locus itself curves around at this point.
RECENT REPORTS
More recently, Sperling (1960) has reported a case of congenital tritanopia. The characteristics of this tritano-ne do not differ substantially from those reported by Wright (1952). Sperling pursues the implications of the finding that a point close to the spectral locus in the violet region represents the "missing" colour receptor process. He exam-ines the question of theoretically derived equal chromaticity space and ebrives (Sperling 1961) a set of fundamental response curves.

. 1 Ob• A
lB
► I I
i ÎI
J\i; jLi '
o-so
040 040
aso
040 Ossr Ian LENGTH
.Mr
--
>-02 — — — .-.4
•
i
- -_ - --'
-0, — -- —
-- -- -
oe.`• D I
oesk E
-- -_ --
- - - / _
-.-....,.., ✓
%
- - -----
•
---'-,
040
030
o-b o,W 040 WN[l[NGrN
Fig. 14. flue Discrimination of Four Tritanopes. (Wright, 1952).

x rig. 19. CIE Chromaticity Diagram Showing Some `l'ritanopic Confusion Loci Converging on tue Co—Punctal C w ►► icl is outside tue Spectral Locus. Consequently, there are uumerons Hue Discrimination Steps at tue Blue End of the Spectrum.

-/s-
Casellato and Spallino (1955) have reported 2 cases of familial congenital tritanopia but the original paper was not available for study.
Since t:-_e binding of this thesis a paper by G. L. Walls* has been published posthumously and this describes the characteristics of four tritanopes. Three of these tritanopes were seen by Walls himself. The fourth was observer C described by Wright (1952) and ":ails sought further information by correspondence. This observer was a professor of metallurgy and was able to carry out observations with the help of his colleagues. The data obtained for these subjects was limited to colour naming of monochromatic lights and Munsell papers, observation of RDP (Maxwell's spot), measurement of neutral points with a rotary colour-mixer and a 3-light assessment of the luminosity curve. There was no rigorous test using spectral lights for dichromasy so that despite the neutral points obtained with the Munsell-paper colour mixer there is no certainty that these subjects are tritanopic. Their colour naming is surprisingly good, so much so that they may well be incomplete tritanopes or tritanomals.
Walls, G.L. Notes on four tritanopes. Vis. Research 4, 3, 1964

-
TRITANOMALY
Nine cases of tritanomaly are to be found in the literature. The first was reported by Engelking (1925). EZliï-e, k; ng found a tritanomalous student as a result of a mass investigation of students using the Helmholtz colour mixture ecuipment. The same defect was later found in two of this subjects maternal uncles.
The results of the investigations of these 3 tritan- omals are to be found in four publications; Engelking (1925), Eno-ling (1926) and Hartung (1926) and Engelking and Hart- ung (1927).
Using the Helmholtz mixture apparatus three prim-aries were found to be necessary in the first subject, who was Hartung himself, if all spectral radiations were to be matched. Some areas of the spectrum could be matched with 2 primaries but this was not possible between 520 mu and 590mu and in the extreme blue. The blue findings are uncertain because of difficulty in obtaining blue light of sufficient intensity.
These results as shown in figure 16, establish that the defect was not dichromatic. The test is similiar to that employed by 'Wright (1952) to establish dichromasy in his tritanopes.
None of the three tritanomals could match the whole spectrum with a mixture of 2 lights only, and although the defect is not dichromatic it need not be anomalous trichro-masy in the same sense as protanomaly and deuteranomaly. Anomalous trichromasy in its well known forms is character-ised by an anomalous matching in which a mixture of 2 lights that will match a third will differ from the mixture chosen by the normal. Moreover, the normal's match is unacceptable to the anomalous observer.
The Rayleigh equation R + G = Y is used in the diagnosis of protanomaly and deuteranomaly. The analogous equation for a blue-yellow defect would be B + G = BG.
Engeling adopted the equation: 471 mu + 517 mu = 490 mu . His tritanomalous observers required an excess of
blue compared with the normal when matching with this equation. In terms of an anomale-quotient similiar to that commonly used for the Rayleigh equation, his subjects had quotients of 1.8, 2.7 and 4.3. The subject having the anomaloquotient

400 500 600 700 mu
Fig. lb. Matching with Two Primaries for a Tritanomal. Primaries b70 mu and 480 mu. Dotted Lines span Region for which a Dichromatic Match is not possible. Ordinates : Proportions of Matching Primaries in Mixture. (After Engieking, 19:25).

- i7-
closest to normal was the one nearest to being a dichro-mate. All 3 observers rejected the mixture selected by normal observers, and appear therefore to present the usual characteristics of anomalous trichromasy.
Engelking was careful to exclude the possibility that the defect found in his 3 subjects was not the result of heavy lenticular or macular pigmentation. It has long been thought that heavy ocular pigmentation could mimic trite defects. The importance of ocular pigmentation in colorimetric investigations has been repeatedly stressed by 'Wright (Wright, 1947, 1957 etc) and the tritanope of Judd et al (1950) did in fact have heavy ocular pigmenta-tion.--711s (1957) on the other hand is skeptical and considers that "Wright over emphasises the frequency with which unusually heavy lentine or macular pigmentation produces any simulation of (tritanoid) colour blindness or ever causes a real defect to be misdiagnosed" and again (Walls and Mathews 1952)", "In its most extreme form, the disease oftlet's blame it on macular pigment' attacks tritanopia". Nevertheless an estimate of the influence of ocular pigmentation forms a necessary part of any investi-gation of trito defects.
Any pre-receptoral selective absorption would result in an absorption system and modified colour vision. Trito-defects can be produced in the laboratory with a coloured filter before the eye of a normal observer. Figures 17 and 18 show the results of the Farnsworth Mun-sell 100 hue test and the Farnsworth Dichotomous Test for two normal subjects who performed the tests through a yellow filter (Wratten No. 16). The test results clearly indicate some form of trito-defect.
In ocular pathology modifications of the trans-parency of the _pre-retinal refringent media give rise to absorption systems. For example, the shorter wavelengths are absorbed in jaundice and in incipient cataract, (Francois and Verriest, (1961). Pre-retinal extravasation of blood will also give use to an absorption system usually in association with erythropsia.
An absorption system can be readily identified by finding the quotients of anomaly for a mixture of monochro-matic lights Àa ♦. t matching a series of wavelengths A,, Az, A3 . The quotients of anomaly (%4/A06„/ , will be constant for an absorption system. This, of course is due to the fact that the ratio of the abnormal pre- receptoral absorptions of AA, and A6 itself remains cons-tant and the fact that a monochromatic stimulus is unaltered in chromaticity by a filter.

ait / FARNSWORTH-MUNSELL 100-HUE TEST For Color Vision
S
MUNSELL COLOR COMPANY, INC. 24.41 North Calvert Street Baltimore 18, Maryland
•
e
595 600 aio
il t
;I
soo
Lab Exp.._
Test L.0
Review.....
Retest
SP!
"Tritanopia" from an Absorption System
Fig. 17. Farnsworth—Munsell 100 IIue Test for 2 Normal Subjects (J.N. & [3.L.C.) when viewing through a No. 16 Yellow Wratten filter. Both subjects make very few errors with this test when not viewing through the
filter.

Subject's Order
TEST
SJsJ BC suri J N RETEST
3 14
REFER CA
I
14
'13 t
10 12 1•1
9 Figure 18 Dichotomous test for 2 normala when viewing through 14 a yellow filter (No, 16 Wratten
15 15
13 t • • i0 12 11
The Psydiologid Corporation, New York 17, N. Y. Printed in 11.S . A 47.I7aC An
REFER Z IZ 1 1
4 1 1 ►- 1 I 1- 01 1Y 1 W CI. 1 Io
1 1
11
4
n I 1
'1 1
FARNSWORTH DICHOTOMOUS TEST for Color Blindness Panel D-15
Name Age ........... . ..Date File No
Department Tester
Retest
DICHOTOMOUS ANALYSIS
Type Axis of Confusion
PROTAN (RED-bluegreen) D DEUTAN (GREEN-redpurple) TRITAN (VIOLET-greenishyellow) D
PASS LI
FAIL [1]
Test
Subject's Order
1 2 3 4 5 6 7 8 9 10 11 12 13 14 15

The congenital anomalous trichromasies, protanomaly and deuteranomaly are not absorption systems but are alter-ation systems. In alteration systems, the quotients of anomaly for N a,+ À 6 to match À,, /\ 2 j À 3 are not constant. This is due to the fact that one of the 3 fundamental response curves of the anomalous trichromate is altered in such a way that it cannot be reproduced by a linear combination of the 3 normal response curves.
The tritanomals of Engelking showed a quotients of anomaly that changed with the wavelength of the homogeneous comparison light.
From the investigations of Engelking and Hartung it seems certain that the disturbance of colour vision exhibited by their subjects is tritanomaly and that it is exactly analogous to the better known anomalous trichromasies. Walls (1961) in a personal communication considered them to be indisputably tritanomalous.
That they are not dichromates and that their defect is not the result of pre-receptoral absorption certainly can-not be disputed but some reservations may be expressed about the validity of the equation 471 mu + 517 mu = 490 mu.
Let us assume that the Engelking tritanomals are in fact tritanopes. They would have a co-punctal point near x = 0.164, y = 0.000 and an iso-colour line could be drawn from the co-punctal point through the point representing 490 mu. This isocolour line will intersect the locus of colours that result from mixing 471 mu and 517 mu. The intersection occurs toward the blue side of the 471 + 517 mixture locus and represents a match that would be acceptable to the tritanope. This is shown in figure 19. The wave-length discrimination of the tritanope is of the order of 8 mu at 490 mu and it is clear that the isocolour line pass-ing through 517 mu will be differentiated from the 490 mu isocolour line. In figure 19 the shaded area includes all those chromaticities that would be indistinguishable from 490 mu. Not only would the mixture of 517 and 471 mu that matches 490 mu be displaced toward the blue but the normals match, which has outside the shaded area, would be rejected. Because of the convergence of the isocolour lines the precision of the match made by the tritanope would be rela-tively good. A further disadvantage of this equation is that the mixtures of 471 and 517 mu are removed from the spectral locus and a satisfactory match requires desatura-tion of 490 mu.

r
x Fig. 1;. CIE, Chromaticity Diagram Showing the 'n leking (1925) '1'i itanomalous J quation, 471 mu and 517 mu = 490 mu. The Point, C, is the Tritanopic Co—Punctal and tue Dotted Line the next Discriminable Step from the Confusion Locus from C to 49O mu. This illustrates how a Tritanomalons Match could be made by
a Tritanope.

This latter disadvantage may account for the failure of the tritanomal reported by Meitner (1941) to make a match with the Engelking equation. Meitner considers his subject to be tritanomalous, and his investigation included fairly extensive spectral matching but by comparison with the Engelking-Hartun tritanomaly his appears atypical. (Walls and Mathews 1952).
The Engelking equation is the basis of the diagnosis of the tritanomal investigated by Oloff (1935) and the same objections may be raised. In addition to this spectral equation Oloff used disk colorimetry demonstrating with a series of equations that his subject was not a dichromat . One of these equations was:
Blue + yellow = grey. It was noted that an excess of blue was necessary for the match and also that the mixture ratios were set with the same precision as would the normal. This result would be highly significant if we could be sure that the matching locus of the blue and yellow ran parallel to the diverging iso-colour lines. Regretably the papers used by Oloff are not specified with any precision and may well cut the iso- colour lines.
Two further cases of tritanomaly came from >cbm i dt (1943). One, a woman aged 35, was tested with Trendelen-berg's anomaloscope (Trendelenberg 1941), and was clearly demonstrated to have a "blue-yellow" defect. The normal match with the Engelking equation was rejected and an excess of blue was required for a match. This was especially notable for the left eye. Other equations included in the investigation demonstrated that the defect was not entirely analogous with the other anomalous trichromasies. Light of 471 mu could be matched to 500 mu and there appeared to be a neutral point at 576 mu for the right eye but not for the left.
The second subject, the father of the first, was 76 years of age. He demonstrated a neutral point in the yellow and could also equate 471 mu with 500 mu as well as 470 mu with 490 mu. These latter matches indicate a great reduction of hue discrimination in the blue and blue-green. This subject was unreliable at the anomaloscope and Schmidt was uncertain whether the defect was tritanomaly or tritanopia. Yellow could not be matched to blue with disk colorimetry and this would appear to indicate trichromasy although the colours could well cut iso-colour lines as has already been illustrated in figure 19.

Schmidt does concede that the defect is more severe than that found in the daughter. She tentatively suggests that the father's defect may be a "symptomatic aggravation of tritanomaly due to pigmentation and age".
Crone (1956) describes two tritanomals who are mem-bers of a complex pedigree. Some members of this pedigree exhibit defects which are considered by Crone to be the result of a combination of trito-defects and red-green defects.
One of his tritanomals made an anomalous match for the equation 513 + 455 mu = 480 mu + white adding excess blue and rejecting the normal's match. The wavelength discrimination curve of this subject showed a moderate disturbance in the blue-green (figu2o).
The tritanomalous equation adopted by Crone avoids the objections that were raised in the discussion of En,elkirs egation. The matching locus joining the violet of 455 mu and the green of 513 mu passes close to the tritanopic co-punctal point and would therefore be on or close to an iso-colour line. The desaturation of 480 mu brings the chroma-ticity of the comparison light onto the matching locus.
Despite the presence in the pedigree of the gene for deuteranopia there is no suggestion of a concomitant red green deficiency for this subject. There was only one error on the Ishihara and the Rayleigh equation although slightly deuteranomalous can be taken as being within normal limits. Routine ophthalmological examination showed no abnormalities and visual acuity was normal. It is unlikely therefore that the defect is of the acquired type.
The second tritanomal described by Crone has charac-teristics not unlike the tritanomals reported by Schmidt (1943). The tritanomaly equation for this second case showed a wide range (0.5 -oo) and the normal match was accepted. Wavelength discrimination was greatly lowered (figure 20) in the blue and green. No neutral zone could be demonstra-ted although wavelength 575 mu was described as being "nearly white". Again there is nothing to suggest the defect is acquired in origin and there is no concomitant red-green defect.
The first case of Crone can be called tritanomaly with good reason.. There is an anomalous match and the normal match is rejected. The second case differs : there is no neutral point and it cannot be tritanopia yet the

normal match in the tritanomaly equation is accepted. Crone has called the disturbance tritanomaly despite this, but in recognising that it is not entirely analogous with the red-green anomalous trichromasies points out that the subject "might as well be called an incomplete tritanope".

20
~ 0 450 500 550 WAVELENGTH (m1)
•
0 450 500 550 600 650 WAVELENGTH (mu)
600
Fig. 20. Hue Discrimination Curves for Tritai ► omalous Subjects,.11, 18 and III, 4
or of Crone (1950).

-
EXTREME TRITANOMALY
The second case of Crone (1956) and both tritanomals of Schmidt (1943) present characteristics which are different from what might expected of tritanomaly. Crone suggests as it has already been remarked that his second case could well be called an incomplete tritanope. All three cases demonstrate either a neutral point or at least a consider-able desaturation in the region of the tritanopic neutral point.
Jaeger (1955) tentatively proposes that this defect be called extreme tritanomaly and be classed with extreme protanomaly and extreme deuteranomaly. Walls (1961) has thoughts on similiar lines. He writes "The only tritanomals I have ever seen were two boys whose mothers were sisters. Both boys came out tritanopic on the H-R-R and on Farnsworth's No. 7, the Wright Picture Post plate, etc. But they did not have a stable neutral point equation and so many of their matches "came and went" while they watched, that I decided to call them 'extreme tritanomals' which makes them unique",
A survey of the literature and consideration of the tritans who were the subjects of this present investigation indicate that Walls "extreme tritanomals" may not be as unique as he thought.
The Extree Anomal.
The anglo-saxon physicists and physiologists who have been pre-eminent in the field of colour vision research since the first part of this century, fixed on a classifi-cation of anomalous trichromasy which allowed only three sub-divisions, protanomaly, deuteranomaly and tritanomaly. Yet experience with the Nagel anomaloscope had demonstrated that two general classes of anomalous trichromasy could be distinguished. These were ordinary anomalous trichromasy and extreme anomalous trichromasy.
the ordinary anomal is characterised by anomalous Rayleigh matching and rejection of the normals match. The anomalous match is repeated with moderate precision for, as a rule, such anomals do not have greatly reduced wavelength discrimination.
Extreme anomaly on the other hand is characterised by a wide but not dichromatic matching range at the Nagel

- 2 3 -
anomaloscope, extreme anomaly being distinguished from ordinary anomalous trichromasy by the rarity of intermed-iate matching ranges. This is the concept of extreme anom-aly offered by Judd (19'+9a) who whilst recognising extreme anomaly to the extent of comment does not include it in his summary table. Francois (1961) defines the extreme anomal similiarly but more precisely.
Francois' definition requires the extreme protanomal to be able to match at the Nagel anomaloscope the red stim-ulus to the yellow and for the extreme deuteranomal to match the green stimulus to the yellow. The extreme anomal, for Francois, accepts the normal's match.
Walls (1959) defines the extreme anomal differently. He claims that "the extreme anomal does not merely and does not permanently exhibit a huge matching range the outstanding characteristic of the extreme anomal is plastic-ity and instability". When the matching range is determined cautiously, step by step, the extreme anomal will show a matching range from one end of the scale to the other or at least to other side of the normal's match point (when some would call him "half extreme"). He can be misdiagnosed as a dichromat. When pre-adapted to a bright white area his matching range reduces so that it assumes the characteris-tics of the ordinary protanomal or deuteranomal.
Walls' recipe for the diagnosis of the extreme anomal has been assumed by the present author, in routine colour vision testing and has yielded one person with defective colour vision demonstrating a wide labile matching range. However, Walls' comcept of extreme anomaly is not generally accepted, that proposed by Francois being the one normally used.
Although it is not common for extreme protanomaly and extreme deuteranomaly to be included in tables classifying defective colour vision, the existence of extreme anomalous trichromasy is sufficiently well established for a separate genetic factor to be assumed (Francois, 1961) .
The adoption of the term "extreme tritanomaly" implies the assumption of separate alleles for tritanomaly, extreme tritanomaly and tritanopia. This is not unreasonable since it would parallel the pattern accepted for the protan and deutan defects. However, our knowledge of the tritan phenotypes is not well enough established to carry to assum-ption of 3 tritan alleles very far.

-a4
An alternative explanation of the appearance of an extreme tritanomaly-like disturbance is to consider the defect to be a phenotypical variation of the gene for tritanopia. The term "incomplete tritanopia" used by Crone (1956) would be more applicable than extreme tritanomaly should this explanation prove to be more acceptable than the concept of a separate allele for extreme tritanomaly. The genetics of trito-defects and in particular this ques-tion of expressivity of the tritanopia gene is taken up again.

- 2 5-
TETARTANOPIA
EARLY CASES.
Some cases of "blue-yellow" defective colour vision do not appear to conform with the accepted characteristics of tritanopia. These observers have dichromatic vision and are able to distinguish reds, yellows and greens from each other but like the tritanope confuse yellow with blue. These observers appear to have two neutral points, one in the neighbourhood of 582 mu, the other near 470 mu .
Muller (1924) proposed they be called tetartanopes, this class constituting a fourth type of dichromat. DN. Sc nce of Colpur (1953) reports "apparently this condition tetartanopia is exceedingly rare since only five cases ever had been described". Walls (1959) in condemning the inclu-sion in the AOHRR pseudoisochromatic plates of plates for tetartanopia takes the stand that "Tetartanopia is real enough, although not a dozen cases have ever been described there is not at present a single "tetartan" known to be living in the entire Western Hemisphere. The only one
reported died near Seattle six years ago". Later Walls 1) remarks "There is only one tetartanope now living in
the world, so far as I know:"
Not all c-?lour vision researchers are as convinced of the existence of tetartanopia as Walls is. Jaeger (1955) believes this additional category unwarranted because of the uniform behaviour of Wright's seven tritanopes. Wright (1952) himself takes the stand that it is unwise to attempt any subdivision of the blue-green defective into different groups.
The five cases referred to by the Science of Colour are not documented but it is likely that these five cases are those cited by Judd (1943) namely Alrutz (1915), Hering - v Vintsch an (1894) Hermann (1882), Richardson-Robertson (1911, 1923), Uhry (1894). A search of the literature added the second case of Koellner (1929) and the case reported by Fischer, Bouman and Ten Doesschate (1951). The cases of probable tetartanopia are shown in Table 4. Judd (1943) and Judd et al (1950) refer to the case of Alrutz (191 5) as one of tetartanopia but there is little justification for this. Gothlin (1943) who also examined this subject reports that Gullstrand considered the defect to be a case of "double sided tritanopia". It is not clear exactly what is meant by double sided tritanopia. It could refer to the type of "tritanopia" with two neutral points' ite alternatively it might mean bilateral.In Gothlin s description of this subject

no second neutral point was apparent. Alrutz had found 2 neutral points, one at 575 mu and the other at 446 mu (walls and Mathews 1952) but Gothlin states that "on this point I personally hold a different view from that expressed by the author of the original studies". Gothlin found a desàturated zone at 465 mu. The position of the yellow neutral point at 571 mu rather than 580 mu and the absence of the second neutral point suggest that this is a case of tritanopia.
In general the methods employed to investigate these observers leaves much to be desired. Like the early reports of tritanopia the most useful data is spectral colour naming, and as dubious as this sort of data is, it provides the only grounds for comparison of subjects.
In an evaluation of the liklihood of these cases repre-senting a second blue-yellow dichromatic state the consider-ation that first comes to mind is the possibility that they have an acquired colour vision defect.
Acquired "tritanopia" is the subject of review below but one can anticipate to this extent: Francois and Ve.rriest (1961) describe the dichromatic stage of acquired blue-yellow deficiency as demonstrating "an obvious neutral zone between 550 and 580 mu and another neutral zone around 465 mu". This is apparent on colour naming. Colour naming by individuals with acquired "tritanopia" is variable but violet, blue and blue-green tints may be considered colourless, blue or green. Green tints are called green although 520-550 mu are commonly labelled as blue. Yellow, of course, is described as colour-less but sometimes rose, red or purple. Orange and red are called red.
It is conceivable that these cases with two neutral points are in fact acquired. Hermann (1882) on Gothlin's (1943) testimony did not take the precaution of excluding the possibility of ocular disease. Richardson - Robertson's case was examined by an ophthalmologist and no signs of ocular disease were apparent but there are later reports from this subject which suggest aggravation of the defect and a worsening of acuity:k.
Francois and Verriest (1961) consider that acquired "tritanopia" in the dichromatic stage is "always associated with a concomitant red-green defect". Hering (1894) maintains that there was a deterioration in red-green perception in the v - Vintschgau - Hering case. A similiar
On the other hand Sloan, and Newhall (1942) consider this case to be one of atypical achromatopsia misdiagnosed as tetartanopia because associated with the blue-yellow defect there was a red-green loss.

loss of red-green discrimination was found in the second case of Koellner (1929). The possibilities are that these cases are either acauired in origin or that they are cases of mixed defects as the result of a mixed hemizygote geno-type. In either case the subjectscannot confidently be considered tetartanopg%
Similarities between the v-Vintschgau-Hering case and the case of Judd, Plaza and Farnsworth can be noted. The spectral observations made by this latter subject showed a neutral zone at 586 mu compared with 571-601 mu for the v-Vintschgau-Hering case. The shortest wavelength at which the subject of Judd et al "was certain of chromatic colour was at about 465 mu" and this should be compared with the other subject who reported increasingly darker grey beyond 488 mu.

Green Red Red
El (4800°K) (2800°K)
570 580
VV Source
Max. PN
Göthlin (1943)
Hering (1894)
Cited by Judd
(1943, 1950)
Göthlin (1943)
555 Koellner (19 9)
465- Richardson-468 Robertson
(1923)
555 Fischer et al (1951)
7. Fischer, 1951 Bouman & Ten Doeschate
Case Designation Dat e
Red Desat Nb
NP
Spectral Observations µ
400 450 00 O 50 0 5 0 6 0 6 700
Violet reen Red 495 00 585 588
1, Hermann 1882
2. V.Vintschgau Hering 1894
3. Uhry 1894
4, Alrutz 1915
5. Koellner 1909
6. Richardson 1923 Robertson
571 601
No data available
Desat
bled Mixed Green Red R & G
461 465 574
Secônd NP in Blue
Green Red ' 457 4
595
Red 605
TABLE 4. TT.
CASES TETARTANOPIA REPORTED IN THE LITERATURE 1882-1964,
NEUTRgh. (Al/oT SKOWN 4✓ SNA96U ARo-q-

,2s-
THE TEETaRTAROPE OF FISCH.ER ET AL (1951)
Fischer, Bouman and ten Doesschate (1951) present the results of their investigation of a 29 year old physicist who they describe as a "case of tritanopy" but who presents characteristics which leads them to conclude that "in the extension of the von Kries (1924) terminology by G.E. Muller (1924) our subject must be identified as tetartanopia".
Their subject demonstrated a neutral point at 570 mu for white light of 4800° K and 580 mu for 2800° K. There was no second neutral point in the blue although the region 480-430 mu appeared desaturated and the region beyond 420 mu gave a sensation of red. The brightness levels for those wavelengths was moderate only and the investigators imply that at higher levels of illumination a neutral point may have been obtained. They suggest that the second neutral point is obliterated by rod function.
Dichromatic spectral co-efficient curves A and hwere determined in terms of matching stimuli 470 mu and 660 mu with units based on a match of 582.5 mu. These curves (figure 21) show that the colour sensation changes from "blue" or "green" to "red" at 430 mu : the curves intersect at about 430 mu. It should be noted that the hj and. OA curves of Wrights tritanopes do not intersect at this point but on extrapolation would intersect at about 390 mu.
The spectral co-efficient curves of Fischer's tetar-tanope yield spectral mixture curves (figure 22) which differ markedly from the corresponding curves derived by Wright.
These curves can be regarded as approximate represen-tations of the two fundamental processes of the colour vision of their subject. If it is assummed that the defect is the result of the loss of the "blue" receptor these curves should represent the "red" and "green" fundamental response curves of the normal trichromat.
The 1"Ga curve is approximately similiar to the Vç curve derived by Wright from the colorimetric examination of his seven tritanopes. The V,Q has its maximum at 610 mu compared with 590 mu of the Wright tritanopes. There is a secondary mode at 43o mu suggesting that either the spectral sensitivity of the "red" receptor has been modified or that the loss model is not applicable. Fischer et al prefer not to speculate stating that "no conclusion can as yet be drawn as to whether indeed with the tritanope one normal system is missing, the remaining two systems being normal".

There is little chance that the defect exhibited by this subject is acquired visual acuity and visual fields were normal, normal matches were made with precision at the Nagel anomaloscope demonstrating that there is no con-comitant red-green defect and there was no past ocular history. The subject was sure that his defect had been present since childhood and there was the possibility that his paternal grandfather was also a tritanope.
It remains to discuss whether there is sufficient evidence or not to justify the diagnosis of tetartanopia.
The co-punctal point of the confusion loci was not determined by Fischer et al but this has been calculated now from théir dichromatic spectral co-efficient curves by the method adopted by Thomson and Wright (1953). The results of this calculation is shown in figure 23. The chromaticity co-ordinates for CIE 1931 chromaticity data are x = 0.1655 to 0.1690, y = 0.001 to .0065. This value is not greatly different from that calculated by Thomson and Wright (1953) who found a value of x = 0.1748, y = .0044 (for CIE 1951 data) using average data for the 7 tritanopes of Wright (1952). In order to permit a more valid comparison the co-punctal point of these 7 tritanopes has been redetermined using CIE 1931 data. This redetermination gives a co-punctal point at x=0.171 to 0.172, y=0000 to .002.
The co-punctal point for the Fischer tetartanope is consistent with desaturation of wavelengths in the vicinity of 430 mu and the appearance of "red" for wavelengths shorter than 420 mu just as the average co-punctal point of Wright's seven tritanopes is consistent with the absence of these features.
The neutral points of 580 mu for 2000° K and 570 mu for 4800° K are inconsistent with each other and the former is inconsistent with the co-punctal point determined. The determination of the spectral co-efficients is independent of pre-receptoral absorbtion whereas neutral point measure-ments using a comparison white light are not. The inconsis-tences could be attributable to pre-receptoral absorbtion such as macular or ocular pigmentation.
The absence of a second neutral point near 480 mu the position of the co-punctal point and the position of the neutral point for 4800° K are characteristic of tritan- opia and there seems to be no justification for consider-ing this subject a tetartanope.

- 3o -
This case is the only co-called tetartanope that has been investigated in precise colorimetric terms. The inves-tigation of the earlier cases leaves a considerable margin of doubt. Müllers zone theory of colour vision predicts the existence of tetartanopia (see p.60 ) but the practical information available is scant : what is available only suggests that tetartanopia may be tritanopia recorded on inaccurate apparatus. Judd, because of his advocacy of Müllers theory which predicts the existence of tetartanopia, appears to assume that tetartanopia does exist. However, in a personal communication (Judd 1964) he admits the uncer-tainty of the evidence and refers to possibility first raised by Sloan and Newhall (1942) that tetartanopia may be atypical achromatopsia misdiagnosed.

600 400 500
1.0 r,,
9a 0
700 mu
Fig. 21. Spectral Coefficients of the So—called Tetartanope of Fischer, Bouman and ten Doesschate (1951)
(Redrawn fro© k'ischer, et al, 1951).
X
Fig. 23. Portion of the CIE Chromaticity Diagram showing the Co—Punctal of the Tetartanope of Fischer et al, 1951 and the Co—l'unctal Calculated by Thomson & Wright (1533) (l'or 1951 CI.? Data).

sens
erg-
400T
400 500 6T00 mu
Fig. 22. Spectral Mixture Curves for the So-called Tetartanope of Fischer, Bouman and 'l'en Doessctiate (1051) (Re-Drawn from Fischer,et al,
1951)0

INHERITANCE OF CONGENITAL TRITAN DEFECTS
TRITANOMALY
The first tritanomal reported (Engelking 1925) had a phenotypically normal mother and two tritanomalous mater-nal uncles (Harting, 1926) ` uro 2-t-) . This suggests that the hereditary mechanism for tritanomaly is a six-linked recessive inheritance similiar to that for the protan and deutan colour vision defects.
This hypothesis has been disputed by Oloff (1935) who observed a tritanomalous female and by Schmidt (1945) who found a man and his daughter affected, which are unlikely findings for sex-linked recessive inheritance of a rare gene.
The tritanomalsobserved by Crone (1956) also detract from the hypothesis that the inheritance is sex-linked rece-ssive. the genetic entanglements of this pedigree (figure 25), do not permit any certain conclusions but subject 111 4 (case 5) presents all the classic characteristics expected of tritanomaly and is a female with a normal father and a mother with reduced discrimination in the blue-green. Her brother is a deuteranope and also has a concomitant trito-defect. the trito defect appears elsewhere in the pedigree and there are two instances where the defect must be trans-mitted from mother to son. Variations in the severity of the defect are to be observed in these cases of Crone and there is the definite possibility that the defect is incom-pletely expressed tritanopia. Crone himself regards the defect as such.
Kalmus (1955) considers tritanomaly to be frequently caused by sex-linked recessive gene but cites no evidence. Francois (1961) assumes that Kalmus arrives at this conclus-ion after studying the data of Wright 0952).
TRITANOPIA
Prior to 1955 it was common to assume on the evidence of the familial distribution of time Engleking-Hartung tritan-omals and the established mode of inheritance of the protan-deutan defects that tritanopia was also transmitted by a sex-linked gene.
Walls and Mathews (1952) commented "It may be assumed, until more information is forthcoming, that genes for tritan-omaly and for tetartanopia* are allelic at a "blue-receptor
Walls and Mathews (1952) use the term tetartanopia to mean congenital tritanopia.

I
2 3
Casa S Casa 6
t a 0-0"0" DQd
Da RI
Da d Oda
5 6 7 D 9 10 II 4 13 14 0 On iS 16
b o 17 IB 19
Da,
5
Case n a
I
®dd O^ 2 Casa
del
nl
t 12 10
n Cam 4
16 17 P IS
nn
13
Casa l M S t ô
20
a
D DEUTERANOPIA A COLOUR AMDLYOPIA
1 TRITO -DEFECT
d FACTOR FOR DEUTERO -DEFECT Da DEUTERANOMALY M MONOCHROMATISM n FACTOR FOR NORMAL RED-GREEN DISCRIMINATION
t FACTOR FOR TRITO-DEFECT
î7Ç. .2 S PED iç REE of ofoav (/9S6)

_ 3Z_
locus in the x chromosome". This view point overlooks the reports of affected women and observation of Fischer, Homan and ten Doesschate 1951 who found their tritanope to have phenotypically normal parents and a paternal grand-father wao was probably tritanopic (figure 26).
Kalmus (1955) investigated the colour vision of the relatives of Wrights (1952) tritanopes and four further cases he found independently. He presents 14 pedigrees and concludes that congenital tritanopia shows an irregular autosomal dominant pattern of inheritance and that one or more genes may involed.
This conclusion is not disputed but it is possible to be critical of his methods of investigation of tritanopias
A total of 49 tritans appear in his 14 pedigrees. Twelve of the 49 were found to have some form of tritan defect after testing at the Wright colorimeter and their diagnosis can therefore be accepted as beyond doubt. A further 8 tritans were established as such on the results of a battery of well validated tests and their diagnosis is also reasonably well assured. No diagnostic data is given for 8 persons deemed to have a "slight tritan defect". The remain-ing 18 persons were established as "tritanopic" or "probably tritanopic" on the basis of anamnesis (3 cases) or the Picture Post pseudoisochromatic plate together with a history and a test called the coloured squares test.
SEJ N S Anamnesis is doubtful evidence (see p. /O for an
example of how misleading data from case history can be). Wright (1952) points out that the Picture Po§t test cannot be accepted as infallible evidence of the existence of tritanopia as viewing conditions and age, among other factors, may influence the result. The validation of the coloured squares test is not entirely satisfactory. The coloured squares test was constructed by Kalmus following suggestions from Trendelenberg (1941) and Fischer et al (1951). The test is fully described by Kalmus and in an introductory description it stated that "The test consisted of a number of squares 1 cm in length of coloured paper gummed at the back which the observer was asked to arrange in daylight and to stick down in appropriate order on a chart on which the most saturated and the most dilute squares of every hue had been put in place before hand Several versions of the coloured squares test) were tried on a few colorimetrically ascertained tritanopes and the final versions was then sent out by post" (p43).

33
Validation data is shown in Kalmus' table 4 and it can be seen that 8 of 45 normals made one error in the blue-green series and 5 normals made one mistake and two made two mistakes in the pink-orange-brown. Errors made with the coloured squares test by the 17 colorimetically determined tritanopes are shown in our table 5. A surprising number of these tritanopes make no errors in one aspect of the test.
Kalmus takes into account the time taken to complete the test although it is extremely doubtful if this is of significance. His subject 18 (Kalmus Table 5) aged 84, made no erros but took 15 minutes to complete the test and is considered to be a "probable tritanope", a most doubtful conclusion.
The diagnostic value of the coloured squares test is small. Tritans may not be detected by it whilst normal subjects are likely to be incorrectly identified as tritans. A history of confusion of blue-green and the Picture Post test do not add much strength to the diagnosis, particularly when it is recalled that the administration of these tests was not always supervised, and that the discrimination of blues and greens can be impaired with age and ocular disease.
The Kalmus pedigrees can be redrawn to include those identified on this evidence alone and also those who do not appear at all in Kalmus's table 5(which gives diagnostic data) .
These are given in figure 27 in this form with an anal-ysis of the procedures used in diagnosing each individual in Table 6.
Pedigrees G, J, M, N can be dismissed as all members of these pedigrees supposed to be tritans have been diagnos-ed as such on inadequate evidence.
In the remaining pedigrees (ABCDEFEIKL) there are 20 members who are almost certainly tritans and of these there are 10 females and 10 males.
In Pedigrees CIF, I and K there are parents who must carry the tritan genotype since one or more of their off-spr-ing are definitely tritans. Whilst the diagnostic data for these parents is too scant to make a certain diagnosis, the fact that they are genotypically tritanopic and that there is some evidence of a blue-green defect makes reasonable the

TABLE 5 , y,
NUMBER OF MISTAKES MADE ON THE COLOURED SQUARES TEST BY 17 CERTAIN TRITANOPES. ADAPTED FROM
DATA OF KALMUS 1955 .
Blue-Green Pink-Orange- Both Brown
No. of Errors 0 1 2 3 0 1 2 3 0 1 2 3 4 5 6
No. of Tritanopea 5 5 5 1 5 4 4 3 3 2 4 2 3 1 1

II I I
1 2 T
1
1261
3131
I I 1 /(r29
l I
A
B
C
if 29 3Y
E
F
H 1
L
M N
• Certain tritan defect
• Disputed cases of tritan defect
® Probable tritan defect
Fourteen tritan pedigrees (data of Kalmus, 1955) modified to slow the Ind hors' interpretation of Kalrons's findings.
F74. 27

Tritanope or ex-tremely tritano- melon;
i Slight trite defect Tritanope
Tritanope
No data given t o
z p/o Insufficient evidence for diagnosis
Tritanope + — 0 2 Tritanope Tritanope + — Tritan Slight trito defect No data given
Deuteranomalous with perhaps a trace of trito defect
No data given
Perhaps some trace of trito defect
No data given
Tritanope + 2 I ply Tritanope Tritanope t o — Insufficient evidenc e
for diagnosis Slight trito defect No data given Tritanope — — 2 2 p(o InstltheIeilt evldenee
fo r diagnosis Some trito defect No data given 9
Tritanope Anamnesis Tritanope — + 0 1 Black Tritan
and navy
Tritanope + 2 0 — Tritan
Probably tritanopia + -- Tritan Tritanopio (L.E. only) — o c )Ib Insufficient. evidence
for diagnosis Slight trito defect Tritanope +
'Tests' and llnaHnlesls Y Tritanope + o o /?'o tatulpc•
Tritanope — + o o 'Crit an
Tritanope — + Tritan Tritanope + + Tritanope Probably a tritanope o Insufficient evidence
for diagnosis
Probably a tritanope o o 61gl Insufficient evidence
Tritanope ( I
2 for diagnosis
Tritanope + — I 2 — Tritanope 'Red-green' defect No data given Slight trito defect No data given
Probable tritanope I o
Tritanope 2 1 Blank, Insufficient evidence
and for diagnosis
nuvy
4' ;t
49
H. 3 11. ;
II. 6
24
Itl. l z6 III. z III. 4
F tt
F : o
M6 M 4
t ; 57
I. 6 n i
I I. z I zo II. 3 41 M 18
II. _; z c — II. 7 39 M 1 #
III. { ti
L. Ii. 2 64 F t 5
It. 2 32 M 12
I. z 6; F 16 I I. t 32 M 14
II. 2 30 — II. 3 26 M 5 Il. 4 24 F ;
I. z 54 F 13 II. t 59 M 18 Ii. z 32 M 13
I. 2 84 F 18
II. 54 M 24
II. 3 49 M 22 IIL 1 28 — III.6 19 —
I. 2 67 M 27
II. 33 M 15
Ta1,h A,nd3i.s t>f' the jmtrfsen pedigrees of Kalm us (1935). Fig. 1.
Ref. co. in
Kalmus 's Ago table 5 Kulmus'.s diagnosis
72 F 17 Tritanope or extremely tritanomalous
II. 2 54 F 12 Tritanope or extreme tritanomaly
Basis for diagnosis
Errors C.S.T.
Col. Bat. bigp/6 Hist. Revised diagnosis
+ +
+ + o o
ligree subject
A I.

Insufficient evidence for diagnosis
— 2 0
::t- ° J
pjo Tritanope Anamnesis
+ + 2 2
No data given
r o — Tritanope 2 3 p/o Tritan
+ + +
2 Insufficient evidence for diagnosis
Pedigree Subject Age
Ref. no. in
Kalmus's table 5
Table 6 (cont.)
Kalmus's diagnosis
H. 1 H 18' F z Tritanope 21'
II. 2 19 M 3 Tritanope
I I. 1 59 3I 26 Tritanope
11. 1 32 F 7 Tritanope II.z 29 J4 9 Tritanope [[.3 z6 F; Probable tritanope
III. I 31 J F 6 Tritanope
111. 3 zh F 5 Tritanope
K 1 I I)eae l -- 'tritanope Il _ bo F 1; Tritanope I I. - 55 -- Slight trito defect
L I. 31 31 to Tritanope II. 1 9 F 1 Tritanope
M 1- 1 55 H 25 Tritanope
11. 3 8 3[ 1 Probable tritanope
L 1 i3 b119 Tritanope
1I . I Io M s9 Probable tritanope
Basis for diagnosis
Col.
+
Bat.
+
Errors C.S.T.
b/g p/b
2 0
2 3
Hist.
—
—
Revised diagnosis
Tritan
Tritanope
0 3 Insufficient evidence for diagnosis
+ 3 3 plo Tritanope + + 2 0 Tritanope
2 2 Insufcient evidence for diagnosis
— 3 1 p/o
— o } Insufficient evidence
p/o
for diagnosis
Key to Table 2
T111s table- ineInsies all persons who appear in Kalmus's pedigrees as having defective colour vision. Reference number is that by KalrituA to those subjects who are listed in his table 5.
Basis for di jnari.n. The data appearing in these columns were obtained from Kalmus's table 5 and his comments on the Pedigrees-
Col. indicates that the diagnosis was based on the Wright colorimeter. B. indicates that a battery of well-validated tests was used to substantiate the diagnosis. E•rore C.S.T. refers to the number of errors on the coloured-squares test. b/g indicates the blue-green confusions and plb the
∎ink-brown confusions. Hist. refers to history of colour confusions (p/o = pink-orange confusions).

assumption that they are tritans. There are four such instances, 3 male and one female.
In pedigrees A, B and H there are tritans who appear to h=.ve phenotypically normal parents. However, in pedigree A, I2, who is very likely to be the carrier since her sister I, 1 is a tritan, is dead and nothing is known of her colour vision. Similiarly, in pedigree B, I2 is dead and nothing is known of her colour vision. In pedigree H, one parent was shown to have normal colour vision but the normality of the other is established by anamnesis only. In the Kalmus pedigrees there is then no instance of a tritan with both parents conclusively shown to be phenotypically normal.
Contrary to Kalmus' conclusion that the gene demonstra-tes irregular dominance his pedigrees examined critically suggest high penetrance.
The inheritance appears to be dominant although there is only one pedigree (A) with three generation of affected members. In pedigree C there are possibily three generations of tritans.
The sex ratio suggests that that it is autosomal and not sex-linked dominance. In the original Kalmus pedigrees there were examples of transmission from father to son (B, G, 17 M and N) which would exclude the possibility of sex-linked dominance but in each of these five instances the diagnosis of at least one member of the father-son relationship has been disputed. In pedigree B, 12, has three daughters with tested normal vision and in pedigree C, I1 who could very probably be a tritanope since he has an affected daughter, has a daughter II 4 with normal colour vision. It is there-fore very unlikely for the inheritance to be by a sex-linked auteoec.l character.

-3s-
Comment
Tritanopia is almost certainly mediated by a domin-ant gene. Because of the well known sex-linked recessive inheritance of the protan-deutan defects the dominant mode o of inheritance of tritanopia might be thought surprising. However, typical congenital chromatopsia is inherited through an autosomal recessive factor although Haldane places the gene on the paired segment of the sex chromosomes. (Franc-ois 1961).
On the other hand the classic red-green defects are not really recessive. Francois (1961) states that they are v very incompletely dominant with high penetrance. The subs-tance behind this statement lies in the nature of the pheno-type of the simple heterozygote. One woman in seven must be a heterozygote and a carrier, and should in theory be pheno-typically normal. Occasionally a simple heterozygote will be affected by the abnormal gene. Affected women with normal fathers have been reported and 8 instances are reviewed by Francois (1961). Furthermore, there are small clinical signs of heterozygosity. These are increased scatter of matches and small displacement of matches at the Nagel anomaloscope, an elevation of saturation thresholds and Schmidt's sign. This last symptom is a displacement of the maximum of the luminosity curve toward the red in carriers of the genes of the protan series.
The simplest and most generally accepted theory explain-ing manifestation of an abnormal gene in a simple heterozy-gote is that of variable dominance or variable manifestation. The defect although generally recessive can sometimes become dominant.
Tritan Defects Associated with
mer Colour Vision Defects
The conjunction of a tritan gene with genes of the protan or deutan series can have two effects : (1) the phenotype can be an expression of both genes, the defect having characteristics representative of both, or; (2) the presence of the tritan genotype can alter the usual dominance relationships of the protan and deutan alleles.
(1) Mixed Dhenotvoes,
The presence of both the tritan gene and one or more
'I'See following page for genetic symbols used in this section,

-3h-
Symbols for Genotype and Phenotype
COLOUR VISION PHENOTYPE SYMBOL
GENOTYPE SYMBOL
Protanopia P a3
Extreme protanomaly EPA a2
Protanomaly PA a/ Normal N A
Deuteranopia D b3
Extreme deuteranomaly IDA bz Deuteranomaly DA b, Normal N B
Tritanopia T t
Tritanomaly TA t1
of the pathological protan or deutan alleles may find
expression as either:
(a) atypical monochromatism (achromatopsia without amblyopia) or incomplete atypical monochromatism.
(b) a protan or deutan defect with concomitant blue yellow deficiency.
(c) chromatic amblyopia
(a) atypical monochromatism
Pitt (1944b) describes a subject who at the Donaldson Colorimeter could match any colour with any other colour and who had a relative luminous efficiency curve very similiar to the so-called green fundamental sensation curve. There was no photophobia, nystagmus and acuity was normal. Pitt regarded the colour vision of this subject to be the result of the absence of the "blue" and "red" fundamental sensa-tions, the subject being a "double dichromat", both a protanope and a tritanope.

König (1894) had reported a similiar case with maximum of the relative luminous efficiency curve at 540 mu.
Sloan and Newhall (1942) describe an achromat with a deuteranopic luminosity curve.
Pitt (1944b) argues the theoretical possibility of two types of atypical monochromats, one resulting from the combination of tritanopia and deuteranopia, the other from tritanopia and protanopia. These are type 1 and type 11 respectively and are characterised by "deuteranopic" and protanooic" luminosity curves. The existence of tetartan-
opia he prefers not to admit and since deuteranopia is con-sider_' by trichromatists such as Pitt to be the result of the fusion of the G' and R' sensations monochromatism from the combination of deuteranopia and protanopia is not pos-sible.
It is apparent that Pitt wants to establish the trich-romatic theory as adequate in explanation of the two known types of atypical monochromatism. The Muller theory (see p. 60) predicts the first form by the failure of the r-g and y-b processes and the second form by the additional failure of the yR - gB process.
Judd (1949a), without supporting evidence, states that both types are the result of congenital red-green defect upon which is imposed acquired tritanopia. Subsequent gene-tic evidence shows that both may be congenital although monochromatism from acquired processes cannot be denied (Francois and Verriest 1961).
:cone (1956) describes two monochromats, one complete and the other incomplete, who appear in a pedigree suffic-iently extensive to allow reasonable inferences as to their genotype. (figure 25)
The first case (case 2, 11 10) has normal acuity, no photophobia and, no mystagmus and with no ophthalmoscopic signs which might suggest the defect is acquired in origin. All spectral colours could match with white, and it can be inferred that the subject is a heterozygote for two allelic
40f the 20 or so atypical monochromat reported.not all can be considered to be "double dichromats". (Crone 1956).

-3g-
genes and a third non-allelic pathological gene. She has a deuteranomalous son, a deuteranopic sister and another sister who has a tritanomalous daughter. Genotypically Abd Ab t can be inferred and it is litely that the mono-chromatism is the result of the combination of deuteranopia and tritanopia. This is supported by the luminosity curve maximum at 570 cru. It is difficult to see why Francois (1961) puts the alternative hypothesis of a conjunction of the tritan gene with a protan type except that he may have been misled by the error by Crone (1956) who describes his case 6, a male, as a "heterozygote for protanopia with an associated trito-defect" when he is obviously referring to case 3.
Crone's second atypical achromat is the son of the first and probably has the genotype Ab,t or Ab3 t. Since he had colour discrimination for larger surfaces and was monochrom-atic only at colour mixing apparatus the diagnosis was incom-plete achromatism.
(b) Protan and deutan defects with cox omitant blug-yellow deficiency.
The observations of Jaeger (1951) proved to be a genetic puzzle (figure 28) and it is not proposed to add hypotheses to those of Jaeger (1951), walls and Mathews (1952) and Fran-cois (1961). It is sufficient to note that from the marriage of a DA man and a woman heterozygotic for a3 (she has a P brother), three children were born : one P son and two daugh-ters who are necessarily mixed heterozygotes for a 3 and b/ One of these (112) was considered by Jaeger to be atypically deuteranomalous and tritanomalous. She made no erros on the Ishihara but made mistakes on the Stilling-Hertel plates for blue-yellow defects. She could not make a match with the Rayleigh equation but the best match was too green compared with the normal. Genotypically she would seem to be Ab/ a3 Bt.
Her sister, 114, with presumably identical genotype was protanopic and had some disturbance of "blue-yellow" perception as did the protanopic son of 112 (a3 Bt). The appearance of tritanomaly in the son precludes the possibility of the tritanomaly appearing as something new from the com-bination of a3 and b,

III YAa
t et YAbt_
3
Ya
2 iv
AB
t
A13136 ,,/((
2 7 (J
t
II iCi'f
Ab; .43 8 Ya3 8
2,
3 11111.1
YAbt
Deuteranomaly Carrier
o
0
protanopia t Additional tritan defect
Fig 28 P.diigroe presented by Jaeger (1951) after Walls & Mathews (1952). A, normal allele; 1,. ,a l• i• t,x protanomaly; a t. allele for extreme protanomaly; a3, allele for protanopia. 13, normal allele: t. allele for (1. utero notnaly ; 6„ allele for extreme deuteranomaly; b3, allele for (let it t!ra opia.

_3?-
Walls and Mathews (152) question whether Jaeger's subject 1,], 2 is genuinely tritanomalous. They describe a non-allelic heterozygote JoB (p146 - 149) who has two sons who are dichromatic but whose diagnosis is uncertain. They were diagnosed in these terms : "Each brother can be considered to have protanopia in its entirely and also a standard deuteranoid defect in its entirely". Accordingly Jo B might be genotypically Abs a3 B and should be pheno- typically normal.
Certainly no errors were made on the Ishihara but at the anomaloscope she preferred a slightly deuteranovalous Rayleigh match and exhibited a deuteranomals contrast phenomenon. Brightness of the yellow was depressed but this may not be significant since naive observers frequently over-estimate the brightness of the yellow.
She failed a number of the Stilling-Hertel plates but many of the errors were easily attributable to the brevity of the exposure of the plates and the ambiguity of some of the numerals. There were some genuine mistakes.
`galls and Mathews think that there is insufficient evidence to warrant the diagnosis of simultaneous deuteran-omaly and tritanomaly and_xonder whether Jaeger had better evidence for his subject 11, 2. The implication is that they doubt the validity of Jaegers DA+t and consider that the defect in both cases is a partial expression of the compound genotype.
Crone (1956) in the pedigree (figure 25) already dis-cussed in part, found a simple hemizygote for b3 with concom-itant blue-yellow deficiency, The blue-yellow deficiency cannot be denied. There was an abnormal anomaloquotient for the equation 480 + W = 513 + 455 (0.4 to 4.5) and there were 3 mistakes on the Stilling plates. The subject was clearly a deuternope at the Nagel anomaloscope and there was a neutral zone at 498-501 mu, The subjects sister is tritanomalous, and the genotype is probably Ab3 t
(c) Chr.emat is amblvooia
Two cases with colour vision described as colour amblyopia are members of the pedigree given by Crone (1956). For the first (case 1; 11, 5) there seems no reason to think the defect is acquired since acuities and dark adaptation were

normal and no abnormalties were found on ophthalmoscopy. The Rayleigh and tritanomalous equation were normal but with an increased range and atypical errors (18 mistakes were made) were found with the Ishihara and 3 with the four Stilling tritan plates. Maximum of the luminosity curve was shifted slightly toward the long wave end (575 mu), wavelength discrim-ination was greatly reduced throughout the spectrum and purity thresholds were raised.
The second case (case 3, 11 11) is also unlikely to be acauired and presents almost identical characteristics but the luminosity curve maximum is shifted to the short wave end and lies at 540 mu. This is the only instance in the pedigree of a short wave shift for the luminosity curve.
The first case is likely to be heterozygous for either deuteranopia or deuteranomaly because of the appearance of both the defects in her relatives. The reduction of blue-green sensitivity suggests the presence of a tritan gene and this is supported by tritanomaly occurring in her daughter.
A simple heterozygote for one pathological gene should be phenotypically normal apart from the minor signs of heter-ozygozity commonly observed. It seems the conjunction of the two genes for a heterozygote produce a marked disturbance of colour vision which is well described by the term "chromatic amblyopia".
There is less evidence for inferences about the geno-type of the second case. The protan shift of the luminosity curve suggests that she is heterozygous for a protan defect but the source of this gene is unknown. Crone regards her as a heterozygote for protanopia with an associated trito defect.
(2) Changes in penetrance and exnressiyity of protan anti deutan detgcts apparently casgd by the presence of a tritan gene.
Subjects 11 5 and 11 11 of Crone (1956) are heterozy-gotes for a pathological gene of the protan-deutan series and show a more marked expression of the gene than is usual which can be assumed to be due to the presence of the additional gene for a tritan defect. Subject ] 7 of the same pedigree shows changed dominance relationships. This subject is infer-red to be a homozygote for deuteranomaly and deuteranopia and should be deuteranomalous but is a deuteranope. Similiarly homozygous subject, 10, is likely to have genes for deuter-

anomaly and deuteranopia with the additional tritan gene. This should yield a phenotype which is a combination of deuteranomaly and a tritan defect but the subject is mono-chromatic suggesting combination of deuteranopia and tritan-opia. This may not necessarily be a correct argument for Beale (1953) reports an atypical monochromate (type 1) heterozygous for protanomaly or extreme protanomaly and deuteranomaly.
Subjects 11, 2 and 11 4 in the pedigree of Jaeger (1951) can be considered to be heterozygous for twoon-allelic pathologic genes (with a gene for tritanomaly). Both should be phenotypically normal. One is atypically deuteranomalous and the second is a protanope. The tritanomaly may be an expression of mixed heterozygosity as Walls and Mathews (1952) suggest or the expression of the abnormal genes may be due to the presence of the tritan gene.
It is known that other pathologic genes may cause variations in expressivity of genes for colour vision defects. Macular degeneration is associated of abnormal colour vision in simple heterozygotes (see Francois 1961), although the macular degeneration itself is associated with an acquired R-G defect which raises doubts in diagnosis of these cases. The gene for pigmentary retinopathy also appears -to sensitize the gene for abnormal colour vision.

-4L2-
FOVEAL TRITANOPIA
Vision of normal subjects is dichromatic and tritanopic with small targets imaged on the fovea. Under the same con-ditions Drotanopes and deuteranopes become monochromats (Willmer 1949 alb).
König (1894) is usually acknowledged as the first to report this phenomenon although Karplus (1947) pointed out that Hering had shown already in 1893 that the validity of colour eauations is limited and are not always valid on very large fields or very small fields. Hering had shown that more blue was needed in blue-green mixtures when small retinal fields are used, although Helmholtz was aware of these facts even before Hering : and before Helmholtz, Lucretius -
"Cloth of purple is shedded; when teased into separate fibres,
Then purple and scarlet, by far the most brilliant of colours,
Are quite effaced"
Willmer (1944) rediscovered the phenomenon at a time when most researches in the subject had either ignored or were ignorant of both Königs results and Hering's discussion of them (Karplus1947) despite the fact, well known in railroad signalling and lighthouse services, that purple, blue and yellow were unsafe at a distance. Willmer and Wright (1945) subsecuently extended findings on foveal tritanopia using the +fright colorimeter. They measured relative luminous efficien-cy curves, dichromatic co-efficients, hue discrimination and calnulated spectral mixture curves for a 20' field with central fixation.
Hartrfdge (1945a,b) investigated the sensitivity of the fovea with a seriesof small yellow-painted test objects and compared this sensitivity with that of the surrounding retina. He concluded that retinal position is of no importance and that it is reduction of size which initiates the effect of "tritanopia". Following this Thomson and Wright (1947) recor-ded characteristics of vision for a 15' test field imaged 20' and 40' from the centre of the fovea and compared these results with those obtained with central fixation. These results are shown in figure 29. They found that vision was dichromatic and tritanopic for each fixation condition confirming, as far
• Lucretiis (96-55 BC) De rerum natura, liherf, sectio 29 quoted by Farnsworth (1 955) .

0-44 C-+A O W o-fl 044 0- 56 0. 58 040 Wa.rleesth (r-)
Asoshivfsy curves far L C. T.
0-6t 0-66 o-64
2
2
2-
2-
1-
1.4
ta
/1 ,i... 044µ
x r
>-
v-
>~
1 1
J
a 0-46µ
X
•
X
1 1
048µ
/• • X
k
1 l
•\
0•61µ
•
X 1C 1
0-63µ
e •
Y/1
0-65} -, 'J 4
• \ "
X 1 l,,
c 20' 40 c 20 40' c 20 40 c 20' 40' c 20' 40' c 20' 40' Displacement
The relative brightness of the test patch in the three retinal positions for .ix wav♦lsnt at the ' tails' of the luminosity curve. Central brightness adjusted to unity. Crosse., W. D. W.1 dot., L C. T.
1 I
7r !,---'
-r-- _
4
i
I
, ___
_ • \l J
'44 , 46 0. 4' J• 5J C•5: ß`•S4 0. St,
Wave-length (s.)
Ihchromatic coefficients. Full curve, central; crosses, 2W; dots, 40'.
0-58
C*M l}60
Fig. 29a. C`Iaracte.i•istics of Fovea! Tritanopia (Thomson & Wright, 1't7,.

0.46 0.4.s 0,52 0.54 0-56 0-58 Wave-length (p.)
Fi¢ 11. W.D.W. Hue-discrimination curves.
0.50 J 60 0.62 064
l3tnf 42t✓
Centre ' _
VAAL
,' I " `
',,„‘
,
Kcd
41f
Apr'
dri oa
.■
\\
\\
Z Cfmre
46 048 0'S0 ß.. Q 0.54 0.56 0.58 Ofi0
Wave-length (p.)
V1'.D.W. Spectral muturc curves.
008
0-06
4 0-04
002
40'
, ,2 ll
1 rntre
■ Mi, I
■ -'` ,
- II
■■M.■■■■■
111112 41Î ■.
E`. -r%\ ► . ' =
-, 0 . , 54 60
Wave-length (s.)
Fig. 12. L.C.T. Hue-discrimination curves.
Fig. 29b. Characteristics of Foveal Tritanopia (Thomson & Wright, 1947).

-443-
as these results go, Hartridges observation that retinal position is not important. According to Gilbert (1950) dichromatism similiar to that of the centre of the fovea can be ellicited from a point 4° from the point of fixation when the luminance is less than 1 troland, suggesting not only that the effect is not confined to the fovea but also that luminance is of significance.
In fact Abney (cited by Hartridge 1950) had already shown that as light intensity is reduced the spectrum is shortened at both ends and that yellow of 570 mu becomes white, and blue of about 470 mu becomes dark grey. Blue-green and a purplish red were found to be invariable and retain their colours after others have become colourless. Hartridge (19)+5b) showed that the visual angle at which a blue or yellow test colour suffers loss of colour depends on illumination and he gives results illustrating a form of re-ciprocation between field size and illumination although his data is not in a form to facillitate the test of formulae, nor did he compare the loss of blue-yellow discrimination relative to losses of red-green discrimination.
Farnsworth (1955) in an attempt to advance this hypo-thesis that "foveal" tritanopia is a function of both retinal luminance and the area of stimulus has drawn together 9 relevant reports including some unpublished data obtained at the Medical Research Laboratory, New London. These data he reduced to common units, as far as this was possible, and found that when plotted for retinal illuminance against area of the test field, the tests which gave tritanomalous results could be separated from those which gave tritanopic results by a line with a slope of 1.
3edford and Wyszecki (1958a) measured wavelength discrim-ination for 10, 12' and 1.5' test fields at luminance levels much higher than previous work, They found little or no tritanopic effect. One reason for this could lie in the view-ing technique they employed.. Whereas previous workers had fixed their gazd on the field Bedford and. Wyszecki used a scanning technioue. McCree (?960a) did find that effects from steady fixation did tend to be tritanopic. In a second paper, McCree (1960b) made a further set of measurements to see if tritanopic confusion occurred with small fields without steady fixation. He found hue discrimination intermediate between those of Wright and those of Bedford and Wyszecki. This can be attributed to the fact that the luminance of McCrees targets

was lower than that of Bedford and Wyszecki. However, iicCree does point out that at 150 trolands with a 15' field he found that wavelength discrimination was reduced much more than the nearest equivalent conditions of Bedford and Wyszecki. Evidently there are individual differences amongst observers, and further work relating the phenomenon to retinal luminance and field area with larger numbers of observers is recuired.
Thomson and Wright (1947) found that the characteris-tics of "foveal" tritanopia varied when differing parts of the fovea were tested and suggested that vision will become trichromatic if fixation is not controlled. The scanning techni ue of fixation must therefore produce results which are contaminated by differing parts of the fovea being sampled. For this reason a tritanopic effect may not be obtained. On the other hand according to McCree staring fixation will produce adaptation effects which tend toward tritanopia. McCree suggests in the light of his own results and those of Bedford and Wyszecki that the existence of small field tritanopia can no longer be taken for granted. Perhaps Kohlraush (1955) was not far from the truth when he stated the radical view that small field tritanopia is an artefact due to the eye not being fully adapted.
MECHANISM OF "FOVEAL" TRITANOPIA
Within the framework of the trichromatic theory the dichromatism demonstratable with small fields suggeststhat there are only 2 effective receptors or two effective path-ways. The phenomenon was originally thought to be confined to the fovea and the fovea was known to have a different receptor population from other parts of the retina, a con-junction of facts which suggests that the rod is the blue receptor. Willmer (1946, 1949c, 1955) has argued that the 2 receptors pathways at the fovea are cone-midget bipolar pathway and the mixed rod-cone-flat (or brush) bipolar path-way. The cone-midget bipolar pathway he considered to be the "red" mechanism and the rod-cone-flat bipolar pathway to be the "green" mechanism. The "blue" mechanism Willmer thought to be mediated by the rod-mop bipolar pathway which is extra foveal. Hartridge (1950) dismisses Willmers explanation partly on the ground that most parts of the fovea and all parts of the para-fovea have a good rod population, but Hartridge does not seem to realise that Willmers hypothesis is based not on the

-4-s-
assumption of a rod free fovea but on the histological evi-dence that within the fovea rods and cones are both connected to the flat bipolar. None the less Willmers explanation of small field tritanopia flounders on the appearance of the phenomenon well beyond the centre of the fovea and its depen-dence on the size and luminance of the test field rather than retinal position.
Hartridge (1950) has suggested that retinal colour receptors lie in clusters of the same type, the clusters resulting from chance association, At the fovea, the green receptor he considers to cluster in a T shaped group some 15 cone units horizontally and 10 cone units high. A simi-liar idea is associated with Granit's (1947) dominator-modu-lator hypothesis in which modulators are responsible for colour perception and dominators for luminosity. Modulators are comparitively rare and are presumably scattered in a random fashion so that with small fields only a few modulators may be stimulated. Cluster hypothesis provides an obvious explanation for small field tritanopia and some support for it comes from the work of Thomson and Wright (1947) who found different visual characteristics for central and slightly eccentric fixations (see figure 29).
Hartridge (1950) has advocated a polychromatic theory of colour vision and has embodied in it an alternative explan-ation of "fovea" tritanopia. Seven types of receptors are postulated, a "crimson" receptor which'has responses in both red and violet; an "orange", a "green" and a "blue-violet" which are the same as those of the Young-Helmholtz theory; and in addition "blue" and a "yellow" receptors. With reduc-tion of visual angle or intensity of the stimulus the yellow and blue receptors lose their function so that blue and yellow tend to become achromatic. With further reduction of angle or intensity the orange, green and blue-violet follow, leaving in operation the crimson and blue-green only. This is illustrated in figure 30.
The concept of multiple receptors which lose their function at different times as visual angle or luminance is reduced implies that each receptor type has a different threshold.
It was Farnsworth (1955) who proposed for the first time, a definitive hypothesis to clarify the experimental findings and discussions of Hartridge, Willmer, Wright and Thomson who had since 1945 talked around the concept of colour receptors having different thresholds. Farnsworth

3 6 to II
To show ,e,i degree of activity of the different types of rc -' r in the different phases of human ytiwxi. \r - ,-Moor :receptors are in an active condition. .w _. _ t , light intensity being too low or visual anile ( •. st “Meet too mall. At l'=) colour perception IS j'.: cDmmccing. .1t (a) there is dichro-matic red _biuegreen—regi vision. At (4) normal tIx3► rDmatic sisaon is -on1niencing• At I•;) there is the transition from dichromatic to full triet(ro mati- vision. At (6) there is full trichromatic vision due to the orange, the ,rrcen and the blue. iolet receptors of the tricolour uni• flit the red, the yellow, the bluegreen, the blue receptor: play a subsidiary pa rt. This is the type if entour vision observed at the fovea when light mgmsuty is good and the test object subtends it the eye a visual at_le of about two degrees. At (7) the tricolour unit is less effective and the yellow and tt•e blue receptors more e-fT,-et1ve. This type of vision rs ren in the fovea at rather high light intensities of Ianamination and in the near leer,phery at normal ight intensities. At gai there is .tcbrortiatic yellow-blue vision. This t. ;.• of vision is ., .•n at the fovea at high intensities and in tige IIerIpIer. of the retina at medium light intensities. At (9; ,calif lo i dichromatic vision is raieng and at 111 i there e olourless vision. This is
, .1.1.1 at the fovea with ser, -ritense illumination and in ext reme peripher. the retina at ordinary
inter•-ities ..t :Rumination.
TilE POLY C'11K0:11ATIC TNEORY
Fig. 30. The Polychromatic Theory (Hartridge, 1950a),
R
Fig. 31.
f (S )
. Schematic representation of different functions relating response to stimulus energy in the three-paired neural systems.
(Hurvich, D. 1960).

_4
took the view that neither "foveal tritanopia" nor "small field tritanopia are adequate terms to subsume the experi-mental results that have been reported; both represent a too limited approach to the phenomenon. He proposed the phrase "threshold tritanomaly". The tritanopic effect bp considered to be constant for a given total luminous energy as represen-ted by the product of stimulus area, intensity and duration (A.I.t). In terms of a simple physiological model for colour vision the degree of threshold tritanopia or tritanomaly be-comes a function of the proportion of blue sensitive receptors to other receptors responding to the stimulus. This requires there to be a higher threshold of response for blue than for red and green, so that the quantity (r+g) changes less with reduction of total flux than the quantity b. This idea is not unique; a reciprocal relation is known to hold between area and inten-sity for other visual functions such as absolute threshold and incremental threshold.
The same hypothesis has been expressed by Hurvich and Jameson (1955, 1957, 1958) in a more explicit form and with specific reference to the opponent colours theory of colour vision. They assume that the white-black, blue-yellow and red-green opponent processes do not have equal rates of response to change in intensity of stimulation nor do they have equal thresholds. These assumptions are visualized in a schematic fashion in the manner shown in figure 3/.
This representation accounts for "foveal tritanopia" (Hurvich and Jameson 1958) and for hue and saturation changes that take place at high intensities of stimulation.
The threshold hypothesis has been tested by McCree (1960b) and while his results substantiate the idea of recip-rocation of luminance and field size there is one point of note. The effects of lowering luminance level are quite different from those which resulted from decreasing field size. Relative to the normal hue discrimination, the curves for low luminance and same field size show a shift of the blue-green maximum toward shorter wavelengths whereas the curve for reduced field size and same luminance shows marked increase in confusion in the blue-green compared with that in the yellow red.
Whilst rarnsworth's threshold concept provides a reason-able working hypothesis it is clear from the data of McCree that it is not an entirely adequate theory and that further research is necessary.

- 1/-7 -
The work of Stiles (referred to in detail below) in which spectral threshold curves are derived for various foveal mechanisms largely confirms the feasability of the threshold hypothesis of foveal tritanopia since the blue mechanisms derived by Stiles have a higher threshold than other mechanisms. The fact that these mechanisms are modi-fied at high intensities (Marriott, 1962) may well account for the differences McCree has observed.

ACQUIRED TRITANOPIA
That tritanopia can be acquired as the result of eye disease has already been remarked and the possibility that the cases of tritanopia reported in the literature are acquired and not congenital has been considered in the present review of these cases.
Acctuired deficiencies of colour vision were known late in the nineteenth century. There is a report in the Proceedings of the Royal Society of 1892 (Cox 1960). In Helmholtz's Phvsi.loeIcal ODtics (1909) there is an exten-sive colorimetric study of a colour vision defect ellicited by the ingestion of santonin and König's acquired tritan-opes have already been described (p 9 ). Koellner reviewed the existing literature in 1912. The most recent review is that of Francois and Verriest (1961) who t -emselves have made a considerable contribution to the study of the acquired colour vision defects. Verriest (1963) should also be consul-ted.
This review of Francois and Verriest (1961) is compre-hensive and removes the need for an extensive review here. Only differences between acquired and congenital defects and the known characteristics of acquired tritanopia are summarised for completeness, and to allow evaluation of cases of tritanopia considered congenital.
The main differences between congenital and acquired dyschromatopsias are:
(a) The severity of the acquired colour vision defect will vary with the course of the causative disease. Unlike the congenital forms the defect the two eyes are frequently differently affected. The defect may be unilateral.
The colour vision may affect only part of the visual field.
Cox (1961) observed a 20 year old patient who had a small absolute scotoma and a 1a9* one for red from a prior attack of retrobulbar neuritis. Vision was less than b/60. No colour vision defect was present
Congenital unilateral defects have been reported, for example the un lateral deuteranope AJC (Hecht and THsia, 1958) and Herman Goldenberg who may have been either a unilateral deuteranopia or unilateral protanope, (walls, 1958) but are rare.

with extra-foveal fixation. Three patients with retrobulbar neuritis were exam-ined by Cox at intervals during the recovery from their attack. She noted that initially the confus-ions with the FM 100 were anarchic but resolved into a deutan defect with improvement of visual acuity.
(b) In acquired defects other visual functions such as visual acuity, dark adaption and CFF will be abnormal.
Francois and Verriest (1961) consider that acquired defects are to be found in nearly every patient with lowered acuity resulting from eye disease. Cox (1960) presents a distribution curve for 103 patients with an acquired defect and this is reproduced in figure 32 Most have reduced acuity.
(d) Colour naming errors will be marked in an acquired defect. In congenital defects even dichromats shown a remar-kable ability to describe colours correctly having learnt to use seccndary cues. In acquired defects chromatoptia may be observed if the defect is of recent origin.
(e) Colour contrast phenomena are reduced in acquired defects. In congenital defects they are normal or exaggerated. For ex ample the contrast phenomenon of the deuteranomal includes yellow appearing green when viewed against red. (Subject Jo,B Walls and Mathews 1952).
(f) At the colorimeter an acquired defect may be demonstrated to be an absorption system or, more likely, a reduction system. In an absorbtion system, when various mono-chromatic wavelengths Aß,,î2 , A3 ----are matched by a mixture of two wavelengths, /\,,,+ X6, the anomaloquotient; A/6 . A6/,n
will be constant. In a reduction system, the normals' matches will be accepted by the affected subject.
An acquired defect will never be an alteration system (Francois and Verriest 1961). An alteration system is iden-tified by an anomaloquotient for various wavelengths which is not constant.
CHARACTERISTICS OF ACQUIRED TRITANOPIA
In the trichromatic stage of acquired tritanopia there are confusions of some purples, violet, blue and green. There is no neutral zone in the spectrum. At the Nagel anomaloscope,
Principle source of this summary is Francois and Verriest (1961).

number of persons tested plotted against
v ■ suol acuity
`no.of defective patients
6 6 6 6 9 1 2 tg 24
6 36
6 60
6 60—
6 6 6
,m()er - . t' tested L "f: `Ju"n"'
nut
rio. 32. Cases of
0
0 30 70 90 oge n years
Distribution of Visual Acuity in Acquired Colour Vision Defects
(Cox, l95l) .
e
(«)
Fig.33 Frxi 100-I lue. Typical tracings for:
(u) the trich romatic stage tif acquired blue )eliow blindness (from a case of closed-angle glaucoma monopolar tracing).
(Francois & Verriest, lt,961) .

the Rayleigh match is normal or slightly protanomalous. With the Farnsworth-Munsell 100 Hue test there is typically a monopolar bulge at chip numbers 48-50 (see figure 33) while the Farnsworth Dichotomous test, Panel D 15, shows simple transpcttions and occassionally diametrical. transpon-tious (figure 34). The Farnsworth tritan plate is seen normally and atypical errors are made with pseudo-isochro-matic plates.
In the dichromatic stage there is a spectral neutral zone between 550-580 mu and near 465 mu. This has already been considered in relation to the discussion of tetartan-opia. The Rayleigh equation is widened and tends to be protanomalous. The 100 hue test shows a bipolar error distribution (figure 35) which may not be typically tritan in axis. It may swing to a tetartan axis or be deutan - tritan in its axis. Panel D 15 gives a tritan axis but this also may atypical. The Farnsworth plate is read normally. A concomitant red-green defect may be found and this also had been considered in the discussion of tetartanopia. The red-green defect can lead to achromasy. Dark adaptation is frequently impaired in acquired tritanopia.
It has been claimed that the luminosity curve - is truncated at the short wave end of the spectrum but a has since been found that it is the long wave half that is depressed (Cox 1960, Francois and Verriest 1961).
DISEASES CAUSING ACQUIRED TRITANOPIA
Acr,uired tritanopia would seem slightly more common than acouired red-green deficiency. Cox (1960) found 56% of her patients to have an acquired tritan defect and Fran-cois and Verriest (1961) found 58%.
Those diseases processes which affect the outer layers of the retina give rise in general to acquired tritanopia. Lesions of the inner layers of the retina and of the optic nerve give rise to a red-green defect.
This general rule is substantiated with few exceptions by recent investigations. The following list of diseases

causing acquired tritanopia is drawn from Francois and Verriest (1961) .
2 retinitis pigmentosa 2 juvenile degeneration of the retina senile macular degeneration3 retinal siderosis myopia gravis retinal detachment chorio-retinitis t oedema of the macula
s central retinitis hypertensive retinitis diabetic retinitis occlusion of retinal vessels glaucoma-7 chocked disk papillitis2 8 secondary optic atrophy drusen of optic nerve head heriditary optic atrophy traumatic optic atrophy
1. Not invariably. 2. Non-pigmented form gives RG defect. Francois and Jerriest (1961) consider that those cases which do give rise to a B-Y defect are cases of typical retinitis pigmentosa. 3. Especially the exudative and haemorrhagic Junius Kundt type rather than the atropic type. 4. Both the active form and pigmented cicatrical lesions. 5. Chorodoretinitis centralis serosa has been extensively reported as the cause of tritan deficiences. 6. Occasionally a RG defect (Cox 1961, one case in 3) . 7. Occasionally a RG defect. Francois and Verriest, report 1 case in 19 cases of open angle glaucoma and 1 case in 25 closed angle glaucoma with RG defect. 8. Often RG defect.
MECHANISM
The study of acquired colour vision defect may well provide another avenue of investigation in the elucidation of colour vision mechanisms. However, no acceptable explan-ation have yet been proposed to explain why outer retinal lesions cause a blue-yellow loss and optic nerve lesions

S2 -
interfere with red-green discrimination. Verriest (1960) (ref. Francois and Verriest 1961) has suggested that retinal lesions may result in selective absorption of short wave-lengths and that the tritanopia is the consequence of pre-receptor-al absorption.
Verriest (1963) states that an absorption mechanism is obviously present in severe cataract and might be present in most diseases of the retina. Such an explanation of acquired defects cannot be accepted for pathology of the optic nerve. Verriest considers that Type 1 red-green deficiencies (i.e. ones with a orotanopic Rayleigh match) can be ascribed to a progressive linear reduction of all photopic fundamental response curves, with selective and more rapid impairment of the red receptor. This he considers could be due to a destruc-tion of all macular cones. Type 11 acquired red-green defic-iencies (i.e. ones characterised by deuteranomalous Rayleigh matches) are thought to be the result of some Leber-Fick mechanism and this is attributed to preferental damage of the "red-green" optic fibres.
An explanation based on a general lowering of the sensitivity functions is favoured by Verriest. The blue mechanism has the highest threshold and is the first there-fore to lose it's effect.
This theory is similiar to that of Farnsworth (1955) for congenital defective and normal tritanopic vision. Vision does become tritan with decreasing illumination and Verriest has found that neutral glasses which have no effect on a normal person made a subject with chorio-retinal degeneration tritanopic, although under normal conditions his colour dis-crimination was entirely normal.

13 '; 10 (b) 12 II
r
2 ia. ;4. :'racincs
Panel D-15 (Farnsworth Dichotomous Test) in Acquired Tritan Defects (Francois &
Verriest,1961).
Fig. 35. Farnsworth-Munsell 100—llue Plot for an Acquired Tritan Defect, Dichromatic Stale
(Francois & Verriest, 19611).

-- 5-3-
EXPLANATIONS OF TRITANOPIA
Explanations of Tritanopia Within The Framework Of A General Theory of Colour Vision.
(1) The Trichromatic Scheme
The Trichromatic scheme originates with the guiding concept that there are 3 types of retinal receptors with different spectral sensitivities, a concept first stated albeit vaguely by Thomas Young in 1302 (Le Grand 1957). It was rejected by Helmholtz in 1852, because 3-colour mixing required desaturation, but taken up and wholeheartly devel-oped by him ten years later when he conceived the possibil-ity of mechanisms with the characteristic that when stimulated alone give rise to a sensation that is not possible to achieve physically; in other words an unreal sensation (Thomson 1952). In its present form the crux of the trichromatic scheme is not that there are just 3 cone pigments, 3 receptors and 3 nerve pathways but is that at some stage in the visual processes, all light stimuli, whatever their spectral energy compositions, are converted into an activity specifyable by 3 variables. Stric-tly there is no wholly trichromatic scheme (Stiles 1960)0
In normal colour vision all spectral and non-spectral colours as well as white can be matched by adjusting the proportions of a mixture of any 3 primary colours, provided the validity of negative quantities of these real primaries is accepted. In dichromatic vision only 2 primary colours are necessary to match all spectral and non spectral colours and this leads to the assumption that there are only 2 effec-tive channels of activity instead of three. Dichromatic vision is the consequence of a reduction and this reduction may come about in 2 ways: there may be a losscf one of the channels of activity or there may be collapse of twoof the channels to form one effective chanel with characteristics that are different from two that have collapsed.
When the dichromats matching stimuli are represented on a chromaticity diagram there are several interesting con-sequences as shown by Maxwell and Helmholtz. 01-rt A)
1. If there is a loss of one channel of activity, for example a loss of the R Process then all chromaticities repre-sented along the line GR will look alike and, all chromatic-ities represented along the line BR will also look alike. The chromaticity represented by the point A will be differ-entiated from that represented at G and that represented at B because both process B and G are operative. The locus of

R C
Fig. 36. Maxwell Colour Triangle Illustrating the IIelmloltzian Argument for Dichromatism.
(see Text).

-f4- those chromaticities which are confused with A will be the line AR because it can intersect neither GR nor BR for the reason that A is seen as being different from both B and G and all chromaticities along GR look the same as each other and likewise along BR.
2. If now the processes G and R have collapsed to become a single chanel of activity, chromaticities long GR will appear the same. Chromaticity at A will be differen-tiated from the chromaticity at G and the locus of colours confused with A cannot intersect the line GR nor pass through either G or R. This confusion locus willlrun parallel to GR since the confused colours will all be matchable by a mixture of B and Gs B and R or Band any proportion of G + R provided the ratio i/G+R is constant.
In this way the loss and collapse models of defective colour vision can be differentiated. According to Pitt's experimental results (1935) the confusion for protanopia converges to the point x = 0.747, y = 0.253 in the XYZ system (Lerand 1957) and a loss system is postulated for protanopia. Pitt showed that the confusion loci for the deutranope were parallel to the green, yellow red spectral locus of the W.D. Wright chromaticity diagram and concluded that the collapse model was appropriate. This viewpoint has gained fairly general acceptance beca se it avoids the embarrasment incurred by the claim that °v " see yellow and blue. If deuteranopia were the loss of the green funda-mental then the colour sensations would be red and blue. However, Le Grand (1957) points out that Pitt has ignored the fact that the reasoning which leads to parallelism of confusion lines in a collapse model applies only to a tri-angle formed by the fundamentals (such as the Maxwell tri-angle) and not for all systems. Pitt obtained his parallel-ism of confusion lines on the Wright chromaticity diagram but in the XYZ system the parallelism does not hold. A convergence to x = 1.08, y = 0.08 is found. Convergence does not exclude the possibility of collapse because parallelism of confusion loci will only occur if the contributions of the 2 merged receptors are equal. It will be seen later (p.8o ) that the collapse model has much to recommend it. A°'Omy
In tritanopia, two primaries are sufficient to match all wavelengths and there is convergence of the confusion lines to x = 0.1748, y = 0.0044 and this has been taken to confirm the idea that tritanopia is the result of a loss of the blue mechanism. There is a loss of luminosity for the shorter wavelengths as shown by the average luminous effic-iency curve of the 7 tritanopes of Wright (1952) but the loss

is slight and may not be significant in a statistical sense. The loss of luminosity is certainly less than that found in protanopia in which the "red" fundamental is missing but this is attributed to the fact that the "blue" fundamental is close to the alchyne and makes very little contribution to luminosity.
Confirmation of the loss hypothesis of tritanopia comes from dark adaption measurements made by Auerbach and Wald (Auerbach 1966). Dark adaptation measurements were made for monochromatic light of various wavelengths following 5 minu-tes adaptation to a bright red light. This resulted in two threshold plateau at the photopic level. Sensitivity curves were read off from this data, and, as a consequence, a peak sensitivity was obtained at 455-400 mu which was especially noticeable 1 minute after ceasation of adaptation. This is considered to be a manifestation of a short wave mechanism. The experiment was also carried out on a tritanope. In this case the sensitivity curve after pre-adaptation to a red light does not show any indication of a short wave mechanism, thus showing that this function is not present.
(2) The Opponent Pairs Scheme
The opponent pairs theory was originally formulated by Hering and has as its most ardent contempory proponents the husband and wife team, Hurvich and Jameson who have developed and quantified the theory. The scheme is frequently thought of as a tetrachromatic one with red, green, blue and yellow processes and therefore a scheme which conflicts with the trichromatic scheme at the most fundamental of points. Hur-vich and Jameson (1957, 1960) have emphasised that the oppon-ent colours theory is a three variable one; that Hering had made it quite clear that his theory was 3 dimensional and Helmholtz himself regarded Hering's theory in the same light. The number of independent variables in the mathamatical sense is not at issue despite later controversy. The differences in the 2 theories lie in how the three variable system of colour vision is structured and functions.
The Hering variables are 3 pairs of visual processes directly associated with three pairs of unique sensory quali-ties. The 2 members of each pair are opponent in terms of mutually exclusive sensory qualities. These paired and oppon-ent visual qualities are yellow-blue, red-green and white-black. The basic schema for the opponent-colours mechansim is shown diagrammatically in fig. 37.

Fig. Hering Theory
700 500 600 Wavelength in millimicrons
. itesp.nse Curves for (Judd, 1949e).
Neural responses
— + — + + —
w-- Dk
57 e . Basic schema for Hering opponent-colon mediation.
(From Hurvich, J. 1960).
i_.
.,.
Light mediating substance

They are mutually exclusive in the sense that we may experience red-blues, green-blues but never yellow-blues and we see yellow-greens or blue-greens but never red-greens. They are opponent in the sense that when the paired processes are in equilibrium a sensation of grey arises. The sensation of blackness arises not from the absence of light but by way of either simultaneous or successive contrast during or follow-ing light stimulation.
Although the scheme causes physicists such as Le Grand (1957) to dismiss the theory in one page with the all-damning remark "this theory is clearly a psychological concept----" (p•431) the predictious of complex visual function and"the breadth of explanation afforded by the theory are impressive (Hurvich 1960, Hurvich and Jameson 1955, 1957) .
The Young-Helmholtz trichromatic theory has difficulty explaining.
1. the predominance of red and green hues at low stimulus levels (threshold tritanopia) and the predominance of blue and yellow at high luminance levels (Bezold-Brucke phenomenon) ;
2. the loss of hues in pairs in congenital dichrom-atism and fails to predict the hued seen by dichromats;
3. the independence of white and chromatic qualities of level of adaptation;
4. the shape of the hue discrimination curve and chromaticity ellicipses of Macadam;
5. the perception of four uniaue hues; red, yellow, green, blue and white;
6. Perception of black and brown.
The original trichromatic theory has been modified and various subsidary hypothesis have been proposed but although the trichromatic theory is readily quantified by means of linear transformations, investigators have found it necessary to propose their own set of transformations to consistently handle the problem of major concern to them. Various ad hoc explanatory devices tend to bring the theory closer to the

opponent colours scheme.
For. example, Wright (1947) proposed a linkage between red and green systems to explain his adaptation data, Pieron ell 1943) proposed a fourth cone to mediate achromatic proces-ses and Walls and Mathews (1952), developed the elaborate excess hypothesis which assumes separate luminosity and hue processes.
In the present form of the Hering theory attempts have been made to meet earlier objections to the theory. Hurvich and Jameson have quantified it in terms more or less accep-table to physicist advocates of the trichromatic theory and they have produced a plausible physiological model, based on neurophysio-logical knowledge not available to Hering. The explanations of defective colour vision which were originally inadequate have been extended. A set of response functions have been derived and colour mixture functions, constant hue contours, and hue discrimative curves at high and low lumin-ance have-been predicted and conform nicely with experimental data (Hurvich LM 1960). Predictions for colour defective observers also show good agreement with observed values (Hur-vich, D 1960) .
Explanation of Tritanopia.
Judd (1949a) considered the Hering hypothesis to be incomplete in explanation of dichromatic vision. Loss of the r-g process results_ in deuteranopia and loss of the y-b process results in tetartanopia. Neither protanopia nor tritanopia are predicted or explained and this can be seen by reference to the tristimulus specifications derived by Judd from the CIE standard observer and the transformation equations proposed by Adams in 1942 (figure 38) .
Hurvich and Jameson (1955) have derived different response functions. The response characteristics of the W-bk process is taken to be given by the relative luminosity curve, the black component having the same distribution as the white but with opposite sign. The response characteristics of the paired chromatic processes were obtained by a method inplicit in the opponents theory itself. A wavelength is selected that evokes, say a blue response. The observer then views in turn, a series of spectral wavelengths that appear yellowish in hue. To each of these yellow stimuli just enough of the selected. blue stimulus is added to cancel the yellow without introduc-ing any blueness: the hue remainder may be green, neutral, or

red depending on the test wavelength. Knowing the energy of the blue stimulus necessary to cancel the yellow the rela-tive magnitude of the yellow hue response evoked by the various test wavelengths can be plotted. In a similiar manner, the blue, green and red hue responses can also be plotted. The response functions derived by this method for two observers are shown in figure 39.
For these response functions loss of the r-g process yields deuteranopia and loss of the y-b process tetartanopia and the limitation which makes the theory unacceptable to Judd (191+9b) means; additional hypotheses are necessary, Protan-opia requires a shift of the remaining two response functions toward the shorter wavelengths in order to explain the loss of luminosity in the red which differentiates the protanope from the deuteranope. Tritanopia requires not only the loss of the y-b process but also an alteration in the response characteris-tics of the r-g system in the manner shown in figure 40 : in the words of Hurvich and Jameson (1957) the "short-wave photo- pigment seems to be missing".
The requirements necessary to predict tritanopia within the opponent-colours theory is less parsimonius than that of the trichromatic theory which predicts a simple loss of the blue fundamental. The assumption by Hurvich and Jameson that there has been a modification of the response characteristics of the b-y process has an ad hoc flavour about it. Neverthe-less the concept of alteration or displacement of the respons-itivity curve of a receptor is one that must be entertained even in the trichromatic theory to explain anomalous trichrom-asy. The protanomal and deuteranomal make anomalous matches with the Rayleigh equation, the protanomal requiring more red in a red and green mixture to match yellow and the deuteran-omal requires an excess of green. Both reject the normals match. Perhaps the most obvious hypothesis is that for protan-omaly there is a partial loss of the red receptor and in deuteranomaly a partial loss of the green receptor. A reduc-tion of numbers of receptors or an equivalent change would not create anomalous trichromasy, for such a system would still result in the acceptance the normals match because the same terms would be removed from both sides of the equation. There must be a displacement or alteration of the responsivity of one of the receptors. This concept has not been developed greatly by the physicist trichromatists although Wright (1947) does acknowledge in passing, the necessity of an alteration hypothesis empd at the same time as entertaining the partial loss hypothesis and Pitt (1949) considered that protanomaly was the result of an alteration of the reddness receptor.

+I.00
+0.70
I+0s0
1+0.25
I 0.00 >
i —0.25
af —0.50
— 0.73
— IDO
+ 1.00
+0.75
+0.50
+025
I 0.00
—0.25
—0.50
—0.75
600 700 WawNigth -mµ
Fig. 39. Response Functions According to the Opp,neut-Colors Theory as Determined Experimentally by Aurvicli
Jameson (1955).
wo 400 500
Fig. 4J. esponse Functions According to the 11p1,uneut- Culors Theory for Dichromats (Ilurvich 8: Jameson,195b).
keeeneve .,
iii //
//
-- --tee --Blue — White
1 500 600 Wavelength - m
WO 400 700
E
000
1 ONE
Tefor+onoge
If \ Tritanapel'
Tr
/
— — Red ----Green — • — White
500 600 700 Wavelength -mµ
1.00
400 1.00

Walls and Mathews (1952) develop the theme at greater length, whilst Jameson and Hurvich (1956) have assumed that there are 3 photo pigments of the rhodopsin type and that in protanomaly and deuteranomaly their absorbtions are dis-placed. This assumption is sufficient to account for the characteristics of anomals who have anomalous Rayleigh matches and good hue discrimination. In addition they postulate that there may also be a partial loss of the r-g process and in this way account for anomals who also have poor hue discrim-ination.
Assumption of displacement of absorbtion maximum of photo pigments is one of many arbitary choices they could have made. The assumption that was made was based on the research-es of Dartnall (see Dartnall 1960) who showed that all absor-btion curves of visual pigments have the same shape when plotted as a function of vibration frequency of the incident light but have differing maxima.
The concept of displacement of responsivity curves is not without foundation and is necessary to explain anomalous trichromasy whether the theory be trichromatic or opponent colours. The explanation offered for protanopia by Hurvich and Jameson is therefore consistent with that found necessary for protanomaly. With tritanopia, on the other hand, the alteration of the b-y function that is postulated is arbitary and does not find a parallel elsewhere in the scheme. The shape of this alteration is necessary to explain the absence of a neutral point at 480 mu and the reported colour percept-ions of tritanopia being green or blue on the short wave side of the 560 mu neutral point and red on the long wave side. Nevertheless the alteration proposed does predict hue discrim-ination data quite well (Hurvich and Jameson; 1955).
Fry's Hypothesis
Fry (1945) has developed a theory which, like the opponent colours schema, has chromaticness subserved by inde-pendent red-green and blue-yellow mechanisms. He has trans-formed the CIE colour mixture data to a "u,v colour mixture diagram" the corners of which represent the stimuli that exite one member of each pair of substances. Fry (1958) has sugges-ted that tritanopia is explained satisfactorily by assuming not a loss of the blue-yellow mechanism but that the blue-yellow mechanism functions as a red-green mechanism.

-6o -
Bpvnton's theory of colour vision.
Boynton (1960) is critical of Hurvich and Jameson's development of the opponent colours theory. He finds it overly complicated and "burdened with an excess of arbitary constants". He objects to tbehypothesis of a shift of excitation curves necessary to explain protanopia because the protanope would not then accept the normals matches. This objection has been discussed above in relation to tri-tanopia. The opponent colours theory has receptor sensitivity functions of a type that overlap. These are similiar to those derived by Hecht in 1932 and are subject to the same object-ions as Hecht's
Boynton proposes a theory which is trichromatic and which also makes use of the opponent colours concept. The theory embodies 3 photopic visual pigments, specified in terms of the CIE distribution co-efficients, X 7 as:
a = 0.5163 x + 0.1496 7 - 0.10332
/3 = 0.5163 + 1.30347+0.10332
y = 0.4000 7
It assumes 5 types of foveal cones called RI Y, GI B and W which contain pigments in various proportions. The R and G cones though anatomically separate and having quite different spectral sensitivities, generate potentials Which interact at a retinal level. A similiar interaction takes place between the B and Y cones. There is no interaction sub-tractive process for the W cones.
Tritanopia is accounted for by the assumption that the gamma pigment is missing from the red cones and that the yellow- blue system is absent entirely. This assumption is quantified and the co-punctal point predicted. The prediction is in good agreement with the experimental determinations of Sperling (1960) and Thomson and Wright (1 953).
3. The Moller Theory
The Müller theory is a zone theory of colour vision in which are postulated 3 separate colour systems, one in the zone of the initial photosensitive substances, a second in the zone of sensory retinal processes aroused by action of the initial photosensitive substances and a third in the zone of excitat-ions of optic-nerve fibres.. The theory was originally

-6/-
conceived by Müller (1924, 1930) although the idea of stages mediating colour vision had been expressed earlier. Accord-ing to Judd (1949a), Donders probably made the first explicit suggestion in 1881. Hering in 1887, kA5nig in 1897 and Von Krles in 1905 had recognised the need ror such an explanation. Fick's idea of collapse of 2 or more of channels of activity to explain the perceptions of colour defectives implies a second stage beyond the retinal level ; the trichromatic scheme itself implies a later stage for the synthesis of yellow and white. Granit's (1947) concept of modulators and dominators describes in effect a stage of a multiple stage mechanism. Thomson (1953) beleives that there are more than 3 retinal receptors but considers that at some later stage the information from these receptors is reduced into 3 channels. The stage theory recognises that the visual pathways are chains of neurones and that each step in the chain may not slavish-ly follow its predecessor but may have its behaviour modified by neighboring events.
The Müller theory has been strongly advocated by Judd (1948, 1949 a) who has shown that quantitatively the theory although elaborate is self-consistent and can be used to explain the metamers of normal vision and all reduction forms of vision.
The first of the 3 stages has red, green and violet primaries and accords with the classical Young hypothesis. The second system includes 2 pairs of antagonist chromatic processes : yR - gB and gY - RB. The first named of each Pair has attributed to it a lightening effect; the last named, a darkening effect. The third system includes 2 pairs of anta-zonistic chromatic excitations and one non-antagonistic pair of achromatic excitations : (r-g) , (y-b) and (w-bk) . White does not cancel black but combines with it to give grey. The tristimulus specifications for each stage proposed by the theory have been calculated by Judd (1949a) and are shown in figure 41.
According to the Muller theory the explanation of the dichromasies is as follows:
Colour Vision
Protanopia nopia tritanopia
Deuteranopia Tetartanopia
Process Lost
yR - gB gY - rB
r g excitation
y - b excitation
Stage
second stage
second stage
third stage third stage

700 450 500 550 600 650 Wavelength in millimicrons
10
9
8
7
654 4 r
3
2
1
-; 0 v
# 14
▪ 1.2
10
08
06
04
02
0
—02
—04 400 450 500 550 600 650
Wavelength in millimicrons 700 400
Fig.41T.rt.timuBt values of spectrum stimuli of unit Irrndlsnce. according to the three stages of the Milner theory (Judd. 1949). Upper left : initial photosensitive-substance stage (same as the Toting theory ). Upper right: stage of the chromatic retinol sensory processes. Lower right: chromstic processes in the optic-nerve fiber stage (same as the Hering theory). Lower left : com-ponents in the luminosity functions (solid line.) for normal and denteranopie vision (Wd ) and for protanopic vision (IV? ). The direct contributions to luminosity from the initial photo-sensitive-substance stage are ■Down in dotted lines: the indirect contributions from the retinal sensory process stage in clot-dash lines_ Protenoplc luminosity I W,) differs from normal luml-nosL•v through absence of the indirect contribution from the yk -0(1 retinal sensory process. The tristlm ulus values of the spectrum for the first stage are given directly by the excitations, P, (upper left) : those for the last two stages are made up of the luminosity function combined with the chromatic functions shown on the right.
I ti I It I
c • •
G
' e ,
, ; ,- , , t ,
r
' t .
1 3 a 3 Co 7 8 9 10 i1
Fig. 42a. Plie Polychromatic Theory
(See Figure 30 for Explanation)

The explanation of tritanopia embodied in this theory predicts that greenish yellow (about 560 mu) and reddish blue (outside the blue limit of the spectrum) will be con-fused with grey. Because of the normal slight darkening effect of the r B process to the theory predicts that the luminosity function of the tritanope is higher than normal at the short wave end although the effect is small. The data obtained by Wright (1952) suggests that the converse is true although because of variability between observers this is not certain . Judd (1949) derives a co-punctal point at x = 0.164, y = 0.00+ from his quantification of the theory. The predictions for colour perceptions for the tritanope are white, black, yellowish red, bluish green.
The characteristics of the processes in the third stage resemble closely those of the Hering theory, and by reduction alone can only yield deuteranopia and tetartanopia. Resor- ting to the second stage with its different response charac-teristics provides an explanation for the other dichromasies. This second stage serves the same purpose as does the shift of receptor sensitivities postulated by Hurvich and Jameson.
(4) The Polychromatic Theory
The polychromatic theory of Hartridge (1950, 1953) pos-tulates seven types of receptors : there are three main receptors called orange, green and blue violet which play a major role under average illuminations with a test field of 20 and are the same receptors as those of the trichromatic theory. In addition there are 2 receptors, a crimson, and a blue green, which under normal conditions play a subsidary role but assume a more prominant part with reduction of visual.. angle or of light intensity. The other 2 receptors are called yellow and blue and these receptors have their greatest effect in the peripheral retina or when the intensity of illumination is very high. The theory is summarised in figure 30. It is a theory which has feet in both the trichromatic and opponent colours camps the orange, green and blue-violet receptors are those of the trichromatic theory and are dominant under average viewing conditions. The crimson and blue green recep-tors and the yellow and the blue receptors are paired and complementary. When both members of a pair are stimulated a white sensations arise and when one member of a pair falls out, owing to some alteration in the conditions of vision, the other member does so also.
The evidence for the theory is diverse although Brindley (1957) finds the theory entirely objectionable because "it is so arbitarily complex and so lacking in verifiable implications".

Trichromatists find objectionable the concept of psychophysical parallelism implicit in the theory (Thomson 1952), although it must be admitted that the evidence for a yellow receptors is convincing. A major objection from the trichromatists point of view is Hartridget refusal to accept Helmholtz's explanation of negative co-efficients. Thomson (1953) agrees that there are more than 3 receptors, and presents evidence of his own in confirmation but prefers to beleive that there is a 3 channel "bottleneck" at some later stare of the colour vision system.
Explanation of Tritanopia
The explanation of defective colour vision embodied in the polychromatic theory is summarised in figure 42b. The congenital tritanope has colour vision mediated solely by the crimson and blue-green opponent pair. The 3 major receptors (orange, green and blue violet) and the paired yellow and blue receptors have been lost. The last that can be said of this explanation is that it is parsimonius, although it is in accord with (and preceded) the threshold hypothesis of Farnsworth (1955) and the speculation that "foveal" tritanopia and the congenital tritanopia have a common explanation.
B. EXPLANATIONS OF TRITANOPIA WHICH ARE INDEPENDENT OF COLOUR VISION THEORIES.
(1) Tritanopia from an - - Absorption System.
Tritanopia has been attributed to an absorption mech-anism in which blue wavelengths are selectively absorbed. Kdnig (1886) (cited by Walls and Mathews 1952) invoked macu-lar pigment in his diagnosis of a blue-defective trichromat and others since have regarded tritanopia as due to excessive macular pigment, insipient cataract or jaundice (see Parsons, 1924; Pitt 1944a). Certainly Judd, Plaza and Farnsworth (1950) found their tritanope to have excessive ocular pigmen-tation whilst jaundice and insipient cataract (Francois and 7erriest 1961) have been shown to cause a tritan deficiency.
Discrimination of blues and greens lessens with age, a common enough observation, and one readily attributable to increased lenticular pigmentation or to senile retinal changes.
There are two likely sources of a yellow pre-receptoral filter. The crystalline lens has a yellowish colouring which is known to increase with age. The lens in the elderly is not

B
D
E
F
A NORMAL VÎSION G a
PROTANOMALOUS VISION 0
CEUTERANOMALOO EEL EJ o
PROTANOP,A
DEUTERANc; A
WAN OP,A L :
Diagram indicating the lu„I,ai i, oJ'd1th•alinn, of the receptor respon,es in %anon. t ∎ l,• . of colour 1,141(111, ... Subjects is it h normal visiuit have set en Mlles of receptor : ltrotoniet. oils subjects have three : deuuterni u nalons subjects have five pmtanojw•s have two : deuteranopes leu ye three, but two of these arc joined physiolotaesilly to act as one type ; tritanoltes
have two.
Fig. 42b. Explanation of Abnormal Colour Vision According to the Polychromatic Theory. (Hartridge, 1950a).

infrecuently seen to be markedly yellow on slit lamp examin-ation. This could be a melanin type pigment (Judd, Plaza and Farnsworth; 1950) which can be inferred to have a spectral transmittance like that derived by Ludvigh and McCarthy (1938) (but see also Pitts D G; 1961).
The second source is macular pigment, a pigment which has played a varied and almost traditional part in the explan-ation of colour vision data and other visual functions (see Walls and Mathews 1952, p 43-51; Dartnall and Thomson, 1949) . Despite its popularity in explanation, whether macular pigment exists in living eyes has been the subject of controversy.
According to Walls and Mathews (1952), Gullstrand in 1905 identified the pigment as lutein although Holstrom in 1940 found a negative Carr-Price reaction for carotenoids and specifically stated that the pigment could not be lutéin. Hoistroms extraction indicated that the pigment was a lipo-chrome with carotenoid solubilities. Wald in 1945 and 1949 again identified the pigment as lutein (leaf xanthophyll). Later Segal suggested that it is a mixture of transient orange and visual yellow derived from rhodopsin. Hartridge (1950 b, 1951) believed it to be a post mortem derivative of vitamin A or of blueness receptor photochemical substance. Hartridge claims Gullstrand and Wolf to have held similiar views and considers that the ophthalmoscopic appearance of the fovea in red light is not due to macular pigment but to the absence of blood vessels and thinness of the retina in this region. The distribution of macular pigment is illus-trated in figure 43 although Dartnall and Thomson (1950) arguing from psychophysical evidence believe that there is less pigment on the slopes of the foveal pit.
Psychophysical evidence for thé existence of macular pigment has been presented. Wald (19+9) suggested that certain shape irregularities in foveal sensitivity curves were caused by the absorbtion bands of the macular pigment but others are by no means impressed by the agreement (Weale 1953, Walls and Mathews 1952, Thomson 1951) . It was thought, furthermore, an that a comparison of photopic foveal and peripherally sensit-ivity curves may yield a quantitative estimate of the optical density of macular pigment lr situ and Wald (1949), did find an apparently qualitative agreement between in situ, density and the value obtained from retinal extracts. However, Weale (1953) by collating data from various sources shows that the differences between foveal and peripheral sensitivity are inexplicable on the basis of macular pigmentation. They point to an enhanced activity of a "blue" mechanism in the periphery because sensitivity to blue light of 460 mu relative to a green of 560 mu increased at perimetric angles beyond the region

where macular pigment is thought to exist.
Wright (1947) found for 36 observers who matched illuminant B with a mixture of 3 primaries that there was considerable scatter which could not be attributed to errors of observation although Hartridge (1950b) does argue that similiar variation is to be found in other data of Wright which could not have been influenced by macular pigment. Wright prefers to believe that macular pigment is a potent source of observer variation although he does not deny that there must also be variations in receptor processes. Wright derives a point from the 36 white match points which he considers likely to represent a nearly unpigmented observer. This is x = 0.28, y = 0.2 which corresponds well to the calculations of v. Schelling (1950) who calculates the white point for illuminant B to be at x = 0.24, y = 0.22. Wrights original data on the variation of the white point has been confirmed by Ruddock (1963) .
Wright's own white point shifted from x = 0.323, y = 0.320 at the age of 22 to x = 0.367, y = 373 at the age of 38 (Wright, 1947; v.Schelling 1950) which Wright attributes to changes of macular pigment with age.
These 2 sets of data imply a dominant wavelength of 574 mu and 576 mu.
Wright (1947) has also compared white point matches made with central fixation and with eccentric fixations of 20, 4° and 6°. The 6° match point corresponds reasonably well with the unpigmented white he had derived earlier and the central 2°, 40 and 6° points lie close to a straight line which intersects the spectral locus near 577 mu. However, Weale's (1953) criticism of foveal and peripheral comparisons must be rememberd and Wright himself was wary of the implica-tions of this particular data.
What appears to be a definitive study is that of Rud-dock (1963). Ruddock selected 4 observers on the basis of the diversity of their white matches for illuminant Bon Two of these observers were considered to have low macular pig-mentation and two were thought to have heavy macular pigment. All 4 had very similiar spectral matching functions and similiar wavelength discrimination curves and since these measurements (using the Wright method of standardisation) are independent of pre-receptoral abso ition these subjects were considered to have no significantAinVonse functions. Each subject made white point matches for central fixations

I mm
Fig. 43a. Distribution of Macular Pigment (Denton & Pireune, 1950).

—Percentage decrease of macular pigment (relative to the. value at the central fovea) required to give the chromaticity of SA at different retinal locations.
II—Percentage decrease of the macular pigment required to give the chromaticity of Se at different retinal locations.
Pig. 43b. Distribution of Macular Pigment as Derived frocs Colorimetric Experiments with Heavily and Lightly Pigmented Observers
(ituddock„ 1963),

- 6`-
and for eccentric fixations of 1°, 2.5°, and 50. The
observers presumed to have little macular pigment showed only small shifts in the white point matches with different fixations. The observers with heavy pigmentation showed marked shifts which conformed approximately to the shifts calculated assuming various densities of xanthophyll at the macular. Ruddock also derived from the spectral matching data of these subjects an optical density curve for macular pigment. This has characteristics of xanthophyll optical density curve but differs slightly from that determined by 41.1d in 1949 by direct measurement. The derived optical density curve predicts shifts of the white point which conform very closely to the shifts exhibited experimentaly by the subjects with high macular pigment. A curve for macular pigment concentration or thickness variation across the fovea is deduced by Ruddock (figure 43b).
This study appears to demonstrate conclusively the existence of macular pigment. Through the use of pigment-free controls it avoids the criticism of Weale (1953) des-pite the use of extra-foveal matches. The pigment would seem to be xanthophyll.
Excessive macular pigmentation would shift the white point to the spectral locus so that spectral radiations in the vicinity of 573 mu would be indistinguishable from illuminant C. There would be a loss of luminosity in the blue and hue discrimination would be affected. Whether there would be a true neutral point under these circumstances has been questioned by Hartridge (1950b) who believes that a white observed through a pre-receptoral yellow filter would look yellow not white. However, chromatopsia is usually a symptoa that is noticed only for a short time after the appearance of the pre-receptoral filter (Francois and Verri est, 1961).
Lenticular pigmentation would produce a similiar effect but according to the calculations of Judd et al (1950) a neutral point of wavelength much longer than 570 mu would appear. This would not be typical of tritanopia. However, it is possible that tritanopia be modified by heavy lenticular pigmentation to produce a tetartanopic-like defect.
That heavy pre-receptoral pigmentation is able to reduce colour discrimination to a state similiar if not identical to tritanopia has been demonstrated by van de Velde and reported by STerriest (1963) .

7 -
With a yellow filter having a sharp cut-off at about 500 mu, the AOHRR, the Farnsworth Dichotomous test and the Farnsworth Tritan plate are responded to just as a typical tritanope. The FM 100 test gives results increasingly tritan-like with increasing density of the yellow filters that were used in this experiment. It was shown by Buyssens that these effects are due to the selective absorption of the filter and not to the reduction in illumination caused by the filter.
Whilst an absorption mechansim causing a tritan defect is assumed to be present in severe cataract it is not readily accepted for either acquired (especially when acquired from optic nerve pathology) or congenital tritanopia.
Congenital, inherited tritanopia has been established without question. It is acknowledged within colour vision theories on the same basis as protanopia and deuteranopia. Neither protanopia nor deuteranopia can be explained by a filter hypothesis (Hurvich, 1963) and it is therefore most unlikely that this hypothesis holds, as a special case, for tritanopia.
(2) Farnsworth's Threshold Hypothesis.
Farnsworth (1955) has proposed the idea that the so called foveal or small field tritanopia is neither primarily foveal nor small field but is a phenomenon resulting from the threshold function specific to the blue mechanism. The tritanomalous effect, it is suggested, is constant for any given product of stimulus area, retinal illuminance and exposure time. This hypothesis has already been reported in the section on 'foveal' tritanopia (p.45.).
The hypothesis is carried further by regarding congen-ital tritanopia, congential tritanomaly and 'foveal' tritan-opia to have a common explanation. Accordingly congenital tritanomaly becomes incomplete tritanopia, an idea which does fit the descriptions of several of the reported cases of tritanomaly (p.i), and both tritanopia and tritanomaly can be considered to be manifestations of an abnormal threshold function of the blue mechanism.
The evidence upon which Farnsworth has based this suggestion of a common explanation for all types is by no means strong. Essentially he compares the relative luminous efficiency curves of tritanopes and normal observers tested

with small fields; and also compares the convergence of confusion loci of tritanopes, tritanomals and normal obser-vers the latter again tested under small field conditions. The various sets of data demonstrate some similiarity*
The luminosity curves that are compared are the average curves of 4 normal observers for 42' and 3' test fields (data of Sperling and Hsia ), and there is a relative loss of luminous efficiency for shorter wavelengths for the 3' field when compared with the 42' field. This loss is similiar to that demonstrated by the 7 tritanopes of Wright (1952) when their average curve is compared to that of a normal observer* Yet the two sets of data by different experimenters using different apparatus, and the loss demonstrated by 7 tritanopes is relative to a normal curve based on the observations of one subject only, that subject being Wright himself; the loss of luminosity is small and there was considerable variability amongst the tritanopes so that there is by no means certain that tritanopes exhibit a loss at all. The loss of sensitiv-ity in the blue shown by Sperling and Hsia for a 3' field compared with a 42' field can easily be attributed to differ-ences in the foveal receptor populations stimulated and not to a threshold effect at all. Thomson and Wright (1947) showed that there was a marked decrease in the sensitivity to blue light with a centrally fixated 15' field which was by no means as marked for slightly eccentric fixations of 20' and 40'. Elsewhere in his paper Farnsworth remarks that his threshold hypothesis is a general one but is obscured by complicating factors such as macular pigmentation, chromatic aberration and also receptor populption differences.
Farnsworth also compares the co-punctal point obtained for complete tritanopes, normal observers tested with 3' and 5' targets and 2 congenital tritanomals which had been inves-tigated by Helen Paulson at the Medical Research Laboratory. Farnsworth considers the 3 sets of data to be sufficiently similiar to warrant the conclusion that they form a coherent series. Unfortunately the co-punctal point for normal obser-vers under small field conditions lies inside the spectral locus of the chromaticity diagram and he invokes macular pigmentation to explain the discrepancy.
There is no speculation in this paper on the physiolog-ical mechanism behind his threshold hypothesis, although for the sake of simplicitrhypothesis is put in terms of the trichromatic theory although it is equally applicable to any other theory. Farnsworth has put his hypothesis in the spirit of speculation. His threshold hypothesis applied to foveal and small field tritanopia has much to commend it; the idea that tritanopia and tritanomaly might be the same thing has

congenital forms can be explained in the same terms as "foveal" tritanopia, and can be thought to be caused by abnormal response characteristics of the blue mechanism.

THE BLUE RECEPTOR
Tritanopia is regarded by all colour vision theories as a functional reduction in the number of colour vision mechanisms. Within the trichromatic theory it is the loss of the receptor mechanism which can be conveniently labelled as the blue receptor; in both the Hering and the Muller theories it is the loss of an opponent blue-yellow process. Needless to say, it is of considerable interest to establish the functional and structural identity of this lost mechan-ism. Attempts to define the physiological identity of colour vision receptors, not just the blue receptor, have occupied research workers in this field for 50 to 100 years. No great interest can attach to the blue receptor in isola-tion since the characteristics of such a receptor usually have meaning only in relation to the function of other recep-tors and any review of the blue mechanism must also account for other processes.
The principal methods of investigation of the physio-logical character of colour vision receptors has been psycho-physical. Neurophysiological methods (Granit 1947) and more recently reflection densitometry In viva (Rushton 1958, Weale 1960) have made contributions. Histological and biochemical approaches have been less fruitful (Dartnall 1960, 1962; Wilimer 1946, 1955; Brown and Wald 1963). There is no struc-tural difference between cones that can be regarded as a structural basis of colour vision and work on cone photopig-ments is still in its infancy (Dartnall, 1960). Whilst methods other than psychophysical offer a promising future, evidence from these sources can at the present be regarded as no more than confirmatory.
The psychophysical methods that command greatest respect are (a) metameric matching for normal and colour defective observers, and;
(b) the increment threshold technique of Stiles (1939).
Both these methods are readily quantifiable in physical terms and involve judgement of colour and brightness differ-ences; they avoid subjective judgements like colour naming and assessment of the wavelengths of unique hues which might be contaminated bycontrolable previous experience and semantic differences.

Character Of The Blue Mechanism Derived From Colour Mixture Data of Normal And
Dichromatic Observers
There have been numerous attempts to derive the colour-imetric characteristics of colour vision receptors from the data of metameric matches. These derivations are based on the following reasoning:
At some stage of the processes of colour vision there are 3 types of sensory apparatus which can be denoted (using the notation of Le Grand; 1957) G/ , G2 , G3 . Each of these sensory mechanisms is characterised by a function of wavelength, ga , and a response G,: . For a radiator with a spectral energy distribution EA , this response has the form
= g EA dA
The sensation of colour is a function of the relative values of GL , and the sensation of light is a function of a linear combination of the 3 responses; that is
1, G, + lz G3 + 13 G3 where 1/ , 12 , 13 are constants which determine the relative luminosity contribution of each receptor and are known as the luminosity units.
The luminosity function, V) , is therefore given as:
21E g = V _ —y where ÿ is distribution co-efficient function of the Y refer-ence stimulus of the XYZ system, for which the luminosity unit, 14, is unity.
The relationships within a general colorimetric system of this kind are all linear because of Abney's and Grassman's laws. Accordingly linear transformations of colour equations can be made. Each transformation will have its own reference stimuli or primaries. The number of transformations that can be made is infinite and each yields a different set of wave-length functions ge
These functions can be explicitly regarded as spectral sensitivity curves of the 3 receptor processes. However, only one set of transformations can represent the actual physiolo-gical sensitivities of these processes.

-7-
One of the major research problems has been to locate the colorimetric primaries that have real physiological basis. Within a colorimetric context this resolves itself into the choice of three primaries which have wavelength functions, Te. that are the same as the spectral sensitivities of the 3 receptors systems.
If it were possible to isolate and stimulate one of the 3 receptor systems without stimulating the other two, the resultant colour sensation could be specified by a set of co-ordinates like any other colour sensation. This chromaticity is called a fundamental sensation, and will be unreal in the sense that it cannot be aroused by physical stimuli. When plotted on the chromaticity diagram it will be outside the spectral locus. This is the consequence of negative quanti-ties always being involved when metameric matches are made with real stimuli. The alternative to unreal fundamental sensations is recourse to strange physiological hypothesis of inhibition.
The first attempt to specify the fundamental sensation:s and to derive the colorimetric consequences of them appears to be that of Maxwell who in 1890 deduced a set of curves from speculations on the shape of the spectral locus (Wright 191+7). Helmholtz, Hecht and Abney derived fundamental response curves from colour mixture and colour discrimination data.
Methods that rest on sturdier foundations are:
(i) derivations from the colour vision of dichromats assuming that dichromatism arises from the suppression of one fundamental. The curves that are derived have been called fundamental sensations of the Konig type (Le Grand; 1957).
(ii) derivations from the colour vision of dichromats assuming that dichromatism is the result of a fusion of 2 fundamentals. This is the collapse hypothesis of Fick,and Le Grand (19 57) refers to the curves derived as the Fick type.
(iii) derivations from adaptation experiments. Since the method of adaptation was first used for this purpose by Wright, these fundamental sensations are termed the Wright type. (Wright, 1947).

(i) Fundamental Sensations Of The König Type.
If dichromatism is the result of the lossof one funda-mental then, following the argument of Maxwell and Helmholtz (p 53 ), the centre of convergence of the confusion loci gives the chromaticity of the fundamental sensation of the missing receptor. Since the red receptor is considered missing in protanopia, the green receptor in deuteranopia and the blue in tritanopia, the fundamental sensations of the 3 receptors can be obtained.
Inig in 1893 established fundamental sensations from approximate co-punctals for dichromats and his curves remained classic for a long time (fig. 44).
Judd (1945 1949) using the data for dichromats of Pitt (1 935) revised hnigs curves (fig. 45) . They assumed the deuteranopes co-punctal was at x = 1, y = 0, rounding off Pitts values. This gives 1 a = 13 = 0, 1/ = 1 which creates difficulties for the protanope who is missing the red funda-mental (G, ) which has all the luminosity.
If the co-ordinates of the co-punctal are not rounded off this difficulty is avoided and good prediction of the deuteranopic and protanopic luminosity curves are obtained.
For both the König and Judd derivations, the "blue" receptor is ascribed a spectral sensitivity which is the same as the CIE distribution co-efficient function, T.
However, the König-Judd fundamentals are defective in that -
(1) for deuteranopia and, protanopia the predicted colour perceptions for the longer wavelengths are red and green respectively, whereas the evidence of unilateral colour defec-tives, such as it is, suggests that the perception should be yellow.
(2) the Bezold-Brüche effect, adaptation effects and judgements of the wavelengths of unique hues do not accord with prediction from these fundamentals.
Some argument has taken place in the past as to whether the G3 fundamental should be regarded as a "blue" or a "violet" one. Gothlin (1941+) found that for wavelengths 430-455 mu the colour threshold gave rise to a sensation of blue and that it was only at higher illuminations that a.sensation of indigo was aroused. Le Grand (1957) derives a set of fundamentals on the assumption that G3 is at x = 0.125, y = 0 but that the violet end of the spectrum is further from the alychne than is assumed by the CIE system. Under the circumstances g3 is still given

-71r
as the CIE distribution co-efficient function z but the g/ curve shows a hump at about 460 mu which makes the blue end of the spectrum appear violet. However no evidence of such a hump can be found in the VA curve of deuteranopes and the hypothesis is not regarded highly.
(ii) Fundamental Sensations Of The Fick Type.
Reduction to 2 systems in dichromatism could result from the fusion of 2 fundamental stimuli, so that in deuter-anopia for which VA is nearly normal, the response of the fused receptors is G1 + Gg and in protanopia in which there is a loss of luminosity in the red, the response is kG1 + G2 where k is small. Pitt (1944,a) accepts the collapse hypothe-sis for deuteranopia but not for protanopia. He derived a set of fundamentals based on the co-punctal of Königs tritan-opes and the position of the green fundamental proposed by waiters (1942) from adaptation experiments.
Le Grand, (1957) has revised these fundamentals in order to account for the constancy of hue for wavelengths greater than 680 mu. He alters the location of G/ and G3 while balancing the fundamentals for the most achromatic white (5200° K) rather than the equienergy spectrum. This yields a set of fundamentals in which the constant k in the response of the fused fundamentals (kG, + Gz ) in protanopia is not zero, as assumed by Pitt, but k = 0.039.
Thomson and Wright (1953) have produced a further set of fundamental response curves of this type which have already been described (p13 ). Their revision is based on their re-determination of the tritanopic co-punctal and the 1951 revision of the CIE standard observer. This resulted in significant changes in the response curve of the blue funda-mental (fig 46).
Another re-determination is that of Sperling (1960,1961) who relocated the fundamental G2 at the intersection of a line from Gff though yellow and a line from G3 passing close to 460 mu. Illuminant B was fixed by setting the ratio of distance from 46o mu to the illuminant B point and from this point to 572 mu as the number of steps from 460 mu to neutral and 572 mu neutral in the saturation discrimination data of Martin, Warburton and Morgan. Sperling tests the validity of his transformation by predicting chromatic discrimination data and in a further transformation (Sperling 1961) predicts luminosity functions under various conditions with an accept-able degree of success despite apparently ad hoc manipulation of macular pigmentation effects.

.UJ Fig. 45a. Judd's unda ►sental (from
Le Grand, 15)7).
.9. i i
3/ '
— —
`l,
'
,
I '
,.10—
9 ,
9
W0 500 600
Fig. 44. Konig's Fundamentals (From Le Grand, 1957).
61)n
WO 000 600
Fig. 45b. Pitt's Fundamentals (from Le Grand, 1957).
Fig. 46. l'tio son & Wright's Fundamentals (Thomson & Wright,
1953).

(iii) Fundamental Sensations Of The Wright Type.
The principle of Wrights method of adaptation is that if a stimulus acted on a single mechanism only its response would be altered in terms of luminosity but the colour sen-sation would remain unaltered. Experiment in this way soon showed that the fundamental sensations are unreal since all monochromatic stimuli change hue after adaptation• however, the red end of the spectrum and a blue close to 460 mu are least affected while yellows and greens change considerably. It is possible to derive the tristimulus values of the unknown fundamental sensation by applying v Kries law of co-efficients (Wright, 1947; Le Grand, 1957), although the resulting equations yielded negative values for gz for wavelengths less than 46o mu. It is, of course, possible that these negative values could result from processes of inhibition but it is more likely that they are the result of experimental error. In particular departures from the law of co-efficients may be the cause which according to Le Grand vitiates the method in the case of the blue funda-mental.
- Comment -
The character of the "blue receptor as determined by these various means is summarised in table 8. The table gives the chromaticity co-ordinates for the XYZ system of the sensation that would be aroused by the blue receptor if it could be isolated from the others. It also shows the response of this receptor as a function of wavelength M3 ) and this has been expressed in terms of the CIE system following the detailed analysis of Le Grand (1957).
From this considerable mass of experimental evidence which has been reviewed here it emerges that the blue funda-mental differs little from the CIE distribution co-efficient function z and makes little or no contribution to luminosity. The identity of the spectral sensitivity of the blue receptor with the function z is a consequence of the assumptions embodied in both the König and Fick analysis. The development of this is to be found in Le Grand (1957). The contribution to luminosity is specified by the luminous unit 13 and in each case the blue fundamental is placed on or close to the alchyne so that 13 is zero or approaches zero.

Luminous Unit
mu - for g
mcuc
3 13
CIE
Konig-Judd
Judd Modified (Le Grand; 1957)
Blue G3
hypothesis
Fick-Pitt
Pitt Idodified (Le Grand; 1957)
Thomson &a Wright (1953)
Sperling (1960)
Wright Type (Adaptation) Method
Stiles (1939) (Increment) Method
0
0
0
0
0,002.
0.0054
OF "BLUE" AECEPTOA AS BY V1L:tIOUS PSYCtt01'HYàIC1.L kŸlsl'ï1011S
_.NL? Cvi3Uii1;E';'AIC ASSU,:P`iIvS
Desi nation î:IE of C;iromaticity
tunca:Iental Co-ordinates of G_ Fund- amental
itesponse
Wavelength Function g3
of "Blue" Fund-amental. G3
% y In Terms of CIE System
0 z 445
z 445
0.1803 0 445
0.125 0 z 445
0.166 0.0015 z 445
0.1633 0
0,1748 0.0044 .001098x -.003231ÿ + 440 1,0002133z
0.1740 0.0065 -0.0091 + 0.025ÿ + 0.233z
Method invalid for G3
0.0017i + 0.99832 440
n 1951 revised CIE observer adopted.

The Fick fundamentals have a number of advantages over the König fundamentals.
(a) The perception of yellow by protanopes and deuter-anopes for wavelengths longer than their neutral point is explined.
(b) The perception of white a.t'the neutral point of protanopes and deuteranopes is also explained.
(c) The position of the fundamentals of the Fick type is in agreement with psychological observations.
(d) It is possible to relate Fick's hypothesis to the evolutionary speculations of Ladd-Franklin (1929) which propose that vision was originally monochromatic until the evolution of a blue-yellow system of colour vision and the yellow is finally elaborated into red and green fundamentals.
(e) In the Fick hypothesis the ratio is about ( 1! = 0.1+31+, 12 = .564) . In protanopia / z it follows
that there would be a marked loss of luminosity compared with that in deuteranopia and there are measurementsof visual acuity and of absolute thresholds which support this ratio of } (Le Grand; 1957), thus confirming Ficks hypothesis. On the other hand it may well be that there is a separate factor for luminosity and certainly Walls (19 58) is very skeptical of the threshold measurements of luminosity as employed by Hecht and Hsia.
One of the recent re-determinationsof the Fick type fundamentals is that of Thomson and Wright (1953), which has the positive location of the tritanopic co-puncta, and the use of the 1951 revision of the CIE observer to recommend it. The spectral sensitivity of the blue receptor obtained. by Thomson and Wright is shown in figure 1+6 compared with the 1931 function-f.
Thomson and Wright's curve for the blue receptor can be related to evidence from other sources, namely:
(1) Blackwell and Blackwell (1961) describe 3 mono-chromats which they categorise as blue monotone monochromats. The reason for this is that careful psychophysical measure-ments showed that there were two visual mechanisms operative: one was a rod mechanism detectable at low levels of retinal luminance (0.0759 trolands) and the other a cone mechanism occurring at higher levels (1.76 trolands). At intermediate

0.5
2.0
1. 5
1.0
0 350 450
wavelength mu
Fig. 47. The Blue Receptor. The CIE (1931) Z Function and 'Thomson & Wrights P3 Function Compared (See Text).
550
z

_77-
levels of luminance both mechanisms were effective and rudimentary colour discrimination was possible. The spec-tral sensitivity of the rod mechanism was describable as a CIE scotopic curve modified by macular pigment. The cone mechanism had a maximum sensitivity at about 440 mu. This curve is compared by Blackwell and Blackwell with the CIE z function and the agreement is said to be good. However, the position of the maximum of the curve and the presence of a hump on the longwave side, are reminicent of Thomson and Wrightsg3 function more than the 1931 CIE z function.
(2) Rushton (1958, 1960) has devised a means of determining the density of cone pigments in vivo by reflection densitometry. Using bleaching lights of different colours it is possible to derive difference spectra for normal and dichromatic eyes. Rushton identified two pigments that he called P. 54 or chlorolabe and P. 59 or erythrolabe. Weale (1960) using a similiar technique has substantially confirmed these results. Additional evidence has come recently from Brown and Wald (1963) who found, by. microspectrophotometry of monkey and human foveas, a red sensitive pigment with .mat 565 mu and a green sensitive pigment at ).,074.535 mu for man, and 527 mu for monkey. There were indications of a third pigment with a. maximum at 440 mu.
Rush ton found that he could not extend his investigat-ions to the blue receptor because his measurements were unstable below 500 mu. This he attributes (Rushton 1960) to eye movements causing macular pigment to move relative to the test light. Since 1960 a blue sensitive pigment (cyanolabe) has been detected in a few subject in whom macu-lar pigment is very slight (Marriot 1962) but no measurements of spectral sensitivity of this pigment have been published.
The significance of this investigation for the blue receptor is no more than this: the protanope was shown to have only the P 54 cone photopigment (other than a 'blue' one) and this conforms well with the protanopic luminosity data of Pitt. The deuteranope was shown to have 2 cone pigments in, the proportions P. 59 + 0.6 P. 54. This can be interpreted as support for the Pitt interpretation of Fick's hypothesis and justification of the same assumptions made by 1Thomson and. Wright (1953) .
However, Rushton has since modified his views and now believes (Marriott, 1962) that the deuteranope like the protan-ope has only one pigment with maximum absorption in the red-green range.

- 7g-
(3) Auerbach and Wald (A erbach, 1960) have found evidence of a blue receptor with a maximum at about 450 mu. Their technioue was to measure thresholds against time in the dark for various wavelengths following adaptation to a red light. Sensitivity curves were read off and a bump in the blue indicated a blue mechanism spared by the red adap-tation. The hump was absent in a tritanope who was examined in this way. Whilst this conarms a loss mechanism in tritanopia, the maximum of the peak does not conftirm with that of the Thomson-Wright derivation.
It is clear that the Thomson-Wright fundamentals can-not be considered definitive : the Pitt-Fick assumptions need further examination and evidence suggesting more than 3 receptors must be considered. In particular, the implica-tions of Stiles increment threshold experiments must be related to trichromatic formulations of the traditional kind.
CHARACTER OF THE BLUE MECHANISM DERIVED FROM THE EXPERIMENTS OF STILES.
Stiles (1939) measured increment thresholds for a 1° test field surrounded by a 10° adaptation field. Both fields were illuminated by monochromatic light of variable wave- length A and respectively. If a single mechanism is operating the characteristic increment threshold curve is expected (fig. 48).
If the wavelength of the adapting field is changed, this curve retains its shape but is displaced along the log WAc, axis. That is the absolute threshold remains the same regardless of A because at the absolute threshold W94.- = o. When W,w A o then the adapting wavelength will alter the response of the mechanism in a way dependent on the sensitiv-ity of the mechanism to the adapting wavelength (fig. 49). If various adapting wavelengths are used the sensitivity of the mechanism as a function of wavelength can be derived by finding the values of the adapting intensity W, that raise the threshold by an arbitary amount. This arbitary amount is taken to be 1 log unit ofd and the resultant curve is the field sensitivity curve. This function is assumed to be related to the absorbtion of the photopigment of the mechan-ism and is taken to represent the spectral sensitivity of it.
Change in the wavelength of the test stimulus A will cause the increment threshold curve to be displaced vertically since the mechanism will not be equally sensitive to all wavelengths of the test light. If absolute thresholds are measured. (or inferred by extrapolation) from a family of

500
620
Log W„
;•' i' a 'f ô Possible shapes for the threshold/intensity curve when only one mechanism is involved. The curves show the effect of a background light of wavelength and intensity W, on the threshold intensity Ux of a test field of wavelength a (VA and W1 in arbitrary unite). (Stiles 1949b)
i II -4 -3 -2 -I 0 I 2
Log Wµ
Log UA
5
700
600 mit
500
400
2
F i 14. 'The effect of varying background wavelength on the threshold/intensity rela-tionship for a single mechanism. The lower curve gives the values of 1V, which raise the test threshold by 1 log unit (the tenfold test increment values of W1) for this mechanism (in fact ss) and the upper curves are the threshold/intensity curves for different values of for a test wavelength À = 500 mµ (UA and W1 in erg/sec. dog,$).

79 -
vertically displaced curves resulting from change in A the spectral threshold function of the mechanism is derived (fig 50).
If there are 2 or more mechanisms curves of the same general shape will be superimposed but the more sensitive mechanism, ignoring summation effects, will be responsible for the threshold. Which mechanism is the more sensitive will depend on both the test wavelength and the adapting wavelength. The curves obtained for logA against log WA when there is more than one mechanism win show discontinuit-ies. Each branch of the curve will be part of the curve of the most sensitive mechanism for the particular set of condit-ions (fig 51) .
If each branch represents a different mechanism then the mechanisms can be identified and by extrapolation of the branches the field sensitivity curve and the spectral thres)I-hold function of each mechanism can be determined.
From analysis of results of the type described above, the existence of 5 foveal colour vision mechanisms has been deduced (fig, 52) . These have been designated g'1, 712, -77- 3 7r4 and 77- 5. The mechanism 1T) was originally called the "green" mechanism and has a maximum test sensitivity at about 540 mu and is active at the absolute threshold between 450 and 570 mu. The mechanism IT 5 has been called the 'red' mechanism and has a maximum test sensitivity at about 580 mu. It is active at the absolute threshold for wavelengths greater than 570 mu.
There appear to be 3 mechanisms that might be labelled as blue mechanisms. The first to be detected was 777 , orig-inally called the blue mechanism, which has a maximum sensit-ivity at about 440 mu. It is active at the absolute threshold for wavelengths shorter than 450 mu only when the subject is defective in 77-2. A lobe at about 570 mu is seen for 7T"1 and this has been attributed by Stiles to the intervention in the 1T1 mechanism of a relatively small number of receptors with higher sensitivity to long wavelengths than the rest of the receptors of the blue mechanisms. The second mechanism is 1T 2 which has only been approximately determined. It is active at absolute thresholds for wavelengths shorter than 450 mu. It has a field sensitivity which is greater than 7r1. The mechanism 7T 3 has a spectral test sensitivity sim-iliar in shape to 1Ï1 but without the lobe and is less sensitive. It has a higher absolute threshold than TT1.

4
420
620
500
560 l
600 500 400 mµ
-2 -I 0 I 2
Log Wµ
F 1 g o 5 0 The effect of varying test wavelength on the threshold/intensity relationship for a single mechanism. The curve on the left is the test spectral threshold curve of the mechanism (in fact ,r) and those on the right are the threshold/intensity curves for different values of A on a background µ =- 600 mµ (('a and W, in erg/sec. deg.').
6
1 I l l T 0 T
Log WN
P 1 g.5 Theoretical threshold/intensity curve when two mechanisms are present. Mechanism A has the lower absolute threshold to light of wavelength A, but is also more sensitive than B to adapting light of wavelength j . At about log WN T, the light-adaptation effect raises the threshold of A for the test. illumination 11,1 above that of B. and at adapting intensities above log WN T. 14 is the mechanism which detects the test spot. The threshold/intensity curve this shows a break at this value of W, (UA and W" in arbitrary units).

Wavelength IA (mµ)
450 500 550 600 650 700 1
T -r 400
•
X) 000 --- 15000 cm' Field wave number (1/k.)
8
1':
1i L_
25.000
Fig, 52 Purves showing the 'qus.l •T clic , hold eew'.itivity for the five mechanisms The value of - log Wo is plotted agrirurt µ; I{' is;the field energy which raises the teat threshold to I log unit alcove its absolute value (the tenfold test increment value of Wo). The abscises scale is plotted on n wa•: e.nurnher basis, ao that equal intervals cor-
respond to equal differences of reeiproK:al wavelength. The held seruitivity of ne has not. horn determined d for short wavelengths. The whole
curve for this mechanism is very approximate, for Gen mµ, only lower limita (shown by arrows) can be given ( IVB, in erg/so'. deg.'),

- So -
Changes in these mechanisms appear to occur at high intensities and there seems to be interaction between mechan-isms (Stiles in Personal communication to Marriott; 1962) and the scheme emerging from Stiles work is obviously far from complete.
Comment
The existence of more than 3 receptors as implied by Stiles later work has been postulated before. Granit (1947) as a result of his electrophysiological experiments postulated colour receptors with narrow spectral sensitivity curves which he called modulators and there appears to be more than three. More recently Granit and Wirth (1953) have suggested 2 or 3 similiar but distinct blue cone mechanisms. On the basis of his own experiments and a collation of others, Hartridge (1950) has suggested 7 receptors, two of which were considered to respond primarily for short wavelengths. Irregularities in the relative luminosity curve (Thomson, 1951 1953) suggest 4 or 5 mechanisms, two of which seem to have maximum responses at 440 mu and 48o mu. Moreover, Blackwell and Blackwell (19 59) have reported data of atypical congenital achromats which they consider to reveal that there are a number of isolated blue cone systems with different action spectra. The blue mechanisms reveal themselves at different levels of luminos-ity measurements and they believe that their results cannot be explained in terms of mixtures of blue cone and rod receptors nor on the basis of macular pigmentation.
Mac Adam (1956) using a technique of binocular adapta-tion examined the v Kries tri-receptor co-efficient law and tried various modifications of the law. The discrepancies between his results and the law led him to formulate an hypothesis of 5 different receptors whose response merged onto 3 channels. In one case the presence of a sixth adapting mechanism was indicated. His experiments did not allow the derivation of spectral sensitivities, but only served to indicate the existence of the processes and their role in chro-matic adaptation.
Four colour receptors were derived by Boynton (1956) following an experiment in which spectral sensitivities were measured by a threshold method under conditions of zero adaptation (absolute threshold), red, yellow and green adapta-tion. The spectral sensitivity functions derived have maxima at 430, 530, 570 and 610 mu and are in good agreement with the functions determined by Jameson and Hurvich (1955). In a

later paper Boynton (1959) reports the results of his tech-nicue applied to colour defective observers and at this time concluded that a three fundamental hypothesis fitted his data better. A doctoral thesis by Ikeka (Boynton, 1963) on the other hand, strongly suggests four mechanisms. This work which concerned temporal summation to flashes of light implied the presence of inhibition when "red" and "green" receptors are stimulated simultaneously. If this interpretation is correct, then it is strong evidence for an opponent colours interaction and a yellow receptor becomes necessary.
Returnih to Stiles multiple blue receptors, the con-tribution of 7,Z and 773 to colour vision is not clear. The revised (1951) CIE function x, 7, z fit the field sensi-tivities of 77 , 7i4c , 7/s , reasonably well considering the limits of accurary possible with Stiles methods, (Marriott, 1962). It is worth noting that the 1931 CIE functions and the fundamental response curves of Pitt (1944a) do not provide such a good fit for Stiles mechanisms. If 712, and Tri are ignored colour matching data can be predicted assuming 7T/, 74 and 's are the only effective fundamentals. Com-pared with the data of Wright (1947) there are significant deviations, notably the lack of negative red in matching blue-green and a lack of red when matching a violet lighto The lack of agreement may be due to experimental error but it seems more likely that the mechanisms 7rz and7t3 must be given some role in the processes of normal colour vision.
Are the IT mechanisms fundamental?
The mechanisms /17 1 171 and 7%- generate a close but not exact approximation to nolmal colour vision data which, if they are assumed fundamental, leaves the function of /T2. and T1-3 uncertain. Moreover the addition of and 17 for higher luminances leads to the suspicion that there maÿ be too many mechanisms for them to be fundamental.
Boynton (1963) points out that the 1 and Tt - curves seem too broad to be fundamental. Narrower sensitivity curves have been obtained for protanopes and for cone monochromats. The curves derived by Boynton, Kandel and Only (1959) are also narrower. On the other hand there is good agreement between
and the blue mechanisms derived by Boynton et al (1959) Akerbach and Wald (A .erbach, 1960) and Blackwell—aria-Blackwell (1961). Stiles data predicts adaptive effects quite well yet if the curves were narrower they would not account for these adaptive effects.

CHARACTER OF THE BLUE RECEPTOR MECHANISM DERIVED FROM OPPONENT-COLOURS THEORY AND
THE MULLER THEORY.
The fundamental response curves of these 2 theories have already been described (p55"--) (figs. 39, 41) . Psycho-physical experiment supports the scheme of the opponent-colours theory but the method, involving judgement of unique hue, is distasteful to those with a physicist background. The Müller theory has stages which are described by transfor-mation from the standard observer.
One of the objections to fundamentals of this general kind and to the concept of opposed processes is the difficulty in providing a plausible physiological background to the mech-anisms. Hurvich and Jameson (1957) have attempted to meet this objection and it is interesting to note that the idea of opponent neural action appearing in other contexts. It has been remarked that Stiles believes that there are interactions between his mechanisms. Furthermore, there are examples of spectral sensitivity curves, like those of Granits modulators, which cannot be related to the properties of any known pigment.
Dartnall (1962) has proposed an idea of opposing neural interaction between photoreceptors to account for the peculiar sensitivity data obtained by Denton and Pirenne for the clawed toad, Xenoous Paevis. Dartnall is aware of the significance of speculations for the opponent colours theory but is caut-iously suggests that much more information is required,
Recent neurophysiological work (Hubel 1963a, 1963b) renders the idea of opponent processes even more plausible and increasingly one must look to the possibility of the blue receptor response taking a form like that assumed in these theories.
THE ROD AS THE BLUE RECEPTOR.
It has been suggested several times in the past (König; 1894; Siven, 1905; Roaf 1930) and revived by Willmer (1946) that the rods using rhodopsin as their receptor pigment act as the blue channel in a trichromatic theory. The dichromasy of the fovea which is, for a small area, rod free was the principal evidence for this in the first place but the occur-ence of 'foveal' tritanopia extra foveally denigrate the hypothesis in its most obvious form. Willmer (1949c) on the basis of histological data provided by Polyak has suggested

- 83-
that the three channels of the trichromatic theory are -
(1) cone-midget-bipolar pathway (pathway A.). (2) rod and cone-flat (or brush) bipolar pathway
pathway (A + B) (3) rod-mop bipolar pathway which provides the blue
mechanism extrafoveally. (Pathway B).
Dichromats are monochromatic at the fovea (Willmer 1î49a, b) and from simple adaptation experiments Willmer (191+9c) postulates that the protanope at the fovea, has a single pathway (A + B) and that normal observers have 2 path-ways,(A + B) and B. Deuteranopes he was able to differentiate into two types : type 1 with a normal spectral sensitivity curve and type 2 who show a definite trend toward insensitiv-ity in the violet. Type 1 deuteranopes are considered to have both receptor systems but only a single nervous pathway B + (A + B) . Type 2 is directly dependent on the cone mechanism only (pathway A). In each case the 'blue' receptor is the extra, foveal rod-mop bipolar pathway.
Willmers theory has not been received with any degree of enthusiasm. Hartridge (1950) and even Brindley (1960) fail to give due weight to the idea of the mixed rod-cone flat bipolar pathway at the foveal centre, and challenge the theory on the ground that there are rods in most of the fovea . Herden (1949) is critical of Willmers methods and interpre-tation in superimposing and combining colorimetric data. Brindley (1957), (1960) finds the rod hypothesis contradicted by the fact that extra foveal matches break down with change in illumination. Marriott (1962) states that the evidence against the theory is overwhelming and points out that Stiles (1939) has with his increment threshold technique detected the rod mechanism which is found to be clearly different from the blue sensitive mechanisms. Finally the Stiles-Crawford effect is strongly active for all 3 colours mechanisms but almost inactive for the rods.
Marriott is probably right.
- -
A SUMMARY OF CURRENT PROBLEMS .
From the preceding review of the literature for tritanopia and related forms of colour vision it is clear that there are several issues that require elucidation.
(1) INCOMPLETE TRITANOPIA , TRITANOMALY AND EXTREME TRITANOMALY.
Several cases of tritanomaly have been described as having characteristics which do not accord with the usual features of anomalous trichromasy. The possibility of incomplete or partially expressing tritanopia has been enter-tained by several authors (Kalmus, 1955; Crone, 1956; Walls, 1261) and it has been noted in this review the tritanomals of Schmidt (1943) might well be regarded as incomplete tritanopes.
An alternative interpretation of these apparently atypical cases of tritanomaly is that they are extreme tritan-omals. Both Jaeger (1955) and Walls (1961) have considered this possibility but there seems to be too little evidence to warrant such an elaboration of categories for trito defects, Farnsworth (1955), as already noted, would have us consider a simplification rather than elaboration for he proposed. that "foveal" tritanopia, tritanopia and tritanomaly are different manifestations of the threshold function of the blue receptor in relation to other receptors.
(2) TETARTANOPIA
The existence of tetartanopia is assumed by some and denied by others. The cases that are cited as examples of tetartanopia are by no means convincing and this is admitted by Judd (1964) who has always seemed to accept tetartanopia.
Whether tetartanopia is accepted or not depends on one's theoretical allegiance, for an opponent-colours theory pre-dicts tetartanopia more readily than it does tritanopia, whereas the trichromatic theory has no time for tetartanopia at all.
(3) GENETICS OF TRITANOPIA
Kalmus (1955) has shown that tritanopia is very likely to be inherited. by an autosomal dominant gene although the possibility of sex-linked dominant inheritance has not been entirely excluded.

- 8S-
The inheritance of tritanomaly is usually thought to be by means of a sex-linked recessive gene but the evidence for this is slender. The ready acceptance of sex-linked recessive inheritance is no doubt the result of analogy with the red-green anomalous trichromasies. More genetical evi-dence for tritanomaly is required but not before the issue of incomplete tritanopia is resolved and certain problems of diagnosis overcome.
(4) EXPLANATION OF TRITANOPIA.
Any explanation of tritanopia is intimatly tied to theories of colour vision, although in general it is agreed that tritanopia is the result of a reduction in the number of effective channels for handling information about colour.
After many years during which the trichromatic theory was pre-eminent fresh view points are now emerging. The opponent-colours scheme of Hurvich and Jameson (1960) and its modification by Boynton (1960) cannot be ignored. Likewise, cognizance must be taken of the evidence for more than 3 colour receptors. Stiles experiments imply 2 blue receptors. Although the function of one of them is by no means clear it does appear to have some function and cannot be ignored in any explanation of tritanopia. On the other hand, Boynton (1963) may right and the mechanisms demonstrated by Stiles may not be fundamental.
(5) PROBLEMS OF DIAGNOSIS
The identification of a trito-defect is not difficult. There are several tests which when combined yield a secure diagnosis. Mistaken diagnosis may arise from increasing pre-receptoral absorption in the elderly when sorting tests like the Farnsworth-Munsell 100 Hue Test but there is now available good data for expected results for each age group (Verriest 1963). Acouired trito defects must be separated from congenital and whilst this is not easy there are guiding criteria (Francois and Verriest 1961) which make the chance of error relatively small.
The identification of the tritanomal is a more difficult diagnostic task and some sources of misdiagnosis have already been discussed in the section on tritanomaly. Wrights criteria for tritanopia is positive enough„ If a tritan can match 530 mu with 420 mu, he is a dichromat ; if he cannot, is he then a trit,nomal, an extreme tritanomal or an incomplete tritanope?

A B + G = BG matching equation would seems a reasonable means of examining this question, but Wright (1952) points out that macular pigment which will selectively absorb the shorter wavelengths will cause complications, and even so what criteria separate tritanomaly from incomplete tritanopia should the latter exist.
There is no proven clinical means of diagnosing the tritanoce and the tritanomal, and a colorimeter must be the cart of appeal, yet not only is this instrument not neces-sarily readily available it may not provide ready answers when it is.

REPORT OF THE INVESTIGATION 0 F 9 TRITANS
INTRODUCTION
an employee of the Victorian College of Optometry, a girl aged 16, on being tested with the iOn11R pseudo-isochromatic plates reported that the tritan symbols appeared fainter than the so-called tetartan symbols on two of the 6 B-Y plates. No significance was attached to this at the time and the matter was not brought to notice again until a few months later the Farnsworth-Munsell 100 Hue Test was acquired. Soon after the arrival of this test it was administered to the subject for no more serious purpose than to gain experience with a new diagnostic tool. It was with some surprise that numerous errors were recorded in her attempt to arrange in sequence the coloured chips which make up the test. The error pattern conformed with the typical error pattern of the tritan. Re-test confirmed these findings which are shown in figure 53.
The following day this subject reported that her mother experienced difficulty with blues and greens and had done so for a considerable period. A family anecdote about her grand- mother who bought green socks instead of blue was recounted. The existence of a tritan defect in the mother was established, using the AOHRR and the FM100 test and it was decided to conduct a survey of the colour vision of the family. This is described in Section I of this report (Survey and Pedigree).
As a result of this survey 9 tritans were identified. However, the battery of tests that was used did not permit these tritans to be specifically identified as tritanopes or tritanomals. colorimeter was not available at this time and a monochromatic-
plus-white colorimeter was constructed with the primary purpose of diagnosing the dichromatic form and with the secondary aim of measuring purity threshold for some of these tritans. This experiment failed in its primary object. The results of this experiment are described in Section II (Measurement of Purity Thresholds).
The possibilities of disc colorimetry were explored with one tritan but this was soon abandoned. Comments on this are to be found in Section III (Disc Colorimetry).
In the final section (Section IV) are described experi-ments carried out with a Donaldson Colorimeter which was acquired and modified in a final and moderately successful attempt to obtain some finality on the character of the 9 tritans.

W Test
Rev:ew
LabVCO EvF BLC subject MB iv8
Propositus
490
Retest
600 610 633 FARNSWORTH-MUNSELL 100-HUE TEST For Color Vision
MUNSELL COLOR COMPANY, INC. 2441 North Calvert Street Baltimore 18, Maryland
• 1st trial • 2nd trial
average
5qc
x i E
as
300
69?
Fig.53. Error score on the Farnsworth—Muüsell 100 hue Test for Subject MB (IV,8)

2,
I
SURVEY AND PEDIGREE OF A FAMILY 1rTITH NINE MEMBERS EXHIBITING A TRITO-DEFECT
METHOD
It has already been remarked in the literature survey that the assumption that trito-defects were rare,resulted in lack of attention to the construction of reliable means of identifying this class of colour vision defects. Because so few cases had been studied, tests that were applicable were often not properly validated.
The propositus had made no errors on the B-Y plates of the AOHhR pseudo-isochromatic plates, and it was obviously unwise to rely on this test alone. The Farnsworth-Munsell 100 Hue Test (F1î100) is capable of diagnosing trito defects, but prior experience with this test had shown the mildly affected deuteranom&.loAA and protanomaloxes observers are likely to make few errors and mildly affected tritans might well be missed.
In addition to the AOHRR and Fi;i100 tests and the usual tests for diagnosing red-green defects, two other tests specifically for the identification of tritans were constructed and added to the battery of tests used in this survey. At a later date, the Farnsworth Dichotomous test was acquired and administered to some members of the family. The two specially constructed tests were the Farnsworth F2 plate and a filter anomaloscope which provided a B + G = BG matching equation.
The object of the survey was to identify tritans and to exclude the possibility of ocular disease of the kind that mimics tritanopia.
The tests and procedures used were:
1. a brief general ocular history and a detailed history of colour confusions; direct ophthalmoscopy
3. visual acuity at distance with glasses if worn; 4. Ishihara pseudo-isochromatic plates t9th ed.); 5. AOH.i. pseudo-isochromatic plates; 6. Farnsworth-Munsell 100 Hue Test;
7. Farnsworth F2 plate; g. Nagel anomaloscope;
9. Filter anomaloscope for B + G = BG equation; 10. Farnsworth Dichotomous Test.

3.
Circumstances prevented the use of all Tests on every tritan subject, but in each case subjects were tested under strict supervision and all tests with pigmented papers were administered under standard illuminant C (Macbeth Easel Lamp). Tests were conducted on each eye separately for most affected members.
Discussion of Diagnostic Techniques
1. History. The nistory encompassed colour confusions experienced by the subject and the time they were first noticed. ä.ny changes in colour perceptions that had occurred since they were first aware of their difficulties with colour were noted. Questions concerning their present and past ocular history were included to determine whether there were grounds for assuming the defect to be acquired in origin. General questions concerning family ocular history and family colour vision history were also asked.
2. Direct ophthalmoscopy. Each subject was examined ophthalmoscopically to determine whether there were present any media or ocular fundus defects. It has already been noted that disturb- ances of the outer layers of the retina and choroid frequently cause trito defects (Francois & Verriest, 1961). A tritan defect may be the result of an absorption system (Verriest, 1963) and for this reason an attempt was made to observe, not only any undue sclerosis and yellowing of the crystalline lens, but also unusual degree of the reputedly normal yellow pigmentation of the macula.
3. Visual acuity test. Monocular visual acuity of each patient was measured with a Snellen letter card to ensure that acuity was sufficient to allow reliable results to be obtained from the various tests supplied and also to assist in determining whether any pathological defects were present.
Wienke (1960) has shown on 6 observers that the proportion of red to green in a mixture to match yellow varies systematically with the observer's spherical refraction : a hypermetrope needs more red and a myope less than the normal and this is related to the chromatic aberration of the eye.
4. Ishihara Pseudo—isochromatic plates (9th ed.). These plates do no more than detect red—green colour defects (Cole 1963), but this they do reliably. The test was included to identify the protan-deutan colour vision defects.
I am grateful to Mr. Noel Verney, a Queensland optometrist, who tested 2 members of the family resident in Queensland. An exception to the rule of strict supervision was the testing of 3 children of one tritanope who were resident in South Africa.

4.
5. AOHAR Pseudo-isochromatic plates (2nd ed., 1957) (figure 54). The authors of this test do not report having given their plates to tritans (Hardy, Rand and Rittler, 1954 a, b, 1956) but Walls (1959) found that 3 tritanopes and 2 tritanomals to whom he gave the test made "strong" tritan scores and did not make any errors with the tetartan characters.
Since the propositus made no errors with the B-Y plates of this test but saw two tritan symbols fainter than the tetartan characters, all members of the family to whom the test was administered were asked, if they made no errors for a particular plate, if one symbol looked fainter than the other.
6. Farnsworth-Munsell 100 Hue Test (figure 55). This test is regarded by Jaeger (1955), Crone (1956) and others as a very valuable diagnostic tool,especially for the detection of tritans.
The test comprises 85 Munsell papers which form a hue circuit, the hue differences being "just easily noticeable" by normals. There are slight differences in value and chroma which call for some expression of colour aptitude in normals and which detects colour defectives by forcing them to resort to criteria other than hue differences. The construction of the test is described in detail by Farnsworth (1943).
The errors made by a subject in arranging the papers in an orderly sequence of colour progression are plotted on a radial scale. Colour defectives are identified by a bipolar error score distribution when plotted on this scale. The axis of this bipolar bulge is characteristic of the type of defective colour vision. The distributions of the midpoints are given by Farnsworth (1957) and are shown in figure 56. These are based on 112 tests on colour abnormals and includes the results of 12 tritans. There is some overlap of the protan and deutan groups and it may not always be possible to differentiate these groups. The tritan distribution however, is more clearly differentiated and there is little chance of considering a deutan to be a tritan. The possibility of such an error should be recognised and it would be unwise, for this reason, to base diagnosis on this test alone.
A further source of error arises from the fact that errors occur preferentially in the blue-green region for normal subjects and because of increase in lenticular yellowing with age, the elderly will tend to give mildly tritan-like error score distributions.
Fortunately, data are now available (Verriest, 1963) for normal subjects by age groups so that individual performances can be compared with a detailed yardstick.

vsEimoisoc9aowKnc . .'..'%AtES
. ..
..rot oillAirw.CUu urowV.TM
gpuµ rye [01.0e ntYTi -
FiçuRE AO •HRR, PSet)Oo-/SOGc( ,CoMATiC PLATE W,TK M17c8E7-4/ 69564 LfiMP
I I IF. F \K\SW1N111I.\ICNSI_I tool ILF. Tl'-tiI
for the cypnlnethn c.o4x l7iecrmmmntùn
F7çc.)RE SS 144,2N57Jo-RTN NSEZL /00—HuE T6ST

pr4x-X Distribution i t mid-puunh train I I.'. lests on color defcititr suhjckts: prutans,
Su deutans and I_' eritani.
tzzxz t ,tt(In.
r •, tr
_ns t,r n, I L r
..,.,i XVE&6. Specimen of calor detective pattern;
Tritan. Average of 2 trials
N .. '7%
t. . •„ y`; .
• • i.% •
•
= Protons
= Deutans
- Tritons
Fig. )b. Distributi,n of error s on the Fa nswo th-Munsell 100 hue Test for Various forms of Co our Vision
:i patterns. _ Spec imen ut calor Defective pattern, Deutan. Average ut 2 trials.

5.
The FM100 provides some measure of the severity of the defect since performance does depend on hue discrimination. Some element of chance does exist in arrangement when the subject has defective colour vision and test—retest variation can be expected. This is particularly so, we have found, when the subject is either young or elderly and may perhaps lack the ability to sustain concentration throughout the test. For normal subjects test—retest reliability has been shown to be moderately good (Farnsworth, 1957) although the retest yields the more important score since it correlates well with a second retest. The limitations of the FM100 as a means of assessing severity of a colour vision defect are discussed by Cole (1964) and it is perhaps undesirable that undue weight be placed on this test as a means of measuring severity.
Mildly affected colour abnormals are likely to make so few errors that the test loses all its diagnostic value, and it is clear that supplementary tests are necessary.
7. Farnsworth F2 plate. This test has been commended by Kalmus (1955), Jaeger (1955) and Walls (1959) as a most useful test for the detection of tritans. It has been described in detail by Kalmus (1955) and it is from this description that the plate was constructed for use in this survey. With this plate the normal subject sees two overlapping squares, one blue and the other green. The green square is seen as the more prominent. The tritan will either see only the blue square or will report the blue square as more prominent than the green. The simplicity of the test rendered it most useful in the examination of the younger members of the family, who were asked to trace the squares. The plate could be presented several times by turning it around.
8. Nagel anomaloscope (figure 57). The Nagel anomaloscope was included for 3 reasons. Firstly, it is accepted as the most valid diagnostic test for the differentiation of the protan and deutan defects and would, therefore, be useful in the event of such defects appearing in the family. This would be particularly important if the association of the two classes of defect became complex or of genetic significance as in the pedigrees of Jaeger (1951) and Crone (1956).
Secondly, acquired tritan defects in the trichromatic stage may have a protanomalous Rayleigh match which in the dichromatic stage is invariable and more marked (Francois & Verriest, 1961).
Thirdly, there is the possibility that a typical achromatopsia may be misdiagnosed as a tritan defect (Sloan & Newall,. 1942). Good discrimination in the green, yellow, red would preclude achromatopsia.
The instrument was used in the step by step method of Walls (1959)x `

6.
9. Filter anomaloscope (figure 58). This apparatus was specially constructed for use in this survey to augment the battery of tests based on the use of pigmented papers. The object was to provide a test based on a matching equation analogous to the Rayleigh equation but applicable to the tritan class of defects. It was hoped, with this instrument, that the dichromat could be distinguished from the trichromat and that it would also provide a precise estimate of the severity of the defect in the event of anomalous trichromasy.
The apparatus comprised a lamp compartment two filter disks, two diffusing chambers and a bipartite viewing field. The filter disks were illuminated by two mirror backed 150 W tungsten lamps. One filter disk carried a blue (Wratten filter No. 49) and green (Wratten filters 45 and 58 superimposed) placed end to end in one quadrant. The other disk carried a cyan filter (Wratten filter No. 45) of half the area of the blue and green filters. Each disk rotated behind an aperture such that rotation of the disk carrying the blue and green filters varied the proportions of blue and green light entering one diffusing chamber and rotation of the other disk varied the amount of cyan light entering the other diffusing chamber. The disks were arbitarily calibrated in degrees. The two diffusing chambers were separated by a thin septum which divided a circular posted glass. The bipartite field was viewed through a simple eyepiece and subtended an angle of approximately 20 at the eye.
Subjects were asked to match the cyan half of the field by adjusting the mixture of blue and green in the other half. The test was administered to subjects in essentially the same manner as was the Nagel anomaloscope. The subject was first allowed to make two practice settings and then make three free settings for each eye. The range was measured for each eye using the step by step method. An arbitrary scale reading of 35 is the setting of the blue—green mixture for the normal. This wasdetermined by taking the mean of ten observations by each of four normal observers. There was very little variation in the settin;_,s of the normal group and the normal matching range on the instrument was of the order of 1 scale unit. The full range is 0 (blue only) to 60 (green).
The apparatus was subsequently modified in mechanical_ design and made more flexible by provision for interchanging filters.
.
The matching locus of the B + G BG equation is shown in figure 59. This equation closely resembles the equation chosen by Crone (1956) and avoids, to an extent, the objections which were earlier raised against Enelkings (1925) equation (see p. /6 ).
. . . . . . .

,=içvRE 31. NgçEC. 4n/oMAcasco/2E.

F C
F C
Q
Fig. 58. Filter Anunalosoco,)e
L Light sources
D I cotatable discs
F Filters
C Diffusing chambers
0 Opal glass
E Eyepiece
See text for explanation.
1

.7 .5 .6 .3 .4 .2
525
G • 550
570
500
OGYS/S
/ 1 oR4/a lN4-N6
A.,0
r
X Fig. 59. CIE Chromaticity Diagram showing Matching Equation used in Filter Anomaloscope 449 + (45 + 58) = 45}; Tritanopic Co-Punctal (Cbl; Munsell Papers used in Disc Colorimetry; and Chromaticity of Donaldson Colorimeter Filters (H, G, G and B) .

RÇuRE 6o FR+tNSWOKTN Dlu10TOi ►+o-t1S TEST

7.
The matching locus chosen was limited by available filters. It cuts the x axis of the CIE chromaticity chart at about x = .15 and the tritanope may well be unable to match the blue of filter No. 49 to the cyan chosen (No. 45). This is because the tritanopic co-punctal point is at x = .1748, y = .0044 and the confusion locus passing through the cyan will cut the matching locus at the blue end. This is shown diagramatically in the figure. A filter with an x value slightly greater than that of the blue filter chosen (No. 49) would have avoided this possibility of ambiguity in identifying the dichromat, but filters of more suitable chromaticity had a luminous transmittance far too low to be practicable in an instrument of this kind.
A second limitation of the instrument was that the green of the B + G mixture did not permit the matching locus to extend to the spectral locus of the chromaticity chart. A tritan able to match the pure green to the cyan may not necessarily be a tritanope : a green closer to 505 mu might be found not to match the cyan. Green filters with the chromaticity required to overcome this limitation are not available. If such a filter were available it would have an extremely low luminous transmittance indeed.
As a consequence of these limitations, a tritan with a matching range of say 0 to 60 cannot be regarded a tritanope with certainty. It is possible he is a tritanope, but there is also the possibility that he is an extreme tritanomal or an incomplete tritanope. On the other hand, a tritan with a range of 10 to 60 may be a tritanope, the fact that he cannot match the pure blue to the cyan merely reflecting the lack of parallelism of the tritanopic confusion line and the matching locus of the instrument.
10. The Farnsworth Dichotomous test, Panel D15, (figure 60), was acquired at a later date and was applied to some affected members. This test was devised for the detection of persons who are functionally colour defective and attempts to dichotomise colour deficiency into "pass-fail" classes at a fairly gross level. The test is intended for such purposes as the detection of employees who cannot surely distinguish coloured products of ordinary industrial usage. As such it can be regarded as an additional measure of the severity of the colour vision defect exhibitied by the affected members of this family.

8.
RESULTS
The tests and procedures described in the preceding Section were administered to 44 relatives of the propositus either at their homes or in a few cases in the laboratory of the College. The family was found to contain nine certain tritans and by anamesis a possible tenth tritan. No more extensive tritan family has been discovered in the literature.
The results of the survey are shown in figure 61 and table ÿ. Detailed results appear in figures 62 and 63.
Visual acuity and oputhalmoscopy
Eight tritans read the Snellen 6/6 line either with glasses or unaided, and one read, unaided, the 6/9 line and a few letters of the 6/6 line. Two subjects (III, 8 and IV, 6) were thought to have pigmentary stippling in the macula area which was slightly in excess of normal. This was the opinion of two independent examiners, but neither examiner considered the stippling to be more than a slight normal variation of the usual appearance of the macula. . The two subjects were mother and daughter.
Subject II, 4, showed a few scattered colloid bodies at the posterior pole and some pigmentary disturbances characteristic of senile macula. degeneration in a very early stage. She was aged 74 and read 6/6 both eyes separately with glasses.

9. KEY TO TABLE
All persons shown as having normal vision (N) in the pedigree (figure 61) were tested with the Ishihara, AOHRR, F2 and such other colour vision tests which were at the time considered necessary to exclude a tritan defect (usually FM100 and filter anomaloscope).
Aye. Age given is the age at the time of the first visit to subject. Some tests were administered 1 or 2 years later.
AOtu. There are 6 characters for tritan defects and a maximum of 6 errors is possible. Some subjects made no errors, but saw tritan symbols faintly.
FM100 Hue. Tritan mid—points, according to Farnsworth (1957) range from 2 — 6 in the orange (o) and 46 — 52 in the blue— green (b—g). The numbers are arbitrary chip numbers of the test.
Verriest (1965) has shown that the FM100 is relatively too difficult in the rec and blue—green regions compared with the
other ones, especially for older subjects.
Therefore, Verriest considers a tritan tracing as abnormal only when the total score is higher than that observed in about 95-0 of an unselected population of the same age group.
The total error score exceeds this criterion in all cases, except IV, 10.
Ishihara. This column gives number of errors in unabridged 9th ed.
Nagel Anomaloscope. Normal RG mixture is 42 and yellow intensity is usually 14 (4214).
Filter Anomaloscope. Normal BG mixture setting is
351. 1- Full range is 0 (blue) to 60 (green).
F2. The normal sees a green square more prominently than the overlapping blue one. The tritan sees only the blue square (b) or tae blue more prominently than the green (b) g).
Farnsworth dichotomous Test. A severely affected tritan should make diametrical transpositions in characteristic direction in which case diagnosis T has been recorded. T (?) means that there were minor (not diametrical) transpositions. Subject III, 11 made no errors on his second trial.

TABLE 9 DIAGNOSTIC DATA FOR 11I1E TRITANS, ONE POSSIBLE TRITAN AND ONE DEUTERANOPE
+,
w x
cn
w
History
AOHRR Errors on
Tritan Plates
m P
oF-+
FM 100 Hue
Axis Mean Miopts Error 0 bg Score
4 ô
Nagel Anomaloscope
Aver. RG/Y Range
Filter Anomaloscope Range
RE LE F2
U) Ç.4 o f CO
oo 4,
w Q H Diagnosis
Possible Tritan 1.1 11 (Dec) B=G
(reputed)
11.1 '-I 78 B=G 6 0 2 48 192 10-60 10-60 b T Tritan
Y=Pink
II.4 F 74 13=G 6 0 7 49 296 - - - - b Tritan
111.2 F 43 B=G 2 0 6 48 324 - - - - b T Tritan
(2 faint)
III.8 F 40 B=G 3 0 5 46 191 39/13 - 0-60 0-60 B T(?) Tritan
Y=Pink (3 faint)
III.10 F 38 B=0 0 0 5 50 180 42/14 - 5-60 5-60 b>g - Tritan
(5 faint)
III.11 M 29 B=G 4 0 4 48 152 30/13 3 0-60 0-60 T Tritan
(2 faint)
IV.6 F 15 B=G 1 0 2 47 154 45/12 40-60 40-60 b No Tritan Error
IV.8 F 18 Nil 0 0 5 48 164 22-60 25-60 b>g No Tritan
(2 faint) Error
IV.10 F 6 Nil ? 0 0 2 49 123 - - 440-60 - b>g - Tritan
(4 faint)
IV.26 M 18 0 0 10 Deutan 168 - Full 35-36 Deuteranope

• TRi isrN
OL`vT'cq 0 g
0 PoSSiecE ,OcoT E11AyV O eC
p PoSSi84E TA/ 1411l
OO cog-AR/6r? FvR ,oFrire7c RnJO / arf-
A.t,uRE 6 /
PEo içREE

I. Eirp D"
Test.___.
11.41/NO/ .
toast
600 610 ses 633 J FARNSWORTH-MUNSELL 100-HUE TEST For Color Vision
MUNSELL COLOR COMPANY, INC.
..... 2441 North Colvert Street Baltimore 18, Maryland
sqo
6
Fig 62b Aso
goo
Farnsworth—Munsell 100 Hue Test findings for subject L.M. (If, 4).

Y10 MUNSELL COLOR COMPANY, INC.
2441 North Calvert Street Baltimore 18, Maryland
o Test 9
`M Retest
soo
Fi962c 40 490
E=P_BLC..
904
610 633 FARNSWORTH-MUNSELL 100-HUE TEST For Color Vision
s4t
Q
°Io
y»
Lab_
JP
Farnsworth—Munsell 100 Hue Test findings
for subject L.H.B. (I11, 2).

600 610 6JJ FARNSWORTH-MUNSELL 100-HUE TEST For Color Vision
I MUNSELL COLOR COMPANY, INC. 2441 North Calvert Street Baltimore 18, Maryland
Ttst .4.44615■
* Rtvitw
• %OW .77-43
69! 690
t
Lob. E=p. B LC 594
i
Farnsworth—Munsell 100 laue Test findings for subject N.B. (III, 8).

49 ..o
Farnsworth-Munsell 100 Hue Test findings for subject 'LB. (III, 10).

MUNSELL COLOR COMPANY, INC. 2441 North Calvert Sties'. Baltimore Moryiancl
Test
* Ihrtiew
!Mee .........
FARNSWORTH-MUNSELL 100-HUE TEST For Color Vision
No
Farnsworth—Munsell ihie Test findings for subject G. M. (III, 11).

S96 FARNSWORTH-MUNSELL 100-HUE TEST
For Color Vision
MUNSELL COLOR COMPANY, INC. 2441 North Calvert Street Baltimore 18, Maryland
Ao • Ted.
a Ihmlow e.
Reese Q---
MS 490
3 t
it
Q
eP%
Farnsworth—Munsell 109 Hue `l'est Findings for subject R. U. (1V, fi).

600 N° °tp FARNSWORTH-MUNSELL 100.HUE TEST For Color Vison
IMUNSELL COLOR COMPANY, INC.
.... 14 2441 North Calvert SO cet ( Baltimore 16, Maryland
F
` ■■■■•nr
1
Fig 62i rPs 844
sue
495
Lab...._ .._ -_ E=p_JN
NY 1es- _ J•---
X
sm.
Review
Retest
Farnsworth—Munsell 1U0 Hue Test findings for su'Jject S.B. (IV, 10).

Name G.Q...(11„1 .) Age 80 Date hile No
BAC Department Tester
10
Fig 63a
FARNSWORTH DICHOTOMOUS TEST for Color Blindness Panel D-15
DICHOTOMOUS ANALYSIS
Type Axis of Confusion
PROTAN (RED-bluegreen) ❑
DEUTAN (GREEN redpurple) ❑
TRITAN ( VIOLET -greenishyellow) U
PASS []
FAIL ❑
Test
Subject's Order
Retest 1 2 3 4 5 6 7 8 9 10 11 12 13 14 15
Subject's Order
TEST RETEST
3; 4 5 3 4
REF C
ARPENCE REFERENCE
CAP
t
15 15
14 14 t
' 13 12 11 12 11
10

DICHOTOMOUS ANALYSIS
Type Axis of Confusion
PROTAN (RED-bluegreen) ❑ DEUTAN (GREEN-redpurple) ❑
TRITAN (VIOLET-greenishyellow) ❑
J PASS
FAIL ❑
5
'
o , 14 o .
13 o
o o 10 12 11
Subject's Order
REFERENC CAP
Fty.G 2 6.
6 o
07
ZP %PN -
' 08
TEST
o' 15
I I, 1 1 1 1 I
09
L:...
Asia
15
REFERENCE o CAP
O
RETEST
FARNSWORTH DICHOTOMOUS TEST for Color Blindness—Panel 1)-15
Name LHB (111.2 Ag,.43 Date Nov 63 bile N()
Tester BLC
Department
Test
Subject's Order
1 2 3 4 5 6 7 8 9 10 11 12 13 14 15
Retest

RETEST
3 4
REFERENCE CAP
REFERENCE CAP
15 15
14 14
1 10 Fig 63c '13; 10
TEST
3 ; 4
F ARNSWORTH IlI(:HOTOMOlIS TEST for Color Blindness—Panel 1)-15
Name N8 1118
Aer 40 Date hile Nu .................... ...
1)epartment Tester BLC
1)Iu1HOTOMUUS ANALYSIS
Type Axis of ( onfusion
PROTAN ( RED-bluegreen) [] DEUTAN ((.-iREEN-redpurple) C TRITAN (VIO1.E.T-greenIshyellow) U
PASS
FAIL (]
Test
Subject's Order
Retest 1 2 3
6 8 9 10 11 12 13 14 15
Subject's Order

PASS []
FAIL
DICHOTOMOUS ANALYSIS
Type Axis of Confusion
PROTAN (RED-bluegreen) DEUTAN (GREEN-redpurple)
TRITAN (VIOLET-g reenishyellow)
I ARNSWORTII I)I(;llO'l'(lMOtlS l'EST for Color Blindness Panel 11-15
,,I ..,.e G M I I I , 11 A . 29 Date ► ilt f
'Festet. BLC
Test
Subject's Order
1 2 3 4 5 6 7 S 9 10 11 12 13 14 15 Retest
RETEST
3 14
REFERENC CAP
15
14 Fig 63d 10
12 11
Z 1
Subject's Order
TEST
2
REFERENCE CAP
15
14 '13
Department

10.
Comment on the results of the tests administered to the Tritan Members of the Family
Subject I, 1 male (deceased) .
Two of the progeny of this subject reported without prompting that he was colour defective : that he was a sea captain made this a point of family interested. It was claimed, on questioning, that he confused blues, blue-green and greens. This evidence is too scant to warrant any definite conclusion; such colour confusions could arise from ocular disease or could be normal impairment of perception of blues and greens which occurs with age, presumably due to yellowing of the crystalline lens. Slit lamp examination of elderly people frequently shows such marked lenticular yellowing. Blue-greens frequently provoke argument amongst those with normal colour vision and the reported confusions may reflect no more than semantic differences of opinion. It should also be remembered that the two who reported their father's colour confusions were themselves tritons and were hardly in a position to judge their father's colour vision.
The unreliability of a history of colour confusions is well illustrated by a subject unrelated to this family who reported daily confusions of greens and blues for twenty years. He also reported that yellow appeared dirty gray. These are classical symptoms of the tritanope. On examination tLe colour vision of this subject was shown to be normal, in fact his performances on the FM100 Hue test was above average.
Subject I, l's reported colour confusion, taken in conjunction with the appearance of a trito-defect in succeeding generaions can suggest the diagnosis "possible triton", but no more.
Subject II, 1 male, aged 78
Test results as shown in Table 9 leave little doubt that this subject has a tritan defect. The range on the filter anomaloscope is nearly complete (10-60). He could match the green to the cyan, but the blue required the addition of a little green for a match. The wide range suggests dichromacsy within the limitations of this instrument. The fact that the range is not complete does not preclude dichrome3y.
The FM100 Hue score is the average of two trials, the first trial giving a much higher score than the second. The relatively high FM100 score, the failure to see all the tritan plates on the 110 and to see tyle green square on the F2 plate, along with the wide anomaloscopic range, give definite indication that the defect is severe.

11,
Subject II, 4 female, aged 74
This subject is the sister of II, 1 and the test results are similar. A11 six tritan symbols of the AOHRR were not recognised and the green square of the F2 was also not seen. The error score on the FM100 hue of 296 is the average of two very similar trials and is the second highest of the 9 tritansinvestigated, The high score may be the result of her age. There was some evidence of senile macula.. degeneration which may also be contributory since this retinal defect is normally associated with an acquired blue—green defect. It is unlikely that the retinal changes are the cause of the trito defect, since II, 4 has been aware of her inability to distinguish blues and greens for many years. The long standing nature of the defect is corroborated by family anecdote. Visual acuities are 6/6 right and left and an acquired defect of this magnitude in the absence of reduced acuity is unlikely.
The findings on the AOHRR, FM100 Hue and the F2 demonstrate a severe defect similar to the defect exhibited by her mother. The moderately exacting anomeloscopic tests were not administered because of the subject's age.
Subject III, 2 female, aged 43.
This subject is resident in South Africa, but her visit to Australia in 19b3 permitted tests to be carried out at the College. The filter anomaloscope was not used on this occasion since by this time the Donaldson colorimeter was available and was used instead. The battery of tests that was administered indicateswithout doubt the existence of a trito defect. The error score on the FM100 was the highest of all the tritans and the Farnsworth Dichotomous test yielded a classical tritan pattern.
Subject III, 8 female, aged 40.
Dichromasy is strongly suggested by this subject's ability to match blue alone and green alone to the cyan at the filter anomaloscope. Three of the six tritan symbols could not be seen and the remaining three appeared fainter than the tetartan symbols. The FM100 Hue error score was similar to II, 1, the second trial showing a much higher score than the first. The green square of F2 was not seen.
There was a long standing history of confusion of blues and greens, especially in artificial light, noticed particularly with sewing. It was reported that these confusions do not occur in day- light, unless the colours are very similar. Occasionally, pink and yellow are confused. She believes that these difficulties have become more noticeable over a period of years.

12.
Tile test results imply a defect as severe as the two affected members of the second generation and it is likely that the defect is tritanopia.
Subject III, 10 female, aged 38
The defect does not appear to be as severe for this subject as for the older affected members of the family. She was aware of the defect, but does not appear to have difficulties with colours to the extent reported by her sister, III,8. She reported no more than she knew of the existence of the defect and confused "some blues and greens only and does not like greens".
That the defect is not as severe is substantiated by the following:
(1) no errors were made with the AOlIRR, although five of the tritan symbols appeared fainter than the corresponding tetartan symbols;
(2) both green and blue squares were seen with the F2, but the blue was seen as the more prominent;
(3) the FM100 hue error score, which is the average of 3 trials, is slightly less than the average error score of the older tritan subjects.
This last point is of dubious significance, since error scores on the FM100 are variable. This subject, for instance, had error scores of 139, 206 and 196 whilst the deuteranope IV.2u (see table 9) is firmly established as a dichromat by means of the Nagel anomaloscope and yet, has the relatively modest FM10;) hue score of 1b8.
The range at the filter anomaloscope is 5-60, right and left eye, so that despite indications that the defect might be less severe than that exhibited by the older tritans, dichromasy is not improbable.
Subject III, 11 male, aged 29
The full range at the filter anomt+loscope suggests dichromasy.
Subject IV, 6 female, aged 15
At the filter a.nom:;loscope the range of mixtures of B + G which match cyan is considerably smaller than that of the subjects already described. The range is from 40 to 60, this being the result of determinations on two separate occasions. The normal match setting of 35 is rejected as being too blue.

13.
Only one error was made on the AOHRR and the FM100 error score is moderate. The green square of the F2 could not be seen.
These findings suggest anomalous trichromasy, but not tritanoa ly. The unexpected and curious nature of these findings will be discussed later.
Subject IV, 8 female, aged 18 (
The findings at the filter anomaloscope are similar for this subject. Like IV, 6, green alone can be matched to the cyan, but the range of mixtures of B + G are limited to 25-60. This range differs from IV, 6 in that the normal's match (35) is accepted. These findings imply extreme anomalous trichromasy, but not extreme tritanomaly.
The lesser severity of the defect is also evidenced by:
(i) correct responses to all the AOHRR tritan plates, although 2 symbols appeared faint;
(ii both squares of the F2 being seen; (iii) failure to make errors in the arrangement of the
coloured papers of Farnsworth's Dichotomous test. Panel D15.
The colour vision of subject VI, 8 was also subject to investigation using disc colorimetry which is described in Section III.
Subject IV,1O female, aged 6
Although aged only 6, this subject gave definite responses to the tests and appeared to be a reliable observer. She failed to see one tritan symbol on the AOHRR and reported, on direct questioning, that 4 of the tritan symbols that were recognised were fainter than their corresponding tetartan symbols. On re-test some weeks later, no errors were made, but the tritan symbols were consistently declared to be faint.
The FM100 hue was administered twice, the second time four months after the first. On the first occasion the error score was 128 compared with 117 on the second occasion. The first test showed a marked band of errors in the orange, red and red- purple and a lesser error bulge in the G, BG and B. The error axis was the same on re-test, but the major bulge was in the blue. Arrangement of the GY-Y and PB-P chips was good, indicating that the subject had grasped the requirements of the test as well a.s having good colour discrimination in this region.

14.
The F2 was less definite. Both squares were seen and the blue seemed to be favoured as the brighter, but her responses were inconsistent.
The range at the filter anomaloscope was 40 to 60, similar to that of subject IV, 6.
The FM100 scores for the 2 trials do. not exceed the 9» criterion recommended by Verriest (i963). All the other cases considered tritans do exceed this criterion, Verriest considers that a tritan-like tracing should only be considered tritan when the total error score exceeds that observed in 95% of an unselected populatiJn of the same age. For the age group 10-14, this criterion is 160 and is likely to be higher for younger subjects.
The mean partial scores for this subject are shown in table 10 compared with Verriest's standard data for partial scores.
TABLE 10 Mean Partial Scores for Subject IV, 10 Compared with normal data of.Verriest (1963) for the 10-14 year age group,
Subject IV, 10 Verriest (10-14 yrs) First Trial Second Trial
R (83-5) 2,5 1.37 0.90 Y (15-22) 0.75 0,37 0.75
2.2 3.5 1.67 B142-51 P67-7 0.5 1.0 0.91
The BG mean partial score and the R mean partial score are higher than the average for the nearest age group, whilst the other partial scores (y and P) are lower. This results suggests a tritan deficiency despite the failure of the total score to reach the 95% criterion. Taken with the performance with the AOHIRR, the F2 and the filter anomaloscope, it is very probable that this subject is a tritan. However, it must be admitted that the diagnosis in this case is the least definite.
Subject IV, 26 male,aged 18
This subject was shown to be a deuteranope at the Nagel anomaloscope, a conclusion supported by the iOHRH and the FM100. His mother, III, 22, was found to have normal colour vision and must be a carrier for deuteranopia.
The deceased father (II, 5) was reported to be grossly colour defective and, although this could not be confirmed, it is very likely that this is the case. He was a potter and many of

15.
the family are artists (the artist members were all found to have normal colour vision, deuteranope IV, 22 resumably having no flair for pots and paint had taken to the stage) and because of their highly developed sense of colour, can be relied on in this judgment. The father's (II, 5) pottery is notable for its restricted colour range.
Since II, 5 is not a blood relati,n of I,1 and I,2, the appearance of deuteranopia need not be considered in discussion of the tritan defect.

16. Comment on the Results of the Tests
Administered to the Apparently Normal Members of the Family
Kalmus (1955) remarked that the severity of the trito defect exhibited by his subjects varied. He reported instances of affected children with unaffected parents apparently demonstrat-ing that the gene does not necessarily find expression. He also characterises some subjects as having a "slight trito defect" but does not show the data upon which this diagnosis was made, although it might be inferred that these subjects exhibit a slightly sub-normal performance in discrimination of blues and greens as a weak expression of the gene.
There is evidence in the pedigree presented here of phenotypical variation, although the limitations of the tests administered in the survey should be borne in mind. In examining the test results of members of the pedigree not obviously tritanopic (Table 11, 12) there are 8 subjects who may be thought to show some signs of reduced colour discrimination for blues and greens and who, as descendents of the presumed tritan I, 1 could conceivably possess the normal gene. It would not be difficult to consider these subjects as exhibiting a "slight tritodefect" and it is this hypothesis that is examined now.
The tests employed do not lend themselves easily to the recognition of colour vision defects which are slight in severity. The AOHitR plates have been shown to error—less for subjects with a trito defect readily demonstrable on other tests. The Farnsworth—Munsell 100 Hue test can give an error score which cannot be differentiated from the normal when the defect is slight. A history of colour confusions is of doubtful value if not misleading.
Of the tests that were administered in the survey,it is the FM100 that is most likely to yield information aboi.t "slight trito defects" despite its limitations.
In using this test amongst normal observers we had noticed that the red caps and the blue—green caps seemed to present the greatest difficulty and errors tended to accumulate in these regions more than in others. For this reason, inthe original draft of this section, control data for the FM100 was obtained from 21 men with normal colour vision. Subsequently,Verriest (1963) published extensive and detailed data for normal observers and it is his data
that is used here. By inspection of the partial scores for R, Y, BG and P regions the scores of our 21 men do not differ significantly from those given by Verriest (Table 13). It is unlikely, therefore, that for reasons of illumination, method of administration or condition of the test, that Verriest's data is not applicable to scores obtained here.

TABLE 11 Diagnostic Data for Members of Pedigree with Apparently Normal Colour Vision and who are Descendents of Trita.ns 1
W H SToR y Ll
III 3 M 38 Nil G 0 — - - - P
III 5 M 45 Doesn't like 02 1 45 Mainly 45/ - P Slight greens one in- in BG 15 trito- stance reported to B defect? of confusion of blue-green with green
III 15 M 38 Nil 0 0
III 17 M ? Nil 0 0 29 Random - Nor- mal
III 20 F 34 Nil 0 24 33 Mainly 46/ Father in BG 11 probably and in 44 - P Deutera.n- R opic
Carrier of D (?) Slight trito-defect?
III 22 F ? Nil - 0 12 Peak in _ Nor- - Known BG mal carrier of
Deuteran-opia Slight trito-defect?
76 Peak in G to BG

F?H-
WI vE
/oo \
‘V L)
i t,
O � .
k 1`
o 'ç' k t,"4 o
i
k
▪
ô w I Z
1. (Ni
III 24 F 51 Nil 0 0 119 Errors - Nor- in GY-G- mal BG-B and
P Slight trito-defect?
AP 92
III 25 M ? Nil 0 0 - - - - P
IV 4 F 7 Nil 0 0
IV 9M12 Nil 0 46 Mainly in green 40/ - Slight
16 +7
trito-defect?
IV 15 F &I Nil P
IV 16 F 5z Nil 0 0 P
IV 17 F 4 Nil 0 0 - - - - P
IV 19 F 12 Nil 0 52 Small - Nor- peaks in mal G9 B-PB
F5 Slight P trito-
defect?
IV 20 F 7 Nil NOT-
mal
IV 21 F 5 Nil
IV 22 M 19 Nil 0 0 16 No trend - Nor- mal
P

FM• /0 41 v
ô i
o k o ,l
v 1 'k- \ t, I`
V ), Ô ô
i t K
kli
'40 3C V
ô ô ô
h ti ,t 8
IV 23 F 14 Nil 0 0 12 No trend - - P
IV 24 F 12 Nil 0 0 16 Errors in BG
- - P
IV 25 F k Nil 0 0 - - - - p
IV 27 M 19 Reports difficul- 0° 2 36 Peak in ty naming colours especially green and blue
G, Bß,B 43/ - 12
P Slight trito- defect?
7 BG only
IV 28 If 14 Nil 0 1 63 GY-G.BG- Normal B-PB-P setting
range 6 units
P Slight trito- defect?
56 GY-G and R-AP- P

Notes on Table
1. The table does not include members who are not descendents of affected members : nor does it include data for normal parents of tritans.
2. This subject (III, 5) reported 2 tritan characters of the B-G . OiIi3.R plates appeared fainter than their corresponding tetartan symbols.
3. On second trial with FM100 Hue no errors were made in the Bù to B region.
4. Di—ficulty was experienced with a number of the .Ishihara
plates.
5. Subject IV, 9 failed the plate F2 on the first trial but passed on repeated subsequent presentations.
6. No errors were made on AOHRR B-G plates, but 4 tritan symbols appeared fainter than the tetartan symbols.

TABLE 12 214100 Data for 8 Subjects who might be considered
to have a "Slight Trito Defect"
Subject Age Sex FM100 Score
Standard Data of Verriest
(1963)
Mean S.
Partial Standard Score Partial BG Score
42-50 BG (Verriest
1963)
III 24 51 F 119 66.3 34.8 4.7 1.60 92
III 545 M 45 93.6 44.0 1.2 1,95
III 22 Approx F 12 68.2 35.0 1.7 1.54 40 76
III 20 34 F 33 60.7 36.2 1.2 1.06
IV 27 19 M 36 60.1 29.4 0.66 1.14 7
IV 28 14 M 63 92.5 29.0 0.77 1.67 56
IV 19 12 F 52 75.3 43.1 0,22 1.67
IV 9 12 M 46 92.5 29.0 0.33 1.67

17.
TABLE 13 Partial Scores for 21 Men with Normal Colour Vision Compared
with those of Verriest
R (83-5) Y (15-22) BG (42-50) P (67-74)
Sample of 21 men (AT. age 28.2 yrs) 0.28 0.35 0,82 0,46
Verriest's Data (25-29 yrs) 0.56 0.41 0.93 0.46
Subject III, 24 female, aged 51
The grounds for considering this subject to have a slight trito—defect are that with 2 trials with the FM100 numerous errors were made and there is a tendency for an error bulge in blue—green. (Table 12). The total error score is within the 1st percentile according to the standardisation data for normals of Farnsworth 01957). Against Verriest's data for her age group, the average score for the 2 trials is more than 1 S.D. from the mean.
The partial score for the BG region (42-50) is much greater than the mean BG partial score for the age group. The partial scores for other colour regions are also raised, but not to the same extent.
TABLE 14 Partial Scores for Subject III, 24
Chip Nos. III, 24 Standard Data (Verriest 1963)
R (s3-5) 1.0 0.94 Y (15-22) 1.06 0.59 BG (42-50) 4.7 1.60 P (67-74) 1.4 0.55
There is some justification for concluding that there is a slight trito defect, but there is no supporting evidence. Moreover, Verriest considers that for the age group 50-54'., a total score of 164 is necessary before a trito defect can be diagnosed by the FM100 with certainty.
Subject III, 5 male aged 45
Tnis subject is in the heart of the tritanopia country : he has a mother, one brother, two sisters and 3 nieces all of whom

18.
are tritanopes. he has a history of confusion of blue with blue— green, but this is Hardly surprising with only his father to back him against the tritanoplejudgments of his 2 sisters and his mother. Two tritan characters of the ÀOil1R appeared fainter than the corresponding tetartan characters.
There is no support from the FM100 since his error score is one standard deviation below the mean and his BG partial score is also less than the mean partial score. The other partial scores are better taan the standard means in proportion with his BG partial score.
The evidence is certainly not definite, but the possibility remains that tais subject may have a slight trito defect, but this is not probable.
Subject III, 22 female, aged 40 (?) and her sons IV. 27 and IV. 28
With the FM100 this subject made few errors in the first trial, although these were in the blue—green region. The second trial yielded a higher error score with a monopolar bulge in the blue—green. Comparison of this data with the standard data indicates that this performance is not likely to be other than that of a normal subject.
Tais subject has a deuteranopic son and must be hetero-zygous for deuteranopia and might be expected to demonstrate slight signs of her heterozygosity (see Francois, 11;61). With this in mind, several known heterozygotes were given the FM10016, but their performance did not differ significantly from a group of colour normal males and it was concluded that the FM100 was not capable of detecting signs of heterozygosity. Since then Verriest (1963) has found no significant difference between the FM100 scores of men and women (F ratio = 0.034) except for the age groups 15-19 and 20-24 years, confirming indirectly that the FM100 cannot detect reduced colour discrimination of heterozygotes.
Although the sons of Subject III, 22 made errors preferentially in the blue—green region of the FM100 comparison with Verriest's standard data indicates that their performance is well within normal limits. One son has a history of difficulty with greens and blues and the other an unusually wide range at the filter anomeloscope and for these reasons a "slight trito" defect might be considered, but again the evidence is too slight.
* I am indebted to Mr. Lex Grocott of Hamilton, N.`L., who administered these tests whilst visiting scholar at the College.

19,
Subject IV. 20 female, aged 34
Itis almost certain that this subject's father was a deuteranope and tuis subject is, therefore, heterozygous for
deuteranopia. This would explain the halting performance and two errors made with the Ishihara and the moderately wide range at the Nagel anomeloscope. With the FM100 errors occurred in the blue- green and red regions, but total error score and partial error score for BG were lower than the standard mean. A trito defect is unlikely, particularly since the presence of a tritan gene is expected to alter the expressivity of the deuteranopic gene so that colour ability would be expected to be worse than as evidenced by the FM100.
Subject IV. 19 female, aged 12
This subject failed tue F2 plate on the first trial,but passed on repeated subsequent trials. The FM100 does not support the idea of a slight trito defect and it must be assumed that the first failure of the F2 was an error of judgment or misunderstanding which would not be surprising in a child of 12.
Subject IV, 9 male, aged 12
This subject has 2 sisters who are tritans and a mother who is affected. His Nagel anomaloscope range is wider than normal and there are peaks in the green region of the FM100. There is little justification for a diagnosis of a trito defect.
Conclusion
Considering each subject individually and the group as a whole, there is little justification for the diagnosis of a slight trito defect, except possibly for Subject III, 24 and Subject III, 5. Tests capable of finer discrimination would be necessary to explore these subjects further.
It would seem likely that the subjects of Kalmus (1955) who he called slight tritans were so diagnosed on the basis of the FM100 when it was not realized that the blue-green region is more difficult than other regions of the test.

200
DISCUSSION
The pedigree includes nine certain congenital tritans and by anamnesis, a aossible tenth tritan. The affected members tested represent three generations and no more extensive pedigree has been found in the literature.
The mode of inheritance appears to be dominant, Oahe ratio of affected to unaffected for the sibs of marriages in which there is an affected parent, being not significantly different from a 1 : 1 ratio*. More females than males are affected, but there is not a significant difference from a 1 : 1 ratio.
This data has been combined with data from the Kalmus pedigrees (1955) and the affected to unaffected and sex ratios are shown to be not significantly different from 1 : 1. The sex ratio is also not significantly different from the 2: 1 sex ratio hypothesis for the combined data.
Critical analysis (P. 32) of the genealogical trees of Kalmus showed that the penetrance of the genotype was high and that the inheritance did not seem to be an "irregular dominance" pattern as was concluded by Kalmus. This pedigree also supports the hypothesis of high penetrance.
The pedigree does not test the hypothesis that the inheritance might be sex-linked dominance, since there is no a=fected son wits an affected father and the sex ratio is not significantly different from 1 : 1.
It is unlikely taat the tritan defects discovered by the survey are acquired in origin.
(1) __.part from one tritan who showed some senile retinal chanes at the macula (Subject II, 4) no evidence of ocular disease was found.
(2) The visual acuity of all subjects was 6/6 each eye, except one who could read 6/9. Francois & Verriest (1961) report that nearly all acquired colour vision deficiency are associated with lowered visual acuity.
$ See X- tables p.21-22.

(3) _acquired defects are often characterised by fluctua-tions in severity which parallel chanes in the causative disease. No suc.. fluctuations were found, except one subject (III,8) reported that her inability to distinguish blues and greens seemed to be getting worse. Since the abilit, of the normal eye to distinguish blues and blue greens deteriorates with age (Weale, 1963, Verriest, 1963), it is likely that it is ageing that is causing this deteriora-tion.
(4) Colour naming is often grossly disturbed in acquired deficiencies. Histories of these subjects did not indicate great difficulty naming colours, although all but 2 subjects were aware of their defect.
(5) Colour contrast phenomenon are reduced in acquired deficiencies. Subject II, 11 demonstrated marked colour contrast phenomena,especially when shown a green-yellow light surrounded by white, when the white appeared purple.
(6) The Act that the defect is inherited and appears, from histories and the wide age range of the affected subjects, to be congenital, suggests that the defect is not acquired.
The defect appears to vary from one affected member to another. suggesting that the gene for tritanopia has a variable expression. however, none of the tests used in this survey can be relied on to give valid -easure o= severity. i<almus (1955) remarked on the apparent variation exhibited b-r his tritanopes, but in neither this pedigree nor those cf iKaL-.us can the existence of phenotypi.ca.l variations hhe taken C.s rover.
CONCLUSION
_. On the evidence of the pedigree presented here as well as t :e = a^i7roes of i<almus (1955) the mode of inheritance for tritanopia an:e_rs to be autosomal dominant although the possibility of sex-linked dominance has not been ecluded.
2. There is some evidence of phenotypical variation but this needs to be confirmed by colorimetric examination.
3. The penetrance of the gene appears to be high.

21b.
Ratio of affected to unaffected in pedigree (figure 61)
Generation Affected Unaffected
II 2 0 III 4 2 Iv 3 5
9
1 : 1 ratio. X2 = 0025 n.s. 1 Only the sibs of marriages in which one parent is affected are included here. For generation II, II, 1 is assumed to be a tritan. Sibs who were not tested have been omitted
Sexitatio of Affected Members in pedigree (figure 61)
Male Female
2 7
2
1 : 1 ratio. X` - 2.7 n.s.

22
Pedigree
d.atio of 1-effected to Unaffected for
Sibs of 10 Marriages)
Not Affected Affected A2
2 0 C 1 1 L 2 1 E 1 0 L 1 0
II, 1 II, 23 1 1 II, 3 II, 4 3 1
III, 1 III, 2 0 3 III, 7 III, 8 1 0 III, 9 III,10 2 7.
14 8 1 : 1 ratio. X2 = 1.63 u.s.
1. Sibs of marriages in which one parent was affected are included. Sibs whose colour vision was not tested have been omitted. Disputed cases of iialmus have been omitted.
2. Pedigrees A, C, D, E and L are those of Kalmus (1955).
3. These are marriages in the pedigree reported in this thesis.
Sex Ratio of Affected Members of 11 Pedigrees exhibiting Tritanopiar'
Pedigree Females Males A 2 2 B 0 1 C 1 1 D 2 1 E 1 1 F 0 1 H 1 1 I 1 1 K 1 0 L 1 1
7 2
1 : 1 ratio X2 = .86 nos. 2 : 1 ratio X = .82 nos.
17 12
1. Pedigrees t► —L are those of Kalmus (1955). Disputed cases of Kalmus have been omitted.

23.
II
DETERMINATION OF THE THRESHOLD OF COLORIMETRIC- PURITY-CLOSE-0-WHITE FOR 3 T'AITxNS
INTRODUCTION
The battery of tests employed to identify the affected members of the family investigated suggest variation of the phenotype. This variation may be no more than the result of the inadequencies of the tests used, the limitations of which have already been discussed.
The test results were indefinite when it came to establishing whether the defect was manifest in a dichromatic_ form or a trichromatic form. We can be reasonably certain that those subjects who could match cyan with mixtures of blue and green throughout the whole range of the filter anomaloscope are dichromats, but we cannot be certain that subjects who had an extended, but not complete range with the anomaloscope, are not dichromats.
There are numerous technical difficulties associated with the exploration of the colour vision of the tritan without a trichromatic colorimeter such as that of Wright (1947, 1952). These difficulties are discussed by Jaeger (1955) who concludes that until a satisfactory test is evolved the investigation of tritanopia will be hampered.
At the time of our survey of the tritan family, we did not have access to a trichromatic colorimeter and the construction of one could not be e.itertained because of the technical complexity of such a project and its cost. Since then a Donaldson colorimeter was acquired and the results of investigations carried out with this instrument, are presented in part IV of this report.
Before the acquisition of the Donaldson Colorimeter, it was resolved to construct a monochromatic-plus-white colorimeter, technically a less formidable project than the construction of a trichromatic colorimeter.
With a monochromatic-plus-white colorimeter, monochromatic light could be matched to a "white". A tritan accepting such a match would be shown to be dichromatic. Measuring difference thresholds of colorimetric-purity-close-to-white with the same apparatus would, in addition, provide a measure of severity of the tritan defect, if it was found in its trichromatic form. It was anticipated t..a.t the tritanope wo.tld have E. tl.reshold for colorimetric purity 6p = oo for a point in the spectrum in the vicinity of 570 mu as well as having raised thresholds compared with the normal for the rest of the spectrum. Tritans with the trichromatic form of the

24.
defect would be expected to exhibit thresholds higher than normal. The more severely affected the individual, the higher the threshold. This expectation was based on the data for dichromats, published by Chapanis (1944).
Least perceptible colorimetric purity data for normal persons have been obtained by Grether (1941), Priest and Brickwedde (1938), Nelson (1937), Wright and Pitt (1937) and Chapanis (1944). These data are compiled in figures 64 and 65. They all agree in showing a point of high threshöld in the yellow and yellow green region (ca. 565-570 mu) decreasing at both spectral extremes.
Chapanis (1944) presents data for 6 observers with defective colour vision and these are given in figure 66. His subjects comprise 3 deuteranomals, one deuteranope,one protanomal and one protanope. It is to be regretted that these diagnoses are uncertain. Chapanis is at pains to detail the visual characteristics of his subjects, but failed to make an anomaloscope examination so that an element of doubt must reain as to the correctness of his diagnosis.
The data demonstrate raised thresholds for all colour defective observers. The deuteranope L.P. has a purity threshold 6p =c40 at 500 mu, the region of the deuteranopic neutral point. The two protan observers show markedly raised thresholds near the protanopic neutral point.
Wright (1947) collates saturation discrimination data for deuteranomslo.us and protanomalous observers. (figure 67).
Chapanis and Wright assume that the raised thresholds are indicative of lowered saturation of spectral colours, although Hecht and Schlair (1936) have questioned this use of purity limens as measures of saturation in tiffe colour blind.
Subjects J.B. and C.S. are identified as colour defectives by the Ishihara pseudo—isochromatic plates and were considered deuternomalons since their everyday colour confusions were slight and there was no reduction of luminosity in the red. C.S. did not demonstrate a neutral point and J.D. is classified as being similar to C.S. because his colour naming was similar. J.D. was not tested for presence of a neutral point. He could well be a deuteranope and this is strongly suggested by his incomplete spectral saturation curve. Subject L.P. was adjudged a deuterampe as a neutral point was established at 500 mu. The illuminant witti respect to this measurement, was not specified, but was probably 5000 K. Neither "red deficient" subject appeared to have a true neutral point and it is possible that both are anomalous. There is no doubt, however,that both are protans.

Fig. 64-6;
3.0
Gr.th.ri data
Humans V.N.-■-
Chimp Hal—o- Tom--a-
Martin—•---Morgan Warburton
?p—
1.5—,
1 .0
0.5
3.0
2.5
2.0
1.0
0.5
MRC - - J B JD
LP
M Kc — WM ---JH
450
610 760
550 600 Wove-length in mu
Fig. 66.
650 700
Re
cip
rocal
of
Pe
rcep
tib
le
Ca
lorim
etr
ic
Pu
rlf y
w
0 3
450 500 SSO 600
Wove- length in mu
Curves showing the least I.c•rceptihlc colorimetric purity at different wavelengths as ohtained hc carinus suhjcrt• 1)4 )1 MI normal and with abnormal colour cisünt. .‘(' a normal subject ; NIB(' a
normal subject ; .IR= a slightly (lcuter,tnnntuluns subject ; .11) a deuteranope ; ('ti a (lciri era uurlN• ; 1.1' - n (Lent crnnolN• ; WTI a
prntarwpe ;.III -= a protationtak suhject. It haparris, 1/144.)

Wive lengt h
Vii. Saturation discrimination curves for 7 protaraomalous observers and for the normal trichromat. Log of reciprocal of colorimetric purity of colours which differ from white by on step, plotted against wavelength. (After .Aright, 1) ).
Normal Trichromat
ilis
Observer B
Observer E Observer F
M
0 60 0.40 0.50
Wavelength
Fig. 671). Saturation discrimination curves for 3 deutersnomalous observer. and for the normal trichromat. Log of reciprocal of colorimetric purity of colours which differ from white by one perceptible step, plotted against wavelength. After Wright, 1947).
0SO 050 0 60 060 050
Fig.
0 040 0.50
050 0 60 0 00A
0.60 0.70A.
• MORMAL 065ERVER 0115e1IVEa A OBSERVER 0 i -r-
0115ERVEO C.
, i
_ 0 equ
I
0'50
ORSEAVM
060
E
0- 50
OaSelEVLR
0 60
WAVE E G
0 50
ENGT X
0858.8V1
0 60
Ill N
0 50
OaRRVea
wL—.........'
2.0
l0
0
1 0
20

25.
APrARti`i'US
A sTiectrum was produced in the plane of the slit, S, (figure 68) by a 200 mm Schmidt & Haensch interference filter (F) and achromatic objective lens,0. The monchrometor light source (Li) was a 1G00W, 250W blower cooled floodlight of colour temperature close to 302400. x wavelength band of 2 mu was passed by the slit S and imaged in the inner photometric field of the Lumner-Brodhun photometer, P.
Light source, L2, desaturated the monochromatic light, the beam splitter, M1, reflecting the desaturating light into the photometer. Lo wasa 100W incandescent globe, operated at 240 volts. Its colour temperature was in the region of 2770°K.
The intensity of the monochromatic light was controlled by an iris diaphragm (D), calibrated in log steps and supplemented by neutral density filters. The intensity of the desaturating light was adjusted by varying the distance of L2 from the photometer.
The outer photometric field was illuminated with light from L which was identical to L2. Lamp L
9 and L3 were matched for
colour temperature.
Calibration
1. Wavelength calibration was provided by the manufacturers of the interference filter. The scale attached to the interference filter was zeroed against the D lines of sodium light and the 546 mu line of mTrcury light. The scale was considered to accurate within - 2 mu, which was sufficiently accurate for the purposes of this experiment.
2. Intensity calibration was necessary to establish the intensity-control scale reading of the monochromator that gave, at the photometer field, a brightness of the monochromatic light filling the inner field equal to that of the comparison white light of the outer field.
Calibration was by direct heterochromatic photometry for light of wavelength 572 mu. Direct heterochromatic matches are legitimate at this wavelength, since the ratio of brightness to luminance, B/L, is unity at this wavelength (Dresler, 1962) and over-rating of luminance, a frequent source of error with some heterochromatic matches, will not occur.
e Facilities for measuring colour temperature above 2854°K were not available. This value is an estimate based on the voltage the 1000W lamp operated at for 2854°K.

L 3
O 2
FiçaRF ‘g . A//94e477.i.S (Set text) , _LL

26.
For this calibration the white light from L illuminated the outer photometer field and the monochromatic light the inner field. The desaturating white light, L2, was switched off. The intensity of the monochromatic light was adjusted by means of the iris diaphragm until the 2 fields were of equal brightness
From this measurement at 572 mu, it is possible to calculate for each wavelength the intensity-control setting that will result in equality of brightness of the 2 fields of the photometer.
If the intensity of the comparison white light is I , and the radiant intensity of the monochromatic light for a given wavelength, A , is I )then the intensity-control setting EIAM to give equality of brightness will be given
Iw I ( eI ► ) V% ° a!► p
'Am= Iw
I`0).VA
where VA is the relative luminous efficiency for the wavelength
The value aAm has been expressed in relative values,
such that a - 1.00 when the iris diaphragm is at its maximum opening and there are no N.D. filters in the light path.
At the standardisation wavelength, X. 572 mu
aim = 0.517 by direct heterochromatic photometry
and Iw = 0.517 (I,
(e572)
..517 (I (e572) ° ' 572
I (eA)' VÀ
Values for V k for ever: millimicron were obtained from Judd (1931). Values for I
(eA) were read off the graph for spectral distribution
of Planckian radiators given in Science of Color (1953). A colour temperature of 3500°K was chosen for these values, although the monochromator lamp was operating at abo. A 3024°K. However, this value was necessarily approximate and an increase in colour temperature serves to fit the normal data obtained here more closely to previously obtained normal data.
Values of a1 for the wavelengths used in this experiment are shown in Table 15 1II

e)%) T = 3500°K
lCe ] y y572 Ie572a `l' = 35000
27.
TABLE 15. Value of aim Derived
from Calibration at 572 mu.
454 51.5 .046 2.37 21.51 455 52.3 .048 2.51 20.31 466 4405 .077 3.43 14.863 475 61.4 .113 6.94 7.346 476 62 .123 7.63 6.682 486 66.5 .176 11.70 4.357 487 67 .183 12.26 4.158 498 72.3 .295 21.33 2.390 511 78.2 .523 40.90 1.246 523 84 .762 64.01 0.796 535 89.4 .915 81.80 0.623 536 89.8 .924 82.98 0.614 548 95 .990 94.05 0.542 554 97.8 1.000 97.80 0.521 559 99.6 .997 99,30 0.513 560 100 .`y95 99.5 0.512 562 100.8 .990 99.79 0.511 564 101.6 .983 99.87 0.510 565 102.0 .979 99.86 0.511 566 102.4 .974 99.74 0.511 568 103.3 .964 99.58 0.512 571 104.5 .946 98.86 0.516 572 105.0 .939 98.60 0.517 574 105.5 0924 96.56 0.528 576 106.4 .907 96.50 0.528 577 106.8 .898 95.91 0.532 578 107.2 .889 95.30 0.535 580 108 .870 93.96 0.543 582 108.7 .850 92.40 0.552 585 109.8 .816 89.60 0.569 587 110.5 .793 87.63 0.582 588 110.0 .781 85.91 0.593 589 111.5 .769 85.74 0.595 594 113.2 .708 80.15 0.636 598 114.6 .657 75.29 0.677 605 117.2 .567 66.45 0.767 610 118.8 .563 59.75 0.853 615 120.5 .441 53.14 0.959 620 122.1 .381 46.52 1.096 626 124 .309 38.32 1.330 636 127 .208 26.42 1.930
55721e572% m
=.939x105.0x.517
== 98.6 x .517 = 50.98

28.
OBSERVERS
Two observers with normal colour vision and three tritan observers participated in the determination of purity thresholds throughout the spectrum. The two normal observers, P.S. and B.L., were tested with the Ishihara and AOHAR plates to ensure the normality of their colour vision.
The three tritan observers were selected to be representative of the range of severity of the defect as indicated by the field tests. Subject G.G. (II, 1) aged 78, was able to match at the filter anomaloscope the cyan with all mixtures of blue and green, except pure blue. Subject G.M. (III, 11), aged 29, matched over the full range of the anomaloscope, whilst subject M.B. (II, 8), aged 18, had an extended, but not full, range rejecting matches at the blue end of the anomaltscope range. Full details of the diagnostic data for these 3 subjects are to be found in Table 9.
PROCEDURE
Subjects were carefully instructed as to what was required of them. The procedure was demonstrated and the distinction between colour difference and a brightness difference was made clear. All the tritans, being untrained observers, had difficulty in grasping this distinction.
Followin this demonstration, the source L2 was adjusted until the two fields of the photometer were of equal luminance. The procedure adopted was an informal application of the method of limits : the monochromator was switched on with the intensity adjusted below threshold. Intensity of the monochromatic light was increased step by step, until the subject reported a just perceptible difference in colour between the two fields. Source L9 was reduced in intensity as the intensity of the monochromatic light was increased. When a difference between the two fields was reported L2 was carefully adjusted in an attempt to eliminate the difference. This ensured that themported colour difference was,in fact, a difference in colour and not a brightness difference. The procedure was then repeated with a descending trial, starting from an intensity above threshold. Ascending and descending trials werere'peated several times, until the operator was confident of the intensity setting which resulted in a just perceptible colour difference. Intensity steps were 0.2 log units.
The findings were highly repeatable, except, in the yellow region where both normal and defective observers found difficulty.
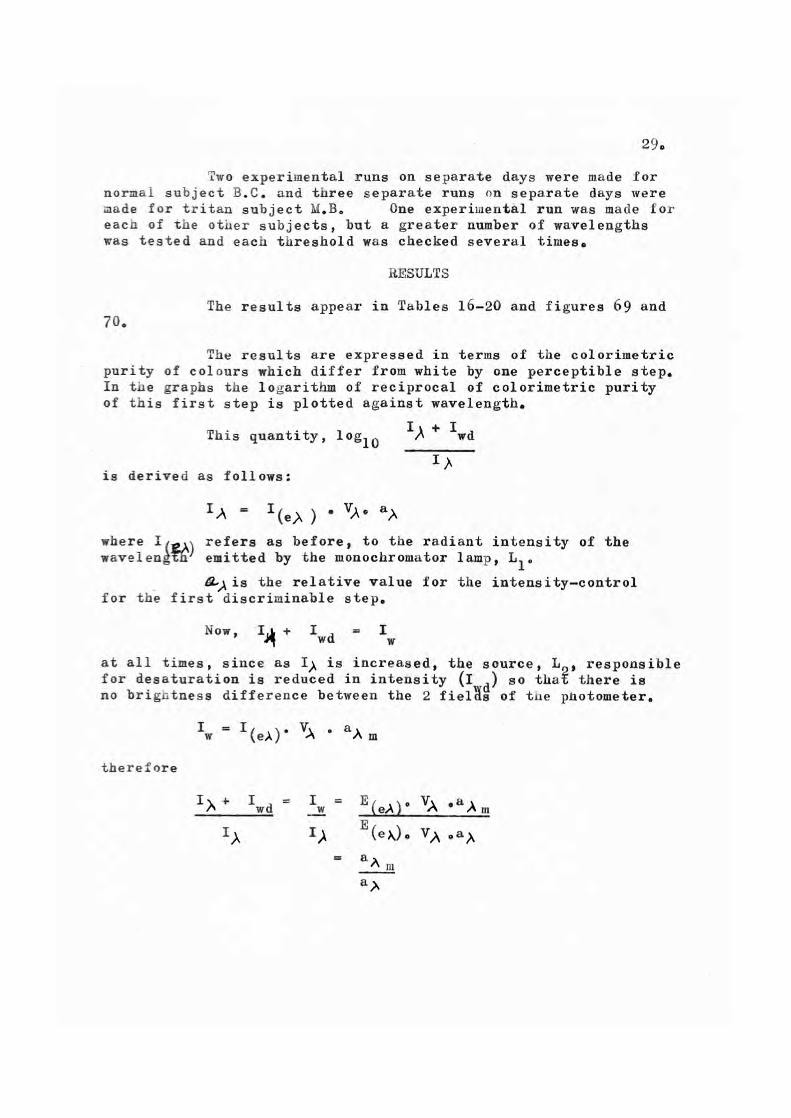
29.
Two experimental runs on separate days were made for normal subject B.C. and three separate runs on separate days were ,wade for tritan subject M.B. One experimental run was macle for each of the other subjects, but a greater number of wavelengths was tested and each threshold was checked several times.
RESULTS
The results appear in Tables 16-20 and figures 69 and 70.
The results are expressed in terms of the colorimetric purity of colours which differ from white by one perceptible step. In the graphs the logarithm of reciprocal of colorimetric purity of this first step is plotted against wavelength.
This quantity, 1og10 IA +
Iwd
IA is derived as follows:
IA = I(e), ) . VA, a)
where 'roll refers as before, to the radiant intensity of the wavelength' emitted by the monochromator lamp, L1,
81.-A is the relative value for the intensity—control for the first discriminable step.
Now, I, + Iwd = Iw
at all times, since as I), is increased, the source, L , responsible for desaturation is reduced in intensity (I
d) so that there is
no brigutness difference between the 2 fiel s of the photometer.
Iw = I(eA)• v • a•A m
therefore
I>s + Iwd = Iw = E(eA)° 'ail m
IA E(eh)° VA °a% a a
A m a),

TABLE 16 Raw Data and Calculation of Purity Discrimination Thresholds (Log Reciprocal Colorimetric Purity of First Discrimination Step) Subject P.S.
(Normal Colour Vision)
30,
mu F. No. of
Variable Aperture
Rel. Int. N.D. Variable Filter Aperture (f.4.5.. 1.00)
A
N.D. a Re1,Int. Re1.Int. (ND 0.0 = (A , 1.00)
B
log10 ap m) AP B) (
a/\
454 11 0.167 0,167 128.8 2.1109 466 11 0.167 0.167 89.0 1.9494 475 11 0.167 0,167 43.99 1.6434 486 11 0.167 0,167 26.09 1.4165 498 11 0,167 0.1 0.8 0.134 17.84 1.2514 511 11 0.167 0.1 0.8 0.134 9.299 0.9684 523 16 0.079 0.1 0.8 0.063 12.640 1.1018 535 16 0.079 0.1 0.8 0.063 9.889 0.9952 548 16 0.079 _ 0.079 6,861 0.8364 554 11 0.167 0.1 0.8 0.134 3.888 0,5897 559 11 0.167 - 0.167 3.072 0.4873 565 11 0,167 0.1 0.8 0.134 3,813 0.5812 572 11 0,167 0.1 0.8 0.134 3.858 0,5864 577 11 0.167 - 0.167 3.186 0,5032 582 11 0.167 - 0.167 3.305 0.5291 588 11 0,167 - 0.167 3.551 0.5512 594 11 0.167 - 0.167 3,808 0.5807 598 11 0.167 0.1 0.8 0.134 5.052 0.7035 605 11 0,167 0.1 0.8 0.134 5,724 0.7577 613 11 0.167 0.1 0.8 0.134 7.157 0,8547 626 8 0.316 0.1 0.8 0.252 5.278 0,7225 636 8 0.316 _ 0.316 6.108 0,7869

TABLE 1 iaw Data. and Calculation of Purity Discrimination Thresholds (Log Reciprocal Colorimetric Purity of First Discrimination Step) Subject B.L.C.
(Normal Colour Vision)
31.
mu F.No. ßel.Int. of Vari-
Vari- able able Aper-Aper- ture ture (1.4.5=
1.00) ,,
N.D. N.D. Tot- F.No. Rel.Int. Fil- Rel. al of Vari- ter Int. Rel. Vari- able
(ND Int. able Aper- C.0= Aper- ture 1.00) ture (1.4.5=
1.00)
N.D. N.D. Tot- Av. p log Fil- Rel. al Tot- (ax m) 10 ter Int. Rel. al zlp
(ND Int. Rel. a,
O.0= 1.00)
'154 11 .167 .167 11 .167
i66 11 .167 .167 11 .167
k75 11 .167 .167 11 .167
k86 11 .167 .167 11 .167 0.1
k98 16 .079 .079 11 .167 0.1 .8
511 11 .167 0.3 95 .084 16 .079
523 11 ,167 0.3 .5 .084 16 .079 0.1 .8
535 11 .167 0.3 .5 .084 11 .167 0.4 .4
548 11 .167 0.3 .5 .084 11 .167 0.4 .4
554 11 .167 0.2 .636 .106 11 .167 0.3 .5
P9 11 .167 0.2 .636 .106 11 .167 0.3 .5
65 8 .316 0.3 .5 .158 8 .316 0.4 .4 72 5.6 .646 0.3 . 5 .323 8 .316 0.3 .5 77 5.6 .646 0.3 .5 .323 5.6 .646 0.4 .4
82 5.6 .646 0.3 .5 .323 8 .316 0.4 .4
88 8 .316 0.3 .5 .158 11 .167 0.4 .4
94 8 .316 0.3 .5 .158 11 .167 0.4 .4 98 11 .167 0.3 .5 .0835 11 .167 0.4 .4 05 11 .167 0.3 .5 .0835 11 .167 0.3 .5 10 15 11 .167 0.3 .5 .0835 11 .167 0.3 .5
26 8 .316 0.3 .5 .158 11 .167 0.3 .5 36 8 .316 0.3 .5 .158 5.6 .646 0,4 .4
.167 .167 128,8 2.1099
.167 .167 89.0 1,9494
.167 .167 43.99 1.6434
.134 .151 28,85 1.4603
.134 .107 22.34 1.3491
.079 .082 15.20 1.1818
.063 .074 10.76 1.0318
.067 .076 8.197 0.9137
.067 .076 7.132 0.8532
.084 .095 5.484 0.7391
.084 .095 5.400 0.7324 565
.126 .142 3.598 0.5561
.158 .241 2.145 0.3314
.258 .291 1.828 0.2620
.126 .225 2.453 0.3897
.067 .113 5.248 0.7200
.067 .113 5.683 0.7546
.034 .084 8.010 0.9036
.084 .084 9.131 0.9605
.084 .084 11.417 1.0577
.084 .121 10.992 1.0410
.258 .208 9.279 0.9675

Rel. Int. N.D. Variable Filter Aperture (f.4.5= 1.00) A $
N.D. Total p log Rel.Int. Intensity (a 10 (ND 0.0= ' m 4p
1.00) la/\
mu F. No. of
Variable Aperture
33.
TABLE 19 Raw Data and Calculation of Purity Discrimination Thresholds (Log Reciprocal Colorimetric Purit,r of First Discrimination Steu) Subject G.M.
(Tritan)
455 8 0.316 0.2 .636 .201 466 16 .079 - - .079 476 16 .079 - - .079 487 11 .167 0.2 .636 .106 498 11 .167 004 .4 .067 511 16 .079 0.3 .5 .040 523 16 .079 0.4' .4 .032 536 11 .167 0.5 .333 .056 548 11 .167 0.5 .333 .056 554 11 .167 0.5 .333 .056 560 11 .167 0.5 .333 .056 362 11 .167 0.5 .333 .056 564 11 .167 0.3 .5 .084 566 8 .316 0.4 .4 .126 568 8 .316 0.3 .5 .158 571 11 .167 0.3 .5 .083 574 8 .316 0.3 .5 .158 57e 8 .316 0.3 .5 .158 578 8 .316 0.3 .5 .158 580 5.6 .646 0.4 .4 .258
582 8 .316 0.1 .8 .253 585 8 .316 004 .4 .126 587 11 .167 0.4 .4 .067 589 11 .167 0.5 .333 .056 594 11 .167 0.4 .4. .067 598 16 .079 0.4 .4 • 032 505 16 .079 0.3 .5 .040
615 15 .079 O.4 .4 .032 626 16 .079 0.4 .4 .032
636 16 .079 0.3 .5 .040
101.0 2.0043 188.14 2.2744 84.58 1.9273 39.23 1.5936 35.67 1.5523 31.15 1.5459 24.88 1.3959 10.96 1.0398 9.679 0.9858 9.304 0.9687 9.143 0.9610 9.125 0.9602 6.071 0,7833 4.056 0.6081 3.2411 0,5106 6,145 0.7886 3.342 0.5240 3.342 0.5240 3.386 0.5297 2.105 0.3232
2.182 0.3389 4.516 0.6548 8.687 0.9389 10.625
3 1.0265
21; ]4 . 5 06 1 2575
19.175 1.2828 29.969 1.4767 41.56 1.6186 48.25 1.6834

34. TABLE 20 F.aw Data and Calculation of Purity Discrimination
Thresholds (Log Reciprocal Colorimetric Purity of First Discrimination Step) Subject G.G.
(Tritan)
mu F. No. Rel. Int. N.D. N.D. Total p log of Variable Filter Rel.Int. Intensity a ) 10
Variable Aperture (ND 0.0= Am) AP Aperture (1.4.5= 1.00) aA
1.00) A B
455 4.5 1.0 0.1 0.8 0.8 25.39 1.4046 466 8 0.316 0.1 0.8 0.253 58,75 1.7690 476 16 0.079 - - 0.079 84,58 1.9274 487 16 0.079 - - 0.079 52.63 1.7216 498 11 0.167 0.4 0.4 0.067 35.67 1.5523 511 11 0.167 0.4 0.4 0.067 18.60 1.2695 523 16 0.079 0.3 0.5 0.040 19.90 1.2989 536 16 0.079 0.3 0.5 0.040 15.35 1.1861 548 11 0.167 0.4 0.4 0.167 8.090 0.9079 554 11 0.167 0.4 0.4 0.067 7.776 0.8907 560 11 0.167 0.4 0.4 0.067 7,642 0.8832 562 11 0.107 0.4 0.4 0.067 7.627 0.8824 564 11 0.167 0.4 0.4 0.067 7.612 0.8816 566 11 0.167 0.4 0.4 0.067 7.627 0.8824 568 11 0.167 0.4 0.4 0.067 7.642 0.8832 571 8 0.316 0.4 0.4 0.126 4.095 0.6122 574 11 0.167 0.4 0.4 0.067 7.881 0.8966 576 .4.5 1.000 0.1 0.8 0.800 0.660 0.0000 578 516 0.646 0.1 0.8 0.517 1.035 0.0149 580 5.6 0.646 0.1 0.8 0.517 1.050 0.0212 582 4.5 1.000 0.1 0.8 0.800 0.690 0.0000 585 5.6 0.646 0.4 0.4 0.258 2.205 0.3434 587 11 0.167 0.4 0.4 0.067 8.687 0.9389 589 8 0.316 0.5 0.333 0.105 5.667 0.7531 594 16 0.079 0.5 0.333 0.026 24.462 1.3885 598 16 0.079 0.4 0.4 0.032 22.16 1.3456 605 16 0.079 0.4 0.4 0.032 23.97 1.3797 615 16 0.079 0.4 0.4 0.032 29.97 1.4767 626 16 0.079 0.3 0.5 0.039 34.10 1.5328 636 16 0.079 0.4 0.4 0.032 61.31 1.7876

25
20
15
10
05
log
. re
cip
rocal of
co
lori
metr
ic p
urit
y
.
..
• \ \ 1 n \
y
\ \
GG .
P
‘a y\a
i • \ .._ •. \ • \ \
4.,
•. • i
.• • .
• o s
. • M
. `,
. . ► \:. \.. .
:, - -
1 n —_ : ,
•• ' N
ar ,. • ,. , . •
.
- 1. . • . .
. •
450
—•-- GG - — GM ... MB
500 550
wavelength mu A BLC • PS
- - - average
600 650
Fig. 69. Saturation Discrimination Data for Three 1'ritans Compared wita Data for Normal Subjects.

35.
DISCUSSION
For all 3 tritans, these data show purity discrimination thresholds that are lower than those of the 2 normal subjects for the wavelengths between 475 mu and about 565 mu and between about 590 mu and 650 mu. In general, and particularly for the longer wavelengths,subject M.B. has thresholds which would be between those of the other 2 tritans and the 2 normals.
For wavelengths, 576 mu - 582 mu, subject G.G. shows a purity threshold of unity or close to unity. On this evidence, subject G.G. is a tritanope, since he has, in effedt, demonstrated a spectral neutral point for 2700°K at 576-582 mu. However, all subjects experienced great difficulty for wavelengths 565-582 mu and the diagnosis of G.M. as tritanopiç was not regarded with a great degree of confidence at the time of the experiment. Nevertheless, this diagnosis was confirmed by tests at a trichromatic colorimeter and this is reported in SectionlV.
The uncertainty of this method as a means of diagnosing tritanopia, is exemplified by the results of subject G.M. This subject did not demonstrate a neutral point i for the wavelengths in the yellow region of the spectrum, G.M. gives thresholds not distinguishable from those oî the normal. The tests at the colorimeter showed him to be a tritanope (Section IV) and for this reason raised purity thresholds have been shown by dotted lines in figure b9 to anticipate a neutral point at 581 mu. Purity thresholds for tritanopes show an extremely rapid rise near 580 mu. Subject G.M. was a very good observer and it can be presumed that, had tùe wavelength steps been smaller, a purity threshold of unity would have been obtained.
Subject M.b. made measurements on 3 occasions and, although there was uncertainty and greatly divergent findings at 572 mu, reasonable confidence was finally placed in the verdict that there was no neutral point, but pcssibly a slightly raised threshold, compared with the normal at 572 mu. It was concluded that M.B. was not a dichromat. This was confirmed subsequently at the colorimeter (Section IV).
The uncertainty of these measurements, at the crucial region of 565 - 580 mu, vitiated this method as a means of establishing dichromasy. This is not to say that the technique could not have been modified to meet the difficulties encountered. Alteration in technique was considered, but not pursued, since the Donaldson Colorimeter became available soon after and it became clear the diagnosis of dichromasy was best undertaken with this instrument.

36 .
For wavelengths, other than those between 565-580 wu, the observations of all subjects were made with precision and it can be concluded without equivocation, that tritans have purity thresholds the same as, or lower than , normal for the ranges 475 mu — 565 mu and 590 mu — 650 mu. If measurements had been made for wavelengths shorter than 450 mu it would seem from the tritan measurements at 450 mu and 406 mu, that there is, beyond 450 mu,an increase in purity thresholds. This is by no means conclusively demonstrated by this data, but such an increase is consistent with the appearance of a second neutral point near 415 mu.
The low purity thresholds exhibited by these 3 tritans appears a surprising result. Chapanis (1944) found his protanopes and deuteranopes to have markedly raised purity thresholds. Wrigat (1947) reporting the data for protanomels, obtained by himself and McKeon and data for deuteranomols obtained by Nelson, shows anomclo.us trichromats also have raised purity thresholds. The exception is observer A, a protanomol, who has purity discrimina-tion close to white which is better than normal for a good part of the spectrum. On the other hand, these data in two cases (protanomils G and I) show thresholds raised to unity for a not inconsiderable part of the spectrum and such an odd result does raise the question of validity of Wright and McKeon's results.
Data for purity discrimination close to white for tritans, has not been previously published and it is of interest to consider the theoretical consequences of the observations made here; that tritans demonstrate lowered thresholds, whereas other colour abnormals have raised thresholds
Prediction from the Trichromatic Theory
The trichromatic theory,despite its long history, does not enjoy general agreement about formulations to meet the experimental facts of saturation and luminosity.
In its traditional form, luminosity is the sum of the responses of the 3 receptors, such that
1121 + 12142 + 13g3
VA y
where g. is the function of wavelength for a given receptor such that the receptor response, G., is given by
Gi =
and where 11, 1, and 1 are constants given various values, depending on the particular set df fundamentals favoured. The constant 13

37.
generally has the value, 17 = 0 and the G3 receptor process con-
It is usual to assume that the sensation of white light is produced by an equal response from all 3 receptors
G1 = Go = G3
Saturation functions are very difficult to explain from these assumptions of the classical three-component theory. Wright (1947) recognizes this weakness of the theory in this respect : "in some ways the data represented by this diagram are amongst the most difficult to explain on a 3 response theory of the classical type... it is.... difficult to explain the marked desaturation of the .56-.57 region of the spectrum" (p.165
Mixture data can be transformed within the trichromatic scheme and theoretical saturation discrimination function can be derived that fit closely experimental curves. This has been done by Judd (1930) and Hecht (1934), but as Judd has indicated, mixture curves derived for interpreting specific functions frequently have serious shortcomings for other data.
In general terms the saturation of a given stimulus will be represented by the ratio of the chromatic response to the white response. The magnitude of the white response will be determined by the magnitude of the smallest response of the 3 receptor processes. The other two processes will contribute to the white response by an amount equal to that of the smallest response and the response of these 2 processes that is in excess of this amount will contribute toward huedness
The white response, W, will be
W = 3 EA gi d A 0
where gi is the smallest response 10 and the chromatic resp•nse, C, will be
C= EA (ii - gi ) (1)% + EA (gi gi
m o n o
so that saturation is
JE(j ° - Si )dA + EA (gi - gi )
ml o n o
tributes nothing to lumino4ity.
3 EA gi dA 0

38.
On inspection of spectral mixture functions of the Fick type (figure 45) it is clear that the most desaturated wavelength, and hence the wavelength for the highest purity discrimination threshold, is near 510 mu. It can also be seen that for wavelengths longer than, say 550 mu, saturation is, more or less, maximal and constant, as g3 approaches zero.
If tritanopia is the result of the loss of the process, the sensation of white is not ;ossible, according to the cia.ssic three—component theory ; all spectral stimuli are maximally saturated and neutral points are coloured, not achromatic. It becomes necessary to postulate subsidiary hypotheses to avoid these unlikely consequences of dichromatism.
The simplest subsidiary hypothesis, but in many ways an uncomfortable one, is to assume that in dichromatism, the lesser response desaturates the greater and that a neutral point appears when the 2 responses are equal. This is an ad hoc hypothesis which flies in the face of the G1 = G9 = G., condition for white which is a principal tenet of the trichromatid theory. It is also a hypothesis which has more than one foot in the camp of the proponents of the opponent—colours theory.
Wallsaad Mathews (1952) have described their excess hypothesis, which is an attempt to avoid the need for such special hypotheses for reduction systems. Their theory rejects the G1 a G2 = G3 condition for white and instead proposes 3 tenets:
1. a pro—sensational process introduces the corresponding unique huedness into the sensation it is exceeds a finite magnitude of another;
2. if two pro—sensations exceed a third,each contributes its respective huedness, with yellow as a special case;
3. a pro—sensational process which exceeds no other enters the sensation as desaturative whiteness, whether it stands alone, or is exceeded by one other pro—sensation or by two others.
The excess hypothesis adequately explains achromaticness of dichromatic neutral points and of the vision of monochromati. It explains why desaturativc whiteness, rather than hue, is the only variable (other than brightness) in spectral colours which are on the same side of any dichromats neutral point. Halls and Mathews do not quo►;tiïy their hypothesis, but it seems that saturation is expressed as
y/ 411A4. gl d% + E (ii + gi ) d%f n m
fE, g. d A 0

39.
and which will not predict saturation functions for colour normals from the usual spectral mixture functions any better than the classical form of the theory does, yet 'tialls and Mathews do not seem aware that this is so.
For tritanopia with the G3
response missing, the excess hypothesis predicts saturation as
= l FA (ii - gi ) d
)(EA gl dA
which can be quantified, assuming a particular set of fundamentals. Here the fundamental curves of Pitt, as modified by Le Grand (1957) have been used
gl = 0.606 x+ 0.516 Ÿ— 0,122 go _ —0.466 x + 1.375 Ÿ + 0.090 z
g3 = z
Saturation of several wavelengths have been calculated for the tritano,:ic system. Purity discrimination thresholds were then calculated by determining the fraction of the spectral light that would have to be added to an achromatic white light to give a fixed saturation ratio of 0.1. It was assumed that a threshold saturation change is associated with a constant visual effect.
-.able 21 It can be seen from figure 70 that there is reasonable
agreement between this theoretical function and the averaged data of 2 tritanopes. There is no discrepancy between the theoretical and experimental neutral points, but this can be attributed to the use of a white of 2700°K in the experiment, whereas the theoretical data is for an equi—energy white.
Prediction from Opponent-Colours Theory
Theopponent—colours scheme developed by iiurvich and Jameson in their series of papers, dating from 1955, permits quantitative theoretical predictions of saturation discrimination data.
Their theoretical curves for normal, protan, and deutan observers show reasonable agreement with experimental findings obtained independently by others (Hurvich and Jameson 1955, Jameson and Hurvich, 1955) although there are significant discrepancies.
We- n

40.
They have also computed a theoretical curve for the saturation discrimination of a tritanope, but had no experimental data for comparison. It can be seen from figure 70 and 71, that the data for tritanopes obtained here, shows reasonable agreement with their predictions, except at 463 mu where one of the 2 tritanopes deviates substantially from the theoretical curve. It should be borne in mind, when comparing these curves, that the experimental findings are with respect to a. white of 2700oK, whilst the theoretical curve is for an equi-energy white. The experimental neutral point should, therefore, be at a wavelength longer than the predicted neutral point.
It is perhaps more pertinent to consider the relationship between the normal and tritanope. For both experimental and theoretical functions the tritanope has lower thresholds than the normal for portions of the spectrum.ase4 In terms of the opponent-colours theory (figure 71), the experimental finding of lower thresholds for tritanopes is not surprising, but expected) an expectation that seems to be fulfilled.
Boynton (1960), it has already been reported, is critical of some aspects of the formulations of Hurvich and Jameson. He gives a theory which is, in effect, a transformation of the opponent-colours scheme and which he believes to be in better accord with known physiological facts. Saturation discrimination is accounted for by computations very similar to those of Hurvich and Jameson, the major difference being that a vector summation of saturations is assumed by Boynton, whereas Hurvich and Jameson assumed a linear summation of the absolute values of the chromatic responses. Boynton finds that there is "little practical difference between the results of the two sets of computations" (p. 940),but does not show the results of his own calculations.
These computations have been re-calculated here and are shown in table 21. Both Jameson and Hurvich's and Boynton's show too steep a rise in the blue end of the spectrum and a neutral point at too long a wavelength for equi-energy white.
Boynton reports no tritanopic .theoretical saturation discrimination functions and it was necessary both to derive a mathematical expression of this function and to calculate theoretical values for this function. The theoretical function was derived as follows:
Boynton assumes that the tritanope has lost the blue (BA) and yellow (YA) processes and has 3 receptor processes only,
the red 00, the green (GA) and the white (WA).

20
41 . 1
-_____.____.----.. _
•
. 1 •.1
1 i 1
i.:.
1 ,
1
Te . T
, 1 1
% ♦ . % + -.
o .a
t
.
i • .
. N `
, 1 ,
G •
N ,
/ /
/ i / / /
•
;
1 i . i f
I
7-- ,
:
o.... .... N4 0
o 0
l ,
450 500 550 600
650
wavelength mu
Fig. 70. Saturation Discrimination for Two T'ritanopes (Average Data : Heavy Continuous Line T{t) and two Normals (,Average Data : Heavy Dotted Liue,Nt) C4mpa.rcd wit,.
Theoretical Predictions of hIurvich & Jameson (Te , Ne)

so
• 5
4
3e
AO
L6
IS
05
0,0
Twuft r■cx.i
4.11-•-•7
♦; •
S5o
1
`••o foe
500 600
WAVELENGTH - mr
yS• 7•. nun-room • P•tvtrto
J-
Figure 71 Theoretioal purity discrimination derived from the opponent colours theory (After Hurvich and Jameson, 1955).

41.
In the normal the red receptor has 3 photopigments such that
R = 840C+ 913 + 4oy
It is assumed that the tritanope has lost the 4 pigment from the R receptor, so that the tritanope has the following receptor
processes
9p
44P
The opponent process, RA — GA , can be described as
AA — GA = 84a — 71p
The pigments o< and ß can be described in terms of the CIE distribution coefficient functions x, Sr- and z as follows
= 0.5163 g + 0,1496 Ÿ — .1033
A = —0.5163 g + 1.3034 ÿ + 0.1033
so that RA— GA = 80.053 x — 79.975 Ÿ — 16.0115
Now, the saturation of a given stimulus for the tritanope is and it is the sum of the saturations arisiag from both the R and the G processes
R), = 840<+
GA = 80A
WA = 44x+
Sur
and saturation is the ratio of the chromatic response C tu the luminance response L, and
and
S - - fv9, - l'
= fl%rl (R A — ( x % ) dA fi W) dA
4Y A = 44 + 44P
44 (1.453 37)
m
63.932 y

42.
or, very nearly
= 64 y
= f E (80x — 80y — 16z )dA . . L 64 IEa
d
= 1. 95 f E, x (IN— JEA ÿ dA — 0., 2 f Ea z dA
/EA y dA
But
fE,dA= X f EA Ÿ 0 = Y
)(EA z dA = Z
where X, Y and Z are CIE tristimulus values
L = 1.25 X — Y — 0.2Z2
and since x= X y Y and z = Z X+ Y+ Z, X+ Y+ Z X+ Y+ Z
then C_
We 1.25 x
—Y-0.2z
L Ar
It is then assumedAsaturation discrimination close to white that for a threshold response the ratio
C L + L = 0.1LW
where, as the proposition of C and L is increased the propo:r tion of LW
is reduced to keep L* + L constant so that the fraction of
the stimulus to be added to white for a threshold response will be
and in terms of the reciprocal of colorimetric purity as has been plotted on these graphs, this will be expressed as
1 = l0 11
Using this derivation saturation discrimination for the tritanope has been calculated and is shown in 'fable 21.

43.
TABLE 21. Theoretical Saturation Discrimination Thresholds for Tritanopes using Boyntonts (1 60)
Opponent-Colours Theory and Walls and Mathews (1952) Excess Hypothesis
Theoretical Tritanope (Boynton)
Theoretical Normal (Boynton)
Theoretical Tritanope (Excess Hypothesis)
440 1.1173 450 - 1.8363 455 1.3096 2.279 460 1.3324 465 1.3365 470 - 2.2330 475 1.2989 1.617 485 1.2380 1.1931 495 1.1818 1.0766 1. 3802 500 510 1.1173 1.1038 520 525 1.0414 1.0682 530 (535) 0.9777 1.0253 545 550 0.850o 0.9355 0.7033 56o 0.7024 565 0.5843 570 0.3979 575 1.996 580 T.8195 0.4843 585 0.3945 0.7466 590 0.6484 600 1.2041 605 1.0254 1.1818 615 1.1492 1.5682 620 625 1.2253 1.2430 630 1.8506 635 1.2718 1.287
This assumes tritanopia to be the loss of the blue receptor and also assumes the modified Pitt equations for the fundamental as given by Le Grand (1957).

This theoretical prediction is not in good agreement with the experimental findings. The theoretical thresholds are too high, especially for shorter wavelengths. Moreover, Boynton's theory predicts tritanope thresholds higher than those of the colour normal, except between 485 mu and 520 mu and this is not in accord with the experimental results and on this evidence Boynton's model for tritanopia, attractive as it is in many ways, requires revision.
CONCLUSION
Saturation discrimination for tritanopes is better for tritanopes than for colour normals, except for yellow radiations.
This experimental finding is accounted for by the opponent colours theory, as quantified by Hurvich and Jameson. Boynton's transformation of this quantification is less satisfactory. The excess hypothesis predicts tritanopic saturation discrimination data from Pick type fundamental equations with reasonable success, tut fails, at the same time, to predict the normal saturation discrimination function. Transformations within the trichromatic theory that do successfully predict saturation data, do not account for other visual properties.

45.
III
DISC COLORIMETRY
Determination of Neutral Point and x—axis Intersection of the Achromatic Confusion Locus for 1 Subject
Preliminary measurements, using disc colorimetry, were made on one subject (IV, 8) in order to assess the feasibility of using this method to measure neutral points of the affected members of the family who were suspected to be tritanopes. It was also hoped that the method could be used to establish co—punctal points, thisbcing useful data for the interpretation of the findings with the filter anomtl oscope.
APPARATUS
The apparatus comprised a variable speed motor on the spindle of which was mounted a full circle plastic protractor and interleaved Munsell papers.
For neutral point measurements Munsell papers, 8" in diameter, of notations 10 GY 5/8 and 10 R 4/8 were interleaved and placed underneath 5" diameter Munsell papers of notation N 4/ and N b/. (figure 59).
The papers and their s:nrround were illuminated with light from a Macbeth Easel Lamp which gave illumination which was close to standard illuminant C.
The measurements were made in a dark room, so that the only illumination was that provided by the Macbeth Lamp.
The subject viewed the disc papers through a circular aperture in a surround of Munsell paper N 5/-. The aperture was varied in size for different trials, the 3 sizes used being 1°36'', ° and 3° 2 . The test distance and normal viewing were maintained by placing the subjects head in a head—rest. Through the aperture the subject could see portion of both the outer coloured and inner grey papers, the aperture being divided by the junction.
Tests were made using the right eye, the other being
occluded. After a match was made it was confirmed with the left eye.
A plastic rule was cut to fit over the spindle of the motor and a line inscribed on the centre of. the rule was used to read off the angles of the sectors of tiffe papers to an accuracy of e.

44).
METHOD
The paper disc sectors were set near the expected settings for a tritanopic neutral point,these settings having been calculated prior to the first session. The disc was set rotating at a speed above CFF and the subject was asked to decide whether the colour of the outer half of the field was too red or too blue or green and whether the inner half was too bright or too dark. Following each judgment, the disc was stopped and the papers adjusted, firstly in steps of 10° and finally in steps of 1°. This gave a potential precision within lmu.
Two determinations of the neutral point were made for each aperture at 3 sessions on different days.
RESULTS
1. Results are shown in Table 22. The CIE chromaticity co-ordinates for the Munsell papers were found by reference to the tables of Kelly at al (1943). These were converted to tristimulus values by multiplying both x and y for both 10 GY 5/8 and 10 F 4/8 by the respective areas of each colour in the final mixture and finding their sum. These tristimulus values were then transformed into chromaticity co-ordinates in the usual way.
The dominant wavelength of the resultant mixture was then determined by plotting its chromaticity on. a large scale CIE chromaticity diagram and and extrapolating to the spectral locus the line between this point and the achromatic point.
2. It is worthy of note that the measurements made in the first session were reasonably precise and the end point was quite definite. In the second and third sessions the matches were transient. A match would be obtained and then would break down. Toward the end of the last session no match could be obtained.
DISCUSSICN
1. Extrapolation of the line through the neutral point and the point .re presenting illuminant C,r;ives ani x-axis intersection beween x _ .170 - .180. This indicates a co-punctal point close to that assumed by Judd et al (1950) and by Pitt (1944a) and to the experimental value established by Thomson and \right (1953).
The diagnosis of a typical trito-defect is further confirmed by this correspondence.

Field Size (Deg)
Sector Size (Deg,) to Match N41 + N61 1 OGY5/8 l Oß.4/8
Range Over Which Match Holds (Deg)
Chromaticity of Final Mixture
Y
Dominant Wavelength
of Mixture (Neutral Point)
mu
x
TABLE 22 Neutral Point Measurement (With Respect to Ilium C) by Disc Colorimetry
for Subject IV. 8.
47
1°36' 255 105 3 .364 .441 567.8
1°36' 257.5 102.5 5 .363 .441 567.8
oo 256 104 8 . 36 3 .441 566.8 oo 258 102 2 .362 .442 566.4
261.5 98.5 .361 .443 566.2
3° 263 97 1 .360 .443 566.1

48.
The "neutral points" yielded by this method for Subject IV, 8 are consistent with those of Wright (1952) and differ from that of Judd et al (1950). There seems, therefore, little possibility that this subject is an atypical tritan or has abnormally heavy ocular pigmentation, although it should be borne in mind that disc colorimetry is less affected by pre—receptoral absorption than is the method used by Wright.
2. It is vary debatable whether, having established a neutral point in this fashion, a diagnosis of dichromasy is warranted.
The existence of a neutral point is usually regarded as being diagnostic of dichromasy, but Munsell papers are necessarily desaturated and do not provide a test as rigorous' esruonochromatic light or other colours which can be located on the spectral locus.
Subject IV, 8 was able to match a mixture of 10 GY 5/8 and 10 It 4/8 to the neutral grey, but would she be able to match a mixture of red and green spectral colours to the grey? She may well be a trichromat as the filter anomaloscope appears to indicate and yet have markedly raised purity thresholds,purity thresholds which are sufficiently high to enable a mixture of 10 GY 5/8 + 10 R 4/8 to match grey, but not a more saturated colour. There is some confirmation of this latter supposition in the subject's inability to make a match on some occasions, particularly during the third session. On other occasions, a match would be established and then break down. Thresholds are probability functions and one interpretation might be that the match attempted borders on the threshold for purity from white.
An alternative interpretation is to conclude that Subject IV, 8 is an extreme anomal. Walls (1961) report of two tritans whom he considered extreme tritanomels,has already been referred to : he describes'two boys whose mothers were sisters and who did not have a table neutral point equation and so many of their matches "came and went" while they watched'. This description closely parallels the observations made with Subject IV, 8.
The second tritanomal described by Crone (1956) had an extended, but net full, range at the anomaloscope for the equation B + G = BG and there was no neutral point, although 575 mu was
described as being "nearly white". .There is no report of variability of tae M.P. eq uation for this subject. Desaturation of yellow was also reported by Schmidt (1943) in her description of the list of her two tritans.

49.
High purity thresholds for "red—green" anomalous trichromats are reported by Chapanis (1944). He found that the highest thresholds occur in the spectral region, corresponding to the neutral point of the dichromatic form of the defect. It is not unreasonable to assume that highest purity thresholds for the trichromatic tritan will also occur in the region of the tritanopic neutral point and that usia relatively desaturated Munsell papers a "neutral point" may well be found for the trichromat. The transientcbarocter of the neutral point may be the result of working close to first purity threshold or of an actual variability which Walls claims defines the extreme anomal.
3. The equation 471 + 517 = 490 used by Engelking has been discussed in detail and it has been argued that matches obtained with this equation could be misleading. Figure 59 shows how the equation adopted in our filter anomaloscope could result in mis- diagnosis. If it is assumed that Subject IV, 8 is a. tritanope and has co—punctal point close to x = 0.17, y = 0.00 as shown by the findings with the disc colorimeter, a matching range on the B + G = BG equation chosen could yield the anomaloscope range fond with this subject.
The range demonstrated by Subject IV, 6 (see Table 9), who rejected the normals match, cannot be explained in this way.

50.
IV
CuLO11IMETRIC 1NVES`l'IGATION
Cases of tritan defects which have been reported in the literature, have raised the possibility of incomplete tritanopia, a defect arising from the partial expression of the abnormal gene. Alternatively, these cases may be instances of extreme tritanomaly.
The results of the tests given as part of the survey of the family under investigation here, suggested variations in the phenotypical expression of the gene, but the limitations of these tests were such that this apparent variation is by no means certain. Investigation with a monnchromatic-plus-white colorimeter and trials with disc colorimetry did not succeed in the endeavour to clarify this question Of variations of severity.
If this family were shown to have affected members who were tritanopes and other members, also affected, but not dichromats, then the existence of incomplete tritanopia would be established. The rarity of the abnormal gene or genes for trito-defects renders improbable the coincidence of 2 different types of tritan genes in the one family.
Since other tests and procedures could not be relied on to measure differences in severity, it became clear that a trichromatic colorimeter was necessary and advantage was taken of the opportunity to acquire, from a Government Department, a Donaldson colorimeter which, with the acvent of spectrophotometry, had outlived its usefulness as an instrument for the specification of colour. This instrument was modified to permit:
1. the application of matching tests to establish dichromasy.
2, the measurement of dichromatic neutral points.
3. the measurement of trichromatic and dichromatic spectral coefficients from which could be derived spectral mixture functions.
The apparatus was also modified to measure hue discriminatinn but hue discrimination measures are not reported here.
APPARATUS
The apparatus is shown in figure 72. The light source (L1) was a 500W, 240 volt projection lamp, operated at the colour temperature of standard illuminant i:e This lamp was standardised by visual photometry from a sub-standard lamp calibrated by National Standards

51.
Laboratories. The calibration of lamp L was within - 10°K of
2854°K. The lamp was supplied through a Stabilac 2 KV constant voltage transformer (CVT) which held voltage within ± 0.25%. Th£äa fluctuation of colour temperature was, therefore, held within 5°K
and the luminous flux varied within - 0.75%. (National Standards Laboratory Personal Communication 1962).
The lamp was monitored by an autotransformer (AT1) and a precision grade voltmeter (V) which was calibrated by the laboratories of the S.E.C., Richmond, Victoria. The same voltmeter was used for calibration of the lamp and for monitoring it during experiments.
The lamp L1 illumi#ated a set of 3 filters mounted at F. These filters were supplied with the instrument. A second green filter wit. chromaticity close to the spectral locus was mounted between glass of the same size as the other filters. This filter was used for the measurement of extended Rayleigh equations (see below).
Measurements of the spectral transmittance of these filters were made with a Hardy spectrophotometer at the laboratories of Defence Standards. From these transmittance curves the chromaticity co-ordinates of the filters were computed in the usual way. These are shown in figure 59 and table 23.
The amount of light passing through these filters is controlled by 3 sliding shutters, (S), controlled by 3 knobs which can be conveniently operated by either the subject or the experimenter. Each shutter is scaled with a vernier linear scale which can be read to 0.1 mm.
The light passing through the filters is selected by a condenser (C1) and enters an integrating sphere (IS). By means of a reflecting prism (P1 ) and a photometer cube (P2), the mixture of the light from the fitters can bp- observed in the lower half of a 2° bi-partite circular field.
In the upper half of the bi-partite field is imaged the test light. The test light was usually spectral light from a Hilger and Watts D292 mirror grating monochromator (M1). The exit slit of this monochromator was adjusted to be at the en1hnce pupil
of the observation optics and light passing through the monochromator
was seen in the u;:per half of the observer's field in Maxwellian view. The monochromator light source was a 100W double frosted photoflood, (L ) light from which was focused in the entrance slit of the mono- chromator. The intensity of the spectral test light source (Lo) was controlled by an auto-transformer (AT3) pl aced so that it could-be adjusted easily by the subject.

240 V
AT t/ÿ viiF 72. )0/149L OS0/1/ C'.oL O7eJM,ETr- ,
SHOa// n/ç MOD /F/c' IT/ On/S t{-i✓O ,q C'C`SSo Y
COntY.eOl C, Ei4R (See -6e t
from CVT
to L2

52.
TABLE 23 Chromaticity Co—ordinates (x , y ) and Luminous Transmittance (Ya) for"Illuminant A
of the Colorimeter Filters
Filter x a
Red.' (R)
Green (G)
Blue (B)
.7240
.1972
.1511
02759
.6586
.0295
4.179
5.623
0.190
"Spectral" Green
(0) .283 .694 4.36

53.
The monochromator was calibrated against spectral lines of sodium and mercury lights in accordance with the instructions of the manufacturers. The wavelength scale can be regarded as accurate to within - 0.5 mu. There was considerable stray light at either end of the spectrum and this should be borne in mind in considering results obtained for wavelengths at the extremes of the scale.
A test light of either 2rs54oK or 6500oIC could be used as an alternative to spectral radiatio-s. ii magnesium oxide screen at d could be swung into the light path of the monochromator cutting off theospectral light. This screen could be illuminated by light of 2834 h from a working standard lamp (L„). A Corning (F blue filter could be used to raise. the colour -eemperature to 6508 K. The intensity of these white sources could be varied by adjusting the distance of the lamp from the M,0 screen and by placing neutral density filters between the lamfï and screen.
The test light could be desaturated with either a white of 6500°K, red, green or blue light. The coloured desaturating lights had the seme chromaticity as the red, green and blue primary filters of the colorimeter. Light from L was deflected by a reflecting prism F to the desaturating pathway. The light passed through a filter (F?) either red, green, blue or ilium C blue) and was deflected into the test beam pathway by a semi-reflecting mirror (M). The intensity of the desaturating light could be adjusted by rotation of a circular neutral density wedge (w) by knob K.
OBSERVERS
Six tritans took part in this phase of the investigation, 3 of whom made extended observations on several occasions.
Two colour normal subjects made trichromatic spectral matches throughout the spectrum and other colour normals provided control data where necessary
PROCEDURE
1. Test for Dichromasy
All the tritans who co-operated in this part of the investigation were asked to match a spectral radiation of wavelength 730 mu by adjusting the proportions of a red and blue mixture.
Considerable care was taken to instruct the subject in the operation of the controls and ample time was allowed. If the subject was able to make such a match, he was asked to make the match again after the previous one had been upset by the experimenter. The

54.
repeatability of the match point was noted and the subject was asked to give a verbal description of his observations as he approached and passed through the match point. As a result a high degree of confidence can be placed in the validity of the match when a subject was able to achieve it.
If this match was made then the subject can be considered to be a tritanope. If a tritan could not make the match, even after repeated instruction, then the controls were adjusted by the experimenter to both the settings that were expected theoretically and to the sett ugs that previous tritan subjects had reported a match. The controls were then adjusted, by the experimenter, step by step on either side and the subject adjusted the intensity control of the monochromator light source in a search for a match. With this procedure a point described as the "closest match" would be found, but this would be described as still being very far from an acceptable match.
When it became clear that 530 mu coh,ld not be matched by adjusting theoh and B controls, an attempt was made to match a white light of :,500 K by adjusting the a + B mixture. If this could not be achieved then 450 mu was used as the test light.
A tritan who failed to make these 3 matches was considered to be a trichromatic tritan.
2. Determination of Neutral point
The subjects that were demonstrated to be tritanopes were asked to match a white of 6500 K to a spectral radiation.
The filters of the Donaldson Colorimeter were removed and a Corning blue filter (F ) was placed at the port of the integrating sphere,thereby filling i(Re lower half of the 2° field with light of 6500°K. The wavelength and the intensity of the spectral light of the upper field were adjusted until a match was obtained. The wavelength was altered in 1 mu steps by the experimenter and at each step the observer attempted to match the lower and upper parts of the circular field by adjusting the intensity of the monochromatic light. Repeated observations were made until the neutral point was established to the satisfaction of the experimenter.
3. Colour Naming
All tritans were asked to name the colour of spectral radiations between 420 ai.b8Q mu at stepsfofff10
mucoloTbe spectral
radiations were presented in the upper field, t::e lower half of the field being dark. Observations were started with 420 mu and were made in order of increasing wavelength.

55. 4. Determination of Spectral Mixture Data
(a) Trichromatic and Dichromatic matching
Three tritans and two normal subjects made matches for various wavelengths throughout tue spectrum. Of the three tritans, one was shown to be tritanopii,and made matches using the red and blue controls only. The other two tritans., needed three controls and for some matches the test light had to be desaturated.
The procedure was to present a test light of a given wavelength and the observer adjusted the mixture controls and the test light intensity until a match was obtained. Several matches were made at each wavelength and after each match the controls were altered by tue experimenter in a non—systematic fashion. If a subject ûad difficulty achieving a match he was guided by the experimenter who might take over the operation of the controls. When desaturation wastAtaquired, the experimenter adjusted the unsealed intensity control of the desaturating light to give an appropriate (previously calculated) desaturating intensity and after the match was made by the subject, the amount of desaturating light was measured. This mea.surewent was made by the subject the followin4, way. The test beam was switched off and if the desaturating light illuminating tue upper half of the colorimeter field was either red, green or blue, the shutter of the appropriate filter was opened until the lower half was filled with light of the same colour and brightness. If the desaturating light was white, then all three shutters had to be adjusted to match the desaturating light.
The procedure described above was modified for some of the measurements made by the two trichromatic tritans. The modification entailed the experimenter making a trichromatic match of a given spectral test stimulus and then asking the tritan subject to report whether it was an acceptable match or not. If it were not an acceptable match he was asked to adjust tue controls till a match was obtained. For subsequent matches of the same wavelength the controls were altered to upset the match in the same way as before and the subject was required to restore the match.
If the experimenter's match was acceptable,then after the subject had made his judgment, the controls were altered to upset the match and the procedure for the first and subsequent matches was the same as is described above.
Particular care was taken with matches of test lights of wavelengths 494 mu and 58205 mu, since these matches were used to standardise data in accordance with the procedure adopted by Wright (1947).

56.
(b) Extended Rayleigh-type matches
One tritan, a. tritanope, was asked to match wavelengths of :i15, 595, 5859 575, 565 and 555 with a mixture of red and green light. The red filter was the salue as tnat used in the other parts of the colorimetric investigation,whilst the green filter (G') had a chromaticity very close to the spectral locus. (x = .283,y=•694).
The same series of matches were made by four colour normal subjects.
This series of matches was made with a view to establishing whether the tritan can be demonstrated to have abnormal pre-receptoral absorption or whether, in addition to tritanopia being a reduction. system, an a.lturation of the spectral response of the remaining colour mechanism is present.
RESULTS
Test for Dichroma.sy
Six tritons were asked to match 530 mu by adjusting the proportions of a red and blue mixture. Three of the tritans (Subjects II, 1; III,2 and III, 11) were able to make this match without difficulty and with a. high degree of repeatability and are therefore trita.nopes.
The other 3 tritans (Subjects III, 8; IV, 6 and IV,8) could not make this match and each described the upper and lower halves of the test field as being of markedly different colour at all times. For instance, Subject 1II,8 found that the nearest match was at scale readings R = 1.4 to 1.3 B = 105.2 The tritanopes found a match at about It = 0.5 to 1.5 B 104.5. For Subject III,8, the spectral radiation 530 mu was called "green" while the red-blue mixture at this nearest match point was called blue or purple.
None of these three tritans could match a white of 6500°K by adjusting the red + blue mixture. The white was called either "pale" or "pale green",whereas the mixture was described as a "strong" (i.e. saturated) colour and nothing approaching a match could be obtained. Two of the three tritans could not match 450 mu with a It + B mixture (this equation was not given to the third Subject, IV, 8),
There is no doubt that these three tritans are not dichromats,

57.
Neutral Points
A neutral point of 568 mu was obtained for Subject III,11 and a neutral point of 570 mu was found for Subject II, 1, Both are neutral points with respect to illuminant C. Careful search between 420 mu and 500 mu showed that there was no second neutral point characteristic of tetartanopia,
Colour Naming
Names given to the colours of spectral radiations from 420 — 680 mu by two tritanopes and three incomplete tritanopes are shown in Table 24.
There is a qualitative difference between the colour naming of the tritanopes and of the incomplete tritanopes.
The tritanopes use the names blue and green more or less appropriately. Tne names suggest desaturation of the very short wavelengths, increasing saturation for 460 mu to 510 and increasing desaturation for 520 mu to 555 mu, For wavelengths longer than 560 rsu, names such as brown, red, purple and bronze are applied.
The incomplete tritanopes are qualitatively distinct because of their use of names such as yellow—green,yellow, gold, apricot and orange for wavelengths between 520-600 mu.
These differences confirm t_e diagnoses made by the matching equations, since tritanopes would be expected to perceive two spectral colours, gree.i and red and to discriminate spectral colours on the basis of saturation changes. Wavelengths at the blue and of tree spectrum and near 570 mu would be expected to be desaturated; from 570 mu toward the shorter wavelength there is expected increasing saturation of blue (perhaps called green when not saturated) and toward longer wavelengths, increasing saturation of red could be predicted. On the other hand, the incomplete tritanopes would be expected to use names suggestive of yellow as well as the names used by the tritanope.

T ti1 e 8 M.B.
TABLE 24. ave— 111.11 e.agth G.M.
400 grey
Colour Naming 11.1 111.b G.G. ' .Be 1t. Be
hnauve
) 420 purple—grey light dirty violet
blue white
53C whitish green
) 520 lightish
green
)
540 pcle white j light green)
)) )
more grey pink green
555 very little green
560 whitish with definite ) purple and pink tinge )
pale light light grey little yellow green
)mauve, )little ?darker
)
)bright blue
;
green with blue flicker of violet
450 deep sky faint blue )violet blue J
) 460 dee2er blue ,blue, be— )
;coming /increasingly )brighter
470 still deep—''
1
480 ; deep blue ) ) with incre4s— ) ingl bright-)
490 J e _
500 greenish— )
blue
'510 L-reen
550 lighter, faint brown )Chartreuse
er blue
)gr::en J 1
yellow tinge in green
Limey green
No colour Milky white
purple
pale blue
58.
Normal (BLC )
violet
violet
blue—violet
deep blue
blue
blue
turquoise
green blue
green
green with liLt].e yellow
increasingly yellow
green with little yellow
green yellow
green yellow
yellow green
green
green
green
intense green
lighter greed
yellow with bit of green
yellow
greeny blue
green
yellow green
pale green lot of yellow
citrus yellow
lemon
grapefruit
)green with mauve witOuncii nged )violet rim little colour
more blue 1
blue )
pale yellow)violet with) or dity )pink tinge ) white )around edge brighter: ) dark ivory )
430 blue-grey
440 deep blue )

59.
TABLE 24 (contd) iv.6 RoBe
IV.8 M.B. Normal 631,0
Wave- length
III.11 I1.1 111.8 G.éi. G. s. N.Be
570 pale dirty pinky j grey with brown j Chartreuse suspicion of 1 with tinge purple ) of orange
yellow old gold yellow with li •tle green
580 light purple brown grey
) purple gold yellow
590 purple light- lot of darker gold with orange bronze orange yellow pink yellow
600 deepish .dark "byres purple bronze Rock
pinky yellow
orange. apricot
omni e
Colour" (not orange)
610 purple darker- red red red tinge orange
like sunset
red orange red-or, n e
620 "sunset "like red with red" molten little
metal" orange
red sunset pink
red
650 purple sane but )red red fainter )
red flame pink
red
640 darker )fading to red ) a very
red red ) )
)dark ) )bronze )
650 darker ) red ) red
setting sun
c.ed
660 darker ) red with red ) tinge of
purple
deep red
670 purple with red
red dark red with black )
680 purple pink -

C1Z
ClZ G + C + CB rA b =
C B
CIï +CG +CB
R +CG + CB
60.
Spectral Mixture Data
The resits of the spectral mixture determinations are shown in figures 73- 78 and tables 25-31.
Spectral coefficients (F/ÇS 73-5)
Spectral coefficients were calculated from the scale readings for mixtures made at tue colorimeter in accordance with the conventions adopted by Wright (1947).
The wavelengths 494 mu and 582.5 mu were taken as the standardisation stimuli. The scale readings, R, G and B, at these wavelengt-ls were adjusted by the correction factors G and G,
B R so that for 494 mu, the B and G scale readings were equal and for 582.5 mu, the R and G scale readings were equal. These correction factors G and G were then applied to the B and A scale readings
B R for other wavelengths. The scale readings corrected in this fashion are tristimulus values and are given the notation, CR, CG
and CB. The spectral coefficients, rA gx and lux were computed from
Spectral coefficients were calculated in this fashion for tritanope G.M. (Subject III,11) except, of course, one scale reading (G) was always zero and only one correction factor was necessary. Similar calculations were made for the incomplete tiitz.nopes, M.B. (Subject IV, 8) and N.Be. (Subject III, 8). In all cases the average of the three or more settings for a given monochromatic stimulus was used. the incomplete tritanopes showed considerable variation at certain wavelengths and for this reason each match was computed for separately in the case of N. Be, who was the more reliable of the two incomplete tritanopes.
The region of greatest variabilit;, was between 480 mu and 540 mu. This accords reasonably well with the hue• discrimination curves of Crone's (1956) two tritanomals who showed a region of reduced discrimination between 500 mu and 540 mu and corresponding minima at 480 mu and 570 mu.

r
10
s
7
6 • •
•
2
o 410 4 30 450 490 5 0 530 550 570 590 6 0 a0
•
1 0
e
6
•
wavelength mu Fig. 73 • Spectral Coefficient Curves for Tritanope G.M.
• First Trial • Second Trial
. . l
-
T •\\N
J ,
-
.
,
r-
fi
\ `\
■
.
- 't. - ; - •.
\
. • . ,,
t
-
_
. 7
1
/ •''1 --t
_-
— - --Y- • -----
-... ---
• • ••
, • •
_
/ 1
-•-
i
4 r.-.
T
•
. --•
• ~ . -----ti--I----11 - .
I
---
.
•••
... •
1 ... •
,,_
430 4150 470 490 510 530 550 570
590
610
630
650
wavelength mu Fig. 74. Spectral Coefficient Curves for Incomplete
Tri tanope fit. ß.
—D r g b
4((.du,o p 60

A? R R R R I 2
i.0
► i j 440 460 4iG 500 520 540
I I 1 I I
560 580 600 620 640 -.4
420
wavelength mu RÇURF ]S SPeCT/lq Co c"fPte,iEn1T CvRvES FaR /NCcnnPL,E7E tvI711 /11,6446iAE OF TRIALS OF 2 No R A4AL SvAreCTS (Owl on%nvov
?
SQ /%nsP
E
er6tT
N
r
.d
t-
C
1N 446.O 1[YP1s476__ _11A419a/LITE i OF MATG{ES. JQ= NO.CMM.c.S ry1R77;f./ REsEarEo 4 ° NoRMACJ' M,¢ TCN #CcefireD

61.
Spectral Mixture Curves
For tritanope, G.M., spectral mixture curves were calculated from his dichromatic spectral coefficients. This calculation was carried out as follow:
For t:Ae dichromat, tae unit equation for some wavelength is obtained as
Ch = rR + gG*
($ Note that following the notation of Wright, 1952, the blue filter is considered to provide a greet. primary).
Suppose the relative luminosities of unit quantities of 1? a . d G are Ln and L
G so that the unit equation for C.), in terms of
luminosity wild be
VA CA= rz\ LR+gA Lg G
where VA is the luminosity of unit quantity of )\, and where
VA = ra LR + gA Lg
and if this be weighted for an equi—energy spectrum with luminosity function V\ ,,
V% E C V
L r% Lr R + Vi) E gA LG G rLR + g),LG r > LR + gALG
which for convenience can be written
= Vtt R + VGX G
= VA E r Ltt r,A LR+ 4\LG
VGA 9 VJ E g LG rALR+ gALG
and V = V + V RA GA
Each ordinate of the equi—energy luminosity curve is thus split up into two component parts V_ Aand VGA . These parts represent the amounts, in luminosity of It and G which when mixed togetier will match Vein both brightness and colour.
where JR

62. For this calculation, the luminosity values,L and LC were
calculated from spectrophotometric mea.sure, ients made jt for the filters
of the colorimeter.
From these spectrophotometric measurements, the luminous transmittance of the red and blue (G) filters were calculated by finding the sura of the products of the lârnznous transmittance and the CIE distribution coefficients y for illuminant A in 5 mu steps throughout the visible spectrum. This yielded luminous transmittance of the red filter Y, . Y.4.17 and for the blue filter Y
B _ .19%.
J 1
The standardisation stimulus for this tritanope was 582.5 mu only, and these luminous transmittances were weighted by the scale readings R and B. The greater of the two was adjusted to lO, and the lesser adjusted proportionately, so that
LR = Yl; ,L1 R LG
4.17 x 4.4 =
Y` B B
.19 x .104.5
= 4.17 x 4.4 = .19 x 104.5 x 100 x 100 .19 x 104.5 .19 x 104.5
= 92.40 = 100
The results of this calculation are shown in table 30 and figure 77. Figure 77 also shows the V , V a 7 functions for the average of seven tritanopes reported by Rwrighï (1952) and there is little practical difference between the two sets of data, especially when the variation exhibited by Wright's seven observersis taken into account.
Spectral mixture functions were not calculated for the two incomplete tritanopes because of the great variability of their matches for parts of the spectrum. Wright (1947) had similar difficulty with several of anomalous trichromats.

• - .--
f L
. ;
, /
•, /
%
-
•
♦ •
f s
•
1
, i ''
•
• 1
1
:
, .
f
M
•
1
1
.
1
i
//,
•
•
\ . t
_ •
.
.'
.
. /
,
' ,
' i
• y..•..
'
J :
;•
I
I
• .,
`
.` \
`'
\
\ \
. r
- -
400 450 500 550 600
wavelength mu 650
V , V for Tritanope G.M. g r V, Vr for the 7 Tritanopes of Wright (1952)
Vr for normal observer (Wright, 1947)
Yig. 77. Spectral Mixture Functions for Tritanope, G.M., compared with Wright's average tritanopic findings and his findings for the normal Vr curve. See also figures 6, 7, 8, 9 and 10.
.8
2

63. TABLE 25 Spectral Coefficients for Tritanope G.I.
Based on Spectral Units (Equality of Coefficients at 582.5 mu)
,vave!ength
(MU)
Average Scale
teadinas
Tristimulus Values
Dichromatic Spectral
Coefficients
B Cl, CB
620 29.7 104.5 29.7 4.4 .87 r .129 610 19.9 104.5 19.9 4.4 .818 .181 600 7.7 104.5 7.7 4.4 .636 .364 594 5.6 104,5 5o
6,. 4.4 •760 .440
582.5 4.4 104.5 4.4 4.4 .500 .500 570 4.0 104.5 4.0 4.4 .476 .5 4 560 3.8 104.5 3.8 4.4 .463 .537 55o 2.3 104.5 2.3 4.4 .343 .657 540 2.0 104,5 2.0 4.4 .312 .688 530 1.9 104.5 1.9 4.4 .302 .698 520 1.3 104.5 1.3 4,4 .228 .772 500 1.0 104.5 1.0 4,4 .185 .814 440 0.9 104.5 009 4.4 .170 0830 420 3,0 95.6 3.0 4.0 0429 .571 410 3.7 104.5 3.7 4.4 .457 .543
Second Trial 600 16.2 105.2 16.2 10.72 .602 .398 590 11.12 105.2 11.12 10.72 .509 .491 582.5 10.72 105.2 10.72 10.72 .500 .500 560 5.2 105.2 5.2 10.72 .327 .673 490 1.1 105.2 1.1 10.72 .093 .907 450 1.2 105.2 1.2 10.72 .101 .899 440 1.8 105.2 1.8 10.72 .144 .856 430 4,42 105.2 4.12 10.72 .278 .722

TABLE 26 Spectral Coefficients for Subject N. Be. Based on Spectral Units (Equality of r1 and gA at
582.5 mu and of gA and b,, at 494.0 mu)
6t4.
Wave- Scale Reading Tristimulus Trichromatic length Values Coefficients (mu) RGB Cli CG CB rA g A b
630 100.4 7.9 -17.1 97.3 7.9 -7.7 .998 .081 - .079
lOJ.4 7.4 +17.4 97.3 7.4 +7.8 .865 .066 + .069 94.7 4.1 +13.7 91.8 4.1 +6.1 .900 .040 + .060
Av. 98.5 6.5 4.7 95.4 6.5 2.1 .917 .062 .020 610 78.2 19.7 -32.5 75.8 19.7 -14,6 .937 .244 - .180
80.7 21.3 -40.3 78.2 21.3 -18.1 .961 .262 - .222 84.3 21.5 -48,6 81.7 21.5 -21.8 1.004 .264 - .268
av. 81,1 20.8 -40.5 78.6 20.8 -18.1 .967 .256 - .223 582,5 82.3 75.4 -11.6
82.2 75.2 -35.9
82.2 76.5 -11,3
70.6 72.8 -27.3 75.2 76.2 -28.8
Av. 77.6 75.2 -24.8 75.2 75.2 -11.1 .540 .540 - .080
570 45.4 95.3 -78.7 44,0 95.3 -35.3 .423 .916 - .339
51.9 96.2 -68.1 50.3 96.2 -30.5 .433 .829 - .263 49.4 97.2 -65.3 47.9 97.2 -29,3 .414 .839 - .253 48.9 96.2 -70.7 414 _96,2 -31.7 .424 .860 - .283
550 17.1 95.3 - 9.8 16.6 95.3 - 4.4 .154 ,887 -0.041
12.7 85.9-1.9 12.3 35.9 - 0.9 .126 .883 -0.009 14.7 85,8 -12,2 14.2 85,8 - 5.5 .149 .908 -0.058
AY, 11.5 89.0 - 8.0 14,3 89.0 - 3.3 ._143 .890 -0.033
NOTES
Accepts norma.l' s match.
Accepts normal's match.
Note this setting omitted from average Rejects norma.l.'s match
CorrectiGn factor G/A Ç 0. 96 9 Rejects norma.l's match
Rejects norma.l's :catch (?)

6 5.. TABLE 26 (contd)
Wave- Scale itieadin g 'Tristimulus Trichromatic NOCES length Values Coefficients
(MO n ii. B CIL Cu (:ii rh 4 it bA
540 1.1 56,5 - 5.8 1.1 56.5 - 2.6 0.020 1.027 -0.047 Acceptance of normal 's match not
0.3 56.5 -23.1 0.3 56.5 -10.3 0,006 1,215 -0.222 tested 3.6 50.5 +31.4 3.4 56.5 14.1 0,046 0.764 0.191
-2.2 56.5 1.8 2.1 56.5 0.8 0.035 0.951 0.013
0.5 56.5 2.5 0.5 56.5 1.1 0.009 0.972 0.019
330 1.6 52.3 42.2 1.5 52.3 18.9 .022 .718 .260 Acceptance 1.6 44.6 34.6 1.6 44.6 15,5 .026 .723 .251 of normal's
match not 1.6 39.7 33.5 1.6 39.7 ].5.9 .028 .694 .278tested
AV.
first 1.6 45.5 36.8 1.6 45.5 16.5 .025 .715 .259
Trial -5.9 39.7 5.6 -5.7 39.7 2.5 -0.156 1.088 .068 -5.9 56.5 1.4 -5.7 56.5 0.6 -0.111 1.099 .012 -5.9 59.8 4.2 -5.7 59.8 1.9 -0.102 1.068 .034
-5.9 52.0 3.7 -5.7 52.0 1.7 -0.119 1.083 .035
520 -4.6 46.7 15.7 -4.6 45.1 9.6 -4.6 51.1 -0.9
Av. -4.6 47.6 4.8 -4.5 47.6 2,2 -0.099 1.051 .049 First Trial
-17.1 28.8 -10.2-16.6 28.8 -4.6 -2.184 3.789 - .605 -16.5 28.1 -15.9
Av Second -16.8 28.5 -12.5-16,3 28,5 -506 -2.470 4.318 -0.848
510 -18.6 81.3 28.2-13.0 81.3 12.6 - .237 1.071 0.166 -18.6 73.6 19.9-18.0 73.6 8.915-.279 1.141 0.138 -15.6 78,7 20.5-18.0 78.7 9.18 -.258 1.126 0.131
Av. -18.6 77.9 22.9-18.0 77.9 10.3 -.256 1.110 0.147

T_31;1 26 (coIItd) 66.
Wave-length (mu)
Scae Reading `l'ristimulus Values
Trichromatic NOTES Coefficients
R G B C CG CB r A g(\
494 -4.3 -0.9 9
-10,5
31.0 21.3 18.9
62.6 64.9 62.5
Correction Factor
lav, First - 7.2 23.7 63.5 -6.6 23.7 23.7 -.162 .581 .581 G/B _ .448 Trial
- 5.0 21.1 59.5 - 5.0 33.8 57.5 - 7.4 39.4 62.8 - 5,8 31.4 59.8
t_v, Sec. Trial ,w, 2 - 6,5 27.6 61.6 -6.3 27.6 27.6 -.129 .564 .564 Trials
4C0 - 6.1 10.0 53.5 -5.9 10.0 24.0 -.210 .356 08./4 - 6.7 10.9 58.0 -6,5 10.9 26.0 -.214 .359 .855 - 6.8 16.8 5.2 -6.0 16.8 2.3 -.528 1.344 .184 - 5.8 10.8 16.0 -5. lu.8 7.2 -.304 .915 .591
460 0.2 5.7 105.3 0.2 5.7 47.2 .004 .107 .838 - 0.5 3.1 105.3 -0.5 3.1 1x7. 2 -.01 .062 .948 0.3 2.3 105.3 0.3 2.3 47.2 .006 .046 .948
Av. 0,1 3.7 105.3 0.1 3.7 47.2 .002 .073 .925 450 3.2 66.6 3.2 29.8 .097 .903
2.8 o 2.8 32.1 .080 .920 1.4 43.4 1.4 19.4 .067 .933
2.5 60.6 2.5 27,1 .084 0916 430 1,6 1.4 71.2 1.6 1,4 31.9 .046 .040 .914
2.0 -0.5 71.2 1.9 -0.5 31,9 .057 -.015 .958 1,3 -1.9 71.2 103 -1.9 31.9 .042 .061 1.019
Av. 1.6 -0,3 71.2 1.5 -0.3 31.9 .045 -.009 .964

T.. BLE 27
Trichromatic Spectral Coefficients for Subject W.B. Based on Spectral
Units
67.
=a e- Scale ..leading TristiLZulus Trichromatic len;;:th VüJ.ues Coeïficients
mu ? L { {% \7 CB r,\ g b\ Correction
factor
494 +20.8 17.8 49.6 B- .334
-24.1 19.1 50.6 +20.8 -94.1 19.2 67.2 +21.5
Note normal's match for 494 was rejected
-24.1 +23.9 21.7 65.9
- • - 1.9 19.5 58.1 -1g6 l9.5 19.5 -.041 .521 582.5 75.6 48.2 , .+ 9.5
26.5 21.8 -31.1
43.6 35.6 -37.1 +11.5
60.5 49. + 7 >6.4 tv . 46.1 38.8 -32.7
r_Y q. _54,4 . 12.1 -0,4
050 25.8 0.5 - 8.5
22.3 0.8 -8.3 +3.8
16.5 0.3 -7.8 +1.f 20.9 0,5 -6.4
610 60.1 14.1 +35.4
59.6 13.0 °1 +<71.3
45.4 8.7 +, .7
750 14.9 92.7 -57.1 + 107
14.1 102.0 -57.1 + 0.3 -37.1 + 2.1
14.5 96,6 -35.7
14.5 95.2
. r '- - A = .842
58.8 38.8-10.9 .582 .582 -.163
17.6 .5 -2.1 1.098 .031 -0.29
45,8 . 124' - .12 ;797 .209 -O02
12.2 96.6-11.9 .126 .997

TABLE 27 (contd) 68,
Wave- Scale heading length
i'risti nulus Values
Trichromatic Coefficients
mu F. G B C, r A g À b;\ Correction
Factor 520
Av.
-24.1 22.8
-24.1 15.4
-24.1 15.7
-24.1 20.4
- 5.5
37.5
i6.'4
25.6
36.2 31.4
82.8
76.5
87.8
93.8 85,2 -4,6 31.4 28.4 -.083 .569 . 514
500
Av.
-24.1 20.1
-23.9 22.3
-24.4 28.0 - .6
11.0
19.1
23.7 17.9
105.2
97.5
88.6
97.1 -0_„5 17.9 32,3 -,010
-
-
.360
.121
.059
.650
.879
480
l'.v.
- - - -
4.9 2.8 3.4 3.7
84.8 75.3 81.7 80.6 -
-
3.7 26,9
, S 19.6
460 - - -
0.5 1.4 0.4 0.8
59.9 55.5 610.0
58.8 ()1 .901 440
Av.
1.2 0.0 0.0 0.0 0.3
0. 8 1.7 2.2 2.3 1.8
44.5 28.4 33.0 35.9 35.5 .25 1.8 11,8 .018 .130 .895
420
AV.
0.9 0.8 0.8 0,8
2.3 1.9 1.7 2.0
1.3 2.3 3.2 2.3 .77 2.0 .77 .200 .571 .299

T..3LE 28 Control Data: Trichromatic Sectral Coefficients 69. for ::ormal Subject B.L.C., Based on Spectral Units
Y1ave - lenr tn
kale iceadings Tristimulus Values
Coefficients Correct.ior. Factor
4,'4
582.5
tt G B CA G r `,A a
-12,0
+ 2.7 - 9.9 104.5
34.9 68.1
29.3 +7.5 -10.9 - 5,4
-6.5 68.1
34.9 6S.1
34.9
-4.1
-.103 0516
.551
.516
.551 -.031 G - .652 77.
A
îï50 40.4 1,4 - 26.3 1.4 - .949 .051 -
640 68.3 2.9 -10.9 44.5 2.9 103 .914 .060 .027 1-10s 0 + 1.1
e30. 87.5 5.7 -10.9 57.1 5.7 .2 .906 .090 .003 ±11.1 002
620 83.7 9..3 -10.9 54.6 9.3 .8 0844 .144 .012 +11,6
.7
610 96.7 16.9 -10.9 63.0 16.9 - .8 .796 .214 -.010 +10, `? - 0.7
600 104.5 29.6 -10.9 68.1 29.6 -1.9 .711 .309 -.020 + 9.3 1.6 •
590 104.5 47.5 -10.9 68.1 47.5 -3.3 .606 .423 -.029 8.1
- ^ . 3
570 81.0 107.7 -10.9 52.8 107.7 -7.6 .345 .704 -.050 ±211.2 - 6.4
560 48.3 107.7 -10.9 31.5 107.7 -5.9 .236 .808 -.044 + :.9 - 5.0
550 29.4 107.7 -10.9 19.2 107.7 -7.7 .161 .904 -.065 + 4.4 - 6.5

TABLE 28 (contd) 70.
;ace- lengt_.
Scale Readings Tristimulus Values
Coefficients Correction Factor
3 G B C il CG CB rt\ g b,
546 51.3 107.7 22.0 4,7 81.0 -5,6 .059 1.011 -.070 -24.1 - 26.7 -26.7 +7,2 81.0 -4.7
530 22.0 23.9 -1.2 81.0 -3.3 -.016 1.059 -.043 -24.1 81.0 -26.7
- 2.8
520 16.3 27.7 -5.1 81.0 1.2 -.066 1.051 .016 -24.1 26.7 - 7.8 81.0 1.0
510 3.7 67.9 -8.9 63.9 11.7 -.133 .953 .173 -17.1 + 9.8 -13.5
300 + 1.3 44.6 21.8 a7.5 44.6 26,0 -.119 .707 .412 -12.8 -11.5
480 • 6.2 19.1 62.1 -4.3 19.1 74.0 -,048 .215 .833 -12.8 - 6.6
470 9,4 11.0 91,3 -2.2 11,0 108.7 -.019 .094 0925 -12 8
- l • %
460 +11.7 5.2 88.6 - .7 5.2 105.5 -.006 .047 .959 -12.8 - 1.1
450 1.9 4.0 105.3 +1.2 -0.3 125.4 . 010 -.002 .993
-0.3
440 3.2 +1.5 105.3 " 1 . -2.8 125.4 .022 -.022 1,00k. 212.1
L=30 3.8 +0.4 105.3 2.5 -3.9 125.4 .020 -.031 1.011 -4.3 -3.9

Wave- length
B C C„,
582.5 105.2 81.4 -12.9 81.4 81.4 510
494 -29.0 93.9 104.5 22.44 93.91
430 2.1 -4.57 104.5 1.625 -4.57
450 0.55 -2.55 104.5 0.425 -2.55
470 -2.67 9.23 104.5 -2.066 9.23
490 -23.48 62.48 104.5 -18.169 62.48
500 -28.27 108.5 54.0 -21.853108.5
510 -23.53 108.5 19.37 -18.203108.5
520 -13.87 108.5 - -10.733108.5
530 - 2.8 108.5 _ - 2.167108.5
540 6.6 108.5 - 9.0 5.107 108.5
550 15.6 108.5 - 9.4 12.071108.5
560 31.6 108.5 - 7,0 24.452108.5
570 57.47 108.5 -7.8 44.470108.5
580 105.2 98.57 - 7.0 81.404 98.57
590 105.2 61.8 - 0.5 81.404 61.8
600 105.2 36.5 - 4.13 81.404 36.5
620 105.2 14.3 2.7 81.404 14.3
640 105.2 5.75 - 81.434 5.75
CB
93.904
93.904
93.904-.020
93.904-.1515 48.524-.162
17.406-.169
.091
.4520
.803
1.007
.929
.679
.359
.162
- -.110 1.110 0
- -.020 1.020
- 8.087 .04€3 1.028 -.677
- 8./177 .1C8 .968 -.875
- 6.29 .193 .857 -,050
- 7.099 .305 .743 -.048
- 6.29 .469 .567 -.03G
- 5.661 .592 .449 -.041
- 3.771 .713 .320 -.033
- 2.426 .873 .153
-
.934
-.0
.066
Correction A Factor
.538 r . Q p f )V -.077 ;a _ .7738
-•136 .563 ' G 8986 .5us ß° •
.018 -.050 1.032
.005 -.023 1.023
TABLE ?5 Control Deta: Trichromatic Coefficients for Normal Subject V.P. Based on Spectral Units
71.

11riLL_ ;0.
70
: ectral ::fixture Ba.ta. Based on '3aectrA. Units (y-,uE? ity of Coefficients at 582.5 mu) for
T ratGro,,e G.M. C emrareu with Data of :ri„ht (1952)*
:avelen;th
(mn)
Relative Tritanope G.M.*
V ;: V G
Luminosity Aver. of Tritanopes* V 1L V
410 .0004 .0005 .00335 .00624 420 .0015 .0023 .00355 .01183 430 .0034 .0085 .00261 .01822 430 .0034 .0195 .00088 .02447 450 .0014 .0365 -.00075 .02835 1..60 -.00011 .0599 -.00189 .03931 470 .0016 .0893 -.00243 .06942 480 .0077 .1313 .00000 .09506 490 .0193 .1887 .00572 .1199 500 .0438 .2792 .02005 .2022 510 ,0888 .4142 .0543 .31184 320 .1538 05561 .1164 .5413 530 .2210 .6410 .1848 .6488 540 .9844 .6695 .2561 .6858 550 .3259 .6691 .3214 .6694 760 .3840 .6109 .3838 .6070 570 .4193 .5327 .4264 .5330 582.5 .4049 .4382 .4736 .4177 7" 590 .3938 .3631 .5061 .2974 600 .3827 .2516 .5053 .1913 610 .4038 .0992 .4643 .1073 620 .3401 .0409 .3688 .04619 630 .2535 .0114 .2412 .01464
$ CalculatiorE for G.L. are based on Tectral coefficients from graph and not from tabulated values.
":;right's values are for 580 mu at this point.

Wave- Subj. length an 1
615 BLC s 104.5 (N) G 27.8 JN A 104.5
T (;,) G 28.3 HBC 104.5 (N) G 29.0
114,j 31,5
ALL R N's G
Gil a 104.5 (T) G 38.1
595 3LC R 104.5 (N) G 68.0
JN n 104,5 (N) G 75.0 BBC R 104.5 (N) G 90.1 J7-.1+. it 104.3 (N) G 72,3 ALL a NIS J
GJ: 1: 104.5 T G 101_, 0
585 BLC R 83,4 (N) G 107.4 JN R 74.5
HBO R 67.2 __12/__2_14.2s3
DD- '.t 81.2 N) s 107.7
ALL R
N's G
GM R 62.5 (T) G 107.4
TAEs.. 31, Extended _,a_yleign Matches. Results of Matching .ionochromc.tic 'lest Stimuli with a Mixture of Red and Green for Four Normal and One Tritanopic
73.
Observers.
Scale Aea.di.igs Quotient
2 3 4 5 6 7 liver. Anomaly of
G
104.5
29.7 29.5 27..1 29.0 27.3 28,5 3.672 1.009
104.5
27.427. ^ 27.3 r .5 28.0 - 27.5 5.804 1.045
104.5
30.6 30.4 31,3 32.0 30.7 3.403 0.936
104,5
23.0 27.5 26.5 27.6 28.2 3.703 1.017
104.5 28.7 3,641 1.000
104.5
5:.3 34.0 38,5 36.0 36.4 2.872 0.789
104.5
71.1 71.9 70.7 67.7 69.8 63.8, 69.7 1.499 1.082
104.5
75..0 76.1 76.0 77.1 75.8 1,37E 0.994
104.5
91.6 87.5 84.,8 85.0 86,6 87,6 1.195 0,861
104.5
66,4 69.5 (36.1 67.9 69.4 1.527 1,102
1,386 1,000
104,5
103 1 1
10" 0 10 0 0 8
83.2 84.0 84.7 84,3 84.1 84.6 84.3 107.4 0.785 1.080
75,1 74.2 75,2 75.4 76,4 107,4 0,6996 0.963
67.7 64.8 69.0 67.4 67.2 107.7 0.624 _ 0.853
92.6 84.4 38.2 84.0 86.1 ( 107_17 0.799 1.099
0.727 1.000
63.7 69.8 65.5 65.5 65•4 107.4 0.609 0,838

T..Bl.i. 31 (cC'.::td, 7 o
Wave- Subj length
ntn
Scale Readings
3 4 5 6 7 R/
G
Quotient af
rinomly
575 BLC 51.7 49.6 51.5 5260 52.4 51.5 51.7 51.4 .479 1.076 (N) G 1 07. 4 107, 4 JN R 46.5 44.3 45.1 47.7 45.5 45.8 .427 0,960 (ti) G 1C7.4 107.4 HBC E. 43.0 43.2 41.4 41,8 41.4 42.2 .391 0.879 (N) G 107.7 103.7 DEV E 5=. 3 50.8 51,8 51.0 53.0 52.2 .484 1.088 (N) G 107.7 107.7 ALL 3 .445 1.000 N's G 40.7
GM3 E 42.1 40.8 39.3 42.7 38.5 40.7 .379 0.852 (T) G 107,4 107.4
565 BLC R 31.6 31.0 31.2 30.7 31.8 31.5 31.2 31.3 .291 1.098 (N/ G 107,4 107.4 JN E 23.6 25.0 26.1 26.5 25.8 25.8 .240 0.906 (N) G 107.4 107..4 HBC R 24.7 9.=0,'3, 24.9 24.2 25.2 24.7 .230 0.868 (N; G 107.4 107.7 Dty: R 51.6 32.4 3(2.9 32.8 32.1 32.4 .300 1.132 (a) G 107.7 107.7 I,L R .265 1.000 N's G Gil ( iL
, f .l/ 25. 2 2502 23,6 23.2 24.6 .229 0.864
(T) G 107,4 107,1,
555 BLC R 16.3 16.5 16.1 16.8 17.8 15,8 16.5 16.5 .154 1.092 (N) G 107.4 107.4 JN E 15.7 12.0 13.5 13.5 12.9 13.1 .122 0.865 (N) G 107,4 147.11 HBC R 13.5 13. 3 12.8 13.4 13.7 13.3 .124 0. 87 9 (N) G 107.7 107.7 DZ: D. 1.J.6 17.8 18.9 17.7 16.5 17.5 .162 1.149 (N) G 107.7 107.7 ALL R .141 1.000 N's G G?.' 2 15.5 10.9 19.1 12.0 12.7 14,0 .119 0.844
(T) s 107,4 107.4

75.
NOTES na TABLE 31
1. Wavelength refers to the test stimulus that is matched by adjusting the proportions of red and green mixture.
2. Quctient of anomaly is given by R : G for individual R : G for average of normals
3. u exact match could not be obtained by G.M. for these two test stimuli. (585 mu and 575 mu).

76.
Co—punctal Point for tritanope, G.M.
The co—punctal for tritanope G.lI. was determined from his spectral mixture data. The chromaticity co—ordinates were calculated for the R + B mixtures that matched each of the wavelengths used in obtaining mixture data.
This calculation was carried out by finding the product of the chromaticity co—ordinates x, y and z of the R and B filters andtbe scale readings for the match, that is
î;, yr R›, zr R k
and xb ï. yb B zb B)
where xr, yr, zr are the CIE chromaticity co—ordinates of the red
filter and RA is the scale reading of the red filter for a match of wavelength a ; and xb, yb, zb are CIE chromaticit:: co—ordinates
for the blue filter and B is the scale reading for the blue filter.
These products were summed to yield the tristimulus values of t_e û + B mixture, namely
X= xrR),+xbBx, Y=yr RA+yb BA , Z= zrRA+zb B)‘
and the chromaticity co—ordinates of the mixture are
_ X _ Y Z x= X+ Y+ Z , y= X+ Y+ Z
z= X+ Y+ Z
The chromaticity co—ordinates of all the matches were plotted on a large scale CIE diagram (1931 data) and a line was drawn through each of these points and also through the point representing the chromaticity of the wavelength that the ii. + B mixture matched.
The co—punctal point was not determined by the least squares solution of Sperling (1960) since by inspection it was clear that the co—punctal of our tritanope, G.M., was not significantly
from those determined by Thomson and Wright (1953) and by Sperling. The co—punctal of tritanope G.M. was estimated to be at x = .1727 y = .009
Extended Rayleigh—type matches
From table 31 and figure 78 it can be seen that tritanope G.M. mazes very slightly deuteranomalous matches when mixing R + G to match spectral radiations between 555 mu and 615 mu. This is consistent with the deuteranomalous match made at the Nagel anomaloscope (table 9).
The Guess green added compared with the normal is by no means
great, but is seen to increase gradually for the test stimuli of longer wavelength.

T r r-
0.6
0.5
0 4
03
V2
0 1
,w
1
v 19 ♦
a 0
1 '
16
'5
14
13
I I
555 565 575 585 515 605 615
wavelength mu File, 73. Extended Uaylci Matches for It Normal and one tritanopic o'.rscrver. Ordinate shows the log of the ratio of the red and green colorimeter state rondin s.

DISCUSSION
Diagnosis
The equation A + B = 530 mu has demonstrated that at least three of the nine affected members of this pedigree are dichromats. There is no reason to regard this diagnosis as uncertain; the equation is a rigorous test of dichromasy. Moreover, the diagnosis of dichromasy is supported by :
isa) the demonstration of a spectral neutral point for the two dichromats for whom this measurement was attempted
(b) the ability of one subject (G.M.) to match all spectral radiations by atwo pert mixtures of primaries
(c) the character of the colour naming of spectral radiations
The defect exhibited by these three individuals is unquestionably tritanopia and there is no evidence that it is in any way atypical. The neutral pointsthat were elicited are characteristic aad the position of the co-punctal point for subject G.E. was close to that determined by others (Wright, 1952; Sperling, 1960). The spectral mixture functions VG, V11 for this
subject conformed with those reported by Wright (1952). There was no evidence to suggest a second spectral neutral point that might characterise tetartanopia.
It is equally certain that the other three tritans who made tests at the colorimeter are not dichromats since they were unable to match 530 mu with a mixture of red and blue or make matches with equations of a. similar kind. Spectral neutral points cold not be elicited for these subjects. Two of these subjects made matches for wavelengths throughout the spectrum and required three primaries for matches.
From this information it is still not possible to surmise
with any degree of confidence about the defect exhibited by the three who were not tested at tie colorimeter. It would seem possible that Subject III, 4 is a tritanope and that IV, 10 is not a dichromat.
Genetical Implications
The existence in this pedigree of both tritanopia and a trichromatic trito-defect confirms the hitherto suspected fact that there are phenotypical variations amongst tritans (Kalmus,1955; Crone, 195o; Section I of this thesis),

78.
Variable expressivity is a common attribute of a gene (-Stern, 1 =60) end -R&y oe due to variability of the gene itself or to variable expression of a stable gene- as a result of interactions with either tae genetic or external environments or both. Variability of the gene, or in other words, mutati.n, is unlikely since genes are usually st=.-,le. On the other hand, similar phenotypes different only in degree, May not always be due to variable expressivity of the same gene different genes et at a variety of loci may result in similar- phenotypes cr i:ultiple alleles of a. single gene may differ in degree of expression. However, in the case of tritanopia we have a. rare ±reit and the chance of more than one trito gene, or for that matter more than one trito allele, being present in the one family is remote.
It is likely that the variable phenotype exhibited by this family, is the result of the variable expressivity of a single gene. The cause of this variable expression is unknown. It could be the result of interactions of the tritan gene with other genes or the result of the influence of the external environment. The latter causal factor is improbable in the case of tritanopia, since it is difficult to conceive of the manner in which the external environment might affect colour vision. If it is genetic interaction,it is not possible to be at all specific as to how the genetic environment affects expression in this case.
Implications of these Findings for Classifications of Defective Colour Vision
The existence of tritanomaly has been accepted since Engleking (1925) reported the tritanomalous vision exhibited by his subjects. Since protanomaly and deuteranomaly are usually regarded genetically at least as anomalies distinct from their dichromatic counterparts, so tritanomaly has been regarded as a defect distinct from tritanopia, and has been accorded a distinct mode of inheritance (Walls and Mathews, 1952; Kalmus, 1955)o
Yet, in this pedigree tritanopia and a defect which could be called tritanomaly exist side by side.
The most plausible explanation is that the tritanomaly is an incomplete expression of a single gene for tritanopia, and for this reason the tern "incomplete tritanopia" seems more appropriate than "tritanomaly".
The term "incomplete tritanopia" is clearly an appropriate description of the three tritons who are not dichromats; it remains to examine how appropriate it would be to also call them tritanomalso
Anomalous colour vision is characterised most generally by the fact that, although anomalous observers like the normal,
require three physical stimuli to match all wavelengths of the visible spectrum, the proportions of the mixture stimuli required by anomalous

79. observers differs significantly from those of the normal observers. The degree to which their matches do differ from normal varies considerably from observer to observer. The degree to which these deviations are accompanied by a reduction in hue discrimination also varies considerably. Ordinary anomals usually have hue discrimina- tion that is not markedly worse than the normals. Other anomals will show a marked reduction in hue discrimination and will,for the most part, be extreme anomals.
The matches made by anomals will not only differ from normal, but will alsosotail the rejectionof the normalh match, provided hue discrimination is not so poor as to cause the normal's match to be included in the range of proportions of the mixture stimuli that tae anomal accepts as a match for a given test stimulus.
Anomalous matches can be denoted by the anomaloquotient, the ratio of the proportions of the anomalous match to those of the normal observer. For the anomalous trichromat this quotient will vary for different stimuli, thus indicating (see literature survey) that the anomalous matches are the result of su alteration of the responsiiity of the receptor systems and are not the result of pre—receptoral absorption.
The incomplete tritanopes tested at the colorimeter, demonstrated the following characteristics:
(i) They required â three—part mixture for most matches and are therefore trichromats,
(ii) Subject Be made anomalous matches and rejected the normal's matches for 430, 450, 460, 494, 570 and 582.5 mu, (Table 26) (It was not ascertained whether the other two tritans rejected the normal's match).
N (iii) The anomaloquotient of subject4Be is not constant when
compared with the results cf normal subjedt E.C. and V.P. (Tables 26, 28 and 29).
(iv) At the filter anomaloscope the incomplete tritanopes M.B. (Subject IV, 8) and R. Be (Subject IV, 6) could not match the cyan with all proportions of the blue and green mixtures and R. Be rejected the normal's match.
It can be concluded that these three subjects have characteristics which would lead to the diagnosis of tritanomaly had it not also been found that there were three tritanopes amongst their close relatives. Phenotypically they are tritanomalous, genotypically they possess an abnormal gene which can express itself as either tritanopia or tritanomaly and which can, for convenience, be called a gene for tritanopia,

80.
There is nothing in the reports of the nine tritanomals which a-3pearg in the literature to preclude the possibility that they are also incomplete tritanopes. In fact, some of the characteristics of these tritanomals suggest that they may well be incomplete tritanopes. •The.first of Engleking's tritanomals could match -:avelengths between 430 and 520 mu and between 590 and 766 mu with a two-part mixture of red and blue light and this partial dichromasy suvgests incomplete tritanopia.. Schmidt (1943) reported a tritaiomal chose father could have been called a tritenope, since he wes demonstrated to have a neutral point and was more severely affected than his tritanomalous daughter. The second subject of Crone (1956) had a. broad matching range which incln ed the- normal's match for the equation 513 mu + 455 mu = 480 + white. Light of wavelength 575 mu was very desaturated for tris subject and Crone himself concluded th a t this subject "could well be called an incomplete tritanope".
Protanomaly and deuteranomaly in both the ordinary and extreme forms are assumed to have separate alleles and there is reasonable evidence for tùis assumption (Francois, 1;61). Tritanomaly has been assumed to have a genetic factor separate from tritanopia. The mode of inheritance of tritanomaly is usually said to be sex-linked recessive on the evidence of the Engelking-Hartung tritanomals, despite the conflicting evidence from Oloff (1933) and Schmidt (1943).
The pedigree presented here demonstrates that tritanopia and tritanomaly can be the result of the same genotype and it must be concluded, until further evidence is forthcoming,tüat there is no separate genetic factor for tritanomaly. What has been called tritanomaly is incomplete tritanopia.
Mechanism of Tritanopia
Both tae trichromatic theory and the opponent-colours theory regard tritanopia as the result of a reduction in the number of systems handling colour information. For the trichromatic theory it is the loss of the blue fundamental, whereas the opponent-colours theory regards it as the loss of the blue-yellow opponent process.
There is no evidence fret these experiments at the colorimeter to suggest that the essential mechanism is not one of loss. However, there are some subsidiary findings which must be related to the
theories which attempt an explanation of colour vision:
(1) The dichromatic spectral mixture curves for tritanope G.M. (figure 77) show a shift of the maximum of the VAR curve from
60u mn for the normal (Wright, 1947, figure 80 p.144) to approximately 580 mu. The average curve for Wright's seven tritanopes (1952)
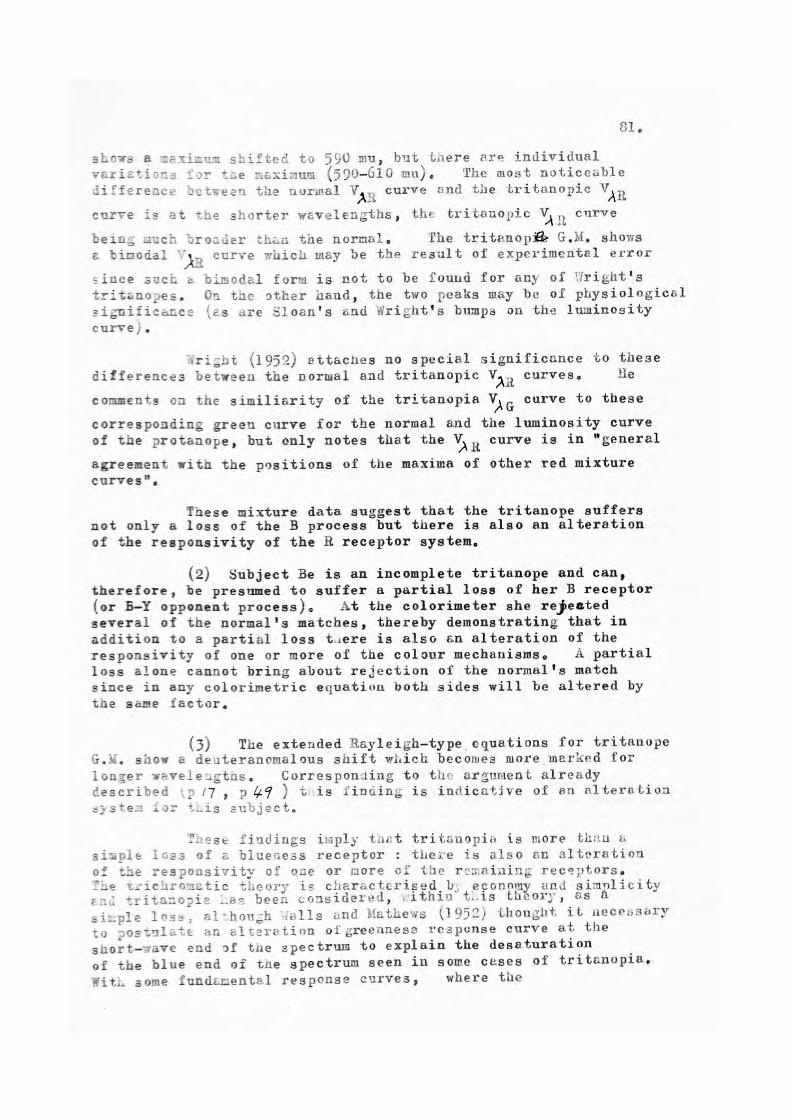
31 0
shows a maximum shifted to 590 mu, but there are individual variations for the maximum (590-610 mu). The most noticeable difference between the norin.al V curve and the tritanopic V'Alÿ
curve is at the shorter wavelengths, the tritanopic Vß.14 curve
being auch broader than the normal. The trita.nopii G.M. shows a bimodal V curve which may be the result of experimental error
since auch a bimodal form is not to be found for any of .'!right's tritanopes. On the other hand, the two peaks may be of physiological significance (es are Sloan's and Wright's bumps on the luminosity curve).
-aright (1952) attaches no special significance to these differences between the normal and tritanopic V, curves. He
comments on the similisrity of the tritanopia VA G curve to these
corresponding green curve for the normal and the luminosity curve of the protanope, but only notes that the V curve is in "general
agreement with the positions of the maxima of other red mixture curves".
These mixture data suggest that the tritanope suffers not only a loss of the B process but there is also an alteration of the responsivity of the R receptor system.
(2) Subject Be is an incomplete tritanope and can, therefore, be presumed to suffer a partial loss of her B receptor (or B—Y opponent process). At the colorimeter she rejected several of the normal's matches, thereby demonstrating that in addition to a partial loss t_.ere is also an alteration of the responsivity of one or more of the colour mechanisms. A partial loss alone cannot bring about rejection of the normal's match since in any colorimetric equation both sides will be altered by the same factor.
(3) The extended Rayleigh-type, equations for tritanope G.M. show a deuteranomalous shift which becomes more,merked for longer wavelengths. Corresponding to the argument already described ;217 , p 4 ) teis finding is indicative of an alteration eystem for tais subject.
eese findings imply that tritanopia is more than simple loss of a blueiess receptor : there is also an alteration of the responsivity of one or more of the rcmaiaing receptors. The tfichromatic theory is characterised b;; economy and simplicity and tritanopie.:ae been considered, cithiu this theory, as h
simple less, although a11s and Mathews (1952) thought it necessary to postulate an alteration of greenness response curve at the short--Tawe end of the spectrum to explain the desaturation of the blue end of the spectrum seen in some cases of tritanopia. With some fundamental response curves, where the

82.
red response comes to exceed the green at the short wave end (e.g. König-type fundamentals) it is necessary to postulate an alteration to avoid the appearance in tritanopia of a tetartanopic neutral point where the red and green responses are equal.
The dichromatic spectral mixture curves of tritanopes derived from trichromatic assumptions, suggest that the VAR
curve shifts 10 mu, from a maximum of 600 mu to one of 590 mu and such a shift is consistent with the deuteranomalous extended Rayleigh matches found for our tritanope G.M.
The opponent colours scheme requires the assumption of an alteration of the r-g response characteristics in addition to the loss of the b-y system. Without the assumption of shifts of the response curves, the opponent colours theory can account for only deuteranopia, tetartanopia and achromaticism. Response curve shifts seem ad hoc and less economical compared with the trichromatic explanation of tritanopia. However, the extended Rayleigh matches made by tritanopie- G.I., are accounted for by assuming that the r-g response curves are displaced toward the blue end of spectrum in the way Hurvich and Jameson (19)5) assume in their explanation of tritanopia.. Such a shift, occurring in the incompletettitanope,together with a partial loss of toe b-y system, is also a plausible explanation of their rejection of the normal's matches. An attemat to quantify a theoretical model for incomplete tritanopia, based partial loss and shift, failed to predict the mixture data that was obtained. This may be because of inadequacy of the opponent colours theory, or more likely,ûecause of the uncertainty of tseizAeo plete tritanopes experimental mixture data, ensuing from their poor hue discrimination.
Boynton (1960), in his modification of the opponent-colours scheme, regards tritanopia as the loss of the b--y process accompanied by the absence of the ô pigment from the red (Z) receptor. The response characteristics of the R-G opponent process for tae normal is given by Boynton as very nearly (R - G ) = 80 (x-y). It was shown in Section II of this thesis, that the tritanopic (R-G) process is ,,iven by (R - G ) = 80 x-y-0.2 z). The loss of the Y pigment from -Lie a receptor therefore results in the absence of an r response at the shortwave end in the same way as postulated by iturvich-and Jameson.
The alteration is, however, confined to wavelengths shorter than 55.: nn and the long wave r response is unaltered. The alteration at 550 mu is very small (0.3) and is not sufficient to account for the deuteranomalous shift observed with tritanope G.M. Boynton's model for tritanopia, on this evidence, requires modifica- tion.

The experimental results obtained at the colorimeter,do not decide between theories of colour vision,although Boynton's model for tritanopia appears inadequate, especially when it is remembered that this model failed to account for saturation discrimination data (Section II).
The data given here do allow the conclusion that an alteration system accompanies complete and incomplete tritanopia. The trichromatic explanation must, therefore, be extended from a simple loss theory. The opponent colours explanationof tritanopia with its dual assumptions of loss and alteration, receives confirma-tion and is no longer open to the objection that it is ad hoc.
A Genetical Speculation
t this point it is of interest to refer to the theoretical analysis of anomalous trichromasy made by Jameson and Hurvich (1956). It is generally recognized that the anomaloscope range and the anomaloquotient for the Rayleigh equation are not correlated. Accordingly,Jameson and Hurvich re-arrange the anomaloscope data of Willis and Farnsworth into four categories, depending on size of the anomaloscope range. They are able to predict, within their theory, the characteristics of range and anomaloquotient of each category from the assumptions that anomalous trichromasy results from :
(a) a displacement of all the photopigments toward the shortwave end in protanomaly or toward the longwave end of the spectrum in deuteranomaly. The extent of the displacement is assumed to vary from one anomalous individual to another.
(b) a displacement in the way just described, accompanied by a partial loss of the r-g opponent process.
The simple displacement yields anomalous matches, whilst good hue discrimination is retained. Displacement, accompanied by loss yields anomalous matches with a reduction of hue dis- crimination. Although, Jameson and Hurvich do not use the term explicitiy,it is to be presumed that the extreme anomal has the latter mechanism, but not all anomals of this second type are extreme anomals.
This explanation of a combined loss and alteration, implies a continuity of dicnromasy with anomalous trichromasy of the second type, although Jameson and Hurvich do not take their analysis to this -joint.
It has been concluded from the colorimeter evidence presented here that incomplete tritanopia exists and that it is the result of a partial loss accompanied by an alteration of the responsivity curves. Incomplete tritanopia can be thought of as an anomalous trichromasy of the second type in the sense of

a3
a3
al
b3
3
b1
t3
8
Jameson and Hurvich (1956). This conclusion strengthens the analysis of anomalous trichromasy of these authors (although it is admitted twat there are some important differences apparent in the conception of incomplete tritanopia and that of the second type of anomalous trichromasy). The speculation that there is a continuity between dichromasy and anomalous trichromasy of the second type is also supported.
It is of interest to carry this speculation further for it nas genetical consequences of some significance.
In the light of the argument above, colour vision defects can be re—classified and assigned genotypes as follows:
PhE OTYPE GENOTYPE
Protanopia P
Protanomaly (Second type) PA 2
Protanomaly (First type) PA 1
Deuteranopia D
Deuteranomaly (Second type) DA 2
Deuteranomaly (First type) DA 1
Tritanopia T
Tritanomaly (Second type) (incomplete tritanopia) T
31a2 and b2 is the
genotype for EPA and EDA
The category of extreme anomaly is abandoned in this classification. It is an arbitrary category based solely on performance at a particular instrument. It has no underlying physiological basis. In its place is Jameson and Hurvich's anomalous trichromasy of the second type. This is considered to be incomplete dichromasy and is, therefore, assigned the same genotype as the dichromatic form. No hypotheses are proposed as to why the genotypes a_ , b
3 and t_express as dichromasy for
some individuals and as incomplete dichromasy for others. Additicnal genes may be necessary, but it is sufficient, at this stage, to attribute the variable expressivity of the genes to difference in genetic background.

85.
There era cases of protan or deutan defects which do not accurately correspond to their genotype. These exceptions embarrass the multiple allelomorphic scheme♦. usually assumed and special explanations are necessary. In these cases the type (protan or deutan) is retained, but the form is changed kfrom DA to D for instance) (Francois, 1961).
The pedigrees in figure 79a are such exceptions. On the usual genetic assumption for normal and defective colour vision it is necessary to postulate idiovariation (mutation to another allele of the same series) or paravariation (under or over expression of the gene) (Brunner cited by Francois, 1961). If it is assumed that there is only one gene (b.3) and that the FDA and
Dpi phenotypes in these pedigrees are anomalous trichromasies of the second type, then the variations in the phenotypes are the result of partial expression in the same way as the tritanomaly in the pedigree reported in this thesis must be the result of partial expression.
The explanation of the pedigrees in ligure 79b also can be simplified in the same way.
T'ais genetic speculation has b_en examined no further than is is icated on these pages. It may come to grief on more critical examination. In particular, it would be necessary to examine the basis for the diagnoses in the pedigrees which have been used as examples. It would also be necessary to consider the consequences for genetical frequencies of colour anomalies. Joreover, the phenotypical characteristics of the so—called extreme aoomal need investigation so that the assertion made here that it is on arbitrary •and instrumental category might be put to test.
Tritely, it can to suggested that further research is needed.

D D
#0D D D D D `` Ar
• Inheritance of congenital dyschromatopsia. Variable manifestation in men. (a, After Gcthlin, 1924, b, after Brunner, 1930; c, after Brunner, 1930; b, after Trendelenburg, 1941.)
el IIEDA O N b) EDA
EDA DA D ■ N
Fi4.7 fib. .. Inheritance of congenital dyschromatopsia. Genealogic trees with heterozygotes for two allelic genes. Phenotype not in accordance with theoretical predicate. (After Brunner, 1930.)

8fi . PRINCIPAL CONCLUSIONS
1. The familial distribution of nine tritans, all members of the one pedigree, confirms with what is believed to be the most extensive tritan pedigree, that the mode of inheritance is by means of an autosomal dominant gene. However, the possibility of sex-lined dominant inheritance has not been excluded by this pedigree or by previous genetical studies.
2. The abnormal gene in the pedigree appears to demonstrate high penetrance and this is in conflict with the conclusion of Kalmus (1955). Kalmus' pedigrees were examined critically and when cases diagnosed as tritanopic on inadequ;.te evidence were excluded, his pedigrees also showed high penetrance.
3. The gene was shown to demonstrate variable expressivity, since at least three affected members were dichromats and at least three were trichromats. Variable expressivity had been suspected before (Kalmus, 1955, Crone, 1956, Walls, 1961) but had not been demonstrated conclusively.
4. The trichromatic tritans have been called incomplete tritanopes. Had they been diagnosed without reference to their tritanopic relatives, they would have been diagnosed as tritanomals. This raised the possibility that all other tritanoma.ls in the literature could also be incomplete tritanopes and it was concluded that there was now no evidence tosupport the assumption of separate genetic factors for tritanomaly and tritanopia.
5. The incomplete tritanopes were compared with the theoretical models for anomalous trichromats devised by Jameson and Hurvich (1956). It was suggested that the incomplete tritanopes conformed to tale second model which assumed a partial loss of one opponent process and an alteration of the response of the intact process. Conversely, it was argued that all anomalous trichromasies of this second type could be regarded as incomplete dichromats. This lead to simplified genetical assumptions and a new classification for protan and deutan defects which avoided the special hypotheses necessary to explain several pedigrees in the literature which have embarassed the usual genetical theory of colour vision.
6. From colorimeter experiments it was concluded that a simple loss hypothesis could not explain tritanopia. It was necessary to postulate, in addition, an alteration of the responsivity of one or more of the remaining receptor mechanism. This required the extension of the trichromatic explanation of tritanopia and provided justification for the Hurvich and Jameson (1955) opponent-colours explanation. Boynton's (1960) explanation of tritanopia was found to need modification.

7. The tritanopia found in this pedigree was found to have characteristics not significantly different from those of Wright's (1952) seven tritanopes.
b. The purity discrimination function of the tritanope was measured. There have been no previous such measurements. Purity discrimination was found to be better for tritanopes than for normals, except at the blue end of the spectrum and for yellows. The results accorded well with the quantitative theoretical prediction of Hurvich and Jameson (1955) from their opponent- coloi:rs sheme. It was also concluded that the trichromatic theory had serious shortcomings in the prediction of purity discrimination functions, although the excess hypothesis gave a. good prediction when put into a quantitative form. Boynton's theoretical tritanope failed to conform with the experimental findings.
9. Information was collected about the efficiency of varions tests applicable to tritans *. It was concluded that the best tritan test is the Farnsworth F2 plate which was failed by all tritans to whom it was given. The A0IIR.R Pseudo- isochromatic plates were found to be errorless for some incomplete tritans. The dichotomous test was completed without difficulty by one tritanope and several of the incomplete tritanopes. The Farnsworth ldunsell 100 Hue test was ambiguous in two cases,but in general provided useful information. With an anomaloscope for a B + G = BG equation great care must be taken to ensure that the matching locus lies along a confusion line.
$ See Cole, 1964. (Reprint enclosed).

88.
REFERENCES
ölrutz, S. (1915) Ef-f fall av violett eller gulblablindheit (tritanopia) Psyke (Upsala) cited by tiothlin (1943).
Auerbach, E. (1960). Discussion of Dartnall, Visual pigments of colour vision in Mechanisms of Colour Discrimination. Proceedings of an International Symposium. London. Pergamon.
B1 s c :we11,E.R. & Blackwell, 0.M. (1959). Blue cane systems isolated in atypical congenital achromatopsia. J. Opt. Soc. Amer., 49, 1137.
Blackwell,E. . & Blackwell, O.M. (1961). Rod and cone receptor mechanisms in typical and atypical congenital achromatopsia. Vision Research, 1, 62.
Bedford, .}.E. & Wyszecki, G.W. (1958a). Wavelength discrimination for point sources. J. Opt. Soc. Amer., 42, 129.
3edford, Wyszecki, G.W. (1958b). Luminosity functions for various field sizes and levels of retinal illuminance. J. Opt. Soc. - er,, 49,406.
Boynton, zR... (1956). Rapid chromatic adaptation and the sensitivity functions of human color vision. J.Opt. Soc. Amer., 46, 172.
Boynton,- 2.V. (1960). Theory of color vision. J.Opt. Soc, Amer., 50, 929.
Boynton, R.M. (1963). Contributions of threshold measureme,its to color discrimination t_.eory. J. Opt. Soc. Amer., 53, 165.
Boynton,3.1i., Randal, G. & Onley,J.W. (1959). Rapid chromatic adaptation of normal and dichromatic observers. J. Opt. Soc. Amer., 49, 654.
Brindley, G.S. (1957). human colour vision. Proar. Biophys., 8, 49.
Brindley, G.S. (1960). Physiology of the :Retina : the Visual Pathway. London. Edward Arnold,
Brown, P.E. & Wald, G. (1963). Visual pigments iu human and monkey retinas, Nature 200 (4901) 37.
Casellato, L. and Spallino, A. (1955). Two cases of familial congenital tritanopia. Atti. Soc. oftal Lombarda, 10, 42 cited in Ophthal. Lit., 9, 4177, 19550

89.
Chapanis, .(1944). Spectral saturation and its relation to colour vision defects. J. Exp. Psychol., 34, 24.
Cole, B.L. (1963). Misuse of the Ishihara Test for Colour Blindness. Brit. J. Physiol. Oatfcs, 20, 113.
Cole, B.L. (1964). Comments on Some Colour Vision Tests and their use for selection. Aust. J. Optom., !6, 56,
Colin, & Nagel, W.f'_. (1907). Lefts. Sinnes pj:ysiol. 41, 74 cited by Judd, Plaza & Farnsworth (1950).
Cox, J. (1960). Colour vision defects acquired in diseases of the eye. 3t. J. Physiol, Optics, 17, 195; (1961) Brit. J, Physiol. Optic;, 18, 3; (1961) Brit. J. Physiol, Optics, 18, 67.
Crone, .i._.. (1956). Combined forms of congenital colour defects. Brit. J. Ophthal, 40, 462.
Dartnall, ;i.J._ . X19' 0; . Vis'ial pigments of colour vision in Mechanisms of Colour Discrimination, Proceedings of an International Sympoisum.- London. P3rgamon,
Dartnall,H,J. . (19f)2). The Photobiology, of Visual Process in Dawson, H. (ed.) The Eye. vol. 2 New York Ada.demic Press.
Dartnall, H.J.._. and Thomson, L.C. (1949 . Retinal oxygen supply and macular pigmentation. Nature , (Lord, ) , 164, 876
Dartnail,H.J.A. & Thomson, L.C. (1950). Retinal oxygen supply and macular pigmentation. Nature,(Lond.), 165, 525.
Denton, E.J. & Pirenne,M.11. (1950). Retinal oxygen supply and macular pigmentation. Nature, (Loud.), 165, 304.
Donders, F.C. (1880). Remarks on colours and colour blindness, Brit.Med. Journal, 2, 767.
Dresler, A. (1962). Personal communication.
Engelking, E. (1925). Die Tritanomalie, ein bisher unbekannter Typus anomaler Trichromasie Graefes :arch. Ophthal,, 116, 196
Engelking, E. (1926). Uber die spektrale Verteilung der Unterschiedsempfindlichkeit fur Farbtone bei ben vescheidenen Formen der anomales. Trichromasies. Klin, i,ibl, ..0 enheilk., 77, 61
Engel ino, E. & üartung, H. (1927). Spektra.luntersuc_`ilugen ,ûber c'ie ::unimalfeldha11ykeiten des Tritanomalen und seine Untuschcidsemp-findlickheit fur .ndernngen der ïielligkeit. Graefes, Arch. Ophthal., 118, 211.

90.
Farnswort_, D. (1943a). The Farnsworth Munsell 103—Hue and Dichotomous Tests for color visl_'n. J. Opt, Soc. Amer,, 33, 563.
Farnsworth, D. (1943b). Description of a subject congenitally déficient in violet—yellow vision. J. Opt. Soc. Amer., 3, 350.
Farnsworth, D. (1947).. The ;Farnsworth Dichotomous Test Manual. New York. Psychological Corporation.
Fa:nsworth,D. (1955). Tritanonialous vision as a threshold function Fsrbe, 4,185.
Farnswcrth,D. (1957). The Farnsworth—Munsell 100—Hue Test Manual. Laltimore. Munsell Color Corp.
Fischer, c.P., Bouman, M. . & ten Doesscnate,J.(1j51). A case of tritanory, Locum. Ophthal, 5-6, 73.
i'rancois, J.(1961). Heredity in Ophthalmology. St. Louis. C.V.Mosby.
Franccis,J. & Verr_est, G. (1961). On acquired deficiency of colour with special reference to its detection and classification by
means cf the tests of Farnsworth, Vision Research, 1, 201.
Fry, G.A. (1945). of color visi;n,
Fry, G.s. (1955).
photoreceptor mechanism for the modulation theory J. Opt. Soc. Amer., 35, 114.
Tritanopia. Farbe,4, 233.
Fry, v.a. (1958). Dichromatism and the mechanisms subserving color visin. J. Opt. Loc, —mer., 48, 509,
Gilbert,M. (195e). Colour perception in parafoveal vision. Froc. phys. Soc., 63, 83.
Gothlin, G.H. (1943)• An analysis of be perception defect in published and spectroscopically investigated cases of congenital tritanopia. tecta Ophthal. (Kopenh) 21, 88.
Gothlin, G.. (1944), Experimental determination of the short wave fundamental color in man's color sense, J. Opta Soc. Amer., 34,147.
Granit, R. (1947), Sensory Mechanisms of be _icetina. London, Oxford University Press,
Granit, R. & Wirth, A. (1953). A scotopic "blue shift" obtained by electrical measurements of flicker resonance, J. Physiol., 122, 386.
Gretler, ri.F. (1941). Spectral saturation curves for man and chimpanzee. J. Exp. Psychol., 28, 419.

91.
Hardy, Led. H., Rand, G. & _littler,:: . (1954a). The IIR!l polychromatic plates. J. Oat. Sin, Amer., 44, 509,
Hr.rdy,Le&. i,., :and, G. & Rittter,M.C. (1954b), HAIR polychromatic plates I._.. test 'for the detection, classification and estimation of the degree of defec;ive color vision.A.L.A. Arch, Ophthal,, 51, 216.
Hardy, Leû, E., Rand, G. x iittler,M.C.(1956). An evaluation of the 30 pseudoisochromatic plates. A.M.A... Àrch. Ophthal., 56, 736.
Hartridge,H. (1945a). Colour vision of the fovea centralis. Nature. (Loud.)., 155, 391.
Hartridge, H. (1545b). The change from trichromatic to dichromatic nisi n in the human retina. Nature (London) 155, 657.
Hartridge, H. (197Ca). Recent Advances inthe Physiology of Vision. London, Churchill.
Hartridge, H. (1950b). Retinal oxygen supply and macular pigmentation. Nature (Lend.), 165, 304.
Hartridge, H. (1951). àacular pigment. Nature (Loud.), 167, 76.
Hartridge,H. (1953), Chromatic aberration and the polychrom ; tic theory. Brit. Med. Bull., 9, 31,
Hartung,H, (1926). Tiber 3 ianiiliare falle von Tritanomalie. Ella. -tn.enheilk. 76, 229.
Hecht, S. (1934). A Handbook of General Experimental :sycholoV. C. 14nrchison,Ed.) ;.:ass. Clerk University Press.
Hecht, 3. and Yun Hsia (1938). Color defect and color theory. Science,127,675.
Helmholtz, H. von (1909). Haudbuch der Physiologoischcv Optik. 3rd Ed., - Trans.. J.P.C. Southhaii. scousin. Optical Society cf :,Merica. 1924
Herden, G. (1949). Discussion of N'ilmer,.N. Colour vision in taie central fovea. i'ocum Oathal., 3, 208.
Bering, E.. (1894). Tiber einen Fall von Gelb-Blaublindheit. Arch. f._d. ges. Physiol., 57,308.
Herkann,_. (1882). Ein Beitray zur Casuikstisk der Farbenblindheit. Dissert. Dorpart cited by Gothlin. (1943).

92. Rubel, D.E. (1963a). The visual cortese of the bruin Sei, Amer., 209, 54.
Hubel,D.H. (1963b), Integrative j,rocesses in central visual pathways of the cat. J. Opt. Soc. _'xicr. , 5-3,580
Huntington, C.E. (1932). A case of apparent blue-blindness, 'er. J. Psvchol., 44, 183.
Hurvich,D. 01960). Seance de Cloture. Proceedings of an International Symposium. éechanisms of Colour Discrimination. London. Pergamon,
Hurvich, L.11.(1960). The opponent-pairs scheme. In Mechanisms of Colour Discrimination. Proceedings of an International Symposium., London. Pergamon.
Hurvich, 1..1A1963). Contributions to color-discrimination theory review, s,mmary, and discussion. J. Opt, Soc, Amer., 53, 196.
Hurvich, i. & Jamieson, D. (1955). Some quantitative aspects of an opponent-colors theory II. Brightness, saturation and hue in normal and âicromatic vision. J. Opt. Soc. Amer.,'45,602.
3urvich,L..,!. & Jameson, D. (1956). Some quantitative aspects of an opponent-colors theory IV. A psychological color specification system. J. Opt. Soc. Amer., 46,416.
Hnrvich, .M. at Jameson, D. (1957). An opponent-process theory of color vision. Psychol. Rev., 64., 384.
Hurvich,L.' . & Jameson, D. (1958) . Further development of a. quantified opponent colours theory. in Nat. Phys. Lab. Symposium No. 3. Tisual Problems of Colour. London. H. M.Stationery Office,691.
Ingvar, D.H. (1960). Discussion of Galifret, Y Au niveau des vcies et des centres. lechanisms of Colour Discrimination. Proceedings of an International Sympsoiu;n. London. Pergamon.
Jaeger, :'.'. (1954. liber ungewo .nliche Menifetations-formen aaseborener. Storungen des Farbesin_ies Bericht Deutch Ophthal. Gee. (56th Meeting, Munich) 61-65.
Jaeger, -i. (1955). Tritoformen angeboreaer und erworbener rarbensinnstorungen. Farbe, 4, 197.
Jameson, D. & Hurvich,L.M. (1955). Some quantitative aspects of an opponent-colors theory I. Chromatic responses and spectral saturation. J. Opt. Soc. Amer., 45, 546.
Jameson, D. & Hurvich, L.M.(1956). Some quantitative aspects of an opponent-colors theory III. Changes in brightness, saturation and hue with chromatic adantatien. J. Ont. Soc. Amer.. 46. 405.

93. ' Ja zeseL, D. HLrvich, =.,.â .. (` .9r. oi. Theoretical analysis of
anomalozs trichromatic colour vision. J. Opt. Soc. _Amer., 46, 1075.
Judd, D. Z.(1930). eduction of data: on mixture of color stimuli. U.S.Fur. ;t_r.cG.rds. J. Res. 4, :75.
Ju d, -.4 931). Extension of the standard visibility function to intervals of 1 millimicron by third difference osculatory interpolation. U.S. Bur. standards J. Res. 6, 465.
Ju.:d, L.E. (1943). Facts of color-blindness. J. Opt. Soc. Amer.,
JuL d, L. (1945). Standard response functions fr protanopic end deuteranopic ;nisi n. J. Out. Soc. :..mer., 35, 199.
Judd, D. B. (1948). Color perception of deuteranopic and protanopic observers. J. ies. Nat. Bur. Stand., 41, 247.
Judd, (1949a). Current views ou colour blindness Docum. :'phthal. 3, 251.
Judd, J. -. (1949b). Standard response functions for protanopic and deuteranopic visicn. J. Opt. Sod. Amer., 39, 505.
Judd, D. B.(1949e). Response functions for types of vision according to the Muller theory. J. Ides. Net. Bur. Stds. 42, 1.
Judd, D. B. (1964). Personal communication.
Judd, D. B. Plaza,:,. and Farnsworth, D. (1950). Tritanopia with abnornelly heavy ocular pigmentation. J. Opt. Soc. Amer., 40, 833.
Kalmus,H.(1955). The familial distribution of congenital tritanopia, Ana. Hum. Genetics,.20, 39
Karplus, 3. (1947). Foveal tritanopia. Nature (Loud.), 160, 647.
Kelly,K. L., Gibson, K.S. and Nickerson, D. (1943). Tristimulus specification of the Munsell Book of Color from spectro photometric measurements. J. Opt. Soc. Amer., 33, 335.
Koelluer (1929). Die Abwerchungen des Farbensinnes in Handbuch der aornalen und pethologischen Physiologie (Berthe, A. ed.), vol 12 (1). Receptionsorga.ne II Berlin. Verlco von Julius Springer.
Köaig,t• (1897). Uber Blaublindheit. S. B.Akad, Wiss. Berlin cited b} Pitt (1944a), Judd (1949b).

94.
K'nig, -. (1903). Uber den menschlichen Sehpingur und seine Bedeutung fur des Schen. Ges. r_bhandl. Z. Physiol. (J. Barth). Leipzig. 338.
nohlraIIsc :, i. (lçjj)• Farbe, 4, 240.
Die angelbiiche Tritanopie der Foven-Mitte.
Ladd-Franklin, C. 01929). Colour & Colour Theories. Harcourt, Bruce a Co.
New York.
Le &rand, Y. (1957). Light Colour and Vision. Trans. by Hunt, E. W. G., Walsh, J. W. T. and Hunt, F.. A. W. London. Chapman Hall. 1.
Levy-Sul, U. (1905). Uber ernen Fall von angeborener beiderseitiger Tritenorie t3laublindheit) Arch. F. Ophthel., 62, 464.
Ln4vih, HcCarthy, E. F. (1938), ,absorption of visible light by refractive media of the human eye. Lrch Ophthal,, 20, 37, 1938.
lacsdam, D. L.(1935). Chromatic adaptation. J. Opt. Soc. Amer., 46, 500.
l:cCree, K. J. (1960a). Colour confusion produced by voluntary fixation, Optics__cta, 7, 281.
licCree, E. J. (1960b) . Small-field tritanopia and the effects of voluntary fixation, Urtica acta, 7, 317.
Warriott, I.C. (1962) (with Pirenne, LII.) Visual Functions , - __ inw` ôrin s r.)a oU -ggPr ed.) The Eye. vol. 2. The Visual Process.
Meitner, H.J. (1941). Uber einen eigenartigen Fall von anomalie des "Blausinnes" Kïin Bibi. Angenheilk., 107, 293.
Muller, G. E. 11930). Uber die Farbenempfindungen. Bd 1 & 2. 2. Psychol. Pi.gsiol. Sinnesorg. Suppl. 17, 1 and suppl. 18, 435 cited by Marriott (1962).
Muller, G. (1924). Darstellung und Erklarung der verschiedener Typen der Farbenblindheit nebst Erorterung der Funktion des Stabchinapparatus sowie des Farbensinus der brenen der Fische, Gottingen. Vandenhoock & Ruprecht,
Nelson, J. H. (1937). The colour vision characteristics of a trichromat, Part C. Proc. Phys. Soc., Lond., 49, 332.
Oloff,H. (1935). Liber angeborener blauauoma1ie Trichromas ie (Tritanemzlie) Elin Mbl. Augenheilk. 94, 11.

Parsons, J._1. (1915) . ? introduction to -00 Study of Colour Vision. Cambridge University 2ress.
Parsons, J. H. (1924). Aa Introduction to the Study of Colour Vision 2nd Ed. Cambridge University Press.
Figer, H. (1905). Zeits. Psychol. 38, & Farnsworth (1950).
Pitt, F. H. G.(1935). Characteristics of Dichromatic Vision. London. H. ti. Stationery Office.
Pitt, F. H. G. (1944a). The nature of normal trichromatic and dichromatic vision. Proc, Roy. Soc. (Lond.) Bo 132, 101.
Pitt, Y. ï. G. (191î4b). Monochromatism. Nature- (Lond.). 154, 466.
Pitt, F. H. G. (1949). Some aspects of anomalous vision. Docum. Qphthal., 3, 307,
Pitts, . (1961). Transmittance of the visible spectrum through the components of the bovine ocular media. t.mer. J. O;otom.â Arch. _seer, Acad. O ton. , 33, 572.
Priest, I.G. â Brick,7£Ide ?. G. (1938). Aiinimum perceptible colorimetric purity as a function of dominant-wavelength. aur. Stand. J. Res. ';:ash., 20, 673.
Richardson-Robertson, F. (1911). ï'c11' ovr-blue blindness. Psychol. Bull. 8,• 55.
Richardson-Robertson, F. (1923). A case of color blindness tu yellow and to blue. Amer. J. Psychol., 34, 157,
P..uidock, R. U.(1963). Evidence for macular pigmentation from colour matching data. Vis. Res., 3, 417,
Rushton, W. A. H. (1958). The Cone pigments of the human fovea in colour blend and normal. National Physical Laboratory. Symposium No. 8. Visual Problems of Colour, I, 73.
Rushton, W. A. H. (1960), Discussion of Dartnall,H. J. A. Visual pigments of colour vision. Mechanisms of Colour Discrimination. Proceedings of an International Symposium. London. Pergamon.
Schelling, von, H. (1950). A method for calculating the effect of filters on color vision. J. Opt. Soc. Amer., 40, 419,
153. Cited by Ju d, Plaza

96. Schmidt, I. (1943). Uber zwei Falle von angelorener Blau-Gelb- Sehs+orung. K?in. Mbl. Augenheilk, 109, 635.
The Science of Color (1953). New York. Thoma. Crowell Company.
Sloan, L. L.& Newhall, S. M.(1942). Atypical and typical achromatopsia. serer, J. Ophthal., 25, 945
Sperling, H. G.(160), Case of congenital tritanopir with implication; for a trichromatic model of color reception. J. Opt. Soc. Amer., 50, 156 J •
Sperling, H. ,.(1961). Prediction of relative luminous efficiency from fundamental sensation curves Vision Research, 1, 42.
Stern, C. (1960). Principles of Human Genetics. San Francisco FreemEn . Co.
Stiles, . Z. (1959). The directional sensitivity of the retina a.ud the spectral sensitivities of the rods and cones. Proc. Roy. Soc. B.127, 64.
Stiles, .;.3. (1949). Increment thresholds and the mechanism of colour vision. Docum. Cphthal. 3, 138.
:tiles, (1960). The trichromatic scheme in Mechanisms of Colour Discrimination, Proceedings of an Internati nal Symposium. London. Pergamon.
Stiles, '.7. S. and Crawford, B. H. (1933). The luminal brightness increment as a function of wavelength for dilferent conditions of the foveal and para foveal retina. Proc. Roy. Soc., B.113, 496.
Stilling, J. (1878). Blau-Gelb-blindheit mit unverkwizten Spectrum. Centralbl. P. prakt Augenheilk, 2, 99, cited by Gothlin (1943).
Thomson, L.C. (1949). Intensity discrimination of the central fovea measured with small fields. J. Ph_; sio1., 108, 78.
Thomson, L.C. (1951). Spectral sensitivity of the central fovea, J. Physiol., 112, 114.
Thomson, L.S. (1952). A review of ideas on colour perccjtion.. 0phthal. Lit.., 6, 3.
Thomson, L. C. (1953), Stinulatnn of the retinr, with light fields of ec.zll size. Brit. Med. Bull. 9, 50.

97.
Thomson, i . C. & Wright, W. D. (1947). The colour sensitivity of the retina within the central fovea of man. J. Fhysiol. 105, 316,
Thomsen, G. :9rigt,, W. D. (1953). The convergeuce of the tritanopic confusion loci and the derivation of the fundaentalespcnse fuActions. J. Oat. Soc. ::r:Ier., 43, 890.
Trendelenberg, G. ;:'. (1941). Ein Anomaloskop Zur Untersuchung von Tritofor:nen der Far'benfehlsichtigkeit mit Spectraler Blauschwache Rlin. 1rbl. NuZenheilk., 106, 537.
Uhry, B. -JeitraT zur Casuistik der Blau-Gelbblindheit. Diss. (Strassburg, 1894 cited by Judd, Plaza & Farnsworth, 1950.
Verriest, G. (1963). Further studies on acquired deficiency of color-discrimination. J. Opt. Soc. Amer., 53, 185.
Wald, G. (1949). The photochemistry of vision. Doc. Ophthal, 3, 94.
Walls, G. L. (1958). Graham's theory of color blindness. Amer. J. Optom & Arch. Amer. Acad. Optom.., 35, 449.
Walls, G. L. (1959). How good is the H-R-R Test for Color Blindness? Lmer. J. Optom & Arch. Amer. Acad. Optom. 36, 169.
Walls, G. L. (1961). Fersonal communication.
Walls, Mathews, R. 71. (1952). New means of '3tudyiag Color Blindness and Normal Foveal Color Berkeley. Uni . Calif. Press.
Walls, G. L.(1957). Comments on W. J. Bright. Diagnostic colour vision. - Ann. Roy. Coll. Surb, Engl., 20, 177, 1957 aurv. ephthal, , 2, 476.
Walters, H. V. (1942). Some experiments on the trichromatic theory of vision. Prod. Roy. Soc., B, 131, 27.
-:'Teale, R. x.(19534). Cone ,monochromatism, J. 'I-hysiol. (Lond,), 121, 548.
,eale, R. ...(1953b). Colour vision in the peripheral retina. Brit. Med. Bull., 9, 61.
'ireale,..i.(1960). Discussion of Galifret,Y. Au nuveau des voies et. des centres. Mechanisms of Colour Discrimination. .Proceedings of an International Symposium. London. Pergamon.
Tests for in
ineale, R. A.(1963). The Aging Eye. London. Lewis.

Nature (Loud.)
98,
Wehrli, iiitt. Thuringen Maturf. Gès, 15 (cited by Kollner,1.929 p. 517).
Wienke,R. E. .(1960). Refractive error and the green/red ratio. J. Cat. Soc. Amer., 50, 341.
iilmer, E. N. (1914). Colour of small objects. 153, 774.
`äillmer, E. :;. (1946). Retinal structure and colour vision. Cambridge University Press.
Willmer,_.. (1949a). The monochromatisrs of the central fovea i - red—green blend subjects. J. Physiol., 110, 377.
E. J. (1949b). Further observations on the properties of the central fovea in colour blend and normal subjects.. J. Physio),, 110, 4=2.
,:ilï=er, L. __. (1949c), 5, 1949.
Colour vision at the central fovea. Docum.
:üiil2er,2. N. (1955). A physiological basis for human colour vision in tLe central fovea. Docum. Ophthal., 9, 235.
Willmar, M. & Wright., W. D. (1945).- Colour sensitivity of the fovea centralis. Nature, (Lond.)., 156,119.
right, (1947). itesearches ou Normal and Defective Colour Vision. St. .Louis. C. V.i osby.
::right, ï1. (195?) . The ch racteristics of tritanopir. . J. 0r:t. Soc. .Amer.,, 42, 509.
Wright, W. D. (1957). Diagnostic tests for colour vision. .nn, LOS. doll. Sura. Baal. 2C, 177.
W;right,W.D.. Pitt, F. U. G. (1937). The saturation—discrimination of two cichromats. Proc. Phys. Soc. bond., 49, 329,

A P P E" D- I x
The Inheritance of Tritanopia with the
Report of an Extensive Pedigree
Ann. Hum. Gen., 27, 219, 1K3 (with
H. Henry and J. Nathan)

Ann. Hum. Genet., Land. (1964), 27, 219
219 Printed in Great Britain
The inheritance of congenital tritanopia with the report of an extensive pedigree
BY G. H. HENRY, B. L. COLE AND J. NATHAN
Victorian College of Optometry, University of Melbourne
INTRODUCTION
Tritanopia is a rare colour vision defect in which blues are confused with greens and pinks
with orange. Its rarity has made difficult the interpretation of the mode of its inheritance and
in fact our knowledge on this subject would be quite rudimentary were it not for a recent
investigation carried out by Kalmus (1955), who obtained his propositi from a survey conducted
by Wright (1952). Wright discovered his tritanopes by publishing a Farnsworth diagnostic plate in a popular magazine and obtained forty-four people considered to be tritanopic, seven-
teen of whom were proved to be tritanopes on detailed examination. This result led Wright to conclude that the incidence was between 1/13,000 and 1/65,000, a much higher frequency than believed previously. An intensive investigation was then carried out into the characteristics of
tritanopic vision. He found it to be a dichromatic condition in which all colours could be
matched by appropriate mixtures of two primary colours. It was shown by Thomson & Wright (1953) that isocolour lines for the tritanope converged to a point at the blue end of the chromati-
city diagram. This suggested that there is a loss of response of the blue receptor, an explanation
which is further advanced by the reduced luminous efficiency at the blue end of the spectrum in
some tritanopes. This is not always apparent and it is never marked because the blue receptor
contributes very little to the luminosity of the normal sensation. Tritanopia could be due to the presence of a blue-absorbing filter, to the complete absence of
the blue receptor or the blue sensitive photochemical or it may arise from the absence of part
of the conducting pathway which runs from the receptor to the cortex. Colour vision, very similar to if not identical with inherited tritanopia, occurs in the normal eye when the retinal
image is confined to an area of the fovea centralis which subtends an angle of 1° at the nodal
point of the eye. Willmer (1949) suggested that this form of tritanopia is due to the absence from the fovea centralis of certain retinal elements. Polyak's (1949) histological studies revealed the
absence of the rod and the mop bipolar cell from this central area which suggests that they are in
some way associated with the blue sensation, a theory not without objections (Brindley, 1960).
Tritanopic colour vision has been frequently described arising from pathological processes usually occurring in the outer layers of the retina or the choroid coat. Great care must be taken
to ensure that the colour vision of the tritanopic members in a pedigree is not the result of some
pathological process.
By analogy with the red-green defects, one would anticipate the existence of an anomalous
trichromatism, tritanomaly, in addition to tritanopia. However, there are no simple tests
available to make a differential diagnosis between these two conditions and although there have been a number of isolated cases of tritanomaly recorded the accuracy of diagnosis has not always
been certain. In our investigation we have experienced difficulty in making the distinction between the tritanope and the tritanomal. A filter anomaloscope was designed for this purpose

220 G. H. HENRY, B. L. COLE AND J. NATHAN
but used with only limited success. However, it is hoped that diagnosis may be made more definite with a Donaldson colorimeter, which is to be used for further investigation. Because of this uncertainty in differential diagnosis, the two conditions have been grouped under the heading of tritan defects and the diagnosis made by using a battery of tests which identify the existence of a tritan defect but do not permit more precise diagnosis.
REVIEW OF THE INHERITANCE OF TRITAN DEFECTS
(1) Tritanomaly
The first case of tritanomaly was recorded by Engelking (1925) and investigated further by Hartung (1926). A spectral colour mixing device was used in making the diagnosis. In this pedigree a phenotypically normal woman had two affected brothers and an affected son. As in the protan-deutan series the form of inheritance for tritanomaly appears to be through the X-chromosome but this has been disputed by Oloff (1935), who observed an affected female. Schmidt (1943) also found a man and his daughter who were affected. If the condition results from a recessive gene in the X-chromosome, then a woman would be required to have two extremely rare genes and the probability of this happening is remote. From a study of the literature Kalmus (1955) concludes that tritanomaly is frequently caused by a sex-linked recessive gene. However, the high proportion of females amongst the recorded cases indicates that this mode of inheritance is not always the case.
(2) Tritanopia
The modern view of the genetics of tritanopia is directed very largely by the work of Kalmus (1955). Kalmus concluded that congenital tritanopia shows an irregular autosomal dominant pattern of inheritance and that one or more genes may be involved. The present authors, while not disputing Kalmus's conclusions, consider that his findings would be more significant if the colour vision tests used in the diagnosis of tritanopia had been more fully evaluated. Since this work has so dominated the thinking in this field, it is important that a very thorough and critical analysis of it should be undertaken. A total of forty-nine tritanopes are shown in Kalmus's fourteen pedigrees. Twelve of the forty-nine were found to have some form of tritan defect after testing at the Wright colorimeter and their diagnosis can therefore be accepted as beyond doubt. A further eight tritans were established as such on the results of a battery of well-validated tests and their diagnosis is reasonably well assured. No diagnostic data are given for eight persons deemed to have a `slight tritan defect'. The remaining eighteen persons were established as tritanopic' or `probably tritanopic' on the basis of anamnesis (three cases) or the Picture Post chart together with a history and a test called the coloured-squares test.
The coloured-squares test was constructed by Kalmus following suggestions from Trendelen-berg (1941) and Fischer, Bouman & Doeschate (1951). This test is fully described by Kalmus and in an introductory description it is stated that `The test consisted of a number of squares 1 cm. in length of coloured paper gummed at the back which the observer was asked to arrange in daylight and to stick down in appropriate order on a chart on which the most saturated and the most dilute squares of every hue had been put in place beforehand ....Several versions (of the coloured-squares test) were tried on a few colorimetrically ascertained tritanopes and the final version was then sent out by post' (p. 43).

The inheritance of congenital tritanopia 221
Wright (1952) points out that the Picture Post test cannot be accepted as infallible evidence of the existence of tritanopia as viewing conditions and age, among other factors, may influence
the response. Moreover, the validation of the coloured-squares test is not entirely satisfactory. In Kalmus's table 4 it can be seen that eight of forty-five normals made one error in the blue-
green series and five normals made one mistake and two made two mistakes in the pink-orange-
brown. One or even two errors cannot therefore be taken as necessarily indicating tritanopia.
Errors made with the coloured-squares test by the seventeen colorimetrically ascertained
tritanopes are shown in Table 1. A surprising number of these tritanopes make no errors in one
aspect of the test. No analytical significance can be attached to the time taken for the test. Subject 18 (Kalmus's table 5), who was aged 84, made no errors but took 15 min. to complete
the test and is considered to be a `probable tritanope'.
Table 1. Number of mistakes made on the coloured-squares test by seventeen
certain tritanopes (data of Kalmus, 1955)
Subject observations
B—G P—O—Br. Both
`
"-------, . \
No. of mistakes o I 2 3 0 I 2 3 o I 2 3 4 5 6
No. of tritanopes 5 5 5 I 5 4 4 3 3 2 4 2 3 I I
The diagnostic value of the coloured-squares test, together with the Picture Post plate and
history of confusion of blue-green, cannot be regarded highly. This view is further strengthened
when it is recalled that the administration of the tests was not always supervised and that the discrimination of blues and greens is impaired with age and ocular disease. The Kalmus pedigrees
can be redrawn to exclude those identified on this evidence alone and also those who do not appear at all in Kalmus's table 5 (which gives detailed diagnostic data). They are given in
Fig. 1 in this form with an analysis of the procedures used in diagnosing each individual in
Table 2.
The Kalmus pedigrees show an autosomal inheritance and there are five pedigrees (B, G, I, M, N) in which a tritanopic son has a tritanopic father therefore excluding the possibility of sex
linkage. However, in each of these five cases the diagnosis has been made from limited evidence
in at least one member of each of these father—son relationships.
(3) Tritan defects associated with other colour vision defects
Jaeger (1951) presented a very unusual pedigree which may provide a link between the
protan-deutan series and the tritan group. It is given by Walls & Mathews (1952) as shown in
Fig. 2. It has been postulated that the additional non-allelic gene, b1, is responsible for the
additional tritan defect and the presence of the b1 causes the genes in the other chromosome or
in the other locus in the case of the male to show labile dominance relationships. However,
III. 2 shows the tritan defect without having the bl gene. The presence of an extra tritan defect
being produced by a non-allelic gene has also been presented in another case by Walls & Mathews
(1952), where a mother of presumably mixed hemizygotes, who apparently has an a3b3 chromo-
some, made tritan mistakes on the Stilling—Hertel charts. Crone (1956) also presents a pedigree
where there are two women with `chromatic amblyopia', which Crone attributes to a combina-tion of deutan and tritan genes.

222 G. H. HENRY, B. L. COLE AND J. NATHAN
Table 2. Analysis of the fourteen pedigrees of Kalmus (1955). Fig. 1. A—N
Pedigree Subject Age
Ref. no. in
Kalmus's table 5 Kalmus's diagnosis
Basis for diagnosis
Revised diagnosis Col.
Errors C.S.T.
Bat. big p/b Hist.
A I. 72 F 17 Tritanope or extremely tritanomalous
+ + — —
Tritanope or ex-
H. 2 54 F 12 Tritanope or extreme tritanomaly
+ + o o i tremely tritano-malous
II. 3 47 — Slight trito defect No data given II. 5 51 F 11 Tritanope I o -
Insufficient eviden II. 6 49 F Io Tritanope 2 I p/o for diagnosis
III. 1 26 M6 Tritanope + 0 2 Tritanope III. z 24 M4 Tritanope + Tritan M. 4 9 Slight trito defect No data given
B I. 3 57 Deuteranomalous with perhaps a trace of trito defect
No data given 9
I. 6 61 Perhaps some trace of trito defect
No data given Y
II. 2 43 M 20 Tritanope + 2 r p/o Tritanope II. 3 41 M 18 Tritanope I o — Insufficient eviden
for diagnosis II. 5 25 - Slight trito defect No data given II. 7 39 M 17 Tritanope — — 2 2 p/o Insufficient eviden
for diagnosis III. 4 8 — Some trito defect No data given
C L 1 Dead — Tritanope Anamnesis b/g II. 2 64 F 15 Tritanope — + o I Black Tritan
and navy
II. 2 32 M 12 Tritanope + 2 0 — Tritan
D I.2 65 F 16 Probably tritanopic — Tritan II. I 32 M 14 Tritanopic (L.E. only) o c p/o Insufficient eviden
for diagnosis II. 2 3o Slight trito defect `Tests' and anamnesis IL 3 26 M5 Tritanope + + o o p/o Tritanope II. 4 24 F3 Tritanope — + o o — Tritan
E I. 2 54 F 13 Tritanope + 2 I Triton II. I 59 M 18 Tritanope + + I I Tritanope II. 2 32 M 13 Probably a tritanope o I — Insufficient eviden
for diagnosis
F I. 2 84 F 18 Probably a tritanope o o b/g Insufficient eviden
II. 2 54 M 24 Tritanope I 2 — for diagnosis
II. 3 49 M 22 Tritanope + — I 2 — Tritanope III. 1 28 `Red-green' defect No data given 9
III.6 19 Slight trito defect No data given 9
G I. 2 67 M 27 Probable tritanope — — I O —
II. I 33 M 15 Tritanope — — 2 1 Black and navy
Insufficient evid for diagnosis

The inheritance of congenital tritanopia 223
Table 2 (cont.)
Basis for diagnosis
Ref. Errors no. in C.S.T.
Kalmus's Subject Age table 5 Kalmus's diagnosis Col. Bat. b/g p/b Hist. Revised diagnosis
II. t 18? F 2 Tritanope — + 2 0 — Tritan 2t?
IL 2 19 M 3 Tritanope + 4- 2 3 — Tritanope
I. t 59 M z6 Tritanope
II. t 32 F 7 Tritanope + II. 2 29 M 9 Tritanope + H. 3 26 F 4 Probable tritanope —
3 r F 6 Tritanope
o 3 Insufficient evidence for diagnosis
3 3 p/o Tritanope + 2 o — Tritanope
2 2 - Insufficient evidence for diagnosis
2 0 p/o
III. 3 28 F 5 Tritanope — t o p/o Insufficient evidence for diagnosis
K I. I Dead — Tritanope H. 2 6o F /4 Tritanope II. 5 55 — Slight trito defect
Anamnesis + + 2 2 p/o Tritanope
No data given
L L t 31 M to Tritanope o — Tritanope IL t 9 F t Tritanope + 2 3 p/o Tritan
M L i 55 M 25 Tritanope — z — Insufficient evidence
H. 3 8 M Probable tritanope — for diagnosis
I. I 43 M 19 Tritanope
II. r to M 29 Probable tritanope
3
o
p/°1 lr Insufficient evidence
p/o for diagnosis
Key to Table 2
This table includes all persons who appear in Kalmus's pedigrees as having defective colour vision. Reference number is that ben by Kalmus to those subjects who are listed in his table 5. Basis for diagnosis. The data appearing in these columns were obtained from Kalmus's table 5 and his comments on the digrees. Col. indicates that the diagnosis was based on the Wright colorimeter. Bat. indicates that a battery of well-validated tests was used to substantiate the diagnosis. Errors C.S.T. refers to the number of errors on the coloured-squares test. b/g indicates the blue-green confusions and p/b the ak-brown confusions. Hist. refers to history of colour confusions (p/o = pink-orange confusions).
Theories concerning character and position of the tritan gene obviously lack certainty. It seems possible as Kalmus points out that more than one gene may be involved. It may be
present in an autosomal chromosome or in the X-chromosome, either in the paired or unpaired segment. Its occurrence in the unpaired segment of the X-chromosome has not been entirely
excluded by the investigations to date and unfortunately our pedigree does not clarify this point.

1
II
III
II
III
II II 2 1;/
L M
1 /'2
4
I I II I I
• Certain tritan defect ® Disputed cases of tritan defect
H 1
II
A
D
C
F
224 G. H. HENRY, B. L. COLE AND J. NATHAN
® Probable tritan defect
Fig. 1. Fourteen tritan pedigrees (data of Kalmus, 1955) modified to show the authors' interpretation of Kalmus's findings.

The inheritance of congenital tritanopia 225
Ya38 A8â38 11( 2t
Y 3
II t Ab; a3 8
,d2®
lil t
t Y233
Ili
YA ,.
3
Deuteranomaly
o
Protanopia •
Carrier
t Additional tritan defect
Fig. 2. Pedigree presented by Jaeger (1951) after Walls & Mathews (1952). A, normal allele; al, allele for protanomaly; a2, allele for extreme protanomaly; a3, allele for protanopia, B, normal allele; b1, allele for deuteranomaly; b2, allele for extreme deuteranomaly; ba, allele for deuteranopia.
DIAGNOSTIC METHODS USED IN DETECTION OF TRITAN DEFECTS
A battery of tests was used in field testing, although circumstances prevented the use of all
the tests on every tritan subject (see Table 3). In addition to the taking of a history, where possible the following tests were employed:
visual acuity measurement,
direct ophthalmoscopy,
Ishihara and A.O.-H.R.R. pseudo-isochromatic plates, Farnsworth—Munsell 100 hue test, Farnsworth F. 2 plate (as described by Kalmus),
Nagel anomaloscope, and a filter anomaloscope.
All subjects were tested under strict supervision and all the tests using pigmented paper were
administered under illuminant C (Macbeth Easel lamp). All the diagnostic colour vision tests were conducted with each eye separately.
Discussion of diagnostic techniques (a) Visual acuity test
The monocular visual acuity of each patient was assessed to ensure that the acuity was sufficient to permit reliable results to be obtained from the various colour vision tests applied and also to assist in determining whether any pathological defects were present.
(b) Ophthalmoscopy
Each subject was ophthalmoscopically examined to determine whether there were present
any media or ocular fundus defects. It has long been known that many pathological conditions
of the eye may cause acquired colour defects. Recently this has been reviewed by François & Verriest (1961). They re-affirmed earlier observations that, in general, diseases affecting the
outer layers of the retina and choroid were liable to cause tritan defects, while lesions of the
inner layers of the retina and pre-geniculate optic pathways were more likely to cause red-green

226 G. H. HENRY, B. L. COLE AND J. NATHAN
defects. It was suggested by François & Verriest that in some cases at least the acquired tritan defects may result from an absorption system introduced by local pathological disturbances.
For this reason, an attempt was made to observe any undue sclerosis and yellowing of the
crystalline lens and any unusual degree of the reputedly normal yellow pigmentation of the
macula.
(c) A.O.-H.R.R. pseudo-isochromatic plates
This test was included because it is designed to differentiate between normals, deutans,
protans, tritans and tetartans. Walls (1959) in evaluating the test was not impressed with its
performance or principle in discriminating between the `mild', `medium' and `strong' defects,
but found that the plates did detect qualitatively the five tritan subjects to whom he gave the tests. In the present survey, abnormals and doubtful normals were re-tested with these plates
at another time.
(d) Farnsworth—Munsell 100 hue test
This test was selected for use because of its ability to detect tritans as well as protans and
deutans. It also provides an approximate assessment of the hue discrimination of each subject. This test is regarded highly as being a useful diagnostic tool (Jaeger, 1955 and Crone, 1956), and it is one of the few clinical tests suitable for identifying tritan defects.
(e) Farnsworth F. 2 plate
The usefulness of this pseudo-isochromatic plate as a tritan detector has been demonstrated
by Kalmus (1955), who borrowed this chart from Farnsworth. Jaeger (1955) advocates the
F. 2 as the most useful pseudo-isochromatic test for detection of tritan defects. The simplicity of this test enables it to be used for testing children as young as 4 years, this being a factor
influencing its selection as a screening test in this survey. The subject was asked to state what geometrical figures he could see on the card, and if he could see both squares he was asked which
appeared the brighter. In the case of young children they were asked to trace with a hair brush what they should see, and if they could see both figures they were asked to point to that which
appeared the brighter. Tritans usually see only one square. Occasionally they can see both in which case the blue square appears brighter than the green whereas for the normal observer the green square is brighter than the blue.
(f) Nagel anomaloscope
This test was selected for use as it is accepted as being the most valid clinical diagnostic test
for differentiating the deutan and protan defects. François & Verriest (1961) report that the
acquired tritan defects in the trichromatic stage have a normal Rayleigh match or one displaced
towards the protanomalous side. In the dichromatic stage of acquired tritan defects the Rayleigh match is nearly always widened and protanomalous. The instrument was used in the step-by-
step method described by Walls (1959).
(g) Filter anomaloscope
This apparatus was specially constructed for use in this survey to augment the battery of
tests based on the use of pigmented papers. It was hoped that such an anomaloscope would give
valuable evidence as to whether the defective was a trichromat or dichromat. The apparatus
comprised a lamp compartment, two filter disks, two diffusing chambers and a bipartite viewing

The inheritance of congenital tritanopia 227
field. The filter disks were illuminated by two mirror backed 150 W. tungsten lamps. One filter
disk carried a blue (Wratten filter no. 49) and green (Wratten filters nos. 45 and 58 super-imposed) placed end to end in one quadrant. The other disk carried a cyan filter (Wratten filter
no. 45) of half the area of the blue and green filters. Each disk rotated behind an aperture such
that rotation of the disk carrying the blue and green filters varied the proportions of blue and
green light entering one diffusing chamber and rotation of the other disk varied the amount of
cyan light entering the other diffusing chamber. The disks were arbitrarily calibrated in degrees. The two diffusing chambers were separated from each other by a thin septum which divided a
circular frosted glass. The bipartite field was viewed through a simple eyepiece and subtended an angle of 2° at the eye.
Subjects were asked to match the cyan half of the field by adjusting the mixture of blue and
green in the other half. The test was administered to the subjects in essentially the same manner
as was the Nagel anomaloscope. The subject was first allowed to make two practice settings and then make three free settings for each eye. The range was then measured for each eye using the step-by-step method. An arbitrary scale reading of 35 is the setting of the blue-green mixture
for the normal. This was determined by taking the mean of four normal observers. There was very little variation in the settings of the normal group and the normal matching range on the
instrument was of the order of 1 scale unit. The full range is 0 (blue) to 60 (green). The tritans tested with this instrument have ranges varying from 0 to 60 (full range) to 40 to
60. This suggests that some of the testees are tritanopes, whilst others are probably either tritanomals or partially expressing tritanopes. However, a full matching range is not conclusive
proof of dichromasy as a suitable green filter on the spectral locus is not available. Likewise an
incomplete range does not definitely exclude the possibility of dichromasy as the matching locus of the instrument may cross isochromatic lines. This is most likely to occur at the blue end of
the range, where the confusion loci are close together.
REPORT ON FAMILY WITH INHERITED TRITAN DEFECTS
A family living in Melbourne, Australia, has been examined and found to contain eight certain
tritans and by anamnesis a possible ninth tritan. No more extensive tritan family tree has been discovered in the literature. Preliminary experimental results are presented here (Table 3).
Results of the family survey
Members of generations II, III, IV of pedigree Fig. 3 were tested. Generation I is included
in the pedigree as several members of the family reported that I. 1 was colour defective. Not all
members shown in the pedigree have been investigated. Some were too young to co-operate and others were geographically inaccessible.
Pedigree Fig. 3
I. 1. Two of his progeny reported without prompting that he was colour defective; that he was a sea captain made this a point of family interest. It is impossible, of course, to be certain
of the nature of the defect from this evidence. It would seem likely that he was a tritanope
despite the appearance of deuteranopia which is commented on below (see IV. 26, III. 22)
because of the appearance of the tritan defect in his descendants. If he was a tritanope it would be of the greatest interest, as it would be the only instance in this pedigree where a male has a tritan defective male offspring (II. 1).

0 2 48 192 — 10-6o to-6o
0 7 49 296 — — — — 0 5 46 191 39/13 — o-6o 0-60
o 5 50 173 42/14 5-6o 5-6o o 4 48 152 38/13 3 o-6o o-6o C 2 47 154 45/12 — 40-60 40-60 o 5 48 164 — — 2o-6o 25-6o 0 2 49 123 — — 40-60 —
to Deutan 168 — Full 35-36 —
tritan b Tritan
b Tritan b Tritan
b > g Tritan — Tritan b Tritan
b > g Tritan b > g Tritan
— Deuteranope
228 G. H. HENRY, B. L. COLE AND J. NATHAN
Table 3. Diagnostic data for eight tritans, one possible tritan and one deuteranope
included in pedigree (Fig. 3)
FM too
Axis Filter AO-HRR mid- Nagel anom. anomaloscope
errors points Mean .—,--, range on tritan ---, error Setting ,—.._—_,
plates Ish. o bg score RG/Y Range RE LE F. 2 Diagnosis
— — — — — — — — — Possible
4
4 o (3 faint)
0 (4 faint) o (2 faint)
i o (2 faint) o (4 faint)
0
Key to Table 3
All persons shown as having normal colour vision in the pedigree were tested with Ishihara and A.O.-H.R.R. tables and su other colour vision tests which were considered necessary to exclude a tritan defect (usually F 2 and FM too hue).
A.O.-H.R.R. There are four symbols for detecting tritan defects. Five subjects called all the symbols correctly but remark on the faintness of the tritan symbols compared with the tetartan symbols.
FM zoo. Tritan mid-points range from 2 to 6 in the orange (o) and 46-52 in the BG-B (bg) (Farnsworth, 1957). Zah. Gives number of errors on unabridged Ishihara tables. Nagel anomaloscope. Normal settings average 42 for the RG mixture and 14 for yellow intensity (42/14). Filter anomaloscope. Normal BG mixture is 35 ± 1. Full range is o (blue) to 6o (green). F. 2. The normal sees a green square as more prominent than a blue one. The tritan sees only the blue square (b) or the bl
more prominent than the green (b > g).
II. 1. Tritan. The almost full range (10-60) on the filter anomaloscope suggests that he is probably a dichromat.
II. 4. Tritan. This subject was too elderly to undertake the moderately exacting anomalo-
scope testing but the results of the A.O.-H.R.R., the F.M. 100 hue and the F. 2 tests demon-
strate the presence of a severe tritan defect. III. 8. Tritan. This subject showed a full range on the filter anomaloscope and is almost
certainly a dichromat. The slightly deuteranomalous setting of the Nagel anomaloscope (39/13)
is probably of no significance (vide supra).
III. 10. Tritan. The wide range of 5-60 on the filter anomaloscope indicates that she is
probably tritanopic. III. 11. Tritan. Again a full range of the filter anomaloscope indicates dichromasy, although
it is interesting to note that he, along with others of the pedigree, made no errors with the A.O.-H.R.R. plates. However, in two of the plates the tritan symbols appeared faint. The
mean setting at the Nagel anomaloscope (38/13) is also slightly deuteranomalous.
IV. 6. Tritan. This subject also had a relatively small filter anomaloscope range of 40-60,
a definite tritan axis at 490 mµ, and failed to see one tritan symbol in the A.O.-H.R.R. plates and could only see the blue square of the F. 2 plate. She had a history of confusing blues with
greens as, for instance, when choosing clothes. There appears to be a deviation from the
typical dichromatic state.
Subject Sex Age History
I. t M Dec. B = G (reputed)
U. , M 78 B = G, Y = pink
II.4 F 74 B = G IH. 8 F 4o B = G,
Y = pink III. to F 38 B = G III. 11 M 29 B = G IV. 6 F t5 B = G IV. 8 F 18 Nil IV. 10 F 6 Nil? IV. 26 M t8 —

• 9.10 • •
0 Possible tritanope
(111 Tritanope Q Reputed colour blind (deuteranopia)
Q Tested normal 00 Carrier for Deuteranopia
Fig. 3. Pedigree.
Deuteranope
O 15© 16 7 0 8 9
6 7
10 13 14.
9 10 11•
12Y13 14"15
• 284 290 300
• 30 •
11 12 4 0
4Q 5
1 0 17 0 18 19 20 21 22 23 40 250 26Q 27 0 0 0 O
in 170 in 19 20 21 22 23 24 25 26 27© 28©
© © m • © © • 29

230 G. H. HENRY, B. L. COLE AND J. NATHAN
IV. 8. Tritan (proposita). This subject did not show a full range at the filter anomaloscope.
The range was 20-60 for the right eye and 25-60 for the left eye. This incomplete range seems to
indicate, as in IV. 6, a deviation from the normal tritanopic phenotype. Again no tritan symbols
were missed on the A.0.—H.R.R. plates but two were seen as being faint. A definite tritan axis was elicited with the F.M. 100 hue test. She was not aware of any colour confusion in everyday
life. IV. 10. Tritan. Although this subject was only 6 years old, her responses to the tests
given were definite and she appeared to be a reliable observer. Using the F. 2 test the blue
square was dominant. Four of the A.O.-H.R.R. tritan symbols were faint and she gave a
definite tritan axis at 495 muu with a mean error score of 123 using the F.M. 100 hue test. Her range on the filter anomaloscope was relatively small, being 40-60. This subject does not appear
to be phenotypically dichromatic. IV. 26. Deuteranope. This diagnosis was arrived at on the basis of his full range with the
Nagel anomaloscope, without any reduction of the luminance level of the yellow when matching
the red end of the scale. The results of the A.0.-H.R.R. test and the F.M. 100 hue test supported this conclusion. III. 22 was found to have normal colour vision and must be a carrier for
deuteranopia. Her deceased father (II. 5) was reputed to have been grossly colour defective.
Her father was not a blood relative of (I. 1) and (I. 2) and therefore it seems unlikely that the
presence of this deutan defect has any bearing on the inheritance of the tritan defect manifest
elsewhere in the pedigree.
DISCUSSION
Although eight tritans have been definitely established, there does appear to be some varia-
tion in the degree of severity of the defect. Provisional diagnosis suggests that there are four and probably five true dichromats. The remaining three do not exhibit a full range at the filter anomaloscope and although this does not exclude dichromasy, it may imply a partially
expressing genotype. Alternatively, it may be tritanomaly or extreme tritanomaly. However,
assuming that tritanomaly, extreme tritanomaly and tritanopia are determined by separate alleles as in the case of the protan and deutan defects, it is most unlikely that two different
alleles would appear in the one pedigree. It is more likely that they represent a phenotypical variation of the tritanopic allele. It is interesting to note that the least severely affected subjects
are the three youngest affected members of the pedigree. This could be interpreted in two
different ways : 1. The phenotype is modified in successive generations as a result of variable expression of
the genotype where the mode of expression depends on the genetic background. Such a theory
would help to account for the low incidence of the defect. This assumes the phenotype can
become so altered that it is indistinguishable from normal colour vision. 2. The severity of the defect increases as the subject grows older. This could be due to an
increase of yellow pigment in the media with age and possibly also an increase in macular
pigmentation. If this were the case the inherited defect may be tritanomaly which changes to
the dichromatic form with an increase of yellow ocular pigmentation. If such a theory were
correct, one could expect a gradual increase in severity with age, but this small sample group does not display this. Whereas the three youngest subjects, aged 6, 12 and 18 years, do have relatively small filter anomaloscope ranges the next three youngest, aged 26, 38 and 40, have

The inheritance of congenital tritanopia 231
complete ranges as does the subject aged over 70. There is a more gradual trend with age if the
mean error score of the F.M. 100 hue test is taken as a criterion of severity but this measurement
is more suspect. A considerable degree of concentration is required to carry out the F.M. 100
hue test and as this is very liable to vary with age and from trial to trial with the same individual,
the results cannot be safely compared. It may of course be argued that any increase in pigmen-
tation that may occur in these cases is not associated with the normal process of senescence but
rather is an abnormal pigmentary deposit which increases rapidly in early adulthood.
CONCLUSION
The tritan defect in this family displays an inheritance pattern which cannot be related to the
well studied, recessive, sex-linked character of the red-green defects. The phenotypes are not
all identical and these variations may arise from differences in the genotypes with the possibility that there is more than one gene responsible for the defect, or if there is one gene only then its
expressivity is dependent upon the genetic background. There can be little doubt that there is
a dominant mode of inheritance but the position occupied by the gene in the chromosome still
remains open to conjecture. REFERENCES
BRINDLEY, G. S. (1960). Physiology of the Retina and the Visual Pathway. London: Arnold Ltd.
CRONE, R. A. (1956). Combined forms of congenital colour defects. Brit. J. Ophthal. 40, 462-72.
ENGELS :CND, E. (1925). Die Tritanomalie, ein bisher unbekannter Typus anomaler Trichromasie. v. Graefes Arch. Ophthal. 116, 1961, 243.
FARNswoRTH, D. (1957). The Farnsworth—Munsell 100 Hue Test Manual. Baltimore: Munsell Color Coy.
FISCHER, P., Bony, M. A. & DOESC3ATE, J. J. (1951). A case of tritanopy. Docum. Ophthal. 5-6, 73-87.
FRANçors, J. & VERRIEST, G. (1961). On acquired deficiency of colour vision, with special reference to its
detection and classification by means of the tests of Farnsworth. Vision Res. 1, 201-19.
HARTCNG, H. (1926). Lber drei familiäre Fälle von Tritanomalie. Alin. Mbl. Augenheilk. 76, 227-40.
JAEGER, W. (1951). t ber ungewöhnliche Manifeatationsformen angeborener Störungen des Farbesinnes.
Ber. dtsch. ophthal. Ges. pp. 61-5 (56th meeting, Munich, 1950).
JAEGER, W. (1955). Tritoformen angeborener und erworbener Farbensinnstörungen. Farbe, 4, 197-216.
KALMT-a, H. (1955). The familial distribution of congenital tritanopia with some remarks on some similar
conditions. Ann. Hum. Genet., Lond., 20, 39-56.
Orovr, H. (1935). L ber angeborene blauansmake Trichromasie (Tritanomalie). Min. Mbl. Augenheilk. 94, 11-20.
POLYAS, F. (1949). Retinal structure and colour vision. Docum. Ophthal. 3, 24.
m® SCT, J (1943). 'Cher Fälle von angeborene Blau-Gelb-Sehstörung. Klin. Mbl. Augenheilk. 109, 635-52.
THOMSON, K. C. & WRIGHT, W. D. (1953). The convergence of the tritanopic confusion loci and the derivation
of the fundamental response functions. J. Opt. Soc. Amer. 43, 890-4.
TREND I.E REBG, W. (1941). Ein Anomaloskop zur Untersuchung von Tritoformen der Farbenfehlsichtigkeit
mit spectraler Blauschwäche. Alin. Mbl. Augenheilk. 106, 537-46.
Weiss, G. L. (1959). How good is the H.R.R. test for color blindness? Amer. J. Optom. 36, 169-93.
WALT-4, G. L. & MATn_:ws, R. W. (1952). New Means of Studying Color Blindness and Normal Foveal Color Vision with some Results and their Genetical Implications. Berkeley: University of California Press.
W n.LMER, E. N. (1949). Colour vision in the central fovea. Docum. Ophthal. 3, 194.
WRIGHT, W. D. (1952). The characteristics of tritanopia. J. Opt. Soc. Amer. 42, 509, 521.

. T . _ it E S Z :7 a .. C : ,_ Â, s
?.ecogn_ition of coloured road traffic light signals 'Ly normal and colour-vision-defective observers. :anuscript of paper in press J. Opt. Soc. Amer. (-rith J. :Ethan and G. H. Henry)
Recognition of road traffic signal lights by persons with normal and defective colour vision. Aust. Road Research, 1, 30, 1963 (with J. Nathan and G. H. Henry)
2. Hisuse of the Ishihara test for colour blindness Hit. J. Physiol. Optics, 20, 113, 1963
3. Some comments on colour vision tests and their use for selection Aust. J. Optom., 47, 56, 1964

RErflGNITICN 3E COLORED ROAD T'"AFFtC 1,?'(1.1 E.LE'NAI+.
3Y NOR.sAL AFD COLOR-VT;'ICN-!?EEIÇTIiIi. OBSER.ViI'SA
Jr* .3tban, ''eoffre, :sery and harry Le Cole
Victorian Coils-4e of !, temetry, The University of Rilbourae. Australia.
Normal and eolcr-derective observers were asked to identify 13 sinal light colors
as either rec;, :Teen or yellow umrver laboratory conditions szTulati;ti,- road trarffic
si,aals only chrcwaticity and t,r.ittae:ss differences a% cues for ileseti-
fieation. C:joicQ ,-eact;on and erreyr, were eeAxsured. A h{,,f, correlation
between these was ; oune am' each Y.-:c anal ,,,seil eeoa.rately.
statistical techniques were necess:arÿ for anal/iris of the errors. Reaction
times provided a enitive -,eaKure and oroved sï.sa;>1er to analyse than errors.
It was eodeluded t!-at t'se c'zroeaticit.,r '>•nuneariss similar to those %° .*c:ic ied
by ASA ß10-1 ere qore reliable for all claires of ca :..servers t'an toe
sore liberal boundaries etatai- i i ched tv the (I: (P)55) :end P' a 1396 (1953).
Nose of the iella= Filters -roved satisfactory for color deractivero. -section
times asd errors suugest t'.at tLe extension of the yellow lirait of the red
signals La the sew U.S. stasdard (1964) my be unties irenls.
I Pï?DLixT 1['N ti
tioad Lra.f f ic signal lits in r st communities utilise a red-yellow-e rcera or
less connonll► a red-oarawe-->elle r-*reen code. Color ?:; t'.e to the
recoysitias< sf such, e i- n:a1 r•: stesR but is not the only cue. Differences in
crizttasfss between colors, fposition of the signal, rezvament of other traffic an
ose occasions Shame, sacei.iav, cues, althowa, t'.e:sr secondary ces are
set always er' i lahla.

Standards specifying the chromaticity of sienal ,:Ave 2e+sfl develo„+er2 and
revised over the last 3 decades. In 1955 the CIL: adeo:te.t recome,enüe,J ïrcnttadaarie:sl
and the : r:tis. stan.:ard2 lies within theme lia•its. The AoC?^ie:.an ÿtare<iar.is
Association 11::: 5t r -'ari3 deviated in rsart *reel the :"Y, reacoeeeeeticiati.. ns ar►ci the
R new staa _ ïura : .; t:i.s deviation. These standards ;:ave tom; developed
free fietl.i an=: i'►uadasiental wore as that of Mc;iic},ol ., . ,
, .. , Fol _ - .,: : , l , . sx • =t ; :>.ent independently ►xkzine color vision *meals as
oi,serv ers . z:.er z'• the CIL was clearly a4are of the special exir:fiattltie3s the
red-erode color defectives r av iso extiected to encounter*.
lido field elmpeerine2nts involving larde zroupw, es!: nreafee:sireesl -"rivers ':avs been
rel;a1..tac:5 1 . In each case the accident rate of the color abuormal z,r up was
sinilar to that of V. normal group. however, .rmnoersr,-ikln .ieln«relü cites
accident..; attributed primarily to protan drivers not seeing' red 1L tts.
4r,er11 examined the vision of 170.1 drive. ^ne 4roup of these drivers had
been referred by the rolice follo.d ' accPents they 1 d caused. The other
series was a control eroue. In tie control orroup e4.71, here color defective an i
in the accident group E..1*.
Laboratory inveestig atic-ns ::n color abstor►iarls have boon confined to air traffic:
signals and aircraft panel lights, lucfd's12 Feroos+ed l.iin its for rec?, blue and
preen lights were tested by Sloan and :abe113 la and eat'; and s,chnieltlK.
F celwdisee S of the 15 "strone 'Irotan mubjects tested, Floes' and Fe3yel t=oua!
Judd's lir.its to be satisfactory, provided th:zt the test li,-ht. °,..ad. at least
10 angular su+htense and a minimum luminance of 0.7qL. Ftooto and :;eiitai-4t
presented lights of small an+znlar sttbtensea (1.37 min.) in short flashes against
various background ,atteerns. Their experimental procedure i.ar► osae.d severe

eeaditioos on tira o'_: tuer+:ers. Tt wa3 found that t:v reçulre;:aent.; ior ~cati.r-
fdctorr groat si7i.al for normals conflicted with those for detectïves, and that
prvtiaoia®e rare pr400 to confuse the Taost carefully selected chroeaticitiRFS.
The test-li=nt 2;eairsance levels usei :.loan and tae5e1 were adjusted to rive
sisleadisr _r_-. i:tneeLaa cues to dichromats and ieattz and Scheidt used tet li47},ts
of equal 1 u, i t.anc es.
DriVIAr reçuiree «accessi-,n of decisions of which the recognition of traffic
sienals may rie one. Tt a rate at which a driver in able to Ikke ?eciei.ons can
be assessed I- reesurirer reaction ti-es. The !river':; rate of °'-andli.o t for-
aatioa will be limited by his reaction tiers. Differenceta in tLe of reaction
to traffic sisaal.s acquire a rsractical. s . -nif icance when considered in relation
to the decisioe rate 1e anp of the driver. . low reactions to signal liphtis
will decrease the 3riiar's capacity to :drowse information and, if the , e►nand
ea sill is id.gh, error will occur or information will he missed or discarded.
hasc:16 rea;.eyrtead an encpe:r-i7,ent which sugeestl the usefulness of reaart i:;a tii,e as
a means of aasirr the ,)erformacacee of color defective suLjwct.>. rev con-
clusions cam ?e :3rave rem iris iriveaxatiration 'ut it was swnwn that an unclassi-
f id color aï=nor+:al 7rour had a sirnificantly slower reacti-vn time thar the
ccne•eal z-roe:=; in liscri:.,inat.inv red and green li,hts of low luminance.
X41; YOD
Apr estas
lnirteen ',-mitten =_elatin filter; were chosen to a-oroxirlate chromaticity ! umd-
arias specified bi the cil' (l;5) recommendations, the AF4% (1958) standard and
the eriti.sn standari (1';$53) ( 1 ur"es 1 and 2). -7.e .0 ht , ource gras standarà

illuminant A. T'Ne chromaticity coord finatef: (1 7 r il.ters r.alculatcad
fret spectrorhotoretric xesa 3 ►are^eert s rade at the ')e', i na i g and end of the
emperiment (Tale I). The l+s^ i rance of t! e test lights «ras of the same order
as that of traffic si).-nais in current use And t}.e luminous trauoittence of
each filter iras adiustm.j to afford a brizhtness cue similar to that found in
:a*actice. The lu'irance of the yellow filter °3 war 3.3°F 10 Kr ft.!.
luminance ralues a.3oÇte:i were :.ased on photometric w.,e,,►surerents of gi snal hcas. '-:
made kT the photometric 2ax.cretory of the State ä"I.ectr.ic.Ity ^cxemission cf
victoria.
The test light :.as at e ea-level and ;ear v:ie!we ? from 1.5 1t stu`Aended an
angle of 1S bin. at the eye, :i,- uïatint7 an cl* diameter tr . tf `i.c: : iwn,y1 lens
viewed from 1S±' feet. ne test light ;urraunJ ccmpri.:red a ratte } lack rec-
taattie of sise 92 x 32 sin. on. a :natte •.:ite backtrroune 27 ae . The
background eauld be illuminated by incandescent lamps to luminance l.eveal!T of
either 1E2 ft.!, cwr O. ft. L. a" cam-driven sfi:utter exposed each `i ltrn^ for 3
seeamads. T.+° seconds r rior to CAe shutter faliina a dim white light placed
♦S° :pelow the °sosizcotal flashed `.rie:3y to i.arn the sttlject. The iallir► f
snutter closed a -Aeros~•itch in the start circuit of a salf-contained gating
counter rhict incorvorate4 a locked 1000 cycle oscillator. :14e counter was
stopped by the senrjeect when he pressed any one of three i 4rxyfyw itche s arranged
redially is fronet of him.
Fie
The there wre presented in random order in four teht runs. iacti filter
appeared 4 tires in each run. ''.te i;:her surround lun finance was used for the,
first and last test rams and the lower surround d lur i.tlance for the second and
The

third runs. Tes giaatar aäa;-tation 4as allowed for tter lower 1win:enee and
2 minutes adartati.,ss was z,iven r,-ricir to the l,iOier luminance test runs.
The suti ects were sal.:?. university students ale' '_etween 17 and SO years.
*lare uera 21; color vision defectives And t= normals. nio;>nc► gis ~rade
the 'a,: e1 anoAalos;cone. There were 1k detrter.ancmals, 2 orotazzrxlelsa, tï uec.lter-
aasres and 7 Iratarsopes.
ctaadard instructions were re.-ed to the sui.-ÿeets. They were told that the test
lights reoresse9ted roed traffic sirnals .and tl.eix- task was to identify rs.aci as
either red, yellow ar vieea presslrsr one of the leLe11er1 keyc.. . .rranve,:i equi-
distantly from tLe knob on ebict they were to rest their. grind tetioer r
They were asked to ^ake► t f e.ir choices as .,uic4L ¢ po!■Isii,le :and were tolJ tt t
the time takes to i'ress the selected ;uttor! was •Neinir. ueasureci. .A preliminary
trial of 2t aocrosures was 7iven to each subject, to familiarise bim with the
ocedure. '.â information e.csut his ,,erfsermarece was riven durßnq the eacpeFri.recant.
:tatijatical Analvsi.
In the emnms•ietmut two measurements were rades
(i) choice react ices time
(ii) suer of errors.
These twe yields hava neem treated separately. Choice reaetioe tk e ?pryii teem
taises as an assessment of tae time required by the subject to resolve uncer-
tainty„ A subject with a leste, reaction time ;mes considered to have had
difficulty recagnisinF the color, even if he identified it correctly. Where
errors occurred togeter with a lou, reaction time, tue results are even mere
s izni `f cant t t.an rendered Lv the statistical Analysis. fi,o conclusions have
teen attempted about ;uiri reaction tires. A sou ject x rth fast rerecti, m times

- c -
and €,igh error score.- esca;.es tba net set to trar• the râ.,Ynxr.i -antly 41>ti, and
again an error
on tie silt of moderation is made. :>paedy but inaccurate
observers mare other ohserverq aoFear relatively hut this effect is
sinia+ised by using t*e 41ean çindinr of lb rer,l.icxtes of a number of .;u2:jects.
moreover, there was no trend for fast reaction ti-les to be associAtord with
leiqh error scores. .isine .c earex,an'k s'an3c Correlation Coefficient to relate t!!e
averace reaction times of all aiinoroal so<lects with their aeresntafie error
score, a coefficient of .86 was obtained and tills is aï:'nif3cant at the .l%
level.
(a) ï.=ï eect of surround luminance
= oa iren " .tudattt's t° test on
surroend luminance showed that
reaction tines. Ccrosel4enti-i
-pooled in an=sasuetrt analysis.
the results obtained at hi>!, loa levels cf
the surround illumination did not affect t!A.e
the results from the four test runs nave been
(L) Reaction times
In the analysis of reaction tics two questions 2:.ve 1 en exa ai•ie .
(i) Do Cie reactios tines for seek filter var. :.:i-xtiirkantly?
(ii) 3o the color vision moans have sirniticantly di:":rerent nee
reaction tues fer _1 particular filter?
T"`e filters were con red ► w±r.• 5 two-way analyses of veriance, ate for erc
color vision ;-rout). Yi,iä revealedie 'seriatim in reaction time for the
different filters and also the variation :..atween individeals within titis groups.
The color vision ,'rou,s care compared uz inn. 13 on-way analyses of variance and
this shoved variation tweer k-rouas in trie recocnition of each of the 13 filters.

(c) 14Vor
If every su.s*-7eet in a 7iven <roo►o .r.es t?fe sane sllseceptikeflity to error on
oerta i n filter the vi :triba¢tion of errors i.et3-eer icd:iviùuala wc:tald. ?Fe esczlecteg
to _:.e a hins-ial :istr±toth^m. iesrection of ttlio result sut*ç+mstecl that this
was not t°.e case am tat a Ctr'Ptirr.i binomial iistrivuti.<+t31 T ,ix a more suit :le
model as 3 Lisib ,or -3'Is.LYSiR ttYemSe data. r -tc3ai te-t as run is* order
to *swine t i= sornesti-sn morio closely: S1 color NI', iects were askei!
to identify 3 equivocal filtere, .t.esenteeii 4 ti;aew ï -sr14,1r conditions stealer
ta those Asrcribed for ttle ..^aits amryer;pertt. The distributions obtained from
this emc;xrioemet eeeffreed the indication that t+?e :listri i tions of errors
s:.culd rerarded as comoun:: di.stritot-i.ons.
The cos,.ocnc3 binomial distri ct iaar is determined by two r)a,rnrete^s.
the seam and the other ±s aparametraz ::t4ch neapures the variation '_etweez9
iadfvi3ae,.tse suace.ptir.ility to error. ttii:ißzs of tNe d?istrit,utioos vt,tnituari
in tht^e experiments 3,Yxicatezf that the ldttc3ß` c<u°aretear eeou.là he re;rar-lael as
the sicle in value for every ¢âOiäD of autiectn, A!te3n dea.3il r with a;+éirtiG1031.oT2'
filter. Time it was ;+oesible to make a w ï;;le ver i:ytmae-stsbilißityt trauas-
eewstias ui:ich, In turn, --.-t.I.a it oossibls to deve3c:s7. a rir:p1e tiwt oF
ensue of difîerenoe :a►t-..eo,era -rows of steLiec:.te, ats?slolcatls to tt:c ono-wn•l
analysis of variance teert. • i he resulting twat cr i tori,catt x
of freedom acne less than t::e rum er of "romie involy t .•
ie,^toes
Oa sew filters the nrae:iers of errors were vo smell that tteee a;,ove teat could
salt be relied 'Dee. In tnese cases caKlowa-iions t-a‘nci on 2 x ? rcatetiapeecick
tenets for which esact:re,'•a ilitie. ere eexmou!®d* urre :ATle.

7tFF.Zi`.';
Filters ?1 and '2 aro reco nixed si-nificantl; .sore quickly than X4 by both
noroels and anomalous trichromats (Talle TI). For all classes of observer ' 1
has a fre ue - o, reco,wniticn patter than e8° an.:t 2 Letter than ?34; (Table T.V).
kltiia rh desterano es and orotaati as ûw.:c 'renter umber of
errors than normal! and deet rtiii ,.ais r filter %2 it vav te concludeA that
this filter a- ei ?i are the nost reliable re ,; tested.
IPrOR`-cco^l Si-+v7,,:/ed `+2 to 1`4a tt3i3 4ellC9ti filter IMzA 77`f!e#Ttl?r` 3:143t]i r,]€t•i
correctly for all zrDt3n8 other than :3t"fitaiZojle9. ! mr the r.rotar.o --L' it is clear,
by ins_ection, ti:at there is no sioni.fieant difference in errors for .7 ^ v3 cari
Ys and that Yl rtro;aU, t-as a sirnificantiv worse frequency of Mcocn i t i on.
Noise the less, all the aietcrr.►,-al ..rouos made s i,=ni z icantlg mere errors than
aerials for 12. in tie basis of reactior, time no rellow filter Is s.ilnf {icantl‘+
Setter than another for ‘au: color violon ,*rostan.
Filters .3, ,'4 ani; ''S être correctly identified 99Ç of the tire by all color
vision rrryu;,s and have si -nificantly faster reaction times than ,.'.l for deuter-
asmges and are faster than G1 and 7,2 for rrrotano; * . The greens towar4 the
reXIw limit, Cl and to a lesser extent 12. are oi-.viouul.,i unsatisfactory filter-
for protane es, on the ?+a^ is of error score alone.
Table III shows that, for :;;t r ► re. neniwnil et.x®r ver^ ' .iv@ :s i ;; ;c:arttl • r
faster ,eactice tires than the abnormal color vision 2'Jr11 .-n' that For m n.: ù'
the filters the deuterananals, s:rotan pals and deutereno;;es cru :i. -ni f icantl
faster than the ûrotano is -roue. Using, rr.ar an'sz :ank . rre.lation
Coefficient, there was no si ►ni fieant correlation for to o èeutcro..no m als ?,utwen

tèe reaction tie and either tie atux-gloscae ran ;
C. d.f.13) or
the quotient of anomaly (" _ -0.20, d.f.33 ).
For saesals all the filters have at least a t5 ; frequency of recognition
sReeptittg 143 (W,) and a4 (58c:). Filter 1::3 i;ituated at the yellow lim it
of the ..- red and 'A is eeet s iJ e V-1 e yellow I in :i t o;,
(,' TT rec.:. ror norma 1 s
4 is equivocal and is named yellow almost as rentl.y ats red.
Deuterum'als rave at least a 45 frequency of reao,rnitfott ter all filters
e.casç+t R3 (W ',, 0-V), sI an '?4 02'). i'ilter n.4 was called yellow .:'nre
often tam rsd; this would ,:e predicted from the finr.iirzs of Rubin" on the
spectral bee Loci of ar.amalou trichromats. Y3 and are at the ;;rear
lit o: ., yellow and A;A (1) resf+ectgvely.
p:ec'?ctoc frac 3tiÎ,iAI3 findings, tbese two filters c.em frequently iK,enti:ied
t, deuteranae;als as <T-,een and sever as red. '"'ucL an error has obvious
potential 3+sta er fer the road user.
For prstasopos, only tt,e lour wavalen>ti, reds (i‘l, r2) and the short wav+elterk?th
greens (r3, G ►, GS) bave an ae:ee;ytai le frequency of reconit irm,. ror douter—
mopes ail too Irvine were satisfactory, although filters û?, 3, 34 end ■:;;S
tave significantly faster reaction ti.ues than filter Cl. ror this group 1
a`3"!!ars aCc!',lt.aLlC, 7.12t not
rot unexpectedly, the tlicttronat has raatest difficulty with tee i dent i:: c +t i< ►n
of 7.1164116 4*+3 reds; this is reflected in the long reaction tiNze$ and th
number of errors s.a..ie. It is evi ent that dic.hrouatu use the . *ri,.°1-tt7esu
difference cue, since they sake coni <e:ratly fe.or errors than normals and
e=ter-v! n1f 11t { 341t . ïi'i' Gquiv,w.3% .°'Ater ..=t.

-10-
Dichromate find least difficulty with the shorter ceveleneth .r.r®ens. 'ï't:ese:
filters grassaàly ar ^eeer to the dichraesat either e.:itae or very desaturated
blue aec eaR be read i T,.. 1 x :4 i nr ui st,ed from t.:e saturated ebr i r ht p ecal.loti;t and.
the %ar#• reds. The -rearm, G.I and C2, are en the yellow side of the dichro-
adis eesefeeioe 1i1.* t)c?eueh the white point on the chromaticity dir► prar+
r■d are therefore mere likely ta be confused with yellows and reds. ne
dwtereeepe raved vrestest d iff iculty , aliOarrt tie « ith !'], and the
pretaneme had difficult-.- with both 1 and (72. Time difference can t'e rel.ate i to
the difference in the neutral points o:f the ,,rotancoe and deutereno7e, the
c'.aateracoopa 'avine the laowez.e.arelen:tL1 neutral hoint.
Likewise, 711o.,7n and i-s he114 , maim?' co i nt sc+urcee of low Iua i nanCe, found that
t i+e ir color de-Fect i ves tendeei to corsfuse the more yellow %- reen.s k it:a re.;
s.iv aals.
It sa; .e aaticiloatec that .:iehm.cata a sli,,Irrtle^ 'fssa.tuiaatesci ÿellcse would
be e-Lore satisfactory road si:-u.al than that specified by the narrow wh3te-
limit of ksA ()153) ;sellow. r iiter 12 was the aoet 4:iesaturartsd of the olloe
filters e+s+od and was in 'ect the rbst freçLentl*r i.;eat.i'ied .,• _.,ll suLjects..
A filter still *ore desatmr?tel, so that it is rove than one discriTinat-i.on step
awe; s,ectr3l locus, n.3 well be ,lore efficient for dichromats, a.lt?iouei'
too -;reet a 4e 7aturation cAus* the dichromat to ce>nFUrte ve11cr.{ K itAe green.
On the '.as°_s of these ;"ioc'.itx°s t;sa .:ore :^astrictiree .:o:ttxixeri.cs :,»ec.:fiad by
VA (1953) =or red env: :-:^eea Li-nal Ii,Thts 'amid ;.e,;;ear to :r: eoree suitable for
color iefectives than the li.nfts esrescribeJ .`-;y - :i37fi 11953) and those :rQcacs-
r,ersiet? hd the Ci=. Compared xitt: tiu: :4:J‘ (1358) standard. the Lt.;`. standard
(19664 ) ras more liberal red and white 110ts for vellor s%qcsals and this is a

lyasl0eatl e chases. 'nt: the. '. t-,-t âßeiard and the ;SA standard ? -'Ve a' ren
luit far the yellow zstieh lies outside the ZIt hecmmemcief9 ;:soundart arid this
appears eeciesi±RaL1e. T`e 2xteczsi:m of Cie ello4 1.i!^it of- the restricted and
intermediate sinal reds oro . csar' in tre standard ,goes nat
ttyese sxreri:nental results althou tr'i.ç sxte-ssi:,n yt .
be recessari to Rair.tair, a-:iezuate luminance for Vie ;-ratZn driver.
CQ1iCLtISI CSS
(1) •creal observers are si-ni = 'neatly faster and make ¢irae, errors i ,ent â. +=v i ns
a number of oelsrej si :nal li ats re;srese3ntastive of road traffic sI>Tnals.
(2) i•!"ot3iK* _5!!i are 5i_T3j"i..^. ?!4t1i ikaké ??Ore errors tf-.in ote1.° color
ai--normals =or several colors, ite 3n ex .eretcn.i i..ri:•htnesa cue
res-,tltiser from their lowereu leseisaous e"ic_erfev :'at• w:3vetl.entth!t
alt'r.cec'- it is .shown that both rratauo:. â and lautaran+crpe, make use of
1e i$ ftaesa :ii f f ee•eat..ea .
(3) Meitner the .amor_3losco_e ratz. ts nor t=e :>,ucstient of aLonal: -ivQc ir>d.ic.a-
tiao of the al.ility of leuterasncxr.als to reccsr tzixe roal-trnf fic Ni ,nal
l.ir hts.
(4) ?est±-ictise .reil road-lt<=.t st-nals to a yellow Unit of not rreater thin
y s.314 is ;esir-?l- le for all classes of eolor
(S) .o yellow Filter testa; was <:,atisactee► r for color ?.eefectivew. rr.lt,r;. ;lt
the ?rose 1i°.its of the CII =nd Aa+R (1tSQ) qir:talp yore callceJ Âreear
71 to et of the tie* by :ieirterameAls and itrtt:er rsa5trittion o = t'si , liwit
eoeld be eonsi=:ereci. mac► e tr.at a ciesraturatee' rella% ti:sa1'
Le lore efficient for .iic*.rostaats, 'alit this needs further investi-1at.icets.

- 12 -
(6) lreen sicsa,1s are recognized by dich rcc.ats ,iore toali i l.y if they axe on
the slue side of the line, -r a 0.73t? - x, rather Con on tqt: sia0
y_ this lime.
AC . A EDGE%?:T
The aettwrs wish to express their appreciation to of the
Statistics _e ..artmeat at the University of Ael: ourno r, Jevelfl,.ei ane:
guided tDe complex statistical analysis rei;,zi re,1 /A( these results.
lie are alas arateful to az'. :. _',. ':°loerttlevorth for Lis technical as aitance.

- 13 -
TArLI: I CIT' Ciraa+atiaity Coordinates and Luminous Transmittance (Illun.A) for 13 Filters Used
101. ? r t at
Filter xa ya Y % a Filter x
a If a Filter Y;,
P1 .722 .278 5.45 Yl .617 .382 22.05-23.79 01 .312 .598 8.26
R2 .710 .290 6.50-6.64 Y2 .597 .394 20.20-21.91 02 .244 .601 10.02-11.41
R3 .685 .315 6.15-6.33 Y3 .557 .441 25.62-27.40 03 .182 .525 8,10-9.40
R4 .656 .343 6.35 Y4 .543 .453 22.88 C4 .124 .366 4.24-4.62
C5 .139 .352 4.44-4.48

TALLE II Choice teaotion Tines (sec.) for Red, Yellow and Crean filters for Five Classes of Color Vision
lar
cion
f i: L'r L: R S mean ;iw,nif icant 1 ► iff"er-
R.T. once in ".T.6
ager Rl R2 R3 t;.4 Yl Y2 Y3 Y4 0:1 61 +ai 05 for all Filter :;iRnificantiy
Filters Faster 'Min
N .468 .465 .487 .556 .495 .500 .512 .475 .501 .506 .482 .515 . 500 .497 i'1,
DA .751 .753 .85R .R91 .784 .783 .797 .799 .800 .7b23 .741 .740 .767 .788 Rl, R2 73, l?4
PA .660 .657 .702 .772 .974 .802 .711 .718 .847 .622 .C41 .645 .652 .708 R1, u2 P4
D .861 .889 .931 .928 .903 .972 .948 .719 .849 .719 .720 .699 .711 .844 82, 03 ^1
04, 85
P .913 .948 .968 1.068 1.103 1.057 1.063 1.013 1.087 1.094 .830 .320 .825 .984 83, 04 Cl, 82
85
* Each filter is compared only with other filters in the sane filter group, e.g. P1 with R2, R3 and R4.
Significance limits wow determined at the 5% level.

- 15 -
TAN.f III :.o*parison of Classes of Color Vision for each Filter
_apse: on Choice Reaction TiI ash
FILTERS
tl R2 R3 R4 Yl Y2 Y3 't4 Cl G2 G3 (14 C5
1G Significantly faster DA DA DA - DA DA DA DA DA OA DA
than D D PA D D D D D
P ' D P F P ?
P
DA e - - D D P P
x P P P
PA F P P
D
P P - P
P
Significance levels were 3etermined at the 5% level.

rouY 2+4T r^
• an raamnec..b reported in this reaper was supported by a prant from the
ism Bond research roard.
!lwmaii s International Commission on T11tnination (CIL)
seas-10n 1555, :01.1, sac.1.3.3.
2. 9.S.1376:1953 Colours of Light Cizna2.s (:srit.c-t.artcïsrds Instit.,
Lamins, 1953).
3. A.S.A. i10-1 (1:1K) Adjustable Face Traffic Control ci,-nal ' eari .
Standards. ieci.,r:.apo.t (.lItBt..l2°a±'Äi1: tfltgC'., Na3éFi:tr,ton. ).
4. U.S. Ctan<iar; for the Colors of Signal Lights. (Natl.Pur. "tandaztiis
handbook %). lu iJY'ejsBCt':ati<1R.
5. et. J. +cNicholas, il . ,-;eseer.:h Na.t1. ?+tr. Standards 17, 955 (1936).
6. J. G. holmes, trans.illun.itr.`'oc. (London, ô, 71 (1941).
7. N. E. G. Fill, Proc.Phys.Soc. (Inndon), 59, 560 (1947).
8. Colours of Light Signals (CIE Publication : o. 2, Faris, 1959), p.22.
9. L. G. %oman, Lancet 1, 1039 (1960).
10. B. Crnsberr-Lanielsen, F7in.00natsbl.AuAeitheilk., 139, 577 (196.1).
11. C. linger tlar.dES.%.c ïrtli_i_w+ ...., m_ ., 54, vfA :1n1). .
12. Deane Judd, Standard Color Filters for Electronics T4u1pment
(trim/ foreerro,dtj4ild1 ?wawa Council Vision Consrnittee, University
of 4t cai'3n, 1952.)
13. Louise L. Sloan k; Adelaide iabel, J.Opt.Soe.km., 45, 592 (1(155).
14. Louise L. Sloan S Adelaide rabel, J.Opt.'yoc.Ar., 45, 599 (1955).
15. '2,crdon eath & Ingebor- ';ctnidt, As.J.cntom., 36, 421 (1959).

-1D-
1à. J. D. Peed, J.Dcntl. Psychol., 39, 118, (1949).
17. J. ^. Çicslla::s J.Royal ûtat. Soc. ((levies ::) 10, 257 (1948).
18 A. L. Rubin, hm.J.::pbthaLmol., 52, 166 (1961).

•li+
TAME I CIC Ctras+atiaity Coordinates and Luminous Transmittance (Il1tw.A) for 13 Filters Used
ma an...a ._.VOR 416.111.121.41111011/1
Y 9,. ._ lter P x2 Y
et
M Alter
P1 .722 .278 5.45 ,1 .617 •382 22.OS•23.79 Cl .312 .5"9f4 a.2,;
:2 .710 .290 6.50.6.64 ti'? .597 .344 20.20••21.91 02 .:44 .t;Ul 10.02-11.41
T'3 .685 .315 6.15-6.33 Y3 .557 .441 25.62.27.40 C3 .192 .525 8.1O-41.40
R4 .656 .343 6.35 Y4 .S43 .451 22.P'' ra; .124 .366 4.24-4.6:'
C!; .13^- .352 4.44-4. :,'

C.I.E. 1955
A.S.A. D1O-1 1958
U.S. 1964
____ B.S. 1376 :1953
0 0.8 0.6 0.4 0.2
X

RES
ya Y3
0.4
C.1.E 1955
AS.A. D10-1 1958
US. 1964
as. 1376:1953
, 0-8
0-5 \

AIR VOIDS AND VOIDS IN MINERAL AGGREGATE IN BITUMINOUS MIXTURES
REFERENCES
1. A.S.T.M. C127-42 and B.S. 812: 1960. 2. A.S.T.M_ C127-57 and B.S. 812: 1960. 3. Symposium on specific gravity of bituminous coated aggregates, A.S.T.M., S.T.P. 191
(1956). 4. McLEOD, N. W. Void requirements for dense graded bituminous paving mixtures,
A.S.T.M 252 (1959). 5. McLEOD, N. W. Density measurements and analysis of compacted paving mixtures for
air voids, voids in mineral aggregate (VMA) and effective asphalt, content, Report (1961).
6. Method of test for specific gravity of compressed bituminous mixtures, A.S.T.M. — D1188 (1956).
7. SANNTL;CCI. L. E. and SCHMIDT, R. J. Immediate core volume by presaturation, A.S.T.M., S.T.P. 309 (1962).
September, 1963 29

The Specialist Committee on Human Factors recommended a study to decide the effect of the available
colour signals on persons with colour defective vision. This is still proceeding at the Victorian College
of Optometry. The following progress report is presented to draw attention of traffic engineers to some
of the ideas being developed. Your active discussion could be of much value to research group.
J. NATHAN
B.Sc., L.O.Sc., Director of Studies, Victorian College of
Optometry, University of Melbourne.
G. H. HENRY B.Sc., B.App.Sc., L.O.Sc., Lecturer, Victorian College of
Optometry, University of Melbourne.
B. L. COLE
B.Sc., L.O.Sc., Lecturer, Victorian College of Optometry,
University of Melbourne.
RECOGNITION OF ROAD TRAFFIC SIGNALS BY PERSONS WITH NORMAL AND DEFECTIVE COLOUR VISION'`
Approximately 8 per cent of male drivers have defective colour vision. It is commonly assumed that they have difficulty in the recognition of road traffic light signals, but the nature and extent of their difficulty is not known, nor have theoretical predictions as to the best colours for traffic lights been tested under conditions simulating road traffic signal lights.
Normal and colour defective observers identified 13 colours as either red, green or amber. Each colour was presented 16 times under 2 levels of surround luminance. The colours were representative of the chroma-ticity boundaries established by the C.I.E. and by the National Standards A.S.A. D 10-1 1958, and B.S. 1376: 1953. Errors and choice reaction times were measured.
Analysis of reaction times is presented. Analysis of error scores is not yet complete. The surround luminances used did not affect reaction times. Choice reaction time findings are found to be consistent with theoretical prediction from known facts concerning defective colour vision.
INTRODUCTION
1. Traffic light signals commonly use a three-colour red-yellow-green code, al-though colour is not the only cue to the correct recognition of the signal. Position-ing of the colour in a constant order, move-ment of other traffic and differences in brightness between the colours are secon-dary cues to recognition. The normal ob-server uses both colour and movement of other vehicles. From introspective reports the authors have obtained the colour defective observer who finds the colour code
uncertain will utilize not only traffic move-ment but also position cues and brightness differences. These secondary cues are not always available. There may be no other traffic or in the case of lane control there may be no position cue.
2. Approximately 8 per cent of the male population and 0.5 per cent of the female population have defective colour vision (Ref. 1).t- Drivers holding private driving licences can be regarded as an unsel-ected population with respect to colour vis-ion. Although licensing authorities in some
•This research has been supported by a grant from the AUSTRALIAN ROAD RESEARCH BOARD. t A list of references is given on page 38.
30 AUSTRALIAN ROAD RESEARCH.

RECOGNITION OF ROAD TRAFFIC SIGNALS
States administer a test for colour vision to applicant for drivers' licences, few drivers are excluded on this count alone. The test administered is often inadequate and fails to detect many with defective colour vision. Those who do fail are usually referred to an optometrist or an ophthalmologist for an opinion as to whether the applicant is fit to hold a licence. The average practitioner does not have sensitive diagnostic colour vision tests and, as there are no established criteria as to which colour vision defects (if any) are significant in the recognition of traffic signals, little is to be gained from referral. The holding of a driver's licence has become a right and an economic neces-sity so that applicants with defective colour vision are usually given the benefit of the doubt by both the practitioner and the lic-ensing authority.
3. Two field experiments involving large groups of occupational drivers have been re-ported (Ref. 2, 3) . In each case the accident rate and the type of accidents incurred were similar for both the colour defective group and the normal control group. How-ever, in these two experiments the subjects were professional drivers and can be pre-sumed to possess a high degree of driving skill and the sample cannot be considered unbiased. There have been reports (Ref. 3) of specific accidents attributed primarily to a DANIELSEN (Ref. 4) considers that the col-our vision defects protanomaly and prota-nopia should bar a man from driving a motor vehicle professionally in heavy traffic. HAGER (Ref. 5) examined the vision of 1,761 drivers. One group of these drivers had been referred by the police following accidents they had caused. The other series was a control group. In the control group 4.7 per cent were colour defective and in the accident group 8.1 per cent.
4. Laboratory investigations have been confined to the investigation of aviation signal lights and aircraft panel indicators. JuDD's (Ref. 6) proposed limits for chroma-ticity of red, blue and green lights were tes-
ted by SLOAN and HAS EL (Ref. 7, 8) and HEATH and SCHMIDT (Ref. 9). Except for protanopes Sloan and Habel found Judd's limits to be satisfactory for lights of 1° angular subtense and minimum luminance of 0.7 mL. Heath and Schmidt using Iights of small angular subtense (1.37 min) found that red and blue-green chromaticities were satisfactory signalling colours but could not establish an acceptable third colour. They also found that protanopes were likely to confuse the most careful selected chroma-ticities.
COLOUR VISION DEFECTS 5. Classification of colour vision de- fects is given in TABLE I. In our investiga-tion the tritanomal, tritanope and the mono-chromat have been ignored because of their low incidence. Moreover, the tritanomal and the tritanope do not experience difficulty differentiating red, yellow and green, and the monochromat usually has such poor vision that he will be excluded from holding a lic-ence on grounds other than colour vision.
What colours do the so-called colour blind see?
6. The term colour blind applies pro- perly only to the monochromat who sees no colour, only shades of black and white. Dichromats are not colour blind but are colour defective: they see a limited number of hues. The deuteranope sees blue, yellow and white. The spectrum appears colour-less at about 500mµ; wavelengths shorter than this appear blue and the longer wave-lengths appear yellow. As the wavelength becomes progressively shorter the colour appearance becomes less of a pastel blue to become a pure blue. Likewise the longer wavelengths become a pure yellow. The protanope probably sees blue, green and white but this is a subject of controversy. Wavelengths near 490mµ are seen as white, shorter wavelengths appearing firstly pastel blue and then pure blue. The longer wave-lengths are also at first desaturated and then with increase in wavelength become
September, 1963 31

Incidence (men)*
%
No. of colour
reteptovst Type or colour vision Spectral colours
confused Colours probably seen
Trichromatic: Normal Deuteranomalous
Protanomalous
Tritanomalous
Dichromatic Deuteranope
Protanope
Tritanoce
Monochromatic:
3
4.69 3 1 Some reduction
.89 3
in wavelength discrimination
Not known
1.42 2 Red yellow green
1.21 2 Red yellow green
.008 2 Blue green
.001 1 All
Reds look darker than normal
Yellow, white, blue
Green I?), white and blue. Reds look darker than normal
White, black
RECOGNITION OF ROAD TRAFFIC SIGNALS
TABLE I CLASSIFICATION OF COLOUR VISION
'Average of several surveys (LEGRAND, Ref. 1). ;Assuming the trichromatic colour vision theory.
purer green. The deuteranope can differen-tiate 27 hues and the protanope 17 hues (Ref. 10).
7. The colour vision defectives known as anomalous trichromats, the deuterano-mals and protanomals, can differentiate a very much greater number of hues. Many of them can differentiate some thousands of hues as can the normal, although some have a defect almost as severe as the dich-romat. These colour defectives suffer from what is known as an alteration system. This causes their perception of colours to be displaced: what a normal observer would call a red might be called yellow by the deu-teranomal. An orange might be called red by the protanomal.
8. An important characteristic of the protan groups of colour defectives, the pro-tanope and the protanomal, is that they have a reduced sensitivity to red light. Reds appear darker than they do to the normal, and the longer the dominant wavelength the darker the red will appear.
9. The colour perception of colour de- fectives has been treated in more detail else-where (Ref. 11) but the characteristics de-scribed above are sufficient to make some theoretical predictions with regard to the recognition of traffic light signals by colour defectives.
COLOUR DEFECTIVES AND TRAFFIC LIGHTS
10. Deuteranopes and protanopes will be unable to differentiate red, yellow and green if the brightness of these colours is kept equal. Putting this another way, they will be able to differentiate these colours only by brightness differences. The green referred to here is one with a dominant wavelength longer than 525mµ. The green-blues with dominant wavelengths between 520mµ and, say 495mµ will be seen as white or near-white and differentiated from yellow and red. Both the B.S. (Ref. 12) and the A.S.A. (Ref. 13) restrict the colour of the green signal to these blueish-green limits and it can be predicted that the dich-romat will be able to identify the green
32 AUSTRALIAN ROAD RESEARCH

RECOGNITION OF ROAD TRAFFIC SIGNALS
signal without error. Yellow and red are likely to be confused although brightness differences which normally exist in practice will reduce the chance of error.
11. The protanope will have an exag- gerated brightness cue in differentiating red and yellow since reds look abnormally dark to him. A yellow light may be correctly identified as yellow by the protanope but when its brightness is reduced he may well regard the change of brightness as change of colour from yellow to red. The danger is that the red signal for the protanope may look so dark that he fails to see it at all. For this reason red signals should have a luminance as high as possible. There are clinical records of instances where this re-duced sensitivity to red in conjunction with dim red signals has led protanopes into dangerous driving situations.
12. The deuteranomal and protanomal usually have only moderately reduced hue discrimination but it can be predicted that the displacement of colour perception that they experience will lead to consistent errors with borderline colours. A yellow signal with a chromaticity on the red limit of the chromaticity boundary of a given standard may be called red by a protanomal. A red signal on the yellow limit of the chromati-city boundaries for red may be called yel-low by a deuteranomal.
THE PRESENT INVESTIGATION
13. The present investigation was for- mulated to establish— (a) The extent and nature of the difficulty
experienced by each group of colour defectives in the recognition of a three-colour signal light system equivalent to road traffic signals in relevant dimen-sions.
(b) The chromaticities which caused least difficulty to normal and colour defec-tive observers.
14. Thirteen filters were chosen with chromaticities near the boundaries of the
green, yellow and red limits defined by the C.I.E. recommendations (Ref. 14) the B.S. and the A.S.A. These filters were presented in random order, each 16 times, under two levels of surround luminance, one mesopic and the other photopic.
15. There were five groups of observers representing persons with normal colour vision and each of the four types of defec-tive colour vision. The observers were re-quired to identify each filter as either red, yellow or green by pressing, as quickly as they could, one of the three keys in front of them. Their reaction times and errors were recorded.
RESULTS
16. The results are shown in TABLE ill, iv and vt. The two yields, reaction time and number of errors, have been treated separ-ately. The reaction time has been taken as an assessment of the length of time the subject required to make up his mind. The interpretation at the outset was that if there is a long reaction time, then the subject has had difficulty in recognizing the colour, even if at the end of this time he makes a correct assessment. If he takes a long time and makes an incorrect assessment then his error makes the result even more significant than will be rendered by statistical analysis.
17. On the other hand, the authors do not aim to draw any conclusions about quick reaction times. If a group of persons has a quick reaction time then they are no longer of interest. If they have quick re-action times and make a lot of mistakes then they escape the net that has been set to trap the significantly slow persons and one errs on the side of moderation. The only damage that can be done by the speedy but inaccurate individuals is to make other individuals appear slower. However, by using mean findings of 16 replicates of a number of individuals it is felt that this effect is minimized. Also the results from the experiment show that there is no signifi-
September, 1963 33

RECOGNITION OF ROAD TRAFFIC SIGNALS
cant tendency for fast reaction times to be associated with a high proportion of errors.
EFFECT OF SURROUND LUMINANCE
18. A paired 'students' t' test showed that the surround illumination did not affect reaction times. In consequence, all the data has been pooled to obtain an average re-action time. The effect of surround lumi-nance on error scores has not yet been sub-ject to analysis.
ANALYSIS OF REACTION TIMES
19. In the analysis of reaction times two questions are under examination—
(a) do the reaction times for each colour vary significantly, and
(b) do the colour vision groups have a sig-nificantly different mean reaction time for a particular colour.
ERROR SCORES
20. Analysis of error scores is not yet complete. It would be extremely rash to draw any conclusions from the tabulated data until this analysis is complete.
21. Preliminary analysis of the error score data suggested that the error score distribution was not a normal distribution. A validation experiment showed that the distribution was in fact a compound binom-ial distribution and special statistical tech-niques were necessary. This analysis is in progress at present.
TABLE III
AVERAGE REACTION TIMES FOR EACH CLASS OF COLOUR VISION
Reaction
Subject
Times
These questions have been answered by 5 two-way analyses of variance comparing colours for each colour vision group and 13 one-way analyses of variance comparing the reaction times of the colour vision groups. The results of these analyses are to be found summarized in the TABLES.
Normals
Deuteranomals
Protanomals
De uteranopes
Protanopes
All Abnormals
.497 sec
.788 sec
.708 sec
.855 sec
.984 sec
.945 sec
TABLE II FILTERS USED IN THE PRESENT INVESTIGATION
Filter
identification,
Na.
Description
2
3 4
Red
Red
Red
Red
Near middle of A.S.A. Near yellow limit of A.S.A. red Near yellow limit of B.S. red Near yellow limit of C.I.E. recommended red
5 Yellow Near red limit of B.S. yellow 6 Yellow On white limit of B.S. yellow 7 Yellow On green limit of B.S. yellow 8 Yellow Near green limit of A.S.A. yellow
9 Green On 'green' limit of C.I.E. green 10 Green Near 'green' limit of B.S. green 11 Green Inside 'green' limit of A.S.A. green 12 Green Near blue limit of A.S.A. green 13 Green Near blue limit of B.S. green
AUSTRALIAN ROAD RESEARCH

TABLE IV AVERAGE ERROR SCORE FOR EACH CLASS OF COLOUR VISION EXPRESSED
AS A PERCENTAGE OF THE NUMBER OF EXPOSURES OF EACH FILTER
Class of
Colour Vision
Per Cent Error Score
Red Yellow Groan
1 2 3 4 5 6 7 8 9 10 11 12 13
Normals 1.04 8.3 41.6 4.16 2.03 1.04
Protanomals 3.12 9.37 25.00 3.12 3.12
Deuteranomals 11.61 65.18 4.02 3.12 7.14 8.04 .89
Deuteranopes 6.25 10.42 7.29 30.21 15.62 17.71 16.67 2.08
Protanopes 1.706 3.57 5.36 11.61 25.89 8.03 9.82 6.25 35.7 9.82 .89
NOTE-Filters are arranged in this table in order of colour progression. The most red is 1; 4 is red but borders on amber; 8 is greenish-yellow and 9 is yellowish-green.
RE
CO
GN
ITIO
N O
F R
OA
D T
RA
FF
IC S
IGN
AL
S

AU
STR
AL
IAN
RO
AD
RE
SEA
RC
H
TABLE V
COMPARISONS OF FILTERS BY GROUPS WITHIN COLOUR CLASSES OF RED, YELLOW AND GREEN
Colour Vision
Red Yellow Green
1 2 3 .4 5 6 7 8 9 10 11 12 13
Normal (N) RT
signif. faster than
RT
signif. faster than
RT
signif. faster than
.468
4
.465
4
.753
3,4
.487 .556 .495 .500 .512 .475
.799
.501 .506 .482 .515 .500
Deuteranomal (DA) .751
3,4
.858 .891 .784 .783 .797 .800 .768 .741
9
.749
9
.767
Protanomal (PA) .660
4
.657
4
.702 .772 .974 .802
5
.711
5
.719
5
.647
.849
.622
.719
9
1.094
.641 .645 .652
Deuteranope (D) RT
signif. faster than
.861 .889 .931 .928 .903 .972 .948 .979 .720
9
.830
9,10
.699
9
.820
9,10
.711
9
.825
9,10
Protanope (P) RT
signif. faster than
.913 .948 .968 1.068 1.103 1.057 1.063 1.013 1.087
NOTE-The Table shows average RT (reaction times in sec) for each filter for the five classes of colour vision. The Table also shows the results of the statistical analysis: e.g. the number 4 beneath the normals' RT for filter 1 means that filter 1 is signifi-cantly faster than filter 4 for the normal. Note that filters have been compared within their own colour class, i.e. filter 1 is significantly faster than filter 4 but no other red filter. It may be faster than a yellow or green filter but this is not shown here.
RE
CO
GN
ITIO
N O
F R
OA
D T
RA
FF
IC S
IGN
AL
S

RECOGNITION OF ROAD TRAFFIC SIGNALS
TABLE VI COMPARISON OF CLASSES OF COLOUR VISION FOR EACH FILTER
Groups compared
Filter
1 2 3 4 5 6 8 9 10 11 12 13
N/ .203 .206 .289 .206 .199 - .245 .212 - .178 .148 .183 /DA .151 .166 .208 .154 .162 .180 .196 - .110 .108 .118
N/ .396 /PA .258
N/ .311 .342 .362 .325 .388 .351 .424 .263 .157 /D .178 .198 .246 .182 .190 .318 .212 .230 - .130
N/ .364 .400 .399 .525 .473 .466 .4.59 .503 .267 .219 .241 /P .172 .190 .236 .176 .184 .306 .204 .228 .126 .128 .134
DA/ /PA
DA/ - .185 - .180 /D .162 - .180
DA/ .162 .193 - .319 .274 .319 .214 .288 .326 /P .143 .158 .146 .152 .256 .170 .185 .190
PA/ /D
PA/ .253 .290 .449 .472 .189 /P .248 .276 .320 .330 .181
D/ .200 .237 .376 .221
/P .176 .222 .228 .123
NOTE-Table shows differences in RT (upper figure) and the difference necessary for it to be significant (lower figure). Where there are no figures the difference is not
significant.
COMMENT
22. Since the analysis of the error score is not complete comment will be restricted to consideration of reaction times.
23. If each filter is compared with all other filters, filters 1 and 2 (reds) are seen to give faster reaction times than other fil-ters used in this investigation; likewise, the greens 10, 11, 12 and 13 yield fast reaction times. When filters are compared within their own class (i.e. a red compared with other reds) again it is seen that filters 1 and
September, 1963
2 are to be preferred to the other reds tested (3 and 4). In the greens, filters 11, 12 lnd
13, in general, are to be preferred to 9 and 10.
24. When reaction times for each class of colour vision are considered much the same conclusion is reached. The normal, the deu-teranomal and the protanomal give faster reaction times to the restricted reds 1 and 2 than filters 3 or 4 or both. The deuteran-ope finds green filter 9 difficult and the pro-tanope finds both green filters 9 and 10 difficult.
37

RECOGNITION OF ROAD TRAFFIC SIGNALS
25. These findings are consistent with theoretical findings. Filter 9 is less of a blue-green than the others and is therefore likely to be confused with yellow and red. Those green filters with more blue were identified with less hesitation.
26. The protanomal finds difficulty with the red-limit yellow which presumably looks reddish to him. This is in accordance with predictions based on the shift of his colour perceptions. The deuteranomal has a shift in the opposite direction having a signifi-cantly slower reaction time for red filter 4 which probably looks yellowish to him.
27. When the classes of colour vision are compared it is clear that the colour de-fective is at a disadvantage compared with the normal. The deuteranomal was signifi-cantly slower than the normal for 9 filters,
the deuteranope for 8 filters and the prot nope for 11 filters.
28. These data suggest, at this stage, th. the restriction of reds is desirable and th. the yellow boundary of the red should as widely separated from the red bounda of the yellow. The chromaticity of t green signal should be such to prefer gree which have a proportion of blue. These r quirements are met by A.S.A. and also • its proposed revision (Ref. 15) . Howev it must be remembered that restriction t the red generally means Iowering the lum nance of the signal.. This brings with it th danger that the protanope may not see o may have a slow reaction time for the signal
29. Work is at present in progress to de termine the minimum signal luminance of red signal that the protanope can recogniz with certainty.
REFERENCES
I LEGRAND, Y. Light, colour and vision, Chapman and Hall, London (1957). 2. NORMAN, L. G. Medical aspects of road safety, Lancet, 1: 1039 (1960). 3. GRAMBERG-DANIELSEN, B. Untersuchungen über die Unfallhäufigkeit von Farben-
tüchtigen im Strassenverkehr, KIin.Mbl.Augenheilk., 139: 677 (1961). 4. GRAMBERG-DANIELSEN, B. Epikritische Betrachtungen zum Problem der Farben-
tüchtigkeit im Strassenverkehr, Ber.dtsch.ophthal.Ges., 64: 529 (1961). 5. HAGER, G. Die Bedeutung von Sehbehinderungen für die Unfallgefährdung im Strassen-
verkehr, Ber.dtsch.ophthal.Ges., 64: 572 (1961). 6. JUDD, O. B. Standard color filters for electronic equipment, Armed Forces - National
Council Vision Committee Secretariat, Univ. of Mich. (1952). 7. SLOAN, L. L. and HABEL, A. Colour signal system for the red-green colour blind,
J.Opt.Soc.Amer., 45: 592 (1955). 8. IBID. Recognition of red and green point sources by colour deficient observers,
J.Opt.Soc.Amer., 45: 599 (1955). 9. HEATH, G. and SCHMIDT, I. Signal color recognition by color defective observers,
J.Optom.Amer. 36: 421 (1959). 10. PITT, F. H. G. Characteristics of dichromatic vision, Med.Res.Council.Rept. XIV,
London, H.M.S.O. (1935). 11. COLE, B. L. Are the colour blind really colour blind? Aust.J.Optom., 45: 258 (1962).
12. B.S. 1376: 1953. 13. A.S.A. D10-1, 1958. 14. Colours of Light Signals, C.I.E. Publications No. 2 (W-1.3.3.), Paris (1959).
15. BECKENRIDGE, F. C. Tentative U.S. standard for colours of signal lights, Ilium. Eng., 57: 718 (1962).
38
AUSTRALIAN ROAD RESEARCH

REPRINTED FROM
The British Journal of
Vol. 20, No. 2, 1963
MISUSE OF THE ISHIHARA TEST FOR COLOUR BLINDNESS
B. L. COLE, B.SC., L.O.SC.
Victorian Collette of Optometry, Melbourne
Published by the British Optical Association

MISUSE OF THE ISHIHARA TEST FOR COLOUR BLINDNESS
B. L. COLE, B.SC., L.O.SC.
Victorian College of Optometry, Melbourne.
Of the many tests for defective colour vision the Ishihara Test for Colour Blindness3 enjoys the greatest popularity amongst clinicians. Despite its common use, the limitations of this test are not always appreciated.
Criterion for Failing Observers with normal colour vision do misread some plates due to carelessness
or to an inability to make sharp distinctions. Some plates lend themselves to ambiguity. For example. plate 4 (9th Ed.) is read as 20 instead of 29 by some normals. Plate 9 shows a 74 which is very frequently called 71, and in plate 17 the 73 is occasionally called 78. The reason for these errors is clear enough when the plates are examined, particularly if we take into account the inexperience of some subjects who may be looking for traps. A few subjects seem to have supranormal discrimination and will call the digits the defective reads even though they can also see the digits the normal reads!
Belcher. Greenshields and Wright' found that of 462 normal observers, 213 made from one to six errors (Table I).
TABLE I Errors made by 462 Normal Observers
when reading the Ishihara Test (10th Ed.) (Data from Belcher, et al.')
Errors
Number of Persons
249
134
58
17
2
1
Per cent of Normal Observers
0
1
3
4
5
6
53.89
29.00
12.55
3.68
.44
.22
.22
Each edition of the test varies and there could also be small variations in colour printing between one copy of the test and another so that these data can only be
113

considered as valid for the 10th edition. However, on these indications, at least three errors should be allowed before considering the subject to have defective colour vision. If it is not important to identify all colour defectives, then a greater number of errors up to six can be allowed. There is very little risk involved in allowing as many as six errors.
Of the 38 colour vision defectives tested with the Ishihara by Belcher et al.' the lowest error score (number of plates misread) was six. This was made by a single deuteranomal. In a series of 40 defectives tested in the laboratories of the Victorian College of Optometry the lowest error score was three. This was made by a deutera-nomal whose deviation from the normal setting was so small and whose hue dis-crimination as measured on the Nagel anomaloscope was so good that he could well be thought of as normal. The next lowest error score was six. This was also made by a deuteranomal with good hue discrimination but his match settings were more markedly deuteranomalous.
The criterion for failing the test must be established, bearing in mind the purpose for which the results are to be used. Clinical testing for interest or general vocational advice does not need a rigorous criterion and six errors may be allowed. Selection of persons for occupations in which the identification and discrimination of colour is vital demands a more rigorous criterion. It is unwise to choose a fail criterion of fewer than three errors as this would result only in the rejection of persons with normal colour vision, without improving the test's ability to identify the abnormal.
Whatever fail criterion may be selected the character of the errors must be taken into account. Most errors that are made by the normal are not typical of those made by the colour defective. Calling the 73 of plate 17, 78, is not an error indicative of defective colour vision. The colour defective, typically, has difficulty in seeing any numbers at all with this plate. The examiner must use his judgment in assessing any errors made.
The efficiency of screening colour vision varies from plate to plate. Belcher et al.' show that in the 10th edition the most useful plates are Nos. 8, 10, 11, 12, 14, 15, 18, 19, 20, 21, 23, 24 and 25. For the 11th edition Crone2 considers the most useful to be Nos. 8, 10, 11, 14, 15, 16, 22, 23, 24 and 25.
Quantitative Diagnosis The Ishihara has a singular advantage in its ability to distinguish clearly those with
normal from those with abnormal colour vision. The ideal test should have an error score distribution for normals which is entirely separate from that of the normals. The overlap of the error distribution of the Ishihara is small'.
However, it is a common misconception that the greater the number of errors the more severe is the defect. The Ishihara is inadequate for quantitative diagnosis. Its strength lies in its ability to differentiate the normal from the abnormal and no more.
Crone2 related the number of errors on the Ishihara to hue discrimination at 590 mu. using the latter measure as an indication of severity. In his series of 30 protanomals and 43 deuteranomals between 21 and 25 of the 25 plates were misread by 26 of the protanomals and 30 of the deuteranomals. Amongst these were both the severely affected and the slightly affected. Only subjects making fewer than 15 errors had consistently mild defects.
Crone does not include data for dichromats. In our series of 40 defectives there
114

TABLE II Errors made by Dichromats
when reading the Ishihara (9th Ed.) (Total possible errors = 24)
Deuteranopes No. of Errors
Protanopes No. of Errors
P.J.B. 23 B.A.M. 24
D.P. 23 G.D.H. 15
D.J.C. 23 C.B.B. 24
W.N.L. 23 W.J.B. 24
D.H. 24 A.J.H. 18 J.L. 23 R.C.S. 20
R.C. 23
were 13 dichromats. The error scores for these dichromats are given in Table II. Since all 13 made 15 or more errors and most made 23 or 24 errors, support is
given to Crone's conclusion that if fewer than 15 errors are made the defect is likely to be mild.
Crone use hue discrimination at 590 mu. as a measure of hue discrimination. When the anomaloscope was first introduced great significance was attached to the deviation of the red and green mixture from the normal when matching yellow. The deutera-nomal adds too much green in a mixture of red and green to match yellow. The pro-tanomal adds too much red. If much red or much green were added, the subject was considered to be severely affected. Nelson (1938), however, showed that the extent of the departure from a normal match is not necessarily related to the loss of colour discrimination6, and this is illustrated again in Figure 1 in which it is seen that range (a measure of hue discrimination) is unrelated to the deviation of the matches. The range of red-green mixtures which match yellow should be measured when using the Nagel anomaloscope. Wright6 considers both the deviation of the match from normal (how much excess green or red is added compared with the normal) and the scatter of the matches should be measured. Walls' places emphasis on a careful measurement, step by step. of the range. This gives a measure of hue discrimination which he considers to be of greater importance in judging how handicapped a protanomal or deuteranomal will be when handling colours.
Walls is no doubt right, although the deviation of the match is, in a different sense, also a measure of the severity of the anomaly. The deviation must reflect the degree to which the spectral sensitivity of the colour receptors is altered from normal. To what extent such responsibility changes affect everyday colour perception is not known. A shift in colour naming would be expected, as Walls remarks, but the magnitude of the shift may not be sufficiently great to cause even the individual with a large deviation any embarrassment.
115

30
25 w 0 20
z w LLI15 CD
w10 U X W
5
Figures 2 and 3 show Ishihara error scores related both to the degree of anomaly and to the range for 27 deuteranomals in our series of 40 colour vision defectives. Neither the range nor the deviation of the match is related in any systematic way to the number of plates misread. As Crone established, it can be seen that both the severely and slightly affected may make 15 or more errors. Those subjects making fewer than 15 errors are either moderately or slightly affected when severity is. assessed by the range. Illumination
The data of Belcher et al. t , of Cronee, and the data given above, were obtained under illumination approximating Illuminant C. Schmidt' found that the number of errors made by a colour defective in reading pseudo-isochromatic plates varied with intensity and colour temperature of the illuminant.
Standardisation of illumination is therefore advisable, particularly if working rules based on the data given here are to be used. It is usually recommended that the Ishihara be administered in daylight3 but this is rarely convenient. Moreover, variations in intensity of daylight may affect the subject's responses. A Macbeth daylight lamp is a convenient source of standardised illumination of high colour temperature. This lamp comprises an incandescent lamp and a blue filter which together provide an illumination of colour temperature 6500°K. A less expensive alternative is a daylight fluorescent tube.
: • • •
•
• • .
. • •• • • ••
• • • • •
•
_ .
• • •
• • •
•
- •
RANGE Fig. 1. Relationship between deviation of the R-G mixture from normal and the range of R-G mixtures
which match yellow. Both the range and deviation are measured with the Nagel anomaloscope. Data of 27 deuteranomaly.
0 5 10 15 20 25 30
116

30
25
20 w co z Q 15 cc
10
5
0
30
25
X w
5
•
•
•
• • • • •
• • •
• •
•
•
• • f •
• •
•
,, •
• t •
10 15
20 NO. OF PLATES MISREAD
Fig. 2. The relationship between the number of plates of the Ishihara which are read incorrectly and the anomaloscope range (in the arbitrary scale units of the anomaloscope). Data of 27 deuteranomals.
: •
••
• •
s
:
• • •
•
• •
• •
•
• • _ •
; • • •
• 0
: •
•
20
5
00 5 10 15 NO, OF PLATES MISREAD
Fig. 3. The relationship between the number of plates of the Ishihara which are read incorrectly and the deviation of the R-G mixture from normal (in arbitrary scale units of the anomaloscope. The normal's setting is given as zero.)
2
117

Two Working Rules Given reasonably standardised conditions of administration the data of Belcher
et al. and Crone can be used to formulate two simple working rules. These are:
(i) A patient who misreads three plates or less is almost certain to have normal colour vision. If he misreads between three and six plates he can be considered to be normal, provided some of the errors are not typical of the errors the
colour defective makes. (ii) No reliable quantitative assessment of the severity of a -defect can be expected
from the Ishihara although between six and 15 errors may indicate a mild defect.
REFERENCES
1. BELCHER, S. J I., GREENSHIELDS, K. W. AND WRIGHT, W. D. "Colour vision survey using the Ishihara, Dvorine, Boström and Kugelberg, Boström and American Optical Hardy-Rand-Ritter tests." Brit. J. Ophthal., 42, 355, 1958.
2. CRONE, R. A. "Quantitative diagnosis of defective colour vision". Amer. J. Ophthal., 51, 298, 1961..
3. ISHIHARA, S. Tests for Colour-Blindness (9th ed.) H. K. Lewis, London. 4. SCHMIDT, I. "Effect of illumination in testing colour vision with pseudo-isochromatic plates."
J. Opt. Soc. Amer., 42, 951, 1952. 5. WALLS, G. L. "How good is the H-R-R test for color blindness?" Amer. J. Optom. and Arch.
Amer. Acad. Optom., 36, 169, 1959. 6. WRIGHT, W. D. "Diagnostic tests for colour vision". Ann. Roy. Coll. Surg. (Eng.), 20, 177, 1957,
118

Designed and produced by VAUGHAN PUBLISHING SERVICES LTD., LONDON, N.W.$
and printed by PERIVAN GROUP LIMITED, SOUTHEND-ON-SEA, ESSEX

Comments on some color vision tests and their use for selection *
By B. L. COLE, Victorian College of Optometry,
There are 2 general categories of colour vision tests. There are those tests intended to identify and perhaps assess the type and severity of abnormal colour vision. Optome-trists are familiar with many of these tests but are less familiar with the second cate- gory which is intended to measure colour aptitude of colour normals. Examples of this latter category are the Color Aptitude Test of the Inter-Society Color Council and the Burnham-Clark-Munsell Color Memory Test.{ Time does not permit evalu-ation of these tests in this paper but reports on the Color Aptitude Test have been made by Tilleard,1e Adams' and Hess.13
Tests for abnormal colour vision usually attempt to separate normal and abnormal colour vision with a minimum of ambiguity. The Ishihara pseudoisochromatic plates do this admirabls ,1."•ty the overlap of error score distributions of normal and abnormal observers being very small. The four screen-ing plates of the AO-HRR pseudo-isochro-matic test (Figure 1) are less effective, oc-casionally missing abnormals and misclassi-fying normals.3 "•1s,-0 Farnsworth's dichoto-mous test and occupational tests with a high face validity, tests such as the lantern tes (Figure 2) and the Color Threshold Tester,'' do not attempt to identify all ab-normals. They seek to identify only those abnormals who would be handicapped in a specific occupation by their defective colour vision.
CLASSIFICATION BY TYPE Some colour vision tests are designed to
classify colour abnormals by type, usually in accordance with part of the usual v. pries classification. The Ishihara has four
', Read at the A.N.Z.A.A.S. Congress, Canberra, 1964.
University of M ell7oll rne.
hi) WO. Ps6üDOttCKRRCMASAC
mats taL umcnKa<wa,n,+a
AND ttiLtAtaw 11aDtGltt as DSih-nW COtOAVülIo
p,qt1CN1 otM041001111 WON
Figure 1. The A.O.-HRR Pseudoisochromatic Plates.
These plates are designed to detect, to classify by type and to estimate the severity of defective colour vision. The test is administered under standard illuminant C. The Macbeth Easel Lamp
in the illustration provides this illumination.
THE AUSTRALIAN JOURNAL OF OPTOMETRY March, 1964 Page 56

Figure 2. Eldrige-Green Lantern Test. This is an occupational test with a high face validity. Observers are required to nome correctly coloured signals of varying angular subtense and
intensity of illumination.
plates which are to differentiate protans and deutans on the basis of differing neutral points but these plates frequently yield either an ambiguous or a misleading diag-nosis (Table I).
TA F I B et''')* c.at ,. p hs a Deta eLktS u.lcrt.: /l4.c,ltia,uk P-4x.T(2.,
Diagnosis Deutans Protans Total % age Da EDa D Pa P
Correct 14 1 3 2 5 25 64.2 Ambiguous 5 0 0 0 0 5 12.8 Incorrect 4 1 3 0 1 9 23.0
Correct diagnosis is based on a battery of tests but principally the Nagel Anomaloscope. In this table and others Da = deuteranomal, EDa = extreme deuteranomal, D = detueranope, Pa = pro-tanomal, EPa = extreme protanomal, P = protanope.
The AO-HRR plates are more ambitious in the attempt to classify according to type. The principle is the same as the diagnostic plates of the Ishihara, but there are more plates and six plates for tritan and the so-
called tetartan defects are included. The re-sult is more successful than for the Ishihara and Table II lends reasonable support to the claims of the authors of the test,'" de-spite Walls'20 pungent criticism.
TABLE II Classification of Protans and Deutans
using the AO-HRR Pseudoisochromatic Plates.
Data of 44 colour defectives (A). The data of «'ails-° is included for comparison (B).
Diagnosis Deutans Protans Total % age Da EDa D Pa EPa P
Correct A 17 1 7 1 6 32 72.7 B 15 11 8 3 8 11 56 80.0
Ambiguous A 8 000 1 920.5 B 2 2 0 2 0 0 6 8.6
Incorrect A 0 1 0 1 1 3 6.8 B 2 3 1 2 0 0 8 11.4
(Correct diagnosis is based, in both sets of data, prin-cipally on the Nagel Anomaloscope.)
The AO-HRR is better in our experience than the Farnsworth Munsell 100 Hue? (Figure 3) which lends itself to ambiguity in separating a number of protans and deu-tans (Table III). The greatest ambiguity occurs with deuteranomals who, if mildly affected, make few errors and cannot be distinguished from normals.
TABLE III Classification of Protans and Deutans using
the Farnsworth-Munsell 100 Hue
Diagnosis Deutans Protans Totals
Da EDa D Pa P /cage
Correct 9 1 6 1 4 21 50.0 Ambiguous 15 0 0 0 2 17 40.5 Incorrect 1 0 0 1 2 4 9.5
(Correct diagnosis is based principally on the Nagel Anomaloscope.)
Page 57 March, 1964 THE AUSTRALIAN JOURNAL OF OPTOMETRY

.R. 1. 1
l'EST
<Y.•.',! `Ji'l.;^;rL.c..Si
Figure 3a. The Farnsworth-Munsell 100 Hue Test requires subjects to sort four sets of coloured discs into an orderly sequence of changing hues.
IDENTIFICATION OF TRITAN DEFECTS
Because of the rarity of tritanopes and tritanomals it is often difficult to validate tests which purport to identify them. The authors of the AO-HRR do not report hav-ing given their plates to tritanss.".lo but Walls" found that the 3 tritanopes and 2
tritanomals to whom he gave the test made "strong tritan" scores and did not make any errors with the `tetartan" characters. We have found that the AO-HRR is likely to miss tritans unless special precautions are taken. Table IV shows the errors made by our 9 congenital tritans. Three of these tri-tans made no errors on the 6 tritan plates although when asked they did say that some of the tritan symbols were fainter than the corresponding tetartan characters. The Farnsworth Plate F2 which was made from Munsell papers following the description given by Kalmust2 gave a positive diagnosis
for all 9 tritans and was equally as good as the 6 plates of the AO-HRH. This supports Walls"20' contention that the average buyer of the AO-HRR should not have to pay for the 6 tritan plates when a single plate like the Farnsworth one is as good.
The Farnsworth-Munsell 100 Hue Test does not always define the protan-deutan groups with great precision but appears re-liable enough in the diagnosis of tritan de-fects. An unequivocal diagnosis was obtain- ed for 7 of our 9 tritans. For the other 2, one could have been interpreted as a deu-tan defect and the other made very few errors and might have been missed had other tests not been used.
The Farnsworth Dichotomous Test (Figure 4) was found to be unreliable for the diagnosis of congenital tritans. Clear-cut diametrical errors of the tritan kind were obtained with 2 tritanopes but simple and
THE AUSTRALIAN JOURNAL OF OPTOMETRY
March, 1964 Page 58

non-diagnostic transpositions were made by another tritanope. The 3 known tritanomals given this test made either no errors at all or simple non-diagnostic transpositions.
The rarity of tritan defects makes them occupationally unimportant although one of our tritans, a tritanope, was a fashion writer
for a metropolitan newspaper and another an advisor on interior decoration for a car-pet manufacturer.
TABLE IV Errors made by 9 Tritans for the 6 Tritan characters of the AO-HRR
(x indicates that character was not seen)
Sub- ject
Tritan Plates Total Errors AO-HRR Diagnosis
Diagnosis on Test Battery
(including Colorimeter)
B-Y Screening Medium B-Y Plates Defect
Strong B-Y Defect
No. Errors
No. Seen as Faint
1 2 17 18 19 20
1 x x x x x x 6 Strong Tritan Tritanope 2 x x x x x x 6 Strong Tritan Tritan 3 x Faint Faint x 2 2 Strong Tritan Tritanope 4 x x x x Faint Faint 4 2 Medium Tritan Tritanope 5 x x x Faint Faint Faint 3 3 Medium Tritan Tritanomal 6 x 0 Mild Tritan Tritanomal
7 Faint Faint 0 2 Normal Tritanomal 8 Faint Faint Faint Faint Faint 0 5 Normal Tritan 9 Faint Faint Faint Faint 0 4 Normal Tritan
Figure 3b. The 100 Hue Test is administered under illuminant C provided by the Macbeth Easel Lamp.
Page 59 March, 1964
THE AUSTRALIAN JOURNAL OF OPTOMETRY

Figure 4. The Farnsworth Dichotomous Test. Fifteen coloured discs have to be arranged in an orderly sequence of changing colour. Severely affected colour defectives make errors in arrangement characteristic of their class of colour vision. Normals
and mildly affected colour defectives do not make errors.
ASSESSMENT OF SEVERITY
Classification of colour defectives into protan, deutan or tritan groups has little practical significance in the selection of personnel although it can be argued that the protan, because of his reduced sensitivity to red light, will be less likely to see red signal lights. There is also evidence11.14.16,17 to suggest that the protanope has greater diffi-culty recognising colours of signal lights than do other colour defectives.
For selection it is more important to have some measure of severity of a defect, al-though for some occupations all colour ab-normals will be excluded and the only need is for a test that will fail all abnormals and pass all normals. Occupations excluding all abnormals Ivill be those in which the con-sequences of an error are serious, or where the cost of training is high and for that reason later exclusion undesirable, or where a high degree of colour aptitude is required. These occupations might include pilots of
commercial aircraft, drivers of public trans-port, operators of colour matching apparatus such as PH meters or visual colormeters, hosiery menders or invisible menders.
In many occupations a high degree of colour aptitude is not necessary and if any colour defectives need to be excluded from these occupations at all, it is only the more severely affected. This •assumption is em-. bodied in the Farnsworth Dichotomous Test, and the high face validity tests in which electric resistor codes have to be identified or coloured lights recognised. A decision to accept some colour abnormals but reject others means that pass-fail criteria have to be established, and there is not a great deal of evidence about how the colour defective performs at everyday tasks that involve the recognition and discrimination of colour. The colour defective has been shown to make more errors than the normal in the recognition of roads' and aviation"''6'ty signal lights. He is not as good as the nor-
THE AUSTRALIAN JOURNAL OF OPTOMETRY
March, 1964 Page 60

mal identifying electrical resistor codes1 ' and his performance is worse under low illuminations.2l
Such laboratory investigations which simulate an everyday task may eliminate im-portant secondary cues and the abnormal will appear to do worse in the laboratory than at the task itself. On the other hand adverse viewing conditions (such as fog, low illumination and movement) may cause the colour abnormal to make more errors on the job than in the laboratory. In the course of another experiment we gave 37 colour defectives some simple occu-pational tests and asked them questions about the difficulties they might have ex-perienced. It is indicative of how well a colour defective can adapt to his deficiency that 14 of 25 anomals and one dichromat of 12 did not know they had a colour vision defect prior to our test. No anomals in this series and only 3 dichromats admitted to ever experiencing difficulty with traffic signals. They all could recognise without hesitation the stages of methyl orange in-dicator although one student of chemistry, a deuteranomal, said he had difficulty with indicators and any university chemistry de-
partment will cite other cases. We found that all anomalous trichromats could group the colours of a multi-wire PMG cable without error although some were hesitant. The dichromats made erorrs with the PMG cable but, except for one dichromat, they all corrected the errors straight after mak-ing them. In naming the colours of the wires several of the dichromats made be-tween 1 and 3 errors and 2 deuteranomals made 1 and 2 errors respectively.
The impression we have gained is that the colour defective is less handicapped in everyday life than might have been antici-pated and that pass-fail criteria can be fair-ly liberal for a wide range of jobs.
There are no standards for colour vision with anything like general acceptance and. most pass-fail criteria are chosen, often arbi-trarily, mainly on the basis of expert advice and to a lesser extent on what evidence there is available. In those selection procedures where colour vision is not treated summar-ily, a battery of tests is usually employed. This battery of tests will often include pseudo isochromatic tests like the Ishihara or the AO-HRR, occupational tests such as the various lantern tests, and perhaps sort-
Figure 5. The Nagel Anomaloscope. The subject is required to match a spectral yellow by adjusting the proportions of a red and green
mixture.
Page 61 March, 1964
THE AUSTRALIAN JOURNAL OF OPTOMETRY

o•••• • • • •
EDa
. • •b° /°
dtchromal •
\ i'
° er••h • .d•°Ian
°.pro,an
10 30 40 SO 60
ing tests like the Farnsworth-Munsell 100 Hue Test or the Farnsworth Dichotomous Test.
The Ishihara makes no attempt at quan-titative diagnosis." but the AO-HRR is more ambitious and classifies severity of the de-fect into mild, medium or strong categories. The Farnsworth-Munsell 100 Hue can be scored on an interval scale. The Dichoto-mous Test attempts what its title implies by dividing colour defectives into severely and mildly affected groups.
An alternative dichotomy is to divide colour abnormals into two groups, dichro-mats and anomalous trichromats. It can be argued that hue discrimination is the at-tribute which determines the degree of diffi-culty a colour defective is likely to experi-ence. Dichromats have a hue discrimination which is always worse than that of ano-malous trichromats, although some anomals, the so-called extreme anomals, may have hue discrimination approaching that of the dichromat.
Walls:'" has stressed the importance of identifying the extreme anomal. Apart from haying hue discrimination worse than ordin-ary anomals, \\'alls claimed that the ex-treme anomal demonstrates unstable colour vision and for this reason is the most dangerous of all colour defectives because the lability of his colour perceptions makes it difficult for him to adapt to his defect.
Argument along these lines requires colour defectives to be divided into 3 groups, dichromats, extreme anomals and ordinary anomals. These are clear-cut categories and do not overlap. The dichromat has worse hue discrimination than the extreme anomal and the extreme anomal has hue discrimina-tion that is worse than that of the ordinary anomal. At the Nagel anomaloscope (Figure 5) individual colour defectives can be assigned to one of these categories without difficulty in almost all cases. Furthermore. the ordinary anomal is clearly differentiated from the extreme anomal because of the comparative rarity of anomals of inter-mediate severity.
Ordinary anomals can be assessed further by measuring at the anomaloscope the range of red-green mixtures that they find will match the yellow. This can be clone at the anomaloscope. A wide matching range can be taken as an indication of poor hue dis-crimination and a narrow matching range as indicating good hue discrimination, although it must be remembered that the Nagel anomaloscope samples hue discrim-ination at only one point of the spectrum. Selection amongst anomals can be based on anomaloscope range, a procedure adopted and advocated by Walls.-Ö This is logical enough but there is no experimental evi-dence to justify the rejection of some ano-mals on this basis and the acceptance of others. We have made several attempts to see if range at the anomaloscope is related to a colour defective's ability to handle colours. We found no relationship between the range of deuteranomals and the errors they made in an experiment on road traffic signals," nor was their reaction time to traffic signals related to their range. We have found that for 24 deuteranomals, those who had never experienced difficulty with colours had an average range of 9.1 units and those who had experienced difficulty
N
Anomaloscope Range
Figure 6. Severity of colour vision defect as assessed by the A.O.-HRR plates related to the range of R-G mixtures that match yellow. The range is a measure of hue discrimination. A full
range indicates dichromosy.
March, 1964 Page 62 THE :AUSTRALIAN JOURNAL OF OPTOMETRY

300
750
200
150
. EDa —
diC h lnmats'
f
loo
50
• -deuton
o - proton
10 20 30 40 SO 00 full
FM
10
0 E
rro
r S
core
had an average range of 13.4 units, but this difference was not statistically significant.
If a liberal view is to be taken toward the selection of colour defectives for occu-pations which involve colour but do not re-quire a high degree of colour aptitude then there is a strong case for excluding dichro-mats and extreme anomals and not exclud-ing anomalous trichromats. For occupations requiring a high degree of skill with colours all colour abnormals can be excluded for occupations with little importance attached to colour, no colour abnormals should be excluded. There is little justification for a more elaborate categorisation.
If categorisation of this kind is accepted then an anomaloscope is essential. Other tests do not have the capacity to differen-tiate the dichromat, extreme anomal and ordinary anomal. In Figure 6, dichromats and extreme anomals (EDa) are contained within the strong and medium categories of the AO-HRR but so are a number of ordinary anomals some of whom have small matching ranges. Walls"" found 3 cases of anomalous trichromasy classed as strong by the AO-HRR and 8 cases classed as medium. Over half Crone's" series of anomals and 53 of 86 anomals in the series of Hardy et al10 were classed as medium or strong.
In Figure 7, which shows data for the 100 Hue Test, a pass-fail score of 100 fails all but one dichromat but also fails a not in-considerable proportion or ordinary ano-mals.
It is difficult to believe that the anomals rated as "medium" or "strong" by the AO-HRR or anomals with series for the Farnsworth-Munsell 100 Hue which are the same or worse than the dichromats are in fact as handicapped as dichromats. Both the AO-HRR and the Farnsworth-Munsell 100 Hue Test would seem to be very im-perfect in their assessment of severity.
CONCLUSION The case that is argued here is that the
best means of selecting on the basis of colour vision is to type colour defectives according
to the usual classification and to have 3 pass-fail criteria according to the demands of the job in question. These three levels are:
(a) Exclude all colour defectives. (b) Exclude dichromats and extreme
anomals.
(c) Exclude no colour abnormals.
A major advantage of using the dichro-mat-extreme anomal-ordinary anomal typology is that the categories do not over-
Anomaloscope Range
Figure 7. Severity of colour vision defect as assessed by the F.-M. 100 related to the range of
R-G mixtures that match yellow.
lap. Moreover, re-testing at the Nagel ano-maloscope will in almost all cases assign the colour abnormal to the same category. This typology has a long history and is firmly embedded in a substantial body of theory: it is not ephemeral. Both hue and satura-tion discrimination of anomals22 are better than that of dichromats" and, whilst it is possible that in everyday circumstances some dichromats may have better colour aptitude than some anomals, the results of formal laboratory experiments make it im-probable. Experiments directed toward elucidating the performance of colour ab-normals in everyday situations are needed and such experiments might well under-mine this argument for selection by type.
Page 63 March, 1964
THE AUSTRALIAN JOURNAL OF OPTOMETRY

Until this occurs it is recommended that asessments of severity by the AO-HRR and Farnsworth-Munsell 100 Hue be treated with reserve and wherever possible recourse should be made to the Nagel anomaloscope.
Unfortunately the Nagel anomaloscope is expensive, is not easily portable and requires more skill to administer than other tests of colour vision and for these reasons is not used as often as it should be. There is a need for an inexpensive instrument which is simple to administer and which will label dichromats and extreme anomals unequivo-cally. Attention is being given at the moment to the development of such an in-strument. A prototype has been built and preliminary tests with this instrument are encouraging.
I. Adams, J. M. Some results obtained with the O.-S.C.C. Colour Aptitude Test. J. Oil & Colour Chemists Assoc., 41, 807, 1958.
2. Hardy, LeG. H„ Rand, G. and Rittler, M.C. A.O: HRR Pseudoisochromatic Plates, 2nd ed., Amer. Opt. Coy., 1957.
3. Belcher, S. J.. Greenshields, K. W. and Wright, W. D. Colour vision survey using the Ishihara, Doorinc Rostrum and Kugelberg, Boström and American Optical Hardy-Rand-Rittler tests. Brit. J. Opthal., 42, 355, 1958.
4. Burnham. R. W. and Clark, J. R. A colour memory test. J. Opt. Soc. Amer., 44, 658, 1954. Color Aptitude Test, 1953 Edition, Inter-Society Color Council.
6. Crone, R A Quantitative diagnosis of defective colour vision. Amer. J. Ophthal., 51, 298, 1961.
7. Farnsworth, D. The Farnsworth-Munsell 100 Hue and Dichotomous Tests for colour vision. J. Opt. Soc. Amer., 33, 568, 1943.
8. Hardy, LeG. H., Rand, G. and Rittler, M. C. H.R.R. Polychromatic plates. J. Opt. Soc Amer, 44, 509, 1954
9. Hardy, LeG., H., Rand, G. and Rittler, M. C. The H.R.R. Polychromatic plates I. A test for the de-tection classification, and estimation of the degree of defective color vision. A.M.A. Arch. Opthal., 51, 216, 1954
10. Hardy, LeG. H., Rand, G. and Rittler, M. C. An evaluation of the A.O.-HRR pseudoisochromatic plates. A.M.A. Arch. Ophthal., 56, 736, 1956.
11. Heath, G. and Schmidt, I. Signal color recognition by color defective observers. Amer. J. Optom., 36, 421, 1959.
12. Kalmus, H. The familial distribution of congenital tritanopia. Ann. Hum. Gen., 20, 39, 1955.
13. Hess, M. Personal experience with the I.-S.C.C. Colour Aptitude Test. J. Oil & Colour Chemists Assoc., 40, 136, 1957.
14. Nathan, J., Henry, G. H. and Cole, B. L. Recog-nition of road traffic signals by persons with normal and defective colour vision. Anst. Road Research, 1, 30, 1963.
15. Sloan, L. L. Selection of colour vision tests for the Army Air Forces. A.M.A. Arch. Ophthal., 36, 263, 1946.
16. Sloan, L. L. and Habel, A. Color signal system for the red-ereen color blind. J. Opt. Soc. Amer., 45, 592, 1955.
17. Sloan, L. L. and Habel, A. Recognition of red and green point sources by color deficient observers. J. Ont. Soc. Amer., 45, 599, 1955.
18. Sloan, L. L. and Habel, A. Tests for color deficiency based on the pseudoisochromatic principle. A com-parative study of several new tests. A.M.A. Arch. Ophthal., 55, 229, 1956.
19. Tilleard, D. L. Colour-aptitude test: an analysis of scores. J. Oil & Colour Chemists Assoc., 41, 797, 1958.
20. Walls, G. L. How good is the H-R-R test for colour blindness? Amer. J. Optom., 36, 169, 1959.
21. Walraven, P. L. and Leebeek, H. L. Recognition of color code by normals and color defectives at several illumination levels. An evaluation study of the H.R.R. plates. Amer. J. Optom., 37, 82, 1960.
22. Wright, W. D. Researches on Normal and Defective Colour Vision. St. Louis, Mosby, 1947.
23. Chapanis, A. Spectral saturation and its relation to1944.
colour vision defects. J. Exp. Psychol., 34, 24,
THE AUSTRALIAN JOURNAL OF OPTOMETRY
March, 1964 Page 64