25fbe10d0ae9a0281dcf9ef4fe28... - Missouri Western State ...
Upload
khangminh22Category
view
0download
0
CHAPTER. 6 What We Raise
Saint Louis Regional Food Study - 2014
Saint Louis Regional Food Study - 20142
What We Raise As stated previously in Chapter 2, Americans today consume 50 pounds more meat per
capita than their 1950s counterparts. We exceed the recommended daily protein intake with meat alone not counting other protein sources.1 Accordingly, farms across America’s Heartland, including the Saint Louis Regional Foodshed, raise a lot of livestock.
As evident by the change in total “land in farms” between 1925 and 2007, the Saint Louis Regional Foodshed’s total pastureland (supporting grazing livestock) decreased from 5,172,164 acres in 1925 to 2,427,737 acres in 20072 which is a 53% decrease in total pastureland over 82 years. The proportion of “land in farms” designated to pastureland decreased from 31% (16,502,375 acres in 1925) to 18% during the same time span.3 As industrialized agriculture systems incentivized farmers to maximize their corn, soybean, and wheat production, farmers in our Foodshed reduced their pastureland by half. Suburban expansion has also converted pasture acres to shopping malls and subdivisions.
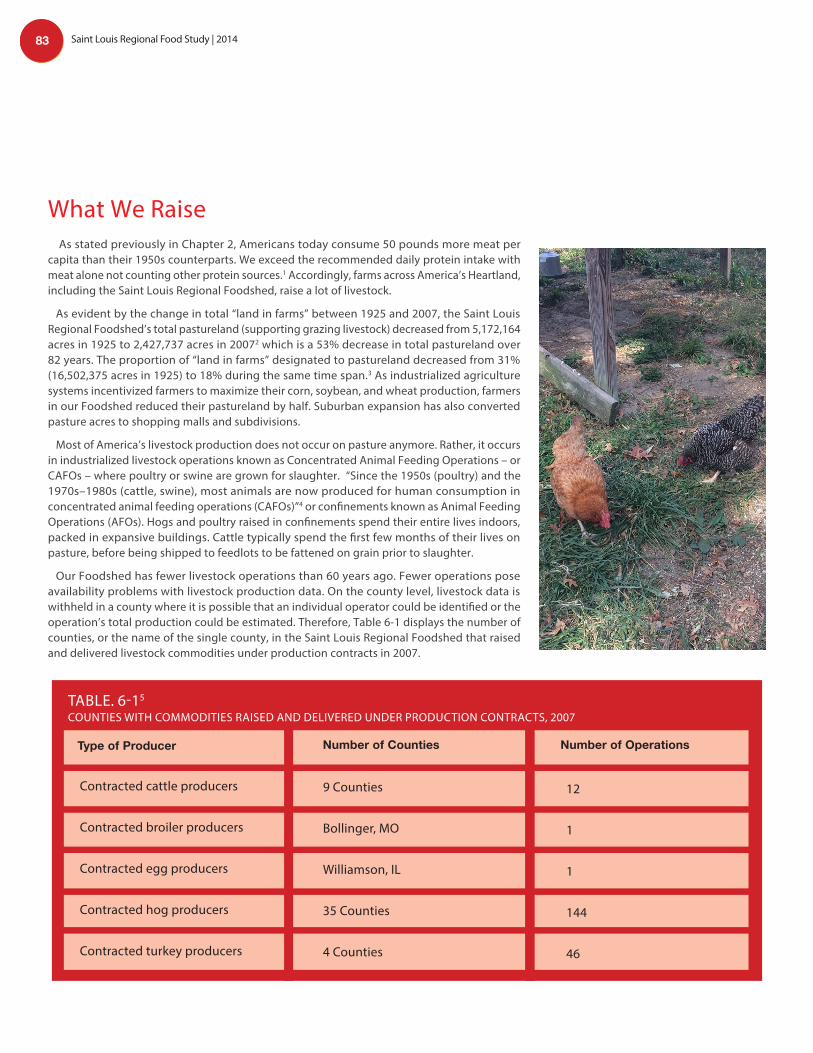
Most of America’s livestock production does not occur on pasture anymore. Rather, it occurs in industrialized livestock operations known as Concentrated Animal Feeding Operations – or CAFOs – where poultry or swine are grown for slaughter. “Since the 1950s (poultry) and the 1970s–1980s (cattle, swine), most animals are now produced for human consumption in concentrated animal feeding operations (CAFOs)”4 or confinements known as Animal Feeding Operations (AFOs). Hogs and poultry raised in confinements spend their entire lives indoors, packed in expansive buildings. Cattle typically spend the first few months of their lives on pasture, before being shipped to feedlots to be fattened on grain prior to slaughter.
Our Foodshed has fewer livestock operations than 60 years ago. Fewer operations pose availability problems with livestock production data. On the county level, livestock data is withheld in a county where it is possible that an individual operator could be identified or the operation’s total production could be estimated. Therefore, Table 6-1 displays the number of counties, or the name of the single county, in the Saint Louis Regional Foodshed that raised and delivered livestock commodities under production contracts in 2007.
TABLE. 6-15 COUNTIES WITH COMMODITIES RAISED AND DELIVERED UNDER PRODUCTION CONTRACTS, 2007
Type of Producer
Contracted cattle producers
Contracted broiler producers
Contracted egg producers
Contracted hog producers
Contracted turkey producers
Number of Counties
9 Counties
Bollinger, MO
Williamson, IL
35 Counties
4 Counties
12
1
1
144
46
Number of Operations
83 Saint Louis Regional Food Study | 2014
Saint Louis Regional Food Study - 2014 3
125
82
55
10
30
102.50.70.5 1.0
FIGURE. 6-1 NUMBER OF ANIMALS PER 1 ANIMAL UNIT
Horses0.5= 1 animal unit
Mature dairy cows0.7= 1 animal unit
Beef cow, feeder, veal calf, cow/calf pair and dairy heifer 1.0 = 1 animal unit Swine weighing over 55lbs. 2.5 = 1 animal unit
Swine weighing under 55lbs.10 = 1 animal unit
Sheep, lambs and meat and dairy goats10 = 1 animal Chicken laying hens, pullets and broilers with a wet handling system 30 = 1 animal unit Turkeys in growout phase55 = 1 animal Chicken laying hens without a wet handling system 82 = 1 animal unit Chicken broilers and pullets, and turkey poults in brood phase, all without a wet handling system125 = 1 animal unit
Class IIClass IC Class IB Class IA Class Category
Class IIClass IC Class IB Class IA Class Category
Horses
Mature dairy cows
Beef cow, feeder, veal calf,cow calf pair and dairy heifer
Swine weighing over 55 pounds
Swine weighting under 55 pounds
Sheep, lambs and meat and dairy goats
Chicken laying hens, pullets and broilers with a wet handling system
Turkeys in growout phase
Chicken laying hens without a wet handling system
Chicken broilers and pullets, and turkey poults in brood phase, all without a wet handling system
7,000
3.500
4,900
17,500
70,000
70,000
210,000
385,000
574,000
875,000
125
3,000 to 6,999
1,500 to 3,499
2,100 to 4,899
7,500 to 17,499
30,000 to 69,999
30,000 to 69,999
90,000 to 209,999
165,000 to 384,999
246,000 to 573,999
375,000 to 874,999
1,000 to 2,999
500 to 1,499
700 to 2,099
2,500 to 7,499
10,000 to 29,999
10,000 to 29,999
30,000 to 89,999
55,000 to 164,999
82,000 to 245,999
125,000 to 374,999
300 to 999
150 to 499
210 to 699
750 to 2,499
3,000 to 9,999
3,000 to 9,999
9,000 to 29,999
16,500 to 54,999
24,500 to 81,999
37,500 to 124,999
7,000 3,000 to 6,999 1,000 to 2,999 300 to 999Animal Unit Equivalent
TABLE. 6-2 NUMBER OF ANIMALS PER 1 ANIMAL UNIT
1 AU =
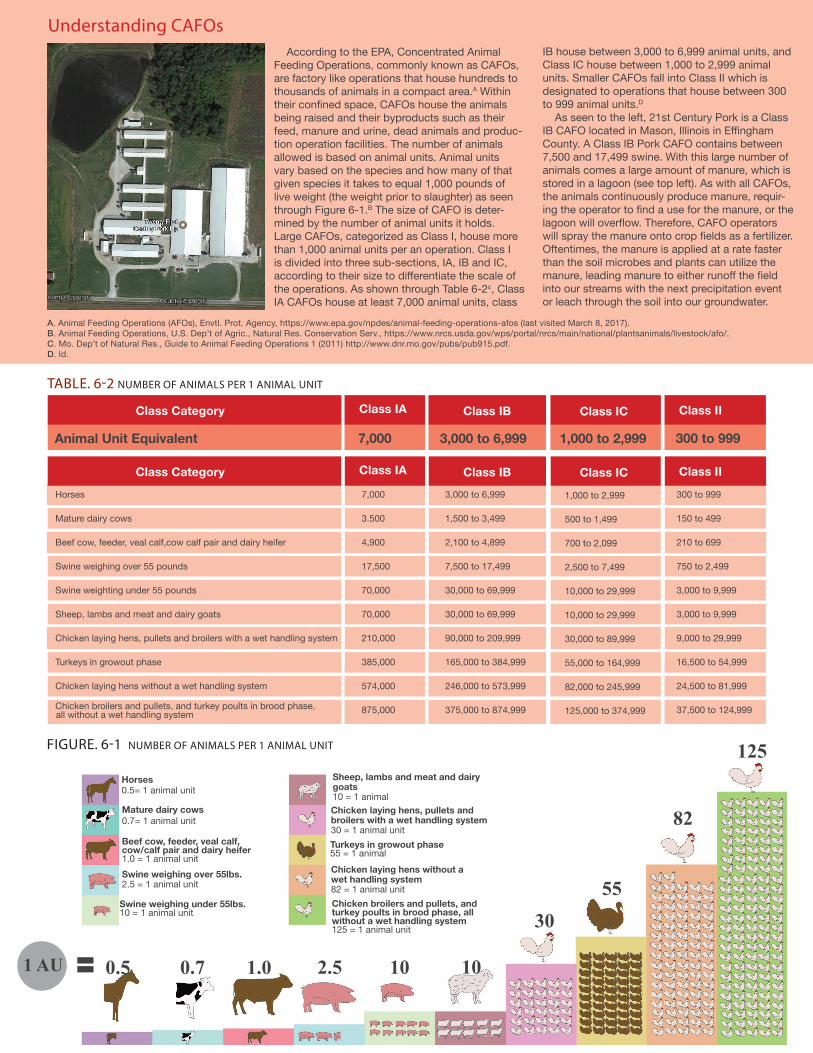
Understanding CAFOs According to the EPA, Concentrated Animal Feeding Operations, commonly known as CAFOs, are factory like operations that house hundreds to thousands of animals in a compact area.A Within their confined space, CAFOs house the animals being raised and their byproducts such as their feed, manure and urine, dead animals and produc-tion operation facilities. The number of animals allowed is based on animal units. Animal units vary based on the species and how many of that given species it takes to equal 1,000 pounds of live weight (the weight prior to slaughter) as seen through Figure 6-1.B The size of CAFO is deter-mined by the number of animal units it holds. Large CAFOs, categorized as Class I, house more than 1,000 animal units per an operation. Class I is divided into three sub-sections, IA, IB and IC, according to their size to differentiate the scale of the operations. As shown through Table 6-2c, Class IA CAFOs house at least 7,000 animal units, class
IB house between 3,000 to 6,999 animal units, and Class IC house between 1,000 to 2,999 animal units. Smaller CAFOs fall into Class II which is designated to operations that house between 300 to 999 animal units.D
As seen to the left, 21st Century Pork is a Class IB CAFO located in Mason, Illinois in Effingham County. A Class IB Pork CAFO contains between 7,500 and 17,499 swine. With this large number of animals comes a large amount of manure, which is stored in a lagoon (see top left). As with all CAFOs, the animals continuously produce manure, requir-ing the operator to find a use for the manure, or the lagoon will overflow. Therefore, CAFO operators will spray the manure onto crop fields as a fertilizer. Oftentimes, the manure is applied at a rate faster than the soil microbes and plants can utilize the manure, leading manure to either runoff the field into our streams with the next precipitation event or leach through the soil into our groundwater.
A. Animal Feeding Operations (AFOs), Envtl. Prot. Agency, https://www.epa.gov/npdes/animal-feeding-operations-afos (last visited March 8, 2017).B. Animal Feeding Operations, U.S. Dep’t of Agric., Natural Res. Conservation Serv., https://www.nrcs.usda.gov/wps/portal/nrcs/main/national/plantsanimals/livestock/afo/.C. Mo. Dep’t of Natural Res., Guide to Animal Feeding Operations 1 (2011) http://www.dnr.mo.gov/pubs/pub915.pdf.D. Id.
Saint Louis Regional Food Study - 20144
Livestock InventoryWhile the total number of livestock raised
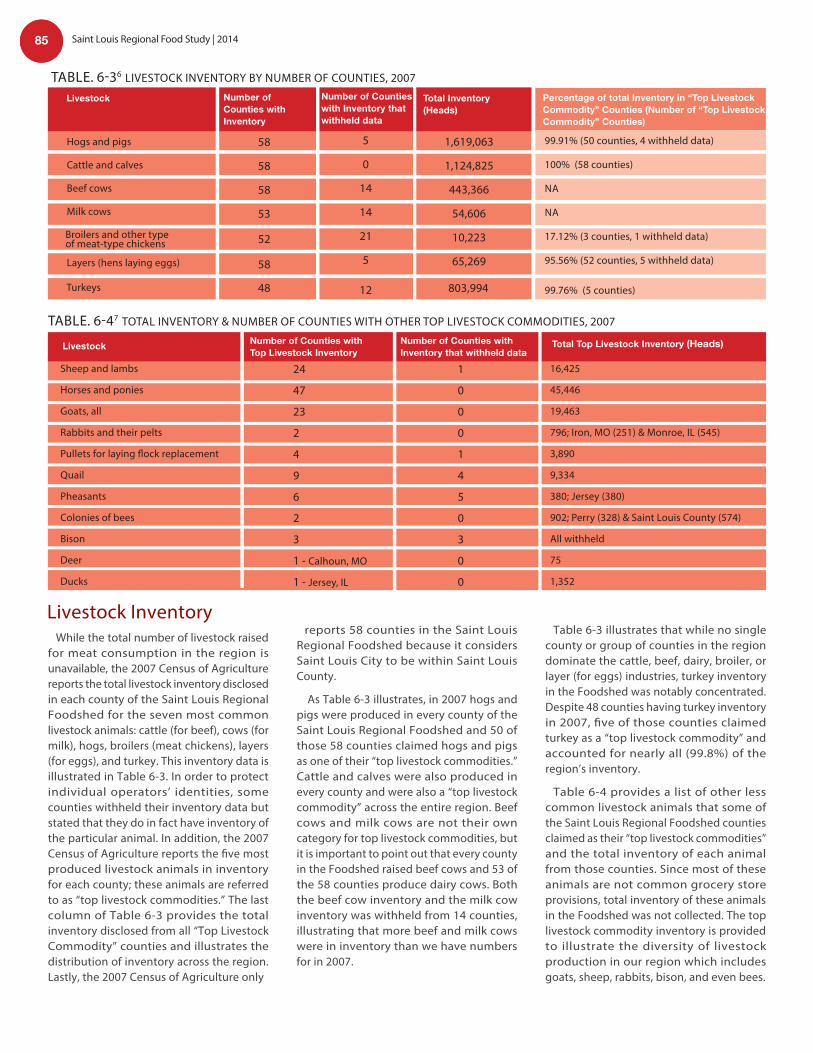
for meat consumption in the region is unavailable, the 2007 Census of Agriculture reports the total livestock inventory disclosed in each county of the Saint Louis Regional Foodshed for the seven most common livestock animals: cattle (for beef), cows (for milk), hogs, broilers (meat chickens), layers (for eggs), and turkey. This inventory data is illustrated in Table 6-3. In order to protect individual operators’ identities, some counties withheld their inventory data but stated that they do in fact have inventory of the particular animal. In addition, the 2007 Census of Agriculture reports the five most produced livestock animals in inventory for each county; these animals are referred to as “top livestock commodities.” The last column of Table 6-3 provides the total inventory disclosed from all “Top Livestock Commodity” counties and illustrates the distribution of inventory across the region. Lastly, the 2007 Census of Agriculture only
reports 58 counties in the Saint Louis Regional Foodshed because it considers Saint Louis City to be within Saint Louis County.
As Table 6-3 illustrates, in 2007 hogs and pigs were produced in every county of the Saint Louis Regional Foodshed and 50 of those 58 counties claimed hogs and pigs as one of their “top livestock commodities.” Cattle and calves were also produced in every county and were also a “top livestock commodity” across the entire region. Beef cows and milk cows are not their own category for top livestock commodities, but it is important to point out that every county in the Foodshed raised beef cows and 53 of the 58 counties produce dairy cows. Both the beef cow inventory and the milk cow inventory was withheld from 14 counties, illustrating that more beef and milk cows were in inventory than we have numbers for in 2007.
Table 6-3 illustrates that while no single county or group of counties in the region dominate the cattle, beef, dairy, broiler, or layer (for eggs) industries, turkey inventory in the Foodshed was notably concentrated. Despite 48 counties having turkey inventory in 2007, five of those counties claimed turkey as a “top livestock commodity” and accounted for nearly all (99.8%) of the region’s inventory.
Table 6-4 provides a list of other less common livestock animals that some of the Saint Louis Regional Foodshed counties claimed as their “top livestock commodities” and the total inventory of each animal from those counties. Since most of these animals are not common grocery store provisions, total inventory of these animals in the Foodshed was not collected. The top livestock commodity inventory is provided to illustrate the diversity of livestock production in our region which includes goats, sheep, rabbits, bison, and even bees.
Hogs and pigs
Cattle and calves
Beef cows
Milk cows
Layers (hens laying eggs)
Broilers and other typeof meat-type chickens
58
58
58
53
52
58
5
0
14
14
21
5
12
1,619,063
1,124,825
443,366
54,606
10,223
65,269
Number of Counties with Top Livestock InventoryLivestock
TABLE. 6-36 LIVESTOCK INVENTORY BY NUMBER OF COUNTIES, 2007
TABLE. 6-47 TOTAL INVENTORY & NUMBER OF COUNTIES WITH OTHER TOP LIVESTOCK COMMODITIES, 2007
Percentage of total Inventory in “Top Livestock Commodity” Counties (Number of “Top Livestock Commodity” Counties)
Total Inventory (Heads)
Number of Counties with Inventory that withheld data
Number ofCounties with Inventory
Livestock
Number of Counties with Inventory that withheld data
Total Top Livestock Inventory (Heads)
Sheep and lambs
Horses and ponies
Goats, all
Rabbits and their pelts
Pullets for laying flock replacement
Quail
Pheasants
Colonies of bees
Bison
Deer
Ducks
24
47
23
2
4
9
6
2
3
1 - Calhoun, MO
1 - Jersey, IL
1
0
0
0
1
4
5
0
3
0
0
16,425
45,446
19,463
796; Iron, MO (251) & Monroe, IL (545)
3,890
9,334
380; Jersey (380)
902; Perry (328) & Saint Louis County (574)
All withheld
75
1,352
Livestock Inventory
Turkeys 48 803,994
99.91% (50 counties, 4 withheld data)
100% (58 counties)
NA
NA
17.12% (3 counties, 1 withheld data)
95.56% (52 counties, 5 withheld data)
99.76% (5 counties)
85 Saint Louis Regional Food Study | 2014
Saint Louis Regional Food Study - 2014 5
The data demonstrates that the Saint Louis Regional Foodshed invests its resources into the livestock industry. In 2007, every county had farmers who raised hogs and pigs, cattle and calves, beef cows, and layers (hens); 52 counties had farmers who raised milk cows, and 51 counties (of 58) had farmers who raised broilers (chickens for meat).8
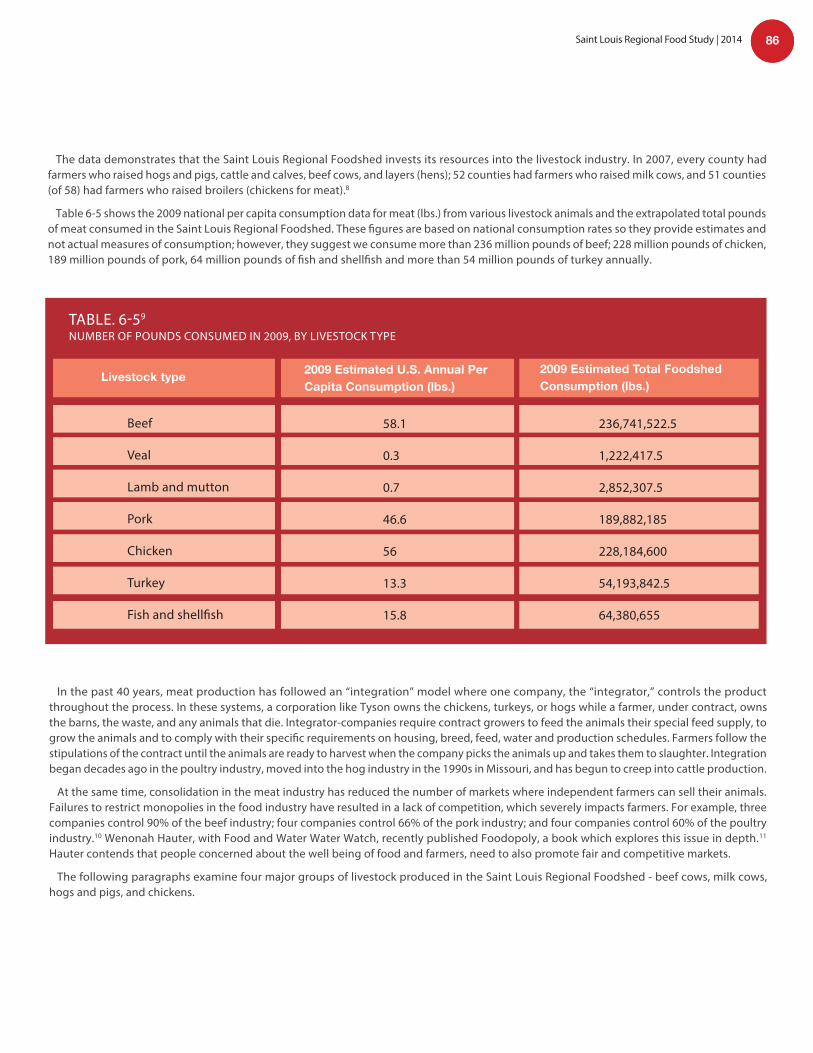
Table 6-5 shows the 2009 national per capita consumption data for meat (lbs.) from various livestock animals and the extrapolated total pounds of meat consumed in the Saint Louis Regional Foodshed. These figures are based on national consumption rates so they provide estimates and not actual measures of consumption; however, they suggest we consume more than 236 million pounds of beef; 228 million pounds of chicken, 189 million pounds of pork, 64 million pounds of fish and shellfish and more than 54 million pounds of turkey annually.
TABLE. 6-59 NUMBER OF POUNDS CONSUMED IN 2009, BY LIVESTOCK TYPE
Livestock type 2009 Estimated U.S. Annual Per Capita Consumption (lbs.)
2009 Estimated Total Foodshed Consumption (lbs.)
Beef
Veal
Lamb and mutton
Pork
Chicken
Turkey
Fish and shellfish
58.1
0.3
0.7
46.6
56
13.3
15.8
236,741,522.5
1,222,417.5
2,852,307.5
189,882,185
228,184,600
54,193,842.5
64,380,655
In the past 40 years, meat production has followed an “integration” model where one company, the “integrator,” controls the product throughout the process. In these systems, a corporation like Tyson owns the chickens, turkeys, or hogs while a farmer, under contract, owns the barns, the waste, and any animals that die. Integrator-companies require contract growers to feed the animals their special feed supply, to grow the animals and to comply with their specific requirements on housing, breed, feed, water and production schedules. Farmers follow the stipulations of the contract until the animals are ready to harvest when the company picks the animals up and takes them to slaughter. Integration began decades ago in the poultry industry, moved into the hog industry in the 1990s in Missouri, and has begun to creep into cattle production.
At the same time, consolidation in the meat industry has reduced the number of markets where independent farmers can sell their animals. Failures to restrict monopolies in the food industry have resulted in a lack of competition, which severely impacts farmers. For example, three companies control 90% of the beef industry; four companies control 66% of the pork industry; and four companies control 60% of the poultry industry.10 Wenonah Hauter, with Food and Water Water Watch, recently published Foodopoly, a book which explores this issue in depth.11 Hauter contends that people concerned about the well being of food and farmers, need to also promote fair and competitive markets.
The following paragraphs examine four major groups of livestock produced in the Saint Louis Regional Foodshed - beef cows, milk cows, hogs and pigs, and chickens.
86Saint Louis Regional Food Study | 2014
Saint Louis Regional Food Study - 20146
Beef Production Between 1964 and 2007, Missouri’s beef
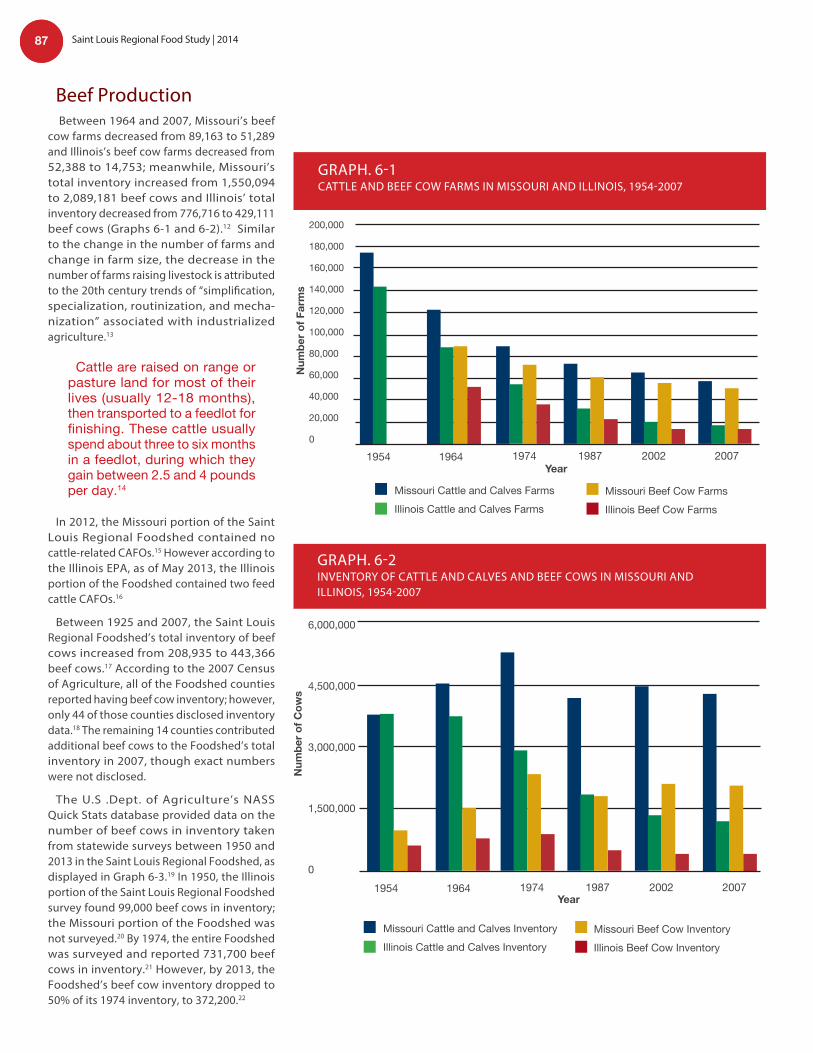
cow farms decreased from 89,163 to 51,289 and Illinois’s beef cow farms decreased from 52,388 to 14,753; meanwhile, Missouri’s total inventory increased from 1,550,094 to 2,089,181 beef cows and Illinois’ total inventory decreased from 776,716 to 429,111 beef cows (Graphs 6-1 and 6-2).12 Similar to the change in the number of farms and change in farm size, the decrease in the number of farms raising livestock is attributed to the 20th century trends of “simplification, specialization, routinization, and mecha-nization” associated with industrialized agriculture.13
Cattle are raised on range or pasture land for most of their lives (usually 12-18 months), then transported to a feedlot for finishing. These cattle usually spend about three to six months in a feedlot, during which they gain between 2.5 and 4 pounds per day.
In 2012, the Missouri portion of the Saint Louis Regional Foodshed contained no cattle-related CAFOs.15 However according to the Illinois EPA, as of May 2013, the Illinois portion of the Foodshed contained two feed cattle CAFOs.16
Between 1925 and 2007, the Saint Louis Regional Foodshed’s total inventory of beef cows increased from 208,935 to 443,366 beef cows.17 According to the 2007 Census of Agriculture, all of the Foodshed counties reported having beef cow inventory; however, only 44 of those counties disclosed inventory data.18 The remaining 14 counties contributed additional beef cows to the Foodshed’s total inventory in 2007, though exact numbers were not disclosed.
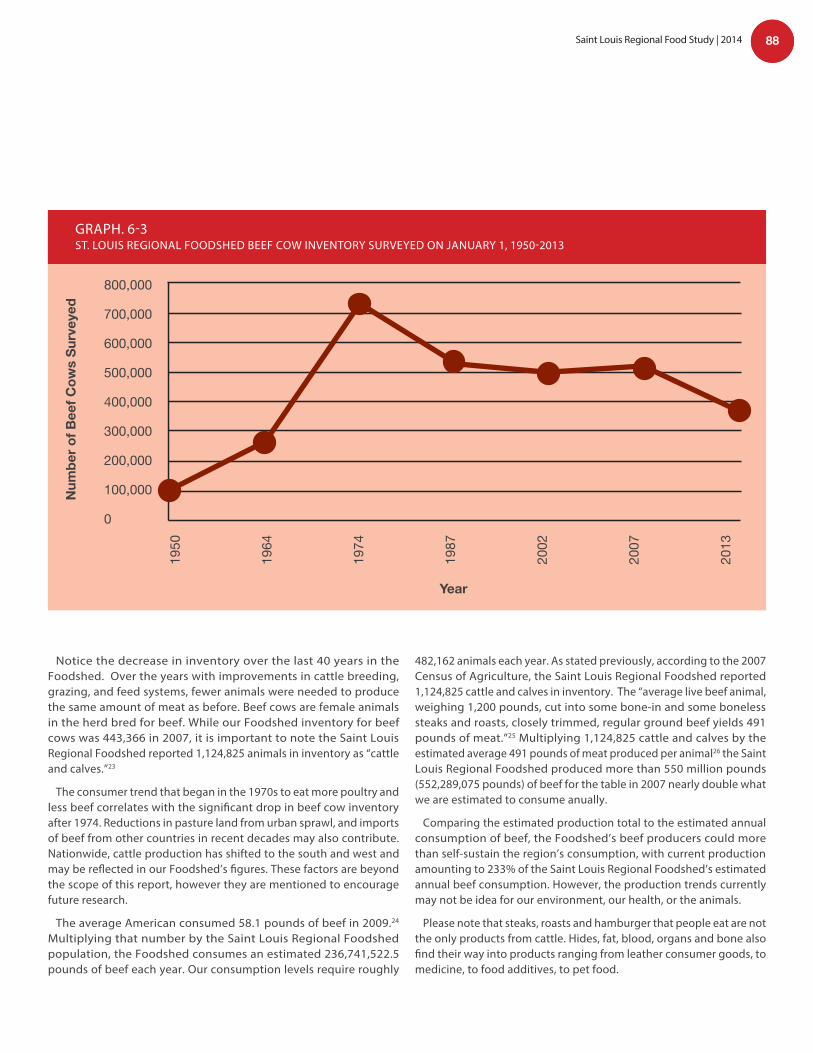
The U.S .Dept. of Agriculture’s NASS Quick Stats database provided data on the number of beef cows in inventory taken from statewide surveys between 1950 and 2013 in the Saint Louis Regional Foodshed, as displayed in Graph 6-3.19 In 1950, the Illinois portion of the Saint Louis Regional Foodshed survey found 99,000 beef cows in inventory; the Missouri portion of the Foodshed was not surveyed.20 By 1974, the entire Foodshed was surveyed and reported 731,700 beef cows in inventory.21 However, by 2013, the Foodshed’s beef cow inventory dropped to 50% of its 1974 inventory, to 372,200.22
1954 1964 1974 1987 2002 2007
200,000
180,000
160,000
140,000
120,000
100,000
80,000
60,000
40,000
20,000
0
Year
Num
ber o
f Far
ms
1954 1964 1974 1987 2002 2007Year
6,000,000
4,500,000
3,000,000
1,500,000
0
Num
ber o
f Cow
s
GRAPH. 6-1 CATTLE AND BEEF COW FARMS IN MISSOURI AND ILLINOIS, 1954-2007
GRAPH. 6-2 INVENTORY OF CATTLE AND CALVES AND BEEF COWS IN MISSOURI AND ILLINOIS, 1954-2007
Missouri Cattle and Calves FarmsIllinois Cattle and Calves Farms
Missouri Beef Cow Farms Illinois Beef Cow Farms
Missouri Cattle and Calves InventoryIllinois Cattle and Calves Inventory
Missouri Beef Cow InventoryIllinois Beef Cow Inventory
Cattle are raised on range or pasture land for most of their lives (usually 12-18 months), then transported to a feedlot for finishing. These cattle usually spend about three to six months in a feedlot, during which they gain between 2.5 and 4 pounds per day.14
87 Saint Louis Regional Food Study | 2014
Saint Louis Regional Food Study - 2014 7
Notice the decrease in inventory over the last 40 years in the Foodshed. Over the years with improvements in cattle breeding, grazing, and feed systems, fewer animals were needed to produce the same amount of meat as before. Beef cows are female animals in the herd bred for beef. While our Foodshed inventory for beef cows was 443,366 in 2007, it is important to note the Saint Louis Regional Foodshed reported 1,124,825 animals in inventory as “cattle and calves.”23
The consumer trend that began in the 1970s to eat more poultry and less beef correlates with the significant drop in beef cow inventory after 1974. Reductions in pasture land from urban sprawl, and imports of beef from other countries in recent decades may also contribute. Nationwide, cattle production has shifted to the south and west and may be reflected in our Foodshed’s figures. These factors are beyond the scope of this report, however they are mentioned to encourage future research.
The average American consumed 58.1 pounds of beef in 2009.24 Multiplying that number by the Saint Louis Regional Foodshed population, the Foodshed consumes an estimated 236,741,522.5 pounds of beef each year. Our consumption levels require roughly
482,162 animals each year. As stated previously, according to the 2007 Census of Agriculture, the Saint Louis Regional Foodshed reported 1,124,825 cattle and calves in inventory. The “average live beef animal, weighing 1,200 pounds, cut into some bone-in and some boneless steaks and roasts, closely trimmed, regular ground beef yields 491 pounds of meat.”25 Multiplying 1,124,825 cattle and calves by the estimated average 491 pounds of meat produced per animal26 the Saint Louis Regional Foodshed produced more than 550 million pounds (552,289,075 pounds) of beef for the table in 2007 nearly double what we are estimated to consume anually.
Comparing the estimated production total to the estimated annual consumption of beef, the Foodshed’s beef producers could more than self-sustain the region’s consumption, with current production amounting to 233% of the Saint Louis Regional Foodshed’s estimated annual beef consumption. However, the production trends currently may not be idea for our environment, our health, or the animals.
Please note that steaks, roasts and hamburger that people eat are not the only products from cattle. Hides, fat, blood, organs and bone also find their way into products ranging from leather consumer goods, to medicine, to food additives, to pet food.
1950
1964
1974
1987
2002
2007
2013
800,000
700,000
600,000
500,000
400,000
300,000
200,000
100,000
0
Num
ber o
f Bee
f Cow
s Su
rvey
ed
Year
GRAPH. 6-3ST. LOUIS REGIONAL FOODSHED BEEF COW INVENTORY SURVEYED ON JANUARY 1, 1950-2013
GRAPH. 6-1 CATTLE AND BEEF COW FARMS IN MISSOURI AND ILLINOIS, 1954-2007
88Saint Louis Regional Food Study | 2014
Saint Louis Regional Food Study - 20148
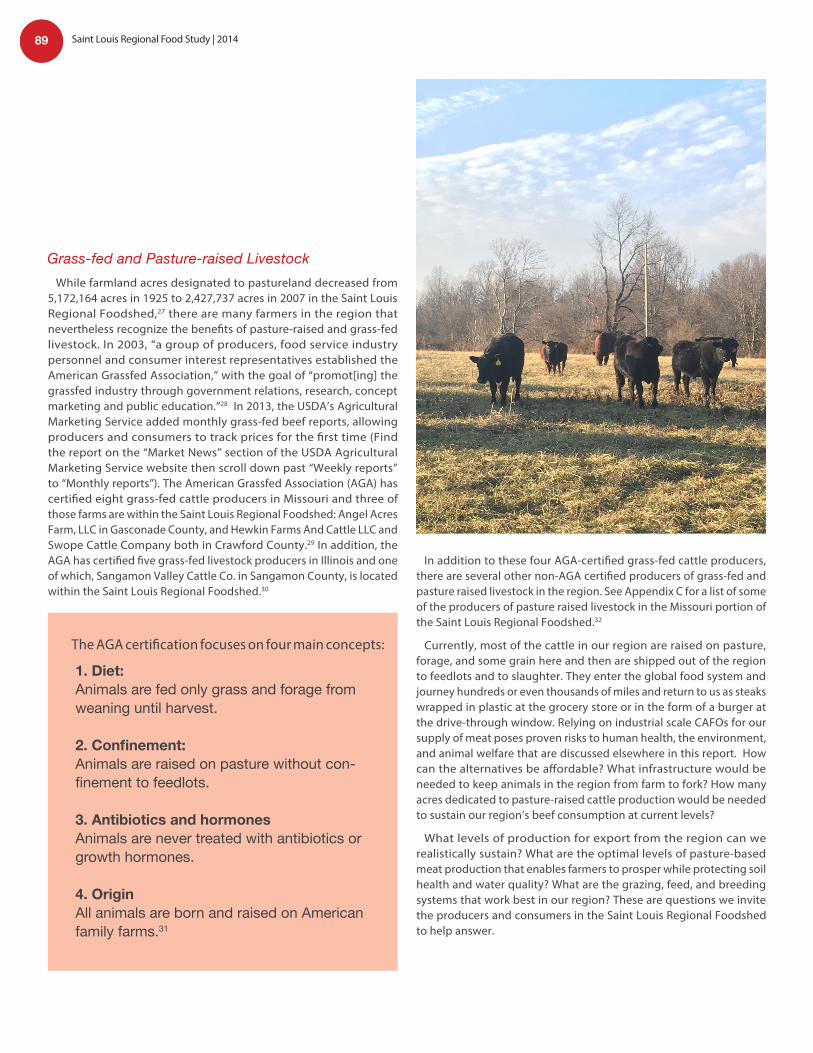
While farmland acres designated to pastureland decreased from 5,172,164 acres in 1925 to 2,427,737 acres in 2007 in the Saint Louis Regional Foodshed,27 there are many farmers in the region that nevertheless recognize the benefits of pasture-raised and grass-fed livestock. In 2003, “a group of producers, food service industry personnel and consumer interest representatives established the American Grassfed Association,” with the goal of “promot[ing] the grassfed industry through government relations, research, concept marketing and public education.”28 In 2013, the USDA’s Agricultural Marketing Service added monthly grass-fed beef reports, allowing producers and consumers to track prices for the first time (Find the report on the “Market News” section of the USDA Agricultural Marketing Service website then scroll down past “Weekly reports” to “Monthly reports”). The American Grassfed Association (AGA) has certified eight grass-fed cattle producers in Missouri and three of those farms are within the Saint Louis Regional Foodshed: Angel Acres Farm, LLC in Gasconade County, and Hewkin Farms And Cattle LLC and Swope Cattle Company both in Crawford County.29 In addition, the AGA has certified five grass-fed livestock producers in Illinois and one of which, Sangamon Valley Cattle Co. in Sangamon County, is located within the Saint Louis Regional Foodshed.30
Grass-fed and Pasture-raised Livestock
In addition to these four AGA-certified grass-fed cattle producers, there are several other non-AGA certified producers of grass-fed and pasture raised livestock in the region. See Appendix C for a list of some of the producers of pasture raised livestock in the Missouri portion of the Saint Louis Regional Foodshed.32
Currently, most of the cattle in our region are raised on pasture, forage, and some grain here and then are shipped out of the region to feedlots and to slaughter. They enter the global food system and journey hundreds or even thousands of miles and return to us as steaks wrapped in plastic at the grocery store or in the form of a burger at the drive-through window. Relying on industrial scale CAFOs for our supply of meat poses proven risks to human health, the environment, and animal welfare that are discussed elsewhere in this report. How can the alternatives be affordable? What infrastructure would be needed to keep animals in the region from farm to fork? How many acres dedicated to pasture-raised cattle production would be needed to sustain our region’s beef consumption at current levels?
What levels of production for export from the region can we realistically sustain? What are the optimal levels of pasture-based meat production that enables farmers to prosper while protecting soil health and water quality? What are the grazing, feed, and breeding systems that work best in our region? These are questions we invite the producers and consumers in the Saint Louis Regional Foodshed to help answer.
1. Diet: Animals are fed only grass and forage from weaning until harvest.
2. Confinement: Animals are raised on pasture without con-finement to feedlots.
3. Antibiotics and hormones Animals are never treated with antibiotics or growth hormones.
4. OriginAll animals are born and raised on American family farms.31
The AGA certification focuses on four main concepts:
89 Saint Louis Regional Food Study | 2014
Saint Louis Regional Food Study - 2014 9
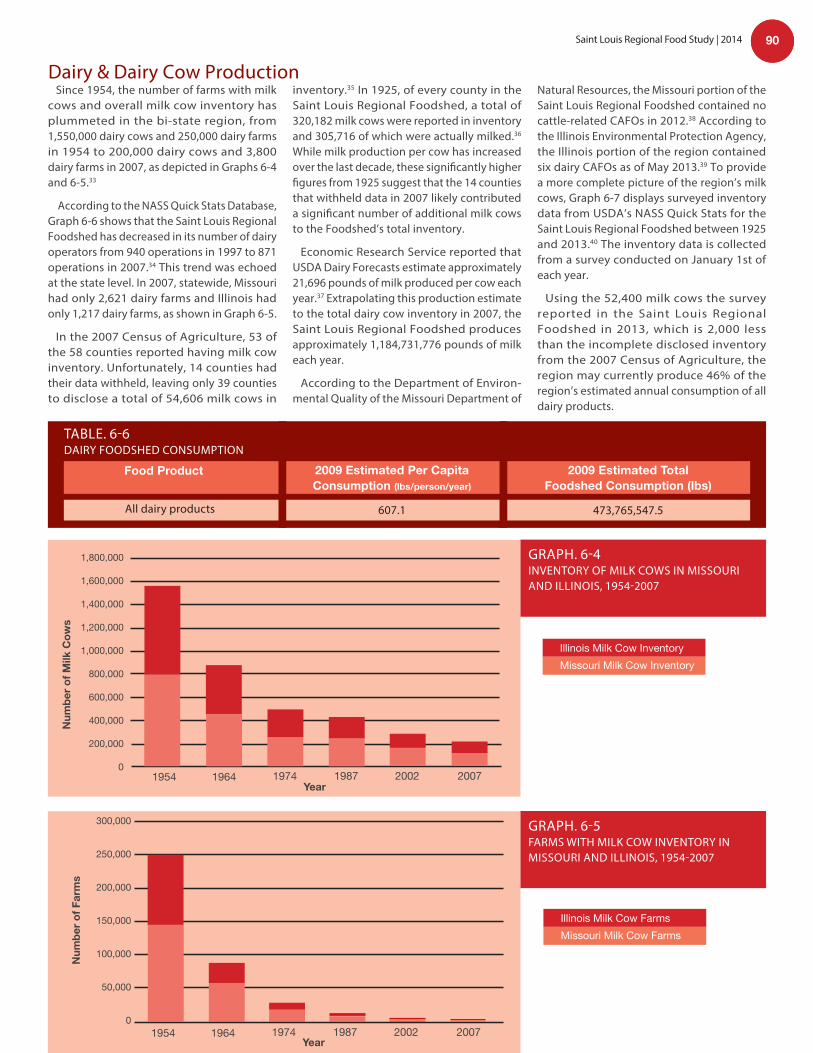
Since 1954, the number of farms with milk cows and overall milk cow inventory has plummeted in the bi-state region, from 1,550,000 dairy cows and 250,000 dairy farms in 1954 to 200,000 dairy cows and 3,800 dairy farms in 2007, as depicted in Graphs 6-4 and 6-5.33
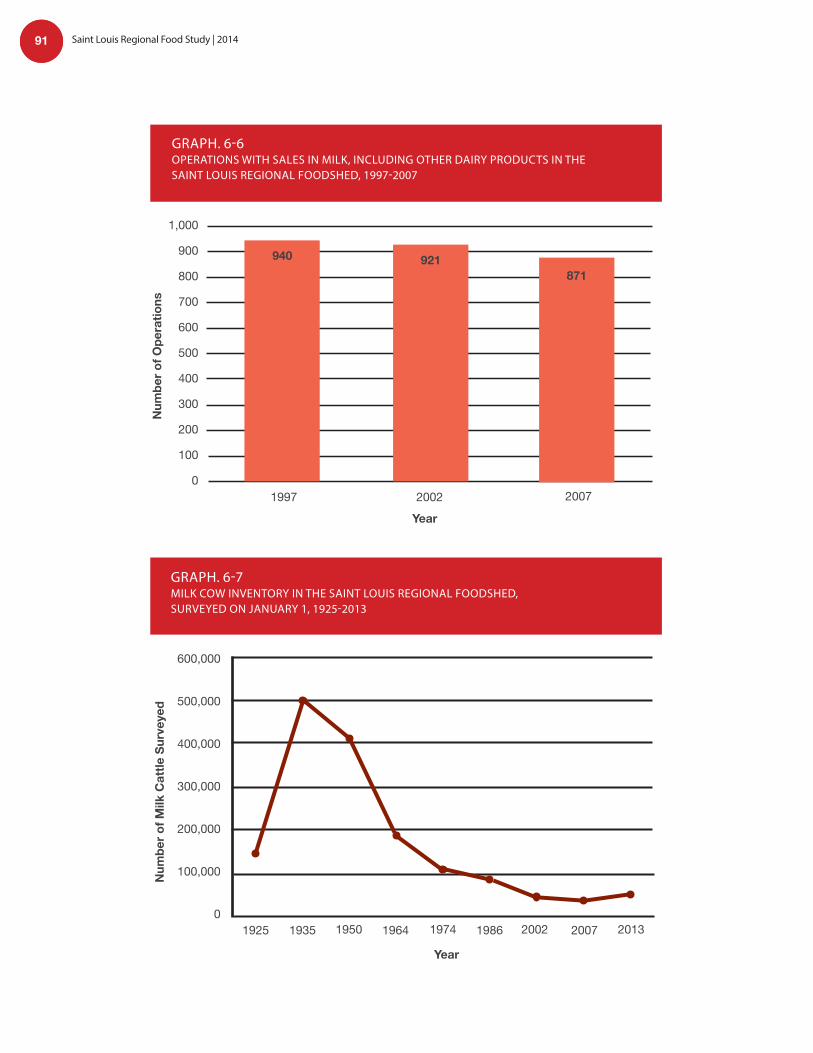
According to the NASS Quick Stats Database, Graph 6-6 shows that the Saint Louis Regional Foodshed has decreased in its number of dairy operators from 940 operations in 1997 to 871 operations in 2007.34 This trend was echoed at the state level. In 2007, statewide, Missouri had only 2,621 dairy farms and Illinois had only 1,217 dairy farms, as shown in Graph 6-5.
In the 2007 Census of Agriculture, 53 of the 58 counties reported having milk cow inventory. Unfortunately, 14 counties had their data withheld, leaving only 39 counties to disclose a total of 54,606 milk cows in
inventory.35 In 1925, of every county in the Saint Louis Regional Foodshed, a total of 320,182 milk cows were reported in inventory and 305,716 of which were actually milked.36 While milk production per cow has increased over the last decade, these significantly higher figures from 1925 suggest that the 14 counties that withheld data in 2007 likely contributed a significant number of additional milk cows to the Foodshed’s total inventory.
Economic Research Service reported that USDA Dairy Forecasts estimate approximately 21,696 pounds of milk produced per cow each year.37 Extrapolating this production estimate to the total dairy cow inventory in 2007, the Saint Louis Regional Foodshed produces approximately 1,184,731,776 pounds of milk each year.
According to the Department of Environ-mental Quality of the Missouri Department of
Natural Resources, the Missouri portion of the Saint Louis Regional Foodshed contained no cattle-related CAFOs in 2012.38 According to the Illinois Environmental Protection Agency, the Illinois portion of the region contained six dairy CAFOs as of May 2013.39 To provide a more complete picture of the region’s milk cows, Graph 6-7 displays surveyed inventory data from USDA’s NASS Quick Stats for the Saint Louis Regional Foodshed between 1925 and 2013.40 The inventory data is collected from a survey conducted on January 1st of each year.
Using the 52,400 milk cows the survey reported in the Saint Louis Regional Foodshed in 2013, which is 2,000 less than the incomplete disclosed inventory from the 2007 Census of Agriculture, the region may currently produce 46% of the region’s estimated annual consumption of all dairy products.
Dairy & Dairy Cow Production
GRAPH. 6-4INVENTORY OF MILK COWS IN MISSOURI AND ILLINOIS, 1954-2007
1954 1964 1974 1987 2002 2007Year
1,800,000
1,600,000
1,400,000
1,200,000
1,000,000
800,000
600,000
400,000
200,000
0
Num
ber o
f Milk
Cow
s
GRAPH. 6-5FARMS WITH MILK COW INVENTORY IN MISSOURI AND ILLINOIS, 1954-2007
1954 1964 1974 1987 2002 2007Year
300,000
250,000
200,000
150,000
100,000
50,000
0
Num
ber o
f Far
ms
Illinois Milk Cow Farms Missouri Milk Cow Farms
Food Product 2009 Estimated Per Capita Consumption (lbs/person/year)
2009 Estimated Total Foodshed Consumption (lbs)
All dairy products 607.1 473,765,547.5
TABLE. 6-6DAIRY FOODSHED CONSUMPTION
Illinois Milk Cow InventoryMissouri Milk Cow Inventory
90Saint Louis Regional Food Study | 2014
Saint Louis Regional Food Study - 201410
1997 2002 2007
Year
1,000
900
800
700
600
500
400
300
200
100
0
Num
ber o
f Ope
ratio
ns
940
GRAPH. 6-6OPERATIONS WITH SALES IN MILK, INCLUDING OTHER DAIRY PRODUCTS IN THE SAINT LOUIS REGIONAL FOODSHED, 1997-2007
600,000
500,000
400,000
300,000
200,000
100,000
0
Num
ber o
f Milk
Cat
tle S
urve
yed
Year
1925 1935 1950 1964 1974 1986 2002 2007 2013
GRAPH. 6-7MILK COW INVENTORY IN THE SAINT LOUIS REGIONAL FOODSHED, SURVEYED ON JANUARY 1, 1925-2013
921871
91 Saint Louis Regional Food Study | 2014
Saint Louis Regional Food Study - 2014 11
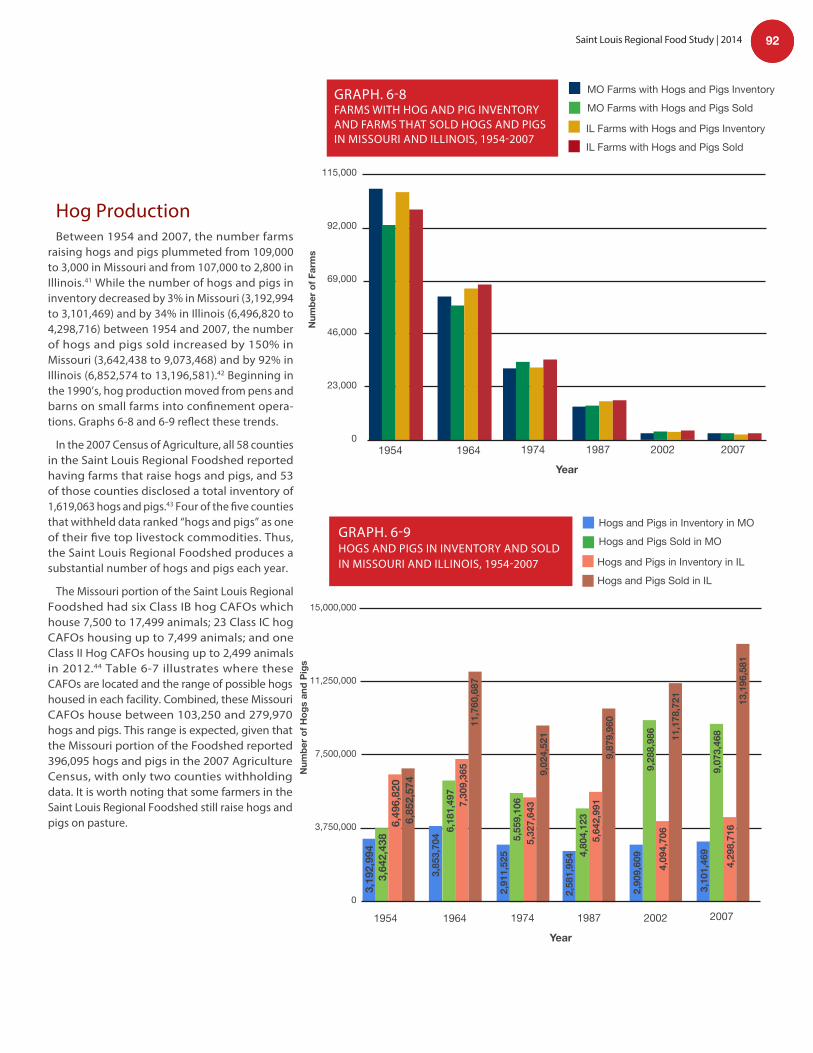
Hog ProductionBetween 1954 and 2007, the number farms
raising hogs and pigs plummeted from 109,000 to 3,000 in Missouri and from 107,000 to 2,800 in Illinois.41 While the number of hogs and pigs in inventory decreased by 3% in Missouri (3,192,994 to 3,101,469) and by 34% in Illinois (6,496,820 to 4,298,716) between 1954 and 2007, the number of hogs and pigs sold increased by 150% in Missouri (3,642,438 to 9,073,468) and by 92% in Illinois (6,852,574 to 13,196,581).42 Beginning in the 1990’s, hog production moved from pens and barns on small farms into confinement opera-tions. Graphs 6-8 and 6-9 reflect these trends.
In the 2007 Census of Agriculture, all 58 counties in the Saint Louis Regional Foodshed reported having farms that raise hogs and pigs, and 53 of those counties disclosed a total inventory of 1,619,063 hogs and pigs.43 Four of the five counties that withheld data ranked “hogs and pigs” as one of their five top livestock commodities. Thus, the Saint Louis Regional Foodshed produces a substantial number of hogs and pigs each year.
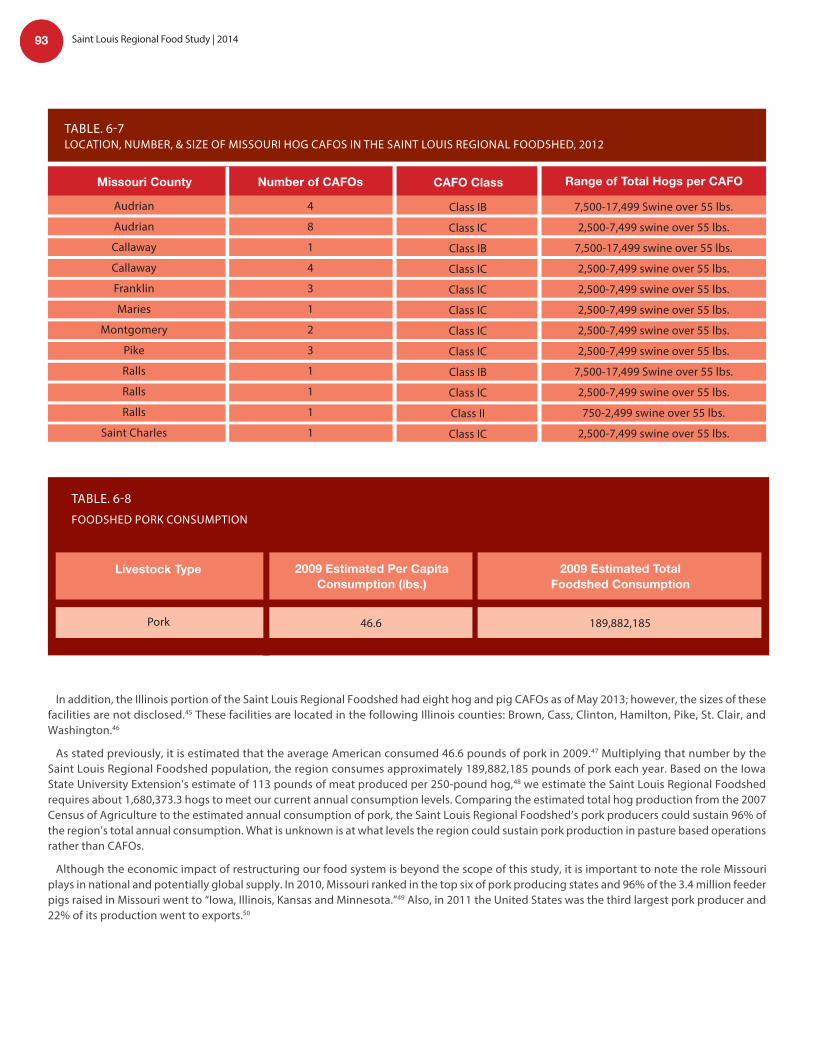
The Missouri portion of the Saint Louis Regional Foodshed had six Class IB hog CAFOs which house 7,500 to 17,499 animals; 23 Class IC hog CAFOs housing up to 7,499 animals; and one Class II Hog CAFOs housing up to 2,499 animals in 2012.44 Table 6-7 illustrates where these
1954 1964 1974 1987 2002 2007
1954 1964 1974 1987 2002 2007
Year
Year
CAFOs are located and the range of possible hogs housed in each facility. Combined, these Missouri CAFOs house between 103,250 and 279,970 hogs and pigs. This range is expected, given that the Missouri portion of the Foodshed reported 396,095 hogs and pigs in the 2007 Agriculture Census, with only two counties withholding data. It is worth noting that some farmers in the Saint Louis Regional Foodshed still raise hogs and pigs on pasture.
GRAPH. 6-8FARMS WITH HOG AND PIG INVENTORY AND FARMS THAT SOLD HOGS AND PIGS IN MISSOURI AND ILLINOIS, 1954-2007
MO Farms with Hogs and Pigs Inventory
MO Farms with Hogs and Pigs Sold
IL Farms with Hogs and Pigs Inventory
IL Farms with Hogs and Pigs Sold
GRAPH. 6-9HOGS AND PIGS IN INVENTORY AND SOLD IN MISSOURI AND ILLINOIS, 1954-2007
115,000
92,000
69,000
46,000
23,000
0
Hogs and Pigs in Inventory in MO
Hogs and Pigs Sold in MO
Hogs and Pigs in Inventory in IL
Hogs and Pigs Sold in IL
15,000,000
11,250,000
7,500,000
3,750,000
0
3,19
2,99
43,
642,
438
6,49
6,82
06,
852,
574
3,85
3,70
4 6,18
1,49
77,
309,
365
2,91
1,52
55,
559,
106
5,32
7,64
39,
024,
521
2,58
1,95
4 4,80
4,12
35,
642,
991
9,87
9,96
0
2,90
9,60
99,
288,
986
4,09
4,70
6
3,10
1,46
99,
073,
468
4,29
8,71
6
Num
ber o
f Far
ms
Num
ber o
f Hog
s an
d Pi
gs
92Saint Louis Regional Food Study | 2014
11,7
60,6
87
11,1
78,7
21 13,1
96,5
81
Saint Louis Regional Food Study - 201412
In addition, the Illinois portion of the Saint Louis Regional Foodshed had eight hog and pig CAFOs as of May 2013; however, the sizes of these facilities are not disclosed.45 These facilities are located in the following Illinois counties: Brown, Cass, Clinton, Hamilton, Pike, St. Clair, and Washington.46
As stated previously, it is estimated that the average American consumed 46.6 pounds of pork in 2009.47 Multiplying that number by the Saint Louis Regional Foodshed population, the region consumes approximately 189,882,185 pounds of pork each year. Based on the Iowa State University Extension’s estimate of 113 pounds of meat produced per 250-pound hog,48 we estimate the Saint Louis Regional Foodshed requires about 1,680,373.3 hogs to meet our current annual consumption levels. Comparing the estimated total hog production from the 2007 Census of Agriculture to the estimated annual consumption of pork, the Saint Louis Regional Foodshed’s pork producers could sustain 96% of the region’s total annual consumption. What is unknown is at what levels the region could sustain pork production in pasture based operations rather than CAFOs.
Although the economic impact of restructuring our food system is beyond the scope of this study, it is important to note the role Missouri plays in national and potentially global supply. In 2010, Missouri ranked in the top six of pork producing states and 96% of the 3.4 million feeder pigs raised in Missouri went to “Iowa, Illinois, Kansas and Minnesota.”49 Also, in 2011 the United States was the third largest pork producer and 22% of its production went to exports.50
Number of CAFOsMissouri County
TABLE. 6-7 LOCATION, NUMBER, & SIZE OF MISSOURI HOG CAFOS IN THE SAINT LOUIS REGIONAL FOODSHED, 2012
CAFO Class Range of Total Hogs per CAFO
Audrian
Audrian
Callaway
Callaway
Franklin
Maries
Montgomery
Pike
Ralls
Ralls
Ralls
Saint Charles
4
8
1
4
3
1
2
3
1
1
1
1
Class IB
Class IC
Class IB
Class IC
Class IC
Class IC
Class IC
Class IC
Class IB
Class IC
Class II
Class IC
7,500-17,499 Swine over 55 lbs.
2,500-7,499 swine over 55 lbs.
7,500-17,499 swine over 55 lbs.
2,500-7,499 swine over 55 lbs.
2,500-7,499 swine over 55 lbs.
2,500-7,499 swine over 55 lbs.
2,500-7,499 swine over 55 lbs.
2,500-7,499 swine over 55 lbs.
7,500-17,499 Swine over 55 lbs.
2,500-7,499 swine over 55 lbs.
750-2,499 swine over 55 lbs.
2,500-7,499 swine over 55 lbs.
TABLE. 6-8
FOODSHED PORK CONSUMPTION
Livestock Type 2009 Estimated Per Capita Consumption (lbs.)
2009 Estimated Total Foodshed Consumption
Pork 46.6 189,882,185
93 Saint Louis Regional Food Study | 2014
Saint Louis Regional Food Study - 2014 13
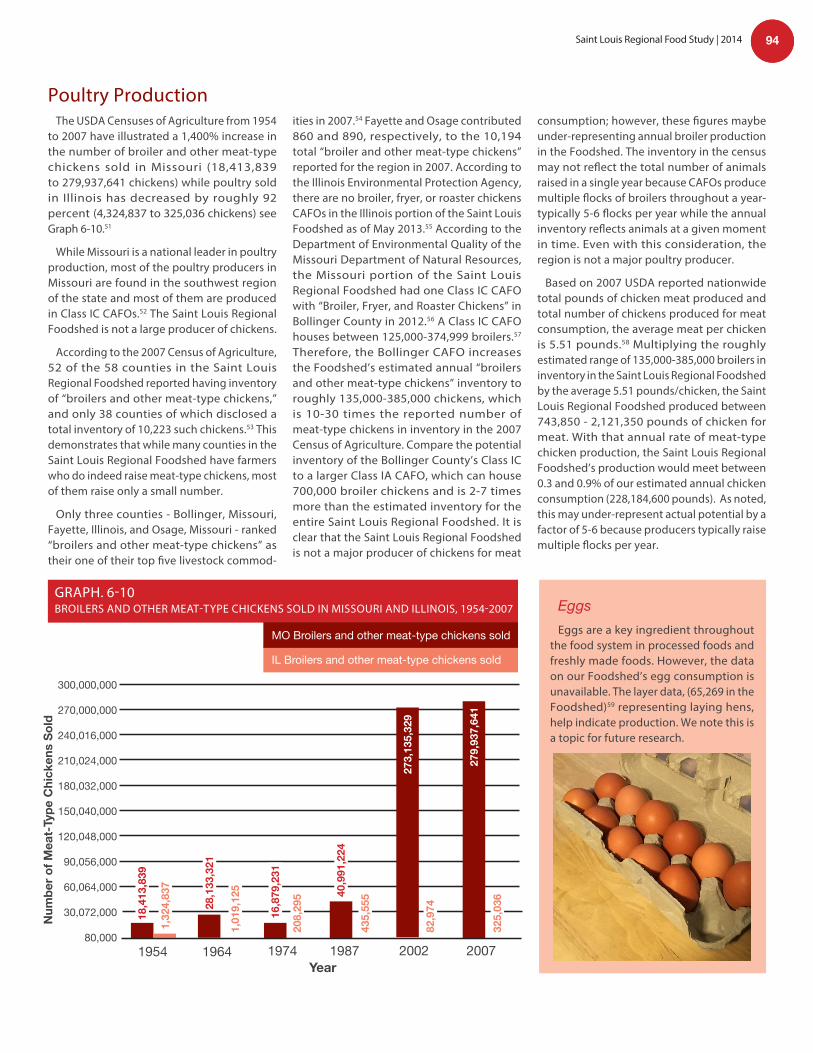
The USDA Censuses of Agriculture from 1954 to 2007 have illustrated a 1,400% increase in the number of broiler and other meat-type chickens sold in Missouri (18,413,839 to 279,937,641 chickens) while poultry sold in Illinois has decreased by roughly 92 percent (4,324,837 to 325,036 chickens) see Graph 6-10.51
While Missouri is a national leader in poultry production, most of the poultry producers in Missouri are found in the southwest region of the state and most of them are produced in Class IC CAFOs.52 The Saint Louis Regional Foodshed is not a large producer of chickens.
According to the 2007 Census of Agriculture, 52 of the 58 counties in the Saint Louis Regional Foodshed reported having inventory of “broilers and other meat-type chickens,” and only 38 counties of which disclosed a total inventory of 10,223 such chickens.53 This demonstrates that while many counties in the Saint Louis Regional Foodshed have farmers who do indeed raise meat-type chickens, most of them raise only a small number.
Only three counties - Bollinger, Missouri, Fayette, Illinois, and Osage, Missouri - ranked “broilers and other meat-type chickens” as their one of their top five livestock commod-
ities in 2007.54 Fayette and Osage contributed 860 and 890, respectively, to the 10,194 total “broiler and other meat-type chickens” reported for the region in 2007. According to the Illinois Environmental Protection Agency, there are no broiler, fryer, or roaster chickens CAFOs in the Illinois portion of the Saint Louis Foodshed as of May 2013.55 According to the Department of Environmental Quality of the Missouri Department of Natural Resources, the Missouri portion of the Saint Louis Regional Foodshed had one Class IC CAFO with “Broiler, Fryer, and Roaster Chickens” in Bollinger County in 2012.56 A Class IC CAFO houses between 125,000-374,999 broilers.57 Therefore, the Bollinger CAFO increases the Foodshed’s estimated annual “broilers and other meat-type chickens” inventory to roughly 135,000-385,000 chickens, which is 10-30 times the reported number of meat-type chickens in inventory in the 2007 Census of Agriculture. Compare the potential inventory of the Bollinger County’s Class IC to a larger Class IA CAFO, which can house 700,000 broiler chickens and is 2-7 times more than the estimated inventory for the entire Saint Louis Regional Foodshed. It is clear that the Saint Louis Regional Foodshed is not a major producer of chickens for meat
consumption; however, these figures maybe under-representing annual broiler production in the Foodshed. The inventory in the census may not reflect the total number of animals raised in a single year because CAFOs produce multiple flocks of broilers throughout a year- typically 5-6 flocks per year while the annual inventory reflects animals at a given moment in time. Even with this consideration, the region is not a major poultry producer.
Based on 2007 USDA reported nationwide total pounds of chicken meat produced and total number of chickens produced for meat consumption, the average meat per chicken is 5.51 pounds.58 Multiplying the roughly estimated range of 135,000-385,000 broilers in inventory in the Saint Louis Regional Foodshed by the average 5.51 pounds/chicken, the Saint Louis Regional Foodshed produced between 743,850 - 2,121,350 pounds of chicken for meat. With that annual rate of meat-type chicken production, the Saint Louis Regional Foodshed’s production would meet between 0.3 and 0.9% of our estimated annual chicken consumption (228,184,600 pounds). As noted, this may under-represent actual potential by a factor of 5-6 because producers typically raise multiple flocks per year.
Poultry Production
EggsEggs are a key ingredient throughout
the food system in processed foods and freshly made foods. However, the data on our Foodshed’s egg consumption is unavailable. The layer data, (65,269 in the Foodshed)59 representing laying hens, help indicate production. We note this is a topic for future research.
1954 1964 1974 1987 2002 2007
18,4
13,8
39
1,32
4,83
7
28,1
33,3
21
16,8
79,2
31
40,9
91,2
24
273,
135,
329
279,
937,
641
1,01
9,12
5
208,
295
435,
555
82,9
74
325,
036
300,000,000
270,000,000
240,016,000
210,024,000
180,032,000
150,040,000
120,048,000
90,056,000
60,064,000
30,072,000
80,000
Num
ber o
f Mea
t-Ty
pe C
hick
ens
Sold
Year
GRAPH. 6-10BROILERS AND OTHER MEAT-TYPE CHICKENS SOLD IN MISSOURI AND ILLINOIS, 1954-2007
MO Broilers and other meat-type chickens sold
IL Broilers and other meat-type chickens sold
94Saint Louis Regional Food Study | 2014
Saint Louis Regional Food Study - 201414
Americans are eating more meat than is historically normal, produced in an industrial way that is decidedly historically abnormal as we have removed livestock from pasture and put animals under roofs in confinement. Industrial scale production processes expose consumers to pathogens, antibiotics,60 and growth hormones.61 Eating meat is generally hard on the digestive62 and cardiovascular systems.63 “Animal-based foods contribute to chronic diseases,”64 such as “heart disease; colon, breast, and prostate cancer; and type II diabetes” due to the larger amount of fat in meat, particularly saturated fat, compared to other protein sources.65 Industrial livestock practices like raising animals in confinement exacerbate these risks.
The health impacts from high-fat, meat-heavy diets come with a price tag. Preventative Medicine authors “Barnard et al. . . . estimated that meat consumption costs the United States roughly $30–60 billion a year in medical costs,” based on “the estimated contribution that eating meat makes to the diseases discussed above, plus other chronic diseases common in affluent countries and food-borne illnesses linked to meat consumption.”66 Concerns are emerging that animals raised in confinement are less nutritious than their pastured counterparts. Compared to pasture-raised cattle, dairy and meat products from CAFOs are higher in fat and lower in “the omega-3 fatty acids often lacking in our diets.”67 Omega-3 fatty acids are important for good health. In contrast, pastured livestock may offer more nutritional benefits. For example, “[p]astured chickens have 21% less total fat, 30% less saturated fat, 28% fewer calories than conventionally raised birds. They have 100% more omega 3’s and 50% more vitamin A than conventional birds.”68 Furthermore, many believe the eggs of pastured chickens have a higher nutritional quality as well. One producer claims, “pastured eggs have one-third less cholesterol, one-fourth less saturated fat, two-thirds more vitamin A, two times more omega-3 fatty acids, three times more vitamin E, seven times more beta-carotene, four to six times as much vitamin D as typical supermarket eggs.”69 Few thorough peer-reviewed studies have been conducted comparing the nutrition of pasture-based eggs to eggs from caged birds or even to “free range” (a term that refers to laying hens with
Health Implications of Livestock We Raise
access to the outdoors, but not necessarily access to pasture and the insects, seeds and grasses found in pasture). The issue is complicated by the variables present from chicken breed to chicken breed, producer to producer, pasture to pasture. In addition, producers may not be eager to document nutritional differences due to production methods. Mother Earth News is less reticent to investigate. It found better nutrition in a comparison of pastured eggs versus USDA data on conventionally produced eggs.70 For Missouri nutrition researchers interested in the best production methods for nutritional outcomes in our region, research opportunities abound.
Health Impacts to CAFO WorkersThe production of industrial livestock in confinement operations
causes adverse health effects for those who work in the industry and those who live near the production sites. Employees of CAFOs and feedlots are at risk due to pollution emissions on site from particle pollution, methane, ammonia, and hydrogen sulfide gas. “The prevalence of occupational respiratory diseases (occupational asthma, acute and chronic bronchitis, organic dust toxic syndrome) in CAFO workers can be as high as 30%.”71 This pollution is mainly a result of CAFOs housing large numbers of animals, which create extraordinary quantities of animal waste on small areas of land.72 The animal waste undergoes “anaerobic digestive fermentation” while in an underground pit below hog or dairy CAFOs or in a lagoon outside.73 This fermentation process “generate[s] four potentially dangerous gases: methane, hydrogen sulfide, carbon dioxide, and ammonia” and exposure to these gases at high concentrations can pose threats to human and animal health, including death to humans.74
Between 1977 and 2004, one study revealed that 77 fatalities occurred “related to on-farm manure storage and handling facilities” and “[t]he most frequently identified cause of death was asphyxiation with elevated levels of sulfide levels in the blood noted in some cases.” 75 Residents downstream and downwind are at risk as well from airborne particulate and water pollution.76
Pastured chickens have 21% less total fat, 30% less saturated fat, 28% fewer
calories than conventionally raised birds. They have 100% more omega 3’s and 50%
more vitamin A than conventional birds.68
“”
95 Saint Louis Regional Food Study | 2014
Saint Louis Regional Food Study - 2014 15
Resource Consumption94 percent, or 9.3 million acres, of the cropland in the Saint Louis Regional Foodshed produces
soybeans, forage, and grain crops. Much of those crops go into the food system as livestock feed. “Cattle eat about 10 percent of U.S. corn production; other animals eat 60 percent.”77 CAFO hogs and poultry are among those animals fed a corn-based diet. In addition, “66% of the U.S. grain production is fed to livestock.”78 Grain crops, as previously stated, include sorghum, wheat, corn, and oats.
“A typical steer will consume more than three thousand pounds of grain during its stay at a feedlot, just to gain four hundred pounds in weight.”79 “Today beef calves can grow from 80 pounds to 1,200 pounds in just fourteen months on a diet of corn, soybean, antibiotics, and hormones,”80 and once they reach the feedlot, beef cattle “are fed a scientifically formulated ration that averages 70 percent to 90 percent grain,”81 and “are brought to slaughter weight at 12-22 months of age.”82 Efficiencies gained by improved breeds, forage, and good grazing management may improve these figures.
In any case, cattle and particularly cattle raised for beef production, consume a significant amount of grain over the course of their 12-22 month lifespan. In fact, “cattle are the most inefficient in their energy conversion, requiring 7 kg of grain to produce 1 kg of beef (compared to 4:1 for pork and 2:1 for chicken) (footnote omitted).”83
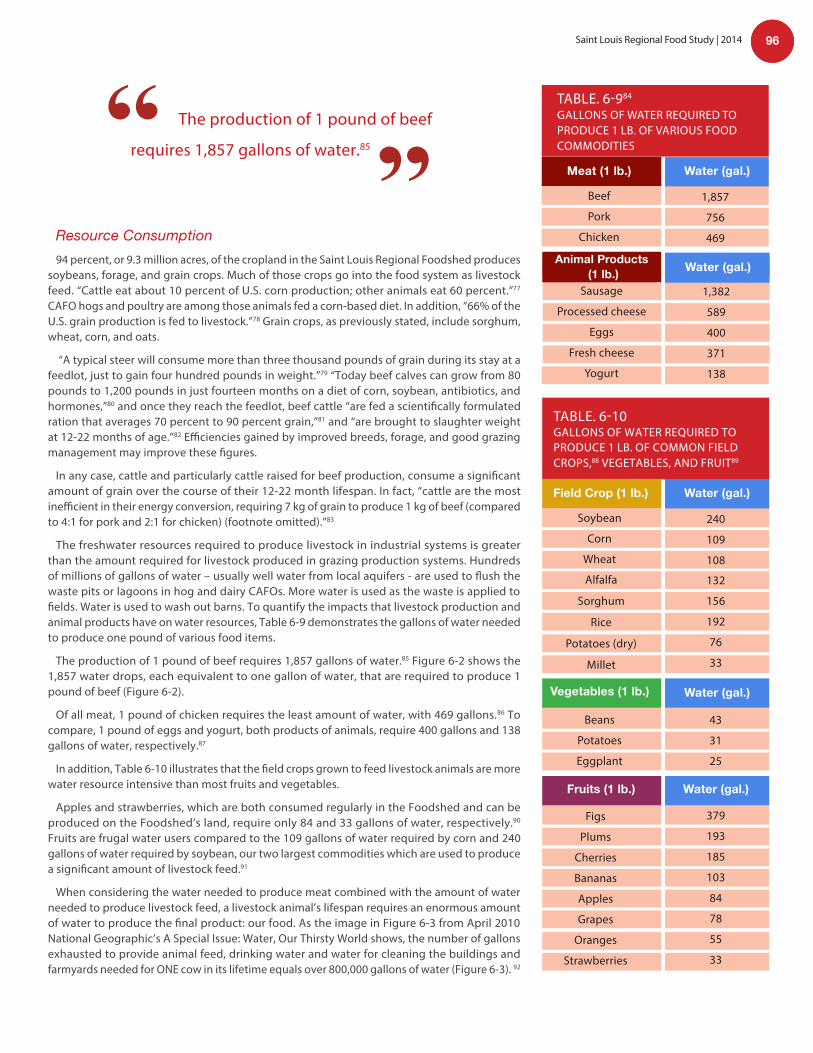
The freshwater resources required to produce livestock in industrial systems is greater than the amount required for livestock produced in grazing production systems. Hundreds of millions of gallons of water – usually well water from local aquifers - are used to flush the waste pits or lagoons in hog and dairy CAFOs. More water is used as the waste is applied to fields. Water is used to wash out barns. To quantify the impacts that livestock production and animal products have on water resources, Table 6-9 demonstrates the gallons of water needed to produce one pound of various food items.
The production of 1 pound of beef requires 1,857 gallons of water.85 Figure 6-2 shows the 1,857 water drops, each equivalent to one gallon of water, that are required to produce 1 pound of beef (Figure 6-2).
Of all meat, 1 pound of chicken requires the least amount of water, with 469 gallons.86 To compare, 1 pound of eggs and yogurt, both products of animals, require 400 gallons and 138 gallons of water, respectively.87
In addition, Table 6-10 illustrates that the field crops grown to feed livestock animals are more water resource intensive than most fruits and vegetables.
Apples and strawberries, which are both consumed regularly in the Foodshed and can be produced on the Foodshed’s land, require only 84 and 33 gallons of water, respectively.90 Fruits are frugal water users compared to the 109 gallons of water required by corn and 240 gallons of water required by soybean, our two largest commodities which are used to produce a significant amount of livestock feed.91
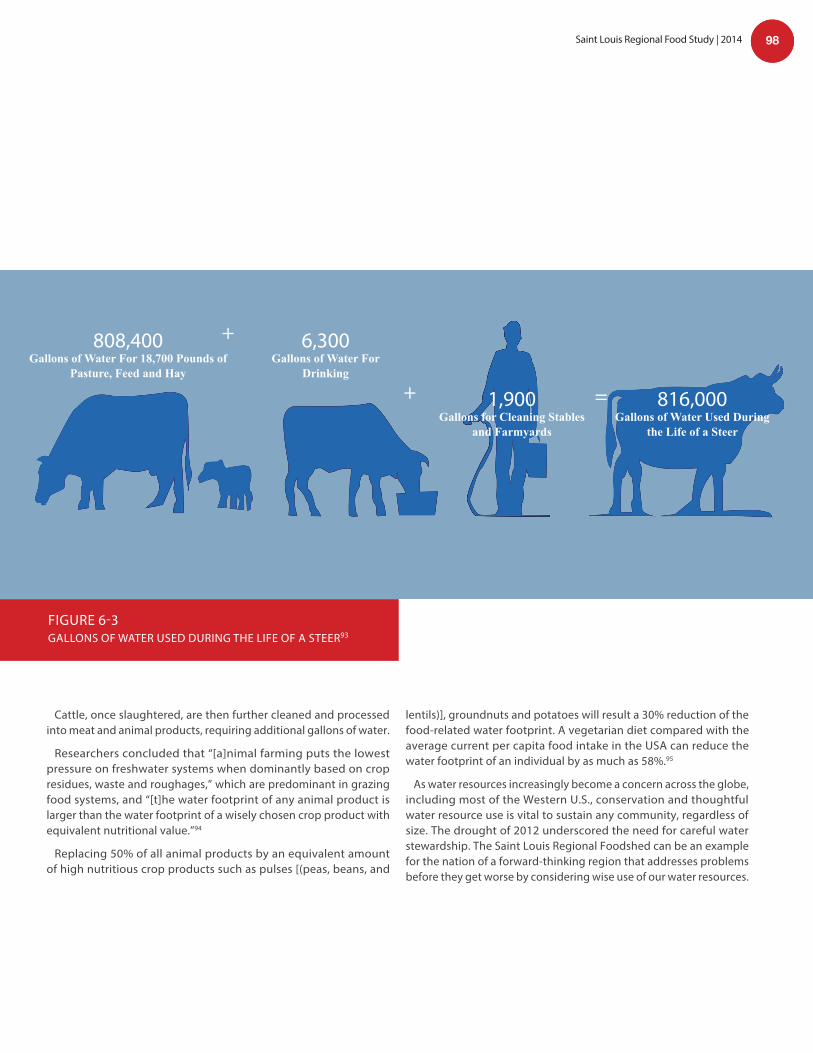
When considering the water needed to produce meat combined with the amount of water needed to produce livestock feed, a livestock animal’s lifespan requires an enormous amount of water to produce the final product: our food. As the image in Figure 6-3 from April 2010 National Geographic’s A Special Issue: Water, Our Thirsty World shows, the number of gallons exhausted to provide animal feed, drinking water and water for cleaning the buildings and farmyards needed for ONE cow in its lifetime equals over 800,000 gallons of water (Figure 6-3). 92
Meat (1 lb.)
1,857
756
469
Water (gal.)Water (gal.)
Animal Products (1 lb.)
1,382
589
400
371
138
Beef
Pork
Chicken
Sausage
Processed cheese
Eggs
Fresh cheese
Yogurt
TABLE. 6-984
GALLONS OF WATER REQUIRED TO PRODUCE 1 LB. OF VARIOUS FOOD COMMODITIES
TABLE. 6-10GALLONS OF WATER REQUIRED TO PRODUCE 1 LB. OF COMMON FIELD CROPS,88 VEGETABLES, AND FRUIT89
Field Crop (1 lb.)
240
109
108
Water (gal.)Water (gal.)
132
156
192
76
33
Soybean
Corn
Wheat
Alfalfa
Sorghum
Rice
Potatoes (dry)
Millet
Beans
Potatoes
Eggplant
Figs
Plums
Cherries
Bananas
Apples
Grapes
Oranges
Strawberries
Water (gal.)
Vegetables (1 lb.) Water (gal.)
Water (gal.)Fruits (1 lb.)
43
31
25
379
193
185
103
84
78
55
33
96Saint Louis Regional Food Study | 2014
The production of 1 pound of beef
requires 1,857 gallons of water.85”“

Saint Louis Regional Food Study - 201416
1,857gallons of water
1 pound of beef
FIGURE. 6-2NUMBER OF GALLONS OF WATER REQUIRED TO PRODUCE 1 POUND OF BEEF = 1 gallon of water
97 Saint Louis Regional Food Study | 2014
Saint Louis Regional Food Study - 2014 17
Cattle, once slaughtered, are then further cleaned and processed into meat and animal products, requiring additional gallons of water.
Researchers concluded that “[a]nimal farming puts the lowest pressure on freshwater systems when dominantly based on crop residues, waste and roughages,” which are predominant in grazing food systems, and “[t]he water footprint of any animal product is larger than the water footprint of a wisely chosen crop product with equivalent nutritional value.”94
Replacing 50% of all animal products by an equivalent amount of high nutritious crop products such as pulses [(peas, beans, and
lentils)], groundnuts and potatoes will result a 30% reduction of the food-related water footprint. A vegetarian diet compared with the average current per capita food intake in the USA can reduce the water footprint of an individual by as much as 58%.95
As water resources increasingly become a concern across the globe, including most of the Western U.S., conservation and thoughtful water resource use is vital to sustain any community, regardless of size. The drought of 2012 underscored the need for careful water stewardship. The Saint Louis Regional Foodshed can be an example for the nation of a forward-thinking region that addresses problems before they get worse by considering wise use of our water resources.
808,400 Gallons of Water For 18,700 Pounds of
Pasture, Feed and Hay
6,300 Gallons of Water For
Drinking
1,900Gallons for Cleaning Stables
and Farmyards
816,000 Gallons of Water Used During
the Life of a Steer
+
+ =
FIGURE 6-3GALLONS OF WATER USED DURING THE LIFE OF A STEER93
98Saint Louis Regional Food Study | 2014
Saint Louis Regional Food Study - 201418
Livestock Waste PollutionLivestock impact our environment beyond resource use. Because
of the industrialization in our livestock systems, the management of livestock waste poses serious problems.
Farmers have relied on animal manure for centuries to fertilize crops because manure contains high levels of nitrogen, a primary nutrient that crops need. With well-managed pastured livestock, the plants provide a source of food for the animals while the animals sustain a source of nutrients for the plants encouraging their growth. Now that animals are confined much of their lives in feedlots or buildings with hundreds to thousands of other animals, manure has become a pollutant rather than an asset. CAFO systems concentrate manure beyond the capacity of the land to absorb it.96 If not absorbed and used by growing plants, excess manure can run into nearby waters or leach into groundwater, causing contamination and pollution concerns with effects including algal blooms, fish kills, or dangerous levels of bacteria.
All confined animal operations produce waste which can be the equivalent in volume to sewage produced by a small city. Based on a 2005 report, animals in U.S. CAFOs (hog, poultry, dairy, and feedlots) produced approximately 335 million tons of dry matter manure waste annually.97 Most CAFO waste in the U.S. is land-applied to adjacent farmland. In Missouri, waste from hog pit barns and lagoons is typically pumped through spraying apparatus and sprayed onto adjacent fields. Chicken litter from Missouri poultry CAFOs is land applied and may be sold or given to other farmers for use as fertilizer. When the amount of manure produced outweighs the land’s ability to incorporate it into the soil, pollution ensues.98 States have come to recognize the need to ensure responsible management for manure from CAFOs.
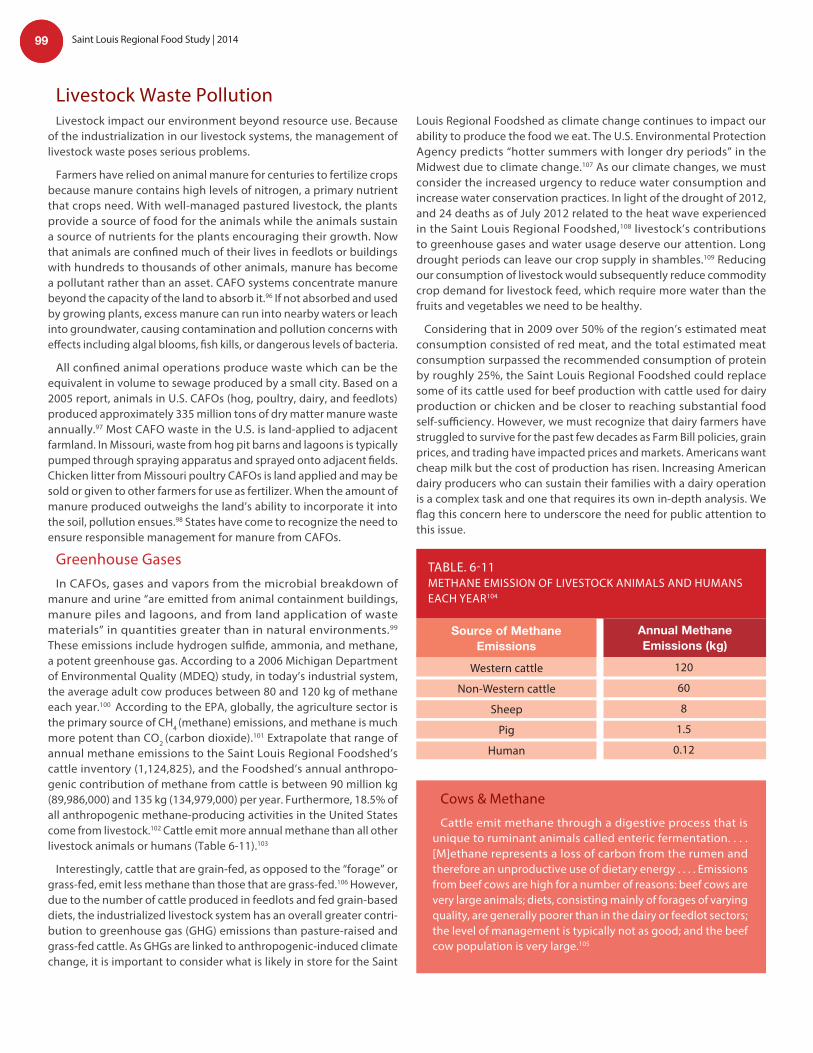
Greenhouse GasesIn CAFOs, gases and vapors from the microbial breakdown of
manure and urine “are emitted from animal containment buildings, manure piles and lagoons, and from land application of waste materials” in quantities greater than in natural environments.99 These emissions include hydrogen sulfide, ammonia, and methane, a potent greenhouse gas. According to a 2006 Michigan Department of Environmental Quality (MDEQ) study, in today’s industrial system, the average adult cow produces between 80 and 120 kg of methane each year.100 According to the EPA, globally, the agriculture sector is the primary source of CH4
(methane) emissions, and methane is much more potent than CO2 (carbon dioxide).101 Extrapolate that range of annual methane emissions to the Saint Louis Regional Foodshed’s cattle inventory (1,124,825), and the Foodshed’s annual anthropo-genic contribution of methane from cattle is between 90 million kg (89,986,000) and 135 kg (134,979,000) per year. Furthermore, 18.5% of all anthropogenic methane-producing activities in the United States come from livestock.102 Cattle emit more annual methane than all other livestock animals or humans (Table 6-11).103
Interestingly, cattle that are grain-fed, as opposed to the “forage” or grass-fed, emit less methane than those that are grass-fed.106 However, due to the number of cattle produced in feedlots and fed grain-based diets, the industrialized livestock system has an overall greater contri-bution to greenhouse gas (GHG) emissions than pasture-raised and grass-fed cattle. As GHGs are linked to anthropogenic-induced climate change, it is important to consider what is likely in store for the Saint
Cows & Methane
Cattle emit methane through a digestive process that is unique to ruminant animals called enteric fermentation. . . . [M]ethane represents a loss of carbon from the rumen and therefore an unproductive use of dietary energy . . . . Emissions from beef cows are high for a number of reasons: beef cows are very large animals; diets, consisting mainly of forages of varying quality, are generally poorer than in the dairy or feedlot sectors; the level of management is typically not as good; and the beef cow population is very large.105
Louis Regional Foodshed as climate change continues to impact our ability to produce the food we eat. The U.S. Environmental Protection Agency predicts “hotter summers with longer dry periods” in the Midwest due to climate change.107 As our climate changes, we must consider the increased urgency to reduce water consumption and increase water conservation practices. In light of the drought of 2012, and 24 deaths as of July 2012 related to the heat wave experienced in the Saint Louis Regional Foodshed,108 livestock’s contributions to greenhouse gases and water usage deserve our attention. Long drought periods can leave our crop supply in shambles.109 Reducing our consumption of livestock would subsequently reduce commodity crop demand for livestock feed, which require more water than the fruits and vegetables we need to be healthy.
Considering that in 2009 over 50% of the region’s estimated meat consumption consisted of red meat, and the total estimated meat consumption surpassed the recommended consumption of protein by roughly 25%, the Saint Louis Regional Foodshed could replace some of its cattle used for beef production with cattle used for dairy production or chicken and be closer to reaching substantial food self-sufficiency. However, we must recognize that dairy farmers have struggled to survive for the past few decades as Farm Bill policies, grain prices, and trading have impacted prices and markets. Americans want cheap milk but the cost of production has risen. Increasing American dairy producers who can sustain their families with a dairy operation is a complex task and one that requires its own in-depth analysis. We flag this concern here to underscore the need for public attention to this issue.
Western cattle
Non-Western cattle
Sheep
Pig
Human
Annual Methane Emissions (kg)
Source of Methane Emissions
120
60
8
1.5
0.12
TABLE. 6-11METHANE EMISSION OF LIVESTOCK ANIMALS AND HUMANS EACH YEAR104
99 Saint Louis Regional Food Study | 2014
Saint Louis Regional Food Study - 2014 19
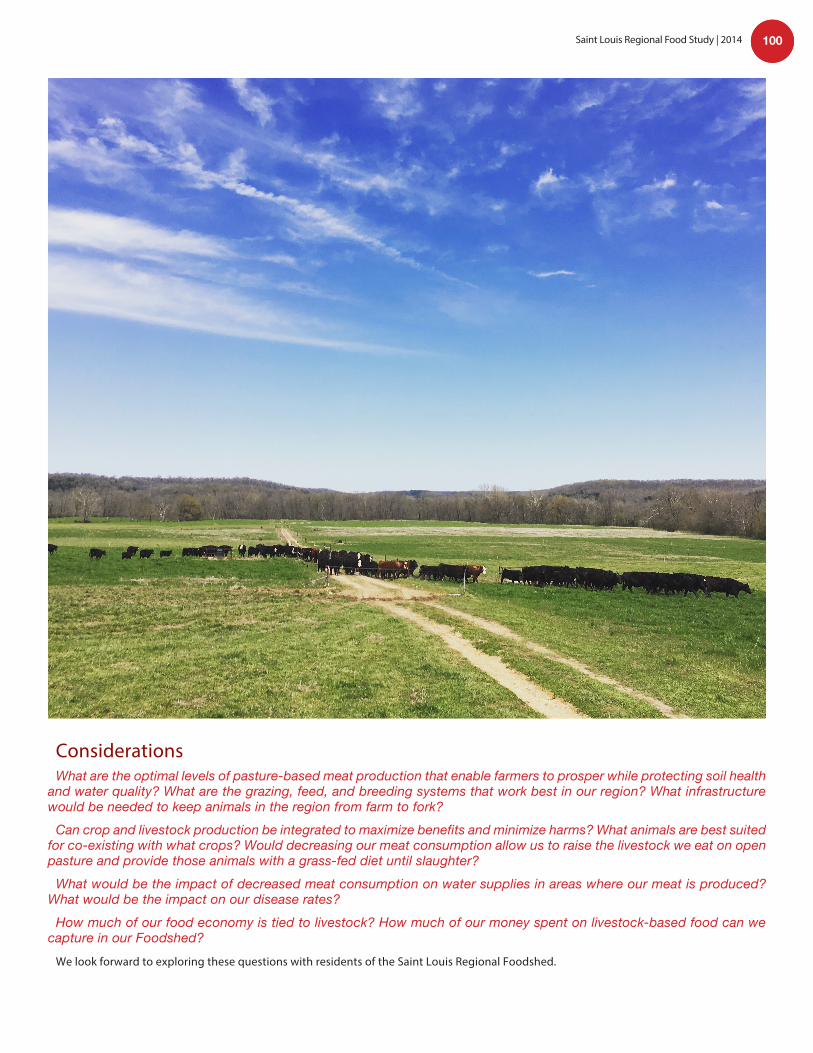
ConsiderationsWhat are the optimal levels of pasture-based meat production that enable farmers to prosper while protecting soil health
and water quality? What are the grazing, feed, and breeding systems that work best in our region? What infrastructure would be needed to keep animals in the region from farm to fork?
Can crop and livestock production be integrated to maximize benefits and minimize harms? What animals are best suited for co-existing with what crops? Would decreasing our meat consumption allow us to raise the livestock we eat on open pasture and provide those animals with a grass-fed diet until slaughter?
What would be the impact of decreased meat consumption on water supplies in areas where our meat is produced? What would be the impact on our disease rates?
How much of our food economy is tied to livestock? How much of our money spent on livestock-based food can we capture in our Foodshed?
We look forward to exploring these questions with residents of the Saint Louis Regional Foodshed.
100Saint Louis Regional Food Study | 2014
Saint Louis Regional Food Study - 201420
1. U.S. Census Bureau, Section 3. Health and Nutrition, in Statistical Ab-stract of the U.S.: 2012, 99, 141, 142 (131st ed. 2011) http://www.census.gov/prod/2011pubs/12statab/health.pdf [hereinafter Section 3. Health and Nutri-tion] (providing 2009-estimated per capita consumption of grain and meat products). Red meat consists of beef, veal, lamb and mutton, and pork. Id. Protein sources consist of meat, poultry, eggs, beans and peas, processed soy products, nuts and seeds, and seafood. U.S. Dep’t of Agric., What Foods are in the Protein Foods Group?, ChooseMyPlate.gov, http://www.choosemyplate.gov/food-groups/protein-foods.html (last visited July 10, 2013) [hereinafter What Foods are in the Protein Foods Group?].2. See U.S. Dep’t of Commerce, Mis-souri, in U.S. Census of Agriculture 1925, 904, 904-16 (1927), http://usda.mannlib.cornell.edu/usda/AgCensusI-mages/1925/01/17/1925-01-17.pdf [hereinafter 1925 Census of Agriculture - Missouri]; U.S. Dep’t of Commerce., Illinois, in U.S. Census of Agriculture 1925, 492, 492-503 (1927), http://usda.mannlib.cornell.edu/usda/AgCensusIm-ages/1925/01/12/1925-01-12.pdf [herein-after 1925 Census of Agriculture - Illinois]; Nat’l Agric. Statistics Serv., U.S. Dep’t of Agric., 2007 Census of Agriculture - Mis-souri - State and County Data 374-88 (2009) http://www.agcensus.usda.gov/Publications/2007/Full_Report/Volume_1,_Chapter_1_State_Level/Missouri/mov1.pdf [hereinafter 2007 Census of Agricul-ture - Missouri]; Nat’l Agric. Statistics Serv., U.S. Dep’t of Agric., 2007 Census of Agriculture - Illinois - State and County Data 359-71 (2009) http://www.agcensus.usda.gov/Publications/2007/Full_Report/Volume_1,_Chapter_2_County_Level/Il-linois/ilv1.pdf [hereinafter 2007 Census of Agriculture - Illinois].3. See 1925 Census of Agriculture – Missouri, supra note 2, at 904-16; 1925 Census of Agriculture – Illinois, supra note 2, at 492-503; 2007 Census of Agriculture – Missouri, supra note 2, at 374-88; 2007 Census of Agriculture - Illinois, supra note 2, at 359-71.4. JoAnn Burkholder et al., Impacts of Waste from Concentrated Animal Feed-ing Operations, Envtl. Health Persp., Feb. 2007, 308, 308, http://www.ncbi.nlm.
nih.gov/pmc/articles/PMC1817674/pdf/ehp0115-000308.pdf.5. See Quick Stats, USDA Nat’l Agricul-ture Stat. Serv., http://quickstats.nass.usda.gov (select “Census” under Pro-gram, select “Animals & Products” under Sector, select “Livestock” and “Poultry” under Group, select “Cattle,” “Chickens,” “Eggs,” “Hogs,” and “Turkeys” under Commodity; select “Production” under Category; select each option with “Op-erations with Production” under Data Item; select “Total” under Domain; select “County” under Geographic Level, select “Missouri” under State, select all Missouri counties in the Saint Louis Regional Food-shed under “County” and select “2007” under year; then select “Get Data”; repeat steps replacing “Illinois” for “Missouri” under State and selecting all Illinois coun-ties in the Saint Louis Regional Foodshed under “County”).6. See 2007 Census of Agriculture - Mis-souri, supra note 2, at 454-68, 419-33, 469-83 (providing inventory numbers for hogs and pigs, cattle and calves, beef cows, milk cows, broilers and other meat-type chickens, layers and turkeys for each county in Missouri); See 2007 Census of Agriculture - Illinois, supra note 2, at 429-41, 398-428, 442-54 (providing inventory numbers for hogs and pigs, cattle and calves, beef cows, milk cows, broilers and other meat-type chickens, layers and tur-keys for each county in Illinois); See 2007 Census Publications - State and County Profiles - Missouri, Census of Agriculture, http://www.agcensus.usda.gov/Publica-tions/2007/Online_Highlights/County_Pro-files/Missouri/ [hereinafter 2007 State and County Profiles - Missouri]; 2007 Census Publications - State and County Profiles - Illinois, Census of Agriculture, http://www.agcensus.usda.gov/Publications/2007/Online_Highlights/County_Profiles/Illi-nois/ [hereinafter 2007 State and County Profiles - Illinois] (follow the hyperlink for each county in the Saint Louis Regional Foodshed to display a summary of the county’s agriculture data, including the top five livestock commodities).7. See 2007 State and County Profiles – Missouri, supra note 6 (follow the hyper-link for each county in the Saint Louis Regional Foodshed to display a summary of the county’s agriculture data, includ-ing the top five livestock commodities);
2007 State and County Profiles – Illinois, supra note 6 (follow the hyperlink for each county in the Saint Louis Regional Food-shed to display a summary of the county’s agriculture data, including the top five livestock commodities).8. See 2007 Census of Agriculture - Mis-souri, supra note 2, at 454-68, 419-33, 469-83 (providing inventory numbers for hogs and pigs, cattle and calves, beef cows, milk cows, broilers and other meat-type chickens, layers and turkeys for each county in Missouri); See 2007 Census of Agriculture - Illinois, supra note 2, at 429-41, 398-428, 442-54 (providing inventory numbers for hogs and pigs, cattle and calves, beef cows, milk cows, broilers and other meat-type chickenrs, layers and turkeys for each county in Illinois).9. See Section 3. Health and Nutrition, supra note 1, at 141.10. See National Family Farm Coalition, Food, Inc. and FRESH: Facts and Solu-tions Needed to Fix the Food System!, http://www.nffc.net/Learn/Fact%20Sheets/food%20inc%20and%20fresh.pdf.11. Wenonah Hauter, Foodopoly: The Battle Over the Future of Food and Farm-ing in America (2012).12. U.S. Dep’t of Commerce, 1987 Census of Agriculture – Missouri State and County Data 7 (1989), http://usda.mannlib.cornell.edu/usda/AgCensusI-mages/1987/01/25/1987-01-25.pdf [hereinafter 1987 Census of Agriculture – Missouri] (providing total number of farms with cattle and calve inventory, total number of farms with beef cow inventory, total cattle and calve inventory, and total beef cow inventory in Missouri for years 1954, 1964, 1974, an 1987); U.S. Dep’t of Commerce, 1987 Census of Agriculture – Illinois State and County Data 7 (1989), http://usda.mannlib.cornell.edu/usda/Ag-CensusImages/1987/01/13/1987-01-13.pdf [hereinafter 1987 Census of Agricul-ture – Illinois] (providing total number of farms with cattle and calve inventory, total number of farms with beef cow inventory, total cattle and calve inventory, and total beef cow inventory in Illinois for years 1954, 1964, 1974, an 1987); 2007 Census of Agriculture - Missouri, supra note 2, at 7 (providing total number of farms with cattle and calve inventory, total number of farms with beef cow inventory, total cattle and calve inventory, and total beef cow
Endnotes
101 Saint Louis Regional Food Study | 2014
Saint Louis Regional Food Study - 2014 21
inventory in Missouri for years 2002 and 2007); 2007 Census of Agriculture - Illinois, supra note 2, at 7 (providing total number of farms with cattle and calve inventory, total number of farms with beef cow inventory, total cattle and calve inventory, and total beef cow inventory in Illinois for years 2002 and 2007).13. Joel Salatin, Folks, This Ain’t Normal 233 (2011) (citing John Ikerd, “a regenerative agriculture evangelist and professor emeri-tus of agricultural economics at the University of Missouri”).14. Nat’l Cattlemen’s Beef Ass’n, Fact Sheet: Feedlot Finishing Cattle 1 (2006) http://www.beefusa.org/uDocs/Feedlot%20finish-ing%20fact%20sheet%20FINAL_4%2026%2006.pdf. [hereinaf-ter Nat’l Cattlemen’s Beef Ass’n]15. See Dep’t of Envtl. Quality, Mo. Dep’t of Natural Res., MO 2012 National Pollutant Discharge Elimination System (NPDES) Animal Feeding Operations [AFOs], Oct. 19, 2012, ftp://msdis.missouri.edu/pub/Environment_conservation/MO_2012_NP-DES_Animal_Feeding_Operations_shp.zip [hereinafter MO 2012 NPDES AFOs]. MCE converted the data using Esri® ArcMap 10.1, © 1999-2012 Esri Inc. to convert the shape file into a KML file, using “Layer to KML Tool” and then subsequently imported the data into Google Earth.16. See General NPDES Permit for Concentrated Animal Feeding Operations, Illinois EPA, http://www.epa.state.il.us/water/permits/cafo/ (providing a list of all NPDES permitted CAFOs in the state with the name and address of each facility) (last visited July 16, 2013). [hereinafter General NPDES Permit for Concentrated Ani-mal Feeding Operations].17. See 1925 Census of Agriculture – Missouri, supra note 2, at 934-48; 1925 Census of Agriculture – Illinois, supra note 2, 520-33; 2007 Census of Agriculture – Missouri, supra note 2, at 251-65; 2007 Census of Agriculture – Illinois, supra note 2, at 251-63.18. See 2007 Census of Agriculture – Missouri, supra note 2, at 251-65; 2007 Census of Agriculture – Illinois, supra note 2, at 251-63.19. See Quick Stats, supra note 5 See Quick Stats, (select “Sur-vey” under Program, select “Animals & Product” under Sector, select “Livestock” under Group, select “Cattle” under Commod-ity, select “Inventory” under Category, select “Cattle, Cows, Beef – Inventory” under Data Item, select “County” under Geographic Area, select “Missouri” under State, and select all Missouri coun-ties in the Saint Louis Regional Foodshed under “County”; select “1950,” “1964,” “1974,” “1987,” “2002,” “2007,” and “2013” un-der Year; then select “Get Data”; repeat steps replacing “Illinois” for “Missouri” under State and selecting all Illinois counties in the Saint Louis Regional Foodshed under “County”).20. See id.21. Id. 22. Id. 23. See 2007 Census of Agriculture - Missouri, supra note 2, at 454-68, 419-33, 469-83 (providing inventory numbers for hogs and pigs, cattle and calves, beef cows, milk cows, broilers and other meat-type chickens, layers and turkeys for each county in Missouri); See 2007 Census of Agriculture - Illinois, supra note 2, at 429-441, 398-428, 442-54 (providing inventory numbers for hogs and pigs, cattle and calves, beef cows, milk cows, broilers and other meat-type chickens, layers and turkeys for each county in Illinois); See 2007 State and County Profiles – Missouri supra note 6; See 2007 State and County Profiles – Illinois supra note 6; (follow the hyperlink for each county in the Saint Louis Regional Foodshed to display a summary of the county’s agriculture data).
24. Section 3. Health and Nutrition, supra note 1, at 141.25. Small Meat Processors Working Group, Iowa State Univ. Extension, Beef and Pork Whole Animal Buying Guide 16 (2013) http://www.extension.iastate.edu/publications/pm2076.pdf [here-inafter Beef and Pork Whole Animal Buying Guide].26. Id. at 21.27. See 1925 Census of Agriculture – Missouri, supra note 2, at 905-16; 1925 Census of Agriculture – Illinois, supra note 2, at 492-503; 2007 Census of Agriculture - Illinois, supra note 2 at 359-71; 2007 Census of Agriculture - Missouri, supra note 2 at 374-88.28. About Us, Am. Grassfed Ass’n, http://www.americangrass-fed.org/about-us/ (last visited July 11, 2013).29. Producer Members by State, Am. Grassfed Ass’n, http://www.americangrassfed.org/producer-profiles/producer-mem-bers-by-state/ (last visited July 11, 2013).30. Id.31. Our Standards, Am. Grassfed Ass’n, http://www.american-grassfed.org/about-us/our-standards/ (last visited Aug. 5, 2014).32. See Pastured Products Directory – Missouri, Eat Wild, http://www.eatwild.com/products/missouri.html.33. See 1987 Census of Agriculture – Missouri, supra note 12, at 7 (providing total milk cow inventory and total number of farms with milk cow inventory in Missouri for years 1954, 1964, 1974, an 1987); 1987 Census of Agriculture – Illinois, supra note 12, at 7 (providing total milk cow inventory and total number of farms with milk cow inventory in Illinois for years 1954, 1964, 1974, an 1987); 2007 Census of Agriculture - Missouri, supra note 2, at 7 (providing total milk cow inventory and total number of farms with milk cow inventory in Missouri for years 2002 and 2007); 2007 Census of Agriculture - Illinois, supra note 2, at 7 (providing total milk cow inventory and total number of farms with milk cow inventory in Illinois for years 2002 and 2007).34. See Quick Stats, supra note 5 (Select “Census” under Pro-gram, select “Animals & Products” under Sector, select “Dairy” under Group, select “Milk” under Commodity, select “Milk, Incl Other Dairy Products - Operations with Sales” under Data Item, select “Total” under Domain, select “County” under Geographic Level, select “Missouri” under State, and select all Missouri counties in the Saint Louis Regional Foodshed under “County”; select “1997,” “2002,” and “2007,” under Year; then select “Get Data”; repeat steps replacing “Illinois” for “Missouri” under State and selecting all Illinois counties in the Saint Louis Regional Foodshed under “County”).35. See 2007 Census of Agriculture - Missouri, supra note 2, at 419-33; 2007 Census of Agriculture - Illinois, supra note 2, at 398-428.36. See 1925 Census of Agriculture – Missouri, supra note 2, at 934-48; 1925 Census of Agriculture – Illinois, supra note 2, at 520-33.37. Rachel J. Johnson, U.S. Dep’t of Agric., Econ. Research Serv., Livestock, Dairy, and Poultry Outlook 15 (2013), http://www.ers.usda.gov/media/1131331/ldpm228.pdf.38. See MO 2012 NPDES AFOs, supra note 15.39. See General NPDES Permit for Concentrated Animal Feeding Operations, supra note 16.40. See Quick Stats, supra note 5 (select “Survey” under Pro-gram, select “Animals & Product” under Sector, select “Live-stock” under Group, select “Cattle” under Commodity, select “In-ventory” under Category, select “Cattle, Cows, Milk – Inventory”
102Saint Louis Regional Food Study | 2014
Saint Louis Regional Food Study - 201422
under Data Item, select “County” under Geographic Area, select “Missouri” under State, and select all Missouri counties in the Saint Louis Regional Foodshed under “County”; select “1925,” “1934,” “1949,” “1964,” “1974,” “1987,” “2002,” “2007,” and “2013” under Year; then select “Get Data”; repeat steps replacing “Illinois” for “Missouri” under State and selecting all Illinois coun-ties in the Saint Louis Regional Foodshed under “County”).41. See 1987 Census of Agriculture – Missouri, supra note 12, at 7 (providing total number of farms with hog and pig inventory and total number of farms with hogs and pigs sold in Missouri for years 1954, 1964, 1974, an 1987); 1987 Census of Agriculture – Illinois, supra note 12, at 7 (providing total number of farms with hog and pig inventory and total number of farms with hogs and pigs sold in Illinois for years 1954, 1964, 1974, an 1987); 2007 Census of Agriculture: Missouri, supra note 2, at 7 (providing total number of farms with hog and pig inventory and total number of farms with hogs and pigs sold in Missouri for years 2002 and 2007); 2007 Census of Agriculture: Illinois, supra note 2, at 7 (providing total number of farms with hog and pig inventory and total number of farms with hogs and pigs sold in Illinois for years 2002 and 2007).42. See 1987 Census of Agriculture – Missouri, supra note 12, at 7 (providing total hog and pig inventory and total number of hogs and pigs sold in Missouri for years 1954, 1964, 1974, an 1987); 1987 Census of Agriculture – Illinois, supra note 12, at 7 (provid-ing total hog and pig inventory and total number of hogs and pigs sold in Illinois for years 1954, 1964, 1974, an 1987); 2007 Census of Agriculture: Missouri, supra note 2, at 7 (providing total hog and pig inventory and total number of hogs and pigs sold in Missouri for years 2002 and 2007); 2007 Census of Agriculture: Illinois, supra note 2, at 7 (providing total hog and pig inventory and total number of hogs and pigs sold in Illinois for years 2002 and 2007).43. See 2007 Census of Agriculture - Missouri, supra note 2, at 454-68; 2007 Census of Agriculture - Illinois, supra note 2, at 429-44.44. See MO 2012 NPDES AFOs, supra note 15.45. See General NPDES Permit for Concentrated Animal Feeding Operations, supra note 16.46. Id.47. Section 3. Health and Nutrition, supra note 1, at 141.48. Beef and Pork Whole Animal Buying Guide, supra note 25, at 16.49. Missouri Swine Audit, U. Mo. Extension Commercial Agric. Program, http://agebb.missouri.edu/commag/swine/audit/ (last visited June 25, 2013).50. Id.51. See 1987 Census of Agriculture – Missouri, supra note 12, at 7 (providing total broilers and other meat-type chickens sold in Missouri for years 1954, 1964, 1974, an 1987); 1987 Cen-sus of Agriculture – Illinois, supra note 12, at 7 (providing total broilers and other meat-type chickens sold in Illinois for years 1954, 1964, 1974, an 1987); 2007 Census of Agriculture: Mis-souri, supra note 2, at 7 (providing number of broilers and other meat type-chickens sold in Missouri for years 2002 and 2007); 2007 Census of Agriculture - Illinois, supra note 2, at 7 (providing number of broilers and other meat type-chickens sold in Illinois for years 2002 and 2007).52. See Map Viewer – Layer Chooser 2.0, Mo. Dep’t of Nat. Res., http://dnr.mo.gov/internetmapviewer/setup.map (select
“Waste” under the CATEGORY column, then select “NPDES Animal Feeding Operations” under the AVAILABLE LAYERS column, then select “Make Map” button at top of page and follow hyperlink; select the “Select by Rectangle” button in the tool bar and drag across the entire map of Missouri; then select “Search/Find” button in the tool bar and follow hyperlink; select “NPDES Animal Feeding Operations” from the drop down menu next to “Change Layer to”; type “Broiler, Fryer, and Roaster Chickens” in the search bar next to “For this word* or phrase* or number,” select the “Search” button and follow hyperlink; then view the number NPDES-permitted “Broiler, Fryer, and Chickens” facilities corresponding with southwest Missouri counties under the “FAC County” column and view the CAFO category of each facility un-der the “P_CAT” column; select “Next Set” at the top of the data sheet to continue viewing the location and size of all broiler, fryer, and roaster chickens facilities in Missouri). 53. See 2007 Census of Agriculture - Missouri, supra note 2, at 469-83 (providing inventory for broilers and other meat-type chickens for each county in Missouri); 2007 Census of Agriculture - Illinois, supra note 2, at 442-54 (providing inventory for broilers and other meat-type chickens for each county in Illinois).54. See 2007 State and County Profiles - Missouri, supra note 6 (follow the hyperlink for Bollinger county to display a summary of the county’s agriculture data, including the top five livestock commodities; then follow the hyperlink for Osage county to display a summary of the county’s agriculture data, including the top five livestock commodities ); 2007 State and County Profiles - Illinois, supra note 6 (follow the hyperlink for Fayette county to display a summary of the county’s agriculture data, including the top five livestock commodities).55. See General NPDES Permit for Concentrated Animal Feeding Operations, supra note 16.56. See MO 2012 NPDES AFOs, supra note 15.57. Mo. Dep’t of Natural Res., Guide to Animal Feeding Opera-tions 1 (2011) http://www.dnr.mo.gov/pubs/pub915.pdf [hereinaf-ter Guide to Animal Feeding Operations].58. Nat’l Agric. Statistics Serv., U.S. Dep’t of Agric., Poultry - Production and Value, 2007 Summary 3 (2008) http://usda01.library.cornell.edu/usda/nass/PoulProdVa//2000s/2008/PoulProd-Va-04-28-2008.pdf.59. See 2007 State and County Profiles – Missouri supra note 2 at 469-83 (providing inventory numbers for layers for each county in Missouri); See 2007 Census of Agriculture - Illinois, supra note 2, at 442-54 (providing inventory numbers for layers for each county in Illinois). “Layers . . . include[] table-egg type layers, hatching layers for meat-types, and hatching layers for table egg types. In 2002, this category was referred to as Layers 20 weeks and older. This is a wording change only; data are comparable.” Nat’l Agric. Statistics Serv., U.S. Dep’t of Agric., 2007 Census of Agriculture - Appendix B. General Explanation and Census of Agriculture Report Form, B-1 (2009), http://www.agcensus.usda.gov/Publications/2007/Full_Report/Volume_1,_Chapter_1_US/usappxb.pdf.60. Leo Horrigan et al., How Sustainable Agriculture Can Address the Environmental and Human Health Harms of Industrial Agri-culture, 110 Env’t Health Persp. 5, 445 (2002), available at http://dx.doi.org/10.1289/ehp.02110445.61. Food & Water Watch, Food Safety Consequences of Factory Farms 3 (2007) http://documents.foodandwaterwatch.org/doc/FoodSafetyFactoryFarms.pdf (citing Doohoo I. et al, Report of the
103 Saint Louis Regional Food Study | 2014
Saint Louis Regional Food Study - 2014 23
Canadian Veterinary Medical Association Expert Panel on rBST, Health Canada (1998)).62. See Levi et al., Processed Meat and the Risk of Selected Digestive Tract and Laryngeal Neoplasms in Switzerland, 15 J. Annals Oncology 346, 346 (2004) http://annonc.oxfordjournals.org/content/15/2/346.full.pdf.63. See Horrigan, et al., supra note 60, at 449.64. Id. at 449.65. Id. at 445.66. Id. at 450.67. Michael Bomford, FOOD:Getting Fossil Fuels Off The Plate 4 (2011) http://www.postcarbon.org/Reader/PCReader-Bomford-Food.pdf.68. Windy Lake Farm, LLC pamphlet. For more information, con-tact [email protected]. Id. (citing Letitia L. Star, The Best Foods to Reduce Choles-terol, The Herb Companion (Feb./Mar. 2012) http://www.herb-companion.com/heal/health/best-foods-to-reduce-cholesterol-zmrz12fmzdeb.aspx?page=4).70. Cheryl Long & Tabitha Alterman, Meet Real Free-Range Eggs, Mother Earth News (2007) http://www.motherearthnews.com/real-food/tests-reveal-healthi-er-eggs.aspx#axzz2hufyockg.71. Id.72. What’s the Problem?, EPA (June 2, 2011), http://www.epa.gov/region9/animalwaste/problem.html.73. Nat’l Inst. for Occupational Safety & Health, Centers for Disease Control & Prevention, Preventing Deaths of Farm Work-ers in Manure Pits (1990) available at http://www.cdc.gov/niosh/docs/90-103/.74. Howard J. Doss, Howard L. Person & William McLeod, Mich. State Univ. Extension, Beware of Manure Pit Hazards 1 (1993) http://www.nasdonline.org/static_content/documents/1298/d001097.pdf.75. Randy L. Beaver & William E. Field, Summary of Documented Fatalities in Livestock Manure Storage and Handling Facili-ties-1975-2004, 12 J. Agromedicine 3, 3 (2007) available at http://www.tandfonline.com/doi/abs/10.1300/J096v12n02_02#preview.76. Horrigan et al., supra note 60, at 451.77. Harvey Blatt, America’s Food, What You Don’t Know About What You Eat 136 (2008).78. Horrigan et al., supra note 60, at 447.79. Eric Schlosser, Fast Food Nation 150 (First Perennial ed. 2002).80. Blatt, supra note 77.81. Nat’l Cattlemen’s Beef Ass’n, supra note 14.82. Marcy Lowe & Gary Gereffi, Duke Univ., Center on Globaliza-tion, Governance & Competitiveness, A Value Chain Analysis of the U.S. Beef and Dairy Industries 6 (2009) http://www.cggc.duke.edu/environment/valuechainanalysis/CGGC_BeefDairyRe-port_2-16-09.pdf.83. Horrigan et al., supra note 60, at 445.84. Hidden Water, A Special Issue: Water, Our Thirsty World, Nat’l Geographic, April 2010, at 16 (providing a special supple-ment, World Rivers/Water Footprint, which illustrates the gallons of water needed to produce common food products) [hereinafter Hidden Water].85. Id.86. See id. (providing a special supplement, World Rivers/Water Footprint, which illustrates the gallons of water needed to pro-
duce common food products).87. Id.88. David Pimentel et al., Water Resources: Agricultural and Envi-ronmental Issues, 54 BioScience 909, 911 (2004).89. See Hidden Water, supra note 84 (providing a special supple-ment, World Rivers/Water Footprint, which illustrates the gallons of water needed to produce common food products).90. Id. 91. Id. 92. See id. (providing an inserted infographic with gallons of wa-ter needed for a steer over the course of its lifetime); The Hidden Water We Use, Nat’l Geographic, http://environment.national-geographic.com/environment/freshwater/embedded-water/ (last visited Aug. 6, 2014).93. See Hidden Water, supra note 84 (providing a special supple-ment, World Rivers/Water Footprint, which illustrates the gallons of water needed by a steer over the course of a lifetime).94. M.M. Mekonnen & A.Y. Hoekstra, The Blue, Green, and Grey Water Footprint of Farm Animals and Animal Products, Volume 1: Main Report 9 (2010), http://www.waterfootprint.org/Reports/Report-48-WaterFootprint-AnimalProducts-Vol1.pdf (emphasis added).95. Id. at 29.96. Horrigan et al., supra note 60, at 448.97. FY-2005 Annual Report Manure and Byproduct Utilization Na-tional Program 206, USDA Agricultural Research Service (Oct. 28, 2008), http://www.ars.usda.gov/research/programs/programs.htm?np_code=206&docid=13337.98. Horrigan et al., supra note 60, at 448.99. Toxic Steering Group, MDEQ, Confined Animal Feeding Oper-ations (CAFOs) Chemicals Associated with Air Emissions 2 (2006) http://www.michigan.gov/documents/CAFOs-Chemicals_Associ-ated_with_Air_Emissions_5-10-06_158862_7.pdf.100. Id. at 8.101. Overview of Greenhouse Gases-Methane, EPA, http://www.epa.gov/ghgemissions/overview-greenhouse-gases#methane. 102. Toxic Steering Group, supra note 99 (citing National Re-source Council 2003).103. Dan Bell, The Methane Makers, BBC News Magazine, Oct. 28 2009, http://news.bbc.co.uk/2/hi/uk_news/maga-zine/8329612.stm.104. See id.105. Ruminant Livestock, EPA, http://www.epa.gov/rlep/faq.html (last updated Mar. 21, 2007).106. Bell, supra note 103.107. Source of image: Climate Change, EPA (Feb. 22, 2012), http://epa.gov/climatechange/index.html. [hereinafter Climate Change].108. Mike Lear, Study: St. Louis Experiencing More Frequent Heat Waves, Missouri Net (Aug. 1, 2012) http://www.missourinet.com/2012/08/01/study-st-louis-experiencing-more-frequent-heat-waves/.109. Climate Change, supra note 107.
104Saint Louis Regional Food Study | 2014
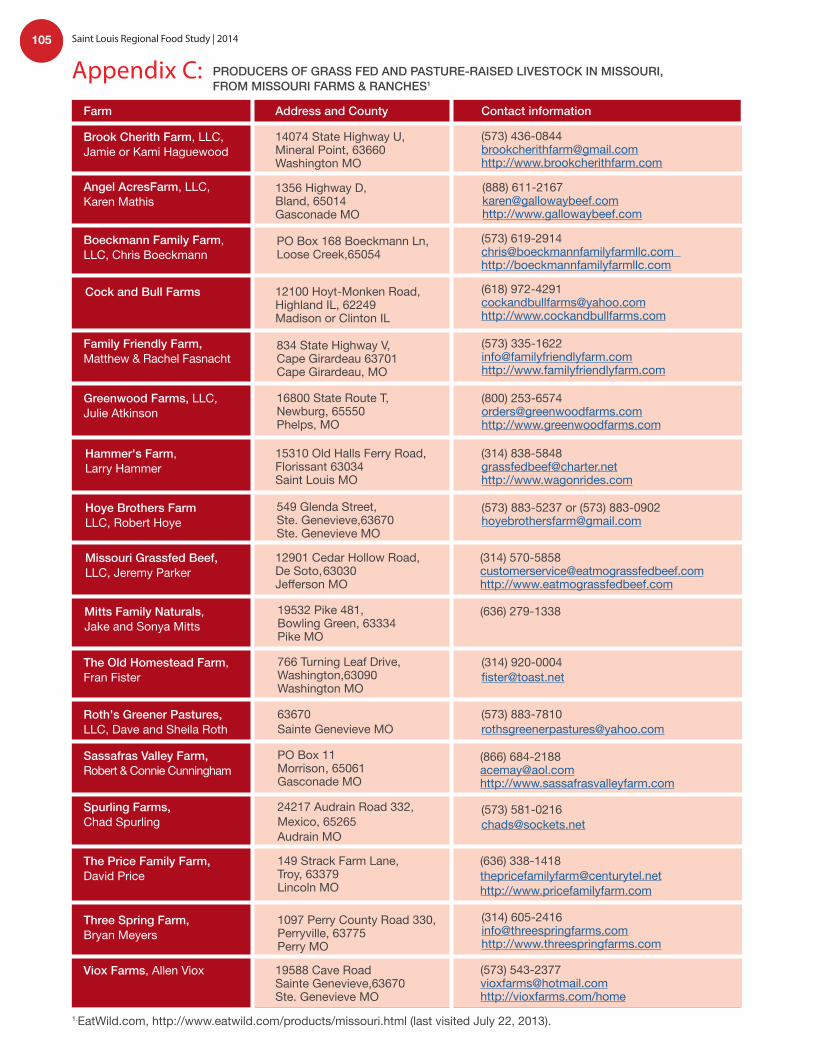
Saint Louis Regional Food Study - 201424
Appendix C: Farm Address and County Contact information
Brook Cherith Farm, LLC, Jamie or Kami Haguewood
14074 State Highway U, Mineral Point, 63660 Washington MO
(573) 436-0844 [email protected] http://www.brookcherithfarm.com
Angel AcresFarm, LLC, Karen Mathis
1356 Highway D, Bland, 65014Gasconade MO
(888) 611-2167 [email protected] http://www.gallowaybeef.com
Boeckmann Family Farm, LLC, Chris Boeckmann
PO Box 168 Boeckmann Ln, Loose Creek,65054
(573) 619-2914 [email protected] http://boeckmannfamilyfarmllc.com
Cock and Bull Farms 12100 Hoyt-Monken Road, Highland IL, 62249Madison or Clinton IL
(618) [email protected]://www.cockandbullfarms.com
Family Friendly Farm, Matthew & Rachel Fasnacht
834 State Highway V, Cape Girardeau 63701 Cape Girardeau, MO
(573) 335-1622 [email protected] http://www.familyfriendlyfarm.com
Greenwood Farms, LLC, Julie Atkinson
16800 State Route T, Newburg, 65550 Phelps, MO
(800) [email protected]://www.greenwoodfarms.com
Hammer's Farm, Larry Hammer
15310 Old Halls Ferry Road, Florissant 63034Saint Louis MO
(314) [email protected]://www.wagonrides.com
Hoye Brothers Farm LLC, Robert Hoye
549 Glenda Street, Ste. Genevieve,63670 Ste. Genevieve MO
(573) 883-5237 or (573) 883-0902 [email protected]
Missouri Grassfed Beef, LLC, Jeremy Parker
12901 Cedar Hollow Road,De Soto, 63030 Jefferson MO
(314) 570-5858 [email protected]://www.eatmograssfedbeef.com
Mitts Family Naturals, Jake and Sonya Mitts
19532 Pike 481, Bowling Green, 63334 Pike MO
(636) 279-1338
The Old Homestead Farm, Fran Fister
766 Turning Leaf Drive,Washington,63090Washington MO
(314) 920-0004 [email protected]
Roth's Greener Pastures, LLC, Dave and Sheila Roth
63670 Sainte Genevieve MO
(573) 883-7810 [email protected]
Sassafras Valley Farm, Robert & Connie Cunningham
PO Box 11 Morrison , 65061 Gasconade MO
(866) 684-2188 [email protected] http://www.sassafrasvalleyfarm.com
Spurling Farms, Chad Spurling
24217 Audrain Road 332, Mexico, 65265Audrain MO
(573) 581-0216 [email protected]
The Price Family Farm, David Price
149 Strack Farm Lane, Troy, 63379Lincoln MO
(636) 338-1418 [email protected] http://www.pricefamilyfarm.com
1097 Perry County Road 330, Perryville, 63775Perry MO
(314) 605-2416 [email protected] http://www.threespringfarms.com
Three Spring Farm, Bryan Meyers
Viox Farms, Allen Viox 19588 Cave Road Sainte Genevieve,63670 Ste. Genevieve MO
(573) [email protected]://vioxfarms.com/home
PRODUCERS OF GRASS FED AND PASTURE-RAISED LIVESTOCK IN MISSOURI, FROM MISSOURI FARMS & RANCHES1
1.EatWild.com, http://www.eatwild.com/products/missouri.html (last visited July 22, 2013).
105 Saint Louis Regional Food Study | 2014
Copyright © 2022 FDOKUMEN